![Government Regulation of Religious Minorities [DRAFT]](https://static.fdokumen.com/doc/165x107/631bdcfa93f371de1901292e/government-regulation-of-religious-minorities-draft.jpg)
Universality of vocational interest structure among racial and ethnic minorities
9
Universality of Vocational Interest Structure Among Racial and Ethnic Minorities Susan X Day and James Rounds University of Illinois at Urbana-Champaign Some multicultural theory holds that it is quite possible for subgroups within the United States to have such di- vergent thought patterns from the White majority that mainstream psychological inventories are inappropriate measures. Differences in the circular structure of J. L. Holland's (1959, 1997) Realistic, Investigative, Artistic, Social, Enterprising, and Conventional vocational inter- ests were investigated across racial and ethnic groups (African Americans, Mexican Americans, Asian Ameri- cans, Native Americans, and Caucasians; N = 49,450), separated by sex. Three-way individual-differences scal- ing revealed that the 10 groups' responses reflected a markedly similar underlying structure, consistent with conventional interpretations of vocational interest pat- terns. The common structure of vocational interests is theoretically related to R. R. McCrae and P. T. Costa's (1997) claim of personality structure as a universal. ~ f you enjoy learning how the brain works, what would you rather do this weekend: explore a science museum or run a lawn mower? Which are more alike: teachers and social workers or pig farmers and jet pilots? The answers seem self-evident. This kind of association be- tween activities that share certain qualities is the basis for interest inventories used in career counseling, inventories that assume a certain structure of likenesses and differ- ences among activities. According to the reasoning of such inventories, people consider teaching and social work as more alike than pig farming and jet piloting. This line of reasoning proceeds to the assumption that if one likes doing social work, then one is more likely to enjoy teaching than a less similar activity, such as jet piloting, and it is this assumption that justifies the use of interest inventories in career counseling. Underlying this reasoning is a belief that people apprehend similar con- stellations of activities--that is, there is no small group of folk dwelling in some remote hollow who actually see pig farming and jet piloting as practically alike and teaching and social work as virtual opposites. This belief is challenged by multicultural theory, which holds that indeed it is quite possible for subgroups within the United States to have such divergent thought patterns. Because it has been shown that subgroups hold their own distinct points of view on weighty subjects like sex, time, individualism, illness, and religion (D. W. Sue & Sue, 1990), it is not inconceivable that the world of work activities has various geographies. Recent re- search and speculation have questioned the use of interest inventories with ethnic groups in the United States: It seems that the structure of scale scores based on Whites' responses does not hold true for responses from ethnic minorities (Haverkamp, Collins, & Hansen, 1994; Rounds & Tracey, 1996). Rounds and Tracey studied the fit of the most popular model of vocational interest struc- ture (Holland's, 1959, 1997; discussed further forthwith) with data from male and female samples of African Americans, American Indians, Hispanics, and Asian Americans. They used a metastructural analysis finding a better fit with data from 73 U.S. White-majority sam- ples than with data from 20 U.S. ethnic samples. If it is true that the inventory scales do not hold the same psychological meaning for members of various groups, standard interpretations of the outcomes cannot be valid (Ben-Porath, 1990). Are There Human Universals? The same argument has been proferred about personality inventories and the underlying structure of personality among various groups: If race and culture affect the basic building blocks of personality, inventories derived from White European and American people should not be ad- ministered and interpreted in the same ways as they are for other groups of people (S. Sue, Keefe, Enomoto, Durvasula, & Chao, 1996). McCrae and Costa (1997) addressed this argument, presenting evidence of a com- mon human structure of personality. They found that the five-factor model, which portrays human traits in terms of the five dimensions of Neuroticism versus Emotional Editor's note. Melissa G. Warren served as action editor for this article. Author's note. Susan X Day and James Rounds, Department of Educa- tional Psychology, University of Illinois at Urbana-Champaign. We wish to thank several colleagues who read, commented on, and shaped this article: Howard Berenbaum, Dov Cohen, Ed Diener, Fritz Drasgow, Lawrence Hubert, Larry Jones, Michelle Perry, Dale Prediger, Julian Rappaport, and Kyle Swaney. Our point of view in this article does not necessarily represent that of these individuals. Correspondence concerning this article should be addressed to Susan X Day, Department of Educational Psychology, University of Illinois at Urbana-Champaign, 210 Education Building, 1310 South Sixth Street, Champaign, IL 61820. Electronic mail may be sent to sx-day @ uiuc.edu. 728 July 1998 • American Psychologist Copyright 1998by the American Psychological Association, Inc. 0003-066X/98/$2.00 Vol. 53, No. 7,728-736
Transcript of Universality of vocational interest structure among racial and ethnic minorities

Universality of Vocational Interest Structure Among Racial and Ethnic Minorities
Susan X Day and James Rounds University of Illinois at Urbana-Champaign
Some multicultural theory holds that it is quite possible for subgroups within the United States to have such di- vergent thought patterns from the White majority that mainstream psychological inventories are inappropriate measures. Differences in the circular structure of J. L. Holland's (1959, 1997) Realistic, Investigative, Artistic, Social, Enterprising, and Conventional vocational inter- ests were investigated across racial and ethnic groups (African Americans, Mexican Americans, Asian Ameri- cans, Native Americans, and Caucasians; N = 49,450), separated by sex. Three-way individual-differences scal- ing revealed that the 10 groups' responses reflected a markedly similar underlying structure, consistent with conventional interpretations of vocational interest pat- terns. The common structure of vocational interests is theoretically related to R. R. McCrae and P. T. Costa's (1997) claim of personality structure as a universal.
~ f you enjoy learning how the brain works, what would you rather do this weekend: explore a science museum or run a lawn mower? Which are more alike: teachers
and social workers or pig farmers and jet pilots? The answers seem self-evident. This kind of association be- tween activities that share certain qualities is the basis for interest inventories used in career counseling, inventories that assume a certain structure of likenesses and differ- ences among activities. According to the reasoning of such inventories, people consider teaching and social work as more alike than pig farming and jet piloting. This line of reasoning proceeds to the assumption that if one likes doing social work, then one is more likely to enjoy teaching than a less similar activity, such as jet piloting, and it is this assumption that justifies the use of interest inventories in career counseling. Underlying this reasoning is a belief that people apprehend similar con- stellations of activities--that is, there is no small group of folk dwelling in some remote hollow who actually see pig farming and jet piloting as practically alike and teaching and social work as virtual opposites.
This belief is challenged by multicultural theory, which holds that indeed it is quite possible for subgroups within the United States to have such divergent thought patterns. Because it has been shown that subgroups hold their own distinct points of view on weighty subjects like sex, time, individualism, illness, and religion (D. W. Sue & Sue, 1990), it is not inconceivable that the world
of work activities has various geographies. Recent re- search and speculation have questioned the use of interest inventories with ethnic groups in the United States: It seems that the structure of scale scores based on Whites' responses does not hold true for responses from ethnic minorities (Haverkamp, Collins, & Hansen, 1994; Rounds & Tracey, 1996). Rounds and Tracey studied the fit of the most popular model of vocational interest struc- ture (Holland's, 1959, 1997; discussed further forthwith) with data from male and female samples of African Americans, American Indians, Hispanics, and Asian Americans. They used a metastructural analysis finding a better fit with data from 73 U.S. White-majority sam- ples than with data from 20 U.S. ethnic samples. If it is true that the inventory scales do not hold the same psychological meaning for members of various groups, standard interpretations of the outcomes cannot be valid (Ben-Porath, 1990).
Are There Human Universals?
The same argument has been proferred about personality inventories and the underlying structure of personality among various groups: If race and culture affect the basic building blocks of personality, inventories derived from White European and American people should not be ad- ministered and interpreted in the same ways as they are for other groups of people (S. Sue, Keefe, Enomoto, Durvasula, & Chao, 1996). McCrae and Costa (1997) addressed this argument, presenting evidence of a com- mon human structure of personality. They found that the five-factor model, which portrays human traits in terms of the five dimensions of Neuroticism versus Emotional
Editor 's note. Melissa G. Warren served as action editor for this article.
Author ' s note. Susan X Day and James Rounds, Department of Educa- tional Psychology, University of Illinois at Urbana-Champaign.
We wish to thank several colleagues who read, commented on, and shaped this article: Howard Berenbaum, Dov Cohen, Ed Diener, Fritz Drasgow, Lawrence Hubert, Larry Jones, Michelle Perry, Dale Prediger, Julian Rappaport, and Kyle Swaney. Our point of view in this article does not necessarily represent that of these individuals.
Correspondence concerning this article should be addressed to Susan X Day, Department of Educational Psychology, University of Illinois at Urbana-Champaign, 210 Education Building, 1310 South Sixth Street, Champaign, IL 61820. Electronic mail may be sent to sx-day @ uiuc.edu.
728 July 1998 • American Psychologist Copyright 1998 by the American Psychological Association, Inc. 0003-066X/98/$2.00
Vol. 53, No. 7,728-736
Susan X Day Photo by Christopher Rory Photography
Stability; Extraversion or Surgency; Openness to Experi- ence or Intellect, Imagination, or Culture; Agreeableness versus Antagonism; and Conscientiousness or Will to Achieve, represents a human universal. English-speaking, German, Portuguese, Hebrew, Chinese, Korean, and Jap- anese samples conformed to the five-factor model, in spite of differing language families and cultural variables. Earlier, Paunonen, Jackson, Trzebinski, and Forsterling (1992) had found the five-factor model highly robust among samples from Canada, Finland, Poland, and Ger- many, using both verbal and nonverbal personality inven- tories. McCrae and Costa invited researchers in other areas, such as vocational psychology, to investigate the possibilities of universality.
The invitation comes at a germane moment for the field of vocational psychology: After more than 20 years of research with mixed results concerning the applicabil- ity of vocational interest models across cultures, in this article we maintain that large-scale studies of U.S. multi- cultural samples now support the sturdiness of Holland's (1959, 1997) six-type model, which is the basis of the most frequently used interest measures. Like the five- factor personality scholarship, these studies examined patterns of covariation among people's responses to items on inventories. For example, on personality inven- tories, a person who endorses items indicating gregari- ousness is likely also to endorse items indicating warmth, assertiveness, and positive emotions; on vocational inter- est inventories, a person whose responses show a liking for social work is likely also to show affinity for teaching and human relations work. Patterns of dislikes appear in the same manner. The idea that people in the United States share similar structures of interests is supported by a recent study of established adult workers from four U.S. ethnic-racial groups (Fouad, Harmon, & Borgen,
1997), as well as the research we report here involving young people not yet embarked on careers. This makes sense when we look at career choice as Holland did, as an extension of personality and an attempt to express personality traits. If personality structure is similar across language and culture, vocational interests probably are too, having grown in the same soil.
Splits and Snags The rampant homogenization of U.S. culture argues against the survival of fundamental disparities in views of activity similarities and differences. Television pipes the same version of reality into an Appalachian hollow and a New York apartment complex. Rowe, Vazsonyi, and Flannery (1995), in explaining their finding of similar developmental processes among Black, Hispanic, and White youths, wrote that "among second-generation eth- nic and racial groups in the United States, cultural differ- ences are smaller than commonly believed because of the omnipresent force of our mass-market culture, from television to fast-food restaurants" (p. 38). An individu- al's perceptions of his or her opportunity to pursue a certain line of work are certainly influenced by sex, eth- nicity, and class as well as the amount of exposure to the activity and the value placed on an activity. These differences might be reflected in group mean endorse- ments of various activit ies--for example, women report that they like social activities more than do men (Dia- mond, 1975). Ethnic or racial differences in mean scale levels, if they are ever reliably found, would suggest differences in perceived opportunity structure, familiar- ity, and values--al l societal variables) But we are look- ing at a qualitatively different matter in the perceptions of similarities and differences in work activities, as mea- sured by patterns of preferences. Explaining disparities in the structure of vocational preference among different ethnic and racial groups within the United States by refer- ence to ancestry and origin rather than culture leads, ultimately, to biology, and racist agendas as well as seem- ingly liberal ones are served. When humans are able to identify a group as essentially "Other," differential treat- ment becomes justifiable. We have witnessed egregious wrongs stemming from views of the two sexes as being essentially different.
A second explanation for the disparities found among subgroups lies in the difficulties of conducting research on group differences. It could be that ethnic minority groups have not been reliably sampled in re- search that has found differences in structure. Recently, Swanson (1992) suggested that negative findings may be due to the use of small, unrepresentative minority sam- pies. Rounds and Tracey (1996) also speculated that the poor fit they found among African American, Hispanic American, and American Indian samples as compared with White-majority samples may be an artifact of the
Mean values for each scale for each group sampled in our study can be found in Swaney (1995).
July 1998 • American Psychologist 729
James Rounds
sampling procedures used in the 20 available U.S. ethnic studies. The difficulty of obtaining sizable general sam- ples of ethnically and racially diverse groups is frequently discussed in ethics and multicultural literature (e.g., Blanck, Bellack, Rosnow, Rotheram-Borus, & Schooler, 1992; Dana, 1993). For example, methods of acquiring participants from an identifiable group may unintention- ally select for other qualities than racial or ethnic cate- gory: Haverkamp et al.'s (1994) study used a sample of Asian American students who were affiliated with iden- tity-politics organizations and who were told that the investigation concerned the usefulness of the inventory with students of varied cultural backgrounds. Arguably, this was a special sample of Asian Americans who may have consistently responded differently from nonaffili- ated Asian American students who were not aware that their ethnic self-definition was a variable of interest.
Furthermore, unmotivated and suspicious respon- dents do not provide precise, genuine information, which might account for Ryan, Tracey, and Rounds's (1996) unusual results when they administered interest invento- ries to African American high school students in a White- dominated, economically depressed, and disintegrating small town. These students, many of whom rendered their inventories unusable before handing them in, may have been acting from what Ogbu (1990) labeled "cultural inversion," an identity-preserving strategy that endorses opposition to White-majority expectations. Filling out researchers' forms with docility and accuracy, among such youths, would represent an ignoble compliance. Ryan et al. ended up analyzing an African American sam- ple that had undergone selective attrition of the more alienated youth.
Finally, race and ethnicity are slippery categories, and people with the exact same backgrounds may define
themselves in different ways, creating nonhomogenous classifications. Notably, categorizations of African Amer- ican are usually made on visual grounds alone: "As a legacy of our ugly history of racism, anyone with a visu- ally evident component of African ancestry belongs to the category of 'black,' even though many persons so designated have substantial, often majoritarian, Cauca- sian ancestry as well" (Gould, 1995, p. 11). Similarly, a minority culture can hold sway over people who grow up in it or study it, even when their ancestry brands them as a member of the majority: White blues musicians, for example, might well be heirs of Black culture more than African American neurosurgeons are. A mere self-report of group membership does not provide a clue to a per- son's acculturation into that group or any other (Betz & Fitzgerald, 1995; Dana, 1993). The degree of assimilation into or differentiation from majority culture cannot be judged on the basis of a group label such as Korean American.
Our study used an unusually large, more representa- tive sample of diverse groups (N = 49,450) to investigate the question of ethnic and racial differences in responses to an interest inventory. In an earlier study, Day, Rounds, and Swaney (1998) analyzed a sample drawn from this group (n = 11,610); the current study represented about four times as many people. This large sample, we believe, corrected for some (bu t not all) of the research problems associated with the study of group differences.
A methodological problem also exists in investiga- tions of vocational interest structure. Researchers (e.g., Fouad et al., 1997; Rounds & Tracey, 1993) typically use Holland's (1959, 1997) six occupational types--Realis- tic (R), Investigative (I), Artistic (A), Social (S), Enter- prising (E), and Conventional (C) - -as stimuli in multidi- mensional-scaling procedures. From inventory responses grouped according to Holland's types, plots are derived that display the arrangement of these types in two-dimen- sional space. These plots are constructed for diverse groups and then examined for how well Holland's model fits the plots. However, according to the constraints of multidimensional scaling, 6 stimuli cannot define two dimensions with trustworthiness: Shepard (1974) recom- mended that the number of stimuli be more than 10 for a two-dimensional solution, and Kruskal and Wish (1978) warned that with less than a 4:1 stimulus to dimensions ratio, stress values (indicators of good fit) are uninterpret- able. Furthermore, common sense says that collecting items into the expected RIASEC categories before analy- sis ensures that the expected categories are reflected in the outcome: Shepard called studies "distressing" when they use stimuli that are "obviously grouped into a few psychologically compact clusters" (p. 395).
By not aggregating responses into the six types, our project worked with 90 stimulus points-- that is, item responses to a standard vocational interest inventory. Us- ing 90 stimuli rather than 6 allowed us to have a great deal of faith in the multidimensional-scaling plots and in the meaningfulness of goodness-of-fit indices. Each item's response pattern was reflected in the outcome in-
730 July 1998 • American Psychologist
stead of being averaged with all other items presorted as the same occupational type.
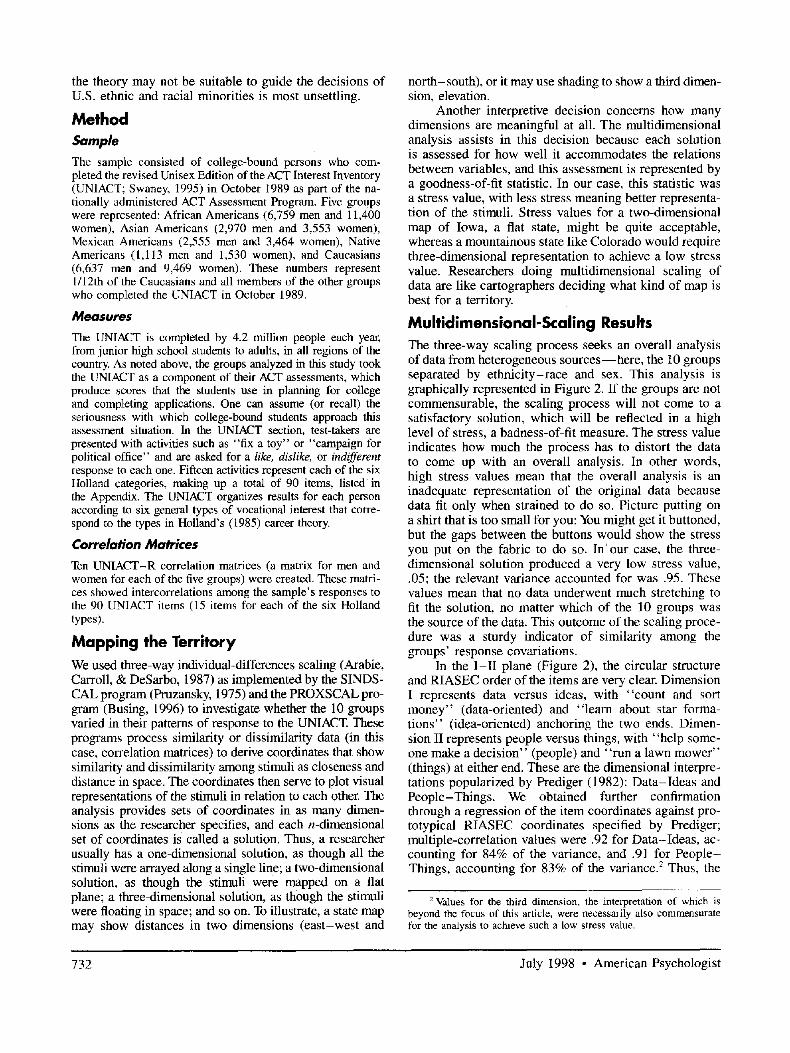
Holland's Circle Since the 1970s, John Holland's (1959, 1973, 1985, 1997) theory of personality types and work environments has dominated the field. In diagramming the relations of concepts in Holland's theory, a two-dimensional model has prevailed as the best representation of vocational interests. The six general interest types in Holland's model are as follows: Realistic, Investigative, Artistic, Social, Enterprising, and Conventional (RIASEC). Hol- land's theory postulates that these six types are related to each other in a circular structure, as in Figure 1. Hol- land and others frequently represent the ideal relation- ships among the six types as a ciroumplex or hexagon (Rounds, 1995; Tracey & Rounds, 1993, 1997). Similar to other circumplex models (Plutchik & Conte, 1997), Holland's RIASEC arrangement reflects the closeness or distance of the conceptual relationships among the types. For example, on Holland's circle the R interest type ap- pears opposite from the S type, indicating that these two do not have much in common, whereas R and I types appear next to each other, indicating shared qualities. This is the model against which we tested data from five racial-ethnic subgroups in the United States.
Each of the six letters stands not only for an interest type but also for a personality type and a work environ- ment type (Holland, 1996). According to Holland's paral- lel typologies, the match between the personality type and the work type is critical, predicting whether the per- son will be satisfied with the job, whether the person's work will be satisfactory, and how long the person will stay with the job. The degree of match between voca-
Figure ! Holland s (1959, 1997) Hexagonal Model
R
1 E
I A
S Note. R = Realistic; I = Invest igat ive; A = Art ist ic; S = Social ; E = Enterpr is ing; C = Conven t i ona l .
tional personality and work environment is labeled con- gruence and can be visualized using the hexagon: A per- son with an R personality is most congruent in an R environment and least congruent in an S environment. Intermediate matches on the hexagon, such as an R per- son in an E environment, imply moderate levels of con- gruence. Holland (1996) described the self-images of the personality types in this way:
Realistic--"practical, conservative, and having manual and mechanical skills--lacking social skills"; Investigative-- "analytical, intelligent, skeptical and having ac- ademic talent--lacking interpersonal skills"; Artistic--"open to experience, innovative, intellectual--lack- ing clerical or office skills"; Social--"empathic, patient, and having interpersonal skills-- lacking mechanical ability"; Enterprising--"having sales and persuasive ability--lacking scientific ability"; and Conventional--"having technical skills in business or produc- tion-lacking artistic competencies." (p. 398)
Holland (1996) listed sample occupations in R envi- ronments as "carpenter, truck operator"; in I environ- ments, "psychologist, microbiologist"; in A environ- ments, "musician, interior designer"; in S environments, "counselor, clergy member"; in E environments, "law- yer, retail store manager"; and in C environments, "pro- duction editor, bookkeeper." Over 12,000 U.S. Depart- ment of Labor occupational titles are classified by three- letter Holland types (Gottfredson & Holland, 1996). The model has also been used to classify college environ- ments, to describe the work done in organizations and how it changes over time, to study career development, and to predict career transition.
Holland's (1959, 1997) association between person- ality type and work type was based on both theory and data. The link between personality structure and voca- tional interest structure has been empirically investigated, with correlational studies reported as early as 1938 and augmented regularly through the 1940s (Darley & Ha- genah, 1955). Darley and Hagenah summarized the litera- ture and concluded, "We are also led by these data to a theoretical position in which measured interests and ac- tual occupational involvement reflect personality and pro- vide opportunities for the fulfillment of personal needs and drives" (p. 133). More recently, Costa, McCrae, and Holland (1984) correlated scores on Holland's scales with scores on personality scales and found significant relationships (p < .001) between Investigative and Artis- tic interests and Openness to Experience and between Social and Enterprising interests and Extraversion. Ho- gan, Hogan, and Roberts (1996) supported the person- environment congruence hypothesis, finding that job per- formance could be predicted by a "5 × 6 model" that considers the Big Five personality domain requirements of jobs classified by Holland's six occupational types: Workers who score highly on their job type's relevant Big Five factors are, indeed, highly rated employees.
The power of Holland's (1959, 1997) theory and the models drawn from it is wide-ranging, and any hint that
July 1998 • American Psychologist 731
the theory may not be suitable to guide the decisions o f U.S. ethnic and racial minorities is most unsettling.
Method Sample The sample consisted of college-bound persons who com- pleted the revised Unisex Edition of the ACT Interest Inventory (UNIACT; Swaney, 1995) in October 1989 as part of the na- tionally administered ACT Assessment Program. Five groups were represented: African Americans (6,759 men and l 1,400 women), Asian Americans (2,970 men and 3,553 women), Mexican Americans (2,555 men and 3,464 women), Native Americans (1,113 men and 1,530 women), and Caucasians (6,637 men and 9,469 women). These numbers represent 1/12th of the Caucasians and all members of the other groups who completed the UNIACT in October 1989.
Measures The UNIACT is completed by 4.2 million people each year, from junior high school students to adults, in all regions of the country. As noted above, the groups analyzed in this study took the UNIACT as a component of their ACT assessments, which produce scores that the students use in planning for college and completing applications. One can assume (or recall) the seriousness with which college-bound students approach this assessment situation. In the UNIACT section, test-takers are presented with activities such as "fix a toy" or "campaign for political office" and are asked for a like, dislike, or indifferent response to each one. Fifteen activities represent each of the six Holland categories, making up a total of 90 items, listed in the Appendix. The UNIACT organizes results for each person according to six general types of vocational interest that corre- spond to the types in Holland's (1985) career theory.
Correlation Matrices Ten UNIACT-R correlation matrices (a matrix for men and women for each of the five groups) were created. These matri- ces showed intercorrelations among the sample's responses to the 90 UNIACT items (15 items for each of the six Holland types).
Mapping the Territory We used three-way individual-differences scaling (Arabie, Carroll, & DeSarbo, 1987) as implemented by the SINDS- CAL program (Pruzansky, 1975) and the PROXSCAL pro- gram (Busing, 1996) to investigate whether the 10 groups varied in their patterns of response to the UNIACT. These programs process similarity or dissimilarity data (in this case, correlation matrices) to derive coordinates that show similarity and dissimilarity among stimuli as closeness and distance in space. The coordinates then serve to plot visual representations of the stimuli in relation to each other. The analysis provides sets of coordinates in as many dimen- sions as the researcher specifies, and each n-dimensional set of coordinates is called a solution. Thus, a researcher usually has a one-dimensional solution, as though all the stimuli were arrayed along a single line; a two-dimensional solution, as though the stimuli were mapped on a flat plane; a three-dimensional solution, as though the stimuli were floating in space; and so on. To illustrate, a state map may show distances i n two dimensions (east-west and
north-south), or it may use shading to show a third dimen- sion, elevation.
Another interpretive decision concerns how many dimensions are meaningful at all. The multidimensional analysis assists in this decision because each solution is assessed for how well it accommodates the relations between variables, and this assessment is represented by a goodness-of-fit statistic. In our case, this statistic was a stress value, with less stress meaning better representa- tion of the stimuli. Stress values for a two-dimensional map of Iowa, a fiat state, might be quite acceptable, whereas a mountainous state like Colorado would require three-dimensional representation to achieve a low stress value. Researchers doing multidimensional scaling of data are like cartographers deciding what kind of map is best for a territory.
Multidimensional-Scaling Results The three-way scaling process seeks an overall analysis of data f rom heterogeneous sources - -here , the 10 groups separated by e thnic i ty-race and sex. This analysis is graphically represented in Figure 2. If the groups are not commensurable, the scaling process will not come to a satisfactory solution, which will be reflected in a high level of stress, a badness-of-fit measure. The stress value indicates how much the process has to distort the data to come up with an overall analysis. In other words, high stress values mean that the overall analysis is an inadequate representation of the original data because data fit only when strained to do so. Picture putting on a shirt that is too small for you: You might get it buttoned, but the gaps between the buttons would show the stress you put on the fabric to do so. In ' our case, the three- dimensional solution produced a very low stress value, .05; the relevant variance accounted for was .95. These values mean that no data underwent much stretching to fit the solution, no matter which of the 10 groups was the source of the data. This outcome of the scaling proce- dure was a sturdy indicator of similarity among the groups ' response covariations.
In the I - I I plane (Figure 2), the circular structure and RIASEC order of the items are very clear. Dimension I represents data versus ideas, with "count and sort m o n e y " (data-oriented) and "learn about star forma- t ions" (idea-oriented) anchoring the two ends. Dimen- sion II represents people versus things, with "help some- one make a decision" (people) and " run a lawn mower" (things) at either end. These are the dimensional interpre- tations popularized by Prediger (1982): Da ta - Ideas and People-Things . We obtained further confirmation through a regression of the item coordinates against pro- totypical RIASEC coordinates specified by Prediger; multiple-correlation values were .92 for Data - Ideas , ac- counting for 84% of the variance, and .91 for Peop le - Things, accounting for 83% of the variance. 2 Thus, the
2 Values for the third dimension, the interpretation of which is beyond the focus of this article, were necessarily also commensurate for the analysis to achieve such a low stress value.
732 July 1998 • American Psychologist

Figure 2 The I-II Plane of the UNIACT Three-Dimensional Solution
2 r~
.v-~
[" 1 I
0 ~D
0
0 • v--~ " 1
r13
~D
18R • 84R •
59CQ41C • • 8 9 C Q90R 35C I • 71C • 65C
11C - 17C • 23C
5C~#C Q;3C • 47C Q83 60R •
• 29C
• 64E O88E • 82E
o57S • 70E Q 40E
~ 3 4 E _ 16E 76E 46E • _ ~ 15S
10E g52E 28E • 58E
69S O
• 72R • 24R
• 66R
5516Q16~P¢709173I
• 25I
• 37I 49I • 6 2 A
• 4E S 22E • 81S
3SIID51S O27S • 33S I O63S , I ,
-1 0 1
32A0 o56A • 131 • 7I
Q 80A • 9S
O87S • 14A 86A{ D
44A • 68~50A D D39S 75S 26A OO8A
• 21S • • 4 5 S
38A • O74A O 20A
-2 2
Dimension I (Data- Ideas) Note. U N I A C T = Unisex Edit ion o f the ACT Interest Inventory; R = Realistic; I = Invest igat ive; A = Art ist ic; S = Social ; E = Enterprising; C = Convent iona l .
traditional structure of vocational interests held true across both sexes and five ethnic-racial groups.
Salient Similarities In the case of vocational interest structure, the idea that racial-ethnic subgroups in the United States vary from the majority is parallel to the idea that these subgroups do not use east-west, north-south, and high- low in their thinking about geography. Multidimensional scaling provides another way to look for this type of fundamental variation among groups. Figure 3 displays the group weight space plot for the two dimensions of.data-ideas and people-things, using coordinates drawn from the three-dimensional solution. Each of the 10 groups has its own set of coordinates, based on only that group's responses to the UNIACT items. Yet, the coordinates for the groups piled up on top of each other to the point of illegibility. The coordinates of all groups' locations are listed in the lower left quadrant, and a glance at the coordinates confirms their proximity as well. This is powerful evidence for thinking that all 10 groups per- ceived the world of work in a very similar way. If the
groups' points were spread widely around the plot, that would mean that they placed widely varying emphasis on the same attributes of work-related activities, which would undermine the validity of instruments such as the UNIACT.
Questions About Race and Ethnicity While wholeheartedly accepting our results, readers may be left with questions about the interpretation of the study. For example, our sample consisted of successful students who planned on going to college: Perhaps they were assimilated into the mainstream way of looking at voca- tional interests more than other minority students. Day et al. (1998) tested this possibility in a limited way by analyzing responses of African American, Hispanic, and Caucasian 10th-grade students in the nationally represen- tative 1992 UNIACT norms sample (Swaney, 1995). They found that all of the 10th graders, college-bound or not, similarly fit Holland's (1959, 1997) model regard- less of their ethnic and racial identification.
One might argue that even given a similar structure of interests, the upshot, choice of career, might be differ-
July 1998 ° American Psychologist 733
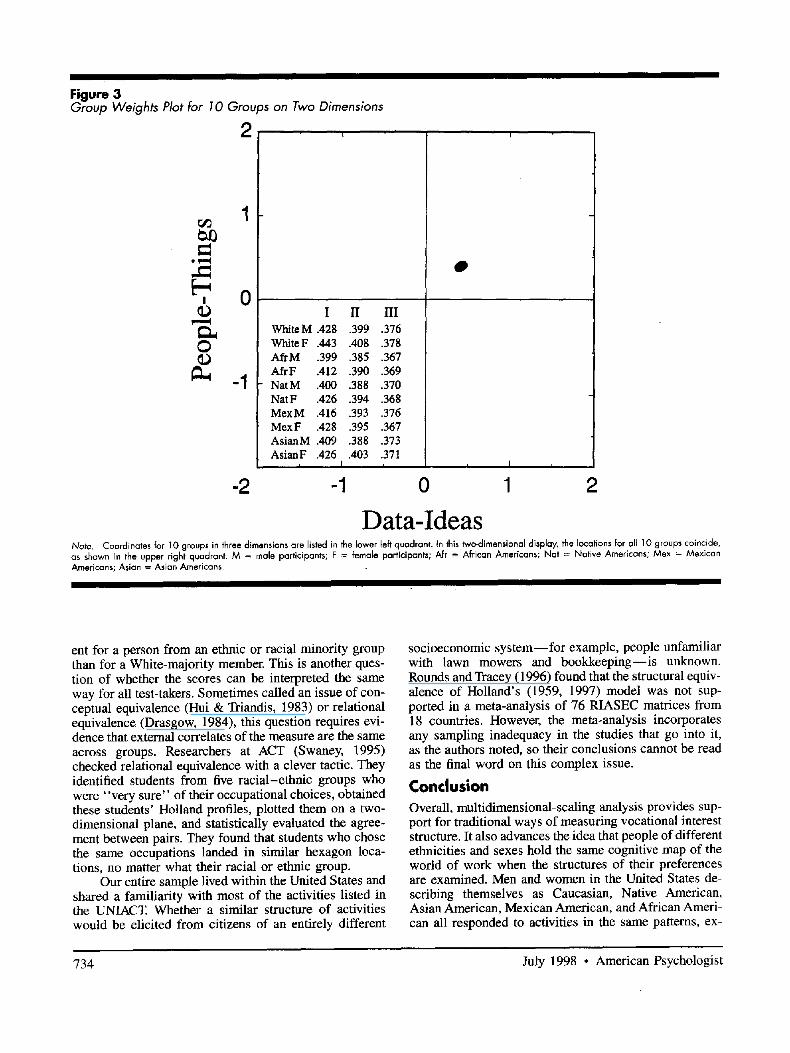
Figure 3 Group Weights Plot for 10 Groups on Two Dimensions
2
I ©
© ©
1
0
-1
I II WhiteM .428 .399 White F .443 .408 AfrM .399 .385 AfrF .412 .390 NatM .400 .388 Nat F .426 .394 MexM .416 .393 MexF .428 .395 AsianM .409 .388 AsianF .426 .403
, I
-1 I ,
.376
.378
.367
.369
.370
.368
.376
.367
.373
.371 i
0 i
-2 1 2
Data-Ideas Note. Coordinates for 10 groups in three dimensions are listed in the lower left quadrant, in this ~odimensional display, the locations for all 10 groups coincide, as shown in the upper right quadrant. M = male participants; F = female participants; Afr = African Americans; Nat = Native Americans; Mex = Mexican Americans; Asian = Asian Americans.
ent for a person from an ethnic or racial minority group than for a White-majority member. This is another ques- tion of whether the scores can be interpreted the same way for all test-takers. Sometimes called an issue of con- ceptual equivalence (Hui & Triandis, 1983) or relational equivalence (Drasgow, 1984), this question requires evi- dence that external correlates of the measure are the same across groups. Researchers at ACT (Swaney, 1995) checked relational equivalence with a clever tactic. They identified students from five racial-ethnic groups who were "very sure" of their occupational choices, obtained these students' Holland profiles, plotted them on a two- dimensional plane, and statistically evaluated the agree- ment between pairs. They found that students who chose the same occupations landed in similar hexagon loca- tions, no matter what their racial or ethnic group.
Our entire sample lived within the United States and shared a familiarity with most of the activities listed in the UNIACT. Whether a similar structure of activities would be elicited from citizens of an entirely different
socioeconomic s y s t e m - - f o r example, people unfamiliar with lawn mowers and bookkeeping-- i s unknown. Rounds and Tracey (1996) found that the structural equiv- alence of Holland's (1959, 1997) model was not sup- ported in a meta-analysis of 76 RIASEC matrices from 18 countries. However, the meta-analysis incorporates any sampling inadequacy in the studies that go into it, as the authors noted, so their conclusions cannot be read as the final word on this complex issue.
Conclusion Overall, multidimensional-scaling analysis provides sup- port for traditional ways of measuring vocational interest structure. It also advances the idea that people of different ethnicities and sexes hold the same cognitive map of the world of work when the structures of their preferences are examined. Men and women in the United States de- scribing themselves as Caucasian, Native American, Asian American, Mexican American, and African Ameri- can all responded to activities in the same patterns, ex-
734 July 1998 • American Psychologist
press ing l ikes and dis l ikes for pursui ts g r o u p e d by Hol - land type (Real is t ic , Inves t iga t ive , Art is t ic , Socia l , Enter - pr is ing, and Conven t iona l ) and a r rayed a long d imens ions o f P e o p l e - T h i n g s and D a t a - I d e a s .
Th is c o m m o n a l i t y is g o o d news for users o f voca - t iona l in teres t inventor ies , w h i c h are o v e r w h e l m i n g l y based on H o l l a n d ' s s t ructure. Counse lo r s shou ld fee l c o m f o r t a b l e in terpre t ing the U N I A C T and s imi la r mea- sures in c o n v e n t i o n a l w a y s for d iverse g roups . T h e R I A S E C a r r angemen t o f genera l occupa t iona l themes prevai l s legi t imately . P rev ious r e sea rch sugges t ing other- w i s e p robab ly suf fe red the mul t ip le per i l s o f g roup-d i f - f e rences r e sea rch d i scussed earl ier: smal l s ample size, unrepresen ta t ive sampl ing , se lec t ive at t r i t ion due to op- pos i t iona l responding , o r a t tenuated ca tegor iza t ion . Inter- pre t ive frai l t ies , e spec ia l ly the impl i ca t ions that g roup d i f fe rences ref lec t b i o l o g y and that rac ia l and e thn ic des- igna t ions are f ixed and u n a m b i g u o u s , have fur ther con- fused the pic ture . In our l a rge-sca le analysis , w e found s t rong e v i d e n c e that p e o p l e share a concep t o f h o w the w o r l d o f w o r k is s t ructured: T h e y all d i sp lay mean ingfu l , p red ic tab le pat terns o f a t t rac t ion and avers ion to w o r k act ivi t ies .
The c o m m o n s t ructure o f voca t i ona l interests is the- o re t i ca l ly re la ted to M c C r a e and C o s t a ' s (1997) c l a i m o f persona l i ty s t ructure as a universal . I f voca t i ona l prefer - ences are indeed man i fes t a t ions o f personal i ty , then the two c la ims are one.
REFERENCES
Arabic, P., Carroll, J. D., & DeSarbo, W. S. (1987). Three-way scaling and clustering. Newbury Park, CA: Sage.
Ben-Porath, Y. S. (1990). Cross-cultural assessment of personality: The case for replicatory factor analysis. In J. N. Butcher & D. Spielberger (Eds.), Advances in personality assessment (Vol. 8, pp. 27-48). Hills- dale, NJ: Erlbaum.
Betz, N. E., & Fitzgerald, L. E (1995). Career assessment and interven- tion with racial and ethnic minorities. In E T. L. Leong (Ed.), Career development and vocational behavior of racial and ethnic minorities (pp. 263-279). Hillsdale, NJ: Erlbaum.
Blanck, E D., Bellack, A. S., Rosnow, R. L., Rotheram-Borus, M. J., & Schooler, N.R. (1992). Scientific rewards and conflicts of ethical choices in human subjects research. American Psychologist, 47, 959- 965.
Busing, E M. T. A. (1996). PROXSCAL user's guide. Unpublished manuscript, Leiden University, Leiden, The Netherlands.
Costa, P. T., McCrae, R. R., & Holland, J. L. (1984). Personality and vocational interests in an adult sample. Journal of Applied Psychol- ogy, 69, 390-400.
Dana, R. H. (1993). Multicultural assessment perspectives for profes- sional psychology. Needham Heights, MA: Allyn & Bacon.
Darley, J. G., & Hagenah, T. (1955). Vocational interest measurement: Theory and practice. Minneapolis: University of Minnesota Press.
Day, S. X., Rounds, J., & Swaney, K. (1998). The structure of vocational interests for diverse racial/ethnic groups. Psychological Science, 9, 40-44.
Diamond, E. E. (Ed.). (1975). Issues of sex bias and sex fairness in career interest measurement. Washington, DC: U.S. Government Printing Office.
Drasgow, E (1984). Scrutinizing psychological tests: Measurement equivalence and equivalent relations with external variables are the central issues. Psychological Bulletin, 95, 134-135.
Fouad, N., Harmon, L. W., & Borgen, E H. (1997). The structure of interests in employed adult members of U.S. racial/ethnic minority
groups and nonminority groups. Journal of Counseling Psychology, 44, 339-345.
Gottfredson, G.D., & Holland, J.L. (1996). Dictionary of Holland occupational codes (3rd ed.). Odessa, FL: Psychological Assessment Resources.
Gould, S. J. (1995). Age-old fallacies of thinking and stinking. Natural History, 104, 6, 10-13.
Haverkamp, B. E., Collins, R, C., & Hansen, J. C. (1994). Structure of interests of Asian-American college students. Journal of Counseling Psychology, 41, 256-264.
Hogan, R., Hogan, J., & Roberts, B.W. (1996). Personality measure- ment and employment decisions: Questions and answers. American Psychologist, 51, 469-477.
Holland, J. L. (1959). A theory of vocational choice. Journal of Coun- seling Psychology, 6, 35-45.
Holland, J. L. (1973). Making vocational choices: A theory of careers. Englewood Cliffs, NJ: Prentice Hall.
Holland, J. L. (1985). Making vocational choices: A theory of voca- tional personalities and work environments (2nd ed.). Englewood Cliffs, NJ: Prentice Hall.
Holland, J. L. (1996). Exploring careers with a typology: What we have learned and some new directions. American Psychologist, 51, 397- 406.
Holland, J. L. (1997). Making vocational choices: A theory of voca- tional personalities and work environments (3rd ed.). Odessa, FL: Psychological Assessment Resources.
Hui, C. H., & Triandis, H. C. (1983). Multistrategy approach to cross- cultural research: The case of locus of control. Journal of Cross- Cultural Psychology, 16, 65-83.
Kruskal, J. B., & Wish, M. (1978). Multidimensional scaling. Newbury Park, CA: Sage.
McCrae, R. R., & Costa, P. T. (1997). Personality trait structure as a human universal. American Psychologist, 52, 509-516.
Ogbu, J. U. (1990). Minority status and literacy in comparative perspec- tive. Daedalus, 119, 141-168.
Paunonen, S. V., Jackson, D. N., Trzebinski, J., & Forsterling, E (1992). Personality structure across cultures: A multimethod evaluation. Journal of Personality and Social Psychology, 62, 447-456.
Plutchik, R., & Conte, H.R. (Eds.). (1997). Orcumplex models of personality and emotions. Washington, DC: American Psychological Association.
Prediger, D. J. (1982). Dimensions underlying Holland's hexagon: Miss- ing links between interests and occupations? Journal of Vocational Behavior, 15, 259-287.
Pruzansky, S. (1975). How to use SINDSCAL: A computer program for individual differences in multidimensional scaling. Unpublished manuscript, AT&T Bell Laboratories, Murray Hill, NJ.
Rounds, J. B. (1995). Vocational interests: Evaluating structural hypoth- eses. In D. Lubinski & R.V. Dawis (Eds.), Assessing individual differences in human behavior: New concepts, methods, and findings (pp. 177-232). Palo Alto, CA: Consulting Psychologists Press.
Rounds, J., & Tracey, T. J. (1993). Prediger's dimensional representation of Holland's RIASEC circumplex. Journal of Applied Psychology, 78, 875-890.
Rounds, J., & Tracey, T. J. (1996). Cross-cultural structural equivalence of RIASEC models and measures. Journal of Counseling Psychology, 43, 310-329.
Rowe, D.C., Vazsonyi, A.T., & Flannery, D.J. (1995). Ethnic and racial similarity in developmental process: A study of academic achievement. Psychological Science, 6, 33-38.
Ryan, J. M., Tracey, T. J. G., & Rounds, J. (1996). Generalizablility of Holland's structure of vocational interests across ethnicity, gender, and socioeconomic status. Journal of Counseling Psychology, 43, 330-337.
Shepard, R. N. (1974). Representation of structure in similarity data: Problems and prospects. Psychometrika, 39, 373-422.
Sue, D.W., & Sue, D. (1990). Counseling the culturally different: Theory and practice (2rid ed.). New York: Wiley.
Sue, S., Keefe, D., Enomoto, K., Durvasula, R. S., & Chao, R. (1996). Asian American and White college students' performance on the MMPI-2. In J.N. Butcher (Ed.), International adaptations of the
July 1998 • A m e r i c a n Psycho log i s t 735
MMPI-2: Research and clinical applications (pp. 206-218). Minne- apolis: University of Minnesota Press.
Swaney, K.B. (1995). Technical manual: Revised Unisex Edition of the ACT lnterest Inventory (UNIACT). Iowa City, IA: ACT.
Swanson, J. L. (1992). The structure of vocational interests for African- American college students. Journal of Vocational Behavior, 40, 129- 143.
Tracey, T.J., & Rounds, J. (1993). Evaluating Holland's and Gati's vocational-interest models: A structural meta-analysis. Psychological Bulletin, 113, 229-246.
Tracey, T. J. G., & Rounds, J. B. (1997). Circular structure of vocational interests. In R. Plutchik & H. R. Conte (Eds.), Circumplex models of personality and emotions (pp. 183- 201). Washington, DC: American Psychological Association.
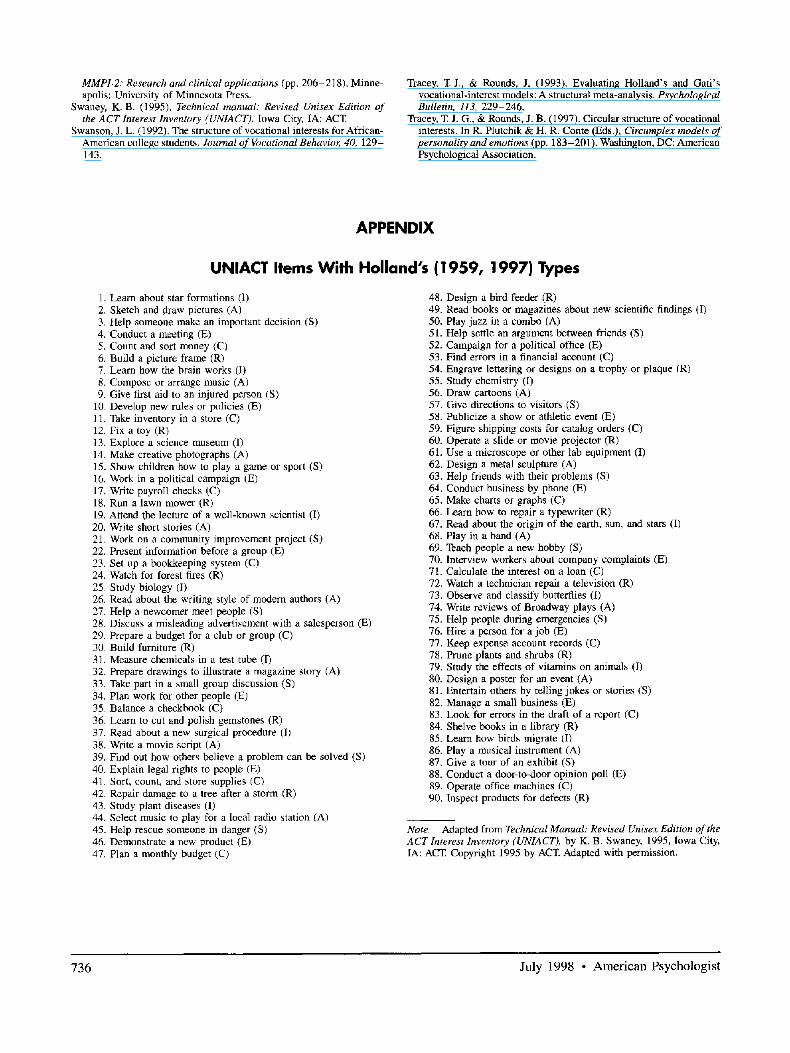
APPENDIX
UNIACT Items With Holland's (1959, 1997) Types
1. Learn about star formations (I) 2. Sketch and draw pictures (A) 3. Help someone make an important decision (S) 4. Conduct a meeting (E) 5. Count and sort money (C) 6. Build a picture frame (R) 7. Learn how the brain works (I) 8. Compose or arrange music (A) 9. Give first aid to an injured person (S)
10. Develop new rules or policies (E) 11. Take inventory in a store (C) 12. Fix a toy (R) 13. Explore a science museum (I) 14. Make creative photographs (A) 15. Show children how to play a game or sport (S) 16. Work in a political campaign (E) 17. Write payroll checks (C) 18. Run a lawn mower (R) 19. Attend the lecture of a well-known scientist (I) 20. Write short stories (A) 21. Work on a community improvement project (S) 22. Present information before a group (E) 23. Set up a bookkeeping system (C) 24. Watch for forest fires (R) 25. Study biology (I) 26. Read about the writing style of modern authors (A) 27. Help a newcomer meet people (S) 28. Discuss a misleading advertisement with a salesperson (E) 29. Prepare a budget for a club or group (C) 30. Build furniture (R) 31. Measure chemicals in a test tube (I) 32. Prepare drawings to illustrate a magazine story (A) 33. Take part in a small group discussion (S) 34. Plan work for other people (E) 35. Balance a checkbook (C) 36. Learn to cut and polish gemstones (R) 37. Read about a new surgical procedure (I) 38. Write a movie script (A) 39. Find out how others believe a problem can be solved (S) 40. Explain legal rights to people (E) 41. Sort, count, and store supplies (C) 42. Repair damage to a tree after a storm (R) 43. Study plant diseases (I) 44. Select music to play for a local radio station (A) 45. Help rescue someone in danger (S) 46. Demonstrate a new product (E) 47. Plan a monthly budget (C)
48. Design a bird feeder (R) 49. Read books or magazines about new scientific findings (I) 50. Play jazz in a combo (A) 51. Help settle an argument between friends (S) 52. Campaign for a political office (E) 53. Find errors in a financial account (C) 54. Engrave lettering or designs on a trophy or plaque (R) 55. Study chemistry (I) 56. Draw cartoons (A) 57. Give directions to visitors (S) 58. Publicize a show or athletic event (E) 59. Figure shipping costs for catalog orders (C) 60. Operate a slide or movie projector (R) 61. Use a microscope or other lab equipment (I) 62. Design a metal sculpture (A) 63. Help friends with their problems (S) 64. Conduct business by phone (E) 65. Make charts or graphs (C) 66. Learn how to repair a typewriter (R) 67. Read about the origin of the earth, sun, and stars (I) 68. Play in a band (A) 69. Teach people a new hobby (S) 70. Interview workers about company complaints (E) 71. Calculate the interest on a loan (C) 72. Watch a technician repair a television (R) 73. Observe and classify butterflies (I) 74. Write reviews of Broadway plays (A) 75. Help people during emergencies (S) 76. Hire a person for a job (E) 77. Keep expense account records (C) 78. Prune plants and shrubs (R) 79. Study the effects of vitamins on animals (I) 80. Design a poster for an event (A) 81. Entertain others by telling jokes or stories (S) 82. Manage a small business (E) 83. Look for errors in the draft of a report (C) 84. Shelve books in a library (R) 85. Learn how birds migrate (I) 86. Play a musical instrument (A) 87. Give a tour of an exhibit (S) 88. Conduct a door-to-door opinion poll (E) 89. Operate office machines (C) 90. Inspect products for defects (R)
Note. Adapted from Technical Manual: Revised Unisex Edition of the ACTlnterest Inventory (UNIACT), by K. B. Swaney, 1995, Iowa City, IA: ACT. Copyright 1995 by ACT. Adapted with permission.
7 3 6 J u l y 1998 • A m e r i c a n P s y c h o l o g i s t