Integration of Vocational Education and Training Experiences
Upload
khangminh22Category
view
0download
0
PROJECT IN VOCATIONAL EDUCATION AND GUIDANCE OF NEGROES
Vocational Education andGuidance. of Negroes
Report of a Survey Conducted bythe Office of Education
By
AMBROSE CALIVERSenior Specialist in the Education of Negroes
BULLETIN, 1937, No. 38
1
a
d
UNITED STATES DEPARTMENT OP THE INTERIOR Harold L. Ickes, SecretaryOPTICS OF EDUCATION - . . - J. W Studebaker, Commissioner
UNITED STATES GOTURNIIINT PRINTING ()RIC& - ....... WAssmorow : 1938
Fat sale by the Superintendent of Dampens*. Waahingtau, D. C. - Price 20 cease
1#0.4"I'. 11,.!V*0'.'"-%:.- ,
_
p.
.
GP O
-
-
Alm
. . s -
-

Contents
44
s.
PageFOREWORD lxCHAPTER I: INTRODUCTORY STATEMENT
Need for the study 1
Scope of the study 3Data and sources 4
CHAPTER II: SUMMARY OF FINDINGS, CONCLUSIONS, AND RECOMMENDATIONS . 8Findings concerning
Schools and colleges 8Teachers and teaching 1 0
High-school pupils, graduates, and nongraduates 1 1
GuidanCe 1 3
Conclusions 1 3
Recommendations 1 4
CHAPTER' III: THE GENERAL EDUCATIONAL PROGRAM AND THE PLACE OP VOCA-TIONAL TRAINING 1 6
General situation 20Federal aid for vocational education 28
CHAPTER IV: VOCATIONAL EDUCATION IN AGRICULTURE 34Number of-schools and classes 35Curriculum offerings and registrations 36Enrollments in types of schools i 38The college program 40Federal aid for vocational agricultural education 46Conclusions 47
CHAPTER V : VOCATIONAL EDUCATION IN HomE EcONOMICS . . . . . . 49Number of schools and classes 49Curriculum offerings and registrations 50Enrollments in types of schools 52Number of teachers 54Federal aid for vocational education in home economics 54Conclusions . 56
4
.11
.
zi
. .
nr
o

IV CONTENTS
PageCHAPTER NI: VOCATIONAL EDUCATION IN TRADES AND INDUSTRIES 58
Number of schools and classes 58Curriculum offerings and registrations 58Enrollments in types of schools I
62Number of teachers 63Federal aid for vocational education in trades and industries 64Conclusions 65
CHAPTER VII: TEACHERS AND TEACHING 6--Preparation, experience, and salaries 6--Federally aided teacher-training program 69Characteristics of representative vocational courses 73Conclusions 76
CHAPTER VIII: INFORMATION NEEDED FOR GUIDANCESocial and economic backgroundSchool interests, activities, and achievements 80Pupils' occupational choices
CHAPTER IX: INFORMATION HELPFUL IN FOR UMLATING GUIDANCE PROGRAMS 91General characteristics 91Interests and activities in school 95Activities and interests after leaving school 99
CHAPTER X: VOCATIONAL GUIDANCE IN SECONDARY SCHOOLS AND COLLEGESFOR NEGROES
Organization and administration of guidance . 4 111Guidance functions and services 112Collection and use of information 113Conclusions 11' .
APPENDIX 'A 121
APPENDIX B. 134
TABLES
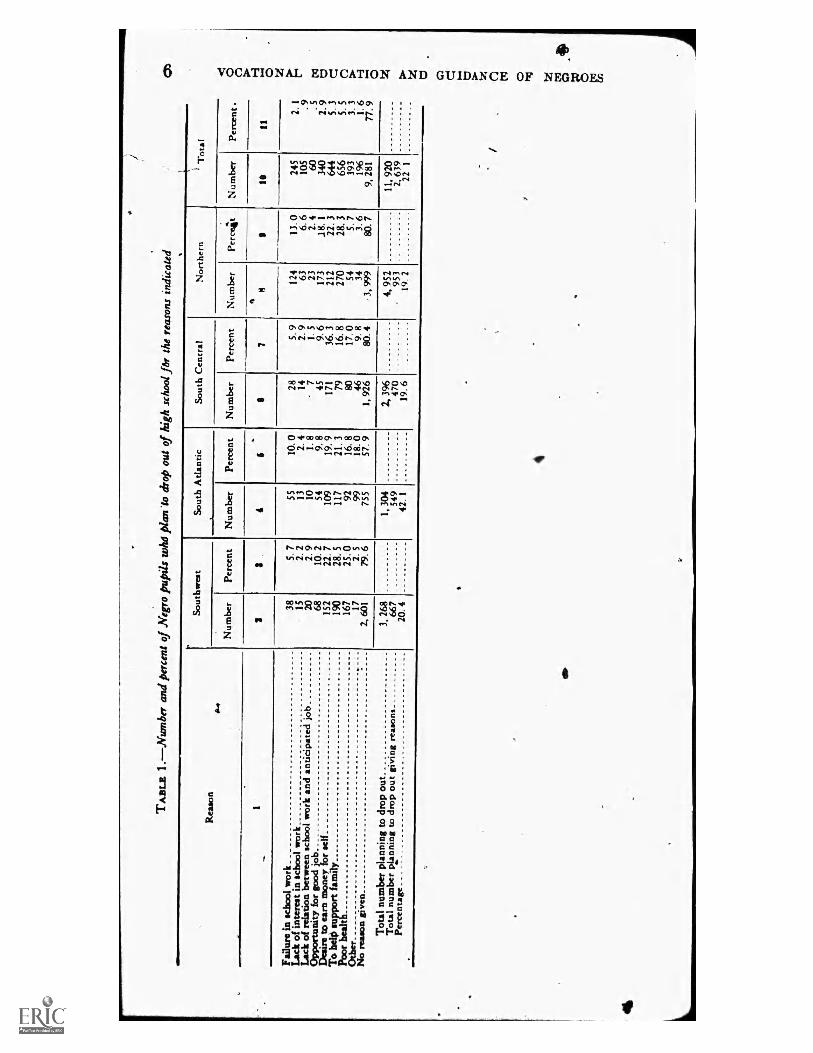
1. Number and percent of Negro pupils who plan to drop out of high school forindicated reAons 6
2. Number and pergent of Negro high-school pupils who are overage in thegrades indicated, according to geographical regions 7
3. Number and distribution of separate high schools for Negroes 174. Negro high-school population and school enrollment, according to States. 185. Ntimber and percent of pupils who attended and who did not attend junior
high school19
6. Number of vocational courses added and dropli10by 207 high schools by yearsfrom 1930 to 1935 20
7. Number of specied vocitional courses added and dropped by 207 highschools for Negroes from 1930 to 1935 .21
8. Curriculum registrations for the past 10 years in 207 high schools for Negroes,by sex 23
9. Number of public colleges offering Negro students specified vocationalCourses 25
10. Number of private Colleges offering Negro students specified vocational. cOursei 26.
11. Number of Negro students registered in vocational curriculums in certaincolleges under public control, for each year from 1930-31 to 1934-35.... 27
1
*****
. . OOOOOO
r
84
. . .
1 1 1
V
.
,
14,

CONTENTS V
Page12. Number and percent of classes for Negroes in federally aided vocational
agriculture, accoiding to types of schools and years, in 1 8 States . . . 3613. Number and percent of total Negro students refistered in each kind of agri-
cultural course by type of school, 1934-35, in 1 8 States 3714. Number and percent of Negro students enrolled in courses in vocational agri-
culture courses in the different types of federally aided schools, accordingto years, in 18 States 39
15. Occupatidnal distribution of the 1934 graduates majoring in agriculture of 5white and 10 Negro agricultural colleges, Southern region, 1935 40
16. Percent of agricultural college graduates trained -as teachers of vocationalagriculture b9P States, 1 935-36 41
17. Number of Negro students enrolled in specified coursei in agriculture in 16public institutions of higher learning, ,1935-36
18. Placement of Negro men trained as teachers of vocational agriculture byStates-, 1935-36 43
19. Kinds of classes conducted by teachers of voeational 'agriculture, fiscal year1935-36
,O. Teaching load of teachers of vocational agriculture, 1935--36 4421. Number of full-time and prorated teachers of all-day classes, fiscal year
1935-36 4522: Amount and percent of Federal funds expended for vocational agriculture in
the different types of schools, according to race and years, in 18 States, . 4723. Number and percent of classes for Negroes in federally aided home econorilics, as
according to types of schools and years, in 18 States 5024. Number and percent of total Negro students registered in each kind of home
economics course by type of school (1934-35), in 18 States 5025. Number of schools reporting and number and percent of Negro pupils regis-
tered in specified home economics courses in regular and reorganized highschools, 1934 51
26. College enrollment in specified home economics courses, in 18 public collegesand 2 private colleges for Negroes 52
27. Number and percent of Negro students enrolled in home economics coursesin the different types of federally aided schooLs, according to years, in 18States 53
28. Pupil-teacher ratio in federally aided home economics courses in all-dayand evening schools, according to race and years 54
29. Amount and percent of Federal funds expended fór home economics in thedifferent types of schools, according to race and years, in 18 States.. 56
30. Number and percent of classes in federally aided trades and industries, accord-ing to types or schools and years, in 18 States 59
31. Number of students registered in federally aided high-school vocationalcotirses in trades and industries, according to race, 1934-35, in 18 States.. 59
32. Number of schools reporting and number and percent of Negro pupilsregistered in specified trade and industries courses in regular and reor-lanized high schools, 1 934 60
33. Numbere41 Negro college students registered in specified vocational coursesin inClustrial arts, architecture, and building construction curriculums. 61
34. Numbet'and percent of Negro studè..nts enrolled in trades and industriescourses in tbe different types of federally aided schools, according to years, in18 States 63
35. Aniount and percent of Federal funds expended for vocational wórk in tradesand industries in the different types of schools, according to race and years,in 18 States 65
42
43
'
. .
e
)
. .
. . .
I

VI**41
CONTENTS
Page36. Niimber and percent of vocational teachers of Negroes studied who holddegrees, 1935-36, according to where they teach . , 67
37. Median number ,of years of teaching experience of vocational teachers ofNegroes, according to educational level attained, 1935-36 68
38. Number and percent of vocational teachers of Negroes studied, employed agiven number of years in the schools in which they arc now working, 1935-36
6939. Distribution of vocational teachers of Negroes, according to annual salary and
svbjects taught, 1935-36 69440. NuMber and percent of Negro students enrolled in federally aided vocational
teacher-training work in the different fields, by years, in 18 States 7041. Amount and percent of Federal funds expended for the different fields in
federally aided teacher-training work, according to race and years, in Stateshaving separate schools 71
42. Amount and percent of Federal expenditure for vocational teacher-trainingduring 1928-29 and 1934-35,rand increase and decrease of 1934-35 com-pared with 1928-29 by State and by race, in 18 States 72
43: Number of teachers indicating the percent of total time allotted to practicalwork and to discussion 74
44. Number of teaChers indicating condition on which courses are offered 7445. Number of teachers intlicating types of materials used in conduct of courses . 7546. Number of teachers indicating the criteria given most weight in determining
students' marks 7547. Number of vocational teachers of Negroes indicating freedom permitted
students in choosing shop or field projects 7648. Number and percent of Negro high-school pupils whose fathers are engaged in
given occupations 7749. Median years of education attained by paients of pupils, by regions 7850. Percent of pupils whose fathers and mothers had attained a given educational
level7851. Number and percent of pupils indicating the number of books in home 7952. Number and percent of pupils from *homes subscribing or not subscribing to
newspapers,80-
53. Percent of pupils who participated in certain extra-classroom activities. . . . 8154. Number and perctnt of pupils of given age when entered first year high school ., 8255. Age-grade distribution of Negro high-school pupils in 33 States and the
District of Columbia, 1936-37 8356. Number ancfpercent of pupils indicating occupational choice, by sex and
"gion -
8557. Number and percent 'of pupils indicating choice of occupation, by size of
community 8658. Percent of pupils attributing their choice of occupation to indicated influ-
.ences, by region and sex , 8859. iTumber of pupils choosing given occupations, according to hobby of first
preference and percent of pupils expressing first preference for given hobby . 8960. Number ang percent of pupils having parents with designated education who
expressed a desire to enter a given occupation 9061. Number and median age of Negro high-school graduates and graduates,
according to size of community in which they live 9262. Number and median age of evening school students who have attained a
given level of education 9363. Number and percent of nongraduates who dropped out of school at given
grades 93at
'-
. . .
.... . . . .
. . . , .
. . . .
...... . . . . ........... . . . ......
. . . . .
,
,
.........i
,
.

e CONTENTS VII
Page64. Number and percent of nongraduates indicatinegrade reached, by rtgion . . . 9465. Number of evening school students who left school at stated grade levels, by
sex 9566. Number and percent of graduates and nongraduates who pursued given
curriculums while in high 'school, by region. 9667. Number and percent of nongraduates and graduates of high school .who had
vocational training related to ,their present job, according to grade leftschool, and by region which school was located 98
68. Number and percent of nongradtxates ind*ating reasons for leaving schoolbefore graduation, according to geographical region and sex 100
69. Reasons for attending evening school, by region 10170. Activity followed by evening school students after leaving day school, accord-
,ing to grade level attained 10271. Number and percent of high-school graduates and nongraduates who secured
their preserlijobs by given means 10472. Means used by evening school students in securing first jobs, acccirding to me-
dian years attaAed in school 10473. Median years of schooling of evening school students indicating wages per
week in first job 1.05
74. Relation between 6ccupation in which employed longest and fathers' occupa-tion N106
75. Percent of graduates and nongraduates working for designated employer,according to region and sex 108
76. Percent of evening school students indicating th-eir present employereby re-gion 10)
77. Number of evening school students indicating present job, according to firstjob0 110
78. Officers in charge of guidance 11279. Sources and procedures used in obtaining information about students 11380. Kinds of information obtained about students 11481. Procedures used m assisting students to obtain information about themselves. 11482. Ways in which information abotlt students is used for guidince purposes. . . . 11 483. Procedures andipurces used in informing students aboitt occupations 11584. Procedures used to relate vocational training to opportunities and conditions
of work in areas served 11685. Guidance objectives with number of institutions establishing each 116
TABLES IN APPENDIX A
I. Number of Negro students and percent they are of all students enrolled infederally aided vocational courses, by years and States 123
IL Number of courses for Negroes and percent they are of all courses in feder-ally aided vocational schools, by years, and States 125
III. Number of Negro teachers and percent they are of all teachers in federallyhided vocational schools, by years and States 126
INrif. Amount and percent of Federal funds expended for vocational work, byrace, years, and States 127
V. Age-grade distribution of Negro high-school pupils in 33 States and the Dis-trict of Columbia, according to geographical region 129
VI. Grade level attained by nongraduates reporting, according to size of corn-munity 132
VII. Number of persons who pursued given curriculums while in high school, bysize of communities in which schools were located f32
jn
. . . . . . . . . . . .
O
.
.
°

VIII UONTENTS
PageVIII. Number of graduates and nongraduates indicating whether or not they
were employed during their high-school career, by size of communitywhere attended school 133
FIGURES
1. Perciptage of Negro pupils registered in different curriculums in 207 highschools for 1925-26 and 1934-35 21
2. Percentage of Negroes in the total population, percent Negroes am of the totalenrollment in federally aided vocational courses, and the percent of totalexpenditures, courses, and teachers available to Negroes in 18 States in1934-35 32
3. Percentage increase or decreese in expenditures, in number of courses andteachers, and in enrollments in federally aided vocational work for Negroes,for each year from 1929-30 to 1934-35 compared with 1928-29 in 18 States. 33
4. Percentage increase in enrollments, number of courses and teachers, and expend-itures in kderally aided agricultural classes each year from 1929-30 to 1934-35, compared with 1928-29, in 18 States 46
5. Percentage increase in enrollments, number of courses and teachers, and ex-penditures in federally aided home economics classes each year from 1929-30to 1934-35 compared with 1928-29, in 18 States 55
6. Percentage of increase in enrollment, in number of courses and teachers and inexpcndituresin federally aided trades and industries classes for each year from1929-30 to_1934-35 compar&I with 1928-29, in 18 States 64
4
*k_tammall
. . . . .

-FOREW911)
i
For a number of years the Office of Education has been interested in.opportunities
.making a study of occupational for Negroes with a view tothe expansion and improvement of facilities for vocational education andguidance. Plans were being perfected to request funds from the CivilWorks Administration in 1934 when the agency was decentralized and fundsfor Federal projects discontinued. When funds became available under theprovisions of the Emergency Relief Appropriation in 1935 for the employ-ment of educational, professional and clerical persons, the Office of Educa-tion wai aiithbrized to conduct, in addition to four other projects, a surveyof opportunities for vocational education and guidance of Negroes.
An advisory committee of 28 persons representing educational, civic,business, and labor organizations gave valuaple counsel during the pre-liminary stages of the study. Individual members and small groups fromthis committee continued to be of assistance throughout the survey, eitherthrough conferences or by correspondence. Invaluable voluntary serviceswere given also by several persons .who acted as project managers in certainStates. In addition, many public and private agencies and institutions
' cooperated by lending members of ¿heir staffs to act as supervisprs or ad-ministrators for a period of from 3 to 14 months; and by lending spaceand equipment for the use of the survey.
The field work was conducted during 1936 by a staff of 500 Neetbreliefworkers who belonged to the "white-collar" class. , and most of'whom hadcollege training. During the first- half of 1937 the data were tabulated,analyzed, and interpreted by a relief and professional etaff in the Office ofEducation. .
To all who cooperated with and who worked on the survey, the Office ofEducation exprcsses its sincere appreciation for their interest and services.
The depression brought out rathèr clearly what had been known for sometime in a general way by students of the subject, namely, that the importantmatter of vocational education and guidance had ,been approached without.definite plan or purpose. Increase in scientific discoveries and inventions,the grothof technology, and the sotial and economic changes that havetaken place during the first quarter of the present cèntury have resultedin widespread vocational maladjustmehts. Occupations have greatlyincreased in number, specialization, and complication. The demands uponworkers have increased and are more exacting. I t has become more difficultfor one to choose a career, and to prepare for, to enter upon, arid to makeprogress in it. In order to correct these maladjustments a great deal more
IX

X FOREN6RD
must be known about future workers and their work. It seemed particularlyappropriate, therefore, thcit relief funds should be used for the prevention
,, of a recurrence of many of these maladjustments.Because of the nairow economic margin on which they operate, their
lack ofeducational opportunity, and their general social status, the problemsmentioned above are particularly acute for Negroes. The situation hasbeen more serious because of a lack of information concerning importantphases of the problem. The purpose of this survey is to supply some of theneeded information and to assist in pointing the way toward a better adjust-ment between education and occupational life. This report constituteswhat might be termed a statistical source book of basic data resulting fromthe survey. While it is recognized that it is only a beginning in the solutionof a major problem, it is hoped that it will be helpful to schools and otheragencies as they endeavor to expand and improve the facilities and oppor-tunities for vocational education and guidance of Negroes.>
BESS GOODYKOONTZ,Assistant Commissioner of Education.
a
4
o
N
_
.0
.

fa
CHAPTER I I
Introductory Statement
PEOPLE IN ALL walks of life have found it necessary to make adjust-ments to new occupational situations resulting from recent developments
in science and technology. Although Negroes have shown exceptionalcapacity in the past to adopt the American social and economic order, theyare finding. it difficult to adjust themselves to our present modern industrialsociety. This is not surprising, for adjustments required today are quite dritferent from those required in the past, and are taxing the best thought andenergies of the most advanced people.
The problems resuldng from this situation have been made especiallyacute for Negroes. One such problem is the reduction in the number ofjobs. As simple manual occupations became mechanized white personssought the jobs formerly held by Negroes, which, under changed conditions,demanded new skills and knowledge and Which paid higher wages. Inmany cases, Negroes were not prepared to meet the new demands of thesejobs, and in other cases they were not employed if white persons wereavailable. In addition to losing jobs formerly held, Negroes have found fewopportunities ip the new occupations resulting from recent technologicalProgress.
The problem has been accentuated by: (1) lack of education; (2) lack ofeducational opportunities and adaptation of education to needs; (3) lack ofversatility and skill arising from limited occupational experience; and (4)attitude toward work.
Studies have been made in addition to the present survey, which showthe following educational conditionsNamong Negroes: (1) A high illiteracyrate; (2) high pupil mortality; (3) large numbers of children who areoverage.,2 (4) large numbers of children out of school; (5) poor school at-tendance; (6) lack of operation of compulsory school attendance laws;
Redcay, E. E. County Training Schools and Public Secondary Education for Negroes in the South. Wash-ington, The John F. Slater Fund, 1935.
"Hose, David T. wed Caliver, Ambrose. Statistics of tilt Education of Negroes. Wuhington, GovernmentPrinting Office, 1936. (United States Department of the Interior, Oft* of Education, Bulletin 1935, No. 13.)
'Journal of Negro Education, 1: 1, July 1932.1
Washington,Caliver, Ambme. Availability of Education to Negroes in Rural Communities. GovernmentPrinting Office, 1935. (United States Department of the Interior, Office of Education, Bulletin 1935, No. 12.)
See tables 1 and 2 for data from pupils included in this survey.
i
s
1
E
e
\e
A._
2
1
.

VOCATIONAL EDUCATION AND GUIDANCE OF NEGROES
(7) lack of schools; (8) lack of general curriculum and extracurriculumofferings; (9) lack of vocational-offerings and. guidance; and (10) lack ofadequate financial support.
Approximately 55 percent of the total number of Negroes 10 years oldand over gaihfully employed are engaged in occupations requiring little orno skill. Since these occupations are usually the first to be affected by any
I economic upheaval and ale the most easily dispensed with, Negro unskilledworkers are among the irst affected during any period of occupationalreadjustment.
In the South there have been strong traditions with refirence tó manuallabor. The white aristocracy for generations scorned it as beneath theirdignity, an attitude which was probably a by-product.of the institution ofslavery. When gegroes became free, they adopted similar prejudices intheir struggle for recognition and self-respect. This attitude frequently pre-vented them from recognizing the possibilities of improvement in the simple,manual tasks in which the majority of them were engaged.
As a result of such problems the Office of Education became interested,and in 1935 was granted $234,934 through Federal emergency funds toconduct the National Survey of Vocational Education and Guidance ofNegroes. The purpose of this survey was to investigate the opportunitiesand facilities for vocational education and guidance of Negroes in rural andurban communities. The specific objectives were:
1. To analyze the vocational offerings of selected high schools, colleges,evening and proprietary schools, and non-school agencies.
2. To analyze the content and method of teaching these cows inselected institutions.
3. To determine the availability of facilities and equipment for'voca-tional courses.
4. To ascertain the training and .qualifications of the teachers ofvocational courses.
5. To discover the extent to which organized personnel and guidance_services are available to Negro high school and college youth.
6. To study certain characteristics of (1) students enrolled in highschools, colleges, evening and proprietary schools, and non-schoolagencies, and (2) graduates and non-graduates of high schools,1926-1935, who had had no further formal
7. To ascertain the attitudes of students and educationaltoward the vocational training of Negroes.
The study was conducted by a director, an associate director, 4 regionaldirectors, 42 State supervisors and project managers, and Ipproximately500 investigators.'
s See appendix B for fuller statement concerning staff.
s.
2
lè.
.

-or
INTRODUCTION 3
SCOPE OF THE STUDY
Within the limit of funds and the designated time, it was not pbssible toinclude every high school attended by Negro youth. In view of the factthat the scope of the Survey was national, it was felt that a true picture of thehigh-school situation could be secured through the selection and study ofschool administrative units that were typical Of the States in those regions inwhich the majority of the Negro population lives. The States of thenorthern region are an exception .because of the concentration'of Negroesin the urban centers. Institutions of higher learning were not selected; allthat could be heard from were included in the study.
Selection of units for study of high schools.j---With the aid of an advisory com-mittee, directors of Negro education, and regional directors and projectsupervisors on the staff of the survey, urban and rural centers (approxi-mately 200) in the Southern States were selected on the basis of the charac-teristics of the Negro population and of their occupations. In these Statesthis selectioil included most of the larger urban centers and a sufficientnumber of rural unitscomnties or parishesto represent the Negropopulation as a whole. In the Northern States, where the Negro is an urbandweller, all of the larger cities were Mcluded. States having areas includedin the study follow:Alabama. Kansas. Ohio.Arkansas. Kentucky. Oklahoma.California. Louisiana. Pennsylvania.Colorado. Maryland. South Carolina.Connecticut. Massachusetts. Tennessee.Delaware., Michigan. Texas.District of Columbia. Minnesota. Virginia.Florida. Mississippi. Washington.Georgia. Missouri. West Virginia.
New Jersey. Wisconsin.Indiana. New York.Iowa. North Carolina.
The institutions. The high schools included in the survey comprise the4-year, and separate junior and senior high schools of each administrativeunit. High schools of the northern region which enroll Negro studentswere included. All colleqs for Negroes were included, but only thosecurriculums directly related to the subject of the survey were studied.
The following institutions ;orhigher education were included:Benedict College. Simmons University.Bennett College. Howe-Roger-William.s Institute.clafiin College. Oakwood College.Virginia Union University. LeMoyne College.
0`.
Howard University. Clark University.Morgan College. Lane College.Shaw University. Miles Memorial College.St. Paul Normal and Industrial School. Bishop Tuttle Training School.Morris Brown College; Atlanta School for Social Work.Selma University. Praitie View State College.
Illinois.
s.

4 VOCATIONAL EDUCATION AND GUIDANCE OF NEGROES
Oklahoma C. A. & N. University.North Carolina N. A. &. T. College.Princess Anne Academy.Alcorn A. & M. College.Virginia State College.Alabama State A. & M. College.West Virginia State College.Florida A. & M. College.Hampton Institute.Tennessee State A. & I. College.Louisiana Normal arid Industrial In-
stitute.
Arkansas A. & M. College.Houston College for Negroes.Lincoln University (Mo.).Southern UniversiDelaware State Coiege.Kentucky State Industrial College.Louisville Municipal College.North Carolina College for Negroes.Winston-Salem Teachers College.South Carolina State College.Cheyney Training School for Teachers.Tuskegee Institute.
All evening schools, proprietary schools,' and nonschool agencies whichoffer courses in vocatiodal education and guidance for Negroes within theareas studiediand from which data could be obtained were included.
DATA AND SOURCES
Enumeration of sources.Data for the Survey were obtained from the follow-ing sources: (1) High schools, (2) colleges, (3) social agenciessuch asY. M. C. A.'s, Y. W. C. A.'s, and community centers, (4) public eveningschools, (5) proprietary schoolssuch as commercial schools and schoolsof beauty culture, (6) high-school and college teachers, (7) high-schoolpupils, (8) students in nurse-trAining institutions, (9) medical schools, (10)graduates and former students of high schools, (11) evening school students,(12) Statistical Division of the Office of Education, and (13) the VocationalEducation Division of the Office of Education.'
Inquiry forms.Most of the data were collected on inquiry forms. Four-teen forms, which are described in appendix B, were used for this purpose.
Other sourses of data.Data concerning the enrollments, courses, teachers,and expenditures in schools having federally aided vocational educationprograms were tabulated 4irectly from the State reports filed in the Voca-tional Education Division of the Office of Education. A study was made ofthe trends in these items from 1928-29 to 1934-35, inclusive.
Letters were sent to a number of educators and employment executivesin order to asceitain their views and suggested solutions relative to the specialproblems in vocational education and occupational adjustment of Negroes.
With two exceptions, all data were gathered by personal contact andinterview by qualified persons', working under the immediate direction ofa local supervisor, and the general direction of a State supervisor. The twoexceptions referred to were data collected on forms mailed directly to theinstitutions concerned.
Accuracy and reliability of data.It is believed that thc use of *he inquiryforms through the interview method assured a high degree of acCuracy and
Private schools operated by a proprietor, such as certain commercial schools, schools of beauty culture, etc.All data on the federally aided vocational education program in this study are from the 18 States maintain-ing separate schools for the Negro and white races.
0

INTRODUCTION
reliability. Moreover, an additional pibecaution was taken .by having thelocal iupervisor check each form. The supervisors were 'selected for .theirsuperior abilitr and acquaintpce with the schools and local communityin general. Samplings of theie forms were checked by .the State super-visor and the regional director.
Cooperation of school officials and other citizens.An investigation of such widescope as this could not be possible but for the generous cooperation of manyindividuals and organizations. Lettets from the Assistant Commissiynerof Education were sent to State superintendents of education requestingtheir cooperation in making .the survey. Similar letters were sent to Satedirectors of Negro education and to the superintendent of each rural andurban administrative unit from which data were gathered. -Prior to visitsto Institutions by members of the, staff, -a letter requesting cooperation wassent to its executive heici from the Director of the Survey.
The National Technical Advisory Committee, composed of nationalleaders in business, industry, and. the professions rendered valuable assist-ance in clarifying the purposes of the survey and in ti-;e selection of ùnitsfor study.
O
a
*
rIVNOLINDOA NOLLVOnaa aoNvaino
TA
BL
E 1
. A
mbe
r an
d pe
rcen
t of
Neg
ro p
upils
whd
pla
n'to
dro
p ou
t of
hig
h sc
hool
Pr
the
reas
ons
indi
cate
d
,
Rea
son
9.4
_
Sout
hwes
t So
uth
Atla
ntic
So
uth
Cen
tral
N
orth
ern
) T
ots I
, Num
ber
Perc
ent
Num
ber
Perc
ent
Num
ber
Perc
ent
7
Num
ber
-
Perc
lit
Num
ber
le
Perc
ent .
.
1 -
3 4
*.
5 s
4 ti
I 11
Failu
re in
sch
ool
wor
k L
ack
of in
tere
st in
sch
ool
wor
k L
ack
of r
elat
ion
betw
een
scho
ol w
ork
and
antic
ipat
ed j
ob
Opp
ortu
nity
for
goo
d jo
b D
esir
e to
ear
n m
oney
for
sel
f T
o be
ll% s
uppo
rt f
amily
Po
or h
ealth
O
ther
t
No
reas
on g
iven
Tot
al n
umbe
r pl
anni
ng t
o dr
op o
ut
Tot
al n
umbe
r pl
anni
ng to
dro
p ou
t gi
ving
rea
sons
Pe
rcen
tage
.
38
15
20
68
152
190
167 17
2,
601
S. 7
2.
2
2. 9
10
. 2
22.
7 28
. 5
25. 0
2.
5
79.
6
55
13
10
54
109
117
92
99
755
10. 0
2. 4
1.
8
9. 8
19
. 9
21.
3
16.
8 18
. 0
57.
9
28
14
- 7
45
171 79
80
46
1,
926
5. 9
2.
9
1. 5
9.
6
36.
3
16.
8 17
. 0
9. 8
80
. 4
124
63
23
173
212
270
54
34
3, 9
99
13. 0
6. 6
2.
4
18.
1
22.
3
28.
3 5.
7
3. 6
80
. 7
245
105 60
34
0 64
4 65
6 39
3 1%
9,
281
2. 1
. 9
. 5
2. 9
5.
3
5. 5
3.
3
1. 6
77
. 9
3, 2
68
667
20 4
1, 3
04
549
42
1
2, 3
96
470
19
6
4, 9
52
953
19
2
11, 92
0 2,
639
22
1
-
4
dB)
I.
Cr)

NOIlDflUOILLNI
TA
BLE
2.
Num
ber
and
perc
ent
of N
egro
hig
h-sc
hool
pup
ils w
ho a
re o
vera
ge i
n th
t gr
ades
ind
icat
ed,
acco
rdin
g to
geo
grap
hica
l re
gion
s
Rep
oli
1
jaao
urtb
ern
th A
tlant
ic
Sout
h C
entr
al
Sout
hwes
t
Tot
al o
vera
ge
Tot
al i
n gr
ade
GR
AD
E
Eig
hth
I
Num
- be
r 81
628
153
465
1, 3
27
2, 6
81
Per-
ce
nt
Nin
th
Num
- be
r
4
61.
8 1,
144
48
.6
625
42.9
49
5 51
.6
642
49.
5 2,
906
8,
362
Per-
ce
nt
3
Ten
th
Num
- be
r
6
33.2
77
7 30
. 4
457
36.3
38
0 42
. 8
450
34.
8 2,
064
7,
073
Per-
ce
nt
Pleventh
Tw
elft
h
Num
- be
r 8
26.4
62
7 25
.9
413
33.3
28
0 36
.7
457
29.
2 1,
777
6,
014
Per-
ce
nt
Num
- be
r
10
27.
4 35
2 28
. 7
nO8
26.
5 23
8 37
. 0
116
29.
5 81
4 3,
236
Per-
ce
nt
11
Gra
nd
tota
l
13
23.
9 2,
981
18
. 4
2, 2
31
30.
1 1,
546
30
. 2
2, 1
30
25
2 8,
888
27
, 36
6
Per-
ce
nt
29.
0 31
. 2
32.
9 40
. 6
32.
5
I In
sev
eral
Sta
tes
in t
he S
outh
whe
re t
he e
lem
enta
ry s
choo
ls c
onsi
st o
f 7
grad
es,
the
eigh
thar
ade
cons
titut
es t
he f
irst
yea
r of
hig
h sc
hool
.
6
IIME
N11
11,,
2
_ ...
.
ir
'No
41,
Cs)
)
411 I
I
Vr
11
ii
411,

I CHAPTER II I iMINNIOW
Summary of Findings, Conclusions, and
Recommendations
FINDINGSS4.;
SCHOOLS AND COLLEGESGeneral.
1. The total number of vocational courses offered in the 207 highschools studied increased from 1930 to 1935; the largest increaseswere in home economics, industrial arts,' and agriculture; thelargest decreases were in the building trades.
12. Slight increases were found in the number/ courses offered in radiorepairing, aviation, refrigeration, janitorffl work, beauty culture,cafeteria managemenr,iand vocational guidance.
3. Nearly half (46.4 percent) of the pupils in the high schools studiedwere registered in academic curriculums in 1934-35.
4. Public colleges studied offer more 'courses -in home economics andagriculture than in any other vo&tional subject.
5. Fewer colleges than high schools reported changes in the numberof vocational courses offered from 1930 to 1935.
6. Fewer college students registered for vocational courses in 1934-35than in 1930-31., though the percentage of such students to thetotal eqollment increased.
7. In each State studied, except one, the percentage of all Federalfunds for vocatiorval education spent on high-school courses for
*Negroes was lower than the percentage of Negroes to the totalpopulation.
8. The number of vocational courses offered, teachers employed, pupilsenrollid, and the expenditures for vocational courses amongNegroes increased between 1928-29 and 1934-35.
9. There were in 1935-36, 1,726 rural !tools for Negroes offering 1 ormore years of high-school instructKn.
Courses in agriculture.---T1. In 1934-35, 542 all-day high schools for Negroes, 320 part-time
schools, and 784 evening schools, participated in the Federal pro-gram of vocational education in agriculture. Most of these schoolsare operated in the same building and are taught by the sameteachers.
8

FINDINGS, CONCLUSIONS, AND RECOMMENDATIONS 9
2. From 1926-27 to 1934-35 the percentage of increase in the numberof all-day schools for Negroes offeting véocational agriculture was73.7. In number of evening, part-time, and day unit classes, thepercentage increase from 1928-29 to 1934-35 was 128.7.
3. The percentages of Negro males enrolled in each type of federallyaided schools offering courses in vocational agriculture of the totalNegroes enrolled are: For 1928-29: All-day, 52.4; evening, 29.9;part-time, 7.9; day unit, 9.7. For 1934-35: All-day, 38.8; evening,40.2; part-time 10.2; day unit, 10.6.
4. The percentage increases of enrollment of Negroes in all types offederally aided schools offering courses in vocational agriculture in1934-35 over 1928-29 were: Males, 110.9; females, 273.1; in all-dayschools the corresponding percentage incresases were for males, 111,anil for females, 122.
5. The three major occupations for which the land-grant cplleges forNegroes prepared their graduates of agricultural courses in 1934-35were: (1) Teaching vocational subjLts iii high school; (2) exten-sion work; and (3) college teaching. In 1935-36, the percentagesof the total Negro and total white graduates in the South trainedas teachers of vocational agriculture were, respectively, 91.6 and41.2.
6. The number of Negro teachers of agriculture in all-day schoolsincreased 35 percent from 1928-29 to 1934-35; the number ofpersons enrolled in courses for the training of teachers of agriculturtincreased 6.5 percent during the same period.
7. Of all Federal funds allotted to the preparation of teachers of agri-culture in the 18 States studied, the proportion allotted to coursesfor Negroes ranged from 11.1 to 16.1 percent during the period1928-29 to 1934-35.
8. Of the Federal funds allotted to instruction in agriculture in the 18States studied, the prportiori allotted to courses for Negroesranged from 8 percerit in 1928-2 to 12 per&nt in 1934-35.
Courses in home economws..
1. There were 225 all-day schools for.Negroes in the 18 States studiedoffering federálly aided vocational courses in home economics .in1934-35; an increase of 543 percent sincg, 1928-29.
2. In 1934-35, 508 classes were offered Negrdes in vocational homeeconomics in evening schools; or 316 percent increase over 1928-29.
3. In the 207 selected high schools, in 1934-35, 14 percent of the girlst were enrolled in home economics curriculums. In the schools for
Negroes which made the regular statistical report to the Office ofEducation for A.234, 21.8 percent of the girls were , enrolled ingeneral home economics in the 4year high schools and 18.8 percentin the junior-ienior high schools.
t..
i.
4
lo VOCATIONAL EDUCATION AND GUIDANCE OF NEGROES
4. The enrollment of Négro girls in federally aided home economicscourses increased 195.3 percent from 1928-29 to 1934-35.
Four percent of the Negro girls 15 to 19 years of age in the 18 Statesstudied were enrolled in federally aided home economics courses inall-day schools in 1934-35.
6. ,Few Negro girls are enrolled in federally aidebd part-lime home'economics courses.
7. 11Yom 1928-29 to 1934-35 the number of Negro home economicsteachers in federally aided all-day schoo,ls increased from 50 to231, or 362 percent; those in evening schools from 136 to 276, or103 'percent.
8. Thel percentage of Federal funds received for vocational homeeconomics in all types of schools for Negroes ranged from 8.2 to10.2 for the 7 years, 1928 to 1935.
Courses in trades and industries.1. There were 61 all-day schools offering federally aided vocational
courses in trades and industries for Negroes in 1934-35, or anincrease of 52.5 percent over 1928-29.
2. In 1934-35 Negro pupils in federally ,aided all-day schools wereregistered in 13 different trades and industries coursed; in eveningschools, 14; and in part-time and trade extension courses, 8.
3. Few Vegro students, enrolled in the high schools reporting to theOffice of Education, or in the 10 public colleges studied, wereregistered in trade and industrial courses.
4. The number of Negro boys and men enrolled iri federally aidedvocational courses in trades and industries in 18 States increasedfrom 4,232 in, 1928-29 W 6,-324 in 1934-35, or 49 percent; girls andwomen, from 2,286 in 1928-29 to 3,255 in 1934-35, or 42.3 percent.5. The number of Negro teachers of federally aided trades and indus-tries coursOs in federally aided all-day schools increased from 87 in1928-29 t144 in 1934-35, or 46 percent; in evening schools, 130to 254, or 95 percent; in part-time trade exiension schools, 14 to58, or 314 percent. The number of teachers in the part-timegeneral continuation schools decreased from 23 to 13, or 77 percent.6. The percentage of expenditures of Federal funds for trades andindustries allotted to schools for Negroes ranged from 4.4 to 6.7during the 7 years studied.
TEACHERS AND TEACHINGTeachers.
1.' The typical vocational teacher of Negroes is a college graduate.The difference in training of such teachers among the sections ofthe country is slight.
J.
.
I
I

FINDINGS, CONCLUSIONS, AND RECOMMENDATIONS 11
2. Home economics teachers have more specialized training thanteachers of the other voCational subjects. The median number ofsemester hours credit for teachers of home economics is 38.89; forteachers of commerce, 27.43; for teachers of agriculture, 30; forteachers of theory, 30.14; and for teachers of trades and industrieg,30.81.
3. Most of the vocational teachers studied have remained in tlKirpositions from 6 to 10 years, and half of them have had 6 or moreyears of experience in occupations related to their fields of teaching.
4. The median age of the vocational teachers studied is 37.3 years.5.. The median annual salary of the votational teachers studied is
$1,871.74. The sàlaries of teachers of the different vocationalsubjects vary only slightly from this median with the exceptiort ofteachers of agriculture, for whom the median salary is $1,060
There is a marked difference in median annual salary of teachersamong the different States. .
6. Frirrp 1928-29 to 1934-35 the percentage increases in the enroll-ment yf Negroes in teacher-training classes were as follows for thedifferent subjects: Agriculture (men).6.6 ; trades and industlies(men), 80, (women) 54.8 for 1933-14; and home economics(women),
Teaching.1. Most of the vocational courses taught by the teachers responding arm .
1 year in length and are offered each year. Few courses welt offeredin alternate years.
2. A large percentage of the teachers offer vocational or prevocational'courses in the seventh and eighth grades.
3. Most of the teachers devote three-fourths of the class time to labora-tory or shop work and one-fourth to group discussion and theory.
4. "Quality of product" was the most frequently mentioned criterionused for determining students' marks.
. HIGH-SCHOOL 'PUPILS, GRAIOUATES AND NONGRADUATEStl
High-school pupils.: 1. The occupational status of fathers of children studied seems to in-
fluence the educatiönal level attained 6y the children.2. The typical parent of the pupils studied had reached the eighth grade.3. Thirty-six percent of the parents own their homes. The median
number of books in each home is 60. Eighty-five percent subsc.ribeto a daily paper, and 70 percent subscribe to a Negro weekly paper.
4. A large number of the pupils supported themselves wholly or in partwhile in school; 17 percent, wholly; and 47 percent, in part.
5. One-third of the 27,366 pupils studied are overage for their grade.
Data not given for 1934-35. *)
.;
I
.

s.
4
12 VOCATIONAL EDUCATION AND GUIDANCE OF NEGROES
6. Occupational choices of Negro pupils studied are limited in rati-geand vary among the geographical regions and communities ofdifferent sizes, but not according to age or grade level of pupil, andonly slightly according to fathers' occupation, or parents' education.7. "Desire to make money" and "belief in their ability" were the twostrongest influences which pupils said affected selection of an occu-pation. "Desire to serve'.' was next.
High-school graduates and nongraduates.1. in the different geographic regions the median age of male high-
school graduates and nongraduates at the time of leaving schoolranged, respectively, from 18.7 to 19.4 and from 17.6 to 18.2;females, from 18.4 to 18.9 and 17.3 to 17.8 The median age at thetime interviewed (1936) of male and female graduates and non-graduates, respecuvely, were: Graduates, 23.2 and 22.8; non-graduates 21.9 and 21.8. The median age of those attendingevening school is 26 years.
2. Nongraduates and evening school students in the Southern regionhad approximately a year less of schooling than those in the otherregions.3. A larger percentage of the graduates and nongraduates in theSouthern regions than in the Northern and Western pursuedacademic curriculums while in high school.4. A larger proportion of the graduates arid nongraduates in theNorthern regions than in the Southern regions had vocationaltraining while in high school. ,
5. More persons who received their vocational training in small com-munities than in the larger ones said that it assisted in obtainingwork.6. Fifty-six percent of the graduates and 44 percent of the nongraduatessupported themselves during high-school attendance.7. The three main reasons the nongraduates studied left high schoolbefore graduation are: (a) Financial needs of family, (b) desire tomake money, and (c) lack of interest.8. A larger percentage of the males in the Southern than in the Northernregions went directly to work after kaving school.9. Most of the persons studied who attend evening schools do so for thepurpose of preparing themselves for a new type of work, or in orderto improve their chances for an increase in rank or salary.10. At time of study, the percentages of male graduates and non-graduates, respectively, who had never been employed were 6.9 °and8.3; female graduates and nongraduates, 21.7 and 28.5.11. Most of the graduates and nongraduates studied obtained their jobsthrough friends or relatives, or by direct application. Few said thatthe school had assisted them.
w.

FINDINGS, CONCLUSIONS, AND RECOMMENDATIONS
12. Evening school students who received aid in obtaining their first jobfrom teachers or the placement bureau of the school had attendedschool longer than the others. Those who obtained their first jobthrough former students had attended school less than the others.
13
. GUIDANCE
1. Few institutions for Negroes have organized guidance programs.2. A variety of organizations and officers are responsible for pidanc'e in the
institutions that provide it.3. A larger number of institutions obtain information about the "family
status" of pupils and students than about any other background factorstudied.
4. The largest number of schools and colleges obtain information aboutpupils and students through "conferences."
5. Exploratory courses are offered by about one-third of the schoolsreporting.
6. "Lectures andassembly programs" were the procedure used by most ofthe institutions in giving the student information about occupations.Six high schools and no colleges used "contacts with industrial, trade,and commeicial establishments." Four schools and two colleges used"occupational surveys."
7. While half of the institutions replying kept "cumulative record cards,"few institutions use the data recorded for guidance purposes.
8. Two-thirds of the high schools and practically all the colleges replyingreported some type of placement and follow-up service.
9. Objectives of the guidance program vary greatly among the institutionsreplying.
CONCLUSIONS1. Improvement in the education of Negroes for effective occupational
adjustment is largely dependent on improvement of general education.For example, there should be reduction of illiteracy, increase in schoolfacilities, increase in the ability of Achools to hold pupils, reduction ofthe number of pupils over-age for their grades, and an enrichment of thecurriculum and extracurriculum offerings.
2. The Adequacy of the program of vocational instruction for Negroes variesamong the different fields studied. More or less improvement in eachfield is needed: (1) In the number of schools offering and io facilities forvocational instruction; (2) in number of courses adapted to moderii'occupational demands; (3) in number of students enrolled in manycourses now offered; (4) in number arid quality of preparation ofvocational teachers; and (5) in financial support.
3. Guidance programs for Negroes are inadequate in number and quality.improvement is needed with respect to: (1) Organization and adminis-tration; (2) information obtained about students and occupations; (3)use of information obtained; and (4) guidance services.
.

14 VOCATIONAL EDUCATION AND GUIDANCE OF NEGROES
4. The curriculum and occupational choice of Negro students indicate alimited educational and voCational outlook.
RECOMMENDATIONS
In view of the findings and conclusions resulting from this survey, thefollowing recommendations are made:
1. That the laiid-grant colleges in each State, particularly those forNegroes, since in many States they are the only publicly controlledinstitutions of higher learning .which they may attend, (1) makespecial studies of problems concerned with the future vocationalsuccess of Negroes, especially within the areas they serve; (2) par-ticipate actively in the State educational program looking towardthe solution of these problems; (3) cooperate with all possibleagencies, such as the colleges and universities, extension workers,industrial and business leaders, agricultural employers, and in-terested public officials and lay citizens, in improving the employ-ment status of and educational facilities for Negroes; (4) cooperatewith other land-grant colleges for Negroes within a given region,through conferences and otherwise, in the study of problemscommon to the particular area; (5) encourage more of their studentsto consider the vocational needs of Negroes and to pursue coursesother than those leading to teaching.
2. That the Negro citizens, in coope,ration with the faculties of theland-grant college, vocational teacher-trainers and supervisors,farm and home demonstration agents, and Jeanes teachers, makea study of the needs of Negroes for vocational education andpresent their findings to the school officials. Such a group shouldacquaint itself with the provisions of the Federal aid program foryocational education, and through the local school officials seekto share in its benefits.
3. That the group give consideration also to the improvement of thegeneral educational situation among Negroes with respect to (1)establishing needed and accessible high schools; (2) increasinsfacilities for vocational instructiori; (3) enforcing school attendancelaws; (4) encouraging an increase in the number, qualification,and compensation of teachers and supervisors.
4. That schools for Negroes give more attention to ways and meansof (1) providing courses, as rapidly as means and personnel permit,that will meet the needs and interests of students and the growingoccupational demands; (2) reducing pupil mortality; (3) adapt-ing materials and methods of teaching to the needs of _modernoccupational life.

FINDINGS, CONCLUSIONS, AND RECOMMENDATIONS 15
5. That, as rapidly as possible, schools for Negroes institute a definiteprogram of guidance in charge of qualified persons, beginningwith the junior high school grades and continuirig through college,which should include: -(1) the application of modern techniquesfor the study of individual interests, needs, and aptitudes; (2) fre-quent studies of the occupations and the status and trend of Negroemployment in the community, State, and Nation; (3) *studentcounseling based on approved procedures; and (4) counselingadults emplOyed and those unemployed.
6. That extension education be established where necessary by schoolsand available colleges for the purpose of (1) providing reeducationto youth and adults; (2) assisting both in keeping abreast of thechanging occupational demands; and (3) repairing the defectsresulting from inadequate earlier eau tion.
7. That schools cooperate with interested individuals and groups' inmaking contacts with employers for the purpose of opening upmore occupational opportunities for Negroes and of assisting themto enter the new fields that are being developed.
8. That schools endeavor to change the attitude of Negroes towardoccupations and the training opportunities designed to assist themto improve in and to retain the jobs they now have, and to preparethem for new opportunities as they become available.
9. That individuals and groups interested in the improvement ofeducational faciliiies for Negroes continue and increase their effortsto promote equitability of educational opportunity and equitabilityin the distribution of funds without regard to race or color,especially with respect to Federal and State funds allotted toeducation.
4

CHAPTER III
The General Educational Program and
The Place of Vocational Training
GUIDANCE in the selection of vocations and preparation for effectiveparticipation in them are two of the major functions of education.
Because of the demands of modern society, more attention is now givento these ¡unctions than ever before. If one is to obtain a clear picture ofthis phase of education for Negroes, it is necessary to study its setting inthe general education program. Heretofore, detailed skills and knowledgehave been stressed in vocational training. At present, specialized skillsand related knowledge quickly become outmoded. Educators are begin-ning to realize that attitudes, perseverance, creative imagination, andcertain other personality traits, which should be products of general educa-tion, are essential to vocational success. In light of this fact, a study ofthe status of general education among Negroes is important in revealingthe situation in vocational education and guidance, and in suggesting thepossibilities for the immediate future. This section is devoted chieflyto a brief discussion of secondary education among Negroes because it isat this level that most of the vocational training programs are found, andwith which this survey particularly concerns itself.
Number and distribution of high schools.While it is difficult to state the exactnumber of high schools open at any given time, the following data arebased on the best available information. In 1936 there were 2,460 schoolsdesignated As separate schools for colored children doing 1 or more yearsof high-school work. Of this number 2,352.were public schools and 108were private schools. The distribution of these schools among States isshown in table 3. There was an increase of approximately 100 percentiri the number of high schools for Negroes since 1930.1 No attemptwas made to classify these schools according to years of work offered, butif the same proportions exist as in 1930, the following classification prevails:1 year, 17.4 percent; 2 years, 23.6 percent; 3 years, 14.9 percent; 4 years,44 percent. Rwal schools constitute 70 percent of the total.
I Secondary Education for Negroes. Washington, Government Printing Office, 1933. (United States Depart-ment of the Interior, Office of Education. Bulletin 1932, No, 17, Monograph No. 7.)16
[ ]

GENERAL EDUCATION AND VOCATIONAL TRAINING
TABLE 3.Number and distribution of separate high schools for Negroes
17
State,
Urban Rural 1 Total Public Private Total
1 t 3 4 6 s 7 .
Al ama 1
a alas,
lawareDistrict of ColumbiaFlorida
GeorgiaIllinoisIndianaKansasKentucky
Louisiana _ ______ .MarylandMississippiMissouri_ _
New Jersey
North CarolinaOklahomaSouth Carolina -Tennessee ,Texas
VirginiaWest Virginia
4140
1
926
7310174
,44
266
9626
1
I 6441512886
2915
1223Ill
6
34
2034
11
35
57275831
1
14043
18859
381
8529
264151
79
60
2761428
479
8333
15457
2
20484
23987
467
114
44
254145
79
60
2581428
478
7233
12957
1
1%84
23083
461
105
44
106
__
18
.._ _____ __ _
1
11__ _ _ _ _
25
1
8
946
9
264151
79
6(
2714
2E4
75
8333
15457'1
(
20184
2358;
46;
11444
Total_ 734 1, 726 2, 460 2, 352 108 2, 46(
All schools in communities with a population of less than 5,000 were considered as rural schools.
Availability of high schools.Several situations must be taken into con-sideration when discussing the availability of schools. One is the rela-tionship between the number of schools and the number of children ofhigh-school age in the Stats to be served. This relationship may be ob-served by comparing data in table 3 with those in table 4. This is a rathercoarse measure of availability; a finer one would be a study of the numberof schools within a county in relation to the number of children of high-school age in that county. Data were not obtained on this item, but*cording to the survey on secondary education made in 1930 2 therewas a serious dearth of high schools for Negroes at that time. For example,
4%
there were 196 counties having a large Negro population without any4-year high schools, and 230 such counties with no high-school facilities.Although the number of high schools has increased, facilities are stillinadequate. In treating this subject, only those States maintaining sepa-rate schools for Negro and white children will be considered.3
Where only a few schools are provi,ded for a large area it is inevitablethat some are located long distances from the homes of the children.This was found to be the case in the 1930 Survey,' and in a later study ofthe situation in rural areas 6 in 1935.
Ibid., p. 28-29.3 In Indiana, New Jersey, and Ohio separate schools are not required by State statute. It is assumed, there-
fore, that where no separate school exists Nerves attend school with the other children.4 Secondary Education for Negroes. Op. cit.
Availability of Education to Negroes in Rural Communities. Op. cit.
..1
-. .
;
.
_ _ _ . ..... _ . . ,
_ ,
..... ......
,
I
s
_
_
_ _ ______
I
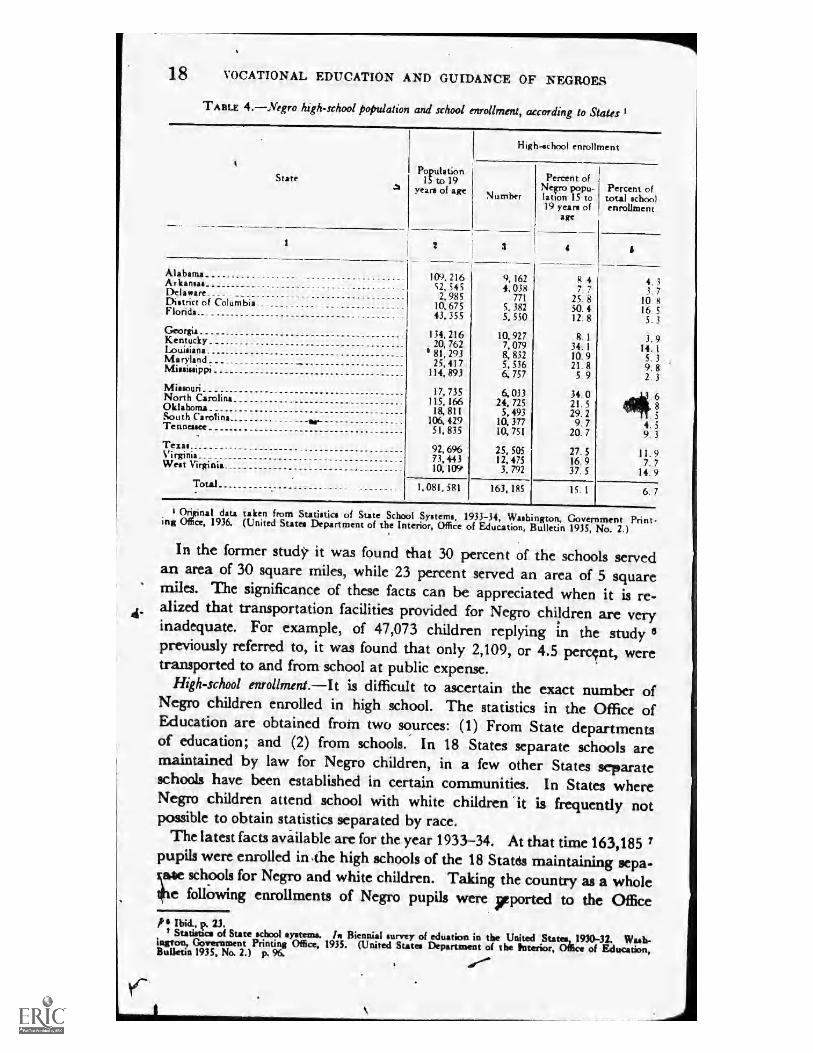
18 VOCATIONAL EDUCATION AND GUIDANCE OF NEGROES
TABLE 4.Negro high-school population and school enrollment, according to Staks
State
Alabama_A rkansas _ _Delaware _ _
District of ColumbiaFlorida
z
GeorgiaKentuckyLouisianaMarylandMississippi
MissouriNorth CarolinaOklahomaSouth CarolinaTennessee
t)
TexasVirginiaWest Virginia
Total
Population15 to 19
years of age
2
High-school enrollment
Number
109, 216 9, 16252, 545 4, 038
2, 985 77110, 675 5, 38243, 355 5, 550
134, 216 10, 92720, 762 7, 079
9 81, 293 8, 83225, 417 5, 536
114, 893 6, 757
17, 735 6, 033115, 166 24, 725
18, 811 5, 493106, 429 10, 37751, 835 10, 751
92, 6% 25, 50573, 443 12, 47510, 109 3, 792
1, 081, 581 163, 185
Percent ofNero popu-lation 15 to19 years of
age
4
g 47. 7
25. 850. 412. 8
8, 134. 110. 921. 85. 9
34. 021. 529. 29. 7
20. 7
27.516.937.5
15. 1
Percent oftotal schoolenrollment
4. 33 7
10 g16. 5
_5 3
3. 914. 1
5. 39. 82. 3
685
4. 59. 3
11. 97. 7
14. 9
6. 7
I Original data taken from Statistics of State School Systems, 1933-34, Washington, Government Print-ing Office, 1936. (United States Department of the Interior, Office of Education, Bulletin 1935, No. 2.)
In the former study it was found that 30 percent of the schools servedan area of 30 square miles, while 23 percent served an area of 5 squaremiles. The significance of these facts can be appreciated when it is re-alized that transportation facilities provided for Negro children are veryinadequate. For example, of 47,073 children replying in the study 6previously referred to, it was found that only 2,109, or 4.5 percçnt, weretransported to and from school at public expense.
High-school enrollment.It is difficult to ascertain the exact number ofNegro children enrolled in high school. The statistics in the Office ofEducation are obtained from two sources: (1) From State departmentsof education; and (2) from schools.' In 18 States separate schools aremaintained by law for Negro children, in a few other States separateschools have been established in certain communities. In States whereNegro children attend school with white children 'it is frequently notpossible to obtain statistics separated by race.
The latest facts avilable are for the year 1933-34. At that time 163,185 7pupils were enrolled in %the high schools of the 18 States maintaining sepa-ymie schools for Negro and white children. Taking the country as a whole4ie folfowing enrollments of Negro pupils were yported to the Officefr. Ibid., p. 23.
Statistics of State school systems. bs Biennial survey of eduation in the United States, 1930-32. Wasb-ington, Government Printing Office, 1935. (United States Department of the toterior, Office of Education,Bulletin 1935, No. 1.) p. 96.
1
.
.
- 3
7
_

GENERAL EDUCATION AND VOCATIONAL TRAINING 19
of Education by the different kinds of secondary schools-for the year 1933-34: Regular high schools, 1 30,478; senior high schools, 15,1 04; junior-senior high schools, 15,569; and junior high schools, 44,035. This givesa total of 205,186 Negro pupils enrolled in schools organized to do sec-ondary work,8 including the junior high schools.
The Negro population 15-19 years of age, inclusive, in the 18 Statesmaintaining, separate schools is 1,0 81,581. Fifteen percent of this numberis enrolled in high school. The percentages of Negro children 1 5-19years of age enrolled in the last 4 years of high school in the 15 Statesstudied increased from 9.5 in 1930 to 14.3 in 1934.
Attendance at reorganized schools.Arnong some of the features of reorganizedschools,' the following appear to have important implications for vocationaleducation and guidance: (1) Greater provision for articulation between theupper highschool unit and the preceding school unit; (2) more systematiceducational and vocational guidance; (3) greater flexibility and compre-hensiveness of the program of studies; and (4) more attention to And develop-ment of extracurricultAn activities. In view of these advantages it shouldbe of interest to inquire into the extent to which,Negroes have attendedjunior high schools. The number and percentage of pupils reported inthis study who attended junior high school for a given period in the dif-ferent regions ale given in table 5 showing that 44.6 percent attendedjunior high school 1 or more years. This is in close agreement with thefindings of the Office of Education in 1934,") showing that 47 percent ofthe pupils in the high schools reporting were enrolled in reorganized schools.There is considerable variation among the different regions in the per-centages of Negro pupils attending junior high school; they are, for therespective regions: Southwest, 27.8; South Atlantic, 37.7; South Central,47; and Northern, 56.8.
TABLE 5.Numbrr and percent of pupils who attended and who did not attend junior high school
.
Southwest,
South At-!antic
South Cen-tral Northern Total
. Num-ber
Per-cent
Num- 1
berPer-cent
Num-ber
Per-cent
Num-ber
Per-cent
Num-ber
Per-cent
L
1 2 3 4 5 11 7 ti I le 11
,Attended junior high school :
1 year 253 4. 8 421 5. 6 449 9. 4 1,336 12. 7 2, 459 8. 82 years 767 14. 5 967 12. 9 795 16. 7 1912, 18. 2 4, 441 15. 83 years 450 8. 5 1, 431 19. 2 1,001 20. 9 2, 717 25. 9 5, 599 20. 0
Did not attend 3, 608 68. 2 4, 029 54. 0 2, 367 49. 7 3,73 5 35. 6 13, 739 49. 1No response____ 215 4. 0 607 8. 1 15 3 3. 2 788 7. 5 1, 763 6. 3
Total._ _ _ _ _ _ Nr_ _ _ _. 5, 293 7, 455 4, 765 10,488 28,001 _
Statistia of public high schools. bt Biennial survey of education in the Unity States, 1930-32. Washing-ton, Government Printing Office, 1935. (United States Department of the Interior, Office of Education, Bulletin1935, No. 2.) p. 23.
I The Reorganization of Secondary Education. Washington, Government Printing Office, 1933. (UnitedState Department of the Interior, Office of Education. Bulletin 1932, No. 17, Monograph No. 5) p. 83.
" Statistics of public high schools. Op cit., p. 23.
s.,
,i
.
. _ _ ....
_ _ ._ _ . _ _ _ _ ....
_
_ _ _ _ _ _
1

20 VOCATIONAL EDUCATION AND GUIDANCE OF NEGROES
The lack of high schools for Negroes and the small enrollment in theschools provided, discussed in the preceding sections, have important im-plications for vocational education and guidance; for, unless there areschools within the reach of children, which they attend, there is little pos-sibility of securing the guidance and training necessary for effective par-ticipation in occupational life.
GENERAL SITUATIONTrends in vocational courses in high school. rder to ascertain trends in
high schools, inquiry w.as made concerning the number of vocationalcourses added and dropped during the 6-year period between 1930 and1935. The results of this inquiry are shown in tables 6 and 7.
Number of schools reporting coursdi added and dropped are shown intable 7. A total of 37 different courses were added. The largest-numberof additions occurred in home economics, agriculture, and industrial arts,the respective number of schools adding them being 20, 17, and 13. Atotal of 16 ylifferent courses were dropped, those dropped by the largestnumber of schools were commerce and the building trades; the respectivenumber of schools dropping them being 13 and 6. The specific comparisonsbetween academic and vocational courses Were not made in this study,but during the depression certain unpublished studies were made whichshowed that vocational courses frequently were the first to be dropped whenretrenchment became necessary.
While the numbers involved in table 7 are perhaps too small to supportdefinite conclusións, certain facts relative to courses in trades and industriesmay have some significance. For example, in the building trades and inplumbing the number of courses dropped exceed those added. Anothersignificant fact to which attention shduld be directed, is the small numberof courses added in certain fields in which expansion has taken place.Some pf these fields are: Radio repairing, vocational guidance, beautyculture, cafeteria management, and janitorial engineering. In view of thegrowth in these occupations it would seem advisable for schools to increase"the offerings in them.
TABLE 6. Number of vocational courses added and dropped by 207 high schools byyears from 1930to 1935
Year
1930193119321933
Coursesadded
12301018
Coursesdropped
83
1414
Year
19341935
Total
A
Courses Coursesadded dropped
3637
143
74
50
'Oh
,
-
.
1
o
a

TABLE 7.
GENERAL EDUCATION AND VOCATIONAL TRAINING 21
Numbq of specified vocational courses added and dropped by 207 high xhools forNegroes from 1930 to 1935
Course
1
Art appreciationAuto mechanicsBeauty cultureBookkeepingBrick masonryBuilding tradesBusiness administration_ _
Cafeteria management_ _
Carpentry and cabinet mak-ing
Commerce _ ,Commercial artDressmakingElectricity
* Farm mechanicsHome economics'Housemaid trainingIndustrial artJanitorial engineering
Numberof schools
addingcourses
626221
10134
62
20-4
13
Numberof schoolsdroppingcourses
3
3
3
6
313
Course
LaunderingMachine shopMechanical drawingMetal workMillineryNursingMusicPlasteringPlumbingPrinting and duplicating.._ .
SalesmanshipShoe repairingTailoringTeacher trainingTrade mathematics__ .. _
Radio repairinfVocational agnculture__ _
Vocational guidance
Numberof schools
addingcourses
3
3
'22
2174
Numberof schoolsdropping
course%
3
--2
21
1
31
2
5
4.1=11=1111.
Guet-ic.olorrtAcórnb19E.5 -Et)1934-515
G.a.m. rob I
1954 -55
NIMM/11/1/1/1/11/111/11111111/NIM
///////////////11111//1"Houa a,hold. Ar4a
19E.5 - Lb1934 -315
Inckiet Art19E5 - Ab1934 35
711/1/14
Tr cuicis19G 5 et71934 35
w/M1
Co rn rrmrc.oa Iwars1954 -35
Agriculture.19E. 51934 -.35
he.r19A5 ab1934 -35
SUMO
Fotsts 1.---Percentige of N jeroszpils registered in different curriculums in 207 high1925-26 and 1934-35.
II
_
... . _ _-
_ ..... - -
2
1
1
.,
_
2
an.
JAMS -Ge
WA
-Ae'fin
--At)
SO
.
011
I.
-a
411
...
5
1
_
_
3
1
------
0
-

22 VOCATIONAL EDUCATION AND GUIDANCE OF NEGROES
Curriculum registrations in high school.Curriculum registrations in 207high schools for each year from 1925-26 to 1934-35 are shown in table 8and figure 1. There Were slight changes during the 10-year period inthe percentage of the total pumber of pupils who were registered in agri-culture, trades, home economics, and industrial arts. The comparativepercentages for the different curriculums are shown below:
Curriculum 1925-26 1934-35
AgricultureTradesHousehold artsIndustrial arts . .
0. 62. 98. 38. 1
0. 93. 38. 48. 2
There was a decrease in registrations in academic or college-preparatorycurriculums from 57.1 percent in 1925-26 to 46.4 percent ix 1934-35.While "this reprennts a difference of 10.7 Nrcent, there was an increasein the number of pupils registered in this curriculum of 127 percent.There was an increase in the percentage distribution in the "generalcurriculum" registrations from 20.5.4in 1925 to 27.9 in 1935, and an increasein numbers registered in this curriculum during- the same period of 282percent.
4.0'
-4
. . .
.
.%
. . . .

NOIIVOIICIa rWNOIIVO0A DNINIV1LL
op
TA
BLE
8.C
urric
ulum
reg
istr
atio
ns fo
r th
e pa
st 1
0 ye
ars
in 2
07 h
igh
scho
ols fo
r N
egro
es,
by s
ex
Cur
ricu
lum
1925
-26
M1
le
1
Fem
ale
Tot
al
1926
.-27
3
Mal
e Fe
mal
e T
otal
7
Aca
dem
ic o
r co
llege
prp
arat
ory
:
Num
ber
Perc
ent
Api
cultu
re:
Num
ber
Perc
ent
Com
mer
cial
: N
umbe
r Pe
rcen
t T
rade
s:
Num
ber
Perc
ent
Gen
eral
: N
umbe
r Pe
rcen
t H
ouse
hold
art
s:
Num
ber
Perc
eak
Indu
stri
al a
rts:
N
umbe
r Pe
rcen
t O
ther
: Num
ber
Perc
ent
Tot
al
-
7, 6
69
12,0
82
20,
425
57.
6 55
.4
57.
1
148
58
206
1. 1
.
3 .6
19
3 50
6 69
9 1.
5
2. 3
1.
9
585
485
1, 0
70
4. 3
2.
2
2. 9
826
4, 5
05
7, 3
31
21.
2 20
. 6
20.
5
8 2,
967
2,
975
06
13
6
8 3
1, 7
44
1, 1
50
2, 8
94
13.
1 5.
2
8. 1
135
40
175
1. 0
.
1 .
5
13,
308
i 21
, 79
3 35
, 77
5
9, 1
85
57.
0
198
1. 2
246
1. 5
688
4. 2
3, 3
87
21.
0 8 05
2, 3
85
14.
9 9 . 06
13,
904
57. 0
98
. 4
461
1. 9
511
2. 1
5, 0
37
20.
6
3, 3
68
13
8
881
3. 6
132
. 5
16,
106
24,
392
23,
81S2
57.
8
2%
. 7
707
1. 7
1, 1
99
2.9
8, 4
/4
20.
4
3, 3
76
8 2
3, 2
66
7. 9
141
. 3
41,
211
1927
-28
Mal
e Fe
mal
e T
otal
8 9
le
1928
-29
Mal
e Fe
mal
e T
otal
11
12
13
1929
-30
Mal
e
14
Fem
ale
16
Tot
al
14
9, 9
63
15,
558
26,
286
10,
247
15, %
7 16
, 80
5 11
, 10
4 16
, 93
5 28
, 54
3 53
. 5
54.
8 55
. 0
51.
3 51
. 8
52.
7 50
. 5
51.
1 51
. 7
278
93
371
304
74
.
378
311
73
384
1. 5
.
3 .
8 -.
1.
5
. 2
. 7
1. 4
.
2 .
7
247
529
776
339
764
1, 1
03
444
961
1, 4
05
1. 3
1.
8
1. 6
1.
7
2. 5
2.
2
2. 0
2.
9
2. 6
86
6 52
4 1,
390
92
6 47
8 I,
404
1,
178
66
7 1,
845
4.
7
1. 8
2.
9
4. 6
1.
5
2. 8
5.
3
2. 0
3.
3
4, 0
79
6, 3
87
10,
466
4, 8
27
7, 2
99
12,
126
5, 1
59
8, 0
61
13,
220
21.
9 22
. 5
21.
9 24
. 1
24.
7 23
. 9
23.
4 24
. 3
24.
0
4, 1
44
4, 1
44
15
4, 1
91
4, 2
06
26
4, 9
27
4, 9
53
14.
6 8.
7
. 08
13
. 6
8. 3
.
1 14
. 9
9. 0
3, 0
66
1,08
0 4,
136
3,
306
1,
327
4,
633
3,
75'
s 77
7 4,
530
16
. 4
4 3.
8
8. 6
M
6 5
4. 3
9.
1
17.
1 2.
3
8. 2
134
59
193
30
140
170
27
264
291
. 7
. 1
. 4
. 2
. 5
. 3
. .
1 .
8 .
5
18,
623
j 28
, 37
4 47
, 76
2 19
, 99
4 !
30,
240
50,
825
22,
002
32,
665
55;
171
See
foot
note
s at
end
Of tit
le.
At
4D
t
2,
6
,
a
.
MI I 0
1.
f 1.
' .A
.
- --
---
r 4
11

44 do aamvaino airtv NOLIVOrlUa
TA
BL
E 8
.--C
urri
culm
reg
istr
atio
n: fo
r th
e pa
st 1
0 ye
aii
in 2
07 h
igh
'sch
ools
for
Neg
roes
, by
sex
Con
tinue
d
4.
Cur
ricu
lum
Aca
dem
ic o
r co
llege
pre
para
tory
: 1
Num
ber
Perc
ent
Agr
icul
ture
: N
umbe
r Pe
rcen
t
Num
ber
Perc
ent_
_ T
rade
s :
.
Num
ber
Perc
ent
Gen
eral
: N
umbe
r Pe
rcen
t H
ouse
hold
art
s:
Num
ber
Perc
ent
Indu
stri
al a
rts
: N
umbe
r Pe
rcen
t O
ther
: Num
ber
, Pe
rcen
t
Tot
al
1930
-31
Fem
ale
18
Tot
al
19
13,
476
21,
190
34,
907
46.
2 49
. 7
48.
5
428
82
510
1. 5
.
2 .
7
984
2, 0
02
2, 9
86
3. 3
4.
7
4. 1
1, 4
16
840
2, 2
56
4. 9
1.
9
3. 1
1931
-32
Mal
e
2
14,5
38
45.7
577
k I.
8
1, 2
12
3. 8
1, 5
85
4. 9
Rs2
93
11,
294
19,5
87
8, 7
85
28.
5 26
. 5
27.
2 27
. 6
6v1i
1 8X
.1
21
. 06
4, 4
30
745
5, 1
75
5,04
1 15
. 2
1. 7
7.
2
, 15
. 9
55
223
278
44
. 2
. S
. 4
. 1
29,
142
42,
620
72, 0
03
31,
803
Fem
ale
21
21,
076
- 47
. 0
108
. 2
2, 2
98
4. 9
888
1. 9
12, 6
82
28.
3
6, 7
14
14.
9
845
1. 9
331
. 7
44,
842
Tot
al
12
35,
614
46.
5
685
. 8
3, 4
10
4. 4
2, 4
73
3. 2
21,
467
28.
1
6, 7
35
8. 8
5, 9
08
7. 7
375
. 5
76, 6
67
19!2
-33
Mal
e
23
16,
003
45.
4
555
1. 6
1, 3
33
3. 8
1, 6
81
4. 8
9, 9
86
28.
4 17
.C4
5, 5
83
15. 9.
50
.1
Fete
ale
24
Tot
al
22,
715
38,
718
47.
2 r°
46
. 6
101
. 2
2, 4
26
5 0
1, 0
98
2. 3
13,
503
28.
1
7, 1
75
14.
9
920
1. 9
130
. 3
35,
208
48, 0
68
656
. 8
3, 7
59
4. 5
2, 7
79
3. 3
23,
489
28.
7, 1
92
8. 6
6, 5
33
7. 8
180
. 2
83,
306
a
1933
-34
Mal
e
17,
450
46.
9
1589
1.
6
1, 4
00
3. 8
1, 7
63
4. 7
10,
629
28.
5
58
. 2
.5,
306
14.
2
48
. 1
37,
243
Fem
ale
27
24,
503
48.
9
112
.
2, 4
97
4. 9
1, 1
77
2. 4
13,
811
27.
6
6, 7
42
13.
5
1, 0
92
2. 2
132
. 3
50,
066
Tot
al
28
41,
953
48.
1
701 . 8
3, 8
97
4. 5
2, 9
40
3. 4
24,
440
27.
9
6, 8
00
7. 8
- 6,
398
7.
3
180
. 2
87,
309
1934
-3i
'
Mal
e -
el
19,
361
44.
8
788
1. 8
1, 6
06
3. 7
2, 0
49
4. 7
12,
284
28.
4
102
. 2
6, 9
50
16.
1
56
. 1
43,
196
Fem
ale
27,
190
, 47
. 7
184
. 3
2, 8
74
5. 0
1, 2
44
2. 2
15,
738
27.
8, 3
36
14.
6
1, 31
3 2.
3
147
. 3
57, 0
26
Tot
al
46,
551
46.
4
972
. 9
4, 4
80
4. 5
3, 2
93
3. 3
28,
022
27.
9
8, 4
38
8.4
8, 2
63
8. 2
203
. 2
100,
222
The
fol
low
ing
num
ber
of
who
se s
ex w
as n
ot g
iven
wer
e re
gist
ered
in
the
acad
emic
cur
ricu
lum
for
the
res
pktiv
e ye
ars
1929
-30,
504
; 19
30-3
1, 2
41.
2iuc
hnsp
erso
ns w
ere
regi
ster
ed i
n in
dust
rial
art
s cu
rric
ulum
in
1931
-32,
and
30
in 1
932-
33.
ads
ika
1925
-26,
674
; 19
26-2
7, 7
13;
1927
-28,
765
; 19
24-2
9, 5
91;
ç.
*
t
. an
mer
cial
: .s
'
......
....
. ...
. M
.A
Mal
e
17 60
.
2
-
24
24
2
34
'
6
° >IP
,44
F.
o ftj
tri
----
----
cs2
-
_
ev
2
,

GENERAL EDUCATION AND VOCATIQNAL TRAINING 25
vocalional okerings in college.The results of an inquiry concerning the num-ber of colleges preparing teachers in specified vocational fields and the num-ber preparing persons to engage in specified occupations are shown for publicand private colleges, respectively, in tables 9 and 10. A larger number ofboth prepare teachers for the upper élementary grades than' for any otherfield, tile respective numbers being 21 and 14. Twenty public collegesprepare teachers of home economics; 19, of primary grades; and 17, ofagriculture. Among the private colleges, 12 prepare high-school teachers;11,. primary teachers; 9, music teachers; and 8, teachers of home economics.The four courses offered by the largest number of pubk colleges for directoccbpational preparation with the numbtr offering eac re: ture,18, home economics .18, carpentry and woodworki 47 15, and auto me-chanics, 147---Prh-g fdtir courses offered by the largest number of privatecolleges for direct os:cupatiónal preparation are: Theotògy 10, pre-medical8, home -economics 7, and pre-dental 6.
TABLE 9. Number of public colleges offering Negro *dents
[Total num ing, 271
Teacher education courses
Academic subjects:Grammar gradePrimaryHigh schoolKindergarten
Home economicsAgricultureIndustrial artsBusiness administrationStenography and typewritingMusicNursingLibrary scienceTrades:
Carpentry and woodworkingAutcrmechanksElectricityPrintingMasonry and-plastering .TailoringPlumbin4Shoemaking and.leather workLaunderingBlacksmithing and iron workInterior decorating
fr Butler's courseCosMachine s p industryPaintingPhotographicSheet metalUpholsteryWelding
Numberof
colleges
211915
2201711101093
2
1110998876
32
ti
ational courses
Direct vpcational courses
AgricultureHome economicsCarpentry and woodworkingAuto mechanksElectricityStenoraph7 and typewritingTailonngMasonry qincl plasteringPrintingBusiness-administrationMusicPaintirigPlumbingPre-medicalPre-dentalPre-/PharmacyBlikksmithing and iron workShoemaking and leather workNursin4Pie-engineeringpre-lawArchitecture..General shop"LaunderingLibrary scienceMechanical artsUpholsteringBeauty culturePhotographyBuilding constructionCeramicsCommercial artCommercial dieteticsInterior decorating
1 -Zlr:iv:ei:TA concretePhysitial educationPoultryPower plant engineering_RadioWeldingWoodcrafts
------
-AS
Numberof
colleges
1818IS14111.1
1110109.,98876655444
333322
`4\
sels
.
N.
.
_
........ _ _ _ _ _
_
5
4
,4
o
--
.
- _ , .
-
1
1
1
1
1
.1
1 .
1
e.
___
110
_ _
_
-----
4
-----
1_ _
1
i

26 VOCATIONAL EDUCATION AND GUIDANCE OF NEGROES
TABLE io. Nu;nber of private colleges offering Negro students specified vocational courses
[Total number replying, 20)
Teacher-education courses
Academic subjectsGrammar gradeHigh schoolPrigaary.Kindergarten
MusicHome economicsSocial administrationBusiness administrationStenography and typewritingNursing
Numberof
colleges
14121149843
3
Direct vocational courses
TheologyPre-tnedical_Home economicsPre-dental _
Pre-pharmacyBus inessAdministrationMusicPre-lawSocial administrttionStenography and typewritingArchitectureCivil engineeringElectrical engineeringMechanical engineenngNursing
Numberof
colleges
10
7
6o
Curriculum regi:er &ions in college.The numbers of persons registered incertain vocational curriculums in public colleges, for eac,h of the years from1930 to 1935, are shown in table 11. In agriculture, architecture, and homeeconomics the trends are downward in both percentages and numbers ofstudents registered from 1930-31 to 1934-35. In nursing there is a slightincrease in numbers, but a decrease in percentage of students registered.In business administration and trades there is an increase in both numbersand percentages of students registered in 1934-35 over 1930-31. Whilethere is an se in the number of students enrolled in all the vocationalcurriculums combined, the numbers being 28,925 and 33,123, for the years1930-31 and 1934-35, respectively, there is a slight decrease in the percent-age of the total enrollment registered in all vocational curriculums. Thepercentages for 1930131 and 1934-35 are, respectiyely, 12.2 apd 11.6.
Of the private colleges, only one reported courses in architecture and engi-neering, three in social administration and trades, and two in home eco-nomics. The numbers involved ave too small to permit of reliable con-clusions. However, it may be noted that there is a slight increase in num-bers and percentages registered in architecture and engineering and inhome economics, a considerable increase in social administration and intrades.
1
;5
42
2
1
1
1
I
1
to
i;
o
1
_

NOUVDnua rIVNOLLVDOA OKINIva.1
TA
BL
E i I
. N
umbe
r of
Neg
ro s
tude
nts
regi
ster
ed i
n vo
catio
nal
curr
icul
ums
in c
erta
in c
olle
ges
unde
r pu
blic
con
trol
, fo
r ea
ch y
ear
from
19
30-3
1 to
19
34-3
5
Cur
ricu
lum
1
Agr
icuk
uret
T
otal
enr
ollm
ent
Cur
ricu
lum
re
gist
ratio
n A
rchi
tect
ure:
T
otal
enr
ollm
ent
Cur
ricu
lum
reg
istr
atio
n B
usin
ess
adm
inis
trat
ion:
T
otal
enr
ollm
ent
Cur
ricu
lum
reg
istr
atio
n H
ome
econ
omic
s:
Tot
al e
nrol
lmen
t C
urri
culu
m r
egis
trat
ion
Nur
sing
: T
otal
enr
ollm
ent
Cur
ricu
lum
reg
istr
atio
n T
rade
: Tot
al e
nrol
lmen
t C
urri
culu
m r
egis
trat
ion
Tot
al v
ocat
iona
l cur
ricu
lum
reg
istr
atio
n_
1930
-31
Mal
es
2, 8
76
723
116 14
1, 2
48
99
3,00
2 5
646
2, 1
67
745
1, 5
86
Fem
ales
a
5, 6
61
310 58
2, 2
48
112
6, 1
24
1, 4
52
939
61
3, 8
40 9
1, 9
44
Tot
al
4
8, 5
37
1, 0
33
174 14
3, 4
%
211
9, 1
26
1, 4
57
1, 5
85
61
6, 0
07
754
3, 5
30
1931
-32
Mal
es
3, 1
12
671
225 6
1, 3
55
119
3, 2
86
637
2, 2
99
773
1, 5
69
Fem
ales
6
5, 2
78
53
2, 3
09
160
5, 7
09
1, 2
53
871 69
3, 8
07
14
1, 4
96
Tot
al
8, 3
90
671
278 6
3, 6
64
279
8, 9
95
1, 2
53
1, 5
08
69
6, 1
06
787
3, 0
65
1932
,-13
Mal
es
8
2, 9
00
778
174 4
1, 4
16
133
3, 0
47
463
2, 1
53
847
1, 7
62
Fem
ales
4, 4
52
54
1, 9
04
165
4, 8
78
864
494 77
2, 9
76
10
1,
116
Tot
al
10
7, 3
52
778
228 4
3, 3
30
298
7, 9
25
864
957 77
5, 1
29
857
2, 8
78
1933
-34
Mak
e
1 1
3, 5
50
1,
115
234 4
1, 6
39
138
3, 7
64
1
860
2, 6
19
865
2, 1
23
Fem
ales
1 e
5, 0
14
88
2, 0
09
202
5, 6
18
1, 4
07
925
137
3, 5
59
27
1, 7
73
Tot
al
fit
8, 5
64
1,
115
322 4
3, 6
48
340
9, 3
82
1, 4
08
1, 7
85
137
6, 1
18
892
3, 8
96
1934
-35
Mal
es
Fem
ales
T
otal
4, 2
20
5, 3
27
9, 5
47
940
____
__
940
381
113
494
6 6
----
-- -
-
1, 82
2 2,
15
6 3,
978
15
9 22
1 38
0
4, 2
65
5, 6
33
9, 8
98
1,
147
1, 14
7
1,05
4 1,
085
2,
139
79
79
3, 0
36
4, 0
31
7, 0
67
1, 2
87
16
1, 3
13
2, 3
92
1, 4
73
3, 86
5
In c
olle
ges
repo
rtin
g: 1
6 sc
hool
s ar
e re
pres
ente
d in
agr
icul
ture
; 18
in h
ome
econ
omic
s; 6
in
busi
ness
adm
inis
trat
ion;
1 in
arc
hite
ctur
e; 3
in
nur
sing
; an
d 12
in
tra
Cle
.
*
7.
'1
. - .
-
(.0
14
14
*
14
__
.
I
trj

28 'VOCATIONAL EDUCATION AND GUIDANCE OF NEGROESI
Trends in vocational offerings in college. The exten?to which colleges areresponsive to occupational trends is indicated by the courses added anddropped. Information on this matter was received from 15 public andAprivate institutions. Of 53 courses added by the 15 public institutions, 25were added by 2, and of the 16 courses added by the 4 private institutions,13 were added by one. In no case did more than one private college add agiven course. The course added by the largest number of public colleges(5) was in the building trades; the course added by the next largest numberof public colleges (4) was in auto mechanics.
Inquiry was made concerning the reasons courses were added. Amongthe private institutions, in every case except one, the courses were addedupon the request of students. The reasons given for adding courses by thepublic institutions, with the number of institutions giving each, are as fol-lows: By request of students, 18; occupational demands, 14; certificationrequirements, 7; to enrich curriculum offerings, 6; to provi de elementaryoccupational training, 4; to encourage students to enter small industries, 4.
FEDERAL AID FOR VOCATIONAL EDUCATIONThe first Morrill Act.The first Morrill Act was for the purpose of estab-
lishing, in cooperation with the States, a system of scientific, technical,and practical higher education." Passed in 1862, this Act made "noprovision for rácial division of students. The result was that the proceedsfrom the sale of the Federal grants of public land or scrip were devoted inmost instances to the creation of endowments for the benefit of white insti-tutions."" Thus, the aid given by the FederaLGovernment to thedevelopment of vocational education on the collegiate level in the States,with the exception of four, was not shared by institutioris for Negroes untilthe passage of the second Morrill Act in 1890. This Act specifically pro-vides' for equitable distribution of the Federal funds appropriated for theestablishment of land-grant colleges, in the following provision:
Provided, That no money shall be paid out under this act to any Stateor Territory for the support and maintenance of a college where a dis-tinction of race or color is made in the admission of students, but theestablishment and maintenance of such colleges separately for whiteand colored students shall be held tb be a compliance with the pro-visions of this act if the funds received in such State or Territory beequitably divided as hereinafter set forth: Provided, That in any Statein which there has been one college established in pursuance of the actof July second, eighteen hundred and sixty-two, and also in which aneducational institution of like character has been established, or may behereafter established, and is now aided by such State from its ownrevenue, for the education of colored students in agriculture and themechanic arts, however named or styled, or whether or not it has re-ceived money heretofore under the act to which this act is an amend-u Survey of Land-Grant Colleges and Universities. Washington, Government Printing Office, 1930. (UnitedStates Department of the Interim, Office of Education, Bulletin 1930, No. 9.)
p. 837.Is Ibid.,
4.
I.

GENERAL EDUCATION AND VOCATIONAL TRAINING 29
ment, the legislature of irch State may propose and report to the Sec-retary of the Interior a Just and equitable division of the fund to bereceived under this act between one college for white students and oneinstitution for colored students established as aforesaid, which shall bedivided into two parts and paid accordingly, and thereupon such insti-tution for colored students shall be entitled to the benefrts of this actand subject to its provisions, as much as it would have been if it hadbeen included under the act of eighteen hundred and sixty-two, andthe fulfillment of the foregoing provisions shall be taken as-a compliancewith the provision in reference to separate colleges for white and coloredstudents.
Each of the Southern States, very soon after the passage of this act, madeprovision for accepting its terms, either by establishing a land-grant collegefor Negroes, by converting an existing State institution into a land-grantcollege, or by transferring the funds which Negroes should receive to pri-vate institutions.
Even after provision was made for vocational education of Negroes on thecollegiate level, by the arragements previously mentioned, its growth wasslow. There were three major reasons for this. First, it required time forNegro students to leave the institutions with which they had become fanuotliar and to change from the liberal arts program found in the private cleges. This resulted in few students in the land-grant colleges. In the ;ec-ond place, because of the limited public education facilities on the elemen-tary and secondary school levels, these newly cl.eated "colleges" were cornwpelled to devote most of their time and energies to education below collegegrade. Finally, because liberal arts training was more popular amongNegroes Min agricultural and mechanical training, because most of theadministrators and teachers in the land-grant colleges were trained alongliberal arts lines, And because there was no clear understanding of the pur-pose and meaning of the legislation establishing the land-grant colleges,emphasis was placed on classical training.
The Smith-Hughes .Act.On February 23, 1917 the Smith-Hughes Actas passed in order "to provide for the promotion of vocational education,"was
ihduding agriculture, trades and industries, and home economics. Supple-mentary acts have been passed providing for commercial training. Thetraining provided by this act must be of less than college grade, for personsover 14 years of age, and specifically to aid pexsons toward competency intheir occupational pursuits.
The general purpose of the act was stated by ex-President Hoover asfollows:
The essential purpose of the Smith-Hughes Act is to provide for theneeds of our youths who do not enter our higher technical and profes-sional educational institutions. Vocational training for the commonerwage-earning pursuits and skilled trades is equally as essential as istraining for the professions. The humblest worker, equally with theyouth who proposes to enter the professions, has a right to the sort of

30 VOCATIONAL EDUCATION AND GUIDANCE OF NEGROES #
training he needs for the occupation by which he proposes to earn hislivelihood and support his family, and through which he will render hisservice to the community in getting the community's work done. Wecannot in fairness continue to provide specialized education free to thefew who propose to enter the professions, while denying education tothe many for the commoner vocations.There is in fact no better economy than the economy of adequatetraining for the pursuits of agriculture, commerce, industry, and thehome. Our youth must enter into these pursuits, and it is on all countsin the public interest that they be well trained for them. To providesuch training is clearly a public responsibility. Education in general,including vocational education for the youth, is democracy's most im-portant business. Democracy in education means that in the field ofeducation opportunity shall be extended equally to allto give all afair start. This is the educational ideal inspiring those who are admin-istering the Federal Vocational Education Act; it is the ideal whichinspired Congress in passing the Act; and it is traditionally the ideal ofeducation in our democracy.
The grants under this act, for the country as a whole, in 1918 amounted to$1,855,586.72. In 1937 the grants amounted to $10,642,580.62. In 1937the George-Deen Act was passed by Congress, "to provide for the furtherdevelopment of vocational education in the several States and Territories."The amount authorized to be appropriated annually under this aci is $14,-750,000. Particular attention is called to the fact that, whereas the Smith-Hughes Act actually appropriated funds, the George-Deen Act merelyauthorizes, or makes possible, appropriations not exceeding the amountstipulated.
Distribution offunds among Negroes. Under these acts the Federal Gov-ernment does not propose to undertake the organization and directionof vocational education in the States, but does agree to make from yearto year substantial financial contribution to its support. It undertakesto pay oyer to the States annually certain sums of money and to coop-erate in fogrring and promoting vocational education and the trainingof vocational teachers. The grants of Federal money are conditional,and the acceptance of these grants imposes upon the States specifip obli-gations to expend the money paid over to them in accordance with theprovisions of the acts.This cooperation of the States with the Federal Government is basedupon four fundamental ideas: (1) That vocational education beingessential to the national welfare, it is a function of the National Govern-ment to stimulate the States to develop and maintain this service;(2) that Federal funds arc required to adjust equitably among theStates the burden of providing the service; (3) that since the FederalGovernment is vitally interested in the success of vocational education,it should, so to speak, secure a degree of participation in this work; and(4) that only by creating such a relationship between the central inlthe local governments can better and more uniform standards of edu-tational efficiency be set up."
13 Statement of policip for the administration of vocational education. Washington, Gownsman PrintlugOffice, 1937 (Revised edition). (United States Department of the Interior.education bulletin 1937, No. 1.)4 at Education. Vocational
.

GENERAL EDUCATION AND VOCATIONAL TRAINING 31
One of the purposes of the act, as shown in (2) in the above quotation, isto "adjust equitably among the States the burden of providing the service"(vocational education). However, no stipulation is made for securing equi-tability within the States, as far as classes for Negroes are concerned. Astudy of the distribution of the funds within the States indicates inequi-tability in provisions for courses in vocational subjects similar to thatreferred to in provision for high-school facilitits.
Trends in we of Federalfunds.The proportion of funds allotted to schoolsfor Negroes from the Federal funds for vocational education for specific pur-poses in 1934 compared with the ratio which dily bear to the totill popula-tion is shown in figure 2. In every State except one (Oklahoma) the per-
tagen ted
of expenditures is less than the ratio indicated. Also, it will bethat the lines representing percentages of courses, enrollments, and
chers are, with few exceptions, consistently above the line representingexpenditures.
There were encouraging increases in number of teachers and courses, andenrollments from 1928-29 to 1934-35 except during the most acute depres-sion period (1931-33). Even then, there was an increase in enrollmentof girLs. Similarly, there were increases in expenditures, but the percentageincrease was far less than in the other items, as shown by figure 3. In somecases the increases during this period in enrollment of Negroes in federallyaided vocational courses exceeded corresponding iiicreases for whites.ComplCte data for the Federally aided vocational work in high schools maybe seen in tables I, il, III, and IV in appendix A.

flITNOLLVDOA xouvonaa
e
nouR
E 2
. Pe
rcen
tage
of
Neg
roes
in
the
tota
l po
pula
tion,
per
cent
Neg
roes
are
of
the
tota
l e n
rohq
en t
in F
eder
ally
aid
ed v
ocat
iona
l co
urse
s,
and
the
perc
ent
of t
he t
otal
exp
endi
ture
s, c
ours
es ,
and
teac
hers
ava
ilabl
e to
the
mii
18 S
tate
s, 1
9 3
4-3
5 .
03
o 011
Key
- el
, 1
IN,p
u ki
tio
Mak
e. t
n ro
t I m
s.nt
Fa
.mo1
1 an
-c I
mcn
t -
4M
MIC
IWo h
firr
C
OU
SMW
O
pa.r
td
ria.0
30
10
, W
.Va.
O
kla.
., _ '
,
,. .
., .1
,
..r
...
., ,
. ......
.. .
...
._
, .:
_..
..,
...
... ...
... ,
n ...
do
... .0
,0_
_ I.
...
.. ,-
....-
.
. ..
_..
A
Ky
DR
.!.
.
e
Tex
P
.1d.
T
*.nn
. A
r k.
-
-,
f.
gib
.1
vQs
N.C
. F
la.
Ala
. La
.
dos
"WN
W.
r
itre.
0,,,,
e - -
t,1
tzi
ri
a,
I
to
r)1
i -tu

GENEML EDUCATION AND VOCATIONAL TRAINING 33
4/t
165
150
110
rol I me. tt nroi rrn. mt
['Sty-
-4)--c1--'1-4-3-
pcnditurt,- - - - ts.4 OA.Ft rnalT...cuc. ha.rC0k)re....
'11=1/
194e9-J0 1930 1111 1931 - L 193t - 33 1933 -34 1934-00011111M
FIGURE 3. Percentage increase or decrease in expenditures, in number of courses, innumber of teachers, and in enrollments in Federally aided vocational work for Negroes,for each year from 1929-30 to 1934-35 compared with 1928-29, in 18 States.
195..
105
90
4 5
30
.3
15
Ex- - cn
e//e
e#
to----e
44:
.#*
.1/
-107---II
31
C

CHAPTER Ila7
Vocational Education in Agriculture'
rTIHE ADEQUACY of vocational education in agriculture for Negroesmust be considered in light of the social and economic situation in
rural areas and of the special relation of Negroes to it.The application of machinery to the farm has caused revolutionizing
changes. The successful farmer today must know how to handle machinesand appliances, power for which is generated by wind, gas, water, steam,oil, and electricity. The application of chemistry to farm problems hasmade available an increakd fund of scientific knowledge. Mpreover, farm-:ing has bcome a highly competitive industry and calls for a high degree ofmanagerial ability. Profitable distribution of farm products demands aknowledge of business and an appreciation of cooperative marketing. Theseconditions have brought about greater specialization of tasks, have increasedthe need for diversification of crops, and have made the farmer less self-sufficient. In addition to other social and economic conditions, thesechanges have been associated with decreasing farm population, increasingsize of farms, and increased production per acre and per man.
The changes have affected Negroes particularly because they are stillpredominantly rural. According to the 1930 Census there were 11,891,143Negroes in the United States. Of this number, 6,697,230, or 56.3 percent,lived in rural areas. The percentages living in rural areas in 1920 and1910, respectively, were 66 and 72.7.
The following examples show the changes that have taken place amongNegro farmers during the s decade:2 (1) there has beed a decrease ofnearly half a million N - or 6.2 percent, in the farm population, andof 42,858, or 4.6 percent, the number operating farms. The number ofNegro farmers per 1,111 egro population fell from 88 in 1920 to 74 in1930 as compared wi a corresponding decrease for white farmers frOm58 to 49 per 1,000 population. (2) The number of farms operated byNegroes in 17 Southern States decreased by 44,659, or 4.9 percent. (3)
Data oa federally aided vocational education in agriculture were taken from the State reports sent to theVocational Education Division of the Office of Education.I The Negro Fanner 1n the United States. Washington, Government Printing Office, *1930. (FifteenthCensus of tbe United States, 1930. Census of agricnitam)
gr.
34
I
.
s

AGRICULTURE . 35
There has been a decrease in the total acreage in farms operated by Negroesof 3,835,050 acres, or 9.3 percent in contrast to an increase of 34,943,840acres, or 3.8 percent, in farms operated by whites. (4) The average size offarms operated by Negroes has decreased from 44.8 acres in 1920 to 42.6acres in 1930. The average farm operated by white farmers increased insize during the same period from 165.7 to 176 acres. (5) The value,of landand buildings of farms operated by Negroes decreased durink the decadeby $854,699,526, or 37.9 percent, while the decrease for whites during thissame period amounted to $17,508,988,184, or 27.4 percent. (§) There wasa decrease in Negro farm operators by each class of tenure as follows:Owners, 37,596, or 17.2 percent; managers, 1,103; or 54.4 percent; tenants,4,159, or 0.6 percent. During this same period white owners decreased8.8 percent, managers decreased 20.3 percent, and tenants increased 12.3percent. The one item which increased during the decade under considera-tion was the value" of implements and machinery owned by Negro farmers.The trends indicated here have important 'implications for educationalprograms for Negroes in rural areas.
NUMBER OF SCHOOLS AND CLASSES
In general, vocational courges atE offered in high school. Vocational in-struction is offered in the upper grades of the elementary school in some.communities, but it is not particularly effective. Such work cannot becarried on in most of the 1,726 rural schools offering 1 or more years ofhigh-school work because of the limited facilities. Only about one-thirdof these schools participate in the Federal program for 'vocational educa-tion in agriculture.
The_ most common type of school providing vocational agricultural in-struction for Negroes is the regular, all-day, county training school. Thework is departmentalized;and that in agriculture is usually federally aided.A few other types of high schools, such as those connected with land-giantcolleges and semiprivate schools, receive support from the State or countyand share in the Federal vocational education program. In 1934-35 therewere 542 all-day schools for Negroes receiving Federal aid for vocationaleducation in agriculture in the 18 States where separate schools are main-tained. Another type of school in which vocational courses in agriculturearc offered is the day-unit school, a ;modification of the all-day school. "Itdiffers from the departmental type only in the amount of agricultural in-struction which is given, this being limited to certain selected units. Thisrestriction is due to the fact that the teacher of agriculture must usuallydivide his time among several schools which are conveniently located, sothat he can make the circuit at least once a week and preferably oftener."In 1934 there were 264 such schools for Negroes.
Unless otherwise indicated all data in this chapter refer to the 18 States maintaining sepCate schools for theNegro and white races.
4 Sargent, H. O. Vocational Education in Agriculture for Negroes. Washington, Government PrintingOffice, 1926. (Federal Board for Vocational Education. Bulletin 1926, No. 111, Agricultara1 series, No. it)
ft
3
s

36 VOCATIONAL EDUCATION AND GUIDANCE OF NEGROES
Part-time schools are designed mainly for farm boys who have droppe'dout of all-day school and wish instruction in agriculture while farming. In1934-35 there were 320 such schools in which Negro boys were enrolled.Still another type of school in which vocational education in agricultureis offered is the evening school. It is designed especially for adult farmers.There were 784 such schools for Negroes in 1934-35. In general, all ofthese different types of schools are operated in the same building and .bythe same leachers.
There is a consistent percentage increase in the number of all-dy schoolsin which vocational agriculture is taught for each of the years from 1926-27to 1934-35 over 1925-26. The number of classes in vocational agriculturefor Negroes in the different types Qf schools increased 128.9 percent from1928-29 to 1934-35. The percentage increase for each year from 1929-30to 1934-35 over 1928-29 is shown below:
1929-30 1930-31 1931-32 1932-33 1933-34 1934-35Percent. .... 27.4 42.3 91.8 65.3 83.5 - 128.9
The dittribution of the classes among the different types of schools isshown in table 12.
TABLE 12.-Aanber and percent of classes for Negroes in federally aided vocational agriculture,according to types of schools by years in 18 States
..
Year and type of school Number Percent Year and type of school
_
,--r Percent
1928-29: 1932-33 :Evening 293 56. 1 Evening_ ___ 442 51. 2Part-time 101 19. 3 Part-time...-. __ _ 224 25. 9Day unit 128 24. 5 Day unit _..Z 197 22. a
Total 522, Total.
863 _
1929-30: 1933-34:Evening 400 60. 1 Evening _ _ .... ......... _ 559 58. 3Part-time 128 19. 2 Part-time _ 225 23. 4Day unit 137 20. 6 Day unit- _-- 174 18. 1
Total 665 Total 958
1930-31:gp; 1934-35:
Evening 460 61. 9 Evening__ _ __ ... 698 58. 4Part-time 126 16. 9 Part-time __ _ 265 12. 1Day unit,
157.
2!. 1 Day unit _ __ 232 19. 4Total 743 Total 1, 195
1931-32:Evening 583 58. 2Part-time 229 22. 8Day unit 189 18. 8
Total 1, 001 ..-- - -..
CURRICULUM OFFERINGS AND REGISTRATIONSAll-day schools.-Courses in vocational agriculture iethe federally aided
all-day schools are offered in conjunction with the regular high-schoolcourses. The high-school curriculums vary among the States as to con-tent, but, in general, they consist of English, science, mathematics, foreignlanguages, social science, and the vocational subject& It is Prescribed by
._ ,
_ _ __ _ __ _
..... - - - - _ .__ _ ____ _ _ . ..._ _ _ .....6-........ -...
l4, 10 ..... . .s.
AO.
,
_ _ _ _ __ _ _ _... - - - -
4...
4
___ _ _44.... _ _ .... _ ... _ _ - -- - -t
.
,
....... ...... - -- -
..... -_
...
,_
_

AGRICULTURE 37
law establishing Federal aid for vocational education that "súch schools orclasses giving instruction to persons who have not entered upon employ-ment shall require that at least half of the time of such instruction be givento practical work on a useful or productive basis, such instruction to extendover not less than 9 months per year and not less than 30 hours per'week."This does not apply to agriculture. Because of the age and general natureof the purposes of the pupils in the all-day schools, the vocational subjectsin agriculture deal with the fpndamentals of farm life. In each of theStates the vocational agriculture courses are based upon the farm enter-prises of that specific region. The students are taught how to perform theoperativeand managerial jobs and solve the problems that are found on
their own farms. Each student actually participates in the work of farm-ing by operating and managing a farm program of his own.
TABLE 13. Number and percent of total Negro students registered in each kind of agriculturalcourse, by type of school, 1934-35, in 18 States' .
Kind of course
Animals, farmCanningCorn and corn productsCottonCrops and crop problemsFarm organtkationFarm reorganizationFarm pructionFarm records and managementGeneral farmingHogs and bog production°Home implementsHome orchardLive-at-homeMarkets and truckingModern pioneersNew Deal problemsPeanuts and alfalfaPoultrySoil
Total enrollment
Type of school
Evening Part-time Day-unit
Nu mber Percent Number Percent Number Percent
273 1. 5165 9919 5. 1
1, 431 8. 0788 4. 3535 2 9
1, 269 7 12, 658 14. 82, 267 12. 72, 491 1 3. 9
163 925 . 1
16 082, 998 16. 7
138 . 79 05
346 1 940 . 2
969 5. 4642 3. 5
17, 859
42
31960736263
1 443426
1, 0404125
104/10154
96755
3, 805
1. 1
8. 315. 98. 41: 6
11. 611. 127. 2
1. 1. 6
2. 75. 54. 0
. 21. 71. 3
7
56 1. 4MP MD
1, 043 26. 4767 19. 4277 7.0
46117
588
11. 6. 4
14. 9 '
10 . 2
leg1. 73.0
243, 944
.....5.4
y 6 44'
ow a.
Vocational Agriculture is no longer taught in day unit courses.
Other types of schools.-the types of courses in vocational agricultureoffered in evening, part-time, and day-unit courses are shown in table 13.In the federally aided evening schools during 1934-35 there were registra-tions in 20 different courses. Students were registered ip 1 6 differentcourses in the part-time school, and in 12 courses in the day-unit schools.The total number and percent of Negro students registered in the differentfederally aided vocational agricultural courses arc also given in the table.The percents are computed from the total enrollment in that particular'
_ _ _ .......
a
.
.. _ _
AMP a». O.
,...
e e.
a. M. an. O O e -
4ED do a... am ab. lor
,--14 213
MID O. 1.
I
_
.m. .0.
i'.......
.
:
MD

38 VOCATIONAL EDUCATION AND GUIDANCE OF NEGROES
type of school. Instead of offering specific courses, some schools use thecross-sectional m7thod of organizing their teaching materials rather' thanthe unit courses. This means that a portion ofall the farm enterprises mabe taught throughout the entire course.Of the 480 regular high schools for Negroes reporting to the StatistiCalDivision of the Office of Education for 1934, enrollments in vocationalcourses in a given number of schools were as follows:
Number ofCourse4 schools RegistrationGeneral agriculture 142 4,211Soils and crops
10 140Animal husbandry 5 82Farrell mechanics2_ 57
Of ther,47,046 pupils enrolled in the 164 reorganized schools reporting,1,775,. or 4 percent, were enrolled in general agriculture. The small regis-o tration in akriculture in the reorganize4340s is probably due to thefact that most of them are in urban communities. While many of theseschools are probably not participating in the federally aided vocationalagricultural program, the data are significant from the guidance point ofview in showing the possibilities f9r pre-vocational education and explora-
its
tory courses. c
ENROLLMENTS IN TYPES OF SCHOOLSTrends in enrollments in federally aided vocational agricultural coursesin the different types of schools for Negroes from 1928-29 to 1934-35 maybe traced in table 14. Although there is an inCrease in the number ofmales enrolled in all-day agricultural classes from 1928-29 to 1934-311the percentage of thè total eArollment decreased during the same periodfrom 42.'4 to 38.8. In evening agricultural classés there was an increase inthe niunber of males enrolled of from 5,197 to 14,761; and 'an increase inthe percentage of the total male enrollment from 29.9 to 40.2. Bothniiinber and percent of females enrolled in all-day schools decreased duringthis period, while there was a marked increase in the number and percentof femalei enrolled in e'venink schools; the former increased from 510 in1918-29 to 3,098 in 1934-35; the latter from 57.4 to 93.5 percent.
forI Organized on junior-senior high-school basis.
rz'
6
,
1
b1/4,
4,
Aim
,
04

AGRICULTURE 39
T*ii I 4. Number and percent of Negro students enrolled in courses in vocational agriculture inthe different types of federally aided schools, according to years, in 18 States
Year and type of school
1
p.
1928-29:All-day_Evening _
Part-time_Day unit_
Total _ _ _
1929-30:All-dayEveningPart-timeDay unit
Total_ _
----------- -----
1930-31:All-day .
_ Evening.. _
Part-time_ _
Day unit__
Total
1931-32':All-day_Evening_Part-time_Day unit
4.
Total
1932-33:All-dayEvening__Part-time_ _
Day unit__ _
Total
1933-34:All-day -Evening__ _
Part-time_Day unit..
Total
1934-35:All-dayEvening__ _
Part-time_Day unit
, Total
Males Females
Number
9, 1105, 1971, 3711, 689
17, 367
9, 5125, 3241, 4201,896
18, 152
10, 4898, 9692, 0472, 597
24, 102
11, 54211, 8512, 8402, 526
28, 759
16, 3158, 5023, 2023, 619
25, 638
12, 68812, 524
3, 2333, 013
31, 458
14, 23614, 761
3, 7413, 900
Percent
3
52. 429. 9
7. 99. 7
52. 4, 29. 3
7. 810. 4
43. 537. 2
8. 410. 7
Number
4
200510
37141
888
148572
6137
863
2641, 585
8456
40. 141. 2
9. 88. 7
2, 013
1312, 274
24207
40. 233. 112. 414. 1
2, 636
1421, 321
74105
tPercent
6
22. S57. 44. 2
15. 9
17. 166. 2
. 615; 8
13. 178. 7
. 37. 71 o Nimi mio 111..
4. 986. 2
. 97. 8
8. 680. 44. 56. 3
40. 339. 810. 29. 5
1, 642
732, 393
2752
2, 545
38. 840. 210. 210. 6
943, 098
3487
2. 894. 01. 02. 0
2. 893. S
1. 02. 6,
36, 638 3, 313
./Below will be found the percentage increase or decrease in enrollment
in all types of schools offering couises in vocation:al agrictilture for e4chyear from 1929-30 to 1934-35 compared with 1928-29, for Negroes by sex.
,-
.
,
1930-31 1931-32....
1932-33 1933-34 1934-35
1
1
-4
jor 3 s,
4 1
47.614. 9
s
81.186.
A
16
441
7
110.273-
91
Male ..Feraa-e....
4.-2.
S8
4t4
38.126.
87
65. 61961
77910P 88--4 Vik
_ _ ___ _ _ .
,
,.. . ..... .
_
-
.......... .
.
I
2 I
mo .....
,
.. .. 11.1 MP MI
.
.
30
,
A
14
. -
_ _ _
_
.
_
_
6
_
_
_ .
J
...

40 VOCATIONAL EDUCATION AND GUIDANCE OF NEGROES
A way to determinek what degree the federally aided vocational agri-culture program is reaching the Negro farm boy is to compute the percent-age that their agriculture enrollment in all-day, part-time, and day-unitschools is of the total number of rural Negro boys in the 14 to 20 year agegroups attending school in- the lg States ..studied. According to datashown in table 14 th'ere were in 034-35, 21,877 boys enrolled in agriculturecourses in all-day, part-time, and day-unit schools in these States.' Thisenrollment constitutes 10.6 percent of the total males 14 to 20 years of age(205,731) attending school in these States. In 1924 the correspondingpercentage was 4.6 This shows considerable improvement in the proportionof Negroes reached.
THE COLLEGE PROGRAMThe land-grant colleges and a few private college's have been the chief
sources of instruction in agriculture for Negroes on the collegiate level.Practically all of the graduates of agriculture courses from these institu-tions enter the field of teaching or related work. The three major occupa-tions followed by graduates of,these colleges are: (1) Vocational teachingin high schools, (2) extension work, and (3) college teaching. This limitedrange is emphasized when the distributions of Negro and white graduatesof 5 white and 10 Negro agricultural colleges according to occupationsfollowed are compar&I, as in table 15. It is further shown by data givenin table 16, which compares the percentage of Negro and white agriculturalcollege graduates trained as teachers of vocational agriculture in theSouthern States for 1935-36. For the regions as a whole the respectivepercentages are, for whites 41.2; for Negroes 91.6.
TABLE I 5.Occupationd distribution of the 1934 graduates majoring in agriculture of 5 white and10 Negro agricultural colleges, Southern Region, 1935 1
Type of occupation
Agricultural extension serviceAgricultural techniciansCommercial lines related to agritultureEducational workers:
College and experiment station woriersGraduate students and assistantsVocational teachersOther teachers _
Forestry, lumbering, and park serviceLandscape gardening and floriculturePractical agricultureRecovery and relief agenciesState Department of AgricultureU. S. Department of AgricultureMiscellaneous nonagricultural occupationsUnemployed or unaccounted for
Total
Graduates
Number
Negro
2
4
6034
228
4
116
White
164
12
42716
51
2929
35
161
168
Percent
Negro
4
1. 7
3. 4
51, 829. 3
1 71. 76. 9
White'
9. 52. 47. 0
2. 416. 19. 53.0
. 6
17. 317. 31. 83.09. 5
. 6
100. 0
LeBeau, Ow Ray. Factors Affectiaig the Need Among Negroes for Graduate Courses in Agriculture.Doctor's thesis. Ithaca, N. Y., CornakkUnwenity, 1936.
I Ibid., p. 13
..... _ _. 1 as a.
Na. .....
3. 5
100. 0
.
a
a
.. a

AGRICULTURE 41
TABLE 16. Percent of agricultural college graduates trained as teachers of vocational agriculture byStates, 1935-36 7
. Graduates
.4State White Negro
Alabama . 38. 7 73. 9
Arkansas 64. 3 100. 0
Florida ***** . 44. 8 94. 1
Georgia 53. 100. 0
Louisiana 51. 4 100. 0
Mississippi ' . 38. 7 100. 0
North Carolina 34. 3 100. 0
Oklahoma 26. 9 90. 9
South Carolina 23. 1 . 100. 0
Tennessee 67. 7 100. 0
Texas:A. & M 29. 9 100. 0
Sam Houston 100. 0
A. & I 100. 0
Technological 60. 0
Virginia 35. 7
Ettrick 66. 7
Hampton 75. 0
Total 41, 2 91. 6
.41111111P
Curriculum offerings and registrations.-The.courses offered in the agriculturecurriculum by 16 public 8 institutions of higher learning and the registrationin each for 1935-36 are given in table 17. New methods of accounting andnew demands made oin the farmer by changes in the credit system resultingfrom the operation of the Federal Farm Credit Administration, wouldsuggest the need of rather large enrollments in subjects relating to account-ing and credits. Of the 11,841 students enrolled in the 16 institutionsreporting registrations in agricultural curriculums, 80 are registered incourses that .are related to these subjects. A similar situation prevails withrespect to the subjects dealing with problems of agritulti.tral reorganizationand cooperative marketing. Even if these topics are included in suchsubjects as marketing and farm organization the numbers enrolled are notin keeping with their growing importance.
Problem ofpreparing,teachers.-Although practically all the Negro graduatesof agriculture curricula from institutions of higher learning enter the field
of teaching, as shown in table 18, reports from school officials indicate thatthe supply of trained Negro teachers in agriculture is inadequate. Enroll-
ment in agricultural teacher-training courses increased 6.5 percent from
1928-29 to 1934-35. This slight increase is probably due to several things,
some of which are lack of funds and lack of interest of school administrators.Chapter VII shows that the percentage of the total amount of Federal funds
expended for the preparation of teachers received by institutions for Negroes
ranged from 11.1 in'1928-29 to 16.1 in 1934-35.
/ Data obtained from the Agricultural Education Service of the Vocational Education Division of the Office
of Education.liampton and Masker!, are included here.
..
.. . .. ...,.. . .
. .
-
.
; 111 .
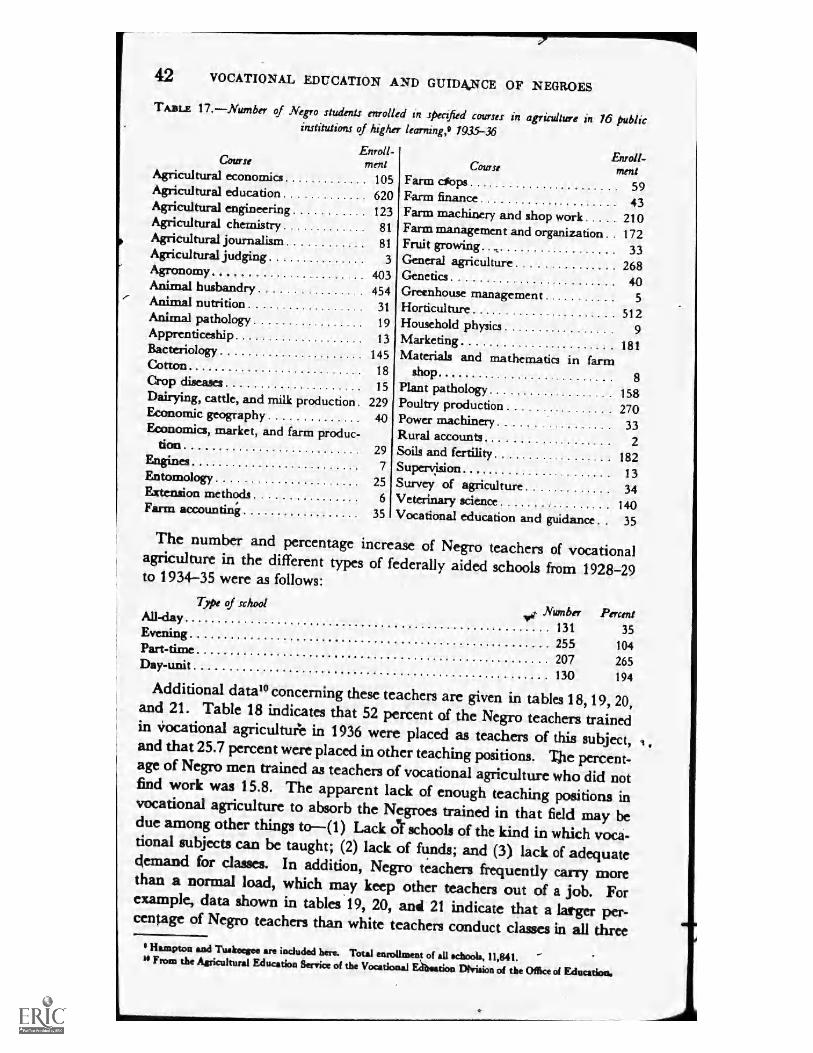
42 VOCATIONAL EDUCATION AND GUIDA,NCE OF NEGROES
TABLE 17. Number of Negro students enrolled in specified courses in agriculture in 16 publicinstitutions of higher learning,9 1935-36
Enroll-Course ment
Agricultural economics 105Agricultural education 620Agricultural engineering 123Agricultural chemistry 81Agricultural journalism 81Agricultural judging 3Agronomy 403Animal husbandry 454Animal nutrition 31Animal pathology 19Apprenticeship 13Bacteriology 145Cotton 18Crop diseases 15Dairying, cattle, and milk production 229Economic geography 40Economics, market, and farm produc-
tionEnginesEntomologyExtension methodsFarm accounting
297
256
35
Enroll-Course merit
Farm c#ops 59Farm finance 43Farm machinery and shop work 210Farm management and organization . 172Fruit growing 33General agriculture 268Genetics 40Greenhouse management 5Horticulture 512Household physics 9Marketing 181Materials and mathematics in farm
shop 8Plant pathology 158Poultry production 270Power machinery ..... 33Rural accounts 2Soils and fertility 182Supervision 13Survey of agriculture 34Veterinary science 140Vocational education and guidance . 35
The number and percentage increase of Negro teachers of vocationalagriculture in the different types of federally aided schools from 1928-29to 1934-35 were as follows:
Type of schoolel, Number PercentAll-day
131 35Evening255 104Part-time207 265Day-unit130 194
Additional data° concerning these teachers are given in tables 18, 19, 20,and 21. Table 18 indicates that 52 percent of the Negro teachers trainedin liocational agricultufe in 1936 were placed as teachers of this subject,and that 25.7 percent were placed in other teaching positions. The percent-age of Negro men trained as teachers of vocational agriculture who did notfind work was 15.8. The apparent lack of enough teaching positions invocational agriculture to absorb the Negroes trained in that field may bedue among other things to(1) Lack ovf schools of the kind in which voci-tional subjects can be taught; (2) lack of funds; and (3) lack of adequatedemand for classes. In addition, Negro tachers frequently carry morethan a normal load, which may keep other teachers out of a job. Forexample, data shown in tables 19, 20, and 21 indicate that a larger per-centage of Negro teachers than white teachers conduct classes in all threeHampton and Tuskeegee are induded here. Total enrollment of all schools, 11,841.If From the Agricultural Education Service of the Vocational E4beation Dltriaion of the Office of Education.
. . .
*
.
0

AGRI CULT U RE 43
types of schools, namely, all-day, evening, and part-time; that the averagenumber of classes per teacher is large!: among Negro than among whiteteachers; and that a larger percentage of Negroes teach other subjects inaddition to agriculture and also act at principals.'The above data indicate that more teachers would be needed if funds for
vocational agriculture and number of schools in which it was offered wereavailable, and the teaching load were improved.
TABLE 1 8.-Placemtnt of Negro men trained as teachers of vocational agriculture by States,1935-36
State s
AlabamaArkansas-FloridaGeorgiaLouisiana
MissisaiwiNorth Carolina_ __-_ _
OklahomaSouth CarolinaTennessee
Texas
ErtrickHampton
Total
Percent_
Totalnum-ber ofnew
teach-ers
quali-fied
Placement of teachers trained, 1936-
As teachers ofvocationalagriculture
In theState
Out ofState
Indtherteach-
ingposi-tions
17 4 10 27 7 0 0
16 4 o 1212 4 o 815 12 o o
11 2 o o9 3 1 1
10 4 0 39 5 0 28 1 1 1
23 14 0 5
8 4 1 36 0 3 2
151 64 16 39
42. 1 9. 9 25. 7
Inposi-tionsothertha n
teach-ing
Num-bernot
placed
Outlook for 1937
Num-ber ex-pected
toqualify
Estimated need
1 0 200 o 10o o 101 o 111 2 11
o 9 103 1 20o 3 9o 2 12o 6 11
4 * 12
0 o 110 1 10
10 24 157
6. 6 15. 8 3. 3
More than this year.10 needed.Probably sufficient.54 if funds available..Sufficient unless new
funds.
3 to 5.Need strong.12 requests.40 if funds available.Depends on funds.
10 to 12 needed.
Quite adequate.Probably sufficient.
I Data obtained from the Agricultural Education Service of the Vocational Education Division of the Office ofEducation.Kentucky did not train Negro teachers of vocational agriculture.
TABLE 1 Kinds of classes Conduaed by teachers of vocational agriculture, fiscal year 1935-36
Region
Total
North AtlanticSouthern:
WhiteNegro
North CentralPacific
Totalteachersof all-
dayclasses
Teachers conducting-
All-day ijOsaes All-day and eve-onl)Ar ning classes
N umber
2
5, 474 2, 537
870
1, 834565
1, 605600
449
37288
1, 104524
Percents
4
46. 34
N umber
1, 712
51. 60
20. 2815. 5768. 7887. 33
87
1,08218330159
Porno
MI-day and part- time,All-day, part-
and eve-time classes ning classes
N umber Percent Nana"
31. 27
7
9.9
58.9932.3818.759.83
Pint"
562
310 35.63
10. 26
84 4. 5317 3.01
140 8. 7211 1. 85
663
24
2%277
606
2. 75
16. 1349.02
3. 73.99
Data obtained horn the Agricultural Education Service of the Vocational Education Division of the Office of&location.
,
...... _ _ .
...... .
Virginia:
_.__ _ .
..... _
3 8 Is
12. 11
I
..111
& 6

rIVNOLINDOA NOLLV011aa
TA
BLE
20
. Tea
chin
g lo
ad o
f tea
cher
: of
voc
atio
nal a
gric
ultu
re,
1935
-36
Reg
ion
Gra
nd t
otal
Tot
al,
whi
te o
nly
Nor
th A
tlant
ic
Sout
hern
N
orth
Cen
tral
Pa
cifi
c_ Tot
al,
Neg
ro o
nly
Sout
hern
O
ther
reg
ions
Num
ber
of
teac
hers
A
ll-da
y
2 5, 4
69
12,
910
4, 9
04
11,
769
865
2, 2
52
1, 8
34
4, 4
28
1, 6
04
3, 7
65
601
1, 3
24
565
1,
141
550
1, 1
07
15
34
Num
ber
"111
1111
1n
of c
lass
es
Part
-tim
e
1, 3
06
1, 0
08
356
419
217 16
298
298 0
Eve
ning
3, 5
87
2, 9
38
141
2, 3
20
399
'1'7
8
649
612 17
Day
-uni
t N
on VO
CA
- tio
nal
530
327 o
327 o o
203
203 o
7 4, 0
13
3, 4
07
399
362
1, 7
51
895
606
587 19
Num
ber
of d
iffe
rent
cla
sses
tau
ght
by t
he a
vera
ge t
each
er d
urin
g th
e ye
ar
All-
day
8 r 36
2. 4
0
2. 6
0 2.
41
2. 3
5 2.
23
2. 0
2
2. 0
1 2.
27
Part
-tim
e
0. 2
4
. 21
. 41
.
23
. 14
. 03
. 53
. 54
0
Eve
ning
10
O.
68
. 60
. 16
1.
26
. 25
.
13
1. 1
5
1.
15
1 13
Day
-uni
t
11 0. 1
0
. 07
0 .
18
0 O .
36
. 37
O
Non
voc
a-
tiona
l
12
0. 7
3
. 70
. 46
.
20
1. 0
9 1.
49
1. 0
7
1 07
27
1
Tot
al
111 4.
11
3. 9
8
3. 6
3 4.
28
3. 8
3 3.
88
5.
13
5. 1
4 4.
67
'Dat
a ob
tain
ed f
rom
the
Agr
icul
tura
l E
duca
tion
Serv
ice
of t
he V
ocat
iona
l E
duca
tion
Div
isio
n of
the
Off
ice
of E
duca
tion.
tzl
'1
4 ..
t ..."
AP.
3
tri
C:1
cl
0-1
1.4
C) :1
OP-
o Cl

TA
BL
E 2
1.N
umbe
r of
ful
l-tim
e an
d pr
orat
ed te
ache
rs o
f al
l-da
yda
mes
, fis
cal y
ear
1935
-36
1
Reg
ion
1
Tot
al
Nor
th A
tlant
icSo
uthe
rn:
Whi
te,
Neg
roN
orth
Cen
tral
Paci
fic
Tot
alte
ach-
eri
of a
ll-da
ycl
asse
s
3
teac
hers
Num
-be
rPe
r-ce
nt
Pror
ated
teac
hers
I
Tot
al
Num
-be
rPe
r-ce
nt
5, 4
693,
249
59. 4
2, 2
2040
. 6
Tea
chin
g 1
othe
r su
bjec
t
Num
-be
rPe
r-ce
nt
Tea
chin
g 2
othe
r su
bjec
ts
Num
-be
rPe
r-ce
nt
Tea
chin
g 3
othe
r su
bjec
ts
Num
-be
rPe
r-ce
nt
8le
1113
475
21. 4
570
25. 7
254
11. 4
145
604
69. 9
261
30. 1
1 83
41,
490
81. 2
344
18. 8
564
214
37. 9
350
62. 1
605
729
45. 4
876
54. 6
121
235
. 338
964
. 7
113
43.3
5822
.225
9.6
116
33. 7
4011
. 620
5. 8
195.
424
.6.
917
4. 9
142
16. 2
,335
38. 2
135
15. 4
8521
. 9'1
1329
.057
14.7
Serv
ing
aspr
inci
pal
Num
-be
rPe
r-ce
nt
1314
417
18. 8
16
6. 1
124
36. 1
140
40. 0
123
14 0
143.
6
Serv
ing
aspr
inci
pal a
ndte
achi
ngon
eot
her
subj
ect
Num
-be
r
1 $ 68 11
520
23 9
Per-
cent is 3. 1
4. 2
1. 5
5. 7
2. 6
23
Serv
ing
aspr
inci
pal a
ndte
achi
ng 2
othe
r su
bjec
ts
Num
-be
r
17 102 5 14 30 40 13
Perk
cent 18 4. 6
1. 9
4. 1
8. 6
4. 6
3. 3
Hav
ing
othe
rpr
orat
ing
ar-
rang
emen
ts
Num
-be
r
1,9 33
4
_33
25 100
78 98
Per-
cent IS 15
. 1
12. 6
7. 3
28. 6
8. 9
25. 2
I D
ata
obta
ined
fro
m th
egr
icul
tura
l Edu
catio
n Se
rvic
e of
the
Voc
atio
nal
Edu
catio
n D
ivis
ion
of th
e O
ffic
e of
Edu
catio
n.A
pro
rate
d te
ache
r is
one
who
is p
erfo
rmin
g du
ties
othe
r th
anvo
catio
nal t
each
ing.
____
___
Full-
time
11/4
1
411
Zg
67
I

46 VOCATIONAL EDUCATION AND GUIDANCE OF NEGROES ,
FEDERAL AID FOR VOCATIONAL AGRICULTURALEDUCATION
Federal expenditures for agriculture in all types of schools from 1928-29to 1934-35 in 18 States are given in table 22. The proportion of fundsallotted to schools for Negroes ranged from 8 to 12 percent for the diffe;-entyears. The range in all-day schools, where most of the money is spent,was from 7.6 to 11.6 percent. The percentage increases and decreases inschools for:Negroes in Federal expenditures, enrollment, and in the numberof courses and teachers in vocational agriculture from 1929-30 to 1934-35compared with 19213-29 are shown in figure 4.
300
el 0
.re40
Z 10
180
1 50
90
60
30
0
-3019C/3-C9
Key -r.xpe,ncksturt..5Malt. t.nrol I rnantFermat a, an K:1 I I rnealtTe.o.c.ha.reCoul...4,41
.
.
- - - - -00"-- - - - -......... ......... .
..
4
%
.
////
-
%%%%.
A*.S4%
. ed40:3k
-ir
I ,
% "ge.4.
%/e .0 .. _
e e.. '"
1
%
%
% 4
s
..""./". _ .
ee
ee
e.
.
Al..... ...
.
19e9-30 1930-31 1931-3t I93L-%33 1938-Z4 1934-Z5
FlouRE 4.Percentage increase or decrease in enrollments, number of courses, and teach-ers, and expenditures in Federally aided agricultural classes each year from 1929-30to 1934-35 compared with 1928-29, in 18 States
DLO
.000 ode
0
-
.,
A
/ .
a.-,,
CmIL40041
.1-*°e i .-/
%
.

AGRICULTURE 47
TABLE 22. Amount and percent of Federal funds expended for vocational agriculture in thedifferent types of schoòls, accorchng to race and years, In 18 States
Type of &chow!
1928-29 1929-30 1930-31 1931-32
Amount Per-cent Amount Per-
cent Amount Per-cent Amount Per-
cent
1 2 3 4 S 6 7 8 II
"Ilkite $1, 242, 530. 81 89. 0 $1, 351, 416. 04 88. 8 $1, 957, 632. 33 91. 7 $2, 473, 609. 54 92. 4Negro 153, 081. 05 10. 9 171, 194. 09 11. 1 177, 107. 54 8. 3 204,044. 52 7.
Evenate_e
_ _ _ _ _ _ _ 35, 913. 84 78. 8 37,648. 86 78. 2 44, 510. 36 79. 0 - 25, 492. 86 72. FNegro _ 9, 660. 46 21. 2 10, 523. 77 21. 8 11, 802. 44 21. 0 9, 522. 00 27. 2Part-time:White 2, 712. 49 68. 2 1, 624. 24 39 5 75 00 4 9 0 00NeFro 1, 267. 47 31. 8 1,062. 50 60. 5 1, 449. 41 95. 1 2, 050. 00 100. CDay-unit:White 10,911.00 80.6 5, 923. 45 62. 2 9, 147. 51 70. 5 5, 418. 60 77. 3Negro_ _ __ ._ _ _ 2, 634.09 19. 4 3, 594. 07 37. 8 3, 835. 77 29. 5 1, 595. 00 21. 7Total:White_ ..... _ _ 1,292, 068. 14 88. 5 1, 396, 612. 59 88. 2 2, 011, 365. 20 91. 2 2, 504, 521. dO 92. CNegro 166, 643. 07 11. 5 186, 374. 43 11. 8 194, 195. 16 8. 8 217, 211. 52 8. C
Grand total_ _ _ _ _ 1,458, 711. 21 1, 582, 987. 02 2, 205, 560. 36 _ _ _ _ _ _ 2, 721, 732. 52
Type of school
WhiteNegro
Evening:White _
NegroPart-time:
WhiteNefro
Day-unit:WhiteNegro
Total:WhiteNegro
Grand total
1932-33
1 e
$1, 251,696.44151, 519. 64
17, 533. 567, 029. 50
063. 00
. 2, 653. 581, 264. 00
1, 271, 883. 58159, 876. 14
1, 431, 759 72
11
89. 210. 8
71. 428. 6
100. 0
67. 732. 3
88. 811. 2
)933-34
12
$1, 190, 904. 95156, 331. 47
16, 176. 557, 654. 66
750. 00262.50
4, 402. 201, 412. 50
1, 212, 233. 70165, 661. 13
1, 377, 894 83
1$
88. 411. 6
67. 932. 1
70. 129. 9
75. 724. 3
87. 912. 1
1934-35
14
$1, 647, 954. 07209, 861. 97
28, 650. 0212, 540. 04
5, 554. 41I, 135. 27
4, 613. 001, 650. 00
1, 686, 771. 50225, 187. 28
1, 911, 958. 78
11
88. 711. 3
69. 630. 4
83. 017. 0
73. 7s 26. 3
88. 211. 8
11,
CONCLUSIONS
In formulating a program in vocational education for Negroes in ruralareas problems growing out of their educational, social, and economicstatus should be considered. This chapter is devoted chiefly to educationalproblems. Obviously the extent to which the federally aided program ishelpful is conditioned by the number of youth and adults reached by it.This depends on the number of children who have enough general educa-tion to profit by the program and the number and accessibility of schools inwhich a federally aided program is offered.
A condition which affects any education program for Negroes is theliteracy situation. In 1930, 20.5 percent of the rural nonfarm and 23.2percent of the rural farm population were illiterate, in contrast to 9.2percent cif the urban Negro population. The educational level of Negroes
-
_ _ ___ _ _
..... _ _ _ _ _
.
ow ...... OD .
,
_ - _ _ _ _
All-day:
_
_
46

48 VOCATIONAL EDUCATION AND GUIDUCE OF NEGROES
must be raised if they are to benefit fully from the instruction offered tomeet new occupational demands.
In 1930 in the United States there were 803,373 Negroes in rural areas15 to 1 9 years of age-12 percent of the total rural Negro population.The number is considerably larger than the urban Negro population of thesame age group. Most orthese young people are in the South, the numberin the North and West being only 26,355. Taking the country as a whole,there are 2,004,082 Negroes 12 to 19 years of age, 1,316,204 of whom wererural, potential candidates for training in useful occupations. In orderadequately to meet this need for training, two provisions are necessary:First, additional high schools for Negroes which participate in the Federalvocational education program' ; second, additional part-time and eveningschools to bring educational facilities to the large number of Negro childrengainfully employed well as to those out of school and not employed.Data on this subject they pertain to rural areas are given in a recentOffice of Educatio i tudy." This study also shows that 5.48 percent of48,707 pupils in rural areas were enrolled in high-school grades. Ninety-four percent of these children, therefore, do not have access to the vocationaleducation opportunities in high school. Mollette found in 1932 tit80,000 Negro boys and girls in Georgia- (90 percent of the schopl popula-tion) settled down on farms after completing the sixth grad° without anyformal training in agriculture.'2
Pending the reduction of the number of Negro children in rural areaswho are overage and who drop out of school early, it may be desirable tointroduce vcational guidance and preparation in the upper grades of theelementary school. This might benefit overage pupils anA provide voca-tional preparation for pupils who otherwise would not receive it.
Il Availability of Education to Negroes in Rural Communities. Op. cit., pp. 8 and 63.Mollette, L S. Agriculture in Negro Schools. Southern Workman, 61: 338-40, August 1932.
_
as,;.'
u

[ CHAPTER V
Vocatioral Eduption in Home Economics
4,
=11.
NUMBER OF SCHOOLS AND CLASSES
All-day schools.Home economics education has been developed in highschools under various circumstances, and in many cases under conditionswhich precluded Federal aid, consequently, relatively few schools offerfedielly aided vocational education in home economics. However, moreschools than those listed below as receiving Federal aid are offeiing workin the field. According to the present investigation in 34-35, therewere 225 all-day schools for Negroes in the 18 States udied offeringvocational educAtion in hòme economics with Federal a This is a 543percent increase over the 35 such schools in 1928-29. The number andpercent of increase of all-day schools for each designated year over 192849follow:
1929-30 1930-31 1931-32 1932-33 1933-34 1934-35Number of schools 55 70 107 128 183 225Percent 57 100 205 265 423 543
Evening and part-time schools. Data were not collected on the number ofevenipg itnd part-time schools for federally aided vocational educati,onin homeeconomics. ,However, the availability of such instruction throughthese schools may be indicated by the number' of classes offered. Table23 shows that in 1934-35, 508, or 97 percent, of the classes offered in thesetwo types of schools for Negroes were offered in evening schools. Thisis an increase of 316 percent over the number of such classes offered in1928-29. Data presentd in the table show also that the total number ofclasses offered in the evening schools increased consistently each year from1928-29 to 1934-35. The trend noted abovels. significant because thetraining which adults receive in these classes can be put to immediate usein their homes. Moreover, it has an important influence on other mem-bers of the family, especially on those girls who do not take such trainingin the all-day school.
I
4.

50
TABLE 23 . Number
VOCATIONAL EDUCATION AND GUIDANCE OF NEGROES
and percent of classes for Negroes in federally aided hom* economics,accordingto types of schools and years, in 18 States
IYear and type of school Number Percent
,
Year and type of school Number Percent
1 2 3 ...
1, 2
._
3r
1928-29: Evening1929-30: Evening1930-31:
EveningPart-time
1931-32:EveningPart-time
,122160
2631
4052
,
100. 0100. 0
99. 6. 4
99. 5. 5
1932-33:EveningPart-time
1933-34: Evening1934-35:
EveningPart-time
, ,
3992
387
50816
99. 5.5
100.0
3.0
CURRICULUM OFFERINGS AND REGISTRATIONSCurriculum offerings in high schools.The home-economics courses offeredin 1934-35 in federally aided evening and part-time schools are listed intable 24. While certain dtiplication exists, some slight indication of theavailability of these courses may be gained from the enrollments. In viewof the fatts concerning infant mortality and general heiath status of Negroesone would expect to find larger enrollments in courses on child care andnursing and hygiene. Similarly, enrollments are not large in parent educa-tioh, although some instruction may be given in this subject in certainother courses.
TABLE 24. Number and percent of total Negro students registered in each kind of home eco-nomics course by type of saool (1934-35), in 18 States
Course
Child careClothingDomesuc service trainingFamily and community relationFoodsGardeningHome economics, generalHome furnishingHom managementMillinery and artNursins and bytielleParent education
Total
Type of school
Evening
Number
........111=1/
1, 0764, 131
401901
2, 538158
Percent
10. 2I 39. 4
3 88 6
14. 21 5
1591 734
44
10, 475
1 516 51. 96. 5
4
-or- Part-time
Numbér
124267
20
52
Percent
27. 859. 8
4. 4
11. 6
23
446
5. 1
Curriculum and course registrations in high schools.In the 207 high schoolsselected for special study, about 14 percent of the girls were e olled inhousehold arts (home economics) curriculums in 1934-35. T percent-Ar
,
.4
_ _ __
_ _ __,.,
-
...... ..... ._..._.
_
....... -__.- -
1931-32:
_ ___ ....... ...... _ _ _
,
....... _ _ _ .......
GOP =, ..... O.
I.
...... .10 am.
I.
.3
'\

HOME ECONOMICS 51
ages of the total enrollment of girls registered in these courses duririg the1044year period from 1925-26 to 1934-35 ranged from 116 to 14.9.In a stUdy made by Jessen 2 of 609,893 pupils in nine States it was foundthat in 1922, 14.9 percent of the total enrollment was registered in homeeconomics. In 1928 the corresponding percentage was 20.3. The regis-trAons of Negroes in the home economics courses in federally aided depart-ments are given in table 24, and in table 25 for reporting to theOffice of Education for the regular quadrennial statistical study made bythe office.
TABLE 25.Number of schools reporting and number and percent of Negro pupils registered inspecified home economics courses in regular and reorganized high schools, 1934 1
Course
Child careClothing-CookingFoodsnutrition, dietetics, cafeteria and tea, room
managementFamily relationshipsGeneral home economics 3Home nursingLaundrySewing
Total number of schools reporting vocationalsubjects in high schools and total enroll-ment in such schools
Total number of schools reporting and totalenrollment in such schools
Regular high schools
gumberof
schoolsreporting
2
3
2527
294
2016
Course registra-tion
Number
811, 8281, 718
1, 96153
12, 215237
Percent
4
Reorganized high schools
Numberof
schoolsreporting
a
0 13. 33. 1
3. 509
21. 84
36
335
480
2, 234
56, 096
66, 504
4. 0
Course registra-tion
Number
21 3, 92612 1, 626
17 2, 333
73 8, 823
6 40413 1, 667
131
164
47, 046
50, 933
Percent
7
8. 33. 5
5. 0
18. 8
.93. 5
I Schools for Negroes making the quadrennial report to the Statistical Division of tlr Office of Education,most of them being in the Southern States.I Many of the specialized courses listed here are included in this course. 1/1
Course regigrations in colleges. Data were gathered on course registrationsfrom 18 colleges under public control and 2 privately supported. Thesedata are given in table 26. While it is difficult to ascertain the exactnature of many of the courses from the titles given, there ppears to begreater emphasis than in the high schools, insofar as that can be judged byregistrations, on certain modern problems in homemaking.
I See ch. table 8. -
I Jessen, Carl A. Secondary Education. bt Biennial survey of education, M62-1928. Washington, Govern-ment Printing Office, 1930. United States Department of the Interior, °Ike of Education, Bulletin 1930,No. 16, ch. VI.
-
3
0e .........
_ ......
..... MP
mi. 1 gib
III,
al.

52 VOCATIONAL EDUCATION AND GUIDANCE OF NEGROES
TABLE 26.College enrollment in specified home economics courses, in 18 public colleges and 2
CourseApplied arts
private colleges fór' Negroes I
Enrollment Course.68
51
10
400622283
Beauty culture 4 . . .
Cafeteria management 4 . ....Child care and home nursing . . . . .
Clothing and textilesClothing selection and construction.Costume designing and art appre-
ciationDairyingEducation and directed teaching. .
Experimental cookery . . ...... .
Fancy cookeryFood selection, preparation, serv-
ing, and preservingFamily relationsGardening And floricultureHome craftsHome economics materials and
methods of observation . . . . .
Home management and problems. ,Horticulture
48219
29714
4
1,0186
19
39
7. 12
23513
EnrollmentHouse care and renovation 35House planning and furnishing. . . 157Household accounts 20Household chemistry 66Household economics 231Household physics 38Housing and equipment 58Hygiene 52Institutional management 4 8Interior decorating 5AMilanery deiigningNutrition and dieteticsNursing and first-aidPoultry and gardeningPractice cottageProblems of consumer buyingQuantity food preparation and
catering 4 19Tailoring 4 11The family 21Weaving 3
4
16267
67765715
ENROLLMtNTS IN TYPES OF SCHOOLSData on enrollment in all types of schools are' show% in table 27. Most
of the federally aided &urses in vocational education in home economicsaie given in all-day and evening schools. Few boys-are enrolled in homeeconomics courses in these schools, although large numbers of Negrc; menare engaged in occupations related to homemaking.
The percentage of the total female enrollment in all, types of schoolsenrolled in the all-day schools increased from 31.4 in 1 928-29 to 46.1 in1934-35, while the corresponding percentage in evening schools decreasedduring the same period from 68.5 to 51.9. Fiale enrollments in all-dayand evening schools increased inarkealy from 11128-29 to 1934-35, thepercentage increases for the respective years are: All-day.,.333, evenini,124. The percentage increases and decreases in female enrollments inhome economics courses in all types of federally aided schools each yearfrom 1929-30 to 1934-35 compared with 1928-29 are shown below:.6
Percentage increase of enrollment compare( with 1928--291929-30 100-31 1931-32 1932-31 -1933-34 104-35
percent ........ . . .... 1 .0 45.2 80.9 120.8 128. 9Percentages are shown graphically in figure 5.These data show significant increases during the 7-yea period.
do bot, however, show the relation to the actual need for such' courses.In 1934-35, 10,416 Negro girls were carolled in federally aided
Total enrollment for 18 publie colleges, 12,833; total enrollment for 2 private colleges, 2,107.4 Not strictly borne economics courses, ordinarily taught as trade courses.
195 . 3
They
home
4
I.
. . . . . . . .......
. . . . .... .. . . ..
. .
. . . ... .
1
"et t
. .. .. .

HOME ECONOMICS 534economics courses in all-day schools. This number is 4 percent of all
Negro girls 15 to 19 yeárs of age in the 18 States studied.
TABLE 27.Number and percent of Negro studentr aug4q1ed in home-economics courses in thedifferent types of federally aided schools, according toyears, in 18 States
Year and type of school
Males
Number
1928-29:All-dayEVeningPart-time
Total
1929-30:All-dayEveningPart-time
Total- -
1930-31:All-dayEvening _
Part-time
Total4
a.
72
Percent
72
1931-32:All-dayEveningPart-time
30
Total 1
1932-33:All-dayEveningPart-time
1933-34:All-dayEvening fPart-time
Total
1934-35:All-dayEveningPaa-time
Total
.r
30
65
11
9161
o
152
11429
54. 545. 4
59. 940. 1
Females
Number L Percent
4
2, 4065, 243
7, 649
2, 7844, 786
31. 468. 5
16. 863. 2
Nan
7, 570If
3, 257 29. 37, 797 70. 2
51 . 5
11, 105
4, 531 32. 79, 264 66. 9
44 . 3
13, 839
5, 90510, 806
180
34. 964. 0
1. 1
16, 891
9, 108. 40
79. 720. 3
143
51. 948. 0
17, 512
10, 416 46. 111, 728 51. 9
446 1. 9
22, 590
That relativelyjew women and girls enrolled i2 part-time schooLs, asshown.in table 27, is probak due to the fact that the federally aided part-time vocational work in home economics is listed with änd is administeredby the departments of -trades and industries in the'clifferent Statçs. In
it itgeneral, s supervised by regd ar ome-conomics superviso having
charge of the all-day programs. Thus, there is maintained a c1c relationbetween the general trades and hpme-economics work. The e rollmentin the part-time schools offering trades and industries in home nomicscourses is showil in chapter VI, tatile 34. Few Negro females are enrolledin these part-time courses.
411,
*61
.4
1
6
11 3
411. -40 IMP I ------
ti.
. ___________ --------------------- - - - - - - -----
'4.
------
------ MO
t*,
6
eS
_
1
*
-
2
,
p.

54 VOCATIONAL EDUCATION AND GUIDANCE OF NEGROES
NUMBER OF TEACHERS
The number of Negro teachers of home economics in all types of federallyaided schools increased 177 percent from 1928-29 to 1934-35. Thenumber in the all-day schools increased during the same period` from 50 to231, or 362 percent; in evening schools from 136 to 276, or 103 percent.In many cases the all-day teachers of home-economics courses in federallyaided departments also teach courses in the evening schools. Sometimesadditional compensation is granted for this extra service or a reduction ismade in number of classes in the all-day program.
trom 1928-29 to 1932-33 there were fewer pupils per teacher in the whiteall-day schools; from 1933-34 to 1.934-35, fewer pupils per teacher amongNegro schools. In the evening schools for each of the years studied therewere fewer pupils per teacher among schools for Negroes. (See table 28.)
TABLE 28. Pupil-ttachtr ratio in federally aided home-economics courses in all-day andevening schools, according to race and years
Type of school
All-Day:White__Negro_
Evening:White_ __ _ - -Negro...
1928-29
Femaleenroll-ment
2
Num-ber ofteach-
ers
3
8, 061 2632, 406 50
26, 399 4655, 243 136
Ratio
30. 648. 1
56. 838. 6
1929-30
Femaleenroll- 4ment
15, 2172, 784
31, 1244, 786
Num-ber ofteach-
ers
41963
531149
Ratio
7
36. 044. 1
58. 632. 1
1930-31
Femaleenroll-ment
22, 1683, 257
37, 5537, 797
Num-ber ofteach-
ers
5%188
Ratio
16
38. 240. 7
63. 041. 5
1931-32
Femaleenroll-ment
11
29, 4264, 531
50, 1609, 264
Num-ber ofteach-
ers
12
891120
705254
Ratio
131.,33. 037 8
71. 136. 5
Type of school
MI-Day:WhiteNegro
Evening:WhiteNegro
1932-33
Femaleenroll-Tent
14
42, 2405, 905
48, 82210, 806
Num-ber ofteach-
ers
11
998138
490233
Ratio
16
42. 342. 8
99. 646. 4
1933-34
Fesnaleenroll-ment
17
56, 9139, 105
41, 5668, 407
Num-ber ofteach-
ers
18
1, 139192
543218
Ratio
11-1934-35
Femaleenroll-ment
26
50. 0 82, 602.47. 4 10, 416
76. 5 43, 49038. 6
1
11, 728
Num-ber ofteach-
ers
21
1, 637231
655276
Ratio
21
50. 445. 1
66. 442. 5
FEliERAL AID FOR VOCATIONAL 'EDUCATION IN HOMEECONOMICS
The amount of Federal funds expended to reimburse States for instructionin home economics i given in table 29. The percentage of the total Federalfunds for home economics allOtted to schools for Negroes each year ranges
.
.
:
8
58080
,........-,.....111
11....

HOM E ECONOMICS
from 8.2 to 10.2. The percentage increase of expenditures for home-economics instruction in classes for Negroes for each of the succeeding 6years over 1.928-29 is greater than the corresponding percentage increases
FIGURE 5. Percentage increase or decrease in enrollments, number of courses andteachers, and evenditures in Federally aided home economics classes each year from
1929-30 to 1934-35 compared with 1928-29, in 18 States.
in the number of courses, enrollment, and number of teachers, as shown infigure 5.
T7910° 38--5 1.1
55
300
..
Keyp a. nclit "
Mole cnrol I rnentC:0.-.0-400.-45 yen ci I 4_ in rol I ma.nt
- Ttache.r-
150
-9019eo-e9
0.Vs*
fir
p-
191E.9- 50 1930-31 1931-SL 1952.-53 193.3-54 1934-35"'41.1
t-cib
-C P- s....e
r.i
lr.0
5 0
MED .1=1. 4.111. .11M. 4ED I1M =1,
.4E10=19rD.EE

56 VOCATIONAL EDUCATION AND GUIDANCE OF NEGROES
TABLE 29.Amousti and percent of Federal funds expended for home economics in Mt differentIpes of schools, according to race andyears, in 18 States
Type of school
.1dday:WhiteNegro
Fvening:White
_ _
Part-time:WhiteNegro
1
Total:WhiteNegro
1928-29
Amount
dZ
Per-cent
3
$68, 709.28 89 18. 432.39 10 9
52,968.21 90 75, 409.02 9. 3
472 22
122, 149.7113, 841.41
Grand total_ 135, 991 12
89 810 2
1929-30
Amount
4
$148, 824. 4011, 733. 01
63, 093. 307, 423. 71
1, 145. 10
213, 062. 8019, 156. 72
232, 219. 52
Per-cent
92. 77. 3
R9. 510. 5
91. 8F. 2
1930-31
Amount
$243,073. 9016, 408. 89
68, 471. 0313, 125. 45
1, 017. 83100. 00
312, 562. 7629, 634. 34
342, 197 10
Per-cent
7
93. 76 3
83 916. 1
91. 18. 9
91. 38. 7
1931-32
Amount
$338, 101. 1625, 654. 06
90, 260. 2413, 910: 90
3, 515. 76749 16
431, 877. 1640, 314. 12
472, 191 28
Per-cent
1
92. 97. 1
46. 553. 5
R2 417. 6
91. 5R. 5
Type of school
All day:WhiteNegro
Evening:WhiteNegro
Part-time:WhiteNegro
Total:WhiteNegro
Grand total
1932-3
Amount
$337, 105. 4629, 721. 32
68, 365. 2312, 431. 52
6, 418 55180 00
411, 889. 2442, 332. 84
454, 222. 08
Per-cent
11
193-3
Amount
12
91. 9 $301, 472. 408. 1 31, 364. 60
84. 6 52, 897. 3815. 4. 9,431.58
97 3 5, 581 522 7
90. 79. 3
359, 951. 3040, 7%. 18
400, 747. 48
Per-cent
90. 69. 4
84. 915. 1
89. 810. 2
1934-3
Amount
14
$483, 588.41f44, 417. 92
58, 148. 8110, 29/ 35
9, 503. 41, 132. 87
Per-cent
16
91 68. 4
84. 915. 0
89. 310. 7
551, 240. 4855,843. 14
607, 083. 62 _
90. 89. 2
CONCLUSIONS
Because of the economic status of Negroes and the effects of the disorgani-zation of their family life during slavery, homemaking education for them isof special importance. Its need is shown by the prevalence 3 of poor health,inadequate housing, early marriage, mothers gainfully employed, and infantmortality amon4 Negroes. Of the 2,405 high schools for Negroes in the 18States studied, 225, or 9.3 percent, participated in the federally aided homeeconomics program in 1934-35.
U. Census, 1930. Op.-cit.Fundamentals in the Education of Negroes. Washington, Government Printing Office, 1935. (United StatesDepartment of the Intetior, Office of Education, Bulletin 1935, No. 6.)
Negro,
_
6
le
- -
1$
.
.10 40.
S.
4
5

HOME ECONOMICS 57The major objective of homemaking education is improving home and
family life. However, instruction in this field is related to certain occupa-tions in which men and women are engaged. Many persons may use homeeconomics instruction, especially that of high-school grade, as an introduc-tion to vocational education in related fields. Domest,ic and personal serviceoccupations is a case in point. The need of preparation for this occupationis shown by the number of Negroes employed. There were, in 1930, 1,152,-560 Neet women 10 years old and over gainfully employed in domesticand fal service. This is 62.6 percent of all gainfully employed Negrowomen.' Negro men engaged in this group of occupations numbo- 423,645or 11.6 percent of the total Negro men gainfully employed in all occupationsIn 1930, Negroes constituted 28.6 percent of all domestic and personalservice workers. This is an increase over the two preceding decades whenthe corresponding percentages were 22 and 21.6, respectively, for 1920 and1910. Since so large a percentage of Negro workers are employed in theseoccupations, and since the demands in personal service occupations areincreasing in number and complexity,6 the school, through home economicsinstruction'or some other agency, should definitely address itself to the taskof preparing persons for effective adjustments in these occupations.
Improvement in the preparation of domestic and personal service workerswill aid in improving the conditions of employment in this field, where thereis a lack of standardization in wages, hours, duties, equipment, and materials,and in the relation between employee and employer. It has been said thathousehold occupations are "the least standardized, the least modernized,the most feudal of all the work in the modern world." 7
Recent Social Trends in the United States (report of the President's researc committee on social trends).New York, McGraw-Hill Book Co., inc., 1933.Johnson, B. Eleanor. Household Employment in Chicago. Washington, Government Printing Office, 1933.(Women's Bureau, Bulletin No. 106.)
'Household Employment Problems (a handbook for round-table discuuions among household employers).Washington, United States Department of the Interior, September 1937. (Office of Education, Vocational DivihrEsc... 1971 )
aI
ion,
A

CHAPTER VI I
Vocational Education in Trades and Industries
NUMBER OF SCHOOLS AND CLASSES
rTHERE WERE 61. all-day schools offering federally aided vocational1 courses in the 18 States studied in trades and industries for Negroes in1934-35. This is an increase of 21, or 52.5 percent, over 1928-29. Thenumber and percent increase or decrease of these schools for each year from1929-30 to 1934-35 compared with 1928-29 are shown below:
1928-29 1929-30 1930-31 1931-32 1932-33 1933-34 1934-35Number... 40 35 33 53 31 52 61Percent 12. 5 17. 5 32. 5 22. 5 30. 0 52. 5
Number of classes.The number of federally aided classes in trades andindustries in the different types of schools for Ifegroes is given in table 30.,There was a total of 3,554 classes in trades awfit industries in 1934-35;
*331 are for Negroes, most of them in evening schools. There was an in-crease in 1934-35 in the total number of classes for Negroes of 108 percentover 1928-29.
CURRICULUM OFFERINGS AND REGISTRATIONS
'Curriculum offerings in high schools.Federally aided courses in schools forNegroes in trades and industries are listed in table 31. White pupils areregistered in 24 different courses in the all-day schools; Negroes in 12.In the federally aided evening schools, white students are registered in 36different wrses, Negroes in 14. White students are registered in 33 differ-ent part-time and trade extension courses; Negroes in 8.
Trades and industries courses offered by the schools reporting regularlyto the Office of Education are shown in table 32.
58
-E
go-
t.
.,
\\\I .
\

TRADES AND INDUSTRIES 59TABLE .Number and percent of classes in federally adied trades and industries, according to
types of schools andyears, in 18 States
Type of school by year
1
1928-29:EveningPart-time trade extension and
trade preparationPart-time general continua-
tion_
Total
1929-30:EveningPart-time trade extension and
trade preparationPart-time general continua-
tion
Total
1930-31:EveningPart-time trade extension and
trade preparatinn_Part-time general continua-
tion
Total
1931-32:EveningPart-time trade extension and
trade preparation _ _ _
Number Percent
127 79. 9
10 6. 3
22 13. 8
159
134 87. 6
12 7. 8
7 4 5
153
189 89. 6
13 6. 2
9 4. 2
215 88 8
17 7. 0
1
Type of school by year Number I Percent
1931-32Continued.Part-time general continua-
ti4p
Total
1932-33:EveningPart-time trade extension and
trade preparationPart-time general continua-
tion
Total1933-34:
EveningPart-time trade extension and
trade preparationPart-time general continua-
tion
Total1934-35:
EveningPart-time trade extension and
trade preparationPart-time general continua-
tion
Total _ _
10 4. 1
242
194
45
15
254
76. 4
17. 7
9
203
50
17
270
262
58
11
331
75. 2
18. 5
6. 3
79. 1
17. 5
3. 3
TABLE 31 . .Number of students registered in federally aided high-school vocational courses intrades and industries, according to race, 1934-35, in 18 States
Type of course
AeronauticsArchitectureAuto mechanicsBlacksmithingBlue-print readingBOM d makingBoatbuildingBoiler workBricklayingBuilding trades A
Cabinetmaking.Carpentry And woodworkCommercial artElectricity ..Fire fightingForemanshipFlour makingGeneral mechanicsGreenhouse work_ _
Harnessmaking _
.Internal-coinbustion enginesIronworkJanitor serviceMachine shopMarble carving
Evening schoo!s
White
305978588
121, 305
54
10483
166291709
1, 0551, 385
74
1, 430
Colored
3
8315
11
Part-time tradeextension courses
White
4
36
5315738
213
46168
1, 018
118
401
41358181469507
2575
101
3723
325614
7939
81670
Colored
I I
3612
46
334
All-day schools
White Colored
7
517948
2, 041207294
41.
171785355
1, 233
1, (50-_
.49
1 7
15085
100
118
_ _
.
2
--
.
______ _
2
5.
_
_
-
_
Illumination
_
2
O
o
162
........
. ...
if
30
-
31 1
,
3
-
.. _
,
. _ _
_ _
_ _ _
_ _ _ _ _ _
,
_
_._ _ _. V V
1
___
_
_ _ _ _ _ _
_ -
_
_ _
_
4.
1,

so
TABLE
VOCATIONAL EDUCATION AND GUIDANCE OF NEGROES
31. Number of students registered in federally aided high-school vocational courses intrades and industries, according to race, 1934-35, in 18 StatesContinued
#
Type of course
MasonryMetal tradesMining_ _
Natural gasPainting_ _
Petroleum industryPlumbingPottery makingPower-plant operationPractical engineeringPrintingPulp and paper makingRadio mechanicsRefrigeration and air conditioningShipbuilding__ __Shoemaking and repairingSign painting_Steel making_SurveyingTailoringTextilesTree surgery _
UpholsteringWelding
Evening schools All-day
White
2
Colored
2851, 988
20S5
109
5216
177477636189
9334
11
------
Part-time tradeextension courses
White
4
144434
522, 774
9639
284
Colored
5
-----
------
26
124
1001191
2, 6391412
530
153
30098
659407
6g5
195
schools
White
7
21
1
6
132632
267
5714
1, 226
26440
9889
14102
152
Colored
7
325
4 3
126
82
TABLE 32. Number of schools reporting and number and percent of Negro pupils registered inspecified trades and industries courses in regular and reorganized high sch6ols, 1934
Course
Auto mechanicsBasketryBrick masonry
Regular high schools
Numberof
schoolsreport-
ing
Carpentry and cabinetmakingChair caningElectric shopIndustrial artsMechanical drawingMachine shop..PrintingSheet metal and metal artShop woWoodArtl_.Freehan riming
85
Total number of schools reporting vocationalsubjects in high schools and total enroll-ment in such schools
Total number of schools reporting and totalenrollment in such schools
8839
5
210
5
30
335
480
Course regis-tration
3 4
Number Pmess796 1. 4
457 . 8580 1. 0
----- _ _ _
5,478 9. 82,182 3. 9
614 1. 1
57 . 1.676 1. 2296 5
1, 227 1. 2
56, 096 alo
66,504
Reorganized high sOools
Numberof
schoolsreport-
ing
5
5
215
1
35834
1
65
336
131
164
Course regis-tration
Number30554
1521, 870
47369
8, 6643, 791
127577504
33
84511, 677
4r04650, 933
7
Perce RIO. 6
. 1
. 3
3. 9. 09. 8
18.4'8. 1
. 3
1. 21. 1
. 07- -
1. 824. 8
ow. *a
Probably should be considered as related or prevocational courses.
1 1
.
_ _ ____
. _ ______ `.
___ _ a.-Mt .w. ... . ... ao .m. .. .
.,
_ ---017 28
_ _ _
,
.
_ _ _ - _ ....._ _ _ ..... _____ _ --......- -....0.11.....4
_ __ _ _ _ _
s
1
....... _ ...... _ .
V
I
7
1
1.
- - --
Ì
_
_
1
.
.0fo
I

TRADES AND INDUSTRIES 61Curriculum offerings in colleges. Data received from 10 public colleges on
courses offered in trades and industries curriculums are shown in table 33.Relatively few students are registered in most of the courses. Only eightpersons are registered in the courses on labor problems. Judging the con-tent by the titles of courses, there is an apparent lack of interest on problemsrelating to employee-employer relationships, and principles governingmodern economic development.
TABLE 33. Number of Negro college students registered in specified vocational courses in in-dustrial arts, architecture, and building construction curriculums
Industrial Arts Curriculum
Title of course
Enroll-ment
Auto mechanics 107Business administration 14Building conAtruction 13Cabinetmaking, woodworking, and
upholsteringCare of equipmentCeramicsCommercial artDraftingElectricity.EngineeringForgingLabor problemsManual training
Title of course
Enroll-ment
Masonry 47Painting 7Physical measurements 37Plumbing and heating 3
210 Printing 68 Radio 19
18 Safety hygiene 1
203 Sheet metal and welding .396 Shop practice and management . 148
79 Surveying 5074 Tailoring .6. 375 Typewriting 1
8 Vocational guidance 199 Vocational and industrial educa-
tion 250
Architecture and Building ConstructiotiCurriculum 3
Applied mechanicsAppreciation of architectureArchitectural designingbuilders' accountingBuilding construction practiceBuilding estimatingBuilding materialsBuilding specificationsBuilding surveyingBusiness principlesCarpentryElements of architecture
5
5
21
4
11
3
43
3
3
74L6
Field management 3History of architecture .. 1
Landscape planning 5Ornamental drawing 6Pain ting 6Principles of construction 1
Secretarial studies 2Shades and shadows 6Strength of materials 6Structural designing 3Water colors 6
Curriculum and course registrations in high schools.The percentage of thetotal enrollment of pupils registered in vocational and prevocationalcourses in the 207 high schools selected for special study was low. Therange of the percentages f9r boys and girls combined from 1925-26 to
I 10 public schools represented, with a total enrollment of 7,818.2 public schools represented, with a total enrollment of 2,661
416"Mniftfta.
v
. . . . .. . ..... .
. . . . . . . .
...
4k
. . . . . . . . .
. . .
....... ..s
.
.
Ol

VOCATIONAL EDUCATION AND GUIDANCE OF NEGROES
1934-35 was from 2.2 to 3.4. The range for the boys separately was from4.3 in 1926-27 to 5.3 in 1929-30. In the study 3 previously referred to forboth 1922 and 1928, 12.6 percent of the pupils were registered in manualtqining (probably the same as the courses discussed here).
The ntwiber of pupils registered in federally aided courses in trades andindustries is shown in table 31. The schools reporting regularly to theOffice of Education report course registrations as indicated in table 32.This table shows that 335 of the 480 regular schools reported registrationsin trades and industries courses. The total enrollment in these schools was56,096. As in the selected high schools, the percentage of the total enroll-ment registered in any one of the different courses is small. A considerablylarger percentage of the pupils in reorganized schools is registered in indus-trial az1 and mechanical and freehand drawing than in the regularschools.
According to data gathered from three sources, namely, the special studyof 207 high schools included in this survey, the federally aided schools, andthe schools reporting to the Statistical Division of the Office of Education,tte following conclusions seem justified: The range of federally aidedcourses in trades and industries offered in secondary schools for Negroes islimited in comparison with .the total number of courses offered; and inmany of those offered relatively few Negroes are enrolled.
ENROLLMENTS IN TYPES OF SCHOOLS
In 1928-29 Negro males enrolled in federally aided vocational courses intrades and industries numbered 4,232. The percentage increases or de-creases for each year from 1929-30 to 1934-35 compared with 1928-29are given below. Similar data concerning other items are shown in figure 8.
The percentage increase or decrease of Negro enrollmerit compared with 1928-29
1929-30 1930-31 1932-32 1932-33 1933-34 1934-35Males 12. 6 22. 7 49. 4 16. 5 29. 2 70. 1Females 3. 4 20. 1 42. 4 103. 5 107. 7 138. 8
The enrollments in all-day schools, listed in table 34, constitute only asmall fraction of the Negro high-school pupils in the States under considera-tion. nie enrollments sin the other types of schools show only a smallfraction of those engaged in occupations in trades and industries. More-over, the rapid migration of Negroes to urban centers indicates that schoolsin these communities should provide facilities preparing for urban occupa-tions. The percentage of Negro girls and women enrolled in part-timegeneral continuation classes in all types of schools is small in view of the'relation betwèen home economics and trades and industries instructionmentioned in chapter V.
s Secondary Education. Op. cit., ch. 5.
62

TRADES AND INDUSTRIES 63TABLE U. Number and percent of Are& students enrolled in trades and industries ours= in the
different types of federally aided schools, according to year, in 18 States
Year and type of school
1928-29:All-dayEveningPart-time trade, extension and preparatoryPart-time general continuation
Total
1929-30:
EveningPart-time trade, extension and preparatoryPart-time general continuation
Total
1930-31:All-dayEveningPart-time trade, extension and preparatory _
Part-time general continuation
Total_
193 1-32:
EveningPart-time trade, extension and preparatory _
Part-time general continuation_
Total
193 2-33:All-dayEveningPart-time trade extension and preparatoryPart-time general continuation
Total
------
1933-34:All-dayEveningPart-time trade, extension and preparatoryPart-time general continuation
Total
1934-35:All-dayEveningPart-time trade, extension and preparatoryPart-time general continuation.
Total
Males
Number
1, 92 21,687
348275
4, 232
2, 23 51, 367
79
3, 700
2, 6632, 274
12 712 7
5, 191
3, 42 32, 696
11 392
6, 344
2,4952, 15 3
19786
4, 93 1
3, 3341, 871
9317 1
5, 469
3, 9912, 650
44 111
7, 19 7
Percent
45. 439. 9
8. 26. 3
eb. 436. 9
. 52. 1
5 1. 343.8
2. 42. 4
54. 142.6
1. 81. 4
50. 543.6
4. 01. 7
60. 934. 2
1. 73. 1
------ -
55.436. 86. 11. 5
Fernales
Number
4411, 352
243250
2, 286
4491, 233
59884
2, 364
5202, 051
31587
2, 973
6112, 156
41177
3, 255
8352, 5101, 031
276
4, 652
3912, 5821, 372
404
4, 749
5193, 4021, 322
216
5, 459
Percent'
19. 359. 110. 610. 9
IR. 952. 125. 33. 5
M.
17. 568. 910. 62. 9
18. 866. 212. 62. 4
17. 953. 922. 25. 9
8. 254. 418. 88. 5
---
9. 562. 324. 23. 9
:b. 01.
NUMBER OF TEACHERS
The number of Negro teachers of trades and industries in all types offederally aided schools increased 84- percent from 1928-29 to 1934-35.The increa3es for the different types of schools during the same period were:All-day 57, or 66 percent; evening 124, or 95 percent; part-time tradeextension 44, ör 314 percent. In the part-tirne generil continuation therewas a decrease _of 13, or 77 percent.
All-day
_ .
e
_
_ _
19
tre. OP OW.
_ _ _
_ _ _
-
_
_
All-day'
,.
e
.
,
_._
_
------ - _ _ _
......
PNI. .. Mr IN. MD
ap .. pm MP
a
II
.

64 EDUCATION AND GUIDANCE OF NEGROES
FEDERAL AID FOR VOCATIONAL EhUCATION IN TRADESAND INDUSTRIES
The' amount of Federal funds allocated to reimburse States for instructionin vocational courses in trades and industries is given in table 35. Thepercentage of expenditures in all-day schools for Negroes is less since thedepression than before, though the enrollment is larger. (See figure 6.)
3.4
ILO
100
00
b0
40
LO
0
-AO
KLy-
1 I rnwtI rn tn t
Expe-nditu raisMoi t asn ro
0-0-e-0-0-0 Fcmcds. a.n rol1- .
I
..
-4-7!
...../.....-'
....-'
%
/I/.
1:.
. //
- - Tco..c...1frve.e.o, Covt-sa..e
/ .--- ....--
SW
4N -
. e 1i /t
.i /e ,I/
NN' . .. .
.. - or.......
. 4...,
...-, -
,,'
.s
- of
z///I .//
% issr.0
.
-..//,
I
19G9- 50 1930-31 1931- SE 143E-33 1933 -34 1934
FIGURE 6. Percentage increase or decrease in enrollments, number of courses andteachers, and expenditures in Federally aided trades and industries classes ach yearfrom 1929-30 to 1934-35 compared with 1928-29, in 18 States.
L
. ... OM ONO MD
.
, .
a
4.....mi-
.
I
I -.
.
/ ' i v
.
.
.
Cr_.,
o
. .
ft_
r
,Ì
)9t4
fi
.
.
.
.
.
.
.
I.
%%to
%
-"--
e
e
......744.
___--
- .5459
O
s

TRADES AND INDUSTRIESIN
65
TABLE 35.Amount and percent of Federal funds expended for vocational work in Irades andindustries in the different types of schools, according to race andyears, in 18 Statel
lifpe of school
ri1928-29
IIP 41929-30 1930-31 1931-32
Amount Per-cent Amount Per-
cent Amount Per-cent Amount cent
1, ....,
..-I I s 7 8
All-dvr:
Negro_ _ _ .. _ _ _ _
Evening:White_Negro_ _ ____ _ _ _ .
Part-time trade exten-sion:
WhitcNegro
Part-time general con-tinuation:
White ---Negro
Total:WhiteNegro
Grand tota4_ _ _ _ _
8149, 038. 4518, 775. 81
134, 648. 057, 778. 98
80, 225. 851, 485. 88
145, 657. 271, 618. 85
,S4,13
11. 2
94. 55. 5
98. 21. 8
98, 91. 1
$158, 480. 8316, 465. 17
144, 526. 516, 361. 50
85, 106. 731, 300. 25
158, 340. 621, 157. 50
96. 69. 4
95. 84. 2
98. 51. 5
99. 3. 7
$159, 930. 4619
210. 097,361. 96
A64, 659. 03
3, 262. 46
163, 735. 371, 330. 22
89. 210. 8
94. 85. 2
95. 24. 8
99. 2. 8
$174, 197. 2027, 002. 39
121, 871. 568, 635. 94
76, 552. 302, 812. 14
170, 408. 831, 229. 64-
86. 613. 4
93. 46. 6
96. 43. 6
99. 37
509, 569. 6229, 659. 52
94. 55. 5
546, 454. 6925, 284. 42
95. 64. 4
521, 534. 9531, 327. 43
94. 35. 7
543, 029. 8939, 680. 11
93. 36. 7
539, 229 14 . _ 571, 739. 11 552, 862. 38 582, 710. 00
1932-3 1933-34,
1934-3
16 11 12- 13 14 11
All-dkrt:iite$198, 437. 80 91. 3 $186, 977. 26 93. 6 $364, 637. 72 93. 3
Negro _ . 18, 996. 95 8. 7 12, 734. 47 6. 4 26, 152, 12 6. 7Even i n: 1.`g
Wh te - 91, 725. 39 91. 4 86, 371. 08 90. 5 123, 031. 03Negro A_ 8, 579. 48 8. 6 9, 049. 64 9. 5 13, 392. 39 9. 8
Pait-time trade extension: .
White 77, 100. 73 96. 5 72, 829. 96 95. 3 144, 299. 22 X. 8Negro .
2, 822. 95 3. 5 3, 568. 60 4. 7 4, 809. 59 3. 2Part-time general continuation:
White 148, 223. 67 99. 6 122, 272. 92 99. 2 177, 962. 84 '98. 7Negro 665. 86 . 4 'k 952. 80 . 8 2, 400. 76 1. 3
Total:White . 515, 487. 59 94. 3 468, 451. 22 94. 7 p09, 930. 81 94. 5Negro 31, 065. 24 5. 7 26, 305. 51 5. 3 46, 754. 86 5. 5
Grand total 546, 552 83 494, 756. 73 856, 685 67. .
CONCLUSIONS
Three important facts are brOught 'jut in this chapter. First, relativelyfew courses are offered; second, few enroll in many of them; and, third, asmall amount of Federal funds is allotted to schools for Negroes for instruc-tion in trades and industries. While it is recognized that a certain amountof the Federal vocational education appropriations for trade and industrialcourses must be used in part-time classes for employed workers, the possi-bility of increasing the opportunities for Negroes to receive such trainingwithin the limitations should be explored. The three facts mentioned haveimportant implications in light of the following occupational Conditionsamong Negroes.
. .
3 9
.
--it....;
.,
.
.
90. 2
I,,..._
_
,
_
_
..
_ _ _ _ _ _

66 VOCATIONAL EDUCATION AND GUIDANCE OF NEGROES
According toicensus data and 'other stAss,4 a large percentage of Negroesengaged in trades and industrial occupations are unskilled, and accordingto a study made by the Vocational Education Division of the Office ofEducation, there is less and less place in the-economic world for the ignorant,unskilled worker. While mucho:)f the ,required skill demanad today mustbe secured on the job, the school should assist in increasing the number ofskilled Negroes by providing a greater number and variety of courses andby adapting its instmctionr to changing conditions. In this way it mayfurnish a larger numbee the background and point of view for meeting thedemands of modem economic life. N
Moreover, it can assist in providing that flexibili developing thosepersonality traits wrftch the President's Comrilittee on Recent Social Trendssuggested were increasingly in demand in our modern industrial society.Two ways of developing an individual's ability to make adjustmehts tomeet the new demands and rapid shift; place in occupational lifeare: To give him a thorough elementary education and to teach him cineoccupation as thoroughly as possible and the rudiments of another. It isbelieved that, in general, persons who are prepared to do more than onething well frequendy make occupational adjustments more easily andquickly than those who know how to do only one thing.
Because of the complexity of the elements underlying occupational shifts,schools should be cautious in-adding and dropping courses without carefulstudy of the census data, the occupational situation in the ,community, andthe interests and needs of the students concerned. In this connection, it iswell for Negro students, teachers, and counselors to know that Negroes areengaged in many highly skilled occupations, generally with success.' In-forming Negroes *of such successful persons, of instances where the use ofindividual?initiative and creativeness assisted in opening opportunides orbringing promotion, and of means by which Negroes have succeeded inovercoming racial barriers in industry will not only give them a broaderoccupational 'outlook but will also make necessary an enriched educationalprogram for guidance in the selection of and preparation for effectiveoccupational adjustment.
4 Recent Social Trends in the United States. Op. cit.Frazier, Edward K. Earnings of Negroes in the Iron and Steel Industry. Monthly Labor Review, 44: 3,
564-79. Mardi 1937.I Raciest social trends in the United States: Op. cit.
'
s.
r.

*4
%
E CHAPTE4 VII I
Teachers and Teaching,
o ,
.
o
PREPARATION, EXPERIENCE, AND SALARIES
Academic preparation.-The median number o rs of college and gradu-ate edti'cation possessed by teachers of the different vocatioual subjects inthe schools included in this investigation is as follows: Agriculture; 4.68;commerce, 1.11 (years of graduate work); hoine economics, 4.39; tradesand industries 4.09; and theory aqd practice, 1.77 (years of gráduatework). Thè median for all teacher's c-ombined (1,001 cases) is 4.48. Intable 36 are shown the number and percentage of vocational teachersstudied holding given degrees, classified accdrding to the type of institutionin which teaching is done.\TABLE 36. Number and percent of vocational teachers of Negroes studied who hold designated
degrees, 1935-36, according to where they teach...
v Type of institution
iI
Land-grant and othercolleges:
Number.Percent
Private high schools:NumberPercent_
.Trade schools:
NumberPercent
Proprietary schools: iNumberPercent_ _ _ ..... _ _, _ _ _
Public high schools:. Number
Percent
Total:N4mber__-_ -Percent
Degree held
A. B. B. S.
2 3
M. A.
4
3 24 243 4 27.3 27 3
2 1112 5 68 7
5 1125 0 55 0
a
1 4 210. 0 40. 0 20. 0
82 246 6418.6 55. 9 14.5
93 2% 9016. 2 51. 6 I 15.7
M. S.
i
2022 7
Ph. D.
33 4
210 0
- .. _
81. 8
'. - -
30. 7
41. 0
Otherbachelordegrees
44, 5
1
6.2
2
20.0
225. 0
295. 0
Profes-sional
dents
11
O. M. a Os m
. Me
m vi ::ii:
;..lt4
5
5
0.9
Total
11
88100. 0
16100. 0
20100. 0
10100. 0
440100. 0
.574100. 0
1 Those schools operattd by a proprietor, such as commercial colleges, schools of beauty culture, etc..
67 .
.
... . Ow
....... .._
.. .... _ _ _
.....alo......
6
Other Othermuterdegreesdegrees
fo5. 2
8
1011.3
4WD eto gl OD
1 1
6.2 6.2
10. 0 Alm
210. 0
8 21. 8 O. 5
gm 06
or_ -1'"
20 5
3.5 0_9
ND No MD
- - - _,
,.
'
'a
7
.40
p.

68 VOCATION/4, . EDUCATION AND GUIDANCE OF NEdROES.
Occupational training.Specialized training of teachers in the subjectstaught was studied. eiccording to the data, home-economics teachers hav'e
more training in their specialized field than those in the other fields studied,the median number of-semester hours' credit being 38.89 as comparedwith 27.43 for teachers of commerce, 30 for teachers of agriculture, 30.14for teachers of 'theory and applied science, and 30.81 for teachers of tradesand industries. The median for all teachers combined is 41.71. Only
67 teachers in land-grant colleges replird to this particular question.According to the data obtained, they have less special vocational arid more
academic training than the high-school teachers studied..xperience and tenure of teachers.Information concerning teaching experi-
ence and tenure ¿f vocational teachers of Negroes studied is shown inv
tables 37 and 38. Data concerning occupational experience were also
collected (details not shown here). The 'median number of years of teachingexperience is 6.86. Teachers with little tfaining have been teaching longerthan those with a greater amount, according to these data. Althoughonly 49 teachers reported- who had 4 years or less of high-school trainirt,they, had been teaching 15.29 years. The median years of experiencedecreases as The level of education increases. The percentage of vocationalteachers of Negroes having a given amount of occupational experivceother.than teaching is as follows: t year, 12.8; 2 years, 8.3; 3- years, 21.2;4 years, 14.5; 16 years or more; 20.8. The percentage of teachers remainingin their presenrposition 6 to 10 yearsis higher than that in any other of theperiods used in this classificatipn.
Muni 37.Median number of year's of teaching exp5rience f vocational teachers of Negroes
=cording to iducational level attir, 1935-36Median Num-
EducationaSlevel attained years of ber ofexperience cases
4 years of high school or less -4° I 5.29 49
6 weeks to 2 Sreirs of college 13.75 134
3 to 4' years of college 11.23 259A
year or more Of graduate work .4.58 216
Total 6.86 658
Age and salary of vocational teacher.t.----Information concernipg the age ofncational teachers was received from 834 teachers. The median age for
the entire groilp wa,s-37.3 years. The .range in the wedians in the varioussubject fields was as follows: Agri,. ¡dram, 363; con114nérce, 35.7; homeeconomict,-35.2; trades and industries, 39.2; and theory and practice, 35.
In table 39 is shown the pumber of vocational ieachers receiving annualsalaries Within a given range and the median annual salary reCeived byteachers of given subjects. The median for all teachers combined is$1,871.74:. The median annual salary (11,851.85) of teachers of theory and
4 applied sciences/is higher than the medians n the other subjects studied;the lowest median ($1,060) is that received by the teachera of agriculture.
to
1II ii, . 0 a
. . . . .
1
.
s
,
.
0111,
\)

TEACHERS AND TEACHING 69
TABLE 38. Number and percent of vocational teachers of Negroes studied, employed a givennumber ofyears in the schools in which they are now working, 1935-36
Itr-
Type of institution
Land-grant and other col-leges:
Number _
PercentPrivate high schoo!s:
NumberPercent _
Traae schools:Number_ _
PercentProprietary schools:
Number_ _ -
Percent _ _
. Pubhc high schools.Number_ _ _
:
NumberPercent _
In present position-
Less ,than 1 1 year 2 years to
5yearsyear6 to 10 1 1 to 15 16 to 30years years years
2 3 I 4 5 s 7 8
1
2 2
151
16
21,
20 2
416 6
920. 0
769. 4
115
98. 6
1
4. 2
48. 8
566. 9
70
17 39 12 416_ 3 37 5 11. 5 3. 8
1 7 7 34 2 29. 2 29. 2 12. S
6 11 12 913 9 25 6 27. 9 20 9
11 16 7 3
247 4 22. 2 15. 5 6. 6
13g 244 136 113517. 1 30 2 16 8 6 7
1736 8 16 8
4'311
30 3A
17416. 9
15415 0
31 ormoreyea rs
Total
9 le
2
1
4 2
91 1
104100.0
24100.0
43100.0
45100.0
809100. 0
1 0251b0 o
TABLE 39.---Da1ribution of vocational teachers of Negroes, according to annual salary and subjectstaught, 1935:-36
Ng%
Subjects taught
AgricultureCommerceHome economics._ _ _ _Trades and industries_Theory and applied
science
Total
Salary range
1
65 273 15
1 1
111P 50
4
1 63
34 3517 30
3 2
55 76
58
2714
3
57
2
212
22
2
40
3'71413
11
48
11c. -Mr"
o
9 le 11 11
1 19 $1, 060.0012 46 84 1, 817- 396 63 22 1, 077. 77
24 159 297 1, 813. 21
3 54 80 1. 851. 85
46 322 703 1, 871, 74
FEDERALLY AIDED TEACHER-TRAINING PROGRAM
NecIrly all Negro vocatiodal te4chers are trained in federally aidedclasses, which are usually conducted by the land-grant colleges. Dataconcerning enrollments and expenditures in these classes are shown intables 40 and 41% The number and percentage of Negro students eniCaled!in teacher-training .clasies in the vocational subject fields for each year.from 1928 to 1934 are given in table 40. *, A rilajOrity of tillmale students isenrolled in agricultural teacher-training classés, and a majority of female
otudents in home economies tocher-traini4 classes. A very small per-.
1
41
.
_ _ _ _ _ _
_
PeMt
-40t,
!
!,
;
.
8
1. 6 .
11.
11. 2
1
I
1
1. o
- ------
1.2
1. 2
ANIL_
1
_
_
.... . _
1
2 3 6 8
.
-WV
..... _ _
_
-
;
1
_
6 7
1
I
1
*.
f;"

70 VOCATIONAL EDUCATION AND GUIDANCE OF NEGROES
centage is enrolled in trades an'd industries classes. From 1928-29 to 1934-35 the increases in male enrollees in teacher-training classes were as follows:Agriculture, 6.6; trades and industries, 8OA For female enrollees in homeeconomics the corresponding increase was 58.7.
In 1928-29 there wert 39 full-time teachers and 1 half4irne teacher ofsubjects i9 the federally aided teacher-training programs for Negroes, in1934-35 the number was 41. The corresponding numbers in each of thesubject-m-atter fields are given below:
Subject 1 9t8-t9 93445
Agriculture 151,4 21
Trades and industries. V 4 2
Home econotnics 20 18
T.ABLE 40.Numbrr and perient of Negro students enrolled in jigaally aided vocational teacher-training work in the different subject-matter fields,*y years in 18 States
Year and type of school
Male Female
Number
2
1928-29:AgriculturalTrade and industryHome economics
Total
1929-30:AgriculturalTrade and industry'Herne economics
Total
1930-31:AgriculturalTrade and industryHome economics
toetai
.
1931-32:Agricultural -4trTrade and industryHome economics
Total
432.-33:AgriculturalTrade and industryHome economics
*la
Total ...
1933-34;AgriculturalTrade and industryHome economics
Total
1934-35:AgriculturalTrade and industfyHome economits
Total
30430
334
34658
404
28115
368
31085
395
32767
1211 195
316
32(54
378
Percent
0. 311. 488. 3
10. 889. 2
t 13' 786. 3
9. 990. 1
_
17. 281. 8
13. 586. 5
100. 0
I ApParent inconsstency here is due to the fact that I State reponed duplicate registrations in courses insteadel total enrollment in subject field.
4-
o
*I^
;
85 614.4 51
422
82 917. 0 73
.351
464
414
,..
710
419
419
r.
,
1
72,
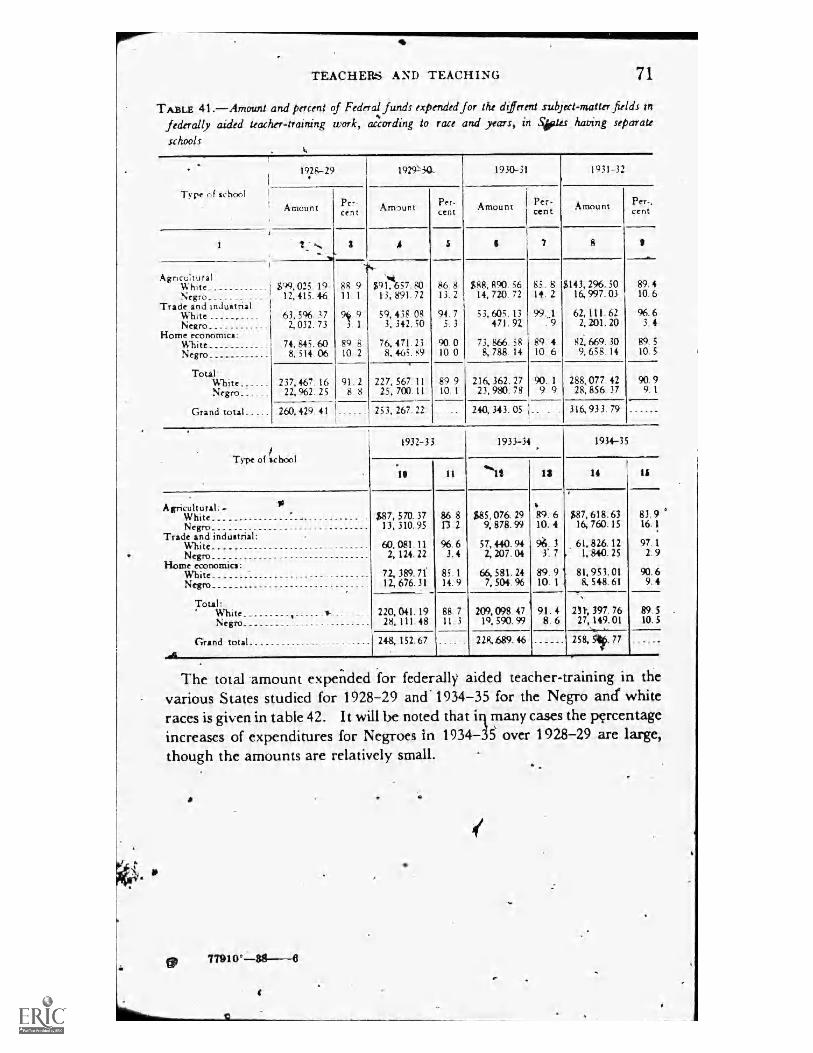
TEACHERS AND TEACHING 71
TABLE 41 .Amount and percent of Federal funds expended for the different subjea-matter fields tn
federally aided teacher-training work, according to race and years, in 40tes having separateschools
.
Type of school
19.2S-29 1929.50,. 1930-31 1931-32
Amount Per-cent Artymint Per-
cent Amount Per-cent Amount Per-,
ccnt
1 .. 3 .4 3 6 7 8 I
Agncultural: . .Ng
White ______ _ _ . . _ . $99, 025. 19 88 9 $91, 657. 80 86. 8 $88, 890. 56 85. 8 $143, 296.50 89. 4
Negro. C
12, 415. 46 11. 1 13, 891. 72 13. 2 14, 720. 72 14. 2 16, 997. 03 10. 6Trade and industrial:
White , 63, 5%. 37 51 9 59, 438.08 94. 7 53, 605. 13 99.,.1 62, 111. 62Negro 4 032. 73 .). 1 3, 342. 50 5. 3 471. 92 . 9 2, 201. 20 3. 4
Home economics:White 74, 845. 60 89. 8 76, 471.23 90. 0 73, 866. 58 89. 4 82, 669. 30 89. 5
Negro 8, 514. 06 10. 2 8, 465. 89 10 0 8, 788. 14 10. 6 9, 658. 14 10. 5
i
Total:White_ .. _ _
Negro_ 237,
22,467.962.
1625
91.8
28
227, 567. 1125, 700. 11
8910.
91
216,23,
362.980.
2778
90. 19. 9
288,28,
077. 42856. 37
90.9.
91
Grand total 260, 429 41 253, 267 22 240, 343 05 316, 933 79
Type of school
Agricultural:.WhitcNegro
Trade and industrial:WhiteNegro
Home economics:WhiteNegro
Total:WhiteNegro
Grand total
1932-33
14
$87, 570. 3713, 310. 95
60, 081. 112, 124. 22
72, 389. 71*
12, 676. 31
220, 041. 1928, 111. 48
248, 152 67
11
86 8I3 2
96. 63. 4
85. 114. 9
88. 711 3
1933-3
$85, 076. 299, 878. 99
57, 440. 942, 207.04
66, 581. 247, 504. 96
209,098. 4719. 590. 99
228,689 46
13
89. 610. 4
94. 33. 7
89. 910. 1
91. 48. 6
1934-35
14 I ii
$87, 618. 6316, 760. 15
61, 826. 121, 840. 25
81, 953. 018, 548. 61
23t, 397. 7627, 149. 01
258, Stp.
83. 916. 1
97. 12. 9
90. 69. 4
89. 5 .
10. 5
7.
The total amount expericled *for federally aided teacher-training in thevarious States studied for 1928-29 and' 1934-35 for the Negro and whiteraces is given in table 42. It will be noted that ill many cases the pgrcentageincreases of expenditures for Negroes in I 934n over 1928-29 are large,though the amounts are relatively small.
a
fr
No.
ib
.
,
_-
.
.
? 4%
vI
_ _ _ .... .
___. ______ . _
1-
40.1
77
$
77910°:--8ge
L.
4/
.I
_ ... _ _ .. _ ...
..1111111,111.

M1011VDOA NOIIvollUa aoNvaino
a
TA
BL
E 4
2.
Am
ount
and
per
cent
of
Fede
ral
expe
nditu
re fo
r vo
catio
nal
teac
her
trai
ning
du
ring
19
28-2
9 an
d 19
34-3
5, a
nd i
ncre
ase
or d
ecre
ase
of 1
934-
35 c
ompa
red
with
192
8-29
, by
Sta
te a
nd b
y ra
ce,
in 1
8 St
ates
Stat
e
Ala
bam
a A
rkan
sas
Del
awar
e Fl
orid
a G
eorg
ia_
Ken
tuck
y L
ouis
iana
M
aryl
and
Mis
siss
ippi
M
isso
un
New
Jers
ey
Nor
th C
arol
ina
Okl
ahom
a So
uth
Car
olin
a T
enne
ssee
Tex
as
Wes
t V
irgi
nia
Tot
al
1928
-29
Whi
te
Am
ount
Pe
rcen
t
3
$16,
445
. 82
86
9
10,
476
20
100
0 5,
987
SO
10
0 0
4, 5
55.
08
93.
8 17
, 36
1. 5
0 94
. 8
11,
681
01
100
0 15
, 68
4. 2
3 86
. 7
9, 2
01.
26
100
0 9,
694
. 45
82
. 9
18,
326.
32
100
0
26,
483
67
100
0 7,
259
. 29
71
. 3
18,
242.
92
94.
7 6,
161
. 04
67
. 8
14,
594
94
100
0
23,
172.
25
81.
4 10
, 81
6. 7
8 82
. 6
11,
322.
237,
467.
16
91.
2 4
Neg
ro
$2, 4
84.
40
13.
1
300.
0Q
, 95
0. 0
0 6.
2
5. 2
2, 4
00.
00
13.
3
1, 9
96.
68
17.
1
2, 9
22.
79
1, 0
20.
36
1, 9
25. 0
0
5, 2
88.
02
2, 2
81.
25
393.
75
22, 9
62.
25
28.
7 5.
3
31.
2
18.
6 17
. 4
3. 4
8. 8
1934
-35
Whi
te
Am
ount
Pe
rcen
t
7
$16,
869
. 02
79.
8 14
, 24
1. 7
2 98
. 3
6, 5
66 6
7 10
0 0
10,
558.
15
94.
0 12
, 78
6. 1
9 93
. 9
12, 0
23.
84
91.
3 12
, 92
6. 1
9 80
. 3
8, 0
37
02
100
0 8,
589
. 87
83
. 5
13,
789
29
WO
0
22,
844
69
100
0 9,
359
. 75
74
. 7
17, 95
/. 51
94
. 2
12,
418.
93
84.
4 12
, /t7
. 82
90.
7
25,
465.
87
r84.
7
12,
290.
63
84.
8 2,
509
. 60
83
. 4
231,
397
. 76
89
. 5
Neg
ro
Am
ount
8
$4,
270.
42
250.
00
675.
00
837.
00
1, 1
39.
87
3, 1
69.
31
1, 6
91.
53
Perc
ent
20
2 1.
7
6. 0
6.
1
8. 7
19
. 7
16.
5
3, 1
63.
254
1, 0
95'5
5 29
9. 6
5 1,
245
. 00
4, 6
02.
18
2, 2
10.
25
500.
00
27,
149.
01
Incr
ease
or
decr
ease
of
1934
-35
over
192
8-29
Whi
te
Am
ount
15
Perc
ent
11
$423
.20
2 6
3, 7
65.
52
35.
9 57
9 17
9
7 6,
003
. 07
13
1. 8
- 4
, 57
5. 3
1 -2
6. 3
342.
83
2 9
- 2,
758.
04
-17
6 - 1,
16
4 24
- 1
2. 7
- 1,
104
. 58
- 1
1. 4
- 4,
537
. 03
-2
4. 8
- 3,
63R
. 98
-1
3. 7
25
. 3
2, 1
00.
46
28.
9 5.
8
-290
. 41
-1. 6
15
4,
6,
257
. 89
10
1. 5
9.
,"
-2, 4
27.
12
- 16.
6
15.
3 2,
293
. 62
9.
9
15.
2 1,
473
. 85
13
. 6
16.
6 -8
, 813
. 30
-7
7. 8
10
5 -6
1 06
9. 4
0 - 2
5
Neg
ro
Am
ount
12
$1,
786.
02
750.
00
375.
00
- 113
. 00
1, 13
9. 8
7 76
9. 3
1
- 305
. 15
240.
46
75.
19
- 625
. 35
_
- 685
. 84
-7
1. 0
0 10
6. 2
5
4,
186.
76
Perc
ent
13 71
. 9
100.
0
125.
0
-11.
9
100.
0
32.
1
-15.
3
C, 40
4
, »
8. 2
4 4
Cl
7.
- 21
P 10
0. 0
C
) - 1
2. 9
tti
-3
. 1
27.
0 0 hq
18
. 2
LND
4IP
2
90
96.
6
1
-I a,
9
,
cc* o
ti
rib Pi
k
t21

TEACHERS AND TEACHING 73
CHARACTERISTICS OF REPRESENTATIVE VOCATIONALCOURSES
Information concerning the period during which courses were offered,
grade in which offered, time allotted to laboratory and shop work and to
gróup discussion, condition on which offered, requireiments, and criteriain marking was sought from high schools and colleges. Data weile received
from 863 teachers as follows: 48 of agriculture, 325 of home economics,
385 of industrial arts, and 105 of commercial subjects. Those reporting
from Southern high schools numbered 397, from Northern hi01 schools,
367, and from Negro colleges, 9.
Period during which courses are offered. Eighty-nine percent of the highschool, and 59 percent of the college teachers indicated that courses were
1-year courses and were offered each year. The percentages of the high-
school and college teachers offering semester courses were 6.4 and 36.4,respectively. There are very slight differences among the subject-matterfields in the percentages of high-school teaciTus teaching year and semester
courses. fn the colleges the following percentages of the teachers offered
year. courses: Agriculture, 71; home economici, 45; trades and industries,
62. Few courses were offered in alternate years, or only when elected by
students in either high schools or colleges.
A large proportion of the high-school teachers offered agricultural courses
in the seventh and eighth grades; a smaller proportion offered courses inhome"economics and trades and industries in these vades; and practically
none of the commercial teachers offered courses in the seventh and eighth
grades. The percentages of the'teachers of differen t subjects offering courses
in, the seventh and eighth grades follow:Percent offering'courser in
Serena EighthKind of leacher# grade grade
Agriculture 62. 5 84. 3
Home ecormics 25. 5 40. 3
Trades anti industries 16. 4 27. 0
Emphasis on various aspects of courses.When the number of courses in thedifferent fields are combined, it is found that a majority of the teachers
4
timedevoted three-fourths of the class to activities in the shop, laboratory,
and garden, and one-fouvtb to group discussion (see table 43). Whenagriculture is considered separately it is found that a majority dev.oted .50
percent or less time to laboratory or shop work. Detailed data are given in
the table.Condition on which courses are offered.Certain vocational courses are re-
.quired of some students and are elect4ç ¡so? others (see table 44) while afew are required of and others are elet4t for all students. Eighteen high-.
school teachers of agriculture and 124 teachers of.industrial arts reported
that courses were required of all boys.
s
.
.

74 VOCATIONAL EDUCATION AND GUIDANCE OF NEGROES
TABLE 43.Number of teachers indicating the Vcentage of the total time allotted to practicalwork 1 and to discussion
Percent of timeallotted
6
To practical work:10255075 .100
Total
To group discussion:10.2550 .75100
Total
High schools
Agri-culture
Homeeco-
nomics
2
21211
7
32
413
5
32
3
Indus-trialarts
Corn-mer-cial
studies
4
42582
15214
277
102167
19832
328
37 95157 1%65 21160 6
2 2
277 320
Total
Colleges
Agri-Home
culture eco-
6 2210 6820 18028 38515 61
79 716
7
1
491
15
22 15832 39817 1138 355 9
84 713
94
15
41018
1
34
181141
34
Indus-trialarts
COM-Mer--cial
studies
1
21
3
258
39
5
169
5
35
1
2
-2
3
Total
11
4
92 I
44)
9
91
5
3729
9
87
Practical work as used here means shop, laboratory, garden projects, etc.
TABLE 44. Number of teachers indicating condition on which courses are offered
Condition on which courses arc offered
9.
1
Required ofRequired ofRequired ofRequired ofElective forElective forElective fnrElective forRequired ofElective for
boys onlyall studentsall vocational studentsthose majoring in departmentall students rboys onlyvocational students only... _
those majoring in departmentall girlsgirls
High schools
Agri-culture
2flo
18
23
1
6- .....
Homeeco-
nomics
3
19155955
465
825
Indus-trialarts
81988-296616
7
Com-mer-cial
studies
125
5322
2
Colleges
Agri-culture
613
1
21
Homeeco-
nomics
7
23012
1
Indus-trialarts
8
1410
83613
1
Com-mer-cial
studies
.111 mo AIM
'We. or
3
4=1, 11,
3
Mann,* of conducting classel. Information was collected concerning themanner of conducting vocational classes for Negroes on the following:Types of materials used (table 45) ; criteria in determining marks (table46) ; freedom permitted in choice of projects (table 47) ; and required workin related subjects. Tektbooks' and notebooks were used by a higherpercentage of the teachers (70) than other types of materials. "Qualityof product" was, the criterion considered for determining marks by the
411.
'40
6
1
ÍgR
. . --------- ._
_ _ -- ..........
.
s10
e.
1
1
8
-
11
3
I
711:
4
124
4
411M
1
1 a. eM MID 4111 a,
-
421.
_ _ _ ___________
_
_
6
1
a
,
1
6
5
1

TEACHERS AND TEACHING 75
highest percentage of teachers; "laboratory exercises" was next. Sixty-three and forty-six percent,*spectively, of the high-school and collegeteachers allowed stiklents to -choose the shop, laboratory, or field project.
TABLE 45. Number of teachers indicating types of materials used in conduct of coursesI
Typ of materials used orrequired
TextbookReferencesTerm paperS yllabusDictationMimeographed material _ _
Notebook_
Total number ofteachers rIplying_
High schools
Agri-culture
242964
101027
28
Horneeco-
nomics
Indus-trialarts
3 4
173 205173 23762 506 24
97 10790 141
220 192.
Com-mer-cial
studiesTotal
93 49546 48511 1296 40
65 27953 29455 494
96 708
Colleges
-Agri-
culture
7
14
9
2
10
16
Homeeco-
nomics
232818
76
1218
27
Indus-trialarts
29354327
20
37
111
32.....2
Total
11
698031IS121949
81
TABLE 46. Number of teachers indicating the 4riVria given- most weight in determining students'marks
Criteria
Participation in class anddiscussion.-- _ - - .
General attitude towardwork
Final examination___,____ _
Oral quizzesDaily recitation responses_ _
Seriesof examinations.. _ _ .Term papersWritten papers or projects _
Laboratory exercises_ _ _
Teachers judgment of stu-dent's work
Regulat attendanceQuality of product
Total number ofteachers replying...
High schcx,lsi Colleges
Agri-culture
2
h
7
21
3
1
41k.65
3
25
27
Homeeco-
nomics
Indus-trialarts
4
23 6
44 4912 17
1 1
16 115 161
12 2762 69
27 478 6
62 92
194 294
Com-mer-cial
studiesTotal
6 41
6 10614 45
1 68 38
12 341
7 5220 156
10 8'71 17
17 176
74 546
Agri-culture
7
Home Indus-es:o- trial
nomics arts
5
1 271
41li 1
2 41 1
1 1
1 5 20
21
2 3
Com-mer-cial
studies
.
2
M. .01
Total
10
319
1
4722
28
21
C.
4
4
1
..
2
270 r314
or
IS
5
8
,
Corti-met-
studies
1
1
1
. .
_ _ -
6 6
31
_
I
1
OW IND
M,
1
3
11
7
60
t4
6
cial
.
_ _ _
_
_____
I
3 10
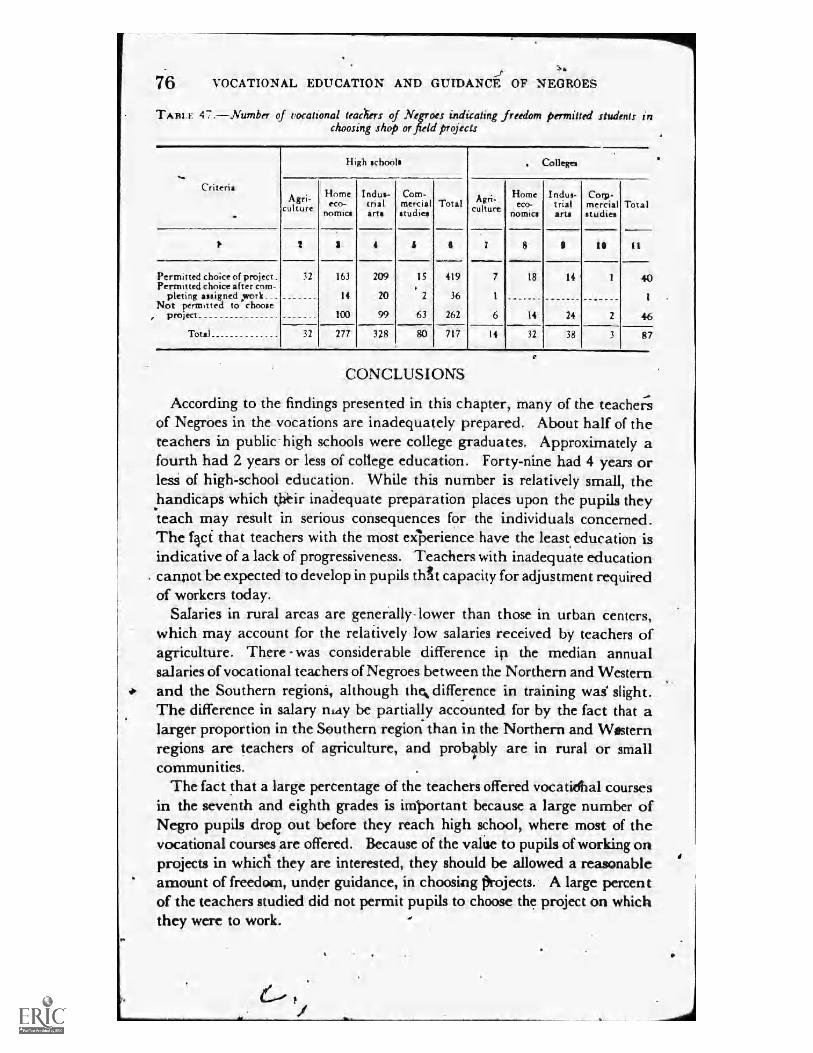
76 VOCATIONAL EDUCATION AND GUIDANCE OF NEGROES
TABLE 47. Number of vocational teacXers of Negroes indicating freedom permitted students inchoosing shop or field projects
Criteria
Permitted choice of projectPermit ted choice after com-
pleting assigned ;workNot permitted to choose
, project
Total..
High schools
Agri-culture
e
32
32
Horneeco-
nomics
163
14
100
277
Indus-trialarts
4
209
20
99
328
Com-mercialstudies
15
2
63
80
Total
419
36
262
717
Colleges
Agri-culture
7
7
6
14
Homeeco-
no. mics
Indus-trialarts
Corp-mercialstudies
Total
8 p is 11
18 14 1 40
1
14 14 2 46
32 38 3 87
CONCLUSIONS
According to the findings presented in this chapter, many of the teachersof Negroes in the vocations are inadequately prepared. About half of theteachers in public- high schools were college graduates. Approximately afourth had 2 years or less of college education. Forty-nine had 4 years orles.4 of high-school education. While this number is relatively small, thehandicaps which tjaèir inadequate preparation places upon the pupils theyteach may result in serious consequences for the individuals concerned.The fici that teachers with the most exPerience have the least education isindicative of a lack of progressiveness. Teachers with inadequte education
. cannot be expected to develop in pupils thát capacity for adjustment requiredof workers today.
Salaries in rural areas are geneially- lower than those in urban centers,which may account for the relaiively low salaries received by teachers ofagriculture. There was considerable difference ip the median annualsalaries of vocational teachers of Negroes between the Northern and Westernand the Southern region, although the, difference in training was' slight.The difference in salary may be partially acc-ounted for by the fact that alarger proportion in the Southern region than in the Northern and Westernregions are teachers of agriculture, and problbly are in rural or smallcommunities.
The fact that a large percentage of the teachers offered vocatidial coursesin the seventh and eighth grades is im'portant because a large number ofNegro pupils drop out before they reach high school, where most of thevocational courses Are offered. Because of the valise to pupils of working onprojects in whicg they are interested, they should be allowed a reasonableamount of freedom, under guidance, in choosing projects. A large percentof the teachers studied did not permit pupils to choose the project on whichthey were to work.
o
b
',bob

CHAPTER
Inforination Needed for Guidance0,
KNOWLEDGE of pupils is-an important, factor in guidance. Informa-tion concerning the social and economic loackgrounds, interests, and
school activities, and achievement anti progreIs of pupils is essential ineffective educational and vocational guidance. This chal5ter of the reportis an attempt to suppqr suclil information.
'I he clta are from 27,980 pupils in 33 States and the District of Columbia.
SOCIAL AND ECONOMIC BACKGROUND
The occupation and education of Parents indicate roughly the economicand cultural background of the pupils. Information concerning them isvaluable in understanding their possible influence on the pupils' educa-tional and vocational choices and in predicting the probabilities of continu-ing through high school. Data in tabres 48, 49, and 50 represent the type ofinformation which schools should have about each pupil. Facts rélatingto conditions of the homes from which children come are also of definitehelp in guidance and counseling. Principals of high schools and universityspecialists in'secondar'y education ranked home condition second in impor-tance for guidance purposes in a list of 18 items concerned with pupils
TABLE 48. Amber and percent of Negro high-school pupils whose _fathers are engaged in givenoccupation
AgricultureForestry and fishingExtraction of mineralsManufacturing and mechanical industriesTransportation and communicationTradePublic serviceProfessional serviceSemiprofessional serviceDomestic and perso411 serviceClerical occupationsOther
J.
PupilsFather's occupation .Number Perceni
1, 464 7. 372 ". 4
171 . 9,5 335 26. 61 710 8. 51 032 5. 11 352 6. 71 204 6. 0
38 . 23, 771 18. 8
409 2. 03, 505 17. 5
Total_ 20, 063 ,100.0
[ VIII T
.1S,''
It
;
. . ...... ,
I.
qa.
77
.. i
I
o
-
0
I
t.
..
), en,
.
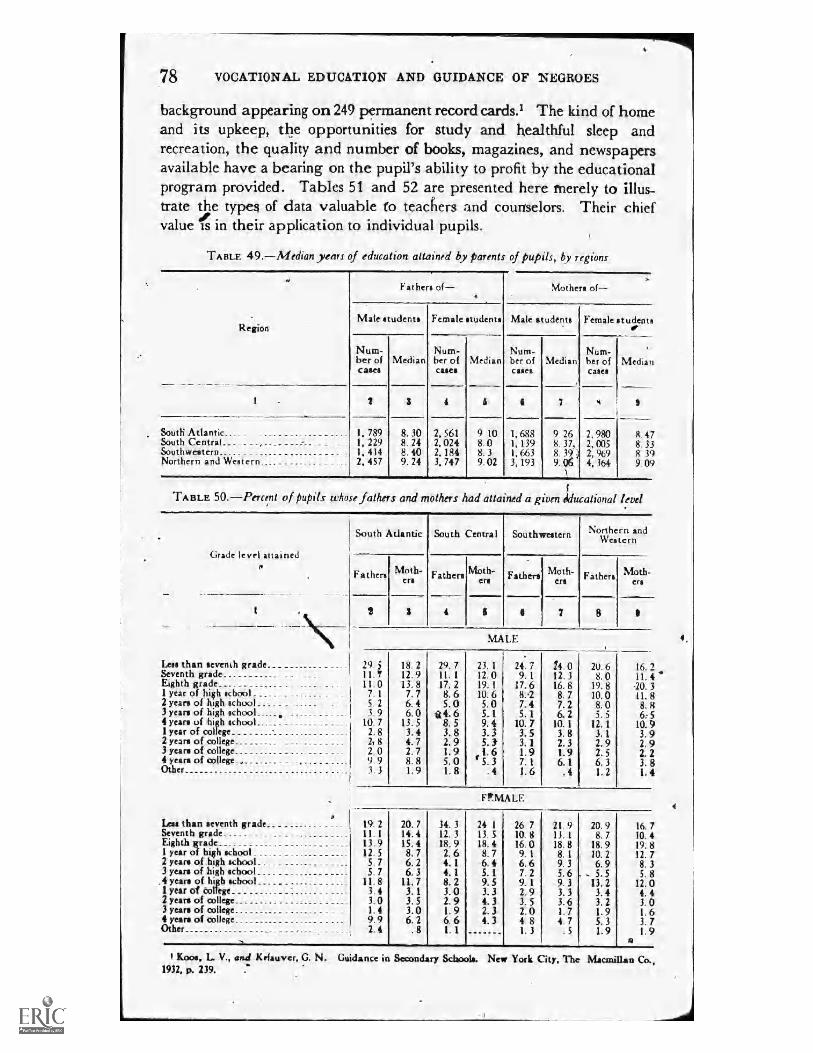
78 VOCATIONAL EDUCATION AND GUIDANCE OF NEGROES
background appearing on 249 permanent record cards.' The kind of homeand its upkeep, the opportunities for study and healthful sleep andrecreation, the quality and number of books, magazines, and newspapersavailable have a bearing on the pupil's ability to profit by the educationalprogram provided. Tables 51 and 52 are presented here merely to illus-trate the types of data valuable fo teachers and counselors. Their chiefvalue is in their application to individual pupils.
TABLE 49. Median years of education attained by parents of pupils, by regions
Region
South Atlantic_South Central..Southwestern__ _ _ . . _ _ _ ......Northern and Western _ _
Fathers of-a
Male students
Num-ber ofCases
3
1, 7891, 2291, 4142, 457
Median
3
Female students
Num-ber ofcases
4
Median
Mothers of-
Male students
Num-ber ofcases
Median
7
Female studentsst
Num-ber ofcases
8. 30 2, 561 9. 10 1, 688 9 26 2, 9808. 24 2, 024 8.0 1, 139 8. 37, 2, 0058. 40 2, 184 8. 3 1, 663 8. 39 : 2, %99. 24 3, 747 9. 02 3, 193 9. 06 4, 364
A
Median
R. 478. 338 399.09
TABLE 50. Percent ef pupils whose fathers and mothers had attained a given erducational level
Grade level attained
Less than seventh grade._ _ _ _ _ _ _ _Seventh gradeEighth grade1 year of high school2 years of high school _
3 years of high school4 years of high school__1 year of college2 years of college__3 years of college4 years of college.... _
Other
Less than seventh grade.Seventh gradeEighth grade1 year of high school2 years of high school3 years of high school
,4 years of high school1 year of College2 years of college3 years of college4 years of college_ _ _ _ _ _ _ _ _ _ _ _ _ _ _
Other
South Adantic
Fathers Moth-ers
3
South Central
Fathers
4
Moth-ers
Southwestern
Fathers Moth-ers
7
Northern andWestern
Fathers
8
Moth-ers
MALE
29. 5 18. 21 1. Y 12. 911. 0 13. 8
7. 1 7. 75. 2 6. 43.9 6.0
10. 7 13. 52. 8 3. 42% 8 4. 72.0 2. 79. 9 8. 83.3 1.9
29. 711. 117. 28. 65. 04. 68. 53. 82. 91. 95. 01. 8
23. 112. 019. I10. 65. 05. 19.3. 35. 11. 65. 3
. 4
24. 79. 1
17. 6
7. 45. 1
10. 73. 53. 11. 97. 1I. 6
24. 0 21i 6 16. 212. 3 8. 0 11. 416. 8 19. 8 -20. 38. 7 10. 0 11. 87. 2 8. 0 8.6. 2 5. 5 6: 5
10. 1 12. 1 10. 93. 8 3. 1 3. 92. 3 2. 9 2. 91.9 2.5 2. 26. 1 6. 3 3. 8
. 4 1. 2 1. 4
FEMALE
19. 2 20. 711. 1 14. 413. 9 15.412. 5 8. 75. 7 6. 25. 7 6. 3
11. 8 11.73. 4 3. 13. 0 3. 51. 4 3.09. 9 6. 22 4 8
34. 312. 318. 92. 64. 14. 18. 23. 02. 91. 96. 61 1
24. 113. 518. 48. 76. 45. 19. 53. 34. 32. 34. 3
26 710. 816. 09. 16. 67. 29. 12.93. 52. 04 81. 3
21. 9 20. 9 16. 713. 1 8. 7 10. 418. 8 18. 9 19. 88. 1 10. 2 12. 79. 3 6. 9 8. 35.6 6 - 5. 5 5. 89. 3 13. 2 12. 03. 3 3. 4 4. 43. 6 3. 2 3. 01. 7 1. 9 1. 64. 7 5. 3 3. 7
. 5 1. 9 1. 9a
Koos, L V., and Kefauver, G. N. Guidance in Secondary Schools. Ncw York City, The Macmillan Co.,1932, p. 239. .*
a
r
a.
6
_
_
. . _
_
_ _ _ _ .....
_ -
. .. _ .
_ _ _ _ _ _ __ . . ... _ _
_ _ _ . _ _ _ _ .
.
3
8.18
/
_
a 9
,
m
1
k 11 6 1
_
_
_ . _ .
_
_ _ _ _
e

(
INFORMATION NEEDED FOR GUIDANCE 79
Information about parents. Information etncerning. the occupations offathers was obtained from 20,063 pupils included in this survey as shownin table 48. The fathers of 6.2 percent of the pupils reporting were engagedin professional and serniprofession* occupations, showing a situationdifferent from average since 2.5 pertent of the total gainfully employedNegroes are professional workers.
According to findings in this study, a larger percentage of the childrenwhose fathers are engaged in the professional, trade, and clerical occupationsattained a higher level of education than others. For the males therespective percentages are 63, 65, and 62; for the females, 69, 69, and 72.There is no evidence that the father's occupation influenced the gradelevel at which the high-school nongraduates left school. Informationconcerning the education of parents is Oven in tables 49 and 50.
Home status of pupils.-Slightly more than one-third (36 percent) of the \parents of pupils included in this study owned or were buying their homes.The corresponding percentage for the Negro populaAon as a whole, ac-cording to the 1930 census, was 23.9. The mediàn number of rooms in thehomes .of the pupils was 5.95; wild the median number of persons in thehomes was 6.05. The percentages of the homes having Oven convenienceswere: Electricity, 78; bathtub, 61.5; toilet, 73.8; piano, 47; and Lupo, 68.
Three-fourths of the pupils come from homes possessing lOis fewerbooks (table 51). Seven percent subscribed to no newspaper (ta sie 52).Another 8 percent did not subscribe to a daily paper, but did subscribe toa Negro paper. A total of 30 percent did not subscribe to a Negro paper.
TABLE 51.---Number and percent of pupils indicating the number of booAs in home
Number of books
25 or fewer26 to 100101 to 500501 to 1,000_41,000 or more
Tons!Median number of books per home_
Southwestern
Num-ber
2
1, 9142, 195
8099025
3
per-cfnt
3R. 243. 516. 0
1.. 5
r00. 0
Region
Smith At-lantic
Nt m-ber
4
1, 7433, 1771, 585
23881
6, 82463. 43
Per-cent
25. 546. 623. 2
3. 51. 2
100. 0
South Central
Num-ber
Per-cent
1, 4792. 022
88914737
4, 57474. 51
44. 219. 4
3. 2. 8
100 0
Northern andWestern
Num-ber
2, 7614, 7012, 113
224106
¡Per-cent
27. 947. 521. 32. 3I. 0
9, 905,A100. 061. VP
Total
Num-ber
le
7, 90712, 0955, 396
699249
26, 34659. 65
Per-cent
I 1
30. 145. 920. 42. 7
. 9
100. 0
OP
4
V.
I'
.
____________
3
8
6 \N\ 7
32.
-
=t47.
_

80 VOCATIONAL EDUCATION AND GUIDANCE OF NEGROES
TABLE 52. Number and percent of pupils from homes subscribing and not subscribing to newspapers
Newspapers
No daily and no NegroNo daily and one or more Negro _
One or more daily and no Negro_ _
One or.more daily and one or moreNegro
Other
Total
Region
Southwestern
Num-ber
2
445575932
3, 214
5, 166
Per-cent
3
8. 6311. 1118.04
62. 22
100. 0
South At-lantic
Num-ber
4
492532
1, 491
4, 18(3
6, 698
Per-cent
7.357. 94
22. 26
62. 45.
100. 0
South Central
Ntim- Per-ber cent
..386 8. 45374 8. 19
1, 274 27. 91
2,529 55. 411 . 02
4, 564 100. 0
0 Northern andWestern
Num- Per-ber cent
8
608 6. 12611 6. 16
2, 235 22. 52
6, 466 65. 192 . 02
9, 922 100. 0
total
Num-ber
i.
1, 9312, 0925, 932
16, 3923
26, 350
Per-cent
11
7. 307. 94
22. 51
62. 21. 01
100. 0
SCHOOL INTERESTS, ACTIVITIES, AND ACHIEVEMENTS
Information concerning school interests, activities, and progress ojpupils is of value to teachers and counselors in furnishing guidance.. Extra-classroom activities provide try-out and exploratory possibilities; developinitiative; leadership, and independence; broaden interests; and assistin discoveling capacities. Self-support of kupils furnishes opportunity togain practical experience, to develop certain habits required in the occu-pational world, -such as industry, perseveraAce, punctuality, and inde-
. pendence. Self-support is detrimental %Alen he amount and conditionof the work interferes with the echica tion'al program, or is injurious tothe pupils' health or character. Information conterning acceleration and
--TeTi;TA'a-iion 'has ""a-15t aring on possible withdrawal,"failure, and success ofSee tables 53, 54, and 55.) Table 53 shows the extracurriculum
activities of this group of students and indicates acceptable types of Richactivities. Table 54 establishes noftn.s for use by counselorsr and alsoshows the large number of pupils overage,' as does table 55. These dataindicate that the high-school curriculum probably needs adjustment andbetter articulation with the elementary school.
Extra-classroom activities and self-support.Information was gathered from22,563, pupils coricerning participation in certain extra-classroom aciivities(table 53). The Vgest percentage of pupils 'engaged n the activiOeslisted vas in athletic teams and squads. Home-room and class organiza-tion, in which 35.5 and 28.5 Percent of the pupils, respectively, partici-pated, are frequently required and therefore are not comparable to theother attivities. However, théy are. important as indicating the prdportionof the pupils who participate in them. *
7
-
o
).
a
4
t'
s.
11

INFORMATION NEEDED FOR GUIDANCE 81
According to information obtained from 27,980 pupils, approximatelytwo-thirds supported themselves in part or entirely; 47 percent, in part;17.3 percent entirely.
TABLE 53. Percentage of pupils who participated in certain extra-classroom activities
ActivitxStudent councilClass organizationHome roomMusical orginizationSchool publicationsAthletic teams .or squad,Dramatic clubsOther school organiz . ..Fraternities, sororities, socialTraffic or safety wads . .
School progress,-*The percentaes Aiof childrep entering first-year highschool af given ages are shown in table 54. Approximately three-fourths,oi 72:1 ..ent, were 14 years of age and abové. One-third Were 15or 16 yè of age. A smaller percentage in the Northern and a, largerpercentage in the South Atlantic: t n in the other regions entered whenrelatively young. .
Of the 27,366 pupils rçpted, one-third 'were overage for their grade.This is an improvement over the situation found among Negro high-scho91pupils in rural areas in a former s'eudy.2 The percentages of pupils overagein cach 6f the bigh-school grades in these twc; studies are .as
Percent Activity Percent
12 2 Debating society . 2. 628 5 School honor society 3. 935 5 4-H clubs 2. 4 ,14 6 'Future farmers . . . ...... . 8
3 6 Boy SCouts . 0824 2 Girl Reserves . 68 3 High Y .
.. 19 4 Other 3. 16 3 None 2. 76. 9
Study
Presentlformer
Grade
Eighth
2
/Incen t49. 582 6
Ninth
3
Percent34. 876 7
Tenth
4
Percent29.272 .3
1
Eleventh Twelfth
4.
Percent29. 670 5
6
Percens25. 2
_
Details regarding the situ4ion are shown in ;able .55. In each grade asmaller percentage of girls than boys is overage, as in the other studies.A smaller percentage of the pupils in the Northern and Western regionsis overage for grade in whicsh enrolled than in the ther regions, as shownin the following: Northern-and Weiltern, 29; Sout Atlantic, 31.2; SouthCentral, 32.9; SQu4restem, 40.0. Details Concerning the agé-gi-clestatus of the pupils in the different regions are shown in table 5 in appendix A.
I Availability of Education to'Negroes in Rural Communities. Op. cit., p. 63.
ip;
.
. .
.......... . . .
.1
.
follows:
-
A
_
.
4
v-
0
f
- .
J.
s
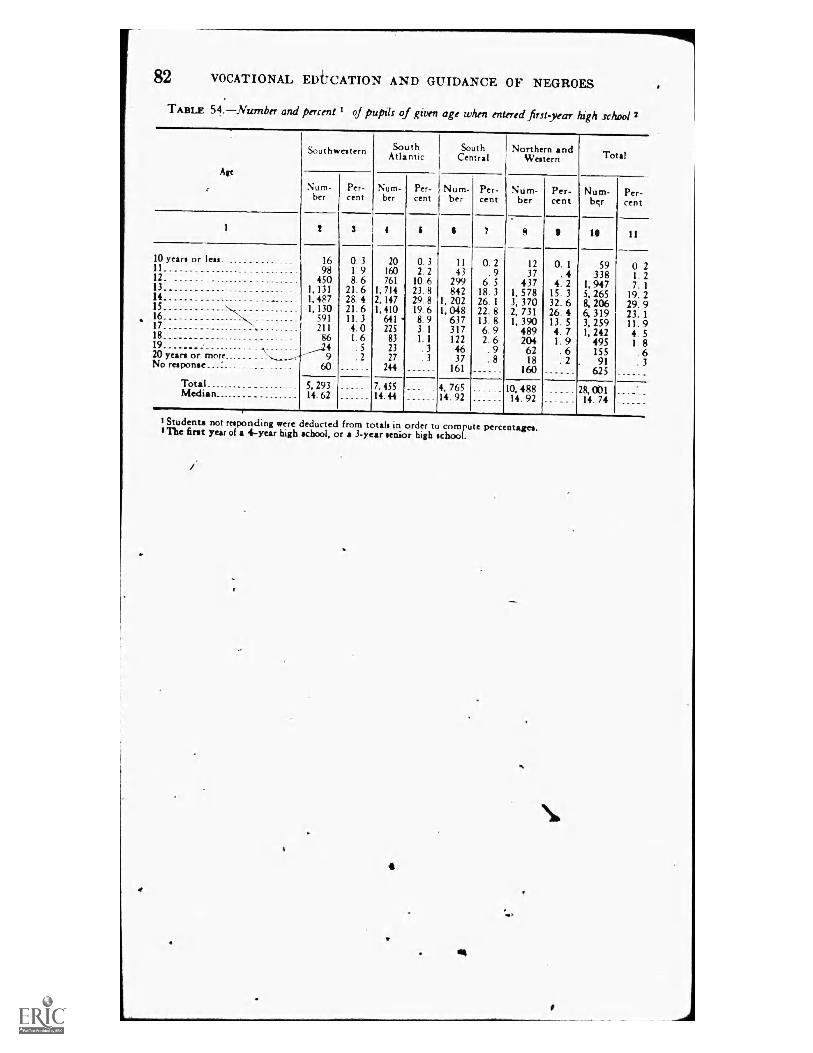
OP
82 VOCATIONAL EDiTCATION AND GUIDANCE OF NEGROES
TABLE 54. Number and percent 1 of pupils of given age when entered first-year high school 2
Age
1
10 years or less.11121314151617181920 years or moreNo response
TotalMedian_
Southwestern
Num-ber
2
1698
4501, 1311, 4871, 130
59121186
49
60
5, 29314 62
Per-cent
3
0. 31. 98. 6
21. 628. 421. 611. 34. 01. 6
. 5
. 2
SouthAtlantic
Num-ber
4
20160761
1, 7142, 1471, 410
64l225
832327
244
7. 45514 44
Per-cent
0. 32. 2
10. 623. 829. 819. 68.3. 11. 1
. 3. 3
SouthCentral
Num-ber
6
1143
299842
1, 2021, 048
637317122
37161
4, 76514 92
Per-cent
O. 2. 9
6. 518. 326. 122. 813. 86. 92. 6
. 9
. 8
NorthernWestern
and
Num-ber
1237
4371, 5783, 3702, 7311, 390
4892046218
160
10, 48814 92
Per-cent
0. 1. 4
4. 215. 332. 626. 413. 54. 71. 9
. 6
. 2AM. ID
Total
Num-
1
59338
1, 9475, 2658, 2066, 3193, 2591, 242
495155
. 91625
28, 00114 74
Per-cent
11
0 21 27. 1
19. 229. 923. 111. 94. 51. 8
. 6
. 3
StudentsI not responding were deducted from totals in order to compute percentages.The first year of a 4-year high school, or a 3-year senior high school.
#4.
b.
dr
7
46
kr
9
I
*.
_
_ _ _
_
9
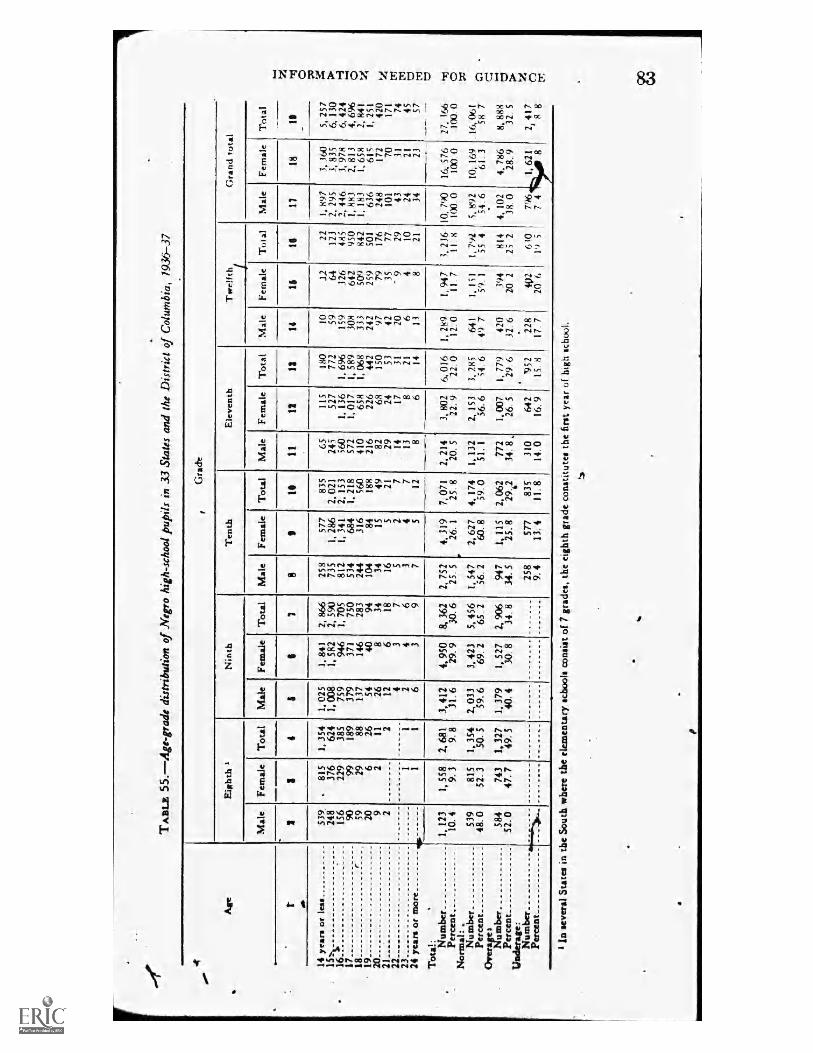
Is:011VItilIOANI HDNvaino
./r
TA
BL
E 5
5.A
ge-g
rade
dis
trib
utio
n of
Neg
ro h
igh-
scho
ol p
upils
in
33 S
tate
s an
d th
e D
istr
ict
of C
olum
bia,
19
36-3
7
Age
14 y
ears
or
less
is
- 16
17
18
19
20
21
22
23
24
yea
rs o
r m
ore_
_ __
Tot
s!: Num
ber
Perc
ent
Nor
mal
: .
Num
ber
Perc
ent
Ove
rage
: N
umbe
r Pe
rcen
t U
nder
age:
N
umbe
r Pe
rcen
t
Gra
ck
Eig
hth
Nin
th
Mal
e Fe
mal
e T
otal
M
ale
2 1
4 6
Fem
ale
Ten
th
Tot
al
Mal
e
7 8
Fem
ale
Ele
vent
h
Tot
al
Mal
e
11
11
539
. 81
5 1,
354
1,
025
1,
841
2,
866
25
8 57
7 83
5 24
8 37
6 62
4 1,
008
1,
582
2,
590
73
5 1,
186
2,
021
15
6 22
9 38
5 75
9 94
6 1,
705
81
2 1,
34
1 2,
15
3 90
99
18
9 37
9 37
1 75
0 53
4 68
4 1,
218
59
29
88
13
7 14
6 28
3 24
4 31
6 56
0 20
6
26
54
40
94
104
84
188
9 2
11
26
8 34
34
15
49
2
2 12
6
18
16
5 21
-
4 3
7 5
2 7
1 1
2 4
6 3
4 7
....._
__
1 1
6 3
9 7
5 12
1,
123
1, 5
58
2, 6
81
3, 4
12
4, 9
50
8, 3
62
10.
4 9.
3
9. 8
31
. 6
29.
9 30
. 6
539
815
1, 3
54
2, 0
33
3, 4
23
5, 4
56
48.
0 52
. 3
SO.
5 59
. 6
69.
2 65
. 2
584
743
1, 3
27
1, 3
79
1, 5
27
2, 9
06
52.
0 47
. 7
49.
5 40
. 4
30.
8 34
. 8
2, 7
52
25.
5
1, 5
47
56.
2
947
34.
5
258
9. 4
4, 3
19
26.
1
2, 6
27
60.
8
1, 1
15
25.
8
577
13.
4
7, 0
71
, 25
. 8
4, 1
74
59.
0
2, 0
62
29.4
2
835
11.
8
65
245
560
572
410
216 82
29
14
13 8
2, 2
14
20.
5
1,
132
51.
1
772
34.
8
310
14.
0
Fem
ale
12
Tot
al
Mal
e
1$
14
115
180
527
772
1, 13
6 1,
696
1,
017
1,
589
65
8 1,
068
22
6 44
2 68
15
0 24
53
17
31
8
21
6 14
3, 8
02
6, 0
16
22.
9 21
0
2,
153
3, 2
85
56.
6 34
6
1, 0
07
1, 77
9 26
. 5
29.
6
642
*952
16
. 9
15
8
10
59
159
308
333
242 97
42
20
6 13
1, 2
89
12
0
641
49
7
420
32
6
228
17.
7
Tw
elft
h _
Fem
ale
15
Tot
al
16
Gra
nd t
otal
Mal
e
17
Fem
ale
Tot
al
111
.12
22
1, 8
97
3, 36
0 5,
257
64
12
3 2,
295
3,
835
6,
130
32
6 48
5 2,
446
3,
978
6,
424
64
2 95
0 1,
88
3 2,
813
4,
696
50
9 84
2 1,
18
3 1,
658
2,
841
25
9 50
1 63
6 61
5 1,
25
1 79
17
6 24
8 17
2 42
0 35
77
10
1 70
17
1 9
29
43
31
74
4 10
24
21
45
8
21
34
23
57
1, 9
4 7
11
7
1,
I í
I
59
1
394
20
2
3, 23
6 1
l 8
1 ,
7`)2
55
4
814
23
2
402
630
20
6 1'
) 3
10,
790
100
0
5, 8
92
54.
6
4,
102
38.
0
796
7 4
In s
ever
al S
tate
s in
the
Sou
th w
here
the
ele
men
tary
sch
ools
con
sist
of
7 gr
ades
, th
e ei
ghth
gra
de c
onst
itute
s th
e fi
rst
year
of
high
sch
ool.
16,
576
100
0
10,
169
61.
3
4, 7
86
28.
9
1 62
1
16,
061
58
7
8, 8
88
32
5
2 41
7 8
8
00'
4
do"
-
.. .
lb
_....
.....-
_.
,
I
.11
18
*
I I
8
"411
tr,
tri
27,
166
100.
0
0 V1

84 VOCATIONAL EDUCATION AND GUIDANCE OF NEGROES
PUPILS' OCCUPATIONAL CHOICES
The choice of an occupation is one of the vital decisions which everynormal individual must make; for this reason both teachers and counselors .
should have as much information as possible which will help in making anintelligent selection. While the choices which pupils make are not alwaysfinal, they frequently have an influence on their curriculum choices and onthe length of time they stay in school. Of the many possible influences onoccupational choice the following are discussed here: Geographical region(table 56), age and educational advancement, size of community, (table 57),personal motives or influences (table 58), hobbies or interests (table 59), andoccupation and education of parents (table 60).
From the standpoint of guidance it is important to know what influence,if any, age of pdpils and grade level in high school have on occupáti6nalchoice and what variation in choice may be expected in differeht geograph-ical regions. Information concerning inflüences in choosing an occupationshould be helpful in assisting pupils in developing different motives or inchanging occupational objectives, when desirable. Informtion aboutinterests may assist in revealing educational and occupational interests, andmay lead to the discovery of capacity in particular activities. A study ofpupils' choice of occupation in relation to parents' occupations and educa-don may aid in the discovery of motives for occupational choice and -mayindicate the possible future contentment in the occupation chosen.
Occupational (hoice in the different regions.A comparison of the occupationalchoice of pupils, by sex, in the different geographical regions is shown intable 56. Among the males there appear to be significant differencesamong the regions in the percentages choosing occupations in manufac-turing and mechanical industries, public service, professional service, andclerical service. Among the females, differences are in manufacturing andmechanical industries, professional service, and clerical sèrvice.
The distribution of pupils making certain occupational chokes accordingto the size of _the communities in which the schools are located is shown intable 57. A larger percentage of the males in the small communities thanin thc large ones chose agriculture. In manufacturing and mechanicalindustries the differences are very slight with the exception of communitiesof 50,000 to 99,999 population. The percentage of females choosing occu-pations of this kind increases consistently with the size of the community.A smaller percentage of both males and females in communities of 100,000or more, thaniS the smaller communities, choose professional service, thedifference being greater among the females. There is also a differencebetween the small and large communities in the percentage of femaleschoosing cleri4occupations.
Occupational choice by age and educational advancement. According to datareceived from 5,517 high-school boys and 9,350 high-school girls, age has'little influence on choice of occupation.
11143/4
I _
1
4

NOLLVIN1110iMI aolszvamo
ob
TA
BL
E56.
Num
berand
percentof
pupilsindicating
tockupationalchoice,
bysex
andregion
Region
Southwest
SouthA
tlantic South'C
entralN
orthernand
Western
Total
thwest_ th
Atlantic
SouthC
entralN
orthernand
Western
`t.
Total
Southwest-
SouthA
tlanticSouth
Central
Northern
andW
estern
Total
Southwest
SouthA
tlanticSouth
Central
Northern
andW
estern
Agriculture
Male N
um-
ber 2
37 46 25 13
Per-cent 12
2.2
19 4
Female
Num
-ber 4
Per-cent 0.02
1211.
4
Total N
um-
ber
37 47 25 13
Per-cent
7 O.
8
.8
. .1
122.
6
Trade
_,
845.
09
0.3
932.
0145
7.0
421.
2187
3.3
947
127
11
1213
21185
5.8
801.
5265
3.2
5086.
1158
1.1
6663.
0
Semiprofessional
3O
.2
6O
.2
90.
26
.3
8.
214
.2
7.
55
.2
12.
346
1.4
37.
783
1.0
62.
756
.4
118.
5
p.
Total
Manufacturing
andm
echanicalindustries
Male N
um-
ber 8
#281542215795
1,833
Per-cent
16.7
25.8
16.2
24.8
22.0
Female
Num
-ber
128142101500
871
Per-cent
11 4.3
4.0
4.1
9,8
6.2
Total
Num
-ber
12
409684316
1,295
2,704
Per-cent
13 8.8
12.2
8.3
15.6
12.1
Publicservice
243175162295
875
14.5
8.3
122
9.2
10.5
3 9 19 31
0.1
.2
.
4
.2
246184162314
906
5.3
3.3
4.3
3.8
4.0
Dom
esticand
personalservice
37 4112 35 125
2.2
2.0
.9
1.1
15
199180155339
873
61.47 5.1
63
66
6.2
236221167374
998
S.1
39
44
4.5
4.5
Other
32 2520 106
183
19
12
15
33
22
24 718 95 198
08
20 3
19
14
56 96 28 201
381
12
17 7
24
17
Transportation
andcom
munication
Male N
um-
ber
14
46 49 52 70 217
Per-cent
15 2.7
2.3
3.9
2.2
2.6
Female
Num
-ber
111
2 1 10 14
Per-cent
17
006
.
02 04
.2
Total N
um-
ber
18
4850 5380 211
Per-cent
1.03
.
91.
4 9'
1.0
Professionalservice
874983664
1,437
3,958
52.1
47.0
49.9
4-4.7
47.6
;,178
2,681
1,842
2,926
9,627
74.0
76.1
74.7
57.4
68.6
3,052
3,664
2,506
4,363
13,585
t2i65.
965.
266.
1t:5
52.5
Tj
60.8
IC
lerical
42 82 228
431
2.5
3.9
59
7,1
52
400389324
1,094
2,207
13.6
11.0
'13.2
21.5
157
442471403
1,322
2,638
/6
8.4
10.6
159
118
.
Tot'al
1,679
2,094
1,330
3,210
8313
2,949
3,5/4
2,463
5,100
14036
4,628
5,618
3,793
8,310
22349
rpi
AL,
...
7
.
4
9
4
NO
VIO
.
ri VI
-79I
.1'
1
1 1b
.- .
1
15 .
:711
oo

86 VOCATIONAL EDUCATION AND GUIDANCE OF NEGROES
In order to find whether or not grade level of pupils has any influenceon occupational choice the percentages of pupils in each grade selectingoccupations in the manufacturing and mechanical industries and pro--fessional service were computed as samples. The percentages selectingmhnufacturing and mechanical industries for each high-school .gradefollow: First year, 22.7; second year, 21.2; third year, 17.5; and fourthyear, 14.2. The percentages in eách grade choosing professional occupa-tions were: First year, 157; second year, 63; third year, 64; and fourthyear, 46. Although the percentages for all the occupations were not corn-
sputed, judging from the above, it appears that grade level has no markedirifluence on the occupational choice of Negio high-school pupils. -Thisconclusion, if supported by furtherstudy, would seem to indicate the needof a closer relation between curriculums and courses, and vocational inter-ests of pupils.
TABLE 57. Number and percent of pupils indicating choice e occupation, ty size of community
Students' choice oi occupation .
1
Agriculture:MaleFemale
Forestry and fishing:MaleFemale
Extraction of minerals :
MaleFemale
Manufacturing and mechanicalindustries:
MaleFemale
Transportation and communica-. tion:
Mak'Female
Trade:MaleFemale
Public service:Male
a FemaleProfessional service:
FemaleSemiprofessional:
FemaleDomestic and personal service:
MaleFemale
Clerical occupations:MaltFemale
Other:Male a. _
Female...
Total:MaleFemale
Size of community
Fewer than 2,500-49,999 50,000 -99.999 100,000 and2,500 more
Num- Per- Num- Per- Num-ber cent ber cent ber
3
16 6. 8
50 21. 48 2. 3
5 2. 1
20 8. 51 . 3
8* 3. 4
120286
kn.
513
713
2
134343
51,383. 4
4
2. 13. 8
2. 96. 7
. 93. S
40. 6S9. 4
4
41 4. 51
6
7
Per- Num- Per-cent ber cent
1. 5 20 0. 4
180 19. 747 2. 9
201
6318%
729
4531, 250
24
27107
33132
2330
2. 2
6. 91. 1
7. 9. 6
49. 678. 2
2. 3
2. 96. 7
3. 63. 2
2. 51. 8
2 . 03
7450
201
545
251620 _
1
1545
1085
1523
Total
Num- Per-ber cent
841
3 . 051
15. 4 1, 332 23. 95.9 646 7. 0
4. 2
6. 91. 1
4. 6
52. 473. 9
.1
3. 1S. 4
1. 110. 1
3. 12. 7
to914
1, 59936. 463. 6
479839'
36. 363. 7
13811
282154
671175
2, 3165, 679
6450
56534
2631, 574
425378
2 5. 1
5. 11. 7
12. 01. 9
41. 661. 7
I. 1. 5
1.05. 8
4. 717. 1
7. 64. 1
1. 2
. 04OD AP ea ma
1, 636 22. 7751 6. 3
183 2. 513 1
398 5. 5182 1. 5
805 11. 2189 1. 6
3, 140 41. 67, 835 65. 3
67 . 955 . 5
103 1. 4699 5.
313 4. 31, 814 15. 1
465443 3. 7
5
5, 5729, 202
37. 762.
37. 862. 2
.
_ _ -
.
7 a
.
11.3
6.
3
IN
Male
Male
2
1_
1.2
339
e.
8

INEORMATION NEEDED FOR GUIDANCE 87Influences in choosing an occupation. The influences which pupils said affected
the selection of an occupation are shown in table 58. Three influences pre-dominate in all the regions among both boys and girls, namely, "desire tomake money," "belief in ability in special field," and "desire to serve."
Choice of occupation, according to interest.Data concerning hobbies or inter-. ests and occupational choice are shown in table 59. Of the 363 male pupils
whose hobby vas scientific and mechanical construction, 37.5 percent gavemanufacturing And mechanical industries as their occupational choice;while 6.6 percent chose transportation and communication service. Bothof thesepoccupations have rather close relation to ihe hobby. Of the 991male pupils whose hobby was hOme workshop or laboratory, 29 percentchose manufacturing and mechanical inddstries as an occupation. Furtheranalysis of the data rnay be made by those. interested in order to study anypossible relationship between other hobbies and occupational choice.
Choice of occupation, according to father's occupation.The extent to whichNegro high-school pupils choose the vocations in which their fathers areengaged was studied. In the South Adantic region 4 percent of the girlschose occupations in manufacturing and mechanical industries, while 20percent of the girls' fathers were engaged in these occupations. Fathers of2.5 percent of the girls were engaged in clerical occupations, but 10.6 percentchose these occupations. Three-fourths of the girls chose professional serv-ice, while only one-twentieth of their fathers were so engaged. .
In the South Atlantic region, 20.7 percent of the boys' fathers werea engaged in manufacturing and mechanical industries, and 25.3 percent of
the boys expressed a desire to ente5 these occupations. Two and seven-tenths percent of the fathers were engaged in clerical service, while 4.6percent ot t e sons indicated ayìrIerence tor clerical wor . Nearly halt othe boys (47.5 percent) chose the oféssions, but only 7.7 percent of theirfathers were engaged in them. Six d five-tenths percent of the fatherswere employed in agriculture, while 1.7 percent of the boys desired to befarmers. In trade occupations there is close agreement between fathers'occupation and sons' choices; the percentages are, respectively, 5.9 and 5.5.The respective percentages of fathers engaged in public service eand sons'choices are 14.2 and 9.3. A more exact measure of relationship betweenoccupation of fathers and occupational choice of their children may beobtained by ascertaining the number of children who expressed a desireto enter the specific occupation in which the fathers are engaged. A totalof 203, or 15.7 percent of the male pupils ii the South Atlantic itegion chosethe occupation 'in whicfi their fathers were engaged. The pércentAge ofsons who chose the occupation in which their fathers were engaged for theother regions are: South Central, 17.4; Southwest, 13.2; and Northern, 13.8.A further study of possible relationship between occupations of fathers andoccupations engaged in by their sons is reported in chapter 9.
71910*-38----T
V.
I
f 4_
a

88 V&ATIONAL EDUCATION AND GUIDANCE OF NEGROESv
TABLE 58.-Percent of pupils attribuling their choice of occupation to indicated influences, by regionand sex
z ..,
Influence
South Atlantic South antral Southwest Northern andWestern
Male.
Female Male Female Male Female Male Female
1 t- 3 4 s il 7 8 9
--Desire to make money 34. 9 28. 1 36. 5 27. 7 39. 7 31. 5 30. 7 27. 9Success of friends 3. 3 3. 2 4. 6 5. 7 3. 1 3. 2 2. 3 2. 7Advice of relatives or friends 3. 5 2. 8 2. 7 2. 3 4. 4 4. 8 3. 2 . 2. 4Teachers_ 2. 5 6. 1 2, 1 8. 8 1. 6 4. 2 1.6 3. 8Desire to serve 13. 8 22. 1 15. 2 18. 5 9. 9 15. 5 10. 3 14. 8Advice of parents 5. 1 7. 2 4, 8 6. 7 3. 8 4. S 6. 2 5. 8Observing people at work 3. 8 3. 0 2. 9 2. 6 2. 4 2. 0 3. 3 4. 3Working vacations or after school_ _ _ 2. 3 . 8 . 9 1. 1 . 1. 3 1. 2 1. 9 1. 1Thinp you read 1. 2 . 8 2. 2 . 9 2. 3 . 9 1. 4 !. 1Guidance counselor . 1. 1 . 6 . 5 . 2 . 2 . 1 1. 0 . 8Belief in ability in special field j 18. 3 20. 9 21. 9 22. 2 23. 7 28. 2 28. 4 30. 7Father's occupation 4. 3 . 3 2. 7 . 7 2. 8 . 4 3. 2 1.0Mother's occupation . 3 . 9 . 3 1. 4 . 4 1. 6 . 1 . 8Course in occupations . 1 . 2 . 2 . 2 . 6 . 3 . 6 . 5Work in shops 3. 8 . 7 1. 8 . 4 2. 5 . 6 3. 2 . bAcademic courses in school . 5 1. 1 . 3 . 3 . 1 . 2 1, 3 .9Extracurricular activities 3 2 . 1 . 04 . 2 . 2 . 2 . 1Motion pictumOut-of-school activities ,
. 4
. 5. 3. 4
. 5
. 1
. 3
. 1
. 5
. 4. 5. 2
. 41. 0
. 2. 5Other 4 3 1 04 2 1
Choice of occupation andparents' education.---Some information concerning theschooling of parents and the occupational choices of pupils was collected forthe purpose of discovering whether or not there is any relationship betweenthem (table 60) . In general, the data indicate that children of parents whoarc college graduates are more apt to choose one of the professions or acareer in the manufacturing and mechanical industries than those of parentswith seventh-grade education only.
T
______
,
..
. .
.
'
-

NOI1VW1IOAKI aoNvamo UHCI:gatsI
TA
BL
E 5
9.W
urnh
er o
f pup
ils c
hoos
ing
give
n oc
cupa
tions
, ac
cord
ing
to i
nter
est
of fi
rst p
refe
renc
e an
d pe
rcen
t of
pup
ils e
xpre
ssin
g fi
rst p
refe
renc
e fo
r gi
ven
inte
rest
Hob
by o
f fi
rst
pref
eren
ce
1
Hom
e w
orks
hop
or l
aboi
ator
y A
thle
tics
Rea
ding
Pl
ayin
g m
uska
i in
stru
men
t Pa
intin
g an
d dr
awin
g
4Mo&
C
hoic
e of
occ
upat
ion
IN
cultu
re
Mal
es
2 23
51
15 2 3 9
rcie
nanc
til o
r m
echa
nica
l co
nstr
uc-
tion
Dra
mat
ics
Oth
er T
otal
2
Fe-
mal
es
111
Man
ufac
- tu
ring
an
d m
e-
chan
ical
in
dust
ries
4
Fe- es
Tra
nspo
r-
tatio
n an
d co
m-
mun
ica-
tio
n Fe-
mal
es
Tra
de
Publ
ic
serv
ice
Fe-
Fe-
mal
es
1O
287
M
21
645
175
79
118
152
14
106
76
13
56
32
11
50
71
12
12
1
69
63
10
62
109
7
136
6 24
11
8
4 2
4 2
11
Prof
es-
sion
al
serv
ice
12
Fe-
mal
es
Sem
i-
prof
es-
sion
al
serv
ice
ii 14
1 60
8
113
2 41
2 43
6 23
3
1%
39
426
17 1
, 24
1 1,
527
17
1
27
35
64
17
334
2, 0
35
10
4 47
15
90
8
494
1, 0
19
10
13
8 36
3
228
319
1 1
20
20
34
9 15
0 82
4 2
2 2
6 2
31
112
1
1 19
15
43
3
134
493
3 20
16
33
13
13
8 93
5 2
M,
MI
Mi
15
1 31
1
146
80
1
5 3
5 1
51
221
10
30
1. 5
54
773
195
12
418
162
881
76 3
, 36
9
Fe-
mal
es
IS 13
10
5 8 8 7 1 3
8, 0
31
60
Dom
estic
an
d pe
rson
al
serv
ice
Mal
es
16 17
53
13
8 2 6 3 3 4
110
Fe-
mal
es
17 65
14
7 13
4 46
79 6 35
69
3 7 6
624
Cle
rica
l oc
cu-
patio
ns
Mal
es
18 28
12
7 35
25
16
21
3 13
20
4 6
298
Fe-
mal
es
19
- 54
40
6 41
4 18
3 49
172 33
163
269 5 38 9
1,
95
Oth
er
Mal
es
II 7
22 3 2 3 1 6 55
Fe-
mal
cs
21
Perc
enta
ge
of p
upils
ex
pres
sing
T
otal
fi
rst
pref
- er
ence
jor
give
n in
tere
st
Mal
es
Z43
4 99
1 15
2,
851
17
635
9 79
8 36
8 8
304
1 59
3
296
12
292
363
3 84
6
20
7817
, 06
1
Fe-
mal
es
23 640
2, 3
42
2, 8
15
1, 3
65
438
1, 1
92
168
784
1, 4
30
98
284 55
11,
611
Mal
es
Fe-
mal
es
24
is
14.
0 5.
5
40.
4 20
. 2
9. 0
24
. 2
11.
3 11
. 8
5. 1
3.
8
4. 3
10
. 3
. 8
1. 4
4.
2
6. 7
4.
1
12.
3
5. 1
.
8 1.
2
2. 4
.
3 .
5
2
11
C.
o
` 11
u
.....
......
. SC
h001
pa
per
Ado
vies
4 2
3
dP
9ID
'
70
11)
27
3
1 ow
5
es
w M
P
6
....
11,
r
4 gr
ò
9
- .1
10
"
o
_
00

rItINIOLLVDOA NOI1V011(13 HO Isl vula 9
TA
BL
E
Num
ber
and
perc
ent of
pup
ils w
hose
par
ents
hav
e de
sign
ated
edu
catio
n w
ho e
xpre
ssed
a d
esire
to
ente
r a
give
r: z
e..c
upat
ion
Occ
upat
iona
l ch
oice
-
1
Avi
cultu
re
Man
ufac
turi
ng a
nd
mec
hani
cal
indu
stri
es
Tra
nspo
rtat
ion
and
com
mun
ica-
tio
n T
rade
Pu
blic
ser
vice
Pr
ofes
sion
al s
ervi
ce
Sem
ipro
fess
iona
l se
rvic
e D
omes
tic a
nd p
erso
nal
serv
ice
Cle
rica
l oc
cupa
tions
O
ther
Tot
al
a M
ales
Fath
ers'
edu
catio
n
Les
s th
a#2
seve
nth
grad
e
'Nur
nber
31
393 48
15
5 20
7 79
0 12
41
4
83
25
1, 7
85
Perc
ent
a 1 7
22. 0
2 7
8. 7
11
. 6
44.
3 .
7
2. 3
4.
6
1. 4
4 ye
ars
of c
olle
ge
Num
ber
4
7
67
14
34
43
313 3 4 13
6
504
Perc
ent
1 4
13.
3
2 8
6. 7
8.
5
62.
1
. 6
. 8
2. 6
1.
2
Mot
hers
' edu
catio
n
Les
s th
an s
even
th
grad
e
Num
ber
6
28
381 34
80
19
2 65
7 7 19
70
24-
1, 5
02
Perc
ent
7 1 9
25.
4
2 3
5. 3
12
. 8
43.
7 .
5
1. 9
4.
7
1. 6
4 ye
ars
of c
olle
ge
Num
ber
.8
4 64
19
31
43
257 1 2 16
2
439
Perc
ent
0 9
14.
6
4 3
7. 1
9.
8
58.
5 .
2
3. 6
. 4
Fem
ales
Fath
ers'
edu
catio
n
Les
s th
an s
even
th
grad
e
Num
ber
Perc
ent
10 19
6
47
19
1, 6
27
15
208
464 19
11 7. 6
4 ye
ars
of c
olle
ge
Num
ber
13
Perc
ent
13
Mot
hers
' edu
catio
n
Les
s th
an s
even
th
. gr
ade
Num
ber
14
Perc
ent
13
21 1
1. 8
8
. 7
6 62
. 7
568
. 6
7
8. 0
23
17
. 9
. 66
.
7 *
4
2, 5
95
704
3. 0
15
9 6.
4
1 1
04
1. 1
21
.
8 . 9
7 .
3 80
. 7
1, 73
5 69
. 4
1. 0
3
. 1
3. 3
17
9 7.
2
9 4
381
15
2 . -1
4 ye
ars
of c
olle
ge
Num
ber
16
1
16
2 3 46
5 7 12
72 2
580
Perc
ent
17 0.
2
2. 8
.
80.
2 1.
2
2. 1
12.4
.
3
sk
9 q t
.
e07.
I I
,
.5
'
6 13
2, 4
99
1
.1
. 5
:3
5
'
T-
3
.
V,

IOW CHAI"TO IX I
Information Helpful in Formulating Guidance
Progr.4ms
GENERAL CHARACTERISTICS4
WIZT HAPPENS to Negroes who gradilate from high school and toe who drop out beforse graduation? What occupational adjust- i
ments do they make? What, if any, relation is there between schooling and \.
occupational adjtistment? To what extent has the school assisted formerpupils in adjusiment? What arç.their interests and in what activities dothey engage? What variation, if any, exists among the different geograph-ical regions with respect to these matters?- Informátion conFerning thesequestions, reported in this chapter, should be helpful in formulating guid-ance programs. The age of persons studied, the amount and kind of edu-cation received, apd the work experkence while in day school shouid in-dicate the kind of assistance needed from schools in making further occupa-tional adjustment. Information concerning reasons for leaving day schodand for attending evening schpol, employment since leaving day school,means of obtainingAemplc;pment, and relationship of son's to father'soccupation is !Hated not only to the present needs of adults but also towhatever revision may made in educational and guidance programsfor youth now in school.' The kind of information reported in this chap-ter is needed about each individual in order to provide effective counseling.
Data were collected from 20,260 high-school graduates and nongraduatesduring 1926 to 1935 in 33 States and the District of Columbia, in com-munities of different sizes, and from 2,540 persons who were enrolled inevening schools ,
Age of studenis.The median age of graduates when interviewed and ofnongraduates, according to the size of community in which they, live, is
sh9wn in table 61. The nongraduates are sligl,Itly younger than the gradu-es; when the two groups are combined thoie who live in the large. cities
are younger than those living in the smaWcommunities. ,
,.. 91I. ,
i-l.,- .1, , i
, ,-.- ,. le. ,.
:;
le
,.
.. s
. e
a
,
.
b
I'''
4 A
o
,.,.,.
.,.
..
,i5 ,,- .
.
A

r 92 VOCATIONAL EDUCATION AND GUIDANCE OF NEGROES
TABLE 61. Number and median age of Negro high-school graduates and nongraduata, accordingto size of community in which they live
Size of community
Fewer than 2,5002,500 to 24,99925,000 to 99,999100,000 to 499,999500,000 and more
Total
Male
Graduates
Number Median
Nongraduates
Number Median
Female
Graduates
Number Median
173592974
1, 605677
4, 021
24. 3024. 2923.6022. 9422. 27
184 23. 09 264488 23.05 1,087%6 22. 39 1, 822
1, 571 41. 90 3, 021552 20. 47 1, 143
23. 27 3, 761 21. 90 7, 537
Nongraduates
Number
23. 5 3 30223.84 81023. 34 1, 57311. 53 2, 02021. 53 809
22. 80 5, 514
Median
22. 6022. 5022. 1021. 6020. 64
21. 83
The median age of persons when they graduated or dropped out variedslightly among the geographic regions. For male graduates the range is from18.74 years in the North Atlantic to 1 9.44 years in the South Central region.For males who did not graduate the range is from 17.63 years in the SouthAtlantic to 18.29 years in the Southwest region. Median age of femalegraduates ranged froFn 18.45 in the North Central region to 18.97 in theSouth Central; of those %who dropped out, from 17.37 years in the SouthCentral region to 17.87 years in the Southwest. The median age of allevenirtg-school students was 26.08 years. Evening-school students in theNorthern and Western regions are 2.64 years younger than those in theSouthern region. Data in table 62 indicate that the older evening-schoolstudents left schdol-rarlier than the younger ones.
Educational level attained.-The number and percentage of nongraduateswho left school at given grades are shown in table 63. Table 64 shows simi-lar information by regions. The difference in attainment between the non-graduates in the Northern and Western regions and the Southern region isfairly pronounced. For example', the percentages of females reaching thetenth grade or higher in the North Central, North Atlantic, and Westernregions are, respectively, 79.8, 78.9, and 81.3. The corresPonding percent-ages are 47.6, 27.7, and 45.8, in the South Atlantic, South Central, andSouthwest regions, respectively. Similar gonwarisons can be made be-tween Northern and Western regions on the basis of median years of educa-tion attained for both malos and females. Detailed analysis of the educationof nongraduates according to size of community was not made, however, theoriginal data are shown in table VI in appendix A for anyone interested inmaking such an analysis.
Differences among the evening-school students in grades reached beforeleaving schbol as shqwn in table 65 are similar to those found among thenongraduates mentioned abov.
411KA,
_
_ _ _ 411
-
,
d.
'

FORKULATION OF GUIDANCE PROGRAMS 93
TABLE 62.Number and median age of evening &tool students who have attained a give: level ofeducation
Level of education
Elementary :
1
2-45-67-8
High school:9-1011-12
College:,
3-4_Did not attend
Regions
Northern and western
Numilltr MediAn age
3
62347
215
2804 38
942533
31
37.8336. 2535. 81
23. 7521. 68
26. 8224. 9625. 21
Southern
Number
4
257
142321
294310
5833
1
Median age
36. 5833. 15
3t9.68
25. 7224. 08
25. 4627. 35
TABLE 63. .Number and percent of nongraduates Ow, dropped out of school al given grades
Gracie on leaving schoolMale
Number
1 2
SeventhEighthNinthTenthEleventhTwelfth
Total
48532
1, 0541, 038
6932445
3, 611
Percent
1. 3
14. 72
28.819. 26. 8
100.0
Female
Number
4
35649
1, 1
1, 6291, 06 304
389
5, 276
Percent
O. 712. 328. 630. 920.7. 4
100. O
.
.
...... . Er
_
p
qi - - -
3
,
1
1-2
4)
lb
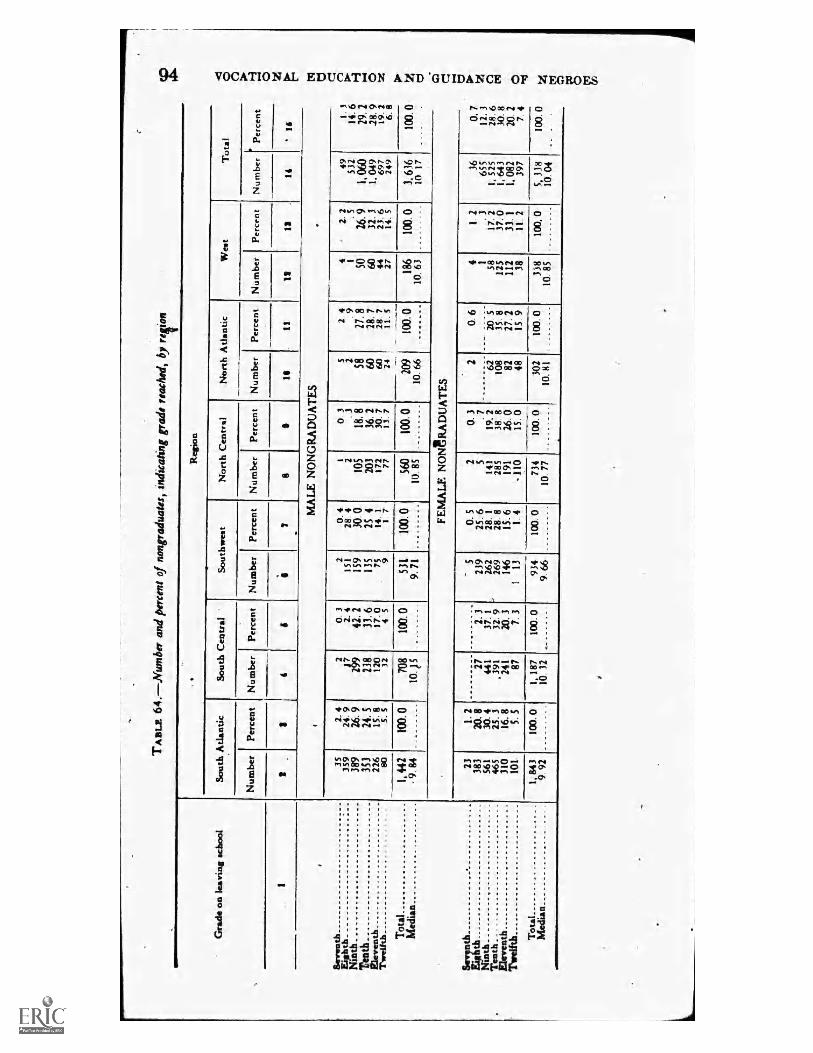
EDUCATION AND 'GUIDANCE
TA
BL
E 6
4.
Num
ber
and
perc
ent
of n
ongr
adua
tes,
ind
icat
ing
grad
e re
ache
d, b
y re
tort
Gra
de o
n le
avin
g sc
hool
1
Seve
nth
Eig
hth
Nin
th
Ten
th
Ele
vent
h T
wel
fth Tot
al
Med
ian
nth
Nin
th
Ten
th
Ele
vent
h T
wel
fth T
otal
M
edia
n
Reg
ion
Sout
h A
tlant
ic
Num
ber
Perc
ent
3
Sout
h C
entr
al
'
Num
ber
4
Perc
ent
Sout
hwes
t
Num
ber
Perc
ent
Nor
th C
entr
al
Num
ber
8
Perc
ent
Nor
th A
tlant
ic
Num
ber
MA
LE
NO
NG
RA
DU
AT
ES
le
Perc
ent
Wes
t
Num
ber
Tot
al
Perc
ent
Num
ber
1$
14
Perc
ent
35
359
389
353
226 80
2. 4
24
. 9
26.
9 24
. 5
15.
8 5.
5
2
2t4
238
120 32
0. 3
2.
4
41.
2
33.
6 17
. 0
- 4.
5
2 15
1 15
9 13
5 75 9
O.
4 28
4
30.
0 25
. 4
14.
1
1 .
7
1 2
105
203
172 77
- 0.
3
. 3
18.
8 36
. 2
30.
7 13
. 7
'
5 2 58
60
60
24
, ,
2. 4
. 9
27.
8 28
. 7
28.7
11
5
4 1
50
60
44
27
. 2.
2
. 5
26.
9 32
. 3
23.
6 14
. 5
49
532
1,06
0 1,
049
69
7 24
9
-
1.
14.1
29
. 18
.1
19.
6.
1, 4
42
, 9.
84
100.
0
____
_...
708
10 )5
10
0. 0
...
___.
53
1 9
71
100.
0
560
10
85
100.
0
_
t
209
10
66
100.
0
. _
_
_.
186
10
63
100.
0
. _
_
-
3, 6
36
10
17
100.
I
FEM
AL
E N
ON
ER
AD
UA
TE
S
23
383
561
465
310
101
1, 8
43
9 92
1 2
20
8 30
. 4
25.
3 16
. 8
5. 5
100.
0
27
441
, 39
1 24
1 87
1, 18
7 10
32
2 3
37.
1
32.
9 20
. 3
7. 3
- 5
239
262
269
146 13
100.
0
934
9 66
0. 5
25
6
28.
1
28.
8 15
. 6
1. 4
100.
0
2 5 14
1 285
191
110
734
10
77
0. 3
7 19
. 2
38 8
26.
0 15
. 0
100.
0
2
62
108 81
48
302
10
81
0 6
20 -
35
8 27
. 2
15
9
100
0
4 1
58
125
112 38
338
10
85
1 2
. 3
17.
2 37
. 0
33.
1
i. 2
100,
0
36
655
1, 52
5 1,
643
1,
082
39
7
5, 3
38
10
04
3 2 8
0. 7
12
. 3
28.
6 30
. 8
20.
2 7.
4
100.
0
'
.....
.....
p
I _
I i
7 II
. 11
18
.
' li
*.
.
.
.
. _
.
i
S.
2
o CD
cp.
4

FORMULATION OF GUIDANCE PROGRAMS 95
TABLE 65. Number of evening-school students who left school at stated grade levels, by sex
Grade level on leaving
1
Elementary:1
2-45-67-8
High school:9-1011-12
College:1-23-4
Total _
Median
Male
4072
165
180123
2013
6189 30
Female Total
3 4
3 8
43 83127 199385 550
398 578652 775
135 1 5549 62
1, 79210 70
2, 41010 26
INTERESTS AND ACTIVITIES IN SCHOOL
Curriculums pursued by graduates and nongraduates.The percentage of peakons
reported in this study; who pursued academic curriculums is higher in theSouthern regions than in either the Northern or Western region. Data areshown in table 66. Data on curriculums pursued by size of community are
given in table VII in appendix A.Vocational training in high school.The number and percentage of graduates
and nongraduates who had vocational training in high khool related to
their present jobs are shown in table 67.. The percentage was highest, formale nongraduates, in the North Atlantic States and lowest in the SouthAtlantic; among male graduates it was higher in the Sputhwestern Statesand lowest in North Central States. Among female nongraduates the per-
centage was highest in the North Atlantic States anCi lowest in the SouthAtlantic Stales: among the female graduates it was highest in the Sotith-western States and lowest in the South Atlantic.
Value of vocational training in securing work.Respondents were asked to statewhether vocational courses were of assistance in securing work. Tabulationsarc according to the size of community. In general, a higher percentage of
persons in sm'aller communities than in larger ones indicated that vocationalcourses helped in securing work. Vhis is true for all groups studied, malesand females, and graduates and nongraduates. The percentages indicatingthat vocational courses assisted in securing work according to size of com-
munities follow:
Size of community
Fewer than 2,5002,500 to 24,99925,000 to 99,999100,000 to 499,999S00,000 and more
Graduates
SO. 024. 717. 822. 623. 6
Female
65. 854. 646. 241. 146. 7
Nongraduatea
Male
4
31. 811. 39. 8
18. 717. 6
Female
46. 538. 322.014.6JO. 2
Adr"5
.s
' Male
a
.
I1
A

NOILVOf1Cla
Mus
ts 6
6.-6
-4/s
ombe
r an
d pe
rcen
t of
gra
duat
es a
nd n
ongr
odua
tes
who
pur
sued
giv
en c
urric
ulum
s w
hile
in h
igh
scho
ol,
by r
egio
n
Cur
ricu
lum
pur
sued
Sout
h A
tlant
ic
Num
ber
Perc
ent
MA
LE
S A
cade
mic
T
rade
s In
dust
rial
art
s T
each
er-t
rain
ing
irel
lietr
oom
ies
Com
mer
cial
-
Oth
er
No
resp
ooee
Tot
aL
3 s
735
221 60
8 19
3 2s
61
12
1, 1
47
64.
0 19
. 2
S. 2
. 6
1. 6
.
2 2.
4
5. 3
1.
0
Non
grad
uate
s
Num
ber
Perc
ent
Sout
h C
entr
al
II.
Num
ber
4
864
331 75
5 18
3 48
84
20
1, 4
48
i s
Perc
ent
7
Non
grad
uate
s
Num
ber
s
Perc
ent
t
59.
6 22
. 8
S. I
.
3 1.
2
. 2
3. 3
S.
8
1. 3
507 30
20
14
15
4 8 57 i
n. 2
4. 5
3.
0
2. 1
2.
2
. 6
1. 2
8.
6
. 1
656
549
21
I 7 4 47
2 1
64 3
708
77.
5 2.
9
2. 4
.
5 6.
6
. 2
. 1
9. 0
. 4
Sout
hwes
t
Gra
duat
es
Num
ber
IS
-ME
L
690 14
38
26
10
2 2
63 3
848
Perc
ent
11 81
. 3
1. 6
4.
4
3. 6
I.
I
. 2
. 2
7. 4
.
3
Non
grad
uate
s
Num
ber
13 37
7 27
43 3 9 3 4
61 4
531
Perc
ent
13
Nor
th C
entr
al
14
Aca
dem
ic
Tra
des
Indu
stri
al a
rts
Tea
cher
-tra
inin
g
=its
raor
nies
C
omm
erci
al
Oth
er
No
resp
onse
Tot
al
)
387 66
25
13 3 34
114 S
11
le
59.
8 10
. 2
3. 8
2.
0
4 S.
2
17. 6
7
235 72
58
4 3 7 43
13
2 6
17
41.
9 12
. 8
10.
3 . r s
1 2
7. 6
23
. S
1 0
Nor
th A
tlant
ic
18
19
. 15
1 21
19 4 19
16
1
65.
3 9.
0
8. 2
1.
7
8. 2
6.
9 4
so 72
52
28
1 2 27
23 4
647
231
209
31 34
. 4
24.
8 13
. 4
. 4
. 9
12.
9 11
. 0
1 9
Wes
t
si
4 19
7 51
46
4
13 3 2
22
51 4
389
Si 50.
6 13
. 1
11.
8 3.
3
. 7
. 5
S. 6
13
. 1
1 0
34 60
17
52
3 1 4 10
39
71. 0
S.
0
8. 1
. S
1. 7
.
5 .
7 11
. 4
tl .
7
0 * 44 o O
I*
-i o
186
32.
2 0
9. 1
ft
l 27
. 9
1. 6
.
5 i
2. 1
20.
9
V
dID
gi
n!,
no
SI 5.
3
g
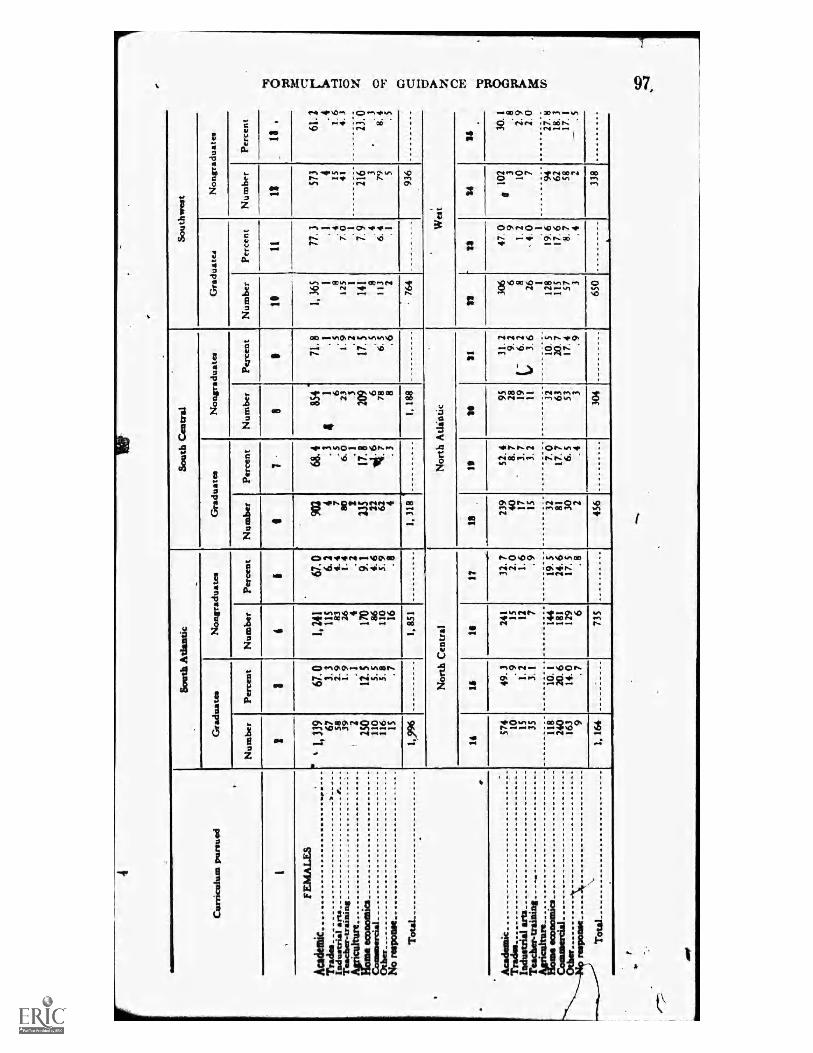
FORMULATION OF GU IDA N CE PROGRAMS
owl
oes sO orl C) 1 .40 I". . . .
0. op I rowl CO
\(;)
owl
11011.011wtera Is
%el e-4
*.
V
V
mme
fe% 6, NO, 0 Ne -r l- *0
albims
ao Os 0e.4 e4
fle
srims Cs I". * fN4 00 rOs
00tw'sea's
CT;r316i
§ 43 6-01 CO LiN P. '6'1r.4 wnw
sml si41
OsO %es Ok lart %A art NO. . . . . . . .. 14:1
0.01CrrlIPIA00000f`4
111
111..11
"Ow
.0. owl arl VD vo*tp el *0 cC)
pet
WEI
IM M r4 NO I Le% p.s. 01/.
sms. ,0 9.0.1 11::DRfoN s
I^ 00 CPCOlk 00 -
tit
TO P. r. r4
el. 00. PP; e°1siON
owl
so
01 CNIwo to", 00
1
1
eel
3
CI '11111144 ....NI:KhoocP:4Iei
...vtrINO.P1011.*000ao N 8-0
( .41 6 5- 00-
es.+e4.-; e4
Cr. r. WO* NI CIO 0 *0 se*r-$ tel fo$ ww usroot (.4 5.1
11bI11411
44MM.m.
ww4
owearar. C)OP 00
cm 5 5-5 5-5
1
1
1
PPS
Goa
$ Cfs 44 41,
CPS 1111.0%10001,r4
11
ca.
III I1111 1{III 1411$ 1III i 11101 11111 11111 1111111 11111 111111 11111 11111 11111 11111 11115 1II t 1 I0 1 I I II 5 I 1 I1 1 s o I
1 I e I1 I I 11 II I I I 1
I 1 I 1 Ilief I 1
0 I II111 1111 1
I I 1
Ia
i
;
le CD et 111 CO Q 1qP1rso ...I 11,0'1 isms we NC
rml 5-5
1
Val
Moe
11.11118111 1
1
1
e
5
1
1111111111 I1111111111 111111 I S 5 t 1111111111 11411 $ S P I $ 11111 $ I S t $ 11111111111 1411 I $ 1111 $ $
1
11 111111/1111 11111461111 1110414111 1I Isels soo Is 1 e 4 1 I 1 1 11
, I .1 4 sIIII II sit la 1 1SI elm Ii I o SO I is e 1 1 141 I14 1 1111 140 1 t e Io I 1
iiiiiiiii E
re
1
1111111/1I 1 1 I 1 5 5 5 s111411111I I I 5 I I 5 I1101161111111111111
97,
0 I6 *Z8
'OE
:L.
ft ts
,61
I
09
le4hi
10f
6t'LlLots .oi
9 *1I '9
'6'If
'14
ES19(f
1161st56
111
95,
Of
SILl
6EZ
)PUIFIW
8S9 'tZS "61
69 10 1L *ti
LI
191 41
L019 'OZ1 '0I
I EZ I6
'6t
6191Ott811
ti
iirnua3 quoN
916
6L
91Z
1*SI
(LS
II
J4clumN
salinpvilluoN
I
C* LL
I I
lua3.sad
I I
9S '9S
S 'LIz.6 '1s.I8 'IL
881
88L960Z
9
JacltunN
va3snpv.to
isartpnos
11:101.rid lagtunN
86 'S9',I '6
1
0 19
158 .1
91ol98Oa
srEs
96(61
11*SS 'SS
I.6 16 'Z
0 19
luacuad raglan's,'
111321111pILLO
1usua3
laaauad iaquanN
aurnpluittroN
.flit mnittPul'I. r 1 w
74°iasoodsai oN
opugaixoe
STIVN3.1
umnr.ra-saqintax*12W llit!xisnPuI
9aPtil'NUPT3v
I.
JacicanN
snrninA0
'PuirPif Ruin
pertartbd ungr32n3

Nouvonaa HONVUIL10
TA
BL
E 6
7.-X
tuni
mir
and
per
cent
of
mon
grad
sate
s an
d gr
adua
tes
of h
igh
scho
ol r
idto
had
voc
atio
nd t
rain
ing
rela
ted
to t
heir
pre
sent
job,
gra
de o
n le
avin
g xh
ool,
and
by
e:0
00
regi
on i
n w
hich
sch
ool
was
loc
ated
Rat
ion
Sout
h A
tlant
ic
Sout
h, C
entr
al
Sout
hwes
t N
orth
Cen
tral
N
orth
Atla
ntic
W
est.
Sout
h A
tlant
ic
Sout
h C
entr
al
Sout
hwes
t N
orth
Cen
tral
N
orth
Atla
ntic
W
est.
Gra
de o
n le
avin
g sc
hool
Seve
nth
Num
ber
Perc
ent
, E
ight
h
NuM
ber
3 4
Perc
ent
Nin
th
Num
ber
Perc
ent
7
Ten
th
Num
ber
Perc
ent
Ele
vent
h
Num
ber
10
Perc
ent
11
Tot
al
Num
ber
Perc
ent
Num
ber
Perc
ent
Num
ber
13
13
14
11
Perc
ent
17
MA
LE
S
8 33
. 3
25
8. 7
,
38
29
'
12.
0 12
.7
39
33
13.
4 16
.1
29
17
.45.
5
17.3
17
7 24
.6
25.
0 15
6 86
13.2
14
. 9
205
126
21.1
22
2
1o. 0
13
10
. 4
16
12.
1 21
18
. 1
16
26.
6 2
25.
0 .7
0 15
. 8
180
40
:
12
16.
2 25
17
. 3
23
18.
5 12
20
. 0
7Z
17.
8 91
18
'
1 25
. 0
1 50
. 0
14
35.
9 11
24
. 4
14
27.
4 4
21.
0 45
28
. 1
58
30.
1 10
0. 0
3
7. 0
9
18.
0 9
,
26.
4 2
9. 5
.
24
15.
7 10
1 29
. !
FEM
AL
ES
38.
4
50.
0 10
0. 0
50 0
33
10
47
13.
3
47.6
34
. 0
33.
3
93
56
66
12
19 6
26.
4 23
.7
46.
4 24
. 4
55.
8 26
. 0
78
70
80
25
24
31
27.
2
35.1
52
. 2
26.
3 46
. 1
55.
3
53
48
32
27
27
16
28.
8 40
. 0
40_
5 34
. 6
52.
9 33
. 3
26
13 4 16
12 8
43.
3
35.
1
66.
6 47
. 0
52.
1
61.
5
288
197
230 82
82
62
25.0
32
.2
44.
1
31.
5 51
. 2
43.6
.483
46
7 65
9 25
8 13
4 21
37.
6 54
. 6
56.
3 43
. 8
48
7 56
. 6
:=4 o
I tfl
85Z
65
9 L
91
f 8f.
Z9
Z8
ZE
1
Of t
£6
1
'19
I 'Z
S 0
L,
9 99
1 f
f I
,
f 6 'Z
S 9
'ff
S 0
91
LZ
L
Z
E
1 f tZ
sr
08
OL
0 '9
Z
8 'S
S
LIZ
9 61
zi
99
95
Lt
01
i '6
Z
3 'O
f r
81
: O
P 1
ZZ
101
8S
16
061
9Z1
SOZ
L *S
I
Hi
8 'S
I 6 tI
Z
'E
l
tZ
ri
OL
98
%
I
S '6
ow
0
'OZ
0
'SZ
0
'St
Z i Z1
Z
L
t '9Z
t.a
S
'81
9 '9
Z
E 'L
I
6 ti CZ
91
L
I
0 81
t.tz
i 'L
I 1
81
1 '9
1
6 i 1
SZ
1Z
EC
0 ' L
6
'SC
III
L 'V
C II
Z1
91
6Z
0 00
1 0
'OS
1 V
I
1 I CI
0 *S
E
0 00
1
1 -
Li
1 02
3.10
d
91
91
*I
II gl
II
iaqt
anN
lu
xuad
Ja
qtun
N
laaa
nd
$av
.4
MU
.
Jaqu
inN
lu
aand
I la
quin
N
lt123
iad
iaqu
inN
lo
aand
triti
aAar
a ql
uai
14(1
al" N
poip
e Su
ptita
i uo
apv
40
pa7v
9o1
sznn
rom
ps y
nym
st!
uot
hi
00
Cp
puv
-por
t litu
urol
140
apv.
42 °
fol.
paso
4 ¿
yip
Ø p
irma4
lus
up4
puoy
oloa
pvy
Or!
loot
ps 1
12N
fo r
ompf
ul p
utt
fo p
alsp
i puv
stq
uatg
--
ratn
,
Ilux
uad
Jac:
ITN
m
ama
trui
sm
ixIt
unN
EL
IA41
S
'ISO
M
3Ftw
er3V
Ilu
E)N
qu
oN
zsar
spno
s pu
nao
Ram
s R
ulci
g '
"ISI
VA
39
"12V
111
"N
penu
ao q
uoN
w
itaat
qlno
s -p
ulur
a le
nos
Nun
uo!S
rv
----
---
-
AG
.
Ilw
elft
h
1 1

FORMULATION OF GUIDANCE PROGRAMS
.mployment during high-school attencia;ce.According to data collectéd butnot shown bere, a larger proportion of male graduatés than of nongraduateswas employed during high chool years, the respective percentages are 55.7and 44.1. The correspon ng
Ipercentages for female graduates and non-
graduates are 24.5 and 22. The percentages for the different regions follow:For male graduatesSouth Atlantip, 52; South Central, 63; Southwest, 49;North Atlantic, 52; North Central), 58; and Western, 65. For male non-graduates the percentages are: South Atlantic, 42; South Cenval, 48;Southwtist, 42; North Atlantic, 47; North Central, 44; and Western, 50.The percentages of female graduates employed during their high/schoolyears range from 20 in the South Atlantic region to 34 in the Western.
- The corresponding range for female nongraduates is from 192 in the Sou,thCentral region to 34 in the North Ntlantic. The number of graduates andnongraduates employed during their high-school years according to size ofcommunities in which schools were located is shown in table VIII, ofAppendix A.
ACTIVITIES AND INTERESTS AFTER LEAVING SCHOOL
Reasons for leaving day school.More boys leave high school because offinancial needs of the family than for any other reason, according to repliesfrom 3,617 given in table 68. "Desire to make money," and "lack of interestin school," appear to be second and third in importance. The perpentagesgiving these reasons, respec,tively, are: 28.9, 26.3, and 12.6. The reasonsfor leaving school most often given by girls, with the percentages are:"Financial needs of family," 22.1; "other," 20.3; "lack of interest," 14.6."Needed at home," anä "desire to make money" rank fourth and fifth;respective percentages are 14.4 and 11.5. Except in a few instances, differ-ences among the geographic regions in reasons forleaving school are slight.A higher percentage of those reporting in the North Central region than inthe other regions named "desire to make money," and a lower percentagenamed "needéd at home" as reasons for kaving school. There is closeagreement between the North iktlantic and South Atlantic regions in thepercentages c;f persons naming the different reasons for leaving school.
00

Tim
m 6
8.--
Xus
aai a
ndpe
rcen
t41
non
grad
vate
sin
dica
ting
reas
ons
for
leav
ing
scho
olbe
fore
gra
duat
ion,
acco
rdin
g to
geo
grap
hica
lre
gion
and
lfle
Rea
son
for
leav
ing
scho
ol
1
Failu
re in
sch
ool
Des
ire
to m
ake
mon
eyN
eede
dat
ban
efi
nanc
ial n
eeds
of
fam
ily.,
Did
not
like
teac
her
Lac
k of
rel
atio
n be
twee
nsc
hool
and
voc
atio
n ch
osen
_
Poor
hea
lthL
ack
of in
tere
stO
ther
Tot
al
Failu
re in
sch.
00l.
Des
ire
to m
ake
mon
eyN
eede
dat
hom
eFi
nanc
ial n
eeds
of
fam
ilyD
idno
t lik
e te
ache
rL
ad o
f re
latio
nbe
twee
n sc
hool
and
voca
tion
chos
enPo
or h
ealth
Lac
k 01
inte
rest
_O
ther
Tot
al
Reg
ion
,r*
re.
Sout
h A
tlant
ic
Num
ber
Perc
ent
Sout
h C
entr
al11
,So
uthw
est
Nor
th C
entr
al
Num
ber
Perc
enN
umbe
rPe
rcen
t
7
Num
ber
Perc
ept
Nor
thA
tlant
W
Num
ber
Perc
ent
1011
Wes
tT
otal
Num
ber
13
Perc
ent
11
Num
ber
14
Perc
ent
15
62 414
133
428
21 34 45 169
133
1, 4
39
MA
LE
4. 3
28. 6 9. 2
29. 6 1. 5
2. 4
3. 1
11. 7
9. 2
31 157
63 212 7 10 29 125 70 704
4. 4
22. 2 8. 9
29. 9 1. 0
1. 4
4. 1
17. 7 9. 9
24 104
95 137
21 9 23 56 60
4. 5
19. 6
17. 9
25. 8 4. 0
1. 7
4. 3
10. 6
11. 3
1311
9 29 173 6 9 14 65 66
-7-
2. 3
32. 0 5. 2
30. 9 I. 1
1. 6
2. 5
11. 6
11. 7
10 60 20 57 2 6 923 19
V
828
. 7 9. 6
27: 3 1. 0
2. 9
4. 3
11. 0
9. 1
22 43 20 452 6 2
20 25
529
554
206
11. 8
23. 1
10. 8
24. 2 1. 1
3. 2
1. 1
10. 8
13. 4
162
957
360
1, 0
52 59.
74 122
458
373
4. 5
26. 3 9. 9
28. 9 1. 6
2. 0
3. 4
11. 6
10. 2
3, 6
17I
-4-
FEM
AL
E
100
5. 4
3525
813
. 991
299
16. 2
144
423
22.9
293
214
37o
lo17
19.
210
624
713
.321
327
214
.727
4
1, 8
291,
180
2. 9
7. 7
12. 1
24. 7 1. 2 .8
8. 9
17. 9
23. 0
45 76 163
190
25 11 72 132
216
930
4. 8
8. 1
17. 4
20. 3 2. 7
1. 2
7. 7
14. 1
23. 0
14 76 103
149 10 13 67 102
186
720
1. 9
10. 3
14. 0
20. 3 1. 4
1. 8
9. 1
13.9
25. 4
13 63 37 663 4
28 33 46
4. 3
20. 7
12. 2
21. 7 1. 0
1. 3
.9.
210
915
. 1
293
22 51 23 612 2 37 46 92 336
6. 5
15. 1 6. 8
18. 1 .
6.6
11. 0
13. 6
27. 3
229
615
769
1, 1
82 76 7748
177
31,
086
5, 2
88
4. 3
11. 5
Co
14. 4
°I1
22. 1 1. 4
til9.
0C
D
14. 6
810
. 3
IC
ompu
ted
on to
tal n
umbe
r of
case
s, in
clud
ing
25 "
nore
spon
se,"
fro
m m
ales
and
64
"no
resp
onse
" fr
om f
emal
es.
1 _ -
____
... -
..-
- -
-
it
0!
A.
......
..40-
83
34
ie
a
.4-
185
1
IMIN
221-
04
¡I.
,
e N'
"
8 C) 0 >i
C1 c)
1. 4

FORMULATION OF GUIDANCE PROGRAMS 101-
Reasons for attending evening school.Theshief reason given by students forattending evening school is to. "prepare for new type of work" (table 69).For the group as a whole (1,991 cases), the main reasons given for attend-ing evening school with the percentage of students are: "To prepare fornew type of work", 35.5; and "to improve chances for an increase in rankor salary,'" 22. The third ranking reason is "to gain general informationfor social and cultural background," 16.2 percent.
Activities followed immethately after leaving high school. The period betweenformal schooling and entrance into occupational activity is an importantone. Data were collected from persons enrolled in evening school con-cerning the activities followed immediately after leaving day school (table70). A larger percentage of males in the Southern region went directlyto work than in the Northern region, and a smaller percentage "sought workwithout suCcess." A similar difference existed among the females. Datanow shown here indicate that 241, or 6.9 percent; of the male high-schoolgraduates have never been employed; and 279, or 8.3 percent, of the nòn-graduates. Of the female graduates 1,460, or 21.7 percent, were neveremployed, and 1,422, or 28.5 percent, of thelemale nongraduates. Datashow slight differences among the commu4ities of different sizes in thenumber of jobs held by graduates and nongraduates after leaving school.For all communities combined the medians are, respectively: Male grad-uates and nongraduates, 1.92 and 1.89; female graduates and nongradu-ates, 1.67 and 1.58.
TABLE 69. Reasons for attending evening school, 8:y region (1,991 cases)
Reason for attending school
,
Male
,
Female Total , Percent
I
.1 2 :
.
4 14,
I
To keep up with developments in present job 79 1% 275 1 3. 1
To prepare for new type of work 168 539 707 3 5.5
To Fain general information for social and cultural background 4 .. 100 222 3 22 16.2To improve chances for an increase in rank or salary 148 190 438 22. 0
To get courses which cannot be taken in day school 36 % 1 32 6.6to get credits for graduation from high school 50 175 225 , 1 1.3
To get credit for entrance to college 66 101 167 8.4To prepare for civil service examinations 40 93 133 6.7Other reasons 25 77 102 5.1
4, L
mi
O
_______ _ _ _
.
j

102 VOCATIONAL EDUCATION AND GUIDANCE OF NEGROES
TABU 70.-Activity followed by evening school students after leaving day xhool according tograde-levd attained
SOUTHERN REGION
Activity
Went directly to workHelped at homeWorked with parents at homeTraveledTook vacation (over 3 months)Sought employment without sucessOther
Total
Elementary High school College
2
2-4
3
5-6 7-8 9-10 11-12 1-2
8
3-4Total Per-
cent
11
MALES
1
2422
Went directly to workHelped at homeBecame housewifeWorked with parents at home_TraveledTook vacation (over 3 months)Sought employment without successOther
Total
451
31
28 50
62 556 46 1
1 23 22 42 1
82 69
265
23
21
39.
401.
n ab an.
0.
6
-1-
2
9
4
aOD =11
aa a a Ow
1
5
222 78. 419 6. 715 5. 37 2. S5 1. 8
10 3. 5S 1. 8
283 100. 0
FEMALES
Went directly to workHelped at homeBecame housewife.Worked with parents at home_TraveledTook vacation (over 3 months)Sought employment without successOther
at)
Total
......
17332
27
591594
1
124362516435
' 3
90 216
353414
336
13
200
87454115
3
132110
236
ID 4ND
4N. 4Eir 41MD
732
33
Or
1
24E, 4a MP Ma MD
a 4a
19 4
3871371175112203632
792
48. 917. 314. 86. 41. 52. 54. 54. 1
100. 0
TOTAL
1
.....
41534
aa.a
1 55
104169721
1
140
186422522
5675
147393415
5
1135042176
132311
1 332
a AM a
3
41110
2-
2
6091561176619254637
56. 714. 510. 96. 11. 82. 34. 33. 4
298 269 275 2 8 9-wr
NORTHERN REGION
1, 075 100. 0
Went directly to workHelped at homeWorked with parents at homeTraveledTook vacation (more than 3 months)._Sought employment without successOther
Total
MALES
52
10
1
2
61444.-
33
32
13 73
3
22
94
303
93
53
2
da a. a ow a.
a 41
174 70. 56 248 3. 1
12 4. 93 1. 2
34 13. 810 4. 0
147 100. 0
E.
41. sr ......
1
7
_ _
_
s
4
dm
1
1
1
2
MOMMOMMili
1M M
51014
m
21
elb
3 9
- -
1
6410. MI es
2 1
2 ea "a es Mo
4. ,- -
1 6
_
1
-73
-',___
1
_ _
_ _,1
5
5
m. m. ms
Mr la Me.
W. OP MI Alb MIR
V.
2
MD AIM IM
MI II 411
ID 4= 11.
40 1M, MI1
40
ao.
10 GIP ms
AP
on. N OW MD Mop

FORMULATION OF GUIDANCE PROGRAMS 103
TABLE 70. Activity Jollowa by evening school students after leaving day school, according tograde-level attainadContinued
NORTHERN REGIONContinued
Activity
Went directly to work _
Helped at homeBecame housewifeWorked with parents at home_TraveledTook vacation (more than 3
months)Sought employment without
successOther
Total
Went directly to work_He lpeZI at homeBecame housewifeWorked with parents at home_TraveledTook vacation (more than 3
months) -Sought employment without
successOther
Total
FEMALES
Elementary
2-4
422
, 3
12
5-6
8572
3
25
7-8
High school
9-10 11-12
60 81 10919 23 3619 19 186 2 153 2 5
5 5 6
8 17 3519 26
120 168 250
College
1-2
20421
2
30
3-4
3
4,41
Other
)-
9424
21
18573
IM 111, moMr
5
38
TOTAL
Total
28289672911
17
6253
610
Per-cent
121191996
6
112
193
145231945
5
3912
262
13939181610
8
4429
303
22421
31
45695673723
20
.9663
857.
46. 214. 610 94. 81. 8
2. 8
10. 28. 7
100. 0
53. 211. 17. 84. 32:7
2. 3
11. 27. 4
100. 0
Means of obtaining job.---The number and percent of graduates and non-
graduates and the methods used to secure jobs are shown in table 71. Inthe main, the highest percentage obtained their jobs through friends; thenext, by direct application; and the next through relatives. A small pro-
portion received assistance from the school. In order to obtain direct infor-mation along this line, responaenti were asked if the "school authorities ren-
dered aid in obtaining emPloyment.", The number and percentage ryly-.ing in the affirmative were,: Male graduates, 335, or 8.8 percent; male non-
graduates, 119, or 3.4 percent; female graduates, 636, or 9.3 percent; and
female nongradtiates, 142, or 3 percCvnt.
The educational levels reached by evning school students .and thjmethods used to obtain their first job are stioWn in table 72. Those receiv-
ing aid from teachers oi the placement bureau of the school had attendedschool longer than other groups; the median years are 11.89 for the Northern *1
giro and 11.64 for-the Southern students. This is probably becausé high schools
have employment agencies. It is also in line with the general policy of the
schools to aid therho have better training. Those viho obtained theirfirst job through the assistance of former students had attended school the
_ .....
a
Imes
.
. ......
3
1
1
2 Moon
3
4 J
.
t
21
77910*-38----8
.

104 VOCATIONAL EDUCATION AND GUIDANCE OF NEGROES
least; the medians are 8.67 years for the Northern students, and 8.60 for theSouthern students. In all these data, it will be noted thar the highest per-cesvage of students obtained their jobs through friends. The method namedby the next highest percentage is "personal search" or."direct application."
Wages in first job.-The number and median years pf schooling and thewages received per week on their first job are given in tab1et..73. Amongmales, there is a definite increase in wages as the education increases untilthe second-year high-school level is reached.
TABLE 71. Number and percent of high-school graduates and nongraduates and methods used tosecure their present jobs
J
Means of securing present job
Public employment agencyPrivate employment agency._ _
RelativesFrièndsPublic-school placement bureau -Principal or teacherDirect application .Own business A
TotalNo job at present
Male
Graduates Nongraduates
Number
2
Percent Numbe Percent
Female
Graduates
Number Percent
180 4. 6 244 6. 7 31757 1. 5 60 t 1. 6 86
5 78 14. 9 553 15. 2. 7641, 141 29. 4 1, 030 28. 31 1, 752
1 I . 3 13 . 4 5294 2. 4 26 . 7 174
168 30. 0 964 26. 5 1, 30740 1. 0 18 . 5 30
3, 271 2, 90861 7 15. 9 729 20. 1
Nongraduates
Number
4. 5 2121. 2 87
10. 8 66024. 6 1, 176
. 7 152. 4 21
18. 4 639. 4 19
4, 4822, 626 37. 0
2, 8292, 361
Percent
4. 11. 7
12. 722. 6
. 3
. 412. 3
. 4
45. 5
TAALE 72.-Means used by evening school students in securing thiir first jQbs, according to medianyears in school
Means of securing first job
Persons worked for before graduationPersonal search for jobAdvertisement by self in paperPublic employment agencyBusiness connection of familyPersonal friends
isobar den" QYor t bureau of high schoolPrivate employment agencyOther
Total
Region. rw- r
Southern Northern and western
Number Median years Number Medinia:chooyear
SO233
325772
43416231248
10. 149. 739. 558. 869. 268. 978. 60
11. 6410. 3311. 10
9. 47
65204
234275
30012142949
823
9. 6410. 6711. 1910. 6910. 3510. 098. 67
11. 8910. 6311. 25
10. 75
Relationship of sons' to fathers' Dooccupation. Negro sons tend to followtheir fathers' occupation?" In an attempt to answer this question, inquirywas made concerning the jobs which were held longest by graduates and
7
- - - -_ . _ _ _ __
_ _ _______ - ON MD ...MD..= . ..ED
.
1,
7 a
school
.At
977
.641.ctreAN. , affig
pv
A
-
4
,
att

FORMULATION OF GUIDANCE PROGRAMS 105
nongraduates. The jobs which were held longest were compared with thefathers' occupatidns in order to discount the transitory nature of many
. jobs held during the depression. According to the data in table 74, 17.2
perCent of the male graduates and 22 percent of the male nongraduateswere following their fathers' occupations. In a follow-up study of 1,600high-school pupils on the Pacific Coast, Proctor found that 13 percentof the sons were found in the same occupations as their fathers. When"rank of occupationl is used as the basis of comparison regarding occu-pational status, it is found that the picture changes materially," reportedProctor. "In this situation, it was discovered that 51 percent of the sons
were in occupations having the same rank as that of their fathers." Ininterpreting the data in this survey regarding relationship of sons' andfathers' occupations, the general social and econornid status of the groupshould be remembered. In view of this status, a lower correlation is to be
expected among them than among the white group whose general socialand economic culture i in advance of that of Negroes. As Negroes' edu-cational level increases, under normW circumstances, their occupationalstatus should improve. The fact that *the occupations of the Negro malenongraduates in this s.tudy had a closer relationship to their father4' occu-pation than male graduates seems tossNstantiate this generalization.
TABLE 73. Median years of schooling of evening-school students and wages per week in first job
Wages per week
SS or less$6 to $10$11 to $15$16 to #4W$21 to $25$26 or more
Total
$5 or less$6 to $10$11 to JIS
t o $201 to ps
or more
J
Totalrilmor
Region
Northern and western
Number
3
Median
Southern
Number
MALE
33797037226
A 247
9. 88 739. 73
10. 44 569. 91, 269 18
4
9. 85 I 250
7. 638. 529. 749. S7
7. S1
FEMALE
104199132
35158
9. 5011. 9111. 3212 00
292275so1210
8
493 11. 21 677
8. 84- 9. 86
.11. 23
9. 69
Proctor, William M. A thileen year follow-up of high school pupils' occurs. The vocational guidance
magazine, IS: 306-10, Jassu)ary /tn.s According to the Barr scab.
Am,
'_ ... ........ ......... ___ lb
l
$16
1h26
1
a
;
Med ian
.
64
89MD DM Am ......
fM ee M NI MM IM ,M1 41.
41. - DM, 40 DM MD NI MID
41ID ..... e
I.
.1
I
.
it
0
a
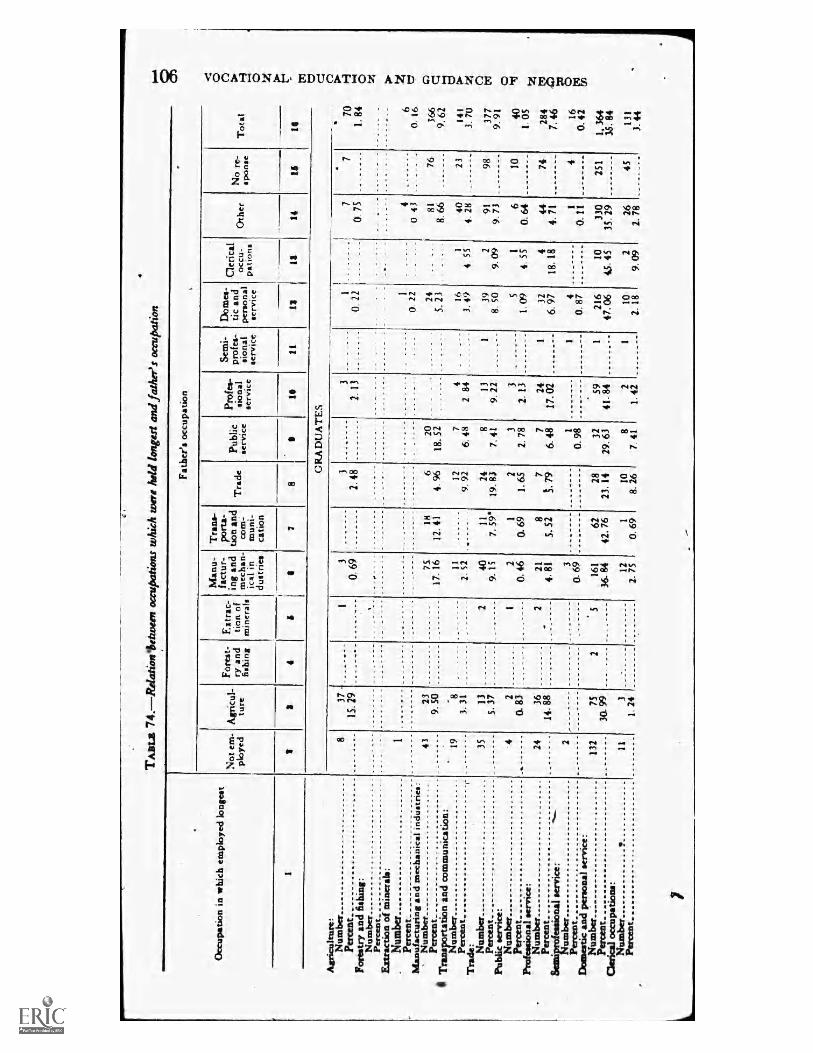
soixvonaa qVNOI1VDOA HONValCIO
TA
BL
E 7
4.-
Rel
atio
ntet
wee
n oc
cupa
tions
whi
ch w
ere
held
long
est
and
fath
er's
occ
upat
ion
Occ
upat
ion
in w
hich
em
ploy
ed l
onge
st
1
Agr
icul
ture
: N
umbe
r Pe
rcen
t Fo
rest
ry a
nd f
ishi
ng:
Num
ber
Perc
ent
Ext
ract
ion
of m
iner
als:
,
Num
ber
Perc
ent
Man
ufac
turi
ng a
nd m
echa
nica
l in
dust
ries
: N
umbe
r Pe
rcen
t T
rans
port
atio
n an
d co
mm
unic
atio
n:
Num
ber
Perc
ent
Tra
de: Num
ber
Perc
ent
Publ
ic s
ervi
ce:
Num
ber
Perc
ent
Prof
essi
onal
ser
vice
: N
umbe
r Pe
rcen
t Se
mip
rofe
ssio
nal
serv
ice:
N
umbe
r Pe
rcen
t D
omes
tic a
nd p
erso
nal
serv
ice:
N
umbe
r.
Perc
ent
Cle
rica
l oc
cupa
tions
: N
umbe
r Pe
rcen
t _
Fath
er's
occ
upat
ion
Not
em
- pl
oyed
3
Agr
icul
- tu
re
3
Fore
st-
ry a
nd
fish
ing
4
Ext
rac-
tio
n of
m
iner
als
Man
u-
fact
ur-
ing
and
mec
han-
ic
Al
in
dust
ries
Tra
ns-
port
a-
tion
and
corn
: m
uni-
ca
tion
7
Tra
de
8
Publ
ic
serv
ice
Prof
es-
sion
al
serv
ice
le
Sem
i-
prof
es-
sion
al
serv
ice
11
Dom
es-
tic a
nd
pers
onal
se
rvic
e
13
Clerical
occu
- pa
tions
1$
Oth
er
14
No
re-
spon
se
15
Tot
al
Is
GR
AD
UA
TE
S
8
43
19
35 4 24
132
11
37 -
IS.
29
23
9 50
13
5. 3
7 2 a
83
36
14.
88
75
30.
99
3 1
24
----
-- 2
1 2 1 2 5
3
0 69
75
17
16
11
2. 5
2 40
9. 15 2
O. 46
21
4. 8
1 3 O
. 69
161
36-
84
12
2. 7
5
OID
18
12.
41
3
2. 4
8 6 20
4
96
18
52
12
7 9.
92
6 48
11
24
8 7
59*
19.83
7 41
1 2
3
O.
69
1. 6
5 2.
78
8 7
7 5.
52
79
6 48
62
28
42
76
13
14
1 10
0
69
8. 2
6
0 98
32
29 6
3 8 7.
41
3 1.
13
4 2
84
13
9 22
3
2. 1
3 24
17 02
59
41
84
2 1
42
----
-
1
1
0 22
1
0 22
24
5. 23
16
3
49
39
8 SO
5
1. 0
9 32
6. 9
7 4 0
87
216
47 0
6 10
2. 1
8
1
4 55
2 9
09
4. 5
5 4 18
18
--
10
4.5
45 2
9 09
7
0 75
4 0
43
81
8 66
40
4 28
91
9. 7
3 6 O
. 64
44
4. 7
1 1
O.
11
330
35.
29
26
2. 7
8
a
7
76
23
98
10
----
-
_ -
74
4
251 45
70
1. 8
4 6 O
. 16
366
9. 6
2
141
3. 7
0
377
trl
40
°21
1. 0
5
9. 9
1
284
7. 4
6 16
0. 4
2
1, 3
64
35.
84
131
3. 4
4
s
411.
2
8 3
31
AP
OI
- --
--
.....
.
.....
.....
VI.
Ow
tz o
I
'to
..411
1110
1...
P.
_
1
----
-

FORMULATION OF GUIDANCE PROGRAMS
Oth
er: Num
ber
Perc
ent
Tot
al
Agr
icul
ture
: N
umbe
r Pe
rcen
t Fo
rest
ry a
nd f
ishi
ng:
Num
ber
Perc
ent
Ext
ract
ion
of m
iner
als:
N
umbe
r Pe
rcen
t M
anuf
actu
ring
and
mec
hani
cal
indu
stri
es:
Num
ber
Perc
ent
Tra
nspo
rtat
ion
and
com
mun
icat
ion:
N
umbe
r_
Perc
ent
Tra
de: Num
ber
Perc
ent
Publ
ic s
ervi
ce:
Num
ber
Perc
ent
Prof
essi
onal
ser
vice
: N
umbe
r Pe
rcen
t Se
mip
rofe
ssig
nal
serv
ice:
N
umbe
r Pe
rcen
t D
omes
tic a
nd p
erso
nal
serv
ice:
N
umbe
r Pe
rcen
t C
leri
cal
occu
patio
ns:
Num
ber
Perc
ent
Oth
er: Num
ber
Perc
ent
Tot
al e
111
391
44
18
18
242
3
3
14
109
24.9
4
437
44
30
34
145
29
23.9
7
121
21
19.
44
108
32
22
70
141
3 ...
.. _ 8
111
24.1
8
459
2 9.
09
22
299
31.9
8
935
191
780
1, 0
00
26.
27
3, 8
06
NO
NG
RA
DU
AT
ES
13 2
46
19
30
1
10 2
133 6
136
398
79
31
85
20
8 06
14
S. 6
5
11
4. 4
4 2 0
81 4
1 61
1
64
25
81 1
0 40
53
21
37
248
.... 2
2 0.
56
5 0
28
1 92
25
. 77
7 13
3
64
2 38
10
64
2 0
56
3 0
84
1
1 67
11
3
9. 0
2 5.
00
10
4 8
20
6.67
14
15
11.4
8 25
.00
4. 1
0 2
3. 3
3
3 3
30
1 7
1. 4
1 7.
69
5 4
7 04
4.
40
9 3
12
68
3. 3
0
1 2
1 41
2
20
4 9
5. 6
3 9
90
7 5
22
105
37
12
29 4
1 -
30.
33
20 0
0
6 2
4 1.
68
1 64
6
67
94
43
18
26.
33
35
25
30 0
0
357
122
60
25
40
35.2
1 43
96
5 %
2
7. 0
4 2.
20
21
20
29 5
8 21
98
71
91
1 3
5
0 54
21
6. 2
7 18
5 37
26
7 76
4 1
19 7
2. 0
9 1
0. 3
0
156
46
57 6
1. 7
9 96
28
66
335
1
7.14
1
7. 1
4
..... 6
42
86
1
7 14
5 35
71
14
20
124
3. 5
1
2 10
0.
28
89
85
378
9. 6
2 10
. 69
56
39
184
6. O
S 5.
20
59
77
285
6 38
8.
06
4 4
20
0 43
O
. 57
16
20
80
1.73
2.
26
1 5
9 0.
11
0. 2
5
286
276
1, 14
8 30
92
32.
47
12
19
64
1. 3
0 1.
81
392
340
1, 2
25
$2.
38
34.
64
925
888
3 53
6
I 11
per
sona
not
em
ploy
ed i
nclu
ded
in t
otal
., 39
per
sons
not
em
ploY
ed i
nclu
ded
in t
otal
.
NO
TIL
-Read t
abk
thus
: O
f th
e 24
2 pe
rson
s w
hose
fat
hers
are
eng
aged
in
agri
cultu
re,
37,
or 1
5.29
per
cent
, ha
ve h
eld
jobs
in
the
agri
cultu
ral
fiel
d lo
nger
tha
n in
any
oth
er;
of t
he 4
37
who
se f
athe
rs a
re e
ngag
ed i
n m
anuf
actu
ring
and
mec
hani
cal
indu
stri
es,
75,
or 1
7.16
per
cent
, al
so h
eld
jobs
lon
gest
in
thes
e oc
cupa
tions
; 11
, or
2.5
2 pe
rcen
t, he
ld j
obs
long
est
in t
he
tran
s-
port
atio
n an
d co
mm
unic
atio
n. f
ield
, an
d 16
1, o
r 36
.84
perc
ent,
wor
ked
in d
omes
tic a
nd p
erso
nal
serv
ice
long
est.
5
45.
. ..
.
a
-
1
1
elb I I
5
1
.....
. . ...
..
3 1
.. _
.
'-
_
---
o o
/:43

wan papttpu! lea asalAndusa =NM Jag isirsumossj t
iZ OZZ 'SI6 EZ *L19 'S1
91
9 118 'SiS II6 .86 01
0 'LL-9Lt'LL
1 18
env n-pup
aivusaA
ealvn
:tioNsaltrn-peso
al11441
113agilliaA09
salvn-pwa-uoN
8 *S99 *ESI ISZ 19 4
I 19'09
gt
salyn-pelO
0 ILS *L9S '69E 'IL8 '0/t
II
0 'ILO't9
590 89L'19
S9
Isalyn salsn
-pia-uoN
Z 't6 '16 '1
efI 'LO't
0 '8f '6SIIL'LL '60
L'S11 .619 111 716 /1L
0 'S9 'LLS6 '66 01
sawsam Ravin"1"19 lION -1"19
awn-plus-a0N
Win
31111:1241A atyll
114133003 WIRM
arnstad 'Puna
salsn
-uON
at*
4o1 ituylsota
IPS UJXK103 cuitaN
11,
mans%----3PgPy qtali
'19111)0011
'Panty Vim*
1
stogie"
(sssvs ger'(t) xss pow witsils4 os Impasse 4isúrfust pefisullusp afhIy een sysigpsAlsoskpm ssporspea fir pagusdp-14 grutvi,

rnsco than among the high-schoolgraduates and nongraduates. This is alsO true of the females. Informationconcerned with evening-school students is given in table 76.
Relation of present job to first job.Table 77 shows the number of evening-school students employed in a given occupation according to their first job.The largest percent of persons who have not changed their type of occupa-tions was in domestic and personal service, especially among women.
FORMULATION OF GUIDANCE PROGRAMS 109
Employers. Inquiry was made concerning the employers of graduates,nongraduates, and evening-school students. Replies are shown in tables 75and 76. The percent of mále graduates employed by Negroes range from11.5 in the North Central region to 16.9 in the North Atlantic region(table 75). Fewer nongraduates find employment in Negro concerns thangraduates, the percent ranging from 7.6 in the North Atlantic region to 13.5in the Southwest. The proportion of male graduates employed by the localState, or Federal.Government is greater than that of the nongraduates inthe Southern regions, but less in the Northern and Western regions. Fur-ther details may be observed from the table. Of the total number of grad-uates and nongraduates studied, 7,139, or slightly more than a third, werenot employed at the time of the investigation. A smaller proportion of themale evening-school students in the So and a larger proportion in theNorth and West worked for Negro
TABLE 76. Percent' of evening-school students indicating their present employer, by region(929 cases)
SouthernNorthern and western
Employed by
Negro concern
Male
3
5. 4lb. 2
Female
Self
5. 724. 5
Mak
5. 97. 4
Female
12. 77. 1
Wbite concern
Male
57. 162. 5
Female
Government
7
Male
8
66. 048. 1
23. 212. 5
Female
4. 59. 5
I Percentages kw other employers not induded here.
Region
,
It
i
_AIL_
3 4 I 6 s

rIVIIOLLVD0A
TA
BL
E 7
7.
Num
ber
of e
veni
ng-s
choo
l stu
dent
s, p
rese
nt jo
bs,
and
first
jobs
ale
Pres
ent
job
1
Agr
icul
ture
-
actu
ring
an
d m
echa
nica
l in
dust
ries
T
rans
port
atio
n an
d co
mm
unic
a-
tion
Tra
de
Prof
essi
onal
ser
vice
D
omes
tic a
nd p
enon
al s
ervi
ce.._
C
leri
cal
Oth
er °T
otal
Firs
t jo
b
Agr
icul
ture
Fem
ale
2 3
Man
ufac
turi
ng
and
mec
hani
cal
indu
stri
es
Mal
e
4
Fem
ale 1
21
2 11
4 1 3 18
37
Tra
nspo
rtat
ion
Mal
e 1 2 3 1 1 9
Fem
ale
7
Tra
de a
nd i
n-
dust
ry
Prof
essi
onal
se
rvic
e D
omes
tic a
nd
pers
onal
ser
vice
Mal
e
8
Fem
ale
6 11
9 1 7 1
20
Mal
e
19 3 7
Fem
ale
11 20
11
36
Mal
e
12 6 6 2 3
34 2 6 60
Fem
ale
13 11
7 9 17
0 10
207
Oth
er
Mal
e
14 2 2 1
Cle
rica
l
Fem
ale
Mal
e
li 14
..... 2
Vem
ale
17 1 5 7 24
38
Tot
al
Mal
e
18 18
18 6 10 6
45 6 14
123
0 0-3 o
Fem
ale
19
tri
3
37
y o 19
41
36
cl
341
0 - Z 0 °T
1
IttA
n T
AB
LE
V
ER
TIC
AL
LY
T
HU
S:
Of
the
11
mal
es w
hose
fir
st j
obs
wer
e in
agr
icul
ture
, 8
are
now
eng
aged
in
agri
cultu
re,
1 in
man
ufac
turi
ng a
nd m
echa
nica
l in
dust
ries
, an
d 2
in d
omes
tic
and
pers
onal
ser
vice
s, e
tc.
Of
the
36 f
emal
es w
bose
fir
st j
obs
wer
e in
the
pro
fess
ions
, 20
are
now
eng
aged
in
the
prof
essi
ons,
11
in
dom
estic
and
per
sona
l se
rvic
e, a
nd 2
in
trad
es,
etc.
Mal
e,
1
8 2
2
1 8
6 1
9
3
1
9
2
2 1
1
205
'
_
1°
_
1 _
%
II
1
,
1 1 1 1
1
1
2
1 1 1
5
i I
0 t:1
C 0 X
c.) 8 8
,
(
r

CHAPTER X I
Vocational Gvidance in Secondary
Schools and Colleges for Negroes
ORGANIZATION AND ADMINISTRATION OF GUIDAN E
INFORMATION concerned with Provisions for guidance was obtsal edfrom 159 high schools and 44 colleges for Negroes. Four of the 11
organization plans for guidance repo* by these institutions are outlinedbriefly in this paragraph. Guidance functions are entrusted to a committeeof interested teachers in 68 high schools and 13 colleges. Sixteen high schoolsand two colleges use a central bureau of vocational guidance, with adirector and trained staff responsible to the superintendent, for the entireschool system in which each was located. Thirteen high schools and threecolleges maintain a central guidance bureau within their institutions.Eleven high schools and two colleges employed trained vocational counselors.Fifty-two percent of the high schools and 45 percént of the colleges had nodefinite guidance organization.
Officers performing guidance funaions.Twenty different officers and teachersperform guidance functions in the 138 high schools and 18 officers *andteachers in the 35 colleges reporting. In the high schools the principal is mostfrequently in charge of guidance;-among the colleges, the dean. In the highschools the homeroom teacher is next; in the colleges, the registrat. Others
...-
in high schools in charge of gmidance are: Vocational teacher, teacher of civ-
ics, counselor, crass adviser, and assistant principal. In the collegés, thedean of men, the dean of women, and guidance committees assume thefunctions. The following is a list of other officers with the number ofinstitutions reporting each: Dean of girls, 8; playground instructor, 5;registrar, 4; health worker, 3; Smith-Hughes worker, 3; dean of boys, 3;psychiatric worker, jeanes worker, and secretary to the president, 1. each.
The number of different officers iesponsible for guidance is indicative of its
ncertain status as a function of schools and colleges for Negroes.oportion
jorof teachers having a part in guidance.While it is desirable that the
functions of guidance should be conducted by certain definite officers,
all teachers should participate. At least, they should have close enoughcontact with it to understand its purposes and to see and apply its implica-tions. Data collected in this study show that 'a large proportion of the
111
)

112 VOCATIONAL EDUCATION AND GUIDANCE OF NEGROES
teachers participate in the guidance programs. A majority of the teachersassist in guidance in 60 high schools and 6 colleges; about half in 24 highschools alnd 7 colleges; and a third in 43 high schools and 16 colleges.
Officers having general charge of ggidance.In table 78 information is givenconcerning the officers who have general charge of guidance. As withofficers performing guidance functions, there is little agreement in practice.Again, the principal is most frequently in charge in the high schools; in thecolleges, the dean.
GUIDANCE FUNCTIONS AND SERVICESType offunctions.Eight different guidance functions were performed by
officers and teachers in the colleges and high schools replying. Counselingis carried on in 66 colleges and 121 high schools. Other functions, with the,number of institu.tions in which each operates, are: (1) Instruction inoccupational informationcolleges, 12; high schools, 90. (2) Place e tcollens, 21; high schools, 28. (3) Advise with parentscolle 3higti schools, 4. (4) Recording and using datacolleges, 12; high schools,26. (5) Make occupational studies and prepare guidance materialcolleges, 6; high schools, 13. (6) Make follow-up studiescolleges, 7;high schools, 10. (7) Testingcolleges, 6; high schools, 19.
Services available.--One hundred and six high schools and 23 collegesresponded to the inquiry conc,erning guidance activities and services.Approximately one7half the high schools and neArly two-thirds of thecolleges provide some guidance for first-year students. The percentage ofhigh schools and colleges offering guidance to all students is 41 and 57,respectively. The number of high schools offering guidance according tothe groups is: Second-year, 29; -year, 31; fourth-year,15; ofcollegessophomores, 4; juniors, 4; seniors, 8. The following is a list of guidanceservices- available in the schpols and, colleges reporting: Orientationcourses, lectures, conferences, general vocational training, placementbureau, psychological and psychiatric services, recreational guidance,health service, courses in citizenship, social guidance, and follow-up services.
Mums 78.---Ofece'rs be sharp of pidasect
. Number of hied-tutions reporting °
i
Officer
_
Number of losti.wives reporting
Millschools College. Highschools C3lieges
1 s a ii s s....,
.Priacipal e e e e 87 6 Class advises 41. 2 - _Gatubseior 7 2 Group adviser r -- 1 _ _.....,3 :Guidance cotaalittes 6 4
trintsodentmasked towbar 6 2 Teacher of civics, economics, etc Sof bays. 2 _ ...... Dean of uses. .-- - - .... 1
1 i Dean of wise.... . .. la M110 12el:eta tanager 2 1 Permed =are-. -_ - - - . _ ,- 3principal 3 ----. 3.. Registrar, ... .. .... . 1, ,_. ..
b.,
e.
OStraf
Doss a MD ............ ... _ _ ...
_
vsios.
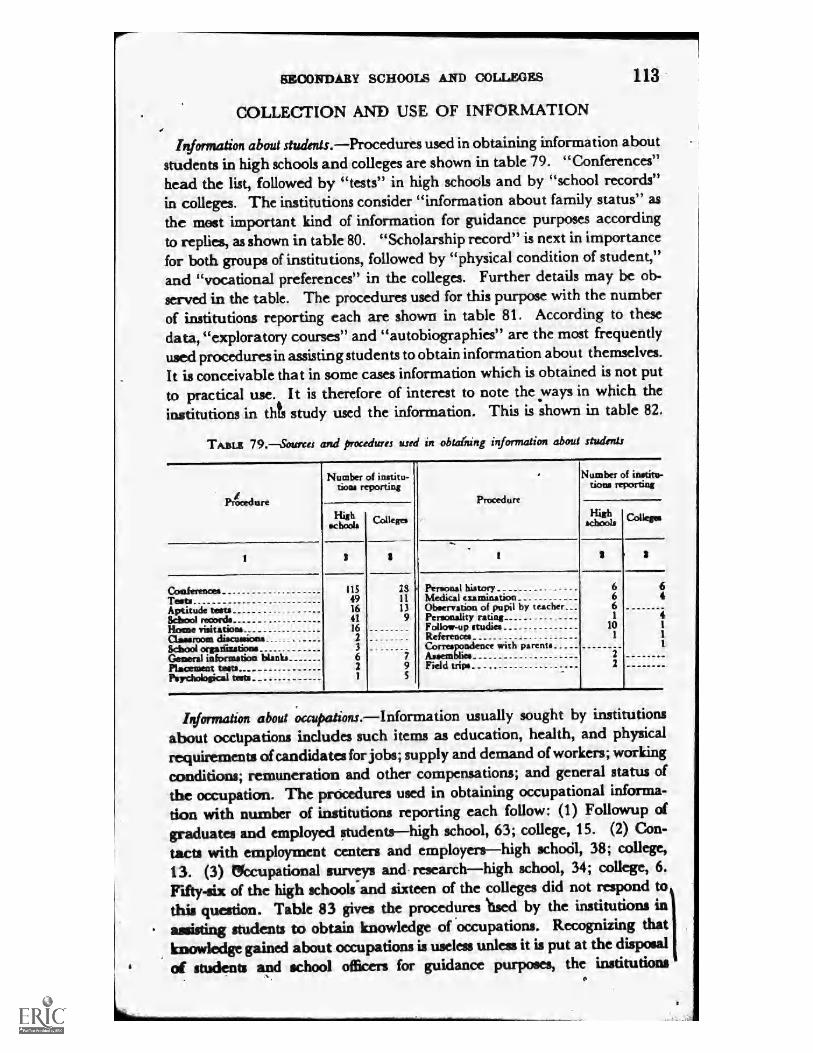
40
SECONDARY SCHOOLS AND COLLEGES
COLLECTION AND USE OF INFORMATION
113
Information about students.Procedures used in obtaining information aboutstudents in high schools and colleges are shown in table 79. "Conferences"head the list, followed by "tests" in high schools and by "school records"
in colleges. The institutions consider "information about family status" as
the most important kind of information for guidance purposes according
to replies, as shown in table 80. "Scholarship record" is next in importance
for both groups of institutions, followed by "physical condition of student,"and "vocational preferences" in the colleges. Further details may be ob-
served in the table. The procedures used for this purpose with the number
of institutions reporting each are shown in table 81. According to these
data, "exploratory courses" and "autobiographies" are the most frequently
used procedures in assisting students to obtain information about themselves.
It is conceivable that in some cases information which is obtained is not put
to practical use. It is therefore of interest to note the ways in which theinstitutions in tilts study used the information. This is shown in table 82.
TABLE 79 .--Sources and procedures used in obtarning information about students
Procedure
ConferencesTestsAptitude testsSchool recordsHoene visitationsClassroom discussionsSchool orgadintionitGeneral information blanksPlacement testsPsychological tests
Number of institu-tions reporting
Highschools
1154916411623621
Colleges
795
Procedure
ON.
Personal historyMedical examinationObservation of pupil by teacherPersonality ratingFollow-up studiesReferencesCorrespondence with parentsAssembliesField trips
Number of institu-tions reporting
Highschools Colkges
666
10
22
64
4
alb ......
Information about occupations. Information usually sought by institutions
about occtipations includes such items as education, health, and physical
requirements of candidates for jobs; supply and demand of workers; working
conditions; remuneration and other compensations; and general status of
the occupation. The procedures used in obtaining occupational informa-
tion with number of institutions reporting each follow: (1) Followup of
graduates and employed studentshigh school, 63; college, 15. (2) Con-
tacts with employment centers and employershigh scho51, 38; college,
13. (3) Mccupational surveys and researchhigh school, 34; college, 6.
Fifty-six of the high schools.and sixteen of the colleges did not respond to
this question. Table 83 gives the procedures )ised by the institutions in
assisting students to obtain knowledge of 'occupations. Recognizing thatknowledge gained about occupations is useless unless it is put at the disposal
of students and school officers for guidance purposes, the institutions
IS'11139 1
.11.
...
s
1
3

114 VOCATIONAL EDUCATION AND GUIDANCE OF NEGROES
included in this study reported the following ways in.wilich occupationalinformation was used: (1) In interviews and conferences; (2) in bulletins,pamphlets, and scrapbooks; (3) in making up content material for subjectson guidance; (4) in vocational forum discussions; (5) in counseling onoccupational decisions; and (6) in the organization of assembly programs.
TABLE 80.Kind of information obtained about students
Kind of information
1
Family statusScholarship recordPhysical condition of pupils__Social recordsPupil's dominant interest _
Pupil's aptitude_ .. -
Number of institu-tions reporting
Highschools
10982464
225
Colleges
3
3 22811
272
Kind of information
Achievement and intelligence tests_Vocational preferencesPersonal historyPersonality ratingsRecommendationsExtracurricular interests
Number of institu-tions reporting
Highschools Colleges
3
279
1029
2
911148.44
1=1.M.0
TABLE 81.Procedures used in assisting students to obtain information about themselves
Procedure
1
tstionnsiresloratory courses
AutobiopaphiesBiotraphic readingsConferencesSeif-analr is blanksOrientation coursesField trips 4Assemblies
Number of institu-tions reporting
Highschools Colleges
337344
2612
31919
z
782416
Procedure
Number of institu-tions reporting
Highschooll Colleges
1
Extracurricular activityTestaCburses in hyttieneVocational guidance programSurveysLecturesTune study chartsCourses in biology
1953445
3
441
2
TABLE 82. Ways in which information about students is used for guidance purposes
Information used in
CounsiefingLectures on vocational guidance.. _
Gaup conferencesSpscial assignment_Assembly ProgramGobs
Number of institu-tions rting
Highschools Colkges
1081213
3
231
283
Information used 4--
School publicationsVocatidnal explorationsAdvice to parentsSchotarstiregedesChoosing
Number of institu-tions reporting
Highschools Colleges
7
1
3
de a ...a a,
1
b.
_ 4M./1G,
...
_
_
ob go
ow .1. rip ob
O. ...a. mi. Ow
5 1
s
r.
_ ........
.. .... M. Mo a. 0.0 ..
7.ro e
a. .....
4.
_
O
5

SECONDARY SCHOOLS AND 'COLLEGES 115
Special guidance procedures and activities. Unless a system of accurate andavailable records is maintained, the time and energy used in securing infor-mation about students and occupations are wasted. Among the newdevices for recording data is the cumulative record card. This recordaffords a fairer appraisal of the student that), isolated items of information.It was used by one-half of the institutions replying. Permanent recordcards of scholastic work were maintained by 53 colleges and 14-high schools.Other kinds of records kept, with the number of institutions keepirig them,follow: Folderscollege, 9, high school, I ; loose-leaf record sheetscollege,4; graphic recordscollege, 6, high school, 6; health recordscollege 7,
high school, 1; ledgercollege, 2. While several kinds of records are keptby the institutions replying, few made definite use of the data rècorded forguidance purposes. Three colleges use the data for abilitY grouping; fivecolleges and three high schools for counseling and research purposes; andone high 'school for remedial work. Officials using records with number ofinstitutions in which each type is used follow: (1) School officials andfacultycollege, 50, high school, 164, (2) guidance functionariescollege, 6,high school, 1; (3) prospective employerscollege, 3, high school, I.
TABLE 83. Procedures and sources used in inforfizing students abóut occupations
Procedure and source
e
Lectum and auembly programs__The general curriculum_..._ _ _Conferences, discussions, etc__Guidance and occu pa tional cou neeField yips, observation tours,
etcLibrary assignments, general and
vocational literature
Number of inst;tu-tions reporting
Highschools Colleges
101165926
38
30
298
215
21
Procedure and source
Contact' with industrial, trade,and commercial establishments _
RadioMoviesOccupational surveysCounselingNo mponse
Number of institu-tions reporting
Highschools
62541
43
Colleges
2.
2
10
Eighty-three high schools and 33 colleges-conducted placement and fol-low-up services. Some of the means by which these services were givedwith kind and number of institutions using them are: By direct contact withemployers-19 high schools, 10 colleges; employment service-40 highschools, 19 colleges; follow-up studies-39 high sc,,kGS7-13 colleges; alumniorganizations-4 high scimols, 1 college; correspondence ,through princi-pal's office-3 high schools and 2 colleges. Placement and follow-up offormer students arc beginning to be considered as important functions ofguidance. The effectiveness of occupational training can ogy be measuraiin the occupation; while only a few of the institutions studied conduct,placement and follow-up services, they set an example which can bee widely
followed. Another phase of this subject has to do with the procedures usedin relating vocational training to opportunities and conditions of work in
3
5
I.
1
11.
2
...

116 VOCATIONAL EDVdATION AND GUIDANCE OF NEGROES
the area served by the institution. Fifty-four of the 207 high schoolsselected for special study stated that no effort was made along this line.The procedures used by 153 high schools and 24 collegel are given in tAbk84. Atmong other activities al"nd organizations used for guidance purposesby a few institutions in addition to those inentioned are the following:Home projects, fraternities, guidance week, student advisory committçes,forums, and occupational exhibits.
TABLE 84. Procedures used to relate vocational training to opportunities and conditions of work
Procedure
Inform pupils concerning vocational opportunitiesSecure information concerning pu &bill ties, interests, and aptitudes.Provide organized placement serviceProvide follow-up of students after they enter occupations_ _ _ _ _ _
Obtain judgment of employers on the educational needs of students or graduates in- their etnploy
Appoint permanent advisory committees of parents and patrons _ _ _ _Appoint permanent guidance committees of teachers
Number of institutions re-porting
.Colkges .High
schools
19171317
lt10
125
R1.58
7232
62C
TABLE 85.Guidance objectives with lumber of institutions establishing each
Objective
Toadde student in choice of suitable vocation, according to individual aptitude andty
.comihunttyTo compile occupational information for students, according to posai-
To aid students in securing knowledge of own strength, limItations; abilities, andaptitudes, and help to formulate goals
To give recognition to personality variances in individuals, and concentration oftraining on &erecter and development of personality
lb teach time importance of efficiency in all lines of endeavorTo counsel bk preparation for hither vocational and educatiopal pursuit* accortin
to ability of individual studentTo develop ability to participate effectively in
.cultural life of Nation __ ...
lb train for good citiunship 21%) give guidance in correct methods of studying occupationsIn order intelligelitly to
life workTo direct interests of pupils toward development of home communitylb show importance of &velopment of sofind healthTo guide in development of a wholesome, happy, and comfortable home lifelb train for worthy use ol leisure timelb assist in occupational placement in order to make for economic securityTo study occupational trends -f-
&mot,lb prepare for Immediate service in simple tasks (maid, . _lb give a definite understanding of the occupational problems of NegroesTo op interest and pride in own racesro educate the head, heart, and handlb teach i of student's personal satisfactionlad enjoyment in workTo assist in building Christian character rTo develop -proficiency isobars than one vocation....lb show that there is nollellnite demarcation between vocatkmal Ana educational
guidanceprepare for leadership in-dprofsional
MI enable the student to utilise more effectively all the 'educational opportunities' of his collegiate experience both on and off die campus
Number of institutionsreporting
High schilols Colleges
22
11
r 6
76 1
69 26 2
104 1
3
2e
21 21 *1 21
1
2
1
2
4
4
, , i.
Pt
_ _ _ ..,_ _,,.
1%
wog'
.t
bilities
choose
..._ _ _ _ .
.etc.). ,-
. -
.. .
fil-d4
5.
f1041P-411- ......
a
s\\
_ _ _____ _
p.
P 1
4.
.
_ _ _
.
ft
.1%)
8
5
-11V
O
SECONDARY SCHOOLS AND COLLEGES 117
The objectives of the guidance program with the number of institutions1
naming each are given in table 85. According to the data furnished thereis cmiderable variation among the institutions in the stated .objectives.Only 61 high schools and 21 colleges replied to the inquiry concerningobjectives. Twenty-two oi the high schools reported that the objective of
idanceth t!,- program was "Tb guide 'pupils in the ¡choice of suitablevcrations, according to individual aptitude and abilityl." This objectiveis stated more than any other by the high schools. The objective statedby the greatest number of colleges was "To aid studentti in securing knowl-edge of strength, limiiations, abilities, and aptitudes, anii to help formulategoals." From thedata presented it appears that there s a need for greaterclarification and specification of objectives, and -a beitter adjustment be-tween them alid the guidance machinery.
CONCLUSIONS
f;
Opportunities available.--e-Opportunities for guidance; service are limitedin the in'stitutions. replying. Only 602 of 2,578 inst*utions for Negroesbffered such serAces. .0f that number, definite infclmation concerningthe gtiidancc program in operation was rtceived frpr# 159 high schools'and 44 colleges. Not only are there relatively few institutions providingguidance, but the Programs art limited as shown by thC\ number gatheringinformation about studepts, about occupations, and ab'out the social and4conomic life of the community, and by the oppbrtiinitit\t\s offered studentsto giin occupational experience. Moreover, few institutWils make use ofthe information after it is gathered, or relate thç educati'onal piogram tooccupational needs..
Characteristics of a good guidance program.Voca 'onal guiciAnce should beconsidered as one phase of the general problem of guidance;\and both as apart of the total educatimaal process. According to Jones an4 Hand,' timeof the major functions of education is to develop in each indivic* "a funda-mental life purpose or goal that will be socially desirable...11'nd personallysatisfying." - In (*der tp do this effectively, education "must start with thechild as hi is, with his abilities, desires, and interests, his needs and prob-lemie, his pattern of life and conduct."
These authors further state: (1) that' the occupation cannot in itself,Jurnish a satisfactory central purpose br goal; (2) that there is tor most
of us no one.and only one position in life, occupation or job that ispreties i. (3) that one does not usually need to change his job orf.position i 'order to be useful in achieving his life purpose; and (4)that, within certiin limits, one may, so chinge the situation in whichhe is placed (his job) as to increase its effectiveness as an agent orelement that contributes to the attainment of one's life purpose.
Guidance in Educationak Institutions, Thirty-seventh Yearbook. pt. I, P. 3. National SocietY for the Studyof Education. Bloomington, IL, Public-School Publishingto., 1938.
o
.
...,
.
e
4
.
14.
I
44*1

118 VOCAT NAL EDUCATION AlsTe GUIDANCE OF NEGROES
While caefuI choice of a job is of greát importance, there is someopportuni in most positions for such personal adjustment as willmake pósib1e the. use of the occupation or othcr activity in theattainment of the central purpose. The oft-quoted advice, "If we
-spent more time in trying to like the things we have to do instead ofin attempting to End the things we like, we would be happier and/more effective," has some value in cases where it is impossible to securethe best job or to change the conditions in the job.
It is generally agreed that the specific functions of vocational guidance ,
should be the following: (1) to assist the individual .to choose an occupa-tion; (2) to prepare for i't; (3) to enter upon it; and (4) to make progress
i', /in it.. This'will require: (1) study of the individual; J2) study of the occu-i pation; (3) counseling; (4) placement; and (5) folloW-up.
, ..
r The carrying out of theJuactions outlined above;lbased on the viewpoint
1
i suggested in the preceding section`requires a staff, activities, and '',rvices.Many organization plans have been suggested for conducting an effectiveguidance program. Ttie most recent is that proposed by the Committee ,
on Guidance of the National Society for the Study of Education.' It re-volvelaroufid three perdins: The teacher, the guidance leader, the special-ist.v The role of the teachef in the guidance program will vary with the size -
of school and other conditions. ,Because of his intimate contapt with thepupil he is in a strategic position to asSist in personally guiding the pupiland in furnishing essential information to others interested in his properguidance. In addition to the teacher-counselor, it is desirable to have aguidance leader in the school, someone to coordinate the effOrts of theteacher and different activities and services and to see that all the potential fguidance facilities of die school and community are focused on the proki-lems of the pupil. This may be one of the teachers or the principalyina small school; a person designated as adviser, cdunselor, dean, director, orlpersonnel worker. jihe physician, employment expert, psychologist,social worker, and many other specialists may have a definite place in aneffective guidance program. It is the business of the teacher and the guid.ance leader to bring the knowledge and skill of these specialists to bear onthe guidance problems which pupils face. The, manner ofIcloing thisnaturally will vary with the community and the school. Since only a fewinstitutions can institute a comprehensive guidance program,--ft is sug-gested that each begin, with what it hb, and expand as conditions permit.
Needs in schools for Negroes.The first need in respect to guidance foregroes is to increase the number of schools which provide a guidance
program. Second, to increase the number of teachers and special guidanceworkers who are trained in principles and, techniques of guidanceA/Third, to improve the "service P given-so as to include such informationabout pupils and adults as was discussed in the *two previous chapter&
Iba,p. 2C.
r
.
i
;.. ;.-- .
'.-.
.k j
- it
va
\
t\,
I
1

SECO liDARY SC H 00ps.
G ES
-
'Fourth, to 'assilt all who are concerned with the edúcation and vitelfare ofNegroes to recognize their sp-écial needs and problems in relatiÓn to theentire educational situatfon.
119
In- making effective occupational adjustments Negroes, in common withpeople in general, need guidance in the selection of an. occuriation andefficnt preparation for it when chose rr. i n effective school programshould meet both general and special prollems in guidance and in voca-tional preparation, Many of the same problems are common io;all youth.A special problem in occupational adjustment for Negroes is due to re-stricted employment opportunities because of racial attitudes ahd preju-dices. The school program can contribute to the sol on roblemthrOugh offering effective guidance; by familiarizi pupils with the factsof thesituation- ly proiding effective training or as many vocatio s asarc open to Negroes; and by gradually widening, as the interests of studentsand the employment situation warrant, oOportunities for training for an
, increasing variety of occupatio.ns.Guidance programs should provide also fo owing studies o: oc-
cupations: "(1) the total numbe e number of Negroes now engagedin eath; (2) the rease d decrease of bothìiL the total number and of
e' Negroes in nunibers percents; (3) the probable future demand forworkers; and (4),the number preparing for'each of the occupations. Negroyouth should be given the facts regarding racial difficulties; the prevailingeconqmic conditions; and causes po far as they are known of the presentoccupational situation with suggested remedies. They should be helpedto rellize that no single rtikedy will solve their problems. Individualcapacity, initiative, and character will alwàys be essential in effectiveparticipation in the changing economic world.
e
4
o.-%-
i. ia.
.
.,.
e
4:6
en
*A fit ..
II»
e
e.
4
.
ea
6
f
779109-38----9
1

APPENDIX A
Additional Statistical Dataa
121
t
4
No-...
..
..
\

SOLLSLIVIS
TA
BL
E I.
Num
ber
of N
egr8
stud
ents
and
per
cent
e all
stu
dent
s en
rolle
d in
fede
rally
aid
ed v
ocat
iona
l M
aus,
by
year
s an
4Sta
tes
Stat
e
1
Ala
bam
a A
rkan
sas'
D
elaw
are
Flor
ida
. G
eorg
ia--
-
Ken
tuck
y L
ouis
iana
M
aryl
and
isiu
ipt
lhO
ssou
n_
_ew
jers
ey
Nor
th C
arol
ina_
_ O
klah
oma
Sout
h C
arol
ina
Ten
ness
ee
Tes
ap
Vir
gini
a W
est
Vir
gini
a
Tot
al
1928
-29
Num
ber
Perc
ent
3
1929
-30
Num
ber
4
Perc
ent 4
6
4930
-31
Num
ber
6
Perc
ent
7
1931
-32
Num
ber
8
Perc
ent
1932
-33
Num
ber
II
Perc
ent
11
1, 4
01
1, 9
37
33
385
2, 6
79
136
2, 0
85
263
1, 9
94
560
45
1,03
6 65
5 2,
647
89
6 2,
278
1,
996
79
MA
LE
S
1933
-34
Num
ber
12
Perc
ent
13
1934
-35
Num
ber
14
Perc
ent
16
14.
1
28.
4 2.
2
9. 8
25
. 3
3. 2
27
. 9
8. 2
28
. 5
5. 6
0.
3
13.
1
8: 8
18
. 0
12.
3 15
. 1
20.
0 2.
8
22,
005
Gra
nd t
otal
_ _
.. 15
7, 2
69
......
1, 4
88
2, 4
63
40
535
2, 5
55-
133
1, 2
70
213
2, 1
20
243
175
2042
, 70
8 3,
092
1,
165
1,
791
2,
143
80
14.
3
27.
8 2.
5
12.
8 19
. 6
2. 0
19
. 0
6. 2
20
. 2
1. 6
O
. 9
13.
5'
7. 3
U
. 8
9. 2
14
. 1
17.
0 2.
7
22,
256
184,
229
17
. 1
1, 9
41
2, 7
11
32
604
3, 3
06
170
1, 3
60
290
3, 6
51
210
166
2, 1
32
862
3, 5
47
2, 1
05
3. 2
08
3, 1
76
90
29,
661
215,
213
14.
4 22
. 6
1. 8
12
. 8
20.
9 2.
5
16.
9 8.
9
34.
3
1. 7
1.
3
13.
3 7.
0
17.
2 13
. 3
15:
5 17
. 6
2. 6
34.
8
36.
8
591
2, 7
49
57
981
3,
142
190
2, 1
16
362
3, 6
21
423
226
2, 9
04
3,
151
4, 4
31
2, 0
71
4, 1
08
2, 2
70
115
35,
508
224,
955
17.
2 55
. 6
5. 1
14.
2 16
. 2
2. 9
22
. 6
8. 6
23
. 6
4. 1
1. 2
17
. 0
23.
8 24
. 1
12.
5
19.
4 14
. 2
2. 8
61.
4
43.
0
2, 4
12
2, 6
33
35
1, 6
84
3, 4
14
200
2, 9
16
329
3, 7
53
309
237
3, 0
37
874
3, 7
57
2, 1
34
464
2, 5
81
144
19.
3
28.
2 2.
8
24.
6 20
. 0
2. 7
23
. 8
7. 1
24.
1
2. 7
1.
5
17.
4 9.
7
19.
8 13
. 8
8. 6
13
. 0
4. 2
30,
913
203,
036
40.
5
29.
1
1, 9
20
2, 8
00
17
1,
190
2, 4
97
281
3, 4
27
565
4, 7
14
343
228
3, 0
63
1, 0
42
4, 8
69
1, 7
70
6, 0
05
2, 4
93
173
37,
397
246,
041
17.
3 26
. 4
1. 3
19
. 0
12.
5 3.
6
35.
4 12
. 9
25.2
2.
9 1.
6 14
.9
6.5
19.9
10
. 5
18.
8 15
. 8
4. 5
69 9
56.
4
2, 6
85
2, 5
26
65
1, 4
45
3, 4
64
91
4, 4
12
899
6, 2
20
448
207
3, 4
50
1, 3
50
4, 5
31
2, 0
60
7, 2
88
3, 0
99
116
44,
356
288,
942
18.
PIC
20
. 1
3. 5
18
. 0
12.
7 11
. 1
39.
0 18
. 8
29.
1
3. 8
1.
1
14.
2 9.
7
18.
2 10
. 4
'
17.
6 17
. 8
2. 1
101.
6
83.
7
4
2
I
1.
1
1.,
t
_
'N.
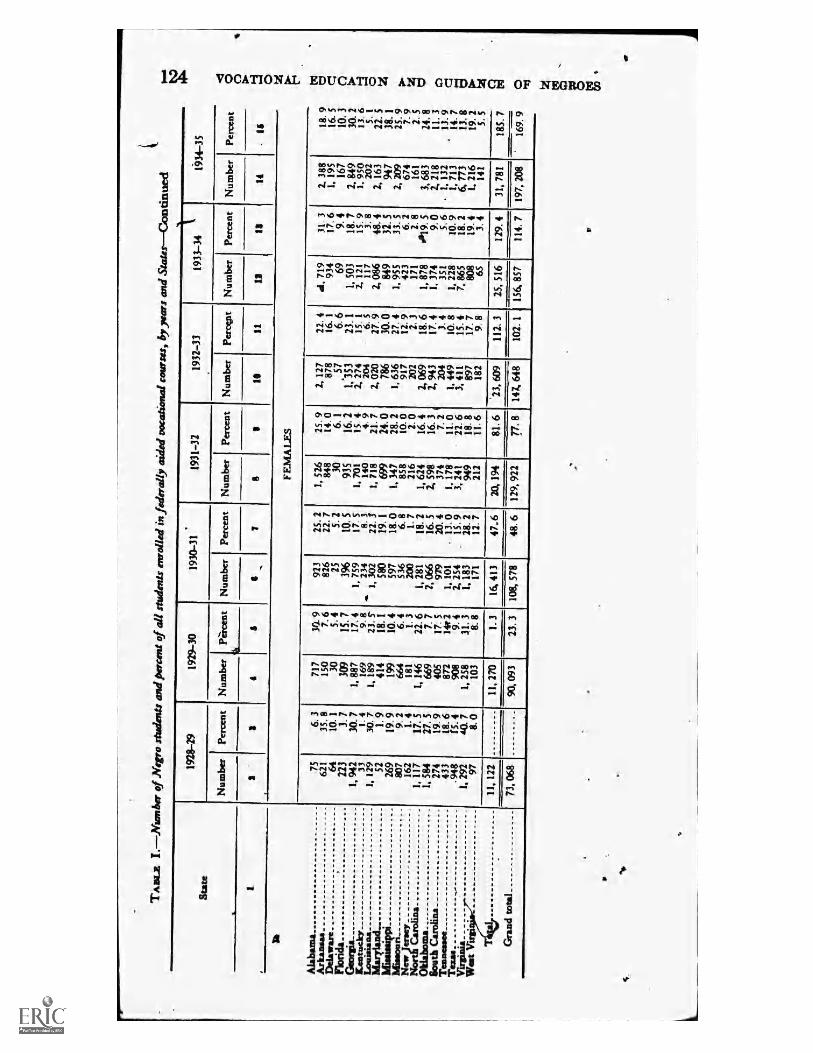
Nouvonaa
TA
BL
E I.
Num
ber of
Neg
ro s
tude
nts
and
perc
ent o
f all
stud
ents
enr
olle
d in
fede
rally
aid
ed v
ocat
iona
l cou
rses
, by
_yea
rs a
nd S
late
s C
ontin
ued
1929
-30
1930
-31
*
1931
-32
1932
-33
1933
-34
Stat
e
Ala
bam
a A
rkan
sas
Del
awar
e Fl
orid
a G
eorg
ia
Ken
tuck
y L
ouis
iana
Kte
sist
ipti
Min
oan
New
jers
ey
Nor
th C
arol
ina
Okl
ahom
a So
uth
Car
olin
a T
enne
ssee
T
ema.
V
irgi
nia
Wes
t V
Gra
nd t
otal
1928
-29
Num
ber
Perc
ent
3
Num
ber
Piik
ent
4
Num
ber
Perc
ent
7
Num
ber
8
Perc
ent
Num
ber
le
Perc
ejit
11
034-
35
Num
ber
13
Perc
ent
111
Num
ber
14
FEM
AL
ES
75
621 64
22
3 1,
942
33
I.
129
52
26
9 80
7 16
2 1,
117
1,
584
27
4 43
3 .9
48
1, 2
92
97
6. 3
35
. 8
10.
1
3. 7
30
. 7
1. 4
30
. 7
1. 9
19
. 9
9. 2
1.
4
17.
5 27
. 5
19. 9
t8. 6
E
5. 4
A
O.
7 8.
0
717
150 30
309
1, 8
87
169
1, 1
89
414
199
664
181
1, 1
46
669
405
872
908
1, 2
58
103
30.
9 7.
6
5. 4
15
. 7
17.
4 9.8
23.
5'
18.
1
10.
4 6.
4
1. 3
22
. 6
7. 7
17
. 5
1# 2
9. 4
31
. 3
8. 8
11,
122
73,
068
11,
270
1. 3
90, 0
93
23.
3
923
826 25
396
1, 7
59
234
1, 3
02
580
597
536
200
1, 2
81
2, 0
66
979
1, 1
01
2, 2
54
1. 1
83
171
16,
413
108,
578
25.
2 22
. 7
S. 2
10
. 5
17.
5 8.
3
22. I
19.
1
18.
0 6.
8
1. 7
18
. 2
16.
5 20
. 4
- 13
. 0
. 15
. 9
28.
2 12
. 7
47_6
48.
6
1. 5
26
848 30
93
5 1,
701
14
0 1,
718
69
9 1,
347
85
8 21
6 1,
624
a
598
374
1, 17
8 3,
241
94
9 21
2
25.
9 14
. 0
6. 1
16.
2 15
. 4
4.9
21.
7 24
. 0
28.
2 10
. 0
2. 0
16
. 4
16.
3 j
7. 2
11
. 0
22.
6 18
. 8
11. 6
20,
194
129,
922
81.
6
2, 1
27
878 57
1,63
53
2, 2
74
204
2, 0
20
786
1, 6
36
917
202
2, 0
69
2, 9
43
204
1, 4
49
3, 4
11
897
182
23,
609
7- 8
147,
648
22.
4 16
. 1
6. 6
23
. 1
15.
1 6.
5
27.
9 30
. 0
17.
4 12
. 9
2. 3
18
. 6
17.
4 3.
4
10.
8 15
. 4
17.
7 9.
8
112.
3
102.
1
d, 7
19
934 69
1. 5
03
2, 1
21
117
2, 0
86
849
1, 9
55
423
171
1, 8
78
1, 3
74
351
1, 2
28
7, 8
65
808
65
25,
516
156.
857
31.
3 17
. 6
9. 4
18
. 7
15.
9 3.
8
48.
4 32
.5
33.
5 6.
2
2. 8
06
19. 9. 0
5.
6
10.
9 18
. 2
19.
4 3.
4
129.
4
114.
7
2, 3
88
1. 1
95
167
2, 8
49
1.950
202
2, 1
63
947
2, 2
09
674
161
3, 6
83
2, 2
18
1, 1
32
1. 7
13
6, 7
73
1. 2
16
141
31,
781
197,
208
18.
9 C
, 16
. 5
10.
3 0
30.
2 13
6
2 22
. 5
38.
1
25.
9 7.
9 2.
5
24.
8 11
. 3
13.9
14
.7
13.8
19
.2
t; 5.
5
185.
7
169.
9
0
ç.
0 or
t-
I.
g1
6 *6
91
' S81
t 61
81
1 11
*Of
'Of
S '9
1 6
81
aoz
4L61
L
111
LS8
'9S1
181
41E
If'
9IZ
'1
fLL
f I
L 'I
U
I 41
RI Z
(8
9 61
191
*49
60Z
`Z
/1
6 19
1 6Z
W
Z
0S6
.1
6t8
L9I
56
1 88
C 7
6Z I
t t Z
81
6 01
9
'S
0 '6
S
'610
Z
'9
S S t 8 '1
6
*S1
L t '6
9 '4
1 f
1 f
I 10
1
1 69
8t9
.Li
f 9 1 91
'Z
Z
t
ZZ
.666
Z1
I 6
9 It
L
8LS
'801
f
*EL
f6
0606
89
0 `I
L
1
TrI
VIN
T-3
.4
lua.
.wad
tI
Jaqu
iriN
t I
3 tla
wad
II
saqu
inN
Sf-1
£61
tf-1
161
SI
"citu
nN
if-1
161
3 U
23.ta
d
8
Jaci
nN
U-1
161
laaa
iad
laqu
mN
3 M
ae('
£3cl
uinI
sl
01-6
Z.6
1
3 U
XU
ad
XX
ICII
ON
6Z1M
61
1112
03 Pu
tigJ
1112
°9
abat
i .1
, 4
1 I
41-
allr
3S
panu
ticro
p sn
ots
pup
ssva
4C4j
(SI
WIJ
W3
.r
.104
2 pi
rpm
AC
ilasa
pafu
.: pa
nolu
s nu
spru
s pa
r,A
W p
uv n
uopo
s oa
w fo
Asq
uotm
ri
erv
Perc
ent
0 -
11
0
5
. 4"
)
ori

SOLLSLIVIS
TA
BL
E
II.
Nai
rn b
er o
f cou
rses
for
Neg
roes
and
per
cent
of al
l cou
rses
in
fede
rally
aid
ed v
ocat
iona
l sc
hool
s, b
y ye
ars
and
Sta
tes
Stat
e
1
Ala
bam
a A
rkan
sas
Del
awar
e Fl
orid
a G
eorg
ia
Ken
tuck
y L
ouis
iana
M
arT
lanc
l ht
ram
atac
ipPi
D
oras
soun
N
orth
Car
olin
a O
klah
oma
Sout
h C
arol
ina
Ten
ness
ee
Tex
as
Vir
gini
a W
est
Vir
gini
a
Tot
al
Gra
nd t
otal
1,28
-29
1929
-30
Num
ber
47
87 2 13
87
1
54 9 63
28
76
62
117 30
81
35
11
803
5, 3
25
Perc
ent
12.
7 29
. 4
4. 0
5.
6
21.
6 . 9
35,
8
9. 0
22
. 8
17.
1
13.
2
21.
1
23.
8 9.
8
12.
5
11.
1
15.
5
Num
ber
4
58
76 4 25
124 5 24
87
16
87
55
155 58
12
2 67
10
978
6, 1
59
Perc
ent
16.
1
26. 9
9.
5
15.
0 22
. 3
2. 9
14
. 3
4. 7
21
. 9
6. 6
13
. 6
18.
7 27
. 2
12.
9 15
. 0
17.
6 11
. 1
21.
8
15.
7
1930
-31
Num
ber
84
92 3 26
165 2 47
9 13
5 14
120 90
50
80
201 88
12
1, 2
18
7, 3
41
Perc
ent
7
1931
-32
Num
ber
8
17.
4 22
. 9
8. 1
10.
6 30
. 2
1. 4
28
. 2
11.
5 22
. 0
5. 1
15.
9 20
. 7
8. 9
3
21.
1
19.
1
9. 5
51.
7
37.
8
144 87 4 81
172 3
97 8
152 24
15
8 91
17
4 81
291 66
17
1, 6
50
8, 4
17
Perc
ent
33. 4
18
. 9
25. 0
26
. 0
22.
8 1.
9
34. 0
8.
3
27.
4 7.
5
18.
6 21
. 6
26.
0 14
. 2
22. 0
12. 6
11.
9
93. 0
58.
1
1932
-33
Num
ber
le 12
5 86
3
53
172 -3
34
145 9
174
108
200 84
203 98
14
1, 5
18
7, 8
15
Perc
ent
11
23.
4 25
. 4
9. 1
17.
4 29
. 6
1. 9
9.
3
8. 1
29.
9 4.
3
17.
2 23
. 4
28.
4 14
. 5
20.
18.
5
11.
89.
0
46.
8
1933
-34
Num
ber
11 90
36
3
63
132 2 36
11
159 8
170 70
19
4 68
478 90
5
8, 1
103
Perc
ent
13
22.
4 11
. 5
7. 3
11.
7
22. 0
1.
4
16.
9 12
. 4
24.
5 4.
7
18.
3 15
. 0
31.
6 15
. 9
22.
8 13
. 6
5.;
101.
1
54.
0
1934
-35
Num
ber
14
Perc
ent
is
160
23.
2 45
13
. 1
4 7.
4
114
41.
3
151
21.
4 1.
2
14.
4 11
11
. 4
246
19. 9
16
7.
6
290
23.
8 89
18
. 2
266
29.
5 77
11
. 3
430
20.
1
113
20.
7 5.
5
2, 0
50
155.
3
10,
289
93. 4
A
cil
7k.
3
14.
1'
.15
10
I.
5 7

41.
a,
.6z-gt6I JaAo
ransiou! a3r39)01m
antra puneluaszad
S 'S9090 'E
1L
'hE
t9 '01t *tZ
018 '61 If
S9t '01L
'6ZtiZ
'0I6 II
186 '81888 'L
1 inc4 Pulu08 *10I
S55. 7L
19Z
LO
78 L
I.
OL
8 'I9 *O
S906 'I
1 *45EI91 'I
8 IItSt 41
4 F.9r 'tiPrloi
LL
E *E
90'S
6Z
1E
IE
'901
Z It
E I
9 IItI
ruAn.A
.ustilI *SI
8L0 *61
EL
1 IISL
L' IZ
f II6 'O
Zit'
Z 'It
tL6 'I Z
f'I r
i 5,8 'tZ
Zit
9 'LI
'116 '1Z
f6Z0
SEZ
9 81661
6 ,M
It'SI
SI!S *L
It6
S 'LI
anE
VI
10188
9 II$9
611L
tnO
PIS
Ual
E'S Z
raZ
1ZfIZ
9 .19ZL
EE
L D
E10f E
S '89ft
0 '8ZtO
Z9 1Z
991Im
1/41"0 lim°1
6 't1Z
8Z
'L8E
E 'S I
LS
1 61901
9 IIL
8S 01
9S9 'I r
S6stootrepic
5 61L
EZ
Z '61
ZL
I0 61
EL
I6 91
fOSI
Z 'Z
ZS51
6 919Z
11 91
f I 1Itugotto
.6101
Z I
Z Z
CI
6 .1i I
t 1f I
i IZ
I0 1
601
6L
aoisE
'961
I 'Sta
9 'Sif
1 "9tt
8 1Z
Ef 1
If6 'L
tfII .
1
Z If
80E, '6Z
tEZ
Z '8Z
611E
1t80Z
t '5191
E "tt
6Z1
E "tZ
611!da!".89i
I 619t
E -9I
Zt
t 'LE
8E0 II
SEE
EO
ff .6
1Z8 .1
01Pay12"711
0 'SfE
aS 'Z
EE
8II 1 E
t616 'O
Z66
6 'IL£8
Z -0Z
titi '6Z
101eurspoi
5101
Z'S
$1S 1
i I0 'S
PiE
"ISI
f 'tf 1
t ZS
tvaluslit It
90ZE
'OE
DI
1*L
lS61
9 '0Z011
8'st
06T1 '9Z
EL
I9 '9Z
191irdiaso
SolI It
6L0 '9Z
LO
I6 'It
EL
9 'SIZ
I1 II
9fS 01
SZIPP011
f '6II
1 'SS
1'S
IL
.,S
Z 1
EZ
'SI
0 'SI
anumpa
6 '9ZL
Z I
Z '9Z
LO
I6 If
III6 'L
Z*II
t 'EE
LE
I9 '6Z
SI IE
'SZZ
1essoinizv
E '0Z
SOZ
S 'CZ
90L
'1ZSL
1E
IZ181
,1 -9 1
SZT
8 IIIW
II 'SI
L8
inizycrirvt1
IIII
IIII
IIg
gL
II
I2
II
luaasadJaquinN
lusaiad.zaquinN
unatadiaqtunN
)uaandJaqum
Num
aradlacitunN
waw
a,/laquraN
uncuadiaciaraN
ems.
Sf-i161tf -f f 6 1
f11Zi6I
EE
-I f6I.
If-Of61
Of-6t6I
6Z-8Z
6I
"Pls Pen' sma449
`s*Pc'llxPuoY
vxaPPP 1112"1"fu!"012"; Ilv fo a" 4Y
7 PsawalPup w
rpn osa,ht fr

SOLLSIIVIS
TA
BL
E IV
. A
nwso
d an
d pe
rcen
t of
Fed
eral
fund
s ex
pend
ed fo
r vo
catio
nal
wor
k, b
y ra
ce, y
ears
, an
d St
ates
Stat
e 19
28-2
9
Am
bu
t
3
Ala
bam
a:
Whi
te__
_ _
_ _
_ _
$125
, 89
0. 8
4 N
egro
16
, 72
4. 9
4 A
rkan
sas:
W
hite
_ _
_ 90
, 81
1. 8
4 83
.1
16M
N
egro
18
, 39
7. 6
6 D
elaw
are:
W
hite
22
, 88
3. 7
2 97
. 9
Neg
ro
SOO
. 00
2.
1
Flor
ida:
W
hite
57
, 63
9. 5
4 91
. 8
Neg
ro__
--
---
5, 1
36.
93
8. 2
Ges
mn
144,
280
. 59
80
. 7
Neg
ro
34,
492.
23
19.
3 K
enti)
cky:
W
hite
13
6, %
9. 0
5 98
. 3
Neg
ro
2, 3
47. S
O
1. 7
L
ouis
iana
: W
hite
_ _
_ 93
, 52
6. 7
1 81
. 1
Neg
ro
21,
855.
22
18. 9
.]
la
nd:
i:x:1
te__
_ 74
, 22
4. 9
2 99
. 2
Ner
o _ --
--
_ _
592.
50
. 8
Ifis
siss
appi
: W
hite
95
, 11
2. 5
2 86
. 4
Neg
ro_
_ _
_ 14
, 96
0. 8
3 13
. 6
lifis
soon
: W
hite
19
7, 5
07.
18
r 98
. 5
s N
egro
3,
069
. 68
1. 5
N
ew J
erse
y:
whi
te
198,
920
. 12
98
. 1
Neg
ro
Nor
th C
arol
ina:
3,
890
. 30
1.
9
- 02
1.
Whi
te
131,
99
87
. 1
Neg
ro
e 19
, 36
0. 6
9 12
. 9
Perc
ent
038.
3
11.
7
1929
-30
1930
-31
Am
ount
4
$137
, 22
7. 4
1 22
, 51
5. 9
9
105,
778
. 19
22
, 33
1. 0
0
24,
202.
27
174.
SO
52,
955.
14
7, 0
37.
75
165,
553
. 80
36
, 09
1. 5
2
154,
637
. 90
4,
643
. 00
91,
713.
00
22, 4
97.
74
76,
832.
84
195.
00
110,
103
. 97
15
, 50
7. 7
0
225,
918
. 28
2,
500
. 00
202,
389
. 85
4, 4
58.
29
150,
832
. 06
20,
825.
22
Perc
ent
85.
9 14
. 1
82. 6
17.
4
99.
3 .
88.
3 11
. 7
82.
1
17.
9
97.
1
2. 9
80.
3 19
. 7
99.
7 .
3
87.
6 12
. 4
98.
9 1.
1
97.
8 2.
2
87.
9 12
. 1
Am
ount
$157
, 55
7. 6
4 24
, 21
8. 6
7
125,
961
. 36
22
, 970
. 75
25, 0
17.
83
165.
00
59,
895.
62
8, 1
35.
37
182,
273
. %
39,
960.
92
176,
086
. 83
5,
527
. 87
W6,
041
. 59
18
, 84
9. 1
9
84,
923.
70
1, 1
78.
29
120,
650
. 34
20
, 98
5. 1
9
243,
373
. 66
f,
9t.
80 ,
205,
745
. 83
5,
173
. 87
171,
586
. 22
22
, 42
6. 1
5
Perc
ent
86.
7 13
. 3
84.
5 15
. 4
99.
3 .
7
88.
0 12
. 0
82.
0 18
. 0
96.
9 3.
1
97. 0
3.
0
98.
6 1.
4
85.
2 14
. 8
99.
2 .
8
97.
5
2. 5
88.
4 11
. 6
1931
-32
Am
ount
8
$188
, 13
0. 6
9 25
, 25
0. 6
5
124
641.
40
31,
478.
71
27,
877.
44
199.
50
78,
033.
22
14,
845.
99
207,
604
. 65
36
, 00
2. 9
6
185,
884
. 92
6,
020
. 62
178,
367
. 56
21
, 35
0. 0
2
89,
1%.
53
1, 9
08. 6
6
1, 0
38,
623.
95
27,
849.
74
227,
473
. 71
3,
653
. 42
219,
843
. 19
4,
922
. 25
196,
447
. 11
23
, 30
5. 5
6
Perc
elit
88.
2 11
. 8
80.
1
19.
9
99.
3 .
7
84. 0
16
. 0
85.
2 14
. 8
96.
9 3.
1
89.
3 10
. 7
97.
9 2.
1
97.
4 2.
6
98.
4 1.
6
97.
8 1.
2
89.
4 10
. 6
1932
-33
Am
ount
10
$148
, 59
4. 4
3 13
, 89
2. 2
4
124,
976
. 28
23
, 01
4. 3
4
25,
525.
04
225.
00
71,
007.
95
11,
664.
50
169,
160
. 56
28
, 96
8. 9
7
165,
753
. 63
8,
875
. 50
112,
726
. 35
22
, 92
3. 4
3
81,
694.
14
1, 9
02.
21
131,
814
. 58
26
, 42
1. 3
3
207,
099
. 66
3, 5
53.
88
190,
996
. 58
5,
350
. 56
198,
086
. 52
23
, 7%
. 77
Perc
ent
11
86.
1
13.
9
84.
4 15
. 6
99.
1
. 9
85.
9 14
. 1
85.
4 14
. 6
94.
9 5.
1
83.
1
16.
9
97.
7 2.
3
83.
3 16
. 7
98.
3
1. 7
97.
3
2. 7
89.
3 10
. 7
1933
-34
Am
oun
t
12
$116
, 21
3. 6
7 7,
701
. 61
114,
883
. 06
19
, 22
3. 7
1
24,
481.
97
329.
34
64,
862.
30
11,
458.
15
155,
008
:21
21,
592.
85
148,
083
. 72
5,
621
. 68
103,
676
. 91
19,
457.
03
73,
9%.
11
1, 6
52. 0
4
117,
821
. 93
22
, 97
3. 2
6
187,
262
. 50
1,
900
. 00
180.
481
. 16
5i
888
. 48
173,
5., 6
0 18
, 97
5. 7
3
-171
,
Perc
ent
1914
-35
Am
ount
13
93.
8 6.
2
85.
7 14
. 3
98.
7 -
1. 3
84.
9 15
. 1
87.
8 12
. 2
96.
3 3.
7
84.
2 15
. 8
97.
8 2.
2
83.
7 16
. 3
99. 0
1.
0
96.
8 3.
.2
90.
1
9. 9
14
$186
, 73
1. 0
0 27
, 83
1. 2
4
151,
679
. 00
27,
104.
74
37,
945.
37
2, 0
78.
91
99,
089.
34
14 8
68.
39
223,
395
. 32
32
, 08
8. 1
4
194,
050
. 84
4,
052
. 37
140,
383
. 05
25,
591.
48
94,
610.
50
2, 5
54.
50
158,
824
. 37
33
, 489
. 72
262,
113
. 10
3,
642
. 81
265,
481
. 48
7,
112
. 52
225,
147
. 49
27
, 31
8. 6
2
le
87.
0 13
. 0
84.
8 15
. 2
94.
8 5.
2
88.
5 11
. 5
87.
4 12
. 6
97.
9 2.
1
.84.
6
15
4
97. 2. 6
82
. 6
17.
4
98.
6 1
4
97.
4 2.
6
89.
2 10
. 8
1
_ __
_
am.
_ __
_ __
7
7
,
_ _
9
Arc
ent
Vai
l=M
M.
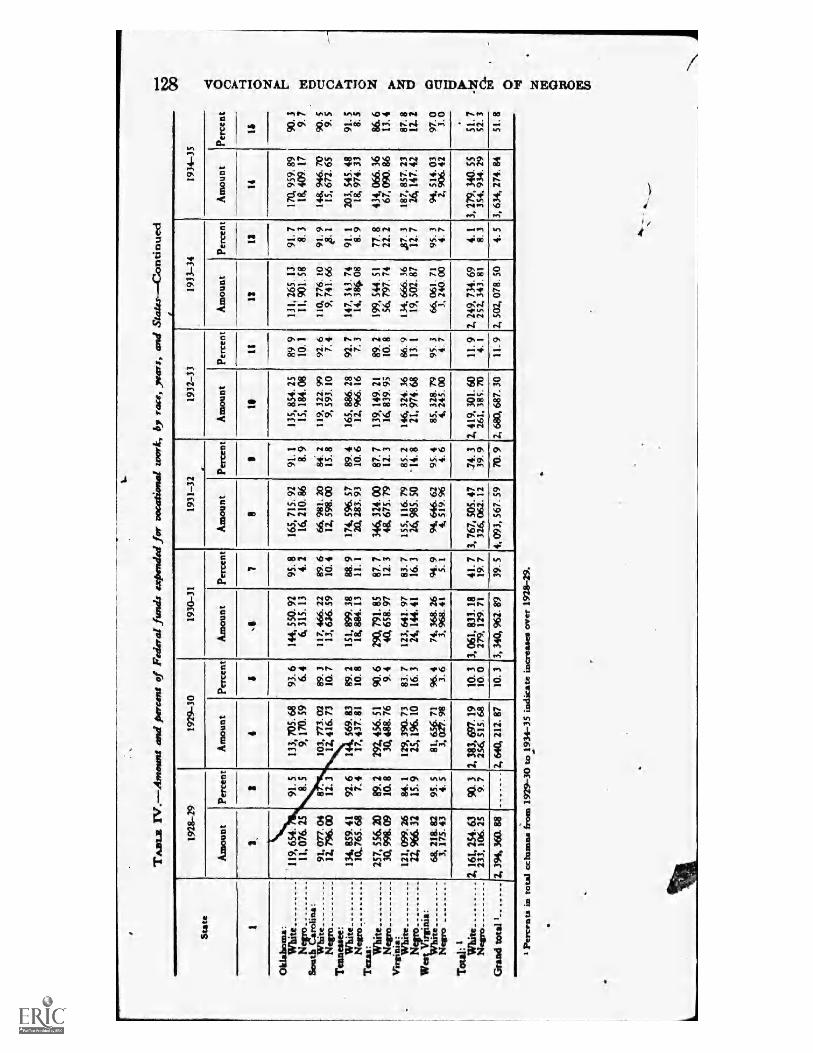
1VNOLIVDOA NOtIvonaa
TA
BL
E W
.Am
ount
and
per
cent
of
Fede
ral f
unds
exp
ende
d fo
r vo
catio
nal
wor
k, b
y ra
ce,
year
s, a
nd S
tate
sCon
tinue
d
Stat
e 19
28-2
9 19
29-3
0 19
30-3
1 19
31-3
2 19
32-3
3 19
33-3
4 19
34-3
5
Am
ount
Pe
rcen
t A
mou
nt
Perc
ent
Am
ount
Pe
rcen
t A
mou
nt
Perc
ent
Am
ount
Pe
rcen
t A
mou
nt
Perc
ent
Am
ount
Pe
rcen
t
1 3,
3
4 1
1 7
8 IS
11
13
13
14
15
Okl
ahom
a :
Whi
te
119,
654
. 91
. 5
133,
705
. 68
93
. 6
144,
550
. 92
95
. 8
165,
715
. 92
91
. 1
135,
854
. 25
89
9
131,
265
. 13
91
. 7
170,
959
. 89
Ner
o 11
, 076
. 25
8.
5
9, 1
70.
59
6. 4
6,
315
. 13
4.
2
16,
210.
86
8. 9
15
, 18
4. 0
8 10
. 1
11,
901.
58
8. 3
18
, 40
9. 1
7 9.
7
Sout
h C
arol
ina:
91
, on.
04
8 10
3, 7
73.
02
89.
3 11
7, 4
66.
22
89.
6 64
981
. 20
84
. 2
119,
322
. 99
92
. 6
110,
776
. 10
91
. 9
148,
946
. 70
N
egro
12
, 79
6. 0
0 12
. 3
12,
416.
73
10.
7 13
, 63
6. 5
9 10
. 4
12,
598.
00
15.
8 9,
593
. 10
7.
4
9, 7
41.
66
48.
1 15
, 67
2. 6
5 9.
5
Ten
ness
ee:
Whi
te
134,
859
. 41
92
. 6
1 56
9. 8
3 89
. 2
151,
899
. 38
88
. 9
174,
596
. 57
89
. 4
165,
886
. 28
92
. 7
147,
343
. 74
91
. 1
203,
545
. 48
91
. 5
Neg
ro
10,.7
6S.
68
7. 4
17
, 43
7. 8
1 10
. 8
18,
884.
13
11.
1 20
, 28
3. 9
3 10
. 6
12,
966.
16
7. 3
14
, 38
4. 0
8 8.
9
18,
974.
33
8. 5
Tez
asith
ite .
257,
556
. 20
89
. 2
292,
456
. 51
90
. 6
290,
791
. 85
87
. 7
346,
324
. 00
87
. 7
139,
149
. 21
89
. 2
199,
544
. 51
77
. 8
434,
066
. 36
86
. 6
Neg
ro
30,
998.
09
10.
8 30
, 48
8. 7
6 9.
4
40, 6
58.
97
12.
3 48
, 67
5. 7
9 12
. 3
16,
839.
95
10.
8 56
, 79
7. 7
4 22
. 2
67, 0
90.
86
13.
4 V
irgi
nia:
W
hite
12
1, 0
99.
26
84.
1 12
9, 3
90.
73
83.
7 12
3, 6
41.
97
83.
7 15
5, 1
16.
79
85.
2 14
6, 3
24.
36
86.
9 13
4, 6
66.
36
$7.
3 18
7, 8
57.
23
87.
8
Nsp
ro.
Wem
irge
mia
:
22, 9
66.
32
15.
9 25
, 1%
. 10
16
. 3
24,
144.
41
71.
1V8.
il
16.
91.
? 3 26
, 98
5. 5
0 '
14.
9.. 8
21,
974.
68
8.1,
13.
9. 1
19,
502.
87
611,
12.
9.. 7
24
91,
514.
147.
42 71
12.
973.
3 2
Neg
ro
_ __
.. _
_
_ lil
t 41
94. i
81; g.
a 94
1-.1
1
ftt.
6 R
I 111
1?)
T44
13..
Tor
l ;
Tot
al:
1 .
Whi
te
2, 1
61,
234.
63
90.
3 2,
383
, 697
. 19
10
. 3
3, 0
61,
833.
18
41.
7 3,
767
, 50
5. 4
7 74
. 3
2, 4
19,
301.
60
11.
9 2,
249
, 73
4. 6
9 4.
1
3, 2
79,
340.
55
51.
7 N
egro
23
3, 1
06.
25
9. 7
25
4 51
5. 6
8 10
. 0
279,
129
. 71
19
. 7
324
062.
12
39.
9 26
1, 3
8S.
70
4. 1
25
2, 3
43.
81
8. 3
35
4, 9
34.
29
52_
3
Gra
nd t
otal
1 2,
394
, 36
0 88
1
2, 6
40,
212.
87
10.
3 3,
340
, 96
2. 8
9 39
. 5
4, 0
93,
567.
59
70. 9
2, 6
80, 6
87.
30
11.
9 2,
502
, 07
8. 5
0 4.
5
3, 6
34,
274.
84
51.
8
'Per
cent
s in
tot
al =
lum
ina
from
. 19
29-3
0 to
193
4-35
ind
icat
e in
crea
ses
over
192
8-29
.
_,
.
I
.
.
_
.
96
/ I
,
I
.....
_ _
- _
_
. .
Whi
te
.
-
A

SDIISLLVIS
TA
BL
E V
.' A
ge-g
rade
dis
trib
utio
n of
Neg
ro h
igh-
scho
ol p
upils
in
33 S
tate
s an
d th
e D
istr
ict
of C
olum
bia,
acc
ordi
ng t
o ge
ogra
phic
al r
egio
n
Ase
1
14 y
ears
or
less
_ 15
16
17
18
......
. AD- 19
20
21
22
23
24
yea
rs o
r m
ore
Gra
de 8
Mal
e
3
Fem
ale
3
Tot
al
4
Gra
de 9
Mal
e Fe
mal
e T
otal
Gra
de 1
0
Mal
e
8
Fem
ale
Tot
al
I.
Gra
de 1
1
Mal
e
11
Fem
ale
13
Tot
al
13
Gra
de 1
2
Mal
e
14
Fem
ale
Ii
Tot
al
Is
Gra
nd t
otal
Mal
e
17
Fem
ale
18
Tot
al
le
7
SOU
TH
AT
LA
NT
IC R
EG
ION
275
129
81
48
18
3 5 1 a
Tot
al
Perc
ent
Nor
mal
Pe
rcen
t
Ove
rage
_-
Perc
ent
Und
erag
e Pe
rcen
t 11.
Eh
388
192 96
39
12 3
..... 1
663
321
177 87
,30 6 5
5W
20.
1
731 16
. 8
1, 2
91
18.
1
292
206
136 76
29
14
4 2 2 2 2
765 27
. 5
572
364
211 89
44
11
2 1
1, 2
94
29.
7
275
49.
1
388
53.
1 66
3 498
51.
4 65
. 1
936 72
.3
864
570
347
165 73
25
6 3 2 2 2
2, 0
59
28.
8
1, 4
34
69.
6
87
196
283
1%
350
546
176
305
481
111
144
255
58
70
128
26
22
48
7 2
9 6
2 8
3 4
4 1
5
672
1, 0
95
1, 7
67
24.
1 25
. 1
24.
7
372
655
1, 0
27
55.
4 59
. 8
58.
1
285 50
. 9
343 46.
9 62
8 26
7 48
. 6
34.
9 35
8 27.
7 62
5 30.
4 21
3 24
4 45
7 31
. 7
-22.
3 25
. 9
87
196
283
12.9
17
. 9
16.0
243
74
137
53
24
10 4 8 5
550 19
.8
259 47.
1
193 35
. 1
98
17.
8
56
136
267
209
118 60
17
tO 7 4 4
888 20.
4
476
53.
6
80
210
404
331
207
113 41
20
11
12 9
1, 4
38
20.
1
735 51
. 1
220 24
.8
192*
21
. 6
413 28
. 7
290 20
2
6 27
47
52
52
34 9 3 2 4
236 8.
5
104
44.
1
52
22.
0
80
33
9
12
80
130
73
34
11 6 3 2
352
'
8.
1
203
57.
7
56
15.
9
93
26.4
7 39
12
7 18
2 12
5 68
20 9 5 6
588 8.
2
307 52.
2
108 18.
4
173 29
4
684
632
577
409
246
130 49
22 8
11
15
2,78
3 10
0. 0
1,50
8 54
. 2
1010
36
. 3
265 ?-
5
1, 2
13
1, 8
97
1, 0
54
1, 686
959
1, 536
611
1, 0
20
317
563
130
260
32
81
19
41
10
18
8 19
7
22
4, 3
60
7,
143
100.
0
100.
0
2, 6
58
4, 1
66
60.
9 58
. 3
1, 2
21
2, 2
31
28.
0 31
. 2
481
746
11.
0 10
. 4
I So
uth
Atla
ntic
reg
ion:
D
elaw
are;
Dis
tric
t of
Col
umbi
a, M
aryl
and,
Ken
tuck
y, N
orth
Car
olin
a, S
outh
Car
olin
a, V
irgi
nia,
and
Wes
t V
irgi
nia.
_
-
_
. ..
_ ..
7
1 1
1
ql
+.4
9
/ 1
b

OZ
199ZL
OS
L16
ZO
Z61
1601Z
66
IS5119rE19SZ
61911Z
i9
LI
6Z6tIt/I
Lt
tit9ttZ
116ZN
EI
Si
CZ
99rs1L
IE91Z06O
Z
tZ89901SL8fSI
9L
I81
A.
SZSL
SS.
IS196
LIZ
1E1
Z61
ZO
IL
89Z
81St58EO
Z86Z09t
9SESLSt!661/E
t
5156
09Z
Nom
ax
pts
6 If9,5
t;)troo
0=4
tot1
99E
'6Z998
6 'SS119 Gt
fr '85*6U
41
0 '001196
1 *68s1
0 '6E089
6'1&
¡
0 '001ftL
1
11Z
16
9C
T81
8161
6Ef9
8t1O
Z1
GU
,S81
HS
96Z159
ILE
S198ff
LO
956t
t *6186
8 '91061
-55-
ER
Z
56SI8Z19S9918
'OZ
61E
S
OR
Z
LIS9SS
9 'Et
-951
0 91£9
ilt611
Z '101
r91
S '6Zoft
tSSO
116If99R
S IZ
SE10E911ft
6-es¿SI
9 'OS661
-zrZ
99
9--
-
ElIC
865911619Z
1O
f
S16E
S rc8658 In
Z 'PtO
tt 'I
661SE
Ell
OS
£1
9f01OS
66ZO
Z01i
r91
Il
19811901581Z
1 I
L'Itos
8 '6EOL
1
S
Lot
s -ttLE
,
E*
96ZRE
tit£01O
S
f56S
6 '1E»
6681
90ZE
519 61es
1 If59
9 191981 '991195
6 '8ZZ9f
8 '8Z£58
9f
S '6S10i
Z '6Z605
I'L
SK
C
018SrIS66Zfl
191
9 'LLSE
fe
Et
6t08t0Z
tf 1
S 'LEtt
IW
WW
WW
loIM
NO
IO311 rIV
ILL
N33
IIMO
S
SI-
aj111213A
t1
31*VN
I
1,101 vpuitio411.
aivuzazi
Ial*P41
tl ePu0
¡VI 0/
IIMIO
1I
atv141
119
aretnaa
OI aP*19
0111U12.4
-------
6 aPlig3
*MN
STnai
so use4401
1na3JadallsJipun
Itie3Jad62113aA
0
lUaand
111111.10N
%0110Jej
ai001ares4trE
t
sly
pentinu0or-880:24 p2t/041o; hyuct=
'veqiimpro fo
PYPIG
.Puv "M
tS4us siY
4n4tonvilf.tv oaw
fouom
viiim PpD
A:-4y--.A
Tuna.

21 22 23 24ye
ars
orm
ore
Tot
alPe
rcen
t
,Nor
mal
Perc
ent
Ove
rage
Perc
ent
Und
erag
ePe
rcen
t
14ye
ars
orless
IS 16 17 18 19 20 21 22 23 24ye
ars
or m
ore
Tot
al.."
`
Perc
ent..
..N
orm
alPe
rcen
t
Ove
rage
__...
..Pe
rcen
t01
,
Und
erag
ePe
rcen
t
11
2
I1
358
544
1R. 0
16. 7
902 17
. 2
2
585
914
1, 4
9929
. 328
. 128
. 6
177
260
49. 3
47. 8
181
. 284
50. 4
52. 2
emam
mom
m.
437 48
. 4
465 51
. 6
p.
299
558
857.
*.51
.261
.157
.7
286
356
642
48.9
38.9
42.8
2 2 2
I3
4-7
122
42
23
2
19 6 5
458
176
71,
225
433
801
22.9
I23
.623
.421
.724
.6
233
429
662
181
433
SO. 9
55. 9
54. 0
41. 8
54. 1
"19
9 43. 4
251
450
199
258
32. 7
36. 7
45. 9
32. 2
2687
113
5311
05.
711
.39.
212
.213
.7
1,23
4 23. 5
614 49
. 8
457 37
. 0
163 H 2
12 2 2 3
159 7.
9
74 46. 5
62 38 9
21 14. 5
NO
RT
hER
NR
EG
ION
*I
17 9 2 20 14 3
33 1S 9 2 2
SO 14 14 4 22 14 3
430
503
390
160 44 20 4 1
682
1,11
268
31,
186
378
768
121
281
2468
121
4 1
701.
6
1
6113
11.
01.
31,
553
36. 4
17 24. 3
33SO
54. 1
38. 2
53 7S. 7
2881
45. 9
61. 8
933 60
. 1
889 31
. S
365 72
. 3
620 39
.9(
,52
4 27. 7
1
3, 4
42 33. S
2, 2
98 66. 8
1, 1
44 33. 2
95 334
401
243 93 24 4 1 1
1,19
728
. 0
182
559
593
271
110 233 2 1
1,74
4 29. 0
735 61
. 415
266
. 1
367 30
. 7
957.
9
410 23
. 5
182 10
. 4
177
893
994
514
203 477 3 1
2, 9
41 28.6
1, 8
87 64. 2
777 26_
4
277 9.
4
13 83 236
257
167 60 153 1 1
836 M
. 6
493 58
.9
247 29. 5
96 11. 5
917
546
142
629
0 69 16 2 2 1
1, 4
51 14. 2
8,7 61
. 1
380 26. 2
184 12
.7
22 258
697
683
457
129 315 3
2, 2
87 22. 3
1, 3
80 60. 3
617 27
. 4
280 12
2
517
24
13
iq3
225
384
6. 9
7. 3
113
187
50. 2
48. 7
5411
624
030
2
5481
25 8
211
8 4 5
1,99
310
0. 0
964 48
. 4
927 46
. 5
102 5.
1
18 6 4 1
3, 2
51 100.
0
1,79
3 55. 2
41 14 6
5, 2
44 100.
0
2, 7
57 52. 6
1, 2
03 37. 0
255 7.
8
2,13
0 40. 6
357 6.
8
3 21 56 160
177
136
41 12
615 14
. 4
337
54. 8
198 32
. 2
80 13 0
2 1813
329
325
911
0 31 11
2
859 14
. 3
552 64
. 3
154 17
. 9
153 17
8
5 39 189
453
436
246 72 237 1 3
1,47
4 14. 3
889 60
3
352 23
. 9
233 15
8
558
950
1 08
882
250
125
4 67 17 9 3 2
4,27
110
0. 0
2,51
558
. 9
1,48
534
. 8
271 6.
3
908
1, 4
501,
574
1, 1
13 685
203 50 15 2 4
1, 4
662,
400
2, 6
62I.
935
1, 1
8645
711
7 32 113 6
6, 0
0410
, 275
100.
010
0. 0
3, 9
896,
504
66. 4
63. 3
1,49
62,
981
-
24. 9
29. 0
519
790
v8.
67
7
9B
ooth
Cen
tral
. reg
ion:
Ala
bam
a, F
iori
da,
Mis
siss
ippi
,an
d T
enne
ssee
.So
uthw
est
regi
on:
Ark
ansa
s, K
ansa
s, L
ouis
iana
,O
klah
oma,
Ten
s.N
ortk
ern
noon
:C
alif
orni
a, C
onna
ctic
ut, C
olor
ado,
Illi
nois
, Ind
iana
, Iow
a, M
assa
chus
etts
, Mkh
igan
;N
.Je
rsey
,N
ew Y
ork,
Ohi
o, P
enns
ylva
nia,
Was
hing
ton,
Wis
cons
in
1.11
1406
.111
m 1
11
......
_
1t
25
8
.
14 1
c/2

132 VOCATIONAL EDUCATION AND GUIDANCE OF NEGROES
TABLE VI.Grcide level attained by non-graduates, according to size of community
Grade level attained
Fewer than2,500
2,500 to24,999
25,000 to,99,999
100,000 to499,999
500,000 andmore To;)a I
_
Male Fe-male Male mFaeie Male Fe-
meal MaleFe-
male MaleFe
male MaleFe-
male
1 I 3 4 5 I 7 8 111 11 11 13,
7 i 1 6 6 2 2 13 2 2 7 25 49 R8 16 19 89 1 12 293 392 105 110 29 22 532 65!9 80 102 145 262 274 456 435 557 126 148 1, 060 1. 52!10 49 85 128 ? 2 30 247 410 466 645 159 273 1, 049 1, 64:11 26 77 78 12 7 99 223 349 445 145 210 697 1, 08:12 7 14 19 39 23 45 15 1 201 49 98 249 39;No response
1 1 3 6 2 4 __ _ _ 3 6 11Tina! 180 298 466 777 941 1, 534 1, 520 1, 964 535 779 3, 642 5, 35:
MBLE Number qf persons who pursued given curriculums while in high school, accordingo to size of communities in u4.4kools were located47-vP411"P"-
Curriculum pur-sued
1
AcademicTradesIndustrial arts_Teacher-training..Apiculture .Home economics _
CnmmercialOtherNo response_ _
Total.. w.
Size of community 'V
Fewer than2,500
AcademicTradesIndustrial arts-%Teacher-training_Agriculture _Home economics. _
Commercial9.therNo response....
Tetal
Grad-uates Drop
3
2,500 to24,999
Grad-uates Drop
25,000 to99,999
Grad-uates Drop
100,000 to499,999
Grad-uates
7 8
Drop
500,060 andmore
Grad-uates
11
Drop
Total
Grad-uates
13
Drop
=111.1=.
13
MALE .
12754
1016
1
112
11 261
441
142
38846162527
312704
176 180 581
19726284
201
67212
466
652748715
3
21088
8
939
6347897
4889
976
941
1,0772285025
1
851
1236
1, 569
92527877745
67144
13
1, 520
42360SI
3
e I39706
189132
70
26
51764
653 535
667403208
784714
11336226
7/20273
207821
133403
37
3, 918 3, 642
FEMALE
173
320
253
5102
268
1852
.392
71
242
57921
1411
18014
131
4172
1036
1
18412
1069
298 054 7n
1, 1186
3979
336240
1299
1, 785
9617
5143
1292
30, 142
2, 177524867
185256134
13
1, 534 2, 932
1, 318666121
3189134157
15
1, 944
40
678682213
124261137
6
206
129225
787
309
4, 725128113320
6
54135
779 7, 348
3, 10616614511S
7865401507
40 4
S, 352,
11
____SL.... ____
................. _ _
.. _ _ ........____ _ _,_ ____ _ _ ....... __ - ___
IIMMININ1191111.
MT
A)
...... .
ere ee
d M.
1111 11
5
2,
.....
My
S
1,
24
.mr
.
VI4S
7=
-
1,
- ---ft =--
r
,
.
3 4
N
=k1Ma
W
.
t.

2,50
0
Few
erth
an 2
,500
*M.
e
q.
STATISTICS 133
TABLE VIII. Number of graduates and nongraduates indicating whether or not they were employedduring their high-school attendance, by size of community
Employed duringhigb-ochool career.
1
YesNo -
No mponse_
Total - _ - _ _ _
YesNoNo response_
Total_ _ - - -
Male graduates by siu of community
2 2 4
103 363 51970 210 410
3 8 10
176 581 939
854704
11
1, 569
6
347298
8
653
7
2, 1861, 692
40
3, 918
.1=.Female graduates
55210
3
268
325724
5
1, 054
3941, 375
16
1, 785
7122, 199
21
2, 932
321 1, 807974 5, 482
14 59
1, 309 7, 348
MAle nongraduates by size of community
9085
5
180
gr*4
219245
2
466
le
411516
14
941
11
703792
25
1, 520
12
186344
5
535
f
IS
1, 6091, 982
51
3. 642
Female nongraduates
57235
6
298
195577
5
77
292411, 211
31
1, 534
4601, 486
18
1, 964
176 1, 180595 4, 104
8 68
779 5, 352
1
f
a
e.
1/
as. -
_ _ _
_
111
.11
8 9
ti6,
_
_
7:1
LEi .§,
,,
q.
441
1.

APPENDIX B
Organization, Personnel, and Inquiry Forms
ORGANIZATION AND STAFF
Because of the nature and scope of the survey it was necessary to centralizeits administration and supervision in the Office of Eciucation. A Director,Associate Director, and four Regional Directors devoted their entire timeto its administration and supervision. The Regional Directors had officesat Richmond, Va.; Birmingham, Ala.; Houston, Tex.; and Columbus,Ohio, for regions 1, 2, 3, and 4, respectively. They supervised the initiationof the survey in each 'State and maintained contacts between the centraloffice and the State staffs. In addition to the central staff, each State unitwas under the direction of a Project Manager and a Supervisor. In some
%casts the functions of both were performed by one person. In most casesthese persons were full-time employees who were loaned by school systems,colleges, and social agencies.
While the survey was a research project, it was also designed to providework for unemployed "white collar" workers on the relief rolls. The majorpart of the interviewing and collecting of data for the study was done bysuch workers. There were approximately 500 of them. Thirty-five per-cent held the bachelor's dègree, and 50 percent had from 1 to 4 years ofcollege education. Twelve held the master's degree. All the nonreliefworkers (supervisors and prOject managers) had university training, sixheld the doctor degree or its equivalent.
PERSONNEL
The chief types of experience the workers had before employment in thestudy, and the number of persons in each type, follow:
Teaching 170Social work 41Tabulating and statistical work 115Stenography and typing 85Filing 213Miscellaneous research work 246
Other.. vocations followed by three or more persons include:, Ministry,medicine, law,' nursing, librarianshiP, insurance, and recreational work.The number, education, experience, and other data concerning the reliefworken are shown in the following table:
134
OP
[
li
1
.
s
id
s'#

ORGANIZATION, PERSONNEL AND INQUIRY FORMS 135
GENERAL CENSUS OF RELIEE PERSONNEL
1. Number of relief workers: Male, 205; female, 274; total, 479.2. Marital status: Married, 221i single, 258.3. Number having given educational preparation:
1. High-school education, 752. Attended college, 2273. Bachelor's degree, 131
4. Graduate work, 345. Master's degree, 12
4. Number having designated types of experience:
Teachers 170Clerks 119Secretaries 90Typists 57
Social workers 41
Investigators 35
Stenographers 28
Supervisors 20
Recreational directors 14
Unskilled laborers 13
Skilled laborers 12
Librarians 7
Preachers 5
Project directors 4
Inturance agents 4
Nurses 4
Principals 4
Lawyers 4
Addressographers 3
Salesmen 3
Business managers
Bookkeepers 3Printers 2Editors 2Farmers 2Morticians 2Correspondent 1
Photographer 1
Architect 1
Druggist 1
Proprietor 1
Matron 1
Registrar 1
Accountant 1
Wi4r. 1
MusicianReporter .
Dentist 1
GardenerContractor.Designer 1
Real estate agent 1
5. Number halving special qualifications:Courses in
Tests and measurements. . . . 139
Guidance 122Trades . 91
Statistics 72
Tabulating 44
p.
779100-38--10 .
Experience i..nInterviewing 246Filing 243Typing 139Scoring tests 133Tabulating 115Shorthand 63
. .
.. .c
1
1
..............
. . ,
.1
... ..... .
.
....
ti
1
r. .
1
.
,
...

136 VOCATIONAL EDUCATION AND GUIDANCE OF NEGROES
INQUIRY FORMS
Inquiry forms Ac and Ah were for colleges and high schools, respectively.They were for the purpose of collecting information concerning organiza-tion, administration, curriculum offeri4s, vocational curriculum trends,enrollment and registration trends, .and use of Federal funds for vocationaleducation. Usable returns were received fróm 73 colleges and 207 highschools.
Inquiry form E was for the purpose of obtaining information concerningthe content and methods of teaching representative courses in vocationaleducation and guidance in high schools. The types of information soughtabout the courses were: Requirements, sequences, purposes, assignments,methods, tests, and materials. There were 968 of these forms that wereusable.
Inquiry form F was designed to ascertain 'facts concerning housingfacilities and amount and kinds of equipment available for vocationalcourses. Although 293 of these forms were received the lack of comparabledata in some oases and the inadequacy of data in other cases considerablyreduced the number that were usable. (Data not included in this report.)
Inquiry forms I and J were for evening and proprietary schools andsocial agencies, and were designed to gather the same general informationfrom these institutions as was obtained from colleges and high schoolsthrough Ac and Ah. Returns were-received from 64 evening and proprie-tary schools and 70 social agencies. Howéver, all these returns were notusable.
Form D was designed for the purpose of collecting personnel data frompupils enrolled in the last 4 years of high school. Vie specific objectiveswere to collect information concerning certain socio-economic backgroundfactors; present educational status, and educational and vocational interestsand plans. Usable returns were received from 27,984 pupils.
Form G is another personnel form. It was used to collect informationconcerning teachers of vocational education and guidance in high schoolsfor Negroes. Information was gathered concerning their academic, pro-fessional, and vocational training, and their teaching and trade experience.The teachers, personally, received the form from the interviewers andwere assured of the confidential manner in which the data would betreated. After filling in the form each teacher returned it directly to theOffice of Education in a self-addmsed envelope. Data were received from1,001 teachers.
Form H also has to do with personnel data. Its purpose was to collectfacts from students in evening schools concerning course registration,previous education, job experience, and the student's opinion concerningthe value of vocational courses prel4iously taken. Returns were receivedfrom 2,540 students.
.
-

ORGANIZATION, PERSONNEL AND INQUIRY FORMS 137
Form K was a guidance inquiry for the purpose of gathering informationconcerning the guidance program, personnel, and policies in certain insti-tutions. The institutions to which form K was sent had previously beenidentified by the use of form X, Aich among other things requested insti-tutions to indicate whether or not they had a guidance program. Although602 institutions answered in the affirmative, only 129 high schools and 35colleges returned form K. It is assumed that most or those that did notreply realized, after the receipt of form K, that they did not have anyguidance program. This belief is strengthened by many letters expressingthis view.
Form M obtained personnel information from 368 students in nurse-training institutions. Data collected on the form included previous train-ing, reasons for vocational choice, plans for the future, and education andoccupation of parents. (Data not presented in this report.)
Forms L and Z were designed to obtain personnel information concerningformer pupils and graduates of high schools from 1926 to 1935, inclusive.Usable information on these forms was supplied by 20,260 persons. Themajor purpose of this inquiry was, to ascertain the relation, if any, betweenthe occupational status and previous schooling and background. Data weregathered concerning such items as occupation of parents, curriculumpursued, subject preference, extracurriculurn participation, occupationalpreference and experience, vocational training, age and grade level at timeof leaving school, and reason for leaving school.
Form X, a preliminary inquiry designed t identify institutions offeringcourses in vocational education and guidance, was sent to all secondaryschools and colleges for Negroes in January 1936. The data requested con-cerned number and kind of curriculum offerings, number of grades or yearsoffered, specific offerings in vocational education, extent of guidance orpersonnel services. Responses were received from all the colleges forNegroes, all of the 4-year and senior high schools, and many secondaryschools offering 1 to 3 years of work. It was possible from this prelimi-nary survey to select institutions for special purposes of the surk/ey.
o

NATIONAL SURVEY OF VOCATIONAL EDUCATIONAND GUIDANCE OF NEGROES
I.TECHNICAL ADVISORY COMMITTEE
W. HARRY BARiata, President National Medical Association,Whiladelphia, Pa.
J. T. CATER, President, National Association of Collegiate Deans and Registrars in Negro Schools,
Talladega College, Talladega, A.
EUGENE CLARY., President, Miner Teachers College; First Vice President of the Federation of
Colored Catholics el the United States, Washington, D. C.
Rums E. CLEMENT, President, National Association Teachers in Colored Schools, Louisville
Municipal College, Louisville, Ky.
MRS. KATHERINE M Cool', Chief, Special Problems Division, Office of Educatiori, United States
Department of the Interior.
MRs. V. J. Coos, Prisident,National Auociation of Colleie Women, Baltimore, Md.
J. D. Djxos, Supervisor of Negro Schools (Representing Me State Agents for Negro Schools),
Atlanta, Ga.
T. L Damon, President, Negro Bar Association, Washington, D. C.
J. F. DRAKE, Prudent, Conference of Negro Land-grant Colleges, State A. & M. College,
Normal, Ala.
GEORGE E. Minna, Secretary, Federal Council of the Churches f Christ, New rosé, N. r..
T. ARNOLD HILL, Acting Ewa:live Secretary, National Urip league, New York,
Autam L HOMY, Secretary, National Nero Business League, Tuskegee Institute, Ala.
Emma K. Jam., Akira en Negro Afairs, Mead Skies Department ci Commerce, Washington,
D. C.
Famaant j: Kamm, East Side Continuation School, New rail, N. r:
B. D. ¡mom, Representative, National Vocational Guidance Association, Teachers College,
Columbia University, Ness York, r.
Amen Kamm, Doan of Wont" Bowen College, Greensboro, N. C.
FRED MoCuirract*, Emilio. Agent, *satiation of Colleges and Secondary Schools qf the ðer*
Stash Notioilk.teiss.
CAKE= Nicamition, Presiding, Naiad Association Negro Musicians, ?laniard Ihtioersitis,
s Washington, D. C.,
LAWRIMAX A. Ox" CA(, Nftv. Division, Mild States Departs...ad of Labor, Washing-
ton, D. C.
JAMS A. PAkS,JL, PhOimet, Ationel
Mu. G. &muds M. Rivets,Abton, Ohio.
Association, Dayton, Ohio.
Association e Celoral Gradates
Aon. O. SAkÌ slfraiat Alai far Mr* &Wit, Wet qf Eitiwatia, Mite, States &pinta
swat. the 1,01.iffra.
18;r% 4.
1 I. 0. S.
;
Joergal qj Nerip Bilissosa, Howard Walk**.v.
&NA Wagisfaisit D.e
Itt1 Sy
10:k ,7 '
.t . (.1. r v '1 1A" , .
*it ..4 :Al , _
#2 /: t i I°e ... t . t
- i )." ii. ' . F;.iti*, 0.10; t. !
1 ,J
CT.
t.iif. 4 I
. , '- t tf, ,. 1 / 1,' i. 7 :P 00,
1
a
. ) 1I
v.,
of
N. T.
X.
, .
#
of
724;',01Lii id.'";ICI. I. t''P/0.'9 lott f.g5Rld
. 1, 'e,,
t
.
.- .. '): .,- .-, - . I . Sr..
.L. -
- : (El! t °',ii it ..;'.:-.V
-.. ...,.,1 .. i
.4? ,*. tie. '-.,..,-,...,, -
i S.1t :,1
117;4w1.. ..,
. , ,'..:,. .,, ., 4.-!*11 i '' :-
o 7,1 ;- -,- 1 . 1, ., r.---= - .,,,,. . A
-'46 IA.' .. % ...iv i , %. -1,, 4. ., ' ' t.. '9 . .. kr t 1, : ,. . . . 1, v t.Irt.:-... i,-J. n_,_- 1.4. . V % t- ' ,t,..!. . , ' is. -,.. . ..
.. . . .?11 1'16., i.:" S *-1.1. -- %., 4, r.141,. . ' t,, e:-.**1!..$411; . ; '.. ... ... .... : i .1, v . . P
30P'4 '.. r : i 4 i4.-, 6/ .- ,
e T.,, ir : .474)-:* Airs'0.4,41.! -':* IS.7 '
, e . Nis 4' al rt : : r.W
W. i' i'l.I. t?,
, I. :, p):143 I *WI. irt:it .
I11 II
4. fit . , 'I , r
/ 3V, f '4.4C% --11
ir. A i /,,Ii.' i. "-''-VLASI S.,-:,
.
aa
. Ilwrset,
.
Dt
7
.."1"
,
.
: '
t
I I
..4,
. ;iff4 ;
cY4:41--
Copyright © 2022 FDOKUMEN