Denitrification in sediments of the Laurentian Trough, St. Lawrence Estuary, Québec, Canada
Upload
khangminh22Category
view
0download
0
A I R Q U A L I T YA G R E E M E N T
P r o g r e s sR e p o r t
2 0 0 0
UN
ITE
D S
TAT
ES
C
AN
AD
A

2 Printed on paper that contains at least 30 percent postconsumer fiber.

A I R Q U A L I T YA G R E E M E N T
P r o g r e s sR e p o r t
2 0 0 0

Your Comments on This Report Would Be Appreciated
Secretary, Canadian SectionInternational Joint Commission234 Laurier Avenue, West22nd FloorOttawa, Ontario K1P 6K6
Fax: (613) 993-5583Email: [email protected]
Secretary, United States SectionInternational Joint Commission1250 23rd Street, NW., Suite 100Washington, DC 20440
Fax: (202) 736-9015Email: [email protected]
The International Joint Commission (IJC) is responsible for inviting public comment on AirQuality Agreement Progress Reports and for distributing comments received on request. Writtencomments on this report should be sent to one of the following offices on or before February 28,2001:
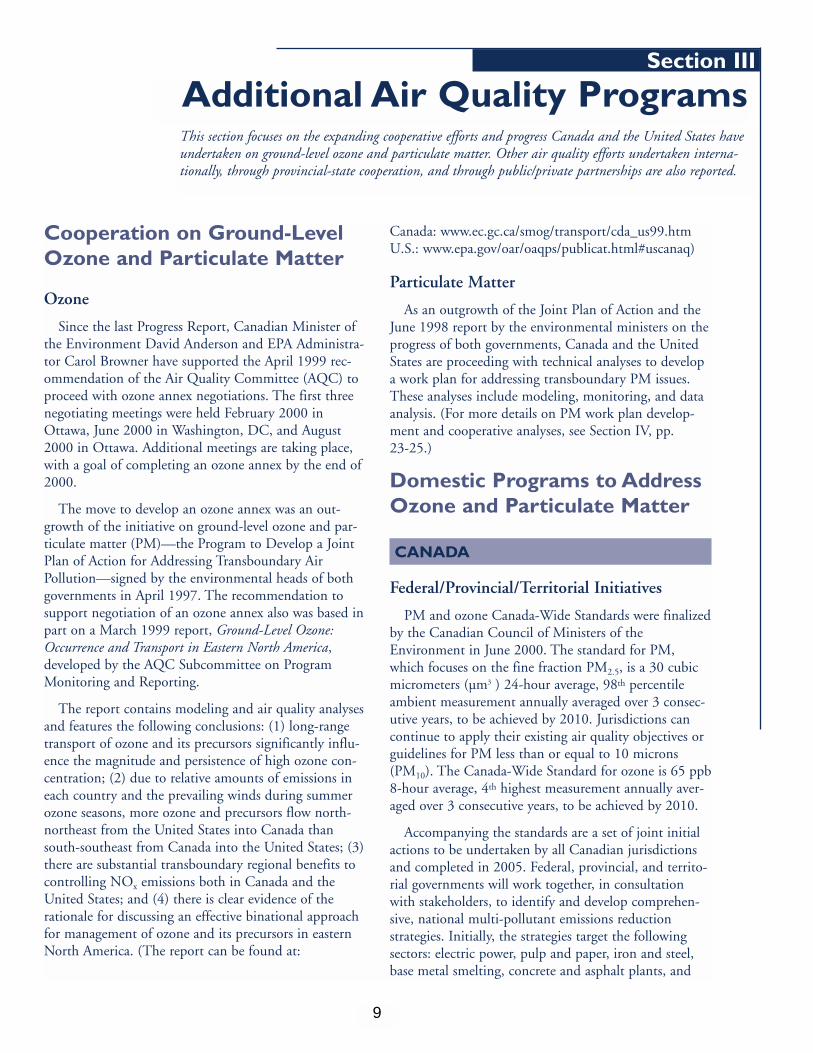
Section I Introduction ..............................................................................1
Section II Progress and Commitments........................................................2
Sulfur Dioxide Reductions ..............................................................................................2
Nitrogen Oxides Reductions ..........................................................................................3
Monitoring of Emissions ................................................................................................4
Prevention of Air Quality Deterioration and Visibility Protection ..................................6
Notification, Assessment, and Mitigation of Significant Transboundary Air Pollution ....7
Section III Additional Air Quality Programs ................................................9
Cooperation on Ground-Level Ozone and Particulate Matter ........................................9
Domestic Programs to Address Ozone and Particulate Matter ........................................9
Other Cooperative Air Quality Efforts ..........................................................................15
Section IV Scientific Information Exchange ..............................................17
Emissions Inventories ....................................................................................................17
Acid Deposition Monitoring ........................................................................................19
Ground-Level Ozone Monitoring and Mapping............................................................21
Particulate Matter Monitoring, Data Analysis, and Modeling ......................................23
Aquatic Effects Research and Monitoring......................................................................26
Forest Effects ................................................................................................................28
Effects on Materials ......................................................................................................31
Health Effects................................................................................................................32
Section V Conclusion ..............................................................................33
Appendix United States-Canada Air Quality Committee..........................35
i
Contents

Figure 1. U.S. SO2 Emissions From 263 Phase I Units ..................................................................2
Figure 2. Saskatchewan-North Dakota PM Monitoring Network ..................................................8
Figure 3. Canada-U.S. SO2 Emissions, 1980-2010 ......................................................................17
Figure 4. Canada-U.S. SO2 Emissions By Sector (1998) ..............................................................17
Figure 5. Canada-U.S. NOx Emissions By Sector (1998)..............................................................18
Figure 6. Canada-U.S. NOx Emissions, 1990-2010......................................................................18
Figure 7. Canada-U.S. VOC Emissions, 1980-2010 ....................................................................18
Figure 8. Canada-U.S. VOC Emissions By Sector (1998) ............................................................19
Figure 9. 1980-1984 Wet Sulfate Deposition ................................................................................20
Figure 10. 1980-1984 Wet Nitrate Deposition ..............................................................................20
Figure 11. 1995-1998 Wet Sulfate Deposition ................................................................................20
Figure 12. 1995-1998 Wet Nitrate Deposition ..............................................................................20
Figure 13. Ozone Concentrations Over Eastern North America, 1996-1998..................................21
Figure 14. Distribution of 4th Highest Daily 8h Maximum Ozone (ppb)
for Regional Sites, 1994-1996 (Median, 5th, 25th, 75th, and 95th Percentiles) ............22
Figure 15. Variations in the Composition of PM in Two Canadian Cities ......................................24
Figure 16. Canadian PM2.5 Monitoring Sites Within 200 Km of U.S. Border ..............................25
Figure 17. Status of PM2.5 Monitoring Deployment (United States) ..............................................25
ii
Figures

iii
AIRMoN Atmospheric Integrated Research Monitoring Network
AIRS Aerometric Information Retrieval System
AQC Air Quality Committee
AQI Air Quality Index
ARNEWS Acid Rain National Early Warning System
AURAMS A Unified Regional Air Quality Modeling System
BAT best available techniques
BC British Columbia
CAAA Clean Air Act Amendments
CAPMoN Canadian Air and Precipitation Monitoring Network
CASTNet Clean Air Status and Trends Network
CEM continuous emission monitoring or monitors
CEPA Canadian Environmental Protection Act
CFS Canadian Forest Service
CL critical loads
CO carbon monoxide
CO2 carbon dioxide
CMAQ Community Multi-Scale Air Quality Model
CUTA Canadian Urban Transit Association
E-GRID Emissions & Generation Resource Integrated Database
EPA U.S. Environmental Protection Agency
eq equivalence
FHM Forest Health Monitoring
FIGCP Forest Indicators of Global Change Project
FRM Federal Reference Method
g/bhp-hr grams per brake horsepower hour
g/mi grams per mile
Acronyms and Abbreviations

iv
IMPROVE Interagency Monitoring of Protected Visual Environments
km kilometers
kt kilotonnes
LRTAP Long-Range Transboundary Air Pollution Protocol
mm millimeter
MOU Memorandum of Understanding
MRP Materials Research Program
MWe megawatts electric
NAAQS National Ambient Air Quality Standards
NADP/NTN National Atmospheric Deposition Program/National Trends Network
NAMP North American Maple Project
NAMS National Air Monitoring Stations
NAPS National Air Pollution Surveillance
NARSTO North American Research Strategy for Tropospheric Ozone
NCPTT National Center for the Preservation of Technology and Training
NEG/ECP New England Governors and Eastern Canadian Premiers
NERAQC Northeast Regional Air Quality Committee
NESCAUM Northeast States for Coordinated Air Use Management
NH3 ammonia
NMHC nonmethane hydrocarbons
NO nitrogen oxide
NOx nitrogen oxides
NO2 nitrogen dioxide
OTC Ozone Transport Commission
PAMS Photochemical Assessment Monitoring Stations
PM particulate matter
PM10 particulate matter less than or equal to 10 microns
PM2.5 particulate matter less than or equal to 2.5 microns
ppb parts per billion
ppm parts per million
PSD Prevention of Significant Deterioration
AC
RON
YM
SA
ND
ABB
REV
IAT
ION
S

v
REMSAD Regional Modeling System for Aerosols and Deposition
RESEF Quebec Forest Intensive Monitoring Network
SIP State Implementation Plan
SLAMS State and Local Air Monitoring Stations
SMB simple mass-balance
SO2 sulfur dioxide
SPM special purpose monitors
SUV sport utility vehicle
TRS total reduced sulfur
USFS U.S. Department of Agriculture Forest Service
VOC volatile organic compound
µm3 cubic micrometers
AC
RON
YM
SA
ND
ABBR
EVIAT
ION
S


This is the fifth Progress Report highlighting thecommitments Canada and the United States madeunder the 1991 Air Quality Agreement to address trans-boundary air pollution. The report details the continuedprogress of both governments in addressing acid rain.The report also focuses on the most recent develop-ments of both governments in expanding cooperativeefforts to reduce ground-level ozone and particulatematter (PM) pollution,which have significantimpacts on human health.The bilateral Canada-U.S.negotiations held this yearto develop an ozone annexto the Agreement signalthe importance both gov-ernments are placing onthis effort.
In this report, Canadaand the United States citesignificant emissionsreductions of major pollu-tants that cause acid rain—sulfur dioxide (SO2) andnitrogen oxides (NOx).Canada’s national cap of3.2 million tonnes for SO2
emissions will become fullyoperational in 2000. Currently, Canada’s SO2 emissionsare at 2.7 million tonnes, and they are projected toremain below the cap in the future. As the United Statesended Phase I of the SO2 program and began Phase IIin 2000, Phase I utility units reported SO2 emissions of4.9 million tons, which was 28 percent below allowablelevels for 1999 and a reduction of more than 50% from1980 levels. Full implementation in 2010 will result in a10-million ton reduction of SO2 emissions, which willbe approximately 40% below 1980 levels. Canada
reduced its year 2000 stationary source NOx emissionsby more than 100,000 tonnes below the forecast level of970,000 tonnes. In the United States, NOx emissionsfrom power generation are expected to be reduced bymore than 2 million tons below forecast levels. NOx
emissions from all source categories are expected to be 2million tons below 1980 levels.
The report also pro-vides information onprogress since 1998 inmeeting other key com-mitments in theAgreement. Updates areincluded on emissionsforecasts, acid depositionmonitoring, scientificresearch, and the airquality programs of bothgovernments.
In 1997, the Canadianand U.S. environmentalministers signed a JointPlan of Action forAddressing TransboundaryAir Pollution on ground-level ozone and PM, andin 1998 the ministersissued a follow-up Joint
Plan Report. The 2000 Progress Report considers coop-erative efforts in data analyses, modeling, monitoring,and information sharing leading to development of anozone annex to the Air Quality Agreement and existingand planned efforts to develop a joint work plan fortransboundary PM.
NOTE: American spelling is used throughout. Futurereports will alternate the use of Canadian and Americanspelling. Dollars are in $U.S. unless otherwise indicated.
1
Section I
Introduction

Sulfur Dioxide Reductions
CANADIAN COMMITMENT
• Sulfur dioxide (SO2) emissions reduction in seveneasternmost provinces to 2.3 million tonnes1 by1994.
• Maintenance of 2.3 million-tonne annual cap foreastern Canada through December 1999.
• Permanent national cap for SO2 emissions of 3.2 mil-lion tonnes by 2000.
Canada’s commitment to reduce acid rain remains apriority in air pollution management. In 1998, totalCanadian SO2 emissions were less than 2.7 milliontonnes, which is below the national cap of 3.2 milliontonnes. Emissions in the seven easternmost provinceswere 1.8 million tonnes below the eastern Canada capof 2.3 million tonnes. Forecasts2 from the 1999 AnnualProgress Report on the Canada-Wide Acid Rain Strategyfor Post-2000 indicate that emissions will remain belowall applicable caps well into the future. Significantreductions of SO2 and/or nitrogen oxides (NOx) couldresult from reduction initiatives that come into effectafter 1998. These initiatives were not included in theforecasts. Examples of these initiatives include new SO2
targets under the Canada-Wide Acid Rain Strategy,reductions under Phase 3 of the Federal SmogManagement Plan and provincial or territorial smog ini-tiatives, and Canada-Wide Standards for PM2.5 (PM lessthan or equal to 2.5 microns) and ozone.
The permanent national cap of 3.2 million tonnesper year by 2000 is currently being implementedthrough the Eastern Canadian Acid Rain Program usingbilateral agreements between each respective provinceand the Federal Government. This program, which willbe fully implemented in 2000, is being succeeded by theCanada-Wide Acid Rain Strategy for Post-2000. The
strategy’s next step, described in Section III, p. 10, tar-gets sulfur, striving for SO2 emissions reductions thatachieve critical loads (CL)3 for acidity throughout thecountry.
UNITED STATES COMMITMENT
• SO2 emissions reduction of 10 million tons4 from1980 levels by 2000, taking into account credits(“allowances”) earned for reductions from 1995 to1999.
• Permanent national cap of 8.95 million tons of SO2per year for electric utilities by the year 2010.
• National SO2 emissions cap of 5.6 million tons forindustrial sources beginning in 1995.
As the U.S. Acid Rain Program entered Phase II inJanuary 2000, data showed that SO2 emissions in 1999were 670,000 tons lower than 1998 levels as sourcesprepared to meet their Phase II reduction obligations.The U.S. Environmental Protection Agency’s (EPA’s)annual review reported SO2 emissions from Phase Iaffected units were 4.9 million tons, or 28 percentbelow the 1999 allowable emissions level for SO2. In1999, the total number of participating units was 398.Of that number, 263 were the highest-emitting units,and 135 were units electing to participate early.
2
This section focuses on Canadian and U.S. progress in meeting commitments underAnnex I of the Air Quality Agreement.
U.S. SO2 Emissions From 263 Phase I Units
1One tonne is equal to 1.1 short tons.2Forecast emissions are interim emissions estimates using 1998 values reported by the provinces and territories. The forecasts are projected withgrowth factors calculated from total provincial changes in emissions found in the National Emissions Inventory and Projections Task GroupConsensus National Base Case Forecast, 1996.3Critical loads are estimates of the maximum pollutant loadings that environmental resources can absorb on a sustained basis without experi-encing measurable degradation.4One (short) ton is equal to 0.9 tonnes.
Progress and CommitmentsSection II
Figure 1

By the end of five years of Phase I implementation,affected units showed an overall reduction in SO2 emis-sions of more than 50% from 1980 levels. In Phase II,the program expands from 400 fossil-fired electric gen-erating units in 25 states to more than 2,000 units in 48states. All major power plants in the contiguous 48states are now covered by the Acid Rain Program.Reductions in Phase I were greater than required inalmost every affected state, with major reductions in thehighest-emitting areas (i.e., the Midwest). Sourcesachieved 100% compliance with regional emissionreductions in every year of Phase I. Full implementationof the program in 2010 will achieve a 10-million-tonreduction of SO2 emissions, about 40% below 1980levels.
During Phase I, under the SO2 Allowance TradingProgram—the centerpiece of the Acid Rain Program—allowance market activity steadily increased among allparticipants, contributing to the lower than expectedcosts for reducing emissions. Through the SO2
Allowance Trading Program, all affected utility units areallocated a specific number of emissions allowances,with one allowance authorizing the emission of one tonof SO2. Allowances are tradable, and utilities may buy,sell, or bank them for future use. On an annual basis, asource must hold allowances that equal or exceed itsannual SO2 emissions.
Industrial SO2 emissions from stationary sources thatare not commercial or residential continue to remainbelow the 5.6-million-ton cap. These emissions are pro-jected to remain below the cap for at least the next 10years. Should emissions from these sources exceed thecap, EPA is authorized to establish regulations to reduceemissions to below 5.6 million tons.
Nitrogen Oxides Reductions
CANADIAN COMMITMENT
• By 2000, reduce stationary source emissions 100,000tonnes below the forecast level of 970,000 tonnes.
• By 1995, develop further annual national emissionsreduction requirements from stationary sources to beachieved by 2000 and/or 2005.
• Implement a NOx control program for mobilesources.
NOx emissions have been reduced by more than100,000 tonnes below the forecast level of 970,000tonnes at power plants, major combustion sources, andmetal smelting operations.
Canada is developing programs to further reduceNOx emissions. (For additional details, see Section III,pp. 10-11.) All provinces are currently discussing plansand progress jointly with the Federal Government toreduce stationary source emissions of NOx. For example,Ontario’s Anti-Smog Action Plan sets an air quality goalto reduce the average number of ozone exceedancehours by 75% by the year 2015. This translates into a45% reduction of NOx emissions and volatile organiccompounds (VOCs) in Ontario from 1990 levels. InJune 2000, all federal, provincial, and territorial govern-
ments agreed to a Canada-Wide Standard for ozone of65 parts per billion (ppb) to be achieved by 2010. Jointinitial actions for reducing NOx and VOC emissions,necessary to meet the standard for ozone, were agreedon and will target industry sectors, including pulp andpaper and electric power, that are among the large sta-tionary source emitters of NOx emissions. (For addi-tional details, see Section III, p. 9.)
Regulations have steered on-road engines, which con-tribute approximately 35% of Canada’s total NOx emis-sions, toward newer, cleaner technology and reducedemissions. Canadian on-road vehicle emissions stan-dards are harmonized with those of the United States.(For additional details, see Section III, pp. 10-11.)
UNITED STATES COMMITMENT
• By 2000, reduce total annual emissions of NOx by 2million tons.
• Implement stationary source control program forelectric utility boilers.
• Implement mobile source control program.
By the end of 2000, EPA’s Acid Rain Program andthe mobile source control program are expected toreduce stationary and mobile source NOx emissions bymore than 2 million tons below 1980 levels, exceedingthe mandate under the 1990 Clean Air ActAmendments (CAAA).
From 1996 to 1999, NOx emissions from coal-firedutility boilers were approximately 400,000 tons per year
3
SEC
TIO
NII - P
ROG
RESS
AN
DC
OM
MIT
MEN
TS

below projections for what emissions would have beenwithout the Acid Rain Program. In 1999, actual NOx
emissions were slightly below 1998 levels and decreasedby approximately 424,000 tons (32 percent) comparedto 1980 levels. Beginning in 2000, NOx emissions fromelectric utility units are expected to be reduced by anadditional 1.7 million tons each year.
EPA also has undertaken efforts to reduce NOx emis-sions under the ground-level ozone provisions of theCAAA. In September 1998, EPA finalized a rule toestablish mandatory NOx emission budgets for 22 east-ern states.5 By 2007, this rule-making is expected toresult in approximately 1 million tons of additionalNOx emission reductions each summer beyond thoseachieved by acid rain and mobile source control pro-grams. In a separate but related rule-making, EPA grant-ed petitions filed under Section 126 of the CAA,identifying specific NOx sources that contribute toozone in the petitioning states. As a result, beginning in2003, a total of 392 facilities in 12 states must reduceannual emissions by about 500,000 tons from expected2007 levels, or about half the emission reductions underthe 22-state program.
In other actions, EPA is working with nine northeast-ern states to implement a trading program for NOx inthe Ozone Transport Region. In 1999, the initial year ofoperation, the first eight participating states reducedNOx emissions by more than 50% from 1990 levels(20% below allowable levels) due to the trading pro-gram.
In December 1999, under continuing implementa-tion of CAAA requirements for mobile sources, EPAannounced more protective tailpipe emissions standardsfor all passenger vehicles, including sport utility vehicles,vans, and pickup trucks. Simultaneously, EPAannounced more stringent standards for sulfur in regulargasoline. The standards will ensure the effectiveness oflow-emission control technologies in vehicles and arethe clean-air equivalent of removing 164 million carsfrom the road. The new standards will require passengervehicles to be 77% to 95% cleaner than those on theroad today, decreasing gasoline’s sulfur content by 90%to 30 parts per million (ppm).
In addition, in June 2000, EPA proposed a majorprogram to significantly reduce emissions from heavy-duty engines and vehicles. This comprehensive 50-state
control program proposal for heavy-duty engine andvehicle standards and highway diesel fuel sulfur controltreats the heavy-duty vehicle and its fuel as a single sys-tem. The proposed rule will cap the sulfur content indiesel fuel sold to consumers at 15 ppm. Diesel fuel’ssulfur content is currently about 500 ppm. The proposalfor tailpipe emission reductions reduces NOx to 0.2grams per brake horsepower hour (g/bhp-hr) andemissions of PM to .01 g/bhp-hr. (For more informa-tion on NOx mobile source efforts, see Section III, pp.13-14).
Monitoring of Emissions
CANADIAN COMMITMENT
• By 1995, estimate emissions of NOx and SO2 fromnew electric utility units and existing electric utilityunits greater than 25 megawatts electric (MWe) usinga method of comparable effectiveness to ContinuousEmissions Monitors (CEMs).
• By 1995, investigate feasibility of using CEMs.• Work toward comparably effective methods of emis-
sion estimation for SO2 and NOx emissions fromother major stationary sources.
An important tool, CEMs provide information thatcan improve emissions estimation methodologies.CEMs also facilitate automatic emissions monitoringand reporting, and establish a “common currency” inemissions trading regimes.
Permitting of CEMs is under provincial jurisdiction,and the type of in situ, extractive, or dilution CEM sys-tem used is site-specific to each application. By 1995,CEM installation in Canada’s utility sector was wide-spread, with SO2 CEMs installed in more than 87% ofthe coal generation capacity (67 units) and more than52% of the oil generation capacity (22 units). Withrespect to NOx CEMs, 72% of the oil generation capac-ity (14 units), more than 78% of the gas generationcapacity (10 units), and more than 85% of the coal gen-eration capacity (43 units) had CEMs installed.
By 2000, this situation had not changed significantlybecause almost all base-loaded fossil steam plants withhigh emission rates had operating CEMs. Few flowmonitors are used, and not all systems have the accuracyand reliability required for emissions trading purposes.The fact that Canada has no interprovincial emissions
4
SEC
TIO
NII
- PR
OG
RES
SA
ND
CO
MM
ITM
ENT
S
5EPA’s final action was subject to legal challenge by a number of parties. In March 2000, the U.S. Court of Appeals for the DC Circuit issued a2-to-1 ruling in favor of EPA on all major issues associated with the NOx State Implementation Plan (SIP) Call. The court remanded issues—including those relating to Wisconsin, Georgia, and Missouri—to EPA. In June 2000, the court ordered SIP revisions addressing requirementsupheld by the Court due by October 30, 2000.

trading regime, however, provides little incentive forimprovement for accuracy and reliability. Monitoringsystems across sectors are designed with less stringencyand more flexibility. For example, exhaust gas volumeand mass emission rates are often determined by estima-tion from several choices of standard calculationmethods.
CEMs have been installed in the nonutility sector tomonitor emissions of either SO2 or NOx in variousjurisdictions across the country. In Quebec, CEMs arerequired on acid plants used to control SO2 in the basemetal sector. Acid plants account for approximately60% of the province’s nonutility SO2 emissions. InOntario, CEMs for SO2, NOx, andother pollutants are recommended formunicipal solid waste, biomedicalwaste incinerators and base metalsmelters. Other requirements forCEMs are for pulp and paper recov-ery boilers that monitor concentra-tions of total reduced sulfur (TRS)and hydrogen sulfide, and woodwaste boilers to monitor temperature.Because of recent publication of anemissions guideline for cement kilns,several cement plants are installingCEM systems for emissions measure-ments and process control functions.Most new gas turbine cogenerationsystems have very low emissions of allpollutants and are able to accuratelyestimate NOx emissions using othermethods, such as predictive monitor-ing or periodic sampling.
Ontario’s major SO2 emitters (i.e.,INCO, Falconbridge, and OntarioHydro) are required to undertakeannual audits to verify SO2 emis-sions. Alberta requires CEMs for vari-ous nonutility sources, including sourgas plants6, pulp and paper, petroleum refining, fertiliz-er, chemical, oil sands, waste incinerators, and woodwaste nonutility generators. In 1999, Alberta publishednew CEM performance guidelines that will soon beapplicable to most industrial sources. British Columbia,through a decentralized provincewide permitting sys-tem, requires installation and operation of CEMs forSO2 and NOx on a case-by-case basis. In the Greater
Vancouver Regional District, the data from installedNOx and SO2 CEMs are used in the emissionsinventory.
UNITED STATES COMMITMENT
• By 1995, new electric utility units and existing unitsgreater than 25 MWe operate CEM systems.
By 1995, all required CEMs were installed by utilitiesunder the Acid Rain Program. They continue to providesome of the most accurate and complete data ever col-lected by EPA. All coal-fired units must use CEMs to
measure concentrations of SO2 andNOx, as well as volumetric flow, todetermine hourly mass emissions ofSO2 and NOx. Those natural gas andoil-fired units that do not use CEMsuse fuel flow meters and frequent fuelsampling and analysis to determinemass SO2 emissions for conservativeemission factors. These units also useCEMs with volumetric flow to deter-mine NOx mass emissions.
Statistics reflect high accuracy andavailability of all CEMs at Phase I andPhase II units. In 1999, relative accura-cy standards were met by 96.2, 94.5,and 99.4 percent of the SO2, NOx, andvolumetric flow CEMs, respectively. In1999, the availability of these dataexceeded 98 percent. By the end of2000, nearly 100 percent of the affect-ed sources will be reporting hourlyemissions and heat input data electron-ically, allowing immediate qualityassurance analyses by EPA’s EmissionsTracking System, feedback to utilities,and verification of quarterly data com-piled from hourly data on SO2, NOx,
and carbon dioxide (CO2.) Quarterly emissions reportsfor every affected unit are available to the public on theInternet at www.epa.gov/acidrain. CEMs data providethe foundation for the SO2 Allowance Trading Programas well as the NOx Budget Trading Program. These dataare used to determine compliance with both the SO2
and NOx reduction programs.
5
SEC
TIO
NII - P
ROG
RESS
AN
DC
OM
MIT
MEN
TS
6Sour gas is raw natural gas with a relatively high concentration of sulfur compounds such as hydrogen sulfide.
SO2 and NOx CEM machine.

Prevention of Air QualityDeterioration and VisibilityProtection
CANADIAN COMMITMENT
• By 1995, develop and implement means (comparableto those implemented in the United States) to pre-vent air quality deterioration and to ensure visibilityprotection for sources that could cause significanttransboundary air pollution.
Canada uses an approach to new sources (e.g.,addressing major new and existing sources, examiningvarious reduction measures, and applying similar tech-nologies) that it considers comparable to the U.S.approach. Since Canada is a federation, the federal andprovincial/territorial, and some municipal governmentseach share in the responsibility of air quality manage-ment and pollution prevention. The report, CanadianMechanisms to Prevent the Deterioration of Air Quality:An Analysis of Requirements for New Sources of AirPollution and Modifications to Existing Sources, providesan overview of the requirements at each level of govern-ment across the country.
In addition to existing measures, the new CanadianEnvironmental Protection Act (CEPA) of September1999 focuses on pollution prevention as the preferredapproach to environmental protection. The Canadiangovernment will use the new act to reduce the impactsof toxic substances. Implementation of similar princi-ples—pollution prevention, continuous improvement,and keeping clean areas clean—is also part of theCanada-Wide Standards. The latter principle recognizesthat polluting “up to a limit” is not acceptable and thatthe best strategy to avoid future problems is keepingclean areas clean. Continuous improvement applies inareas with ambient levels below the levels of the stan-
dards but still above the levels associated with observablehealth effects. Jurisdictions are encouraged to take reme-dial and preventative actions to reduce emissions fromanthropogenic sources to the extent practicable.
Federal, provincial, and territorial governments willwork with stakeholders during the next several years toestablish implementation plans and programs for PM2.5
and ozone Canada-Wide Standards that apply pollutionprevention and best management practices. These prac-tices could include ensuring that new facilities andactivities incorporate the best available, economicallyfeasible technologies to reduce PM and ozone levels.They could also include reviewing new activities thatmight contribute to PM and ozone level increases.
UNITED STATES COMMITMENT
• Maintain means for preventing significant deteriora-tion and protecting visibility as required under theCAA for sources that could cause significant trans-boundary air pollution.
The U.S. Prevention of Significant Deterioration(PSD) Program has three key goals: (1) protecting pub-lic health from any adverse effects that might occur—even at air pollution levels lower than the NationalAmbient Air Quality Standards (NAAQS); (2) preserv-ing, protecting, and enhancing the air quality in Class Iareas such as large national parks and wilderness areas;and (3) ensuring that economic growth occurs in har-mony with the preservation of existing clean air sources.
The PSD Program sets maximum air quality degrada-tion limits to ensure that air quality in many areas ofthe country remains better than levels mandated by theNAAQS. The program also requires implementation ofthe best available control technology for all new sources.
In April 1999, EPA issued the final regional haze reg-ulations that expand the scope of 1980 visibility rules.
6
SEC
TIO
NII
- PR
OG
RES
SA
ND
CO
MM
ITM
ENT
S
Good visibility day in Great Smokey Mountains. Visualrange is 100 miles.
Bad visibility day at same location. Visual range is 20 miles.
Source: National Park Service

The regulations will improve visibility at specially pro-tected Class I national parks and wilderness areas,addressing visibility impairment caused by numeroussources located over broad regions. The program estab-lishes the basis from which states can work together todevelop implementation plans designed to achieve “rea-sonable progress” toward the national visibility goal ofno human-caused impairment in the 156 mandatoryClass I federal areas nationwide.
States are required to establish goals to improve visi-bility on the 20% worst days and to allow no degrada-tion on the 20% best days for each Class I area in thestate. In establishing any progress goal, states must ana-lyze the progress rate for the next 10- to 15-year imple-mentation period that would, if maintained, achievenatural visibility conditions by 2064. States will need toshow reasonable progress. In addition to identifyinggoals, state plans must include the following: (1) emis-sions reduction measures to meet these targets in combi-nation with other state measures; (2) requirements forBest Available Retrofit Technology on certain large,existing sources or an alternative emissions trading pro-gram; and (3) visibility monitoring representative of allClass I areas.
State regional haze plans are due in the 2003 to 2008timeframe. Due to common precursors and the regionalnature of the PM and haze problems, the haze ruleincludes specific provisions for states working togetherin regional planning groups to assess these problems anddevelop coordinated, regional emission reduction strate-gies. One provision allows nine Grand Canyon VisibilityTransport Commission States (i.e., Arizona, California,Colorado, Idaho, Nevada, New Mexico, Oregon, Utah,and Wyoming) to submit initial plans in 2003 to imple-ment their past recommendations within the frameworkof the national regional haze program. Another provi-sion allows certain states to develop coordinated strate-gies for regional haze and PM until 2008, contingentupon future participation in regional planning groups.
The new regional haze regulations require ambientmonitoring representative of each of the Class I areas totrack progress toward the U.S. national visibility goal.Required regional haze trend assessments will be basedon changes in visibility expressed in deciviews7. To facili-tate these assessments, the aerosol portion of theInteragency Monitoring of Protected VisualEnvironments (IMPROVE) visibility monitoring net-work is being expanded from 30 to 110 sites during the
year 2000. The expanded network will now represent allClass I areas where monitoring can be practically imple-mented.
Implementation of the PM and Ozone NAAQS, inconjunction with the regional haze program, is expectedto improve visibility in urban as well as rural areasnationwide. Other air quality programs are expected toreduce emissions and improve visibility in certainregions of the country. The Acid Rain Program isexpected to reduce sulfate haze, particularly in the east-ern United States, by achieving significant regionalreductions in SO2 emissions. In addition, visibilityimpairment in Class I and other areas should improvebecause of a number of regulatory activities, includingthe NOx State Implementation Plan (SIP) Call, mobilesource emissions and fuel standards, certain air toxicsstandards, and the implementation of smoke manage-ment and wood stove programs to reduce fuel combus-tion and soot emissions.
Notification,Assessment, andMitigation of SignificantTransboundary Air Pollution
JOINT EFFORT COMMITMENT
• Each party shallnotify the otherconcerning a pro-posed action,activity, or projectthat would belikely to cause sig-nificant trans-boundary airpollution.
Notification
Canada and theUnited States arecontinuing notifica-tion procedures, ini-tiated in fall 1994,to identify possiblenew sources and modifications to existing sources oftransboundary air pollution within 100 kilometers(km)—62 miles—of the border. The countries are alsonotifying one another of new sources or modifications
7
SEC
TIO
NII - P
ROG
RESS
AN
DC
OM
MIT
MEN
TS
7A measure of visibility that captures the relationship between air pollution and human perception of visibility. When air is free of particles thatcause visibility degradation, the Deciview Haze Index is zero. The higher the deciview level, the poorer the visibility.

of concern beyond the 100-km limit. Canada has noti-fied the United States of 20 sources, and the UnitedStates has notified Canada of 14 sources. Transboundarynotification information is available on the Internet sitesof both governments at: Canada: www.ec.gc.ca/pdb/can_us/applic_e.html U.S.: www.epa.gov/ttn/gei/uscadata.html.
Since the last Progress Report, Canada and theUnited States have sustained successful, ongoing consul-tations on sources of concern. Consultations on theBoundary Dam power station in Saskatchewan and theAlgoma Steel Plant in Ontario have led to joint air qual-ity monitoring efforts. A binational consultation groupcomposed of federal, state, provincial, and BoundaryDam power station authorities has developed a 5-yearmonitoring plan for the area around the power stationon both sides of the border. Beginning in 2000, moni-toring is designed to characterize air quality in the area,with five samplers set up within 60 km of the localcommunity of Estevan (see Figure 2 below). Forums onair quality such as the one held in the summer of 2000provide information to concerned citizens and the gen-eral public about existing efforts and future plans.
A similar plan, also developed by a joint consultationgroup, is being implemented in the area surroundingthe Algoma Steel Plant. Dust fall monitoring sites havebeen established in Sault Ste. Marie, Michigan. Snowsampling has been conducted at a number of sites there,as well as in Sault Ste. Marie, Ontario. A PM2.5 moni-toring network consisting of two monitoring stations isscheduled to begin in summer 2000. Ongoing consulta-tions on the Connors Creek Detroit Edison Power Plantwere resolved to the satisfaction of all parties involved.
The plant, which went back into operation in the sum-mer of 1999, is now using natural gas instead of coal.The plant is using CEMs as well.
Assessment and Mitigation
Canada and the United States have continued tomake progress in assessment and mitigation despite dif-ferent interpretations of the commitment under the AirQuality Agreement. In response to the Federal EnergyRegulatory Commission’s adoption of the open accesstransmission policy and Canada’s concerns about possi-ble increased transboundary flows of emissions, EPA hasestablished an electronic database—the Emissions &Generation Resource Integrated Database (E-GRID). E-GRID reports publicly available emissions and gener-ation data for virtually every power plant and companythat generates electricity in the United States. EPA hasdemonstrated the operation of E-GRID to Canada andshared emissions monitoring and tracking results. Thesecond E-GRID provides 1997 data and includes newinformation on company, owner type, and fossil-onlyemission rates for utilities.
The next version, E-GRID 2000, scheduled forrelease before the end of the year, will include actualemissions and resource mix data for 1998 and prelimi-nary data for 1999 for all plants, including nonutilitygenerators. The data will be configured according toindustry and power grid structure in 2000 reflecting thelatest corporate mergers, power plant sales, and gridreconfigurations. In addition to emission profiles forSO2, NOx, and CO2, E-GRID 2000 is expected toreport plant-specific emissions and emission rates formercury for the first time. A database of power inter-change between regions of the grid is also under devel-opment for future versions. (The E-GRID Web site is atwww.epa.gov/acidrain/egrid.)
8
SEC
TIO
NII
- PR
OG
RES
SA
ND
CO
MM
ITM
ENT
S
Saskatchewan-North Dakota PM Monitoring Network
Figure 2
Saskatchewan-North Dakota public meeting.
Cooperation on Ground-LevelOzone and Particulate Matter
Ozone
Since the last Progress Report, Canadian Minister ofthe Environment David Anderson and EPA Administra-tor Carol Browner have supported the April 1999 rec-ommendation of the Air Quality Committee (AQC) toproceed with ozone annex negotiations. The first threenegotiating meetings were held February 2000 inOttawa, June 2000 in Washington, DC, and August2000 in Ottawa. Additional meetings are taking place,with a goal of completing an ozone annex by the end of2000.
The move to develop an ozone annex was an out-growth of the initiative on ground-level ozone and par-ticulate matter (PM)—the Program to Develop a JointPlan of Action for Addressing Transboundary AirPollution—signed by the environmental heads of bothgovernments in April 1997. The recommendation tosupport negotiation of an ozone annex also was based inpart on a March 1999 report, Ground-Level Ozone:Occurrence and Transport in Eastern North America,developed by the AQC Subcommittee on ProgramMonitoring and Reporting.
The report contains modeling and air quality analysesand features the following conclusions: (1) long-rangetransport of ozone and its precursors significantly influ-ence the magnitude and persistence of high ozone con-centration; (2) due to relative amounts of emissions ineach country and the prevailing winds during summerozone seasons, more ozone and precursors flow north-northeast from the United States into Canada thansouth-southeast from Canada into the United States; (3)there are substantial transboundary regional benefits tocontrolling NOx emissions both in Canada and theUnited States; and (4) there is clear evidence of therationale for discussing an effective binational approachfor management of ozone and its precursors in easternNorth America. (The report can be found at:
Canada: www.ec.gc.ca/smog/transport/cda_us99.htmU.S.: www.epa.gov/oar/oaqps/publicat.html#uscanaq)
Particulate Matter
As an outgrowth of the Joint Plan of Action and theJune 1998 report by the environmental ministers on theprogress of both governments, Canada and the UnitedStates are proceeding with technical analyses to developa work plan for addressing transboundary PM issues.These analyses include modeling, monitoring, and dataanalysis. (For more details on PM work plan develop-ment and cooperative analyses, see Section IV, pp. 23-25.)
Domestic Programs to AddressOzone and Particulate Matter
CANADA
Federal/Provincial/Territorial Initiatives
PM and ozone Canada-Wide Standards were finalizedby the Canadian Council of Ministers of theEnvironment in June 2000. The standard for PM,which focuses on the fine fraction PM2.5, is a 30 cubicmicrometers (µm3 ) 24-hour average, 98th percentileambient measurement annually averaged over 3 consec-utive years, to be achieved by 2010. Jurisdictions cancontinue to apply their existing air quality objectives orguidelines for PM less than or equal to 10 microns(PM10). The Canada-Wide Standard for ozone is 65 ppb8-hour average, 4th highest measurement annually aver-aged over 3 consecutive years, to be achieved by 2010.
Accompanying the standards are a set of joint initialactions to be undertaken by all Canadian jurisdictionsand completed in 2005. Federal, provincial, and territo-rial governments will work together, in consultationwith stakeholders, to identify and develop comprehen-sive, national multi-pollutant emissions reductionstrategies. Initially, the strategies target the followingsectors: electric power, pulp and paper, iron and steel,base metal smelting, concrete and asphalt plants, and
9
Section III
This section focuses on the expanding cooperative efforts and progress Canada and the United States haveundertaken on ground-level ozone and particulate matter. Other air quality efforts undertaken interna-tionally, through provincial-state cooperation, and through public/private partnerships are also reported.
Additional Air Quality Programs

lumber and allied wood products. These sectors, basedon current emission inventories, are significant emittersof the precursor pollutants that cause PM and ozone.The pollutants are common to most jurisdictions andaffect many communities across Canada.
The Canada-Wide Acid Rain Strategy for Post-2000calls for a number of actions, including new emissionsreduction targets in Ontario, Quebec, New Brunswick,and Nova Scotia and the pursuit of further SO2 emis-sions reduction commitments from the United States.Ontario, Quebec, New Brunswick, and Nova Scotiamade a commitment at the Canadian Council ofMinisters of the Environment meeting in November1999 to announce new targets before the end of 2000.Ontario has since announced its target of a 50% reduc-tion from 1990 levels by 2015. Quebec has committedto a preliminary target of 40% from 1990 levels by2002.
Federal Initiatives
Based on scientificrecommendations, theministers of environ-ment and healthannounced PM10 astoxic under the new1999 CanadianEnvironmentalProtection Act(CEPA).
Under CEPA 1999,a concrete timeframeto bring a toxic sub-stance under effectivecontrol is required.Key industrial sectors will be required to set emissionreduction targets and timetables to meet those targets.The Government of Canada’s action on PM10 is one ofa number of immediate and long-term actions on cleanair. Official notification was published in the CanadaGazette for a 60-day public comment period.
To effectively reduce the ambient concentrations ofPM, management strategies must address the pollutantsthat are emitted as precursors to PM. In that regard, theFederal Government announced its intention to recom-mend to the Governor in Council that the principalprecursors to PM (SO2, NOx, VOCs, and ammonia) beadded to Schedule 1 of CEPA’s list of toxic substances.The announcement launched a 60-day comment periodduring which interested parties have the opportunity to
provide the ministers of environment and health withcomments regarding this proposal. These comments willbe considered by the ministers prior to finalizing theirrecommendation to the Governor in Council.
In fall 2000, the Federal Government is releasingPhase 3 of the Federal Smog Management Plan, contin-uing the effort begun in 1990 with the Phase 1NOx/Volatile Organic Compound (VOC) ManagementPlan and the subsequent 1997 Phase 2 Federal SmogManagement Plan. The Phase 3 Plan provides for initia-tives to reduce emissions from transportation and petro-leum fuels as well as stationary sources. The plan alsoprovides for further scientific research and analysis ofthe smog problem, better ambient air monitoring andreporting, and public education. The plan addresses keyindustrial sectors, including electric power, iron andsteel, base metal smelting, pulp and paper, and lumberand allied wood products.
The Phase 3 Smog Plan and its initiatives are devel-oped using multi-stakeholder consultation processes, in
cooperation with otherinterested levels ofgovernment. Phase 3initiatives will beimplemented in amulti-pollutantapproach, consideringnot only ozone andPM, but also initia-tives already underwayto address toxics, acidrain, and climatechange.
As a sector, on-roadvehicles are the largest
contributor to NOx and carbon monoxide (CO) emis-sions in Canada, and the second largest contributor toVOC emissions. Given the integrated nature of theNorth American market, Canadian motor vehicle emis-sion standards generally mirror those in the UnitedStates. The current Tier 1 standards establish limits onhydrocarbons, CO, NOx, and PM emissions. In 1997,harmonization with the United States was written intothe Motor Vehicle Safety Regulations. The federal emis-sion standards were previously established under theMotor Vehicle Safety Act but are now found underCEPA 1999.
The CEPA provisions also create new authorities toset national emission standards for vehicles and enginesused in a variety of off-road applications (e.g., agri-
10
SEC
TIO
NIII
- A
DD
ITIO
NA
LA
IRQ
UA
LIT
YPR
OG
RA
MS

cultural and construction equipment) and nonroadapplications (e.g., lawn mowers, generators, and chainsaws). Under CEPA, Canada plans to continue aligningits emission standards for new vehicles and engines withcorresponding U.S. federal programs. EnvironmentCanada also plans to consult with stakeholders to devel-op a multi-year agenda for implementing an effectiveemission control program for vehicles, engines, andfuels.
Restrictions from mobile sources also will reduce SO2
levels. Beginning in July 2002, through regulationsunder CEPA, gasoline’s sulfur content must not exceedan average of 150 parts per million (ppm). This limit isfurther restricted to 30 ppm by January 2005. Thereduction in gasoline sulfur levels is expected to reduceambient concentrations of SO2 and sulfate particles, aswell as VOC, CO, and NOx emissions from gasolinevehicles equipped with catalytic converters. Sulfur indiesel regulations, effective since January 1, 1998, limitthe sulfur content of diesel fuel used in on-road vehiclesto a maximum of 500 ppm. Benzene in gasoline regula-tions, effective since July 1999, limit the content of ben-zene in gasoline to below 1% by volume.
To fill the regulatory gap until CEPA 1999 providedthe necessary new authorities, Environment Canadaannounced a Memorandum of Understanding (MOU)with members of the Canadian Marine ManufacturersAssociation. Under this voluntary MOU, outboardengines and personal watercraft sold in Canada will bedesigned to comply with U.S. federal emission standardsbeginning in the 2001 model year. EnvironmentCanada also has engaged in dialogue with industry asso-ciations and engine manufacturers representing the utili-ty engine and off-road diesel sectors to implementsimilar programs.
Environment Canada is working closely with theCanadian Urban Transit Association (CUTA),Bombardier, and other private sector partners to delivera major nationwide sustainable transportation cam-paign. Running in 61 Canadian cities, the campaign issupported by board advertisements on buses and publicservice announcements. The campaign focuses on alter-natives to single-occupancy vehicles and highlights therole of public transit in creating cleaner and healthiercommunities.
Provincial/Regional Emission Reduction Plans
Ontario
Ontario has developed an Anti-Smog Action Plan,which covers a wide variety of sectors, to reduce 1990NOx and VOC emissions levels 45% by the year 2015.The action plan has currently identified, planned, orimplemented reduction opportunities. These opportuni-ties are expected to assist Ontario in achieving up to80% of the targeted NOx reductions and 60% of thetargeted VOC reductions. Other opportunities andactions are being identified by a team of stakeholdersfrom industry, nongovernmental organizations, ministrystaff, and other levels of government.
The Ontario government addresses air quality prob-lems using a mix of regulatory and voluntary tools. OnJanuary 24, 2000, Ontario announced new actions toimprove air quality, including a commitment to reducethe province’s SO2 emissions 50% beyond theCountdown Acid Rain Program cap of 885 kilotonnes(kt) per year, by 2015. New regulations will cap NOx
and SO2 emissions and will require mandatory emis-sions monitoring and reporting. These regulations willfirst apply to the electricity sector, then extend to otherindustrial and commercial sectors. In 2001, annual SO2
and NOx emissions (as nitrogen oxide) from coal andoil-burning power plants greater than 25 megawattselectric (MWe) will be limited to 157.5 kt and 36 ktnet—more than 19% and 28% below the levels emittedin 1990. The province also announced emissions per-formance standards for Ontario, as well as U.S.-basedgenerators wishing to sell to the Ontario market.
At the same time, the province proposed a “Cap,Credit, and Trade” emissions reduction trading pro-gram. A new environmental assessment regulation hasalso been announced for Ontario that would specifyenvironmental assessment requirements for electricitysector activities. Drive Clean, initiated in 1999, is a pro-gram for inspection and maintenance of passenger vehi-cles, trucks, and buses to reduce emissions from existingvehicles. When fully implemented, this program willeliminate 62,000 tonnes of smog-causing pollutants peryear. The province’s gasoline volatility regulation hasbeen updated and requires gasoline refiners and blendersto reduce the smog-causing fumes emitted fromsummer-grade gasoline.
More than 100 air quality standards will have beenreviewed and revised or updated by the end of fiscal year
11
SEC
TIO
NIII - A
DD
ITIO
NA
LA
IRQ
UA
LITY
PRO
GR
AM
S

1999/2000 to ensure that the environment is protected.Ontario also established an interim air quality standardfor PM10. Currently, the province is developing a PMreduction strategy. The ministry also launched thePartners in Air Program, a partnership of high schools,government, business, and industry. The program willinclude in-class instruction for students on reducingsmog and monitoring air quality. Provincewide resultsare posted for students on a Partners in Air InternetWeb site at www.partnersinair.org
British Columbia
British Columbia (BC) has been the leader in a num-ber of clean transportation initiatives. BC is the onlyprovince to regulate beyond federal tailpipe emissionstandards for new vehicles. After a review of the relativebenefits of U.S. Tier 2 and California Low EmissionVehicle Standards II standards, BC announced in March2000 that it will follow the U.S. Tier 2 standardsbecause they will provide the best air quality improve-ments. A fuel tax exemption is provided to encouragethe use of natural gas, propane, and high-level alcoholblends to reduce emissions related to smog, fine particleformation, and greenhouse gases. A new exemption wascreated for low-level ethanol blends in the 1999 provin-cial budget.
BC’s AirCare Program has regulated the emissions ofexisting vehicles since 1992. A number of improvementswill take effect when AirCare2 testing begins later in2000 or early 2001. BC also began mandatory testing ofheavy vehicle emissions in 1999. BC has Canada’s onlyprogram to provide financial incentives to take olderpolluting vehicles off the road. The program wasrelaunched in November 1998 with a wider range ofincentives. BC has also supported fuel cell commercial-ization through the purchase of three Ballard hydrogenfuel cell buses, used since fall 1999.
The Lower Fraser Valley is an international air shedbordered by seacoast and mountains. The Canadianportion is shared by the Fraser Valley Regional Districtand the Greater Vancouver Regional District. Both areashave management plans aimed at improving air qualityor preventing further deterioration. (Detailed informa-tion on air quality management efforts in both regionscan be found at: www.gvrd.bc.ca/services/air/index.htmland www.fvrd.bc.ca/home.html.)
UNITED STATES
Revised Ozone and PM Standards
In July 1997, EPA established an 8-hour primaryozone standard to protect against longer exposure peri-ods that are of concern for both human health and theenvironment. The level of the national 8-hour primaryand secondary ambient air quality standards for ozone isan 0.08 ppm daily maximum, 8-hour average, over 3years. The standards are met when the 3-year average ofthe annual fourth-highest daily maximum 8-hour ozoneconcentration is less than or equal to 0.08 ppm.
The 8-hour ozone standard was subject to legal chal-lenge. In May 1999, the U.S. Court of Appeals for theDC Circuit remanded the case back to EPA for furtherconsideration. The court has since agreed to review thedecision.
EPA is taking other actions to protect against therisks of ozone pollution while litigation continues overits more protective 8-hour standard. EPA is retainingthe 1-hour ozone standard where it currently appliesand has reinstated it in areas where it was previouslyrevoked. These areas will continue monitoring forozone, and some will need to take action to prevent oreliminate ozone violations. Once the 8-hour standardhas become fully enforceable and is subject to no furtherlegal challenge, EPA will take action to evoke the 1-hourstandard in areas where air quality meets that standard.
Regarding PM standards, the last review of the stan-dards concluded that further protection from adversehealth effects is needed. Based on this review, the pri-mary (health-based) PM standards were revised in July1997, adding two new PM2.5 standards that offer pro-tection from fine particles. The new PM2.5 standardswere set at 15 µm3 and 65 µm3, respectively, for theannual and 24-hour standards. The secondary (welfare-based) PM2.5 standards were made identical to the pri-mary standards and will be implemented in conjunctionwith a revised visibility protection program to addressregional haze in mandatory federal Class I areas. In May1999, the U.S. Court of Appeals for the DC Circuitvacated the revised PM10 standards, remanding themback to EPA for further consideration. The SupremeCourt has since agreed to review the decision in May2000. EPA is currently reviewing the PM standards,scheduled for completion by 2002.
12
SEC
TIO
NIII
- A
DD
ITIO
NA
LA
IRQ
UA
LIT
YPR
OG
RA
MS

In other efforts, EPA began deployment of a newmonitoring network in early 1999 to assess fine PMdata with respect to the new PM2.5 standards (seeSection IV, p. 24 for more details).
The Ozone Transport Reduction Rule andRelated Actions
In September 1998, EPA finalized the OzoneTransport Reduction Rule, known as the NOx StateImplementation Plan (SIP) Call, requiring 22 states8
and the District of Columbia to submit SIPs addressingthe regional transport of ground-level ozone. Byimproving air quality and reducing NOx emissions, theactions directed by these plans will decrease the trans-port of ozone across state boundaries in the eastern halfof the United States. The rule requires emissions reduc-tion measures to be in place by May 2004. The finalrule does not mandate which sources must reduce pollu-tion. States will have the ability to meet the rule’srequirements by reducing emissions from the sourcesthey choose. Utilities and large nonutility point sources,however, would be one of the most likely sources ofNOx emissions reductions. The final rule includes amodel NOx Budget Trading Program that will allowstates to achieve more than 90% of the required emis-sions reductions in a highly cost-effective way. This rulewill reduce total summertime NOx emissions in theaffected states and the District of Columbia by about25% (approximately 1 million tons) beginning in 2003.EPA projects that these regional NOx reductions, incombination with existing local controls, will bring thevast majority of all new ozone nonattainment areas intoattainment with the 8-hour ozone standard. They alsowill help reduce ozone levels in the remaining nonat-tainment areas east of the Mississippi River.
In 1997, in a separate but related action,Connecticut, Maine, Massachusetts, New Hampshire,New York, Pennsylvania, Rhode Island, and Vermontfiled petitions with EPA under Section 126 of the CleanAir Act Amendments (CAAA) to reduce the transport ofground-level ozone. The petitions identified 30 states,plus the District of Columbia, as containing sourcesthat significantly contribute to the regional transport ofground-level ozone. The petitions asked EPA to find
that certain utilities and other NOx emissions sourcessignificantly contribute to these states’ ozone problems.9
In April 1999, EPA issued a final rule determiningthat four of the eight petitions could be approved basedsolely on technical considerations under the 1-hourstandard. In January 2000, EPA granted these four peti-tions.10 As a result, 392 facilities will have to reduceannual emissions about 510,000 tons from 2007 levels.
Tier 2 Standards for Auto Tailpipe Emissionsand Low Sulfur in Gasoline
In December 1999, EPA announced more protectivetailpipe emissions standards for all passenger vehicles,including sport utility vehicles (SUVs), minivans, vans,and pickup trucks. Simultaneously, EPA announcedmore stringent standards for sulfur in gasoline, which
will ensure the effectiveness of low-emission controltechnologies in vehicles and reduce harmful air pollu-tion. The implementation of the new tailpipe and sulfurstandards will equate to removing 164 million cars fromthe road. These new standards require passenger vehiclesto be 77% to 95% cleaner than those on the road todayand to reduce gasoline’s sulfur content by up to 90%.
The new tailpipe standards are set at an average of0.07 grams per mile (g/mi) of NOx emissions for allclasses of passenger vehicles, beginning in 2004. Thisregulation marks the first time that SUVs and otherlight-duty trucks—even the largest passenger vehicles—are subject to the same national pollution standards ascars. Vehicles weighing less than 6,000 pounds will bephased into this standard between 2004 and 2007.
13
SEC
TIO
NIII - A
DD
ITIO
NA
LA
IRQ
UA
LITY
PRO
GR
AM
S
8EPA’s final action was subject to legal challenge by a number of parties. In March 2000, the U.S. Court of Appeals for the DC Circuit issueda 2-to-1 ruling in favor of EPA on all major issues associated with the NOx SIP Call. The court remanded issues—including those relating toWisconsin, Georgia, and Missouri—to EPA. In June 2000, the court ordered SIP revisions addressing requirements upheld by the Court dueby October 30, 2000.
9All eight petitioning states requested findings under the 1-hour ozone standard; five also requested findings under the 8-hour standard. Foreach petition, EPA made separate technical determinations for the 1-hour and 8-hour ozone standards.
10EPA denied petitions for the 1-hour standard filed by Maine, New Hampshire, Rhode Island, and Vermont because these states no longerhad areas that were not attaining the 1-hour standard.

For the heaviest light-duty trucks, the program pro-vides a three-step approach to reducing emissions. First,in 2004, vehicles must not exceed 0.6 g/mi—a morethan 60% reduction from current standards. Second,these vehicles are required to achieve an interim stan-dard of 0.2 g/mi to be phased in between 2004 and2007—an 80% reduction from current standards. Inthe final step, half of these vehicles will meet the 0.07standard by 2008, and the remaining will comply in2009. Vehicles weighing between 8,500 and 10,000pounds can take advantage of additional flexibilityduring the 2004 to 2008 interim period.
Beginning in 2004, the nation’s gasoline refiners andimporters will have the flexibility to manufacture gaso-line with a range of sulfur levels, as long as all their pro-duction is capped at 300 ppm and their average annualcorporate sulfur levels are capped at 120 ppm. In 2005,the refinery average will be set at 30 ppm, with a corpo-rate average of 90 ppm and a cap of 300 ppm. Both theaverage standards can be met by using credits generatedby other refiners that reduce sulfur levels early. Finally,in 2006, refiners will meet a 30-ppm average sulfur levelwith a maximum cap of 80 ppm. Gasoline produced forsale in parts of the western United States will be allowedto meet a 150-ppm refinery average and a 300-ppm capthrough 2006 but will have to meet the 30-ppmaverage/80-ppm cap by 2007.
Small refiners (i.e., those that have no more than1,500 employees and a corporate crude oil capacity ofno more than 155,000 barrels per day) will be requiredto comply with less stringent interim standards through2007, when they must meet the final sulfur standards. Ifnecessary, small refiners that demonstrate a severe eco-nomic hardship can apply for an additional extension ofup to two years.
Proposed Heavy-Duty Engine and VehicleStandards and Highway Diesel Fuel SulfurControl Requirements
In June 2000, EPA proposed a major program to sig-nificantly reduce emissions from heavy-duty engines andvehicles. This comprehensive 50-state control programregulates the heavy-duty vehicle and its fuel as a singlesystem. Under the proposal, new emission standards willbegin to take effect in 2007 and will apply to heavy-duty highway engines and vehicles operated on any fuel.As proposed, this program will reduce emissions of NOx
and nonmethane hydrocarbons (NMHC)—key ingredi-ents in ground-level ozone—by 2.8 million and305,000 tons per year in 2030, respectively. Particulateemissions from these vehicles would be reduced by110,000 tons per year in 2030.
The proposed PM emissions standards for new heavy-duty engines of 0.01 g/bhp-hr would take effect in the2007 model year. Standards for NOx and NMHC are0.20 g/bhp-hr and 0.14 g/bhp-hr, respectively. TheseNOx and NMHC standards would be phased in togeth-er for diesel engines between 2007 and 2010. Proposedstandards for complete heavy-duty vehicles would beimplemented on the same schedule as for engine stan-dards. For vehicles between 10,000 and 14,000 pounds,the proposed standards are 0.4 g/mi for NOx, 0.02 g/mifor PM, and 0.23 g/mi for NMHC. Proposed standardsfor diesel fuel specify that fuel sold to consumers for usein highway vehicles have a sulfur content no greaterthan 15 ppm, beginning in June 2006. Current sulfurcontent in fuel is about 500 ppm.
State Efforts
Attainment Demonstrations
The CAAA requires each state containing an area des-ignated nonattainment for ozone to submit an attain-ment demonstration plan to meet the ozone standard.EPA has recently proposed action on attainmentdemonstrations for 10 major urban areas: Atlanta,Baltimore, Houston, New York, Philadelphia, Chicago,Milwaukee, western Massachusetts, greater Connecticut,and Washington, DC. Attainment demonstrations forthese areas will involve 13 states and the District ofColumbia.
The CAAA specifies certain measures that must beadopted in nonattainment areas—reasonably availablecontrol technology on major sources, and vehicleinspection and maintenance, for example. However,each state can choose the additional measures needed
14
SEC
TIO
NIII
- A
DD
ITIO
NA
LA
IRQ
UA
LIT
YPR
OG
RA
MS

for attainment. The rule-making action for each planprovides details of the control measures the plans relyupon.
Northeast Ozone Transport Region
The CAAA established the Northeast OzoneTransport Region and the Ozone TransportCommission (OTC) in recognition of long-standingregional ozone problems inthe northeastern UnitedStates. The OTC comprisesthe governors or theirdesignees and an air pollu-tion control official fromConnecticut, Delaware,Maine, Maryland, NewHampshire, New Jersey,New York, Pennsylvania,Rhode Island, Vermont,Virginia, and the District ofColumbia. Administratorsfor three northeastern EPAregions also participate.
The OTC states decidedon a number of steps toreduce regional air pollution. For example, they agreedto significantly reduce NOx emissions throughout theregion from large stationary sources such as powerplants and other large fuel combustion sources usingmarket-based approaches. This program is expected toreduce 1990 baseline emissions by 52 percent.
Other Cooperative Air QualityEfforts
United Nations Long-Range TransboundaryAir Pollution Protocol
The United Nations Economic Commission forEurope’s Convention on Long-Range TransboundaryAir Pollution Protocol (LRTAP), signed in 1979, wasthe first international agreement recognizing environ-mental and health problems caused by the flow of airpollutants across borders and the need for regional solu-tions. On LRTAP’s 20th anniversary in December 1999,Canada and the United States signed the Protocol toAbate Acidification, Eutrophication, and Ground-LevelOzone. The signing of this agreement initiates a newphase within LRTAP to increase emphasis on imple-mentation, compliance, review, and extension of existingprotocols.
To accommodate the domestic (acid rain) and bilater-al (acid rain and ozone) agreements in place or currentlyunderway in both countries, Canada and the UnitedStates will incorporate their emissions reduction com-mitments for SO2, NOx, and VOCs into the new proto-col at the time of ratification. This will enable inclusionof the bilateral initiative to complete negotiations of anozone annex to the Air Quality Agreement in 2000.Emissions reduction commitments in the protocol relate
to emission limit values fornew and existing station-ary sources and newmobiles sources; applica-tion of best available tech-niques (BAT); andmeasures to reduce VOCemissions associated withthe use of products. Thereare no Canadian or U.S.commitments related toammonia. (For more infor-mation on the LRTAPConvention and protocols,see www.unece.org/env/lrtap.)
New England Governors and EasternCanadian Premiers
The Conference of New England Governors andEastern Canadian Premiers (NEG/ECP) announced res-olutions containing action plans for acid rain and mer-cury at its July 1998 annual meeting. In 1999, theNEG/ECP Acid Rain Steering Committee called on theFederal Governments to reduce SO2 emissions 50% andannual NOx emissions 30% beyond current commit-ments. State and provincial implementation of theNEG/ECP Acid Rain Action Plan has led to the forma-tion of focused work groups on forest mapping, surfacewater quality, fine particle monitoring, public outreach,and data exchange. (For details on scientific activitiesand NEG/ECP projects, see Section IV, pp. 27 and 28.)
Canada-U.S. Georgia Basin EcosystemInitiative
In January 2000, Canadian Minister of theEnvironment David Anderson and EPA AdministratorCarol Browner signed a British Columbia-WashingtonEnvironmental Cooperation Agreement. This coopera-tive initiative builds on several years of conservation andprotection work at the state/provincial/regional levels,strengthening the governments’ partnership in address-
15
SEC
TIO
NIII - A
DD
ITIO
NA
LA
IRQ
UA
LITY
PRO
GR
AM
S

ing the region’s transboundary and global environmentalchallenges. As part of this initiative, Canada and theUnited States will establish a joint EnvironmentCanada-EPA work group of senior-level officials todevelop annual action plans. The plans will share scien-tific information on the ecosystem, develop jointresearch initiatives, ensure coordination of environmen-tal management initiatives, and jointly consider longerterm planning issues. Enhanced cooperation on air qual-ity issues is expected to be one of the first action items.
North American Research Strategy forTropospheric Ozone
The North American Research Strategy forTropospheric Ozone (NARSTO) is a public/privatepartnership that includes Canada, the United States,and Mexico. It coordinates research on atmosphericprocesses involved in ozone and ozone precursor accu-mulation, transformation, and transport in the conti-nental troposphere, as well as on fine particles.NARSTO’s report, An Assessment of Tropospheric OzonePollution: A North American Perspective, is expected to bereleased by fall 2000. The report will address tropos-
pheric ozone and ozone precursor transboundary issues,emissions, monitoring trends, modeling, and methodsdevelopment. Research continues under NARSTO todetermine efficient and effective strategies for local andregional ozone management across the North Americancontinent. NARSTO also is preparing a PM scienceassessment expected to be completed by the end of2002.11
Northeast Regional Air Quality Committee
The Northeast Regional Air Quality Committee(NERAQC), established in response to Prevention ofSignificant Deterioration (PSD) and visibility protectionunder Annex 1, is focused on protected areas in NewEngland and Atlantic Canada. NERAQC is made up offederal, state, and provincial representatives. The com-mittee holds meetings and conferences to exchangeinformation about air pollution research, air monitor-ing, and mitigation efforts that impact parks and pro-tected areas. (For more information on NERAQC, seehttp://capita.wustl.edu/NEARdat/transflo/NERAQC/NERAQC.htm.)
16
SEC
TIO
NIII
- A
DD
ITIO
NA
LA
IRQ
UA
LIT
YPR
OG
RA
MS
11Quality assurance and data management guidelines and assistance are available to all NARSTO researchers at the Oak Ridge NationalLaboratory in Oak Ridge, Tennessee.

Emissions Inventories
Emissions inventories provide the foundation for airquality management programs. They are used to identi-fy major sources of air pollution, provide data to inputinto air quality models, and track the progress of controlstrategies. In this section, SO2, NOx, and VOCs are themain pollutants addressed. SO2 and NOx emissions arethe dominant precursors of acidic deposition; NOx andVOCs are primary contributors to the formation ofground-level ozone; and all three pollutants contributeto PM formation.
In this section, emissions trends estimates for SO2,NOx, and VOCs for both Canada and the United States(Figures 3, 6, and 7) are presented reflecting newmethodologies for determining total estimates and usingnew models and results (e.g., the NONROAD model).In addition to the joint emissions trends data, the latestavailable data (1998) on sources of emissions by sectorare presented in Figures 4, 5, and 8. Canadian emissionsdata are preliminary
Sulfur Dioxide
Coal and oil combustion, smelting, and a few indus-trial processes continue to be the principal anthro-pogenic sources of SO2. Overall, a 39% reduction inSO2 emissions is projected in Canada and the UnitedStates from 1980 to 2010.
Section IV
Scientific Information ExchangeThis section focuses on Canadian and U.S. progress under Annex 2 of the Air Quality Agreement tocooperate and to exchange scientific information related to transboundary air quality issues. Thiscooperation and exchange of data is essential for comparing atmospheric and ecosystem changes relatedto variations in emissions of pollutants. It is also important for publishing results in common formats.The emissions graphics and acid deposition maps presented in this section are examples of cooperativedata sharing. Throughout the 1990s, cooperative efforts focused primarily on acid rain. In recentyears, the two governments have undertaken joint analyses and shared data in the areas of ground-level ozone and fine particulates.
Canada-U.S. SO2 Emissions By Sector
Figure 4
United States - 1998
Canada - 1998
17
No data were available in 1980 to estimate emissions from U.S.nonroad diesel and gasoline vehicles. For purposes of consis-tency, these emissions have been removed from all other years.
Figure 3
Canada-U.S. SO2 Emissions, 1980-2010

Nitrogen Oxides
The principal anthropogenic source of NOx emissionsremains the combustion of fuels in stationary andmobile sources. Motor vehicles, residential and commer-cial furnaces, industrial and electric utility boilers andengines, and other equipment contribute to this catego-ry. U.S. reductions in NOx emissions are attributed tocontrols in electric utilities under the Acid Rain
Program, the estimated controls associated with EPA’sRegional Transport NOx State Implementation Plan(SIP) Call, and the Tier 2 Tailpipe Standard. Overallestimated trends for anthropogenic emissions of NOx inCanada and the United States from 1990 to 2010 areshown below.
Volatile Organic Compounds
Anthropogenic emissions of VOCs come from a widevariety of sources, including mobile sources and indus-trial processes (e.g., chemical manufacturing and theproduction of petroleum products). Emissions in theUnited States are expected to decline by the year 2000and then remain stable through 2010. Overall estimatedtrends in anthropogenic VOC emissions for Canada andthe United States from 1980 to 2010 are shown below.
18
SEC
TIO
NIV
- S
CIE
NT
IFIC
INFO
RM
ATIO
NEX
CH
AN
GE
Year
Canada-U.S. NOx Emissions By Sector
Figure 6
Figure 7
Figure 5
Canada-U.S.VOC Emissions, 1980-2010
Canada-U.S. NOx Emissions, 1990-2010
Canada - 1998
United States - 1998

19
SEC
TIO
NIV
- SC
IENT
IFICIN
FOR
MAT
ION
EX
CH
AN
GE
Acid Deposition Monitoring
Acid deposition monitoring is measured both as wetdeposition in the form of rain, snow, and fog, and drydeposition through analyses of particles and gases.Canada and the United States have well-established net-works that measure wet and dry deposition. Both coun-tries contributed to an integrated data set used for themaps on page 20 that show North American depositiontrends.
Status and Trends
Following implementation of Phase I of the AcidRain Program, analyses of National Atmospheric Depo-sition Program/National Trends Network(NADP/NTN) data for 1995 to 1998 showed a dramat-ic and unprecedented sulfate deposition reduction of upto 25% over a large area of the eastern United States.The greatest reductions were in the northeastern UnitedStates, where many sensitive ecosystems are located.
In eastern Canada, sulfate concentrations in precipita-tion did not exhibit the same sudden decrease in 1995as seen in the United States. While the Canadian con-centration trends generally moved downward in 1995,the decrease appeared as a continuation of a slowdecline begun several years earlier. The magnitude of theslow decline between the 1986 to 1989 period and the1993 to 1996 period ranged from 12% to 30% at mostCanadian Air and Precipitation Monitoring Network(CAPMoN) sites.
A 10-year trend analysis for the 1988 to 1998 periodat 34 eastern U.S. Clean Air Status and Trends Network(CASTNet) sites shows significant declines in SO2 andsulfate concentrations in ambient air. The average SO2
reduction was 38 percent; for sulfate, the reduction was22 percent. In the early 1990s, ambient SO2 concentra-tions in the rural eastern United States were highest inwestern Pennsylvania and along the Ohio Valley in thevicinity of Chicago and Gary, Indiana. Large SO2 airquality improvements can be seen by comparing the1990 to 1991 period with the 1997 to 1998 period.The largest decrease in concentrations are noted in thevicinity of Chicago and throughout states bordering theOhio Valley (Illinois, Indiana, Ohio, Pennsylvania,Kentucky, and West Virginia). The highest SO2 concen-trations in the rural parts of the eastern United Statesare concentrated in southwestern Pennsylvania.
In eastern Canada, SO2 and sulfate concentrations inair exhibited similar trends to those in the easternUnited States. At most CAPMoN sites, SO2 and sulfateconcentrations decreased from highs in the 1988 to1991 period until 1995, after which they leveled off. Aswith the U.S. CASTNet measurements, the sulfatedecline tended to be slower than that of SO2. HighestSO2 and sulfate concentrations occurred in the south-ernmost parts of Ontario and Quebec, in close proximi-ty to the northern areas of the United States thatexperienced the highest concentrations.
Analyses of Atmospheric Integrated Research Moni-toring Network (AIRMoN) wet and dry deposition sites
Figure 8
Canada-U.S.VOC Emissions By Sector
Canada - 1998
United States - 1998

20
SEC
TIO
NIV
- S
CIE
NT
IFIC
INFO
RM
ATIO
NEX
CH
AN
GE
1995-1998 Wet Nitrate Deposition
1980-1984 Wet Nitrate Deposition1980-1984 Wet Sulfate Deposition
1995-1998 Wet Sulfate Deposition
Figure 9 Figure 10
Figure 11 Figure 12
Wet Sulfate and Wet Nitrate Deposition in 1980-1984 and 1995-1998
Wet depostion before (1980-1984) and after (1995-1998) the implementation of the Phase 1 CAAA con-trols can be compared in Figures 9 through 12. Wet sulfate deposition decreased substantially from theearly 1980s to the post-implementation period. Nitrate wet deposition, on the other hand, showed minorchanges between these periods. Units are kilograms per hectare per year. These analyses are based onmeasurements of precipitation chemistry from the NADP/NTN and CASTNet in the United States andfrom federal and provincial monitoring networks in Canada. Wet sulfate deposition has been adjusted forthe sea-salt contribution of sulfate. Contours are not shown in figures 10 and 12 in Ontario and Quebecbecause provincial data were not available; values shown in those provinces are for federal sites only.

21
SEC
TIO
NIV
- SC
IENT
IFICIN
FOR
MAT
ION
EX
CH
AN
GE
focusing primarily in the Northeast showed sulfate con-centrations dropping as utility SO2 emissions decreased.There was a one-to-one change in total sulfur concen-trations reduced (SO2 and sulfate) to SO2 emissionsreduced.
Nitrate concentration in precipitation remainsunchanged when comparing NADP/NTN nitrate datacollected from 1983 to 1984 with data collected from1995 to 1998. CASTNet data also showed no change intotal nitrate concentrations. The highest nitrate concen-trations were found in Ohio, Indiana, and Illinois.
In eastern Canada, the concentrations of nitrate inprecipitation, as measured by CAPMoN, showed differ-ent trends depending on the location. In Ontario, themajority of sites did not exhibit an obvious trendthroughout the 1980s and up to 1997; in Quebec andthe Atlantic regions, most sites showed increases in thelast few years of the 1980s or the first few years of the1990s, followed by decreases until early 1997. Thisbehavior is consistent with the trend in NOx emissionsin eastern North America.
CANADA
Wet deposition in Canada is measured by various fed-eral and provincial/territorial governments.Environment Canada operates 19 federal sites inCanada under the auspices of CAPMoN. Three addi-tional sites will be added in 2000/2001. Provincial wetdeposition monitoring networks, comprising 77 sites,are operated by the governments of British Columbia,Alberta, Quebec, New Brunswick, Nova Scotia,Newfoundland, and the Northwest Territories. Ontarioclosed its monitoring network of approximately 20 sitesin April 2000, leaving only 7 CAPMoN sites operatingin that province.
Dry deposition is determined at 10 of EnvironmentCanada’s CAPMoN sites using a technique known asthe inferential method (a similar approach is used in theUnited States). Two more sites will be added in2000/2001. No dry deposition measurements are madeby the provinces or territories.
UNITED STATES
The United States has three acid deposition monitor-ing networks: NADP/NTN; AIRMoN, which is part ofNADP; and CASTNet. NADP/NTN has more than
200 wet deposition monitoring sites, including 15 collo-cated dry deposition sites monitored on a weekly basis.Nine AIRMoN sites monitor wet deposition on a dailybasis, and 15 sites monitor dry deposition on a weeklybasis. CASTNet has 74 sites monitoring dry depositionand rural ozone concentrations.
Information and Data Exchange
EPA and Environment Canada have broadened theircoordination on comparability issues, sharing of infor-mation on quality control, and data management. AnEPA workshop held in May 2000 focused on challengesfacing the operation of dry deposition monitoring net-works in both countries. During the next few years,research efforts will be directed at developing better esti-mates of dry deposition, emphasizing nitrogen.
Ground-Level OzoneMonitoring and Mapping
Ground-level ozone (the primary constituent ofsmog) continues to be a pervasive pollution problemthroughout many areas of the United States and south-ern Canada. Ozone is not emitted directly into the air,but is formed by the reaction of VOCs and NOx in thepresence of heat and sunlight. Ground-level ozone formsreadily in the atmosphere, usually during hot summerweather. As reported in Section III, p. 9, the Air QualityCommittee produced a joint transboundary ozonereport including modeling and air quality analyses.
Status and Trends
Figure 13 (above) shows the fourth highest daily max-imum 8-hour ozone concentration for the northeasternportion of North America, averaged over the years 1996
Ozone Concentrations Over Eastern North America, 1996-1998
Figure 13

22
SEC
TIO
NIV
- S
CIE
NT
IFIC
INFO
RM
ATIO
NEX
CH
AN
GE
to 1998. This figure was created for EnvironmentCanada using the EPA-sponsored Map GeneratorProgram. The figure incorporates data from 271 ozonemonitoring sites that had at least two years of observa-tions in the 1996 to 1998 period.
Figure 14 shows the distribution of the fourth highestdaily maximum 8-hour ozone concentration at sites inthe Canada-U.S. border region using data for 1994 to1996. The highest values are recorded at the U.S. sitesand at the southwestern Ontario sites; the lowest valuesare recorded at sites in the Prairies and the Vancouverarea.
Concentrations of combined nitrogen oxide (NO),nitrogen dioxide (NO2) and NOx decreased in urbansites from 1989 to 1996 in Montreal, the Toronto area,southwestern Ontario, and Vancouver-Lower FraserValley. About half of this change was recorded between1989 and 1990. In contrast, there has been little or nodetectable change in mean VOC concentrations duringthe same period.
Ozone Monitoring
Both governments have extensive ground-level ozonemonitoring programs.
CANADA
Ambient monitoring of ground-level ozone and NOx
is performed throughout Canada under the National AirPollution Surveillance (NAPS) network. The NAPS net-work is a joint program of the federal and provincial
governments for monitoring and assessing the ambientair quality at 150 air monitoring stations in 52 urbancenters across Canada. Air quality data for the criteriapollutants (SO2, carbon monoxide (CO), NO2, ozone,and PM) and for other pollutants such as particulatelead, sulfate, and nitrate are collected, validated, andarchived in the NAPS database.
Data records for ozone and NO2 go back to the early1980s. Special VOC measurements have been collectedsince 1989. Most monitoring of ground-level ozone andprecursors is focused in the country’s densely urbanizedregions. In addition, Environment Canada operatesCAPMoN, which is representative of most nonurbanregions of the country.
UNITED STATES
The national ambient air quality monitoring pro-gram—the State and Local Air Monitoring Stations(SLAMS) network—is implemented by state and localair pollution control agencies. The SLAMS networkconsists of three major categories of monitoring stations:(1) those that are SLAMS only; (2) National AirMonitoring Stations (NAMS); and (3) PhotochemicalAssessment Monitoring Stations (PAMS). PAMS meas-ure a variety of criteria and noncriteria pollutants. EPAalso operates CASTNet, which provides ozone levels inrural areas, as well as dry acidic deposition levels andtrends (see pages 19 and 21).
Currently, there are 578 SLAMS for ozone, which areused for SIP support, state/local data, and EPA regionaloffice oversight. There are 208 NAMS sites for ozone,which are used for national policy support, nationaltrends development, measurement of maximum concen-trations and population exposures, and EPA headquar-ters oversight. Additionally, the state and local agenciesoperate 265 special purpose monitors (SPM) for ozone.These are generally used for special state- or local-levelstudies and state/local oversight.
The PAMS networks measure ozone precursors (i.e.,approximately 60 volatile hydrocarbons and carbonyl) asrequired by the 1990 Clean Air Act Amendments(CAAA) to monitor the most severe ozone nonattain-ment areas. The PAMS requirements were designed toprovide information on the roles of ozone precursors,pollutant transport, and local meteorology in thephotochemical process, and to assist in informationgathering for proposed ozone control strategies. In2000, approximately 83 PAMS will be in operation.
R E G I O N
30
40
50
60
70
80
90
100
110
AT MAINE M O N T O R S W MICH NY OHIO PENN PR VA W A S H
Distribution of 4th Highest Daily 8h Maximum Ozone(ppb) for Regional Sites, 1994-1996 (Median, 5th, 25th,75th, and 95th Percentiles)
Figure 14

23
SEC
TIO
NIV
- SC
IENT
IFICIN
FOR
MAT
ION
EX
CH
AN
GE
Ozone Mapping
JOINT EFFORTS
AIRNOW Expansion
AIRNOW, EPA’s real-time air quality program, willexpand into Canada in 2000 to cover the Atlanticprovinces and Quebec. The AIRNOW animated OzoneMap shows ozone concentrations within categories rang-ing from “Good” to varying degrees of “Unhealthy.”(For more information, see www.epa.gov/airnow.)
The expansion into eastern Canada is a cooperativeventure involving New England states, eastern Canadianprovinces, the Northeast States for Coordinated Air UseManagement (NESCAUM), EPA, and EnvironmentCanada. Ontario has been invited to join the project. InMay 2000, the partners initiated efforts to begin trans-fer of the real-time ozone data. The resulting map isexpected to be available to the general public in 2000.The project, in reaching out to the public, will comple-ment existing smog advisory programs and the develop-ing smog forecasting program. Currently, 32 statesparticipate in AIRNOW.
UNITED STATES
Air Quality Index
In 1999, EPA finalized revisions to the Air QualityIndex (AQI), formerly known as the Pollutant StandardsIndex. Significant revisions were made, including: (1)changes to better reflect the continuum of health risksassociated with increased pollutant concentrations; (2)the addition of pollutant-specific health and cautionarystatements to inform the public of effective risk reduc-tion behaviors; (3) an AQI update for use in the media(i.e., television and newspapers); and (4) specific revi-sions to add an ozone subindex in terms of 8-hour aver-age concentrations, as well as a new subindex for finePM (PM2.5). (For more information, seewww.epa.gov/airnow/publications.html.)
Particulate Matter Monitoring,Data Analysis, and Modeling
JOINT EFFORTS
Canada and the United States are conducting cooper-ative analyses and developing a joint work plan fortransboundary inhalable particles as an outgrowth of theJoint Plan of Action signed in 1997 and the Joint PlanReport of the environmental ministers in 1998. Thework plan will include both data analysis and atmos-pheric modeling efforts to quantify the impacts of trans-boundary PM and precursors transport across theregion.
The first workshop on ambient data analysis and airquality modeling activities was held in September 1999.The workshop participants recommended developing a3- to 4-year plan, taking advantage of the first genera-tion of PM models to assess transboundary PM impacts.The Air Quality Committee supported the recommen-dation that all available models be used at this stage atits November 1999 meeting in Washington, DC.
The plan provides an inventory of transboundaryepisodes, data comparability studies, Canadian/U.S.database infrastructure, source-receptor modeling,extended episode analysis and reporting, and enteringdata into the database.
In addition, Canadian/U.S. analysis of specificepisodes is already under way in eastern North Americafollowing two episodes. During February 1998, veryhigh particle nitrate concentrations were observed, fol-lowed by increasing particle sulfate concentrations as airmasses began to move at the end of the episode. In theJuly 1995 summer episode, particle sulfate dominatedthe mass observations.
Transboundary impacts model applications will bemade using a combined 1995/1996 Canadian-U.S.emissions inventory. In addition, applications for theregional scale modeling system, Models-3/CommunityMulti-Scale Air Quality (CMAQ) have been initiatedfor the continental United States and southern Canada,with a 36-kilometer (km) grid for the 1996 base year.CMAQ will be applied for PM2.5 visibility and severalPM species. Preliminary results are expected by the endof the year.

24
SEC
TIO
NIV
- S
CIE
NT
IFIC
INFO
RM
ATIO
NEX
CH
AN
GE
There are several different monitoring methods usedwithin the Canadian and U.S. networks. They operateon various sampling schedules, from continuous hourlymeasurements to 24-hour average measurements takenonce every six days. A major challenge of the ambientdata analysis work is determining how these variousmethods can be compared. Another challenge is under-standing the spatial patterns and historical trends bymerging data from these different methods andnetworks.
During 2001, another workshop on modeling anddata analysis will assess progress and products, andrefine joint efforts to complete the transboundaryimpact assessment.
Particulate Matter Monitoring
CANADA
Canada has monitored for PM2.5 and PM10 under theNAPS program since 1984. Currently, the highestobserved PM2.5 concentrations are in eastern Canada’sborder regions. More than half the PM, especially thefiner fraction PM2.5, is of secondary origin from atmos-
pheric reactions of precursor gases, including SO2, NOx,VOCs, and ammonia (NH3). This results in PM com-position varying with season and location, as illustratedbelow left for Abbotsford, British Columbia, and St.Andrews, New Brunswick. The most recent nationalsummary of Canadian PM air quality and impacts canbe found in the Particulate Matter, Science AssessmentDocument, 1999, at www.hc-sc.gc.ca/ehp/ehd/catlogue/bch_pubs/99ehd220-1.htm.
UNITED STATES
In the United States, deployment of new monitoringnetworks for PM2.5 is supplying additional informationto both the Aerometric Information Retrieval System(AIRS) and AQI systems. Specific monitoring networkdata will include:
• Approximately 300 Federal Reference Method(FRM) sites that have complete data for 1999, andabout 600 FRM sites with some 1999 data and com-plete 2000 data. The network will have 1,089 FRMsites installed by December 2000.
• Approximately 200 continuous ambient monitors.• The initial 15 speciation sites, which had limited data
available as of April 2000. The completed speciationnetwork, expected to total 250 to 300 sites with 54sites operating for trends purposes, will be installedby December 2000.
• Eight supersites with useful data in 2001.• An expansion of the IMPROVE network, expected
to be complete by December 2000. It will include110 sites nationally.
• CASTNet data.
Particulate Matter Modeling
CANADA
Understanding the potential for long-range transportof particles between Canada and the United Statesrequires insight from both ambient data and predictedambient concentrations using regional chemical trans-port models. These models use the current understand-ing of chemical transformations and meteorologicalinfluences on particle behavior, plus the best estimatesof primary particle and precursor gas emissions esti-mates. The governments are working jointly to mergemobile source emission and modeling files. This com-mon emission inventory is critical as a foundation to thejoint modeling effort to characterize transboundaryimpacts.
Figure 15
Abbotsford, British Columbia
St.Andrews, New Brunswick
Variations in the Composition of PM in TwoCanadian Cities

25
SEC
TIO
NIV
- SC
IENT
IFICIN
FOR
MAT
ION
EX
CH
AN
GE
Canadian modeling efforts are directed toward devel-opment and evaluation of A Unified Regional AirQuality Modeling System (AURAMS), capable of pre-dicting multi-pollutant responses to changes in gaseousand particle emissions. This model, now in its first stageof development, can predict size-resolved particle massconcentrations (including sulfate, nitrate, ammonium,organic carbon, elemental carbon, crustal material, andwater), sulfate and nitrate deposition, and ozone. Thismodel is currently being evaluated on an eastern NorthAmerica domain, and plans are in place to apply it towestern North America.
UNITED STATES
The United States also is proceeding with develop-ment, testing, and application of the Regional ModelingSystem for Aerosols and Deposition (REMSAD). Theapplication of the REMSAD into a variety of sensitivityanalyses and control strategy simulations continues.Current applications are for the continental UnitedStates with 36 km grids. Concentration estimates arebeing made for PM2.5, visibility, and several PM specieswith a complete 1996 base year (both emissions andmeteorological conditions). In addition, consistent withrecommendations from a scientific peer review, themodel is being updated and documented for both emis-sions and air quality. Model performance comparisonswill be conducted with observed data for both the 1996base year application and the improved model. As dis-cussed previously as part of a joint effort, progress isbeing made in applying the regional scale CMAQ forthe continental United States and southern Canada forPM, visibility, and acid deposition.
Data Analysis
UNITED STATES
A completed general trends analysis using IMPROVEdata for PM2.5 appears in the 1998 National AmbientAir Quality Trends Report. Ongoing data analysis activi-ties with both short- and long-term products are under-way to spatially and temporally characterize PM2.5.These activities include but are not limited to: (1) con-tinual data quality assessment of the monitoring net-work; (2) investigation of interrelationships betweenprimary and secondary formed pollutants; (3) inter-comparison of pollutants and emission patterns; and (4)investigation of uncertainties and limitations in source-receptor analysis. The use of data from various databasesand networks is an issue that is continually addressed.
Particulate Matter Mapping
UNITED STATES
In addition to ozone mapping, EPA is workingtoward making real-time PM2.5 data available throughthe AIRNOW Web site at www.epa.gov/airnow. Basedon feedback at the annual Ozone Mapping Workshop,data are expected to be readily available across theUnited States in 2001. Several states will make dataavailable this year, but the majority prefer to wait untilthey are fully operational with real-time ozone databefore extending their coverage to PM2.5.
Dichots/Partisols
TEOMS
WINDSOR
WINNIPEG
MONTRÉALQUÉBEC
OSHAWA
KEJIMKUJIK
KAMLOOPS
SIMCOEST. CATHARINES
CHILLIWACK
KELOWNA REGINA
SAULT STE. MARIE
BATHURST
ESTEVAN
Canadian PM2.5 Monitoring Sites Within 200 Km ofU.S. Border
Status of PM2.5 Monitoring Deployment (UnitedStates)
Figure 16Figure 17

26
SEC
TIO
NIV
- S
CIE
NT
IFIC
INFO
RM
ATIO
NEX
CH
AN
GE
12Stoddard, J.L., et al. “Regional trends in aquatic recovery from acidification in North America and Europe.” Nature, Volume 401, October 7,1999.
Particulate Matter Research
UNITED STATES
EPA is carrying out a major PM research programfocused on: (1) improving the scientific underpinningsfor setting ambient air standards; and (2) expanding thescientific and technical tools to implement controlstrategies needed to attain the standards. To supportstandard setting, research is conducted to improveunderstanding of the characteristics of particles to whichpeople are exposed; to identify and clarify mechanismsby which particles cause adverse health effects; to under-stand factors that place some subpopulations atincreased risk; and to characterize the risks to publichealth. Research to support standards implementation isdesigned to determine major sources of PM, to developmethods to measure PM constituents, to develop airquality models of PM’s atmospheric fate and transport,and to identify the most cost-effective methods toreduce or prevent risks associated with PM exposure.
During the next sev-eral years, EPA’s PMresearch program willaddress the immediateand long-term researchpriorities recommendedby the NationalResearch Council’sCommittee on ResearchPriorities for AirborneParticulate Matter.Specific examples ofongoing efforts include:
• Conducting atmos-pheric sciencesresearch such as spe-ciated ambient monitoring, emissions characteriza-tion, atmospheric chemistry and processes, andmodeling, under the aegis of NARSTO. (For moreinformation on NARSTO, see Section III, p. 16.)
• Carrying out “exposure panel studies” that followsmall groups of individuals by using intensive person-al exposure monitoring and activity diaries.
• Using concentrated ambient particle systems toexplore animal susceptibility models and to evaluatecharacteristics of particles affecting health in humanclinical, animal toxicological, and in vitro systems.
• Reviewing and summarizing exposure and healtheffects work for the next Air Quality CriteriaDocument for PM.
• Conducting risk management research to evaluateoptions for reducing emissions of both particles andgaseous precursors.
(For more information on EPA’s research program,see the international inventory of PM research activitiesat www.pmra.org.)
Aquatic Effects Research andMonitoring
Cooperative Regional Trends Assessment
In 1999, Canadian and U.S. researchers12 analyzedwhether emissions reductions have led to chemicalrecovery of surface waters in five North Americanregions: Maine/Atlantic Canada, Vermont/Quebec,southern/central Ontario, Adirondacks/Catskills, andmidwestern North America. The analysis examinedregional trends in surface water chemistry between 1980
and 1995. Results generallyconfirmed those reportedin the 1998 ProgressReport.
Trends in surface watersulfate concentrations pro-vided the strongest evi-dence for regionalresponses to decreasing sul-fate deposition. Lake andstream sulfate concentra-tions decreased in all NorthAmerican regions, withdownward trends strongerin the 1990s than in the
1980s. Regional declines in lake and stream nitrate con-centrations were rarer, smaller in magnitude, and likelyconfounded by climatic effects and effects of insectinfestations. Researchers expected to see recovery (eitherdecreasing acidity or increasing alkalinity) in all areaswith strong regional sulfate declines. Recovery wasobserved, however, only in the Vermont/Quebec regionin the 1990s. Southern/central Ontario, the Adirondackand Catskill Mountains, and midwestern NorthAmerica demonstrated either an absence of regionalincreases in alkalinity or continued acidification. Lack of

27
SEC
TIO
NIV
- SC
IENT
IFICIN
FOR
MAT
ION
EX
CH
AN
GE
13Positively charged ions, such as magnesium, calcium, potassium, and sodium, that increase the pH of water when released to solution throughmineral weathering and ion exchange reactions.
14Dupont, J. 1997. Projet Noranda Phase III–Effets des réductions de SO2 sur la qualité de l’eau des lacs de l’ouest québécois. Ministère del’Environnement et de lat Faune du Québec, Direction de la qualité des cours d’eau, rapport no. Pa-53/1, Envirodoq no. EN 980066.
15Keller,W., et al. 2000. Sulphate and nitrate in Sudbury lakes: Trends and status. Cooperative Freshwater Ecology Unit, Laurentian University,Sudbury, Ontario.
16Department of Fisheries and Oceans. 2000. The Effects of Acid Rain on Atlantic Salmon of the Southern Upland of Nova Scotia. DFOMaritimes Regional Habitat Status Report 2000/2E.
recovery in the Canadian and U.S. regions is primarilyattributed to strong regional declines in base cation13
concentrations. These declines exceeded decreases in sul-fate concentrations. Another potential factor is theincreasing role of nitrogen in acid-sensitive regions assulfate levels decline. Evidence points to base cationdeclines being caused by high rates of acidic deposition,which in the past, have leached enough cations fromsensitive soils to severely deplete cation pools.
As described in Section III, the New EnglandGovernors and Eastern Canadian Premiers (NEG/ECP)Acid Rain Action Plan also provides a forum forexchange of scientific information related to aquaticeffects monitoring. The Action Plan resulted in prepara-tion of two state-of-the-art reviews. One review by theNEG/ECP Water Quality Monitoring Workgroup in2000, Is Nitrogen Deposition a Serious Issue?, addressesthe issue of nitrogen. The other is a 2000 report, ModelEstimations of the Effects of SO2 Emission Reductions onRegional Aquatic Chemistry and Biology in Eastern NorthAmerica, issued by Environment Canada’s NationalWater Research Institute. A review of the biologicaldamages caused by acid deposition is planned for2000/2001. Also, regional lake and river monitoringsites in four New England states and four Canadianprovinces will be used to jointly assess temporal trendsin water chemistry.
CANADA
Monitoring lakes near major SO2 sources at Rouyn-Noranda, Quebec, and Sudbury, Ontario, complementsthe regional trends analyses. Emissions from the smelterat Rouyn-Noranda have declined by more than 70%since the early 1980s. This reduction, added to thoseachieved in Ontario and in the United States, explainthe 40% to 50% sulfate decrease in surrounding lakes.Like the regional results, however, reduction of lakeacidity has been less successful. There was a significantincrease in pH (mean 0.5 unit) in clear water lakessouth of the smelter between 1991 and 1996, but the
pH of colored lakes remained low. Alkalinity remainedstable or decreased slightly, while base cations and alu-minum decreased significantly. Finally, despite nochange in atmospheric deposition or land use, there wasa twofold increase in nitrate concentrations in lakeswithin 50 km of Rouyn-Noranda.14
Lakes near the smelters at Sudbury show the strongestevidence of acidification recovery. Of 38 monitoredlakes, 35 exhibit increasing alkalinity. The consistency ofrecovery response in Sudbury lakes is probably due tolocal emission reductions being very large (about 90%overall) and the fact that a large proportion of thereduction occurred in the 1970s. Hence, Sudbury lakeshave had a longer time to adjust to lower acid inputthan the regional or Rouyn-Noranda lakes. Localsmelters’ influence on lake water sulfate and acidityextends out approximately 45 km. Beyond this radius,lake chemistry and trends are indistinguishable fromthose more than 200 km away. Unlike Rouyn-Noranda,there are few nitrate trends in Sudbury area lakes.15
Acid deposition has had a major destructive impact inmany of Canada’s lakes and rivers. Salmon spawningrivers in southern Nova Scotia continue to acidify, andthere is no evidence of salmon recovery.16 Nova Scotia isthe most heavily impacted Canadian province in termsof the proportion of fish habitat damaged by acid rain.The Southern Upland is the main area impacted.Naturally reproducing salmon are no longer present inmany of the 65 rivers that have their source in theSouthern Upland, and they are reduced in all other arearivers. The principal factors responsible are acid toxicitydue to acid deposition, and low marine survival.Because of acid deposition, salmon reproduction is nolonger possible in several rivers and impeded to varyingdegrees in most others. Chemistry data from sixSouthern Upland rivers show a sulfate decline between1982 and 1996. This decline did not result in a decreasein acidity, however. Instead, pH declined from 1992 to1996. In addition to calls for further reductions in aciddeposition, liming has been used as a management toolto protect remaining salmon stocks.

28
SEC
TIO
NIV
- S
CIE
NT
IFIC
INFO
RM
ATIO
NEX
CH
AN
GE
UNITED STATES
In 1999, the Hubbard Brook Research Foundationconvened a 10-member scientific work group to assessPatterns and Effects of Acidic Deposition in theNortheastern U.S.17 The study utilized recent literatureand other studies in addition to model calculations tosynthesize current scientific knowledge about the extentand effects of acidic deposition in the northeasternUnited States. The study focused particularly on SO2. Itfound that, despite SO2 control measures under the1970 Clean Air Act (CAA) and the 1990 CAAA, acidicdeposition is still high and adversely affecting lakes andstreams. Recovery of surface water acidity has beendelayed due to effects of long-term deposition inputs onthe leaching of nutrient cations such as calcium fromforest soils.
The report shows that decreasing atmospheric deposi-tion of sulfur during the last few decades has coincidedwith some decrease in the acidity of New England lakes.But little change is evident in lakes and streams of theAdirondack and Catskill regions of New York. Surveysshow that 41% of lakes greater than 2.5 acres in size inthe Adirondack region and 15% of lakes in NewEngland are either acidic year round or susceptible toacidic conditions for short periods associated with highflow. Surface water acidification affects fish populationsby decreasing size, number, and diversity.
The study also includes computer model calculationsestimating that acid-sensitive surface waters, like thosein New Hampshire’s Hubbard Brook ExperimentalForest, will not recover significantly under acidic deposi-tion reductions anticipated from the 1990 CAAA. Thestudy’s modeling projections indicate that additionalemissions reductions are necessary to accelerate therecovery of forested watersheds.
Forest Effects
Exposure of forest ecosystems to air pollutants—andthe effects these pollutants and other stressors mighthave on susceptible forest resources—is a major foresthealth issue.
JOINT EFFORTS
Both countries are cooperating to assess impacts of airpollution and acid deposition on forest ecosystems. Aforest mapping initiative included in the Acid RainAction Plan adopted by NEG/ECP builds on recentresearch in North America. The research shows aciddeposition resulted in both acidification and depletionof nutrient cations (e.g., calcium, magnesium) essentialfor tree growth in relatively poor soils. This forest map-ping initiative will assist scientists in assessing risks thatacid deposition poses to forest ecosystems in NewEngland and eastern Canadian provinces.
CANADA18-22
Forest research scientists from the Quebec Ministry ofNatural Resources documented losses of calcium, mag-nesium, and potassium from forest soils at their inten-sive monitoring site at Forêt Duchesnay near QuebecCity. During the study, the watershed lost 2.5% of theavailable calcium pool per year and 3% of the availablemagnesium pool. If calcium depletion continues at thisrate, the site will be calcium-deficient in 4 to 5 decades.Lake sediment analysis indicates base cations losses sincethe 1920s. Liming the site during a 4-year period hasresulted in strong positive tree growth response.
In addition, CL for forest soil acidification of theQuebec Forest Intensive Monitoring Network—knownas RESEF—were calculated using the simple mass-bal-ance (SMB) approach. The CL calculations indicatedthat 18 of the 31 RESEF plots received atmospheric
17Driscoll, C.T., et al. Acidic deposition in the Northeastern U.S.: Sources and inputs, ecosystem effects, and management strategies.Bioscience, in review.
18Houle, D., R. Paquin, C. Camiré, R. Ouimet, and L. Duchesne. 1997. Response of the Lake Clair Watershed (Duchesnay, Québec) tochanges in precipitation chemistry (1988-1994). Can. J. For. Res. 27.
19Moore, J.D., C. Camiré, and R. Ouimet. 2000. Effects of liming on the nutrition, vigor, and growth of sugar maple at the Duchesnay foreststation, Québec, Canada. Can. J. For. Res. 30.
20Ouimet, R., L. Duchesne, D. Houle, and P.A. Arp. 2000. Critical loads of atmospheric S and N deposition and current exceedances fornorthern temperate and boreal forests in Quebec. Water Air Soil Pollut. (accepted).
21McLaughlin, D. 1998. A decade of forest tree monitoring in Canada: Evidence of air pollution effects. Environ. Rev. 6.22Arp, P. A., T. Oja, and M. Marsh. 1996. Calculating critical S and N current exceedances for upland forests in southern Ontario, Canada.
Can. J. For. Res. 26.

29
SEC
TIO
NIV
- SC
IENT
IFICIN
FOR
MAT
ION
EX
CH
AN
GE
acidic inputs in excess of their CL (55% and 61% of thehardwood and coniferous plots, respectively). The rangeof CL exceedance varied from 60 to 470 equivalence(eq) per hectare per year for the hardwood stands, andfrom 10 to 590 eq per hectare per year for the conifer-ous stands. The stands with CL exceedance were mainlylocated in western and central Quebec.
Stand growth associated with exceedance class of acid-ity was determined usingRESEF plots and selectedpermanent forest surveyplots that had similar sitecharacteristics and for whichlonger growth records wereavailable. A significant nega-tive correlation was foundbetween forest growth ratesand exceedance of criticalsoil acidification for boththe northern hardwood andboreal conifer sites.Specifically, plots withexceedances had a growthreduction of about 30%from 1972 to 1990 (plotswith no exceedance of soilacidification served as con-trols). While this correlationis not necessarily causal, it isconsistent with the notionthat increased losses of soilbase cations due to growingsoil acidification lead todeteriorating forest health.These results correspond togrowth-exceedance trendstudies reported for Ontario that suggest northern hard-wood stand growth has declined by 0.66 to 0.96 cubicmeters per hectare per year since the mid-1960s andthat forest decline has been greatest on poorly bufferedsoils. The results also agree with the tree decline versusCL exceedance evaluation for southern Ontario. On theaverage, forest decline rates were about 30% to 40%higher for forest stands with estimated exceedances of300 to 500 eq per hectare per year than for forest standswith no exceedance.
In a broader context, from preliminary analyses basedon data from Acid Rain National Early Warning Systemplots (ARNEWS), CL are consistently exceeded insouthern and central Ontario and portions of theMaritimes. Preliminary analyses indicate that annual
productivity losses of 10% are associated with areas ofhighest CL exceedance.
In 1998, the Canadian Forest Service (CFS) initiatedthe Forest Indicators of Global Change Project(FIGCP). Its objectives are to: develop new early-warn-ing indicators of forest conditions; investigate interac-tions among air pollution, climate change, and forestproductivity; and establish an array of permanent
research/monitoring plots fordetailed studies of nutrient/car-bon cycling in eastern Canada.The gradient, or study area,stretches 1,800 km and encom-passes the highest levels of acidicdeposition in Canada. The areaincludes ecosystems receivingamong the highest incidences ofground-level ozone in Canada.There is a variation of 2° to 7°Celsius of mean annual tempera-ture and a 700 to 1,500 millime-ter (mm) variation of meanannual precipitation across thegradient. The temperature andprecipitation gradients will yieldinsight into the climate’s role ininfluencing other stressors onforest ecosystems.
In 1999, the CFS decided tofocus on case studies and longerterm research and monitoringlinked to specific issues and poli-cy direction. The ARNEWS andNorth American Maple Project(NAMP) plot networks were
affected. Plots within these networks, but not support-ing current investigations such as the Global ChangeGradient, would be archived.
Currently, 26 sites from Turkey Lakes, Ontario, toFundy National Park, New Brunswick, supportingeither adult sugar maple or adult conifers (white pine inthe west, red spruce in the east), are selected for FIGCP.Eighteen were a subset of ARNEWS, and four were asubset of NAMP. Three sites were added to fill geo-graphical gaps. The sugar maple series (17 sites) and theconifer series (15 sites) were chosen to be as ecologicallyanalogous as possible given the geographic extent.
Within this gradient, plot monitoring continues,using ARNEWS protocols. During 1999, leaf surfacestudies were initiated on selected plots; passive ozone

30
SEC
TIO
NIV
- S
CIE
NT
IFIC
INFO
RM
ATIO
NEX
CH
AN
GE
monitors were deployed and monitored across the gradi-ent. Several university and provincial government agen-cies have joined as partners in FIGCP, which willevaluate several candidate plots for inclusion in NovaScotia and Prince Edward Island from 2000 to 2001.
Preliminary analysis of cumulative ozone levels, meas-ured by passive ozone monitors within this gradient’splots, suggest that modeled levels extrapolated fromurban-centered continuous ozone monitors consistentlyhave underestimated actual ozone levels occurring with-in the gradient. During three separate time periods ofaccumulated ozone measurements from May to August1999, the onsite passive ozone monitors recorded higheractual ozone levels when compared with the most cur-rent modeled values for the gradient area. Generally,cumulative totals were between 30 and 40 ppb.
UNITED STATES
The Forest Health Monitoring Program (FHM) is ajoint effort among the U.S. Department of AgricultureForest Service (USFS), the National Association of StateForesters, and universities to address forest health andsustainability. FHM has collected data on forest healthsince 1991 and had expanded to include 36 states as of2000. FHM uses ground plots and surveys, aerial sketchmapping, and satellite imagery to evaluate the status andchanges of stressors and indicators of forest ecosystemconditions throughout the United States. The programevaluates stressors such as land use and forest fragmenta-tion, air pollution, drought, storms, insects andpathogens, alteration of historic fire cycles, and non-indigenous invasive species.23
Current Forest Conditions
The biological condition of U.S. forests was recentlyevaluated, and three major geographical areas of concernwere identified: the North (i.e., the Northeast, GreatLakes States, and mid-Atlantic); the Rocky Mountains(i.e., western Wyoming and northern Idaho); and thePacific Coast (i.e., eastern Oregon and Washington andparts of California). The factors that raised concerns inthese areas were the fragmentation and land use offorests, native and invasive insects and pathogens,
altered fire regimes, air pollution, relatively high deterio-ration of tree crowns, and invasive plant species. In theNorth, the 1998 status of dieback of tree crowns was atthe highest level for hardwood trees in 2% of the areaand 16% of the area for softwood trees. There was agreater than 2% per year increase in dieback found in2% of the area’s softwoods and 3% of its hardwoods.Hardwood transparency was at the highest level in 8%of the area; softwood transparency was at the highestlevel in 19% of the area. In this same general area,annual increases of greater than 2% were found in 19%of the area’s hardwoods and 8% of its softwoods. In theSouth, 1998 crown condition estimates indicated only avery small percentage of forest had relatively highdieback or transparency values.24 Overall, FHM foundmortality ratios greater than 0.625 in 22% of forests inthe North. No forest areas in the South were affected.
Sulfate and Nitrate Deposition
Since the last Progress Report, FHM evaluated thedeposition of sulfate, nitrate, ammonium, total nitro-gen, and precipitation pH in all forests in the contigu-ous 48 states from 1979 from 1995. Wet deposition ofthese substances were analyzed from 1979 to 1995 forall states from the NADP/NTN and CAPMoN pro-grams. The analysis estimated that relatively high sulfatedeposition covered 46.2% of forest area in the Northand 20.9% of forest area in the South. Relatively highnitrate deposition was estimated to cover 39.7% of for-est area in the North and 0.7% of forest area in theSouth. Similarly, relatively high annual ammonium dep-osition was estimated to cover 62.1% of forests in theNorth, 19.8% of forests in the South, and 0.8% offorests in the Rocky Mountains. Annual total nitrogendeposition was relatively high in 42.1% of forests in theNorth and 1.5% of forests in the South. The annualdeposition of the most acidic precipitation (4.2 to 4.5pH) covered 61% of the North and 20.4% of theSouth. Most forested areas in both the North (85%)and South (90.7%) received precipitation with an annu-al average pH of less than 4.8.
Ground-Based Ozone Forest Effects
FHM has developed an ozone monitoring plot systemthroughout much of the Northeast, the Great Lake
23Stolte, et al. 2000. FHM National Technical Report 2000 (1991-1998). In preparation. USDA Forest Service, Southern Research Station.General Technical Documents.
24Stolte, K.W., et al. 2000. FHM-RPA Summary Report 2000. Forest Health. In review. USDA Forest Service, RPA 2000 Report.25A mortality ratio of 0.6 means that for every 1.0 cubic meter of wood produced in growth, 0.6 cubic meters are lost to mortality.

31
SEC
TIO
NIV
- SC
IENT
IFICIN
FOR
MAT
ION
EX
CH
AN
GE
states, the mid-Atlantic, the South, and some parts ofthe West. Analysis of ozone air pollution from 1993 to1996 indicated that much of the eastern and parts ofthe western United States were exposed to relativelyhigh ozone. The analysis used a range of W126 (index)values grouped into different classes to reflect the sus-pected sensitivity of tree species to ozone exposures.26
Level 1 exposures affect only the mostsensitive tree species, such as blackcherry. According to study results,54% of the North and16.6% of the Southendured Level 1 exposures.Level 1 exposures also werefound in the RockyMountain region and thePacific Coast, but it isunclear whether tree speciesin drier climates are sensitiveto these relatively low levels.Level 2 exposures are believedto affect slightly more toleranttree species such as green andwhite ash, tulip poplar, andwhite pine, as well as the moresensitive Level 1 species. Level2 exposures were estimated tooccur in 44.3% of the Northand 83.3% of the South. Level2 exposures also were found inthe Rocky Mountain and PacificCoast regions, but it is unclearwhether the western treespecies are sensitive tothese exposure levels. Level3 exposures are believed toaffect even more tolerant treespecies such as loblolly pine, white and red Oak,American beech, and Virginia pine, as well as Level 1and 2 species. Level 3 exposures are estimated to occurin only 0.1% of the South, 1.8% of the RockyMountains, and 10.5% of the Pacific Coast, mostly inthe mountainous areas of southern and centralCalifornia. Level 4 exposures are believed to affect alleastern tree species susceptible to Levels 1 to 3, as wellas western tree species such as ponderosa pine, Jeffreypine, and black oak. Level 4 exposures were found onlyin 1.6% of the Pacific Coast region, affecting the moun-tainous forests of southern California.
Effects on Materials
Canada and the United States continue research onthe extent and nature of SO2 and NOx depositioneffects on buildings and materials.
JOINT EFFORTS
Through federal research support, the U.S. NationalCenter for the Preservation of Technology and Training(NCPTT) and the Canadian Conservation Institute willconduct studies on using lasers for conservation of cul-
tural materials and on the potential benefits of lasertechnology in general. This research will rely on
use of the newly established NCPTT-spon-sored Laser Research Facility at the LosAngeles County Museum of Art in LosAngeles. From projects generated by this col-
laboration, NCPTT researchers plan to investi-gate the interaction of air pollutants with
laser-cleaned stone surfaces.
UNITED STATES
U.S. efforts to understand air pollutant effects onmaterials and cultural resources continue throughNCPTT’s Materials Research Program (MRP) inNatchitoches, Louisiana. The evolution of soiling pat-terns on limestone buildings is the focus of a research
group at Carnegie Mellon University in Pittsburgh,Pennsylvania. The group’s hypothesis is that soilingresults from two competing processes: the deposition ofpollution to the stone and the dissolution and washingof stone surfaces by rain. Studies also are being conduct-ed on changes in soiling patterns at the Cathedral ofLearning Building at the University of Pittsburgh. Thestudies are based on examination of archival photo-graphs, analysis of soiling on architectural features,measurement of air pollutant concentrations and depo-sition, and computer modeling of rain impingement.
Another NCPTT-funded project studies interactionsbetween air pollutants and biofilms on historic lime-stone. Although it is known that air pollutants haveserious detrimental effects on limestone buildings andmonuments, the mechanisms of deterioration are poorlyunderstood. A Harvard University team is heading astudy looking at the role of microorganisms in lime-
26Southern Appalachian Man and the Biosphere (SAMB). 1996. The Southern Appalachian Assessment Atmospheric Technical Report. Report3 of 5. Atlanta: U.S. Department of Agriculture, Forest Service, Southern Region.

32
SEC
TIO
NIV
- S
CIE
NT
IFIC
INFO
RM
ATIO
NEX
CH
AN
GE
stone degradation in the presence of air pollutants. Atthe July 1999 International BiodeteriorationSymposium in Washington, DC, the Harvard teamreported that the population of sulfur-utilizing bacteriais three times higher on stones in polluted areas than onstones in clean environments. Similarly, the number ofhydrocarbon-degrading microorganisms is approximate-ly twice as high in polluted areas. Using electronmicroscopy studies, the team demonstrated that pollu-tants stimulate penetration of microflora into limestone.Currently, the team is examining the production of acidby these microorganisms and their ability to release cal-cium from the limestone.
Health Effects
The effect of SO2, NOx, and PM on human health,particularly the human heart and lungs, is beingresearched through various efforts and studies.
JOINT EFFORTS
Investigators from EPA’s Pulmonary ToxicologyBranch are continuing ongoing work with investigatorsfrom Health Canada in Ottawa to study the hematolog-ical and cardiopulmonary effects of urban particles incardiac-compromised rats. Joint efforts are taking placeto measure the various biological endpoints examinedin this study. The investigators plan to study ratsover a wide age range and in various stages ofhealth and disease.
CANADA
In 1999, Environment Canada and Health Canadapublished the PM science assessment document (seewww.hc-sc.gc.ca/ehp/ehd/catalogue/bch_pubs/99ehd220-1.htm). The science assessment adds to thenumerous studies that are providing the scientific basisfor action on PM by governments. Although concentra-tions of PM10 have long been associated with adversehealth effects, recent studies show that these particles areresponsible for premature deaths from lung and heartdisease-related causes and that the population is beingaffected at current concentrations across the country.Scientists now believe that there is no apparent “thresh-old,” or safe level for exposure to PM10. Children, the
elderly, and people with respiratory disorders such asasthma are particularly susceptible to health effectscaused by PM10.
The effect is even more accute with smaller PM2.5
particles. Health effects include breathing and respirato-ry symptoms, irritation, inflammation and damage tothe lungs, and premature death. PM is not limited tourban areas. Exposure to PM10 in Canada is demon-strated to be widespread, and it remains a problem inevery region of Canada throughout the year.
PM is also an effective delivery mechanism for othertoxic air pollutants, which attach themselves to airbornePM. These toxics are then delivered into the lungswhere they can be absorbed into the blood and tissue.
UNITED STATES
The United States hasconcentrated much of itshealth effects and risk man-agement work on PM,both exclusively and incombination with otherpollutants. As discussed ear-lier (see p. 26), this programhas been coordinatedamong a number of differ-
ent groups and has focused onpriorities identified by a NationalAcademy of Sciences committee. RecentEPA research on PM toxicity has providedcritical insight into how factors such asparticle size and chemical nature might
cause adverse health effects in humans. EPAalso conducted research with the University of NorthCarolina on the health effects of PM on sensitive groups(elderly persons in Baltimore, Maryland). The researchyielded insights into heart and lung functioningchanges.

33
Canada and the United States have not only success-fully reduced emissions of SO2 and NOx—the majorcontributors of acid rain—but also surpassed currentreduction requirements. Acid rain was the initial focusof cooperative transboundary efforts under the AirQuality Agreement. With significant progress, both gov-ernments continue to cooperatively pursue efforts toaddress acid rain.
During the last few years, the two governmentsexpanded their commitments to cooperatively addresstransboundary air issues to include ground-level ozoneand PM. This was an outgrowth of the April 1997 sign-ing of an agreement by the Canadian and U.S. environ-mental ministers to develop a Joint Plan of Action forAddressing Transboundary Air Pollution. Since the last
Air Quality Committee Progress Report in 1998, thegovernments have made significant headway. Canadaand the United States held bilateral negotiations thisyear to develop an ozone annex to the Air QualityAgreement, addressing their common concerns aboutground-level ozone’s transboundary impacts. At thesame time, both governments are undertaking newcooperative efforts in PM modeling, monitoring, anddata analyses to assess transboundary PM impacts andsupport development of a joint work plan to addressPM.
Following a successful decade of working together toreduce acid deposition, Canada and the United Statesare pursuing a new era of cooperation on additionaltransboundary air issues.
Section V
Conclusion

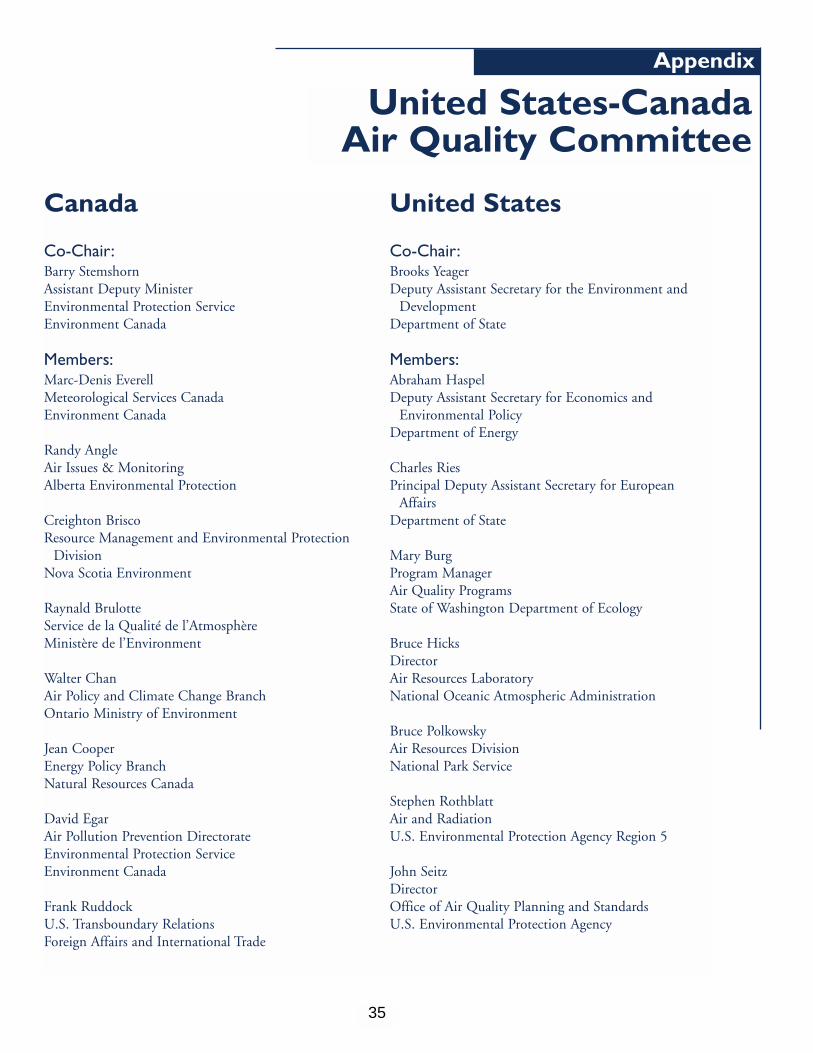
35
Canada
Co-Chair:Barry StemshornAssistant Deputy MinisterEnvironmental Protection ServiceEnvironment Canada
Members:Marc-Denis EverellMeteorological Services CanadaEnvironment Canada
Randy AngleAir Issues & MonitoringAlberta Environmental Protection
Creighton BriscoResource Management and Environmental Protection
DivisionNova Scotia Environment
Raynald BrulotteService de la Qualité de l’AtmosphèreMinistère de l’Environment
Walter ChanAir Policy and Climate Change BranchOntario Ministry of Environment
Jean CooperEnergy Policy BranchNatural Resources Canada
David EgarAir Pollution Prevention DirectorateEnvironmental Protection ServiceEnvironment Canada
Frank RuddockU.S. Transboundary RelationsForeign Affairs and International Trade
United States
Co-Chair:Brooks YeagerDeputy Assistant Secretary for the Environment and
Development Department of State
Members:Abraham HaspelDeputy Assistant Secretary for Economics and
Environmental PolicyDepartment of Energy
Charles RiesPrincipal Deputy Assistant Secretary for European
AffairsDepartment of State
Mary BurgProgram ManagerAir Quality ProgramsState of Washington Department of Ecology
Bruce HicksDirectorAir Resources LaboratoryNational Oceanic Atmospheric Administration
Bruce PolkowskyAir Resources DivisionNational Park Service
Stephen RothblattAir and RadiationU.S. Environmental Protection Agency Region 5
John SeitzDirectorOffice of Air Quality Planning and StandardsU.S. Environmental Protection Agency
United States-Canada Air Quality Committee
Appendix

36
United States Committee Members(continued)
Paul StolpmanDirectorOffice of Atmospheric ProgramsU.S. Environmental Protection Agency
Richard ValentinettiDirectorAir Pollution Control DivisionState of Vermont Agency of Natural Resources
Subcommittee on Program Monitoring and Reporting
Co-Chairs:
Steve HartDirectorTransboundary Air Issues BranchEnvironmental Protection ServiceEnvironment Canada
Brian McLeanDirector, Clean Air Markets DivisionOffice of Atmospheric ProgramsEnvironmental Protection Agency
Subcommittee on Scientific Cooperation
Co-Chairs:
Ann McMillanDirector, Policy and International Affairs DivisionMeteorological ServicesEnvironment Canada
Lawrence J. FolinsbeeChief, Environmental Media Assessment BranchNational Center for Environmental AssessmentEnvironmental Protection Agency
APP
END
IX

To Obtain Additional Information, Please Contact:
In Canada
Transboundary Air Issues BranchEnvironment Canada351 St. Joseph Boulevard11th Floor, Place Vincent MasseyHull, Quebec KIA 0H3Internet: www.ec.gc.ca/envhome.html
In the United States
Clean Air Markets DivisionU.S. Environmental Protection AgencyMail Code 6204J1200 Pennsylvania Avenue, NW.Washington, DC 20460Internet: www.epa.gov/acidrain

1EP
AU
nite
d S
tate
s E
nviro
nmen
tal P
rote
ctio
n A
genc
y12
00 P
enns
ylva
nia
Ave
nue,
NW
.(6
204J
)W
ashi
ngto
n, D
C 2
0460
Offi
cial
Bus
ines
sP
enal
ty f
or P
rivat
e U
se $
300
EP
A43
0R-0
0-00
920
00
Copyright © 2022 FDOKUMEN