UNITED COMPANY RUSAL LIMITED UNITED ... - HKEXnews
1141
UNITED COMPANY RUSAL LIMITED (Incorporated under the laws of Jersey with limited liability) Stock code: 486 Joint Sponsors, Global Coordinators and Bookrunners Joint Bookrunners Financial Adviser GLOBAL OFFERING
-
Upload
khangminh22 -
Category
Documents
-
view
0 -
download
0
Transcript of UNITED COMPANY RUSAL LIMITED UNITED ... - HKEXnews

UNITED COMPANY RUSAL LIMITED
UNITED COMPANY RUSAL LIMITED
UN
ITED
CO
MPA
NY
RU
SAL LIM
ITED
(Incorporated under the laws of Jersey with limited liability)Stock code: 486
Joint Sponsors, Global Coordinators and Bookrunners
Joint Bookrunners
Financial Adviser
GLOBAL OFFERING
IMPORTANT: If you are in any doubt about any of the contents of this prospectus, you should seek independent professional advice.
GLOBAL OFFERING
Number of Offer Shares in the Global Offering : 1,610,292,840 Offer Shares (in the form ofShares or in the form of Global DepositaryShares) (subject to the Over-allotment Option)
Maximum Offer Price : HK$12.50 per Offer Share, plus brokerage of1%, SFC transaction levy of 0.004%, and HongKong Stock Exchange trading fee of 0.005%(payable in full on application in Hong Kongdollars and subject to refund)
Nominal value : US$0.01 per ShareStock code : 486
Joint Sponsors, Global Coordinators and Bookrunners
Joint Bookrunners
Financial Adviser
Hong Kong Exchanges and Clearing Limited, The Stock Exchange of Hong Kong Limited and Hong Kong Securities Clearing CompanyLimited take no responsibility for the contents of this prospectus, make no representation as to its accuracy or completeness and expresslydisclaim any liability whatsoever for any loss howsoever arising from or in reliance upon the whole or any part of the contents of thisprospectus.
A copy of this prospectus, having attached thereto the documents specified in the paragraph headed “Documents Delivered to the Registrarof Companies and Available for Inspection” in Appendix IX, has been registered by the Registrar of Companies in Hong Kong as requiredby Section 342C of the Hong Kong Companies Ordinance (Chapter 32 of the Laws of Hong Kong). The Securities and Futures Commissionand the Registrar of Companies in Hong Kong take no responsibility for the contents of this prospectus or any other document referred toabove.
A copy of this document has been delivered to the registrar of companies in Jersey in accordance with Article 5 of the Companies (GeneralProvisions) (Jersey) Order 2002, and the registrar has given, and has not withdrawn, consent to its circulation. The Jersey Financial ServicesCommission has given, and has not withdrawn, its consent under Article 2 of the Control of Borrowing (Jersey) Order 1958 to the issue ofsecurities in the Company. It must be distinctly understood that, in giving these consents, neither the registrar of companies in Jersey nor theJersey Financial Services Commission takes any responsibility for the financial soundness of the Company or for the correctness of anystatements made, or opinions expressed, with regard to it.
The Offer Price is expected to be fixed by agreement between the Joint Global Coordinators (on behalf of the Underwriters) and the Companyon the Price Determination Date. The Price Determination Date is expected to be on or around Friday, 22 January 2010 and, in any event,not later than Monday, 25 January 2010. The Offer Price is currently expected to be no more than HK$12.50 per Offer Share and no less thanHK$9.10 per Offer Share, unless otherwise announced. If, for any reason, the Company and the Joint Global Coordinators (on behalf of theUnderwriters) are unable to reach an agreement on the Offer Price, the Global Offering will not become unconditional and will not proceed.
Prior to making an investment decision, prospective investors should consider carefully all of the information set out in this prospectus,including the risk factors set out in the section headed “Risk Factors”.
ATTENTIONAn investment in shares in United Company RUSAL Limited (the “Company”) involves significant risk. investors may lose partor all of the value of their investment. Subscription for Shares in the Company is being limited to potential investors who areprofessional investors or who are willing to subscribe for or purchase at least HK$1 million worth of Shares. Trading in the Shareswill be limited to minimum board lots of the number of Shares that make up a minimum board lot trading value at the ListingDate of HK$200,000. Shares in the Company should only be bought and traded by persons who are particularly knowledgeable ininvestment matters and can afford to lose their investment.
31 December 2009
IMPORTANT
S.342(2A)
App1A-111.078.0219.05(1)(b)
App1A-15(1)
3rd Sch-2
App1A-23(1)
App1A-3
11.2010.06(1)(b)(xi)17.02(4)
S.342(1)S.342C(1), (2)(b)

The Company does not meet the profit test to qualify for listing on theMain Board of the Hong Kong Stock Exchange Limited (the“Exchange”). The Company has been admitted to listing on theExchange on the basis of a large market capitalisation, revenue of morethan HK$500,000,000 and positive cash flows from operating activities.
In late 2009, the Group entered into agreements with creditors torestructure US$16.8 billion of indebtedness. The Group continues tohave significant debt obligations and is subject to stringent covenantsand repayment schedules that severely limit its operations and ability toincur new financing. The restructuring has generally extended thematurity of the Group’s debt obligations until 2013. However, animportant part of the Group’s debt falls due in less than ten months’time. By 29 October 2010, unless the Company obtains an extension, theCompany must repay a US$4.5 billion loan from Vnesheconombank(“VEB”), a financial institution controlled by the Russian Governmentand used to support and develop the Russian economy. If the repaymentof the whole of the Group’s indebtedness is accelerated, for examplebecause a relevant member of the Group is unable to comply with orsatisfy any of the terms or conditions of, or triggers any event of defaultunder, the debt restructuring or other debt obligations, or if theCompany should be unable to extend or refinance or repay the VEBloan as and when it falls due (for any reason including, withoutlimitation, should OJSC Savings Bank of the Russian Federation(“Sberbank”) not assume the rights, claims and obligations under theVEB loan), the Group may cease to continue as a going-concern.
Investors are directed to read the Risk Factors commencing on page 21of this prospectus for a description of these and other risks.
IMPORTANT
— i —

Pursuant to section 6(3)(b) of the Securities and Futures (Stock Market Listing) Rules, theSecurities and Futures Commission is imposing the following conditions to the listing of theShares on the Hong Kong Stock Exchange:
1. The provisions of the Management, Supervision and Internal Control Guidelines (“ICG”)and the Code of Conduct for Persons Licensed by or Registered with the SFC (“Code”)apply to the placing of the Offer Shares and must be complied with by intermediariesplacing the Offer Shares in Hong Kong.
2. The offer for subscription or purchase of the Offer Shares in Hong Kong will be conductedby way of placing only. Where the Offer Shares are placed in Hong Kong, subscribers foror purchasers of the Offer Shares must be limited to:
(a) persons falling under paragraphs (a) to (i) of the definition of “professional investors”in Part 1 of Schedule 1 to the Securities and Futures Ordinance (where the provisionsspecified in paragraph 15.5 of the Code may be waived);
(b) persons falling under paragraph (j) of the definition of “professional investors” in Part1 of Schedule 1 to the Securities and Futures Ordinance (where the provisions specifiedin paragraph 15.5 of the Code may be waived in relation to a person provided that theintermediary placing the Offer Shares in Hong Kong has, in respect of that personcomplied with paragraphs 15.3 and 15.4 of the Code); or
(c) other clients of an intermediary provided that the subscription price or purchase pricepayable by each client is a minimum of HK$1 million and the intermediary complieswith the requirements in respect of suitability set out in paragraph 5.2 of the Code.
3. The intermediaries placing the Offer Shares in Hong Kong confirm to the Joint Sponsorsand the Company that condition 2 above has been fulfilled in respect of Offer Shares placedby them.
4. The Joint Sponsors confirm in writing to the SFC and the Hong Kong Stock Exchange by1700 hours Hong Kong time on the business day immediately preceding the Listing Datethat condition 2 above has been fulfilled.
5. The trading board lot size of the Shares at and after listing of the Shares must be no lessthan the number of Shares that make up a minimum board lot trading value of HK$200,000based on the Offer Price, or such other number of Shares as the SFC may from time to timespecify by notice in writing to the Hong Kong Stock Exchange and the Company in responseto any proposed corporate action in connection with the share capital of the Company whichwill or is reasonably likely to materially reduce the value of a board lot of Shares in theCompany.
6. The conditions being imposed by the SFC for not objecting to the listing are set out in fullin this prospectus.
IMPORTANT
— ii —

2010(1)
Expected Price Determination Date(2) . . . . . . . . . . . . . . . . . . . . . . . . . . . . . . . . .Friday, 22 January
Announcement of the Offer Price, an indication of the level ofinterest and the basis of allocation of the Offer Shares ofthe Global Offering to be published on the Company’swebsite at www.rusal.com and the website of theHong Kong Stock Exchange at www.hkexnews.hkon or before . . . . . . . . . . . . . . . . . . . . . . . . . . . . . . . . . . . . . . . . . . . . . . . . .Monday, 25 January
Despatch of share certificates on or before(3) . . . . . . . . . . . . . . . . . . . . . . . . . .Tuesday, 26 January
Dealings in Shares on the Hong Kong Stock Exchangeto commence on . . . . . . . . . . . . . . . . . . . . . . . . . . . . . . . . . . . . . . . . . . . .Wednesday, 27 January
Notes:
(1) All references to times in this prospectus are Hong Kong local time, except as otherwise stated. Details of the structureof the Global Offering, including its conditions, are set out in the section titled “Structure of the Global Offering”.
(2) The Price Determination Date, being the date on which the Offer Price is to be determined, is expected to be on or aboutFriday, 22 January 2010 and, in any event, not later than Monday, 25 January 2010. If, for any reason, the Offer Priceis not agreed between the Joint Global Coordinators (on behalf of the Underwriters) and the Company by Monday, 25January 2010, the Global Offering will not proceed and will lapse, unless otherwise agreed by the Company and the JointGlobal Coordinators.
(3) Share certificates are expected to be issued on Tuesday, 26 January 2010 but will only become valid certificatesof title when the Global Offering has become unconditional in all respects, provided that the International PlacingAgreement has not been terminated in accordance with its terms, which is scheduled to be at around 8:00 a.m. onWednesday, 27 January 2010.
EXPECTED TIMETABLE
— iii —
App1A-15(2)(k)
App1A-15(2)(g)
App1A-22
IMPORTANT NOTICE TO INVESTORS
You should rely only on the information contained in this prospectus to make your investmentdecision. We have not authorised anyone to provide you with information that is different fromwhat is contained in this prospectus. Any information or representation not made in thisprospectus must not be relied on by you as having been authorised by us, the Joint GlobalCoordinators, the Joint Bookrunners, the Joint Sponsors, the Underwriters, any of their respectivedirectors or any other person or party involved in the Global Offering.
Expected Timetable . . . . . . . . . . . . . . . . . . . . . . . . . . . . . . . . . . . . . . . . . . . . . . . . . . . . . . . iii
Contents . . . . . . . . . . . . . . . . . . . . . . . . . . . . . . . . . . . . . . . . . . . . . . . . . . . . . . . . . . . . . . . . iv
Summary . . . . . . . . . . . . . . . . . . . . . . . . . . . . . . . . . . . . . . . . . . . . . . . . . . . . . . . . . . . . . . . 1
Forward-Looking Statements . . . . . . . . . . . . . . . . . . . . . . . . . . . . . . . . . . . . . . . . . . . . . . . 19
Risk Factors . . . . . . . . . . . . . . . . . . . . . . . . . . . . . . . . . . . . . . . . . . . . . . . . . . . . . . . . . . . . 21
Waivers from Compliance with the Listing Rules and the Companies Ordinance . . . . . . 53
Information About this Prospectus and the Global Offering . . . . . . . . . . . . . . . . . . . . . . . 60
Directors and Parties Involved in the Global Offering . . . . . . . . . . . . . . . . . . . . . . . . . . . 63
Corporate Information . . . . . . . . . . . . . . . . . . . . . . . . . . . . . . . . . . . . . . . . . . . . . . . . . . . . 69
Industry and Market Overview . . . . . . . . . . . . . . . . . . . . . . . . . . . . . . . . . . . . . . . . . . . . . . 72
History and Corporate Structure . . . . . . . . . . . . . . . . . . . . . . . . . . . . . . . . . . . . . . . . . . . . 86
Business . . . . . . . . . . . . . . . . . . . . . . . . . . . . . . . . . . . . . . . . . . . . . . . . . . . . . . . . . . . . . . . . 92
Overview . . . . . . . . . . . . . . . . . . . . . . . . . . . . . . . . . . . . . . . . . . . . . . . . . . . . . . . . . . . . 92
Strengths and Strategies . . . . . . . . . . . . . . . . . . . . . . . . . . . . . . . . . . . . . . . . . . . . . . . . 94
The Group’s Operations . . . . . . . . . . . . . . . . . . . . . . . . . . . . . . . . . . . . . . . . . . . . . . . . 104
Energy Supply . . . . . . . . . . . . . . . . . . . . . . . . . . . . . . . . . . . . . . . . . . . . . . . . . . . . . . . . 130
Sales and Distribution . . . . . . . . . . . . . . . . . . . . . . . . . . . . . . . . . . . . . . . . . . . . . . . . . . 139
Norilsk Nickel and Material Joint Ventures . . . . . . . . . . . . . . . . . . . . . . . . . . . . . . . . . . 142
Transportation . . . . . . . . . . . . . . . . . . . . . . . . . . . . . . . . . . . . . . . . . . . . . . . . . . . . . . . 145
Quality Control and Certification . . . . . . . . . . . . . . . . . . . . . . . . . . . . . . . . . . . . . . . . . 147
Environmental, Health and Safety Matters . . . . . . . . . . . . . . . . . . . . . . . . . . . . . . . . . . . 147
Operational Hazards and Insurance . . . . . . . . . . . . . . . . . . . . . . . . . . . . . . . . . . . . . . . 151
Employees . . . . . . . . . . . . . . . . . . . . . . . . . . . . . . . . . . . . . . . . . . . . . . . . . . . . . . . . . . . 152
Property . . . . . . . . . . . . . . . . . . . . . . . . . . . . . . . . . . . . . . . . . . . . . . . . . . . . . . . . . . . . 153
Intellectual Property . . . . . . . . . . . . . . . . . . . . . . . . . . . . . . . . . . . . . . . . . . . . . . . . . . . 153
Litigation . . . . . . . . . . . . . . . . . . . . . . . . . . . . . . . . . . . . . . . . . . . . . . . . . . . . . . . . . . . 153
Competition . . . . . . . . . . . . . . . . . . . . . . . . . . . . . . . . . . . . . . . . . . . . . . . . . . . . . . . . . 161
CONTENTS
— iv —
Financial Information . . . . . . . . . . . . . . . . . . . . . . . . . . . . . . . . . . . . . . . . . . . . . . . . . . . . . 162
Directors and Senior Management . . . . . . . . . . . . . . . . . . . . . . . . . . . . . . . . . . . . . . . . . . . 259
Substantial Shareholders . . . . . . . . . . . . . . . . . . . . . . . . . . . . . . . . . . . . . . . . . . . . . . . . . . . 284
Relationship with the Controlling Shareholders and Non-Competition . . . . . . . . . . . . . . . 300
Connected Transactions . . . . . . . . . . . . . . . . . . . . . . . . . . . . . . . . . . . . . . . . . . . . . . . . . . . . 305
Share Capital . . . . . . . . . . . . . . . . . . . . . . . . . . . . . . . . . . . . . . . . . . . . . . . . . . . . . . . . . . . . 312
Future Plans and Use of Proceeds . . . . . . . . . . . . . . . . . . . . . . . . . . . . . . . . . . . . . . . . . . . 315
The Cornerstone Placing . . . . . . . . . . . . . . . . . . . . . . . . . . . . . . . . . . . . . . . . . . . . . . . . . . . 316
Underwriting . . . . . . . . . . . . . . . . . . . . . . . . . . . . . . . . . . . . . . . . . . . . . . . . . . . . . . . . . . . . 319
Structure of the Global Offering . . . . . . . . . . . . . . . . . . . . . . . . . . . . . . . . . . . . . . . . . . . . 326
Presentation of Certain Cost Information . . . . . . . . . . . . . . . . . . . . . . . . . . . . . . . . . . . . . 333
Definitions . . . . . . . . . . . . . . . . . . . . . . . . . . . . . . . . . . . . . . . . . . . . . . . . . . . . . . . . . . . . . . 336
Glossary of Technical Terms . . . . . . . . . . . . . . . . . . . . . . . . . . . . . . . . . . . . . . . . . . . . . . . . 345
Appendix I — Accountants’ Report . . . . . . . . . . . . . . . . . . . . . . . . . . . . . . . . . . . . . I-1
Appendix II — Financial Statements of MMC Norilsk Nickel . . . . . . . . . . . . . . . . . II-1
Appendix III — Unaudited Pro Forma Financial Information . . . . . . . . . . . . . . . . . . III-1
Appendix IV — Profit Forecast . . . . . . . . . . . . . . . . . . . . . . . . . . . . . . . . . . . . . . . . . . IV-1
Appendix V — Property Valuation . . . . . . . . . . . . . . . . . . . . . . . . . . . . . . . . . . . . . . V-1
Appendix VI — Independent Technical Report . . . . . . . . . . . . . . . . . . . . . . . . . . . . . VI-1
Appendix VII — Summary of the Constitution of the Company andJersey Companies Law . . . . . . . . . . . . . . . . . . . . . . . . . . . . . . . . . . VII-1
Appendix VIII — Statutory and General Information . . . . . . . . . . . . . . . . . . . . . . . . .VIII-1
Appendix IX — Documents Delivered to the Registrar of Companies andAvailable for Inspection . . . . . . . . . . . . . . . . . . . . . . . . . . . . . . . . . IX-1
Appendix X — Extracts from Cherney v. Deripaska 2008 EWHC 1530 (Comm) . . . X-1
CONTENTS
— v —
This summary is an overview of the information contained in this prospectus and does not containall the information that may be important to you. You should read the whole document before youdecide to invest in the Offer Shares.
There are risks associated with any investment. Some of the particular risks in investing in the OfferShares are set out in the section headed “Risk Factors” in this prospectus. You should read thatsection carefully before you decide to invest in the Offer Shares.
Overview
United Company RUSAL Limited is the world’s largest producer of aluminium, with a particularfocus on the upstream segment of the industry — the production and sale of primary aluminium(including alloys and value-added products). Within its upstream business, the United CompanyRUSAL Limited Group is vertically integrated to a high degree, having secured supplies of bauxiteand having the capacity to produce alumina in excess of its current requirements. The Group’s coresmelters are located in Siberia, Russia, and benefit from access to low cost hydro generated electricity.This is a region where the Group is generally the principal consumer of electricity and there are few,if any, alternative sources of significant demand. The Group’s scale, upstream focus and position onthe cost curve provide a unique exposure to the aluminium industry, which in turn is highly leveredto the economic cycle.
With the onset of the global economic downturn in the second half of 2008, some of the keyend-user sectors for the aluminium industry (including automotive and transportation, constructionand electrical engineering) suffered a sharp contraction of demand. This resulted in a surplus supplyof aluminium in the market and a decline in the price of the metal and intermediate products such asalumina. In response, the Group reduced output at some of its older and higher-cost productionfacilities, as did many other leading companies in the industry globally, and restructured its debt asdescribed in greater detail below. Output reduction measures have effectively balanced the Group interms of its alumina requirements and have helped to optimise financial performance. According toCRU, the first quarter of 2009 marked the bottom of the aluminium industry cycle, in terms of demandfor primary aluminium and prices. Since then, both measures have improved sharply.
As a result of the global economic downturn and the sharp decline in aluminium prices startingfrom September 2008 and continuing into the first half of 2009, as well as an increase in the Group’sindebtedness in the first half of 2008, the Group experienced a liquidity shortage and breachedcovenants under most of its loan agreements. In late 2009, the Company and certain of its subsidiariesentered into a series of agreements that effected a comprehensive restructuring of the Group’sindebtedness and other obligations. See “— Debt Restructuring” below.
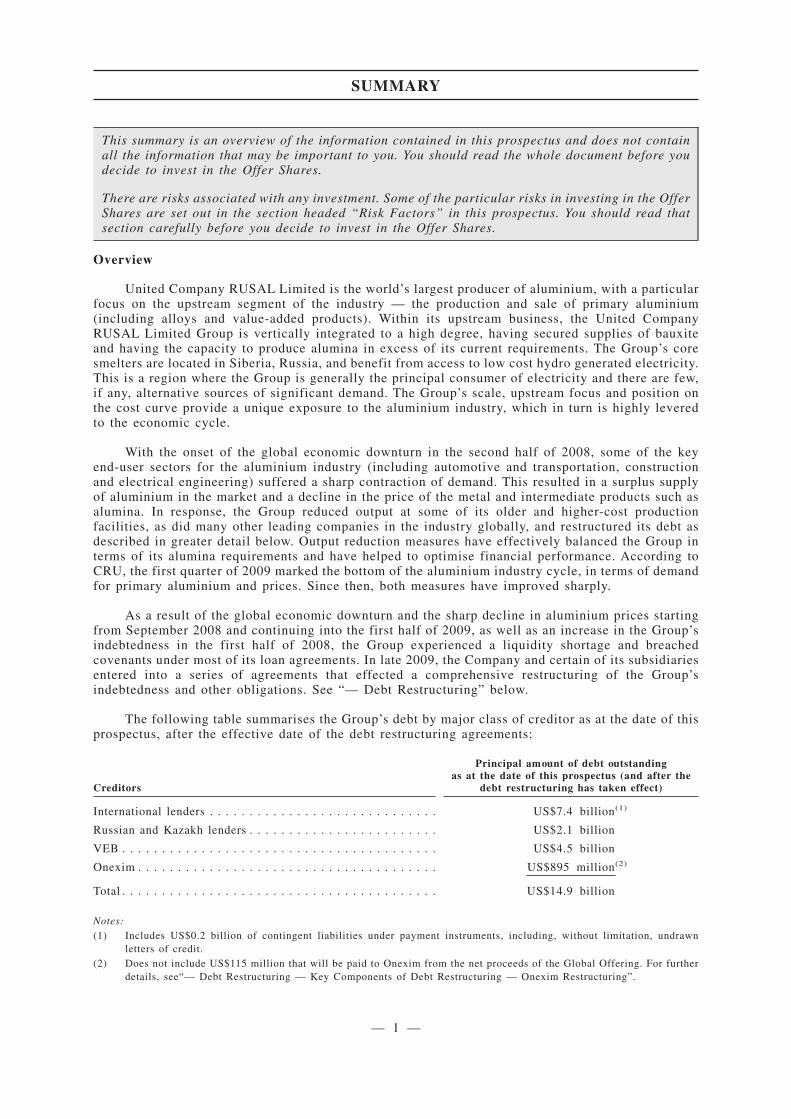
The following table summarises the Group’s debt by major class of creditor as at the date of thisprospectus, after the effective date of the debt restructuring agreements:
Creditors
Principal amount of debt outstandingas at the date of this prospectus (and after the
debt restructuring has taken effect)
International lenders . . . . . . . . . . . . . . . . . . . . . . . . . . . . . US$7.4 billion(1)
Russian and Kazakh lenders . . . . . . . . . . . . . . . . . . . . . . . . US$2.1 billion
VEB . . . . . . . . . . . . . . . . . . . . . . . . . . . . . . . . . . . . . . . . US$4.5 billion
Onexim . . . . . . . . . . . . . . . . . . . . . . . . . . . . . . . . . . . . . . US$895 million(2)
Total . . . . . . . . . . . . . . . . . . . . . . . . . . . . . . . . . . . . . . . . US$14.9 billion
Notes:(1) Includes US$0.2 billion of contingent liabilities under payment instruments, including, without limitation, undrawn
letters of credit.(2) Does not include US$115 million that will be paid to Onexim from the net proceeds of the Global Offering. For further
details, see“— Debt Restructuring — Key Components of Debt Restructuring — Onexim Restructuring”.
SUMMARY
— 1 —

As evidence of economic recovery emerges, the Group has retained the flexibility to re-start itsmothballed capacity to take advantage of improved market conditions. In the long-run, subject to itsdebt restructuring agreements, the Group may pursue a number of growth options, including, amongothers, completion of the Taishet and Boguchansky aluminium smelters. Additionally, the Group’sproximity to China provides an opportunity for the Group to benefit from the long-term potential forfurther aluminium demand growth in that country.
The Group’s revenue was US$15,685 million for the year ended 31 December 2008 andUS$3,757 million for the six months ended 30 June 2009.
The Group has evolved over the past decade through acquisitions and organic growth,culminating in the acquisition in March 2007 of SUAL, then one of the world’s ten largest producersof aluminium, and certain of the aluminium and alumina businesses of Glencore, a companyspecialising in the production and processing of metals and the trading of metals, oil and agriculturalproducts. The Group has operations in 19 countries across five continents, with more than 75,000employees, and, despite recent developments in the global financial markets, has significantopportunities for growth through a number of modernisation programmes and approved projects invarious stages of development in all parts of the aluminium upstream value chain, including energy.
The Shareholders of the Company have by resolution dated 26 December 2009 resolved that theCompany will be renamed as United Company RUSAL plc, with effect from the admission of theShares to trading on the Hong Kong Stock Exchange. The change of the Company’s name is subjectto the registration of the change of the name becoming effective in Jersey and the registration of thechange of the Company’s name under Part XI of the Companies Ordinance. The Company will publishan announcement on the change of name and the arrangements for the exchange of share certificates,if any, as soon as practicable after the new name has been registered and the registration has takeneffect.
Debt Restructuring
Background of the Debt Restructuring
As noted above, as a result of the economic downturn and a sharp decline in aluminium pricesstarting from September 2008 and continuing into the first half of 2009, as well as an increase in theGroup’s indebtedness in the first half of 2008, including its incurrence of indebtedness in April 2008to finance its acquisition of a stake in Norilsk Nickel, the Group experienced a liquidity shortage andbreached covenants under most of its loan agreements. Accordingly, in late 2009, the Company andcertain of its subsidiaries entered into a series of agreements that effected a comprehensiverestructuring of the Group’s US$16.8 billion of indebtedness and certain other obligations to theGroup’s international, Russian and Kazakh lenders and certain other creditors.
The principal objective of the Directors and management in negotiating the debt restructuringwas to give the Company greater time and flexibility to meet its debt obligations in anticipation ofaluminium price recovery. This has been achieved through the following arrangements:
• linking debt repayment obligations to the Company’s ability to generate excess operatingcash flow (subject to meeting certain cumulative debt repayment targets);
• allowing a portion of interest charges to be capitalised under a pay in kind arrangement; and
• converting into equity a substantial obligation to Onexim.
SUMMARY
— 2 —

The Directors believe that over time it will be necessary to reduce further the Company’s newdebt level of US$14.9 billion, and pursuant to the terms of the debt restructuring the Company hasmade certain commitments to:
• dedicate excess operating cash flow to the repayment of debt;
• sell assets and/or raise equity or subordinated debt to fund debt repayments;
• restrict dividend payments until total net debt has been reduced sufficiently; and
• limit capital expenditure, acquisitions and certain other investments.
Key Components of the Debt Restructuring
In its debt restructuring, the Company has executed a series of agreements with four differentcreditor groups.
• International Debt Restructuring: The Company has entered into an arrangement with 65creditors under international facilities accounting for US$7.4 billion of debt and contingentliabilities pursuant to which such creditors have agreed to extend maturities until 6December 2013. This arrangement is documented in an international override agreement,which became effective on 7 December 2009, and other related agreements. Thearrangement does not require any fixed loan repayments but requires the Company to makecertain repayments to the extent cash is available and contains certain overall debtrepayment targets. For detailed information concerning the international debt restructuring,see “Financial Information — Management’s Discussion and Analysis of FinancialCondition and Results of Operations — Liquidity and Capital Resources — DebtRestructuring — Terms of International Debt Restructuring” at pages 226 to 238 of thisprospectus;
• Russian and Kazakh Debt Restructuring: Lenders under certain bilateral Russian andKazakh loan facilities accounting for US$2.1 billion of indebtedness have also entered intonew agreements and/or revised bilateral arrangements, which largely mirror theinternational banks’ arrangements, but contain bank-by-bank cumulative debt repaymentobligations. For detailed information concerning the Russian and Kazakh debt restructuring(other than VEB), see “Financial Information — Management’s Discussion and Analysis ofFinancial Condition and Results of Operations — Liquidity and Capital Resources — DebtRestructuring — Terms of Russian and Kazakh Debt Restructuring (other than VEB)” atpages 242 to 244 of this prospectus;
• Onexim Restructuring: Pursuant to the terms of the Company’s acquisition of the NorilskNickel shareholding, there was US$2.7 billion plus accrued interest outstanding to Onexim.Under the terms of its restructuring, the interest accrued until and including 5 November2009 and a restructuring fee in an aggregate amount of US$275 million were or are to bepaid in cash (of which US$160 million was paid to Onexim on 1 December 2009 andUS$115 million will be paid to Onexim from proceeds of the Global Offering); US$880million plus accrued interest of approximately US$15 million will be paid to Onexim inaccordance with and pro rata with the debt repayments to international, Russian and Kazakhlenders. The balance was converted into Shares representing approximately 6% of theCompany’s share capital on 7 December 2009. For detailed information concerning theOnexim debt restructuring, see “Financial Information — Management’s Discussion andAnalysis of Financial Condition and Results of Operations — Liquidity and CapitalResources — Debt Restructuring — Terms of Onexim Debt Restructuring” at page 244 ofthis prospectus;
SUMMARY
— 3 —
• Vnesheconombank (“VEB”) Restructuring: The VEB Debt (as defined below) amounts toUS$4.5 billion and relates to a refinancing of the Company’s debt raised for the acquisitionof its shareholding in Norilsk Nickel. VEB also benefits from security over these shares inNorilsk Nickel. On 30 October 2009, the Company signed an agreement involving theextension of this facility for 12 months, until 29 October 2010. The arrangements with VEBdiffer from those with the other creditor groups as:
— under the Federal Law No.173-FZ dated 13 October 2008 “On Additional Measuresfor the Support of Financial System of the Russian Federation” (“Federal Law No.173”), VEB is not permitted to provide loans that have a maturity that extends beyondone year; and
— VEB has security over the Norilsk Nickel shares, which as of 17 December 2009 hada value that was 51% in excess of the outstanding debt owed to VEB and which arelisted securities.
The Company intends to seek a further extension of the amounts outstanding under the US$4.5billion loan dated 30 October 2008 between the Company and VEB (the “VEB Debt”) or to requestSberbank to assume all rights, claims and obligations of VEB under the VEB Debt pursuant to theSberbank Letter Agreement (as defined below), prior to the maturity date of the VEB Debt. It is theexpectation of the Directors that VEB will extend the maturity of the VEB Debt for successive oneyear periods through the override period to October 2013, however VEB has no current obligation toextend the loan, and, if it does extend, there can be no assurance as to the terms of any such extension.For detailed information concerning the VEB Debt restructuring, including the reasons why theDirectors believe it likely that the Company will be able to obtain an extension of the VEB Debt, see“Financial Information — Management’s Discussion and Analysis of Financial Condition and Resultsof Operations — Liquidity and Capital Resources — Debt Restructuring — Terms of the VEB DebtRestructuring” at pages 238 to 242 of this Prospectus. On 23 December 2009, Sberbank entered intoa letter agreement with the Company (the “Sberbank Letter Agreement”) stating an unconditional andirrevocable commitment to assume all rights, claims and obligations of VEB under the VEB Debtfollowing a request from the Company. The Sberbank Letter Agreement states that following suchassumption, the maturity date of the debt would be extended to 7 December 2013. The assumption bySberbank of the rights, claims and obligations under the VEB Debt is subject to VEB assigning theVEB Debt to Sberbank. As consideration for such assumption by Sberbank, a commission of 2.00%of the outstanding principal amount, together with any other amounts accrued and payable under theVEB Debt and assumed by Sberbank as of the date of the assignment, is payable in cash to Sberbankby the Company (the Company being subject to a best efforts obligation to pay such commissionwithout breaching any of the Group’s obligations under the international override agreement) or,failing which, by the Major Shareholders. The commission is payable in instalments, some of whichwill fall due prior to the assumption by Sberbank of the rights, claims and obligations of VEB underthe VEB Debt, including a first instalment of US$22.5 million, which is payable by 31 December 2009if paid by the Company or by 4 January 2010 if paid by the Major Shareholders. It is expected thatthe first instalment will be paid by the Major Shareholders on or before 4 January 2010. For furtherinformation concerning Sberbank, including selected financial and other background information, see“Financial Information — Management’s Discussion and Analysis of Financial Condition and Resultsof Operations — Liquidity and Capital Resources — Debt Restructuring — Terms of the VEB DebtRestructuring” at pages 241 to 242. The Company does not perceive there to be any additional materialrisks associated with the Sberbank Letter Agreement to those disclosed in this prospectus, includingin “Risk Factors — Risks Relating to the Group and its Business — The terms of the debt restructuringagreements impose strict limits on the Group’s capital expenditure and other uses of available cashwhich will limit its ability to expand its business and to pay dividends, and failure by the Group tocomply with the terms and conditions of these agreements may materially adversely affect the Groupand its shareholders” and “Risk Factors — Risks Relating to the Group and its Business — Risks
SUMMARY
— 4 —
relating to the multijurisdictional regulatory, social, legal, tax and political environment in which theGroup operates — Political instability, changes in government or in economic policy and arbitrarygovernment actions could adversely affect the Group’s business and the value of investments in theOffer Shares”.
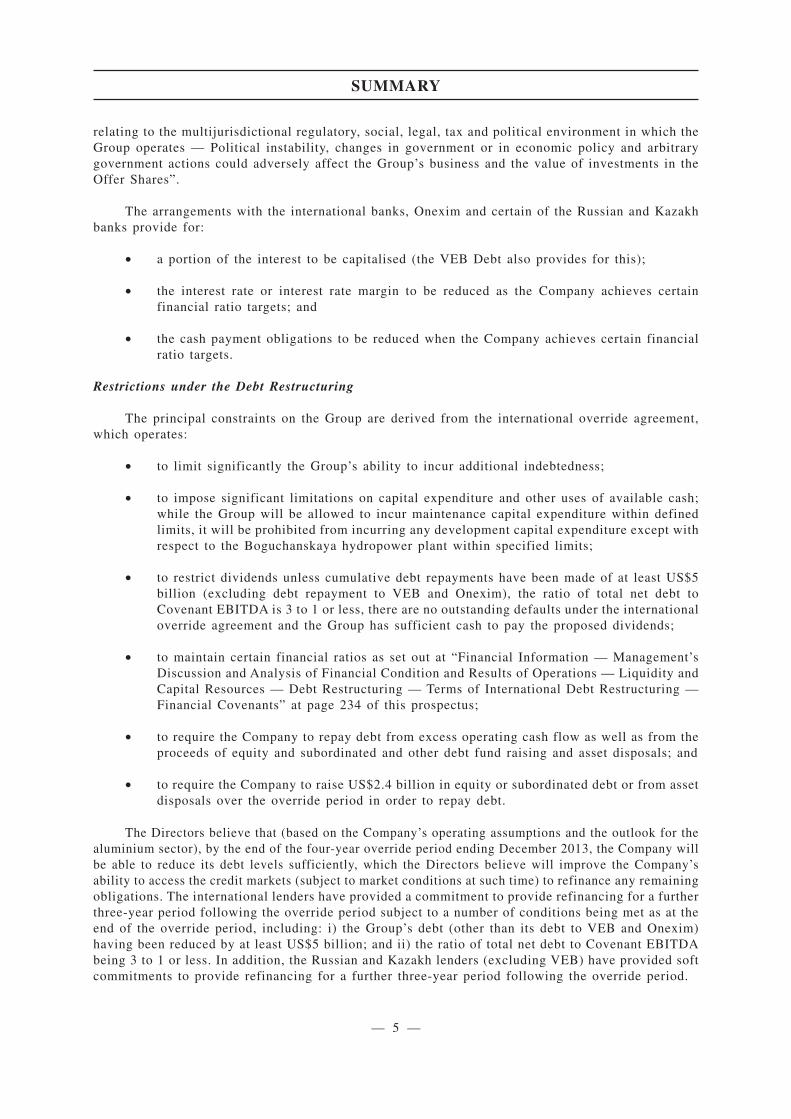
The arrangements with the international banks, Onexim and certain of the Russian and Kazakhbanks provide for:
• a portion of the interest to be capitalised (the VEB Debt also provides for this);
• the interest rate or interest rate margin to be reduced as the Company achieves certainfinancial ratio targets; and
• the cash payment obligations to be reduced when the Company achieves certain financialratio targets.
Restrictions under the Debt Restructuring
The principal constraints on the Group are derived from the international override agreement,which operates:
• to limit significantly the Group’s ability to incur additional indebtedness;
• to impose significant limitations on capital expenditure and other uses of available cash;while the Group will be allowed to incur maintenance capital expenditure within definedlimits, it will be prohibited from incurring any development capital expenditure except withrespect to the Boguchanskaya hydropower plant within specified limits;
• to restrict dividends unless cumulative debt repayments have been made of at least US$5billion (excluding debt repayment to VEB and Onexim), the ratio of total net debt toCovenant EBITDA is 3 to 1 or less, there are no outstanding defaults under the internationaloverride agreement and the Group has sufficient cash to pay the proposed dividends;
• to maintain certain financial ratios as set out at “Financial Information — Management’sDiscussion and Analysis of Financial Condition and Results of Operations — Liquidity andCapital Resources — Debt Restructuring — Terms of International Debt Restructuring —Financial Covenants” at page 234 of this prospectus;
• to require the Company to repay debt from excess operating cash flow as well as from theproceeds of equity and subordinated and other debt fund raising and asset disposals; and
• to require the Company to raise US$2.4 billion in equity or subordinated debt or from assetdisposals over the override period in order to repay debt.
The Directors believe that (based on the Company’s operating assumptions and the outlook for thealuminium sector), by the end of the four-year override period ending December 2013, the Company willbe able to reduce its debt levels sufficiently, which the Directors believe will improve the Company’sability to access the credit markets (subject to market conditions at such time) to refinance any remainingobligations. The international lenders have provided a commitment to provide refinancing for a furtherthree-year period following the override period subject to a number of conditions being met as at theend of the override period, including: i) the Group’s debt (other than its debt to VEB and Onexim)having been reduced by at least US$5 billion; and ii) the ratio of total net debt to Covenant EBITDAbeing 3 to 1 or less. In addition, the Russian and Kazakh lenders (excluding VEB) have provided softcommitments to provide refinancing for a further three-year period following the override period.
SUMMARY
— 5 —

The chart below provides a simplified cash waterfall under the terms of the debt restructuringarrangements.
Available Cash Flow
Cash interest payments
Restricted capitalexpenditure
Minimum cash buffer
Cash sweep
Dividends
• Interest split between cash interest and capitalised interest
• Amount of cash interest increases as the Company’s total net debtto Covenant EBITDA ratio improves
• Maintenance capital expenditure that is permitted within specifiedlimits
• Development capital expenditure with respect to theBoguchanskaya hydropower plant, within specified limits
• Capital expenditure required to comply with environmental law
• Expansion capital expenditures only allowed from proceeds ofnon-recourse project financing and project equity
(see “Financial Information — Management’s Discussion andAnalysis of Financial Condition and Results of Operations —Liquidity and Capital Resources — Debt Restructuring — CapitalExpenditure Restrictions” at page 235 of this prospectus)
• Minimum cash balance of US$400 million required before anydebt repayments
• Surplus cash distributed pro rata amongst the internationallenders, the Russian and Kazakh lenders and Onexim to repaydebt
• Cumulative repayment targets and obligations
• Dividends only allowed once cumulative debt repayments havebeen made of at least US$5 billion (excluding debt repayment toVEB and Onexim), and the ratio of total net debt to CovenantEBITDA is 3 to 1 or less
• Under the terms of the restructuring agreements, the Companydoes not expect to be in a position to declare dividends in respectof any year at least through 2013
In addition, cash generated from equity and subordinated and other debt raisings and assetdisposals will be used to repay debt. If the Company is not able to raise non-recourse project financingand project equity to fund any expansion capital expenditure, the Company’s existing operationalfacilities should not be negatively impacted. However, the Company may be delayed or preventedfrom exploiting certain growth opportunities.
SUMMARY
— 6 —

The table below provides a timetable of the Company’s minimum target cumulative debtrepayment profile and minimum closing debt balance (excluding capitalised interest) assuming thatthe Company will meet the minimum target cumulative debt repayments as set out in the internationaloverride agreement. The minimum closing debt balance takes into account the cash raised in theGlobal Offering and the target cumulative repayment profile excludes the debt owed to Onexim andVEB.
(Billion US$)
Pre GlobalOffering (andafter the debtrestructuring
has takeneffect)
31 December2010
30 September2011
30 September2012
30 September2013
Target cumulative repayment amountexcluding Onexim and VEB . . . . . . — 1.4 3.0 4.0 5.0
Minimum closing debt balance(1)
(excluding capitalised interest) . . . . 14.7(2) 12.7(3) 11.6 10.5 9.4
Notes:
(1) Includes cumulative repayments to Onexim, which, for purposes of the table, are assumed to be pro rata to the targetcumulative payment amount, with pro-rating based on Onexim’s share of the closing debt balance (excluding the VEBDebt) on the effective date of the international override agreement.
(2) Does not include US$0.2 billion of contingent liabilities under payment instruments, including, without limitation,undrawn letters of credit.
(3) Reflects application of the proceeds of the Global Offering to repayment of debt (assuming approximately US$2 billionof net proceeds from the Global Offering prior to exercise of the Over-allotment Option and following the cash settlementof fee warrants (assuming an Offer Price of HK$10.80 per Offer Share, being the mid-point of the estimated Offer Pricerange)).
Further details of the Russian and Kazakh bank repayment profiles, which form part of the abovetarget cumulative repayment amounts, are included on page 243 of this prospectus. The aboveminimum closing debt balances do not include the capitalised interest that is being charged by certaincreditors, as outlined on pages 230 and 243 of the prospectus, which would be cumulative on theclosing debt balance.
Compliance with the Debt Restructuring and Sensitivity Analysis
Pages 222 to 226 of this prospectus outline the reasons why the Directors believe that theCompany will comply with the target cumulative repayment amounts and other terms and conditionsof the debt restructuring agreements and, based on the assumptions therein, the Directors believe thatthe Company should generate sufficient cash to exceed the minimum target cumulative repaymentamounts, reducing debt levels during the override period in excess of the minimum closing debtbalance.
The Directors’ compliance expectations were tested against an estimate of operationalperformance, which was then adjusted by changing certain assumptions to test compliance in anenvironment of greater stress (including a reduction in the aluminium price). A summary of theassumptions underlying the updated base case is presented on pages 223 to 224 of this prospectus.
Stress test scenarios. Based on the stress test scenario described in pages 224 and 225 of thisprospectus, the Directors believe that in any year between 2010 and 2013, should the averagealuminium price assumed for that year be reduced by up to approximately 20% (assuming that theproduction volume and cash cost assumptions are consistent with the assumed aluminium price asdescribed on page 223 and all other assumptions remain as per the updated base case), the Companyshould be able to comply with the financial covenants and debt reduction targets that form part of thedebt restructuring.
SUMMARY
— 7 —
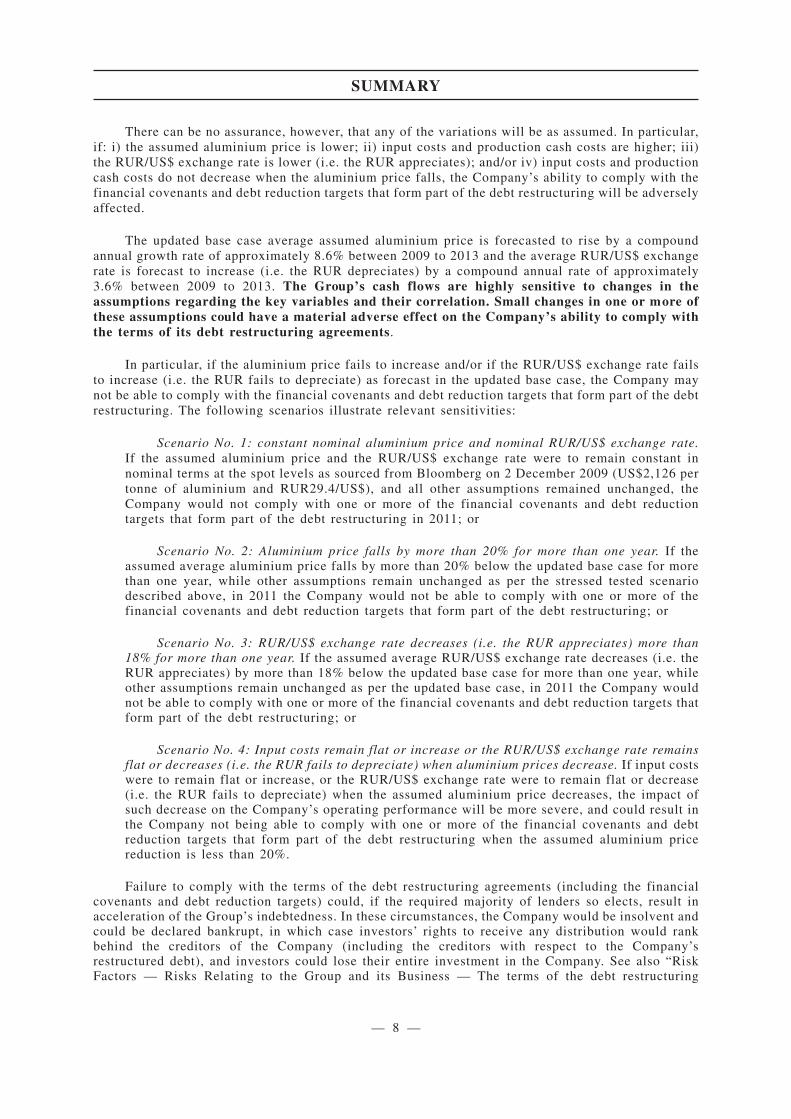
There can be no assurance, however, that any of the variations will be as assumed. In particular,if: i) the assumed aluminium price is lower; ii) input costs and production cash costs are higher; iii)the RUR/US$ exchange rate is lower (i.e. the RUR appreciates); and/or iv) input costs and productioncash costs do not decrease when the aluminium price falls, the Company’s ability to comply with thefinancial covenants and debt reduction targets that form part of the debt restructuring will be adverselyaffected.
The updated base case average assumed aluminium price is forecasted to rise by a compoundannual growth rate of approximately 8.6% between 2009 to 2013 and the average RUR/US$ exchangerate is forecast to increase (i.e. the RUR depreciates) by a compound annual rate of approximately3.6% between 2009 to 2013. The Group’s cash flows are highly sensitive to changes in theassumptions regarding the key variables and their correlation. Small changes in one or more ofthese assumptions could have a material adverse effect on the Company’s ability to comply withthe terms of its debt restructuring agreements.
In particular, if the aluminium price fails to increase and/or if the RUR/US$ exchange rate failsto increase (i.e. the RUR fails to depreciate) as forecast in the updated base case, the Company maynot be able to comply with the financial covenants and debt reduction targets that form part of the debtrestructuring. The following scenarios illustrate relevant sensitivities:
Scenario No. 1: constant nominal aluminium price and nominal RUR/US$ exchange rate.If the assumed aluminium price and the RUR/US$ exchange rate were to remain constant innominal terms at the spot levels as sourced from Bloomberg on 2 December 2009 (US$2,126 pertonne of aluminium and RUR29.4/US$), and all other assumptions remained unchanged, theCompany would not comply with one or more of the financial covenants and debt reductiontargets that form part of the debt restructuring in 2011; or
Scenario No. 2: Aluminium price falls by more than 20% for more than one year. If theassumed average aluminium price falls by more than 20% below the updated base case for morethan one year, while other assumptions remain unchanged as per the stressed tested scenariodescribed above, in 2011 the Company would not be able to comply with one or more of thefinancial covenants and debt reduction targets that form part of the debt restructuring; or
Scenario No. 3: RUR/US$ exchange rate decreases (i.e. the RUR appreciates) more than18% for more than one year. If the assumed average RUR/US$ exchange rate decreases (i.e. theRUR appreciates) by more than 18% below the updated base case for more than one year, whileother assumptions remain unchanged as per the updated base case, in 2011 the Company wouldnot be able to comply with one or more of the financial covenants and debt reduction targets thatform part of the debt restructuring; or
Scenario No. 4: Input costs remain flat or increase or the RUR/US$ exchange rate remainsflat or decreases (i.e. the RUR fails to depreciate) when aluminium prices decrease. If input costswere to remain flat or increase, or the RUR/US$ exchange rate were to remain flat or decrease(i.e. the RUR fails to depreciate) when the assumed aluminium price decreases, the impact ofsuch decrease on the Company’s operating performance will be more severe, and could result inthe Company not being able to comply with one or more of the financial covenants and debtreduction targets that form part of the debt restructuring when the assumed aluminium pricereduction is less than 20%.
Failure to comply with the terms of the debt restructuring agreements (including the financialcovenants and debt reduction targets) could, if the required majority of lenders so elects, result inacceleration of the Group’s indebtedness. In these circumstances, the Company would be insolvent andcould be declared bankrupt, in which case investors’ rights to receive any distribution would rankbehind the creditors of the Company (including the creditors with respect to the Company’srestructured debt), and investors could lose their entire investment in the Company. See also “RiskFactors — Risks Relating to the Group and its Business — The terms of the debt restructuring
SUMMARY
— 8 —
agreements impose strict limits on the Group’s capital expenditure and other uses of available cashwhich will limit its ability to expand its business and to pay dividends, and failure by the Group tocomply with the terms and conditions of these agreements may materially adversely affect the Groupand its shareholders”.
The Directors believe that, based on the Company’s operating assumptions and the outlook forthe aluminium sector, at the end of the four year override period ending December 2013, the Companywill be able to reduce its debt levels sufficiently, allowing the Company to refinance the closing debtbalance (including capitalised interest) from new debt facilities to be provided by:
• existing international lenders subject to a number of conditions being met as at the end ofthe override period, including, without limitation: i) the Group’s debt (other than its debtto VEB and Onexim) has been repaid by at least US$5 billion; and ii) the ratio of total netdebt to Covenant EBITDA being 3 to 1 or less (for a description of these conditions, see“Financial Information — Management’s Discussion and Analysis of Financial Conditionand Results of Operations — Liquidity and Capital Resources — Debt Restructuring —Terms of the International Debt Restructuring — Refinancing” at page 238 of thisprospectus); and/or
• Russian and Kazakh lenders; and/or
• other third party sources of finance.
Pages 226 and 238 of this prospectus provide further details of the refinancing and the basis ofthe Directors’ belief why the Company should be able to raise the new debt. However there can be noassurance that the Company will be able to refinance the closing debt balance in 2013. If the Companycannot do so, it would be insolvent and could be declared bankrupt, in which case investors’ rights toreceive any distribution would rank behind the creditors of the Company (including the creditors withrespect to the Company’s restructured debt), and investors could lose their entire investment in theCompany.
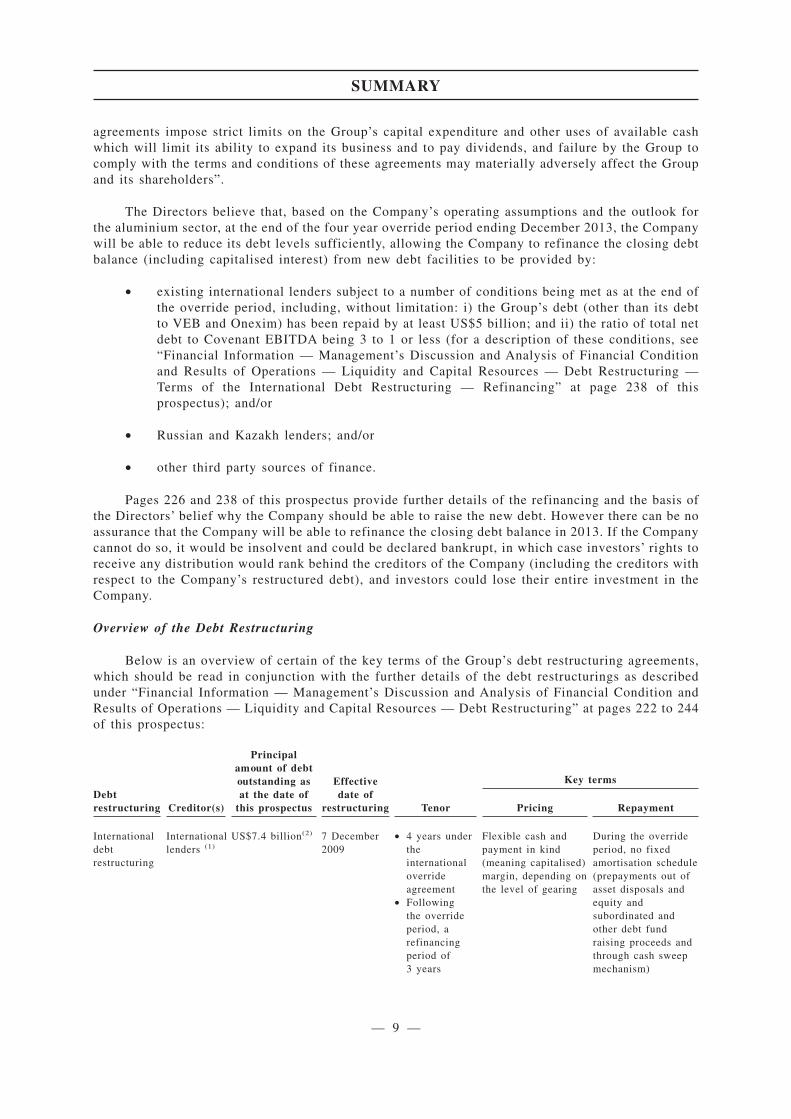
Overview of the Debt Restructuring
Below is an overview of certain of the key terms of the Group’s debt restructuring agreements,which should be read in conjunction with the further details of the debt restructurings as describedunder “Financial Information — Management’s Discussion and Analysis of Financial Condition andResults of Operations — Liquidity and Capital Resources — Debt Restructuring” at pages 222 to 244of this prospectus:
Debtrestructuring Creditor(s)
Principalamount of debtoutstanding asat the date of
this prospectus
Effectivedate of
restructuring Tenor
Key terms
Pricing Repayment
Internationaldebtrestructuring
Internationallenders (1)
US$7.4 billion(2) 7 December2009
• 4 years undertheinternationaloverrideagreement
• Followingthe overrideperiod, arefinancingperiod of3 years
Flexible cash andpayment in kind(meaning capitalised)margin, depending onthe level of gearing
During the overrideperiod, no fixedamortisation schedule(prepayments out ofasset disposals andequity andsubordinated andother debt fundraising proceeds andthrough cash sweepmechanism)
SUMMARY
— 9 —
Debtrestructuring Creditor(s)
Principalamount of debtoutstanding asat the date of
this prospectus
Effectivedate of
restructuring Tenor
Key terms
Pricing Repayment
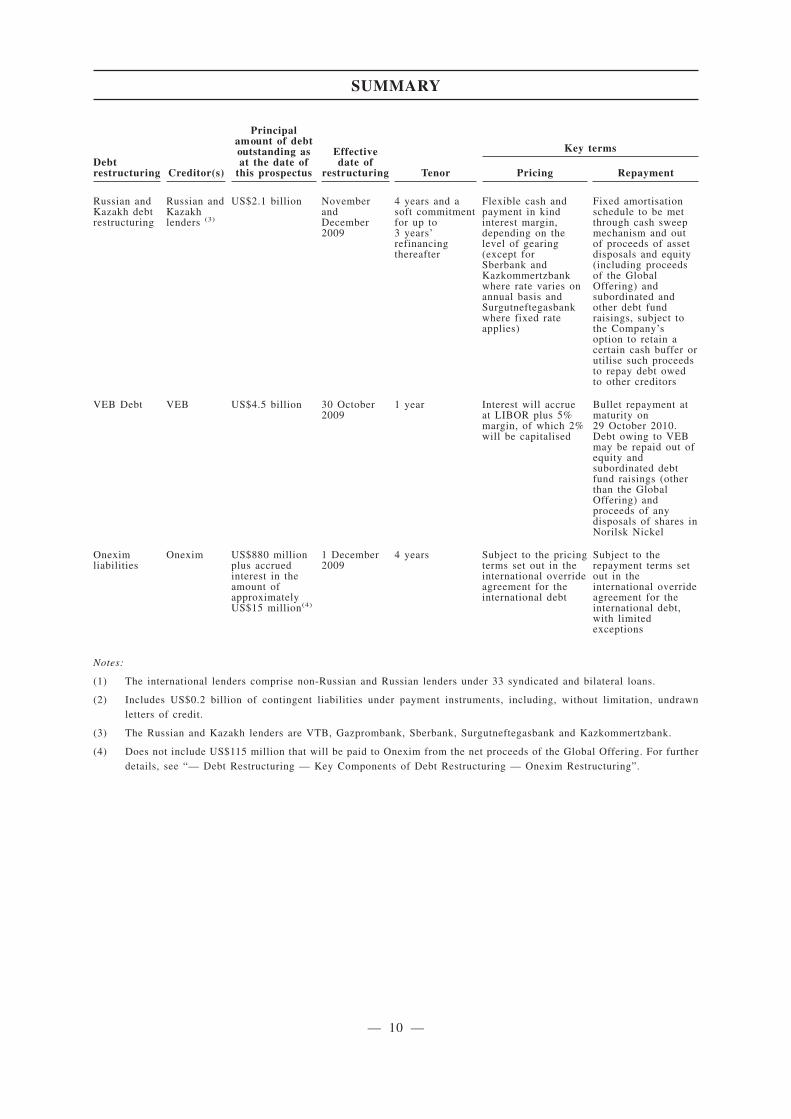
Russian andKazakh debtrestructuring
Russian andKazakhlenders (3)
US$2.1 billion NovemberandDecember2009
4 years and asoft commitmentfor up to3 years’refinancingthereafter
Flexible cash andpayment in kindinterest margin,depending on thelevel of gearing(except forSberbank andKazkommertzbankwhere rate varies onannual basis andSurgutneftegasbankwhere fixed rateapplies)
Fixed amortisationschedule to be metthrough cash sweepmechanism and outof proceeds of assetdisposals and equity(including proceedsof the GlobalOffering) andsubordinated andother debt fundraisings, subject tothe Company’soption to retain acertain cash buffer orutilise such proceedsto repay debt owedto other creditors
VEB Debt VEB US$4.5 billion 30 October2009
1 year Interest will accrueat LIBOR plus 5%margin, of which 2%will be capitalised
Bullet repayment atmaturity on29 October 2010.Debt owing to VEBmay be repaid out ofequity andsubordinated debtfund raisings (otherthan the GlobalOffering) andproceeds of anydisposals of shares inNorilsk Nickel
Oneximliabilities
Onexim US$880 millionplus accruedinterest in theamount ofapproximatelyUS$15 million(4)
1 December2009
4 years Subject to the pricingterms set out in theinternational overrideagreement for theinternational debt
Subject to therepayment terms setout in theinternational overrideagreement for theinternational debt,with limitedexceptions
Notes:
(1) The international lenders comprise non-Russian and Russian lenders under 33 syndicated and bilateral loans.
(2) Includes US$0.2 billion of contingent liabilities under payment instruments, including, without limitation, undrawnletters of credit.
(3) The Russian and Kazakh lenders are VTB, Gazprombank, Sberbank, Surgutneftegasbank and Kazkommertzbank.
(4) Does not include US$115 million that will be paid to Onexim from the net proceeds of the Global Offering. For furtherdetails, see “— Debt Restructuring — Key Components of Debt Restructuring — Onexim Restructuring”.
SUMMARY
— 10 —
Strengths and Strategies
Strengths
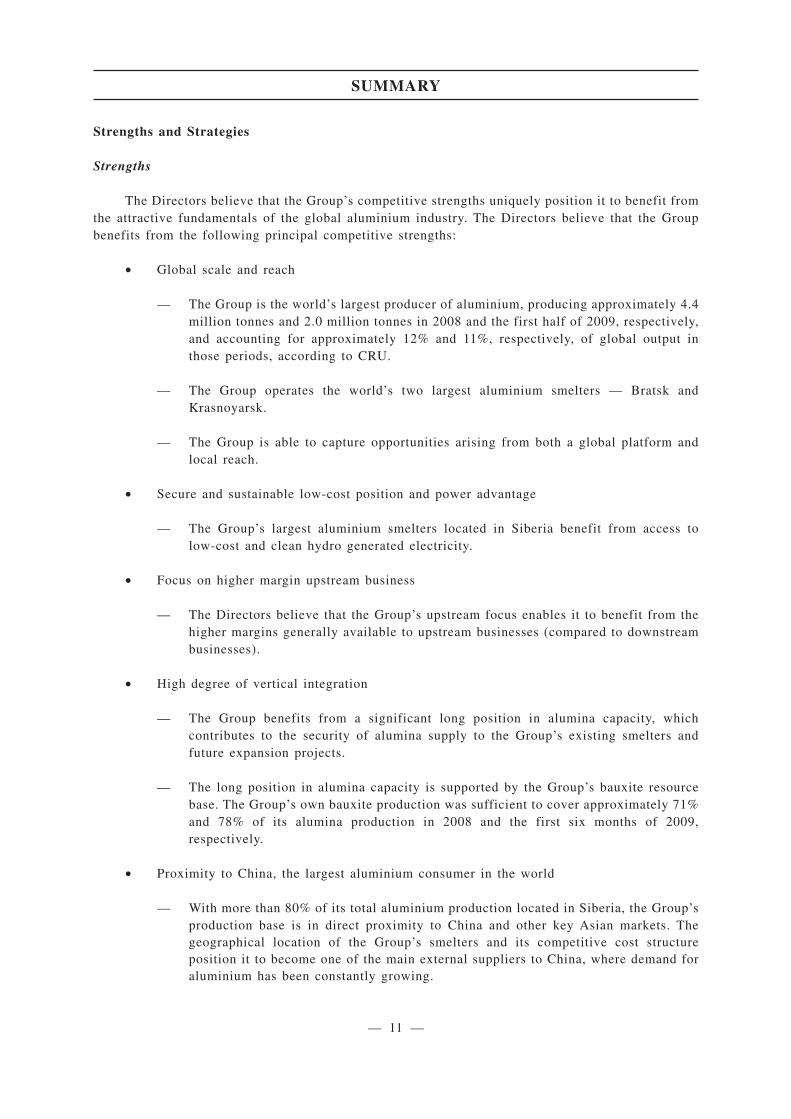
The Directors believe that the Group’s competitive strengths uniquely position it to benefit fromthe attractive fundamentals of the global aluminium industry. The Directors believe that the Groupbenefits from the following principal competitive strengths:
• Global scale and reach
— The Group is the world’s largest producer of aluminium, producing approximately 4.4million tonnes and 2.0 million tonnes in 2008 and the first half of 2009, respectively,and accounting for approximately 12% and 11%, respectively, of global output inthose periods, according to CRU.
— The Group operates the world’s two largest aluminium smelters — Bratsk andKrasnoyarsk.
— The Group is able to capture opportunities arising from both a global platform andlocal reach.
• Secure and sustainable low-cost position and power advantage
— The Group’s largest aluminium smelters located in Siberia benefit from access tolow-cost and clean hydro generated electricity.
• Focus on higher margin upstream business
— The Directors believe that the Group’s upstream focus enables it to benefit from thehigher margins generally available to upstream businesses (compared to downstreambusinesses).
• High degree of vertical integration
— The Group benefits from a significant long position in alumina capacity, whichcontributes to the security of alumina supply to the Group’s existing smelters andfuture expansion projects.
— The long position in alumina capacity is supported by the Group’s bauxite resourcebase. The Group’s own bauxite production was sufficient to cover approximately 71%and 78% of its alumina production in 2008 and the first six months of 2009,respectively.
• Proximity to China, the largest aluminium consumer in the world
— With more than 80% of its total aluminium production located in Siberia, the Group’sproduction base is in direct proximity to China and other key Asian markets. Thegeographical location of the Group’s smelters and its competitive cost structureposition it to become one of the main external suppliers to China, where demand foraluminium has been constantly growing.
SUMMARY
— 11 —

• Proprietary R&D and leading internal EPCM expertise
— With the acquisition of SUAL in March 2007, the Group consolidated over 70 yearsof Russian know-how and research and development in the aluminium industry.
— Within its Engineering and Construction Division, the Group has established researchand development (“R&D”) centres with focuses on aluminium (located inKrasnoyarsk), alumina (in St. Petersburg) and design (in Irkutsk).
— The Group is developing proprietary RA-300, RA-400 and RA-500 cell technologies.A variant of the RA-300 technology was selected for and successfully implemented atthe Group’s Khakas aluminium smelter.
• Strategic investments, including:
— Acquisition of a more than 25% stake in Norilsk Nickel — the world’s largest nickeland palladium producer (based on production in 2008 according to CRU) and one ofthe leading producers of platinum and copper.
— LLP Bogatyr Komir 50/50 joint venture with Samruk-Kazyna in Kazakhstan — anoperator of open-pit mines in the Ekibastuz coal basin, one of the largest coal basinsin the CIS.
• Experienced management team and world class corporate governance
— The Group has a highly skilled and experienced team of managers with provenindustry expertise and an impressive track record of managing growth.
— Even while privately held, the Group has adopted international standards of corporategovernance.
Strategies
The Group’s management is pursuing and will pursue the following strategies over differenttimeframes:
• Maintain sustainable low-cost positioning through continuous cost reduction
— The Group is pursuing a multi-pronged strategy that includes, subject to the debtrestructuring agreements, a number of initiatives, such as improving energy efficiencyat its smelters, seeking to build smelter-generation complexes in regions in whichlow-cost captive energy sources are available and seeking to invest in selectiveenergy-related assets, such as coal and power generating facilities.
• Maintain active and responsive production management
— Production cuts and/or facility shutdowns allow the Group to respond actively tooversupply situations whenever they occur. By cutting output at higher cost facilities,the Group is able to maintain high utilisation rates at its core low-cost smelters locatedin Siberia.
• Debt reduction through cash flow management
— The Directors consider reduction of the Group’s leverage pursuant to its debtrestructuring agreements to be a key priority in the near and medium term.
SUMMARY
— 12 —
• Maintain leadership in the global aluminium industry in terms of market share and positionon the cost curve through a number of measures, including:
— Completion of the Boguchanskaya hydropower plant — Under the debt restructuringagreements, the Group is permitted to fund capital expenditure up to US$300 millionfor Phase 1 of the BEMO project.
— Medium-term strategies, such as exploiting its proximity to China and the rest of Asiaand increasing sales to China; subject to its debt restructuring agreements, completingadvanced projects with attractive fundamentals, such as the Taishet and Boguchanskyaluminium smelters, and pursuing brownfield development projects such as Kindia(Guinea)-2.
— M&A growth options in the long term.
SUMMARY
— 13 —

Summary Financial Information
Six months ended30 June Year ended 31 December
2009 2008 2008 2007 2006
(Mln. US$)
CONSOLIDATED INCOME STATEMENT DATA
Revenue . . . . . . . . . . . . . . . . . . . . . . . . . . . . . . 3,757 8,354 15,685 13,588 8,429
Cost of sales . . . . . . . . . . . . . . . . . . . . . . . . . . . (3,449) (5,306) (11,073) (8,356) (4,186)
Gross profit . . . . . . . . . . . . . . . . . . . . . . . . . . . 308 3,048 4,612 5,232 4,243
Distribution expenses . . . . . . . . . . . . . . . . . . . . . (284) (383) (798) (528) (328)
Administrative expenses . . . . . . . . . . . . . . . . . . . (311) (585) (1,103) (842) (455)
Loss on disposal of property, plant and equipment . . (7) (8) (56) (97) (5)
Impairment of non-current assets . . . . . . . . . . . . . (37) (344) (3,668) — —
Other operating expenses . . . . . . . . . . . . . . . . . . . (156) (62) (215) (118) (143)
Results from operating activities. . . . . . . . . . . . . (487) 1,666 (1,228) 3,647 3,312
Finance income . . . . . . . . . . . . . . . . . . . . . . . . . 23 120 106 101 176
Finance expenses . . . . . . . . . . . . . . . . . . . . . . . . (680) (302) (1,594) (494) (265)
Share of (losses)/profits of associates . . . . . . . . . . 348 79 (3,302) (14) (16)
Share of (losses)/profits of jointly controlledentities. . . . . . . . . . . . . . . . . . . . . . . . . . . . . . (8) 40 (35) (15) (12)
Excess of the Group’s share in net identifiableassets over cost of acquisition . . . . . . . . . . . . . . — — — — 28
(Loss)/profit before taxation . . . . . . . . . . . . . . . . (804) 1,603 (6,053) 3,225 3,223
Income tax expense . . . . . . . . . . . . . . . . . . . . . . . (64) (194) 69 (419) (336)
(Loss)/profit from continuing operations . . . . . . . (868) 1,409 (5,984) 2,806 2,887
Profit from discontinued operations(net of income tax) . . . . . . . . . . . . . . . . . . . . . — — — — 10
Net (loss)/profit for the year/period . . . . . . . . . . (868) 1,409 (5,984) 2,806 2,897
Attributable to:
Shareholders of the Company . . . . . . . . . . . . . . (868) 1,411 (5,952) 2,809 2,897
Non-controlling interests . . . . . . . . . . . . . . . . . — (2) (32) (3) —
CONSOLIDATED BALANCE SHEET DATA
Total assets . . . . . . . . . . . . . . . . . . . . . . . . . . . . 22,219 36,005 24,005 22,063 9,252
Equity attributable to:
Shareholders of the Company . . . . . . . . . . . . . . 3,077 16,715 4,488 10,095 3,078
Non-controlling interests . . . . . . . . . . . . . . . . . — 30 — 44 61
Total non-current liabilities . . . . . . . . . . . . . . . . . 934 10,093 929 8,141 4,236
Net current assets/(liabilities) . . . . . . . . . . . . . . . (14,397) (3,220) (13,516) 1,518 735
CONSOLIDATED CASH FLOW STATEMENTDATA
Cash flows (used in)/generated from operatingactivities . . . . . . . . . . . . . . . . . . . . . . . . . . . . (232) 1,878 3,017 3,346 2,790
Cash flows used in investing activities. . . . . . . . . . (61) (5,271) (5,802) (2,853) (584)
Cash flows (used in)/generated from financingactivities . . . . . . . . . . . . . . . . . . . . . . . . . . . . (143) 3,379 3,250 (477) (2,366)
Cash and cash equivalents at end of year/period . . . 239 237 685 247 229
SUMMARY
— 14 —
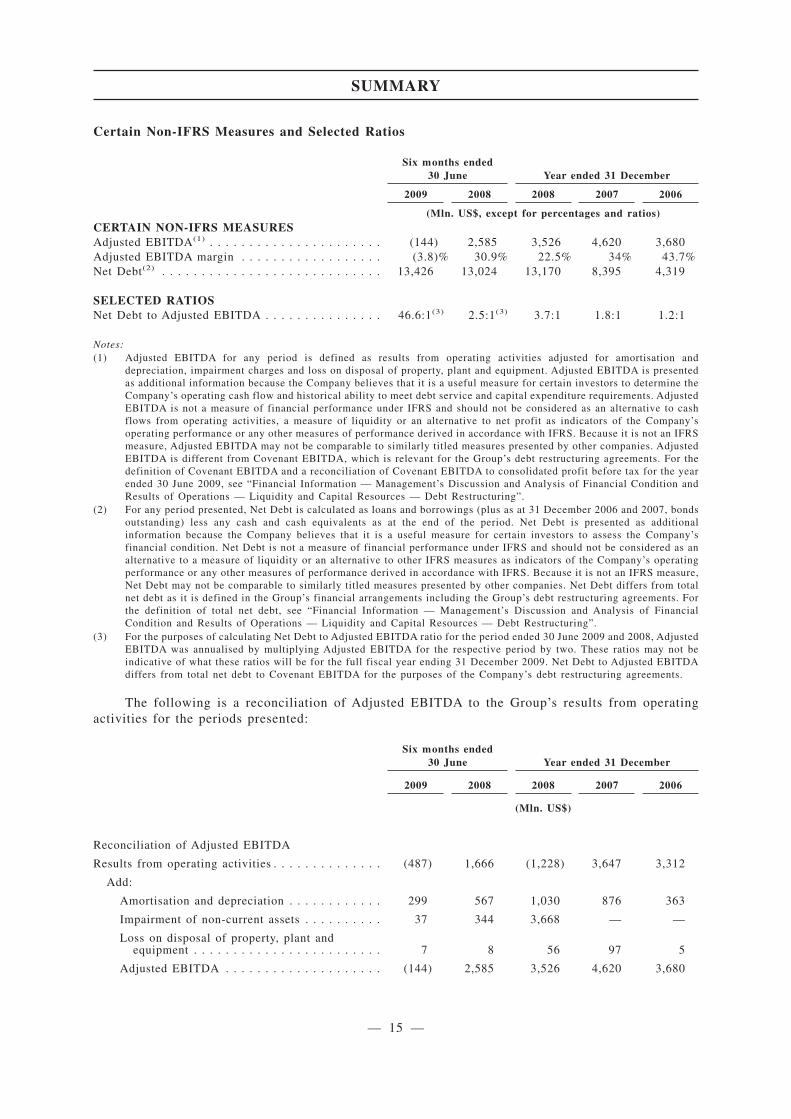
Certain Non-IFRS Measures and Selected Ratios
Six months ended30 June Year ended 31 December
2009 2008 2008 2007 2006
(Mln. US$, except for percentages and ratios)CERTAIN NON-IFRS MEASURESAdjusted EBITDA(1) . . . . . . . . . . . . . . . . . . . . . . (144) 2,585 3,526 4,620 3,680Adjusted EBITDA margin . . . . . . . . . . . . . . . . . . (3.8)% 30.9% 22.5% 34% 43.7%Net Debt(2) . . . . . . . . . . . . . . . . . . . . . . . . . . . . 13,426 13,024 13,170 8,395 4,319
SELECTED RATIOSNet Debt to Adjusted EBITDA . . . . . . . . . . . . . . . 46.6:1(3) 2.5:1(3) 3.7:1 1.8:1 1.2:1
Notes:(1) Adjusted EBITDA for any period is defined as results from operating activities adjusted for amortisation and
depreciation, impairment charges and loss on disposal of property, plant and equipment. Adjusted EBITDA is presentedas additional information because the Company believes that it is a useful measure for certain investors to determine theCompany’s operating cash flow and historical ability to meet debt service and capital expenditure requirements. AdjustedEBITDA is not a measure of financial performance under IFRS and should not be considered as an alternative to cashflows from operating activities, a measure of liquidity or an alternative to net profit as indicators of the Company’soperating performance or any other measures of performance derived in accordance with IFRS. Because it is not an IFRSmeasure, Adjusted EBITDA may not be comparable to similarly titled measures presented by other companies. AdjustedEBITDA is different from Covenant EBITDA, which is relevant for the Group’s debt restructuring agreements. For thedefinition of Covenant EBITDA and a reconciliation of Covenant EBITDA to consolidated profit before tax for the yearended 30 June 2009, see “Financial Information — Management’s Discussion and Analysis of Financial Condition andResults of Operations — Liquidity and Capital Resources — Debt Restructuring”.
(2) For any period presented, Net Debt is calculated as loans and borrowings (plus as at 31 December 2006 and 2007, bondsoutstanding) less any cash and cash equivalents as at the end of the period. Net Debt is presented as additionalinformation because the Company believes that it is a useful measure for certain investors to assess the Company’sfinancial condition. Net Debt is not a measure of financial performance under IFRS and should not be considered as analternative to a measure of liquidity or an alternative to other IFRS measures as indicators of the Company’s operatingperformance or any other measures of performance derived in accordance with IFRS. Because it is not an IFRS measure,Net Debt may not be comparable to similarly titled measures presented by other companies. Net Debt differs from totalnet debt as it is defined in the Group’s financial arrangements including the Group’s debt restructuring agreements. Forthe definition of total net debt, see “Financial Information — Management’s Discussion and Analysis of FinancialCondition and Results of Operations — Liquidity and Capital Resources — Debt Restructuring”.
(3) For the purposes of calculating Net Debt to Adjusted EBITDA ratio for the period ended 30 June 2009 and 2008, AdjustedEBITDA was annualised by multiplying Adjusted EBITDA for the respective period by two. These ratios may not beindicative of what these ratios will be for the full fiscal year ending 31 December 2009. Net Debt to Adjusted EBITDAdiffers from total net debt to Covenant EBITDA for the purposes of the Company’s debt restructuring agreements.
The following is a reconciliation of Adjusted EBITDA to the Group’s results from operatingactivities for the periods presented:
Six months ended30 June Year ended 31 December
2009 2008 2008 2007 2006
(Mln. US$)
Reconciliation of Adjusted EBITDA
Results from operating activities . . . . . . . . . . . . . . (487) 1,666 (1,228) 3,647 3,312
Add:
Amortisation and depreciation . . . . . . . . . . . . 299 567 1,030 876 363
Impairment of non-current assets . . . . . . . . . . 37 344 3,668 — —
Loss on disposal of property, plant andequipment . . . . . . . . . . . . . . . . . . . . . . . . 7 8 56 97 5
Adjusted EBITDA . . . . . . . . . . . . . . . . . . . . (144) 2,585 3,526 4,620 3,680
SUMMARY
— 15 —

For the Group’s net current liabilities as at 30 September 2009, see “Financial Information —Management’s Discussion and Analysis of Financial Condition and Results of Operations — BalanceSheet”, for the Group’s loans and borrowings as at 30 September 2009, see “Financial Information —Selected Financial Data of the Group — Capitalisation” and for the Group’s capital commitments asat 30 June 2009, see “Financial Information — Management’s Discussion and Analysis of FinancialCondition and Results of Operations — Liquidity and Capital Resources — Capital Commitments”.
Key Operating Data
The table below provides selected aggregate attributable production information for the Group.
Production
Six monthsended
30 June Year ended 31 December
2009 2008 2007 2006
Primary aluminium (ktonnes) . . . . . . . . . . . . . . . . . . . . . . . . 1,980 4,424 4,202 3,958
Alumina (ktonnes)(1) . . . . . . . . . . . . . . . . . . . . . . . . . . . . . . 3,738 11,317 11,347 11,313
Bauxite (mtonnes wet) (2). . . . . . . . . . . . . . . . . . . . . . . . . . . 6.1 19.1 18.5 19.2
Notes:
(1) Alpart and Windalco are consolidated by the Group on a proportionate basis as they are jointly controlled assets andoperations (the Group’s interests in Alpart and Windalco are 65% and 93%, respectively). Accordingly, the aluminaproduction data set forth above includes the Group’s pro rata share of Alpart and Windalco’s production. Zaporozhyealumina refinery is a fully consolidated subsidiary of the Company, so the attributable production is presented on a 100%plant production basis to reflect UC RUSAL’s effective control of the finished product. QAL is consolidated on an equitybasis and accordingly the data shown is the proportion attributed to UC RUSAL based on its 20% equity interest.
(2) Because Alpart and Windalco are consolidated on a proportionate basis, the bauxite production data set forth aboveincludes the Group’s pro rata share of Alpart’s and Windalco’s respective production. The total production of the Group’sfully consolidated subsidiaries is included, even if there are minority interests. Accordingly, the total production ofTiman and BCGI is included, even though the Group’s interests in Timan and BCGI are approximately 80% and 90%,respectively.
Global Offering Statistics
The Company is offering 1,610,292,840 Offer Shares in the form of Shares or Global DepositaryShares (subject to an Over-allotment Option as described in the section headed “Underwriting -International Placing”) in the Global Offering that comprises (1) the International Placing, i.e. aninternational private placing of Offer Shares outside the United States (including to professionalinvestors within Hong Kong) in offshore transactions in reliance on Regulation S, and in the UnitedStates to QIBs in reliance on Rule 144A or another exemption from the registration requirements underthe US Securities Act and (2) the Hong Kong Placing, i.e. a concurrent placing of Offer Shares tocertain eligible investors in Hong Kong. This prospectus relates only to the Hong Kong Placing. TheInternational Placing is being made pursuant to a separate offering document.
The Company expects to enter into the International Placing Agreement relating to theInternational Placing and Hong Kong Placing on the Price Determination Date.
Assuming that the Global Offering becomes unconditional at or before 8:00 a.m. in Hong Kongon Wednesday, 27 January 2010, it is expected that dealings in the Shares on the Stock Exchange willcommence on Wednesday, 27 January 2010.
SUMMARY
— 16 —

Shareholding Structure
The following table sets out the Group’s shareholding structure immediately followingcompletion of the Global Offering, assuming the Over-allotment Option is not exercised:
Name or class of Shareholder Number and class of securities(1)
Approximate percentageinterest in the Company
immediately after theGlobal Offering
En+(2) . . . . . . . . . . . . . . . . . . . . . . . . . . . . . . . 7,202,910,267 Shares (L) 47.59%
Onexim . . . . . . . . . . . . . . . . . . . . . . . . . . . . . . 2,586,499,596 Shares (L) 17.09%
SUAL Partners . . . . . . . . . . . . . . . . . . . . . . . . . 2,400,970,089 Shares (L) 15.86%
Amokenga Holdings . . . . . . . . . . . . . . . . . . . . . . 1,309,620,048 Shares (L) 8.65%
Public . . . . . . . . . . . . . . . . . . . . . . . . . . . . . . . 1,636,363,646 Shares (L) 10.81%(3)
Of which:
Vnesheconombank . . . . . . . . . . . . . . . . . . . . . 477,090,000 Shares (L) 3.15%
International lenders(4) . . . . . . . . . . . . . . . . . . 26,070,806 Shares (L) 0.17%
Total(5) . . . . . . . . . . . . . . . . . . . . . . . . . . . . . . . 15,136,363,646 Shares (L) 100%
Notes:
(1) The letter “L” denotes the shareholder has a long position in such securities.
(2) Mr. Oleg Deripaska beneficially owns the entire issued share capital of En+. For information about a claim that couldaffect the size of En+’s interest in the Company, see “Risk Factors — Risks relating to the Group and its Business —A certain claim against the beneficial owner of En+ could have a material adverse effect on the Company and/or thetrading price of its Shares”, “Substantial Shareholders — Litigation Involving Certain Beneficial Owners — LitigationInvolving Mr. Deripaska” and Appendix X to this prospectus.
(3) Includes Shares to be sold in the form of Global Depositary Shares evidenced by Global Depositary Receipts (the“GDSs”) in the International Placing. The GDSs are to be issued by The Bank of New York Mellon, as depositary,pursuant to a deposit agreement to be entered into between the Company and the Depositary. Each GDS will represent20 Shares. Pursuant to the deposit agreement, the Shares represented by the GDSs will be held by The Hongkong andShanghai Banking Corporation Limited, as custodian (the “Custodian”), for the benefit of the Depositary. The Custodianwill be the registered holder of such Shares in the share register of the Company. The number of GDSs to be sold in theInternational Placing will be determined by the Joint Global Coordinators following pricing of the Global Offering. Forthe avoidance of doubt, both Shares and GDS will be sold in the International Placing.
(4) Shares held by international lenders pursuant to conversion of fee warrants issued to such lenders on the date ofeffectiveness of the international override agreement.
(5) Excludes such number of bonus Shares as may be issued to the management of the Company. See “Directors and Senior
Management — Future Compensation of Directors and Senior Management”.
Dividend Policy
Under the terms of its restructuring agreements, the Company is not permitted to pay dividendsunless its ratio of total net debt to Covenant EBITDA is 3 to 1 or less (as of 30 June 2009, such ratiowas 47.2:1), the Group has made cumulative debt repayments of at least US$5 billion (excluding debtrepayments to VEB and Onexim), there are no outstanding defaults under the international overrideagreement and the Group has sufficient cash to pay the proposed dividends. As a result, the Companydoes not expect to be in a position to declare dividends in respect of any year at least through 2013.
SUMMARY
— 17 —

The Company’s current Major Shareholders expect to adopt a dividend policy under theShareholders’ Agreement between Major Shareholders only, which is a shareholders’ agreementexpected to be entered into by En+, SUAL Partners, Glencore and Onexim, to which the Company isnot a party. This agreement sets out certain agreed matters between the Major Shareholders in relationto board appointments, board committees, voting, transfers of shares, veto rights with respect tocertain related party transactions and certain matters of corporate law and certain other matters. Forfurther information relating to the Shareholders’ Agreement between Major Shareholders only, see“Substantial Shareholders — Shareholders’ Agreement between Major Shareholders only”. Under thedividend policy set out in this shareholders’ agreement, not less than 50% of the annual consolidatednet profits of the Group in each financial year are to be distributed to shareholders within four monthsafter the end of the relevant financial year, subject to any applicable legislation. See “SubstantialShareholders — Shareholders’ Agreement between Major Shareholders only”. This dividend policywould, however, be subject to the limitations contained in the Company’s debt restructuringagreements and so would not be expected to come into effect in respect of any year through 2013 atleast.
Use of Proceeds
The Company estimates that it will receive net proceeds from the Global Offering ofapproximately HK$16,790 million (assuming an Offer Price of HK$10.80 per Offer Share, being themid-point of the estimated Offer Price range), after deducting the underwriting fees and commissionsand estimated expenses payable by the Company in relation to the Global Offering.
The Group intends to use all of the net proceeds received from the Global Offering immediatelyto reduce outstanding debt and to satisfy other obligations to its creditors (which include thesettlement of fee warrants exercised for cash and a specified payment to Onexim) pursuant to the termsof its debt restructuring agreements. Certain of the Underwriters and/or their affiliates have lendingexposure to the Group that will be reduced by application of the net proceeds from the Global Offeringand have either elected to have their fee warrants settled in cash or will take delivery of the Sharesunderlying such fee warrants. See “Underwriting — Underwriters’ Interests in the Company”.
Risk Factors
The Group and investors in the Offer Shares are subject to risks relating to the Group’s business,and investors in the Offer Shares are also subject to risks relating to the Global Offering and the OfferShares. Among others, these risks include: that the Group operates in a cyclical industry subject tosignificant price and demand volatility and overcapacity; that the Group depends on continued accessto inexpensive and uninterrupted electricity; that the Group depends on uninterrupted transportationservices and access to state-owned infrastructure at acceptable prices; that the Group must complywith the terms of its debt restructuring agreements; and that the Group’s effective tax rate may change.In addition, due to its position in the Russian aluminium market, the Group is also subject tocompliance with specific requirements under Russian anti-monopoly laws. Furthermore, because theGroup’s assets and production facilities are located in many countries (including, principally, inRussia), the businesses conducted in those countries are subject to specific risks that are discussed ingreater detail in “Risk Factors”. Investors should familiarise themselves with these country specificrisks prior to making an investment decision. For a description of these and other risks, see “RiskFactors”. In particular, investors should note that if the Company fails to comply with the terms andconditions of its debt restructuring agreements, and for this or other reasons its outstanding debt isaccelerated, it would be insolvent and could be declared bankrupt, in which case investors’ rights toreceive any distribution would rank behind the creditors of the Company (including the creditors withrespect to the Company’s restructured debt), and investors could lose their entire investment in theCompany.
SUMMARY
— 18 —
This prospectus contains certain statements that are, or may be deemed to be, “forward-lookingstatements”. These forward-looking statements may be identified by the use of forward-lookingterminology, including the terms “believes”, “estimates”, “plans”, “projects”, “anticipates”,“expects”, “intends”, “may”, “will” or “should” or, in each case, their negative or other variations, orcomparable terminology, or by discussions of strategy, plans, objectives, goals, future events orintentions. These forward-looking statements include all matters that are not historical facts. Theyappear in a number of places throughout this prospectus and include, but are not limited to, statementsregarding the Group’s intentions, beliefs or current expectations concerning, among other things, theGroup’s business, results of operations, financial position, liquidity, prospects, growth, strategies andthe bauxite, alumina and aluminium industries.
By their nature, forward-looking statements involve risk and uncertainty because they relate tofuture events and circumstances. Forward-looking statements are not guarantees of future performanceand of the actual results of the Group’s operations, financial position and liquidity, and thedevelopment of the markets and the industries in which the Group operates may differ materially fromthe development of those same industries as described in, or suggested by, the forward-lookingstatements contained in this prospectus. In addition, even if the Group’s results of operations,financial position and liquidity, and the development of the markets and the industries in which theGroup operates, are consistent with the forward-looking statements contained in this prospectus, thoseresults or developments may not be indicative of results or developments in subsequent periods. Anumber of risks, uncertainties and other factors could cause results and developments to differmaterially from those expressed or implied by the forward-looking statements including, withoutlimitation:
• materially adverse changes in economic or industry conditions generally or in the marketsserved by the Group;
• changes in the supply and demand for and the price of aluminium, alumina, aluminiumproducts and other products;
• fluctuations in inflation, interest rates and exchange rates;
• the Group’s ability to comply with the terms of its debt restructuring agreements;
• changes in the costs of the materials required for the Group’s production of aluminium;
• changes in the Group’s operating costs, including the costs of energy and transportation;
• changes in the Group’s capital expenditure requirements, including those relating to theGroup’s potential environmental liabilities or the ability of the Group to fund its capitalexpenditure requirements through borrowing or otherwise;
• the Group’s ability to successfully implement any of its business strategies;
• the Group’s ability to obtain or extend the terms of the licences necessary for the operationof the Group’s business;
• developments in, or changes to, laws, regulations, governmental policies, taxation oraccounting standards or practices affecting the Group’s operations;
• the Group’s ability to recover its reserves or develop new resources and reserves;
• the Group’s success in accurately identifying future risks to its business and managing therisks of the aforementioned factors; and
• other factors discussed in “Risk Factors”, “Business” and “Financial Information”.
FORWARD-LOOKING STATEMENTS
— 19 —

Forward-looking statements may and often do differ materially from actual results. Anyforward-looking statements in this prospectus reflect the Group management’s current view withrespect to future events and are subject to risks relating to future events and other risks, uncertaintiesand assumptions relating to the Group’s business, results of operations, financial position, liquidity,prospects, growth, strategies and the bauxite, alumina and aluminium industries. Investors shouldspecifically consider the factors identified in this prospectus, which could cause actual results todiffer, before making any investment decision. Subject to the requirements of the Listing Rules andexcept as may be required by applicable law, the Company undertakes no obligation to revise anyforward-looking statements that appear in this prospectus to reflect any change in the Company’sexpectations, or any events or circumstances, that may occur or arise after the date of this prospectus.All forward-looking statements in this prospectus are qualified by reference to this cautionarystatement.
FORWARD-LOOKING STATEMENTS
— 20 —
In addition to other information in this prospectus, you should carefully consider the following riskfactors, which may not typically be associated with investing in equity securities of companies fromother jurisdictions, before making any investment decision in relation to the Offer Shares. If anyof the possible events described below occur, our business, financial condition or results ofoperations could be materially and adversely affected and the market price of the Offer Sharescould fall significantly. In particular, investors should note that if the Company fails to comply withthe terms and conditions of its debt restructuring agreements, and for this or other reasons itsoutstanding debt is accelerated, it would be insolvent and could be declared bankrupt, in whichcase investors’ rights to receive any distribution would rank behind the creditors of the Company(including the creditors with respect to the Company’s restructured debt), and investors could losetheir entire investment in the Company. The risks described in this prospectus are not the only risksthe Company faces. Additional risk factors not currently known or which are currently deemedimmaterial may also have a material adverse effect on the Group, its business, financial conditionand results of operations and development. Certain risks relating specifically to the Company’sfacilities are also described in the Independent Technical Report in Appendix VI.
Risks Relating to the Group and its Business
The Group operates in a cyclical industry that has recently experienced significant price anddemand volatility and overcapacity, which has had and may continue to have a material adverseeffect on the Group’s performance and financial results
The aluminium industry is cyclical, and is currently suffering from significant overcapacity.Prices for the Group’s products are difficult to forecast. While the Group benefited from the businesscycle in 2006 through 2008, with the average price of aluminium quoted on the LME increasing froman average price of US$2,568 per tonne in 2006 to an average price of US$2,662 per tonne in 2007and to US$2,836 per tonne in the first six months of 2008 before reaching a maximum price ofUS$3,341 per tonne in mid-July 2008, aluminium prices declined precipitously in the second half of2008 and continued to decline at the beginning of 2009 (with a lowest price of US$1,290 per tonnein February 2009), reflecting a significant decrease in demand for aluminium as a result of the globaleconomic downturn. The average price of aluminium quoted on the LME in the last quarter of 2008was US$1,830 per tonne, which was below the average cost of production of aluminium worldwide.The sharp decline in aluminium prices resulted in significant reductions in aluminium productionvolumes worldwide.
Although prices have increased slightly since the beginning of 2009 to US$2,035 per tonne asof 30 November 2009, the timing and extent of price recovery and return to prior levels cannot bepredicted. An eventual rebound in aluminium prices will likely depend on a broad recovery from thecurrent global economic downturn and a more favourable supply-demand balance, although the lengthand nature of business cycles affecting the aluminium industry have historically been unpredictable.The Group does not control a number of factors affecting aluminium prices, which include, but are notlimited to:
• global and regional economic and political conditions;
• global supply of and demand for bauxite, alumina and aluminium and expectations of futuresupply and demand (including significant spare capacity in the industry and decisions bycompetitors to reactivate idle capacity);
• volatility of electricity and, in general, of energy costs;
• demand for key products for which aluminium is used, such as cars, aircraft, infrastructureand aluminium food packaging materials;
RISK FACTORS
— 21 —
App1A-34 (1)(b)
• speculative trading;
• the release of built-up reserves of aluminium commodities that can be used as a substitutefor aluminium;
• variations in freight and transport costs with respect to raw materials and finished products;
• the use of new technologies, including technologies that enable commodity substitution orthe use of scrap commodities; and
• government regulations and regulatory actions, including tariffs, quotas and customs duties.
In addition, following the decline in demand for and price of aluminium, the demand for andprice of alumina also experienced a sharp decline beginning in the second half of 2008. This causedthe Group to reduce its alumina production capacity, to match its aluminium production. Accordingly,the Group’s decision to expand its aluminium production will also be affected by alumina prices andthe Group may decide to increase its aluminium production to match its alumina production capacityor sell excess alumina on the market. The market for alumina is primarily governed by contractualarrangements in which the pricing is not publicly available information. There is only a small portionof the world alumina trade that is conducted on the spot market.
As a result of the fall in demand for both aluminium and alumina, there has been significantovercapacity in these markets. In response, the Group cut back production at its facilities, reducingaluminium and alumina production by 10% and 33%, respectively, for the first six months of 2009,compared to the first six months of 2008.
Continued financial weakness among substantial consumers of aluminium products such asautomobile manufacturers, and persistent weakness in demand for their products, would furtherexacerbate the negative trend in the current market conditions experienced by the aluminium industry.While the Company has implemented a variety of measures to mitigate the impact of the marketdownturn and the decline in demand for aluminium, including through reductions in production byclosing higher cost facilities and reducing production volumes, further cost reductions, more effectivemanagement of raw materials and energy supplies, decreases in management expenses, headcountoptimisation and significant revision of investment plans, these measures may not prove sufficient interms of cost-saving or in realigning the Group’s production levels with reduced demand to maintainthe Group’s profitability going forward.
Unfavourable changes in the price of aluminium and alumina have had and could continue tohave a material adverse effect on the Group’s business, financial condition and results of operations.A sustained fall of more than 20% in the price of aluminium could also adversely affect the Company’sability to meet certain targets and financial covenants under its debt restructuring agreements. A fallof 50% in the price of aluminium from current levels would likely cause the Group to be unable tocomply fully with the terms of its debt restructuring agreements and would, moreover, make theGroup’s operations (and, the Company believes, the operations of substantially all other aluminiumproducers) unprofitable. See “— The terms of the debt restructuring agreements impose strict limitson the Group’s capital expenditure and other uses of available cash which will limit its ability toexpand its business and to pay dividends, and failure by the Group to comply with the terms andconditions of these agreements may materially adversely affect the Group and its shareholders”.
RISK FACTORS
— 22 —
The Group’s competitive position in the global aluminium industry is highly dependent oncontinued access to inexpensive and uninterrupted electricity supply, in particular, long-termcontracts for such electricity; increased electricity prices (particularly as a result of deregulationof electricity tariffs), as well as interruptions in the supply of electricity, could have a materialadverse effect on the Group’s business, financial condition and results of operations
Energy costs, particularly the cost of electricity, comprise a significant portion of the Group’scost of goods sold and in 2008 and in the six months ended 30 June 2009, represented approximately18.5% and 26.4%, respectively, of such costs. Historically, the Group has benefited from access tocompetitively priced electricity. In 2008 and the first half of 2009, approximately 80% and 84%,respectively, of the Group’s aluminium was produced by Siberian smelters, which obtain their energymainly from low-cost hydropower stations with few, if any, alternative sources of significant demand.In 2008, hydropower accounted for approximately 79% of the Group’s total energy consumption. Animportant part of the Group’s energy strategy is to enter into long-term contracts for the supply oflow-cost electricity to these Siberian smelters. As of the date of this prospectus, the Group has securedthree such long-term contracts for its Bratsk, Krasnoyarsk and Irkutsk aluminium smelters. For theremaining 20% of the Group’s production, it relies more heavily on thermal power. In 2008,aluminium smelters in Siberia paid a production-weighted average of US$0.0192/kWh for electricity,compared to a production-weighted average of US$0.0355/kWh in the Urals region andUS$0.0473/kWh in the European region of Russia (excluding the Urals region), compared to aweighted average price of US$0.0376/kWh paid by the world’s aluminium producers, according toCRU. See “Business — Strengths and Strategies — Strategies — Maintain sustainable low-costpositioning through continuous cost reduction”, “Business — Energy Supply ” and “ConnectedTransactions — Electricity and Capacity Supply Contracts”.
Electricity prices in Russia are partially regulated by the Russian Government. Tariffs are set inRoubles and have increased at least in line with inflation, though some of the former SUAL smeltershave experienced more significant increases. In April 2007, the Russian Government establishedguidelines for a share of total national electricity production to be sold on the wholesale electricitymarket under regulated tariffs during the period from 1 January 2007 to 31 December 2010. That shareranges from 45% to 50% during the period of 1 July to 31 December 2009 and is expected to graduallydecrease to 15 to 20% by 1 July 2010. National electricity production that is not supplied to industrialusers under regulated tariffs is supplied at free market prices. Starting from 1 January 2011, allelectricity production volumes are expected to be supplied to industrial users under free market prices.
Electricity tariffs for industrial users have risen since 2007, and are expected to be furtherincreased following further deregulation, as a result of such price liberalisation and growth in demand.Electricity tariffs may also increase as a result of expected fuel price increases for generators that relyon thermal power. With regard to the latter, regulated natural gas prices in Russia are also expectedto increase. See “Business — Energy Supply”.
In addition to electricity for aluminium production, significant heat energy is required to refinebauxite into alumina. The Group’s alumina refineries primarily use fuel oil, gas and coal to generatethe required heat energy and fluctuation in these fuel prices directly impact the cost of production.
Reliance on affiliated suppliers
In 2008, 69% of electricity used by the Group was supplied by subsidiaries of En+ (a ControllingShareholder), 21% from state-owned suppliers and the remaining 10% from various wholesaleelectricity market suppliers.
RISK FACTORS
— 23 —
App1A-28(b)
Service/supply interruption
Electricity price increases may also result from the need to secure alternative electricity suppliesfollowing industrial accidents or breakdowns at major electricity suppliers. In August 2009, a majoraccident occurred at the Sayano-Shushenskaya hydroelectric power plant in Siberia, which was themain supplier of electricity to the Group’s Sayanogorsk and Khakas aluminium smelters. Accordingto preliminary estimates, it may take up to several years to fully restore the station’s previousproduction capacity. The accident resulted in a temporary cessation of power supplies to theSayanogorsk and Khakas aluminium smelters and SAYANAL and a reduction in power supplies to theNovokuznetsk aluminium smelter. The Group estimates that losses incurred as a consequence of theaccident amounted to approximately RUR41.6 million (approximately US$1.33 million at theexchange rate of the Central Bank of Russia as of 30 June 2009). The accident at theSayano-Shushenskaya hydroelectric power plant has led to changes to the main power supply sourcefor the Sayanogorsk and Khakas aluminium smelters. Currently, nearly all of the electricity for theGroup’s Sayanogorsk and Khakas aluminium smelters is transferred from the Krasnoyarsk andKemerovo regions. Though all of the affected smelters have secured alternative electricity suppliesand resumed operating at normal capacity in a short timeframe, and although the Russian Governmenthas indicated its intention to control the price of electricity in the region to minimise any potentialnegative effect of the accident, there is a risk that electricity costs could increase. Further, in view ofthe effect of the accident on the industry and consumers in the region in general, the RussianGovernment may inquire whether production cuts at the Group’s smelter facilities are possible ornecessary to alleviate the pressure on the regional electricity supply system, in particular, duringseasons with peak electrical use. To mitigate any negative effect from such possible production cuts,the Company may need to consider shifting production to its less cost efficient facilities or reroutingelectricity supplies from other regions. Increases in electricity prices resulting from using alternativesuppliers of electricity or production cuts may have a material adverse effect on the Group’s business,financial condition and results of operations.
The Group depends on the provision of uninterrupted transportation services and access tostate-owned infrastructure for the transportation of its materials and end products acrosssignificant distances, and the prices for such services (particularly rail tariffs) could increase
Rail tariffs and infrastructure
The production of aluminium generally involves the transportation of materials and end productsfrom and to various locations, often over great distances, because bauxite mines, alumina refineries,aluminium smelters and the principal markets for aluminium products are located in different parts ofthe world. Most of the Group’s main smelters are located in Siberia, far from their sources ofmaterials, seaports and primary markets. Railway transportation is the Group’s principal means oftransporting materials, mainly alumina, to its smelters, and end products to its customers. The Groupalso relies on key Russian ports to receive shipments of foreign-sourced alumina and to exportfinished aluminium products.
Russian railway tariffs are currently regulated by the government and consist of two parts:infrastructure costs and carriage costs. In recent years, annual tariff increases have been in line withinflation (except for 2008, when tariffs rose faster than inflation), and in 2006 and 2007 the increaseswere less than inflation. Although according to current government policy, tariffs are planned toincrease in line with inflation from 2010 through 2012, there can be no assurance that this policy willbe maintained.
The Group currently benefits from favourable rail tariffs on certain routes, and protection fromrate increases, pursuant to Russian regulations adopted in 2003 and 2004 (the “Railway TariffRegulations”) and an implementing agreement entered into in 2004 between a former RUSAL entityand the railway operator, JSC Russian Railways. Under these regulations and the implementingagreement, the infrastructure component of the railway tariff for transportation on specified routes of
RISK FACTORS
— 24 —

certain materials is fixed in Roubles at the level prevailing at 1 October 2003 subject to conversioninto US dollars at the average RUR/USD exchange rate for the preceding quarter until December 2011,provided that increasing annual volume levels are met. Subject to the possibility of early terminationby either party before any calendar year end, the agreement is automatically renewed on an annualbasis. If the Group fails to comply with its volume increase obligations under the agreement, or if theRailway Tariff Regulations are amended or repealed, the Group could become subject to the standardrailway tariffs, which could be significantly higher than the currently applicable tariffs.
The tariffs set by the Railway Tariff Regulations and implemented by the agreement areapplicable to the transportation of the current and future production of certain former RUSAL Russianaluminium smelters and alumina refineries. The tariffs under the agreement apply to approximately70% of the Group’s production. These regulations and the implementing agreement do not apply to theformer SUAL facilities.
In 2008, the Group agreed with JSC Russian Railways to fix the infrastructure component oftransport tariffs generally applicable to specific types of raw materials and products at 2008 levels,subject to a certain diminishing factor with subsequent annual increases indexed in accordance withgeneral annual tariff indexation. Such fixed transport tariffs would apply to the principal types of rawmaterials and products usually transported by the Group, rather than particular entities ortransportation routes, and thus would indirectly benefit the entire Group inclusive of the former SUALfacilities. The Group intends to continue the negotiation process in relation to the fixed transporttariffs in 2010. Once the negotiations with JSC Russian Railways and the Federal Service for Tariffs(“FST”) are finalised, it is expected that new regulations will have to be issued by the state tariffservice in order to give effect to the new tariffs. Upon entry of the new tariffs into force, the RailwayTariff Regulations and the implementing agreement will terminate. Until then, the Group expects thatthe Railway Tariff Regulations and the implementing agreement with JSC Russian Railways willcontinue to apply. As an alternative, the Group is also discussing with JSC Russian Railways thepossibility of extending the current agreement to SUAL and new production facilities with asimultaneous extension of its term until 2020. If the Group fails to complete the negotiations, newregulations are not adopted or JSC Russian Railways terminates the existing agreement, or the Groupfails to extend such agreement’s term, the Group could be subject to the standard railway tariffs, whichcould be significantly higher than the currently applicable tariffs. Further, the Group could be subjectto certain penalties if the Company fails to comply with its obligations to increase volumes under theagreement.
The infrastructure component of the tariff, which is fixed as described above, representsapproximately 85% of the tariff, while the carriage component accounts for the remainder. Thecarriage component is not stipulated for in the implementing agreement and is not subject to theongoing negotiations with JSC Russian Railways. The carriage component is subject to indexation inline with inflation, which is typically undertaken annually. Currently, the Russian Government iscontemplating plans to increase competition through the privatisation of the rolling stock owned byJSC Russian Railways, which could influence the carriage costs portion of the tariff. Although theCompany believes that it is more likely that the Russian Government will limit any increase in thecarriage component of the tariff until December 2010 so as not to exceed the inflation rate, shouldderegulation occur, the pricing structure for the rail industry would be difficult to predict and theGroup could be subject to tariff increases that would adversely affect its financial results.
Certain portions of the railway tracks, such as rail sidings and branch lines laid from the mainrail system directly to several of the Group’s production facilities, are not owned by the Group or byJSC Russian Railways. Although not likely to affect production, the Group’s reliance on suchinfrastructure may result in further increases in its transportation costs and cause additional expenses,such as expenses related to the maintenance of larger inventories of materials to secure againstdisruptions of rail delivery schedules.
RISK FACTORS
— 25 —

Sea Transport
The Group transports materials, mainly alumina, from its overseas facilities to its Russiansmelters and distributes most of its upstream output to customers in markets outside Russia by sea viaa number of ports, primarily St. Petersburg and Vanino. The St. Petersburg port has experiencedbottlenecks in recent years due to increasing volumes of goods being transported as well as delays dueto a work-to-rule slowdown. Starting in June 2009, deliveries of goods to and from the Vanino porthave been subject to delays and interruptions due to increasing volumes of goods being transportedvia the regional railway system, which has a limited capacity. In September and October 2009, JSCRussian Railways suspended deliveries of non-ferrous metals to the Vanino port for a period notexceeding one month.
In Russia, cargo rates are subject to state agency regulation. To secure timely delivery ofmaterials and finished products when the volume of cargo resumes, the Group may consider thedevelopment of its own port facilities in Ust’-Luga and may also consider development opportunitiesin Novorossiysk, St. Petersburg and Russia’s Far East. A failure in the transportation of materials tothe Group’s upstream production facilities, or any delays in deliveries, or any increase in costs arisingfrom the use of the ports, could reduce the Group’s competitiveness in international markets.
The terms of the debt restructuring agreements impose strict limits on the Group’s capitalexpenditure and other uses of available cash which will limit its ability to expand its business andto pay dividends, and failure by the Group to comply with the terms and conditions of theseagreements may materially adversely affect the Group and its shareholders
As a result of the global economic downturn and a sharp decline in aluminium prices startingfrom September 2008 and continuing into the first half of 2009, as well as an increase in the Group’sindebtedness in the first half of 2008, including its incurrence of indebtedness in April 2008 to financeits acquisition of a stake in Norilsk Nickel, the Group experienced a liquidity shortage and breachedcovenants under most of its loan agreements. The Group’s debt as at 30 June 2009 included US$13,690million under 54 syndicated and bilateral loans with international and Russian and Kazakh lenders.The Group also had obligations to Onexim, one of the Group’s substantial shareholders, in the amountof US$2.7 billion plus accrued interest in respect of deferred consideration for the purchase of sharesin Norilsk Nickel. In addition, the Company had US$260 million of off-balance sheet liabilities inrelation to a guarantee of indebtedness of its joint venture.
On 7 December 2009, the Company and certain of its subsidiaries entered into an internationaloverride agreement with the Group’s international lenders implementing a long-term restructuring ofthe Group’s debt to its international lenders, providing for a stated maturity date on 6 December 2013,subject to earlier repayments out of excess cashflow and the proceeds of asset disposals and equityand subordinated and other debt fund raisings. In addition, in late 2009, the Company and certain ofits subsidiaries entered into debt restructuring agreements to various existing bilateral loans withRussian and Kazakh lenders providing for the long-term restructuring of these loans on broadly similarterms, except in the case of the loan agreement with VEB, which was extended for a shorter period.Further, on 1 December 2009, the Company entered into an amendment agreement in relation to astock purchase agreement among the Company, Onexim and certain other parties relating to theacquisition of shares in Norilsk Nickel to restructure deferred consideration in the amount of US$2.7billion plus interest accrued thereon. In accordance with the amendment agreement, the Company’sobligations in respect of US$880 million plus interest accrued on the total amount of deferredconsideration from 6 November 2009 until the date of effectiveness of the international overrideagreement (in the amount of approximately US$15 million) and any interest capitalised thereon duringthe override period will be settled out of excess cashflow and other proceeds used to prepay debt(being proceeds of asset disposals and equity and subordinated and other debt fund raisings) duringthe term of the international override agreement. The remaining obligations were converted intoShares representing approximately 6% of the Company’s share capital on the date of effectiveness of
RISK FACTORS
— 26 —
the international override agreement. The interest accrued until and including 5 November 2009 anda restructuring fee in an aggregate amount of US$275 million were or are to be paid in cash: US$160million was paid by the Company on the date of the effectiveness of the international overrideagreement; and US$115 million will be paid out of the proceeds of the Global Offering. For adescription of the debt restructuring, see “Financial Information — Management’s Discussion andAnalysis of Financial Condition and Results of Operations — Liquidity and Capital Resources — DebtRestructuring”.
The terms of the debt restructuring agreements:
• significantly limit the Group’s ability to incur additional indebtedness;
• impose significant limitations on capital expenditure; while the Group will be allowed tomake maintenance capital expenditure within specified limits it will be prohibited frommaking development capital expenditure, except with respect to the Boguchanskayahydropower plant (within specified limits) or to comply with environmental laws;
• oblige the Company, under certain circumstances, to dispose of its interest in NorilskNickel or a considerable part of it to repay debt to VEB;
• do not permit the Company to pay dividends unless its ratio of total net debt to CovenantEBITDA is 3 to 1 or less, the Group’s debt (other than its debt to VEB and Onexim) hasbeen repaid by at least US$5 billion, there are no outstanding defaults under theinternational override agreement and the Group has sufficient cash to pay the proposeddividends;
• oblige the Group to use excess operating cash flow and the net proceeds of asset disposalsand equity and subordinated and other debt fund raisings (including proceeds from theGlobal Offering) to repay outstanding indebtedness; and
• oblige the Group to maintain specified financial ratios.
Compliance with these terms will considerably reduce the Group’s ability to expand itsoperations and to pay dividends.
Further, a substantial portion of the Company’s operating cash flow is required to service its debtand other payment obligations, which reduces funds available to finance its operations and pursue newbusiness opportunities, limits its flexibility in responding to changing business and economicconditions, including technological changes and increased competition, and potentially makes theCompany more vulnerable than certain of its competitors to a future downturn in the economy. In theevent that cash flow from operations is less than anticipated and the Company is unable to secureadditional funding to cover its expenses, the Company’s business, financial condition, expansion plansand operations would be materially adversely affected.
The international override agreement and the debt restructuring agreements relating to theGroup’s Russian and Kazakh loans, as well as the agreement with Onexim, have only recently becomeeffective, and the Company has had no track record of complying with them. When considering theterms and conditions of the debt restructuring agreements, the Group’s management has taken intoaccount its best estimate of the Company’s projected operational and financial performance during theoverride period. There are, however, many factors, including many that are beyond the control of theGroup (such as aluminium, alumina and raw materials, fuel, electricity and transport prices, baseinterest rates and the value of the Rouble against the US dollar and the Euro) that may adversely affectthe Group’s performance during the override period. Accordingly, there are limitations onmanagement’s best estimate of the Group’s performance and, as a result, there are risks associatedwith the Group’s ability to comply with the terms and conditions of the debt restructuring agreements.
RISK FACTORS
— 27 —
App1A-12
For example, a sustained fall of more than 20% in the price of aluminum could adversely affect theGroup’s ability to meet certain targets and financial covenants under the debt restructuringagreements. See “Financial Information — Management’s Discussion and Analysis of FinancialCondition and Results of Operations — Liquidity and Capital Resources — Debt Restructuring”.Failure to comply with the terms or conditions of the debt restructuring agreements (includingconditions subsequent) could, if the required majority of lenders so elects, result in acceleration of theGroup’s indebtedness. Further, adverse outcomes in litigation involving members of the Group or theCompany’s shareholders could potentially lead to an event of default under the terms of theinternational override agreement, which could, if the required majority of lenders so elect, result inacceleration of the Group’s indebtedness. See “Financial Information — Management’s Discussionand Analysis of Financial Condition and Results of Operations — Liquidity and Capital Resources —Debt Restructuring — Terms of the International Debt Restructuring — Events of Default”. In theabove circumstances, the Company would be insolvent and could be declared bankrupt, in which caseinvestors’ rights to receive any distribution would rank behind the creditors of the Company (includingthe creditors with respect to the Company’s restructured debt), and investors could lose their entireinvestment in the Company. In addition, failure to meet certain debt repayment targets could have amaterial adverse effect, including, among others, potential dilution of shareholders’ interests in theCompany through the issuance of zero strike equity compensation warrants to the international lendersand compulsory disposal of shares in Norilsk Nickel.
In addition to providing for acceleration in the event of a failure relating to the Group, the debtrestructuring agreements also provide for mandatory prepayment of all outstanding indebtedness if aperson (or a group of persons acting in concert) other than Mr. Deripaska and members of hisimmediate family acquires effective control of the Company (meaning the ownership of more than onehalf of the Shares in the Company, the right to exercise voting rights with respect to more than onehalf of the Company’s Shares or elect more than half of its Board of Directors, or the power otherwiseto direct the affairs of the Company). For a discussion of circumstances in which Mr. Deripaska’seffective interest in the Company may be reduced, see “— Risks relating to the Group and its Business— A certain claim against the beneficial owner of En+ could have a material adverse effect on theCompany and/or the trading price of its Shares”, “— En+ is completing a restructuring of its debts andwill give its lenders a pledge over 15% of the outstanding Shares” and “Risks Relating to the GlobalOffering and Offer Shares — The sale or availability for sale of substantial amounts of the Shares orequity-related securities could adversely affect their trading prices”.
Moreover, the VEB Debt matures on 29 October 2010. The Company expects either to requestVEB to extend the maturity of the VEB Debt for successive one-year periods through the end of theoverride period in December 2013, or to request Sberbank to assume the rights, claims and obligationsof VEB under the VEB Debt pursuant to the Sberbank Letter Agreement. If VEB does not extend thematurity of the VEB Debt through the end of the override period and Sberbank does not assume therights, claims and obligations of VEB under the VEB Debt pursuant to the Sberbank Letter Agreement,the Company expects that it will be able to generate sufficient proceeds to repay the VEB Debt in fullupon maturity (by way of refinancing permitted under the terms of the international overrideagreement, from equity and/or subordinated debt issuances and/or from the possible sale of its morethan 25% stake in Norilsk Nickel). See “Financial Information — Management’s Discussion andAnalysis of Financial Condition and Results of Operations — Liquidity and Capital Resources — DebtRestructuring — Terms of the VEB Debt Restructuring”. However, if VEB does not extend thematurity of the VEB Debt through the end of the override period, and Sberbank does not assume therights, claims and obligations under the VEB Debt pursuant to the Sberbank Letter Agreement, and iffor any reason the Company were not able to generate sufficient cash out of the sources specifiedabove to repay the VEB Debt on its maturity date, the Company would be in default under its debtrestructuring agreements, which could, if the required majority of lenders so elect, result inacceleration of the Group’s indebtedness. In these circumstances, the Company would be insolvent andcould be declared bankrupt, in which case investors’ rights to receive any distribution would rankbehind the creditors of the Company (including the creditors with respect to the Company’srestructured debt), and investors could lose their entire investment in the Company.
RISK FACTORS
— 28 —
The Group benefits significantly from its low effective tax rate, and changes to the Group’s taxposition may increase the Group’s tax liability and affect its cost structure
The Group’s effective tax rate for the year ended 31 December 2006 was 10% and for the yearended 31 December 2007 was 13%. The concept of effective tax rate is not meaningful where thereis negative profit before tax, as was the case for the Group for the year ended 31 December 2008 andthe six months ended 30 June 2009. The difference between the statutory tax rate and the Group’seffective tax rate results primarily from the location of Group operations in tax-efficient jurisdictions,including the Group’s trading structure being located in Switzerland as well as the principal tradingcompany being registered in Jersey; and the holding company of the Group, which is also registeredin Jersey and holds Group assets through a number of intermediary holding companies registered inCyprus, Jersey, BVI, Bahamas and other tax-efficient jurisdictions.
The Group also uses tolling arrangements, mainly because a substantial portion of its alumina issourced from outside Russia and processed by smelters in Russia, and the majority of third party salesof aluminium are outside Russia. Pursuant to the Group’s international tolling arrangements, a tollingcompany, registered and subject to taxation in Switzerland and acting upon instructions of theprincipal trading company of the Group, purchases materials, such as alumina, and arranges for theirdelivery to manufacturers, such as aluminium smelters, in another country for processing into endproducts, such as primary aluminium, in consideration for a tolling (or processing) fee. The title tothe materials or end products is not transferred to the manufacturers and, therefore, where tolling isemployed, the shipment of raw materials and end products into and out of the country of themanufacturer is not characterised as an import/export operation and is not subject to localimport/export duties. The tolling company and the manufacturer are taxed on their respective profitsin their respective countries of tax residence. This tax treatment of tolling arrangements in Russia issubject, among other things, to the requirement that imported materials are processed within a setperiod of time and, consequently, that finished goods are exported from Russia within that timeframe.This requirement may limit the ability of the Group to retain materials and finished goods at its sitesin Russia prior to their processing and export to customers outside Russia. See “Business — Sales andDistribution” and “Financial Information — Management’s Discussion and Analysis of FinancialCondition and Results of Operations — Certain Factors Affecting the Group’s Results of Operations— Certain Factors Affecting Results of Operations — Effective Tax Rate”.
Management intends to continue relying on tolling arrangements of the kind described abovewith respect to aluminium production in Russia when the alumina is sourced, and the finishedaluminium is sold, outside Russia. Tolling arrangements are permitted under Russian law and theGroup’s tolling agreements are regularly registered by the Russian customs authorities. The Directorsbelieve that the Group’s tolling arrangements are conducted on appropriate commercial terms basedon applicable Russian law and regulation. Processing fees are clearly indicated on the Group’s taxdeclarations in Russia, and the Russian anti-monopoly authorities also receive periodic reports fromeach of the Group’s smelters on the breakdown of the amount of aluminium that is “produced” versus“processed”.
Group transfer prices are generally linked to LME prices, less amounts reflecting transportation,marketing, financing and other logistical and overhead costs absorbed by the Group tradingcompanies.
Russian transfer pricing rules effective since 1999 give the Russian tax authorities the right tomake transfer pricing adjustments and to impose additional tax liabilities with respect to all“controlled” transactions, provided that the transaction price differs from the market price (upwardsor downwards) by more than 20%. “Controlled” transactions include transactions with related parties,barter transactions, foreign trade transactions and transactions with unrelated parties with significantprice fluctuations (i.e., if the price of such transactions differs from the prices of similar transactionsby more than 20% within a short period of time). Special transfer pricing rules apply to securities
RISK FACTORS
— 29 —

transactions and derivatives. The Russian transfer pricing rules are vaguely drafted, leaving widescope for interpretation by Russian tax authorities and courts. There has been very little guidance(although some court practice is available) as to how these rules should be applied. In addition, in theevent that a transfer pricing adjustment is assessed by Russian tax authorities, the Russian transferpricing rules do not provide for an offsetting adjustment to the related counterparty in the transactionthat is subject to adjustment. Certain amendments to the Russian transfer pricing laws and regulationsare expected to be considered by the Russian legislative authorities and the new rules are expected tobecome effective in the near future. Such amendments, if adopted, are expected to result in strictertransfer pricing rules. The control functions of the Russian tax authorities are expected to be expandedgiving rise to higher tax risks for Russian corporate taxpayers, including the Group. Taxpayers areexpected to be given an option to conclude price formation agreements with the tax authorities, whichshould allow them to manage such risks and, as described below, the Group is seeking to concludesuch arrangements.
Russian tax and customs laws and regulations, including the transfer pricing rules describedabove, are subject to varying interpretations and changes, which can occur frequently. It is expected,for example, that the unified social tax will be abolished starting from 2010 and will be replaced byduties payable to non-budgetary funds.
Management’s interpretation of such legislation as applied to the transactions and activities ofthe Group may be challenged by the relevant local, regional and federal authorities, which have widediscretion to do so. Recent developments in the Russian environment suggest that the Russianauthorities are becoming more active in seeking to enforce, through the Russian court system,interpretations of the tax legislation, in particular in relation to the use of certain commercial tradingstructures, which may be selective for particular tax payers and different from the authorities’ previousinterpretations or practices. The limitation period for review of taxation in Russia is generally threeyears. See “Risks relating to the Group and its Business — Risks relating to the multijurisdictionalregulatory, social, legal, tax and political environment in which the Group operates — Uncertaintiesrelating to the tax systems of some of the countries in which the Group operates complicate theGroup’s tax planning and business decisions”.
The Russian entities in the Group are regularly audited by the Russian tax authorities and, inparticular, audits of the tax years 2005 and 2006 of the Group’s major Russian operating subsidiaries,including SUAL and its branches, have been completed. See “— Risks relating to themultijurisdictional regulatory, social, legal, tax and political environment in which the Group operates— Uncertainties relating to the tax systems of some of the countries in which the Group operatescomplicates the Group’s tax planning and business decisions”. As a result of these tax audits, theDirectors believe that the Group’s commercial structure and its terms are acceptable to the Russian taxauthorities. The Directors also believe that the Group’s non-Russian trading companies involved inthese arrangements are not subject to taxes outside their countries of incorporation or where they haveestablished and declared tax residency. However, there is a risk that Russian tax authorities may stillchallenge the treatment of these companies and their transactions. Finally, the laws that currentlypermit tolling in Russia, or that regulate transfer pricing or the circumstances in which profits earnedoutside Russia are free of Russian profit tax, could be changed, requiring the Group to revise ordiscontinue its existing arrangements. Any of these developments could increase the Group’s effectivetax rate going forward, and any successful challenge to the Group’s practices under applicable law atthe time could result in material liability for additional tax, penalties and interest, which couldadversely impact the Group’s financial condition.
The Group’s effective tax rate could also be affected by a number of other risk factors referredto in “— Risks relating to the multijurisdictional regulatory, social, legal, tax and politicalenvironment in which the Group operates — Uncertainties relating to the tax systems of some of thecountries in which the Group operates complicate the Group’s tax planning and business decisions”.
RISK FACTORS
— 30 —
The Group is exposed to foreign currency fluctuations which may affect its financial results
Substantially all of the Group’s revenues are either denominated in US dollars or linked to theUS dollar. While the majority of the Group’s costs are also denominated in, or linked to the US dollar,a significant part is denominated in Roubles, Euros and the Ukrainian Hryvnia, because the Group hassubstantial production facilities in Russia, the EU and Ukraine. Accordingly, depreciation of thesecurrencies against the US dollar has a positive effect, and appreciation of these currencies against theUS dollar has a negative effect, on the Group’s operating margins. Moreover, inflation of the Group’scosts in Roubles, Euros and Hryvnia, if not counterbalanced by a corresponding depreciation of therelevant currency against the US dollar or an increase in prices for aluminium and related products,could adversely affect the Group’s margins. For the year ended 2008 the Company recorded a US$201million foreign exchange loss. The Company recorded a foreign exchange loss of US$79 million in thefirst six months of 2009. The Group enters into very limited foreign currency swaps to mitigate to asmall extent the foreign currency risk, but there can be no assurance that such hedging will beeffective. For more information on the Group’s exposure to foreign currency fluctuations, see“Financial Information — Management’s Discussion and Analysis of Financial Condition and Resultsof Operations — Certain Factors Affecting the Group’s Results of Operations — Certain FactorsAffecting Results of Operations — Changes in Foreign Currency Exchange Rates” and “FinancialInformation — Management’s Discussion and Analysis of Financial Condition and Results ofOperations — Quantitative and Qualitative Disclosures About Market Risk — Interest Rate andForeign Currency Risk”.
En+ is able to influence the outcome of important decisions relating to the Group’s business andthe Group’s business includes transactions with certain related parties
En+, in which Mr. Deripaska has a controlling interest as described in “Substantial Shareholders— En+”, owns approximately 53.35% of the issued ordinary shares in the Company as of the date ofthis prospectus and will continue to own 47.59% following the Global Offering assuming theOver-allotment Option is not exercised and no bonus Shares are issued to management. Mr. Deripaska,the Group’s CEO, is the beneficial owner of En+. As a result, En+ and Mr. Deripaska have substantialpower in relation to all matters requiring shareholder approval, including the election of Directors andsignificant corporate transactions, and may be in a position where their own interests and those ofother shareholders are in conflict. For information about a claim that could affect the size of En+’sinterest in the Company, see “— A certain claim against the beneficial owner of En+ could have amaterial adverse effect on the Company and/or the trading price of its Shares”, “SubstantialShareholders — Litigation Involving Certain Beneficial Owners — Litigation Involving Mr.Deripaska” and Appendix X to this prospectus. In addition, SUAL Partners, Amokenga Holdings andOnexim Holdings own approximately 17.78%, 9.70% and 19.16%, respectively, of the issued ordinaryshares in the Company as of the date of this prospectus and will own 15.86%, 8.65% and 17.09%,respectively, following the Global Offering assuming the Over-allotment Option is not exercised andno bonus Shares are issued to management. En+ and the other Major Shareholders of the Companyhave agreed how control rights will be exercised in relation to the Company pursuant to theShareholders’ Agreement between Major Shareholders only expected to be entered into by the MajorShareholders. See “Substantial Shareholders — Shareholders’ Agreement between Major Shareholdersonly”.
In the course of its business, the Group engages in transactions with related parties, primarilytransactions with En+ and entities under its control. In particular, electricity suppliers controlled bythe beneficial owners of En+, a controlling shareholder of the Company, were suppliers of electricityto Group smelters that accounted for approximately 57.3% of its aluminium production in 2008. TheGroup has entered into long-term energy supply contracts with the hydropower suppliers controlled bythe beneficial owners of En+. Generally speaking, such transactions may be on terms more or lessfavourable to the Group than those that could be obtained from a third-party supplier. See “Business— Energy Supply — Security of Power Supply” and “Connected Transactions”.
RISK FACTORS
— 31 —
When the Group acquired certain of the alumina businesses of Glencore in late March 2007, itbecame subject to contracts for the supply of alumina to Glencore that continued through 2008, indeclining amounts. The Group sold to Glencore approximately 36% of its excess alumina in 2008. TheCompany also has a variety of supply contracts with Glencore for alumina and primary aluminium,including long-term supply contracts, and Glencore was the Group’s largest customer of alumina andprimary aluminium in the six months ended 30 June 2009, accounting for approximately 21% of theGroup’s sales of primary aluminum and alloys.
En+ is completing a restructuring of its debts and will give its lenders a pledge over 15% of theoutstanding Shares
En+ has been going through a complex restructuring of its bank debt of approximately US$1.04billion as described below (all information in this description being based on information provided tothe Company by En+). The debts consist of a US$750 million syndicated loan, a second US$200million syndicated loan to one of its subsidiaries which has been elevated to En+ and US$90 millionin bilateral debt. Following extensive negotiations over recent months, it is proposed that thesefacilities will be converted into one new loan facility. The current status of the debt restructuring isthat the requisite majority (more than 75% by value) of lenders under the two syndicates have signeda standstill agreement which has attached the complete documentation for the new facility which isagreed in final form. The bilateral debt is in the process of being re-financed by a new lender whichhas agreed to roll its loan into the new facility. Currently En+ is completing the conditions precedentto the standstill agreement which, when effective, will enable the implementation of the restructuringeither via a scheme of arrangement or, if all lenders agree, by consensual execution of the new loandocumentation. En+ expects that the debt restructuring will be fully implemented by the end of thefirst quarter of 2010.
The new facility has been structured to allow En+ a period of time to improve its liquiditysituation through the sale of non-core assets and the raising of equity. The main terms are:
• 100% bullet repayment on 31 December 2011, with two possible one-year extensions up to31 December 2013, subject to a deleveraging test on the secured assets;
• one tranche with all interest paid in kind (meaning capitalised) for two years and a smallequity-based upside (payable to the lenders as a lump sum amount in cash on maturity,based upon the increase in value of En+ as a company over the period of the loan), thesecond tranche with a small cash margin, lower payment in kind (meaning capitalised)interest and no equity-based upside;
• security over 15% of the outstanding (post-Global Offering) shares in the Company andadditional Shares as may be required to be pledged to meet loan to value tests, plus 25%of the holding company of the En+ electricity business;
• a secured cash sweep mechanism for prepayment of the debt after operating costs andinterest;
• extensive information and other covenants (all of which exclude the Company) typical ofa restructured debt facility, which prevent En+ from making most additional investments oracquisitions; and
• additional governance measures, including the addition of an independent director and aboard observer to the board of En+.
RISK FACTORS
— 32 —
Accordingly, there are minimal mandatory principal or interest payments over the first two yearsof the restructured debt period. En+ expects to fund these payments and its operating costs andsignificantly reduce the size of the facility through pre-payments over the next two years from the saleof non-core assets. En+ also expects to fund partial repayment of the debt through raising equitydirectly or at the level of its subsidiaries.
If En+ is not able to complete its restructuring in the manner described, its existing lenders maytake action against En+ to recover their existing debt from En+’s assets, including its shareholding inthe Company. If, as described, En+ completes its restructuring by the end of the first quarter 2010,there is a risk that it will be unable to complete the proposed asset sales to fund interest payments,or that it will default against the large number of covenants and undertakings in the restructured loanagreement. In that event, its lenders may exercise security and seek to sell the Shares pledged by En+.One or the other of these events could reduce En+’s share in the Company to the level that Mr.Deripaska is no longer able to exert the same level of influence over the Company as he now does,result in sales of Shares into the market that would not otherwise occur and/or contribute to a changein control of the Company that could result in acceleration of the Group’s indebtedness under theCompany’s debt restructuring agreements. For the implications of these events for the Company andthe trading price of the Shares, see “— The Group depends on the services of key senior managementpersonnel and the strategic guidance of the beneficial owner of En+”, “— Risks Relating to the GlobalOffering and the Offer Shares — The sale or availability for sale of substantial amounts of the Sharesor equity-related securities could adversely affect their trading prices” and “— The terms of the debtrestructuring agreements impose strict limits on the Group’s capital expenditure and other uses ofavailable cash which will limit its ability to expand its business and to pay dividends, and failure bythe Group to comply with the terms and conditions of these agreements may materially adverselyaffect the Group and its shareholders”.
The Group depends on the services of key senior management personnel and the strategic guidanceof the beneficial owner of En+
The Group’s business has benefited from the contributions of a number of the Group’s key seniormanagers, whose services may cease to be available to the Group. Factors critical to retaining theGroup’s present management and attracting additional highly qualified managers include the Group’sability to provide these individuals with competitive compensation arrangements. Competition forqualified management personnel is intense, and the Group’s business may be adversely affected if itis unable to retain or attract highly qualified individuals in key management positions.
The Group has also benefited from the strategic guidance of Mr. Deripaska, the beneficial ownerof En+, the Company’s controlling shareholder, and starting from January 2009, the Company’s CEO.The Group’s business may be adversely affected if Mr. Deripaska ceases to have a significant interestin the Company, and consequently ceases to provide strategic guidance. Mr. Deripaska’s interest in theCompany could be reduced for any reason, including meeting his liquidity requirements or those ofEn+. As discussed above, En+ has informed the Company that it is in the process of completing arestructuring of approximately US$1.04 billion of its indebtedness. In the event, however, that thedebt restructuring is not concluded, En+ creditors could foreclose on the debt and seek to realiseagainst assets of En+, including Shares in the Company. Moreover, as discussed above, En+ isexpected to pledge 15% of the issued share capital of the Company to the lenders of En+ in connectionwith En+’s debt restructuring arrangements and additional Shares may be required to be so pledgedto meet loan to value tests. Further, 5% of the issued share capital of the Company is expected to bepledged by En+, SUAL Partners, Glencore and Onexim on a pro rata basis to VEB in connection withthe restructuring of the Company’s obligations to VEB. If an event of default were to occur withrespect to the restructured indebtedness of En+ or the Group’s indebtedness to VEB, the relevantcreditors could seek to foreclose on the Shares in the Company that will be pledged to secure suchindebtedness. For a description of a pending claim against Mr. Deripaska that, if successful (or if itresults in a substantial monetary award), could lead to a significant reduction of his interest in the
RISK FACTORS
— 33 —
Company, see “— A certain claim against the beneficial owner of En+ could have a material adverseeffect on the Company and/or the trading price of its Shares” and “Substantial Shareholders —Litigation Involving Certain Beneficial Owners — Litigation Involving Mr. Deripaska” and AppendixX to this prospectus. Pursuant to the terms of the Shareholders’ Agreement between MajorShareholders only, expected to be entered into by the Major Shareholders, En+ has the right tonominate (and the other Major Shareholders have agreed to use their respective voting rights toprocure the appointment of) Directors representing 50% of the Board. En+ retains this right unless anduntil it holds less than 40% of the Shares held by the Major Shareholders and their respective whollyowned subsidiaries. For a description of the rights En+ will have to nominate Directors when it holdsless than 40% of the Shares held by the Major Shareholders and their respective wholly ownedsubsidiaries, see “Substantial Shareholders — Shareholders’ Agreement between Major Shareholdersonly”. In addition, as discussed above, the Company’s debt restructuring agreements provide foracceleration if a person (or a group of persons acting in concert) other than Mr. Deripaska or membersof his immediate family acquires effective control of the Company (meaning the ownership of morethan one half of the Shares in the Company, the right to exercise voting rights with respect to morethan one half of the Shares or elect more than half of its Board of Directors, or the power otherwiseto direct the affairs of the Company).
A certain claim against the beneficial owner of En+ could have a material adverse effect on theCompany and/or the trading price of its Shares
On 24 November 2006, a claim was issued on behalf of Mr. Michael Cherney (“Mr. Cherney”)against Mr. Deripaska, the beneficial owner of En+, from the High Court of Justice, Queen’s BenchDivision, Commercial Court, London (the “High Court”). Neither UC RUSAL nor any of itssubsidiaries is a party to this dispute — it is entirely between two individuals, Mr. Cherney and Mr.Deripaska. UC RUSAL has not had access to non-public information about the case and is not privyto the litigation strategy of either party or the prospects of settlement.
The claim relates to the alleged breach or repudiation by Mr. Deripaska of certain allegedcontractual commitments to sell for Mr. Cherney’s benefit 20% of Russian Aluminium (“RA”), anentity that the claim does not formally identify, but which may be Rusal Limited, now a wholly owneddirect subsidiary of UC RUSAL (see “History and Corporate Structure — History and Development”).The claim states that, at least pending receipt by Mr. Cherney of the amounts due to him pursuant tothese alleged commitments, Mr. Cherney is entitled to and seeks:
• A declaration that Mr. Deripaska (directly or indirectly) holds (i) 20% of the shares in RAand (ii) 20% of the 66% shareholding in UC RUSAL (held by former shareholders of RA)in trust for Mr. Cherney and to his order.
• A declaration that any benefits or proceeds derived directly or indirectly by Mr. Deripaskafrom such shares and shareholding as well as any assets acquired using directly orindirectly any dividends or other monies or benefits received by Mr. Deripaska andreferable to the shares and shareholding are held on trust for Mr. Cherney, alternativelysubject to a lien in Mr. Cherney’s favour.
• A declaration that, insofar as the shares are held indirectly by a person acting subject to Mr.Deripaska’s directions or companies or entities owned and controlled by Mr. Deripaska, Mr.Deripaska’s right to control those persons, companies or entities and to sell the said sharesis held on trust for and to be exercised on behalf of and at the direction of Mr. Cherney.
• A declaration that, if and to the extent that Mr. Deripaska directly or indirectly acquiredassets from RA (further or alternatively Sibal) or UC RUSAL for “inadequateconsideration”, such assets and/or proceeds thereof are subject to the aforementioned trustand/or lien.
RISK FACTORS
— 34 —
• An order that Mr. Deripaska sell or procure the sale of 20% of the shares in RA and 20%of the 66% of the shares in UC RUSAL at the market price and account to Mr. Cherney forthe proceeds of that sale.
• The claim alleges further, or alternatively, that by reason of Mr. Deripaska’s breaches ofcontract, Mr. Cherney suffered loss and damage at least equal to the market value of 20%of RA and 20% of 66% of UC RUSAL, which the claim alleges to be in excess of US$4billion, less US$250 million already paid, increased by the value of any assets diverted for“inadequate consideration”.
• Mr. Cherney also claims interest on the amounts alleged to be owed him.
The High Court determined on 3 July 2008 that it had jurisdiction to hear the claim, and the Courtof Appeal upheld this determination. On 9 December 2009 the United Kingdom Supreme Court refusedMr. Deripaska’s application for permission to appeal the decision of the Court of Appeal. On 14December 2009 Mr. Deripaska was served with Mr. Cherney’s claim. Mr. Deripaska will be requiredto serve a defence to Mr. Cherney’s claim in early 2010. Accordingly, proceedings with respect to themerits of the claim have only just commenced. At present, there is considerable uncertainty as to thepossible scope and the potential outcomes in the case and how, if at all, UC RUSAL and/or itssubsidiaries and/or its or their respective assets might be affected by any decision against Mr.Deripaska. Nonetheless, the following can be noted:
• Neither UC RUSAL nor any of its subsidiaries or investees, nor En+ (the majorityshareholder owned indirectly by Mr. Deripaska), nor any other direct shareholder in UCRUSAL, is currently a party in this case.
• When the merits of the case are heard, issues to be resolved will include whether there wasin fact a contract with respect to 20% of RA as alleged by Mr. Cherney and, if so, whetherit is governed by English or Russian law.
• In the event that Mr. Cherney were to prevail on the merits, the essence of his claim wouldbe for money from Mr. Deripaska. The quantum of the claim referred to above (in excessof US$4 billion in respect of 20% of RA, and 20% of 66% of UC RUSAL, plus possibleadditional amounts) has not yet been subject to judicial examination, and it is uncertain atthis time how the quantum of the claim ultimately would be determined.
• As noted above, given that (i) UC RUSAL is not a party to the litigation and (ii) thelitigation is still at a very early stage, UC RUSAL is unable to express a view on the meritsof Mr. Cherney’s claim. However, in the event that Mr. Cherney succeeds in his claim andobtains the relief he is seeking, then, unless Mr. Deripaska funds the judgment bill entirelyfrom assets unconnected with the Group, Mr. Deripaska’s beneficial interest in UC RUSALor (depending on the remedy granted) certain assets of the Group, such as a portion of UCRUSAL’s interest in RA, would be affected adversely by the claim. In such circumstances,such adverse effects could also have adverse consequences under the terms of the Group’sdebt restructuring agreements. Mr. Deripaska’s beneficial interest in UC RUSAL wouldalso be adversely affected if he financed any settlement of the claim through a sale of hisbeneficially owned shares in UC RUSAL. For further discussion, see “SubstantialShareholders — Litigation Involving Certain Beneficial Owners — Litigation InvolvingMr. Deripaska”, “— The terms of the debt restructuring agreements impose strict limits onthe Group’s capital expenditure and other uses of available cash which will limit its abilityto expand its business and to pay dividends, and failure by the Group to comply with theterms and conditions of these agreements may materially adversely affect the Group and itssubsidiaries”, “— The Group depends on the services of key senior management personnel
RISK FACTORS
— 35 —
and the strategic guidance of the beneficial owner of En+” and “— Risks Relating to theGlobal Offering and the Offer Shares — The sale or availability for sale of substantialamounts of the Shares or equity-related securities could adversely affect their tradingprices”.
A final decision against Mr. Deripaska in this case that resulted in a trust or lien being declaredover, or the sale of, shares in UC RUSAL or RA, or that otherwise affected Group assets, couldadversely affect the trading price of the Shares. Moreover, even before a final decision is made, furtherproceedings in respect of this claim, and publicity surrounding them, could adversely affect thetrading price of the Shares.
Mr. Deripaska has informed the Company that he strongly denies and will vigorouslyresist Mr. Cherney’s claim. The Company would vigorously contest any claim if made against it,any of its subsidiaries or any of its or their respective assets. See “Substantial Shareholders —Litigation Involving Certain Beneficial Owners — Litigation Involving Mr. Deripaska” fora fuller description of the case, including the High Court’s assessment on 3 July 2008 of therelative strengths of the arguments about this alleged contract by each side as presented at thattime. For extracts from the 3 July 2008 decision of the High Court on jurisdiction, see Appendix Xto this prospectus. The full decision is on public display and can be found at<www.bailii.org/ew/cases/EWHC/Comm/2008/1530.html>.
Adverse media speculation, claims and other public statements could adversely affect the value ofthe Offer Shares
The media and others have speculated publicly from time to time about a wide variety of mattersrelating to the Group, its shareholders and beneficial owners and members of its management. Thesehave included the manner in which the businesses that now comprise the Group were acquired bypredecessors of companies that combined to form the Group, or by the Company itself, and a numberof allegations regarding these transactions have been made, some in the context of legal claims. See“History and Corporate Structure — History and Development”. There has also been speculation aboutthe consequences of a claim that has been brought against Mr. Deripaska, the beneficial owner of En+and the chief executive officer of the Company, including the possibility that Mr. Deripaska’s interestin the Company could be reduced or that the Group or its assets could be affected. See “SubstantialShareholders — Litigation Involving Certain Beneficial Owners — Litigation Involving Mr.Deripaska” and “— A certain claim against the beneficial owner of En+ could have a material adverseeffect on the Company and/or the trading price of its Shares”.
In addition, there has been negative coverage in the media recently relating to the rejection byU.S. authorities of Mr. Deripaska’s application for a visa to enter the United States. Some of suchcoverage includes speculation that the rejection was due to alleged connections to organised crime.There were also media reports alleging that Mr. Deripaska had travelled to the United States twice inthe past few months using entry permits arranged by the Federal Bureau of Investigation, with whomhe is alleged to have met during his visits. Mr. Deripaska has confirmed to the Company that he hadan application for a U.S. visa denied in 1998 pursuant to Section 212(a)(3) of the U.S. Immigrationand Nationality Act, which relates to aliens deemed ineligible for U.S. visas based on security,unlawful activity and related reasons, and that this position was reiterated in 1999 and 2000. Mr.Deripaska has repeatedly and consistently challenged these denials as being unwarranted andunsupported. He has also confirmed to the Company that he subsequently visited the United Stateslawfully a number of times. The most recent visits were in August and October 2009. On theseoccasions, Mr. Deripaska was permitted to enter the United States pursuant to Section 212(d)(5) of theU.S. Immigration and Nationality Act, whereby neither his movements nor his activities wasrestricted. Mr. Deripaska has also confirmed to the Company that, to the best of his knowledge, he isnot under investigation by any U.S. authority.
RISK FACTORS
— 36 —

Mr. Deripaska has also confirmed to the Company that he was denied visas to Canada in 2003and 2006 pursuant to section 37(1)(a) of the Immigration and Refugee Protection Act of Canada whichrelates to persons deemed ineligible for Canadian visas based on alleged criminality. Mr. Deripaskahas confirmed to the Company that he challenged these denials, and was subsequently issued Canadianvisas based on entry permits on multiple occasions, covering a number of periods from 30 March 2007to 28 July 2008. With respect to the United Kingdom, Mr. Deripaska has confirmed to the Companythat he has visited the United Kingdom on numerous occasions, has been issued with a succession ofU.K visas and recently obtained a new multiple entry visa to enter the United Kingdom which expiresin May 2010.
While Mr. Deripaska is not subject to any special restrictions on his travel, as a Russian citizenhe is subject to ordinary requirements to obtain visas or other permits when traveling outside Russia.There can be no assurance he will be granted permission to enter the United States, Canada or anyother country in the future or that any limitation on his ability to travel to the United States, Canadaor any such other country will not adversely affect his ability, as the Chief Executive Officer of theCompany, to interact directly with existing and prospective business counterparties of the Company,the shareholders of the Company and other stakeholders of the Company in the United States, Canadaand any such other countries.
In October 2009, the Russian newspaper Vedomosti, and related publications, publishedconfidential information about the Company’s financial performance leaked by an unknown person.Because that information appeared to be derived from a publication that contained a strictconfidentiality clause, the Company, concerned about the Listing Rules and other rules againstpublicity in advance of the Global Offering, instructed its Russian legal advisor to seek to stop furtherpublication by Vedomosti. As a result, Vedomosti has accused the legal advisor of “an informationterror campaign”, which both the Company and the legal advisor have denied.
Adverse media speculation, claims and other public statements of the kinds referred to abovemay adversely affect the value of the Offer Shares or distract management from their day to daymanagement responsibilities.
The Group’s results of operations in 2008 were significantly and adversely affected by impairmentcharges related principally to its property, plant and equipment and to its equity investment inNorilsk Nickel and by the Group’s pro rata portion of loss suffered by Norilsk Nickel, and there canbe no assurances that further impairment charges will not be necessary or that further losses relatedto the Norilsk Nickel investment will not occur
The Group recognised US$6,774 million and US$37 million in impairment charges relating tonon-current assets in 2008 and the first six months of 2009, respectively, as compared to no suchimpairment in 2007 and 2006. Following the global economic downturn in the fourth quarter of 2008,the Group carried out impairment tests for all of its significant cash-generating units, for itsinvestment in Norilsk Nickel, which is accounted for using the equity method, and for certain otherprojects. These impairment tests led to recognition of impairment charges of US$3,532 millionrelating to property, plant and equipment, US$2,408 million relating to the Group’s investment inNorilsk Nickel (which was recognised in UC RUSAL’s Accountants’ Report in the line item “Share oflosses of associates”), US$554 million relating to fair value adjustment on financial instruments(which was recognised in UC RUSAL’s Accountants’ Report in the line item “Finance Expense”) andUS$280 million relating to other assets as of 31 December 2008. For further information, see“Financial Information — Management’s Discussion and Analysis of Financial Condition and Resultsof Operations — Year Ended 31 December 2008 Compared to Year Ended 31 December 2007 —Impairment of Non-Current Assets”. In addition, the Group’s results of operations in 2008 werenegatively impacted by its US$881 million share in the net loss of Norilsk Nickel for that year.
RISK FACTORS
— 37 —
If demand for and prices of aluminium are not sustained as the Group currently expects, theGroup could be required to record additional impairment charges related to property, plant andequipment. Moreover, if recovery of demand for and prices of nickel, palladium and other metalsproduced by Norilsk Nickel are not sustained as the Group currently expects, the Group could berequired to record additional impairment charges related to its investment in Norilsk Nickel. As of 30June 2009, the carrying value of the Norilsk Nickel investment in the Group’s balance sheet wasUS$7,158 million. The Group’s share of market capitalisation of Norilsk Nickel, based on the RTSclosing price, was US$4,527 million on 30 June 2009 and was US$6,791 million on 17 December2009.
In addition, if recovery of demand for and prices of Norilsk Nickel’s products are not sustainedas the Group currently expects, Norilsk Nickel may experience further losses, which would adverselyaffect the Group’s results of operations.
Furthermore, under the terms of the Group’s debt restructuring, the Group may be required to sellall or a significant portion of its stake in Norilsk Nickel under certain circumstances. Such a requiredsale could result in a substantial loss to the Group. See “Financial Information — Management’sDiscussion and Analysis of Financial Condition and Results of Operations — Liquidity and CapitalResources — Debt Restructuring — Terms of International Debt Restructuring”.
The Group does not have operational or management control over Norilsk Nickel and other materialjoint ventures
The Group currently owns an interest of more than 25% in the share capital of Norilsk Nickel.The Group’s representatives on the board of directors of Norilsk Nickel do not constitute the majorityof the board. Although the Group is able to exert significant influence over Norilsk Nickel, theDirectors believe that the Group’s interest in the share capital and the presence of its directors on theboard does not provide the Group with the ability to control actions that require shareholder approval.As a result the Group does not have the ability to prevent Norilsk Nickel from engaging in activitiesor pursuing strategic objectives that may conflict with the interests or overall strategic objectives ofthe Group. The Group also does not control the cashflows of Norilsk Nickel and its profit out of thisinvestment is limited to the amount of dividends paid by Norilsk Nickel, which the Group does notcontrol. See “Business — Norilsk Nickel and Material Joint Ventures”.
Further, the Group is a party to certain material joint venture agreements through which itowns a:
• 20% equity interest in Queensland Alumina Limited (“QAL”);
• 50% equity interest in companies comprising Boguchanskoye Energy and Metals Complex(“BEMO”); and
• 50% equity interest in LLP Bogatyr Komir (“BK”),
and the Group’s representatives on the boards of directors of QAL, companies comprising BEMO andBK do not constitute majorities. Consequently, the Directors believe that the Group’s interest in theshare capital and the presence of its directors on the respective boards does not provide the Group withthe ability to exert control over actions that require shareholder approval. See Notes 19 and 20 of UCRUSAL’s Accountants’ Report.
The Group’s business may be affected by labour disruptions, shortages of skilled labour and labourcost inflation
Competition for skilled labour is intense in the aluminium industry, and labour costs have in thepast increased significantly, particularly in Russia. The demand and hence costs for skilled engineers,construction workers and operators will continue to increase, reflecting the significant demand fromother industries and public infrastructure projects. Continual high demand for skilled labour andcontinued increases in labour costs could have a material adverse effect on the Group’s business,financial condition and results of operations.
RISK FACTORS
— 38 —
Approximately 70% of the Group’s employees in Russia are members of labour unions. TheGroup has not experienced any strikes that have had a material adverse effect on the Group, and theDirectors believe its present labour relations are good overall. However, there can be no assurance thata material work slowdown, stoppage or strike will not occur, and the Directors are unable to estimatethe effect of any such work slowdown, stoppage or strike on the Group’s production levels. Forexample, commencing on 22 November 2009, Bauxite Company of Guyana Inc., a subsidiary of theCompany engaged in bauxite mining, has been experiencing a strike that had led to temporarysuspension of production (through 7 December 2009). In addition, although the Directors do notconsider the strike to be material, miners in one of the Group’s Russian bauxite mines staged asit-down strike in March-April 2008. While the Group is insured against business interruptions up tocertain limits (see “Business — Operational Hazards and Insurance”), significant work slowdowns,stoppages or other labour-related developments could have an adverse effect on the Group’s business,financial condition and results of operations, particularly if they occur at either the Bratsk aluminiumsmelter or the Krasnoyarsk aluminium smelter, which together account for approximately half of theGroup’s primary aluminium production.
As a result of recent suspensions of operations at certain Group facilities, there is potential forunrest amongst affected employees, local communities and/or labour unions, although no such unresthas been experienced to date. Such unrest could result in a material work slowdown, stoppage or strikeand/or negative publicity in respect of the Group, which may affect its public image and business.
The Group relies on third-party suppliers for certain materials
The Group’s mines supplied most of the bauxite it used in alumina production in 2008 and thefirst six months of 2009, with the remainder being supplied by third-party mines with which the Grouphas medium- and long-term supply contracts. These contracts are generally effective through 2011 and2013. If the Group is unable to renew its bauxite supply contracts or expand production from its minesor acquire new mines, the Group might have to acquire bauxite from other suppliers at less favourableprices, which could adversely affect the Group’s business, financial condition and results ofoperations.
The Group’s cathode plant, Shanxi RUSAL Cathode Co. Ltd., located in China, suppliedapproximately 20% of the Group’s own consumption of cathodes in the first half of 2009. In March2008, the Group acquired assets of another cathode plant in China, which have been integrated intoShanxi RUSAL Cathode Co. Ltd. The Group is considering further expansion of its cathode productionon the basis of the acquired assets. See “Business — The Group’s Operations — Aluminium Division”.As a result, the Group relies on third-party suppliers of cathodes for the remainder. It could be difficultfor the Group to find alternative sources of these materials on commercially acceptable terms or at all,if production by its third-party suppliers were disrupted. Failure by the Group to secure the supply ofthese materials, either through purchases from other third-party suppliers or through an increase in itsown production capacity, could have a material adverse effect on the Group’s business, financialcondition and results of operations.
Equipment failures or other difficulties may result in production curtailments or shutdowns
The manufacturing processes of all aluminium producers depend on critical pieces of equipment,which may, on occasion, be put out of service unexpectedly as a result of failures, unplannedmaintenance, ageing or otherwise. In addition, the business of mining, smelting and refining metalsinvolves a number of other risks and hazards, including unusual or unexpected geological conditions,mine collapses, fires, explosions, adverse weather conditions and other natural phenomena such asearthquakes, hurricanes and floods. Moreover, the production of aluminium is dependent on theconsistent supply of electricity, which can be interrupted for many reasons. Certain operational risksrelating to specific sites and facilities are outlined in the Independent Technical Report in AppendixVI.
RISK FACTORS
— 39 —

The occurrence of any of these events could result in production curtailments or shutdowns,reduced sales, increased costs, significant damage to property or the environment, or a need for theGroup to incur larger than expected capital expenditure to remedy the situation (such capitalexpenditures should be permitted under the terms of the debt restructuring agreements to the extentthat they fall within the limits approved by such agreements for maintenance capital expenditures).For example, as a result of damage to the boiler at the Group’s Friguia alumina refinery in 2006, therefinery’s alumina and bauxite production fell, and alumina purchases increased, leading to highercosts that were only partially offset by insurance coverage.
While the Group has not experienced significant electricity interruptions, the generators andtransmission infrastructure in Russia, which supply most of the Group’s smelters, are ageing. Despiteconsumption redundancy within the Russian electricity grid, interruptions could occur. See “— TheGroup’s competitive position in the global aluminium industry is highly dependent on continuedaccess to inexpensive and uninterrupted electricity supply, in particular, long-term contracts for suchelectricity; increased electricity prices (particularly as a result of deregulation of electricity tariffs),as well as interruptions in the supply of electricity, could have a material adverse effect on the Group’sbusiness, financial condition and results of operations” for information relating to the recent accidentat the Sayano-Shushenskaya hydropower plant. While the Group’s insurance agreements coverbusiness interruption, including losses in circumstances such as these up to specific limits (see“Business — Operational Hazards and Insurance”), significant events, particularly at either of theBratsk aluminium smelter or the Krasnoyarsk aluminium smelter, which are the two largest smeltersin the world in terms of production capacity and which produce approximately half of the Group’sprimary aluminium, could have a material adverse effect on the Group’s business, financial conditionand results of operations. Neither of these smelters has experienced significant productioncurtailments or shutdowns to date. In addition, the Group’s combined insurance policies may beinsufficient to cover all of the Group’s potential liability, loss of business or increased costs.
The Group is subject to certain requirements under Russian anti-monopoly laws
As a condition to obtaining anti-monopoly approval in Russia for RUSAL’s acquisition of SUALand certain of the alumina and aluminium businesses of Glencore (the “Glencore Businesses”), whichoccurred in 2007, the Group is required to notify the Russian regulatory authorities of any change inthe prices of its products above a permitted range and, subject to certain exceptions, of acquisitionsof more than a 10% interest in entities, which supply products to the Russian market with annualrevenues for such supply greater than or equal to RUR2.5 billion (approximately US$80 million at theexchange rate of the Central Bank of Russia as of 30 June 2009). In addition, for 20 years followingthe acquisition, the Group cannot charge a price for primary aluminium higher than a price calculatedpursuant to a formula based primarily on the LME price and transportation costs when entering intoagreements with purchasers in Russia. The Group also may not undertake “unsubstantiated” actionsto reduce or limit production (with the exception of modernisation) of its Russian subsidiaries duringsuch 20-year period without obtaining the preliminary consent of the regulatory authorities. Inaddition, during such 20-year period, the Group must maintain or increase (with certain exceptions)the production of the Group’s Russian subsidiaries, unless it receives the prior consent of theregulatory authorities, satisfy the demand on the Russian market at reasonable prices, particularly withrespect to products of which the Group is the sole Russian producer (to the extent possible), offernon-discriminatory terms to all purchasers on Russian commodities markets, and not increase the priceof foil and certain other products by more than 5% each quarter or 20% each year. For a period of fiveyears following the acquisition, the Group is also required to provide the regulatory authorities withquarterly price and volume reports for aluminium and half-yearly price and volume reports foralumina and bauxite. In addition, the Group was required to investigate the establishment of a Russiantrading exchange for the sale of the Group’s products within three years of effective date of theacquisition. The Group completed its investigation and issued a report to the Federal AntimonopolyService of Russia (“FAS”) on 1 October 2009, concluding that there is no economic basis for theestablishment of a trading exchange for the Group’s products in Russia at the present time. The Group
RISK FACTORS
— 40 —
App1A-28(6)
is also expected to continue investing in the foil production facilities with a view to improving thequality and the competitiveness of the product. Furthermore, the Group is required to inform theantimonopoly authority of any change in Group structure, position on the market of any member ofthe Group, and in merchandise policy.
In connection with the Group’s international expansion, past or future transactions, such asacquisitions, could be subject to reviews or approvals of foreign national or regional antitrustauthorities, which could result in fines, sanctions, delay or prevent the Group from completingtransactions or restrict its ability to realise expected financial strategic goals.
The Group operates in an industry that gives rise to health, safety and environmental risks
As with other large aluminium, alumina and bauxite companies, the Group’s operations produceemissions and by-products that are hazardous to the environment and are subject to increasinglystringent regulatory oversight in all jurisdictions in which it operates. Specific environmental risksrelating to certain sites and facilities are set out in the Independent Technical Report in Appendix VI.Compliance by the Group with environmental laws and regulations requires the commitment ofsignificant financial resources. A study undertaken on behalf of the Group in 2008 and 2009 estimatesthe capital expenditure the Group would have to make over a five-year period between 2010 and 2014to address known and potential environmental, health and safety and social issues at the level of US$5million or more per issue per site. The estimate does not include costs relating to the decommissioningof redundant equipment associated with any Group asset, or any decommissioning or closure costs,including restoration costs, or charges that may be required as a result of changes in specifications forplant operation. The study estimates that, when adjusted for probability, the Group’s most likely casescenario would entail aggregate capital expenditure of US$1.2 billion and its reasonable worst-casescenario would entail an aggregate capital expenditure of US$1.3 billion (such capital expenditure ispermitted under the debt restructuring agreements to the extent that they are required for compliancewith environmental laws). The study concluded that most of this capital expenditure would pertain tothe reduction of air emissions from the Group’s aluminium smelters. The study also identified that partof this capital expenditure may be required to address soil and groundwater conditions at a numberof the Group’s sites (including the conditions existing at the Eurallumina refinery), in the form of onand off-site soil and groundwater remediation. In addition, the Group’s ongoing waste managementneeds are likely to require capital expenditure in the future as existing waste management facilitiesare rehabilitated and new facilities are constructed to receive waste from future production. The mainsocial issue reflected in the study concerns the possible relocation of communities from the sanitaryprotection zones surrounding some of the smelters, including the relocation of residents located closeto the Bratsk aluminium smelter to the town of Bratsk. The Group may be responsible for the costsof relocating inhabitants from the sanitary protection zones surrounding its smelters. Any suchrelocation could also have a negative impact on the reputation of the Group. According to the study,the Urals aluminium smelter has over 17,500 inhabitants residing within the site’s sanitary protectionzone, along with accompanying social infrastructure. The study estimates that if the residents wererequired to be resettled (the study indicates that there is a 1% to 10% probability that this will berequired), direct costs to the Group would be US$160 million in the most likely case and US$200million in the reasonable worst-case. Also according to the study, the sanitary protection zone at theBogoslovsk aluminium smelter has approximately 50,000 people resident within it. The Group isplanning to implement a modernisation programme that is expected to reduce the size of the sanitaryprotection zone at the site. Approximately 5,500 people could be resident inside the reduced sanitaryprotection zone, and the report estimates that if such residents need to be resettled (the study indicatesthat there is a 1% to 10% probability that this will be required), direct costs to the Group would beUS$48.5 million in the most likely case and US$60 million in the reasonable worst-case scenario. See“Business — Environmental, Health and Safety Matters”.
RISK FACTORS
— 41 —
Approximately 70% of the Group’s primary aluminium is produced at smelters using Söderbergtechnology, which produces greater levels of emissions and is generally more damaging to theenvironment than pre-bake technology. One of the Group’s environmental priorities is to invest in themodernisation of its Söderberg pots to reduce emissions of air pollutants. The Engineering andTechnology Centre has been conducting research and trials to improve the environmental performanceof Söderberg cells in a project referred to as “Clean Söderberg Technology”. See “Business — TheGroup’s Operations — Engineering and Construction Division”. There can be no assurance that theGroup’s technical solutions will become commercially viable or whether the Group will be able underthe terms of the debt restructuring documents to use its capital resources to make such improvements.
The Group’s mines, refineries, smelters and other plants located in Russia are subject to statutorylimits on air emissions and the discharge of liquids and other substances. Russian authorities maypermit, in accordance with the relevant Russian laws and regulations, a particular Group facility toexceed these statutory limits, provided that the Group develops a plan for the reduction of theemissions or discharge and pays a levy based on the amount of contaminants released in excess of thelimits. Fees are assessed on a sliding scale in accordance with the relevant laws and regulations: thelowest fees are imposed for pollution within the statutory limits, intermediate fees are imposed forpollution within the individually approved limits, and the highest fees are imposed for pollutionexceeding all such limits. In 2007, 2008 and the first six months of 2009, such fees amounted toUS$29.7 million, US$29.4 million and US$8.2 million, respectively. It is within the discretion of theRussian authorities to permit pollution in excess of the statutory limits, but any request may be denied.Moreover, the payment of fees for exceeding these limits does not relieve the Group from itsresponsibility to take environmental protection measures and undertake restoration and clean-upactivities.
Compliance with environmental regulations in the jurisdictions where the Group has facilities,including EU regulations applicable to the Group’s current and potential future assets located in theEU, is an ongoing process. New laws and regulations, the imposition of stricter requirements forobtaining licences, increasingly strict enforcement or new interpretations of existing environmentallaws, regulations or licences and/or the discovery of previously unknown contamination may requirefurther expenditure to modify operations, install pollution control equipment, perform site clean-ups,curtail or cease certain operations, pay fees or fines or make other payments for discharges or otherbreaches of environmental laws or regulations. Measures required to be taken by the Group to complywith environmental regulations, either as a result of the conditions identified in the environmentalstudy described above or to comply with any future legislation or otherwise, could require additionalexpenditure beyond those anticipated, or result in the shutdown of certain of the Group’s facilities. Inthe event the Group incurs significant additional unbudgeted expenditure, or experiences shutdownsof Group facilities as a result of the above, this could have a material adverse effect on the Group’sbusiness, financial condition and results of operations (even if permitted under the terms of the debtrestructuring agreements).
A violation of environmental or health and safety laws relating to a mine, refinery, smelter orother plant, or failure to comply with the regulations or instructions of relevant environmental orhealth and safety authorities could lead to, among other things, a temporary shut down of all or aportion of a mine, refinery, smelter or other plant; the loss of a right to mine or operate a refinery,smelter or other plant; confiscation of manufactured goods; and/or the imposition of other costlycompliance procedures and/or legal action or other claims from individuals who have been affected.Several of the Group’s Russian subsidiaries do not at this time have certain licences and permitsrequired for some of their operations. In addition, various Russian subsidiaries of the Group holdcertain licences and environmental permits, which expire on 31 December 2009 or 1 January 2010.While the relevant companies have applied for new licences or permits or are in the final stages ofpreparation for the application for such licences or permits, certain of these may not be replaced withnew licences or permits prior to the expiry of the existing ones. The Directors view the renewalprocess as largely procedural and administrative and believe that, notwithstanding any delay, these
RISK FACTORS
— 42 —

licences and permits will ultimately be replaced. Under Russian law, temporary shut down or, incertain cases, confiscation of manufactured goods may be imposed as a sanction for the absence ofsuch licences or permits, although such sanctions are not usually applied in such cases in practice. Todate, enforcement by Russian authorities of the existing environmental or health and safety laws hasbeen somewhat inconsistent, with much discretion resting on the part of the regulators andprosecutors. However, this trend may change and enforcement may become stricter. In September2009, a red mud basin of one of the Group’s mothballed facilities, the Eurallumina refinery, wassequestrated and its environmental permit for production operations and management of the red mudbasin was suspended owing to failure to comply with instructions of the Italian Ministry for theProtection of the Environment (the “Italian Environmental Ministry”). See “Business — Litigation —Italian Environmental Ministry”. If environmental or health and safety authorities require the Groupto shut down all or a portion of a mine, refinery, smelter or other plant, or impose other penalties orimplement costly compliance measures, whether pursuant to new or existing environmental or healthand safety laws or other regulations, such measures could have a material adverse effect on theGroup’s business, financial condition and results of operations. While the Group has experiencedseveral temporary shutdowns of smaller facilities or minor portions of facilities since 1 January 2006,none of the Group’s major facilities has been shut down for health or safety reasons to date or due toabsence of the above-mentioned licences and permits.
In addition, even if the Group is in full compliance with applicable environmental and health andsafety laws of the countries in which it operates, these requirements may not reflect international bestpractices in all respects. If it does not operate fully in accordance with such best practices, the Groupmay be subject to public criticism for its business practices in these countries despite being in fullcompliance with local law, which could damage the Group’s reputation, result in certain clients facingpressure for doing business with the Group and/or affect its ability to obtain financing or the rate atwhich it obtains financing.
Ore Reserves and Mineral Resources data are only estimates and are inherently uncertain, and suchOre Reserves and Mineral Resources may be depleted more rapidly than anticipated
Ore Reserves and Mineral Resources data of aluminium producers are only estimates and areinherently uncertain. SRK has reviewed the available GKZ approved reserves compiled by the Groupand has restated the Reserves and Resources in accordance with JORC as at 1 July 2009. See “Business— The Group’s Operations — Alumina Division”. The Group’s estimations of Reserves and Resourcesas at 1 July 2009 may change substantially if new information subsequently becomes available orthrough the continued selective mining of better-than-average grades. Fluctuations in the price ofcommodities, variations in production costs and/or changes in recovery rates may also result in arevision of the Group’s estimated Reserves. If such a revision were to indicate a substantial reductionin Reserves at one or more of its major production facilities, it could negatively affect the Group’sbusiness, financial condition and results of operations.
The Group’s licences and concession rights to explore and mine Ore Reserves may be suspended,amended or terminated prior to the end of their terms or may not be renewed
The Group currently conducts its mining operations in the Russian Federation, Ukraine,Kazakhstan, Guinea and Guyana under exploration and production licences and concessionagreements, which are due to expire between 2010 and 2033 (mining operations in Jamaica arecurrently suspended). The continued validity and extension of these licences and agreements areconditioned upon the Group’s compliance with their terms, which generally include obligations for therestoration of the mined land, maintenance of a certain level of production, certain investmentcommitments and compliance with environmental laws. Generally speaking, the process forterminating a licence is complex, and involves provision of notice and a period of time to bring themine into compliance. Nonetheless, the Group’s failure to comply with any of these conditions couldresult in the suspension, amendment, termination or non-renewal of a mining licence or concession,
RISK FACTORS
— 43 —
which may have a material adverse effect on the Group’s business, financial condition and results ofoperations. The Group’s mines in Jamaica currently have a backlog of land requiring restoration. TheJamaican Government has not taken any action to date, as the Group has developed and coordinatedwith such government a phased mine reclamation plan in compliance with the licence terms; however,the Jamaican Government may choose to take action in the future requiring the Group to restore theland, resulting in significant capital expenditure (which would be permitted under the debtrestructuring agreements to the extent required for compliance with environmental laws).
Risks relating to the multijurisdictional regulatory, social, legal, tax and political environment inwhich the Group operates
Like other large multinational companies, the Group sells its products throughout the world andproduces them in many countries. The Group has production facilities in Russia, where most of itsfixed assets are located, Ireland, Jamaica, Ukraine, Italy, Sweden, Guinea, Guyana, Nigeria, Australia,Armenia, Kazakhstan and China. There are a number of risks associated with operating in some ofthese countries, including, but not limited to, those set forth below.
Political instability, changes in government or in economic policy and arbitrary government actionscould adversely affect the Group’s business and the value of investments in the Offer Shares
General. Some of the countries in which the Group’s production facilities are located haveexperienced, and continue to experience, a great deal of political and social instability. Changes ingovernment or in economic policy, unlawful, arbitrary or selective government action, officialcorruption or the occurrence of armed conflicts, territorial disputes, terrorist activities or social unrestcould disrupt the Group’s operations or increase the Group’s costs.
Russia. Political conditions in Russia were highly volatile in the 1990s, as the nationalgovernment sought to manage the difficult transition from a planned to a market economy andsurrendered authority to the regions, but the political situation has stabilised since 2000 under theprevious President, Mr. Vladimir Putin, and central authority has been restored. For example, the headof each sub-federal political unit (e.g., the governor of a region) is now nominated by the Presidentand confirmed by the legislature of the relevant unit.
The most recent State Duma elections held on 2 December 2007 resulted in a further increase inthe share of the aggregate vote received by United Russia and other political parties allied with thePresident, bringing that percentage to more than two thirds. The Russian presidential election was heldon 2 March 2008 and resulted in Mr. Dmitry Medvedev, Mr. Putin’s successor, being elected as thethird President of the Russian Federation. On 7 May 2008, Mr. Medvedev was inaugurated asPresident, and, on 8 May 2008, Mr. Putin became Prime Minister. Although the new President haspublicly announced that he will continue the former President’s policies, there can be no assurancethat significant changes in the economic and political environment will not occur. Shifts ingovernmental policy and regulation in Russia, which are less predictable than in many Westerncountries, could negatively affect the Russian economic and political environment in the near term.
In the international sphere, Russia has adopted a more assertive approach to the definition andpursuit of its interests. To some observers, Russia has appeared on several occasions to have usedeconomic leverage or control over oil and gas supply to achieve political objectives. If Russia wereto adopt restrictive economic measures against countries that are important to the Group’s business,or if trade between Russia and such countries were otherwise to be interrupted for political reasons,the Group’s business, financial condition and results of operations could be materially and adverselyaffected.
Over the past several years, Russia has been involved in conflicts, both economic and military,with other countries, including members of the Commonwealth of Independent States group ofcountries (“CIS”). On several occasions, this has resulted in the deterioration of Russia’s relations
RISK FACTORS
— 44 —

with other members of the international community, including the United States and various countriesin Europe. For example, a military conflict in August 2008 between Russia and Georgia involvingSouth Ossetia and Abkhazia has resulted in the deterioration of Russia’s relations with certain othercountries. The Russian stock exchanges experienced heightened volatility and significant overall pricedeclines following these events. The emergence of new or escalated tensions between Russia and othercountries, including any escalation of such conflicts, or the imposition of economic or other sanctionsin response to the tensions, could negatively affect economies in the region, including the Russianeconomy.
In the economic sphere, the use of governmental power against particular companies or persons,for example through tax, environmental or prosecutorial authorities, could adversely affect Russia’seconomic climate and, if directed against the Group’s companies, its substantial shareholders or itsbeneficial owners, it could also affect the Group’s business, financial condition and results ofoperations. Russian authorities have recently challenged some Russian companies and prosecuted theirexecutive officers and shareholders on tax evasion and related charges. In some cases, the results ofsuch prosecutions and challenges have been significant claims against companies for unpaid taxes andthe imposition of prison sentences on individuals. In the metals sector, public statements by theRussian Prime Minister in the summer of 2008 in relation to pricing techniques used by certainRussian steel companies caused a negative market reaction. Some observers have speculated that incertain cases these challenges and prosecutions were intended to punish, and deter, opposition to thegovernment or the pursuit of disfavoured political or economic agendas. Some observers have alsospeculated that certain environmental challenges brought by Russian authorities in the oil and gassector have been targeted at specific Russian businesses under non-Russian control, with a view tobringing them under state control. More generally, some observers have noted that takeovers in recentyears of major private sector companies in the oil and gas, metals and manufacturing sectors bystate-controlled companies following tax, environmental and other challenges may reflect a shift inofficial policy in favour of state control at the expense of individual or private ownership, at leastwhere large and important enterprises are concerned.
As is the case for all international companies, the Company has dealings with the governmentsof, and is affected by the laws and regulations of, the countries where it operates. In the case of Russia,this involves, in the ordinary course of business, interaction from time to time with the relevantRussian governmental, regulatory and other authorities, including such authorities in respect of tax,railways and electricity, among others. As one of the largest employers in Russia, the Group has alsomaintained periodic communications with senior Russian government officials, includingparticipation in industry-related government consultations on potential policy changes. During theglobal economic downturn in 2008, the Group experienced a liquidity shortage and (along with othereligible companies) was granted a loan by VEB of US$4.5 billion, a financial institution controlledby the Russian Government and used to support and develop the Russian economy. In addition, on 23December 2009, Sberbank, in which the Central Bank of Russia holds a 57.6% interest, entered intothe Sberbank Letter Agreement with the Company, stating an unconditional and irrevocablecommitment to the Company to assume all rights, claims and obligations under the VEB Debtfollowing a request from the Company, following which assumption the maturity date of the debtwould be extended to 7 December 2013. As consideration for such assumption by Sberbank, acommission is payable in cash to Sberbank by the Company (the Company being subject to a bestefforts obligation to pay such commission without breaching any of the Group’s obligations under theinternational override agreement) or, failing which, by the Major Shareholders. The Directors believethat the Group has maintained a good relationship with the Russian Government and the relevantRussian governmental, regulatory and other authorities, although the Group may from time to timeexercise its legal rights to challenge the decisions of such authorities, where the Group believes thatsuch action is appropriate.
RISK FACTORS
— 45 —

Nonetheless, and although the Company has sought to arrange its affairs in compliance with thelaw, including the tax laws, the Directors cannot exclude the possibility that, for the reasons describedabove, members of the Group may be charged with violations of law, such as tax evasion, that suchcharges may be upheld by a Russian court and that, as a result, the Group’s assets in Russia may besubject to forfeiture or effective nationalisation.
Ukraine. The political environment in Ukraine in recent years has been particularly unstable,with frequent changes of government. Private enterprises, including the Group’s businesses, can beaffected by these political changes. The Group acquired the Nikolaev alumina refinery in aprivatisation that was challenged in the past, and the Zaporozhye aluminium complex in a privatisationthat is currently being challenged (see “Business — Litigation — ZAlK”). Political change in Ukrainecould result in a revival or intensification of such challenges.
Nigeria. Over the past decade, Nigeria has suffered from political and social instability as rivalreligious, political and economic factions vied for power. Despite the election of a new president in2007, Nigeria has experienced continuing violence, in particular around the oil-rich Niger Deltaregion. Militants have targeted foreign economic interests, including a number of large multi-nationalcompanies operating in that area, frequently using tactics such as kidnappings and armed robbery. InJune 2007, militants attacked a residential community of the Group’s employees at ALSCON inNigeria, kidnapping six Group employees. These employees were released in October 2007. InDecember 2008, there was a further attack by a group of militants on a township of the Group’semployees and two employees were kidnapped. These employees were released in February 2009.There are also risks relating to the ALSCON privatisation, which has been the subject of litigation inthe past. In particular, legal proceedings were initiated in the United States in connection with tortiousinterference, unfair competition, and conspiracy to commit fraud in connection with suchprivatisation. These proceedings were conditionally dismissed on 23 March 2007. The claimant,however, retains the right to sue in Nigeria on the claims set forth in its original complaint. Inaccordance with this conditional dismissal, the defendant Group companies would be unable tochallenge the Nigerian court’s jurisdiction over the matter should the claimant proceeds to sue inNigeria. For further information concerning these proceedings, see “Business — Litigation — BFIG”.
Republic of Guinea. In 2006, pursuant to a transaction with the government of the Republic ofGuinea, the Group acquired the Friguia bauxite and alumina complex in Guinea. Subsequently, thegovernment of the Republic of Guinea has granted other mining companies tenure rights, overlappingwith the area under which the Group conducts mining operations at the Friguia bauxite mine. Inresponse, the Group is currently contemplating taking action to protect its rights. Further, in 2009, thegovernment of the Republic of Guinea initiated proceedings against Russky Aluminy Ltd., thesubsidiary of the Group incorporated in BVI (formerly Russkij Aluminij LLC, an entity incorporatedin Delaware, USA) that acquired the Friguia bauxite and alumina complex from the Republic ofGuinea, contending that the privatisation should be declared null and void, Friguia’s shares should betransferred back to the government of the Republic of Guinea, compensation in the amount of US$1.0billion should be paid to the government of the Republic of Guinea and that an expert should beappointed to determine the extent of the alleged loss suffered by the government of the Republic ofGuinea. In addition, the government of the Republic of Guinea recently issued two decrees that mayincrease the potential for expropriation of mining assets in the Republic of Guinea. For furtherinformation concerning this proceeding, see “Business — Litigation — Republic of Guinea”. Inaddition, the Republic of Guinea has been subject to political instability in the recent past.
Kazakhstan. In December 2008, UC RUSAL established a 50/50 joint venture withSamruk-Energo, a subsidiary of Samruk-Kazyna, a Kazakh state holding company, to jointly operateBogatyr, one of the world’s largest open-cast coal mines, and Severny mine, in the Ekibastuz coalbasin. The establishment of the joint venture provides the Group with a hedge against exposure toincreases in the tariffs charged by local independent electricity generators to the Group’s Urals-basedaluminium smelters. The Group’s investment in the joint venture is subject to specific risks relating
RISK FACTORS
— 46 —

to Kazakhstan. For example, the laws and regulations of Kazakhstan relating to foreign investment andsubsurface use, among others, are still developing, and uncertainties or changes in the law could havean adverse effect on the Group’s investment in the joint venture. With respect to laws governingsubsurface rights, Article 71 of the Kazakhstan Subsurface Law provides the Republic of Kazakhstanwith a pre-emption right in relation to the transfer of the Group’s subsurface use rights. The exactscope of this law is uncertain, and no precedent exists to indicate how it may be applied.
Weaknesses in the legal systems and legislation of some of the countries in which the Group operatescreate an uncertain environment for investment and business activity and could subject the Group tomaterial liabilities
Weaknesses in the legal systems and legislation of some of the countries in which the Groupoperates could create an uncertain environment for investment and for business activity. Many of thesecountries are still developing the legal framework required by a market economy. In many instancesfundamental laws have only recently become effective. The limited experience of members of thejudiciary and the difficulty of enforcing court decisions and governmental discretion in instigating,joining and enforcing claims could prevent the Group or its investors from obtaining effective redressin court proceedings, including in respect of expropriation or nationalisation.
The risks associated with the legal system of some of the countries in which the Group operatesinclude:
• the untested nature of the independence of the judiciary and its immunity from economic,political and nationalistic influences;
• the inconsistencies among laws, decrees and governmental and ministerial orders andresolutions;
• the lack of judicial or administrative guidance on interpreting the laws;
• a high degree of discretion on the part of the governmental authorities;
• conflicting local, regional and federal laws and regulations;
• the relative inexperience of judges and courts in interpreting new legal norms;
• the unpredictability of enforcement of judicial orders and arbitral awards;
• substantial gaps in the legal framework due to the delay or absence of implementingregulations for certain legislation;
• expropriation and nationalisation of the Group’s assets;
• alleged corruption within the judiciary and the governmental authorities; and
• bankruptcy procedures that are not well developed and are subject to abuse.
Any or all of these weaknesses could affect the Group’s ability to enforce its legal rights in therelevant jurisdiction, including rights under its contracts, or to defend against claims by others in suchjurisdiction.
RISK FACTORS
— 47 —

Uncertainties relating to the tax systems of some of the countries in which the Group operatescomplicate the Group’s tax planning and business decisions
The tax systems of some of the countries in which the Group operates are still evolving and, assuch, are often confusing and difficult to interpret and apply. For example, Russian tax laws,regulations and court practice are subject to frequent changes and varying interpretation andinconsistent and selective enforcement. In some instances, although it may be viewed as contrary toRussian constitutional law, the Russian tax authorities have applied certain new taxes retroactively,issued tax claims for periods for which the statute of limitations had expired and reviewed the sametax period multiple times. Furthermore, it is possible that the current interpretation of the law orunderstanding of practice may change or, indeed, that the law may be changed with retroactive effect.In practice, Russian tax authorities generally interpret the tax laws in ways that do not favourtaxpayers, who often have to resort to court proceedings to defend their position against the taxauthorities. Moreover, court decisions in one jurisdiction of Russia may provide little, if any,precedent for other jurisdictions.
Taxes payable by Russian mineral companies are substantial and include, inter alia, incometaxes, customs duties, excise duties, mineral extraction tax, value added tax, payroll related taxes,property taxes and other.
The Group’s Russian subsidiaries are subject to periodic tax inspections that may result in taxassessments and additional amounts being owed by such subsidiaries for prior tax periods. Generally,tax declarations of the Group’s Russian subsidiaries remain open and subject to inspection by taxand/or customs authorities for three calendar years immediately preceding the year in which thedecision to conduct an audit is taken. However, the fact that a particular year has been reviewed bytax authorities does not preclude that year from further review or audit during the eligible three-yearlimitation period by a superior tax authority. Although on 17 March 2009, the Constitutional Court ofthe Russian Federation issued a decision preventing the Russian tax authorities from carrying out asubsequent tax audit for the same tax period as an initial audit if the court decision which was takenin respect of the tax dispute between the relevant taxpayer and the relevant tax authority coveredtaxation matters raised during the initial tax audit has not been revised or discharged, currently, it isunclear how this decision will be applied and followed in practice by the Russian tax authorities. Inaddition, on 14 July 2005 the Russian Constitutional Court issued a decision allowing the statute oflimitations for tax liabilities to be extended beyond the three-year term set forth in the tax laws if acourt determines that the taxpayer has obstructed or hindered a tax inspection. Moreover, recentamendments to the first part of the Tax Code, effective 1 January 2007, provide for the extension ofthe three-year statute of limitations if the actions of the taxpayer created insurmountable obstacles forthe tax audit. Because none of the relevant terms is defined, tax authorities may have broad discretionto argue that a taxpayer has “obstructed”, “hindered” or “created insurmountable obstacles” in respectof an inspection and to ultimately seek review and possibly apply penalties beyond the three-yearterm, and there is no guarantee that the tax authorities will not review the Group’s compliance withapplicable tax law beyond the three-year limitation period. In addition to the Group’s substantial taxburden, these conditions complicate the Group’s tax planning and related business decisions.
It is possible for changes to be made to the results of a prior tax audit if a repeat tax audit takesplace. Repeat tax audits may be carried out by: 1) by the higher tax authorities monitoring theactivities of the tax authorities which have performed the tax audit; or 2) the tax authorities whocarried out the tax audit if a revised tax return for a lower amount of taxes is filed. Under the currenttax legislation of Russia the limitation period for a repeat tax audit is three years immediatelypreceding the year in which the decision to conduct a repeat tax audit is taken. Therefore, repeat taxaudits for the years 2006, 2007 and 2008 may be conducted by the Russian tax authorities in 2009.Tax audits for 2007 and 2008 were begun in March to May 2009 and have not yet been completed. Thisis in compliance with current Russian tax legislation which provides for a period for tax audit of upto six months, which period may be extended in the event of ‘suspension’, as provided by Russian tax
RISK FACTORS
— 48 —
law. Suspension may occur due to the following reasons: 1) collection of documents from thecounterparties; 2) collection of information from the foreign state authorities; 3) execution of expertexamination (for instance, examination of document authenticity); 4) translation of documents intoRussian. The above mentioned tax audits were suspended due to collection of documents fromcounterparties.
On 12 October 2006, the Plenum of the Supreme Arbitration Court of the Russian Federationissued Ruling No. 53 formulating the concept of “unjustified tax benefit”, which is described in theruling by reference to specific circumstances, such as absence of business purpose or transactionswhere the form does not match the substance, and which could lead to the disallowance of tax benefitsresulting the transaction or the recharacterisation of the transaction. There has been very little furtherguidance on the interpretation of this concept by the tax authorities or courts, but it is likely that thetax authorities will actively seek to apply this concept when challenging tax positions taken bytaxpayers in Russian courts. While the intention of this Ruling might have been to combat abuse oftax laws, in practice there is no assurance that the tax authorities will not seek to apply this conceptin a broader sense than may have been intended by the Supreme Arbitration Court.
Financial statements of Russian companies are not consolidated for tax purposes under Russianlaw. As a result, each entity in the Group pays its own Russian taxes and may not offset its profit orloss against the loss or profit of another entity in the Group, which may result in higher taxes for theGroup than if taxes were assessed on a consolidated basis. Intercompany dividends are subject to awithholding tax of 9%, if being distributed to Russian residents, subject to new provisions of the taxlaw described below, and 15%, if being distributed to non-Russian residents that are legal entities andorganisations as well as to individuals who are not Russian tax residents, subject to benefits underdouble tax treaties. With effect from January 2008, the dividend income of Russian entities is exemptfrom taxation in Russia provided that the parent company owns not less than 50% of the shares of thesubsidiary paying the dividends for a period of not less than 365 days as at the date the dividends aredeclared and provided that the consideration paid for the shares in the dividend paying companyexceeded 500 million Roubles. In the case of foreign subsidiaries, the above exemption applies onlyif the subsidiary’s jurisdiction of tax residency is not included in the list of offshore jurisdictionspublished by the Ministry of Finance of the Russian Federation. These tax requirements could imposeadditional tax burdens and costs on the Group’s operations, including management resources.
The Russian Government, in its “Major Trends in Tax Policy for 2009 and 2010-2011 PlanningPeriod”, has proposed the introduction of consolidated tax reporting to enable the consolidation of thefinancial results of Russian taxpayers which are part of one group for corporate income tax purposes.At this stage, it is impossible to predict whether, when or how such consolidated tax reportingprinciples will be enacted.
The Group operates in various jurisdictions and includes companies incorporated outside ofRussia. Russian tax laws do not provide for detailed rules on taxation of foreign companies in Russiaor operations of Russian companies abroad. It is possible that with the evolution of these rules orchanges in the approach of the Russian tax authorities, the Group might be subject to additionaltaxation in Russia in respect of its operations outside Russia.
Russian tax legislation in effect as of the date of this prospectus does not contain a concept ofcorporate tax residency (rather, the Russian domestic legislation recognises the concept of a taxpayer).Russian legal entities are taxed on their worldwide income whilst foreign legal entities are taxed inRussia on income attributable to their permanent establishment and on Russian source income,received by these foreign legal entities. The Russian Government, in its “Major Trends in Tax Policyin the Russian Federation for 2008-2010”, has proposed the introduction to the domestic tax law ofa concept of tax residency for legal entities. According to the proposals, a non-Russian entity wouldbe deemed a Russian tax resident based on the place of its effective management and control and/orbased on the residence of its shareholders. No assurance can be given as to whether and when these
RISK FACTORS
— 49 —
App1A-31

amendments will be enacted, their exact nature, their interpretation by the tax authorities and possibleimpact on the Group. The Group cannot rule out that, as a result of the introduction of these changesto the Russian tax legislation, certain Group companies might be deemed to be Russian tax residents,subject to all applicable Russian taxes.
The above uncertainty related to Russian tax laws exposes the Group to significant fines andpenalties and to enforcement measures, despite the Group’s best efforts at compliance, and couldresult in a greater than expected tax burden. The Group’s best estimate of the aggregate maximum ofadditional amounts that it is reasonably possible may become payable if its tax positions were notsustained at 30 June 2009 is US$516 million. See Note 34(a) to UC RUSAL’s Accountants’ Report.
It is likely that the tax legislation of some of the countries in which the Group operates willbecome more sophisticated in the future. The introduction of new tax provisions may affect the overalltax efficiency of the Group and may result in significant additional taxes becoming payable.Additional tax exposure could materially adversely affect the Group business, financial condition andresults of operations. In addition, the tax authorities of some of the countries in which the Groupoperates may be taking a more assertive position in their interpretation of legislation and assessments,and it is possible that transactions and activities that have not been challenged in the past may bechallenged. As a result, significant additional taxes, penalties and interest may be assessed.
The tax position of the Group is influenced by a number of agreements and rulings as betweenGroup companies and relevant local, federal and national tax authorities that may provide preferentialtax incentives to the Group. These agreements may include conditions that the particular Groupcompany must satisfy in order for the agreements to be effective, including but not limited tominimum production volumes/sales of aluminium and minimum staff headcount in that jurisdiction.If these conditions are not satisfied by the Group companies then the agreements could cease to applyand the Group’s tax position could be materially affected.
Given the cross-border nature of the Group’s business and corporate structure, the Group’s taxposition is dependant on a number of taxation treaties between national governments. The existenceand terms of these treaties are outside the control of the Group. Any termination or renegotiation ofthe terms of such treaties could have a material adverse impact on the tax position of the Group.
Legislation may not adequately protect against expropriation or nationalisation
Some of the countries in which the Group operates have enacted legislation to protect foreigninvestments and other property against expropriation and nationalisation without fair compensation,and the principles of international law are to similar effect. However, there is no assurance that suchprotections would be enforced. For information concerning a relevant legal proceeding in Guinea, see“Business — Litigation — Republic of Guinea”. While the Group maintains political risk insurancewith respect to its operations in Nigeria, it currently does not have political risk insurance with respectto its operations in Guinea, and expropriation or nationalisation of certain of the Group’s assets inthese and other jurisdictions could have a material adverse effect on the Group’s business, financialcondition and results of operations or on the value of the Offer Shares. In addition, expropriation ornationalisation of assets of a member of the Group could have adverse consequences under the termsof the Group’s debt restructuring agreements. See “Financial Information — Management’sDiscussion and Analysis of Financial Condition and Results of Operations — Liquidity and CapitalResources — Debt Restructuring — Events of Default”.
Risks Relating to the Global Offering and Offer Shares
The Shares have not previously been listed, and, prior to the Global Offering, there has been nopublic market for the Shares. The initial Offer Price range offered to the public for the Offer Sharesis the result of negotiations between the Company and the Joint Global Coordinators (on behalf of theUnderwriters). You should not view the Offer Price that the Company and the Joint Global
RISK FACTORS
— 50 —
Coordinators establish as any indication of the price that will prevail in the trading market. The marketprice for the Shares may decline below the Offer Price. The Company has applied to list and deal inthe Shares on the Hong Kong Stock Exchange. However, a listing on the Hong Kong Stock Exchangedoes not guarantee that an active and liquid trading market for the Shares will develop or be sustainedfollowing the Global Offering or in the future.
The sale or availability for sale of substantial amounts of the Shares or equity-related securitiescould adversely affect their trading prices
Sales of a substantial amount of the Shares, or securities exercisable into or exchangeable for theShares, if any, in the public market after the completion of the Global Offering, or the perception thatthese sales could occur, could adversely affect the market price of the Shares and could materiallyimpair the Group’s future ability to raise capital through offerings of the Shares or securities relatingto the Shares. In connection with the Global Offering, the Company and existing Shareholders andeach lender who receives Shares upon physical settlement of their fee warrants has agreed, amongother things, not to sell Shares for six months after the Listing Date without the prior written consentof the Joint Global Coordinators. However, the Joint Bookrunners may release these securities fromthese restrictions at any time. A number of events could result in distressed sales of Shares. In theevent that the currently pending implementation of the En+ debt restructuring is not concluded, En+creditors could foreclose on the En+ debt and seek to realize against assets of En+, including Sharesin the Company. In addition, En+ is expected to pledge 15% of the issued share capital of the Companyto the lenders of En+ in connection with En+’s debt restructuring arrangements, and additional sharesmay be required to be so pledged to meet loan to value tests. Further, 5% of the issued share capitalof the Company is expected to be pledged by En+, SUAL Partners, Glencore and Onexim on a pro ratabasis in connection with the restructuring of the Company’s obligations to VEB. Moreover, Sharesmay be sold in the event that there is a decision against Mr. Deripaska (or a settlement that has to befunded by Mr. Deripaska) in connection with the claim made against him by Mr. Cherney. See “—Risks Relating to the Group and its Business — A certain claim against the beneficial owner of En+could have a material adverse effect on the Company and/or the trading price of its Shares”. We cannotpredict what effect, if any, significant future sales will have on the market price of the Shares.
In addition, failure to meet certain debt repayment targets under the Group’s debt restructuringagreements would result in issuance of zero strike warrants that would have an immediate dilutiveeffect. See “Financial Information — Management’s Discussion and Analysis of Financial Conditionand Results of Operations — Liquidity and Capital Resources — Debt Restructuring — Terms ofInternational Debt Restructuring”. The sale of any Shares issued following exercise of these warrantscould also have an adverse effect on the trading price.
The minimum trading board lot size for the Shares, as imposed by the Securities and FuturesCommission, could affect the Shares’ liquidity, trading volume and trading price in the secondarymarket after Listing Date.
The SFC is imposing a condition to the listing and trading of the Shares on the Hong Kong StockExchange requiring that the minimum trading board lot size of the Shares at and after listing of theShares must be no less than the number of Shares that make up a minimum board lot trading value ofHK$200,000 based on the Offer Price, or such other number of Shares as the SFC may from time totime specify by notice in writing to the Hong Kong Stock Exchange and the Company in response toany proposed corporate action in connection with the share capital of the Company which will or isreasonably likely to materially reduce the value of a board lot of Shares. The minimum trading boardlot size of the Shares as at listing is large, relative to that of other shares traded on the Hong KongStock Exchange, and may increase in future. This minimum trading board lot trading value and theboard lot size specified by the SFC from time to time could adversely affect the liquidity, tradingvolume and trading price of the Shares in the secondary market after Listing Date. The Joint Global
RISK FACTORS
— 51 —

Coordinators are not obligated to make a market in the Shares and market making may be prohibitedunder or restricted by applicable law. Reduced liquidity may cause the trading price of the Shares tostay at a lower level than would otherwise develop. Details of the structure of the Global Offering areset out in “Structure of the Global Offering”.
The liquidity and market prices of the Shares following the Global Offering may be volatile
The price and trading volume of the Shares may be highly volatile. The market price of theShares may fluctuate substantially in response to, among others, the following factors:
• the Group’s debt restructuring and its ability to service and reduce its debt;
• fluctuations in the Group’s results of operations;
• changes in financial estimates by securities analysts;
• announcements of technological innovations by the Group or its competitors;
• investors’ perception of the Group and the international investment environment;
• changes in pricing made by the Group, its competitors or providers of alternative productsor services;
• the depth and liquidity of the market for the Shares; and
• general economic and other factors.
There is a risk of termination of the International Placing Agreement
The International Placing Agreement relating to the Global Offering can be terminated by theJoint Global Coordinators (on behalf of the Underwriters) up to (and including) the date of thesettlement-delivery of the offered securities in certain circumstances (see “Underwriting”). In the casewhere the International Placing Agreement are terminated in such a manner, all negotiations that havetaken place since the date of the first negotiation, regarding the Shares related to the Global Offering,would be retroactively cancelled, and each investor would be responsible for any damages or costsresulting from such a termination.
It may be difficult to serve process on and enforce legal judgments against the Company or itsdirectors
The Company is a holding company organised under the laws of Jersey with business operationsconducted through various subsidiaries. The Company will be registered as a non-Hong Kongcompany in Hong Kong under Part XI of the Companies Ordinance and will appoint an authorisedrepresentative to accept service on its behalf in Hong Kong. As a result, it will be possible for HongKong investors to effect service of process on the Company within Hong Kong.
The Directors reside outside Hong Kong in Russia, the United Kingdom, Switzerland and theUnited States of America. In these circumstances, Hong Kong investors will have to apply to the HighCourt in Hong Kong for leave to serve process outside Hong Kong. In the event that leave is granted,service may be effected in Russia, the United Kingdom, Switzerland and the United States in termsof the Convention on the Service Abroad of Judicial and Extrajudicial Documents in Civil orCommercial Matters to which the PRC on behalf of Hong Kong and the other states mentioned areparties.
Hong Kong has no bilateral reciprocal agreements or arrangements with any of Russia,Switzerland, the United Kingdom and the United States that provide for the recognition andenforcement of any judgments of the Hong Kong Courts. As a result, it may be difficult for Hong Konginvestors to enforce any judgments of the Hong Kong courts against the Company or its Directorsoutside Hong Kong.
RISK FACTORS
— 52 —
In preparation for the Global Offering, the Company has sought the following waivers from strictcompliance with the relevant provisions of the Listing Rules and the Companies Ordinance:
MANAGEMENT PRESENCE IN HONG KONG: RULE 8.12 REQUIREMENTS
Pursuant to Rule 8.12 of the Listing Rules, the Company must have sufficient managementpresence in Hong Kong. This normally means that at least two of the Company’s Executive Directorsmust be ordinarily resident in Hong Kong. The Group operates in 19 countries across five continents,the operation of the Group being managed from outside Hong Kong. The executive Directors of theCompany are based outside Hong Kong and the Group does not, and in the foreseeable future, will nothave any management presence in Hong Kong.
Accordingly, the Group has applied to the Hong Kong Stock Exchange for a waiver from strictcompliance with the requirements under Rule 8.12 of the Listing Rules. In order to maintain effectivecommunication with the Hong Kong Stock Exchange, the Company will put in place the followingmeasures in order to ensure that regular communication is maintained between the Hong Kong StockExchange and the Company:
(a) The Company has appointed two authorised representatives pursuant to Rule 3.05 of theListing Rules, who will act as the Company’s principal channel of communication with theStock Exchange and ensure that the Group complies with the Listing Rules at all times. Thetwo authorised representatives are Mr. Oleg Deripaska, an executive Director, and Wong PoYing, Aby, the Hong Kong Company Secretary. The Hong Kong Company Secretary isordinarily resident in Hong Kong. Each of the authorised representatives will be availableto meet with the Stock Exchange within a reasonable time frame upon the request of theStock Exchange and will be readily contactable by telephone, facsimile and email (ifapplicable). The Company will be registered as a non-Hong Kong company under theCompanies Ordinance. The Hong Kong Company Secretary will also be authorised toaccept service of legal process and notices in Hong Kong on behalf of the Company.
(b) Each of the authorised representatives has means to contact all members of the Board ofDirectors (including the independent non-executive Directors) and of the seniormanagement team promptly at all times as and when the Hong Kong Stock Exchange wishesto contact the directors for any matters. To enhance the communication between the HongKong Stock Exchange, the authorised representatives and the Directors, the Company willimplement a policy that (i) each executive Director, non-executive Director andindependent non-executive Director will provide their respective office phone numbers,mobile phone numbers, fax numbers and email addresses (if applicable) to the authorisedrepresentatives; and (ii) all the executive Directors, non-executive Directors andindependent non-executive Directors and authorised representatives will provide theiroffice phone numbers, mobile phone numbers, fax numbers and email addresses (ifapplicable) to the Hong Kong Stock Exchange.
(c) In addition, all Directors have confirmed that they possess valid travel documents to visitHong Kong for business purposes and would be able to come to Hong Kong and meet theStock Exchange within a reasonable period of time.
In compliance with Rule 3A.19 of the Listing Rules, the Group has appointed Somerley Limitedas compliance adviser to act as the alternate channel of communication with the Hong Kong StockExchange for the period commencing on the date of the initial listing of the shares of the Companyon the Main Board of the Hong Kong Stock Exchange and ending on the date on which the Companycomplies with Rule 13.46 in respect of its financial results for the first full financial year commencingafter the date of its initial listing.
WAIVERS FROM COMPLIANCE WITH THE LISTING RULES AND THECOMPANIES ORDINANCE
— 53 —
App1A-3

CONNECTED TRANSACTIONS
Members of the Group have entered into certain transactions which would constitute continuingconnected transactions of the Company under the Listing Rules following the completion of the GlobalOffering. The Company has received from the Hong Kong Stock Exchange a waiver from strictcompliance with the announcement and independent shareholders’ approval requirements set out inChapter 14A of the Listing Rules for such continuing connected transactions. Further details of suchcontinuing connected transactions and the waiver are set out in “Connected Transactions” in thisprospectus.
EXEMPTION AND WAIVER FROM CERTAIN REQUIREMENTS REGARDING PROPERTYVALUATION REPORT
We currently own about 336 parcels of land with an aggregate site area of approximately 39,900hectares and lease about 800 parcels of land with an aggregate site area of approximately 26,500hectares, and use in perpetuity about 90 parcels of land with an aggregate site area of approximately2,800 hectares, and such properties are located in Russia, Armenia, China, Guinea, Guyana, Ireland,Italy, Jamaica, Sweden and Ukraine. We currently also own 18,681 buildings and land improvementswith an aggregate gross floor area (“GFA”) of approximately 9,100,000 square meters, and thesebuildings are located in Russia, Armenia, China, Guinea, Guyana, Ireland, Italy, Jamaica, Nigeria,Sweden and Ukraine.
Owing to the substantial number of properties and buildings we own or lease, we have appliedto the SFC for an exemption and the Hong Kong Stock Exchange for a waiver from strict compliancewith certain of the valuation report requirements contained in paragraph 34 of Part II of the ThirdSchedule to the Hong Kong Companies Ordinance and Rules 5.01 and 5.06 and paragraph 3(a) ofPractice Note 16 of the Hong Kong Listing Rules, respectively, on the grounds that:
(a) it would be unduly burdensome to provide valuations for all of our properties and buildings;and
(b) for those properties and buildings which we procure a valuation, it would be undulyburdensome for us to reproduce the full valuation report in this prospectus.
The Directors confirm that (1) all properties owned or leased by the Group which are located inMainland China, and (2) all properties owned or leased by the Group, on which the facilities whichare the most important to the business of the Group have been built or are being built, and those whichare located in proximity to such facilities and which are necessary for their operation, as well as thosewhich are identified as being properties of significant size or importance, together with all buildingsconstructed on top of such properties (“Valuation Properties”), have been valued by AmericanAppraisal and such valuation is set out in a report prepared in full compliance with the requirementsof the Third Schedule of the Companies Ordinance and the Listing Rules. For the purpose ofidentifying properties falling within category (2), qualitative and quantitative metrics reflectingproduction capacity, revenue, operating or non-operating status, and the Group’s plans regardingfuture use, were applied on a non-cumulative basis to all distinct business units in the alumina andaluminium divisions of the Group, being a group essentially engaged in the production of primaryaluminium, in order to capture all potential higher production capacity and all lower cost highermargin operations. Valuation was then carried out on all properties owned or leased by such distinctbusiness units, and all core buildings and improvements, and certain specified additional buildings andimprovements, which are constructed on such properties.
WAIVERS FROM COMPLIANCE WITH THE LISTING RULES AND THECOMPANIES ORDINANCE
— 54 —
The exemption in respect of not undertaking a valuation of the other properties and buildingsowned or leased by the Group, and in respect of not reproducing in this prospectus the full valuationreport for the properties and buildings which are being valued, has been granted by the SFC undersection 342A(1) of the Hong Kong Companies Ordinance, and the corresponding waiver has beengranted by the Hong Kong Stock Exchange under the Listing Rules, subject to the followingconditions:
(a) a summary valuation report in respect of the Valuation Properties, which has been preparedon the basis of the full valuation report mentioned above, shall be set out in this prospectus— please refer to the summary valuation report which is reproduced as Appendix V to thisprospectus;
(b) the following information shall be set out in this prospectus — please refer to the summaryvaluation report which is reproduced as Appendix V to this prospectus:
(1) the detailed criteria for selecting properties to be excluded from valuation, a genericdescription of all properties and those which are excluded from valuation; and
(2) the aggregate number, book value by classification and percentage of consolidatedtotal assets of the Group represented by the book value of (i) the properties andbuildings owned and leased by the Group; (ii) the Valuation Properties; and (iii) theproperties and buildings owned and leased by the Group which have not been valued;
(c) a copy of the full valuation report in respect of the Valuation Properties in English onlyshall be made available for inspection — please refer to Appendix IX under the sectionheaded “Documents for Inspection”;
(d) this prospectus contains statements that the Directors have confirmed that:-
(1) the properties excluded from the portfolio of Valuation Properties individually andcollectively are not crucial to the Company’s operations;
(2) there has been no significant acquisition or disposal from the portfolio of theproperties of the Group since 30 June 2009; and
(e) particulars of the exemption and waiver as the case may be shall be disclosed in thisprospectus.
Excluded properties
Properties that do not fall under any of the following categories have been excluded from thevaluation:
(A) Properties in the PRC
Properties owned or leased (the “Properties”) by the Group in the PRC together with allbuildings and improvements thereon.
WAIVERS FROM COMPLIANCE WITH THE LISTING RULES AND THECOMPANIES ORDINANCE
— 55 —
(B) Properties with Crucial Facilities
Other Properties, on which the facilities which are the most important to its business have beenbuilt or are being built, and identified by using the following method:
(1) Identify Distinct Business Units
(A) Identify the divisions which are critical to the business of the Group as the producerof primary aluminum (Critical Divisions). These would be the Alumina Division andthe Aluminum Division, accounting for about 97% of Group revenue for the first sixmonths of 2009. The divisions which represent non-core business of the Group, i.e.downstream operations, generating only about 3% of Group revenue for the first sixmonths of 2009, are excluded.
(B) Identify all the distinct business operating units within such Critical Divisions of theGroup which are the most important in terms of production capacity, revenue,operating or non-operating status, and the Group’s plans regarding future use (DistinctBusiness Units). Such qualitative and quantitative metrics are applied on anon-cumulative basis in order to capture all potential higher production capacity andall lower cost higher margin operations. Upon testing aggregate production capacityand aggregate contribution to revenue, it was found that the 16 Distinct Business Unitsrepresented about 62% of alumina and about 90% of aluminum production capacity ofthe Group and that the revenue from the aluminum smelters operated by DistinctBusiness Units represented about 94% of total Group revenue.
(2) Identify all buildings and improvements located on the Properties of the Distinct BusinessUnits which are of the following nature (Core and Proximate Buildings and Improvements):
(A) for mines: (i) shafts and mine workings; (ii) collar houses; (iii) winder buildings; (iv)other buildings and improvements critical for production;
(B) for alumina refineries: (i) crushing and milling buildings; (ii) digestion buildings; (iii)red and white filtration buildings; (iv) evaporation buildings; (v) slag storages; (vi)chimney stacks; (vii) other buildings and improvements critical for production;
(C) for aluminium smelters: (i) pot rooms; (ii) foundry buildings; (iii) anode pasteproduction, anode baking and assembly production buildings; (iv) other buildings andimprovements critical for production; and
(D) for cryolite plants: (i) furnaces building; (ii) hydrofluoric acid production building;(iii) gas purification facilities; (iv) aluminum sulfate production building; (v) otherbuildings and improvements critical for production.
(3) Check the aggregate net book value of the Properties of all the Distinct Business Units andthe Core and Proximate Buildings and Improvements.
WAIVERS FROM COMPLIANCE WITH THE LISTING RULES AND THECOMPANIES ORDINANCE
— 56 —

(C) Other Significant and Important Properties
Other Properties, which were identified as being properties of significant size or importance,using the following method:
(1) Identify all buildings and improvements located on the Properties of the Distinct BusinessUnits which support the operations of the Core and Proximate Buildings and Improvementsand are of the following nature (Additional Buildings and Improvements):
(A) for mining operations: (i) administrative buildings; (ii) locker rooms; (iii) mechanicalshop building; (iv) warehouses; and (v) other significant buildings and improvements;
(B) for alumina refineries: (i) boiler houses; (ii) administrative buildings; (iii) buildingsfor storage of raw materials and final products; (iv) red mud ponds; (v) coolingtowers; (vi) stacks; (vii) other significant buildings and improvements;
(C) for aluminium smelters: (i) boiler houses; (ii) slag storages; (iii) transformersubstations; (iv) railways; (v) repair shop buildings; (vi) stacks; (vii) other significantbuildings and improvements; and
(D) for cryolite plants: (i) administrative buildings; (ii) slime storage; (iii) warehouses;(iv) final product storage; (v) other significant buildings and improvements.
(2) Check what is the aggregate net book value of the Additional Buildings and Improvements.Upon calculation it was found that such buildings and improvements accounted for another18% of the net book value of the Group’s real property, making a total of 68.2% of the netbook value of the Group’s real property under valuation after adding the PRC Propertiesand the Properties and the Core and Proximate Buildings and Improvements described inparagraph (B)(3) above.
Details and description of properties and buildings that have not been valued
Usage of properties and buildings
Aggregate net book value (Note)
Number ofproperties and
buildings(Note)(US$)
% of theconsolidated
total assets ofthe Group
Smelters . . . . . . . . . . . . . . . . . . . . . . . . . . . . . . . 441,173,511 1.96% 9,711
Refineries . . . . . . . . . . . . . . . . . . . . . . . . . . . . . . 194,744,702 0.86% 5,290
Other Production Facilities in Current Use . . . . . . . . 101,578,489 0.45% 497
Non-Core Downstream Operations . . . . . . . . . . . . . . 101,332,113 0.45% 391
Production Facilities in the PRC . . . . . . . . . . . . . . . 0 0.00% 0
Production Facilities in Indefinite Suspension . . . . . . 0 0.00% 1,593
TOTAL . . . . . . . . . . . . . . . . . . . . . . . . . . . . . . . . 838,828,815 3.72% 17,482
Note: Based on the Company’s IFRS unaudited data as of 30 September 2009
WAIVERS FROM COMPLIANCE WITH THE LISTING RULES AND THECOMPANIES ORDINANCE
— 57 —

Details and description of properties and buildings that have been valued
Usage of properties and buildings
Aggregate net book value (Note)
Number ofproperties and
buildings(Note)(US$)
% of theconsolidated
total assets ofthe Group
Smelters . . . . . . . . . . . . . . . . . . . . . . . . . . . . . . . 1,107,625,392 4.91% 833
Refineries . . . . . . . . . . . . . . . . . . . . . . . . . . . . . . 296,387,037 1.32% 587
Other Production Facilities in Current Use . . . . . . . . 0 0.00% 0
Non-Core Downstream Operations . . . . . . . . . . . . . . 0 0.00% 0
Production Facilities in the PRC . . . . . . . . . . . . . . . 4,662,109 0.02% 119
Production Facilities in Indefinite Suspension . . . . . . 0 0.00% 0
TOTAL . . . . . . . . . . . . . . . . . . . . . . . . . . . . . . . . 1,408,674,538 6.25% 1,535
Note: Based on the Company’s IFRS unaudited data as of 30 September 2009
Details and description of all properties and buildings of the Group
Usage of properties and buildings
Aggregate net book value (Note)
Number ofproperties and
buildings(Note)(US$)
% of theconsolidated
total assets ofthe Group
Smelters . . . . . . . . . . . . . . . . . . . . . . . . . . . . . . . 1,548,798,903 6.87% 10,542
Refineries . . . . . . . . . . . . . . . . . . . . . . . . . . . . . . 491,131,739 2.18% 5,875
Other Production Facilities in Current Use . . . . . . . . 101,856,940 0.45% 497
Non-Core Downstream Operations . . . . . . . . . . . . . . 101,332,113 0.45% 391
Production Facilities in the PRC . . . . . . . . . . . . . . . 4,662,109 0.02% 119
Production Facilities in Indefinite Suspension . . . . . . 0 0.00% 1,593
TOTAL . . . . . . . . . . . . . . . . . . . . . . . . . . . . . . . . 2,247,503,353 9.97% 19,017
Note: Based on the Company’s unaudited IFRS data as of 30 September 2009
The Directors are of the view that the excluded properties and buildings are individually andcollectively not crucial to the Company’s operations and their exclusion from the prospectus ofvaluation information will not prejudice the interests of the investing public and will not adversely andmaterially impact the ability of prospective investors to assess the operations, financial condition,results and business prospects of the Group. The Directors also confirm that there has been nosignificant acquisition or disposal from the portfolio of the properties of the Group since 30 June2009. The Company is not a property development company and the vast majority of the excludedproperties and buildings are in the nature of purpose-built industrial properties that have no alternativeuse and cannot be disposed off in a piecemeal manner. Such properties are largely located in remoteareas and have no development value. Excluded properties and buildings had an aggregate net bookvalue of approximately US$706 million as at 30 June 2009, or approximately 3.17% of consolidatedtotal assets of the Group, as stated in its audited accounts for the six months ended 30 June 2009, ofUS$22,219 million. On an individual basis, the highest net book value assigned to an excludedproperty or building was US$15 million or 0.067% of such consolidated total assets. Further detailswith respect to excluded properties and buildings may be found under the section entitled “Land andProperties” of this prospectus, including a summary description of use of such properties.
WAIVERS FROM COMPLIANCE WITH THE LISTING RULES AND THECOMPANIES ORDINANCE
— 58 —
PUBLIC FLOAT REQUIREMENTS
Rule 8.08(1)(a) of the Listing Rules requires that at least 25.0% of the issuer’s total issued sharecapital must at all times be held by the public. We have applied to the Hong Kong Stock Exchangeto request the Hong Kong Stock Exchange to exercise, and the Hong Kong Stock Exchange hasconfirmed that it will exercise, its discretion under the Listing Rules to accept a lower public floatpercentage of the Company of the higher of: (i) 10% of the Company’s Shares, and (ii) the percentageof public shareholding that equals HK$6 billion at the Listing Date, as the minimum percentage ofpublic float of the Company. The above discretion is subject to the condition that the Company willmake appropriate disclosure of the lower prescribed percentage of public float in this prospectus andconfirm sufficiency of the above-mentioned public float in its successive annual reports after thelisting.
In the event that the public float percentage falls below the minimum percentage prescribed bythe Stock Exchange, the Directors and the controlling shareholder will take appropriate steps whichinclude a further issue of equity and/or the substantial shareholders of the Company placing some oftheir Shares to independent third parties, to ensure the minimum percentage of public float prescribedby the Stock Exchange is complied with.
MINIMUM NUMBER OF SHAREHOLDERS REQUIREMENT
In view of the SFC requirements for the offer of Shares in Hong Kong to be by way of placingonly and the subscription price or purchase price payable by each investor as described underparagraph 2(c) of the SFC Conditions (as defined below) to be a minimum of HK$1 million, theCompany has applied to the Hong Kong Stock Exchange for a waiver from strict compliance with (a)the requirement under Listing Rule 8.08(2) that there should be at least 300 shareholders in the publictranche as at Listing Date, and (b) the requirement under paragraph 4 of Appendix 6 to the ListingRules that there must be not less than 3 shareholders for every HK$1,000,000 placed in the GlobalOffering, and the Stock Exchange has granted the waiver subject to (i) the SFC imposing as acondition to listing that the offer for subscription or purchase of the Offer Shares in Hong Kong willbe conducted by way of placing only; and (ii) that the Company would have a minimum of 100Shareholders upon listing.
CONFIRMATION OF JERSEY AS AN ACCEPTABLE JURISDICTION
On 7 March 2007, the Hong Kong Stock Exchange and the SFC published a Joint PolicyStatement Regarding the Listing of Overseas Companies (the “JPS”) aimed at facilitating the listingof overseas companies in Hong Kong. The JPS requires companies incorporated outside Hong Kongand other recognised jurisdictions seeking a primary listing on the Hong Kong Stock Exchange todemonstrate that they are subject to standards of shareholder protection at least equivalent to thoserequired under Hong Kong law. Rule 19.05(1)(b) of the Listing Rules provides that the Hong KongStock Exchange reserves the right, in its absolute discretion, to refuse a listing of securities of anoverseas issuer if the Hong Kong Stock Exchange is not satisfied that the overseas issuer isincorporated or otherwise established in a jurisdiction where the standards of shareholder protectionare at least equivalent to those provided in Hong Kong, and that the Hong Kong Stock Exchange maypermit a listing subject to the overseas issuer making such variations to its constitutive documents asthe Hong Kong Stock Exchange may require.
A summary of the Articles of Association of the Company is set out in Appendix VII of thisprospectus.
The Company applied for confirmation, and the Hong Kong Stock Exchange has confirmed, thatJersey, the jurisdiction in which the Company is incorporated, is acceptable as an approvedjurisdiction for the purpose of the listing of the Company.
WAIVERS FROM COMPLIANCE WITH THE LISTING RULES AND THECOMPANIES ORDINANCE
— 59 —
DIRECTORS’ RESPONSIBILITY FOR THE CONTENTS OF THIS PROSPECTUS
This prospectus includes particulars provided in compliance with the Hong Kong CompaniesOrdinance, the Securities and Futures (Stock Exchange Listing) Rules and the Listing Rules for thepurpose of giving information to the public with regard to the Group. The Directors collectively andindividually accept full responsibility for the accuracy of the information contained in this prospectus.The Directors confirm, to the best of their knowledge and belief, and having made all reasonableenquiries in this respect, that there are no other facts the omission of which would make any statementin this prospectus misleading.
INFORMATION ON THE GLOBAL OFFERING
The Offer Shares are offered or sold by way of placing solely on the basis of the informationcontained and representations made in this prospectus and on the terms and subject to the conditionsset out herein. No person is authorised to give any information in connection with the Global Offeringor to make any representation not contained in this prospectus, and any information or representationnot contained herein must not be relied upon as having been authorised by the Company, the JointSponsors, the Joint Bookrunners, the Underwriters, any of their respective directors, agents,employees or advisers or any other party involved in the Global Offering.
Pursuant to section 6(3)(b) of the Securities and Futures (Stock Market Listing) Rules, theSecurities and Futures Commission is imposing the following conditions (“SFC Conditions”) to thelisting of the Shares on the Hong Kong Stock Exchange:
1. The provisions of the Management, Supervision and Internal Control Guidelines (“ICG”)and the Code of Conduct for Persons Licensed by or Registered with the SFC (“Code”)apply to the placing of the Offer Shares and must be complied with by intermediariesplacing the Offer Shares in Hong Kong.
2. The offer for subscription or purchase of the Offer Shares in Hong Kong will be conductedby way of placing only. Where the Offer Shares are placed in Hong Kong, subscribers foror purchasers of the Offer Shares must be limited to:
(a) persons falling under paragraphs (a) to (i) of the definition of “professional investors”in Part 1 of Schedule 1 to the Securities and Futures Ordinance (where the provisionsspecified in paragraph 15.5 of the Code may be waived);
(b) persons falling under paragraph (j) of the definition of “professional investors” in Part1 of Schedule 1 to the Securities and Futures Ordinance (where the provisionsspecified in paragraph 15.5 of the Code may be waived in relation to a personprovided that the intermediary placing the Offer Shares in Hong Kong has, in respectof that person complied with paragraphs 15.3 and 15.4 of the Code); or
(c) other clients of an intermediary provided that the subscription price or purchase pricepayable by each client is a minimum of HK$1 million and the intermediary complieswith the requirements in respect of suitability set out in paragraph 5.2 of the Code.
3. The intermediaries placing the Offer Shares in Hong Kong confirm to the Joint Sponsorsand the Company that condition 2 above has been fulfilled in respect of Offer Shares placedby them.
4. The Joint Sponsors confirm in writing to the SFC and the Hong Kong Stock Exchange by1700 hours Hong Kong time on the business day immediately preceding the Listing Datethat condition 2 above has been fulfilled.
INFORMATION ABOUT THIS PROSPECTUS AND THE GLOBAL OFFERING
— 60 —
App1A-2Rule 11.12,11.07, 17.02(2)(d),19.08(1)

5. The trading board lot size of the Shares at and after listing of the Shares must be no lessthan the number of Shares that make up a minimum board lot trading value of HK$200,000based on the Offer Price, or such other number of Shares as the SFC may from time to timespecify by notice in writing to the Hong Kong Stock Exchange and the Company inresponse to any proposed corporate action in connection with the share capital of theCompany which will or is reasonably likely to materially reduce the value of a board lotof Shares.
6. The conditions being imposed by the SFC for not objecting to the listing are set out in fullin this prospectus.
Details of the structure of the Global Offering, including its conditions, are set out in the sectionheaded “Structure of the Global Offering”.
RESTRICTIONS ON OFFER AND SALE OF THE OFFER SHARES
No action has been taken to permit a public offering of the Offer Shares in Hong Kong or anyother jurisdiction, or the distribution of this prospectus in any jurisdiction other than Hong Kong.Accordingly, this prospectus may not be used for the purpose of, and does not constitute an offer orinvitation in any jurisdiction or in any circumstances in which such an offer or invitation is notauthorised or to any person to whom it is unlawful to make such an offer or invitation. The distributionof this prospectus and the offering and sale of the Offer Shares in other jurisdictions are subject torestrictions and may not be made except as permitted under the applicable securities laws of suchjurisdictions pursuant to registration with or authorisation by the relevant securities regulatoryauthorities or an exemption therefrom.
APPLICATION FOR LISTING OF THE SHARES ON THE HONG KONG STOCK EXCHANGE
We have applied to the listing committee of the Hong Kong Stock Exchange for the authorisationto list, and the permission to deal in, our Shares in issue, and for our Shares to be issued pursuant tothe Global Offering (including any Shares which may be issued pursuant to the exercise of theOver-allotment Option).
Aside from the concurrent listing of Global Depositary Shares on the Professional Segment ofEuronext Paris, no part of our Shares is listed on or dealt in on any other stock exchange and no suchlisting or permission to list is being or proposed to be sought in the near future.
REGISTER OF MEMBERS AND STAMP DUTY
The Company’s principal register of members will be maintained by our principal registrar, OgierCorporate Services (Jersey) Limited, in Jersey, and the Company’s Hong Kong register of memberswill be maintained by our Hong Kong Share Registrar, Computershare Hong Kong Investor ServicesLimited, in Hong Kong.
Dealings in our Shares registered on our Hong Kong Share Registrar will be subject to HongKong stamp duty. See the section entitled “D. Other Information — 7. Taxation of Holders of Shares— (a) Hong Kong” in “Appendix VIII — Statutory and General Information” to this prospectus.
PROFESSIONAL TAX ADVICE RECOMMENDED
Potential investors in the Global Offering are recommended to consult their professional advisersif they are in any doubt as to the taxation implications of subscribing for, purchasing, holding ordisposing of, and dealing in our Shares (or exercising rights attached to them). None of us, the Joint
INFORMATION ABOUT THIS PROSPECTUS AND THE GLOBAL OFFERING
— 61 —
App1A-14(1)
App1A-11
Global Coordinators, the Joint Sponsors, the Joint Bookrunners, the Underwriters, any of theirrespective directors or any other person or party involved in the Global Offering accepts responsibilityfor any tax effects on, or liabilities of, any person resulting from the subscription, purchase, holdingor disposal of, dealing in, or the exercise of any rights in relation to, the Offer Shares.
STRUCTURE OF THE GLOBAL OFFERING
You may find details of the structure of the Global Offering, including its conditions, in thesection entitled ‘‘Structure of the Global Offering’’ in this prospectus.
CURRENCY TRANSLATIONS
Unless otherwise specified, amounts denominated in US$ have been translated, for the purposeof illustration only, into Hong Kong dollars in this prospectus at the following rates:
HK$7.76: US$1.00
No representation is made that any amounts in US$ can be or could have been at the relevantdates converted at the above rates or any other rates or at all.
LANGUAGE
If there is any inconsistency between the names of any of the entities mentioned in thisprospectus which are not in the English language and their English translations, such foreign languagenames shall prevail and vice versa.
ROUNDING
Any discrepancies in any table between totals and sums of amounts listed therein are due torounding.
INFORMATION ABOUT THIS PROSPECTUS AND THE GLOBAL OFFERING
— 62 —
DIRECTORS
Name Residential Address Nationality
Executive Directors
Oleg Deripaska 64 Severnaya Street, OktyabrskyKhutor, Ust-Labinsk District,Krasnodar Territory, Russia
Russian
Petr Sinshinov 19 Bakhrushina Street,Building 2, apt. 12Moscow, Russia
Russian
Tatiana Soina 50 Gilyarovskogo St.,apt. 70, Moscow, Russia
Russian
Non-executive Directors
Victor Vekselberg (Chairman) 19 Bakhrushina St., Building 2,apt. 15, Moscow, Russia
Russian
Dmitry Afanasiev Tallinskaya Street, 8, apt. 34,St. Petersburg, Russia
Russian
Len Blavatnik 15B Kensington Palace Gardens,London W8 4QG U.K.
U.S.A.
Igor Ermilin(1) Bolshaya Gruzinskaya Str. 20Apt. 84, Moscow 123242, Russia
Russian
Ivan Glasenberg Gehrimoosweg 6, 8803Rüschlikon, Switzerland
Australian
Vladimir Kiryukhin Admiral Nakhimov Street,Building 14, apt. 25 Kuparvna,Zheleznodorozhny, Russia
Russian
Alexander Popov Novokosinskaya Str. 13,Building 2, apt. 49, Moscow111673 Russia
Russian
Dmitry Razumov Malaya Filevskaya 56/20Moscow 121433, Russia
Russian
Jivko Savov 37a St. John’s Wood Terrace,London NW8 6JL U.K.
U.K.
Vladislav Soloviev 3.1.1 Sormovskaya St. 109444Moscow, Russia
Russian
Anatoly Tikhonov Slavyanskiy Bulvar 9-1 apt. 180,121352, Moscow, Russia
Russian
DIRECTORS AND PARTIES INVOLVED IN THE GLOBAL OFFERING
— 63 —
App1A-413rd Sch-6
Name Residential Address Nationality
Independent Non-executive Directors
Barry Cheung Chun-yuen(1) Apartment 12C, Pearl Garden7 Conduit Road, Mid-LevelsHong Kong
Chinese
Peter Nigel Kenny Chemin Sous-Bois 7,1166 Perroy Vaud, Switzerland
U.K.
Philip Lader 151 Meeting StreetSuite 600CharlestonSC 29401, U.S.A.
U.S.A.
Elsie Leung Oi-sie Flat A, 4/F Hoover Mansion,16 Oaklands Path, Hong Kong
Chinese
Note:
(1) Appointment effective from the Listing Date.
PARTIES INVOLVED IN THE GLOBAL OFFERING
Joint Global Coordinators and Joint Sponsors BNP Paribas Capital (Asia Pacific) Limited59/F - 63/F, Two International Finance Centre8 Finance StreetCentralHong Kong
Credit Suisse (Hong Kong) Limited45/F Two Exchange Square8 Connaught PlaceCentralHong Kong
Joint Bookrunners BNP Paribas Capital (Asia Pacific) Limited59/F - 63/F, Two International Finance Centre8 Finance StreetCentralHong Kong
Credit Suisse (Hong Kong) Limited45/F Two Exchange Square8 Connaught Place CentralHong Kong
Merrill Lynch International2 King Edward StreetLondon EC1A 1HQUnited Kingdom
DIRECTORS AND PARTIES INVOLVED IN THE GLOBAL OFFERING
— 64 —
App1A-3
Merrill Lynch Far East Limited15/F Citibank Tower3 Garden RoadCentralHong Kong
BOCI Asia Limited26/F, Bank of China Tower1 Garden RoadCentralHong Kong
Nomura International plcNomura HouseOne St Martin’-le-GrandLondon EC1A 4NPUnited Kingdom
Renaissance Securities (Cyprus) LimitedArch. Makariou III2-4, Capital Center9th FloorNicosia, 1065Republic of Cyprus
Savings Bank of the Russian Federation19 Vavilova Street117997 MoscowRussia
VTB Capital plc14 CornhillLondon EC3V 3NDUnited Kingdom
Joint Lead Managers ABN AMRO Bank N.V. (London branch)250 BishopsgateLondon EC2M 4AAUnited Kingdom
CLSA Limited18/F, One Pacific Place88 QueenswayHong Kong
ING Bank N.V., London Branch60 London WallLondon EC2M 5TQUnited Kingdom
NATIXIS30 Avenue Pierre Mendès France75013 ParisFrance
DIRECTORS AND PARTIES INVOLVED IN THE GLOBAL OFFERING
— 65 —

Société Générale29, boulevard Haussmann75009 ParisFrance
CJSC “Investment Company “Troika Dialog”4, Romanov Pereulok125009 MoscowRussia
UniCredit CAIB Securities UK Ltd.Moor House120 London WallLondon EC2Y 5ETUnited Kingdom
Co-Lead Managers Liberum Capital LimitedCityPoint, 10th FloorOne Ropemaker StreetLondon EC2Y 9HTUnited Kingdom
Macquarie Capital Securities LimitedLevel 18, One International Finance Centre1 Harbour View StreetCentralHong Kong
Financial Adviser to the Company N M Rothschild & Sons (Hong Kong) Limited16th Floor, Alexandra House18 Chater RoadCentralHong Kong
Legal Advisers to the Company As to Hong Kong Law:Sidley AustinLevel 39, Two International Finance Centre8 Finance StreetCentral, Hong Kong
As to English, United States and French Law:Cleary Gottlieb Steen & Hamilton LLPCity Place House55 Basinghall StreetLondon EC2V 5EHUnited Kingdom
Cleary Gottlieb Steen & Hamilton LLP12, rue de Tilsitt75008 ParisFrance
DIRECTORS AND PARTIES INVOLVED IN THE GLOBAL OFFERING
— 66 —
App1A-3
As to Russian Law:Egorov, Puginsky, Afanasiev & Partners40 B.Ordynka Str., Bld. 4, suite 320Moscow 119017Russian Federation
As to English Law:Ashurst LLPBroadwalk House5 Appold StreetLondonEC2A 2HAUnited Kingdom
As to French Law:Bredin Prat130, rue du Faubourg Saint-Honoré75008 ParisFrance
As to Jersey Law:OgierWhiteley ChambersDon StreetSt Helier JE4 9WGJersey
As to PRC Law:Jun He Law OfficesShanghai Kerry Centre, 32nd Floor1515 Nanjing Road WestShanghai 200040China
As to Guinea Law:Cabinet D’ Avocats “BAO & Fils”Immeuble Alima3e EtageQuartier BoulbinetCommune de Kaloum1926 ConakryGuinea
As to Ukraine Law:Asters Law FirmLeonardo Business Center19-21 Bohdana Khmelnytskoho StreetKyiv 01030Ukraine
DIRECTORS AND PARTIES INVOLVED IN THE GLOBAL OFFERING
— 67 —
Legal Advisers to the Underwriters As to English, Hong Kong and United StatesLaws:Linklaters10th Floor, Alexandra HouseChater RoadHong Kong
As to Russian Law:Linklaters CISPaveletskaya Sq. 2 bld. 2Moscow 115054Russian Federation
As to French Law:Linklaters LLP25 rue de Marignan75008 ParisFrance
Joint Reporting Accountants ZAO KPMGMember of the Chamber of Auditors of RussiaNaberezhnaya Tower Complex, Block C10 Presnenskaya NaberezhnayaMoscow, 123317Russia
KPMGCertified Public Accountants8th Floor, Prince’s Building10 Chater Road, CentralHong Kong
Property Valuer American Appraisal China Limited1506 Dah Sing Financial Centre108 Gloucester Road, WanchaiHong Kong
Technical Advisers Hatch Associates Limited9th Floor, Portland HouseBressenden PlaceLondonSW1E 5BHUnited Kingdom
SRK Consulting (UK) Limited5th Floor, Churchill House17 Churchill WayCardiff, CF10 2HHUnited Kingdom
CRU Strategies Limited31 Mount PleasantLondonWC1X OADUnited Kingdom
DIRECTORS AND PARTIES INVOLVED IN THE GLOBAL OFFERING
— 68 —
App1A-3
App1A-43rdSch-183rdSch-43
Principal place of business Themistokli Dervi, 12Palais D’Ivoire HouseP.C. 1066, NicosiaCyprus
Registered office in Jersey Whiteley ChambersDon StreetSt Helier JE4 9WGJersey
Place of business in Hong Kongregistered under Part XI of theHong Kong Companies Ordinance
15th Floor, Entertainment Building30 Queen’s Road CentralHong Kong
Company’s Website www.rusal.com (information contained on this websitedoes not form part of this prospectus)
Jersey Company Secretary Ogier Corporate Services (Jersey) LimitedWhiteley ChambersDon StreetSt Helier JE4 9WGJersey
Hong Kong Company Secretary Wong Po Ying, Aby ACIS, ACS
Authorised Representatives Mr. Oleg Deripaska, Executive Director64 Severnaya Street, Oktyabrsky KhutorUst-Labinski DistrictKrasnodar TerritoryRussian Federation
Wong Po Ying, AbyFlat 7A, Block 26South HorizonsApleichauHong Kong
Audit Committee Dr. Nigel Kenny (Chairman)Mr. Philip LaderMs. Elsie LeungMr. Alexander PopovMr. Dmitry Razumov
Remuneration Committee Mr. Philip Lader (Chairman)Dr. Nigel KennyMr. Barry Cheung (with effect from the Listing Date)Mr. Len BlavatnikMr. Vladislav Soloviev
CORPORATE INFORMATION
— 69 —
App1A-29(2)
App1A-43
App1A-6App1A-43S.342(1)(a)(v)
App1A-42App1A-3

Corporate Governance andNominations Committee
Mr. Philip Lader (Chairman)Dr. Nigel KennyMr. Barry Cheung (with effect from the Listing Date)Mr. Ivan GlasenbergMr. Vladislav Soloviev
Jersey Principal Share Registrarand Transfer Office
Ogier Corporate Services (Jersey) LimitedWhiteley ChambersDon StreetSt Helier JE4 9WGJersey
Joint Reporting Accountants andJoint Auditors
ZAO KPMGNaberezhnaya Tower Complex, Block C10 Presnenskaya NaberezhnayaMoscow, 123317Russia
KPMG8th Floor, Prince’s Building10 Chater Road, CentralHong Kong
Hong Kong Share Registrar Computershare Hong Kong Investor Services LimitedShops 1712-171617th Floor, Hopewell Centre183 Queen’s Road EastWanchai, Hong Kong
Compliance Adviser Somerley Limited10th Floor, The Hong Kong Club Building3A Chater Road, CentralHong Kong
Principal Bankers Sumitomo Mitsui Banking Corporation99 Queen Victoria StreetLondonEC4V 4EHUnited Kingdom
ING Bank N.V.Bijlmerplein 888,AmsterdamThe Netherlands1102 MG
BBVA108 Cannon StreetLondon, EC4N 6EUUnited Kingdom
CORPORATE INFORMATION
— 70 —
App1A-3
App1A-4
App1A-3App1A-43
App1A-3

Société GénéraleSG CIBCAFI/NAT/CIS189, rue d’Aubervilliers75886 Paris Cedex 18France
Bayerische LandesbankBrinner Strasse 18D-80333 MunichGermany
CalyonBroadwalk House5 Appold StreetLondonEC2A 2DAUnited Kingdom
BNP Paribas (Suisse) SAPlace de Hollande 2CH-1211Geneva 11Switzerland
Unicredit GroupArabellastrasse 14D-81925 MunichGermany
Bank of Tokyo Mitsubishi UFJ, Ltd.12-15 Finsbury CircusLondon, EC2M 7BTUnited Kingdom
Natixis68/76 Quai de la Rapée75012 ParisFrance
CORPORATE INFORMATION
— 71 —
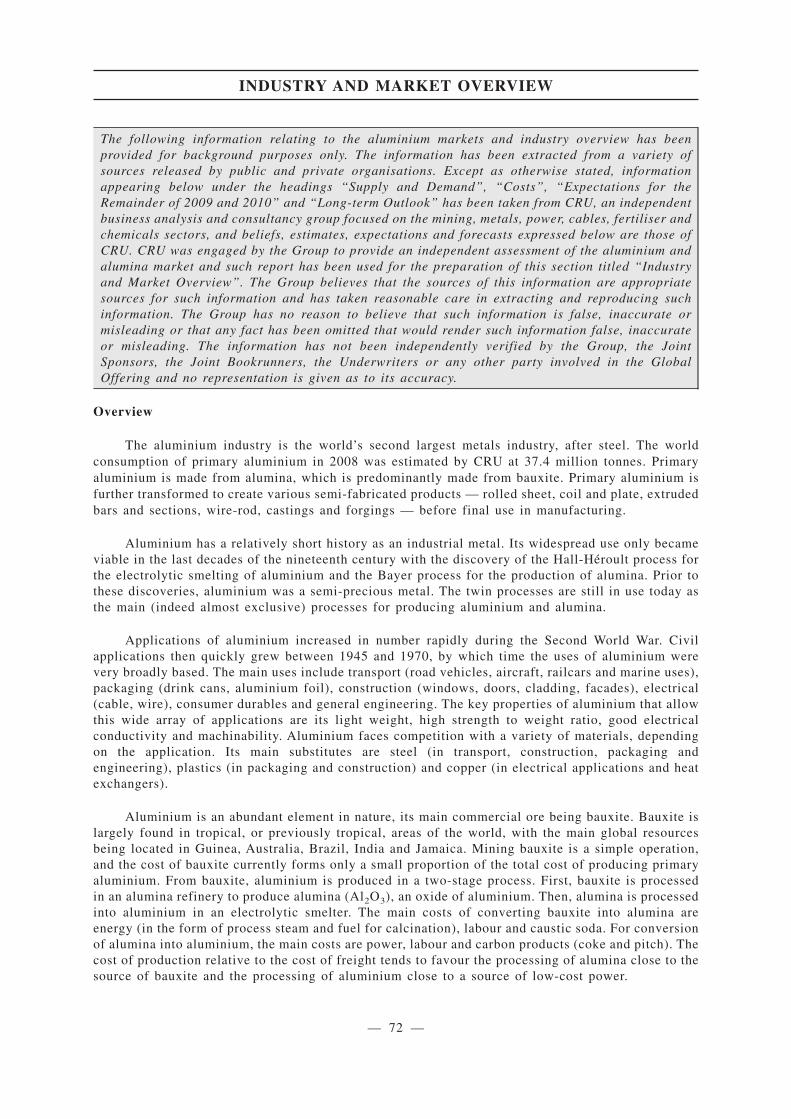
The following information relating to the aluminium markets and industry overview has beenprovided for background purposes only. The information has been extracted from a variety ofsources released by public and private organisations. Except as otherwise stated, informationappearing below under the headings “Supply and Demand”, “Costs”, “Expectations for theRemainder of 2009 and 2010” and “Long-term Outlook” has been taken from CRU, an independentbusiness analysis and consultancy group focused on the mining, metals, power, cables, fertiliser andchemicals sectors, and beliefs, estimates, expectations and forecasts expressed below are those ofCRU. CRU was engaged by the Group to provide an independent assessment of the aluminium andalumina market and such report has been used for the preparation of this section titled “Industryand Market Overview”. The Group believes that the sources of this information are appropriatesources for such information and has taken reasonable care in extracting and reproducing suchinformation. The Group has no reason to believe that such information is false, inaccurate ormisleading or that any fact has been omitted that would render such information false, inaccurateor misleading. The information has not been independently verified by the Group, the JointSponsors, the Joint Bookrunners, the Underwriters or any other party involved in the GlobalOffering and no representation is given as to its accuracy.
Overview
The aluminium industry is the world’s second largest metals industry, after steel. The worldconsumption of primary aluminium in 2008 was estimated by CRU at 37.4 million tonnes. Primaryaluminium is made from alumina, which is predominantly made from bauxite. Primary aluminium isfurther transformed to create various semi-fabricated products — rolled sheet, coil and plate, extrudedbars and sections, wire-rod, castings and forgings — before final use in manufacturing.
Aluminium has a relatively short history as an industrial metal. Its widespread use only becameviable in the last decades of the nineteenth century with the discovery of the Hall-Héroult process forthe electrolytic smelting of aluminium and the Bayer process for the production of alumina. Prior tothese discoveries, aluminium was a semi-precious metal. The twin processes are still in use today asthe main (indeed almost exclusive) processes for producing aluminium and alumina.
Applications of aluminium increased in number rapidly during the Second World War. Civilapplications then quickly grew between 1945 and 1970, by which time the uses of aluminium werevery broadly based. The main uses include transport (road vehicles, aircraft, railcars and marine uses),packaging (drink cans, aluminium foil), construction (windows, doors, cladding, facades), electrical(cable, wire), consumer durables and general engineering. The key properties of aluminium that allowthis wide array of applications are its light weight, high strength to weight ratio, good electricalconductivity and machinability. Aluminium faces competition with a variety of materials, dependingon the application. Its main substitutes are steel (in transport, construction, packaging andengineering), plastics (in packaging and construction) and copper (in electrical applications and heatexchangers).
Aluminium is an abundant element in nature, its main commercial ore being bauxite. Bauxite islargely found in tropical, or previously tropical, areas of the world, with the main global resourcesbeing located in Guinea, Australia, Brazil, India and Jamaica. Mining bauxite is a simple operation,and the cost of bauxite currently forms only a small proportion of the total cost of producing primaryaluminium. From bauxite, aluminium is produced in a two-stage process. First, bauxite is processedin an alumina refinery to produce alumina (Al2O3), an oxide of aluminium. Then, alumina is processedinto aluminium in an electrolytic smelter. The main costs of converting bauxite into alumina areenergy (in the form of process steam and fuel for calcination), labour and caustic soda. For conversionof alumina into aluminium, the main costs are power, labour and carbon products (coke and pitch). Thecost of production relative to the cost of freight tends to favour the processing of alumina close to thesource of bauxite and the processing of aluminium close to a source of low-cost power.
INDUSTRY AND MARKET OVERVIEW
— 72 —
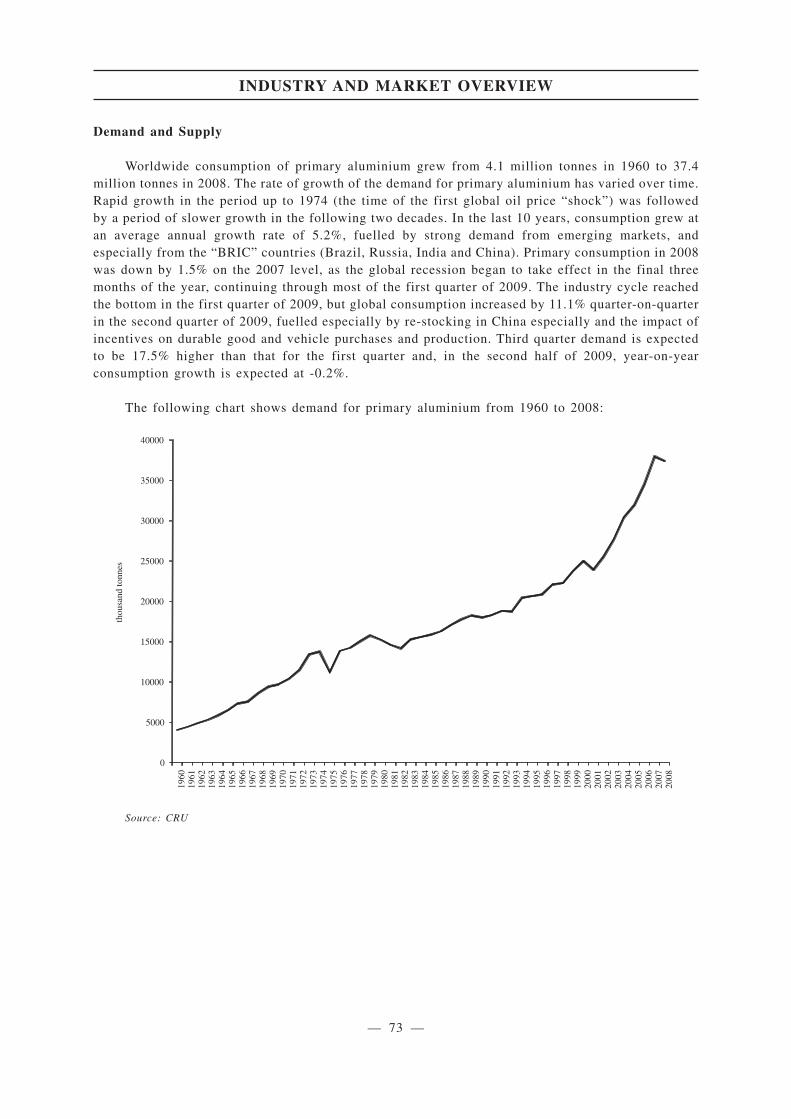
Demand and Supply
Worldwide consumption of primary aluminium grew from 4.1 million tonnes in 1960 to 37.4million tonnes in 2008. The rate of growth of the demand for primary aluminium has varied over time.Rapid growth in the period up to 1974 (the time of the first global oil price “shock”) was followedby a period of slower growth in the following two decades. In the last 10 years, consumption grew atan average annual growth rate of 5.2%, fuelled by strong demand from emerging markets, andespecially from the “BRIC” countries (Brazil, Russia, India and China). Primary consumption in 2008was down by 1.5% on the 2007 level, as the global recession began to take effect in the final threemonths of the year, continuing through most of the first quarter of 2009. The industry cycle reachedthe bottom in the first quarter of 2009, but global consumption increased by 11.1% quarter-on-quarterin the second quarter of 2009, fuelled especially by re-stocking in China especially and the impact ofincentives on durable good and vehicle purchases and production. Third quarter demand is expectedto be 17.5% higher than that for the first quarter and, in the second half of 2009, year-on-yearconsumption growth is expected at -0.2%.
The following chart shows demand for primary aluminium from 1960 to 2008:
0
5000
10000
15000
20000
25000
30000
35000
40000
1960
1961
1962
1963
1964
1965
1966
1967
1968
1969
1970
1971
1972
1973
1974
1975
1976
1977
1978
1979
1980
1981
1982
1983
1984
1985
1986
1987
1988
1989
1990
1991
1992
1993
1994
1995
1996
1997
1998
1999
2000
2001
2002
2003
2004
2005
2006
2007
2008
thou
sand
tonn
es
Source: CRU
INDUSTRY AND MARKET OVERVIEW
— 73 —
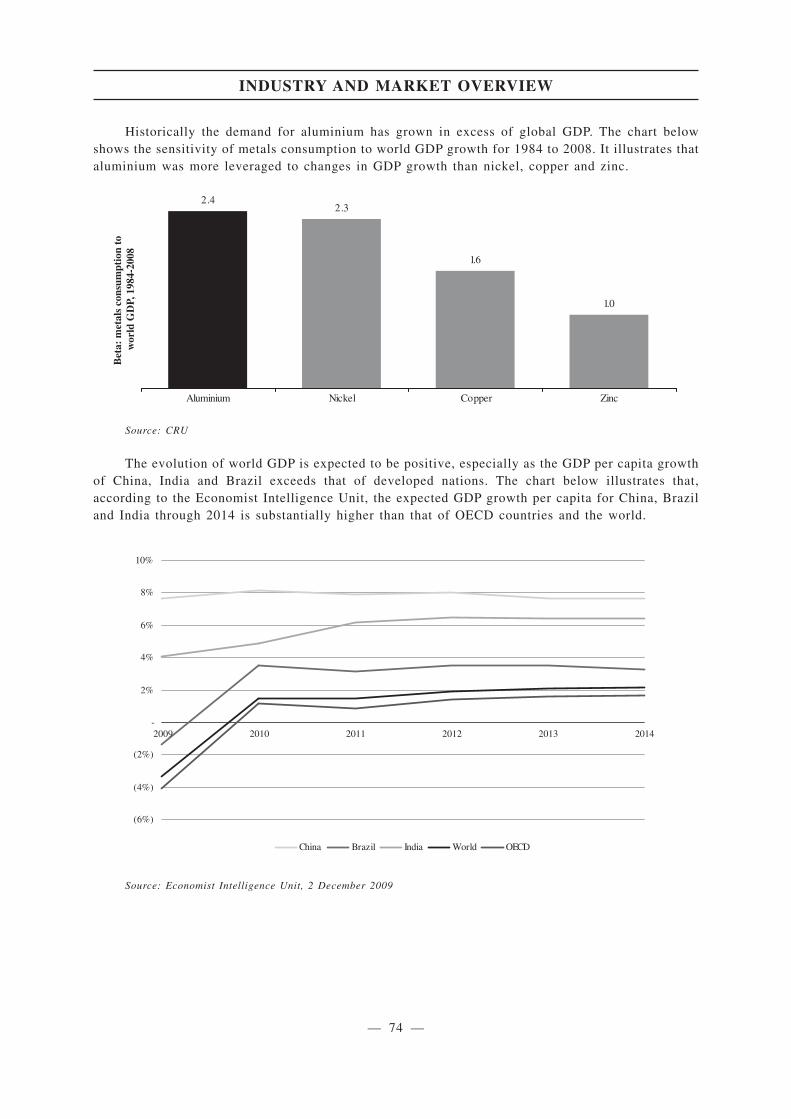
Historically the demand for aluminium has grown in excess of global GDP. The chart belowshows the sensitivity of metals consumption to world GDP growth for 1984 to 2008. It illustrates thataluminium was more leveraged to changes in GDP growth than nickel, copper and zinc.
2.42.3
1.6
1.0
cniZreppoClekciNmuinimulA
Bet
a: m
etal
s co
nsum
ptio
n to
w
orld
GD
P, 1
984-
2008
Source: CRU
The evolution of world GDP is expected to be positive, especially as the GDP per capita growthof China, India and Brazil exceeds that of developed nations. The chart below illustrates that,according to the Economist Intelligence Unit, the expected GDP growth per capita for China, Braziland India through 2014 is substantially higher than that of OECD countries and the world.
20142012 2013201120102009
China Brazil India World OECD
Source: Economist Intelligence Unit, 2 December 2009
INDUSTRY AND MARKET OVERVIEW
— 74 —

The chart below summarises the relation between per capita consumption of aluminium and GDPper capita in countries with different degrees of economic development. As illustrated in the chartbelow, countries with currently lower levels of GDP per capita (lower left circle) generally, on a percapita basis, consume lower levels of aluminium in comparison to countries with higher levels of GDPper capita (upper right circle). As the GDP per capita of countries in the lower left circle, such asChina, India and Brazil, increases, the amount of aluminium on a per capita basis they consume areexpected to increase toward the level shown by the countries in the upper right circle.
0
5
10
15
20
25
30
35
40
0 5000 10000 15000 20000 25000 30000 35000 40000 45000
USA
Turkey
Thailand
Taiwan
South Korea
Russia
Japan
Italy
India
Greece
Germany
FranceChina
kg p
er c
apit
a
Canada
Brazil
Austria
Australia
GDP per capita (PPP US$ 2000)
Source: CRU
Growth in aluminium consumption in 2009 has so far been concentrated in Asia, and in particularin China, which benefited from the strong performance of the automotive sector, combined withgovernment stimulus measures which have proved to be more effective and more immediate than manyprogrammes announced in developed countries. Car production in China grew by 90% year-on-year inAugust 2009, while investment in the real estate sector rose by 11.6% over the first seven months of2009. Demand for primary aluminium in China has recovered from the low point of early 2009, andCRU expects it to reach 13.4 million tonnes for the year, an increase of 6.2% over 2008.
Excluding China, global primary aluminium consumption is expected to grow through 2009.CRU expects the demand in the fourth quarter to be 18.7% higher than demand in the first quarter. Indeveloped markets, investor sentiment has benefited from a streak of improved economic data in someof the major countries. In the United States, there have been improvements in the housing market datafor prices, new starts and sales, while the “cash for clunkers” programme has reinvigorated theautomotive sector. Europe showed an improvement in economic sentiment following theannouncement that France and Germany were out of recession, thanks especially to the rebound in theautomotive sector. Unemployment has however still not started to decrease in the United States andEurope, creating uncertainty on the pace of the recovery.
Excluding China, there has been some evidence of improved demand in some of the Asianemerging economies during the second quarter of 2009 in particular, certainly on a quarter-on-quarterbasis. In India, which is expected to become an important country for aluminium consumption, CRUexpects growth in demand for primary aluminium to reach 11.8% in the second half of 2009.
INDUSTRY AND MARKET OVERVIEW
— 75 —
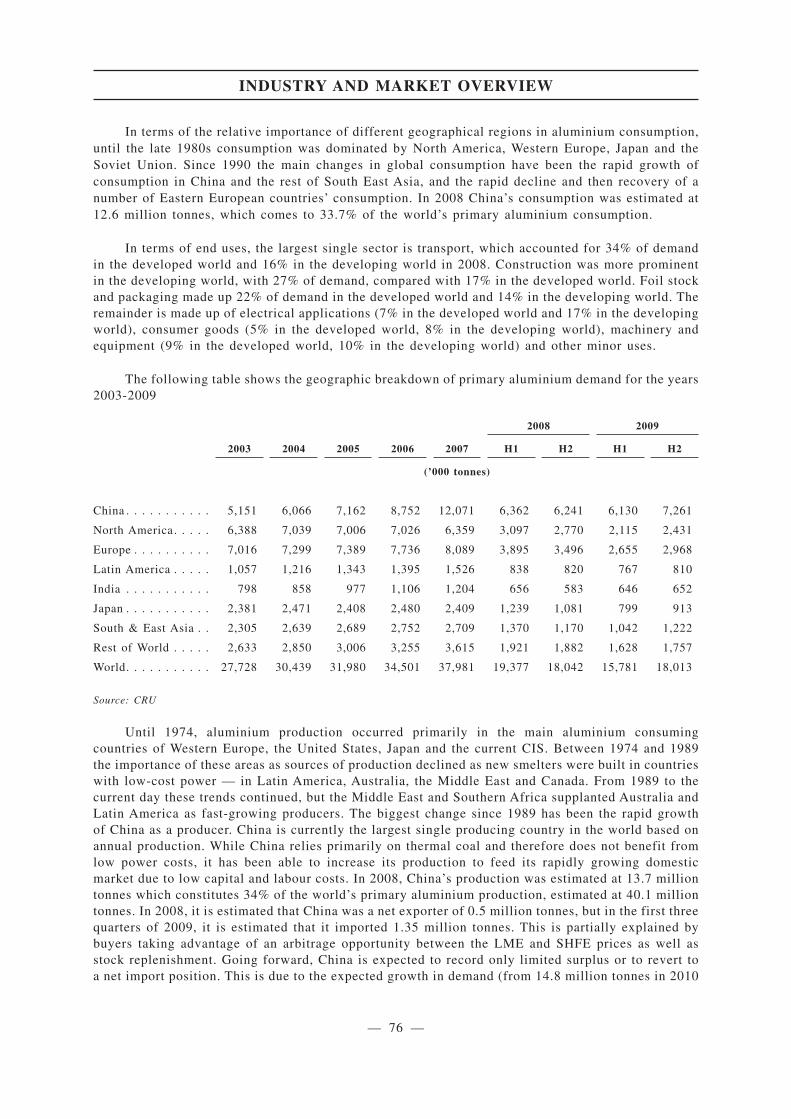
In terms of the relative importance of different geographical regions in aluminium consumption,until the late 1980s consumption was dominated by North America, Western Europe, Japan and theSoviet Union. Since 1990 the main changes in global consumption have been the rapid growth ofconsumption in China and the rest of South East Asia, and the rapid decline and then recovery of anumber of Eastern European countries’ consumption. In 2008 China’s consumption was estimated at12.6 million tonnes, which comes to 33.7% of the world’s primary aluminium consumption.
In terms of end uses, the largest single sector is transport, which accounted for 34% of demandin the developed world and 16% in the developing world in 2008. Construction was more prominentin the developing world, with 27% of demand, compared with 17% in the developed world. Foil stockand packaging made up 22% of demand in the developed world and 14% in the developing world. Theremainder is made up of electrical applications (7% in the developed world and 17% in the developingworld), consumer goods (5% in the developed world, 8% in the developing world), machinery andequipment (9% in the developed world, 10% in the developing world) and other minor uses.
The following table shows the geographic breakdown of primary aluminium demand for the years2003-2009
2003 2004 2005 2006 2007
2008 2009
H1 H2 H1 H2
(’000 tonnes)
China . . . . . . . . . . . 5,151 6,066 7,162 8,752 12,071 6,362 6,241 6,130 7,261
North America. . . . . 6,388 7,039 7,006 7,026 6,359 3,097 2,770 2,115 2,431
Europe . . . . . . . . . . 7,016 7,299 7,389 7,736 8,089 3,895 3,496 2,655 2,968
Latin America . . . . . 1,057 1,216 1,343 1,395 1,526 838 820 767 810
India . . . . . . . . . . . 798 858 977 1,106 1,204 656 583 646 652
Japan . . . . . . . . . . . 2,381 2,471 2,408 2,480 2,409 1,239 1,081 799 913
South & East Asia . . 2,305 2,639 2,689 2,752 2,709 1,370 1,170 1,042 1,222
Rest of World . . . . . 2,633 2,850 3,006 3,255 3,615 1,921 1,882 1,628 1,757
World. . . . . . . . . . . 27,728 30,439 31,980 34,501 37,981 19,377 18,042 15,781 18,013
Source: CRU
Until 1974, aluminium production occurred primarily in the main aluminium consumingcountries of Western Europe, the United States, Japan and the current CIS. Between 1974 and 1989the importance of these areas as sources of production declined as new smelters were built in countrieswith low-cost power — in Latin America, Australia, the Middle East and Canada. From 1989 to thecurrent day these trends continued, but the Middle East and Southern Africa supplanted Australia andLatin America as fast-growing producers. The biggest change since 1989 has been the rapid growthof China as a producer. China is currently the largest single producing country in the world based onannual production. While China relies primarily on thermal coal and therefore does not benefit fromlow power costs, it has been able to increase its production to feed its rapidly growing domesticmarket due to low capital and labour costs. In 2008, China’s production was estimated at 13.7 milliontonnes which constitutes 34% of the world’s primary aluminium production, estimated at 40.1 milliontonnes. In 2008, it is estimated that China was a net exporter of 0.5 million tonnes, but in the first threequarters of 2009, it is estimated that it imported 1.35 million tonnes. This is partially explained bybuyers taking advantage of an arbitrage opportunity between the LME and SHFE prices as well asstock replenishment. Going forward, China is expected to record only limited surplus or to revert toa net import position. This is due to the expected growth in demand (from 14.8 million tonnes in 2010
INDUSTRY AND MARKET OVERVIEW
— 76 —

to 18.5 million tonnes in 2012 according to CRU) and the high cost of thermal coal which localsmelters predominantly use. CRU estimated that the average power tariffs paid by Chinese aluminiumsmelters in 2008 were US$52 per MWh, compared to a world average of US$38 per MWh (the Group’saverage power tariff in 2008 was US$24 per MWh). Depleting domestic bauxite resources in Chinaare not expected to be a constraint upon aluminium production before 2012, but in the longer termCRU expects a greater proportion of bauxite or alumina to be imported by China.
In the context of the sharp reduction in demand that took place in the last quarter of 2008 andthe first quarter of 2009, aluminium and alumina producers have reacted by mothballing and idlingcapacity. It is estimated that by the end of June 2009, 9.2 million tonnes of existing primary aluminiumcapacity and 17.4 million tonnes of existing alumina refining capacity were idled. In previous downcycles where significant cutbacks occurred, a price increase generally followed in the following year.In 1974-75, 30% cutbacks were implemented at all major producers, and prices rose by 26% in 1975,whereas an organised curtailment through a memorandum of understanding in 1992-93 led to a priceincrease of 58% in 1994-95. However, in 1981-82, cutbacks occurred only at high cost plants, whichled to increasing deliveries into LME warehouses and prices were only 5% higher as late as 1985. Inthis cycle, currently idled capacity stands at 8.6 million tonnes per year (“tpy”) as of the fourth quarterof 2009, following restarts in China. Around 5.5 million tpy of capacity are expected to bepermanently mothballed in the medium term, for reasons including the closure of low amperage cellsin China, the inability to secure acceptable power tariffs and substitution by more competitive newgreenfield and brownfield expansions both in China and places such as the Middle East and/or India.
The following table shows a geographic breakdown of aluminium production, capacity andcapacity utilisation for the years 2003-2009:
Production 2003 2004 2005 2006 2007 2008 2009(1)
(’000 tonnes)
China . . . . . . . . . . . . . . . . . . . . . . . . 5,517 6,646 7,812 9,324 12,574 13,695 13,377
North America . . . . . . . . . . . . . . . . . . 5,495 5,110 5,382 5,333 5,642 5,782 4,739
Europe . . . . . . . . . . . . . . . . . . . . . . . 4,416 4,651 4,712 4,543 4,654 4,975 3,908
Latin America. . . . . . . . . . . . . . . . . . . 2,276 2,357 2,391 2,494 2,556 2,660 2,518
Middle East & Africa . . . . . . . . . . . . . 2,756 3,196 3,503 3,781 3,843 3,829 4,197
Rest of world . . . . . . . . . . . . . . . . . . . 7,557 7,922 8,169 8,438 8,848 9,190 8,724
World . . . . . . . . . . . . . . . . . . . . . . . . 28,017 29,883 31,970 33,913 38,117 40,131 37,462
Capacity 2003 2004 2005 2006 2007 2008 2009(2)
(’000 tonnes)
China . . . . . . . . . . . . . . . . . . . . . . . . 6,633 8,889 10,286 11,504 13,975 16,672 19,634
North America . . . . . . . . . . . . . . . . . . 6,982 6,507 6,734 6,733 6,684 6,756 6,757
Europe. . . . . . . . . . . . . . . . . . . . . . . . 4,538 4,733 4,834 4,902 4,912 5,260 5,319
Latin America. . . . . . . . . . . . . . . . . . . 2,390 2,388 2,425 2,529 2,604 2,757 2,777
Middle East & Africa . . . . . . . . . . . . . 3,078 3,525 3,852 4,050 4,196 4,378 4,795
Rest of world . . . . . . . . . . . . . . . . . . . 7,841 8,217 8,437 8,694 9,035 9,517 9,983
World . . . . . . . . . . . . . . . . . . . . . . . . 31,462 34,258 36,568 38,412 41,405 45,339 49,265
INDUSTRY AND MARKET OVERVIEW
— 77 —
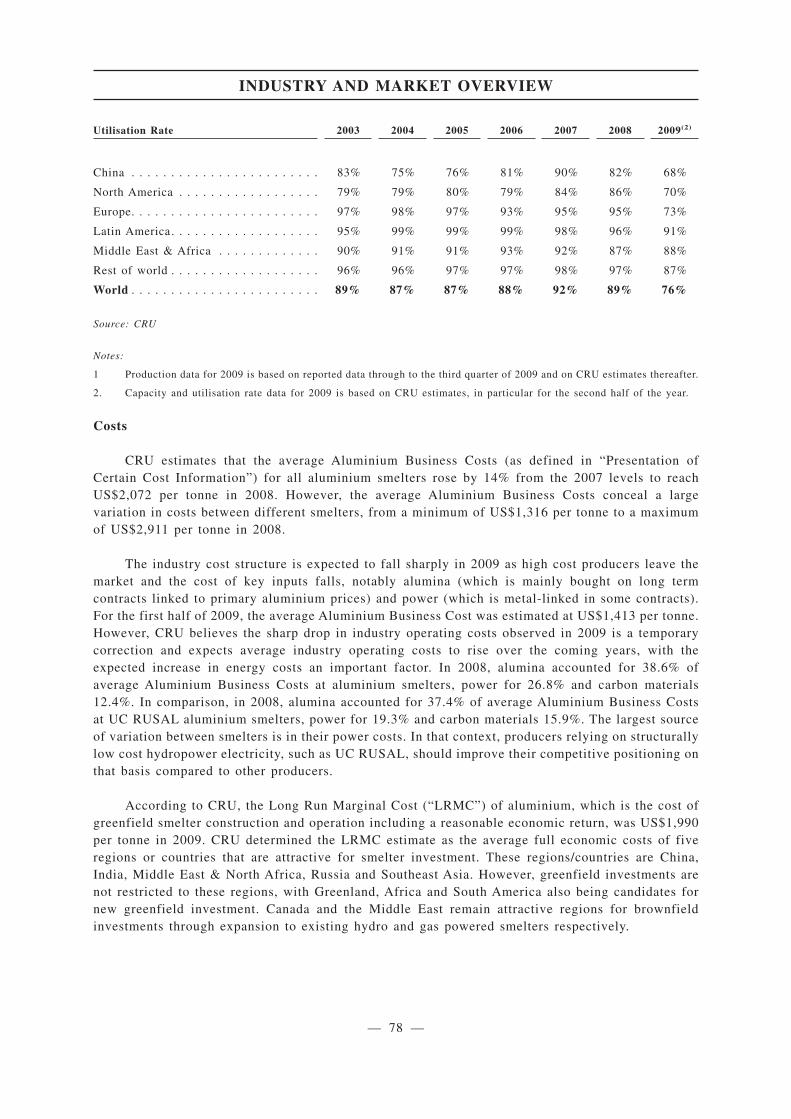
Utilisation Rate 2003 2004 2005 2006 2007 2008 2009(2)
China . . . . . . . . . . . . . . . . . . . . . . . . 83% 75% 76% 81% 90% 82% 68%
North America . . . . . . . . . . . . . . . . . . 79% 79% 80% 79% 84% 86% 70%
Europe. . . . . . . . . . . . . . . . . . . . . . . . 97% 98% 97% 93% 95% 95% 73%
Latin America. . . . . . . . . . . . . . . . . . . 95% 99% 99% 99% 98% 96% 91%
Middle East & Africa . . . . . . . . . . . . . 90% 91% 91% 93% 92% 87% 88%
Rest of world . . . . . . . . . . . . . . . . . . . 96% 96% 97% 97% 98% 97% 87%
World . . . . . . . . . . . . . . . . . . . . . . . . 89% 87% 87% 88% 92% 89% 76%
Source: CRU
Notes:
1 Production data for 2009 is based on reported data through to the third quarter of 2009 and on CRU estimates thereafter.
2. Capacity and utilisation rate data for 2009 is based on CRU estimates, in particular for the second half of the year.
Costs
CRU estimates that the average Aluminium Business Costs (as defined in “Presentation ofCertain Cost Information”) for all aluminium smelters rose by 14% from the 2007 levels to reachUS$2,072 per tonne in 2008. However, the average Aluminium Business Costs conceal a largevariation in costs between different smelters, from a minimum of US$1,316 per tonne to a maximumof US$2,911 per tonne in 2008.
The industry cost structure is expected to fall sharply in 2009 as high cost producers leave themarket and the cost of key inputs falls, notably alumina (which is mainly bought on long termcontracts linked to primary aluminium prices) and power (which is metal-linked in some contracts).For the first half of 2009, the average Aluminium Business Cost was estimated at US$1,413 per tonne.However, CRU believes the sharp drop in industry operating costs observed in 2009 is a temporarycorrection and expects average industry operating costs to rise over the coming years, with theexpected increase in energy costs an important factor. In 2008, alumina accounted for 38.6% ofaverage Aluminium Business Costs at aluminium smelters, power for 26.8% and carbon materials12.4%. In comparison, in 2008, alumina accounted for 37.4% of average Aluminium Business Costsat UC RUSAL aluminium smelters, power for 19.3% and carbon materials 15.9%. The largest sourceof variation between smelters is in their power costs. In that context, producers relying on structurallylow cost hydropower electricity, such as UC RUSAL, should improve their competitive positioning onthat basis compared to other producers.
According to CRU, the Long Run Marginal Cost (“LRMC”) of aluminium, which is the cost ofgreenfield smelter construction and operation including a reasonable economic return, was US$1,990per tonne in 2009. CRU determined the LRMC estimate as the average full economic costs of fiveregions or countries that are attractive for smelter investment. These regions/countries are China,India, Middle East & North Africa, Russia and Southeast Asia. However, greenfield investments arenot restricted to these regions, with Greenland, Africa and South America also being candidates fornew greenfield investment. Canada and the Middle East remain attractive regions for brownfieldinvestments through expansion to existing hydro and gas powered smelters respectively.
INDUSTRY AND MARKET OVERVIEW
— 78 —
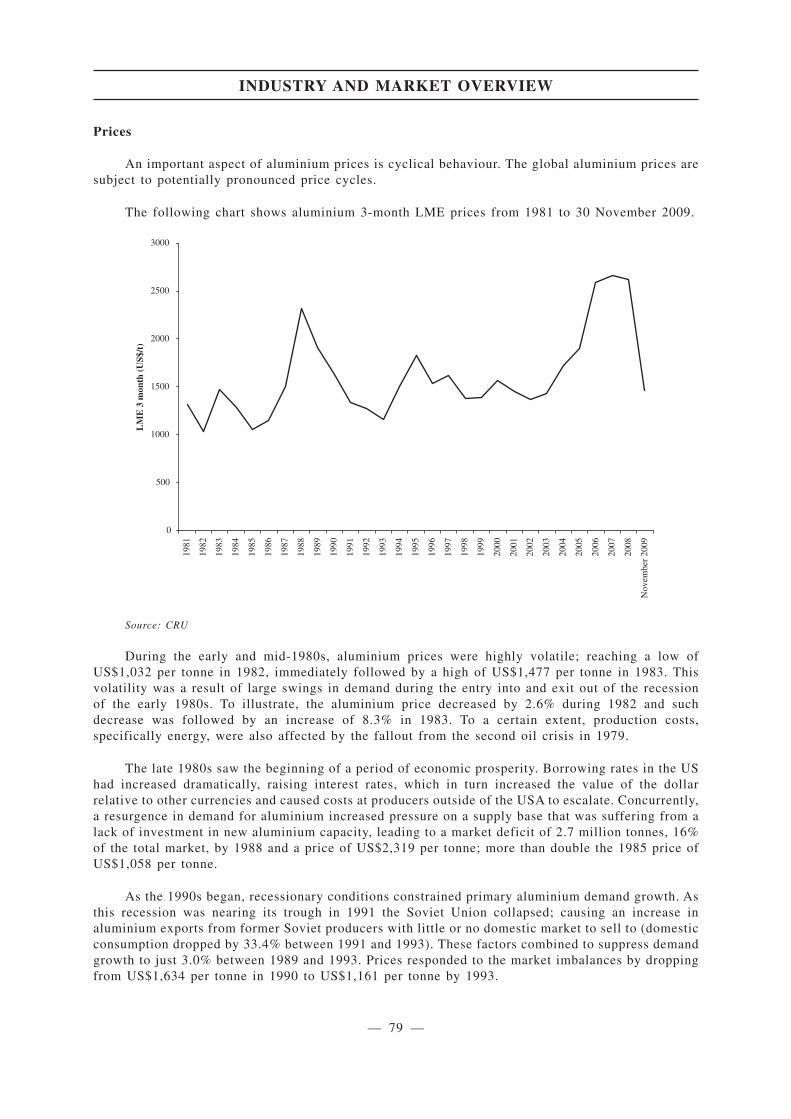
Prices
An important aspect of aluminium prices is cyclical behaviour. The global aluminium prices aresubject to potentially pronounced price cycles.
The following chart shows aluminium 3-month LME prices from 1981 to 30 November 2009.
0
500
1000
1500
2000
2500
3000
Nov
embe
r20
09
LM
E3
mon
th(U
S$/t
)
1981
1982
1983
1984
1985
1986
1987
1988
1989
1990
1991
1992
1993
1994
1995
1996
1997
1998
1999
2000
2001
2002
2003
2004
2005
2006
2007
2008
Source: CRU
During the early and mid-1980s, aluminium prices were highly volatile; reaching a low ofUS$1,032 per tonne in 1982, immediately followed by a high of US$1,477 per tonne in 1983. Thisvolatility was a result of large swings in demand during the entry into and exit out of the recessionof the early 1980s. To illustrate, the aluminium price decreased by 2.6% during 1982 and suchdecrease was followed by an increase of 8.3% in 1983. To a certain extent, production costs,specifically energy, were also affected by the fallout from the second oil crisis in 1979.
The late 1980s saw the beginning of a period of economic prosperity. Borrowing rates in the UShad increased dramatically, raising interest rates, which in turn increased the value of the dollarrelative to other currencies and caused costs at producers outside of the USA to escalate. Concurrently,a resurgence in demand for aluminium increased pressure on a supply base that was suffering from alack of investment in new aluminium capacity, leading to a market deficit of 2.7 million tonnes, 16%of the total market, by 1988 and a price of US$2,319 per tonne; more than double the 1985 price ofUS$1,058 per tonne.
As the 1990s began, recessionary conditions constrained primary aluminium demand growth. Asthis recession was nearing its trough in 1991 the Soviet Union collapsed; causing an increase inaluminium exports from former Soviet producers with little or no domestic market to sell to (domesticconsumption dropped by 33.4% between 1991 and 1993). These factors combined to suppress demandgrowth to just 3.0% between 1989 and 1993. Prices responded to the market imbalances by droppingfrom US$1,634 per tonne in 1990 to US$1,161 per tonne by 1993.
INDUSTRY AND MARKET OVERVIEW
— 79 —
A short-term recovery was seen in 1994 and 1995, a result of a production decrease of 3.1% from1993 to 1994, and subsequent inventory drawdown as demand grew by 9.0% over the same period. Thepeak price of US$1,832 per tonne in 1995 was a result of speculative investment from funds, supportedby agreements to limit shipments of ex-Soviet aluminium to the West. End-users increased inventoriesto protect against further price rises, thereby adding further price support.
In 1996, destocking of the inventories built up over the previous two years caused prices to dropagain; falling from US$1,832 per tonne in 1995 to $1,535 per tonne by 1996. A minor recovery wasseen in 1997, to US$1,618 per tonne; however, this was immediately followed by the Asian financialcrisis, which caused a sharp drop in Asian purchasing and had a knock-on effect elsewhere, reducingprices to US$1,379 per tonne by 1998. By 1998 the bottom of the mini-cycle had been reached andprices firmed, led by increased consumer demand from Asia and elsewhere, totalling a 12.1% demandincrease by 2000. This rise continued until 2001 when the end of the dot com boom caused a smallUS-led recession; and demand decreased by 4.5%.
During the period from 1981 to 2004, the nominal 3-month LME prices averaged US$1,468 pertonne. However, annual average prices varied from a low of US$1,032 per tonne in 1982 to a high ofUS$2,319 per tonne in 1988. In the 1990s, the cycle was less marked, but prices varied from a lowof US$1,161 per tonne in 1993 to a high of US$1,832 per tonne in 1995. Between 1996 and 2004,annual average prices remained within a relatively narrow band (by historical standards) of US$1,364to US$1,721 per tonne. The years ended 31 December 2005, 2006 and 2007 have seen the mostsubstantial increase in aluminium prices since the late 1980s, with an annual average price for the yearending on 31 December 2007 of US$2,662 per tonne. The beginning of the last major price rise wasin 2003, driven by the emergence of China as a major consumer of aluminium. Chinese demandincreased by 160% between 2003 and 2008. Intensive growth of LME prices continued in the first halfof 2008 with 3-month LME prices reaching the highest point in July (US$3,122 per tonne). In termsof real prices, that was still below the peaks of 1980 and 1988, when real prices exceeded US$3,500per tonne. Despite the extraordinary growth in the first half of the year, the LME 3-month price annualaverage in 2008 was slightly lower than in 2007: US$2,621 per tonne. The global financial andeconomic crisis resulted in aluminium prices falling continuously until the end of 2008 and throughthe first quarter of 2009, when the 3-month LME price averaged US$1,396 per tonne. Since then,aluminium prices have recovered strongly and the 3-month LME price averaged US$1,965 per tonnein August 2009, before easing back to US$1,867 per tonne in September 2009.
Expectations for the Remainder of 2009 and 2010-2012
CRU believes that the first quarter of 2009 marked the bottom of the industry cycle, in terms ofdemand for primary aluminium and prices. Since then, both measures have improved sharply: in thethird quarter of 2009 demand is expected to be 17.5% higher than the first quarter and LME 3-monthprices in the third quarter of 2009 averaged 31.5%, or US$440 per tonne more than in the first quarterof 2009.
Several factors are expected to impact the sector for the remainder of 2009 and 2010 and thealuminium prices during the period:
• Demand. In 2010, CRU expects primary aluminium consumption growth of around 9% aftera 9.7% fall in 2009. About 45% of the global growth in demand is expected to beattributable to China, corresponding to a growth rate in the region of 10%. Similarly, allother geographical areas are expected to record strong growth levels: 8% in North Americaand around 5% in Western Europe, as confidence returns in the mature markets and around10% in India and Southeast Asia. Demand in South America is expected to grow by around8% in 2010.
INDUSTRY AND MARKET OVERVIEW
— 80 —

• Supply. It is still unknown whether there will be new smelter capacity coming onstream orbeing restarted in 2010, but CRU expects total production to grow less than demand,thereby reducing the surplus in the market. Factors affecting the variations in availablesupply include (i) the possible restart of some of the mothballed facilities and the level offacilities expected to be permanently mothballed (the latter estimated by CRU at 2.9 milliontpy in 2010), (ii) the ramp-up of greenfield and brownfield projects, especially in theMiddle-East and in India and (iii) possible production cuts from high cost operations,especially as a result of higher energy prices.
• Trading. Another key driver would be the impact of positive investor sentiment from fundsand the impact of traders locking-in metal prices in financing deals, thereby mitigating highLME stock levels.
• The economic downturn resulted in a considerable accumulation of inventory, as theindustry closures and cutbacks were insufficient to balance the abrupt drop in primarydemand. Total reported stocks, comprising LME and Nymex stocks, producer stocksreported to the IAI and stocks in Japanese ports totalled 6.0 million tonnes at the endof the third quarter of 2009. CRU estimates that there were 3.4 million tonnes ofunreported stocks at the same time, bringing total world stocks to 9.4 million tonnes,the equivalent of 99 days of consumption, compared with 71 days of consumption atthe end of 2008 and 35 days of consumption at the end of 2007.
• CRU expects the level of reported stocks to increase slightly in 2010-11 and to peakat 6.9 million tonnes in 2012. As the first wave of new supply from greenfield smeltersis absorbed by rising demand, stocks are expected to start to fall back; CRU expects6.5 million tonnes in reported stocks at the end of 2014, and steeper reductions inunreported stocks.
• While inventories will put some downward pressure on the LME aluminium price overthe next two years, CRU believes that the impact should be mitigated considerably bythe volumes tied up in stock financing deals. Stock financing has been profitable formost of 2009 because of the shape of the LME forward curve, low interest rates andthe discounts on warehouse rents. An unreported (but estimated by CRU to besignificant) proportion of the 4.6 million tonnes in LME warehouses at the end ofNovember 2009 is involved in such transactions, meaning that the balance availableimmediately to the aluminium industry is much less than the full volume of currentstock. This has been evident in the fourth quarter of 2009: despite record inventories,the 3-month LME price increased from US$1,914 per tonne in October to US$1,982per tonne in November, and reached US$2,164 per tonne on 7 December 2009. Spotmetal premiums, which reflect the availability of physical material, are estimated byCRU at US$135 per tonne in Japan at mid-December 2009, compared to an annualaverage of US$69 per tonne in 2007 and US$80 per tonne in 2008.
• In the medium term, there are also changing patterns of supply and demand whichCRU believes imply a requirement for higher stock levels: a large proportion ofaluminium consumption in China and other emerging economies, where distributionnetworks and supply chain processes are not yet fully optimised; and European andNorth American smelter closures, meaning that metal consumers need to importmaterial from other regions, the distance between supplier and consumer is greaterand therefore more stocks are required near the consumer to compensate for the longersupply chain.
Competing Producers
With 11.3 million tonnes of alumina production in 2008 (on an attributable basis), the Companyhad a 13% share of global production of alumina according to CRU estimates.
INDUSTRY AND MARKET OVERVIEW
— 81 —

With 4.4 million tonnes of primary aluminium production in 2008 (on an attributable basis), CRUestimates that the Company had a 11% share of global production of aluminium.
The Group’s principal competitors are other major international aluminium producers, includingAlcoa, Rio Tinto Alcan, Chalco, Norsk Hydro, Hindalco and BHP Billiton. Rankings of alumina andaluminium production for 2008 by major company are shown below. These are on the basis of equityshare, rather than by control1. On this basis, in 2008 UC RUSAL is estimated to have been the largestproducer of both aluminium and alumina. The Company is moderately long in alumina.
CRU estimates of alumina production by equity share, 2008 (million tonnes)
Production RankShare of total
production
UC RUSAL . . . . . . . . . . . . . . . . . . . . . . . . . 11.3 1 13%
Chalco . . . . . . . . . . . . . . . . . . . . . . . . . . . . 10.3 2 12%
Alcoa . . . . . . . . . . . . . . . . . . . . . . . . . . . . . 9.5 3 11%
Rio Tinto Alcan . . . . . . . . . . . . . . . . . . . . . . 7.6 4 9%
Alumina Ltd . . . . . . . . . . . . . . . . . . . . . . . . 5.8 5 7%
BHP Billiton . . . . . . . . . . . . . . . . . . . . . . . . 4.5 6 5%
Vale . . . . . . . . . . . . . . . . . . . . . . . . . . . . . . 2.9 7 3%
Weiqiao . . . . . . . . . . . . . . . . . . . . . . . . . . . . 2.5 8 3%
Chiping Xinfa . . . . . . . . . . . . . . . . . . . . . . . 2.5 9 3%
Hydro Aluminium . . . . . . . . . . . . . . . . . . . . . 2.3 10 3%
Source: CRU
CRU estimates of primary aluminium production, by equity share, 2008 (million tonnes)
Production RankShare of total
production
UC RUSAL . . . . . . . . . . . . . . . . . . . . . . . . . 4.42 1 12%
Rio Tinto Alcan . . . . . . . . . . . . . . . . . . . . . . 4.06 2 10%
Alcoa . . . . . . . . . . . . . . . . . . . . . . . . . . . . . 3.99 3 10%
Chalco . . . . . . . . . . . . . . . . . . . . . . . . . . . . 2.64 4 7%
Hydro . . . . . . . . . . . . . . . . . . . . . . . . . . . . . 1.68 5 4%
BHP Billiton . . . . . . . . . . . . . . . . . . . . . . . . 1.24 6 3%
Dubal . . . . . . . . . . . . . . . . . . . . . . . . . . . . . 0.90 7 2%
Aluminium Bahrain . . . . . . . . . . . . . . . . . . . . 0.87 8 2%
Century . . . . . . . . . . . . . . . . . . . . . . . . . . . . 0.80 9 2%
China Power Inv. Corp. . . . . . . . . . . . . . . . . . 0.75 10 2%
Source: CRU
Primary aluminium and alumina are both “commodity” products, being largely homogenous andreadily tradable. In the case of primary aluminium, producers receive the same benchmark price(determined on the London Metals Exchange, and in the case of China, the Shanghai FuturesExchange), subject to premiums for location and precise purity, alloy and shape. Alumina is not tradedon an exchange, but the market for spot or formula-based contracts is reasonably transparent and iswell-reported by industry analysts.
(1) AWAC (estimated 2008 production of 14.4 million tonnes of alumina) is a 60:40 joint venture between Alcoa and Alumina
Ltd, although CRU reports that Alcoa is usually regarded as having 100% control over the business.
INDUSTRY AND MARKET OVERVIEW
— 82 —

In a commodity industry, competition is principally on the basis of costs. The premiums availablefor service or quality (assuming a minimum acceptable level) are modest in comparison. The mainsource of competitive advantage in primary aluminium is sustainably low cost electricity. The mainsources of competitive advantage in alumina are access to bauxite with a low delivered cost, and lowcost energy.
Major barriers to entry into the aluminium business include the substantial capital expendituresand time required to construct aluminium smelters and alumina refineries (including the time forfeasibility analysis and financing). A second major barrier is the need to secure access to sustainablylow-cost energy supplies and raw materials.
The Group’s low electricity, labour and other costs resulted in Aluminium Business Costs ofUS$1,832 per tonne in 2008, compared with an industry average of US$2,072 per tonne, according toCRU. This ranked the Group in the second quartile of the aluminium industry cost curve, accordingto CRU. At the same time, smelters representing approximately 65% of the Group’s output (primarilythe Group’s major Siberian smelters) were in the first quartile on the industry cost curve in 2008,according to CRU, with small-scale smelters dispersed along the cost curve.
As for all aluminium producers, electricity is a significant part of the Group’s cash costs ofproduction. The Group’s aluminium smelters benefit from access to low-cost and clean electricity. In2008, approximately 80% of the Group’s aluminium was produced by its Siberian smelters, which relyon low-cost hydro generation as their principal source of electricity. In 2008, the production-weightedaverage price paid by the Group’s smelters for electricity was US$0.0192/kWh in Siberia,US$0.0355/kWh in the Urals region and US$0.0473/kWh in the European region of Russia (excludingthe Urals region), as compared to a weighted average price of US$0.0376/kWh paid by the world’saluminium producers, according to CRU.
Longer-term Outlook
There are a number of structural developments that are expected to shape the aluminium industryin the longer term, and can be considered as longer term opportunities to an incumbent producer.
Availability of low-cost energy
A step increase in future power costs and/or carbon taxes is a possibility. Smelters and refineriesface competition for power sources and/or environmental regulation, including carbon emissionsabatement policies. Since the start of the EU Greenhouse Gas Emission Trading Scheme in 2005, othercountries have discussed the implementation of similar schemes. The impact of a wider roll-out incarbon emissions regulation will be to increase the cost base in certain countries. How much of astructural upward shift it causes will depend on the extent to which it is applied to the likely regionsfor new smelting capacity, such as the Middle East, North Africa and Russia. However, even if theseregions avoid carbon taxes or limits, there is expected to be an increased demand for new capacity toreplace capacity that becomes uneconomic in locations such as Europe, benefiting companies withaccess to growth opportunities in locations with sustainable low cost energy in stranded markets.
Opportunities to exploit energy resources in some regions may not be as abundant as in the recentpast. For example, policy in the Middle East has been to invest in energy-intensive industries and indue course, to invest downstream in semis production in order to create regional clusters ofmanufacturing strength. Beyond a five-year horizon, it is unclear whether the main gas producingcountries of Qatar, Iran and Abu Dhabi will continue to invest in aluminium smelters to diversify theirindustrial base. The alternatives include selling LNG at what are likely to be higher prices, orinvesting in other energy-intensive metals and chemicals.
INDUSTRY AND MARKET OVERVIEW
— 83 —
Continued strong rates of industrialisation and urbanisation may place further strain on China’senergy resources, creating import opportunities for non-Chinese suppliers. Higher energy prices wouldaffect domestic smelters directly (through power costs) and indirectly (through the cost of rawmaterials such as domestically produced alumina and carbon materials, as well as freight costs),making them less competitive against imports. Moreover the government is likely to resume its policyof containing aluminium industry development during the long term.
Demand
Growth in China has dominated the industry over the past decade, and the country still offersenormous potential for further aluminium demand growth. Other countries, and especially India, alsooffer a particularly strong growth potential. India constitutes a major opportunity for the aluminiumindustry, fuelled by an increasing number of inhabitants expected to live in urban conditions (risingfrom a current 286 million to 575 million by 2030, according to the UN Development Programme).
Higher energy prices and more stringent regulation on carbon emissions also encouragelight-weighting in the automotive sector, which may present attractive opportunities for substitutionfrom steel to aluminium. The substitution trend is already well-established: according to theAluminum Association, the average aluminium content of vehicles in North America in 2009 isestimated at 148 kilograms (“kg”), up 20% compared to the average content of 123 kg in 2002.Average aluminium content has increased by 25% in the EU over the same period.
However, structurally high energy prices can pose some downside risks. If energy prices increaseso much as to result in “demand destruction” in the wider economy, that will affect long term growthrates for aluminium consumption. Some input prices (for example carbon products and raw materialfreight) are highly exposed to energy prices.
More generally, advances in competing materials to aluminium, such as plastics and composites,could result in greater substitution away from aluminium than forecast in the long term: for example,if technological advances permitted the widespread use of composites in the automotive and aerospaceindustries.
Bauxite resources
A lack of available bauxite to Chinese refineries could act as the most severe constraint on theChinese alumina sector. There is huge uncertainty surrounding the long-term sustainability of bauxitesupplies from Indonesia, including the possibility that the Indonesian government may stop bauxiteexports in order to foster a domestic aluminium industry. Similarly, there are concerns about thelongevity of domestic bauxite supplies. Unless major new Chinese resources are discovered, theavailability and cost of bauxite will increasingly present a hurdle to entry for new participants andrestrict the potential opportunities for expansions at existing operations. This is likely to exert upwardstructural pressure on the long run price of alumina and therefore aluminium.
Beyond China, a general decline in bauxite grades is also a possibility. As existing operationsreach the end of their mine life, they are generally being replaced by deposits that previously had beenconsidered unattractive to mine owing to higher costs. This is due to the fact that they contain lowergrade material and/or are located in less accessible regions.
Technology
In smelting, continual improvements to increase the amperage of cells will improve metal outputproductivity and reduce operating costs. It is believed that the introduction of inert anode technologycould reduce the long run marginal cost by as much as 10-30%. However, there are still many material,operational, design, fabrication, metal purity, energy savings, and productivity issues that need to befully resolved before inert anodes can reach full commercialisation.
INDUSTRY AND MARKET OVERVIEW
— 84 —

A potential downside risk to long term primary aluminium prices arises if Chinese producersincrease the export of their technology to countries that would provide them with access to cheaperpower, for example Indonesia, Iran, Saudi Arabia and parts of Africa. The combination of low costenergy and low cost Chinese technology and construction techniques could reduce the long runmarginal cost for primary aluminium.
REPORTS COMMISSIONED FROM CRU
The Company commissioned CRU, an independent business analysis and consultancy groupfocused on the mining, metals, power, cables, fertiliser and chemicals sectors to provide anindependent assessment of the aluminium and alumina market and such report has been used for thepreparation of this section titled “Industry and Market Overview”.
The parameters and assumptions of CRU’s reports reflect its understanding of the prevailinginternational aluminium markets at the time of preparation of the reports. The historical market dataare generated through the analysis of relevant data such as production, trade and consumption that areprepared by various governmental and industry associations such as the Aluminum Association (whichserves the United States and Canada) and the European Aluminum Association. For some countries,published data may not be available or up-to-date, in which case it is necessary to make estimatesbased on regular contact (e.g., via telephone interviews and in-person meetings) with industryparticipants such as producers, consumers and traders, as well as secondary sources such as conferencepresentations and news articles. Market forecasts are driven by CRU’s own in-depth, macro-economicplatforms that present CRU’s view of the key demand drivers such as gross domestic product andindustrial production on a country-by-country and key sector basis. CRU then seeks views from itsindustry contacts on factors such as intensity of use in key end-use sectors and inventory changes, andcombines these with its macro-economic outlook and long experience of the shape of cycles in theindustry to come up with a forecast. The terms of engagement in respect of the report prepared by CRUare primarily standard terms including consulting fees, payment method, timing of completion of thereport and confidentiality terms. The consulting fees, amounting in the aggregate to not more thanUS$98 thousand, were paid by the Company. Such fees were determined under normal commercialterms after arms’ length negotiations.
INDUSTRY AND MARKET OVERVIEW
— 85 —
History and Development
UC RUSAL traces its history to the early 1990s when Mr. Deripaska, the Company’s CEO andthe beneficial owner of En+, a Controlling Shareholder of the Company, started his business as acommodities agent and broker at the Moscow Trade Stock Exchange (Moskovskaya Tovarnaya Birzha(MTB)) and then at the Russian Commodities and Raw Materials Exchange (RossiyskayaTovarno-Syryevaya Birzha (RTSB)), dealing in a wide range of commodities, including aluminium.His work included trading with major Russian aluminium smelters.
Between 1991 and 1994, companies set up by Mr. Deripaska started investing trading profits inthe then substantially undervalued shares of Sayanogorsk aluminum smelter (“SAZ”), one of thenewest and most modern aluminium plants built in Soviet times (1980-1985) with an annual capacityof around 220,000 tonnes per year. SAZ was privatized in 1992 and its shares were sold to potentialinvestors through tenders and auctions. A secondary market in SAZ shares also began to develop. Atthis time a group called Transworld Group (“TWG”) was a significant player in the aluminum businessin Russia. In the summer of 1994, TWG also started buying shares of SAZ, and by the fall of 1994both the companies controlled by Mr. Deripaska and TWG had enough shares to elect Mr. Deripaskaas the General Director of SAZ. In addition, TWG and the companies controlled by Mr. Deripaskabegan extensive trading operations with SAZ through a 50/50 joint venture. While the joint venturecame to an end in early 1998, the companies controlled by Mr. Deripaska increased their shareholdingsin SAZ to a controlling stake through additional acquisitions of shares.
Since then, gradual strategic acquisitions and growth projects have led to the creation of theworld’s largest aluminium producer, based on production in 2008, and one of the largest aluminaproducers, based on production in 2008:
• In 1997, as part of a general restructuring of the companies controlled by Mr. Deripaska,Sibirsky Aluminium was established to manage aluminium and alumina assets acquired bycompanies related to Mr. Deripaska. By 2000, Sibirsky Aluminium managed, among otheraluminium-related assets, majority interests in the Sayanogorsk aluminium smelter, theSayana foil mill and a fabricating plant in Samara, Russia, and a minority interest in theNikolaev alumina refinery in Ukraine.
• In 2000, Sibirsky Aluminium and Millhouse Capital agreed to manage jointly thealuminium and alumina assets they controlled. At that time, Millhouse Capital managedmajority interests in the Bratsk aluminium smelter, the Krasnoyarsk aluminium smelter andthe Achinsk alumina refinery in Russia.
• By 2002, Sibirsky Aluminium and Millhouse Capital were managing controlling stakes inthe Armenal foil mill in Armenia and the Belaya Kalitva metallurgical plant andNovokuznetsk aluminium smelter in Russia, and also took under management the Friguiabauxite and alumina complex and Bauxite of Kindia Company in Guinea.
• In 2003, companies related to Mr. Deripaska increased their stake in those companies undercommon management to 75% by acquiring half of the interest managed by MillhouseCapital. Later in that year, those companies under common management were restructuredunder a British Virgin Islands holding company, Rusal Holding Limited (referred to asRUSAL in this prospectus), which was subsequently renamed Rusal Limited andredomiciled in Jersey. In Ukraine, RUSAL increased its share in the Nikolaev aluminarefinery to 98%.
• In 2004, the consolidation of RUSAL’s ownership by companies related to Mr. Deripaskawas completed with the acquisition of the remaining 25% equity interest in RUSALmanaged by Millhouse Capital. At this time, RUSAL made the strategic decision to focuson the upstream business and began disposing of its downstream assets, including the saleof its fabricating division to Alcoa Inc. in January 2005. This divestiture process waslargely completed in 2006 with the distribution of certain aluminium construction plantsand other non-core assets to companies controlled by RUSAL’s beneficial owner.
HISTORY AND CORPORATE STRUCTURE
— 86 —
• From 2004 to 2006, RUSAL acquired several strategically important assets. In 2004,RUSAL acquired a 90% interest in the Boxitogorsk alumina refinery in Russia andincreased its holding in the Nikolaev alumina refinery to 100%. In 2005, RUSAL boughta 50% stake in the Komi alumina project from SUAL and became its partner in the project,which involved the construction of an integrated bauxite and alumina complex in Russia’sKomi Republic. In the same year, RUSAL completed the acquisition of a 20% equityinterest in one of the world’s largest alumina refineries in terms of production capacity,Queensland Alumina Limited, located in Queensland, Australia. RUSAL’s joint venturepartner in Queensland Alumina Limited is Rio Tinto.
• In 2005, RUSAL purchased assets of a cathode plant in Lingshi County of Shanxi Province,China. In 2006, RUSAL acquired assets of the Aroaima Mining Company in Guyana,acquired the remaining equity interest in the Friguia bauxite and alumina complex inGuinea, completed an extensive retrofit of the Armenal foil mill and commissioned theKhakas aluminium smelter in Russia — one of the most advanced aluminium productionfacilities in the world. RUSAL also acquired a 56.16% equity interest in the Italian aluminarefinery, Eurallumina. In May 2006, RUSAL and RusHydro signed a co-operationagreement for the construction of the Boguchanskaya hydropower plant (HPP) and theBoguchansky aluminium smelter. RUSAL increased ownership in the Bratsk, Krasnoyarsk,Sayanogorsk and Novokuznetsk aluminium smelters to 100% through buyouts of theresidual minority interests in November 2006, 100% ownership of the Achinsk andBoksitogorsk alumina refineries and the Russian National Aluminium and MagnesiumInstitute (“VAMI”) through squeeze-out of the residual minority interests in November2006 and a 100% ownership interest of Sayanal through squeeze-out of the minority interestin June 2007.
• In December 2006, RUSAL acquired through a privatisation process a 77.5% equity interestin the Aluminium Smelter Company of Nigeria (ALSCON). The Group acquired a further7.5% equity interest in ALSCON from MAN Ferrostaal AG in January 2008.
• In late March 2007, RUSAL completed the acquisition of SUAL and the GlencoreBusinesses and the three businesses were all combined under UC RUSAL. See “FinancialInformation — Management’s Discussion and Analysis of Financial Condition and Resultsof Operations — The Acquisition of SUAL and the Glencore Businesses”. This acquisitionexpanded RUSAL’s asset base to include the Irkutsk, Urals, Kandalaksha, Bogoslovsk,Nadvoitsy, Pikalyovo, Volgograd and Volkhov aluminium smelters in Russia, theZaporozhye aluminium complex in Ukraine, the Pikalyovo alumina refinery in Russia, theNorth Urals bauxite mines in Russia and the Urals foil mill in Russia, all part of SUAL; andthe Aughinish refinery in Ireland, a 93% equity interest in the Windalco refineries andbauxite mines and a 65% equity interest in the Alpart refinery and bauxite mine, all inJamaica, and the remaining 43.84% equity interest in the Eurallumina alumina refinery inItaly, as well as the Kubikenborg aluminium smelter in Sweden, all comprising theGlencore Businesses. This transaction completed the fifteen-year process of consolidatingthe Russian aluminium industry, and created the world’s largest aluminium producer (basedon production in 2008).
• In November 2007, the Group signed a cooperation agreement with Samruk-Energo, asubsidiary of Samruk-Kazyna, on the creation of a 50/50 joint venture in respect of theoperation of the LLP Bogatyr Komir, the largest coal mining company in Kazakhstan, withan annual production of approximately 40 million tonnes of coal.
• In April 2008, the Group completed the acquisition from Onexim of a 25% plus one shareequity interest in Norilsk Nickel, the world’s largest nickel and palladium producer (basedon production in 2008, according to CRU). The acquisition allowed the Group to diversifyits asset base. The consideration for the shares in Norilsk Nickel was partially paid in cashand partially in shares. As a result, Onexim acquired a 14% equity interest in the Company.See “Substantial Shareholders”. Following the acquisition of the equity interest in NorilskNickel, the Company is entitled to representation by four out of a total of 13 directors onthe board of directors of Norilsk Nickel. The Company does not, however, have operationalor management control over Norilsk Nickel. In addition, the Group nominates the First
HISTORY AND CORPORATE STRUCTURE
— 87 —

Deputy General Director responsible for the operational matters of Norilsk Nickel. See also“Risk Factors — Risks related to the Group and its Business — The Group does not haveoperational or management control over Norilsk Nickel and other material joint ventures”.For information relating to Norilsk Nickel, see “Business — Norilsk Nickel and MaterialJoint Ventures”. In April 2008, the Company also acquired assets of another cathode plantin Taigu County of Shanxi Province, China, which have been integrated into the existingcathode plant in Lingshi County of Shanxi Province, China.
The Group has historically adopted the policy of fully integrating assets it acquires and controlsunder centralised operational and management control. The Group has achieved increased productionand efficiency in most of its acquired facilities through so-called production “creep” (improvementsachieved through targeted improvements to key processes), as well as by undertaking keymodernisation and expansion projects. The Directors believe that this history of acquisitions andexpansion in Russia and other challenging markets and its cost cutting initiatives developed inresponse to the recent aluminium and financial market collapse uniquely position the Group to recoverstrongly from the crisis and strengthen its position.
The consolidation of the Group’s assets involved a number of hostile transactions. Civil actionswere brought in various jurisdictions by individuals and legal entities in relation to the acquisitionsof interests in certain Russian assets, including the Sayanogorsk, Krasnoyarsk and Novokuznetskaluminium smelters, and contracts to which such assets and smelters were parties, including withrespect to the repudiation of such contracts. The claims included allegations, in some instances, ofimproper manipulation of the Russian court system, fraud, corruption and violence. In each case, theproceedings have been terminated, either by final judgment/award or settlement agreement andrelease. In no such case did any such final judgment/award or settlement agreement hold, conclude orotherwise acknowledge that any of such allegations had been proven or were true. Moreover, nocriminal charges have been brought against any UC RUSAL or Group directors, officers, employees,shareholders or individual beneficial owners in connection with any of these matters. In addition, thereis ongoing litigation relating to acquisitions through privatisations in Ukraine (see “Business —Litigation — ZAlK”), the Republic of Guinea (see “Business — Litigation — Republic of Guinea”)and Nigeria (see “Business — Litigation — BFIG”). For a description of a commercial dispute broughtby Mr. Cherney against Mr. Deripaska relating to an alleged contract said to have been made aroundthe time of the combination of the aluminium businesses managed by Sibirsky Aluminium (in whichbusinesses Mr. Cherney claims to have held an ownership interest) and those of Millhouse Capital, see“Substantial Shareholders — Litigation Involving Certain Beneficial Owners — Litigation InvolvingMr. Deripaska” and “Risk Factors — Risks relating to the Group and its Business — A certain claimagainst the beneficial owner of En+ could have a material adverse effect on the Company and/or thetrading price of its Shares”. Mr. Cherney’s claims regarding the early history of the Group and thenature of his ownership interest in the aluminium businesses managed by Sibirsky Aluminium are setout in the extracts from the 3 July 2008 decision on the jurisdiction of English courts over this matterincluded in Appendix X to this prospectus. Save as disclosed in this prospectus, during the three yearsended 31 December 2008, the six months ended 30 June 2009 and the period from 1 July 2009 to thedate of this prospectus, there were no proceedings brought against the Group or settled by the Grouprelating to or involving allegations of fraud, corruption or perversion of justice.
Shareholding and Corporate Structure
The Group operates and/or owns 16 aluminium smelters located in Russia, Ukraine, Sweden andNigeria. Three of the Group’s smelters each produce over 500 thousand tonnes of primary aluminiumper annum. Two of these, the Bratsk aluminium smelter and the Krasnoyarsk aluminium smelter inSiberia, are the largest aluminium smelters in the world, based on production, and each produces closeto one million tonnes of primary aluminium per annum. The Group operates and/or owns 13 aluminarefineries, located in Russia, Ireland, Jamaica, Ukraine, Italy and Guinea, with an additional jointventure project in Australia, eight bauxite mining complexes, located in Russia, Jamaica, Guinea andGuyana, one nepheline syenite mine in Russia, one fluorite mine in Russia, two coal mines inKazakhstan and two quartzite mines in Russia and Ukraine. In addition, the Group also operates and/orowns three powder metallurgy plants in Russia, three silicon smelters in Russia and Ukraine, threesecondary aluminium plants in Russia, three aluminium foil mills in Armenia and Russia, two cryoliteplants in Russia and one cathode plant in China.
HISTORY AND CORPORATE STRUCTURE
— 88 —
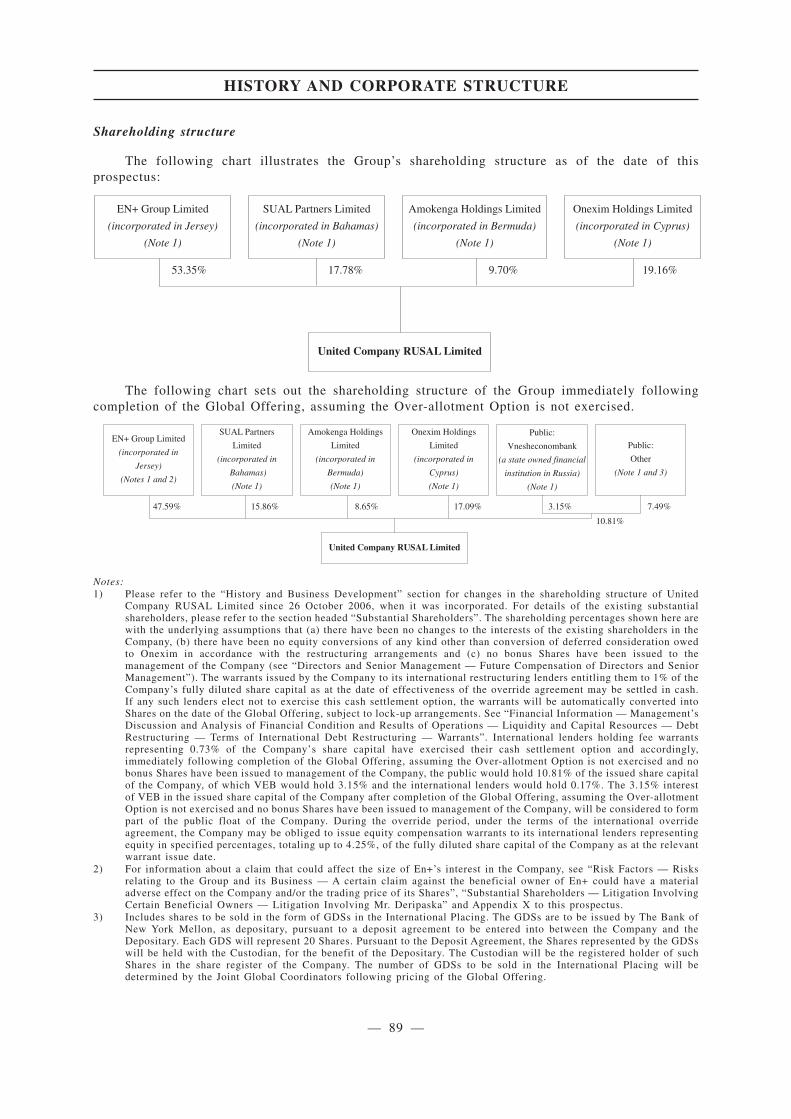
Shareholding structure
The following chart illustrates the Group’s shareholding structure as of the date of thisprospectus:
53.35% 17.78% 9.70% 19.16%
EN+ Group Limited
(incorporated in Jersey)
(Note 1)
SUAL Partners Limited
(incorporated in Bahamas)
(Note 1)
Amokenga Holdings Limited
(incorporated in Bermuda)
(Note 1)
Onexim Holdings Limited
(incorporated in Cyprus)
(Note 1)
United Company RUSAL Limited
The following chart sets out the shareholding structure of the Group immediately followingcompletion of the Global Offering, assuming the Over-allotment Option is not exercised.
47.59% 15.86% 8.65% 17.09% 3.15% 7.49%
10.81%
EN+ Group Limited
(incorporated in
Jersey)
(Notes 1 and 2)
SUAL Partners
Limited
(incorporated in
Bahamas)
(Note 1)
Amokenga Holdings
Limited
(incorporated in
Bermuda)
(Note 1)
Onexim Holdings
Limited
(incorporated in
Cyprus)
(Note 1)
United Company RUSAL Limited
Public:
Vnesheconombank
(a state owned financial
institution in Russia)
(Note 1)
Public:
Other
(Note 1 and 3)
Notes:1) Please refer to the “History and Business Development” section for changes in the shareholding structure of United
Company RUSAL Limited since 26 October 2006, when it was incorporated. For details of the existing substantialshareholders, please refer to the section headed “Substantial Shareholders”. The shareholding percentages shown here arewith the underlying assumptions that (a) there have been no changes to the interests of the existing shareholders in theCompany, (b) there have been no equity conversions of any kind other than conversion of deferred consideration owedto Onexim in accordance with the restructuring arrangements and (c) no bonus Shares have been issued to themanagement of the Company (see “Directors and Senior Management — Future Compensation of Directors and SeniorManagement”). The warrants issued by the Company to its international restructuring lenders entitling them to 1% of theCompany’s fully diluted share capital as at the date of effectiveness of the override agreement may be settled in cash.If any such lenders elect not to exercise this cash settlement option, the warrants will be automatically converted intoShares on the date of the Global Offering, subject to lock-up arrangements. See “Financial Information — Management’sDiscussion and Analysis of Financial Condition and Results of Operations — Liquidity and Capital Resources — DebtRestructuring — Terms of International Debt Restructuring — Warrants”. International lenders holding fee warrantsrepresenting 0.73% of the Company’s share capital have exercised their cash settlement option and accordingly,immediately following completion of the Global Offering, assuming the Over-allotment Option is not exercised and nobonus Shares have been issued to management of the Company, the public would hold 10.81% of the issued share capitalof the Company, of which VEB would hold 3.15% and the international lenders would hold 0.17%. The 3.15% interestof VEB in the issued share capital of the Company after completion of the Global Offering, assuming the Over-allotmentOption is not exercised and no bonus Shares have been issued to management of the Company, will be considered to formpart of the public float of the Company. During the override period, under the terms of the international overrideagreement, the Company may be obliged to issue equity compensation warrants to its international lenders representingequity in specified percentages, totaling up to 4.25%, of the fully diluted share capital of the Company as at the relevantwarrant issue date.
2) For information about a claim that could affect the size of En+’s interest in the Company, see “Risk Factors — Risksrelating to the Group and its Business — A certain claim against the beneficial owner of En+ could have a materialadverse effect on the Company and/or the trading price of its Shares”, “Substantial Shareholders — Litigation InvolvingCertain Beneficial Owners — Litigation Involving Mr. Deripaska” and Appendix X to this prospectus.
3) Includes shares to be sold in the form of GDSs in the International Placing. The GDSs are to be issued by The Bank ofNew York Mellon, as depositary, pursuant to a deposit agreement to be entered into between the Company and theDepositary. Each GDS will represent 20 Shares. Pursuant to the Deposit Agreement, the Shares represented by the GDSswill be held with the Custodian, for the benefit of the Depositary. The Custodian will be the registered holder of suchShares in the share register of the Company. The number of GDSs to be sold in the International Placing will bedetermined by the Joint Global Coordinators following pricing of the Global Offering.
HISTORY AND CORPORATE STRUCTURE
— 89 —
App1A-28(2)App1A-29(1)
App1A-28(2)App1A-29(1)

Cor
pora
teS
tru
ctu
re
The
foll
owin
gch
art
sets
out
the
sim
plif
ied
corp
orat
est
ruct
ure
ofth
eG
roup
asat
the
date
ofth
isP
rosp
ectu
s.T
heco
rpor
ate
stru
ctur
eof
the
Gro
upw
ill
beth
esa
me
imm
edia
tely
foll
owin
gco
mpl
etio
nof
the
Glo
bal
Off
erin
g.
Sim
pli
fied
Cor
por
ate
Str
uct
ure
ofth
eG
rou
p(N
ote
1)
100%
65%
100%
100%
100%
100%
100%
10
0%
100%
100%
10
0%
100%
100%
100%
100%
100%
100%
100%
100%
50%
93%
100%
100%
100%
43.8
4%
56.1
6%
50%
50
%
79.9
%
100%
100%
100%
100%
100%
97.5
5%
100%
99.9
%
100%
100%
100%
90%
100%
100%
100%
50%
93.7
2% 10
0%
100%
100%
100%
25%
100%
100%
50%
100%
100%
100%
100%
100%
94.1
7%
93.4
9%
100%
100%
85%
100%
20%
100%
100%
100%
100%
100%
100%
100%
UN
ITED
CO
MPA
NY
RU
SAL
LIM
ITED
(N
ote
38)
SUA
L In
tern
atio
nal L
td.
(Not
e 44
)
SUA
L, O
JSC
(Not
e 12
)
Bran
ches
: Irk
utsk
Alu
min
ium
Sm
elte
r Bo
goslo
vsk
Alu
min
ium
Sm
elte
r U
rals
Alu
min
ium
Sm
elte
r K
anda
laks
ha A
lum
iniu
m S
mel
ter
Nad
voits
y A
lum
iniu
m S
mel
ter
Vol
gogr
ad A
lum
iniu
m S
mel
ter
Vol
khov
Alu
min
ium
Sm
elte
r
OJS
C Ru
ssia
n A
lum
iniu
m
(Not
e 5)
OJS
C RU
SAL
Brat
sk
(Not
e 7)
OJS
C RU
SAL
Saya
nogo
rsk
(Not
e 8)
OJS
C RU
SAL
Kra
snoy
arsk
(Not
e 6)
OJS
C RU
SAL
Nov
okuz
netsk
(Not
e 9)
CJSC
Bog
ucha
nsk
Alu
min
ium
Sm
elte
r (N
ote
49)
RUSA
L SA
YA
NA
L O
JSC
(Not
e 10
) K
rem
niy,
CJS
C (N
ote
15)
Ura
ls-Fo
il, O
JSC
(Not
e 45
)
SUA
L PM
, LL
C
(Not
e 14
)
SUA
L K
rem
ny U
ral,
LLC
(Not
e 18
)
OJS
C Za
poro
zhye
Alu
min
ium
Com
bine
(N
ote
39)
OJS
C SU
BR(N
ote
43)
OJS
C U
nite
d Co
mpa
ny
RUSA
L Tr
adin
g H
ouse
(N
ote
41)
Alu
min
ium
Sm
elte
r Com
pany
of
Nig
eria
PLC
(N
ote
46)
Emer
gofin
B.V
. (N
ote
3)
Inve
stmen
t and
Man
agem
ent
Ltd
(Not
e 30
)
Uni
ted
Com
pany
RU
SAL
Alu
min
ium
Lim
ited
(Not
e 48
)
LLC
Kha
kas A
lum
iniu
m S
mel
ter
(Not
e 16
)
Alu
min
um G
roup
, Ltd
. (N
ote
47)
CJSC
Alu
kom
-Tai
shet
(N
ote
11)
RUSA
L Re
sal L
LC
(Not
e 13
)
Belis
LLC
(N
ote
51)
JSC
Tsve
tmet
obra
botk
a(N
ote
52)
Uni
ted
Com
pany
RU
SAL
Ener
gy L
imite
d
(Not
e 53
)
Uni
ted
Com
pany
RU
SAL
Mar
ketin
g &
Man
agem
ent
Lim
ited
(Not
e 56
)
RS In
tern
atio
nal G
mbH
(N
ote
33)
RUSA
L M
arke
ting
Gm
bH
(Not
e 35
)
Boge
s Lim
ited
(Not
e 54
)
Bogu
chan
skay
ahy
droe
lect
ric p
ower
stat
ion
(Not
e 55
)
RUSA
L G
loba
l Man
agem
ent
B.V
. (N
ote
31)
Que
ensla
nd A
lum
ina
Lim
ited
(Not
e 29
)
Alu
min
ium
Sili
con
Mar
king
G
mbH
(N
ote
42)
Uni
ted
Com
pany
RU
SAL
Alu
min
a Li
mite
d
(Not
e 40
)
OJS
C RU
SAL
Boxi
togo
rsk
Alu
min
a
OJS
C RU
SAL
Ach
insk
(N
ote
25)
LLC
RUSA
L N
ikol
aev
Alu
min
a Re
finer
y (N
ote
37)
Alu
min
a Pa
rtner
s of J
amai
ca(N
ote 5
7)
SUA
L K
omi B
.V.
(Not
e 60
)
Baux
ite C
ompa
ny o
f Guy
ana
Inc
(Not
e 58
)
Eura
llum
ina
SpA
(Not
e 27
)
Kom
y A
lum
iniu
m C
ypru
sLi
mite
d (N
ote
59)
UC
RUSA
L A
lum
ina
Jam
aica
II L
imite
d (N
ote
36)
(Not
e 26)
Russ
ky A
lum
iny
Ltd.
(N
ote
62)
Com
pagn
ie D
es B
auxi
tes D
e K
indi
a (N
ote
21)
Frig
uia
S.A
.(N
ote
63)
OJS
C Bo
ksit
Tim
ana
(Not
e 24
)
CJSC
Kom
i-Alu
min
ium
(N
ote
23)
Alu
min
a &
Bau
xite
Com
pany
Ltd.
(Not
e 28
)
Pack
agin
g D
ivis
ion
Alu
min
ium
Div
isio
n
Eng
inee
ring
and
Con
stru
ctio
n D
ivis
ion
Alu
min
a D
ivis
ion
Hol
ding
Com
pani
es
Uni
ted
Com
pany
RU
SAL
Raw
M
ater
ials
Ltd
(N
ote6
6)
OJS
C Po
levs
koy
Cryo
lite
Plan
t(N
ote
67)
OJS
C So
uth
Ura
ls Cr
yolit
e Pl
ant
(Not
e 68)
RUSA
L Sh
anxi
Cat
hode
Co.
,Lt
d (N
ote
70)
Calib
re P
rope
rties
Wor
ldw
ide
Ltd.
(N
ote
64)
Kub
iken
borg
Alu
min
ium
AB
(Not
e 17
)
Aug
hini
sh A
lum
ina
Ltd.
(N
ote
20)
Wes
t Ind
ies A
lum
ina
Com
pany
("W
inda
lco"
) (N
ote
64)
RUSA
L Sa
yana
Foi
l LLC
(D
mitr
ov)
(Not
e 65
)
RUSA
L A
rmen
al C
JSC
(Not
e 4)
RUS-
Engi
neer
ing
Ltd
(Not
e 19
)
Gui
nea
Inve
sting
Com
pany
Lim
ited
(Not
e 22
)
UC
RUSA
L In
vestm
ent
Man
agem
ent
(Not
e 73
)
Mira
dore
Ent
erpr
ises L
imite
d(N
ote
70)
Foru
m M
uide
r B.V
.(N
ote
71)
Boga
tyr K
omir,
Lim
ited
Liab
ility
Par
tner
ship
(N
ote 7
2)
OJS
C M
MC
Nor
ilsk
Nic
kel
(Not
e 2)
RUSA
L A
mer
ica
Corp
orat
ion
(Not
e 32
)
RUSA
L Li
mite
d (N
ote
50)
RTI L
imite
d (N
ote
34)
HISTORY AND CORPORATE STRUCTURE
— 90 —

Notes1) The subsidiaries and associated companies of United Company
RUSAL Limited as shown in the structure chart here includethe subsidiaries which principally affected the results, assetsand liabilities of the Group as set out on in Note 36 to the UCRUSAL Accountants’ Report and the associated companieswhich principally affected the results of the Group as set outNote 19 to the UC RUSAL Accountants’ Report. Please alsonote that not all wholly owned intermediate holding companiesare shown in the chart and there are approximately 500subsidiaries in total in the Group
2) OJSC MMC Norilsk Nickel was incorporated in Russia on 4July 1997
3) Emergofin BV was incorporated in the Netherlands on 28February 2000
4) CJSC Rusal Armenal was incorporated in Armenia on 17 May2000
5) OJSC Russian Aluminium was incorporated in Russia on 25December 2000
6) OJSC RUSAL Krasnoyarsk was incorporated in Russia on 16November 1992
7) OJSC RUSAL Bratsk was incorporated in Russia on 26November 1992
8) OJSC RUSAL Sayanogorsk was incorporated in Russia on 29July 1999
9) OJSC RUSAL Novokuznetsk was incorporated in Russia on 26June 1996
10) OJSC RUSAL SAYANAL was incorporated in Russia on 29December 2001
11) CJSC Alucom-Taishet was incorporated in Russia on 18September 2000
12) OJSC SUAL was incorporated in Russia on 26 September 199613) LLC RUSAL Resal was incorporated in Russia on 15 November
199414) SUAL-PM LLC was incorporated in Russia on 20 October 199815) CJSC Kremniy was incorporated in Russia on 3 August 199816) LLC Khakas Aluminium Smelter was incorporated in Russia on
23 July 200317) Kubikenborg Aluminium AB was incorporated in Sweden on 26
January 193418) SUAL-Kremniy-Ural LLC was incorporated in Russia on 1
March 199919) RUS-Engineering Ltd was incorporated in Russia on 18 August
200520) Aughinish Alumina Ltd was incorporated in Ireland on 22
September 197721) Compagnie Des Bauxites De Kindia S.A. was incorporated in
Guinea on 29 November 200022) Guinea Investing Company Limited was incorporated in the
BVI on 16 July 199923) CJSC Komi Aluminium was incorporated in Russia on 13
February 200324) OJSC Boksit Timana was incorporated in Russia on 29
December 199225) OJSC RUSAL Achinsk was incorporated in Russia on 20 April
199426) OJSC RUSAL Boxitogorsk Alumina was incorporated in Russia
on 27 October 199227) Eurallumina SpA was incorporated in Italy on 21 March 200228) Alumina & Bauxite Company Limited was incorporated in the
BVI on 3 March 200429) Queensland Alumina Limited was incorporated in Australia on
28 October 196330) Investments and Management Ltd was incorporated in Russia
on 6 December 200231) Rusal Global Management B.V. was incorporated in the
Netherlands on 8 March 200132) Rusal America Corporation was incorporated in the USA on 29
March 199933) RS International GmbH was incorporated in Switzerland on 22
May 200734) RTI Limited was incorporated in Jersey on 27 October 200635) Rusal Marketing GmbH was incorporated in Switzerland on 22
May 200736) UC RUSAL Alumina Jamaica II Limited was incorporated in
Jamaica on 16 May 200437) LLC RUSAL Nikolaev Alumina Refinery was incorporated in
Ukraine on 16 September 200438) United Company RUSAL Limited was incorporated in Jersey
on 26 October 2006
39) OJSC Zaporozhye Aluminium Combine was incorporated inUkraine on 30 September 1994
40) United Company Rusal Alumina Limited was incorporated inCyprus on 22 April 2004
41) OJSC United Company RUSAL Trading House wasincorporated in Russia on 15 March 2000
42) Aluminium Silicon Marketing GmbH was incorporated inSwitzerland on 20 November 2000
43) OJSC SUBR was incorporated in Russia on 24 October 1996
44) SUAL International Ltd. was incorporated in Bahamas on 20September 2002
45) Urals-Foil OJSC was incorporated in Russia on 31 March 2003
46) Aluminium Smelter Company of Nigeria Plc. was incorporatedin Nigeria on 24 November 1989
47) Aluminum Group Ltd. was incorporated in BVI on 4 March2004
48) United Company RUSAL Aluminium Ltd was incorporated inCyprus on 29 October 2004
49) CJSC Boguchansk Aluminium Smelter was incorporated inRussia on 26 July 2006
50) RUSAL Limited was incorporated in BVI on 7 May 2003 andre-registered in Jersey on 23 May 2005
51) Belis LLC was incorporated in Russia on 8 August 1999
52) JSC Tsvetmetobrabotka was incorporated in Russia on 28 June2002
53) United Company RUSAL Energy Limited was incorporated inCyprus on 18 March 2005
54) Boges Limited was incorporated in Cyprus on 26 October 2006
55) Boguchanskaya hydroelectric power station was incorporatedin Russia on 19 June 1996
56) United Company RUSAL Marketing and Management Limitedwas incorporated in Cyprus on 3 July 2006
57) Alumina Partners of Jamaica (“Alpart”) was incorporated inJamaica on 15 February 2006
58) Bauxite Company of Guyana Inc. was incorporated in Guyanaon 22 November 2004
59) Komy Aluminium Cyprus Limited was incorporated in Cypruson 13 September 2005
60) SUAL Komi B.V. was incorporated in the Netherlands on 12February 2003
61) Timan Engineering LLC was incorporated in Russia on 19October 2005
62) Russky Aluminy Ltd. was incorporated in USA on 28 July 2000and re-registered in BVI on 11 September 2006
63) Friguia S.A. was incorporated in Guinea on 02 August 2005
64) West Indies Alumina Company (“Windalco”) was incorporatedin Jamaica on 1 June 2001
65) RUSAL Sayana Foil LLC (Dmitrov) was incorporated in Russiaon 5 January 2001
66) United Company RUSAL Raw Materials Limited wasincorporated in Cyprus on 30 August 2004
67) OJSC Polevskoy Cryolite Plant was incorporated in Russia on13 January 1993
68) OJSC South Urals Cryolite Plant was incorporated in Russia on19 February 1993
69) RUSAL Shanxi Cathode Co., Ltd was incorporated in China on22 September 2005
70) Miradore Enterprises Limited was incorporated in Cyprus on 23September 2004
71) Forum Muider B.V. was incorporated in the Netherlands on 25October 1991
72) Bogatyr Komir, Limited Liability Partnership was incorporatedin Kazakhstan on 24 March 1997
73) UC RUSAL Investment Management was incorporated inRussia on 22 December 2008
HISTORY AND CORPORATE STRUCTURE
— 91 —
OVERVIEW
The Group is the world’s largest producer of aluminium, producing 4.4 million tonnes and 2.0million tonnes in 2008 and the first half of 2009, respectively, and accounting for approximately 12%and 11% of global output in those periods, according to CRU. The Group’s business is focused on theupstream segment of the industry — the production and sale of primary aluminium (including alloysand value-added products, such as aluminium sheet ingot and aluminium billet). Within its upstreambusiness, the Group is vertically integrated to a high degree, having secured supplies of bauxite andhaving the capacity to produce alumina in excess of its current requirements. The Group’s own bauxiteproduction was sufficient to cover approximately 71% and 78% of its alumina production in 2008 andthe first six months of 2009, respectively, with additional bauxite being purchased under medium- andlong-term contracts to cover the Group’s alumina-long position. The Group is the world’s largestproducer of alumina, producing approximately 11.3 million tonnes and 3.7 million tonnes in 2008 andthe first half of 2009, respectively and accounting for 13% and 10% of global output in those periods,according to CRU. To produce 4.4 million tonnes and 2.0 million tonnes of aluminium in 2008 andthe first half of 2009, respectively, the Group required approximately 8.6 million tonnes and 3.4million tonnes of alumina.
With the onset of the global economic downturn in the second half of 2008, some of the keyend-user sectors for the aluminium industry (including automotive and transportation, construction,electrical engineering) suffered a sharp contraction of demand. This resulted in surplus supply ofaluminium in the market and decline in the price of the metal and intermediate products such asalumina (see “Industry and Market Overview”). In response, the Group decided to reduce output atsome of its older and higher-cost production facilities, as did many other leading companies in theindustry globally, and restructured its debt. The Directors expect reductions in its aluminium andalumina production of approximately 11% and 36%, respectively, in 2009 as compared to 2008(calculated by comparing the production for the year ended 2008 against the annualised production forthe first half of 2009, adjusted to take into account the idling of capacity that has occurred to date).Output reduction measures have effectively balanced the Group in terms of its alumina requirementsand contributed to optimisation of financial performance due to lower production and maintenancecosts. As the evidence of economic recovery emerges, the Group retains the flexibility to re-start itsmothballed capacity to take advantage of improved market conditions.
The Group’s revenue was US$15,685 million for the year ended 31 December 2008 andUS$3,757 million for the six months ended 30 June 2009. A cost curve produced by CRU ranked theGroup’s 2008 aggregate aluminium operations in the second quartile of world production of primaryaluminium.
The Group has evolved over the past decade through acquisitions and organic growth,culminating in the acquisition in March 2007 of SUAL, then one of the world’s ten largest producersin the aluminium business, and certain of the aluminium and alumina businesses of Glencore, acompany specialising in the production and processing of metals and the trading of metals, oil andagricultural products. The Group has operations in 19 countries across five continents, with more than75,000 employees, and despite recent developments in the global financial markets, has significantopportunities for growth through a number of modernisation programmes and approved projects invarious stages of development in all parts of the aluminium upstream value chain, including energy.
BUSINESS
— 92 —
App1A-28(1)(a)App1A-34(1)(a)3rdSch-13rdSch-311.07
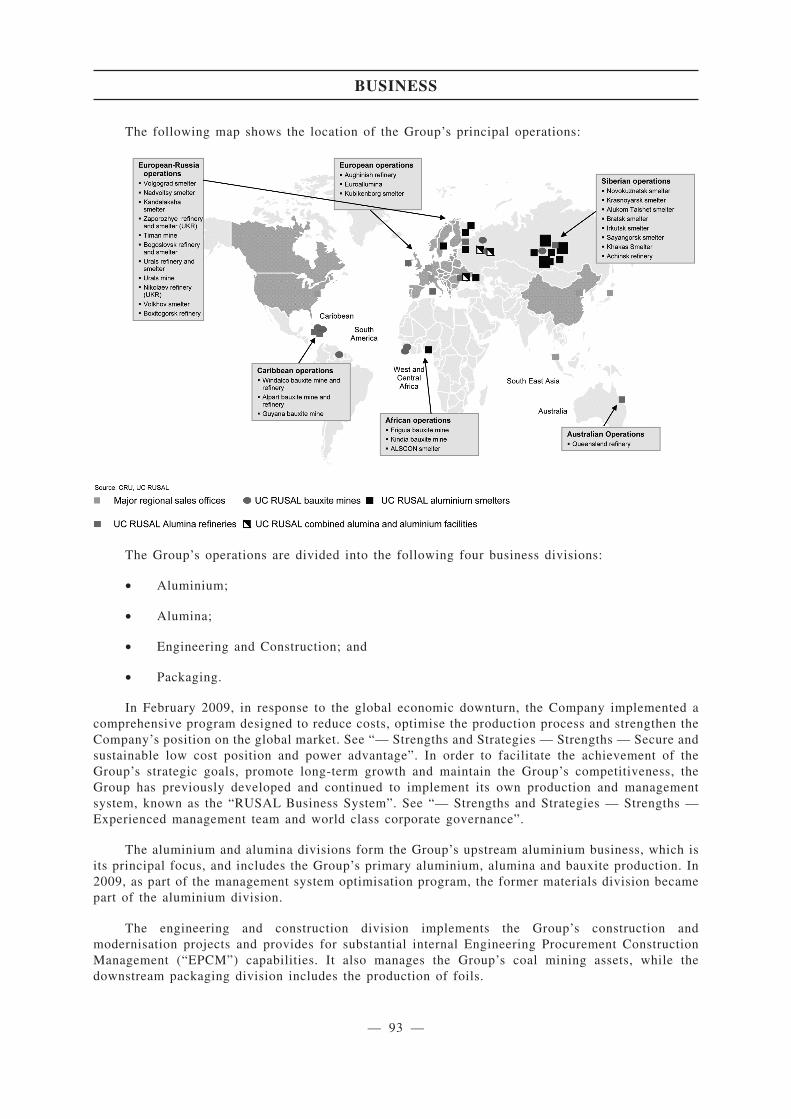
The following map shows the location of the Group’s principal operations:
The Group’s operations are divided into the following four business divisions:
• Aluminium;
• Alumina;
• Engineering and Construction; and
• Packaging.
In February 2009, in response to the global economic downturn, the Company implemented acomprehensive program designed to reduce costs, optimise the production process and strengthen theCompany’s position on the global market. See “— Strengths and Strategies — Strengths — Secure andsustainable low cost position and power advantage”. In order to facilitate the achievement of theGroup’s strategic goals, promote long-term growth and maintain the Group’s competitiveness, theGroup has previously developed and continued to implement its own production and managementsystem, known as the “RUSAL Business System”. See “— Strengths and Strategies — Strengths —Experienced management team and world class corporate governance”.
The aluminium and alumina divisions form the Group’s upstream aluminium business, which isits principal focus, and includes the Group’s primary aluminium, alumina and bauxite production. In2009, as part of the management system optimisation program, the former materials division becamepart of the aluminium division.
The engineering and construction division implements the Group’s construction andmodernisation projects and provides for substantial internal Engineering Procurement ConstructionManagement (“EPCM”) capabilities. It also manages the Group’s coal mining assets, while thedownstream packaging division includes the production of foils.
BUSINESS
— 93 —
In addition, in 2009 two new management units were created — the transportation directorate,responsible for identifying the most effective routes and logistical schemes, and for implementing aprogramme designed to fully utilise new rolling stock and avoid transportation delays, and theexecutive directorate, which supervises and coordinates all ongoing cost-cutting activities.
STRENGTHS AND STRATEGIES
Strengths
The Directors believe that the Group’s competitive strengths uniquely position it to benefit fromthe attractive fundamentals of the global aluminium industry.
Global scale and reach
As the world’s largest aluminium producer, accounting for 12% of global output in 2008, witha primary focus on the upstream aluminium segment, the Group is among the world’s largest pure-playaluminium companies. With an established presence in 19 countries, the Group is able to captureopportunities arising from both a global platform and a local reach, enabling it to identify andparticipate in growth markets globally. The Group has a well-diversified sales platform covering theUnited States and Japan with a strategic focus on Europe and on high-growth markets, such as SouthEast Asia and China.
The Group’s scale also provides a number of distinct operational advantages to its aluminium andalumina divisions, including greater bargaining power with key providers of transportation, logisticaland engineering services and with raw material suppliers. The Group’s global reach allows it toactively manage the flow of aluminium products, alumina and other raw materials within the Groupin order to optimise capacity utilisation at the Group’s smelting and refining operations and to managetransportation, energy and other operational costs.
During the recent global economic downturn and the resulting contraction in the aluminiumindustry, the Group has been able to actively manage its production profile by reducing or mothballingcapacity at its least cost-effective smelters and refineries and, at the same time, maintaining optimalutilisation rates at its lower cost facilities.
The Group’s diverse operational base and global reach also enhance the Group’s ability todevelop and implement proprietary technologies, such as RA-300 and RA-400, and compete globallyfor the best operational, managerial and financial expertise and human capital.
Secure and sustainable low cost position and power advantage
The Group’s low electricity, labour and other costs resulted in Aluminium Business Costs ofUS$1,832 per tonne in 2008, compared with an industry average of US$2,072 per tonne and US$1,285per tonne in the first half of 2009, compared with an industry average of US$1,413 per tonne in thesame period, in each case according to CRU. This ranked the Group in the second quartile of thealuminium industry cost curve, according to CRU. At the same time, smelters representingapproximately 65% of the Group’s output (primarily the Group’s major Siberian smelters) were in thefirst quartile on the industry cost curve in 2008, according to CRU, with small-scale smeltersdispersed along the cost curve.
As for all aluminium producers, electricity is a significant part of the Group’s cash operatingcosts. The Group’s aluminium smelters benefit from access to low-cost and clean electricity. In 2008,approximately 80% of the Group’s aluminium was produced by its Siberian smelters, which rely onlow-cost hydro generation as their principal source of electricity. In those parts of Siberia where these
BUSINESS
— 94 —
smelters are located, the Group is generally the principal consumer of electricity, and there are few,if any, alternative sources of significant demand. In addition to meeting its electricity needs throughhydropower stations (in 2008, hydropower accounted for approximately 79% of the Group’s energyconsumption), the Group also obtains electricity from thermal generators.
The Directors believe that access to low-cost and relatively abundant hydro generation will allowthe Group to retain its current competitive position on the global cost curve going forward, asenvironmental concerns and competition for energy sources continue to put pressure on the cost baseof other aluminium producers that rely more on thermal or gas power.
To support the sustainability of the Group’s operations during the global economic downturn, inFebruary 2009, the Group implemented a comprehensive program designed to reduce costs, optimisethe production process and strengthen the Company’s position as one of the world’s most cost-efficientaluminium producers. The program includes the following measures:
• reducing aluminium output and alumina production by lowering output at leastcost-efficient smelters and closing the Group’s least cost-efficient refineries, which isexpected to result in reductions in its aluminium production and alumina production ofapproximately 11% and 36%, respectively, in 2009 as compared to 2008 (calculated bycomparing the production for the year ended 2008 against the annualised production for thefirst half of 2009, adjusted to take into account idling of capacity completed to date);
• seeking to further reduce aluminium production costs through more effective managementof raw materials and energy supplies, optimised transport and logistics services includinglower reshipment rates at ports, decreased freight rates, increase in the use ofprivate-owned carriers in the supply chain, which is expected to result in a 20% reductionin tariffs in 2009 as compared to 2008;
• reduction in overheads and decrease in personnel expense in the first half of 2009 ascompared to the second half of 2008, accompanied by a 16% headcount reduction in thesecond quarter of 2009 as compared to the first quarter of 2009; and
• significant revision of discretionary investment plans, with a contemplated 69% reductionin capital expenditure in 2009 as compared to 2008.
Focus on higher margin upstream business
The Group’s business is focused on the production and sale of upstream products, principallyprimary aluminium (including alloys and value added products, such as aluminium sheet ingot andaluminium billet), which accounted for 76.9% and 84.1% of the Group’s revenues in 2008 and the firstsix months of 2009, respectively. The Directors believe that the Group’s upstream focus enables it tobenefit from the higher margins generally available to upstream aluminium businesses (compared todownstream business). Within its upstream business, the Group seeks to improve margins further byexpanding sales of alloys and value added products to end customers and distributors (as opposed tosales of commodity primary aluminium to global traders). More than half of the Group’s aggregatevolume of primary aluminium sales in 2008 was of alloys and other value added products, representingapproximately 52% of the Group’s revenue.
To consolidate its focus on the upstream segment, RUSAL disposed of its fabricating division toAlcoa in 2005 and certain of its aluminium construction plants and other non-core assets, includingits can production facilities, prior to its acquisition of SUAL and certain of the aluminium and aluminaassets of Glencore. SUAL also disposed of most of its downstream assets prior to the acquisition. Salesof downstream products such as foil accounted for less than 1.7% of the Group’s revenues in 2008.
BUSINESS
— 95 —
High degree of vertical integration
The Group benefits from a high degree of vertical integration within its upstream business, withprimary aluminium production backed by a significant long position in alumina capacity. In aggregate,the Group produced approximately 11.3 million tonnes of alumina in 2008, purchased approximately1.8 million tonnes and consumed approximately 8.6 million tonnes, reflecting in a long position ofapproximately 4.5 million tonnes. Of the Group’s 11.3 million tonnes of alumina production in 2008,72% was produced outside Russia and 58% outside the CIS. The Group’s own bauxite production wassufficient to cover approximately 71% and 78% of its alumina production in 2008 and the first sixmonths of 2009, respectively, with additional bauxite being purchased under medium- and long-termcontracts.
In connection with the reduction of its aluminium production, and also in response to the declinesin alumina prices, due to the global economic downturn starting in the second half of 2008, the Groupreduced its alumina output in order to balance production along the value chain and minimise lossesat some of its least cost-efficient facilities, such as its geographically remote Jamaican operations andits Eurallumina refinery in Sardinia, Italy. As a result, the Group produced approximately 3.7 milliontonnes of alumina in the first six months of 2009 and expects its full-year 2009 alumina output to be7.2 million tonnes, or 36% lower than in 2008. As market conditions continue to improve, the Group’smothballed alumina capacity can be gradually re-started to accommodate future increases inaluminium production and/or new smelting projects as they come on stream. The Group’s longposition in alumina capacity helps ensure security of supply for the potential expansion of the Group’saluminium production capacity in the future.
The long position in alumina capacity is supported by the Group’s bauxite and nepheline syeniteResource base. At 1 July 2009, according to SRK, the Group had aggregate JORC bauxite MineralResources (dry) of 1,835 million tonnes, of which 611 million tonnes were Measured, 626 milliontonnes were Indicated and 598 million tonnes were Inferred. Included in these bauxite Resources areJORC Proved and Probable bauxite Ore Reserves of 384 million tonnes (dry), of which 147 milliontonnes were Proved and 238 million tonnes were Probable. For the six months ended 30 June 2009 andthe year ended 31 December 2008, the aggregate attributable bauxite production from the Group’smines was 6.1 and 19.1 million tonnes (wet), respectively.
In addition to the Group’s alumina production from its bauxite resources, at Achinsk it producesalumina from nepheline syenite and limestone. At 1 July 2009, according to SRK, the Group hadaggregate nepheline syenite JORC Mineral Resources of 63 million tonnes, of which 9 million tonneswere indicated and 54 million tonnes were Inferred. Included in these Resources were 9 million tonnesof Probable Ore Resources. The Achinsk complex also had 90 million tonnes of limestone JORCMineral Resources in the Indicated category, which included 13 million tonnes of Probable OreReserves, as at 1 July 2009.
The Group has also taken measures to partially secure supply of other major inputs used inaluminium production. For example, the Company owns a cathode plant in China, which has been fullyintegrated into the Group operating structure and allowed the Company to source internallyapproximately 100% of its cathode requirements in 2008 and 55% in the first half of 2009.
BUSINESS
— 96 —

Proximity to China, the largest aluminium consumer in the world
With more than 80% of its total aluminium production located in Siberia, the Group’s productionbase is in direct proximity to China and other key Asian markets. The geographical location of theGroup’s smelters and its competitive cost structure positions it to become one of the main externalsuppliers to China, where demand for aluminium has been constantly growing. The Group enjoys thefollowing key strategic advantages that position it well vis-à-vis the growing markets of China:
• low-cost large production capacity based on clean hydro power, whereas most Chineseproducers rely mainly on more expensive thermal-powered operation units;
• existing and prospective capacity is concentrated in direct proximity to China; and
• ability to transport large volumes of products by rail or sea to the key aluminium consumermarkets in China.
Such competitive advantages also apply to other attractive Asian markets in which the Groupintends to continue developing, such as India. The Group supplied a sizeable proportion of its productsto the Asian market, representing 21% of its revenue in 2008. Sales to China, while minimal in 2008,are expected to increase to 5% of the Group’s revenue in 2009, and the Group’s target is to expandsales to China to 10% of revenue by 2015.
Proprietary R&D and leading internal EPCM expertise
The acquisition of SUAL in late March 2007 represented the culmination of a process throughwhich the Group consolidated over 70 years of Russian know-how and research and development inthe aluminium industry. Within the Group’s Engineering and Construction Division, its Engineeringand Technology Centre (“ETC”) provides the core of its R&D function. A centre specialising inaluminium was established in 2002 in Krasnoyarsk, while a centre specialising in alumina was formedin St. Petersburg and a centre specialising in design was established in Irkutsk, in each case in 2006.The ETC also has pilot project sites for aluminium and alumina at the Sayanogorsk aluminium smelterand the Nikolaev alumina refinery, respectively. During the period from 2006 to 2008, UC RUSALspent over US$137 million on R&D.
Approximately 70% of the Group’s primary aluminium is produced at smelters using Söderbergtechnology and the remaining 30% is produced with pre-baked technology. Smelters using Söderbergtechnology produce greater levels of emissions and generally have a higher environmental impact thanpre-bake technology, which is the latest technology used in the industry.
The ETC has devoted considerable R&D attention to modernising the Group’s Söderberg cells.Improved environmental performance of Söderberg cells would allow the Group’s facilities tocontinue production over the long term with relatively low ongoing capital expenditure. Since 2002,the Group has been conducting research and trials to reduce the emissions of Söderberg cells to thelevel of pre-bake technology in a project referred to as Clean Söderberg Technology. The Group hasdeveloped technical solutions and is now seeking to develop commercially viable applications. Also,the production of colloidal anode paste has started on a commercial scale and is currently capable ofsupplying four potrooms (352 cells). The Group intends to utilise its Clean Söderberg technology atits two largest aluminium smelters: Bratsk and Krasnoyarsk. The Clean Söderberg Technology projectwill also have the benefit of increasing capacity. See “— The Group’s Operations — Engineering andConstruction Division”.
The Group has undertaken modernisation programmes to improve its existing Söderberg potlines(such as alumina point feeding, new dry-scrubbing gas treatment centres and conversion of Söderbergpots to dry anode technology) to reduce costs, improve efficiency and to lessen environment impact.
BUSINESS
— 97 —
App1A-28(5)

A modernisation programme has been implemented at the Krasnoyarsk aluminium smelter, the secondlargest smelter of the Group. Following implementation of the programme, annual production capacityof the smelter has been increased by approximately 91 thousand tonnes and dust and fluorideemissions have been significantly reduced.
The Group has also installed advanced pre-bake, cleaner technology in certain of its smelters,which improves productivity, results in less capital expenditure per tonne of production and lowersoperating expenses such as personnel, maintenance and repair costs. Using the Sayanogorskaluminium smelter as a testing centre, the Group has developed a new baked anode/high amperageprocess that uses RA-300 and RA-400 cells, and plans to install RA-500 cells in the near future. Byincreasing throughput, installing new generation RA cell technology with higher amperage improvesproductivity, resulting in less capital expenditure per tonne of production, and also lowers ongoingoperating expenses such as personnel, maintenance and repair costs. In the development andimplementation of the Group’s technologies, such as RA-300, RA-400, RA-500 and Clean Söderberg,the Company considers environmental impact, reduction of consumption rates, increased capacity andoutput of pots, which enables the introduction of new capacity to be more efficient in terms of cashoperating costs. RA-300 cells were first put into operation on a pilot basis in December 2003 andRA-400 cells in December 2005. A variant of the RA-300 cell technology was selected for the Khakasaluminium smelter adjacent to the Sayanogorsk aluminium smelter, which has the lowest aluminiumcash operating cost of the Group’s smelters, and has now been installed on an industrial scale. Thetechnology is also expected to be installed at the Boguchansky aluminium smelter. Currently, sixteenRA-400 cells are operating on a pilot basis at the Sayanogorsk aluminium smelter, and it is expectedthat RA-400 cells will be used at the Taishet aluminium smelter. See “— The Group’s Operations —Aluminium Division — Approved Projects within the Aluminium Division”. A prototype of RA-500cells has also been developed, and it is expected that eight of these cells will be installed on a pilotbasis at the Sayanogorsk aluminium smelter in the near future. The Group has also developed shelldigestion technology for alumina refining that allows the processing of low-quality bauxite thatrequires particularly high temperatures to dissolve.
Many other of the world’s largest aluminium companies are also developing their own specificform of pre-bake technology.
In addition to its R&D function, the Group’s Engineering and Construction Division providesfully integrated, internal EPCM capabilities, offering a wide range of tailored services on a globalscale to the various operations within the Group. The Group’s first EPCM team was established in2005. Comprising approximately 9,500 employees and engineers, the team has two scientific institutes(RUSAL-Vami in Saint-Petersburg and Sibvami in Irkutsk) and currently services projects in Russia,Ukraine, Guinea and Nigeria. The Directors believe that the Group’s ability to manage all aspects ofa project, including equipment manufacturing, project design, construction and repair andmaintenance, and to do so throughout the world, enables it to execute its projects faster and morecost-effectively than its competitors. The advantages of the Group’s EPCM function are illustrated bythe development of advanced proprietary technology, RA-400, to be used in the construction of theTaishet smelter. Incorporating novel design elements, the new RA-400 technology is expected to helpreduce environmental impact, extend service life, improve efficiency and reduce consumption of rawmaterials as well as improve the magnetohydrodynamic parameters of pots.
Strategic investments
Over the recent years, UC RUSAL has made two significant investments. To diversify itsexposure to other metals, it acquired a stake of 25% plus one share in Norilsk Nickel. In addition, toprovide a natural energy hedge, it created the 50/50 coal joint venture LLP Bogatyr Komir with theKazakhstan state-controlled national welfare fund Samruk-Kazyna.
BUSINESS
— 98 —

Acquisition of a 25% plus one share interest in Norilsk Nickel
In April 2008, the Group completed the acquisition from Onexim of a 25% plus one share stakein Norilsk Nickel, the world’s largest nickel and palladium producer (based on production in 2008,according to CRU) and one of the leading producers of platinum and copper. In addition, it producesa variety of by-products, such as cobalt, chromium, rhodium, silver, gold, iridium, ruthenium,selenium, tellurium and sulfur. According to CRU, in 2008, Norilsk Nickel’s market share was 20.5%in the global production of refined nickel and 48.6% in the global production of palladium1. It is alsoone of the top four producers of platinum1, with a 10.7% market share in global production and aleading producer of copper, with a 2.7% market share in global production, according to CRU. As astrategic investor in Norilsk Nickel, UC RUSAL has significant exposure to Norilsk Nickel’s suite ofcommodities, which upon a recovery in the global markets, may potentially reduce volatility of cashflows and offer additional growth opportunities.
LLP Bogatyr Komir 50/50 joint venture with Samruk Holding in Kazakhstan
In December 2008, UC RUSAL established a 50/50 joint venture with Samruk-Kazyna to jointlyoperate Bogatyr, one of the world’s largest open-cast coal mines, and Severny mine, in the Ekibastuzcoal basin. The acquisition provides UC RUSAL with a growth platform in energy production capacityand a strategic energy hedge through thermal coal.
The Ekibastuz coal basin, one of the largest in the CIS, is located in the Pavlodar region ofKazakhstan, 22 kilometers from the town of Ekibastuz. LLP Bogatyr Komir extracts coal at theSeverny (in operation since 1955) and Bogatyr (in operation since 1970) opencast mines as part of thisjoint venture with Samruk-Kazyna. The Bogatyr and Severny opencast mines have approximately 1.0billion tonnes in Proved and Probable Coal Reserves (JORC) and approximately 2.4 billion tonnes ofmeasured and indicated Mineral Resources (JORC) as at 1 July 2009. The combined production of thetwo mines in 2008 was 46 million tonnes per annum, which was approximately 42% of the total annualcoal output from Kazakhstan. The largest consumers of the Ekibastuz coal are Kazakh and Russianpower-plants. As of 30 June 2009, the production facilities of Bogatyr and Severny employed over7,000 people.
Experienced management team and world class corporate governance
The Group has a highly skilled and experienced team of managers with proven industry expertiseand an impressive track record of managing growth through acquisitions and organic growth inchallenging environments. Starting with a few small investments in the early 1990s in the privatisedand fragmented Russian aluminium industry, members of the Group’s management team created theworld’s largest aluminium company, operating in 19 countries, in slightly more than a decade. Theydid this through acquisitions, culminating in the acquisition of SUAL and the Glencore Businesses inlate March 2007, and through expanding the capacity and improving the efficiency of the Group’ssmelters and other facilities. From 2000 to 2008, management integrated a number of plants in variousjurisdictions, including the Novokuznetsk aluminium smelter and the Boxitogorsk alumina refinery inRussia, the Nikolaev alumina refinery in Ukraine, the Alumina Company of Guinea, which operatesthe Friguia alumina refinery in the Republic of Guinea, and the Eurallumina refinery in Italy. In thefirst half of 2009, the Group’s management implemented a series of significant crisis managementmeasures to counteract the impact of the global financial downturn and falling aluminium pricesincluding responsible production curtailment and active reduction of operating costs and debtrestructuring. See “History and Corporate Structure — History and Development”.
Even while privately held, the Group has adopted international standards of corporategovernance. RUSAL began the implementation of corporate governance standards and processes basedon international best practices a number of years ago with, for example, the introduction of a Code
1 Excluding Stillwater Mining production
BUSINESS
— 99 —
of Ethics in February 2005. Also in 2005, in order to allocate management resources more effectivelyand to facilitate day-to-day decision-making on various Company projects, several managementcommittees consisting of senior and mid-level management were formed. The committees’ objectivesare to ensure that matters are properly referred to the Chief Executive Officer and the Board ofDirectors and to enhance the oversight over Company project management and general corporatematters. In early 2006, following due diligence performed by the International Finance Corporation(“IFC”) and European Bank for Reconstruction and Development (“EBRD”) in connection with theproposed financing of a project, the Company memorialised its intent to follow the corporategovernance and disclosure guidelines set forth in a plan agreed with the IFC and EBRD. By the endof 2006, the corporate governance and nominations committee and the audit committee of the Boardwere established and, in March 2007, two independent directors were appointed. Currently, in additionto those committees, the Board has in place, inter alia, a remuneration committee and a health, safetyand environmental committee. A third independent director, Mr. Simon Thompson, was appointed atthe end of 2007 and resigned in 2009. Two further independent directors, Ms. Elsie Leung Oi-sie andMr. Barry Cheung Chun-yuen, were appointed in November 2009 and with effect from the ListingDate, respectively.
On the management level, the Company has an Executive Committee consisting of theCompany’s key executives, including its Chief Executive Officer, who serves as Chairman of thecommittee and six management committees, the corporate governance and capital markets committee,the debt restructuring committee and management committees of each of the aluminium, alumina,engineering and construction and packaging divisions, all of which report to the Executive Committee.See “Directors and Senior Management — Committees”.
The Company plans to continue to develop in this area and to adhere to internationallyrecognised standards of corporate governance, transparency, disclosure and accountability for publiclytraded companies.
Strategies
Building on the strengths described in the previous section, the Group’s management is pursuingand will pursue the following strategies over different timeframes. Once the Group has reduced itsrestructured debt and subject to its restructuring agreements, the Group expects to be in a position topromptly restart projects currently on hold and take advantage of a more favourable macro-economicenvironment and improved global aluminium markets. The Group’s flexible growth platform allowsthe Group to respond quickly to changes in broader market conditions by accelerating or slowing downimplementation of the Group’s growth projects.
Maintain sustainable low-cost positioning through continuous cost reduction
The Group’s average Aluminium Business Costs were US$1,832 per tonne in 2008, comparedwith an industry average of US$2,072 per tonne in the same period, and US$1,285 per tonne in thefirst half of 2009 as compared to the industry average of US$1,413 per tonne in the same period, ineach case according to CRU. To a large extent this cost advantage is due to the Group’s access tosources of low-cost power. The Group measures its competitiveness, among others, on the basis of itsposition on the global cost curve.
In April 2007, the Russian Government established guidelines for the share of electricityproduction volumes to be sold on the wholesale electricity market under regulated tariffs during theperiod from 1 January 2007 to 31 December 2010. During the period from 1 July to 31 December 2009,the share of electricity supplied under regulated tariffs is from 45% to 50% of the total electricityproduced but this share is expected to gradually decrease to 15% to 20% by 1 July 2010. Beginningon 1 January 2011, all electricity production is expected to be supplied to industrial users under free
BUSINESS
— 100 —
App1A-34(1)(b)App1A-34(1)(c)
market prices. Electricity tariffs for industrial users have risen since 2007, and are expected to furtherrise following deregulation, as a result of price liberalisation and growth in demand. To mitigatepotential increases in electricity prices, the Group is pursuing a multi-pronged strategy that includes,within the constraints imposed by its debt restructuring agreements:
• improving energy efficiency through the installation of enhanced production technologyand adoption of better operating methods for the Group’s existing technology, such asRA-300, RA-400 and Clean Söderberg Technology;
• seeking to secure supply for its existing smelters, particularly in Siberia, through long-termcontracts with energy generating companies controlled by beneficial owners of thesubstantial shareholders, the State and independent investors;
• seeking to build smelter-generation complexes in regions in which low-cost captive energysources are available, such as the Boguchansk project; and
• seeking to invest in selective energy-related assets, such as coal and power generatingfacilities, as a potential hedge against increased energy costs (such as the LLP BogatyrKomir 50/50 joint venture).
The Group’s immediate objective is to secure power supply to the smelters accounting forslightly more than 80% of its current aluminium production. The implementation of the Group’sstrategy varies by region.
In Siberia, the Group has entered into long-term supply contracts for its key Bratsk, Krasnoyarskand Irkutsk aluminium smelters with Irkutsk Joint Stock Power and Electricity Company(“Irkutskenergo”) and JSC Krasnoyarskaya Hydro-Power Plant (“Krasnoyarskaya HPP”), twoelectricity suppliers controlled by the beneficial owner of En+, a Controlling Shareholder of theCompany. The Bratsk, Krasnoyarsk and Irkutsk aluminium smelters accounted for approximately 53%of the Group’s aggregate aluminium production in 2008 and 56% in the first half of 2009. For adescription of the long-term contracts, see “— Energy Supply — Security of Power Supply”.
With respect to its Urals-based smelters, which accounted for approximately 7% of the Group’saggregate aluminium production in 2008, the Group plans to hedge its exposure to increases in thetariffs charged by local independent electricity producers through its interest in the LLP BogatyrKomir in Kazakhstan, which supply coal to the Urals region. See “— Energy Supply”.
The Kubikenborg smelter in Sweden has in place a long-term power contract valid until 2016.ALSCON in Nigeria has its own gas-fired power plant, and the Group has concluded a 20 year takeor pay gas contract with Nigerian Gas Company to supply gas to that power plant.
With respect to new aluminium smelters that the Group intends to commission in the medium tolong term, the Group’s strategy will be to secure electricity supply through either long-term electricitysupply contracts or self-generation. In the case of the self-generation option, the Group will be lookingfor partnership opportunities with a leading local or global strategic player in the power generationsector. For example, the BEMO project includes a hydropower station for supplying the new smelterbeing built with electricity. RusHydro is a 50% partner in the project.
For further information, see “Aluminium Division — Approved projects within the AluminiumDivision — Medium-term — Taishet Aluminium Smelter”, and “Aluminium Division — PrincipalAluminium Smelters — Irkutsk Aluminium Smelter”.
BUSINESS
— 101 —
Maintain active and responsive production management
During the recent economic downturn the Group responded to weakening demand and pricingenvironment by actively reducing production volumes at its least cost-effective facilities. Comparedto 2008 levels, the Group’s aluminium and alumina production in 2009 is expected to decrease by 11%and 36%, respectively (calculated by comparing the production for the year ended 2008 against theannualised production for the first half of 2009, adjusted to take into account idling of capacity thathas occurred to date).
Production cuts and/or facility shutdowns allow the Group to actively respond to oversupplysituations whenever they occur. By reducing output at higher cost facilities, the Group is able tomaintain high utilisation rates at its core low-cost smelters located in Siberia. The Group’smanagement has prepared comprehensive action plans for a number of least cost-effective facilitiesthat allow the Group to adjust its output and/or idle excess capacity to quickly adapt to changes indemand.
Debt reduction through cash flow management
The Group’s debt as at 30 June 2009 included US$13,690 million under 54 syndicated andbilateral loans with Russian and international lenders. On 7 December 2009, the Group signed aninternational override agreement with 65 international banks and in November and December 2009,the Group signed agreements on the restructuring of its debt with five Russian and Kazakh banks.Further, on 30 October 2009, the Company signed an amendment agreement with VEB. Therestructuring agreements extend the final maturity under the Group’s loans by four years (with theexception of the loan from VEB, which is extended until 29 October 2010). The international lendershave provided a commitment to provide refinancing for a further three-year period following theoverride period subject to a number of conditions being met as at the end of the override period. Inaddition, the Russian and Kazakh lenders (excluding VEB) have provided soft commitments to providerefinancing for a further three-year period following the override period. Interest and principalrepayments under the restructuring agreements are linked to the Group’s performance. Therestructuring agreements limit the Group’s ability to pay dividends, pursue mergers and acquisitionsor make capital expenditure. For further information on the debt restructuring agreements, see“Financial Information — Management’s Discussion and Analysis of Financial Condition and Resultsof Operations — Liquidity and Capital Resources — Debt Restructuring”.
The Group’s management considers reduction of the Group’s leverage as a key priority in thenear and medium term. In addition to the cost management programs described above, the Group’smanagement also intends to monitor opportunities presented by the debt markets to refinance theGroup’s existing debt obligations under more favourable terms.
Maintain leadership in the global aluminium industry in terms of market share and position on the costcurve
Completion of Boguchanskaya Hydropower Plant
One of the key conditions discussed in the Group’s debt restructuring process was that the Groupwould retain BEMO and would be permitted to fund capital expenditure for Phase 1 up to US$300million but would be obliged to refinance by completion through non-recourse debt or, failing which,through additional equity or asset disposal proceeds. This would allow the Group to secure electricitythrough a self-generated long-term electricity contract for the smelter. The Group also intends to seekpartnership opportunities with a leading local or global strategic player in the power generation sector.
BUSINESS
— 102 —
Medium term strategies
Exploit proximity to China/Asia and increase sales to China
The Chinese economy continues to be one of the key drivers in global demand for aluminium.The Group’s aim is to become one of the main external suppliers for Chinese consumers of primaryaluminium, leveraging on its close proximity to the Asian markets and low-cost large productioncapacity. The Group’s marketing strategy aims to increase the percentage of the Group’s total revenuederived from sales to Asia from 21% in 2008 to 29% by 2015, with a target 10% of its total revenuein 2015 derived directly from China.
Completion of advanced projects with attractive fundamentals
In the medium term, once the Group has reduced its restructured debt and subject to itsrestructuring agreements, the Group can quickly resume construction of the 588 thousand tonne perannum Boguchansky smelter and the 750 thousand tonne per annum Taishet smelter if there is arebound in market conditions. The Group also has a number of attractive brownfield and greenfieldbauxite/alumina development opportunities with specific projects including the 413 thousand tonneper annum expansion of the Friguia alumina complex in Guinea and expansion of capacity at theNikolaev alumina refinery (NGZ). Moreover, there is an opportunity for expansion of the ALSCONsmelter.
Kindia (Guinea)-2
The Kindia (Guinea)-2 project is a brownfield development to secure additional bauxiteproduction for the Group. The Kindia Mine in Guinea is operated by Compagnie des Bauxites deKindia (“CBK”) which rents and has the exclusive use of these fixed and certain movable assets fromSociété des Bauxites de Guinée (SBK). The Kindia Mine has 38.2 million tonnes of Proved andProbable Ore Reserves in accordance with the JORC Code. A significant proportion of the proved andprobable reserves of Kindia are attributed to Kindia-2. The Kindia-2 project supports the Group’s orereserves and production at Kindia-2 is expected to increase to 3.8 million tonnes per annum by 2012.The increase in production of bauxite is intended to be shipped predominantly to the Company’sNikolaev refinery, Ukraine.
Long term strategy
In the longer term, the Group has several projects under consideration: greenfield bauxite /alumina opportunities in South East Asia (Vietnam and Indonesia), project Dian Dian in Guinea (abauxite and alumina complex with a proposed alumina production capacity of approximately 5.1million tonnes per annum), and construction of a power plant and up to approximately 600 thousandtonnes per annum aluminium smelter in Libya.
M&A growth options
The Group is not contemplating material acquisitions of assets or companies in the near term.Under the terms of the Group’s debt restructuring agreements, except if certain restrictive conditionsare met, the Group’s ability to pursue M&A opportunities is limited. See “Financial Information —Management’s Discussion and Analysis of Financial Condition and Results of Operations —Restructuring”. Once in a position to do so, the Group’s management will consider opportunistic M&Aoptions that would reinforce the Group’s position as a low-cost vertically integrated primaryaluminium player and enable it to gain further exposure to growth markets and segments.
BUSINESS
— 103 —
Important decision factors for prospective acquisitions in the aluminium smelting segment wouldbe a potential target’s position on the cost curve and access to captive and low-cost electricity. Despitethe Group’s current long position in alumina capacity, the Group’s management will be screeningattractive bauxite mining and alumina refinery acquisition opportunities that would allow the Groupto maintain its self-sufficiency in alumina and support future production increases in the aluminiumsegment.
THE GROUP’S OPERATIONS
As the world’s largest producer of aluminium and alumina based on production in 2008, theGroup has operations in 19 countries across five continents. Some of the Group’s bauxite mines,refineries and smelters are geographically close to each other, and in a few cases form part of the samecomplex. Proximity of facilities results in significant transport cost savings.
The Group’s Aluminium Business Costs in 2008 were US$1,832 per tonne, compared to anindustry average of US$2,072 per tonne in 2008 and US$1,285 per tonne in the first half of 2009,compared with an industry average of US$1,413 per tonne in the same period, according to CRU. Acost curve produced by CRU ranked the Group’s 2008 aggregate aluminium operations in the secondquartile of world production of primary aluminium. The Group’s strong position on the primaryaluminium cost curve is primarily due to its access to competitively priced energy. In-house aluminaproduction and low labour costs are additional factors that contribute to the Group’s relatively lowproduction cost.
The Group’s Alumina Business Costs in 2008 were US$328 per tonne compared to an industryaverage of US$264 per tonne in 2008, and US$235 per tonne in the first six months of 2009, accordingto CRU. A cost curve produced by CRU ranked the Group’s 2008 aggregate alumina operations in thefourth quartile of world production of alumina.
The Group’s Aluminium and Alumina Business Costs fell considerably in the first half of 2009,as the Group implemented a cost reduction programme. See “Financial Information — Management’sDiscussion and Analysis of Financial Condition and Results of Operations — Certain Factors affectingthe Group’s Results of Operations — Cost Reduction”.
The Group’s operations are divided into the following four business divisions:
• Aluminium;
• Alumina;
• Engineering and Construction; and
• Packaging.
Aluminium Division
The Group operates 16 aluminium smelters. The aluminium smelting assets of the Group arelocated in four countries: the Russian Federation (13 plants), Ukraine (one plant), Sweden (one plant)and Nigeria (one plant). Three of the Group’s smelters each produce over 500 thousand tonnes ofprimary aluminium per annum. Two of these, the Bratsk aluminium smelter and the Krasnoyarskaluminium smelter, located in Siberia, are the largest aluminium smelters in the world in terms ofproduction capacity and each produces close to one million tonnes of primary aluminium per annum.The aggregate aluminium production from the Group’s smelters in 2008 was 4.4 million tonnes (and2.0 million tonnes in the first six months of 2009). The Group’s smelters ran at full or near fullcapacity over the three-year period from 2006 to 2008. See “— Capacity and Utilisation”. The Grouphas increased the installed capacities of its key aluminium smelters through the installation ofadditional cells, improved operating practices, enhanced technology and modernisation that have ledto higher efficiency and amperages and longer cell life.
BUSINESS
— 104 —
App1A-28(8)

To address the consequences of the global economic downturn and the deterioration of thealuminium market in 2008 and 2009, the Company introduced a number of measures, including cuttingaluminium production volumes. See “— Strengths and Strategies — Strengths — Secure andsustainable low cost position and power advantage”. Production was reduced at unprofitable facilitieswhich significantly reduced the Group’s average aluminium production costs. Aluminium productionwas reduced by 10% in the first six months of 2009 as compared to the first six months of 2008. Thisenabled the Group to reduce average aluminium production costs by 28% within the first six monthsof 2009 as compared to the same period in 2008.
The Group’s Aluminium Division is managed on a day to day basis by the Director of theAluminium Division under the supervision of the Chief Executive Officer. Each of the Group’saluminium smelters has its own managing director who reports to the Director of the AluminiumDivision. Each such managing director is highly qualified and has substantial experience in thealuminium industry.
Production process of aluminium
The chart below illustrates the production process of aluminium by the Hall-Heroult process. Thetwo major types of technology involved in the electrolysis are Söderberg technology and Pre-baketechnology:
Dissolved in an electrolytic bath of molten cryolite
An electric current is passed through theelectrolyte at low voltage but very high current
The current flows between the petroleum cokeanode and graphite lining cathode
Molten aluminium accumulates at the bottom ofthe pot and its periodically siphoned off and
transported to a holding furnace to be cleanedand cast
The process is continuous, however several potsfrom a “potline” may be taken out of service at
one time to be relined
Alumina
BUSINESS
— 105 —
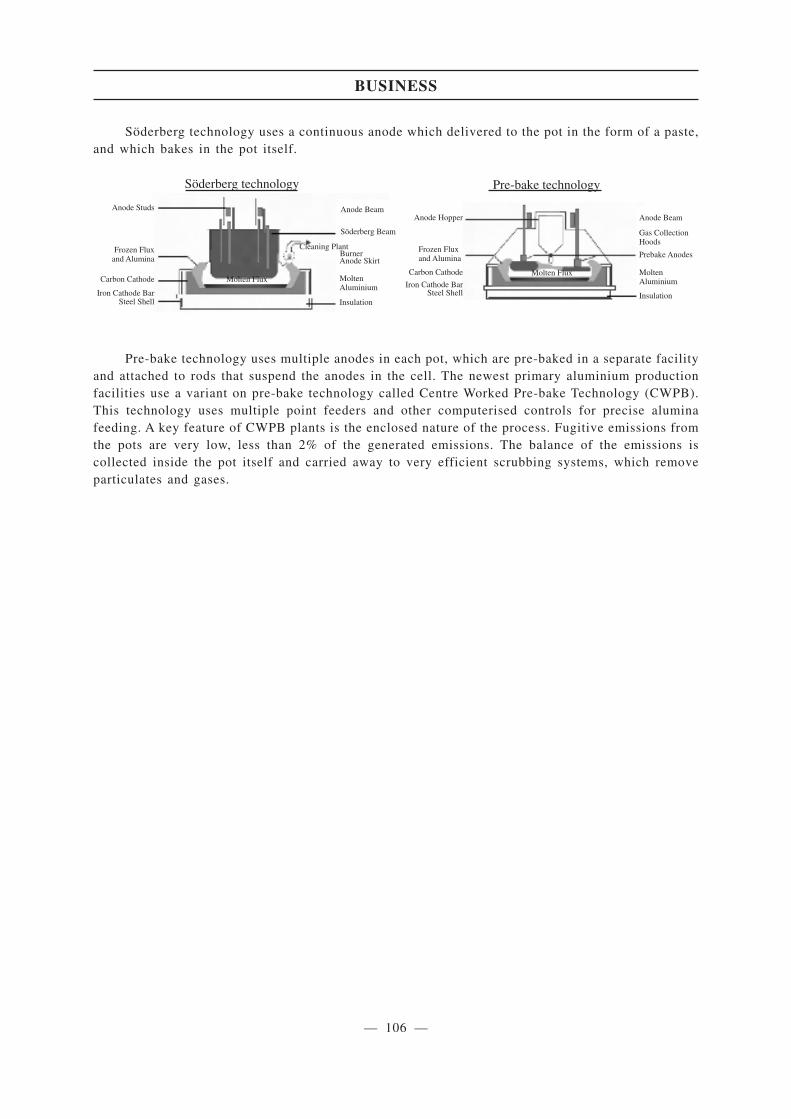
Söderberg technology uses a continuous anode which delivered to the pot in the form of a paste,and which bakes in the pot itself.
Anode Studs
Frozen Fluxand Alumina
Carbon Cathode
Iron Cathode BarSteel Shell
Anode Beam
Söderberg Beam
Cleaning PlantBurner
Insulation
Anode Skirt
MoltenAluminium
Anode Hopper
Frozen Fluxand Alumina
Carbon Cathode
Iron Cathode BarSteel Shell
Anode Beam
Gas CollectionHoods
Prebake Anodes
Insulation
MoltenAluminium
Molten Flux
Pre-bake technologySöderberg technology
Molten Flux
Pre-bake technology uses multiple anodes in each pot, which are pre-baked in a separate facilityand attached to rods that suspend the anodes in the cell. The newest primary aluminium productionfacilities use a variant on pre-bake technology called Centre Worked Pre-bake Technology (CWPB).This technology uses multiple point feeders and other computerised controls for precise aluminafeeding. A key feature of CWPB plants is the enclosed nature of the process. Fugitive emissions fromthe pots are very low, less than 2% of the generated emissions. The balance of the emissions iscollected inside the pot itself and carried away to very efficient scrubbing systems, which removeparticulates and gases.
BUSINESS
— 106 —
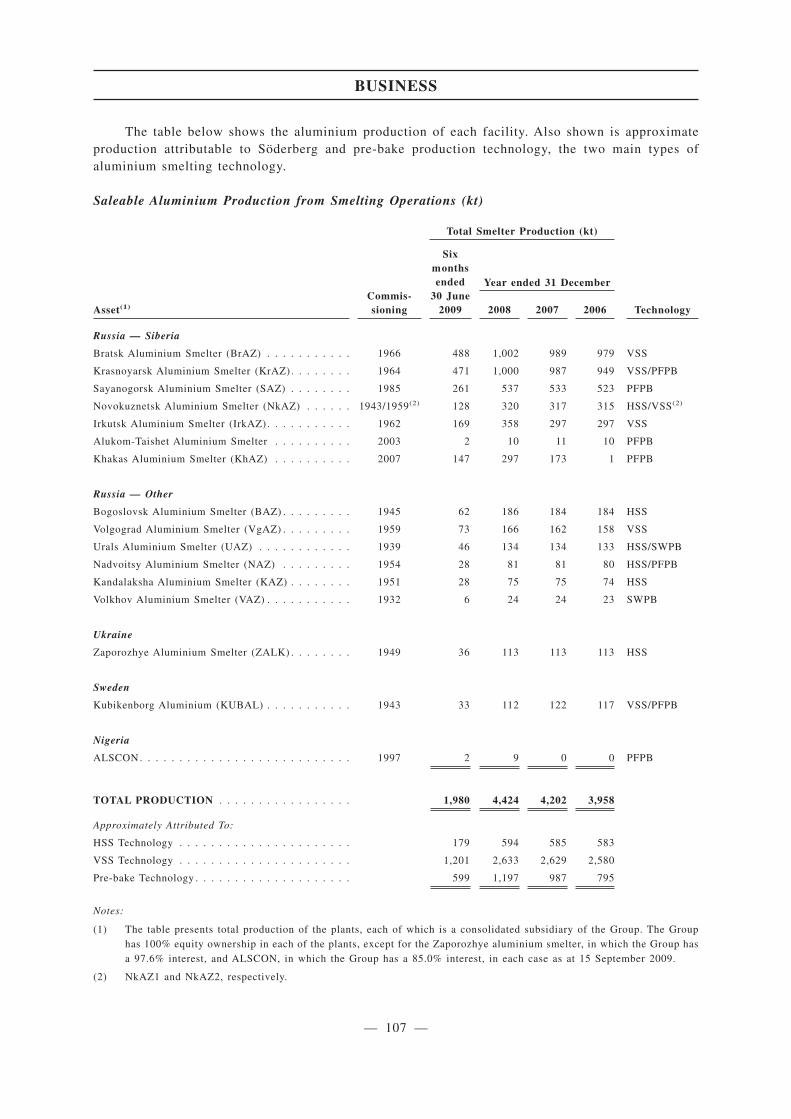
The table below shows the aluminium production of each facility. Also shown is approximateproduction attributable to Söderberg and pre-bake production technology, the two main types ofaluminium smelting technology.
Saleable Aluminium Production from Smelting Operations (kt)
Asset(1)
Commis-sioning
Total Smelter Production (kt)
Sixmonthsended
30 June2009
Year ended 31 December
2008 2007 2006 Technology
Russia — Siberia
Bratsk Aluminium Smelter (BrAZ) . . . . . . . . . . . 1966 488 1,002 989 979 VSS
Krasnoyarsk Aluminium Smelter (KrAZ). . . . . . . . 1964 471 1,000 987 949 VSS/PFPB
Sayanogorsk Aluminium Smelter (SAZ) . . . . . . . . 1985 261 537 533 523 PFPB
Novokuznetsk Aluminium Smelter (NkAZ) . . . . . . 1943/1959(2) 128 320 317 315 HSS/VSS(2)
Irkutsk Aluminium Smelter (IrkAZ) . . . . . . . . . . . 1962 169 358 297 297 VSS
Alukom-Taishet Aluminium Smelter . . . . . . . . . . 2003 2 10 11 10 PFPB
Khakas Aluminium Smelter (KhAZ) . . . . . . . . . . 2007 147 297 173 1 PFPB
Russia — Other
Bogoslovsk Aluminium Smelter (BAZ) . . . . . . . . . 1945 62 186 184 184 HSS
Volgograd Aluminium Smelter (VgAZ) . . . . . . . . . 1959 73 166 162 158 VSS
Urals Aluminium Smelter (UAZ) . . . . . . . . . . . . 1939 46 134 134 133 HSS/SWPB
Nadvoitsy Aluminium Smelter (NAZ) . . . . . . . . . 1954 28 81 81 80 HSS/PFPB
Kandalaksha Aluminium Smelter (KAZ) . . . . . . . . 1951 28 75 75 74 HSS
Volkhov Aluminium Smelter (VAZ) . . . . . . . . . . . 1932 6 24 24 23 SWPB
Ukraine
Zaporozhye Aluminium Smelter (ZALK) . . . . . . . . 1949 36 113 113 113 HSS
Sweden
Kubikenborg Aluminium (KUBAL) . . . . . . . . . . . 1943 33 112 122 117 VSS/PFPB
Nigeria
ALSCON . . . . . . . . . . . . . . . . . . . . . . . . . . . 1997 2 9 0 0 PFPB
TOTAL PRODUCTION . . . . . . . . . . . . . . . . . 1,980 4,424 4,202 3,958
Approximately Attributed To:
HSS Technology . . . . . . . . . . . . . . . . . . . . . . 179 594 585 583
VSS Technology . . . . . . . . . . . . . . . . . . . . . . 1,201 2,633 2,629 2,580
Pre-bake Technology . . . . . . . . . . . . . . . . . . . . 599 1,197 987 795
Notes:
(1) The table presents total production of the plants, each of which is a consolidated subsidiary of the Group. The Grouphas 100% equity ownership in each of the plants, except for the Zaporozhye aluminium smelter, in which the Group hasa 97.6% interest, and ALSCON, in which the Group has a 85.0% interest, in each case as at 15 September 2009.
(2) NkAZ1 and NkAZ2, respectively.
BUSINESS
— 107 —
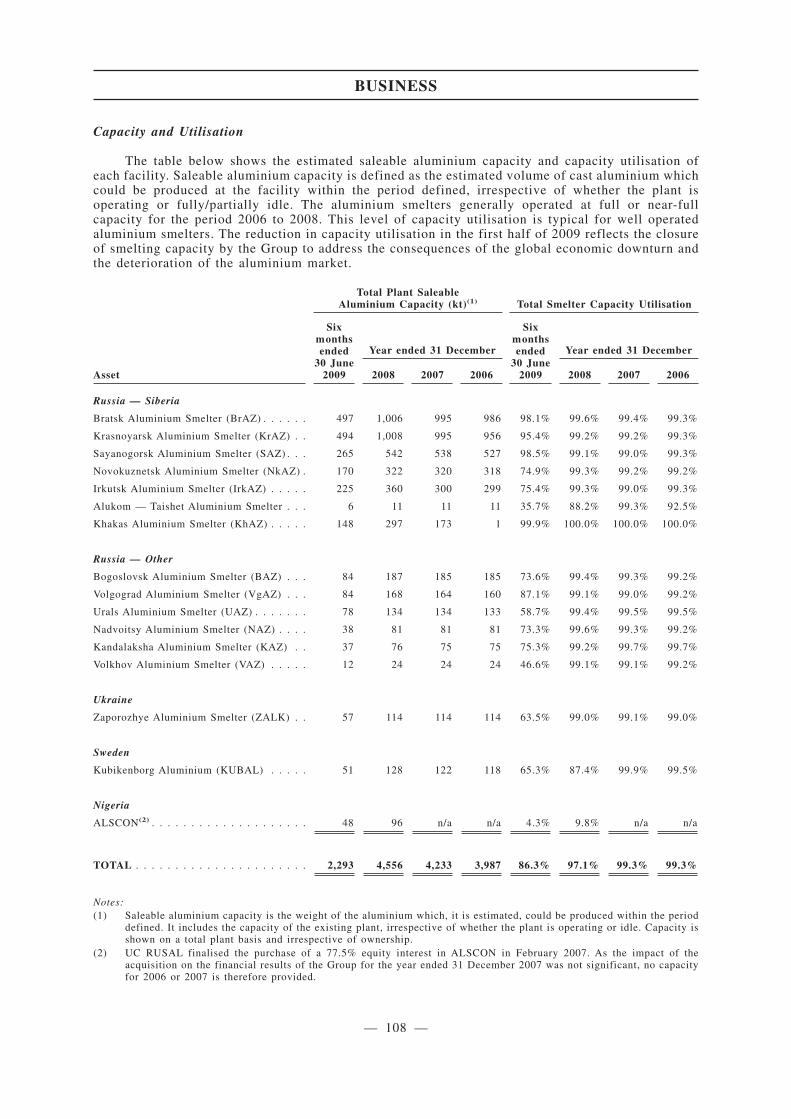
Capacity and Utilisation
The table below shows the estimated saleable aluminium capacity and capacity utilisation ofeach facility. Saleable aluminium capacity is defined as the estimated volume of cast aluminium whichcould be produced at the facility within the period defined, irrespective of whether the plant isoperating or fully/partially idle. The aluminium smelters generally operated at full or near-fullcapacity for the period 2006 to 2008. This level of capacity utilisation is typical for well operatedaluminium smelters. The reduction in capacity utilisation in the first half of 2009 reflects the closureof smelting capacity by the Group to address the consequences of the global economic downturn andthe deterioration of the aluminium market.
Total Plant SaleableAluminium Capacity (kt)(1) Total Smelter Capacity Utilisation
Asset
Sixmonthsended
30 June2009
Year ended 31 December
Sixmonthsended
30 June2009
Year ended 31 December
2008 2007 2006 2008 2007 2006
Russia — Siberia
Bratsk Aluminium Smelter (BrAZ) . . . . . . 497 1,006 995 986 98.1% 99.6% 99.4% 99.3%
Krasnoyarsk Aluminium Smelter (KrAZ) . . 494 1,008 995 956 95.4% 99.2% 99.2% 99.3%
Sayanogorsk Aluminium Smelter (SAZ) . . . 265 542 538 527 98.5% 99.1% 99.0% 99.3%
Novokuznetsk Aluminium Smelter (NkAZ) . 170 322 320 318 74.9% 99.3% 99.2% 99.2%
Irkutsk Aluminium Smelter (IrkAZ) . . . . . 225 360 300 299 75.4% 99.3% 99.0% 99.3%
Alukom — Taishet Aluminium Smelter . . . 6 11 11 11 35.7% 88.2% 99.3% 92.5%
Khakas Aluminium Smelter (KhAZ) . . . . . 148 297 173 1 99.9% 100.0% 100.0% 100.0%
Russia — Other
Bogoslovsk Aluminium Smelter (BAZ) . . . 84 187 185 185 73.6% 99.4% 99.3% 99.2%
Volgograd Aluminium Smelter (VgAZ) . . . 84 168 164 160 87.1% 99.1% 99.0% 99.2%
Urals Aluminium Smelter (UAZ) . . . . . . . 78 134 134 133 58.7% 99.4% 99.5% 99.5%
Nadvoitsy Aluminium Smelter (NAZ) . . . . 38 81 81 81 73.3% 99.6% 99.3% 99.2%
Kandalaksha Aluminium Smelter (KAZ) . . 37 76 75 75 75.3% 99.2% 99.7% 99.7%
Volkhov Aluminium Smelter (VAZ) . . . . . 12 24 24 24 46.6% 99.1% 99.1% 99.2%
Ukraine
Zaporozhye Aluminium Smelter (ZALK) . . 57 114 114 114 63.5% 99.0% 99.1% 99.0%
Sweden
Kubikenborg Aluminium (KUBAL) . . . . . 51 128 122 118 65.3% 87.4% 99.9% 99.5%
Nigeria
ALSCON(2) . . . . . . . . . . . . . . . . . . . . 48 96 n/a n/a 4.3% 9.8% n/a n/a
TOTAL . . . . . . . . . . . . . . . . . . . . . . 2,293 4,556 4,233 3,987 86.3% 97.1% 99.3% 99.3%
Notes:(1) Saleable aluminium capacity is the weight of the aluminium which, it is estimated, could be produced within the period
defined. It includes the capacity of the existing plant, irrespective of whether the plant is operating or idle. Capacity isshown on a total plant basis and irrespective of ownership.
(2) UC RUSAL finalised the purchase of a 77.5% equity interest in ALSCON in February 2007. As the impact of theacquisition on the financial results of the Group for the year ended 31 December 2007 was not significant, no capacityfor 2006 or 2007 is therefore provided.
BUSINESS
— 108 —

The Group’s six largest aluminium smelters accounted for 79% and 84% of its aggregatealuminium production for the year ended 31 December 2008 and the six months ended 30 June 2009,respectively. A summary description of each of the Group’s principal aluminium smelters is set outbelow. The capacity data provided indicates the capacity for 2008. In recent years, the Group operatedat or near capacity, which generally increased over time with respect to each aluminium smelter dueto productivity, technological and other improvements. In accordance with cost-saving measures (see“— Strengths and Strategies — Strengths — Secure and sustainable low cost position and poweradvantage”), the Group shutdown capacities of some of its facilities, including the followingaluminium smelters, Alukom-Taishet (100% of the smelter’s capacity was shutdown as at 30 April2009), Zaporozhye (75% of the smelter’s capacity was shutdown as at 30 June 2009), Volkhov (50%of the smelter’s capacity was shutdown as at 30 June 2009), Nadvoitsy, Kandalaksha, Bogoslovsk andNovokuznetsk (35% of each smelter’s capacity was shutdown as at 30 June 2009). Two HSS potlinesat Urals aluminium smelter commissioned in 1941-1942 were permanently shutdown (35% of thesmelter capacity) and have been torn down as part of the Company’s environmental policy.
Principal Aluminium Smelters
Bratsk Aluminium Smelter. The Bratsk aluminium smelter is the largest producer of primaryaluminium in the world in terms of production capacity, accounting for approximately 25% ofaluminium production in Russia and, according to CRU estimates, approximately 2.7% of the world’soutput in 2008, with a total saleable aluminium production capacity in 2008 of 1,006 thousand tonnesper annum.
• Alumina source — various refineries, including the Group’s Urals, Achinsk, Friguia,Nikolaev and QAL alumina refineries, and third party sources, with alumina from eachsource being processed in potrooms dedicated to such source, which promotes the stabilityof the production process;
• Energy source — electrical power is supplied primarily by the Bratsk hydroelectric powerstation owned and operated by Irkutskenergo, which is controlled by the beneficial ownersof En+. The Bratsk hydroelectric power station is situated on the Angara Riverapproximately 8 miles from the Bratsk aluminium smelter. The grid connecting the powerstation to the smelter is owned by the Group. In 2008, the smelter consumed approximately75% of the power generated by the Bratsk hydroelectric power station, which currentlyoperates at below full capacity.
The Bratsk aluminium smelter is located approximately 15 km by road from the town of Bratskin the Irkutsk region in Siberia.
The Bratsk aluminium smelter has direct rail links to the nearby Trans-Siberian rail system,providing ready means for materials and end products transportation. Pitch and coke for use in theon-site anode paste production facilities are supplied by a variety of sources from China and fromwithin the Russian Federation, and cathode blocks are sourced from China.
The small settlement, Chekanovsky, is located close to the smelter and, under a federal plan andan agreement signed with the local communities in March 2007, the residents will be relocated out ofthis town to Bratsk and other communities for health and safety reasons at an anticipated cost ofUS$20 million. The relocation is expected to be completed in 2012. See “Risk Factors — Risksrelating to the Group and its Business — The Group operates in an industry that gives rise to health,safety and environmental risks”.
BUSINESS
— 109 —

Krasnoyarsk Aluminium Smelter. The Krasnoyarsk aluminium smelter is the second largestsmelter in the world in terms of production capacity and accounts for approximately 24% ofaluminium production in Russia and, according to CRU estimates, approximately 2.43% of globaloutput in 2008, with a production capacity in 2008 of 1,008 thousand tonnes per annum.
• Alumina source — various refineries, including the Group’s Achinsk and Bogoslovskalumina refineries, and third party sources (supplies from each refinery are provided todedicated potrooms for better production performance);
• Energy source — electrical power is provided via the Krasnoyarskenergo grid.Krasnoyarskenergo obtains electricity in part from the Krasnoyarskaya HPP, which iscontrolled by the beneficial owner of En+ and is situated on the Yenisei Riverapproximately 45 km from the smelter. The capacity of the power station is in excess ofcurrent local requirements.
The Krasnoyarsk aluminium smelter is located on the outskirts of the city of Krasnoyarsk, whichis located on the Trans-Siberian railway and other major rail routes, providing good rail access for thesupply of materials and delivery of finished products.
The Krasnoyarsk aluminium smelter has just finished implementing a modernisation programme,which is expected to reduce hazardous emissions of hydrogen fluoride, tarry matters and benzapyreneby 1.5 times, 2.7 times and 2.5 times, respectively, for every tonne of aluminium produced. Theprogramme commenced in 2004 and was completed in September 2009. The total capital expenditurefor the project was approximately US$296 million, excluding VAT.
The Krasnoyarsk aluminium smelter has a single anode paste plant on-site that produces theanode paste required for the Söderberg cells. The smelter also has three potrooms pre-bake cells, forwhich anodes are purchased from the Sayanogorsk aluminium smelter and Chinese suppliers. Pitchand coke for use in the production of anode paste at the on-site anode paste plant are delivered by railfrom a variety of sources within the Russian Federation and China.
Sayanogorsk Aluminium Smelter. The Sayanogorsk aluminium smelter is the third largestaluminium producer in Russia in terms of production capacity, which in 2008 constituted 542 thousandtonnes per annum.
• Alumina source — the Nikolaev alumina refinery;
• Energy source — electrical power for the Sayanogorsk smelter used to be provided via theindependent Khakasenergo grid, which was supplied by the Sayano-Shushenskayahydroelectric power plant, situated on the Yenisei River approximately 50 km from thesmelter. Following a major accident at Sayano-Shushenskaya HPP in August 2009,alternative power suppliers have been located to ensure supply of electricity to the affectedsmelters. The accident resulted in temporary loss of production from eight cells (less than3% of total production), but the smelter resumed operating at normal capacity within a shorttimeframe. See “Risk Factors — Risks relating to the Group and its Business — TheGroup’s competitive position in the global aluminium industry is highly dependent oncontinued access to inexpensive and uninterrupted electricity supply, in particular,long-term contracts for such electricity; increased electricity prices (particularly as a resultof deregulation of electricity tariffs), as well as interruptions in the supply of electricity,could have a material adverse effect on the Group’s business, financial condition and resultsof operations”.
The Sayanogorsk aluminium smelter is located on the outskirts of the town of Sayanogorsk,Khakasia Republic in southern Siberia, approximately 75 km south of the regional capital city ofAbakan. The town has good rail access for the supply of materials and delivery of finished products.
BUSINESS
— 110 —
App1A-28(b)

The Sayanogorsk aluminium smelter is a relatively modern aluminium production facility, whichutilises pre-baked anode technology throughout. The Sayanogorsk smelter has its own carbonfacilities, including a recently constructed baking furnace for the Khakas aluminium smelter. Thefurnace has reached its full capacity of 15,000 tonnes of anodes per month, allowing the Group to meetthe demand for anodes of both the Sayanogorsk aluminium smelter and the Khakas aluminium smelterin full. The smelter receives the required pitch from suppliers within the Russian Federation and cokefrom a variety of suppliers in the Russian Federation and China. In addition to metals produced,Sayanogorsk also produces liquid aluminium, which is transferred to SAYANAL, one of the Group’spackaging plants, located adjacent to the Sayanogorsk smelter.
Khakas Aluminium Smelter. The Khakas aluminium smelter is the first Russian smelterconstructed in over 20 years and is the largest construction project in the Russian aluminium industrysince Soviet times. The smelter was constructed by the Group adjacent to the Sayanogorsk aluminiumsmelter as its fifth potline.
• 2008 Capacity — 297 thousand tonnes per annum;
• Alumina source — QAL, Australia;
• Energy source — electrical power for the Khakas smelter used to be provided via theKhakasenergo grid, which was supplied by the Sayano-Shushenskaya hydroelectric powerplant. Following a major accident at Sayano-Shushenskaya HPP in August 2009 alternativepower suppliers have been located to ensure supply of electricity to the affected smelters.See “Risk Factors — Risks relating to the Group and its Business — The Group’scompetitive position in the global aluminium industry is highly dependent on continuedaccess to inexpensive and uninterrupted electricity supply, in particular, long-termcontracts for such electricity; increased electricity prices (particularly as a result ofderegulation of electricity tariffs), as well as interruptions in the supply of electricity, couldhave a material adverse effect on the Group’s business, financial condition and results ofoperations”.
Engineering for the smelter commenced in August 2004, and construction began in March 2005.Commissioning of the smelter was undertaken in four phases. The first metal production at Khakasoccurred in late November 2006, and the last pot came on line in October 2007, at which point thesmelter became operational. The project was fully implemented by the Group’s own Engineering,Procurement, Construction and Management (“EPCM”) team and the smelter utilises state-of-the-arttechnology developed by UC RUSAL, including pre-bake anodes. At the end of 2008, the Khakasaluminium smelter reached its full capacity of approximately 297 thousand tonnes per annum. The gastreatment centres at the smelter exceed global environmental standards. The total capital expenditurefor the construction of the smelter constituted US$710.3 million.
Irkutsk Aluminium Smelter. The Irkutsk aluminium smelter is one of the oldest aluminiumsmelters in Siberia.
• 2008 Capacity — 360 thousand tonnes per annum;
• Alumina source — the Achinsk alumina refinery, Bogoslovsk alumina refinery, Uralsalumina refinery and third party sources;
• Energy source — electrical power is supplied primarily by Irkutskenergo (which iscontrolled by the beneficial owners of En+) via the regional grid. The grid is supplied bythree primary hydroelectric plants at Irkutsk, Bratsk and Ust-Ilimsk and supplemented bya series of smaller hydro and thermal power stations located around the province.
BUSINESS
— 111 —
App1A-28(6)
The Irkutsk aluminium smelter is situated 1.7 km from the town of Shelekhov, around 22 km tothe northwest of the city of Irkutsk. The east-west Siberian railway runs 2 km east of the facility.
The Group is currently in the process of completing the IrKAZ-5 Project, which involves theconstruction of a fifth aluminium smelting potline using high amperage pre-bake technologydeveloped by SibVAMI. After the commissioning of the new potline, the total capacity of the smelteris expected to increase by approximately 169 thousand tonnes, to approximately 466 thousand tonnesper annum. Baked anode blocks for the new potline will be procured from China and delivered to thesmelter by rail. Construction of IrKAZ-5 commenced in 2005, and the project first produced metal in2007. 77% of 300 kA PFPB cells, gas treatment centres and a new casthouse have been commissionedand the full commissioning of the remaining cells is scheduled to occur by the end of 2009. The totalcapital expenditure for the construction of the project is currently estimated at approximately US$617million, excluding VAT, of which US$561 million had been spent as of 30 June 2009.
The Irkutsk aluminium smelter is currently served by two railway stations adjacent to theproduction facilities (Zavodskaya and Goncharovo). The smelter receives pitch and coke for theproduction of anode paste by rail from a variety of sources within the Russian Federation.
Novokuznetsk Aluminium Smelter. The Novokuznetsk aluminium smelter comprises two separateand relatively independent smelter sites, although for management, sales, accounting and maintenancepurposes the sites are considered to be one integrated smelter operation.
• 2008 Capacity — 322 thousand tonnes per annum;
• Alumina source — the Urals alumina refinery and third party sources;
• Energy source — electrical power for the smelter is purchased from the wholesale energymarket.
Both production sites are located in Novokuznetsk, which is situated in the Kemerovo Regionalong the Tom’ River. Each of the two production sites at the smelter has a dedicated casthouse andits own anode paste production facility. Calcined coke for the anode paste plant is delivered by railfrom suppliers from the USA, India and Argentina. The plant receives pitch from a Novokuznetsksupplier by rail.
Approved Projects within the Aluminium Division
The Group is currently undertaking the following projects within the constraints imposed by itsdebt restructuring agreements. See “Financial Information — Liquidity and Capital Resources — DebtRestructuring”.
Boguchanskoye Energy and Metals Project (BEMO Project). In May 2006, RUSAL andRusHydro (previously HydroOGK), controlled by the Russian Government, entered into a cooperationagreement to jointly construct the Boguchanskoye Energy and Metals Complex. BEMO is ultimatelyintended to involve the construction of the 3,000 MW Boguchanskaya hydropower plant (HPP) on theAngara River and the approximately 588 thousand tonnes per annum Boguchansky aluminium smelter8 kilometres southeast of Tayozhniy, in the Krasnoyarsk region. At the date of this prospectus, onlycapital expenditure relating to the HPP is permitted under the terms of the Group’s debt restructuringagreements. For further information concerning the BEMO Project, see “— Norilsk Nickel andMaterial Joint Ventures — Material Joint Ventures — Boguchanskoye Energy and Metals Project(BEMO Project)”.
Medium-Term — Taishet Aluminium Smelter. The first stage of the 750 thousand tonne per annumTaishet aluminium smelter is expected to be commissioned in 2011, and the entire plant is expectedto reach full capacity in 2014. Construction at the Taishet aluminium smelter began in April 2007. The
BUSINESS
— 112 —
Taishet aluminium smelter will comprise four potrooms equipped with state-of-the-art RA-400 cellsdeveloped by the Group’s Engineering and Technology Centre. The total capital expenditure for theTaishet aluminium smelter (excluding construction of the anode plant) is currently estimated atapproximately US$1,987 million, excluding VAT, of which US$495 million, excluding VAT, had beenspent as of 30 June 2009. The construction has been temporarily suspended in view of the currentmarket downturn. The debt restructuring agreements generally prohibit the Group from incurringcapital expenditure in relation to this project through the end of the override period but permit theGroup to fund development of the project on a project finance (non-recourse) basis or through certainequity investments in the project. The Group is in the process of negotiating project financing fromvarious international lenders, including with support from export credit agencies in Japan and Koreaand potential participation of Korean and Japanese equity investors in the project. The Group is alsoconsidering integration of the project with the BEMO project.
The Taishet aluminium smelter is located in the outskirts of Taishet in Siberia, on the EastSiberian rail route, in the Irkutsk region of the Russian Federation, situated approximately midwaybetween Bratsk and Krasnoyarsk.
Medium-Term-ALSCON. ALSCON is located at Ikot Abasi in the Akwa Ibom State of Nigeria andwas initially conceived in 1981 by the government of Nigeria to take advantage of the abundant gasreserves in the region. Construction of the smelter was completed by Ferrostaal AG and ReynoldsInternational and first metal produced in 1997, but the smelter was closed in June 1999 for lack ofworking capital. The Group acquired a 77.5% ownership stake in ALSCON in February 2007. TheGroup has entered into a long-term take or pay gas contract with Nigerian Gas Company that isnecessary for production at ALSCON and resumed production at the smelter in February 2008. In2010, it is expected that an additional 54 cells will become operational and that it will also produceits own anode.
ALSCON is currently a loss-generating asset and is not expected to become profitable until acapital investment program has been completed with the smelter reaching its full capacity of 197thousand tonnes per annum. A feasibility study for internal investment approval was completed inSeptember 2008. The program requires an investment of approximately US$298 million over theperiod of 2009-2011, of which US$76 million had been spent as of 30 June 2009. The debtrestructuring agreements generally prohibit the Group from incurring capital expenditure in relationto this program through the end of the override period but permit the Group to fund the program ona project finance (non-recourse) basis or through certain equity investments in the project. The Groupis currently considering a disposal of 50% of its interest in ALSCON to a strategic investor.
Production of Other Aluminium Products or Other Materials Related to Aluminium Production
In addition to the production of primary aluminium, the Group also has facilities for theproduction of a number of other aluminium products, including aluminium powder, silicon andsecondary aluminium and it produces other materials related to aluminium production.
The Group has two cryolite plants and one cathode plant, which produce essential materials forthe aluminium production process. The Group also has a number of anode production facilities, whichare integrated with certain aluminium smelters.
Aluminium fluoride, cryolite and fluoride concentrate. Both of the Group’s cryolite plants, OJSCPolevskoy Cryolite Plant and OJSC South Urals Cryolite Plant, are located in the Russian Federation.The main products of the cryolite plants are cryolite and aluminium fluoride, which are both used inthe aluminium production process at the Group’s smelters. The plants’ cryolite production more thanmeets the demand for the product by Group aluminium smelters, with the excess production sold tothird parties. In 2008, the two plants produced approximately 75% (and in the first six months of 2009,approximately 70%) of the Group’s demand for non-granulated aluminium fluoride. In July 2008,operations of certain Polevskoy Cryolite Plant facilities were temporarily suspended for a period of
BUSINESS
— 113 —
less than 30 days due to violations of industrial safety requirements, following which operations wereresumed. The main supplier of fluoride (CaF2) concentrate (FF-90) for production of cryolite andaluminium fluoride is Yaroslavskaya Gorno-Rudnaya Company, which is held by the Group togetherwith UK RGRK on a 50/50 basis. The Yaroslavskaya Gorno-Rudnaya Company holds the Yaroslavskymine, which is the largest fluoride mine in the world.
Cathodes. The Group’s demand for cathode blocks for regular repair is 31 to 45 thousand tonnesper annum depending on relining schedule and cell life cycle. The Group’s cathode plant located inChina, Shanxi RUSAL Cathode Co. Ltd., currently has a capacity for production of cathode blocks ofmore than 15 thousand tonnes per annum and is undergoing an expansion and modernisationprogramme to increase production capacity to 19.8 thousand tonnes per annum. In March 2008, theGroup acquired assets of another cathode plant in Taigu County of Shanxi Province, China which havebeen integrated into Shanxi RUSAL Cathode Co. Ltd., and such integration has increased the Group’sproduction of cathodes by up to 15 thousand tonnes of cathode blocks annually. Upon completion ofShanxi RUSAL Cathode Co. Ltd. expansion program, including the integrated assets of the cathodeplant in Taigu County, the Group’s production of cathodes is expected to increase up to 40.7 thousandtonnes of cathode blocks annually. The expanded facility is expected to come on line by the end of2012. The Group purchases the remainder of its cathodes requirement from the Novosibirsk ElectrodePlant and Ukranian Graphite. The Group is currently considering options to increase its cathode blocksproduction capacity through further acquisitions and/or joint ventures.
Anodes. Although a number of the Group’s aluminium smelters (including Khakas, Sayanogorskand ALSCON) have captive anode-shops capable of producing sufficient anodes to meet theirrequirements, the Group currently does not have sufficient anode production capacity to meet itsoverall demand for anodes.
The table below shows the production data from each cryolite and cathode facility.
Cryolite, Aluminium Fluoride and Cathode Production (kt)
Asset (1) Product
Total Plant Production
Six monthsended 30
June 2009
Year ended 31 December
2008 2007 2006
Polevskoy Cryolite Plant . . . . . . . . . . . . . . . . Cryolite 0.7 4.0 4.0 5.5
Alum. Fluoride 7.5 36.3 35.0 36.2
South Urals Cryolite Plant . . . . . . . . . . . . . . . Cryolite 2.4 6.4 7.0 9.0
Alum. Fluoride 21.6 56.7 55.0 53.1
Shanxi RUSAL Cathode Co. Ltd. . . . . . . . . . . Cathodes 10.3 14.6 15.4 11.2
Note:
(1) The table presents total production of the plants, each of which is a consolidated subsidiary of the Group. The Grouphas 94.17% equity ownership in OJSC Polevskoy Cryolite Plant, 93.49% equity ownership in OJSC South Urals CryolitePlant, 100% equity ownership in Shanxi RUSAL Cathode Co. Ltd., which has a branch located in Taigu County of ShanxiProvince, China in each case as at 15 September 2009.
Aluminium Powder Metallurgy. The Group has three aluminium powder metallurgy plants, andthe aggregate aluminium powder production from the Group’s plants was 18.7 thousand tonnes in 2008and 6.7 thousand tonnes in the first six months of 2009.
BUSINESS
— 114 —
Silicon Smelting. The Group has three silicon smelters. The aggregate attributable siliconproduction from the Group’s plants was 58.0 thousand tonnes in 2008 and 9.0 thousand tonnes in thefirst six months of 2009. The Group uses most of this silicon in the production of alloys. The Groupis currently considering a disposal of all or part of its silicon assets. These assets are non-core to theGroup’s business, and such disposal would not be expected to have a material impact on its operations.
Secondary Aluminium. The Group has three secondary aluminium plants, and the aggregateattributable secondary aluminium production from the Group’s plants was 28.7 thousand tonnes in2008 and 10.0 thousand tonnes in the first six months of 2009.
Alumina Division
The Group’s Alumina Division comprises both the alumina refineries involved in aluminaproduction and the mining assets of the Group.
Alumina Production
The Group has 13 alumina refineries. In recent years, the Group has substantially increased itsrefining capacities by means of new acquisitions and increased holdings in existing assets. See“History and Corporate Structure — History and Development”. The alumina refineries of the Groupare located in six countries: Ireland (one plant), Jamaica (two plants), Ukraine (two plants), Italy (oneplant), the Russian Federation (four plants) and Guinea (one plant). In addition, the Group holds a 20%equity stake in Queensland Alumina Limited, the second largest alumina refinery in the world in termsof production capacity. Most of the Group’s refineries have ISO9001 certified quality control systems,ten refineries and QAL have been ISO14001 certified for their environmental management and threehave received OHSAS18001 certification for their health and safety management system.
The aggregate alumina production from the Group’s plants was 11.3 million tonnes for the yearended 31 December 2008 and 3.7 million tonnes for the six months ended 30 June 2009.
As part of the cost-cutting measures implemented in response to the global economic downturnand aimed at increasing the Group’s efficiency, the Company optimised alumina production throughsuspension of its operations at Alpart and Windalco (Jamaica), Eurallumina (Italy) and ZALK(Ukraine), and by decreasing production volumes at Aughinish (Ireland) by 39.5%, at AGK (Russia)by 16.6% and at BGZ (Russia) by 26.4% in 2009 according to the Company’s estimates. Aluminaproduction in the first six months of 2009 was reduced by 36% (on an annualised basis, adjusted totake into account the idling of capacity that has occurred to date) as compared to the first six monthsof 2008. See also “— Strengths and Strategies”.
BUSINESS
— 115 —
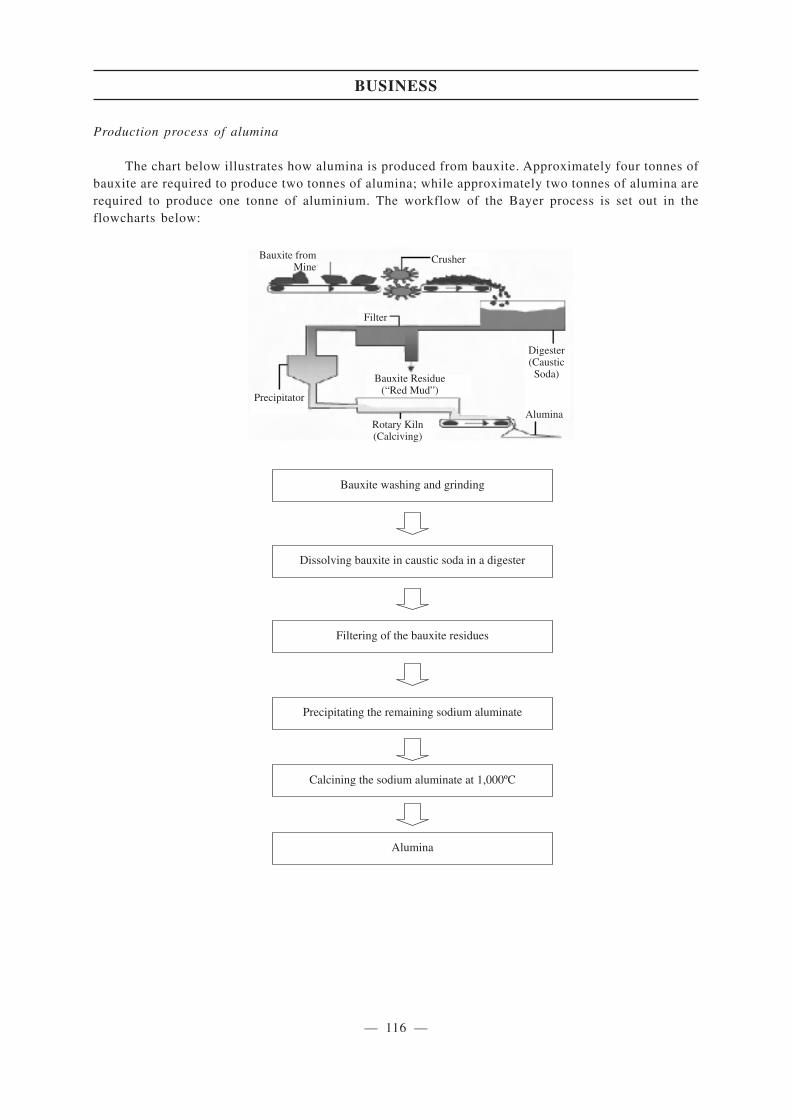
Production process of alumina
The chart below illustrates how alumina is produced from bauxite. Approximately four tonnes ofbauxite are required to produce two tonnes of alumina; while approximately two tonnes of alumina arerequired to produce one tonne of aluminium. The workflow of the Bayer process is set out in theflowcharts below:
Bauxite washing and grinding
Dissolving bauxite in caustic soda in a digester
Filtering of the bauxite residues
Precipitating the remaining sodium aluminate
Calcining the sodium aluminate at 1,000ºC
Alumina
Bauxite fromMine
Crusher
Filter
Precipitator
Bauxite Residue(“Red Mud”)
Digester(CausticSoda)
AluminaRotary Kiln(Calciving)
BUSINESS
— 116 —
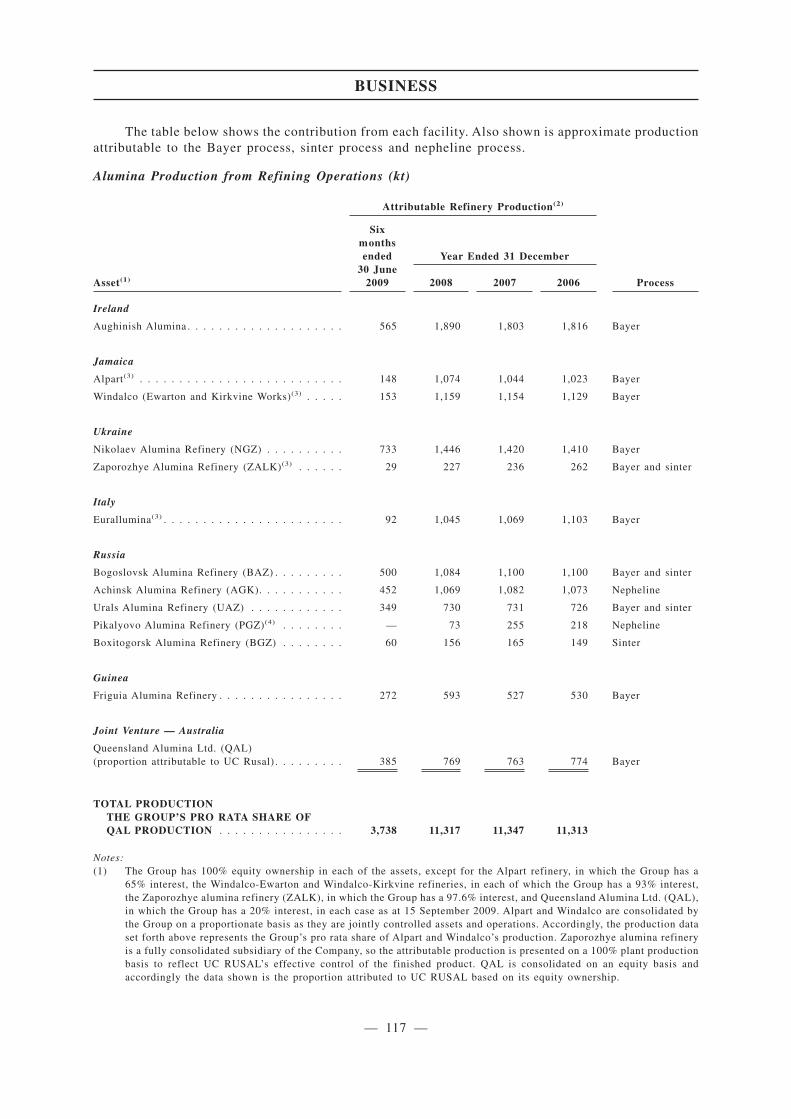
The table below shows the contribution from each facility. Also shown is approximate productionattributable to the Bayer process, sinter process and nepheline process.
Alumina Production from Refining Operations (kt)
Attributable Refinery Production(2)
Asset(1)
Sixmonthsended
30 June2009
Year Ended 31 December
2008 2007 2006 Process
Ireland
Aughinish Alumina . . . . . . . . . . . . . . . . . . . . 565 1,890 1,803 1,816 Bayer
Jamaica
Alpart(3) . . . . . . . . . . . . . . . . . . . . . . . . . . 148 1,074 1,044 1,023 Bayer
Windalco (Ewarton and Kirkvine Works)(3) . . . . . 153 1,159 1,154 1,129 Bayer
Ukraine
Nikolaev Alumina Refinery (NGZ) . . . . . . . . . . 733 1,446 1,420 1,410 Bayer
Zaporozhye Alumina Refinery (ZALK)(3) . . . . . . 29 227 236 262 Bayer and sinter
Italy
Eurallumina(3) . . . . . . . . . . . . . . . . . . . . . . . 92 1,045 1,069 1,103 Bayer
Russia
Bogoslovsk Alumina Refinery (BAZ) . . . . . . . . . 500 1,084 1,100 1,100 Bayer and sinter
Achinsk Alumina Refinery (AGK). . . . . . . . . . . 452 1,069 1,082 1,073 Nepheline
Urals Alumina Refinery (UAZ) . . . . . . . . . . . . 349 730 731 726 Bayer and sinter
Pikalyovo Alumina Refinery (PGZ)(4) . . . . . . . . — 73 255 218 Nepheline
Boxitogorsk Alumina Refinery (BGZ) . . . . . . . . 60 156 165 149 Sinter
Guinea
Friguia Alumina Refinery . . . . . . . . . . . . . . . . 272 593 527 530 Bayer
Joint Venture — Australia
Queensland Alumina Ltd. (QAL)(proportion attributable to UC Rusal) . . . . . . . . . 385 769 763 774 Bayer
TOTAL PRODUCTIONTHE GROUP’S PRO RATA SHARE OFQAL PRODUCTION . . . . . . . . . . . . . . . . 3,738 11,317 11,347 11,313
Notes:(1) The Group has 100% equity ownership in each of the assets, except for the Alpart refinery, in which the Group has a
65% interest, the Windalco-Ewarton and Windalco-Kirkvine refineries, in each of which the Group has a 93% interest,the Zaporozhye alumina refinery (ZALK), in which the Group has a 97.6% interest, and Queensland Alumina Ltd. (QAL),in which the Group has a 20% interest, in each case as at 15 September 2009. Alpart and Windalco are consolidated bythe Group on a proportionate basis as they are jointly controlled assets and operations. Accordingly, the production dataset forth above represents the Group’s pro rata share of Alpart and Windalco’s production. Zaporozhye alumina refineryis a fully consolidated subsidiary of the Company, so the attributable production is presented on a 100% plant productionbasis to reflect UC RUSAL’s effective control of the finished product. QAL is consolidated on an equity basis andaccordingly the data shown is the proportion attributed to UC RUSAL based on its equity ownership.
BUSINESS
— 117 —

(2) Includes calcined and hydrate alumina. Aughinish alumina refinery produced 64,260 tonnes of hydrate in 2008.Eurallumina produced 71,054 tonnes of hydrate in 2008. Windalco (Ewarton and Kirkvine combined) produced 32,297tonnes of hydrate in 2008. Nikolaev alumina refinery produced 27,843 tonnes of hydrate in 2008. Bogoslovsk aluminarefinery produced 35,281 tonnes of hydrate in 2008. Achinsk alumina refinery produced 12,166 tonnes of hydrate in2008. Urals alumina refinery produced 9,146 tonnes of hydrate in 2008 and Boxitogorsk alumina refinery produced60,157 tonnes of hydrate in 2008. ZAlK produced 1,390 tonnes of hydrate in 2008. QAL, Alpart and Friguia producecalcined alumina only.
(3) Production was temporarily suspended in the first six months of 2009.
(4) Pikalyovo alumina refinery was sold to Basel-Cement in 2008.
The Group’s six largest alumina refineries in terms of production accounted for 68% and 80%,respectively, of its aggregate alumina production for the year ended 31 December 2008 and for the sixmonths ended 30 June 2009. A summary of each of the Group’s principal alumina refineries is set outbelow. The capacity data provided indicates the capacity for 2008. Through 2008, the Group operatedat or near capacity, which before 2008 has generally increased over time with respect to each aluminarefinery due to productivity, technological and other improvements. In 2009, however, the Groupreduced output of its alumina refineries to adjust to the decrease in demand for aluminium.
Alumina is predominantly produced through the purification of bauxite to aluminium oxide usingthe Bayer process, though several other processes exist. All of the Group’s refineries process bauxite,with the exception of the Achinsk alumina refinery, which uses nepheline ore as the feedstock. TheGroup is progressively upgrading and modernising its alumina refining equipment to improve thealumina quality, yield, physical properties and raw material consumption.
Principal Alumina Refineries
Aughinish Alumina Refinery. The Aughinish alumina refinery is the Group’s largest aluminarefinery in terms of production capacity.
• 2008 production — 1.89 million tonnes per annum;
• Bauxite sources — Compagnie des Bauxites de Guinea (CBG) in Guinea and Mineracao Riodo Norte (MRN) in Brazil;
• Alumina deliveries — to the Group smelters and third parties;
• Energy source — all of the refinery’s electricity and steam requirements are sourced froman on-site combined heat and power (CHP) plant, which was commissioned in January2006. Currently, the CHP plant generates steam and electricity for the refinery and suppliessurplus energy to the local grid.
The refinery is situated on Aughinish Island on the south side of the Shannon estuary betweenAskeaton and Foynes, 32 km downstream from Limerick City, Ireland.
The Aughinish alumina refinery has a research and development programme supported byextensive links with the Irish government, Limerick University and various industry bodies. Therefinery has successfully obtained external funding for a variety of research activities, and theprogramme has led to enhancements in the operation of the refinery, especially in the areas ofdigestion and calcining.
BUSINESS
— 118 —

The Aughinish alumina refinery is served by a captive deep-water terminal in the ShannonEstuary for both the import of materials and the export of finished product. Currently, Aughinish isoperated on a reduced production mode as one of the precipitation trains has been removed fromoperations. If it were to become necessary, Aughinish could return to full capacity after a two-monthperiod required for preparation.
Nikolaev Alumina Refinery. The Nikolaev alumina refinery is the second largest producer ofalumina in the CIS in terms of production capacity.
• 2008 production — 1.45 million tonnes per annum;
• Bauxite source — several sources, predominantly Compagnie des Bauxites de Kindia(“CBK”), but also from Bauxite Company of Guyana Inc. (“BCGI”) and the Weipa mine inAustralia;
• Alumina deliveries — to a number of smelters within the Group, including the Bratskaluminium smelter, Krasnoyarsk aluminium smelter and the Sayanogorsk aluminiumsmelter, as well as to third parties;
• Energy source — approximately two-thirds of the refinery’s electricity needs are met by thenational grid, the remainder being supplied by the refinery’s own generating facility. TheNikolaev alumina refinery power station is also used to generate steam for the refinery. Themain fuel used by the captive power station is natural gas, heavy fuel oil being used onlyas a standby/backup energy source.
The Nikolaev alumina refinery is located on the Yuzhny (Southern) Bug river, approximately30km upstream from the Black Sea coast in Ukraine, and approximately 25km from the town centreof Nikolaev.
The Nikolaev alumina refinery is undertaking an expansion project that is expected to increaseplant production from 1.4 million tonnes per annum to 1.7 million tonnes per annum. The Group iscontractually obligated to produce alumina at the Nikolaev refinery in amount of not less than 1.6million tonnes not later than 2012. The total capital expenditure is estimated at US$155 million,including value-added-tax, of which US$125 million has been incurred as of 30 June 2009. Consistentwith the terms of its debt restructuring agreements, the Group intends to spend US$2.2 million toincrease alumina production to 1.5 million tonnes in 2010 and to then suspend the expansion projectsthrough the end of the override period. The Group will need (and expects to receive) a waiver fromits contractual counterparty in connection with that suspension.
The refinery also includes a hydrometallurgical facility that produces gallium metal.
Bogoslovsk Alumina Refinery. The Bogoslovsk alumina refinery, part of the Bogoslovsk aluminaand aluminium complex, is the fourth largest producer of alumina in the CIS in terms of productioncapacity.
• 2008 production — 1.08 million tonnes per annum;
• Bauxite source — Timan and North Urals bauxite mines;
• Alumina deliveries — to a number of smelters within the Group, including the on-siteBogoslovsk smelter and the Kandalaksha, Nadvoitsy and Volgograd aluminium smelters;
BUSINESS
— 119 —

• Energy source — electricity is supplied by several wholesale market suppliers via theregional grid, which is operated by Sverdlovskenergo. A third-party owned off-site thermalpower station also produces electrical power, as well as steam and hot water for the townand plant. The calciner kilns and the sintering kilns are fired by natural gas supplied byUralnorthgas with heavy fuel oil used for standby supply/backup.
The Bogoslovsk alumina and aluminium complex is situated in the centre of the town ofKrasnoturyinsk, located in the Ural Mountains, approximately 370km to the north of Ekaterinburg inthe Sverdlovsk region.
Achinsk Alumina Refinery. The Achinsk alumina refinery is one of the largest alumina refineriesin Russia in terms of production capacity.
• 2008 production — 1.07 million tonnes per annum;
• Nepheline and limestone sources — Kiya Shaltyr nepheline mine and the adjacentMazulsky limestone quarry, which are leased by Achinsk alumina refinery;
• Alumina deliveries — to Krasnoyarsk, Bratsk, Irkutsk and Volkhov aluminium smelters;
• Energy source — captive thermal power plant on site. Currently, the plant also purchasespower from Krasnoyarskenergosbyt to supplement its own supply. The captive powerstation also meets the steam and hot water requirements of the refinery and the town ofAchinsk.
The Achinsk alumina refinery is located in Siberia close to Krasnoyarsk on the Bank of Chulymriver.
The Achinsk alumina refinery also produces sodium carbonate, potassium carbonate andaluminium sulphate as principal by-products. In 2007, the refinery undertook an expansion project toincrease capacity for alumina production by 57 thousand tonnes per annum. The project includedreducing bottlenecking at the alumina refinery, as well as modernising and increasing the capacity ofthe power plant and soda production. The total capital expenditure for the project constituted US$90.7million, excluding VAT. The Group is currently undertaking additional minor works relating to suchexpansion.
The Achinsk alumina refinery is also undertaking a soda quality improvement project, expectedto be completed in 2009. The capital expenditure for the soda quality improvement project is estimatedat US$9.6 million including VAT (as a result US$9.9 million has been incurred as of 30 June 2009).The Achinsk alumina refinery also started a turbine construction project, which has been recentlymothballed. The estimated capital expenditure for the turbine project is US$43 million including VAT(of which US$41.2 million has been incurred as of 30 June 2009).
Other Alumina Refineries
Urals Alumina Refinery. The Urals alumina refinery, part of the Urals alumina and aluminiumcomplex, is the fourth largest producer of alumina in the CIS in terms of production capacity.
• 2008 production — 0.73 million tonnes per annum;
• Bauxite source — the Timan and North Urals bauxite mines;
• Alumina deliveries — to a number of smelters within the Group, including the on-site Uralssmelter and the Novokuznetsk, Irkutsk, Volgograd, Bratsk and Volkhov aluminiumsmelters;
BUSINESS
— 120 —
• Energy source — electricity is supplied by the regional grid. A third-party owned off-sitethermal power station also produces electrical power, as well as steam and hot water for thetown and plant. The calciner kilns and the sintering kilns are fired by natural gas suppliedby Uralnorthgas, with heavy fuel oil used for standby supply/as a backup.
The Urals alumina and aluminium complex is situated in the town of Kamensk-Uralskiy, locatedapproximately 100 km to the south-east of Ekaterinburg in the Sverdlovsk region.
Friguia Alumina Refinery. The Friguia alumina refinery, located in the town of Friguia in theRepublic of Guinea, is approximately 160 km northeast of the capital and main port of Conakry. Theadjoining Friguia mine, operated by Friguia S.A., a wholly owned subsidiary of the Group, is locatedon the Fouta Djalon plateau in the northwest of Guinea, about 105 km from Conakry, and is fullyvertically integrated with the Friguia alumina refinery where its entire production is delivered. Thereare currently no facilities to export bauxite from the mine or the Conakry alumina loading point.
• 2008 production — 0.59 million tonnes per annum;
• Bauxite source — the integrated Friguia mine;
• Alumina deliveries — to the Bratsk aluminium smelter;
• Energy source — a captive power plant on site supplies electricity and steam to the refineryand the town of Friguia. There is no standby/backup power source via an external grid.
In 2009, the government of the Republic of Guinea initiated proceedings against the Groupcontending, among other things, that the privatisation of the Friguia bauxite and alumina complexshould be declared null and void and compensation in the amount of US$1.0 billion should be paidto the government of the Republic of Guinea. If the Government of the Republic of Guinea issuccessful, the Group may be required to pay damages and/or return its shares in Friguia to theGovernment of the Republic of Guinea. In addition, the government of the Republic of Guinea recentlyissued two decrees that may increase the potential for expropriation of mining assets in the Republicof Guinea. See “Risk Factors — Risks relating to the Group and its Business — Risks relating to themultijurisdictional regulatory, social, legal, tax and political environment in which the Group operates— Legislation may not adequately protect against expropriation or nationalisation” and “— Litigation— Republic of Guinea”.
Queensland Alumina Limited (“QAL”). QAL is the second largest alumina refinery in the worldin terms of production capacity, located in Gladstone in the State of Queensland, Australia. For furtherinformation concerning QAL, see “— Norilsk Nickel and Material Joint Ventures”.
Alpart. Alumina Partners of Jamaica (“Alpart”) is the Group’s second largest alumina refineryin terms of production and is a joint venture between UC RUSAL Alumina and Norsk Hydro. TheGroup has a 65% equity ownership in Alpart, with the remaining stake being held by Norsk Hydro.Alpart’s financial statements are consolidated on a proportionate basis in the Group’s consolidatedfinancial statements as it is a jointly controlled asset and operation.
As a cost-cutting measure, production was temporarily suspended in May 2009 for at least 12months.
• 2008 production — 1.07 million tonnes per annum (attributable);
• Bauxite source — the integrated Alpart bauxite mine;
• Alumina deliveries — to the Group facilities and third parties;
BUSINESS
— 121 —
• Energy source — electrical power and steam is provided by a dedicated co-generatingpowerhouse. The boilers in the powerhouses are fired by heavy fuel oil. There is no tie-into the national grid.
Alpart is situated in the plains of St. Elizabeth, some 5 km from the village of Nain in Jamaica.The mining operations and site offices are located near Mandeville in the Manchester District, some70 km west from Kingston, Jamaica.
The refinery is connected to its port, Port Kaiser, by a dedicated railway. Port Kaiser servicesAlpart for the movement of bulk material, primarily alumina, fuel oil and caustic. Bauxite from theAlpart bauxite mine is transported to the refinery by a 17 km belt conveyer. Alpart also envisagesrecovering bauxite from the Malvern Plateau and it is planned to either construct a cable belt from theMalvern plateau or to utilise subcontracted road haulage to deliver the bauxite to the refinery.
Alpart holds one mining licence, one exploration licence and a contract to mine under a furtherlicence owned by a third-party company. Excluding this licence, 55% of the surface rights within theAlpart licences are owned by either Alpart or the Jamaican government, which makes these areasimmediately accessible for mining under the terms of the licences. The remaining 45% are privatelyowned, which will require prior land acquisition and possible resettlement of residents beforecommencement of mining. The third-party agreement allows the mining of 25 million dry metrictonnes from the Jamalco licence area before the year 2014, with an option to extend the agreement.In addition, in 2005, Alpart entered into a 30-year agreement with the Jamaican government requiringthe government to guarantee suitable quantities and qualities of bauxite Resource areas to meet theplant requirements for the period of the agreement.
Based on the restarting plan developed by the Company, the plant is expected to be able toresume production within three months from the date on which it is decided to restart operations.
Windalco-Ewarton and Windalco-Kirkvine Works. Ewarton Works and Kirkvine Works are bothpart of the West Indies Aluminium Company (Windalco). The Group has 93.0% equity ownership ineach of Ewarton Works and Kirkvine Works, with the remaining stake held by Jamaica Bauxite MiningLimited, representing the Jamaican government. Windalco’s financial statements are consolidated ona proportionate basis in the Group’s consolidated financial statements as it is a jointly controlled assetand operation.
As a cost-cutting measure, production was temporarily suspended in April 2009 for at least 12months.
• 2008 production — 1.16 million tonnes per annum (attributable);
• Bauxite source — the integrated Ewarton and Kirkvine bauxite mines;
• Alumina deliveries — to third parties;
• Energy source — steam and electricity are provided by an on-site co-generatingpowerhouse for each of the Ewarton and Kirkvine Works. The boilers in the powerhousesare fired by heavy fuel oil. There is also a tie-in to the Jamaican national grid.
Ewarton Works is situated about 10km north of the market town of Linstead, and about 5kmsouth of the town of Ewarton in Jamaica. Kirkvine Works is situated in the hilly regions of the centreof Jamaica, some 15km from Mandeville. The Ewarton mining operations are located in the St.Catherine’s District, approximately 40km north of Kingston, and the Kirkvine mining operations arelocated near the Alpart operations in the Manchester District, approximately 70 km west of Kingston.
BUSINESS
— 122 —
Windalco holds two mining licences and one exploration licence. The majority of the surfacerights for the Windalco licences are privately owned by third parties, which will require prior landacquisition and possible resettlement of residents before commencement of mining. In 2001, Windalcoentered into a 30-year agreement with the Jamaican government requiring the government to guaranteesuitable quantities and qualities of bauxite Resource areas to meet the plant requirements for theperiod of the agreement.
In June 2006, a ten-year mining contract was signed between Windalco and Washington GroupInternational (WGINT) for exploration, drilling, mine development, post-mining reclamation andstockpile management. The Group has agreed to pay US$3.6 million per annum over the next twoyears to compensate WGINT for suspension of production at these works. Windalco remainsresponsible for maintaining community relations and the long-term mine plan.
Based on the restarting plan developed by the Company, the plant is expected to be able toresume production within three months from the date on which it is decided to restart operations.
Eurallumina Refinery. Eurallumina is the largest alumina refinery in Italy and one of the largestproducers of alumina in Europe.
As a cost-cutting measure, production was temporarily suspended in March 2009 for at least 12months. Further, in September 2009, one of its red mud basins was sequestrated and its environmentalpermit for production operations and management of the red mud basin was suspended. See “—Litigation — Italian Environmental Ministry”.
• 2008 production — 1.05 million tonnes per annum;
• Bauxite source — the Weipa mine in Australia and the Kindia mine in the Republic ofGuinea;
• Alumina deliveries — to a number of smelters within the Group and third parties;
• Energy source — steam for the refinery is generated in three high sulphur fuel oil firedboilers, and all of the electricity supplied to the refinery comes from the Italian nationalgrid.
Eurallumina is located in Portoscuso, on the southwest coast of Sardinia, Italy.
Subject to the release of Eurallumina’s red mud basin from sequestration and the reinstatementof its environmental permit and based on the restarting plan developed by the Company, the plant isexpected to be able to resume production within three months from the date on which it is decided torestart operations.
BUSINESS
— 123 —

Mining
The Group’s mining assets comprise 16 mines and mine complexes, including eight bauxitemines, two quartzite mines, one fluorite mine, two coal mines, one nepheline syenite mine and twolimestone mines. The Company jointly operates two coal mines with Samruk-Kazyna under a 50/50joint venture, LLP Bogatyr Komir. The aggregate attributable bauxite production from the Group’smines for the six months ended 30 June 2009 and for the year ended 31 December 2008 was 6.1 and19.1 million tonnes, respectively. The table below sets forth the attributable production of the minesin which the Group has interests for the six months ended 30 June 2009 and the years ended 31December 2006, 2007 and 2008.
Production
Mining Asset Location
UCRUSAL(1)
Interest(%)
Sixmonthsended
30 June2009
Year ended 31 December
2008 2007 2006
Bauxite (Mt Wet)(6)
Alpart . . . . . . . . . . . . . . . . . . . . . . . . Jamaica 65(2) 0.3 3.2 2.9 3.3
North Urals . . . . . . . . . . . . . . . . . . . . Russia 100 1.6 3.3 3.4 3.3
Windalco — Ewarton . . . . . . . . . . . . . . Jamaica 93(3) 0.1 2.0 1.9 2.1
Windalco — Kirkvine . . . . . . . . . . . . . . . Jamaica 93(3) 0.1 1.9 1.8 1.9
Timan . . . . . . . . . . . . . . . . . . . . . . . . Russia 80(4) 1.0 1.9 1.9 2.4
Friguia . . . . . . . . . . . . . . . . . . . . . . . . Guinea 100 0.9 2.0 1.7 1.9
Kindia . . . . . . . . . . . . . . . . . . . . . . . . Guinea 100 1.4 3.2 3.0 3.1
Bauxite Co. De Guyana (BCGI). . . . . . . . . Guyana 90(5) 0.7 1.6 1.9 1.2
Total Bauxite Mining (Mt Wet) . . . . . . . . 6.1 19.1 18.5 19.2
Nepheline Process Mines (Achinsk)
Kiya Shaltyr Nepheline Syenite (Mt Wet) . . . Russia 100 2.2 4.8 4.9 5.1
Mazulsky Limestone (Mt) . . . . . . . . . . . . Russia 100 3.1 7.4 6.9 6.9
Limestone (Mt)
Petropavlovsky Limestone . . . . . . . . . . . . Russia 100 0.4 1.0 1.0 1.0
Quartzite (kt)
Cheremshansk . . . . . . . . . . . . . . . . . . . Russia 99.91 95 230 199 208
Glukhovsky . . . . . . . . . . . . . . . . . . . . . Ukraine 97.55 4 55 51 55
Total Quartzite (kt) . . . . . . . . . . . . . . . 99 285 250 233
Fluorite (kt)
Yaroslavsky . . . . . . . . . . . . . . . . . . . . . Russia 50(7) 441 799 899 807
Coal (Mt)
LLP Bogatyr Komir . . . . . . . . . . . . . . . . Kazakhstan 50(8) 7.1 23.05 19.2 20.8
Notes:(1) Beneficial ownership as at 15 September 2009.(2) The remaining 35% is held by Norsk Hydro.(3) The remaining 7% is held by Jamaican Bauxite Mining Limited, representing the Jamaican government.(4) Approximately 20% is indirectly held by the Komi Republic, while minority shareholders hold an immaterial interest.(5) The government of Guyana retains ownership of 10% in BCGI.
BUSINESS
— 124 —
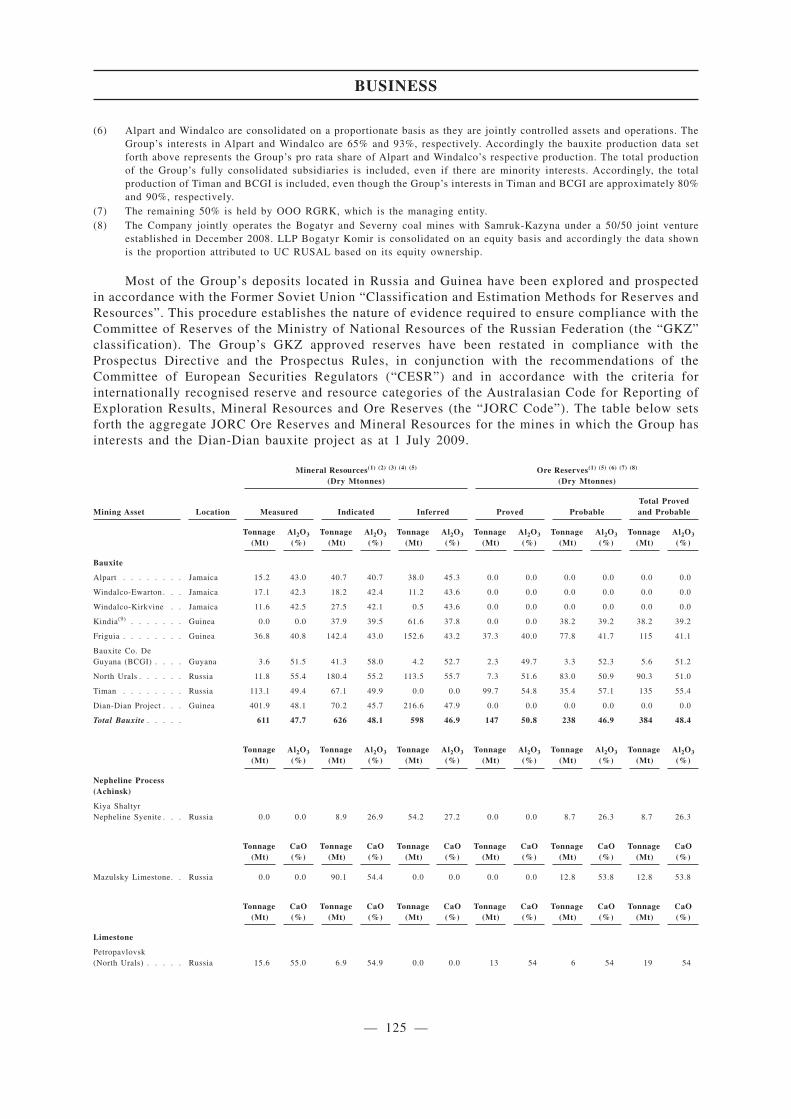
(6) Alpart and Windalco are consolidated on a proportionate basis as they are jointly controlled assets and operations. TheGroup’s interests in Alpart and Windalco are 65% and 93%, respectively. Accordingly the bauxite production data setforth above represents the Group’s pro rata share of Alpart and Windalco’s respective production. The total productionof the Group’s fully consolidated subsidiaries is included, even if there are minority interests. Accordingly, the totalproduction of Timan and BCGI is included, even though the Group’s interests in Timan and BCGI are approximately 80%and 90%, respectively.
(7) The remaining 50% is held by OOO RGRK, which is the managing entity.(8) The Company jointly operates the Bogatyr and Severny coal mines with Samruk-Kazyna under a 50/50 joint venture
established in December 2008. LLP Bogatyr Komir is consolidated on an equity basis and accordingly the data shownis the proportion attributed to UC RUSAL based on its equity ownership.
Most of the Group’s deposits located in Russia and Guinea have been explored and prospectedin accordance with the Former Soviet Union “Classification and Estimation Methods for Reserves andResources”. This procedure establishes the nature of evidence required to ensure compliance with theCommittee of Reserves of the Ministry of National Resources of the Russian Federation (the “GKZ”classification). The Group’s GKZ approved reserves have been restated in compliance with theProspectus Directive and the Prospectus Rules, in conjunction with the recommendations of theCommittee of European Securities Regulators (“CESR”) and in accordance with the criteria forinternationally recognised reserve and resource categories of the Australasian Code for Reporting ofExploration Results, Mineral Resources and Ore Reserves (the “JORC Code”). The table below setsforth the aggregate JORC Ore Reserves and Mineral Resources for the mines in which the Group hasinterests and the Dian-Dian bauxite project as at 1 July 2009.
Mineral Resources(1) (2) (3) (4) (5)
(Dry Mtonnes)Ore Reserves(1) (5) (6) (7) (8)
(Dry Mtonnes)
Mining Asset Location Measured Indicated Inferred Proved ProbableTotal Provedand Probable
Tonnage(Mt)
Al2O3
(%)Tonnage
(Mt)Al2O3
(%)Tonnage
(Mt)Al2O3
(%)Tonnage
(Mt)Al2O3
(%)Tonnage
(Mt)Al2O3
(%)Tonnage
(Mt)Al2O3
(%)
Bauxite
Alpart . . . . . . . . Jamaica 15.2 43.0 40.7 40.7 38.0 45.3 0.0 0.0 0.0 0.0 0.0 0.0
Windalco-Ewarton . . . Jamaica 17.1 42.3 18.2 42.4 11.2 43.6 0.0 0.0 0.0 0.0 0.0 0.0
Windalco-Kirkvine . . Jamaica 11.6 42.5 27.5 42.1 0.5 43.6 0.0 0.0 0.0 0.0 0.0 0.0
Kindia(9) . . . . . . . Guinea 0.0 0.0 37.9 39.5 61.6 37.8 0.0 0.0 38.2 39.2 38.2 39.2
Friguia . . . . . . . . Guinea 36.8 40.8 142.4 43.0 152.6 43.2 37.3 40.0 77.8 41.7 115 41.1
Bauxite Co. DeGuyana (BCGI) . . . . Guyana 3.6 51.5 41.3 58.0 4.2 52.7 2.3 49.7 3.3 52.3 5.6 51.2
North Urals . . . . . . Russia 11.8 55.4 180.4 55.2 113.5 55.7 7.3 51.6 83.0 50.9 90.3 51.0
Timan . . . . . . . . Russia 113.1 49.4 67.1 49.9 0.0 0.0 99.7 54.8 35.4 57.1 135 55.4
Dian-Dian Project . . . Guinea 401.9 48.1 70.2 45.7 216.6 47.9 0.0 0.0 0.0 0.0 0.0 0.0
Total Bauxite . . . . . 611 47.7 626 48.1 598 46.9 147 50.8 238 46.9 384 48.4
Tonnage(Mt)
Al2O3
(%)Tonnage
(Mt)Al2O3
(%)Tonnage
(Mt)Al2O3
(%)Tonnage
(Mt)Al2O3
(%)Tonnage
(Mt)Al2O3
(%)Tonnage
(Mt)Al2O3
(%)
Nepheline Process(Achinsk)
Kiya ShaltyrNepheline Syenite . . . Russia 0.0 0.0 8.9 26.9 54.2 27.2 0.0 0.0 8.7 26.3 8.7 26.3
Tonnage(Mt)
CaO(%)
Tonnage(Mt)
CaO(%)
Tonnage(Mt)
CaO(%)
Tonnage(Mt)
CaO(%)
Tonnage(Mt)
CaO(%)
Tonnage(Mt)
CaO(%)
Mazulsky Limestone. . Russia 0.0 0.0 90.1 54.4 0.0 0.0 0.0 0.0 12.8 53.8 12.8 53.8
Tonnage(Mt)
CaO(%)
Tonnage(Mt)
CaO(%)
Tonnage(Mt)
CaO(%)
Tonnage(Mt)
CaO(%)
Tonnage(Mt)
CaO(%)
Tonnage(Mt)
CaO(%)
Limestone
Petropavlovsk(North Urals) . . . . . Russia 15.6 55.0 6.9 54.9 0.0 0.0 13 54 6 54 19 54
BUSINESS
— 125 —
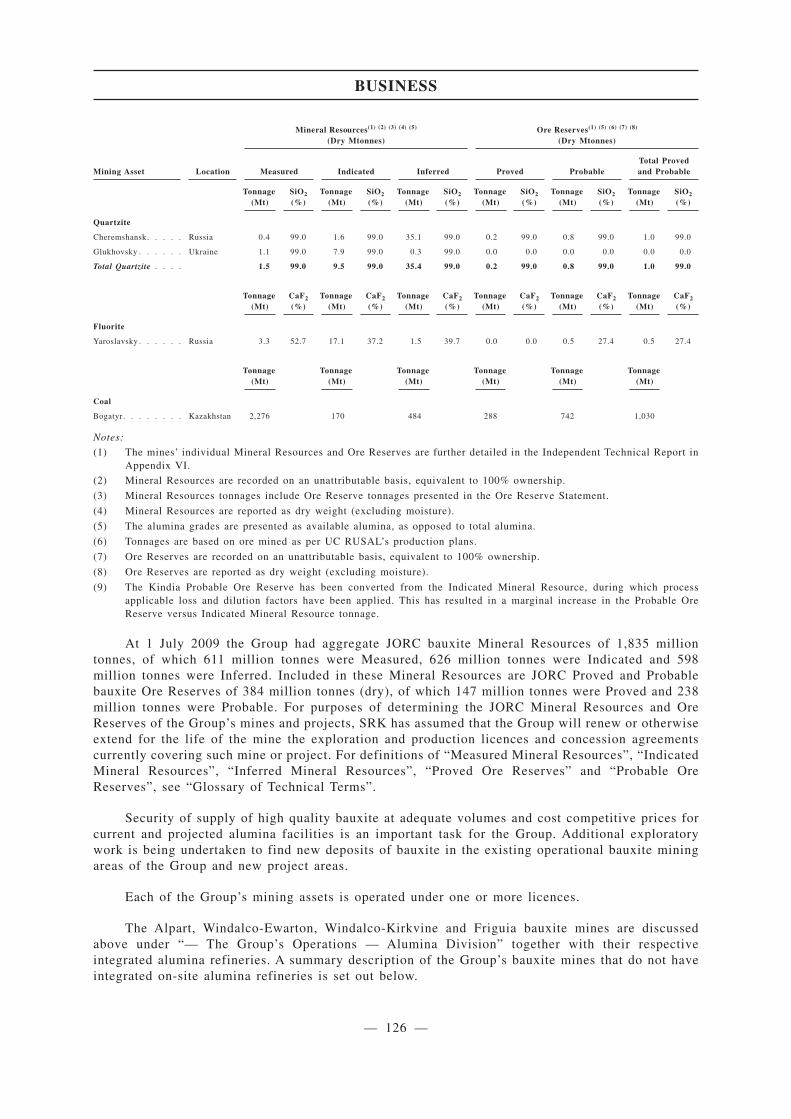
Mineral Resources(1) (2) (3) (4) (5)
(Dry Mtonnes)Ore Reserves(1) (5) (6) (7) (8)
(Dry Mtonnes)
Mining Asset Location Measured Indicated Inferred Proved ProbableTotal Provedand Probable
Tonnage(Mt)
SiO2
(%)Tonnage
(Mt)SiO2
(%)Tonnage
(Mt)SiO2
(%)Tonnage
(Mt)SiO2
(%)Tonnage
(Mt)SiO2
(%)Tonnage
(Mt)SiO2
(%)
Quartzite
Cheremshansk. . . . . Russia 0.4 99.0 1.6 99.0 35.1 99.0 0.2 99.0 0.8 99.0 1.0 99.0
Glukhovsky . . . . . . Ukraine 1.1 99.0 7.9 99.0 0.3 99.0 0.0 0.0 0.0 0.0 0.0 0.0
Total Quartzite . . . . 1.5 99.0 9.5 99.0 35.4 99.0 0.2 99.0 0.8 99.0 1.0 99.0
Tonnage(Mt)
CaF2
(%)Tonnage
(Mt)CaF2
(%)Tonnage
(Mt)CaF2
(%)Tonnage
(Mt)CaF2
(%)Tonnage
(Mt)CaF2
(%)Tonnage
(Mt)CaF2
(%)
Fluorite
Yaroslavsky . . . . . . Russia 3.3 52.7 17.1 37.2 1.5 39.7 0.0 0.0 0.5 27.4 0.5 27.4
Tonnage(Mt)
Tonnage(Mt)
Tonnage(Mt)
Tonnage(Mt)
Tonnage(Mt)
Tonnage(Mt)
Coal
Bogatyr . . . . . . . . Kazakhstan 2,276 170 484 288 742 1,030
Notes:
(1) The mines’ individual Mineral Resources and Ore Reserves are further detailed in the Independent Technical Report inAppendix VI.
(2) Mineral Resources are recorded on an unattributable basis, equivalent to 100% ownership.
(3) Mineral Resources tonnages include Ore Reserve tonnages presented in the Ore Reserve Statement.
(4) Mineral Resources are reported as dry weight (excluding moisture).
(5) The alumina grades are presented as available alumina, as opposed to total alumina.
(6) Tonnages are based on ore mined as per UC RUSAL’s production plans.
(7) Ore Reserves are recorded on an unattributable basis, equivalent to 100% ownership.
(8) Ore Reserves are reported as dry weight (excluding moisture).
(9) The Kindia Probable Ore Reserve has been converted from the Indicated Mineral Resource, during which processapplicable loss and dilution factors have been applied. This has resulted in a marginal increase in the Probable OreReserve versus Indicated Mineral Resource tonnage.
At 1 July 2009 the Group had aggregate JORC bauxite Mineral Resources of 1,835 milliontonnes, of which 611 million tonnes were Measured, 626 million tonnes were Indicated and 598million tonnes were Inferred. Included in these Mineral Resources are JORC Proved and Probablebauxite Ore Reserves of 384 million tonnes (dry), of which 147 million tonnes were Proved and 238million tonnes were Probable. For purposes of determining the JORC Mineral Resources and OreReserves of the Group’s mines and projects, SRK has assumed that the Group will renew or otherwiseextend for the life of the mine the exploration and production licences and concession agreementscurrently covering such mine or project. For definitions of “Measured Mineral Resources”, “IndicatedMineral Resources”, “Inferred Mineral Resources”, “Proved Ore Reserves” and “Probable OreReserves”, see “Glossary of Technical Terms”.
Security of supply of high quality bauxite at adequate volumes and cost competitive prices forcurrent and projected alumina facilities is an important task for the Group. Additional exploratorywork is being undertaken to find new deposits of bauxite in the existing operational bauxite miningareas of the Group and new project areas.
Each of the Group’s mining assets is operated under one or more licences.
The Alpart, Windalco-Ewarton, Windalco-Kirkvine and Friguia bauxite mines are discussedabove under “— The Group’s Operations — Alumina Division” together with their respectiveintegrated alumina refineries. A summary description of the Group’s bauxite mines that do not haveintegrated on-site alumina refineries is set out below.
BUSINESS
— 126 —
Kindia Bauxite Mine. The Kindia bauxite mine (“Kindia”) in Guinea is operated by Compagniedes Bauxites de Kindia (CBK), which is wholly owned by the Group. The Kindia deposits are locatedin southeast Guinea, 90 km northeast of the capital city of Conakry and 32 km southwest of the localadministrative town of Kindia. The bauxite produced at the mine is transported by rail to the Conakryport and shipped predominantly to the Group’s Nikolaev alumina refinery in Ukraine. Mining at thesite is governed by a convention between the Guinean government and the Group, which was signedin November 2000 and is valid for a period of 25 years. The government of the Republic of Guinearecently issued two decrees that may increase the potential for expropriation of mining assets in theRepublic of Guinea. See “Risk Factors — Risks relating to the Group and its Business — Risksrelating to the multijurisdictional regulatory, social, legal, tax and political environment in which theGroup operates — Legislation may not adequately protect against expropriation or nationalisation”.
Guyana Bauxite Mine. Bauxite Company of Guyana Inc. (BCGI) was established in 2004pursuant to an agreement on bauxite mine development in Guyana between RUSAL and thegovernment of Guyana. The government of Guyana retains 10% of ownership of BCGI, with theremaining 90% owned by the Group. The mining operations are located some 200 km south of thecapital of Guyana, Georgetown. BCGI hold mining permits for a number of deposit areas, includingKwakwani, 20 Green Creek, 16 Bissuaruni (left and right banks), Souwari, 22 Kurubuka and the“Aroaima Property” encompassing the north, south and west deposits.
Commencing on 22 November 2009, BCGI has been experiencing a strike that has led totemporary suspension of production (through 7 December 2009).
Approved Projects within the Alumina Division
Kindia Bauxite Mine (Kindia-2). Mine production from the Kindia Bauxite Mine (Republic ofGuinea) is anticipated to increase up to 3,800 thousand tonnes per annum by 2012. By 2012, thecrushing plant at Debele is due to become obsolete and the Group does not expect to replace it. Thiswould require that the production tonnage from the Kindia deposits be mined using Wirtgen surfaceminers entirely, which would produce a product of a size that does not require subsequent crushing.Additional surface miners will be purchased. The capital expenditure estimated to be required for theproject amounts to US$76 million including value-added tax, of which US$24 million had been spentas of 30 June 2009. The debt restructuring agreements generally prohibit the Group from incurringcapital expenditure in relation to this project through the end of the override period but permit theGroup to fund the program on a project finance (non-recourse) basis or through certain equityinvestments in the project. The Company intends to seek financing for this project in a mannerconsistent with the debt restructuring agreements.
Engineering and Construction Division
One of the Group’s most significant competitive advantages is its in-house EPCM (Engineering,Procurement, Construction, Management) structure, embodied by the Engineering and ConstructionDivision (“ECD”), which was established by RUSAL in July 2005. Historically, aluminium companiesused to implement engineering and construction projects using their own resources. The outsourcingof these services has resulted in the emergence of engineering and construction service companies.When RUSAL faced the challenge of implementing large-scale projects amidst its global expansion,the contract engineering and construction companies were unable to meet its needs as efficiently orin as timely a manner as RUSAL could itself by drawing on its over 70 years of Russian know-how.The Group therefore resumed its past practice by using in-house resources for the implementation ofits engineering and construction projects. The key advantage of the Group’s in-house EPCM structureis its ability to provide comprehensive R&D and engineering and construction services, resulting inthe reduction of capital expenditure at all stages of planning and implementation of the Group’sinvestment projects.
BUSINESS
— 127 —

The major functional areas of the ECD are as follows:
• extensive R&D activities and development of advanced aluminium and alumina productiontechnologies;
• implementation of complex engineering and construction projects with an EPCM approach;and
• maintenance, repair and replacement of process equipment at all Group facilities.
Technology
The ECD develops process solutions for new production assets, as well as for facilitiesundergoing modernisation and expansion. The ECD has the Engineering and Technology Centre(“ETC”) in Krasnoyarsk, the Engineering and Technology Centre for Alumina Production (“AluminaETC”) in St. Petersburg and a centre specialising in design (SibVAMI) in Irkutsk.
The ETC in Krasnoyarsk was established in 2002 and is responsible for the development of newaluminium production technologies, reduction pre-bake technologies, such as RA-300, RA-400 andRA-500, and for improving the Group’s Söderberg technology and developing technologies aimed atreducing the cost of production. The Group is installing advanced pre-bake, cleaner technology incertain of its smelters, particularly in its new projects. Using the Sayanogorsk aluminium smelter asa testing centre, the Group has developed a new baked-anode/high-amperage process that uses RA-300and RA-400 cells, and plans to install RA-500 cells in the near future. RA-400 cell technology alsohas been recently modernised to increase productivity by 6% (RA-400T). By increasing throughput,installing new generation RA cell technology with higher amperage improves productivity, resultingin less capital expenditure per tonne of production, and also lowers ongoing operating expenses suchas personnel, maintenance and repair costs. RA-300 cells were first put into operation on a pilot basisin December 2003 and RA-400 cells in December 2005. A variant of the RA-300 cell technology wasselected for the Khakas aluminium smelter adjacent to the Sayanogorsk aluminium smelter, and hasbeen installed on an industrial scale. The technology is also expected to be installed at the Boguchanskaluminium smelter. Currently, sixteen RA-400T cells are operating on a pilot basis at the Sayanogorskaluminium smelter, and it is expected that RA-400T cells will be used at the Taishet aluminiumsmelter. A prototype of RA-500 cells has also been developed, and it is expected that eight of thesecells will be installed on a pilot basis at the Sayanogorsk aluminium smelter in 2010. The Group hasalso been developing aluminium production technology using vertical inert electrodes which isexpected to fully avoid the emission of greenhouse gases and reduce the cost of production by 15 to20% and construction capital expenditure by 30 to 40%.
In addition to pre-bake technologies, the ETC in Krasnoyarsk has also devoted considerableR&D attention to improving the environmental performance of the Group’s Söderberg cells, whichproduced approximately 80% of the Group’s aluminium in 2008. Improved environmentalperformance of Söderberg cells would allow the Group’s facilities to continue production over thelong term with relatively low ongoing capital expenditure. Since 2002, the Group has been conductingresearch and trials to reduce the emissions of Söderberg cells to the level of pre-bake technology ina project referred to as “Clean Söderberg Technology”. The Group has developed technical solutionsand is now seeking to develop commercially viable applications. There are currently five test cells inoperation at the Krasnoyarsk aluminium smelter, and a new project has been approved to installSöderberg cells with improved environmental performance at the Krasnoyarsk aluminium smelter (inaggregate 352 cells) and to finance the production of colloidal anode paste on a commercial scale. TheGroup intends to utilise its Clean Söderberg Technology at its two largest aluminium smelters: Bratskand Krasnoyarsk, as well as at the Novokuznetsk and Irkutsk aluminium smelters. The CleanSöderberg Technology project will also have the benefit of increasing capacity.
BUSINESS
— 128 —
App1A-28(5)
The Alumina ETC was established in 2003 and is responsible for the development of high-yieldand low-cost alumina production technologies and the design of high capacity equipment for newgeneration alumina refineries. It has successfully developed the high temperature shell-and-tubedigestion technology for the Komi alumina project, the reliability and performance of which has beenconfirmed by international experts. New types of alumina production equipment and process flow arecurrently being tested at special sites at the Nikolaev alumina refinery and the Urals aluminiumsmelter.
Engineering and Project Feasibility Studies
The engineers and other specialists working within the ECD perform a thorough assessment oftechnical solutions and capital expenditures through all phases of each investment project, startingfrom potential construction site examination, selection of process technologies, determination ofoptimal transportation and production infrastructure, down to manpower planning and conceptualdesign. An Engineering Department has been established within ECD to perform these tasks and workswith the other engineering centres within the ECD, including RUSAL VAMI, the TechnologyEngineering Centre, and the SibVAMI.
The largest of these, RUSAL VAMI, was initially founded as a research institute in 1931 and wasacquired by RUSAL in 2003. The institute, together with the Engineering Department within the ECD,provides a full range of services, including raw materials research, project and process developmentfor enterprises working with aluminium, alumina and magnesium, and participation in all stages ofgreenfield as well as expansion and modernisation projects. More than 40 industrial enterprises for theproduction of aluminium, magnesium and carbon products have been constructed on the basis ofproject and maintenance services rendered by RUSAL VAMI in the former USSR, China, Turkey,Egypt, India, Israel and the former Yugoslavia. RUSAL VAMI has over 460 patents and licenses itsproprietary technologies for alumina, aluminium and magnesium production.
Construction
During the execution of projects, the ECD acts as the EPCM contractor to the Group. The ECDperforms a full range of activities related to execution, including detailed design documentation,purchase of equipment, and services construction and equipment installation management,commissioning and start-up activities and production ramp-up.
The ECD’s ability to provide centralised full EPCM services, which are essential for large-scaleEPCM projects in Siberia, Western Europe, Africa and other parts of the world, presents a majorcompetitive advantage for the Group and provides strong support for the Group’s existing assets andexpansion plans on a global scale. The advantages of the ECD’s EPCM capabilities are illustrated bythe construction of the Group’s Khakas smelter. Work commenced on the facility in March 2005, thefirst metal production was brought on line in December 2006, and the smelter became fully operationalin November 2007. Capital expenditure in the Khakas project was US$2,415 per tonne of installedRA-300 aluminium smelting capacity. See “— The Group’s Operations — Aluminium Division —Principal Aluminium Smelters”.
Packaging Division
While the Group focuses on the upstream segment of the industry, its downstream assetsnonetheless comprise a profitable niche business for the Group. The Group has three aluminium foilmills. The Sayanal and Urals foil facilities are located in the Russian Federation, and ARMENAL islocated in Armenia. The Sayanal foil mill is the largest foil producer in Russia in terms of productioncapacity, with a maximum production capacity of 39.5 thousand tonnes of foil per annum in 2008.ARMENAL has undergone a modernisation programme and will reach its full capacity of 24 thousandtonnes per annum by 2010. Capital expenditure for the programme totalled US$70 million, excludingVAT.
BUSINESS
— 129 —
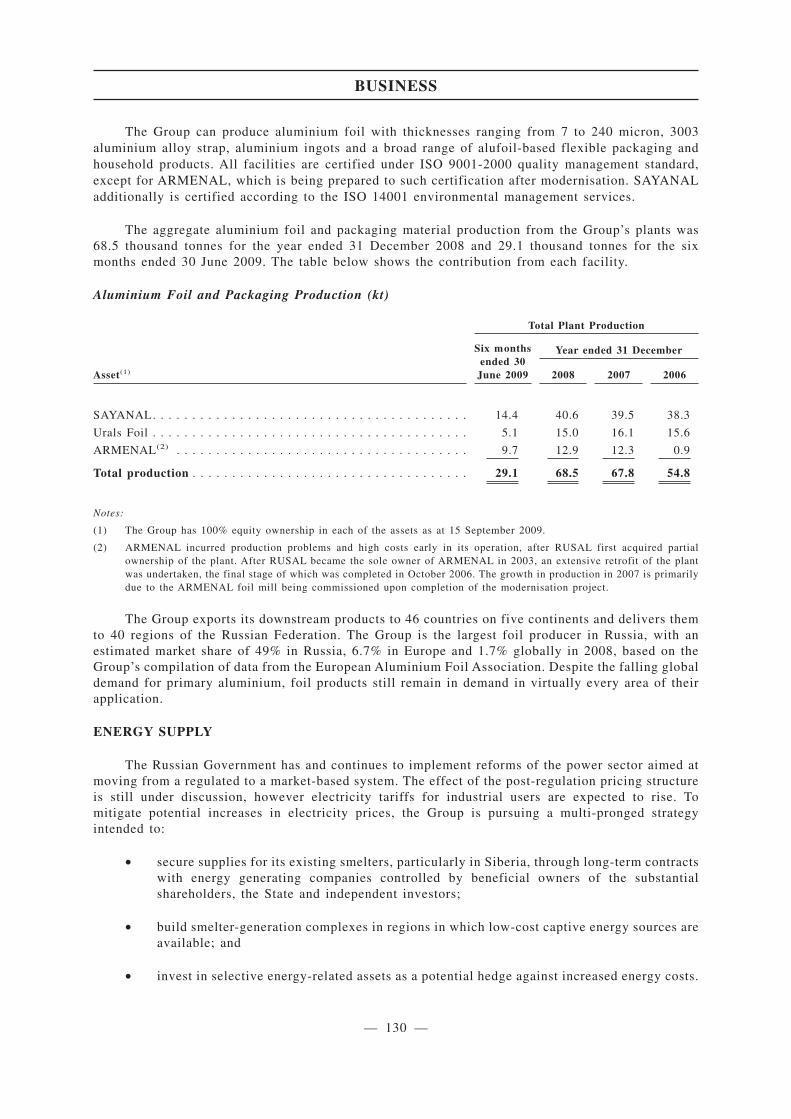
The Group can produce aluminium foil with thicknesses ranging from 7 to 240 micron, 3003aluminium alloy strap, aluminium ingots and a broad range of alufoil-based flexible packaging andhousehold products. All facilities are certified under ISO 9001-2000 quality management standard,except for ARMENAL, which is being prepared to such certification after modernisation. SAYANALadditionally is certified according to the ISO 14001 environmental management services.
The aggregate aluminium foil and packaging material production from the Group’s plants was68.5 thousand tonnes for the year ended 31 December 2008 and 29.1 thousand tonnes for the sixmonths ended 30 June 2009. The table below shows the contribution from each facility.
Aluminium Foil and Packaging Production (kt)
Asset(1)
Total Plant Production
Six monthsended 30
June 2009
Year ended 31 December
2008 2007 2006
SAYANAL. . . . . . . . . . . . . . . . . . . . . . . . . . . . . . . . . . . . . . . . 14.4 40.6 39.5 38.3
Urals Foil . . . . . . . . . . . . . . . . . . . . . . . . . . . . . . . . . . . . . . . . 5.1 15.0 16.1 15.6
ARMENAL(2) . . . . . . . . . . . . . . . . . . . . . . . . . . . . . . . . . . . . . 9.7 12.9 12.3 0.9
Total production . . . . . . . . . . . . . . . . . . . . . . . . . . . . . . . . . . . 29.1 68.5 67.8 54.8
Notes:
(1) The Group has 100% equity ownership in each of the assets as at 15 September 2009.
(2) ARMENAL incurred production problems and high costs early in its operation, after RUSAL first acquired partialownership of the plant. After RUSAL became the sole owner of ARMENAL in 2003, an extensive retrofit of the plantwas undertaken, the final stage of which was completed in October 2006. The growth in production in 2007 is primarilydue to the ARMENAL foil mill being commissioned upon completion of the modernisation project.
The Group exports its downstream products to 46 countries on five continents and delivers themto 40 regions of the Russian Federation. The Group is the largest foil producer in Russia, with anestimated market share of 49% in Russia, 6.7% in Europe and 1.7% globally in 2008, based on theGroup’s compilation of data from the European Aluminium Foil Association. Despite the falling globaldemand for primary aluminium, foil products still remain in demand in virtually every area of theirapplication.
ENERGY SUPPLY
The Russian Government has and continues to implement reforms of the power sector aimed atmoving from a regulated to a market-based system. The effect of the post-regulation pricing structureis still under discussion, however electricity tariffs for industrial users are expected to rise. Tomitigate potential increases in electricity prices, the Group is pursuing a multi-pronged strategyintended to:
• secure supplies for its existing smelters, particularly in Siberia, through long-term contractswith energy generating companies controlled by beneficial owners of the substantialshareholders, the State and independent investors;
• build smelter-generation complexes in regions in which low-cost captive energy sources areavailable; and
• invest in selective energy-related assets as a potential hedge against increased energy costs.
BUSINESS
— 130 —

Power Market Regulation in the Russian Federation and Ukraine
In the Russian Federation and Ukraine, current regulations prescribe the approval of energyprices by relevant regulatory bodies for specified periods of time. All current power contracts at theGroup’s smelters in the Russian Federation and Ukraine run from 1 January 2009 to 31 December2009, with the exception of the Bogoslovsk, Urals, Novokuznetsk, Krasnoyarsk, Bratsk, Irkutsk,Sayanogorsk, Khakas and Volgograd aluminium smelters, which purchase power on the openwholesale market.
Electricity prices in Russia are partly regulated by the Russian Government. The RussianGovernment controls hydro and nuclear power generation, and regulates tariffs through the FederalService for Tariffs (“FST”). Reforms of the state electricity system began in the mid-1990s, when theelectricity market was divided into the national wholesale market, organised by price zones, and thelocal retail market. The national wholesale market was further divided into two segments, oneregulated by the FST with the other being a free market segment characterised by online trading andsignificant price fluctuations. The local retail markets have been fully controlled by the regionalenergy commissions (RECs), who have tariff-setting authority based on the FST benchmark tariffs.Tariffs are set in Roubles and have increased at least in line with inflation, though some of the formerSUAL smelters have experienced more significant increases.
In April 2007, the Russian Government established guidelines for the share of electricityproduction volumes to be supplied on the wholesale electricity market under regulated tariffs duringthe period from 1 January 2007 to 31 December 2010. That share is from 45% to 50% during the periodof 1 July to 31 December 2009 and is expected to gradually decrease to 15 to 20% by 1 July 2010.Beginning on 1 January 2011, all electricity production volumes are expected to be supplied toindustrial users under free market prices. Once deregulation has occurred, electricity tariffs forindustrial users are expected to rise as a result of electricity price liberalisation and demand growth.See “Risk Factors — Risks Relating to the Group and its Business — The Group’s competitiveposition in the global aluminium industry is highly dependent on continued access to inexpensive anduninterrupted electricity supply, in particular, long-term contracts for such electricity; increasedelectricity prices (particularly as a result of deregulation of electricity tariffs), as well as interruptionsin the supply of electricity, could have a material adverse effect on the Group’s business, financialcondition and results of operations”.
Security of Power Supply
The aluminium smelting process is energy intensive and requires access to a continuous energysupply. Electricity consumption is proportionate to the aluminium produced, and so an increase in thevolume of aluminium produced by a smelter will result in a corresponding increase in the electricityconsumed by the smelter.
The Group’s Siberian smelters, accounting for approximately 80% of its production in 2008,obtain their energy mainly from low-cost hydropower stations with few, if any, alternative sources ofsignificant demand. The lack of alternative demand for the power stations is a result of two keyfactors; there are few consumers requiring a sufficient scale of electricity to compete with the demandof the Group, and it is difficult economically to transport electricity over the grid to more distantconsumers. At the same time, there are few significant suppliers of electricity in Siberia. As a result,the Siberian power stations and the Group’s Siberian smelters are interdependent. Elsewhere, theGroup relies more heavily on thermal power. To the extent the Group relies on thermal power, itselectricity costs are affected by the prices of the fuel used by the generators, in particular natural gasand coal. Natural gas prices in Russia are regulated by the Russian Government, but deregulation isexpected and price rises are anticipated. In 2008, gas prices increased up to approximately US$92 perthousand cubic metres, which constituted a 24.5% increase as compared to the gas price for 2007. Itis expected that in 2010 average gas price will increase for another 26.5% as compared toapproximately US$106.7 per thousand cubic metres in 2009.
BUSINESS
— 131 —
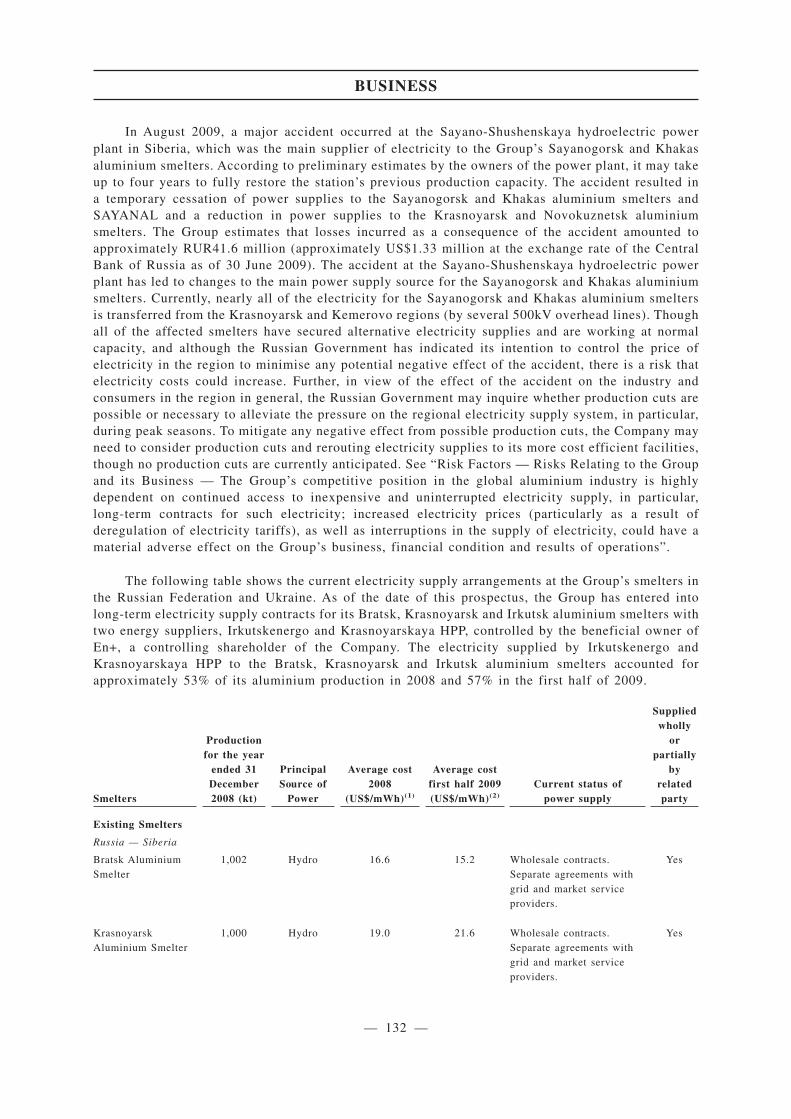
In August 2009, a major accident occurred at the Sayano-Shushenskaya hydroelectric powerplant in Siberia, which was the main supplier of electricity to the Group’s Sayanogorsk and Khakasaluminium smelters. According to preliminary estimates by the owners of the power plant, it may takeup to four years to fully restore the station’s previous production capacity. The accident resulted ina temporary cessation of power supplies to the Sayanogorsk and Khakas aluminium smelters andSAYANAL and a reduction in power supplies to the Krasnoyarsk and Novokuznetsk aluminiumsmelters. The Group estimates that losses incurred as a consequence of the accident amounted toapproximately RUR41.6 million (approximately US$1.33 million at the exchange rate of the CentralBank of Russia as of 30 June 2009). The accident at the Sayano-Shushenskaya hydroelectric powerplant has led to changes to the main power supply source for the Sayanogorsk and Khakas aluminiumsmelters. Currently, nearly all of the electricity for the Sayanogorsk and Khakas aluminium smeltersis transferred from the Krasnoyarsk and Kemerovo regions (by several 500kV overhead lines). Thoughall of the affected smelters have secured alternative electricity supplies and are working at normalcapacity, and although the Russian Government has indicated its intention to control the price ofelectricity in the region to minimise any potential negative effect of the accident, there is a risk thatelectricity costs could increase. Further, in view of the effect of the accident on the industry andconsumers in the region in general, the Russian Government may inquire whether production cuts arepossible or necessary to alleviate the pressure on the regional electricity supply system, in particular,during peak seasons. To mitigate any negative effect from possible production cuts, the Company mayneed to consider production cuts and rerouting electricity supplies to its more cost efficient facilities,though no production cuts are currently anticipated. See “Risk Factors — Risks Relating to the Groupand its Business — The Group’s competitive position in the global aluminium industry is highlydependent on continued access to inexpensive and uninterrupted electricity supply, in particular,long-term contracts for such electricity; increased electricity prices (particularly as a result ofderegulation of electricity tariffs), as well as interruptions in the supply of electricity, could have amaterial adverse effect on the Group’s business, financial condition and results of operations”.
The following table shows the current electricity supply arrangements at the Group’s smelters inthe Russian Federation and Ukraine. As of the date of this prospectus, the Group has entered intolong-term electricity supply contracts for its Bratsk, Krasnoyarsk and Irkutsk aluminium smelters withtwo energy suppliers, Irkutskenergo and Krasnoyarskaya HPP, controlled by the beneficial owner ofEn+, a controlling shareholder of the Company. The electricity supplied by Irkutskenergo andKrasnoyarskaya HPP to the Bratsk, Krasnoyarsk and Irkutsk aluminium smelters accounted forapproximately 53% of its aluminium production in 2008 and 57% in the first half of 2009.
Smelters
Productionfor the year
ended 31December2008 (kt)
PrincipalSource of
Power
Average cost2008
(US$/mWh)(1)
Average costfirst half 2009(US$/mWh)(2)
Current status ofpower supply
Suppliedwholly
orpartially
byrelatedparty
Existing Smelters
Russia — Siberia
Bratsk AluminiumSmelter
1,002 Hydro 16.6 15.2 Wholesale contracts.Separate agreements withgrid and market serviceproviders.
Yes
KrasnoyarskAluminium Smelter
1,000 Hydro 19.0 21.6 Wholesale contracts.Separate agreements withgrid and market serviceproviders.
Yes
BUSINESS
— 132 —
App1A-28(6)

Smelters
Productionfor the year
ended 31December2008 (kt)
PrincipalSource of
Power
Average cost2008
(US$/mWh)(1)
Average costfirst half 2009(US$/mWh)(2)
Current status ofpower supply
Suppliedwholly
orpartially
byrelatedparty
SayanogorskAluminium Smelter
537 Hydro 19.4 16.6 Wholesale contracts.Separate agreements withgrid and market serviceproviders.
Yes
NovokuznetskAluminium Smelter
320 Thermal 27.1 25.5 Wholesale contracts.Separate agreements withgrid and market serviceproviders.
Yes
Irkutsk AluminiumSmelter
358 Hydro 19.8 14.7 Wholesale contracts.Separate agreements withgrid and market serviceproviders.
Yes
Alukom AluminiumSmelter
10 Hydro n.a n.a The plant became a branchof the Bratsk AluminiumSmelter in the second halfof 2007. Power supplyarrangements of BrAZequally apply.
No
Khakas AluminiumSmelter
297 Hydro 19.2 18.0 Wholesale contract.Separate agreements withgrid and market serviceproviders.
No
Russia — OtherBogoslovskAluminium Smelter
186 Thermal 35.3 33.8 Wholesale contracts.Separate agreements withgrid and market serviceproviders.
Yes
VolgogradAluminium Smelter
166 Hydro 46.4 31.8 Wholesale contracts.Separate agreements withgrid and market serviceproviders.
No
Urals AluminiumSmelter
134 Thermal 35.8 34.0 Wholesale contracts.Separate agreements withgrid and market serviceproviders.
No
NadvoitsyAluminium Smelter
81 Hydro 38.4 27.5 Annual retail contract withKarelskayaEnergosbytovayaKompaniya.
No
KandalakshaAluminium Smelter
75 Hydro/Nuclear
31.1 22.5 Annual retail contract withKolskaya EnergosbytovayaKompaniya.
No
BUSINESS
— 133 —
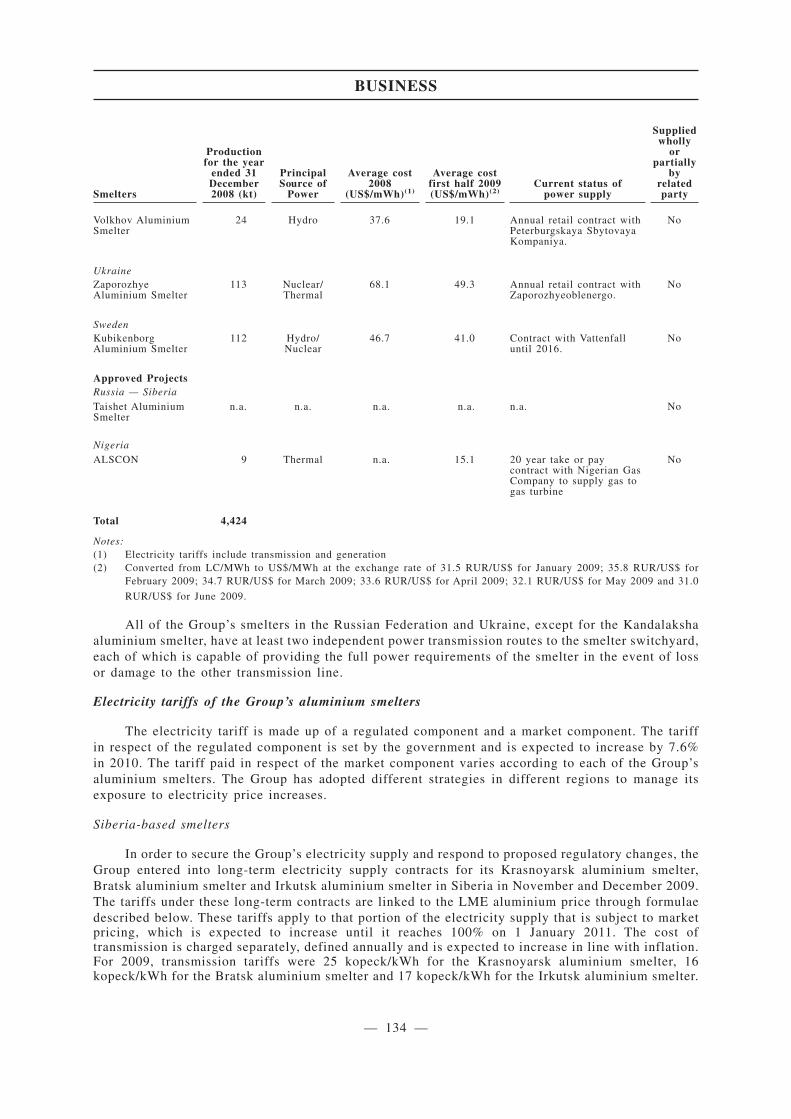
Smelters
Productionfor the year
ended 31December2008 (kt)
PrincipalSource of
Power
Average cost2008
(US$/mWh)(1)
Average costfirst half 2009(US$/mWh)(2)
Current status ofpower supply
Suppliedwholly
orpartially
byrelatedparty
Volkhov AluminiumSmelter
24 Hydro 37.6 19.1 Annual retail contract withPeterburgskaya SbytovayaKompaniya.
No
UkraineZaporozhyeAluminium Smelter
113 Nuclear/Thermal
68.1 49.3 Annual retail contract withZaporozhyeoblenergo.
No
SwedenKubikenborgAluminium Smelter
112 Hydro/Nuclear
46.7 41.0 Contract with Vattenfalluntil 2016.
No
Approved ProjectsRussia — SiberiaTaishet AluminiumSmelter
n.a. n.a. n.a. n.a. n.a. No
NigeriaALSCON 9 Thermal n.a. 15.1 20 year take or pay
contract with Nigerian GasCompany to supply gas togas turbine
No
Total 4,424
Notes:(1) Electricity tariffs include transmission and generation(2) Converted from LC/MWh to US$/MWh at the exchange rate of 31.5 RUR/US$ for January 2009; 35.8 RUR/US$ for
February 2009; 34.7 RUR/US$ for March 2009; 33.6 RUR/US$ for April 2009; 32.1 RUR/US$ for May 2009 and 31.0
RUR/US$ for June 2009.
All of the Group’s smelters in the Russian Federation and Ukraine, except for the Kandalakshaaluminium smelter, have at least two independent power transmission routes to the smelter switchyard,each of which is capable of providing the full power requirements of the smelter in the event of lossor damage to the other transmission line.
Electricity tariffs of the Group’s aluminium smelters
The electricity tariff is made up of a regulated component and a market component. The tariffin respect of the regulated component is set by the government and is expected to increase by 7.6%in 2010. The tariff paid in respect of the market component varies according to each of the Group’saluminium smelters. The Group has adopted different strategies in different regions to manage itsexposure to electricity price increases.
Siberia-based smelters
In order to secure the Group’s electricity supply and respond to proposed regulatory changes, theGroup entered into long-term electricity supply contracts for its Krasnoyarsk aluminium smelter,Bratsk aluminium smelter and Irkutsk aluminium smelter in Siberia in November and December 2009.The tariffs under these long-term contracts are linked to the LME aluminium price through formulaedescribed below. These tariffs apply to that portion of the electricity supply that is subject to marketpricing, which is expected to increase until it reaches 100% on 1 January 2011. The cost oftransmission is charged separately, defined annually and is expected to increase in line with inflation.For 2009, transmission tariffs were 25 kopeck/kWh for the Krasnoyarsk aluminium smelter, 16kopeck/kWh for the Bratsk aluminium smelter and 17 kopeck/kWh for the Irkutsk aluminium smelter.
BUSINESS
— 134 —
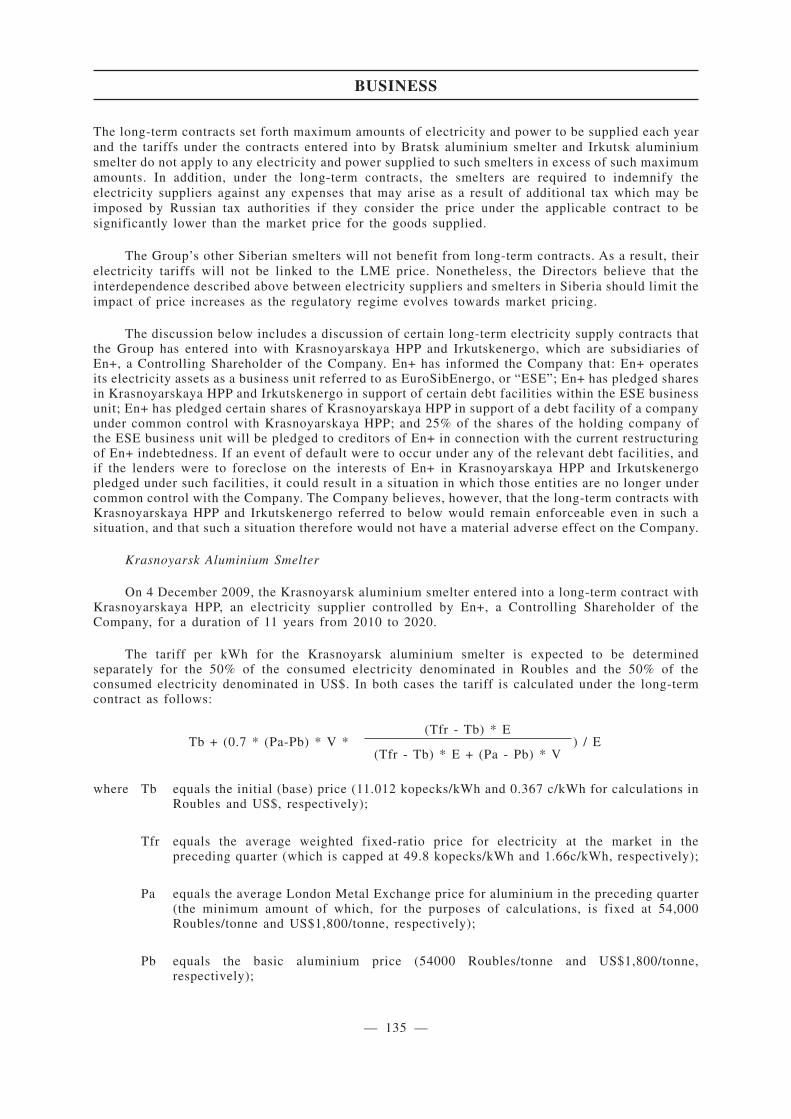
The long-term contracts set forth maximum amounts of electricity and power to be supplied each yearand the tariffs under the contracts entered into by Bratsk aluminium smelter and Irkutsk aluminiumsmelter do not apply to any electricity and power supplied to such smelters in excess of such maximumamounts. In addition, under the long-term contracts, the smelters are required to indemnify theelectricity suppliers against any expenses that may arise as a result of additional tax which may beimposed by Russian tax authorities if they consider the price under the applicable contract to besignificantly lower than the market price for the goods supplied.
The Group’s other Siberian smelters will not benefit from long-term contracts. As a result, theirelectricity tariffs will not be linked to the LME price. Nonetheless, the Directors believe that theinterdependence described above between electricity suppliers and smelters in Siberia should limit theimpact of price increases as the regulatory regime evolves towards market pricing.
The discussion below includes a discussion of certain long-term electricity supply contracts thatthe Group has entered into with Krasnoyarskaya HPP and Irkutskenergo, which are subsidiaries ofEn+, a Controlling Shareholder of the Company. En+ has informed the Company that: En+ operatesits electricity assets as a business unit referred to as EuroSibEnergo, or “ESE”; En+ has pledged sharesin Krasnoyarskaya HPP and Irkutskenergo in support of certain debt facilities within the ESE businessunit; En+ has pledged certain shares of Krasnoyarskaya HPP in support of a debt facility of a companyunder common control with Krasnoyarskaya HPP; and 25% of the shares of the holding company ofthe ESE business unit will be pledged to creditors of En+ in connection with the current restructuringof En+ indebtedness. If an event of default were to occur under any of the relevant debt facilities, andif the lenders were to foreclose on the interests of En+ in Krasnoyarskaya HPP and Irkutskenergopledged under such facilities, it could result in a situation in which those entities are no longer undercommon control with the Company. The Company believes, however, that the long-term contracts withKrasnoyarskaya HPP and Irkutskenergo referred to below would remain enforceable even in such asituation, and that such a situation therefore would not have a material adverse effect on the Company.
Krasnoyarsk Aluminium Smelter
On 4 December 2009, the Krasnoyarsk aluminium smelter entered into a long-term contract withKrasnoyarskaya HPP, an electricity supplier controlled by En+, a Controlling Shareholder of theCompany, for a duration of 11 years from 2010 to 2020.
The tariff per kWh for the Krasnoyarsk aluminium smelter is expected to be determinedseparately for the 50% of the consumed electricity denominated in Roubles and the 50% of theconsumed electricity denominated in US$. In both cases the tariff is calculated under the long-termcontract as follows:
Tb + (0.7 * (Pa-Pb) * V *(Tfr - Tb) * E
) / E(Tfr - Tb) * E + (Pa - Pb) * V
where Tb equals the initial (base) price (11.012 kopecks/kWh and 0.367 c/kWh for calculations inRoubles and US$, respectively);
Tfr equals the average weighted fixed-ratio price for electricity at the market in thepreceding quarter (which is capped at 49.8 kopecks/kWh and 1.66c/kWh, respectively);
Pa equals the average London Metal Exchange price for aluminium in the preceding quarter(the minimum amount of which, for the purposes of calculations, is fixed at 54,000Roubles/tonne and US$1,800/tonne, respectively);
Pb equals the basic aluminium price (54000 Roubles/tonne and US$1,800/tonne,respectively);
BUSINESS
— 135 —
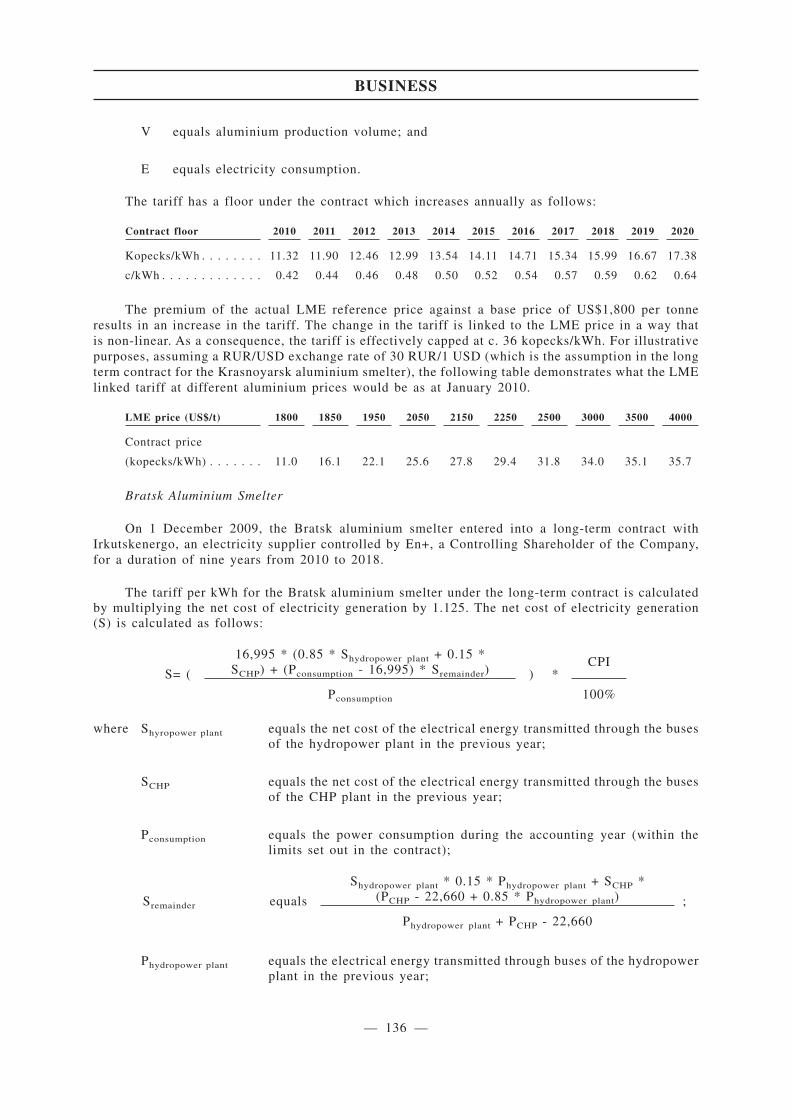
V equals aluminium production volume; and
E equals electricity consumption.
The tariff has a floor under the contract which increases annually as follows:
Contract floor 2010 2011 2012 2013 2014 2015 2016 2017 2018 2019 2020
Kopecks/kWh . . . . . . . . 11.32 11.90 12.46 12.99 13.54 14.11 14.71 15.34 15.99 16.67 17.38
c/kWh . . . . . . . . . . . . . 0.42 0.44 0.46 0.48 0.50 0.52 0.54 0.57 0.59 0.62 0.64
The premium of the actual LME reference price against a base price of US$1,800 per tonneresults in an increase in the tariff. The change in the tariff is linked to the LME price in a way thatis non-linear. As a consequence, the tariff is effectively capped at c. 36 kopecks/kWh. For illustrativepurposes, assuming a RUR/USD exchange rate of 30 RUR/1 USD (which is the assumption in the longterm contract for the Krasnoyarsk aluminium smelter), the following table demonstrates what the LMElinked tariff at different aluminium prices would be as at January 2010.
LME price (US$/t) 1800 1850 1950 2050 2150 2250 2500 3000 3500 4000
Contract price
(kopecks/kWh) . . . . . . . 11.0 16.1 22.1 25.6 27.8 29.4 31.8 34.0 35.1 35.7
Bratsk Aluminium Smelter
On 1 December 2009, the Bratsk aluminium smelter entered into a long-term contract withIrkutskenergo, an electricity supplier controlled by En+, a Controlling Shareholder of the Company,for a duration of nine years from 2010 to 2018.
The tariff per kWh for the Bratsk aluminium smelter under the long-term contract is calculatedby multiplying the net cost of electricity generation by 1.125. The net cost of electricity generation(S) is calculated as follows:
S= (
16,995 * (0.85 * Shydropower plant + 0.15 *SCHP) + (Pconsumption - 16,995) * Sremainder) ) *
CPI
Pconsumption 100%
where Shyropower plant equals the net cost of the electrical energy transmitted through the busesof the hydropower plant in the previous year;
SCHP equals the net cost of the electrical energy transmitted through the busesof the CHP plant in the previous year;
Pconsumption equals the power consumption during the accounting year (within thelimits set out in the contract);
Sremainder equals
Shydropower plant * 0.15 * Phydropower plant + SCHP *(PCHP - 22,660 + 0.85 * Phydropower plant) ;
Phydropower plant + PCHP - 22,660
Phydropower plant equals the electrical energy transmitted through buses of the hydropowerplant in the previous year;
BUSINESS
— 136 —

PCHP equals the electrical energy transmitted through buses of the CHP plantin the previous year; and
CPI equals the consumer price index in the previous year.
If the LME price exceeds the levels stated in the following table, the tariff will be increased byA, where A equals 0.035 * max (0; (Prm - Prt)); Prm equals the average weighted LME price foraluminium in the quarter preceding the accounting quarter and Prt equals the maximum LME price inthe respective year as follows:
US$/t 2010 2011 2012 2013 2014 2015 2016 2017 2018
Prt . . . . . . . . . . . . . . . . . . . 1,949 1,990 2,002 1,998 1,987 1,976 2,000 2,000 2,000
The tariff has a floor under the contract of c. 15.57 kopecks/kWh and a ceiling of c. 34.89kopecks/kWh, which is adjusted annually for the consumer price index in the previous year. For everyUS$1 that the LME reference rate exceeds the thresholds specified in the table above, the tariff perkWh will increase by 0.035 kopecks. If the reference LME price per tonne is US$100 higher than thethreshold, the Aluminium Cash Operating Cost increases by approximately US$19.12 per tonne (at theexchange rate of the Central Bank of Russia as of 30 June 2009).
Irkutsk Aluminium Smelter
On 15 November 2009, SUAL entered into a long-term contract for supply of electricity toIrkutsk aluminium smelter with Irkutskenergo, an electricity supplier controlled by En+, a ControllingShareholder of the Company, which is for a duration of nine years from 2010 to 2018.
The tariff per kWh for the Irkutsk aluminium smelter under the long-term contract is calculatedby multiplying the net cost of electricity generation by 1.125. The net cost of electricity generation(S) is calculated as follows:
S= (
5,665 * (0.85 * Shydropower plant + 0.15 * SCHP) +(Pconsumption - 5,665) * Sremainder) ) *
CPI
Pconsumption 100%
where Shyropower plant equals the net cost of the electrical energy transmitted through the busesof the hydropower plant in the previous year;
SCHP equals the net cost of the electrical energy transmitted through the busesof the CHP plant in the previous year;
Pconsumption equals the power consumption during the accounting year (within thelimits set out in the contract);
Sremainder equals
Shydropower plant * 0.15 * Phydropower plant + SCHP *(PCHP - 22,660 + 0.85 * Phydropower plant) ;
Phydropower plant + PCHP - 22,660
Phydropower plant equals the electrical energy transmitted through buses of the hydropowerplant in the previous year;
BUSINESS
— 137 —
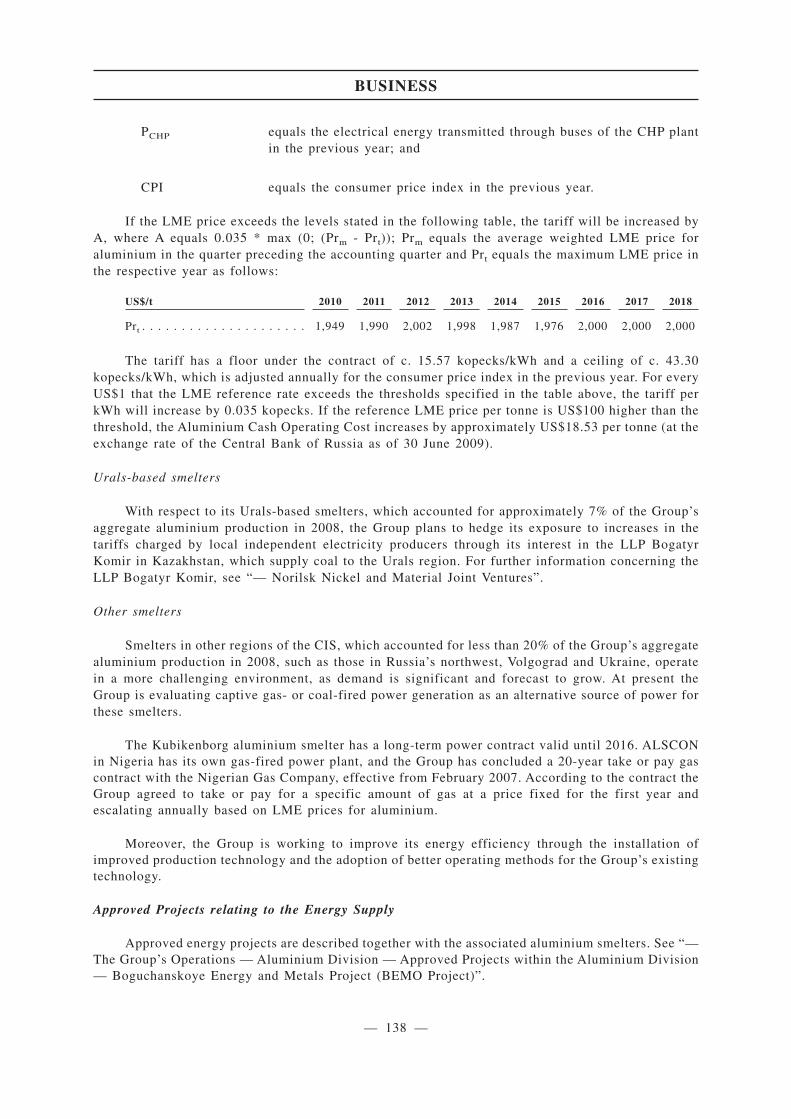
PCHP equals the electrical energy transmitted through buses of the CHP plantin the previous year; and
CPI equals the consumer price index in the previous year.
If the LME price exceeds the levels stated in the following table, the tariff will be increased byA, where A equals 0.035 * max (0; (Prm - Prt)); Prm equals the average weighted LME price foraluminium in the quarter preceding the accounting quarter and Prt equals the maximum LME price inthe respective year as follows:
US$/t 2010 2011 2012 2013 2014 2015 2016 2017 2018
Prt . . . . . . . . . . . . . . . . . . . . . 1,949 1,990 2,002 1,998 1,987 1,976 2,000 2,000 2,000
The tariff has a floor under the contract of c. 15.57 kopecks/kWh and a ceiling of c. 43.30kopecks/kWh, which is adjusted annually for the consumer price index in the previous year. For everyUS$1 that the LME reference rate exceeds the thresholds specified in the table above, the tariff perkWh will increase by 0.035 kopecks. If the reference LME price per tonne is US$100 higher than thethreshold, the Aluminium Cash Operating Cost increases by approximately US$18.53 per tonne (at theexchange rate of the Central Bank of Russia as of 30 June 2009).
Urals-based smelters
With respect to its Urals-based smelters, which accounted for approximately 7% of the Group’saggregate aluminium production in 2008, the Group plans to hedge its exposure to increases in thetariffs charged by local independent electricity producers through its interest in the LLP BogatyrKomir in Kazakhstan, which supply coal to the Urals region. For further information concerning theLLP Bogatyr Komir, see “— Norilsk Nickel and Material Joint Ventures”.
Other smelters
Smelters in other regions of the CIS, which accounted for less than 20% of the Group’s aggregatealuminium production in 2008, such as those in Russia’s northwest, Volgograd and Ukraine, operatein a more challenging environment, as demand is significant and forecast to grow. At present theGroup is evaluating captive gas- or coal-fired power generation as an alternative source of power forthese smelters.
The Kubikenborg aluminium smelter has a long-term power contract valid until 2016. ALSCONin Nigeria has its own gas-fired power plant, and the Group has concluded a 20-year take or pay gascontract with the Nigerian Gas Company, effective from February 2007. According to the contract theGroup agreed to take or pay for a specific amount of gas at a price fixed for the first year andescalating annually based on LME prices for aluminium.
Moreover, the Group is working to improve its energy efficiency through the installation ofimproved production technology and the adoption of better operating methods for the Group’s existingtechnology.
Approved Projects relating to the Energy Supply
Approved energy projects are described together with the associated aluminium smelters. See “—The Group’s Operations — Aluminium Division — Approved Projects within the Aluminium Division— Boguchanskoye Energy and Metals Project (BEMO Project)”.
BUSINESS
— 138 —

SALES AND DISTRIBUTION
As a result of the global economic slowdown and reduced demand for aluminium the Group’ssales strategy has been refined to achieve closer interaction with end-users to create new value-addedproducts that meet the specific requirements of the Group’s customers, further improve customerservice and the quality of its products. At the same time the Group’s main objective in 2009 has beento increase profitability by improving its sales system, decreasing its working capital requirements andcutting costs. The Group’s goal is to sell its entire production capacity in a combination of annual andspot contracts and to sell as many value added products, such as primary foundry alloys, billets, slabs,wire rod and high purity aluminium, as possible. About 50% of the primary aluminium produced bythe Group is sold through annual and longer-term contracts. Sales of value added products tend to havehigher margins than the Group’s other products, though the Group maintains flexibility to switch itsproduction from value added products to other products based on market conditions.
The volume of value added products produced by the Group has increased from 2,178 milliontonnes in 2007 to 2,216 million tonnes in 2008, highlighting the successful implementation of thisstrategy. Due to the recent changes to the financial and metal markets, the volume of value addedproducts sold in the first six months of 2009 has decreased to 901 million tonnes as compared to 1,181million tonnes in the same period in 2008, in line with the general decline in Group sales in 2009.
Value added products comprised approximately 52% of the Group’s aggregate attributablesaleable aluminium production in 2008 (and 45% in the first six months of 2009). The Group attemptsto fix maximum possible level of premiums guided by the market level of premiums in each region.
The Group has an established marketing and distribution infrastructure. The Group’s twoprincipal trading arms are RUSAL Marketing GmbH, which deals with exports to customers outsideof the Russian Federation and acts as agent of RTI Limited, and OJSC United Company RUSALTrading House, which deals with sales within the Russian Federation. The Group has a trading entityin the United States and a subsidiary in Japan.
UC RUSAL has in place tolling arrangements, which are similar in form to those adopted byother major international companies. UC RUSAL has followed a tolling strategy for the followingreasons:
• a substantial portion of UC RUSAL’s alumina is sourced from outside Russia and processedby smelters in Russia;
• a majority of third-party sales of aluminium products are outside Russia; and
• Russian law permits such arrangements.
Pursuant to international tolling arrangements, a tolling company registered and subject totaxation in Switzerland and acting upon instructions of the principal trading company of the Group,purchases materials, such as alumina, and arranges for their delivery to manufacturers, such asaluminium smelters, in another country for processing into end products, such as primary aluminium,in consideration of a tolling (or processing) fee. The title to the materials and end products is nottransferred to the manufacturers and, therefore, where tolling is employed, the shipment of rawmaterials and end products into and out of the country of the manufacturer is not characterised as animport/export operation and is not subject to local import/export duties. The tolling company and themanufacturer are taxed on their respective profits in their respective countries of tax residence. UCRUSAL’s tolling arrangements involve the processing by smelters in Russia of alumina producedoutside Russia and purchased by Group trading companies outside Russia for sale of aluminiumoutside Russia. The Group utilises tolling arrangements as its key material, alumina, is sourcedprimarily from outside Russia, while the production of aluminium takes place mostly within Russia.In addition, the majority of the Group’s third party sales of aluminium products are outside Russia.
BUSINESS
— 139 —
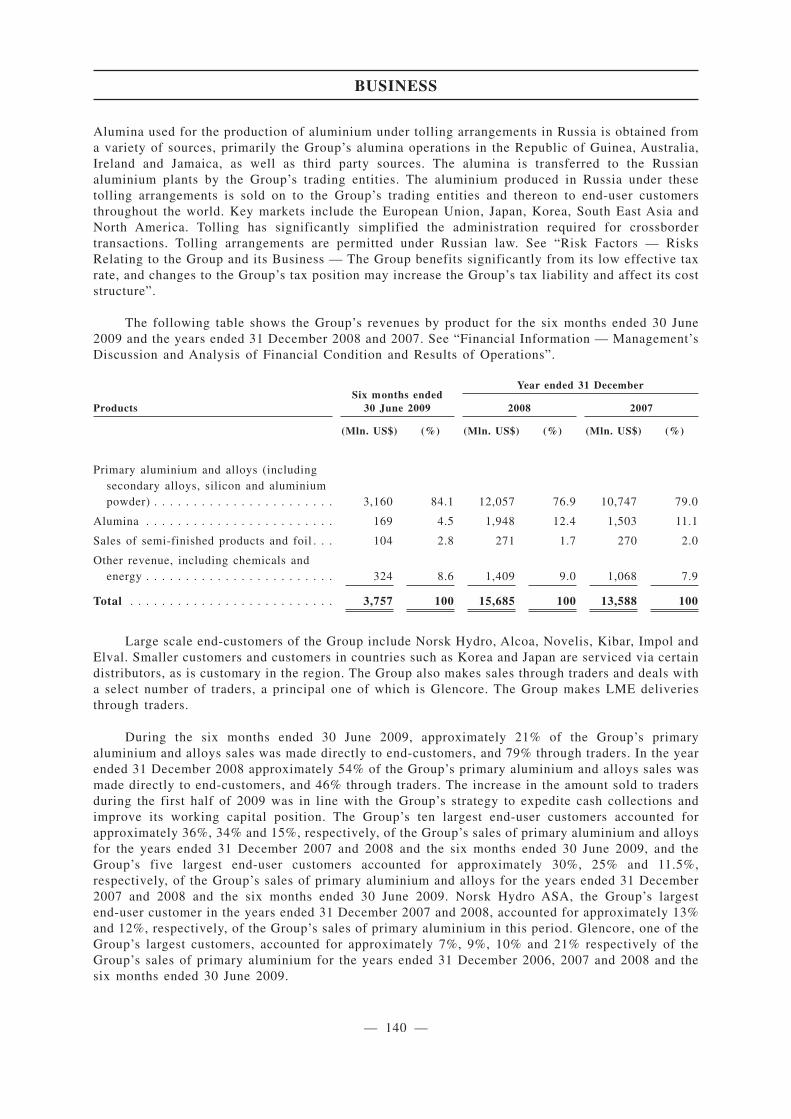
Alumina used for the production of aluminium under tolling arrangements in Russia is obtained froma variety of sources, primarily the Group’s alumina operations in the Republic of Guinea, Australia,Ireland and Jamaica, as well as third party sources. The alumina is transferred to the Russianaluminium plants by the Group’s trading entities. The aluminium produced in Russia under thesetolling arrangements is sold on to the Group’s trading entities and thereon to end-user customersthroughout the world. Key markets include the European Union, Japan, Korea, South East Asia andNorth America. Tolling has significantly simplified the administration required for crossbordertransactions. Tolling arrangements are permitted under Russian law. See “Risk Factors — RisksRelating to the Group and its Business — The Group benefits significantly from its low effective taxrate, and changes to the Group’s tax position may increase the Group’s tax liability and affect its coststructure”.
The following table shows the Group’s revenues by product for the six months ended 30 June2009 and the years ended 31 December 2008 and 2007. See “Financial Information — Management’sDiscussion and Analysis of Financial Condition and Results of Operations”.
ProductsSix months ended
30 June 2009
Year ended 31 December
2008 2007
(Mln. US$) (%) (Mln. US$) (%) (Mln. US$) (%)
Primary aluminium and alloys (includingsecondary alloys, silicon and aluminiumpowder) . . . . . . . . . . . . . . . . . . . . . . . 3,160 84.1 12,057 76.9 10,747 79.0
Alumina . . . . . . . . . . . . . . . . . . . . . . . . 169 4.5 1,948 12.4 1,503 11.1
Sales of semi-finished products and foil . . . 104 2.8 271 1.7 270 2.0
Other revenue, including chemicals andenergy . . . . . . . . . . . . . . . . . . . . . . . . 324 8.6 1,409 9.0 1,068 7.9
Total . . . . . . . . . . . . . . . . . . . . . . . . . . 3,757 100 15,685 100 13,588 100
Large scale end-customers of the Group include Norsk Hydro, Alcoa, Novelis, Kibar, Impol andElval. Smaller customers and customers in countries such as Korea and Japan are serviced via certaindistributors, as is customary in the region. The Group also makes sales through traders and deals witha select number of traders, a principal one of which is Glencore. The Group makes LME deliveriesthrough traders.
During the six months ended 30 June 2009, approximately 21% of the Group’s primaryaluminium and alloys sales was made directly to end-customers, and 79% through traders. In the yearended 31 December 2008 approximately 54% of the Group’s primary aluminium and alloys sales wasmade directly to end-customers, and 46% through traders. The increase in the amount sold to tradersduring the first half of 2009 was in line with the Group’s strategy to expedite cash collections andimprove its working capital position. The Group’s ten largest end-user customers accounted forapproximately 36%, 34% and 15%, respectively, of the Group’s sales of primary aluminium and alloysfor the years ended 31 December 2007 and 2008 and the six months ended 30 June 2009, and theGroup’s five largest end-user customers accounted for approximately 30%, 25% and 11.5%,respectively, of the Group’s sales of primary aluminium and alloys for the years ended 31 December2007 and 2008 and the six months ended 30 June 2009. Norsk Hydro ASA, the Group’s largestend-user customer in the years ended 31 December 2007 and 2008, accounted for approximately 13%and 12%, respectively, of the Group’s sales of primary aluminium in this period. Glencore, one of theGroup’s largest customers, accounted for approximately 7%, 9%, 10% and 21% respectively of theGroup’s sales of primary aluminium for the years ended 31 December 2006, 2007 and 2008 and thesix months ended 30 June 2009.
BUSINESS
— 140 —
App1A-28(1)(b)(iv)
App1A-28(1)(b)(iii)
App1A-28(1)(b)(v)
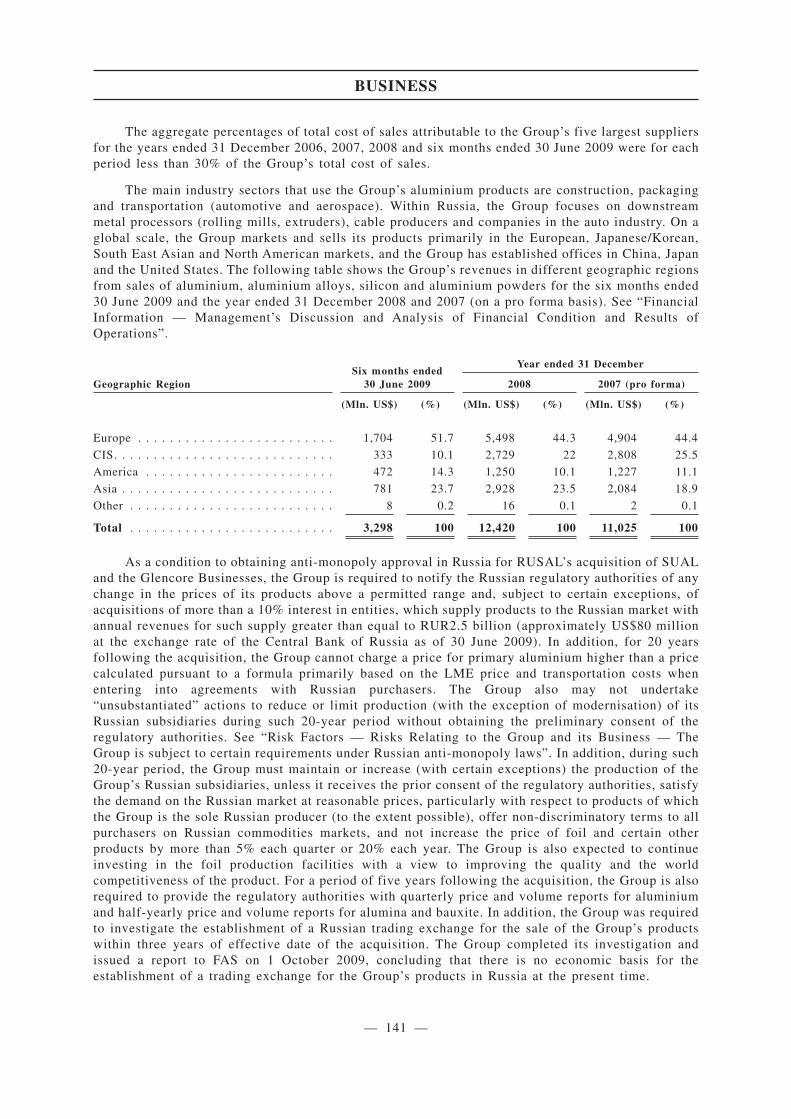
The aggregate percentages of total cost of sales attributable to the Group’s five largest suppliersfor the years ended 31 December 2006, 2007, 2008 and six months ended 30 June 2009 were for eachperiod less than 30% of the Group’s total cost of sales.
The main industry sectors that use the Group’s aluminium products are construction, packagingand transportation (automotive and aerospace). Within Russia, the Group focuses on downstreammetal processors (rolling mills, extruders), cable producers and companies in the auto industry. On aglobal scale, the Group markets and sells its products primarily in the European, Japanese/Korean,South East Asian and North American markets, and the Group has established offices in China, Japanand the United States. The following table shows the Group’s revenues in different geographic regionsfrom sales of aluminium, aluminium alloys, silicon and aluminium powders for the six months ended30 June 2009 and the year ended 31 December 2008 and 2007 (on a pro forma basis). See “FinancialInformation — Management’s Discussion and Analysis of Financial Condition and Results ofOperations”.
Geographic RegionSix months ended
30 June 2009
Year ended 31 December
2008 2007 (pro forma)
(Mln. US$) (%) (Mln. US$) (%) (Mln. US$) (%)
Europe . . . . . . . . . . . . . . . . . . . . . . . . . 1,704 51.7 5,498 44.3 4,904 44.4
CIS. . . . . . . . . . . . . . . . . . . . . . . . . . . . 333 10.1 2,729 22 2,808 25.5
America . . . . . . . . . . . . . . . . . . . . . . . . 472 14.3 1,250 10.1 1,227 11.1
Asia . . . . . . . . . . . . . . . . . . . . . . . . . . . 781 23.7 2,928 23.5 2,084 18.9
Other . . . . . . . . . . . . . . . . . . . . . . . . . . 8 0.2 16 0.1 2 0.1
Total . . . . . . . . . . . . . . . . . . . . . . . . . . 3,298 100 12,420 100 11,025 100
As a condition to obtaining anti-monopoly approval in Russia for RUSAL’s acquisition of SUALand the Glencore Businesses, the Group is required to notify the Russian regulatory authorities of anychange in the prices of its products above a permitted range and, subject to certain exceptions, ofacquisitions of more than a 10% interest in entities, which supply products to the Russian market withannual revenues for such supply greater than equal to RUR2.5 billion (approximately US$80 millionat the exchange rate of the Central Bank of Russia as of 30 June 2009). In addition, for 20 yearsfollowing the acquisition, the Group cannot charge a price for primary aluminium higher than a pricecalculated pursuant to a formula primarily based on the LME price and transportation costs whenentering into agreements with Russian purchasers. The Group also may not undertake“unsubstantiated” actions to reduce or limit production (with the exception of modernisation) of itsRussian subsidiaries during such 20-year period without obtaining the preliminary consent of theregulatory authorities. See “Risk Factors — Risks Relating to the Group and its Business — TheGroup is subject to certain requirements under Russian anti-monopoly laws”. In addition, during such20-year period, the Group must maintain or increase (with certain exceptions) the production of theGroup’s Russian subsidiaries, unless it receives the prior consent of the regulatory authorities, satisfythe demand on the Russian market at reasonable prices, particularly with respect to products of whichthe Group is the sole Russian producer (to the extent possible), offer non-discriminatory terms to allpurchasers on Russian commodities markets, and not increase the price of foil and certain otherproducts by more than 5% each quarter or 20% each year. The Group is also expected to continueinvesting in the foil production facilities with a view to improving the quality and the worldcompetitiveness of the product. For a period of five years following the acquisition, the Group is alsorequired to provide the regulatory authorities with quarterly price and volume reports for aluminiumand half-yearly price and volume reports for alumina and bauxite. In addition, the Group was requiredto investigate the establishment of a Russian trading exchange for the sale of the Group’s productswithin three years of effective date of the acquisition. The Group completed its investigation andissued a report to FAS on 1 October 2009, concluding that there is no economic basis for theestablishment of a trading exchange for the Group’s products in Russia at the present time.
BUSINESS
— 141 —
App1A-28(1)(b)(vi)

The Group’s strong customer relations reflect the quality of its product and reliability of itssupply through established logistic channels. Of the liquid aluminium produced by the Group’ssmelters, the vast majority is LME-grade with an aluminium content of 99.7% or higher. 54% of theGroup’s production was sold under direct contracts to its customers in 2008, with the remainder soldto global and regional traders. Contract terms generally are for a period of one year and provide forannual extensions. Part of the metal was sold pursuant to spot contracts. The Group also has a numberof long-term supply contracts for primary aluminium and alloys with industry leaders such as Hydro,Alcoa, Glencore and Novelis, which link prices to LME prices. The Company believes it can offer itsmajor customers significant amounts of metal for periods as long as seven years at stable prices. Forexample, in October 2009 the Company entered into an agreement to supply 1.68 million tonnes ofaluminium to China-based Norinco between 2010 and 2016. Contracts with a period of greater thanone year typically require payment against release of bill or lading in Russian port or on delivery; theGroup normally does not extend credit (except in countries such as the United States where it is anindustry norm and selectively for sales of value added and other products or to long-term, well-knowncustomers) or enter into take or pay contracts. Typically, prices in both annual and longer-termcontracts are calculated based on a formula connected to market prices, i.e., the LME price ofaluminium. Prices are determined on a case-by-case basis following negotiations with each purchaser,so there are instances where short-term contracts are entered into for a fixed price and the LME-linkedformula may vary depending on the purchaser, specific contract features (such as volume and duration)as well as the type and quality of the metal.
Sales of primary aluminium and alloys are made at prices directly linked to LME quoted pricesand increased by a premium or decreased by applicable discounts. The premium depends on themarket, product type, quantity, brand reputation, terms of delivery payment terms, quotation periodand current market trend. Within Russia and CIS, the prices of primary aluminium and alloys for allcustomers are linked to LME prices and increased by a premium, which can be renegotiated monthly.The Group’s average realised price per tonne of aluminium is generally higher than that quoted on theLME due to inclusion of certain alloys in the Group’s products (allowing a premium over LMEquotations to be earned), higher grade aluminium, supply and demand dynamics in particular markets,financing costs and the inclusion of certain transportation services in the final price. See “FinancialInformation — Management’s Discussion and Analysis of Financial Condition and Results ofOperations — Certain Factors Affecting the Group’s Results of Operations — Certain FactorsAffecting Results of Operations — Demand for and Price of Aluminium and Alumina”.
Currently, the Group does not hedge its exposure to aluminium or alumina prices, though it mayconsider such mitigation in the future. It does hedge sales to the United States and sales made fromits Kubikenborg smelter. The objective of the Group’s hedging of its sales to the United States andfrom its Kubikenborg aluminium smelter is to achieve the average LME official cash price for themonth of production. After the Group has entered into an agreement for physical sale of aluminium,it hedges the physical sale forward on the LME. At a suitable time in the future it unwinds the forwardlong hedge by selling the cash average of production.
NORILSK NICKEL AND MATERIAL JOINT VENTURES
Norilsk Nickel
The Company holds a more than 25% stake in Norilsk Nickel and accounts for it on the equitybasis. The following information and related data concerning Norilsk Nickel in this prospectus, andNorilsk Nickel’s audited consolidated financial statements the year ended 31 December 2008 andunaudited condensed consolidated financial statements for the six months ended 30 June 2009included in Appendix II to this prospectus, have been extracted or reproduced based on publiclyavailable information published by Norilsk Nickel. The Directors believe that the sources of thisinformation are appropriate sources for such information and has taken reasonable care in extractingand reproducing such information. The Directors have no reason to believe that such information is
BUSINESS
— 142 —

false, inaccurate or misleading or that any fact has been omitted that would render such informationfalse, inaccurate or misleading. The information has not been independently verified by the Group, theJoint Sponsors, the Joint Bookrunners, the Underwriters or any other party involved in the GlobalOffering and no representation is given as to its accuracy. In addition, neither Norilsk Nickel nor itsauditors have been involved in the preparation of this prospectus.
Norilsk Nickel is an open joint-stock company incorporated in Dudinka, located in theKrasnoyarsk Territory of the Russian Federation. According to Norilsk Nickel’s annual report toshareholders for the year ended 31 December 2008:
• Norilsk Nickel is the world’s largest producer of nickel and palladium and one of theleading producers of platinum and copper. It also produces various by-products, such ascobalt, chromium, rhodium, silver, gold, iridium, ruthenium, selenium, tellurium andsulphur.
• Norilsk Nickel is involved in prospecting, exploration, extraction, refining andmetallurgical processing of minerals, as well as in production, marketing and sale of baseand precious metals.
• Norilsk Nickel’s production facilities are located on four continents and in the following sixcountries Russia, Australia, Botswana, Finland, the United States of America and SouthAfrica.
In Russia, Norilsk Nickel’s shares are traded on the Moscow Interbank Currency Exchange(“MICEX”) and the Russian Trading System (“RTS”).
In addition to the Company, according to publicly available information, other significantshareholders in Norilsk Nickel as of 26 May 2009 were V.O. Potanin with 25%, Norilsk Nickel’ssubsidiaries with 8.55% and VEB with 3.68%. The Bank of New York International Nominees asnominal holder and depository for Norilsk Nickel’s ADR program holds 25.4% and others hold13.25%.
The Group has pledged 25% plus one share in Norilsk Nickel as collateral to secure the Group’sindebtedness to VEB.
For additional information in respect of Norilsk Nickel and the Group’s investment, see“Financial Information — Management’s Discussion and Analysis of Financial Condition and Resultsof Operations — The Acquisition of a 25% plus one share stake in Norilsk Nickel and SubsequentImpairment” and the Norilsk Nickel audited financial statements at “Financial Statements of NorilskNickel” which have been extracted from publicly available information and are set out in AppendixII.
Material Joint Ventures
The following discussion relates to certain joint ventures and equity investments that the Groupdeems to be material. The accounts of such joint ventures and equity investments are consolidated onthe equity basis in the Group’s consolidated financial statements included elsewhere in the prospectus.
Boguchanskoye Energy and Metals Project (BEMO Project)
In May 2006, RUSAL and RusHydro, a company controlled by the Russian Government, enteredinto a cooperation agreement to jointly construct the Boguchanskoye Energy and Metals Complex(“BEMO”). The BEMO project is ultimately intended to comprise the construction of the 3,000 MWBoguchanskaya hydropower plant (“Boguchanskaya HPP”) on the Angara River and the
BUSINESS
— 143 —
approximately 588 thousand tonnes per annum Boguchansky aluminium smelter eight kilometressoutheast of Tayozhniy, in the Krasnoyarsk region. At the date of this prospectus, only capitalexpenditure relating to the Boguchanskaya HPP up to a certain threshold is permitted under the termsof the Group’s debt restructuring agreements.
In 2006, RUSAL and RusHydro spent approximately US$101.3 million, excluding VAT, onpreliminary work and engineering for both the smelter and the Boguchanskaya HPP. In 2007, RUSALand RusHydro spent approximately US$222 million, excluding VAT, for construction of thehydropower plant. The banking feasibility study for the project was approved in 2007. In addition, thepartners procured commitments for the project from major contractors and significant preparatoryworks were completed at the end of 2007.
The Group’s capital expenditure for the Boguchanskaya HPP is currently estimated atapproximately US$725 million, excluding VAT, of which US$366 million had been spent as of 30 June2009. The debt restructuring agreements permit the Group to incur capital expenditure, within certainlimits, during the override period in relation to this project. See “Financial Information —Management’s Discussion and Analysis of Financial Condition and Results of Operations — Liquidityand Capital Resources — Debt Restructuring — Terms of the International Debt Restructuring —Capital Expenditure Restrictions”.
The Russian Federation’s Investment Fund will finance the necessary infrastructure (whose costsare not included in the project budget). State authorities have allocated approximately US$1.4 billionfor the comprehensive development of the Lower Angara region development programme, which ismanaged by the Council of the Administration of the Krasnoyarsk Region. These funds will be spenton new power transmission lines, roads and railways necessary for the complex and other local plantsand industries. Construction of infrastructure units commenced in 2007 and is expected to becompleted by 2011 in accordance with the construction schedule approved by the RussianGovernment. The Russian Federation Investment Fund’s projected budget for construction of newpower transmission lines for the BEMO project in 2009 was approximately RUR7.8 billion.
The proposed smelter is expected to contain two potlines (672 cells), each utilising the RA-300technology. The project is divided into two stages, with the first start-up complex scheduled forcompletion by 2013 and the second by the end of 2015. The debt restructuring agreements generallyprohibit the Group from incurring capital expenditures in relation to this project through the end ofthe override period but permit the Group to fund the project on a project finance (non-recourse) basisor through certain equity investments in the project. UC RUSAL is currently negotiating the financingof the project with several banks and potential co-investors to complete the construction of the firststart-up complex earlier than 2013 (as the case may be, in 2012). The Group’s capital expenditure forthe aluminium smelter is currently estimated at approximately US$717 million, excluding VAT, ofwhich approximately US$126 million, excluding VAT, had been incurred as of 30 June 2009.
Queensland Alumina Limited (QAL)
In 2005, RUSAL completed the acquisition of a 20% equity interest in Queensland AluminaLimited (“QAL”), one of the world’s largest alumina refineries, in terms of production capacity, withannual production of approximately 3.84 million tonnes of smelter grade alumina for the year ended31 December 2008. The refinery is located on 80 hectares of a 400 hectare site on the south-eastoutskirts of the city of Gladstone in the State of Queensland on the east coast of Australia. The aluminarefinery is owned and operated by the joint venture, a consortium of Rio Tinto Alcan, which owns 80%and the Group, whose equity ownership is 20%. QAL produces alumina on a toll basis (a tolling chargeper tonne of alumina produced is applied to recover the costs of processing, including operating,maintenance, raw materials, energy and administration) for two companies, Rio Tinto Aluminium andUC RUSAL. Each joint venture partner supplies the refinery with bauxite from the Weipa mine, innorthern Queensland, in return for product alumina in proportion to its respective equity in thealumina refinery.
BUSINESS
— 144 —

LLP Bogatyr Komir
Pursuant to contractual arrangements entered into in connection with the Group’s acquisition ofSUAL in 2007, the Group acquired the right to receive a 100% interest in LLP Bogatyr Komir subjectto the pre-emptive rights of the Kazakh government. In November 2007, the Group signed acooperation agreement with Samruk-Energo, a subsidiary of Samruk-Kazyna, a Kazakh state holdingcompany, pursuant to which the Bogatyr mines would be operated by LLP Bogatyr Komir, a 50/50joint venture between the Group and Samruk-Energo. In April 2008, the share purchase agreement,whereby the Group sold 50% of its equity interest in LLP Bogatyr Komir to Samruk-Energo, tookeffect and, consequently, the Kazakh government waived its pre-emptive rights in respect of the LLPBogatyr Komir. LLP Bogatyr Komir produces approximately 40 million tonnes of coal annually, hasapproximately 1.0 billion tonnes of Proved and Probable Reserves (JORC) and has Measured andIndicated Mineral Resources of approximately 2.4 billion tonnes. LLP Bogatyr Komir generated salesof US$685 million in 2008. Sales are divided evenly between Russia and Kazakhstan.
TRANSPORTATION
The Group has transportation arrangements in place to ensure that its facilities can receive thenecessary materials and that its products can reach its customers. All production assets of the Groupare located so that they can access major railway networks, ports and other transportationinfrastructure facilitating the transportation of materials and products.
The Group’s primary means of transporting its materials and products is by railway, whichcarries approximately 85% of the materials received by the Group and approximately 90% of theproducts it ships. The Russian rail network, although old and not comparable with modern systems interms of equipment and signalling, has been maintained to a sufficient level to ensure a relativelyefficient rail infrastructure. It is controlled by JSC Russian Railways, a wholly owned entity of theRussian Federation, which currently has a monopoly over infrastructure, locomotives and most freightbusinesses.
Russian railway tariffs are currently regulated by the government and consist of two parts:infrastructure costs and carriage costs. The Group benefits from favourable rail tariffs on certainroutes, and protection from rate increases, pursuant to Russian Railway Tariff Regulations adopted in2003 and 2004 and an implementing agreement entered into in 2004 between a former RUSAL entityand the railway operator, JSC Russian Railways. Under these regulations and the implementingagreement, the infrastructure component of the railway tariff for transportation on specified routes ofcertain materials is fixed in Roubles at the level prevailing at 1 October 2003 subject to conversioninto US dollars at an average RUR/USD exchange rate for the preceding quarter until December 2011,provided that increasing annual volume levels are met. Subject to the possibility of early terminationby either party before any calendar year end, the agreement is automatically renewed on an annualbasis.
The tariffs set by the Railway Tariff Regulations and implemented by the agreement areapplicable to the transportation of current and future production of the former RUSAL Russianaluminium smelters and alumina refineries. These regulations and the implementing agreement do notapply to the former SUAL facilities.
In 2008, the Group agreed with JSC Russian Railways to fix the infrastructure component oftransport tariffs generally applicable to specific types of raw materials and products at 2008 levelssubject to a certain diminishing factor with subsequent annual increases indexed in accordance withgeneral annual tariff indexation. Such fixed transport tariffs would apply to the principal types of rawmaterials and products usually transported by the Group, rather than particular entities ortransportation routes, and thus would indirectly benefit the entire Group. The Group intends tocontinue the negotiation process in relation to the fixed transport tariffs in 2010. Once the negotiationsare finalised it is expected that new regulations will have to be issued by the state tariff service in
BUSINESS
— 145 —
order to give effect to the new tariffs. Upon entry of the new tariffs into force, the Railway TariffRegulations and the implementing agreement will terminate. Until then, the Group expects that theRailway Tariff Regulations and the implementing agreement with JSC Russian Railways will continueto apply. As an alternative, the Group is also discussing with JSC Russian Railways the possibility ofextending the current agreement to SUAL and new production facilities with the simultaneousextension of its term until 2020.
Furthermore, the Group is currently in the process of negotiating a 30% discount to theinfrastructure component of the tariff to apply if the LME price falls below US$1,650 per tonne. Whilethis has been approved by JSC Russian Railways, it remains subject to approval by the FST.
The infrastructure component of the tariff, which is fixed as described above, representsapproximately 85% of the tariff, while the carriage component accounts for the remainder. Thecarriage component is not stipulated for in the implementing agreement and is not subject to theongoing negotiations with JSC Russian Railways. The carriage component is subject to indexation tothe rate of inflation, which is typically undertaken annually. Currently, the Russian Government iscontemplating plans to increase competition through the privatisation of the rolling stock owned byJSC Russian Railways, which could influence the carriage costs portion of the tariff. Although it ismore likely that the government will limit any increase in the carriage component of the tariff untilDecember 2010 so as not to exceed the inflation rate, the pricing structure for the rail industry, shouldderegulation occur, would be difficult to determine and the Group could be subject to tariff increases.See “Risk Factors — Risks relating to the Group and its Business — The Group depends on theprovision of uninterrupted transportation services and access to state-owned infrastructure for thetransportation of its materials and end products across significant distances, and the prices for suchservices (particularly rail tariffs) could increase”.
The Group’s costs related to its shipments may be increased, when the cargo flow resumes, asa result of a shortage of railcars and logistical problems. To mitigate this risk, the Group may needto consider the acquisition of its own rolling stock for cargo transport.
The Group’s primary aluminium and value added products delivered abroad are mainlytransported by rail and delivered at seaports. The Group ships its exports to end customers through anumber of Russian and Ukrainian ports depending on the location of a particular customer. Costsrelated to railway transportation of aluminium to the port are incurred by the Group, while furthercosts of transportation are incurred either by the Group or by the customer, depending upon the typeof contract and delivery terms. Products for the northwestern markets are shipped through St.Petersburg and Murmansk, products for the southern markets are shipped through Temryuk andNovorossiysk and products for the eastern markets are shipped through Nakhodka, Vanino andVladivostok, with more than 90% of the Group’s products shipped to the New Port in St. Petersburg,the Vanino in Khabarovsky and the Novorossiysk in Krasnodarsky Krai. To secure timely delivery ofmaterials and finished products when the cargo flow resumes, the Group will consider developing itsown port facilities.
In April 2008, the Group signed a memorandum of cooperation with JSC “Ust-Luga Company”,the developer of Ust Luga trade sea port, to jointly construct the complex, which will consist of twoterminals designed to transport aluminium and alumina at Ust Luga trade sea port. The complex isexpected to have an initial shipment capacity of 3.5 million tonnes of alumina imports and 2.6 milliontonnes of aluminium exports. The Group’s investments into the construction of the complex areestimated to be at approximately US$300 million. The Ust Luga project has been suspended due to thecurrent reduction in the cargo flows. The Group is also considering development opportunities inNovorossiysk, St. Petersburg and Russia’s Far East.
BUSINESS
— 146 —

The following tariffs applied to railway transportation between the Krasnoyarsk, Bratsk, Khakasand Sayanogorsk aluminium smelters and the St. Petersburg, Novorossiyisk and Vanino ports inSeptember 2009:
Aluminium(US$/t)
September2009 St Petersburg Novorossiyisk Vanino
Alumina(US$/t)
September2009 St Petersburg Novorossiyisk Vanino
KrasnoyarskAluminiumSmelter
45.61 50.52 n.a. KrasnoyarskAluminiumSmelter
43.92 n.a. n.a.
BratskAluminiumSmelter
55.90 57.39 51.44 BratskAluminiumSmelter
48.48 n.a. 42.12
KhakasAluminiumSmelter
44.51 n.a. n.a. KhakasAluminiumSmelter
n.a. n.a. 49.07
SayanogorskAluminiumSmelter
45.10 55.25 n.a. SayanogorskAluminiumSmelter
n.a. n.a. n.a.
Transportation outside of Russia and the CIS is managed by offshore trading companies. TheGroup manages its transportation (i) through transportation units located at each of its productionfacilities, which are responsible for the maintenance of the railway track owned by each facility andfor day-to-day management of various transportation issues, and (ii) through subdivisions of UCRUSAL’s management company, which are responsible for organising the transportation of theGroup’s products and materials in Russia and abroad. Agreements with the main railroads, carriers andseaports for transportation of the Group’s products and materials are in place.
QUALITY CONTROL AND CERTIFICATION
The Group adheres to strict internal and industry-wide quality standards. In 2008, 72% of itsaggregate aluminium production originated from LME certified plants. The following plants areapproved for LME metal contracts: Krasnoyarsk aluminium smelter, Sayanogorsk aluminium smelter,Novokuznetsk aluminium smelter, Bratsk aluminium smelter, Irkutsk aluminium smelter, Bogoslovskalumina and aluminium complex, Volgograd aluminium smelter, Kandalaksha aluminium smelter,Nadvoitsy aluminium smelter, Urals alumina and aluminium complex and Kubikenborg aluminiumsmelter. Nearly all of the Group’s aluminium smelters and alumina refineries have been ISO 9001certified and certain plants have also received ISO/TS 16949 certification, which governs theapplication of ISO 9001 to suppliers of the automotive industry.
ENVIRONMENTAL, HEALTH AND SAFETY MATTERS
As with other natural resources and mineral processing companies, the Group’s operations createhazardous and non-hazardous waste, effluent emissions into the atmosphere, water and soil and safetyconcerns for its workforce. Consequently, the Group is required to comply with a range of health,safety and environmental (“HSE”) laws and regulations. The Group believes its operations are incompliance in all material respects with the applicable HSE legislation of the Russian Federation, its
BUSINESS
— 147 —
regions and the countries and regions where the Group’s plants are situated and intends to upgradewhere feasible to comply with international standards. The Group’s annual cost of compliance withsuch laws and regulations was US$166.34 million and US$107.3 million in the years ended 31December 2007 and 2008, respectively, and is forecasted to be US$47.5 million for the year ended 31December 2009. However, the Group also incurs fines for minor violations of environmental rules andregulations. These were US$0.03 million, US$0.04 million and US$0.05 million in the years ended 31December 2007 and 2008 and the six months ended 30 June 2009, respectively.
The Group considers health and safety a fundamental value that is central to its business. To thisend, the Group has formulated a series of health and safety principles, policies and guidelines andestablished a health and safety management system. The purpose of these initiatives is to eliminate anyharm caused to employees at all stages of its production activity. In addition, the Group has engagedcompanies such as DuPont Safety Resources and Det Norske Veritas, world recognised leaders insafety programme deployment, to assist in the development and installation of safety policies,programmes, standards, practices and procedures. In January 2008, Det Norske Veritas certified thatthe health and safety management system of the Company’s major aluminium production facilitiescomplies with Occupational Health and Safety Specification (OHSAS) 18001. Ten of the Group’s sitesand facilities are already OHSAS 18001 certified and it is the objective of the Group to acquireOHSAS 18001 certification for all of its operating facilities.
Care for the health of Group employees is a key element of the Group’s social policy. The Groupprovides a full range of medical services for its employees and promotes a healthy lifestyle. The Groupemphasises preventive medicine and the reduction of lost working time resulting from occupationalillnesses through corporate medical centres it has established in most regions where the Groupoperates.
Health and safety is an ongoing process and the programmes covering each area are updated andimproved upon continuously, based on changing regulations and business need. Reports coveringperformance are generated daily, weekly, monthly and annually, according to regulatory and Groupreporting requirements. In the event of an injury or accident, as mandated by local law, aninvestigation is carried out to determine causation and corrective action. Group safety standards alsorequire an internal investigation to determine causation and any behavioural deficiencies thatcontributed to the incident.
Lost Time Injury Frequency Rate (“LTIFR”) is used to gauge internal safety performance and tobenchmark the Group or individual plants against peers or alternative industries. The Group calculatesLTIFR as a sum of fatalities and lost time injuries per 200,000 man-hours, which is the method usedby most of its direct competitors and data-gathering agencies. In 2008, the LTIFR rate for the Groupdecreased to 0.18 compared to a level of 0.19 in 2007, both of which are lower than the LTIFR of 0.32per 200,000 hours worked reported by the International Aluminium Institute in Safety PerformanceBenchmarking Report 2008 for the industry as a whole for 2006-2008. In 2009, the Group aims toreduce the LTIFR by at least 5%. Another indicator of the Group’s improved safety measures is thegeneral reduction in the number of fatalities over time, although the fatality rate tends to fluctuatewidely. In 2006, there were six fatal accidents involving employees and five involving contractors. In2007, there were 19 fatal accidents involving employees and three involving contractors. In 2008, thenumber of fatal accidents involving employees reduced to eight and the number of fatalities involvingcontractors was four. In respect of the 26 fatal accidents that have occurred from the period beginning1 January 2007 and ending 30 June 2009, the total compensation paid by the Group was approximatelyUS$1 million.
BUSINESS
— 148 —
The Group has also taken steps to lessen the environmental impact of its operations and complywith all applicable environmental laws and regulations. A violation of environmental laws or failureto comply with the regulations or instructions of relevant environmental authorities could lead to,among other things, a temporary shut down of all or a portion of a mine, refinery, smelter or otherplant; the loss of a right to mine or operate a refinery, smelter or other plant; and/or the impositionof other costly compliance procedures. See “Risk Factors — Risks Relating to the Group and itsBusiness — The Group operates in an industry that gives rise to health, safety and environmentalrisks”.
The Group’s mines, refineries, smelters and other plants located in Russia are subject to statutorylimits on air emissions and the discharge of liquids and other substances. Russian authorities maypermit, in accordance with the relevant Russian laws and regulations, a particular Group facility toexceed statutory emission limits, provided that the Group develops a plan for the reduction of theemissions or discharge and pays a levy based on the amount of contaminants released in excess of thelimits. Fees are assessed on a sliding scale in accordance with the relevant laws and regulations: thelowest fees are imposed for pollution within the statutory limits, intermediate fees are imposed forpollution within the individually approved limits, and the highest fees are imposed for pollutionexceeding such limits. In 2007 and 2008 and the first six months of 2009, such fees constitutedUS$29.7 million, US$29.4 million and US$8.2 million, respectively. It is within the discretion of theRussian authorities to permit pollution in excess of the statutory limits, and any request may bedenied. Moreover, the payment of fees for exceeding these limits does not relieve the Group from itsresponsibility to take environmental protection measures and undertake restoration and clean-upactivities. In addition, some of the Group’s sites benefit from higher limits on air emissions, as agreedwith the authorities, on the condition that modernisation programmes will be completed at those sites.
A study undertaken on behalf of the Group in 2008-2009 estimates the capital expenditure theGroup would have to make over a five-year period to address known and potential environmental,health and safety and social issues, at the level of US$5 million or more per issue per site. Theestimate does not include costs relating to the decommissioning of redundant equipment associatedwith any Group asset, or any decommissioning or closure costs, including restoration costs, or chargesthat may be required as a result of changes in specifications of plant operation. The study estimatesthat, when adjusted for probability, the Group’s most likely case scenario would entail aggregatecapital expenditure of US$1.2 billion and its reasonable worst-case scenario would entail an aggregatecapital expenditure of US$1.3 billion.
The study aggregates issues of various probabilities, including remote. The Company believesthat actual required capital expenditure will be several orders of magnitude less than those indicatedin the study. Environmental, health and safety and social programs are budgeted under the Company’soverall capital expenditure budgets. The amounts required to address environmental, health and safetyand social programs are expected to range from approximately US$40 million to US$80 millionannually over the next five years. Annual capital expenditure to address environmental, health andsafety and social programs is determined based on a number of factors, including capital expenditurespend in past years, an analysis of and expectations for upcoming projects and requirements, andconsideration of applicable rules and regulations and expenditures required in order to ensurecompliance. Such capital expenditure is to some extent required under environmental laws, andtherefore permitted under the terms of the debt restructuring agreements, and to some extentdiscretionary on the part of the Company. Under IFRS, the Company is not required to make, andaccordingly has not made, any provision in its financial statements for this future capital expenditure.
The study concluded that most of this capital expenditure would pertain to the reduction of airemissions from the Group’s aluminium smelters. The Group is undertaking large-scale modernisationprojects at a number of its facilities, including the Bratsk aluminium smelter, which are expected toimprove environmental standards as well as increase production. The Krasnoyarsk aluminium smelterfinished implementing a modernisation programme in September 2009, which is expected to reduce
BUSINESS
— 149 —

emissions and increase production. The study also identified the soil and groundwater conditions ata number of the Group’s sites as potential environmental issues that may require material capitalexpenditure by the Group, in the form of on- and off-site soil and groundwater remediation, such asthe conditions existing at the Eurallumina refinery due to past contamination by industrial facilitiesin the Sulcis-Iglesiente region. In September 2009, one of Eurallumina’s red mud basins wassequestrated and its environmental permit for production operations and management of the red mudbasin was suspended owing to failure to comply with instructions of the Italian Ministry for theProtection of the Environment (the “Italian Environmental Ministry”). See “Business — Litigation —Italian Environmental Ministry”. Eurallumina is realising a phased decontamination project as part ofthe general plan of the Sardinian government applicable to all industrial enterprises in the region. Themain social issue reflected in the study concerns the possible relocation of communities from thesanitary protection zones surrounding some of the smelters, including the relocation of residentslocated close to the Bratsk aluminium smelter to the town of Bratsk. Under a federal plan and anagreement signed with local communities in March 2007, residents in the Chekanovsky settlement,located close to the Bratsk aluminium smelter, will be relocated to the town of Bratsk and othercommunities for health and safety reasons at an anticipated cost to the Group of US$20 million (whichhas been fully provided for in UC RUSAL’s Accountants’ Report). The relocation is expected to becompleted in 2011. The Group may be responsible for the costs of relocating inhabitants from thesanitary protection zones surrounding its smelters. Any such relocation could also have a negativeimpact on the reputation of the Group. According to the report, the Urals aluminium smelter has over17,500 inhabitants residing within the site’s sanitary protection zone, along with accompanying socialinfrastructure. The study estimates that if the residents were required to be resettled (the studyindicates that there is a 1 to 10% probability that this will be required), direct costs to the Group wouldbe US$160 million in the most likely case and US$200 million in the reasonable worst-case. Alsoaccording to the study, the sanitary protection zone at the Bogoslovsk aluminium smelter hasapproximately 50,000 people resident within it. The Group is planning to implement a modernisationprogramme that is expected to reduce the size of the sanitary protection zone at the site.Approximately 5,500 people could be resident inside the reduced sanitary protection zone, and thestudy estimates that if such residents need to be resettled (the study indicates that there is a 1 to 10%probability that this will be required), direct costs to the Group would be US$48.5 million in the mostlikely case and US$60 million in the reasonable worst-case scenario. If the Group is required to incursuch costs, it will be required to do so by environmental law and therefore permitted to do so underthe terms of the debt restructuring agreements.
The Group is committed to investigating practicable remedies to address the key environmental,health and safety issues that it faces, according to the respective Performance Standards of the IFC,and to implement such remedies against a realistic timeframe. One of the Group’s environmentalpriorities is to invest in the modernisation of Söderberg technology in order to reduce emissions of airpollutants. Overall, the Group’s goal is to achieve, by 2017 or earlier if required by law or regulation,the air emission limits set by the laws of the countries in which it operates. However, currently at theboundary of the Krasnoyarsk aluminium smelter’s sanitary protection zone, emissions exceedmaximum permissible limits, and the site has advised the regulator that by 2015 it will achieve thepermissible limits.
For the construction of the Khakas aluminium smelter (as well as for any of its large-scaleprojects), the Group initiated an environmental and social management plan that aimed to ensure thatpotential adverse environmental and social impacts were limited to acceptable levels not only in theconstruction phase, but also in the subsequent operation of the smelter.
BUSINESS
— 150 —

In 2007, The Group signed a memorandum of understanding with the United NationsDevelopment Programme (UNDP). The aim of the memorandum is the implementation of measures tominimise the impact on climate by reducing GHG emissions. The Group is actively participating inthe International Aluminium Institute’s activities related to GHG emissions and energy efficiency. TheGroup has achieved significant improvements in GHG emission reductions. For instance, the Group’saluminium smelters have reduced GHG emissions in 2008 by more than 30% compared to 1990.
The Group is a member of the National Carbon Union in Russia, a partnership of leadingbusinesses created in July 2003 with the support of President Putin’s administration. The NationalCarbon Union aims to create a regulatory structure for the control of greenhouse gas emissions andto develop a strategy for the application of the Kyoto protocol in Russia. The Group also participatesin activities conducted by the Russian Ministry for Economic Development concerning thedevelopment of Russia’s carbon market.
The Group is voluntarily aiming to reduce the level of greenhouse gases that its facilities emitand replace equipment that contains polychlorinated biphenyls (a pollutant that eventually will beprohibited under the Stockholm Convention on Persistent Organic Pollutants). Under the Conventionsuch equipment may be used until 2025 and shall be then replaced with new polychlorinated biphenylsemission free equipment. The Group also expects to increase the proportion of bauxite mining land itrehabilitates annually, in line with the objectives set by the International Aluminium Institute. TheGroup further plans to strengthen its environment management systems. Fifteen aluminium smelters,nine alumina refineries, and QAL have already received ISO 14001 certification to date for theirenvironmental management.
The Group’s social performance is guided by the ten universal social and environmentalprinciples of the UN Global Compact, which the Company is a signatory to. The Company measuresits social performance in accordance with the requirements of the Global Reporting Initiative’sBusiness Guide to the Sustainability Reporting Guidelines. The principles of the Global ReportingInitiative’s reporting system are fully compatible with the principles of the UN Global Compact.
There has been no material environmental pollution incident at any of the Group’s sites orfacilities during the three years ended 31 December 2008 and the six months ended 30 June 2009.
OPERATIONAL HAZARDS AND INSURANCE
The Group’s operations are subject to numerous operating risks, including geological conditions,seismic activity, climatic conditions, political unrest, terrorist or similar activities, interruption ofpower supplies, environmental hazards, technical failures, fires, explosions and other accidents atmines, refineries, smelters or other facilities. These risks and hazards could result in damage toproduction facilities, personal injury, fatalities, environmental damage, business interruption andpossible legal liability.
In Russia, the Group maintains a mandatory policy covering employer’s liability for death orinjury to workers is maintained through the Russian state social insurance fund. The Group maintainsthird-party liability mandatory insurance for all of its vehicles and for hazardous objects registeredwith Russian state supervision agencies. The Group also maintains certain voluntary policies withRussian and international insurers, including property, business interruption and other commercialrisks insurance for losses up to US$150 million per occurrence, cargo insurance for losses up to US$50million, political risk insurance with respect to the Group’s operations in Nigeria (which coversnationalisation) for losses up to US$130 million, kidnap and ransom insurance for losses up to US$3million, general liability insurance worldwide for losses up to US$75 million, which covers, inter alia,product liability and sudden and accidental pollution.
BUSINESS
— 151 —

EMPLOYEES
The following table sets forth the aggregate average number of people (full-time equivalents)employed by each division of the Group during each of the last three years ended 31 December 2008and the six months ended 30 June 2009.
Division
Six monthsended 30
June 2009
Year Ended 31 December
2008 2007 2006
Aluminium . . . . . . . . . . . . . . . . . . . . . . . . . . . . . . . . . . . 34,615 36,959 46,802 16,244
Alumina . . . . . . . . . . . . . . . . . . . . . . . . . . . . . . . . . . . . . 15,795 19,501 24,105 10,110
Engineering and Construction . . . . . . . . . . . . . . . . . . . . . . . 23,520 25,325 17,273 13,089
Materials . . . . . . . . . . . . . . . . . . . . . . . . . . . . . . . . . . . . . — 2,551 3,109 377
Energy . . . . . . . . . . . . . . . . . . . . . . . . . . . . . . . . . . . . . . 13 26 17 —
Packaging . . . . . . . . . . . . . . . . . . . . . . . . . . . . . . . . . . . . 2,166 2,223 2,283 1,469
Managing Company . . . . . . . . . . . . . . . . . . . . . . . . . . . . . 506 601 754 645
Others. . . . . . . . . . . . . . . . . . . . . . . . . . . . . . . . . . . . . . . 2,277 2,722 2,803 1,932
Totals . . . . . . . . . . . . . . . . . . . . . . . . . . . . . . . . . . . . . . . 78,892 89,908 97,146 43,866
In 2006, each of RUSAL, SUAL and Glencore and from 2007 through 2008, UC RUSAL hasprovided its employees with regular salary increases resulting in increasing payroll costs, althoughsalaries have not increased in 2009. The Group aims to continue to improve productivity bystreamlining its workforce, including by centralising R&D and production services functions throughthe Engineering and Construction Division.
Certain subsidiaries of the Group, or certain of their branches, have collective agreements withtrade union representatives that primarily relate to social benefits in favour of their employees. Thecollective agreements have been entered into for terms of up to three years and apply to all employeesof the relevant subsidiary or branch (which currently constitute 97% of the Group’s employees).
The remuneration paid by the Group is based on an employee’s qualifications and performance,as well as the complexity of his or her job. Wages for each employee are generally reviewed annuallyand revised in accordance with a performance assessment and local labour market conditions.
The UC RUSAL Personnel Policy and the UC RUSAL Corporate Code of Conduct govern therelationship between the Group and its staff. The Group’s Corporate Code of Conduct strictly prohibitsdiscrimination based on gender, race and religion and forbids any form of child, forced or indenturedlabour. The Code of Conduct, which is enforced through compliance procedures established by theGroup, regulates the professional behaviour and business communications of all the Group’semployees. In December 2007, the Group established and widely disseminated a “hot line” to reportviolations of the Code of Conduct and to answer employees’ questions about the Code of Conduct andother corporate procedures. The Group emphasises the creation of favourable work and leisureconditions for its employees by offering social benefits, pension plans, cultural events and subsidisedmeals. The Group also assists its employees with career development and further education.
BUSINESS
— 152 —
App1A-28(7)
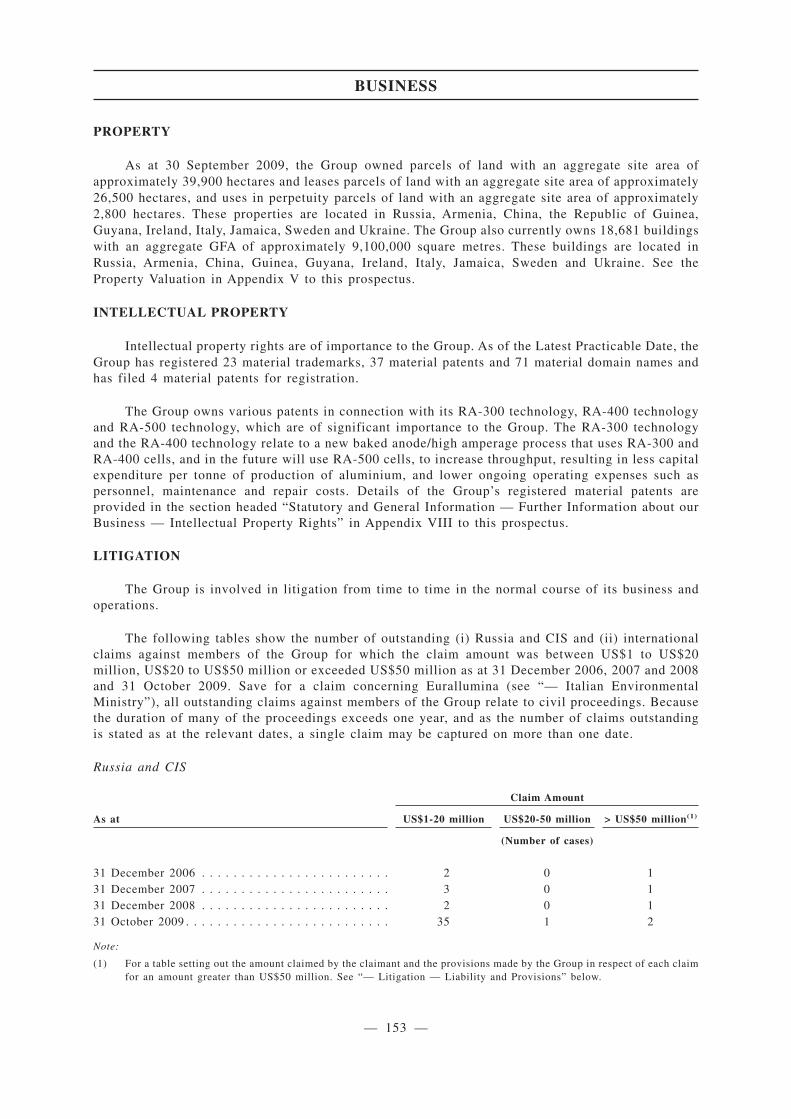
PROPERTY
As at 30 September 2009, the Group owned parcels of land with an aggregate site area ofapproximately 39,900 hectares and leases parcels of land with an aggregate site area of approximately26,500 hectares, and uses in perpetuity parcels of land with an aggregate site area of approximately2,800 hectares. These properties are located in Russia, Armenia, China, the Republic of Guinea,Guyana, Ireland, Italy, Jamaica, Sweden and Ukraine. The Group also currently owns 18,681 buildingswith an aggregate GFA of approximately 9,100,000 square metres. These buildings are located inRussia, Armenia, China, Guinea, Guyana, Ireland, Italy, Jamaica, Sweden and Ukraine. See theProperty Valuation in Appendix V to this prospectus.
INTELLECTUAL PROPERTY
Intellectual property rights are of importance to the Group. As of the Latest Practicable Date, theGroup has registered 23 material trademarks, 37 material patents and 71 material domain names andhas filed 4 material patents for registration.
The Group owns various patents in connection with its RA-300 technology, RA-400 technologyand RA-500 technology, which are of significant importance to the Group. The RA-300 technologyand the RA-400 technology relate to a new baked anode/high amperage process that uses RA-300 andRA-400 cells, and in the future will use RA-500 cells, to increase throughput, resulting in less capitalexpenditure per tonne of production of aluminium, and lower ongoing operating expenses such aspersonnel, maintenance and repair costs. Details of the Group’s registered material patents areprovided in the section headed “Statutory and General Information — Further Information about ourBusiness — Intellectual Property Rights” in Appendix VIII to this prospectus.
LITIGATION
The Group is involved in litigation from time to time in the normal course of its business andoperations.
The following tables show the number of outstanding (i) Russia and CIS and (ii) internationalclaims against members of the Group for which the claim amount was between US$1 to US$20million, US$20 to US$50 million or exceeded US$50 million as at 31 December 2006, 2007 and 2008and 31 October 2009. Save for a claim concerning Eurallumina (see “— Italian EnvironmentalMinistry”), all outstanding claims against members of the Group relate to civil proceedings. Becausethe duration of many of the proceedings exceeds one year, and as the number of claims outstandingis stated as at the relevant dates, a single claim may be captured on more than one date.
Russia and CIS
Claim Amount
As at US$1-20 million US$20-50 million > US$50 million(1)
(Number of cases)
31 December 2006 . . . . . . . . . . . . . . . . . . . . . . . . 2 0 131 December 2007 . . . . . . . . . . . . . . . . . . . . . . . . 3 0 131 December 2008 . . . . . . . . . . . . . . . . . . . . . . . . 2 0 131 October 2009 . . . . . . . . . . . . . . . . . . . . . . . . . . 35 1 2
Note:
(1) For a table setting out the amount claimed by the claimant and the provisions made by the Group in respect of each claimfor an amount greater than US$50 million. See “— Litigation — Liability and Provisions” below.
BUSINESS
— 153 —
App1A-28(4)
App1A-40
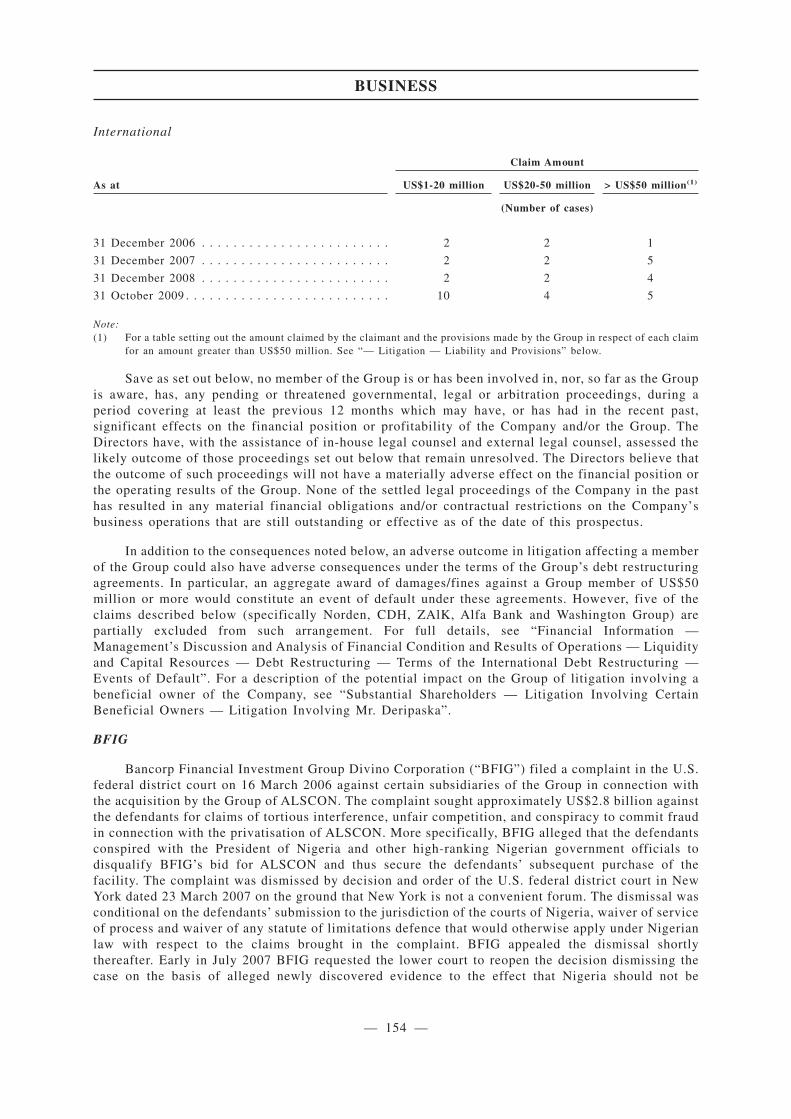
International
Claim Amount
As at US$1-20 million US$20-50 million > US$50 million(1)
(Number of cases)
31 December 2006 . . . . . . . . . . . . . . . . . . . . . . . . 2 2 1
31 December 2007 . . . . . . . . . . . . . . . . . . . . . . . . 2 2 5
31 December 2008 . . . . . . . . . . . . . . . . . . . . . . . . 2 2 4
31 October 2009 . . . . . . . . . . . . . . . . . . . . . . . . . . 10 4 5
Note:(1) For a table setting out the amount claimed by the claimant and the provisions made by the Group in respect of each claim
for an amount greater than US$50 million. See “— Litigation — Liability and Provisions” below.
Save as set out below, no member of the Group is or has been involved in, nor, so far as the Groupis aware, has, any pending or threatened governmental, legal or arbitration proceedings, during aperiod covering at least the previous 12 months which may have, or has had in the recent past,significant effects on the financial position or profitability of the Company and/or the Group. TheDirectors have, with the assistance of in-house legal counsel and external legal counsel, assessed thelikely outcome of those proceedings set out below that remain unresolved. The Directors believe thatthe outcome of such proceedings will not have a materially adverse effect on the financial position orthe operating results of the Group. None of the settled legal proceedings of the Company in the pasthas resulted in any material financial obligations and/or contractual restrictions on the Company’sbusiness operations that are still outstanding or effective as of the date of this prospectus.
In addition to the consequences noted below, an adverse outcome in litigation affecting a memberof the Group could also have adverse consequences under the terms of the Group’s debt restructuringagreements. In particular, an aggregate award of damages/fines against a Group member of US$50million or more would constitute an event of default under these agreements. However, five of theclaims described below (specifically Norden, CDH, ZAlK, Alfa Bank and Washington Group) arepartially excluded from such arrangement. For full details, see “Financial Information —Management’s Discussion and Analysis of Financial Condition and Results of Operations — Liquidityand Capital Resources — Debt Restructuring — Terms of the International Debt Restructuring —Events of Default”. For a description of the potential impact on the Group of litigation involving abeneficial owner of the Company, see “Substantial Shareholders — Litigation Involving CertainBeneficial Owners — Litigation Involving Mr. Deripaska”.
BFIG
Bancorp Financial Investment Group Divino Corporation (“BFIG”) filed a complaint in the U.S.federal district court on 16 March 2006 against certain subsidiaries of the Group in connection withthe acquisition by the Group of ALSCON. The complaint sought approximately US$2.8 billion againstthe defendants for claims of tortious interference, unfair competition, and conspiracy to commit fraudin connection with the privatisation of ALSCON. More specifically, BFIG alleged that the defendantsconspired with the President of Nigeria and other high-ranking Nigerian government officials todisqualify BFIG’s bid for ALSCON and thus secure the defendants’ subsequent purchase of thefacility. The complaint was dismissed by decision and order of the U.S. federal district court in NewYork dated 23 March 2007 on the ground that New York is not a convenient forum. The dismissal wasconditional on the defendants’ submission to the jurisdiction of the courts of Nigeria, waiver of serviceof process and waiver of any statute of limitations defence that would otherwise apply under Nigerianlaw with respect to the claims brought in the complaint. BFIG appealed the dismissal shortlythereafter. Early in July 2007 BFIG requested the lower court to reopen the decision dismissing thecase on the basis of alleged newly discovered evidence to the effect that Nigeria should not be
BUSINESS
— 154 —
considered an adequate alternative forum. The defendants opposed that request, and late in 2007 thelower court denied BFIG’s request to reopen judgment. BFIG appealed that decision. Subsequently,both appeals were consolidated for the purpose of scheduling an oral hearing date. The joint appealwas heard on 24 October 2008 and by summary order dated 4 November 2008 the lower court’sdismissal was affirmed. The dismissal of the complaint and affirmance of that decision means thatBFIG may not reassert the claims set forth in its complaint in the U.S. In accordance with the termsof the conditional dismissal of 23 March 2007, BFIG does, however, retain the right to sue in Nigeriaon the claims set forth in the complaint of 16 March 2006. Also, in accordance with the conditionaldismissal, the defendant Group subsidiaries would be unable to challenge the Nigerian court’sjurisdiction over the matter should BFIG proceed to sue in Nigeria. In principle, BFIG could alsoreassert such claims in any other court of competent jurisdiction outside the U.S., although to date,as far as the Company is aware, BFIG has not given any indication of its intention to do so, whetherin Nigeria or elsewhere. Although a decision against the Group may have an adverse effect on theGroup’s ALSCON operations in Nigeria, including the potential loss of ALSCON and consequent lossof revenue, the Directors do not believe that any resulting liabilities will materially adversely affectthe Group’s financial position or its operations as a whole.
TadAZ
During 2003-2004, Elleray Management Limited, a Group member, was involved in a tradingbusiness with the Tajik Aluminium Plant (“TadAZ”), an enterprise owned by the Tajik government.This business was conducted through Hamer Investment Ltd. (“Hamer”), a joint venture with a thirdparty, Ansol Limited (“Ansol”). The joint venture was engaged in supplying TadAZ with alumina (andother raw materials) and acquiring finished aluminium from TadAZ for resale. In December 2004,TadAZ suspended the delivery of primary aluminium to Hamer and repudiated the extension of thecontract between TadAZ and Hamer for 2005, which effectively resulted in the termination of the jointbusiness. As a result, proceedings in London began in early 2005 between TadAZ and Ansol et al andin which Ansol eventually made claims against certain Group members, as well as Mr. Deripaska,Director of the Company (by way of Part 20 Claims), claiming that they had violated alleged dutiesto the joint venture, and had conspired to usurp the business between Hamer and TadAZ. Followinga hearing in 2006, the judge did not permit the Part 20 Claim to proceed against Mr. Deripaska (ashe did not recognise him as a proper defendant in the case). The claim did, however, continue againstthe corporate defendants.
In the context of the same dispute, in 2006, Ansol and Ashton Investments Ltd. (a companyassociated with Ansol) brought an action in the High Court against OJSC Rusal and certain othersincluding Mr. Deripaska, alleging that OJSC Rusal et al illegally obtained access to Ashton’scomputers in the UK and thereby obtained certain confidential documents relating to the abovementioned litigation pending in the UK. At a hearing at an early stage in the proceedings, the judgedid not permit the action to proceed against Mr. Deripaska. The case did however proceed against thecorporate defendants, The judge held that there was no evidence that Mr. Deripaska had anyknowledge of the alleged activity.
All the above claims by Ansol and Ashton were settled in early 2007 and, as part of thesettlement, the Group acquired 100% of Hamer.
In June 2007, Hamer filed a claim in arbitration in Switzerland against TadAZ for approximatelyUS$256 million (plus interest and costs). This claim relates to unpaid trade receivables accumulatedby TadAZ in favour of Hamer. TadAZ filed a counterclaim and indemnity claim against Hamer in thisarbitration for approximately US$500 million in the aggregate, alleging that Hamer participated inand/or knowingly benefited from a fraudulent and corrupt scheme by Ansol to gain effective controlover TadAZ resulting in its entry into unfavourable trading contracts from 2003 through 2004. Theparties exchanged submissions and evidence and a final hearing date was scheduled for June 2009, but
BUSINESS
— 155 —
did not take place, as in December 2008 the parties agreed in principle to settle this case, as well asthe TadAZ and CDH cases noted below, for no consideration paid and no admission of liability. InNovember 2009, TadAZ reopened the Hamer arbitration, but subsequently, in December 2009, theparties agreed to stay the case again.
In July 2007, TadAZ also brought claims in the aggregate amount of approximately US$485million against certain Company affiliates in the British Virgin Islands (“BVI”), certain of theseclaims being similar to those in the Swiss arbitration, as well as claims relating to the pre-Hamerperiod of 1996 through 2003. As a first line of defence, the defendants moved to dismiss the complainton jurisdictional and venue grounds. A hearing on this motion took place on 15 — 17 July 2008, butbefore any decision was issued, this case, as noted above, was settled in principle and adjournedpending final settlement.
The settlement in principle in respect of the TadAZ cases as well as the CDH cases noted belowhas not yet been formalised by a final settlement agreement. The terms of the draft settlementagreement provide for the termination of the TadAZ cases, as well as the CDH cases noted below.Until a final settlement agreement has been duly concluded between the parties, each and any of therelevant cases could, in principle, be reopened, as in the case of the CDH case referred to below.Further, the settlement agreement will provide for certain agreements between the parties to beexcluded from the settlement: however, the Group believes that it is unlikely that a dispute will arisein respect of these excluded agreements and, in any event, the excluded agreements are not material.The Directors do not believe that any resulting liabilities will materially adversely affect the Group’sfinancial position or its operations as a whole.
CDH
A Group member is claimant in a Swiss arbitration commenced in June 2007 for US$56 million(plus interest and costs) against a trading company, CDH Investments Corp. (“CDH”), a BVI companyrelated to OrienBank, a leading Tajik bank. CDH was a trading partner of TadAZ in 2005-2006. Theclaim is for lost profits and other damages incurred as a result of CDH’s failure to perform under analumina supply contract. The parties have exchanged submissions and evidence. A final hearing datewas scheduled for March 2009, but did not take place, the parties having agreed to settle in principleand having adjourned the case pending final settlement.
In November 2007, CDH filed a request for arbitration in Sweden against the same Groupmember that is claimant in the above described Swiss arbitration, seeking US$53-120 million foralleged breach of a trading contract. After exchange of briefs and evidence the case was originallystayed as part of the settlement in principle described in “— TadAZ”, but was recommenced by CDHin December 2009. Following a procedural conference on 21 December 2009, the arbitral tribunal setdown various deadlines and dates in January, February, June and July 2010 for certain procedural stepsto take place, including the filing of additional submissions and witness statements. An evidentiaryhearing is currently scheduled for September 2010. The Directors do not believe that any resultingliabilities will materially adversely affect the Group’s financial position or its operations as a whole.
Republic of Guinea
On or about 8 May 2009, the Republic of Guinea (“RG”) filed a complaint in the court of firstinstance of Kaloum-Conakry, Guinea, against Russky Aluminy Ltd., a BVI subsidiary of the Group(formerly Russkij Alminij LLC, an entity incorporated in Delaware, USA). In the complaint the RGclaims that the sale, in April-May 2006, of shares of Friguia, a company incorporated under the lawsof the RG, to Russky Aluminy Ltd., should be declared null and void and that Friguia’s shares shouldbe transferred back to the RG. The complaint further requests compensation in the amount of
BUSINESS
— 156 —
US$1,000 million and the appointment of an expert to determine the extent of the alleged loss sufferedby the RG. There have been a number of hearings subsequent to the filing of the complaint, at whichthe Company has taken the position that the RG courts lack jurisdiction over the dispute, as therelevant agreement governing the share sale contains a valid and enforceable arbitration clause,according to which all relevant disputes are to be resolved by arbitration in Paris under the rules ofthe International Court of Arbitration of the International Chamber of Commerce (“ICC”). On 10September 2009, the RG court ruled (the “Ruling”) that (1) it had jurisdiction over the dispute; (2) theact of transfer of shares is null and void; (3) the shares are to be restituted to the RG; and (4) an expertis to be appointed to determine the measure of damages suffered by the RG. Only the fourth point ofthe decision entered into force upon issuance of the Ruling. The first three points of the Ruling werenot to enter into force unless Russky Aluminy Ltd. failed to lodge an appeal of the Ruling within tendays of its issuance. Russky Aluminy Ltd. lodged such an appeal on 16 September 2009, whereuponthe effectiveness of the first three points of the Ruling was suspended pending resolution of theappeal. The Guinean appellate court in Conakry set a hearing date for 15 December 2009, but suchhearing did not take place for technical reasons. No new hearing date has yet been set. The Companyintends to submit a brief at any subsequent appellate hearing essentially reiterating its prior positionthat the court in Guinea lacks jurisdiction so as to preserve the Company’s right to arbitrate. Talkscontinue with the Guinean government about resolving the dispute out of court. In addition, thegovernment of the Republic of Guinea recently issued two decrees that may increase the potential forexpropriation of mining assets in the Republic of Guinea. See also “Risk Factors — Risks Relatingto the Group and its Business — Risks relating to the multijurisdictional regulatory, social, legal, taxand political environment in which the Group operates”. No provision is recognised for the claimmade by RG in respect of Friguia as, following the lodging of an appeal by Russky Aluminy Ltd.against the Ruling, only the fourth point of the decision became effective and the Directors believethat the claim has no merit and the risk of any cash outflow in connection with this claim is low. SeeNote 34(c) to UC RUSAL’s Accountants’ Report. An adverse outcome for the Group may have anadverse effect on the Group’s Friguia operations in the Republic of Guinea, including the potentialloss of Friguia, consequent loss of revenue and loss of production of alumina, which is used inproduction of aluminium at the Bratsk aluminium smelter. The Company believes it could replace anysuch loss of alumina production with its own production from other facilities or through marketpurchases. The Directors do not believe that any resulting liabilities will materially adversely affectthe Group’s financial position or its operations as a whole.
Norden
RTI Ltd. (“RTI”), a Jersey subsidiary of the Group, is involved in several contract disputes withNorden A/S (“Norden”), a Danish shipowner, relating to seven contracts of affreightment entered intoin late 2007 and 2008 for the shipment of bauxite. Early in 2009, Norden commenced arbitration inLondon for breach of the seven contracts and simultaneously obtained attachment of approximatelyUS$98 million RTI’s assets in New York by initiating litigation in the U.S. District Court for theSouthern District of New York. Only about $2 million was ever arrested in fact; thereafter the casewas dismissed without prejudice, the arrested funds being paid into the court pending the outcome ofthe London arbitration. Norden’s claims in the seven London arbitrations are estimated to be in theamount of approximately US$90 million, including demurrage. At present, Norden has filedstatements of claim in respect of the seven contracts. The Company has been contesting the claimsand, simultaneously, has been engaged in settlement negotiations. The Directors do not believe thatany resulting liabilities will materially adversely affect the Group’s financial position or its operationsas a whole.
ZAlK
In 1993, prior to the privatisation of OAO Zaporozhsky Aluminievii Kombinat, also known asZaporozhye Aluminium Complex, (“ZAlK”), ZAlK’s owner, the Government of Ukraine, decided toequip ZAlK to produce foil. Foil mill equipment (the “Equipment”) was purchased for US$71.7
BUSINESS
— 157 —

million, 15% of which was financed by ZAlK (US$10.9 million) and 85% (US$60.9 million) byUkreximbank acting as agent of the Ukrainian Ministry of Finance. It was contemplated that ZAlKwould repay the US$60.9 million loan granted by Ukreximbank (the “Loan”) out of proceeds from foilsales scheduled to begin in 2000. However, the Equipment was never installed and foil productionnever began. In 2001, ZAlK was privatised. AVTOVAZ-Invest purchased a 68.01% stake in ZAlK ata public auction, the purchase being conditional on AVTOVAZ-Invest accepting ZAlK’s debt inrespect of the Loan (US$76.5 million, including interest and charges).
In September 2003, AVTOVAZ-Invest sued in the civil court of Ukraine for a declaration that itsobligations under the Loan were discharged; such declaration was issued, and a confirmation wasgiven that the Equipment was state property. This decision was affirmed on appeal. In November 2004,while appeal was pending, the Equipment was transferred to a state-owned entity formed specificallyfor the purpose of receiving the Equipment. However, in March 2006, the Ukrainian Supreme Courtreversed the two lower-court decisions on the ground that the civil court lacked jurisdiction to hearsuch an action.
In April 2006, ZAlK sued in the commercial court of Ukraine for a declaration that the agreementin respect of the Loan was rescinded. Such a declaration was issued. The decision was affirmed atvarious levels of appeal: September and November 2006. The Supreme Court of Ukraine affirmed inFebruary 2007.
In June 2006, while the above case was pending on appeal, the Zaporozhye tax inspectorate suedZAlK in the Zaporozhye commercial court for payment of indebtedness under the credit extendedunder state guarantees and for forfeiture in the amount of approximately US$140 million. On 14November 2007, the Zaporozhye Economic Court ruled in favour of ZAlK. The Tax inspectorate filedan appeal. On 8 December 2008, the Dnepropetrovsk Administrative Court of Appeal reversed thedecision of the Zaporozhye Region Economic Court and upheld the State Tax Inspectorate’s claim.ZAlK filed a cassation appeal with the Supreme Administrative Court of Ukraine. On 14 May 2009,the Supreme Administrative Court of Ukraine terminated the proceedings in the case for lack ofjurisdiction of administrative courts to hear the case. The tax authority or the prosecutor’s office mayfile a new claim but this time with the system of Ukraine’s economic courts. The Directors do notbelieve that any resulting liabilities, including any judgment for payment of such indebtedness, willmaterially adversely affect the Group’s financial position or its operations as a whole.
Further, in 2008, the General Attorney’s Office of Ukraine filed a claim with the KievCommercial Court for the invalidation of a privatisation agreement for 68.01% of the shares in ZAlKconcluded in March 2006. On 2 September 2008, the claim was rejected by the court due to lack ofjurisdiction to hear such claim. In October 2008 and March 2009, both the Kiev Appellate CommercialCourt and the Supreme Commercial Court rejected appeals of the General Attorney’s Office of Ukrainedue to failure to comply with the statute of limitation. Nevertheless, on 30 June 2009, the SupremeCourt of Ukraine granted the appeal of the General Attorney’s Office of Ukraine and transferred thecase to the Kiev Commercial Appellate Court. On 29 September 2009, the Kiev Commercial AppellateCourt dismissed the decision of the Kiev Commercial Court and returned the case back to the courtto hear the case on the merits. ZAlK and its shareholder, Velbay Holdings Limited, have filed cassationappeals.
Alfa Bank
Alfa Bank filed two claims with the Arbitrazh Court of the City of Moscow for repayment of aloan, interest, and late penalties: one against SUAL for US$78,533,518, the other against SayanogorskAluminum Smelter for US$12,652,373. In both cases Krasnoyarsk Aluminum Smelter was aco-defendant due to being a surety under the loan agreements with SUAL and Sayanogorsk AluminumSmelter. In the first case, on 26 May 2009, the Arbitrazh Court of the City of Moscow held partiallyin favour of the claimant and ordered SUAL and Krasnoyarsk Aluminum Smelter to pay
BUSINESS
— 158 —
US$73,812,587 (i.e., awarding a late penalty in the amount of approximately US$5 million less thanclaimed). On 7 August 2009, the Ninth Arbitrazh Appellate Court affirmed the lower court’s decision.In the second case, on 11 June 2009 the Arbitrazh Court of the City of Moscow held partially in favourof the claimant and ordered Sayanogorsk aluminum smelter and Krasnoyarsk aluminum smelter to payUS$12,047,794 (i.e., awarding about US$600,000 less than claimed). On 10 September 2009, theNinth Arbitrazh Appellate Court affirmed the decision of the Arbitrazh Court of the City of Moscowagainst Sayanogorsk Aluminum Smelter and Krasnoyarsk Aluminum Smelter. Based on the relevantcourt decisions Alfa Bank filed for bankruptcy of SUAL and Krasnoyarsk Aluminum Smelter on 24September 2009. On the same date the debtors paid all the indebtedness to Alfa Bank claimed by itin the amount of approximately US$85,860,381. Based on that fact the Arbitrazh Court of SverdlovskRegion and the Arbitrazh Court of Krasnoyarsk Region refused to accept Alfa Bank’s bankruptcypetitions on 30 September 2009 and 1 October 2009, respectively. In October 2009, Alfa Bank filedappeals challenging the court’s rulings. Each of the appeals was considered on 5 November 2009 andrejected.
In addition, in late October 2009, Alfa Bank filed two more claims with the Arbitrazh Court ofthe City of Moscow for repayment of penalties due to late repayment of the principal amount of debtand interest under the loan agreements described above: one against SUAL for approximatelyUS$8,700,825, and the other against Sayanogorsk aluminium smelter for approximatelyUS$1,762,169, both with Krasnoyarsk aluminium smelter as a co-defendant. On 18 November 2009,the Group and Alfa Bank entered into settlement agreements in respect of each of these claims, thefirst of which was approved by the Arbitrazh Court of the City of Moscow on 9 December 2009 andthe second on 2 December 2009. Pursuant to the settlement agreements, the first claim was settled forapproximately US$3,023,607 and the second for approximately US$487,415.
Italian Environmental Ministry
In September 2009, in proceedings involving an alleged violation of Article 434 of the ItalianCriminal Code relating to the alleged failure of Eurallumina SpA (“Eurallumina”) to comply withcertain instructions of the Italian Environmental Ministry, a red mud basin of the Eurallumina refinery(and an ENEL hydraulic pump station, which is part of an electric power station and used byEurallumina) became subject to sequestration. In addition, also in September 2009, an Italian regionalEnvironmental Protection Department suspended Eurallumina’s comprehensive environmental permitfor production operations and management of the same red mud basin.
In connection with this matter, the Group expects that reclamation and water rectificationmeasures are likely to be imposed. The Group’s current best estimate of the cost of implementing suchmeasures is approximately EUR3 million. In addition, Eurallumina could be ordered to payenvironmental damages in connection with this matter. While such damages, if imposed, couldpotentially be significant (and could exceed US$50 million), due to the lack of clear precedent and theearly stage of the proceedings, the Group is unable to estimate the likelihood that damages will beimposed or the amount of any such damages, if imposed.
Eurallumina intends to contest these claims. As Eurallumina has not been operational since thefull closure of the plant in the first quarter of 2009, the proceedings have not affected operations atthe plant or resulted in any loss of alumina production. The Directors do not believe that any resultingliabilities will materially adversely affect the Group’s financial position or its operations as a whole.
In addition, on 2 December 2009, the European Court of Justice set aside a December 2007judgment of the General Court of the European Union that had annulled a decision of the EuropeanCommission of December 2005. The European Court of Justice has referred the cases back to theGeneral Court of the European Union for determination. In the event that the legality of the decisionof the European Commission is finally confirmed, Eurallumina may be subject to a liability ofEUR19.3 million for receipt of allegedly unlawful state aid. If this is the case, there is also apossibility that Italian tax authorities may recommence a claim (which was previously dismissed by
BUSINESS
— 159 —
the Italian Court) in the amount of EUR7.7 million against Eurallumina. In the event that Euralluminais ultimately found liable for the abovementioned sums, Eurallumina may also be liable to pay interestthereon. As the outcome of the above proceedings is uncertain, it is not presently possible to determinewhether Eurallumina may be liable to pay such interest nor the amount of such potential interest, ifliable.
Washington Group
On 1 April 2009, as part of the Group’s cost-cutting measures, the Company suspended itsoperations at the West Indies Alumina Company (“Windalco”), an alumina refinery in which the Groupholds a 93% equity interest. Upon the suspension of operations, Windalco stopped making paymentsand consuming services under two Mining and Transportation Contracts with Washington GroupJamaica Limited (“WGJL”) under which WGJL provided exploration, drilling, mine development andpost-mining reclamation stockpile management services. On 30 November 2009, WGJL gave notice ofthe commencement of the stepped dispute resolution procedure prescribed by the Mining andTransportation Contracts and claimed for, inter alia, US$54 million in damages resulting from allegedtermination of the contracts and/or US$71 million in damages resulting from alleged breach ofcontractual obligations. On 28 December 2009 the Parties entered into a suspension agreement tosuspend the Mining and Transportation Contracts through 31 December 2011. For the duration of theagreement WGJL has agreed to forebear from making the said claims and to waive the same providedthat Windalco complies with the terms of the agreement. In the event that the contracts are notreinstated Windalco has agreed to pay certain termination fees. In addition, the Group will make aninitial payment to WGJL and pay a monthly suspension fee.
Tax Claims
Certain Group companies are currently subject to tax claims. Tax claims have been issuedagainst, inter alia, the following members of the Group: KrAZ in the amount of approximatelyUS$56.5 million, BrAZ in the amount of US$24.1 million, SUAL in the amount of approximatelyUS$48.2 million plus fines and penalties and NGZ in the amount of approximately US$7.6 million.
Liability and Provisions
The following table shows, in respect of the relevant claims above, (i) the amount claimed by theclaimant in respect of such claim, not including all interest and costs, and (ii) the provision made bythe Group in respect of such claims as at 30 June 2009.
Claimant
Amount ofoutstanding claim as
at the date of this prospectus
Provisionmade for the claimas at 30 June 2009
BFIG . . . . . . . . . . . . . . . . . . . . US$2,800 million No specific provision made
TadAZ. . . . . . . . . . . . . . . . . . . . US$985 million No specific provision made
CDH . . . . . . . . . . . . . . . . . . . . . US$53-120 million No specific provision made
RG . . . . . . . . . . . . . . . . . . . . . . US$1,000 million No specific provision made
Norden . . . . . . . . . . . . . . . . . . . US$90 million, including demurrage US$25 million
ZAlK . . . . . . . . . . . . . . . . . . . . US$140 million US$14 million
Alfa Bank . . . . . . . . . . . . . . . . . — No specific provision made
Italian Environmental Ministry . . . N/A No specific provision made
Various tax authorities . . . . . . . . US$136.4 million No specific provision made
BUSINESS
— 160 —
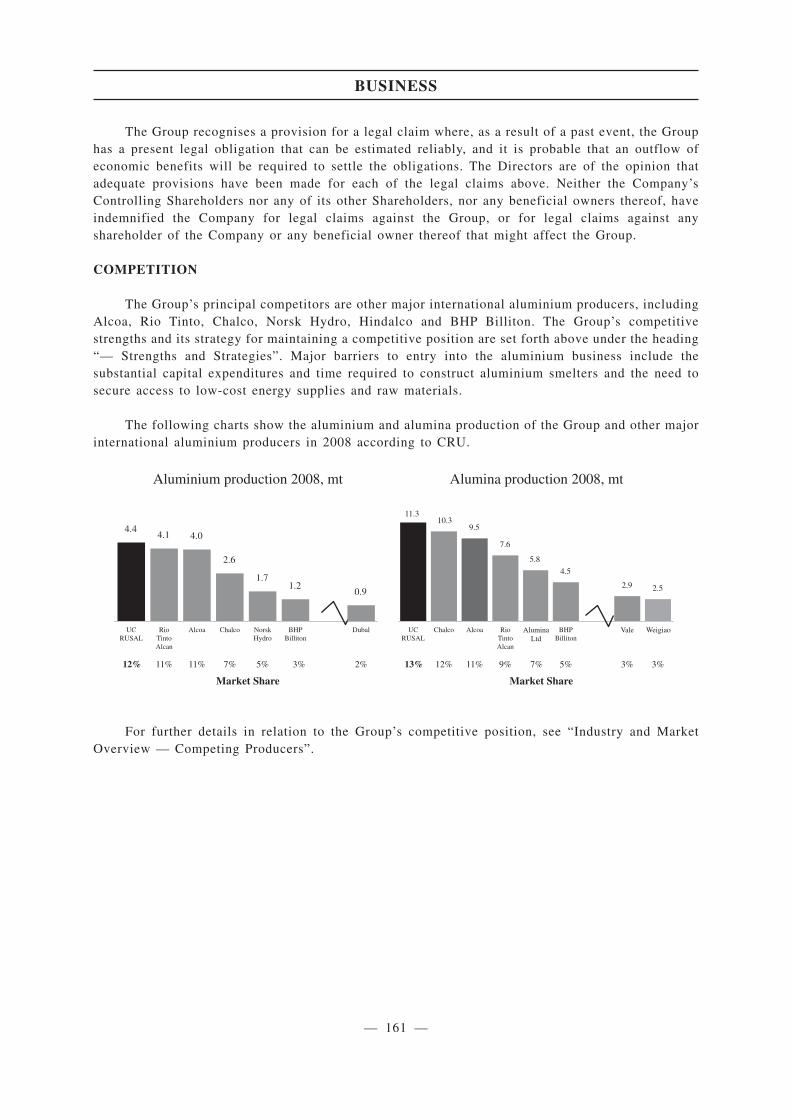
The Group recognises a provision for a legal claim where, as a result of a past event, the Grouphas a present legal obligation that can be estimated reliably, and it is probable that an outflow ofeconomic benefits will be required to settle the obligations. The Directors are of the opinion thatadequate provisions have been made for each of the legal claims above. Neither the Company’sControlling Shareholders nor any of its other Shareholders, nor any beneficial owners thereof, haveindemnified the Company for legal claims against the Group, or for legal claims against anyshareholder of the Company or any beneficial owner thereof that might affect the Group.
COMPETITION
The Group’s principal competitors are other major international aluminium producers, includingAlcoa, Rio Tinto, Chalco, Norsk Hydro, Hindalco and BHP Billiton. The Group’s competitivestrengths and its strategy for maintaining a competitive position are set forth above under the heading“— Strengths and Strategies”. Major barriers to entry into the aluminium business include thesubstantial capital expenditures and time required to construct aluminium smelters and the need tosecure access to low-cost energy supplies and raw materials.
The following charts show the aluminium and alumina production of the Group and other majorinternational aluminium producers in 2008 according to CRU.
10.39.5
5.8
2.9 2.5
4.5
11.3
7.6
4.44.1 4.0
2.6
1.71.2
0.9
12% 11% 11% 7% 5% 3% 2% 13% 12% 11% 9% 5% 3% 3%7%
AluminaLtd
Vale Weigiao
Alumina production 2008, mt
UCRUSAL
RioTintoAlcan
Alcoa Chalco NorskHydro
BHPBilliton
Dubal
Market Share
Aluminium production 2008, mt
Market Share
ChalcoUCRUSAL
RioTintoAlcan
Alcoa BHPBilliton
For further details in relation to the Group’s competitive position, see “Industry and MarketOverview — Competing Producers”.
BUSINESS
— 161 —
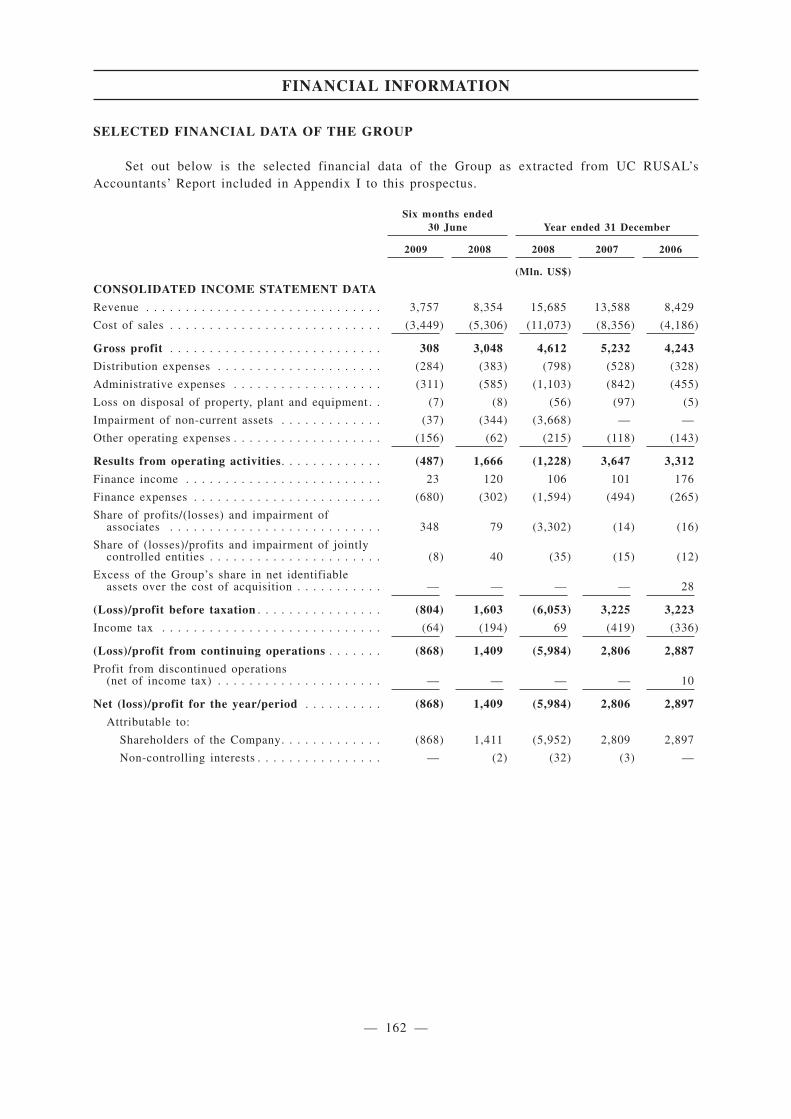
SELECTED FINANCIAL DATA OF THE GROUP
Set out below is the selected financial data of the Group as extracted from UC RUSAL’sAccountants’ Report included in Appendix I to this prospectus.
Six months ended30 June Year ended 31 December
2009 2008 2008 2007 2006
(Mln. US$)
CONSOLIDATED INCOME STATEMENT DATA
Revenue . . . . . . . . . . . . . . . . . . . . . . . . . . . . . . 3,757 8,354 15,685 13,588 8,429
Cost of sales . . . . . . . . . . . . . . . . . . . . . . . . . . . (3,449) (5,306) (11,073) (8,356) (4,186)
Gross profit . . . . . . . . . . . . . . . . . . . . . . . . . . . 308 3,048 4,612 5,232 4,243
Distribution expenses . . . . . . . . . . . . . . . . . . . . . (284) (383) (798) (528) (328)
Administrative expenses . . . . . . . . . . . . . . . . . . . (311) (585) (1,103) (842) (455)
Loss on disposal of property, plant and equipment . . (7) (8) (56) (97) (5)
Impairment of non-current assets . . . . . . . . . . . . . (37) (344) (3,668) — —
Other operating expenses . . . . . . . . . . . . . . . . . . . (156) (62) (215) (118) (143)
Results from operating activities. . . . . . . . . . . . . (487) 1,666 (1,228) 3,647 3,312
Finance income . . . . . . . . . . . . . . . . . . . . . . . . . 23 120 106 101 176
Finance expenses . . . . . . . . . . . . . . . . . . . . . . . . (680) (302) (1,594) (494) (265)
Share of profits/(losses) and impairment ofassociates . . . . . . . . . . . . . . . . . . . . . . . . . . . 348 79 (3,302) (14) (16)
Share of (losses)/profits and impairment of jointlycontrolled entities . . . . . . . . . . . . . . . . . . . . . . (8) 40 (35) (15) (12)
Excess of the Group’s share in net identifiableassets over the cost of acquisition . . . . . . . . . . . — — — — 28
(Loss)/profit before taxation . . . . . . . . . . . . . . . . (804) 1,603 (6,053) 3,225 3,223
Income tax . . . . . . . . . . . . . . . . . . . . . . . . . . . . (64) (194) 69 (419) (336)
(Loss)/profit from continuing operations . . . . . . . (868) 1,409 (5,984) 2,806 2,887
Profit from discontinued operations(net of income tax) . . . . . . . . . . . . . . . . . . . . . — — — — 10
Net (loss)/profit for the year/period . . . . . . . . . . (868) 1,409 (5,984) 2,806 2,897
Attributable to:
Shareholders of the Company. . . . . . . . . . . . . (868) 1,411 (5,952) 2,809 2,897
Non-controlling interests . . . . . . . . . . . . . . . . — (2) (32) (3) —
FINANCIAL INFORMATION
— 162 —
App1A-35

At 30 June At 31 December
2009 2008 2007 2006
(Mln. US$)CONSOLIDATED BALANCE SHEET DATAASSETSNon-current assetsProperty, plant and equipment. . . . . . . . . . . . . . . . . . . . . . . . 6,201 6,602 10,429 4,514Intangible assets . . . . . . . . . . . . . . . . . . . . . . . . . . . . . . . . . 4,044 4,187 4,895 1,342Interests in associates . . . . . . . . . . . . . . . . . . . . . . . . . . . . . 7,566 7,536 443 442Interests in jointly controlled entities. . . . . . . . . . . . . . . . . . . 502 506 219 127Financial investments . . . . . . . . . . . . . . . . . . . . . . . . . . . . . — — 606 —Loans to related parties . . . . . . . . . . . . . . . . . . . . . . . . . . . . — — 2 —Deferred tax assets . . . . . . . . . . . . . . . . . . . . . . . . . . . . . . . 44 59 105 33Other non-current assets . . . . . . . . . . . . . . . . . . . . . . . . . . . 51 43 63 182
Total non-current assets . . . . . . . . . . . . . . . . . . . . . . . . . . . 18,408 18,933 16,762 6,640
Current assetsInventories. . . . . . . . . . . . . . . . . . . . . . . . . . . . . . . . . . . . . 2,159 2,938 2,883 1,378Loans to related parties . . . . . . . . . . . . . . . . . . . . . . . . . . . . — — 7 39Trade and other receivables . . . . . . . . . . . . . . . . . . . . . . . . . 1,388 1,426 2,150 954Cash and cash equivalents . . . . . . . . . . . . . . . . . . . . . . . . . . 264 708 261 241
Total current assets . . . . . . . . . . . . . . . . . . . . . . . . . . . . . . 3,811 5,072 5,301 2,612
Total assets . . . . . . . . . . . . . . . . . . . . . . . . . . . . . . . . . . . . 22,219 24,005 22,063 9,252
EQUITY AND LIABILITIESEquityShare capital . . . . . . . . . . . . . . . . . . . . . . . . . . . . . . . . . . . — — — —Share premium . . . . . . . . . . . . . . . . . . . . . . . . . . . . . . . . . . 12,517 12,517 6,425 —Other reserves . . . . . . . . . . . . . . . . . . . . . . . . . . . . . . . . . . 3,014 2,912 2,937 2,808Currency translation reserve . . . . . . . . . . . . . . . . . . . . . . . . . (3,902) (3,257) 366 2Retained profits/(accumulated losses). . . . . . . . . . . . . . . . . . . (8,552) (7,684) 367 268
Total equity attributable to shareholders of the Company. . . 3,077 4,488 10,095 3,078Non-controlling interests . . . . . . . . . . . . . . . . . . . . . . . . . . . — — 44 61
Total equity . . . . . . . . . . . . . . . . . . . . . . . . . . . . . . . . . . . 3,077 4,488 10,139 3,139
Non-current liabilitiesLoans and borrowings . . . . . . . . . . . . . . . . . . . . . . . . . . . . . — — 6,622 3,213Provisions . . . . . . . . . . . . . . . . . . . . . . . . . . . . . . . . . . . . . 388 393 465 156Deferred tax liabilities . . . . . . . . . . . . . . . . . . . . . . . . . . . . . 526 509 1,021 541Other non-current liabilities . . . . . . . . . . . . . . . . . . . . . . . . . 20 27 33 98Bonds outstanding. . . . . . . . . . . . . . . . . . . . . . . . . . . . . . . . — — — 228
Total non-current liabilities . . . . . . . . . . . . . . . . . . . . . . . . 934 929 8,141 4,236
Current liabilitiesLoans and borrowings . . . . . . . . . . . . . . . . . . . . . . . . . . . . . 13,690 13,878 1,789 1,011Bonds outstanding. . . . . . . . . . . . . . . . . . . . . . . . . . . . . . . . — — 245 108Income tax payable . . . . . . . . . . . . . . . . . . . . . . . . . . . . . . . 40 48 52 116Trade and other payables . . . . . . . . . . . . . . . . . . . . . . . . . . . 1,424 1,711 1,611 565Deferred consideration. . . . . . . . . . . . . . . . . . . . . . . . . . . . . 2,867 2,782 — —Provisions . . . . . . . . . . . . . . . . . . . . . . . . . . . . . . . . . . . . . 187 169 86 77
Total current liabilities . . . . . . . . . . . . . . . . . . . . . . . . . . . 18,208 18,588 3,783 1,877
Total liabilities . . . . . . . . . . . . . . . . . . . . . . . . . . . . . . . . . 19,142 19,517 11,924 6,113
Total equity and liabilities . . . . . . . . . . . . . . . . . . . . . . . . . 22,219 24,005 22,063 9,252
Net current assets/(liabilities) . . . . . . . . . . . . . . . . . . . . . . . (14,397) (13,516) 1,518 735
Total assets less current liabilities. . . . . . . . . . . . . . . . . . . . 4,011 5,417 18,280 7,375
FINANCIAL INFORMATION
— 163 —
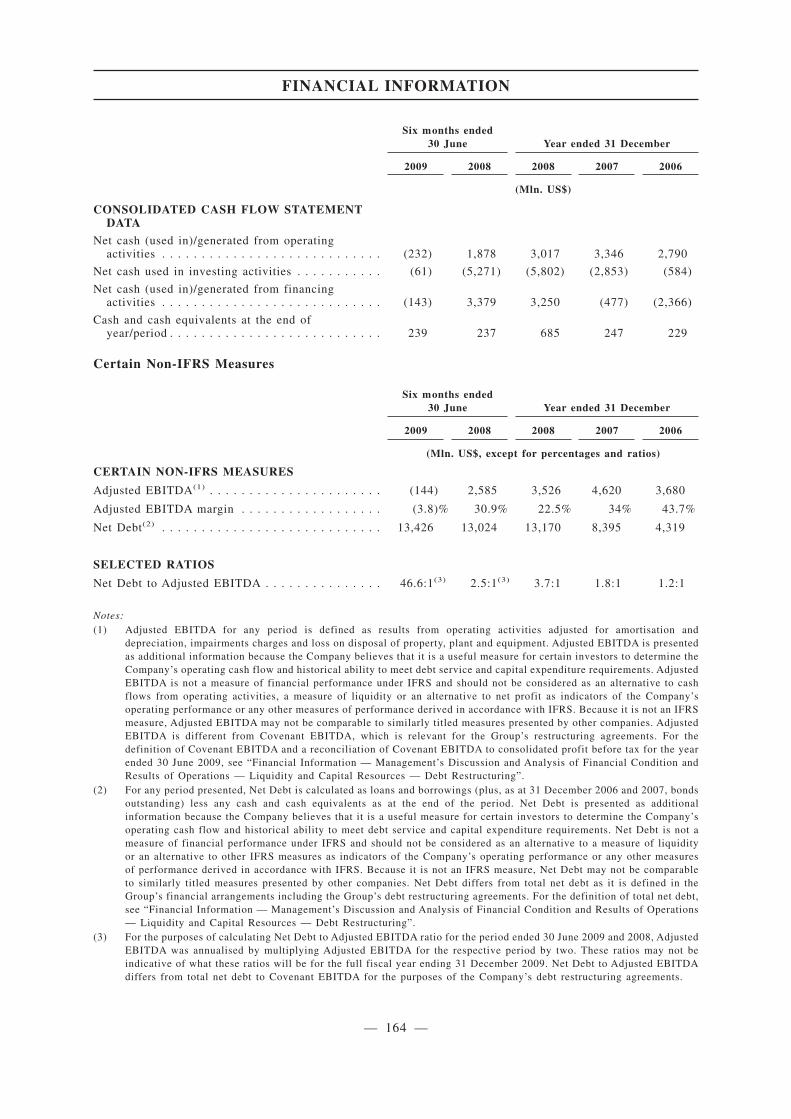
Six months ended30 June Year ended 31 December
2009 2008 2008 2007 2006
(Mln. US$)
CONSOLIDATED CASH FLOW STATEMENTDATA
Net cash (used in)/generated from operatingactivities . . . . . . . . . . . . . . . . . . . . . . . . . . . . (232) 1,878 3,017 3,346 2,790
Net cash used in investing activities . . . . . . . . . . . (61) (5,271) (5,802) (2,853) (584)
Net cash (used in)/generated from financingactivities . . . . . . . . . . . . . . . . . . . . . . . . . . . . (143) 3,379 3,250 (477) (2,366)
Cash and cash equivalents at the end ofyear/period . . . . . . . . . . . . . . . . . . . . . . . . . . . 239 237 685 247 229
Certain Non-IFRS Measures
Six months ended30 June Year ended 31 December
2009 2008 2008 2007 2006
(Mln. US$, except for percentages and ratios)
CERTAIN NON-IFRS MEASURES
Adjusted EBITDA(1) . . . . . . . . . . . . . . . . . . . . . . (144) 2,585 3,526 4,620 3,680
Adjusted EBITDA margin . . . . . . . . . . . . . . . . . . (3.8)% 30.9% 22.5% 34% 43.7%
Net Debt(2) . . . . . . . . . . . . . . . . . . . . . . . . . . . . 13,426 13,024 13,170 8,395 4,319
SELECTED RATIOS
Net Debt to Adjusted EBITDA . . . . . . . . . . . . . . . 46.6:1(3) 2.5:1(3) 3.7:1 1.8:1 1.2:1
Notes:(1) Adjusted EBITDA for any period is defined as results from operating activities adjusted for amortisation and
depreciation, impairments charges and loss on disposal of property, plant and equipment. Adjusted EBITDA is presentedas additional information because the Company believes that it is a useful measure for certain investors to determine theCompany’s operating cash flow and historical ability to meet debt service and capital expenditure requirements. AdjustedEBITDA is not a measure of financial performance under IFRS and should not be considered as an alternative to cashflows from operating activities, a measure of liquidity or an alternative to net profit as indicators of the Company’soperating performance or any other measures of performance derived in accordance with IFRS. Because it is not an IFRSmeasure, Adjusted EBITDA may not be comparable to similarly titled measures presented by other companies. AdjustedEBITDA is different from Covenant EBITDA, which is relevant for the Group’s restructuring agreements. For thedefinition of Covenant EBITDA and a reconciliation of Covenant EBITDA to consolidated profit before tax for the yearended 30 June 2009, see “Financial Information — Management’s Discussion and Analysis of Financial Condition andResults of Operations — Liquidity and Capital Resources — Debt Restructuring”.
(2) For any period presented, Net Debt is calculated as loans and borrowings (plus, as at 31 December 2006 and 2007, bondsoutstanding) less any cash and cash equivalents as at the end of the period. Net Debt is presented as additionalinformation because the Company believes that it is a useful measure for certain investors to determine the Company’soperating cash flow and historical ability to meet debt service and capital expenditure requirements. Net Debt is not ameasure of financial performance under IFRS and should not be considered as an alternative to a measure of liquidityor an alternative to other IFRS measures as indicators of the Company’s operating performance or any other measuresof performance derived in accordance with IFRS. Because it is not an IFRS measure, Net Debt may not be comparableto similarly titled measures presented by other companies. Net Debt differs from total net debt as it is defined in theGroup’s financial arrangements including the Group’s debt restructuring agreements. For the definition of total net debt,see “Financial Information — Management’s Discussion and Analysis of Financial Condition and Results of Operations— Liquidity and Capital Resources — Debt Restructuring”.
(3) For the purposes of calculating Net Debt to Adjusted EBITDA ratio for the period ended 30 June 2009 and 2008, AdjustedEBITDA was annualised by multiplying Adjusted EBITDA for the respective period by two. These ratios may not beindicative of what these ratios will be for the full fiscal year ending 31 December 2009. Net Debt to Adjusted EBITDAdiffers from total net debt to Covenant EBITDA for the purposes of the Company’s debt restructuring agreements.
FINANCIAL INFORMATION
— 164 —

The following is a reconciliation of Adjusted EBITDA to the Group’s results from operatingactivities for the periods presented:
Six months ended30 June Year ended 31 December
2009 2008 2008 2007 2006
(Mln. US$)
Reconciliation of Adjusted EBITDA
Results from operating activities . . . . . . . . . . . . . . (487) 1,666 (1,228) 3,647 3,312
Add:
Amortisation and depreciation . . . . . . . . . . . . 299 567 1,030 876 363
Impairment of non-current assets . . . . . . . . . . 37 344 3,668 — —
Loss on disposal of property, plant andequipment . . . . . . . . . . . . . . . . . . . . . . . . 7 8 56 97 5
Adjusted EBITDA . . . . . . . . . . . . . . . . . . . . (144) 2,585 3,526 4,620 3,680
Key operating Data
The table below provides selected aggregate attributable production information for the Group.
Production
Six monthsended
30 June Year ended 31 December
2009 2008 2007 2006
Primary aluminium (ktonnes) . . . . . . . . . . . . . . . . . . . . . . . . 1,980 4,424 4,202 3,958
Alumina (ktonnes) . . . . . . . . . . . . . . . . . . . . . . . . . . . . . . . 3,738 11,317 11,347 11,313
Bauxite (mtonnes wet) . . . . . . . . . . . . . . . . . . . . . . . . . . . . 6.1 19.1 18.5 19.2
Notes:
(1) Alpart and Windalco are consolidated by the Group on a proportionate basis as they are jointly controlled assets andoperations (the Group’s interests in Alpart and Windalco are 65% and 93%, respectively). Accordingly, the aluminaproduction data set forth above represents the Group’s pro rata share of Alpart and Windalco’s production. Zaporozhyealumina refinery is a fully consolidated subsidiary of the Company, so the attributable production is presented on a 100%plant production basis to reflect UC RUSAL’s effective control of the finished product. QAL is consolidated on an equitybasis and accordingly the data shown is the proportion attributed to UC RUSAL based on its 20% equity interest.
(2) Because Alpart and Windalco are consolidated on a proportionate basis, the bauxite production data set forth aboverepresents the Group’s pro rata share of Alpart and Windalco’s respective production. The total production of the Group’sfully consolidated subsidiaries is included, even if there are minority interests. Accordingly, the total production ofTiman and BCGI is included, even though the Group’s interests in Timan and BCGI are approximately 80% and 90%,respectively.
FINANCIAL INFORMATION
— 165 —

Capitalisation
The following table shows the Group’s current and non-current loans and borrowings, deferredconsideration and capitalisation as at 30 September 2009, (i) as adjusted to reflect the completion ofthe Group’s debt restructuring; (ii) as further adjusted to reflect the Global Offering and theapplication of the proceeds thereof, in each case as though it had occurred on 30 September 2009; and(iii) assuming an Offer Price of HK$10.80 per Offer Share, being the approximate mid-point of theproposed offer price range of HK$9.10 to HK$12.50.
As of 30 September 2009
ActualAs adjusted for
restructuring(1)(2)
As furtheradjusted for
Global Offeringand application ofproceeds thereof
(Mln. US$)(unaudited)
Current loans and borrowings and deferred considerationBank and other loans. . . . . . . . . . . . . . . . . . . . . . . . . . . . . 13,638 1,777 —Deferred consideration. . . . . . . . . . . . . . . . . . . . . . . . . . . . 2,915 501 219
Total current loans and borrowings and current deferredconsideration(3) . . . . . . . . . . . . . . . . . . . . . . . . . . . . . . 16,553 2,278 219
Non-current loans and borrowings and deferredconsideration
Bank loans . . . . . . . . . . . . . . . . . . . . . . . . . . . . . . . . . . . — 11,376 11,271Deferred consideration. . . . . . . . . . . . . . . . . . . . . . . . . . . . — 541 541
Total non-current loans and borrowings and deferredconsideration(3) . . . . . . . . . . . . . . . . . . . . . . . . . . . . . . — 11,917 11,812
Total equity(4) . . . . . . . . . . . . . . . . . . . . . . . . . . . . . . . . . 3,697 6,055 8,219(5)
Total capitalisation(6). . . . . . . . . . . . . . . . . . . . . . . . . . . . . 3,697 17,972 20,031
Notes:
(1) Current and non-current loans and borrowings and deferred consideration as adjusted to reflect the completion of theGroup’s debt restructuring are reflected at fair value, rather than contractual value. The allocation between current loansand borrowings and deferred consideration and non-current loans and borrowings and deferred consideration is on thebasis of an estimate of what is expected to be repaid by 30 September 2010, based on the terms of the debt restructuringagreements. The maturity of the VEB Debt was extended to 29 October 2010 and the VEB Debt is therefore treated asnon-current loans and borrowings.
(2) There is no fixed amortisation schedule of the debt repayment during the override period. The Directors estimated shortterm portions of bank and other loans payable and the deferred consideration as at 30 September 2009 to be US$1,777million and US$501 million, respectively. The Group estimates the gain to be recognised on the extinguishment of debtas a result of this debt restructuring at US$485 million, net of various override fees and expenses of US$262 million andthe gain to be recognised on the extinguishment of deferred consideration as a result of this restructuring at US$673million, net of various restructuring fees and expenses of US$49 million. In addition, the Group estimates the fair valueof new equity resulting from the conversion of a portion of deferred consideration into 6% of the Company’s share capitalat US$1,200 million.
(3) As at 31 October 2009 the indebtedness of the Group amounted to US$16,569 million, which included US$13,646 millionof current loans and borrowings and US$2,923 million of current deferred consideration (including accrued interest)payable to Onexim. The amount stated does not take into account the effect of debt restructuring in December 2009 northe effect of the Global Offering. The details of the securities and guarantees in relation to the Group’s borrowings arestated on page 217 of this Prospectus.
(4) There was no material change in total equity of the Group between 30 September 2009 and 31 October 2009 in respectof share capital and share premium, which are not affected by the period results of the Group for the month of October2009.
FINANCIAL INFORMATION
— 166 —

(5) In the event the offer is priced at the low end of the price range, the net proceeds would be US$1,814 million andresulting total equity would be US$7,869 million. In the event the offer is priced at the high end of the price range, thenet proceeds would be US$2,513 million and resulting total equity would be US$8,568 million. If the Global Offeringis priced above or below the mid-point of the proposed offer price range, the change in estimated net proceeds will bebalanced by a change in bank loans and deferred consideration so total capitalisation will not vary as a result of a changeto estimated net proceeds.
(6) The Group’s total capitalisation is equal to the sum of non-current loans and borrowings and deferred consideration and
total equity.
Balance sheet
As of 30 September 2009 and 30 June 2009, the Group’s net current liabilities wereapproximately US$14,361 million and US$14,397 million, respectively, comprising the following:
As of30 September
2009
As of30 June
2009
(Mln. US$)(unaudited)
(Mln. US$)
ASSETS
Current assets
Inventories . . . . . . . . . . . . . . . . . . . . . . . . . . . . . . . . . . . . . . . . . . . . . . 2,132 2,159
Trade and other receivables . . . . . . . . . . . . . . . . . . . . . . . . . . . . . . . . . . . 1,455 1,388
Cash and cash equivalents . . . . . . . . . . . . . . . . . . . . . . . . . . . . . . . . . . . . 298 264
Total current assets . . . . . . . . . . . . . . . . . . . . . . . . . . . . . . . . . . . . . . . . 3,885 3,811
Current liabilities
Loans and borrowings . . . . . . . . . . . . . . . . . . . . . . . . . . . . . . . . . . . . . . 13,638 13,690
Income tax payable . . . . . . . . . . . . . . . . . . . . . . . . . . . . . . . . . . . . . . . . 53 40
Trade and other payables . . . . . . . . . . . . . . . . . . . . . . . . . . . . . . . . . . . . 1,414 1,424
Deferred consideration . . . . . . . . . . . . . . . . . . . . . . . . . . . . . . . . . . . . . . 2,915 2,867
Provisions . . . . . . . . . . . . . . . . . . . . . . . . . . . . . . . . . . . . . . . . . . . . . . . 226 187
Total current liabilities . . . . . . . . . . . . . . . . . . . . . . . . . . . . . . . . . . . . . 18,246 18,208
Net current liabilities. . . . . . . . . . . . . . . . . . . . . . . . . . . . . . . . . . . . . . . (14,361) (14,397)
The Group’s total assets were US$22.2 billion as of 30 June 2009, US$24.0 billion at 31December 2008, US$22.1 billion at 31 December 2007 and US$9.3 billion at 31 December 2006. Thedecrease in total assets from 31 December 2008 to 30 June 2009 mainly resulted from decreases ininventories, cash and cash equivalents and property, plant and equipment. The increase in total assetsfrom 31 December 2007 to 31 December 2008 mainly resulted from increases in interest in associatesand jointly controlled entities, and cash and cash equivalents, partially offset by decreases in property,plant and equipment, and intangibles assets. The increase in total assets from 31 December 2006 to31 December 2007 primarily resulted from the acquisitions of the SUAL and Glencore Businesses.
FINANCIAL INFORMATION
— 167 —

MANAGEMENT’S DISCUSSION AND ANALYSIS OF FINANCIAL CONDITION ANDRESULTS OF OPERATIONS
A prospective investor should read the following review in conjunction with the rest of thisprospectus, including the Accountants’ Report and the notes thereto included elsewhere in thisprospectus (see “Appendix I — Accountants’ Report”), and should not rely solely on the informationcontained in this section. This discussion contains forward-looking statements that involve risks anduncertainties that could cause the Group’s actual results to differ from those expressed or implied bysuch forward-looking statements. These risks and uncertainties are discussed in “Forward-LookingStatements” and “Risk Factors”.
The following is a discussion of:
• the material factors that management believes are likely to affect the Group’s financialcondition and results of operations;
• the historical financial information of UC RUSAL for the six months ended 30 June 2009and 2008 and for the three years ended 31 December 2008, 2007 and 2006 (including thefinancial information of RUSAL for periods prior to UC RUSAL’s acquisition of SUAL andthe Glencore Businesses); and
• the liquidity and capital resources of the Group.
As a result of the global economic downturn and a sharp decline in aluminium prices startingfrom September 2008 and continuing into 2009, as well as an increase in the Group’s indebtedness inthe first half of 2008, including its incurrence of indebtedness in April 2008 to finance its acquisitionof a stake in Norilsk Nickel, the Group experienced a liquidity shortage and breached covenants undercertain of its loan agreements. This gave rise to a material uncertainty casting a significant doubt overthe Group’s ability to continue as a going concern without successfully completing the restructuringof its financial indebtedness. This uncertainty has, however, been resolved by the completion of theGroup’s debt restructuring. For further information, see “— Restructuring” and “Liquidity and CapitalResources — Debt Restructuring”.
Overview
The Group is the world’s largest producer of aluminium, producing approximately 4.4 milliontonnes and 2.0 million tonnes in 2008 and the first half of 2009, respectively, and accounting forapproximately 12% and 11% of global output in those periods, according to CRU. The Group’sbusiness is focused on the upstream segment of the industry — the production and sale of primaryaluminium (including alloys and value added products, such as aluminium sheet ingot and aluminiumbillet). Within its upstream business, the Group is vertically integrated to a high degree, having securesupplies of bauxite and having the capacity to produce alumina in excess of its current requirements.The Group’s core smelters are located in Siberia, Russia, and benefit from access to low cost hydrogenerated electricity. This is a region where the Group is generally the principal consumer ofelectricity and there are few, if any, alternative sources of significant demand. In the first half of 2009,the Group reduced its alumina capacity to volumes sufficient for its internal use by suspendingoperations at some of its alumina refineries as part of its response to the downturn in aluminiumindustry production. The Group’s own bauxite production was sufficient to cover approximately 71%and 78% of its alumina production in 2008 and the first six months of 2009, respectively, withadditional bauxite being purchased under medium- and long-term contracts to cover the Group’salumina-long position. The Group is the world’s largest producer of alumina, producing approximately11.3 million tonnes and 3.7 million tonnes of alumina in 2008 and the first half of 2009, respectively
FINANCIAL INFORMATION
— 168 —

and accounting for 13% and 10% of global output in those periods, according to CRU. To produceapproximately 4.4 million tonnes and 2.0 million tonnes of aluminium in 2008 and the first half of2009, respectively, the Group required approximately 8.6 million tonnes and 3.4 million tonnes ofalumina.
The Group’s revenue was US$15,685 million for the year ended 31 December 2008 andUS$3,757 million for the six months ended 30 June 2009. The Group reported a net loss of US$5,984million for the year ended 31 December 2008 and US$868 million for the six months ended 30 June2009.
The Group has evolved over the past decade through acquisitions and organic growth. In March2007, RUSAL acquired SUAL, then one of the world’s ten largest producers in the aluminiumbusiness, and certain of the aluminium and alumina businesses of Glencore, a company specialisingin the production and processing of metals and the trading of metals, oil and agricultural products,creating the Group in its current form. The Group now has operations in 19 countries across fivecontinents, with more than 75,000 employees.
The Group has four reporting business segments which are also the Group’s strategic businessunits. These business units are managed separately. The business segments are as follows:
• Aluminium: the Aluminium segment is involved in the production and sale of primaryaluminium and related products (and includes the repair and maintenance activities carriedout by the Engineering and Construction business division);
• Alumina: the Alumina segment is involved in mining and refining of bauxite into aluminaand sale of alumina;
• Energy: the Energy segment includes the Group companies and projects engaged in miningand sale of coal and generation and transmission of electricity produced from varioussources. Where the generating facility is solely a part of an alumina or aluminiumproduction facility it is included in the respective operating segment; and
• Mining and Metals: the Mining and Metals segment includes the Group’s equity investmentin Norilsk Nickel.
Other operations include the manufacturing of semi-finished products from primary aluminiumfor the transportation, packaging, building and construction, consumer goods and technologyindustries and for the activities of the Group’s administrative centres. In 2006, 2007, 2008 and 2009,none of these segments met the quantitative thresholds required to be deemed reportable segments.
The Aluminium and Alumina segments are vertically integrated, whereby the Alumina segmentsupplies alumina to the Aluminium segment for refining and smelting and has limited sales of aluminaoutside the Group. Integration between the Aluminium, Alumina and Energy segments also includesshared servicing and distribution. Inter-segment pricing is determined on a consistent basis usingmarket benchmarks (such as market prices for alumina).
The Aluminium segment accounted for approximately 79.7% and 88.4% of the Group’s revenuefor the year ended 31 December 2008 and for the six months ended 30 June 2009, respectively. TheGroup also presents revenue, capital expenditure and assets on a geographic segment basis. See Note4(iii) to the UC RUSAL Accountants’ Report.
FINANCIAL INFORMATION
— 169 —
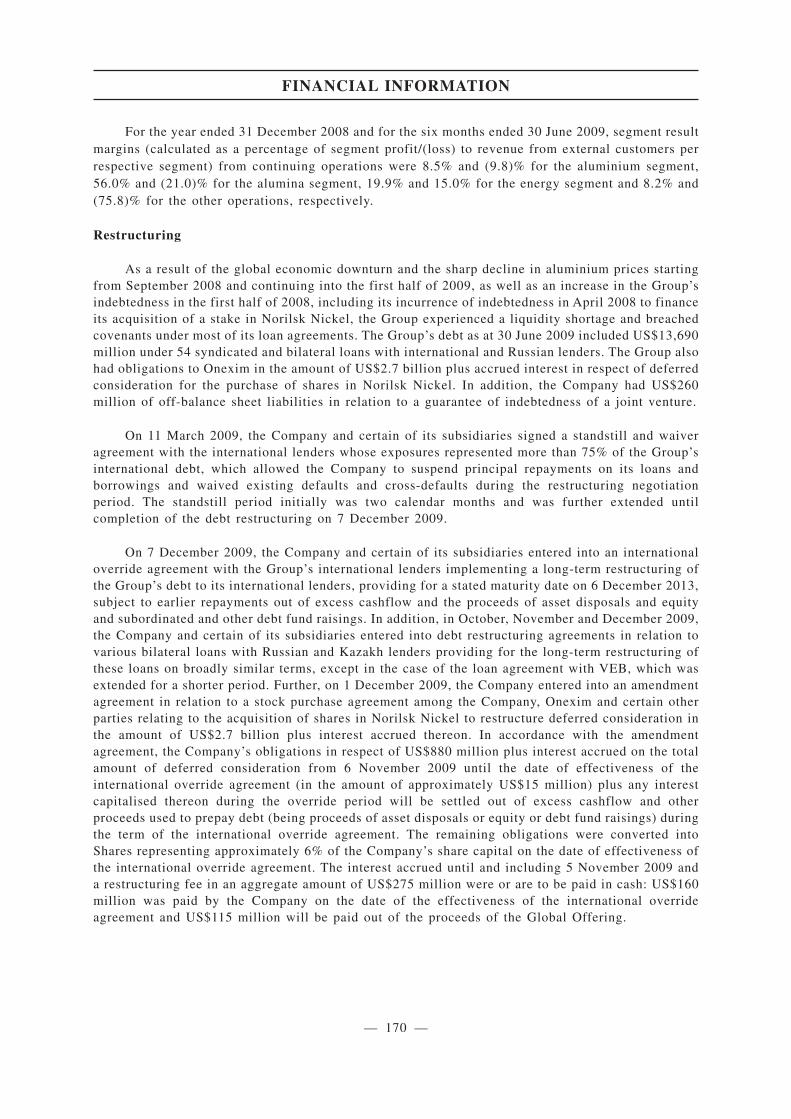
For the year ended 31 December 2008 and for the six months ended 30 June 2009, segment resultmargins (calculated as a percentage of segment profit/(loss) to revenue from external customers perrespective segment) from continuing operations were 8.5% and (9.8)% for the aluminium segment,56.0% and (21.0)% for the alumina segment, 19.9% and 15.0% for the energy segment and 8.2% and(75.8)% for the other operations, respectively.
Restructuring
As a result of the global economic downturn and the sharp decline in aluminium prices startingfrom September 2008 and continuing into the first half of 2009, as well as an increase in the Group’sindebtedness in the first half of 2008, including its incurrence of indebtedness in April 2008 to financeits acquisition of a stake in Norilsk Nickel, the Group experienced a liquidity shortage and breachedcovenants under most of its loan agreements. The Group’s debt as at 30 June 2009 included US$13,690million under 54 syndicated and bilateral loans with international and Russian lenders. The Group alsohad obligations to Onexim in the amount of US$2.7 billion plus accrued interest in respect of deferredconsideration for the purchase of shares in Norilsk Nickel. In addition, the Company had US$260million of off-balance sheet liabilities in relation to a guarantee of indebtedness of a joint venture.
On 11 March 2009, the Company and certain of its subsidiaries signed a standstill and waiveragreement with the international lenders whose exposures represented more than 75% of the Group’sinternational debt, which allowed the Company to suspend principal repayments on its loans andborrowings and waived existing defaults and cross-defaults during the restructuring negotiationperiod. The standstill period initially was two calendar months and was further extended untilcompletion of the debt restructuring on 7 December 2009.
On 7 December 2009, the Company and certain of its subsidiaries entered into an internationaloverride agreement with the Group’s international lenders implementing a long-term restructuring ofthe Group’s debt to its international lenders, providing for a stated maturity date on 6 December 2013,subject to earlier repayments out of excess cashflow and the proceeds of asset disposals and equityand subordinated and other debt fund raisings. In addition, in October, November and December 2009,the Company and certain of its subsidiaries entered into debt restructuring agreements in relation tovarious bilateral loans with Russian and Kazakh lenders providing for the long-term restructuring ofthese loans on broadly similar terms, except in the case of the loan agreement with VEB, which wasextended for a shorter period. Further, on 1 December 2009, the Company entered into an amendmentagreement in relation to a stock purchase agreement among the Company, Onexim and certain otherparties relating to the acquisition of shares in Norilsk Nickel to restructure deferred consideration inthe amount of US$2.7 billion plus interest accrued thereon. In accordance with the amendmentagreement, the Company’s obligations in respect of US$880 million plus interest accrued on the totalamount of deferred consideration from 6 November 2009 until the date of effectiveness of theinternational override agreement (in the amount of approximately US$15 million) plus any interestcapitalised thereon during the override period will be settled out of excess cashflow and otherproceeds used to prepay debt (being proceeds of asset disposals or equity or debt fund raisings) duringthe term of the international override agreement. The remaining obligations were converted intoShares representing approximately 6% of the Company’s share capital on the date of effectiveness ofthe international override agreement. The interest accrued until and including 5 November 2009 anda restructuring fee in an aggregate amount of US$275 million were or are to be paid in cash: US$160million was paid by the Company on the date of the effectiveness of the international overrideagreement and US$115 million will be paid out of the proceeds of the Global Offering.
FINANCIAL INFORMATION
— 170 —
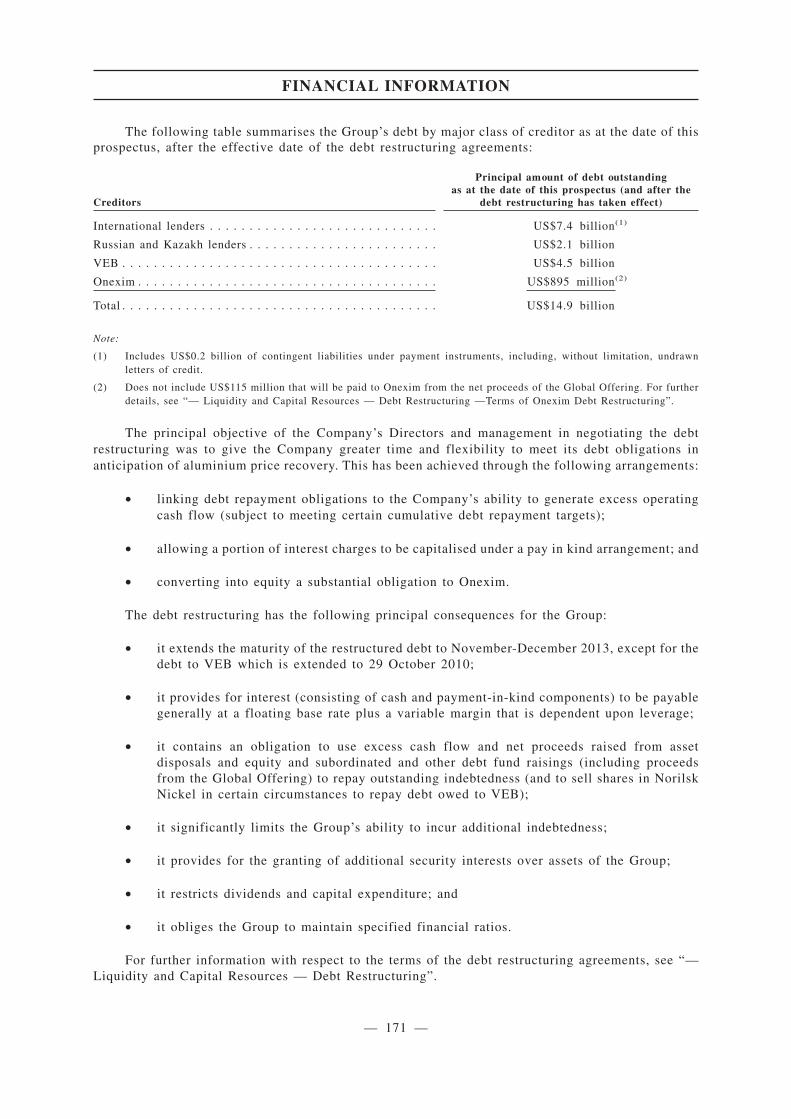
The following table summarises the Group’s debt by major class of creditor as at the date of thisprospectus, after the effective date of the debt restructuring agreements:
Creditors
Principal amount of debt outstandingas at the date of this prospectus (and after the
debt restructuring has taken effect)
International lenders . . . . . . . . . . . . . . . . . . . . . . . . . . . . . US$7.4 billion(1)
Russian and Kazakh lenders . . . . . . . . . . . . . . . . . . . . . . . . US$2.1 billion
VEB . . . . . . . . . . . . . . . . . . . . . . . . . . . . . . . . . . . . . . . . US$4.5 billion
Onexim . . . . . . . . . . . . . . . . . . . . . . . . . . . . . . . . . . . . . . US$895 million(2)
Total . . . . . . . . . . . . . . . . . . . . . . . . . . . . . . . . . . . . . . . . US$14.9 billion
Note:
(1) Includes US$0.2 billion of contingent liabilities under payment instruments, including, without limitation, undrawnletters of credit.
(2) Does not include US$115 million that will be paid to Onexim from the net proceeds of the Global Offering. For furtherdetails, see “— Liquidity and Capital Resources — Debt Restructuring —Terms of Onexim Debt Restructuring”.
The principal objective of the Company’s Directors and management in negotiating the debtrestructuring was to give the Company greater time and flexibility to meet its debt obligations inanticipation of aluminium price recovery. This has been achieved through the following arrangements:
• linking debt repayment obligations to the Company’s ability to generate excess operatingcash flow (subject to meeting certain cumulative debt repayment targets);
• allowing a portion of interest charges to be capitalised under a pay in kind arrangement; and
• converting into equity a substantial obligation to Onexim.
The debt restructuring has the following principal consequences for the Group:
• it extends the maturity of the restructured debt to November-December 2013, except for thedebt to VEB which is extended to 29 October 2010;
• it provides for interest (consisting of cash and payment-in-kind components) to be payablegenerally at a floating base rate plus a variable margin that is dependent upon leverage;
• it contains an obligation to use excess cash flow and net proceeds raised from assetdisposals and equity and subordinated and other debt fund raisings (including proceedsfrom the Global Offering) to repay outstanding indebtedness (and to sell shares in NorilskNickel in certain circumstances to repay debt owed to VEB);
• it significantly limits the Group’s ability to incur additional indebtedness;
• it provides for the granting of additional security interests over assets of the Group;
• it restricts dividends and capital expenditure; and
• it obliges the Group to maintain specified financial ratios.
For further information with respect to the terms of the debt restructuring agreements, see “—Liquidity and Capital Resources — Debt Restructuring”.
FINANCIAL INFORMATION
— 171 —
The Acquisition of a 25% plus one share stake in Norilsk Nickel and Subsequent Impairment
In April 2008, the Group completed the acquisition of a 25% plus one share stake in NorilskNickel from Onexim. The Group’s investment in Norilsk Nickel is accounted for under the equitymethod, because UC RUSAL is able to exert significant influence over Norilsk Nickel. Under theequity method, the investment is initially recognised at cost and the carrying amount is increased ordecreased to recognise the investor’s share of the profit or loss of the investee after the date ofacquisition. The investor’s share of profit or loss of the investee is recognised in the investor’s incomestatement after purchase price allocation adjustments, if any (such as revaluation of property, plantand equipment of the investee at fair value on the date of acquisition and recognition of the miningassets). Distributions received from the investee reduce the carrying amount of the investment.
The Group’s share in the profit/loss of Norilsk Nickel from the date of acquisition through 31December 2008 was a loss of US$881 million and for the first six months of 2009 was a profit ofUS$42 million. In addition, following the sharp decline in demand for products of Norilsk Nickel inthe fourth quarter of 2008, the Group recognised US$2,408 million in impairment charges related toits investment in Norilsk Nickel at 31 December 2008 of which US$308 million was reversed duringthe six month period ended 30 June 2009. For further information, see “— Results of Operations —Certain Factors Affecting Results of Operations — Impairment of non-current assets”, and “— Resultsof Operations — Year ended 31 December 2008 compared to the year ended 31 December 2007 —Impairment of non-current assets” and Note 19(a) to UC RUSAL’s Accountants’ Report. The carryingvalue of the Group’s investment in Norilsk Nickel is significantly influenced by foreign currencyexchange rate movements which could have a material impact in future periods. See “Risk Factors —Risks Relating to the Group and its Business — The Group’s results of operations in 2008 weresignificantly and adversely affected by impairment charges related principally to its property, plantand equipment and to its equity investment in Norilsk Nickel and by the Group’s pro rata portion ofloss suffered by Norilsk Nickel, and there can be no assurances that further impairment charges willnot be necessary or that further losses related to the Norilsk Nickel investment will not occur”.
The Acquisition of SUAL and the Glencore Businesses
In late March 2007, En+, SUAL Partners and Glencore and/or its subsidiaries contributed to UCRUSAL their respective interests in RUSAL, SUAL and the Glencore Businesses. The Companybelieves that the transfer to it of these respective interests in March 2007 was effective at the time.As discussed below, this transaction is treated for accounting purposes, and is described in thisprospectus, as the acquisition of SUAL and the Glencore Businesses by RUSAL/UC RUSAL. Theacquisition strengthened the Group’s vertical integration by bringing together aluminium smelting andalumina production capacity, thereby reducing exposure to price movements.
Prior to UC RUSAL’s acquisition of SUAL and the Glencore Businesses, RUSAL and SUALdisposed of selected downstream operations and other assets, enabling the Group to focus on theupstream aluminium business. On 29 December 2006, in connection with UC RUSAL’s acquisition ofSUAL and the Glencore Businesses, RUSAL transferred packaging, aluminium construction,magnesium and energy assets to its shareholder as a distribution. Similarly, in connection with theacquisition, SUAL consolidated under a separate holding company assets that would not be acquiredby UC RUSAL, including a producer of semi-finished products, and sold this holding company inJanuary 2007.
For accounting purposes, the contribution to UC RUSAL of RUSAL, SUAL and the GlencoreBusinesses has been treated as follows:
• the formation of UC RUSAL and its acquisition of RUSAL is considered to be anon-substantive transaction, meaning that UC RUSAL’s consolidated financial history priorto 27 March 2007 is that of RUSAL; and
• the contribution to UC RUSAL of interests in SUAL and the Glencore Businesses is treatedas a purchase of these entities on 27 March 2007.
FINANCIAL INFORMATION
— 172 —

Accordingly, the historical financial information of UC RUSAL for the year ended 31 December2007 includes the trading results of SUAL and the Glencore Businesses with effect from 1 April 2007,and the UC RUSAL balance sheet as at 31 December 2007 consolidates SUAL and the GlencoreBusinesses. UC RUSAL’s consolidated financial statements for the year ended 31 December 2008 andfor the six month periods ended 30 June 2009 and 2008 include the results of operations and thefinancial position of the Group taken as a whole.
Certain Factors Affecting the Group’s Results of Operations
Selected Operating and Financial Data
Historical Data
Set out below is selected operating and financial data for the years ending 31 December 2006 to2008 and the first half of 2009 and the Company’s minimum operational targets.
Six monthsended
30 June Year ended 31 December
2009 2008 2007 2006
Aluminium and alumina price informationAluminium price per tonne quoted on the LME
(US$ per tonne)(1) . . . . . . . . . . . . . . . . . . . . . . . 1,422 2,620 2,662 2,568Alumina price per tonne (US$ per tonne)(2) . . . . . . . . 196 341 343 436
CapacityTotal plant saleable aluminium capacity (ktonnes)(3) . . 2,293 4,556 4,233 3,987Primary aluminium production as % of total plant
saleable aluminium capacity (Capacity utilisation) . 86.3% 97.1% 99.3% 99.3%
ProductionPrimary aluminium (ktonnes) . . . . . . . . . . . . . . . . . . 1,980 4,424 4,202 3,958Alumina (ktonnes) . . . . . . . . . . . . . . . . . . . . . . . . . 3,738 11,317 11,347 11,313Bauxite (mtonnes wet) . . . . . . . . . . . . . . . . . . . . . . 6.1 19.1 18.5 19.2Coal (mtonnes) . . . . . . . . . . . . . . . . . . . . . . . . . . . . 7.1 23.05 19.2 20.8
Selected income statement data (mln. US$)Revenue . . . . . . . . . . . . . . . . . . . . . . . . . . . . . . . . 3,757 15,685 13,588 8,429Cost of sales . . . . . . . . . . . . . . . . . . . . . . . . . . . . . (3,449) (11,073) (8,356) (4,186)
of which energy costs . . . . . . . . . . . . . . . . . . . . . (901) (2,044) (1,271) (525)Distribution expenses . . . . . . . . . . . . . . . . . . . . . . . (284) (798) (528) (328)Adjusted EBITDA
margin . . . . . . . . . . . . . . . . . . . . . . . . . . . . . . .(144) 3,526 4,620 3,680
(3.8%) 22.5% 34.0% 43.7%Results from operating activities
(excluding impact of impairment charges) . . . . . . . (450) 2,440 3,647 3,312margin . . . . . . . . . . . . . . . . . . . . . . . . . . . . . . . (12.0%) 15.6% 26.8% 39.3%
Income tax expense . . . . . . . . . . . . . . . . . . . . . . . . . (64) 69 (419) (336)
Selected cash flow statement data (mln. US$)Net cash flows generated from operating activities . . . (232) 3,017 3,346 2,790Net cash flows used in investing activities . . . . . . . . . (61) (5,802) (2,853) (584)
of which capex(4) . . . . . . . . . . . . . . . . . . . . . . . . (69) (1,348) (1,684) (867)
Notes:
(1) Represents the average of the daily closing prices for each period.
(2) The average alumina price per tonne provided in this table is based on the daily closing spot prices of alumina as reportedby Datastream; Metal Bulletin. Approximately 10% to 15% of alumina is sold on the spot market, the rest being soldprimarily on a contractual basis at prices that may differ from the then-prevailing spot prices. The spot prices providedherein therefore may not be representative of the alumina market generally.
(3) Saleable aluminium capacity is the weight of the aluminium which, it is estimated, could be produced within the perioddefined. It includes the capacity of the existing plant, irrespective of whether the plant is operating or idle. Capacity isshown on a total plant basis and irrespective of ownership.
(4) Capex defined as payment for the acquisition of property, plant and equipment.
FINANCIAL INFORMATION
— 173 —

As outlined in “Business — Strengths and Strategies — Strengths — High degree of verticalintegration”, the Company consumes a large proportion of the alumina it produces and the majorityof the bauxite it mines. In 2008 the Company consumed approximately 8.6 million tonnes of alumina,of which 1.8 million tonnes was purchased from third parties in addition to the approximately 11.3million tonnes produced internally. The Company’s own bauxite production in 2008 was sufficient tocover approximately 71% of its alumina production.
Operational Outlook
Based on the updated base case assumptions (as described in “— Liquidity and Capital Resources— Debt Restructuring”) and on the Company’s historical operational and financial performance, theDirectors believe that the Company’s aluminium production and operating margins should reach levelssimilar to those achieved in 2008 (excluding the impact of impairment charges) from 2011. Assumedaluminium production and operating margin levels constitute forward-looking statements, involvesignificant risk and uncertainty and have been included herein pursuant to regulatory requirements.There can be no guarantee that these production and margin levels can be achieved or that suchassumptions will prove to be correct or accurate. Actual operational and financial performance maybe significantly worse than the Directors’ updated base case assumptions, and as a result the Group’sbusiness and financial condition may be materially and adversely affected. Moreover, the updated basecase assumptions include assumptions about a number of matters outside the Group’s control,including prices for aluminium, alumina, electricity, transportation, raw materials and other inputs aswell as general economic and market conditions and uninterrupted production. There are a number ofrisks, uncertainties and other factors that could cause the actual events, circumstances anddevelopments to differ materially from these assumptions. See also “Forward-Looking Statements”.
Certain Factors Affecting Results of Operations
The primary factor affecting the Group’s results of operations is the demand for and price ofaluminium (and, to a lesser extent, the demand for and price of alumina). Other important factors thathave affected and are expected to continue to affect the Group’s results of operations include thefollowing:
• demand for and price of aluminium and alumina;
• prices of materials;
• electricity prices;
• transportation tariffs;
• effective tax rate;
• changes in foreign currency exchange rates;
• impairment of non-current assets;
• cost reductions; and
• impact of restructuring going forward.
The Group’s results of operations, turnaround position and prospects for growth will also beaffected substantially by the implementation of the debt restructuring agreed in late 2009 withsubstantially all its creditors following default on its indebtedness and the Group’s ability to complywith the restructuring’s deleveraging requirements.
FINANCIAL INFORMATION
— 174 —

Demand for and Price of Aluminium and Alumina
The Group’s operating results are affected significantly by the demand for price of aluminiumas quoted on the LME and, to a lesser extent, by the demand for and price of alumina. Aluminiumprices were high relative to average historical prices from 2005 through the first half of 2008. Theaverage price per tonne of aluminium as quoted on the LME increased from US$1,900 in 2005 toUS$2,568 in 2006, or by 35%, to US$2,662 in 2007, or by 3.7% and then to US$2,836 in the first sixmonths of 2008, or by 6.5%. The increase in the price of aluminium over this period was largely dueto growth in demand for aluminium products, which was primarily driven by growing markets, suchas Russia, India and China; a decline in world aluminium production; and, with respect to 2006, analumina deficit, which resulted in a global aluminium production cost increase. In the second half of2008 and the first half of 2009, however, aluminium prices declined sharply, due to a steep declinein demand resulting from the global financial crisis and recession. The average price per tonne ofaluminium as quoted on the LME decreased to US$2,304 in the second half of 2008 and US$1,422 inthe first half of 2009.
The Group also sells alumina to and purchases alumina from third parties. Alumina is priced inone of two principal ways: on a spot basis at a fixed price for a specified period; or on a formula basisrelated to the price of aluminium as quoted on the LME.
The following table sets forth certain price information for aluminium and alumina for theperiods indicated.
High Low Average(1)
(US$, except percentages)
Aluminium price per tonne quoted on the LMESix months ended 30 June 2009. . . . . . . . . . . . . . . . . . . . . . . . . . . . . 1,646 1,290 1,422Six months ended 30 June 2008. . . . . . . . . . . . . . . . . . . . . . . . . . . . . 3,175 2,359 2,836Year ended 31 December 2008 . . . . . . . . . . . . . . . . . . . . . . . . . . . . . 3,341 1,464 2,620Year ended 31 December 2007 . . . . . . . . . . . . . . . . . . . . . . . . . . . . . 2,953 2,316 2,662Year ended 31 December 2006 . . . . . . . . . . . . . . . . . . . . . . . . . . . . . 3,273 2,267 2,568Year ended 31 December 2005 . . . . . . . . . . . . . . . . . . . . . . . . . . . . . 2,289 1,675 1,900
Alumina price per tonne(2)
Six months ended 30 June 2009. . . . . . . . . . . . . . . . . . . . . . . . . . . . . 215 181 196As % of LME price . . . . . . . . . . . . . . . . . . . . . . . . . . . . . . . . . . . . 13.1 14.0 13.8
Six months ended 30 June 2008. . . . . . . . . . . . . . . . . . . . . . . . . . . . . 435 360 401As % of LME price . . . . . . . . . . . . . . . . . . . . . . . . . . . . . . . . . . . . 13.7 15.3 14.1
Year ended 31 December 2008 . . . . . . . . . . . . . . . . . . . . . . . . . . . . . 394 316 341As % of LME price . . . . . . . . . . . . . . . . . . . . . . . . . . . . . . . . . . . . 11.8 21.6 13.0
Year ended 31 December 2007 . . . . . . . . . . . . . . . . . . . . . . . . . . . . . 360 205 343As % of LME price . . . . . . . . . . . . . . . . . . . . . . . . . . . . . . . . . . . . 12.2 8.9 12.9
Year ended 31 December 2006 . . . . . . . . . . . . . . . . . . . . . . . . . . . . . 617 202 436As % of LME price . . . . . . . . . . . . . . . . . . . . . . . . . . . . . . . . . . . . 18.9 8.9 17.0
Year ended 31 December 2005 . . . . . . . . . . . . . . . . . . . . . . . . . . . . . 576 399 446As % of LME price . . . . . . . . . . . . . . . . . . . . . . . . . . . . . . . . . . . . 25.2 23.8 23.5
Notes:
(1) Represents the average of the daily closing prices for each period.
(2) The high, low and average alumina price per tonne provided in this table is based on the daily closing spot prices ofalumina as reported by Datastream; Metal Bulletin. Approximately 10% to 15% of alumina is sold on the spot market,the rest being sold primarily on a contractual basis at prices that may differ from the then-prevailing spot prices. Thespot prices provided herein therefore may not be representative of the alumina market generally.
FINANCIAL INFORMATION
— 175 —
Revenue from aluminium sales to all markets (including the Russian Federation) is closely linkedto movements in the LME price of aluminium. The Group’s average realised price per tonne ofaluminium generally has been higher than the average price quoted on the LME due to its productionof value added products and the inclusion of certain alloys in the Group’s products. Factors affectingthe amount of premium charged for a particular product include the product type, the geographicmarket in which the product is sold, the quantity of the product ordered, the terms of delivery andpayment and current market trends. In addition, in some cases the Group includes transportationservices, reflecting the Group’s transportation costs, in the final price charged to customers.
Following the acquisition of the Glencore Businesses the Group produced more alumina than itrequired for its aluminium production and sold this excess to third parties. Following the economicdownturn at the end of 2008, the Group has reduced its alumina capacity to volumes that are sufficientfor its internal use.
Currently the Group does not hedge its exposure to aluminium or alumina prices, though it mayconsider such hedging in the future. It does hedge sales to the United States and sales made from itsKubikenborg smelter. The objective of the Group’s hedging of its sales to the United States and fromits Kubikenborg aluminium smelter is to achieve the average LME official cash price for the monthof production. After the Group has entered into an agreement for physical sale of aluminium, it hedgesthe physical sale forward on the LME. At a suitable time in the future it unwinds the forward longhedge by selling the cash average of production.
Prices of Materials
The main component of the Group’s cost of sales is cost of materials, and therefore the Group’sresults of operations are affected by movements in such materials’ prices. Cost of materialsrepresented 58.5% and 55.8% of the Group’s cost of sales in the year ended December 2008 and thesix months ended 30 June 2009, respectively. The principal materials purchased include bauxite,caustic soda, fuel oil and natural gas, used in the production of alumina, and alumina, caustic soda,fluoride, pitch and coke, used in the production of aluminium. The cost of alumina and bauxite hasbeen a significant component of cost of materials, representing 20.2% and 20.6% of the Group’s costof sales for the year ended 31 December 2008 and for the six months ended 30 June 2009, respectively.The Group will, due to ongoing contractual commitments, continue to source for a certain period oftime considerable amounts of alumina from third parties notwithstanding in-house production that isnow in excess of its needs. For example, UC RUSAL has entered into a long-term contract withSirinidia Trading AG (which was subsequently assigned to ENR Alumina AG), which now operates thegeographically isolated Pavlodar alumina refinery in Kazakhstan, to purchase alumina through 2016.Pavlodar’s location enables the Group to secure favourable long-term contracts as it currently is theonly geographically well-placed customer. See “Business — Strengths and Strategies — Strengths —High Degree of Vertical Integration”. While the Group will thus continue to source a considerablequantity of materials from third parties, the Group’s alumina production will serve as a hedge againstprice increases, while at the same time creating some exposure to price decreases. Following thedownturn in the aluminium industry and the sharp decline in aluminium prices at the end of 2008 andbeginning 2009, the Group reduced its alumina production capacity by temporarily suspending theoperations of a number of higher cost alumina refineries. The Group now meets most of its bauxiterequirements from its own mines and sources the rest through medium- to long-term contracts, but theprice adjustment provisions leave some exposure to price variations. Moreover, the Group continuesto rely on third-party sources to supply its aluminium smelters and alumina refineries with most of theother materials it requires, in particular, fuel oil, caustic soda, pitch and coke. The prices of these othermaterials have generally risen in recent years.
FINANCIAL INFORMATION
— 176 —
Electricity Prices
Electricity purchases by the Group’s aluminium smelters represent a significant component ofthe Group’s costs of sales. The Group has benefited and expects to continue to benefit from relativelylow electricity prices in the parts of Siberia where its main smelting operations are located. Followingthe liberalisation of the electricity market in 2008, the Group has seen a significant increase in tariffs,which drove up its electricity expense; however, on average, electricity prices remain a structurallycompetitive advantage for the Group.
For each of the three years ended 31 December 2008 and for the six months ended 30 June 2009,the Group’s aluminium smelters consumed, on an aggregate basis, approximately 47,765 mkWh,71,700 mkWh, 74,862 mkWh and 33,047 mkWh of electricity, respectively. The energy costs of theGroup at its aluminium smelters, were approximately US$474 million, US$1,100 million, US$1,849million and US$757 million for each of the three years ended 31 December 2008 and for the sixmonths ended 30 June 2009, respectively, or amounted to approximately US$196, US$301, US$400and US$346 per tonne for each of the three years ended 31 December 2008 and for the six monthsended 30 June 2009, respectively. Electricity costs account for the vast majority of energy costs, withthe balance mainly oil and gas costs predominantly for use in the carbon and casthouse areas.
In 2006, 2007, 2008 and for the six months ended 30 June 2009, approximately 100%, 79%, 80%and 84%, respectively, of the Group’s aluminium was produced by Siberian smelters which obtainedtheir energy mainly from low-cost hydropower stations with few, if any, alternative sources ofsignificant demand. In those parts of Siberia where these smelters are located, the Group is generallythe principal consumer of electricity, and there are few, if any, alternative sources of significantdemand. In addition to meeting its electricity needs through hydropower stations, the Group alsoobtains electricity from thermal generators. In 2006, 2007, 2008 and the six months ended 30 June2009, aluminium smelters in Siberia paid a production-weighted average of US$0.0110/kWh,US$0.0129/kWh, US$0.0192/kWh and US$0.0182/kWh, respectively, for electricity. This compareswith a production-weighted average in 2007, 2008 and the six months ended 30 June 2009, ofUS$0.0308/kWh, US$0.0355/kWh and US$0.0339/kWh, respectively, in the Urals region, andUS$0.0321/kWh, US$0.0473/kWh and US$0.0285/kWh, respectively, in the European region ofRussia (excluding the Urals region).
Electricity price increases may result from the need to secure alternative electricity suppliesfollowing industrial accidents or breakdowns at major electricity suppliers. In August 2009, a majoraccident occurred at the Sayano-Shushenskaya hydroelectric power plant in Siberia, which was themain supplier of electricity to the Group’s Sayanogorsk and Khakas aluminium smelters. Thisdisruption did not have a material effect on our business. Electricity price increases may also resultfrom changes in the regulation of the Russian electricity industry. For further information, see “RiskFactors — Risks Relating to the Group and its Business — The Group’s competitive position in theglobal aluminium industry is highly dependent on continued access to inexpensive and uninterruptedelectricity supply, in particular, long-term contracts for such electricity; increased electricity prices(particularly as a result of deregulation of electricity tariffs), as well as interruptions in the supply ofelectricity, could have a material adverse effect on the Group’s business, financial condition andresults of operations”.
The Group’s strategy for maintaining access to low-cost electricity for its existing smeltersvaries by region. See “Business — Strengths and Strategies — Strengths — Secure and sustainablelow cost position and power advantage” and “Business — Energy Supply — Security of PowerSupply”.
Transportation Tariffs
The Group’s transportation costs are recorded in cost of sales (as part of cost of raw materials)and relate mainly to the transportation of alumina and other materials to the Group’s aluminiumsmelters. Distribution costs are recorded in distribution expenses and relate to the transportation offinished aluminium products to customers. Distribution expenses represented 5.1% and 7.6% of itsrevenue, for 2008 and the six months ended 30 June 2009, respectively.
FINANCIAL INFORMATION
— 177 —

Railway transportation is the Group’s principal means of transporting materials, mainly alumina,to its smelters and end products to its customers. The Group also relies on key Russian ports to receiveshipments of foreign-sourced alumina and to export finished aluminium products. See “Business —Transportation”.
Russian railway tariffs are currently regulated by the government and consist of two parts:infrastructure costs and carriage costs. In recent years, annual tariff increases have been in line withinflation (except for 2008, when tariffs rose faster than inflation) and in 2006 and 2007 the increaseswere less than inflation. There can be no assurance, however, that this policy will be maintained.
The Group benefits from favourable rail tariffs on certain routes, and protection from rateincreases, pursuant to Russian regulations adopted in 2003 and 2004 (the “Railway TariffRegulations”) and an implementing agreement entered into in 2004 between RUSAL and the railwayoperator, JSC Russian Railways. Under these regulations and the implementing agreement, theinfrastructure component of the railway tariff for transportation on specified routes of certainmaterials was fixed in Roubles until December 2010 at the level of 1 October 2003, provided thatincreasing annual volume levels are met. Subject to the possibility of early termination by either partybefore any year-end, the agreement is automatically renewed on an annual basis.
The tariffs set by the Railway Tariff Regulations and implemented by the agreement areapplicable to the transportation of current and future production of the former RUSAL Russianaluminium smelters and alumina refineries.
In 2008, the Group entered into a memorandum of understanding with JSC Russian Railways tofix infrastructure component of transport tariffs generally applicable to specific types of raw materialsand products at 2008 levels subject to a certain diminishing factor with subsequent annual increasesindexed in accordance with general annual tariff indexation. Such fixed transport tariffs would applyto the principal types of raw materials and products usually transported by the Group, rather thanparticular entities or transportation routes, thus, would indirectly provide benefit to the entire Group.The Group intends to continue the negotiation process in relation to this memorandum ofunderstanding in 2010. Once the negotiations are finalised, it is expected that new regulations willhave to be issued by the state tariff agency in order to give effect to the new tariffs. Upon entry ofthe new tariffs into force, the Railway Tariff Regulations and the implementing agreement willterminate. Until then, the Group expects that the Railway Tariff Regulations and the implementingagreement with JSC Russian Railways continue to apply. As an alternative, the Group is alsodiscussing with JSC Russian Railways the possibility of extending the current agreement to SUAL andnew production facilities with the simultaneous extension of its term until 2020.
Furthermore, the Group is currently in the process of negotiating a 30% discount to theinfrastructure component of the tariff to apply if the LME price falls below US$1,650 per tonne. Whilethis has been approved by JSC Russian Railways, it remains subject to approval by the FST.
The infrastructure component of the tariff, which is fixed as described above, representsapproximately 85% of the tariff, while the carriage component accounts for the remainder. Thecarriage component is not stipulated in the Railway Tariff Regulations or in the implementingagreement and is not subject to the ongoing negotiations with JSC Russian Railways. The carriagecomponent is subject to indexation to the rate of inflation, typically undertaken annually. Currently,the Russian Government is contemplating plans to increase competition through the partialprivatisation of the rolling stock owned by JSC Russian Railways, which could influence the carriagecosts portion of the tariff. Although it is most likely that the government will limit any increase in thecarriage component of the tariff until 2010 so as not to exceed the inflation rate, the pricing structurefor the rail industry, should deregulation occur, is difficult to determine and the Group could besubject to tariff increases.
FINANCIAL INFORMATION
— 178 —
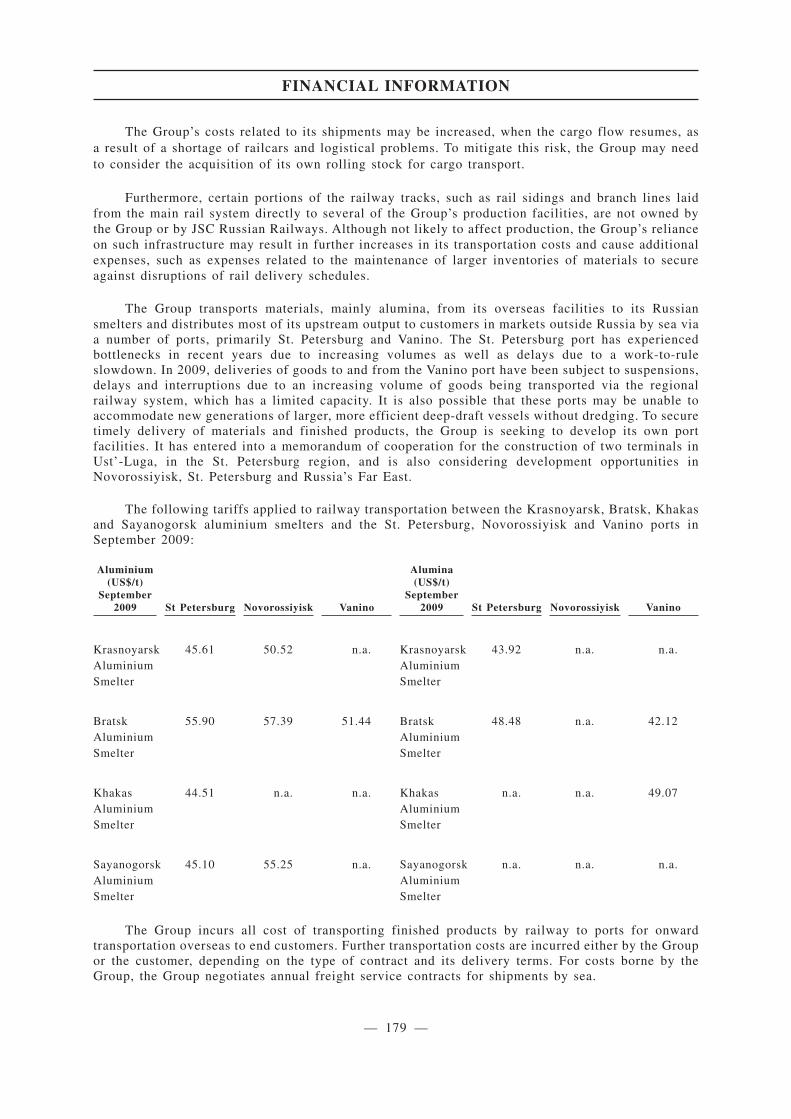
The Group’s costs related to its shipments may be increased, when the cargo flow resumes, asa result of a shortage of railcars and logistical problems. To mitigate this risk, the Group may needto consider the acquisition of its own rolling stock for cargo transport.
Furthermore, certain portions of the railway tracks, such as rail sidings and branch lines laidfrom the main rail system directly to several of the Group’s production facilities, are not owned bythe Group or by JSC Russian Railways. Although not likely to affect production, the Group’s relianceon such infrastructure may result in further increases in its transportation costs and cause additionalexpenses, such as expenses related to the maintenance of larger inventories of materials to secureagainst disruptions of rail delivery schedules.
The Group transports materials, mainly alumina, from its overseas facilities to its Russiansmelters and distributes most of its upstream output to customers in markets outside Russia by sea viaa number of ports, primarily St. Petersburg and Vanino. The St. Petersburg port has experiencedbottlenecks in recent years due to increasing volumes as well as delays due to a work-to-ruleslowdown. In 2009, deliveries of goods to and from the Vanino port have been subject to suspensions,delays and interruptions due to an increasing volume of goods being transported via the regionalrailway system, which has a limited capacity. It is also possible that these ports may be unable toaccommodate new generations of larger, more efficient deep-draft vessels without dredging. To securetimely delivery of materials and finished products, the Group is seeking to develop its own portfacilities. It has entered into a memorandum of cooperation for the construction of two terminals inUst’-Luga, in the St. Petersburg region, and is also considering development opportunities inNovorossiyisk, St. Petersburg and Russia’s Far East.
The following tariffs applied to railway transportation between the Krasnoyarsk, Bratsk, Khakasand Sayanogorsk aluminium smelters and the St. Petersburg, Novorossiyisk and Vanino ports inSeptember 2009:
Aluminium(US$/t)
September2009 St Petersburg Novorossiyisk Vanino
Alumina(US$/t)
September2009 St Petersburg Novorossiyisk Vanino
KrasnoyarskAluminiumSmelter
45.61 50.52 n.a. KrasnoyarskAluminiumSmelter
43.92 n.a. n.a.
BratskAluminiumSmelter
55.90 57.39 51.44 BratskAluminiumSmelter
48.48 n.a. 42.12
KhakasAluminiumSmelter
44.51 n.a. n.a. KhakasAluminiumSmelter
n.a. n.a. 49.07
SayanogorskAluminiumSmelter
45.10 55.25 n.a. SayanogorskAluminiumSmelter
n.a. n.a. n.a.
The Group incurs all cost of transporting finished products by railway to ports for onwardtransportation overseas to end customers. Further transportation costs are incurred either by the Groupor the customer, depending on the type of contract and its delivery terms. For costs borne by theGroup, the Group negotiates annual freight service contracts for shipments by sea.
FINANCIAL INFORMATION
— 179 —

Effective Tax Rate
The Group’s effective tax rate for the year ended 31 December 2006 was 10% and for the yearended 31 December 2007 was 13%. The concept of effective tax rate is not meaningful when there isnegative profit before tax, as was the case for the Group for the year ended 31 December 2008 andthe six months ended 30 June 2009. The difference between the statutory tax rate and the Group’seffective tax rate results primarily from the location of Group operations in tax-efficient jurisdictions,including the Group’s trading structure being located in Switzerland as well as the principal tradingcompany being registered in Jersey; and the holding company of the Group, which is also registeredin Jersey and holds Group assets through a number of intermediary holding companies registered inCyprus, Jersey, BVI, the Bahamas and other tax-efficient jurisdictions.
The Group also uses tolling arrangements, mainly because a substantial portion of its alumina issourced from outside Russia and processed by smelters in Russia, and the majority of third party salesof aluminium are outside Russia. Pursuant to the Group’s international tolling arrangements, a tollingcompany, registered and subject to taxation in Switzerland and acting upon instructions of theprincipal trading company of the Group, purchases materials, such as alumina, and arranges for theirdelivery to manufacturers, such as aluminium smelters, in another country for processing into endproducts, such as primary aluminium, in consideration of a tolling (or processing) fee. The title to thematerials or end products is not transferred to the manufacturers and, therefore, where tolling isemployed, the shipment of raw materials and end products into and out of the country of themanufacturer is not characterised as an import/export operation and is not subject to localimport/export duties. The tolling company and the manufacturer are taxed on their respective profitsin their respective countries of tax residence. See “Business — Sales and Distribution” and Note 10to UC RUSAL’s Accountants’ Report.
The Company intends to continue relying on tolling arrangements of the kind described abovewith respect to aluminium production in Russia when the alumina is sourced, and the finishedaluminium is sold, outside Russia. Tolling arrangements are permitted under Russian law and theGroup’s tolling agreements are regularly registered by the Russian customs authorities. The Directorsbelieve that the Group’s tolling arrangements are conducted on appropriate commercial terms basedon applicable Russian law and regulation. Processing fees are clearly indicated on the Group’s taxdeclaration in Russia, and the Russian anti-monopoly authorities also receive periodic reports fromeach of the Group’s smelters on the breakdown of the amounts of aluminium that are “produced”versus “processed”.
Group transfer prices were generally linked to LME prices, less amounts reflecting oftransportation, marketing, other logistical and overhead costs absorbed by the Group tradingcompanies.
The Russian entities in the Group are regularly audited by the Russian tax authorities and, inparticular, audits of the tax years 2005 and 2006 of the Group’s major Russian operating subsidiarieshave been completed. For a discussion of the period during which, and the reasons for which a taxyear’s audit may be repaid, see “Risk Factors — Risks Relating to the Group and its Business — Risksrelating to the multijurisdictional regulatory, social, legal, tax and political environment in which theGroup operates — Uncertainties relating to the tax systems of some of the countries in which theGroup operates complicate the Group’s tax planning and business decisions”. As a result of these taxaudits, the Directors believe that the Group’s commercial structure and its terms are acceptable to theRussian tax authorities. The Directors also believe that the Group’s non-Russian trading companiesinvolved in these arrangements are not subject to taxes outside their countries of incorporation orwhere they have established and declared tax residency.
A risk remains, however, that Russian tax authorities may still challenge the treatment of thesetransactions and these companies. Moreover, the laws that currently permit tolling in Russia, or thatregulate transfer pricing or the circumstances in which profits earned outside Russia are free ofRussian profit tax, could be changed, requiring the Group to revise or discontinue its existingarrangements. Any of these developments could increase the Group’s effective tax rate going forward,and any successful challenge to the Group’s practices under applicable law at the time could result inmaterial liability for additional tax, penalties and interest. The Directors do not believe that it is
FINANCIAL INFORMATION
— 180 —

possible to estimate the amount of any such liability for additional tax, penalties and interest in respectof its tolling arrangements and trading structure as it is unclear what approach (or combinationthereof) would be adopted by the tax authorities in order to assess additional taxation, penalties andinterest in respect of such arrangements or how existing Russian legislation, including transfer pricinglegislation, would be interpreted.
Changes in Foreign Currency Exchange Rates
Many large multinational companies face to some extent a mismatch between the currencies inwhich their revenues and costs are denominated. As a result, they are vulnerable to some degree tomargin erosion if the currencies in which their costs are denominated appreciate in real terms againstthe currencies in which their revenues are denominated. Substantially all of the Group’s revenues areeither denominated in U.S. dollars or linked to the U.S. dollar. While a large portion of the Group’scosts is also denominated in or linked to the U.S. dollar, a significant part is denominated in Roubles,Euros and the Ukrainian Hryvnia, because the Group has substantial production facilities in Russia,the EU and Ukraine. Accordingly, depreciation of these currencies against the U.S. dollar has apositive effect, and appreciation of these currencies has a negative effect, on the Group’s operatingmargins. Moreover, inflation of the Group’s costs in Roubles, Euros and Hryvnia, if notcounterbalanced by a corresponding depreciation of the relevant currency against the U.S. dollar oran increase in prices for aluminium and related products, could adversely affect the Group’s margins.
Impairment of Non-Current Assets
The Group recognised US$6,774 million and US$37 million in impairment and other chargesrelating to non-current assets in 2008 and the first six months of 2009, respectively, as compared tono such impairment in 2007 and 2006. As a result of the sharp decline in aluminium prices in thefourth quarter of 2008, management determined that it was necessary to carry out impairment tests forall significant cash-generating units of the Group, for the Group’s investment in Norilsk Nickel andfor certain other projects. These impairment tests led to recognition of impairment charges ofUS$3,532 million relating to property, plant and equipment, US$2,408 million relating to the Group’sinvestment in Norilsk Nickel (which was recognised in UC RUSAL’s Accountants’ Report in the lineitem “Share of losses and impairment of associates”), US$554 million relating to fair value adjustmenton financial instruments (which was recognised in UC RUSAL Accountants’ Report within line item“Finance Expense”) and US$280 million relating to other assets as of 31 December 2008. In addition,during the first half of 2008, impairment charges of US$297 million were recognised in relation to theKomi project, which was suspended at that time due to uncertainty relating to its gas supply andinfrastructure. For further information, see “— Results of Operations — Year Ended 31 December2008 Compared to the Year Ended 31 December 2007 — Impairment of Non-Current Assets”. Duringthe six months ended 30 June 2009 there was a decrease in the carrying amount of the Group’sinvestment in Norilsk Nickel after application of the equity method of accounting includingrecognition of the Group’s share of the net profit of Norilsk Nickel and the effect of foreign currencytranslation of the investment to US dollars from its functional currency. Following the application ofthe equity method management analysed changes in the economic environment and nickel and relatedindustries since 31 December 2008 and concluded that the value in use or the recoverable amount ofthe Group’s investment in Norilsk Nickel increased in its functional currency and remained unchangedin US dollars. As a result, the Group recognised a partial reversal of the previously recordedimpairment in the amount of US$308 million during the six months ended 30 June 2009.
Cost Reduction
To support the sustainability of the Group’s operations during the global economic downturn, inFebruary 2009, the Group implemented a comprehensive program designed to reduce costs andimprove the production process. See “Business — Strengths and Strategies — Strengths — Secure andsustainable low cost position and power advantage”. The program includes the following measures:
• reduction of aluminium output and alumina production by closing higher cost facilities andreducing production volumes;
FINANCIAL INFORMATION
— 181 —
• further reduction of aluminium production costs through more effective management of rawmaterials and energy supplies, optimised transport and logistics services;
• decrease in management expenses and headcount optimisation; and
• significant revision of investment plans.
The Group’s Aluminium Cash Operating Costs per tonne of aluminium is a key operating metric.Partially as a result of its cost reduction program, the Group’s Aluminium Cash Operating Costs havedecreased by 27%, or US$513 per tonne (inclusive of exchange rate effects) from an average ofUS$1,915 per tonne for the year ended 31 December 2008 to an average of US$1,402 per tonne forthe first six months of 2009. The principal contributors to this decrease were decreases of US$219 pertonne in alumina cost, US$113 per tonne in raw and auxiliary materials costs and US$83 per tonne inother costs including repair and maintenance and administrative expense. The Group’s AluminiumCash Operating Costs were an average of US$1,889 per tonne for the month of December 2008 andUS$1,389 per tonne for the month of June 2009.
The Group’s Alumina Cash Operating Costs have also decreased, by 28.7%, or US$100 per tonnefrom an average of US$349 per tonne for the year ended 31 December 2008 to an average of US$249for the first six months of 2009. The principal contributors to this decrease were decreases of US$45per tonne in power consumption cost, US$36 per tonne in raw materials costs and US$17 per tonnein other costs. The Group’s Alumina Cash Operating Costs were an average of US$294.8 per tonne forthe month of December 2008 and US$251.7 per tonne for the month of June 2009.
A substantial portion of the foregoing reductions in Aluminium and Alumina Cash OperatingCosts was attributable to the Group’s mothballing of higher cost smelters and refineries during thefirst half of 2009. The weakening of the Russian rouble against the US dollar and other currencies alsocontributed significantly to the reductions.
Impact of Restructuring Going Forward
The international override agreement and the debt restructuring agreements relating to theGroup’s Russian and Kazakh loans as well as the agreement with Onexim have only recently becomeeffective, and the Company has had no track record of complying with them. Failure to comply couldresult in acceleration of the Group’s indebtedness. In these circumstances, the Company would beinsolvent and could be declared bankrupt, in which case investors’ rights to receive any distributionwould rank behind the creditors of the Company (including the creditors with respect to theCompany’s restructured debt), and investors could lose their entire investment in the Company.
The terms of the restructuring agreements:
• significantly limit the Group’s ability to incur additional indebtedness;
• permit the Group to make maintenance capital expenditure within specified limits butprohibit the Group from making development capital expenditure, except with respect to theBoguchanskaya HPP (within specified limits) or to comply with environmental law;
• oblige the Company, under certain circumstances, to dispose of all or a considerable partof its interest in Norilsk Nickel;
• do not permit the Company to pay dividends unless the Group’s debt (other than its debtto VEB and Onexim) has been repaid by at least US$5 billion, its ratio of total net debt toCovenant EBITDA is 3 to 1 or less, there are no outstanding defaults under the internationaloverride agreement and the Group has sufficient cash to pay proposed dividends;
• oblige the Group to use excess cash flow and the net proceeds of asset disposals or equityor subordinated and other debt fund raisings (including proceeds from the Global Offering)to repay outstanding indebtedness; and
• oblige the Group to maintain specified financial ratios.
FINANCIAL INFORMATION
— 182 —
App1A-12

Compliance with these terms will considerably reduce the Group’s ability to expand itsoperations and to pay dividends.
Results of Operations
For purposes of the following discussion, UC RUSAL’s historical financial information forperiods prior to 1 April 2007 represents the financial results of RUSAL. Effective 1 April 2007, UCRUSAL’s historical financial information also includes the results of SUAL and the GlencoreBusinesses.
The following table sets forth UC RUSAL’s consolidated income statement for the six monthsended 30 June 2009 and 2008 and the three years ended 31 December 2008, 2007 and 2006.
Six months ended 30 June Year ended 31 December
2009 2008 2008 2007 2006
MlnUS$
% ofRevenue
MlnUS$
% ofRevenue
MlnUS$
% ofRevenue
MlnUS$
% ofRevenue
MlnUS$
% ofRevenue
Revenue . . . . . . . . . . . 3,757 100.0 8,354 100.0 15,685 100.0 13,588 100.0 8,429 100.0Cost of sales . . . . . . . . (3,449) (91.8) (5,306) (63.5) (11,073) (70.6) (8,356) (61.5) (4,186) (49.7)Gross profit . . . . . . . . 308 8.2 3,048 36.5 4,612 29.4 5,232 38.5 4,243 50.3Distribution expenses . . . (284) (7.6) (383) (4.6) (798) (5.1) (528) (3.9) (328) (3.9)Administrative expenses . (311) (8.2) (585) (7) (1,103) (7) (842) (6.2) (455) (5.4)Loss on disposal of
property, plant andequipment . . . . . . . . (7) (0.2) (8) (0.1) (56) (0.4) (97) (0.7) (5) (0.1)
Impairment ofnon-current assets. . . . (37) (1.0) (344) (4.1) (3,668) (23.4) — — — —
Other operating expenses . (156) (4.2) (62) (0.7) (215) (1.4) (118) (0.9) (143) (1.7)Results from operating
activities . . . . . . . . . (487) (13) 1,666 19.9 (1,228) (7.8) 3,647 26.8 3,312 39.3Finance income . . . . . . . 23 0.6 120 1.4 106 0.7 101 0.7 176 2.1Finance expenses . . . . . . (680) (18.1) (302) (3.6) (1,594) (10.1) (494) (3.6) (265) (3.1)Share of profits/(loss) of
associates. . . . . . . . . 348 9.3 79 0.9 (3,302) (21.1) (14) (0.1) (16) (0.2)Share of (loss)/profits of
jointly controlledentities . . . . . . . . . . (8) (0.2) 40 0.5 (35) (0.2) (15) (0.1) (12) (0.1)
Excess of the Group’sshare in netidentifiable assets overthe cost of acquisition . — — — — — — — — 28 0.3
(Loss)/profit beforeincome tax . . . . . . . . (804) (21.4) 1,603 19.2 (6,053) (38.6) 3,225 23.7 3,223 38.2
Income tax . . . . . . . . . (64) (1.7) (194) (2.3) 69 0.4 (419) (3.1) (336) (4.0)(Loss)/profit from
continuing operations . (868) (23.1) 1,409 16.9 (5,984) (38.2) 2,806 20.6 2,887 34.3Profit for the year/period
from discontinuedoperations (net ofincome tax) . . . . . . . — — — — — — — 10 0.1
Net(loss)/profit for theyear . . . . . . . . . . . . (868) (23.1) 1,409 16.9 (5,984) (38.2) 2,806 20.7 2,897 34.4
Attributable to:Shareholders of the
Company . . . . . . . (868) (23.1) 1,411 16.9 (5,952) (38.0) 2,809 20.7 2,897 34.4Non-controlling
interests . . . . . . . . — — (2) (0.02) (32) (0.2) (3) (0.02) — —
FINANCIAL INFORMATION
— 183 —
3rdSch-27

Six Months Ended 30 June 2009 Compared to the Six Months Ended 30 June 2008
Revenue
The table below sets forth a breakdown by product line of UC RUSAL’s revenue, volumes soldand average realised prices for the first six months ended 30 June 2009 and 2008.
Six months ended 30 June
2009 2008
Mln. US$Thousand
Tonnes
AverageRealised
PricesUS$/Tonne Mln. US$
ThousandTonnes
AverageRealised
PricesUS$/Tonne
Sales of primary aluminium and alloys . . . . . . . 3,160 2,116 1,493 6,404 2,229 2,873
Sales of alumina . . . . . . . . . . . . . . . . . . . . . . 169 746 227 994 2,694 369
Sales of foil . . . . . . . . . . . . . . . . . . . . . . . . . 104 — — 146 — —
Other revenue including chemicals and energy . . 324 — — 810 — —
Total . . . . . . . . . . . . . . . . . . . . . . . . . . . . . . 3,757 8,354
The table below sets forth a breakdown of UC RUSAL’s revenue by geographic area for the sixmonths ended 30 June 2009 and 2008, showing the percentage of revenue attributable to each region.
Six months ended 30 June
2009 2008
Mln. US$% of
Revenue Mln. US$% of
Revenue
Europe . . . . . . . . . . . . . . . . . . . . . . . . . . . . . . . . . . . . . . . . . . . 1,822 48.5 3,671 43.9
CIS. . . . . . . . . . . . . . . . . . . . . . . . . . . . . . . . . . . . . . . . . . . . . . 595 15.8 2,157 25.8
Americas . . . . . . . . . . . . . . . . . . . . . . . . . . . . . . . . . . . . . . . . . . 513 13.7 873 10.5
Asia . . . . . . . . . . . . . . . . . . . . . . . . . . . . . . . . . . . . . . . . . . . . . 812 21.6 1,621 19.4
Other . . . . . . . . . . . . . . . . . . . . . . . . . . . . . . . . . . . . . . . . . . . . 15 0.4 32 0.4
Total . . . . . . . . . . . . . . . . . . . . . . . . . . . . . . . . . . . . . . . . . . . . 3,757 100.0 8,354 100.0
Note: Data is based on location of purchaser, which may differ from location of end-user.
FINANCIAL INFORMATION
— 184 —
App1A-33(1)
Revenue decreased by US$4,597 million, or 55.0%, to US$3,757 million in the first six monthsof 2009 compared to US$8,354 million in the same period in 2008. The decrease in revenue wasprimarily due to decreased sales of primary aluminium and alloys, which accounted for 84.1% and76.7% of UC RUSAL’s revenue for the first six months of 2009 and 2008, respectively.
Revenue from sales of primary aluminium and alloys decreased by US$3,244 million, or by50.7%, to US$3,160 million in the first six months of 2009 as compared to US$6,404 million in thesame period in 2008. The decrease in revenue over the period resulted primarily from the steep declinein worldwide aluminium prices starting in the fourth quarter of 2008, by approximately 48% onaverage in the first six months of 2009 as compared to the same period in 2008. The effect of decreasedprices was coupled with the decrease in production volumes of primary aluminium and alloys at thehigher cost facilities by approximately 9% as part of the Group’s strategy to overcome the economicdownturn and reduce costs.
Revenue from sales of alumina decreased by US$825 million, or 83.0%, to US$169 million inthe first six months of 2009 from US$994 million in the same period in 2008. The decrease in revenuein the first six months of 2009 was primarily the result of a decrease in volume of sales of aluminaby 72%, resulting in a reduction in revenue from sales of US$442 million, and a decrease in aluminasales prices, in line with the sharp decline in the aluminium prices, by 38% on average, resulting ina reduction in revenue from sales of US$383 million. The Group’s alumina output in the first sixmonths of 2009 was reduced by 33% as compared to the similar period of 2008 as a result ofsuspending a number of higher cost alumina refineries, including mothballing Alpart, Windalco andEurallumina and reducing production at Aughinish and a number of other refineries, as a response tothe downturn in the aluminium industry and the sharp decline in aluminium prices at the end of 2008and beginning of 2009. This decrease in alumina output volumes was done primarily at the expenseof sales of alumina outside of the Group and only to a smaller extent in conjunction with a reductionof aluminium production. In 2009, the Group continues to sell alumina to outside parties only underspecific long-term contracts.
Revenue from sales of foil decreased to US$104 million in the first six months of 2009, or by28.8%, from US$146 million in the same period in 2008. The decrease in revenues from sales of foilin 2009 was primarily due to a decrease in average realised price during the first six months of 2009by approximately 23% compared to the corresponding period for 2008, following the decline in thealuminium price. Production volumes remained relatively stable with a slight decrease ofapproximately 3% in the first half of 2009.
Revenue from other sales, including chemicals and energy, decreased to US$324 million in thefirst six months of 2009, or by 60.0%, from US$810 million in the same period in 2008. The decreasein 2009 was primarily due to a decrease in sales of coal during the first half of 2009 to Nil comparedto US$162 million during the corresponding period of 2008, as a result of the sale of a 50% equityinterest in coal traders to Samruk-Kazyna as part of the sale and purchase agreement with respect toLLP Bogatyr Komir reached in April 2008. Other factors contributing to the decrease in other saleswere reductions in prices and volumes of various by-products and secondary materials, includingsilicon, hydrate, soda, aluminium powders and electricity following the overall economic downturnand the resulting decrease in capacity of a number of the Group’s production entities. In addition, theGroup sold Pikalyovo alumina refinery to Basel-Cement in 2008 which reduced other sales by US$36million in the first half of 2009 compared to the corresponding period of 2008 and cut down the salesof bauxite outside the Group by US$42 million compared to the first half of 2008.
FINANCIAL INFORMATION
— 185 —
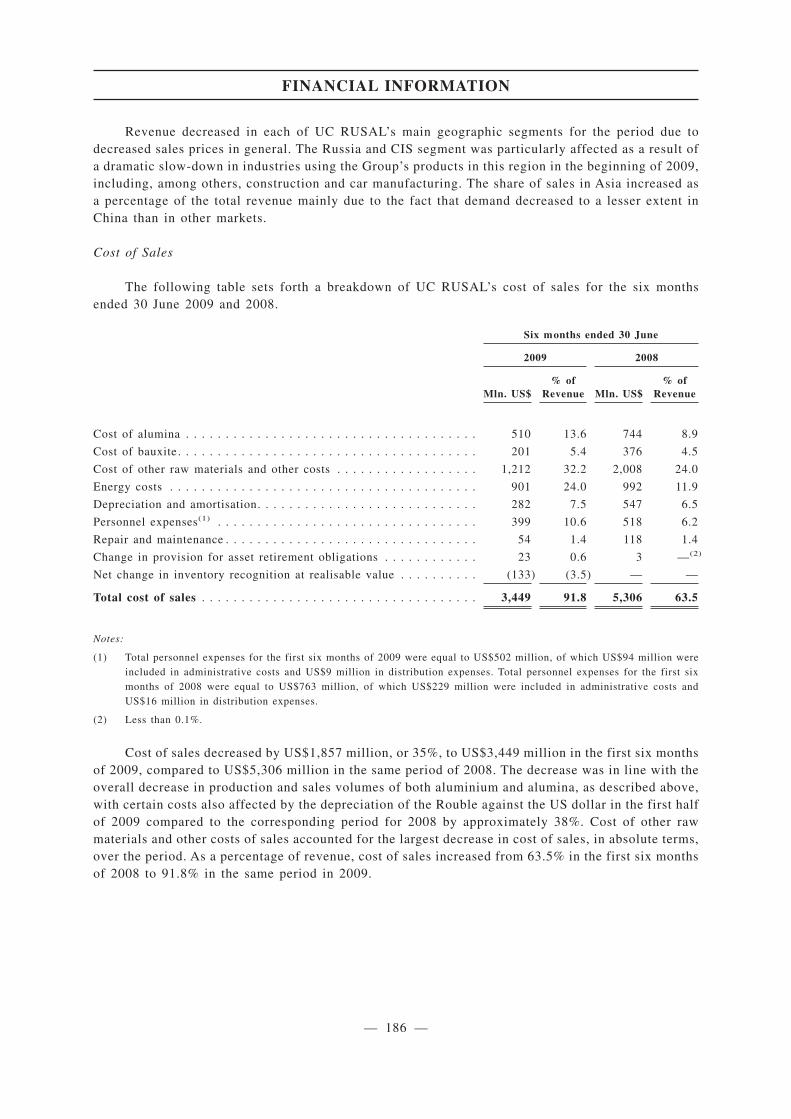
Revenue decreased in each of UC RUSAL’s main geographic segments for the period due todecreased sales prices in general. The Russia and CIS segment was particularly affected as a result ofa dramatic slow-down in industries using the Group’s products in this region in the beginning of 2009,including, among others, construction and car manufacturing. The share of sales in Asia increased asa percentage of the total revenue mainly due to the fact that demand decreased to a lesser extent inChina than in other markets.
Cost of Sales
The following table sets forth a breakdown of UC RUSAL’s cost of sales for the six monthsended 30 June 2009 and 2008.
Six months ended 30 June
2009 2008
Mln. US$% of
Revenue Mln. US$% of
Revenue
Cost of alumina . . . . . . . . . . . . . . . . . . . . . . . . . . . . . . . . . . . . . 510 13.6 744 8.9
Cost of bauxite . . . . . . . . . . . . . . . . . . . . . . . . . . . . . . . . . . . . . . 201 5.4 376 4.5
Cost of other raw materials and other costs . . . . . . . . . . . . . . . . . . 1,212 32.2 2,008 24.0
Energy costs . . . . . . . . . . . . . . . . . . . . . . . . . . . . . . . . . . . . . . . 901 24.0 992 11.9
Depreciation and amortisation. . . . . . . . . . . . . . . . . . . . . . . . . . . . 282 7.5 547 6.5
Personnel expenses(1) . . . . . . . . . . . . . . . . . . . . . . . . . . . . . . . . . 399 10.6 518 6.2
Repair and maintenance . . . . . . . . . . . . . . . . . . . . . . . . . . . . . . . . 54 1.4 118 1.4
Change in provision for asset retirement obligations . . . . . . . . . . . . 23 0.6 3 —(2)
Net change in inventory recognition at realisable value . . . . . . . . . . (133) (3.5) — —
Total cost of sales . . . . . . . . . . . . . . . . . . . . . . . . . . . . . . . . . . . 3,449 91.8 5,306 63.5
Notes:
(1) Total personnel expenses for the first six months of 2009 were equal to US$502 million, of which US$94 million wereincluded in administrative costs and US$9 million in distribution expenses. Total personnel expenses for the first sixmonths of 2008 were equal to US$763 million, of which US$229 million were included in administrative costs andUS$16 million in distribution expenses.
(2) Less than 0.1%.
Cost of sales decreased by US$1,857 million, or 35%, to US$3,449 million in the first six monthsof 2009, compared to US$5,306 million in the same period of 2008. The decrease was in line with theoverall decrease in production and sales volumes of both aluminium and alumina, as described above,with certain costs also affected by the depreciation of the Rouble against the US dollar in the first halfof 2009 compared to the corresponding period for 2008 by approximately 38%. Cost of other rawmaterials and other costs of sales accounted for the largest decrease in cost of sales, in absolute terms,over the period. As a percentage of revenue, cost of sales increased from 63.5% in the first six monthsof 2008 to 91.8% in the same period in 2009.
FINANCIAL INFORMATION
— 186 —
Cost of alumina decreased by US$234 million, or 31.5%, to US$510 million in the first sixmonths of 2009, compared to US$744 million in the same period in 2008. Cost of alumina includesthe cost of purchased alumina. The decrease in the first six months of 2009 was primarily attributableto the decrease in volumes of alumina purchased from third parties following an overall decrease inproduction volumes, as well as the decrease in price of alumina. As a percentage of revenue, cost ofalumina increased from 8.9% in the first six months of 2008 to 13.6% in the same period in 2009.
Cost of bauxite decreased by US$175 million, or 46.5%, to US$201 million in the first sixmonths of 2009, as compared to US$376 million in the same period in 2008. Cost of bauxite representsthe cost of purchased bauxite. The decrease in the cost of bauxite over the period resulted primarilyfrom the reduction of purchased bauxite as part of the overall reduction in production volumes. As apercentage of revenue, cost of bauxite increased from 4.5% in the first six months of 2008 to 5.4%in the same period in 2009.
Cost of other raw materials and other costs decreased by US$796 million, or 39.6%, to US$1,212million in the first six months of 2009 as compared to US$2,008 million in the same period in 2008.Other raw materials and other costs include tolling fees, costs of bauxite mining, industrial servicesprovided by third parties and costs of purchasing materials, such as coke, pitch, fluoride, cathodes,anodes and other materials required for the production of aluminium and alumina. The decrease in costof other raw materials and other costs over the period was primarily due to reductions in the cost offuel and other materials, particularly related to the mothballed facilities. As a percentage of revenue,cost of other raw materials increased from 24.0% in the first six months of 2008 to 32.3% in the sameperiod in 2009.
Energy costs decreased by US$91 million, or 9.2%, to US$901 million in the first six months of2009 compared to US$992 million in the first six months of 2008. The decrease in electricity costsover the period resulted primarily from decreased consumption, the effect of which was partially offsetby increased tariffs and Rouble depreciation. Consumption in the first six months of 2009 decreaseddue to decreased production volumes. The increase in energy costs in the first six months of 2009 wasalso due to a 10.4% increase in weighted-average electricity tariffs. The increase in weighted-averageelectricity tariffs was mainly due to continued market liberalisation and increased share of electricitysold through the whole-sale market. Electricity tariffs are generally quoted in Roubles and increasedin line with the Russian consumer price index. The depreciation of the Rouble against the US dollarin the first half of 2009 compared to the corresponding period for 2008 by approximately 38% had acorresponding effect on the electricity tariffs. As a percentage of revenue, energy costs increased from11.9% in the first six months of 2008 to 24.0% in the same period in 2009.
Depreciation and amortisation decreased by US$265 million, or 48.4%, to US$282 million in thefirst six months of 2009 compared to US$547 million in the same period in 2008. The depreciationand amortisation expenses decreased as a result of substantial impairments of property, plant andequipment and intangible assets recognised at 31 December 2008. As a percentage of revenue,depreciation and amortisation increased from 6.5% in the first six months of 2008 to 7.5% in the sameperiod in 2009.
Personnel expenses recorded in cost of sales decreased by US$119 million, or 23.0%, to US$399million in the first six months of 2009 compared to US$518 million in the same period in 2008. Thedecrease in personnel expenses in 2009 was mainly attributable to the mothballing of a number ofproduction facilities, the depreciation of certain local currencies against the US dollar as well assignificant staff reductions in the first half of 2009 resulting from the Group’s cost optimisationarrangements. As a percentage of revenue, personnel expenses increased from 6.2% in the first sixmonths of 2008 to 10.6% in the same period in 2009.
FINANCIAL INFORMATION
— 187 —
Repair and maintenance costs decreased by US$64 million, or 54.2%, to US$54 million in thefirst six months of 2009 compared to US$118 million in the same period in 2008. The decrease inrepair and maintenance costs in the first six months of 2008 was due to a decrease in productioncapacity, including the mothballing of certain production facilities, as well as the depreciation of theRouble against the US dollar. As a percentage of revenue, repair and maintenance costs remainedconstant at 1.4% for the first six months of 2008 and for the same period in 2009.
The provision for asset retirement obligations was US$3 million for the first six months of 2008and US$23 million for the first six months of 2009. The increase in the provision resulted fromchanges in expected future cash flows related to asset restoration.
Net change in inventory recognition at realisable value
The net change in a reserve to write inventory down to its net realisable value represents achange in the provision made between 31 December 2008 and 30 June 2009. The provision decreasedfollowing a reduction in the production cost of inventories, and therefore a portion of the amountpreviously provided at 31 December 2008 was released through the profit and loss statement.
Gross Profit
As a result of the foregoing factors, UC RUSAL reported a gross profit of US$308 million andUS$3,048 million for the six months ended 30 June 2009 and 2008, respectively, representing grossmargins of 8.2% and 36.5%, respectively.
Distribution Expenses
Distribution expenses decreased by US$99 million, or 25.8%, to US$284 million in the first sixmonths of 2009, compared to US$383 million in the same period in 2008. The decrease in distributionexpenses in 2009 was mainly due to decreased sales volumes and a reduction in transportation tariffs.As a percentage of revenue, distribution expenses increased from 4.6% in the first six months of 2008to 7.6% in the same period of 2009.
Administrative Expenses
Administrative expenses decreased by US$274 million, or 46.8%, to US$311 million in the firstsix months of 2009, as compared to US$585 million in the same period in 2008. Personnel costsrecorded under administrative expenses decreased by US$135 million, primarily due to theimplementation of actions to optimise the number of employees and a decision not to increase salariesand, for the most part, not to index them. In addition, the Group did not pay any year-end bonuses for2008. As a percentage of revenue, administrative expenses increased from 7% in the first six monthsof 2008 to 8.3% in the same period of 2009.
Loss on Disposal of Property, Plant and Equipment
Loss on disposal of property, plant and equipment remained essentially constant at US$8 millionin the first six months of 2008 and US$7 million in the first six months of 2009.
FINANCIAL INFORMATION
— 188 —
3rdSch-27

Other Operating Expenses
The following table sets forth a breakdown of UC RUSAL’s other operating expenses for the sixmonths ended 30 June 2009 and 2008.
Six months ended30 June
2009 2008
(Mln. US$)
Impairment loss on trade and other receivables . . . . . . . . . . . . . . . . . . . . . . . . . . . . . . 54 3
Provisions for legal claims . . . . . . . . . . . . . . . . . . . . . . . . . . . . . . . . . . . . . . . . . . . . 30 —
Charitable donations . . . . . . . . . . . . . . . . . . . . . . . . . . . . . . . . . . . . . . . . . . . . . . . . 3 18
Other operating expenses . . . . . . . . . . . . . . . . . . . . . . . . . . . . . . . . . . . . . . . . . . . . . 69 41
Total other operating expenses . . . . . . . . . . . . . . . . . . . . . . . . . . . . . . . . . . . . . . . . 156 62
Other operating expenses increased by US$94 million, or 151.6%, to US$156 million in the firstsix months of 2009 compared to US$62 million in the same period of 2008. The increase in otheroperating expenses in 2009 resulted primarily from recording provisions for legal claims, mostly inconnection with litigation with the Group’s counterparties, in particular transportation companies aswell as an increase in the provision on VAT receivable of US$45 million. As a percentage of revenue,other operating expenses increased from 0.7% in the first six months of 2008 to 4.2% in the sameperiod in 2009.
Impairment loss on trade and other receivables were US$3 million for the first six months of2008 and US$54 million in the first six months of 2009. The provisions in both periods representedprovisions against receivables from municipal authorities, mainly for distribution of thermal powerand water by the Group aluminium smelters to local communities.
Charitable donations were US$18 million in the first six months of 2008 and US$3 million in thefirst six months of 2009. Charitable donations throughout the period related to UC RUSAL’s donationsto various charities, including orphanages, cancer treatment hospitals and nursing homes.
Results from Operating Activities
As a result of the foregoing factors, UC RUSAL reported a loss from operating activities ofUS$487 million in the six months ended 30 June 2009, as compared to income from operatingactivities US$1,666 million for the six months ended 30 June 2008, respectively, representingoperating margins of (13)% and 19.9%, respectively.
FINANCIAL INFORMATION
— 189 —
Finance Income
The following table sets forth a breakdown of UC RUSAL’s finance income for the six monthsended 30 June 2009 and 2008.
Six months ended30 June
2009 2008
(Mln. US$)
Interest income on third party loans and deposits . . . . . . . . . . . . . . . . . . . . . . . . . . . . 18 18
Interest income on loans to related parties . . . . . . . . . . . . . . . . . . . . . . . . . . . . . . . . . 1 3
Net foreign exchange gain . . . . . . . . . . . . . . . . . . . . . . . . . . . . . . . . . . . . . . . . . . . . — 44
Gain on disposal of financial investments . . . . . . . . . . . . . . . . . . . . . . . . . . . . . . . . . . — 42
Change in fair value of financial instruments . . . . . . . . . . . . . . . . . . . . . . . . . . . . . . . 4 13
Total finance income . . . . . . . . . . . . . . . . . . . . . . . . . . . . . . . . . . . . . . . . . . . . . . . 23 120
Finance income decreased by US$97 million, or 80.8%, to US$23 million in first six months of2009 as compared to US$120 million in the same period in 2008. Finance income in 2008 is primarilyrepresented by net foreign exchange gain and a gain from disposal of financial investments. As apercentage of revenue, finance income decreased from 1.4% in the first six months of 2008 to 0.6%in the same period of 2009.
Interest income on third party loans and deposits remained constant at US$18 million in the firstsix months of both 2008 and 2009.
Interest income on loans to related parties decreased from US$3 million in the first half of 2008to US$1 million in the first half of 2009. Interest income on loans to related parties representedinterest on deposits with and promissory notes from related parties.
Net foreign exchange gain was US$44 million in the first six months of 2008 primarily as a resultof the appreciation of the Rouble against the U.S. dollar. UC RUSAL recorded a foreign exchange lossof US$79 million in the first six months of 2009.
UC RUSAL recorded gain on disposal of financial investments in the first six months of 2008in the amount of US$42 million, which resulted from the sale in April 2008 of 50% in LLP BogatyrKomir, the right to which was acquired by the Group as part of the acquisition of SUAL in late March2007, in accordance with an agreement with Samruk-Energo. See Note 20(a) to UC RUSAL’sAccountants’ Report.
Change in fair value of financial instruments was US$4 million in the first six months of 2009and US$13 million in the same period in 2008 and resulted from gains on transactions to hedge foreignexchange and interest rate risk related to financing activities and to reduce risk of fluctuating pricesin both periods.
FINANCIAL INFORMATION
— 190 —

Finance Expenses
The following table sets forth a breakdown of UC RUSAL’s finance expenses for the six monthsended 30 June 2009 and 2008.
Six months ended30 June
2009 2008
(Mln. US$)
Interest expense on bank loans wholly repayable within five years and other bank charges(1). 497 282
Less: interest expense capitalized into property, plant and equipment . . . . . . . . . . . . . . . — (30)
Total interest expense . . . . . . . . . . . . . . . . . . . . . . . . . . . . . . . . . . . . . . . . . . . . . . . 497 252
Interest expense on deferred consideration . . . . . . . . . . . . . . . . . . . . . . . . . . . . . . . . . 85 25
Net foreign exchange loss . . . . . . . . . . . . . . . . . . . . . . . . . . . . . . . . . . . . . . . . . . . . 79 —
Interest expense on provisions . . . . . . . . . . . . . . . . . . . . . . . . . . . . . . . . . . . . . . . . . 19 25
Total finance expenses . . . . . . . . . . . . . . . . . . . . . . . . . . . . . . . . . . . . . . . . . . . . . . 680 302
Note:
(1) During the six months ended 30 June 2009, the Group incurred charges of US$82 million under the Standstill and WaiverAgreement and Waiver Agreement referred to in Note 28 to UC RUSAL’s Accountants’ Report which is included in thisprospectus.
Finance expenses increased by US$378 million, or 125.2%, to US$680 million in the first sixmonths of 2009, as compared to US$302 million in the same period of 2008. The increase in financeexpenses in 2009 was primarily due to increased interest expense on bank loans and other bankcharges. As a percentage of revenue, finance expenses increased from 3.6% in the first six months of2008 to 18.1% in the same period of 2009.
Interest expense on bank loans increased by US$215 million, or 76.2%, to US$497 million in thefirst six months of 2009, compared to US$282 million in the same period in 2008. The increase ininterest expense in the first six months of 2009 was primarily due to additional interest expensesincurred in connection with the VEB Debt (as defined below) obtained in October 2008 at higherinterest rates than the bridge facility that the VEB Debt refinanced as well as costs incurred inconnection with the Group’s debt restructuring. The bridge facility was obtained by the Group in April2008 in connection with the Company’s investment in Norilsk Nickel.
In the first six months of 2009, UC RUSAL recorded net foreign exchange loss of US$79 millionprimarily as a result of the depreciation of the Rouble against the U.S. dollar. UC RUSAL recordeda foreign exchange gain in the first six months of 2008.
In the first six months of 2009, UC RUSAL recorded US$85 million of interest expense ondeferred consideration, as compared to US$25 million in the first six months of 2008. Interest expenseon deferred consideration represents interest payable by the Company to Onexim on certain deferredconsideration for the shares in Norilsk Nickel acquired in April 2008.
FINANCIAL INFORMATION
— 191 —
Share of (Losses)/Profits and Impairment of Associates and Jointly Controlled Entities
Share of profit and impairment of associates was US$348 million in the first six months of 2009and US$79 million in the first six months of 2008. Share of profits of associates in both periodsresulted primarily from the Company’s investment in Norilsk Nickel. The Group’s share in net profitof Norilsk Nickel for the first six months of 2009 amounted to US$350 million (including the reversalof a previously recognised impairment of US$308 million), as compared to a share in net profit ofUS$82 million for the period from 1 May 2008 through 30 June 2008.
Share of losses of jointly controlled entities was US$8 million in the first six months of 2009 andprofit of US$40 million in the first six months of 2008. These represent shares of results andimpairment in the Group’s joint ventures — BEMO Project and LLP Bogatyr Komir.
(Loss)/Profit Before Income Tax
As a result of the foregoing factors, UC RUSAL sustained a loss before income tax of US$804million for the six months ended 30 June 2009, as compared to profit before income tax of US$1,603million for the six months ended 30 June 2008.
Income Tax Expense
UC RUSAL’s income tax expense for the six months ended 30 June 2009 and 2008 comprisedthe following:
Six months ended30 June
2009 2008
(Mln. US$)
Current tax expense
Current year. . . . . . . . . . . . . . . . . . . . . . . . . . . . . . . . . . . . . . . . . . . . . . . . . . . . . . 32 244
Deferred tax expense
Origination and reversal of temporary differences . . . . . . . . . . . . . . . . . . . . . . . . . . . . 32 (50)
Income tax expense . . . . . . . . . . . . . . . . . . . . . . . . . . . . . . . . . . . . . . . . . . . . . . . . 64 194
Income tax expense decreased by US$130 million, or 67.0%, to US$64 million in the first sixmonths of 2009, as compared to US$194 million in the same period in 2008. The decrease in 2009 wasprimarily due to a decrease in current tax expense.
Current tax expense decreased by US$212 million, or 86.9%, to US$32 million in the first sixmonths of 2009, compared to US$244 million in the same period in 2008. The decrease in current taxexpense was primarily due to the Group’s pre-tax loss in the first six months of 2009.
FINANCIAL INFORMATION
— 192 —

Net (Loss)/Profit
As a result of the foregoing factors, UC RUSAL sustained a net loss of US$868 million for thesix months ended 30 June 2009, as compared to net profit of US$1,409 million for the six monthsended 30 June 2008, representing net margins of (23.1)% and 16.9%, respectively.
Year Ended 31 December 2008 Compared to the Year Ended 31 December 2007
Revenue
The table below sets forth a breakdown by product line of UC RUSAL’s revenue, volumes soldand average realised prices for the years ended 31 December 2008 and 2007.
Year ended 31 December
2008 2007
Mln. US$Thousand
Tonnes
AverageRealised
PricesUS$/Tonne Mln. US$
ThousandTonnes
AverageRealised
PricesUS$/Tonne
Sales of primary aluminium and alloys . . . . . . . 12,057 4,435 2,719 10,747 3,562 3,017
Sales of alumina . . . . . . . . . . . . . . . . . . . . . . 1,948 5,464 357 1,503 3,087 487
Sales of foil . . . . . . . . . . . . . . . . . . . . . . . . . 271 n/a n/a 270 n/a n/a
Other revenue including chemicals and energy . . 1,409 1,068
Total . . . . . . . . . . . . . . . . . . . . . . . . . . . . . . 15,685 13,588
The table below sets forth a breakdown of UC RUSAL’s revenue by geographic segment for theyears ended 31 December 2008 and 2007, showing the percentage of revenue attributable to eachregion.
Year ended 31 December
2008 2007
Mln. US$% of
Revenue Mln. US$% of
Revenue
Europe . . . . . . . . . . . . . . . . . . . . . . . . . . . . . . . . . . . . . . . . . . . 6,729 42.9 6,115 45.0
CIS. . . . . . . . . . . . . . . . . . . . . . . . . . . . . . . . . . . . . . . . . . . . . . 3,970 25.3 3,624 26.7
Americas . . . . . . . . . . . . . . . . . . . . . . . . . . . . . . . . . . . . . . . . . . 1,688 10.8 1,611 11.8
Asia . . . . . . . . . . . . . . . . . . . . . . . . . . . . . . . . . . . . . . . . . . . . . 3,215 20.5 2,121 15.6
Other . . . . . . . . . . . . . . . . . . . . . . . . . . . . . . . . . . . . . . . . . . . . 83 0.5 117 0.9
Total . . . . . . . . . . . . . . . . . . . . . . . . . . . . . . . . . . . . . . . . . . . . 15,685 100.0 13,588 100.0
Note: Data is based on location of purchaser, which may differ from location of end-user.
FINANCIAL INFORMATION
— 193 —

Revenue increased by US$2,097 million, or 15.4%, to US$15,685 million in 2008 compared toUS$13,588 million in 2007. The increase in revenue was primarily due to increased sales of primaryaluminium and alloys, which accounted for 76.9% and 79.1% of UC RUSAL’s revenue for 2008 and2007, respectively. The decrease in primary aluminium and alloy sales as a percentage of revenue wasprimarily due to an increase in sales of alumina as a result of the full-year consolidation of SUAL andthe Glencore Businesses.
Sales of aluminium and alloys increased by 12.2%, due to an increase in volume of sales that waspartially offset by a decrease in average realised prices per tonne.
Sales volumes increased by 873 thousand metric tonnes, or 24.5%, to 4,435 thousand metrictonnes in 2008, from 3,562 thousand metric tonnes in 2007. The increase in sales volumes principallyresulted from the launch of the Khakas aluminium smelter (300 thousand metric tonnes), the additionalcapacity at IrKAZ (47 thousand metric tonnes) and the full year consolidation of SUAL in 2008.
Revenue from sales of alumina increased by US$445 million, or 29.6%, to US$1,948 million in2008 from US$1,503 million in 2007. The increase in revenue was primarily attributed to theadditional volume of alumina produced by SUAL and Glencore, as both companies were consolidatedinto the Group for the entire year during 2008 as compared to only three quarters in 2007. Averageprices decreased by 27% in 2008 as compared to 2007, which partially offset increases in revenuecontributed by SUAL and the Glencore Businesses. The sales volume increased by 2,377 thousandmetric tonnes, or 77%, to 5,464 thousand metric tonnes in 2008.
Revenues from sales of foil remained relatively constant from US$270 million in 2007 toUS$271 million in 2008.
Revenue from other sales, including chemicals and energy, increased to US$1,409 million in2008, or by 31.9%, from US$1,068 million in 2007. The increase in other revenue is mainlyattributable to the revenue from transportation services rendered to associates (coal companies) ofUS$201 million. In 2007, these coal companies were consolidated as subsidiaries, as described below,and therefore revenue from services rendered to such companies was eliminated upon consolidation.Other changes in revenue from other sales were due to a US$118 million increase in sales of silicon,soda and other materials, which was offset by a US$168 million decrease in sales of coal. Theincreases of US$65 million and US$20 million in sales of silicon and soda, respectively, were mainlydue to increases of 179% and 86% in selling prices of silicon and soda, respectively. The decrease insales of coal was due to the disposal of a 50% share in certain coal traders at the end of the first quarterof 2008 as part of an agreement reached with Samruk-Kazyna with regard to LLP Bogatyr Komir.
Revenue increased in a majority of UC RUSAL’s geographic segments from 2007 to 2008.Revenue growth was strongest in Asia, reflecting growing demand in that region. Revenue growth inthe Americas was relatively slow, primarily because UC RUSAL continued to shift production fromthe American market in to other markets due to the reduced premiums for primary aluminium andalloys available in the Americas.
FINANCIAL INFORMATION
— 194 —

Cost of Sales
The following table sets forth a breakdown of UC RUSAL’s cost of sales for the years ended 31December 2008 and 2007.
Year ended 31 December
2008 2007
Mln. US$% of
Revenue Mln. US$% of
Revenue
Cost of alumina . . . . . . . . . . . . . . . . . . . . . . . . . . . . . . . . . . . . . 1,478 9.4 1,180 8.7
Cost of bauxite . . . . . . . . . . . . . . . . . . . . . . . . . . . . . . . . . . . . . . 763 4.9 520 3.8
Cost of other raw materials and other costs . . . . . . . . . . . . . . . . . . 4,242 27.0 3,413 25.1
Fair value mark-up on inventories(1) . . . . . . . . . . . . . . . . . . . . . . . — — 135 1.0
Energy costs . . . . . . . . . . . . . . . . . . . . . . . . . . . . . . . . . . . . . . . 2,044 13.0 1,271 9.4
Depreciation and amortisation. . . . . . . . . . . . . . . . . . . . . . . . . . . . 990 6.3 842 6.2
Personnel expenses(2) . . . . . . . . . . . . . . . . . . . . . . . . . . . . . . . . . 995 6.3 748 5.5
Repairs and maintenance . . . . . . . . . . . . . . . . . . . . . . . . . . . . . . . 222 1.4 203 1.5
Change in asset retirement obligations . . . . . . . . . . . . . . . . . . . . . . — — 42 0.3
Net change in provision for inventory . . . . . . . . . . . . . . . . . . . . . . 339 2.2 2 —
Total cost of sales . . . . . . . . . . . . . . . . . . . . . . . . . . . . . . . . . . . 11,073 70.6 8,356 61.5
Notes:
(1) Inventories of SUAL and the Glencore Businesses were recorded at their fair value on the date of acquisition in lateMarch 2007. See Note 5 to the UC RUSAL Accountants’ Report.
(2) Total personnel expenses for 2008 were equal to US$1,386 million, of which US$364 million were included inadministrative expenses and US$27 million in distribution expenses. Total personnel expenses for 2007 were equal toUS$1,078 million, of which US$304 million were included in administrative expenses and US$26 million in distribution
expenses.
Cost of sales increased by US$2,717 million, or 32.5%, to US$11,073 million in 2008, comparedto US$8,356 million in 2007, primarily due to an increase in production volumes, increases in theprices of the main raw materials used in production and increases in energy tariffs.
Cost of alumina increased by US$298 million, or 25.3%, to US$1,478 million in 2008, comparedto US$1,180 million in 2007. The increase was primarily attributable to the increased volume ofalumina purchased, the increased price of alumina and increased transportation tariffs. The Groupincreased its aluminium production by 5.3% in 2008, as compared to 2007. Alumina prices are linkedto LME quotations and the average LME quotation for the first six months of 2008 was 8% higher thanthe average LME quotation in 2007. This increase resulted in a 3% increase in average purchase pricein 2008. As a percentage of revenue, cost of alumina increased from 8.7% in 2007 to 9.4% in 2008.
Cost of bauxite increased by US$243 million, or 46.7%, to US$763 million in 2008, comparedto US$520 million in 2007. The increase in the cost of bauxite resulted primarily from an increase inthe volume of bauxite purchased, the increase in bauxite prices and increased transportation tariffs.As a percentage of revenue, cost of bauxite increased from 3.8% in 2007 to 4.9% in 2008.
FINANCIAL INFORMATION
— 195 —

Cost of other raw materials and other costs increased by US$829 million, or 24.3%, to US$4,242million in 2008 as compared to US$3,413 million in 2007. The increase was primarily due to the effectof the full-year consolidation of Glencore and SUAL in 2008, increases in prices, including increasesof the average prices of fuel and coke. Prices of coal and pitch coke increased by 19% and prices ofcaustic soda by 12%. As a percentage of revenue, cost of other raw materials increased from 25.1%in 2007 to 27.0% in 2008.
Energy costs increased by US$773 million, or 60.8%, to US$2,044 million in 2008 as comparedto US$1,271 million in 2007. The increase resulted primarily from an increase of more than 50% inweighted-average electricity tariffs, in US dollar terms, supplemented by an increase in productionand the consequential growth in electricity consumption of 6%. The increase in weighted-averageelectricity tariffs in dollar terms was primarily an outcome of the liberalisation of the Russian energyindustry and the increased portion of electricity purchases made by the Group on the open market (ascompared to fixed-tariff long-term contracts that were more commonly used during the previousperiod). The strengthening of the Russian Rouble against the US dollar on average by 3% in 2008, ascompared to 2007, also resulted in the weighted-average electricity tariffs increasing. As a percentageof revenue, energy costs increased from 9.4% in 2007 to 13.0% in 2008.
Depreciation and amortisation increased by US$148 million, or 17.6%, to US$990 million in2008 as compared to US$842 million in 2007. Depreciation and amortisation was 9% and 10% of costsof sales in 2008 and 2007, respectively. Depreciation and amortisation expenses increased in 2008 asa result of the full-year consolidation of SUAL and Glencore. As a percentage of revenue, depreciationand amortisation remained relatively constant at 6.2% in 2007 and 6.3% in 2008.
Personnel expenses recorded in cost of sales increased by US$247 million, or 33.0%, to US$995million in 2008 as compared to US$748 million in 2007. As production staff salaries are primarilydenominated in Russian Roubles, which appreciated against the US Dollar in 2008, part of thisincrease related to foreign exchange rate fluctuations. Average salaries indexation during the periodresulted in a 7% increase in personnel expenses. As a percentage of revenue, personnel expensesincreased from 5.5% in 2007 to 6.3% in 2008.
Repairs and maintenance expenses increased by US$19 million, or 9.4%, to US$222 million in2008 as compared to US$203 million in 2007. The increase in repairs and maintenance expenses wasmainly due to consolidation of SUAL and Glencore operations for the whole year. As a percentage ofrevenue, repairs and maintenance expenses remained relatively constant at 1.5% in 2007 and 1.4% in2008.
Change in asset retirement obligations was nil for 2008, as compared to US$42 million for 2007,and related to adjustment of basic parameters of retired assets in both periods.
Net change in inventory recognition at realisable value
The net change in a reserve to write inventory down to its net realisable value represents achange in the provision made between 31 December 2007 and 2008. The provision increased followinga decrease in market price of aluminium and alumina.
Gross Profit
As a result of the foregoing factors, UC RUSAL reported a gross profit of US$4,612 million andUS$5,232 million for the years ended 31 December 2008 and 2007, respectively, representing grossmargins of 29.4% and 38.5%, respectively.
FINANCIAL INFORMATION
— 196 —
Distribution Expenses
Distribution expenses increased by US$270 million, or 51.1%, to US$798 million in 2008,compared to US$528 million in 2007. The increase was mainly attributable to the increase intransportation expenses of US$287 million, due to increased sales volumes and transportation tariffs,which was partially compensated by decreases in other lines. As a percentage of revenue, distributionexpenses increased from 3.9% in 2007 to 5.1% in 2008.
Administrative Expenses
Administrative expenses increased by US$261 million, or 31%, to US$1,103 million in 2008 ascompared to US$842 million in 2007. The administrative expenses increased in 2008 primarily as aresult of an increase in consulting and other services by US$56 million, the increase in personnel costsby US$60 million and the increase in taxes and penalties of US$54 million. The increase in consultingand other services was due to the fees paid to advisors involved in the acquisition of shares of NorilskNickel and related financing. The increase in personnel costs was in line with the overall indexationof salaries introduced by the Group during 2008 and the impact of the Rouble depreciation against theUS Dollar. As a percentage of revenue, administrative expenses increased from 6.2% in 2007 to 7%in 2008.
Loss on Disposal of Property, Plant and Equipment
Loss on disposal of property, plant and equipment decreased by US$41 million to US$56 millionin 2008, as compared to US$97 million in 2007. There is no active trading market for aluminiumproduction equipment. Even though the technology used by different producers or at differentfacilities is generally similar, each item of equipment is modified and is tailored to suit the needs ofeach production facility (even within the Group). Hence, a major part of property, plant and equipmentis liquidated upon reaching the end of its useful life or when technical updates or modernisation worksperformed make it obsolete. Fixed assets sold relate to transport vehicles, various computers andsimilar equipment and buildings and other real estate no longer needed for production. The loss ondisposal of property, plant and equipment in 2007 resulted from writing off equipment not intendedto be used in production and/or obsolete in 2007, resulting in a greater loss during the prior periodand a decrease in loss on disposal during 2008. As a percentage of revenue, loss on disposal ofproperty, plant and equipment decreased from 0.7% in 2007 to 0.4% in 2008.
Impairment of Non-Current Assets
Charges for impairment of non-current assets amounted to US$3,668 million in 2008. Thesecharges consisted principally of impairment of property, plant and equipment and intangible assets.
Following the sharp decline in aluminium prices in the fourth quarter of 2008, managementdetermined that it was necessary to carry out impairment tests for all significant cash-generating unitsof the Group. As a result of these impairment tests, the Group recognised US$3,532 million (includingUS$161 million of impairment related to Komi project) in impairment charges relating to property,plant and equipment as of 31 December 2008. For information concerning the assumptions used bymanagement in carrying out these impairment tests, see Note 17(a) to UC RUSAL Accountants’ Reportand “— Critical Accounting Policies — Property, Plant and Equipment — Recoverable Amount”.
FINANCIAL INFORMATION
— 197 —
In 2008, the Group’s management performed an additional feasibility analysis of the KomiProject, which led to an impairment of property, plant and equipment items in the amount of US$161million (see above), an impairment of goodwill recognised on the acquisition of SUAL Komi BV inthe amount of US$67 million and write offs of other intangible assets related to this project in theamount of US$69 million.
Other Operating Expenses
The following table sets forth a breakdown of UC RUSAL’s other operating expenses for theyears ended 31 December 2008 and 2007.
Year ended 31 December
2008 2007
Mln. US$% of
Revenue Mln. US$% of
Revenue
Impairment loss and trade and other receivable . . . . . . . . . . . . . . . 117 0.8 27 0.2
Provision for legal claims . . . . . . . . . . . . . . . . . . . . . . . . . . . . . . 50 0.3 — —
Charitable donations . . . . . . . . . . . . . . . . . . . . . . . . . . . . . . . . . . 31 0.2 51 0.4
Other operating expenses . . . . . . . . . . . . . . . . . . . . . . . . . . . . . . . 17 0.1 40 0.3
Total other operating expenses . . . . . . . . . . . . . . . . . . . . . . . . . . 215 1.4 118 0.9
Other operating expenses increased by US$97 million to US$215 million in 2008 as comparedto US$118 million in 2007, principally due to provisions and bad debt expense in 2008. As apercentage of revenue, other operating expenses increased from 0.9% in 2007 to 1.4% in 2008.
The impairment loss on trade and other receivables of US$117 million mainly consisted of thewrite-off of receivables of US$95 million relating to the settlements of disputes in respect of the jointactivity in Tadjikistan with a third party and US$17 million for 2008 and US$27 million for 2007related to other impairments. The provisions against other receivables in both periods representedprovisions against receivables from municipal authorities.
Provision for legal claims of US$50 million were accrued by the Group as a consequence of itsalleged violation of contractual terms with transportation companies at the end of 2008; thetransportation companies have filed a number of claims in this respect. See “Business — Litigation”.
Charitable donations costs were US$31 million in 2008 and US$51 million in 2007. Charitabledonations in both periods related to UC RUSAL’s donations to various charities, including orphanages,cancer treatment hospitals and nursing homes.
Results from Operating Activities
As a result of the foregoing factors, UC RUSAL sustained a loss from operating activities ofUS$1,228 million in the year ended 31 December 2008 and a profit income from operating activitiesof US$3,647 million for the year ended 31 December 2007, representing operating margins of (7.8)%and 26.8%, respectively.
FINANCIAL INFORMATION
— 198 —
Finance Income
The following table sets forth a breakdown of UC RUSAL’s finance income for the years ended31 December 2008 and 2007.
Year ended 31 December
2008 2007
Mln. US$% of
Revenue Mln. US$% of
Revenue
Interest income on third party loans and deposits . . . . . . . . . . . . . . 38 0.2 29 0.2
Interest income on loans to related parties . . . . . . . . . . . . . . . . . . . 3 — 7 0.1
Foreign exchange gain . . . . . . . . . . . . . . . . . . . . . . . . . . . . . . . . . — — 45 0.3
Gain on disposal of financial investment . . . . . . . . . . . . . . . . . . . . 42 0.3 — —
Change in fair value of financial instruments . . . . . . . . . . . . . . . . . 23 0.2 20 0.1
Total finance income . . . . . . . . . . . . . . . . . . . . . . . . . . . . . . . . . 106 0.7 101 0.7
Finance income amounted to US$106 million in 2008 as compared to US$101 million in 2007.As a percentage of revenue, finance income remained constant at 0.7% in both 2007 and 2008.
Gain on disposal of financial investments of US$42 million in 2008 relates to the sale of theGroup’s 50% interest in LLP Bogatyr Komir (a coal producer in Kazakhstan) to a third party. Thisinvestment was acquired as part of the SUAL acquisition in March 2007 and was valued at US$606million (for a 100% interest in LLP Bogatyr Komir). No such gain was recorded in 2007.
The foreign exchange gain of US$45 million in 2007 was the result of the appreciation of theRouble against the US dollar and the annual revaluation of financial assets denominated in Roubles.In 2008, UC RUSAL incurred a foreign exchange loss, as discussed below under “— FinanceExpenses”.
Change in fair value of financial instruments was US$23 million in 2008 and US$20 million in2007. The gain from derivatives in 2008 was the result of gains on forward sales and purchasecontracts for primary aluminium of US$29 million and loss of US$6 million from the foreign exchangehedge. Gain from derivatives in 2007 of US$20 million relates to hedging of foreign exchange andinterest rate risk related to financing activities.
FINANCIAL INFORMATION
— 199 —

Finance Expenses
The following table sets forth a breakdown of UC RUSAL’s finance expenses for the years ended31 December 2008 and 2007.
Year ended31 December
2008 2007
(Mln. US$)
Interest expense on bank loans wholly repayable within five years and other bank charges . 766 358
Interest expense on bank loans wholly repayable after five years . . . . . . . . . . . . . . . . . . — 148
Total interest expense on financial liabilities . . . . . . . . . . . . . . . . . . . . . . . . . . . . . . . 766 506
Less: interest expense capitalised into property, plant and equipment . . . . . . . . . . . . . . . (58) (52)
Total interest expense . . . . . . . . . . . . . . . . . . . . . . . . . . . . . . . . . . . . . . . . . . . . . . . 708 454
Loss on fair-value adjustment on financial instruments . . . . . . . . . . . . . . . . . . . . . . . . . 554 —
Interest expense on deferred consideration . . . . . . . . . . . . . . . . . . . . . . . . . . . . . . . . . 99 —
Net foreign exchange loss . . . . . . . . . . . . . . . . . . . . . . . . . . . . . . . . . . . . . . . . . . . . 201 —
Interest expense on provisions . . . . . . . . . . . . . . . . . . . . . . . . . . . . . . . . . . . . . . . . . 32 40
Total finance expenses . . . . . . . . . . . . . . . . . . . . . . . . . . . . . . . . . . . . . . . . . . . . . . 1,594 494
Finance expenses tripled to US$1,594 million in 2008, as compared to US$494 million in 2007.The increase in finance expenses in 2008 was primarily due to foreign exchange loss and a significantincrease in interest expense on bank loans, other bank charges and loss on financial instruments. Asa percentage of revenue, finance expenses increased from 3.6% in 2007 to 10.2% in 2008.
In the second half of 2008, the Group acquired a derivative financial instrument relating to theshares of Norilsk Nickel for total consideration of US$554 million. Under the terms of such financialinstrument, the Group also has an option to acquire up to 5% of the shares of Norilsk Nickel from athird party on certain future dates at market prices prevailing on such dates. The Directors estimatedthat the fair value of this financial instrument at 31 December 2008 was nil. The investment waswritten off to its fair value through the income statement. After 30 June 2009, the Group partiallyunwound this arrangement in respect of an option to acquire up to 3% of the shares of Norilsk Nickel,with a resulting gain of US$23 million. There is no outstanding contractual obligation on the part ofthe Company under this financial instrument. See Note 21 of UC RUSAL’s Accountants’ Report.
The foreign exchange loss of US$201 million in 2008 resulted from the depreciation of theRouble against the US dollar.
Interest expense increased by US$254 million, or 55.9%, to US$708 million in 2008, ascompared to US$454 million in 2007. The increase in interest expense in 2008 was the result offinancing obtained in April 2008. Further, the average outstanding balance of borrowings increased by65% in 2008 compared to 2007 in part as a result of debt incurred in April 2008 in connection withthe Group’s investment in Norilsk Nickel. As a percentage of revenue, interest expense increased from3.3% in 2007 to 4.5% in 2008.
The increase in interest expenses on bank loans repayable within 5 years and other bank chargesis also explained by the payment of a facilitation fee in the amount of US$67 million in respect of asyndicated loan used for the acquisition of the Norilsk Nickel shares and the payment of a US$22million fee for the refinancing of this loan.
FINANCIAL INFORMATION
— 200 —
Interest expense on deferred consideration amounted to US$99 million in 2008 and relates toUS$2.7 billion in deferred cash consideration payable to Onexim in connection with UC RUSAL’spurchase of its investment in Norilsk Nickel in April 2008. For further information, see Notes 19 and27(c) to the UC RUSAL Accountants’ Report.
Interest expense on provisions of US$32 million and US$40 million in 2008 and 2007,respectively, related to interest expenses on defined benefit plans and the unwinding of interest onasset retirement obligations of the Group.
Share of Loss and Impairment of Associates
Share of loss of associates was US$3,302 million in 2008 and US$14 million in 2007. Share ofloss of associates in 2008 consisted primarily of UC RUSAL’s US$881 million share in the loss ofNorilsk Nickel for the period from 24 April through 31 December 2008, and share of loss ofQueensland Alumina Limited in an amount of US$13 million.
In addition, following the substantial decline in demand for products of Norilsk Nickel in thefourth quarter of 2008, management determined that it was necessary to carry out an impairment testof UC RUSAL’s investment in Norilsk Nickel. As a result of this impairment test, UC RUSALrecognised US$2,408 million in impairment charges related to its investment in Norilsk Nickel. Forinformation concerning the assumptions used by management in carrying out this impairment test, seeNote 19 to the UC RUSAL Accountants’ Report.
Share of Loss and Impairment of Jointly Controlled Entities
Share of loss of jointly controlled entities was US$35 million in 2008 and US$15 million in2007. Share of loss of jointly controlled entities in 2008 consists of a share in the loss of the BEMOProject in the amount of US$24 million and an impairment loss of US$144 million recognised inrespect of the equity investment in LLP Bogatyr Komir, compensated by profit in the amount ofUS$133 million relating to LLP Bogatyr Komir and coal traders. Share of loss of jointly controlledentities of US$15 million in 2007 related to the results of operations of Rounio Limited in the firstquarter 2007, prior to the acquisition of SUAL, and the subsequent reclassification of the investmentin Rounio Limited as investments in subsidiaries.
(Loss)/Profit Before Income Tax
As a result of the foregoing factors, UC RUSAL sustained a loss before income tax of US$6,053million for the year ended 31 December 2008 and a profit before income tax of US$3,225 million forthe year ended 31 December 2007.
FINANCIAL INFORMATION
— 201 —
App1A-33(4)(e)

Income Tax (Benefit)/Expense
UC RUSAL’s income tax (benefit)/expense for the years ended 31 December 2008 and 2007comprised the following:
Year ended31 December
2008 2007
(Mln. US$)
Current tax expense
Current year. . . . . . . . . . . . . . . . . . . . . . . . . . . . . . . . . . . . . . . . . . . . . . . . . . . . . . 396 489
Deferred tax expense
Origination and reversal of temporary differences . . . . . . . . . . . . . . . . . . . . . . . . . . . . (364) (70)
Changes in enacted tax rate . . . . . . . . . . . . . . . . . . . . . . . . . . . . . . . . . . . . . . . . . . . (101) —
Income tax (benefit)/expense . . . . . . . . . . . . . . . . . . . . . . . . . . . . . . . . . . . . . . . . . (69) 419
Income tax benefit amounted to US$69 million in 2008, as compared to income tax expense ofUS$419 million in 2007.
Current tax expense decreased by US$93 million, or 19.0%, to US$396 million in 2008, ascompared to US$489 million in 2007. The decrease was primarily due to a decrease in taxable profitsresulting from the significant decline in aluminium prices during the second half of the year 2008.
Deferred tax benefit increased by US$294 million to US$364 million in 2008, as compared toUS$70 million in 2007. The increase in deferred tax benefit in 2008 was primarily due to impairmentof property, plant and equipment resulting in a US$386 million decrease in deferred tax liabilities.
Net (Loss)/Profit for the Year
As a result of the foregoing factors, UC RUSAL sustained a net loss of US$5,984 million for theyear ended 31 December 2008, as compared to a net profit of US$2,806 million for the year ended 31December 2007.
FINANCIAL INFORMATION
— 202 —
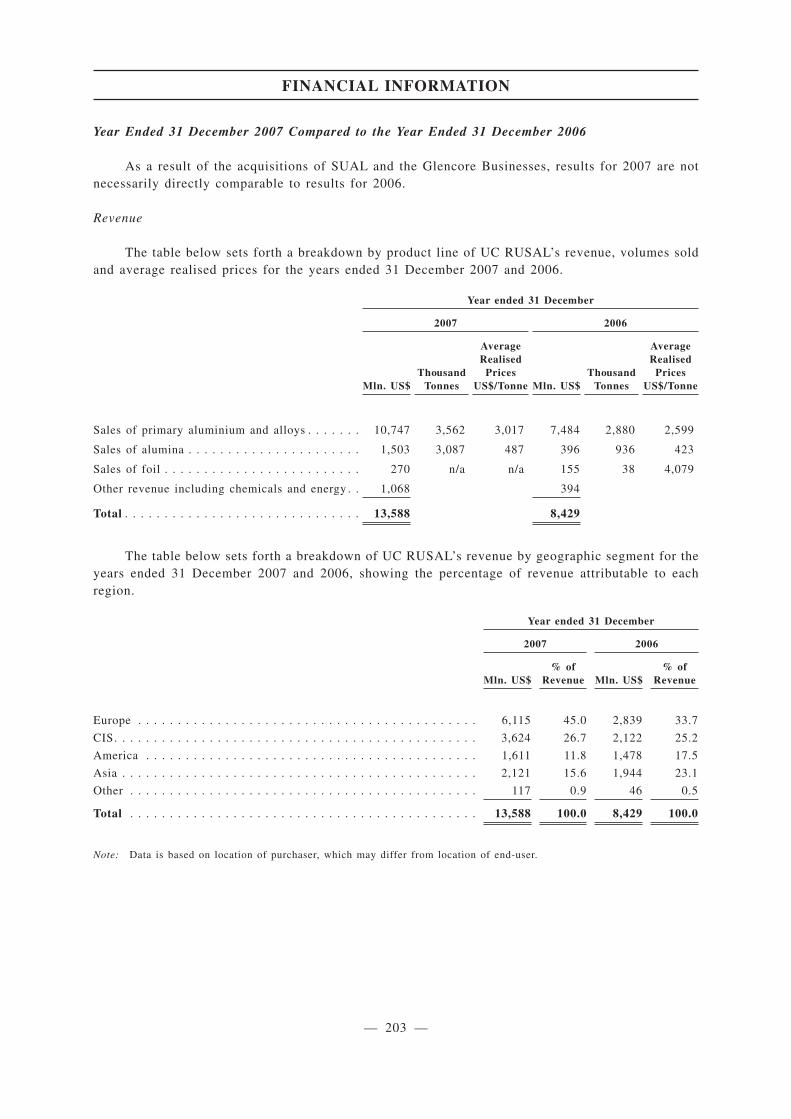
Year Ended 31 December 2007 Compared to the Year Ended 31 December 2006
As a result of the acquisitions of SUAL and the Glencore Businesses, results for 2007 are notnecessarily directly comparable to results for 2006.
Revenue
The table below sets forth a breakdown by product line of UC RUSAL’s revenue, volumes soldand average realised prices for the years ended 31 December 2007 and 2006.
Year ended 31 December
2007 2006
Mln. US$Thousand
Tonnes
AverageRealised
PricesUS$/Tonne Mln. US$
ThousandTonnes
AverageRealised
PricesUS$/Tonne
Sales of primary aluminium and alloys . . . . . . . 10,747 3,562 3,017 7,484 2,880 2,599
Sales of alumina . . . . . . . . . . . . . . . . . . . . . . 1,503 3,087 487 396 936 423
Sales of foil . . . . . . . . . . . . . . . . . . . . . . . . . 270 n/a n/a 155 38 4,079
Other revenue including chemicals and energy . . 1,068 394
Total . . . . . . . . . . . . . . . . . . . . . . . . . . . . . . 13,588 8,429
The table below sets forth a breakdown of UC RUSAL’s revenue by geographic segment for theyears ended 31 December 2007 and 2006, showing the percentage of revenue attributable to eachregion.
Year ended 31 December
2007 2006
Mln. US$% of
Revenue Mln. US$% of
Revenue
Europe . . . . . . . . . . . . . . . . . . . . . . . . . . . . . . . . . . . . . . . . . . . 6,115 45.0 2,839 33.7
CIS. . . . . . . . . . . . . . . . . . . . . . . . . . . . . . . . . . . . . . . . . . . . . . 3,624 26.7 2,122 25.2
America . . . . . . . . . . . . . . . . . . . . . . . . . . . . . . . . . . . . . . . . . . 1,611 11.8 1,478 17.5
Asia . . . . . . . . . . . . . . . . . . . . . . . . . . . . . . . . . . . . . . . . . . . . . 2,121 15.6 1,944 23.1
Other . . . . . . . . . . . . . . . . . . . . . . . . . . . . . . . . . . . . . . . . . . . . 117 0.9 46 0.5
Total . . . . . . . . . . . . . . . . . . . . . . . . . . . . . . . . . . . . . . . . . . . . 13,588 100.0 8,429 100.0
Note: Data is based on location of purchaser, which may differ from location of end-user.
FINANCIAL INFORMATION
— 203 —

Revenue increased by US$5,159 million, or 61.2%, to US$13,588 million in 2007 compared toUS$8,429 million in 2006. The increase in revenue was primarily due to increased sales of primaryaluminium and alloys, which accounted for 79.1% and 88.8% of UC RUSAL’s revenue for 2007 and2006, respectively. Share of primary aluminium sales decreased in 2007 primarily due to increase insales of alumina as a result of the acquisition of SUAL and the Glencore Businesses.
Revenue from sales of primary aluminium and alloys increased to US$10,747 million in 2007,or by 43.6% as compared to US$7,484 million in 2006. The increase was primarily the result ofincreases in realised prices, as well as an increase in sales volumes of primary aluminium and alloysfrom 2006 to 2007. The increases in realised prices resulted primarily from improved marketconditions, as the average price per tonne of aluminium as quoted on the LME increased by 3.7% from2006 to 2007. See “— Certain Factors Affecting the Group’s Results of Operations — Certain FactorsAffecting Results of Operations — Demand for and Price of Aluminium and Alumina”. Realised pricesalso increased as a result of management’s strategy to shift production from commodity primaryaluminium to alloys and value added products, both of which attain higher premiums.
Sales volumes increased by 682 thousand metric tonnes, or 23.7%, to 3,562 thousand metrictonnes in 2007, from 2,880 thousand metric tonnes in 2006, following the acquisition of SUAL andthe Glencore Businesses in March 2007.
Revenue from sales of alumina more than tripled to US$1,503 million in 2007 from US$396million in 2006. The increase was primarily the result of an increase in alumina prices and increasedsales volumes. The sales volume increased by 2,151 thousand metric tonnes, or 230%, to 3,087thousand metric tonnes in 2007 as compared to 936 thousand metric tonnes in 2006.
Revenue from sales of foil increased to US$270 million in 2007, or by 74%, from US$155million in 2006. The increase was primarily due to increased production volumes facilities reachingtheir full capacity.
Revenue from other sales, including chemicals and energy, increased to US$1,068 million in2007, or by 171%, from US$394 million in 2006. The increase was primarily due to sales of coalbusiness contributed to UC RUSAL upon the acquisition of SUAL and the Glencore Businesses in lateMarch 2007.
Revenue increased in each of UC RUSAL’s geographic segments from 2006 to 2007. Sales topurchasers in the CIS increased primarily as a result of demand growth within these jurisdictions.Sales to purchasers in Europe increased notwithstanding a 6% import customs duty, which, withrespect to primary aluminium, was reduced to 3% in May 2007. Revenue from sales to purchasers inAsia increased. Revenue from sales to purchasers in America increased but decreased as a percentageof revenues, primarily because UC RUSAL shifted sales from the American market to other marketsdue to the reduced premiums for primary aluminium and alloys available in America.
FINANCIAL INFORMATION
— 204 —

Cost of Sales
The following table sets forth a breakdown of UC RUSAL’s cost of sales for the years ended 31December 2007 and 2006.
Year ended 31 December
2007 2006
Mln. US$% of
Revenue Mln. US$% of
Revenue
Cost of alumina . . . . . . . . . . . . . . . . . . . . . . . . . . . . . . . . . . . . . 1,180 8.7 1,245 14.8
Cost of bauxite . . . . . . . . . . . . . . . . . . . . . . . . . . . . . . . . . . . . . . 520 3.8 263 3.1
Cost of other raw materials and other costs . . . . . . . . . . . . . . . . . . 3,413 25.1 1,382 16.4
Fair value mark-up on inventories(1) . . . . . . . . . . . . . . . . . . . . . . . 135 1.0 — —
Energy costs . . . . . . . . . . . . . . . . . . . . . . . . . . . . . . . . . . . . . . . 1,271 9.4 525 6.2
Depreciation and amortisation. . . . . . . . . . . . . . . . . . . . . . . . . . . . 842 6.2 341 4.0
Personnel expenses(2) . . . . . . . . . . . . . . . . . . . . . . . . . . . . . . . . . 748 5.5 328 3.9
Repairs and maintenance . . . . . . . . . . . . . . . . . . . . . . . . . . . . . . . 203 1.5 72 0.9
Net change in asset retirement obligation . . . . . . . . . . . . . . . . . . . . 42 0.3 30 0.4
Net change in provision for inventories . . . . . . . . . . . . . . . . . . . . . 2 — — —
Total cost of sales . . . . . . . . . . . . . . . . . . . . . . . . . . . . . . . . . . . 8,356 61.5 4,186 49.7
Notes:(1) Inventories of SUAL and the Glencore Businesses were recorded at their fair value on the date of acquisition in late
March 2007. See Note 5(c) to UC RUSAL’s Accountants’ Report.(2) Total personnel expenses for 2007 were equal to US$1,078 million, of which US$304 million were included in
administrative expenses and US$26 million in distribution expenses; for 2006 - US$506 million (US$165 million wasincluded in administrative expenses and US$13 million in distribution expenses).
Cost of sales increased by US$4,170 million, or 99.6%, to US$8,356 million in 2007, comparedto US$4,186 million in 2006. The increase was primarily due to the acquisition of SUAL and theGlencore Businesses and relatively higher cost of sales of the acquired businesses as compared to thatof RUSAL. Cost of other raw materials and other costs accounted for the largest increase in cost ofsales, in absolute terms. As a percentage of revenue, cost of sales increased from 49.7% in 2006 to61.5% in 2007.
Cost of alumina decreased by US$65 million, or 5.2%, to US$1,180 million in 2007, comparedto US$1,245 million in 2006. The decrease was primarily attributable to a reduction in the volume ofalumina purchased primarily as a result of the acquisition in 2007 of SUAL and the GlencoreBusinesses and the resulting long position in alumina. UC RUSAL also purchased less alumina as aresult of a decrease in the volume of alumina it was no longer contractually committed to sell and anincrease in the volume of alumina processed from bauxite pursuant to tolling arrangements. As apercentage of revenue, cost of alumina declined from 14.8% in 2006 to 8.7% in 2007.
Cost of bauxite increased by US$257 million, or 97.7%, to US$520 million in 2007, comparedto US$263 million in 2006. The increase in the cost of bauxite resulted primarily from increases inthe volume of bauxite purchased and an increase in the average price of bauxite. As a percentage ofrevenue, cost of bauxite increased from 3.1% in 2006 to 3.8% in 2007.
Cost of other raw materials and other costs increased by US$2,031 million, or 147%, toUS$3,413 million in 2007 as compared to US$1,382 million in 2006. The significant increase in costof other raw materials and other costs in 2007 was due to the acquisition of SUAL and the GlencoreBusinesses, the related increased share of alumina production and bauxite mining of the enlarged
FINANCIAL INFORMATION
— 205 —
Group and relatively higher production costs of the acquired businesses compared to those of RUSAL.In part the increase in cost of other raw materials was due to increases in prices, including a 32%increase in the average price of caustic soda and increases in the prices of fuel oil, natural gas, pitchand aluminium fluoride. The increase in cost of other raw materials also resulted from increases in thevolumes of materials such as soda ash and aluminium fluoride. As a percentage of revenue, cost ofother raw materials increased from 16.4% in 2006 to 25.1% in 2007.
Energy costs increased by US$746 million, or 142%, to US$1,271 million in 2007 as comparedto US$525 million in 2006. The increase resulted primarily from increases in consumption and tariffs.Consumption in 2007 increased significantly due to increased production volumes as a result of theacquisition of SUAL and the Glencore Businesses. The increase in energy costs in 2007 was also dueto an increase in weighted-average production electricity tariffs. Electricity tariffs are generallyquoted in Roubles and increased in line with the Russian consumer price index. The real appreciationof the Rouble against the dollar over the period, therefore, resulted in higher electricity tariffs. As apercentage of revenue, energy costs increased from 6.2% in 2006 to 9.4% in 2007.
Depreciation and amortisation increased by US$501 million, or 147%, to US$842 million in 2007as compared to US$341 million in 2006. Depreciation and amortisation expenses increased in 2007 asa result of the acquisition of SUAL and the Glencore Businesses. As a percentage of revenue,depreciation and amortisation increased from 4.0% in 2006 to 6.2% in 2007.
Personnel expenses recorded in cost of sales increased by US$420 million, or 128%, to US$748million in 2007 as compared to US$328 million in 2006. The increase in personnel expenses in 2007was attributable to an increased headcount as a result of the acquisition in 2007 of SUAL and theGlencore Businesses and the increase of average salaries in line with inflation. The increase in salarieswas due to the Group’s strategy to offer competitive remuneration packages to attract employees andto improve employee productivity. As a percentage of revenue, personnel expenses increased from3.9% in 2006 to 5.5% in 2007.
Repairs and maintenance increased by US$131 million, or 182%, to US$203 million in 2007 ascompared to US$72 million in 2006. The increase in repairs and maintenance costs in 2007 was dueto the acquisition of SUAL and the Glencore Businesses. As a percentage of revenue, repairs andmaintenance increased from 0.9% in 2006 to 1.5% in 2007.
The change in provision for asset retirement obligations of US$42 million for 2007 as comparedto US$30 million for 2006 related to RUSAL’s obligation to restore land and retire assets in thecountries in which it has its primary operations.
Net Change in Inventory Recognition at Realisable Value
The net change in a reserve to write inventory down to its net realisable value represents achange in the provision made between 31 December 2006 and 2007. The provision increased followinga decrease in the market price of aluminium and alumina.
Gross Profit
As a result of the foregoing factors, UC RUSAL reported a gross profit of US$5,232 million andUS$4,243 million for the years ended 31 December 2007 and 2006, respectively, representing grossmargins of 38.5% and 50.3%, respectively.
FINANCIAL INFORMATION
— 206 —

Distribution Expenses
Distribution expenses increased by US$200 million, or 61%, to US$528 million in 2007,compared to US$328 million in 2006. The increase in distribution expenses in 2007 was mainly dueto an increase in sales volumes resulting from the acquisition of SUAL and the Glencore Businesses.As a percentage of revenue, distribution expenses remained at 3.9% in 2006 and 2007.
Administrative Expenses
Administrative expenses increased by US$387 million, or 85%, to US$842 million in 2007 ascompared to US$455 million in 2006. The administrative expenses increased in 2007 primarily as aresult of the acquisition of SUAL and the Glencore Businesses. As a percentage of revenue,administrative expenses increased from 5.4% in 2006 to 6.2% in 2007.
Loss on Disposal of Property, Plant and Equipment
Loss on disposal of property, plant and equipment increased by US$92 million to US$97 millionin 2007 as compared to US$5 million in 2006. The loss on disposal of property, plant and equipmentin 2007 resulted from losses relating to the consolidation of SUAL and Glencore operations for thelast nine months of 2007. These operations and assets were not consolidated in the Group’sconsolidated financial statements in 2006. As a percentage of revenue, loss on disposal of property,plant and equipment increased from 0.1% in 2006 to 0.7% in 2007.
Other Operating Expenses
The following table sets forth a breakdown of UC RUSAL’s other operating expenses for theyears ended 31 December 2007 and 2006.
Year ended 31 December
2007 2006
Mln. US$% of
Revenue Mln. US$% of
Revenue
Provision for legal claims . . . . . . . . . . . . . . . . . . . . . . . . . . . . . . — — 60 0.7
Impairment loss on trade and other receivables . . . . . . . . . . . . . . . . 27 0.2 21 0.2
Charitable donations . . . . . . . . . . . . . . . . . . . . . . . . . . . . . . . . . . 51 0.4 34 0.4
Other operating expenses . . . . . . . . . . . . . . . . . . . . . . . . . . . . . . . 40 0.3 28 0.3
Total other operating expenses . . . . . . . . . . . . . . . . . . . . . . . . . . 118 0.9 143 1.7
Other operating expenses decreased by US$25 million, or 17.5%, to US$118 million in 2007 ascompared to US$143 million in 2006. As a percentage of revenue, other operating expenses decreasedfrom 1.7% in 2006 to 0.9% in 2007.
The provision for legal claims in 2006 relates to the settlement with Ansol pertaining to thetermination of joint operations and the write-offs of amounts receivable from Ansol and the initialinvestment made by RUSAL in the joint operations. See “Business — Litigation” and Note 30(c) toUC RUSAL’s Accountants’ Report.
Impairment loss on trade and other receivables were US$27 million for 2007 and US$21 millionfor 2006. The provisions against other receivables in both years represented provisions againstreceivables from municipal authorities.
FINANCIAL INFORMATION
— 207 —

Charitable donations were US$51 million in 2007 and US$34 million in 2006. Charitabledonations in both years related to RUSAL’s donations to various charities, including orphanages,cancer treatment hospitals and nursing homes.
Results from Operating Activities
As a result of the foregoing factors, UC RUSAL had results from operating activities ofUS$3,647 million and US$3,312 million for the years ended 31 December 2007 and 2006,respectively, representing operating margins of 26.8% and 39.3%, respectively.
Finance Income
The following table sets forth a breakdown of UC RUSAL’s finance income for the years ended31 December 2007 and 2006.
Year ended 31 December
2007 2006
Mln. US$% of
Revenue Mln. US$% of
Revenue
Interest income on third party loans and deposits . . . . . . . . . . . . . . 29 0.2 21 0.2
Interest income on loans to related parties . . . . . . . . . . . . . . . . . . . 7 0.1 33 0.4
Net foreign exchange gain . . . . . . . . . . . . . . . . . . . . . . . . . . . . . . 45 0.3 17 0.2
Change in fair value of financial instruments . . . . . . . . . . . . . . . . . 20 0.1 37 0.4
Gain from disposal of available-for-sale investments reclassedfrom equity . . . . . . . . . . . . . . . . . . . . . . . . . . . . . . . . . . . . . . — — 68 0.8
Total finance income . . . . . . . . . . . . . . . . . . . . . . . . . . . . . . . . . 101 0.7 176 2.1
Finance income decreased by US$75 million, or 42.6%, to US$101 million in 2007 as comparedto US$176 million in 2006. The decrease was primarily the result of the recognition, in 2006, of aUS$68 million gain on the disposal of shares of Sayano-Shushenskaya HPP to the shareholder priorto the merger. As a percentage of revenue, finance income decreased from 2.1% in 2006 to 0.7% in2007.
Interest income on third party loans and deposits increased by US$8 million, or by 38%, toUS$29 million in 2007 as compared to US$21 million in 2006. The increase in interest income in 2007was primarily the result of an increase in deposits, including deposits held as collateral for creditfacilities entered into in 2007 and 2006.
Interest income on loans to related parties decreased by US$26 million, or 78.8%, to US$7million in 2007 as compared to US$33 million in 2006. These loans were repaid in instalments andwere discharged in full in 2006. Interest income on loans to related parties in 2007 represented incomeon deposits and promissory notes from related parties.
In 2006, the Group also accounted for US$12 million as interest income on loans to companiesclassified as discontinued operations and disposed of to the shareholder of RUSAL before theacquisition of SUAL and the Glencore Businesses. No such income was accounted for in 2007.
FINANCIAL INFORMATION
— 208 —

Net foreign exchange gain was US$45 million in 2007 and US$17 million in 2006. The foreignexchange gain in each of 2007 and 2006 was the result of the appreciation of the Rouble against theUS dollar and the annual revaluation of financial assets denominated in Roubles.
UC RUSAL did not record any gain from disposal of investments in 2007. In 2006, gain fromdisposal of available-for-sale investments released from equity constituted US$68 million. Gain fromdisposal of available-for-sale investments released from equity in 2006 related to the disposal ofshares of Sayano-Shushenskaya HPP in connection with UC RUSAL’s acquisition of SUAL and theGlencore Businesses.
Change in fair value of financial instruments was US$20 million in 2007 and US$37 million in2006. Gain from derivatives in each year was the result of gains on transactions to hedge foreignexchange and interest rate risk related to financing activities.
Finance Expenses
The following table sets forth a breakdown of UC RUSAL’s finance expenses for the years ended31 December 2007 and 2006.
Year ended31 December
2007 2006
(Mln. US$)
Interest expense on bank loans wholly repayable within five years and other bank charges . 358 230
Interest expense on bank loans wholly repayable within five years. . . . . . . . . . . . . . . . . 148 66
Interest expense on loans to related parties wholly repayable within five years . . . . . . . . — 16
Total interest expense on financial liabilities . . . . . . . . . . . . . . . . . . . . . . . . . . . . . . . 506 312
Less: interest expense capitalised into property, plant and equipment . . . . . . . . . . . . . . . (52) (53)
Total interest expense . . . . . . . . . . . . . . . . . . . . . . . . . . . . . . . . . . . . . . . . . . . . . . . 454 259
Interest expense on provisions . . . . . . . . . . . . . . . . . . . . . . . . . . . . . . . . . . . . . . . . . 40 6
Total finance expenses . . . . . . . . . . . . . . . . . . . . . . . . . . . . . . . . . . . . . . . . . . . . . . 494 265
Finance expenses increased by US$229 million, or 86.4%, to US$494 million in 2007, ascompared to US$265 million in 2006. The increase in finance expenses in 2007 was due to asignificant increase in interest expense on bank loans. As a percentage of revenue, finance expensesincreased from 3.1% in 2006 to 3.6% in 2007.
Interest expense on bank loans increased by US$210 million, or 71%, to US$506 million in 2007,as compared to US$296 million in 2006. The increase in interest expense in 2007 was mainly the resultof an increase in borrowings, and in base rates (due in part to the extension of the maturities ofRUSAL’s loan portfolio), partly offset by a reduction in margins over the base rate charged. As apercentage of revenue, total interest expense on financial liabilities was 3.7% in 2006 and 2007.
Interest expense on loans to related parties amounted to US$16 million in 2006. No such interestexpense was recorded in 2007. The decrease resulted from periodic repayments and final discharge in2006. These loans are described under “— Finance Income” above.
FINANCIAL INFORMATION
— 209 —

Share of Loss and Impairment of Associates and Jointly Controlled Entities
Share of loss of associates and jointly controlled entities was US$29 million in 2007 and US$28million in 2006. Share of loss and impairment of associates and jointly controlled entities in both yearsresulted primarily from the Group’s share of the losses experienced by Queensland Alumina Limited.In 2006 these losses were also attributable to RUSAL’s share of the losses experienced by SUAL KomiB.V., in which RUSAL held a 50% equity stake prior to the formation of the Company. See Notes 19and 20 to UC RUSAL’s Accountants’ Report.
Excess of the Group’s Share in Net Identifiable Assets over the Cost of Acquisition
Excess of the Group’s share in net identifiable assets over the cost of acquisition amounted toUS$28 million in 2006. No such excess was recorded in 2007. The amount in 2006 was mainly theresult of the excess of the fair value of RUSAL’s share of the acquired net identifiable assets of theFriguia bauxite and the Eurallumina alumina complex over their respective costs of acquisition.
Profit Before Income Tax
As a result of the foregoing factors, UC RUSAL earned a profit before income tax of US$3,225million and US$3,223 million for the years ended 31 December 2007 and 2006, respectively.
Income Tax Expense
UC RUSAL’s income tax expense for the years ended 31 December 2007 and 2006 comprised thefollowing:
Year ended31 December
2007 2006
(Mln. US$)
Current tax expense
Current year. . . . . . . . . . . . . . . . . . . . . . . . . . . . . . . . . . . . . . . . . . . . . . . . . . . . . . 489 337
Deferred tax benefit
Origination and reversal of temporary differences . . . . . . . . . . . . . . . . . . . . . . . . . . . . (70) (1)
Income tax expense . . . . . . . . . . . . . . . . . . . . . . . . . . . . . . . . . . . . . . . . . . . . . . . . 419 336
Income tax expense increased by US$83 million, or 24.7%, to US$419 million in 2007, ascompared to US$336 million in 2006. The increase in 2007 was the result of an increase in currenttax expense.
Current tax expense increased by US$152 million, or 45.1%, to US$489 million in 2007, ascompared to US$337 million in 2006. The increase in current tax expense in 2007 was due to both anincrease in taxable profits and an increase in the effective tax rate.
Deferred tax benefit increased by US$69 million to US$70 million in 2007 as compared to US$1million in 2006. The increase in deferred tax benefit in 2007 was due to revision applied to theproperty, plant and equipment tax bases performed by management.
UC RUSAL’s effective tax rate increased to 13% for the year ended 31 December 2007 from 10%for the year ended 31 December 2006. The increase in the effective tax rate over the period resultedfrom blending of former RUSAL and SUAL effective tax rates and increases in tolling fees receivedby RUSAL companies resident in Russia. See Note 10 to UC RUSAL’s Accountants’ Report.
FINANCIAL INFORMATION
— 210 —
Profit from Continuing Operations
As a result of the foregoing factors, UC RUSAL earned a profit from continuing operations ofUS$2,806 million and US$2,887 million for the years ended 31 December 2007 and 2006,respectively.
Profit for the Year from Discontinued Operation (Net of Income Tax)
Gains from discontinued operations of US$10 million were recorded in 2006. No such gain wasrecorded in 2007. The gain in 2006 represents the operating result of RUSAL’s former packaging,aluminium construction and magnesium assets, which were transferred to its shareholder as adistribution.
Net Profit
As a result of the foregoing factors, UC RUSAL earned a net profit of US$2,806 million andUS$2,897 million for the years ended 31 December 2007 and 2006, respectively, representing netmargins of 20.7% and 34.4%, respectively.
Total Equity
The Group’s total equity was US$3.1 billion as of 30 June 2009, compared to US$4.5 billion asof 31 December 2008, US$10.1 billion at 31 December 2007 and US$3.1 billion at 31 December 2006.The decrease in total equity from 31 December 2008 to 30 June 2009 mainly resulted from a net losssustained by the Group for that period and negative change in the currency translation reserve due tothe depreciation of Roubles and the Ukrainian Hryvania against the US dollar, partially offset by anincrease in other reserves. The decrease in total equity from 31 December 2007 to 31 December 2008mainly resulted from a net loss of the Group for that year and a negative change in the currencytranslation reserve due to the depreciation of Roubles and the Ukrainian Hryvania against the USdollar, partially offset by an increase in the share premium due to the issue of new shares in partialconsideration for the acquisition of a 25% plus one share stake in Norilsk Nickel. The increase in totalequity from 31 December 2006 to 31 December 2007 mainly resulted from an increase in the sharepremium due to the issue of new shares in partial consideration for the acquisitions of the SUAL andGlencore Businesses and overall positive financial results of the Group.
Property, Plant and Equipment
Property, plant and equipment constituted US$6.2 billion as of 30 June 2009, US$6.6 billion at31 December 2008, US$10.4 billion at 31 December 2007 and US$4.5 billion at 31 December 2006.The decrease from 31 December 2008 to 30 June 2009 was mainly as a result of the absence ofsignificant capital expenditures and routine depreciation charges. The decrease from 31 December2007 to 31 December 2008 was mainly as a result of the impairment loss. Following the globaleconomic downturn and significant decrease in the price of and the demand for aluminium in thefourth quarter of 2008, at 31 December 2008 the Directors considered it to be necessary to carry outimpairment tests for all significant cash generating units of the Group at that date. In accordance withIAS 36, testing was carried out in respect of the cash-generating units, rather than particular items ofproperty, plant and equipment. The recoverable amount of each cash-generating unit was determinedby discounting expected future net cash flows of each cash-generating unit. For key assumptions andresults of the impairment tests, see Note 17(a) to UC RUSAL’s Accountants’ Report. The increase from31 December 2006 to 31 December 2007 was mainly as a result of additions due to the acquisitionsof the SUAL and Glencore Businesses.
FINANCIAL INFORMATION
— 211 —
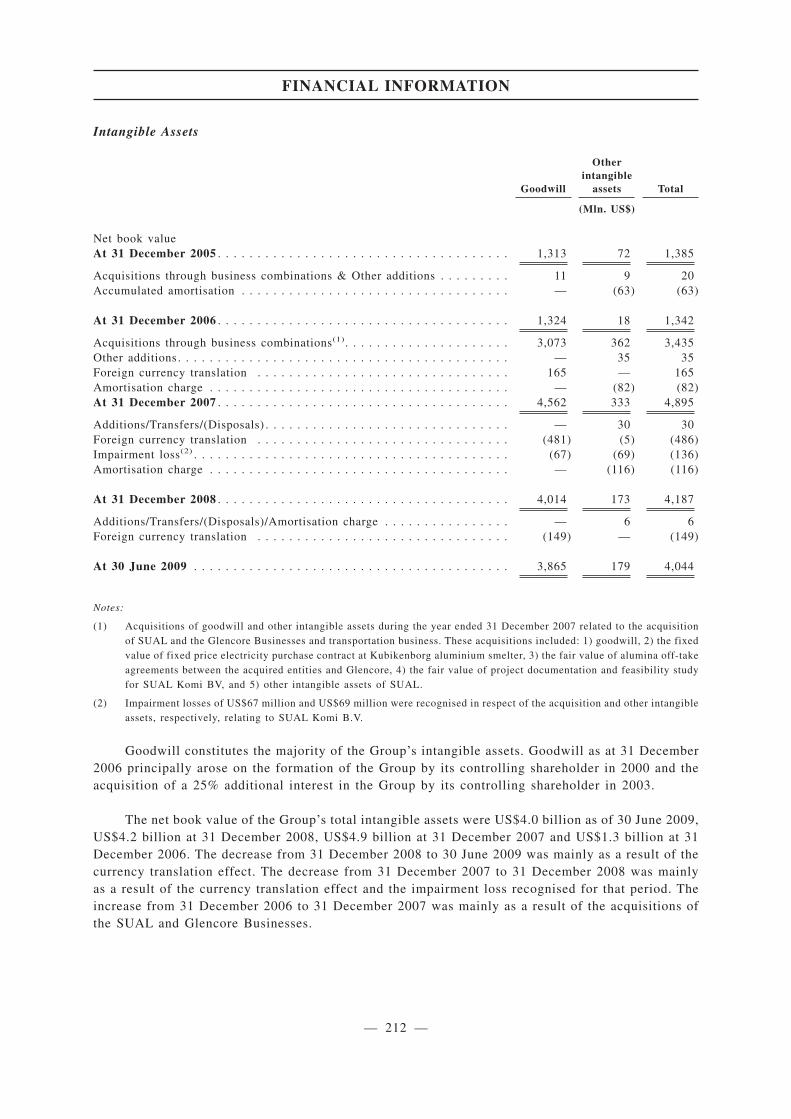
Intangible Assets
Goodwill
Otherintangible
assets Total
(Mln. US$)
Net book valueAt 31 December 2005 . . . . . . . . . . . . . . . . . . . . . . . . . . . . . . . . . . . . . 1,313 72 1,385
Acquisitions through business combinations & Other additions . . . . . . . . . 11 9 20Accumulated amortisation . . . . . . . . . . . . . . . . . . . . . . . . . . . . . . . . . . — (63) (63)
At 31 December 2006 . . . . . . . . . . . . . . . . . . . . . . . . . . . . . . . . . . . . . 1,324 18 1,342
Acquisitions through business combinations(1). . . . . . . . . . . . . . . . . . . . . 3,073 362 3,435Other additions . . . . . . . . . . . . . . . . . . . . . . . . . . . . . . . . . . . . . . . . . . — 35 35Foreign currency translation . . . . . . . . . . . . . . . . . . . . . . . . . . . . . . . . 165 — 165Amortisation charge . . . . . . . . . . . . . . . . . . . . . . . . . . . . . . . . . . . . . . — (82) (82)At 31 December 2007 . . . . . . . . . . . . . . . . . . . . . . . . . . . . . . . . . . . . . 4,562 333 4,895
Additions/Transfers/(Disposals) . . . . . . . . . . . . . . . . . . . . . . . . . . . . . . . — 30 30Foreign currency translation . . . . . . . . . . . . . . . . . . . . . . . . . . . . . . . . (481) (5) (486)Impairment loss(2) . . . . . . . . . . . . . . . . . . . . . . . . . . . . . . . . . . . . . . . . (67) (69) (136)Amortisation charge . . . . . . . . . . . . . . . . . . . . . . . . . . . . . . . . . . . . . . — (116) (116)
At 31 December 2008 . . . . . . . . . . . . . . . . . . . . . . . . . . . . . . . . . . . . . 4,014 173 4,187
Additions/Transfers/(Disposals)/Amortisation charge . . . . . . . . . . . . . . . . — 6 6Foreign currency translation . . . . . . . . . . . . . . . . . . . . . . . . . . . . . . . . (149) — (149)
At 30 June 2009 . . . . . . . . . . . . . . . . . . . . . . . . . . . . . . . . . . . . . . . . 3,865 179 4,044
Notes:
(1) Acquisitions of goodwill and other intangible assets during the year ended 31 December 2007 related to the acquisitionof SUAL and the Glencore Businesses and transportation business. These acquisitions included: 1) goodwill, 2) the fixedvalue of fixed price electricity purchase contract at Kubikenborg aluminium smelter, 3) the fair value of alumina off-takeagreements between the acquired entities and Glencore, 4) the fair value of project documentation and feasibility studyfor SUAL Komi BV, and 5) other intangible assets of SUAL.
(2) Impairment losses of US$67 million and US$69 million were recognised in respect of the acquisition and other intangibleassets, respectively, relating to SUAL Komi B.V.
Goodwill constitutes the majority of the Group’s intangible assets. Goodwill as at 31 December2006 principally arose on the formation of the Group by its controlling shareholder in 2000 and theacquisition of a 25% additional interest in the Group by its controlling shareholder in 2003.
The net book value of the Group’s total intangible assets were US$4.0 billion as of 30 June 2009,US$4.2 billion at 31 December 2008, US$4.9 billion at 31 December 2007 and US$1.3 billion at 31December 2006. The decrease from 31 December 2008 to 30 June 2009 was mainly as a result of thecurrency translation effect. The decrease from 31 December 2007 to 31 December 2008 was mainlyas a result of the currency translation effect and the impairment loss recognised for that period. Theincrease from 31 December 2006 to 31 December 2007 was mainly as a result of the acquisitions ofthe SUAL and Glencore Businesses.
FINANCIAL INFORMATION
— 212 —
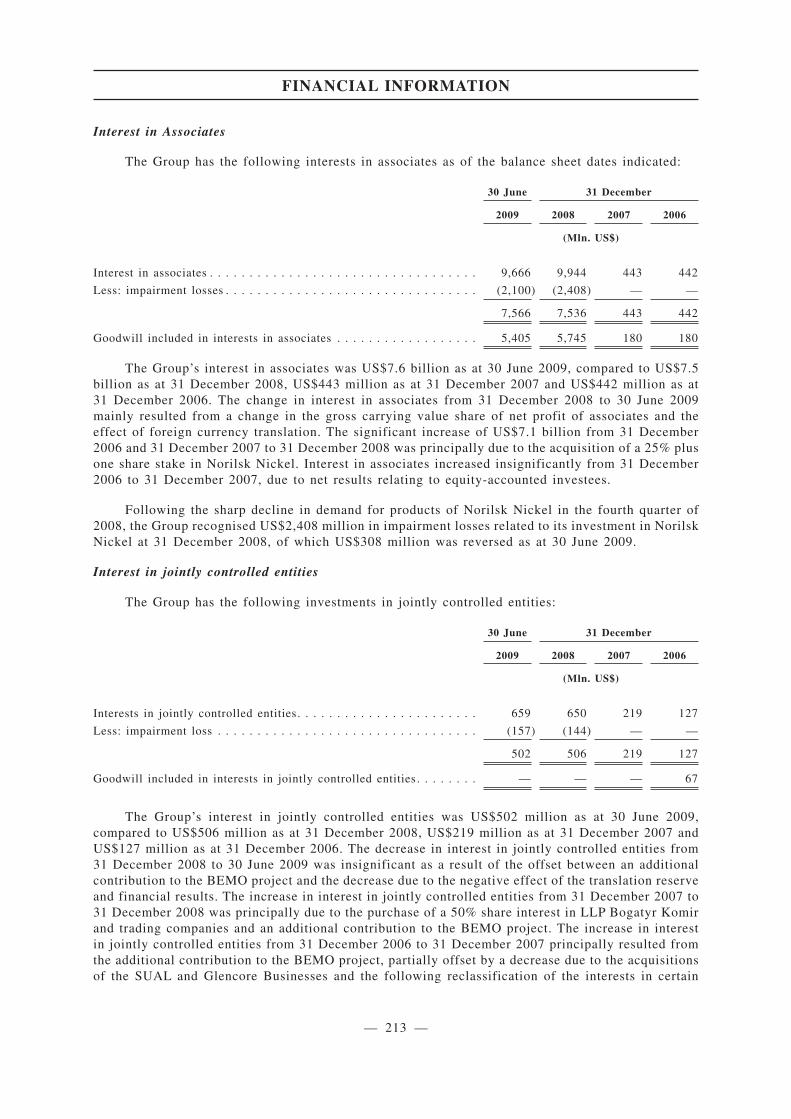
Interest in Associates
The Group has the following interests in associates as of the balance sheet dates indicated:
30 June 31 December
2009 2008 2007 2006
(Mln. US$)
Interest in associates . . . . . . . . . . . . . . . . . . . . . . . . . . . . . . . . . . 9,666 9,944 443 442
Less: impairment losses . . . . . . . . . . . . . . . . . . . . . . . . . . . . . . . . (2,100) (2,408) — —
7,566 7,536 443 442
Goodwill included in interests in associates . . . . . . . . . . . . . . . . . . 5,405 5,745 180 180
The Group’s interest in associates was US$7.6 billion as at 30 June 2009, compared to US$7.5billion as at 31 December 2008, US$443 million as at 31 December 2007 and US$442 million as at31 December 2006. The change in interest in associates from 31 December 2008 to 30 June 2009mainly resulted from a change in the gross carrying value share of net profit of associates and theeffect of foreign currency translation. The significant increase of US$7.1 billion from 31 December2006 and 31 December 2007 to 31 December 2008 was principally due to the acquisition of a 25% plusone share stake in Norilsk Nickel. Interest in associates increased insignificantly from 31 December2006 to 31 December 2007, due to net results relating to equity-accounted investees.
Following the sharp decline in demand for products of Norilsk Nickel in the fourth quarter of2008, the Group recognised US$2,408 million in impairment losses related to its investment in NorilskNickel at 31 December 2008, of which US$308 million was reversed as at 30 June 2009.
Interest in jointly controlled entities
The Group has the following investments in jointly controlled entities:
30 June 31 December
2009 2008 2007 2006
(Mln. US$)
Interests in jointly controlled entities. . . . . . . . . . . . . . . . . . . . . . . 659 650 219 127
Less: impairment loss . . . . . . . . . . . . . . . . . . . . . . . . . . . . . . . . . (157) (144) — —
502 506 219 127
Goodwill included in interests in jointly controlled entities . . . . . . . . — — — 67
The Group’s interest in jointly controlled entities was US$502 million as at 30 June 2009,compared to US$506 million as at 31 December 2008, US$219 million as at 31 December 2007 andUS$127 million as at 31 December 2006. The decrease in interest in jointly controlled entities from31 December 2008 to 30 June 2009 was insignificant as a result of the offset between an additionalcontribution to the BEMO project and the decrease due to the negative effect of the translation reserveand financial results. The increase in interest in jointly controlled entities from 31 December 2007 to31 December 2008 was principally due to the purchase of a 50% share interest in LLP Bogatyr Komirand trading companies and an additional contribution to the BEMO project. The increase in interestin jointly controlled entities from 31 December 2006 to 31 December 2007 principally resulted fromthe additional contribution to the BEMO project, partially offset by a decrease due to the acquisitionsof the SUAL and Glencore Businesses and the following reclassification of the interests in certain
FINANCIAL INFORMATION
— 213 —
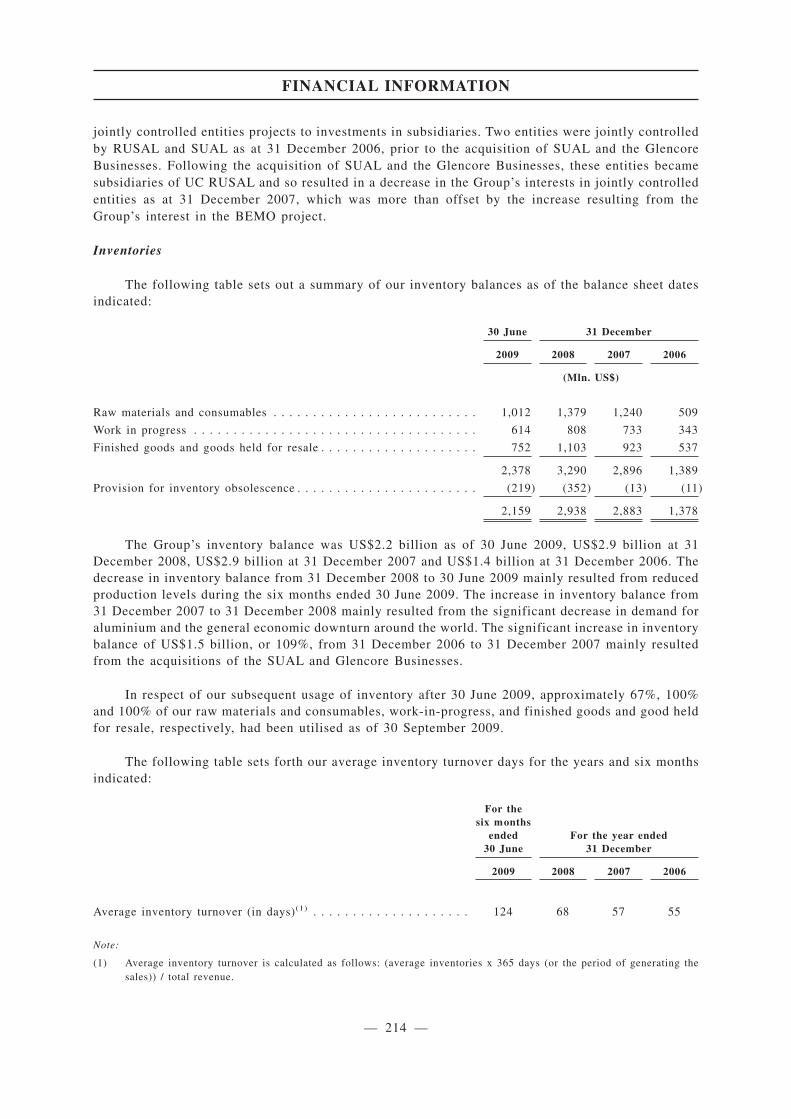
jointly controlled entities projects to investments in subsidiaries. Two entities were jointly controlledby RUSAL and SUAL as at 31 December 2006, prior to the acquisition of SUAL and the GlencoreBusinesses. Following the acquisition of SUAL and the Glencore Businesses, these entities becamesubsidiaries of UC RUSAL and so resulted in a decrease in the Group’s interests in jointly controlledentities as at 31 December 2007, which was more than offset by the increase resulting from theGroup’s interest in the BEMO project.
Inventories
The following table sets out a summary of our inventory balances as of the balance sheet datesindicated:
30 June 31 December
2009 2008 2007 2006
(Mln. US$)
Raw materials and consumables . . . . . . . . . . . . . . . . . . . . . . . . . . 1,012 1,379 1,240 509
Work in progress . . . . . . . . . . . . . . . . . . . . . . . . . . . . . . . . . . . . 614 808 733 343
Finished goods and goods held for resale . . . . . . . . . . . . . . . . . . . . 752 1,103 923 537
2,378 3,290 2,896 1,389
Provision for inventory obsolescence . . . . . . . . . . . . . . . . . . . . . . . (219) (352) (13) (11)
2,159 2,938 2,883 1,378
The Group’s inventory balance was US$2.2 billion as of 30 June 2009, US$2.9 billion at 31December 2008, US$2.9 billion at 31 December 2007 and US$1.4 billion at 31 December 2006. Thedecrease in inventory balance from 31 December 2008 to 30 June 2009 mainly resulted from reducedproduction levels during the six months ended 30 June 2009. The increase in inventory balance from31 December 2007 to 31 December 2008 mainly resulted from the significant decrease in demand foraluminium and the general economic downturn around the world. The significant increase in inventorybalance of US$1.5 billion, or 109%, from 31 December 2006 to 31 December 2007 mainly resultedfrom the acquisitions of the SUAL and Glencore Businesses.
In respect of our subsequent usage of inventory after 30 June 2009, approximately 67%, 100%and 100% of our raw materials and consumables, work-in-progress, and finished goods and good heldfor resale, respectively, had been utilised as of 30 September 2009.
The following table sets forth our average inventory turnover days for the years and six monthsindicated:
For thesix months
ended30 June
For the year ended31 December
2009 2008 2007 2006
Average inventory turnover (in days)(1) . . . . . . . . . . . . . . . . . . . . 124 68 57 55
Note:
(1) Average inventory turnover is calculated as follows: (average inventories x 365 days (or the period of generating thesales)) / total revenue.
FINANCIAL INFORMATION
— 214 —
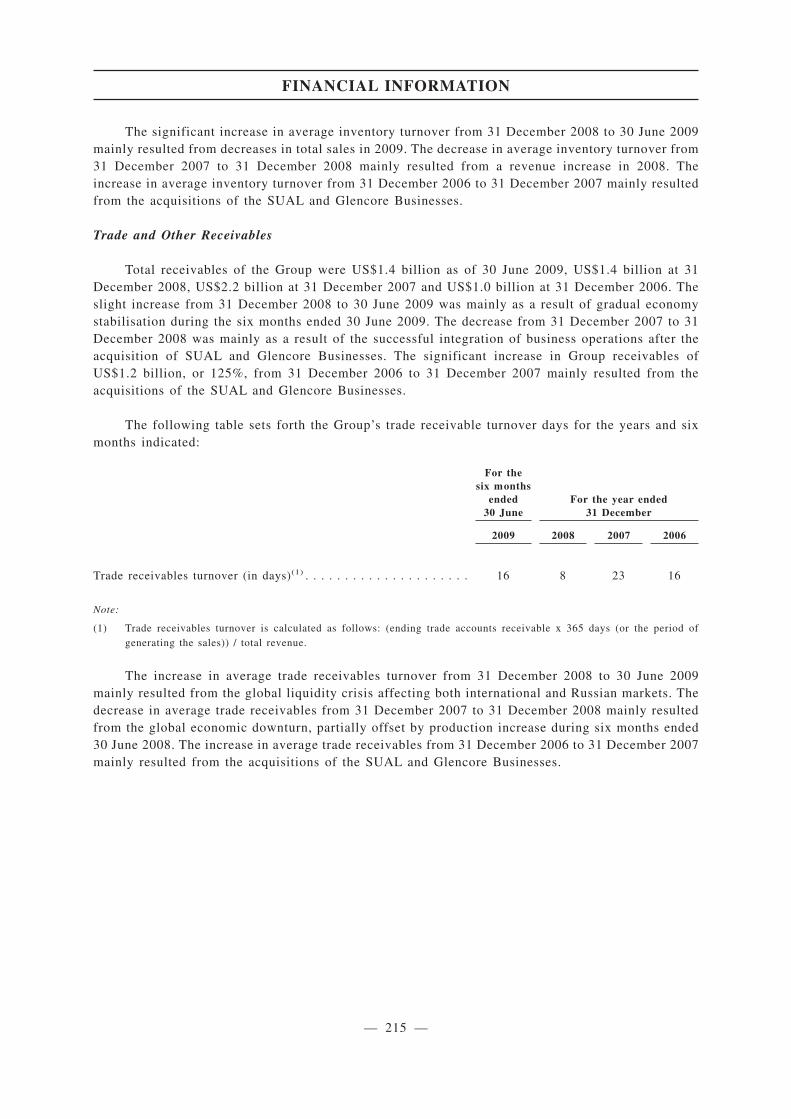
The significant increase in average inventory turnover from 31 December 2008 to 30 June 2009mainly resulted from decreases in total sales in 2009. The decrease in average inventory turnover from31 December 2007 to 31 December 2008 mainly resulted from a revenue increase in 2008. Theincrease in average inventory turnover from 31 December 2006 to 31 December 2007 mainly resultedfrom the acquisitions of the SUAL and Glencore Businesses.
Trade and Other Receivables
Total receivables of the Group were US$1.4 billion as of 30 June 2009, US$1.4 billion at 31December 2008, US$2.2 billion at 31 December 2007 and US$1.0 billion at 31 December 2006. Theslight increase from 31 December 2008 to 30 June 2009 was mainly as a result of gradual economystabilisation during the six months ended 30 June 2009. The decrease from 31 December 2007 to 31December 2008 was mainly as a result of the successful integration of business operations after theacquisition of SUAL and Glencore Businesses. The significant increase in Group receivables ofUS$1.2 billion, or 125%, from 31 December 2006 to 31 December 2007 mainly resulted from theacquisitions of the SUAL and Glencore Businesses.
The following table sets forth the Group’s trade receivable turnover days for the years and sixmonths indicated:
For thesix months
ended30 June
For the year ended31 December
2009 2008 2007 2006
Trade receivables turnover (in days)(1) . . . . . . . . . . . . . . . . . . . . . 16 8 23 16
Note:
(1) Trade receivables turnover is calculated as follows: (ending trade accounts receivable x 365 days (or the period ofgenerating the sales)) / total revenue.
The increase in average trade receivables turnover from 31 December 2008 to 30 June 2009mainly resulted from the global liquidity crisis affecting both international and Russian markets. Thedecrease in average trade receivables from 31 December 2007 to 31 December 2008 mainly resultedfrom the global economic downturn, partially offset by production increase during six months ended30 June 2008. The increase in average trade receivables from 31 December 2006 to 31 December 2007mainly resulted from the acquisitions of the SUAL and Glencore Businesses.
FINANCIAL INFORMATION
— 215 —
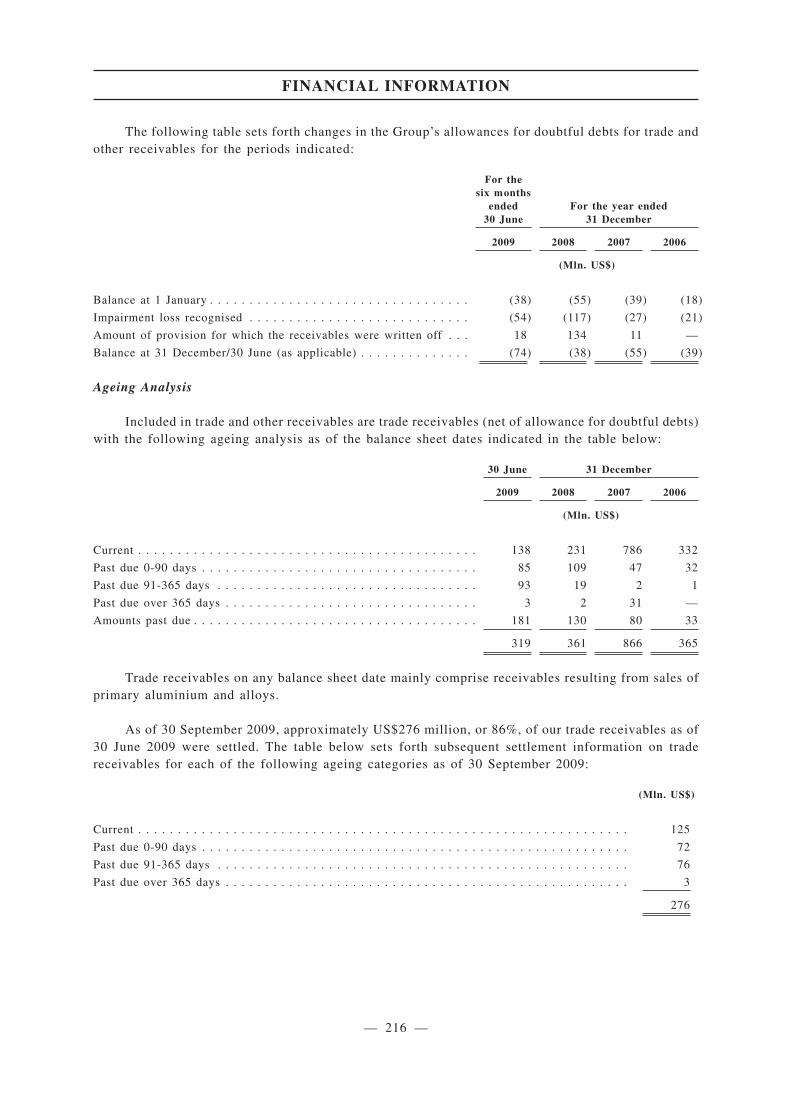
The following table sets forth changes in the Group’s allowances for doubtful debts for trade andother receivables for the periods indicated:
For thesix months
ended30 June
For the year ended31 December
2009 2008 2007 2006
(Mln. US$)
Balance at 1 January . . . . . . . . . . . . . . . . . . . . . . . . . . . . . . . . . (38) (55) (39) (18)
Impairment loss recognised . . . . . . . . . . . . . . . . . . . . . . . . . . . . (54) (117) (27) (21)
Amount of provision for which the receivables were written off . . . 18 134 11 —
Balance at 31 December/30 June (as applicable) . . . . . . . . . . . . . . (74) (38) (55) (39)
Ageing Analysis
Included in trade and other receivables are trade receivables (net of allowance for doubtful debts)with the following ageing analysis as of the balance sheet dates indicated in the table below:
30 June 31 December
2009 2008 2007 2006
(Mln. US$)
Current . . . . . . . . . . . . . . . . . . . . . . . . . . . . . . . . . . . . . . . . . . . 138 231 786 332
Past due 0-90 days . . . . . . . . . . . . . . . . . . . . . . . . . . . . . . . . . . . 85 109 47 32
Past due 91-365 days . . . . . . . . . . . . . . . . . . . . . . . . . . . . . . . . . 93 19 2 1
Past due over 365 days . . . . . . . . . . . . . . . . . . . . . . . . . . . . . . . . 3 2 31 —
Amounts past due . . . . . . . . . . . . . . . . . . . . . . . . . . . . . . . . . . . . 181 130 80 33
319 361 866 365
Trade receivables on any balance sheet date mainly comprise receivables resulting from sales ofprimary aluminium and alloys.
As of 30 September 2009, approximately US$276 million, or 86%, of our trade receivables as of30 June 2009 were settled. The table below sets forth subsequent settlement information on tradereceivables for each of the following ageing categories as of 30 September 2009:
(Mln. US$)
Current . . . . . . . . . . . . . . . . . . . . . . . . . . . . . . . . . . . . . . . . . . . . . . . . . . . . . . . . . . . . . . 125
Past due 0-90 days . . . . . . . . . . . . . . . . . . . . . . . . . . . . . . . . . . . . . . . . . . . . . . . . . . . . . . 72
Past due 91-365 days . . . . . . . . . . . . . . . . . . . . . . . . . . . . . . . . . . . . . . . . . . . . . . . . . . . . 76
Past due over 365 days . . . . . . . . . . . . . . . . . . . . . . . . . . . . . . . . . . . . . . . . . . . . . . . . . . . 3
276
FINANCIAL INFORMATION
— 216 —

Trade and Other Payables
Total payables of the Group were US$1.4 billion as of 30 June 2009, US$1.7 billion at 31December 2008, US$1.6 billion at 31 December 2007 and US$0.6 billion at 31 December 2006. Thedecrease in total payables from 31 December 2008 to 30 June 2009 mainly resulted from thecontinuous interaction with the Group’s suppliers and from the implementation of a working capitalstabilization program. The increase in total payables from 31 December 2007 to 31 December 2008mainly resulted from the global liquidity crisis affecting both international and Russian markets. Thesignificant increase in total payables of US$1 billion, or 185%, from 31 December 2006 to 31December 2007 mainly resulted from the acquisitions of the SUAL and Glencore Businesses.
The following table sets forth our trade payables turnover days for the years and six monthsindicated:
For thesix months
ended30 June
For the year ended31 December
2009 2008 2007 2006
Trade payables turnover (in days)(1) . . . . . . . . . . . . . . . . . . . . . . 44 33 32 27
Note:
(1) Trade payables turnover is calculated as follows: (ending trade accounts payable / total cost of goods sold) x 365 days(or the period of generating cost of goods sold).
The increase in average trade payables turnover from 31 December 2008 to 30 June 2009 resultedfrom the Company’s working capital optimisation, including extensions of contractual paymentperiods under certain of our existing contracts. The increase in average trade payables turnover from31 December 2006 to 31 December 2007 mainly resulted from the acquisitions of the SUAL andGlencore Businesses.
Ensuring that the Group’s obligations to its suppliers are met is one of the main responsibilitiesof the Company’s deputy CEO. For these purposes, there is also a committee responsible forconsidering and regulating relations regarding obligations to suppliers and for ensuring that suchobligations are met.
The entire balance of trade and other payables at each reporting date is due within 12 months oron demand.
Indebtedness
Borrowings
At the close of business on 31 October 2009, being the latest practicable date for the purpose ofthis indebtedness statement prior to the printing of this circular, the Group had total borrowings ofapproximately US$13,646 million, comprising secured short-term bank borrowings of approximatelyUS$10,389 million and unsecured short-term bank borrowings of approximately US$3,257 million.Additionally, the Group recorded US$2,923 million of the deferred consideration (including accruedinterest) payable to Onexim in respect of its acquisition of a 25% plus one share interest in NorilskNickel.
FINANCIAL INFORMATION
— 217 —
Subsequent to the breach of a number of restrictive covenants at 31 December 2008, whichresulted in defaults and cross-defaults on a substantial portion of the Group’s credit portfolio theentire amount of its long-term loans and borrowings has been reclassified to current liabilities toreflect the ability of the lenders to demand immediate repayment. Therefore all borrowings as at 31October 2009 are considered short-term.
Following the Group’s successful long-term restructuring of its debt to its international andRussian and Kazakh lenders in November and December 2009, its debt profile changed significantly.This indebtedness statement is provided as at 31 October 2009 and therefore is not reflective of thischange. Details of the debt restructuring, its new maturity profile and key terms are set out in “— DebtRestructuring”.
Security (including mortgages and pledges of assets) and guarantees
As at 31 October 2009, the Group’s bank borrowings were secured as follows:
• US$4,500 million loan from VEB is secured by pledges of shares of the following Groupcompanies:
— 25% plus one share in Norilsk Nickel;
— 100% shares of Gershvin Investments Corp Limited;
— 25% shares of OJSC RUSAL Bratsk;
— 25% shares of OJSC RUSAL Krasnoyarsk;
• US$137 million by the pledge of 100% shares of Alumina & Bauxite Company Limited andassignment of alumina sales proceeds;
• US$455 million by a UC RUSAL guarantee, the pledge of 100% of shares of Khakasaluminium smelter, pledge of 100% of shares of Tameko Development Inc. and of Noirieux— Consultadoria e Serviços Sociedade Unipessoal, Lda, as well as by a pledge over assetsof Khakas aluminium smelter;
• By assignment of aluminium sales proceeds of approximately US$5,093 million;
• US$172 million by a pledge of assets of SUAL and a mortgage over real estate of SUAL;
• US$9 million by a pledge of assets of LLP Bogatyr Trans; and
• US$23 million by a pledge of assets of Bratsk aluminium smelter and a guarantee issuedby UC RUSAL.
Off balance sheet commitments and arrangements
• As at 31 October 2009, UC RUSAL had a US$260 million guarantee issued in respect ofthe joint business between RUSAL and OJSC RusHydro related to the Boguchanskyaluminium smelter.
• The Group is a guarantor of indebtedness of several non-Group controlling shareholderrelated entities. At 31 October 2009 the Group, either directly or indirectly, has guaranteedpromissory notes payable of US$42 million.
Available facilities
As at 31 October 2009, the Group did not have any unutilised bank facilities available.
FINANCIAL INFORMATION
— 218 —
App1A-32(4)

Cash and cash equivalents
Cash and cash equivalents as at 31 October 2009 amounted to US$297 million.
Disclaimers
Save as aforesaid and apart from intra-group liabilities and normal trade payables in the ordinarycourse of business, as at the close of business on 31 October 2009, the Group did not have any debtsecurities issued and outstanding or agreed to be issued, bank overdrafts or other similar indebtedness,liabilities under acceptances (other than normal trade bills) or acceptance credits, mortgages, charges,finance leases or hire purchase commitments, guarantees or other material contingent liabilities.
The Directors confirmed that apart from the long term debt restructuring covered above, therehave been no material changes in the indebtedness and contingent liabilities of the Group since 31October 2009 up to and including the Latest Practicable Date.
For information concerning the impact of the Group’s debt restructuring on the Group’sindebtedness, see “Financial Information — Selected Financial Data of the Group — Capitalisation”.
Liquidity and Capital Resources
Liquidity
In 2006 and 2007, the Group’s principal source of liquidity was cash flows from operations. In2008, the principal sources of liquidity were operating cash flows of US$3,017 million and financingcash flows of US$3,250 million. The Group’s principal uses of cash through 2012 are expected to befor operating expenses, debt repayment and limited capital expenditure pursuant to the terms of itsdebt restructuring agreements. It expects to fund its liquidity needs mainly through operating cashflow.
The Group expects that payments for purchases of materials, energy and other goods and servicesthroughout the forecast period as well as payment of profit and other taxes and capital expenditureswill be financed by operating cash inflow.
The Group intends to use all of the net proceeds received from the Global Offering to reduceoutstanding debt and to satisfy other obligations to its creditors (which include the settlement of feewarrants exercised for cash and payment of US$115 million to Onexim) pursuant to the terms of itsdebt restructuring agreements. In 2010, the Group expects to repay bank loans and other debt inaccordance with the terms of its debt restructuring agreements, including a proportionate repaymentto international and Russian and Kazakh lenders (excluding the VEB Debt, as discussed below) andOnexim. The principal sources for the repayment of the debt will be operating cash flow.
According to its amended loan agreement with VEB, the Company is required to repay US$4,500million on 29 October 2010. For a discussion of the Group’s expectations concerning extension of thisloan and repayment of this loan on its maturity date if it were not extended, see “— Debt Restructuring— Terms of the VEB Debt Restructuring”.
The Group has obligations to Onexim in respect of the deferred consideration for the purchaseof shares in Norilsk Nickel. In 2009, the Company restructured US$880 million of its obligations toOnexim in line with the restructuring of its international debt which will mature in 2013. Theremaining obligations were converted into Shares representing 6% of the Company’s share capital onthe date of effectiveness of the international override agreement. See “— Debt Restructuring — Termsof the Onexim Debt Restructuring”
FINANCIAL INFORMATION
— 219 —
App1A-32(1),(3)
App1A-32(b)(c)
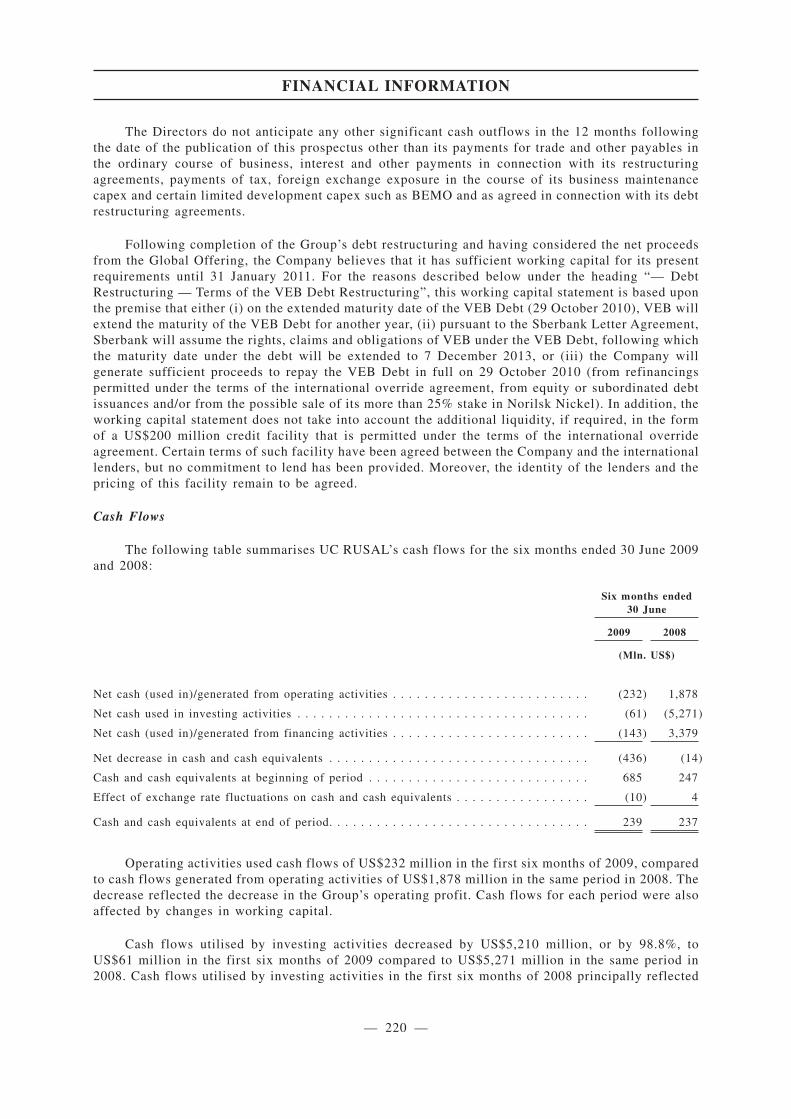
The Directors do not anticipate any other significant cash outflows in the 12 months followingthe date of the publication of this prospectus other than its payments for trade and other payables inthe ordinary course of business, interest and other payments in connection with its restructuringagreements, payments of tax, foreign exchange exposure in the course of its business maintenancecapex and certain limited development capex such as BEMO and as agreed in connection with its debtrestructuring agreements.
Following completion of the Group’s debt restructuring and having considered the net proceedsfrom the Global Offering, the Company believes that it has sufficient working capital for its presentrequirements until 31 January 2011. For the reasons described below under the heading “— DebtRestructuring — Terms of the VEB Debt Restructuring”, this working capital statement is based uponthe premise that either (i) on the extended maturity date of the VEB Debt (29 October 2010), VEB willextend the maturity of the VEB Debt for another year, (ii) pursuant to the Sberbank Letter Agreement,Sberbank will assume the rights, claims and obligations of VEB under the VEB Debt, following whichthe maturity date under the debt will be extended to 7 December 2013, or (iii) the Company willgenerate sufficient proceeds to repay the VEB Debt in full on 29 October 2010 (from refinancingspermitted under the terms of the international override agreement, from equity or subordinated debtissuances and/or from the possible sale of its more than 25% stake in Norilsk Nickel). In addition, theworking capital statement does not take into account the additional liquidity, if required, in the formof a US$200 million credit facility that is permitted under the terms of the international overrideagreement. Certain terms of such facility have been agreed between the Company and the internationallenders, but no commitment to lend has been provided. Moreover, the identity of the lenders and thepricing of this facility remain to be agreed.
Cash Flows
The following table summarises UC RUSAL’s cash flows for the six months ended 30 June 2009and 2008:
Six months ended30 June
2009 2008
(Mln. US$)
Net cash (used in)/generated from operating activities . . . . . . . . . . . . . . . . . . . . . . . . . (232) 1,878
Net cash used in investing activities . . . . . . . . . . . . . . . . . . . . . . . . . . . . . . . . . . . . . (61) (5,271)
Net cash (used in)/generated from financing activities . . . . . . . . . . . . . . . . . . . . . . . . . (143) 3,379
Net decrease in cash and cash equivalents . . . . . . . . . . . . . . . . . . . . . . . . . . . . . . . . . (436) (14)
Cash and cash equivalents at beginning of period . . . . . . . . . . . . . . . . . . . . . . . . . . . . 685 247
Effect of exchange rate fluctuations on cash and cash equivalents . . . . . . . . . . . . . . . . . (10) 4
Cash and cash equivalents at end of period. . . . . . . . . . . . . . . . . . . . . . . . . . . . . . . . . 239 237
Operating activities used cash flows of US$232 million in the first six months of 2009, comparedto cash flows generated from operating activities of US$1,878 million in the same period in 2008. Thedecrease reflected the decrease in the Group’s operating profit. Cash flows for each period were alsoaffected by changes in working capital.
Cash flows utilised by investing activities decreased by US$5,210 million, or by 98.8%, toUS$61 million in the first six months of 2009 compared to US$5,271 million in the same period in2008. Cash flows utilised by investing activities in the first six months of 2008 principally reflected
FINANCIAL INFORMATION
— 220 —
App1A-36
App1A-32(5)(a)
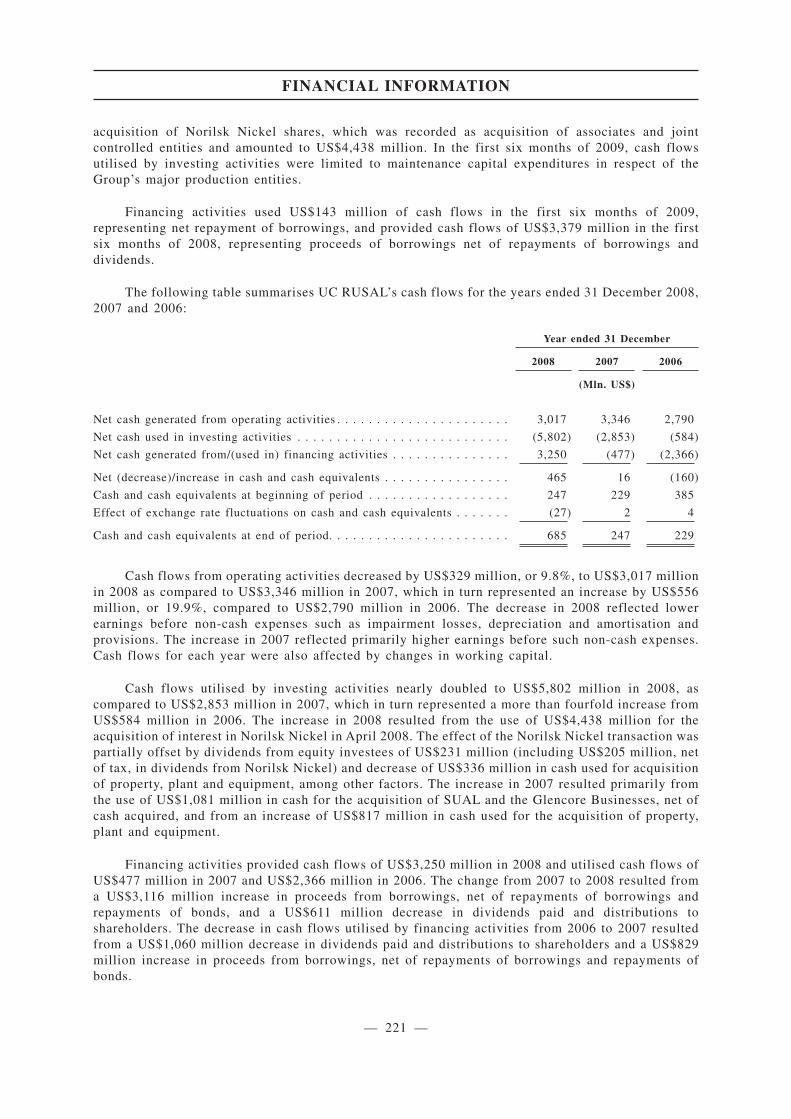
acquisition of Norilsk Nickel shares, which was recorded as acquisition of associates and jointcontrolled entities and amounted to US$4,438 million. In the first six months of 2009, cash flowsutilised by investing activities were limited to maintenance capital expenditures in respect of theGroup’s major production entities.
Financing activities used US$143 million of cash flows in the first six months of 2009,representing net repayment of borrowings, and provided cash flows of US$3,379 million in the firstsix months of 2008, representing proceeds of borrowings net of repayments of borrowings anddividends.
The following table summarises UC RUSAL’s cash flows for the years ended 31 December 2008,2007 and 2006:
Year ended 31 December
2008 2007 2006
(Mln. US$)
Net cash generated from operating activities . . . . . . . . . . . . . . . . . . . . . . 3,017 3,346 2,790
Net cash used in investing activities . . . . . . . . . . . . . . . . . . . . . . . . . . . (5,802) (2,853) (584)
Net cash generated from/(used in) financing activities . . . . . . . . . . . . . . . 3,250 (477) (2,366)
Net (decrease)/increase in cash and cash equivalents . . . . . . . . . . . . . . . . 465 16 (160)
Cash and cash equivalents at beginning of period . . . . . . . . . . . . . . . . . . 247 229 385
Effect of exchange rate fluctuations on cash and cash equivalents . . . . . . . (27) 2 4
Cash and cash equivalents at end of period. . . . . . . . . . . . . . . . . . . . . . . 685 247 229
Cash flows from operating activities decreased by US$329 million, or 9.8%, to US$3,017 millionin 2008 as compared to US$3,346 million in 2007, which in turn represented an increase by US$556million, or 19.9%, compared to US$2,790 million in 2006. The decrease in 2008 reflected lowerearnings before non-cash expenses such as impairment losses, depreciation and amortisation andprovisions. The increase in 2007 reflected primarily higher earnings before such non-cash expenses.Cash flows for each year were also affected by changes in working capital.
Cash flows utilised by investing activities nearly doubled to US$5,802 million in 2008, ascompared to US$2,853 million in 2007, which in turn represented a more than fourfold increase fromUS$584 million in 2006. The increase in 2008 resulted from the use of US$4,438 million for theacquisition of interest in Norilsk Nickel in April 2008. The effect of the Norilsk Nickel transaction waspartially offset by dividends from equity investees of US$231 million (including US$205 million, netof tax, in dividends from Norilsk Nickel) and decrease of US$336 million in cash used for acquisitionof property, plant and equipment, among other factors. The increase in 2007 resulted primarily fromthe use of US$1,081 million in cash for the acquisition of SUAL and the Glencore Businesses, net ofcash acquired, and from an increase of US$817 million in cash used for the acquisition of property,plant and equipment.
Financing activities provided cash flows of US$3,250 million in 2008 and utilised cash flows ofUS$477 million in 2007 and US$2,366 million in 2006. The change from 2007 to 2008 resulted froma US$3,116 million increase in proceeds from borrowings, net of repayments of borrowings andrepayments of bonds, and a US$611 million decrease in dividends paid and distributions toshareholders. The decrease in cash flows utilised by financing activities from 2006 to 2007 resultedfrom a US$1,060 million decrease in dividends paid and distributions to shareholders and a US$829million increase in proceeds from borrowings, net of repayments of borrowings and repayments ofbonds.
FINANCIAL INFORMATION
— 221 —
Debt restructuring
Background of the Debt Restructuring
In October, November and December 2009, the Company and certain of its subsidiariesrestructured their debt and certain other obligations to the Group’s international, Russian and Kazakhlenders and certain other creditors.
The principal objective of the Company’s Directors and management in negotiating the debtrestructuring was to give the Company greater time and flexibility to meet its debt obligations inanticipation of the expected aluminium price recovery. This has been achieved through the followingarrangements:
• linking debt repayment obligations to the Company’s ability to generate excess operatingcash flow (subject to meeting certain cumulative debt repayment targets);
• allowing a portion of interest charges to be capitalised under a pay in kind arrangement; and
• converting into equity a substantial obligation to Onexim.
Compliance with the Debt Restructuring and Sensitivity Analysis
In considering the terms of the debt restructuring, the Directors have taken into account their bestestimates of the projected operational and financial performance of the Group during the term of theoverride period until December 2013, as well as the limitations on that estimate as disclosed under“Risk Factors — Risks Relating to the Group and its Business — The terms of the debt restructuringagreements impose strict limits on the Group’s capital expenditure and other uses of available cashwhich will limit its ability to expand its business and to pay dividends, and failure by the Group tocomply with the terms and conditions of these agreements may materially adversely affect the Groupand its shareholders”. The Directors also considered the Group’s ability to realise cash from proceedsfrom possible disposals of shares in Norilsk Nickel in excess of the amount required for repaymentof the VEB Debt and potential future equity and subordinated debt fundraisings. On that basis, andsubject to such limitations, the Directors have reasonable grounds to believe that the Company willbe able to comply with the relevant performance targets, covenants and restrictions under the termsof the debt restructuring agreements for the duration of the override period.
However, there can be no assurance that the Company will be able to dispose of its NorilskNickel shares at a price that will generate excess amounts after repaying the VEB Debt or to raisefuture equity or subordinated debt if and when required. Furthermore, disposing of its Norilsk Nickelshares at a price that will generate excess amounts after repaying the VEB Debt, or raising equity orsubordinated debt, is likely to be more challenging in an environment of low commodity prices, whichis when the Company might be required to take such action.
The Company used the 23 October 2009 aluminium price and RUR/US$ exchange rate forwardcurves as the basis for the assumptions used when preparing the profit forecast for the year ending 31December 2009 and working capital memorandum for the 15 months period ending 31 December 2010(“restructuring base case”). The profit forecast and working capital memorandum assume that the VEBloan will be rolled over to 2013 or refinanced on equivalent terms. See also “Financial Information— Management’s Discussion and Analysis of Financial Condition and Results of Operations —Liquidity and Capital Resources — Debt Restructuring — Terms of the VEB Debt Restructuring”. Inthe following discussion, in order to provide the most up to date available information, the Company
FINANCIAL INFORMATION
— 222 —

has utilised the 27 November 2009 aluminium price and RUR/US$ exchange rate forward curves assourced from Bloomberg to update the restructuring base case (“updated base case”), which arepresented in the table below for reference.
2009 2010 2011 2012 2013
Aluminium price (US$/t)
Updated base case. . . . . . . . . . . . . . . . . . . . . . . . . . . . . 1,649 2,051 2,147 2,224 2,297
RUR/US$ exchange rate
Updated base case. . . . . . . . . . . . . . . . . . . . . . . . . . . . . 31.78 30.56 32.60 34.70 36.65
The Directors believe that the forward curves for aluminium prices and exchange rates used inthe Company’s updated base case are the best available objective publicly sourced forecasts of thesetwo variables.
Based on historical information, the Company believes that the long-term behaviour of thealuminium spot price and the spot RUR / US$ exchange rate is inversely correlated, and that, measuredover an extended period of time, the RUR will tend to depreciate (i.e. the RUR / US$ exchange ratewill tend to increase) when the aluminium price decreases. This does not happen every single time thealuminium price changes and is not always reflected by the short-term movements of these variablesor by their forward curves as other factors also drive the shapes of these curves including, in the caseof aluminium prices, such factors as the market’s view on current and future supply of aluminium, thecost of keeping physical aluminium in storage, interest rates and availability of financing and, in thecase of the RUR/US$ exchange rate, interest rates, global flow of funds and inflation rate differentialsbetween Russia and the US.
The Directors’ compliance expectations were tested against an estimate of operationalperformance in the updated base case, which was then adjusted by changing certain assumptions to testcompliance in an environment of greater stress (including a reduction in the aluminium price). Asummary of the assumptions underlying the updated base case is presented below. These assumptionsrelate to future events, circumstances and developments. By their nature, these assumptions involverisk and uncertainty and there can be no guarantee that such assumptions will prove to be accurate orcorrect. Moreover, a number of these assumptions relate to matters outside the Group’s control,including prices for aluminium, alumina, electricity, transportation, raw materials and other inputs aswell as general economic and market conditions and uninterrupted production. There are a number ofrisks, uncertainties and other factors that could cause the actual events, circumstances anddevelopments to differ materially from these assumptions. See also “Forward-Looking Statements”.
• Aluminium production and sales volumes: assumes that production and sales volumesincrease to levels in line with those of 2008 when the aluminium market recovers;
• Aluminium prices: forecast is based on the LME aluminium forward curve as at 27November 2009 as sourced from Bloomberg;
• RUR/US$ exchange rates: forecast is based on the RUR/US$ forward curve as at 27November 2009 as sourced from Bloomberg;
• Production cash costs: based on management’s best internal estimates of the evolution ofkey cost components such as alumina price, electricity costs, transportation costs and otherraw material and input costs consistent with an economic environment supporting theassumed aluminium prices and exchange rates referred to above;
FINANCIAL INFORMATION
— 223 —

• Capital expenditure: capital expenditure for this period will be limited to maintenancecapital expenditure within specified limits except with respect to the Boguchanskayahydropower plant, as permitted by the international override agreement; and
• Net proceeds from the Global Offering following the cash settlement of fee warrants:assumed to be approximately US$2 billion (assuming an Offer Price of HK$10.80 per OfferShare, being the mid-point of the estimated Offer Price range).
Stress test scenarios. Based on the Company’s historical performance, the Directors believe thatthe impact of changes to any particular assumptions underlying the updated base case cannot bepresented in isolation, as they believe that a reduction in aluminium prices will be offset to a degreeby a reduction in input costs (including the cost of alumina, anode blocks, coke, pitch, andtransportation costs), reducing the Company’s overall production cash costs. The analysis presentedbelow reflects the Directors’ estimate of the Company’s ability to comply with the financial covenantsand debt reduction targets that form part of the debt restructuring under the assumption that aluminiumprices are approximately 20% below the updated base case. In this stress test scenario, productionvolume and cash costs are assumed to decline in relation to the reduction in the assumed aluminiumprice based on the Company’s historical operational performance between 2008 and 2009.
The Directors believe that this stress test scenario provides investors with an appropriatedownside case representing the impact of a severe downturn in the global economy and in thealuminium industry, comparable to that experienced by the aluminium industry in general, and theCompany specifically, in the last six months of 2008 and in 2009. Due to the downturn in the globaleconomy at the end of 2008 and in 2009, aluminium producers curtailed approximately 17% of annualaluminium production on an annualised basis due to the low aluminium price. The impact of theassumptions described above would reduce the Company’s operating margin to a level comparable tothat expected for 2009.
In any year between 2010 and 2013, should the average aluminium price assumption for that yearbe reduced by up to 20% (assuming that the production volume and cash cost assumptions areconsistent with the assumed aluminium price as described above and all other assumptions remain asper the updated base case), the Directors believe that the Company should be able to comply with thefinancial covenants and debt reduction targets that form part of the debt restructuring. In isolation,changes in the RUR/US$ exchange rate forecast have less of an impact in comparison to changes inthe aluminium price assumption.
There can be no assurance, however, that any of the variations will be as assumed. In particular,if: i) the assumed aluminium price is lower; ii) input costs and production cash costs are higher; iii)the RUR/US$ exchange rate is lower (i.e. the RUR appreciates); and/or iv) input costs and productioncash costs do not decrease when the aluminium price falls, the Company’s ability to comply with thefinancial covenants and debt reduction targets that form part of the debt restructuring will be adverselyaffected.
The updated base case average assumed aluminium price is forecasted to rise by a compoundannual growth rate of approximately 8.6% between 2009 to 2013 and the average RUR/US$ exchangerate is forecast to increase (i.e. the RUR depreciates) by a compound annual rate of approximately3.6% between 2009 to 2013. The Group’s cash flows are highly sensitive to changes in theassumptions regarding the key variables and their correlation. Small changes in one or more ofthese assumptions could have a material adverse effect on the Company’s ability to comply withthe terms of its debt restructuring agreements.
Should the aluminium price fail to increase and/or if the RUR/US$ exchange rate fails to increase(i.e. the RUR fails to depreciate) as forecast in the updated base case, the Company may not be ableto comply with financial covenants and debt reduction targets that form part of the debt restructuring.The following scenarios illustrate relevant sensitivities:
Scenario No. 1: constant nominal aluminium price and nominal RUR/US$ exchange rate.If the assumed aluminium price and the RUR/US$ exchange rate were to remain constant innominal terms at the spot levels as sourced from Bloomberg on 2 December 2009 (US$2,126/tof aluminium and RUR29.4/US$1.0), and all other assumptions under the updated base caseremained unchanged, the Company would not comply with one or more of the financialcovenants and debt reduction targets that form part of the debt restructuring in 2011; or
FINANCIAL INFORMATION
— 224 —
Scenario No. 2: Aluminium price falls by more than 20% for more than one year. If theassumed average aluminium price falls by more than 20% below the updated base case for morethan one year, while other assumptions remain unchanged as per the stressed tested scenariodescribed above, in 2011 the Company would not be able to comply with one or more of thefinancial covenants and debt reduction targets that form part of the debt restructuring; or
Scenario No. 3: RUR/US$ exchange rate decreases (i.e. the RUR appreciates) more than18% for more than one year. If the assumed average RUR/US$ exchange rate decreases (i.e. theRUR appreciates) by more than 18% below the updated base case for more than one year, whileother assumptions remain unchanged as per the updated base case, in 2011 the Company wouldnot be able to comply with one or more of the financial covenants and debt reduction targets thatform part of the debt restructuring; or
Scenario No. 4: Input costs remain flat or increase or the RUR/US$ exchange rate remainsflat or decreases (i.e. the RUR appreciates) when aluminium prices decrease. If input costs wereto remain flat or increase, or the RUR/US$ exchange rate was to remain flat or decrease (i.e. theRUR appreciates) when the assumed aluminium price decreases, the impact of such decrease onthe Company’s operating performance will be more severe, and could result in the Company notbeing able to comply with one or more of the financial covenants and debt reduction targets thatform part of the debt restructuring when the assumed aluminium price reduction is less than 20%.
While the future level of aluminium prices and RUR/US$ exchange rate remain uncertain, theDirectors take considerable comfort from the Company’s position on the aluminium cost curve, whichpositions it amongst the lowest cost aluminium producers in the world, and the fact that aluminiumprice levels are unlikely to fall below the aluminium industry’s average cost of production for anyextended period. As set out in “Industry and Market Overview — Demand and Supply”, historicallythe demand for aluminium has grown in excess of global GDP. The Directors expect this trend tocontinue, especially as the GDP per capita growth of China, India and Brazil exceeds that of developednations. Given the evolution of global demand for aluminium through the economic cycles, theDirectors believe that only a prolonged downturn in the global economy, including the economies ofChina, India and Brazil, could cause the aluminium price to remain at unsustainably low levels suchthat the aluminium industry is not profitable. There can be no assurance that aluminium prices willnot fall below the industry’s average cost of production for an extended period of time. If that werethe case, the Company’s ability to comply with the financial covenants and debt reduction targets thatform part of the debt restructuring will be adversely affected.
If the Company’s cash generation is not sufficient to satisfy its debt restructuring obligations,there are a number of actions which the Company’s management can undertake in an attempt to meetthese debt restructuring obligations, including delaying capital expenditures (e.g. rescheduling potrebuilds), reducing production or mothballing higher cost facilities and managing working capital.There can be no assurance that these or other additional actions that the Company’s managementundertakes in an attempt to satisfy these debt restructuring obligations will be sufficient to allow theCompany to comply with the financial covenants and debt reduction targets that form part of the debtrestructuring.
Failure to comply with the terms of the debt restructuring agreements (including the financialcovenants and debt reduction targets) could, if the required majority of lenders so elects, result inacceleration of the Group’s indebtedness. In these circumstances, the Company would be insolvent andcould be declared bankrupt, in which case investors’ rights to receive any distribution would rankbehind the creditors of the Company (including the creditors with respect to the Company’srestructured debt), and investors could lose their entire investment in the Company. See also “RiskFactors — Risks Relating to the Group and its Business — The terms of the debt restructuringagreements impose strict limits on the Group’s capital expenditure and other uses of available cashwhich will limit its ability to expand its business and to pay dividends, and failure by the Group tocomply with the terms and conditions of these agreements may materially adversely affect the Groupand its shareholders”.
FINANCIAL INFORMATION
— 225 —
Refinancing of the debt following the Override Period
The Directors believe that (based on the Company’s operating assumptions and their outlook forthe aluminium sector) by the end of the four year override period ending in December 2013 theGroup’s debt (including capitalised interest) level will be reduced significantly, which the Directorsbelieve will improve the Company’s ability to access the credit markets (subject to market conditionsat that time) to refinance the outstanding debt at the end of the four year override period endingDecember 2013. In addition, the existing international lenders have agreed to provide new debtfacilities to refinance outstanding debt (including capitalised interest) at the end of the override period(6 December 2013), subject to a number of conditions being met as at the end of the override period,including: i) meeting certain debt reduction targets that are part of the international overrideagreement; and ii) the total net debt to Covenant EBITDA being 3 to 1 or less. The Russian and Kazakhbanks (other than VEB) have also provided a soft commitment to provide new debt to refinanceoutstanding debt. The new debt facilities would have a maturity of three years.
Based on the Directors’ best estimates of the projected operational and financial performance ofthe Group, the Company should:
• be in a financial position to raise new debt from other sources of finance in order torefinance the outstanding debt as at the end of the override period (including capitalisedinterest);
• comply with the international lenders’ conditions in order to refinance outstanding debt(including capitalised interest) from new debt facilities to be provided by the internationallenders; and
• be able to refinance from new debt to be provided by the Russian and/or Kazakh banks.
There can be no assurance, however, that the Company will meet the total net debt to CovenantEBITDA condition, the debt reduction targets included in the international override agreement, andcertain other conditions required by the international lenders, or be able to raise new debt to refinancethe debt as at the end of the override period. If the Group is unable to meet such conditions or targetsor unable to raise such new debt, it would be insolvent and could be declared bankrupt, in which caseinvestors’ rights to receive any distribution would rank behind the creditors of the Company (includingthe creditors with respect to the Company’s restructured debt), and investors could lose their entireinvestment in the Company. See “Risk Factors — Risks Relating to the Group and its Business — Theterms of the debt restructuring agreements impose strict limits on the Group’s capital expenditure andother uses of available cash which will limit its ability to expand its business and to pay dividends,and failure by the Group to comply with the terms and conditions of these agreements may materiallyadversely affect the Group and its shareholders”.
Terms of International Debt Restructuring
The long-term restructuring of the Group’s financial indebtedness to its international lenders willbe completed in two phases: phase one (with a duration of 48 months) being governed by theinternational override agreement, which harmonises certain provisions of the Group’s internationalloan facilities; and phase two (with a duration of 36 months) involving a refinancing of outstandingdebt out of new debt facilities, if necessary.
Override
The Company has entered into an arrangement with 65 creditors under international facilitiesaccounting for US$7.4 billion of debt and contingent liabilities pursuant to which such creditors haveagreed to extend maturities until 6 December 2013. This arrangement is documented in aninternational override agreement, which became effective on 7 December 2009, and other relatedagreements.
FINANCIAL INFORMATION
— 226 —
App1A-32(5)(b)3rd Sch23

The international override agreement imposes certain obligations on the Group during theoverride period and harmonises the pricing and amortisation schedule of existing international loanfacilities. The international override agreement contains standard financial covenants, including withrespect to the maintenance of specified ratios, such as free cashflow to net finance charges, total netdebt to Covenant EBITDA and total net debt to equity, tested quarterly. The Company paid an upfrontfee to the restructuring lenders, including 0.5% of the lenders’ exposure in cash and nominal strikewarrants (“fee warrants”) entitling the restructuring lenders to 1% of the Company’s fully dilutedshare capital as at the date of effectiveness of the international override agreement. On the effectivedate of the international override agreement, the principal amount of debt outstanding subject to theinternational override agreement was US$7.4 billion (including US$0.2 billion of contingentliabilities).
For the purposes of the Group’s debt restructuring agreements, “Covenant EBITDA” means, inrespect of any relevant period, the Company’s consolidated profit before tax for that relevant period:
(a) before deducting any Finance Charges and not including any Finance Income;
(b) not including any earnings before interest, tax, depreciation and amortisation (calculated onthe same basis as this definition) of any project company of the Group where (1) the projectcompany is set up solely for the purpose of carrying out the relevant project, where thelenders have no recourse to any member of the Group (including by way of completionguarantee or similar instrument or offtake agreement on preferential terms) other than to theproject company, and (2) no other member of the Group provides any funding to suchproject company and where the financing of such project company is otherwise ring-fencedfrom the rest of the Group on terms acceptable to the majority international lenders (beinginternational lenders representing 66 2⁄3% or more of the aggregate exposures of theinternational lenders at that time), recalculated on the basis that any sales to other membersof the Group and purchases from other members of the Group by any such project companyare recorded at the average market price used for sales of the relevant product to personsnot being members of the Group and purchases of the relevant product from persons notbeing members of the Group during the relevant period;
(c) not including any exceptional, one off, non-recurring or extraordinary items;
(d) after deducting the amount of any profit (or adding back the amount of any loss) of anymember of the Group which is attributable to minority interests;
(e) adding the amount of the net income of Norilsk Nickel or deducting the amount of net lossattributable to the shares owned by members of the Group in Norilsk Nickel, if not alreadyincluded in consolidated profit before tax of the Group;
(f) before taking into account any upward or downward adjustment of any non-cash provision;
(g) after adding back any amount attributable to the amortisation, depreciation or impairmentof assets of members of the Group to the extent not added before;
(h) before taking into account any foreign exchange gains or losses recognised as such in theCompany’s consolidated financial statements prepared in accordance with IFRS; and
(i) before deducting any amount paid to the holders of warrants that is required to be paid asa result of a distribution being made by the Company to its Shareholders,
in each case, to the extent the above adjustments are not already made, as the case may be, for thepurposes of determining the consolidated profit before tax.
FINANCIAL INFORMATION
— 227 —
For the purposes of the definition of “Covenant EBITDA”, (A) “Finance Charges” means, for anyrelevant period, the aggregate amount of the accrued interest (other than payment-in-kind interest),commission, fees, discounts, prepayment fees, premiums or charges and other finance payments inrespect of certain borrowings whether paid or payable by any member of the Group (calculated on aconsolidated basis) in respect of that relevant period: (i) including any upfront fees or costs; (ii)including the interest (but not the capital) element of payments in respect of finance leases; (iii)including any commission, fees, discounts and other finance payments payable by (and deducting anysuch amounts payable to) any member of the Group under any interest rate hedging arrangement; and(iv) excluding any payments to the holders of warrants according to the warrant documents, providedthat no amount shall be added (or deducted) more than once and (B) “Finance Income” meansconsolidated interest income on financial investments (including available-for-sale financial assets),dividend income, gains on the disposal of available-for-sale financial assets, changes in the fair valueof financial assets at fair value through profit and loss, gains on hedging instruments that arerecognised in consolidated profit or loss of the relevant company and other items recognised as suchin the Company’s consolidated financial statements prepared in accordance with IFRS.
The following is a reconciliation of Covenant EBITDA to consolidated profit before tax for the12 months ended 30 June 2009:
Reconciliation of Covenant EBITDAYear ended
30 June 2009
(Mln. US$)
Consolidated profit/(loss) before tax . . . . . . . . . . . . . . . . . . . . . . . . . . . . . . . . . . . . . (8,460)Add:
Net Finance charge . . . . . . . . . . . . . . . . . . . . . . . . . . . . . . . . . . . . . . . . . . . . . . . . 1,059Amortisation and depreciation . . . . . . . . . . . . . . . . . . . . . . . . . . . . . . . . . . . . . . . . . 762Impairment of non-current assets . . . . . . . . . . . . . . . . . . . . . . . . . . . . . . . . . . . . . . . 3,361Impairment of other assets . . . . . . . . . . . . . . . . . . . . . . . . . . . . . . . . . . . . . . . . . . . 2,812FOREX . . . . . . . . . . . . . . . . . . . . . . . . . . . . . . . . . . . . . . . . . . . . . . . . . . . . . . . . 324Other . . . . . . . . . . . . . . . . . . . . . . . . . . . . . . . . . . . . . . . . . . . . . . . . . . . . . . . . . . 437
Covenant EBITDA . . . . . . . . . . . . . . . . . . . . . . . . . . . . . . . . . . . . . . . . . . . . . . . . . . 294
For the purposes of the Group’s debt restructuring agreements, “total net debt” means, at anytime, the aggregate amount of all obligations of members of the Group for or in respect of Borrowingsat that time but:
(a) excluding any such obligations to any other member of the Group;
(b) excluding to the extent they constitute Borrowings:
(i) any Quasi-Equity; and
(ii) any project financings of the Group whereby, in each case, (1) the borrower of suchfinancing is a project company set up solely for the purpose of carrying out therelevant project, where the lenders have no recourse to any member of the Group(including by way of completion guarantee or similar instrument or offtake agreementon preferential terms) other than to the project company, and (2) where no othermember of the Group provides any funding to such project company and where suchfinancing is otherwise ring-fenced from the rest of the Group on terms acceptable tothe majority international lenders;
(c) including, in the case of finance or capital leases only, their capitalised value; and
FINANCIAL INFORMATION
— 228 —

(d) deducting the aggregate amount of cash and cash equivalent investments held by anymember of the Group,
and so that no amount shall be included or excluded more than once.
For the purposes of the definition of total net debt, (A) “Borrowings” means, at any time, theaggregate outstanding principal, capital or nominal amount (and any fixed or minimum premiumpayable on prepayment or redemption) of any Financial Indebtedness of members of the Group otherthan Financial Indebtedness falling under paragraph (h) of the definition of Financial Indebtedness tothe extent they constitute payment instruments and only in respect of amounts which are not then dueand payable thereunder; (B) “Financial Indebtedness” means, without double counting, in relation toa person, its obligation (whether present or future, actual or contingent, as principal or surety) for thepayment or repayment of money (whether in respect of interest, principal or otherwise) incurred inrespect of (a) moneys borrowed or raised (including in each case, for the avoidance of doubt, anyinterest that has capitalised thereon) and debit balances at banks or other financial institutions; (b) anybond, note, loan stock, debenture or similar instrument issued with an objective of borrowing orraising money; (c) any amount raised pursuant to any acceptance credit (but excluding acceptancecredits issued in the ordinary course of business payable in less than 90 days), bill discounting orfactoring facility (but excluding any amount raised without recourse); (d) the purchase of any goodsor services from any person which is more than 60 days past the due date; (e) any amount raised bythe issue of shares which are redeemable (other than at the option of the issuer) before the date fallingfour years after the override repayment date; (f) any hire purchase agreement, conditional saleagreement or lease, where that agreement has been entered into primarily as a method of raisingfinance or financing the acquisition of an asset; (g) any finance or capital lease; (h) any guarantee,bond, stand-by letter of credit or other similar instrument issued in connection with the performanceof contracts, including such instruments granted in respect of project finance undertakings in theordinary course of business and any documentary credit (except to the extent such instrument is apayment instrument and only in respect of amounts which are not then due and payable thereunder);(i) any interest rate or currency swap agreement or any other hedging (including commoditieshedging) or derivatives instrument or agreement (with the amount of such Financial Indebtednessbeing calculated on a mark to market valuation); (j) any arrangement pursuant to which any asset soldor otherwise disposed of by that person is or may be leased to or re-acquired by the relevant person(whether following the exercise of an option or otherwise); (k) any amount raised under any othertransaction having the commercial effect of a borrowing or otherwise classified as borrowings underIFRS; and (l) any guarantee, indemnity or similar insurance against financial loss given in respect ofthe obligation of any person; and (C) “Quasi-Equity” means an unsecured loan (not constituting adiscounted instrument) to the Company by a person that is not a member of the Group where (a) nocash interest is payable and (b) the tenor ends no earlier than four years after the end of the overrideperiod; and (c) the loan is duly subordinated (as to principal and interest) on terms acceptable to therequisite majority of international lenders.
FINANCIAL INFORMATION
— 229 —

Margin
During the override period, the restructured debt bears interest at the currently applicable baserate (either LIBOR or Euribor depending on the denomination of the debt), plus a margin that variesdepending on the ratio of total net debt to Covenant EBITDA and includes cash and payment-in-kind(“PIK”, meaning capitalised) components, as follows:
Ratio of Total Net Debt to Covenant EBITDA Total MarginCash PayMargin PIK Margin
more than 15 . . . . . . . . . . . . . . . . . . . . . . . . . . . . . . . 7.00% p.a. 1.75% p.a. 5.25% p.a.
7.5 to 15 . . . . . . . . . . . . . . . . . . . . . . . . . . . . . . . . . . 5.50% p.a. 1.75% p.a. 3.75% p.a.
4.0 to 7.5 . . . . . . . . . . . . . . . . . . . . . . . . . . . . . . . . . 4.50% p.a. 2.25% p.a. 2.25% p.a.
3.0 to 4.0 . . . . . . . . . . . . . . . . . . . . . . . . . . . . . . . . . 4.00% p.a. 3.00% p.a. 1.00% p.a.
less than 3.0 . . . . . . . . . . . . . . . . . . . . . . . . . . . . . . . 3.50% p.a. 3.50% p.a. N/A
Until the first interest period commencing after receipt of audited consolidated financialstatements of the Group for 2009 the applicable total margin is set at 7.00% per annum, including a1.75% per annum cash pay margin and a 5.25% per annum PIK margin. The ratio of total net debt toCovenant EBITDA was 47.2 to 1 as at 30 June 2009. If a material event of default (breach ofconditions subsequent, payment default or failure to meet Event of Default Cumulative Amounttargets) has occurred, the applicable PIK margin will increase by 2% per annum, but so that the totalmargin does not exceed 7%.
Repayment
No fixed amortisation schedule applies during the override period, with all debt outstandingunder the international facilities becoming due at the end of the override period (i.e., December 2013).However, the net proceeds raised from asset disposals and equity and subordinated and other debt fundraisings (including the proceeds of the Global Offering) and excess cashflow (subject to the Groupbeing allowed to retain a US$400 million cash buffer) must be applied to repay the Group’soutstanding indebtedness on a pro rata basis.
Disposal and Equity Injection Undertakings, Debt Repayment Targets
The Company is obliged to dispose of assets and/or raise equity or subordinated debt by the endof the override period (i.e., by December 2013) sufficient to generate net proceeds of at least US$2.4billion. Compliance with this obligation is tested only once, at the end of the override period.
The Company is also obliged to ensure that debt of the Group (other than debt owed to VEB andOnexim) is repaid during the override period in the following amounts:
Test Dates
TargetCumulative
Amount
Event of DefaultCumulative
AmountPercentage of
share capital(1)
(Mln. US$) (%)
31 December 2010 . . . . . . . . . . . . . . . . . . . . . . . . . . . 1,400 750 0.75
30 September 2011 . . . . . . . . . . . . . . . . . . . . . . . . . . . 3,000 2,000 0.75
30 September 2012 . . . . . . . . . . . . . . . . . . . . . . . . . . . 4,000 3,000 1.25
End of override period . . . . . . . . . . . . . . . . . . . . . . . . 5,000 4,000 1.50
FINANCIAL INFORMATION
— 230 —

Note:(1) Percentage of share capital of the Company for which equity compensation warrants shall be issued is calculated on the
relevant issue date without taking into account any warrants then in issue.
If the Target Cumulative Amounts are not met and/or on the third and fourth test dates certainleverage ratios are not met, the Company will be obliged to issue zero strike warrants (“equitycompensation warrants”) to the international lenders representing equity in specified percentages. Forexample, if we are unable to meet our Target Cumulative Amount on 31 December 2010 (but aresuccessful in meeting the Event of Default Cumulative Amount) after giving effect to the GlobalOffering we would be required to issue equity compensation warrants representing 0.75% of the fullydiluted share capital of the Company as at the relevant issue date. The issuance of such warrants wouldhave an immediate dilutive effect to our shareholders. Failure to meet the Event of Default CumulativeAmount targets will result in an event of default.
In certain circumstances, the Group may be obliged to dispose of a number of shares in NorilskNickel (see “Business — The Group’s Operations — Norilsk Nickel and Material Joint Ventures”)sufficient to enable it to repay amounts outstanding under a US$4.5 billion loan dated 30 October 2008between the Company and State Corporation “Bank for Development and Foreign Economic Affairs”(the “VEB Debt”), as described below:
• The Company’s obligation to sell will be triggered if, (i) during the period starting on thefirst date of the override period and ending three months prior to the end of the overrideperiod, (a) the market value of the Company’s 25% plus one share stake in Norilsk Nickel(the “NN Stake”) exceeds the Trigger Value (as defined below) for 15 consecutive businessdays; or (b) the Company receives an offer from a third party in respect of a number ofshares in Norilsk Nickel sufficient to enable the Company to repay the VEB Debt with animplied value of at least the Trigger Value for the entire NN Stake; or (ii) the Company failsto meet an Event of Default Cumulative Amount target.
• The sale obligation is suspended until 30 November 2010. If, prior to that date, the Grouprepays indebtedness outstanding to its international lenders in an amount at least equal toUS$1.4 billion using cashflow, proceeds from any new equity raising (including proceedsof the Global Offering), proceeds from any disposal of any shares in Norilsk Nickel (at theCompany’s sole discretion) and proceeds from any disposal of any non core assets (meaningassets not involved in the Group’s primary business of aluminium or alumina productionand any assets of the former SUAL group other than Irkutsk aluminium smelter assets), thesale obligation will be further suspended until 31 March 2012.
• The sale obligation will no longer be suspended if a material event of default occurs underthe international override agreement, i.e., a payment default, a default under the debtreduction covenant or failure to meet any conditions subsequent under the internationaloverride agreement.
• Whether or not the obligation to sell is still suspended, if, prior to 31 March 2012, theGroup repays indebtedness outstanding to its international lenders in an amount at leastequal to US$3 billion using cashflow, proceeds from any new equity raising (includingproceeds of the Global Offering), proceeds from any disposal of any shares in NorilskNickel (at the Company’s sole discretion) and proceeds from any disposal of any non coreassets (meaning assets not involved in the Group’s primary business of aluminium oralumina production and any assets of the former SUAL group other than Irkutsk aluminiumsmelter assets), the sale obligation will cease to apply.
• “Trigger Value” means US$7.5 billion plus the aggregate amount of principal (includingcapitalised interest) which has been repaid to the Group’s international lenders prior tocommencement of the sale process as a result of any new equity raisings (including
FINANCIAL INFORMATION
— 231 —
proceeds of the Global Offering), operation of the cashflow sweep mechanism and disposalof any non core assets (including any shares in Norilsk Nickel). The question whether ornot the sale obligation has been triggered at any time during any suspension period will bedetermined by reference to the Trigger Value as at the end of the suspension period. Forexample, if the market value of the NN Stake rises to US$8 billion in March 2010 andremains at that level but, on or before 30 November 2010, the Company has issuedadditional equity in the amount of US$600 million, then the sale obligation will not arisesince the Trigger Value at the end of the suspension period will be at least US$8.1 billion.
• If the obligation to sell is triggered as described in sub-paragraph (i) of the first bulletabove, the Company will have up to 12 months following the date when the obligation wastriggered, but no less than six months following the end of the suspension period to sell theNN Stake (“first mandatory sale period”). If the suspension period has terminated followingan occurrence of a material event of default, the first mandatory sale period will be reducedto three months after the later of (a) the date when the obligation to sell is triggered inaccordance with sub-paragraph (i) of the first bullet above and (b) the end of the suspensionperiod.
• During the first mandatory sale period, a prescribed auction process will be arranged by themandate banks. There will be no obligation to sell the shares in Norilsk Nickel during thefirst mandatory sale period if the Company is unable to realise net proceeds at least equalto the Trigger Value (or its pro rata share if less than the entire NN Stake is to be sold).
• If the obligation to sell is triggered as described in sub-paragraph (ii) of the first bulletabove or if the sale does not occur during the first mandatory sale period and the saleobligation continues to apply, a second mandatory sale period of three months willcommence, during which the price may be any amount resulting in net proceeds sufficientto repay the VEB Debt. During the second mandatory sale period a prescribed actionprocess will be arranged by the mandate banks. A sale during the second mandatory saleperiod could result in a material loss for the Group.
• The Company has the option, at any time after the obligation to sell is triggered, of avoidinga sale of the NN Stake by (i) raising equity or subordinated debt sufficient to repay the VEBDebt in full or (ii) repaying the international debt in an amount (the “Required Amount”)necessary to ensure that the outstanding amount under the international facilities is reduced(x) to no more than 50% of the amount outstanding as at the start of the override period or(y) if less than the Required Amount, by US$4 billion. In addition, the Company may avoidthe obligation to sell the NN Stake to the winner of the auction by selling it instead to athird party on arm’s length terms.
Additional Security
In addition to the security provided under its existing loan facilities, the Group provided oragreed to provide additional security to the international lenders over the following:
• 25% of the shares in the Bratsk and Krasnoyarsk aluminium smelters plus, on a secondaryranking basis, one share in each of them (following the release of the security held by VEB,security over one share in each of the Bratsk and Krasnoyarsk aluminium smelters shall beprovided on a primary ranking basis);
• 39% less one share in each of the Novokuznetsk aluminium smelters, SUAL and Achinskalumina refinery and 27.15% in Sayanogorsk aluminium smelter, provided that percentageof shares subject to pledge in each of those entities will be reduced to 25% plus one share
FINANCIAL INFORMATION
— 232 —

once the Group repays indebtedness outstanding to its international lenders in an amountat least equal to US$1.4 billion using cashflow, proceeds from any new equity raising(including proceeds of the Global Offering) and proceeds from disposal of non-core assets(including shares in Norilsk Nickel);
• receivables under certain offtake, export and tolling contracts and certain intra-group loanssubject to certain exceptions;
• 100% of the shares or interest in certain non-Russian operating companies or their holdingcompanies;
• security over fixed assets of the Russian aluminium smelters and Achinsk alumina refinerysplit between international lenders and Russian lenders according to pre-agreedpercentages, where international lenders’ share in security over fixed assets does not exceed10% of the assets of each of the aluminium smelters and 30% of the fixed assets of Achinskalumina refinery; the fixed assets of the Bratsk and Krasnoyarsk aluminium smelters aresubject to security in favour of the international lenders only; and
• security over aluminium owned by certain Group companies.
Following the repayment of the VEB Debt, the Company will be obliged to provide security overany shares in Norilsk Nickel that the Group then continues to hold and which are not subject tosecurity in favour of the international lenders (the Company is also obliged to provide security overcertain assets it controls following the unwinding of the derivative financial instrument relating to theshares in Norilsk Nickel). In addition, as a condition to the restructuring of the guarantee of theBoguchanskoye project loan, the Company has provided security over shares in its intermediaryholding companies controlling the Group’s interest in the Boguchansk project and has agreed toprovide, subject to RusHydro’s consent, security over its interest in the BEMO project (including atthe operating companies’ level).
Dividends
The restructuring agreements restrict the Group’s ability to pay dividends. In particular,dividends may not be paid until the Group’s ratio of total net debt to Covenant EBITDA is 3 to 1 orless and its debt (excluding debt owed to VEB and Onexim) has been repaid by at least US$5 billion.Further, there should be no continuing default under the international override agreement and theGroup should be able to demonstrate that it has sufficient cash to pay the proposed dividends. If andwhen dividends become payable, they are limited to no more than 50% of the Group’s annual net profit(excluding earnings, but including dividends, of Norilsk Nickel) in any one year.
Warrants
Fee warrants will be automatically converted into the Company’s Shares at the nominal value ofthe Shares on the date of the Global Offering. International lenders may require the Company to settlethe fee warrants (issued on the first day of the override period) in cash in lieu of shares at a price pershare equal to the US dollar price per Share under the International Placing less certain portion ofcommissions, fees and expenses relating to the Global Offering. Otherwise, Shares into whichwarrants are converted following the Global Offering will be subject to a lock-up of 180 daysfollowing the date of completion of the Global Offering (or such shorter lock-up period as may applyto the Company’s shareholders). International lenders holding fee warrants representing 0.73% of theCompany’s share capital (immediately following completion of the Global Offering, assuming theOver-allotment Option is not exercised and no bonus Shares are issued to management) have exercisedtheir cash settlement option.
FINANCIAL INFORMATION
— 233 —
App1A-12
App1A-23(2)

Equity compensation warrants that may be issued by the Company during the override period willbe convertible, in whole but not in part, into the Company’s Shares at any time following the GlobalOffering at the election of the warrantholders. Shares for which any warrants are exercised may besold by the relevant warrantholders subject to the Company’s right of first refusal.
Financial Covenants
The Group is obliged to comply with certain financial covenants during the override period,including total net debt to Covenant EBITDA, total net debt to equity and free cashflow to net financecharges as follows:
Testing Period Ending
Total Net Debtto Covenant
EBITDATotal Net Debt
to Equity
Free Cashflowto Net Finance
Charges
31 December 2009(1) . . . . . . . . . . . . . . . . . . . . . . . . . . . . 18.5x 4.0x 0.7x
31 March 2010 (1) . . . . . . . . . . . . . . . . . . . . . . . . . . . . . . . 18.5x 4.0x 0.7x
30 June 2010 (1) . . . . . . . . . . . . . . . . . . . . . . . . . . . . . . . . 15.0x 2.5x 1.0x
30 September 2010 . . . . . . . . . . . . . . . . . . . . . . . . . . . . . 15.0x 2.5x 1.0x
31 December 2010 . . . . . . . . . . . . . . . . . . . . . . . . . . . . . . 13.5x 2.5x 1.0x
31 March 2011 . . . . . . . . . . . . . . . . . . . . . . . . . . . . . . . . 13.5x 2.5x 1.0x
30 June 2011 . . . . . . . . . . . . . . . . . . . . . . . . . . . . . . . . . 13.5x 2.5x 1.0x
30 September 2011 . . . . . . . . . . . . . . . . . . . . . . . . . . . . . 13.5x 2.5x 1.0x
31 December 2011 . . . . . . . . . . . . . . . . . . . . . . . . . . . . . . 11.0x 1.7x 1.0x
31 March 2012 . . . . . . . . . . . . . . . . . . . . . . . . . . . . . . . . 11.0x 1.7x 1.0x
30 June 2012 . . . . . . . . . . . . . . . . . . . . . . . . . . . . . . . . . 11.0x 1.7x 1.0x
30 September 2012 . . . . . . . . . . . . . . . . . . . . . . . . . . . . . 11.0x 1.7x 1.0x
31 December 2012 . . . . . . . . . . . . . . . . . . . . . . . . . . . . . . 6.5x 1.6x 1.2x
31 March 2013 . . . . . . . . . . . . . . . . . . . . . . . . . . . . . . . . 6.5x 1.6x 1.2x
30 June 2013 . . . . . . . . . . . . . . . . . . . . . . . . . . . . . . . . . 6.5x 1.6x 1.2x
30 September 2013 . . . . . . . . . . . . . . . . . . . . . . . . . . . . . 6.5x 1.6x 1.2x
31 December 2013 . . . . . . . . . . . . . . . . . . . . . . . . . . . . . . 4.0x 1.0x 2.0x
Note:
(1) Prior to 30 September 2010, the Group will be required to provide the relevant calculations in respect of the financial
covenants, but will not be tested for compliance.
Testing of compliance with the financial covenants occurs on a quarterly basis starting from 30September 2010 with reference to historical financial information for the preceding 12 months.
FINANCIAL INFORMATION
— 234 —
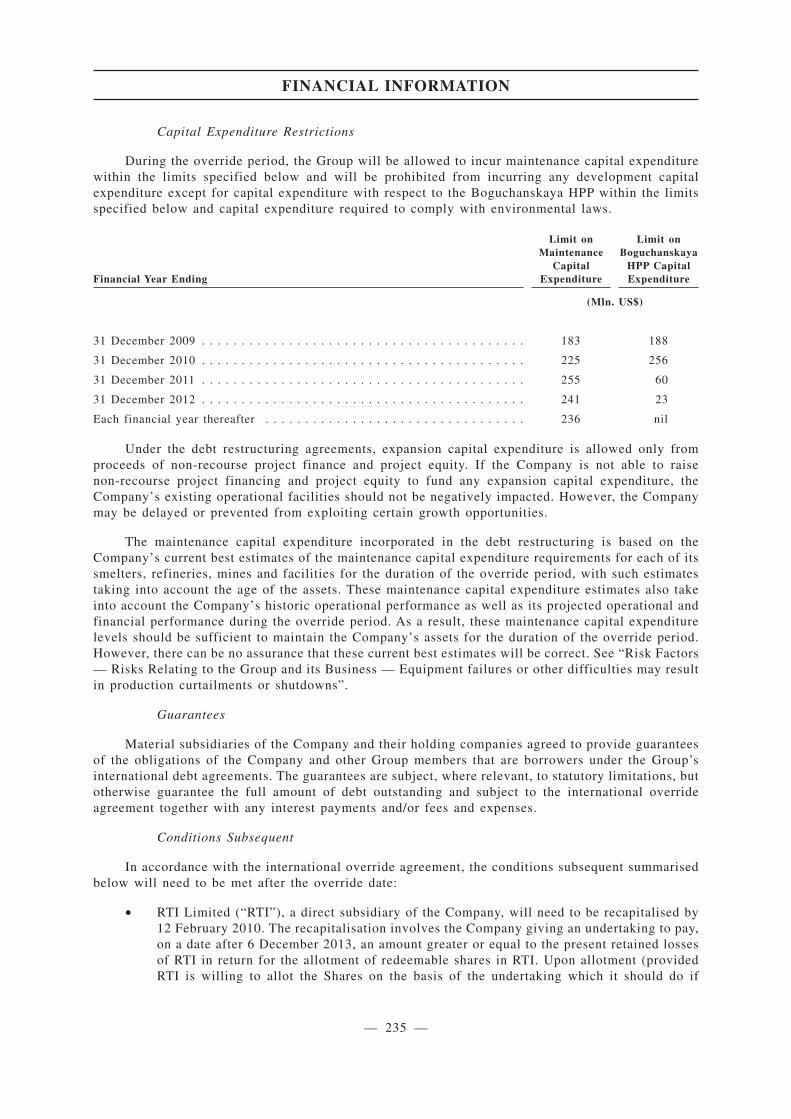
Capital Expenditure Restrictions
During the override period, the Group will be allowed to incur maintenance capital expenditurewithin the limits specified below and will be prohibited from incurring any development capitalexpenditure except for capital expenditure with respect to the Boguchanskaya HPP within the limitsspecified below and capital expenditure required to comply with environmental laws.
Financial Year Ending
Limit onMaintenance
CapitalExpenditure
Limit onBoguchanskaya
HPP CapitalExpenditure
(Mln. US$)
31 December 2009 . . . . . . . . . . . . . . . . . . . . . . . . . . . . . . . . . . . . . . . . . 183 188
31 December 2010 . . . . . . . . . . . . . . . . . . . . . . . . . . . . . . . . . . . . . . . . . 225 256
31 December 2011 . . . . . . . . . . . . . . . . . . . . . . . . . . . . . . . . . . . . . . . . . 255 60
31 December 2012 . . . . . . . . . . . . . . . . . . . . . . . . . . . . . . . . . . . . . . . . . 241 23
Each financial year thereafter . . . . . . . . . . . . . . . . . . . . . . . . . . . . . . . . . 236 nil
Under the debt restructuring agreements, expansion capital expenditure is allowed only fromproceeds of non-recourse project finance and project equity. If the Company is not able to raisenon-recourse project financing and project equity to fund any expansion capital expenditure, theCompany’s existing operational facilities should not be negatively impacted. However, the Companymay be delayed or prevented from exploiting certain growth opportunities.
The maintenance capital expenditure incorporated in the debt restructuring is based on theCompany’s current best estimates of the maintenance capital expenditure requirements for each of itssmelters, refineries, mines and facilities for the duration of the override period, with such estimatestaking into account the age of the assets. These maintenance capital expenditure estimates also takeinto account the Company’s historic operational performance as well as its projected operational andfinancial performance during the override period. As a result, these maintenance capital expenditurelevels should be sufficient to maintain the Company’s assets for the duration of the override period.However, there can be no assurance that these current best estimates will be correct. See “Risk Factors— Risks Relating to the Group and its Business — Equipment failures or other difficulties may resultin production curtailments or shutdowns”.
Guarantees
Material subsidiaries of the Company and their holding companies agreed to provide guaranteesof the obligations of the Company and other Group members that are borrowers under the Group’sinternational debt agreements. The guarantees are subject, where relevant, to statutory limitations, butotherwise guarantee the full amount of debt outstanding and subject to the international overrideagreement together with any interest payments and/or fees and expenses.
Conditions Subsequent
In accordance with the international override agreement, the conditions subsequent summarisedbelow will need to be met after the override date:
• RTI Limited (“RTI”), a direct subsidiary of the Company, will need to be recapitalised by12 February 2010. The recapitalisation involves the Company giving an undertaking to pay,on a date after 6 December 2013, an amount greater or equal to the present retained lossesof RTI in return for the allotment of redeemable shares in RTI. Upon allotment (providedRTI is willing to allot the Shares on the basis of the undertaking which it should do if
FINANCIAL INFORMATION
— 235 —

satisfied as to its current and future solvency), the additional paid in capital from theallotment will be coedited to the share capital account of RTI and will therefore offsetagainst the retained losses of RTI. As at 30 November 2009, RTI had retained negativeequity of approximately US$1 billion. Under the recapitalisation procedure, the Companywill not have to make any payment to RTI in respect of its undertaking to pay (as referredto above) until December 2013 at the earliest. In the event that RTI trades solvently throughDecember 2013, then the receipt of monies from the Company to RTI and the payment ofredemption monies by RTI to the Company are likely to cancel each other out. In light ofthis, no sums have been set aside in this respect. Under Jersey law, there is no requirementfor recapitalisation and negative net assets do not prevent a company from continuing totrade or from paying dividends.
• Certain members of the Group will need to accede to the finance documents as guarantorsby no later than 31 January 2010.
• The Company shall ensure that a BEMO technical report by an independent advisor(confirming the BEMO project schedule, levels of capital expenditure required tocommission the Boguchanskaya HPP and for the Boguchanskaya HPP to reach first andfinal stage full capacity and including an updated technical and commercial review ofBEMO) is delivered no later than the date falling 60 days after the override date.
• Additional security shall be provided within a period from 1 month up to 180 days after theoverride date over certain receivables, certain shares in Group companies and certain fixedassets, valuation obtained for fixed assets that need to become subject to security andcertain other steps taken to ensure the perfection of security granted. There is norequirement that such fixed assets attain a certain value.
• No later than 15 January 2010, a final BEMO valuation report shall be delivered confirmingthat, as of the override date, on the assumption that commissioning and final completion ofthe Boguchanskaya HPP project is achieved, the net present value of the Group’s interestin the Boguchanskaya HPP project is at least US$260 million (after taking into account suchcapital expenditures as are expected to be required to commission the Boguchanskaya HPPand to reach its final completion).
• The Company shall provide certain information, including:
• no later than 3 months after the override date, any further information required by anyfinance party in order to enable it to comply with any “know your client” or othermoney laundering checks;
• no later than 14 January 2010, a copy of each related party contract (includingpromissory note and aluminium purchase contract with Krasnoyarsk MetallurgicalPlant);
• Within 5 business days of the shareholders’ resolution dated 24 December 2009 amendingthe Company’s articles to reduce the nominal value of the Company’s Shares to US$0.01from US$1 per Share the Company shall issue replacement warrant certificates to eachwarrantholder.
• By 31 January 2010, the Company shall deliver certain corporate documents in relation toSUAL, one of guarantors, and ensure that SUAL accedes to a security document grantingsecurity over certain intra-group receivables.
FINANCIAL INFORMATION
— 236 —
• By 12 January 2010, a member of the Group holding Norilsk Nickel shares shall grant apower of attorney to the mandated bank in accordance with the Norilsk Nickel disposalundertaking. See “— Management’s Discussion and Analysis of Financial Condition andResults of Operations — Liquidity and Capital Resources — Debt Restructuring — Termsof International Debt Restructuring — Disposal and Equity Injection Undertakings, DebtRepayment Targets”.
In addition to the above, in accordance with the terms of the Russian restructuring agreements,the Group will need to provide security over certain shares and fixed assets and provide additionalguarantees within a period from 30 to 180 days following the execution of the relevant Russianrestructuring agreements.
Corporate authorisations and market standard legal opinions will be required in relation to thestatus, execution and due authorisation or validity and enforceability of the relevant agreementsentered into by the Group members.
The Directors view the conditions subsequent as largely administrative and procedural in natureand expect them to be implemented within the time allowed, and external counsel has confirmed thatit is not aware of any legal impediment to the satisfaction of the conditions subsequent under the debtrestructuring agreements within the time allowed. In the event that the Company fails to fulfil any ofthe conditions subsequent by the applicable deadline, the Company would seek a waiver or extensionfrom the lenders in respect of such conditions subsequent. If such a waiver or extension were notgranted, failure to meet such conditions subsequent by the applicable deadline would result in an eventof default. If, under such circumstances, the requisite majority of lenders under the loan facilitieselected to accelerate their debt, the Company would become insolvent and could be declared bankrupt,in which case investors’ rights to receive any distribution would rank behind the creditors of theCompany (including the creditors with respect to the Company’s restructured debt), and investorscould lose their entire investment in the Company. The Directors believe, however, that if theCompany were unable to fulfil one or more of the conditions subsequent by the applicable deadline,the lenders would likely grant a waiver or extension.
Events of Default
An event of default may occur under the international override agreement upon the occurrenceof certain events and circumstances, including (i) in the event that there is a failure to payindebtedness when due (including failure to meet Event of Default Cumulative Amount Targets); (ii)when certain covenants are breached, including restrictions on incurring further indebtedness,acquisitions, capital expenditure, disposal of shares in Group members, requirements to enter intotransactions on arm’s length terms and various information undertakings; (iii) if a court or arbitraltribunal awards material damages or fines against any member of the Group (subject to certainexceptions described below), or a Group member fails to comply with a final court decision; (iv) uponcreditors’ actions against members of the Group or their assets, including attachment, sequestration,distress or execution, subject to a materiality threshold; and (v) upon certain governmentalintervention actions, including seizure, nationalisation, expropriation or compulsory acquisition. Theoccurrence of an event of default would, if the required majority of lenders so elected, lead toacceleration. In these circumstances, the Company would be insolvent and could be declared bankrupt,in which case investors’ rights to receive any distribution would rank behind the creditors of theCompany (including the creditors with respect to the Company’s restructured debt), and investorscould lose their entire investment in the Company.
For purposes of clause (iii) above, damages or fines awarded against any member of the Groupare material if (A) such damages or fines are in excess of US$50 million in aggregate for that memberof the Group or (B) such damages or fines have or could reasonably be expected to have a materialadverse effect on the business, operations, property, financial or other condition or prospects of anyguarantor or the Company or the Group, taken as a whole; or (C) such damages or fines have or could
FINANCIAL INFORMATION
— 237 —

reasonably be expected to have a material adverse effect on the Company’s or guarantors’ ability toperform their obligations under the debt restructuring documents or enforceability or validity of anydebt restructuring documents. Damages or fines awarded in connection with the litigation disclosedunder the heading “Business — Litigation — Republic of Guinea”, however, will not give rise to anevent of default insofar they are awarded against (or not complied with by) any member of the Groupincorporated in the Republic of Guinea or a judgment of a Guinean court is held against other membersof the Group, unless such judgment is held to be enforceable or is enforced by a court of a membercountry of the Organisation for Economic Cooperation and Development or a country where theCompany or its subsidiaries carry on operations. In addition, damages or fines awarded in connectionwith the following litigation disclosed in this Prospectus under the heading “Business — Litigation”do not give rise to an event of default unless they exceed the relevant threshold amount set forthbelow:
Litigation Threshold Amount
CDH . . . . . . . . . . . . . . . . . . . . . . . . . . . . . . . . . . . . . . . . . . . . . . . . . . . . US$120 millionNorden . . . . . . . . . . . . . . . . . . . . . . . . . . . . . . . . . . . . . . . . . . . . . . . . . . US$90 millionZAlK . . . . . . . . . . . . . . . . . . . . . . . . . . . . . . . . . . . . . . . . . . . . . . . . . . . US$95 millionWashington Group . . . . . . . . . . . . . . . . . . . . . . . . . . . . . . . . . . . . . . . . . . US$72 million
It should be noted that (i) for each of the cases appearing in the table, the amount claimed againstthe Group member is in excess of the threshold amount listed above. Therefore, in a scenario wherea Court awarded damages over the threshold amount, the claims listed above would give rise to anevent of default; and (ii) apart from those listed in the table above, none of the other claims disclosedin “Business — Litigation” are exempted. Therefore, an award against a Group member in respect ofany of these or other claims resulting in fines or damages in aggregate for that member of the Groupin excess of US$50 million would constitute an event of default.
Refinancing
Following the override period, subject to certain conditions being met, the existing internationallenders have agreed to provide new debt facilities on the terms specified below. The Company has theoption to refinance any indebtedness outstanding as at the end of the override period out of any othersources.
The key terms of the refinancing are set out in a termsheet and a commitment letter. Subject toa flex within 90 days prior to the start of the refinancing period, the margin during the refinancingperiod will be 4.5% per annum in the first year, 5.0% per annum in the second year and 6.0% perannum in the final year and will be payable in cash. The principal amount of debt outstanding will befully amortised during the refinancing period and the Group will be obliged to prepay any debtoutstanding out of asset disposal proceeds and, subject to certain exceptions, equity and debt fundraising proceeds. In addition, if total net debt to Covenant EBITDA exceeds 3 to 1, the Group will beobliged to use all of its excess cashflow above the applicable cash buffer and if total net debt toCovenant EBITDA exceeds 2 to 1, 50% of its excess cashflow above the applicable cash buffer toprepay debt.
During the refinancing period, after the Group’s ratio of total net debt to Covenant EBITDA is3 to 1 or less, the Group will be allowed to incur development capital expenditure up to 50% of excesscashflow above the applicable cash buffer that is not required to be used to repay outstandingindebtedness.
Terms of the VEB Debt Restructuring
On 30 October 2009, the Company signed an agreement with VEB pursuant to which the maturitydate of US$4.5 billion owed to VEB was extended for 12 months until 29 October 2010. The VEB Debtrelates to a refinancing of the Company’s debt raised for the acquisition of its shareholding in Norilsk
FINANCIAL INFORMATION
— 238 —

Nickel. Interest on the VEB Debt accrues at the rate of 12-month LIBOR plus 5% margin, of whichmargin LIBOR plus 3% is paid quarterly in cash and 2% is capitalised and paid at maturity. The VEBDebt is secured by a pledge by the Company of its stake of 25% plus one share in Norilsk Nickel anda pledge over 25% of the Company’s shares in the Bratsk and Krasnoyask aluminium smelters. TheCompany expects (i) to request VEB to extend the maturity of the VEB Debt for successive one-yearperiods through the end of the override period in December 2013, (ii) to request Sberbank to assumethe rights, claims and obligations of VEB under the VEB Debt pursuant to the Sberbank LetterAgreement or (iii) to generate sufficient proceeds to repay the VEB Debt in full upon maturity (by wayof refinancing permitted under the terms of the international override agreement, from equity and/orsubordinated debt issuances and/or from the possible sale of its more than 25% stake in NorilskNickel).
The Company’s restructuring base case (described above under “— Debt Restructuring”)assumes that, and it is the expectation of the Directors that, if requested, VEB will extend the maturityof the VEB Debt for successive one-year periods through the end of the override period in 2013,however, VEB has no current obligation to extend the loan, and, if it does extend, there can be noassurance as to the terms of any such extension. In making this assumption, the Directors haveconsidered the following factors:
• VEB is not a commercial bank but a state corporation authorised to engage in bankingactivities that serves in effect as an arm of the Russian Government. It has a SupervisoryBoard chaired by the Prime Minister. The VEB Debt was provided to the Company as partof the Russian Federation’s state assistance programme in October 2008 introduced byFederal Law No. 173. This legislation was established by the Russian Federation inresponse to the global downturn and specifically to refinance loans provided to strategicRussian companies by foreign banks. The Accounts Chamber of Russia performed a reviewon the accounts of the Group at the end of 2008 to the beginning of 2009 following theprovision of the loan in October 2008. There was no intention expressed by the AccountsChamber of Russia to perform such a review on any regular basis;
• Under Federal Law No. 173, the maximum duration of each loan made by VEB is a periodof 12 months. However VEB is able to extend the maturity of the loan for further 12 monthperiod(s), as evidenced by VEB agreeing on 30 October 2009 to extend the maturity of itsloan to the Company for a further 12 months;
• This is consistent with the approach VEB has taken with all other companies to which it hasextended loans, including Evraz (US$1.8 billion), Altimo (US$2 billion), and others suchas PIK Group and Gazpromneft, each of whose loans were rolled over for a further twelvemonths;
• In order to facilitate the Group’s debt restructuring, VEB agreed to reduce its level ofrecourse against the Company by switching from a pledge over 25% of the Company’sshares in the Bratsk and Krasnoyask aluminium smelters, which produce approximately halfof the Group’s aluminium, to a pledge, provided by existing shareholders, over 5% of theoutstanding shares in the Company. In addition, VEB has agreed that a portion of interestmay be capitalised;
• VEB will become a shareholder in the Company following the Global Offering, as it hasentered into the cornerstone placing agreement with the Company and the JointBookrunners to acquire a 3% interest in the fully diluted share capital of the Companyimmediately following completion of the Global Offering (but prior to any exercise of theOver-allotment Option) as a cornerstone investor (see “The Cornerstone Placing — TheCornerstone Investors”); on 25 November 2009 the Russian Minister of Finance announcedthat he expects VEB to remain a shareholder for at least three years; and
FINANCIAL INFORMATION
— 239 —
• The size of the VEB equity investment is expected to amount to about US$664 millionbased on its holding 3.15% of the shares of the Company in issue upon completion of theGlobal Offering (assuming the Over-allotment Option is not exercised and no bonus Sharesare issued to management of the Company), based on an Offer Price of HK$10.80 per OfferShare, being the mid-point of the estimated Offer Price range. Should the Company run intofinancial difficulties, the equity holders of the Company will rank behind all creditors. Assuch, the interest of VEB (as an equity investor of the Company) is closely aligned with allother shareholders of the Company.
In addition, Mr. Vladimir Dmitriev, the Chairman of VEB, has issued a letter to The StockExchange of Hong Kong Limited stating that “VEB confirms that it continues to support the financialstability and solvency of UC Rusal both as a lender and a future shareholder” and that “[i]n this regard,in future and on an on-going basis, if UC Rusal were to make requests to have its loan extended, VEBwould cooperate in providing such an extension on a yearly basis, subject to the approval of VEB’sSupervisory Council and in accordance with applicable law”. In reaching this conclusion, Mr.Dmitriev noted that:
• UC Rusal is the largest aluminium producer in the world, operating numerous mining,refining and smelting facilities in Russia and other countries which secures supply ofnecessary aluminium for Russian and international customers;
• UC Rusal is one of the key employers and major project developers in Russia and overseas,and significant deterioration in its financial position could result in excessive andunnecessary instability, as well as in social pressures, in particular in Russia;
• For these reasons, VEB supported and continues to support UC Rusal’s operations;
• In particular, the Supervisory Board of VEB has recently approved the extension of theUS$4.5 billion facility to 29 October 2010 and VEB’s participation in the Global Offeringas a cornerstone investor in accordance with VEB’s long-term investment strategy; and
• Russian law would permit annual extension of the VEB Debt to support such strategy,pursuant to a decision of the Supervisory Board of VEB, as occurred in October 2009.
Taking these factors into account, the Directors believe that:
• VEB would not take any actions that would endanger the Company’s solvency, as thiswould be inconsistent with the original remit of its lending programme (given that servesin effect as an arm of the Russian Government), inconsistent with the position it has takenon agreeing the first one-year roll-over and contrary to its interests as a shareholder(following completion of the Global Offering); and
• accordingly, at the end of 12 months there is a high probability that VEB will agree tofurther extend the maturity of the loan.
In addition to the Company’s analysis of the VEB arrangements, certain third parties evaluatedthe Company’s arrangements with VEB:
• the impact of the VEB arrangements on the liquidity of the Company was the subject ofconsiderable analysis by the Group’s creditors in the context of assessing the viability ofthe Company’s restructuring, which has now become effective; and
• VEB has a representative on the Company’s Board and, like all the other Directors on theBoard, he will be responsible for the contents of the prospectus including the workingcapital sufficiency statement. Such working capital sufficiency statement will cover aperiod to 31 January 2011, i.e. after the current maturity date of the VEB Debt.
On 23 December 2009, Sberbank entered into the Sberbank Letter Agreement with the Company,stating an unconditional and irrevocable commitment to assume all rights, claims and obligationsunder the VEB Debt following receipt of written request from the Company between 1 August and 1
FINANCIAL INFORMATION
— 240 —
September of each year from 2010 to 2013 inclusive. The Sberbank Letter Agreement states thatfollowing such an assignment of the rights and obligations of VEB under the VEB Debt to Sberbank,the maturity date under the debt will be extended to 7 December 2013. The assumption by Sberbankof the rights, claims and obligations under the VEB Debt is subject to VEB assigning its rights andobligations under the VEB Debt to Sberbank. On 17 December 2009, the Supervisory Board of VEBprovided its authorisation to the assignment of all rights and obligations of VEB under the VEB Debtto Sberbank. As consideration for such assumption by Sberbank, a commission of 2.00% of theoutstanding principal amount, together with any other amounts accrued and payable under the VEBDebt and assumed by Sberbank as of the date of the assignment, is payable in cash to Sberbank by theCompany (the Company being subject to a best efforts obligation to pay such commission withoutbreaching any of the Group’s obligations under the international override agreement) or, failingwhich, by the Major Shareholders, who have (severally and not jointly) guaranteed to Sberbank to payon demand such commission in the event the Company is unable to pay all or any part of thecommission due to such payment being inconsistent with the Group’s obligations under theinternational override agreement. The guarantee of the Major Shareholders to Sberbank to pay suchcommission is not subject to any rights of termination by the Major Shareholders. Pursuant to theSberbank Letter Agreement the commission is payable by the Company in the following instalments:a) US$22.5 million by 31 December 2009, b) ¼ (one quarter) of the commission annually by 31December of the years 2010, 2011 and 2012, provided that no assignment has occurred in such yearor any previous year and c) the outstanding amount of the commission (as reduced by amounts paidunder a) and b)) not later than three business days prior to the date of the assignment. If suchinstalments are paid by the Major Shareholders, the Major Shareholders are required to make suchpayments within one business day from the date when the payment of the commission falls due underthe Sberbank Letter Agreement. The first instalment of US$22.5 million is expected to be paid by theMajor Shareholders on or before 4 January 2010. Sberbank may assign all of its rights, claims andobligations under the VEB Debt, or under any transactions entered into to secure repayment of theVEB Debt, to any third party without the Company’s consent. The Sberbank Letter Agreement statesthat the Company has a unilateral right to terminate the Sberbank Letter Agreement. The Companydoes not intend to exercise such termination right until the VEB Debt has either been repaid orextended to 7 December 2013.
The following information and related data concerning Sberbank in this prospectus have beenextracted or reproduced based on publicly available information published by Sberbank. The Directorsbelieve that the sources of this information are appropriate sources for such information and theCompany has taken reasonable care in extracting and reproducing such information. The Directorshave no reason to believe that such information is false, inaccurate or misleading or that any fact hasbeen omitted that would render such information false, inaccurate or misleading. The information hasnot been independently verified by the Group, the Joint Sponsors, the Joint Bookrunners, theUnderwriters or any other party involved in the Global Offering and no representation is given as toits accuracy. In addition, neither Sberbank nor its auditors have been involved in the preparation ofthis prospectus.
Sberbank is the largest credit institution in Russia and the CIS, accounting for approximately aquarter of aggregate Russian banking assets and a third of Russian banking capital. As of 8 May 2009,the Central Bank of Russia owned 57.6% of Sberbank’s total share capital, making it Sberbank’scontrolling shareholder. Sberbank’s international ratings are: “BBB” long term issuer default ratingfrom Fitch Ratings and “Baa1” long term foreign currency deposit rating from Moody’s InvestorsService — both of which are at the Russian sovereign ceiling.
The following table shows selected financial information prepared in accordance with IFRS bySberbank as at 30 September 2009 and 31 December 2008. The selected financial information has beenextracted without material adjustment from, and should be read in conjunction with, Sberbank’spublished IFRS financial statements as at 30 September 2009 and 31 December 2008 and for the yearthen ended.
FINANCIAL INFORMATION
— 241 —

Balance sheets items30 September
200931 December
2008
(USD bn) (USD bn)
Assets . . . . . . . . . . . . . . . . . . . . . . . . . . . . . . . . . . . . . . . . . . . . . . 224 229
Loans to customers (net) . . . . . . . . . . . . . . . . . . . . . . . . . . . . . . . . . 168 173
Due to customers . . . . . . . . . . . . . . . . . . . . . . . . . . . . . . . . . . . . . . 166 163
Equity . . . . . . . . . . . . . . . . . . . . . . . . . . . . . . . . . . . . . . . . . . . . . 26 26
Tier I capital adequacy ratio (Basel I) . . . . . . . . . . . . . . . . . . . . . . . . 11.8% 12.1%
Total capital adequacy ratio (Basel I) . . . . . . . . . . . . . . . . . . . . . . . . 18.8% 18.9%
Income statement items
Year ended31 December
2008
(USD bn)
Total operating revenues . . . . . . . . . . . . . . . . . . . . . . . . . . . . . . . . . . . . . . . . . . . . . . . . 18
Operating profit before provisions . . . . . . . . . . . . . . . . . . . . . . . . . . . . . . . . . . . . . . . . . . 9
Margin. . . . . . . . . . . . . . . . . . . . . . . . . . . . . . . . . . . . . . . . . . . . . . . . . . . . . . . . . . . 50.7%
Net profit . . . . . . . . . . . . . . . . . . . . . . . . . . . . . . . . . . . . . . . . . . . . . . . . . . . . . . . . . . 4
Margin. . . . . . . . . . . . . . . . . . . . . . . . . . . . . . . . . . . . . . . . . . . . . . . . . . . . . . . . . . . 21.7%
EPS . . . . . . . . . . . . . . . . . . . . . . . . . . . . . . . . . . . . . . . . . . . . . . . . . . . . . . . . . . . . . . 0.18
Sberbank’s website can be accessed at: http://www.sbrf.ru/en/ (information contained on thiswebsite does not form part of this prospectus).
Should the Company need to repay the VEB Debt, it has a number of options available includingpossible refinancing (which is permitted provided certain criteria are met as set out in the internationaloverride agreement) and equity and subordinated debt fund raising. However, the Company also hasthe option to repay it through the sale of its Norilsk Nickel stake. In this regard Norilsk Nickel is theworld’s largest nickel miner and, as noted above, the stake in Norilsk Nickel has a market value ofUS$6.8 billion as of 17 December 2009, representing a 51% premium to the outstanding principalamount of the VEB Debt.
Terms of Russian and Kazakh Debt Restructuring (other than VEB)
The long term restructuring of the Russian and Kazakh debt is implemented by agreementsentered into in November and December 2009 amending the loan agreements or refinancing theexisting loans between each Russian and Kazakh bank (other than VEB) and the Group. On theeffective date of the restructuring, the principal amount of debt outstanding under the loan agreementswith the Russian and Kazakh banks (other than VEB) was: RUR20 billion under loan agreements withVTB; US$455 million and EUR140 million under loan agreements with Gazprombank; US$722million under loan agreements with Sberbank; US$23 million under loan agreement withSurgutneftegasbank and US$8.9 million under loan agreements with Kazkommertzbank. All of theloans outstanding under such loan agreements are subject to restructuring agreements.
The maturities of the Group’s obligations to Russian and Kazakh banks (other than the VEBDebt) have been extended until November or December 2013, subject to annual debt repaymenttargets. Upfront restructuring fees were paid to the Russian banks (other than VEB andSurgutneftegasbank) in the amount of 1% of their exposure. An upfront restructuring fee was paid toSurgutneftegasbank in the amount of 0.5% of its exposure. No restructuring fee was paid toKazkommertzbank.
FINANCIAL INFORMATION
— 242 —

Annual debt repayment targets under the restructuring agreements with the Russian and Kazakhbanks (other than VEB) are, shown on a cumulative basis, as follows (and represent part of the debtreduction targets under the international override agreement).
Date Gazprombank VTB Sberbank Surgutneftegasbank Kazkommertzbank
Alternative Basic
(in millions)(in
billions) (in millions)
31 December 2010 US$35.4and
EUR10.9
US$66.0and
EUR20.3
RUR1.6 US$60.2 US$1.82 US$0.7
30 September 2011 US$93.4and
EUR28.7
US$140.3and
EUR43.2
RUR4.2 US$160.5 US$4.85 US$1.3
30 September 2012 US$139.0and
EUR42.8
US$185.9and
EUR57.2
RUR6.2 US$240.7 US$7.28 US$2.3
End of the 4 year period US$184.1and
EUR55.7
US$231.0and
EUR71.1
RUR8.2 US$320.9 US$ 9.7 US$3.3
Debt Balance (excluding capitalizedinterest) to be refinanced at the endof the 4 year period
US$270.9and
EUR83.3
US$224.0and
EUR68.9
RUR11.8 US$401.1 US$13.3 US$5.5
Failure to make repayments under the basic repayment schedule relating to Gazprombank facilitymay result in penalties being payable by the Group on the difference between such amounts and theamounts actually repaid. Failure to make repayments under the alternative (in the event ofGazprombank) or the stipulated repayment schedule will result in an event of default.
Interest on the Russian and Kazakh bank debt (other than the VEB Debt and the loan fromSurgutneftegasbank) includes a payment-in-kind component or is calculated in a way as to give aneconomic equivalent of part of the interest being capitalised and either is based on the CBR rate oraccrues at a fixed rate varying annually or on the basis of the total net debt to the Covenant EBITDAratio. Interest on the loan by Surgutneftegasbank accrues at a fixed rate of 8.35% and is payable incash. The table below sets out the interest rates under various other Russian loans.
VTB Gazprombank Sberbank Kazkommertzbank
Ratio of total netdebt to Covenant
EBITDA Cash/PIK
Ratio of total netdebt to Covenant
EBITDA Cash/PIK Period Cash Period Cash
More than 15 CBR/3.0% More than 15 8%/1.5% year 1 (until
March 2010)
12.5% — —
7.5 to 15 CBR plus
0.5%/2.5%
7.5 to 15 8.0%/1.0% year 1 (from
March 2010
until
November
2010)
8% year 1 8%
4.0 to 7.5 CBR plus
1.5%/1.5%
4.0 to 7.5 8.5%/0% year 2 8% year 2 8%
3.0 to 4.0 CBR plus
2.5%/0.5%
3.0 to 4.0 8.5%/0% year 3 10.7% year 3 10.7%
Less than 3.0 CBR plus
3%
Less than 3.0 8.5%/0% year 4 10.7% year 4 10.7%
FINANCIAL INFORMATION
— 243 —

Covenants and restrictions under the restructuring agreements with Russian and Kazakh bankslargely mirror those under the international override agreement.
The Group provided or agreed to provide additional security to the Russian banks (other thanVEB), in addition to existing security, over:
• certain fixed assets of the Russian aluminium smelters (other than the Bratsk andKrasnoyarsk aluminium smelters) and Achinsk alumina refinery split between internationallenders and Russian banks according to pre-agreed percentages and security over certainfixed assets of SAYANAL;
• shares in Sayanogorsk aluminium smelter representing 7.85% of its share capital; and
• shares in each of SUAL, Novokuznetsk aluminium smelter and Achinsk alumina refineryrepresenting 11% of the entity’s share capital.
Terms of Onexim Debt Restructuring
On 1 December 2009, the Company entered into an amendment agreement in relation to a stockpurchase agreement between the Company, Onexim and certain other parties relating to the acquisitionof shares in Norilsk Nickel to restructure deferred consideration in the amount of US$2.7 billion plusinterest accrued thereon. In accordance with the amendment agreement, the Company’s obligations inrespect of US$880 million plus interest accrued on the total amount of deferred consideration from 6November 2009 until the date of effectiveness of the international override agreement (in the amountof approximately US$15 million) plus any interest capitalised thereon during the override period willbe settled out of excess cashflow and other proceeds used to prepay debt (being proceeds of assetdisposals and equity and subordinated and other debt fund raisings) during the term of theinternational override agreement on the same terms as those applicable to the international lenderswith limited exceptions. The remaining obligations were converted into Shares representingapproximately 6% of the Company’s share capital on the date of effectiveness of the internationaloverride agreement. The deferred consideration in the amount of US$880 million (together withadditional interest accrued from 6 November 2009 until the date of effectiveness of the internationaloverride agreement) will accrue interest on the same terms as international debt as set out in theinternational override agreement. See “— Terms of International Debt Restructuring — Margin”. Theinterest accrued until and including 5 November 2009 on the total amount of the deferredconsideration and a restructuring fee in an aggregate amount of US$275 million were or are to be paidin cash: US$160 million was paid by the Company within one day of the date of the effectiveness ofthe international override agreement and US$115 million will be paid out of the net proceeds of theGlobal Offering.
Capital Expenditure
In addition to meeting its working capital requirements, UC RUSAL expects that repayments ofoutstanding debt and limited capital expenditure pursuant to the terms of the restructuring agreementwill represent the Company’s most significant use of funds for a period of several years. See “—Contractual Commitments” for a description of the amount and term of the Company’s obligations inrespect of outstanding long-term debt and certain other commitments.
FINANCIAL INFORMATION
— 244 —

The table below sets forth a breakdown of the Company’s capital expenditure by businesssegments (excluding acquisitions) in the first six months of 2009 and the years ended 31 December2006, 2007 and 2008.
Sixmonthsended
30 June Year ended 31 December
2009 2008 2007 2006
(Mln. US$)
Aluminium. . . . . . . . . . . . . . . . . . . . . . . . . . . . . . . . . . . . . . . . 49 1,104 1,198 710
Alumina . . . . . . . . . . . . . . . . . . . . . . . . . . . . . . . . . . . . . . . . . 18 238 470 128
Mining and metals . . . . . . . . . . . . . . . . . . . . . . . . . . . . . . . . . . — — — —
Energy . . . . . . . . . . . . . . . . . . . . . . . . . . . . . . . . . . . . . . . . . . 4 6 7 —
Other operations . . . . . . . . . . . . . . . . . . . . . . . . . . . . . . . . . . . . 3 26 44 29
Total capital expenditure . . . . . . . . . . . . . . . . . . . . . . . . . . . . . 74 1,374 1,719 867
In addition, the Company paid US$55 million, US$4,633 million, US$1,461 million and US$110million for acquisitions in the first six months of 2009 and in 2008, 2007 and 2006, respectively.
Contractual Commitments
The Group had significant contractual commitments at 30 June 2009, as described below.
Debt Maturities
Following completion of the Group’s debt restructuring, all of the Group’s debt except itsindebtedness to VEB has a single maturity date of 6 December 2013, four years after the effective dateof the restructuring. Payments will be made earlier out of equity or debt fund raisings (includingGlobal Offering), asset disposals or excess cash flow. In addition, there are debt reduction targets, forboth the international banks and the Russian and Kazakh banks (other than VEB), as described aboveunder “— Debt Restructuring”.
The indebtedness to VEB matures on 29 October 2010. Management currently intends to seek afurther extension of the VEB Debt before it falls due.
Capital Commitments
The following table represents the Group’s capital commitments to make future payments undercontracts and commitments as of 30 June 2009:
Six months ended30 June 2009
(Mln. US$)
Capital Commitments . . . . . . . . . . . . . . . . . . . . . . . . . . . . . . . . . . . . . . . . . . . . . . . . 615
The Group has entered into contracts that result in contractual obligations primarily relating tovarious construction and capital repair works approximating US$615 million as at 30 June 2009. Thesecommitments are due over a number of years. See Note 33(a) to UC RUSAL’s Accountants’ Report.Approximately 70% of these capital commitments relate to the Taishet aluminium smelter project (see
FINANCIAL INFORMATION
— 245 —
App1A-32(5)(b)

“Business — The Group’s Operations — Aluminium Division — Approved Projects within theAluminium Division — Medium-term — Taishet Aluminium Smelter”). During the override period,these commitments have to be funded from project financing or equity investments permitted underthe international override agreement.
In March 2000, the Group acquired a 30% interest in Nikolaev alumina refinery in an auction.In accordance with the original agreement with the State Property Fund of Ukraine, the Group wasobligated to construct a primary aluminium plant with a production capacity at a minimum level of100,000 metric tonnes. In August 2004, the Group re-negotiated the terms of the agreement with theState Property Fund of Ukraine. In accordance with the revised agreement, the Group is obliged toincrease the production capacity of Nikolaev alumina refinery by up to 1,600 thousand metric tonnesper year. The revised agreement nullifies the requirement stipulated in the original agreement toconstruct a primary aluminium plant. The amount of the capital commitment cannot be estimatedreliably.
Moreover, in May 2006, the Group entered into a co-operation agreement with RusHydro. Underthis co-operation agreement RusHydro and the Group jointly committed to finance the constructionand future operation of the Boguchanskaya hydropower plant and an aluminium plant, which isplanned to be the main customer of the hydropower plant. The parties established two joint companieswith a 50:50 ownership, into which the Group committed to invest US$2,303 million by the end of2012. As at 30 June 2009, the outstanding commitment of the Group for the construction of thealuminium plant was approximately US$1,277 million, to be committed by the end of 2011 andoutstanding commitment for the hydropower station was US$448 million, to be committed by the endof 2012. See Note 20(c) to UC RUSAL’s Accountants’ Report. At the end of 2008, due to the economicdownturn, the parties have postponed the contemplated completion date of the aluminium plant fromthe end of 2011 to the end of 2014.
Purchase Commitments
Commitments with third parties to purchase supplies of alumina, bauxite, other raw materials andindustrial services from 2009 to 2016 under long-term supply agreements are estimated to range fromUS$4,137 million to US$4,483 million at 30 June 2009, depending on the actual purchase volumes andapplicable prices. Commitments with related parties for purchases of alumina, bauxite and other rawmaterials in 2009 to 2010 under supply contracts are estimated to range from US$86 million to US$95million at 30 June 2009. These commitments will be settled at market prices on the date of delivery.
Commitments with third parties for purchases of transportation services between 2009 to 2011under long-term agreements were estimated to range from US$185 million to US$205 million at 30June 2009. Commitments with related parties for purchases of transportation services in the 2009 to2010 period under long-term agreements were estimated at US$22 million as at 30 June 2009.
Sale Commitments
Commitments with third parties for sales of alumina, bauxite and other raw materials from 2009to 2013 are estimated to range from US$1,225 million and US$1,297 million as at 30 June 2009 andwill be settled at market prices on the date of delivery. Commitments with related parties for sales ofalumina, bauxite and other raw materials from 2009 to 2010 were estimated from US$373 million toUS$387 million at 30 June 2009. Commitments with related parties for sales of primary aluminiumfrom 2009 to 2016 are estimated to range from US$4,386 million to US$5,361 million at 30 June 2009.Commitments with third parties for sales of primary aluminium in the 2009 to 2016 period areestimated to range from US$1,708 million to US$4,152 million as at 30 June 2009. Thesecommitments will be settled at market prices on the date of delivery.
FINANCIAL INFORMATION
— 246 —
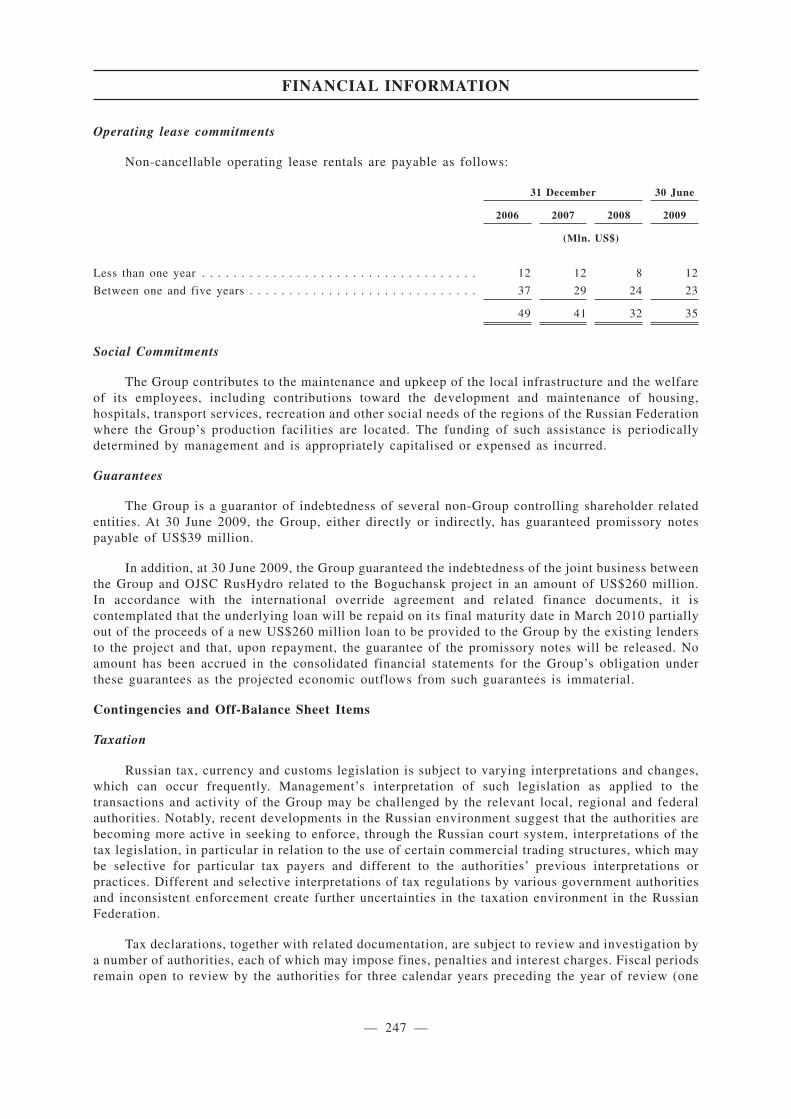
Operating lease commitments
Non-cancellable operating lease rentals are payable as follows:
31 December 30 June
2006 2007 2008 2009
(Mln. US$)
Less than one year . . . . . . . . . . . . . . . . . . . . . . . . . . . . . . . . . . . 12 12 8 12
Between one and five years . . . . . . . . . . . . . . . . . . . . . . . . . . . . . 37 29 24 23
49 41 32 35
Social Commitments
The Group contributes to the maintenance and upkeep of the local infrastructure and the welfareof its employees, including contributions toward the development and maintenance of housing,hospitals, transport services, recreation and other social needs of the regions of the Russian Federationwhere the Group’s production facilities are located. The funding of such assistance is periodicallydetermined by management and is appropriately capitalised or expensed as incurred.
Guarantees
The Group is a guarantor of indebtedness of several non-Group controlling shareholder relatedentities. At 30 June 2009, the Group, either directly or indirectly, has guaranteed promissory notespayable of US$39 million.
In addition, at 30 June 2009, the Group guaranteed the indebtedness of the joint business betweenthe Group and OJSC RusHydro related to the Boguchansk project in an amount of US$260 million.In accordance with the international override agreement and related finance documents, it iscontemplated that the underlying loan will be repaid on its final maturity date in March 2010 partiallyout of the proceeds of a new US$260 million loan to be provided to the Group by the existing lendersto the project and that, upon repayment, the guarantee of the promissory notes will be released. Noamount has been accrued in the consolidated financial statements for the Group’s obligation underthese guarantees as the projected economic outflows from such guarantees is immaterial.
Contingencies and Off-Balance Sheet Items
Taxation
Russian tax, currency and customs legislation is subject to varying interpretations and changes,which can occur frequently. Management’s interpretation of such legislation as applied to thetransactions and activity of the Group may be challenged by the relevant local, regional and federalauthorities. Notably, recent developments in the Russian environment suggest that the authorities arebecoming more active in seeking to enforce, through the Russian court system, interpretations of thetax legislation, in particular in relation to the use of certain commercial trading structures, which maybe selective for particular tax payers and different to the authorities’ previous interpretations orpractices. Different and selective interpretations of tax regulations by various government authoritiesand inconsistent enforcement create further uncertainties in the taxation environment in the RussianFederation.
Tax declarations, together with related documentation, are subject to review and investigation bya number of authorities, each of which may impose fines, penalties and interest charges. Fiscal periodsremain open to review by the authorities for three calendar years preceding the year of review (one
FINANCIAL INFORMATION
— 247 —
3rd Sch23
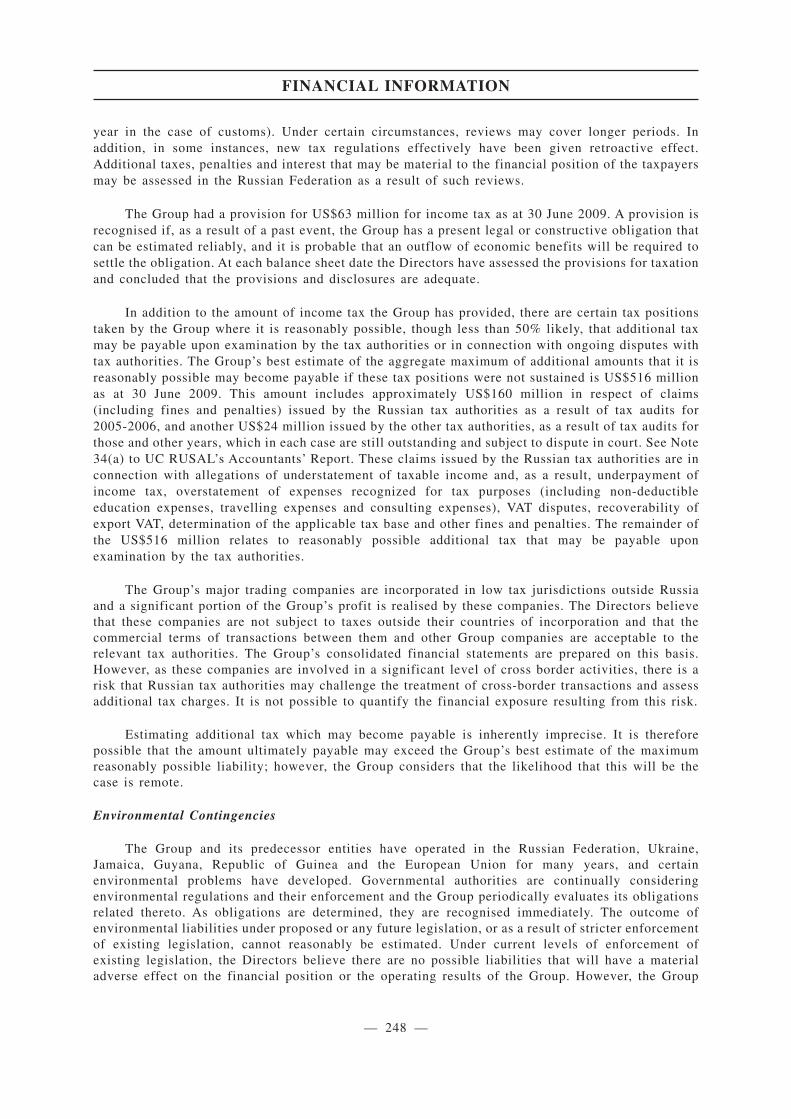
year in the case of customs). Under certain circumstances, reviews may cover longer periods. Inaddition, in some instances, new tax regulations effectively have been given retroactive effect.Additional taxes, penalties and interest that may be material to the financial position of the taxpayersmay be assessed in the Russian Federation as a result of such reviews.
The Group had a provision for US$63 million for income tax as at 30 June 2009. A provision isrecognised if, as a result of a past event, the Group has a present legal or constructive obligation thatcan be estimated reliably, and it is probable that an outflow of economic benefits will be required tosettle the obligation. At each balance sheet date the Directors have assessed the provisions for taxationand concluded that the provisions and disclosures are adequate.
In addition to the amount of income tax the Group has provided, there are certain tax positionstaken by the Group where it is reasonably possible, though less than 50% likely, that additional taxmay be payable upon examination by the tax authorities or in connection with ongoing disputes withtax authorities. The Group’s best estimate of the aggregate maximum of additional amounts that it isreasonably possible may become payable if these tax positions were not sustained is US$516 millionas at 30 June 2009. This amount includes approximately US$160 million in respect of claims(including fines and penalties) issued by the Russian tax authorities as a result of tax audits for2005-2006, and another US$24 million issued by the other tax authorities, as a result of tax audits forthose and other years, which in each case are still outstanding and subject to dispute in court. See Note34(a) to UC RUSAL’s Accountants’ Report. These claims issued by the Russian tax authorities are inconnection with allegations of understatement of taxable income and, as a result, underpayment ofincome tax, overstatement of expenses recognized for tax purposes (including non-deductibleeducation expenses, travelling expenses and consulting expenses), VAT disputes, recoverability ofexport VAT, determination of the applicable tax base and other fines and penalties. The remainder ofthe US$516 million relates to reasonably possible additional tax that may be payable uponexamination by the tax authorities.
The Group’s major trading companies are incorporated in low tax jurisdictions outside Russiaand a significant portion of the Group’s profit is realised by these companies. The Directors believethat these companies are not subject to taxes outside their countries of incorporation and that thecommercial terms of transactions between them and other Group companies are acceptable to therelevant tax authorities. The Group’s consolidated financial statements are prepared on this basis.However, as these companies are involved in a significant level of cross border activities, there is arisk that Russian tax authorities may challenge the treatment of cross-border transactions and assessadditional tax charges. It is not possible to quantify the financial exposure resulting from this risk.
Estimating additional tax which may become payable is inherently imprecise. It is thereforepossible that the amount ultimately payable may exceed the Group’s best estimate of the maximumreasonably possible liability; however, the Group considers that the likelihood that this will be thecase is remote.
Environmental Contingencies
The Group and its predecessor entities have operated in the Russian Federation, Ukraine,Jamaica, Guyana, Republic of Guinea and the European Union for many years, and certainenvironmental problems have developed. Governmental authorities are continually consideringenvironmental regulations and their enforcement and the Group periodically evaluates its obligationsrelated thereto. As obligations are determined, they are recognised immediately. The outcome ofenvironmental liabilities under proposed or any future legislation, or as a result of stricter enforcementof existing legislation, cannot reasonably be estimated. Under current levels of enforcement ofexisting legislation, the Directors believe there are no possible liabilities that will have a materialadverse effect on the financial position or the operating results of the Group. However, the Group
FINANCIAL INFORMATION
— 248 —

anticipates undertaking significant capital projects to improve its future environmental performanceand to bring it into full compliance with current legislation. For a discussion of the Group’s expectedenvironmental capital expenditures, see “— Capital Expenditure” and “Business — Environmental,Health and Safety Matters”.
In addition, the Group had recorded provisions of US$273 million at 30 June 2009 relating to sitereclamation obligations. For information concerning risk-adjusted expected expenditures in relation tosuch obligations, see Note 30(b) to UC RUSAL’s Accountants’ Report.
Legal Contingencies
The Group is the named defendant in a number of lawsuits as well as a named party in otherproceedings arising in the ordinary course of business. See “Business — Litigation”. In addition to theamounts that the Group has provided for legal claims (US$94 million at 30 June 2009), there are anadditional US$124 million in legal claims with respect to which management assesses a cash outflowas possible. See Note 30(c) to UC RUSAL’s Accountants’ Report.
The Directors have assessed the likely outcome of such contingencies, lawsuits or otherproceedings and believes that any resulting liabilities will not have a materially adverse effect on thefinancial position or the operating results of the Group.
Profit Forecast
The Directors believe that, in the absence of unforeseen circumstances and on the bases andassumptions set out in Appendix IV — Profit Forecast, the forecast consolidated net profit attributableto the equity holders of the Company for the year ending 31 December 2009 (which includes theestimated net gain of US$1,067 in relation to the debt restructuring in December 2009) is unlikely tobe less than US$434 million (approximately HK$3,366 million) and the pro forma forecast earningsper share for the year ending 31 December 2009 is unlikely to be less than US$0.03 (approximatelyHK$0.23).
The forecast of the consolidated net profit attributable to the equity holders of the Company forthe year ending 31 December 2009 is based on the audited consolidated financial results of the Groupfor the six months ended 30 June 2009, the consolidated results from the unaudited financialinformation of the Group for the nine months ended 30 September 2009 (which include the auditedconsolidated financial results for the six months ended 30 June 2009), and a forecast of theconsolidated results of the Group for the remaining three months ending 31 December 2009. The profitforecast has been presented on the basis of the accounting policies consistent in all material respectswith those currently adopted by our Group as summarised in the Accountants’ Report, the text ofwhich is set out in Appendix I to this prospectus.
The unaudited pro forma forecast earnings per Share is calculated by dividing the forecastconsolidated net profit attributable to the equity holders of the Company for the year ending 31December 2009 by the adjusted weighted average number of Shares outstanding of 14,353,757,032Shares during the entire year. The adjusted weighted average number of Shares outstanding reflectsthe actual weighted average number of Shares outstanding prior to the debt restructuring of 11,628Shares or 12,690,128,270 Shares on an adjusted basis to reflect the effect of (a) the share subdivisionon 24 December 2009; (b) the capitalisation issue of the Company’s ordinary shares in conjunctionwith the Global Offering; (c) 809,781,730 Shares issued on 7 December 2009 pursuant to theconversion of a portion of the obligations to Onexim, weighted for the portion of the period that suchShares were outstanding and adjusted for the share subdivision on 24 December 2009 andcapitalization issue in conjunction with the Global Offering; and (d) 1,610,292,840 Shares to be issued
FINANCIAL INFORMATION
— 249 —
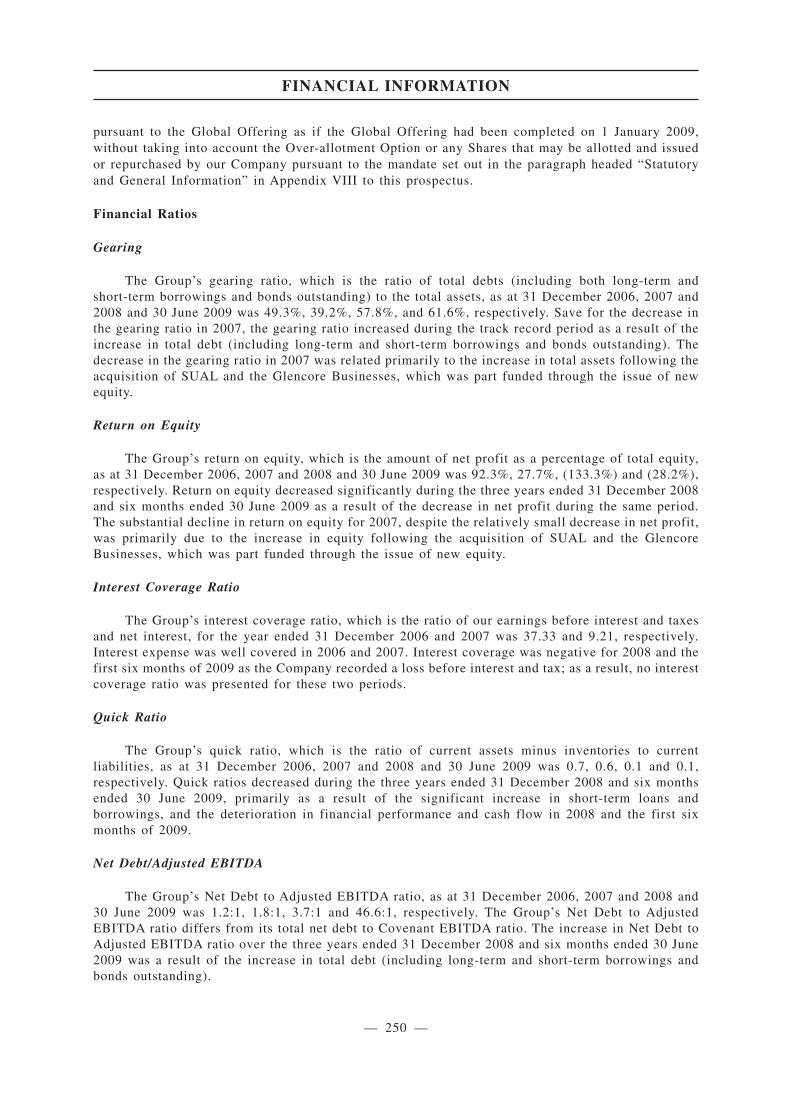
pursuant to the Global Offering as if the Global Offering had been completed on 1 January 2009,without taking into account the Over-allotment Option or any Shares that may be allotted and issuedor repurchased by our Company pursuant to the mandate set out in the paragraph headed “Statutoryand General Information” in Appendix VIII to this prospectus.
Financial Ratios
Gearing
The Group’s gearing ratio, which is the ratio of total debts (including both long-term andshort-term borrowings and bonds outstanding) to the total assets, as at 31 December 2006, 2007 and2008 and 30 June 2009 was 49.3%, 39.2%, 57.8%, and 61.6%, respectively. Save for the decrease inthe gearing ratio in 2007, the gearing ratio increased during the track record period as a result of theincrease in total debt (including long-term and short-term borrowings and bonds outstanding). Thedecrease in the gearing ratio in 2007 was related primarily to the increase in total assets following theacquisition of SUAL and the Glencore Businesses, which was part funded through the issue of newequity.
Return on Equity
The Group’s return on equity, which is the amount of net profit as a percentage of total equity,as at 31 December 2006, 2007 and 2008 and 30 June 2009 was 92.3%, 27.7%, (133.3%) and (28.2%),respectively. Return on equity decreased significantly during the three years ended 31 December 2008and six months ended 30 June 2009 as a result of the decrease in net profit during the same period.The substantial decline in return on equity for 2007, despite the relatively small decrease in net profit,was primarily due to the increase in equity following the acquisition of SUAL and the GlencoreBusinesses, which was part funded through the issue of new equity.
Interest Coverage Ratio
The Group’s interest coverage ratio, which is the ratio of our earnings before interest and taxesand net interest, for the year ended 31 December 2006 and 2007 was 37.33 and 9.21, respectively.Interest expense was well covered in 2006 and 2007. Interest coverage was negative for 2008 and thefirst six months of 2009 as the Company recorded a loss before interest and tax; as a result, no interestcoverage ratio was presented for these two periods.
Quick Ratio
The Group’s quick ratio, which is the ratio of current assets minus inventories to currentliabilities, as at 31 December 2006, 2007 and 2008 and 30 June 2009 was 0.7, 0.6, 0.1 and 0.1,respectively. Quick ratios decreased during the three years ended 31 December 2008 and six monthsended 30 June 2009, primarily as a result of the significant increase in short-term loans andborrowings, and the deterioration in financial performance and cash flow in 2008 and the first sixmonths of 2009.
Net Debt/Adjusted EBITDA
The Group’s Net Debt to Adjusted EBITDA ratio, as at 31 December 2006, 2007 and 2008 and30 June 2009 was 1.2:1, 1.8:1, 3.7:1 and 46.6:1, respectively. The Group’s Net Debt to AdjustedEBITDA ratio differs from its total net debt to Covenant EBITDA ratio. The increase in Net Debt toAdjusted EBITDA ratio over the three years ended 31 December 2008 and six months ended 30 June2009 was a result of the increase in total debt (including long-term and short-term borrowings andbonds outstanding).
FINANCIAL INFORMATION
— 250 —
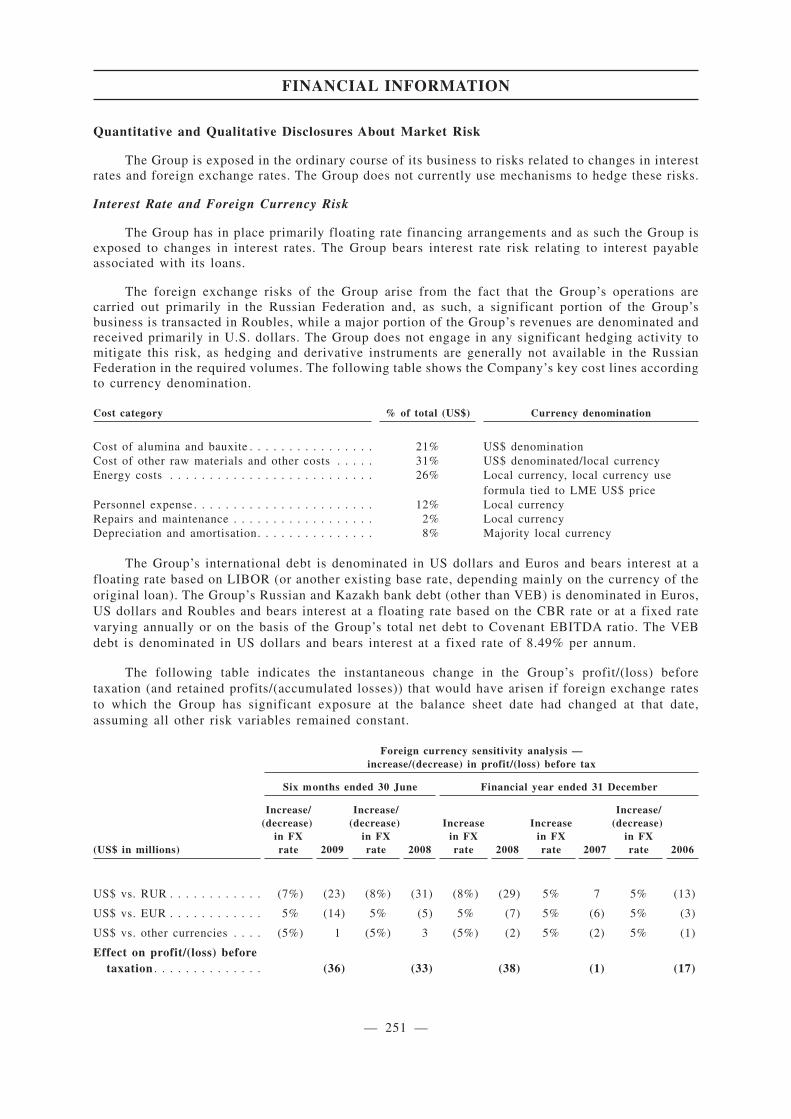
Quantitative and Qualitative Disclosures About Market Risk
The Group is exposed in the ordinary course of its business to risks related to changes in interestrates and foreign exchange rates. The Group does not currently use mechanisms to hedge these risks.
Interest Rate and Foreign Currency Risk
The Group has in place primarily floating rate financing arrangements and as such the Group isexposed to changes in interest rates. The Group bears interest rate risk relating to interest payableassociated with its loans.
The foreign exchange risks of the Group arise from the fact that the Group’s operations arecarried out primarily in the Russian Federation and, as such, a significant portion of the Group’sbusiness is transacted in Roubles, while a major portion of the Group’s revenues are denominated andreceived primarily in U.S. dollars. The Group does not engage in any significant hedging activity tomitigate this risk, as hedging and derivative instruments are generally not available in the RussianFederation in the required volumes. The following table shows the Company’s key cost lines accordingto currency denomination.
Cost category % of total (US$) Currency denomination
Cost of alumina and bauxite . . . . . . . . . . . . . . . . 21% US$ denominationCost of other raw materials and other costs . . . . . 31% US$ denominated/local currencyEnergy costs . . . . . . . . . . . . . . . . . . . . . . . . . . 26% Local currency, local currency use
formula tied to LME US$ pricePersonnel expense . . . . . . . . . . . . . . . . . . . . . . . 12% Local currencyRepairs and maintenance . . . . . . . . . . . . . . . . . . 2% Local currencyDepreciation and amortisation. . . . . . . . . . . . . . . 8% Majority local currency
The Group’s international debt is denominated in US dollars and Euros and bears interest at afloating rate based on LIBOR (or another existing base rate, depending mainly on the currency of theoriginal loan). The Group’s Russian and Kazakh bank debt (other than VEB) is denominated in Euros,US dollars and Roubles and bears interest at a floating rate based on the CBR rate or at a fixed ratevarying annually or on the basis of the Group’s total net debt to Covenant EBITDA ratio. The VEBdebt is denominated in US dollars and bears interest at a fixed rate of 8.49% per annum.
The following table indicates the instantaneous change in the Group’s profit/(loss) beforetaxation (and retained profits/(accumulated losses)) that would have arisen if foreign exchange ratesto which the Group has significant exposure at the balance sheet date had changed at that date,assuming all other risk variables remained constant.
Foreign currency sensitivity analysis —increase/(decrease) in profit/(loss) before tax
Six months ended 30 June Financial year ended 31 December
(US$ in millions)
Increase/(decrease)
in FXrate 2009
Increase/(decrease)
in FXrate 2008
Increasein FXrate 2008
Increasein FXrate 2007
Increase/(decrease)
in FXrate 2006
US$ vs. RUR . . . . . . . . . . . . (7%) (23) (8%) (31) (8%) (29) 5% 7 5% (13)
US$ vs. EUR . . . . . . . . . . . . 5% (14) 5% (5) 5% (7) 5% (6) 5% (3)
US$ vs. other currencies . . . . (5%) 1 (5%) 3 (5%) (2) 5% (2) 5% (1)
Effect on profit/(loss) beforetaxation . . . . . . . . . . . . . . (36) (33) (38) (1) (17)
FINANCIAL INFORMATION
— 251 —

Critical Accounting Policies
The preparation of the Group’s consolidated financial statements requires management to makejudgments and estimates and form assumptions that affect the reported amounts of assets andliabilities and the disclosure of contingent liabilities at the date of the financial statements, and thereported revenue and costs during the periods presented. On an ongoing basis, management evaluatesits judgments and estimates in relation to assets, liabilities, contingent liabilities, revenue and costs.
Management bases its judgments and estimates on historical experience and on other factors itbelieves to be appropriate and reasonable under the circumstances, the results of which form the basisof the carrying values of assets and liabilities that are not readily apparent from other sources. Actualresults may differ from these estimates under different assumptions and conditions.
The Group has identified the following critical accounting policies under which significantjudgments, estimates and assumptions are made and where actual results may differ from theseestimates under different assumptions and conditions and may materially affect financial results or thefinancial position reported in future periods.
Property, Plant and Equipment — Recoverable Amount
In accordance with the Group’s accounting policy, each asset or cash-generating unit is evaluatedevery reporting period to determine whether there are any indications of impairment. If any suchindication exists, a formal estimate of recoverable amount is performed and an impairment lossrecognised to the extent that carrying amount exceeds recoverable amount. The recoverable amountof an asset or cash-generating group of assets is measured at the higher of fair value less costs to selland value in use.
Fair value is determined as the amount that would be obtained from the sale of the asset in anarm’s length transaction between knowledgeable and willing parties, and is generally determined asthe present value of the estimated future cash flows expected to arise from the continued use of theasset, including any expansion prospects, and its eventual disposal.
Value in use is also generally determined as the present value of the estimated future cash flows,but only those expected to arise from the continued use of the asset in its present form and its eventualdisposal. Present values are determined using a risk-adjusted pre-tax discount rate appropriate to therisks inherent in the asset. Future cash flow estimates are based on expected production and salesvolumes, commodity prices (considering current and historical prices, price trends and relatedfactors), reserves (see “— Bauxite Reserve Estimates”), operating costs, restoration and rehabilitationcosts and future capital expenditure. This policy requires management to make these estimates andassumptions that are subject to risk and uncertainty; hence there is a possibility that changes incircumstances will alter these projections, which may impact the recoverable amount of the assets. Insuch circumstances, some or all of the carrying value of the assets may be impaired and theimpairment would be charged against the income statement.
Inventories — Net Realisable Value
The Group recognises write-down of inventories based on an assessment of the net realisablevalue of the inventories. A write-down is applied to the inventories where events or changes incircumstances indicate that the net realisable value is less than cost. The determination of netrealisable value requires the use of judgement and estimates. Where the expectation is different fromthe original estimates, such difference will impact carrying value of the inventories and write-downof inventories charged to income statement in the periods in which such estimate has been changed.
FINANCIAL INFORMATION
— 252 —
Goodwill — Recoverable Amount
In accordance with the Group’s accounting policy, goodwill is allocated to the Group’sAluminium segment as it represents the lowest level within the Group at which the goodwill ismonitored for internal management purposes and is tested for impairment annually by preparing aformal estimate of recoverable amount. The recoverable amount is estimated as the value in use of theAluminium segment.
Similar considerations to those described above in respect of assessing the recoverable amountof property, plant and equipment apply to goodwill.
Investments in Associates and Jointly Controlled Entities — Recoverable Amount
In accordance with the Group’s accounting policy, each investment in associate or jointlycontrolled entities is evaluated every reporting period to determine whether there are any indicationsof impairment after application of equity method of accounting. If any such indication exists, a formalestimate of recoverable amount is performed and an impairment loss recognised to the extent that thecarrying amount exceeds the recoverable amount. The recoverable amount of an investment inassociate or jointly controlled entities is measured at the higher of fair value less costs to sell andvalue in use.
Similar considerations to those described above in respect of assessing the recoverable amountof property, plant and equipment apply to investments in associates or jointly controlled entities. Inaddition to the considerations described above, the Group may also assess the estimated future cashflows expected to arise from dividends to be received from the investment, if such information isavailable and considered reliable.
Legal Proceedings
In the normal course of business the Group may be involved in legal proceedings. Wheremanagement considers that it is more likely than not those proceedings will result in the Groupcompensating third parties, a provision is recognised for the best estimate of the amount expected tobe paid. Where management considers that it is more likely than not that proceedings will not resultin the Group compensating third parties or where in rare circumstances it is not considered possibleto provide a sufficiently reliable estimate of the amount expected to be paid, no provision is made forany potential liability under the litigation but the circumstances and uncertainties involved aredisclosed as contingent liabilities.
The assessment of the likely outcome of legal proceedings and the amount of any potentialliability involves significant judgement. As law and regulations in many of the countries in which theGroup operates are continuing to evolve, particularly in the areas of taxation, sub-soil rights andprotection of the environment, uncertainties regarding litigation and regulation are greater than thosetypically found in countries with more developed legal and regulatory frameworks.
Provision for Restoration and Rehabilitation
The Group’s accounting policy requires the recognition of provisions for the restoration andrehabilitation of each site when a legal or constructive obligation exists to dismantle the assets andrestore the site. The provision recognised represents management’s best estimate of the present valueof the future costs required. Significant estimates and assumptions are made in determining theamount of restoration and rehabilitation provisions. Those estimates and assumptions deal withuncertainties such as: changes to the relevant legal and regulatory framework; the magnitude ofpossible contamination; and the timing, extent and costs of required restoration and rehabilitationactivity. These uncertainties may result in future actual expenditures differing from the amountscurrently provided.
FINANCIAL INFORMATION
— 253 —

The provision recognised for each site is periodically reviewed and updated based on the factsand circumstances available at the time. Changes to the estimated future costs for operating sites arerecognised in the balance sheet by adjusting both the restoration and rehabilitation asset andprovision. Such changes give rise to a change in future depreciation and interest charges. For closedsites, changes to estimated costs are recognised immediately in the income statement.
Taxation
The Group’s accounting policy for taxation requires management’s judgment in assessingwhether deferred tax assets and certain deferred tax liabilities are recognised on the balance sheet.Deferred tax assets, including those arising from carried forward tax losses, capital losses andtemporary differences, are recognised only where it is considered more likely than not that they willbe recovered, which is dependent on the generation of sufficient future taxable profits. Deferred taxliabilities arising from temporary differences in investments, caused principally by retained earningsheld in foreign tax jurisdictions, are recognised unless repatriation of retained earnings can becontrolled and are not expected to occur in the foreseeable future.
Assumptions about the generation of future taxable profits and repatriation of retained earningsdepend on management’s estimates of future cash flows. These depend on estimates of futureproduction and sales volumes, commodity prices, reserves, operating costs, restoration andrehabilitation costs, capital expenditure, dividends and other capital management transactions.Assumptions are also required about the application of income tax legislation. These estimates andassumptions are subject to risk and uncertainty, hence there is a possibility that changes incircumstances will alter expectations, which may impact the amount of deferred tax assets anddeferred tax liabilities recognised on the balance sheet and the amount of other tax losses andtemporary differences not yet recognised. In such circumstances, some or all of the carrying amountof recognised deferred tax assets and liabilities may require adjustment, resulting in a correspondingcredit or charge to the income statement.
The Group generally provides for current tax based on positions taken (or expected to be taken)in its tax returns. Where it is more likely than not that upon examination by the tax authorities of thepositions taken by the Group additional tax will be payable, the Group provides for its best estimateof the amount expected to be paid (including any interest and/or penalties) as part of the tax charge.
Bauxite Reserve Estimates
Reserves are estimates of the amount of product that can be economically and legally extractedfrom the Group’s properties. In order to calculate reserves, estimates and assumptions are requiredabout a range of geological, technical and economic factors, including quantities, grades, productiontechniques, recovery rates, production costs, transport costs, commodity demand, commodity pricesand exchange rates.
The Group determines and reports ore reserves under the Australasian Code for Reporting ofMineral Resources and Ore Reserves (December 2004), known as the JORC Code. The JORC Coderequires the use of reasonable investment assumptions to calculate reserves.
Estimating the quantity and/or grade of reserves requires the size, shape and depth of ore bodiesor fields to be determined by analysing geological data such as drilling samples. This process mayrequire complex and difficult geological judgments and calculations to interpret the data.
Since economic assumptions used to estimate reserves change from period to period, and sinceadditional geological data is generated during the course of operations, estimates of reserves maychange from period to period.
FINANCIAL INFORMATION
— 254 —
Changes in reported reserves may affect the Group’s financial results and financial position ina number of ways, including the following:
• Asset carrying values may be affected due to changes in estimated future cash flows.
• Depletion charged in the income statement may change where such charges are determinedby the units of production basis or where the useful economic lives of assets change.
• Decommissioning, site restoration and environmental provisions may change wherechanges in estimated reserves affect expectations about the timing or cost of theseactivities.
Exploration and Evaluation Expenditure
The Group’s accounting policy for exploration and evaluation expenditure results in certainitems of expenditure being capitalised for an area of interest where it is considered likely to berecoverable by future exploitation or sale or where the activities have not reached a stage whichpermits a reasonable assessment of the existence of reserves. This policy requires management tomake certain estimates and assumptions as to future events and circumstances, in particular whetheran economically viable extraction operation can be established. Any such estimates and assumptionsmay change as new information becomes available. If, after having capitalised the expenditure underthe policy, a judgment is made that recovery of the expenditure is unlikely, the relevant capitalisedamount will be written off to the income statement.
Development Expenditure
Development activities commence after project sanctioning by the appropriate level ofmanagement. Judgement is applied by management in determining when a project has reached a stageat which economically recoverable reserves exist such that development may be sanctioned. Inexercising this judgement, management is required to make certain estimates and assumptions similarto those described above for capitalised exploration and evaluation expenditure. Any such estimatesand assumptions may change as new information becomes available. If, after having commenced thedevelopment activity, a judgment is made that a development asset is impaired, the appropriate amountwill be written off to the income statement.
Defined Benefit Pension and Other Post-Retirement Schemes
For defined benefit schemes, the cost of benefits charged to the income statement includescurrent and past service costs, interest costs on defined benefit obligations and the effect of anycurtailments or settlements, net of expected returns on plan assets. An asset or liability is consequentlyrecognised in the balance sheet based on the present value of defined obligations, less anyunrecognised past service costs and the fair value of plan assets.
The accounting policy requires management to make judgments as to the nature of benefitsprovided by each scheme and thereby determine the classification of each scheme. For defined benefitschemes, management is required to make annual estimates and assumptions about future returns onclasses of scheme assets, future remuneration changes, employee attrition rates, administration costs,changes in benefits, inflation rates, exchange rates, life expectancy and expected remaining periodsof service of employees. In making these estimates and assumptions, management considers adviceprovided by external advisers, such as actuaries. Where actual experience differs to these estimates,actuarial gains and losses are recognised directly in the statement of comprehensive income.
FINANCIAL INFORMATION
— 255 —
App1A-33(4)(a), (b), (c), (d), (e)
Fair Values of Identifiable Net Assets of Acquired Companies
The Group’s policy is to engage an independent appraiser to assist in determining fair values ofidentifiable net assets of acquired companies for all significant business combinations.
A variety of valuation techniques is applied to appraise the acquired net assets depending on thenature of the assets acquired and available market information. The details of methods used andassumptions made to determine fair values of property, plant and equipment are disclosed in Note 17,intangible assets are disclosed in Note 18, provisions are disclosed in Note 30 and financialinvestments are disclosed in Note 21 of UC RUSAL’s Accountants’ Report. Other assets and liabilitiesacquired including provisions are evaluated in accordance with the Group’s applicable accountingpolicies disclosed in Note 3 of UC RUSAL’s Accountants’ Report.
Going concern
The Group was in breach of a number of covenants relating to its debt agreements at 31December 2008 and subsequently suspended servicing certain loans and borrowings. See Note 2(d) toUC RUSAL’s Accountants’ Report. On 7 December 2009, the Group completed restructuringnegotiations with its lenders. The Directors believe that the restructuring terms will allow the Groupsuccessfully to continue its operations and repay its debts as and when they fall due. Accordingly, UCRUSAL’s Accountants’ Report has been prepared on a going concern basis.
However, the validity of the going concern assumption is premised on future events, the outcomeof which is inherently uncertain, being dependent on the Group’s ability to generate cash inflows fromfuture operations. If the repayment of the whole of the Group’s debt should be accelerated, forexample because a relevant member of the Group is unable to comply with or satisfy any of the termsor conditions of or triggers any event of default under, the debt restructuring or other debt obligations,or if the Company should be unable to extend or refinance or repay the VEB Debt as and when it fallsdue, it may cease to continue as a going concern. UC RUSAL’s Accountants’ Report does not includeany adjustments relating to the recoverability and classification of recorded asset amounts or toamounts and classification of liabilities that may be necessary if the Group were unable to continueas a going concern.
DISCLOSURE PURSUANT TO RULES 13.13 TO 13.19 OF THE LISTING RULES
In the second half of 2008, as a result of the global liquidity crisis which resulted in, among otherthings, contractions in many sectors of the real economy and a sharp drop in aluminium prices, theGroup was in breach of a number of covenants relating to its debt agreements and subsequentlysuspended servicing certain loans and borrowings. At 30 June 2009, the Group’s current liabilitiesexceeded its current assets by US$14,397 million. On 7 December 2009, the Group completedrestructuring negotiations with its lenders in order to establish financial stability and to put thenecessary arrangements in place to allow the Group to meet its obligations when they fall due as partof ongoing operations. Details of the debt restructuring arrangements are set out in “FinancialInformation — Management’s Discussion and Analysis of Financial Condition and Results ofOperations — Liquidity and Capital Resources — Debt Restructuring” of this prospectus. Save asdisclosed in this paragraph, we confirm that as of the Latest Practicable Date, we are not aware of anycircumstances that would give rise to a disclosure requirement under Rules 13.13 to 13.19 of theListing Rules.
DISTRIBUTABLE RESERVES
As of 30 June 2009, the Company had reserves available for distribution to its shareholders inthe amount of US$2,958 million. Please refer to Note 27 (e) of UC RUSAL’s Accountants’ Report.
FINANCIAL INFORMATION
— 256 —

PROPERTY INTERESTS AND PROPERTY VALUATION REPORT
The value of the Group’s selected real estate property interests as of 30 September 2009 valuedby American Appraisal, an independent property valuer of our Company, was US$1,744 million. Therewas a net revaluation surplus, representing the excess market value of the properties over their bookvalue as of 30 September 2009. Further details of the Group’s property interests and the text of theletter and valuation certificates of these selected property interests prepared by American Appraisalare set out in Appendix V to this prospectus.
Disclosure of the reconciliation of the valuation of the interests in properties subject to valuationas of 30 September 2009 and such property interests in our consolidated statements of financialposition as of 30 June 2009 as required under Rule 5.07 of Listing Rules is set forth below:
US$(in millions)
Net book value of property interests as of 30 June 2009
Smelters . . . . . . . . . . . . . . . . . . . . . . . . . . . . . . . . . . . . . . . . . . . . . . . . . . . . . . . . . . . . . 1,532
Refineries . . . . . . . . . . . . . . . . . . . . . . . . . . . . . . . . . . . . . . . . . . . . . . . . . . . . . . . . . . . . 498
Other Production Facilities in Current use . . . . . . . . . . . . . . . . . . . . . . . . . . . . . . . . . . . . . . 105
Non-Core Downstream Operations . . . . . . . . . . . . . . . . . . . . . . . . . . . . . . . . . . . . . . . . . . . . 94
Production Facilities in PRC . . . . . . . . . . . . . . . . . . . . . . . . . . . . . . . . . . . . . . . . . . . . . . . 5
Total as of 30 June 2009 . . . . . . . . . . . . . . . . . . . . . . . . . . . . . . . . . . . . . . . . . . . . . . . . . . 2,234
Net movement for the period from 1 July 2009 to 30 September 2009 . . . . . . . . . . . . . . . . . . . 14
Net book value as of 30 September 2009 . . . . . . . . . . . . . . . . . . . . . . . . . . . . . . . . . . . . . . . 2,248
Properties and buildings that have not been valued . . . . . . . . . . . . . . . . . . . . . . . . . . . . . . . . (839)
Properties and buildings that have been valued . . . . . . . . . . . . . . . . . . . . . . . . . . . . . . . . . . 1,409
Valuation surplus as of 30 September 2009 . . . . . . . . . . . . . . . . . . . . . . . . . . . . . . . . . . . . . 335
Valuation as of 30 September 2009 . . . . . . . . . . . . . . . . . . . . . . . . . . . . . . . . . . . . . . . . . . . 1,744
NO MATERIAL ADVERSE CHANGE
The Directors confirm that there has been no material adverse change in the financial or tradingposition or prospects since 30 June 2009, being the date of the latest consolidated financial statementsas set out in UC RUSAL’s Accountants’ Report included in Appendix I to this prospectus.
ADDITIONAL INTERIM REPORTING AFTER LISTING
In addition to compliance with the financial reporting requirements under the Listing Rules, theCompany’s proposed quarterly disclosure for the first and third quarters of each financial year isintended to include:
(i) Qualitative interim management statements, which will include (a) an explanation ofmaterial events and transactions that have taken place since the start of the relevant periodand their impact on the issuer’s financial condition; and (b) a general description of thefinancial position and performance of the group during that time, and quarterly revenues ofeach business segment of the Company in compliance with European TransparencyDirective and French laws and regulations which would apply to the Company as a resultof its listing on Euronext Paris.
FINANCIAL INFORMATION
— 257 —
App1A-38

(ii) Unaudited consolidated summary IFRS financial information for the quarter and on acumulative basis for the fiscal year including:
(a) Narrative describing the results for the cumulative results for the fiscal year and thequarter;
(b) Narrative describing the liquidity and capital resources of the Company;
(c) Information on aluminium and alumina production volumes;
(d) Information on aluminium and alumina sales volumes;
(e) Condensed profit and loss statement under IFRS in US$;
(f) Condensed balance sheet under IFRS in US$;
(g) Condensed cashflow statement under IFRS in US$,
(iii) A statement in connection with the Company’s compliance with the financial covenantsunder the international override agreement.
FINANCIAL INFORMATION
— 258 —

GENERAL
The Board consists (subject to the appointment of Mr. Barry Cheung and Mr. Igor Ermilin witheffect from the Listing Date) of 18 Directors, comprising three executive Directors, 11 non-executiveDirectors and four independent non-executive Directors.
The Directors of the Company are as follows:
Name Age Position
Oleg Deripaska . . . . . . . . . . . . . . . . 41 Chief Executive Officer, Executive Director
Petr Sinshinov . . . . . . . . . . . . . . . . 55 Deputy Chief Executive Officer, Executive Director
Tatiana Soina . . . . . . . . . . . . . . . . . 47 Chief Financial Officer, Executive Director
Victor Vekselberg . . . . . . . . . . . . . . 52 Chairman and Non-executive Director
Dmitry Afanasiev . . . . . . . . . . . . . . 40 Non-executive Director
Len Blavatnik . . . . . . . . . . . . . . . . 52 Non-executive Director
Ivan Glasenberg . . . . . . . . . . . . . . . 52 Non-executive Director
Vladimir Kiryukhin . . . . . . . . . . . . . 52 Non-executive Director
Alexander Popov . . . . . . . . . . . . . . 37 Non-executive Director
Dmitry Razumov . . . . . . . . . . . . . . 34 Non-executive Director
Jivko Savov . . . . . . . . . . . . . . . . . . 42 Non-executive Director
Vladislav Soloviev . . . . . . . . . . . . . 36 Non-executive Director
Anatoly Tikhonov . . . . . . . . . . . . . . 40 Non-executive Director
Igor Ermilin . . . . . . . . . . . . . . . . . 49 Non-executive Director
Peter Nigel Kenny . . . . . . . . . . . . . 61 Independent Non-executive Director
Philip Lader . . . . . . . . . . . . . . . . . . 63 Independent Non-executive Director
Elsie Leung Oi-sie . . . . . . . . . . . . . 70 Independent Non-executive Director
Barry Cheung Chun-yuen . . . . . . . . . 51 Independent Non-executive Director
The Directors of the Company who have held in the three years prior to the listing, or arecurrently holding, directorships in public companies that have securities listed on any securitiesmarket in Hong Kong or overseas are as follows:
Name Listed Company Period of Appointment Stock ExchangeCurrent Role withListed Company
Oleg Deripaska . . . . . Norilsk Nickel 30 June 2008 -26 December 2008
MICEXRTS
None
Dmitry Afanasiev . . . Norilsk Nickel 26 December 2008 -30 June 2009
MICEXRTS
None
Len Blavatnik . . . . . . Warner MusicGroup Corp.
2004 - 2008 New York StockExchange(“NYSE”)
None
Ivan Glasenberg . . . . Xstrata plc February 2002 -present
LSESIX
Member of Boardof Directors
MinaraResourcesLimited
December 2000 -present
Australian StockExchange
Member of Boardof Directors
DIRECTORS AND SENIOR MANAGEMENT
— 259 —
App1A-41(1)
3rdSch-6
Name Listed Company Period of Appointment Stock ExchangeCurrent Role withListed Company
Peter Nigel Kenny . . . PartyGamingPlc.
May 2005 - December2006
LSE None
First CityMonument Bankplc
July 2007 - present Lagos StockExchange
Member of Boardof Directors
JP MorganEmergingMarketsInvestmentTrust plc
September 2008 -present
LSE Member of Boardof Directors
Dmitry Razumov . . . . Norilsk Nickel June 2009 - present MICEXRTS
Member of Boardof Directors
OPIN 2008 - present MICEXRTS
Member of Boardof Directors
Vladislav Soloviev. . . Norilsk Nickel 26 December 2008 -present
MICEXRTS
Member of Boardof Directors,Member of theBoard’s StrategyCommittee,Chairman of theBoard’s BudgetCommittee
OJSC OGK-3 6 February 2009 -present
MICEXRTS
Member of Boardof Directors,Member of theBoard’s StrategyCommittee,Chairman of theBoard’s BudgetCommittee
Barry CheungChun-yuen . . . . . .
TitanPetrochemicalsGroup Limited
9 July 2004 -23 July 2008
Hong KongStock Exchange
None
Philip Lader . . . . . . . WPP plc 1 February 2001 -present
LSENASDAQ
Non-executiveChairman
AESCorporation
1 February 2001 -present
NYSE Member of Boardof Directors
Marathon OilCorporation
1 February 2002 -present
NYSE Member of Boardof Directors
SongbirdEstates Plc.
1 June 2006 - present AIM Member of Boardof Directors
Save as disclosed in this prospectus, none of our Directors has had any other directorships in thelast three years in public companies the securities of which are listed on any securities market in HongKong or overseas.
DIRECTORS AND SENIOR MANAGEMENT
— 260 —
Each of the Directors can be contacted at the Company’s registered address at WhiteleyChambers, Don Street, St Helier JE4 9WG, Jersey.
As at the date of this prospectus the Board has nine Directors nominated by En+, two Directorsnominated by SUAL Partners, one Director nominated by Glencore and one Director nominated byOnexim. VEB also has the right under the loan agreement with the Company to nominate forappointment one Director.
There are four independent non-executive Directors on the Board. Two independentnon-executive Directors, Peter Nigel Kenny and Philip Lader, have acted in such capacity since theacquisition of SUAL and the Glencore Businesses in March 2007. A majority of the members of eachof the Audit Committee, Remuneration Committee and Corporate Governance and NominationsCommittee are independent non-executive Directors. See “— Committees — Board Committees”.
Notwithstanding that a Director may have been nominated to the Board by a particularshareholder and irrespective of whether that Director is an executive, non-executive and/orindependent Director, every Director of a Jersey company owes the same fiduciary duties under Jerseylaw to the company as a whole including a statutory obligation in exercising their powers anddischarging their duties to act honestly and in good faith with a view to the best interests of thecompany. Under common law, the Directors have a general duty to act in good faith, exercise theirpowers for a proper purpose and manage conflicts of interest appropriately.
Pursuant to the Company’s Articles of Association, if any Director has an interest that conflictswith the interests of the Company, that Director is required to disclose such conflict at the earliestBoard meeting at which it is practicable to do so. Save in limited circumstances, a Director shall notvote on any resolution concerning any contract, transaction, arrangement, or any other proposal inwhich he has a material interest. If any question arises at any meeting as to the materiality of aDirector’s interest (other than an independent non-executive Director’s interest) or as to theentitlement of any Director (other than an independent non-executive Director) to vote, and suchquestion is not resolved by his voluntarily agreeing to abstain from voting, such question shall bereferred to the independent non-executive Directors present at the meeting. The independentnon-executive Directors’ ruling, by simple majority of those independent non-executive Directorspresent at the meeting, in relation to the Director concerned shall be final and conclusive. SeeAppendix VII for a summary of the Company’s Articles of Association.
The roles of the Chairman and the CEO are not exercised by the same individual. Appropriatetraining and an induction programme is undertaken in respect of all Directors on appointment and,subsequently, such briefing and professional development as is necessary, taking into account existingqualifications and experience.
The Directors understand that the Board is collectively responsible for the management andoperations of the Company. The Directors believe, based on due and careful enquiry and in the contextof the requirements of the Listing Rules, that each member of the Board has the character, experienceand integrity and is able to demonstrate a standard of competence commensurate with his or herposition as a director of a listed issuer of the Hong Kong Stock Exchange.
DIRECTORS AND SENIOR MANAGEMENT
— 261 —
Biographies of each of the Directors are set out below:
Executive Directors
Oleg Deripaska, aged 41 (Chief Executive Officer, Executive Director)
Oleg Deripaska was appointed as Executive Director and Chief Executive Officer of theCompany, Chief Executive Officer and head of the Moscow Branch of RUSAL Global ManagementB.V. in January 2009 and he has been a member of the Company’s Board of Directors since 26 March2007. He is responsible for the development and implementation of the Company’s strategy as bothan energy and metals corporation that meets best international standards for production, productquality, environment, industrial safety and corporate governance. Mr. Deripaska is also focused onensuring the sustainable development of the Company in the context of the global financial crisis andon implementing a series of crisis management measures.
Having raised his initial capital by trading in metals, Mr. Deripaska acquired shares in theSayanogorsk aluminium smelter and became its Director General in 1994. In 1997, Mr. Deripaskainitiated the creation of the Sibirsky Aluminium Group LLC, which was Russia’s first verticallyintegrated industrial group. Between 2000 and 2003, Mr. Deripaska was Director General of RussianAluminium OJSC, which was set up as a result of the combination of aluminium smelters and aluminarefineries of Sibirsky Aluminium and the Sibneft oil company. From October 2003 to February 2007he held the position of Chairman of the Board in Russian Aluminium OJSC. Since January 2003, hehas been a director of Basic Element Limited. Since September 2003, he has held the position ofChairman of the Supervisory Board of Company Bazovy Element LLC and from March 2009 onwardshe has held the position of General Director of that same company. He has been the Chairman of theBoard of OJSC “Russian Machines” (formerly “RusPromAvto LLC”) since November 2006. He wasa director of Transstroy Engineering & Construction Company LLC from April 2008 to April 2009.
Mr. Deripaska was born in the city of Dzerzhinsk in 1968. In 1993, he graduated with distinctionfrom the Physics Department of Moscow State University, Lomonosov, and in 1996 he received adegree from Plekhanov Academy of Economics. Mr. Deripaska is Vice President of the Russian Unionof Industrialists and Entrepreneurs and Chairman of the Executive Board of the Russian NationalCommittee of the International Chamber of Commerce and a member of the Competitiveness andEntrepreneurship Council, an agency of the Russian Government. In 2004, Russian President VladimirPutin appointed Mr. Deripaska to represent the Russian Federation on the Asia-Pacific EconomicCooperation Business Advisory Council. In 2007, he was appointed Chairman of the Russian sectionof the Council. He sits on the Board of Trustees of many institutions including the Bolshoi Theatreand the School of Economics at Moscow State University, Lomonosov and is co-founder of theNational Science Support Foundation and the National Medicine Fund. His charity foundation, VolnoeDelo supports a wide range of projects including initiatives to help children, improve medical care andincrease educational opportunities throughout Russia.
Mr. Deripaska received the Order of Friendship in 1999, a state award from the RussianFederation. He was named businessman of the year in 1999, 2006, 2007 by Vedomosti, a leadingRussian business daily published in partnership with The Wall Street Journal and The Financial Times.
Mr. Deripaska is beneficially interested in 660,000 Shares through En+ as at the date of thisprospectus. Save as aforesaid, Mr. Deripaska has no interests in the Shares within the meaning of PartXV of the SFO. Save as disclosed above, Mr. Deripaska is independent from and not related to anyother Directors, senior management, substantial shareholders or controlling shareholders of theCompany. Save as disclosed above, Mr. Deripaska has not held any directorship in any other publiccompanies the securities of which are listed on any securities market in Hong Kong or overseas in the
DIRECTORS AND SENIOR MANAGEMENT
— 262 —
past three years. Mr. Deripaska was nominated as an executive Director of the Company by En+ asmajor shareholder of the Company. Save as disclosed above, there is no other information which isrequired to be disclosed pursuant to any of the requirements under Rules 13.51(2)(h) to 13.51(2)(v)of the Listing Rules.
Petr Sinshinov, aged 55 (Deputy Chief Executive Officer and Executive Director)
Petr Sinshinov was appointed a member of UC RUSAL’s Board on 23 November 2009. AsDeputy Chief Executive Officer of the Moscow Branch of RUSAL Global Management B.V., heoversees the general expenditure cutting and production cost reduction activities. His responsibilitiesalso include seeking effective alternative solutions to the Group’s procurement and purchasingschemes and optimising transportation and logistics costs.
From October 2006 until 2008, Mr. Sinshinov was the Chief Executive Officer of TransmashHolding. In 2005-2006 he held several executive positions at Kuzbassrazrezugol where he served onthe board of directors starting from the beginning of 2006. From 2002 to 2003 Mr. Sinshinov was theChief Executive Officer of Ruspromavto. In 2000-2001, he was the Chief Executive Officer ofSoyuzmetalresurs, a holding company for several industrial operations. From 1995 to 2000 Mr.Sinshinov was the commercial director and deputy managing director of the Sayanogorsk aluminiumsmelter. In 1977 he began his professional career at the Norilsk mining plant. Mr. Sinshinov was bornin 1954. Mr. Sinshinov graduated from the Institute of Non-Ferrous Metals in Krasnoyarsk in 1977.
Mr. Sinshinov has no interests in the Shares within the meaning of Part XV of the SFO. Save asdisclosed herein, Mr. Sinshinov is independent from and not related to any other Directors, seniormanagement, substantial shareholders or controlling shareholders of the Company. Mr. Sinshinov hasnot held any directorship in any other public companies the securities of which are listed on anysecurities market in Hong Kong or overseas in the past three years. Mr. Sinshinov was nominated asan executive Director of the Company by En+ as major shareholder of the Company. Save as disclosedabove, there is no other information which is required to be disclosed pursuant to any of therequirements under Rules 13.51(2)(h) to 13.51(2)(v) of the Listing Rules.
Tatiana Soina, aged 47 (Chief Financial Officer and Executive Director)
Tatiana Soina was appointed a member of the UC RUSAL Board with effect from 9 November2009. Tatiana Soina was appointed head of the Finance Directorate of the Moscow Branch of RUSALGlobal Management B.V. in January 2009. In addition to financial planning and auditingresponsibilities, she is in charge of business transaction analysis and oversees information technology(SAP/R3) and efficiency management systems. Previously, Ms. Soina was Director of the Budget andPlanning Department, first of RUSAL, from 2003 onwards, then of UC RUSAL upon its establishmentin March 2007. Between 2000 and 2002, she was Deputy Director of the Budget and PlanningDepartment. From 1986 to 1991 she worked as an economist in various Russian and foreign companiesand between 1999 and 2000 she headed the economic and planning department at ‘SiberianAluminium’. Ms. Soina was born in 1962. In 1983 she graduated from the Kiev State UniversityInstitute of National Economy, majoring in Economics. In 2004 she was awarded an MBA diplomafrom the Higher School of Economics in Moscow with a focus on ‘General and StrategicManagement’.
Ms. Soina has no interests in the Shares within the meaning of Part XV of the SFO. Save asdisclosed above, Ms. Soina is independent from and not related to any other Directors, seniormanagement, substantial shareholders or controlling shareholders of the Company. Ms. Soina has notheld any directorship in any other public companies the securities of which are listed on any securitiesmarket in Hong Kong or overseas in the past three years. Ms. Soina was nominated as an ExecutiveDirector of the Company by En+ as major shareholder of the Company. Save as disclosed above, thereis no other information which is required to be disclosed pursuant to any of the requirements underRules 13.51(2)(h) to 13.51(2)(v) of the Listing Rules.
DIRECTORS AND SENIOR MANAGEMENT
— 263 —
Non-executive Directors
Victor Vekselberg, aged 52 (Chairman and Non-executive Director)
Victor Vekselberg was appointed non-executive Director and Chairman of the UC RUSAL Boardon 26 March 2007. From January 2003 to March 2007, Victor Vekselberg was Chairman of the Boardat SUAL, where he was previously President from 2000 to 2003. In October 2003, after theestablishment of TNK-BP Limited, Mr. Vekselberg became the Managing Director for Production andTechnologies and joined the TNK-BP Limited board of directors. As at the date of this prospectus,while remaining a member of the TNK-BP Limited board of directors, he also holds the position ofChairman of the Supervisory Committee of the RENOVA Group, Executive Director for Gas BusinessDevelopment of OAO TNK-BP Management and Chairman of the board of directors of “RUSIAPetroleum”. From April 2002 through October 2003 he was the Chairman of the Management Boardof TNK. In 1996, Mr. Vekselberg created SUAL, which incorporated the Irkutsk and Urals aluminiumsmelters, and he held the position of Chief Executive Officer of SUAL from 1996 to 2000. In 1990,he became one of the founders of RENOVA.
Victor Vekselberg was born in 1957 in Drogobych, a provincial town in the Lviv region, Ukraine.In 1979, he completed his studies in Automatic Control Systems and graduated from the MoscowInstitute of Transport Engineers with Honours. That same year, he continued his education with apost-graduate course at the Computer Centre of the Academy of Science. He is a Member of theBureau of the Management Board of the Russian Union of Industrialists and Entrepreneurs (RSPP) andChairman of the RSPP Committee on International Cooperation.
Mr. Vekselberg is beneficially interested in 78,800 Shares through SUAL Partners as at the dateof this prospectus. Save as aforesaid, Mr. Vekselberg has no interests in the Shares within the meaningof Part XV of the SFO. Save as disclosed above, Mr. Vekselberg is independent from and not relatedto any other Directors, members of senior management, substantial shareholders or controllingshareholders of the Company. Mr. Vekselberg has not held any directorship in any public companiesthe securities of which are listed on any securities market in Hong Kong or overseas in the past threeyears. Mr. Vekselberg was nominated as a non-executive Director of the Company by SUAL Partnersas shareholder of the Company. Save as disclosed above, there is no other information which isrequired to be disclosed pursuant to any of the requirements under Rules 13.51(2)(h) to 13.51(2)(v)of the Listing Rules.
Dmitry Afanasiev, aged 40 (Non-executive Director)
Dmitry Afanasiev was appointed a member of the UC RUSAL Board on 26 March 2007. He isthe Chairman of Egorov, Puginsky, Afanasiev and Partners, a Russian law firm that provides legalservices the Company. Prior to co-founding the firm in 1994, he worked at Schnader Harrison Segal& Lewis LLP and Wolf Block Schorr and Solis-Cohen LLP. He specializes in corporate transactions,dispute resolution and public policy. He has represented the interests of the Russian Federation onnumerous occasions in various legal matters and participated in the drafting of some of Russia’sfederal laws, including antitrust legislation.
Dmitry Afanasiev was born in 1969. He studied law at Leningrad State University, the Universityof Pennsylvania and the St. Petersburg Institute of Law. He was awarded a medal by the FederalChamber of Advocates of the Russian Federation for professional excellence and received acommendation from the President of Russia for achievements in defending human rights. He is amember of the General Council of Business Russia, a national non-profit association, and a foundingmember of the Russian-American Business Council.
DIRECTORS AND SENIOR MANAGEMENT
— 264 —

Mr. Afanasiev has no interests in the Shares within the meaning of Part XV of the SFO. Mr.Afanasiev is independent from and not related to any other Directors, senior management, substantialshareholders or controlling shareholders of the Company. Save as disclosed in this Prospectus, Mr.Afanasiev has not held any directorship in any other public companies the securities of which arelisted on any securities market in Hong Kong or overseas in the past three years. Mr. Afanasiev wasnominated as a non-executive Director of the Company by En+ as major shareholder of the Company.Save as disclosed above, there is no other information which is required to be disclosed pursuant toany of the requirements under Rules 13.51(2)(h) to 13.51(2)(v) of the Listing Rules.
Len Blavatnik, aged 52 (Non-executive Director)
Len Blavatnik was appointed a member of the UC RUSAL Board at its creation on 26 March2007. Mr. Blavatnik has been a Director and the Vice President of SUAL Partners Limited sinceOctober 2006 and was a Director of SUAL International Limited from October 2001 to September2006. Mr. Blavatnik is the founder and Chairman of Access Industries, a privately-held U.S. industrialgroup with holdings in natural resources and chemicals, media and telecommunications, and realestate. Incorporated in 1986, Access Industries is today an international industrial concern withstrategic investments in the U.S., Europe and South America. Mr. Blavatnik was raised in Russia andbecame a U.S. citizen in 1981. He received his Master’s degree in Computer Science from ColumbiaUniversity in 1981 and his MBA from Harvard Business School in 1989.
Mr. Blavatnik serves on the board of numerous companies in the Access Industries portfolioincluding LyondellBasell Industries (the world’s third largest independent chemical company) andTNK-BP (a vertically integrated oil major). Mr. Blavatnik remains engaged in educational pursuitsand, in addition to corporate directorships, sits on academic boards at Cambridge University, HarvardBusiness School and Tel Aviv University. An active philanthropist, Mr. Blavatnik also sits on boardsof directors of, inter alia, The White Nights Foundation of America, the 92nd Street Y in New Yorkand The Center for Jewish History in New York.
Mr. Blavatnik is beneficially interested in 67,300 Shares through the indirect ownership ofapproximately 30.56% of the issued share capital of SUAL Partners as at the date of this prospectus.Mr. Blavatnik has no interests in the Shares within the meaning of Part XV of the SFO. Save asdisclosed above, Mr. Blavatnik is independent from and not related to any other Directors, seniormanagement, substantial shareholders or controlling shareholders of the Company. Save as disclosedabove, Mr. Blavatnik has not held any directorship in any other public companies the securities ofwhich are listed on any securities market in Hong Kong or overseas in the past three years. Mr.Blavatnik was nominated as a non-executive Director of the Company by SUAL Partners asshareholder of the Company. Save as disclosed above, there is no other information which is requiredto be disclosed pursuant to any of the requirements under Rules 13.51(2)(h) to 13.51(2)(v) of theListing Rules.
Igor Ermilin, aged 49 (Non-executive Director)
Mr. Ermilin has been appointed as a member of the Board with effect from the Listing Date.Since April 2009, he has been the General Counsel of the En+ where his responsibilities includemanaging the legal aspects of the En+’s mergers and acquisitions projects, creating joint ventures,accessing the international financing and capital markets, court activities, claims and contracting.From 2003 to 2009, Mr. Ermilin held various executive positions in the legal department of BasicElement, most recently as the company’s General Counsel. Prior to joining Basic Element in 2003, Mr.Ermilin worked for the Russian Government, the European Bank for Reconstruction and Developmentand practiced law at major law firms in Moscow, London, Washington D.C. and New York. Mr. Ermilinwas born in 1960. Mr. Ermilin graduated from Moscow State University in 1982 and GeorgetownUniversity Law Center in 1997.
DIRECTORS AND SENIOR MANAGEMENT
— 265 —
Mr. Ermilin has no interests in the Shares within the meaning of Part XV of the SFO. Save asdisclosed above, Mr. Ermilin is independent from and not related to any other Directors, members ofsenior management, substantial shareholders or controlling shareholders of the Company. Mr. Ermilinhas not held any directorship in any other public companies the securities of which are listed on anysecurities market in Hong Kong or overseas in the past three years. Mr. Ermilin was nominated as anon-executive Director of the Company by En+ as major shareholder of the Company. Save asdisclosed above, there is no other information which is required to be disclosed pursuant to any of therequirements under Rules 13.51(2)(h) to 13.51(2)(v) of the Listing Rules.
Ivan Glasenberg, aged 52 (Non-executive Director)
Ivan Glasenberg was appointed a member of the UC RUSAL Board and a member of the StandingCommittee of the Company on 26 March 2007. He has been Glencore’s Chief Executive Officer since2002. Mr. Glasenberg is a member of the board of directors of Xstrata plc and Minara ResourcesLimited. He joined Glencore in 1984 and worked in the coal department in South Africa for three yearsand in Australia for two years. From 1988 to 1989, he managed Glencore’s Hong Kong and Beijingoffices. In 1990, he became head of coal and in 2002 he was appointed Chief Executive Officer ofGlencore. Prior to joining Glencore, Mr. Glasenberg worked at Levitt Kirson Chartered Accountantsfor five years. He is a Chartered Accountant of South Africa. He holds a Bachelor’s degree inAccountancy from Witwatersrand University, South Africa, as well as a master’s degree in BusinessAdministration from the University of Southern California, Los Angeles.
Mr. Glasenberg has no interests in the Shares within the meaning of Part XV of the SFO. Saveas disclosed above, he is independent from and not related to any other Directors, members of seniormanagement, substantial shareholders or controlling shareholders of the Company. Save as disclosedabove, he has not held any directorship in any other public companies the securities of which are listedon any securities market in Hong Kong or overseas in the past three years. Mr. Glasenberg wasnominated as a non-executive Director of the Company by Glencore as shareholder of the Company.Save as disclosed above, there is no other information which is required to be disclosed pursuant toany of the requirements under Rules 13.51(2)(h) to 13.51(2)(v) of the Listing Rules.
Vladimir Kiryukhin, aged 52 (Non-executive Director)
Vladimir Kiryukhin was appointed a member of the UC RUSAL Board on 10 June 2009. He hasacted as Government Relations Director of En+ since June 2009. He is responsible for providinginteraction between En+ and the federal and regional authorities within the framework of theimplementation of the company’s business strategy. He has held the position of Chief ExecutiveOfficer of En+ Development since 2008.
Prior to joining En+, Mr. Kiryukhin held different positions, including First Deputy ChiefExecutive Officer and Chief Executive Officer, at EuroSibEnergo (a public company that managespower assets of En+) in the period 2003-2008.
Vladimir Kiryukhin is a member of the Supervisory Board of Non-Commercial PartnershipMarket Council; Adviser to the Russian Federation Federal Tariff Service; Adviser to the Council ofthe Federation Commission on Natural Monopolies; Assistant to Member of the Council of theFederation. Mr. Kiryukhin graduated from A Popov Higher Naval Radio-Electronics Academy in 1979,Mr. Kiryukhin also holds a PhD in Automated Information Systems from the All-Soviet Union Scienceand Research Institute of Interindustries Information which he received in 1988.
DIRECTORS AND SENIOR MANAGEMENT
— 266 —
Mr. Kiryukhin has no interests in the Shares within the meaning of Part XV of the SFO. Save asdisclosed above, he is independent from and not related to any other Directors, members of seniormanagement, substantial shareholders or controlling shareholders of the Company. He has not heldany directorship in any public companies the securities of which are listed on any securities marketin Hong Kong or overseas in the past three years. Mr. Kiryukhin was nominated as a non-executiveDirector of the Company by En+, as shareholder of the Company. Save as disclosed above, there isno other information which is required to be disclosed pursuant to any of the requirements under Rules13.51(2)(h) to 13.51(2)(v) of the Listing Rules.
Alexander Popov, aged 37 (Non-executive Director)
Alexander Popov was appointed a member of the Board on 24 April 2008. Mr. Popov joined En+in March 2007 as Group Financial Controller and has responsibility for building the finance functionin the newly created Energy Sector within Basic Element Group. Prior to joining En+, AlexanderPopov worked as head of corporate financial reporting department in oil company OAO “LUKOIL”for six years. From 1994 to 1999 Alexander Popov held various positions in the audit companyPricewaterhouseCoopers, rendering consulting and audit services to major oil and gas companies inRussia. Mr. Popov was born in 1971 in Togliatti. He is a Certified Public Accountant (member of theAmerican Institute of Certified Public Accountants), holds a Master’s degree in Engineering(automobile industry) from State Polytechnic University in Togliatti (Russia) and a Bachelor’s degreein accounting and audit from Saratov State Academy of Economics in Saratov, Russia.
Mr. Popov has no interests in the Shares within the meaning of Part XV of the SFO. Save asdisclosed above, Mr. Popov is independent from and not related to any other Directors, members ofsenior management, substantial shareholders or controlling shareholders of the Company. Mr. Popovhas not held any directorship in any other public companies the securities of which are listed on anysecurities market in Hong Kong or overseas in the past three years. Mr. Popov was nominated as anon-executive Director of the Company by En+ as major shareholder of the Company. Save asdisclosed above, there is no other information which is required to be disclosed pursuant to any of therequirements under Rules 13.51(2)(h) to 13.51(2)(v) of the Listing Rules.
Dmitry Razumov, aged 34 (Non-executive Director)
Mr. Razumov was appointed a member of the Board on 24 April 2008. In June 2007, he wasappointed to his current position as CEO of LLC “Onexim Group”. He is also a member of the Boardof Directors of Norilsk Nickel, Investment and Development Group OPIN, MMC Intergeo, MFK Bankand Soglasie Insurance Company.
Earlier in his career, Mr. Razumov practiced business and corporate law at Clifford Chance LLP,following which he gained investment banking experience at Renaissance Capital, a leading Russianinvestment bank. In 1998, Mr. Razumov left Renaissance Capital to co-found the independent venturecapital firm LV Finance that stands behind the success of MegaFon, the third largest mobile phoneoperator in Russia, before selling his interest in the firm in 2003. Between 2001 and 2005, Mr.Razumov served as Deputy Chief Executive Officer for Strategy and M&A at Norilsk Nickel, Russia’slargest mining company, leading its transformation into a world class company throughgroundbreaking deals with Stillwater Mining Company, Gold Fields and Polyus Gold, and pioneeringindustry best corporate governance standards among Russian blue-chip companies.
In 1997, Mr. Razumov graduated from the International Law Department of Moscow StateInstitute of International Relations, receiving a Master’s degree in International Trade Law.
DIRECTORS AND SENIOR MANAGEMENT
— 267 —
Mr. Razumov has no interests in the Shares within the meaning of Part XV of the SFO. Save asdisclosed above, he is independent from and not related to any other Directors, members of seniormanagement, substantial shareholders or controlling shareholders of the Company. Save as disclosedabove, he has not held any directorship in any other public companies the securities of which are listedon any securities market in Hong Kong or overseas in the past three years. Mr. Razumov wasnominated as a non-executive Director of the Company by Onexim as shareholder of the Company.Save as disclosed above, there is no other information which is required to be disclosed pursuant toany of the requirements under Rules 13.51(2)(h) to 13.51(2)(v) of the Listing Rules.
Jivko Savov, aged 42 (Non-executive Director)
Mr. Jivko Savov was appointed a member of the UC RUSAL Board on 24 March 2009. He alsoserved as a member of the UC RUSAL Board from 1 March 2008 through 30 October 2008. Mr. JivkoSavov joined En+ in 2006 and is responsible for the management and optimisation of the electricitygeneration portfolio of En+. Mr. Jivko Savov worked for over 12 years in the energy sector in privateequity, business development and structured finance roles.
From 2002 till 2006 Mr. Savov was Head of Energy Investments at MMC Energy Europe andEquest Partners in London managing private equity investments in power and renewable energyprojects, oil and gas, and metals in Eastern Europe and Russia. Prior to that, he worked as a Manager,structured marketing and origination with EDF Trading in London, where he was responsible for theEast European and Benelux markets.
Mr. Savov serves on the board of directors of En+ Power Ltd, EuroSibEnergo LLC,EuroSibEnergo OJSC and Irkutsenergo OJSC. Before joining EDF Trading, Jivko Savov worked forEnron Europe, London in the project finance and trading teams covering South East Europe andTurkey. He began his career in 1996 at the World Bank as Project Officer for the Energy and StateEnterprise sectors. Born in 1966, Mr. Savov received an MBA from INSEAD, France in 1998 and anMSc in International Relations (with Honours) from the Moscow State Institute of InternationalRelations, Russia in 1992.
Mr. Savov has no interests in the Shares within the meaning of Part XV of the SFO. Save asdisclosed above, Mr. Savov is independent from and not related to any other Directors, members ofsenior management, substantial shareholders or controlling shareholders of the Company. Mr. Savovhas not held any directorship in any public companies the securities of which are listed on anysecurities market in Hong Kong or overseas in the past three years. Mr. Savov was nominated as anon-executive Director of the Company by En+ as major shareholder of the Company. Save asdisclosed above, there is no other information which is required to be disclosed pursuant to any of therequirements under Rules 13.51(2)(h) to 13.51(2)(v) of the Listing Rules.
Vladislav Soloviev, aged 36 (Non-executive Director)
Vladislav Soloviev was appointed a member of the UC RUSAL Board on 18 October 2007. InJanuary 2008, Mr. Soloviev was appointed Chief Executive Officer of En+ Management LLC. From2007 to 2008, Mr. Soloviev was head of the Company’s Finance Directorate upon the Company’sformation. Previously he was head of the Finance Directorate and before that the director of theCompany’s accounting department. Prior to joining the Company, Mr. Soloviev was Deputy Directorof the department of tax policy and worked as adviser to the minister for taxes of the RussianFederation, where he was responsible for implementing amendments to tax laws. From 1994 to 1998,he held various top positions in UNICON/MC Consulting and was in charge of auditing oil and gascompanies. Mr. Soloviev serves on the board of directors of United Oil Group LLC, EuroSibPowerCompany Ltd, EuroSibPower Company OJSC, En+, En+ Power Limited, Norilsk Nickel, OGK-3 OJSC
DIRECTORS AND SENIOR MANAGEMENT
— 268 —
and OJSC NK RussNeft. Mr. Soloviev was born in 1973. In 1995, he graduated from the Higher Schoolof the State Academy of Management with Honours, and in 1996, he graduated from the StankinMoscow Technical University. In 2004, he graduated from the Finance Academy of the Governmentof the Russian Federation and was awarded an MBA degree by Antwerp University in Belgium.
Mr. Soloviev has no interests in the Shares within the meaning of Part XV of the SFO. Save asdisclosed above, Mr. Soloviev is independent from and not related to any other Directors, seniormanagement, substantial shareholders or controlling shareholders of the Company. Save as disclosedabove, Mr. Soloviev has not held any directorship in any other public companies the securities ofwhich are listed on any securities market in Hong Kong or overseas in the past three years. Mr.Soloviev was nominated as a non-executive Director of the Company by En+ as major shareholder ofthe Company. Save as disclosed above, there is no other information which is required to be disclosedpursuant to any of the requirements under Rules 13.51(2)(h) to 13.51(2)(v) of the Listing Rules.
Anatoly Tikhonov, aged 40 (Non-Executive Director)
Anatoly Tikhonov became a member of the UC RUSAL Board on 24 March 2009. Mr. Tikhonovhas been a member of the Management Board and First Deputy Chairman of State Corporation “Bankfor Development and Foreign Economic Affairs (Vnesheconombank)” since October 2008. He workedas Deputy Governor of the Krasnoyarsk Region Administration from 2003 to 2007 and as Deputy Headof the Krasnoyarsk Region Government from 2007 to 2008.
In 2007-2008, Mr. Tikhonov headed the External Relations and Investment Policy Department atthe Krasnoyarsk Region Administration as Deputy Governor of the Krasnoyarsk Region. From 2003to 2007, he acted as Deputy Governor of the Krasnoyarsk Region and Head of the PermanentRepresentation of the Krasnoyarsk Region Administration in the Russian Government. From 1999 to2003, Mr. Tikhonov worked as Deputy Chairman of the Finance Committee at the St. Petersburg CityAdministration.
In 1996-1999, Mr. Tikhonov held the position of Director for Commerce and Vice-President forEconomics and Finance of the Russian Public Fund of Disabled War Veterans. In 1995-1996, he wasGeneral Director of ZAO Bagram.
Mr. Tikhonov’s professional career began in 1987, when he started his work as a recording clerkat the Moscow Garrison’s military court. In 1989, he completed his two-year military service. AnatolyTikhonov was born on 13 June 1969 in Moscow. In 1995, he graduated from the Moscow StateUniversity, Lomonosov majoring in jurisprudence.
Mr. Tikhonov has no interests in the Shares within the meaning of Part XV of the SFO. Mr.Tikhonov is independent from and not related to any other Directors, senior management, substantialshareholders or controlling shareholders of the Company. Mr. Tikhonov has not held any directorshipin any other public companies the securities of which are listed on any securities market in Hong Kongor overseas in the past three years. Save as disclosed above, there is no other information which isrequired to be disclosed pursuant to any of the requirements under Rules 13.51(2)(h) to 13.51(2)(v)of the Listing Rules nor are there any matters which need to be brought to the attention of theShareholders in connection with Mr. Tikhonov’s appointment as a non-executive Director of theCompany.
In order to promote good corporate governance, the Company’s Articles have provided that in theevent of conflict of interest, the interested Director is required to abstain from voting for the relevantresolution. Mr. Tikhonov, as a Director nominated by VEB, will abstain from voting for anyresolutions on transactions that the Company may have with VEB.
DIRECTORS AND SENIOR MANAGEMENT
— 269 —

Barry Cheung Chun-yuen, aged 51 (Independent Non-executive Director)
Mr. Cheung has been appointed a member of the Board with effect from the Listing Date. Mr.Cheung is the Chairman of the Hong Kong Mercantile Exchange Ltd. He is also Chairman of both theUrban Renewal Authority and the Standing Committee on Disciplined Services’ Salaries andConditions of Service in Hong Kong. From July 2004 to January 2008, Mr. Cheung was first the ChiefExecutive Officer of Titan Petrochemicals Group Limited and later its Deputy Chairman. Mr. Cheungpreviously served as Chairman of the Corruption Prevention Advisory Committee of the IndependentCommission Against Corruption. From 1987 to 1994, he was a consultant with McKinsey & Companyin the United States and Asia. From 1993 to 1994 he also served as a full-time member of the HongKong Government’s Central Policy Unit on secondment from McKinsey & Company. Mr. Cheung wasborn in 1958. Mr. Cheung holds a Bachelor of Science degree with First Class Honours in Mathematicsand Computer Science from the University of Sussex and an MBA from Harvard Business School.
Mr. Cheung has no interests in the Shares within the meaning of Part XV of the SFO. Save asdisclosed above, Mr. Cheung is independent from and not related to any other Directors, members ofsenior management, substantial shareholders or controlling shareholders of the Company. Save asdisclosed above, Mr. Cheung has not held any directorship in any other public companies the securitiesof which are listed on any securities market in Hong Kong or overseas in the past three years. Saveas disclosed above, there is no other information which is required to be disclosed pursuant to any ofthe requirements under Rules 13.51(2)(h) to 13.51(2)(v) of the Listing Rules nor are there any matterswhich need to be brought to the attention of the Shareholders in connection with Mr. Cheung’sappointment as a non-executive Director of the Company.
Peter Nigel Kenny, aged 61 (Independent Non-executive Director)
Dr. Peter Nigel Kenny was appointed independent non-executive Director and Chairman of theAudit Committee of the Company on 26 March 2007. He is currently a partner at Sabre CapitalWorldwide Inc., a private equity company specialising in emerging markets.
From 1992 to 2002, Dr. Kenny held a number of senior positions at Standard Chartered Bank Plc,including Group Head of Audit, Regional General Manager for UK & Europe, Group Head ofOperations, Corporate and Institutional Banking and Group Finance Director. In 1978 he joined ChaseManhattan Bank where he assumed regional responsibilities for the bank’s audit activities throughoutEurope, the Middle East and Africa.
Dr. Kenny started his career at PriceWaterhouse and is a Chartered Accountant. He holds a PhDin Theoretical Physics (1973) and a Bachelor’s of Science in Physics (1970), both degrees wereawarded by the University of Surrey.
Dr. Kenny is currently a non-executive director of First City Monument Bank plc, a bank listedon the Nigerian stock exchange, and an independent director of JPMorgan Emerging MarketsInvestment Trust plc.
Dr. Kenny has no interests in the Shares within the meaning of Part XV of the SFO. Dr. Kennyis independent from and not related to any other Directors, senior management, substantialshareholders or controlling shareholders of the Company. Save as disclosed above, Dr. Kenny has notheld any directorship in any other public companies the securities of which are listed on any securitiesmarket in Hong Kong or overseas in the past three years. Save as disclosed above, there is no otherinformation which is required to be disclosed pursuant to any of the requirements under Rules13.51(2)(h) to 13.51(2)(v) of the Listing Rules nor are there any matters which need to be brought tothe attention of the Shareholders in connection with Dr. Kenny’s appointment as a non-executiveDirector of the Company.
DIRECTORS AND SENIOR MANAGEMENT
— 270 —

Philip Lader, aged 63 (Independent Non-executive Director)
Philip Lader is an independent non-executive Director of the Company appointed on 26 March2007. Since 2001, he has held the position of Non-executive Chairman of WPP plc, the worldwideadvertising and communications services company, and Senior Adviser to Morgan Stanley. He alsoserves on the boards of Lloyd’s of London, Marathon Oil Corporation, AES Corporation and SongbirdEstates Plc. Formerly, in addition to senior executive positions in several U.S. companies, he was U.S.Ambassador to the United Kingdom and served in senior positions in the U.S. government, includingWhite House Deputy Chief of Staff.
Mr. Lader holds a Bachelor’s degree in Political Science from Duke University (1966) and aMaster’s degree in History from the University of Michigan (1967). He completed graduate studies inlaw at Oxford University in 1968 and obtained a Juris Doctor degree from Harvard Law School in1972.
Mr. Lader has no interests in the Shares within the meaning of Part XV of the SFO. Save asdisclosed above, Mr. Lader is independent from and not related to any other Directors, seniormanagement, substantial shareholders or controlling shareholders of the Company. Save as disclosedabove, Mr. Lader has not held any directorship in any other public companies the securities of whichare listed on any securities market in Hong Kong or overseas in the past three years. Save as disclosedabove, there is no other information which is required to be disclosed pursuant to any of therequirements under Rules 13.51(2)(h) to 13.51(2)(v) of the Listing Rules nor are there any matterswhich need to be brought to the attention of the Shareholders in connection with Mr. Lader’sappointment as a non-executive Director of the Company.
Elsie Leung Oi-sie, aged 70 (Independent Non-executive Director)
Ms. Leung was appointed a member of the Board on 30 November 2009. From 1997 to 2005 Ms.Leung was the Secretary for Justice of the Hong Kong Special Administrative Region, as well as amember of the Executive Council of Hong Kong. Ms. Leung was admitted as a solicitor of theSupreme Court of Hong Kong in 1968. She was a partner of P. H Sin & Co., a Hong Kong law firm,which amalgamated with the law firm Iu, Lai & Li Solicitors & Notaries in 1993; she was a seniorpartner with Iu, Lai & Li Solicitors & Notaries from 1993 to 1997. In 2006, she resumed practice atIu, Lai & Li Solicitors & Notaries. Ms. Leung has served on several government boards andcommittees, including the Independent Police Complaints Council, Equal Opportunities Commission,Social Welfare Advisory Committee and Inland Revenue Board of Review. Ms. Leung was appointedas a Delegate of the People’s Congress of Guangdong Province in 1989. In 1993, she was appointedas a Delegate of the 8th National People’s Congress as well as a Hong Kong Affairs Adviser. Since2006 she has been the Deputy Director of the Hong Kong Basic Law Committee of the StandingCommittee of the National People’s Congress of the People’s Republic of China. Ms. Leung was bornin 1939. Ms. Leung is a qualified Solicitor in England and Wales and obtained a Master of Law degreefrom the University of Hong Kong in 1988.
Ms. Leung has no interests in the Shares within the meaning of Part XV of the SFO. Save asdisclosed above, Ms. Leung is independent from and not related to any other Directors, members ofsenior management, substantial shareholders or controlling shareholders of the Company. Ms. Leunghas not held any directorship in any other public companies the securities of which are listed on anysecurities market in Hong Kong or overseas in the past three years. Save as disclosed above, there isno other information which is required to be disclosed pursuant to any of the requirements under Rules13.51(2)(h) to 13.51(2)(v) of the Listing Rules nor are there any matters which need to be brought tothe attention of the Shareholders in connection with Ms. Leung’s appointment as a non-executiveDirector of the Company.
DIRECTORS AND SENIOR MANAGEMENT
— 271 —
As of the Latest Practicable Date, save as disclosed under the section headed “C. FurtherInformation about Directors and Substantial Shareholders” in Appendix VIII to this prospectus, ourDirectors do not have any interest or short positions in the shares or underlying shares in the Companywithin the meaning of Part XV of the SFO.
Please refer to the section headed “C. Further Information about Directors and SubstantialShareholders” in Appendix VIII to this prospectus for the amount of the Directors’ emoluments andthe basis of determining such emoluments.
Senior Management
The Group’s senior management team, in addition to the executive Directors listed above, is asfollows:
Name Age Position
Kirill Aleksandrov . . . . . . . . . . . . . 49 Chief Legal Officer
Alexey Arnautov . . . . . . . . . . . . . . . 35 Director of Aluminium Division (acting)
Sergey Belsky . . . . . . . . . . . . . . . . 42 Director of Marketing and Sales
Valery Freis . . . . . . . . . . . . . . . . . . 55 Director of Resources Protection
Eugueny Fyodorov . . . . . . . . . . . . . 31 Director of Engineering and Construction Division
Vadim Geraskin . . . . . . . . . . . . . . . 41 Director of Government Relations
Oleg Mukhamedshin . . . . . . . . . . . . 36 Director of Capital Markets
Pavel Ovchinnikov . . . . . . . . . . . . . 34 Director of Alumina Division
Artem Volynets. . . . . . . . . . . . . . . . 42 Director of Corporate Strategy
Aby Wong Po Ying . . . . . . . . . . . . 44 Hong Kong Company Secretary
Each of the members of the senior management team listed above can be contacted at theCompany’s registered address at Whiteley Chambers, Don Street, St Helier JE4 9WG, Jersey.
The senior management team listed above, together with the executive Directors, are all membersof the Executive Committee, which is responsible for the day-to-day management of the Group.
Biographies of each of the members of the senior management team are set out below:
Kirill Aleksandrov, aged 49 (Chief Legal Officer)
Kirill Aleksandrov has led Legal Directorate of the Moscow Branch of RUSAL GlobalManagement B.V. since January 2008 and has been a director of RUSAL Global Management B.V.since March 2008. Before joining UC RUSAL, Mr. Aleksandrov served as Chief Legal Officer andMember of the Executive Committee of the Siberian Coal Energy Company (SUEK). From 2003 to2005, he headed the legal activities of British Petroleum’s trade representative office in Russia. From2000 to 2003, Mr. Aleksandrov provided legal support to SIDANCO as Senior Vice-President andMember of the Executive Committee. From 1994 to 2000, he worked as Chief Legal Officer inGlencore International AG supporting the CIS activities. Kirill Aleksandrov was born in 1960. Heholds a degree in law from Moscow State University, Lomonosov (1982).
DIRECTORS AND SENIOR MANAGEMENT
— 272 —

Alexey Arnautov, aged 35 (Director of Aluminium Division (acting))(1)
Alexey Arnautov assumed the role of Acting Director of the Aluminium Division of the MoscowBranch of RUSAL Global Management B.V. in March 2009. He is responsible for raising efficiencyas well as achieving steadily high-performance results from the division’s assets. He is also in chargeof developing a new production management system, which will aim to match the world’s bestpractices. Prior to this appointment, Mr. Arnautov was Financial Director of the Aluminium Divisionfrom April 2006. From November 2004 until April 2006, he was the Director of the FinancialDepartment of the Engineering and Construction Division. Between 1998-2000, he held severalpositions in the financial services in Sibneft. He began his professional career in Noyabrskneftegazin the Far North in 1996. Born in 1974, he graduated from Donbass State Academy of Constructionand Architecture with a degree in engineering and construction (1996). He received a degree withhonours from the International Academy of Entrepreneurship (1998) and an MBA in Economics fromthe Institute of Business and Economics at California State University (2004).
Sergey Belsky, aged 42 (Director of Marketing and Sales)
Sergey Belsky was appointed the Director of the Marketing and Sales Directorate of theCompany in November 2008. He is responsible for the marketing and sales of the company’s wideproduct mix, including aluminium, silicon, and aluminium powders to the international markets inAsia, America, Europe, and the CIS. He is also responsible for developing long-term relationshipswith existing clients, whilst searching for new sales opportunities and strengthening the Company’sties with domestic and international end-users of its products.
Since the foundation of Russian Aluminium in 2000, Sergey Belsky has worked as the Head ofSales Department, Russia and the CIS, including as the Sales Director of the Company’s Moscowoffice from 2007 to 2008. Between 1999 and 2000 he was the head of the export sales department inSibirsky Aluminium. Mr. Belsky started his career as a trader in Raznoimport before working his wayup to head a division at Trans World Group in 1996. Sergey Belsky was born in Moscow in 1967. In1991, Mr. Belsky graduated from the Moscow Institute of Steel and Alloys where he majored in metalengineering. A year later, he graduated from the Moscow Institute of International Business of theMinistry of Economic Relations and Trade. In 2003, he received training at the London BusinessSchool.
Valery Freis, aged 55 (Director of Resources Protection)
Valery Freis has been the Director of the Resources Protection Directorate of the Moscow branchof RUSAL Global Management B.V. since February 2008. He is responsible for the creation andeffective management of the security system and the development of a policy and strategy in the fieldof resource protection from causing harm to the Company’s economic interests, business standing,business processes, and personnel.
(1) It is the Group’s informal policy to designate members of senior management as Acting Directors of their respectivedivisions for a discretionary period, typically lasting approximately one year from their appointment. Mr. Arnautov’spredecessor as Director of the Aluminium Division, Mr. Mikhail Erenburg, was Acting Director of the Aluminium Divisionfrom March 2008 to January 2009 and Director of the Aluminium Division from January 2009 through Mr. Arnautov’sappointment in March 2009. Mr. Erenburg left the position of Director of the Aluminium Division upon a promotion outsidethe Aluminum Division, but left the Group shortly thereafter. Prior to the appointment of Mr. Erenburg, Mr. ViktorZhirnakov was Director of the Aluminium Division from July 2005 until his departure in March 2008.
DIRECTORS AND SENIOR MANAGEMENT
— 273 —

Before joining the Company, Valery Freis was Deputy General Director for Economic Securityat OAO Irkutskenergo and Chairman of the Board of Directors of several companies. In the periodbetween 1996 and 2002 he was Deputy General Director for Security at OAO Ust-Ulimsk TimberProcessing Complex. From 1989 to 1996 Valery Freis held the post of General Director of Lestorgurs.Earlier he served in the Combating the Theft of Socialist Property Agency of the Ministry of theInterior of the Russian Federation. Valery Freis was born in 1954. In 1979, Valery Freis graduatedfrom the Kuybyshev Planning Institute; he underwent training at the Academy of National Economyof the Russian Federation Government.
Eugueny Fyodorov, aged 31 (Director of Engineering and Construction Division)
Eugueny Fyodorov has been in charge of the Company’s Engineering and Construction Divisionsince January 2009. He is responsible for the development of the structure that includes LLC “RussianEngineering Company”, of which he acts as chief executive officer, the Engineering and TechnologyCentre, and VAMI. Some of the priority projects of the Division are construction of aluminiumsmelters in the Krasnoyarsk and Irkutsk regions, the Boguchanskaya HPP, construction of the bauxiteand alumina complex in the Komi Republic, creation of the Company’s proprietary aluminiumproduction technology (RA-400, RA-500), upgrading the existing production sites, along with otherprojects running both in Russia and abroad. Prior to this appointment Mr. Fyodorov was the Head ofEnergy Division of Moscow Branch of RUSAL Global Management B.V. (since March 2008) and wasresponsible for creating the Company’s own energy base for aluminium production, searching forprospective energy sources and other opportunities for developing this area of business.
Between 2006 and 2008 Mr. Fyodorov was the Head of the Boguchanskoye Energy and Metalscomplex, the joint project of the Company and RusHydro. Earlier he was the Head of the PowerEngineering unit within the Company’s Engineering and Construction Division, and Head of theprojected development unit of the Energy Department of the Company. Mr. Fyodorov was born in thecity of Obninsk in 1978. In 2001, he graduated from the Bauman’s Moscow State Technical University,and later took a post-graduate course in science and economics at the Moscow Energy Institute,earning a PhD in 2003.
Vadim Geraskin, aged 41 (Director of Government Relations)
Vadim Geraskin was appointed as the Director of Government Relations of Moscow Branch ofRusal Global Management B.V. in January 2009 and has been a member of the Executive Committeesince March 2008. He manages the company’s relationships with federal and regional authorities, theRussian Parliament, the government, and public organizations. Mr. Geraskin is also responsible forpublic-private partnership projects, for the support of social and economic development in the regionswhere the Company is based, and for improving the Company’s security system. Between January2008 and January 2009, Mr. Geraskin was Acting Director of Government Relations. From March2004 until March 2007, Mr. Geraskin was in charge of the Directorate of Natural Monopolies atMoscow Branch of RUSAL Global Management B.V. and previously, LLC “RUSAL ManagementCompany”. Earlier, Mr. Geraskin was head of the Transport & Logistics Directorate, and Director ofRUSAL’s Transport Department. From 1997-2000, he held the office of General Director of‘Zarubezhkontrakt’, and from 1993 he was a specialist of Alyumin Product. Vadim Geraskin was bornin 1968. In 1993, he graduated from the Faculty of Physics at Moscow State University, Lomonosov,majoring in Physics.
DIRECTORS AND SENIOR MANAGEMENT
— 274 —

Vera Kurochkina, aged 39 (Director of Public Relations)
Vera Kurochkina was appointed the Director of the Public Relations Directorate of the MoscowBranch of RUSAL Global Management B.V. in late March 2007. She is responsible for thedevelopment and the implementation of the external and internal communications strategy of theCompany and for establishing co-operational ties with industrial and non-commercial associations.She is also responsible for media relations projects, event management, advertisements, charity andsocial programmes.
From 2006 to 2007 Ms. Kurochkina was the Public Relations Director of RUSAL. Prior to 2006,she headed RUSAL’s mass media relations department. From 2001-2003, she was the Public Relationsand Marketing Director at LUXOFT, a large Russian software developer. From 2000 to 2001, Veramanaged a group of projects in Mikhailov & Partners, a strategic communications agency, and from1998 to 2000 she was a Marketing and Communications Manager at PricewaterhouseCoopers.
Vera Kurochkina holds a Master’s degree from the Peoples’ Friendship University of Russia inMoscow, from which she graduated with Honours in 1995. She also holds a Master’s degree from theFinance Academy of the Russian Government.
Oleg Mukhamedshin, aged 36 (Director of Capital Markets)
Oleg Mukhamedshin was appointed Director of Capital Markets of the Moscow Branch ofRUSAL Global Management B.V. at the creation of the Company in late March 2007. He is responsiblefor raising finance on capital markets, including both debt and equity products, the use of financialderivatives, as well as relations with credit rating agencies and capital market regulators. In addition,he currently supervises other areas of corporate finance, including trade, pre-export and projectfinancing. He is a member of the board of directors of Russian Aluminium, a subsidiary of UCRUSAL. From August 2004 to March 2007, Mr. Mukhamedshin was Deputy Chief Financial Officerof RUSAL in charge of Corporate Finance and led the preparation, execution and financing of anumber of major mergers and acquisitions transactions. From 2000 to August 2004, he was Directorof RUSAL’s Department for Corporate Finance. Before joining RUSAL, Mr. Mukhamedshin occupiedleading corporate finance positions in the Tumen Oil Company (TNK), the Rosprom-YUKOS Groupand Menatep Bank. Between 1999 and 2000, he was an advisor to the principal shareholder of theIndustrial Investors Group. From 1994 to 1995, he worked with the investment bank PaineWebber tohelp establish the Russia Partners Fund, one of the first international direct investment funds inRussia. Mr. Mukhamedshin was born in 1973. Mr. Mukhamedshin holds a Bachelor’s degree inEconomics from Moscow State University, Lomonosov, from which he graduated with Honours in1995.
Pavel Ovchinnikov, aged 34 (Director of Alumina Division)
Pavel Ovchinnikov was appointed Director of the Alumina Division of the Moscow Branch ofRUSAL Global Management B.V. in late March 2007. He is responsible for the Company’s Russianand international bauxite and alumina production facilities, overseeing the introduction of productionsystems, improvement of labour efficiency and optimisation of process flows. Mr. Ovchinnikov wasappointed head of RUSAL’s Alumina Division in April 2006. From 2007 to 2008 he served as adirector of Aughinish Alumina Limited, Limerick Alumina Refining Limited, UC RUSAL AluminaJamaica Limited, UC RUSAL Alumina and Jamaica II Limited. He also served as an ExecutiveCommittee Member of the West Indies Alumina Company (Windalco) and Eurallumina S.p.A. From2006 to 2008 he was a director of Friguia S.A., and served as an Executive Committee Member ofOAO “BGZ” and the Achinsk alumina refinery from June 2005 to June 2006 and June 2006 toFebruary 2007 respectively. From October 2005 to March 2006 he held the position of ManagingDirector of the Achinsk alumina refinery. Currently, he is a director of Alpart Farms (Jamaica)Limited, Bauxite Company of Guyana Inc., and an Executive Committee Member of Alumina Partnersof Jamaica (Alpart) and OJSC Boksit Timana. From early 2004 to 2005, he was Financial Director of
DIRECTORS AND SENIOR MANAGEMENT
— 275 —

RUSAL’s Alumina Division, and from 2003 to 2004, he was Financial Director for the aluminacomplex project in Guinea. He joined RUSAL in March 2001, and served as Deputy Director of theCorporate Finance Department through 2003. Prior to joining RUSAL, Mr. Ovchinnikov held anumber of executive positions in foreign investment funds focused on Russian enterprises. He beganhis career as an oil, gas and metals analyst at the Alliance-Menatep investment company, where he wasresponsible for structural financing of various gold-mining and engineering companies. Mr.Ovchinnikov was born in 1975. In 1997, he graduated from the Applied Mathematics and CyberneticsDepartment at Moscow State University, Lomonosov. Mr. Ovchinnikov holds a PhD in Economicsfrom Moscow State University, Lomonosov, which he obtained in 2002.
Maxim Sokov, aged 30 (Director of Investment Management)
Maxim Sokov was appointed Director of Investment Management of the Moscow Branch ofRUSAL Global Management B.V. in May 2008. Among other things, he is responsible for managingall issues relating to the Group’s shareholding in Norilsk Nickel. Mr. Sokov was elected as a memberof the Board of Directors of Norilsk Nickel on December 26, 2008. In 2009, Mr. Sokov also joinedthe Board of Directors of OJSC OGK-3.
Prior to assuming his current role at the Company, Mr. Sokov was the Director of the Departmentfor Strategic Projects at the Moscow Branch of RUSAL Global Management B.V. from 2007 to 2008.From 2004 to 2006 Mr. Sokov was the Head of the Legal Department for Mergers and Acquisitionsof LLC RUSAL — Management Company. Prior to joining the Group, Mr. Sokov worked at theMoscow office of Herbert Smith CIS Legal Services.
Mr. Sokov was born in 1979 and graduated with honors from the Russian State Tax Academyunder the Russian Ministry of Taxes, majoring in law, in 2000. Mr. Sokov also graduated from NewYork University School of Law with a Master’s degree in 2002.
Artem Volynets, aged 42 (Director of Corporate Strategy)
Artem Volynets was appointed Director for Corporate Strategy and Business Development of theMoscow Branch of RUSAL Global Management B.V. in March 2007. He is responsible for thedevelopment of the Company, identification, preparation and execution of M&A and organic growthprojects. Mr. Volynets is working on transactions that strengthen the company’s competitive positionwithin its core industry and expand its reach to new geographies and sectors. From 2004 to 2007, Mr.Volynets was Chief Development Officer at SUAL, and Vice President Business Development from2003 to 2004. From 1997 to 2003 he worked as strategy consultant and corporate finance advisor atMonitor Group in London, UK. Mr. Volynets lived in the U.S.A. from 1991 to 1997 studying atGeorgetown and American Universities and working on the consulting projects for the United StatesAgency for International Development and The World Bank. In 2009, Mr. Volynets was elected theChairman of the International Aluminium Institute — a international organisation for the aluminiumindustry, representing over 80% of global production. Mr. Volynets was born in 1967. Mr. Volynetsreceived an MBA from Georgetown University in 1997. While at Georgetown, he also studied as anexchange student at INSEAD Business School in France. In addition he received a BA in Economicsfrom the American University in Washington, D.C. in 1994, and studied Geology and Philosophy atthe Lomonosov Moscow State University from 1984 to 1986 and 1989 to 1991. Mr. Volynetscompleted two years of military service from 1986 to 1988.
Wong Po Ying, Aby, aged 44, (Hong Kong Company Secretary)
Wong Po Ying, Aby was appointed Hong Kong Company Secretary on 29 November 2009. Ms.Wong has over 6 years experience in corporate secretarial practice working with various law firms andcorporate services companies as company secretary and company secretarial manager. Ms. Wong is an
DIRECTORS AND SENIOR MANAGEMENT
— 276 —
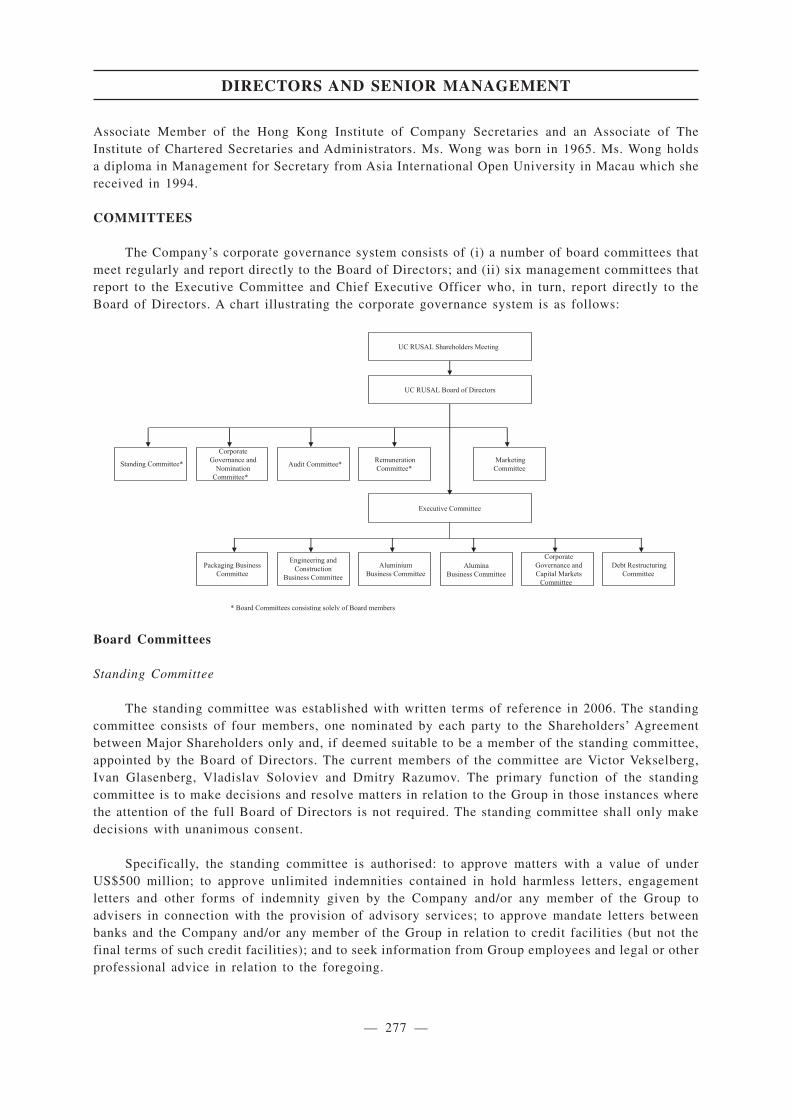
Associate Member of the Hong Kong Institute of Company Secretaries and an Associate of TheInstitute of Chartered Secretaries and Administrators. Ms. Wong was born in 1965. Ms. Wong holdsa diploma in Management for Secretary from Asia International Open University in Macau which shereceived in 1994.
COMMITTEES
The Company’s corporate governance system consists of (i) a number of board committees thatmeet regularly and report directly to the Board of Directors; and (ii) six management committees thatreport to the Executive Committee and Chief Executive Officer who, in turn, report directly to theBoard of Directors. A chart illustrating the corporate governance system is as follows:
UC RUSAL Shareholders Meeting
UC RUSAL Board of Directors
Executive Committee
CorporateGovernance and
NominationCommittee*
Audit Committee*Standing Committee*RemunerationCommittee*
MarketingCommittee
Packaging BusinessCommittee
Engineering andConstruction
Business Committee
AluminiumBusiness Committee
AluminaBusiness Committee
CorporateGovernance andCapital Markets
Committee
Debt RestructuringCommittee
* Board Committees consisting solely of Board members
Board Committees
Standing Committee
The standing committee was established with written terms of reference in 2006. The standingcommittee consists of four members, one nominated by each party to the Shareholders’ Agreementbetween Major Shareholders only and, if deemed suitable to be a member of the standing committee,appointed by the Board of Directors. The current members of the committee are Victor Vekselberg,Ivan Glasenberg, Vladislav Soloviev and Dmitry Razumov. The primary function of the standingcommittee is to make decisions and resolve matters in relation to the Group in those instances wherethe attention of the full Board of Directors is not required. The standing committee shall only makedecisions with unanimous consent.
Specifically, the standing committee is authorised: to approve matters with a value of underUS$500 million; to approve unlimited indemnities contained in hold harmless letters, engagementletters and other forms of indemnity given by the Company and/or any member of the Group toadvisers in connection with the provision of advisory services; to approve mandate letters betweenbanks and the Company and/or any member of the Group in relation to credit facilities (but not thefinal terms of such credit facilities); and to seek information from Group employees and legal or otherprofessional advice in relation to the foregoing.
DIRECTORS AND SENIOR MANAGEMENT
— 277 —
Audit Committee
We have established an audit committee with written terms of reference in compliance with Rule3.21 of the Listing Rules and paragraph C3 of the Code on Corporate Governance Practices, as set outin Appendix 14 to the Listing Rules. The audit committee consists of five Directors: three independentnon-executive Directors, being Dr. Nigel Kenny, an independent non-executive Director with theappropriate professional qualifications who shall serve as chairman of the committee, Mr. Philip Laderand Ms. Elsie Leung and two non-executive Directors, Mr. Dmitry Razumov and Mr. Alexander Popov.The primary duties of the audit committee are to assist our Board in providing an independent viewof the effectiveness of our financial reporting process, internal control and risk management system,to oversee the audit process and to perform other duties and responsibilities as assigned by our Board.
Remuneration Committee
We have established a remuneration committee with written terms of reference in compliancewith paragraph B1 of the Code on Corporate Governance Practices, as set out in Appendix 14 to theListing Rules. The remuneration committee consists of three independent non-executive Directors,being Mr. Philip Lader, who is the chairman of the remuneration committee, Dr. Nigel Kenny and Mr.Barry Cheung (with effect from the Listing Date) and two non-executive Directors, being Mr. LenBlavatnik, and Mr. Vladislar Soloviev. The primary function of the remuneration committee is to makerecommendations to the Board of Directors on the remuneration package of the Company’s Directorsand senior management and to evaluate and make recommendations on employee benefitarrangements.
Corporate Governance and Nomination Committee
We have established a corporate governance and nomination committee with written terms ofreference as recommended under the Code on Corporate Governance Practices, set out in Appendix 14to the Listing Rules. The corporate governance and nomination committee consists of threeindependent non-executive Directors, being Mr. Philip Lader, who is the Chairman of the corporategovernance and nomination committee, Dr. Nigel Kenny and Mr. Barry Cheung (with effect from theListing Date) and two non-executive Directors, being Mr. Ivan Glasenberg and Mr. Vladislav Soloviev.The primary function of the corporate governance and nomination committee is to develop,recommend and annually review corporate governance guidelines for the Company and itsconsolidated subsidiaries and to oversee corporate governance matters, as well as to makerecommendations to our Board on the appointment and removal of Directors of the Company.
Marketing Committee
We have established a marketing committee consisting of Mr. Vladislav Soloviev, who shallserve as chairman of the committee and two non-directors, being Mr. V. Kremer and Mr. G. Fegel. Themain functions of the committee are (a) to review and approve UC RUSAL’s marketing strategy; (b)to recommend the appointment of marketing directors for aluminium and alumina; and (c) torecommend to the CEO of UC RUSAL the removal of marketing directors. The marketing committeeincludes in its terms of reference an explanation of its role and the authority delegated to it by theBoard.
Management Committees
The Group’s business is managed on a day to day basis by the Chief Executive Officer and thesenior management team. As discussed in greater detail below, the Chief Executive Officer and thesenior management team meet as the Executive Committee at least twice monthly, and sub-committeesof the executive committee assist the Executive Committee in the management of the Group’s businessdivisions and other functions.
DIRECTORS AND SENIOR MANAGEMENT
— 278 —
The Executive Committee
We have established an Executive Committee consisting of the Chief Executive Officer, each ofthe other executive Directors and the senior management team. The primary role of the ExecutiveCommittee is to assist the Chief Executive Officer and senior management with the day-to-daymanagement of the Group and to assist the Board of Directors in formulating and implementing theGroup’s strategy and monitoring its performance.
Additional duties and responsibilities of the Executive Committee include, but are not limited to,developing Group strategy for Board approval and implementing such strategy once approved,reviewing and opining on any matter involving an outlay of more than US$75 million before referringsuch matter to the Board and overseeing and monitoring the financial performance of the Group. Inaddition, the Executive Committee is empowered to establish committees of its members from timeto time.
The Executive Committee meets as frequently as necessary, but not less than twice per month.The Executive Committee operates as the management board of the Company’s subsidiary, RusalGlobal Management B.V. The Chief Executive Officer formally reports the decisions and actions ofthe Executive Committee to the Board at meetings of the Board.
Sub-committees of the Executive Committee
Corporate Governance and Capital Markets Committee
We have established a corporate governance and capital markets committee consisting of fivemembers being Mr. Artem Volynets, who shall serve as chairman of the committee, Mr. KirillAlexandrov, Ms. Tatiana Soina (CFO), Mr. Oleg Mukhamedshin and Mr. Dmitry Yudin. The powersof the committee include coordination and optimisation of the Group’s corporate governance structure,M&A, corporate development, implementation of matters related to the IPO, capital markets,disclosure of information, and formulation of position on substantial litigations.
Debt Restructuring Committee
We have established a debt restructuring committee consisting of five members being Mr. OlegMukhamedshin, who shall serve as chairman of the committee, Mr. Kirill Alexandrov, Ms. TatianaSoina (CFO), Mr. Artem Volynets, Mrs. Vera Kurochkina and Mr. Maxim Sokov. Each of the membersof the debt restructuring committee is also a member of the Group’s senior management team. The roleof the committee is to coordinate the restructuring of the Company’s debts to its major creditors,including Onexim by developing and improving the Company debt restructuring policy as well asmonitoring the efficiency of its application.
The debt restructuring committee is empowered to pass resolutions on issues with budgets of upto US$10 million. Among other things, the debt restructuring committee is authorised to develop andintroduce a company debt restructuring policy, approve positions during negotiations with Companycreditors in relation to debts and monitor compliance with the company debt restructuring policy.
The debt restructuring committee is composed of senior management and reports to theExecutive Committee of the Company. As set out above, the Executive Committee reports to the Boardof Directors on debt restructuring matters.
Division Committees
We have established four division committees: the aluminium business committee, the aluminabusiness committee, the engineering and construction business committee and the packaging businesscommittee. The role of these committees is to assist the Executive Committee in the management ofthe relevant business divisions of the Company, being aluminium, alumina, engineering and
DIRECTORS AND SENIOR MANAGEMENT
— 279 —
construction and packaging. Ms. Tatiana Soina, CFO of the Company, chairs the division committeesfor the aluminium, alumina and engineering and construction businesses. The directors of the divisionsare members of the relevant committees. The representatives of the internal audit department andinternal control department are also members of the division committees.
COMPLIANCE ADVISER
We have appointed Somerley Limited as our compliance adviser pursuant to Rule 3A.19 of theListing Rules. Pursuant to Rule 3A.23 of the Listing Rules, our compliance adviser will advise us inthe following circumstances:
• before the publication of any regulatory announcement, circular or financial report;
• where a transaction, which might be a notifiable or connected transaction, is contemplated,including share issues and share repurchases;
• where we propose to use the proceeds of the Global Offering in a manner different from thatdetailed in this prospectus or where our business activities, developments or resultsdeviated from any estimate or other information in this prospectus; and
• where the Hong Kong Stock Exchange makes an inquiry of us regarding unusualmovements in the price or grading volume of our Shares.
The terms of the appointment shall commence on the Listing Date and end on the date which wedistribute our annual report in respect of our financial results for the first full financial yearcommencing after the Listing Date and such appointment may be subject to extension by mutualagreement.
HISTORICAL COMPENSATION OF DIRECTORS AND SENIOR MANAGEMENT(2)
The aggregate remuneration the Group’s Directors have received (including fees, salaries,discretionary bonus, contributions to defined contribution benefit plans (including pension), housingand other allowances, and other benefits in kind) for the years ended 31 December 2006, 2007 and2008 and the six months ended 30 June 2009 was approximately US$18.9 million, US$22.0 million,US$14.1 million and US$0.8 million, respectively.
The aggregate amount of fees, salaries, discretionary bonus, defined contribution benefit plans(including pension), housing and other allowances, and other benefits in kind paid to our five highestpaid individuals of the Company, including Directors, during the years ended 31 December 2006, 2007and 2008 and the six months ended 30 June 2009 were approximately US$25.5 million, US$30.0million, US$26.4 million and US$3.0 million, respectively.
(2) The total basic remuneration for the Group’s Directors per annum is GBP120,000 (or approximately US$240,000,US$227,000 and US$179,000 for the years ending 31 December 2007, 2008 and the first half of 2009 on an annualisedbasis, respectively). In addition, each of the Group’s Directors receives GBP10,000 (or approximately US$20,000,US$19,000 and US$15,000 for the years ending 31 December 2007, 2008 and the first half of 2009 on an annualisedbasis, respectively) for membership in each of the Board committees; and GBP15,000 (or approximately US$30,000,US$28,000 and US$22,000 for the years ending 31 December 2007, 2008 and the first half of 2009 on an annualisedbasis, respectively) for chairing any of the Board committees. The conversion rates between GBP and USD used in theforegoing were GBP1 : US$2.00181 for 2007, GBP1 : US$1.85518 for 2008 and GBP1 : USD1.49345 for the first halfof 2009, being the average spot conversion rate shown on the relevant page of OANDA for the relevant period. The CEOof the Company is also the CEO of RUSAL Global Management B.V., a member of the Group, and receives hiscompensation from RUSAL Global Management B.V.
DIRECTORS AND SENIOR MANAGEMENT
— 280 —
App1A-33(2)(a), (b), (c), (d),(e), (f) and (g)App1A-46(2)
App1A-33(3),(b), (c), (d) and (e)

Save as disclosed above, no other payments have been paid or are payable, in respect of the threeyears ended 31 December 2006, 2007 and 2008 and six months ended 30 June 2009, by us or any ofour subsidiaries to our Directors. We have paid an aggregate amount of approximately US$37.8million, including benefits and contributions, to our Directors as remuneration by us, excluding anydiscretionary bonus payable to our Directors, in respect of the years ended 31 December 2006, 2007and 2008 and six months ended 30 June 2009, according to the present arrangements.
Under the arrangements currently in force, we estimate the aggregate amount of fees, salaries,discretionary bonus, defined contribution benefit plans (including pension), housing and otherallowances, and other benefits in kind of our Directors payable for the year ending 31 December 2009to be approximately US$10.4 million.
FUTURE COMPENSATION OF DIRECTORS AND SENIOR MANAGEMENT
A proposal has been put to the Board of Directors, on the recommendation of the RemunerationCommittee, to consider and approve the following in relation to the compensation of the Company’snon-executive directors, chief executive officer and certain members of senior management and otheremployees:
A. Non-Executive Directors
1. Non-executive Chairman
(a) To be paid, lump-sum and pre-Global Offering, a 2009 Chairman’s fee of US$400,000per annum for services from 1 January 2009 through 31 December 2009 or pro-ratedthrough the completion of the Global Offering, if earlier;
(b) Thereafter, to be paid monthly a pro-rated US$400,000 per annum Chairman’s fee.
2. Non-executive Directors
(a) Commencing with the Global Offering, all non-executive Directors are to be paid apro-rated GBP120,000 per annum, paid monthly; those non-executive Directors whoare employed or retained by the Company’s Major Shareholders will consult with suchshareholders as to whether the Directors, as individuals, may retain such fees orwhether such fees should be paid to their respective employing entities;
(b) Additional fees for committee assignments - GBP15,000 per annum for chairman,GBP10,000 for member - commencing after pertinent appointments, to be made at therecommendation of the Corporate Governance and Nomination Committee, early in2010;
(c) The two independent non-executive directors who have contributed to theestablishment of the Company’s governance structure and preparation for the GlobalOffering shall each receive an IPO bonus in the amount of GBP60,000 uponcompletion of the Global Offering.
DIRECTORS AND SENIOR MANAGEMENT
— 281 —
B. Chief Executive Officer
1. For services rendered since assuming the role of Chief Executive, the incumbent CEO is toreceive a lump-sum payment before the Global Offering in the amount of the aggregate ofthe following:
(a) US$10 million per annum base salary;
(b) An annual bonus in the amount of 2.5% of the Company’s net profit (excluding theone-off 2009 IFRS adjustment for gain from the debt restructuring);
(c) Such annual bonus shall be adjusted downward annually in any year in which theprevious year’s minimum bonus exceeded 2.5% of net profits, such downwardadjustment to be in the amount of that short-fall, but in no event shall such downwardadjustment reduce the annual bonus below the minimum bonus level of US$10million;
(d) This compensation package shall continue until completion of the Global Offering oruntil otherwise modified by the Company’s Board of Directors, at the RemunerationCommittee’s recommendation.
2. For his services in preparation of the Global Offering, the CEO will be paid an IPO bonusof up to US$75 million, subject to certain conditions, in the form of restricted Shares of theCompany, with a two-year lock-up (being 53,888,889 Shares, assuming an Offer Price ofHK$10.80 per Offer Share, being the mid-point of the estimated Offer Price range).
3. Post-Global Offering, the CEO’s annual compensation will comprise the following:
(a) US$10 million per annum base salary, paid monthly;
(b) Short-term Incentive Program (“STIP”): a performance-linked cash payment within 30days after the Company’s Audit Committee’s approval of entire-year audited financialstatement for the previous year, in the potential amount of 200% of base salary, to bedecided on the basis of the Remuneration Committee’s specific criteria;
(c) Long-Term Incentive Program (“LTIP”): all such awards, based strictly on 12-monthshare price appreciation, comprising:
(i) 50% restricted shares of the Company, vesting annually in equal amounts overthree years with no performance conditions other than continued employment;and
(ii) 50% performance shares of the Company, vesting in three equal tranches overthree years, subject to the CEO’s continued employment and each of suchsubsequent year’s substantial achievement of that prior year’s business plan andsuch shares being in the form of restricted shares, with each tranche to bereleased after a further two-year holding period from the date of vesting andsubject to continued employment through such period;
(d) The quantum of the LTIP award will be based strictly on share price appreciationcompared with a comparator group of 6-15 global, public, complex and (though notexclusively) extractive-industry companies’ share price movements.
DIRECTORS AND SENIOR MANAGEMENT
— 282 —

C. Other Management/Employee Bonus Shares:
Certain members of senior management and other employees will be awarded restricted shares(with the same terms as the CEO’s restricted share potential awards) and performance shares (alsowith same terms as the CEO’s potential performance shares).
For services provided in preparation of the Global Offering, certain members of seniormanagement and other employees will be paid an IPO bonus of approximately US$15 million, subjectto certain conditions and to increase in certain circumstances, 60% of which will be in the form ofShares of the Company (half of such Shares being performance Shares and the remaining half beingrestricted Shares), with a two-year lock-up, and 40% of which will be in cash. Assuming that theamount of the bonus is US$15 million and an Offer Price of HK$10.80 per Offer Share, being themid-point of the estimated Offer Price range, the number of Shares that would be issued to seniormanagement and other employees in respect of the IPO bonus would be 6,466,667 Shares.
In addition, on the recommendation of the Remuneration Committee, the Company’s Board ofDirectors also adopted in principle a management incentive compensation plan, the details of whichremain to be specified. It is expected that the management incentive compensation plan will involveshort-term and long-term elements, and a mixture of cash and stock incentive compensation, and thatthe stock portion will include restricted shares, some of which will vest only if performance criteriaare met going forward.
This implementation of certain aspects of the future compensation arrangements set forth abovewill require the consent of the Company’s lenders under its debt restructuring agreements.
DIRECTORS AND SENIOR MANAGEMENT
— 283 —

So far as the Directors are aware, the following persons will, immediately following thecompletion of the Global Offering and taking no account of any Shares which may be issued pursuantto the exercise of the Over-allotment Option or any bonus shares that may be issued to management,have interests or short positions in the Shares or underlying Shares which would fall to be disclosedto the Company under the provisions of Divisions 2 and 3 of Part XV of the SFO:
Name of shareholder Capacity/Nature of interest Number of Shares held
Approximate percentageof interest in the
Company immediatelyafter the Global Offering
Oleg Deripaska . . . . . . . Interest of a controlledcorporation
7,202,910,267 Sharesheld by En+(1)
47.59%
En+(1) . . . . . . . . . . . . . . Beneficial owner 7,202,910,267 Shares 47.59%Onexim . . . . . . . . . . . . . Beneficial owner 2,586,499,596 Shares 17.09%TCO Holdings Inc. . . . Interest of controlled
corporation860,507,680 Shares(2)
117,341,956 Shares(2)5.68%0.77%
TZ Columbus ServicesLimited . . . . . . . . . . .
Interest of controlledcorporation
860,507,680 Shares(3)
117,341,956 Shares(3)5.68%0.77%
Renova HoldingsLimited . . . . . . . . . . .
Interest of controlledcorporation
860,507,680 Shares(4)
117,341,956 Shares(4)5.68%0.77%
Renova Metals &Mining Limited . . . . .
Interest of controlledcorporation
860,507,680 Shares(5)
117,341,956 Shares(5)5.68%0.77%
SUAL Partners . . . . . . . Beneficial owner 2,400,970,089 Shares(6)
327,405,012 Shares(7)15.86%
2.16%Amokenga Holdings . . . Beneficial owner 1,309,620,048 Shares 8.65%
Notes:
(1) Mr. Oleg Deripaska beneficially owns the entire issued share capital of En+. For information about a claim that couldaffect the size of En+’s interest in the Company, see “Risk Factors — Risks relating to the Group and its Business —A certain claim against the beneficial owner of En+ could have a material adverse effect on the Company and/or thetrading price of its Shares”, “Substantial Shareholders — Litigation Involving Certain Beneficial Owners — LitigationInvolving Mr. Deripaska” and Appendix X to this prospectus.
(2) TCO Holdings Inc. is the beneficial owner of 100% of the shares in TZ Columbus Services Limited, which in turn actsas trustee of a trust (details of which are referred to in Note 3 below) holding an indirect interest in 35.84% of the issuedshare capital of SUAL Partners. TCO Holdings Inc. is therefore deemed to be interested in the Shares in which SUALPartners has an interest.
(3) TZ Columbus Services Limited is the trustee of a trust of which Victor Vekselberg is the sole beneficiary and thebeneficial owner of 100% of the shares in Renova Holdings Limited and is therefore deemed to be interested in the Sharesin which SUAL Partners has an interest.
(4) Renova Holdings Limited is the beneficial owner of 100 % of the shares in Renova Metals and Mining Limited and istherefore deemed to be interested in the Shares in which SUAL Partners has an interest.
(5) Renova Metals and Mining Limited is the beneficial owner of 35.84% of the shares in SUAL Partners and is thereforedeemed to be interested in the Shares in which SUAL Partners has an interest.
(6) Shares held by SUAL Partners. These represent the Shares in which SUAL Partners has a direct beneficial interest.
(7) Shares held by SUAL Partners. These represent the Shares in which SUAL Partners has an interest as a result of certainrights of first refusal granted by Glencore — see “Substantial Shareholders — Shareholders’ Agreement between MajorShareholders only - Rights of first refusal-Glencore”.
En+
En+ is a limited liability company incorporated under the laws of Jersey with its registered officeat Whiteley Chambers, Don Street, St. Helier, Jersey, Channel Islands, JE4 9WG. En+ is ultimatelycontrolled by its sole beneficial owner Mr. Oleg Deripaska. For a description of the business activitiesof En+, see “Relationship with the Controlling Shareholder and Non-Competition — En+’s Business”.
SUBSTANTIAL SHAREHOLDERS
— 284 —
3rd Sch-30App1A-45(2)App1A-27AApp1A-27
Onexim
Onexim is a company incorporated under the laws of Cyprus, whose registered address is atVyronos, 36 Nicosia Tower Centre, 801 P.C., 1506 Nicosia, Cyprus. Onexim is ultimately controlledby Mr. Mikhail Prokhorov who founded the Company in 2007. It is one of Russia’s largest privateequity funds and its portfolio includes investments in base and precious metals producers, the Russianenergy, financial services and real estate sectors and the media and high technology sectors.
SUAL Partners
SUAL Partners is a limited liability company incorporated under the laws of the Bahamas whoseregistered office is at 2nd Terrace West, Centreville, Nassau, Commonwealth of the Bahamas. SUALPartners is beneficially owned by a number of individuals, with Mr. Victor Vekselberg and Mr. LenBlavatnik, together being the controlling shareholders of SUAL Partners. SUAL Partners is a holdingcompany that holds interests in UC RUSAL and a separate kitchenware and houseware business.
Amokenga Holdings
Amokenga Holdings is a company incorporated in Bermuda whose registered office is at 22Victoria Street, Canon’s Court, Hamilton, HM12, Bermuda. Amokenga Holdings is ultimatelycontrolled by Glencore International AG, which is 100% owned by management and key employees(including one of the Company’s Directors, Ivan Glasenberg), none of which controls more than 20%of the share capital of Glencore International AG. For a description of the business activities ofGlencore, see “Relationship with the Controlling Shareholder and Non-Competition — Glencore —Glencore’s Business”.
The following table shows the indirect holdings of ordinary shares in the Company of thebeneficial owners as at the date hereof, where such holding exceeds 3% of the issued share capital ofthe Company:
Beneficial Owner
Number of Ordinaryshares at the date of
this Prospectus
Percentageof issued
share capital
Oleg Deripaska(1) . . . . . . . . . . . . . . . . . . . . . . . . . . . . . . . . . . 660,000 53.35%
Victor Vekselberg(2) . . . . . . . . . . . . . . . . . . . . . . . . . . . . . . . . 78,800 6.37%
Len Blavatnik(1)(3) . . . . . . . . . . . . . . . . . . . . . . . . . . . . . . . . . 67,300 5.44%
Mikhail Prokhorov . . . . . . . . . . . . . . . . . . . . . . . . . . . . . . . . . 237,000 19.16%
Total . . . . . . . . . . . . . . . . . . . . . . . . . . . . . . . . . . . . . . . . . . . 1,043,100 84.32%
Notes:(1) Company’s Director. See “Directors and Senior Management”.(2) Chairman of the Company’s Board of Directors. See “Directors and Senior Management”.(3) Mr. Len Blavatnik and his family members are the beneficiaries of trusts which are indirectly interested in 30.56% of
SUAL Partners, which owns shares in the Company as disclosed herein.
Shareholder Options
En+ and SUAL Options
Pursuant to a deed dated 25 July 2008 between En+, SUAL Partners and Glencore, Glencoregranted En+ and SUAL Partners the option (the “Glencore Call Option”) to acquire all ordinary sharesin the Company held by Glencore on the date of exercise of the Glencore Call Option that were also(i) held by Glencore on 26 March 2007 or (ii) issued to Glencore by the Company after 26 March 2007
SUBSTANTIAL SHAREHOLDERS
— 285 —
but before exercise of the Glencore Call Option (both of which, for the avoidance of doubt, excludeany shares in the Company acquired by Glencore on an arms length basis from anyone other than theCompany following an initial public offering or any shares in the Company sold by Glencore to anythird party in compliance with the shareholders’ agreement then in force in relation to the Company)(the “Glencore Option Securities”). The Glencore Call Option may only be exercised by En+, butfollowing exercise, SUAL Partners have the right to participate in proportion to their holding ofShares at that time vis-à-vis En+. The Glencore Call Option is exercisable until 26 March 2017.
The exercise price of the option will be determined by an investment bank as 120% of the higherof (i) market value of Glencore option securities, which is determined by reference to the enterprisevalue of the Group on the relevant option exercise date or after an initial public offering, the volumeweighted average price of an ordinary share over the preceding five trading days; and (ii) a valuationcalculated by reference to the cumulative aggregate EBITDA of the Group for the preceding 12quarters and the discounted enterprise value/EBITDA multiple at which certain of the Group’scompetitors trade.
Pursuant to a deed dated 25 July 2008 as amended and restated on 18 December 2009 betweenSUAL Partners and En+, En+ granted put options to SUAL Partners. If the Company is not listed onthe Official List in London by 31 December 2010, such listing complying with certain other bestpractice criteria, SUAL Partners will have the right to put the Shares it holds onto En+ at 115% of theirmarket value (100% if the Shares had been acquired from Glencore). The right to exercise this putoption will terminate upon the earlier of (i) completion of an initial public offering on a majorinternationally recognised stock exchange other than Moscow; (ii) if En+’s interest in the Companyfalls below 52% plus one Share as a result of an issue of Shares approved by SUAL Partners (the “En+Dilution Condition”) and (iii) 8 June 2013. In addition, if the Company proposes a non-London initialpublic offering, SUAL Partners will have the right to put the Shares it holds onto En+ at 115% of theirmarket value until the earlier of (i) completion of the London initial public offering; (ii) seven daysafter Board approval of a non-London initial public offering; (iii) satisfaction of the En+ DilutionCondition and (iv) 25 April 2012. Both put options will terminate upon the Listing Date.
Onexim Options
Pursuant to the terms of a deed dated 20 November 2007, as amended and restated on 11 April2008 and 1 December 2009 between Onexim, the Company and En+, Onexim has granted En+ the rightto acquire any Shares held by Onexim in excess of 7% of the then issued share capital of the Company.This call option is exercisable from the date of admission to trading of the Company’s shares to amajor international stock exchange, for a period of two years. The exercise price is the greater of thethen market price and such valuation which corresponds to a valuation for the Group of US$22 billionprior to the issue of any Shares or other share capital reorganisation subsequent to 1 December 2009.
On 1 December 2009, the Company entered into an amendment and restatement of the put andcall option deed between the Company, Onexim and EN+ dated 11 April 2008. Pursuant to this deedas amended and restated, the Company has granted Onexim a put option (the “Onexim Put Option”)in respect of the Shares Onexim received in April 2008 as part consideration for the sale by Oneximto the Company of a 25% plus one share stake in Norilsk Nickel.
The Onexim Put Option would terminate with respect to the Company if it could show that it hadused best endeavours to achieve admission of the Shares to trading on a major international stockexchange prior to 31 December 2013 (“Admission”). If Onexim exercised the Onexim Put Option andthe Company could not show that it had used best endeavours to achieve Admission, to the extent theCompany was legally prevented from acquiring those Shares, En+ would be obliged to acquire them.In addition, if Onexim exercised the Onexim Put Option and the Company could show that it had usedbest endeavours to achieve Admission, En+ would also be obliged to acquire them unless it could showthat it had also used best endeavours to achieve Admission.
SUBSTANTIAL SHAREHOLDERS
— 286 —
The aggregate exercise price of the Onexim Put Option is US$6,226,981,156 or, depending oncertain payment conditions, US$7,325,859,992.
The Onexim Put Option will terminate on the Listing Date.
Shareholders’ Agreement between Major Shareholders only
En+, SUAL Partners, Glencore and Onexim (the “Major Shareholders”) have agreed the terms ofa shareholders’ agreement that is expected to be entered into before the Listing Date, to which theCompany is not a party, which sets out certain agreed matters between the Major Shareholders inrelation to board appointments, board committees, voting, transfers of Shares and certain other matters(the “Shareholders’ Agreement between Major Shareholders only”). The principal terms of theShareholders’ Agreement between Major Shareholders only are described below. Unless otherwisestated, references to En+, SUAL Partners, Glencore and Onexim are deemed to include reference toother entities controlled by those Major Shareholders (other than any member of the Group).
Board of the Company
• For as long as En+ holds at least 30% of the Shares held by the Major Shareholders and theirrespective wholly owned subsidiaries (the “Major Shareholders’ Shares”), the MajorShareholders have agreed to use their respective voting and other rights to procure, so far as theyare able, that the Board shall consist of a minimum of 16 and a maximum of 18 Directors andthat Directors proposed for nomination or removal under the Articles or otherwise by theShareholders will be appointed to or removed from the Board to achieve the following:
• For as long as En+ holds at least 40% of the Major Shareholders’ Shares, Directorsrepresenting at least 50% of the Board shall be directors proposed by En+ (excludingindependent Directors), one of whom shall be the vice chairman of the Board. For as longas En+ holds at least 30% of the Major Shareholders’ Shares, En+ shall have the right tonominate for appointment and removal, the chief executive officer of the Company (the“CEO”). The appointment of the CEO will be subject to approval by a majority of the Boardand the Board will retain the ability to remove the CEO. The number of directors (other thanindependent Directors) which En+ is entitled to propose for nomination and removal to theBoard shall reduce by one for as long as its shareholding, as a percentage of the MajorShareholders’ Shares, is between 35% and 40%, and by two for as long as such percentageis between 30% and 35%. In addition, En+ shall be entitled to propose for nomination andremoval two independent Directors for as long as it holds at least 40% of the MajorShareholders’ Shares and one independent Director for as long as that percentage remainsbetween 10% and 40%. En+ shall have the right to veto the appointment of any independentDirector nominated by SUAL Partners or Onexim on the grounds set out in theShareholders’ Agreement between Major Shareholders only.
• For as long as Glencore holds at least 8.6% of the total Shares in issue (or such lesserpercentage as results from dilution on a further share issue), Glencore shall have the rightto propose for nomination and removal as a Director, the CEO of Glencore and to veto theappointment of any independent Director nominated by En+, SUAL Partners or Onexim onthe grounds set out in the Shareholders’ Agreement between Major Shareholders only.
• For as long as SUAL Partners holds at least 8.6% of the total Shares in issue (or such lesserpercentage as results from dilution on a further share issue), SUAL Partners shall have theright to propose for nomination and removal three Directors, one of whom shall beindependent, and to veto the appointment of any independent Director nominated by En+or Onexim on the grounds set out in the Shareholders’ Agreement between MajorShareholders only.
SUBSTANTIAL SHAREHOLDERS
— 287 —
• For as long as Onexim holds at least 5% of the total Shares in issue, Onexim shall have theright to propose for nomination and removal one Director and to veto the appointment ofany independent Director nominated by En+ or SUAL Partners on the grounds set out in theShareholders’ Agreement between Major Shareholders only. In addition, if Mr. BarryCheung Chun-yuen resigns as a Director, Onexim shall be entitled to propose fornomination and removal one independent Director.
• For as long as it is required pursuant to the facilities agreement between VEB and theGroup, one director shall be proposed by VEB.
• Victor Vekselberg will remain as chairman for so long as both En+ holds at least 40% ofthe Major Shareholders’ Shares and SUAL Partners holds at least 8.6% of the total Sharesin issue (or such lesser percentage as results from dilution on a further share issue).
• For as long as En+ holds less than 30% of the Major Shareholders’ Shares, the MajorShareholders have agreed to use their respective voting and other rights to procure, so far as theyare able, that the Board shall consist of between 15 and 19 directors comprising:
• four independent Directors, to be nominated in accordance with the rights of proposal ofEn+, SUAL Partners and Onexim described above (if relevant) and, to the extent required,by the corporate governance and nomination committee;
• one director proposed by VEB, if required; and
• Directors (other than independent Directors) who shall be proposed for nomination andremoval by the Major Shareholders in proportion to their respective holdings of Sharesfrom time to time.
• The Major Shareholders have agreed to exercise their respective voting and other rights toprocure that, for as long as the Company is able to appoint between two and five Directors tothe board of Norilsk Nickel, Onexim is entitled to propose one Director for appointment to thatboard, and for as long as the Company is able to appoint six or more directors, Onexim is entitledto propose two directors for appointment to that board.
Boards of Subsidiaries
• The Major Shareholders have agreed to use their respective voting and other rights to procure,so far as they are able, that the Directors proposed for nomination or dismissal by theShareholders will be appointed to or removed from the boards of an agreed list of subsidiariesof the Company (the “Agreed Subsidiaries”) to achieve the following:
• The board of each of RUSAL Global Management B.V. and RUSAL America Corp. shallcomprise:
• four directors proposed by En+, for as long as the shareholding of En+ as a percentageof the Major Shareholders’ Shares is at least 40%, provided that the number ofdirectors to be proposed by En+ shall be three where such percentage is between 30%and 40%, shall be two where it is between 20% and 30% and shall be one where it isless than 20%; and
• one director proposed by each of Glencore, SUAL Partners and Onexim, for as longas in each case the relevant Major Shareholder holds at least 8.6% of the total Sharesin issue (or such lesser percentage as results from dilution on a further share issue),in the case of each of Glencore and SUAL Partners, and 5% of the total Shares inissue, in the case of Onexim.
SUBSTANTIAL SHAREHOLDERS
— 288 —
• The board of each other Agreed Subsidiary shall comprise:
• three directors proposed by En+ for as long as the shareholding of En+ as a percentageof the Major Shareholders’ Shares is at least 40%, provided that the number ofdirectors to be proposed by En+ shall be two where such percentage is between 20%and 40% and shall be one where it is less than 20%; and
• one director proposed by each of Glencore and SUAL Partners, for as long as in eachcase the relevant Major Shareholder holds at least 8.6% of the total Shares in issue (orsuch lesser percentage as results from dilution on a further share issue).
Committees of the Board
• The Major Shareholders have agreed to procure, so far as they are able, that certain committeesof the Board are to be established, with the composition, functions and responsibilities set outbelow.
• An audit committee, remuneration committee and corporate governance and nominationcommittee, each to be established in accordance with the requirements of the Code onCorporate Governance Practices. The audit committee shall consist of five members, ofwhom three shall be independent Directors (as approved by the Board), one shall beappointed by En+ and one by Onexim. The remuneration committee shall consist of fivemembers, of whom three shall be independent Directors (as approved by the Board), oneshall be appointed by En+ and one by SUAL Partners. The corporate governance andnomination committee shall consist of five members, of whom three shall be independentDirectors (as approved by the Board), one shall be appointed by En+ and one by Glencore.Summaries of the functions of these committees are set out in “Directors and SeniorManagement — Committees”.
• A marketing committee consisting of one member proposed for appointment by each ofEn+, SUAL Partners and Glencore, whose responsibilities include the review and approvalof the Company’s marketing strategy, recommending the appointment of marketingdirectors for aluminium and alumina and recommending to the CEO of the Company theremoval of marketing directors.
• A health, safety and environmental committee, whose composition, functions and terms ofreference are to be determined from time to time by the Board.
• A standing committee consisting of four members who may or may not be Directors, oneproposed for appointment by each of En+, SUAL Partners, Glencore and Onexim. Thestanding committee shall have authority to take certain decisions in relation to the Groupwithout further approval of the Board or the Shareholders.
Exercise of voting rights by Onexim
• At general meetings of the Company, with respect to certain agreed matters customarily reservedto Shareholders, Onexim will undertake to exercise its voting rights in the same manner as En+exercises its voting rights, provided that in no event shall Onexim be required to vote its holdingof Shares: (A) in a manner that would contravene applicable law; (B) in a manner that would bedirectly and materially adverse to the interests of Onexim in its capacity as a direct or indirectholder of Shares; (C) if Onexim shall have exercised a right of “veto” (as described below) inrespect of the relevant matter; or (D) if and for so long as En+ is in material breach of theShareholders’ Agreement between Major Shareholders only or the Shareholders’ Agreement withthe Company.
Veto rights
• The Major Shareholders have agreed to exercise their voting rights with a view to giving theMajor Shareholders effective veto rights as set out below, by procuring that Directors proposedby them for appointment vote against any resolution in respect of which a Major Shareholder hasexercised its “veto”:
SUBSTANTIAL SHAREHOLDERS
— 289 —
• Each of En+, Glencore, SUAL Partners and Onexim is to be given an effective right of vetoin relation to any Related Party Transaction (or amendment to or renewal of an existingRelated Party Transaction). For this purpose, “Related Party Transaction” means anyagreement, transaction or arrangement between any member of the Group on the one hand,and En+, Glencore, SUAL Partners or Onexim (or, in the case of En+, SUAL Partners andOnexim, their beneficial owners) involving the aggregate payment or transfer of value inany calendar year by one or more members of the Group of an amount which, whenaggregated with any payment or transfer of value under any related agreement, transactionor arrangement would exceed US$1 million.
• Each of En+, Glencore and SUAL Partners and Onexim is to be given an effective right ofveto in respect of any matter proposed to be undertaken by the Company or any of itssubsidiaries which would require a special resolution were the Company or the relevantsubsidiary incorporated in England and Wales (e.g., alteration of articles of association;change of name; re-registration of a private company as a public company; re-registrationof an unlimited company as limited; re-registration of a public company as a privatecompany; offer to issue shares or rights to subscribe for shares other than pro rata toexisting shareholders by disapplying statutory pre-emption rights; reduction of sharecapital; to give, revoke, renew or vary the authority for the company to purchase (offmarket) shares in itself; and to redeem or purchase own shares out of capital).
• The Company does not believe that these veto rights will have any material impact on theoperation of the Company.
Matters inconsistent with the Shareholders’ Agreement between Major Shareholders only
• The Major Shareholders have agreed that they shall use their voting and other rights availableto them to procure that no resolutions are passed or actions taken or refrained from being takenby the Company or any other member of the Group to the extent that they would be inconsistentwith the terms of the Shareholders’ Agreement between Major Shareholders only.
KraMZ/KUMZ supply agreements and agreements with Glencore
• The Major Shareholders have agreed to use their voting and other rights available to them toprocure that all board and shareholder approvals and resolutions which are required under theListing Rules in respect of the supply agreement entered into between the Group andKamensk-Uralsky Metallurgical Works Joint-Stock Company, a company owned by certainshareholders of SUAL Partners and the supply agreement entered into between the Group andKraMZ group companies, a group of companies owned by Mr. Deripaska are passed inaccordance with those laws and rules.
• If the entry into, amendment of or exercise of any rights under any agreements between theGroup and Glencore require shareholder approval under the Listing Rules, the MajorShareholders have agreed to use their voting and other rights available to them to procure thatsuch approvals and resolutions are passed in accordance with those laws and rules.
Dividend policy
• The Major Shareholders have agreed to procure compliance by the Group with a dividend policy,to the extent permissible under the terms of the restructuring agreements, under which not lessthan 50% of the annual consolidated net profits of the Group in each financial year aredistributed to Shareholders within four months after the end of the relevant financial year,subject to any applicable legislation. Currently, the Company does not expect to declaredividends in respect of any year through at least 2013.
SUBSTANTIAL SHAREHOLDERS
— 290 —

Encumbrances over Shares
• Until 26 March 2012, and subject to the exception stated below, En+ has agreed not to encumberShares comprising 40% of the Major Shareholders Shares. Notwithstanding the foregoing, En+will be entitled to encumber Shares equal to a maximum of 17% of the total Shares in issue fromtime to time in favour of a finance provider as bona fide security for indebtedness of En+ or itssubsidiaries.
• Glencore and SUAL Partners have agreed not to encumber any Shares except for (i) pursuant tocertain Glencore security agreements; (ii) a pledge as set out below; and (iii) the same proportionof their holding of Shares as the proportion which En+ is entitled to encumber as stated above.
• There will be no restrictions on Onexim encumbering its Shares.
• The Major Shareholders acknowledge that they may be required to pledge in aggregate 5% of thetotal issued Shares, on a pro rata basis, as security for indebtedness owed by the Group to VEB.The rights of the Major Shareholders to encumber a certain proportion of their Shares asdescribed above is in addition to any such pledge granted by them to VEB.
Rights of first refusal — SUAL Partners Shares
• Subject to certain exceptions, if SUAL Partners wishes to sell any of its holding of Shares in anon-market transaction, it must serve notice on En+, offering it a right of first refusal. The priceat which En+ will be entitled to acquire the Shares offered by SUAL Partners is the volumeweighted average price per Share for the three trading days prior to the date on which therelevant notice is sent by SUAL Partners.
• SUAL Partners will not be obliged to offer En+ a right of first refusal in respect of Shares soldby it to the extent that:
• the aggregate number of Shares sold in any one trading day by SUAL Partners does notexceed 20% of the daily average trading volume for the 30 trading days immediatelypreceding that trading day; and
• the aggregate number of Shares sold within the above limits does not in any period of fourmonths exceed 0.5% of the total Shares in issue at the time of the relevant sale.
Rights of first refusal — Glencore’s Shares
• Glencore must offer En+ and SUAL Partners a right of first refusal in respect of any proposedsale of Shares by Glencore in an on-market transaction, on substantially the same terms as theright of first refusal to be offered in respect of Shares held by SUAL Partners (as describedabove), subject to the same carve outs as described above in relation to SUAL Partners.
Onexim tag along rights
• Upon any sale of Shares by En+, SUAL Partners or Onexim, such that the aggregate number ofShares sold by those three Major Shareholders in any rolling four month period exceeds 25% ofthe Shares then in issue, the sale shall not proceed unless the purchaser has also offered, on thesame terms, to acquire the Shares then held by Onexim which were received by Onexim as partconsideration for the acquisition by the Company of a stake of 25% plus one share in NorilskNickel.
SUBSTANTIAL SHAREHOLDERS
— 291 —

Share placing
• To the extent that the Company proposes to undertake a bookbuilt placing or underwrittenoffering of Shares of in excess of 1% of the issued share capital of the Company, the MajorShareholders have agreed to use their voting and other rights to procure that the MajorShareholders are also entitled to sell a pro rata proportion of their Shares as part of such placingor offering.
No mandatory offer
• The Major Shareholders have agreed not to acquire or dispose of any voting rights which wouldbe exercisable at a general meeting of the Company, if such acquisition or disposal would triggera mandatory obligation under the Hong Kong Codes on Takeovers and Mergers and ShareRepurchases to make an offer for Shares and have undertaken to indemnify each other in theevent of a breach of such undertaking.
Licences
• For as long as Onexim is a Shareholder, En+, SUAL Partners and Glencore have agreed not to,and to use their respective voting and other rights to procure that neither the Company nor anyof its subsidiaries will, bid for or acquire, and that the Company will take reasonable steps toprocure that Norilsk Nickel will not bid for or acquire, certain specified geological licencesrelating to nickel, copper, platinum and cobalt without the prior written consent of Onexim.
Termination for particular shareholders
• The Shareholders’ Agreement between Major Shareholders only shall terminate in respect of therelevant Major Shareholder in the following circumstances:
• Upon completion of the Glencore Call Option under the deed described in “— ShareholderOptions”.
• Upon completion of the SUAL Put Option under the deed described in “— ShareholderOptions”, such that all of SUAL’s Shares have been transferred.
• Upon either Glencore or SUAL Partners ceasing to hold at least 8.6% of the total Sharesin issue (or such lesser percentage as results from dilution on a further share issue)Glencore or SUAL Partners (as the case may be) shall lose their rights to propose Directorsfor nomination to the Board, and upon such shareholdings falling below 50% of the relevantminimum shareholding stated above they shall lose their respective veto rights as describedabove.
• Upon En+ ceasing to hold at least 8.6% of the total Shares in issue (or such lesserpercentage as results from dilution on a further share issue), it shall lose any rights topropose Directors for nomination to the Board, and upon such shareholding falling below50% of the relevant minimum shareholding stated above, it shall lose its veto rights asdescribed above.
• Upon Onexim ceasing to hold at least 5% of the total Shares in issue, other than as a resultof dilution on a further share issue, it shall lose all of its rights and obligations under theShareholders’ Agreement between Major Shareholders only.
SUBSTANTIAL SHAREHOLDERS
— 292 —

• If Onexim holds less than 5% of the total Shares in issue, but still has any rights under theShareholders Agreement between Major Shareholders only, it shall lose all of its rights andobligations under the Shareholders’ Agreement between Major Shareholders only upon anysubsequent disposal by it of Shares or entry into derivative contracts or arrangements inrelation to Shares.
• Upon any Major Shareholder ceasing to hold at least 3% of the total Shares in issue, forwhatever reason, it shall lose all of its rights and obligations under the Shareholders’Agreement between Major Shareholders only.
• Subject to certain exceptions, if there is a change of control of Glencore or a third partyacquires all or substantially all of Glencore’s assets, it shall lose its rights to proposeDirectors for nomination to the Board and the veto rights described above. See “—Shareholders’ Agreement between Major Shareholders only — Board of the Company” and“— Shareholders’ Agreement between Major Shareholders only — Veto Rights”.
• If there is a change of control of Onexim or a third party acquires all or substantially allof Onexim’s assets, it shall lose all rights and its obligations under the Shareholders’Agreement between Major Shareholders only.
Shareholders Agreement between Major Shareholders and the Company
The Major Shareholders have agreed the terms of a shareholders’ agreement that is expected tobe entered into before the Listing Date to which the Company is also a party (the “Shareholders’Agreement with the Company”). The principal terms of the Shareholders’ Agreement with theCompany are described below. Unless otherwise stated, references to En+, SUAL Partners, Glencoreand Onexim are deemed to include reference to other entities controlled by those Major Shareholders(other than any member of the Group).
Right of first refusal — bauxite, alumina, aluminium
• The Major Shareholders must offer the Company a right of first refusal in respect of any assetsor development opportunities related to the production of bauxite, alumina or aluminium(“Industrial Assets”) that they wish to acquire where such Industrial Asset or a group of relatedIndustrial Assets has a value in excess of US$50 million.
• The minimum threshold of US$50 million stated above is subject to adjustment with effect from26 March 2012 up to a maximum of US$1 billion, depending on the LME price of aluminium onthe last business day before that date.
• Each Major Shareholder must disclose to the Company any opportunity which has come to their(or their associates’) respective attentions to acquire Industrial Assets of whatever value.
Right of first refusal — nickel, copper, platinum, cobalt, palladium
• Until 25 April 2010, En+ and Onexim must offer the Company a right of first refusal in respectof any industrial assets or development opportunities related to the production of nickel, copper,platinum, cobalt or palladium, save for RTB Bor Copper moveable and fixed assets licences inSerbia (“Mining Assets”) or any licences for the mining of any such Mining Asset (save forcertain agreed existing or prospective licences) (“Geological Licences”) that they wish to acquirewhere such Mining Asset has a value in excess of US$150 million, or such Geological Licencehas a value in excess of US$100 million.
• Each of En+ and Onexim must disclose to the Company any opportunity which has come to their(or their associates’) respective attentions to acquire Mining Assets or Geological Licenceswhere the value is reasonably likely to give rise to a right of first refusal.
SUBSTANTIAL SHAREHOLDERS
— 293 —

• This right of first refusal will only apply to En+ if the aggregate direct and indirect interest ofEn+ and its ultimate beneficial owner in Shares exceeds 40% of the total Shares in issue (or suchlesser percentage as a result of any dilution on a further Share issue) and will only apply toOnexim if the aggregate direct and indirect interest of Onexim and its ultimate beneficial ownerin Shares exceeds 5% of the total Shares in issue.
Acquisitions of Norilsk Nickel shares
• Onexim will undertake not to acquire shares in Norilsk Nickel before 25 April 2010 without theprior consent of the Company.
• Each of En+, SUAL and Glencore will undertake not to acquire shares in Norilsk Nickel before25 April 2010 without the prior consent of the Company and Onexim.
Relationship between the Company and the Major Shareholders
• Each Major Shareholder must ensure that any contract between it or any of its associates and anymember of the Group is entered into on an arms’ length commercial basis and on terms that arenot unfairly prejudicial to the interests of any Major Shareholder or the Group.
• If there is a dispute between a Major Shareholder or any of its associates and the Company, thatShareholder will not, and will procure that any Directors appointed by it will not, do anythingto prevent or hinder the Company’s handling of the dispute.
• The Major Shareholders agree to act in good faith in relation to the Group and in a manner thatis not unfairly prejudicial to the interests of the Shareholders generally, and that the Group willbe operated in accordance with the corporate governance standards set out in the Code onCorporate Governance Practices.
Termination for particular Shareholders
• The Shareholders’ Agreement with the Company shall terminate in respect of the relevant MajorShareholder in the following circumstances:
• Upon completion of the Glencore Call Option or the put option granted by Glencore underthe deed described in “— Shareholder Options”.
• Upon completion of the SUAL Put Option under the deed described in “— ShareholderOptions”, such that all of SUAL’s Shares have been transferred.
• Upon Onexim ceasing to hold a minimum shareholding of 5% of the total Shares in issue,other than as a result of dilution on a further share issue, it shall lose all of its rights andobligations under the Shareholders’ Agreement with the Company.
• If Onexim holds less than 5% of the total Shares in issue, but still has any rights under theShareholders’ Agreement with the Company, it shall lose all of its rights and obligationsunder the Shareholders’ Agreement with the Company upon any subsequent disposal by itof Shares or entry into derivative contracts or arrangements in relation to Shares.
• Upon any Major Shareholder ceasing to hold at least 3% of the total Shares in issue, forwhatever reason, it shall lose all of its rights and obligations under the Shareholders’Agreement with the Company.
• Subject to certain exceptions, if there is a change of control of Glencore or a third partyacquires all or substantially all of Glencore’s assets, it shall lose its right of first refusaloutlined above.
SUBSTANTIAL SHAREHOLDERS
— 294 —

• If there is a change of control of Onexim or a third party acquires all or substantially allof Onexim’s assets, it shall lose all rights and its obligations under the Shareholders’Agreement with the Company.
Litigation Involving Certain Beneficial Owners
Litigation Involving Mr. Deripaska
On 24 November 2006 a claim was issued on behalf of Mr. Cherney against Mr. Deripaska fromthe High Court. Neither UC RUSAL nor any of its subsidiaries is a party to this dispute — it is entirelybetween two individuals, Mr. Cherney and Mr. Deripaska. UC RUSAL has not had access tonon-public information about the case and is not privy to the litigation strategy of either party or theprospects of settlement.
In his claim, Mr. Cherney alleges that:
• (i) Mr. Cherney and Mr. Deripaska each held a beneficial interest in OJSC United CompanySiberian Aluminium (“Sibal”). (ii) In March 2001, Mr. Deripaska and Mr. Cherney enteredinto an agreement (the “Agreement”) in anticipation of the proposed transfer of the assetsof Sibal to an entity called Russian Aluminium (“RA”, an entity that the claim does notformally identify but which may be Rusal Limited, now a wholly owned direct subsidiaryof UC RUSAL (see “History and Corporate Structure — History and Development”)). (iii)As a result of the transfer, Mr. Cherney would become entitled to a 20% beneficial interestin RA.
In his claim, Mr. Cherney also alleges that:
• (i) Under the Agreement, Mr. Deripaska agreed to pay Mr. Cherney US$250 million for a17.5% shareholding in Sibal. (ii) Under a supplement to the Agreement, Mr. Deripaska wasalso to hold 20% of the shares in RA on behalf of Mr. Cherney (directly or indirectlythrough entities owned or controlled by Mr. Deripaska) and to realise such shares startingno later than 10 March 2005 and complete this exercise by 10 March 2007. (iii) Mr.Deripaska was to pay the proceeds of such realisation (or an amount based on a formula ifsuch realisation did not take place), less US$250 million, to the account of Mr. Cherneywithin six months of the shares being sold, and in any event within six months of 10 March2007 (i.e., by no later than 10 September 2007). (iv) Although Mr. Deripaska met hisobligations with respect to the payment of US$250 million, he did not perform hisremaining obligations.
The claim states that, at least pending receipt by Mr. Cherney of the amounts due to him pursuantto the arrangements referred to above, Mr. Cherney is entitled to and seeks:
• A declaration that Mr. Deripaska (directly or indirectly) holds (i) 20% of the shares in RAand (ii) 20% of the 66% shareholding in UC RUSAL (held by former shareholders of RA)on trust for Mr. Cherney and to his order.
• A declaration that any benefits or proceeds derived directly or indirectly by Mr. Deripaskafrom such shares and shareholding as well as any assets acquired using directly orindirectly any dividends or other monies or benefits received by Mr. Deripaska andreferable to the shares and shareholding are held on trust for Mr. Cherney, alternativelysubject to a lien in Mr. Cherney’s favour.
• A declaration that, insofar as the shares are held indirectly by a person acting subject to Mr.Deripaska’s directions or companies or entities owned and controlled by Mr. Deripaska, Mr.Deripaska’s right to control those persons, companies or entities and to sell the said sharesis held on trust for and to be exercised on behalf of and at the direction of Mr. Cherney.
SUBSTANTIAL SHAREHOLDERS
— 295 —
• A declaration that, if and to the extent that Mr. Deripaska directly or indirectly acquiredassets from RA (further or alternatively Sibal) or UC RUSAL for “inadequateconsideration”, such assets and/or proceeds thereof are subject to the aforementioned trustand/or lien.
• An order that Mr. Deripaska sell or procure the sale of 20% of the shares in RA and 20%of the 66% of the shares in UC RUSAL at the market price and account to Mr. Cherney forthe proceeds of that sale.
• The claim alleges further, or alternatively, that by reason of Mr. Deripaska’s breaches ofcontract, Mr. Cherney suffered loss and damage at least equal to the market value of 20%of RA and 20% of 66% of UC RUSAL, which the claim alleges to be in excess of US$4billion, less US$250 million, increased by the value of any assets diverted for “inadequateconsideration”.
• Mr. Cherney also claims interest on the amounts alleged to be owed him.
The procedural history of Mr. Cherney’s claim is as follows:
• On 24 November 2006, the claim against Mr. Deripaska was issued on behalf of Mr.Cherney in the High Court.
• On 3 May 2007, the High Court set aside the claim on jurisdictional and proceduralgrounds, and Mr. Cherney’s application for permission to appeal such decision to the Courtof Appeal was refused on two occasions.
• On 3 December 2007, Mr. Cherney filed an amended claim form and particulars of claimwhich claimed that he and Mr. Deripaska had agreed the English Courts as a forum forresolution of disputes arising from the Agreement and English law as the governing law ofthe Agreement, and also issued an application for permission to serve Mr. Deripaska out ofthe jurisdiction.
• On 3 July 2008, the High Court held that although Mr. Cherney had a good arguable casethat the alleged agreement was made (and that insofar as any judgment could be reached onpresent material Mr. Cherney had much the better side of the argument), there was not agood and arguable case that there was any oral agreement between Mr. Cherney and Mr.Deripaska as to English law and jurisdiction in connection with the alleged agreement. TheHigh Court’s reasoning on these matters is set out in the extracts from the 3 July 2008decision included in Appendix X to this Prospectus. The High Court also concluded,however, that the risks inherent in a trial in Russia (including risks of assassination, arreston trumped up charges and lack of a fair trial) were sufficient to make England the forumin which the case could most suitably be tried. The High Court, therefore, gave permissionfor the claim form to be served outside the jurisdiction. In this connection, however, theHigh Court also stated that it “cannot tell whether any threat to Mr. Cherney is likely tocome from a figure from his supposed criminal past or a former business rival (or someonewho falls into both categories) or neither”. The full decision of the High Court is on publicdisplay and can be found at <www.bailii.org/ew/cases/EWHC/Comm/2008/1530.html>.
SUBSTANTIAL SHAREHOLDERS
— 296 —
• The High Court subsequently granted Mr. Deripaska’s application to appeal and Mr.Deripaska timely appealed the 3 July 2008 decision.
• On 31 July 2009 the Court of Appeal dismissed Mr. Deripaska’s appeal and subsequentlyrefused permission to appeal to the House of Lords (now known as the Supreme Court).
• On 17 September 2009, Mr. Deripaska filed an application to the Supreme Court forpermission to appeal the decision of the Court of Appeal.
• On 9 December 2009 the Supreme Court refused Mr. Deripaska’s application for permissionto appeal the decision of the Court of Appeal. On 14 December 2009 Mr. Deripaska wasserved with Mr. Cherney’s claim. Mr. Deripaska will be required to serve a defence to Mr.Cherney’s claims in early 2010.
At present, there is considerable uncertainty as to the possible scope and the potential outcomesin the case and how and to what extent, if at all, UC RUSAL and/or its subsidiaries and/or its or theirrespective assets might be affected by any decision against Mr. Deripaska. Nonetheless, the followingcan be noted:
• Neither UC RUSAL nor any of its subsidiaries or investees, nor En+ (the majorityshareholder owned indirectly by Mr. Deripaska), nor any other direct shareholder in UCRUSAL, is currently a party in this case.
• When the merits of the case are heard, issues to be resolved will include whether there wasin fact a contract with respect to 20% of RA as alleged by Mr. Cherney and, if so, whetherit is governed by English or Russian law.
• In the event that Mr. Cherney were to prevail on the merits, the essence of his claim wouldbe for money from Mr. Deripaska. The quantum of the claim referred to above (in excessof US$4 billion in respect of 20% of RA, and 20% of 66% of UC RUSAL, plus possibleadditional amounts) has not yet been subject to judicial examination, and it is uncertain atthis time how the quantum of the claim ultimately would be determined.
• If the claim were to be paid by Mr. Deripaska without any adverse impact on his beneficialinterest in UC RUSAL, his directorship or office in the Group, there would be no directconsequences for UC RUSAL or any of its subsidiaries.
• As noted above, given that (i) UC RUSAL is not a party to the litigation and (ii) thelitigation is still at a very early stage, UC RUSAL is unable to express a view on the meritsof Mr. Cherney’s claim. However, in the event that Mr. Cherney were to succeed in hisclaim and obtain the relief he is seeking, then, unless Mr. Deripaska funds the judgment billentirely from assets unconnected with the Group, Mr. Deripaska’s beneficial interest in UCRUSAL or (depending on the remedy granted) certain assets of the Group, such as a portionof UC RUSAL’s interest in RA, would be affected adversely by the claim. For example, ifMr. Cherney succeeds in his claim on the basis that the contract is found to be governedby English law:
— Mr. Deripaska’s beneficial interest in, and thus his influence over, UC RUSAL wouldbe significantly reduced, through the declaration of a trust or lien in favour of Mr.Cherney over UC RUSAL shares owned indirectly by Mr. Deripaska and/or throughthe sale of such shares to satisfy an award for damages and interest. (A similarconsequence would arise from a settlement that Mr. Deripaska financed through a saleof shares he beneficially owns in UC RUSAL.)
SUBSTANTIAL SHAREHOLDERS
— 297 —
— If Mr. Cherney were to elect to pursue his claim in respect of shares in RA, rather thanshares in UC RUSAL beneficially owned by Mr. Deripaska, a court could ultimatelydeclare a trust or lien over, and order the sale of, shares in RA instead of shares in UCRUSAL. If, as may be the case, RA is Rusal Limited, this would lead to the creationof a new minority interest in the Group. Rusal Limited and its subsidiaries accountedfor 73%, 44% and 37% of the Company’s production of aluminium, alumina andbauxite, respectively, in 2008, and 76%, 52% and 50%, respectively, in the first halfof 2009. The creation of a minority interest in Rusal Limited, or any other subsidiaryof the Company, would itself give rise to a loss for the Group and might potentiallyhave adverse consequences under the Group’s debt restructuring agreements. See“Financial Information — Management’s Discussion and Analysis of FinancialCondition and Results of Operations — Liquidity and Capital Resources — DebtRestructuring — Events of Default”. In addition, on an ongoing basis, the creation ofa minority interest would reduce the Company’s net profit/(loss) attributable toShareholders for the affected periods, the Company’s comprehensive income/(loss)attributable to Shareholders for such periods and the Company’s Covenant EBITDAfor such periods. The Company’s total equity attributable to Shareholders would alsobe reduced. Neither total net profit/(loss), nor total comprehensive income/(loss), nortotal equity, nor Adjusted EBITDA would be affected, however.
— The Company has received legal advice from external counsel under English law that:
• If Mr. Cherney were to prevail on the merits, Mr. Cherney would have to choosebetween seeking a declaration of trust or a lien over shares in UC RUSAL andseeking the same over shares in RA. While it is difficult to assess the relativeinherent values of the two interests, and in any event this judgement would bemade by Mr. Cherney at the end of the process, the Company believes that sharesin UC RUSAL after the listing would be considerably easier to sell than sharesin Rusal Limited and that this might favor a decision by Mr. Cherney to pursuea remedy in relation to UC RUSAL shares beneficially owned by Mr. Deripaskarather than Rusal Limited shares.
• If Mr. Cherney were to succeed in establishing his claim to a trust over UCRUSAL shares or over shares in RA, Mr. Cherney could claim for dividends orother monies or benefits referable to those shares and trace into any assetspurchased using any such dividends, monies or benefits, which might includeshares of UC RUSAL, or of RA, or other Group assets. In the event that Mr.Cherney were to succeed in establishing that assets of RA or UC RUSAL hadbeen transferred for “inadequate consideration”, it is possible that Mr. Cherneywould be able to trace his claim into these assets as well (or other assets derivedfrom them), which also might include shares of UC RUSAL, or of RA, or otherGroup assets.
• The Company has also received legal advice from external counsel under Russian law,based on the assumptions that (a) the alleged contract is found to be governed by Russianlaw and (b) it is held to be valid and binding based on the fulfillment of all Russian legalrequirements, including that the subject matter thereof be identified definitively. In suchassumed circumstances, Mr. Cherney’s remedy would be limited to recovering moneydamages from Mr. Deripaska, as the only other party to the alleged contract. Mr. Cherneywould not be able to recover shares or assets from RA, UC RUSAL or En+ directly, wouldnot be able to seek specific performance from any of these companies, and would nototherwise have any legal remedies against them or any of their assets. If, however, Mr.Deripaska did not otherwise satisfy any monetary judgment against him, his non-monetaryassets, as well as his monetary assets, would be subject to attachment. Such non-monetaryassets might include his interest in entities that indirectly hold shares of UCR and RA.
SUBSTANTIAL SHAREHOLDERS
— 298 —
• Even before a final decision on the merits is made, further proceedings in respect of thisclaim, and publicity surrounding them, could adversely affect the trading price of theshares.
Mr. Deripaska has informed the Company that he strongly denies and will vigorously resist Mr.Cherney’s claim. The Company would vigorously contest any claim if made against it, any of itssubsidiaries or any of its or their respective assets.
Litigation Involving Mr. Vekselberg
The Swiss Financial Market Supervisory Authority (formerly the EidgenössischeBankenkommission) (“FINMA”) commenced two administrative proceedings (eingreifendesVerwaltungsverfahren) against Mr. Vekselberg in the context of acquisitions of shares in OC OerlikonCorporation AG (“Oerlikon”) and Sulzer AG (“Sulzer”), in relation to Oerlikon, on 20 June 2007 and,in relation to Sulzer, on 28 February 2007.
The proceedings relate to an alleged failure by Mr. Vekselberg and other investors to comply withdisclosure obligations under the relevant Swiss statutory provisions arising out of the aboveacquisitions. Both proceedings are currently with the Swiss Federal Department of Finance(Eidgenössisches Finanzdepartement) (the “EFD”). The proceedings have been and continue to bevigorously contested by Mr. Vekselberg.
On 2 April 2009, the EFD issued a final protocol in the Oerlikon proceedings, stating that Mr.Vekselberg and other investors had violated their disclosure duties. The EFD may now render itsadministrative order for penalty (Strafbescheid) in the Oerlikon proceedings. It is not known when theEFD will issue the final protocol in the Sulzer proceedings. Accordingly, it is currently uncertainwhether, and if so when, an administrative order for penalty will be issued by the EFD. If anadministrative order for penalty is appealed, the order becomes an indictment before the Swiss FederalCriminal Tribunal (Bundesstrafgericht) for judicial decision.
The maximum penalty that it is expected could be imposed by EFD on Mr. Vekselberg in thisrespect is double the stock exchange price of the non-disclosed holdings at the date of the allegednon-compliance.
SUBSTANTIAL SHAREHOLDERS
— 299 —

Immediately following completion of the Global Offering, En+ will be interested inapproximately 47.59% of the Company’s then issued share capital (if the Over-allotment Option is notexercised and no bonus Shares are issued to management) or approximately 46.89% of the Company’sthen issued share capital (if the Over-allotment Option is exercised in full but no bonus Shares areissued to management) and will be the Company’s Controlling Shareholder. For information about aclaim that could affect the size of En+’s interest in the Company, see “Risk Factors — Risks relatingto the Group and its Business — A certain claim against the beneficial owner of En+ could have amaterial adverse effect on the Company and/or the trading price of its Shares”, “SubstantialShareholders — Litigation Involving Certain Beneficial Owners — Litigation Involving Mr.Deripaska” and Appendix X to this prospectus.
En+’s Business
En+’s strategy is to focus on businesses which extract raw materials for energy production,generate electricity and produce non-ferrous metals. En+ specialises in metals that require high energyconsumption and then look for synergies between its energy producing and energy consumingbusinesses.
En+’s origins lie in its core business of aluminium production. Apart from being our ControllingShareholder, En+ also owns Central European Aluminum Company (CEAC) which operates analuminium smelter and bauxite mine in Montenegro.
INDEPENDENCE FROM EN+
Having considered all relevant factors, the Directors are satisfied that the Group can conduct itsbusiness independently of En+ after the Global Offering:
Independence of our Board and our Senior Management and Senior Management of En+
The Board consists (subject to the appointment of Mr. Barry Cheung and Mr. Igor Ermilin witheffect from the Listing Date) of 18 Directors, comprising three executive Directors, 11 non-executiveDirectors and four independent non-executive Directors. The Board currently comprises a majority ofnon-executive Directors due to a historical arrangement between En+, SUAL Partners, Glencore andOnexim, pursuant to which they are each entitled to nominate a certain number of candidates forappointment as Directors. As at the Latest Practicable Date, nine of the Directors were nominated byEn+ and one of such Director was also a director of En+. The overlapping Director, namely Mr.Vladislav Soloviev, is a non-executive Director in both the Company and En+ and has been electedon the basis of his qualifications and breadth of experience, as set out in more detail in “Directors andSenior Management”. Mr. Deripaska, CEO and executive Director of the Company, is not a directorof and holds no other position at En+. The Company’s non-executive Directors attend Board meetingsand provide guidance to and decide on the Company’s important matters. Certain of the non-executiveDirectors also sit on the committees of the Board and are responsible for the matters related to suchcommittees.
For the following reasons, the Directors are of the view that the Group is able to operateindependently from En+ notwithstanding that nine Directors, including the CEO, are nominated byEn+ and one Director is also a director of En+:
(a) the decision-making mechanism of our Board set out in the Articles of Association providesthat in the event of a conflict of interest or duty, all Directors with a conflicting interestshall abstain from voting when a conflicted resolution is to be discussed and voted on;
RELATIONSHIP WITH THE CONTROLLING SHAREHOLDER AND NON-COMPETITION
— 300 —
App1A-27A

(b) the Group’s day-to-day operations are managed by three executive Directors, each of whomis nominated by En+, and our senior management team. All non-Board members of oursenior management are independent of and not connected with En+. Mr. Deripaska devotesapproximately 80% of his time to the Group; and
(c) the Board has four independent non-executive Directors (subject to the appointment of Mr.Barry Cheung with effect from the Listing Date) with extensive corporate governance andfinancial experience and is able to review, enhance and implement measures to manage anyconflict of interests between En+ and our Group in order to protect minority shareholders’interests and to manage the affairs of the Group independently of En+. A committee of theindependent non-executive Directors will make recommendations to the independentshareholders on how to vote for any resolution relating to connected transactions witheffect from the Listing Date.
Based on the above, the Board is satisfied that the Board as a whole, together with our seniormanagement team are able to perform the managerial role in the Group independently.
Operational Independence
The Group has full control of its assets and its businesses, and the Group has operated throughoutthe Track Record Period and continue to operate as at this time, as a business group which is separatefrom and fully independent of the Controlling Shareholder.
The Group has, as disclosed under the section entitled “Connected Transactions” of thisprospectus, entered into contracts with companies controlled by the Controlling Shareholder for thepurchase of electricity, and may continue to do so after Listing.
As aluminium production is energy intensive, access to relatively inexpensive Siberianhydropower is central to the competitive strategy of the Group. However, notwithstanding the volumeof such purchases from companies owned and controlled by the Controlling Shareholder, and theimportance of electricity cost to the production activities of the Group, the Company for the followingreasons does not consider that it is as a consequence overly reliant on the Controlling Shareholder:
(1) the Group has access to alternative sources of electricity as the Group’s Russian smeltersare connected to the Russian power grid, meaning that electricity supplies can be obtainedfrom various power plants, all of which are also connected to the grid. These supplies areavailable to the Group at market prices;
(2) a fixed tariff set by the Russian Government currently applies to approximately 50% of theelectricity supplies purchased from companies controlled by the Controlling Shareholder.The remainder is purchased primarily at prices determined independently of these powerproducers by an independent market council that sets applicable daily prices on the basisof a pricing model applied across Russia and is entitled to apply market smoothingmechanisms. As a result, there would be relatively limited price impact in switching tosuppliers unrelated to our Controlling Shareholder except to the extent we were to obtainsupplies from higher-cost coal producers;
(3) none of the contracts is in take-or-pay format;
(4) even with the staged reduction of the proportion of each supply contract which is subjectto regulated tariffs in accordance with existing regulations in Russia, which are expectedto reduce such regulated proportion to zero by 1 January 2011, the Group is currentlyalready a very large volume user with significant negotiating power in the Russian powermarket. For the year ended 2008, the Group consumed approximately 30% of the powergenerated in Siberia; and
RELATIONSHIP WITH THE CONTROLLING SHAREHOLDER AND NON-COMPETITION
— 301 —
(5) the power plants owned or controlled by the Controlling Shareholder are located in remoteregions where there are a limited number of large volume users located in proximity to suchplants. Sales to distant users would involve significant transmission losses and, becauseSiberia is a surplus energy producer, the result is that these plants are more reliant on thecustomer than vice versa.
Financial Independence
The Group’s financial auditing system is independent from En+ and employs a sufficient numberof dedicated financial accounting personnel responsible for financial auditing of our accounts. Wehave independent bank accounts and independent tax registration.
The Group’s treasury operations are handled by our Treasury Department, whose functionsinclude financing, treasury and cash management and operates independently from En+ and shares nofunctions or resources with En+.
The Group’s choice of financial institutions is mainly based on the credit standing of theinstitutions and the terms offered by them.
As at the Latest Practicable Date, En+ has not provided any security and/or guarantee on theGroup’s borrowings.
Based on the above, the Directors believe that the Group is able to maintain financialindependence from En+.
Non-competition
None of the Directors nor the Controlling Shareholder of the Company has any business whichcompetes with or is likely to compete with the Group’s business, either directly or indirectly, exceptfor the excluded business described below. However, by reason of the nature of such excluded businessand the clear delineation between the Group’s business and such excluded business, the Group is fullycapable of carrying on its business independently of and at arm’s length from such excluded business.There is no real competitive threat to the Group’s business from the excluded business and there isno intention for the Company to acquire such excluded business.
Mr. Deripaska owns Central European Aluminium Company (“CEAC”) (which operates inMontenegro an aluminium smelter called Kombinat Aluminijuma Podgorica and a bauxite mine calledRudnic Boxita Niksic which supplies raw material for the smelter). CEAC’s revenue was 44.7 millionRoubles for the six months ended 30 June 2009. CEAC’s net loss was 94.6 million Roubles for the sixmonths ended 30 June 2009. One of CEAC’s assets is the Kombinat Aluminijuma Podgorica(Aluminum Plant Podgorica) (“KAP”), based in Montenegro, which manufactures a wide range ofaluminium alloys. CEAC employs more 2,500 people and produces 120,000 tonnes of aluminumannually. KAP’s main suppliers are the electricity company of Montenegro, the Port of Bar,Montenegro Railways and bauxite mines. KAP’s largest customers are aluminium traders (KAP sellsmost of its aluminium into the market at LME based prices).
Mr. Deripaska also owns the KraMZ group of companies (which operate the KrasnoyarskMetallurgical Plant (“KraMZ”). The KraMZ plant was opened in the 1960s and currently employs inexcess of 2,000 individuals. In 2008 the KraMZ plant produced approximately 112,000 tonnes ofsemi-finished aluminium alloys. KraMZ’s revenue was 2,803.5 million Roubles for the six monthsended 30 June 2009. KraMZ’s net loss was 59.1 million Roubles for the six months ended 30 June2009. Most of the KraMZ plant’s raw materials (principally aluminium) are purchased from companieswithin the Group (primarily KrAZ). KraMZ’s main customers are industrial customers located withinRussia that purchase aluminium rods, tools, dies and cast aluminium alloys.
RELATIONSHIP WITH THE CONTROLLING SHAREHOLDER AND NON-COMPETITION
— 302 —

In addition, Mr. Deripaska is a beneficial owner of Dmitrov Pilot Plant for Aluminium CanningTape (“DOZAKL”) (the sole manufacturer in Russia and the CIS of aluminium tape for soft food cansand aluminium strips for lamplight reflectors and lath ceilings). The DOZAKL plant was opened in1972 and currently employs more than 360 individuals. It manufactures aluminium tape for food cansand lamplight reflectors in Russia or the CIS. DOZAKL’s revenue was 381.6 million Roubles for thesix months ended 30 June 2009. DOZAKL’s net loss was 0.6 million Roubles for the six months ended30 June 2009. DOZAKL purchases most of its raw materials (principally aluminium) from the Group’sRussian aluminium smelters. DOZAKL’s main customers are industrial customers located withinRussia and the CIS.
KraMZ and DOZAKL are focused on the downstream market for aluminium products, and not theupstream market on which the Group has taken a strategic decision to focus. As a result, a decisionwas taken not to include them in the Group at the time of the 2007 merger because they do not fit theGroup’s strategic profile, which is to focus on more profitable upstream businesses. CEAC is ageographically isolated producer of aluminium and would not be of interest to the Group due to itsrelatively high cost structure and certain privatization obligations.
The Company does not consider the above operations to pose any real competitive threat due totheir small size, limited geographical reach and focus on the downstream segment, which is not partof the Company’s business strategy.
GLENCORE
Immediately following completion of the Global Offering, Glencore will be indirectly interestedin approximately 8.65% of the Company’s then issued share capital (if the Over-allotment Option isnot exercised and no bonus Shares are issued to management) or approximately 8.53% of theCompany’s then issued share capital (if the Over-allotment Option is exercised in full but no bonusShares are issued to management) and will not be a controlling shareholder of the Company.
Mr. Glasenberg is a shareholder, director and CEO of Glencore, whose principal business is theproduction and trading of commodities including aluminium. Mr. Glasenberg is a Non-executiveDirector of the Company and is also a member of the Remuneration Committee and the standingcommittee. As he is not an executive Director, he does not participate in the day-to-day managementof the Company, and accordingly is not involved in the daily operations of the aluminium tradingdivision and so does not have access to confidential contracts entered into by that division. As his roleon the Board of UC RUSAL as a Non-executive Director does not require his involvement inday-to-day management of the Company, this does not preclude Mr. Glasenberg from fulfilling hisfiduciary duties. In case Mr. Glasenberg has a conflicting interest, he shall abstain from voting atBoard meetings when a conflicted resolution is to be discussed and voted on, subject to certainexceptions. See “Summary of the Constitution of the Company and Jersey Company Law — Articlesof Association — Disclosure of interests in contracts with the Company or any of its subsidiaries” inAppendix VII.
Glencore’s Business
Glencore is one of the world’s largest suppliers of a wide range of commodities and rawmaterials to industrial consumers. Headquartered in Baar, Switzerland, Glencore is a privately heldcompany owned by its management and employees.
Glencore’s customers are located around the world, in a variety of industries such as automotive,power generation, steel production and food processing. Glencore supplies its customers with metalsand minerals (including bauxite, alumina and aluminium), crude oil and oil products, coal andagricultural products. These commodities originate either from Glencore’s directly or indirectlyowned production assets, or are secured by Glencore from third parties, or they benefit from therefining, processing or marketing expertise of Glencore.
RELATIONSHIP WITH THE CONTROLLING SHAREHOLDER AND NON-COMPETITION
— 303 —

When the Group acquired certain of the alumina businesses of Glencore in late March 2007, itbecame subject to a contract for the supply of alumina to Glencore that continued through 2008, indeclining amounts. The Group sold to Glencore approximately 36% of its excess alumina in 2008. TheCompany also has long term supply contracts with Glencore for alumina and primary aluminium, andGlencore was the Group’s largest customer of alumina and primary aluminium in the six months ended30 June 2009, accounting for approximately 21% of the Group’s sales of primary aluminum. See“Business — Sales and Distribution”.
INDEPENDENCE FROM GLENCORE
Having considered all relevant factors, the Group is satisfied that it can conduct its businessindependently of Glencore after the Global Offering:
Independence of our Board and our Senior Management and Senior Management of Glencore
The Board consists (subject to the appointment of Mr. Barry Cheung and Mr. Igor Ermilin witheffect from the Listing Date) of 18 Directors, comprising three executive Directors, 11 non-executiveDirectors and four independent non-executive Directors .
For the following reasons, the Directors are of the view that the Group is able to operateindependently from Glencore notwithstanding that one Director is also a director of Glencore:
(a) the decision-making mechanism of our Board set out in the Articles of Association providesthat in the event of a conflict of interest or duty, all Directors with a conflicting interestshall abstain from voting when a conflicted resolution is to be discussed and voted on;
(b) the Group’s day-to-day operations are managed by three executive Directors who areindependent of and not connected with Glencore and our senior management team, who areall independent of and not connected with Glencore; and
(c) the Board has (subject to the appointment of Mr. Barry Cheung with effect from the ListingDate) four independent non-executive Directors with extensive corporate governance andfinancial experience and is capable to review, enhance and implement measures to manageany conflict of interests between Glencore and the Group in order to protect minorityshareholders’ interests and to manage the affairs of our Group independently of Glencore.A committee of the independent non-executive Directors will make recommendations to theindependent shareholders on how to vote for any resolution relating to connectedtransactions with effect from the Listing Date.
Based on the above, the Board is satisfied that the Board as a whole, together with the seniormanagement team are able to perform the managerial role in the Group independently.
Competition
Glencore and its subsidiaries are involved in the production of primary aluminium. Glencore andits subsidiaries also participate in the marketing of both aluminium and alumina from world marketsas well as from its owned industrial assets. Glencore’s subsidiaries own 100% of the Columbia Fallsaluminium smelter, 100% of the Sherwin alumina refinery and have an interest of 44% of CenturyAluminum Company, a NASDAQ-quoted company whose assets include: the Ravenswood aluminiumsmelter, a 49.7% equity interest in the Mt. Holly aluminium smelter, a 100% equity interest in theHawesville aluminium smelter and a 100% equity interest in the Nordural aluminium smelter.Consequently, Glencore competes with the Group as an aluminium producer. Glencore, in its businessof production and trading, is also a customer of the Group and the Company and an aluminiumproducer.
RELATIONSHIP WITH THE CONTROLLING SHAREHOLDER AND NON-COMPETITION
— 304 —
Set out below is a summary of the transactions which the Group will enter into before the ListingDate, and are expected to continue after the Listing, or which will be entered into after the ListingDate, and which, in either case, fall within the definition of continuing connected transactions underthe Listing Rules.
Electricity and Capacity Supply Contracts
The aluminium smeltering process is energy intensive and it is critical to secure access to acontinuous supply of energy. See “Business — Energy Supply — Security of Power Supply”.
In the Russian Federation, energy prices are prescribed by regulations of the federal and localauthorities on an annual basis. The Russian Government controls hydro and nuclear power generation,and regulates tariffs through the FST. Reforms of the state electricity system began in the mid-1990s,when the electricity market was divided into the national wholesale market, organised by price zones,and the local retail market. The national wholesale market was further divided into two segments, oneregulated by the FST with the remaining being a free market segment characterised by online tradingand significant price fluctuations. The local retail markets have been fully controlled by the regionalenergy commissions, who have tariff-setting authority based on the FST benchmark tariffs.
In April 2007, the Russian Government established guidelines for the share of electricityproduction volumes to be supplied on the wholesale market under regulated tariffs during the periodfrom 1 January 2007 to 31 December 2010. That share is from 45% to 50% during the period of 1 Julyto 31 December 2009 and is expected to gradually decrease to 15% to 20% by 1 July 2010. Beginningon 1 January 2011, all electricity production volumes are expected to be supplied to industrial usersunder free market prices. Once deregulation has occurred, electricity tariffs for industrial users areexpected to rise as a result of electricity price liberalisation and demand growth.
Subsidiaries of the Group, namely Bratsk aluminium smelter, Krasnoyarsk aluminium smelter,Sayanogorsk aluminium smelter, Novokuznetsk aluminium smelter and SUAL enter into, from time totime as part of their ordinary course of business, short-term electricity and capacity supply contractswith Irkutskenergo and Krasnoyarskaya HPP, companies controlled by En+. En+ is the controllingshareholder of the Company. Accordingly, the short-term electricity and capacity supply contractsbetween Irkutskenergo and members of the Group or Krasnoyarskaya HPP and members of the Groupwill constitute continuing connected transactions for the Company under the Listing Rules after theListing Date.
The electricity and capacity supplied under these short-term electricity and capacity supplycontracts are derived from hydro-electric power plants operated by Irkutskenergo and KrasnoyarskayaHPP in Siberia. Approximately 50% of the electricity supplied by Irkutskenergo is provided at a fixedprice prescribed by the Russian Government with the remaining 50% supplied at market prices. Withrespect to the portion pegged to market prices, it is supplied in accordance with the Regulations onTransitional Wholesale Electric Power (Capacity) Market approved by the Russian Government, theWholesale Power Trade System Accession Agreement (the “Accession Agreement”) and related rulesand regulations. Such contracts are entered on an arm’s length basis on pricing terms approved by theNon-Commercial Partnership Market Council (the “Market Council”), an independent industry bodywhich is responsible for making any amendments to the Accession Agreement or the market rules andregulations. With respect to the portion prescribed by the Russian Government, it is supplied at a fixedprice based on tariffs set by the Russian Government through the FST. In accordance with theguidelines established by the Russian Government for the share of electricity production to besupplied under regulated tariffs, this portion is expected to decrease gradually until 31 December2010, and from 1 January 2011, all electricity supplied to the Company will be supplied at free marketprices. Accordingly, at present, the parties have limited scope for negotiation of the pricing of shortterm electricity supply contracts.
CONNECTED TRANSACTIONS
— 305 —
The Company expects that these short-term contracts will be replaced upon their expiry by thelong-term electricity capacity contracts below. See also “Business — Energy Supply — Security ofPower Supply”.
(a) On 1 December 2009, Bratsk aluminum smelter, a subsidiary of the Company, andIrkutskenergo, a power generating company owned by En+, entered into a long-termelectricity and capacity supply contract pursuant to which Bratsk aluminium smelter hasagreed to purchase electricity and capacity from Irkutskenergo for a period of nine yearsfrom 2010 to 2018.
(b) On 15 November 2009, SUAL, a subsidiary of the Company, and Irkutskenergo entered intoa long-term electricity and capacity supply contract pursuant to which SUAL has agreed topurchase electricity and capacity for Irkutsk aluminium smelter, a branch of SUAL, fromIrkutskenergo for a period of nine years from 2010 to 2018.
(c) On 4 December 2009, Krasnoyarsk aluminum smelter, a subsidiary of the Company, andKrasnoyarskaya HPP, a hydroelectric power station controlled by En+ entered into along-term electricity and capacity supply contract pursuant to which Krasnoyarskaluminium smelter has agreed to purchase electricity from Krasnoyarskaya HPP for a periodof 11 years from 2010 to 2020.
En+ is the controlling shareholder of the Company. Accordingly, the electricity and capacitysupply contracts between members of the Group and Irkutskenergo and Krasnoyarskaya HPP willconstitute continuing connected transactions for the Company under the Listing Rules after the ListingDate.
The electricity and capacity supplied under these electricity and capacity supply contracts arederived from hydro-electric power plants operated by En+ in Siberia and is related only to the portionof the electricity supply that is not subject to government regulated pricing. It is estimated that eachof Bratsk, Krasnoyarsk and Irkutsk aluminium smelters will purchase approximately 60% of itselectricity requirements from the power companies operated by En+ in the first half of 2010, whichwill increase to approximately 80% in the second half of 2010, and further increase to 100% of itsrequirements from 2011 onwards. During 2010, each of the Bratsk, Krasnoyarsk and Irkutskaluminium smelters will satisfy the balance of its electricity demand with power to be supplied fromthe open market.
The prices for the long-term electricity and capacity contracts are not regulated strictly by theMarket Council and the electricity supplied by Irkutskenergo and Krasnoyarskaya HPP are based ona fixed formula which is tied to the market prices of electricity and the prices of aluminium quotedon the LME to link electricity costs to the Group’s revenue. See “Business — Energy Supply —Security of Power Supply — Electricity tariffs of the Group’s aluminium smelters”. In addition, thetariff for Bratsk aluminium smelter and Irkutsk aluminium smelter is also affected by changes inpower generating costs at the supplier company. Electricity under these long-term electricity andcapacity supply contracts is therefore supplied at the contract price rather than the market price.Depending on the prices of aluminium on the LME and the market prices of electricity, the prices ofthe electricity supplied by Irkutskenergo and Krasnoyarskaya HPP may be adjusted.
In each of the four years from 2005 through and including 2008, Krasnoyarskaya HPP has hadan availability ratio of 100%, and Irkutskenergo has had an availability ratio of 93-94%, whereavailability ratio is defined as the percentage of time during which the plant is actually operationaland able to produce electricity to supply the smelters of the Group. The Group’s long-term electricitysupply contracts with Irkutskenergo and Krasnoyarskaya HPP provide for the suppliers to deliverspecified maximum quantities of electricity, and to make available specified maximum capacities, foreach year during the term of the contracts. The parties to the contracts have mutual obligations todeliver and purchase, respectively, electricity and capacity in amounts as close as possible to the
CONNECTED TRANSACTIONS
— 306 —
specified maximum amounts. The specified amounts are those that the Company believes it will needfor the operations of the relevant smelters during the term of the contracts. Based on past experiencewith Irkutskenergo and Krasnoyarskaya HPP, the Company believes that these suppliers will be ableto deliver and make available the required quantities of electricity and capacity during the term of thecontracts.
The Company considers that the long-term electricity and capacity supply contracts will helpsecure a stable source of supply of electricity and capacity for the aluminium smelters of the Companyand reduce unpredictability in price movements amidst the deregulating electricity supply market inRussia. Linking the electricity cost to the price of its products also tends to reduce the effect ofvolatility in the market price of aluminium on the Group’s margins. The Directors are of the view thatthe terms of the long-term electricity and capacity supply contracts are fair and reasonable, conductedunder normal commercial terms and are generally in the interest of the Company and its shareholdersas a whole and are of the view that it is common practice for companies in the metals and miningindustry to enter into energy supply contracts of similar duration to ensure uninterrupted production.
In addition to the long-term contracts, the Company also enters into short-term electricity andcapacity supply contracts with power generating plants which are controlled either through equityownership or management arrangements, by CJSC Integrated Energy Systems (IES), which in turn iscontrolled by one of the ultimate beneficial owners of SUAL Partners, a substantial shareholder of theCompany. All such contracts are entered into at government prescribed prices, on terms determinedby the Market Council and JSC “TSA”, an entity controlled by the Market Council, a non-profitpartnership that regulates the electricity market in Russia, with no negotiation possible of the pricepaid by the Company.
Owing to the nature of the Group’s business these contracts are typically signed for short periodsof time, each with terms of either six months or one year, on a rolling basis. If the Company had tocomply strictly with Chapter 14A with respect to each of these contracts, the Company would berequired to make regular disclosure of each electricity and capacity supply contract entered into,engage independent financial advisers to consider their terms and obtain the prior approval ofindependent shareholders for such contracts prior to entering into them. Further, it would have tospend each year convening multiple meetings and incurring unjustifiable costs.
Because short-term electricity and capacity supply contracts will account for more than 40% ofthe Group’s electricity demand and all such contracts would be transacted at market prices or at thegovernment-prescribed price and the terms of supply are based on standard terms for the supply ofelectricity and capacity in Russia, strict compliance with the reporting, announcement andindependent Shareholders’ approval requirements for each of the contracts would result in unnecessaryexpense and inconvenience placed on the Company and would not provide any substantial additionalprotection for the public Shareholders.
Historical transaction record
For the three years ended 31 December 2006, 2007 and 2008 and the six months ended 30 June2009, the sum paid by the Company to power generating companies under En+ was approximatelyUS$199 million, US$281 million, US$389 million and US$225 million, respectively. Changes in thesums paid by the Company to power generating companies during the three years ended 31 December2006, 2007 and 2008 and the six months ended 30 June 2009 were primarily due to changes inelectricity prices and volumes of electricity supplied. The changes in volume of electricity appliedwere mainly driven by changes in the volumes of production of the Group’s aluminium smelters,which were reduced in the second half of 2008 and the first six months of 2009 in response to thevolatile global macroeconomic environment during that period.
CONNECTED TRANSACTIONS
— 307 —
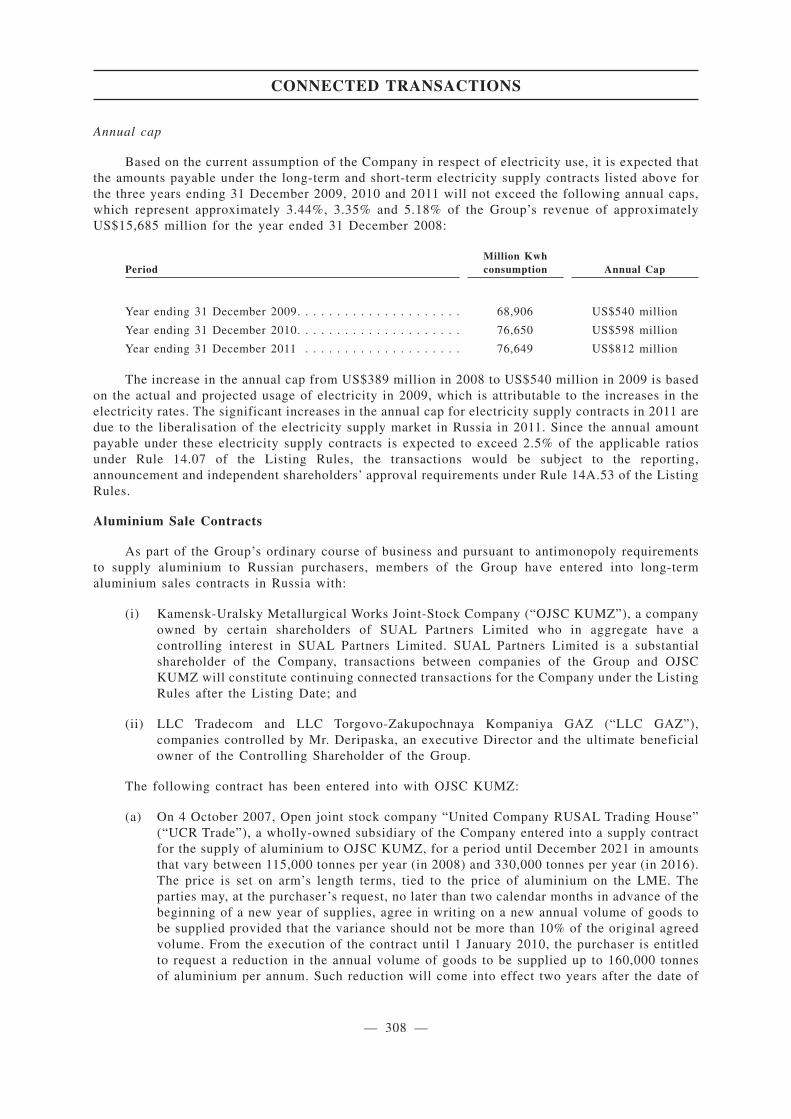
Annual cap
Based on the current assumption of the Company in respect of electricity use, it is expected thatthe amounts payable under the long-term and short-term electricity supply contracts listed above forthe three years ending 31 December 2009, 2010 and 2011 will not exceed the following annual caps,which represent approximately 3.44%, 3.35% and 5.18% of the Group’s revenue of approximatelyUS$15,685 million for the year ended 31 December 2008:
PeriodMillion Kwhconsumption Annual Cap
Year ending 31 December 2009. . . . . . . . . . . . . . . . . . . . . 68,906 US$540 million
Year ending 31 December 2010. . . . . . . . . . . . . . . . . . . . . 76,650 US$598 million
Year ending 31 December 2011 . . . . . . . . . . . . . . . . . . . . 76,649 US$812 million
The increase in the annual cap from US$389 million in 2008 to US$540 million in 2009 is basedon the actual and projected usage of electricity in 2009, which is attributable to the increases in theelectricity rates. The significant increases in the annual cap for electricity supply contracts in 2011 aredue to the liberalisation of the electricity supply market in Russia in 2011. Since the annual amountpayable under these electricity supply contracts is expected to exceed 2.5% of the applicable ratiosunder Rule 14.07 of the Listing Rules, the transactions would be subject to the reporting,announcement and independent shareholders’ approval requirements under Rule 14A.53 of the ListingRules.
Aluminium Sale Contracts
As part of the Group’s ordinary course of business and pursuant to antimonopoly requirementsto supply aluminium to Russian purchasers, members of the Group have entered into long-termaluminium sales contracts in Russia with:
(i) Kamensk-Uralsky Metallurgical Works Joint-Stock Company (“OJSC KUMZ”), a companyowned by certain shareholders of SUAL Partners Limited who in aggregate have acontrolling interest in SUAL Partners Limited. SUAL Partners Limited is a substantialshareholder of the Company, transactions between companies of the Group and OJSCKUMZ will constitute continuing connected transactions for the Company under the ListingRules after the Listing Date; and
(ii) LLC Tradecom and LLC Torgovo-Zakupochnaya Kompaniya GAZ (“LLC GAZ”),companies controlled by Mr. Deripaska, an executive Director and the ultimate beneficialowner of the Controlling Shareholder of the Group.
The following contract has been entered into with OJSC KUMZ:
(a) On 4 October 2007, Open joint stock company “United Company RUSAL Trading House”(“UCR Trade”), a wholly-owned subsidiary of the Company entered into a supply contractfor the supply of aluminium to OJSC KUMZ, for a period until December 2021 in amountsthat vary between 115,000 tonnes per year (in 2008) and 330,000 tonnes per year (in 2016).The price is set on arm’s length terms, tied to the price of aluminium on the LME. Theparties may, at the purchaser’s request, no later than two calendar months in advance of thebeginning of a new year of supplies, agree in writing on a new annual volume of goods tobe supplied provided that the variance should not be more than 10% of the original agreedvolume. From the execution of the contract until 1 January 2010, the purchaser is entitledto request a reduction in the annual volume of goods to be supplied up to 160,000 tonnesof aluminium per annum. Such reduction will come into effect two years after the date of
CONNECTED TRANSACTIONS
— 308 —
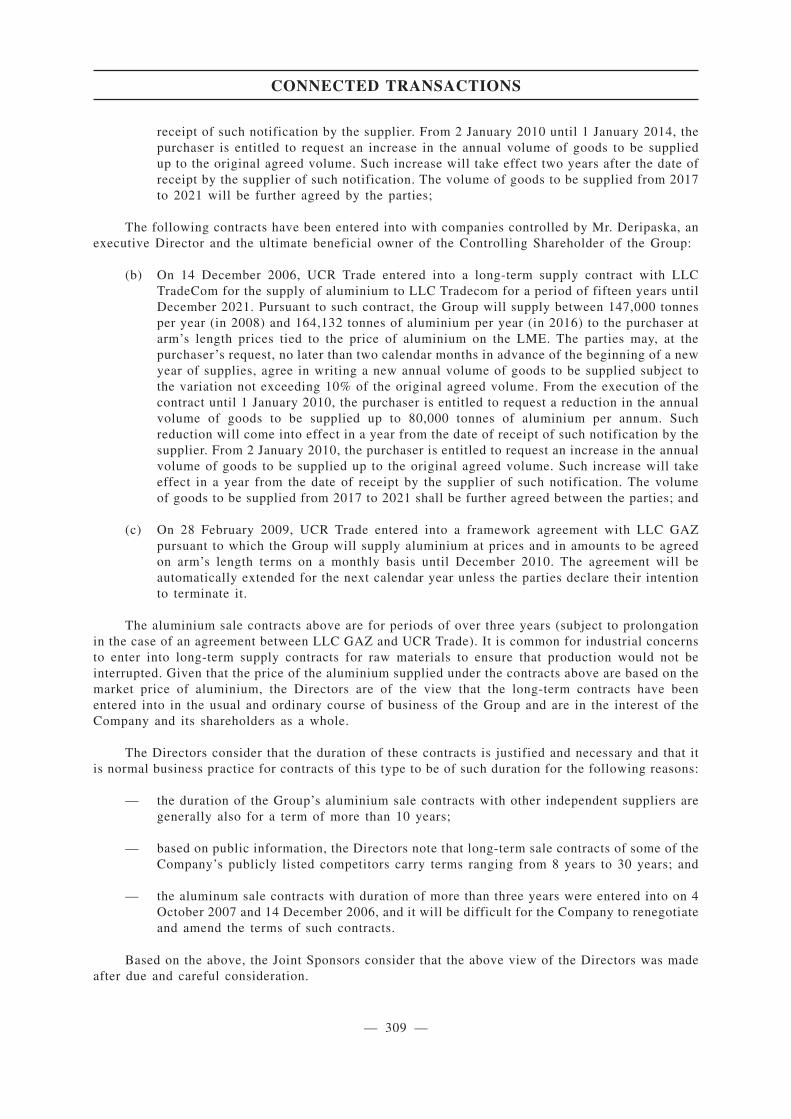
receipt of such notification by the supplier. From 2 January 2010 until 1 January 2014, thepurchaser is entitled to request an increase in the annual volume of goods to be suppliedup to the original agreed volume. Such increase will take effect two years after the date ofreceipt by the supplier of such notification. The volume of goods to be supplied from 2017to 2021 will be further agreed by the parties;
The following contracts have been entered into with companies controlled by Mr. Deripaska, anexecutive Director and the ultimate beneficial owner of the Controlling Shareholder of the Group:
(b) On 14 December 2006, UCR Trade entered into a long-term supply contract with LLCTradeCom for the supply of aluminium to LLC Tradecom for a period of fifteen years untilDecember 2021. Pursuant to such contract, the Group will supply between 147,000 tonnesper year (in 2008) and 164,132 tonnes of aluminium per year (in 2016) to the purchaser atarm’s length prices tied to the price of aluminium on the LME. The parties may, at thepurchaser’s request, no later than two calendar months in advance of the beginning of a newyear of supplies, agree in writing a new annual volume of goods to be supplied subject tothe variation not exceeding 10% of the original agreed volume. From the execution of thecontract until 1 January 2010, the purchaser is entitled to request a reduction in the annualvolume of goods to be supplied up to 80,000 tonnes of aluminium per annum. Suchreduction will come into effect in a year from the date of receipt of such notification by thesupplier. From 2 January 2010, the purchaser is entitled to request an increase in the annualvolume of goods to be supplied up to the original agreed volume. Such increase will takeeffect in a year from the date of receipt by the supplier of such notification. The volumeof goods to be supplied from 2017 to 2021 shall be further agreed between the parties; and
(c) On 28 February 2009, UCR Trade entered into a framework agreement with LLC GAZpursuant to which the Group will supply aluminium at prices and in amounts to be agreedon arm’s length terms on a monthly basis until December 2010. The agreement will beautomatically extended for the next calendar year unless the parties declare their intentionto terminate it.
The aluminium sale contracts above are for periods of over three years (subject to prolongationin the case of an agreement between LLC GAZ and UCR Trade). It is common for industrial concernsto enter into long-term supply contracts for raw materials to ensure that production would not beinterrupted. Given that the price of the aluminium supplied under the contracts above are based on themarket price of aluminium, the Directors are of the view that the long-term contracts have beenentered into in the usual and ordinary course of business of the Group and are in the interest of theCompany and its shareholders as a whole.
The Directors consider that the duration of these contracts is justified and necessary and that itis normal business practice for contracts of this type to be of such duration for the following reasons:
— the duration of the Group’s aluminium sale contracts with other independent suppliers aregenerally also for a term of more than 10 years;
— based on public information, the Directors note that long-term sale contracts of some of theCompany’s publicly listed competitors carry terms ranging from 8 years to 30 years; and
— the aluminum sale contracts with duration of more than three years were entered into on 4October 2007 and 14 December 2006, and it will be difficult for the Company to renegotiateand amend the terms of such contracts.
Based on the above, the Joint Sponsors consider that the above view of the Directors was madeafter due and careful consideration.
CONNECTED TRANSACTIONS
— 309 —
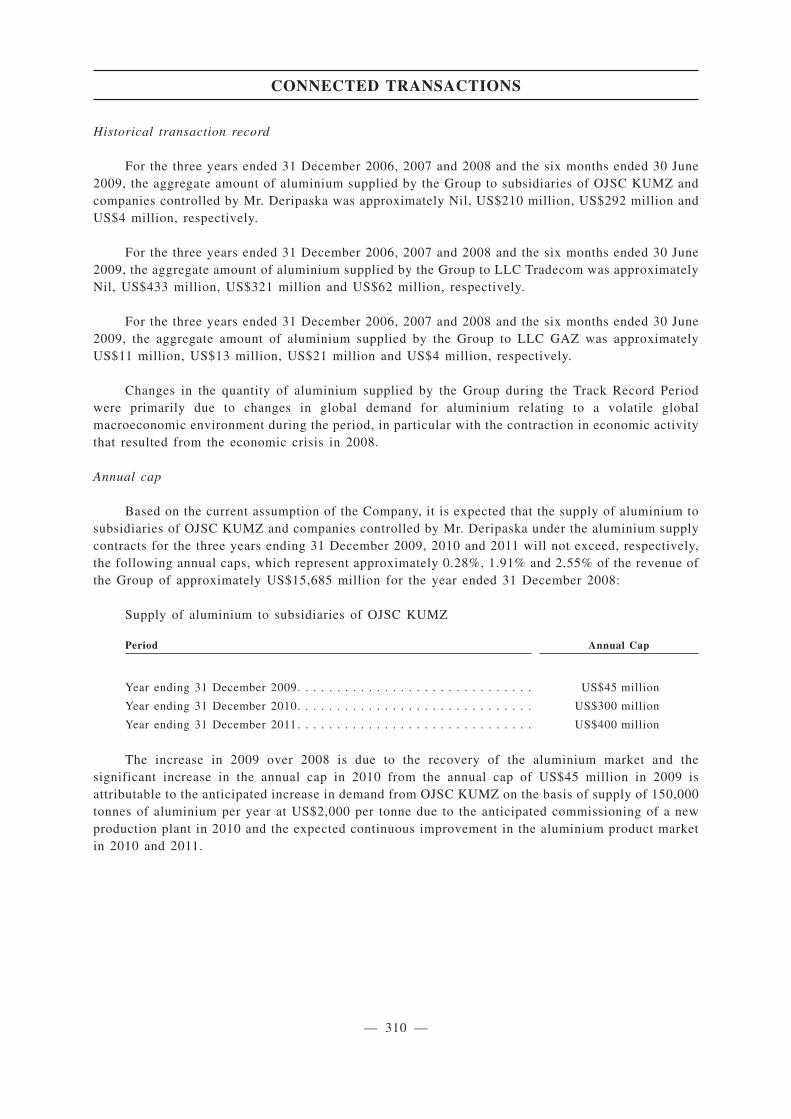
Historical transaction record
For the three years ended 31 December 2006, 2007 and 2008 and the six months ended 30 June2009, the aggregate amount of aluminium supplied by the Group to subsidiaries of OJSC KUMZ andcompanies controlled by Mr. Deripaska was approximately Nil, US$210 million, US$292 million andUS$4 million, respectively.
For the three years ended 31 December 2006, 2007 and 2008 and the six months ended 30 June2009, the aggregate amount of aluminium supplied by the Group to LLC Tradecom was approximatelyNil, US$433 million, US$321 million and US$62 million, respectively.
For the three years ended 31 December 2006, 2007 and 2008 and the six months ended 30 June2009, the aggregate amount of aluminium supplied by the Group to LLC GAZ was approximatelyUS$11 million, US$13 million, US$21 million and US$4 million, respectively.
Changes in the quantity of aluminium supplied by the Group during the Track Record Periodwere primarily due to changes in global demand for aluminium relating to a volatile globalmacroeconomic environment during the period, in particular with the contraction in economic activitythat resulted from the economic crisis in 2008.
Annual cap
Based on the current assumption of the Company, it is expected that the supply of aluminium tosubsidiaries of OJSC KUMZ and companies controlled by Mr. Deripaska under the aluminium supplycontracts for the three years ending 31 December 2009, 2010 and 2011 will not exceed, respectively,the following annual caps, which represent approximately 0.28%, 1.91% and 2.55% of the revenue ofthe Group of approximately US$15,685 million for the year ended 31 December 2008:
Supply of aluminium to subsidiaries of OJSC KUMZ
Period Annual Cap
Year ending 31 December 2009. . . . . . . . . . . . . . . . . . . . . . . . . . . . . . US$45 million
Year ending 31 December 2010. . . . . . . . . . . . . . . . . . . . . . . . . . . . . . US$300 million
Year ending 31 December 2011. . . . . . . . . . . . . . . . . . . . . . . . . . . . . . US$400 million
The increase in 2009 over 2008 is due to the recovery of the aluminium market and thesignificant increase in the annual cap in 2010 from the annual cap of US$45 million in 2009 isattributable to the anticipated increase in demand from OJSC KUMZ on the basis of supply of 150,000tonnes of aluminium per year at US$2,000 per tonne due to the anticipated commissioning of a newproduction plant in 2010 and the expected continuous improvement in the aluminium product marketin 2010 and 2011.
CONNECTED TRANSACTIONS
— 310 —
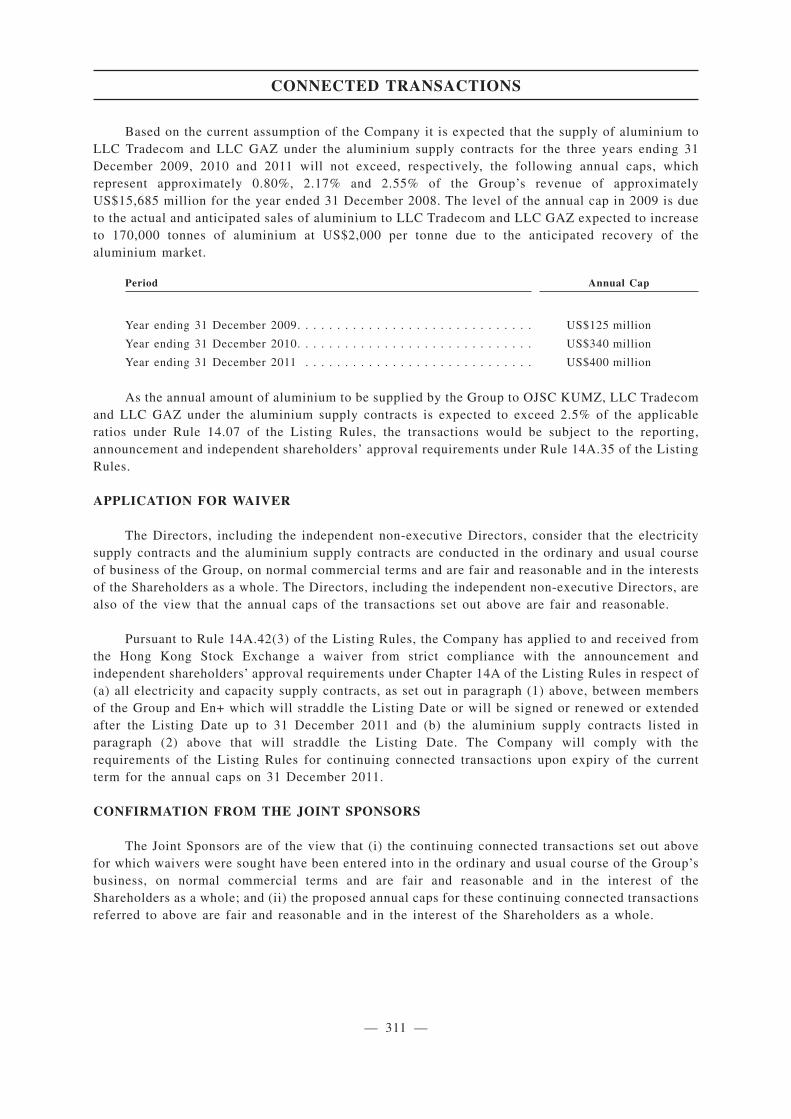
Based on the current assumption of the Company it is expected that the supply of aluminium toLLC Tradecom and LLC GAZ under the aluminium supply contracts for the three years ending 31December 2009, 2010 and 2011 will not exceed, respectively, the following annual caps, whichrepresent approximately 0.80%, 2.17% and 2.55% of the Group’s revenue of approximatelyUS$15,685 million for the year ended 31 December 2008. The level of the annual cap in 2009 is dueto the actual and anticipated sales of aluminium to LLC Tradecom and LLC GAZ expected to increaseto 170,000 tonnes of aluminium at US$2,000 per tonne due to the anticipated recovery of thealuminium market.
Period Annual Cap
Year ending 31 December 2009. . . . . . . . . . . . . . . . . . . . . . . . . . . . . . US$125 million
Year ending 31 December 2010. . . . . . . . . . . . . . . . . . . . . . . . . . . . . . US$340 million
Year ending 31 December 2011 . . . . . . . . . . . . . . . . . . . . . . . . . . . . . US$400 million
As the annual amount of aluminium to be supplied by the Group to OJSC KUMZ, LLC Tradecomand LLC GAZ under the aluminium supply contracts is expected to exceed 2.5% of the applicableratios under Rule 14.07 of the Listing Rules, the transactions would be subject to the reporting,announcement and independent shareholders’ approval requirements under Rule 14A.35 of the ListingRules.
APPLICATION FOR WAIVER
The Directors, including the independent non-executive Directors, consider that the electricitysupply contracts and the aluminium supply contracts are conducted in the ordinary and usual courseof business of the Group, on normal commercial terms and are fair and reasonable and in the interestsof the Shareholders as a whole. The Directors, including the independent non-executive Directors, arealso of the view that the annual caps of the transactions set out above are fair and reasonable.
Pursuant to Rule 14A.42(3) of the Listing Rules, the Company has applied to and received fromthe Hong Kong Stock Exchange a waiver from strict compliance with the announcement andindependent shareholders’ approval requirements under Chapter 14A of the Listing Rules in respect of(a) all electricity and capacity supply contracts, as set out in paragraph (1) above, between membersof the Group and En+ which will straddle the Listing Date or will be signed or renewed or extendedafter the Listing Date up to 31 December 2011 and (b) the aluminium supply contracts listed inparagraph (2) above that will straddle the Listing Date. The Company will comply with therequirements of the Listing Rules for continuing connected transactions upon expiry of the currentterm for the annual caps on 31 December 2011.
CONFIRMATION FROM THE JOINT SPONSORS
The Joint Sponsors are of the view that (i) the continuing connected transactions set out abovefor which waivers were sought have been entered into in the ordinary and usual course of the Group’sbusiness, on normal commercial terms and are fair and reasonable and in the interest of theShareholders as a whole; and (ii) the proposed annual caps for these continuing connected transactionsreferred to above are fair and reasonable and in the interest of the Shareholders as a whole.
CONNECTED TRANSACTIONS
— 311 —

The following is a description of the authorised and issued share capital of the Company as atthe date of this prospectus and immediately after completion of the Global Offering (but prior to theexercise of the Over-allotment Option):
As at the date of this prospectus US$
Authorised share capital:
1,350,000 Shares of US$0.01 each 13,500
Issued share capital:
1,237,000 Shares of US$0.01 each 12,370
Immediately after completion of the Global Offering(1) US$
Authorised share capital:
20,000,000,000 Shares of US$0.01 each 200,000,000
Issued share capital (after Capitalisation Issue):
13,500,000,000 Shares of US$0.01 each 135,000,000
Issued share capital (after Capitalisation Issue and conversion of feewarrants):
13,526,070,806 135,260,708.06
Issue of Shares as part of the Global Offering:
1,610,292,840 Shares of US$0.01 each 16,102,928.40(1)
Total issued Shares on completion of the Global Offering:
15,136,363,646 Shares of US$0.01 each 151,363,636.46(1)
Note
(1) Excludes such number of bonus Shares as may be issued to the management of the Company. See “Directors and SeniorManagement — Future Compensation of Directors and Senior Management”.
(2) Includes shares to be sold in the form of GDSs in the International Placing. The GDSs are to be issued by The Bank ofNew York, Mellon, as depositary, pursuant to a deposit agreement to be entered into between the Company and theDepositary. Each GDS will represent 20 Shares. Pursuant to the Deposit Agreement, the Shares represented by the GDSswill be held with the custodian, for the benefit of the Depositary. The custodian will be the registered holder of suchShares in the share register of the Company. The number of GDSs to be sold in the International Placing will bedetermined by the Joint Global Coordinators following pricing of the Global Offering.
SHARE CAPITAL
— 312 —
App1A-23(1)3rd Sch-2
App1A-15(1)App1A-23(1)
ASSUMPTIONS
The tables above assume the Global Offering becomes unconditional and is completed inaccordance with the relevant terms and conditions. It takes no account of (a) any of the new Shareswhich may be issued upon the exercise of the Over-allotment Option; (b) any Shares which may beissued under the general mandate given to our Directors for the issue and allotment of Shares; or (c)any Shares which may be repurchased by us pursuant to the general mandate given to our Directorsfor the repurchase of Shares.
Fee warrants entitling the Group’s restructuring lenders to 1% of the Company’s fully dilutedshare capital were issued in connection with its debt restructuring arrangements. Lenders may requirethe Company to settle the fee warrants fully in cash in lieu of Shares. Otherwise, warrants will beautomatically converted into Shares on the date of the Global Offering, subject to lock-uparrangements. See “Financial Information — Management’s Discussion and Analysis of FinancialCondition and Results of Operations — Liquidity and Capital Resources — Debt Restructuring —Terms of International Debt Restructuring — Warrants”. Immediately following completion of theGlobal Offering, assuming the Over-allotment Option is not exercised and no bonus Shares are issuedto management, En+ would hold 47.59%, SUAL Partners would hold 15.86%, Amokenga Holdingswould hold 8.65%, Onexim would hold 17.09% and the public would hold 10.81% (of which, VEBwould hold 3.15% and the international lenders would hold 0.17% of the issued share capital of theCompany. For information about a claim that could affect the size of En+’s interest in the Company,see “Risk Factors — Risks relating to the Group and its Business — A certain claim against thebeneficial owner of En+ could have a material adverse effect on the Company and/or the trading priceof its Shares”, “Substantial Shareholders — Litigation Involving Certain Beneficial Owners —Litigation Involving Mr. Deripaska” and Appendix X to this prospectus.
RANKING
The Offer Shares are ordinary shares in the share capital of the Company and rank equally withall Shares currently in issue or to be issued and, in particular, will rank in full for all dividends or otherdistributions declared, made or paid on the Shares in respect of a record date which falls after the dateof this prospectus.
GENERAL MANDATE TO ISSUE SHARES
Subject to the conditions stated in the section headed “Structure of the Global Offering —Conditions of the Global Offering”, our Directors have been granted a general unconditional mandateto allot, issue and deal with Shares (otherwise than pursuant to, or in consequence of, the GlobalOffering, a rights issue or the exercise of any subscription rights under any scrip dividend scheme orsimilar arrangements, or any adjustment of rights to subscribe for Shares under options and warrantsor a special authority granted by our shareholders) with an aggregate nominal value of not more thanthe sum of:
(a) 20% of the aggregate nominal value of the share capital of the Company in issueimmediately following completion of the Global Offering; and
(b) the aggregate nominal value of the share capital of the Company repurchased by theCompany (if any) under the general mandate to repurchase Shares referred to below.
This general mandate to issue Shares will remain in effect until:
(a) the conclusion of the Company’s next annual general meeting of shareholders;
(b) the expiration of the period within which the Company’s next annual general meeting ofshareholders is required by any applicable law or our Articles of Association to be held; or
SHARE CAPITAL
— 313 —
App1A-25(2)3rd Sch-20
(c) it is varied or revoked by an ordinary resolution of our shareholders in general meeting ofshareholders, whichever is the earliest.
GENERAL MANDATE TO REPURCHASE SHARES
Subject to the conditions stated in the section headed “Structure of the Global Offering —Conditions of the Global Offering” and subject to the requirements of the Jersey Companies Law, ourDirectors have been granted a general unconditional mandate to exercise all our powers to repurchaseShares (Shares which may be listed on the Hong Kong Stock Exchange or on any other stock exchangeand Shares which are recognised by the Securities and Futures Commission and the Hong Kong StockExchange for this purpose) with a total nominal value of not more than 10% of the aggregate nominalvalue of the Company’s share capital in issue immediately following completion of the GlobalOffering.
This mandate only relates to repurchases made on the Hong Kong Stock Exchange, or on anyother stock exchange on which our Shares are listed (and which is recognised by the Securities andFutures Commission and the Hong Kong Stock Exchange for this purpose), and made in accordancewith all applicable laws and the requirements of the Listing Rules. A summary of the relevant ListingRules is set out in the section headed “Repurchase of the Company’s own Shares” in Appendix VIII.
The general mandate to repurchase Shares will remain in effect until the earliest of:
(a) the conclusion of the Company’s next annual general meeting of shareholders;
(b) the expiration of the period within which the Company’s next annual general meeting ofshareholders is required by any applicable law or our Articles of Association to be held; or
(c) it is varied or revoked by a special resolution of the Company’s shareholders in generalmeeting of shareholders.
PUBLIC FLOAT REQUIREMENTS
Rule 8.08(1)(a) of the Listing Rules requires that at least 25.0% of the issuer’s total issued sharecapital must at all times be held by the public. The Company has applied to the Hong Kong StockExchange to request the Hong Kong Stock Exchange to exercise, and the Hong Kong Stock Exchangehas confirmed that it will exercise, its discretion under the Listing Rules to grant the Company awaiver from strict compliance with Rule 8.08(1)(a) of the Listing Rules and to accept a lower publicfloat percentage of our Company of the higher of: (1) 10% of the Company’s Shares, and (ii) thepercentage of public shareholding that equals HK$6 billion at the Listing Date, as the minimumpercentage of public float of the Company. The above discretion is subject to the condition that theCompany will make appropriate disclosure of the lower prescribed percentage of public float in thisprospectus and confirm sufficiency of above-mentioned public float in its successive annual reportsafter the listing.
The Company shall maintain a list of the directors, chief executive and substantial shareholdersof the Company and their respective associates and their respective shareholdings in the Company,which shall be updated on a regular basis. The Company shall review the list regularly to ensure thatthe percentage of total issued Shares held in public hands will be no less than the minimum percentageof public float prescribed by the Hong Kong Stock Exchange. In the event that the public floatpercentage falls below the minimum percentage prescribed by the Hong Kong Stock Exchange, theDirectors and the controlling shareholder will take appropriate steps which include a further issue ofequity and/or the substantial shareholders of the Company placing some of their Shares to independentthird parties, to ensure the minimum percentage of public float prescribed by the Hong Kong StockExchange is complied with. If the lowest prescribed percentage of the public float is not maintainedthen the Hong Kong Stock Exchange may, pursuant to Rule 8.08 of the Listing Rules, suspend tradingof the Shares until appropriate steps have been taken.
SHARE CAPITAL
— 314 —

FUTURE PLANS
See the section headed “Business — Strengths and Strategies” for a detailed description of ourfuture plans.
USE OF PROCEEDS
We estimate that we will receive net proceeds from the Global Offering of approximatelyHK$16,790 million (assuming an Offer Price of HK$10.80 per Share, being the mid-point of theestimated Offer Price range), after deducting the underwriting fees and commissions and estimatedexpenses payable by us in relation to the Global Offering.
We intend to use all of the net proceeds we will receive from the Global Offering to reduceoutstanding debt and to satisfy other obligations to its creditors (which include the settlement of feewarrants exercised for cash and a specified payment to Onexim) pursuant to the terms of our debtrestructuring agreements.
To the extent that the net proceeds of the Global Offering are not immediately used for thepurposes described above they will be placed in short term demand deposits and/or money marketinstruments.
FUTURE PLANS AND USE OF PROCEEDS
— 315 —
App1A-28(8)
App1A-483rd Sch7
App1A-17

THE CORNERSTONE PLACING
The Cornerstone Placing
In December 2009, as part of the International Placing, the Company entered into placingagreements with certain cornerstone investors (the “Cornerstone Investors”) who have agreed tosubscribe Offer Shares (both in the form of Shares and in the form of Global Depositary Shares) atthe Offer Price. Assuming a mid-point Offer Price of HK$10.80, the total number of Offer Shares (bothin the form of Shares and in the form of Global Depositary Shares) subscribed by the CornerstoneInvestors would be approximately 635,071,480 Offer Shares, which represent approximately (i) 4.20%of the Shares issued and outstanding upon completion of the Global Offering, and (ii) 39.44% of theOffer Shares (both in the form of Shares and in the form of Global Depositary Shares), in each case,assuming that the Over-allotment Option is not exercised and no bonus Shares are issued to themanagement of the Company.
None of the Cornerstone Investors are related to each other and are independent third partiesvis-à-vis the Company, the Directors and/or their associates and not a connected person as definedunder the Listing Rules. None of the Cornerstone Investors will subscribe for any Offer Shares (bothin the form of Shares and in the form of Global Depositary Shares) under the Global Offering otherthan pursuant to the relevant cornerstone placing agreement. Immediately following the completion ofthe Global Offering, save for the existing Board membership of Mr. Anatoly Tikhonov, arepresentative of VEB appointed as a Director prior to the Company’s submission of the listingapplication, no Cornerstone Investor will have any board representation in our Company, nor will anyCornerstone Investor become our substantial shareholder. The Offer Shares (both in the form of Sharesand in the form of Global Depositary Shares) to be subscribed by the Cornerstone Investors will rankpari passu in all respects respectively with the fully paid Shares in issue and the Global DepositaryShares to be issued in the Global Offering, and the Offer Shares to be subscribed by the CornerstoneInvestors will be counted towards the public float of the Company.
The Cornerstone Investors
A brief description of the Cornerstone Investors is as follows:
Vnesheconombank (A State Corporation “The Bank for Development and Foreign EconomicAffairs (Vnesheconombank)”, “VEB”) was established in the Russian Federation. On 17 May 2007,then Russian President Vladimir Putin signed the Federal Law N82-FZ “On Bank for Development.”On 8 June 2007, VEB was registered in the Unified State Register of Legal Entities. VEB is one ofthe key instruments of the government investment policy. The major areas of VEB’s investmentactivity are the implementation of investment projects aimed at removing infrastructure restrictionsimpeding economic growth, fostering innovations, enhancing the efficiency of natural resourcesutilization, improving ecological situation, developing small- and medium-sized enterprises, and alsoproviding support for exports of industrial products and services.
VEB has agreed to subscribe for 477,090,000 Offer Shares (in the form of Shares) at the OfferPrice.
NR Investments Limited (“NR Investments”) is the principal investment vehicle of theHonourable Nathaniel Rothschild. It is independent of and not connected with N M Rothschild & SonsLimited, the financial adviser to the Company. NR Investments holds both private and publicinvestments in a wide range of assets and jurisdictions.
NR Investments has agreed to subscribe for (i) such number of Offer Shares (in the form ofShares) (rounded down to the nearest board lot) as may be purchased with the Hong Kong dollarequivalent of US$50 million at the Offer Price and such number of Global Depositary Receipts(rounded down to the nearest whole number of Global Depositary Receipts) as may be purchased with
THE CORNERSTONE PLACING
— 316 —

US$50 million at the Offer Price; or (ii) if the Global Depositary Receipts are not listed on theProfessional Segment of Euronext Paris on the Listing Date, such number of International PlacingShares (in the form of Shares) (rounded down to the nearest board lot) as may be purchased with theHong Kong dollar equivalent of US$100 million at the Offer Price. The Hong Kong dollar equivalentshall be determined based on the closing middle point spot rate quoted by The Hong Kong andShanghai Banking Corporation Limited for US dollars at the close of business in Hong Kong on theday on which the Offer Price is determined (or next following business day if such day is not abusiness day). NR Investments is committed to acquire the Offer Shares (in the form of Shares andthe Global Depositary Receipts) between the estimated Offer Price range of HK$9.10 and HK$12.50as stated in this prospectus. Assuming a mid-point Offer Price of HK$10.80 per Offer Share, NRInvestments will purchase 71,851,851 Offer Shares (both in the form of Shares and in the form ofGlobal Depositary Shares), representing approximately 4.46% of the total Shares and GlobalDepositary Shares initially available under the International Placing and approximately 0.47% of theissued share capital (both in the form of Shares and in the form of Global Depositary Shares) of theCompany upon completion of the Global Offering (if the Over-allotment Option is not exercised andno bonus Shares are issued to the management of the Company).
Paulson & Co. Inc. (“Paulson”) is a privately owned fund manager that is based in New Yorkand has been registered with the U.S. Securities and Exchange Commission as an investment advisorsince 2004. Funds and separate accounts managed by Paulson & Co. Inc. have assets undermanagement in excess of US$30 billion as of 1 December 2009. The firm manages funds withevent-driven strategies, focusing on securities of companies involved in corporate events such asmergers, restructurings and bankruptcies. The sole shareholder of the firm is John Paulson.
Other than in connection with the investment that is the subject of the cornerstone placingagreement, Paulson & Co. Inc. and funds and accounts managed by it have no relationship to, orbusiness dealings with, the Company.
Paulson has agreed, on behalf of the funds and accounts managed by it, to subscribe for suchnumber of Offer Shares (in the form of Shares) (rounded down to the nearest board lot) as may bepurchased with HK$775 million (which is equivalent to US$100 million at the exchange rate ofUS$1.00 = HK$7.75) at the Offer Price. Paulson is committed to acquire the Offer Shares (in the formof Shares) between the estimated Offer Price range of HK$9.10 and HK$12.50 as stated in thisprospectus. Assuming a mid-point Offer Price of HK$10.80 per Offer Share, Paulson will purchase71,759,259 Offer Shares (in the form of Shares), representing approximately 4.45% of the total OfferShares under the International Placing and approximately 0.47% of the issued share capital (both inthe form of Shares and in the form of Global Depositary Shares) of the Company upon completion ofthe Global Offering (if the Over-allotment Option is not exercised and no bonus Shares are issued tothe management of the Company).
Mr. Kuok Hock Nien, Kerry Trading Co. Limited, Cloud Nine Limited and Twin TurboLimited
Mr. Kuok Hock Nien, Kerry Trading Co. Limited, Cloud Nine Limited and Twin Turbo Limitedhave agreed to subscribe for such number of Offer Shares (in the form of Shares) (rounded down tothe nearest board lot) as may be purchased with the Hong Kong dollar equivalent in the aggregateamount of US$20,000,000 at the Offer Price. Assuming a mid-point Offer Price of HK$10.80 per OfferShare, Mr. Kuok Hock Nien, Kerry Trading Co. Limited, Cloud Nine Limited and Twin Turbo Limitedwill in aggregate purchase 14,370,370 Offer Shares (in the form of Shares), representing 0.89% of thetotal Offer Shares under the International Placing and approximately 0.09% of the issued share capital(both in the form of Shares and in the form of Global Depositary Shares) of the Company uponcompletion of the Global Offering (if the Over-allotment Option is not exercised and no bonus Sharesare issued to the management of the Company).
THE CORNERSTONE PLACING
— 317 —
The Hong Kong dollar equivalent of US$20,000,000 shall be determined based on the closingmiddle point spot rate quoted by The Hong Kong and Shanghai Banking Corporation Limited for U.S.dollars at the close of business in Hong Kong on the day on which the Offer Price is determined (ornext following business day if such day is not a business day).
Each of Kerry Trading Co. Limited, Cloud Nine Limited and Twin Turbo Limited is a privatecompany incorporated in Hong Kong engaged in the business of investment holding, and a memberof the Kuok group, being companies owned and/or controlled by Mr. Kuok Hock Nien and/or interestsassociated with him.
Conditions Precedent
The subscription obligation of each Cornerstone Investor is conditional upon, among others, theInternational Placing Agreement being entered into and having become effective and unconditionaland not having been terminated.
Restrictions on Disposals by the Cornerstone Investors
Each of the Cornerstone Investors has agreed that, without the prior written consent of theCompany and the relevant Joint Bookrunners which are parties to the relevant cornerstone placingagreement, it will not, at any time during the period starting on the date of execution of its cornerstoneplacing agreement and ending 6 months following the Listing Date, directly or indirectly, dispose ofany Offer Shares (both in the form of Shares and in the form of Global Depositary Shares) subscribedby it pursuant to the cornerstone placing agreement to which it is party, other than transfer to thetransferees as permitted in the relevant cornerstone placing agreement and on the basis that thetransferee will be subject to the same restrictions on disposal.
THE CORNERSTONE PLACING
— 318 —

Global Offering
In connection with the International Placing and Hong Kong Placing, it is expected that theCompany will enter into the International Placing Agreement with the Joint Global Coordinators andthe other Underwriters on or about the Price Determination Date. Under the International PlacingAgreement, the Underwriters would, subject to certain conditions set out therein, severally, and notjointly, agree to procure purchasers for the International Placing Shares or Global Depositary Sharesbeing offered pursuant to the International Placing Agreement or failing which to purchase for suchInternational Placing Shares or Global Depositary Shares.
The Company will grant to the Underwriters the Over-allotment Option, exercisable by the JointGlobal Coordinators on behalf of the Underwriters on or before 26 February 2010, being the 30th dayfrom the Listing Date, to require the Company to issue and allot up to an aggregate of 225,000,000additional Shares, together representing approximately 14.0% of the Offer Shares, at the Offer Price,among other things, to cover over-allocations in the Global Offering, if any.
Purchasers of Offer Shares under International Placing will have the option of taking delivery ofsuch shares either in the form of Shares or Global Depositary Shares. For further informationconcerning the Global Depositary Shares, see “Structure of the Global Offering — Global Offering —The International Placing”.
Grounds for termination
The Joint Global Coordinators (for themselves and on behalf of the Underwriters) shall beentitled to give notice in writing to the Company on or prior to 8:00 am on the Listing Date toterminate the International Placing Agreement if there has occurred:
(i) any change, or any development or occurrence of any event, matter or circumstance orseries of events, matters or circumstances or prospective change, in the condition (financialor otherwise), in the earnings, results of operations, business, properties or business ortrading prospects of the Group;
(ii) any change in international financial, political or economic conditions or currencyexchange rates or exchange controls or taxation in France, Jersey, Hong Kong, Russia, theUnited Kingdom or the United States;
(iii) any suspension or material limitation of trading in securities generally on the Hong KongStock Exchange, Euronext, the New York Stock Exchange, the National Association ofSecurities Dealers Automated Quotations or the London Stock Exchange, or any setting ofminimum or maximum prices for trading on such exchange;
(iv) any suspension of trading of any securities of the Company on any exchange or in theover-the-counter market;
(v) any banking moratorium declared by any authority in any of France, Jersey, Hong Kong,Russia, the United Kingdom or the United States;
(vi) any major disruption of settlements of securities, payment, or clearance services in any ofFrance, Jersey, Hong Kong, Russia, the United Kingdom or the United States, or
(vii) any act of God, war, riot, public disorder, civil commotion, economic sanctions, fire, flood,explosion, epidemic, outbreak of an infectious disease, strike or lock-out any attack on,outbreak or escalation of hostilities or act of terrorism, any declaration of war by the UnitedStates, the People’s Republic of China or France or any other national or internationalcalamity or emergency the effect of which,
UNDERWRITING
— 319 —
App1A-15(2)(i)

in the case of any paragraphs (i) to (vii), is at the sole and absolute discretion of the Joint GlobalCoordinators so material and adverse to make it impracticable or inadvisable to market the OfferShares or to enforce contracts for the sale of the Offer Shares.
In addition, the International Placing Agreement may be terminated in case customary conditionsprecedent are not fulfilled as contemplated in the International Placing Agreement.
Lock-up
Pursuant to the International Placing Agreement, the Company will not, except pursuant to theGlobal Offering (including pursuant to the exercise of the Over-allotment Option), without the priorwritten consent of the Joint Global Coordinators (on behalf of the Underwriters) and unless incompliance with the Hong Kong Listing Rules during the period from the date hereof until the expiryof six months from the Listing Date: (i) offer, accept subscription for, pledge, charge, allot, issue,repurchase, sell, lend, mortgage, assign, sell any option or contract to purchase, purchase any optionor contract to sell, grant any option, right or warrant to purchase or subscribe for any of the Shares,Global Depositary Shares and other securities of the Company or any interest therein (including, butnot limited to, any securities that are convertible into or exercisable or exchangeable for, or thatrepresent the right to receive, any such Shares, Global Depositary Shares or securities or any interesttherein), except for the issuance and conversion of the fee warrants or pursuant to any existingemployee, officer or director stock or benefit plan; (ii) enter into any swap or other arrangement thattransfers to another, in whole or in part, any of the economic consequences of ownership of any suchShares, Global Depositary Shares or securities or any interest therein; (iii) enter into any transactionwith the same economic effect as any transaction described in paragraphs (i) or (ii) above; or (iv)agree or contract to, or publicly announce any intention to, enter into any such transaction describedin paragraphs (i), (ii) or (iii) above, whether any such transaction described in paragraphs (i), (ii) or(iii) above is to be settled by delivery of Shares or other securities, in cash or otherwise.
Pursuant to Rule 10.07 of the Listing Rules, each of Mr. Deripaska and En+ has undertaken tothe Company and to the Hong Kong Stock Exchange that he or it will not, and shall procure that theregistered holders controlled by him or it will not:
(a) in the period commencing on the date (the “Reference Date”) by reference to whichdisclosure of their shareholding is made in the prospectus (“Prospectus”) of the Companyin relation to the Global Offering and ending on the date (the “End Date”) which is sixmonths from the Listing Date, dispose of, or enter into any agreement to dispose of, orotherwise create any options, rights, interests or encumbrances (save pursuant to a pledgeor charge as security in favour of an authorised institution (as defined in the BankingOrdinance, Chapter 155 of the Laws of Hong Kong) in respect of, any of those securitiesof the Company in respect of which he or it is shown by the Prospectus to be the beneficialowners (the “Relevant Securities”) for a bona fide commercial loan (the “PermittedPledges”); and
(b) in the period of six months commencing from the End Date, dispose of, or enter into anyagreement to dispose of, or otherwise create any options, rights, interests or encumbrances(save pursuant to any Permitted Pledges) in respect of the Relevant Securities if,immediately following such disposal or upon the exercise or enforcement of such options,rights, interests or encumbrances, he or it would cease to be a controlling shareholder (asdefined in the Listing Rules) of the Company.
UNDERWRITING
— 320 —

In accordance with Note 3 to Rule 10.07(2) of the Listing Rules, Mr. Deripaska and En+ alsoirrevocably and unconditionally undertake to the Company and the Stock Exchange that within theperiod commencing on the Reference Date and ending on the date which is 12 months from the ListingDate, he or it will:
(a) when he or it pledges or charges any securities of the Company beneficially owned by himor it in favour of an authorised institution (as defined in the Banking Ordinance, Chapter155 of the Laws of Hong Kong), immediately inform the Company in writing of such pledgeor charge together with the number of securities so pledged or charged; and
(b) when either he or it receives indications, either verbal or written, from the pledgee orchargee that any of the pledged or charged securities of the Company shall be disposed of,immediately inform the Company in writing of such indications.
Each of En+, Onexim, SUAL Partners and Amokenga Holdings has undertaken to the Companyand each of the Joint Global Coordinators that, subject to certain exceptions, it will not, for a periodof 180 days after the Listing Date, offer, sell, contract to sell, pledge, charge, allot, contract to allot,sell any option or contract to purchase, purchase any option or contract to sell, grant or agree to grantany option, right or warrant to purchase or subscribe for, lend or otherwise transfer, or otherwisedispose of, directly or indirectly, any of the share capital of the Company or any securities of theCompany or any interest therein, enter into a transaction which would have the same effect, or enterinto any swap, hedge or other arrangement that transfers, in whole or in part, any of the economicconsequences of ownership of any such share capital or securities, without, in each case, the priorwritten consent of each of the Joint Global Coordinators, except pursuant to (i) any stock borrowingagreement to which any such Shareholder is a party and pursuant to which such Shareholder will lendShares to facilitate the settlement of over-allotments, (ii) any pledge over Shares granted by En+,Onexim, SUAL Partners and Amokenga Holdings in connection with the Company’s debt restructuringobligations to VEB and in the case of En+ its own debt restructuring obligations, and (iii) in the caseof SUAL Partners, pursuant to any grant of security by SUAL Partners in respect of any Shares,securities or any interest in favour of any duly authorised bank or other financial institution for a bonafide commercial loan.
Commission and expenses
Under the terms and conditions of the International Placing Agreement, assuming an Offer Priceof HK$10.80 per Share, being the mid-point of the estimated Offer Price range, the Underwriters willreceive a gross commission of approximately HK$328 million assuming the Over-allotment Option isnot exercised, or approximately HK$351 million assuming the Over-allotment Option is exercised infull. In addition, the Company may, in its sole discretion, pay the Underwriters an additional incentivefee of up to 0.5% of the aggregate amount of the aggregate gross proceeds of the Global Offering(including any proceeds raised pursuant to the exercise of the Over-allotment Option).
Based on an Offer Price of HK$10.80 per Share, being the mid-point of the estimated Offer Pricerange, total fees and commissions in connection with the Global Offering, together with the HongKong Stock Exchange and Euronext listing fees, the SFC transaction levy and the Hong Kong StockExchange trading fees, legal and other professional fees, printing and other expenses relating to theGlobal Offering, are estimated to amount to approximately HK$601 million if the Over-allotmentOption is not exercised and no additional incentive fee is paid to the Underwriters, or to approximatelyHK$624 million if the Over-allotment Option is exercised in full and no additional incentive fee ispaid to the Underwriters.
The Company has agreed to indemnify the Underwriters for certain losses which they may suffer,including losses incurred arising from their performance of their obligations under the InternationalPlacing Agreement and any breach by us of the International Placing Agreement.
UNDERWRITING
— 321 —
App1A-20(2)3rdSch-15
Underwriters’ Interests in the Company
Certain of the Joint Sponsors, other Underwriters or their respective affiliates have in the pastprovided, currently may provide and may in the future provide, investment and commercial bankingand other services to the Group and its affiliates, as well as to the Company’s shareholders and theirrespective affiliates, in the ordinary course of business for which they have received or may receive,as the case may be, customary compensation.
Underwriters’ Interests under the Debt Restructuring
Affiliates of BNP Paribas and BNP Paribas Capital (Asia Pacific) Limited (collectively referredto as “BNP Paribas” for the purposes of this section) are parties to the international overrideagreement as further described under “Financial Information — Management’s Discussion andAnalysis of Financial Condition and Results of Operations — Liquidity and Capital Resources — DebtRestructuring — Terms of the International Debt Restructuring — Override”. BNP Paribas has alending exposure to the Group of approximately US$415 million.
Affiliates of Credit Suisse (Hong Kong) Limited are parties to the international overrideagreement as further described under “Financial Information — Management’s Discussion andAnalysis of Financial Condition and Results of Operations — Liquidity and Capital Resources — DebtRestructuring — Terms of the International Debt Restructuring — Override”. Affiliates of CreditSuisse (Hong Kong) Limited have lending exposure to the Company of approximately US$32.3million.
Affiliates of BOCI Asia Limited (collectively referred to as “Bank of China” for purposes of thissection) are parties to the international override agreement as further described under “FinancialInformation — Management’s Discussion and Analysis of Financial Condition and Results ofOperations — Liquidity and Capital Resources — Debt Restructuring — Terms of the InternationalDebt Restructuring — Override”. According to the international override agreement, Bank of Chinahas a lending exposure to the Group of approximately US$4 million. As far as BOCI Asia Limited isaware, Bank of China has no other lending exposure to the Group.
VTB Capital plc. and affiliates of VTB Capital plc. (collectively referred to as “VTB GroupMembers” for the purposes of this section) are parties to the international override agreement asfurther described under “Financial Information — Management’s Discussion and Analysis of FinancialCondition and Results of Operations — Liquidity and Capital Resources — Debt Restructuring —Terms of the International Debt Restructuring — Override”. VTB Group Members have a lendingexposure to the Group of approximately US$61.1 million.
Affiliates of CLSA Limited (collectively referred to as “Calyon” for the purposes of this section)are parties to the international override agreement as further described under “Financial Information— Management’s Discussion and Analysis of Financial Condition and Results of Operations —Liquidity and Capital Resources — Debt Restructuring — Terms of the International DebtRestructuring — Override”. Calyon has a lending exposure to the Group of approximately US$507.59million.
Affiliates of UniCredit CAIB Securities UK Ltd (collectively referred to as “UCB” for thepurposes of this section) are parties to the international override agreement as further described under“Financial Information — Management’s Discussion and Analysis of Financial Condition and Resultsof Operations — Liquidity and Capital Resources — Debt Restructuring — Terms of the InternationalDebt Restructuring — Override”. UCB has a lending exposure to the Group of approximatelyUS$360.86 million.
UNDERWRITING
— 322 —

Affiliates of Société Générale and Bank Société Générale Vostok (“BSGV”) (collectivelyreferred to as “SG” for the purposes of this section) are parties to the international override agreementas further described under “Financial Information — Management’s Discussion and Analysis ofFinancial Condtion and Results of Operations — Liquidity and Capital Resources — DebtRestructuring — Terms of the International Debt Restructuring — Override”. SG has a lendingexposure to the Group of approximately US$401 million.
ABN AMRO Bank N.V. (London Branch) and affiliates of ABN AMRO Bank N.V. (LondonBranch) (collectively referred to as “ABN AMRO” for the purposes of this section) are parties to theinternational override agreement as further described under “Financial Information — Management’sDiscussion and Analysis of Financial Condition and Results of Operations — Liquidity and CapitalResources — Debt Restructuring — Terms of the International Debt Restructuring — Override”. ABNAMRO has a lending exposure to the Group of approximately US$219.2 million.
Affiliates of Sberbank of the Russian Federation (collectively referred to as “Sberbank” for thepurposes of this section) are parties to the international override agreement as further described under“Financial Information — Management’s Discussion and Analysis of Financial Condition and Resultsof Operations — Liquidity and Capital Resources — Debt Restructuring — Terms of the InternationalDebt Restructuring — Override”. Sberbank has a lending exposure to the Group of approximatelyUS$822.15 million.
NATIXIS or affiliates of NATIXIS (collectively referred to as “NATIXIS” for the purposes ofthis section) are parties to the international override agreement as further described under “FinancialInformation — Management’s Discussion and Analysis of Financial Condition and Results ofOperations — Liquidity and Capital Resources — Debt Restructuring — Terms of the InternationalDebt Restructuring — Override”. NATIXIS has a lending exposure to the Group of approximatelyUS$305 million.
Affiliates of ING Bank N.V., London Branch (collectively referred to as “ING” for purposes ofthis section) are parties to the international override agreement as further described under “FinancialInformation — Management’s Discussion and Analysis of Financial Condtion and Results ofOperations — Liquidity and Capital Resources — Debt Restructuring — Terms of the InternationalDebt Restructuring — Override”. ING has a lending exposure to the Group of approximately US$458million, including US$25 million in the BEMO facility which is 50% guaranteed by the Company.
As stated under “Future Plans and Use of Proceeds”, the Company intends to use all of the netproceeds it will receive from the Global Offering to reduce its outstanding debt, reducing such lendingexposure.
Furthermore, under the terms of the international override agreement, the Company will pay anupfront fee to the lender parties thereto, including (a) 0.5% of such lenders’ exposure in cash and (b)nominal strike warrants (“fee warrants”) entitling such lenders to 1% (in aggregate) of the Company’sfully diluted share capital as at the date of effectiveness of the international override agreement.
Fee warrants representing, at the date of effectiveness of the international override agreement,6.361221 Shares (not including fee warrants to be issued to Banca Nazionale del Lavoro (“BNL”), anaffiliate of BNP Paribas) have been issued to BNP Paribas. BNP Paribas does not presently intend tosettle the fee warrants in cash in connection with the Global Offering (except for BNL, whichcurrently intends to settle fee warrants in cash).
Notes:1 The Shares have subsequently been sub-divided by the Company from Shares with par value US$1.00 into Shares with
par value US$0.01.
UNDERWRITING
— 323 —

Fee warrants representing, at the date of effectiveness of the international override agreement,0.546961 Shares have been issued to Credit Suisse AG. Credit Suisse AG will settle the fee warrantsin cash as contemplated herein.
Fee warrants representing, at the date of effectiveness of the international override agreement,0.067661 Shares have been issued to Bank of China. Bank of China will settle the fee warrants in cashas contemplated herein.
Fee warrants representing, at the date of effectiveness of the international override agreement,1.202861 Shares have been issued to VTB Group Members. VTB Group Members will settle the feewarrants in cash as contemplated herein.
Fee warrants representing, at the date of effectiveness of the international override agreement,8.585921 Shares have been issued to Calyon. Calyon does not presently intend to settle the feewarrants in cash in connection with the Global Offering.
Fee warrants representing, at the date of effectiveness of the international override agreement,6.104121 Shares have been issued to UCB. UCB will settle the fee warrants in cash as contemplatedherein.
Fee warrants representing, at the date of effectiveness of the international override agreement,0.106641 Shares have been issued to BSGV and fee warrants representing, at the date of effectivenessof the international override agreement, 6.532621 Shares have been issued to SG. SG will settle thefee warrants in cash as contemplated herein.
Fee warrants representing, at the date of effectiveness of the international override agreement,3.707631 Shares have been issued to ABN AMRO. ABN AMRO will settle the fee warrants in cash ascontemplated herein.
Fee warrants representing, at the date of effectiveness of the international override agreement,1.292311 Shares have been issued to Sberbank. Sberbank will settle the fee warrants in cash ascontemplated herein.
Fee warrants representing, at the date of effectiveness of the international override agreement,4.619311 Shares were issued to NATIXIS. NATIXIS will settle the fee warrants in cash ascontemplated herein.
Fee warrants representing, at the date of effectiveness of the international override agreement,7.016111 Shares have been issued to ING. ING does not presently intend to settle the fee warrants incash in connection with the Global Offering.
Shares to be issued upon exercise of such fee warrants on the Listing Date will remain subjectto a 180 day lock-up as described under “Financial Information — Management’s Discussion andAnalysis of Financial Condition and Results of Operations — Liquidity and Capital Resources — DebtRestructuring — Terms of the International Debt Restructuring — Warrants”. All of the net proceedsfrom the Global Offering will be used to reduce outstanding debt and to satisfy other obligations tothe Group’s creditors (which include the settlement of fee warrants exercised for cash).
In addition the Company may, under certain circumstances have the obligation to issue zerostrike warrants to the international lenders, including to affiliates of BNP Paribas, Credit Suisse (HongKong) Limited, Bank of China, VTB Group Members, Calyon, UCB, SG, ABN AMRO, NATIXIS andING (see “Financial Information — Management’s Discussion and Analysis of Financial Conditionand Results of Operations — Liquidity and Capital Resources — Debt Restructuring — Terms of theInternational Debt Restructuring — Disposal and Equity Injection Undertakings, Debt RepaymentTargets”).
Notes:1 The Shares have subsequently been sub-divided by the Company from Shares with par value US$1.00 into Shares with
par value US$0.01.
UNDERWRITING
— 324 —
BNP Paribas SA (an affiliate of BNP Paribas Capital (Asia Pacific) Limited) is facility agent andsecurity beneficiary in respect of three pre-existing facilities which have been restructured as part ofthe Debt Restructuring. In connection with the Debt Restructuring, BNP Paribas (Suisse) SA (anaffiliate of BNP Paribas Capital (Asia Pacific) Limited), acted as co-chairman of the CoordinatingCommittee coordinating the restructuring efforts of the lenders under international bank facilities andhas also been appointed by the lenders under the international bank facilities to act as soleadministrative and security agent. As a compensation for such services, BNP Paribas SA and BNPParibas (Suisse) SA have received and are entitled to receive fees from the Company.
In addition, certain of the Joint Sponsors, other Underwriters or their respective affiliates havein the past had, currently have and may in the future have disputes with the Company and its affiliates,as well as with the Shareholders and their respective affiliates, arising out of the provision of suchinvestment and commercial banking and other services (including a dispute relating to the repaymentof a shortfall of approximately US$80 million under an equity financing by BNP Paribas (which hasbeen sub-participated in part, including with certain underwriters) to an indirect wholly-ownedsubsidiary of En+ shareholder Basic Element Limited in respect of the financing of a stake in MagnaInternational Limited).
Save as disclosed above, none of the Underwriters is interested legally or beneficially in anyshares of any members of the Group or has any right or option (whether legally enforceable or not)to subscribe for or purchase or to nominate persons to subscribe for or purchase securities in anymembers of the Group in the Global Offering.
UNDERWRITING
— 325 —
THE GLOBAL OFFERING
The Company is offering 1,610,292,840 Offer Shares in the form of Shares or Global DepositaryShares (subject to an Over-allotment Option as described in the section headed “Underwriting —International Placing”) in the Global Offering that comprises (1) the International Placing, i.e. aninternational private placing of Offer Shares outside the United States (including to professionalinvestors within Hong Kong) in offshore transactions in reliance on Regulation S, and in the UnitedStates to QIBs in reliance on Rule 144A or another exemption from the registration requirements underthe US Securities Act and (2) the Hong Kong Placing, i.e. a concurrent placing of Offer Shares (in theform of Shares) to certain eligible investors in Hong Kong. Request for admission to trading andlisting of Global Depositary Shares on the Professional Segment of Euronext Paris has been made bythe Company. This prospectus relates only to the Hong Kong Placing. The International Placing isbeing made pursuant to a separate offering document.
Pursuant to section 6(3)(b) of the Securities and Futures (Stock Market Listing) Rules, theSecurities and Futures Commission is imposing the following conditions to the listing of the Shareson the Hong Kong Stock Exchange:
1. The provisions of the Management, Supervision and Internal Control Guidelines (“ICG”)and the Code of Conduct for Persons Licensed by or Registered with the SFC (“Code”)apply to the placing of the Offer Shares and must be complied with by intermediariesplacing the Offer Shares in Hong Kong.
2. The offer for subscription or purchase of the Offer Shares in Hong Kong will be conductedby way of placing only. Where the Offer Shares are placed in Hong Kong, subscribers foror purchasers of the Offer Shares must be limited to:
(a) persons falling under paragraphs (a) to (i) of the definition of “professional investors”in Part 1 of Schedule 1 to the Securities and Futures Ordinance (where the provisionsspecified in paragraph 15.5 of the Code may be waived);
(b) persons falling under paragraph (j) of the definition of “professional investors” in Part1 of Schedule 1 to the Securities and Futures Ordinance (where the provisionsspecified in paragraph 15.5 of the Code may be waived in relation to a personprovided that the intermediary placing the Offer Shares in Hong Kong has, in respectof that person complied with paragraphs 15.3 and 15.4 of the Code); or
(c) other clients of an intermediary provided that the subscription price or purchase pricepayable by each client is a minimum of HK$1 million and the intermediary complieswith the requirements in respect of suitability set out in paragraph 5.2 of the Code.
3. The intermediaries placing the Offer Shares in Hong Kong confirm to the Joint Sponsorsand the Company that condition 2 above has been fulfilled in respect of Offer Shares placedby them.
4. The Joint Sponsors confirm in writing to the SFC and the Hong Kong Stock Exchange by17:00 hours Hong Kong time on the business day immediately preceding the Listing Datethat condition 2 above has been fulfilled.
5. The trading board lot size of the Shares at and after listing of the Shares must be no lessthan the number of Shares that make up a minimum board lot trading value of HK$200,000based on the Offer Price, or such other number of Shares as the SFC may from time to timespecify by notice in writing to the Hong Kong Stock Exchange and the Company inresponse to any proposed corporate action in connection with the share capital of theCompany which will or is reasonably likely to materially reduce the value of a board lotof Shares.
6. The conditions being imposed by the SFC for not objecting to the listing are set out in fullin this prospectus.
STRUCTURE OF THE GLOBAL OFFERING
— 326 —
App1A-15(2)
THE INTERNATIONAL PLACING
Number of Offer Shares
The International Placing together with the Hong Kong Placing will consist of an offering of1,610,292,840 new Shares in the form of Shares and in the form of Global Depositary Shares (subjectto the Over-allotment Option).
Purchasers of Offer Shares will have the option of taking delivery of such shares either in theform of Shares or in the form of Global Depositary Shares. The Global Depositary Shares will beevidenced by Global Depositary Receipts and each Global Depositary Share will represent 20 Shares.The Global Depositary Receipts will be issued by Bank of New York Mellon, as depositary. The Sharesunderlying the Global Depositary Shares will be held by Hong Kong and Shanghai Banking Corp., ascustodian for the Depositary. The Global Depositary Shares will be listed and traded on theProfessional Segment of Euronext Paris.
Allocation
The International Placing will include selective marketing of Shares and/or Global DepositaryShares to institutional and professional investors and other investors anticipated to have a sizeabledemand for Shares and/or Global Depositary Shares. Professional investors generally include brokers,dealers, companies (including fund managers) whose ordinary business involves dealing in shares andother securities and corporate entities which regularly invest in shares and other securities. Allocationof Shares and/or Global Depositary Shares pursuant to the International Placing will be effected inaccordance with the “book-building” process described in the paragraph headed “Pricing andAllocation” below and based on a number of factors, including the level and timing of demand, thetotal size of the relevant investor’s invested assets or equity assets in the relevant sector and whetheror not it is expected that the relevant investor is likely to buy further Shares, and/or hold or sell itsShares, after the listing of the Shares on the Hong Kong Stock Exchange and Global Depositary Shareson Euronext Paris. Such allocation is intended to result in a distribution of the Shares and GlobalDepositary Shares on a basis which would lead to the establishment of a solid professional andinstitutional shareholder base to the benefit of the Company and its shareholders as a whole.
The Joint Global Coordinators (on behalf of the Underwriters) may require any investor who hasbeen offered Shares and/or Global Depositary Shares under the International Placing, to providesufficient information to the Joint Bookrunners so as to allow them to establish the investor’sindependence from the Company.
THE HONG KONG PLACING
Number of Offer Shares offered
The Hong Kong Placing, together with the International Placing, will consist of an offering of1,610,292,840 new Shares representing all of the Offer Shares available under the Global Offering(subject to the Over-allotment Option).
The offer for subscription or sale of the Offer Shares in Hong Kong will be conducted by wayof placing only. Where the Offer Shares are placed in Hong Kong, subscribers or purchasers of theOffer Shares will be limited to:
(a) persons falling under paragraphs (a) to (i) of the definition of “professional investors” inPart 1 to Schedule 1 to the SFO (where the provisions specified in paragraph 15.5 of theCode of Conduct for Persons Licensed by or Registered with the SFC (the “Code”) may bewaived);
STRUCTURE OF THE GLOBAL OFFERING
— 327 —
(b) persons falling under paragraph (j) of the definition of “professional investors” in Part 1 ofSchedule 1 to the SFO (where the provisions specified in paragraph 15.5 of the Code maybe waived in relation to a person provided that the intermediary placing the Offer Sharesin Hong Kong has, in respect of that person complied with paragraphs 15.3 and 15.4 of theCode); or
(c) other clients of an intermediary provided that the subscription price or purchase amount isa minimum of HK$1 million and the intermediary complies with the requirements in respectof suitability set out in paragraph 5.2 of the Code.
OVER-ALLOTMENT OPTION
In connection with the Global Offering, it is expected that the Company will grant theOver-allotment Option to the Underwriters, exercisable by the Joint Global Coordinators on behalf ofthe Underwriters.
Pursuant to the Over-allotment Option, the Underwriters have the right, exercisable by the JointGlobal Coordinators at any time from the Listing Date and on or before 26 February 2010, being the30th day from the Listing Date, to require the Company to issue and allot up to 225,000,000 newShares, representing approximately 14.0% of the Offer Shares, at the same price per Share under theGlobal Offering, to, among other things, cover over-allocations in the Global Offering, if any. If theOver-allotment Option is exercised in full, the additional Offer Shares will represent approximately1.5% of the Company’s enlarged issued share capital immediately following the completion of theGlobal Offering and the exercise of the Over-allotment Option. In the event that the Over-allotmentOption is exercised, an announcement will be made.
STOCK BORROWING AGREEMENT
In order to facilitate the settlement of over-allotments in connection with the Global Offering,Credit Suisse (Hong Kong) Limited may choose to borrow up to 225,000,000 Shares pursuant to astock borrowing agreement to be entered on or about Price Determination Date.
STABILISATION
Stabilisation is a practice used by underwriters in some markets to facilitate the distribution ofsecurities. To stabilise, the underwriters may bid for, or purchase, the newly issued securities in thesecondary market, during a specified period of time, to retard and, if possible, prevent any decline inthe market price of the securities below the offer price. In Hong Kong and a number of otherjurisdictions, activity aimed at reducing the market price is prohibited, and the price at whichstabilisation is effected is not permitted to exceed the offer price.
In connection with the Global Offering, Credit Suisse (Hong Kong) Limited, its affiliates or anyperson acting for it, as stabilising manager (the “Stabilisation Agent”), on behalf of the Underwriters,may effect transactions with a view to stabilising or supporting the market price of our Shares orGlobal Depositary Shares at a level higher than that which might otherwise prevail for a limited periodafter the Listing Date. However, there is no obligation on the Stabilisation Agent, its affiliates or anypersons acting for it, to conduct any such stabilising action. Such stabilisation action, if commenced,may be discontinued at any time, and is required to be brought to an end after a limited period. Shouldstabilising transactions be effected in connection with the Global Offering, this will be at the absolutediscretion of the Stabilisation Agent, its affiliates or any person acting for it.
Stabilisation action permitted in Hong Kong pursuant to the Securities and Futures (PriceStabilising) Rules, as amended, includes (i) over-allocating for the purpose of preventing orminimising any reduction in the market price of our Shares, (ii) selling or agreeing to sell our Sharesso as to establish a short position in them for the purpose of preventing or minimising any reduction
STRUCTURE OF THE GLOBAL OFFERING
— 328 —
App1A-15(3)(c), (d), (e)
App1A-15(3)(a), (b)

in the market price of our Shares, (iii) purchasing or subscribing for, or agreeing to purchase orsubscribe for, our Shares pursuant to the Over-allotment Option in order to close out any positionestablished under (i) or (ii) above, (iv) purchasing, or agreeing to purchase, any of our Shares for thesole purpose of preventing or minimising any reduction in the market price of our Shares, (v) sellingor agreeing to sell any Shares in order to liquidate any position established as a result of thosepurchases and (vi) offering or attempting to do anything as described in (ii), (iii), (iv) or (v) above.
Specifically, prospective applicants for and investors in the Offer Shares should note that:
• the Stabilisation Agent, its affiliates or any person acting for it, may, in connection with thestabilising action, maintain a long position in our Shares or Global Depositary Shares;
• there is no certainty regarding the extent to which and the time or period for which theStabilisation Agent, its affiliates or any person acting for it, will maintain such a longposition;
• liquidation of any such long position by the Stabilisation Agent, its affiliates or any personacting for it, may have an adverse impact on the market price of our Shares or GlobalDepositary Shares;
• no stabilising action can be taken to support the price of our Shares or Global DepositaryShares for longer than the stabilising period which will begin on the Listing Date, and isexpected to expire on 26 February 2010, being the 30th day after the Listing Date. After thisdate, when no further stabilising action may be taken, demand for our Shares or GlobalDepositary Shares, and therefore the price of our Shares or Global Depositary Shares, couldfall;
• the price of any security (including our Shares and the Global Depositary Shares) cannotbe assured to stay at or above its offer price by the taking of any stabilising action; and
• stabilising bids may be made or transactions effected in the course of the stabilising actionat any price at or below the Offer Price, which means that stabilising bids may be made ortransactions effected at a price below the price paid by applicants for, or investors in, ourShares or Global Depositary Shares.
In addition, any stabilisation action is subject to compliance with applicable legal and regulatoryrequirements such as, with respect to the Global Depositary Shares, Regulation (EC) No. 2273/2003of the European Commission dated 22 December 2003 applying the European Parliament andCouncil’s 20036/06/EC directive of 28 January 2003 relating to insider dealing and marketmanipulation.
Over-allocation
Following any over-allocation of the Offer Shares in connection with the Global Offering, theJoint Global Coordinators, their affiliates or any person acting for them may cover suchover-allocation by (among other methods) using Shares or Global Depositary Shares purchased by theJoint Global Coordinators, their affiliates or any person acting for them in the secondary market,exercising the Over-allotment Option in full or in part. Any such purchases will be made in accordancewith the laws, rules and regulations in place in Hong Kong, including in relation to stabilisation, theSecurities and Futures (Price Stabilising) Rules, as amended, made under the SFO. The number ofShares which can be over-allocated will not exceed the number of Shares which may be issued uponexercise of the Over-allotment Option, being 225,000,000 Shares, representing approximately 14.0%of the Offer Shares initially available under the Global Offering.
STRUCTURE OF THE GLOBAL OFFERING
— 329 —
PRICING AND ALLOCATION
The Underwriters will be soliciting from prospective investors indications of interest inacquiring Offer Shares in the International Placing. Prospective professional and institutionalinvestors will be required to specify the number of Offer Shares (in the form of Shares or GlobalDepositary Shares) under the International Placing they would be prepared to acquire either atdifferent prices or at a particular price. This process, known as “book-building”, is expected tocontinue up to, and to cease on or around, 22 January 2010.
Pricing for the Offer Shares for the purpose of the various offerings under the Global Offeringwill be fixed on the Price Determination Date, which is expected to be on or around 22 January 2010and in any event on or before 25 January 2010, by agreement between the Joint Global Coordinators,on behalf of the Underwriters, and the Company and the number of Offer Shares to be allocated underthe Global Offering will be determined shortly thereafter.
The Offer Price is expected to be no more than HK$12.50 per Offer Share and is expected to beno less than HK$9.10 per Offer Share. Prospective investors should be aware that the Offer Price tobe determined on the Price Determination Date may be, but is not expected to be, outside of theseboundaries.
The offer price per Global Depositary Shares in Euro (or in US dollars) will be determined basedon one Global Depositary Shares representing 20 Shares and on the Offer Price per Offer Share in HK$(inclusive of brokerage fee, Hong Kong Stock Exchange trading fee and SFC transaction levy),adjusted for a HK$/EUR (or HK$/US$, as appropriate) foreign exchange rate as of the date of pricingof the Global Offering.
The Joint Global Coordinators, on behalf of the Underwriters, may, where consideredappropriate, based on the level of interest expressed by prospective professional and institutionalinvestors during the book-building process, and with the consent of the Company, reduce the numberof Offer Shares and/or the indicative Offer Price range above/below that stated in this prospectus atany time on or prior to 21 January 2010. In such a case, we will, as soon as practicable following thedecision to make such reduction, and in any event not later than 22 January 2010 cause there to bepublished on the Company’s website and the Hong Kong Stock Exchange’s website notices of thevariation. Upon issue of such a notice, the revised offer price range will be final and conclusive andthe Offer Price, if agreed upon by the Joint Global Coordinators, on behalf of the Underwriters, andthe Company, will be fixed within such revised offer price range. Investors should have regard to thepossibility that any announcement of a reduction in the number of Offer Shares and/or the indicativeoffer price range may not be made until 22 January 2010. Such notice will also include confirmationor revision, as appropriate, of the working capital statement and the Global Offering statistics ascurrently set out in this prospectus, and any other financial information which may change as a resultof any such reduction. In the absence of any such notice so published, the number of Offer Shares willnot be reduced and/or the Offer Price, if agreed upon with the Company and the Joint GlobalCoordinators, will under no circumstances be set outside the offer price range as stated in thisprospectus.
The net proceeds from the Global Offering accruing to the Company (after deduction ofunderwriting fees and estimated expenses payable by us in relation to the Global Offering, assumingthat the Over-allotment Option is not exercised), are estimated to be approximately HK$16,790million, assuming an Offer Price of HK$10.8 per Offer Share, being the approximate mid-point of theproposed offer price range of HK$9.10 to HK$12.50.
STRUCTURE OF THE GLOBAL OFFERING
— 330 —
App1A-15(2)
App1A-15(2)(c)

The Offer Price, the level of indications of interest and basis of allocation in the Global Offeringare expected to be announced on or before 25 January 2010 on the Company’s website and the websiteof Hong Kong Stock Exchange.
INTERNATIONAL PLACING AGREEMENT
We expect to enter into the International Placing Agreement relating to the Global Offering onthe Price Determination Date.
The underwriting arrangements under the International Placing Agreement are summarised in thesection headed “Underwriting” in this prospectus.
CONDITIONS OF THE GLOBAL OFFERING
The Global Offering will be conditional on:
(i) the Listing Committee of the Hong Kong Stock Exchange granting approval for the listingof, and permission to deal in, our Shares in issue (including the Shares that may beallocated pursuant to the exercise of the Over-allotment Option) and our Shares beingoffered pursuant to the Global Offering (subject only to allotment);
(ii) the execution and delivery of the International Placing Agreement on the PriceDetermination Date; and
(iii) the obligations of the Underwriters under the International Placing Agreement becomingand remaining unconditional and not having been terminated in accordance with the termsof the agreement,
in each case on or before the dates and times specified in the International Placing Agreement (unlessand to the extent such conditions are validly waived on or before such dates and times) and in anyevent not later than 8:00 a.m., 27 January 2010.
If, for any reason, the Offer Price is not agreed between the Company and the Joint GlobalCoordinators (on behalf of the Underwriters) on or before 25 January 2010, the Global Offering willnot proceed and will lapse.
If the above conditions are not fulfilled or waived prior to the times and dates specified, theGlobal Offering will lapse and the Hong Kong Stock Exchange will be notified immediately. Noticeof the lapse of the Global Offering will be published by the Company on the Company’s website andthe Hong Kong Stock Exchange’s website on the next day following such lapse.
Share certificates for the Offer Shares (in the case of Shares) will only become valid certificatesof title at 8:00 a.m. on 27 January 2010 provided that (i) the Global Offering has become unconditionalin all respects and (ii) the right of termination as described in the section headed “Underwriting —Global Offering — Grounds for termination” has not been exercised.
SHARES WILL BE ELIGIBLE FOR ADMISSION INTO CCASS
If the Hong Kong Stock Exchange grants the listing of, and permission to deal in, the Shares andthe Company complies with the stock admission requirements of HKSCC, the Shares will be acceptedas eligible securities by HKSCC for deposit, clearance and settlement in CCASS with effect from thedate of commencement of dealings in the Shares on the Hong Kong Stock Exchange or any other dateHKSCC chooses. Settlement of transactions between participants of the Hong Kong Stock Exchangeis required to take place in CCASS on the second Business Day after any trading day.
STRUCTURE OF THE GLOBAL OFFERING
— 331 —
App1A-15(2)(i)
App1A-15(2)(g)

All activities under CCASS are subject to the General Rules of CCASS and CCASS OperationalProcedures in effect from time to time.
All necessary arrangements have been made enabling the Shares to be admitted into CCASS.
DEALING
Assuming that the Global Offering becomes unconditional at or before 8:00 a.m. in Hong Kongon 27 January 2010, it is expected that dealings in the Shares on the Stock Exchange will commenceat 9:30 a.m. on 27 January 2010. The Shares will be traded in board lots of 24,000 Shares each.
STRUCTURE OF THE GLOBAL OFFERING
— 332 —
App1A-22
CRU Cost Definitions and Cost Curves
This prospectus contains references to “cost curves”. A cost curve is a graphical representationin which the production volume of a given commodity across the relevant industry is arranged on thebasis of average unit costs of production from lowest to highest to permit comparisons of the relativecost positions of particular production sites, individual producers or groups of producers within agiven country, region or market. Generally, a producer’s position on a cost curve is described in termsof the particular quartile or tercile, in which the production of a given plant or producer or group ofproducers appears, the first quartile or tercile being the lowest cost and the fourth quartile or the thirdtercile being the highest.
The cost curves referred to in this document have been obtained by the Company from anindependent industry analyst, CRU, with recognised experience in constructing cost curves for therelevant commodities. To construct cost curves, the industry analyst compiles information from avariety of sources, including reports made available by producers, site visits, personal contacts, tradepublications and other analysts’ reports. Although producers may thus participate to some extent in theprocess through which cost curves are constructed, they are typically unwilling to validate costanalyses directly because of commercial sensitivities. Inevitably, assumptions must be made by theanalyst with respect to data that such analyst is unable to obtain and judgement must be brought tobear in the case of virtually all data, however obtained. In addition, the time required to produce costcurves means that even the most recent available examples will be unable to take account of recentdevelopments; in some cases, the most recent available cost curve may be based on data that is severalyears old. Costs data for specific producers may be based on costs incurred by the producers over theirrespective accounting years; to the extent these differ, the direct comparability of their costs may belimited.
The cost curves referred to in this document reflect CRU’s estimates of the Group’s “AluminiumBusiness Costs” and “Alumina Business Costs”. The Group’s “Aluminium Business Costs” representthe production-weighted average of the Business Costs of each of the Group’s aluminium smelters.“Business Costs” are, with respect to a specific aluminium smelter, all costs incurred at that smelter(including raw materials costs and conversion costs) and include the additional costs associated withthe transportation, sale and marketing of aluminium products, as well as interest on working capitaland sustaining capital investment, but exclude unrelated overhead, corporate liabilities, depreciation,interest and tax expenses. In calculating the Business Costs of an aluminium smelter, any aluminaprocessed into aluminium in consideration of a tolling fee is treated as having been purchased fromthe tolling company at an arms-length market price, which is a composite price of the prevailing spotprice and the price obtained in alumina contracts. Business Costs with respect to an aluminium smelterare expressed in terms of costs per tonne of aluminium produced. The Group’s “Alumina BusinessCosts” represent the production-weighted average of the Business Costs of each of the Group’salumina refineries. “Business Costs” are, with respect to a specific alumina refinery, all costs incurredat that refinery (including raw materials costs and conversion costs) and include the additional costsassociated with the transportation, sale and marketing of alumina products, as well as interest onworking capital and sustaining capital investment, but exclude unrelated overhead, corporateliabilities, depreciation, interest and tax expenses. Business Costs with respect to an alumina refineryare expressed in terms of costs per tonne of alumina produced. All cost curves also embody a numberof significant assumptions with respect to exchange rates and other variables. In summary, the mannerin which cost curves are constructed means that they have a number of significant inherent limitations.
In certain cases, cost curves produced by more than one reputable industry analyst may exist withregard to a specific commodity. The methodologies employed and conclusions reached by suchanalysts may differ. Moreover, the reliability of any given cost curve may be difficult to assess, as theaccuracy of the data, and the reasonableness of the assumptions on which it has been based, usuallycannot be tested directly. Particular producers are, however, in a position to validate the accuracy of
PRESENTATION OF CERTAIN COST INFORMATION
— 333 —
the presentation with respect to their own costs subject to adjustments to bring their methodology inline with the methods of the others. This can provide a useful indication of the reliability of a costcurve overall and, notwithstanding their shortcomings, independently produced cost curves are widelyused in the industries in which the Group operates.
The cost curves to which this prospectus refers are the most recent cost curves that have beenobtained by the Company from CRU. All such cost curves are based on 2008 data. The cost curveshave been prepared using cost data for the Group’s and other producers’ operations.
The Group’s Cost Definitions
The Group’s Cash Operating Costs are a key operating metric. The following specific parametersare used in the Group’s management accounting.
“Aluminium Cash Operating Costs” represent the average weighted costs of aluminiumproduction (including maintenance costs, pot rebuild costs, capacity expansion or capacity closurecosts, changes in work in progress/inventory and warehouse costs of commodity aluminium) and salescosts (including transport, security and handling), as well as general administrative costs of theGroup’s management company.
“Alumina Cash Operating Costs” represent the average weighted costs of calcined aluminaproduction (including changes in inventory, work in progress and warehouse costs of commodityalumina) and sales costs (including transport, security and handling).
The main difference between the principles for the calculation of Aluminium Cash OperatingCosts by the Group and the calculation of Aluminium Business Costs by CRU are as follows:
• CRU calculates the cash cost of ingot production to eliminate the impact of casthouse costsat various smelters, whereas the Group calculates the cash cost of aluminium as averageweighted for the entire product mix;
• CRU excludes certain overheads, but includes plant overheads and costs of sales andmarketing, even if the latter is carried out centrally; and
• the Group does not include the refundable part of cash costs included in the aluminiumprice, such as aluminium freight.
PRESENTATION OF CERTAIN COST INFORMATION
— 334 —

The following is a reconciliation of CRU’s Aluminium and Alumina Business Costs to UCRUSAL’s Aluminium and Alumina Cash Operating Costs for the periods presented.
Year ended31 December
2008
Six monthsended 30 June
2009
(US$ per tonne)
Aluminium
UC RUSAL Aluminium Cash Operating Cost . . . . . . . . . . . . . . . . . . . 1,915 1,402
Adjusted for:
Overheads, charity, PR, GR, change of inventories . . . . . . . . . . . . (3) (15)
Interest cost on finished product. . . . . . . . . . . . . . . . . . . . . . . . . 7 5
Casthouse shape realisation cost . . . . . . . . . . . . . . . . . . . . . . . . . (87) (106)
CRU Aluminium Business Cost . . . . . . . . . . . . . . . . . . . . . . . . 1,832 1,285
Alumina
UC RUSAL “cash operating costs excl freight” . . . . . . . . . . . . . . . . . . 349 249
Adjusted for:net realisation cost . . . . . . . . . . . . . . . . . . . . . . . . . . . . . . . . . . (21) (13)
CRU Alumina Business Cost . . . . . . . . . . . . . . . . . . . . . . . . . . 328 235
PRESENTATION OF CERTAIN COST INFORMATION
— 335 —
In this prospectus, unless the context otherwise requires, the following words and expressionshave the following meanings. Certain other terms are explained in the sections headed “Presentationof Certain Cost Information” and “Glossary of Technical Terms”.
“Achinsk alumina refinery” or“AGK”
OJSC RUSAL Achinsk, a company incorporated under thelaws of the Russian Federation, which is a wholly ownedsubsidiary of the Company
“affiliate” person or entity directly or indirectly controlled by, orunder the direct or indirect common control of, one personor entity
“Alpart” Alumina Partners of Jamaica, a company incorporated inJamaica in which the Company indirectly holds a 65%equity interest
“ALSCON” Aluminium Smelter Company of Nigeria, a companyincorporated in Nigeria and in which the Companyindirectly holds a 85% interest
“Alukom Taishet aluminiumsmelter”
A branch of OJSC RUSAL Bratsk, to which all property ofCJSC Alukom Taishet, a wholly owned subsidiary of theCompany, was transferred and which is being liquidated upto date.
“Amokenga Holdings” Amokenga Holdings Limited, a company incorporated inBermuda and which is a wholly owned subsidiary ofGlencore and a shareholder of the Company;
“Aroaima Mining Company” Aroaima Mining Company, Inc., a company incorporated inGuyana, which is an independent third party
“Articles of Association” or“Articles”
the articles of association of the Company, adopted on 24November 2009 with effect from the admission of Shares totrading on the Main Board of the Hong Kong StockExchange and as amended from time to time, a summary ofwhich is set forth in Appendix VII to this prospectus
“associate(s)” has the meaning ascribed to such expression in the ListingRules
“Aughinish alumina refinery” Aughinish Alumina Ltd, a company incorporated inIreland, which is a wholly owned subsidiary of theCompany
“BCGI” Bauxite Company of Guyana Inc., a company incorporatedin Guyana in which the Company indirectly holds a 90%interest
“Board” the board of Directors of the Company
DEFINITIONS
— 336 —

“Bogoslovsk aluminium smelter”,“Bogoslovsk alumina refinery” or“BAZ”
Bogoslovsk Aluminium Smelter, a branch of OJSC SUAL
“Boxitogorsk alumina refinery” or“BGZ”
OJSC RUSAL Boxitogorsk, a company incorporated underthe laws of the Russian Federation, which is a whollyowned subsidiary of the Company
“Bratsk aluminium smelter” or“BrAZ”
OJSC RUSAL Bratsk, a company incorporated under thelaws of the Russian Federation, which is a wholly ownedsubsidiary of the Company
“Business Day” a day that is not a Saturday, Sunday or public holiday inHong Kong
“BVI” the British Virgin Islands
“Capitalisation Issue” the issue of Shares to En+, SUAL Partners, AmokengaHoldings and Onexim to be made upon the capitalisation ofcertain sums standing to the credit of the share premiumaccount of the Company so that such Shareholders hold theamounts of Shares set out against their names on pageVIII-21 upon completion of the Global Offering
“CCASS” the Central Clearing and Settlement System establishedand operated by HKSCC
“CCASS Clearing Participant” a person admitted to participate in CCASS as a directclearing participant or general clearing participant
“CCASS Custodian Participant” a person admitted to participate in CCASS as a custodianparticipant
“CCASS Investor Participant” a person admitted to participate in CCASS as an investorparticipant who may be an individual or joint individuals ora corporation
“CCASS Participant” a CCASS Clearing Participant or a CCASS CustodianParticipant or a CCASS Investor Participant
“China” or “PRC” the People’s Republic of China, but for the purpose of thisprospectus and for geographical reference only and exceptwhere the context requires, references in this prospectus to“China” and the “PRC” do not apply to Taiwan, the MacauSpecial Administrative Region and Hong Kong
“CIS” Commonwealth of Independent States
DEFINITIONS
— 337 —
“Company”, “our Company”, “UCRUSAL”, “we”, “us” or “our”
United Company RUSAL Limited, a company incorporatedunder the laws of Jersey on 26 October 2006 and, exceptwhere the context otherwise requires, all of its subsidiariesor where the context refers to any time prior to itsincorporation, the business which its predecessors or thepredecessors of its present subsidiaries were engaged inand which were subsequently assumed by it
“connected person(s)” has the meaning ascribed to such expression in the ListingRules
“connected transaction(s)” has the meaning ascribed to such expression in the ListingRules
“controlling shareholder” has the meaning ascribed to such expression in the ListingRules and “controlling interest” shall be construedaccordingly. Immediately following completion of theGlobal Offering, Mr. Oleg Deripaska and En+ will be theCompany’s controlling shareholders, the “ControllingShareholders”
“CRU” CRU Strategies Limited, a company incorporated inEngland and Wales, an independent business analysis andconsulting group focused on the mining, metals, powercables, fertiliser and chemicals sectors
“Director(s)” director(s) of the Company
“En+” EN+ Group Limited, a company incorporated in Jersey,which is the Controlling Shareholder of the Company
“EPCM” engineering, procurement, construction and maintenance
“EU” European Union
“Euro”, “EUR” or “ C= ” Euro, the lawful currency of the relevant member states ofthe EU that have adopted the Euro as their currency
“Friguia” Friguia SA, a company incorporated in Guinea, which is awholly owned subsidiary of the Company
“GBP” or “£” Pound Sterling, the lawful currency of the United Kingdom
“Glencore” Glencore International AG, a company incorporated inSwitzerland and which is an indirect shareholder of theCompany
“Global Depositary Receipts” global depositary receipts evidencing Global DepositaryShares, each of which represents 20 Shares
DEFINITIONS
— 338 —
“Global Depositary Shares” global depositary shares evidenced by Global DepositaryReceipts
“Global Offering” the International Placing and the Hong Kong Placing
“Group” UC RUSAL and its subsidiaries from time to time
“Hatch” Hatch Associates Limited
“HK$” or “Hong Kong dollars” or“HK dollars”
Hong Kong dollars, the lawful currency of Hong Kong
“HKSCC” Hong Kong Securities Clearing Company Limited
“HKSCC Nominees” HKSCC Nominees Limited, a wholly-owned subsidiary ofHKSCC
“Hong Kong” or “HK” The Hong Kong Special Administrative Region of the PRC
“Hong Kong Companies Ordinance” the Hong Kong Companies Ordinance (Chapter 32 of theLaws of Hong Kong) (as amended from time to time)
“Hong Kong Placing” the conditional placing by the Underwriters to certaineligible investors in Hong Kong, as further described in thesection headed “Structure of the Global Offering” in thisprospectus
“Hong Kong Placing Shares” the new Shares being offered by the Company forsubscription or purchase under the Hong Kong Placing aspart of the Global Offering, subject to the Over-allotmentOption as described in the section headed “Structure of theGlobal Offering” in this prospectus
“Hong Kong Stock Exchange” The Stock Exchange of Hong Kong Limited
“IFRS” International Financial Reporting Standards
“International Placing” the conditional placing by the Underwriters of theInternational Placing Shares, as further described in thesection headed ‘‘Structure of the Global Offering’’ in thisprospectus
“International Placing Agreement” the international placing agreement relating to theInternational Placing and Hong Kong Placing to be enteredinto among the Company and the Underwriters on oraround 22 January 2010
“International Placing Shares” the new Shares being offered by the Company forsubscription or purchase under the International Placing aspart of the Global Offering, subject to the Over-allotmentOption as described in the section headed “Structure of theGlobal Offering” in this prospectus
DEFINITIONS
— 339 —
“Irkutsk aluminium smelter” or“IrkAZ”
Irkutsk Aluminium Smelter, a branch of OJSC SUAL
“Jersey Companies Law” the Companies (Jersey) Law 1991, as amended
“Joint Bookrunners” BNP Paribas Capital (Asia Pacific) Limited, Credit Suisse(Hong Kong) Limited, BOCI Asia Limited, Merrill LynchInternational, Nomura International plc, RenaissanceSecurities (Cyprus) Limited, Savings Bank of the RussianFederation, VTB Capital plc
“Joint Global Coordinators” BNP Paribas Capital (Asia Pacific) Limited and CreditSuisse (Hong Kong) Limited
“Joint Sponsors” BNP Paribas Capital (Asia Pacific) Limited and CreditSuisse (Hong Kong) Limited
“JSC RUSAL” JSC “RUSAL”, a company incorporated under the laws ofthe Russian Federation and which was a predecessorholding company for certain of the Russian facilities thatare now part of the Group
“Kandalaksha aluminium smelter”or “KAZ”
Kandalaksha Aluminium Smelter, a branch of OJSC SUAL
“Khakas aluminium smelter” or“KhAZ”
Khakas Aluminium Smelter Ltd, a company incorporatedunder the laws of the Russian Federation, which is a whollyowned subsidiary of the Company
“Kindia” Compagnie de Bauxite de Kindia, a company incorporatedin Guinea, which is a wholly owned subsidiary of theCompany
“Krasnoyarsk aluminium smelter” or“KrAZ”
OJSC RUSAL Krasnoyarsk, a company incorporated underthe laws of the Russian Federation, which is a whollyowned subsidiary of the Company
“Kubikenborg aluminium smelter”or “KUBAL”
Kubikenborg Aluminium AB, a company incorporated inSweden, which is a wholly owned subsidiary of theCompany
“Latest Practicable Date” 24 December 2009, being the latest practicable date priorto the printing of this prospectus for the purpose ofascertaining certain information contained in thisprospectus
“Listing Date” the date, expected to be on 27 January 2010 on whichdealings in the Company’s Shares first commence on theHong Kong Stock Exchange
“Listing Rules” the Rules Governing the Listing of Securities on The StockExchange of Hong Kong Limited (as amended from time totime)
DEFINITIONS
— 340 —

“LME” London Metal Exchange
“Major Shareholders” En+, SUAL Partners, Glencore and Onexim
“Memorandum of Association” or“Memorandum”
the memorandum of association of the Company effectivesimultaneously with the admission of Shares to trading onthe Main Board of the Hong Kong Stock Exchange, whichwas conditionally adopted by special resolution on 26December 2009 and as further amended from time to time,a summary of which is set forth in Appendix VII to thisprospectus
“MMC Norilsk Nickel” or “NorilskNickel”
OJSC MMC Norilsk Nickel, a company incorporated in theRussia Federation, in which the Company holds a morethan 25% equity interest
“Nadvoitsy aluminium smelter” or“NAZ”
Nadvoitsy Aluminium Smelter, a branch of OJSC SUAL
“Nikolaev alumina refinery” or“NGZ”
Mykolayiv Alumina Refinery Company Limited, acompany incorporated under the laws of Ukraine, which isa wholly owned subsidiary of the Company
“North Urals” OJSC Sevuralboxitruda (OJSC SUBR), a companyincorporated under the laws of the Russian Federation,which is a wholly owned subsidiary of the Company
“Novokuznetsk aluminium smelter”or “NkAZ”
OJSC RUSAL Novokuznetsk, a company incorporatedunder the laws of the Russian Federation, which is a whollyowned subsidiary of the Company
“Offer Price” the final Hong Kong dollar price per Offer Share (exclusiveof brokerage fee, Hong Kong Stock Exchange trading feeand SFC transaction levy) at which the Offer Shares are tobe subscribed or purchased
“Offer Shares” the 1,610,292,840 new Shares (in the form of Shares orGlobal Depositary Shares in case of the InternationalPlacing and in the form of Shares only in case of the HongKong Placing) being offered by the Company forsubscription pursuant to the Global Offering whichcomprises the International Placing and Hong KongPlacing (subject to the Over-allotment Option)
“Onexim” Onexim Holdings Limited, a company incorporated inCyprus and which is a shareholder of the Company
DEFINITIONS
— 341 —

“Over-allotment Option” the option expected to be granted by the Company to theUnderwriters exercisable by the Joint Global Coordinatorsunder the International Placing Agreement pursuant towhich the Company may be required by the Joint GlobalCoordinators to issue and allot up to an aggregate of225,000,000 additional Shares at the Offer Price asdescribed in the section headed “Structure of the GlobalOffering”
“Pikalyovo alumina refinery” or“PGZ”
Pikalyovo Alumina Refinery, a former branch of OJSCSUAL, which was sold by the Company to Basel-Cement in2008
“Price Determination Date” the date, expected to be on or around 22 January 2010, butno later than 25 January 2010, on which the Offer Price isfixed for the purposes of the Global Offering
“professional investor” has the meaning ascribed to it in Part 1 of Schedule 1 to theSFO
“Qualified Institutional Buyers” or“QIBs”
qualified institutional buyers within the meaning of Rule144A
“Queensland Alumina Limited” or“QAL”
Queensland Alumina Limited, a company incorporated inQueensland, Australia, in which the Company indirectlyholds a 20% equity interest
“Regulation S” Regulation S under the US Securities Act
“Restructuring” the Group’s debt restructuring detailed in “Management’sDiscussion and Analysis of Financial Condition andResults of Operations — Restructuring”
“Roubles” or “RUR” Roubles, the lawful currency of the Russian Federation
“Rule 144A” Rule 144A under the US Securities Act
“RUSAL” RUSAL Limited, a company incorporated under the laws ofJersey and which is a wholly-owned subsidiary of theCompany
“RusHydro” JSC “Rushydro” (Federal Hydrogenation Company), acompany organised under the laws of the RussianFederation, which is an independent third party
“Samruk-Energo” Samruk-Energo, a company incorporated in Kazakhstan,which is an independent third party
DEFINITIONS
— 342 —

“Sayanogorsk aluminium smelter”or “SAZ”
OJSC RUSAL Sayanogorsk, a company incorporated underthe laws of the Russian Federation, which is a whollyowned subsidiary of the Company
“Securities and FuturesCommission” or “SFC”
the Securities and Futures Commission of Hong Kong
“SFO” the Securities and Futures Ordinance (Chapter 571 of theLaws of Hong Kong)
“Share(s)” ordinary share(s) with nominal value of US$0.01 each inthe share capital of the Company
“Shareholder(s)” holder(s) of Share(s)
“Shareholders’ Agreement with theCompany”
the shareholders’ agreement expected to be entered intobefore the Listing Date by En+, SUAL Partners, Glencore,Onexim and the Company
“Shareholders’ Agreement betweenMajor Shareholders only”
the shareholders’ agreement expected to be entered intobefore the Listing Date by En+, SUAL Partners, Glencoreand Onexim only
“Sibirsky Aluminium” Sibirsky Aluminium, a company incorporated under thelaws of the Russia Federation and which was a predecessorshareholder for certain of the businesses that now form partof the Group
“SRK” SRK Consulting (UK) Limited, a company incorporated inEngland and Wales
“SUAL” SUAL International Limited, a company incorporated inthe British Virgin Islands, which is a wholly-ownedsubsidiary of the Company
“SUAL Partners” SUAL Partners Limited, a company incorporated under thelaws of the Bahamas, which is a shareholder of theCompany
“subsidiary” has the meaning ascribed to such expression under theListing Rules
“substantial shareholder” has the meaning ascribed to it under the Listing Rules
“Timan” OJSC Boksit Timana, a company incorporated under thelaws of the Russian Federation in which the Companyindirectly holds an approximately 80% interest
DEFINITIONS
— 343 —
“Underwriters” the several underwriters of the Global Offering, led by theJoint Global Coordinators and expected to enter into theInternational Placing Agreement to underwrite the GlobalOffering
“United States” or “US” the United States of America, its territories, its possessionsand all areas subject to its jurisdiction
“Urals aluminium smelter”, “Uralsalumina refinery” or “UAZ”
Urals Aluminium Smelter, a branch of OJSC SUAL
“US$”, “USD” or “US dollars” United States dollars, the lawful currency of the UnitedStates
“US Securities Act” the US Securities Act of 1933, as amended, and the rulesand regulations promulgated thereunder
“Volgograd aluminium smelter” or“VgAZ”
Volgograd Aluminium Smelter, a branch of OJSC SUAL
“Volkhov aluminium smelter” or“VAZ”
Volkhov Aluminium Smelter, a branch of OJSC SUAL
“Windalco” West Indies Alumina Company, a company incorporated inJamaica, in which the Company indirectly holds a 93%interest
“Yavoslavsky” YAGRK Limited, a company incorporated under the lawsof the Russian Federation and in which the Companyindirectly holds a 50% interest
“Zaporozhye aluminium smelter”,“Zaporozhye alumina refinery or“ZAlK”
OJSC Zaporozhye Aluminium Combine, a companyincorporated in Ukraine, in which the Company indirectlyholds a 97.55% interest
DEFINITIONS
— 344 —
The following is a glossary of technical terms used in this document.
“alumina” An aluminium oxide, a white or nearly colourlesscrystalline substance that is used as a starting material forthe smelting of aluminium. It also serves as the rawmaterial for a broad range of advanced ceramic productsand as an active agent in chemical processing.
“anode” A positive terminal or electrode of an electrolytic cell atwhich oxidation occurs.
“anode paste” Made from calcined petroleum coke or calcined coal tarcoke and electrode grade coal tar pitch. Usually is used tofill Söderberg anodes and form anode blocks for furtherbaking.
“bauxite” A mineral, a mixture of hydrated aluminium oxides usuallycontaining oxides of iron and silicon in varying quantities,characteristically composed of small, round concretions.
“Bayer Process” A method of producing alumina from bauxite by extractingit with a sodium hydroxide solution. The modern version ofthe process (developed in the 1880s) maintains the four keysteps of digestion, clarification, precipitation, andcalcination to produce alumina.
“billet” A piece of semi-finished aluminium nearly square insection made by rolling an ingot or bloom.
“calcinations” The process of heating a substance, but below its meltingpoint, causing a loss of moisture, oxidation and conversioninto powder or lime. The reaction also causes thedecomposition of carbonates.
“cathode” A negative terminal or electrode through which electronsenter a direct current load, such as an electrolytic cell or anelectron tube, and the positive terminal of a battery or othersource of electrical energy through which they return.
“cathode block” Rectangular shaped block with a specially shaped slotproduced from anthracite and/or graphite that is utilised forconstruction of reduction cell cathodes.
“cell” In aluminium production the electrolytic reduction cell,commonly called a “pot” in which alumina dissolved inmolten cryolite is reduced to metallic aluminium. A seriesof cells connected electrically is called a “potline” (seebelow).
“coke” Solid residue remaining after certain types of bituminouscoals are heated to a high temperature out of contact withair until substantially all of the volatile constituents havebeen burnt off.
GLOSSARY OF TECHNICAL TERMS
— 345 —
“Horizontal Stud Söderberg cell” or”HSS”
A Söderberg cell where electrical connections to the anodeare made by a number of horizontal steel studs, baked intothe carbon anode body.
“Indicated Mineral Resource” The part of a Mineral Resource for which tonnage,densities, shape, physical characteristics, grade andmineral content can be estimated with a reasonable level ofconfidence. It is based on exploration, sampling and testinginformation gathered through appropriate techniques fromlocations such as outcrops, trenches, pits, workings anddrill holes. The locations are too widely or inappropriatelyspaced to confirm geological and/or grade continuity butare spaced closely enough for continuity to be assumed.
“Inferred Mineral Resource” A Mineral Resource for which tonnage, grade and mineralcontent can be estimated with a low level of confidence. Itis inferred from geological evidence and assumed but notverified geological and/or grade continuity. It is based oninformation gathered through appropriate techniques fromlocations such as outcrops, trenches, pits, workings anddrill holes which may be limited or of uncertain quality andreliability.
“JORC” Joint Ore Reserves Committee of the Australasian Instituteof Mining and Metallurgy; Australasian Institute ofGeoscientists and the Minerals Council of Australia.
“JORC Code” The Australasian Code for Reporting of ExplorationResults, Mineral Resources and Ore Reserves (December2004) published by JORC.
“kA” Kilo Amperes.
“kWh” Kilowatt-hour.
“Measured Mineral Resource” A Mineral Resource for which tonnage, densities, shape,physical characteristics, grade and mineral content can beestimated with a high level of confidence. It is based ondetailed and reliable exploration, sampling and testinginformation gathered through appropriate techniques fromlocations such as outcrops, trenches, pits, workings anddrill holes. The locations are spaced closely enough toconfirm geological and grade continuity.
GLOSSARY OF TECHNICAL TERMS
— 346 —
“Mineral Resource” A concentration or occurrence of material of intrinsiceconomic interest in or on the earth’s crust in such form,quality and quantity that there are reasonable prospects foreventual economic extraction. The location, quantity,grade, geological characteristics and continuity of aMineral Resource are known, estimated or interpreted fromspecific geological evidence and knowledge. MineralResources are sub-divided, in order of increasinggeological confidence, into Inferred, Indicated andMeasured categories.
“MW” Megawatt.
“nepheline” A hexagonal mineral that is a usually glassy crystallinesilicate of sodium, potassium and aluminium common inigneous rocks.
“Nepheline Process” A method of producing alumina from nepheline ore, asodium/potassium alumino-silicate. The Nepheline Processis a variation on the Sintering Process. Nepheline ore isfirst sintered with limestone. The resulting sinter cake iscrushed, ground and leached, and alumina hydrateprecipitated by carbonation. The alumina hydrate iswashed, dried and calcined to produce alumina.
“Ore Reserve” The economically mineable part of a Measured and/orIndicated Mineral Resource. It includes diluting materialsand allowances for losses, which may occur when thematerial is mined. Appropriate assessments and studieshave been carried out, and include consideration of andmodification by realistically assumed mining,metallurgical, economic, marketing, legal, environmental,social and governmental factors. These assessmentsdemonstrate at the time of reporting that extraction couldreasonably be justified. Ore Reserves are sub-divided inorder of increasing confidence into Probable Ore Reservesand Proved Ore Reserves.
“pitch” A black or dark viscous substance obtained as a residue inthe distillation of organic materials and especially tars.
“Point Feeded Pre-Bake cell” or“PFPB”
A cell utilising pre-baked anodes during the reductionprocess, which is equipped with special systems consistingof point breakers and feeders which feed the cell withalumina according to a predefined algorithm.
“potline” A single, discrete group of electrolytic reduction cellselectrically connected in series, in which alumina isreduced to form aluminium.
“potroom” A building unit combining a group of electrolytic cells inwhich aluminium is produced.
GLOSSARY OF TECHNICAL TERMS
— 347 —
“pre-bake” A method of primary aluminium reduction using an anodethat was baked in an anode-baking furnace, which isintroduced into the top of the reduction cell and consumedas part of the reduction process.
“pre-baked anode” An anode (usually rectangular in shape) produced fromcalcined petroleum coke and coal tar pitch and baked in ananode-baking furnace.
“Probable Ore Reserve” The economically mineable part of an Indicated, and insome circumstances, a Measured Mineral Resource. Itincludes diluting materials and allowances for losses whichmay occur when the material is mined. Appropriateassessments and studies have been carried out, and includeconsideration of and modification by realistically assumedmining, metallurgical, economic, marketing, legal,environmental, social and governmental factors. Theseassessments demonstrate at the time of reporting thatextraction could reasonably be justified.
“Proved Ore Reserve” The economically mineable part of a Measured MineralResource. It includes diluting materials and allowances forlosses which may occur when the material is mined.Appropriate assessments and studies have been carried out,and include consideration of and modification byrealistically assumed mining, metallurgical, economic,marketing, legal, environmental, social and governmentalfactors. These assessments demonstrate at the time ofreporting that extraction could reasonably be justified.
“rod” Round, thin semi-finished aluminium length that is rolledfrom a billet and coiled for further processing.
“Side-Worked Pre-Bake cell” or“SWPB”
A cell wing pre-based anodes during the reduction process,which has anodes spaced down the centre of the pot wherealumina feeding and other cell activities are performedalong the longitudinal sides of the cell
“Sintering Process” A method of producing alumina from bauxite containinghigh silica content. The ore is sintered (roasted) withlimestone, and the resulting sinter cake is crushed, groundand leached, and alumina hydrate precipitated bycarbonation. The alumina hydrate is washed, dried andcalcined to produce alumina.
“Söderberg” A method of primary aluminium reduction using aself-baked anode that utilises the heat of the reductionprocess in a cell that is introduced into the top of thereduction cell in the form of anode paste and consumed aspart of the reduction process.
“Vertical Stud Söderberg cell” or“VSS”
A Söderberg cell where electrical connections to the anodeare made by a number of vertical steel studs, baked into thecarbon anode body.
GLOSSARY OF TECHNICAL TERMS
— 348 —

The following is the text of a report, prepared for the purpose of inclusion in this prospectus,received from the joint reporting accountants, ZAO KPMG, Member of the Chamber of Auditors ofRussia, and KPMG, Certified Public Accountants, Hong Kong.
ZAO KPMGNaberezhnaya Tower ComplexBlock C10 Presnenskaya NaberezhnayaMoscow 123317Russia
KPMG8th FloorPrince’s Building10 Chater RoadCentralHong Kong
31 December 2009
The DirectorsUnited Company RUSAL Limited
BNP Paribas Capital (Asia Pacific) LimitedCredit Suisse (Hong Kong) Limited
Dear Sirs
Introduction
We set out below our report on the financial information relating to United Company RUSAL Limited(the “Company”) and its subsidiaries (hereinafter collectively referred to as the “Group”), includingthe consolidated income statements, the consolidated statements of comprehensive income, theconsolidated statements of changes in equity and the consolidated cash flow statements of the Group,for each of the years ended 31 December 2006, 2007 and 2008 and the six months ended 30 June 2009(the “Relevant Period”), the consolidated balance sheets of the Group as at 31 December 2006, 2007and 2008 and 30 June 2009 and the balance sheets of the Company as at 31 December 2006, 2007 and2008 and 30 June 2009 together with the notes thereto (the “Financial Information”) for inclusion inthe prospectus of the Company dated 31 December 2009 (the “Prospectus”).
The Company is a limited liability company incorporated under the Laws of Jersey on 26 October2006. Pursuant to a group reorganisation completed on 27 March 2007 as further described in SectionA below, the Company became the holding company of the Group.
Details of the principal subsidiaries, in which the Company has direct and indirect interests as at 30June 2009 and the names of the respective auditors, are set out in note 36 of Section C. The Companyand its subsidiaries have adopted 31 December as their financial year end date. The statutory financialstatements of the Company and principal subsidiaries were prepared in accordance with InternationalFinancial Reporting Standards (“IFRSs”) or the relevant accounting rules and regulations applicableto entities in the countries in which they were incorporated.
APPENDIX I ACCOUNTANTS’ REPORT
— I-1 —
3rd Sch31,32, 33
App1A-29(1)
Basis of preparation
The directors of the Company have prepared the consolidated financial statements of the Group forthe Relevant Period and the balance sheets of the Company as at 31 December 2006, 2007 and 2008and 30 June 2009 in accordance with IFRSs (the “underlying Financial Statements”). The underlyingFinancial Statements for each of the years ended 31 December 2006, 2007 and 2008 and the six monthsended 30 June 2009 and the balance sheets of the Company as at 31 December 2006, 2007 and 2008and 30 June 2009 were audited by ZAO KPMG in accordance with International Standards onAuditing.
The Financial Information has been prepared by the directors of the Company based on the underlyingFinancial Statements, after making such adjustments as are appropriate, including those adjustmentsto comply with the disclosure requirements of the Hong Kong Companies Ordinance and theapplicable disclosure provisions of the Rules Governing the Listing of Securities on The StockExchange of Hong Kong Limited (“the Listing Rules”), and on the basis set out in Section A below.
Respective responsibilities of directors and reporting accountants
The directors of the Company are responsible for the preparation and true and fair presentation of theFinancial Information in accordance with IFRSs. This responsibility includes designing, implementingand maintaining internal controls relevant to the preparation and the true and fair presentation of theFinancial Information that is free from material misstatement, whether due to fraud or error; selectingand applying appropriate accounting policies; and making accounting estimates that are reasonable inthe circumstances.
Our responsibility is to form an opinion on the Financial Information based on our procedures.
Basis of opinion
As a basis for forming an opinion on the Financial Information, for the purpose of this report, we havecarried out appropriate procedures as we considered necessary in accordance with Auditing Guideline“Prospectuses and the Reporting Accountant” (Statement 3.340) issued by the Hong Kong Institute ofCertified Public Accountants (the “HKICPA”).
We have not audited any financial statements of the companies comprising the Group in respect of anyperiod subsequent to 30 June 2009.
Opinion
In our opinion, for the purpose of this report, all adjustments considered necessary have been madeand the Financial Information, on the basis of presentation set out in Section A below and inaccordance with the accounting policies set out in Section C below, gives a true and fair view of theGroup’s consolidated results and cash flows for the Relevant Period, and the state of affairs of theGroup and the Company as at 31 December 2006, 2007 and 2008 and 30 June 2009.
APPENDIX I ACCOUNTANTS’ REPORT
— I-2 —
Corresponding financial information
For the purpose of this report, we have also reviewed the unaudited corresponding interim financialinformation of the Group comprising the consolidated income statement, the consolidated statementof comprehensive income, the consolidated statement of changes in equity and the consolidated cashflow statement for the six months ended 30 June 2008 (the “Corresponding Financial Information”),for which the directors are responsible, in accordance with International Standard on ReviewEngagements 2410 “Review of Interim Financial Information Performed by the Independent Auditorof the Entity” issued by the International Auditing and Assurance Standards Board. Our responsibilityis to express a conclusion on the Corresponding Financial Information based on our review.
A review consists of making enquiries, primarily of persons responsible for financial and accountingmatters, and applying analytical and other review procedures. A review is substantially less in scopethan an audit conducted in accordance with International Standards on Auditing and consequently doesnot enable us to obtain assurance that we would become aware of all significant matters that mightbe identified in an audit. Accordingly, we do not express an audit opinion on the CorrespondingFinancial Information.
Based on our review, for the purpose of this report, nothing has come to our attention that causes usto believe that the Corresponding Financial Information is not prepared, in all material respects, inaccordance with the same basis adopted in respect of the Financial Information.
APPENDIX I ACCOUNTANTS’ REPORT
— I-3 —
A BASIS OF PRESENTATION
United Company RUSAL Limited (the “Company” or “UC RUSAL”) was established by thecontrolling shareholder of RUSAL Limited (“RUSAL”) as a limited liability company under thelaws of Jersey on 26 October 2006. On 27 March 2007, the Company (which had no business orassets of its own) became the holding company of the Group through transfer of the interest inRUSAL from the controlling shareholder and the acquisitions of SUAL International Limited(“SUAL”) and the alumina and aluminium businesses of Glencore International AG (the“Glencore Businesses”) from third parties. For accounting and financial reporting purposes, thistransaction has been treated as follows:
• The formation of the Company and its acquisition of RUSAL is considered to be anon-substantive transaction, meaning that the Group’s consolidated financial informationprior to 27 March 2007 is that of RUSAL and that the financial information of the Grouphas been prepared as if the combination of the Company and RUSAL had taken place on1 January 2006; and
• The acquisition by the Company of SUAL and the Glencore Businesses is treated as apurchase of these entities on 27 March 2007.
Further details relating to this acquisition are provided in note 5 of Section C.
Intra-group balances and transactions and any unrealised profits arising from intra-grouptransactions are eliminated in full in preparing the Financial Information. Unrealised lossesresulting from intra-group transactions are eliminated in the same way as unrealised gains butonly to the extent that there is no evidence of impairment.
Details of the principal subsidiaries, in which the Company has direct and indirect interests asat 30 June 2009, are set out in note 36 of Section C of this report.
APPENDIX I ACCOUNTANTS’ REPORT
— I-4 —
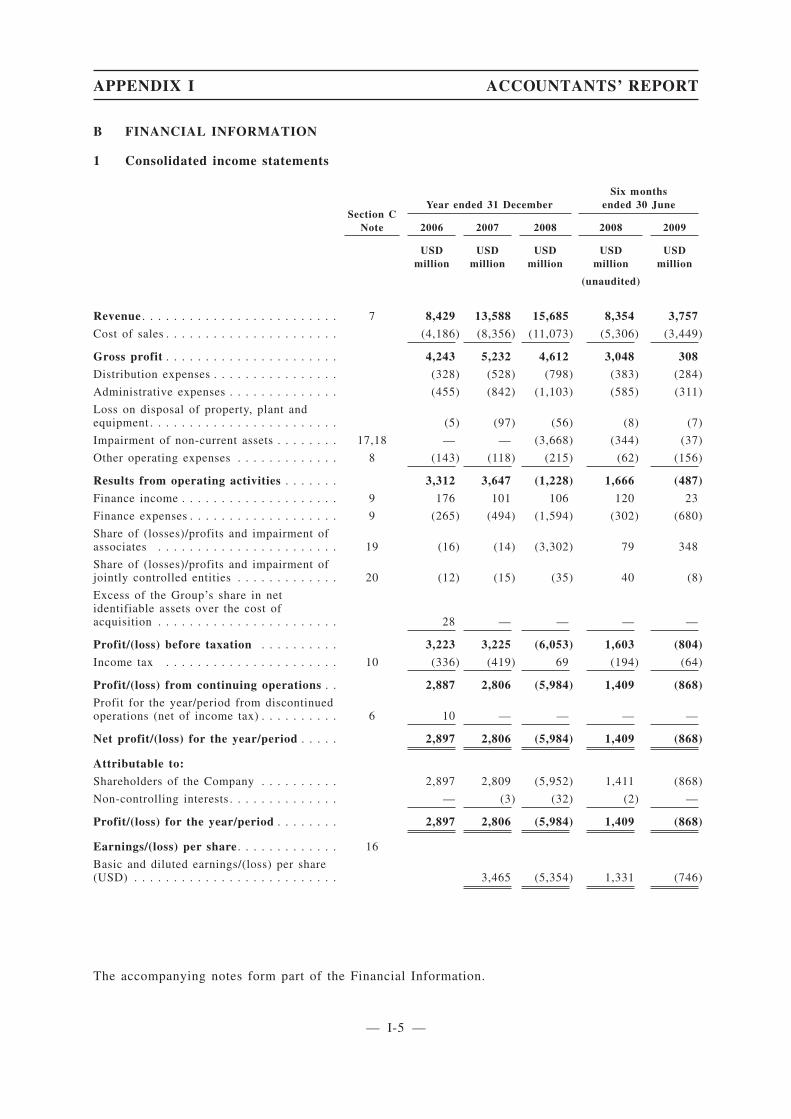
B FINANCIAL INFORMATION
1 Consolidated income statements
Section CNote
Year ended 31 DecemberSix months
ended 30 June
2006 2007 2008 2008 2009
USDmillion
USDmillion
USDmillion
USDmillion
USDmillion
(unaudited)
Revenue . . . . . . . . . . . . . . . . . . . . . . . . . 7 8,429 13,588 15,685 8,354 3,757
Cost of sales . . . . . . . . . . . . . . . . . . . . . . (4,186) (8,356) (11,073) (5,306) (3,449)
Gross profit . . . . . . . . . . . . . . . . . . . . . . 4,243 5,232 4,612 3,048 308
Distribution expenses . . . . . . . . . . . . . . . . (328) (528) (798) (383) (284)
Administrative expenses . . . . . . . . . . . . . . (455) (842) (1,103) (585) (311)
Loss on disposal of property, plant andequipment . . . . . . . . . . . . . . . . . . . . . . . . (5) (97) (56) (8) (7)
Impairment of non-current assets . . . . . . . . 17,18 — — (3,668) (344) (37)
Other operating expenses . . . . . . . . . . . . . 8 (143) (118) (215) (62) (156)
Results from operating activities . . . . . . . 3,312 3,647 (1,228) 1,666 (487)
Finance income . . . . . . . . . . . . . . . . . . . . 9 176 101 106 120 23
Finance expenses . . . . . . . . . . . . . . . . . . . 9 (265) (494) (1,594) (302) (680)
Share of (losses)/profits and impairment ofassociates . . . . . . . . . . . . . . . . . . . . . . . 19 (16) (14) (3,302) 79 348
Share of (losses)/profits and impairment ofjointly controlled entities . . . . . . . . . . . . . 20 (12) (15) (35) 40 (8)
Excess of the Group’s share in netidentifiable assets over the cost ofacquisition . . . . . . . . . . . . . . . . . . . . . . . 28 — — — —
Profit/(loss) before taxation . . . . . . . . . . 3,223 3,225 (6,053) 1,603 (804)
Income tax . . . . . . . . . . . . . . . . . . . . . . 10 (336) (419) 69 (194) (64)
Profit/(loss) from continuing operations . . 2,887 2,806 (5,984) 1,409 (868)
Profit for the year/period from discontinuedoperations (net of income tax) . . . . . . . . . . 6 10 — — — —
Net profit/(loss) for the year/period . . . . . 2,897 2,806 (5,984) 1,409 (868)
Attributable to:
Shareholders of the Company . . . . . . . . . . 2,897 2,809 (5,952) 1,411 (868)
Non-controlling interests . . . . . . . . . . . . . . — (3) (32) (2) —
Profit/(loss) for the year/period . . . . . . . . 2,897 2,806 (5,984) 1,409 (868)
Earnings/(loss) per share . . . . . . . . . . . . . 16
Basic and diluted earnings/(loss) per share(USD) . . . . . . . . . . . . . . . . . . . . . . . . . . 3,465 (5,354) 1,331 (746)
The accompanying notes form part of the Financial Information.
APPENDIX I ACCOUNTANTS’ REPORT
— I-5 —
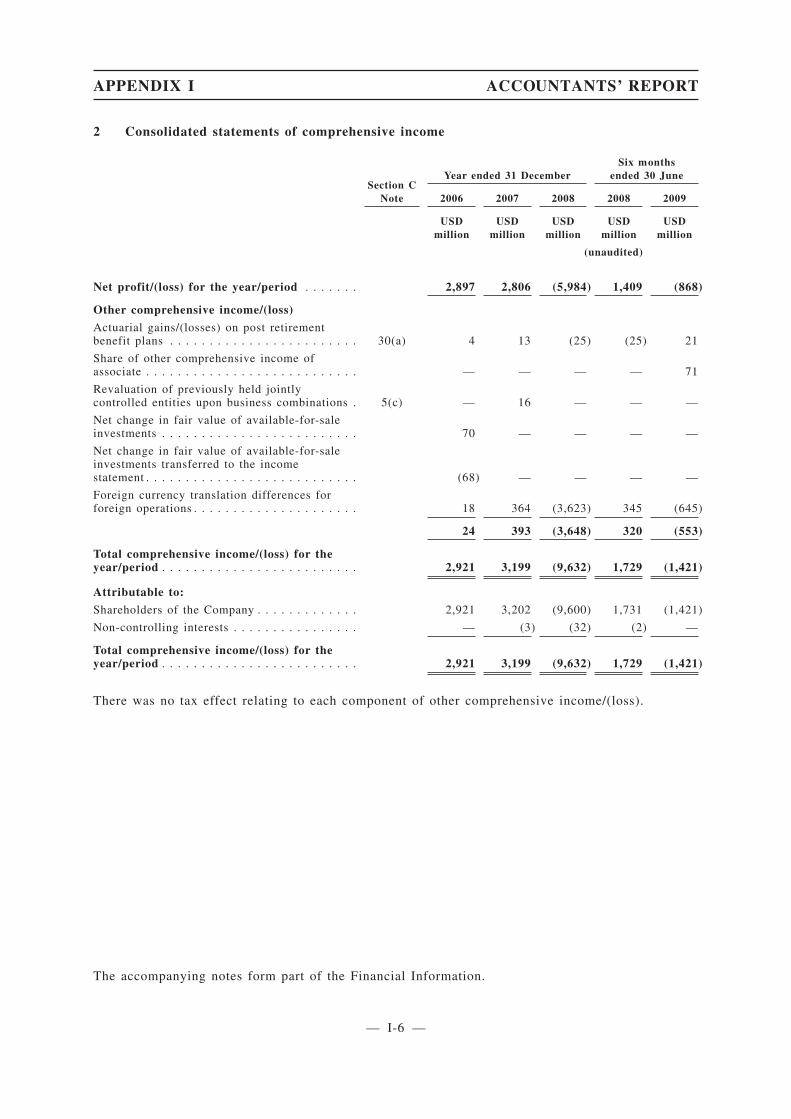
2 Consolidated statements of comprehensive income
Section CNote
Year ended 31 DecemberSix months
ended 30 June
2006 2007 2008 2008 2009
USDmillion
USDmillion
USDmillion
USDmillion
USDmillion
(unaudited)
Net profit/(loss) for the year/period . . . . . . . 2,897 2,806 (5,984) 1,409 (868)
Other comprehensive income/(loss)
Actuarial gains/(losses) on post retirementbenefit plans . . . . . . . . . . . . . . . . . . . . . . . . 30(a) 4 13 (25) (25) 21
Share of other comprehensive income ofassociate . . . . . . . . . . . . . . . . . . . . . . . . . . . — — — — 71
Revaluation of previously held jointlycontrolled entities upon business combinations . 5(c) — 16 — — —
Net change in fair value of available-for-saleinvestments . . . . . . . . . . . . . . . . . . . . . . . . . 70 — — — —
Net change in fair value of available-for-saleinvestments transferred to the incomestatement . . . . . . . . . . . . . . . . . . . . . . . . . . . (68) — — — —
Foreign currency translation differences forforeign operations . . . . . . . . . . . . . . . . . . . . . 18 364 (3,623) 345 (645)
24 393 (3,648) 320 (553)
Total comprehensive income/(loss) for theyear/period . . . . . . . . . . . . . . . . . . . . . . . . . 2,921 3,199 (9,632) 1,729 (1,421)
Attributable to:
Shareholders of the Company . . . . . . . . . . . . . 2,921 3,202 (9,600) 1,731 (1,421)
Non-controlling interests . . . . . . . . . . . . . . . . — (3) (32) (2) —
Total comprehensive income/(loss) for theyear/period . . . . . . . . . . . . . . . . . . . . . . . . . 2,921 3,199 (9,632) 1,729 (1,421)
There was no tax effect relating to each component of other comprehensive income/(loss).
The accompanying notes form part of the Financial Information.
APPENDIX I ACCOUNTANTS’ REPORT
— I-6 —

3 Consolidated balance sheets
Section CNote
31 December30 June
20092006 2007 2008
USDmillion
USDmillion
USDmillion
USDmillion
ASSETS
Non-current assets
Property, plant and equipment. . . . . . . . . . . . . . . . . . . 17 4,514 10,429 6,602 6,201
Intangible assets . . . . . . . . . . . . . . . . . . . . . . . . . . . . 18 1,342 4,895 4,187 4,044
Interests in associates . . . . . . . . . . . . . . . . . . . . . . . . 19 442 443 7,536 7,566
Interests in jointly controlled entities. . . . . . . . . . . . . . 20 127 219 506 502
Financial investments . . . . . . . . . . . . . . . . . . . . . . . . 21 — 606 — —
Loans to related parties . . . . . . . . . . . . . . . . . . . . . . . — 2 — —
Deferred tax assets . . . . . . . . . . . . . . . . . . . . . . . . . . 23 33 105 59 44
Other non-current assets . . . . . . . . . . . . . . . . . . . . . . 182 63 43 51
Total non-current assets . . . . . . . . . . . . . . . . . . . . . . 6,640 16,762 18,933 18,408
Current assets
Inventories. . . . . . . . . . . . . . . . . . . . . . . . . . . . . . . . 24 1,378 2,883 2,938 2,159
Loans to related parties . . . . . . . . . . . . . . . . . . . . . . . 39 7 — —
Trade and other receivables . . . . . . . . . . . . . . . . . . . . 25 954 2,150 1,426 1,388
Cash and cash equivalents . . . . . . . . . . . . . . . . . . . . . 26 241 261 708 264
Total current assets . . . . . . . . . . . . . . . . . . . . . . . . . 2,612 5,301 5,072 3,811
Total assets . . . . . . . . . . . . . . . . . . . . . . . . . . . . . . . 9,252 22,063 24,005 22,219
The accompanying notes form part of the Financial Information.
APPENDIX I ACCOUNTANTS’ REPORT
— I-7 —
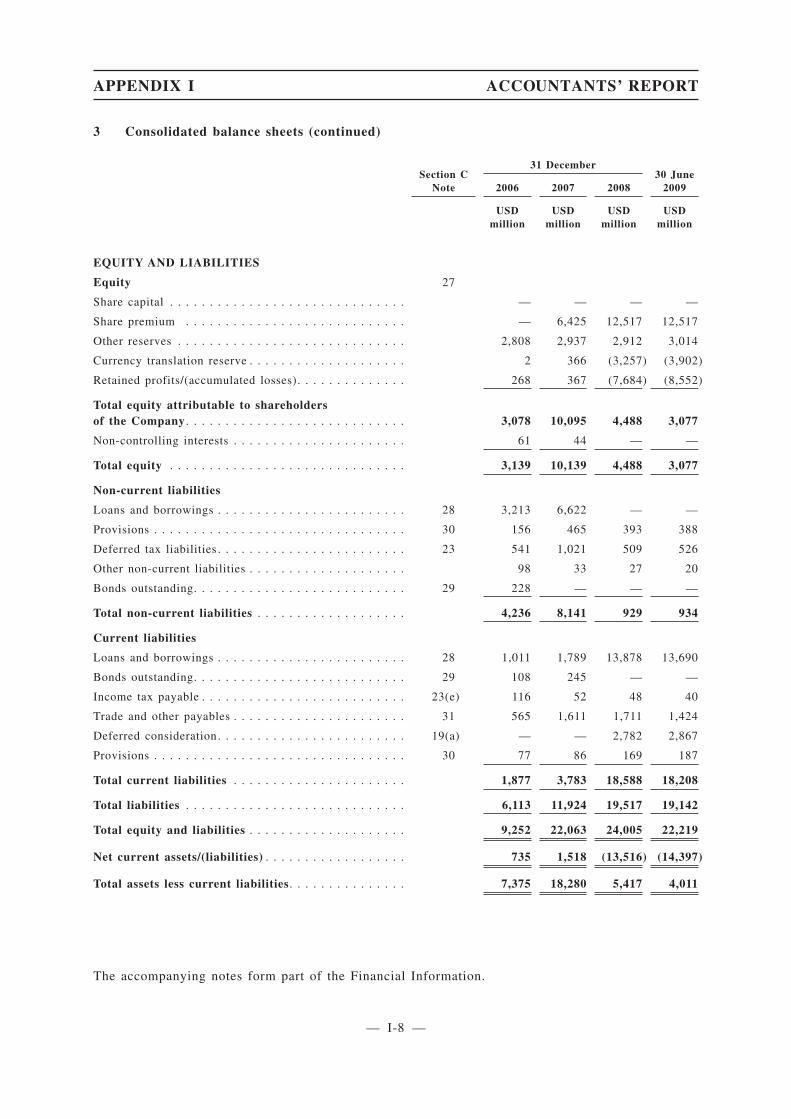
3 Consolidated balance sheets (continued)
Section CNote
31 December30 June
20092006 2007 2008
USDmillion
USDmillion
USDmillion
USDmillion
EQUITY AND LIABILITIES
Equity 27
Share capital . . . . . . . . . . . . . . . . . . . . . . . . . . . . . . — — — —
Share premium . . . . . . . . . . . . . . . . . . . . . . . . . . . . — 6,425 12,517 12,517
Other reserves . . . . . . . . . . . . . . . . . . . . . . . . . . . . . 2,808 2,937 2,912 3,014
Currency translation reserve . . . . . . . . . . . . . . . . . . . . 2 366 (3,257) (3,902)
Retained profits/(accumulated losses). . . . . . . . . . . . . . 268 367 (7,684) (8,552)
Total equity attributable to shareholdersof the Company . . . . . . . . . . . . . . . . . . . . . . . . . . . . 3,078 10,095 4,488 3,077
Non-controlling interests . . . . . . . . . . . . . . . . . . . . . . 61 44 — —
Total equity . . . . . . . . . . . . . . . . . . . . . . . . . . . . . . 3,139 10,139 4,488 3,077
Non-current liabilities
Loans and borrowings . . . . . . . . . . . . . . . . . . . . . . . . 28 3,213 6,622 — —
Provisions . . . . . . . . . . . . . . . . . . . . . . . . . . . . . . . . 30 156 465 393 388
Deferred tax liabilities . . . . . . . . . . . . . . . . . . . . . . . . 23 541 1,021 509 526
Other non-current liabilities . . . . . . . . . . . . . . . . . . . . 98 33 27 20
Bonds outstanding. . . . . . . . . . . . . . . . . . . . . . . . . . . 29 228 — — —
Total non-current liabilities . . . . . . . . . . . . . . . . . . . 4,236 8,141 929 934
Current liabilities
Loans and borrowings . . . . . . . . . . . . . . . . . . . . . . . . 28 1,011 1,789 13,878 13,690
Bonds outstanding. . . . . . . . . . . . . . . . . . . . . . . . . . . 29 108 245 — —
Income tax payable . . . . . . . . . . . . . . . . . . . . . . . . . . 23(e) 116 52 48 40
Trade and other payables . . . . . . . . . . . . . . . . . . . . . . 31 565 1,611 1,711 1,424
Deferred consideration. . . . . . . . . . . . . . . . . . . . . . . . 19(a) — — 2,782 2,867
Provisions . . . . . . . . . . . . . . . . . . . . . . . . . . . . . . . . 30 77 86 169 187
Total current liabilities . . . . . . . . . . . . . . . . . . . . . . 1,877 3,783 18,588 18,208
Total liabilities . . . . . . . . . . . . . . . . . . . . . . . . . . . . 6,113 11,924 19,517 19,142
Total equity and liabilities . . . . . . . . . . . . . . . . . . . . 9,252 22,063 24,005 22,219
Net current assets/(liabilities) . . . . . . . . . . . . . . . . . . 735 1,518 (13,516) (14,397)
Total assets less current liabilities. . . . . . . . . . . . . . . 7,375 18,280 5,417 4,011
The accompanying notes form part of the Financial Information.
APPENDIX I ACCOUNTANTS’ REPORT
— I-8 —
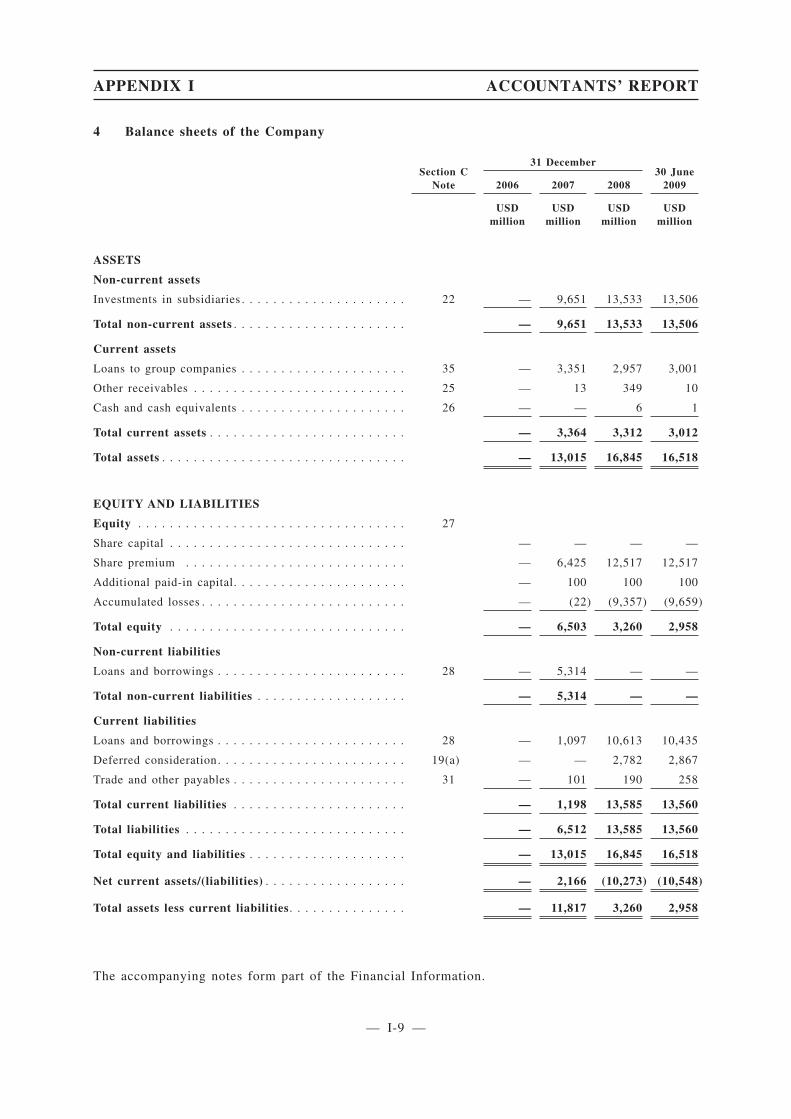
4 Balance sheets of the Company
Section CNote
31 December30 June
20092006 2007 2008
USDmillion
USDmillion
USDmillion
USDmillion
ASSETS
Non-current assets
Investments in subsidiaries . . . . . . . . . . . . . . . . . . . . . 22 — 9,651 13,533 13,506
Total non-current assets . . . . . . . . . . . . . . . . . . . . . . — 9,651 13,533 13,506
Current assets
Loans to group companies . . . . . . . . . . . . . . . . . . . . . 35 — 3,351 2,957 3,001
Other receivables . . . . . . . . . . . . . . . . . . . . . . . . . . . 25 — 13 349 10
Cash and cash equivalents . . . . . . . . . . . . . . . . . . . . . 26 — — 6 1
Total current assets . . . . . . . . . . . . . . . . . . . . . . . . . — 3,364 3,312 3,012
Total assets . . . . . . . . . . . . . . . . . . . . . . . . . . . . . . . — 13,015 16,845 16,518
EQUITY AND LIABILITIES
Equity . . . . . . . . . . . . . . . . . . . . . . . . . . . . . . . . . . 27
Share capital . . . . . . . . . . . . . . . . . . . . . . . . . . . . . . — — — —
Share premium . . . . . . . . . . . . . . . . . . . . . . . . . . . . — 6,425 12,517 12,517
Additional paid-in capital. . . . . . . . . . . . . . . . . . . . . . — 100 100 100
Accumulated losses . . . . . . . . . . . . . . . . . . . . . . . . . . — (22) (9,357) (9,659)
Total equity . . . . . . . . . . . . . . . . . . . . . . . . . . . . . . — 6,503 3,260 2,958
Non-current liabilities
Loans and borrowings . . . . . . . . . . . . . . . . . . . . . . . . 28 — 5,314 — —
Total non-current liabilities . . . . . . . . . . . . . . . . . . . — 5,314 — —
Current liabilities
Loans and borrowings . . . . . . . . . . . . . . . . . . . . . . . . 28 — 1,097 10,613 10,435
Deferred consideration. . . . . . . . . . . . . . . . . . . . . . . . 19(a) — — 2,782 2,867
Trade and other payables . . . . . . . . . . . . . . . . . . . . . . 31 — 101 190 258
Total current liabilities . . . . . . . . . . . . . . . . . . . . . . — 1,198 13,585 13,560
Total liabilities . . . . . . . . . . . . . . . . . . . . . . . . . . . . — 6,512 13,585 13,560
Total equity and liabilities . . . . . . . . . . . . . . . . . . . . — 13,015 16,845 16,518
Net current assets/(liabilities) . . . . . . . . . . . . . . . . . . — 2,166 (10,273) (10,548)
Total assets less current liabilities. . . . . . . . . . . . . . . — 11,817 3,260 2,958
The accompanying notes form part of the Financial Information.
APPENDIX I ACCOUNTANTS’ REPORT
— I-9 —

5 Consolidated statements of changes in equity
Section CNote
Attributable to the shareholders of the Company
Sharecapital
Sharepremium
Otherreserves
Currencytranslation
reserve
Retained profits/(accumulated
losses) Total
Non-controlling
interestsTotal
equity
USDmillion
USDmillion
USDmillion USD million
USDmillion
USDmillion USD million
USDmillion
Balance at 1 January 2006 . . — — 2,803 (16) 1,446 4,233 43 4,276
Total comprehensive incomefor the year . . . . . . . . . — — 6 18 2,897 2,921 — 2,921
Acquisition of non-controllinginterest . . . . . . . . . . . — — — — — — (40) (40)
Acquisition of subsidiaries. . . 5(a) — — — — — — 61 61
Transfer to other reserves uponcapitalisation . . . . . . . . . — — 11 — (11) — — —
Distributions to shareholders . . 27(e) — — (12) — (313) (325) (3) (328)
Dividends to shareholders . . . 15 — — — — (3,751) (3,751) — (3,751)
Balance at 31 December 2006 . — — 2,808 2 268 3,078 61 3,139
Balance at 1 January 2007 . . — — 2,808 2 268 3,078 61 3,139
Total comprehensive incomefor the year . . . . . . . . . — — 29 364 2,809 3,202 (3) 3,199
Shares issue for acquisition ofsubsidiaries . . . . . . . . . — 6,425 — — — 6,425 (14) 6,411
Capital contribution fromshareholders . . . . . . . . . 5(c) — — 100 — — 100 — 100
Distributions to shareholders . . 27(e) — — — — (210) (210) — (210)
Dividends to shareholders . . . 15 — — — — (2,500) (2,500) — (2,500)
Balance at 31 December 2007 . — 6,425 2,937 366 367 10,095 44 10,139
The accompanying notes form part of the Financial Information.
APPENDIX I ACCOUNTANTS’ REPORT
— I-10 —

Section CNote
Attributable to the shareholders of the Company
Sharecapital
Sharepremium
Otherreserves
Currencytranslation
reserve
Retained profits/(accumulated
losses) Total
Non-controlling
interestsTotal
equity
USDmillion
USDmillion
USDmillion USD million
USDmillion
USDmillion USD million
USDmillion
Balance at 1 January 2008 . . — 6,425 2,937 366 367 10,095 44 10,139
Total comprehensive loss forthe year . . . . . . . . . . . — — (25) (3,623) (5,952) (9,600) (32) (9,632)
Shares issue for acquisition ofassociates . . . . . . . . . . 19 — 6,092 — — — 6,092 — 6,092
Acquisition of non-controllinginterest . . . . . . . . . . . — — — — — — (12) (12)
Dividends to shareholders . . . 15 — — — — (2,099) (2,099) — (2,099)
Balance at 31 December 2008 . — 12,517 2,912 (3,257) (7,684) 4,488 — 4,488
Balance at 1 January 2009 . . — 12,517 2,912 (3,257) (7,684) 4,488 — 4,488
Total comprehensive loss forthe period . . . . . . . . . . — — 92 (645) (868) (1,421) — (1,421)
Other changes resulting fromtransactions with entities undercommon control . . . . . . . — — 10 — — 10 — 10
Balance at 30 June 2009 . . . — 12,517 3,014 (3,902) (8,552) 3,077 — 3,077
Section CNote
Attributable to the shareholders of the Company
Sharecapital
Sharepremium
Otherreserves
Currencytranslation
reserve
Retained profits/(accumulated
losses) Total
Non-controlling
interestsTotal
equity
USDmillion
USDmillion
USDmillion USD million
USDmillion
USDmillion USD million
USDmillion
(Unaudited) (Unaudited) (Unaudited) (Unaudited) (Unaudited) (Unaudited) (Unaudited) (Unaudited)
Balance at 1 January 2008 . . — 6,425 2,937 366 367 10,095 44 10,139
Total comprehensive incomefor the period . . . . . . . . — — (25) 345 1,411 1,731 (2) 1,729
Shares issue for acquisition ofassociates . . . . . . . . . . 19 — 6,092 — — — 6,092 — 6,092
Acquisition of non-controllinginterest . . . . . . . . . . . — — — — — — (12) (12)
Dividends to shareholders . . . 15 — — — — (1,203) (1,203) — (1,203)
Balance at 30 June 2008 . . . — 12,517 2,912 711 575 16,715 30 16,745
The accompanying notes form part of the Financial Information.
APPENDIX I ACCOUNTANTS’ REPORT
— I-11 —

6 Consolidated cash flow statements
Year ended 31 DecemberSix months
ended 30 June
2006 2007 2008 2008 2009
USDmillion
USDmillion
USDmillion
USDmillion
USDmillion
(unaudited)
OPERATING ACTIVITIESNet profit/(loss) for the year/period . . . . . . . . . . . . . . . 2,897 2,806 (5,984) 1,409 (868)
Adjustments for:
Depreciation (note 11(b)) . . . . . . . . . . . . . . . . . . . . . . 361 794 914 511 291
Amortisation (note 11(b)) . . . . . . . . . . . . . . . . . . . . . . 2 82 116 56 8
Impairment of non-current assets (notes 17, 18) . . . . . . — — 3,668 344 37
Loss on fair-value adjustment on financial investments(note 21) . . . . . . . . . . . . . . . . . . . . . . . . . . . . . . . . . — — 554 — —
Gain on disposal of financial investments . . . . . . . . . . . — — (42) (42) —
Excess of the Group’s share in net identifiable assetsover the cost of acquisition . . . . . . . . . . . . . . . . . . . . (28) — — — —
Impairment loss of trade and other receivables (note 8) . 21 27 117 3 54
Impairment loss/(reversal of impairment loss) ofinventories . . . . . . . . . . . . . . . . . . . . . . . . . . . . . . . . — 2 339 — (133)
Provision for legal claims (note 8) . . . . . . . . . . . . . . . 23 — 50 — 30
Foreign exchange (gains)/losses . . . . . . . . . . . . . . . . . (1) (16) 119 24 56
Loss on disposal of property, plant and equipment . . . . . 5 97 56 8 7
Loss on disposal of intangible assets . . . . . . . . . . . . . . — — — — 10
Interest expense . . . . . . . . . . . . . . . . . . . . . . . . . . . . 238 466 711 274 501
Interest income. . . . . . . . . . . . . . . . . . . . . . . . . . . . . (54) (36) (41) (21) (19)
Changes in fair value of financial instruments (note 9). . (37) (20) (23) (13) (4)
Income tax expense/(benefit) . . . . . . . . . . . . . . . . . . . 336 419 (69) 194 64
Share of losses/(profits) and impairment of associates(note 19) . . . . . . . . . . . . . . . . . . . . . . . . . . . . . . . . . 16 14 3,302 (79) (348)
Share of losses/(profits) and impairment of jointlycontrolled entities (note 20) . . . . . . . . . . . . . . . . . . . . 12 15 35 (40) 8
Gain from disposal of available-for-sale investments . . . (68) — — — —
3,723 4,650 3,822 2,628 (306)(Increase)/decrease in inventories . . . . . . . . . . . . . . . . (270) (453) (341) (447) 864
(Increase)/decrease in trade and other receivables . . . . . (282) (251) 439 110 (49)
(Increase)/decrease in prepaid expenses and other assets. (48) (22) 17 (3) (20)
Increase/(decrease) in trade and other payables . . . . . . . 71 525 122 26 (294)
Increase/(decrease) in provisions . . . . . . . . . . . . . . . . . 103 (46) (75) (3) (13)
Cash generated from operations . . . . . . . . . . . . . . . . 3,297 4,403 3,984 2,311 182Income taxes paid . . . . . . . . . . . . . . . . . . . . . . . . . . . (254) (561) (368) (228) (6)
Interest paid. . . . . . . . . . . . . . . . . . . . . . . . . . . . . . . (253) (496) (599) (205) (408)
Net cash generated from/(used in) operatingactivities . . . . . . . . . . . . . . . . . . . . . . . . . . . . . . . . . 2,790 3,346 3,017 1,878 (232)
The accompanying notes form part of the Financial Information.
APPENDIX I ACCOUNTANTS’ REPORT
— I-12 —
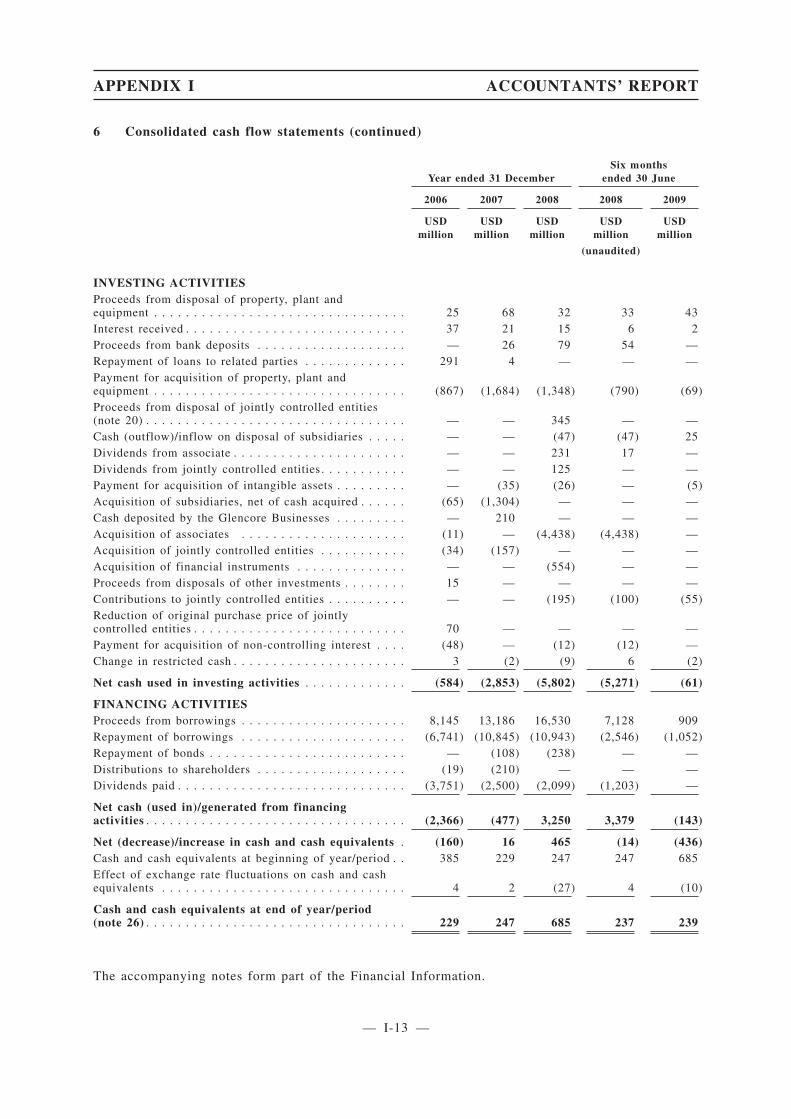
6 Consolidated cash flow statements (continued)
Year ended 31 DecemberSix months
ended 30 June
2006 2007 2008 2008 2009
USDmillion
USDmillion
USDmillion
USDmillion
USDmillion
(unaudited)
INVESTING ACTIVITIESProceeds from disposal of property, plant andequipment . . . . . . . . . . . . . . . . . . . . . . . . . . . . . . . . 25 68 32 33 43Interest received . . . . . . . . . . . . . . . . . . . . . . . . . . . . 37 21 15 6 2Proceeds from bank deposits . . . . . . . . . . . . . . . . . . . — 26 79 54 —Repayment of loans to related parties . . . . . . . . . . . . . 291 4 — — —Payment for acquisition of property, plant andequipment . . . . . . . . . . . . . . . . . . . . . . . . . . . . . . . . (867) (1,684) (1,348) (790) (69)Proceeds from disposal of jointly controlled entities(note 20) . . . . . . . . . . . . . . . . . . . . . . . . . . . . . . . . . — — 345 — —Cash (outflow)/inflow on disposal of subsidiaries . . . . . — — (47) (47) 25Dividends from associate . . . . . . . . . . . . . . . . . . . . . . — — 231 17 —Dividends from jointly controlled entities . . . . . . . . . . . — — 125 — —Payment for acquisition of intangible assets . . . . . . . . . — (35) (26) — (5)Acquisition of subsidiaries, net of cash acquired . . . . . . (65) (1,304) — — —Cash deposited by the Glencore Businesses . . . . . . . . . — 210 — — —Acquisition of associates . . . . . . . . . . . . . . . . . . . . . (11) — (4,438) (4,438) —Acquisition of jointly controlled entities . . . . . . . . . . . (34) (157) — — —Acquisition of financial instruments . . . . . . . . . . . . . . — — (554) — —Proceeds from disposals of other investments . . . . . . . . 15 — — — —Contributions to jointly controlled entities . . . . . . . . . . — — (195) (100) (55)Reduction of original purchase price of jointlycontrolled entities . . . . . . . . . . . . . . . . . . . . . . . . . . . 70 — — — —Payment for acquisition of non-controlling interest . . . . (48) — (12) (12) —Change in restricted cash . . . . . . . . . . . . . . . . . . . . . . 3 (2) (9) 6 (2)
Net cash used in investing activities . . . . . . . . . . . . . (584) (2,853) (5,802) (5,271) (61)
FINANCING ACTIVITIESProceeds from borrowings . . . . . . . . . . . . . . . . . . . . . 8,145 13,186 16,530 7,128 909Repayment of borrowings . . . . . . . . . . . . . . . . . . . . . (6,741) (10,845) (10,943) (2,546) (1,052)Repayment of bonds . . . . . . . . . . . . . . . . . . . . . . . . . — (108) (238) — —Distributions to shareholders . . . . . . . . . . . . . . . . . . . (19) (210) — — —Dividends paid . . . . . . . . . . . . . . . . . . . . . . . . . . . . . (3,751) (2,500) (2,099) (1,203) —
Net cash (used in)/generated from financingactivities . . . . . . . . . . . . . . . . . . . . . . . . . . . . . . . . . (2,366) (477) 3,250 3,379 (143)
Net (decrease)/increase in cash and cash equivalents . (160) 16 465 (14) (436)Cash and cash equivalents at beginning of year/period . . 385 229 247 247 685Effect of exchange rate fluctuations on cash and cashequivalents . . . . . . . . . . . . . . . . . . . . . . . . . . . . . . . 4 2 (27) 4 (10)
Cash and cash equivalents at end of year/period(note 26) . . . . . . . . . . . . . . . . . . . . . . . . . . . . . . . . . 229 247 685 237 239
The accompanying notes form part of the Financial Information.
APPENDIX I ACCOUNTANTS’ REPORT
— I-13 —
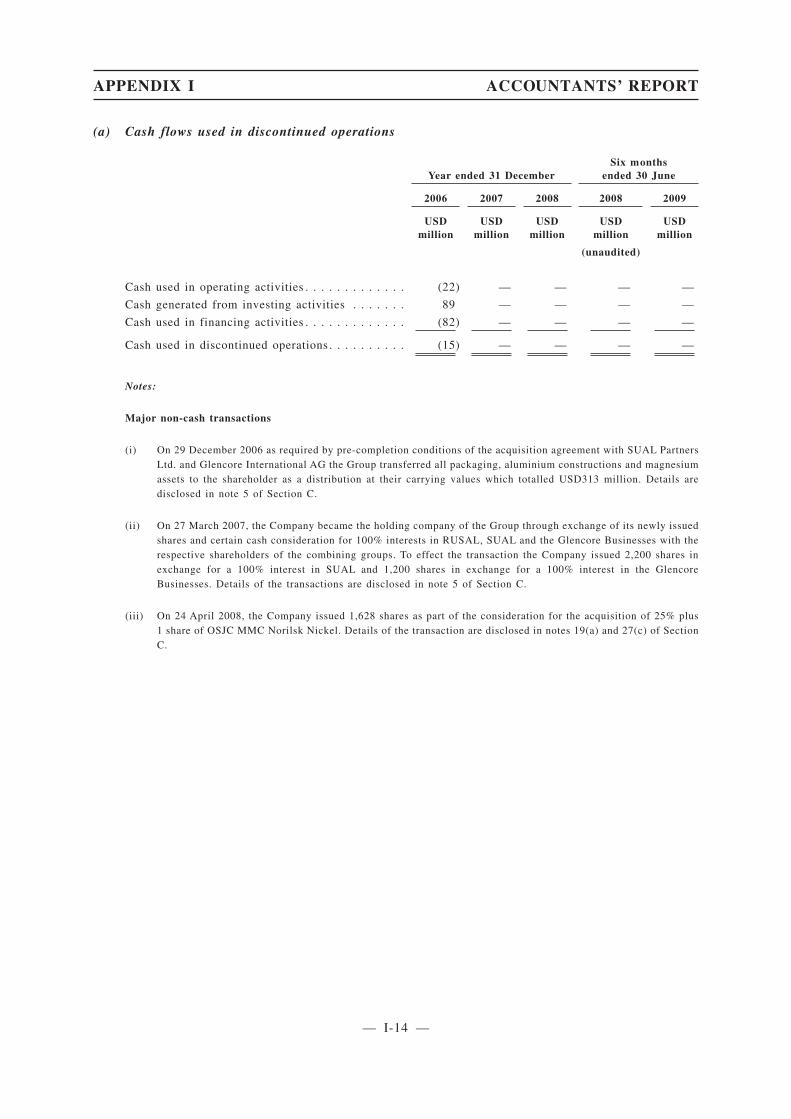
(a) Cash flows used in discontinued operations
Year ended 31 DecemberSix months
ended 30 June
2006 2007 2008 2008 2009
USDmillion
USDmillion
USDmillion
USDmillion
USDmillion
(unaudited)
Cash used in operating activities . . . . . . . . . . . . . (22) — — — —
Cash generated from investing activities . . . . . . . 89 — — — —
Cash used in financing activities . . . . . . . . . . . . . (82) — — — —
Cash used in discontinued operations . . . . . . . . . . (15) — — — —
Notes:
Major non-cash transactions
(i) On 29 December 2006 as required by pre-completion conditions of the acquisition agreement with SUAL PartnersLtd. and Glencore International AG the Group transferred all packaging, aluminium constructions and magnesiumassets to the shareholder as a distribution at their carrying values which totalled USD313 million. Details aredisclosed in note 5 of Section C.
(ii) On 27 March 2007, the Company became the holding company of the Group through exchange of its newly issuedshares and certain cash consideration for 100% interests in RUSAL, SUAL and the Glencore Businesses with therespective shareholders of the combining groups. To effect the transaction the Company issued 2,200 shares inexchange for a 100% interest in SUAL and 1,200 shares in exchange for a 100% interest in the GlencoreBusinesses. Details of the transactions are disclosed in note 5 of Section C.
(iii) On 24 April 2008, the Company issued 1,628 shares as part of the consideration for the acquisition of 25% plus1 share of OSJC MMC Norilsk Nickel. Details of the transaction are disclosed in notes 19(a) and 27(c) of SectionC.
APPENDIX I ACCOUNTANTS’ REPORT
— I-14 —

C NOTES TO THE FINANCIAL INFORMATION
1 Background
(a) Organisation
United Company RUSAL Limited (the “Company” or “UC RUSAL”) was established by thecontrolling shareholder of RUSAL Limited (“RUSAL”) as a limited liability company under thelaws of Jersey on 26 October 2006.
The Company’s registered office is Whiteley Chambers, Don Street, St. Helier, Jersey JE4 9WG,Channel Islands.
The Company directly or through its wholly owned subsidiaries controls a number of productionand trading entities (see note 36) engaged in the aluminium business and other entities, whichtogether with the Company are referred to as “the Group”.
On 27 March 2007, the Company (which had no business or assets of its own) became the holdingcompany of the Group through transfer of the interest in RUSAL from the common controlshareholder and the acquisitions of SUAL International Limited (“SUAL”) and the alumina andaluminium businesses of Glencore International AG (the “Glencore Businesses”) from thirdparties. For accounting purposes, this transaction has been treated as follows:
• The formation of the Company and its acquisition of RUSAL is considered to be anon-substantive transaction, meaning that the Company’s consolidated financial historyprior to 27 March 2007 is that of RUSAL and that the financial information of the Grouphas been prepared as if the combination of the Company and RUSAL had taken place on1 January 2006; and
• The acquisition by the Company of SUAL and the Glencore Businesses is treated as apurchase of these entities on 27 March 2007.
Further details relating to this acquisition are provided in note 5.
In April 2008 the Company issued 1,628 new shares to Onexim Holdings Limited representing14% of the total shares outstanding post issue (refer to note 27). The shares were issued as apartial consideration upon acquisition of 25%+1 share investment in OJSC MMC Norilsk Nickel(refer to note 19).
As at 30 June 2009, the Group is controlled by En+ Group Limited, which holds 56.76% of theCompany’s shares with SUAL Partners Limited, Onexim Holdings Limited and AmokengaHoldings Limited holding 18.92%, 14.00% and 10.32% of the Company’s shares, respectively.
En+ Group Limited is controlled by Mr. Oleg V. Deripaska. SUAL Partners Limited is controlledby Mr. Victor Vekselberg and Mr. Len Blavatnik together. Onexim Holdings Limited is controlledby Mr. Mikhail Prokhorov. Amokenga Holdings Limited is a wholly owned subsidiary ofGlencore International AG which is controlled by its management and key employees.
Related party transactions are detailed in note 35.
APPENDIX I ACCOUNTANTS’ REPORT
— I-15 —

(b) Operations
The Group operates in the aluminium industry primarily in the Russian Federation, Ukraine,Guinea, Jamaica, Ireland, Italy, Nigeria and Sweden and is principally engaged in the mining andrefining of bauxite and nepheline ore into alumina, the smelting of primary aluminium fromalumina and the fabrication of aluminium and aluminium alloys into semi-fabricated and finishedproducts. The Group sells its products primarily in Europe, the Commonwealth of IndependentStates (“CIS”), Asia and North America.
(c) Business environment in emerging economies
The Russian Federation, Ukraine, Jamaica, Nigeria and Guinea have been experiencing politicaland economic changes that have affected, and may continue to affect, the activities of enterprisesoperating in these environments. Consequently, operations in these countries involve risks thattypically do not exist in other markets, including reconsideration of privatisation terms in certaincountries where the Group operates following changes in governing political powers. In addition,the recent contraction in the capital and credit markets has further increased the level ofeconomic uncertainty in these environments.
The Financial Information reflects management’s assessment of the impact of the Russian,Ukrainian, Jamaican, Nigerian and Guinean business environments on the operations and thefinancial position of the Group. The future business environment may differ from management’sassessment.
2 Basis of preparation
(a) Statement of compliance
The Financial Information has been prepared in accordance with the International FinancialReporting Standards (“IFRSs”), which collective term includes all International AccountingStandards and related interpretations, promulgated by the International Accounting StandardsBoard (“IASB”).
The IASB has issued a number of new and revised IFRSs. For the purpose of preparing thisFinancial Information, the Group has adopted all these new and revised IFRSs in the RelevantPeriod, except for any new standards or interpretations that are not yet effective for accountingperiods beginning after 1 January 2009. The revised and new accounting standards andinterpretations issued but not yet effective for the accounting year beginning on 1 January 2009are set out in note 40.
This Financial Information also complies with the disclosure requirements of the Hong KongCompanies Ordinance and the applicable disclosure provisions of the Rules Governing theListing of Securities on The Stock Exchange of Hong Kong Limited.
The accounting policies set out below have been applied consistently to all periods presented inthe Financial Information.
(b) Basis of measurement
The Financial Information comprises the Company and its subsidiaries and the Group’s interestsin associates and jointly controlled entities. For periods prior to 27 March 2007, the FinancialInformation has been presented as if the combination of the Company and RUSAL had takenplace on 1 January 2006.
The Financial Information is prepared on the historical cost basis except as set out in thesignificant accounting policies in note 3 below.
APPENDIX I ACCOUNTANTS’ REPORT
— I-16 —

The carrying amounts of assets, liabilities and equity items in existence at 31 December 2002include adjustments for the effect of hyperinflation, which were calculated using conversionfactors derived from the Russian Federation Consumer Price Index published by the RussianStatistics Agency, GosKomStat. Russia ceased to be hyperinflationary for IFRSs purposes as of1 January 2003.
(c) Functional and presentation currency
The Company’s functional currency is the United States Dollar (“USD”) because it reflects theeconomic substance of the underlying events and circumstances of the Company. The functionalcurrencies of the Group’s significant subsidiaries are the currencies of the primary economicenvironment and key business processes of these subsidiaries and include USD, Russian Roubles(“RUR”), Ukrainian Hryvna and Euros (“EUR”). The Financial Information is presented in USD,rounded to the nearest million, except as otherwise stated herein.
(d) Going concern
In the second half of 2008, the ongoing global liquidity crisis resulted in, among other things,a lower level of capital markets funding, lower liquidity levels across the international andRussian banking sectors, higher interbank lending rates and significant contractions in manysectors of the real economy. In the fourth quarter of 2008, aluminium prices suffered a sharpdecline due to a significant decrease in the demand for aluminium which forced the Group todecrease production at a number of its production sites. During the six months ended 30 June2009, the Group reduced production levels by 10% for aluminium, by 33% for alumina and by37% for bauxite compared to the same period of the prior year.
These factors have had a significant adverse impact on the revenue and profitability of theGroup. As a result, at 31 December 2008 the Group was in breach of a number of covenantsrelating to its debt agreements and subsequently suspended servicing certain loans andborrowings. At 30 June 2009, the Group’s current liabilities exceeded its current assets byUSD14,397 million.
Future unfavourable changes in the prices of aluminium and alumina could have a furthermaterial adverse effect on the Group’s business, financial condition and results of operations. Asustained fall in the price of or demand for aluminium could also adversely affect the Company’sability to meet certain targets and financial covenants under its debt restructuring agreements(see below).
In December 2009, the Group completed restructuring negotiations with its lenders in order toestablish financial stability and to put the necessary arrangements in place to allow the Groupto meet its obligations when they fall due as part of ongoing operations. The restructuringarrangements contain a number of terms and conditions, including conditions subsequent (seenote 38 (b)). Details of the debt restructuring arrangements are set out in note 38(b). Thefollowing summarises the principal terms of the debt restructuring:
• The Group signed an international override agreement, subject to certain conditionssubsequent, with its international lenders implementing the long-term restructuring of theGroup’s debt to the international lenders which became effective on 7 December 2009 withall conditions precedent having been satisfied by that date. In addition, in November 2009the Group signed amendments to the bilateral loan agreements with its Russian and Kazakhlenders providing for the long-term restructuring of these loans on similar terms, except inthe case of the loan agreement with Vnesheconombank (“VEB”), which was extended until29 October 2010.
APPENDIX I ACCOUNTANTS’ REPORT
— I-17 —
• In addition, on 1 December 2009 the Group entered into an amendment agreement inrelation to a stock purchase agreement between the Group, Onexim Holdings Limited(“Onexim”) and certain other parties relating to the acquisition of shares in OJSC MMCNorilsk Nickel (“Norilsk Nickel”) (see note 19), in order to restructure the outstandingdeferred consideration in the amount of USD2,700 million plus accrued interest. Inaccordance with the amendment agreement, on the date of the effectiveness of theinternational override agreement, part of the Group’s obligations were converted intoordinary shares of the Company representing 6% of the Company’s share capital postconversion. In addition, USD880 million plus interest will be settled on the terms similarto those agreed under the international override agreement and the accrued interest ofUSD226 million and a restructuring fee of USD49 million will be paid in cash.
• No fixed amortisation schedule applies to the Group’s loans to its international, Russianand Kazakh lenders and Onexim during the override period (four years from the overridedate as defined in the international override agreement), with all debt outstanding under theinternational, Russian and Kazakh facilities and Onexim, except the VEB loan, becomingdue at the end of the override period. As there is no fixed amortisation schedule for the debt,debt repayment is based on a cash sweep mechanism, which is designed to structure therepayment of debt based on the Group’s financial performance and is subject to minimumdebt reduction covenants.
• The debt restructuring agreements provide for the acceleration of debt repayment if aperson other than Mr. Oleg Deripaska acquires effective control of the Company.
• The debt restructuring agreements contain certain targets and financial covenants, which,if not met, could result in acceleration of the Group’s debt repayment, as described below,or require the Group to dispose of certain assets, including the compulsory disposal ofshares in Norilsk Nickel.
• The Group is required to fulfill certain conditions subsequent which are described in note38(b).
Failure to comply with the terms and conditions of the debt restructuring agreements (includingthe conditions subsequent) could, if the required majority of lenders so elects, result in theacceleration of the Group’s debt repayment and the realisation by its lenders of the securityprovided, which could have a material adverse impact on the Group and its shareholders. Further,adverse outcomes in litigation involving any member of the Group, except certain currentlypending litigation or alleged claims, in excess of USD50 million in aggregate could alsopotentially lead to an event of default under the terms of the international override agreement,which could, if the required majority of lenders so elects, again result in the acceleration of theGroup’s debt repayment and realisation by its lenders of the security provided.
The Directors believe that the restructuring terms will allow the Group to successfully continueits operations and repay its debts as and when they fall due and, therefore, the Directors haveprepared the Financial Information on a going concern basis. As part of their assessment of theapplicability of the going concern basis of preparation of the Financial Information, the Directorshave considered additional sources of financing and are of the opinion that:
• The likelihood of an adverse outcome in any litigation in excess of USD50 million resultingin an event of default and acceleration of the Group’s debt repayment and realisation by itslenders of the security provided as described above is remote;
• The Group will be able to raise additional funds as a result of an equity offering in one ofthe international capital markets which will be used to reduce the Group’s indebtedness;
APPENDIX I ACCOUNTANTS’ REPORT
— I-18 —
• The VEB loan may be assigned to Sberbank upon the request of the Company should theVEB loan not be extended beyond 29 October 2010, as is currently anticipated. For thesepurposes, the Group has obtained an irrevocable and unconditional letter from Sberbankwhich allows the Group to request Sberbank to assume the rights, claims and obligationsunder the VEB loan by notifying Sberbank in writing during the period from 1 August to1 September of each year from 2010 to 2013, inclusive. Following such assumption, thematurity of the existing VEB loan will be extended to 7 December 2013 from the originalrepayment date. Commission of 2.00% of the outstanding principal amount and any otheroutstanding as of the date of the assignment will be payable to Sberbank by the Group asfollows: a) USD22.5 million by 31 December 2009, b) ¼ (one quarter) of the commissionannually by 31 December of the years 2010, 2011 and 2012, provided that no assignmentoccurred in such year or any previous year and c) the amount of the commission to bereduced by amounts paid in a) and b) once the assignment has occured. The Company hasalso entered into an unconditional and irrevocable deed with its current shareholders,pursuant to which the current shareholders guarantee to Sberbank to pay on demand thecommission when it falls due should the payment be inconsistent with the obligations of theGroup under the international override agreement.
• The Group has an agreement in place to draw up to USD100 million from Sberbank, andplans to use this facility in December 2009.
If the repayment of the whole of the Group’s indebtedness is accelerated, for example, becausea relevant member of the Group is unable to comply with or satisfy any of the terms or conditionsof, or triggers any event of default under, the debt restructuring or other debt obligations, or ifthe Company should be unable to extend or refinance or repay the VEB loan as and when it fallsdue, the Group may cease to continue as a going concern.
The Financial Information does not include any adjustments relating to the recoverability andclassification of recorded asset amounts or to the amount and classification of liabilities that maybe necessary if the Group were unable to comply with the terms of its debt restructuringagreements and/or if the Group were unable to continue as a going concern.
(e) Use of judgements, estimates and assumptions
The preparation of Financial Information in conformity with IFRSs requires management tomake judgements, estimates and assumptions that affect the application of policies and reportedamounts of assets and liabilities and the disclosure of contingent liabilities at the date of theFinancial Information, and the reported revenue and costs during Relevant Period.
Management bases its judgements and estimates on historical experience and various otherfactors that are believed to be appropriate and reasonable under the circumstances, the results ofwhich form the basis of making the judgements about carrying values of assets and liabilities thatare not readily apparent from other sources. Actual results may differ from these estimates underdifferent assumptions and conditions.
The estimates and underlying assumptions are reviewed on an ongoing basis. Revisions toaccounting estimates are recognised in the period in which the estimate is revised if the revisionaffects only that period, or in the period of the revision and future periods if the revision affectsboth current and future periods.
Judgements made by management in the application of IFRSs that have significant effect on theFinancial Information and estimates with a significant risk of material adjustment in the nextyear are discussed in note 39.
APPENDIX I ACCOUNTANTS’ REPORT
— I-19 —
3 Significant accounting policies
The following significant accounting policies have been applied in the preparation of theFinancial Information. These accounting policies have been consistently applied to all periodspresented in this Financial Information.
(a) Basis of consolidation
(i) Subsidiaries and non-controlling interests
Subsidiaries are entities controlled by the Group. Control exists when the Company has thepower to govern the financial and operating policies of an entity so as to obtain benefits fromits activities. In assessing control, potential voting rights that presently are exercisable are takeninto account. The financial information of subsidiaries is included in the Financial Informationfrom the date that control commences until the date that control ceases.
Non-controlling interests represent the portion of the net assets of subsidiaries attributable tointerests that are not owned by the Company, whether directly or indirectly through subsidiaries,and in respect of which the Group has not agreed any additional terms with the holders of thoseinterests which would result in the Group as a whole having a contractual obligation in respectof those interests that meets the definition of a financial liability. Non-controlling interests arepresented in the consolidated balance sheet within equity, separately from equity attributable tothe equity shareholders of the Company. Non-controlling interests in the results of the Group arepresented on the face of the consolidated income statements and the consolidated statements ofcomprehensive income as an allocation of the total profit or loss and total comprehensive incomefor the year/period between non-controlling interests and the equity shareholders of theCompany.
Where losses applicable to the non-controlling interests exceed the non-controlling shareholder’sinterest in the equity of a subsidiary, the excess, and any further losses applicable to thenon-controlling shareholder, are charged against the Group’s interest except if thenon-controlling shareholder has a binding obligation to, and is able to, make additionalinvestment to cover the losses. If the subsidiary subsequently reports profits, the Group’s interestis allocated all such profits until the non-controlling shareholder’s share of losses previouslyabsorbed by the Group has been recorded.
In the Company’s balance sheet, an investment in a subsidiary is stated at cost less impairmentlosses.
(ii) Acquisitions of non-controlling interests
The acquisition of an additional non-controlling interest in an existing subsidiary after controlhas been obtained is accounted for as an equity transaction with any difference between the costof the additional investment and the carrying amount of the net assets acquired at the date ofexchange recognised directly in equity.
(iii) Acquisitions from entities under common control
Business combinations arising from transfers of interests in entities that are under the commoncontrol of the shareholder that controls the Company are accounted for as if the acquisition hadoccurred at the beginning of the earliest period presented or, if later, at the date that commoncontrol was established. The assets and liabilities acquired are recognised at the carryingamounts recognised previously in the Group’s controlling shareholder’s consolidated financialstatements. The components of the equity of the acquired entities are added to the samecomponents within Group equity except that any share capital of the acquired entities isrecognised as part of additional paid-in capital.
APPENDIX I ACCOUNTANTS’ REPORT
— I-20 —
(iv) Associates and jointly controlled entities (equity accounted investees)
Associates are those entities in which the Group has significant influence, but not control, overthe financial and operating policies. Significant influence is presumed to exist when the Groupholds between 20 and 50 percent of the voting power of another entity. Jointly controlled entitiesare those entities over whose activities the Group has joint control, established by contractualagreement and requiring unanimous consent for strategic financial and operating decisions.
Investments in associates and jointly controlled entities are accounted for using the equitymethod (equity accounted investees) and are recognised initially at cost. The Group’s investmentincludes goodwill identified on acquisition, net of any accumulated impairment losses. TheFinancial Information includes the Group’s share of the income and expenses and equitymovements of equity accounted investees, after adjustments to align the accounting policies withthose of the Group, from the date that significant influence or joint control commences until thedate that significant influence or joint control ceases. When the Group’s share of losses exceedsits interest in an equity accounted investee, the carrying amount of that interest, including anylong-term investments, is reduced to nil, and the recognition of further losses is discontinuedexcept to the extent that the Group has an obligation or has made payments on behalf of theinvestee.
(v) Jointly controlled assets and operations
The Group has certain contractual arrangements with other participants to engage in jointactivities that do not in substance give rise to a jointly controlled entity. These arrangementsinvolve the joint ownership of assets dedicated to the purposes of each venture. These contractualarrangements do not create a jointly controlled entity due to the fact that the joint ventureoperates under the policies of the venturers that directly derive the benefits of operation of theirjointly owned assets, rather than deriving returns from an interest in a separate entity.
The Financial Information includes the Group’s share of the assets in such joint ventures,together with the liabilities, revenues and expenses arising jointly or otherwise from thoseoperations. All such amounts are measured in accordance with the terms of each arrangement,which are usually in proportion to the Group’s interest in the jointly controlled assets oroperations.
(vi) Transactions eliminated on consolidation
Intra-group balances and transactions, and any unrealised income and expenses arising fromintra-group transactions, are eliminated in preparing the Financial Information. Unrealised gainsarising from transactions with equity accounted investees are eliminated against the investmentto the extent of the Group’s interest in the investee. Unrealised losses are eliminated in the sameway as unrealised gains, but only to the extent that there is no evidence of impairment.
(b) Foreign currency
(i) Foreign currency transactions
Transactions in foreign currencies are translated into the respective functional currencies ofGroup entities at exchange rates at the dates of the transactions. Monetary assets and liabilitiesdenominated in foreign currencies at the reporting date are retranslated to the functional currencyat the exchange rate at that date. The foreign currency gain or loss on monetary items is thedifference between the amortised cost in the functional currency at the beginning of the period,adjusted for effective interest and payments during the period, and the amortised cost in foreign
APPENDIX I ACCOUNTANTS’ REPORT
— I-21 —
currency translated at the exchange rate at the end of the reporting period. Foreign currencydifferences arising on retranslation are recognised in the income statement, except fordifferences arising on the retranslation of available-for-sale equity instruments which isrecognised in the statement of comprehensive income.
(ii) Foreign operations
The assets and liabilities of foreign operations, including goodwill and fair value adjustmentsarising on acquisition, are translated from their functional currencies to USD at the exchangerates ruling at the reporting date. The income and expenses of foreign operations are translatedto USD at exchange rates approximating exchange rates at the dates of the transactions.
Foreign currency differences arising on translation are recognised in other comprehensiveincome. For the purposes of foreign currency translation, the net investment in a foreignoperation includes foreign currency intra-group balances for which settlement is neither plannednor likely in the foreseeable future and foreign currency differences arising from such amonetary item is recognised in the statement of comprehensive income.
When a foreign operation is disposed of, in whole or in part, the relevant amount of the currencytranslation reserve is transferred to the profit or loss as part of the gain or loss on disposal.
(c) Financial instruments
(i) Non-derivative financial instruments
Non-derivative financial instruments comprise investments in equity and debt securities, tradeand other receivables, cash and cash equivalents, loans and borrowings and trade and otherpayables.
Non-derivative financial instruments are recognised initially at fair value plus, for instrumentsnot classified as at fair value through profit or loss (see below), any directly attributabletransaction costs.
A financial instrument is recognised when the Group becomes a party to the contractualprovisions of the instrument. Financial assets are derecognised if the Group’s contractual rightsto the cash flows from the financial assets expire or if the Group transfers the financial asset toanother party without retaining control or substantially all risks and rewards of the asset.Financial liabilities are derecognised if the Group’s obligations specified in the contract expireor are discharged or cancelled.
Financial assets and liabilities are offset and the net amount presented in the balance sheetswhen, and only when, the Group has a legal right to offset the amounts and intends either to settleon a net basis or to realise the asset and settle the liability simultaneously.
Subsequent to initial recognition non-derivative financial instruments are measured as describedbelow.
Cash and cash equivalents comprise cash balances and call deposits.
Accounting for finance income and expenses is discussed in note 3(o).
Held-to-maturity investments
If the Group has the positive intent and ability to hold debt securities to maturity, then they areclassified as held-to-maturity. Held-to-maturity investments are measured at amortised costusing the effective interest method, less any impairment losses.
APPENDIX I ACCOUNTANTS’ REPORT
— I-22 —
Available-for-sale financial assets
The Group’s investments in equity securities and certain debt securities are classified asavailable-for-sale financial assets. Subsequent to initial recognition, they are measured at fairvalue and changes therein, other than impairment losses (see note 3(h)(i)), and foreign currencydifferences on available-for-sale equity instruments (see note 3(b)(i)), are recognised in othercomprehensive income and presented within equity. When an investment is derecognised, thecumulative gain or loss in equity is transferred to the income statement.
Other
Other non-derivative financial instruments are measured at amortised cost using the effectiveinterest method, less any impairment losses. Investments in equity securities that are not quotedon a stock exchange and where fair value cannot be estimated on a reasonable basis by othermeans are stated at cost less impairment losses.
(ii) Derivative financial instruments
Derivatives are recognised initially at fair value; attributable transaction costs are recognised inprofit or loss when incurred. Subsequent to initial recognition, derivatives are measured at fairvalue and changes therein are recognised immediately in the income statement.
Embedded derivatives are separated from the host contract and accounted for separately if theeconomic characteristics and risks of the host contract and the embedded derivative are notclosely related, a separate instrument with the same terms as the embedded derivative wouldmeet the definition of a derivative and the combined instrument is not measured at fair valuethrough profit or loss.
(d) Property, plant and equipment
(i) Recognition and measurement
Items of property, plant and equipment, are measured at cost less accumulated depreciation andimpairment losses. The cost of property, plant and equipment at 1 January 2004, the date oftransition to IFRSs, was determined by reference to its fair value at that date.
Cost includes expenditure that is directly attributable to the acquisition of the asset. The cost ofself-constructed assets includes the cost of materials and direct labour, any other costs directlyattributable to bringing the asset to a working condition for its intended use, the costs ofdismantling and removing the items and restoring the site on which they are located andcapitalised borrowing costs (see note 3(o)). Purchased software that is integral to thefunctionality of the related equipment is capitalised as part of that equipment.
When parts of an item of property, plant and equipment have different useful lives, they areaccounted for as separate items (major components) of property, plant and equipment.
The cost of periodic relining of electrolyse cells is capitalised and depreciated over the expectedproduction period.
Gains or losses on disposal of an item of property, plant and equipment are determined bycomparing the proceeds from disposal with the carrying amount of property, plant andequipment, and are recognised net within gain/(loss) on disposal of property, plant andequipment in the income statement.
APPENDIX I ACCOUNTANTS’ REPORT
— I-23 —
(ii) Subsequent costs
The cost of replacing a part of an item of property, plant and equipment is recognised in thecarrying amount of the item if it is probable that the future economic benefits embodied withinthe part will flow to the Group and its cost can be measured reliably. The carrying amount of thereplaced part is derecognised. The costs of the day-to-day servicing of property, plant andequipment are recognised in the income statement as incurred.
(iii) Exploration and evaluation assets
Exploration and evaluation activity involves the search for mineral resources, the determinationof technical feasibility and the assessment of commercial viability of an identified resource.Exploration and evaluation activity includes:
• researching and analysing historical exploration data;
• gathering exploration data through topographical, geochemical and geophysical studies;
• exploratory drilling, trenching and sampling;
• determining and examining the volume and grade of the resource;
• surveying transportation and infrastructure requirements; and
• conducting market and finance studies.
Administration costs that are not directly attributable to a specific exploration area are chargedto the income statement.
License costs paid in connection with a right to explore in an existing exploration area arecapitalised and amortised over the term of the permit.
Exploration and evaluation expenditure is capitalised as exploration and evaluation assets whenit is expected that expenditure related to an area of interest will be recouped by futureexploitation, sale, or, at the reporting date, the exploration and evaluation activities have notreached a stage that permits a reasonable assessment of the existence of commerciallyrecoverable ore reserves. Capitalised exploration and evaluation expenditure is recorded as acomponent of property, plant and equipment at cost less impairment losses. As the asset is notavailable for use, it is not depreciated. All capitalised exploration and evaluation expenditure ismonitored for indications of impairment. Where there are indicators of potential impairment, anassessment is performed for each area of interest in conjunction with the group of operatingassets (representing a cash-generating unit) to which the exploration is attributed. Explorationareas at which reserves have been discovered but that require major capital expenditure beforeproduction can begin are continually evaluated to ensure that commercial quantities of reservesexist or to ensure that additional exploration work is underway or planned. To the extent thatcapitalised expenditure is not expected to be recovered it is charged to the income statement.
Exploration and evaluation assets are transferred to mining property, plant and equipment orintangible assets when development is sanctioned.
(iv) Stripping costs
Expenditure relating to the stripping of overburden layers of ore, including estimated siterestoration costs, is included in the cost of production in the period in which it is incurred.
APPENDIX I ACCOUNTANTS’ REPORT
— I-24 —

(v) Mining assets
Mining assets are recorded as construction in progress and transferred to mining property, plantand equipment when a new mine reaches commercial production.
Mining assets include expenditure incurred for:
• Acquiring mineral and development rights;
• Developing new mining operations.
Mining assets include interest capitalised during the construction period, when financed byborrowings.
(vi) Depreciation
The carrying amounts of property, plant and equipment (including initial and any subsequentcapital expenditure) are depreciated to their estimated residual value over the estimated usefullives of the specific assets concerned, or the estimated life of the associated mine or minerallease, if shorter. Estimates of residual values and useful lives are reassessed annually and anychange in estimate is taken into account in the determination of remaining depreciation charges.Leased assets are depreciated over the shorter of the lease term and their useful lives. Freeholdland is not depreciated.
The property, plant and equipment is depreciated on a straight-line or units of production basisover the respective estimated useful lives as follows:
• Buildings 40 to 50 years
• Plant, machinery and equipment 15 to 40 years
• Electrolysers 4 to 15 years
• Mining assets units of production on proven and probable reserves
• Other (except for explorationand evaluation assets)
5 to 20 years
(e) Intangible assets
(i) Goodwill
On the acquisition of a subsidiary, an interest in a jointly controlled entity or an associate or aninterest in a joint arrangement that comprises a business, the identifiable asset, liabilities andcontingent liabilities of the acquired business (or interest in a business) are recognised at theirfair values unless the fair values cannot be measured reliably. Where the fair values of assumedcontingent liabilities cannot be measured reliably, no liability is recognised but the contingentliability is disclosed in the same manner as other contingent liabilities.
Goodwill arises when the cost of acquisition exceeds the fair value of the Group’s interest in thenet fair value of identifiable net assets acquired. Goodwill is not amortised but is tested forimpairment annually. For this purpose, goodwill arising on a business combination is allocatedto the cash-generating units expected to benefit from the acquisition and any impairment loss
APPENDIX I ACCOUNTANTS’ REPORT
— I-25 —

recognised is not reversed even where circumstances indicate a recovery in value. In respect ofassociates or jointly controlled entities, the carrying amount of goodwill is included in thecarrying amount of the interest in the associate and jointly controlled entity and the investmentas a whole is tested for impairment whenever there is objective evidence of impairment.
When the fair value of the Group’s share of identifiable net assets acquired exceeds the cost ofacquisition, the difference is recognised immediately in the income statement.
(ii) Research and development
Expenditure on research activities, undertaken with the prospect of gaining new scientific ortechnical knowledge and understanding, is recognised in the income statement when incurred.
Development activities involve a plan or design for the production of new or substantiallyimproved products and processes. Development expenditure is capitalised only if developmentcosts can be measured reliably, the product or process is technically and commercially feasible,future economic benefits are probable and the Group intends to and has sufficient resources tocomplete development and to use or sell the asset. The expenditure capitalised includes the costof materials, direct labour and overhead costs that are directly attributable to preparing the assetfor its intended use and capitalised borrowing costs. Other development expenditure isrecognised in the income statement when incurred.
Capitalised development expenditure is measured at cost less accumulated amortisation andaccumulated impairment losses.
(iii) Other intangible assets
Other intangible assets that are acquired by the Group, which have finite useful lives, aremeasured at cost less accumulated amortisation and accumulated impairment losses.
(iv) Subsequent expenditure
Subsequent expenditure is capitalised only when it increases the future economic benefitsembodied in the specific asset to which it relates. All other expenditure, including expenditureon internally generated goodwill and brands, is recognised in the income statement whenincurred.
(v) Amortisation
Amortisation is recognised in the income statement on a straight-line basis over the estimateduseful lives of intangible assets, other than goodwill, from the date that they are available foruse. The estimated useful lives for the current and comparative periods are as follows:
• software 5 years;
• contracts, acquired on business combinations 2-8 years.
The amortisation method, useful lives and residual values are reviewed at each financial year-endand adjusted if appropriate.
(f) Leased assets
Leases under the terms of which the Group assumes substantially all the risks and rewards ofownership are classified as finance leases. Upon initial recognition the leased asset is measuredat an amount equal to the lower of its fair value and the present value of the minimum leasepayments. Subsequent to initial recognition, the asset is accounted for in accordance with theaccounting policy applicable to that asset.
APPENDIX I ACCOUNTANTS’ REPORT
— I-26 —
The corresponding finance lease obligation is included within interest bearing liabilities. Theinterest element is allocated to accounting periods during the lease term to reflect a constant rateof interest on the remaining balance of the obligation for each accounting period.
Assets held under other leases (operating leases) are not recognised in the balance sheet.Payments made under the lease are charged to the income statement in equal instalments over theaccounting periods covered by the lease term, except where an alternative basis is morerepresentative of the pattern of benefits to be derived from the leased assets. Lease incentivesreceived are recognised in the income statement as an integral part of the aggregate net leasepayments made. Contingent rentals are charged to the income statement in the accounting periodin which they incurred.
(g) Inventories
Inventories are measured at the lower of cost or net realisable value. Net realisable value is theestimated selling price in the ordinary course of business, less the estimated costs of completionand selling expenses.
The cost of inventories is principally determined under the weighted average cost method, andincludes expenditure incurred in acquiring the inventories, production or conversion costs andother costs incurred in bringing them to their existing location and condition. In the case ofmanufactured inventories and work in progress, cost includes an appropriate share of productionoverheads based on normal operating capacity.
The production costs include mining and concentrating costs, smelting, treatment and refiningcosts, other cash costs and depreciation and amortisation of operating assets.
(h) Impairment
(i) Financial assets
A financial asset not carried at fair value through profit or loss is assessed at each reporting dateto determine whether there is any objective evidence that it is impaired. A financial asset isconsidered to be impaired if objective evidence indicates that one or more events have had anegative effect on the estimated future cash flows of that asset.
Objective evidence that financial assets (including equity securities) are impaired can includedefault or delinquency by a debtor, restructuring of an amount due to the Group on terms thatthe Group would not consider otherwise, indications that a debtor or issuer will enter bankruptcyand the disappearance of an active market for a security. In addition, for an investment in anequity security, a significant or prolonged decline in its fair value below its cost is objectiveevidence of impairment.
An impairment loss in respect of a financial asset measured at cost is calculated as the differencebetween its carrying amount and the present value of the estimated future cash flows discountedat the current market rate of return for a similar financial asset.
An impairment loss in respect of a financial asset measured at amortised cost is calculated as thedifference between its carrying amount and the present value of the estimated future cash flowsdiscounted at the original effective interest rate. An impairment loss in respect of anavailable-for-sale financial asset is calculated by reference to its fair value.
APPENDIX I ACCOUNTANTS’ REPORT
— I-27 —
An impairment loss in respect of an investment in associate or jointly controlled entity iscalculated as the difference between its carrying amount after application of the equity methodof accounting (note 3(a)(iv)) and its recoverable amount. The recoverable amount of suchinvestment is the greater of its value in use and its fair value less cost to sell. In determining thevalue in use of the investment the Company estimates: (a) its share of the present value of theestimated future cash flows expected to be generated by the investee, including the cash flowsfrom the operations of the investee and the proceeds on the ultimate disposal of the investment;or (b) the present value of the estimated future cash flows expected to arise from the dividendsto be received from the investee and from its ultimate disposal depending on which availableinformation with respect to each investee is more reliable. An impairment loss is reversed to theextent that the recoverable amount of the investment subsequently increases and the resultingcarrying amount does not exceed the carrying amount that would have been determined, afterapplication of the equity method, had no impairment loss previously been recognised.
Individually significant financial assets are tested for impairment on an individual basis. Theremaining financial assets are assessed collectively in groups that share similar credit riskcharacteristics.
All impairment losses are recognised in the income statement. Any cumulative loss in respect ofan available-for-sale financial asset recognised in the statement of comprehensive income, andpresented in equity, is transferred to the income statement.
An impairment loss is reversed if the reversal can be related objectively to an event occurringafter the impairment loss was recognised. For financial assets measured at amortised cost andavailable-for-sale financial assets that are debt securities, the reversal is recognised in theincome statement. For available-for-sale financial assets that are equity securities, the reversalis recognised in the statement of comprehensive income.
Impairment losses for trade receivables included within trade and other receivables whoserecovery is considered doubtful but not remote are recorded using an allowance account. Whenthe Group is satisfied that recovery is remote, the amount considered irrecoverable is written offagainst trade receivables directly and any amounts held in the allowance account relating to thatreceivable are reversed. Subsequent recoveries of amounts previously charged to the allowanceaccount are reversed against the allowance account. Other changes in the allowance account andsubsequent recoveries of amounts previously written off directly are recognised in the incomestatement.
(ii) Non-financial assets
The carrying amounts of the Group’s non-financial assets, other than inventories and deferred taxassets, are reviewed at each reporting date to determine whether there is any indication ofimpairment. If any such indication exists then the asset’s recoverable amount is estimated. Forgoodwill and intangible assets that are not yet available for use, the recoverable amount isestimated at each reporting date.
An impairment loss is recognised if the carrying amount of an asset or its cash-generating unitexceeds its recoverable amount. A cash-generating unit is the smallest identifiable asset groupthat generates cash flows that are largely independent from other assets and groups. Impairmentlosses are recognised in profit or loss. Impairment losses recognised in respect ofcash-generating units are allocated first to reduce the carrying amount of any goodwill allocatedto the units and then to reduce the carrying amount of the other assets in the unit (group of units)on a pro rata basis.
APPENDIX I ACCOUNTANTS’ REPORT
— I-28 —
The recoverable amount of an asset or cash-generating unit is the greater of its value in use andits fair value less costs to sell. In assessing value in use, the estimated future cash flows arediscounted to their present value using a pre-tax discount rate that reflects current marketassessments of the time value of money and the risks specific to the asset.
An impairment loss in respect of goodwill is not reversed. In respect of other assets, impairmentlosses recognised in prior periods are assessed at each reporting date for any indications that theloss has decreased or no longer exists. An impairment loss is reversed if there has been a changein the estimates used to determine the recoverable amount. An impairment loss is reversed onlyto the extent that the asset’s carrying amount does not exceed the carrying amount that wouldhave been determined, net of depreciation or amortisation, if no impairment loss had beenrecognised.
Goodwill that forms part of the carrying amount of an investment in an associate or a jointlycontrolled entity is not recognised separately and, therefore, is not tested for impairmentseparately. Instead, the entire amount of the investment is tested for impairment as a single assetwhen there is objective evidence that the investment in an associate or a jointly controlled entitymay be impaired.
(i) Insurance contracts
Where the Group enters into financial guarantee contracts to guarantee the indebtedness of othercompanies, controlled by the beneficial shareholder of the Group, the Group considers these tobe insurance arrangements and accounts for them as such. In this respect, the Group treats theguarantee contract as a contingent liability until such time as it becomes probable that the Groupwill be required to make a payment under the guarantee.
(j) Dividends
Dividends on ordinary shares are recognised as a liability in the period in which they aredeclared.
(k) Employee benefits
(i) Salaries, annual bonuses, paid annual leave and cost of non-monetary benefits
Salaries, annual bonuses, paid annual leave and cost of non-monetary benefits are accrued in theyear in which the associated services are rendered by employees. Where payment or settlementis deferred and the effect would be material, these amounts are stated at their present values.
(ii) Defined benefit pension and other post-retirement plans
The Group’s net obligation in respect of defined benefit pension and other post-retirement plansis calculated separately for each plan by estimating the amount of future benefit that employeeshave earned in return for their service in the current and prior periods; that benefit is discountedto determine its present value and any unrecognised past service costs and the fair value of anyplan assets are deducted. The discount rate is the yield at the reporting date on government bondsthat have maturity dates approximating the terms of the Group’s obligations. The calculation isperformed using the projected unit credit method. When the calculation results in a benefit to theGroup, the recognised asset is limited to the net total of any unrecognised past service costs andthe present value of any future refunds from the plan or reductions in future contributions to theplan.
Where there is a change in actuarial assumptions, the resulting actuarial gains and losses arerecognised directly in the statement of comprehensive income.
APPENDIX I ACCOUNTANTS’ REPORT
— I-29 —
App1A-33(4)(e)
When the benefits of a plan are improved, the portion of the increased benefit relating to pastservice by employees is recognised in the income statement on a straight-line basis over theaverage period until the benefits become vested. To the extent that the benefits vest immediately,the expense is recognised immediately.
(iii) State pension funds
The Group makes contributions for the benefit of employees to Russia’s and the UkrainianState’s pension funds. The contributions are expensed as incurred.
(l) Provisions
A provision is recognised if, as a result of a past event, the Group has a present legal orconstructive obligation that can be estimated reliably, and it is probable that an outflow ofeconomic benefits will be required to settle the obligation. Provisions are determined bydiscounting the expected future cash flows at a pre-tax rate that reflects current marketassessments of the time value of money and the risks specific to the liability.
(i) Site restoration
The mining, refining and smelting activities of the Group can give rise to obligations for siterestoration and rehabilitation. Restoration and rehabilitation works can include facilitydecommissioning and dismantling; removal or treatment of waste materials; land rehabilitation;and site restoration. The extent of work required and the associated costs are dependent on therequirements of law and the interpretations of the relevant authorities.
Provisions for the cost of each restoration and rehabilitation program are recognised at the timethat environmental disturbance occurs. When the extent of disturbance increases over the life ofan operation, the provision is increased accordingly. Costs included in the provision encompassobligated and reasonably estimable restoration and rehabilitation activity expected to occurprogressively over the life of the operation and at the time of closure in connection withdisturbances at the reporting date. Routine operating costs that may impact the ultimaterestoration and rehabilitation activities, such as waste material handling conducted as an integralpart of a mining or production process, are not included in the provision. Costs arising fromunforeseen circumstances, such as the contamination caused by unplanned discharges, arerecognised as an expense and liability when the event gives rise to an obligation which isprobable and capable of reliable estimation.
Restoration and rehabilitation provisions are measured at the expected value of future cashflows, discounted to their present value and determined according to the probability ofalternative estimates of cash flows occurring for each operation. Discount rates used are specificto the country in which the operation is located. Significant judgements and estimates areinvolved in forming expectations of future activities and the amount and timing of the associatedcash flows. Those expectations are formed based on existing environmental and regulatoryrequirements.
When provisions for restoration and rehabilitation are initially recognised, the correspondingcost is capitalised as an asset, representing part of the cost of acquiring the future economicbenefits of the operation. The capitalised cost of restoration and rehabilitation activities isamortised over the estimated economic life of the operation on a units of production orstraight-line basis. The value of the provision is progressively increased over time as the effectof discounting unwinds, creating an expense recognised as part of finance expenses.
APPENDIX I ACCOUNTANTS’ REPORT
— I-30 —

Restoration and rehabilitation provisions are also adjusted for changes in estimates. Thoseadjustments are accounted for as a change in the corresponding capitalised cost, except where areduction in the provision is greater than the unamortised capitalised cost, in which case thecapitalised cost is reduced to nil and the remaining adjustment is recognised in the incomestatement. Changes to the capitalised cost result in an adjustment to future amortisation charges.Adjustments to the estimated amount and timing of future restoration and rehabilitation cashflows are a normal occurrence in light of the significant judgements and estimates involved.Factors influencing those changes include revisions to estimated reserves, resources and lives ofoperations; developments in technology; regulatory requirements and environmentalmanagement strategies; changes in the estimated costs of anticipated activities, including theeffects of inflation and movements in foreign exchange rates; and movements in general interestrates affecting the discount rate applied.
(ii) Restructuring
A provision for restructuring is recognised when the Group has approved a detailed and formalrestructuring plan and the restructuring either has commenced or has been announced publicly.Future operating costs are not provided for.
(m) Revenue
(i) Goods sold
Revenue from the sale of goods is recognised when the significant risks and rewards ofownership have been transferred to the buyer, recovery of the consideration is probable, theassociated costs and possible return of goods can be estimated reliably and there is no continuingmanagement involvement with the goods. This is generally when title passes.
In the majority of sales, sales agreements specify that title passes on the bill of lading date,which is the date the commodity is delivered to the shipping agent. Revenue is recognised on thebill of lading date.
Revenue is not reduced for royalties or other taxes payable from production.
(n) Other expenses
(i) Social expenditure
To the extent that the Group’s contributions to social programs benefit the community at largeand are not restricted to the Group’s employees, they are recognised in the income statement asincurred.
(o) Finance income and expenses
Finance income comprises interest income on funds invested, dividend income, gains on thedisposal of available-for-sale financial assets, changes in the fair value of financial assets at fairvalue through profit or loss and foreign currency gains. Interest income is recognised as itaccrues, using the effective interest method. Dividend income is recognised on the date that theGroup’s right to receive payment is established.
Finance expenses comprise interest expense on borrowings, unwinding of the discount onprovisions, foreign currency losses and changes in the fair value of financial assets at fair valuethrough profit or loss. All borrowing costs are recognised in the income statement using theeffective interest method, except for borrowing costs related to the acquisition, construction andproduction of qualifying assets which are recognised as part of the cost of such assets.
APPENDIX I ACCOUNTANTS’ REPORT
— I-31 —

Foreign currency gains and losses are reported on a net basis.
(p) Income tax expense
Income tax expense comprises current and deferred tax. Income tax expense is recognised in theincome statement except to the extent that it relates to items recognised directly in equity, inwhich case it is recognised in equity.
Current tax is the expected tax payable on the taxable income for the year, using tax rates enactedor substantively enacted at the reporting date, and any adjustment to tax payable in respect ofprevious years.
Deferred tax is recognised using the balance sheet method, providing for temporary differencesbetween the carrying amounts of assets and liabilities for financial reporting purposes and theamounts used for taxation purposes. Deferred tax is not recognised for the following temporarydifferences: the initial recognition of goodwill, the initial recognition of assets or liabilities ina transaction that is not a business combination and that affects neither accounting nor taxableprofit, and differences relating to investments in subsidiaries to the extent that they probably willnot reverse in the foreseeable future. Deferred tax is measured at the tax rates that are expectedto be applied to the temporary differences when they reverse, based on the laws that have beenenacted or substantively enacted by the reporting date. Deferred tax assets and liabilities areoffset when they relate to income taxes levied by the same taxation authority and the Group hasboth the right and the intention to settle its current tax assets and liabilities on a net orsimultaneous basis.
A deferred tax asset is recognised to the extent that it is probable that future taxable profits willbe available against which temporary difference can be utilised. Deferred tax assets are reviewedat each reporting date and are reduced to the extent that it is no longer probable that the relatedtax benefit will be realised.
Additional income taxes that arise from the distribution of dividends are recognised at the sametime as the liability to pay the related dividend is recognised.
(q) Non-current assets held for sale and discontinued operations
Non-current assets (or disposal groups comprising assets and liabilities), that are expected to berecovered primarily through sale rather than through continuing use, are classified as held forsale. Immediately before classification as held for sale, the measurement of the assets (or allassets and liabilities in a disposal group) is brought up-to-date in accordance with applicableIFRSs. Then, on initial classification as held for sale, non-current assets or disposal groups arerecognised at the lower of carrying amount and fair value less costs to sell. Any impairment losson a disposal group first is allocated to goodwill and then to remaining assets and liabilities onpro rata basis, except that no loss is allocated to inventories, financial assets, deferred tax assetsand employee benefit assets, which continue to be measured in accordance with the Group’saccounting policies.
A discontinued operation is a component of the Group’s business that represents a separate majorline of business or geographical area of operations or is a subsidiary acquired exclusively witha view to resale.
Classification as a discontinued operation occurs upon disposal or when the operation meets thecriteria to be classified as held for sale, if earlier.
APPENDIX I ACCOUNTANTS’ REPORT
— I-32 —
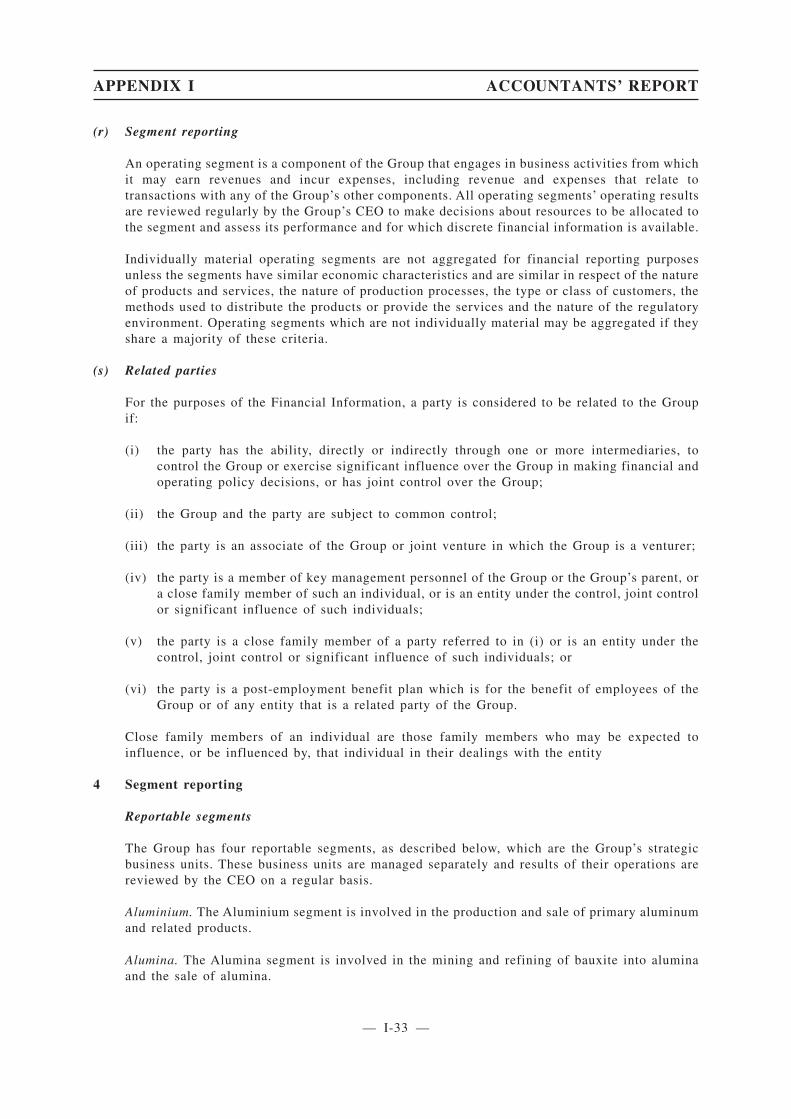
(r) Segment reporting
An operating segment is a component of the Group that engages in business activities from whichit may earn revenues and incur expenses, including revenue and expenses that relate totransactions with any of the Group’s other components. All operating segments’ operating resultsare reviewed regularly by the Group’s CEO to make decisions about resources to be allocated tothe segment and assess its performance and for which discrete financial information is available.
Individually material operating segments are not aggregated for financial reporting purposesunless the segments have similar economic characteristics and are similar in respect of the natureof products and services, the nature of production processes, the type or class of customers, themethods used to distribute the products or provide the services and the nature of the regulatoryenvironment. Operating segments which are not individually material may be aggregated if theyshare a majority of these criteria.
(s) Related parties
For the purposes of the Financial Information, a party is considered to be related to the Groupif:
(i) the party has the ability, directly or indirectly through one or more intermediaries, tocontrol the Group or exercise significant influence over the Group in making financial andoperating policy decisions, or has joint control over the Group;
(ii) the Group and the party are subject to common control;
(iii) the party is an associate of the Group or joint venture in which the Group is a venturer;
(iv) the party is a member of key management personnel of the Group or the Group’s parent, ora close family member of such an individual, or is an entity under the control, joint controlor significant influence of such individuals;
(v) the party is a close family member of a party referred to in (i) or is an entity under thecontrol, joint control or significant influence of such individuals; or
(vi) the party is a post-employment benefit plan which is for the benefit of employees of theGroup or of any entity that is a related party of the Group.
Close family members of an individual are those family members who may be expected toinfluence, or be influenced by, that individual in their dealings with the entity
4 Segment reporting
Reportable segments
The Group has four reportable segments, as described below, which are the Group’s strategicbusiness units. These business units are managed separately and results of their operations arereviewed by the CEO on a regular basis.
Aluminium. The Aluminium segment is involved in the production and sale of primary aluminumand related products.
Alumina. The Alumina segment is involved in the mining and refining of bauxite into aluminaand the sale of alumina.
APPENDIX I ACCOUNTANTS’ REPORT
— I-33 —

Energy. The Energy segment includes the Group companies and projects engaged in the miningand sale of coal and the generation and transmission of electricity produced from varioussources. Where the generating facility is solely a part of alumina or aluminium productionfacility it is included in the respective reportable segment.
Mining and Metals. The Mining and Metals segment includes the equity investment in NorilskNickel.
Other operations include manufacturing of semi-finished products from primary aluminium forthe transportation, packaging, building and construction, consumer goods and technologyindustries; and the activities of the Group’s administrative centres. Other operations in 2006 alsoincluded packaging, aluminium construction and magnesium operations which were disposed ofin 2006 (see note 6). None of these segments meets any of the quantitative thresholds fordetermining reportable segments during the Relevant Period.
The Aluminium and Alumina segments are vertically integrated whereby the Alumina segmentsupplies alumina to the Aluminium segment for further refining and smelting with limited salesof alumina outside the Group. Integration between the Aluminium, Alumina and Energy segmentsalso includes shared servicing and distribution.
Segment results, assets and liabilities
For the purposes of assessing segment performance and allocating resources between segments,the Group’s senior executive management monitor the results, assets and liabilities attributableto each reportable segment on the following bases:
Segment assets include all tangible, intangible assets and current assets with the exception ofincome tax assets and corporate assets. Segment liabilities include trade and other payablesattributable to the production and sales activities of the individual segments. Loans andborrowings are not allocated to individual segments as they are centrally managed by the headoffice.
Revenue and expenses are allocated to the reportable segments with reference to sales generatedby those segments and the expenses incurred by those segments or which otherwise arise fromthe depreciation or amortisation of assets attributable to those segments.
The measure used for reporting segment results is profit or loss before income tax adjusted foritems not specifically attributed to individual segments, such as finance income, costs of loansand borrowings and other head office or corporate administration costs. The segment profit orloss is included in the internal management reports that are reviewed by the Group’s CEO.Segment profit or loss is used to measure performance as management believes that suchinformation is the most relevant in evaluating the results of certain segments relative to otherentities that operate within these industries.
In addition to receiving segment information concerning segment results, management isprovided with segment information concerning revenue (including inter-segment revenue), thecarrying value of investments and share of (losses)/profits of associates and jointly controlledentities, depreciation, amortisation, impairment and additions of non-current segment assets usedby the segments in their operations. Inter-segment pricing is determined on a consistent basisusing market benchmarks.
APPENDIX I ACCOUNTANTS’ REPORT
— I-34 —
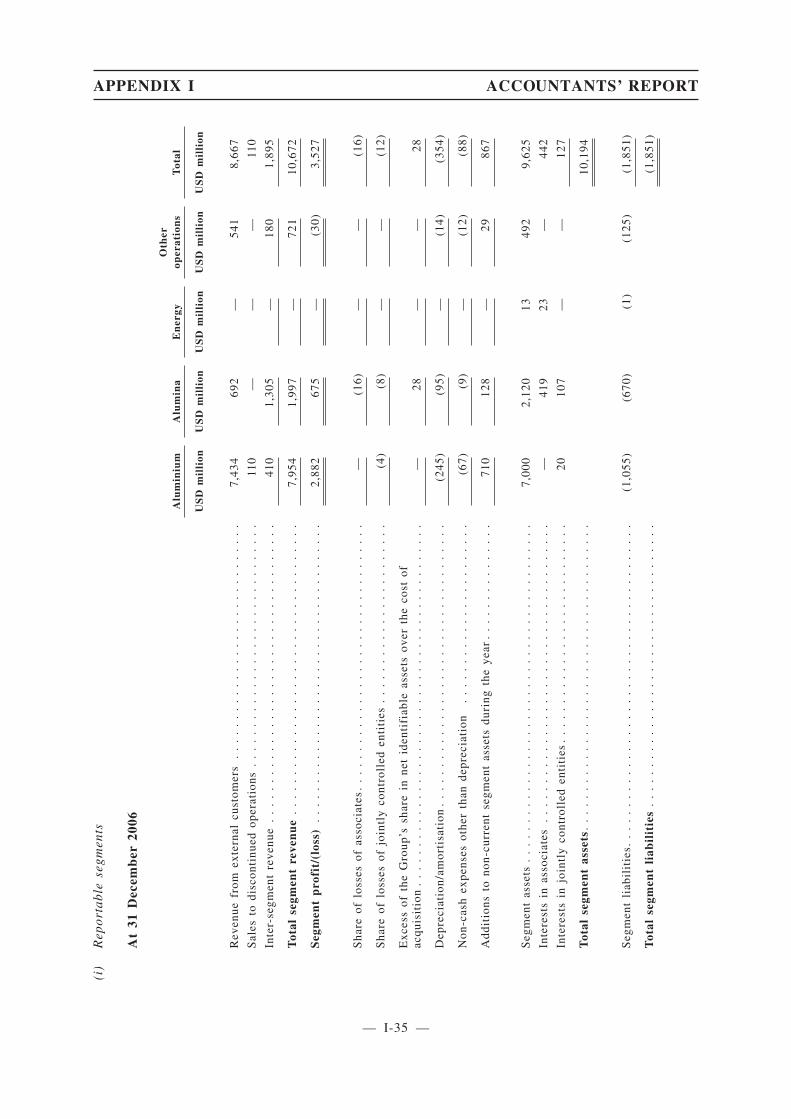
(i)
Rep
orta
ble
segm
ents
At
31D
ecem
ber
2006
Alu
min
ium
Alu
min
aE
ner
gyO
ther
oper
atio
ns
Tot
al
US
Dm
illi
onU
SD
mil
lion
US
Dm
illi
onU
SD
mil
lion
US
Dm
illi
on
Rev
enue
from
exte
rnal
cust
omer
s.
..
..
..
..
..
..
..
..
..
..
..
..
..
..
.7,
434
692
—54
18,
667
Sal
esto
disc
onti
nued
oper
atio
ns.
..
..
..
..
..
..
..
..
..
..
..
..
..
..
..
110
——
—11
0
Inte
r-se
gmen
tre
venu
e.
..
..
..
..
..
..
..
..
..
..
..
..
..
..
..
..
..
..
.41
01,
305
—18
01,
895
Tot
alse
gmen
tre
ven
ue
..
..
..
..
..
..
..
..
..
..
..
..
..
..
..
..
..
..
.7,
954
1,99
7—
721
10,6
72
Seg
men
tp
rofi
t/(l
oss)
..
..
..
..
..
..
..
..
..
..
..
..
..
..
..
..
..
..
..
2,88
267
5—
(30)
3,52
7
Sha
reof
loss
esof
asso
ciat
es.
..
..
..
..
..
..
..
..
..
..
..
..
..
..
..
..
.—
(16)
——
(16)
Sha
reof
loss
esof
join
tly
cont
roll
eden
titi
es.
..
..
..
..
..
..
..
..
..
..
..
(4)
(8)
——
(12)
Exc
ess
ofth
eG
roup
’ssh
are
inne
tid
enti
fiab
leas
sets
over
the
cost
ofac
quis
itio
n.
..
..
..
..
..
..
..
..
..
..
..
..
..
..
..
..
..
..
..
..
..
..
.—
28—
—28
Dep
reci
atio
n/am
orti
sati
on.
..
..
..
..
..
..
..
..
..
..
..
..
..
..
..
..
..
.(2
45)
(95)
—(1
4)(3
54)
Non
-cas
hex
pens
esot
her
than
depr
ecia
tion
..
..
..
..
..
..
..
..
..
..
..
.(6
7)(9
)—
(12)
(88)
Add
itio
nsto
non-
curr
ent
segm
ent
asse
tsdu
ring
the
year
..
..
..
..
..
..
..
.71
012
8—
2986
7
Seg
men
tas
sets
..
..
..
..
..
..
..
..
..
..
..
..
..
..
..
..
..
..
..
..
..
.7,
000
2,12
013
492
9,62
5
Inte
rest
sin
asso
ciat
es.
..
..
..
..
..
..
..
..
..
..
..
..
..
..
..
..
..
..
.—
419
23—
442
Inte
rest
sin
join
tly
cont
roll
eden
titi
es.
..
..
..
..
..
..
..
..
..
..
..
..
..
.20
107
——
127
Tot
alse
gmen
tas
sets
..
..
..
..
..
..
..
..
..
..
..
..
..
..
..
..
..
..
..
.10
,194
Seg
men
tli
abil
itie
s..
..
..
..
..
..
..
..
..
..
..
..
..
..
..
..
..
..
..
..
.(1
,055
)(6
70)
(1)
(125
)(1
,851
)
Tot
alse
gmen
tli
abil
itie
s.
..
..
..
..
..
..
..
..
..
..
..
..
..
..
..
..
..
.(1
,851
)
APPENDIX I ACCOUNTANTS’ REPORT
— I-35 —
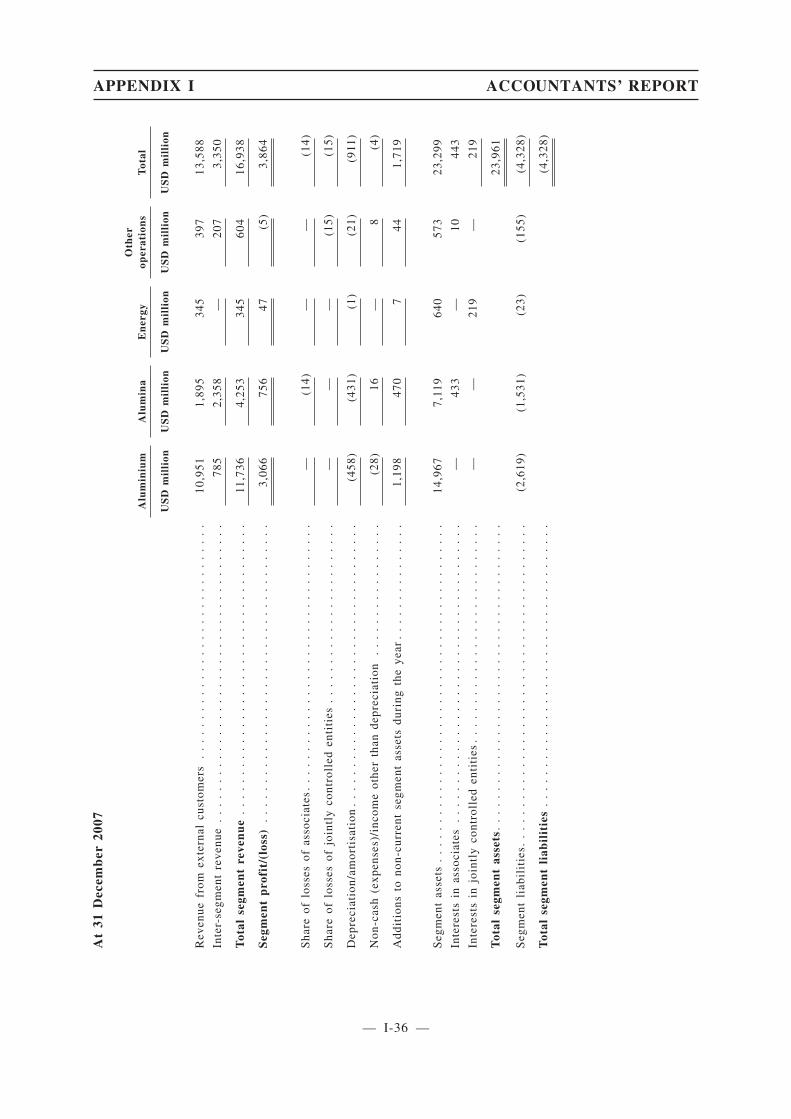
At
31D
ecem
ber
2007
Alu
min
ium
Alu
min
aE
ner
gyO
ther
oper
atio
ns
Tot
al
US
Dm
illi
onU
SD
mil
lion
US
Dm
illi
onU
SD
mil
lion
US
Dm
illi
on
Rev
enue
from
exte
rnal
cust
omer
s.
..
..
..
..
..
..
..
..
..
..
..
..
..
..
.10
,951
1,89
534
539
713
,588
Inte
r-se
gmen
tre
venu
e.
..
..
..
..
..
..
..
..
..
..
..
..
..
..
..
..
..
..
.78
52,
358
—20
73,
350
Tot
alse
gmen
tre
ven
ue
..
..
..
..
..
..
..
..
..
..
..
..
..
..
..
..
..
..
.11
,736
4,25
334
560
416
,938
Seg
men
tp
rofi
t/(l
oss)
..
..
..
..
..
..
..
..
..
..
..
..
..
..
..
..
..
..
..
3,06
675
647
(5)
3,86
4
Sha
reof
loss
esof
asso
ciat
es.
..
..
..
..
..
..
..
..
..
..
..
..
..
..
..
..
.—
(14)
——
(14)
Sha
reof
loss
esof
join
tly
cont
roll
eden
titi
es.
..
..
..
..
..
..
..
..
..
..
..
——
—(1
5)(1
5)
Dep
reci
atio
n/am
orti
sati
on.
..
..
..
..
..
..
..
..
..
..
..
..
..
..
..
..
..
.(4
58)
(431
)(1
)(2
1)(9
11)
Non
-cas
h(e
xpen
ses)
/inc
ome
othe
rth
ande
prec
iati
on.
..
..
..
..
..
..
..
..
(28)
16—
8(4
)
Add
itio
nsto
non-
curr
ent
segm
ent
asse
tsdu
ring
the
year
..
..
..
..
..
..
..
.1,
198
470
744
1,71
9
Seg
men
tas
sets
..
..
..
..
..
..
..
..
..
..
..
..
..
..
..
..
..
..
..
..
..
.14
,967
7,11
964
057
323
,299
Inte
rest
sin
asso
ciat
es.
..
..
..
..
..
..
..
..
..
..
..
..
..
..
..
..
..
..
.—
433
—10
443
Inte
rest
sin
join
tly
cont
roll
eden
titi
es.
..
..
..
..
..
..
..
..
..
..
..
..
..
.—
—21
9—
219
Tot
alse
gmen
tas
sets
..
..
..
..
..
..
..
..
..
..
..
..
..
..
..
..
..
..
..
.23
,961
Seg
men
tli
abil
itie
s..
..
..
..
..
..
..
..
..
..
..
..
..
..
..
..
..
..
..
..
.(2
,619
)(1
,531
)(2
3)(1
55)
(4,3
28)
Tot
alse
gmen
tli
abil
itie
s.
..
..
..
..
..
..
..
..
..
..
..
..
..
..
..
..
..
.(4
,328
)
APPENDIX I ACCOUNTANTS’ REPORT
— I-36 —
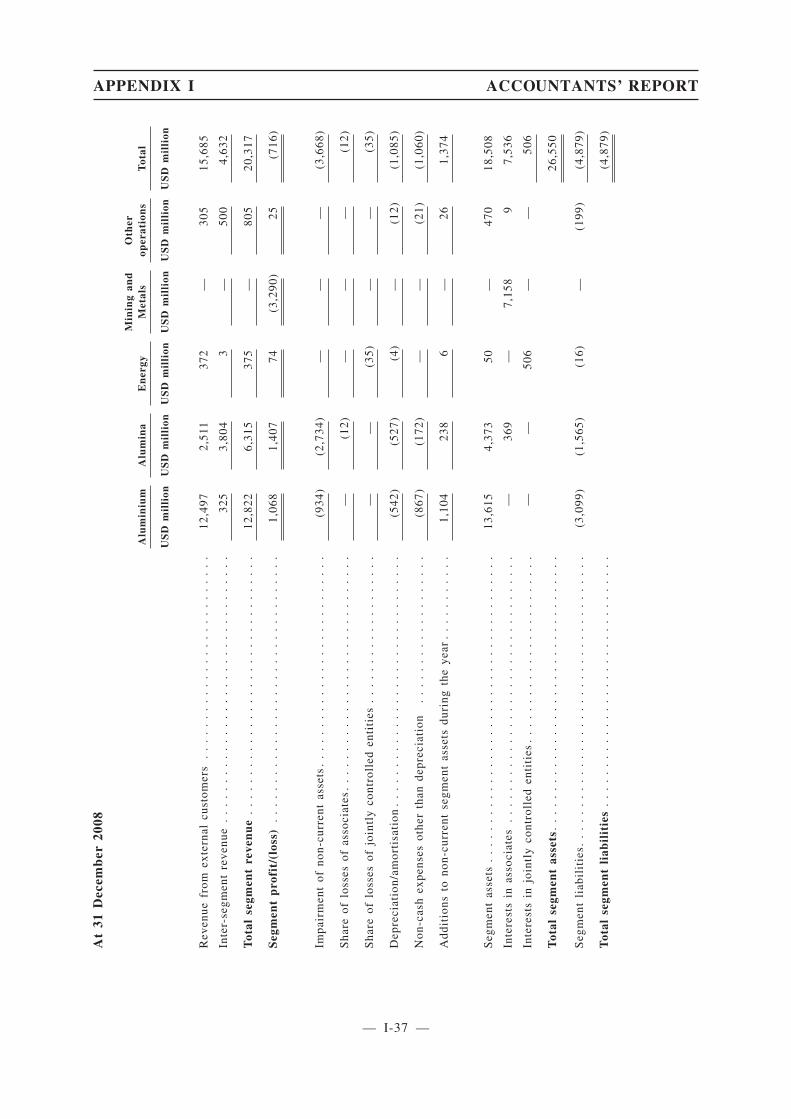
At
31D
ecem
ber
2008
Alu
min
ium
Alu
min
aE
ner
gyM
inin
gan
dM
etal
sO
ther
oper
atio
ns
Tot
al
US
Dm
illi
onU
SD
mil
lion
US
Dm
illi
onU
SD
mil
lion
US
Dm
illi
onU
SD
mil
lion
Rev
enue
from
exte
rnal
cust
omer
s.
..
..
..
..
..
..
..
..
..
..
..
..
.12
,497
2,51
137
2—
305
15,6
85
Inte
r-se
gmen
tre
venu
e.
..
..
..
..
..
..
..
..
..
..
..
..
..
..
..
..
.32
53,
804
3—
500
4,63
2
Tot
alse
gmen
tre
ven
ue
..
..
..
..
..
..
..
..
..
..
..
..
..
..
..
..
.12
,822
6,31
537
5—
805
20,3
17
Seg
men
tp
rofi
t/(l
oss)
..
..
..
..
..
..
..
..
..
..
..
..
..
..
..
..
..
1,06
81,
407
74(3
,290
)25
(716
)
Impa
irm
ent
ofno
n-cu
rren
tas
sets
..
..
..
..
..
..
..
..
..
..
..
..
..
.(9
34)
(2,7
34)
——
—(3
,668
)
Sha
reof
loss
esof
asso
ciat
es.
..
..
..
..
..
..
..
..
..
..
..
..
..
..
.—
(12)
——
—(1
2)
Sha
reof
loss
esof
join
tly
cont
roll
eden
titi
es.
..
..
..
..
..
..
..
..
..
——
(35)
——
(35)
Dep
reci
atio
n/am
orti
sati
on.
..
..
..
..
..
..
..
..
..
..
..
..
..
..
..
.(5
42)
(527
)(4
)—
(12)
(1,0
85)
Non
-cas
hex
pens
esot
her
than
depr
ecia
tion
..
..
..
..
..
..
..
..
..
.(8
67)
(172
)—
—(2
1)(1
,060
)
Add
itio
nsto
non-
curr
ent
segm
ent
asse
tsdu
ring
the
year
..
..
..
..
..
.1,
104
238
6—
261,
374
Seg
men
tas
sets
..
..
..
..
..
..
..
..
..
..
..
..
..
..
..
..
..
..
..
.13
,615
4,37
350
—47
018
,508
Inte
rest
sin
asso
ciat
es.
..
..
..
..
..
..
..
..
..
..
..
..
..
..
..
..
.—
369
—7,
158
97,
536
Inte
rest
sin
join
tly
cont
roll
eden
titi
es.
..
..
..
..
..
..
..
..
..
..
..
.—
—50
6—
—50
6
Tot
alse
gmen
tas
sets
..
..
..
..
..
..
..
..
..
..
..
..
..
..
..
..
..
.26
,550
Seg
men
tli
abil
itie
s..
..
..
..
..
..
..
..
..
..
..
..
..
..
..
..
..
..
.(3
,099
)(1
,565
)(1
6)—
(199
)(4
,879
)
Tot
alse
gmen
tli
abil
itie
s.
..
..
..
..
..
..
..
..
..
..
..
..
..
..
..
.(4
,879
)
APPENDIX I ACCOUNTANTS’ REPORT
— I-37 —

At
30Ju
ne
2008
Alu
min
ium
Alu
min
aE
ner
gyM
inin
gan
dM
etal
sO
ther
oper
atio
ns
Tot
al
US
Dm
illi
on(u
nau
dit
ed)
US
Dm
illi
on(u
nau
dit
ed)
US
Dm
illi
on(u
nau
dit
ed)
US
Dm
illi
on(u
nau
dit
ed)
US
Dm
illi
on(u
nau
dit
ed)
US
Dm
illi
on(u
nau
dit
ed)
Rev
enue
from
exte
rnal
cust
omer
s.
..
..
..
..
..
..
..
..
..
..
..
..
.6,
652
1,27
225
1—
179
8,35
4
Inte
r-se
gmen
tre
venu
e.
..
..
..
..
..
..
..
..
..
..
..
..
..
..
..
..
.18
21,
853
——
256
2,29
1
Tot
alse
gmen
tre
ven
ue
..
..
..
..
..
..
..
..
..
..
..
..
..
..
..
..
.6,
834
3,12
525
1—
435
10,6
45
Seg
men
tp
rofi
t/(l
oss)
..
..
..
..
..
..
..
..
..
..
..
..
..
..
..
..
..
1,21
881
247
8212
2,17
1
Impa
irm
ent
ofno
n-cu
rren
tas
sets
..
..
..
..
..
..
..
..
..
..
..
..
..
.—
(333
)(1
1)—
—(3
44)
Sha
reof
loss
esof
asso
ciat
es.
..
..
..
..
..
..
..
..
..
..
..
..
..
..
.—
(3)
——
—(3
)
Sha
reof
prof
its
ofjo
intl
yco
ntro
lled
enti
ties
..
..
..
..
..
..
..
..
..
.—
—40
——
40
Dep
reci
atio
n/am
orti
sati
on.
..
..
..
..
..
..
..
..
..
..
..
..
..
..
..
.(2
80)
(281
)(3
)—
(8)
(572
)
Non
-cas
hex
pens
esot
her
than
depr
ecia
tion
..
..
..
..
..
..
..
..
..
.(6
)(4
)—
——
(10)
Add
itio
nsto
non-
curr
ent
segm
ent
asse
tsdu
ring
the
peri
od.
..
..
..
..
608
152
3—
2779
0
APPENDIX I ACCOUNTANTS’ REPORT
— I-38 —
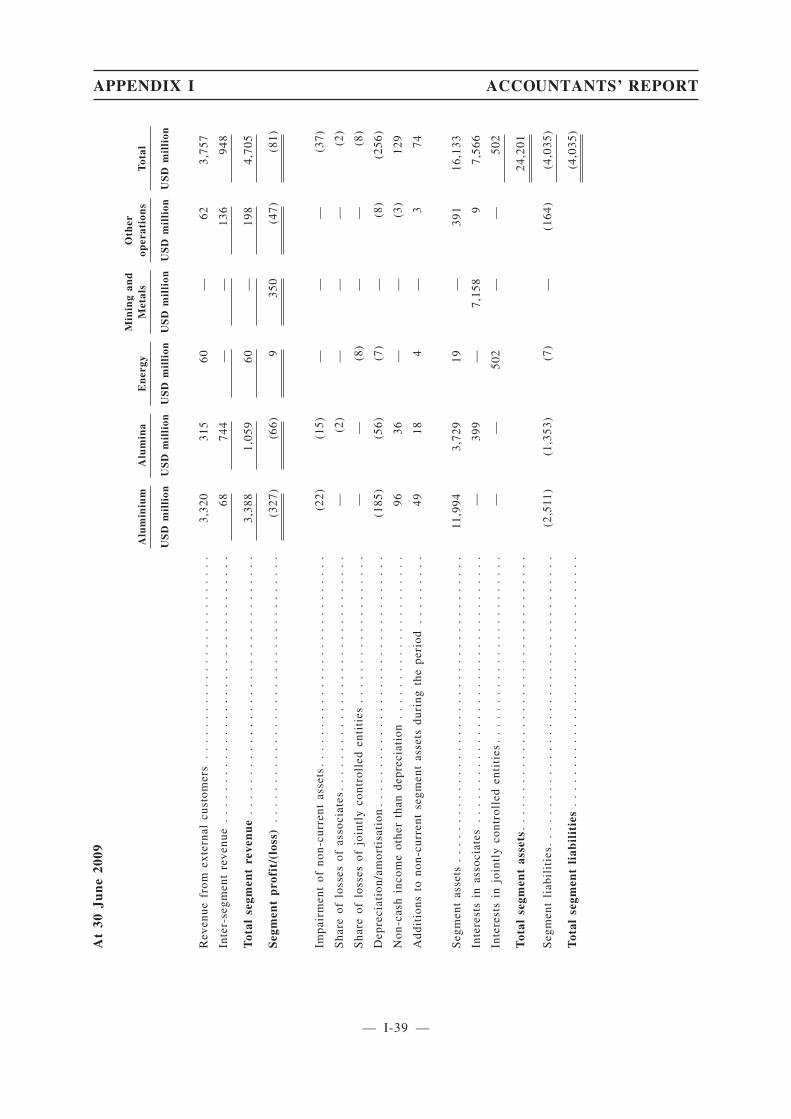
At
30Ju
ne
2009
Alu
min
ium
Alu
min
aE
ner
gyM
inin
gan
dM
etal
sO
ther
oper
atio
ns
Tot
al
US
Dm
illi
onU
SD
mil
lion
US
Dm
illi
onU
SD
mil
lion
US
Dm
illi
onU
SD
mil
lion
Rev
enue
from
exte
rnal
cust
omer
s.
..
..
..
..
..
..
..
..
..
..
..
..
.3,
320
315
60—
623,
757
Inte
r-se
gmen
tre
venu
e.
..
..
..
..
..
..
..
..
..
..
..
..
..
..
..
..
.68
744
——
136
948
Tot
alse
gmen
tre
ven
ue
..
..
..
..
..
..
..
..
..
..
..
..
..
..
..
..
.3,
388
1,05
960
—19
84,
705
Seg
men
tp
rofi
t/(l
oss)
..
..
..
..
..
..
..
..
..
..
..
..
..
..
..
..
..
(327
)(6
6)9
350
(47)
(81)
Impa
irm
ent
ofno
n-cu
rren
tas
sets
..
..
..
..
..
..
..
..
..
..
..
..
..
.(2
2)(1
5)—
——
(37)
Sha
reof
loss
esof
asso
ciat
es.
..
..
..
..
..
..
..
..
..
..
..
..
..
..
.—
(2)
——
—(2
)
Sha
reof
loss
esof
join
tly
cont
roll
eden
titi
es.
..
..
..
..
..
..
..
..
..
——
(8)
——
(8)
Dep
reci
atio
n/am
orti
sati
on.
..
..
..
..
..
..
..
..
..
..
..
..
..
..
..
.(1
85)
(56)
(7)
—(8
)(2
56)
Non
-cas
hin
com
eot
her
than
depr
ecia
tion
..
..
..
..
..
..
..
..
..
..
.96
36—
—(3
)12
9
Add
itio
nsto
non-
curr
ent
segm
ent
asse
tsdu
ring
the
peri
od.
..
..
..
..
4918
4—
374
Seg
men
tas
sets
..
..
..
..
..
..
..
..
..
..
..
..
..
..
..
..
..
..
..
.11
,994
3,72
919
—39
116
,133
Inte
rest
sin
asso
ciat
es.
..
..
..
..
..
..
..
..
..
..
..
..
..
..
..
..
.—
399
—7,
158
97,
566
Inte
rest
sin
join
tly
cont
roll
eden
titi
es.
..
..
..
..
..
..
..
..
..
..
..
.—
—50
2—
—50
2
Tot
alse
gmen
tas
sets
..
..
..
..
..
..
..
..
..
..
..
..
..
..
..
..
..
.24
,201
Seg
men
tli
abil
itie
s..
..
..
..
..
..
..
..
..
..
..
..
..
..
..
..
..
..
.(2
,511
)(1
,353
)(7
)—
(164
)(4
,035
)
Tot
alse
gmen
tli
abil
itie
s.
..
..
..
..
..
..
..
..
..
..
..
..
..
..
..
.(4
,035
)
APPENDIX I ACCOUNTANTS’ REPORT
— I-39 —
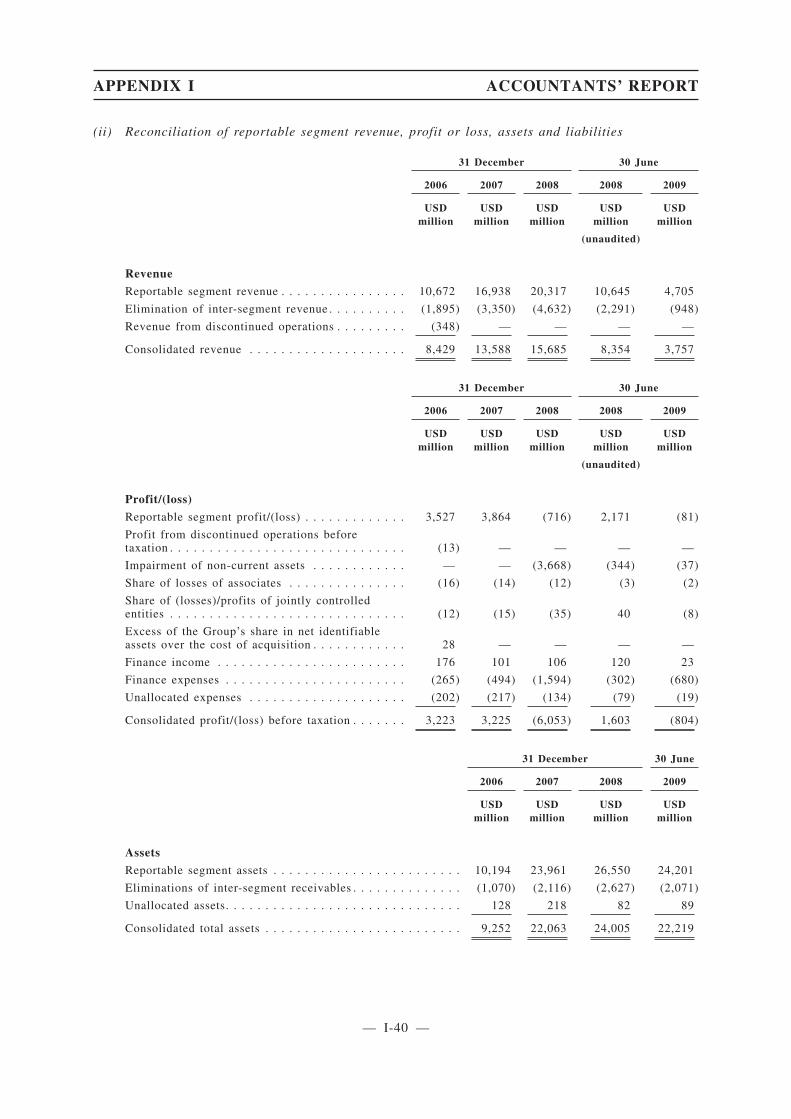
(ii) Reconciliation of reportable segment revenue, profit or loss, assets and liabilities
31 December 30 June
2006 2007 2008 2008 2009
USDmillion
USDmillion
USDmillion
USDmillion
USDmillion
(unaudited)
Revenue
Reportable segment revenue . . . . . . . . . . . . . . . . 10,672 16,938 20,317 10,645 4,705
Elimination of inter-segment revenue . . . . . . . . . . (1,895) (3,350) (4,632) (2,291) (948)
Revenue from discontinued operations . . . . . . . . . (348) — — — —
Consolidated revenue . . . . . . . . . . . . . . . . . . . . 8,429 13,588 15,685 8,354 3,757
31 December 30 June
2006 2007 2008 2008 2009
USDmillion
USDmillion
USDmillion
USDmillion
USDmillion
(unaudited)
Profit/(loss)
Reportable segment profit/(loss) . . . . . . . . . . . . . 3,527 3,864 (716) 2,171 (81)
Profit from discontinued operations beforetaxation . . . . . . . . . . . . . . . . . . . . . . . . . . . . . . (13) — — — —
Impairment of non-current assets . . . . . . . . . . . . — — (3,668) (344) (37)
Share of losses of associates . . . . . . . . . . . . . . . (16) (14) (12) (3) (2)
Share of (losses)/profits of jointly controlledentities . . . . . . . . . . . . . . . . . . . . . . . . . . . . . . (12) (15) (35) 40 (8)
Excess of the Group’s share in net identifiableassets over the cost of acquisition . . . . . . . . . . . . 28 — — — —
Finance income . . . . . . . . . . . . . . . . . . . . . . . . 176 101 106 120 23
Finance expenses . . . . . . . . . . . . . . . . . . . . . . . (265) (494) (1,594) (302) (680)
Unallocated expenses . . . . . . . . . . . . . . . . . . . . (202) (217) (134) (79) (19)
Consolidated profit/(loss) before taxation . . . . . . . 3,223 3,225 (6,053) 1,603 (804)
31 December 30 June
2006 2007 2008 2009
USDmillion
USDmillion
USDmillion
USDmillion
Assets
Reportable segment assets . . . . . . . . . . . . . . . . . . . . . . . . 10,194 23,961 26,550 24,201
Eliminations of inter-segment receivables . . . . . . . . . . . . . . (1,070) (2,116) (2,627) (2,071)
Unallocated assets. . . . . . . . . . . . . . . . . . . . . . . . . . . . . . 128 218 82 89
Consolidated total assets . . . . . . . . . . . . . . . . . . . . . . . . . 9,252 22,063 24,005 22,219
APPENDIX I ACCOUNTANTS’ REPORT
— I-40 —

31 December 30 June
2006 2007 2008 2009
USDmillion
USDmillion
USDmillion
USDmillion
LiabilitiesReportable segment liabilities . . . . . . . . . . . . . . . . . . . . . . (1,851) (4,328) (4,879) (4,035)Eliminations of inter-segment payables . . . . . . . . . . . . . . . 1,070 2,116 2,627 2,071Unallocated liabilities . . . . . . . . . . . . . . . . . . . . . . . . . . . (5,332) (9,712) (17,265) (17,178)
Consolidated total liabilities . . . . . . . . . . . . . . . . . . . . . . . (6,113) (11,924) (19,517) (19,142)
(iii) Geographic information
The Group’s business segments are managed on a worldwide basis, but operate in four principalgeographical areas: the CIS, Europe, Africa and the Americas. In the CIS, production facilitiesoperate in Russia and Ukraine. In Europe, production facilities are located in Italy, Ireland andSweden. African production facilities are represented by the bauxite mines and an aluminarefinery in Guinea and an aluminium plant under construction in Nigeria. In the Americas theGroup operates two production facilities in Jamaica, one in Guyana and a trading subsidiary inthe United States of America.
The following table sets out information about the geographical location of (i) the Group’srevenue from external customers and (ii) the Group’s property, plant and equipment, intangibleassets, goodwill and interests in associates and jointly controlled entities (“specified non-currentassets”). The geographical location of customers is based on the location at which the serviceswere provided or the goods delivered. The geographical location of the specified non-currentassets is based on the physical location of the asset. Unallocated specified non-current assetscomprise mainly goodwill and interests in associates and jointly controlled entities.
Revenue from external customersRevenue from external
customers
Year ended 31 December Six months ended 30 June
2006 2007 2008 2008 2009
USD million USD million USD millionUSD
million USD million(unaudited)
Netherlands . . . . . . . . . . . . . . . . . . 659 1,612 1,878 954 549Russia . . . . . . . . . . . . . . . . . . . . . . . 1,813 2,483 3,366 1,498 533USA . . . . . . . . . . . . . . . . . . . . . . . . 1,458 1,254 1,523 703 490China . . . . . . . . . . . . . . . . . . . . . . . 47 100 397 207 379South Korea . . . . . . . . . . . . . . . . . . . 837 662 1,117 589 332Turkey . . . . . . . . . . . . . . . . . . . . . . 593 1,135 1,204 600 231United Kingdom . . . . . . . . . . . . . . . . 20 286 399 163 208Japan . . . . . . . . . . . . . . . . . . . . . . . 808 1,122 1,275 712 174Italy . . . . . . . . . . . . . . . . . . . . . . . . 135 373 242 161 141Norway . . . . . . . . . . . . . . . . . . . . . . 289 974 854 535 94Sweden . . . . . . . . . . . . . . . . . . . . . . 148 488 334 197 70Germany . . . . . . . . . . . . . . . . . . . . . 240 137 271 165 61Greece . . . . . . . . . . . . . . . . . . . . . . 219 283 297 191 32Canada . . . . . . . . . . . . . . . . . . . . . . 11 198 242 114 9Other countries . . . . . . . . . . . . . . . . . 1,152 2,481 2,286 1,565 454
8,429 13,588 15,685 8,354 3,757
APPENDIX I ACCOUNTANTS’ REPORT
— I-41 —
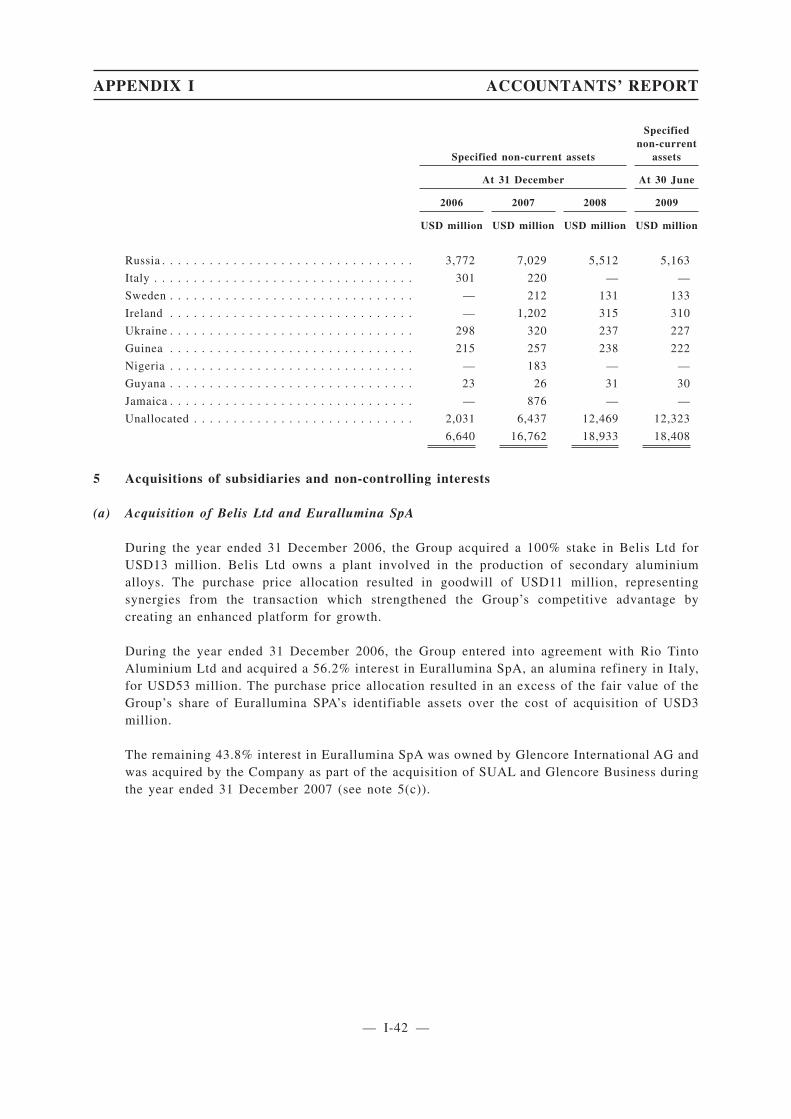
Specified non-current assets
Specifiednon-current
assets
At 31 December At 30 June
2006 2007 2008 2009
USD million USD million USD million USD million
Russia . . . . . . . . . . . . . . . . . . . . . . . . . . . . . . . . 3,772 7,029 5,512 5,163
Italy . . . . . . . . . . . . . . . . . . . . . . . . . . . . . . . . . 301 220 — —
Sweden . . . . . . . . . . . . . . . . . . . . . . . . . . . . . . . — 212 131 133
Ireland . . . . . . . . . . . . . . . . . . . . . . . . . . . . . . . — 1,202 315 310
Ukraine . . . . . . . . . . . . . . . . . . . . . . . . . . . . . . . 298 320 237 227
Guinea . . . . . . . . . . . . . . . . . . . . . . . . . . . . . . . 215 257 238 222
Nigeria . . . . . . . . . . . . . . . . . . . . . . . . . . . . . . . — 183 — —
Guyana . . . . . . . . . . . . . . . . . . . . . . . . . . . . . . . 23 26 31 30
Jamaica . . . . . . . . . . . . . . . . . . . . . . . . . . . . . . . — 876 — —
Unallocated . . . . . . . . . . . . . . . . . . . . . . . . . . . . 2,031 6,437 12,469 12,323
6,640 16,762 18,933 18,408
5 Acquisitions of subsidiaries and non-controlling interests
(a) Acquisition of Belis Ltd and Eurallumina SpA
During the year ended 31 December 2006, the Group acquired a 100% stake in Belis Ltd forUSD13 million. Belis Ltd owns a plant involved in the production of secondary aluminiumalloys. The purchase price allocation resulted in goodwill of USD11 million, representingsynergies from the transaction which strengthened the Group’s competitive advantage bycreating an enhanced platform for growth.
During the year ended 31 December 2006, the Group entered into agreement with Rio TintoAluminium Ltd and acquired a 56.2% interest in Eurallumina SpA, an alumina refinery in Italy,for USD53 million. The purchase price allocation resulted in an excess of the fair value of theGroup’s share of Eurallumina SPA’s identifiable assets over the cost of acquisition of USD3million.
The remaining 43.8% interest in Eurallumina SpA was owned by Glencore International AG andwas acquired by the Company as part of the acquisition of SUAL and Glencore Business duringthe year ended 31 December 2007 (see note 5(c)).
APPENDIX I ACCOUNTANTS’ REPORT
— I-42 —
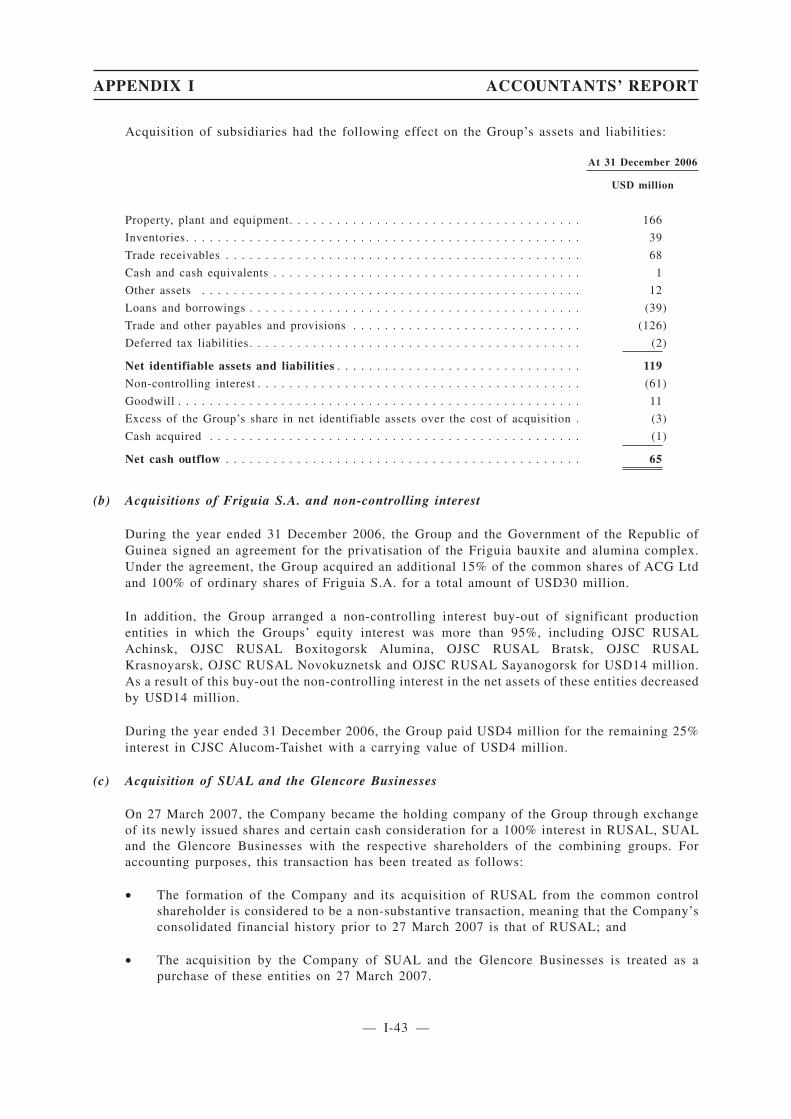
Acquisition of subsidiaries had the following effect on the Group’s assets and liabilities:
At 31 December 2006
USD million
Property, plant and equipment. . . . . . . . . . . . . . . . . . . . . . . . . . . . . . . . . . . . . 166
Inventories. . . . . . . . . . . . . . . . . . . . . . . . . . . . . . . . . . . . . . . . . . . . . . . . . . 39
Trade receivables . . . . . . . . . . . . . . . . . . . . . . . . . . . . . . . . . . . . . . . . . . . . . 68
Cash and cash equivalents . . . . . . . . . . . . . . . . . . . . . . . . . . . . . . . . . . . . . . . 1
Other assets . . . . . . . . . . . . . . . . . . . . . . . . . . . . . . . . . . . . . . . . . . . . . . . . 12
Loans and borrowings . . . . . . . . . . . . . . . . . . . . . . . . . . . . . . . . . . . . . . . . . . (39)
Trade and other payables and provisions . . . . . . . . . . . . . . . . . . . . . . . . . . . . . (126)
Deferred tax liabilities . . . . . . . . . . . . . . . . . . . . . . . . . . . . . . . . . . . . . . . . . . (2)
Net identifiable assets and liabilities . . . . . . . . . . . . . . . . . . . . . . . . . . . . . . . 119
Non-controlling interest . . . . . . . . . . . . . . . . . . . . . . . . . . . . . . . . . . . . . . . . . (61)
Goodwill . . . . . . . . . . . . . . . . . . . . . . . . . . . . . . . . . . . . . . . . . . . . . . . . . . . 11
Excess of the Group’s share in net identifiable assets over the cost of acquisition . (3)
Cash acquired . . . . . . . . . . . . . . . . . . . . . . . . . . . . . . . . . . . . . . . . . . . . . . . (1)
Net cash outflow . . . . . . . . . . . . . . . . . . . . . . . . . . . . . . . . . . . . . . . . . . . . . 65
(b) Acquisitions of Friguia S.A. and non-controlling interest
During the year ended 31 December 2006, the Group and the Government of the Republic ofGuinea signed an agreement for the privatisation of the Friguia bauxite and alumina complex.Under the agreement, the Group acquired an additional 15% of the common shares of ACG Ltdand 100% of ordinary shares of Friguia S.A. for a total amount of USD30 million.
In addition, the Group arranged a non-controlling interest buy-out of significant productionentities in which the Groups’ equity interest was more than 95%, including OJSC RUSALAchinsk, OJSC RUSAL Boxitogorsk Alumina, OJSC RUSAL Bratsk, OJSC RUSALKrasnoyarsk, OJSC RUSAL Novokuznetsk and OJSC RUSAL Sayanogorsk for USD14 million.As a result of this buy-out the non-controlling interest in the net assets of these entities decreasedby USD14 million.
During the year ended 31 December 2006, the Group paid USD4 million for the remaining 25%interest in CJSC Alucom-Taishet with a carrying value of USD4 million.
(c) Acquisition of SUAL and the Glencore Businesses
On 27 March 2007, the Company became the holding company of the Group through exchangeof its newly issued shares and certain cash consideration for a 100% interest in RUSAL, SUALand the Glencore Businesses with the respective shareholders of the combining groups. Foraccounting purposes, this transaction has been treated as follows:
• The formation of the Company and its acquisition of RUSAL from the common controlshareholder is considered to be a non-substantive transaction, meaning that the Company’sconsolidated financial history prior to 27 March 2007 is that of RUSAL; and
• The acquisition by the Company of SUAL and the Glencore Businesses is treated as apurchase of these entities on 27 March 2007.
APPENDIX I ACCOUNTANTS’ REPORT
— I-43 —
SUAL operates in the aluminium industry in the Russian Federation and Ukraine and isprincipally engaged in the mining and refining of bauxite into alumina, the smelting of primaryaluminium from alumina and the fabrication of aluminium and aluminium alloys intosemi-fabricated and finished products.
The Glencore Businesses comprise three production facilities engaged in the mining and refiningof bauxite into alumina located in Jamaica and Ireland, one production facility engaged in thesmelting of primary aluminium from alumina located in Sweden and a 43.8% equity interest inEurallumina SpA.
During the period from 27 March 2007 to 31 December 2007 SUAL and the Glencore Businessescontributed USD3,385 million to the consolidated revenue and USD421 million to theconsolidated net profit of the Group.
If the acquisitions had occurred on 1 January 2007, management estimates that, on a pro formabasis, consolidated revenue for the period from 1 January to 31 December 2007 would have beenUSD14,962 million, consolidated profit before taxation would have been USD3,471 million andconsolidated profit for the period would have been USD3,033 million. In determining thesefigures it has been assumed that the fair value adjustments at 1 January 2007 would have beenthe same as the fair value adjustments that arose at the date of acquisition. This pro formainformation has been prepared taking into account additional depreciation and amortisationresulting from recording non-current assets at fair value, interest costs relating to the cashconsideration paid and the pre-closing distributions to shareholders, additional cost of salesrelating to recording finished goods and work in progress at fair value and related tax effects butdoes not purport to represent the results of the Group that actually would have occurred had theacquisition taken place on 1 January 2007 and should not be taken to be representative of futureresults.
APPENDIX I ACCOUNTANTS’ REPORT
— I-44 —
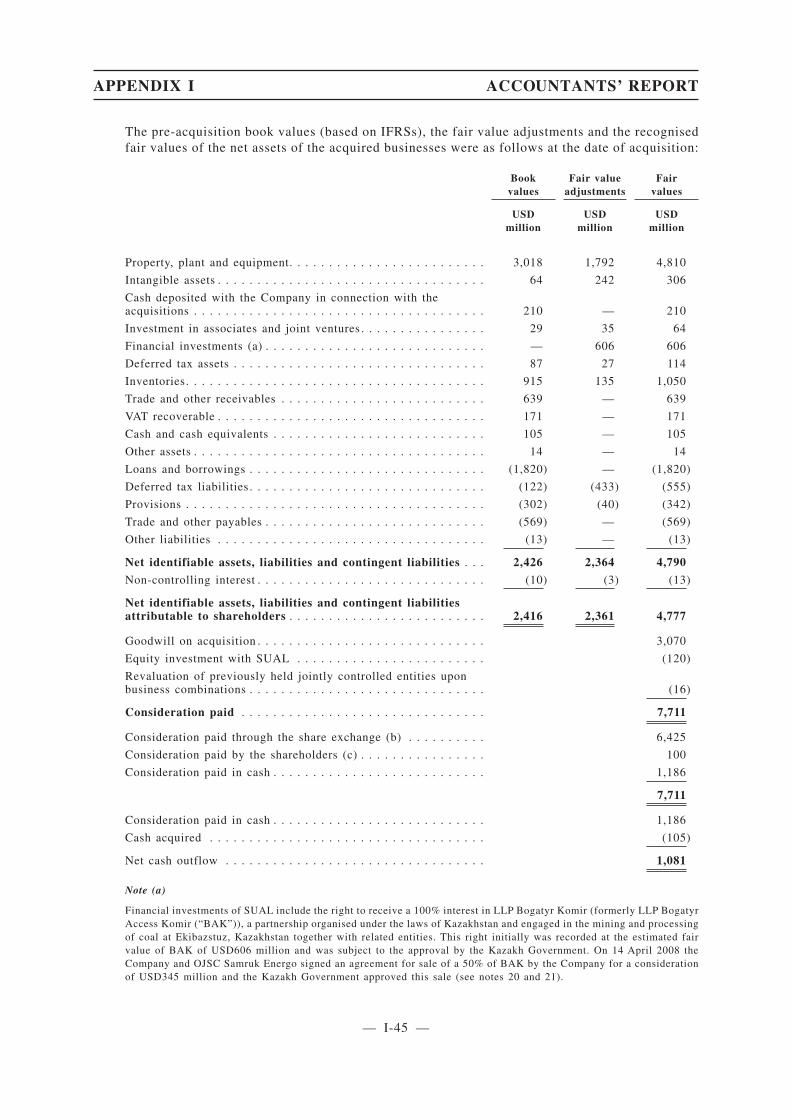
The pre-acquisition book values (based on IFRSs), the fair value adjustments and the recognisedfair values of the net assets of the acquired businesses were as follows at the date of acquisition:
Bookvalues
Fair valueadjustments
Fairvalues
USDmillion
USDmillion
USDmillion
Property, plant and equipment. . . . . . . . . . . . . . . . . . . . . . . . . 3,018 1,792 4,810
Intangible assets . . . . . . . . . . . . . . . . . . . . . . . . . . . . . . . . . . 64 242 306
Cash deposited with the Company in connection with theacquisitions . . . . . . . . . . . . . . . . . . . . . . . . . . . . . . . . . . . . . 210 — 210
Investment in associates and joint ventures . . . . . . . . . . . . . . . . 29 35 64
Financial investments (a) . . . . . . . . . . . . . . . . . . . . . . . . . . . . — 606 606
Deferred tax assets . . . . . . . . . . . . . . . . . . . . . . . . . . . . . . . . 87 27 114
Inventories. . . . . . . . . . . . . . . . . . . . . . . . . . . . . . . . . . . . . . 915 135 1,050
Trade and other receivables . . . . . . . . . . . . . . . . . . . . . . . . . . 639 — 639
VAT recoverable . . . . . . . . . . . . . . . . . . . . . . . . . . . . . . . . . . 171 — 171
Cash and cash equivalents . . . . . . . . . . . . . . . . . . . . . . . . . . . 105 — 105
Other assets . . . . . . . . . . . . . . . . . . . . . . . . . . . . . . . . . . . . . 14 — 14
Loans and borrowings . . . . . . . . . . . . . . . . . . . . . . . . . . . . . . (1,820) — (1,820)
Deferred tax liabilities . . . . . . . . . . . . . . . . . . . . . . . . . . . . . . (122) (433) (555)
Provisions . . . . . . . . . . . . . . . . . . . . . . . . . . . . . . . . . . . . . . (302) (40) (342)
Trade and other payables . . . . . . . . . . . . . . . . . . . . . . . . . . . . (569) — (569)
Other liabilities . . . . . . . . . . . . . . . . . . . . . . . . . . . . . . . . . . (13) — (13)
Net identifiable assets, liabilities and contingent liabilities . . . 2,426 2,364 4,790
Non-controlling interest . . . . . . . . . . . . . . . . . . . . . . . . . . . . . (10) (3) (13)
Net identifiable assets, liabilities and contingent liabilitiesattributable to shareholders . . . . . . . . . . . . . . . . . . . . . . . . . 2,416 2,361 4,777
Goodwill on acquisition . . . . . . . . . . . . . . . . . . . . . . . . . . . . . 3,070
Equity investment with SUAL . . . . . . . . . . . . . . . . . . . . . . . . (120)
Revaluation of previously held jointly controlled entities uponbusiness combinations . . . . . . . . . . . . . . . . . . . . . . . . . . . . . . (16)
Consideration paid . . . . . . . . . . . . . . . . . . . . . . . . . . . . . . . 7,711
Consideration paid through the share exchange (b) . . . . . . . . . . 6,425
Consideration paid by the shareholders (c) . . . . . . . . . . . . . . . . 100
Consideration paid in cash . . . . . . . . . . . . . . . . . . . . . . . . . . . 1,186
7,711
Consideration paid in cash . . . . . . . . . . . . . . . . . . . . . . . . . . . 1,186
Cash acquired . . . . . . . . . . . . . . . . . . . . . . . . . . . . . . . . . . . (105)
Net cash outflow . . . . . . . . . . . . . . . . . . . . . . . . . . . . . . . . . 1,081
Note (a)
Financial investments of SUAL include the right to receive a 100% interest in LLP Bogatyr Komir (formerly LLP BogatyrAccess Komir (“BAK”)), a partnership organised under the laws of Kazakhstan and engaged in the mining and processingof coal at Ekibazstuz, Kazakhstan together with related entities. This right initially was recorded at the estimated fairvalue of BAK of USD606 million and was subject to the approval by the Kazakh Government. On 14 April 2008 theCompany and OJSC Samruk Energo signed an agreement for sale of a 50% of BAK by the Company for a considerationof USD345 million and the Kazakh Government approved this sale (see notes 20 and 21).
APPENDIX I ACCOUNTANTS’ REPORT
— I-45 —

Note (b)
To effect the transaction the Company issued 2,200 shares in exchange for a 100% interest in SUAL and 1,200 sharesin exchange for a 100% interest in the Glencore Businesses.
At the time of the acquisition, there were no published market prices for equity instruments issued by the Company orequity instruments of any of RUSAL, SUAL or the Glencore Businesses. In order to determine value of the sharesexchanged, management engaged independent appraisers to evaluate RUSAL, SUAL and the Glencore Businesses.
The independent appraiser determined ranges of equity values for each of the entities using a variety of valuationtechniques including discounted cash flow models; comparable companies’ valuation (application of publicly tradedcompanies to various financial metrics); precedent transactions valuation (application of multiples from recenttransactions to various financial metrics). Based on this data, management used the mid-range independent valuation forRUSAL as the basis for determining relative amounts of consideration given to the shareholders of SUAL and theGlencore Businesses.
Note (c)
In accordance with the terms of the transaction the shareholder of RUSAL was required to make a payment directly toSUAL Partners Limited in addition to the share exchange and consideration paid in cash by the Company. The amounthas been recorded as a contribution to other reserves in this Financial Information.
In most business acquisitions, there is part of the cost that is not capable of being attributed in accounting terms toidentifiable assets and liabilities acquired and is therefore recognised as goodwill. In the case of the acquisitions ofSUAL and the Glencore Businesses, this goodwill is underpinned by a number of elements, which individually cannotbe quantified. Goodwill recognised on the acquisitions is primarily attributable to expected synergies that are specificto the Group, to the potential value of expansion opportunities and to the leading market position attained by the Group.Prior to the acquisitions, RUSAL needed to acquire significant quantities of alumina and bauxite necessary for itssmelting operations from third parties. As a result of the acquisitions, the Group became the world’s leading verticallyintegrated aluminium producer, self-sufficient in alumina refining capacity and largely self-sufficient in bauxite miningcapacity with a significant pipeline of approved and potential expansion opportunities.
(d) Acquisition of Fairfex Transportation Holding Ltd
In October 2007, the Group acquired a 100% interest in a transportation business located inKazakhstan for USD95 million in cash. The acquired business is engaged in the transportationof coal and iron ore from the Bogatyr strip mine in Kazakhstan to Russia by railway. Thepurchase price allocation resulted in goodwill of USD3 million.
(e) Acquisition of Alscon
In February 2006, the Group signed an agreement with the Government of Nigeria to purchase77.5% of the issued shares of Aluminium Smelter Company of Nigeria (“Alscon”) for USD250million. The initially agreed purchase price of USD250 million was decreased to USD130 millionas the seller of the shares was released from the obligation to dredge the river adjoining thesmelter, a condition included in the initial acquisition agreement. The transaction was finalisedin February 2007. Legal fees of USD10 million were paid in connection with the acquisition andwere included in the amount of consideration paid.
Alscon is now under construction and had been in “care and maintenance” for a number of yearspreceding acquisition by the Group.
The impact of acquisition on the financial results of the Group for the year ended 31 December2007 was not significant.
APPENDIX I ACCOUNTANTS’ REPORT
— I-46 —

(f) Acquisition of non-controlling interest
In December 2007 the Group signed an agreement with MAN Ferrostaal AG for the purchase of7.5% of the ordinary shares of Aluminium Smelter Company of Nigeria Plc for USD12 millionin addition to the Group’s existing controlling interests. The transaction was completed inJanuary 2008.
6 Discontinued operations
Packaging, aluminium construction and magnesium assets
On 29 December 2006 as required by pre-completion conditions of the acquisition agreementwith SUAL Partners Ltd. and Glencore International AG the Group transferred all packaging,aluminium construction and magnesium assets, including RUSAL MOSMEK, RUSAL Dmitrov,RUSAL ROSTAR, RUSAL ROSTAR Vsevolozhsk, RusAlumStroy, Trade House “RussianAluminium Tara” as well as certain energy assets (investment in shares of Sayano-Shushenskhydropower station) to the shareholder as a distribution at the carrying values of these assetswhich totalled USD313 million.
Operations of the packaging, aluminium construction and magnesium companies were treated asdiscontinued in this Financial Information.
Income and expenses from discontinued operations are presented below:
Year ended31 December 2006
USD million
Revenue . . . . . . . . . . . . . . . . . . . . . . . . . . . . . . . . . . . . . . . . . . . . . . . . . . . . . 348
Cost of sales . . . . . . . . . . . . . . . . . . . . . . . . . . . . . . . . . . . . . . . . . . . . . . . . . . (279)
Other operating expenses . . . . . . . . . . . . . . . . . . . . . . . . . . . . . . . . . . . . . . . . . . (44)
Net finance expense . . . . . . . . . . . . . . . . . . . . . . . . . . . . . . . . . . . . . . . . . . . . . (12)
Income tax expense . . . . . . . . . . . . . . . . . . . . . . . . . . . . . . . . . . . . . . . . . . . . . . (3)
Net income . . . . . . . . . . . . . . . . . . . . . . . . . . . . . . . . . . . . . . . . . . . . . . . . . . . 10
APPENDIX I ACCOUNTANTS’ REPORT
— I-47 —
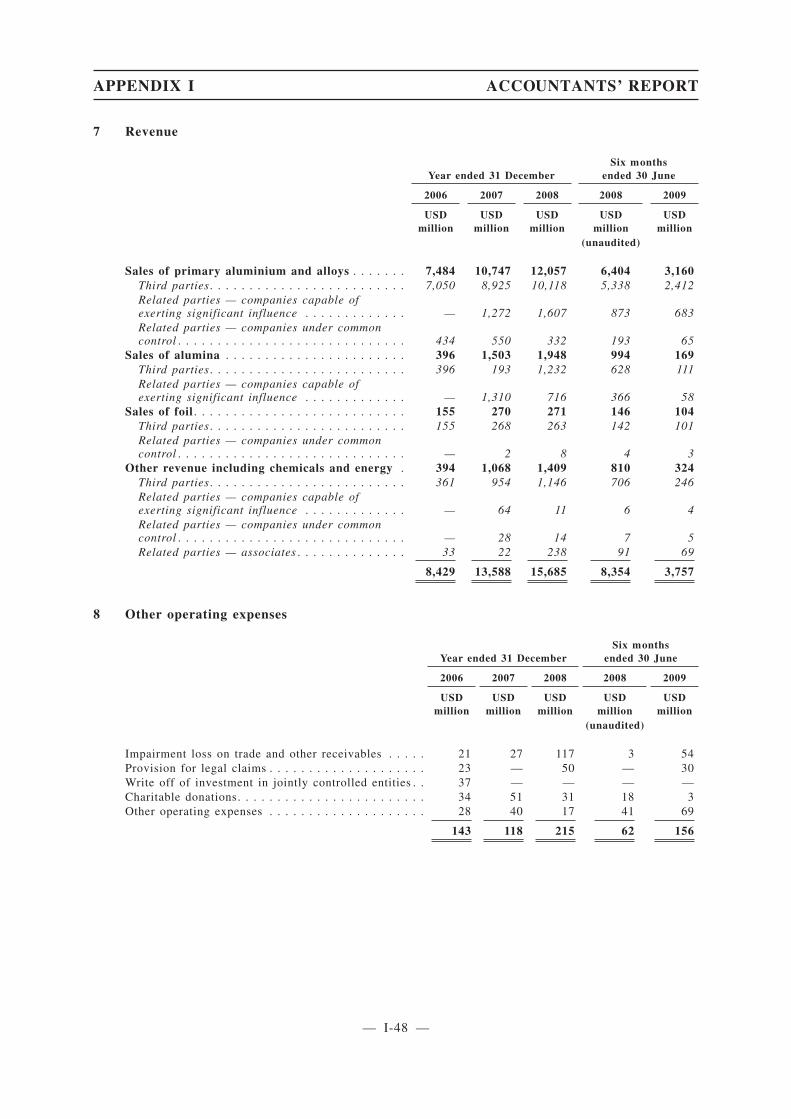
7 Revenue
Year ended 31 DecemberSix months
ended 30 June
2006 2007 2008 2008 2009
USDmillion
USDmillion
USDmillion
USDmillion
USDmillion
(unaudited)
Sales of primary aluminium and alloys . . . . . . . 7,484 10,747 12,057 6,404 3,160Third parties . . . . . . . . . . . . . . . . . . . . . . . . . 7,050 8,925 10,118 5,338 2,412Related parties — companies capable ofexerting significant influence . . . . . . . . . . . . . — 1,272 1,607 873 683Related parties — companies under commoncontrol . . . . . . . . . . . . . . . . . . . . . . . . . . . . . 434 550 332 193 65
Sales of alumina . . . . . . . . . . . . . . . . . . . . . . . 396 1,503 1,948 994 169Third parties . . . . . . . . . . . . . . . . . . . . . . . . . 396 193 1,232 628 111Related parties — companies capable ofexerting significant influence . . . . . . . . . . . . . — 1,310 716 366 58
Sales of foil . . . . . . . . . . . . . . . . . . . . . . . . . . . 155 270 271 146 104Third parties . . . . . . . . . . . . . . . . . . . . . . . . . 155 268 263 142 101Related parties — companies under commoncontrol . . . . . . . . . . . . . . . . . . . . . . . . . . . . . — 2 8 4 3
Other revenue including chemicals and energy . 394 1,068 1,409 810 324Third parties . . . . . . . . . . . . . . . . . . . . . . . . . 361 954 1,146 706 246Related parties — companies capable ofexerting significant influence . . . . . . . . . . . . . — 64 11 6 4Related parties — companies under commoncontrol . . . . . . . . . . . . . . . . . . . . . . . . . . . . . — 28 14 7 5Related parties — associates . . . . . . . . . . . . . . 33 22 238 91 69
8,429 13,588 15,685 8,354 3,757
8 Other operating expenses
Year ended 31 DecemberSix months
ended 30 June
2006 2007 2008 2008 2009
USDmillion
USDmillion
USDmillion
USDmillion
USDmillion
(unaudited)
Impairment loss on trade and other receivables . . . . . 21 27 117 3 54Provision for legal claims . . . . . . . . . . . . . . . . . . . . 23 — 50 — 30Write off of investment in jointly controlled entities . . 37 — — — —Charitable donations. . . . . . . . . . . . . . . . . . . . . . . . 34 51 31 18 3Other operating expenses . . . . . . . . . . . . . . . . . . . . 28 40 17 41 69
143 118 215 62 156
APPENDIX I ACCOUNTANTS’ REPORT
— I-48 —
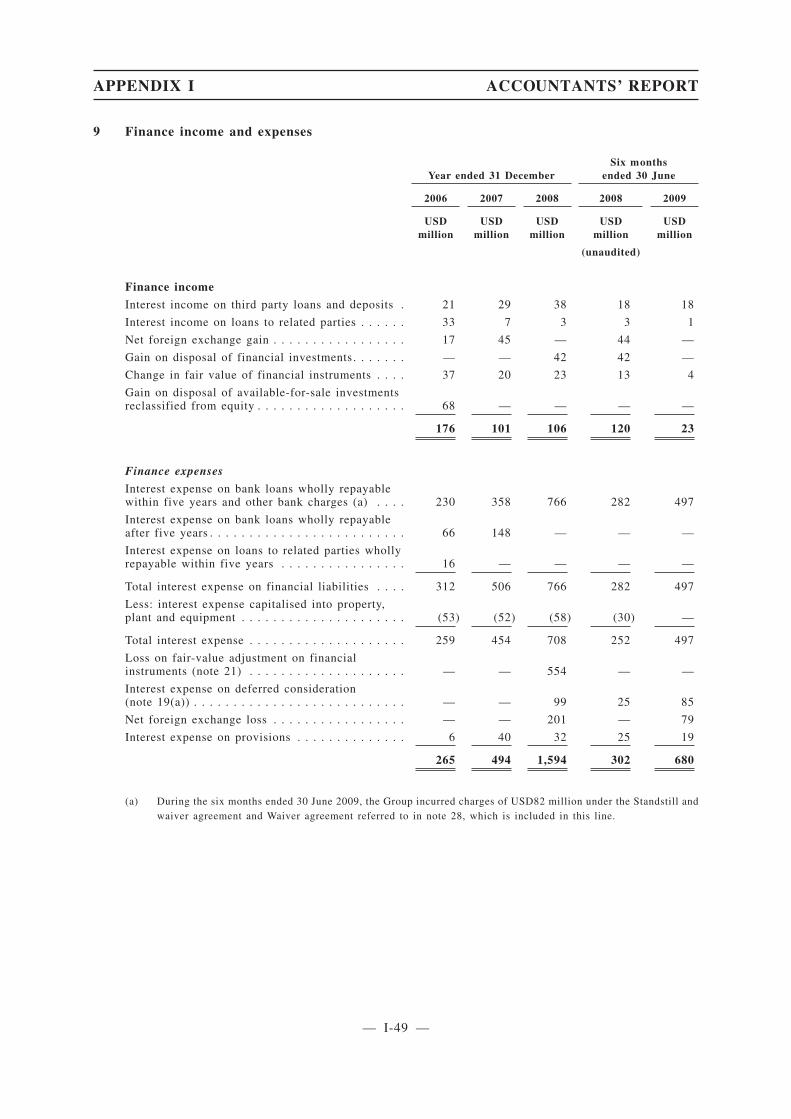
9 Finance income and expenses
Year ended 31 DecemberSix months
ended 30 June
2006 2007 2008 2008 2009
USDmillion
USDmillion
USDmillion
USDmillion
USDmillion
(unaudited)
Finance income
Interest income on third party loans and deposits . 21 29 38 18 18
Interest income on loans to related parties . . . . . . 33 7 3 3 1
Net foreign exchange gain . . . . . . . . . . . . . . . . . 17 45 — 44 —
Gain on disposal of financial investments . . . . . . . — — 42 42 —
Change in fair value of financial instruments . . . . 37 20 23 13 4
Gain on disposal of available-for-sale investmentsreclassified from equity . . . . . . . . . . . . . . . . . . . 68 — — — —
176 101 106 120 23
Finance expenses
Interest expense on bank loans wholly repayablewithin five years and other bank charges (a) . . . . 230 358 766 282 497
Interest expense on bank loans wholly repayableafter five years . . . . . . . . . . . . . . . . . . . . . . . . . 66 148 — — —
Interest expense on loans to related parties whollyrepayable within five years . . . . . . . . . . . . . . . . 16 — — — —
Total interest expense on financial liabilities . . . . 312 506 766 282 497
Less: interest expense capitalised into property,plant and equipment . . . . . . . . . . . . . . . . . . . . . (53) (52) (58) (30) —
Total interest expense . . . . . . . . . . . . . . . . . . . . 259 454 708 252 497
Loss on fair-value adjustment on financialinstruments (note 21) . . . . . . . . . . . . . . . . . . . . — — 554 — —
Interest expense on deferred consideration(note 19(a)) . . . . . . . . . . . . . . . . . . . . . . . . . . . — — 99 25 85
Net foreign exchange loss . . . . . . . . . . . . . . . . . — — 201 — 79
Interest expense on provisions . . . . . . . . . . . . . . 6 40 32 25 19
265 494 1,594 302 680
(a) During the six months ended 30 June 2009, the Group incurred charges of USD82 million under the Standstill andwaiver agreement and Waiver agreement referred to in note 28, which is included in this line.
APPENDIX I ACCOUNTANTS’ REPORT
— I-49 —
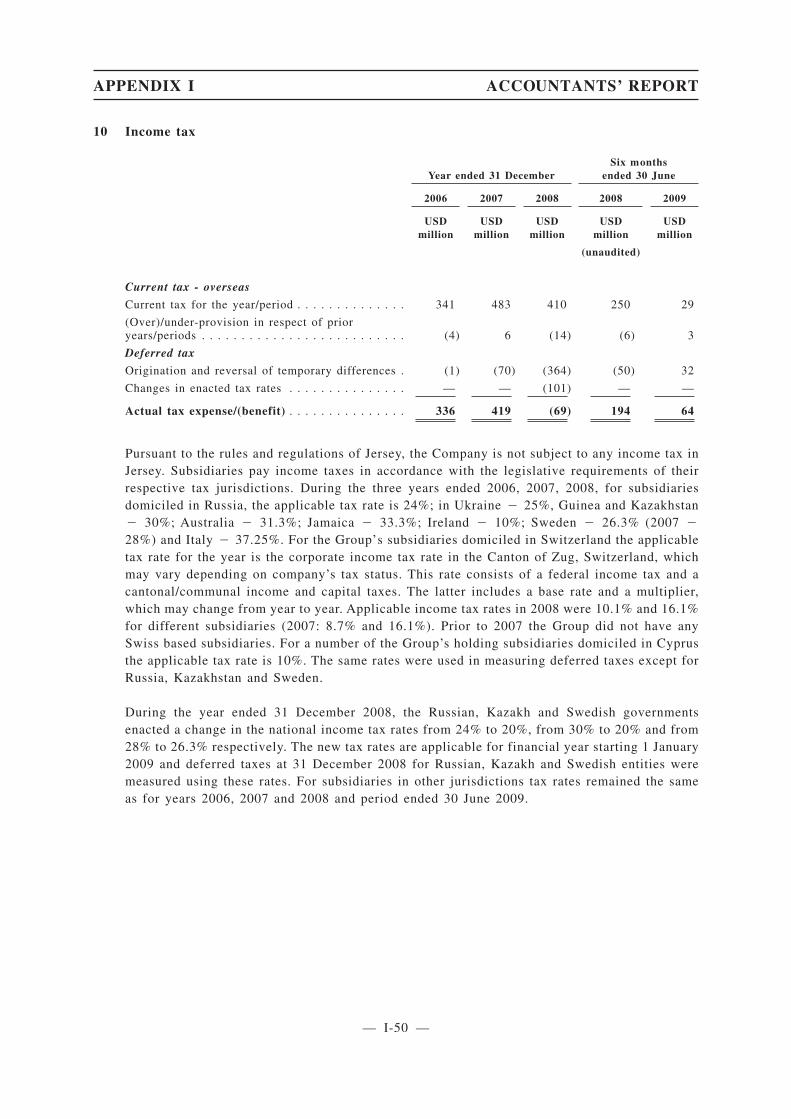
10 Income tax
Year ended 31 DecemberSix months
ended 30 June
2006 2007 2008 2008 2009
USDmillion
USDmillion
USDmillion
USDmillion
USDmillion
(unaudited)
Current tax - overseas
Current tax for the year/period . . . . . . . . . . . . . . 341 483 410 250 29
(Over)/under-provision in respect of prioryears/periods . . . . . . . . . . . . . . . . . . . . . . . . . . (4) 6 (14) (6) 3
Deferred tax
Origination and reversal of temporary differences . (1) (70) (364) (50) 32
Changes in enacted tax rates . . . . . . . . . . . . . . . — — (101) — —
Actual tax expense/(benefit) . . . . . . . . . . . . . . . 336 419 (69) 194 64
Pursuant to the rules and regulations of Jersey, the Company is not subject to any income tax inJersey. Subsidiaries pay income taxes in accordance with the legislative requirements of theirrespective tax jurisdictions. During the three years ended 2006, 2007, 2008, for subsidiariesdomiciled in Russia, the applicable tax rate is 24%; in Ukraine � 25%, Guinea and Kazakhstan� 30%; Australia � 31.3%; Jamaica � 33.3%; Ireland � 10%; Sweden � 26.3% (2007 �
28%) and Italy � 37.25%. For the Group’s subsidiaries domiciled in Switzerland the applicabletax rate for the year is the corporate income tax rate in the Canton of Zug, Switzerland, whichmay vary depending on company’s tax status. This rate consists of a federal income tax and acantonal/communal income and capital taxes. The latter includes a base rate and a multiplier,which may change from year to year. Applicable income tax rates in 2008 were 10.1% and 16.1%for different subsidiaries (2007: 8.7% and 16.1%). Prior to 2007 the Group did not have anySwiss based subsidiaries. For a number of the Group’s holding subsidiaries domiciled in Cyprusthe applicable tax rate is 10%. The same rates were used in measuring deferred taxes except forRussia, Kazakhstan and Sweden.
During the year ended 31 December 2008, the Russian, Kazakh and Swedish governmentsenacted a change in the national income tax rates from 24% to 20%, from 30% to 20% and from28% to 26.3% respectively. The new tax rates are applicable for financial year starting 1 January2009 and deferred taxes at 31 December 2008 for Russian, Kazakh and Swedish entities weremeasured using these rates. For subsidiaries in other jurisdictions tax rates remained the sameas for years 2006, 2007 and 2008 and period ended 30 June 2009.
APPENDIX I ACCOUNTANTS’ REPORT
— I-50 —
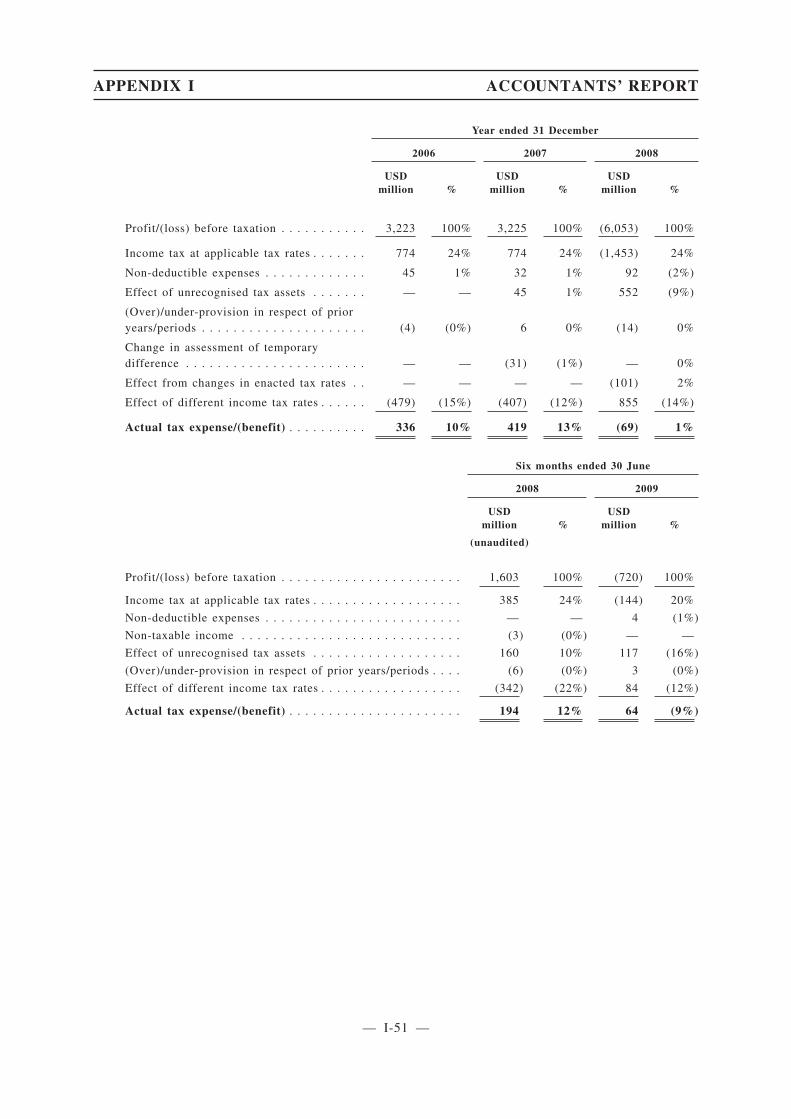
Year ended 31 December
2006 2007 2008
USDmillion %
USDmillion %
USDmillion %
Profit/(loss) before taxation . . . . . . . . . . . 3,223 100% 3,225 100% (6,053) 100%
Income tax at applicable tax rates . . . . . . . 774 24% 774 24% (1,453) 24%
Non-deductible expenses . . . . . . . . . . . . . 45 1% 32 1% 92 (2%)
Effect of unrecognised tax assets . . . . . . . — — 45 1% 552 (9%)
(Over)/under-provision in respect of prioryears/periods . . . . . . . . . . . . . . . . . . . . . (4) (0%) 6 0% (14) 0%
Change in assessment of temporarydifference . . . . . . . . . . . . . . . . . . . . . . . — — (31) (1%) — 0%
Effect from changes in enacted tax rates . . — — — — (101) 2%
Effect of different income tax rates . . . . . . (479) (15%) (407) (12%) 855 (14%)
Actual tax expense/(benefit) . . . . . . . . . . 336 10% 419 13% (69) 1%
Six months ended 30 June
2008 2009
USDmillion %
USDmillion %
(unaudited)
Profit/(loss) before taxation . . . . . . . . . . . . . . . . . . . . . . . 1,603 100% (720) 100%
Income tax at applicable tax rates . . . . . . . . . . . . . . . . . . . 385 24% (144) 20%
Non-deductible expenses . . . . . . . . . . . . . . . . . . . . . . . . . — — 4 (1%)
Non-taxable income . . . . . . . . . . . . . . . . . . . . . . . . . . . . (3) (0%) — —
Effect of unrecognised tax assets . . . . . . . . . . . . . . . . . . . 160 10% 117 (16%)
(Over)/under-provision in respect of prior years/periods . . . . (6) (0%) 3 (0%)
Effect of different income tax rates . . . . . . . . . . . . . . . . . . (342) (22%) 84 (12%)
Actual tax expense/(benefit) . . . . . . . . . . . . . . . . . . . . . . 194 12% 64 (9%)
APPENDIX I ACCOUNTANTS’ REPORT
— I-51 —

11 Profit for the year/period
Profit for the year/period is arrived at after charging/(crediting):
(a) Personnel costs
Year ended 31 DecemberSix months
ended 30 June
2006 2007 2008 2008 2009
USDmillion
USDmillion
USDmillion
USDmillion
USDmillion
(unaudited)
Wages and salaries . . . . . . . . . . . . . . . . . . . . . . 499 1,060 1,365 752 496
Contributions to defined contribution retirementplans . . . . . . . . . . . . . . . . . . . . . . . . . . . . . . . . 7 18 21 11 6
Contributions to defined benefit retirement plans. . 7 21 21 13 6
513 1,099 1,407 776 508
The employees of the Group are members of the retirement schemes operated by localauthorities. The Group is required to contribute a certain percentage of their payroll to theseschemes to fund the benefits.
The Group’s total contribution to those schemes charged to the income statement during theRelevant Period is shown above.
(b) Other items
Year ended 31 DecemberSix months
ended 30 June
2006 2007 2008 2008 2009
USDmillion
USDmillion
USDmillion
USDmillion
USDmillion
(unaudited)
Amortisation of intangible assets . . . . . . . . . . . . 2 82 116 56 8
Depreciation (net of amount included ininventories) . . . . . . . . . . . . . . . . . . . . . . . . . . . 361 794 914 511 291
Impairment losses/(reversal of impairment loss) of:
- property, plant and equipment . . . . . . . . . . . . . — — 3,532 203 37
- interests in associates . . . . . . . . . . . . . . . . . . . — — 2,408 — (308)
- interests in jointly controlled entities . . . . . . . . — — 144 — 13
- goodwill . . . . . . . . . . . . . . . . . . . . . . . . . . . . — — 67 67 —
- other intangible assets . . . . . . . . . . . . . . . . . . . — — 69 69 —
Mineral restoration tax . . . . . . . . . . . . . . . . . . . 6 48 77 29 11
Increase in provisions (including provision forlegal claims) . . . . . . . . . . . . . . . . . . . . . . . . . . 72 156 48 33 58
Auditors’ remuneration . . . . . . . . . . . . . . . . . . . 2 7 7 3 3
Operating lease charges in respect of property . . . 21 28 42 21 7
Cost of inventories (note 24) . . . . . . . . . . . . . . . 2,770 4,824 6,374 2,951 1,670
APPENDIX I ACCOUNTANTS’ REPORT
— I-52 —
App1A-33(4)(e)
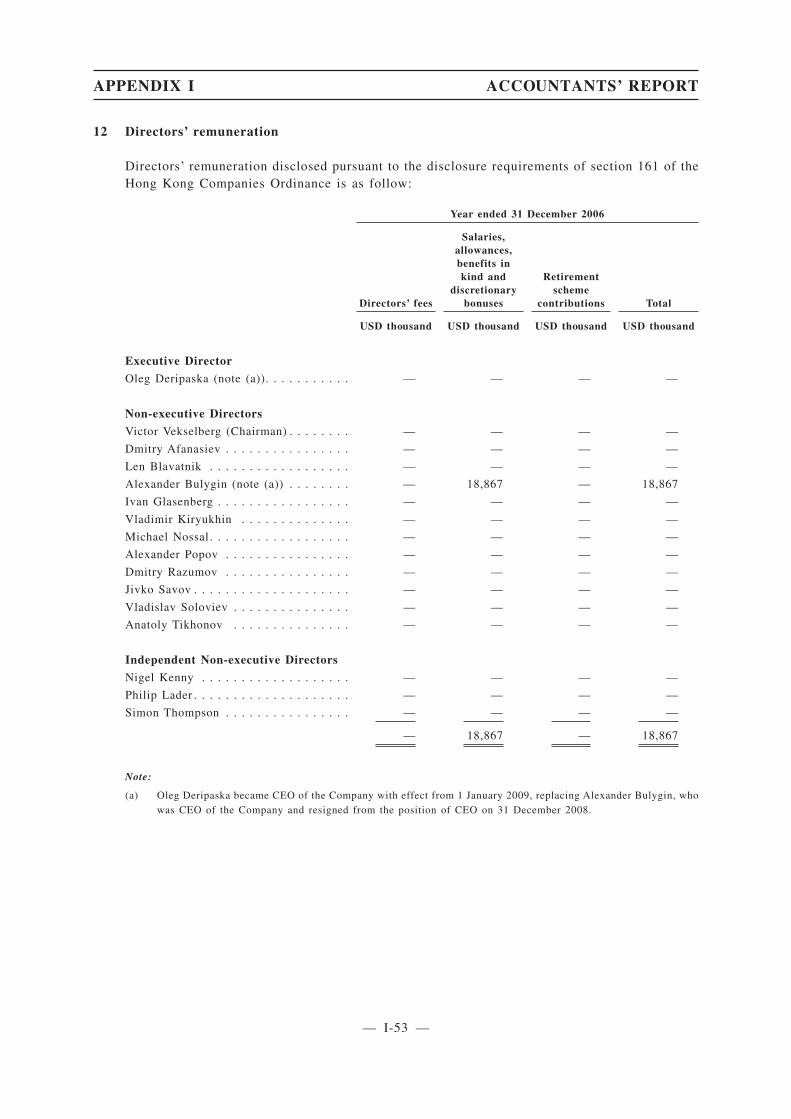
12 Directors’ remuneration
Directors’ remuneration disclosed pursuant to the disclosure requirements of section 161 of theHong Kong Companies Ordinance is as follow:
Year ended 31 December 2006
Directors’ fees
Salaries,allowances,benefits inkind and
discretionarybonuses
Retirementscheme
contributions Total
USD thousand USD thousand USD thousand USD thousand
Executive Director
Oleg Deripaska (note (a)). . . . . . . . . . . — — — —
Non-executive Directors
Victor Vekselberg (Chairman) . . . . . . . . — — — —
Dmitry Afanasiev . . . . . . . . . . . . . . . . — — — —
Len Blavatnik . . . . . . . . . . . . . . . . . . — — — —
Alexander Bulygin (note (a)) . . . . . . . . — 18,867 — 18,867
Ivan Glasenberg . . . . . . . . . . . . . . . . . — — — —
Vladimir Kiryukhin . . . . . . . . . . . . . . — — — —
Michael Nossal . . . . . . . . . . . . . . . . . . — — — —
Alexander Popov . . . . . . . . . . . . . . . . — — — —
Dmitry Razumov . . . . . . . . . . . . . . . . — — — —
Jivko Savov . . . . . . . . . . . . . . . . . . . . — — — —
Vladislav Soloviev . . . . . . . . . . . . . . . — — — —
Anatoly Tikhonov . . . . . . . . . . . . . . . — — — —
Independent Non-executive Directors
Nigel Kenny . . . . . . . . . . . . . . . . . . . — — — —
Philip Lader . . . . . . . . . . . . . . . . . . . . — — — —
Simon Thompson . . . . . . . . . . . . . . . . — — — —
— 18,867 — 18,867
Note:
(a) Oleg Deripaska became CEO of the Company with effect from 1 January 2009, replacing Alexander Bulygin, whowas CEO of the Company and resigned from the position of CEO on 31 December 2008.
APPENDIX I ACCOUNTANTS’ REPORT
— I-53 —

Year ended 31 December 2007
Directors’ fees
Salaries,allowances,benefits inkind and
discretionarybonuses
Retirementscheme
contributions Total
USD thousand USD thousand USD thousand USD thousand
Executive Director
Oleg Deripaska (note (a)). . . . . . . . . . . — — — —
Non-executive Directors
Victor Vekselberg (Chairman) . . . . . . . . — — — —
Dmitry Afanasiev . . . . . . . . . . . . . . . . — — — —
Len Blavatnik . . . . . . . . . . . . . . . . . . — — — —
Alexander Bulygin (note (a)) . . . . . . . . — 15,864 — 15,864
Ivan Glasenberg . . . . . . . . . . . . . . . . . — — — —
Vladimir Kiryukhin . . . . . . . . . . . . . . — — — —
Michael Nossal . . . . . . . . . . . . . . . . . . — — — —
Alexander Popov . . . . . . . . . . . . . . . . — — — —
Dmitry Razumov . . . . . . . . . . . . . . . . — — — —
Jivko Savov . . . . . . . . . . . . . . . . . . . . — — — —
Vladislav Soloviev (note (b)) . . . . . . . . — 6,110 — 6,110
Anatoly Tikhonov . . . . . . . . . . . . . . . — — — —
Independent Non-executive Directors
Nigel Kenny . . . . . . . . . . . . . . . . . . . — — — —
Philip Lader . . . . . . . . . . . . . . . . . . . . — — — —
Simon Thompson . . . . . . . . . . . . . . . . — — — —
— 21,974 — 21,974
Notes:
(a) Oleg Deripaska became CEO of the Company with effect from 1 January 2009, replacing Alexander Bulygin, whowas CEO of the Company and resigned from the position of CEO on 31 December 2008.
(b) Vladislav Soloviev was CFO of the Company during the year ended 31 December 2007 and resigned from theposition of CFO in February 2008.
APPENDIX I ACCOUNTANTS’ REPORT
— I-54 —
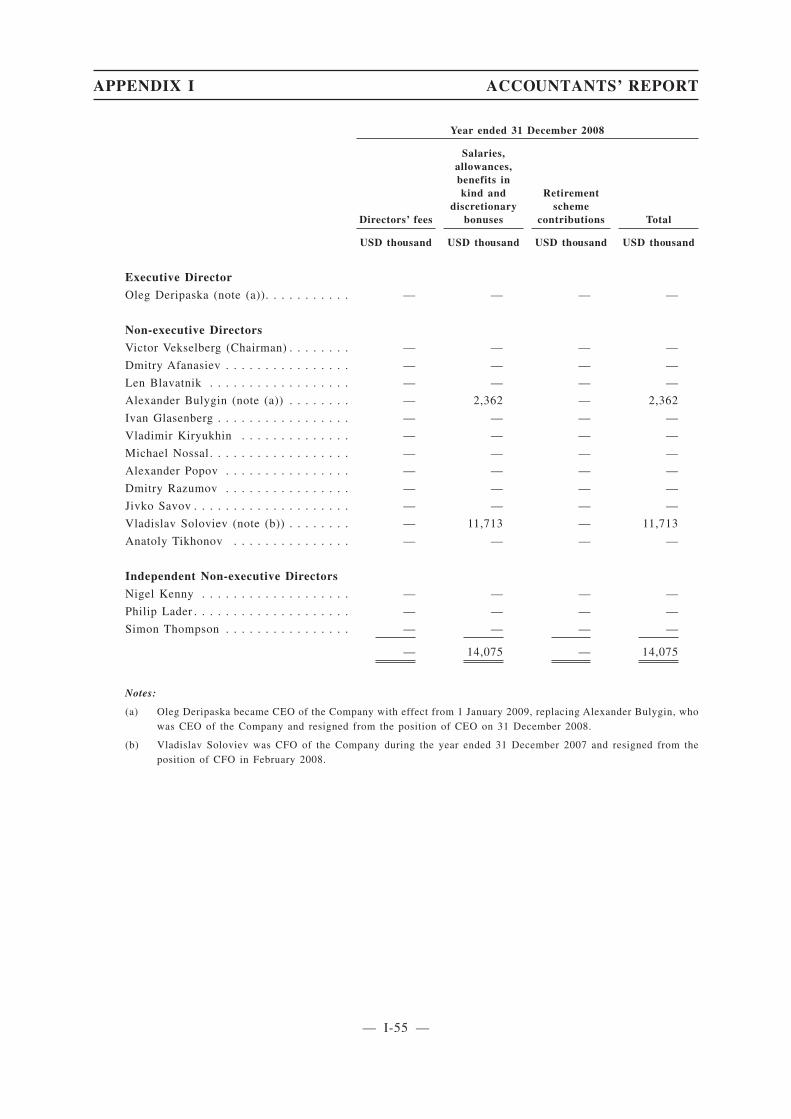
Year ended 31 December 2008
Directors’ fees
Salaries,allowances,benefits inkind and
discretionarybonuses
Retirementscheme
contributions Total
USD thousand USD thousand USD thousand USD thousand
Executive Director
Oleg Deripaska (note (a)). . . . . . . . . . . — — — —
Non-executive Directors
Victor Vekselberg (Chairman) . . . . . . . . — — — —
Dmitry Afanasiev . . . . . . . . . . . . . . . . — — — —
Len Blavatnik . . . . . . . . . . . . . . . . . . — — — —
Alexander Bulygin (note (a)) . . . . . . . . — 2,362 — 2,362
Ivan Glasenberg . . . . . . . . . . . . . . . . . — — — —
Vladimir Kiryukhin . . . . . . . . . . . . . . — — — —
Michael Nossal . . . . . . . . . . . . . . . . . . — — — —
Alexander Popov . . . . . . . . . . . . . . . . — — — —
Dmitry Razumov . . . . . . . . . . . . . . . . — — — —
Jivko Savov . . . . . . . . . . . . . . . . . . . . — — — —
Vladislav Soloviev (note (b)) . . . . . . . . — 11,713 — 11,713
Anatoly Tikhonov . . . . . . . . . . . . . . . — — — —
Independent Non-executive Directors
Nigel Kenny . . . . . . . . . . . . . . . . . . . — — — —
Philip Lader . . . . . . . . . . . . . . . . . . . . — — — —
Simon Thompson . . . . . . . . . . . . . . . . — — — —
— 14,075 — 14,075
Notes:
(a) Oleg Deripaska became CEO of the Company with effect from 1 January 2009, replacing Alexander Bulygin, whowas CEO of the Company and resigned from the position of CEO on 31 December 2008.
(b) Vladislav Soloviev was CFO of the Company during the year ended 31 December 2007 and resigned from theposition of CFO in February 2008.
APPENDIX I ACCOUNTANTS’ REPORT
— I-55 —

(unaudited) Six months ended 30 June 2008
Directors’ fees
Salaries,allowances,benefits inkind and
discretionarybonuses
Retirementscheme
contributions Total
USD thousand USD thousand USD thousand USD thousand
Executive Director
Oleg Deripaska (note (a)). . . . . . . . . . . — — — —
Non-executive Directors
Victor Vekselberg (Chairman) . . . . . . . . — — — —
Dmitry Afanasiev . . . . . . . . . . . . . . . . — — — —
Len Blavatnik . . . . . . . . . . . . . . . . . . — — — —
Alexander Bulygin (note (a)) . . . . . . . . — — — —
Ivan Glasenberg . . . . . . . . . . . . . . . . . — — — —
Vladimir Kiryukhin . . . . . . . . . . . . . . — — — —
Michael Nossal . . . . . . . . . . . . . . . . . . — — — —
Alexander Popov . . . . . . . . . . . . . . . . — — — —
Dmitry Razumov . . . . . . . . . . . . . . . . — — — —
Jivko Savov . . . . . . . . . . . . . . . . . . . . — — — —
Vladislav Soloviev (note (b)) . . . . . . . . — 11,713 — 11,713
Anatoly Tikhonov . . . . . . . . . . . . . . . — — — —
Independent Non-executive Directors
Nigel Kenny . . . . . . . . . . . . . . . . . . . — — — —
Philip Lader . . . . . . . . . . . . . . . . . . . . — — — —
Simon Thompson . . . . . . . . . . . . . . . . — — — —
— 11,713 — 11,713
Notes:
(a) Oleg Deripaska became CEO of the Company with effect from 1 January 2009, replacing Alexander Bulygin, whowas CEO of the Company and resigned from the position of CEO on 31 December 2008.
(b) Vladislav Soloviev was CFO of the Company during the year ended 31 December 2007 and resigned from theposition of CFO in February 2008.
APPENDIX I ACCOUNTANTS’ REPORT
— I-56 —
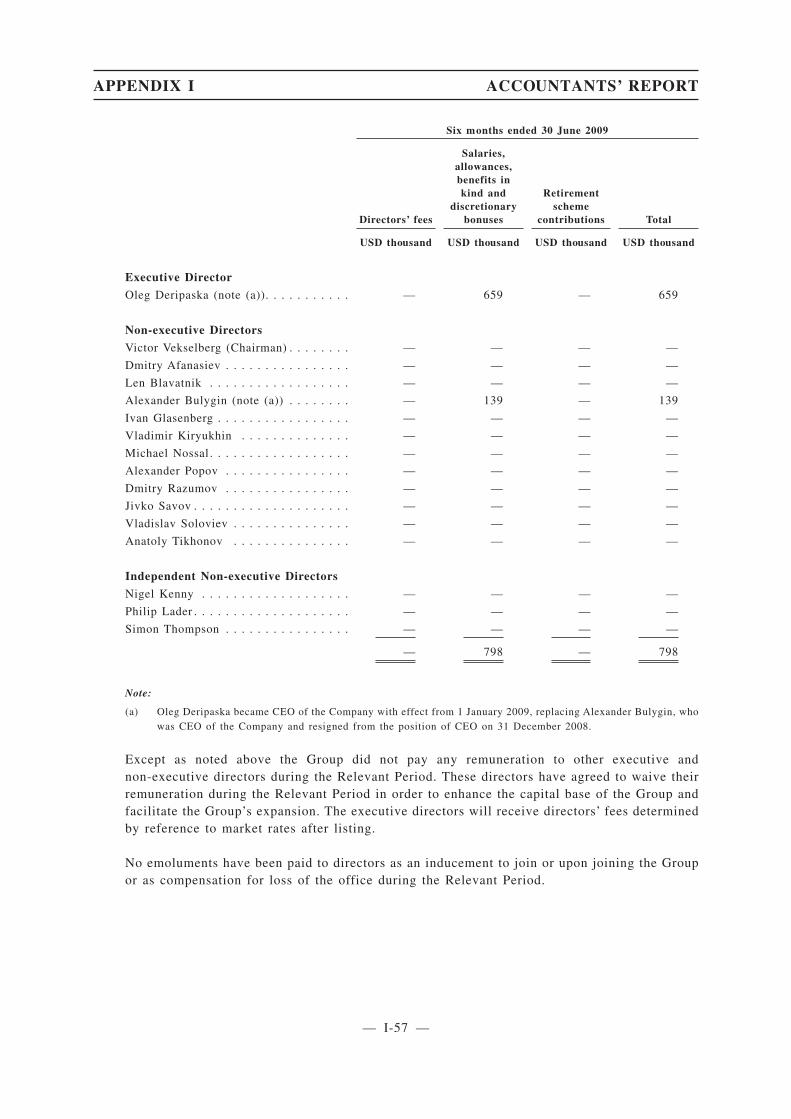
Six months ended 30 June 2009
Directors’ fees
Salaries,allowances,benefits inkind and
discretionarybonuses
Retirementscheme
contributions Total
USD thousand USD thousand USD thousand USD thousand
Executive Director
Oleg Deripaska (note (a)). . . . . . . . . . . — 659 — 659
Non-executive Directors
Victor Vekselberg (Chairman) . . . . . . . . — — — —
Dmitry Afanasiev . . . . . . . . . . . . . . . . — — — —
Len Blavatnik . . . . . . . . . . . . . . . . . . — — — —
Alexander Bulygin (note (a)) . . . . . . . . — 139 — 139
Ivan Glasenberg . . . . . . . . . . . . . . . . . — — — —
Vladimir Kiryukhin . . . . . . . . . . . . . . — — — —
Michael Nossal . . . . . . . . . . . . . . . . . . — — — —
Alexander Popov . . . . . . . . . . . . . . . . — — — —
Dmitry Razumov . . . . . . . . . . . . . . . . — — — —
Jivko Savov . . . . . . . . . . . . . . . . . . . . — — — —
Vladislav Soloviev . . . . . . . . . . . . . . . — — — —
Anatoly Tikhonov . . . . . . . . . . . . . . . — — — —
Independent Non-executive Directors
Nigel Kenny . . . . . . . . . . . . . . . . . . . — — — —
Philip Lader . . . . . . . . . . . . . . . . . . . . — — — —
Simon Thompson . . . . . . . . . . . . . . . . — — — —
— 798 — 798
Note:
(a) Oleg Deripaska became CEO of the Company with effect from 1 January 2009, replacing Alexander Bulygin, whowas CEO of the Company and resigned from the position of CEO on 31 December 2008.
Except as noted above the Group did not pay any remuneration to other executive andnon-executive directors during the Relevant Period. These directors have agreed to waive theirremuneration during the Relevant Period in order to enhance the capital base of the Group andfacilitate the Group’s expansion. The executive directors will receive directors’ fees determinedby reference to market rates after listing.
No emoluments have been paid to directors as an inducement to join or upon joining the Groupor as compensation for loss of the office during the Relevant Period.
APPENDIX I ACCOUNTANTS’ REPORT
— I-57 —

13 Individuals with highest emoluments
Of the five individuals with the highest emoluments, one, two, one, one and one are directorsduring the years ended 31 December 2006, 2007, 2008 and the six months ended 30 June 2008and 2009 respectively whose emoluments are disclosed in note 12. The aggregate of theemoluments in respect of the other individuals are as follows:
Year ended 31 DecemberSix months
ended 30 June
2006 2007 2008 2008 2009
USDmillion
USDmillion
USDmillion
USDmillion
USDmillion
(unaudited)
Salaries and bonuses . . . . . . . . . . . . . . . . . . . . . 6,661 8,041 14,729 11,235 2,356
The emoluments of the other individuals with the highest emoluments are with the followingbands:
Year ended 31 DecemberSix months
ended 30 June
2006 2007 2008 2008 2009
Number ofindividuals
Number ofindividuals
Number ofindividuals
Number ofindividuals
Number ofindividuals
(unaudited)
HK$3,500,001 - HK$4,000,000 . . . . . . . . . . . 1 — — — 2
HK$4,000,001 - HK$4,500,000 . . . . . . . . . . . — — — — 1
HK$4,500,001 - HK$5,000,000 . . . . . . . . . . . — — — — 1
HK$5,000,001 - HK$10,000,000 . . . . . . . . . . 1 — — — —
HK$10,000,001 - HK$20,000,000 . . . . . . . . . — 2 — 2 —
HK$20,000,001 - HK$30,000,000 . . . . . . . . . 1 1 3 2 —
HK$30,000,001 - HK$40,000,000 . . . . . . . . . 1 — 1 — —
No emoluments have been paid to these individuals as an inducement to join or upon joining theGroup or as compensation for loss of office during the Relevant Period.
14 Profit/(loss) attributable to equity shareholders of the Company
The consolidated profit/(loss) attributable to equity shareholders of the Company includes profitsof nil for the year ended 31 December 2006 and USD2,340 million for the year ended 31December 2007, and losses of USD7,236 million for the year ended 31 December 2008 andUSD302 million for six months ended 30 June 2009, which have been dealt with in the financialstatements of the Company.
15 Dividends
Dividends totalling USD2,362 million, USD2,099 million, USD1,203 million and nil perordinary share were declared and paid by the Company during the years ended 31 December 2007and 2008 and the six months ended 30 June 2008 and 2009 respectively. In addition, during theyears ended 31 December 2006 and 2007 the Group distributed dividends of USD3,751 millionand USD138 million, respectively to its then shareholders.
APPENDIX I ACCOUNTANTS’ REPORT
— I-58 —
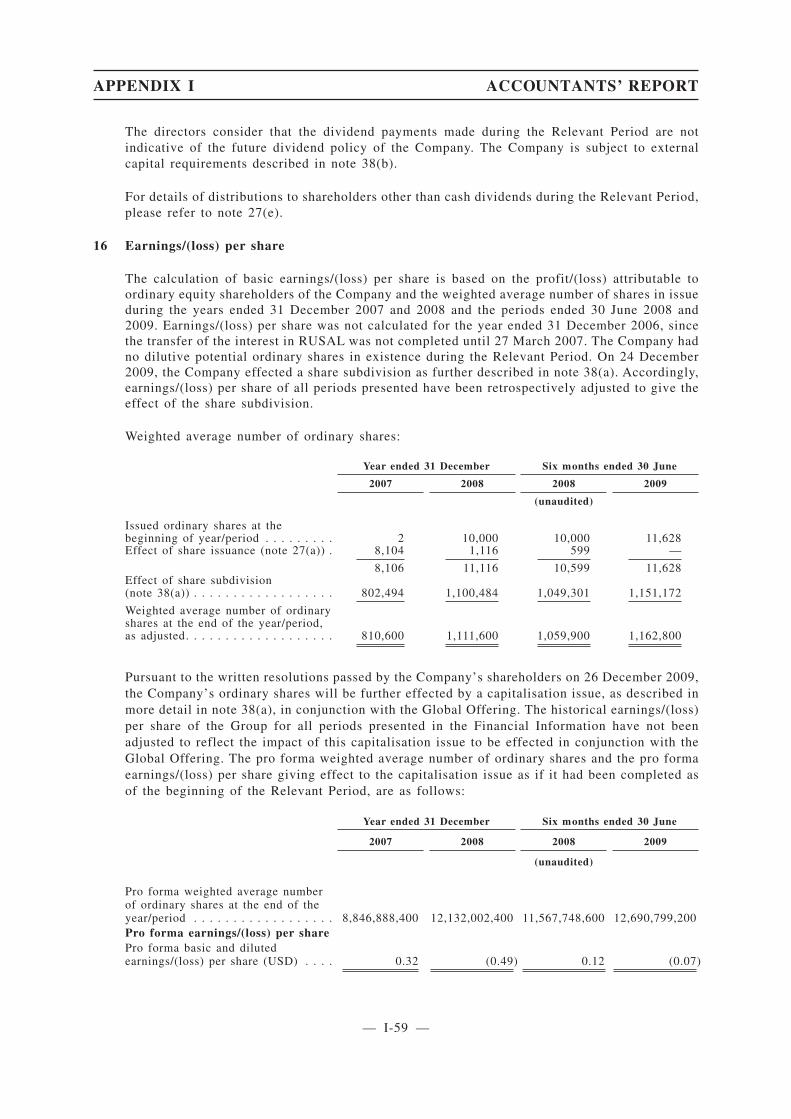
The directors consider that the dividend payments made during the Relevant Period are notindicative of the future dividend policy of the Company. The Company is subject to externalcapital requirements described in note 38(b).
For details of distributions to shareholders other than cash dividends during the Relevant Period,please refer to note 27(e).
16 Earnings/(loss) per share
The calculation of basic earnings/(loss) per share is based on the profit/(loss) attributable toordinary equity shareholders of the Company and the weighted average number of shares in issueduring the years ended 31 December 2007 and 2008 and the periods ended 30 June 2008 and2009. Earnings/(loss) per share was not calculated for the year ended 31 December 2006, sincethe transfer of the interest in RUSAL was not completed until 27 March 2007. The Company hadno dilutive potential ordinary shares in existence during the Relevant Period. On 24 December2009, the Company effected a share subdivision as further described in note 38(a). Accordingly,earnings/(loss) per share of all periods presented have been retrospectively adjusted to give theeffect of the share subdivision.
Weighted average number of ordinary shares:
Year ended 31 December Six months ended 30 June
2007 2008 2008 2009
(unaudited)
Issued ordinary shares at thebeginning of year/period . . . . . . . . . 2 10,000 10,000 11,628Effect of share issuance (note 27(a)) . 8,104 1,116 599 —
8,106 11,116 10,599 11,628Effect of share subdivision(note 38(a)) . . . . . . . . . . . . . . . . . . 802,494 1,100,484 1,049,301 1,151,172
Weighted average number of ordinaryshares at the end of the year/period,as adjusted. . . . . . . . . . . . . . . . . . . 810,600 1,111,600 1,059,900 1,162,800
Pursuant to the written resolutions passed by the Company’s shareholders on 26 December 2009,the Company’s ordinary shares will be further effected by a capitalisation issue, as described inmore detail in note 38(a), in conjunction with the Global Offering. The historical earnings/(loss)per share of the Group for all periods presented in the Financial Information have not beenadjusted to reflect the impact of this capitalisation issue to be effected in conjunction with theGlobal Offering. The pro forma weighted average number of ordinary shares and the pro formaearnings/(loss) per share giving effect to the capitalisation issue as if it had been completed asof the beginning of the Relevant Period, are as follows:
Year ended 31 December Six months ended 30 June
2007 2008 2008 2009
(unaudited)
Pro forma weighted average numberof ordinary shares at the end of theyear/period . . . . . . . . . . . . . . . . . . 8,846,888,400 12,132,002,400 11,567,748,600 12,690,799,200Pro forma earnings/(loss) per sharePro forma basic and dilutedearnings/(loss) per share (USD) . . . . 0.32 (0.49) 0.12 (0.07)
APPENDIX I ACCOUNTANTS’ REPORT
— I-59 —
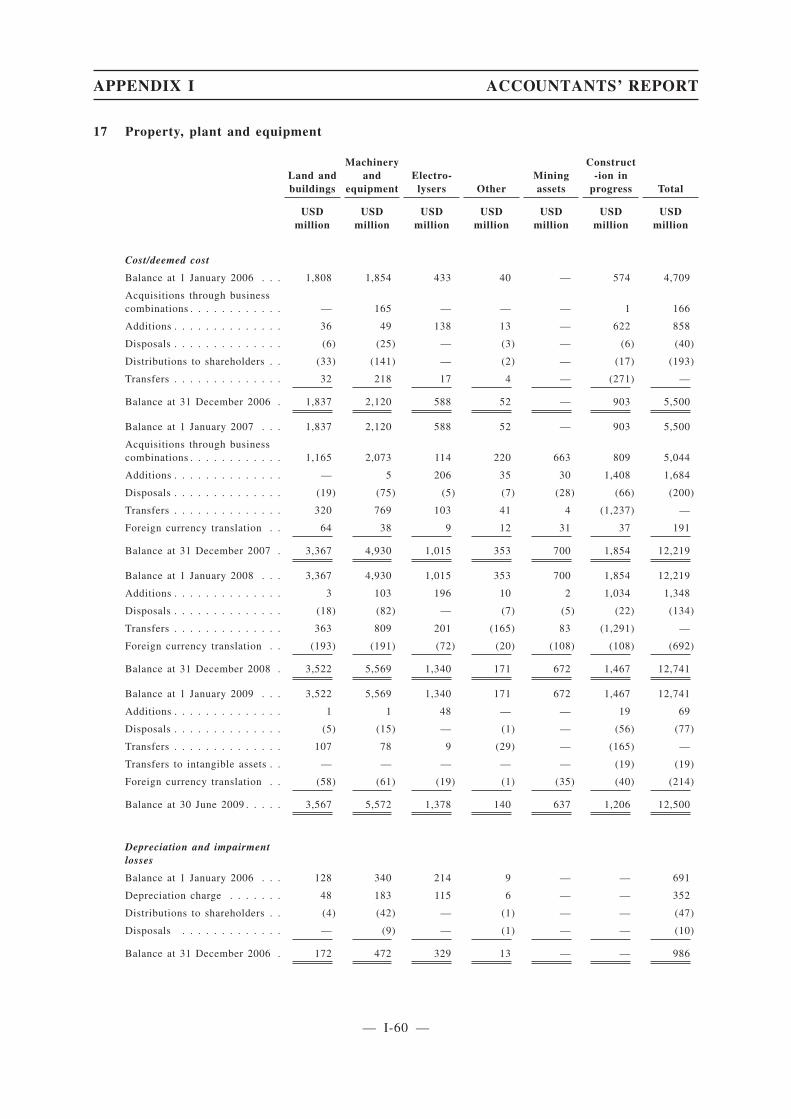
17 Property, plant and equipment
Land andbuildings
Machineryand
equipmentElectro-
lysers OtherMiningassets
Construct-ion in
progress Total
USDmillion
USDmillion
USDmillion
USDmillion
USDmillion
USDmillion
USDmillion
Cost/deemed cost
Balance at 1 January 2006 . . . 1,808 1,854 433 40 — 574 4,709
Acquisitions through businesscombinations . . . . . . . . . . . . — 165 — — — 1 166
Additions . . . . . . . . . . . . . . 36 49 138 13 — 622 858
Disposals . . . . . . . . . . . . . . (6) (25) — (3) — (6) (40)
Distributions to shareholders . . (33) (141) — (2) — (17) (193)
Transfers . . . . . . . . . . . . . . 32 218 17 4 — (271) —
Balance at 31 December 2006 . 1,837 2,120 588 52 — 903 5,500
Balance at 1 January 2007 . . . 1,837 2,120 588 52 — 903 5,500
Acquisitions through businesscombinations . . . . . . . . . . . . 1,165 2,073 114 220 663 809 5,044
Additions . . . . . . . . . . . . . . — 5 206 35 30 1,408 1,684
Disposals . . . . . . . . . . . . . . (19) (75) (5) (7) (28) (66) (200)
Transfers . . . . . . . . . . . . . . 320 769 103 41 4 (1,237) —
Foreign currency translation . . 64 38 9 12 31 37 191
Balance at 31 December 2007 . 3,367 4,930 1,015 353 700 1,854 12,219
Balance at 1 January 2008 . . . 3,367 4,930 1,015 353 700 1,854 12,219
Additions . . . . . . . . . . . . . . 3 103 196 10 2 1,034 1,348
Disposals . . . . . . . . . . . . . . (18) (82) — (7) (5) (22) (134)
Transfers . . . . . . . . . . . . . . 363 809 201 (165) 83 (1,291) —
Foreign currency translation . . (193) (191) (72) (20) (108) (108) (692)
Balance at 31 December 2008 . 3,522 5,569 1,340 171 672 1,467 12,741
Balance at 1 January 2009 . . . 3,522 5,569 1,340 171 672 1,467 12,741
Additions . . . . . . . . . . . . . . 1 1 48 — — 19 69
Disposals . . . . . . . . . . . . . . (5) (15) — (1) — (56) (77)
Transfers . . . . . . . . . . . . . . 107 78 9 (29) — (165) —
Transfers to intangible assets . . — — — — — (19) (19)
Foreign currency translation . . (58) (61) (19) (1) (35) (40) (214)
Balance at 30 June 2009 . . . . . 3,567 5,572 1,378 140 637 1,206 12,500
Depreciation and impairmentlosses
Balance at 1 January 2006 . . . 128 340 214 9 — — 691
Depreciation charge . . . . . . . 48 183 115 6 — — 352
Distributions to shareholders . . (4) (42) — (1) — — (47)
Disposals . . . . . . . . . . . . . — (9) — (1) — — (10)
Balance at 31 December 2006 . 172 472 329 13 — — 986
APPENDIX I ACCOUNTANTS’ REPORT
— I-60 —
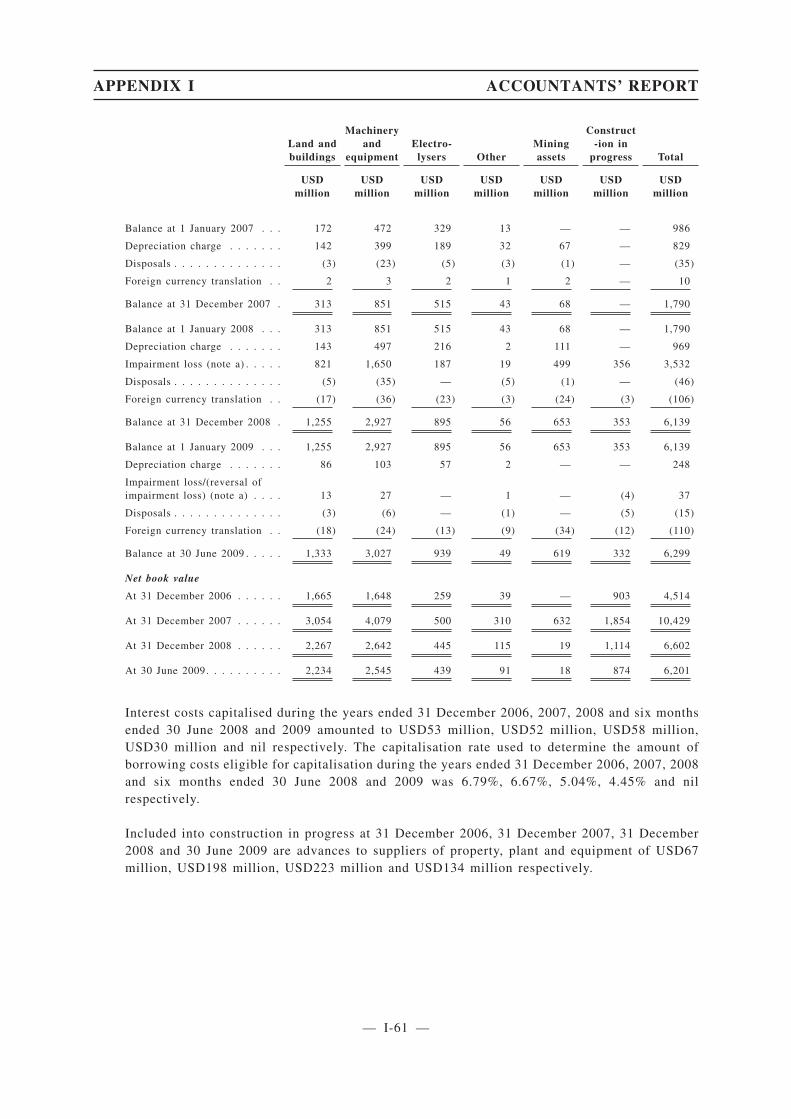
Land andbuildings
Machineryand
equipmentElectro-
lysers OtherMiningassets
Construct-ion in
progress Total
USDmillion
USDmillion
USDmillion
USDmillion
USDmillion
USDmillion
USDmillion
Balance at 1 January 2007 . . . 172 472 329 13 — — 986
Depreciation charge . . . . . . . 142 399 189 32 67 — 829
Disposals . . . . . . . . . . . . . . (3) (23) (5) (3) (1) — (35)
Foreign currency translation . . 2 3 2 1 2 — 10
Balance at 31 December 2007 . 313 851 515 43 68 — 1,790
Balance at 1 January 2008 . . . 313 851 515 43 68 — 1,790
Depreciation charge . . . . . . . 143 497 216 2 111 — 969
Impairment loss (note a) . . . . . 821 1,650 187 19 499 356 3,532
Disposals . . . . . . . . . . . . . . (5) (35) — (5) (1) — (46)
Foreign currency translation . . (17) (36) (23) (3) (24) (3) (106)
Balance at 31 December 2008 . 1,255 2,927 895 56 653 353 6,139
Balance at 1 January 2009 . . . 1,255 2,927 895 56 653 353 6,139
Depreciation charge . . . . . . . 86 103 57 2 — — 248
Impairment loss/(reversal ofimpairment loss) (note a) . . . . 13 27 — 1 — (4) 37
Disposals . . . . . . . . . . . . . . (3) (6) — (1) — (5) (15)
Foreign currency translation . . (18) (24) (13) (9) (34) (12) (110)
Balance at 30 June 2009 . . . . . 1,333 3,027 939 49 619 332 6,299
Net book value
At 31 December 2006 . . . . . . 1,665 1,648 259 39 — 903 4,514
At 31 December 2007 . . . . . . 3,054 4,079 500 310 632 1,854 10,429
At 31 December 2008 . . . . . . 2,267 2,642 445 115 19 1,114 6,602
At 30 June 2009. . . . . . . . . . 2,234 2,545 439 91 18 874 6,201
Interest costs capitalised during the years ended 31 December 2006, 2007, 2008 and six monthsended 30 June 2008 and 2009 amounted to USD53 million, USD52 million, USD58 million,USD30 million and nil respectively. The capitalisation rate used to determine the amount ofborrowing costs eligible for capitalisation during the years ended 31 December 2006, 2007, 2008and six months ended 30 June 2008 and 2009 was 6.79%, 6.67%, 5.04%, 4.45% and nilrespectively.
Included into construction in progress at 31 December 2006, 31 December 2007, 31 December2008 and 30 June 2009 are advances to suppliers of property, plant and equipment of USD67million, USD198 million, USD223 million and USD134 million respectively.
APPENDIX I ACCOUNTANTS’ REPORT
— I-61 —
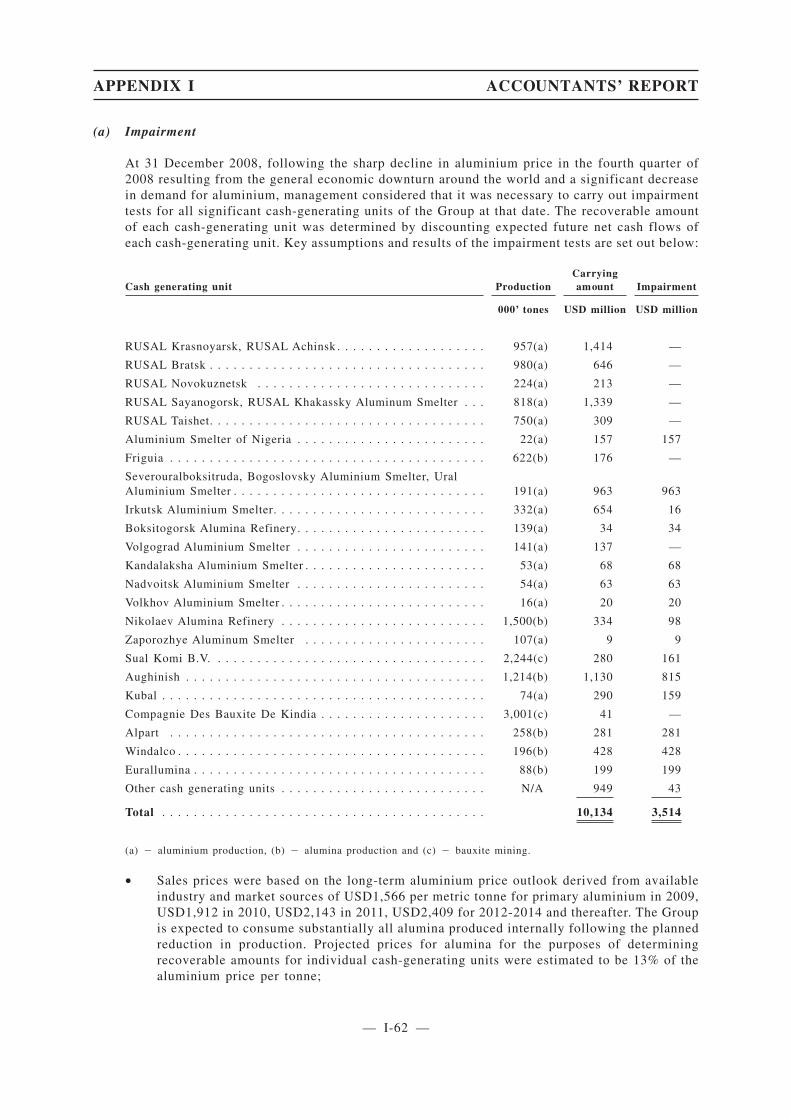
(a) Impairment
At 31 December 2008, following the sharp decline in aluminium price in the fourth quarter of2008 resulting from the general economic downturn around the world and a significant decreasein demand for aluminium, management considered that it was necessary to carry out impairmenttests for all significant cash-generating units of the Group at that date. The recoverable amountof each cash-generating unit was determined by discounting expected future net cash flows ofeach cash-generating unit. Key assumptions and results of the impairment tests are set out below:
Cash generating unit ProductionCarryingamount Impairment
000’ tones USD million USD million
RUSAL Krasnoyarsk, RUSAL Achinsk . . . . . . . . . . . . . . . . . . . 957(a) 1,414 —
RUSAL Bratsk . . . . . . . . . . . . . . . . . . . . . . . . . . . . . . . . . . . 980(a) 646 —
RUSAL Novokuznetsk . . . . . . . . . . . . . . . . . . . . . . . . . . . . . 224(a) 213 —
RUSAL Sayanogorsk, RUSAL Khakassky Aluminum Smelter . . . 818(a) 1,339 —
RUSAL Taishet. . . . . . . . . . . . . . . . . . . . . . . . . . . . . . . . . . . 750(a) 309 —
Aluminium Smelter of Nigeria . . . . . . . . . . . . . . . . . . . . . . . . 22(a) 157 157
Friguia . . . . . . . . . . . . . . . . . . . . . . . . . . . . . . . . . . . . . . . . 622(b) 176 —
Severouralboksitruda, Bogoslovsky Aluminium Smelter, UralAluminium Smelter . . . . . . . . . . . . . . . . . . . . . . . . . . . . . . . . 191(a) 963 963
Irkutsk Aluminium Smelter. . . . . . . . . . . . . . . . . . . . . . . . . . . 332(a) 654 16
Boksitogorsk Alumina Refinery. . . . . . . . . . . . . . . . . . . . . . . . 139(a) 34 34
Volgograd Aluminium Smelter . . . . . . . . . . . . . . . . . . . . . . . . 141(a) 137 —
Kandalaksha Aluminium Smelter . . . . . . . . . . . . . . . . . . . . . . . 53(a) 68 68
Nadvoitsk Aluminium Smelter . . . . . . . . . . . . . . . . . . . . . . . . 54(a) 63 63
Volkhov Aluminium Smelter . . . . . . . . . . . . . . . . . . . . . . . . . . 16(a) 20 20
Nikolaev Alumina Refinery . . . . . . . . . . . . . . . . . . . . . . . . . . 1,500(b) 334 98
Zaporozhye Aluminum Smelter . . . . . . . . . . . . . . . . . . . . . . . 107(a) 9 9
Sual Komi B.V. . . . . . . . . . . . . . . . . . . . . . . . . . . . . . . . . . . 2,244(c) 280 161
Aughinish . . . . . . . . . . . . . . . . . . . . . . . . . . . . . . . . . . . . . . 1,214(b) 1,130 815
Kubal . . . . . . . . . . . . . . . . . . . . . . . . . . . . . . . . . . . . . . . . . 74(a) 290 159
Compagnie Des Bauxite De Kindia . . . . . . . . . . . . . . . . . . . . . 3,001(c) 41 —
Alpart . . . . . . . . . . . . . . . . . . . . . . . . . . . . . . . . . . . . . . . . 258(b) 281 281
Windalco . . . . . . . . . . . . . . . . . . . . . . . . . . . . . . . . . . . . . . . 196(b) 428 428
Eurallumina . . . . . . . . . . . . . . . . . . . . . . . . . . . . . . . . . . . . . 88(b) 199 199
Other cash generating units . . . . . . . . . . . . . . . . . . . . . . . . . . N/A 949 43
Total . . . . . . . . . . . . . . . . . . . . . . . . . . . . . . . . . . . . . . . . . 10,134 3,514
(a) � aluminium production, (b) � alumina production and (c) � bauxite mining.
• Sales prices were based on the long-term aluminium price outlook derived from availableindustry and market sources of USD1,566 per metric tonne for primary aluminium in 2009,USD1,912 in 2010, USD2,143 in 2011, USD2,409 for 2012-2014 and thereafter. The Groupis expected to consume substantially all alumina produced internally following the plannedreduction in production. Projected prices for alumina for the purposes of determiningrecoverable amounts for individual cash-generating units were estimated to be 13% of thealuminium price per tonne;
APPENDIX I ACCOUNTANTS’ REPORT
— I-62 —

• Cash flow projections are in nominal terms and cover a period of seven years. A terminalvalue is derived following the forecast period assuming a 2% annual growth rate;
• The Group is at a mature stage of operations and volume of production is assumed tocontinue at the current planned levels for 2009 during the initial forecast period andthereafter. Operating costs were projected based on the historical performance of the Groupand adjusted for planned cost reductions;
• Real foreign currency exchange rates applied to convert operating costs of the Groupdenominated in RUR into USD were RUR30 for one USD in 2009, RUR29 for one USD in2010-2015 and thereafter. Inflation of 6.0 � 11.4% in RUR and 2% in USD was assumedin determining recoverable amounts;
• The pre-tax discount rate was estimated in nominal terms based on the weighted averagecost of capital basis and was in the range of 15.97% - 19.66%.
Values assigned to key assumptions and estimates used to measure the units’ recoverable amountsare consistent with external sources of information and historical data for each cash generatingunit. Management believes that the values assigned to the key assumptions and estimatesrepresent the most realistic assessment of future trends.
At 30 June 2009, management analysed changes in the economic environment and developmentsin the aluminium industry and the Group’s operations since 31 December 2008 and concludedthat no significant changes occurred during this period that may give rise to additionalimpairment of the Group’s cash-generating units.
In addition to the above, an impairment loss of USD37 million and USD18 million wasrecognised in relation to specific items that are no longer used at 30 June 2009 and 31 December2008 respectively.
(b) Determination of the fair value of property, plant and equipment of SUAL and the GlencoreBusinesses
Management commissioned an independent appraiser to assist in determining the fair values ofidentifiable net assets of SUAL and the Glencore Businesses on 27 March 2007, the date ofacquisition (see note 5).
The majority of the property, plant and equipment of these acquired subsidiaries, other thanimmovable property and land, is specialised in nature and is rarely sold on the open market otherthan as part of a continuing business. The market for similar plant and equipment is not activein Russia and does not provide a sufficient number of sales of comparable plant and equipmentfor using a market-based approach for determining fair value.
Consequently the fair value of plant and equipment was primarily determined using thedepreciated replacement cost (“DRC”) method. This method estimates the cost required toreproduce or replace the plant and equipment, adjusted for physical, functional or economicdepreciation and obsolescence. The fair value of immovable property and land owned by theacquired subsidiaries was primarily determined using a market-based approach.
The DRC was estimated based on internal sources and analysis of the Russian and internationalmarkets for similar plant and equipment. Various market data was collected from publishedinformation, catalogues and statistical data, and industry experts and suppliers of plant andequipment were contacted both in Russia and abroad.
APPENDIX I ACCOUNTANTS’ REPORT
— I-63 —

In addition to the determination of the DRC, cash flow testing was conducted in order to assessthe reasonableness of those values. Key assumptions and results of the valuation are set outbelow:
Production levels
Cash generating unit Bauxite Alumina Aluminium Fair value
000’ tonnes 000’ tonnes 000’ tonnes USD million
SUBR, Bogoslovsky Aluminium Smelter, UralAluminium Smelter . . . . . . . . . . . . . . . . . . . . . . . 3,646 1,826 314 1,211
Irkutsk Aluminium Smelter. . . . . . . . . . . . . . . . . . — — 362 605
Volgograd Aluminium Smelter . . . . . . . . . . . . . . . — — 158 192
Kandalaksha Aluminium Smelter . . . . . . . . . . . . . . — — 74 85
Nadvoitsk Aluminium Smelter . . . . . . . . . . . . . . . — — 81 84
Volkhov Aluminium Smelter . . . . . . . . . . . . . . . . . — — 23 23
Pikalevsky Alumina Refinery . . . . . . . . . . . . . . . . — 252 — —
ZALK . . . . . . . . . . . . . . . . . . . . . . . . . . . . . . . . — 235 112 —
SUAL Komi B.V. . . . . . . . . . . . . . . . . . . . . . . . . 6,607 — — 265
Aughinish . . . . . . . . . . . . . . . . . . . . . . . . . . . . . — 1,820 — 1,226
Kubal . . . . . . . . . . . . . . . . . . . . . . . . . . . . . . . . — — 140 122
Alpart . . . . . . . . . . . . . . . . . . . . . . . . . . . . . . . . 2,981 1,202 — 292
Windalco . . . . . . . . . . . . . . . . . . . . . . . . . . . . . . 3,171 884 — 533
Other . . . . . . . . . . . . . . . . . . . . . . . . . . . . . . . . — — — 172
Total . . . . . . . . . . . . . . . . . . . . . . . . . . . . . . . . 16,405 6,219 1,264 4,810
Cash flows were calculated based on the current production capacity and the 10-year businessplan with the exception of Alpart and Windalco. For Alpart and Windalco cash flows werecalculated based on the expected remaining life of the mines of seven and nine years,respectively.
Sales prices were based on the long-term aluminium price outlook derived from availableindustry and market sources of USD2,586 per metric tonne for primary aluminium and 13% ofthe London Metal Exchange (“LME”) price for alumina. Sales prices of bauxite for SUAL KomiB.V. were estimated at cost plus 10% mark-up. For other bauxite producing cash-generatingunits, bauxite was assumed to be utilised internally within each unit.
A terminal value was calculated at the end of a 10-year period. A growth rate of 3% was usedwhen calculating the terminal value of cash generating units.
(c) Security
The carrying value of property, plant and equipment subject to lien under loan agreements wasUSD438 million, USD431 million, USD739 million and USD702 million at 31 December 2006,31 December 2007, 31 December 2008 and 30 June 2009 respectively (see note 28).
APPENDIX I ACCOUNTANTS’ REPORT
— I-64 —

(d) The analysis of the net book value of properties is as follows:
The Group 31 December 30 June
2006 2007 2008 2009
USDmillion
USDmillion
USDmillion
USDmillion
Medium leases
In the Russian Federation. . . . . . . . . . . . . . . . . . . . . . . . . . . 1,418 2,484 2,022 1,994
Outside the Russian Federation . . . . . . . . . . . . . . . . . . . . . . . 247 570 245 240
1,665 3,054 2,267 2,234
Representing
Land and buildings . . . . . . . . . . . . . . . . . . . . . . . . . . . . . . 1,665 3,054 2,267 2,234
18 Intangible assets
Goodwill
Otherintangible
assets Total
USDmillion
USDmillion
USDmillion
Cost
Balance at 1 January 2006 . . . . . . . . . . . . . . . . . . . . . . . . . . . . . . . . . 1,313 72 1,385
Acquisitions through business combinations . . . . . . . . . . . . . . . . . . . . . 11 — 11
Additions. . . . . . . . . . . . . . . . . . . . . . . . . . . . . . . . . . . . . . . . . . . . . — 9 9
Balance at 31 December 2006. . . . . . . . . . . . . . . . . . . . . . . . . . . . . . . 1,324 81 1,405
Balance at 1 January 2007 . . . . . . . . . . . . . . . . . . . . . . . . . . . . . . . . . 1,324 81 1,405
Acquisitions through business combinations . . . . . . . . . . . . . . . . . . . . . 3,073 362 3,435
Additions. . . . . . . . . . . . . . . . . . . . . . . . . . . . . . . . . . . . . . . . . . . . . — 35 35
Foreign currency translation . . . . . . . . . . . . . . . . . . . . . . . . . . . . . . . . 165 — 165
Balance at 31 December 2007. . . . . . . . . . . . . . . . . . . . . . . . . . . . . . . 4,562 478 5,040
Balance at 1 January 2008 . . . . . . . . . . . . . . . . . . . . . . . . . . . . . . . . . 4,562 478 5,040
Additions. . . . . . . . . . . . . . . . . . . . . . . . . . . . . . . . . . . . . . . . . . . . . — 26 26
Disposals . . . . . . . . . . . . . . . . . . . . . . . . . . . . . . . . . . . . . . . . . . . . . — (6) (6)
Transfers . . . . . . . . . . . . . . . . . . . . . . . . . . . . . . . . . . . . . . . . . . . . . — 10 10
Foreign currency translation . . . . . . . . . . . . . . . . . . . . . . . . . . . . . . . . (481) (6) (487)
Balance at 31 December 2008. . . . . . . . . . . . . . . . . . . . . . . . . . . . . . . 4,081 502 4,583
Balance at 1 January 2009 . . . . . . . . . . . . . . . . . . . . . . . . . . . . . . . . . 4,081 502 4,583
Additions. . . . . . . . . . . . . . . . . . . . . . . . . . . . . . . . . . . . . . . . . . . . . — 5 5
Disposals . . . . . . . . . . . . . . . . . . . . . . . . . . . . . . . . . . . . . . . . . . . . . — (10) (10)
Transfers from property, plant and equipment . . . . . . . . . . . . . . . . . . . . — 19 19
Foreign currency translation . . . . . . . . . . . . . . . . . . . . . . . . . . . . . . . . (149) — (149)
Balance at 30 June 2009 . . . . . . . . . . . . . . . . . . . . . . . . . . . . . . . . . . 3,932 516 4,448
APPENDIX I ACCOUNTANTS’ REPORT
— I-65 —
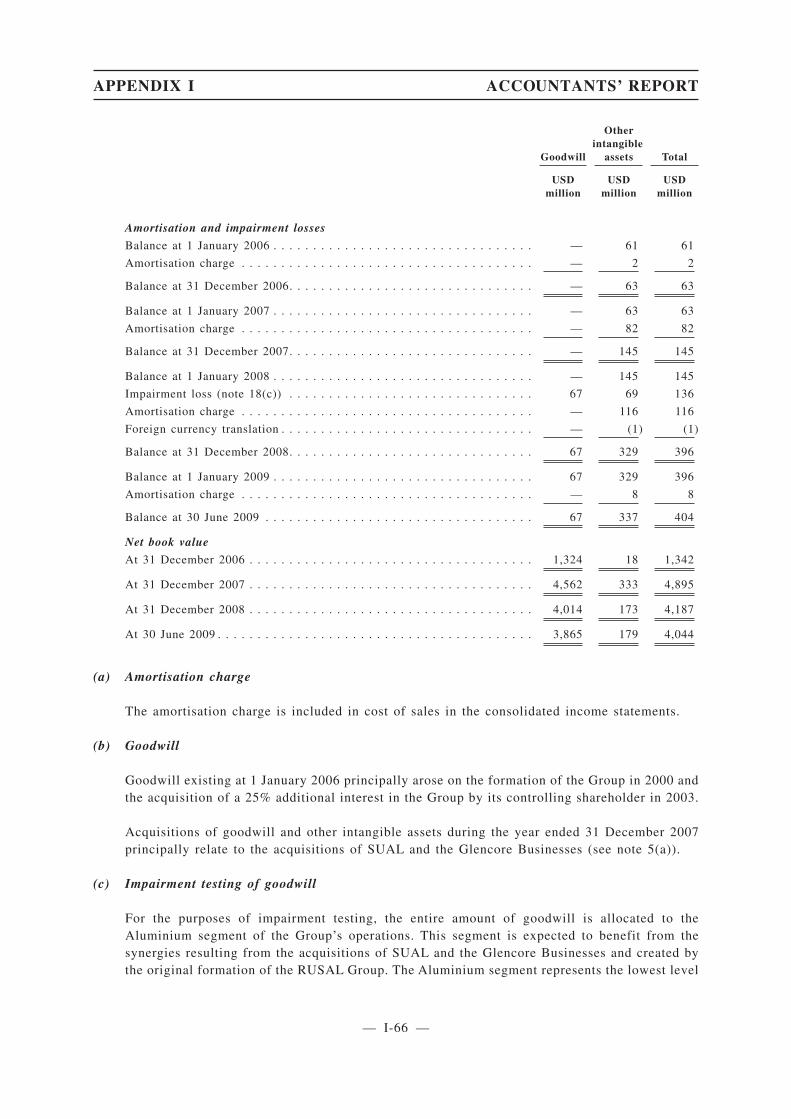
Goodwill
Otherintangible
assets Total
USDmillion
USDmillion
USDmillion
Amortisation and impairment losses
Balance at 1 January 2006 . . . . . . . . . . . . . . . . . . . . . . . . . . . . . . . . . — 61 61
Amortisation charge . . . . . . . . . . . . . . . . . . . . . . . . . . . . . . . . . . . . . — 2 2
Balance at 31 December 2006. . . . . . . . . . . . . . . . . . . . . . . . . . . . . . . — 63 63
Balance at 1 January 2007 . . . . . . . . . . . . . . . . . . . . . . . . . . . . . . . . . — 63 63
Amortisation charge . . . . . . . . . . . . . . . . . . . . . . . . . . . . . . . . . . . . . — 82 82
Balance at 31 December 2007. . . . . . . . . . . . . . . . . . . . . . . . . . . . . . . — 145 145
Balance at 1 January 2008 . . . . . . . . . . . . . . . . . . . . . . . . . . . . . . . . . — 145 145
Impairment loss (note 18(c)) . . . . . . . . . . . . . . . . . . . . . . . . . . . . . . . 67 69 136
Amortisation charge . . . . . . . . . . . . . . . . . . . . . . . . . . . . . . . . . . . . . — 116 116
Foreign currency translation . . . . . . . . . . . . . . . . . . . . . . . . . . . . . . . . — (1) (1)
Balance at 31 December 2008. . . . . . . . . . . . . . . . . . . . . . . . . . . . . . . 67 329 396
Balance at 1 January 2009 . . . . . . . . . . . . . . . . . . . . . . . . . . . . . . . . . 67 329 396
Amortisation charge . . . . . . . . . . . . . . . . . . . . . . . . . . . . . . . . . . . . . — 8 8
Balance at 30 June 2009 . . . . . . . . . . . . . . . . . . . . . . . . . . . . . . . . . . 67 337 404
Net book value
At 31 December 2006 . . . . . . . . . . . . . . . . . . . . . . . . . . . . . . . . . . . . 1,324 18 1,342
At 31 December 2007 . . . . . . . . . . . . . . . . . . . . . . . . . . . . . . . . . . . . 4,562 333 4,895
At 31 December 2008 . . . . . . . . . . . . . . . . . . . . . . . . . . . . . . . . . . . . 4,014 173 4,187
At 30 June 2009 . . . . . . . . . . . . . . . . . . . . . . . . . . . . . . . . . . . . . . . . 3,865 179 4,044
(a) Amortisation charge
The amortisation charge is included in cost of sales in the consolidated income statements.
(b) Goodwill
Goodwill existing at 1 January 2006 principally arose on the formation of the Group in 2000 andthe acquisition of a 25% additional interest in the Group by its controlling shareholder in 2003.
Acquisitions of goodwill and other intangible assets during the year ended 31 December 2007principally relate to the acquisitions of SUAL and the Glencore Businesses (see note 5(a)).
(c) Impairment testing of goodwill
For the purposes of impairment testing, the entire amount of goodwill is allocated to theAluminium segment of the Group’s operations. This segment is expected to benefit from thesynergies resulting from the acquisitions of SUAL and the Glencore Businesses and created bythe original formation of the RUSAL Group. The Aluminium segment represents the lowest level
APPENDIX I ACCOUNTANTS’ REPORT
— I-66 —

within the Group at which the goodwill is monitored for internal management purposes. Therecoverable amount represents value in use as determined by discounting the future cash flowsgenerated from the continuing use of the plants within the Group’s Aluminium segment.
The recoverable amount of net assets of the Aluminium segment at 31 December 2006 exceededthe carrying amount of net assets of this segment including goodwill.
The following key assumptions were used in determining the recoverable amount of the segment:
• The Aluminium segment was at the mature stage of business growth; a seven year cash flowprojection period was used for the purpose of estimating the recoverable amount.
• The total production of the Aluminium segment was projected at approximately 2.6 millionmetric tonnes. The Aluminium smelters within the segment currently were operating at theirmaximum capacity; therefore no production growth was included in the cash flowprojections.
• Sales prices were based on the LME price of aluminium price in range between USD2,300and USD2,800 per metric tonne.
• A discount rate of 11.4% was applied in determining the recoverable amount for the plants.The discount rate was estimated based on the industry weighted average cost of capital,which was based on a debt leveraging of 20% at an interest rate of 10% and long-terminflation rate of 2.6%.
• A terminal value was derived at the end of a seven-year period assuming no future growth.
The values assigned to the key assumptions represent management’s assessment of future trendsin the primary aluminum production industry and are based on both external sources (Report ofBrook Hunt on the metal industry) and internal sources (historic company data).
Impairment testing of goodwill at 31 December 2007, which did not result in impairmentcharges, was based on the following key assumptions:
• Total production was estimated based on existing sustainable production levels of 3.9million metric tonnes of primary aluminium, 6.2 million metric tonnes of alumina and 16.4million metric tonnes of bauxite. Bauxite and alumina will be used primarily internally forproduction of primary aluminium. The aluminium smelters within the segment currentlywere operating at their maximum capacity; therefore no production growth was included inthe cash flow projections.
• Sales prices were based on the long-term aluminium price outlook derived from availableindustry and market sources of USD2,586 per metric tonne for primary aluminium and 13%of the LME price for alumina.
• A discount rate of 11.98% was applied in determining the recoverable amount for the plants.The discount rate was estimated based on the industry weighted average cost of capital,which was based on a debt leveraging of 20% at an interest rate of 10% and a long-terminflation rate of 2.6%.
• A terminal value was derived at the end of a seven-year period assuming no future growth.
APPENDIX I ACCOUNTANTS’ REPORT
— I-67 —
At 31 December 2008, management analysed developments in the aluminium industry and theGroup’s operations since 31 December 2007. The economic environment in the aluminiumindustry has changed significantly compared to 2007 and the impairment testing for goodwillwas carried out at 31 December 2008 using the following revised assumptions to determine therecoverable amount of the segment:
• Total production was estimated based on adjusted sustainable production levels of 3.9million metric tonnes of primary aluminium, 7.6 million metric tonnes of alumina and 12.6million metric tonnes of bauxite. This represents a 10% decrease in aluminium production,a 33% decrease in alumina production and a 29% decrease in bauxite production comparedto 2007 production levels. Bauxite and alumina will be used primarily internally forproduction of primary aluminium. No production growth was included in the cash flowprojections;
• Sales prices were based on the long-term aluminium price outlook derived from availableindustry and market sources. For details refer to note 17 above. Operating costs wereprojected based on the historical performance of each cash generating unit and adjusted forplanned cost reductions;
• Real foreign currency exchange rates applied to convert operating costs of the Groupdenominated in RUR into USD were RUR30 for 1 USD in 2009, RUR29 for 1 USD in2010-2015 and thereafter. Long-term inflation of 6% in RUR and 2% in USD was assumedin determining recoverable amounts;
• The pre-tax discount rate was estimated in nominal terms based on the weighted averagecost of capital basis and was 17.26%; and
• A terminal value was derived at the end of a seven-year period assuming a 2% annualgrowth rate.
Values assigned to key assumptions and estimates used to measure the unit’s recoverable amountare consistent with external sources of information and historic data for the Group’s Aluminiumsegment. Management believes that the values assigned to the key assumptions and estimatesrepresent the most realistic assessment of future trends. The results are particularly sensitive tothe following key assumptions:
• A 5% reduction in the projected aluminium price level would result in a decrease in therecoverable amount by 19% and would not lead to impairment;
• A 5% increase in the projected level of operating costs would result in a 18% decrease inthe recoverable amount and would not lead to the additional impairment;
• A 1% increase in the discount rate would result in a 7% change in the recoverable amountand would not lead to impairment.
At 31 December 2008 goodwill and intangible assets of USD67 million and USD69 million,respectively, were considered to be impaired.
Management analysed changes in the economic environment and developments in the aluminiumindustry and the Group’s operations since 31 December 2008 and concluded that no significantchanges occurred during this period that may give rise to additional impairment and therefore noimpairment assessment has been performed as at 30 June 2009.
APPENDIX I ACCOUNTANTS’ REPORT
— I-68 —
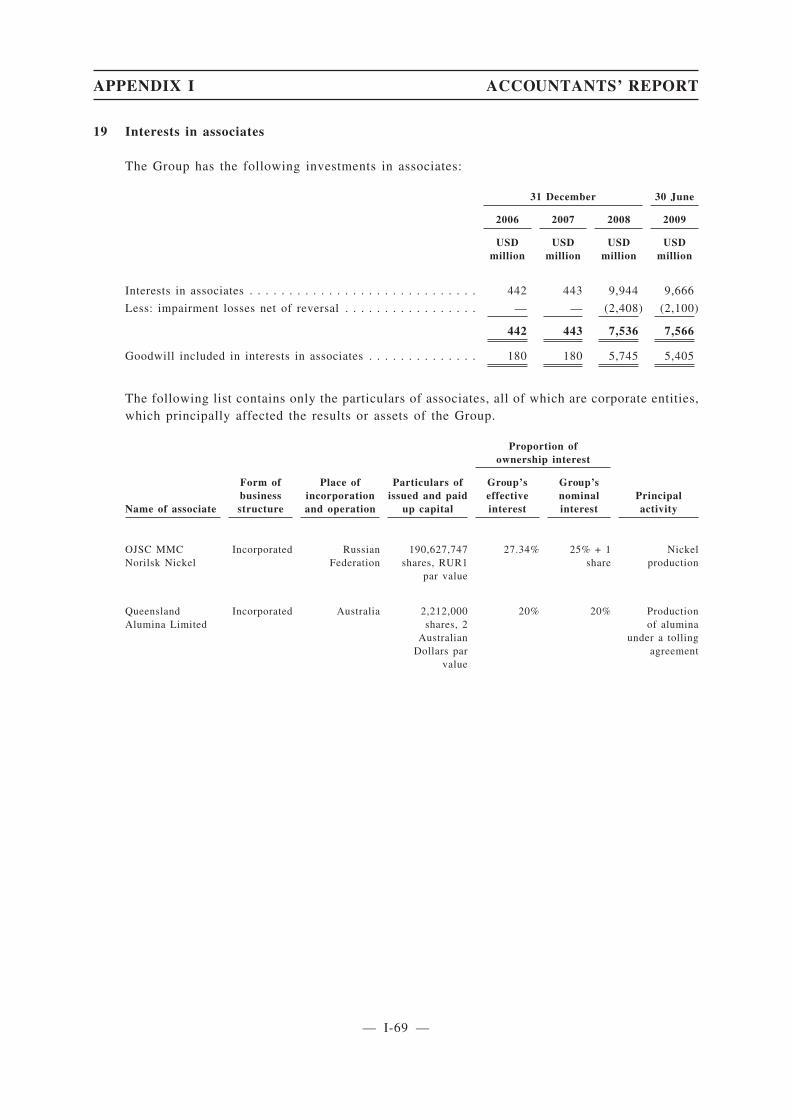
19 Interests in associates
The Group has the following investments in associates:
31 December 30 June
2006 2007 2008 2009
USDmillion
USDmillion
USDmillion
USDmillion
Interests in associates . . . . . . . . . . . . . . . . . . . . . . . . . . . . . 442 443 9,944 9,666
Less: impairment losses net of reversal . . . . . . . . . . . . . . . . . — — (2,408) (2,100)
442 443 7,536 7,566
Goodwill included in interests in associates . . . . . . . . . . . . . . 180 180 5,745 5,405
The following list contains only the particulars of associates, all of which are corporate entities,which principally affected the results or assets of the Group.
Proportion ofownership interest
Name of associate
Form ofbusinessstructure
Place ofincorporationand operation
Particulars ofissued and paid
up capital
Group’seffectiveinterest
Group’snominalinterest
Principalactivity
OJSC MMCNorilsk Nickel
Incorporated RussianFederation
190,627,747shares, RUR1
par value
27.34% 25% + 1share
Nickelproduction
QueenslandAlumina Limited
Incorporated Australia 2,212,000shares, 2
AustralianDollars par
value
20% 20% Productionof alumina
under a tollingagreement
APPENDIX I ACCOUNTANTS’ REPORT
— I-69 —
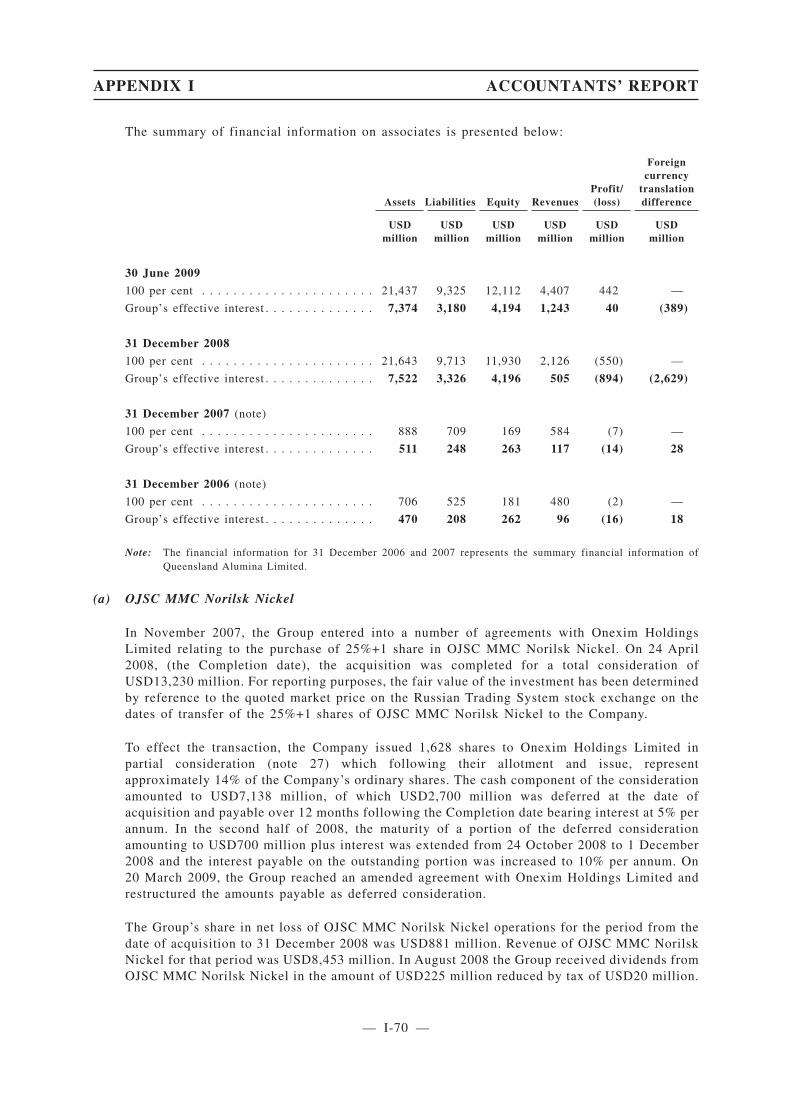
The summary of financial information on associates is presented below:
Assets Liabilities Equity RevenuesProfit/(loss)
Foreigncurrency
translationdifference
USDmillion
USDmillion
USDmillion
USDmillion
USDmillion
USDmillion
30 June 2009
100 per cent . . . . . . . . . . . . . . . . . . . . . . 21,437 9,325 12,112 4,407 442 —
Group’s effective interest . . . . . . . . . . . . . . 7,374 3,180 4,194 1,243 40 (389)
31 December 2008
100 per cent . . . . . . . . . . . . . . . . . . . . . . 21,643 9,713 11,930 2,126 (550) —
Group’s effective interest . . . . . . . . . . . . . . 7,522 3,326 4,196 505 (894) (2,629)
31 December 2007 (note)
100 per cent . . . . . . . . . . . . . . . . . . . . . . 888 709 169 584 (7) —
Group’s effective interest . . . . . . . . . . . . . . 511 248 263 117 (14) 28
31 December 2006 (note)
100 per cent . . . . . . . . . . . . . . . . . . . . . . 706 525 181 480 (2) —
Group’s effective interest . . . . . . . . . . . . . . 470 208 262 96 (16) 18
Note: The financial information for 31 December 2006 and 2007 represents the summary financial information ofQueensland Alumina Limited.
(a) OJSC MMC Norilsk Nickel
In November 2007, the Group entered into a number of agreements with Onexim HoldingsLimited relating to the purchase of 25%+1 share in OJSC MMC Norilsk Nickel. On 24 April2008, (the Completion date), the acquisition was completed for a total consideration ofUSD13,230 million. For reporting purposes, the fair value of the investment has been determinedby reference to the quoted market price on the Russian Trading System stock exchange on thedates of transfer of the 25%+1 shares of OJSC MMC Norilsk Nickel to the Company.
To effect the transaction, the Company issued 1,628 shares to Onexim Holdings Limited inpartial consideration (note 27) which following their allotment and issue, representapproximately 14% of the Company’s ordinary shares. The cash component of the considerationamounted to USD7,138 million, of which USD2,700 million was deferred at the date ofacquisition and payable over 12 months following the Completion date bearing interest at 5% perannum. In the second half of 2008, the maturity of a portion of the deferred considerationamounting to USD700 million plus interest was extended from 24 October 2008 to 1 December2008 and the interest payable on the outstanding portion was increased to 10% per annum. On20 March 2009, the Group reached an amended agreement with Onexim Holdings Limited andrestructured the amounts payable as deferred consideration.
The Group’s share in net loss of OJSC MMC Norilsk Nickel operations for the period from thedate of acquisition to 31 December 2008 was USD881 million. Revenue of OJSC MMC NorilskNickel for that period was USD8,453 million. In August 2008 the Group received dividends fromOJSC MMC Norilsk Nickel in the amount of USD225 million reduced by tax of USD20 million.
APPENDIX I ACCOUNTANTS’ REPORT
— I-70 —

The carrying value and market value of the Group’s investment in OJSC MMC Norilsk Nickelas at 31 December 2008 and 30 June 2009 were as follows:
31 December 2008 30 June 2009
USD million USD million
Carrying value . . . . . . . . . . . . . . . . . . . . . . . . . . . . . . . . . . . . 7,158 7,158
Market value . . . . . . . . . . . . . . . . . . . . . . . . . . . . . . . . . . . . . 3,011 4,527
The Group engaged an independent appraiser to determine the fair values of assets acquired andliabilities assumed upon acquisition of the equity investment in OJSC MMC Norilsk Nickel. Thepurchase price allocation resulted in goodwill of USD6,970 million recognised upon acquisitionas part of the carrying value of investment in an associate.
Following the sharp decline in demand for metals of OJSC MMC Norilsk Nickel resulting froma significant decrease in share price and the worldwide general economic downturn, managementconsidered that it was necessary to carry out an impairment test of its investment at 31 December2008 after the application of the equity method of accounting. The recoverable amount of theinvestment was determined based on the underlying value in use of its businesses with thefollowing significant assumptions:
• The long term commodity price forecasts for nickel, copper and other by-products, aremanagement’s estimates based on their experience of the specific commodities markets asat the date of the impairment test, and are within the range of external market forecasts. Theprices used are as follows:
Type of metal Units 2009 2010 2011 2012 2013 2014 2015
Nickel . . . . . . . . USD/ton 11,088 13,163 15,542 17,094 17,436 17,785 18,140
Copper . . . . . . . USD/ton 4,161 4,740 5,579 5,952 6,071 6,192 6,316
Platinum . . . . . . USD/kg 29,859 34,214 34,214 38,102 38,864 39,641 40,434
Palladium . . . . . USD/kg 6,532 8,553 10,186 12,690 12,944 13,203 13,467
• Total production volume was based on the existing sustainable production levels of 317thousand tons of nickel, 382 thousand tons of copper, 25.4 tons of platinum and 97 tons ofpalladium.
• The real foreign currency exchange rates applied to convert operating costs denominated inRUR into USD, were RUR30 for one USD in 2009, RUR29 for one USD in 2010-2015 andthereafter. Inflation of 6.0 � 11.4% in RUR was assumed in determining the recoverableamounts.
Discount rates reflect management’s assessment of the risks specific to each production unit.This rate is based on the weighted average cost of capital specific to each cash-generating unitand averaged 16.68% pre-tax. As a result, an impairment loss of USD2,408 million wasrecognised in addition to the Group’s share of losses of the associate at 31 December 2008.
APPENDIX I ACCOUNTANTS’ REPORT
— I-71 —

During the six months ended 30 June 2009 there was a decrease in the carrying amount of theGroup’s investment in Norilsk Nickel after application of the equity method of accountingincluding recognition of the Group’s share of the net profit of Norilsk Nickel and the effect offoreign currency translation of the investment to US dollars from its functional currency.Following the application of the equity method management analysed changes in the economicenvironment and nickel and related industries since 31 December 2008 and concluded that thevalue in use or the recoverable amount of the Group’s investment in Norilsk Nickel increased inits functional currency and remained unchanged in US dollars. As a result, the Group recogniseda partial reversal of the previously recorded impairment in the amount of US$308 million duringthe six months ended 30 June 2009.
(b) Queensland Alumina Limited (“QAL”)
In October 2004 the Group won the auction sale of 20% percent of the common shares of QALand signed the purchase agreement with the seller subject to the United States Bankruptcy Court,Australian state authorities, QAL’s shareholders and creditors approvals, which were obtained in2005. This acquisition was completed on 1 April 2005. In accordance with the agreement theGroup paid USD418 million in cash, assumed the sellers’ debt to QAL of USD35 million and aguarantee of QAL’s debts of USD60 million and acquired alumina and bauxite inventory of theformer shareholder of QAL of USD10 million.
20 Interests in jointly controlled entities
The Group has the following investments in jointly controlled entities:
31 December 30 June
2006 2007 2008 2009
USDmillion
USDmillion
USDmillion
USDmillion
Interests in jointly controlled entities. . . . . . . . . . . . . . . . . . . 127 219 650 659
Less: impairment loss . . . . . . . . . . . . . . . . . . . . . . . . . . . . . — — (144) (157)
127 219 506 502
Goodwill included in interests in jointly controlled entities . . . . 67 — — —
APPENDIX I ACCOUNTANTS’ REPORT
— I-72 —

Details of the Group’s interest in the jointly controlled entities are as follows:
Proportion ofownership interest
Name of jointlycontrolled entity
Form ofbusinessstructure
Place ofincorporationand operation
Particulars ofissued and paid
up capital
Group’seffectiveinterest
Held by asubsidiary
Principalactivity
Bogatyr Access Komirand its tradingcompanies (FORUMMuider BV)
Incorporated RussianFederation/Kazakhstan
18,150 shares,EUR1
50% 50% Coal mining
BEMO project Incorporated RussianFederation
BOGES Limited- 10,000 shares
EUR1.71;BALP Limited
- 10,000 sharesEUR1.71
50% 50% Energy /Aluminiumproduction
Rounio Limited * Incorporated Cyprus/Russian
Federation
1,000 shares,USD2.681
50% 50% Cryoliteproduction
Sual Komi BV * Incorporated Netherlands/Russian
Federation
18,000 shares,EUR1
50% 50% Bauxitemining
* prior to 27 March 2007 investments in Rounio Limited and Sual Komi BV were accounted for using the equitymethod. During the year ended 31 December 2008, the Group acquired the remaining interests from the othershareholders and Rounio Limited and Sual Komi BV became the wholly-owned subsidiaries of the Group. The resultsof Rounio Limited and Sual Komi BV have been consolidated in the Group’s consolidated financial statements sincecontrol was obtained.
Summary financial information on jointly controlled entities — Group’s effective interest ispresented below:
31 December 30 June
2006 2007 2008 2009
USDmillion
USDmillion
USDmillion
USDmillion
Non-current assets . . . . . . . . . . . . . . . . . . . . . . . . . . . . . . . 221 374 810 806
Current assets . . . . . . . . . . . . . . . . . . . . . . . . . . . . . . . . . . 67 116 130 84
Non-current liabilities . . . . . . . . . . . . . . . . . . . . . . . . . . . . . (65) (261) (402) (351)
Current liabilities . . . . . . . . . . . . . . . . . . . . . . . . . . . . . . . . (96) (10) (32) (37)
Net assets . . . . . . . . . . . . . . . . . . . . . . . . . . . . . . . . . . . . . 127 219 506 502
Income . . . . . . . . . . . . . . . . . . . . . . . . . . . . . . . . . . . . . . . 113 76 557 88
Expenses . . . . . . . . . . . . . . . . . . . . . . . . . . . . . . . . . . . . . . (125) (91) (448) (83)
(Loss)/profit for the year/period . . . . . . . . . . . . . . . . . . . . . . (12) (15) 109 5
Foreign currency translation differences for foreign operations . — 13 (64) (51)
APPENDIX I ACCOUNTANTS’ REPORT
— I-73 —
(a) LLP Bogatyr Komir and trading companies
On 27 March 2007, as a consequence of the acquisition of SUAL, the Group acquired the rightto receive a 100% interest in LLP Bogatyr Komir (formerly LLP Bogatyr Access Komir), apartnership organised under the laws of Kazakhstan and engaged in the mining and processingof coal at Ekibastuz, Kazakhstan together with related trading companies. The trading companieswere transferred to the Group with effect from this date. However, the transfer of the interest inLLP Bogatyr Komir to the Group was pending receipt of regulatory approvals in Kazakhstan (seenote 5). This right was recorded at the estimated fair value of LLP Bogatyr Komir of USD606million as at 31 December 2007.
In November 2007 the Group has signed a memorandum of cooperation with the Government ofKazakhstan whereby it has agreed to sell a 50% interest in LLP Bogatyr Komir to theGovernment immediately upon receipt of the necessary governmental approvals. In April 2008the necessary approvals were received and the Group signed a sale-and-purchase agreement withOJSC Samruk Energo, a company controlled by the state of Kazakhstan, to sell a 50% interestin LLP Bogatyr Komir and a 50% interest in related coal traders for USD345 million. Thistransaction resulted in a gain of USD42 million.
According to the sale-and-purchase agreement the Group controlled and could distribute 100%of net income and retained earnings of LLP Bogatyr Komir and related coal traders generatedbefore OJSC Samruk Energo made the final payment. The full consideration under agreementwas received on 24 December 2008.
Management carried out an impairment test of its investment in LLP Bogatyr Komir and coaltrading companies and recognised an impairment loss of USD144 million in addition toapplication of the equity method at 31 December 2008. Additional impairment of USD13 millionwas recognised at 30 June 2009.
(b) BEMO project
In May 2006, the Group signed a Co-operation agreement with OJSC RosHydro and RAO UES.Under this Co-operation agreement, OJSC RosHydro and the Group jointly committed to financethe construction and future operation of Boguchansk hydropower station (BoGES) and analuminum plant which is planned to be the main customer of the hydropower station (note 33(a)),together referred to as the “BEMO project”.
During 2007, the Group and HydroOGK established two joint companies to control BoGES andthe Boguchansky Aluminium Smelter (BoAZ). By 31 December 2007, the Group had contributedUSD206 million to the joint companies as total consideration for its 50% interest in the jointbusiness including its 29.4% interest in BoGES valued at USD23 million. During the year ended31 December 2008 and the six months ended 30 June 2009 the Group contributed an additionalUSD195 million and USD55 million to the project, respectively.
(c) Sual Komi BV
In April 2005, the Group signed a Joint Venture and Shareholders’ Agreement with SUAL todevelop the Timan bauxite mine and to construct an alumina refinery. The Group paid USD137million as consideration for a 50% interest in the joint business in July 2005. In January 2006,the parties renegotiated certain acquisition terms, which resulted in a reduction of the originalpurchase price paid by the Group by USD70 million and an agreement to provide 50%proportionate share of a USD150 million long-term financing to the joint venture in the form ofa loan.
APPENDIX I ACCOUNTANTS’ REPORT
— I-74 —

(d) Rounio Limited
In April 2005 the Group paid USD24 million for a 50 % interest in Rounio Limited (“Rounio”),a holding company established by SUAL. Rounio Limited owns the controlling interests in twoplants involved in the production of aluminium fluoride.
21 Financial investments
31 December 30 June
2006 2007 2008 2009
USDmillion
USDmillion
USDmillion
USDmillion
Non-currentOther investments . . . . . . . . . . . . . . . . . . . . . . . . . . . . . . . . — 606 — —
— 606 — —
On 27 March 2007, as a consequence of the acquisition of SUAL, the Group acquired the rightto receive a 100% interest in LLP Bogatyr Access Komir, a partnership organised under the lawsof Kazakhstan and engaged in the mining and processing of coal at Ekibazstuz, Kazakhstantogether with related trading companies. The trading companies were transferred to the Groupwith effect from this date. However, the transfer of the interest in LLP Bogatyr Access Komirto the Group was pending receipt of regulatory approvals in Kazakhstan (note 5). This right wasrecorded at the estimated fair value of LLP Bogatyr Access Komir of USD606 million as at 31December 2007. Following the signing of a sale-purchase agreement with OJSC Samruk Energoin April 2008 to sell a 50% interest in LLP Bogatyr Access Komir and a 50% interest in therelated coal traders the Group’s interest in LLP Bogatyr Access Komir was recorded as aninvestment in a jointly controlled entity (note 20).
In the second half of 2008 the Group acquired a derivative financial instrument linked to theprice of shares of OJSC MMC Norilsk Nickel for a total consideration of USD554 million. Underthe terms of the contract the Group also has an option to acquire up to 5% of the shares of OJSCMMC Norilsk Nickel from a third party on certain future dates at the market prices prevailingat those future dates. Management estimated the fair value of the instrument at 31 December2008 and 30 June 2009 at nil. The change in fair value is included in “finance expenses” in theconsolidated income statements. Subsequent to 30 June 2009 the Group has partially unwoundthis arrangement in respect of an option to acquire up to 3% of the shares of OJSC MMC NorilskNickel with a resulting gain of USD23 million.
22 Investments in subsidiaries
The Company
31 December 30 June
2006 2007 2008 2009
USDmillion
USDmillion
USDmillion
USDmillion
Unlisted shares, at cost . . . . . . . . . . . . . . . . . . . . . . . . . . . . — 9,651 23,057 23,043Less: impairment . . . . . . . . . . . . . . . . . . . . . . . . . . . . . . . . — — (9,524) (9,537)
— 9,651 13,533 13,506
Details of the principal subsidiaries are set out in note 36 to the Financial Information.
APPENDIX I ACCOUNTANTS’ REPORT
— I-75 —

23D
efer
red
tax
asse
tsan
dli
abil
itie
s
(a)
Rec
ogn
ised
defe
rred
tax
asse
tsan
dli
abil
itie
s
Def
erre
dta
xas
sets
and
liab
ilit
ies
are
attr
ibut
able
toth
efo
llow
ing
tem
pora
rydi
ffer
ence
s:
Ass
ets
Lia
bil
itie
sN
et
31D
ecem
ber
30Ju
ne
31D
ecem
ber
30Ju
ne
31D
ecem
ber
30Ju
ne
2006
2007
2008
2009
2006
2007
2008
2009
2006
2007
2008
2009
US
Dm
illi
onU
SD
mil
lion
US
Dm
illi
onU
SD
mil
lion
US
Dm
illi
onU
SD
mil
lion
US
Dm
illi
onU
SD
mil
lion
US
Dm
illi
onU
SD
mil
lion
US
Dm
illi
onU
SD
mil
lion
Pro
pert
y,pl
ant
and
equi
pmen
t..
..
..
.—
5614
41(5
59)
(1,0
72)
(537
)(5
84)
(559
)(1
,016
)(5
23)
(543
)
Inve
ntor
ies
..
..
..
..
..
..
..
..
..
..
372
5943
—(1
3)(3
)(2
2)37
(11)
5621
Tra
dean
dot
her
rece
ivab
les
..
..
..
..
719
122
—(2
)(8
)(1
4)7
174
(12)
Oth
ers
..
..
..
..
..
..
..
..
..
..
..
.11
153
3866
(4)
(59)
(25)
(14)
794
1352
Def
erre
dta
xas
sets
/(li
abil
itie
s).
..
..
.55
230
123
152
(563
)(1
,146
)(5
73)
(634
)(5
08)
(916
)(4
50)
(482
)
Set
off
ofde
ferr
edta
xati
on.
..
..
..
.(2
2)(1
25)
(64)
(108
)22
125
6410
8—
——
—
Net
def
erre
dta
xas
sets
/(li
abil
itie
s).
.33
105
5944
(541
)(1
,021
)(5
09)
(526
)(5
08)
(916
)(4
50)
(482
)
APPENDIX I ACCOUNTANTS’ REPORT
— I-76 —
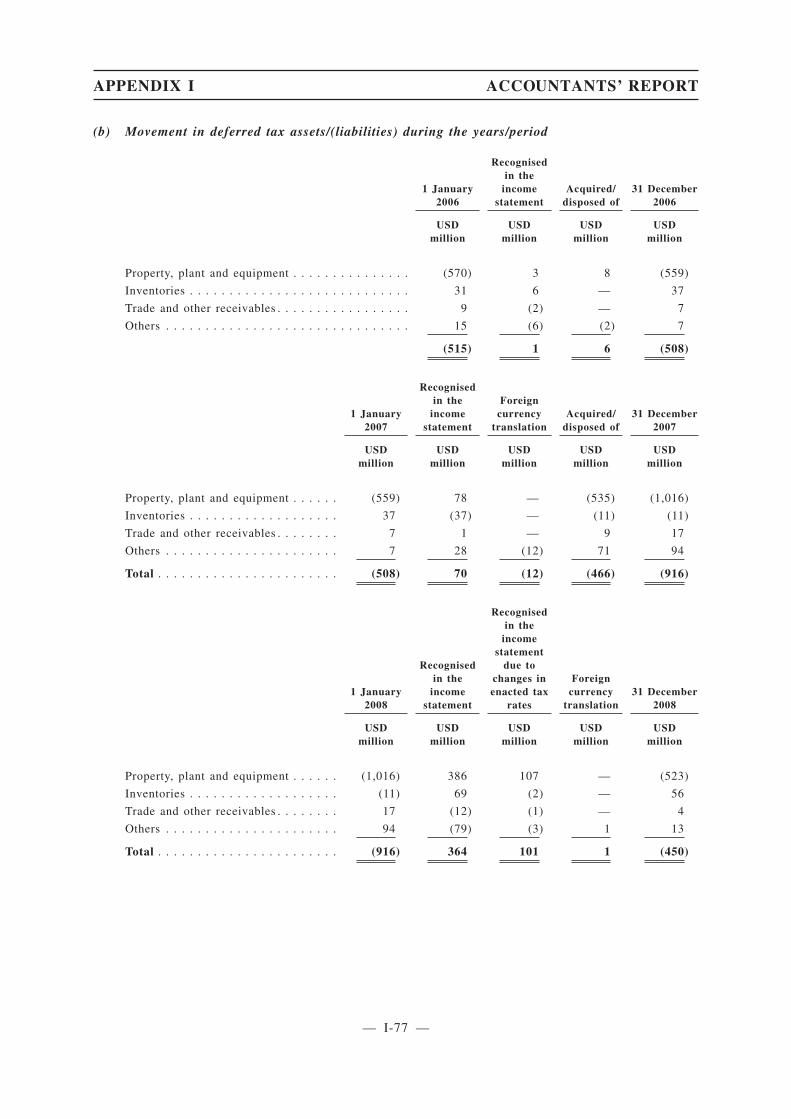
(b) Movement in deferred tax assets/(liabilities) during the years/period
1 January2006
Recognisedin the
incomestatement
Acquired/disposed of
31 December2006
USDmillion
USDmillion
USDmillion
USDmillion
Property, plant and equipment . . . . . . . . . . . . . . . (570) 3 8 (559)
Inventories . . . . . . . . . . . . . . . . . . . . . . . . . . . . 31 6 — 37
Trade and other receivables . . . . . . . . . . . . . . . . . 9 (2) — 7
Others . . . . . . . . . . . . . . . . . . . . . . . . . . . . . . . 15 (6) (2) 7
(515) 1 6 (508)
1 January2007
Recognisedin the
incomestatement
Foreigncurrency
translationAcquired/
disposed of31 December
2007
USDmillion
USDmillion
USDmillion
USDmillion
USDmillion
Property, plant and equipment . . . . . . (559) 78 — (535) (1,016)
Inventories . . . . . . . . . . . . . . . . . . . 37 (37) — (11) (11)
Trade and other receivables . . . . . . . . 7 1 — 9 17
Others . . . . . . . . . . . . . . . . . . . . . . 7 28 (12) 71 94
Total . . . . . . . . . . . . . . . . . . . . . . . (508) 70 (12) (466) (916)
1 January2008
Recognisedin the
incomestatement
Recognisedin the
incomestatement
due tochanges inenacted tax
rates
Foreigncurrency
translation31 December
2008
USDmillion
USDmillion
USDmillion
USDmillion
USDmillion
Property, plant and equipment . . . . . . (1,016) 386 107 — (523)
Inventories . . . . . . . . . . . . . . . . . . . (11) 69 (2) — 56
Trade and other receivables . . . . . . . . 17 (12) (1) — 4
Others . . . . . . . . . . . . . . . . . . . . . . 94 (79) (3) 1 13
Total . . . . . . . . . . . . . . . . . . . . . . . (916) 364 101 1 (450)
APPENDIX I ACCOUNTANTS’ REPORT
— I-77 —

1 January2009
Recognisedin the
incomestatement
30 June2009
USDmillion
USDmillion
USDmillion
Property, plant and equipment. . . . . . . . . . . . . . . . . . . . . . . . . (523) (20) (543)
Inventories. . . . . . . . . . . . . . . . . . . . . . . . . . . . . . . . . . . . . . 56 (35) 21
Trade and other receivables . . . . . . . . . . . . . . . . . . . . . . . . . . 4 (16) (12)
Others . . . . . . . . . . . . . . . . . . . . . . . . . . . . . . . . . . . . . . . . . 13 39 52
Total . . . . . . . . . . . . . . . . . . . . . . . . . . . . . . . . . . . . . . . . . (450) (32) (482)
(c) Unrecognised deferred tax assets
The Group
Deferred tax assets have not been recognised in respect of the following items:
31 December 30 June
2006 2007 2008 2009
USDmillion
USDmillion
USDmillion
USDmillion
Deductible temporary differences . . . . . . . . . . . . . . . . . . . . . — — 344 377
Tax loss carry-forwards . . . . . . . . . . . . . . . . . . . . . . . . . . . . 4 49 257 341
4 49 601 718
APPENDIX I ACCOUNTANTS’ REPORT
— I-78 —
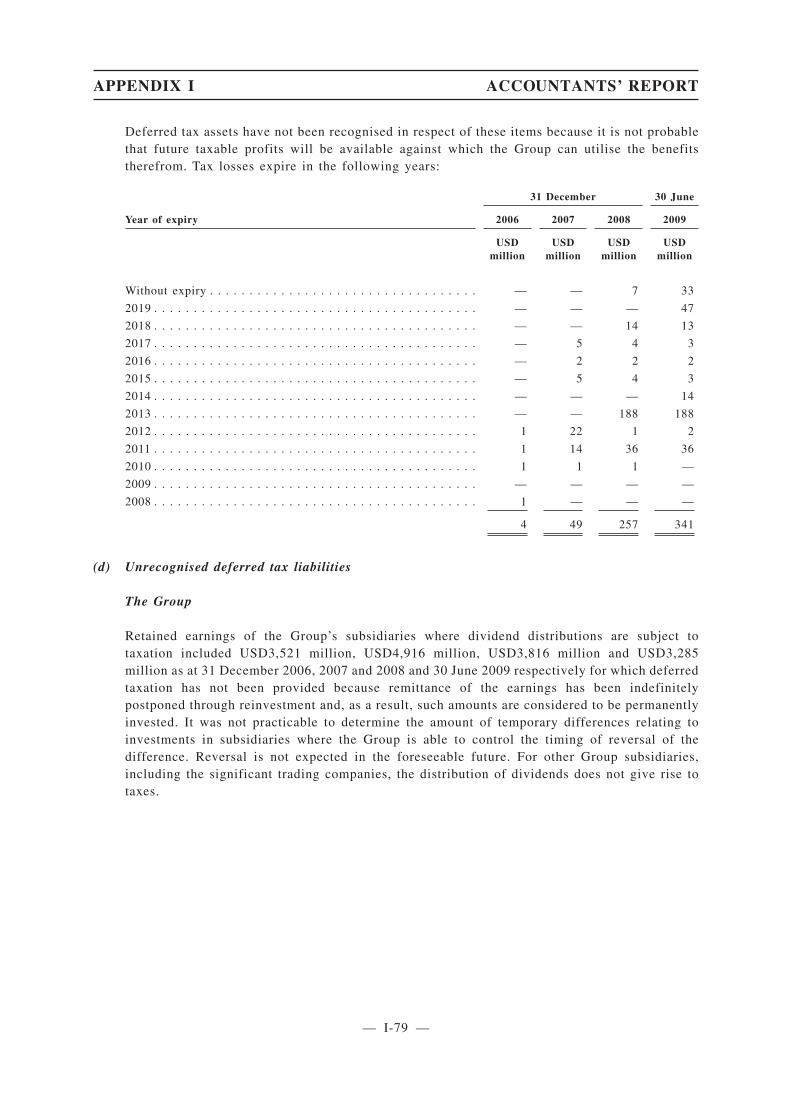
Deferred tax assets have not been recognised in respect of these items because it is not probablethat future taxable profits will be available against which the Group can utilise the benefitstherefrom. Tax losses expire in the following years:
31 December 30 June
Year of expiry 2006 2007 2008 2009
USDmillion
USDmillion
USDmillion
USDmillion
Without expiry . . . . . . . . . . . . . . . . . . . . . . . . . . . . . . . . . . — — 7 33
2019 . . . . . . . . . . . . . . . . . . . . . . . . . . . . . . . . . . . . . . . . . — — — 47
2018 . . . . . . . . . . . . . . . . . . . . . . . . . . . . . . . . . . . . . . . . . — — 14 13
2017 . . . . . . . . . . . . . . . . . . . . . . . . . . . . . . . . . . . . . . . . . — 5 4 3
2016 . . . . . . . . . . . . . . . . . . . . . . . . . . . . . . . . . . . . . . . . . — 2 2 2
2015 . . . . . . . . . . . . . . . . . . . . . . . . . . . . . . . . . . . . . . . . . — 5 4 3
2014 . . . . . . . . . . . . . . . . . . . . . . . . . . . . . . . . . . . . . . . . . — — — 14
2013 . . . . . . . . . . . . . . . . . . . . . . . . . . . . . . . . . . . . . . . . . — — 188 188
2012 . . . . . . . . . . . . . . . . . . . . . . . . . . . . . . . . . . . . . . . . . 1 22 1 2
2011 . . . . . . . . . . . . . . . . . . . . . . . . . . . . . . . . . . . . . . . . . 1 14 36 36
2010 . . . . . . . . . . . . . . . . . . . . . . . . . . . . . . . . . . . . . . . . . 1 1 1 —
2009 . . . . . . . . . . . . . . . . . . . . . . . . . . . . . . . . . . . . . . . . . — — — —
2008 . . . . . . . . . . . . . . . . . . . . . . . . . . . . . . . . . . . . . . . . . 1 — — —
4 49 257 341
(d) Unrecognised deferred tax liabilities
The Group
Retained earnings of the Group’s subsidiaries where dividend distributions are subject totaxation included USD3,521 million, USD4,916 million, USD3,816 million and USD3,285million as at 31 December 2006, 2007 and 2008 and 30 June 2009 respectively for which deferredtaxation has not been provided because remittance of the earnings has been indefinitelypostponed through reinvestment and, as a result, such amounts are considered to be permanentlyinvested. It was not practicable to determine the amount of temporary differences relating toinvestments in subsidiaries where the Group is able to control the timing of reversal of thedifference. Reversal is not expected in the foreseeable future. For other Group subsidiaries,including the significant trading companies, the distribution of dividends does not give rise totaxes.
APPENDIX I ACCOUNTANTS’ REPORT
— I-79 —
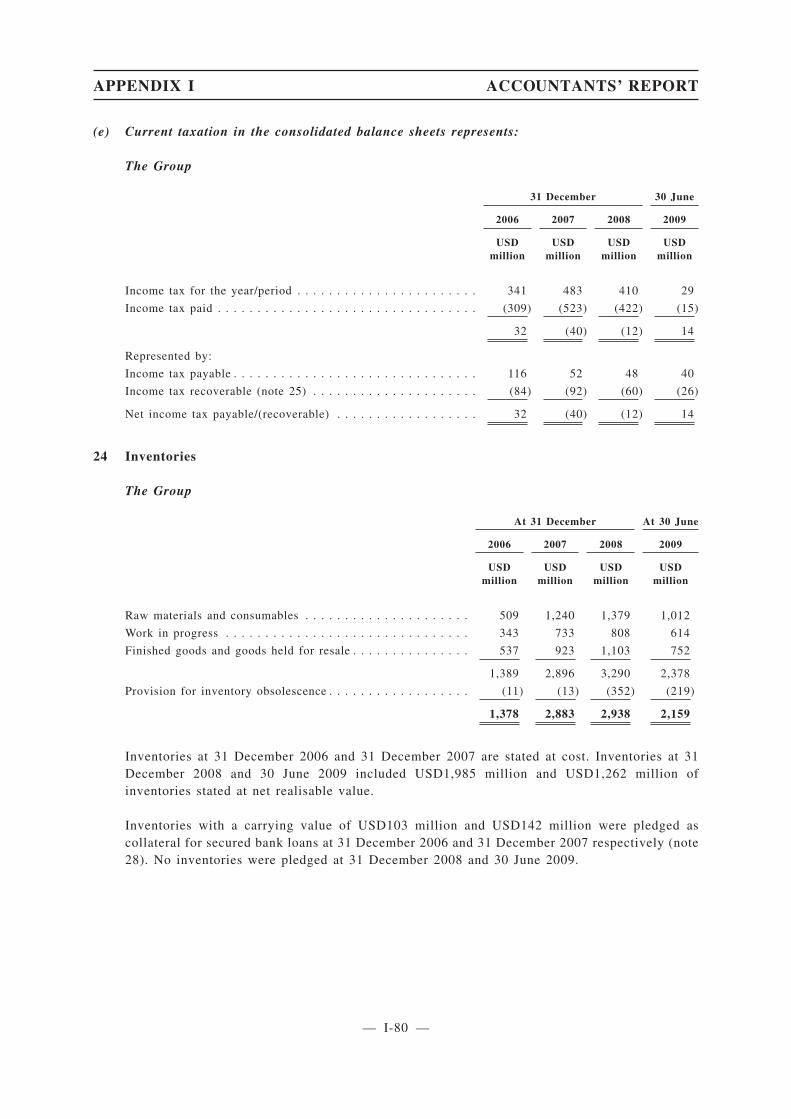
(e) Current taxation in the consolidated balance sheets represents:
The Group
31 December 30 June
2006 2007 2008 2009
USDmillion
USDmillion
USDmillion
USDmillion
Income tax for the year/period . . . . . . . . . . . . . . . . . . . . . . . 341 483 410 29
Income tax paid . . . . . . . . . . . . . . . . . . . . . . . . . . . . . . . . . (309) (523) (422) (15)
32 (40) (12) 14
Represented by:
Income tax payable . . . . . . . . . . . . . . . . . . . . . . . . . . . . . . . 116 52 48 40
Income tax recoverable (note 25) . . . . . . . . . . . . . . . . . . . . . (84) (92) (60) (26)
Net income tax payable/(recoverable) . . . . . . . . . . . . . . . . . . 32 (40) (12) 14
24 Inventories
The Group
At 31 December At 30 June
2006 2007 2008 2009
USDmillion
USDmillion
USDmillion
USDmillion
Raw materials and consumables . . . . . . . . . . . . . . . . . . . . . 509 1,240 1,379 1,012
Work in progress . . . . . . . . . . . . . . . . . . . . . . . . . . . . . . . 343 733 808 614
Finished goods and goods held for resale . . . . . . . . . . . . . . . 537 923 1,103 752
1,389 2,896 3,290 2,378
Provision for inventory obsolescence . . . . . . . . . . . . . . . . . . (11) (13) (352) (219)
1,378 2,883 2,938 2,159
Inventories at 31 December 2006 and 31 December 2007 are stated at cost. Inventories at 31December 2008 and 30 June 2009 included USD1,985 million and USD1,262 million ofinventories stated at net realisable value.
Inventories with a carrying value of USD103 million and USD142 million were pledged ascollateral for secured bank loans at 31 December 2006 and 31 December 2007 respectively (note28). No inventories were pledged at 31 December 2008 and 30 June 2009.
APPENDIX I ACCOUNTANTS’ REPORT
— I-80 —

The analysis of the amount of inventories recognised as an expense is as follows:
Year ended 31 DecemberSix months
ended 30 June
2006 2007 2008 2008 2009
USDmillion
USDmillion
USDmillion
USDmillion
USDmillion
(unaudited)
Carrying amount of inventories sold . . . . . . . . . . . . 2,770 4,822 6,035 2,951 1,803
Write-down/(reversal of write-down) of inventories . . — 2 339 — (133)
2,770 4,824 6,374 2,951 1,670
25 Trade and other receivables
The Group
31 December 30 June
2006 2007 2008 2009
USDmillion
USDmillion
USDmillion
USDmillion
Trade receivables from third parties. . . . . . . . . . . . . . . . . . . . 270 597 274 196
Impairment loss on trade receivables . . . . . . . . . . . . . . . . . . . (19) (37) (35) (21)
Net trade receivables from third parties . . . . . . . . . . . . . . . 251 560 239 175
Trade receivables from related parties, including: . . . . . . . . 114 306 122 144
Related parties — companies capable of exerting significantinfluence . . . . . . . . . . . . . . . . . . . . . . . . . . . . . . . . . . . . — 184 47 48
Related parties — companies under common control. . . . . . . 114 120 65 87
Related parties — associates . . . . . . . . . . . . . . . . . . . . . . . — 2 10 9
VAT recoverable . . . . . . . . . . . . . . . . . . . . . . . . . . . . . . . . . 217 474 548 614
Impairment loss on VAT recoverable . . . . . . . . . . . . . . . . . . . (8) (4) (3) (53)
Net VAT recoverable . . . . . . . . . . . . . . . . . . . . . . . . . . . . . 209 470 545 561
Advances paid to third parties . . . . . . . . . . . . . . . . . . . . . . 118 214 115 104
Advances paid to related parties, including: . . . . . . . . . . . . 32 135 57 63
Related parties — companies capable of exerting significantinfluence . . . . . . . . . . . . . . . . . . . . . . . . . . . . . . . . . . . . — 70 3 4
Related parties — companies under common control. . . . . . . 3 5 — 3
Related parties — associates . . . . . . . . . . . . . . . . . . . . . . . 29 60 54 56
Prepaid expenses . . . . . . . . . . . . . . . . . . . . . . . . . . . . . . . . 26 31 43 77
Prepaid income taxation (note 23(e)) . . . . . . . . . . . . . . . . . . 84 92 60 26
Prepaid other taxes . . . . . . . . . . . . . . . . . . . . . . . . . . . . . . 5 104 61 43
Other receivables . . . . . . . . . . . . . . . . . . . . . . . . . . . . . . . . 127 252 184 195
Impairment loss on other receivables . . . . . . . . . . . . . . . . . . . (12) (14) — —
Net other receivables . . . . . . . . . . . . . . . . . . . . . . . . . . . . . 115 238 184 195
954 2,150 1,426 1,388
APPENDIX I ACCOUNTANTS’ REPORT
— I-81 —

(a) Ageing analysis
Included in trade and other receivables are trade receivables (net of allowance for doubtful debts)with the following ageing analysis as of the balance sheet dates:
31 December 30 June
2006 2007 2008 2009
USDmillion
USDmillion
USDmillion
USDmillion
Current . . . . . . . . . . . . . . . . . . . . . . . . . . . . . . . . . . . . . . . 332 786 231 138
Past due 0-90 days . . . . . . . . . . . . . . . . . . . . . . . . . . . . . . . 32 47 109 85
Past due 91-365 days . . . . . . . . . . . . . . . . . . . . . . . . . . . . . 1 2 19 93
Past due over 365 days . . . . . . . . . . . . . . . . . . . . . . . . . . . . — 31 2 3
Amounts past due . . . . . . . . . . . . . . . . . . . . . . . . . . . . . . . . 33 80 130 181
365 866 361 319
Trade receivables are on average due within 60 days from the date of billing. Further details ofthe Group’s credit policy are set out in note 32(e).
(b) Impairment of trade receivables
Impairment losses in respect of trade receivables are recorded using an allowance account unlessthe Group is satisfied that recovery of the amount is remote, in which case the impairment lossis written off against trade receivables directly.
The movement in the allowance for doubtful debts during the year/period, including both specificand collective loss components, is as follows:
Year ended 31 December
Sixmonthsended
30 June
2006 2007 2008 2009
USDmillion
USDmillion
USDmillion
USDmillion
Balance at the beginning of the year/period . . . . . . . . . . . . . . (10) (19) (37) (35)
Impairment loss recognised . . . . . . . . . . . . . . . . . . . . . . . . . (9) (18) (117) (4)
Uncollectible amounts written off . . . . . . . . . . . . . . . . . . . . . — — 119 18
Balance at the end of the year/period. . . . . . . . . . . . . . . . . . . (19) (37) (35) (21)
As at 31 December 2006, 2007 and 2008 and 30 June 2009, the Group’s trade receivables ofUSD19 million, USD37 million, USD35 million and USD21 million respectively wereindividually determined to be impaired. Management assessed that the receivables are notexpected to be recovered. Consequently, specific allowances for doubtful debts were recognised.
The Group does not hold any collateral over these balances.
APPENDIX I ACCOUNTANTS’ REPORT
— I-82 —
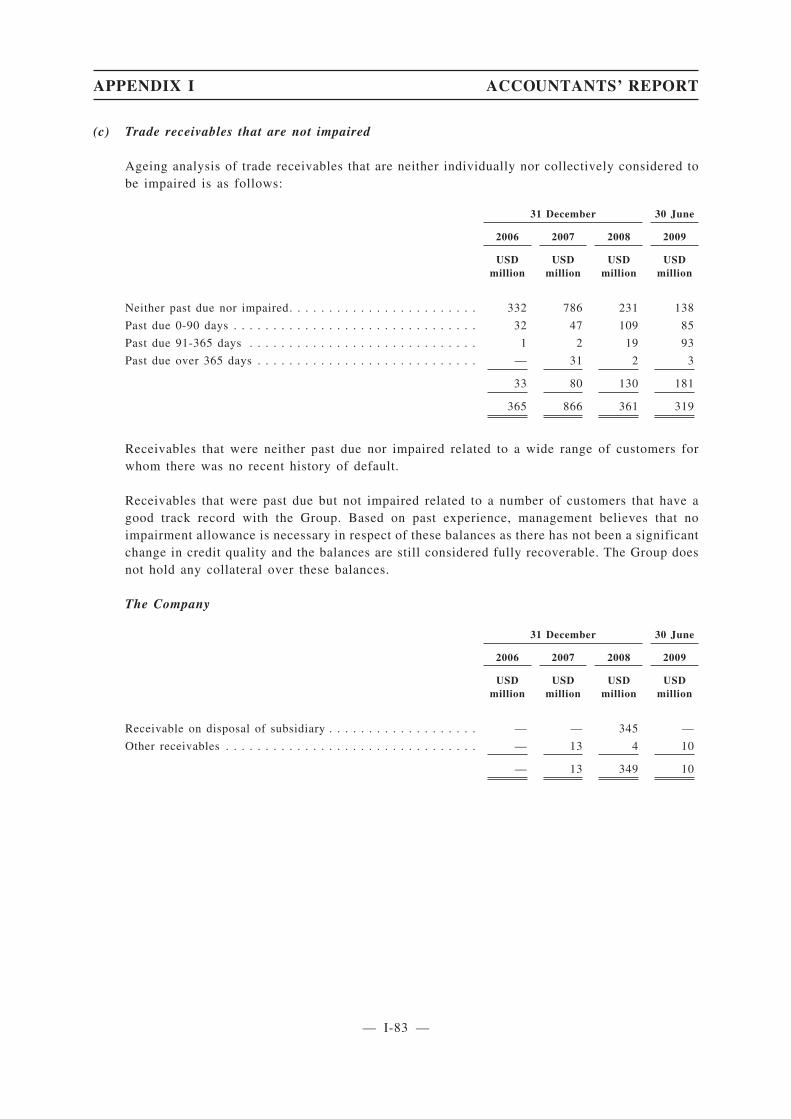
(c) Trade receivables that are not impaired
Ageing analysis of trade receivables that are neither individually nor collectively considered tobe impaired is as follows:
31 December 30 June
2006 2007 2008 2009
USDmillion
USDmillion
USDmillion
USDmillion
Neither past due nor impaired. . . . . . . . . . . . . . . . . . . . . . . . 332 786 231 138
Past due 0-90 days . . . . . . . . . . . . . . . . . . . . . . . . . . . . . . . 32 47 109 85
Past due 91-365 days . . . . . . . . . . . . . . . . . . . . . . . . . . . . . 1 2 19 93
Past due over 365 days . . . . . . . . . . . . . . . . . . . . . . . . . . . . — 31 2 3
33 80 130 181
365 866 361 319
Receivables that were neither past due nor impaired related to a wide range of customers forwhom there was no recent history of default.
Receivables that were past due but not impaired related to a number of customers that have agood track record with the Group. Based on past experience, management believes that noimpairment allowance is necessary in respect of these balances as there has not been a significantchange in credit quality and the balances are still considered fully recoverable. The Group doesnot hold any collateral over these balances.
The Company
31 December 30 June
2006 2007 2008 2009
USDmillion
USDmillion
USDmillion
USDmillion
Receivable on disposal of subsidiary . . . . . . . . . . . . . . . . . . . — — 345 —
Other receivables . . . . . . . . . . . . . . . . . . . . . . . . . . . . . . . . — 13 4 10
— 13 349 10
APPENDIX I ACCOUNTANTS’ REPORT
— I-83 —

26 Cash and cash equivalents
The Group
At 31 December At 30 June
2006 2007 2008 2009
USDmillion
USDmillion
USDmillion
USDmillion
Bank balances, USD . . . . . . . . . . . . . . . . . . . . . . . . . . . . . 96 89 419 140
Bank balances, RUR . . . . . . . . . . . . . . . . . . . . . . . . . . . . . 19 51 237 79
Bank balances, other currencies . . . . . . . . . . . . . . . . . . . . . 6 35 17 15
Cash in transit . . . . . . . . . . . . . . . . . . . . . . . . . . . . . . . . . 3 1 10 3
Short-term bank deposits . . . . . . . . . . . . . . . . . . . . . . . . . . 105 71 2 2
Cash and cash equivalents in the statement of cash flows . . . . 229 247 685 239
Restricted cash . . . . . . . . . . . . . . . . . . . . . . . . . . . . . . . . . 12 14 23 25
Cash and cash equivalents in the balance sheet . . . . . . . . . 241 261 708 264
As at 31 December 2006, 31 December 2007, 31 December 2008 and 30 June 2009 included incash and cash equivalents was restricted cash of USD12 million, USD14 million, USD23 millionand USD25 million, respectively, for letters of credit pledged with the banks.
Included in cash and cash equivalents at 31 December 2006, 31 December 2007, 31 December2008 and 30 June 2009 are cash balances denominated in RUR of approximately nil, USD4million, USD137 million and nil, respectively, at a bank, which is a related party.
The Company
31 December 30 June
2006 2007 2008 2009
USDmillion
USDmillion
USDmillion
USDmillion
Bank balances, USD . . . . . . . . . . . . . . . . . . . . . . . . . . . . . . — — 6 1
— — 6 1
APPENDIX I ACCOUNTANTS’ REPORT
— I-84 —

27 Equity
(a) Share capital
Number of shares unless otherwise stated
Ordinary shares
As at 31 DecemberAs at
30 June
2006 2007 2008 2009
Authorised
Ordinary shares of USD 1 each. . . . . . . . . . . . . . . . . . . . . . . — 2 11,628 11,628
Ordinary shares issued and fully paid at 1 January . . . . . . . . . — 2 10,000 11,628
Ordinary shares issued. . . . . . . . . . . . . . . . . . . . . . . . . . . . . 2 9,998 1,628 —
Ordinary shares at the end of reporting period . . . . . . . . . . 2 10,000 11,628 11,628
The Company was incorporated on 26 October 2006 with an authorised share capital ofUSD10,000 divided into 10,000 ordinary shares of USD1 each, of which one subscriber sharewas issued to each of two subscribers on incorporation. On 27 October 2006, these two shareswere transferred to En+ Group Limited. In March 2007, 6,598 ordinary shares were issued to En+Group Limited, 2,200 ordinary shares were issued to SUAL Partners Limited and 1,200 ordinaryshares were issued to a wholly owned subsidiary of Glencore International AG in partialconsideration for the transfer to the Company of RUSAL Limited, SUAL International Limitedand the Glencore Businesses respectively.
On 24 April 2008, the authorised share capital of the Company was increased to USD11,628divided into 11,628 ordinary shares of USD1 each. In April 2008, 1,628 ordinary shares wereissued to Onexim Holdings Limited in partial consideration for the acquisition of 25%+1 shareof OJSC MMC Norilsk Nickel (refer to note 19).
The holders of ordinary shares are entitled to receive dividends as declared from time to time andare entitled to one vote per share at general meetings of the Company. All ordinary shares rankequally with regard to the Company’s residual assets.
APPENDIX I ACCOUNTANTS’ REPORT
— I-85 —
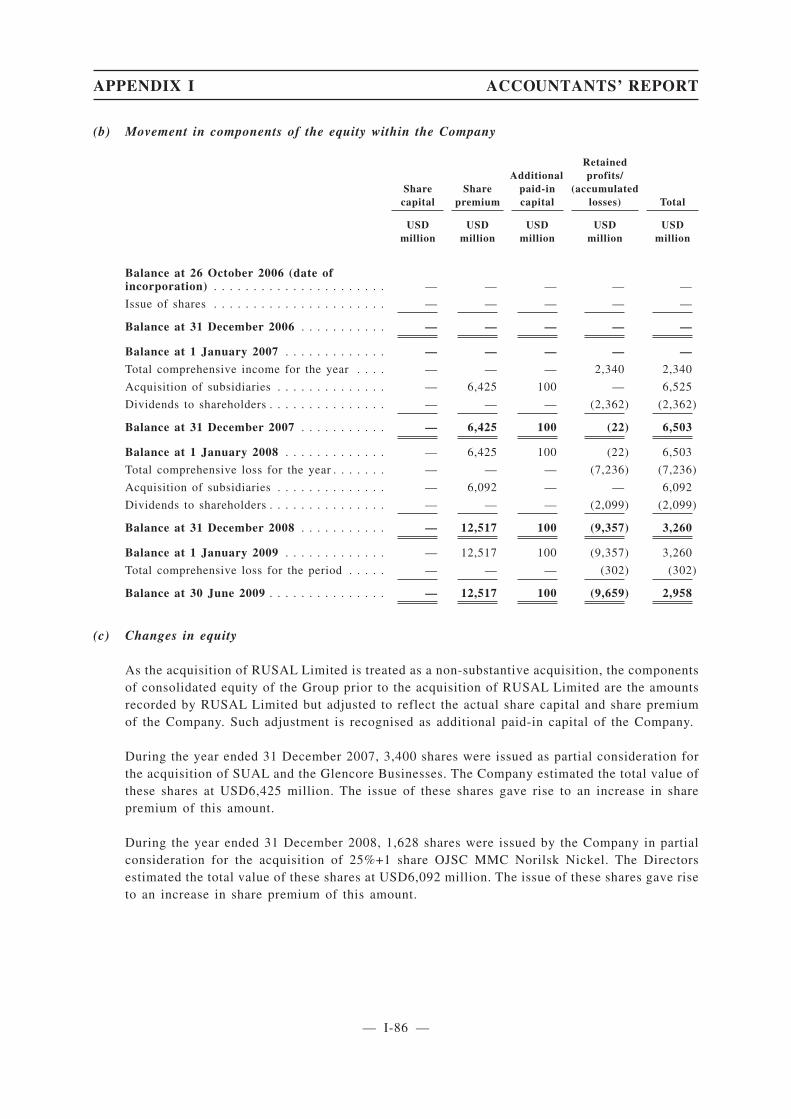
(b) Movement in components of the equity within the Company
Sharecapital
Sharepremium
Additionalpaid-incapital
Retainedprofits/
(accumulatedlosses) Total
USDmillion
USDmillion
USDmillion
USDmillion
USDmillion
Balance at 26 October 2006 (date ofincorporation) . . . . . . . . . . . . . . . . . . . . . . — — — — —
Issue of shares . . . . . . . . . . . . . . . . . . . . . . — — — — —
Balance at 31 December 2006 . . . . . . . . . . . — — — — —
Balance at 1 January 2007 . . . . . . . . . . . . . — — — — —
Total comprehensive income for the year . . . . — — — 2,340 2,340
Acquisition of subsidiaries . . . . . . . . . . . . . . — 6,425 100 — 6,525
Dividends to shareholders . . . . . . . . . . . . . . . — — — (2,362) (2,362)
Balance at 31 December 2007 . . . . . . . . . . . — 6,425 100 (22) 6,503
Balance at 1 January 2008 . . . . . . . . . . . . . — 6,425 100 (22) 6,503
Total comprehensive loss for the year . . . . . . . — — — (7,236) (7,236)
Acquisition of subsidiaries . . . . . . . . . . . . . . — 6,092 — — 6,092
Dividends to shareholders . . . . . . . . . . . . . . . — — — (2,099) (2,099)
Balance at 31 December 2008 . . . . . . . . . . . — 12,517 100 (9,357) 3,260
Balance at 1 January 2009 . . . . . . . . . . . . . — 12,517 100 (9,357) 3,260
Total comprehensive loss for the period . . . . . — — — (302) (302)
Balance at 30 June 2009 . . . . . . . . . . . . . . . — 12,517 100 (9,659) 2,958
(c) Changes in equity
As the acquisition of RUSAL Limited is treated as a non-substantive acquisition, the componentsof consolidated equity of the Group prior to the acquisition of RUSAL Limited are the amountsrecorded by RUSAL Limited but adjusted to reflect the actual share capital and share premiumof the Company. Such adjustment is recognised as additional paid-in capital of the Company.
During the year ended 31 December 2007, 3,400 shares were issued as partial consideration forthe acquisition of SUAL and the Glencore Businesses. The Company estimated the total value ofthese shares at USD6,425 million. The issue of these shares gave rise to an increase in sharepremium of this amount.
During the year ended 31 December 2008, 1,628 shares were issued by the Company in partialconsideration for the acquisition of 25%+1 share OJSC MMC Norilsk Nickel. The Directorsestimated the total value of these shares at USD6,092 million. The issue of these shares gave riseto an increase in share premium of this amount.
APPENDIX I ACCOUNTANTS’ REPORT
— I-86 —
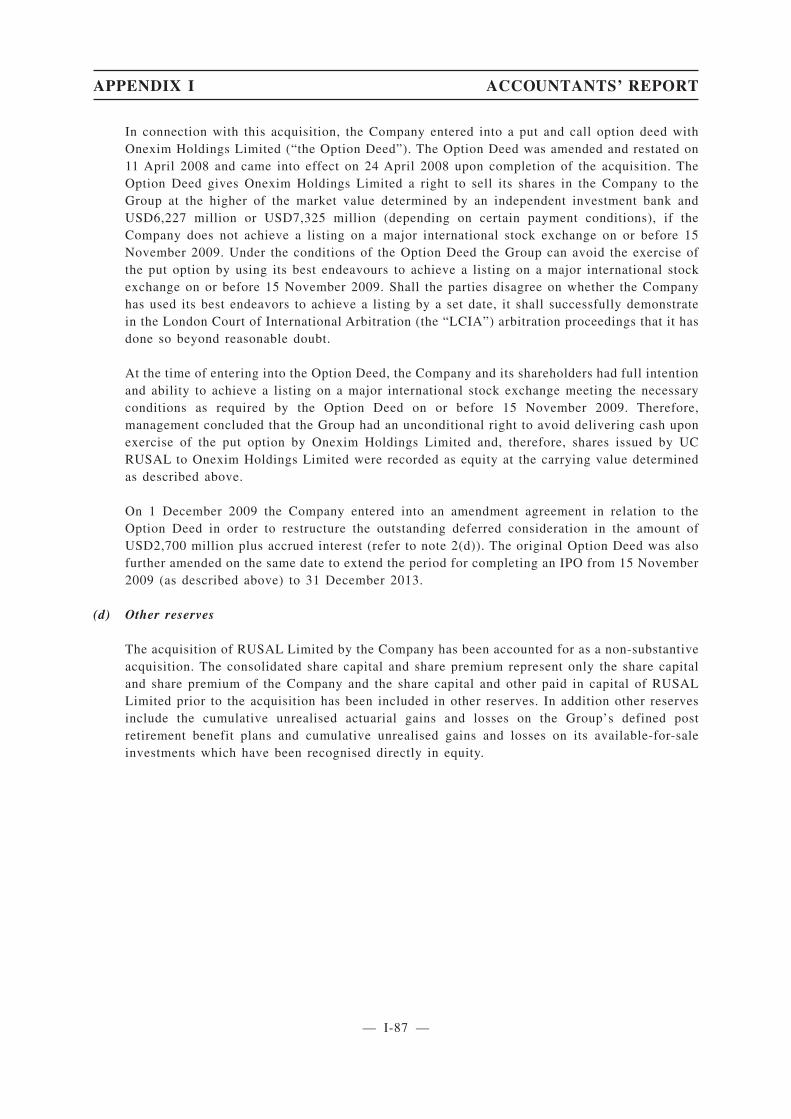
In connection with this acquisition, the Company entered into a put and call option deed withOnexim Holdings Limited (“the Option Deed”). The Option Deed was amended and restated on11 April 2008 and came into effect on 24 April 2008 upon completion of the acquisition. TheOption Deed gives Onexim Holdings Limited a right to sell its shares in the Company to theGroup at the higher of the market value determined by an independent investment bank andUSD6,227 million or USD7,325 million (depending on certain payment conditions), if theCompany does not achieve a listing on a major international stock exchange on or before 15November 2009. Under the conditions of the Option Deed the Group can avoid the exercise ofthe put option by using its best endeavours to achieve a listing on a major international stockexchange on or before 15 November 2009. Shall the parties disagree on whether the Companyhas used its best endeavors to achieve a listing by a set date, it shall successfully demonstratein the London Court of International Arbitration (the “LCIA”) arbitration proceedings that it hasdone so beyond reasonable doubt.
At the time of entering into the Option Deed, the Company and its shareholders had full intentionand ability to achieve a listing on a major international stock exchange meeting the necessaryconditions as required by the Option Deed on or before 15 November 2009. Therefore,management concluded that the Group had an unconditional right to avoid delivering cash uponexercise of the put option by Onexim Holdings Limited and, therefore, shares issued by UCRUSAL to Onexim Holdings Limited were recorded as equity at the carrying value determinedas described above.
On 1 December 2009 the Company entered into an amendment agreement in relation to theOption Deed in order to restructure the outstanding deferred consideration in the amount ofUSD2,700 million plus accrued interest (refer to note 2(d)). The original Option Deed was alsofurther amended on the same date to extend the period for completing an IPO from 15 November2009 (as described above) to 31 December 2013.
(d) Other reserves
The acquisition of RUSAL Limited by the Company has been accounted for as a non-substantiveacquisition. The consolidated share capital and share premium represent only the share capitaland share premium of the Company and the share capital and other paid in capital of RUSALLimited prior to the acquisition has been included in other reserves. In addition other reservesinclude the cumulative unrealised actuarial gains and losses on the Group’s defined postretirement benefit plans and cumulative unrealised gains and losses on its available-for-saleinvestments which have been recognised directly in equity.
APPENDIX I ACCOUNTANTS’ REPORT
— I-87 —

(e) Distributions
During 2006 the Group transferred subsidiaries to the shareholder as required by thepre-completion conditions of the agreement with SUAL Partners Ltd. and Glencore InternationalAG. The following table summarises the carrying values of distributed assets and liabilities:
USD million
Property, plant and equipment. . . . . . . . . . . . . . . . . . . . . . . . . . . . . . . . . . . . . . . . . . 146
Equity investments . . . . . . . . . . . . . . . . . . . . . . . . . . . . . . . . . . . . . . . . . . . . . . . . . 17
Other investments . . . . . . . . . . . . . . . . . . . . . . . . . . . . . . . . . . . . . . . . . . . . . . . . . . 117
Cash and cash equivalents . . . . . . . . . . . . . . . . . . . . . . . . . . . . . . . . . . . . . . . . . . . . 7
Receivables . . . . . . . . . . . . . . . . . . . . . . . . . . . . . . . . . . . . . . . . . . . . . . . . . . . . . . 53
Inventories. . . . . . . . . . . . . . . . . . . . . . . . . . . . . . . . . . . . . . . . . . . . . . . . . . . . . . . 79
VAT recoverable . . . . . . . . . . . . . . . . . . . . . . . . . . . . . . . . . . . . . . . . . . . . . . . . . . . 9
Other non-current assets . . . . . . . . . . . . . . . . . . . . . . . . . . . . . . . . . . . . . . . . . . . . . 3
Current liabilities . . . . . . . . . . . . . . . . . . . . . . . . . . . . . . . . . . . . . . . . . . . . . . . . . . (40)
Short-term borrowing . . . . . . . . . . . . . . . . . . . . . . . . . . . . . . . . . . . . . . . . . . . . . . . (6)
Long-term borrowing. . . . . . . . . . . . . . . . . . . . . . . . . . . . . . . . . . . . . . . . . . . . . . . . (61)
Deferred tax liabilities . . . . . . . . . . . . . . . . . . . . . . . . . . . . . . . . . . . . . . . . . . . . . . . (8)
Non-controlling interests . . . . . . . . . . . . . . . . . . . . . . . . . . . . . . . . . . . . . . . . . . . . . (3)
Distribution to shareholder . . . . . . . . . . . . . . . . . . . . . . . . . . . . . . . . . . . . . . . . . . 313
During 2006, the Group distributed another USD12 million of amounts previously contributed bythe shareholder and included within other reserves in equity.
During the year ended 31 December 2007, RUSAL Limited distributed an additional USD210million in cash to its then shareholders as payment for the foil assets of RUSAL in accordancewith the requirement of the agreement with SUAL Partners Ltd and Glencore International AG.
During the first quarter 2007 the Group distributed dividends of USD138 million prior to theacquisition of SUAL and the Glencore Businesses.
In accordance with the Companies Law of Jersey, the Company may make distributions at anytime in such amounts as are determined by the Company out of the assets of the Company otherthan the capital redemption reserve and nominal capital accounts, provided that the Directors ofthe Company make a solvency statement in accordance with that Law at the time the distributionsare proposed. As at 31 December 2006, 2007 and 2008 and 30 June 2009, the aggregate amountof reserves available for distribution to equity shareholders of the Company was nil, USD7,308million, USD3,260 million and USD2,958 million respectively.
(f) Currency translation reserves
The currency translation reserve comprises all foreign exchange differences arising from thetranslation of the financial information of foreign operations. The reserve is dealt with inaccordance with the accounting policies set out in note 3(b).
APPENDIX I ACCOUNTANTS’ REPORT
— I-88 —
App1A-33(5)

28 Loans and borrowings
This note provides information about the contractual terms of the Group’s loans and borrowings.For more information about the Group’s exposure to interest rate and foreign currency risk, referto note 32.
The Group
31 December 30 June
2006 2007 2008 2009
USDmillion
USDmillion
USDmillion
USDmillion
Non-current liabilities
Secured bank loans . . . . . . . . . . . . . . . . . . . . . . . . . . . . . . . 2,896 5,834 — —
Unsecured bank loans . . . . . . . . . . . . . . . . . . . . . . . . . . . . . 317 788 — —
3,213 6,622 — —
Current liabilities
Current portion of secured bank loans . . . . . . . . . . . . . . . . . . 68 515 — —
Secured bank loans . . . . . . . . . . . . . . . . . . . . . . . . . . . . . . . 113 134 10,575 10,487
Current portion of unsecured bank loans . . . . . . . . . . . . . . . . 18 116 — —
Unsecured bank loans . . . . . . . . . . . . . . . . . . . . . . . . . . . . . 811 1,024 3,303 3,203
Loans from other parties . . . . . . . . . . . . . . . . . . . . . . . . . . . 1 — — —
1,011 1,789 13,878 13,690
APPENDIX I ACCOUNTANTS’ REPORT
— I-89 —

Terms and debt repayment schedule as at 31 December 2006
TOTALWithin1 year
Morethan
1 yearbut less
than2 years
Morethan
2 yearsbut less
than5 years
Morethan
5 years
USDmillion
USDmillion
USDmillion
USDmillion
USDmillion
Secured bank loans
Variable
USD - Libor + 1.5% and less . . . . . . . . . . . . . . . . . 2,189 98 203 1,551 337
USD - Libor + 1.6 % - 2.5 % . . . . . . . . . . . . . . . . . 297 7 62 163 65
USD - Libor + 2.6% and more . . . . . . . . . . . . . . . . 39 22 17 — —
Euro - Euribor + 0.6%. . . . . . . . . . . . . . . . . . . . . . 24 24 — — —
Fixed
USD - 2.0% . . . . . . . . . . . . . . . . . . . . . . . . . . . . . 97 7 14 42 34
USD - 7.0% and more . . . . . . . . . . . . . . . . . . . . . . 429 21 42 263 103
Euro - 3.74% . . . . . . . . . . . . . . . . . . . . . . . . . . . . 1 1 — — —
Unsecured bank loans
Variable
USD - Libor + 1.5% and less . . . . . . . . . . . . . . . . . 699 699 — — —
USD - Libor + 1.6 % - 2.5 % . . . . . . . . . . . . . . . . . 194 — — 194 —
Euro - Euribor + 0.35% - 2.5% . . . . . . . . . . . . . . . . 113 17 20 51 25
Euro - Euribor + 0.6%. . . . . . . . . . . . . . . . . . . . . . 13 13 — — —
Fixed
USD - 4.41% . . . . . . . . . . . . . . . . . . . . . . . . . . . . 5 1 1 3 —
USD - 6.85% . . . . . . . . . . . . . . . . . . . . . . . . . . . . 23 — — 23 —
USD - 7.0% and more . . . . . . . . . . . . . . . . . . . . . . 100 100 — — —
Loans from other parties . . . . . . . . . . . . . . . . . . . . 1 1 — — —
4,224 1,011 359 2,290 564
The secured bank loans were secured by pledges of shares of the following Group companies:
— 100% of the shares of Albaco;
— 100% of Khakas Aluminium Smelter;
— 25% of RUSAL Sayanogorsk;
— 11.9% of RUSAL Bratsk.
The secured bank loans were also secured by the following:
— Properties with a carrying amount of USD438 million;
— Inventories with a carrying amount of USD103 million;
— Assignment of certain sales and purchase contracts and rights of the Group, including allmoneys and claims, arising out of these contracts.
APPENDIX I ACCOUNTANTS’ REPORT
— I-90 —

Terms and debt repayment schedule as at 31 December 2007
TOTALWithin1 year
Morethan
1 yearbut less
than2 years
Morethan
2 yearsbut less
than5 years
Morethan
5 years
USDmillion
USDmillion
USDmillion
USDmillion
USDmillion
Secured bank loans
Variable
USD - Libor + 1.5% and less . . . . . . . . . . . . . . . . . 6,161 565 1,029 3,297 1,270
USD - Libor + 1.6 % - 2.5 % . . . . . . . . . . . . . . . . . 291 62 62 134 33
USD - Libor + 2.6% and more . . . . . . . . . . . . . . . . 27 18 1 8 —
Fixed
other - 7.0% and more . . . . . . . . . . . . . . . . . . . . . . 3 3 — — —
Unsecured bank loans
Variable
USD - Libor + 1.5% and less . . . . . . . . . . . . . . . . . 794 389 91 314 —
USD - Libor + 1.6 % - 2.5 % . . . . . . . . . . . . . . . . . 319 — — 319 —
EUR - Euribor + 0.35% - 2.5%. . . . . . . . . . . . . . . . 49 11 10 24 4
EUR - Euribor + 0.6%. . . . . . . . . . . . . . . . . . . . . . 57 57 — — —
Fixed
USD - 4.41% . . . . . . . . . . . . . . . . . . . . . . . . . . . . 4 1 1 2 —
USD - 6.85% . . . . . . . . . . . . . . . . . . . . . . . . . . . . 23 — — 23 —
USD - 7.0% and more . . . . . . . . . . . . . . . . . . . . . . 597 597 — — —
EUR - 7.0% and more . . . . . . . . . . . . . . . . . . . . . . 65 65 — — —
RUR - 7.0% and more . . . . . . . . . . . . . . . . . . . . . . 21 21 — — —
8,411 1,789 1,194 4,121 1,307
The secured bank loans were secured by pledges of shares of the following Group companies:
— 100% of the shares of Albaco;
— 100% of Khakas Aluminium Smelter;
— 100% of Tameko.
The secured bank loans were also secured by the following:
— Properties with a carrying amount of USD431 million;
— Inventories with a carrying amount of USD142 million;
— Assignment of certain sales and purchase contracts and rights of the Group, including allmoneys and claims, arising out of these contracts.
At 31 December 2007 rights, including all moneys and claims, arising out of certain sales andpurchase contracts between the Group’s major trading subsidiaries, RTI Limited and RSInternational GmbH, and certain counterparties, were assigned to secure syndicated bank loans.
APPENDIX I ACCOUNTANTS’ REPORT
— I-91 —
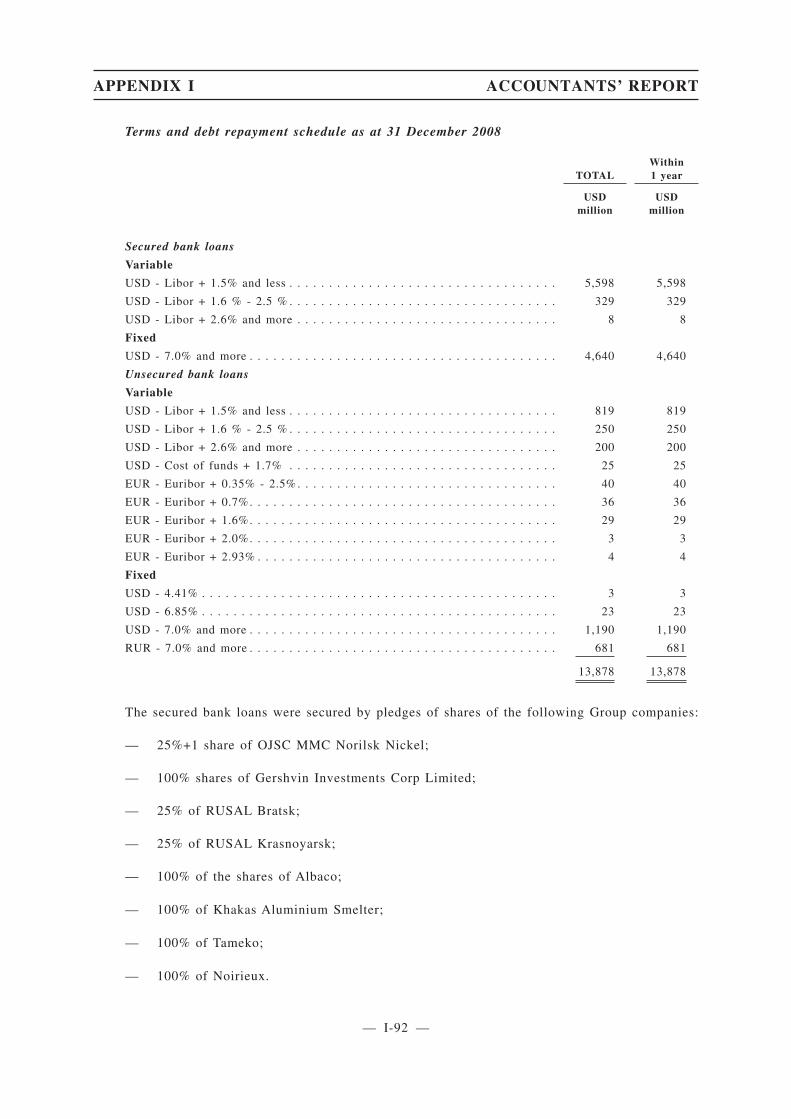
Terms and debt repayment schedule as at 31 December 2008
TOTALWithin1 year
USDmillion
USDmillion
Secured bank loans
Variable
USD - Libor + 1.5% and less . . . . . . . . . . . . . . . . . . . . . . . . . . . . . . . . . . 5,598 5,598
USD - Libor + 1.6 % - 2.5 % . . . . . . . . . . . . . . . . . . . . . . . . . . . . . . . . . . 329 329
USD - Libor + 2.6% and more . . . . . . . . . . . . . . . . . . . . . . . . . . . . . . . . . 8 8
Fixed
USD - 7.0% and more . . . . . . . . . . . . . . . . . . . . . . . . . . . . . . . . . . . . . . . 4,640 4,640
Unsecured bank loans
Variable
USD - Libor + 1.5% and less . . . . . . . . . . . . . . . . . . . . . . . . . . . . . . . . . . 819 819
USD - Libor + 1.6 % - 2.5 % . . . . . . . . . . . . . . . . . . . . . . . . . . . . . . . . . . 250 250
USD - Libor + 2.6% and more . . . . . . . . . . . . . . . . . . . . . . . . . . . . . . . . . 200 200
USD - Cost of funds + 1.7% . . . . . . . . . . . . . . . . . . . . . . . . . . . . . . . . . . 25 25
EUR - Euribor + 0.35% - 2.5%. . . . . . . . . . . . . . . . . . . . . . . . . . . . . . . . . 40 40
EUR - Euribor + 0.7%. . . . . . . . . . . . . . . . . . . . . . . . . . . . . . . . . . . . . . . 36 36
EUR - Euribor + 1.6%. . . . . . . . . . . . . . . . . . . . . . . . . . . . . . . . . . . . . . . 29 29
EUR - Euribor + 2.0%. . . . . . . . . . . . . . . . . . . . . . . . . . . . . . . . . . . . . . . 3 3
EUR - Euribor + 2.93% . . . . . . . . . . . . . . . . . . . . . . . . . . . . . . . . . . . . . . 4 4
Fixed
USD - 4.41% . . . . . . . . . . . . . . . . . . . . . . . . . . . . . . . . . . . . . . . . . . . . . 3 3
USD - 6.85% . . . . . . . . . . . . . . . . . . . . . . . . . . . . . . . . . . . . . . . . . . . . . 23 23
USD - 7.0% and more . . . . . . . . . . . . . . . . . . . . . . . . . . . . . . . . . . . . . . . 1,190 1,190
RUR - 7.0% and more . . . . . . . . . . . . . . . . . . . . . . . . . . . . . . . . . . . . . . . 681 681
13,878 13,878
The secured bank loans were secured by pledges of shares of the following Group companies:
— 25%+1 share of OJSC MMC Norilsk Nickel;
— 100% shares of Gershvin Investments Corp Limited;
— 25% of RUSAL Bratsk;
— 25% of RUSAL Krasnoyarsk;
— 100% of the shares of Albaco;
— 100% of Khakas Aluminium Smelter;
— 100% of Tameko;
— 100% of Noirieux.
APPENDIX I ACCOUNTANTS’ REPORT
— I-92 —

The secured bank loans were also secured by properties with a carrying amount of USD739million and the assignment of certain sales and purchase contracts and rights of the Group,including all moneys and claims, arising out of these contracts.
At 31 December 2008 rights, including all moneys and claims, arising out of certain sales andpurchase contracts between the Group’s major trading subsidiaries, RTI Limited and RSInternational GmbH, and certain counterparties, were assigned to secure syndicated bank loans.
Terms and debt repayment schedule as at 30 June 2009
TOTALWithin1 year
USDmillion
USDmillion
Secured bank loans
Variable
USD - Libor + 1.5% and less . . . . . . . . . . . . . . . . . . . . . . . . . . . . . . . . . . 5,410 5,410
USD - Libor + 1.6 % - 2.5 % . . . . . . . . . . . . . . . . . . . . . . . . . . . . . . . . . . 307 307
USD - Libor + 2.6% and more . . . . . . . . . . . . . . . . . . . . . . . . . . . . . . . . . 9 9
Fixed
USD - 7.0% and more . . . . . . . . . . . . . . . . . . . . . . . . . . . . . . . . . . . . . . . 4,588 4,588
RUR - 7.0% and more . . . . . . . . . . . . . . . . . . . . . . . . . . . . . . . . . . . . . . . 173 173
Unsecured bank loans
Variable
USD - Libor + 1.5% and less . . . . . . . . . . . . . . . . . . . . . . . . . . . . . . . . . . 759 759
USD - Libor + 1.6 % - 2.5 % . . . . . . . . . . . . . . . . . . . . . . . . . . . . . . . . . . 250 250
USD - Libor + 2.6% and more . . . . . . . . . . . . . . . . . . . . . . . . . . . . . . . . . 200 200
USD - Cost of funds + 1.7 . . . . . . . . . . . . . . . . . . . . . . . . . . . . . . . . . . . . 25 25
EUR - Euribor + 0.35% - 2.0%. . . . . . . . . . . . . . . . . . . . . . . . . . . . . . . . . 39 39
EUR - Euribor + 0.7%. . . . . . . . . . . . . . . . . . . . . . . . . . . . . . . . . . . . . . . 23 23
EUR - Euribor + 2.0%. . . . . . . . . . . . . . . . . . . . . . . . . . . . . . . . . . . . . . . 13 13
EUR - Euribor + 2.93% . . . . . . . . . . . . . . . . . . . . . . . . . . . . . . . . . . . . . . 1 1
Fixed
USD - 4.41% . . . . . . . . . . . . . . . . . . . . . . . . . . . . . . . . . . . . . . . . . . . . . 3 3
USD - 6.85% . . . . . . . . . . . . . . . . . . . . . . . . . . . . . . . . . . . . . . . . . . . . . 23 23
USD - 7.0% and more . . . . . . . . . . . . . . . . . . . . . . . . . . . . . . . . . . . . . . . 1,193 1,193
EUR - 7.0% and more . . . . . . . . . . . . . . . . . . . . . . . . . . . . . . . . . . . . . . . 196 196
RUR - 7.0% and more . . . . . . . . . . . . . . . . . . . . . . . . . . . . . . . . . . . . . . . 478 478
13,690 13,690
APPENDIX I ACCOUNTANTS’ REPORT
— I-93 —

The secured bank loans are secured by pledges of shares of the following Group companies:
— 25%+1 share of OJSC MMC Norilsk Nickel;
— 100% shares of Gershvin Investments Corp Limited;
— 25% of RUSAL Bratsk;
— 25% of RUSAL Krasnoyarsk;
— 100% of the shares of Albaco;
— 100% of Khakas Aluminium Smelter;
— 100% of Tameko;
— 100% of Noirieux.
The secured bank loans are also secured by properties with a carrying amount of USD702 millionand the assignment of certain sales and purchase contracts and rights of the Group, including allmoneys and claims, arising out of these contracts.
At 30 June 2009 rights, including all moneys and claims, arising out of certain sales and purchasecontracts between the Group’s major trading subsidiaries, RTI Limited and RS InternationalGmbH, and certain counterparties, are assigned to secure syndicated bank loans.
Available facilities
Bank facilities available but not yet utilised amount to USD331 million, USD72 million,USD458 million and nil at 31 December 2006, 31 December 2007, 31 December 2008 and 30June 2009, respectively.
Debt maturities
Subsequent to the breach of a number of restrictive covenants at 31 December 2008, whichresulted in defaults and cross-defaults on a substantial portion of the Group’s credit portfolio theentire amount of its long-term loans and borrowings has been reclassified to current liabilitiesto reflect the ability of the lenders to demand immediate repayment.
On 6 March 2009 the Group and its lenders signed the “Standstill and waiver agreement” and“Waiver agreement” for the period of restructuring negotiations which has subsequently beenextended until 11 December 2009 providing for the temporary waiver of testing of financialcovenants on 31 December 2008, and, where relevant, on 31 March 2009 and 30 June 2009,waiver of default and/or potential default and subsequent cross-default (caused by potentialnon-compliance with the financial covenants and other defaults in accordance with the terms ofthe relevant facilities) as well as a temporary suspension of certain principal repayments. The“Standstill and waiver agreement” and “Waiver agreement” came into force on 11 March 2009after the approval of more than 75% of the lenders.
On 12 August 2009 the Group has entered into a non-binding term sheet with the CoordinatingCommittee reflecting the key terms and conditions of the long-term restructuring of existingfinancial indebtedness. The term sheet is subject to (a) certain conditions precedent; (b)satisfactory legal documentation; and (c) approvals at the level of competent corporateauthorities of the Group as well as credit committees of the relevant lenders.
APPENDIX I ACCOUNTANTS’ REPORT
— I-94 —
App1A-33(5)(b)
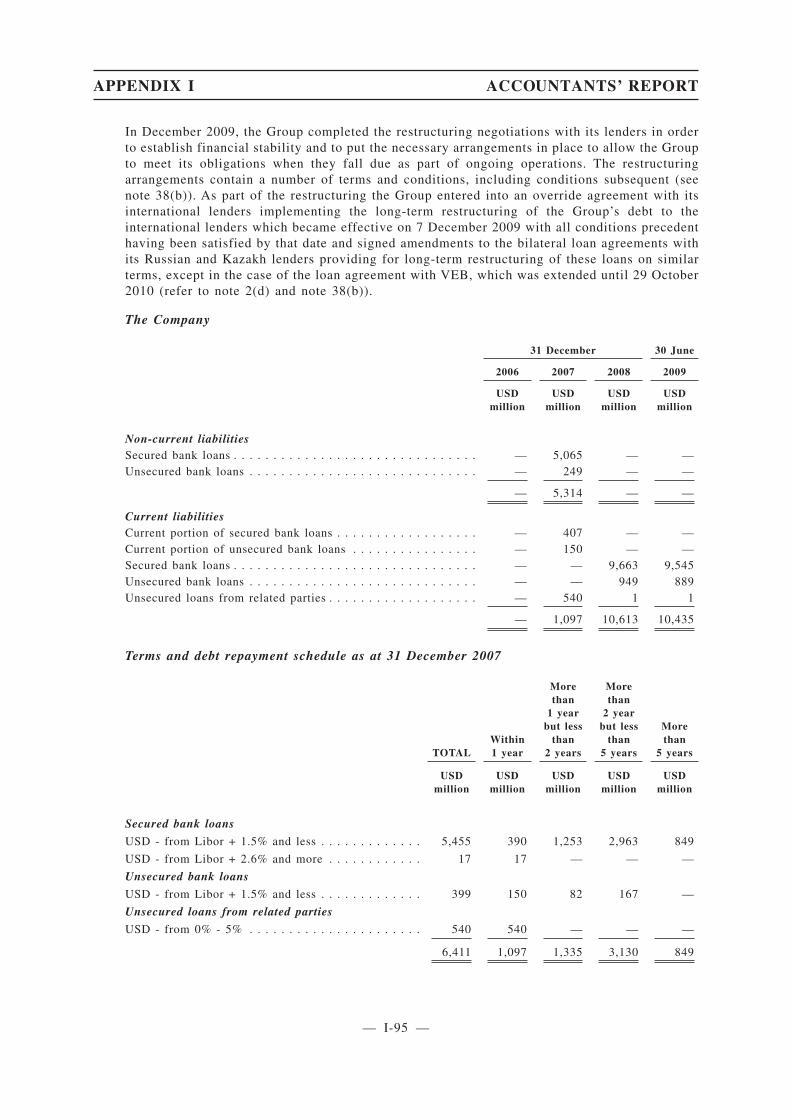
In December 2009, the Group completed the restructuring negotiations with its lenders in orderto establish financial stability and to put the necessary arrangements in place to allow the Groupto meet its obligations when they fall due as part of ongoing operations. The restructuringarrangements contain a number of terms and conditions, including conditions subsequent (seenote 38(b)). As part of the restructuring the Group entered into an override agreement with itsinternational lenders implementing the long-term restructuring of the Group’s debt to theinternational lenders which became effective on 7 December 2009 with all conditions precedenthaving been satisfied by that date and signed amendments to the bilateral loan agreements withits Russian and Kazakh lenders providing for long-term restructuring of these loans on similarterms, except in the case of the loan agreement with VEB, which was extended until 29 October2010 (refer to note 2(d) and note 38(b)).
The Company
31 December 30 June
2006 2007 2008 2009
USDmillion
USDmillion
USDmillion
USDmillion
Non-current liabilitiesSecured bank loans . . . . . . . . . . . . . . . . . . . . . . . . . . . . . . . — 5,065 — —Unsecured bank loans . . . . . . . . . . . . . . . . . . . . . . . . . . . . . — 249 — —
— 5,314 — —
Current liabilitiesCurrent portion of secured bank loans . . . . . . . . . . . . . . . . . . — 407 — —Current portion of unsecured bank loans . . . . . . . . . . . . . . . . — 150 — —Secured bank loans . . . . . . . . . . . . . . . . . . . . . . . . . . . . . . . — — 9,663 9,545Unsecured bank loans . . . . . . . . . . . . . . . . . . . . . . . . . . . . . — — 949 889Unsecured loans from related parties . . . . . . . . . . . . . . . . . . . — 540 1 1
— 1,097 10,613 10,435
Terms and debt repayment schedule as at 31 December 2007
TOTALWithin1 year
Morethan
1 yearbut less
than2 years
Morethan
2 yearbut less
than5 years
Morethan
5 years
USDmillion
USDmillion
USDmillion
USDmillion
USDmillion
Secured bank loans
USD - from Libor + 1.5% and less . . . . . . . . . . . . . 5,455 390 1,253 2,963 849
USD - from Libor + 2.6% and more . . . . . . . . . . . . 17 17 — — —
Unsecured bank loans
USD - from Libor + 1.5% and less . . . . . . . . . . . . . 399 150 82 167 —
Unsecured loans from related parties
USD - from 0% - 5% . . . . . . . . . . . . . . . . . . . . . . 540 540 — — —
6,411 1,097 1,335 3,130 849
APPENDIX I ACCOUNTANTS’ REPORT
— I-95 —
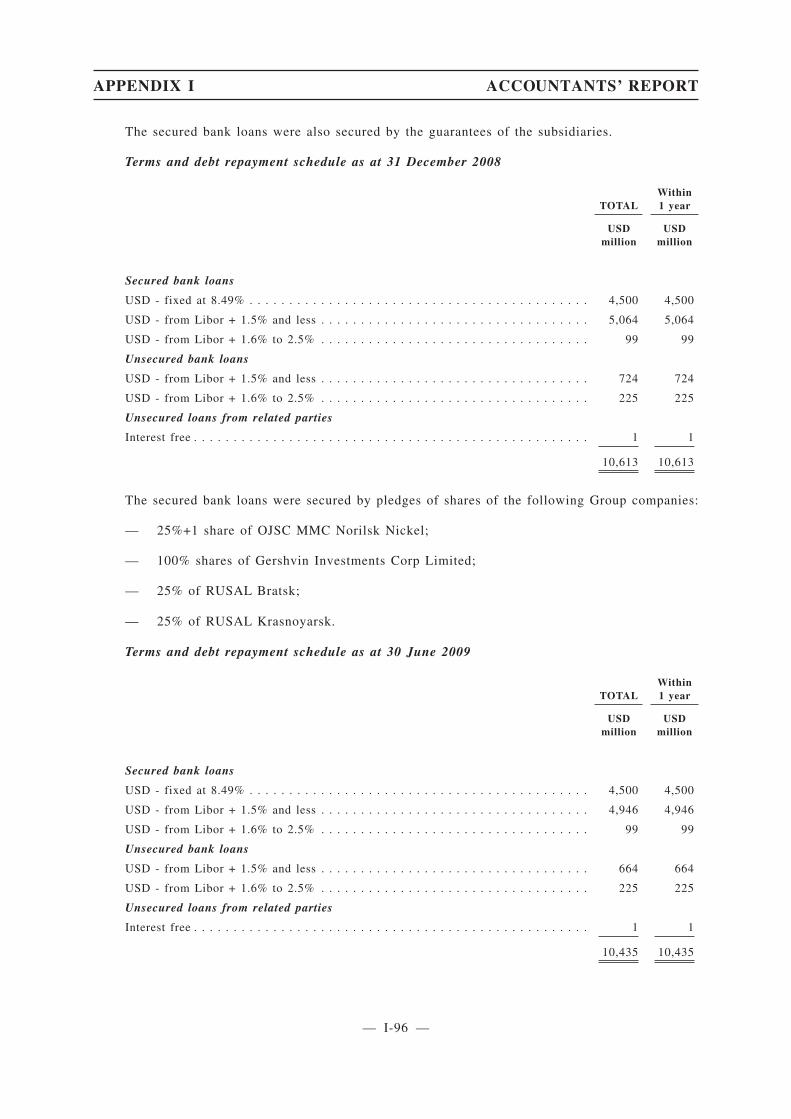
The secured bank loans were also secured by the guarantees of the subsidiaries.
Terms and debt repayment schedule as at 31 December 2008
TOTALWithin1 year
USDmillion
USDmillion
Secured bank loans
USD - fixed at 8.49% . . . . . . . . . . . . . . . . . . . . . . . . . . . . . . . . . . . . . . . . . . . 4,500 4,500
USD - from Libor + 1.5% and less . . . . . . . . . . . . . . . . . . . . . . . . . . . . . . . . . . 5,064 5,064
USD - from Libor + 1.6% to 2.5% . . . . . . . . . . . . . . . . . . . . . . . . . . . . . . . . . . 99 99
Unsecured bank loans
USD - from Libor + 1.5% and less . . . . . . . . . . . . . . . . . . . . . . . . . . . . . . . . . . 724 724
USD - from Libor + 1.6% to 2.5% . . . . . . . . . . . . . . . . . . . . . . . . . . . . . . . . . . 225 225
Unsecured loans from related parties
Interest free . . . . . . . . . . . . . . . . . . . . . . . . . . . . . . . . . . . . . . . . . . . . . . . . . . 1 1
10,613 10,613
The secured bank loans were secured by pledges of shares of the following Group companies:
— 25%+1 share of OJSC MMC Norilsk Nickel;
— 100% shares of Gershvin Investments Corp Limited;
— 25% of RUSAL Bratsk;
— 25% of RUSAL Krasnoyarsk.
Terms and debt repayment schedule as at 30 June 2009
TOTALWithin1 year
USDmillion
USDmillion
Secured bank loans
USD - fixed at 8.49% . . . . . . . . . . . . . . . . . . . . . . . . . . . . . . . . . . . . . . . . . . . 4,500 4,500
USD - from Libor + 1.5% and less . . . . . . . . . . . . . . . . . . . . . . . . . . . . . . . . . . 4,946 4,946
USD - from Libor + 1.6% to 2.5% . . . . . . . . . . . . . . . . . . . . . . . . . . . . . . . . . . 99 99
Unsecured bank loans
USD - from Libor + 1.5% and less . . . . . . . . . . . . . . . . . . . . . . . . . . . . . . . . . . 664 664
USD - from Libor + 1.6% to 2.5% . . . . . . . . . . . . . . . . . . . . . . . . . . . . . . . . . . 225 225
Unsecured loans from related parties
Interest free . . . . . . . . . . . . . . . . . . . . . . . . . . . . . . . . . . . . . . . . . . . . . . . . . . 1 1
10,435 10,435
APPENDIX I ACCOUNTANTS’ REPORT
— I-96 —
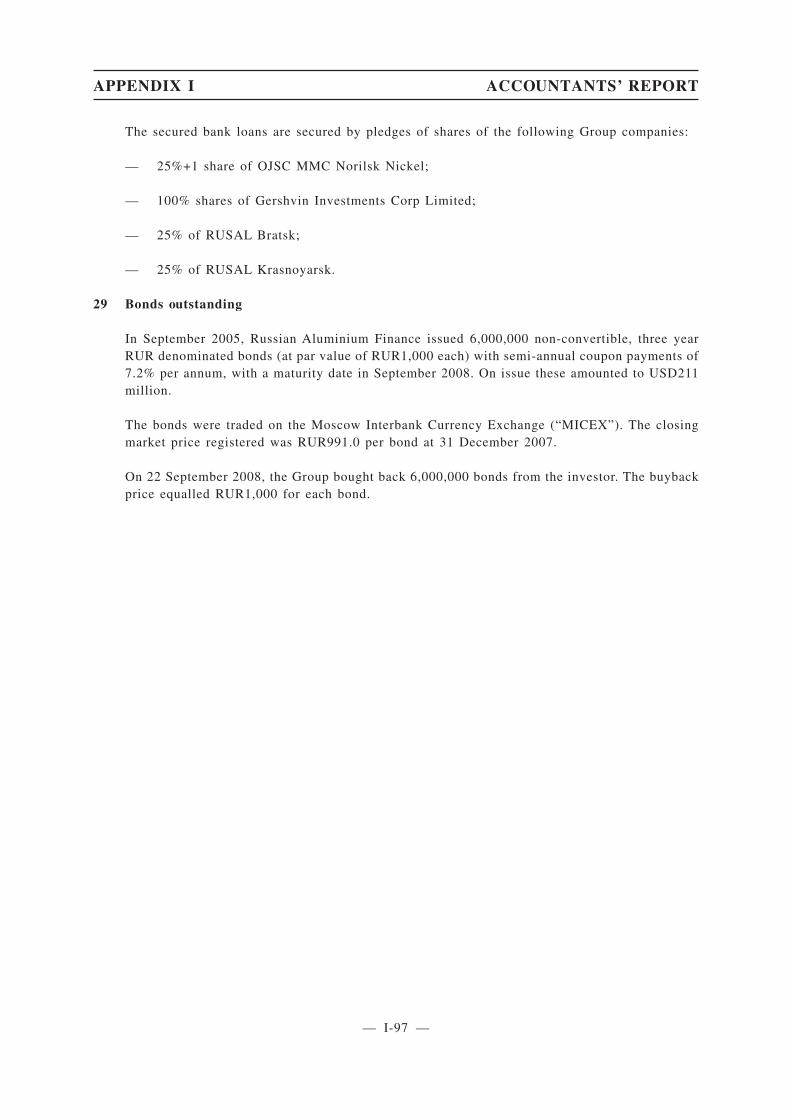
The secured bank loans are secured by pledges of shares of the following Group companies:
— 25%+1 share of OJSC MMC Norilsk Nickel;
— 100% shares of Gershvin Investments Corp Limited;
— 25% of RUSAL Bratsk;
— 25% of RUSAL Krasnoyarsk.
29 Bonds outstanding
In September 2005, Russian Aluminium Finance issued 6,000,000 non-convertible, three yearRUR denominated bonds (at par value of RUR1,000 each) with semi-annual coupon payments of7.2% per annum, with a maturity date in September 2008. On issue these amounted to USD211million.
The bonds were traded on the Moscow Interbank Currency Exchange (“MICEX”). The closingmarket price registered was RUR991.0 per bond at 31 December 2007.
On 22 September 2008, the Group bought back 6,000,000 bonds from the investor. The buybackprice equalled RUR1,000 for each bond.
APPENDIX I ACCOUNTANTS’ REPORT
— I-97 —
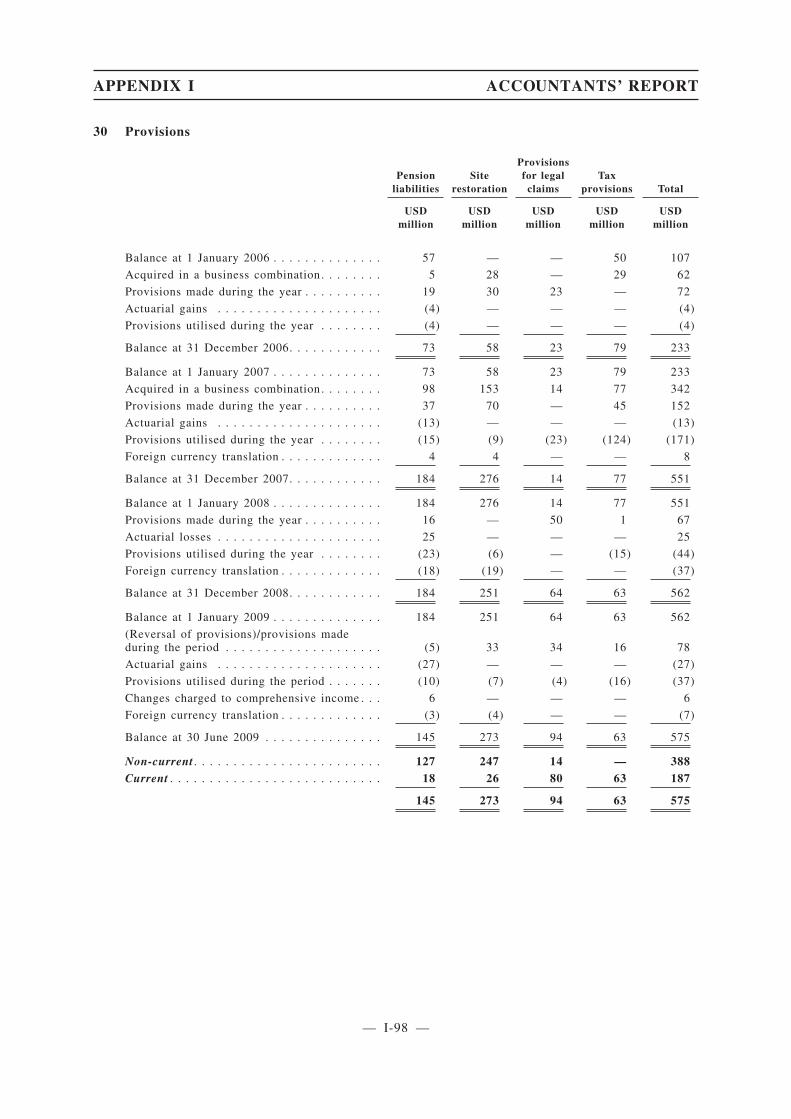
30 Provisions
Pensionliabilities
Siterestoration
Provisionsfor legal
claimsTax
provisions Total
USDmillion
USDmillion
USDmillion
USDmillion
USDmillion
Balance at 1 January 2006 . . . . . . . . . . . . . . 57 — — 50 107
Acquired in a business combination . . . . . . . . 5 28 — 29 62
Provisions made during the year . . . . . . . . . . 19 30 23 — 72
Actuarial gains . . . . . . . . . . . . . . . . . . . . . (4) — — — (4)
Provisions utilised during the year . . . . . . . . (4) — — — (4)
Balance at 31 December 2006. . . . . . . . . . . . 73 58 23 79 233
Balance at 1 January 2007 . . . . . . . . . . . . . . 73 58 23 79 233
Acquired in a business combination . . . . . . . . 98 153 14 77 342
Provisions made during the year . . . . . . . . . . 37 70 — 45 152
Actuarial gains . . . . . . . . . . . . . . . . . . . . . (13) — — — (13)
Provisions utilised during the year . . . . . . . . (15) (9) (23) (124) (171)
Foreign currency translation . . . . . . . . . . . . . 4 4 — — 8
Balance at 31 December 2007. . . . . . . . . . . . 184 276 14 77 551
Balance at 1 January 2008 . . . . . . . . . . . . . . 184 276 14 77 551
Provisions made during the year . . . . . . . . . . 16 — 50 1 67
Actuarial losses . . . . . . . . . . . . . . . . . . . . . 25 — — — 25
Provisions utilised during the year . . . . . . . . (23) (6) — (15) (44)
Foreign currency translation . . . . . . . . . . . . . (18) (19) — — (37)
Balance at 31 December 2008. . . . . . . . . . . . 184 251 64 63 562
Balance at 1 January 2009 . . . . . . . . . . . . . . 184 251 64 63 562
(Reversal of provisions)/provisions madeduring the period . . . . . . . . . . . . . . . . . . . . (5) 33 34 16 78
Actuarial gains . . . . . . . . . . . . . . . . . . . . . (27) — — — (27)
Provisions utilised during the period . . . . . . . (10) (7) (4) (16) (37)
Changes charged to comprehensive income . . . 6 — — — 6
Foreign currency translation . . . . . . . . . . . . . (3) (4) — — (7)
Balance at 30 June 2009 . . . . . . . . . . . . . . . 145 273 94 63 575
Non-current . . . . . . . . . . . . . . . . . . . . . . . . 127 247 14 — 388Current . . . . . . . . . . . . . . . . . . . . . . . . . . . 18 26 80 63 187
145 273 94 63 575
APPENDIX I ACCOUNTANTS’ REPORT
— I-98 —

(a) Pension liabilities
Group subsidiaries in the Russian Federation and Ukraine
The Group voluntarily offers a number of pension and employee benefit programs to employeesat its Russian production facilities, including:
• Occupational pension programs under which retirees are entitled to a whole-life regular(old age or disability) pension from the Group. Future pension levels for some of theprograms are independent of salary levels and are either fixed monetary amounts or aredependent on past service of an employee;
• Regular whole-life pensions to its veterans of World War II;
• Long-term and post-employment benefits to its employees including death-in-service, lumpsum upon retirement, material support for pensioners and death-in-pension benefits.
Due to legal requirements, the Ukrainian subsidiaries are responsible for partial financing of theState hardship pensions for those of its employees who worked, or still work, under severe andhazardous labour conditions (hardship early retirement pensions). These pensions are paid untilthe recipient reaches the age of entitlement to the State old age pension (55 years for female and60 years for male employees). In Ukraine, the Group also voluntarily provides long-term andpost-employment benefits to its employees including death-in-service, lump sum benefits uponretirement and death-in-pension benefits.
All the above pension and employee benefit programs are of a defined benefit nature. The Groupfinances these programs on an unfunded pay-as-you-go basis.
The number of employees eligible for the plans as at 31 December 2006, 2007, 2008 and 30 June2009 was 76,994, 76,892, 69,189 and 58,002, respectively. The number of pensioners as at 31December 2006, 2007, 2008 and 30 June 2009 was 38,259, 31,968, 32,995 and 32,138,respectively.
Group subsidiaries outside the Russian Federation and Ukraine
In Jamaica, the Group provided employees with a defined benefit pension plan andpost-retirement medical benefits. At 31 December 2007 and 2008, there were 1,793 and 1,687active employees and 1,084 and 1,095 (deferred) pensioners, respectively.
During the first half of 2009, the Group temporarily closed its Alpart operations and dischargedits employees until further notice. Effective 1 June 2009, the Group stopped makingcontributions to the pension Trust of Alpart. The pension Trust is currently being wound-up andmanagement does not expect to have to make up any deficit or receive any surplus as a result ofthe winding-up based on the actuarial estimates at this time. In the winding-up, it is highlyunlikely that Alpart will have to make up any deficit. For accounting purposes, both assets andliabilities have been set to equal to zero as per the valuation date. Any surplus distribution to theemployer will be recognised if and when information on the size of such surplus allocation isknown. At Windalco no major changes have taken place and the company continues to provideits employees with a defined benefit pension plan and post-retirement medical benefits.
In Ireland, the Group offers employees a final pay pension plan, with a pension equal to 1/60thof pensionable salary, adjusted for social security and shift earnings, for each year of service.Apart from that the Group offers long-term and post-employment benefits to its employeesincluding death-in-service, lump sum upon retirement and death-in-pension benefits. The plansin Ireland and Jamaica are funded plans.
APPENDIX I ACCOUNTANTS’ REPORT
— I-99 —

In Sweden, the Group provides defined benefit lifelong and temporary pension benefits. Thelifelong benefits are dependent on the past service and average salary level of the employee, withan accrual rate that depends on the salary bracket the employee is in. The liability relates onlyto benefits accrued before 1 January 2004. These plans are unfunded.
In several other subsidiaries, the Group provides lump sum benefits upon retirement which arefinanced on an unfunded pay-as-you-go basis.
The following tables summarise the components of the benefit expense recognised in theconsolidated income statements and the amounts recognised in the consolidated balance sheetsand in the statements of comprehensive income in relation to the plans. The amounts recognisedin the consolidated income statements are as follows:
Year ended 31 DecemberSix months
ended 30 June
2006 2007 2008 2009
USDmillion
USDmillion
USDmillion
USDmillion
Current service cost . . . . . . . . . . . . . . . . . . . . . . . . . . . 4 15 18 6
Amortisation of past service cost . . . . . . . . . . . . . . . . . . 3 6 3 (15)
Interest cost . . . . . . . . . . . . . . . . . . . . . . . . . . . . . . . . 6 24 32 15
Actuarial expected return on plan assets . . . . . . . . . . . . . — (15) (24) (9)
Net expense/(income) recognised in the income statement . 13 30 29 (3)
The reconciliations of the present value of the defined benefit obligation to the liabilitiesrecognised in the consolidated balance sheets are as follows:
31 December 30 June
2006 2007 2008 2009
USDmillion
USDmillion
USDmillion
USDmillion
Present value of defined benefit obligations . . . . . . . . . . . . . . 93 459 362 299
Fair value of plan assets . . . . . . . . . . . . . . . . . . . . . . . . . . . — (275) (191) (161)
Present value of obligations . . . . . . . . . . . . . . . . . . . . . . . . . 93 184 171 138
Unrecognised past service cost . . . . . . . . . . . . . . . . . . . . . . . (20) (22) (12) (6)
Assets not recognised . . . . . . . . . . . . . . . . . . . . . . . . . . . . . — 22 25 13
Net liability in the balance sheet . . . . . . . . . . . . . . . . . . . . . . 73 184 184 145
APPENDIX I ACCOUNTANTS’ REPORT
— I-100 —

Changes in the present value of the net liability are as follows:
31 December 30 June
2006 2007 2008 2009
USDmillion
USDmillion
USDmillion
USDmillion
Net liability at beginning of year/period. . . . . . . . . . . . . . . . . 57 73 184 184
Acquisitions . . . . . . . . . . . . . . . . . . . . . . . . . . . . . . . . . . . . 5 98 — —
Other changes charged directly to the equity. . . . . . . . . . . . . . — — — 6
Net expense recognised in the income statement . . . . . . . . . . . 13 30 29 (3)
Contributions paid into the plan by the employers . . . . . . . . . . (4) (15) (23) (10)
Actuarial (gains)/losses charged to comprehensive income . . . . (4) (23) 22 (15)
Currency exchange losses/(gains) charged to income statement . 6 7 (13) (2)
Foreign currency translation . . . . . . . . . . . . . . . . . . . . . . . . . — 4 (18) (3)
Changes in assets not recognised charged directly to equity . . . — 10 3 (12)
Net liability at end of year/period . . . . . . . . . . . . . . . . . . . . . 73 184 184 145
The reconciliation of the present value of the defined benefit obligation to the liabilitiesrecognised in the consolidated balance sheet is as follows:
At 31 December At 30 June
2006 2007 2008 2009
USDmillion
USDmillion
USDmillion
USDmillion
Present value of defined benefit obligations at beginningof year . . . . . . . . . . . . . . . . . . . . . . . . . . . . . . . . . . . . . . 79 93 459 362
Service cost . . . . . . . . . . . . . . . . . . . . . . . . . . . . . . . . . . . 4 15 18 6
Interest cost . . . . . . . . . . . . . . . . . . . . . . . . . . . . . . . . . . . 6 24 32 15
Actuarial gains . . . . . . . . . . . . . . . . . . . . . . . . . . . . . . . . . (4) (26) (63) (12)
Currency exchange losses/(gains) . . . . . . . . . . . . . . . . . . . . 6 17 (41) (11)
Past service cost . . . . . . . . . . . . . . . . . . . . . . . . . . . . . . . . 1 6 (7) (21)
Contributions by employees . . . . . . . . . . . . . . . . . . . . . . . . — 2 5 2
Benefits paid . . . . . . . . . . . . . . . . . . . . . . . . . . . . . . . . . . (4) (15) (23) (11)
Acquisitions . . . . . . . . . . . . . . . . . . . . . . . . . . . . . . . . . . . 5 339 — —
Translation difference . . . . . . . . . . . . . . . . . . . . . . . . . . . . — 4 (18) (3)
Other changes charged directly to the equity. . . . . . . . . . . . . — — — (28)
Present value of defined benefit obligations at end of year . . . 93 459 362 299
APPENDIX I ACCOUNTANTS’ REPORT
— I-101 —
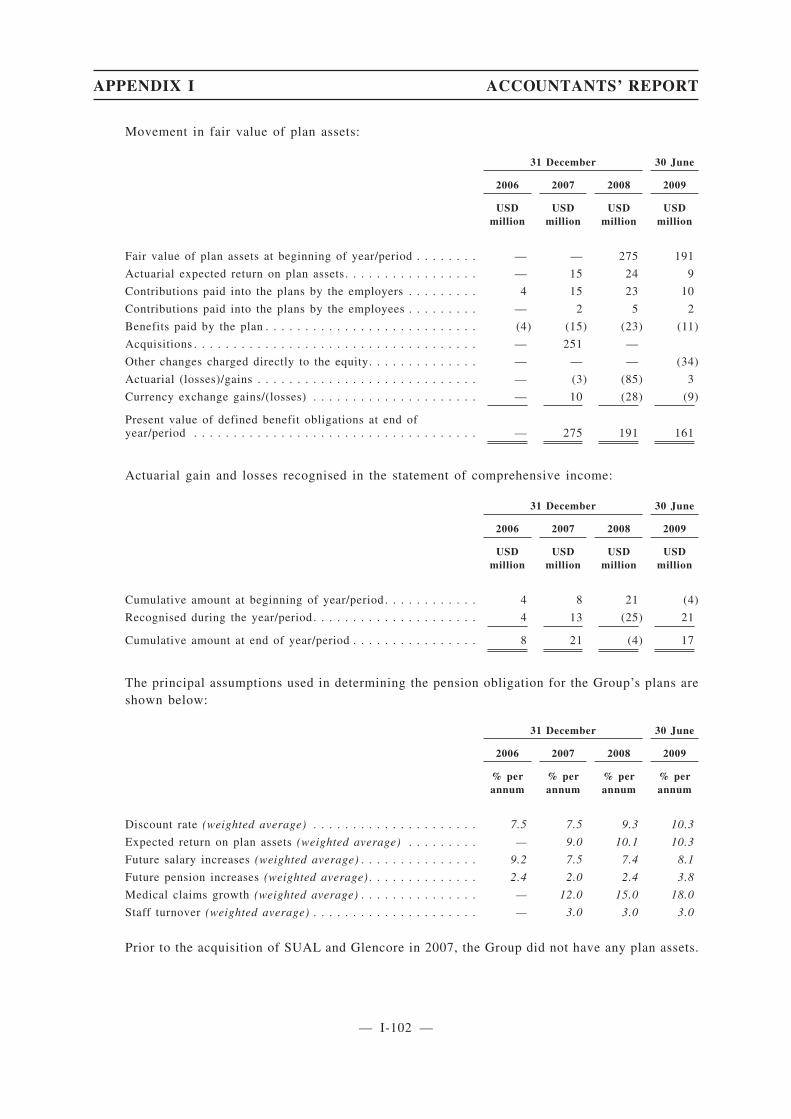
Movement in fair value of plan assets:
31 December 30 June
2006 2007 2008 2009
USDmillion
USDmillion
USDmillion
USDmillion
Fair value of plan assets at beginning of year/period . . . . . . . . — — 275 191
Actuarial expected return on plan assets . . . . . . . . . . . . . . . . . — 15 24 9
Contributions paid into the plans by the employers . . . . . . . . . 4 15 23 10
Contributions paid into the plans by the employees . . . . . . . . . — 2 5 2
Benefits paid by the plan . . . . . . . . . . . . . . . . . . . . . . . . . . . (4) (15) (23) (11)
Acquisitions . . . . . . . . . . . . . . . . . . . . . . . . . . . . . . . . . . . . — 251 —
Other changes charged directly to the equity. . . . . . . . . . . . . . — — — (34)
Actuarial (losses)/gains . . . . . . . . . . . . . . . . . . . . . . . . . . . . — (3) (85) 3
Currency exchange gains/(losses) . . . . . . . . . . . . . . . . . . . . . — 10 (28) (9)
Present value of defined benefit obligations at end ofyear/period . . . . . . . . . . . . . . . . . . . . . . . . . . . . . . . . . . . . — 275 191 161
Actuarial gain and losses recognised in the statement of comprehensive income:
31 December 30 June
2006 2007 2008 2009
USDmillion
USDmillion
USDmillion
USDmillion
Cumulative amount at beginning of year/period . . . . . . . . . . . . 4 8 21 (4)
Recognised during the year/period . . . . . . . . . . . . . . . . . . . . . 4 13 (25) 21
Cumulative amount at end of year/period . . . . . . . . . . . . . . . . 8 21 (4) 17
The principal assumptions used in determining the pension obligation for the Group’s plans areshown below:
31 December 30 June
2006 2007 2008 2009
% perannum
% perannum
% perannum
% perannum
Discount rate (weighted average) . . . . . . . . . . . . . . . . . . . . . 7.5 7.5 9.3 10.3
Expected return on plan assets (weighted average) . . . . . . . . . — 9.0 10.1 10.3
Future salary increases (weighted average) . . . . . . . . . . . . . . . 9.2 7.5 7.4 8.1
Future pension increases (weighted average) . . . . . . . . . . . . . . 2.4 2.0 2.4 3.8
Medical claims growth (weighted average) . . . . . . . . . . . . . . . — 12.0 15.0 18.0
Staff turnover (weighted average) . . . . . . . . . . . . . . . . . . . . . — 3.0 3.0 3.0
Prior to the acquisition of SUAL and Glencore in 2007, the Group did not have any plan assets.
APPENDIX I ACCOUNTANTS’ REPORT
— I-102 —
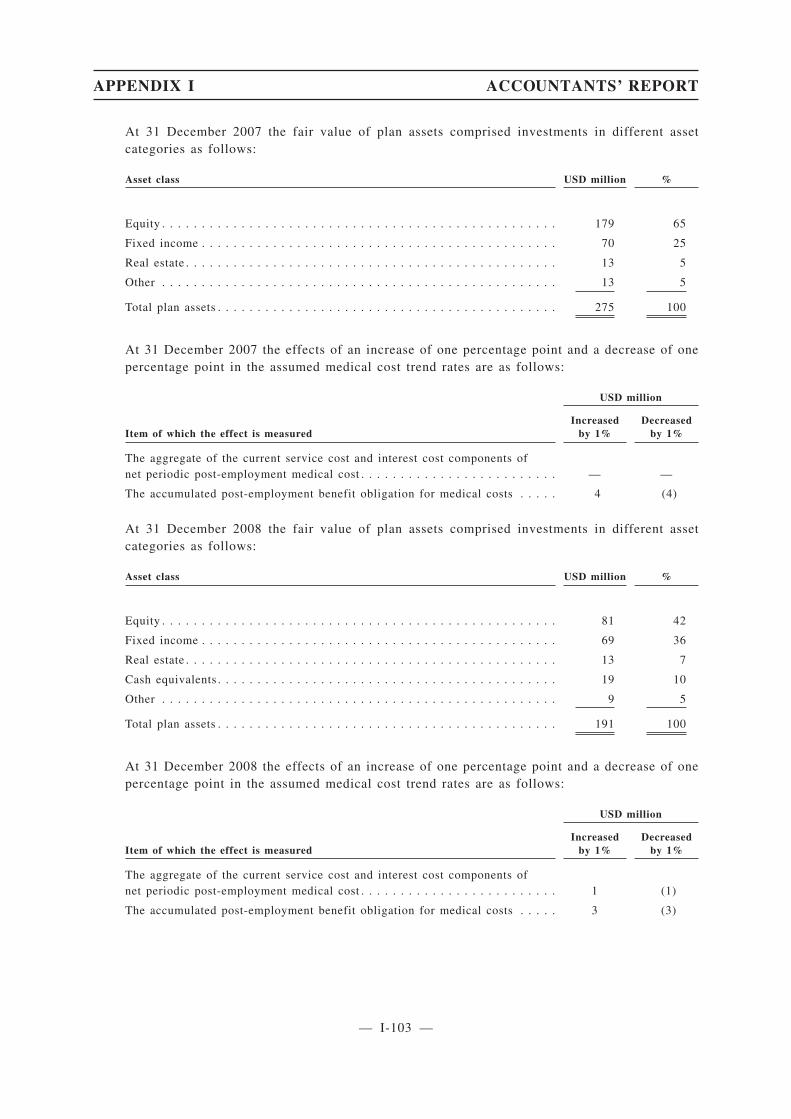
At 31 December 2007 the fair value of plan assets comprised investments in different assetcategories as follows:
Asset class USD million %
Equity . . . . . . . . . . . . . . . . . . . . . . . . . . . . . . . . . . . . . . . . . . . . . . . . . . 179 65
Fixed income . . . . . . . . . . . . . . . . . . . . . . . . . . . . . . . . . . . . . . . . . . . . . 70 25
Real estate . . . . . . . . . . . . . . . . . . . . . . . . . . . . . . . . . . . . . . . . . . . . . . . 13 5
Other . . . . . . . . . . . . . . . . . . . . . . . . . . . . . . . . . . . . . . . . . . . . . . . . . . 13 5
Total plan assets . . . . . . . . . . . . . . . . . . . . . . . . . . . . . . . . . . . . . . . . . . . 275 100
At 31 December 2007 the effects of an increase of one percentage point and a decrease of onepercentage point in the assumed medical cost trend rates are as follows:
USD million
Item of which the effect is measuredIncreased
by 1%Decreased
by 1%
The aggregate of the current service cost and interest cost components ofnet periodic post-employment medical cost . . . . . . . . . . . . . . . . . . . . . . . . . — —
The accumulated post-employment benefit obligation for medical costs . . . . . 4 (4)
At 31 December 2008 the fair value of plan assets comprised investments in different assetcategories as follows:
Asset class USD million %
Equity . . . . . . . . . . . . . . . . . . . . . . . . . . . . . . . . . . . . . . . . . . . . . . . . . . 81 42
Fixed income . . . . . . . . . . . . . . . . . . . . . . . . . . . . . . . . . . . . . . . . . . . . . 69 36
Real estate . . . . . . . . . . . . . . . . . . . . . . . . . . . . . . . . . . . . . . . . . . . . . . . 13 7
Cash equivalents . . . . . . . . . . . . . . . . . . . . . . . . . . . . . . . . . . . . . . . . . . . 19 10
Other . . . . . . . . . . . . . . . . . . . . . . . . . . . . . . . . . . . . . . . . . . . . . . . . . . 9 5
Total plan assets . . . . . . . . . . . . . . . . . . . . . . . . . . . . . . . . . . . . . . . . . . . 191 100
At 31 December 2008 the effects of an increase of one percentage point and a decrease of onepercentage point in the assumed medical cost trend rates are as follows:
USD million
Item of which the effect is measuredIncreased
by 1%Decreased
by 1%
The aggregate of the current service cost and interest cost components ofnet periodic post-employment medical cost . . . . . . . . . . . . . . . . . . . . . . . . . 1 (1)
The accumulated post-employment benefit obligation for medical costs . . . . . 3 (3)
APPENDIX I ACCOUNTANTS’ REPORT
— I-103 —

At 30 June 2009 the fair value of plan assets comprised investments in different asset categoriesas follows:
Asset class USD million %
Equity . . . . . . . . . . . . . . . . . . . . . . . . . . . . . . . . . . . . . . . . . . . . . . . . . . 69 43
Fixed income . . . . . . . . . . . . . . . . . . . . . . . . . . . . . . . . . . . . . . . . . . . . . 56 35
Real estate . . . . . . . . . . . . . . . . . . . . . . . . . . . . . . . . . . . . . . . . . . . . . . . 9 5
Cash equivalents . . . . . . . . . . . . . . . . . . . . . . . . . . . . . . . . . . . . . . . . . . . 25 16
Other . . . . . . . . . . . . . . . . . . . . . . . . . . . . . . . . . . . . . . . . . . . . . . . . . . 2 1
Total plan assets . . . . . . . . . . . . . . . . . . . . . . . . . . . . . . . . . . . . . . . . . . . 161 100
At 30 June 2009 the effects of an increase of one percentage point and a decrease of onepercentage point in the assumed medical cost trend rates are as follows:
USD million
Item of which the effect is measuredIncreased
by 1%Decreased
by 1%
The aggregate of the current service cost and interest cost components ofnet periodic post-employment medical cost . . . . . . . . . . . . . . . . . . . . . . . . . 1 —
The accumulated post-employment benefit obligation for medical costs . . . . . 3 (2)
The Group expects USD18 million to be paid to the defined benefit retirement plans during theannual period beginning on 1 July 2009.
(b) Site restoration
The Group provides for site restoration obligations when there is a specific legal or constructiveobligation for mine reclamation, landfill closure (primarily comprising red mud basin disposalsites) or specific lease restoration requirements. The Group does not record any obligations withrespect to decommissioning of its refining or smelting facilities and restoration andrehabilitation of the surrounding areas unless there is a specific plan to discontinue operationsat a facility. This is because any significant costs in connection with decommissioning of refiningor smelting facilities and restoration and rehabilitation of the surrounding areas would beincurred no earlier than when the facility is closed and the facilities are currently expected tooperate over a term in excess of 50-100 years due to the perpetual nature of the refineries andsmelters and continuous maintenance and upgrade programs resulting in the fair values of anysuch liabilities being negligible.
APPENDIX I ACCOUNTANTS’ REPORT
— I-104 —
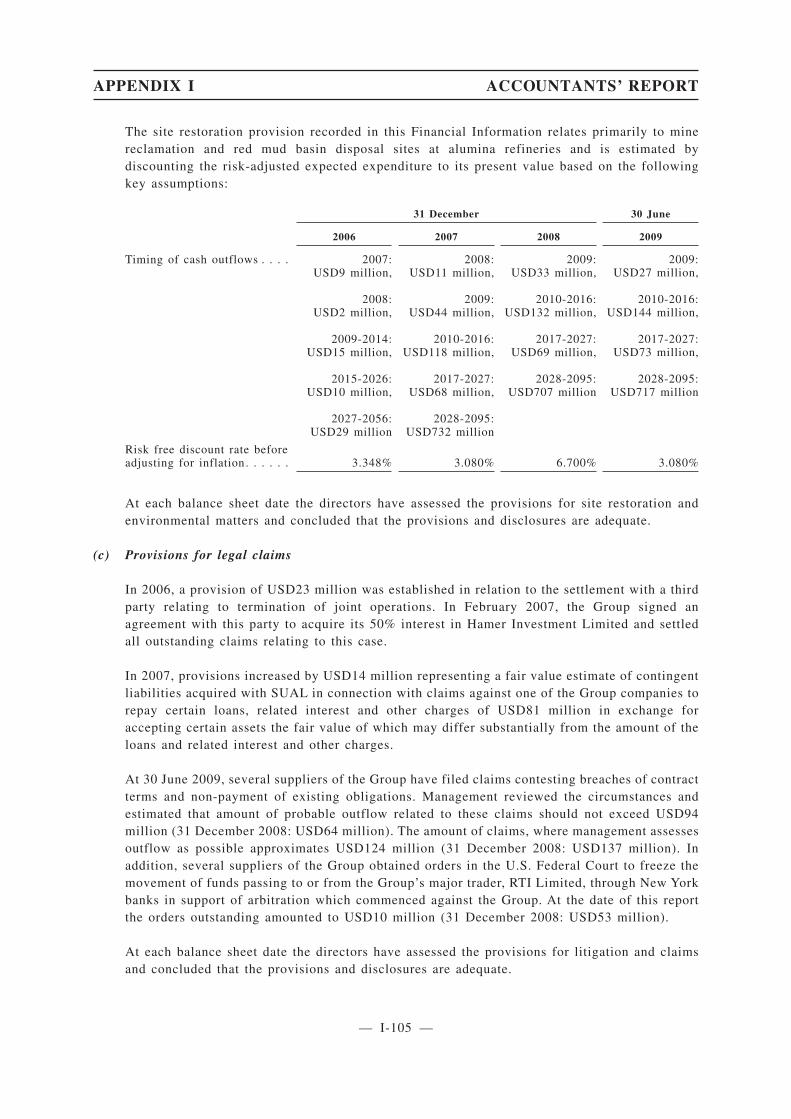
The site restoration provision recorded in this Financial Information relates primarily to minereclamation and red mud basin disposal sites at alumina refineries and is estimated bydiscounting the risk-adjusted expected expenditure to its present value based on the followingkey assumptions:
31 December 30 June
2006 2007 2008 2009
Timing of cash outflows . . . . 2007:USD9 million,
2008:USD2 million,
2009-2014:USD15 million,
2015-2026:USD10 million,
2027-2056:USD29 million
2008:USD11 million,
2009:USD44 million,
2010-2016:USD118 million,
2017-2027:USD68 million,
2028-2095:USD732 million
2009:USD33 million,
2010-2016:USD132 million,
2017-2027:USD69 million,
2028-2095:USD707 million
2009:USD27 million,
2010-2016:USD144 million,
2017-2027:USD73 million,
2028-2095:USD717 million
Risk free discount rate beforeadjusting for inflation. . . . . . 3.348% 3.080% 6.700% 3.080%
At each balance sheet date the directors have assessed the provisions for site restoration andenvironmental matters and concluded that the provisions and disclosures are adequate.
(c) Provisions for legal claims
In 2006, a provision of USD23 million was established in relation to the settlement with a thirdparty relating to termination of joint operations. In February 2007, the Group signed anagreement with this party to acquire its 50% interest in Hamer Investment Limited and settledall outstanding claims relating to this case.
In 2007, provisions increased by USD14 million representing a fair value estimate of contingentliabilities acquired with SUAL in connection with claims against one of the Group companies torepay certain loans, related interest and other charges of USD81 million in exchange foraccepting certain assets the fair value of which may differ substantially from the amount of theloans and related interest and other charges.
At 30 June 2009, several suppliers of the Group have filed claims contesting breaches of contractterms and non-payment of existing obligations. Management reviewed the circumstances andestimated that amount of probable outflow related to these claims should not exceed USD94million (31 December 2008: USD64 million). The amount of claims, where management assessesoutflow as possible approximates USD124 million (31 December 2008: USD137 million). Inaddition, several suppliers of the Group obtained orders in the U.S. Federal Court to freeze themovement of funds passing to or from the Group’s major trader, RTI Limited, through New Yorkbanks in support of arbitration which commenced against the Group. At the date of this reportthe orders outstanding amounted to USD10 million (31 December 2008: USD53 million).
At each balance sheet date the directors have assessed the provisions for litigation and claimsand concluded that the provisions and disclosures are adequate.
APPENDIX I ACCOUNTANTS’ REPORT
— I-105 —
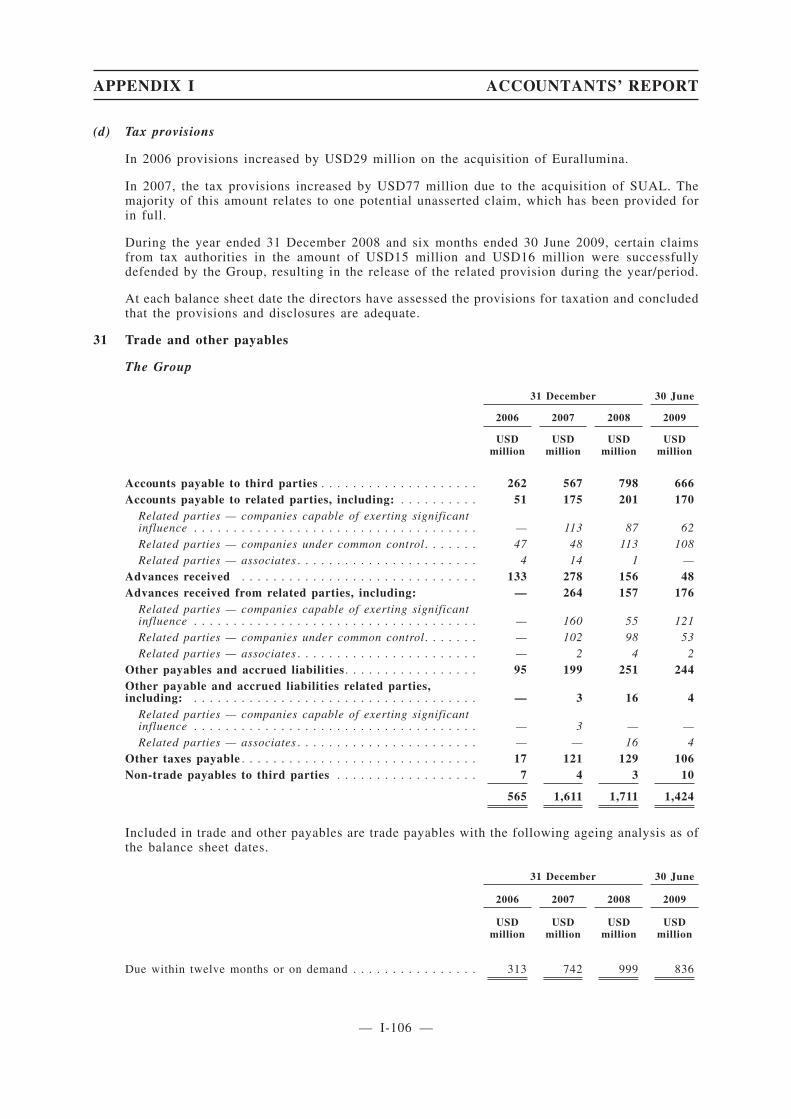
(d) Tax provisions
In 2006 provisions increased by USD29 million on the acquisition of Eurallumina.
In 2007, the tax provisions increased by USD77 million due to the acquisition of SUAL. Themajority of this amount relates to one potential unasserted claim, which has been provided forin full.
During the year ended 31 December 2008 and six months ended 30 June 2009, certain claimsfrom tax authorities in the amount of USD15 million and USD16 million were successfullydefended by the Group, resulting in the release of the related provision during the year/period.
At each balance sheet date the directors have assessed the provisions for taxation and concludedthat the provisions and disclosures are adequate.
31 Trade and other payables
The Group
31 December 30 June
2006 2007 2008 2009
USDmillion
USDmillion
USDmillion
USDmillion
Accounts payable to third parties . . . . . . . . . . . . . . . . . . . . 262 567 798 666Accounts payable to related parties, including: . . . . . . . . . . 51 175 201 170
Related parties — companies capable of exerting significantinfluence . . . . . . . . . . . . . . . . . . . . . . . . . . . . . . . . . . . . — 113 87 62Related parties — companies under common control. . . . . . . 47 48 113 108Related parties — associates . . . . . . . . . . . . . . . . . . . . . . . 4 14 1 —
Advances received . . . . . . . . . . . . . . . . . . . . . . . . . . . . . . 133 278 156 48Advances received from related parties, including: — 264 157 176
Related parties — companies capable of exerting significantinfluence . . . . . . . . . . . . . . . . . . . . . . . . . . . . . . . . . . . . — 160 55 121Related parties — companies under common control. . . . . . . — 102 98 53Related parties — associates . . . . . . . . . . . . . . . . . . . . . . . — 2 4 2
Other payables and accrued liabilities . . . . . . . . . . . . . . . . . 95 199 251 244Other payable and accrued liabilities related parties,including: . . . . . . . . . . . . . . . . . . . . . . . . . . . . . . . . . . . . — 3 16 4
Related parties — companies capable of exerting significantinfluence . . . . . . . . . . . . . . . . . . . . . . . . . . . . . . . . . . . . — 3 — —Related parties — associates . . . . . . . . . . . . . . . . . . . . . . . — — 16 4
Other taxes payable . . . . . . . . . . . . . . . . . . . . . . . . . . . . . . 17 121 129 106Non-trade payables to third parties . . . . . . . . . . . . . . . . . . 7 4 3 10
565 1,611 1,711 1,424
Included in trade and other payables are trade payables with the following ageing analysis as ofthe balance sheet dates.
31 December 30 June
2006 2007 2008 2009
USDmillion
USDmillion
USDmillion
USDmillion
Due within twelve months or on demand . . . . . . . . . . . . . . . . 313 742 999 836
APPENDIX I ACCOUNTANTS’ REPORT
— I-106 —
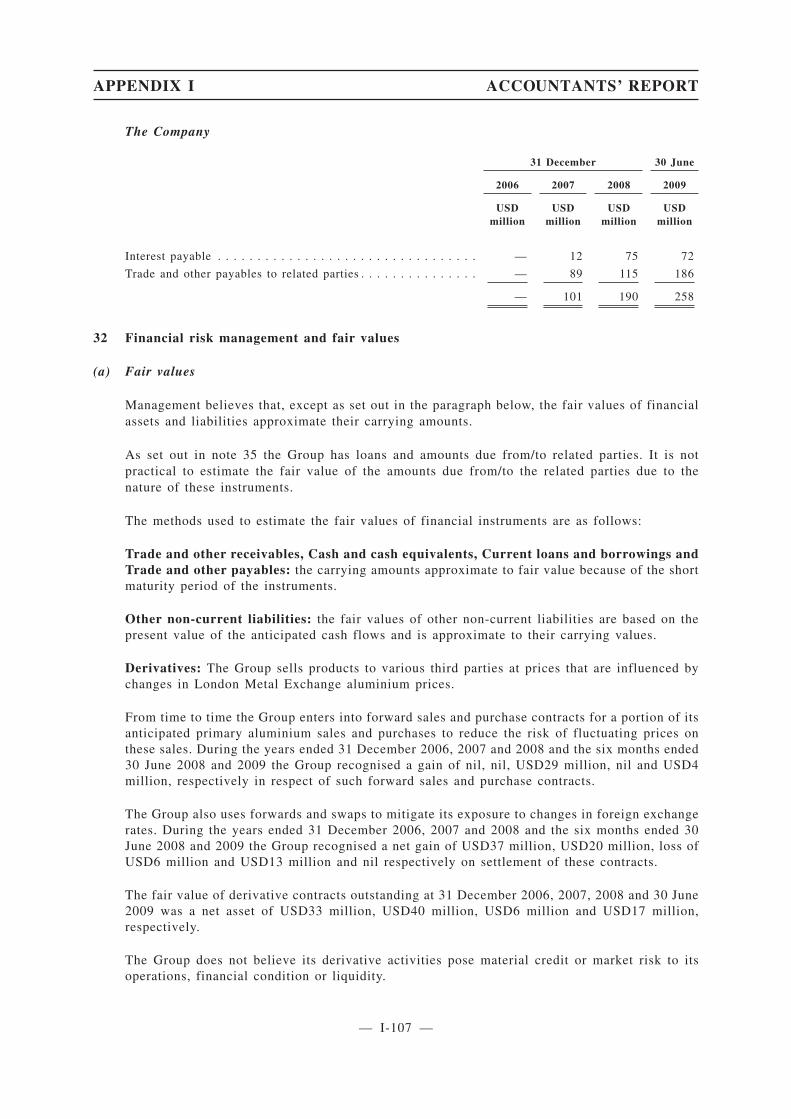
The Company
31 December 30 June
2006 2007 2008 2009
USDmillion
USDmillion
USDmillion
USDmillion
Interest payable . . . . . . . . . . . . . . . . . . . . . . . . . . . . . . . . . — 12 75 72
Trade and other payables to related parties . . . . . . . . . . . . . . . — 89 115 186
— 101 190 258
32 Financial risk management and fair values
(a) Fair values
Management believes that, except as set out in the paragraph below, the fair values of financialassets and liabilities approximate their carrying amounts.
As set out in note 35 the Group has loans and amounts due from/to related parties. It is notpractical to estimate the fair value of the amounts due from/to the related parties due to thenature of these instruments.
The methods used to estimate the fair values of financial instruments are as follows:
Trade and other receivables, Cash and cash equivalents, Current loans and borrowings andTrade and other payables: the carrying amounts approximate to fair value because of the shortmaturity period of the instruments.
Other non-current liabilities: the fair values of other non-current liabilities are based on thepresent value of the anticipated cash flows and is approximate to their carrying values.
Derivatives: The Group sells products to various third parties at prices that are influenced bychanges in London Metal Exchange aluminium prices.
From time to time the Group enters into forward sales and purchase contracts for a portion of itsanticipated primary aluminium sales and purchases to reduce the risk of fluctuating prices onthese sales. During the years ended 31 December 2006, 2007 and 2008 and the six months ended30 June 2008 and 2009 the Group recognised a gain of nil, nil, USD29 million, nil and USD4million, respectively in respect of such forward sales and purchase contracts.
The Group also uses forwards and swaps to mitigate its exposure to changes in foreign exchangerates. During the years ended 31 December 2006, 2007 and 2008 and the six months ended 30June 2008 and 2009 the Group recognised a net gain of USD37 million, USD20 million, loss ofUSD6 million and USD13 million and nil respectively on settlement of these contracts.
The fair value of derivative contracts outstanding at 31 December 2006, 2007, 2008 and 30 June2009 was a net asset of USD33 million, USD40 million, USD6 million and USD17 million,respectively.
The Group does not believe its derivative activities pose material credit or market risk to itsoperations, financial condition or liquidity.
APPENDIX I ACCOUNTANTS’ REPORT
— I-107 —

(b) Financial risk management objectives and policies
The Group’s principal financial instruments comprise bank loans, overdrafts and trade payables.The main purpose of these financial instruments is to raise finance for the Group’s operations.The Group has various financial assets such as trade receivables and cash and short-termdeposits, which arise directly from its operations.
The main risks arising from the Group’s financial instruments are cash flow interest rate risk,liquidity risk, foreign currency risk and credit risk. Management reviews and agrees policies formanaging each of these risks which are summarised below.
The Board of Directors has overall responsibility for the establishment and oversight of theGroup’s risk management framework. The Board has established a risk management group withinits Department of Internal Control, which is responsible for developing and monitoring theGroup’s risk management policies. The Department reports regularly to the Board of Directorson its activities.
The Group’s risk management policies are established to identify and analyse the risks faced bythe Group, to set appropriate risk limits and controls and to monitor risks and adherence to limits.Risk management policies and systems are reviewed regularly to reflect changes in marketconditions and the Group’s activities. The Group, through its training and management standardsand procedures, aims to develop a disciplined and constructive control environment in which allemployees understand their roles and obligations.
The Group’s Audit Committee oversees how management monitors compliance with the Group’srisk management policies and procedures and reviews the adequacy of the risk managementframework in relation to the risks faced by the Group. The Group’s Audit Committee is assistedin its oversight role by the Group’s Internal Audit function. The Group’s Internal Audit functionundertakes both regular and ad hoc reviews of risk management controls and procedures, theresults of which are reported to the Audit Committee.
(c) Market risk
Market risk is the risk that changes in market prices, such as foreign exchange rates, interestrates and equity prices will affect the Group’s income or the value of its holdings of financialinstruments. The objective of market risk management is to manage and control market riskexposures within acceptable parameters, while optimising returns.
The Group does not apply hedge accounting in order to manage volatility in profit or loss.
(i) Interest rate risk
The Group’s exposure to the risk of changes in market interest rates relates primarily to theGroup’s long-term debt obligations with floating interest rates (refer to note 28). The Group’spolicy is to manage its interest cost by monitoring changes in interest rates with respect to itsborrowings.
APPENDIX I ACCOUNTANTS’ REPORT
— I-108 —
3rd Sch23
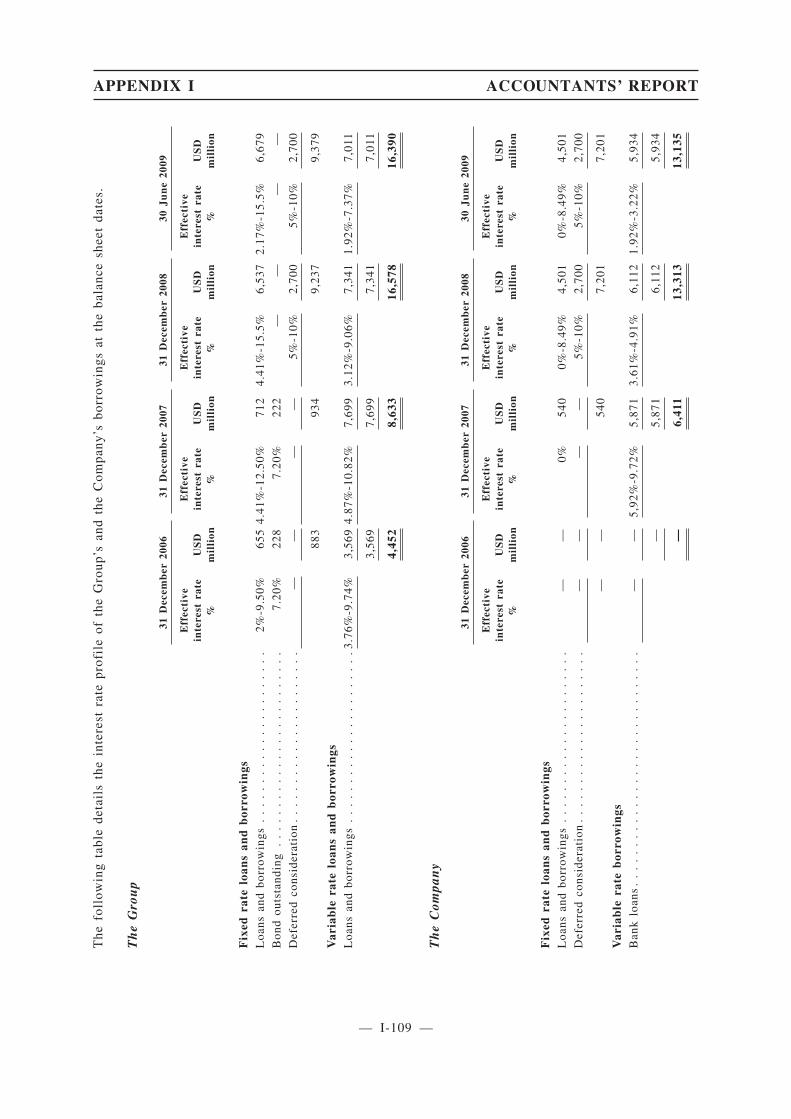
The
foll
owin
gta
ble
deta
ils
the
inte
rest
rate
prof
ile
ofth
eG
roup
’san
dth
eC
ompa
ny’s
borr
owin
gsat
the
bala
nce
shee
tda
tes.
Th
eG
rou
p
31D
ecem
ber
2006
31D
ecem
ber
2007
31D
ecem
ber
2008
30Ju
ne
2009
Eff
ecti
vein
tere
stra
te%
US
Dm
illi
on
Eff
ecti
vein
tere
stra
te%
US
Dm
illi
on
Eff
ecti
vein
tere
stra
te%
US
Dm
illi
on
Eff
ecti
vein
tere
stra
te%
US
Dm
illi
on
Fix
edra
telo
ans
and
bor
row
ings
Loa
nsan
dbo
rrow
ings
..
..
..
..
..
..
..
..
..
..
..
2%-9
.50%
655
4.41
%-1
2.50
%71
24.
41%
-15.
5%6,
537
2.17
%-1
5.5%
6,67
9B
ond
outs
tand
ing
..
..
..
..
..
..
..
..
..
..
..
..
.7.
20%
228
7.20
%22
2—
——
—D
efer
red
cons
ider
atio
n.
..
..
..
..
..
..
..
..
..
..
.—
——
—5%
-10%
2,70
05%
-10%
2,70
0
883
934
9,23
79,
379
Var
iab
lera
telo
ans
and
bor
row
ings
Loa
nsan
dbo
rrow
ings
..
..
..
..
..
..
..
..
..
..
..3
.76%
-9.7
4%3,
569
4.87
%-1
0.82
%7,
699
3.12
%-9
.06%
7,34
11.
92%
-7.3
7%7,
011
3,56
97,
699
7,34
17,
011
4,45
28,
633
16,5
7816
,390
Th
eC
ompa
ny
31D
ecem
ber
2006
31D
ecem
ber
2007
31D
ecem
ber
2008
30Ju
ne
2009
Eff
ecti
vein
tere
stra
te%
US
Dm
illi
on
Eff
ecti
vein
tere
stra
te%
US
Dm
illi
on
Eff
ecti
vein
tere
stra
te%
US
Dm
illi
on
Eff
ecti
vein
tere
stra
te%
US
Dm
illi
on
Fix
edra
telo
ans
and
bor
row
ings
Loa
nsan
dbo
rrow
ings
..
..
..
..
..
..
..
..
..
..
..
——
0%54
00%
-8.4
9%4,
501
0%-8
.49%
4,50
1D
efer
red
cons
ider
atio
n.
..
..
..
..
..
..
..
..
..
..
.—
——
—5%
-10%
2,70
05%
-10%
2,70
0
——
540
7,20
17,
201
Var
iab
lera
teb
orro
win
gsB
ank
loan
s.
..
..
..
..
..
..
..
..
..
..
..
..
..
..
.—
—5,
92%
-9.7
2%5,
871
3.61
%-4
.91%
6,11
21.
92%
-3.2
2%5,
934
—5,
871
6,11
25,
934
—6,
411
13,3
1313
,135
APPENDIX I ACCOUNTANTS’ REPORT
— I-109 —
App1A-32(2)
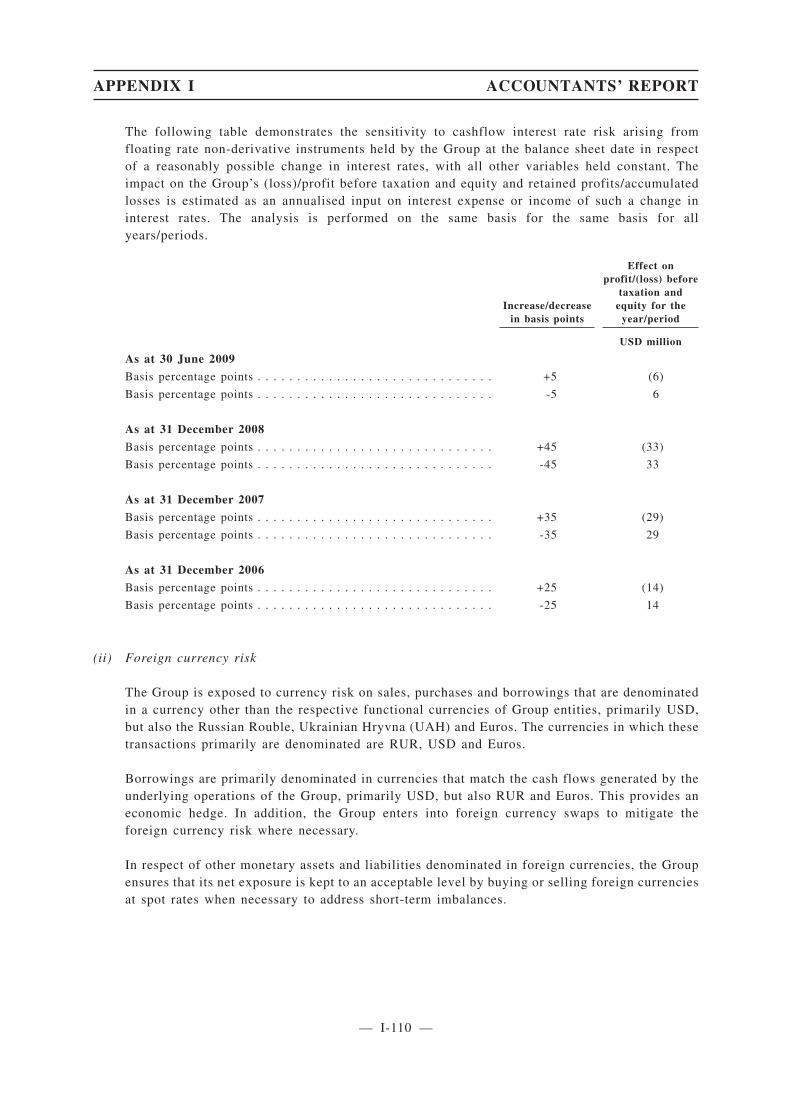
The following table demonstrates the sensitivity to cashflow interest rate risk arising fromfloating rate non-derivative instruments held by the Group at the balance sheet date in respectof a reasonably possible change in interest rates, with all other variables held constant. Theimpact on the Group’s (loss)/profit before taxation and equity and retained profits/accumulatedlosses is estimated as an annualised input on interest expense or income of such a change ininterest rates. The analysis is performed on the same basis for the same basis for allyears/periods.
Increase/decreasein basis points
Effect onprofit/(loss) before
taxation andequity for the
year/period
USD million
As at 30 June 2009
Basis percentage points . . . . . . . . . . . . . . . . . . . . . . . . . . . . . . +5 (6)
Basis percentage points . . . . . . . . . . . . . . . . . . . . . . . . . . . . . . -5 6
As at 31 December 2008
Basis percentage points . . . . . . . . . . . . . . . . . . . . . . . . . . . . . . +45 (33)
Basis percentage points . . . . . . . . . . . . . . . . . . . . . . . . . . . . . . -45 33
As at 31 December 2007
Basis percentage points . . . . . . . . . . . . . . . . . . . . . . . . . . . . . . +35 (29)
Basis percentage points . . . . . . . . . . . . . . . . . . . . . . . . . . . . . . -35 29
As at 31 December 2006
Basis percentage points . . . . . . . . . . . . . . . . . . . . . . . . . . . . . . +25 (14)
Basis percentage points . . . . . . . . . . . . . . . . . . . . . . . . . . . . . . -25 14
(ii) Foreign currency risk
The Group is exposed to currency risk on sales, purchases and borrowings that are denominatedin a currency other than the respective functional currencies of Group entities, primarily USD,but also the Russian Rouble, Ukrainian Hryvna (UAH) and Euros. The currencies in which thesetransactions primarily are denominated are RUR, USD and Euros.
Borrowings are primarily denominated in currencies that match the cash flows generated by theunderlying operations of the Group, primarily USD, but also RUR and Euros. This provides aneconomic hedge. In addition, the Group enters into foreign currency swaps to mitigate theforeign currency risk where necessary.
In respect of other monetary assets and liabilities denominated in foreign currencies, the Groupensures that its net exposure is kept to an acceptable level by buying or selling foreign currenciesat spot rates when necessary to address short-term imbalances.
APPENDIX I ACCOUNTANTS’ REPORT
— I-110 —
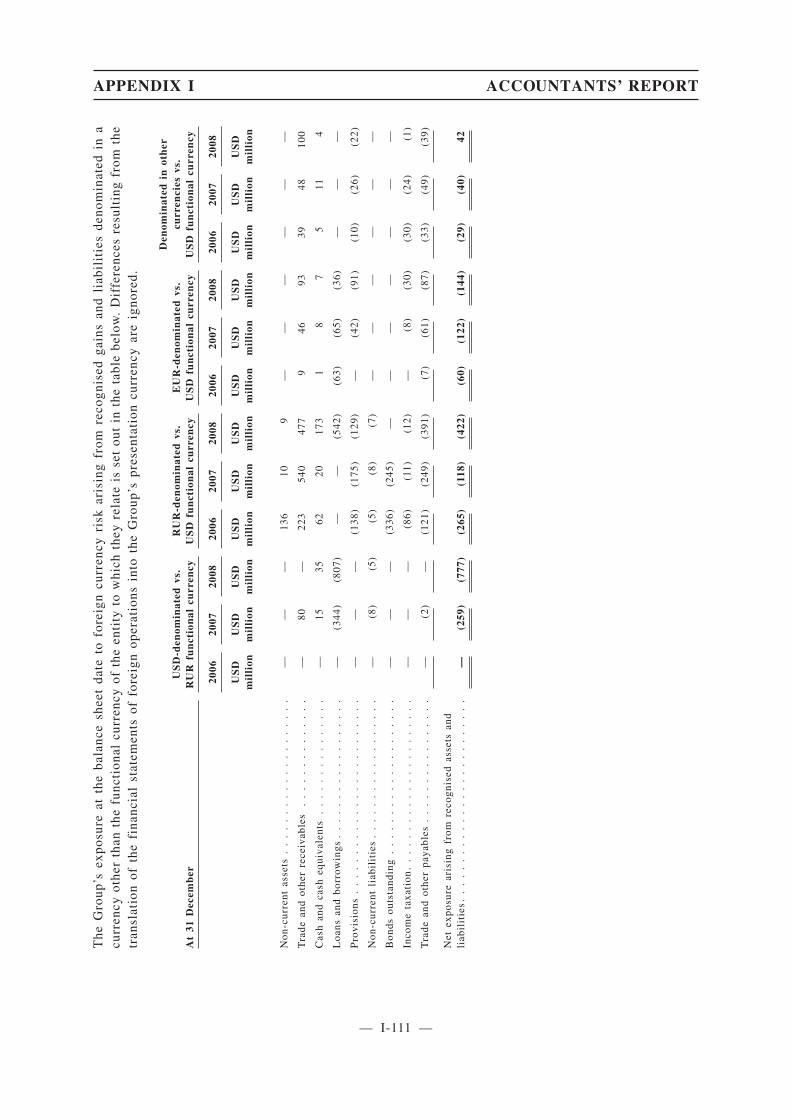
The
Gro
up’s
expo
sure
atth
eba
lanc
esh
eet
date
tofo
reig
ncu
rren
cyri
skar
isin
gfr
omre
cogn
ised
gain
san
dli
abil
itie
sde
nom
inat
edin
acu
rren
cyot
her
than
the
func
tion
alcu
rren
cyof
the
enti
tyto
whi
chth
eyre
late
isse
tou
tin
the
tabl
ebe
low
.D
iffe
renc
esre
sult
ing
from
the
tran
slat
ion
ofth
efi
nanc
ial
stat
emen
tsof
fore
ign
oper
atio
nsin
toth
eG
roup
’spr
esen
tati
oncu
rren
cyar
eig
nore
d.
At
31D
ecem
ber
US
D-d
enom
inat
edvs
.R
UR
fun
ctio
nal
curr
ency
RU
R-d
enom
inat
edvs
.U
SD
fun
ctio
nal
curr
ency
EU
R-d
enom
inat
edvs
.U
SD
fun
ctio
nal
curr
ency
Den
omin
ated
inot
her
curr
enci
esvs
.U
SD
fun
ctio
nal
curr
ency
2006
2007
2008
2006
2007
2008
2006
2007
2008
2006
2007
2008
US
Dm
illi
onU
SD
mil
lion
US
Dm
illi
onU
SD
mil
lion
US
Dm
illi
onU
SD
mil
lion
US
Dm
illi
onU
SD
mil
lion
US
Dm
illi
onU
SD
mil
lion
US
Dm
illi
onU
SD
mil
lion
Non
-cur
rent
asse
ts.
..
..
..
..
..
..
..
..
..
.—
——
136
109
——
——
——
Tra
dean
dot
her
rece
ivab
les
..
..
..
..
..
..
..
—80
—22
354
047
79
4693
3948
100
Cas
han
dca
sheq
uiva
lent
s.
..
..
..
..
..
..
..
—15
3562
2017
31
87
511
4
Loa
nsan
dbo
rrow
ings
..
..
..
..
..
..
..
..
..
—(3
44)
(807
)—
—(5
42)
(63)
(65)
(36)
——
—
Pro
visi
ons
..
..
..
..
..
..
..
..
..
..
..
..
.—
——
(138
)(1
75)
(129
)—
(42)
(91)
(10)
(26)
(22)
Non
-cur
rent
liab
ilit
ies
..
..
..
..
..
..
..
..
..
—(8
)(5
)(5
)(8
)(7
)—
——
——
—
Bon
dsou
tsta
ndin
g.
..
..
..
..
..
..
..
..
..
.—
——
(336
)(2
45)
——
——
——
—
Inco
me
taxa
tion
..
..
..
..
..
..
..
..
..
..
..
——
—(8
6)(1
1)(1
2)—
(8)
(30)
(30)
(24)
(1)
Tra
dean
dot
her
paya
bles
..
..
..
..
..
..
..
..
—(2
)—
(121
)(2
49)
(391
)(7
)(6
1)(8
7)(3
3)(4
9)(3
9)
Net
expo
sure
aris
ing
from
reco
gnis
edas
sets
and
liab
ilit
ies.
..
..
..
..
..
..
..
..
..
..
..
..
.—
(259
)(7
77)
(265
)(1
18)
(422
)(6
0)(1
22)
(144
)(2
9)(4
0)42
APPENDIX I ACCOUNTANTS’ REPORT
— I-111 —
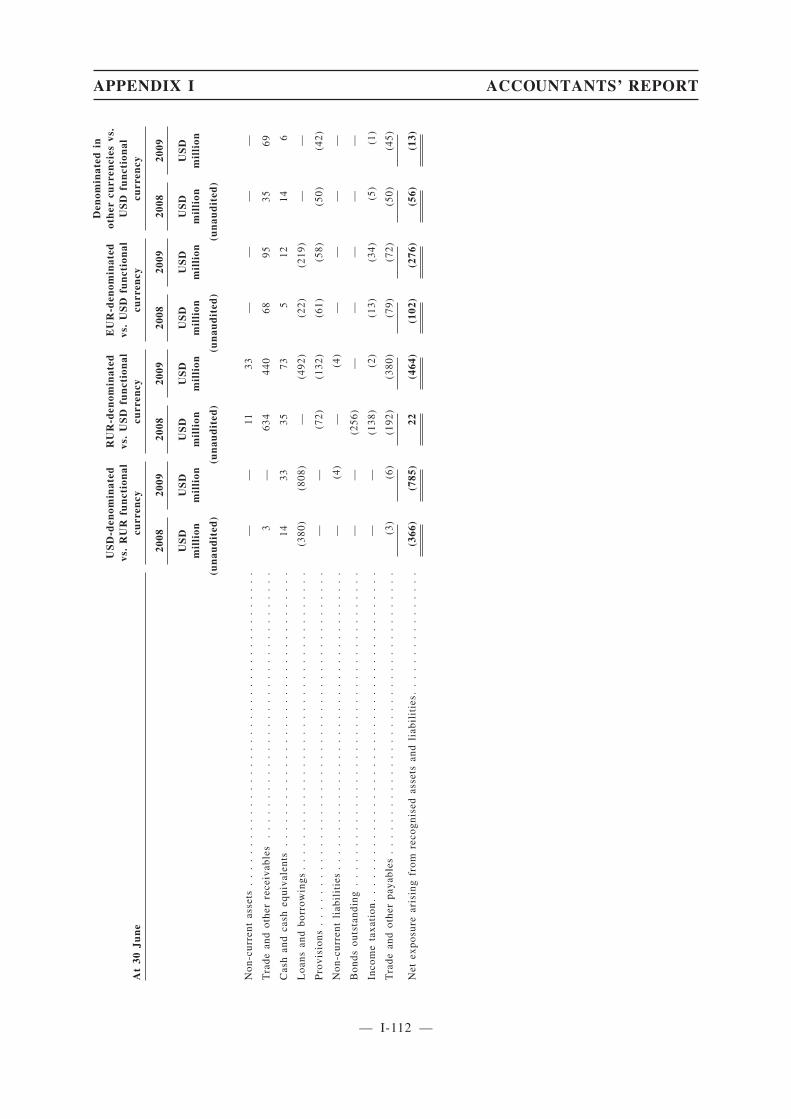
At
30Ju
ne
US
D-d
enom
inat
edvs
.R
UR
fun
ctio
nal
curr
ency
RU
R-d
enom
inat
edvs
.U
SD
fun
ctio
nal
curr
ency
EU
R-d
enom
inat
edvs
.U
SD
fun
ctio
nal
curr
ency
Den
omin
ated
inot
her
curr
enci
esvs
.U
SD
fun
ctio
nal
curr
ency
2008
2009
2008
2009
2008
2009
2008
2009
US
Dm
illi
onU
SD
mil
lion
US
Dm
illi
onU
SD
mil
lion
US
Dm
illi
onU
SD
mil
lion
US
Dm
illi
onU
SD
mil
lion
(un
aud
ited
)(u
nau
dit
ed)
(un
aud
ited
)(u
nau
dit
ed)
Non
-cur
rent
asse
ts.
..
..
..
..
..
..
..
..
..
..
..
..
..
..
..
..
..
..
..
.—
—11
33—
——
—
Tra
dean
dot
her
rece
ivab
les
..
..
..
..
..
..
..
..
..
..
..
..
..
..
..
..
..
3—
634
440
6895
3569
Cas
han
dca
sheq
uiva
lent
s.
..
..
..
..
..
..
..
..
..
..
..
..
..
..
..
..
..
1433
3573
512
146
Loa
nsan
dbo
rrow
ings
..
..
..
..
..
..
..
..
..
..
..
..
..
..
..
..
..
..
..
(380
)(8
08)
—(4
92)
(22)
(219
)—
—
Pro
visi
ons
..
..
..
..
..
..
..
..
..
..
..
..
..
..
..
..
..
..
..
..
..
..
.—
—(7
2)(1
32)
(61)
(58)
(50)
(42)
Non
-cur
rent
liab
ilit
ies
..
..
..
..
..
..
..
..
..
..
..
..
..
..
..
..
..
..
..
—(4
)—
(4)
——
——
Bon
dsou
tsta
ndin
g.
..
..
..
..
..
..
..
..
..
..
..
..
..
..
..
..
..
..
..
.—
—(2
56)
——
——
—
Inco
me
taxa
tion
..
..
..
..
..
..
..
..
..
..
..
..
..
..
..
..
..
..
..
..
..
——
(138
)(2
)(1
3)(3
4)(5
)(1
)
Tra
dean
dot
her
paya
bles
..
..
..
..
..
..
..
..
..
..
..
..
..
..
..
..
..
..
(3)
(6)
(192
)(3
80)
(79)
(72)
(50)
(45)
Net
expo
sure
aris
ing
from
reco
gnis
edas
sets
and
liab
ilit
ies.
..
..
..
..
..
..
..
.(3
66)
(785
)22
(464
)(1
02)
(276
)(5
6)(1
3)
APPENDIX I ACCOUNTANTS’ REPORT
— I-112 —

Foreign currency sensitivity analysis-increase/(decrease) in profit/(loss) before taxation
The following tables indicate the instantaneous change in the Group’s profit/(loss) after taxation(and retained profits/(accumulated losses)) that could arise if foreign exchange rates to which theGroup has significant exposure at the balance sheet date had changed at that date, assuming allother risk variables remained constant.
Year ended 31 December
Increase/(decrease)
inexchange
rates 2006
Increase/(decrease)
inexchange
rates 2007
Increase/(decrease)
inexchange
rates 2008
USDmillion
USDmillion
USDmillion
USD vs RUR . . . . . . . . . . . . . . . . . . . . . 5% (13) 5% 7 (8%) (29)
USD vs EUR . . . . . . . . . . . . . . . . . . . . . 5% (3) 5% (6) 5% (7)
USD vs other currencies . . . . . . . . . . . . . 5% (1) 5% (2) (5%) (2)
Effect on profit/(loss) before taxation . . . (17) (1) (38)
Six months ended 30 June
Increase/(decrease)
inexchange
rates 2008
Increase/(decrease)
inexchange
rates 2009
USDmillion
USDmillion
(unaudited)
USD vs RUR . . . . . . . . . . . . . . . . . . . . . . . . . . . . . . . . . . . (8%) (31) (7%) (23)
USD vs EUR . . . . . . . . . . . . . . . . . . . . . . . . . . . . . . . . . . . 5% (5) 5% (14)
USD vs other currencies . . . . . . . . . . . . . . . . . . . . . . . . . . . (5%) 3 (5%) 1
Effect on profit/(loss) before taxation . . . . . . . . . . . . . . . . . (33) (36)
Results of the analysis as presented in the above tables represent an aggregation of theinstantaneous effects on the Group entities’ profit/(loss) after taxation measured in the respectivefunctional currencies, translated into USD at the exchange rate ruling at the balance sheet datefor presentation purposes.
The sensitivity analysis assumes that the change in foreign exchange rates had been applied tore-measure those financial instruments held by the Group which expose the Group to foreigncurrency risk at the balance sheet date. The analysis excludes differences that would result fromthe translation of other financial statements of foreign operations into the Group’s presentationcurrency. The analysis is performed on the same basis for all years/periods.
APPENDIX I ACCOUNTANTS’ REPORT
— I-113 —

(d) Liquidity risk
Liquidity risk is the risk that the Group will not be able to meet its financial obligations as theyfall due. The Group policy is to maintain sufficient cash and cash equivalents or have availablefunding through an adequate amount of committed credit facilities to meet its operating andfinancial commitments. Following significant financial difficulties resulting from a number offactors described in note 2(d) the Group has restructured its outstanding debt to restore itsliquidity profile and secure ongoing operations (see notes 2(d), 28 and 38(b)).
The following tables show the remaining contractual maturities at the balance sheet date of theGroup’s non-derivative financial liabilities, which are based on contractual undiscountedcashflows (including interest payment computed using contractual rates, or if floating, based onrates current at the balance sheet date) and the earliest the Group can be required to pay, withouttaking into consideration the changes to the repayment terms as a result of the debt restructuringin December 2009 as further described in note 2(d) and note 38(b).
The Group
31 December 2006Contractual undiscounted cash outflow
Within1 yearor on
demand
Morethan
1 yearbut less
than2 years
Morethan
2 yearsbut less
than5 years
Morethan
5 years TOTAL
Balancesheet
carryingamount
USDmillion
USDmillion
USDmillion
USDmillion
USDmillion
USDmillion
Trade and other payables to third parties . . 451 — — — 451 451
Trade and other payables to related parties . 58 — — — 58 58
Loans and borrowings . . . . . . . . . . . . . . . 1,320 570 2,637 602 5,129 4,263
Bonds outstanding. . . . . . . . . . . . . . . . . . 108 228 — — 336 336
1,937 798 2,637 602 5,974 5,108
Financial guarantees issued:
Maximum amount guaranteed . . . . . . . . . . 75 — — — 75 —
APPENDIX I ACCOUNTANTS’ REPORT
— I-114 —

31 December 2007Contractual undiscounted cash outflow
Within1 yearor on
demand
Morethan
1 yearbut less
than2 years
Morethan
2 yearsbut less
than5 years
Morethan
5 years TOTAL
Balancesheet
carryingamount
USDmillion
USDmillion
USDmillion
USDmillion
USDmillion
USDmillion
Trade and other payables to third parties . . 1,124 — — — 1,124 1,124
Trade and other payables to related parties . 340 — — — 340 340
Loans and borrowings . . . . . . . . . . . . . . . 2,234 1,535 4,622 1,400 9,791 8,437
Bonds outstanding. . . . . . . . . . . . . . . . . . 245 — — — 245 245
3,943 1,535 4,622 1,400 11,500 10,146
Financial guarantees issued:
Maximum amount guaranteed . . . . . . . . . . 260 — — — 260 —
31 December 2008Contractual undiscounted cash outflow
Within1 yearor on
demand
Morethan
1 yearbut less
than2 years
Morethan
2 yearsbut less
than5 years
Morethan
5 years TOTAL
Balancesheet
carryingamount
USDmillion
USDmillion
USDmillion
USDmillion
USDmillion
USDmillion
Trade and other payables to third parties . . 1,115 — — — 1,115 1,115
Trade and other payables to related parties . 374 — — — 374 374
Loans and borrowings . . . . . . . . . . . . . . . 13,971 — — — 13,971 13,971
Deferred consideration. . . . . . . . . . . . . . . 2,782 — — — 2,782 2,782
18,242 — — — 18,242 18,242
Financial guarantees issued:
Maximum amount guaranteed . . . . . . . . . . 260 — — — 260 —
APPENDIX I ACCOUNTANTS’ REPORT
— I-115 —
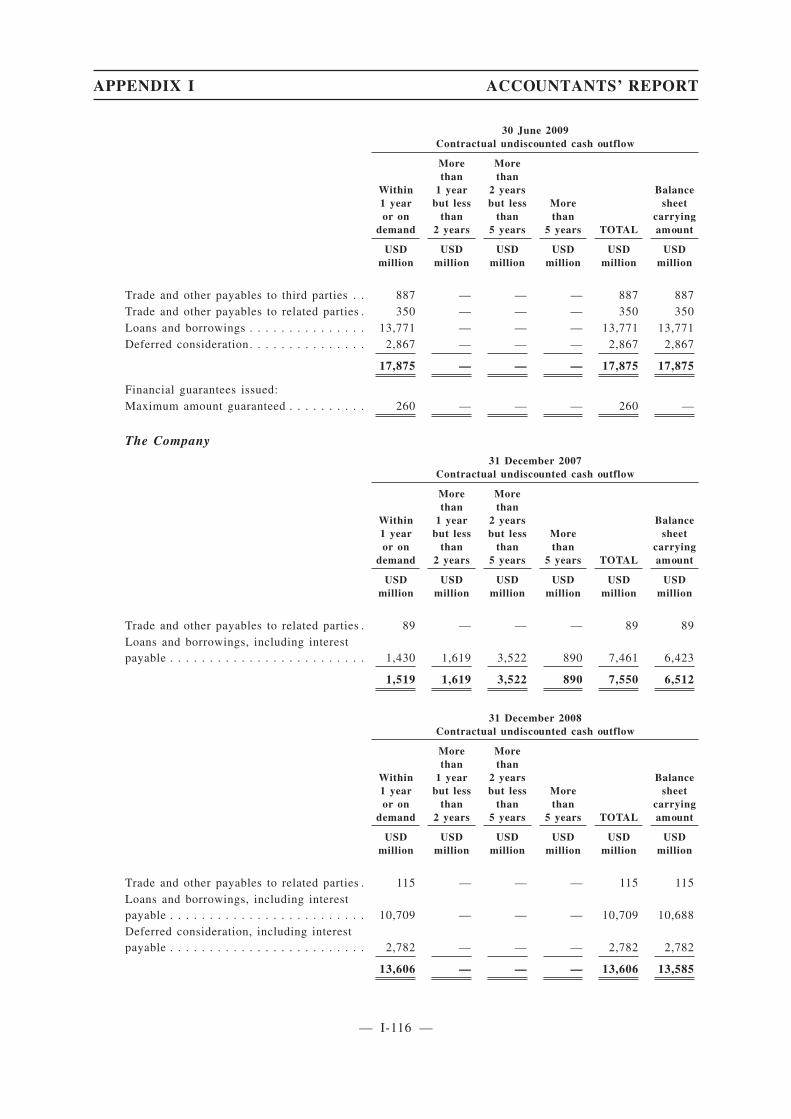
30 June 2009Contractual undiscounted cash outflow
Within1 yearor on
demand
Morethan
1 yearbut less
than2 years
Morethan
2 yearsbut less
than5 years
Morethan
5 years TOTAL
Balancesheet
carryingamount
USDmillion
USDmillion
USDmillion
USDmillion
USDmillion
USDmillion
Trade and other payables to third parties . . 887 — — — 887 887Trade and other payables to related parties . 350 — — — 350 350Loans and borrowings . . . . . . . . . . . . . . . 13,771 — — — 13,771 13,771Deferred consideration. . . . . . . . . . . . . . . 2,867 — — — 2,867 2,867
17,875 — — — 17,875 17,875
Financial guarantees issued:Maximum amount guaranteed . . . . . . . . . . 260 — — — 260 —
The Company
31 December 2007Contractual undiscounted cash outflow
Within1 yearor on
demand
Morethan
1 yearbut less
than2 years
Morethan
2 yearsbut less
than5 years
Morethan
5 years TOTAL
Balancesheet
carryingamount
USDmillion
USDmillion
USDmillion
USDmillion
USDmillion
USDmillion
Trade and other payables to related parties . 89 — — — 89 89Loans and borrowings, including interestpayable . . . . . . . . . . . . . . . . . . . . . . . . . 1,430 1,619 3,522 890 7,461 6,423
1,519 1,619 3,522 890 7,550 6,512
31 December 2008Contractual undiscounted cash outflow
Within1 yearor on
demand
Morethan
1 yearbut less
than2 years
Morethan
2 yearsbut less
than5 years
Morethan
5 years TOTAL
Balancesheet
carryingamount
USDmillion
USDmillion
USDmillion
USDmillion
USDmillion
USDmillion
Trade and other payables to related parties . 115 — — — 115 115Loans and borrowings, including interestpayable . . . . . . . . . . . . . . . . . . . . . . . . . 10,709 — — — 10,709 10,688Deferred consideration, including interestpayable . . . . . . . . . . . . . . . . . . . . . . . . . 2,782 — — — 2,782 2,782
13,606 — — — 13,606 13,585
APPENDIX I ACCOUNTANTS’ REPORT
— I-116 —

30 June 2009Contractual undiscounted cash outflow
Within1 yearor on
demand
Morethan
1 yearbut less
than2 years
Morethan
2 yearsbut less
than5 years
Morethan
5 years TOTAL
Balancesheet
carryingamount
USDmillion
USDmillion
USDmillion
USDmillion
USDmillion
USDmillion
Trade and other payables to related parties . 186 — — — 186 186
Loans and borrowings, including interestpayable . . . . . . . . . . . . . . . . . . . . . . . . . 10,525 — — — 10,525 10,507
Deferred consideration, including interestpayable . . . . . . . . . . . . . . . . . . . . . . . . . 2,867 — — — 2,867 2,867
13,578 — — — 13,578 13,560
(e) Credit risk
The Group trades only with recognised, creditworthy third parties. It is the Group’s policy thatall customers who wish to trade on credit terms are subject to credit verification procedures. Themajority of the Group’s third party trade receivables represent balances with the world leadinginternational corporations operating in the metals industry. In addition, receivable balances aremonitored on an ongoing basis with the result that the Group’s exposure to bad debts is notsignificant. Goods are normally sold subject to retention of title clauses, so that in the event ofnon-payment the Group may have a secured claim. The Group does not require collateral inrespect of trade and other receivables. The details of impairment of trade and other receivablesare disclosed in note 25. The extent of the Group’s credit exposure is represented by theaggregate balance of financial assets and financial guarantees given. Information on financialguarantees is disclosed in note 33(f).
At 31 December 2006, 2007, 2008 and 30 June 2009, the Group has certain concentration ofcredit risk as 0.9%, 2.8%, 1.7% and 8.5% of the total trade and other receivables were due fromthe Group’s largest customer and 13.5%, 23.7%, 9.9% and 9.7% of the total trade and otherreceivables were due from the Group’s five largest customers respectively.
With respect to credit risk arising from guarantees the Group’s policy is to provide financialguarantees only to wholly-owned subsidiaries and associates. The details of the guaranteesoutstanding are disclosed in note 33(f).
There are no significant concentrations of credit risk within the Group.
(f) Capital risk management
The Group’s objectives when managing capital are to safeguard the Group’s ability to continueas a going concern in order to provide returns for shareholders and benefits for otherstakeholders and to maintain an optimal capital structure to reduce the cost of capital.
APPENDIX I ACCOUNTANTS’ REPORT
— I-117 —

The Group manages its capital structure and makes adjustments to it, in light of changes ineconomic conditions. To maintain or adjust the capital structure, the Group may adjust theamount of dividends paid to shareholders, return capital to shareholders, issue new shares or sellassets to reduce debt.
The Board’s policy is to maintain a strong capital base so as to maintain investor, creditor andmarket confidence and to sustain future development of the business. The Board of Directorsmonitors the return on capital, which the Group defines as net operating income divided by totalshareholders’ equity, excluding non-redeemable preference shares and non-controlling interests.The Board of Directors also monitors the level of dividends to ordinary shareholders.
The Board seeks to maintain a balance between higher returns that might be possible with higherlevels of borrowings and the advantages and security afforded by a sound capital position.
There were no changes in the Group’s approach to capital management during the year.
The Company and its subsidiaries were subject to externally imposed capital requirements in allof the years and periods presented within this report. Please refer to notes 2(d) and 38(b).
33 Commitments
(a) Capital commitments
In March 2000, the Group acquired a 30% interest in the Nikolaev Alumina Plant in an auction.In accordance with the original agreement with the State Property Fund of Ukraine the Groupwas obliged to construct a primary aluminium plant with the production capacity at a level of100,000 metric tonnes of primary aluminium. In August 2004, the Group re-negotiated the termsof the agreement with the State Property Fund of Ukraine. In accordance with the revisedagreement the Group is obliged to increase the production capacity of Nikolaev Alumina Plantup to 1,600,000 metric tonnes per year. The revised agreement nullifies the requirementstipulated in the original agreement to construct a primary aluminium plant. The amount of thecapital commitment cannot be estimated reliably.
In May 2006, the Group signed a Co-operation agreement with OJSC RusHydro and RAO UES.Under this Co-operation agreement OJSC RusHydro and the Group jointly committed to financethe construction and future operating of BoGES and an aluminium plant, the planned maincustomer of the hydropower station. The parties established two joint companies with 50:50ownership, into which the Group is committed to invest USD2,303 million by the end of 2012.As at 30 June 2009, the outstanding commitment of the Group for the construction of thealuminum plant was approximately USD1,277 million to be committed by the end of 2011 andthe outstanding commitment for the hydropower station was USD448 million to be committed bythe end of 2012.
At the end of 2008 due to economic downturn, the parties have postponed the completion dateof aluminium plant from the end of 2011 to the end of 2014.
The Group has entered into contracts that result in contractual obligations primarily relating tovarious construction and capital repair works. The commitments at 31 December 2006, 2007 and2008 and 30 June 2009 approximated nil, USD905 million, USD690 million and USD615 millionrespectively. These commitments are due over a number of years.
APPENDIX I ACCOUNTANTS’ REPORT
— I-118 —
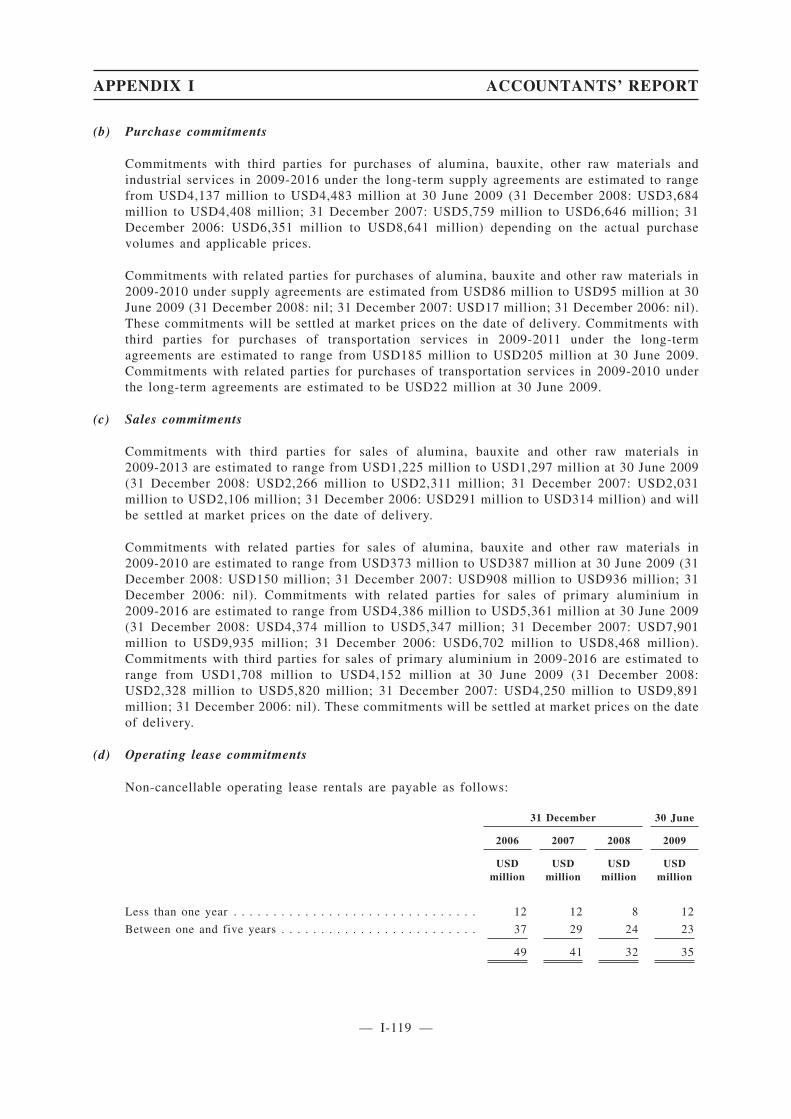
(b) Purchase commitments
Commitments with third parties for purchases of alumina, bauxite, other raw materials andindustrial services in 2009-2016 under the long-term supply agreements are estimated to rangefrom USD4,137 million to USD4,483 million at 30 June 2009 (31 December 2008: USD3,684million to USD4,408 million; 31 December 2007: USD5,759 million to USD6,646 million; 31December 2006: USD6,351 million to USD8,641 million) depending on the actual purchasevolumes and applicable prices.
Commitments with related parties for purchases of alumina, bauxite and other raw materials in2009-2010 under supply agreements are estimated from USD86 million to USD95 million at 30June 2009 (31 December 2008: nil; 31 December 2007: USD17 million; 31 December 2006: nil).These commitments will be settled at market prices on the date of delivery. Commitments withthird parties for purchases of transportation services in 2009-2011 under the long-termagreements are estimated to range from USD185 million to USD205 million at 30 June 2009.Commitments with related parties for purchases of transportation services in 2009-2010 underthe long-term agreements are estimated to be USD22 million at 30 June 2009.
(c) Sales commitments
Commitments with third parties for sales of alumina, bauxite and other raw materials in2009-2013 are estimated to range from USD1,225 million to USD1,297 million at 30 June 2009(31 December 2008: USD2,266 million to USD2,311 million; 31 December 2007: USD2,031million to USD2,106 million; 31 December 2006: USD291 million to USD314 million) and willbe settled at market prices on the date of delivery.
Commitments with related parties for sales of alumina, bauxite and other raw materials in2009-2010 are estimated to range from USD373 million to USD387 million at 30 June 2009 (31December 2008: USD150 million; 31 December 2007: USD908 million to USD936 million; 31December 2006: nil). Commitments with related parties for sales of primary aluminium in2009-2016 are estimated to range from USD4,386 million to USD5,361 million at 30 June 2009(31 December 2008: USD4,374 million to USD5,347 million; 31 December 2007: USD7,901million to USD9,935 million; 31 December 2006: USD6,702 million to USD8,468 million).Commitments with third parties for sales of primary aluminium in 2009-2016 are estimated torange from USD1,708 million to USD4,152 million at 30 June 2009 (31 December 2008:USD2,328 million to USD5,820 million; 31 December 2007: USD4,250 million to USD9,891million; 31 December 2006: nil). These commitments will be settled at market prices on the dateof delivery.
(d) Operating lease commitments
Non-cancellable operating lease rentals are payable as follows:
31 December 30 June
2006 2007 2008 2009
USDmillion
USDmillion
USDmillion
USDmillion
Less than one year . . . . . . . . . . . . . . . . . . . . . . . . . . . . . . . 12 12 8 12
Between one and five years . . . . . . . . . . . . . . . . . . . . . . . . . 37 29 24 23
49 41 32 35
APPENDIX I ACCOUNTANTS’ REPORT
— I-119 —

(e) Social commitments
The Group contributes to the maintenance and upkeep of the local infrastructure and the welfareof its employees, including contributions toward the development and maintenance of housing,hospitals, transport services, recreation and other social needs of the regions of the RussianFederation where the Group’s production entities are located. The funding of such assistance isperiodically determined by management and is appropriately capitalised or expensed as incurred.
(f) Guarantees
The Group is a guarantor of indebtedness of several non-Group controlling shareholder relatedentities. At 31 December 2006, 2007 and 2008 and 30 June 2009, the Group, either directly orindirectly, has guaranteed promissory notes payable of USD40 million, USD54 million, USD42million and USD39 million respectively.
In addition, at 31 December 2006, 2007 and 2008 and 30 June 2009, the Group guaranteedindebtedness of the joint business between RUSAL and OJSC RusHydro related to theBoguchansk project (refer to note 20) in an amount of USD260 million. In addition, at 31December 2006 the Group guaranteed indebtedness of a joint venture between RUSAL andSUAL related to Sual Komi BV in amount of USD75 million. No amount has been accrued in thisFinancial Information for the Group’s obligation under these guarantees as the projectedeconomic outflows from such guarantees are considered to be immaterial.
34 Contingencies
(a) Taxation
Russian tax, currency and customs legislation is subject to varying interpretations, and changes,which can occur frequently. Management’s interpretation of such legislation as applied to thetransactions and activities of the Group may be challenged by the relevant local, regional andfederal authorities. Notably recent developments in the Russian environment suggest that theauthorities in this country are becoming more active in seeking to enforce, through the Russiancourt system, interpretations of the tax legislation, in particular in relation to the use of certaincommercial trading structures, which may be selective for particular tax payers and different tothe authorities’ previous interpretations or practices. Different and selective interpretations oftax regulations by various government authorities and inconsistent enforcement create furtheruncertainties in the taxation environment in the Russian Federation.
Tax declarations, together with related documentation, are subject to review and investigation bya number of authorities, each of which may impose fines, penalties and interest charges. Fiscalperiods remain open to review by the authorities for three calendar years preceding the year ofreview (one year in the case of customs). Under certain circumstances reviews may cover longerperiods. In addition, in some instances, new tax regulations effectively have been givenretroactive effect. Additional taxes, penalties and interest which may be material to the financialposition of the taxpayers may be assessed in the Russian Federation as a result of such reviews.
In addition to the amounts of income tax the Group has provided (refer to note 30), there arecertain tax positions taken by the Group where it is reasonably possible (though less than 50%likely) that additional tax may be payable upon examination by the tax authorities or inconnection with ongoing disputes with tax authorities. The Group’s best estimate of theaggregate maximum of additional amounts that it is reasonably possible may become payable ifthese tax positions were not sustained at 31 December 2006, 2007 and 2008 and 30 June 2009is USD83 million, USD349 million, USD588 million and USD516 million respectively.
APPENDIX I ACCOUNTANTS’ REPORT
— I-120 —
3rd Sch23

The Group’s major trading companies are incorporated in low tax jurisdictions outside Russiaand a significant portion of the Group’s profit is realised by these companies. Managementbelieves that these trading companies are not subject to taxes outside their countries ofincorporation and that the commercial terms of transactions between them and other Groupcompanies are acceptable to the relevant tax authorities. This Financial Information has beenprepared on this basis. However, as these companies are involved in a significant level of crossborder activities, there is a risk that Russian or other tax authorities may challenge the treatmentof cross-border activities and assess additional tax charges. It is not possible to quantify thefinancial exposure resulting from this risk.
Estimating additional tax which may become payable is inherently imprecise. It is, therefore,possible that the amount ultimately payable may exceed the Group’s best estimate of themaximum reasonably possible liability; however, the Group considers that the likelihood thatthis will be the case is remote.
(b) Environmental contingencies
The Group and its predecessor entities have operated in the Russian Federation, Ukraine,Jamaica, Guyana, Republic of Guinea and the European Union for many years and certainenvironmental problems have developed. Governmental authorities are continually consideringenvironmental regulations and their enforcement and the Group periodically evaluates itsobligations related thereto. As obligations are determined, they are recognised immediately. Theoutcome of environmental liabilities under proposed or any future legislation, or as a result ofstricter enforcement of existing legislation, cannot reasonably be estimated. Under current levelsof enforcement of existing legislation, management believes there are no possible liabilities,which will have a material adverse effect on the financial position or the operating results of theGroup. However, the Group anticipates undertaking significant capital projects to improve itsfuture environmental performance and to bring it into full compliance with current legislation.
(c) Legal contingencies
The Group’s business activities expose it to a variety of lawsuits and claims which are monitored,assessed and contested on the ongoing basis. Where management believes that a lawsuit oranother claim would result in the outflow of the economic benefits for the Group, a best estimateof such outflow is included in provisions in the Financial Information (see note 30(c)).
In May 2009, the Government of the Republic of Guinea filed a claim against one of the Group’ssubsidiaries for USD1,000 million contesting the terms of privatisation of the Group’ssubsidiaries in Guinea. Management believes that the claim has no merit and the risk of any cashoutflow in connection with this claim is low and, therefore, no provision has been recorded inthis regard in the Financial Information.
During the six months ended 30 June 2009 several suppliers of the Group obtained orders in theU.S. Federal Court to freeze the movement of funds passing to or from the Group’s major trader,RTI Limited, through New York banks in support of arbitration which was commenced againstthe Group. At the time of issuance of this Financial Information the orders outstanding amountto USD10 million (31 December 2008: USD53 million, 31 December 2007: nil, 31 December2006: nil).
APPENDIX I ACCOUNTANTS’ REPORT
— I-121 —
On 24 November 2006 a claim was issued on behalf of Mr. Michael Cherney (“Mr. Cherney”)against Mr. Oleg Deripaska (“Mr. Deripaska”), the controlling shareholder of En+ GroupLimited. Neither the Company nor any of its subsidiaries is a party to this dispute which isentirely between two individuals, Mr. Cherney and Mr. Deripaska. The Company has not hadaccess to non-public information about the case and is not privy to the litigation strategy of eitherparty or the prospects of settlement. The claim relates to the alleged breach or repudiation by Mr.Deripaska of certain alleged contractual commitments to sell for Mr. Cherney’s benefit 20% ofRussian Aluminium (“RA”), an entity that the claim does not formally identify, but which maybe Rusal Limited, now a wholly-owned direct subsidiary of the Company.
Proceedings with respect to the merits of the claim have not yet commenced. At present, thereis considerable uncertainty as to the possible scope and the potential outcomes in the case andhow, if at all, the Company and/or its subsidiaries and/or its or their respective assets might beaffected by any decision against Mr. Deripaska. However since neither the Company nor any ofits subsidiaries or investees, nor any direct shareholders in the Company, is currently a party inthis case and Mr. Deripaska has informed the Company that he strongly denies and willvigorously resist Mr. Cherney’s claim, the Company believes that the risk of outflow of anysignificant economic benefits or any significant adverse impact on the Group’s financial positionor results of its operations as a result of this claim is low.
(d) Risks and concentrations
A description of the Group’s major products and its principal markets, as well as exposure toforeign currency risks are provided in note 1 “Background” and note 3 “Significant accountingpolicies”. The price at which the Group can sell its products is one of the primary drivers of theGroup’s revenue. The Group’s prices are largely determined by prices set in the internationalmarket. The Group’s future profitability and overall performance is strongly affected by the priceof primary aluminium that is set in the international market.
(e) Insurance
The insurance industry in the Russian Federation is in a developing stage and many forms ofinsurance protection common in other parts of the world are not yet generally available. TheGroup does not have full coverage for its plant facilities, business interruption or third partyliability in respect of property or environmental damage arising from accidents on Groupproperties or relating to Group operations. Until the Group obtains adequate insurance coverage,there is a risk that the loss or destruction of certain assets could have a material adverse effecton the Group’s operations and financial position.
APPENDIX I ACCOUNTANTS’ REPORT
— I-122 —

35 Related party transactions
The Group’s parent company is En+ Group Limited which holds 56.76% of the Company’s shareswith SUAL Partners Limited, Onexim Holdings Limited and Amokenga Holdings Limitedholding 18.92%, 14.00% and 10.32% of the Company’s shares, respectively.
(a) Transactions with management and close family members
Management remuneration
Key management received the following remuneration, which is included in personnel costs(refer to note 11(a)):
Year ended 31 DecemberSix months
ended 30 June
2006 2007 2008 2008 2009
USDmillion
USDmillion
USDmillion
USDmillion
USDmillion
(unaudited)
Salaries and bonuses . . . . . . . . . . . . . . . . . . . . . . 28 42 50 38 7
Contributions to State pension fund . . . . . . . . . . . . . 1 1 1 1 —
29 43 51 39 7
(b) Transactions with associates
Sales to associates are disclosed in note 7, trade receivables from associates are disclosed in note25 and trade payables to associates are disclosed in note 31.
(c) Transactions with other related parties
The Group transacts with other related parties, the majority of which are entities under commoncontrol with the Group or under the control of SUAL Partners Limited or its controllingshareholders or Glencore International AG or entities under its control or Onexim HoldingsLimited or its controlling shareholders.
Sales to related parties for the year are disclosed in note 7, trade receivables from related partiesare disclosed in note 25, cash and cash equivalents are disclosed in note 26, trade and otherpayables to related parties are disclosed in note 31, commitments to/by related parties aredisclosed in note 33 and other transactions with shareholders are disclosed in note 27.
APPENDIX I ACCOUNTANTS’ REPORT
— I-123 —

The Group
Purchases of raw materials and services from related parties and interest income and expense arerecurring and for the year were as follows:
Year ended 31 DecemberSix months
ended 30 June
2006 2007 2008 2008 2009
USDmillion
USDmillion
USDmillion
USDmillion
USDmillion
(unaudited)
Purchases of raw materials — companies undercommon control . . . . . . . . . . . . . . . . . . . . . . . . . . 103 611 160 108 28
Purchases of alumina, bauxite and other rawmaterials — companies capable of exertingsignificant influence . . . . . . . . . . . . . . . . . . . . . . . — 572 1,009 459 104
Purchases of raw materials — associates . . . . . . . . . 44 31 96 95 —
Energy costs — companies under common control . . . 77 229 373 139 147
Energy costs — companies capable of exertingsignificant influence . . . . . . . . . . . . . . . . . . . . . . . — 238 184 108 14
Other costs — companies under common control . . . . — 1 — — —
Other costs — companies capable of exertingsignificant influence . . . . . . . . . . . . . . . . . . . . . . . — 1 4 103 —
Other costs — associates . . . . . . . . . . . . . . . . . . . . 39 105 126 60 58
263 1,788 1,952 1,072 351
The Company
31 December 30 June
2006 2007 2008 2009
USDmillion
USDmillion
USDmillion
USDmillion
Investments in subsidiaries . . . . . . . . . . . . . . . . . . . . . . . . . . — 9,651 13,533 13,506
Loans to group companies . . . . . . . . . . . . . . . . . . . . . . . . . . — 3,351 2,957 3,001
Loans and borrowings from related parties . . . . . . . . . . . . . . . — 540 2,701 2,701
Trade and other payables to related parties . . . . . . . . . . . . . . . — 89 115 186
Loans given to Group companies are unsecured, current or payable on demand and bear interestat rates ranging from 0% to Libor + 0.9% to 4.5% per annum.
(d) Pricing policies
Prices for transactions with related parties are determined on a case by case basis but are notnecessarily at arm’s length.
The Group has entered into three categories of related-party transactions: (i) those entered intoon an arm’s length basis (such as purchases of electricity), (ii) those entered into on non-arm’slength terms but as part of a wider deal resulting from arm’s length negotiations with unrelatedthird parties, and (iii) transactions unique to the Group and the counterparty.
APPENDIX I ACCOUNTANTS’ REPORT
— I-124 —
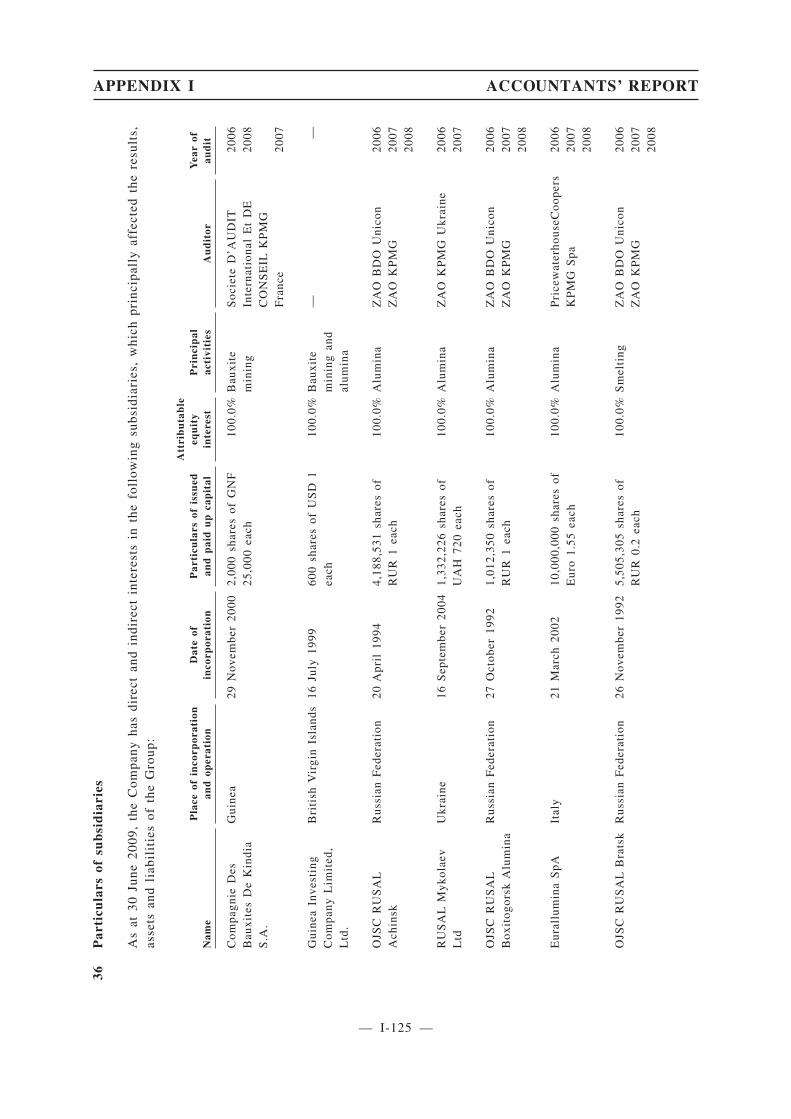
36P
arti
cula
rsof
sub
sid
iari
es
As
at30
June
2009
,th
eC
ompa
nyha
sdi
rect
and
indi
rect
inte
rest
sin
the
foll
owin
gsu
bsid
iari
es,
whi
chpr
inci
pall
yaf
fect
edth
ere
sult
s,as
sets
and
liab
ilit
ies
ofth
eG
roup
:
Nam
eP
lace
ofin
corp
orat
ion
and
oper
atio
nD
ate
ofin
corp
orat
ion
Par
ticu
lars
ofis
sued
and
pai
du
pca
pit
al
Att
rib
uta
ble
equ
ity
inte
rest
Pri
nci
pal
acti
viti
esA
ud
itor
Yea
rof
aud
it
Com
pagn
ieD
esB
auxi
tes
De
Kin
dia
S.A
.
Gui
nea
29N
ovem
ber
2000
2,00
0sh
ares
ofG
NF
25,0
00ea
ch10
0.0%
Bau
xite
min
ing
Soc
iete
D’A
UD
ITIn
tern
atio
nal
Et
DE
CO
NS
EIL
KP
MG
Fra
nce
2006
2008
2007
Gui
nea
Inve
stin
gC
ompa
nyL
imit
ed,
Ltd
.
Bri
tish
Vir
gin
Isla
nds
16Ju
ly19
9960
0sh
ares
ofU
SD
1ea
ch10
0.0%
Bau
xite
min
ing
and
alum
ina
——
OJS
CR
US
AL
Ach
insk
Rus
sian
Fed
erat
ion
20A
pril
1994
4,18
8,53
1sh
ares
ofR
UR
1ea
ch10
0.0%
Alu
min
aZ
AO
BD
OU
nico
nZ
AO
KP
MG
2006
2007
2008
RU
SA
LM
ykol
aev
Ltd
Ukr
aine
16S
epte
mbe
r20
041,
332,
226
shar
esof
UA
H72
0ea
ch10
0.0%
Alu
min
aZ
AO
KP
MG
Ukr
aine
2006
2007
OJS
CR
US
AL
Box
itog
orsk
Alu
min
aR
ussi
anF
eder
atio
n27
Oct
ober
1992
1,01
2,35
0sh
ares
ofR
UR
1ea
ch10
0.0%
Alu
min
aZ
AO
BD
OU
nico
nZ
AO
KP
MG
2006
2007
2008
Eur
allu
min
aS
pAIt
aly
21M
arch
2002
10,0
00,0
00sh
ares
ofE
uro
1.55
each
100.
0%A
lum
ina
Pri
cew
ater
hous
eCoo
pers
KP
MG
Spa
2006
2007
2008
OJS
CR
US
AL
Bra
tsk
Rus
sian
Fed
erat
ion
26N
ovem
ber
1992
5,50
5,30
5sh
ares
ofR
UR
0.2
each
100.
0%S
mel
ting
ZA
OB
DO
Uni
con
ZA
OK
PM
G20
0620
0720
08
APPENDIX I ACCOUNTANTS’ REPORT
— I-125 —
App1A-29(1)

Nam
eP
lace
ofin
corp
orat
ion
and
oper
atio
nD
ate
ofin
corp
orat
ion
Par
ticu
lars
ofis
sued
and
pai
du
pca
pit
al
Att
rib
uta
ble
equ
ity
inte
rest
Pri
nci
pal
acti
viti
esA
ud
itor
Yea
rof
aud
it
OJS
CR
US
AL
Kra
snoy
arsk
Rus
sian
Fed
erat
ion
16N
ovem
ber
1992
85,4
78,5
36sh
ares
ofR
UR
20ea
ch10
0.0%
Sm
elti
ngZ
AO
BD
OU
nico
nZ
AO
KP
MG
2006
2007
2008
OJS
CR
US
AL
Nov
okuz
nets
kR
ussi
anF
eder
atio
n26
June
1996
53,9
97,1
70sh
ares
ofR
UR
0.1
each
100.
0%S
mel
ting
ZA
OB
DO
Uni
con
ZA
OK
PM
G20
0620
0720
08
OJS
CR
US
AL
Say
anog
orsk
Rus
sian
Fed
erat
ion
29Ju
ly19
9959
,902
,661
,099
shar
esof
RU
R0.
068
each
100.
0%S
mel
ting
ZA
OB
DO
Uni
con
ZA
OK
PM
G20
0620
0720
08
Kha
kas
Alu
min
ium
Sm
elte
rL
tdR
ussi
anF
eder
atio
n23
July
2003
char
ter
fund
ofR
UR
10,0
77,5
94,5
15.0
710
0.0%
Sm
elti
ngZ
AO
BD
OU
nico
nZ
AO
KP
MG
2006
2007
2008
CJS
CA
luco
m-T
aish
etR
ussi
anF
eder
atio
n18
Sep
tem
ber
2000
8,80
4sh
ares
ofR
UR
15,0
00ea
ch10
0.0%
Sm
elti
ngZ
AO
BD
OU
nico
nZ
AO
KP
MG
2006
2007
RU
SA
LR
esal
Ltd
Rus
sian
Fed
erat
ion
15N
ovem
ber
1994
char
ter
fund
ofR
UR
27,9
51,2
17.2
910
0.0%
Pro
cess
ing
ZA
OB
DO
Uni
con
ZA
OK
PM
G20
0620
0720
08
OJS
CR
US
AL
SA
YA
NA
LR
ussi
anF
eder
atio
n29
Dec
embe
r20
0159
,902
,661
,099
shar
esof
RU
R0.
006
each
100.
0%F
oil
ZA
OB
DO
Uni
con
ZA
OK
PM
G20
0620
0720
08
CJS
CR
US
AL
AR
ME
NA
LA
rmen
ia17
May
2000
3,14
0,70
0sh
ares
ofA
MD
1,00
0ea
ch10
0.0%
Foi
lK
PM
GA
rmen
iaC
JSC
2006
2007
2008
RU
S-E
ngin
eeri
ngL
tdR
ussi
anF
eder
atio
n18
Aug
ust
2005
char
ter
fund
ofR
UR
2,02
6,20
0,13
6.37
100.
0%R
epai
rsan
dm
aint
enan
ceZ
AO
BD
OU
nico
nZ
AO
KP
MG
2006
2007
2008
APPENDIX I ACCOUNTANTS’ REPORT
— I-126 —

Nam
eP
lace
ofin
corp
orat
ion
and
oper
atio
nD
ate
ofin
corp
orat
ion
Par
ticu
lars
ofis
sued
and
pai
du
pca
pit
al
Att
rib
uta
ble
equ
ity
inte
rest
Pri
nci
pal
acti
viti
esA
ud
itor
Yea
rof
aud
it
OJS
CR
ussi
anA
lum
iniu
mR
ussi
anF
eder
atio
n25
Dec
embe
r20
0023
,124
,000
,000
shar
esof
RU
R1
each
100.
0%H
oldi
ngco
mpa
nyZ
AO
BD
OU
nico
nZ
AO
KP
MG
2006
2007
2008
Inve
stm
ent
and
man
agem
ent
Ltd
Rus
sian
Fed
erat
ion
6D
ecem
ber
2002
char
ter
fund
ofR
UR
881,
939,
909.
7510
0.0%
Man
agem
ent
com
pany
ZA
OB
DO
Uni
con
ZA
OK
PM
G20
0620
0720
08
Rus
alG
loba
lM
anag
emen
tB
.V.
Rus
sian
Fed
erat
ion
8M
arch
2001
char
ter
fund
ofR
UR
50,0
0010
0.0%
Man
agem
ent
com
pany
KP
MG
Net
herl
ands
2007
2008
OJS
CU
nite
dC
ompa
nyR
US
AL
Tra
ding
Hou
se
Rus
sian
Fed
erat
ion
15M
arch
2000
163,
660
shar
esof
RU
R10
0ea
ch10
0.0%
Tra
ding
ZA
OB
DO
Uni
con
ZA
OK
PM
G20
0620
0720
08
Rus
alA
mer
ica
Cor
p.U
SA
29M
arch
1999
1,00
0sh
ares
ofU
SD
0.01
each
100.
0%T
radi
ngK
PM
GL
LP
2006
2007
RS
Inte
rnat
iona
lG
mbH
Sw
itze
rlan
d22
May
2007
1sh
are
wit
hno
min
alva
lue
ofC
HF
20,0
0010
0.0%
Tra
ding
——
Rus
alM
arke
ting
Gm
bHS
wit
zerl
and
22M
ay20
07C
apit
alqu
ota
ofC
HF
2,00
0,00
010
0.0%
Tra
ding
——
RT
IL
imit
edJe
rsey
27O
ctob
er20
062
shar
esof
US
D1
each
100.
0%T
radi
ngZ
AO
KP
MG
2006
2007
2008
Alu
min
a&
Bau
xite
Com
pany
Lim
ited
Bri
tish
Vir
gin
Isla
nds
3M
arch
2004
50,0
00sh
ares
ofU
SD
1ea
ch10
0.0%
Tra
ding
ZA
OK
PM
G20
0620
0720
08
APPENDIX I ACCOUNTANTS’ REPORT
— I-127 —

Nam
eP
lace
ofin
corp
orat
ion
and
oper
atio
nD
ate
ofin
corp
orat
ion
Par
ticu
lars
ofis
sued
and
pai
du
pca
pit
al
Att
rib
uta
ble
equ
ity
inte
rest
Pri
nci
pal
acti
viti
esA
ud
itor
Yea
rof
aud
it
CJS
CK
omi
Alu
min
iiR
ussi
anF
eder
atio
n13
Feb
ruar
y20
031,
703,
000,
000
shar
esof
RU
R1
each
100.
0%A
lum
ina
Ern
st&
You
ngZ
AO
KP
MG
2006
2007
2008
OJS
CB
auxi
te-T
iman
aR
ussi
anF
eder
atio
n29
Dec
embe
r19
9244
,500
,000
shar
esof
RU
R10
each
80.0
%B
auxi
tem
inin
gE
rnst
&Y
oung
ZA
OK
PM
G20
0620
0720
08
OJS
CS
ever
o-U
rals
kyB
auxi
teM
ine
Rus
sian
Fed
erat
ion
24O
ctob
er19
962,
386,
254
shar
esof
RU
R27
5.85
each
100.
0%B
auxi
tem
inin
gE
rnst
&Y
oung
ZA
OK
PM
G20
0620
0720
08
OJS
CS
UA
LR
ussi
anF
eder
atio
n26
Sep
tem
ber
1996
2,54
2,94
1,93
2sh
ares
ofR
UR
1ea
ch10
0.0%
Pri
mar
yal
umin
uman
dal
umin
apr
oduc
tion
Ern
st&
You
ngZ
AO
KP
MG
2006
2007
2008
OJS
CZ
apor
ozhy
eA
lum
inum
Com
bine
(“Z
AL
K”)
Ukr
aine
30S
epte
mbe
r19
9462
2,72
9,12
0sh
ares
ofR
UR
0.25
each
98.0
%P
rim
ary
alum
inum
and
alum
ina
prod
ucti
on
LL
CA
udit
Com
pany
“Kap
ital
”Z
AO
KP
MG
Ukr
aine
ZA
OB
DO
Uni
con
2006
2007
2008
SU
AL
-PM
LL
CR
ussi
anF
eder
atio
n20
Oct
ober
1998
char
ter
fund
ofR
UR
56,3
00,9
5910
0.0%
Alu
min
umpo
wde
rspr
oduc
tion
OO
O“F
BK
”Z
AO
KP
MG
2006
2007
2008
CJS
CK
rem
niy
Rus
sian
Fed
erat
ion
3A
ugus
t19
9832
0,64
4sh
ares
ofR
UR
1,00
0ea
ch10
0.0%
Sil
icon
prod
ucti
onO
OO
“FB
K”
ZA
OK
PM
G20
0620
0720
08
SU
AL
-Kre
mni
y-U
ral
LL
CR
ussi
anF
eder
atio
n1
Mar
ch19
99ch
arte
rfu
ndof
RU
R8,
763,
098
100.
0%S
ilic
onpr
oduc
tion
Ern
st&
You
ngZ
AO
KP
MG
2006
2007
2008
APPENDIX I ACCOUNTANTS’ REPORT
— I-128 —
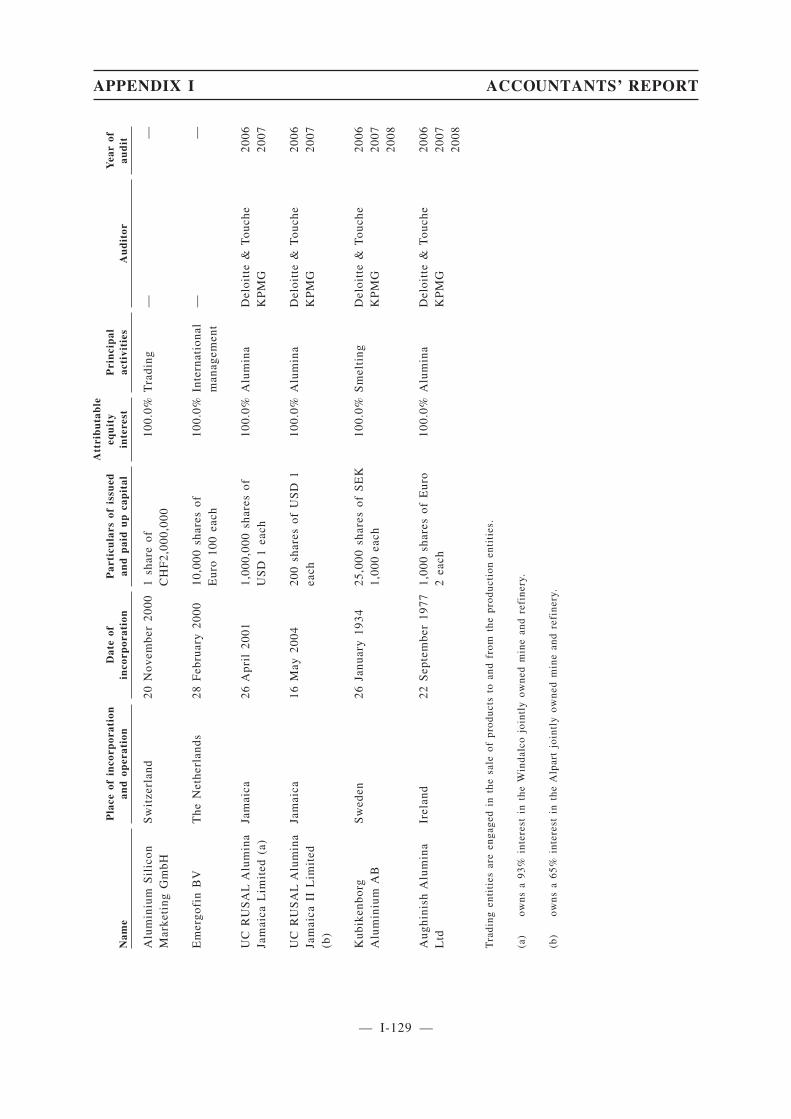
Nam
eP
lace
ofin
corp
orat
ion
and
oper
atio
nD
ate
ofin
corp
orat
ion
Par
ticu
lars
ofis
sued
and
pai
du
pca
pit
al
Att
rib
uta
ble
equ
ity
inte
rest
Pri
nci
pal
acti
viti
esA
ud
itor
Yea
rof
aud
it
Alu
min
ium
Sil
icon
Mar
keti
ngG
mbH
Sw
itze
rlan
d20
Nov
embe
r20
001
shar
eof
CH
F2,
000,
000
100.
0%T
radi
ng—
—
Em
ergo
fin
BV
The
Net
herl
ands
28F
ebru
ary
2000
10,0
00sh
ares
ofE
uro
100
each
100.
0%In
tern
atio
nal
man
agem
ent
——
UC
RU
SA
LA
lum
ina
Jam
aica
Lim
ited
(a)
Jam
aica
26A
pril
2001
1,00
0,00
0sh
ares
ofU
SD
1ea
ch10
0.0%
Alu
min
aD
eloi
tte
&T
ouch
eK
PM
G20
0620
07
UC
RU
SA
LA
lum
ina
Jam
aica
IIL
imit
ed(b
)
Jam
aica
16M
ay20
0420
0sh
ares
ofU
SD
1ea
ch10
0.0%
Alu
min
aD
eloi
tte
&T
ouch
eK
PM
G20
0620
07
Kub
iken
borg
Alu
min
ium
AB
Sw
eden
26Ja
nuar
y19
3425
,000
shar
esof
SE
K1,
000
each
100.
0%S
mel
ting
Del
oitt
e&
Tou
che
KP
MG
2006
2007
2008
Aug
hini
shA
lum
ina
Ltd
Irel
and
22S
epte
mbe
r19
771,
000
shar
esof
Eur
o2
each
100.
0%A
lum
ina
Del
oitt
e&
Tou
che
KP
MG
2006
2007
2008
Tra
ding
enti
ties
are
enga
ged
inth
esa
leof
prod
ucts
toan
dfr
omth
epr
oduc
tion
enti
ties
.
(a)
owns
a93
%in
tere
stin
the
Win
dalc
ojo
intl
yow
ned
min
ean
dre
fine
ry.
(b)
owns
a65
%in
tere
stin
the
Alp
art
join
tly
owne
dm
ine
and
refi
nery
.
APPENDIX I ACCOUNTANTS’ REPORT
— I-129 —
37 Immediate and ultimate controlling party
At 30 June 2009, the directors consider the immediate parent of the Group to be En+ GroupLimited, which is incorporated in Jersey with its registered office at Whiteley Chambers, DonStreet, St. Helier, Jersey JE4 9WG. B-Finance Limited, the ultimate parent undertaking of theGroup, is incorporated in the British Virgin Islands and is ultimately controlled by a singleindividual, Mr. Oleg Deripaska. None of the entities produces financial statements available forpublic use.
38 Events subsequent to the balance sheet date
(a) Share capital and capitalisation issue
On 1 December 2009, the authorised share capital was increased from 11,628 to 13,500 ordinaryshares of USD1.00 each and on 7 December 2009, 742 new ordinary shares were allotted toOnexim.
On 24 December 2009, the entire authorised and issued share capital of the Company wassubdivided by the division of the nominal share capital of each ordinary share from USD1.00each to USD0.01 each thereby increasing the number of authorised ordinary shares from 13,500to 1,350,000 and the number of issued ordinary shares from 12,370 to 1,237,000.
Pursuant to the written resolutions of the Company’s shareholders on 26 December 2009, theauthorised share capital of the Company will increase from USD13,500, comprising 1,350,000ordinary shares of USD0.01 each, to USD200,000,000, comprising 20,000,000,000 ordinaryshares of USD0.01 each, in conjunction with the Global Offering.
Immediately following the capitalisation issue but excluding the shares to be issued inconjunction with the Global Offering, the number of issued ordinary shares will be13,500,000,000 shares.
(b) Debt restructuring
In December 2009, the Group completed restructuring negotiations with its lenders in order toestablish financial stability and to put the necessary arrangements in place to allow the Groupto meet its obligations when they fall due as part of ongoing operations. The restructuringarrangements contain a number of terms and conditions, including conditions subsequent (seebelow). As part of the debt restructuring, the Group entered into an international overrideagreement with its international lenders implementing the long-term restructuring of the Group’sdebt to the international lenders which became effective on 7 December 2009 with all conditionsprecedent having been satisfied by that date and signed amendments to the bilateral loanagreements with its Russian and Kazakh lenders providing for long-term restructuring of theseloans on similar terms, except in the case of the loan agreement with VEB, which was extendeduntil 29 October 2010.
APPENDIX I ACCOUNTANTS’ REPORT
— I-130 —
3rd Sch23
In addition, on 1 December 2009 the Group entered into an amendment agreement in relation toa stock purchase agreement between the Group, Onexim and certain other parties relating to theacquisition of shares in Norilsk Nickel, in order to restructure the outstanding deferredconsideration in the amount of USD2,700 million plus accrued interest. In accordance with theamendment agreement, on the date of the effectiveness of the international override agreementpart of the Group’s obligations were converted into ordinary shares of the Company representing6% of the Company’s share capital post conversion. In addition, USD880 million plus interestwill be settled on the terms similar to those agreed under the international override agreementand the accrued interest of USD226 million and a restructuring fee of USD49 million will be paidin cash. As part of this restructuring the original Option Deed was also further amended on thesame date to extend the period for completing an initial public offering from 15 November 2009to 31 December 2013.
The Group’s main purpose in designing the debt restructuring was to match its principalrepayment and interest payment obligations to its cash generating capacity in an appropriate way.The debt restructuring seeks to do this by: (1) deferring the maturity dates of the Group’sprincipal repayment obligations (and, in the case of Onexim, converting a substantial liabilityinto equity); (2) providing for earlier repayments of principal only out of excess cash flow andthe proceeds of asset disposals and equity and subordinated and other debt fund raisings; and (3)providing for the capitalisation of significant portions of the Group’s interest paymentobligations while its ratio of total net debt to Covenant EBITDA (as defined in the overrideagreement) is high.
The debt restructuring has the following principal consequences for the Group:
• it extends the maturity of the restructured debt to December 2013, except for the debt toVEB which is extended to 29 October 2010;
• it provides for interest (consisting of cash and payment-in-kind components) to be payablegenerally on a floating base rate plus a variable margin that is dependent upon leverage;
• it contains an obligation to use excess cash flow and net proceeds raised from assetdisposals, equity and subordinated and other debt fund raisings to repay outstandingindebtedness (and to sell shares in Norilsk Nickel in certain circumstances to repay the loanto VEB);
• it significantly limits the Group’s ability to incur additional indebtedness;
• it provides for the granting of additional security interests over assets of the Group; and
• it restricts dividends and capital expenditure.
The details of the principal restructuring terms are set out below:
The international and Russian and Kazakh override agreements impose certain obligations on theGroup during the override period (four years from override date as defined in the internationaloverride agreement) and harmonises the pricing and amortisation schedule of existing facilities.The international override agreement contains standard financial covenants, including themaintenance of specified ratios, such as free cashflow to net finance charges, total net debt toCovenant EBITDA and total net debt to equity (as defined in the international overrideagreement), tested on a quarterly basis, and a minimum cash balance at USD100 million at theend of each calendar month. The Company paid an upfront fee to the restructuring lenders,including 0.5% of the lenders’ exposure in cash and nominal strike warrants (“fee warrants”)entitling the restructuring lenders to 1% of the Company’s fully diluted share capital as at thedate of effectiveness of the international override agreement.
APPENDIX I ACCOUNTANTS’ REPORT
— I-131 —
In addition, the Group will be allowed to incur capital expenditure for maintenance within thelimits as specified in the international override agreement and will be prohibited from incurringcertain capital expenditure for development.
Margin
During the override period, the restructured debt bears interest at the currently applicable baserate (either LIBOR or Euribor depending on the denomination of the debt), plus a margin thatvaries depending on the ratio of total net debt to Covenant EBITDA (as defined in theinternational override agreement), and includes cash and payment-in-kind (“PIK”) components,as follows:
Ratio of total net debt to Covenant EBITDA Total margin Cash pay margin PIK margin
More than 15 . . . . . . . . . . . . . . . . . . . . . . . . 7.00% p.a. 1.75% p.a. 5.25% p.a.
7.5 to 15 . . . . . . . . . . . . . . . . . . . . . . . . . . . 5.50% p.a. 1.75% p.a. 3.75% p.a.
4.0 to 7.5 . . . . . . . . . . . . . . . . . . . . . . . . . . 4.50% p.a. 2.25% p.a. 2.25% p.a.
3.0 to 4.0 . . . . . . . . . . . . . . . . . . . . . . . . . . 4.00% p.a. 3.00% p.a. 1.00% p.a.
Less than 3.0 . . . . . . . . . . . . . . . . . . . . . . . . 3.50% p.a. 3.50% p.a. N/A
Until the first interest period commencing after receipt of audited consolidated financialstatements of the Group for the year ending 31 December 2009 the applicable total margin is setat 7.00% per annum, including a 1.75% per annum cash pay margin and a 5.25% per annum PIKmargin. If a material event of default (breach of conditions subsequent, payment default orfailure to meet event of default cumulative amount targets (as defined in the internationaloverride agreement)) has occurred, the applicable PIK margin will increase by 2% per annum,but so that the total margin does not exceed 7%.
Repayment
No fixed amortisation schedule applies during the override period, with all debt outstandingbecoming due at the end of the override period as referred to above. Following the overrideperiod, subject to certain conditions being met, the existing international lenders have agreed toprovide new debt facilities on certain agreed terms. The Company has the option to refinance anyindebtedness outstanding as at the end of the override period out of any other sources.
However, the net proceeds raised from asset disposals and equity, subordinated and other debtfund raisings (including the proceeds of the Global Offering) and excess cashflow (subject to theGroup being allowed to retain a USD400 million cash buffer) must be applied to repay theGroup’s outstanding indebtedness on a pro rata basis.
APPENDIX I ACCOUNTANTS’ REPORT
— I-132 —
Disposal and Equity Injection Undertakings, Debt Repayment Targets
The Company is obliged to dispose of assets and/or raise equity or subordinated debt by the endof the override period sufficient to generate net proceeds of at least USD2.4 billion. Compliancewith this obligation is tested only once, at the end of the override period. The Company is alsoobliged to ensure that debt of the Group (other than debt from VEB and Onexim) is repaid duringthe override period in the following amounts:
Test datesTarget cumulative
amount
Event of defaultcumulative
amountPercentage of
share capital (a)
USD millions %
31 December 2010 . . . . . . . . . . . . . . . . . . . . 1,400 750 0.75
30 September 2011 . . . . . . . . . . . . . . . . . . . . 3,000 2,000 0.75
30 September 2012 . . . . . . . . . . . . . . . . . . . . 4,000 3,000 1.25
End of override period . . . . . . . . . . . . . . . . . 5,000 4,000 1.50
Note (a): percentage of share capital of the Company for which equity compensation warrants shall be issued iscalculated on the relevant issue date without taking into account any warrants then in issue.
If the target cumulative amounts (as defined in the international override agreement) are not metand/or on the third and fourth test dates certain leverage ratios are not met, the Company willbe obliged to issue zero strike warrants (“equity compensation warrants”) to the internationallenders representing equity in specified percentages. The issuance of such warrants would havean immediate dilutive effect on shareholders. Failure to meet the event of default cumulativeamount targets will result in an event of default.
In certain circumstances, the Group may be obliged to dispose of a number of shares in NorilskNickel sufficient to enable it to repay amounts outstanding under the USD4,500 million loandated 30 October 2008 between the Company and VEB, as described below:
• The Company’s obligation to sell will be triggered if, (i) during the period starting on thefirst date of the international override period and ending three months prior to the end ofthe override period, (a) the market value of the Company’s 25% plus one share stake inNorilsk Nickel (the “NN Stake”) exceeds the Trigger Value (as defined below) for 15consecutive business days; or (b) the Company receives an offer from a third party inrespect of a number of shares in Norilsk Nickel sufficient to enable the Company to repaythe debt owned to VEB with an implied value of at least the Trigger Value for the entireNN Stake; or (ii) the Company fails to meet an event of default cumulative amount target.
• The sale obligation is suspended until 30 November 2010. If, prior to that date, the Grouprepays indebtedness outstanding to its international lenders in an amount at least equal toUSD1.4 billion using cashflow, proceeds from any new equity raising (including proceedsof the Global Offering), proceeds from any disposal of any shares in Norilsk Nickel (at theCompany’s sole discretion) and proceeds from any disposal of any non-core assets(meaning assets not involved in the Group’s primary business of aluminium or aluminaproduction and any assets of the former SUAL group other than Irkutsk aluminium smelterassets), the sale obligation will be further suspended until 31 March 2012.
• The sale obligation will no longer be suspended if a material event of default occurs underthe international override agreement, i.e., a payment default, a default under the debtreduction covenant or failure to meet any conditions subsequent to the internationaloverride agreement.
APPENDIX I ACCOUNTANTS’ REPORT
— I-133 —
• Whether or not the obligation to sell is still suspended, if, prior to 31 March 2012, theGroup repays indebtedness outstanding to its international lenders in an amount at leastequal to USD3 billion using cashflow, proceeds from any new equity raising (includingproceeds of the Global Offering), proceeds from any disposal of any shares in NorilskNickel (at the Company’s sole discretion) and proceeds from any disposal of any non-coreassets (meaning assets not involved in the Group’s primary business of aluminium oralumina production and any assets of the former SUAL group other than Irkutsk aluminiumsmelter assets), the sale obligation will cease to apply.
• “Trigger Value” means USD7.5 billion plus the aggregate amount of principal (includingcapitalised interest) which has been repaid to the Group’s international lenders prior tocommencement of the sale process as a result of any new equity raisings (includingproceeds of the Global Offering), operation of the cashflow sweep mechanism and disposalof any non-core assets (including any shares in Norilsk Nickel). The question whether ornot the sale obligation has been triggered at any time during any suspension period will bedetermined by reference to the Trigger Value as at the end of the suspension period.
• If the obligation to sell is triggered as described in the first bullet above, the Company willhave up to 12 months following the date when the obligation was triggered, but no less thansix months following the end of the suspension period to sell the NN Stake (“firstmandatory sale period”). If the suspension period has terminated following an occurrenceof a material event of default, the first mandatory sale period will be reduced to threemonths after the later of (a) the date when the obligation to sell is triggered in accordancewith the first bullet above and (b) the end of the suspension period.
• During the first mandatory sale period, a prescribed auction process will be arranged by themandate banks. There will be no obligation to sell the shares in Norilsk Nickel during thefirst mandatory sale period if the Company is unable to realise net proceeds at least equalto the Trigger Value (or its pro rata share if less than the entire NN Stake is to be sold).
• If the obligation to sell is triggered as described in the first bullet above or if the sale doesnot occur during the first mandatory sale period and the sale obligation continues to apply,a second mandatory sale period of three months will commence, during which the price maybe any amount resulting in net proceeds sufficient to repay the debt to VEB. During thesecond mandatory sale period a prescribed auction process will be arranged by the mandatebanks. A sale during the second mandatory sale period could result in a material loss forthe Group.
• The Company has the option, at any time after the obligation to sell is triggered, of avoidinga sale of the NN Stake by (i) raising equity or subordinated debt sufficient to repay the debtto VEB in full or (ii) repaying the international debt in an amount (the “Required Amount”)necessary to ensure that the outstanding amount under the international facilities is reduced(x) to no more than 50% of the amount outstanding as at the start of the override period or(y) if less than the Required Amount, by USD4 billion. In addition, the Company may avoidthe obligation to sell the NN Stake to the winner of the auction by selling it instead to athird party on arm’s length terms.
To secure its ability to extend the maturity of the VEB loan, should VEB not agree to extend itbeyond 29 October 2010, the Group has obtained an irrevocable and unconditional letter fromSberbank which allows the Group to request Sberbank to assume the rights, claims andobligations under the VEB loan, by notifying Sberbank in writing during the period from 1August to 1 September of each year from 2010 to 2013, inclusive. Following such assumption,the maturity of the existing VEB loan will be extended to 7 December 2013 from the originalrepayment date. Commission of 2.00% of the outstanding principal amount and any other
APPENDIX I ACCOUNTANTS’ REPORT
— I-134 —

outstanding as of the date of the assignment will be payable to Sberbank by the Group as follows:a) USD22.5 million by 31 December 2009, b) ¼ (one quarter) of the commission annually by 31December of the years 2010, 2011 and 2012, provided that no assignment occurred in such yearor any previous year and c) the amount of the commission to be reduced by amounts paid in a)and b) once the assignment has occured. The Company has also entered into an unconditional andirrevocable deed with its current shareholders, pursuant to which the current shareholdersguarantee to Sberbank to pay on demand the commission when it falls due should the paymentbe inconsistent with the obligations of the Group under the international override agreement.
Additional Security
In addition to the security provided under its existing loan facilities, the Group has provided oragreed to provide additional security to the international lenders over the following:
• 25% of the shares in the Bratsk and Krasnoyarsk aluminium smelters plus, on a secondaryranking basis, one share in each of them (following the release of security over debt toVEB, security over one share shall be provided on a primary ranking basis);
• 39% less one share in each of the Novokuznetsk aluminium smelters, SUAL and AchinskAlumina Refinery and 27.15% in Sayanogorsk aluminium smelter, provided that thepercentage of shares subject to pledge in each of those entities will be reduced to 25% plusone share once the Group repays indebtedness outstanding to its international lenders in anamount at least equal to USD1.4 billion using cashflow, proceeds from any new equityraising (including proceeds of the Global Offering) and proceeds from disposal of non-coreassets (including shares in Norilsk Nickel);
• receivables under certain offtake, export and tolling contracts and certain intra-group loanssubject to certain exceptions;
• 100% of the shares or interest in certain non-Russian operating companies or their holdingcompanies;
• security over fixed assets of the Russian aluminium smelters and Achinsk Alumina Refinerysplit between international lenders and Russian and Kazakh lenders according to pre-agreedpercentages, where the international lenders’ share in the aluminium smelters’ assets doesnot exceed 10% of the assets of the relevant entity and fixed assets of Bratsk andKrasnoyarsk aluminium smelters are subject to security in favour of the internationallenders only; and
• security over aluminium owned by the Russian aluminium smelters and Group tradingcompanies.
Following the repayment of loan to VEB, the Company will be obliged to provide security overany shares in Norilsk Nickel that the Group then continues to hold in favour of the internationallenders (the Company is also obliged to provide security over certain assets it controls followingthe unwinding of the derivative financial instrument relating to the shares in Norilsk Nickel). Inaddition, as a condition to the restructuring of the guarantee of the BEMO project loan, theCompany has provided security over shares in its intermediary holding companies controlling theGroup’s interest in the Boguchansk project and has agreed to provide, subject to RusHydro’sconsent, security over its interest in the BEMO project (including at the operating companies’level).
APPENDIX I ACCOUNTANTS’ REPORT
— I-135 —

Dividends
The debt restructuring agreements restrict the Group’s ability to pay dividends. In particular,dividends may not be paid until the Group’s ratio of net debt to EBITDA is no more than 3 to1 and its debt (excluding debt owed to VEB and Onexim) has been repaid by at least USD5billion. Further, there should be no outstanding default under the international overrideagreement and the Group should be able to demonstrate that it has sufficient cash to pay theproposed dividends. If and when dividends become payable, they are limited to no more than50% of the Group’s annual net profit (excluding earnings, but including dividends, of NorilskNickel) in any one year.
Warrants
Warrants will be automatically converted into the Company’s shares for no more than theirnominal value on the date of the Global Offering. International lenders may require the Companyto settle the fee warrants (issued on the first day of the override period) in cash in lieu of sharesat a price per share equal to the offering price less commissions, fees and expenses relating tothe Global Offering. Otherwise, shares into which warrants are converted following the GlobalOffering will be subject to a lock-up of 180 days following the date of completion of the GlobalOffering (or such shorter lock-up period as may apply to the Company’s shareholders).International lenders holding fee warrants representing 1% of the Company’s share capital haveexercised their cash settlement option.
Equity compensation warrants that may be issued by the Company during the override period willbe convertible into the Company’s ordinary shares either at any further public offering of theCompany’s shares, upon a change of control or at the end of the override period. Shares for whichwarrants are exercised may be sold by the relevant lenders subject to the Company’s right of firstrefusal.
Conditions Subsequent
The override agreement also contains a number of certain conditions subsequent, which includethe following requirements:
• RTI Limited will need to be recapitalised through certain corporate procedures by 12February 2010;
• Certain members of the Group will need to accede to the finance documents as guarantorsby no later than 31 January 2010;
• The Company shall ensure that a BEMO technical report by an independent advisor(confirming the BEMO project schedule, levels of capital expenditure required tocommission the BEMO hydropower station project and for the BEMO hydropower stationproject to reach first and final stage full capacity and including an updated technical andcommercial review of BEMO) is delivered no later than the date falling 60 days after theoverride date;
• The Company shall ensure that additional securities (which included certain receivables,shares in certain subsidiaries of the Group and fixed assets) are provided within the periodstipulated in the international override agreement. In addition, the Company shall delivera valuation report for fixed assets of the Group which are proposed to be subject to security.The Company should also ensure certain necessary procedures are carried out for thecompletion of the security granting process;
APPENDIX I ACCOUNTANTS’ REPORT
— I-136 —

• No later than 15 December 2009, a draft, and no later than 15 January 2010, a final BEMOvaluation report shall be delivered confirming that, as of the override date, on theassumption that commissioning and final completion of the BEMO hydropower stationproject is achieved, the net present value of the Group’s interest in the BEMO project is atleast USD260,000,000 (after taking into account such capital expenditure as is expected tobe required to complete commissioning and final completion);
• The Company shall provide certain information, including:
• no later than three months after the override date, any further information required byany finance party in order to enable it to comply with any “know your client” or othermoney laundering checks;
• no later than 14 January 2010, a copy of each agreement referred to in the related partycontract summary as defined in the international override agreement;
• The Company shall ensure that the amendments and waivers with respect to a projectfinance facility raised by Alumina and Bauxite Company Limited set out in a waiver lettergranted before the override date are effected no later than the date falling two weeks afterthe date of the international override agreement. At the date of this Financial Informationthe Company has obtained a consent from the lender in respect of the amendments andwaivers referred to above and is currently in process of completing relevant legaldocumentation;
• By no later than 14 January 2010, each Russian bank shall provide a letter confirming theirsoft commitment with respect to the refinancing period. At the date of this FinancialInformation the Company has obtained the letters referred to above from the Russianlenders in the agreed form; and
• Procedures and undertakings by the Company to provide various reports, certificates andother supporting documentation to the lenders during a certain set period after the overridedate.
Failure to comply with any of the conditions subsequent would result in an event of default. Thedeadlines for satisfaction of the various conditions subsequent fall between approximately 30days and approximately 180 days after the date of effectiveness of the international overrideagreement as defined in the international override agreement.
Events of Default
The events of default include non-payment and compliance with financial covenants, repaymenttargets and conditions subsequent. In addition the events of default include customary conditionssuch as government intervention, insolvency/insolvency proceedings, the agreement/compliancewith the agreement becoming unlawful, change of business, change of control,misrepresentation, amendments of charter, cross-default and material adverse change. The eventsof default also include situation when there is an adverse outcomes in litigation involving anymember of the Group, except certain currently pending litigation or alleged claims, in excess ofUSD50 million in aggregate for that member of the Group.
The occurrence of an event of default may lead to acceleration and realisation by the lenders ofthe security provided, if the required majority of lenders so elects.
39 Accounting estimates and judgements
The Group has identified the following critical accounting policies under which significantjudgements, estimates and assumptions are made and where actual results may differ from theseestimates under different assumptions and conditions and may materially affect financial resultsor the financial position reported in future periods.
APPENDIX I ACCOUNTANTS’ REPORT
— I-137 —
Property, plant and equipment � recoverable amount
In accordance with the Group’s accounting policy, each asset or cash generating unit is evaluatedevery reporting period to determine whether there are any indications of impairment. If any suchindication exists, a formal estimate of recoverable amount is performed and an impairment lossrecognised to the extent that the carrying amount exceeds the recoverable amount. Therecoverable amount of an asset or cash generating group of assets is measured at the higher offair value less costs to sell and value in use.
Fair value is determined as the amount that would be obtained from the sale of the asset in anarm’s length transaction between knowledgeable and willing parties and is generally determinedas the present value of the estimated future cash flows expected to arise from the continued useof the asset, including any expansion prospects, and its eventual disposal.
Value in use is also generally determined as the present value of the estimated future cash flows,but only those expected to arise from the continued use of the asset in its present form and itseventual disposal. Present values are determined using a risk-adjusted pre-tax discount rateappropriate to the risks inherent in the asset. Future cash flow estimates are based on expectedproduction and sales volumes, commodity prices (considering current and historical prices, pricetrends and related factors), reserves (see ‘Bauxite reserve estimates’ below), operating costs,restoration and rehabilitation costs and future capital expenditure. This policy requiresmanagement to make these estimates and assumptions which are subject to risk and uncertainty;hence there is a possibility that changes in circumstances will alter these projections, which mayimpact the recoverable amount of the assets. In such circumstances, some or all of the carryingvalue of the assets may be impaired and the impairment would be charged against the incomestatement.
Inventories � net realisable value
The Group recognises write-down of inventories based on an assessment of the net realisablevalue of the inventories. A write-down is applied to the inventories where events or changes incircumstances indicate that the net realisable value is less than cost. The determination of netrealisable value requires the use of judgement and estimates. Where the expectation is differentfrom the original estimates, such difference will impact carrying value of the inventories andwrite-down of inventories charged to the income statement in the periods in which such estimatehas been changed.
Goodwill � recoverable amount
In accordance with the Group’s accounting policy, goodwill is allocated to the Group’sAluminium segment as it represents the lowest level within the Group at which the goodwill ismonitored for internal management purposes and is tested for impairment annually by preparinga formal estimate of the recoverable amount. The recoverable amount is estimated as the valuein use of the Aluminium segment.
Similar considerations to those described above in respect of assessing the recoverable amountof property, plant and equipment apply to goodwill.
Investments in associates and jointly controlled entities — recoverable amount
In accordance with the Group’s accounting policy, each investment in an associate or jointlycontrolled entity is evaluated every reporting period to determine whether there are anyindications of impairment after application of the equity method of accounting. If any such
APPENDIX I ACCOUNTANTS’ REPORT
— I-138 —
indication exists, a formal estimate of recoverable amount is performed and an impairment lossrecognised to the extent that the carrying amount exceeds the recoverable amount. Therecoverable amount of an investment in an associate or jointly controlled entity is measured atthe higher of fair value less costs to sell and value in use.
Similar considerations to those described above in respect of assessing the recoverable amountof property, plant and equipment apply to investments in associates or jointly controlled entities.In addition to the considerations described above the Group may also assess the estimated futurecash flows expected to arise from dividends to be received from the investment, if suchinformation is available and considered reliable.
Legal proceedings
In the normal course of business the Group may be involved in legal proceedings. Wheremanagement considers that it is more likely than not that proceedings will result in the Groupcompensating third parties a provision is recognised for the best estimate of the amount expectedto be paid. Where management considers that it is more likely than not that proceedings will notresult in the Group compensating third parties or where, in rare circumstances, it is notconsidered possible to provide a sufficiently reliable estimate of the amount expected to be paid,no provision is made for any potential liability under the litigation but the circumstances anduncertainties involved are disclosed as contingent liabilities. The assessment of the likelyoutcome of legal proceedings and the amount of any potential liability involves significantjudgement. As law and regulations in many of the countries in which the Group operates arecontinuing to evolve, particularly in the areas of taxation, sub-soil rights and protection of theenvironment, uncertainties regarding litigation and regulation are greater than those typicallyfound in countries with more developed legal and regulatory frameworks.
Provision for restoration and rehabilitation
The Group’s accounting policies require the recognition of provisions for the restoration andrehabilitation of each site when a legal or constructive obligation exists to dismantle the assetsand restore the site. The provision recognised represents management’s best estimate of thepresent value of the future costs required. Significant estimates and assumptions are made indetermining the amount of restoration and rehabilitation provisions. Those estimates andassumptions deal with uncertainties such as: changes to the relevant legal and regulatoryframework; the magnitude of possible contamination and the timing, extent and costs of requiredrestoration and rehabilitation activity. These uncertainties may result in future actual expenditurediffering from the amounts currently provided.
The provision recognised for each site is periodically reviewed and updated based on the factsand circumstances available at the time. Changes to the estimated future costs for operating sitesare recognised in the balance sheet by adjusting both the restoration and rehabilitation asset andprovision. Such changes give rise to a change in future depreciation and interest charges. Forclosed sites, changes to estimated costs are recognised immediately in the income statement.
Taxation
The Group’s accounting policy for taxation requires management’s judgement in assessingwhether deferred tax assets and certain deferred tax liabilities are recognised on the balancesheet. Deferred tax assets, including those arising from carried forward tax losses, capital lossesand temporary differences, are recognised only where it is considered more likely than not thatthey will be recovered, which is dependent on the generation of sufficient future taxable profits.Deferred tax liabilities arising from temporary differences in investments, caused principally byretained earnings held in foreign tax jurisdictions, are recognised unless repatriation of retainedearnings can be controlled and is not expected to occur in the foreseeable future.
APPENDIX I ACCOUNTANTS’ REPORT
— I-139 —
Assumptions about the generation of future taxable profits and repatriation of retained earningsdepend on management’s estimates of future cash flows. These depend on estimates of futureproduction and sales volumes, commodity prices, reserves, operating costs, restoration andrehabilitation costs, capital expenditure, dividends and other capital management transactions.Assumptions are also required about the application of income tax legislation. These estimatesand assumptions are subject to risk and uncertainty, hence there is a possibility that changes incircumstances will alter expectations, which may impact the amount of deferred tax assets anddeferred tax liabilities recognised on the balance sheet and the amount of other tax losses andtemporary differences not yet recognised. In such circumstances, some or all of the carryingamount of recognised deferred tax assets and liabilities may require adjustment, resulting in acorresponding credit or charge to the income statement.
The Group generally provides for current tax based on positions taken (or expected to be taken)in its tax returns. Where it is more likely than not that upon examination by the tax authoritiesof the positions taken by the Group additional tax will be payable, the Group provides for its bestestimate of the amount expected to be paid (including any interest and/or penalties) as part ofthe tax charge.
Bauxite reserve estimates
Reserves are estimates of the amount of product that can be economically and legally extractedfrom the Group’s properties. In order to calculate reserves, estimates and assumptions arerequired about a range of geological, technical and economic factors, including quantities,grades, production techniques, recovery rates, production costs, transport costs, commoditydemand, commodity prices and exchange rates.
The Group determines ore reserves under the Australasian Code for Reporting of MineralResources and Ore Reserves September 1999, known as the JORC Code. The JORC Coderequires the use of reasonable investment assumptions to calculate reserves.
Estimating the quantity and/or grade of reserves requires the size, shape and depth of ore bodiesor fields to be determined by analysing geological data such as drilling samples. This processmay require complex and difficult geological judgements and calculations to interpret the data.
Since economic assumptions used to estimate reserves change from period to period, and sinceadditional geological data is generated during the course of operations, estimates of reserves maychange from period to period.
Changes in reported reserves may affect the Group’s financial results and financial position ina number of ways, including the following:
• Asset carrying values may be affected due to changes in estimated future cash flows.
• Depletion charged in the income statement may change where such charges are determinedby the units of production basis, or where the useful economic lives of assets change.
• Decommissioning, site restoration and environmental provisions may change wherechanges in estimated reserves affect expectations about the timing or cost of theseactivities.
APPENDIX I ACCOUNTANTS’ REPORT
— I-140 —

Exploration and evaluation expenditure
The Group’s accounting policy for exploration and evaluation expenditure results in certainitems of expenditure being capitalised for an area of interest where it is considered likely to berecoverable by future exploitation or sale or where the activities have not reached a stage whichpermits a reasonable assessment of the existence of reserves. This policy requires managementto make certain estimates and assumptions as to future events and circumstances, in particularwhether an economically viable extraction operation can be established. Any such estimates andassumptions may change as new information becomes available. If, after having capitalised theexpenditure under the policy, a judgement is made that recovery of the expenditure is unlikely,the relevant capitalised amount will be written off to the income statement.
Development expenditure
Development activities commence after project sanctioning by the appropriate level ofmanagement. Judgement is applied by management in determining when a project has reached astage at which economically recoverable reserves exist such that development may besanctioned. In exercising this judgement, management is required to make certain estimates andassumptions similar to those described above for capitalised exploration and evaluationexpenditure. Any such estimates and assumptions may change as new information becomesavailable. If, after having commenced the development activity, a judgement is made that adevelopment asset is impaired, the appropriate amount will be written off to the incomestatement.
Defined benefit pension and other post retirement schemes
For defined benefit pension schemes, the cost of benefits charged to the income statementincludes current and past service costs, interest costs on defined benefit obligations and theeffect of any curtailments or settlements, net of expected returns on plan assets. An asset orliability is consequently recognised in the balance sheet based on the present value of definedobligations, less any unrecognised past service costs and the fair value of plan assets.
The accounting policy requires management to make judgements as to the nature of benefitsprovided by each scheme and thereby determine the classification of each scheme. For definedbenefit pension schemes, management is required to make annual estimates and assumptionsabout future returns on classes of scheme assets, future remuneration changes, employee attritionrates, administration costs, changes in benefits, inflation rates, exchange rates, life expectancyand expected remaining periods of service of employees. In making these estimates andassumptions, management considers advice provided by external advisers, such as actuaries.Where actual experience differs to these estimates, actuarial gains and losses are recogniseddirectly in the statement of comprehensive income.
Fair values of identifiable net assets of acquired companies
The Group’s policy is to engage an independent appraiser to assist in determining fair values ofidentifiable net assets of acquired companies for all significant business combinations.
A variety of valuation techniques is applied to appraise the acquired net assets depending on thenature of the assets acquired and available market information. The details of methods used andassumptions made to determine fair values of property, plant and equipment are disclosed in note17, intangibles assets � in note 18, provisions � in note 30 and financial investments � in note21. Other assets and liabilities acquired including provisions are evaluated in accordance withthe Group’s applicable accounting policies disclosed in note 3.
APPENDIX I ACCOUNTANTS’ REPORT
— I-141 —
Going concern
As disclosed in note 2(d), the Group was in breach of a number of covenants relating to its debtagreements at 31 December 2008 and subsequently suspended servicing certain loans andborrowings. On 7 December 2009, the Group completed the restructuring negotiation with itslenders. The Directors believe that the restructuring terms will allow the Group to successfullycontinue its operations and repay its debts as and when they fall due. Accordingly, the FinancialInformation has been prepared on a going concern basis.
However, the validity of the going concern assumption is premised on future events, the outcomeof which is inherently uncertain, being dependent on the Group’s ability to generate cash inflowsfrom future operations. If the repayment of the whole of the Group’s indebtedness is accelerated,for example, because a relevant member of the Group is unable to comply with or satisfy any ofthe terms or conditions of, or triggers any event of default under, the debt restructuring or otherdebt obligations, or if the Company should be unable to extend or refinance or repay the VEBloan as and when it falls due, the Group may cease to continue as a going concern. The FinancialInformation does not include any adjustments relating to the recoverability and classification ofrecorded asset amounts or to amounts and classification of liabilities that may be necessary if theGroup were unable to continue as a going concern.
40 Possible impact of amendments, new standards and interpretations issued but not yeteffective for the Relevant Period
Up to the date of approval of this Financial Information, the IASB has issued the followingamendments, new standards and interpretations which are not yet effective in respect of thefinancial periods included in the Relevant Period, and which have not been adopted in thisFinancial Information.
The Group is in the process of making an assessment of what the impact of these amendments,new standards and new interpretations is expected to be in the period of initial application butis not yet in a position to state whether these amendments, new standards and interpretationswould have a significant impact on the Group’s results of operations and financial position.
Effectivefor accounting
periods beginningon or after
IFRS 3 (Revised), Business combinations . . . . . . . . . . . . . . . . . . . . . . . . . . . . . . . 1 July 2009
Amendments to IAS 27, Consolidated and separate financial statements. . . . . . . . . . 1 July 2009
Amendments to IAS 39, Financial instruments:
Recognition and measurement - Eligible hedged items . . . . . . . . . . . . . . . . . . . . . . 1 July 2009
IFRIC 17, Distributions of non-cash assets to owners . . . . . . . . . . . . . . . . . . . . . . 1 July 2009
Improvements to IFRSs 2009 . . . . . . . . . . . . . . . . . . . . . . . . . . . . . . . . . . . . . . . 1 July 2009 or
1 January 2010
APPENDIX I ACCOUNTANTS’ REPORT
— I-142 —
D Subsequent Financial Statements
No audited financial statements have been prepared by the Group, the Company or any of thecompanies comprising the Group in respect of any period subsequent to 30 June 2009.
Yours faithfully
ZAO KPMGMember of The Chamber of
Auditors of RussiaRussia
Yours faithfully
KPMGCertified Public Accountants
Hong Kong
APPENDIX I ACCOUNTANTS’ REPORT
— I-143 —
The following audited financial information regarding MMC Norilsk Nickel for the year ended 31 December 2008 andunaudited financial information for MMC Norilsk Nickel for the six months ended 30 June 2009 has been reproduced frompublicly available information published by MMC Norilsk Nickel. The Group believes that the sources of this information areappropriate sources for such information and has taken reasonable care in extracting and reproducing such information. TheGroup has no reason to believe that such information is false, inaccurate or misleading or that any fact has been omitted thatwould render such information false, inaccurate or misleading. The information has not been independently verified by theGroup, the Joint Sponsors, the Joint Bookrunners, the Underwriters or any other party involved in the Global Offering and norepresentation is given as to its accuracy. In addition, neither Norilsk Nickel nor its auditors have been involved in thepreparation of this prospectus and Norilsk Nickel has not consented to the inclusion of such financial statements.
— II-1 —
APPENDIX II FINANCIAL STATEMENTS OF MMC NORILSK NICKEL

— II-2 —
APPENDIX II FINANCIAL STATEMENTS OF MMC NORILSK NICKEL

MINING AND METALLURGICAL COMPANY NORILSK NICKEL
INTERIM CONDENSED CONSOLIDATED INCOME STATEMENTFOR THE SIX MONTHS ENDED 30 JUNE 2009 US Dollars million
Notes
For the six months ended
30 June 2009
For the six months ended
30 June 2008
Revenue
Metal sales 7.1 3,289 7,210Other sales 7.2 789 1,101
Total revenue 4,078 8,311
Cost of metal sales 8.1 (2,004) (2,677)Cost of other sales 8.2 (737) (1,063)
Gross profit 1,337 4,571
Selling and distribution expenses 9 (55) (320)General and administrative expenses 10 (273) (492)Impairment of non-financial assets (10) (169)Loss on derivatives classified as held for trading (7) (10)Other net operating expenses 11 (29) (225)
Operating profit 963 3,355
Finance costs (98) (224)Income from investments, net 66 414Foreign exchange (loss)/gain, net (304) 96Excess of the Group’s share in the fair value of net assets acquired over
the cost of acquisition 4 −Share of (losses)/profits of associates (15) 28
Profit before tax 616 3,669
Income tax expense
Current income tax expense (185) (1,008)Deferred tax benefit 8 21
Total income tax expense (177) (987)
Profit for the period 439 2,682
Attributable to:
Shareholders of the parent company 419 2,689Minority interest 20 (7)
439 2,682
EARNINGS PER SHARE
Weighted average number of ordinary shares in issue during the period 16 174,362,861 188,916,863
Basic and diluted earnings per share attributable to shareholders of the parent company (US Dollars per share) 2.4 14.2
— II-3 —
APPENDIX II FINANCIAL STATEMENTS OF MMC NORILSK NICKEL

MINING AND METALLURGICAL COMPANY NORILSK NICKEL
INTERIM CONDENSED CONSOLIDATED STATEMENT OF COMPREHENSIVE INCOME FOR THE SIX MONTHS ENDED 30 JUNE 2009 US Dollars million
For the six months ended
30 June 2009
For the six months ended
30 June 2008
Profit for the period 439 2,682
Other comprehensive (loss)/income
Effect of translation to presentation currency and translation of foreign operations (466) 740
Increase/(decrease) in fair value of available-for-sale investments and gain on cash flow hedge 271 (226)
Realised gain on disposal of available-for-sale investments and cash flow hedge (6) (115)
Other comprehensive (loss)/income for the period, net of tax (201) 399
Total comprehensive income for the period, net of tax 238 3,081
Attributable to:
Shareholders of the parent company 283 2,982Minority interest (45) 99
238 3,081
— II-4 —
APPENDIX II FINANCIAL STATEMENTS OF MMC NORILSK NICKEL
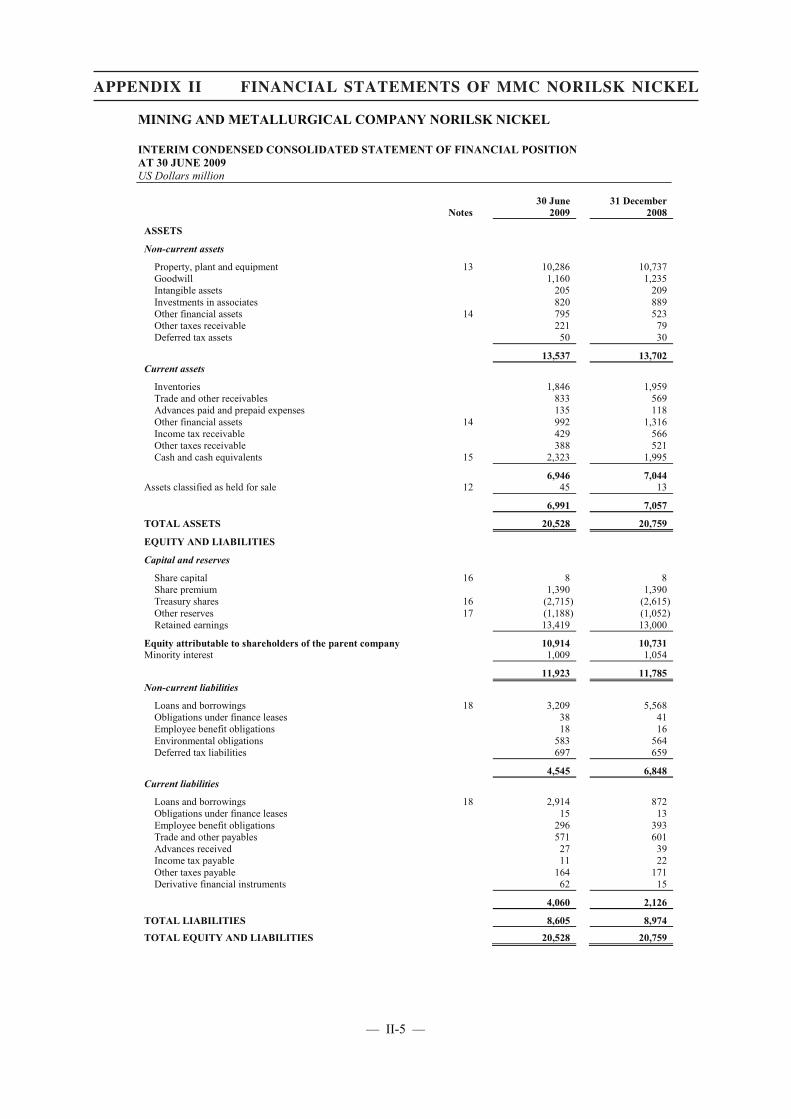
MINING AND METALLURGICAL COMPANY NORILSK NICKEL
INTERIM CONDENSED CONSOLIDATED STATEMENT OF FINANCIAL POSITION AT 30 JUNE 2009 US Dollars million
Notes30 June
200931 December
2008
ASSETS
Non-current assets
Property, plant and equipment 13 10,286 10,737Goodwill 1,160 1,235Intangible assets 205 209Investments in associates 820 889Other financial assets 14 795 523Other taxes receivable 221 79Deferred tax assets 50 30
13,537 13,702Current assets
Inventories 1,846 1,959Trade and other receivables 833 569Advances paid and prepaid expenses 135 118Other financial assets 14 992 1,316Income tax receivable 429 566Other taxes receivable 388 521Cash and cash equivalents 15 2,323 1,995
6,946 7,044Assets classified as held for sale 12 45 13
6,991 7,057
TOTAL ASSETS 20,528 20,759
EQUITY AND LIABILITIES
Capital and reserves
Share capital 16 8 8Share premium 1,390 1,390Treasury shares 16 (2,715) (2,615)Other reserves 17 (1,188) (1,052)Retained earnings 13,419 13,000
Equity attributable to shareholders of the parent company 10,914 10,731Minority interest 1,009 1,054
11,923 11,785Non-current liabilities
Loans and borrowings 18 3,209 5,568Obligations under finance leases 38 41Employee benefit obligations 18 16Environmental obligations 583 564Deferred tax liabilities 697 659
4,545 6,848Current liabilities
Loans and borrowings 18 2,914 872Obligations under finance leases 15 13Employee benefit obligations 296 393Trade and other payables 571 601Advances received 27 39Income tax payable 11 22Other taxes payable 164 171Derivative financial instruments 62 15
4,060 2,126
TOTAL LIABILITIES 8,605 8,974
TOTAL EQUITY AND LIABILITIES 20,528 20,759
— II-5 —
APPENDIX II FINANCIAL STATEMENTS OF MMC NORILSK NICKEL

MINING AND METALLURGICAL COMPANY NORILSK NICKEL
INTERIM CONDENSED CONSOLIDATED CASH FLOW STATEMENT FOR THE SIX MONTHS ENDED 30 JUNE 2009 US Dollars million
For the six months ended
30 June 2009
For the six months ended
30 June 2008
OPERATING ACTIVITIES
Profit before tax 616 3,669
Adjustments for:Depreciation and impairment of property, plant and equipment 408 804Loss on disposal of property, plant and equipment 5 11Amortisation and impairment of intangible assets 26 18Impairment of assets classified as held for sale 6 −Excess of the Group’s share in the fair value of net assets acquired over
the cost of acquisition (4) −Share of post-acquisition losses/(profit) and impairment of investments in associates 15 (28)Gain on disposal of available-for-sale investments (4) (144)Gain on disposal of associates (2) −Impairment of other financial assets (2) 14Change in provision for onerous contracts (5) 150Loss on derivatives classified as held for trading 7 10Finance costs 98 224Interest income (59) (296)Foreign exchange loss/(gain), net 304 (96)Dividend income − (6)Other (2) −
1,407 4,330Movements in working capital:
Inventories (7) (128)Trade and other receivables (193) 29Advances paid and prepaid expenses (44) (49)Other tax receivables (41) (41)Employee benefit obligations (65) (29)Trade and other payables 51 (6)Advances received (8) 22Other taxes payable 6 29
Cash generated from operations 1,106 4,157
Interest paid (76) (200)Income tax paid (98) (1,400)
Net cash generated from operating activities 932 2,557
INVESTING ACTIVITIES
Acquisition of subsidiaries, net of cash acquired and increase of ownership in subsidiaries − (335)Proceeds from disposal of subsidiaries 1 47Acquisition and advances paid for acquisition of associates (42) (51)Proceeds from disposal of associates 26 −Purchase of property, plant and equipment (470) (1,207)Proceeds from disposal of property, plant and equipment 16 17Purchase of intangible assets (6) (20)Purchase of other financial assets (21) (81)Net change in deposits placed 360 1,495Proceeds from sale of other financial assets 83 440
Net cash (used in)/generated from investing activities (53) 305
FINANCING ACTIVITIES
Proceeds from borrowings 45 2,543Repayments of borrowings (373) (3,699)Buy back of issued shares, including income tax paid on transfer of treasury shares from
Company to its subsidiaries in the amount of USD 74 million (100) −Dividends paid by the Company − (803)
Net cash used in financing activities (428) (1,959)
Net increase in cash and cash equivalents 451 903
Cash and cash equivalents at beginning of the period 1,995 4,008
Effect of translation to presentation currency (123) 27
Cash and cash equivalents at end of the period 2,323 4,938
— II-6 —
APPENDIX II FINANCIAL STATEMENTS OF MMC NORILSK NICKEL
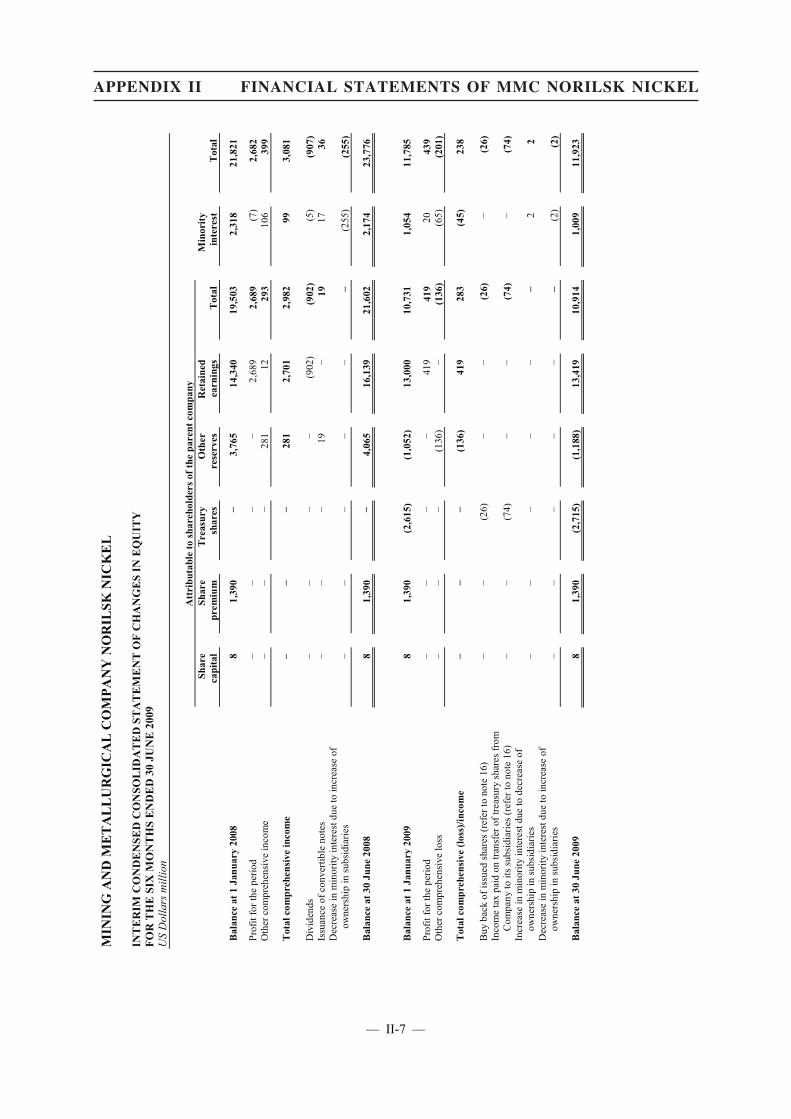
MIN
ING
AN
D M
ET
AL
LU
RG
ICA
L C
OM
PAN
Y N
OR
ILSK
NIC
KE
L
INT
ER
IM C
ON
DE
NSE
D C
ON
SOL
IDA
TE
D S
TAT
EM
EN
T O
F C
HA
NG
ES
IN E
QU
ITY
FOR
TH
E S
IX M
ON
TH
S E
ND
ED
30
JUN
E 2
009
US
Dol
lars
mill
ion
Att
ribu
tabl
e to
shar
ehol
ders
of t
he p
aren
t com
pany
Min
ority
inte
rest
Shar
e ca
pita
lSh
are
prem
ium
Tre
asur
y sh
ares
Oth
er
rese
rves
Ret
aine
d ea
rnin
gsT
otal
Tot
al
Bal
ance
at 1
Jan
uary
2008
81,
390
−3,
765
14,3
4019
,503
2,31
821
,821
Prof
it fo
r the
per
iod
−−
−−
2,68
92,
689
(7)
2,68
2O
ther
com
preh
ensi
ve in
com
e−
−−
281
1229
310
639
9
Tot
al c
ompr
ehen
sive
inco
me
−−
−28
12,
701
2,98
299
3,08
1
Div
iden
ds−
−−
−(9
02)
(902
)(5
)(9
07)
Issu
ance
of c
onve
rtibl
e no
tes
−−
−19
−19
1736
Dec
reas
e in
min
ority
inte
rest
due
to in
crea
se o
fow
ners
hip
in su
bsid
iarie
s−
−−
−−
−(2
55)
(255
)
Bal
ance
at 3
0 Ju
ne 2
008
81,
390
−4,
065
16,1
3921
,602
2,17
423
,776
Bal
ance
at 1
Jan
uary
200
98
1,39
0(2
,615
)(1
,052
)13
,000
10,7
311,
054
11,7
85
Prof
itfo
r the
per
iod
− −
− −
419
419
2043
9O
ther
com
preh
ensi
ve lo
ss−
− −
(136
)−
(136
)(6
5)(2
01)
Tot
al c
ompr
ehen
sive
(los
s)/in
com
e−
− −
(136
)41
928
3(4
5)23
8
Buy
bac
k of
issu
ed sh
ares
(ref
er to
not
e 16
)−
− (2
6)−
− (2
6)−
(26)
Inco
me
tax
paid
on
trans
fer o
f tre
asur
y sh
ares
from
C
ompa
ny to
its s
ubsi
diar
ies (
refe
r to
note
16)
− −
(74)
− −
(74)
− (7
4)In
crea
se in
min
ority
inte
rest
due
to d
ecre
ase
of
owne
rshi
p in
subs
idia
ries
− −
− −
− −
22
Dec
reas
e in
min
ority
inte
rest
due
to in
crea
se o
f ow
ners
hip
in su
bsid
iarie
s−
− −
− −
− (2
)(2
)
Bal
ance
at 3
0 Ju
ne 2
009
81,
390
(2,7
15)
(1,1
88)
13,4
1910
,914
1,00
911
,923
— II-7 —
APPENDIX II FINANCIAL STATEMENTS OF MMC NORILSK NICKEL
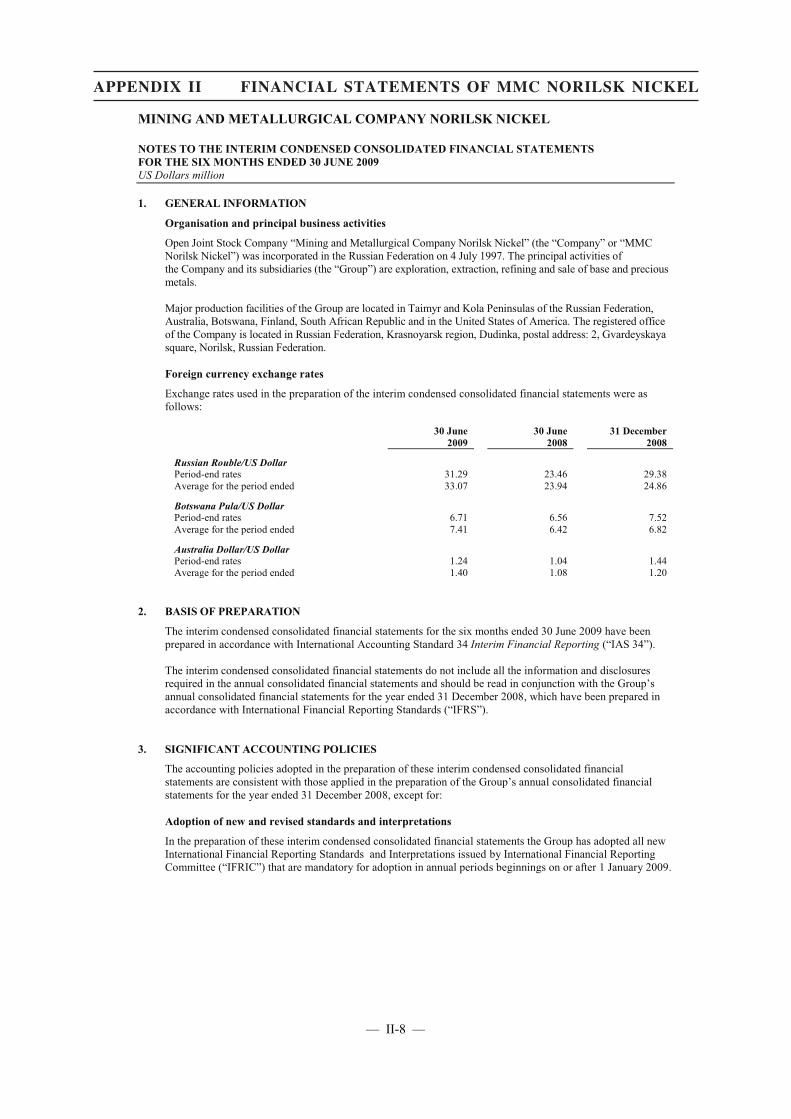
MINING AND METALLURGICAL COMPANY NORILSK NICKEL
NOTES TO THE INTERIM CONDENSED CONSOLIDATED FINANCIAL STATEMENTS FOR THE SIX MONTHS ENDED 30 JUNE 2009 US Dollars million
1. GENERAL INFORMATION
Organisation and principal business activities
Open Joint Stock Company “Mining and Metallurgical Company Norilsk Nickel” (the “Company” or “MMC Norilsk Nickel”) was incorporated in the Russian Federation on 4 July 1997. The principal activities of the Company and its subsidiaries (the “Group”) are exploration, extraction, refining and sale of base and precious metals.
Major production facilities of the Group are located in Taimyr and Kola Peninsulas of the Russian Federation, Australia, Botswana, Finland, South African Republic and in the United States of America. The registered office of the Company is located in Russian Federation, Krasnoyarsk region, Dudinka, postal address: 2, Gvardeyskaya square, Norilsk, Russian Federation.
Foreign currency exchange rates
Exchange rates used in the preparation of the interim condensed consolidated financial statements were as follows:
30 June 2009
30 June 2008
31 December 2008
Russian Rouble/US DollarPeriod-end rates 31.29 23.46 29.38Average for the period ended 33.07 23.94 24.86
Botswana Pula/US DollarPeriod-end rates 6.71 6.56 7.52Average for the period ended 7.41 6.42 6.82
Australia Dollar/US DollarPeriod-end rates 1.24 1.04 1.44Average for the period ended 1.40 1.08 1.20
2. BASIS OF PREPARATION
The interim condensed consolidated financial statements for the six months ended 30 June 2009 have been prepared in accordance with International Accounting Standard 34 Interim Financial Reporting (“IAS 34”).
The interim condensed consolidated financial statements do not include all the information and disclosures required in the annual consolidated financial statements and should be read in conjunction with the Group’s annual consolidated financial statements for the year ended 31 December 2008, which have been prepared in accordance with International Financial Reporting Standards (“IFRS”).
3. SIGNIFICANT ACCOUNTING POLICIES
The accounting policies adopted in the preparation of these interim condensed consolidated financial statements are consistent with those applied in the preparation of the Group’s annual consolidated financial statements for the year ended 31 December 2008, except for:
Adoption of new and revised standards and interpretations
In the preparation of these interim condensed consolidated financial statements the Group has adopted all new International Financial Reporting Standards and Interpretations issued by International Financial Reporting Committee (“IFRIC”) that are mandatory for adoption in annual periods beginnings on or after 1 January 2009.
— II-8 —
APPENDIX II FINANCIAL STATEMENTS OF MMC NORILSK NICKEL
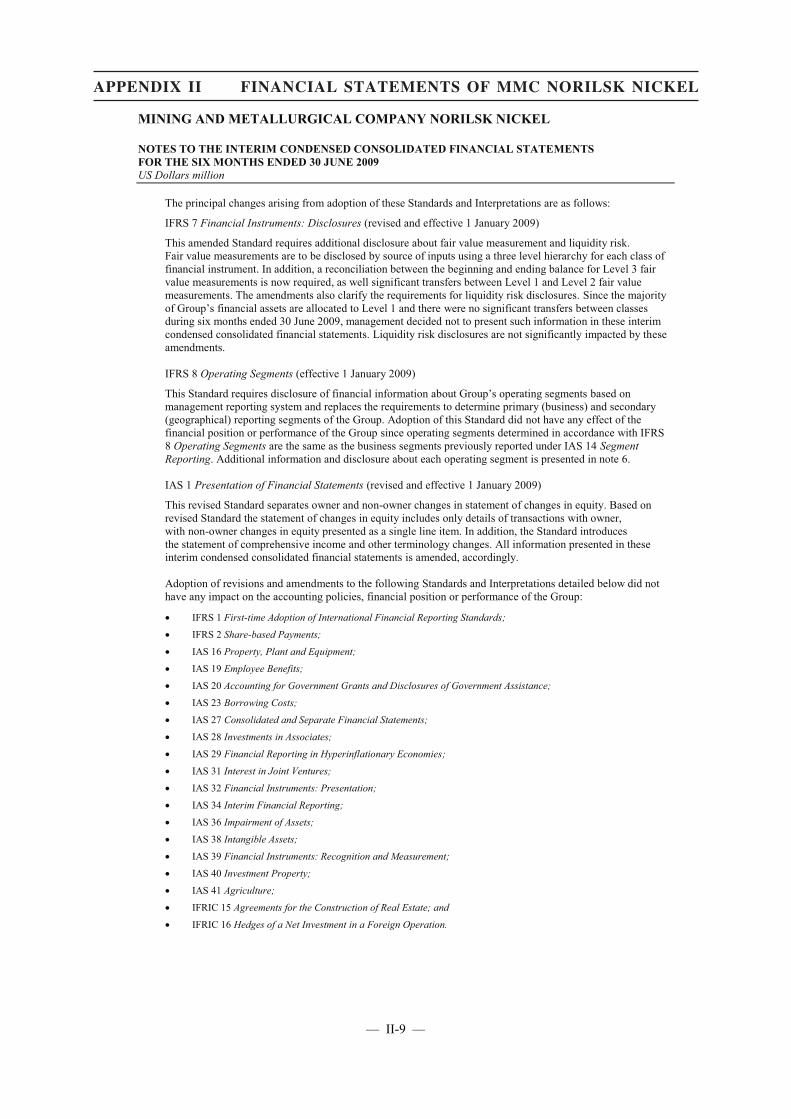
MINING AND METALLURGICAL COMPANY NORILSK NICKEL
NOTES TO THE INTERIM CONDENSED CONSOLIDATED FINANCIAL STATEMENTS FOR THE SIX MONTHS ENDED 30 JUNE 2009 US Dollars million
The principal changes arising from adoption of these Standards and Interpretations are as follows:
IFRS 7 Financial Instruments: Disclosures (revised and effective 1 January 2009)
This amended Standard requires additional disclosure about fair value measurement and liquidity risk. Fair value measurements are to be disclosed by source of inputs using a three level hierarchy for each class of financial instrument. In addition, a reconciliation between the beginning and ending balance for Level 3 fair value measurements is now required, as well significant transfers between Level 1 and Level 2 fair value measurements. The amendments also clarify the requirements for liquidity risk disclosures. Since the majority of Group’s financial assets are allocated to Level 1 and there were no significant transfers between classes during six months ended 30 June 2009, management decided not to present such information in these interim condensed consolidated financial statements. Liquidity risk disclosures are not significantly impacted by these amendments.
IFRS 8 Operating Segments (effective 1 January 2009)
This Standard requires disclosure of financial information about Group’s operating segments based on management reporting system and replaces the requirements to determine primary (business) and secondary (geographical) reporting segments of the Group. Adoption of this Standard did not have any effect of the financial position or performance of the Group since operating segments determined in accordance with IFRS 8 Operating Segments are the same as the business segments previously reported under IAS 14 Segment Reporting. Additional information and disclosure about each operating segment is presented in note 6.
IAS 1 Presentation of Financial Statements (revised and effective 1 January 2009)
This revised Standard separates owner and non-owner changes in statement of changes in equity. Based on revised Standard the statement of changes in equity includes only details of transactions with owner, with non-owner changes in equity presented as a single line item. In addition, the Standard introduces the statement of comprehensive income and other terminology changes. All information presented in these interim condensed consolidated financial statements is amended, accordingly.
Adoption of revisions and amendments to the following Standards and Interpretations detailed below did not have any impact on the accounting policies, financial position or performance of the Group:
� IFRS 1 First-time Adoption of International Financial Reporting Standards;
� IFRS 2 Share-based Payments;
� IAS 16 Property, Plant and Equipment;
� IAS 19 Employee Benefits;
� IAS 20 Accounting for Government Grants and Disclosures of Government Assistance;
� IAS 23 Borrowing Costs;
� IAS 27 Consolidated and Separate Financial Statements;
� IAS 28 Investments in Associates;
� IAS 29 Financial Reporting in Hyperinflationary Economies;
� IAS 31 Interest in Joint Ventures;
� IAS 32 Financial Instruments: Presentation;
� IAS 34 Interim Financial Reporting;
� IAS 36 Impairment of Assets;
� IAS 38 Intangible Assets;
� IAS 39 Financial Instruments: Recognition and Measurement;
� IAS 40 Investment Property;
� IAS 41 Agriculture;
� IFRIC 15 Agreements for the Construction of Real Estate; and
� IFRIC 16 Hedges of a Net Investment in a Foreign Operation.
— II-9 —
APPENDIX II FINANCIAL STATEMENTS OF MMC NORILSK NICKEL
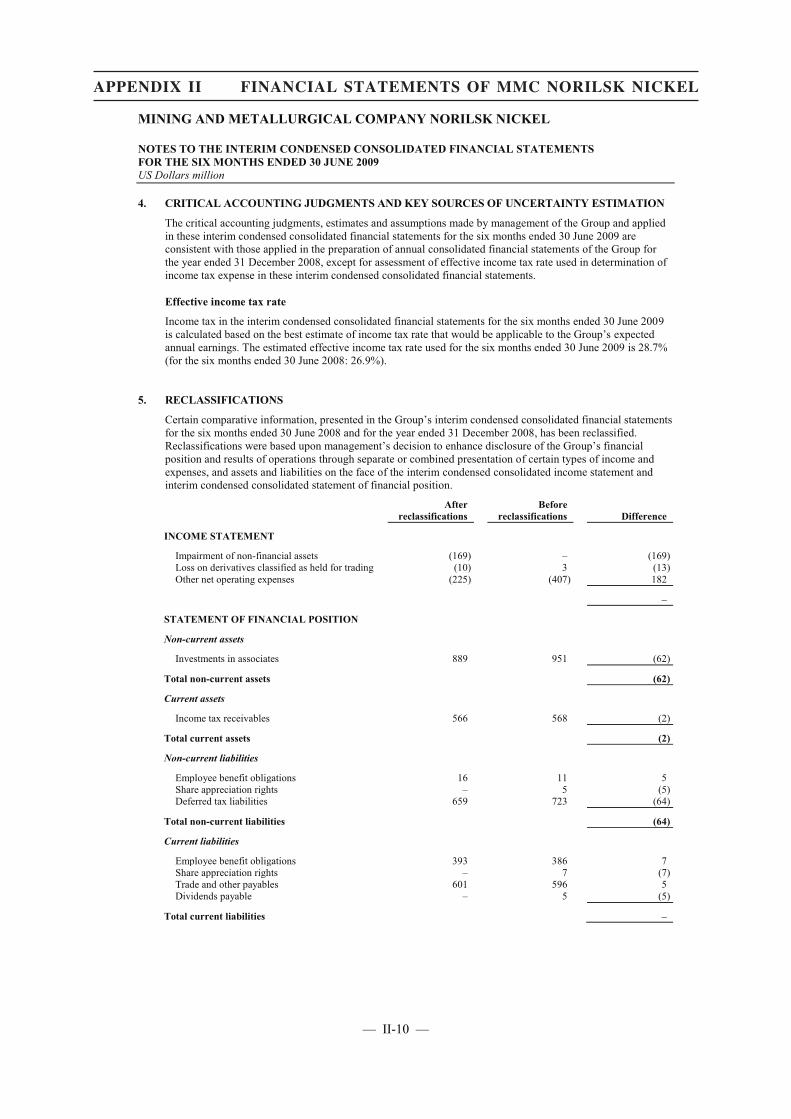
MINING AND METALLURGICAL COMPANY NORILSK NICKEL
NOTES TO THE INTERIM CONDENSED CONSOLIDATED FINANCIAL STATEMENTS FOR THE SIX MONTHS ENDED 30 JUNE 2009 US Dollars million
4. CRITICAL ACCOUNTING JUDGMENTS AND KEY SOURCES OF UNCERTAINTY ESTIMATION
The critical accounting judgments, estimates and assumptions made by management of the Group and applied in these interim condensed consolidated financial statements for the six months ended 30 June 2009 are consistent with those applied in the preparation of annual consolidated financial statements of the Group for the year ended 31 December 2008, except for assessment of effective income tax rate used in determination of income tax expense in these interim condensed consolidated financial statements.
Effective income tax rate
Income tax in the interim condensed consolidated financial statements for the six months ended 30 June 2009 is calculated based on the best estimate of income tax rate that would be applicable to the Group’s expectedannual earnings. The estimated effective income tax rate used for the six months ended 30 June 2009 is 28.7%(for the six months ended 30 June 2008: 26.9%).
5. RECLASSIFICATIONS
Certain comparative information, presented in the Group’s interim condensed consolidated financial statements for the six months ended 30 June 2008 and for the year ended 31 December 2008, has been reclassified. Reclassifications were based upon management’s decision to enhance disclosure of the Group’s financial position and results of operations through separate or combined presentation of certain types of income and expenses, and assets and liabilities on the face of the interim condensed consolidated income statement and interim condensed consolidated statement of financial position.
Afterreclassifications
Beforereclassifications Difference
INCOME STATEMENT
Impairment of non-financial assets (169) – (169)Loss on derivatives classified as held for trading (10) 3 (13)Other net operating expenses (225) (407) 182
–
STATEMENT OF FINANCIAL POSITION
Non-current assets
Investments in associates 889 951 (62)
Total non-current assets (62)
Current assets
Income tax receivables 566 568 (2)
Total current assets (2)
Non-current liabilities
Employee benefit obligations 16 11 5Share appreciation rights – 5 (5)Deferred tax liabilities 659 723 (64)
Total non-current liabilities (64)
Current liabilities
Employee benefit obligations 393 386 7Share appreciation rights – 7 (7)Trade and other payables 601 596 5Dividends payable – 5 (5)
Total current liabilities –
— II-10 —
APPENDIX II FINANCIAL STATEMENTS OF MMC NORILSK NICKEL
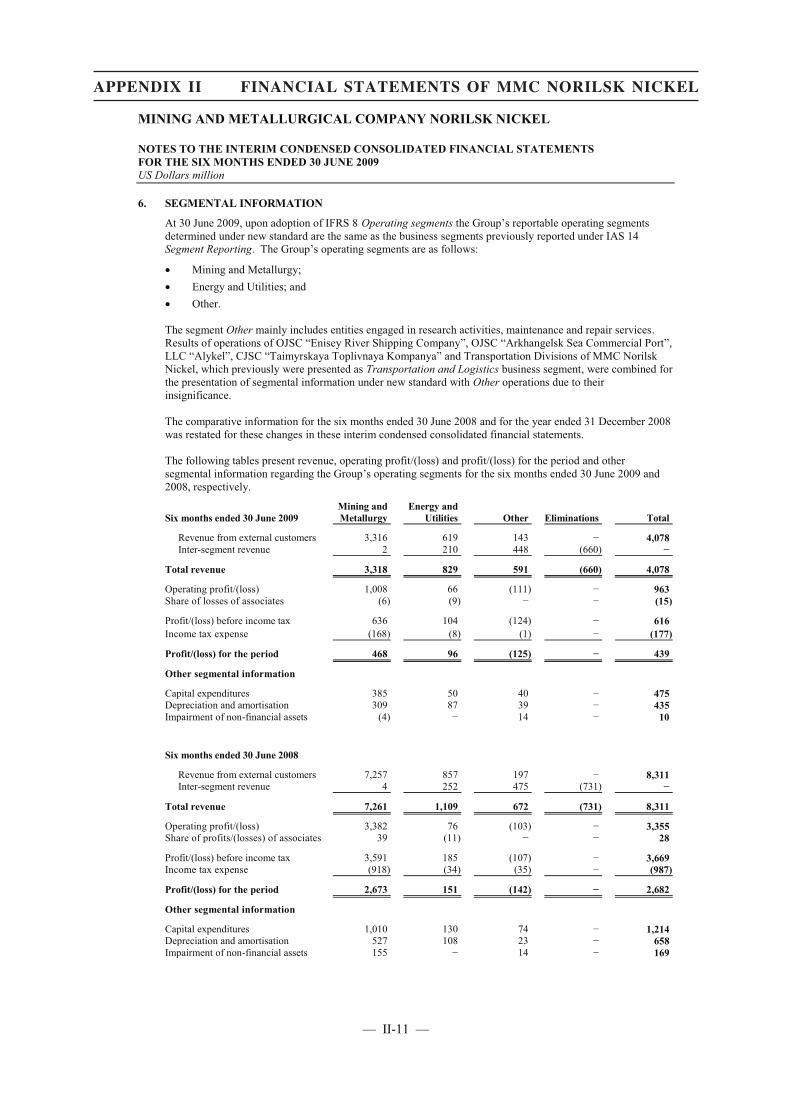
MINING AND METALLURGICAL COMPANY NORILSK NICKEL
NOTES TO THE INTERIM CONDENSED CONSOLIDATED FINANCIAL STATEMENTS FOR THE SIX MONTHS ENDED 30 JUNE 2009 US Dollars million
6. SEGMENTAL INFORMATION
At 30 June 2009, upon adoption of IFRS 8 Operating segments the Group’s reportable operating segments determined under new standard are the same as the business segments previously reported under IAS 14 Segment Reporting. The Group’s operating segments are as follows:
� Mining and Metallurgy; � Energy and Utilities; and � Other.
The segment Other mainly includes entities engaged in research activities, maintenance and repair services.Results of operations of OJSC “Enisey River Shipping Company”, OJSC “Arkhangelsk Sea Commercial Port”,LLC “Alykel”, CJSC “Taimyrskaya Toplivnaya Kompanya” and Transportation Divisions of MMC Norilsk Nickel, which previously were presented as Transportation and Logistics business segment, were combined for the presentation of segmental information under new standard with Other operations due to their insignificance.
The comparative information for the six months ended 30 June 2008 and for the year ended 31 December 2008 was restated for these changes in these interim condensed consolidated financial statements.
The following tables present revenue, operating profit/(loss) and profit/(loss) for the period and other segmental information regarding the Group’s operating segments for the six months ended 30 June 2009 and 2008, respectively.
Six months ended 30 June 2009Mining and Metallurgy
Energy and Utilities Other Eliminations Total
Revenue from external customers 3,316 619 143 − 4,078 Inter-segment revenue 2 210 448 (660) −
Total revenue 3,318 829 591 (660) 4,078
Operating profit/(loss) 1,008 66 (111) − 963 Share of losses of associates (6) (9) − − (15)
Profit/(loss) before income tax 636 104 (124) − 616Income tax expense (168) (8) (1) − (177)
Profit/(loss) for the period 468 96 (125) − 439
Other segmental information
Capital expenditures 385 50 40 − 475 Depreciation and amortisation 309 87 39 − 435Impairment of non-financial assets (4) − 14 − 10
Six months ended 30 June 2008
Revenue from external customers 7,257 857 197 − 8,311 Inter-segment revenue 4 252 475 (731) −
Total revenue 7,261 1,109 672 (731) 8,311
Operating profit/(loss) 3,382 76 (103) − 3,355 Share of profits/(losses) of associates 39 (11) − − 28
Profit/(loss) before income tax 3,591 185 (107) − 3,669 Income tax expense (918) (34) (35) − (987)
Profit/(loss) for the period 2,673 151 (142) − 2,682
Other segmental information
Capital expenditures 1,010 130 74 − 1,214 Depreciation and amortisation 527 108 23 − 658 Impairment of non-financial assets 155 − 14 − 169
— II-11 —
APPENDIX II FINANCIAL STATEMENTS OF MMC NORILSK NICKEL
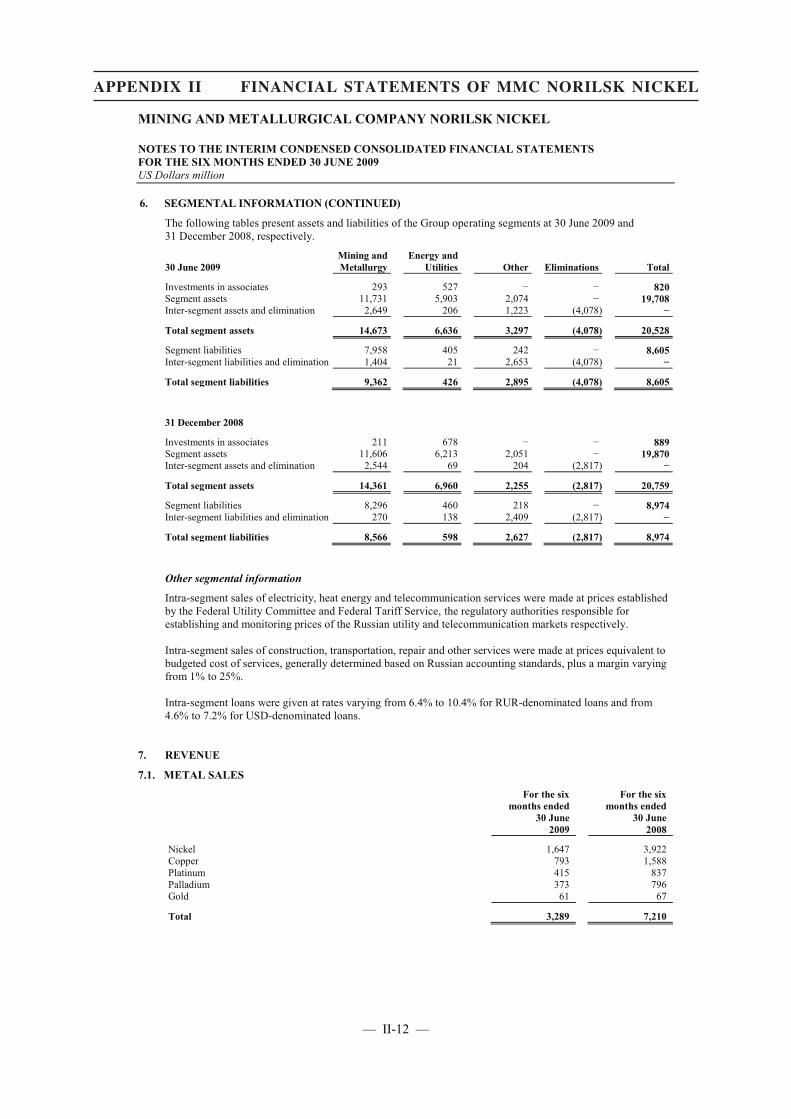
MINING AND METALLURGICAL COMPANY NORILSK NICKEL
NOTES TO THE INTERIM CONDENSED CONSOLIDATED FINANCIAL STATEMENTS FOR THE SIX MONTHS ENDED 30 JUNE 2009 US Dollars million
6. SEGMENTAL INFORMATION (CONTINUED)
The following tables present assets and liabilities of the Group operating segments at 30 June 2009 and 31 December 2008, respectively.
30 June 2009Mining and Metallurgy
Energy and Utilities Other Eliminations Total
Investments in associates 293 527 − − 820Segment assets 11,731 5,903 2,074 − 19,708Inter-segment assets and elimination 2,649 206 1,223 (4,078) −
Total segment assets 14,673 6,636 3,297 (4,078) 20,528
Segment liabilities 7,958 405 242 − 8,605Inter-segment liabilities and elimination 1,404 21 2,653 (4,078) −
Total segment liabilities 9,362 426 2,895 (4,078) 8,605
31 December 2008
Investments in associates 211 678 − − 889Segment assets 11,606 6,213 2,051 − 19,870Inter-segment assets and elimination 2,544 69 204 (2,817) −
Total segment assets 14,361 6,960 2,255 (2,817) 20,759
Segment liabilities 8,296 460 218 − 8,974Inter-segment liabilities and elimination 270 138 2,409 (2,817) −
Total segment liabilities 8,566 598 2,627 (2,817) 8,974
Other segmental information
Intra-segment sales of electricity, heat energy and telecommunication services were made at prices established by the Federal Utility Committee and Federal Tariff Service, the regulatory authorities responsible for establishing and monitoring prices of the Russian utility and telecommunication markets respectively.
Intra-segment sales of construction, transportation, repair and other services were made at prices equivalent to budgeted cost of services, generally determined based on Russian accounting standards, plus a margin varying from 1% to 25%.
Intra-segment loans were given at rates varying from 6.4% to 10.4% for RUR-denominated loans and from4.6% to 7.2% for USD-denominated loans.
7. REVENUE
7.1. METAL SALES
For the six months ended
30 June 2009
For the six months ended
30 June 2008
Nickel 1,647 3,922Copper 793 1,588Platinum 415 837Palladium 373 796Gold 61 67
Total 3,289 7,210
— II-12 —
APPENDIX II FINANCIAL STATEMENTS OF MMC NORILSK NICKEL
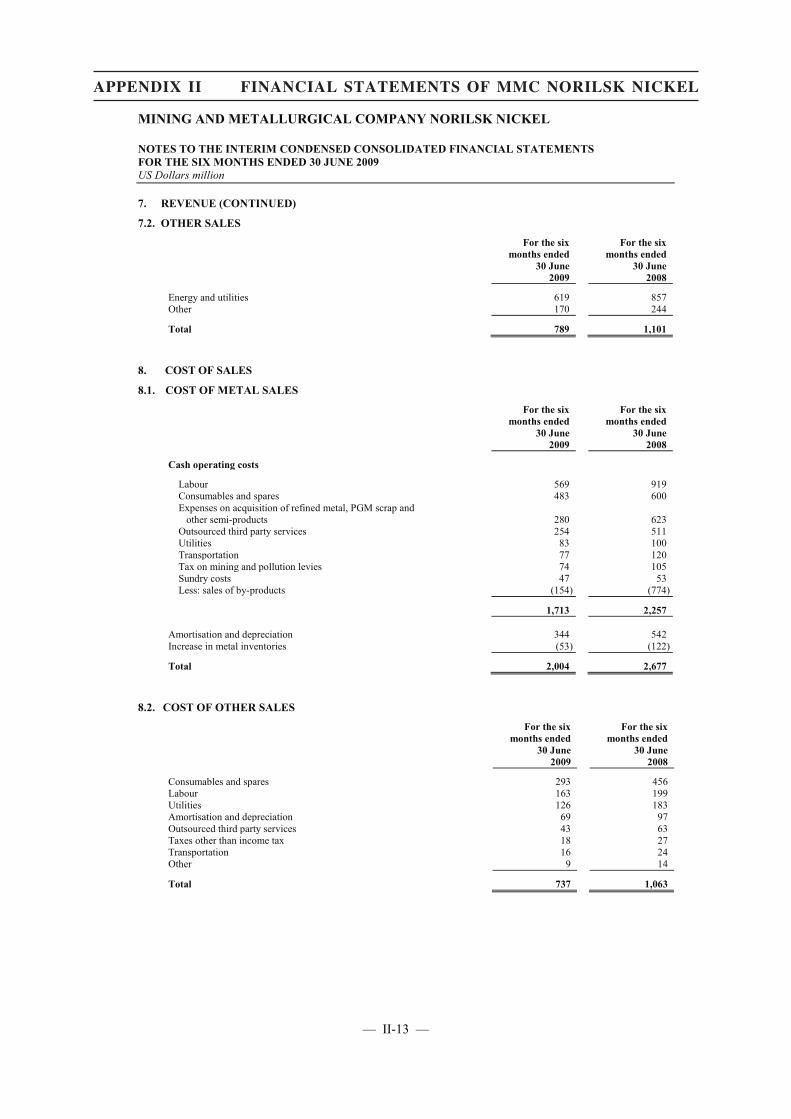
MINING AND METALLURGICAL COMPANY NORILSK NICKEL
NOTES TO THE INTERIM CONDENSED CONSOLIDATED FINANCIAL STATEMENTS FOR THE SIX MONTHS ENDED 30 JUNE 2009 US Dollars million
7. REVENUE (CONTINUED)
7.2. OTHER SALES
For the six months ended
30 June 2009
For the six months ended
30 June 2008
Energy and utilities 619 857Other 170 244
Total 789 1,101
8. COST OF SALES
8.1. COST OF METAL SALES
For the six months ended
30 June 2009
For the six months ended
30 June 2008
Cash operating costs
Labour 569 919Consumables and spares 483 600Expenses on acquisition of refined metal, PGM scrap and
other semi-products 280 623Outsourced third party services 254 511Utilities 83 100Transportation 77 120Tax on mining and pollution levies 74 105Sundry costs 47 53Less: sales of by-products (154) (774)
1,713 2,257
Amortisation and depreciation 344 542Increase in metal inventories (53) (122)
Total 2,004 2,677
8.2. COST OF OTHER SALES
For the six months ended
30 June2009
For the six months ended
30 June 2008
Consumables and spares 293 456Labour 163 199Utilities 126 183Amortisation and depreciation 69 97Outsourced third party services 43 63Taxes other than income tax 18 27Transportation 16 24Other 9 14
Total 737 1,063
— II-13 —
APPENDIX II FINANCIAL STATEMENTS OF MMC NORILSK NICKEL
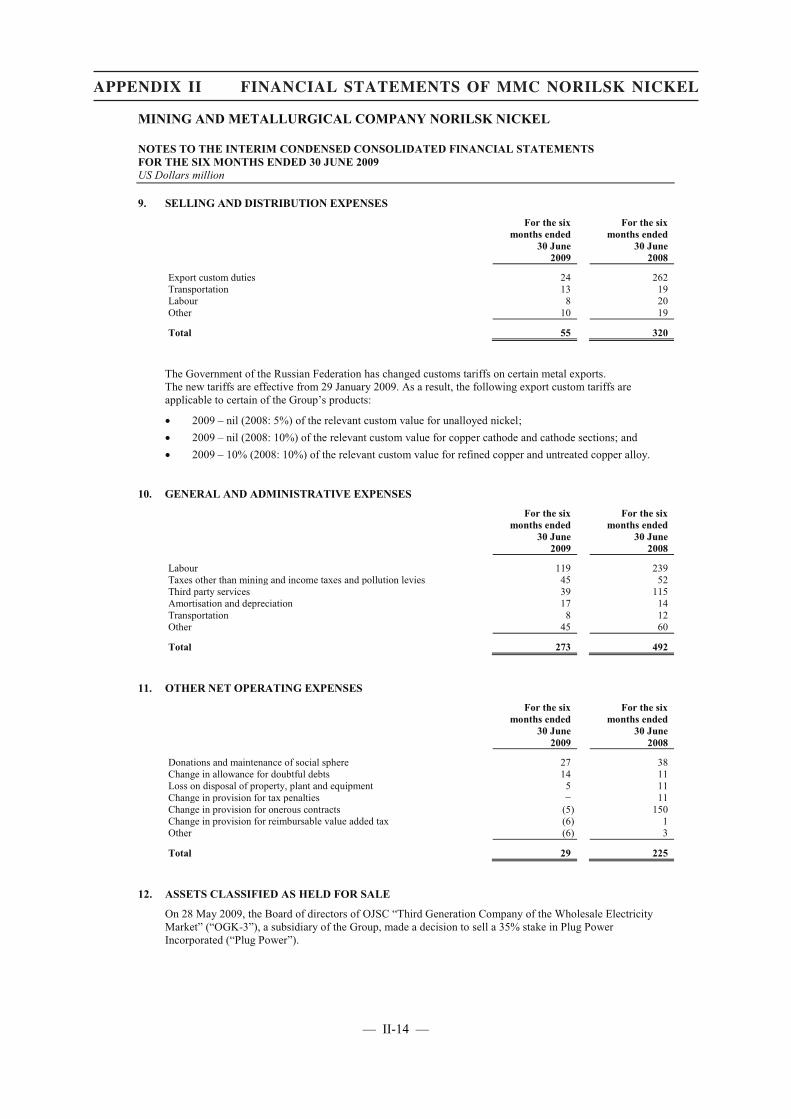
MINING AND METALLURGICAL COMPANY NORILSK NICKEL
NOTES TO THE INTERIM CONDENSED CONSOLIDATED FINANCIAL STATEMENTS FOR THE SIX MONTHS ENDED 30 JUNE 2009 US Dollars million
9. SELLING AND DISTRIBUTION EXPENSES
For the six months ended
30 June 2009
For the six months ended
30 June 2008
Export custom duties 24 262Transportation 13 19Labour 8 20Other 10 19
Total 55 320
The Government of the Russian Federation has changed customs tariffs on certain metal exports.The new tariffs are effective from 29 January 2009. As a result, the following export custom tariffs are applicable to certain of the Group’s products:
� 2009 – nil (2008: 5%) of the relevant custom value for unalloyed nickel;� 2009 – nil (2008: 10%) of the relevant custom value for copper cathode and cathode sections; and � 2009 – 10% (2008: 10%) of the relevant custom value for refined copper and untreated copper alloy.
10. GENERAL AND ADMINISTRATIVE EXPENSES
For the six months ended
30 June 2009
For the six months ended
30 June 2008
Labour 119 239Taxes other than mining and income taxes and pollution levies 45 52Third party services 39 115Amortisation and depreciation 17 14Transportation 8 12Other 45 60
Total 273 492
11. OTHER NET OPERATING EXPENSES
For the six months ended
30 June 2009
For the six months ended
30 June 2008
Donations and maintenance of social sphere 27 38Change in allowance for doubtful debts 14 11Loss on disposal of property, plant and equipment 5 11Change in provision for tax penalties − 11Change in provision for onerous contracts (5) 150Change in provision for reimbursable value added tax (6) 1Other (6) 3
Total 29 225
12. ASSETS CLASSIFIED AS HELD FOR SALE
On 28 May 2009, the Board of directors of OJSC “Third Generation Company of the Wholesale Electricity Market” (“OGK-3”), a subsidiary of the Group, made a decision to sell a 35% stake in Plug Power Incorporated (“Plug Power”).
— II-14 —
APPENDIX II FINANCIAL STATEMENTS OF MMC NORILSK NICKEL

MINING AND METALLURGICAL COMPANY NORILSK NICKEL
NOTES TO THE INTERIM CONDENSED CONSOLIDATED FINANCIAL STATEMENTS FOR THE SIX MONTHS ENDED 30 JUNE 2009 US Dollars million
12. ASSETS CLASSIFIED AS HELD FOR SALE (CONTINUED)
At 30 June 2009, the Group's investment in Plug Power in the amount of USD 38 million was classified as an asset held for sale and presented separately in the interim condensed consolidated statement of financial position. The cumulative translation reserve of USD 10 million attributable to Plug Power is recognised as part of other comprehensive income of the Group.
At 30 June 2009, construction-in-progress in the amount of USD 7 million (31 December 2008: USD 13 million) attributable to Activox Refinery Project was classified as assets held for sale and presented separately in the interim condensed consolidated statement of financial position.
13. PROPERTY, PLANT AND EQUIPMENT
Mining assets
Non-mining
assets
Capital construction-
in-progress Total
Cost
At 31 December 2008 8,428 8,126 1,517 18,071 Additions 167 − 302 469 Transfers − 360 (360) −Disposals (15) (50) (2) (67)Effect of translation to presentation currency 325 (381) (63) (119)
At 30 June 2009 8,905 8,055 1,394 18,354
Accumulated depreciation and impairment
At 31 December 2008 as previously reported (4,516) (2,713) (105) (7,334)Reclassifications 86 (90) 4 −
At 1 January 2009 after reclassifications (4,430) (2,803) (101) (7,334)Charge for the period (143) (266) − (409)Eliminated on disposals 11 35 1 47Impairment 4 − (8) (4)Effect of translation to presentation currency (440) 69 3 (368)
At 30 June 2009 (4,998) (2,965) (105) (8,068)
Carrying value
At 31 December 2008 3,912 5,413 1,412 10,737
At 30 June 2009 3,907 5,090 1,289 10,286
14. OTHER FINANCIAL ASSETS
30 June 2009
31 December 2008
Non-current
Available-for-sale investments in securities 591 312 Bank deposits 111 115 Loans issued and other receivables 70 73Held to maturity investments 23 23
Total non-current 795 523
Current
Bank deposits 969 1,273 Available-for-sale investments in securities 22 19Loans issued and other receivables 1 24
Total current 992 1,316
— II-15 —
APPENDIX II FINANCIAL STATEMENTS OF MMC NORILSK NICKEL
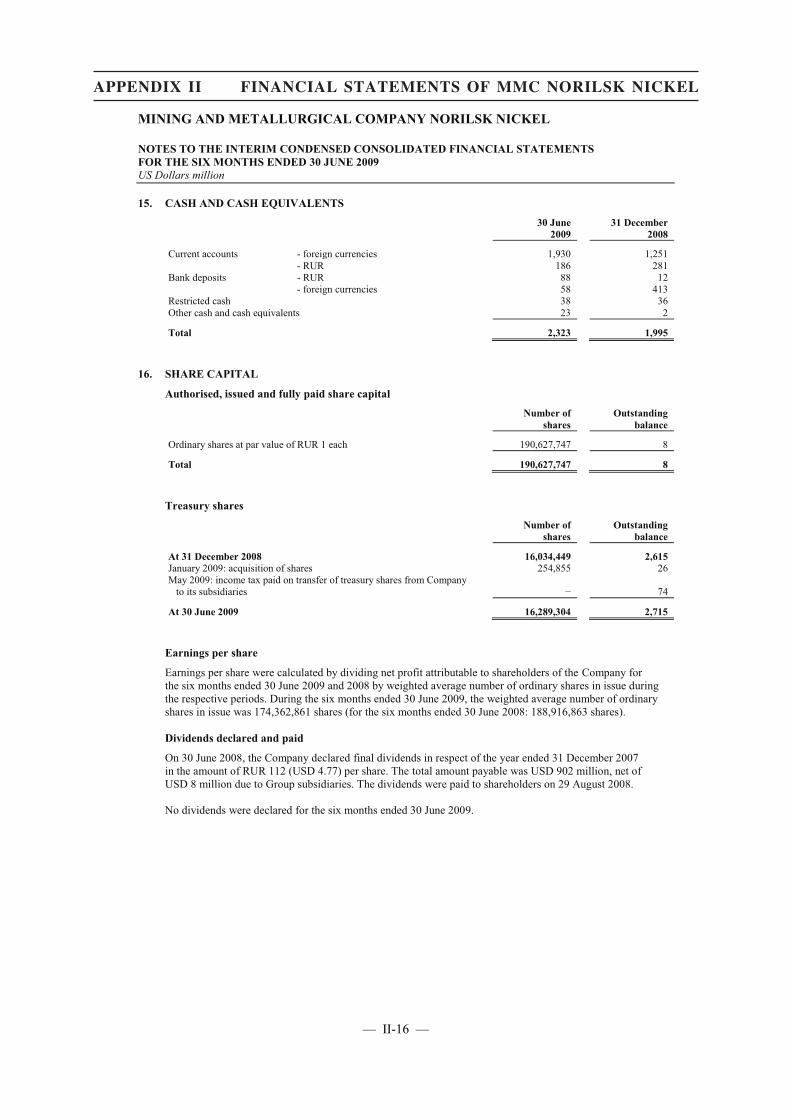
MINING AND METALLURGICAL COMPANY NORILSK NICKEL
NOTES TO THE INTERIM CONDENSED CONSOLIDATED FINANCIAL STATEMENTS FOR THE SIX MONTHS ENDED 30 JUNE 2009 US Dollars million
15. CASH AND CASH EQUIVALENTS
30 June 2009
31 December 2008
Current accounts - foreign currencies 1,930 1,251- RUR 186 281
Bank deposits - RUR 88 12- foreign currencies 58 413
Restricted cash 38 36Other cash and cash equivalents 23 2
Total 2,323 1,995
16. SHARE CAPITAL
Authorised, issued and fully paid share capital
Number of shares
Outstanding balance
Ordinary shares at par value of RUR 1 each 190,627,747 8
Total 190,627,747 8
Treasury shares
Number of shares
Outstanding balance
At 31 December 2008 16,034,449 2,615January 2009: acquisition of shares 254,855 26May 2009: income tax paid on transfer of treasury shares from Company
to its subsidiaries − 74
At 30 June 2009 16,289,304 2,715
Earnings per share
Earnings per share were calculated by dividing net profit attributable to shareholders of the Company for the six months ended 30 June 2009 and 2008 by weighted average number of ordinary shares in issue during the respective periods. During the six months ended 30 June 2009, the weighted average number of ordinary shares in issue was 174,362,861 shares (for the six months ended 30 June 2008: 188,916,863 shares).
Dividends declared and paid
On 30 June 2008, the Company declared final dividends in respect of the year ended 31 December 2007 in the amount of RUR 112 (USD 4.77) per share. The total amount payable was USD 902 million, net ofUSD 8 million due to Group subsidiaries. The dividends were paid to shareholders on 29 August 2008.
No dividends were declared for the six months ended 30 June 2009.
— II-16 —
APPENDIX II FINANCIAL STATEMENTS OF MMC NORILSK NICKEL
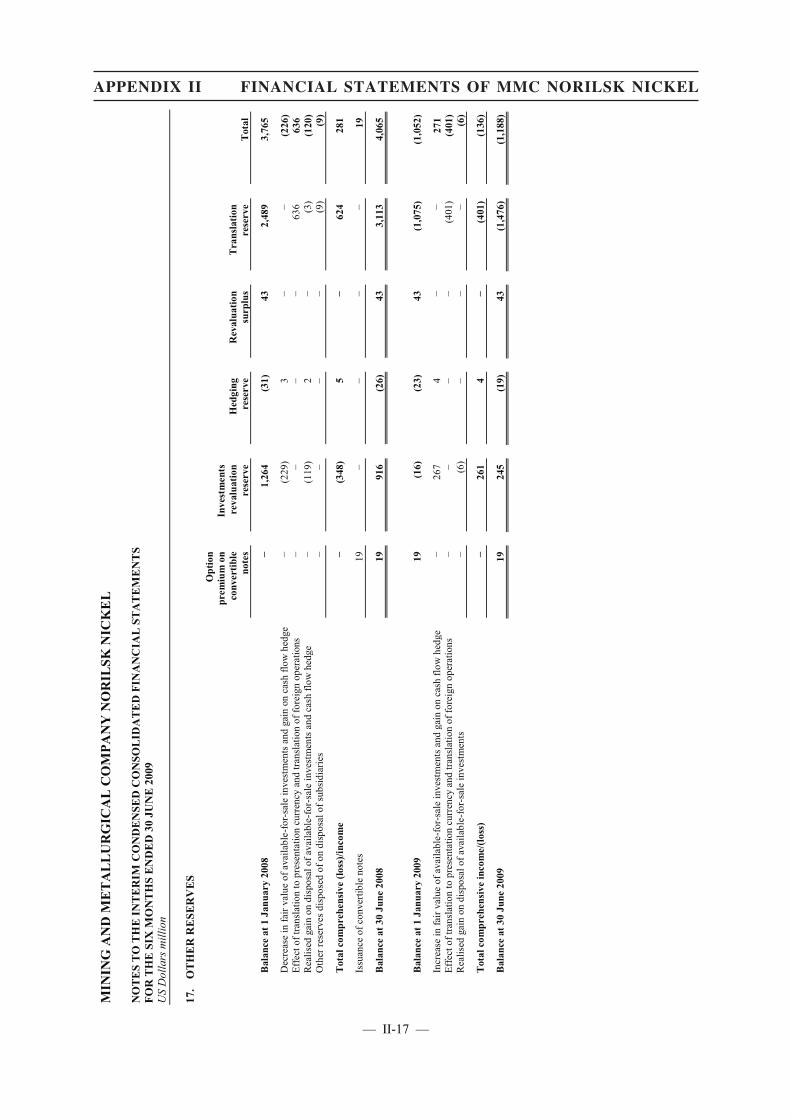
MIN
ING
AN
D M
ET
AL
LU
RG
ICA
L C
OM
PAN
Y N
OR
ILSK
NIC
KE
L
NO
TE
S T
O T
HE
INT
ER
IM C
ON
DE
NSE
D C
ON
SOL
IDA
TE
D F
INA
NC
IAL
ST
AT
EM
EN
TS
FOR
TH
E S
IX M
ON
TH
S E
ND
ED
30
JUN
E 2
009
US
Dol
lars
mill
ion
17.
OT
HE
R R
ESE
RV
ES
Opt
ion
prem
ium
on
conv
ertib
le
note
s
Inve
stm
ents
re
valu
atio
n re
serv
eH
edgi
ng
rese
rve
Rev
alua
tion
surp
lus
Tra
nsla
tion
rese
rve
Tot
al
Bal
ance
at 1
Jan
uary
200
8−
1,26
4(3
1)43
2,48
93,
765
Dec
reas
e in
fair
valu
e of
ava
ilabl
e-fo
r-sa
le in
vest
men
tsan
d ga
in o
n ca
sh fl
ow h
edge
−(2
29)
3−
−(2
26)
Effe
ct o
f tra
nsla
tion
to p
rese
ntat
ion
curr
ency
and
trans
latio
n of
fore
ign
oper
atio
ns−
−−
−63
663
6R
ealis
ed g
ain
on d
ispo
sal o
f ava
ilabl
e-fo
r-sa
le in
vest
men
tsan
d ca
sh fl
ow h
edge
−(1
19)
2−
(3)
(120
)O
ther
rese
rves
dis
pose
d of
on
disp
osal
of s
ubsid
iarie
s−
−−
−(9
)(9
)
Tot
al c
ompr
ehen
sive
(los
s)/in
com
e−
(348
)5
−62
428
1
Issu
ance
of c
onve
rtibl
e no
tes
19−
−−
−19
Bal
ance
at 3
0 Ju
ne 2
008
1991
6(2
6)43
3,11
34,
065
Bal
ance
at 1
Jan
uary
200
919
(16)
(23)
43(1
,075
)(1
,052
)
Incr
ease
in fa
ir va
lue
of a
vaila
ble-
for-
sale
inve
stm
ents
and
gai
n on
cas
h flo
w h
edge
−26
74
−−
271
Effe
ct o
f tra
nsla
tion
to p
rese
ntat
ion
curr
ency
and
tran
slat
ion
of fo
reig
n op
erat
ions
−−
−−
(401
)(4
01)
Rea
lised
gai
n on
dis
posa
l of a
vaila
ble-
for-
sale
inve
stm
ents
−(6
)−
−−
(6)
Tot
al c
ompr
ehen
sive
inco
me/
(loss
)−
261
4−
(401
)(1
36)
Bal
ance
at 3
0 Ju
ne 2
009
1924
5 (1
9)43
(1,4
76)
(1,1
88)
— II-17 —
APPENDIX II FINANCIAL STATEMENTS OF MMC NORILSK NICKEL
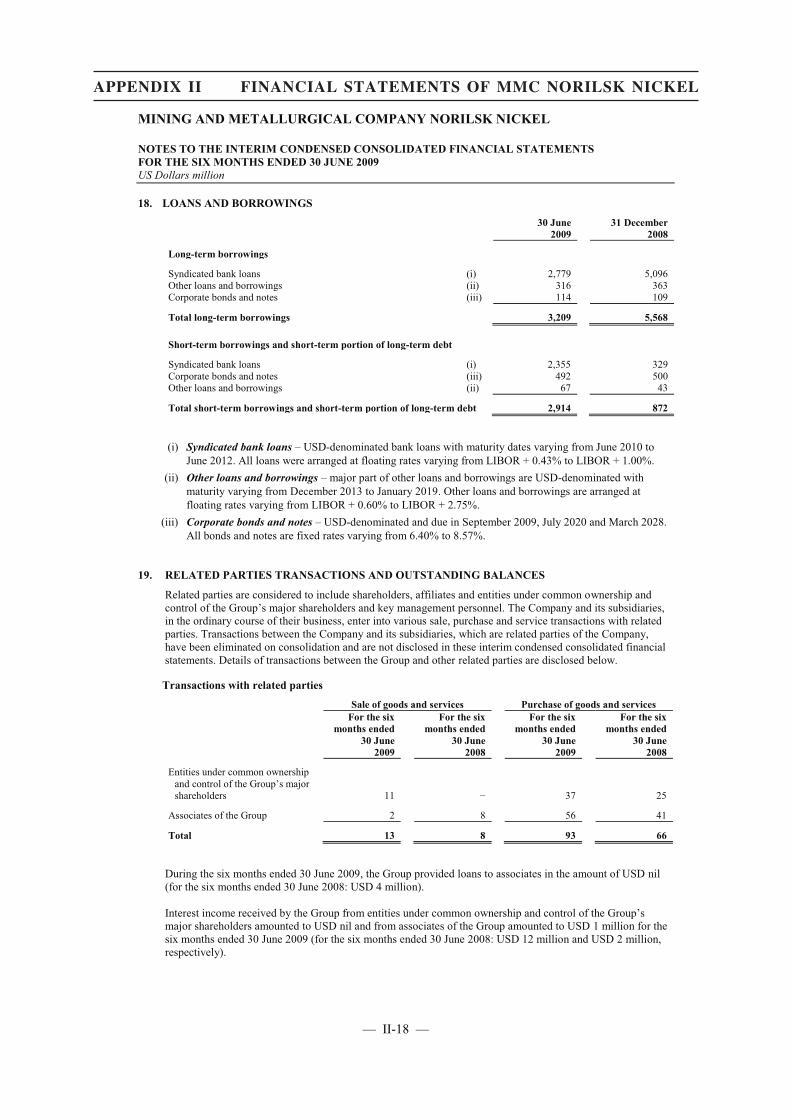
MINING AND METALLURGICAL COMPANY NORILSK NICKEL
NOTES TO THE INTERIM CONDENSED CONSOLIDATED FINANCIAL STATEMENTS FOR THE SIX MONTHS ENDED 30 JUNE 2009 US Dollars million
18. LOANS AND BORROWINGS
30 June 2009
31 December 2008
Long-term borrowings
Syndicated bank loans (i) 2,779 5,096 Other loans and borrowings (ii) 316 363 Corporate bonds and notes (iii) 114 109
Total long-term borrowings 3,209 5,568
Short-term borrowings and short-term portion of long-term debt
Syndicated bank loans (i) 2,355 329 Corporate bonds and notes (iii) 492 500 Other loans and borrowings (ii) 67 43
Total short-term borrowings and short-term portion of long-term debt 2,914 872
(i) Syndicated bank loans – USD-denominated bank loans with maturity dates varying from June 2010 to June 2012. All loans were arranged at floating rates varying from LIBOR + 0.43% to LIBOR + 1.00%.
(ii) Other loans and borrowings – major part of other loans and borrowings are USD-denominated with maturity varying from December 2013 to January 2019. Other loans and borrowings are arranged at floating rates varying from LIBOR + 0.60% to LIBOR + 2.75%.
(iii) Corporate bonds and notes – USD-denominated and due in September 2009, July 2020 and March 2028. All bonds and notes are fixed rates varying from 6.40% to 8.57%.
19. RELATED PARTIES TRANSACTIONS AND OUTSTANDING BALANCES
Related parties are considered to include shareholders, affiliates and entities under common ownership and control of the Group’s major shareholders and key management personnel. The Company and its subsidiaries, in the ordinary course of their business, enter into various sale, purchase and service transactions with related parties. Transactions between the Company and its subsidiaries, which are related parties of the Company, have been eliminated on consolidation and are not disclosed in these interim condensed consolidated financial statements. Details of transactions between the Group and other related parties are disclosed below.
Transactions with related parties
Sale of goods and services Purchase of goods and servicesFor the six
months ended 30 June
2009
For the six months ended
30 June 2008
For the six months ended
30 June 2009
For the six months ended
30 June 2008
Entities under common ownership and control of the Group’s major shareholders 11 − 37 25
Associates of the Group 2 8 56 41
Total 13 8 93 66
During the six months ended 30 June 2009, the Group provided loans to associates in the amount of USD nil (for the six months ended 30 June 2008: USD 4 million).
Interest income received by the Group from entities under common ownership and control of the Group’s major shareholders amounted to USD nil and from associates of the Group amounted to USD 1 million for the six months ended 30 June 2009 (for the six months ended 30 June 2008: USD 12 million and USD 2 million, respectively).
— II-18 —
APPENDIX II FINANCIAL STATEMENTS OF MMC NORILSK NICKEL

MINING AND METALLURGICAL COMPANY NORILSK NICKEL
NOTES TO THE INTERIM CONDENSED CONSOLIDATED FINANCIAL STATEMENTS FOR THE SIX MONTHS ENDED 30 JUNE 2009 US Dollars million
19. RELATED PARTIES TRANSACTIONS AND OUTSTANDING BALANCES (CONTINUED)
Outstanding balances with related parties
Accounts receivable, investments and cash
Accounts payable, loans and borrowings received
30 June 2009
31 December2008
30 June 2009
31 December2008
Entities under common ownership and control of the Group’s major shareholders 15 23 5 9
Associates of the Group 45 22 10 21
Total 60 45 15 30
At 30 June 2009, the Group recognised impairment provision for loans provided to related parties of the Group in the amount of USD 140 million (31 December 2008: USD 140 million) and for accounts receivable from related parties of the Group in the amount of USD 5 million (31 December 2008: USD 4 million). All outstanding balances are expected to be settled in cash.
Terms and conditions of transactions with related parties
Sales to and purchase from related parties of electricity, heat energy and natural gas supply were made at prices established by the Federal Utility Committee and Federal Tariff Service, the regulatory authorities responsible for establishing and monitoring prices on the utility and telecommunication markets in the Russian Federation.
Sales of construction, transportation, repair and other services were made at prices calculated at budgeted cost of services, generally determined based on Russian accounting standards, plus a margin varying from 1% to 25%.
Loans were provided to related parties at rates varying from 6.5% to 10.4% for RUR-denominated loans (31 December 2008: 6.5%) and from 5.6% to 6.1% for USD-denominated loans (31 December 2008: from 5.6% to 6.1%).
20. COMMITMENTS AND CONTINGENCIES
Capital commitments
At 30 June 2009, contracted capital commitments amounted to USD 780 million.
Operating lease
The land in the Russian Federation on which the Group’s production facilities are located is owned by the state. The Group leases land through operating lease agreements, which expire in various years through 2033. According to the terms of lease agreements rent fees are revised annually by reference to an order issued by the relevant local authorities. The Group entities have a renewal option at the end of lease period and an option to buy land at any time, at a price established by the local authorities.
During the six months ended 30 June 2009, the Group entered into three aircraft lease agreements. The respective lease agreements have an average life of six-years with renewal option at the end of the term. There are no restrictions placed upon the lessee by entering into these agreements.
Future minimum lease payments due under non-cancelable operating lease agreements at 30 June 2009 were as follows:
Due within one year 26 From one to five years 72 Thereafter 42
Total 140
— II-19 —
APPENDIX II FINANCIAL STATEMENTS OF MMC NORILSK NICKEL
MINING AND METALLURGICAL COMPANY NORILSK NICKEL
NOTES TO THE INTERIM CONDENSED CONSOLIDATED FINANCIAL STATEMENTS FOR THE SIX MONTHS ENDED 30 JUNE 2009 US Dollars million
20. COMMITMENTS AND CONTINGENCIES (CONTINUED)
Litigation
At 30 June 2009, unresolved tax litigations amounted to approximately USD 38 million. Management believes that the risk of an unfavorable outcome of the litigation is possible.
In 2007 Federal Service for Supervision of Natural Resource Usage of the Russian Federation (“Federal Service”) required the Group to compensate for damage of water resources in the amount of USD 225 million. In 2008 Federal Service has filed a lawsuit against the Group in the amount of USD 139 million. Management believes that the risk of an unfavorable outcome of the litigation is possible.
Taxation contingencies in the Russian Federation
The Russian Federation currently has a number of laws related to various taxes imposed by both federal and regional governmental authorities. Applicable taxes include VAT, corporate income tax, UST, together with others. Tax declarations, together with other legal compliance areas (for example, customs and currency control matters), are subject to review and investigation by a number of authorities, which are enabled by law to impose severe fines, penalties and interest charges. Generally, tax declarations remain open and subject to inspection for a period of three years following the tax year.
While management believes that it has adequately provided for tax liabilities based on its interpretation of current and previous legislation, the risk remains that tax authorities in the Russian Federation could take differing positions with regard to interpretive issues. This uncertainty may expose the Group to additional taxation, fines and penalties.
With regards to matters where practice concerning payment of taxes is unclear, management estimate possible tax exposure at 30 June 2009 to be USD 178 million (31 December 2008: USD 234 million).
21. EVENTS SUBSEQUENT TO THE BALANCE SHEET DATE
Guaranteed notes
During July and August 2009 guaranteed notes in the amount of USD 11 million were bought back by the Group for a cash consideration of USD 11 million. On 30 September 2009, principal of USD 481 million and a coupon of USD 18 million were paid to the guaranteed notes holders.
— II-20 —
APPENDIX II FINANCIAL STATEMENTS OF MMC NORILSK NICKEL

— II-21 —
APPENDIX II FINANCIAL STATEMENTS OF MMC NORILSK NICKEL
— II-22 —
APPENDIX II FINANCIAL STATEMENTS OF MMC NORILSK NICKEL
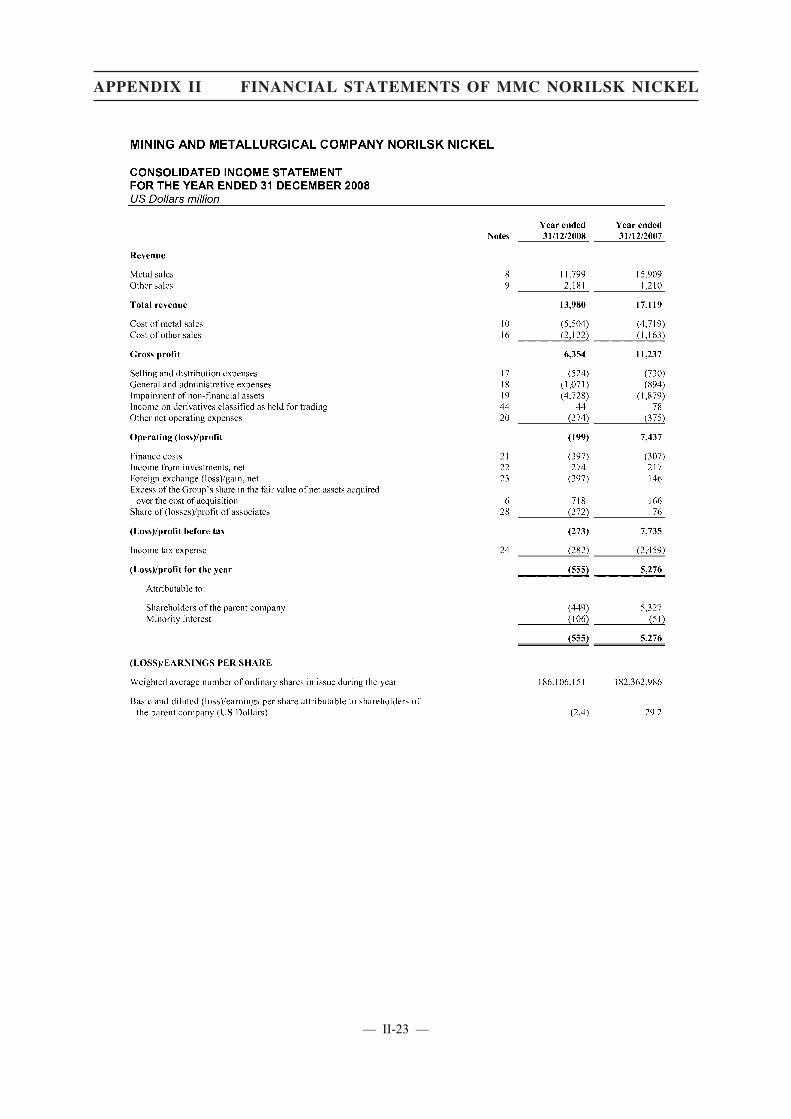
— II-23 —
APPENDIX II FINANCIAL STATEMENTS OF MMC NORILSK NICKEL
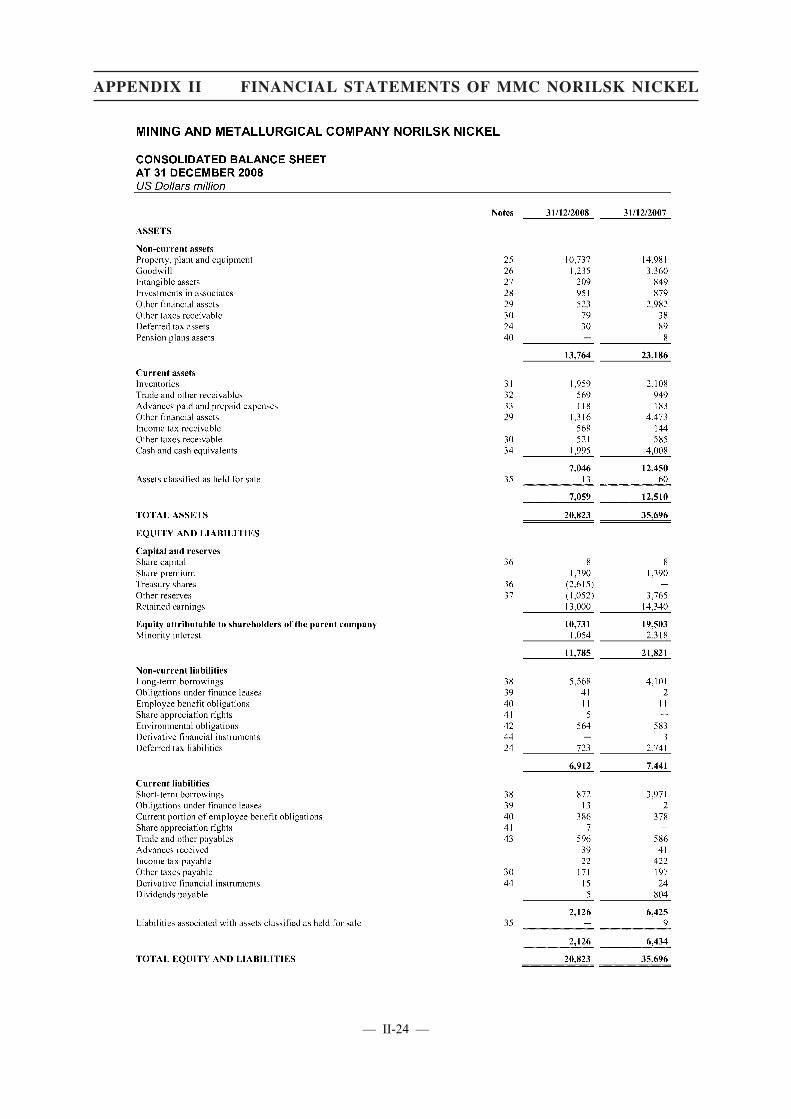
— II-24 —
APPENDIX II FINANCIAL STATEMENTS OF MMC NORILSK NICKEL
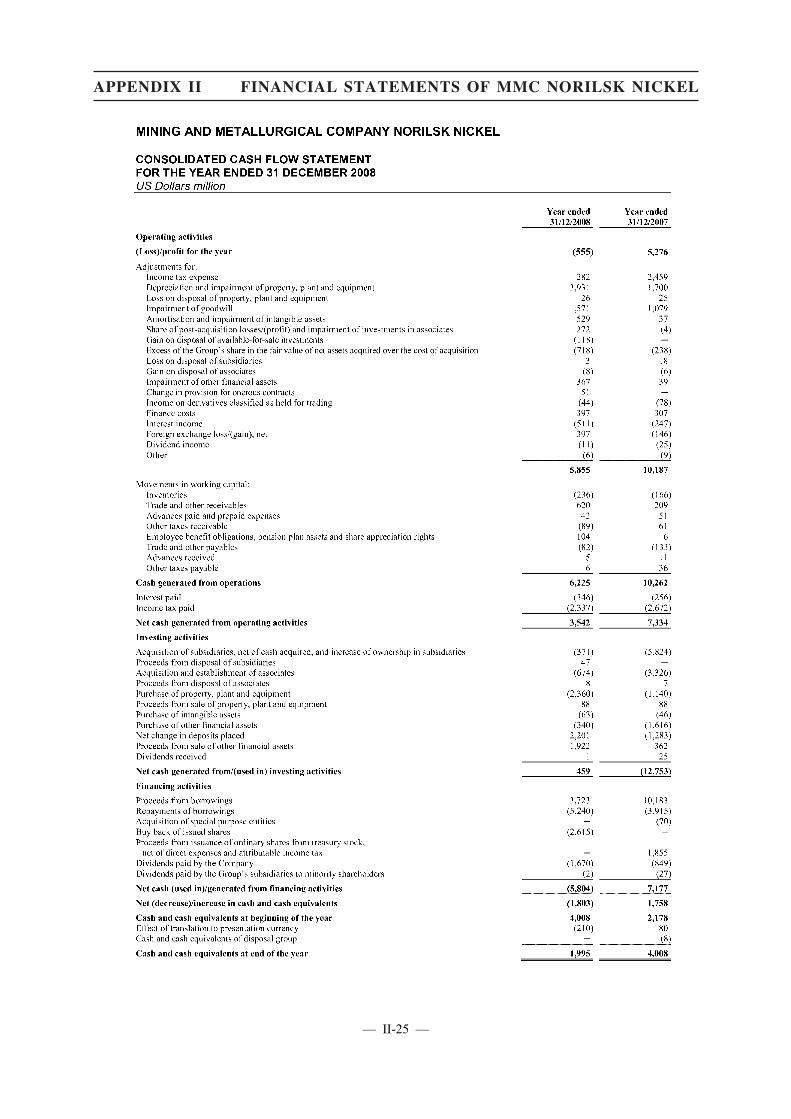
— II-25 —
APPENDIX II FINANCIAL STATEMENTS OF MMC NORILSK NICKEL

— II-26 —
APPENDIX II FINANCIAL STATEMENTS OF MMC NORILSK NICKEL

— II-27 —
APPENDIX II FINANCIAL STATEMENTS OF MMC NORILSK NICKEL
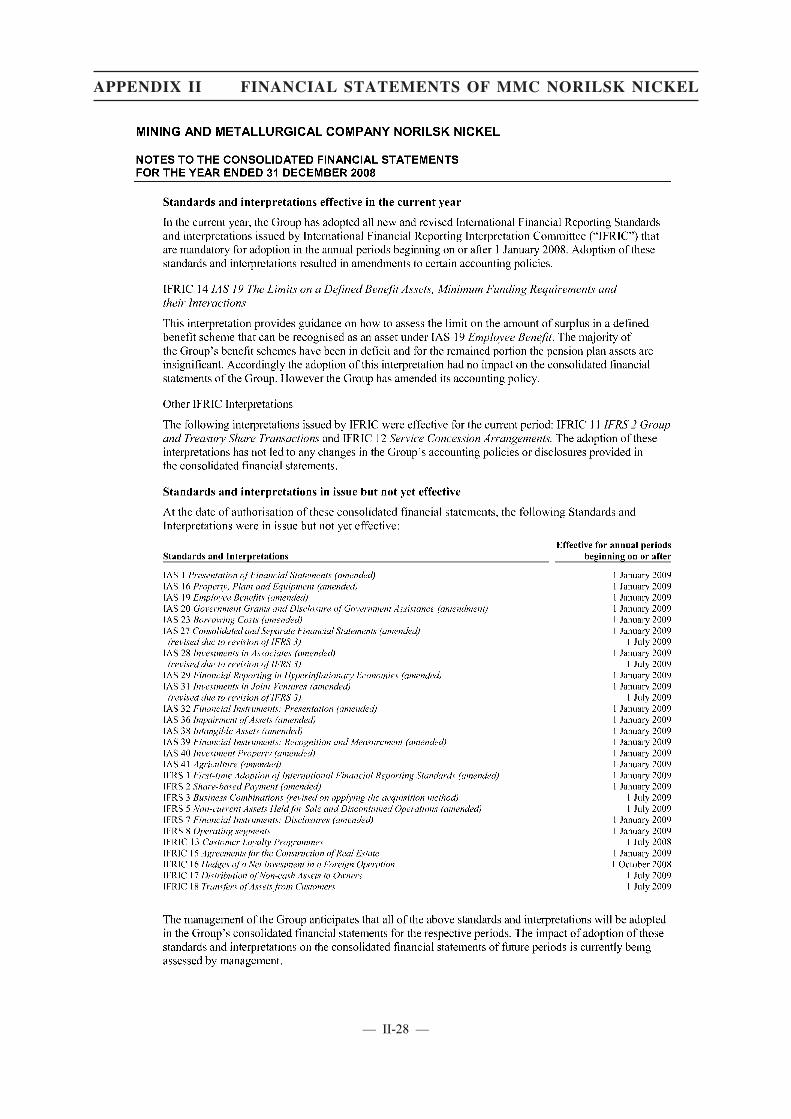
— II-28 —
APPENDIX II FINANCIAL STATEMENTS OF MMC NORILSK NICKEL

— II-29 —
APPENDIX II FINANCIAL STATEMENTS OF MMC NORILSK NICKEL

— II-30 —
APPENDIX II FINANCIAL STATEMENTS OF MMC NORILSK NICKEL

— II-31 —
APPENDIX II FINANCIAL STATEMENTS OF MMC NORILSK NICKEL
— II-32 —
APPENDIX II FINANCIAL STATEMENTS OF MMC NORILSK NICKEL
— II-33 —
APPENDIX II FINANCIAL STATEMENTS OF MMC NORILSK NICKEL
— II-34 —
APPENDIX II FINANCIAL STATEMENTS OF MMC NORILSK NICKEL

— II-35 —
APPENDIX II FINANCIAL STATEMENTS OF MMC NORILSK NICKEL
— II-36 —
APPENDIX II FINANCIAL STATEMENTS OF MMC NORILSK NICKEL

— II-37 —
APPENDIX II FINANCIAL STATEMENTS OF MMC NORILSK NICKEL

— II-38 —
APPENDIX II FINANCIAL STATEMENTS OF MMC NORILSK NICKEL

— II-39 —
APPENDIX II FINANCIAL STATEMENTS OF MMC NORILSK NICKEL
— II-40 —
APPENDIX II FINANCIAL STATEMENTS OF MMC NORILSK NICKEL

— II-41 —
APPENDIX II FINANCIAL STATEMENTS OF MMC NORILSK NICKEL

— II-42 —
APPENDIX II FINANCIAL STATEMENTS OF MMC NORILSK NICKEL

— II-43 —
APPENDIX II FINANCIAL STATEMENTS OF MMC NORILSK NICKEL
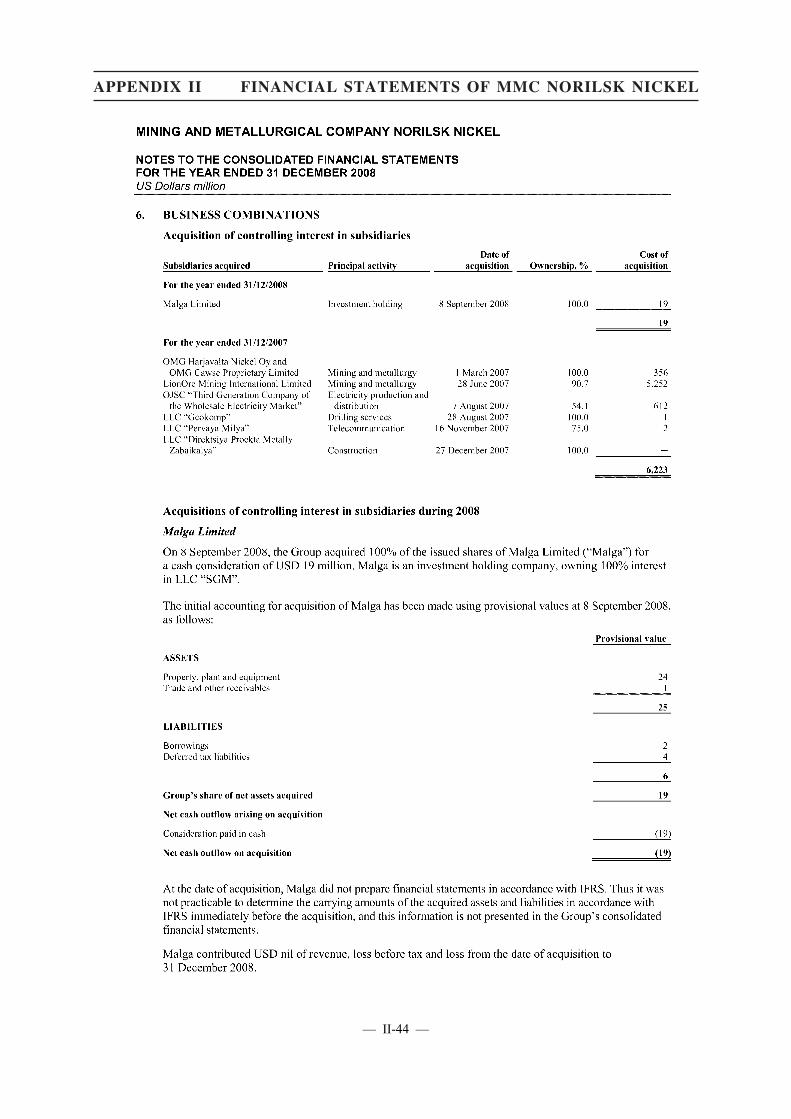
— II-44 —
APPENDIX II FINANCIAL STATEMENTS OF MMC NORILSK NICKEL

— II-45 —
APPENDIX II FINANCIAL STATEMENTS OF MMC NORILSK NICKEL
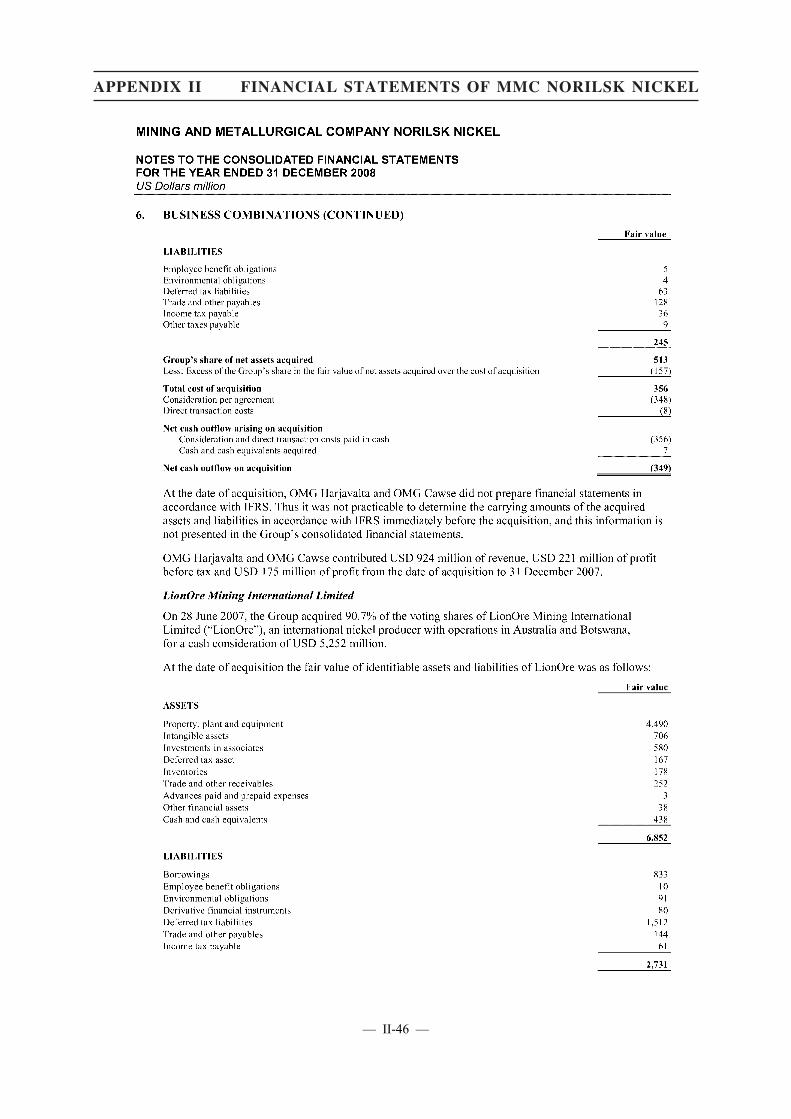
— II-46 —
APPENDIX II FINANCIAL STATEMENTS OF MMC NORILSK NICKEL
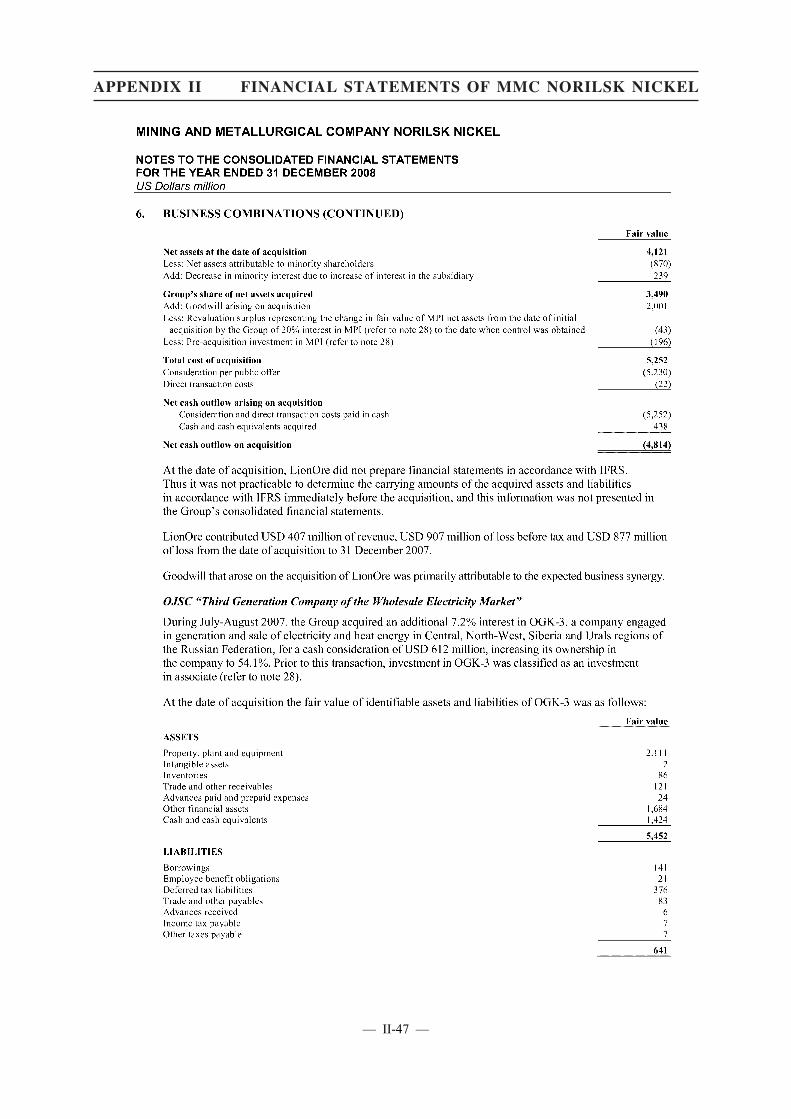
— II-47 —
APPENDIX II FINANCIAL STATEMENTS OF MMC NORILSK NICKEL
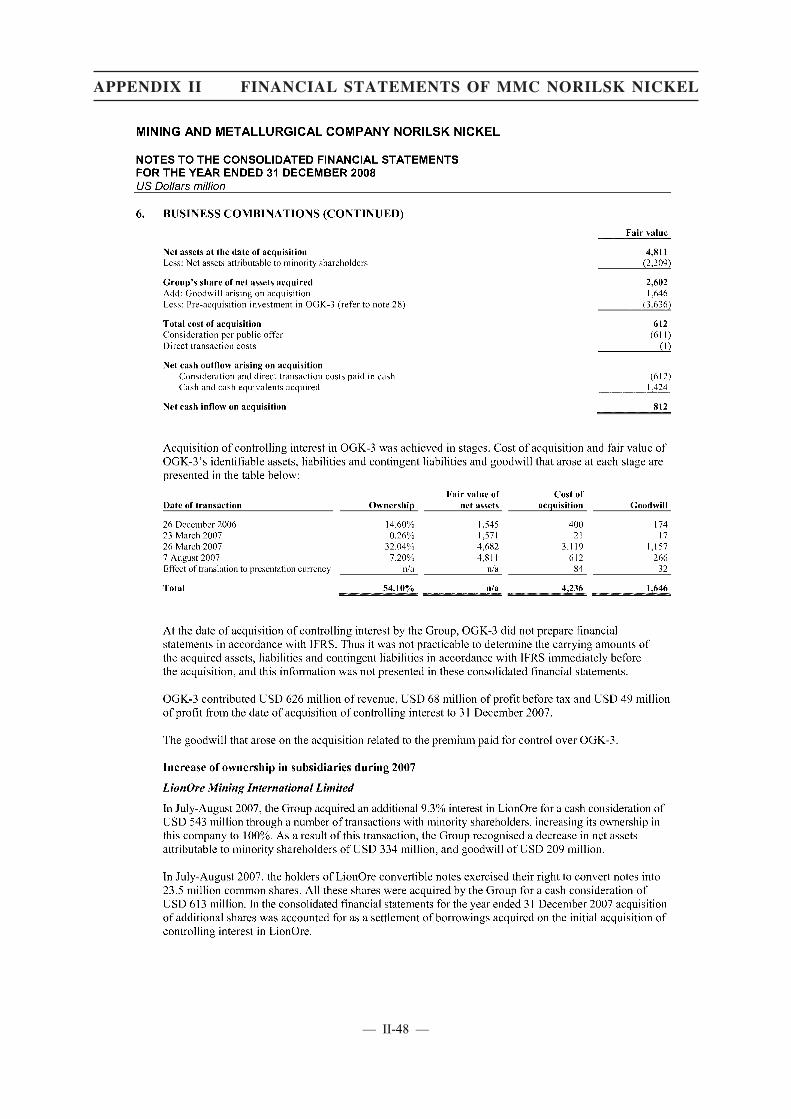
— II-48 —
APPENDIX II FINANCIAL STATEMENTS OF MMC NORILSK NICKEL
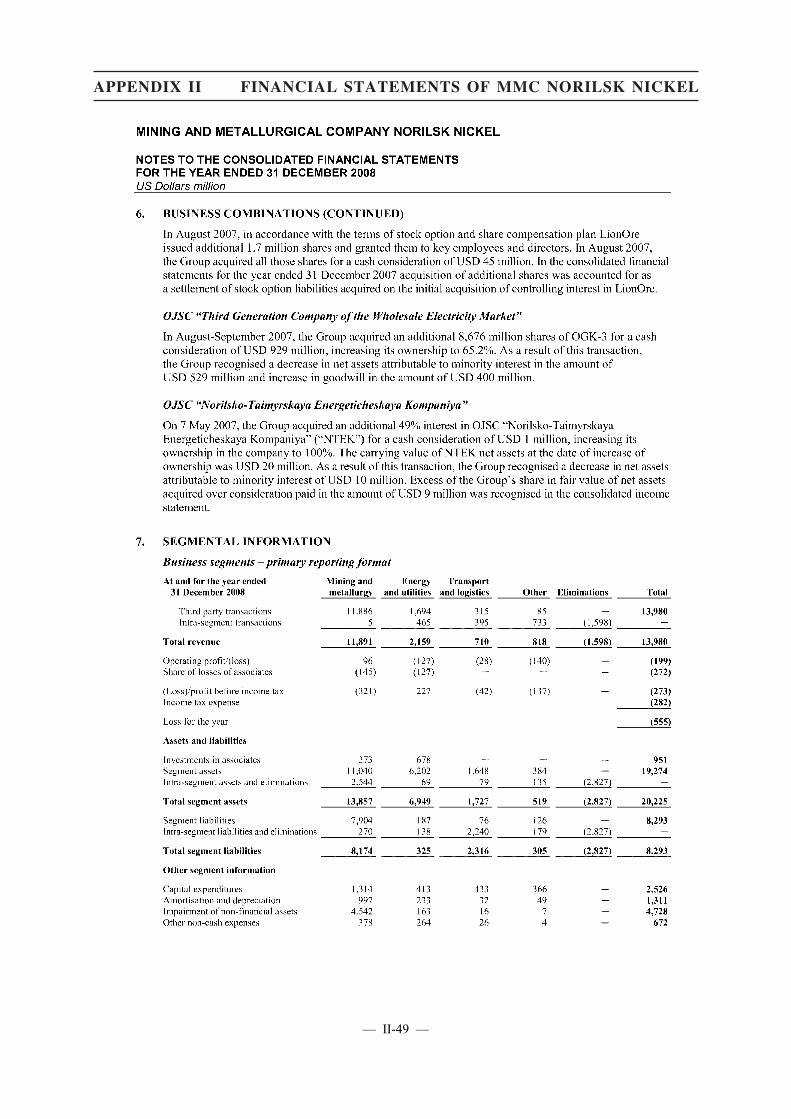
— II-49 —
APPENDIX II FINANCIAL STATEMENTS OF MMC NORILSK NICKEL

— II-50 —
APPENDIX II FINANCIAL STATEMENTS OF MMC NORILSK NICKEL
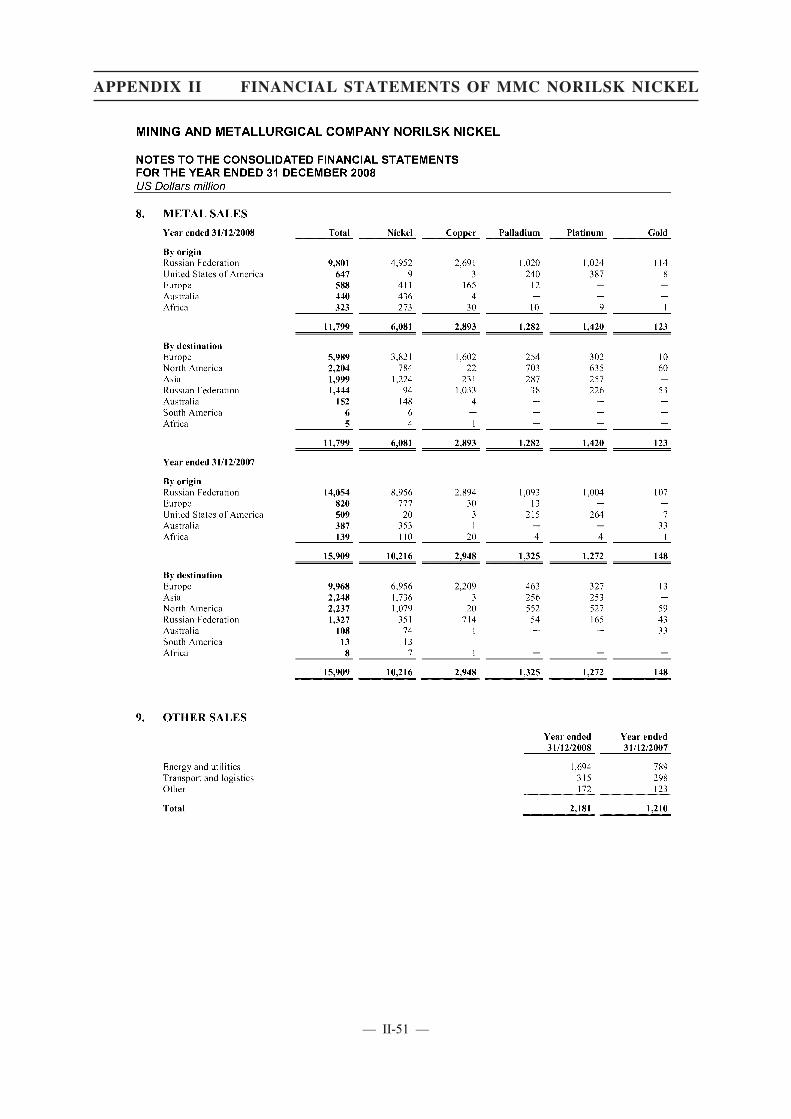
— II-51 —
APPENDIX II FINANCIAL STATEMENTS OF MMC NORILSK NICKEL

— II-52 —
APPENDIX II FINANCIAL STATEMENTS OF MMC NORILSK NICKEL
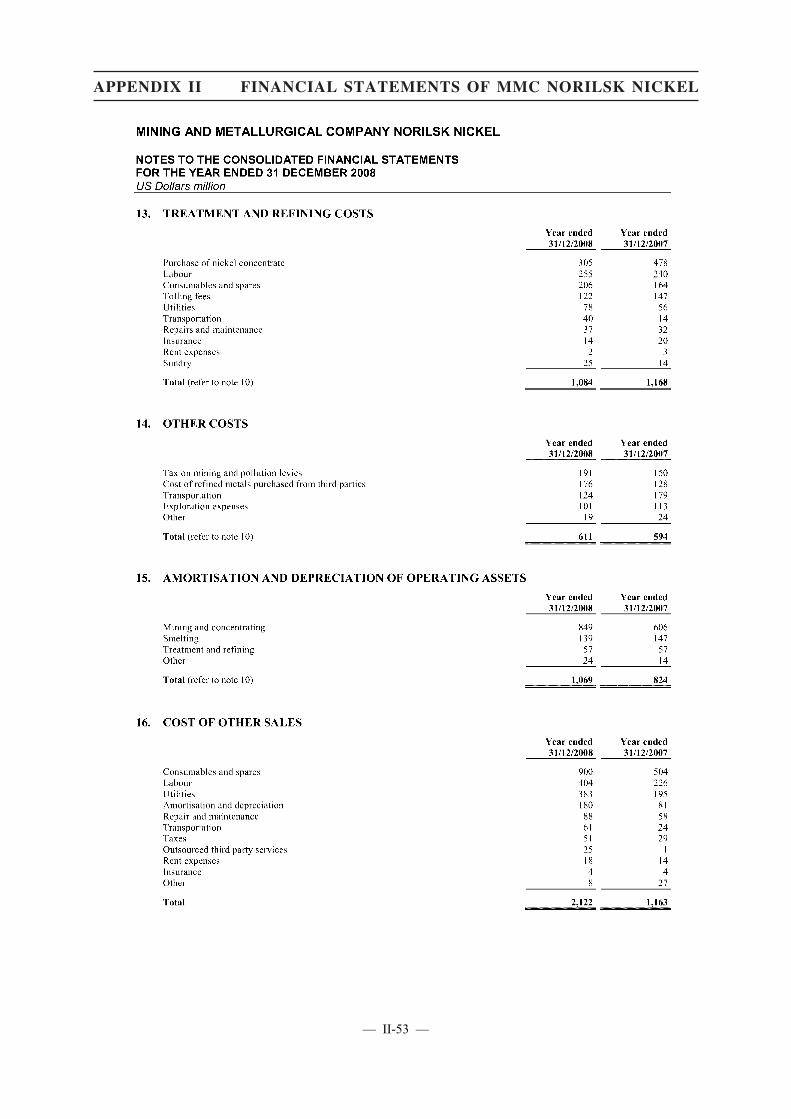
— II-53 —
APPENDIX II FINANCIAL STATEMENTS OF MMC NORILSK NICKEL

— II-54 —
APPENDIX II FINANCIAL STATEMENTS OF MMC NORILSK NICKEL

— II-55 —
APPENDIX II FINANCIAL STATEMENTS OF MMC NORILSK NICKEL
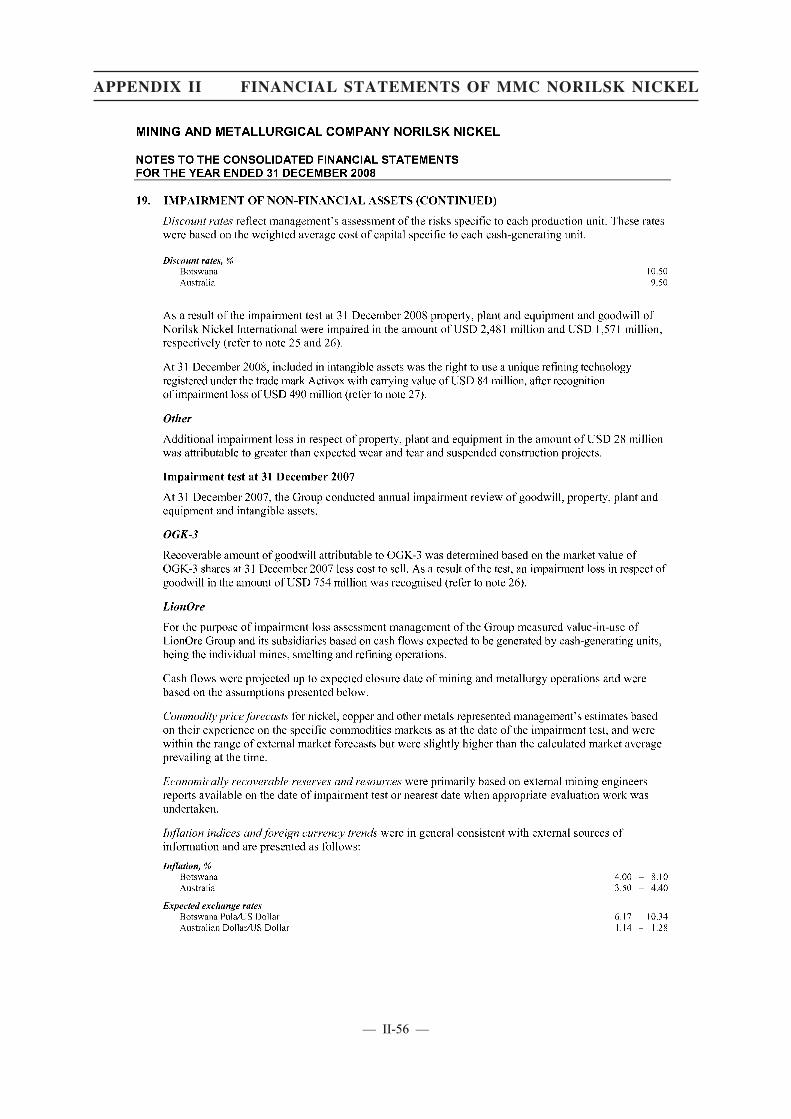
— II-56 —
APPENDIX II FINANCIAL STATEMENTS OF MMC NORILSK NICKEL

— II-57 —
APPENDIX II FINANCIAL STATEMENTS OF MMC NORILSK NICKEL

— II-58 —
APPENDIX II FINANCIAL STATEMENTS OF MMC NORILSK NICKEL

— II-59 —
APPENDIX II FINANCIAL STATEMENTS OF MMC NORILSK NICKEL
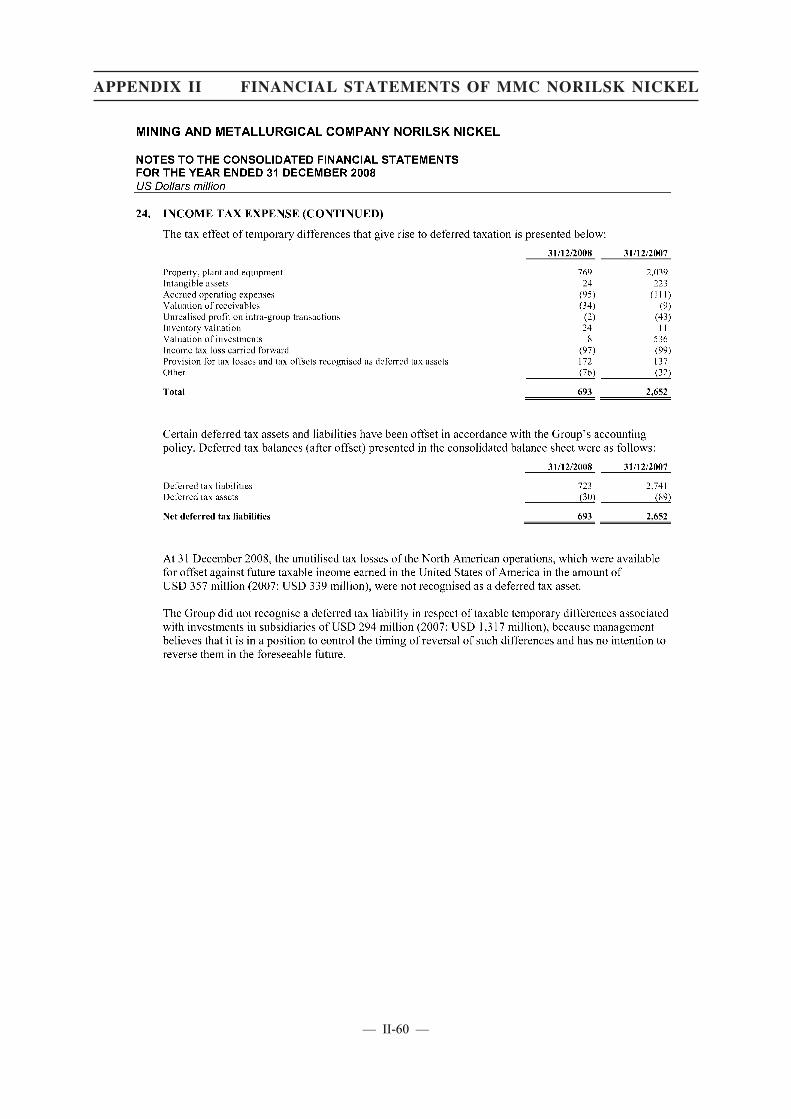
— II-60 —
APPENDIX II FINANCIAL STATEMENTS OF MMC NORILSK NICKEL
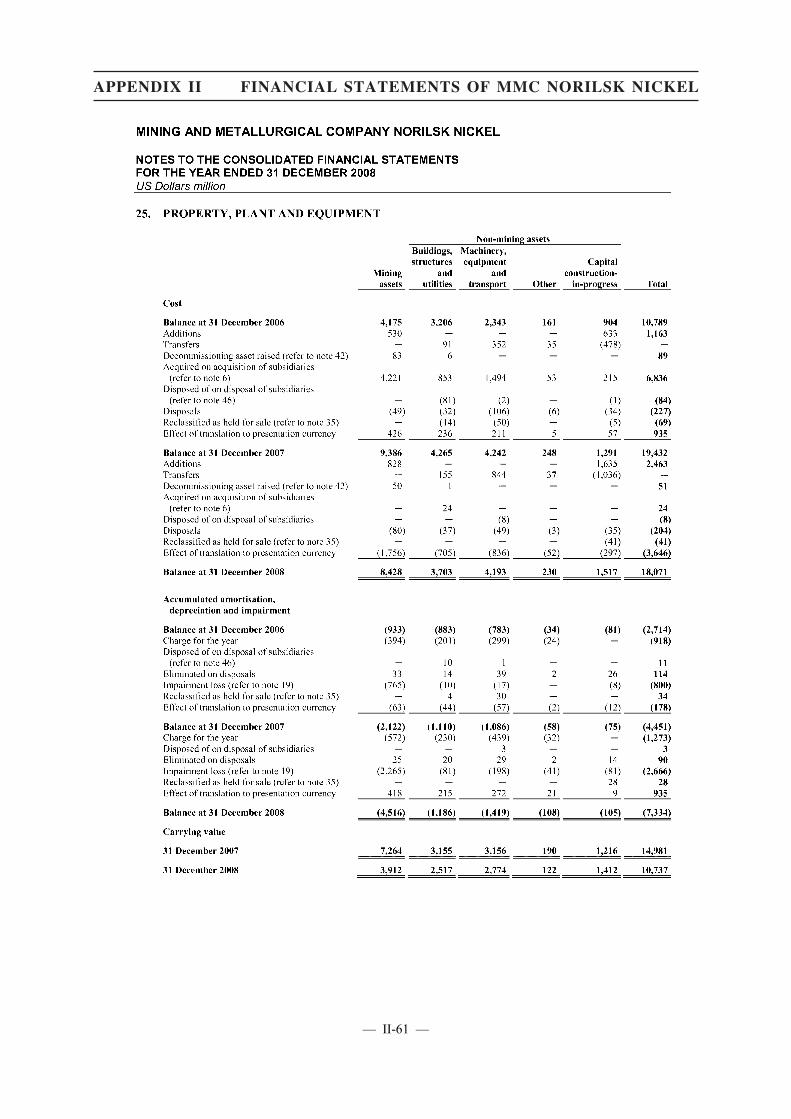
— II-61 —
APPENDIX II FINANCIAL STATEMENTS OF MMC NORILSK NICKEL

— II-62 —
APPENDIX II FINANCIAL STATEMENTS OF MMC NORILSK NICKEL

— II-63 —
APPENDIX II FINANCIAL STATEMENTS OF MMC NORILSK NICKEL

— II-64 —
APPENDIX II FINANCIAL STATEMENTS OF MMC NORILSK NICKEL
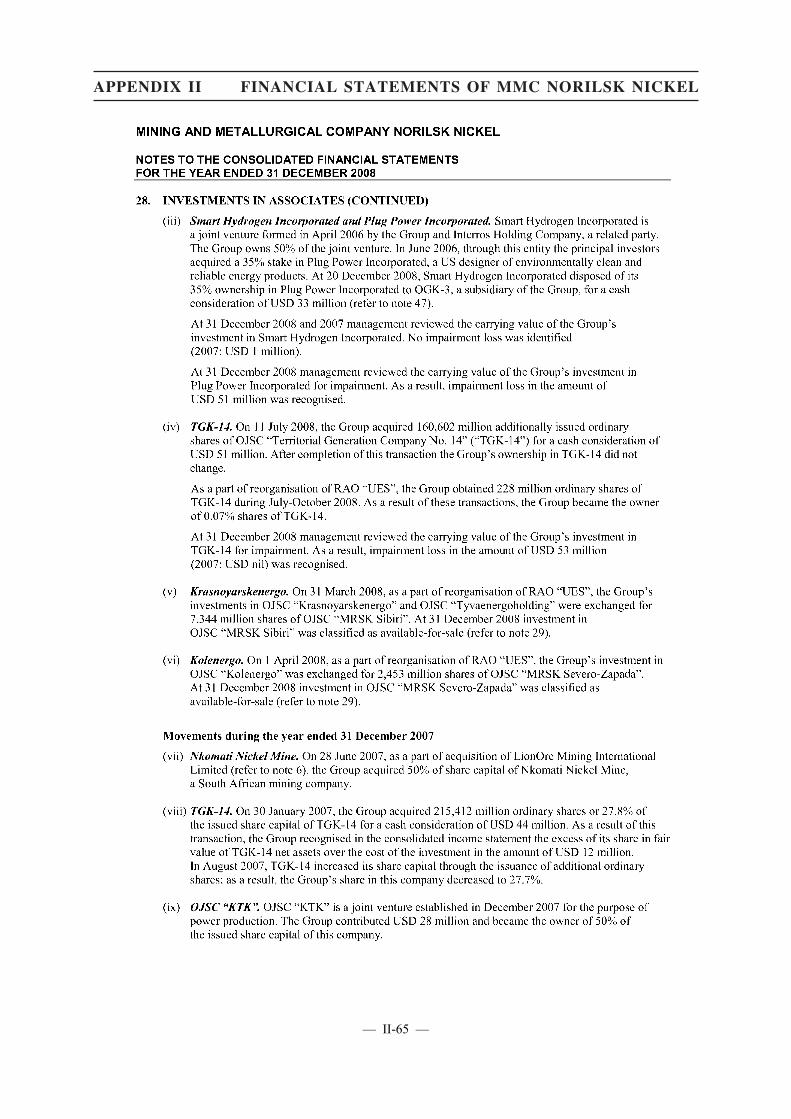
— II-65 —
APPENDIX II FINANCIAL STATEMENTS OF MMC NORILSK NICKEL
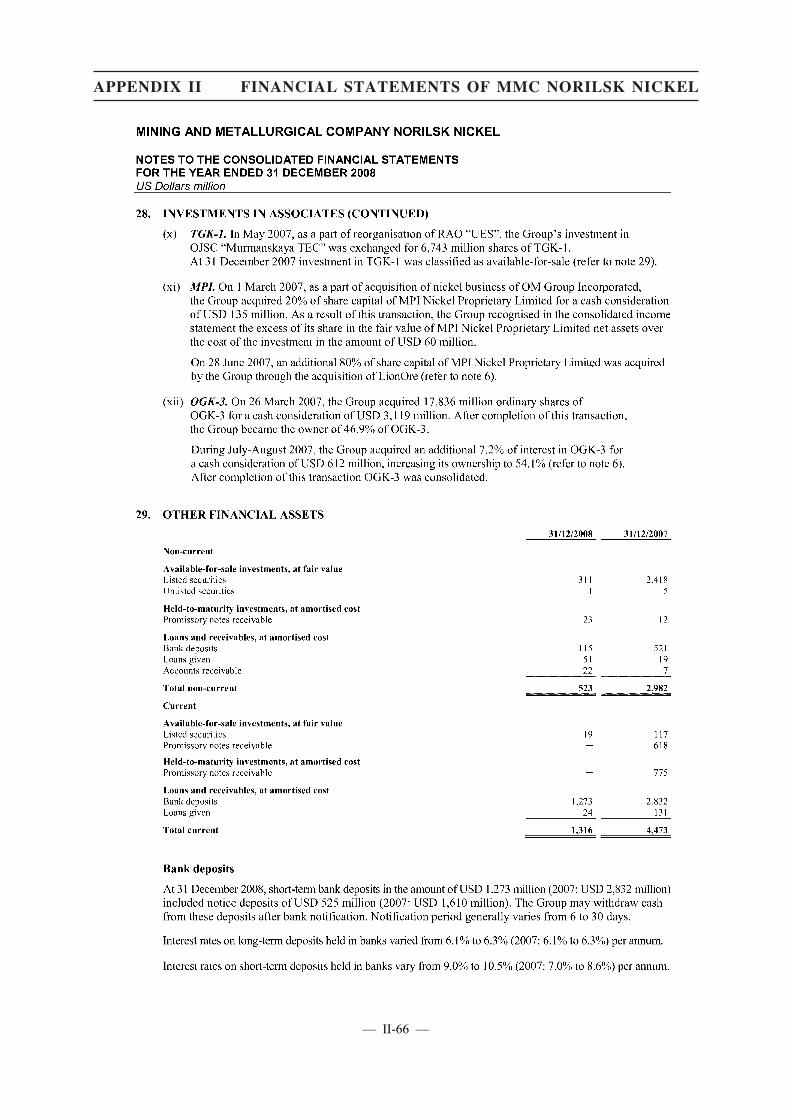
— II-66 —
APPENDIX II FINANCIAL STATEMENTS OF MMC NORILSK NICKEL
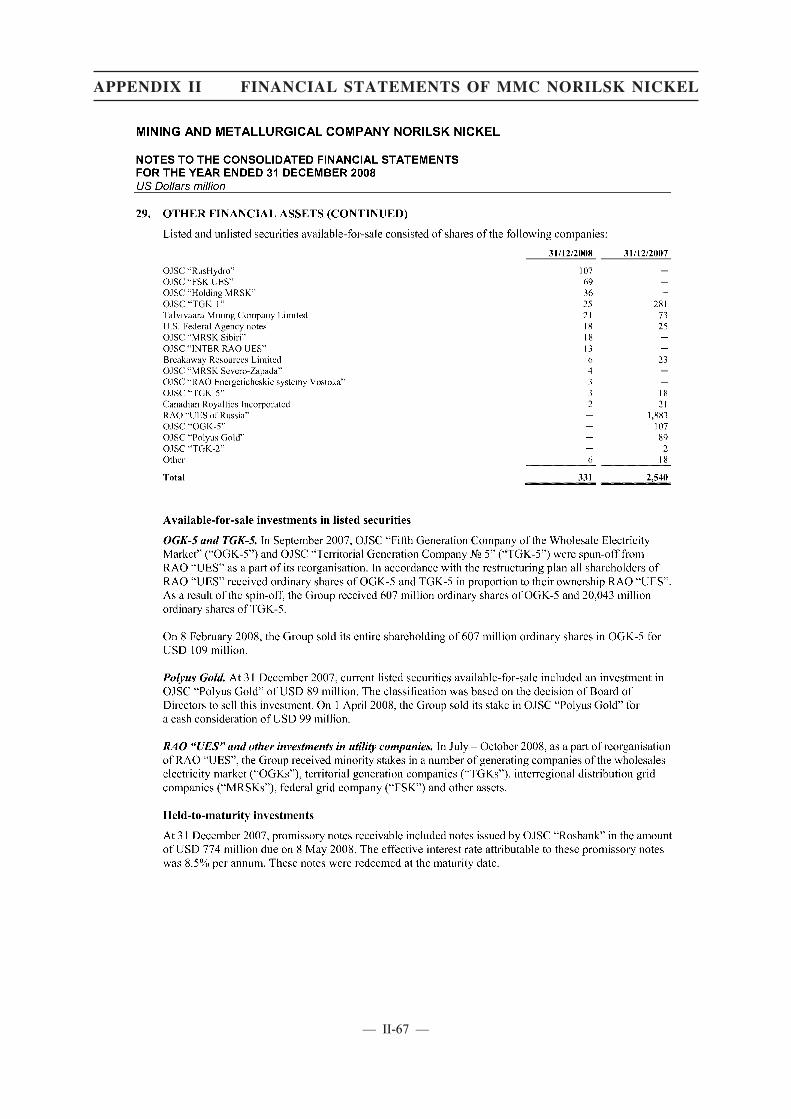
— II-67 —
APPENDIX II FINANCIAL STATEMENTS OF MMC NORILSK NICKEL

— II-68 —
APPENDIX II FINANCIAL STATEMENTS OF MMC NORILSK NICKEL
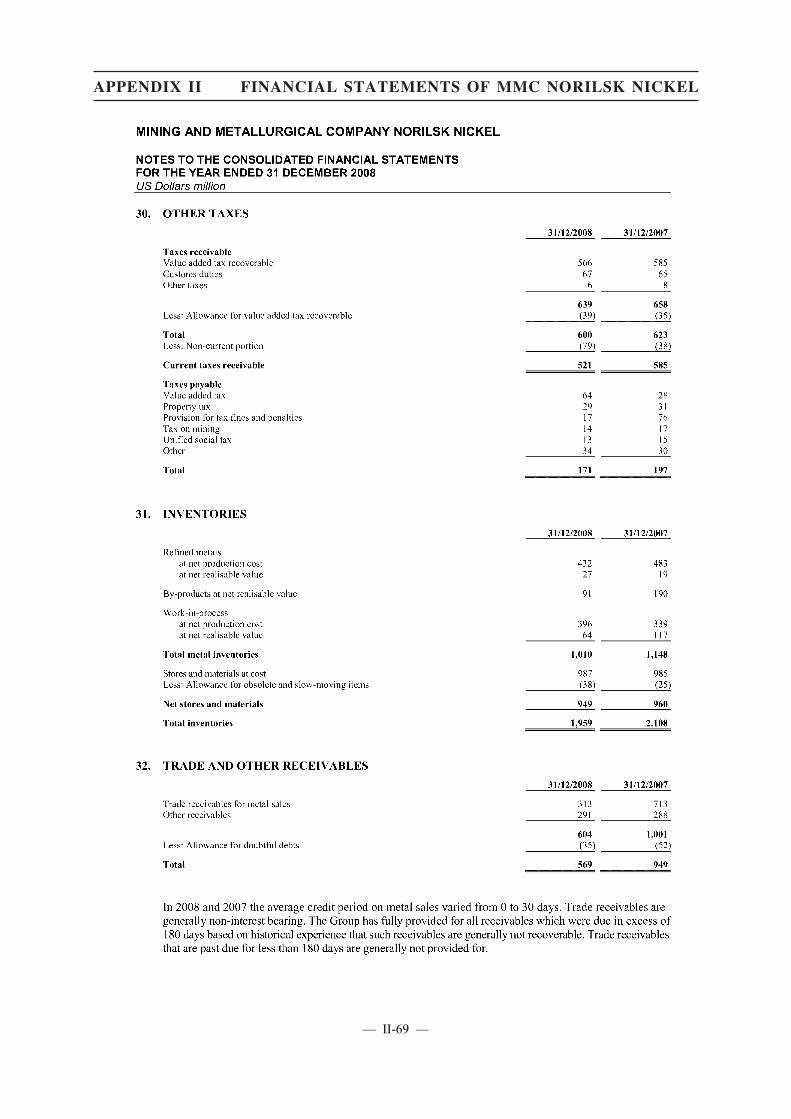
— II-69 —
APPENDIX II FINANCIAL STATEMENTS OF MMC NORILSK NICKEL

— II-70 —
APPENDIX II FINANCIAL STATEMENTS OF MMC NORILSK NICKEL

— II-71 —
APPENDIX II FINANCIAL STATEMENTS OF MMC NORILSK NICKEL

— II-72 —
APPENDIX II FINANCIAL STATEMENTS OF MMC NORILSK NICKEL
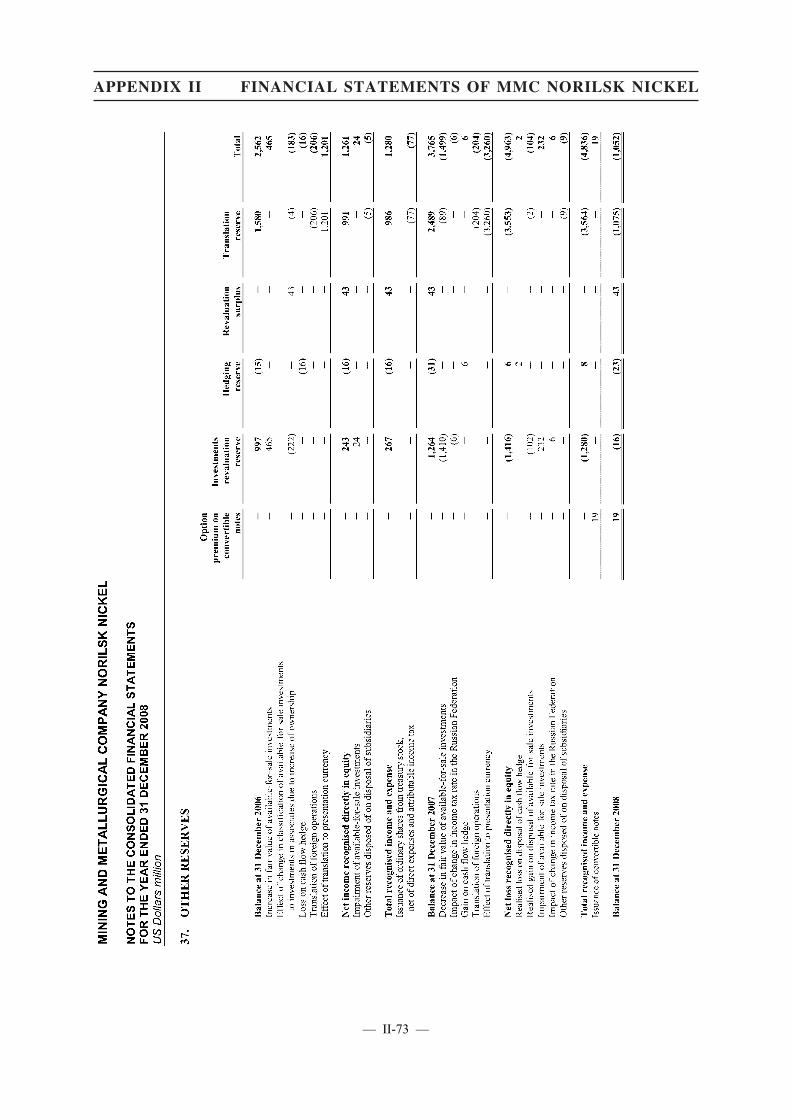
— II-73 —
APPENDIX II FINANCIAL STATEMENTS OF MMC NORILSK NICKEL

— II-74 —
APPENDIX II FINANCIAL STATEMENTS OF MMC NORILSK NICKEL

— II-75 —
APPENDIX II FINANCIAL STATEMENTS OF MMC NORILSK NICKEL

— II-76 —
APPENDIX II FINANCIAL STATEMENTS OF MMC NORILSK NICKEL
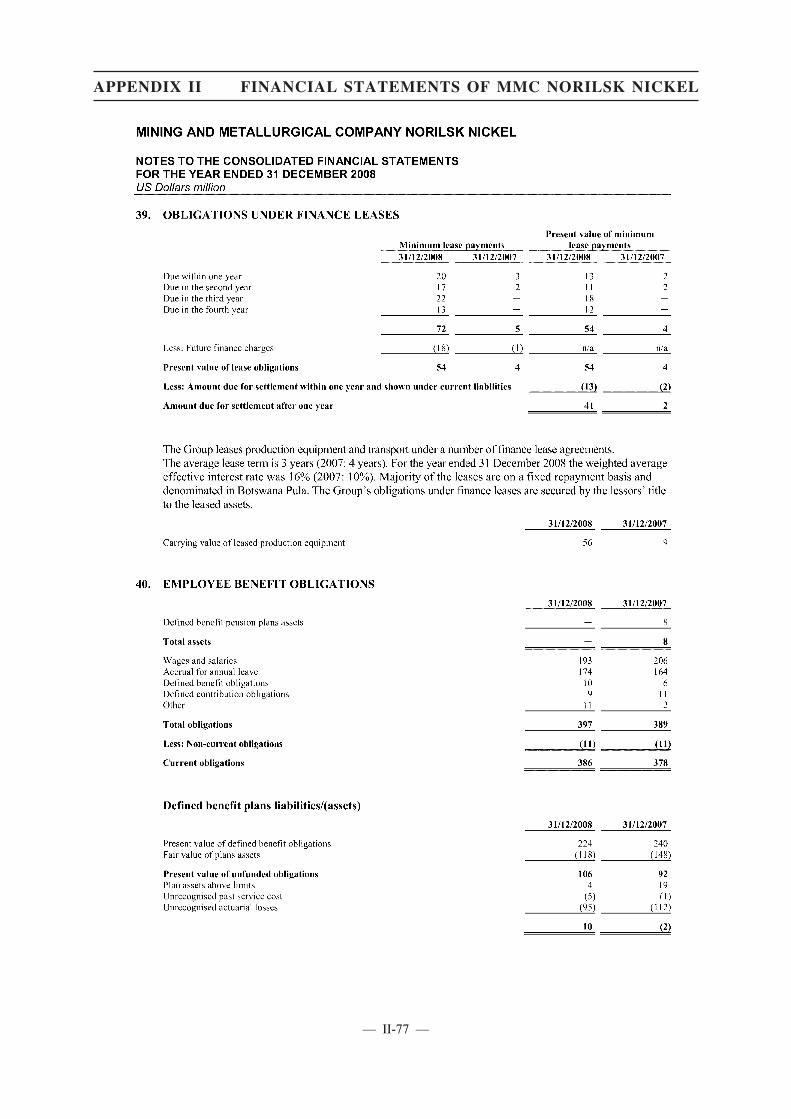
— II-77 —
APPENDIX II FINANCIAL STATEMENTS OF MMC NORILSK NICKEL
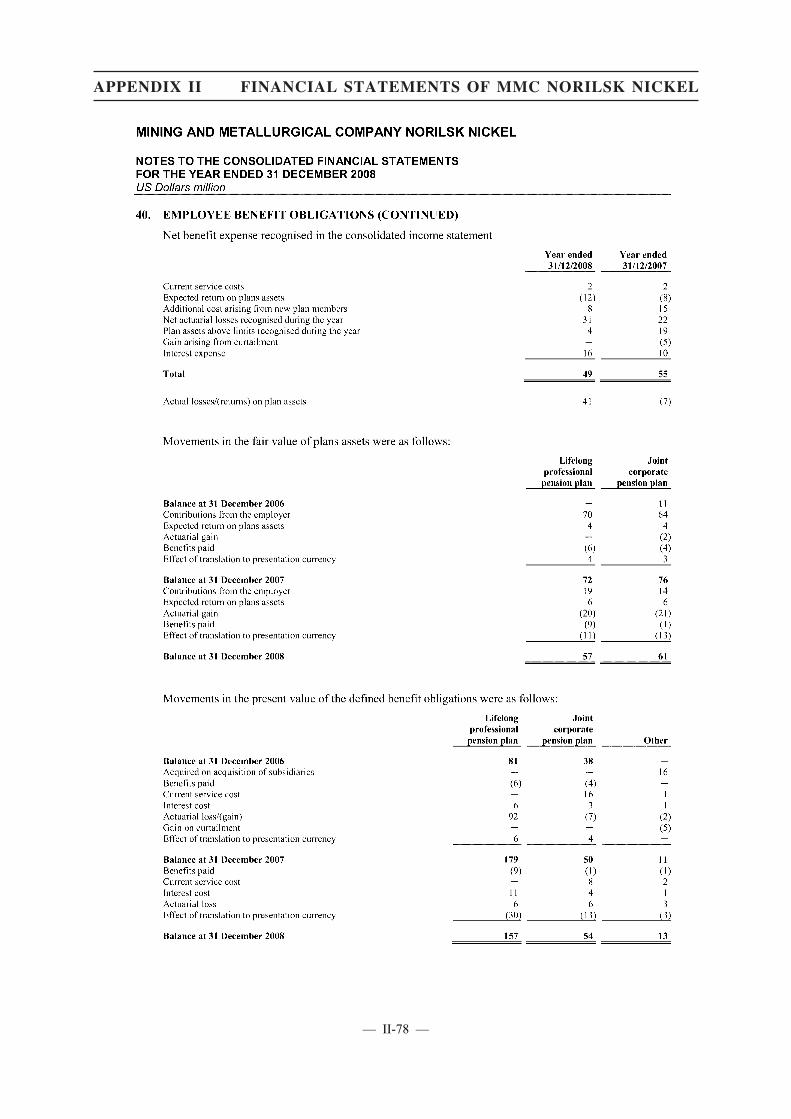
— II-78 —
APPENDIX II FINANCIAL STATEMENTS OF MMC NORILSK NICKEL

— II-79 —
APPENDIX II FINANCIAL STATEMENTS OF MMC NORILSK NICKEL
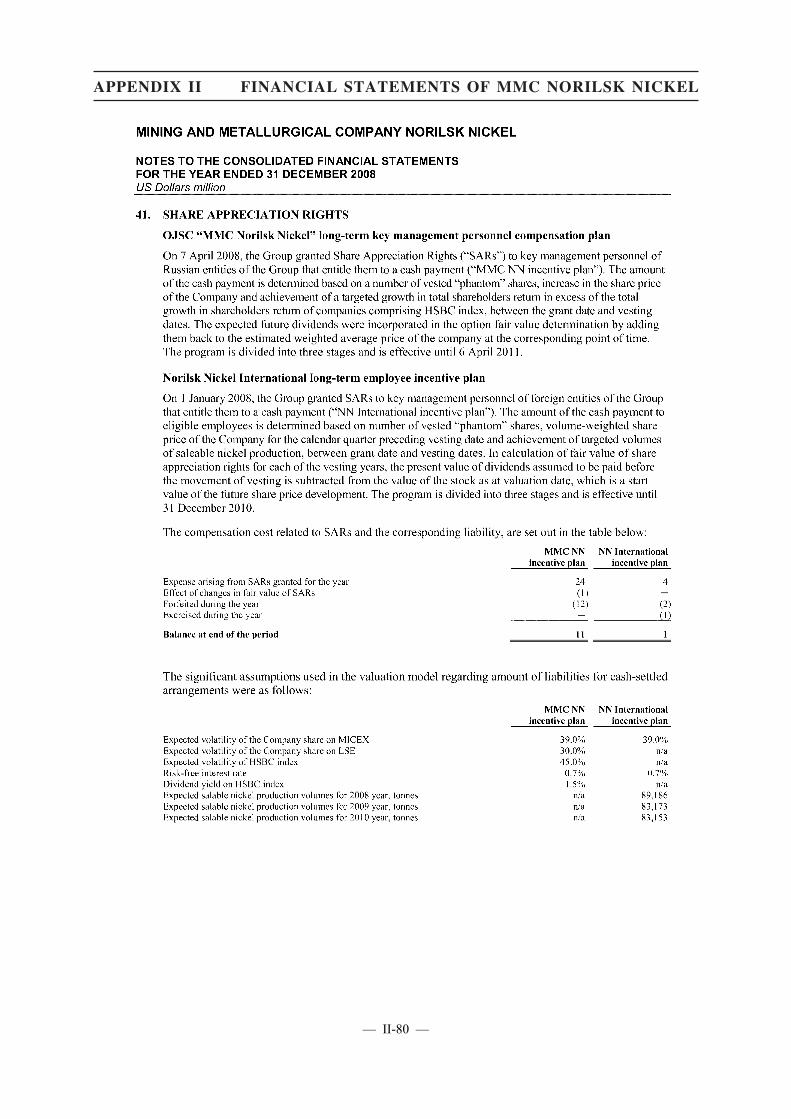
— II-80 —
APPENDIX II FINANCIAL STATEMENTS OF MMC NORILSK NICKEL

— II-81 —
APPENDIX II FINANCIAL STATEMENTS OF MMC NORILSK NICKEL

— II-82 —
APPENDIX II FINANCIAL STATEMENTS OF MMC NORILSK NICKEL

— II-83 —
APPENDIX II FINANCIAL STATEMENTS OF MMC NORILSK NICKEL

— II-84 —
APPENDIX II FINANCIAL STATEMENTS OF MMC NORILSK NICKEL

— II-85 —
APPENDIX II FINANCIAL STATEMENTS OF MMC NORILSK NICKEL
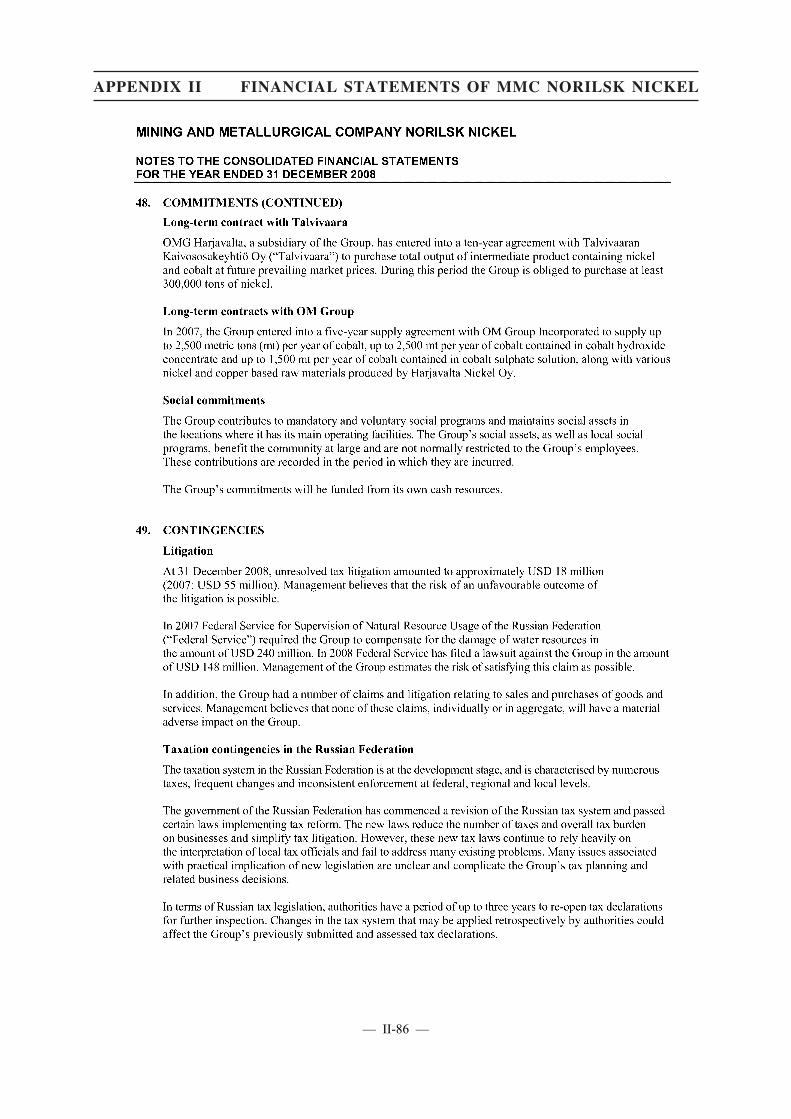
— II-86 —
APPENDIX II FINANCIAL STATEMENTS OF MMC NORILSK NICKEL
— II-87 —
APPENDIX II FINANCIAL STATEMENTS OF MMC NORILSK NICKEL
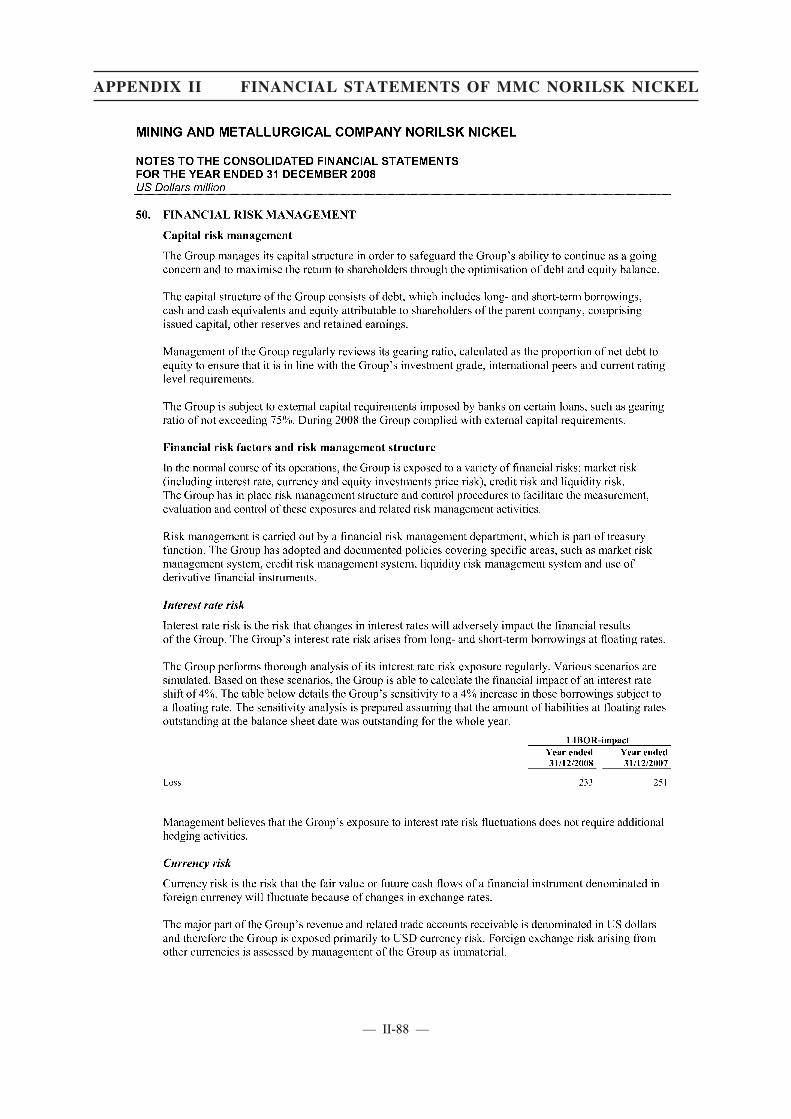
— II-88 —
APPENDIX II FINANCIAL STATEMENTS OF MMC NORILSK NICKEL
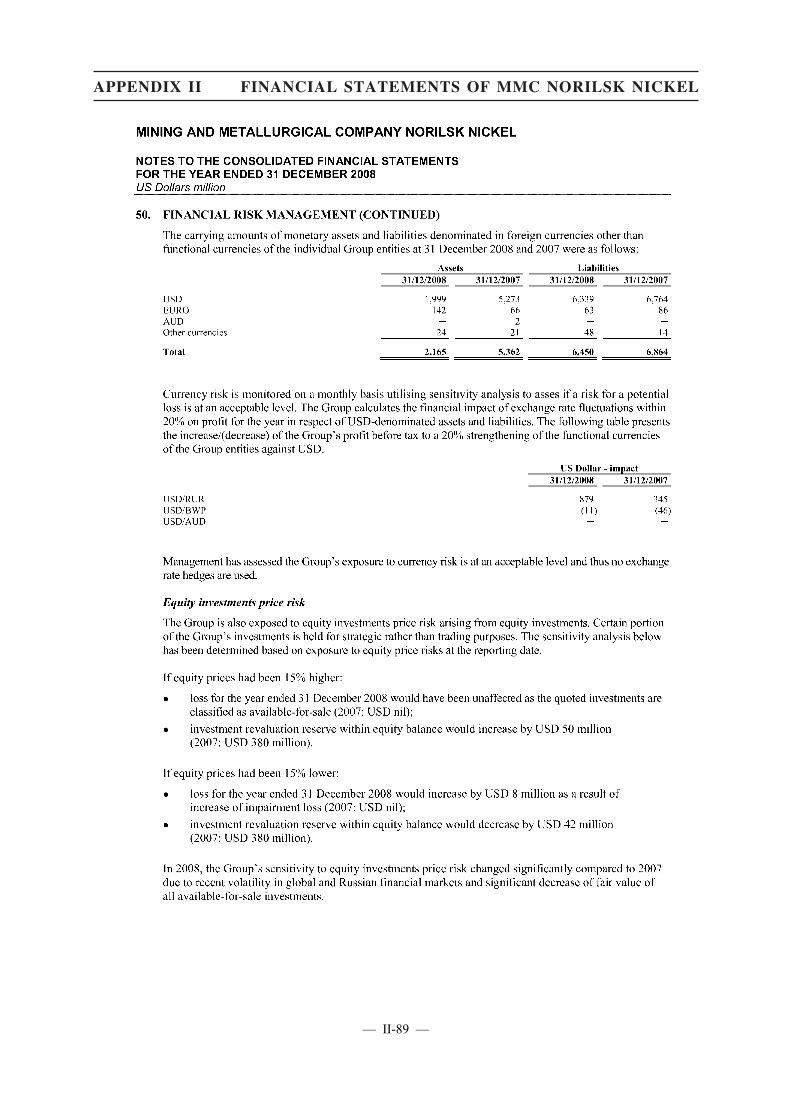
— II-89 —
APPENDIX II FINANCIAL STATEMENTS OF MMC NORILSK NICKEL

— II-90 —
APPENDIX II FINANCIAL STATEMENTS OF MMC NORILSK NICKEL
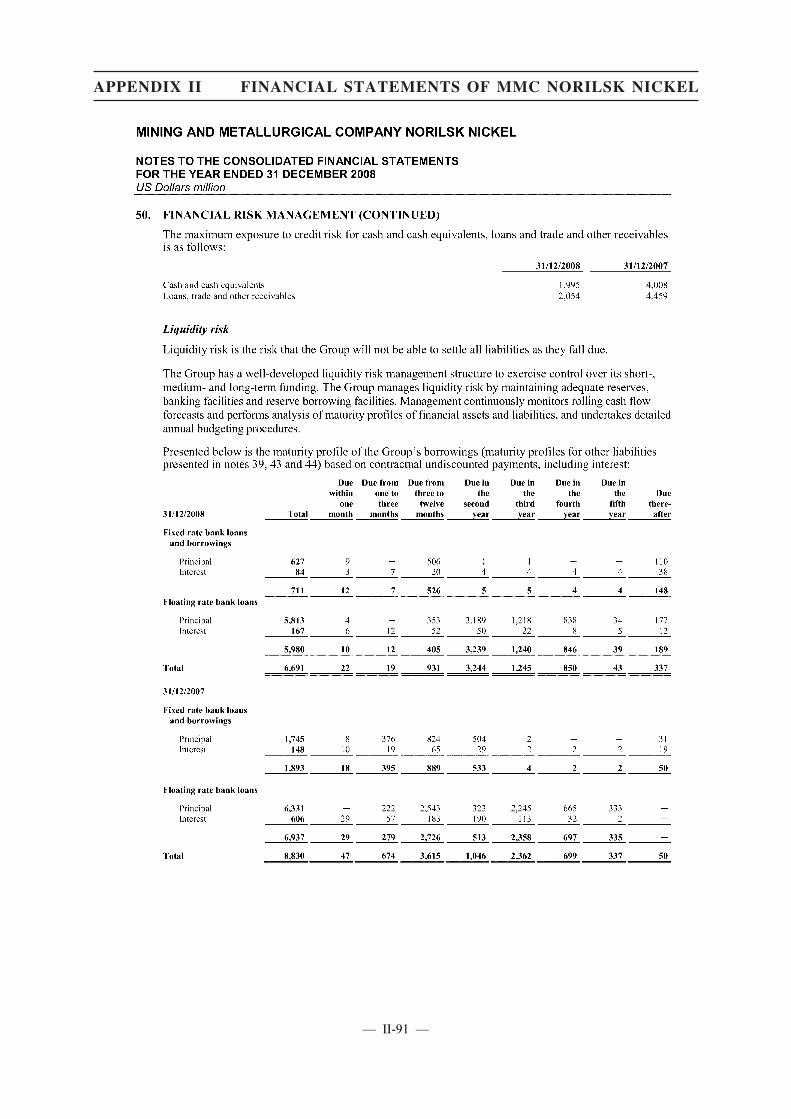
— II-91 —
APPENDIX II FINANCIAL STATEMENTS OF MMC NORILSK NICKEL
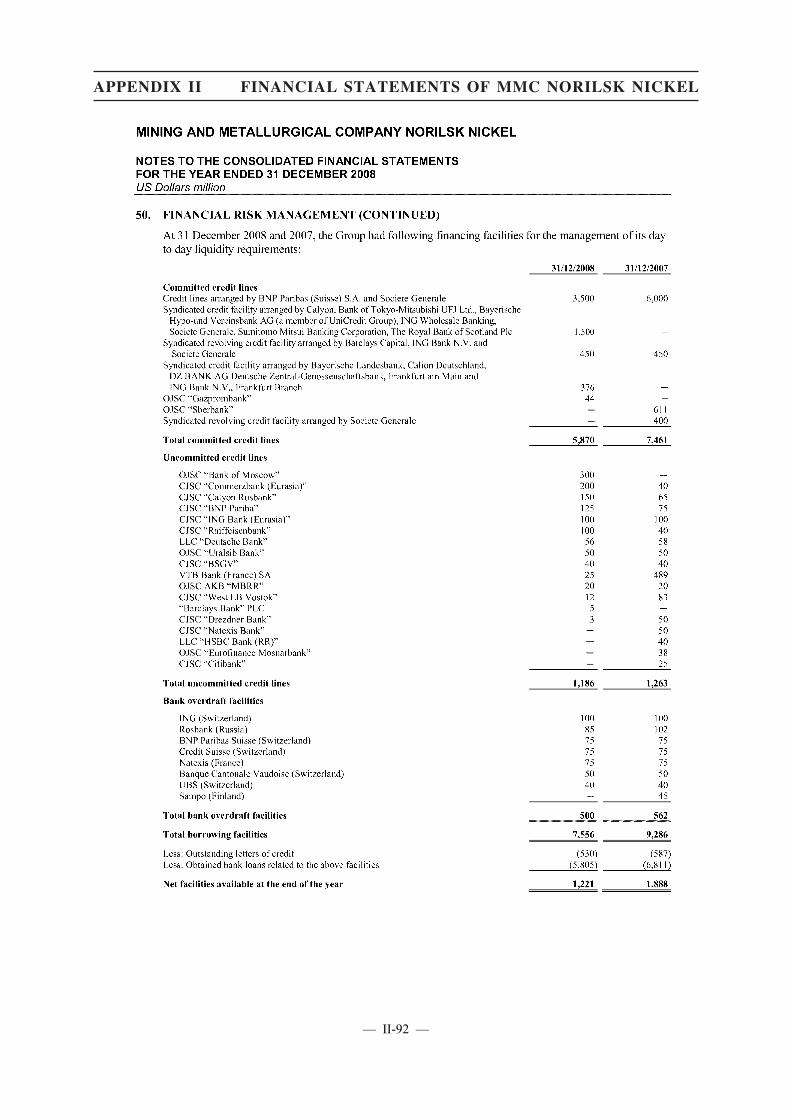
— II-92 —
APPENDIX II FINANCIAL STATEMENTS OF MMC NORILSK NICKEL
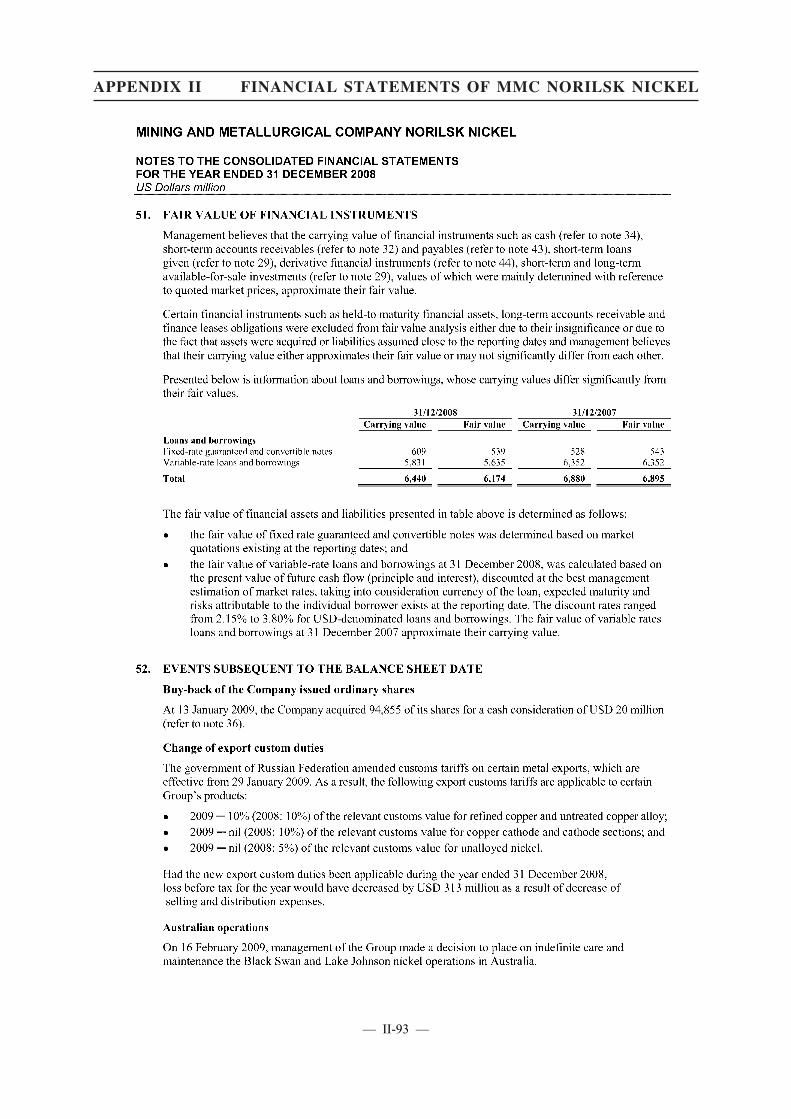
— II-93 —
APPENDIX II FINANCIAL STATEMENTS OF MMC NORILSK NICKEL
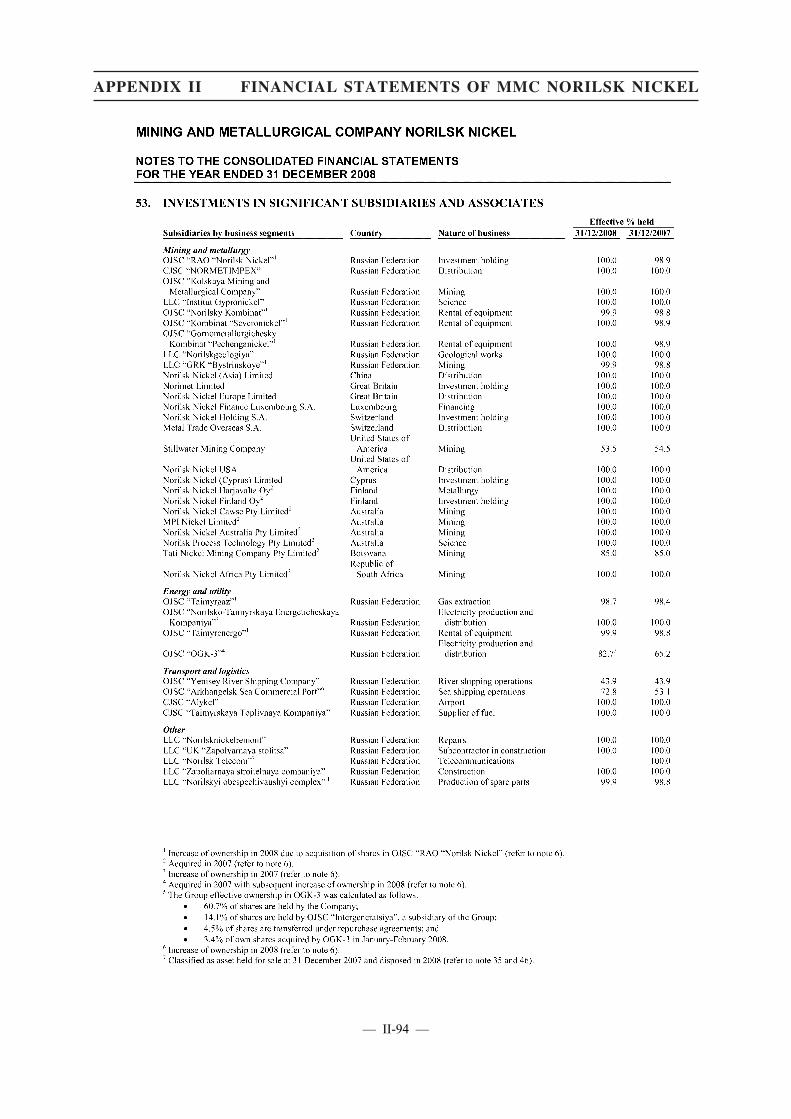
— II-94 —
APPENDIX II FINANCIAL STATEMENTS OF MMC NORILSK NICKEL
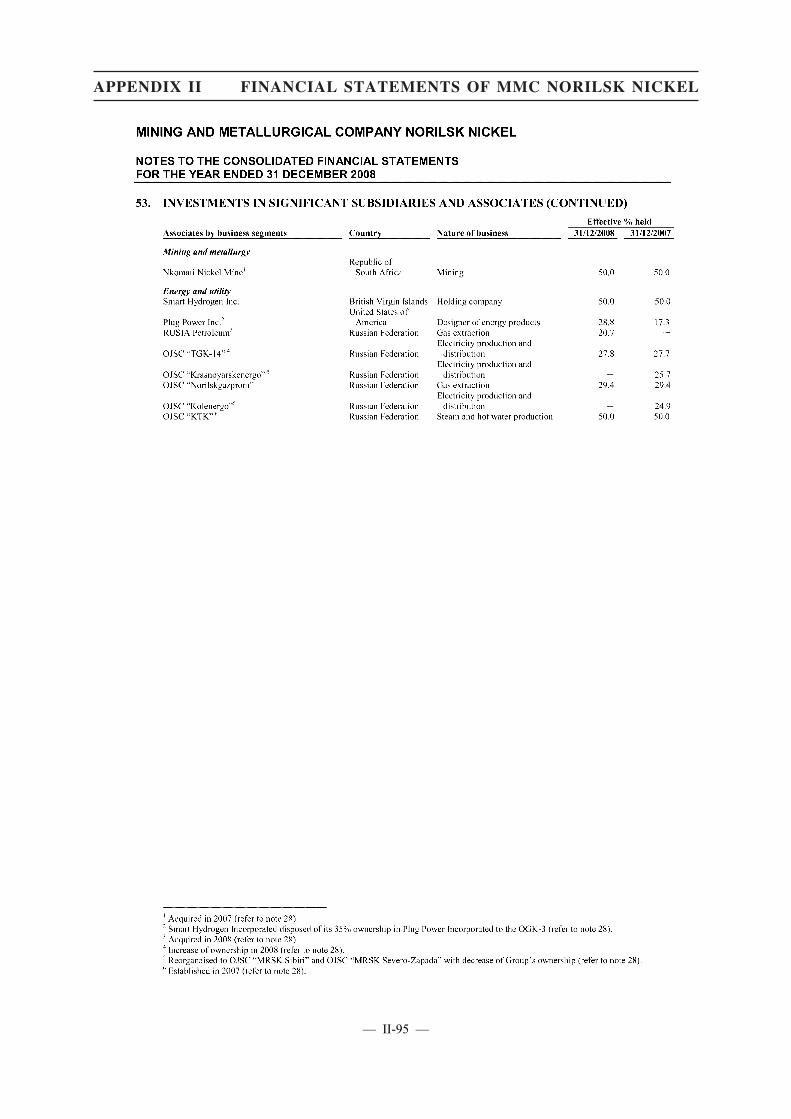
— II-95 —
APPENDIX II FINANCIAL STATEMENTS OF MMC NORILSK NICKEL
— II-96 —
APPENDIX II FINANCIAL STATEMENTS OF MMC NORILSK NICKEL
— II-97 —
APPENDIX II FINANCIAL STATEMENTS OF MMC NORILSK NICKEL

MINING AND METALLURGICAL COMPANY NORILSK NICKEL
CONSOLIDATED INCOME STATEMENT FOR THE YEAR ENDED 31 DECEMBER 2007 US Dollars million
Notes 2007 2006
Revenue
Metal sales 7 15,909 11,550Other sales 8 1,210 373
Total revenue 17,119 11,923
Cost of metal sales 9 (4,719) (3,158)Cost of other sales 15 (1,163) (345)
Gross profit 11,237 8,420
Selling and distribution expenses 16 (730) (536)General and administrative expenses 17 (894) (554)Impairment of goodwill 24 (1,079) �Change in fair value of derivative financial liabilities held for trading 40 72 �Other net operating expenses 18 (1,175) (267)
Operating profit 7,431 7,063
Finance costs 19 (307) (79)Income/(loss) from investments 20 223 (199)Foreign exchange gain, net 21 146 25Excess of the Group’s share in the fair value of net assets acquired
over the cost of acquisition 5 166 �Share of profits/(losses) of associates 26 76 (33)
Profit before tax 7,735 6,777
Income tax 22 (2,459) (1,805)
Profit for the year from continuing operations 5,276 4,972
Profit for the year from discontinued operation 48 � 993
Profit for the year 5,276 5,965
Attributable to:
Shareholders of the parent company 5,327 5,989Minority interest (51) (24)
5,276 5,965
EARNINGS PER SHARE
Weighted average number of ordinary shares in issue during the year 34 182,362,986 188,767,177
Basic and diluted earnings per share from continuing and discontinued operations attributable to shareholders of the parent company (US Dollars) 29.2 31.7
Basic and diluted earnings per share from continuing operations attributable to shareholders of the parent company (US Dollars) 29.2 26.5
— II-98 —
APPENDIX II FINANCIAL STATEMENTS OF MMC NORILSK NICKEL

MINING AND METALLURGICAL COMPANY NORILSK NICKEL
CONSOLIDATED BALANCE SHEET AT 31 DECEMBER 2007 US Dollars million
Notes 2007 2006
ASSETS
Non-current assets Property, plant and equipment 23 14,981 8,075Goodwill 24 3,360 25Intangible assets 25 849 107Investments in associates 26 879 208Other financial assets 27 2,982 2,615Other taxes receivable 28 38 44Deferred tax assets 22 89 �Pension plans assets 37 8 �
23,186 11,074
Current assets Inventories 29 2,108 1,471Trade and other receivables 30 949 697Advances paid and prepaid expenses 31 183 153Other financial assets 27 4,473 104Income tax receivable 144 27Other taxes receivable 28 585 575Cash and cash equivalents 32 4,008 2,178
12,450 5,205Assets classified as held for sale 33 60 �
12,510 5,205
TOTAL ASSETS 35,696 16,279
EQUITY AND LIABILITIES
Capital and reserves Share capital 34 8 8Share premium 1,390 611Treasury shares 34 � (999)Other reserves 35 3,765 2,562Retained earnings 14,340 10,635
Equity attributable to shareholders of the parent company 19,503 12,817Minority interest 2,318 319
21,821 13,136
Non-current liabilities Long-term borrowings 36 4,103 632Employee benefit obligations 37 11 57Environmental obligations 38 583 322Derivative financial liabilities 40 3 �Deferred tax liabilities 22 2,741 881
7,441 1,892
Current liabilities Short-term borrowings 36 3,973 158Current portion of employee benefit obligations 37 378 259Trade and other payables 39 586 370Advances received 41 51Income tax payable 422 244Other taxes payable 28 197 149Derivative financial liabilities 40 24 15Dividends payable 804 5
6,425 1,251Liabilities associated with assets classified as held for sale 33 9 �
6,434 1,251
TOTAL EQUITY AND LIABILITIES 35,696 16,279
— II-99 —
APPENDIX II FINANCIAL STATEMENTS OF MMC NORILSK NICKEL

MINING AND METALLURGICAL COMPANY NORILSK NICKEL
CONSOLIDATED CASH FLOW STATEMENT FOR THE YEAR ENDED 31 DECEMBER 2007 US Dollars million
2007 2006
Operating activities
Profit for the year 5,276 5,965
Adjustments for: Income tax 2,459 1,817Amortisation and depreciation 937 586Finance costs 307 88Impairment of property, plant and equipment 800 87Loss on disposal of property, plant and equipment 25 21Impairment of other financial assets 39 83Impairment of goodwill 1,079 �Share of post-acquisition profits and impairment of investments in associates (4) 33Loss/(gain) on disposal of subsidiaries 18 (6)Excess of the Group’s share in the fair value of net assets acquired over the cost of acquisition (238) �Change in fair value of derivative financial liabilities held for trading (72) �Interest income (247) (79)Foreign exchange gain, net (146) (25)Gain on disposal of available-for-sale investments � (733)Gain on disposal of associates (6) (117)Dividend income (25) (6)Other (9) (5)
Operating profit before working capital changes 10,193 7,709
Increase in inventories (166) (73)Decrease/(increase) in trade and other receivables 209 (265)Decrease/(increase) in advances paid and prepaid expenses 51 (64)Decrease in other taxes receivable 61 49Increase in employee benefit obligations 6 15(Decrease)/increase in trade and other payables (133) 120Increase/(decrease) in advances received 11 (38)Increase/(decrease) in other taxes payable 36 (17)
Cash flows from operations 10,268 7,436
Interest paid (256) (63)Income tax paid (2,672) (1,726)
Net cash generated from operating activities 7,340 5,647
Investing activities
Acquisition of subsidiaries, net of cash acquired, and increase of ownership in subsidiaries (5,824) (269)Purchase of property, plant and equipment (1,140) (743)Purchase of intangible assets (46) (27)Proceeds from sale of property, plant and equipment 88 46Acquisition and establishment of associates (3,326) (151)Proceeds from disposal of associates 7 156Purchase of other financial assets (3,575) (865)Proceeds from sale of other financial assets 1,032 2,225Dividends received 25 6
Net cash (used in)/generated from investing activities (12,759) 378
Financing activities
Proceeds from borrowings 10,183 573Repayments of borrowings (3,915) (1,066)Proceeds from increase in share capital of a special purpose entity � 28Acquisition of special purpose entities (70) �Buy back of issued shares � (999)Proceeds from issuance of ordinary shares from treasury stock,
net of direct expenses and attributable income tax 1,855 �Cash distributed to shareholders on disposal of Polyus Group � (2,366)Dividends paid by the Company (849) (1,079)Dividends paid by the Group’s subsidiaries to minority shareholders (27) �
Net cash generated from/(used in) financing activities 7,177 (4,909)
Net increase in cash and cash equivalents 1,758 1,116
Cash and cash equivalents at beginning of the year 2,178 922Effect of translation to presentation currency 80 140Cash and cash equivalents of disposal group (8) �
Cash and cash equivalents at end of the year 4,008 2,178
— II-100 —
APPENDIX II FINANCIAL STATEMENTS OF MMC NORILSK NICKEL
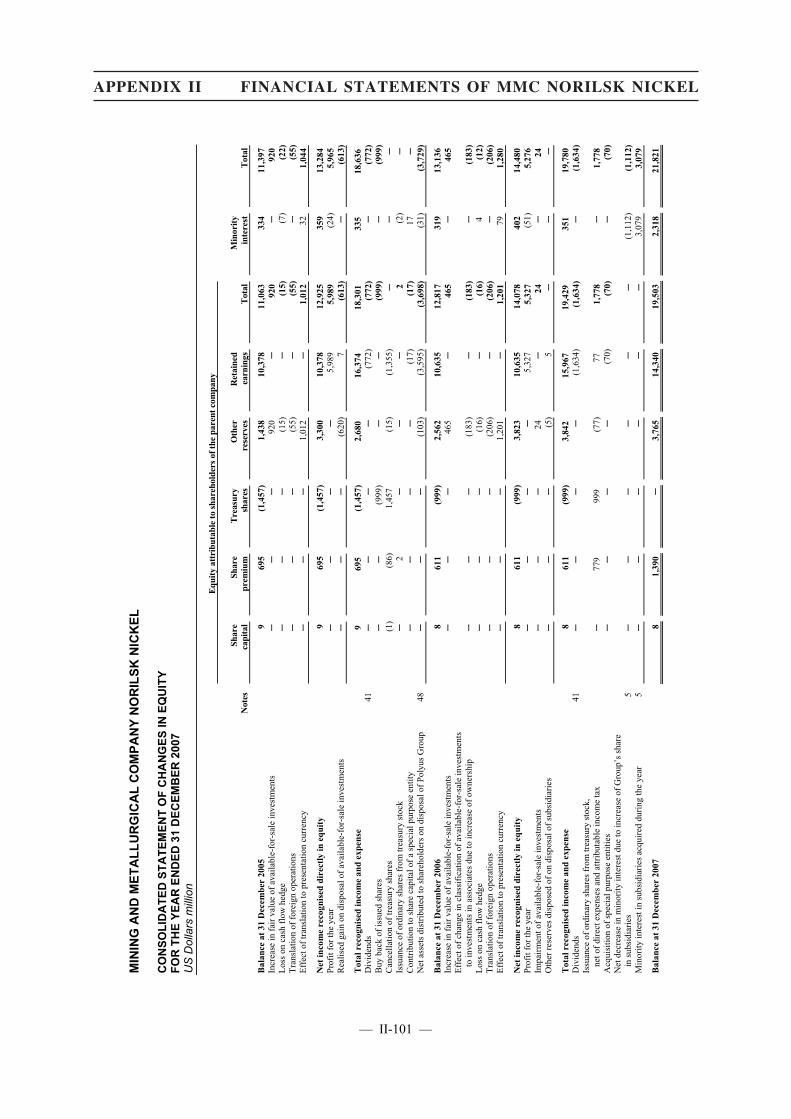
MIN
ING
AN
D M
ET
AL
LU
RG
ICA
L C
OM
PA
NY
NO
RIL
SK
NIC
KE
L
CO
NS
OL
IDA
TE
D S
TA
TE
ME
NT
OF
CH
AN
GE
S IN
EQ
UIT
Y
FO
R T
HE
YE
AR
EN
DE
D 3
1 D
EC
EM
BE
R 2
007
U
S D
olla
rs m
illio
n
Equi
ty a
ttrib
utab
le to
shar
ehol
ders
of t
he p
aren
t com
pany
Not
esSh
are
capi
tal
Shar
epr
emiu
mTr
easu
ry
shar
esO
ther
re
serv
esR
etai
ned
earn
ings
Tota
lM
inor
ity
inte
rest
Tota
l
Bal
ance
at 3
1 D
ecem
ber
2005
9
695
(1,4
57)
1,43
810
,378
11,0
6333
411
,397
Incr
ease
in f
air
valu
e of
ava
ilabl
e-fo
r-sa
le in
vest
men
ts
��
�92
0�
920
�92
0L
oss
on c
ash
flow
hed
ge
��
�(1
5)�
(15)
(7)
(22)
Tra
nsla
tion
of f
orei
gn o
pera
tions
�
��
(55)
�(5
5)�
(55)
Eff
ect o
f tr
ansl
atio
n to
pre
sent
atio
n cu
rren
cy
��
�1,
012
�1,
012
321,
044
Net
inco
me
reco
gnis
ed d
irec
tly in
equ
ity
969
5(1
,457
)3,
300
10,3
7812
,925
359
13,2
84Pr
ofit
for
the
year
�
��
�5,
989
5,98
9(2
4)5,
965
Rea
lised
gai
n on
dis
posa
l of
avai
labl
e-fo
r-sa
le in
vest
men
ts
��
�(6
20)
7(6
13)
�(6
13)
Tot
al r
ecog
nise
d in
com
e an
d ex
pens
e 9
695
(1,4
57)
2,68
016
,374
18,3
0133
518
,636
Div
iden
ds
41�
��
�(7
72)
(772
)�
(772
)B
uy b
ack
of is
sued
sha
res
��
(999
)�
�(9
99)
�(9
99)
Can
cella
tion
of tr
easu
ry s
hare
s (1
)(8
6)1,
457
(15)
(1,3
55)
��
�Is
suan
ce o
f or
dina
ry s
hare
s fr
om tr
easu
ry s
tock
�
2�
��
2(2
)�
Con
trib
utio
n to
sha
re c
apita
l of
a sp
ecia
l pur
pose
ent
ity
��
��
(17)
(17)
17�
Net
ass
ets
dist
ribu
ted
to s
hare
hold
ers
on d
ispo
sal o
f Po
lyus
Gro
up
48�
��
(103
)(3
,595
)(3
,698
)(3
1)(3
,729
)
Bal
ance
at 3
1 D
ecem
ber
2006
8
611
(999
)2,
562
10,6
3512
,817
319
13,1
36In
crea
se in
fai
r va
lue
of a
vaila
ble-
for-
sale
inve
stm
ents
�
��
465
�46
5�
465
Eff
ect o
f ch
ange
in c
lass
ific
atio
n of
ava
ilabl
e-fo
r-sa
le in
vest
men
ts
to in
vest
men
ts in
ass
ocia
tes
due
to in
crea
se o
f ow
ners
hip
��
�(1
83)
�(1
83)
�(1
83)
Los
s on
cas
h fl
ow h
edge
�
��
(16)
�(1
6)4
(12)
Tra
nsla
tion
of f
orei
gn o
pera
tions
�
��
(206
)�
(206
)�
(206
)E
ffec
t of
tran
slat
ion
to p
rese
ntat
ion
curr
ency
�
��
1,20
1�
1,20
179
1,28
0
Net
inco
me
reco
gnis
ed d
irec
tly in
equ
ity
861
1(9
99)
3,82
310
,635
14,0
7840
214
,480
Prof
it fo
r th
e ye
ar
��
��
5,32
75,
327
(51)
5,27
6Im
pair
men
t of
avai
labl
e-fo
r-sa
le in
vest
men
ts
��
�24
�24
�24
Oth
er r
eser
ves
disp
osed
of
on d
ispo
sal o
f su
bsid
iari
es
��
�(5
)5
��
�
Tot
al r
ecog
nise
d in
com
e an
d ex
pens
e8
611
(999
)3,
842
15,9
6719
,429
351
19,7
80D
ivid
ends
41
��
��
(1,6
34)
(1,6
34)
�(1
,634
)Is
suan
ce o
f or
dina
ry s
hare
s fr
om tr
easu
ry s
tock
, ne
t of
dire
ct e
xpen
ses
and
attr
ibut
able
inco
me
tax
�77
999
9(7
7)77
1,77
8�
1,77
8A
cqui
sitio
n of
spe
cial
pur
pose
ent
ities
�
��
�(7
0)(7
0)�
(70)
Net
dec
reas
e in
min
ority
inte
rest
due
to in
crea
se o
f G
roup
’s s
hare
in
sub
sidi
arie
s 5
��
��
��
(1,1
12)
(1,1
12)
Min
ority
inte
rest
in s
ubsi
diar
ies
acqu
ired
dur
ing
the
year
5
��
��
��
3,07
93,
079
Bal
ance
at 3
1 D
ecem
ber
2007
8
1,39
0�
3,76
514
,340
19,5
032,
318
21,8
21
— II-101 —
APPENDIX II FINANCIAL STATEMENTS OF MMC NORILSK NICKEL

MINING AND METALLURGICAL COMPANY NORILSK NICKEL
NOTES TO THE CONSOLIDATED FINANCIAL STATEMENTS FOR THE YEAR ENDED 31 DECEMBER 2007
1. GENERAL
Organisation
Open Joint Stock Company “Mining and Metallurgical Company Norilsk Nickel” (the “Company” or “MMC Norilsk Nickel”) was incorporated in the Russian Federation on 4 July 1997. The principal activities of the Company and its subsidiaries (the “Group” or “Norilsk Nickel Group”) are exploration, extraction, refining and sale of base and precious metals. Further details regarding the nature of the business and structure of the Group are presented in note 50.
Major production facilities of the Group are located in Taimyr and Kola Peninsulas of the Russian Federation, Australia, Botswana, Finland, South Africa and the United States of America. The registered office of the Company is located at 22, Voznesensky pereulok, Moscow, Russian Federation.
Shareholding structure of the Group as at 31 December 2007 and 2006 was the following:
31 December 2007 31 December 2006
ShareholdersNumber of
shares % heldNumber of
shares % held
CJSC “ING Bank (Eurasia)” (nominee) 82,644,397 43.75% 80,209,132 44.21%OJS� AKB “Rosbank” (nominee) 31,999,525 16.94% 46,386,181 25.57%CJSC “Depository Clearing Company” 26,612,447 14.09% 12,547,555 6.92%OJS� “VTB Bank” (nominee) 16,152,948 8.55% � �Non-for-Profit Partnership
“National Depository Centre” 13,843,424 7.33% 10,713,585 5.91%Dimosenco Holdings Co. Limited � � 6,920,313 3.81%Pharanco Holdings Co. Limited � � 6,920,313 3.81%Other, less than 5% 17,664,122 9.34% 17,720,834 9.77%
Total 188,916,863 100.00% 181,417,913 100.00%
Statement of compliance
The consolidated financial statements of the Group have been prepared in accordance with International Financial Reporting Standards (“IFRS”).
Basis of preparation
The entities of the Group maintain their accounting records in accordance with the laws, accounting and reporting regulations of the jurisdictions in which they are incorporated and registered. Accounting principles in certain jurisdictions may differ substantially from those generally accepted under IFRS.Financial statements of such entities have been adjusted to ensure that the consolidated financial statements are presented in accordance with IFRS.
The consolidated financial statements of the Group are prepared on the historical cost basis, except for:
� mark-to-market valuation of by-products, in accordance with IAS 2 Inventories; and
� mark-to-market valuation of certain classes of financial instruments, in accordance with IAS 39 Financial Instruments: Recognition and Measurement.
— II-102 —
APPENDIX II FINANCIAL STATEMENTS OF MMC NORILSK NICKEL

MINING AND METALLURGICAL COMPANY NORILSK NICKEL
NOTES TO THE CONSOLIDATED FINANCIAL STATEMENTS FOR THE YEAR ENDED 31 DECEMBER 2007
Standards and interpretations effective in the current year
In the current year, the Group has adopted all new and revised International Financial Reporting Standards and interpretations issued by International Financial Reporting Interpretation Committee (“IFRIC”) that are mandatory for adoption in the annual periods beginning on or after 1 January 2007. Adoption of these standards and interpretations did not have any effect on the financial performance or position of the Group but gave rise to additional disclosures in the consolidated financial statements as follows:
IAS 1 Presentation of Financial Statements (amendment)
This amendment required the Group to provide new disclosures to enable users of the consolidated financial statements to evaluate the Group’s principal policies and procedures for managing capital (refer to note 46).
IFRS 7 Financial Instruments: Disclosures
This standard introduced new disclosures that enable users of the consolidated financial statements to evaluate the significance of the Group’s financial instruments and the nature and extent of risks arising from those financial instruments. Appropriate disclosures are presented through out the consolidated financial statements.
IFRIC Interpretations
The following interpretations issued by IFRIC were effective for the current period: IFRIC 7 Applying the Restatement Approach under IAS 29; IFRIC 8 Scope of IFRS 2; IFRIC 9 Reassessment of Embedded Derivatives; and IFRIC 10 Interim Financial Reporting and Impairment. The adoption of these interpretations has not led to any changes in the Group’s accounting policies or disclosures provided in the consolidated financial statements.
Standards and interpretations in issue but not yet adopted
At the date of authorisation of these consolidated financial statements, the following Standards and Interpretations were in issue but not yet effective:
Standards and InterpretationsEffective for annual periods
beginning on or after
IAS 1 Presentation of Financial Statements (amendment) 1 January 2009IAS 23 Borrowing Costs (amendment) 1 January 2009IAS 27 Consolidated and Separate Financial Statements (amendment due to revision of IFRS 3) 1 July 2009IAS 28 Investments in Associates (amendments due to revision of IFRS 3) 1 July 2009IAS 31 Investments in Joint Ventures (amendments due to revision of IFRS 3) 1 July 2009IAS 32 Financial Instruments: Presentation (amendment) 1 January 2009IAS 36 Impairment of Assets (amendment) 1 January 2009IAS 38 Intangible Assets (amendment) 1 January 2009IAS 39 Financial Instruments: Recognition and Measurement (amendment) 1 January 2009IAS 40 Investment Property (amendment) 1 January 2009IAS 41 Agriculture (amendment) 1 January 2009IFRS 2 Share-based Payment (amendment) 1 January 2009IFRS 3 Business Combinations (revised on applying the acquisition method) 1 July 2009IFRS 8 Operating Segments 1 January 2009IFRIC 11 IFRS 2: Group and Treasury Share Transactions 1 March 2007IFRIC 12 Service Concession Arrangements 1 January 2008IFRIC 13 Customer Loyalty Programmes 1 July 2008IFRIC 14 IAS 19: The Limit on a Benefit Asset, Minimum Funding Requirements and their Interaction 1 January 2008
The management of the Group anticipates that all of the above standards and interpretations will be adopted in the Group’s consolidated financial statements for the respective periods. The impact of adoption of those standards and interpretations on the consolidated financial statements of future periods is currently being assessed by management.
— II-103 —
APPENDIX II FINANCIAL STATEMENTS OF MMC NORILSK NICKEL
MINING AND METALLURGICAL COMPANY NORILSK NICKEL
NOTES TO THE CONSOLIDATED FINANCIAL STATEMENTS FOR THE YEAR ENDED 31 DECEMBER 2007
2. SIGNIFICANT ACCOUNTING POLICIES
Basis of consolidation
Subsidiaries
The consolidated financial statements incorporate financial statements of the Company and its subsidiaries, from the date that control effectively commenced until the date that control effectively ceased. Control is achieved where the Company has power to govern the financial and operating policies of an entity so as to obtain benefits from its activities.
Minority interest in the net assets (excluding goodwill) of consolidated subsidiaries is identified separately from the Group’s equity therein. Minority interest includes interest at the date of the original business combination and minority’s share of changes in net assets since the date of the combination. Losses applicable to minority in excess of minority’s interest in the subsidiary’s net assets are allocated against the interest of the Group except to the extent that a minority has a binding obligation and is able to make an additional investment to cover the losses.
All intra-group balances, transactions and any unrealised profits or losses arising from intra-group transactions are eliminated in full on consolidation.
Associates
An associate is an entity over which the Group exercises significant influence, but not control, through participation in financing and operating policy decisions, in which it normally owns between 20% and 50% of the voting equity. Associates are equity accounted for from the date significant influence commenced until the date that significant influence effectively ceased.
Investments in associates are carried at cost, including goodwill, as adjusted for the Group’s the share of post-acquisition changes in associate’s retained earnings and other movements in reserves. The carrying value of investments in associates is reviewed on a regular basis and if any impairment in value has occurred, it is written down in the period in which these circumstances are identified.
The results of associates are equity accounted for based on their most recent financial statements. Losses of associates are recorded in the consolidated financial statements until the investment in such associates is written down to nil value. Thereafter losses are only accounted for to the extent that the Group is committed to provide financial support to such associates.
Profits and losses resulting from transactions with associates are eliminated to the extent of the Group’s interest in the relevant associates.
Special purpose entities
Special purpose entities (“SPEs”) are those undertakings that are created to satisfy specific business needs of the Group and the Group has the right to the majority of the benefits of the SPE, or is exposed to risks associated with the activities of the SPE. SPEs are consolidated in the same manner as subsidiaries.
Accounting for acquisitions
Where an investment in a subsidiary or an associate is made, any excess of the purchase consideration over the fair value of the identifiable assets, including mineral rights, liabilities and contingent liabilities at the date of acquisition is recognised as goodwill. Goodwill in respect of subsidiaries is disclosed separately and goodwill relating to associates is included in the carrying value of the investment in associates. Goodwill is reviewed for impairment at least annually. If impairment has occurred, it is recognised in the consolidated income statement during the period in which the circumstances are identified and is not subsequently reversed.
— II-104 —
APPENDIX II FINANCIAL STATEMENTS OF MMC NORILSK NICKEL

MINING AND METALLURGICAL COMPANY NORILSK NICKEL
NOTES TO THE CONSOLIDATED FINANCIAL STATEMENTS FOR THE YEAR ENDED 31 DECEMBER 2007
Where an investment in a subsidiary or an associate is made, any excess of the Group’s share in the fair value of acquiree’s identifiable assets, liabilities and contingent liabilities over cost is recognised in the consolidated income statement immediately.
Where an acquisition is achieved in stages, goodwill is calculated separately for each exchange transaction, based on the cost of each exchange transaction, and the appropriate share of the acquirer’s net assets based on net fair values at the time of each exchange transaction. When control is achieved, the acquired net assets are stated at net fair value at the date of acquisition and any adjustment to fair values related to previously held interests is a revaluation, which is accounted for as an adjustment directly in equity.
On acquisition of additional shares of subsidiaries from minority shareholders, any excess of consideration paid over the acquired interest in the carrying value of net assets at the date of increase in ownership is recognised as a goodwill; and any excess of the Group’s share in the carrying value of subsidiary net assets over cost of acquisition is recognised in the consolidated income statement.
Impairment of goodwill
For the purpose of impairment testing, goodwill is allocated to each of the Group’s cash-generating units expected to benefit from the synergies of the business combination. Cash-generating units to which goodwill has been allocated are tested for impairment annually, or more frequently when there is an indication that the unit may be impaired. If the recoverable amount of the cash-generating unit is less than its carrying amount, the impairment loss is allocated as follows: first to reduce the carrying amount of any goodwill allocated to this unit, and then to the other assets of the unit pro-rata on the basis of the carrying amount of each asset in the unit. An impairment loss recognised for goodwill is not reversed in a subsequent period.
Functional and presentation currency
The individual financial statements of each Group entity are presented in its functional currency.
The Russian Rouble (“RUR”) is the functional currency of the Company and all foreign subsidiaries of the Group, except for the following subsidiaries operating with a significant degree of autonomy:
Subsidiary Functional currency
Stillwater Mining Company US Dollar Norilsk Nickel Harjavalta Oy US Dollar Norilsk Nickel Finland Oy US Dollar LionOre Mining International Limited and its subsidiaries Australian Dollar and Botswana Pula Norilsk Nickel Cawse Proprietary Limited Australian Dollar
The presentation currency of the consolidated financial statements of the Group is US Dollar. Using USD as a presentation currency is common practice for global mining companies. In addition, USD is a more relevant presentation currency for international users of the consolidated financial statements of the Group.
The translation into presentation currency is made as follows:
� all assets and liabilities, both monetary and non-monetary, are translated at closing exchange rates at the dates of each balance sheet presented;
� all income and expenses in each income statement are translated at the average exchange rates for the periods presented;
� all resulting exchange differences are recognised as a separate component in equity; and
� in the consolidated statement of cash flows, cash balances at beginning and end of each period presented are translated at exchange rates at the respective dates. All cash flows are translated at the average exchange rates for the periods presented. Resulting exchange differences are presented as Effect of translation to presentation currency.
— II-105 —
APPENDIX II FINANCIAL STATEMENTS OF MMC NORILSK NICKEL
MINING AND METALLURGICAL COMPANY NORILSK NICKEL
NOTES TO THE CONSOLIDATED FINANCIAL STATEMENTS FOR THE YEAR ENDED 31 DECEMBER 2007
Exchange rates used in preparation of the consolidated financial statements were as follows:
2007 2006
Russian Rouble/US Dollar
31 December 24.55 26.33Average for the year 25.58 27.19
Botswana Pula/US Dollar
31 December 6.14 n/aAverage for the year 6.11 n/a
Australian Dollar/US Dollar
31 December 1.14 n/aAverage for the year 1.19 n/a
Foreign currency transactions
Transactions in currencies other than the entity’s functional currency (foreign currencies) are recorded at the exchange rates prevailing at the date of the transactions. At each balance sheet date monetary assets and liabilities denominated in foreign currencies are translated at the exchange rates prevailing at the balance sheet date. Non-monetary items carried at historical cost are translated at the exchange rate prevailing at the date of transaction. Non-monetary items carried at fair value are translated at the exchange rate prevailing at the date on which the most recent fair value was determined. Exchange differences arising from changes in exchange rates are recognised in the consolidated income statement.
Property, plant and equipment
Mineral rights, mineral resources and ore reserves
Mineral rights, mineral resources and ore reserves are recorded as assets when acquired as part of a business combination and are then amortised over the life of mine, which is based on estimated proven and probable ore reserves. Estimated proven and probable ore reserves reflect the economically recoverable quantities which can be legally recovered in the future from known mineral deposits and are determined by independent professional appraisers.
Mining assets
Mining assets are recorded at cost less accumulated amortisation and impairment losses. Mining assets include the cost of acquiring and developing mining properties, pre-production expenditure, mine infrastructure, mining and exploration licenses and the present value of future decommissioning costs.
Amortisation of mining assets is charged from the date on which a new mine reaches commercial production quantities and is included in the cost of production. Mining assets are amortised on straight-line basis over the lesser of their economic useful lives or the life of mine, varying from 2 to 49 years.
Mine development costs
Mine development costs are capitalised and transferred to mining property, plant and equipment when a new mine reaches commercial production quantities.
Capitalised mine development costs comprise expenditures directly related to:
� acquiring mining and exploration licenses; � developing new mining operations; � defining further mineralisation in existing ore bodies; and � expanding the capacity of a mine.
Mine development costs include interest capitalised during the construction period, when financed by borrowings.
— II-106 —
APPENDIX II FINANCIAL STATEMENTS OF MMC NORILSK NICKEL

MINING AND METALLURGICAL COMPANY NORILSK NICKEL
NOTES TO THE CONSOLIDATED FINANCIAL STATEMENTS FOR THE YEAR ENDED 31 DECEMBER 2007
Non-mining assets
Non-mining assets include metallurgical processing plants, buildings, infrastructure, machinery and equipment and other non-mining assets. Non-mining assets are stated at cost less accumulated depreciation and impairment losses. Plant and equipment that process extracted ore are located near mining operations and amortised on a straight-line basis over the lesser of their economic useful lives or the life of mine. Other non-mining assets are amortised on a straight-line basis over their economic useful lives.
Depreciation is calculated over the following economic useful lives:
� plant, buildings and infrastructure 10 – 50 years � machinery and equipment 4 – 11 years � other non-mining assets 5 – 10 years
Capital construction-in-progress
Capital construction-in-progress comprises costs directly related to construction of buildings, processing plant, infrastructure, machinery and equipment. Cost also includes finance charges capitalised during the construction periods where such costs are financed by borrowings. Depreciation of these assets commences when the assets are put into production.
Intangible assets, excluding goodwill
Intangible assets are recorded at cost less accumulated amortisation and impairment losses. Intangible assets mainly include patents and licenses, long-term favourable contracts and software. Amortisation is charged on a straight-line basis over the following economic useful lives of these assets:
� Activox technology patent indefinite useful life
� patents and licenses, except for Activox technology 2 – 10 years
� long-term favourable contracts 7 years
� software 2 – 10 years
Impairment of tangible and intangible assets, excluding goodwill
At each balance sheet date, the Group reviews the carrying amounts of its tangible and intangible assets to determine whether there is any indication that those assets have suffered an impairment loss. If any such indication exists, the recoverable amount of the asset is estimated in order to determine the extent of the impairment loss (if any). Where it is not possible to estimate the recoverable amount of an individual asset, the Group estimates the recoverable amount of the cash-generating unit to which the asset belongs.
The recoverable amount is the higher of fair value less cost to sell and value-in-use. In assessing value-in-use, the estimated future cash flows are discounted to their present value using a pre-tax discount rate that reflects current market assessments of the time value of money and the risks specific to the asset, for which the estimates of the future cash flows have not been adjusted. If the recoverable amount of an asset (or cash-generating unit) is estimated to be less than its carrying amount, the carrying amount of the asset (or cash-generating unit) is reduced to its recoverable amount. An impairment loss is recognised in the consolidated income statement immediately.
Where an impairment loss subsequently reverses, the carrying amount of the asset (or cash-generating unit) is increased to the revised estimate of its recoverable amount, but only to the extent that the increased carrying amount does not exceed the original carrying amount that would have been determined had no impairment loss been recognised in prior periods. A reversal of an impairment loss is recognised in the consolidated income statement immediately.
— II-107 —
APPENDIX II FINANCIAL STATEMENTS OF MMC NORILSK NICKEL

MINING AND METALLURGICAL COMPANY NORILSK NICKEL
NOTES TO THE CONSOLIDATED FINANCIAL STATEMENTS FOR THE YEAR ENDED 31 DECEMBER 2007
Research and exploration expenditure
Research and exploration expenditure, including geophysical, topographical, geological and similar types of expenditure, is expensed in the period in which it is incurred, unless it is deemed that such expenditure will lead to an economically viable capital project. In this case the expenditure is capitalised and amortised over the life of mine, when a mine reaches commercial production quantities.
Research and exploration expenditure written-off before development and construction starts is not subsequently capitalised, even if a commercial discovery subsequently occurs.
Inventories
Refined metals
Joint products, i.e. nickel, copper, palladium, platinum and gold, are measured at the lower of net cost of production or net realisable value. The net cost of production of joint products is determined as total production cost less net revenue from sales of by-products and valuation of by-product inventories on hand, allocated to each joint product in the ratio of their contribution to total amount of sales.
Production costs include on-mine and concentrating costs, smelting costs, treatment and refining costs, other cash costs and amortisation and depreciation of operating assets.
By-products, i.e. cobalt, ruthenium, rhodium, iridium, silver and other minor metals, are measured at net realisable value, through a mark-to-market valuation.
Work-in-process
Work-in-process is valued at net cost of production based on the percentage of completion method.
Stores and materials
Stores and materials consist of consumable stores and are valued at the weighted average cost less allowance for obsolete and slow-moving items.
Financial assets
Financial assets are recognised when the Group has become a party to the contractual arrangement of the instrument and are initially measured at fair value, plus transaction costs, except for those financial assets classified as at fair value through profit or loss, which are initially measured at fair value.
Financial assets are classified into the following specified categories:
� financial assets at fair value through profit or loss; � held-to-maturity investments; � available-for-sale financial assets; and � loans and receivables.
The classification depends on the nature and purpose of the financial assets and is determined at the time of initial recognition.
Effective interest method
The effective interest method is a method of calculating the amortised cost of a financial asset and of allocating interest income over the relevant period. The effective interest rate is the rate that exactly discounts estimated future cash receipts (including transaction costs and other premiums or discounts) through the expected life of the financial asset, or, where appropriate, a shorter period.
Income is recognised on an effective interest basis for debt securities other that those financial assets designated as at fair value through profit or loss.
— II-108 —
APPENDIX II FINANCIAL STATEMENTS OF MMC NORILSK NICKEL
MINING AND METALLURGICAL COMPANY NORILSK NICKEL
NOTES TO THE CONSOLIDATED FINANCIAL STATEMENTS FOR THE YEAR ENDED 31 DECEMBER 2007
Financial assets at fair value through profit or loss
Financial assets are classified as at fair value through profit or loss where the financial asset is either held for trading or it is designated as at fair value through profit or loss.
A financial asset is classified as held for trading if:
� it has been acquired principally for the purpose of selling in the near future; or
� it is a part of an identified portfolio of financial instruments that the Group manages together and has a recent actual pattern of short-term profit-taking; or
� it is a derivative that is not designated and effective as a hedging instrument.
Financial assets at fair value through profit or loss are stated at fair value, with any resultant gain or loss recognised in the consolidated income statement. The net gain or loss recognised in the consolidated income statement incorporates any dividend or interest earned on the financial asset.
Held-to-maturity investments
Promissory notes and debentures with fixed or determinable payments and fixed maturity dates that the Group has the positive intent and ability to hold to maturity other than loans and receivables are classified as held-to-maturity investments. Held-to-maturity investments are recorded at amortised cost using the effective interest method less any allowance for impairment.
Amortisation of discount or premium on the acquisition of a held-to-maturity investment is recognised in interest income over the term of the investment. Held-to-maturity investments are included in non-current assets, unless they mature within twelve months of the balance sheet date.
Available-for-sale financial assets
Available-for-sale financial assets mainly include investments in listed and unlisted shares.
Listed shares held by the Group that are traded in an active market are stated at their market value. Gains and losses arising from changes in fair value are recognised directly in equity in the investments revaluation reserve with the exception of impairment losses, interest calculated using the effective interest method and foreign exchange gains and losses on monetary assets, which are recognised directly in the consolidated income statement. Where the investment is disposed of or is determined to be impaired, the cumulative gain or loss previously recognised in the investment revaluation reserve is included in the consolidated income statement for the period.
Dividends on available-for-sale equity instruments are recognised in the consolidated income statementwhen the Group’s right to receive the dividends is established.
Investments in unlisted shares that do not have a quoted market price in an active market and whose fair value cannot be reliably measured are recorded at management’s estimate of fair value.
Loans and receivables
Trade receivables, loans, and other receivables that have fixed or determinable payments that are not quoted in an active market are classified as loans and receivables. Loans and receivables are measured at amortised cost using the effective interest method, less any impairment. Interest income is recognised by applying the effective interest rate, except for short-term receivables when the recognition of interest would be immaterial.
— II-109 —
APPENDIX II FINANCIAL STATEMENTS OF MMC NORILSK NICKEL
MINING AND METALLURGICAL COMPANY NORILSK NICKEL
NOTES TO THE CONSOLIDATED FINANCIAL STATEMENTS FOR THE YEAR ENDED 31 DECEMBER 2007
Impairment of financial assets
Financial assets, other than those at fair value through profit or loss, are assessed for indicators of impairment at each balance sheet date. Financial assets are impaired where there is objective evidence that, as a result of one or more events that occurred after the initial recognition of the financial asset, the estimated future cash flows of the investment have been impacted.
For unlisted shares classified as available-for-sale, a significant or prolonged decline in the fair value of the security below its cost is considered to be objective evidence of impairment.
For certain categories of financial asset, such as trade receivables, assets that are assessed not to be impaired individually are subsequently assessed for impairment on a collective basis. Objective evidence of impairment for a portfolio of receivables could include the Group’s past experience of collecting payments, an increase in the number of delayed payments as well as observable changes in economic conditions that correlate with defaults on receivables.
For financial assets carried at amortised cost, the amount of the impairment is the difference between the asset’s carrying amount and the present value of estimated future cash flows, discounted at the financial asset’s original effective interest rate.
The carrying amount of the financial asset is reduced by the impairment loss directly for all financial assets with the exception of trade receivables, where the carrying amount is reduced through the use of an allowance for impairment. When a trade receivable is considered uncollectible, it is written off against the allowance. Subsequent recoveries of amounts previously written off are credited against the allowance. Changes in the carrying amount of the allowance are recognised in the consolidated income statement.
With the exception of available-for-sale equity instruments, if, in a subsequent period, the amount of the impairment loss decreases and the decrease can be related objectively to an event occurring after the impairment was recognised, the previously recognised impairment loss is reversed through the consolidated income statement to the extent that the carrying amount of the investment at the date the impairment is reversed does not exceed what the amortised cost would have been had the impairment not been recognised.
When a decline in fair value of an available-for-sale investment has been recognised directly in equity and there is objective evidence that investment is impaired, the cumulative loss that had been recognised directly in equity is removed from equity and recognised in the consolidated income statement even though the investment has not been derecognised. Impairment losses previously recognised through consolidated income statement are not reversed. Any increase in fair value subsequent to an impairment loss is recognised directly in equity.
Derecognition of financial assets
The Group derecognises a financial asset only when the contractual rights to the cash flows from the asset expire; or it transfers the financial asset and substantially all the risks and rewards of ownership of the asset to another entity. If the Group neither transfers nor retains substantially all the risks and rewards of ownership and continues to control the transferred asset, the Group recognises its retained interest in the asset and an associated liability for amounts it may have to pay. If the Group retains substantially all the risks and rewards of ownership of a transferred financial asset, the Group continues to recognise the financial asset and also recognises a collateralised borrowing for the proceeds received.
Financial liabilities
Financial liabilities, including borrowings, are initially measured at fair value, net of transaction costs and subsequently measured at amortised cost using the effective interest method.
— II-110 —
APPENDIX II FINANCIAL STATEMENTS OF MMC NORILSK NICKEL

MINING AND METALLURGICAL COMPANY NORILSK NICKEL
NOTES TO THE CONSOLIDATED FINANCIAL STATEMENTS FOR THE YEAR ENDED 31 DECEMBER 2007
Effective interest method
The effective interest method is a method of calculating the amortised cost of a financial liability and of allocating interest expense over the relevant period. The effective interest rate is the rate that exactly discounts estimated future cash payments through the expected life of the financial liability, or, where appropriate, a shorter period.
Derecognition of financial liabilities
The Group derecognises financial liabilities when, and only when, the Group’s obligations are discharged, cancelled or they expire.
Derivative financial instruments
The Group uses derivative financial instruments to manage its exposure to the risk of changes in metal prices.
Derivative financial instruments are initially measured at fair value on the contract date, and are re-measured to fair value at subsequent reporting dates. The resulting gain or loss is recognised in the consolidated income statement immediately unless the derivative is designated as a cash flow hedge.
The effective portion of changes in the fair value of derivative financial instruments that are designated as cash flow hedges is recognised directly in equity. The ineffective portion of cash flow hedges is recognised in the consolidated income statement. Amounts deferred in equity are recycled in the consolidated income statement in the periods when the hedged item is recognised in the consolidated income statement. However, when the forecast transaction that is hedged results in the recognition of a non-financial asset or a non-financial liability, the gains and losses previously deferred in equity are transferred from equity and included in the initial measurement of the cost of the asset or liability.
Hedge accounting is discontinued when the Group revokes the hedging relationship, the hedging instrument expires or is sold, terminated, or exercised, or no longer qualifies for hedge accounting. Any cumulative gain or loss deferred in equity at that time remains in equity and is recognised when the forecast transaction is ultimately recognised in the consolidated income statement. When a forecast transaction is no longer expected to occur, the cumulative gain or loss that was deferred in equity is recognised immediately in the consolidated income statement.
Cash and cash equivalents
Cash and cash equivalents comprise cash balances, cash deposits and highly liquid investments with maturities of three months or less, which are readily convertible to known amounts of cash and are subject to an insignificant risk of changes in value.
Employee benefits
Remuneration to employees in respect of services rendered during a reporting period is recognised as an expense in that reporting period.
Defined contribution plans
The Group contributes to the following major defined contribution plans:
� Pension Fund of the Russian Federation;
� Corporate pension option program; and
� Stillwater Mining Company savings plan.
The only obligation of the Group with respect to these and other defined contribution plans is to make the specified contributions in the period in which they arise. These contributions are recognised in the consolidated income statement when employees have rendered services entitling them to the contribution.
— II-111 —
APPENDIX II FINANCIAL STATEMENTS OF MMC NORILSK NICKEL
MINING AND METALLURGICAL COMPANY NORILSK NICKEL
NOTES TO THE CONSOLIDATED FINANCIAL STATEMENTS FOR THE YEAR ENDED 31 DECEMBER 2007
Defined benefit plans
The Group operates a number of funded defined benefit plans for its employees. At management’s discretion and within the established annual budgets, the Group admits employees, who have met certain criteria, into one of the following retirement benefit plans:
� Lifelong professional pension plan, whereby a retired employee receives a monthly allowance equal to 200% of the Russian Federation state pension for the rest of his/her life; or
� Joint corporate pension plan, whereby a retired employee receives a monthly allowance equal to 1/150th of the total Starting and Counter capital for the rest of his/her life. Starting capital is determined on an individual basis taking into account seniority, salary level, etc. Counter capital consists of a contribution funded by the Group amounted to 3% of salaries paid to an employee during the period of participation in the plan.
The Group’s liability recognised in the consolidated balance sheet in respect of defined benefit plans represent the present value of the defined benefit obligation at the balance sheet date less the fair value of the plans assets, together with adjustments for unrecognised actuarial gains or losses and past service costs. The defined benefit obligation is calculated using the projected unit credit method.
Actuarial gains and losses are recognised as income or expense when the cumulative unrecognised actuarial gains or losses for each individual plan exceed 10% of the higher of defined benefit obligation and the fair value of plans assets. The excess of cumulative actuarial gains or losses over the 10% of the higher of defined benefit obligation and the fair value of plans assets are recognised over the expected average remaining working lives of the employees participating in the plans.
Past service cost is recognised immediately in the consolidated income statement to the extent that the benefits are already vested, and otherwise amortised on the straight-line basis over the average period until the benefit becomes vested.
Where the estimation results in a benefit to the Group asset recognised is limited to the net total of any unrecognised actuarial losses and past service costs and present value of any future refunds from the plan or reductions in the future contribution to the plans.
Income tax
Income tax expense represents the sum of the tax currently payable and deferred tax.
Income tax is recognised as an expense or income in the consolidated income statement, except when it relates to items recognised directly in equity, in which case the tax is also recognised directly in equity, or where they arise from the initial accounting for a business combination.
In the case of a business combination, the tax effect is taken into account in calculating goodwill or determining the excess of the acquirer’s interest in the net fair value of the acquiree’s identifiable assets, liabilities and contingent liabilities over cost of the business combination.
Current tax
Current tax is based on taxable profit for the year. Taxable profit differs from profit for the year as reported in the consolidated income statement because it excludes items of income or expense that are taxable or deductible in other years and it further excludes items that are never taxable or deductible. The Group’s liability for current tax is calculated using tax rates that have been enacted or substantively enacted by the balance sheet date.
— II-112 —
APPENDIX II FINANCIAL STATEMENTS OF MMC NORILSK NICKEL

MINING AND METALLURGICAL COMPANY NORILSK NICKEL
NOTES TO THE CONSOLIDATED FINANCIAL STATEMENTS FOR THE YEAR ENDED 31 DECEMBER 2007
Deferred tax
Deferred tax is recognised on differences between the carrying amounts of assets and liabilities in the consolidated balance sheet and the corresponding tax bases used in the computation of taxable profit, and are accounted for using the balance sheet liability method. Deferred tax liabilities are recognised for all taxable temporary differences, and deferred tax assets are recognised for all deductible temporary differences to the extent that it is probable that taxable profits will be available against which those deductible temporary differences can be utilised. Such assets and liabilities are not recognised if the temporary difference arises from goodwill or from the initial recognition (other than in a business combination) of other assets and liabilities in a transaction that affects neither the taxable profit nor the accounting profit.
Deferred tax liabilities are recognised for taxable temporary differences associated with investments in subsidiaries, except where the Group is able to control the reversal of the temporary difference and it is probable that the temporary difference will not reverse in the foreseeable future. Deferred tax assets arising from deductible temporary differences associated with such investments and interests are only recognised to the extent that it is probable that there will be sufficient taxable profits against which to utilise the benefits of the temporary differences and they are expected to reverse in the foreseeable future.
The carrying amount of deferred tax assets is reviewed at each balance sheet date and reduced to the extent that it is no longer probable that sufficient taxable profits will be available to allow all or part of the asset to be recovered.
The measurement of deferred tax liabilities and assets reflects the tax consequences that would follow from the manner in which the Group expects, at the reporting date, to recover or settle the carrying amount of its assets and liabilities. Deferred tax assets and liabilities are offset when there is a legally enforceable right to set off current tax assets against current tax liabilities and when they relate to income taxes levied by the same taxation authority and the Group intends to settle its current tax assets and liabilities on a net basis.
Government grants
Government grants related to assets are deducted from the cost of these assets in arriving at their carrying value.
Revenue recognition
Metal sales revenue
Revenue from metal sales is recognised when the risks and rewards of ownership are transferred to the buyer and represents invoiced value of all joint products shipped to customers, net of value-added tax. Revenues from the sale of by-products are netted-off against production costs.
Revenue from contracts that are entered into and continue to meet the Group’s expected sale requirements designated for that purpose at their inception, and are expected to be settled by physical delivery, are recognised in the consolidated financial statements as and when they are delivered.
Sales of certain metals are provisionally priced such that the price is not settled until a predetermined future date based on the market price at that time. Revenue on these sales is initially recognised at the current market price. Provisionally priced metal sales are marked to market at each reporting date using the forward price for the period equivalent to that outlined in the contract. This mark to market adjustment is recorded in revenue.
— II-113 —
APPENDIX II FINANCIAL STATEMENTS OF MMC NORILSK NICKEL

MINING AND METALLURGICAL COMPANY NORILSK NICKEL
NOTES TO THE CONSOLIDATED FINANCIAL STATEMENTS FOR THE YEAR ENDED 31 DECEMBER 2007
Other revenue
Revenue from sale of goods, other than metals, is recognised when significant risks and rewards of ownership are transferred to the buyer in accordance with the shipping terms specified in the sales agreements.
Revenue from service contracts are recognised when the services are rendered and the outcome can be reliably measured.
The Group provides the following principal types of services:
� supply of electricity and heat energy; and
� transportation services.
Provisions
Provisions are recognised when the Group has a legal or constructive obligations as a result of a past event for which it is probable that an outflow of economic benefits will be required to settle the obligations, and the amount of the obligations can be reliably estimated.
The amount recognised as a provision is the best estimate of the consideration required to settle the present obligation at the balance sheet date, taking into account the risks and uncertainties surrounding obligation. Where a provision is measured using the cash flows estimated to settle the present obligation, its carrying amount is the present value of those cash flows.
Interest on borrowings
Interest on borrowings relating to major qualifying capital projects under construction is capitalised during the construction period in which they are incurred. Once a qualifying capital project has been fully commissioned, the associated interest is recorded in the consolidated income statement as and when incurred.
Interest relating to operating activities is expensed when incurred.
Leases
Leases under which the Group assumes substantially all the risks and rewards of ownership are classified as finance leases. Assets subject to finance leases are capitalised as property, plant and equipment at the lower of fair value or present value of future minimum lease payments at the date of acquisition, with the related lease obligation recognised at the same value. Assets held under finance leases are depreciated over their estimated economic useful lives or over the term of the lease, if shorter. If there is reasonable certainty that the lessee will obtain ownership at the end of the lease term, the period of expected use is useful life of the asset.
Finance lease payments are allocated using the effective interest rate method, between the lease finance cost, which is included in finance costs, and the capital repayment, which reduces the related lease obligation to the lessor.
Leases where the lessor retains substantially all the risks and benefits of ownership of the asset are classified as operating leases. Operating lease payments are recognised as an expense in the consolidated income statement on a straight-line basis over the lease term.
Dividends
Dividends payable and related taxation thereon are recognised in the period in which they have been declared and become legally payable.
Accumulated profits legally distributable are based on the amounts available for distribution in accordance with the applicable legislation and as reflected in the statutory financial statements of the individual entities of the Group. These amounts may differ significantly from the amounts calculated on the basis of IFRS.
— II-114 —
APPENDIX II FINANCIAL STATEMENTS OF MMC NORILSK NICKEL

MINING AND METALLURGICAL COMPANY NORILSK NICKEL
NOTES TO THE CONSOLIDATED FINANCIAL STATEMENTS FOR THE YEAR ENDED 31 DECEMBER 2007
Environmental obligations
Environmental obligations include decommissioning and land restoration costs.
Future decommissioning costs, discounted to net present value, are capitalised and the corresponding decommissioning obligations raised as soon as the constructive obligation to incur such costs arises and the future decommissioning cost can be reliably estimated. Decommissioning assets are depleted over the life of mine. The unwinding of the decommissioning obligations is included in the consolidated income statement as finance costs. Decommissioning obligations are periodically reviewed in light of current laws and regulations, and adjustments made as necessary.
Provision for land restoration, representing the cost of restoring land damage after the commencement of commercial production, is estimated at net present value of the expenditures expected to settle the obligation. Change in provision and unwinding of discount on land restoration are recognised to the consolidated income statement and included in cost of production.
Ongoing rehabilitation costs are expensed when incurred.
Assets held for sale
Non-current assets and disposal groups are classified as held for sale if their carrying amount will be recovered through a sale transaction rather than through continuing use. This condition is regarded as met only when sale is highly probable within one year from the date of classification and the asset or disposal group is available for immediate sale in its present condition and management has committed to the sale.
Non-current assets and disposal groups classified as held for sale are measured at the lower of their previous carrying amount and fair value less costs to sell.
Discontinued operations
Discontinued operations are disclosed when a component of the Group either has been disposed of during the reporting period, or is classified as held for sale at the balance sheet date. This condition is regarded as met only when the disposal is highly probable within one year from the date of classification.
Comparative information related to the discontinued operations is amended in the consolidated income statement for the prior period.
Assets and liabilities of a disposal group are presented in the balance sheet separately from other assets and liabilities. Comparative information related to discontinued operations is not amended in the consolidated balance sheet for the prior period.
Segmental information
The Group’s primary segment reporting format is business segments. A business segment is a group of assets and operations engaged in providing products or services that are subject to risks and returns that are different to those of other business segments. The Group’s primary business segments are:
� mining and metallurgy;
� energy and utilities;
� transport and logistics; and
� other.
The business segment “other” mainly includes entities engaged in research activities, maintenance and repair services and other.
— II-115 —
APPENDIX II FINANCIAL STATEMENTS OF MMC NORILSK NICKEL

MINING AND METALLURGICAL COMPANY NORILSK NICKEL
NOTES TO THE CONSOLIDATED FINANCIAL STATEMENTS FOR THE YEAR ENDED 31 DECEMBER 2007
The Group’s secondary segment reporting format is geographic segments which are based on the geographic location of the Group’s operations. The Group mainly operates in:
• Russian Federation;
• North America;
• Australia;
• Africa;
• Europe; and
• Asia.
3. CRITICAL ACCOUNTING JUDGEMENTS AND KEY SOURCE OF ESTIMATION UNCERTAINTY
Preparation of the consolidated financial statements in accordance with IFRS requires the Group’s management to make estimates and assumptions that affect the reported amounts of assets and liabilities and disclosure of contingent assets and liabilities at the date of the consolidated financial statements, and the reported amounts of revenues and expenses during the reporting period. The determination of estimates requires judgments which are based on historical experience, current and expected economic conditions, and all other available information. Actual results could differ from those estimates.
The most significant areas requiring the use of management estimates and assumptions relate to:
� useful economic lives of property, plant and equipment;
� impairment of assets;
� impairment of goodwill;
� allowances for doubtful debts, obsolete and slow-moving raw materials and spare parts;
� environmental obligations;
� defined benefit plans; and
� tax matters.
Useful economic lives of property, plant and equipment
The Group’s mining assets, classified within property, plant and equipment, are amortised on a straight-line basis over the lesser of their economic useful lives or the life of mine. When determining life of mine, assumptions that were valid at the time of estimation, may change when new information becomes available.
The factors that could affect the estimation of the life of mine include the following:
� changes in proven and probable ore reserves;
� the grade of mineral reserves varying significantly from time to time;
� differences between actual commodity prices and commodity price assumptions used in the estimation and classification of ore reserves;
� unforeseen operational issues at mine sites; and
� changes in capital, operating, mining, processing and reclamation costs, discount rates and foreign exchange rates could possibly adversely affect the economic viability of ore reserves.
Any of these changes could affect prospective amortisation of mining assets and their carrying value. Useful economic lives of non-mining property, plant and equipment is reviewed by management periodically. The review is based on the current condition of the assets and the estimated period during which they will continue to bring economic benefit to the Group.
— II-116 —
APPENDIX II FINANCIAL STATEMENTS OF MMC NORILSK NICKEL
MINING AND METALLURGICAL COMPANY NORILSK NICKEL
NOTES TO THE CONSOLIDATED FINANCIAL STATEMENTS FOR THE YEAR ENDED 31 DECEMBER 2007
Impairment of assets, excluding goodwill
The Group reviews the carrying amounts of its tangible and intangible assets excluding goodwill to determine whether there is any indication that those assets are impaired. In making the assessment for impairment, assets that do not generate independent cash flows are allocated to an appropriate cash-generating unit. Management necessarily applies its judgment in allocating assets that do not generate independent cash flows to appropriate cash-generating units, and also in estimating the timing and value of the underlying cash flows within the value-in-use calculation. Subsequent changes to the cash-generating unit allocation or to the timing of cash flows could impact the carrying value of the respective assets.
Impairment of goodwill
Assessment whether goodwill is impaired requires an estimation of value-in-use of the cash-generating unit to which goodwill is allocated. The value-in-use calculations require management to estimate the future cash flows expected to arise from the cash-generating unit and a suitable discount to calculate present value. Details of impairment loss calculations related to mining and non-mining business units of the Group is presented in note 24.
Allowances
The Group creates allowances for doubtful debts to account for estimated losses resulting from the inability of customers to make the required payments. As at 31 December 2007, the allowance for doubtful debts amounted to USD 52 million (2006: USD 71 million). When evaluating the adequacy of an allowance for doubtful debts, management bases its estimate on current overall economic conditions, ageing of the accounts receivable balances, historical write-off experience, customer creditworthiness and changes in payment terms. Changes in the economy, industry or specific customer conditions may require adjustments to the allowance for doubtful debts recorded in the consolidated financial statements.
The Group also creates an allowance for obsolete and slow-moving raw materials and spare parts. As at 31 December 2007, the allowance for obsolete and slow-moving items amounted to USD 25 million (2006: USD 30 million). In addition, certain finished goods of the Group are carried at net realisable value. Estimates of net realisable value of inventories are based on the most reliable evidence available at the time the estimates are made. These estimates take into consideration fluctuations of price or cost directly relating to events occurring subsequent to the balance sheet date to the extent that such events confirm conditions existing at the end of the period.
Environmental obligations
The Group’s mining and exploration activities are subject to various environmental laws and regulations. The Group estimates environmental obligations based on management’s understanding of the current legal requirements in the various jurisdictions in which it operates, terms of the license agreements and internally generated engineering estimates. Provision is made, based on net present values, for decommissioning and land restoration costs as soon as the obligation arises. Actual costs incurred in future periods could differ materially from the amounts provided. Additionally, future changes to environmental laws and regulations, life of mine estimates and discount rates could affect the carrying amount of this provision.
Defined benefit plans
The most significant assumptions used in estimation of defined benefit plans are the expected rate of return on plan assets, the discount rate, future salary increases, state pensions growth rate and mortality assumptions.
The overall expected rate of return on pension plans assets is calculated based on the expected long-term investment returns for each category of assets.
The present value of the benefits is determined by discounting the estimated future cash outflows using interest rates of high-quality government bonds that have terms to maturity approximating to the terms of the related pension obligations.
Estimation of future salary levels takes into account projected levels of inflation and seniority of personnel.
— II-117 —
APPENDIX II FINANCIAL STATEMENTS OF MMC NORILSK NICKEL

MINING AND METALLURGICAL COMPANY NORILSK NICKEL
NOTES TO THE CONSOLIDATED FINANCIAL STATEMENTS FOR THE YEAR ENDED 31 DECEMBER 2007
Income taxes
The Group is subject to income taxes in numerous jurisdictions. Significant judgment is required in determining the worldwide provision for income taxes due to the complexity of legislation. There are many transactions and calculations for which the ultimate tax determination is uncertain. The Group recognises liabilities for anticipated tax audit issues based on estimates of whether additional taxes will be due. Where the final tax outcome of these matters is different from the amounts that were initially recorded, such differences will impact the income tax and deferred tax provisions in the period in which such determination is made.
Deferred tax assets are reviewed at each balance sheet date and reduced to the extent that it is no longer probable that sufficient taxable income will be available to allow all or part of the deferred tax asset to be utilised. The estimation of that probability includes judgments based on the expected performance. Various factors are considered to assess the probability of the future utilisation of deferred tax assets, including past operating results, operational plans, expiration of tax losses carried forward, and tax planning strategies. If actual results differ from these estimates or if these estimates must be adjusted in future periods, the financial position, results of operations and cash flows may be negatively affected.
— II-118 —
APPENDIX II FINANCIAL STATEMENTS OF MMC NORILSK NICKEL
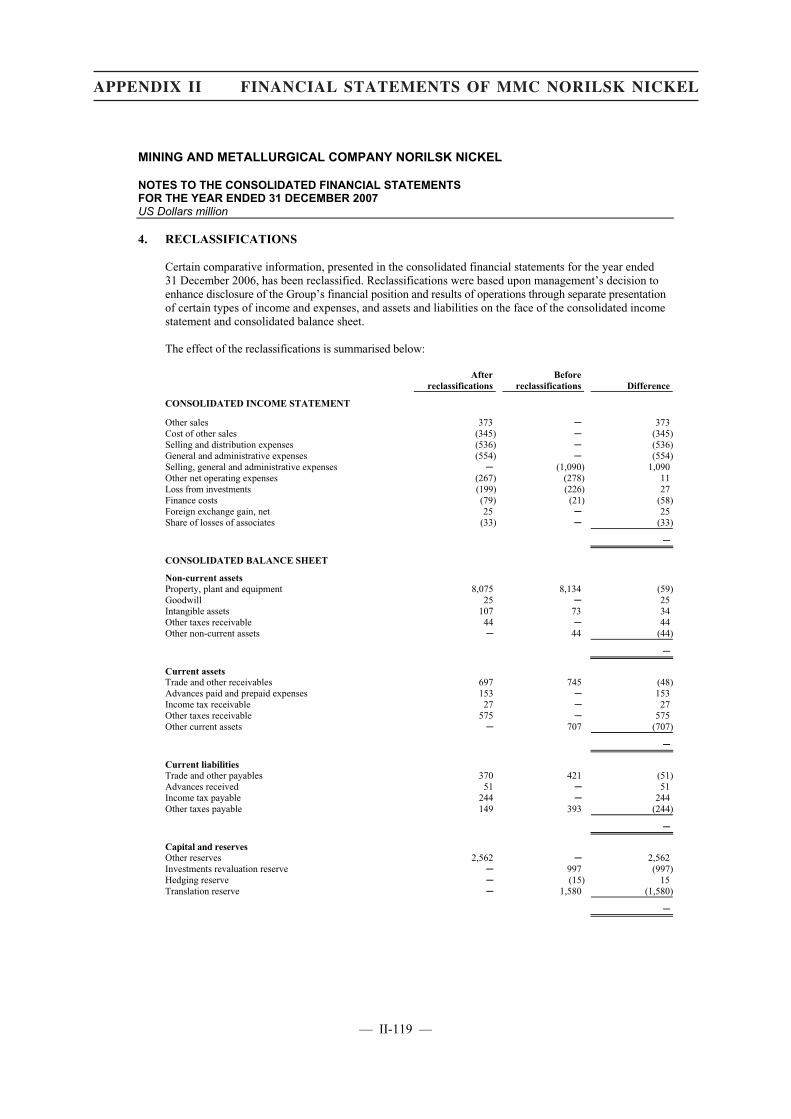
MINING AND METALLURGICAL COMPANY NORILSK NICKEL
NOTES TO THE CONSOLIDATED FINANCIAL STATEMENTS FOR THE YEAR ENDED 31 DECEMBER 2007 US Dollars million
4. RECLASSIFICATIONS
Certain comparative information, presented in the consolidated financial statements for the year ended 31 December 2006, has been reclassified. Reclassifications were based upon management’s decision to enhance disclosure of the Group’s financial position and results of operations through separate presentation of certain types of income and expenses, and assets and liabilities on the face of the consolidated income statement and consolidated balance sheet.
The effect of the reclassifications is summarised below:
Afterreclassifications
Beforereclassifications Difference
CONSOLIDATED INCOME STATEMENT
Other sales 373 � 373Cost of other sales (345) � (345)Selling and distribution expenses (536) � (536)General and administrative expenses (554) � (554)Selling, general and administrative expenses � (1,090) 1,090Other net operating expenses (267) (278) 11Loss from investments (199) (226) 27Finance costs (79) (21) (58)Foreign exchange gain, net 25 � 25Share of losses of associates (33) � (33)
�
CONSOLIDATED BALANCE SHEET
Non-current assets Property, plant and equipment 8,075 8,134 (59)Goodwill 25 � 25Intangible assets 107 73 34Other taxes receivable 44 � 44Other non-current assets � 44 (44)
�
Current assets Trade and other receivables 697 745 (48)Advances paid and prepaid expenses 153 � 153Income tax receivable 27 � 27Other taxes receivable 575 � 575Other current assets � 707 (707)
�
Current liabilities Trade and other payables 370 421 (51)Advances received 51 � 51Income tax payable 244 � 244Other taxes payable 149 393 (244)
�
Capital and reserves Other reserves 2,562 � 2,562Investments revaluation reserve � 997 (997)Hedging reserve � (15) 15Translation reserve � 1,580 (1,580)
�
— II-119 —
APPENDIX II FINANCIAL STATEMENTS OF MMC NORILSK NICKEL
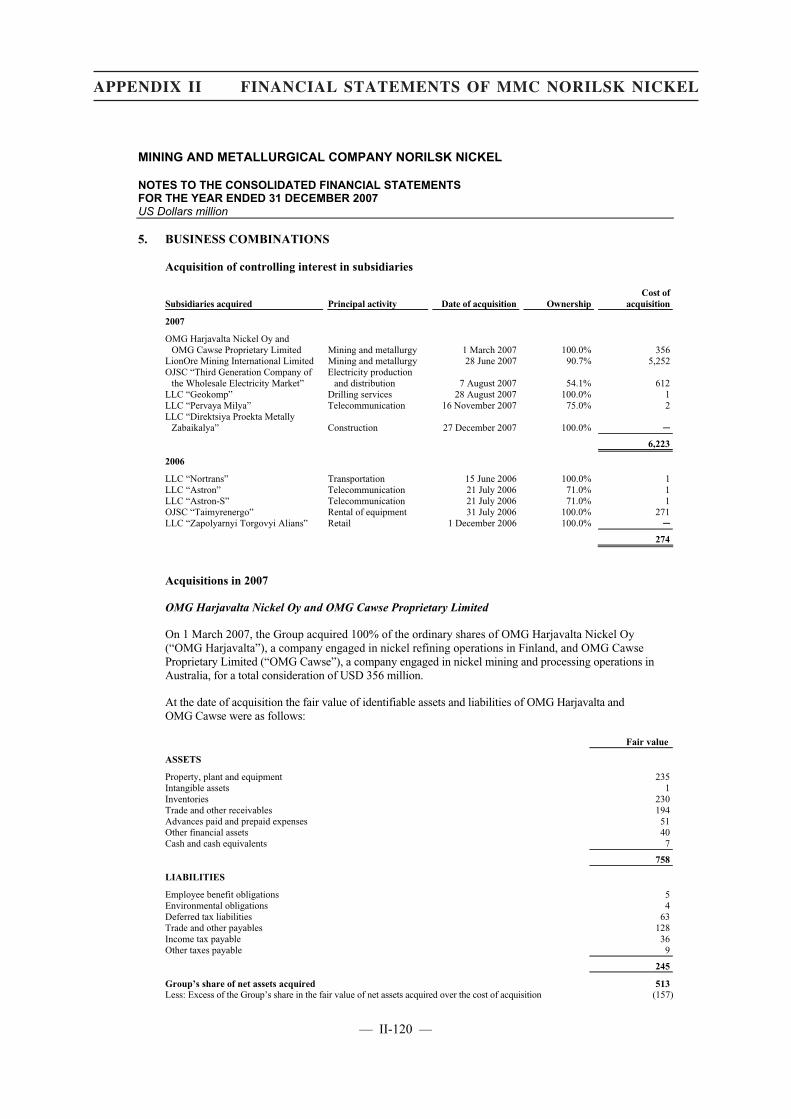
MINING AND METALLURGICAL COMPANY NORILSK NICKEL
NOTES TO THE CONSOLIDATED FINANCIAL STATEMENTS FOR THE YEAR ENDED 31 DECEMBER 2007 US Dollars million
5. BUSINESS COMBINATIONS
Acquisition of controlling interest in subsidiaries
Subsidiaries acquired Principal activity Date of acquisition OwnershipCost of
acquisition
2007
OMG Harjavalta Nickel Oy and OMG Cawse Proprietary Limited Mining and metallurgy 1 March 2007 100.0% 356
LionOre Mining International Limited Mining and metallurgy 28 June 2007 90.7% 5,252OJSC “Third Generation Company of
the Wholesale Electricity Market” Electricity production
and distribution 7 August 2007 54.1% 612LLC “Geokomp” Drilling services 28 August 2007 100.0% 1LLC “Pervaya Milya” Telecommunication 16 November 2007 75.0% 2LLC “Direktsiya Proekta Metally
Zabaikalya” Construction 27 December 2007 100.0% �
6,223
2006
LLC “Nortrans” Transportation 15 June 2006 100.0% 1LLC “Astron” Telecommunication 21 July 2006 71.0% 1LLC “Astron-S” Telecommunication 21 July 2006 71.0% 1OJSC “Taimyrenergo” Rental of equipment 31 July 2006 100.0% 271LLC “Zapolyarnyi Torgovyi Alians” Retail 1 December 2006 100.0% �
274
Acquisitions in 2007
OMG Harjavalta Nickel Oy and OMG Cawse Proprietary Limited
On 1 March 2007, the Group acquired 100% of the ordinary shares of OMG Harjavalta Nickel Oy (“OMG Harjavalta”), a company engaged in nickel refining operations in Finland, and OMG Cawse Proprietary Limited (“OMG Cawse”), a company engaged in nickel mining and processing operations in Australia, for a total consideration of USD 356 million.
At the date of acquisition the fair value of identifiable assets and liabilities of OMG Harjavalta and OMG Cawse were as follows:
Fair value
ASSETS
Property, plant and equipment 235Intangible assets 1Inventories 230Trade and other receivables 194Advances paid and prepaid expenses 51Other financial assets 40Cash and cash equivalents 7
758
LIABILITIES
Employee benefit obligations 5Environmental obligations 4Deferred tax liabilities 63Trade and other payables 128Income tax payable 36Other taxes payable 9
245
Group’s share of net assets acquired 513Less: Excess of the Group’s share in the fair value of net assets acquired over the cost of acquisition (157)
— II-120 —
APPENDIX II FINANCIAL STATEMENTS OF MMC NORILSK NICKEL

MINING AND METALLURGICAL COMPANY NORILSK NICKEL
NOTES TO THE CONSOLIDATED FINANCIAL STATEMENTS FOR THE YEAR ENDED 31 DECEMBER 2007 US Dollars million
Fair value
Total cost of acquisition 356Consideration per agreement (348)Direct transaction costs (8)
Net cash outflow arising on acquisition Consideration and direct transaction costs paid in cash (356)Cash and cash equivalents acquired 7
Net cash outflow on acquisition (349)
At the date of acquisition, OMG Harjavalta and OMG Cawse did not prepare financial statements in accordance with IFRS. Thus it was not practicable to determine the carrying amounts of the acquired assets and liabilities in accordance with IFRS immediately before the acquisition, and this information is not presented in the Group’s consolidated financial statements.
OMG Harjavalta and OMG Cawse contributed USD 924 million of revenue and USD 221 million of profit before tax from the date of acquisition to 31 December 2007.
LionOre Mining International Limited
On 28 June 2007, the Group acquired 90.7% of the voting shares of LionOre Mining International Limited (“LionOre”), an international nickel producer with operations in Australia and Botswana, for a cash consideration of USD 5,252 million.
At the date of acquisition the fair value of identifiable assets and liabilities of LionOre were as follows:
Fair value
ASSETS
Property, plant and equipment 4,490Intangible assets 706Investments in associates 580Deferred tax asset 167Inventories 178Trade and other receivables 252Advances paid and prepaid expenses 3Other financial assets 38Cash and cash equivalents 438
6,852
LIABILITIES
Borrowings 833Employee benefit obligations 10Environmental obligations 91Derivative financial liabilities 80Deferred tax liabilities 1,512Trade and other payables 144Income tax payable 61
2,731
Net assets at the date of acquisition 4,121Less: Net assets attributable to minority shareholders (870)Add: Decrease in minority interest due to increase of interest in the subsidiary 239
Group’s share of net assets acquired 3,490Add: Goodwill arising on acquisition 2,001Less: Revaluation surplus representing change in fair value of MPI net assets from the date of initial
acquisition by the Group of 20% interest in MPI (refer to note 26) to the date when control was obtained (43)Less: Pre-acquisition investment in MPI (refer to note 26) (196)
— II-121 —
APPENDIX II FINANCIAL STATEMENTS OF MMC NORILSK NICKEL

MINING AND METALLURGICAL COMPANY NORILSK NICKEL
NOTES TO THE CONSOLIDATED FINANCIAL STATEMENTS FOR THE YEAR ENDED 31 DECEMBER 2007 US Dollars million
Fair value
Total cost of acquisition 5,252Consideration per public offer (5,230)Direct transaction costs (22)
Net cash outflow arising on acquisition Consideration and direct transaction costs paid in cash (5,252)Cash and cash equivalents acquired 438
Net cash outflow on acquisition (4,814)
At the date of acquisition, LionOre did not prepare financial statements in accordance with IFRS. Thus it was not practicable to determine the carrying amounts of the acquired assets and liabilities in accordance with IFRS immediately before the acquisition, and this information was not presented in the Group’s consolidated financial statements.
In July-August 2007, the Group acquired an additional 9.3% interest in LionOre for a cash consideration of USD 543 million through a number of transactions with minority shareholders, increasing its ownership in this company to 100%. As a result of this transaction, the Group recognised a decrease in net assets attributable to minority shareholders of USD 334 million, and a goodwill of USD 209 million.
In July-August 2007, the holders of LionOre convertible notes exercised their right to convert notes into 23.5 million common shares. All these shares were acquired by the Group for a cash consideration of USD 613 million. In the consolidated financial statements for the year ended 31 December 2007 acquisition of additional shares was accounted for as a settlement of borrowings acquired on the initial acquisition of controlling interest in LionOre.
In August 2007, in accordance with the terms of stock option and share compensation plan LionOre issued additional 1.7 million shares and granted them to key employees and directors. In August 2007, the Group acquired all those shares for a cash consideration of USD 45 million. In the consolidated financial statements for the year ended 31 December 2007 acquisition of additional shares was accounted for as a settlement of stock option liabilities acquired on the initial acquisition of controlling interest in LionOre.
LionOre contributed USD 407 million of revenue and USD 907 million of loss before tax from the date of acquisition to 31 December 2007.
Goodwill that arose on acquisition of LionOre was primarily attributable to the expected business synergy.
OJSC “Third Generation Company of the Wholesale Electricity Market”
During July-August 2007, the Group acquired an additional 7.2% interest in OJSC “Third Generation Company of the Wholesale Electricity Market” (“OGK-3”), a company engaged in generation and sale of electricity and heat energy in Central, North-West, Siberia and Urals regions of the Russian Federation, for a cash consideration of USD 612 million, increasing its ownership in the company to 54.1%. Prior to this transaction, investment in OGK-3 was classified as investment in associate (refer to note 26).
At the date of acquisition the fair value of identifiable assets and liabilities of OGK-3 were as follows:
Fair value
ASSETS
Property, plant and equipment 2,111Intangible assets 2Inventories 86Trade and other receivables 121Advances paid and prepaid expenses 24Other financial assets 1,684Cash and cash equivalents 1,424
5,452
— II-122 —
APPENDIX II FINANCIAL STATEMENTS OF MMC NORILSK NICKEL

MINING AND METALLURGICAL COMPANY NORILSK NICKEL
NOTES TO THE CONSOLIDATED FINANCIAL STATEMENTS FOR THE YEAR ENDED 31 DECEMBER 2007 US Dollars million
LIABILITIES
Borrowings 141Employee benefit obligations 21Deferred tax liabilities 376Trade and other payables 83Advances received 6Income tax payable 7Other taxes payable 7
641
Net assets at the date of acquisition 4,811Less: Net assets attributable to minority shareholders (2,209)
Group’s share of net assets acquired 2,602Add: Goodwill arising on acquisition 1,646Less: Pre-acquisition investment in OGK-3 (refer to note 26) (3,636)
Total cost of acquisition 612Consideration per public offer (611)Direct transaction costs (1)
Net cash outflow arising on acquisition Consideration and direct transaction costs paid in cash (612)Cash and cash equivalents acquired 1,424
Net cash inflow on acquisition 812
Acquisition of controlling interest in OGK-3 was achieved in stages. Cost of acquisition and fair value of OGK-3’s identifiable assets, liabilities and contingent liabilities and goodwill that arose at each stage are presented in the table below:
Date of transaction OwnershipFair value of
net assetsCost of
acquisition Goodwill
26 December 2006 14.60% 1,545 400 174 23 March 2007 0.26% 1,571 21 17 26 March 2007 32.04% 4,682 3,119 1,157 7 August 2007 7.20% 4,812 612 266 Effect of translation to presentation currency n/a n/a 84 32
Total 54.10% n/a 4,236 1,646
At the date of acquisition of controlling interest by the Group, OGK-3 did not prepare financial statements in accordance with IFRS. Thus it was not practicable to determine the carrying amounts of the acquired assets, liabilities and contingent liabilities in accordance with IFRS immediately before the acquisition, and this information was not presented in these consolidated financial statements.
In August-September 2007, the Group acquired an additional 8,676 million shares of OGK-3 for a cash consideration of USD 929 million, increasing its ownership to 65.2%. As a result of this transaction, the Group recognised a decrease in net assets attributable to minority interest in the amount of USD 529 million and increase in goodwill in the amount of USD 400 million.
OGK-3 contributed USD 626 million of revenue and USD 68 million of profit before tax from the date of acquisition of controlling interest to 31 December 2007.
The goodwill that arose on the acquisition related to the premium paid for control over OGK-3.
— II-123 —
APPENDIX II FINANCIAL STATEMENTS OF MMC NORILSK NICKEL
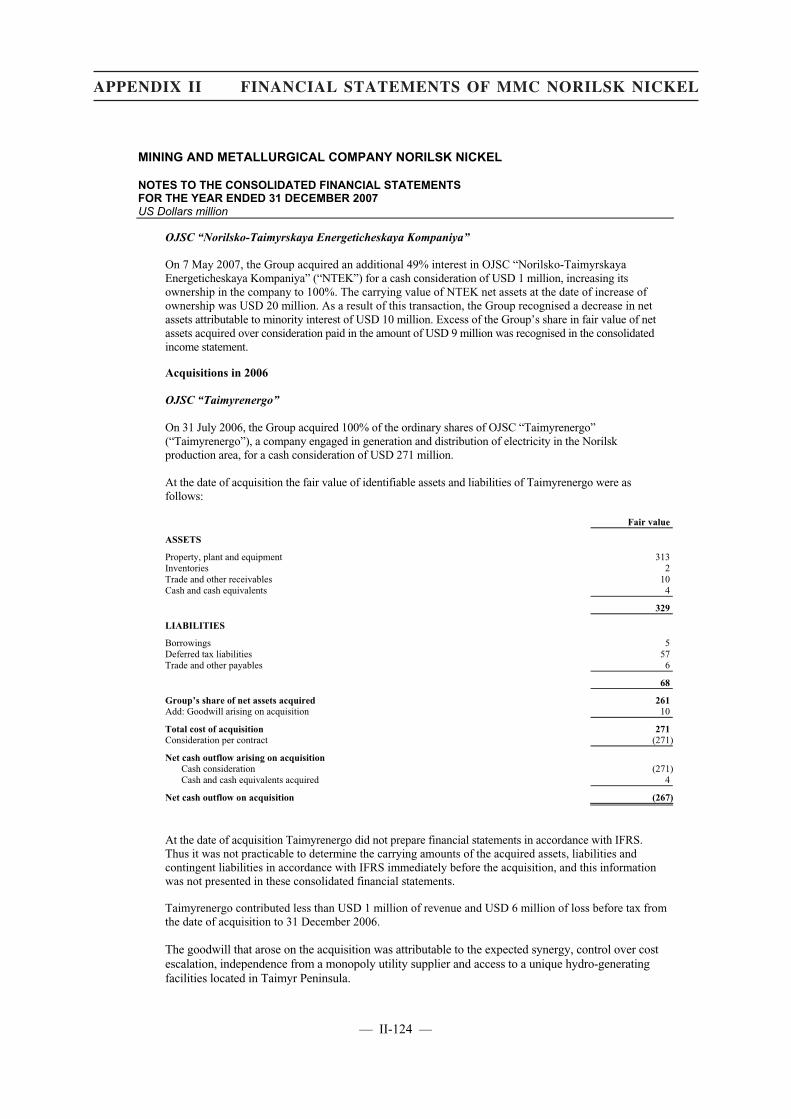
MINING AND METALLURGICAL COMPANY NORILSK NICKEL
NOTES TO THE CONSOLIDATED FINANCIAL STATEMENTS FOR THE YEAR ENDED 31 DECEMBER 2007 US Dollars million
OJSC “Norilsko-Taimyrskaya Energeticheskaya Kompaniya”
On 7 May 2007, the Group acquired an additional 49% interest in OJSC “Norilsko-Taimyrskaya Energeticheskaya Kompaniya” (“NTEK”) for a cash consideration of USD 1 million, increasing its ownership in the company to 100%. The carrying value of NTEK net assets at the date of increase of ownership was USD 20 million. As a result of this transaction, the Group recognised a decrease in net assets attributable to minority interest of USD 10 million. Excess of the Group’s share in fair value of net assets acquired over consideration paid in the amount of USD 9 million was recognised in the consolidated income statement.
Acquisitions in 2006
OJSC “Taimyrenergo”
On 31 July 2006, the Group acquired 100% of the ordinary shares of OJSC “Taimyrenergo” (“Taimyrenergo”), a company engaged in generation and distribution of electricity in the Norilsk production area, for a cash consideration of USD 271 million.
At the date of acquisition the fair value of identifiable assets and liabilities of Taimyrenergo were as follows:
Fair value
ASSETS
Property, plant and equipment 313Inventories 2Trade and other receivables 10Cash and cash equivalents 4
329
LIABILITIES
Borrowings 5Deferred tax liabilities 57Trade and other payables 6
68
Group’s share of net assets acquired 261Add: Goodwill arising on acquisition 10
Total cost of acquisition 271Consideration per contract (271)
Net cash outflow arising on acquisition Cash consideration (271)Cash and cash equivalents acquired 4
Net cash outflow on acquisition (267)
At the date of acquisition Taimyrenergo did not prepare financial statements in accordance with IFRS. Thus it was not practicable to determine the carrying amounts of the acquired assets, liabilities and contingent liabilities in accordance with IFRS immediately before the acquisition, and this information was not presented in these consolidated financial statements.
Taimyrenergo contributed less than USD 1 million of revenue and USD 6 million of loss before tax from the date of acquisition to 31 December 2006.
The goodwill that arose on the acquisition was attributable to the expected synergy, control over cost escalation, independence from a monopoly utility supplier and access to a unique hydro-generating facilities located in Taimyr Peninsula.
— II-124 —
APPENDIX II FINANCIAL STATEMENTS OF MMC NORILSK NICKEL

MINING AND METALLURGICAL COMPANY NORILSK NICKEL
NOTES TO THE CONSOLIDATED FINANCIAL STATEMENTS FOR THE YEAR ENDED 31 DECEMBER 2007 US Dollars million
6. SEGMENTAL INFORMATION
Business segments – primary reporting format
2007 Mining and metallurgy
Energy and utilities
Transport and logistics Other Eliminations Total
Third party transactions 15,959 789 298 73 � 17,119Intra-segment transactions 5 348 269 574 (1,196) �
Total revenue 15,964 1,137 567 647 (1,196) 17,119
Operating profit/(loss) 8,285 (736) (17) (101) � 7,431Share of profits of associates 43 33 � � � 76
Profit/(loss) before income tax 8,470 (610) (23) (102) � 7,735Income tax expense (2,459)
Profit for the year 5,276
Assets and liabilities
Investments in associates 575 304 � � � 879Segment assets 22,907 10,145 1,092 440 � 34,584Intra-segment assets and eliminations 1,753 27 9 118 (1,907) �
Total segment assets 25,235 10,476 1,101 558 (1,907) 35,463
Segment liabilities 10,341 161 93 117 � 10,712Intra-segment liabilities and eliminations 143 158 1,448 158 (1,907) �
Total segment liabilities 10,484 319 1,541 275 (1,907) 10,712
Other segment information
Capital expenditures 774 84 21 330 � 1,209Amortisation and depreciation 768 129 22 36 � 955Impairment of goodwill 325 754 � � � 1,079Other non-cash expenses 779 � 28 27 � 834
2006
Third party transactions 11,561 101 207 54 � 11,923Intra-segment transactions � 278 197 79 (554) �
Total revenue 11,561 379 404 133 (554) 11,923
Operating profit/(loss) 7,131 21 (26) (63) � 7,063Share of losses of associates � (33) � � � (33)
Profit/(loss) before income tax 6,783 94 (42) (58) � 6,777Income tax expense (1,805)
Profit for the year 4,972
Assets and liabilities
Investments in associates � 207 � 1 � 208Segment assets 11,406 3,095 1,097 446 � 16,044Intra-segment assets and eliminations 1,505 22 7 104 (1,638) �
Total segment assets 12,911 3,324 1,104 551 (1,638) 16,252
Segment liabilities 1,757 72 67 122 � 2,018Intra-segment liabilities and eliminations 128 468 850 192 (1,638) �
Total segment liabilities 1,885 540 917 314 (1,638) 2,018
Other segment information
Capital expenditures 636 44 51 65 � 796Amortisation and depreciation 521 44 10 15 � 590Other non-cash expenses 199 14 13 11 � 237
— II-125 —
APPENDIX II FINANCIAL STATEMENTS OF MMC NORILSK NICKEL
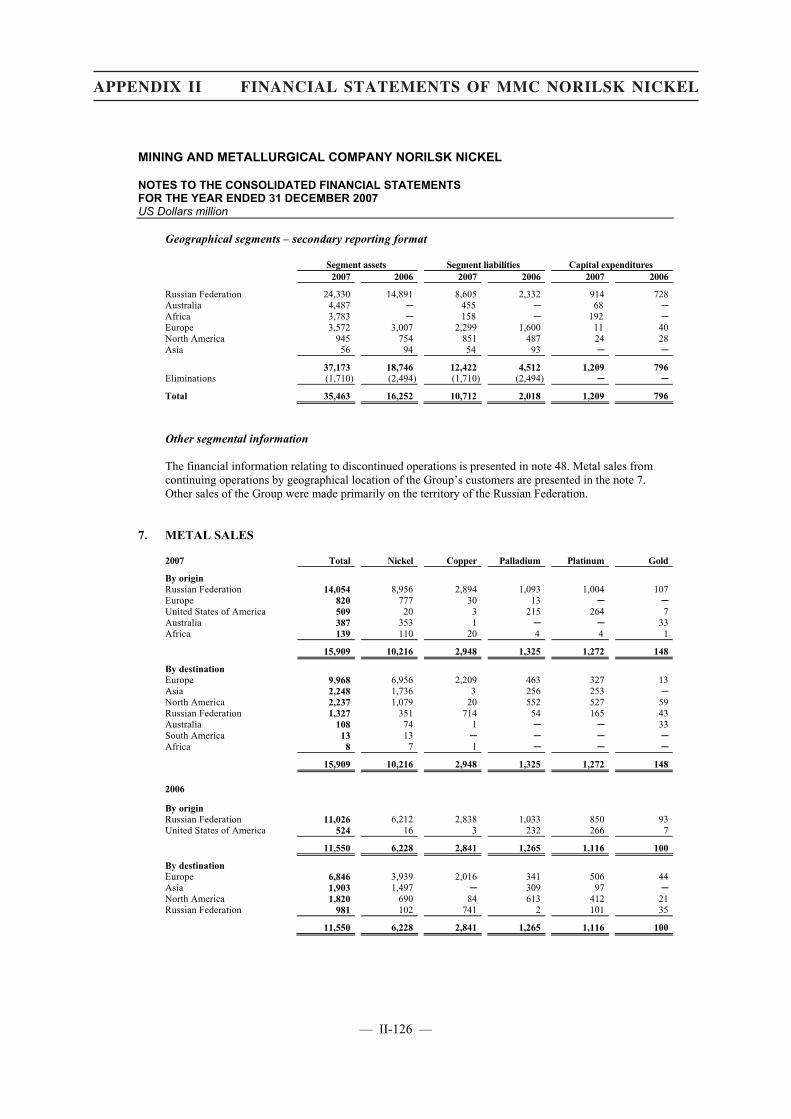
MINING AND METALLURGICAL COMPANY NORILSK NICKEL
NOTES TO THE CONSOLIDATED FINANCIAL STATEMENTS FOR THE YEAR ENDED 31 DECEMBER 2007 US Dollars million
Geographical segments – secondary reporting format
Segment assets Segment liabilities Capital expenditures 2007 2006 2007 2006 2007 2006
Russian Federation 24,330 14,891 8,605 2,332 914 728 Australia 4,487 � 455 � 68 �Africa 3,783 � 158 � 192 �Europe 3,572 3,007 2,299 1,600 11 40North America 945 754 851 487 24 28Asia 56 94 54 93 � �
37,173 18,746 12,422 4,512 1,209 796 Eliminations (1,710) (2,494) (1,710) (2,494) � �
Total 35,463 16,252 10,712 2,018 1,209 796
Other segmental information
The financial information relating to discontinued operations is presented in note 48. Metal sales from continuing operations by geographical location of the Group’s customers are presented in the note 7. Other sales of the Group were made primarily on the territory of the Russian Federation.
7. METAL SALES
2007 Total Nickel Copper Palladium Platinum Gold
By origin Russian Federation 14,054 8,956 2,894 1,093 1,004 107 Europe 820 777 30 13 � �United States of America 509 20 3 215 264 7Australia 387 353 1 � � 33Africa 139 110 20 4 4 1
15,909 10,216 2,948 1,325 1,272 148
By destination Europe 9,968 6,956 2,209 463 327 13Asia 2,248 1,736 3 256 253 �North America 2,237 1,079 20 552 527 59Russian Federation 1,327 351 714 54 165 43Australia 108 74 1 � � 33South America 13 13 � � � �Africa 8 7 1 � � �
15,909 10,216 2,948 1,325 1,272 148
2006
By origin Russian Federation 11,026 6,212 2,838 1,033 850 93United States of America 524 16 3 232 266 7
11,550 6,228 2,841 1,265 1,116 100
By destination Europe 6,846 3,939 2,016 341 506 44Asia 1,903 1,497 � 309 97 �North America 1,820 690 84 613 412 21Russian Federation 981 102 741 2 101 35
11,550 6,228 2,841 1,265 1,116 100
— II-126 —
APPENDIX II FINANCIAL STATEMENTS OF MMC NORILSK NICKEL

MINING AND METALLURGICAL COMPANY NORILSK NICKEL
NOTES TO THE CONSOLIDATED FINANCIAL STATEMENTS FOR THE YEAR ENDED 31 DECEMBER 2007 US Dollars million
2007 2006
8. OTHER SALES
Energy and utilities 789 101Transport and logistics 298 207Other 123 65
Total 1,210 373
9. COST OF METAL SALES
Cash operating costs On-mine and concentrating costs (refer to note 10) 2,031 1,454Smelting costs (refer to note 11) 1,143 915Treatment and refining costs (refer to note 12) 1,168 453Other costs (refer to note 13) 594 388Sales of by-products (1,119) (672)
Total cash operating costs 3,817 2,538
Amortisation and depreciation of operating assets (refer to note 14) 824 568Decrease in metal inventories 78 52
Total 4,719 3,158
10. ON-MINE AND CONCENTRATING COSTS
Labour 962 648Consumables and spares 564 464Repair and maintenance 135 109Utilities 70 31Transportation 59 35Rent expenses 51 17Insurance 48 51Outsourced mining services 45 23Tailing pile maintenance and relocation 38 35Sundry on-mine and concentrating costs 59 41
Total (refer to note 9) 2,031 1,454
11. SMELTING COSTS
Labour 348 245Platinum group scrap metals purchased 310 268Consumables and spares 271 223Insurance 69 70Repairs and maintenance 53 45Utilities 30 28External tolling 26 �Transportation 18 13Rent expenses 7 7Sundry smelting costs 11 16
Total (refer to note 9) 1,143 915
— II-127 —
APPENDIX II FINANCIAL STATEMENTS OF MMC NORILSK NICKEL

MINING AND METALLURGICAL COMPANY NORILSK NICKEL
NOTES TO THE CONSOLIDATED FINANCIAL STATEMENTS FOR THE YEAR ENDED 31 DECEMBER 2007 US Dollars million
2007 2006
12. TREATMENT AND REFINING COSTS
Purchase of nickel concentrate 478 �Labour 240 167Consumables and spares 164 146Tolling fees 147 77Utilities 56 18Repairs and maintenance 32 14Insurance 20 17Transportation 14 5Rent expenses 3 3Sundry treatment and refining costs 14 6
Total (refer to note 9) 1,168 453
13. OTHER COSTS
Transportation 179 143Tax on mining and pollution levies 150 127Cost of refined metals purchased from third parties 128 28Exploration expenses 113 49Other 24 41
Total (refer to note 9) 594 388
14. AMORTISATION AND DEPRECIATION OF OPERATING ASSETS
Mining and concentrating 606 338Smelting 147 165Treatment and refining 57 51Other 14 14
Total (refer to note 9) 824 568
15. COST OF OTHER SALES
Consumables and spares 504 150Labour 226 100Utilities 195 11Amortisation and depreciation 81 11Repair and maintenance 58 19Taxes 29 3Transportation 24 13Rent expenses 14 16Other 32 22
Total 1,163 345
16. SELLING AND DISTRIBUTION EXPENSES
Export customs duties 644 484Transportation expenses 31 13Labour 24 14Commission paid 16 12Insurance 6 5Other 9 8
Total 730 536
— II-128 —
APPENDIX II FINANCIAL STATEMENTS OF MMC NORILSK NICKEL
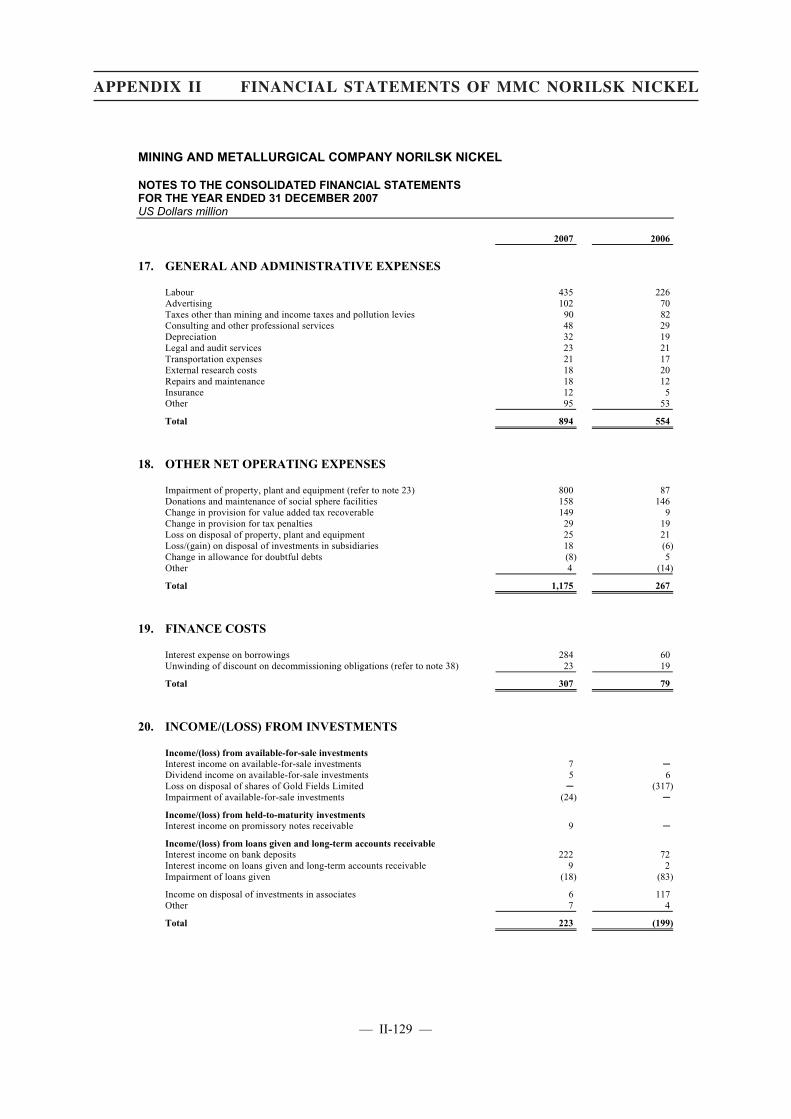
MINING AND METALLURGICAL COMPANY NORILSK NICKEL
NOTES TO THE CONSOLIDATED FINANCIAL STATEMENTS FOR THE YEAR ENDED 31 DECEMBER 2007 US Dollars million
2007 2006
17. GENERAL AND ADMINISTRATIVE EXPENSES
Labour 435 226Advertising 102 70Taxes other than mining and income taxes and pollution levies 90 82Consulting and other professional services 48 29Depreciation 32 19Legal and audit services 23 21Transportation expenses 21 17External research costs 18 20Repairs and maintenance 18 12Insurance 12 5Other 95 53
Total 894 554
18. OTHER NET OPERATING EXPENSES
Impairment of property, plant and equipment (refer to note 23) 800 87Donations and maintenance of social sphere facilities 158 146Change in provision for value added tax recoverable 149 9Change in provision for tax penalties 29 19Loss on disposal of property, plant and equipment 25 21Loss/(gain) on disposal of investments in subsidiaries 18 (6)Change in allowance for doubtful debts (8) 5Other 4 (14)
Total 1,175 267
19. FINANCE COSTS
Interest expense on borrowings 284 60Unwinding of discount on decommissioning obligations (refer to note 38) 23 19
Total 307 79
20. INCOME/(LOSS) FROM INVESTMENTS
Income/(loss) from available-for-sale investments Interest income on available-for-sale investments 7 �Dividend income on available-for-sale investments 5 6Loss on disposal of shares of Gold Fields Limited � (317)Impairment of available-for-sale investments (24) �
Income/(loss) from held-to-maturity investments Interest income on promissory notes receivable 9 �
Income/(loss) from loans given and long-term accounts receivable Interest income on bank deposits 222 72Interest income on loans given and long-term accounts receivable 9 2Impairment of loans given (18) (83)
Income on disposal of investments in associates 6 117Other 7 4
Total 223 (199)
— II-129 —
APPENDIX II FINANCIAL STATEMENTS OF MMC NORILSK NICKEL

MINING AND METALLURGICAL COMPANY NORILSK NICKEL
NOTES TO THE CONSOLIDATED FINANCIAL STATEMENTS FOR THE YEAR ENDED 31 DECEMBER 2007 US Dollars million
2007 2006
21. FOREIGN EXCHANGE GAIN, NET
Foreign currency exchange gain on financing activities, net 324 58Foreign currency exchange loss on investing activities, net (82) �Foreign currency exchange loss on operating activities, net (96) (33)
Total 146 25
22. INCOME TAX
Current tax expense 2,622 1,893Deferred tax benefit (163) (88)
Total 2,459 1,805
A reconciliation of statutory income tax, calculated at the rate effective in the Russian Federation, the location of the Head office and major production assets of the Group, to the amount of actual income tax expense recorded in the consolidated income statement is as follows:
Profit before tax from continuing operations 7,735 6,777
Profit before tax from discontinued operation (refer to note 48) � 1,005
Profit before tax from continuing and discontinued operations 7,735 7,782
Income tax at statutory rate of 24% 1,856 1,868Effect of different tax rates of subsidiaries operating in other jurisdictions 14 (291)Tax effect of permanent differences 259 164Tax effect of goodwill impairment 259 �Tax effect of change in provisions for tax penalties and recoverable amount of
value added tax 43 7Deferred tax asset not recognised on impairment of financial assets 4 29Taxable losses of subsidiaries not carried forward � 2Effect of unused tax losses and tax offsets not recognised as deferred tax assets 24 38
Income tax at effective rate of 32% (2006: 23%) 2,459 1,817
Less: Income tax attributable to discontinued operation (refer to note 48) � (12)
Income tax expense attributable to continuing operations 2,459 1,805
The corporate income tax rates in other countries where the Group has a taxable presence vary from 0% to 39%.
Deferred income tax
Balance at beginning of the year 881 543Benefit recognised during the year (163) (88)Revaluation of available-for-sale investments 149 304Effect of change in classification of available for sale investments to investments
in associates due to increase of ownership (73) �Acquisition of subsidiaries (refer to note 5) 1,784 57Disposal of subsidiaries (refer to note 42) (14) �Hedging reserve (7) �Effect of translation to presentation currency 95 65
Balance at end of the year 2,652 881
— II-130 —
APPENDIX II FINANCIAL STATEMENTS OF MMC NORILSK NICKEL
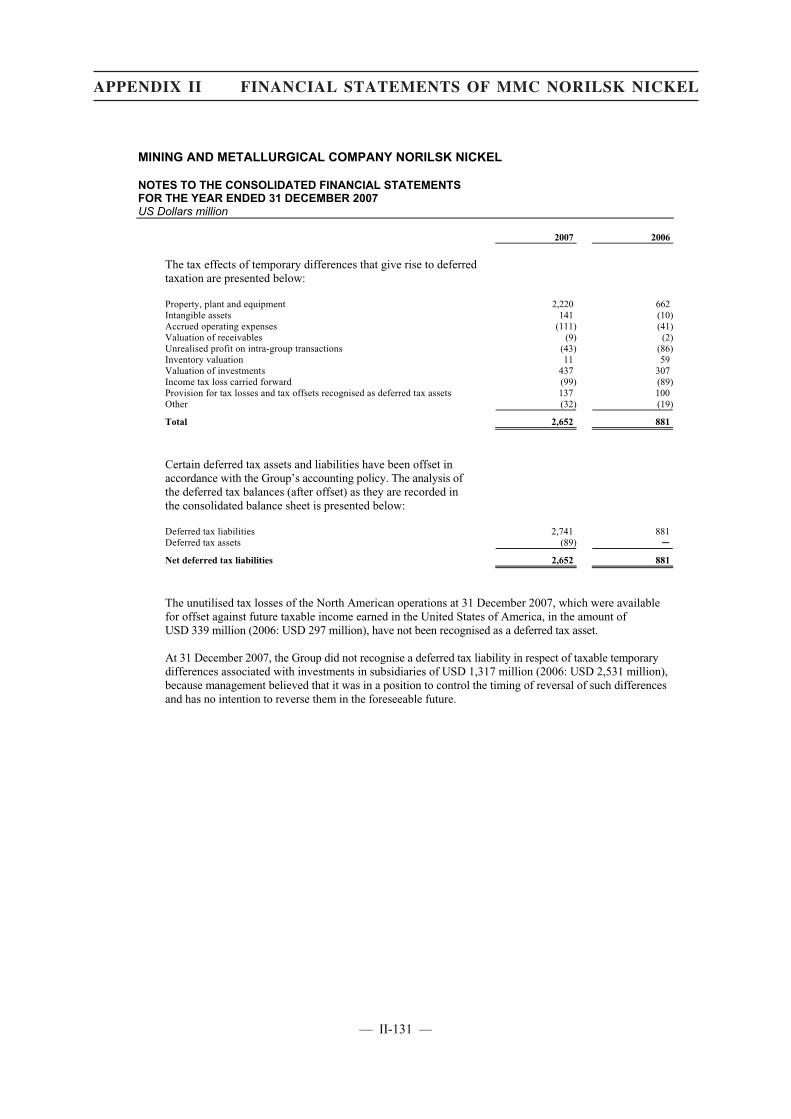
MINING AND METALLURGICAL COMPANY NORILSK NICKEL
NOTES TO THE CONSOLIDATED FINANCIAL STATEMENTS FOR THE YEAR ENDED 31 DECEMBER 2007 US Dollars million
2007 2006
The tax effects of temporary differences that give rise to deferred taxation are presented below:
Property, plant and equipment 2,220 662Intangible assets 141 (10)Accrued operating expenses (111) (41)Valuation of receivables (9) (2)Unrealised profit on intra-group transactions (43) (86)Inventory valuation 11 59Valuation of investments 437 307Income tax loss carried forward (99) (89)Provision for tax losses and tax offsets recognised as deferred tax assets 137 100Other (32) (19)
Total 2,652 881
Certain deferred tax assets and liabilities have been offset in accordance with the Group’s accounting policy. The analysis of the deferred tax balances (after offset) as they are recorded in the consolidated balance sheet is presented below:
Deferred tax liabilities 2,741 881Deferred tax assets (89) �
Net deferred tax liabilities 2,652 881
The unutilised tax losses of the North American operations at 31 December 2007, which were available for offset against future taxable income earned in the United States of America, in the amount of USD 339 million (2006: USD 297 million), have not been recognised as a deferred tax asset.
At 31 December 2007, the Group did not recognise a deferred tax liability in respect of taxable temporary differences associated with investments in subsidiaries of USD 1,317 million (2006: USD 2,531 million), because management believed that it was in a position to control the timing of reversal of such differences and has no intention to reverse them in the foreseeable future.
— II-131 —
APPENDIX II FINANCIAL STATEMENTS OF MMC NORILSK NICKEL
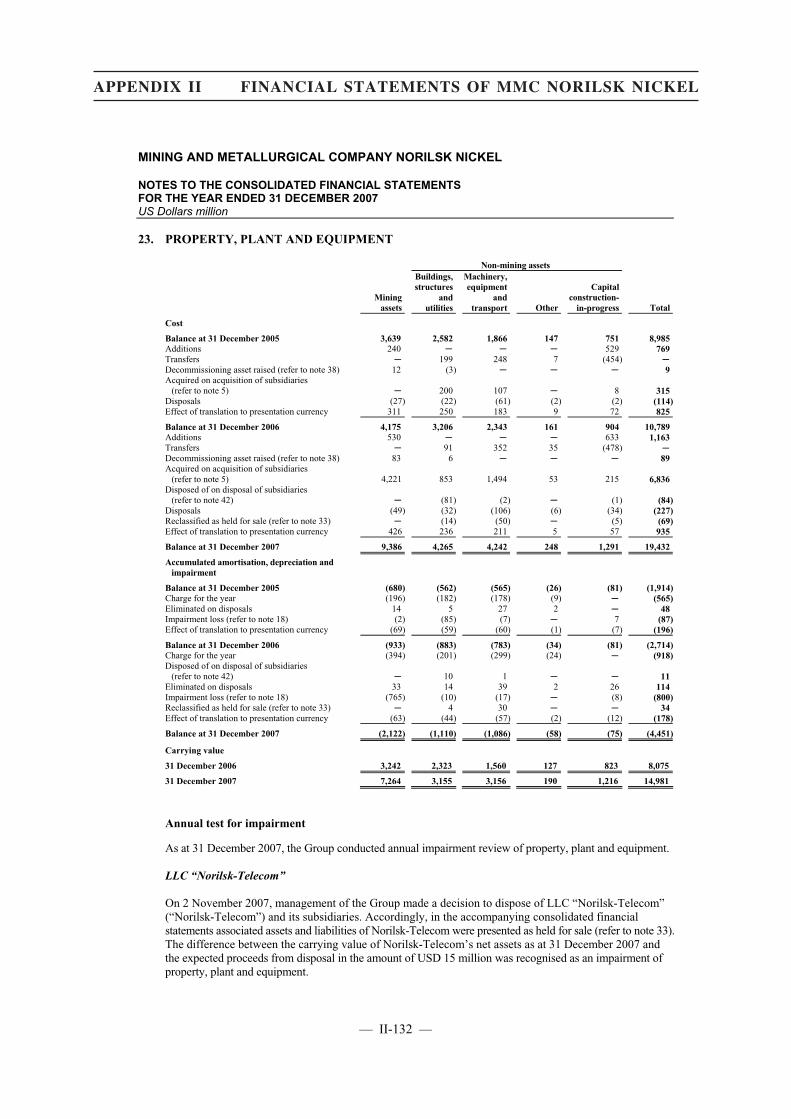
MINING AND METALLURGICAL COMPANY NORILSK NICKEL
NOTES TO THE CONSOLIDATED FINANCIAL STATEMENTS FOR THE YEAR ENDED 31 DECEMBER 2007 US Dollars million
23. PROPERTY, PLANT AND EQUIPMENT
Non-mining assets
Mining assets
Buildings, structures
and utilities
Machinery, equipment
and transport Other
Capital construction-
in-progress Total
Cost
Balance at 31 December 2005 3,639 2,582 1,866 147 751 8,985Additions 240 � � � 529 769Transfers � 199 248 7 (454) �Decommissioning asset raised (refer to note 38) 12 (3) � � � 9Acquired on acquisition of subsidiaries
(refer to note 5) � 200 107 � 8 315Disposals (27) (22) (61) (2) (2) (114)Effect of translation to presentation currency 311 250 183 9 72 825
Balance at 31 December 2006 4,175 3,206 2,343 161 904 10,789Additions 530 � � � 633 1,163Transfers � 91 352 35 (478) �Decommissioning asset raised (refer to note 38) 83 6 � � � 89Acquired on acquisition of subsidiaries
(refer to note 5) 4,221 853 1,494 53 215 6,836Disposed of on disposal of subsidiaries
(refer to note 42) � (81) (2) � (1) (84)Disposals (49) (32) (106) (6) (34) (227)Reclassified as held for sale (refer to note 33) � (14) (50) � (5) (69)Effect of translation to presentation currency 426 236 211 5 57 935
Balance at 31 December 2007 9,386 4,265 4,242 248 1,291 19,432
Accumulated amortisation, depreciation and impairment
Balance at 31 December 2005 (680) (562) (565) (26) (81) (1,914)Charge for the year (196) (182) (178) (9) � (565)Eliminated on disposals 14 5 27 2 � 48Impairment loss (refer to note 18) (2) (85) (7) � 7 (87)Effect of translation to presentation currency (69) (59) (60) (1) (7) (196)
Balance at 31 December 2006 (933) (883) (783) (34) (81) (2,714)Charge for the year (394) (201) (299) (24) � (918)Disposed of on disposal of subsidiaries
(refer to note 42) � 10 1 � � 11Eliminated on disposals 33 14 39 2 26 114Impairment loss (refer to note 18) (765) (10) (17) � (8) (800)Reclassified as held for sale (refer to note 33) � 4 30 � � 34Effect of translation to presentation currency (63) (44) (57) (2) (12) (178)
Balance at 31 December 2007 (2,122) (1,110) (1,086) (58) (75) (4,451)
Carrying value
31 December 2006 3,242 2,323 1,560 127 823 8,075
31 December 2007 7,264 3,155 3,156 190 1,216 14,981
Annual test for impairment
As at 31 December 2007, the Group conducted annual impairment review of property, plant and equipment.
LLC “Norilsk-Telecom”
On 2 November 2007, management of the Group made a decision to dispose of LLC “Norilsk-Telecom” (“Norilsk-Telecom”) and its subsidiaries. Accordingly, in the accompanying consolidated financial statements associated assets and liabilities of Norilsk-Telecom were presented as held for sale (refer to note 33). The difference between the carrying value of Norilsk-Telecom’s net assets as at 31 December 2007 and the expected proceeds from disposal in the amount of USD 15 million was recognised as an impairment of property, plant and equipment.
— II-132 —
APPENDIX II FINANCIAL STATEMENTS OF MMC NORILSK NICKEL
MINING AND METALLURGICAL COMPANY NORILSK NICKEL
NOTES TO THE CONSOLIDATED FINANCIAL STATEMENTS FOR THE YEAR ENDED 31 DECEMBER 2007 US Dollars million
Tati Nickel, a subsidiary of LionOre
Subsequent to acquisition of LionOre, an extensive feasibility review of the Activox Refinery Project at Tati Nickel, a subsidiary of LionOre, was conducted by management of the Group and an independent third party. The review highlighted a substantial project cost escalation from the feasibility study conducted by the previous owners. The major contributing factors to the substantial cost escalation were:
� an increase in construction and equipment cost worldwide, and
� project management cost worldwide.
In addition, short-term energy capacity constraints being experienced in Southern Africa have been assessed as a risk that would have adversely affected the commissioning time to production and the overall economic of the Activox Refinery Project.
Based on these facts and circumstances management of the Group made a decision to postpone the project indefinitely. As a result, as at 31 December 2007 mineral rights presented within mining assets and goodwill recognised on acquisition of LionOre were impaired in the amounts of USD 765 million and USD 325 million, respectively (refer to note 24).
Others
Additional impairment loss recognised in respect of property, plant and equipment in the amount of USD 20 million was attributable to the greater than anticipated wear and tear and certain frozen construction projects.
The impairment loss was recorded within other operating expenses in the consolidated income statement.
— II-133 —
APPENDIX II FINANCIAL STATEMENTS OF MMC NORILSK NICKEL

MINING AND METALLURGICAL COMPANY NORILSK NICKEL
NOTES TO THE CONSOLIDATED FINANCIAL STATEMENTS FOR THE YEAR ENDED 31 DECEMBER 2007 US Dollars million
2007 2006
24. GOODWILL
Cost
Balance at beginning of the year 25 14Acquired on acquisition of subsidiaries (refer to note 5) 4,256 10Effect of translation to presentation currency 158 1
Balance at end of the year 4,439 25
Accumulated impairment losses
Balance at beginning of the year � �Impairment loss (1,079) �
Balance at end of the year (1,079) �
Carrying value
31 December 2006 25 14
31 December 2007 3,360 25
Allocation of goodwill to separate cash-generating units
The carrying amount of goodwill, prior to recognition of impairment loss, was allocated to the following segments and smallest individual cash-generating units within respective segments:
Mining and metallurgy segment LionOre – Botswana operations 1,691 �LionOre – Australia operations 596 �
Total allocated to mining and metallurgy segment 2,287 �Energy and utilities segment
OGK-3 2,125 �Taimyrenergo 11 10
Total allocated to energy and utilities segment 2,136 10Total allocated to transport and logistics segment 16 15Total 4,439 25
Annual test for impairment
OGK-3
Recoverable amount of goodwill attributable to OGK-3 was determined based on the market value of OGK-3 shares as at 31 December 2007 less cost to sell. As a result of the test, an impairment loss of USD 754 million was recognised.
— II-134 —
APPENDIX II FINANCIAL STATEMENTS OF MMC NORILSK NICKEL

MINING AND METALLURGICAL COMPANY NORILSK NICKEL
NOTES TO THE CONSOLIDATED FINANCIAL STATEMENTS FOR THE YEAR ENDED 31 DECEMBER 2007 US Dollars million
LionOre
For the purpose of impairment loss assessment management of the Group measured value-in-use of LionOre Group and its subsidiaries based on cash flows expected to be generated by cash-generating units, being the individual mines, smelting and refining operations.
Cash flows were projected up to the expected closure date of mining and metallurgy operations and were based on the assumptions presented below.
The long-term commodity price forecasts for nickel, copper and other by-products, for purposes of performing the value-in-use calculations, is management’s estimates based on their experience of the specific commodities markets as at the date of the impairment test, that are within the range of external market forecasts and is slightly higher than the calculated market average prevailing at the time, varying in accordance with the year in which the sale is expected to occur.
Economically recoverable reserves and resources were primarily based on the external mining engineers reports available on the date of impairment test or nearest date when appropriate evaluation work was undertaken.
Inflation expectations and foreign currency trends were in general consistent with the external sources of information and presented is as follows:
Inflation expectations, %
Botswana 4.00 – 8.10Australia 3.50 – 4.40
Expected exchange rates Botswana Pula/US Dollar 6.17 – 10.34Australian Dollar/US Dollar 1.14 – 1.28
Discount rates reflect management’s assessment of the risks specific to each production unit and are supported by reviews conducted by external valuation specialists. These rates are based on the weighted average cost of capital specific to each cash-generating unit and presented is as follows:
Discount rates, %
Botswana 10.40Australia 6.87
Goodwill impairment test for LionOre was undertaken at 31 December 2007 based on appropriate results and assumptions used in valuation of identifiable assets, liabilities and contingent liabilities of LionOre and it’s subsidiaries performed as at 28 June 2007 by independent qualified appraiser. Due to facts and circumstances described in details in note 23, an impairment loss of USD 325 million was recognised by the Group in respect of goodwill attributable to Tati Nickel, a subsidiary of LionOre.
— II-135 —
APPENDIX II FINANCIAL STATEMENTS OF MMC NORILSK NICKEL
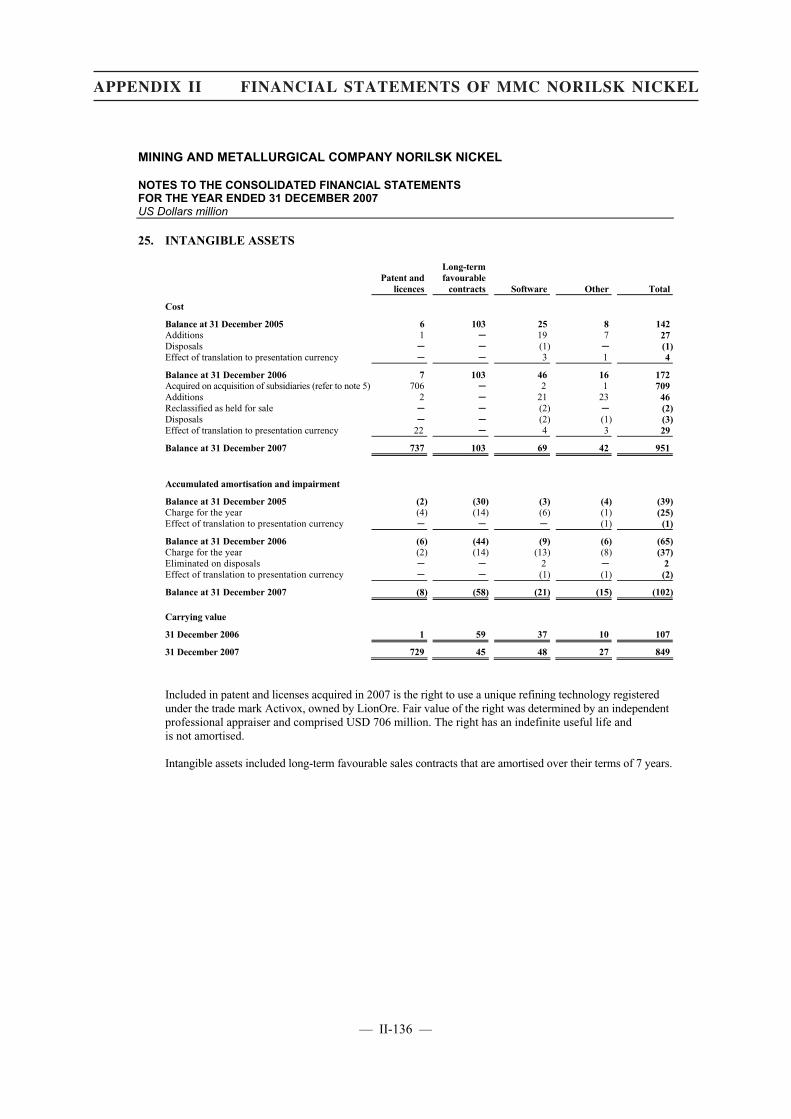
MINING AND METALLURGICAL COMPANY NORILSK NICKEL
NOTES TO THE CONSOLIDATED FINANCIAL STATEMENTS FOR THE YEAR ENDED 31 DECEMBER 2007 US Dollars million
25. INTANGIBLE ASSETS
Patent and licences
Long-term favourable
contracts Software Other Total
Cost
Balance at 31 December 2005 6 103 25 8 142Additions 1 � 19 7 27Disposals � � (1) � (1)Effect of translation to presentation currency � � 3 1 4
Balance at 31 December 2006 7 103 46 16 172Acquired on acquisition of subsidiaries (refer to note 5) 706 � 2 1 709Additions 2 � 21 23 46Reclassified as held for sale � � (2) � (2)Disposals � � (2) (1) (3)Effect of translation to presentation currency 22 � 4 3 29
Balance at 31 December 2007 737 103 69 42 951
Accumulated amortisation and impairment
Balance at 31 December 2005 (2) (30) (3) (4) (39)Charge for the year (4) (14) (6) (1) (25)Effect of translation to presentation currency � � � (1) (1)
Balance at 31 December 2006 (6) (44) (9) (6) (65)Charge for the year (2) (14) (13) (8) (37)Eliminated on disposals � � 2 � 2Effect of translation to presentation currency � � (1) (1) (2)
Balance at 31 December 2007 (8) (58) (21) (15) (102)
Carrying value
31 December 2006 1 59 37 10 107
31 December 2007 729 45 48 27 849
Included in patent and licenses acquired in 2007 is the right to use a unique refining technology registered under the trade mark Activox, owned by LionOre. Fair value of the right was determined by an independent professional appraiser and comprised USD 706 million. The right has an indefinite useful life and is not amortised.
Intangible assets included long-term favourable sales contracts that are amortised over their terms of 7 years.
— II-136 —
APPENDIX II FINANCIAL STATEMENTS OF MMC NORILSK NICKEL

MINING AND METALLURGICAL COMPANY NORILSK NICKEL
NOTES TO THE CONSOLIDATED FINANCIAL STATEMENTS FOR THE YEAR ENDED 31 DECEMBER 2007 US Dollars million
2007 2006
26. INVESTMENTS IN ASSOCIATES
Balance at beginning of the year 208 95Acquired during the year 3,298 151Established during the year 28 �Acquired on acquisition of subsidiaries (refer to note 5) 580 �Disposed of during the year (1) (39)Reclassified from investments available-for-sale due to increase of ownership 427 �Reclassified to investments available-for-sale due to decrease of ownership (3) (35)Reclassified to investment in subsidiaries due to increase of ownership (3,832) �Share of post-acquisition profits 5 3Excess of the Group’s share in the fair value of associates' identifiable assets,
liabilities and contingent liabilities over the cost of acquisition 72 �Dividends received (20) �Impairment (1) (36)Reclassified from assets held for sale � 56Effect of translation to presentation currency 118 13
Balance at end of the year 879 208
Details of the Group’s associates were as follows:
Name of associate Market
value
Carrying value of
investmentTotal assets
Total liabilities Sales
Profit/(loss)
2007 Nkomati Nickel Mine (i) n/a 575 1,190 40 58 (11)Smart Hydrogen Incorporated (ii) n/a 111 222 � � �OJSC “TGK-14” (iii) 74 58 279 73 193 (6)OJSC “Krasnoyarskenergo” (iv) 170 40 215 60 269 31OJSC “Norilskgazprom” n/a 33 148 39 135 6OJSC “KTK” (v) n/a 28 57 � � �OJSC “Kolenergo” 30 17 94 29 104 4Other n/a 17 66 3 353 (3)
879 2,271 244 1,112 21
2006 Smart Hydrogen Incorporated (ii) n/a 112 224 � � (76)OJSC “Krasnoyarskenergo” (iv) 164 30 143 31 225 6OJSC “Norilskgazprom” n/a 30 140 36 122 16OJSC “Kolenergo” 51 15 85 27 100 �Other n/a 21 226 106 972 (20)
208 818 200 1,419 (74)
(i) Nkomati Nickel Mine. On 28 June 2007, as a part of acquisition of LionOre Mining International Limited (refer to note 5), the Group acquired 50% of share capital of Nkomati Nickel Mine, a South African mining company.
(ii) Smart Hydrogen Incorporated. The Company is a joint venture formed in April 2006 by the Group and Interros Holding Company, a related party. The Group owns 50% of the joint venture. In June 2006, through this entity the principal investors acquired a 35% stake in Plug Power Incorporated, a US designer of environmentally clean and reliable energy products.
At 31 December 2007 and 2006 management reviewed the carrying value of the Group’s investment in Smart Hydrogen Incorporated for impairment. As a result, impairment loss in the amount of USD 1 million (2006: USD 36 million) was recognised.
— II-137 —
APPENDIX II FINANCIAL STATEMENTS OF MMC NORILSK NICKEL

MINING AND METALLURGICAL COMPANY NORILSK NICKEL
NOTES TO THE CONSOLIDATED FINANCIAL STATEMENTS FOR THE YEAR ENDED 31 DECEMBER 2007 US Dollars million
(iii) TGK-14. On 30 January 2007, the Group acquired 215,412 million ordinary shares, or 27.8% of the issued share capital of OJSC “Territorial Generation Company � 14” (“TGK-14”) for cash consideration of USD 44 million. As a result of this transaction, the Group recognised in the consolidated income statement the excess of the Group’s share the fair value of TGK-14 intangible assets, liabilities and contingent liabilities over the cost of the investment in the amount of USD 12 million.
In August 2007, TGK-14 increased its share capital through the issuance of additional ordinary shares; as a result, the Group’s share in this company decreased to 27.7%.
(iv) Krasnoyarskenergo. In October 2005 and March 2006, as a result of the reorganisation of OJSC “Krasnoyarskenergo” the Group became a shareholder in OJSC “Krasnoyarskaya Generatsiya” and OJSC “Krasnoyarskiye Magistralniye Seti”. In November 2006, the Group sold its share in OJSC “Krasnoyarskaya Generatsiya” for a cash consideration of USD 156 million (refer to note 43).
(v) KTK. OJS� “KTK” is a joint venture established in December 2007 for the purpose of generating steam and hot water. The Group contributed USD 28 million into share capital and became the owner of 50% interest in this entity.
Other significant movements during the years ended 31 December 2007 and 2006
(vi) TGK-1. In November 2006, as a part of the reorganisation of RAO “UES of Russia” the Group’s investments in OJSC “Kolskaya Generiruyuschaya Kompania” and OJSC “Apatitskaya TEC” were exchanged for 208,928 million shares of OJSC “Territorial Generation Company � 1” (“TGK-1”).
In May 2007, the Group’s investment in OJSC “Murmanskaya TEC” was exchanged for 6,743 million shares of TGK-1. At 31 December 2007 and 2006 investment in TGK-1 was classified as investment in listed securities available-for-sale (refer to note 27).
(vii) MPI. On 1 March 2007, as a part of acquisition of nickel business of OM Group Incorporated, the Group acquired 20% of share capital of MPI Nickel Proprietary Limited for a cash consideration of USD 135 million.
As a result of this transaction, the Group recognised in the consolidated income statement the excess of the Group’s share in the fair value of MPI Nickel Proprietary Limited identifiable assets, liabilities and contingent liabilities over cost of the investment in the amount of USD 60 million.
On 28 June 2007, an additional 80% of share capital of MPI Nickel Proprietary Limited was acquired by the Group through acquisition of LionOre (refer to note 5).
(viii) OGK-3. On 26 March 2007, the Group acquired 17,836 million ordinary shares of OJSC “Third Generation Company of the Wholesale Electricity Market” (“OGK-3”) (refer to note 5) for a cash consideration of USD 3,119 million. After completion of this transaction the Group became the owner of 46.9% of OGK-3.
During July-August 2007, the Group acquired an additional 7.2% of interest in OGK-3 for a cash consideration of USD 612 million, increasing its ownership to 54.1% (refer to note 5). After completion of this transaction investment in OGK-3 was consolidated as investment in subsidiary.
— II-138 —
APPENDIX II FINANCIAL STATEMENTS OF MMC NORILSK NICKEL
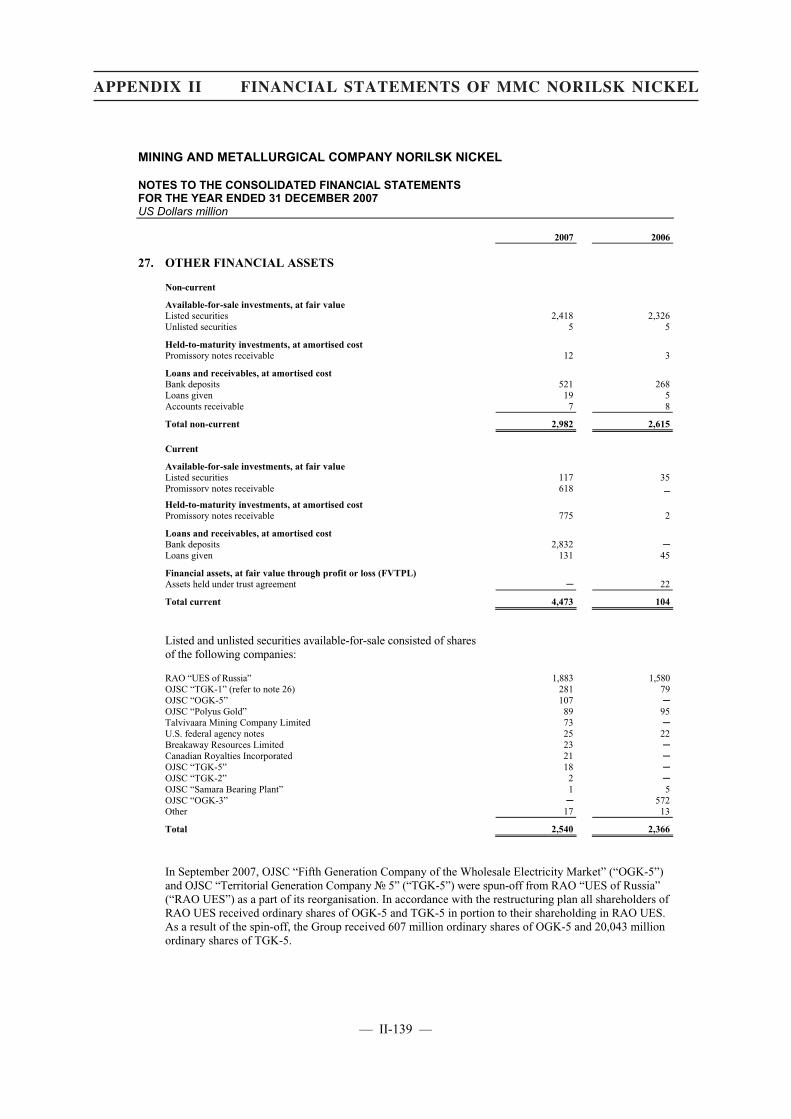
MINING AND METALLURGICAL COMPANY NORILSK NICKEL
NOTES TO THE CONSOLIDATED FINANCIAL STATEMENTS FOR THE YEAR ENDED 31 DECEMBER 2007 US Dollars million
2007 2006
27. OTHER FINANCIAL ASSETS
Non-current
Available-for-sale investments, at fair value Listed securities 2,418 2,326Unlisted securities 5 5
Held-to-maturity investments, at amortised cost Promissory notes receivable 12 3
Loans and receivables, at amortised cost Bank deposits 521 268Loans given 19 5Accounts receivable 7 8
Total non-current 2,982 2,615
Current
Available-for-sale investments, at fair value Listed securities 117 35Promissory notes receivable 618
�
Held-to-maturity investments, at amortised cost Promissory notes receivable 775 2
Loans and receivables, at amortised cost Bank deposits 2,832 �Loans given 131 45
Financial assets, at fair value through profit or loss (FVTPL) Assets held under trust agreement � 22
Total current 4,473 104
Listed and unlisted securities available-for-sale consisted of shares of the following companies:
RAO “UES of Russia” 1,883 1,580OJSC “TGK-1” (refer to note 26) 281 79OJSC “OGK-5” 107 �OJSC “Polyus Gold” 89 95Talvivaara Mining Company Limited 73 �U.S. federal agency notes 25 22Breakaway Resources Limited 23 �Canadian Royalties Incorporated 21 �OJSC “TGK-5” 18 �OJSC “TGK-2” 2 �OJSC “Samara Bearing Plant” 1 5OJSC “OGK-3” � 572Other 17 13
Total 2,540 2,366
In September 2007, OJSC “Fifth Generation Company of the Wholesale Electricity Market” (“OGK-5”) and OJSC “Territorial Generation Company � 5” (“TGK-5”) were spun-off from RAO “UES of Russia” (“RAO UES”) as a part of its reorganisation. In accordance with the restructuring plan all shareholders of RAO UES received ordinary shares of OGK-5 and TGK-5 in portion to their shareholding in RAO UES. As a result of the spin-off, the Group received 607 million ordinary shares of OGK-5 and 20,043 million ordinary shares of TGK-5.
— II-139 —
APPENDIX II FINANCIAL STATEMENTS OF MMC NORILSK NICKEL
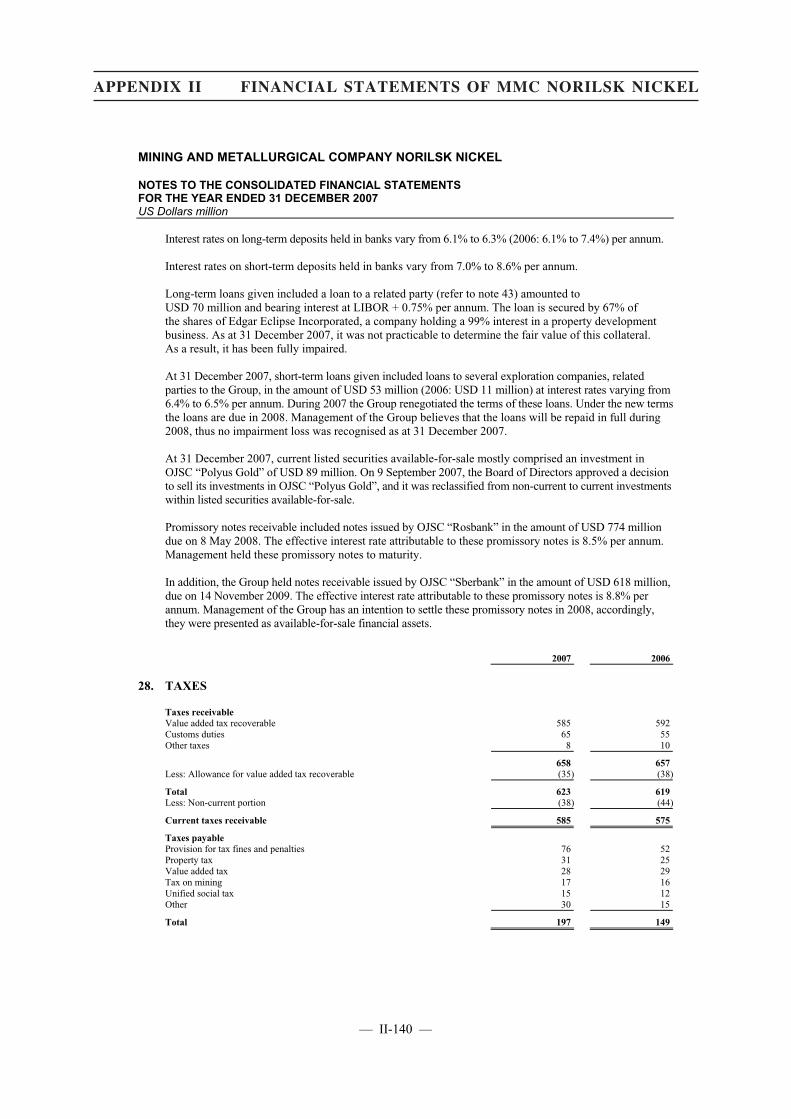
MINING AND METALLURGICAL COMPANY NORILSK NICKEL
NOTES TO THE CONSOLIDATED FINANCIAL STATEMENTS FOR THE YEAR ENDED 31 DECEMBER 2007 US Dollars million
Interest rates on long-term deposits held in banks vary from 6.1% to 6.3% (2006: 6.1% to 7.4%) per annum.
Interest rates on short-term deposits held in banks vary from 7.0% to 8.6% per annum.
Long-term loans given included a loan to a related party (refer to note 43) amounted to USD 70 million and bearing interest at LIBOR + 0.75% per annum. The loan is secured by 67% of the shares of Edgar Eclipse Incorporated, a company holding a 99% interest in a property development business. As at 31 December 2007, it was not practicable to determine the fair value of this collateral. As a result, it has been fully impaired.
At 31 December 2007, short-term loans given included loans to several exploration companies, related parties to the Group, in the amount of USD 53 million (2006: USD 11 million) at interest rates varying from 6.4% to 6.5% per annum. During 2007 the Group renegotiated the terms of these loans. Under the new terms the loans are due in 2008. Management of the Group believes that the loans will be repaid in full during 2008, thus no impairment loss was recognised as at 31 December 2007.
At 31 December 2007, current listed securities available-for-sale mostly comprised an investment in OJSC “Polyus Gold” of USD 89 million. On 9 September 2007, the Board of Directors approved a decision to sell its investments in OJSC “Polyus Gold”, and it was reclassified from non-current to current investments within listed securities available-for-sale.
Promissory notes receivable included notes issued by OJSC “Rosbank” in the amount of USD 774 million due on 8 May 2008. The effective interest rate attributable to these promissory notes is 8.5% per annum. Management held these promissory notes to maturity.
In addition, the Group held notes receivable issued by OJSC “Sberbank” in the amount of USD 618 million, due on 14 November 2009. The effective interest rate attributable to these promissory notes is 8.8% per annum. Management of the Group has an intention to settle these promissory notes in 2008, accordingly,they were presented as available-for-sale financial assets.
2007 2006
28. TAXES
Taxes receivable Value added tax recoverable 585 592Customs duties 65 55Other taxes 8 10
658 657Less: Allowance for value added tax recoverable (35) (38)
Total 623 619Less: Non-current portion (38) (44)
Current taxes receivable 585 575
Taxes payable Provision for tax fines and penalties 76 52Property tax 31 25Value added tax 28 29Tax on mining 17 16Unified social tax 15 12Other 30 15
Total 197 149
— II-140 —
APPENDIX II FINANCIAL STATEMENTS OF MMC NORILSK NICKEL
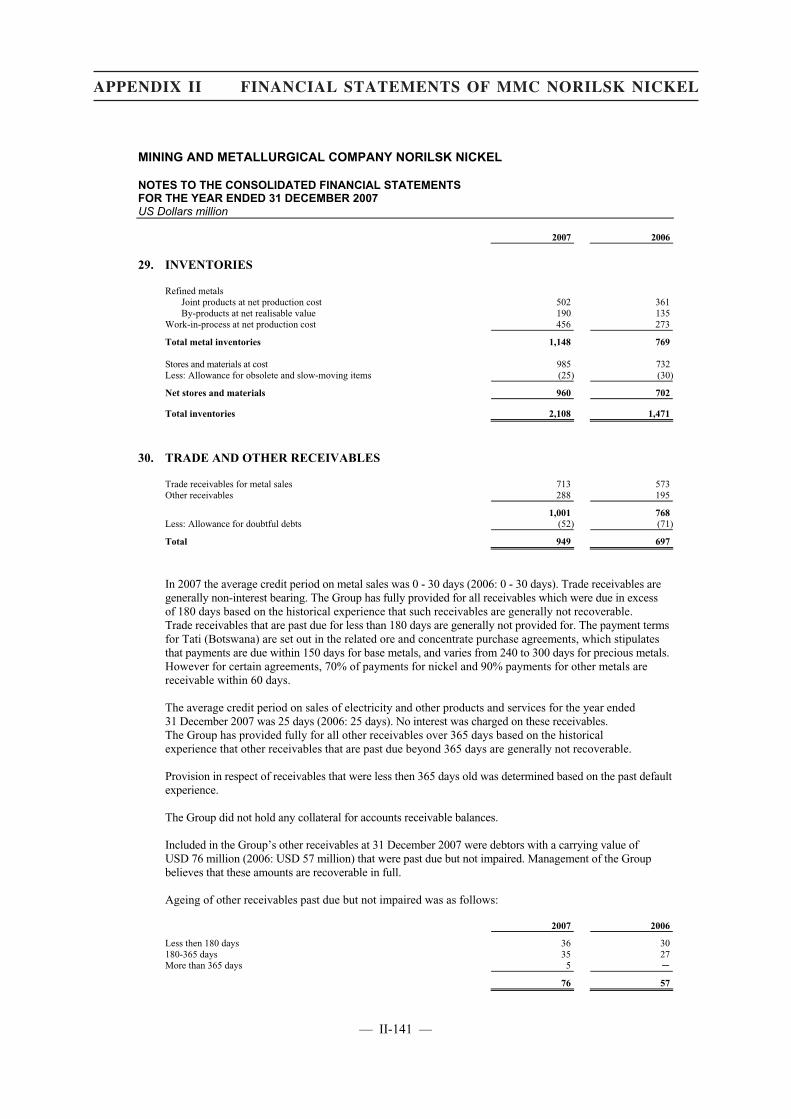
MINING AND METALLURGICAL COMPANY NORILSK NICKEL
NOTES TO THE CONSOLIDATED FINANCIAL STATEMENTS FOR THE YEAR ENDED 31 DECEMBER 2007 US Dollars million
2007 2006
29. INVENTORIES
Refined metals Joint products at net production cost 502 361By-products at net realisable value 190 135
Work-in-process at net production cost 456 273
Total metal inventories 1,148 769
Stores and materials at cost 985 732Less: Allowance for obsolete and slow-moving items (25) (30)
Net stores and materials 960 702
Total inventories 2,108 1,471
30. TRADE AND OTHER RECEIVABLES
Trade receivables for metal sales 713 573Other receivables 288 195
1,001 768Less: Allowance for doubtful debts (52) (71)
Total 949 697
In 2007 the average credit period on metal sales was 0 - 30 days (2006: 0 - 30 days). Trade receivables are generally non-interest bearing. The Group has fully provided for all receivables which were due in excess of 180 days based on the historical experience that such receivables are generally not recoverable. Trade receivables that are past due for less than 180 days are generally not provided for. The payment terms for Tati (Botswana) are set out in the related ore and concentrate purchase agreements, which stipulates that payments are due within 150 days for base metals, and varies from 240 to 300 days for precious metals. However for certain agreements, 70% of payments for nickel and 90% payments for other metals are receivable within 60 days.
The average credit period on sales of electricity and other products and services for the year ended 31 December 2007 was 25 days (2006: 25 days). No interest was charged on these receivables. The Group has provided fully for all other receivables over 365 days based on the historical experience that other receivables that are past due beyond 365 days are generally not recoverable.
Provision in respect of receivables that were less then 365 days old was determined based on the past default experience.
The Group did not hold any collateral for accounts receivable balances.
Included in the Group’s other receivables at 31 December 2007 were debtors with a carrying value of USD 76 million (2006: USD 57 million) that were past due but not impaired. Management of the Group believes that these amounts are recoverable in full.
Ageing of other receivables past due but not impaired was as follows:
2007 2006
Less then 180 days 36 30180-365 days 35 27More than 365 days 5 �
76 57
— II-141 —
APPENDIX II FINANCIAL STATEMENTS OF MMC NORILSK NICKEL
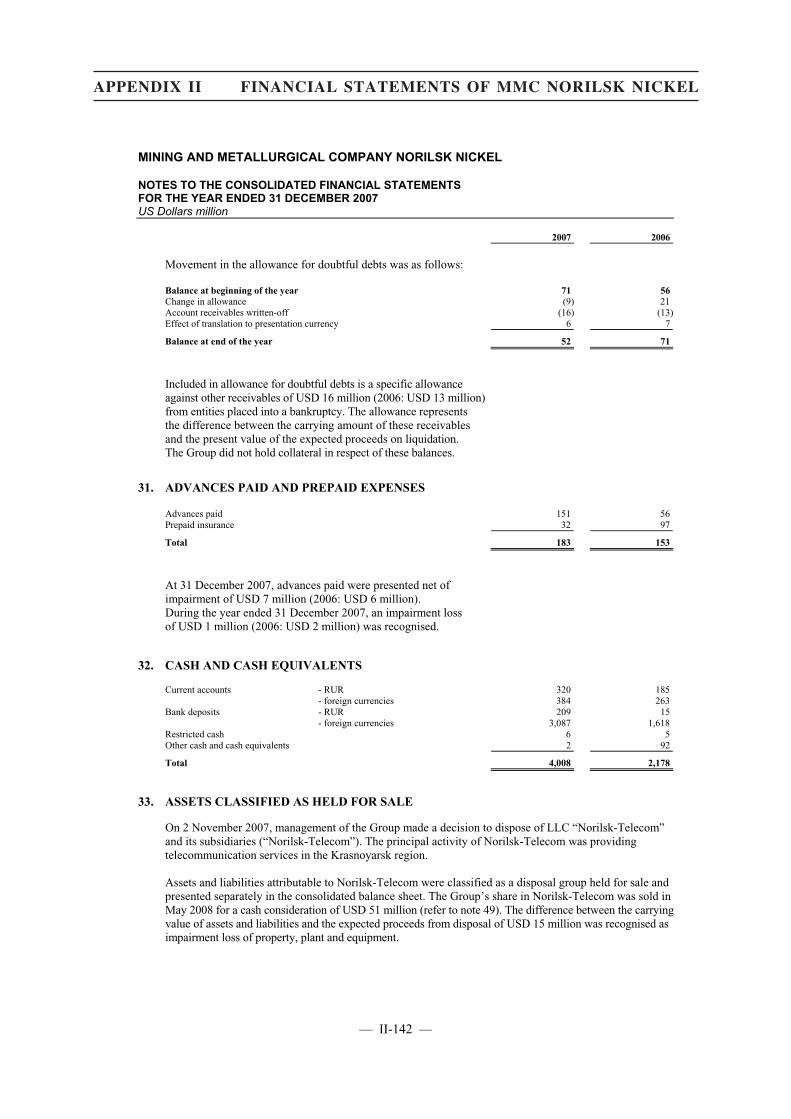
MINING AND METALLURGICAL COMPANY NORILSK NICKEL
NOTES TO THE CONSOLIDATED FINANCIAL STATEMENTS FOR THE YEAR ENDED 31 DECEMBER 2007 US Dollars million
2007 2006
Movement in the allowance for doubtful debts was as follows:
Balance at beginning of the year 71 56Change in allowance (9) 21Account receivables written-off (16) (13)Effect of translation to presentation currency 6 7
Balance at end of the year 52 71
Included in allowance for doubtful debts is a specific allowance against other receivables of USD 16 million (2006: USD 13 million) from entities placed into a bankruptcy. The allowance represents the difference between the carrying amount of these receivables and the present value of the expected proceeds on liquidation. The Group did not hold collateral in respect of these balances.
31. ADVANCES PAID AND PREPAID EXPENSES
Advances paid 151 56Prepaid insurance 32 97
Total 183 153
At 31 December 2007, advances paid were presented net of impairment of USD 7 million (2006: USD 6 million). During the year ended 31 December 2007, an impairment loss of USD 1 million (2006: USD 2 million) was recognised.
32. CASH AND CASH EQUIVALENTS
Current accounts - RUR 320 185 - foreign currencies 384 263Bank deposits - RUR 209 15 - foreign currencies 3,087 1,618Restricted cash 6 5Other cash and cash equivalents 2 92
Total 4,008 2,178
33. ASSETS CLASSIFIED AS HELD FOR SALE
On 2 November 2007, management of the Group made a decision to dispose of LLC “Norilsk-Telecom” and its subsidiaries (“Norilsk-Telecom”). The principal activity of Norilsk-Telecom was providing telecommunication services in the Krasnoyarsk region.
Assets and liabilities attributable to Norilsk-Telecom were classified as a disposal group held for sale and presented separately in the consolidated balance sheet. The Group’s share in Norilsk-Telecom was sold in May 2008 for a cash consideration of USD 51 million (refer to note 49). The difference between the carrying value of assets and liabilities and the expected proceeds from disposal of USD 15 million was recognised as impairment loss of property, plant and equipment.
— II-142 —
APPENDIX II FINANCIAL STATEMENTS OF MMC NORILSK NICKEL

MINING AND METALLURGICAL COMPANY NORILSK NICKEL
NOTES TO THE CONSOLIDATED FINANCIAL STATEMENTS FOR THE YEAR ENDED 31 DECEMBER 2007 US Dollars million
The major classes of assets and liabilities classified as held for sale as at 31 December 2007 were as follows:
2007
Property, plant and equipment (refer to note 23) 35Trade and other receivables 11Cash and cash equivalents 8Inventory 2Other assets 4
Total assets held for sale 60
Trade and other payables 4Employee benefit obligations 2Other liabilities 3
Total liabilities associated with assets held for sale 9
Net assets held for sale 51
2007 2006
34. SHARE CAPITAL
Authorised, issued and fully paid share capital
31 December 2007: 190,627,747 ordinary shares at par value of RUR 1 each 8 �31 December 2006: 190,627,747 ordinary shares at par value of RUR 1 each � 8
Total 8 8
Treasury shares
31 December 2007: 1,710,884 ordinary shares � �31 December 2006: 9,209,834 ordinary shares � (999)
Total � (999)
Number of ordinary shares in issue at end of the year 188,916,863 181,417,913
Weighted average number of ordinary shares in issue during the year 182,362,986 188,767,177
On 27 March 2006, 23,278,137 treasury shares were cancelled by the Company.
On 28 December 2006, 7,498,950 ordinary shares were bought back from shareholders at RUR 3,510 per share for a total consideration of USD 999 million.
On 16 November 2007, 7,498,950 of the Company’s shares were reissued from treasury stock at USD 285 per share for a total consideration of USD 2,137 million. Direct expenses in the amount of USD 10 million and income tax associated with reissuance in the amount of USD 272 million were deducted from proceeds.
— II-143 —
APPENDIX II FINANCIAL STATEMENTS OF MMC NORILSK NICKEL

MINING AND METALLURGICAL COMPANY NORILSK NICKEL
NOTES TO THE CONSOLIDATED FINANCIAL STATEMENTS FOR THE YEAR ENDED 31 DECEMBER 2007 US Dollars million
35. OTHER RESERVES
Investments revaluation
reserveHedging reserve
Revaluation surplus
Translation reserve Total
Balance at 31 December 2005 690 � � 748 1,438Increase in fair value of available-for-sale
investments 920 � � � 920Loss on cash flow hedge � (15) � � (15)Translation of foreign operations � � � (55) (55)Effect of translation to presentation currency � � � 1,012 1,012
Net income recognised directly in equity 1,610 (15) � 1,705 3,300Realised gain on disposal of available-for-sale
investments (613) � � (7) (620)
Total recognised income and expense 997 (15) � 1,698 2,680Cancellation of treasury shares � � � (15) (15)Net assets distributed to shareholders on
disposal of Polyus Group � � � (103) (103)
Balance at 31 December 2006 997 (15) � 1,580 2,562Increase in fair value of available-for-sale
investments 465 � � � 465Effect of change in classification of
available-for-sale investments to investments in associates due to increase of ownership (222) � 43 (4) (183)
Loss on cash flow hedge � (16) � � (16)Translation of foreign operations � � � (206) (206)Effect of translation to presentation currency � � � 1,201 1,201
Net income recognised directly in equity 1,240 (31) 43 2,571 3,823Impairment of available-for-sale investments 24 � � � 24Other reserves disposed of on disposal of
subsidiaries � � � (5) (5)
Total recognised income and expense 1,264 (31) 43 2,566 3,842Issuance of ordinary shares from treasury
stock, net of direct expenses and attributable income tax � � � (77) (77)
Balance at 31 December 2007 1,264 (31) 43 2,489 3,765
— II-144 —
APPENDIX II FINANCIAL STATEMENTS OF MMC NORILSK NICKEL

MINING AND METALLURGICAL COMPANY NORILSK NICKEL
NOTES TO THE CONSOLIDATED FINANCIAL STATEMENTS FOR THE YEAR ENDED 31 DECEMBER 2007 US Dollars million
2007 2006
36. BORROWINGS
Currency Rate,%Outstanding
balance Rate, %Outstanding
balance
Bank loans
Societe Generale, syndicated loan (i) USD LIBOR+0.53-0.63 3,473 � �
BNP Paribas (ii) USD LIBOR+0.30-0.40 2,497 � �
Sberbank (iii) RUR 8.75 612 � �Societe Generale (iv) USD LIBOR+0.43 200 � �Toronto Dominion (v) USD LIBOR+2.5 95 LIBOR+3.25 96
ANZ Syndicate (vi) AUD BBSY+
0.61-1.01 66 � �Gazprombank (vii) USD � � 5.95 120West LB Vostok (viii) USD � � 5.80 25Other vary vary 25 vary 21
Promissory notes (ix) RUR 5.50 580 � �
Guaranteed notes (x) USD 7.125 499 7.125 499
Exempt Facility Reversal Bonds Series 2000 (xi) USD 8.57 29 8.57 29
Total 8,076 790
Less: current portion due within twelve months and presented under short-term borrowings (3,973) (158)
Long-term borrowings 4,103 632
The maturity profile of the Group’s borrowings is as follows:
Due within one month 8 153Due from one to three months 598 �Due from three to twelve months 3,367 5
Total short-term borrowings 3,973 158
Due in the second year 827 4Due in the third year 2,247 502Due in the fourth year 665 93Due in the fifth year 333 �Due thereafter 31 33
Total long-term borrowings 4,103 632
Total 8,076 790
— II-145 —
APPENDIX II FINANCIAL STATEMENTS OF MMC NORILSK NICKEL
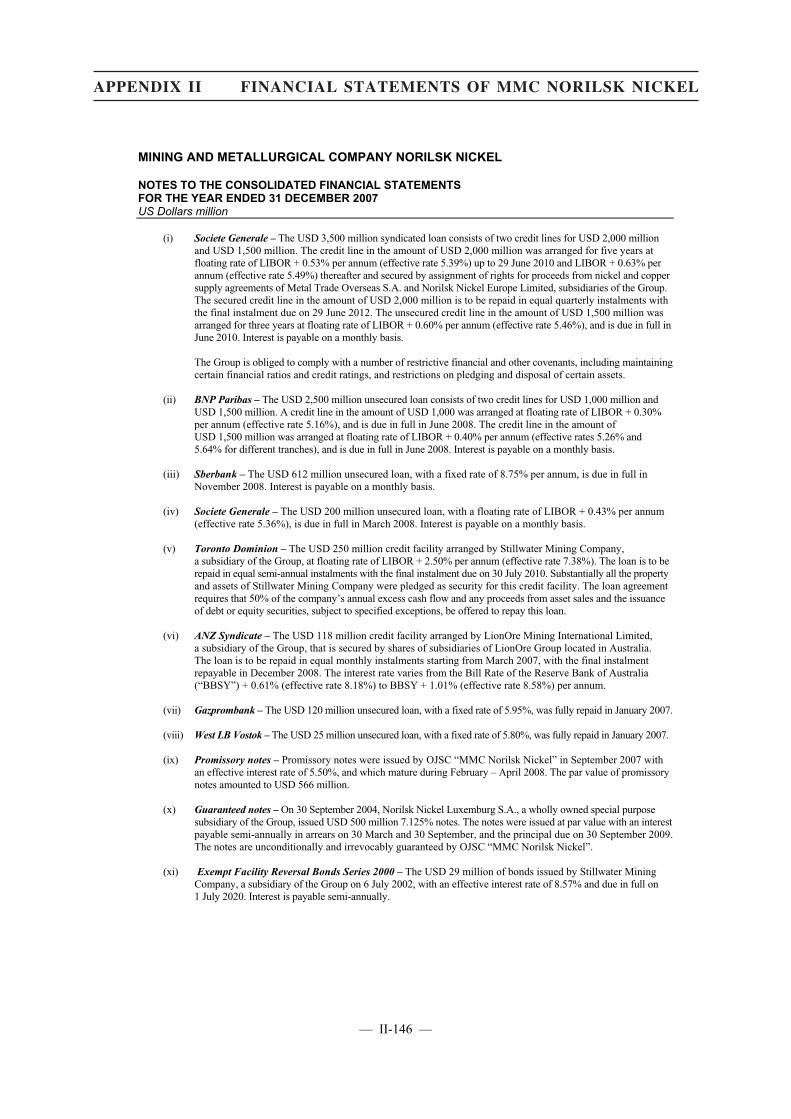
MINING AND METALLURGICAL COMPANY NORILSK NICKEL
NOTES TO THE CONSOLIDATED FINANCIAL STATEMENTS FOR THE YEAR ENDED 31 DECEMBER 2007 US Dollars million
(i) Societe Generale – The USD 3,500 million syndicated loan consists of two credit lines for USD 2,000 million and USD 1,500 million. The credit line in the amount of USD 2,000 million was arranged for five years at floating rate of LIBOR + 0.53% per annum (effective rate 5.39%) up to 29 June 2010 and LIBOR + 0.63% per annum (effective rate 5.49%) thereafter and secured by assignment of rights for proceeds from nickel and copper supply agreements of Metal Trade Overseas S.A. and Norilsk Nickel Europe Limited, subsidiaries of the Group. The secured credit line in the amount of USD 2,000 million is to be repaid in equal quarterly instalments with the final instalment due on 29 June 2012. The unsecured credit line in the amount of USD 1,500 million was arranged for three years at floating rate of LIBOR + 0.60% per annum (effective rate 5.46%), and is due in full in June 2010. Interest is payable on a monthly basis.
The Group is obliged to comply with a number of restrictive financial and other covenants, including maintaining certain financial ratios and credit ratings, and restrictions on pledging and disposal of certain assets.
(ii) BNP Paribas – The USD 2,500 million unsecured loan consists of two credit lines for USD 1,000 million and USD 1,500 million. A credit line in the amount of USD 1,000 was arranged at floating rate of LIBOR + 0.30% per annum (effective rate 5.16%), and is due in full in June 2008. The credit line in the amount of USD 1,500 million was arranged at floating rate of LIBOR + 0.40% per annum (effective rates 5.26% and 5.64% for different tranches), and is due in full in June 2008. Interest is payable on a monthly basis.
(iii) Sberbank – The USD 612 million unsecured loan, with a fixed rate of 8.75% per annum, is due in full in November 2008. Interest is payable on a monthly basis.
(iv) Societe Generale – The USD 200 million unsecured loan, with a floating rate of LIBOR + 0.43% per annum (effective rate 5.36%), is due in full in March 2008. Interest is payable on a monthly basis.
(v) Toronto Dominion – The USD 250 million credit facility arranged by Stillwater Mining Company, a subsidiary of the Group, at floating rate of LIBOR + 2.50% per annum (effective rate 7.38%). The loan is to be repaid in equal semi-annual instalments with the final instalment due on 30 July 2010. Substantially all the property and assets of Stillwater Mining Company were pledged as security for this credit facility. The loan agreement requires that 50% of the company’s annual excess cash flow and any proceeds from asset sales and the issuance of debt or equity securities, subject to specified exceptions, be offered to repay this loan.
(vi) ANZ Syndicate – The USD 118 million credit facility arranged by LionOre Mining International Limited, a subsidiary of the Group, that is secured by shares of subsidiaries of LionOre Group located in Australia. The loan is to be repaid in equal monthly instalments starting from March 2007, with the final instalment repayable in December 2008. The interest rate varies from the Bill Rate of the Reserve Bank of Australia (“BBSY”) + 0.61% (effective rate 8.18%) to BBSY + 1.01% (effective rate 8.58%) per annum.
(vii) Gazprombank – The USD 120 million unsecured loan, with a fixed rate of 5.95%, was fully repaid in January 2007.
(viii) West LB Vostok – The USD 25 million unsecured loan, with a fixed rate of 5.80%, was fully repaid in January 2007.
(ix) Promissory notes – Promissory notes were issued by OJSC “MMC Norilsk Nickel” in September 2007 with an effective interest rate of 5.50%, and which mature during February – April 2008. The par value of promissory notes amounted to USD 566 million.
(x) Guaranteed notes – On 30 September 2004, Norilsk Nickel Luxemburg S.A., a wholly owned special purpose subsidiary of the Group, issued USD 500 million 7.125% notes. The notes were issued at par value with an interest payable semi-annually in arrears on 30 March and 30 September, and the principal due on 30 September 2009. The notes are unconditionally and irrevocably guaranteed by OJSC “MMC Norilsk Nickel”.
(xi) Exempt Facility Reversal Bonds Series 2000 – The USD 29 million of bonds issued by Stillwater Mining Company, a subsidiary of the Group on 6 July 2002, with an effective interest rate of 8.57% and due in full on 1 July 2020. Interest is payable semi-annually.
— II-146 —
APPENDIX II FINANCIAL STATEMENTS OF MMC NORILSK NICKEL
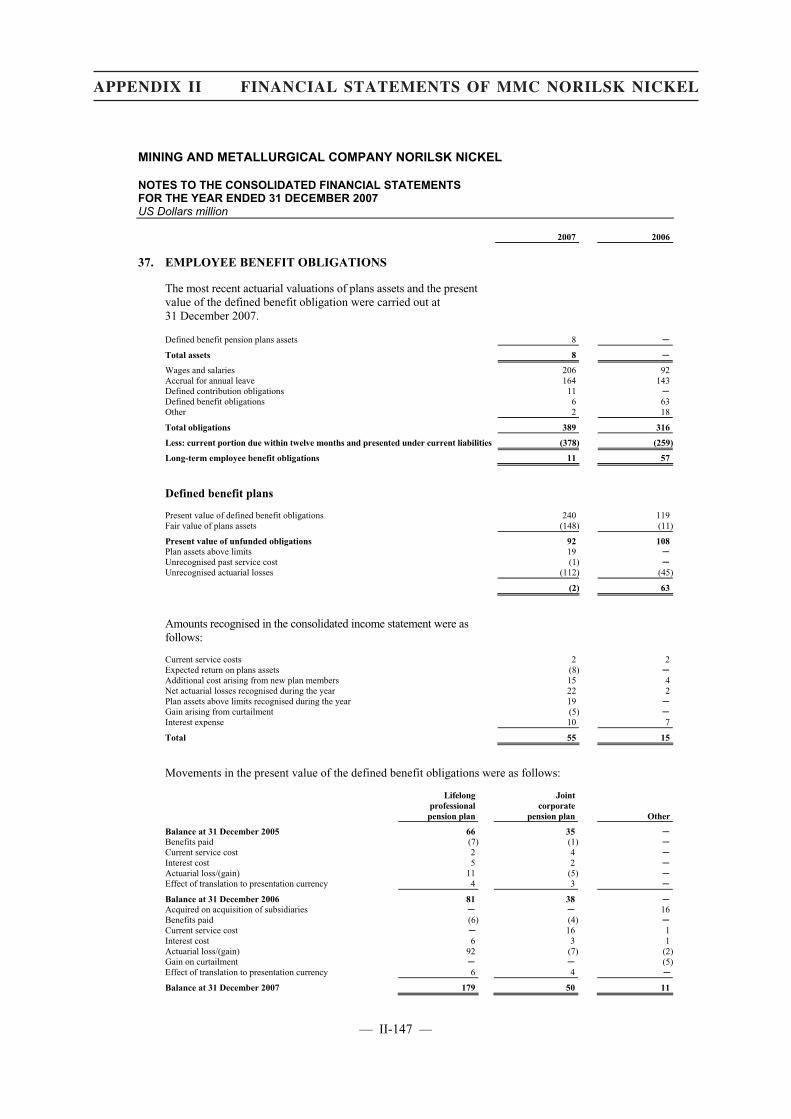
MINING AND METALLURGICAL COMPANY NORILSK NICKEL
NOTES TO THE CONSOLIDATED FINANCIAL STATEMENTS FOR THE YEAR ENDED 31 DECEMBER 2007 US Dollars million
2007 2006
37. EMPLOYEE BENEFIT OBLIGATIONS
The most recent actuarial valuations of plans assets and the present value of the defined benefit obligation were carried out at 31 December 2007.
Defined benefit pension plans assets 8 �
Total assets 8 �Wages and salaries 206 92Accrual for annual leave 164 143Defined contribution obligations 11 �Defined benefit obligations 6 63Other 2 18
Total obligations 389 316
Less: current portion due within twelve months and presented under current liabilities (378) (259)
Long-term employee benefit obligations 11 57
Defined benefit plans
Present value of defined benefit obligations 240 119Fair value of plans assets (148) (11)
Present value of unfunded obligations 92 108Plan assets above limits 19 �Unrecognised past service cost (1) �Unrecognised actuarial losses (112) (45)
(2) 63
Amounts recognised in the consolidated income statement were as follows:
Current service costs 2 2Expected return on plans assets (8) �Additional cost arising from new plan members 15 4Net actuarial losses recognised during the year 22 2Plan assets above limits recognised during the year 19 �Gain arising from curtailment (5) �Interest expense 10 7
Total 55 15
Movements in the present value of the defined benefit obligations were as follows:
Lifelong professional pension plan
Jointcorporate
pension plan Other
Balance at 31 December 2005 66 35 �Benefits paid (7) (1) �Current service cost 2 4 �Interest cost 5 2 �Actuarial loss/(gain) 11 (5) �Effect of translation to presentation currency 4 3 �
Balance at 31 December 2006 81 38 �Acquired on acquisition of subsidiaries � � 16Benefits paid (6) (4) �Current service cost � 16 1Interest cost 6 3 1Actuarial loss/(gain) 92 (7) (2)Gain on curtailment � � (5)Effect of translation to presentation currency 6 4 �
Balance at 31 December 2007 179 50 11
— II-147 —
APPENDIX II FINANCIAL STATEMENTS OF MMC NORILSK NICKEL
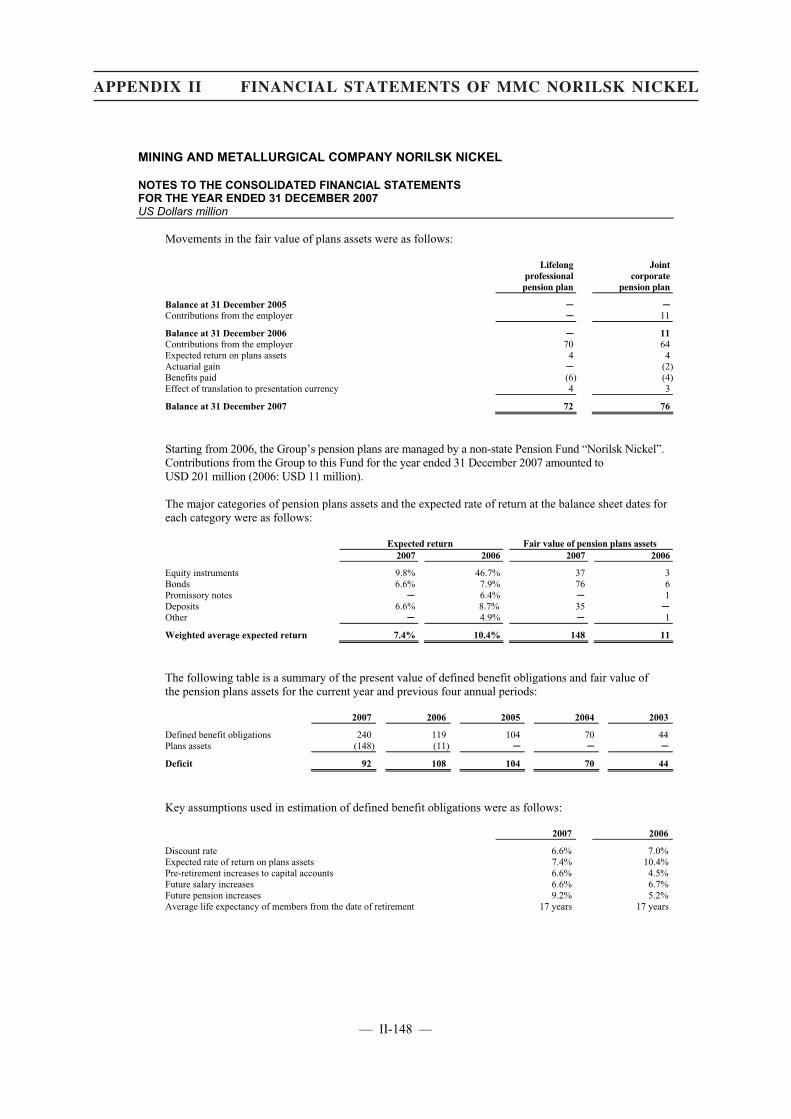
MINING AND METALLURGICAL COMPANY NORILSK NICKEL
NOTES TO THE CONSOLIDATED FINANCIAL STATEMENTS FOR THE YEAR ENDED 31 DECEMBER 2007 US Dollars million
Movements in the fair value of plans assets were as follows:
Lifelong professional
pension plan
Jointcorporate
pension plan
Balance at 31 December 2005 � �Contributions from the employer � 11
Balance at 31 December 2006 � 11Contributions from the employer 70 64Expected return on plans assets 4 4Actuarial gain � (2)Benefits paid (6) (4)Effect of translation to presentation currency 4 3
Balance at 31 December 2007 72 76
Starting from 2006, the Group’s pension plans are managed by a non-state Pension Fund “Norilsk Nickel”. Contributions from the Group to this Fund for the year ended 31 December 2007 amounted to USD 201 million (2006: USD 11 million).
The major categories of pension plans assets and the expected rate of return at the balance sheet dates for each category were as follows:
Expected return Fair value of pension plans assets 2007 2006 2007 2006
Equity instruments 9.8% 46.7% 37 3Bonds 6.6% 7.9% 76 6Promissory notes � 6.4% � 1Deposits 6.6% 8.7% 35 �Other � 4.9% � 1
Weighted average expected return 7.4% 10.4% 148 11
The following table is a summary of the present value of defined benefit obligations and fair value of the pension plans assets for the current year and previous four annual periods:
2007 2006 2005 2004 2003
Defined benefit obligations 240 119 104 70 44Plans assets (148) (11) � � �
Deficit 92 108 104 70 44
Key assumptions used in estimation of defined benefit obligations were as follows:
2007 2006
Discount rate 6.6% 7.0% Expected rate of return on plans assets 7.4% 10.4% Pre-retirement increases to capital accounts 6.6% 4.5% Future salary increases 6.6% 6.7% Future pension increases 9.2% 5.2% Average life expectancy of members from the date of retirement 17 years 17 years
— II-148 —
APPENDIX II FINANCIAL STATEMENTS OF MMC NORILSK NICKEL
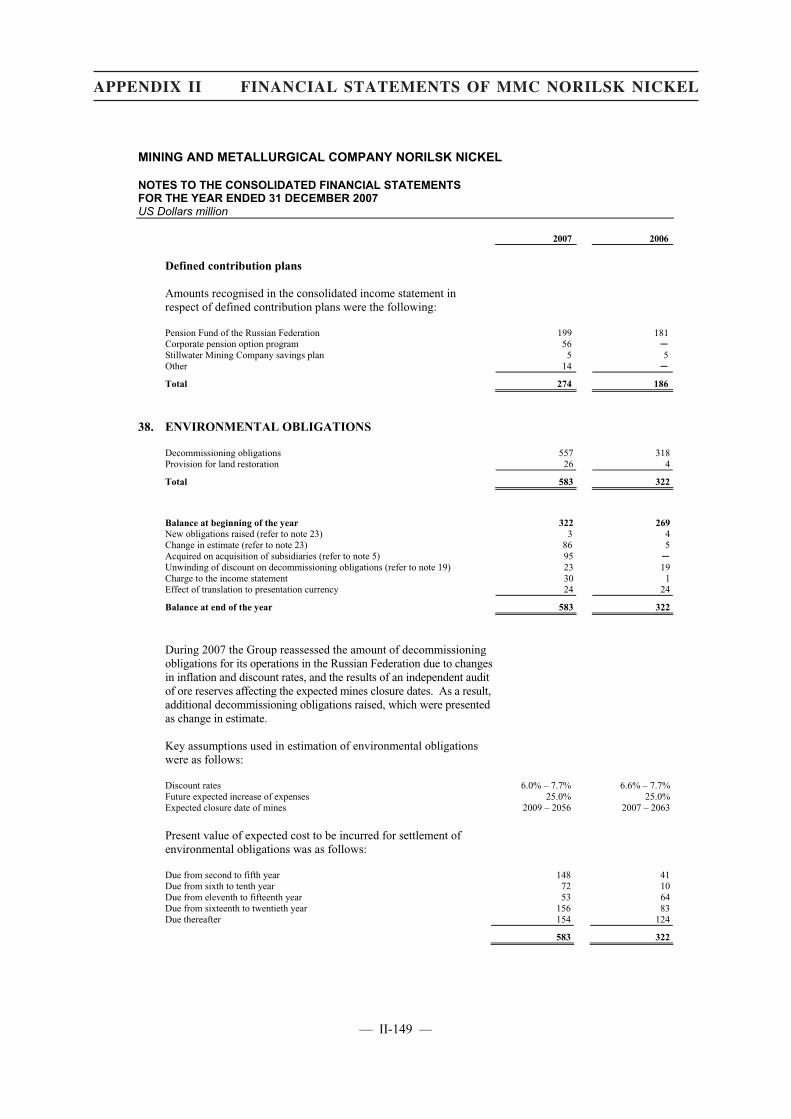
MINING AND METALLURGICAL COMPANY NORILSK NICKEL
NOTES TO THE CONSOLIDATED FINANCIAL STATEMENTS FOR THE YEAR ENDED 31 DECEMBER 2007 US Dollars million
2007 2006
Defined contribution plans
Amounts recognised in the consolidated income statement in respect of defined contribution plans were the following:
Pension Fund of the Russian Federation 199 181 Corporate pension option program 56 �Stillwater Mining Company savings plan 5 5Other 14 �
Total 274 186
38. ENVIRONMENTAL OBLIGATIONS
Decommissioning obligations 557 318Provision for land restoration 26 4
Total 583 322
Balance at beginning of the year 322 269New obligations raised (refer to note 23) 3 4Change in estimate (refer to note 23) 86 5Acquired on acquisition of subsidiaries (refer to note 5) 95 �Unwinding of discount on decommissioning obligations (refer to note 19) 23 19Charge to the income statement 30 1Effect of translation to presentation currency 24 24
Balance at end of the year 583 322
During 2007 the Group reassessed the amount of decommissioning obligations for its operations in the Russian Federation due to changes in inflation and discount rates, and the results of an independent audit of ore reserves affecting the expected mines closure dates. As a result, additional decommissioning obligations raised, which were presented as change in estimate.
Key assumptions used in estimation of environmental obligations were as follows:
Discount rates 6.0% – 7.7% 6.6% – 7.7%Future expected increase of expenses 25.0% 25.0%Expected closure date of mines 2009 – 2056 2007 – 2063
Present value of expected cost to be incurred for settlement of environmental obligations was as follows:
Due from second to fifth year 148 41Due from sixth to tenth year 72 10Due from eleventh to fifteenth year 53 64Due from sixteenth to twentieth year 156 83Due thereafter 154 124
583 322
— II-149 —
APPENDIX II FINANCIAL STATEMENTS OF MMC NORILSK NICKEL

MINING AND METALLURGICAL COMPANY NORILSK NICKEL
NOTES TO THE CONSOLIDATED FINANCIAL STATEMENTS FOR THE YEAR ENDED 31 DECEMBER 2007 US Dollars million
2007 2006
39. TRADE AND OTHER PAYABLES
Trade payables 352 191Insurance payable 22 107Payables for property, plant and equipment 44 21Other creditors 168 51
Total 586 370
The maturity profile of the Group’s trade and other payables was as follows:
Due within one month 406 212Due from one to three months 45 68Due from three to twelve months 135 90
Total 586 370
40. DERIVATIVE FINANCIAL LIABILITIES
Cash flow hedges Nickel future contracts 10 �Platinum future contracts 6 15
Total cash flow hedges 16 15
At fair value through profit and loss Derivatives held for trading 11 �
Total at fair value through profit and loss 11 �
Less: current portion due within twelve months and presented under current liabilities (24) (15)
Long-term derivative financial liabilities 3 �
The maturity profile of the Group’s derivative financial liabilities was as follows:
Cash flow hedges Due within one month 2 2Due from one to three months 7 3Due from three to twelve months 7 10
Total 16 15
At fair value through profit and loss Due from one to three months 2 �Due from three to twelve months 6 �Due from one to five years 3 �
Total 11 �
— II-150 —
APPENDIX II FINANCIAL STATEMENTS OF MMC NORILSK NICKEL
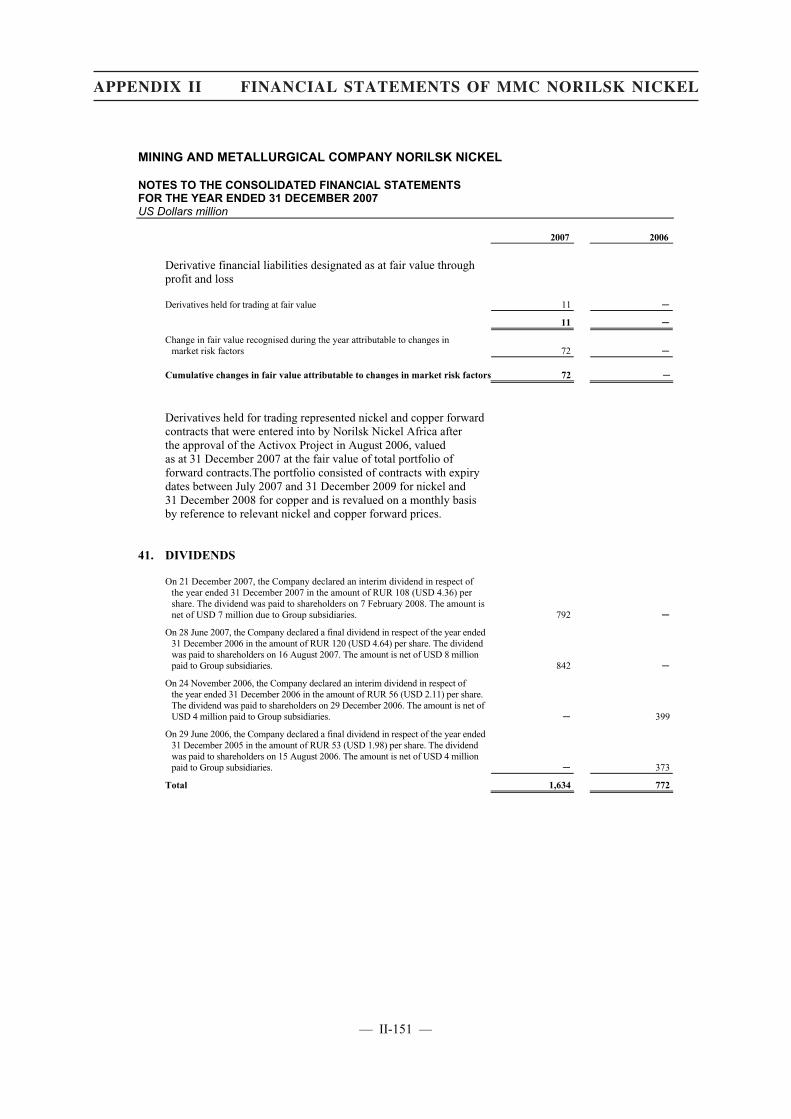
MINING AND METALLURGICAL COMPANY NORILSK NICKEL
NOTES TO THE CONSOLIDATED FINANCIAL STATEMENTS FOR THE YEAR ENDED 31 DECEMBER 2007 US Dollars million
2007 2006
Derivative financial liabilities designated as at fair value through profit and loss
Derivatives held for trading at fair value 11 �
11 �
Change in fair value recognised during the year attributable to changes in market risk factors 72 �
Cumulative changes in fair value attributable to changes in market risk factors 72 �
Derivatives held for trading represented nickel and copper forward contracts that were entered into by Norilsk Nickel Africa after the approval of the Activox Project in August 2006, valued as at 31 December 2007 at the fair value of total portfolio of forward contracts.The portfolio consisted of contracts with expiry dates between July 2007 and 31 December 2009 for nickel and 31 December 2008 for copper and is revalued on a monthly basis by reference to relevant nickel and copper forward prices.
41. DIVIDENDS
On 21 December 2007, the Company declared an interim dividend in respect of the year ended 31 December 2007 in the amount of RUR 108 (USD 4.36) per share. The dividend was paid to shareholders on 7 February 2008. The amount is net of USD 7 million due to Group subsidiaries. 792 �
On 28 June 2007, the Company declared a final dividend in respect of the year ended 31 December 2006 in the amount of RUR 120 (USD 4.64) per share. The dividend was paid to shareholders on 16 August 2007. The amount is net of USD 8 million paid to Group subsidiaries. 842 �
On 24 November 2006, the Company declared an interim dividend in respect of the year ended 31 December 2006 in the amount of RUR 56 (USD 2.11) per share. The dividend was paid to shareholders on 29 December 2006. The amount is net of USD 4 million paid to Group subsidiaries. � 399
On 29 June 2006, the Company declared a final dividend in respect of the year ended 31 December 2005 in the amount of RUR 53 (USD 1.98) per share. The dividend was paid to shareholders on 15 August 2006. The amount is net of USD 4 million paid to Group subsidiaries. � 373
Total 1,634 772
— II-151 —
APPENDIX II FINANCIAL STATEMENTS OF MMC NORILSK NICKEL

MINING AND METALLURGICAL COMPANY NORILSK NICKEL
NOTES TO THE CONSOLIDATED FINANCIAL STATEMENTS FOR THE YEAR ENDED 31 DECEMBER 2007 US Dollars million
42. DISPOSAL OF SUBSIDIARIES
On 25 May 2007, the Group sold its interest in Vimon Investments Limited BVI, the company which owned the entire share capital of CJSC “Kraus-M” a subsidiary, to a related party for a cash consideration of less than USD 1 million (refer to note 43). Under the terms of the sale agreement, intra-group debt of Vimon Investments Limited amounting to USD 41 million was assigned to the buyer. The carrying value of Vimon Investments Limited net assets at the date of disposal amounted to USD 18 million.
In January 2006, 51.0% Group’s interest in LLC “KHK “CSKA” was disposed of for a cash consideration of USD 1 million.
Net assets of the subsidiaries disposed of were as follows:
2007 2006
Property, plant and equipment (refer to note 23) 73 �Other taxes receivable 4 �Trade and other receivables 3 �Deferred tax liabilities (refer to note 22) (14) �Borrowings (48) �Trade and other payables � (5)
Group’s share of assets disposed of 18 (5)(Loss)/gain on disposal (18) 6
Net cash inflow from disposal of subsidiaries � 1
43. RELATED PARTIES
Related parties are considered to include shareholders, affiliates and entities under common ownership and control with the Group and members of key management personnel. The Company and its subsidiaries, in the ordinary course of their business, enter into various sale, purchase and service transactions with related parties.
Transactions with related parties
Sale of goods
Purchase of goods
Purchase of services
Loans given
Year ended 31 December 2007
Company 121 11 44 72Subsidiaries of the Group 94 242 60 �
Total 215 253 104 72
Year ended 31 December 2006
Company 54 12 71 70Subsidiaries of the Group 51 154 69 �
Total 105 166 140 70
Interest income received by the Group from related parties amounted to USD 26 million for the year ended 31 December 2007 (2006: USD 13 million).
In May 2007, the Group sold its investment in a subsidiary to a related party for a cash consideration of less than USD 1 million (refer to note 42).
During the year ended 31 December 2006, the Group sold property, plant and equipment to related parties for a total cash consideration of USD 19 million.
In November 2006, the Group sold its investment in OJSC “Krasnoyarskaya generatsiya” to related parties for a cash consideration of USD 156 million (refer to note 26).
— II-152 —
APPENDIX II FINANCIAL STATEMENTS OF MMC NORILSK NICKEL
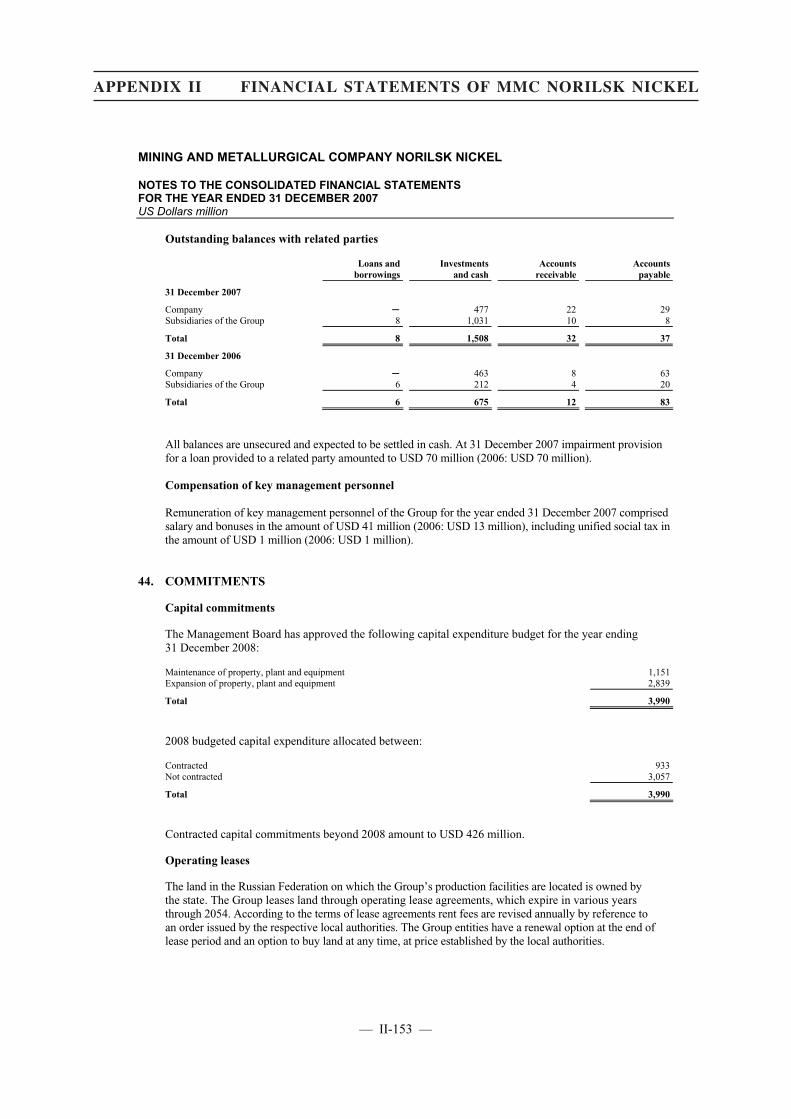
MINING AND METALLURGICAL COMPANY NORILSK NICKEL
NOTES TO THE CONSOLIDATED FINANCIAL STATEMENTS FOR THE YEAR ENDED 31 DECEMBER 2007 US Dollars million
Outstanding balances with related parties
Loans and borrowings
Investments and cash
Accounts receivable
Accounts payable
31 December 2007
Company � 477 22 29Subsidiaries of the Group 8 1,031 10 8
Total 8 1,508 32 37
31 December 2006
Company � 463 8 63Subsidiaries of the Group 6 212 4 20
Total 6 675 12 83
All balances are unsecured and expected to be settled in cash. At 31 December 2007 impairment provision for a loan provided to a related party amounted to USD 70 million (2006: USD 70 million).
Compensation of key management personnel
Remuneration of key management personnel of the Group for the year ended 31 December 2007 comprised salary and bonuses in the amount of USD 41 million (2006: USD 13 million), including unified social tax in the amount of USD 1 million (2006: USD 1 million).
44. COMMITMENTS
Capital commitments
The Management Board has approved the following capital expenditure budget for the year ending 31 December 2008:
Maintenance of property, plant and equipment 1,151Expansion of property, plant and equipment 2,839
Total 3,990
2008 budgeted capital expenditure allocated between:
Contracted 933Not contracted 3,057
Total 3,990
Contracted capital commitments beyond 2008 amount to USD 426 million.
Operating leases
The land in the Russian Federation on which the Group’s production facilities are located is owned by the state. The Group leases land through operating lease agreements, which expire in various years through 2054. According to the terms of lease agreements rent fees are revised annually by reference to an order issued by the respective local authorities. The Group entities have a renewal option at the end of lease period and an option to buy land at any time, at price established by the local authorities.
— II-153 —
APPENDIX II FINANCIAL STATEMENTS OF MMC NORILSK NICKEL
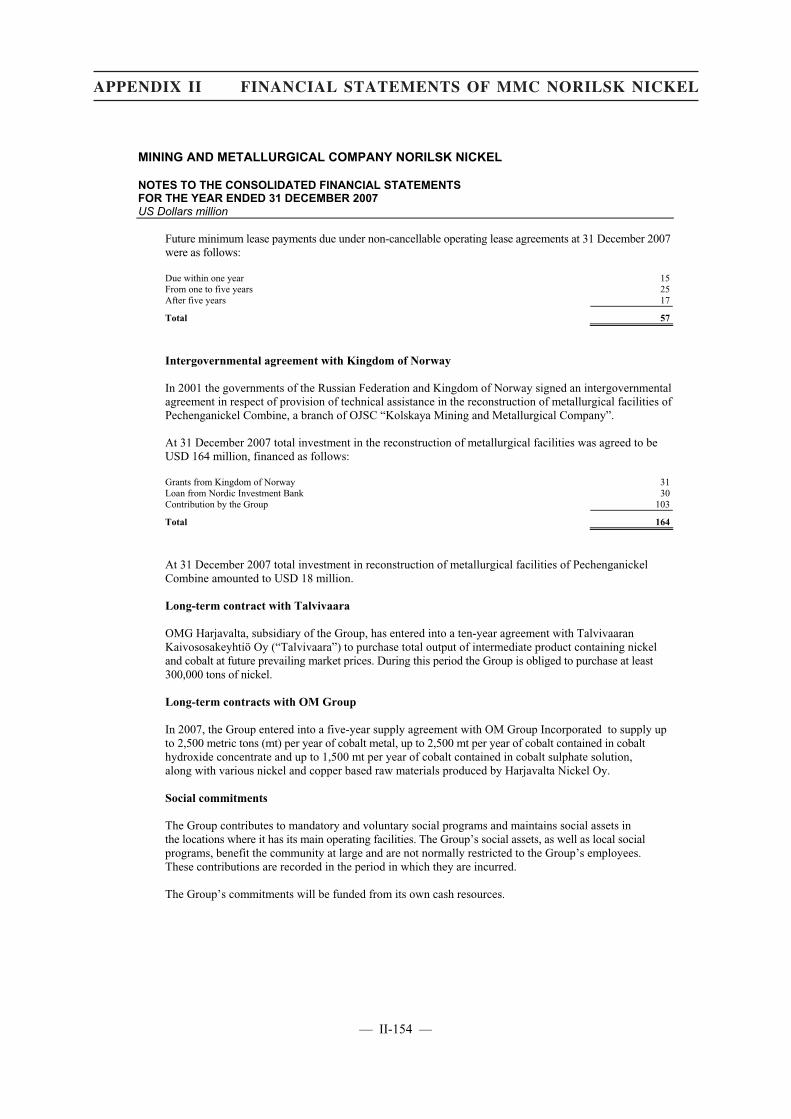
MINING AND METALLURGICAL COMPANY NORILSK NICKEL
NOTES TO THE CONSOLIDATED FINANCIAL STATEMENTS FOR THE YEAR ENDED 31 DECEMBER 2007 US Dollars million
Future minimum lease payments due under non-cancellable operating lease agreements at 31 December 2007were as follows:
Due within one year 15From one to five years 25After five years 17
Total 57
Intergovernmental agreement with Kingdom of Norway
In 2001 the governments of the Russian Federation and Kingdom of Norway signed an intergovernmental agreement in respect of provision of technical assistance in the reconstruction of metallurgical facilities of Pechenganickel Combine, a branch of OJSC “Kolskaya Mining and Metallurgical Company”.
At 31 December 2007 total investment in the reconstruction of metallurgical facilities was agreed to be USD 164 million, financed as follows:
Grants from Kingdom of Norway 31Loan from Nordic Investment Bank 30Contribution by the Group 103
Total 164
At 31 December 2007 total investment in reconstruction of metallurgical facilities of Pechenganickel Combine amounted to USD 18 million.
Long-term contract with Talvivaara
OMG Harjavalta, subsidiary of the Group, has entered into a ten-year agreement with Talvivaaran Kaivososakeyhtiö Oy (“Talvivaara”) to purchase total output of intermediate product containing nickel and cobalt at future prevailing market prices. During this period the Group is obliged to purchase at least 300,000 tons of nickel.
Long-term contracts with OM Group
In 2007, the Group entered into a five-year supply agreement with OM Group Incorporated to supply up to 2,500 metric tons (mt) per year of cobalt metal, up to 2,500 mt per year of cobalt contained in cobalt hydroxide concentrate and up to 1,500 mt per year of cobalt contained in cobalt sulphate solution, along with various nickel and copper based raw materials produced by Harjavalta Nickel Oy.
Social commitments
The Group contributes to mandatory and voluntary social programs and maintains social assets in the locations where it has its main operating facilities. The Group’s social assets, as well as local social programs, benefit the community at large and are not normally restricted to the Group’s employees. These contributions are recorded in the period in which they are incurred.
The Group’s commitments will be funded from its own cash resources.
— II-154 —
APPENDIX II FINANCIAL STATEMENTS OF MMC NORILSK NICKEL

MINING AND METALLURGICAL COMPANY NORILSK NICKEL
NOTES TO THE CONSOLIDATED FINANCIAL STATEMENTS FOR THE YEAR ENDED 31 DECEMBER 2007 US Dollars million
45. CONTINGENCIES
Litigation
At 31 December 2007 unresolved tax litigation amounted to approximately USD 55 million (2006: USD 95 million). Management believes that the risk of an unfavourable outcome of the litigation is possible.
In 2007 Federal Service for Supervision of Natural Resource Usage of the Russian Federation (“Federal Service”) required the Group to compensate for the damage of water resources in the amount of USD 287 million. In 2008 Federal Service has filed a lawsuit against the Group in the amount of USD 177 million. Management of the Group estimates the risk of satisfying claims related to compensation of the environmental damage as possible.
In addition, the Group had a number of claims and litigation relating to sales and purchases of goods and services from suppliers. Management believes that none of these claims, individually or in aggregate, will have a material adverse impact on the Group.
Taxation contingencies in the Russian Federation
The taxation system in the Russian Federation is at the development stage, and is characterised by numerous taxes, frequent changes and inconsistent enforcement at federal, regional and local levels.
The government of the Russian Federation has commenced a revision of the Russian tax system and passed certain laws implementing tax reform. The new laws reduce the number of taxes and overall tax burden on businesses and simplify tax litigation. However, these new tax laws continue to rely heavily on the interpretation of local tax officials and fail to address many existing problems. Many issues associated with practical implication of new legislation are unclear and complicate the Group’s tax planning and related business decisions.
In terms of Russian tax legislation, authorities have a period of up to three years to re-open tax declarations for further inspection. Changes in the tax system that may be applied retrospectively by authorities could affect the Group’s previously submitted and assessed tax declarations.
While management believes that it has adequately provided for tax liabilities based on its interpretation of current and previous legislation, the risk remains that tax authorities in the Russian Federation could take differing positions with regard to interpretive issues. This uncertainty may expose the Group to additional taxation, fines and penalties that could be significant.
With regards to matters where practice concerning payment of taxes is unclear, management estimate possible tax exposure at 31 December 2007 to be USD 146 million (2006: USD 204 million).
Environmental matters
The Group is subject to extensive federal, state and local environmental controls and regulations in the countries in which it operates. The Group’s operations involve the discharge of materials and contaminants into the environment and the disturbance of land that could potentially impact on flora and fauna, and give rise to other environmental concerns.
The Group’s management believes that its mining and production technologies are in compliance with all current existing environmental legislation in the countries in which it operates. However, environmental laws and regulations continue to evolve. The Group is unable to predict the timing or extent to which those laws and regulations may change. Such change, if it occurs, may require that the Group modernise technology to meet more stringent standards.
— II-155 —
APPENDIX II FINANCIAL STATEMENTS OF MMC NORILSK NICKEL
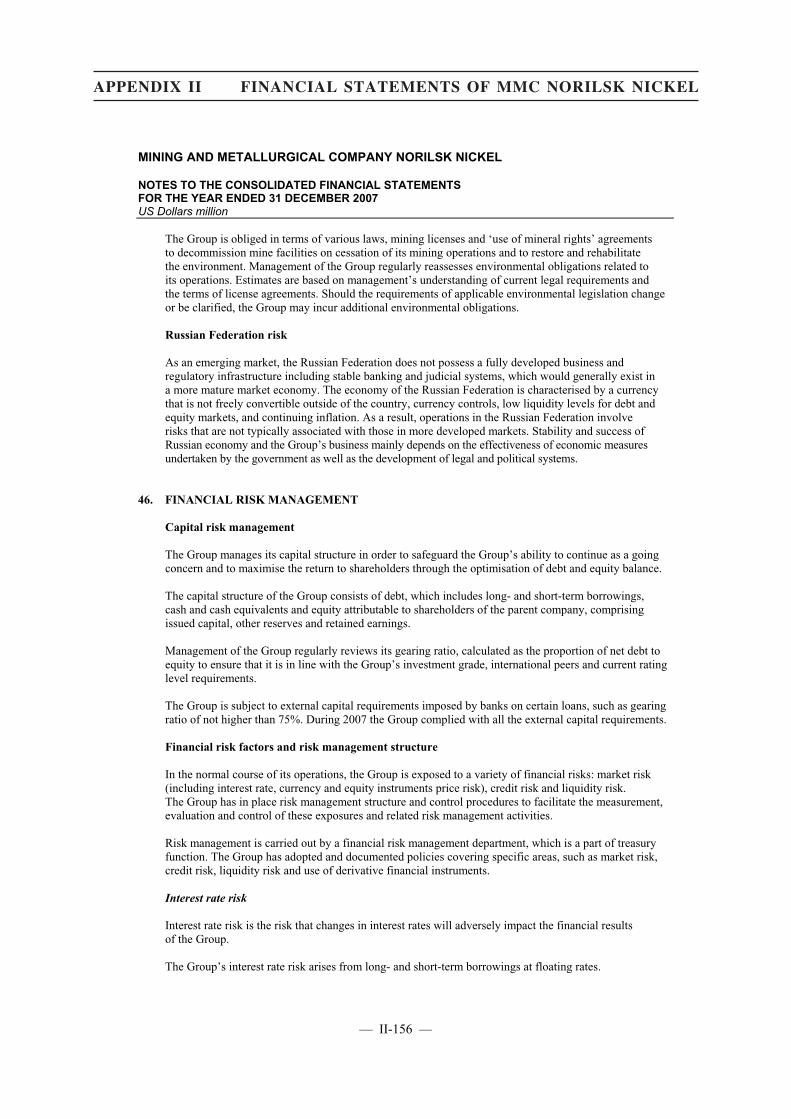
MINING AND METALLURGICAL COMPANY NORILSK NICKEL
NOTES TO THE CONSOLIDATED FINANCIAL STATEMENTS FOR THE YEAR ENDED 31 DECEMBER 2007 US Dollars million
The Group is obliged in terms of various laws, mining licenses and ‘use of mineral rights’ agreements to decommission mine facilities on cessation of its mining operations and to restore and rehabilitate the environment. Management of the Group regularly reassesses environmental obligations related to its operations. Estimates are based on management’s understanding of current legal requirements and the terms of license agreements. Should the requirements of applicable environmental legislation change or be clarified, the Group may incur additional environmental obligations.
Russian Federation risk
As an emerging market, the Russian Federation does not possess a fully developed business and regulatory infrastructure including stable banking and judicial systems, which would generally exist in a more mature market economy. The economy of the Russian Federation is characterised by a currency that is not freely convertible outside of the country, currency controls, low liquidity levels for debt and equity markets, and continuing inflation. As a result, operations in the Russian Federation involve risks that are not typically associated with those in more developed markets. Stability and success of Russian economy and the Group’s business mainly depends on the effectiveness of economic measures undertaken by the government as well as the development of legal and political systems.
46. FINANCIAL RISK MANAGEMENT
Capital risk management
The Group manages its capital structure in order to safeguard the Group’s ability to continue as a going concern and to maximise the return to shareholders through the optimisation of debt and equity balance.
The capital structure of the Group consists of debt, which includes long- and short-term borrowings, cash and cash equivalents and equity attributable to shareholders of the parent company, comprising issued capital, other reserves and retained earnings.
Management of the Group regularly reviews its gearing ratio, calculated as the proportion of net debt to equity to ensure that it is in line with the Group’s investment grade, international peers and current rating level requirements.
The Group is subject to external capital requirements imposed by banks on certain loans, such as gearing ratio of not higher than 75%. During 2007 the Group complied with all the external capital requirements.
Financial risk factors and risk management structure
In the normal course of its operations, the Group is exposed to a variety of financial risks: market risk (including interest rate, currency and equity instruments price risk), credit risk and liquidity risk. The Group has in place risk management structure and control procedures to facilitate the measurement, evaluation and control of these exposures and related risk management activities.
Risk management is carried out by a financial risk management department, which is a part of treasury function. The Group has adopted and documented policies covering specific areas, such as market risk, credit risk, liquidity risk and use of derivative financial instruments.
Interest rate risk
Interest rate risk is the risk that changes in interest rates will adversely impact the financial results of the Group.
The Group’s interest rate risk arises from long- and short-term borrowings at floating rates.
— II-156 —
APPENDIX II FINANCIAL STATEMENTS OF MMC NORILSK NICKEL

MINING AND METALLURGICAL COMPANY NORILSK NICKEL
NOTES TO THE CONSOLIDATED FINANCIAL STATEMENTS FOR THE YEAR ENDED 31 DECEMBER 2007 US Dollars million
During 2007 and 2006 the Group’s borrowings at floating rates were denominated in US dollars. At 31 December 2007, the Group also had a credit facility denominated in Australian Dollars with interest rate varying from Bill Rate of Bank of Australia (“BBSY”).
The Group performs thorough analysis of its interest rate risk exposure regularly. Various scenarios are simulated. Based on these scenarios, the Group is able to calculate the financial impact of an interest rate shift of 1%.
The table below details the Group’s sensitivity to a 1% change in those borrowings subject to a floating rate. The sensitivity analysis is prepared assuming that the amount liabilities at floating rates outstanding at the balance sheet date was outstanding for the whole year.
LIBOR-impact BBSY-impact 2007 2006 2007 2006
Loss or gain 62 1 1 �
Management believes that the Group’s exposure to interest rate risk fluctuations does not require additional hedging activities.
Currency risk
Currency risk is the risk that the fair value or future cash flows of a financial instrument denominated in foreign currency will fluctuate because of changes in exchange rates.
The major part of the Group’s revenue and related trade accounts receivable is denominated in US dollars and therefore the Group is exposed primarily to USD currency risk. Foreign exchange risk arising from other currencies is assessed by the management of the Group as immaterial.
Weakening of USD against other functional currencies of the Group’s subsidiaries is partially offset by increase in commodity prices for metals produced by the Group, which are generally priced on world markets in US dollars.
The carrying amounts of monetary assets and liabilities denominated in foreign currencies other than functional currencies of the individual Group entities as at 31 December 2007 and 2006 were as follows:
Assets Liabilities 2007 2006 2007 2006
USD 5,273 2,515 6,764 698EURO 66 10 86 15AUD 2 � � �Other currencies 21 7 14 �
Total 5,362 2,532 6,864 713
Currency risk is monitored on a monthly basis utilising sensitivity analysis to asses if a risk for a potential loss is at an acceptable level. The Group calculates the financial impact of exchange rate fluctuations within 5% on profit for the year in respect of USD-denominated assets and liabilities. The following table presents the sensitivity of the Group’s profit before tax to a 5% strengthening of the functional currencies of the Group entities against USD.
— II-157 —
APPENDIX II FINANCIAL STATEMENTS OF MMC NORILSK NICKEL

MINING AND METALLURGICAL COMPANY NORILSK NICKEL
NOTES TO THE CONSOLIDATED FINANCIAL STATEMENTS FOR THE YEAR ENDED 31 DECEMBER 2007 US Dollars million
US Dollars – impact 2007 2006
USD/RUR 86 (91)USD/BWP (12) �USD/AUD � �
Management has assessed the Group’s exposure to currency risk is at an acceptable level and thus no exchange rate hedges are used.
Equity investments price risk
The Group is also exposed to equity investments price risk arising from equity investments. Certain portion of the Group’s investments is held for strategic rather than trading purposes. The sensitivity analysis below has been determined based on the exposure to equity price risks at the reporting date.
If equity prices had been 5% higher/lower:
� profit for the year ended 31 December 2007 would have been unaffected as the quoted investments are classified as available-for-sale; and
� investment revaluation reserve within equity balance would increase/decrease by USD 380 million (2006: increase/decrease by USD 354 million), as a result of changes in fair value of listed securities available-for-sale.
In 2007 the Group’s sensitivity to equity investments price risk did not change significantly compared to 2006.
Credit risk
Credit risk refers to the risk that counterparty will default on its contractual obligations resulting in financial loss to the Group. Credit risk arises from cash and cash equivalents, deposits with banks as well as credit exposures to customers, including outstanding uncollateralised trade and other receivables. The Group’s exposure to credit risk is continuously monitored and controlled.
Prior to dealing with new counterparty, management assesses the credit worthiness of a potential customer or financial institution. Where the counterparty is rated by major independent credit-rating agencies, this rating is used to evaluate creditworthiness; otherwise it is evaluated using an analysis of the latest available financial statements of the counterparty.
Credit limits for the Group as a whole are not set up.
The balances of ten major counterparties are presented below:
Outstanding balance 2007 2006
Bank A 3,438 659Bank B 665 484Bank C 642 402Bank D 593 142Bank E 550 119
Total 5,888 1,806
— II-158 —
APPENDIX II FINANCIAL STATEMENTS OF MMC NORILSK NICKEL
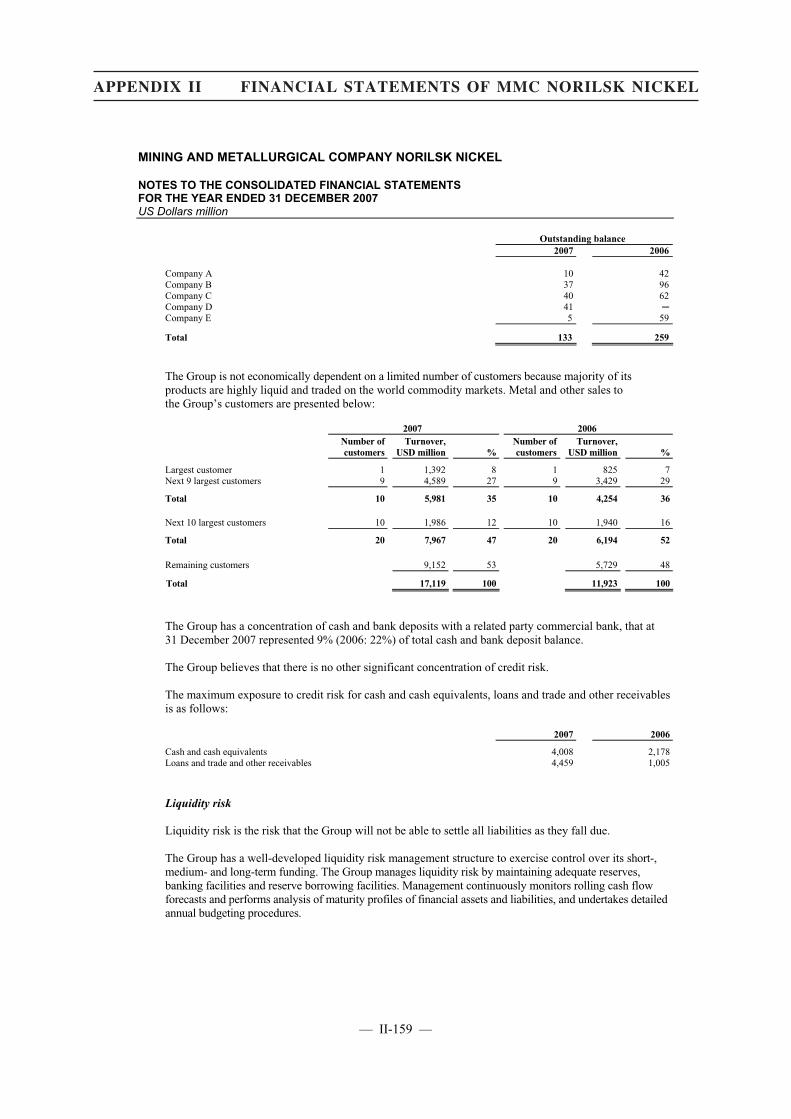
MINING AND METALLURGICAL COMPANY NORILSK NICKEL
NOTES TO THE CONSOLIDATED FINANCIAL STATEMENTS FOR THE YEAR ENDED 31 DECEMBER 2007 US Dollars million
Outstanding balance2007 2006
Company A 10 42Company B 37 96Company C 40 62Company D 41 �Company E 5 59
Total 133 259
The Group is not economically dependent on a limited number of customers because majority of its products are highly liquid and traded on the world commodity markets. Metal and other sales to the Group’s customers are presented below:
2007 2006 Number of customers
Turnover, USD million %
Number �f customers
Turnover, USD million %
Largest customer 1 1,392 8 1 825 7Next 9 largest customers 9 4,589 27 9 3,429 29
Total 10 5,981 35 10 4,254 36
Next 10 largest customers 10 1,986 12 10 1,940 16
Total 20 7,967 47 20 6,194 52
Remaining customers 9,152 53 5,729 48
Total 17,119 100 11,923 100
The Group has a concentration of cash and bank deposits with a related party commercial bank, that at 31 December 2007 represented 9% (2006: 22%) of total cash and bank deposit balance.
The Group believes that there is no other significant concentration of credit risk.
The maximum exposure to credit risk for cash and cash equivalents, loans and trade and other receivables is as follows:
2007 2006
Cash and cash equivalents 4,008 2,178Loans and trade and other receivables 4,459 1,005
Liquidity risk
Liquidity risk is the risk that the Group will not be able to settle all liabilities as they fall due.
The Group has a well-developed liquidity risk management structure to exercise control over its short-, medium- and long-term funding. The Group manages liquidity risk by maintaining adequate reserves, banking facilities and reserve borrowing facilities. Management continuously monitors rolling cash flow forecasts and performs analysis of maturity profiles of financial assets and liabilities, and undertakes detailed annual budgeting procedures.
— II-159 —
APPENDIX II FINANCIAL STATEMENTS OF MMC NORILSK NICKEL

MINING AND METALLURGICAL COMPANY NORILSK NICKEL
NOTES TO THE CONSOLIDATED FINANCIAL STATEMENTS FOR THE YEAR ENDED 31 DECEMBER 2007 US Dollars million
Presented below is the maturity profile of the Group’s borrowings (maturity profiles for other liabilities presented in notes 38 and 39) based on contractual undiscounted payments, including interest:
2007 Total
Due within
one month
Due from one to three
months
Due from three to
twelve months
Due in the
second year
Due in the
third year
Due in the
fourth year
Due in the
fifth year
Due there-after
Fixed rate bank loans and borrowings
Principle 1,745 8 376 824 504 2 � � 31Interest 148 10 19 65 29 2 2 2 19
1,893 18 395 889 533 4 2 2 50
Floating rate bank loans
Principle 6,331 � 222 2,543 323 2,245 665 333 �Interest 606 29 57 183 190 113 32 2 �
6,937 29 279 2,726 513 2,358 697 335 �
Total 8,830 47 674 3,615 1,046 2,362 699 337 50
2006
Fixed rate bank loans and borrowings
Principle 694 153 � 4 3 501 � � 33Interest 131 4 6 29 38 29 2 2 21
825 157 6 33 41 530 2 2 54
Floating rate bank loans
Principle 96 � � 1 1 1 93 � �Interest 29 1 1 6 8 8 5 � �
125 1 1 7 9 9 98 � �
Total 950 158 7 40 50 539 100 2 54
— II-160 —
APPENDIX II FINANCIAL STATEMENTS OF MMC NORILSK NICKEL

MINING AND METALLURGICAL COMPANY NORILSK NICKEL
NOTES TO THE CONSOLIDATED FINANCIAL STATEMENTS FOR THE YEAR ENDED 31 DECEMBER 2007 US Dollars million
At 31 December 2007 and 2006 the Group had financing facilities for the management of its day to day liquidity requirements available with the following banks:
2007 2006
Committed credit lines OJSC “Sberbank” 611 �Syndicated revolving credit facility arranged by Barclays Capital,
ING Bank N.V. and Societe Generale 450 �Syndicated revolving credit facility arranged by Societe Generale 400 400Credit lines arranged by BNP Paribas (Suisse) S.A. and Societe Generale 6,000 �
Total committed credit lines 7,461 400
Uncommitted credit lines
OJSC “VTB Bank” 489 100CJSC “ING Bank (Eurasia)” 100 100CJSC “West LB Vostok” 83 76CJSC “BNP Pariba” 75 50CJSC “Calyon Rusbank” 65 50LLC “Deutsche Bank” 58 37CJSC “Natexis Bank” 50 50CJSC “Drezdner Bank” 50 50OJSC “Uralsib Bank” 50 50CJSC “Societe Generale Vostok” 40 40CJSC “Commerzbank (Eurasia)” 40 20CJSC “Raiffeisenbank Austria” 40 �LLC “HSBC Bank (RR)” 40 �OJSC “Eurofinance Mosnarbank” 38 35CJSC “Citibank” 25 25OJSC KB “MBRD” 20 20CJSC “Gazprombank” � 120
Total uncommitted credit lines 1,263 823
Bank overdraft facilities
ING (Switzerland) 100 100Rosbank (Russia) 102 95BNP Paribas Suisse (Switzerland) 75 150Credit Suisse (Switzerland) 75 75Natexis (France) 75 75Banque Cantonale Vaudoise (Switzerland) 50 50Sampo (Finland) 45 �UBS (Switzerland) 40 40
Total bank overdraft facilities 562 585
Total borrowing facilities 9,286 1,808
Less: Outstanding letters of credit (587) (194)Less: Obtained bank loans related to the above facilities (6,811) (145)
Net facilities available 1,888 1,469
47. FAIR VALUE OF FINANCIAL INSTRUMENTS
The estimated fair values of certain financial instruments have been determined using available market information or other valuation methodologies that require considerable judgment in interpreting market data and developing estimates. Accordingly, the estimates applied are not necessarily indicative of the amounts that the Group could realise in a current market exchange. The use of different assumptions and estimation methodologies may have a material impact on the estimated fair values.
Where it was available, management of the Group determined fair value of unlisted shares using a valuation technique that was supported by publicly available market information. In the absence of such information available-for-sale investments, were presented at cost, net of impairment.
— II-161 —
APPENDIX II FINANCIAL STATEMENTS OF MMC NORILSK NICKEL

MINING AND METALLURGICAL COMPANY NORILSK NICKEL
NOTES TO THE CONSOLIDATED FINANCIAL STATEMENTS FOR THE YEAR ENDED 31 DECEMBER 2007 US Dollars million
At 31 December 2007, the estimated fair values of financial assets, including cash and cash equivalents, investments in securities, trade and other receivables, loans given and promissory notes, derivative financial liabilities and trade and other payables approximated their carrying values due to the short-term nature of these instruments. At 31 December 2007, a USD 500 million corporate bonds due in 2009 had a fair value of 105.85% or USD 529 million. The fair values of other fixed-rate debt and floating-rate debt approximate their carrying values.
48. DISCONTINUED OPERATION
On 30 September 2005, at an Extraordinary General Meeting of shareholders, the majority of shareholders of OJSC “MMC Norilsk Nickel” voted in favour of the spin-off of CJSC “Gold Mining Company Polyus” and its subsidiaries (the “Polyus Group”) into a new company OJSC “Polyus Gold” by way of a single transaction which was completed on 17 March 2006.
The major classes of assets and liabilities of Polyus Group were as follows:
17 March 2006
Property, plant and equipment and other non-current assets 1,164Cash and cash equivalents 2,366Other financial assets 772Trade and other payables (294)Other liabilities (240)
Net assets 3,768
Less: Shares of OJSC “Polyus Gold” received by the Group (39)Less: Minority interest (31)
Net assets distributed to shareholders 3,698
The results of operations and net cash flows of Polyus Group were as follows:
Period from 1 January 2006
to 17 March 2006
Metal sales 132Cost of metal sales (71)General and administrative expenses (15)Other net operating expenses (23)Finance costs (2)Income from investments 984
Profit before tax (refer to note 22) 1,005
Income tax (refer to note 22) (12)
Profit for the period 993
Net cash used in operating activities (56)Net cash generated from investing activities 1,963Net cash generated from financing activities 50
Earnings per share
Basic and diluted earnings per share from discontinued operations (US Dollars) 5.2
— II-162 —
APPENDIX II FINANCIAL STATEMENTS OF MMC NORILSK NICKEL

MINING AND METALLURGICAL COMPANY NORILSK NICKEL
NOTES TO THE CONSOLIDATED FINANCIAL STATEMENTS FOR THE YEAR ENDED 31 DECEMBER 2007 US Dollars million
49. EVENTS SUBSEQUENT TO THE BALANCE SHEET DATE
Share based payment arrangements
On 29 February 2008, the Board of Directors of OJSC “MMC “Norilsk Nickel” approved a new share based compensation program for management of the Company, under which top managers are entitled to receive “phantom shares” of OJSC “MMC “Norilsk Nickel”. The program is effective from April 2008 to April 2011.
Disposal of investments
Disposal of available-for-sale investments in share of OJSC “OGK-5”
On 8 February 2008, the Group sold its entire shareholding of 607,181,796 ordinary shares in OJSC “Fifth Generation Company of the Wholesale Electricity Market” (“OGK-5”) at a price of USD 0.18 per share. Net proceeds from the sale amounted to USD 109 million.
Disposal of available-for-sale investments in shares of OJSC “Polyus Gold”
On 1 April 2008, Corbiere Holdings Limited, a subsidiary of the Group, sold its stake in OJSC “Polyus Gold” for a cash consideration of USD 99 million.
Disposals of investments in LLC “Norilsk-Telecom”, a subsidiary of the Group
On 5 May 2008, the Group sold its interest in LLC “Norilsk-Telecom”, a 100% subsidiary of the Group, for a cash consideration of USD 51 million.
— II-163 —
APPENDIX II FINANCIAL STATEMENTS OF MMC NORILSK NICKEL
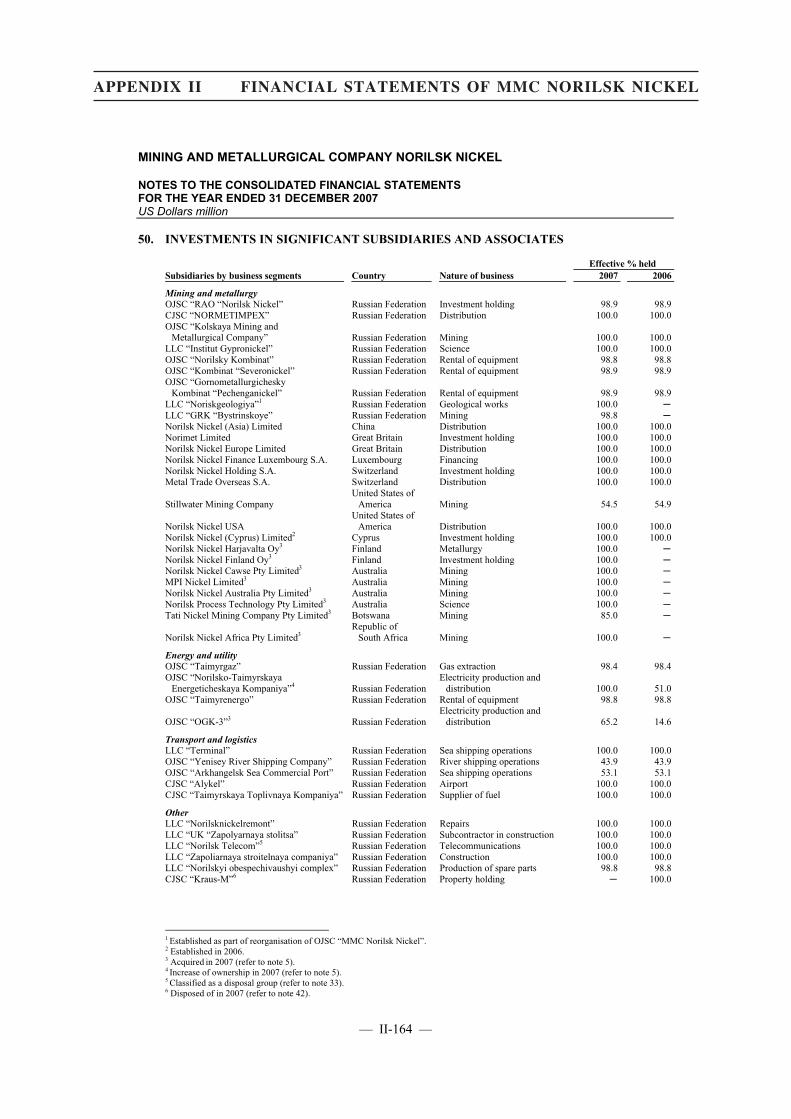
MINING AND METALLURGICAL COMPANY NORILSK NICKEL
NOTES TO THE CONSOLIDATED FINANCIAL STATEMENTS FOR THE YEAR ENDED 31 DECEMBER 2007 US Dollars million
50. INVESTMENTS IN SIGNIFICANT SUBSIDIARIES AND ASSOCIATES
Effective % held Subsidiaries by business segments Country Nature of business 2007 2006
Mining and metallurgy
OJSC “RAO “Norilsk Nickel” Russian Federation Investment holding 98.9 98.9CJSC “NORMETIMPEX” Russian Federation Distribution 100.0 100.0OJSC “Kolskaya Mining and
Metallurgical Company” Russian Federation Mining 100.0 100.0LLC “Institut Gypronickel” Russian Federation Science 100.0 100.0OJSC “Norilsky Kombinat” Russian Federation Rental of equipment 98.8 98.8OJSC “Kombinat “Severonickel” Russian Federation Rental of equipment 98.9 98.9OJSC “Gornometallurgichesky
Kombinat “Pechenganickel” Russian Federation Rental of equipment 98.9 98.9LLC “Noriskgeologiya”1 Russian Federation Geological works 100.0 �LLC “GRK “Bystrinskoye” Russian Federation Mining 98.8 �Norilsk Nickel (Asia) Limited China Distribution 100.0 100.0Norimet Limited Great Britain Investment holding 100.0 100.0Norilsk Nickel Europe Limited Great Britain Distribution 100.0 100.0Norilsk Nickel Finance Luxembourg S.A. Luxembourg Financing 100.0 100.0Norilsk Nickel Holding S.A. Switzerland Investment holding 100.0 100.0Metal Trade Overseas S.A. Switzerland Distribution 100.0 100.0
Stillwater Mining Company United States of
America Mining 54.5 54.9
Norilsk Nickel USA United States of
America Distribution 100.0 100.0Norilsk Nickel (Cyprus) Limited21 Cyprus Investment holding 100.0 100.0Norilsk Nickel Harjavalta Oy3 Finland Metallurgy 100.0 �Norilsk Nickel Finland Oy3 Finland Investment holding 100.0 �Norilsk Nickel Cawse Pty Limited3 Australia Mining 100.0 �MPI Nickel Limited3 Australia Mining 100.0 �Norilsk Nickel Australia Pty Limited3 Australia Mining 100.0 �Norilsk Process Technology Pty Limited3 Australia Science 100.0 �Tati Nickel Mining Company Pty Limited3 Botswana Mining 85.0 �
Norilsk Nickel Africa Pty Limited3 Republic of
South Africa Mining 100.0 �
Energy and utility OJSC “Taimyrgaz” Russian Federation Gas extraction 98.4 98.4OJSC “Norilsko-Taimyrskaya
Energeticheskaya Kompaniya”4 Russian Federation Electricity production and
distribution 100.0 51.0OJSC “Taimyrenergo”2 Russian Federation Rental of equipment 98.8 98.8
OJSC “OGK-3”3 Russian Federation Electricity production and
distribution 65.2 14.6
Transport and logistics LLC “Terminal” Russian Federation Sea shipping operations 100.0 100.0OJSC “Yenisey River Shipping Company” Russian Federation River shipping operations 43.9 43.9OJSC “Arkhangelsk Sea Commercial Port” Russian Federation Sea shipping operations 53.1 53.1CJSC “Alykel” Russian Federation Airport 100.0 100.0CJSC “Taimyrskaya Toplivnaya Kompaniya” Russian Federation Supplier of fuel 100.0 100.0
Other LLC “Norilsknickelremont” Russian Federation Repairs 100.0 100.0LLC “UK “Zapolyarnaya stolitsa” Russian Federation Subcontractor in construction 100.0 100.0LLC “Norilsk Telecom”5 Russian Federation Telecommunications 100.0 100.0LLC “Zapoliarnaya stroitelnaya companiya” Russian Federation Construction 100.0 100.0LLC “Norilskyi obespechivaushyi complex” Russian Federation Production of spare parts 98.8 98.8CJSC “Kraus-M”6 Russian Federation Property holding � 100.0
1 Established as part of reorganisation of OJSC “MMC Norilsk Nickel”.2 Established in 2006. 3 Acquired in 2007 (refer to note 5).4 Increase of ownership in 2007 (refer to note 5). 5 Classified as a disposal group (refer to note 33). 6 Disposed of in 2007 (refer to note 42).
— II-164 —
APPENDIX II FINANCIAL STATEMENTS OF MMC NORILSK NICKEL
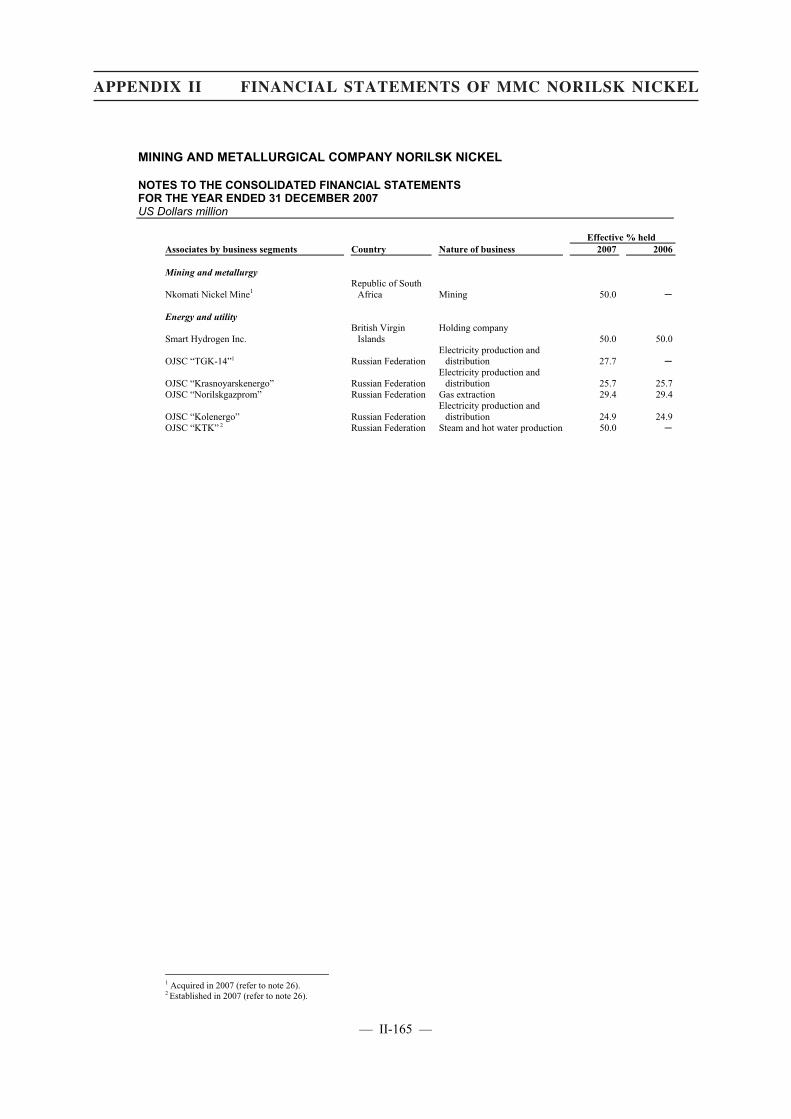
MINING AND METALLURGICAL COMPANY NORILSK NICKEL
NOTES TO THE CONSOLIDATED FINANCIAL STATEMENTS FOR THE YEAR ENDED 31 DECEMBER 2007 US Dollars million
Effective % held Associates by business segments Country Nature of business 2007 2006
Mining and metallurgy
Nkomati Nickel Mine1 Republic of South
Africa Mining 50.0 �
Energy and utility
Smart Hydrogen Inc. British Virgin
Islands Holding company
50.0 50.0
OJSC “TGK-14”1 Russian Federation Electricity production and
distribution 27.7 �
OJSC “Krasnoyarskenergo” Russian Federation Electricity production and
distribution 25.7 25.7OJSC “Norilskgazprom” Russian Federation Gas extraction 29.4 29.4
OJSC “Kolenergo” Russian Federation Electricity production and
distribution 24.9 24.9OJSC “KTK” 2 Russian Federation Steam and hot water production 50.0 �
1 Acquired in 2007 (refer to note 26). 2 Established in 2007 (refer to note 26).
— II-165 —
APPENDIX II FINANCIAL STATEMENTS OF MMC NORILSK NICKEL
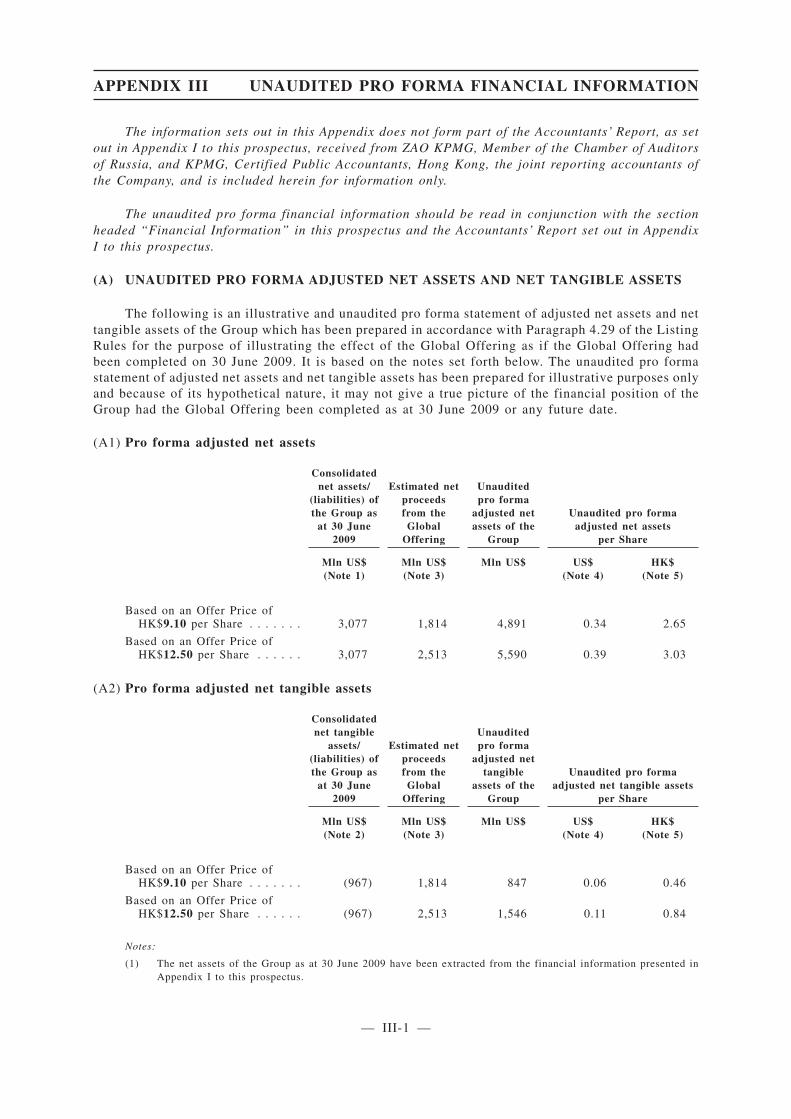
The information sets out in this Appendix does not form part of the Accountants’ Report, as setout in Appendix I to this prospectus, received from ZAO KPMG, Member of the Chamber of Auditorsof Russia, and KPMG, Certified Public Accountants, Hong Kong, the joint reporting accountants ofthe Company, and is included herein for information only.
The unaudited pro forma financial information should be read in conjunction with the sectionheaded “Financial Information” in this prospectus and the Accountants’ Report set out in AppendixI to this prospectus.
(A) UNAUDITED PRO FORMA ADJUSTED NET ASSETS AND NET TANGIBLE ASSETS
The following is an illustrative and unaudited pro forma statement of adjusted net assets and nettangible assets of the Group which has been prepared in accordance with Paragraph 4.29 of the ListingRules for the purpose of illustrating the effect of the Global Offering as if the Global Offering hadbeen completed on 30 June 2009. It is based on the notes set forth below. The unaudited pro formastatement of adjusted net assets and net tangible assets has been prepared for illustrative purposes onlyand because of its hypothetical nature, it may not give a true picture of the financial position of theGroup had the Global Offering been completed as at 30 June 2009 or any future date.
(A1) Pro forma adjusted net assets
Consolidatednet assets/
(liabilities) ofthe Group as
at 30 June2009
Estimated netproceedsfrom theGlobal
Offering
Unauditedpro forma
adjusted netassets of the
Group
Unaudited pro formaadjusted net assets
per Share
Mln US$(Note 1)
Mln US$(Note 3)
Mln US$ US$(Note 4)
HK$(Note 5)
Based on an Offer Price ofHK$9.10 per Share . . . . . . . 3,077 1,814 4,891 0.34 2.65
Based on an Offer Price ofHK$12.50 per Share . . . . . . 3,077 2,513 5,590 0.39 3.03
(A2) Pro forma adjusted net tangible assets
Consolidatednet tangible
assets/(liabilities) ofthe Group as
at 30 June2009
Estimated netproceedsfrom theGlobal
Offering
Unauditedpro forma
adjusted nettangible
assets of theGroup
Unaudited pro formaadjusted net tangible assets
per Share
Mln US$(Note 2)
Mln US$(Note 3)
Mln US$ US$(Note 4)
HK$(Note 5)
Based on an Offer Price ofHK$9.10 per Share . . . . . . . (967) 1,814 847 0.06 0.46
Based on an Offer Price ofHK$12.50 per Share . . . . . . (967) 2,513 1,546 0.11 0.84
Notes:
(1) The net assets of the Group as at 30 June 2009 have been extracted from the financial information presented inAppendix I to this prospectus.
APPENDIX III UNAUDITED PRO FORMA FINANCIAL INFORMATION
— III-1 —
App1A-21

(2) The net tangible assets of the Group as at 30 June 2009:
Mln US$
Net assets of the Group as set out in Appendix I to this prospectus . . . . . . . . . . . . . . . . 3,077
Less: Intangible assets and goodwill . . . . . . . . . . . . . . . . . . . . . . . . . . . . . . . . . . . (4,044)
Net tangible assets/(liabilities) of the Group . . . . . . . . . . . . . . . . . . . . . . . . . . . . . . (967)
(3) Estimated net proceeds from the Global Offering
Based on anOffer Price of
HK$9.10 per Share
Based on anOffer Price of
HK$12.50 per Share
Mln US$ Mln US$
Gross proceeds from the Global Offering . . . . . . . . . . . . 1,889 2,595
Underwriting fees and other expenses associated withthe Global Offering . . . . . . . . . . . . . . . . . . . . . . . . (75) (82)
Net proceeds from the Global Offering . . . . . . . . . . . . . . 1,814 2,513
The estimated net proceeds from the Global Offering take no account of any Shares that may be issued uponexercise of the Over-allotment Option. The estimated net proceeds from the Global Offering are converted intoUS dollars at an exchange rate of HK$7.76 to US$1.00.
(4) The unaudited pro forma net assets and net tangible assets per Share are arrived at after adjustments referred toabove and on the basis that a total of 14,300,511,110 Shares (including 11,628 Shares in issue as at 30 June 2009or 12,690,218,270 Shares on an adjusted basis after giving effect of the subdivision on 24 December 2009 and thecapitalisation issue in conjunction with the Global Offering, and 1,610,292,840 Shares to be issued under theGlobal Offering) were in issue and take no account of any Share that may be issued upon exercise of theOver-allotment Option.
(5) The translation of US dollars into Hong Kong dollars has been made at the rate of HK$7.76 to US$1.0. Norepresentation is made that the US dollar amounts have been, could have been or could be converted to Hong Kongdollar, or vice versa, at that rate, or at any other rate or at all.
(6) Details of the valuation of the Group’s properties as at 30 September 2009 are set out in Appendix V — PropertyValuation. The net revaluation surplus of such properties classified under the captions “Property, plant andequipment”, in the Accountants’ Report set out in Appendix I, representing the excess of market values of theproperties over their book values, is approximately US$395 million. In accordance with the Group’s accountingpolicies, such properties are stated at historical cost less accumulated depreciation/amortisation and impairment.As such, the net revaluation surplus arising from the valuation of properties will not be included in the Group’sconsolidated financial statements for the year ending 31 December 2009. The calculation of the above unauditedpro forma adjusted net assets and net tangible assets of the Group does not take into account the revaluationsurplus. Additional annual depreciation of approximately US$7 million would be charged against the incomestatement had such properties been stated at the revalued amounts.
(7) No adjustment has been made to reflect any trading results or other transactions entered into subsequent to 30 June2009 except for the effects of the subdivision on 24 December 2009 and capitalisation issue in conjunction withGlobal Offering. In particular, the calculation of the above unaudited pro forma adjusted net assets and nettangible assets of the Group does not take into account the impact of the debt restructuring in December 2009 andof the conversion of a portion of the obligations to Onexim into Shares, nor, in the calculation of the unauditedpro forma adjusted net assets and net tangible assets per share at the denominator, the number of new sharescreated following the debt conversion. Details of the debt restructuring are set out in the section headed “FinancialInformation — Debt Restructuring” in this prospectus.
APPENDIX III UNAUDITED PRO FORMA FINANCIAL INFORMATION
— III-2 —

(B) UNAUDITED PRO FORMA FORECAST EARNINGS PER SHARE
The following unaudited pro forma forecast earnings per Share for the year ending 31 December2009 has been prepared on the basis set out in the notes below for the purpose of illustrating the effectof the Global Offering as if it had been taken place on 1 January 2009. This unaudited pro formaforecast earnings per Share has been prepared for illustrative purposes only and because of itshypothetical nature, it may not give a true picture of the financial results of the Group for the yearending 31 December 2009 or any future period.
Forecast consolidated net profit attributable tothe equity holders of the Company for the yearending 31 December 2009 (Note 2) . . . . . . . . . . . . . . . . . . . . Not less than US$434 million
(approximately HK$3,366 million)
Unaudited pro forma forecast earnings per Share— (Note 3) . . . . . . . . . . . . . . . . . . . . . . . . . . . . . . . . . . . . . . . . . . . . Not less than US$0.03
(approximately HK$0.23)
Notes:
1 All statistics in this table are based on the assumption that the Over-allotment Option is not exercised.
2 The forecast consolidated net profit attributable to the equity holders of the Company for the year ending 31December 2009 is extracted from the section headed “Financial Information — Profit forecast” in this prospectus.The bases and assumptions on which the above profit forecast has been prepared are set out in Appendix IV tothis prospectus. The directors of the Company have prepared the forecast consolidated net profit attributable tothe equity holders of the Company for the year ending 31 December 2009 based on the audited consolidatedfinancial results of the Group for the six months ended 30 June 2009, the consolidated results shown in theunaudited financial information of the Group for the nine months ended 30 September 2009 (which include theaudited consolidated financial results of the Group for the six months ended 30 June 2009) and a forecast of theconsolidated results of the Group for the remaining three months ending 31 December 2009.
3 The unaudited pro forma forecast earnings per Share is calculated by dividing the forecast consolidated net profitattributable to the equity holders of the Company for the year ending 31 December 2009 by the adjusted weightedaverage number of Shares outstanding of 14,353,757,032 Shares during the entire year. The adjusted weightedaverage number of Shares outstanding reflects the actual weighted average number of Shares outstanding prior tothe debt restructuring of 11,628 Shares or 12,690,218,270 Shares on an adjusted basis to reflect the effect of (a)the share subdivision on 24 December 2009; (b) the capitalisation issue of the Company’s ordinary shares inconjunction with the Global Offering; (c) 809,781,730 Shares issued on 7 December 2009 pursuant to theconversion of a portion of the obligations to Onexim, weighted for the portion of the period that such Shares wereoutstanding and adjusted for the share subdivision on 24 December 2009 and capitalisation issue in conjunctionwith the Global Offering; and (d) 1,610,292,840 Shares to be issued pursuant to the Global Offering as if theGlobal Offering had been completed on 1 January 2009, without taking into account the Over-allotment Optionor any Shares that may be allotted and issued or repurchased by our Company pursuant to the mandate set out inthe paragraph headed “Statutory and General Information” in Appendix VIII to this prospectus.
4 The translation of US dollars into Hong Kong dollars has been made at the rate of HK$7.76 to US$1.00. Norepresentation is made that the US dollar amounts have been, could have been or could be converted to Hong Kongdollars, or vice versa, at that rate, or at any other rate or at all.
APPENDIX III UNAUDITED PRO FORMA FINANCIAL INFORMATION
— III-3 —
(C) REPORT ON UNAUDITED PRO FORMA FINANCIAL INFORMATION
The following is the text of a report received from the joint reporting accountants, ZAO KPMG,Member of the Chamber of Auditors of Russia, and KPMG, Certified Public Accountants, Hong Kong,for the purpose of incorporation in this prospectus.
ZAO KPMGNaberezhnaya Tower ComplexBlock C10 Presnenskaya NaberezhnayaMoscow 123317Russia
KPMG8th FloorPrince’s Building10 Chater RoadCentralHong Kong
31 December 2009
The DirectorsUnited Company RUSAL Limited
Dear Sirs
We report on the unaudited pro forma statement of adjusted net assets and net tangible assets andunaudited pro forma forecast earnings per Share (hereinafter collectively referred to as the “UnauditedPro Forma Financial Information”) of United Company RUSAL Limited (the “Company”) and itssubsidiaries (hereinafter collectively referred to as “the Group”) set forth on pages III-1 to III-3 ofAppendix III to the prospectus dated 31 December 2009 (the “Prospectus”), which has been preparedby the directors of the Company solely for illustrative purposes to provide information about how theproposed Global Offering of the Company’s shares might have affected the financial informationpresented. The basis of preparation of the Unaudited Pro Forma Financial Information is set out in thenotes on pages III-1 to III-3 of Appendix III to the Prospectus.
Responsibilities
It is the responsibility solely of the directors of the Company to prepare the Unaudited Pro FormaFinancial Information in accordance with paragraph 4.29 of the Rules Governing the Listing ofSecurities on The Stock Exchange of Hong Kong Limited (the “Listing Rules”) and with reference toAccounting Guideline 7 “Preparation of Pro Forma Financial Information for Inclusion in InvestmentCirculars” issued by the Hong Kong Institute of Certified Public Accountants (the “HKICPA”).
It is our responsibility to form an opinion, as required by paragraph 4.29 of the Listing Rules,on the Unaudited Pro Forma Financial Information and to report our opinion to you. We do not acceptany responsibility for any reports previously given by us on any financial information used in thecompilation of the Unaudited Pro Forma Financial Information beyond that owed to those to whomthose reports were addressed by us at the dates of their issue.
APPENDIX III UNAUDITED PRO FORMA FINANCIAL INFORMATION
— III-4 —

Basis of Opinion
We conducted our engagement in accordance with Hong Kong Standard on Investment CircularReporting Engagements 300 “Accountants’ Reports on Pro Forma Financial Information in InvestmentCirculars” issued by the HKICPA. Our work consisted primarily of comparing the unadjusted financialinformation with source documents, considering the evidence supporting the adjustments anddiscussing the Unaudited Pro Forma Financial Information with the directors of the Company. Theengagement did not involve independent examination of any of the underlying financial information.
Our work did not constitute an audit or review made in accordance with Hong Kong Standardson Auditing or Hong Kong Standards on Review Engagements issued by the HKICPA and, accordingly,we do not express any such audit or review assurance on the Unaudited Pro Forma FinancialInformation.
We planned and performed our work so as to obtain the information and explanations weconsidered necessary in order to provide us with sufficient evidence to give reasonable assurance thatthe Unaudited Pro Forma Financial Information has been properly compiled by the directors of theCompany on the basis stated, that such basis is consistent with the accounting policies of the Groupand that the adjustments are appropriate for the purposes of the Unaudited Pro Forma FinancialInformation as disclosed pursuant to paragraph 4.29(1) of the Listing Rules.
Our procedures on the Unaudited Proforma Financial Information have not been carried out inaccordance with attestation standards or other standards and practices generally accepted in the UnitedStates of America or auditing standards of the Public Company Accounting Oversight Board (UnitedStates) and accordingly should not be relied upon as if they had been carried out in accordance withthose standards and practices.
The Unaudited Pro Forma Financial Information is for illustrative purpose only, based on thejudgements and assumptions of the directors of the Company, and, because of its hypothetical nature,does not provide any assurance or indication that any event will take place in the future and may notbe indicative of:
— the financial position of the Group as at 30 June 2009 or any future date, or
— the earnings per Share of the Group for the year ending 31 December 2009 or any futureperiods.
We make no comments regarding the reasonableness of the amount of net proceeds from theissuance of the Company’s shares, the application of those net proceeds, or whether such use willactually take place as described under “Use of Proceeds” set out in the section headed “Future Plansand Use of Proceeds” in the Prospectus.
APPENDIX III UNAUDITED PRO FORMA FINANCIAL INFORMATION
— III-5 —

Opinion
In our opinion:
(a) the Unaudited Pro Forma Financial Information has been properly compiled by the directorsof the Company on the basis stated;
(b) such basis is consistent with the accounting policies of the Group; and
(c) the adjustments are appropriate for the purposes of the Unaudited Pro Forma FinancialInformation as disclosed pursuant to paragraph 4.29(1) of the Listing Rules.
Yours faithfully
ZAO KPMGMember of the Chamber of
Auditors of RussiaRussia
Yours faithfully
KPMGCertified Public Accountants
Hong Kong
APPENDIX III UNAUDITED PRO FORMA FINANCIAL INFORMATION
— III-6 —
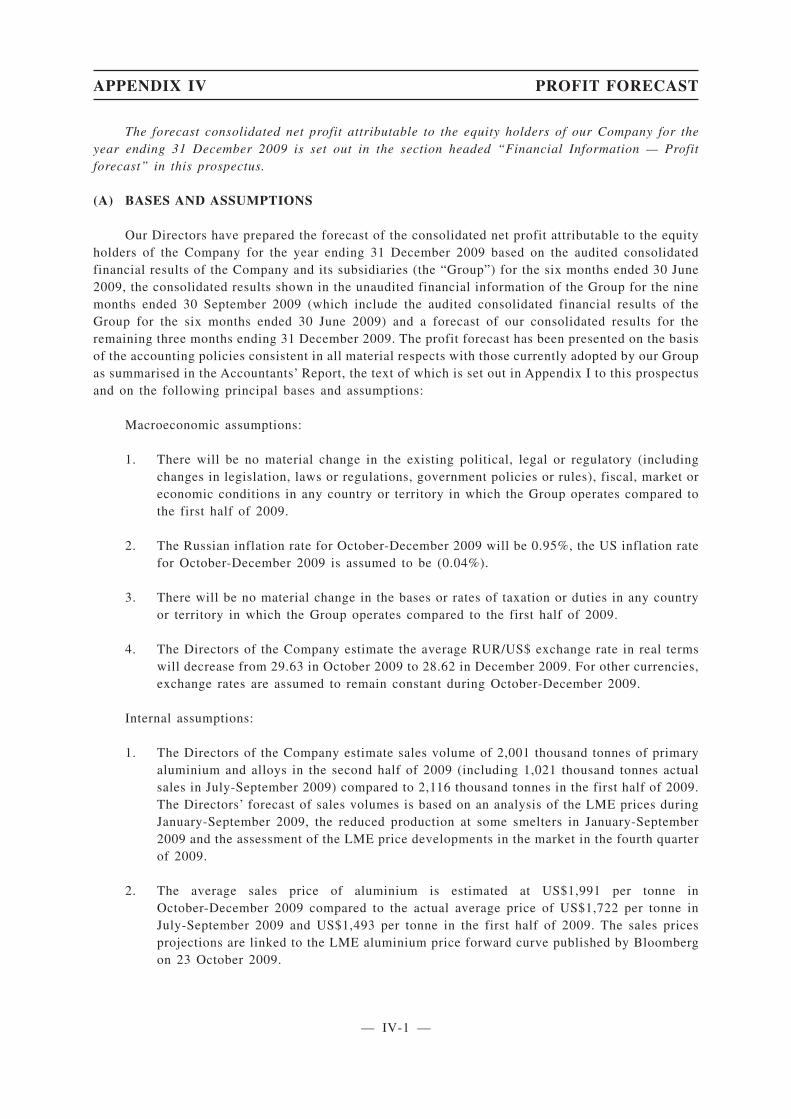
The forecast consolidated net profit attributable to the equity holders of our Company for theyear ending 31 December 2009 is set out in the section headed “Financial Information — Profitforecast” in this prospectus.
(A) BASES AND ASSUMPTIONS
Our Directors have prepared the forecast of the consolidated net profit attributable to the equityholders of the Company for the year ending 31 December 2009 based on the audited consolidatedfinancial results of the Company and its subsidiaries (the “Group”) for the six months ended 30 June2009, the consolidated results shown in the unaudited financial information of the Group for the ninemonths ended 30 September 2009 (which include the audited consolidated financial results of theGroup for the six months ended 30 June 2009) and a forecast of our consolidated results for theremaining three months ending 31 December 2009. The profit forecast has been presented on the basisof the accounting policies consistent in all material respects with those currently adopted by our Groupas summarised in the Accountants’ Report, the text of which is set out in Appendix I to this prospectusand on the following principal bases and assumptions:
Macroeconomic assumptions:
1. There will be no material change in the existing political, legal or regulatory (includingchanges in legislation, laws or regulations, government policies or rules), fiscal, market oreconomic conditions in any country or territory in which the Group operates compared tothe first half of 2009.
2. The Russian inflation rate for October-December 2009 will be 0.95%, the US inflation ratefor October-December 2009 is assumed to be (0.04%).
3. There will be no material change in the bases or rates of taxation or duties in any countryor territory in which the Group operates compared to the first half of 2009.
4. The Directors of the Company estimate the average RUR/US$ exchange rate in real termswill decrease from 29.63 in October 2009 to 28.62 in December 2009. For other currencies,exchange rates are assumed to remain constant during October-December 2009.
Internal assumptions:
1. The Directors of the Company estimate sales volume of 2,001 thousand tonnes of primaryaluminium and alloys in the second half of 2009 (including 1,021 thousand tonnes actualsales in July-September 2009) compared to 2,116 thousand tonnes in the first half of 2009.The Directors’ forecast of sales volumes is based on an analysis of the LME prices duringJanuary-September 2009, the reduced production at some smelters in January-September2009 and the assessment of the LME price developments in the market in the fourth quarterof 2009.
2. The average sales price of aluminium is estimated at US$1,991 per tonne inOctober-December 2009 compared to the actual average price of US$1,722 per tonne inJuly-September 2009 and US$1,493 per tonne in the first half of 2009. The sales pricesprojections are linked to the LME aluminium price forward curve published by Bloombergon 23 October 2009.
APPENDIX IV PROFIT FORECAST
— IV-1 —

3. The average aluminium cash cost per tonne, FOB is projected to increase from US$1,442actually incurred in July-September 2009 to US$1,485 in October-December 2009,compared to US$1,402 in the first half of 2009. Cash cost per tonne of USD1,402 in the firsthalf of 2009 was reviewed by Hatch and SRK. The projected increase in the cash cost pertonne in the fourth quarter of 2009 is primarily driven by the forecast increase in the LMEprices and the appreciation of the Russian Rouble against the US dollar.
4. In preparing the profit forecast, the Directors of the Company have assumed the followingimpact of debt restructuring in December 2009 and the related cost of debt:
a) the finance expense/(income) net before the debt restructuring impact is estimated toamount to US$504 million in the second half of 2009, of which US$534 million relatesto interest expense, which was forecast based on the existing loan agreements (beforerestructuring) and the override agreement with international lenders and the amendedbilateral agreements with the Russian and Kazakh lenders (after restructuring).
b) restructuring fees, including standstill and waiver fees and fee warrants issued to theinternational lenders at the override date and other restructuring expenses areestimated to amount to US$201 million (including US$82 million incurred during thesix months ended 30 June 2009) based on the agreements concluded with the lendersin December 2009,
c) accounting for the extinguishment of the existing debt (including the deferredconsideration payable to Onexim) and the recognition of the fair value of the debtunder the new terms would result in a gain of US$1,268 million recognised inDecember 2009.
5. The Directors of the Company estimate a share of profit from associates of US$90 millionin October-December 2009, including a profit of US$100 million from the investment inNorilsk Nickel compared to a profit from investment in associates and jointly controlledentities of US$146 million in July-September 2009 (including a profit of US$142 millionfrom the investment in Norilsk Nickel). The share of profits of Norilsk Nickel in the fourthquarter of 2009 was projected based on the average forecasts of Norilsk Nickel’s net profitfor 2009 published by ING, Merrill Lynch, Deutsche Bank, Unicredit, URALSIB, RMG,CS, DB in October 2009 and the Group’s effective ownership.
6. The Directors of the Company assume that there will be no impairment or reversals of theimpairment booked in prior periods in the second half of 2009.
7. The Board is currently in the process of approving the remuneration package for theGroup’s CEO and management, which includes remuneration in the form of a cash bonusand shares. The expected impact on the income statement in 2009 is US$119 million.
Other assumptions:
1. The Group’s operations and business will not be severely interrupted by any force majeureevents or unforeseeable factors or any unforeseeable reasons that are beyond the control ofthe Directors, including but not limited to the occurrence of natural disasters orcatastrophes, epidemics or serious accidents; and
2. The Group’s operations and financial performance will not be materially and adverselyaffected by any of the risk factors as set out in the section headed “Risk Factors” in thisprospectus.
APPENDIX IV PROFIT FORECAST
— IV-2 —

Sensitivities
The Directors believe that the Group is exposed in the ordinary course of its business to thefollowing key risks which may affect the projected financial results:
• fluctuations in LME (London Metal Exchange) aluminium sales prices
• changes in the RUR/US$ exchange rate
• fluctuations in key raw materials and electricity prices
The analysis below sets forth a sensitivity analysis of the forecast consolidated net profitattributable to the equity holders of the Company for the year ending 31 December 2009 with respectto:
a) the variation in the forecast average LME aluminium prices in the fourth quarter of 2009and on the assumption that there is no change in other input variables, including fixed andvariable costs:
Average LMEaluminium price(US$ per tonne)
Variation from basecase scenario LME
aluminium price, %
Corresponding 2009forecast net profitattributable to theequity holders of
the Company,US$ million
Variation frombase case, %
1,727 (15%) 259 (40%)1,792 (10%) 318 (27%)1,856 (5%) 376 (13%)1,922 — 434 —1,986 5% 492 13%2,051 10% 550 27%2,115 15% 608 40%
Note: The LME aluminium price represents the average price for the three months ending 31 December 2009.Only the prices for November and December are sensitised, whereas the prices for October are actual.
b) the variation in the forecast average RUR/US$ exchange rates in the fourth quarter of 2009and on the assumption that there is no change in other input variables:
Average RUR/US$exchange rate
(RUR/USD)
Variation from basecase scenario RUR/US$
exchange rate, %
Corresponding 2009forecast net profitattributable to theequity holders of
the Company,US$ million
Variation frombase case,%
26.5802 (15%) 310 (29%)27.5599 (10%) 351 (19%)28.5396 (5%) 387 (11%)29.5193 — 434 —30.4990 5% 447 3%31.4787 10% 472 9%32.4584 15% 494 14%
Note: The average RUR/US$ exchange rate represents the average exchange rate for the three months ending 31December 2009. Only forecast exchange rates for November and December are sensitised, whereas theOctober rates are actual.
APPENDIX IV PROFIT FORECAST
— IV-3 —
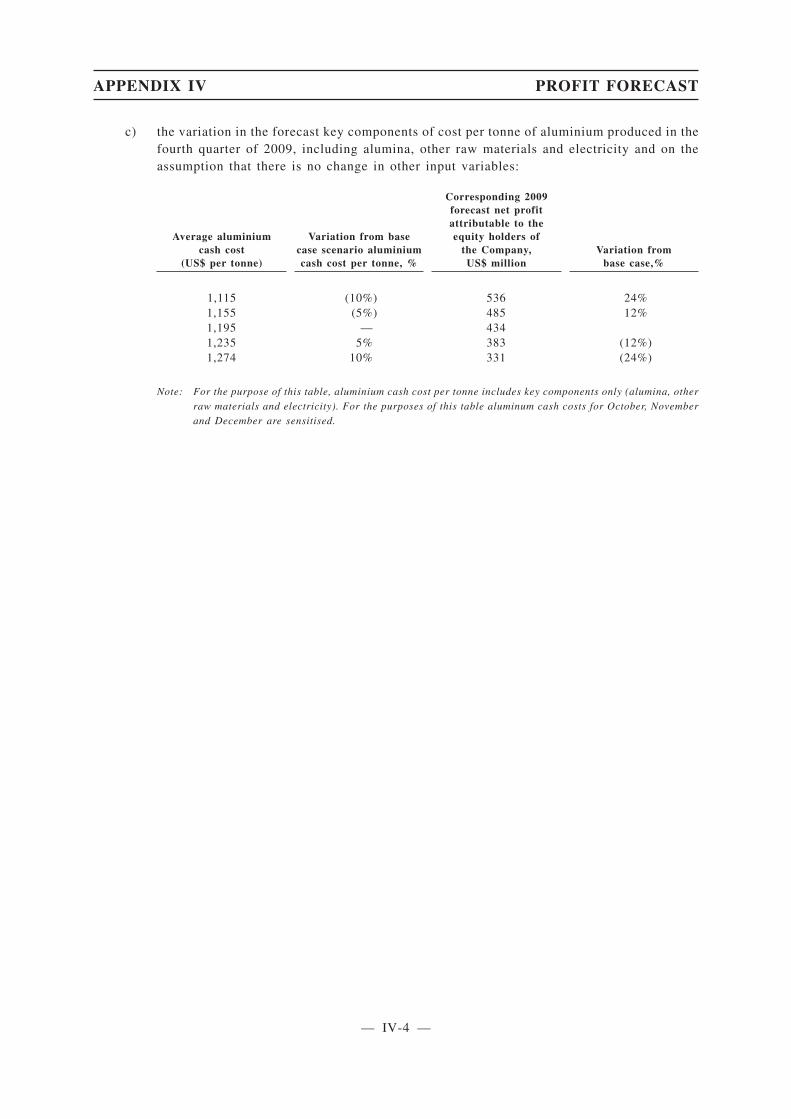
c) the variation in the forecast key components of cost per tonne of aluminium produced in thefourth quarter of 2009, including alumina, other raw materials and electricity and on theassumption that there is no change in other input variables:
Average aluminiumcash cost
(US$ per tonne)
Variation from basecase scenario aluminiumcash cost per tonne, %
Corresponding 2009forecast net profitattributable to theequity holders of
the Company,US$ million
Variation frombase case,%
1,115 (10%) 536 24%1,155 (5%) 485 12%1,195 — 4341,235 5% 383 (12%)1,274 10% 331 (24%)
Note: For the purpose of this table, aluminium cash cost per tonne includes key components only (alumina, otherraw materials and electricity). For the purposes of this table aluminum cash costs for October, Novemberand December are sensitised.
APPENDIX IV PROFIT FORECAST
— IV-4 —
(B) LETTER FROM THE JOINT REPORTING ACCOUNTANTS
The following is the text of a letter from the joint reporting accountants, ZAO KPMG, Memberof the Chamber of Auditors of Russia and KPMG, Certified Public Accountants, Hong Kong inconnection with the forecast consolidated net profit attributable to the equity holders of the Companyfor the year ending 31 December 2009 for the purpose of incorporation in this prospectus.
ZAO KPMGNaberezhnaya Tower ComplexBlock C10 Presnenskaya NaberezhnayaMoscow 123317Russia
KPMG8th FloorPrince’s Building10 Chater RoadCentralHong Kong
31 December 2009
The DirectorsUnited Company RUSAL Limited
BNP Paribas Capital (Asia Pacific) LimitedCredit Suisse (Hong Kong) Limited
Dear Sirs
We have reviewed, in accordance with the Auditing Guideline 3.341 “Accountants’ Report onprofit forecasts”, issued by the Hong Kong Institute of Certified Public Accountants, the accountingpolicies adopted and calculations made in arriving at the forecast of the consolidated net profitattributable to the equity holders of United Company RUSAL Limited (the “Company”) for the yearending 31 December 2009 (the “Profit Forecast”), for which the directors of the Company (the“Directors”) are solely responsible, as set out in the section headed “Financial Information — ProfitForecast” in the prospectus of the Company dated 31 December 2009 (the “Prospectus”).
The Profit Forecast has been prepared by the Directors based on the audited consolidatedfinancial results of the Company and its subsidiaries (collectively referred to as the “Group”) for thesix months ended 30 June 2009, the consolidated results shown in the unaudited financial informationof the Group for the nine months ended 30 September 2009 (which include the audited consolidatedfinancial results of the Group for the six months ended 30 June 2009) and a forecast of theconsolidated results of the Group for the remaining three months ending 31 December 2009.
In our opinion, so far as the accounting policies and calculations are concerned, the ProfitForecast has been properly compiled in accordance with the assumptions made by the Directors as setout in part A of Appendix IV to the Prospectus and is presented on a basis consistent in all materialrespects with the accounting policies normally adopted by the Group as set out in our accountants’report dated 31 December 2009, the text of which is set out in Appendix I to the Prospectus.
APPENDIX IV PROFIT FORECAST
— IV-5 —

Without qualifying our opinion above, we draw attention to section headed “Bases andAssumptions” on page IV-2 of the Prospectus which sets out the assumptions and estimates adoptedby the Directors regarding the impact of the debt restructuring in December 2009. In preparing theProfit Forecast, the Directors of the Company have assumed that there will be a gain recognised inrespect of the debt restructuring of US$1,067 million, net of various restructuring fees and expensesof US$201 million, for the year ending 31 December 2009. The Directors believe this is the bestestimate of the gain on the debt restructuring. Should the actual gain differ from the amount estimatedby the Directors, such difference would have the effect of increasing or decreasing the consolidatednet profit attributable to the equity shareholders of the Company for the year ending 31 December2009.
Yours faithfully
ZAO KPMGMember of the Chamber of
Auditors of RussiaRussia
Yours faithfully
KPMGCertified Public Accountants
Hong Kong
APPENDIX IV PROFIT FORECAST
— IV-6 —
(C) LETTER FROM THE JOINT SPONSORS
The following is the text of a letter, prepared for inclusion in this prospectus, which we havereceived from BNP Paribas Capital (Asia Pacific) Limited and Credit Suisse (Hong Kong) Limited, theJoint Sponsors, in connection with the profit forecast of our consolidated net profits attributable toequity holders of the Company for the year ending 31 December 2009.
BNP Paribas Capital (Asia Pacific) Limited59/F-63/F Two International Finance Centre
8 Finance StreetCentral
Hong Kong
Credit Suisse (Hong Kong) Limited45/F, Two Exchange Square
8 Connaught PlaceCentral
Hong Kong
31 December 2009
The Board of DirectorsUnited Company RUSAL Limited
Dear Sirs,
We refer to the forecast consolidated net profit attributable to equity holders of UC RUSALLimited (the “Company”) and its subsidiaries (hereinafter collectively referred to as the “Group”) forthe year ending 31 December 2009 (the “Profit Forecast”) as set out in the section headed “FinancialInformation — Profit Forecast” in the prospectus issued by the Company dated 31 December 2009 (the“Prospectus”).
We understand that the Profit Forecast, for which the directors of the Company are solelyresponsible, has been prepared by them based on the audited consolidated financial results of theGroup for the six months ended 30 June 2009, the consolidated results shown in the unauditedfinancial information of the Group for the nine months ended 30 September 2009 (which include theaudited consolidated financial results of the Group for the six months ended 30 June 2009) and aforecast of the consolidated results of the Group for the remaining three months ending 31 December2009.
We have discussed with you the bases and assumptions made by the directors of the Companyas set out in part A of Appendix IV to the Prospectus, to the extent applicable, upon which the ProfitForecast has been made. We have also considered, and relied upon, the letter dated 31 December 2009addressed to yourselves and ourselves from ZAO KPMG and KPMG (the “Joint ReportingAccountants”) regarding the accounting policies and calculations upon which the Profit Forecast hasbeen made.
On the basis of the information comprising the Profit Forecast and on the basis of the accountingpolicies and calculations adopted by you and reviewed by the Joint Reporting Accountants, we are ofthe opinion that the Profit Forecast, for which you as the directors of the Company are solelyresponsible, has been made after due and careful enquiry.
Yours faithfully,For and on behalf of
BNP Paribas Capital (Asia Pacific) LimitedIsadora Li
Head of Investment Banking — North Asia
For and on behalf ofCredit Suisse (Hong Kong) Limited
David ChengManaging Director
APPENDIX IV PROFIT FORECAST
— IV-7 —
The following is the text of a letter, summary of values and valuation certificates, prepared forinclusion in this prospectus, received from American Appraisal China Limited, an independent valuer,in connection with their valuations as of September 30, 2009, of the property interests of the Group.
The Board of DirectorsUnited Company RUSAL Limited
Dear Sirs,
In accordance with your instructions, we have valued selected property interests of UnitedCompany RUSAL Limited (“RUSAL” or the “Company”) and its subsidiaries (together referred to asthe “Group”) in Guinea, Ireland, the People’s Republic of China (“PRC”), the Russian Federation(“Russia”), and Ukraine. We confirm that we have conducted investigation for the properties, maderelevant enquiries and obtained such further information as we consider necessary for the purpose ofproviding you with our opinion of the values of such property interests as of September 30, 2009 (the“valuation date”).
This letter that forms part of our valuation report explains the basis and methodology ofvaluations and clarifies our assumptions made on the legal title of the subject properties and thelimiting conditions.
GENERAL INFORMATION
RUSAL is the world’s largest aluminium and alumina producer focused on primary aluminiumproduction and a sole global primary aluminium pureplay. 47 subsidiaries of the Company operate in11 countries and are engaged in bauxite mining, alumina refining and aluminium smelting employingover 90,000 people.
The Group operates and/or owns 16 aluminium smelters located in Nigeria, Russia, Sweden andUkraine. Three of the Group’s smelters each produces over 500 thousand tonnes of primary aluminiumper annum. Two of these, the Bratsk and the Krasnoyarsk aluminium smelters in Siberia, are the largestin the world, based on production, and each produces close to one million tonnes of primaryaluminium per annum. The Company’s aluminium smelters located in Siberia, Russia are the core ofthe Company’s aluminium business. The Siberian smelters are also among the lowest cash costaluminium smelting operations in the world. About 90% of the Company’s aluminium production and70% of alumina production are produced by high capacity low cost operations.
The Group operates and/or owns 11 alumina refineries, located in Guinea, Ireland, Italy, Jamaica,Russia and Ukraine, with an additional joint venture project in Australia, and seven bauxite miningcomplexes, located in Guinea, Guyana, Jamaica, and Russia. In addition, the Group also operatesand/or owns three powder metallurgy plants in Russia, three silicon smelters in Russia and Ukraine,three secondary aluminium plants in Russia, three aluminium foil mills in Armenia and Russia, twocryolite plants in Russia and two cathode plants in PRC.
As of the valuation date, the Group owned about 336 parcels of land with an aggregate site areaof approximately 39,900 hectares, leased about 800 parcels of land with an aggregate site area ofapproximately 26,500 hectares, and used in perpetuity about 90 parcels of land with an aggregate site
APPENDIX V PROPERTY VALUATION
— V-1 —
3rd Sch34
I.F.5.06(8)&5.07

area of approximately 2,800 hectares. The Group also owns 18,681 buildings and land improvementswith an aggregate gross floor area (“GFA”) of approximately 9,100,000 square meters. The propertiesare located in Armenia, Guinea, Guyana, Ireland, Italy, Jamaica, Nigeria, PRC, Sweden, Russia, andUkraine.
PROPERTIES APPRAISED
According to the Group’s instructions, our valuation included only 1,535 selected real estateproperties, comprising land, buildings, and land improvements which the Group considers the mostimportant to its business as detailed in Exhibit C.
According to the information provided, the number of real estate properties selected by theGroup for the purposes of the valuation and reported in the Group’s IFRS compliant fixed assetsregisters differs from the number of properties specified in respective legal documents. For thepurposes of the valuation the Group reconciled accounting and legal records and provided us withrespective reconciliation tables.
The subject properties are mostly purpose-built industrial facilities operated by 18 businessdivisions (17 subsidiaries) of the Alumina Division and the Aluminium Division. They are located in5 countries, including the PRC, and are used for mining, alumina refining, aluminium smelting, aswell as cathodes and cryolite production. Brief descriptions of the properties appraised are providedin the valuation certificates in Exhibit B. The property values are summarized in Exhibit A hereto.
Our valuations were limited to the scope described above. As requested by the Group, other realproperties owned or leased by the Group which were not considered critical to the Group’s businesswere excluded from our consideration. A summary description of the excluded properties is providedin Exhibit C hereto.
BASIS OF VALUATION
As part of our valuation, the market value of the subject property was estimated which is definedby International Valuation Standards (IVS1) and the Royal Institution of Chartered Surveyors (RICS2)as “the estimated amount for which a property should exchange on the date of valuation between awilling buyer and a willing seller in an arm’s-length transaction after proper marketing wherein theparties had each acted knowledgeably, prudently and without compulsion”.
The market value is the best price reasonably obtainable in the market by the seller and the mostadvantageous price reasonably obtainable in the market by the buyer. This estimate specificallyexcludes an estimated price inflated or deflated by special considerations or concessions granted byanyone associated with the sale, or any element of special value3. The value of a property is alsoestimated without regard to costs of sales and purchase, and without offset for any associated taxes4.
VALUATION METHODOLOGY
The properties appraised are purpose-built industrial facilities mostly located in remote areas.They are operated according to their highest and best use with limited if any alternative use. Uponconsideration of all relevant facts it was concluded that the real properties subject to valuations arespecialized properties.
1 IVS: 8th Edition, 2007. Concepts Fundamental to Generally Accepted Valuation Principles, para. 5.22 The RICS Valuation Standards, 6th Edition 2008 (the “Red Book”)3 The RICS Valuation Standards, 6th Edition 2008: Practice Statement, par. 3.2.14 The RICS Valuation Standards, 6th Edition 2008: Practice Statement, par. 3.3
APPENDIX V PROPERTY VALUATION
— V-2 —

The market approach may not be used to value specialized property due to the fact that activemarket for it does not exist. As required by IVS, depreciated replacement cost approach is used wherethere is insufficient market data to arrive at market value by means of market-based evidence5.
Depreciated replacement cost is defined by RICS and IVS6 as “the current cost of replacing theasset with its modern equivalent asset less deductions for physical deterioration and all relevant formsof obsolescence and optimizations”.
IVS requires that for a private sector entity with specialized assets, the valuer reports the resultat market value subject to a test of adequate profitability or justified service potential, a test whichis the responsibility of the entity7.
In testing profitability the impact that current economical conditions may potentially have on theGroup’s operations, financial performance, expectations of financial performance or financialconditions is considered. The assessment of such impact is reflected in the models prepared by theGroup for the purposes of debt restructuring and the Prospectus as well as in RUSAL most recentimpairment test and management analysis of the economic environment and development in thealuminium industry, that were made available to us.
The financial statements of the Group as of June 30, 2009 report impairment of SUBR, NikolaevAlumina Refinery, Aughinish Alumina Limited, and Friguia which are part of the Alumina Division,as well as Bogoslovsk Aluminium Smelter and Irkutsk Aluminium Smelter which are part of theAluminium Division. Adjustments for economic obsolescence were applied accordingly.
We have attributed no commercial value to leased and rented land plots in Group I8 as these landplots are restricted from transfer to third parties without the approval from local authorities, andsubstantial profit rent is lacking.
For the property interests in Group II8, which are rented and occupied by the UC RUSAL inGuinea, they are considered to have no commercial value either because of their non-assignability inthe market or because there are prohibitions against subletting and/or assignment contained in thetenancy agreements.
ASSUMPTIONS
Our valuations have been made on the assumption that due to its specialized nature the appraisedproperty may not be sold in the market, except by way of a sale of the business or entity of which itis part.
The profitability test for the specialized assets relied on the models and projections prepared bythe Group for the purposes of debt restructuring and the Prospectus as well as financial reporting inaccordance with IFRS.
No allowance has been made in our valuations for any charges, mortgages or amounts owing onany of the property valued nor for any expenses or taxation which may be incurred in effecting a sale.Unless otherwise stated, it is assumed that all the property interests are free from encumbrances,restrictions and outgoings of an onerous nature which could affect their values.
5 IVS: IVG Note #8, para. 4.16 IVS: 8th Edition, 2007. 3.0 Definitions. Par. 3.17 IVS: IVG Note #8, para. 5.12.1 and IVS: IVG Note #8 Appendix A.48 Group I refers to owned assets and Group II refers to rented assets.
APPENDIX V PROPERTY VALUATION
— V-3 —
We have assumed that all consents, approvals and licenses from relevant government authoritiesfor the buildings and structures erected or to be erected on the sites have been granted. Also, we haveassumed that unless otherwise stated, all buildings and structures erected on the sites are held by theowners or permitted to be occupied by the owners.
It is assumed that all applicable zoning, land use regulations and other restrictions have beencomplied with unless a non-conformity has been stated, defined and considered in the valuationcertificates. Further, it is assumed that the utilization of the land and improvements is within theboundaries of the property interests described and that no encroachment or trespass exists unless notedin the valuation certificates.
Other special assumptions and qualifications for each property, if any, have been stated in thefootnotes of the valuation certificate for the respective property.
TITLE INVESTIGATION
We have been provided with extracts of documents in relation to the title of the property interestsfor the selected plants situated in Guinea, Ireland, PRC, Russia, and Ukraine.
However, we have not scrutinized the original documents to verify ownership or to verify anyamendments which may not appear on the copies handed to us. We have relied to a considerable extenton the information provided by RUSAL and the opinions provided by Guinea legal advisor, CabinetD Avocats “BAO et FILS” (“Guinea legal opinion”), PRC legal advisor, Jun He Law offices (“PRClegal opinion”), Russian legal advisor, Egorov Puginsky Afanasiev and Partners (“Russian legalopinion”), and the opinions provided by Ukraine legal advisor, Asters (“Ukraine legal opinion”).
All legal documents disclosed in this letter and valuation certificates are for reference only andno responsibility is assumed for any legal matters concerning the legal title to the property interestsset out in this letter and valuation certificates.
LIMITING CONDITIONS
We have relied to a considerable extent on the information provided by RUSAL and haveaccepted advice given to us by the Company on such matters as statutory notices, easements, tenure,occupancy, site and floor areas and all other relevant matters. Dimensions and areas included in thevaluation certificates are based on information contained in the documents provided to us and are onlyapproximations.
We have no reason to doubt the truth and accuracy of the information as provided to us byRUSAL. We were also advised by the Company that no material facts have been omitted from theinformation so supplied. We consider we have been provided with sufficient information to reach aninformed view.
We have inspected the exterior and, where possible, the interior of the selected major propertiesincluded in the attached valuation certificates. However, no structural survey has been made and weare therefore unable to report as to whether the properties are or are not free of rot, infestation or anyother structural defects. No tests were carried out on any of the services.
We have not carried out investigations on site to determine the suitability of ground conditionsand services for the properties, nor have we undertaken archaeological, ecological or environmentalsurveys. Our valuations are prepared on the assumption that these aspects are satisfactory and that noextraordinary expenses or delays will be incurred.
APPENDIX V PROPERTY VALUATION
— V-4 —
COMPLIANCE
In valuing the property interests, we have complied with all the requirements contained inParagraph 34(2), (3) of Schedule 3 of the Companies Ordinance (Cap. 32), Chapter 5 and Practice Note12 to the Rules Governing the Listing of Securities issued by The Stock Exchange of Hong KongLimited, the RICS Valuation Standards (6th Edition 2008) published by the Royal Institution ofChartered Surveyors, International Valuation Standards (8th Edition 2007) published by InternationalValuation Standards Committee and the HKIS Valuation Standards on Properties (1st Edition 2005)published by the Hong Kong Institute of Surveyors.
We understand that the exemption in respect of not undertaking valuations of the selectedindividual properties and buildings owned or leased by the Group, and in respect of not reproducingin this prospectus the full valuation report for the properties and buildings which are being valued, hasbeen granted to the Group by the SFC under section 342A(1) of the Hong Kong Companies Ordinance,and the corresponding waiver has been granted by the Hong Kong Stock Exchange under the ListingRules.
According to the above mentioned waiver, all properties owned or leased by the Group which arelocated in the PRC, as well as the properties the Group considers critical to its businesses wereincluded in the valuations.
The Group identified the properties that are critical to its businesses as all properties owned orleased by the Group, on which the facilities which are the most important to the business of the Grouphave been built or are being built, and those which are located in proximity to such facilities and whichare necessary for their operation, as well as those which are identified as being properties ofsignificant size or importance, together with all buildings constructed on top of such properties.
For this purpose, the operations which are currently the most important to the business of theCompany (Distinct Business Units) have been identified based on an importance of operations to thebusiness of the Group as the producer of primary aluminum and revenue contribution. Further withinthese Distinct Business Units, Core and Additional Facilities were selected. Core facilities which arebeing valued have been identified based on usage, function and size of the properties, importance ofproperties in respect to IFRS Net Book Value. Properties of a significant size or importance(Additional facilities) have been identified based on usage, function and size of the properties,importance of properties in respect to IFRS Net Book Value.
With respect to the remainder of the real properties owned or leased by the Company (the“Excluded Properties”), the Company considers that inclusion of valuation information on theExcluded Properties would be irrelevant to the investment decision of potential investors in theCompany’s global offering and the exclusion of such information from the prospectus would notprejudice the interest of the investing public. A detailed description of the assets selectionmethodology is provided in Exhibit C hereto.
APPENDIX V PROPERTY VALUATION
— V-5 —
I.F.5.06(8)&5.07
REMARKS
Unless otherwise stated, all monetary amounts stated in this report are in United State Dollar(USD). The exchange rate adopted in our valuations as of September 30, 2009 being 1 USD = 30.0922Roubles = 5,025 GNF = 8.01 UAH = 0.6829 EUR.
We enclose herewith the summary of values and the valuation certificates.
Yours Faithfully,For and on behalf of
American Appraisal China LimitedEric M. H. PoonMRICS, MHKIS
Assistant Vice President
Alexander N. LopatnikovMRICS, RSA
Managing Director
Note: Mr. Eric Poon, who is a Chartered Valuation Surveyor, has over 9 years experience in valuation of properties in HongKong, the PRC and overseas.
Mr. Alexander Lopatnikov, who is a Chartered Surveyor, has over 10 years experience in valuation in Russia andoverseas.
Mr. Poon has carried out valuation of property interests in the PRC. The valuation on the property interests in overseasis supported by American Appraisal (AAR), Inc.
APPENDIX V PROPERTY VALUATION
— V-6 —
I.F.5.06(7)PN12 4
EXHIBIT ASummary of Values
APPENDIX V PROPERTY VALUATION
— V-7 —

SUMMARY OF VALUATION
Group I — Property interests held and occupied by the Group in Ireland, Russia, Guinea,Ukraine and the PRC
No. Property
Capital value inexisting state as at
September 30, 2009(USD)
Alumina Division
1 Aughinish Alumina Limited, Limerick Alumina Refining Limited 126,000,000
2 OJSC Boksit Timana 24,800,000
3 JSC Friguia (Republic of Guinea) No Commercial Value
4 LLC Nikolaev Alumina Refinery 51,500,000
5 OJSC RUSAL Achinsk Alumina Refinery 268,200,000
6 OJSC Sevuralboksitruda (SUBR) No Commercial Value
Sub-total: 470,500,000
Aluminium Division
7 LLC Khakass Aluminium Smelter 178,600,000
8 OJSC RUSAL Bratsk Aluminium Smelter,including affiliate in Taishet
280,800,000
9 OJSC RUSAL Krasnoyarsk Aluminium Smelter 250,000,000
10 OJSC Novokuznetsk Aluminium Smelter 65,800,000
11 OJSC RUSAL Sayanogorsk Aluminium Smelter 335,900,000
12 OJSC SUAL Bogoslovsk Aluminium Smelter branch No Commercial Value
13 OJSC SUAL Irkutsk Aluminium Smelter branch 105,300,000
14 OJSC Polevskoy Cryolite Plant 3,600,000
15 OJSC South Ural Cryolite Plant 49,000,000
16 Shanxi RUSAL of Lingshi County 2,080,000
17 Shanxi RUSAL of Taigu County 2,900,000
Sub-total: 1,273,980,000
Total: 1,744,480,000
Group II — Property interests rented and occupied by the Group in Guinea
18 Compagnie des Bauxite de Kindia No Commercial Value
Sub-total: No Commercial Value
GRAND TOTAL: 1,744,480,000
APPENDIX V PROPERTY VALUATION
— V-8 —

EXHIBIT BValuation Certificates
APPENDIX V PROPERTY VALUATION
— V-9 —
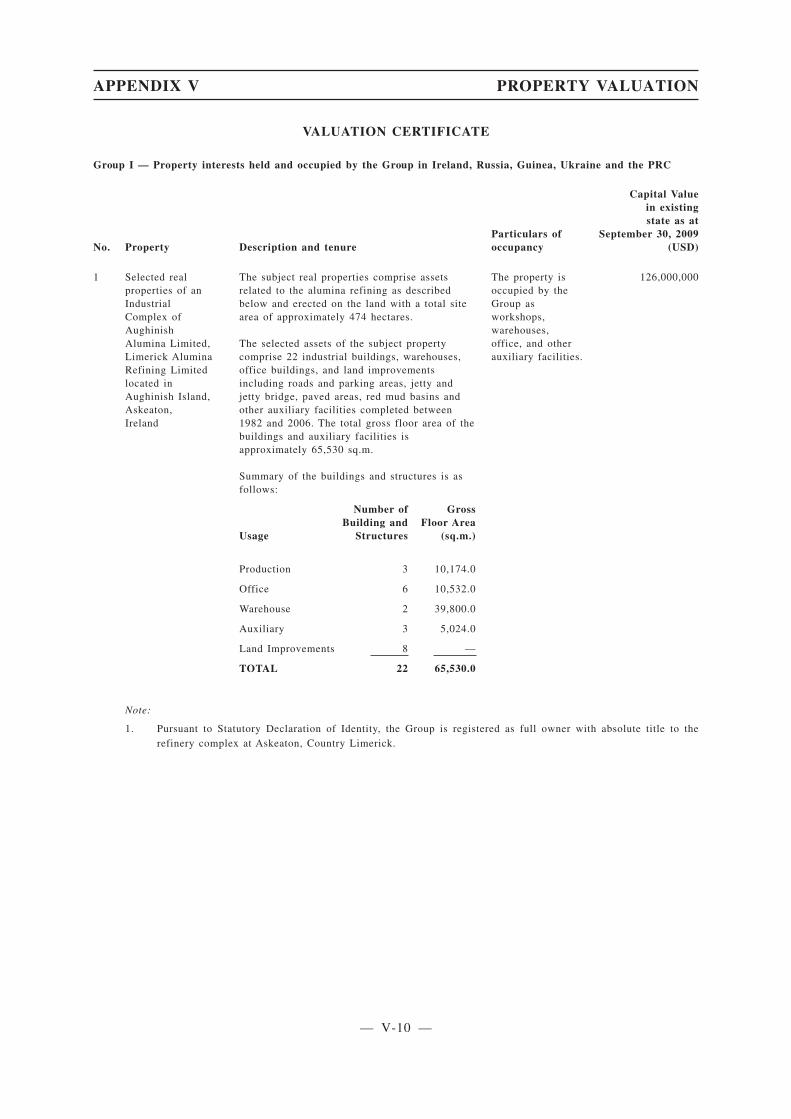
VALUATION CERTIFICATE
Group I — Property interests held and occupied by the Group in Ireland, Russia, Guinea, Ukraine and the PRC
No. Property Description and tenureParticulars ofoccupancy
Capital Valuein existingstate as at
September 30, 2009(USD)
1 Selected realproperties of anIndustrialComplex ofAughinishAlumina Limited,Limerick AluminaRefining Limitedlocated inAughinish Island,Askeaton,Ireland
The subject real properties comprise assetsrelated to the alumina refining as describedbelow and erected on the land with a total sitearea of approximately 474 hectares.
The selected assets of the subject propertycomprise 22 industrial buildings, warehouses,office buildings, and land improvementsincluding roads and parking areas, jetty andjetty bridge, paved areas, red mud basins andother auxiliary facilities completed between1982 and 2006. The total gross floor area of thebuildings and auxiliary facilities isapproximately 65,530 sq.m.
Summary of the buildings and structures is asfollows:
Number of GrossBuilding and Floor Area
Usage Structures (sq.m.)
Production 3 10,174.0
Office 6 10,532.0
Warehouse 2 39,800.0
Auxiliary 3 5,024.0
Land Improvements 8 —
TOTAL 22 65,530.0
The property isoccupied by theGroup asworkshops,warehouses,office, and otherauxiliary facilities.
126,000,000
Note:
1. Pursuant to Statutory Declaration of Identity, the Group is registered as full owner with absolute title to therefinery complex at Askeaton, Country Limerick.
APPENDIX V PROPERTY VALUATION
— V-10 —
I.F.5.06(8)I.F.5.06(1)

VALUATION CERTIFICATE
No. Property Description and tenureParticulars ofoccupancy
Capital Valuein existingstate as at
September 30, 2009(USD)
2 Selected realproperties of anIndustrialComplex ofOJSC BoksitTimana located inRussia, KomiRepublic,KnyazhpogostskyDistrict, Emva
The subject real properties comprise assetsrelated to the open pit mine and auxiliaryfacilities as described below and erected on 4land parcels with a total site area ofapproximately 236.7 hectares.
The selected assets of the subject propertycomprise 7 office, auxiliary buildings,warehouses and land improvements includingroads completed between 1991 and 2007. Thetotal gross floor area of the buildings isapproximately 3,350.6 sq.m.
Summary of the buildings and structures is asfollows:
Number of GrossBuilding and Floor Area
Usage Structures (sq.m.)
Production — —
Office 1 1,865.9
Warehouse 1 767.3
Auxiliary 1 717.4
Land Improvements 4 —
TOTAL 7 3,350.6
The property isoccupied by theGroup as repairworkshop,warehouse andother auxiliaryfacilities exceptfor portion of theproperties whichare rented tovariousindependent thirdparties (refer toNote 1).
24,800,000
Notes:
1. Pursuant to rental agreements, 4 parcels of land with a total site area of about 236.7 hectares are leased by theGroup from municipality for industrial use.
2. According to building ownership certificates, 3 buildings and 4 land improvements with a total gross floor areaof about 3,350.6 sq.m. were held by the Group.
3. We have attributed no commercial value to the leased land plots with a total site area of about 236.7 hectares asthis land is not transferable to other parties without the consent of the relevant local authorities, or substantialprofit rent is lacking.
4. The Russian legal opinion confirms, inter alia, that:
a. The Group leases 4 land plots of total area of 236.7 hectares.
b. The Group holds valid title to 7 real estate facilities with a total floor area of 3,350.6 sq.m.
APPENDIX V PROPERTY VALUATION
— V-11 —
I.F.5.06(8)I.F.5.06(1)
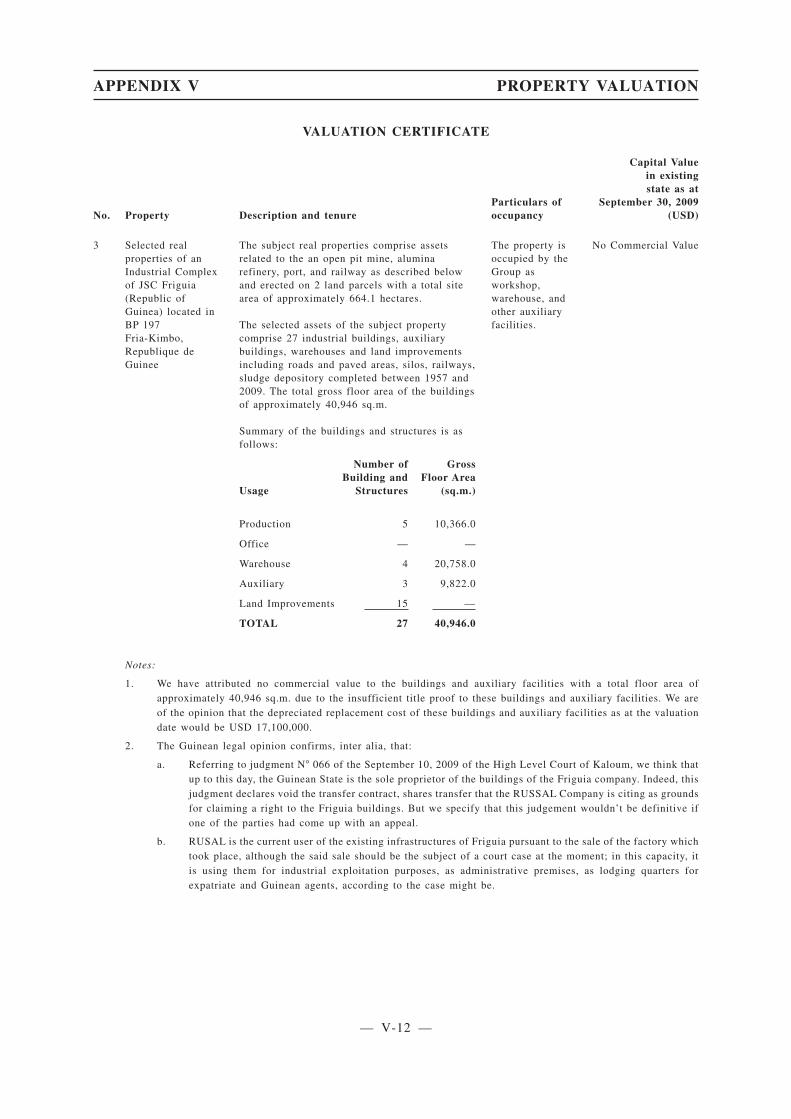
VALUATION CERTIFICATE
No. Property Description and tenureParticulars ofoccupancy
Capital Valuein existingstate as at
September 30, 2009(USD)
3 Selected realproperties of anIndustrial Complexof JSC Friguia(Republic ofGuinea) located inBP 197Fria-Kimbo,Republique deGuinee
The subject real properties comprise assetsrelated to the an open pit mine, aluminarefinery, port, and railway as described belowand erected on 2 land parcels with a total sitearea of approximately 664.1 hectares.
The selected assets of the subject propertycomprise 27 industrial buildings, auxiliarybuildings, warehouses and land improvementsincluding roads and paved areas, silos, railways,sludge depository completed between 1957 and2009. The total gross floor area of the buildingsof approximately 40,946 sq.m.
Summary of the buildings and structures is asfollows:
Number of GrossBuilding and Floor Area
Usage Structures (sq.m.)
Production 5 10,366.0
Office — —
Warehouse 4 20,758.0
Auxiliary 3 9,822.0
Land Improvements 15 —
TOTAL 27 40,946.0
The property isoccupied by theGroup asworkshop,warehouse, andother auxiliaryfacilities.
No Commercial Value
Notes:
1. We have attributed no commercial value to the buildings and auxiliary facilities with a total floor area ofapproximately 40,946 sq.m. due to the insufficient title proof to these buildings and auxiliary facilities. We areof the opinion that the depreciated replacement cost of these buildings and auxiliary facilities as at the valuationdate would be USD 17,100,000.
2. The Guinean legal opinion confirms, inter alia, that:
a. Referring to judgment N� 066 of the September 10, 2009 of the High Level Court of Kaloum, we think thatup to this day, the Guinean State is the sole proprietor of the buildings of the Friguia company. Indeed, thisjudgment declares void the transfer contract, shares transfer that the RUSSAL Company is citing as groundsfor claiming a right to the Friguia buildings. But we specify that this judgement wouldn’t be definitive ifone of the parties had come up with an appeal.
b. RUSAL is the current user of the existing infrastructures of Friguia pursuant to the sale of the factory whichtook place, although the said sale should be the subject of a court case at the moment; in this capacity, itis using them for industrial exploitation purposes, as administrative premises, as lodging quarters forexpatriate and Guinean agents, according to the case might be.
APPENDIX V PROPERTY VALUATION
— V-12 —
I.F.5.06(8)I.F.5.06(1)

VALUATION CERTIFICATE
No. Property Description and tenureParticulars ofoccupancy
Capital Valuein existingstate as at
September 30, 2009(USD)
4 Selected realproperties of anIndustrial Complexof LLC NikolaevAlumina Refinerylocated in Ukraine,Nikolaev
The subject real properties comprise assetsrelated to the alumina production as describedbelow and erected on 7 land parcels with a totalsite area of approximately 690.4 hectares.
The selected assets of the subject propertycomprise 80 industrial buildings, warehouses,offices, auxiliary buildings and landimprovements including bauxite and aluminastorages, red mud basins, roads and railroads,tanks and other auxiliary facilities completedbetween 1976 and 2008. The total gross floorarea of the buildings is approximately 244,698.6sq.m.
Summary of the buildings and structures is asfollows:
Number of GrossBuilding and Floor Area
Usage Structures (sq.m.)
Production 19 123,184.0
Office 10 44,520.2
Warehouse 2 6,692.8
Auxiliary 16 70,301.6
Land Improvements 33 —
TOTAL 80 244,698.6
The property isoccupied by theGroup asworkshop,warehouse, officeand other auxiliaryfacilities, exceptfor portion of theproperties whichare rented tovariousindependent thirdparties (refer tonote 3).
51,500,000
Notes:
1. Among the 7 parcels of land held by the Group with a total site area of about 690.4 hectares, 2 parcels with a totalsite area of 19.0046 hectares are leased from municipality for industrial use; 5 land parcels with a total site areaof 671.4 hectares have no title.
2. The company has obtained an ownership certificate for integral property complexes.
3. Pursuant to various Tenancy Agreements, portion of the properties with a total floor area of about 55,000 sq.m.are rented to various independent third parties for various terms.
4. We have attributed no commercial value to the land improvements leased from the State as this properties are nottransferable to other parties without the consent of the State.
5. We have attributed no commercial value to the leased land plots with a total site area of 690.4 hectares as this landis not transferable to other parties without the consent of the relevant local authorities, or substantial profit rentis lacking.
6. The Ukrainian legal opinion confirms, inter alia, that:
a. The Group holds due right of ownership to the owned buildings.
b. The Group leases 2 land plots with a total site area of 19.0046 hectares.
c. The Group holds no title to land with a total site area of about 671.4 hectares. The legal predecessor ofOJSC “Nikolaev Alumina Refinery” used to hold the right of perpetual use to the mentioned land, howeverthe mentioned right did not pass to the Group by way at legal succession as such succession with regardto the right of perpetual use is not allowed by Ukrainian law
APPENDIX V PROPERTY VALUATION
— V-13 —
I.F.5.06(8)I.F.5.06(1)
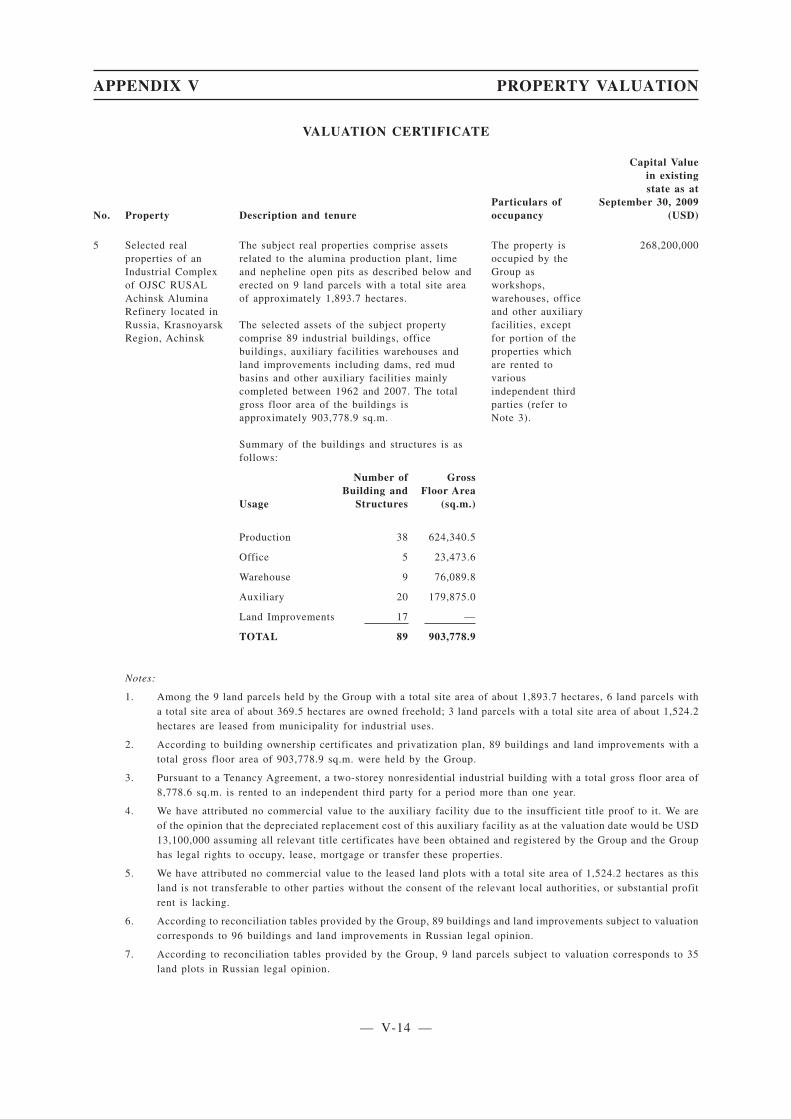
VALUATION CERTIFICATE
No. Property Description and tenureParticulars ofoccupancy
Capital Valuein existingstate as at
September 30, 2009(USD)
5 Selected realproperties of anIndustrial Complexof OJSC RUSALAchinsk AluminaRefinery located inRussia, KrasnoyarskRegion, Achinsk
The subject real properties comprise assetsrelated to the alumina production plant, limeand nepheline open pits as described below anderected on 9 land parcels with a total site areaof approximately 1,893.7 hectares.
The selected assets of the subject propertycomprise 89 industrial buildings, officebuildings, auxiliary facilities warehouses andland improvements including dams, red mudbasins and other auxiliary facilities mainlycompleted between 1962 and 2007. The totalgross floor area of the buildings isapproximately 903,778.9 sq.m.
Summary of the buildings and structures is asfollows:
Number of GrossBuilding and Floor Area
Usage Structures (sq.m.)
Production 38 624,340.5
Office 5 23,473.6
Warehouse 9 76,089.8
Auxiliary 20 179,875.0
Land Improvements 17 —
TOTAL 89 903,778.9
The property isoccupied by theGroup asworkshops,warehouses, officeand other auxiliaryfacilities, exceptfor portion of theproperties whichare rented tovariousindependent thirdparties (refer toNote 3).
268,200,000
Notes:
1. Among the 9 land parcels held by the Group with a total site area of about 1,893.7 hectares, 6 land parcels witha total site area of about 369.5 hectares are owned freehold; 3 land parcels with a total site area of about 1,524.2hectares are leased from municipality for industrial uses.
2. According to building ownership certificates and privatization plan, 89 buildings and land improvements with atotal gross floor area of 903,778.9 sq.m. were held by the Group.
3. Pursuant to a Tenancy Agreement, a two-storey nonresidential industrial building with a total gross floor area of8,778.6 sq.m. is rented to an independent third party for a period more than one year.
4. We have attributed no commercial value to the auxiliary facility due to the insufficient title proof to it. We areof the opinion that the depreciated replacement cost of this auxiliary facility as at the valuation date would be USD13,100,000 assuming all relevant title certificates have been obtained and registered by the Group and the Grouphas legal rights to occupy, lease, mortgage or transfer these properties.
5. We have attributed no commercial value to the leased land plots with a total site area of 1,524.2 hectares as thisland is not transferable to other parties without the consent of the relevant local authorities, or substantial profitrent is lacking.
6. According to reconciliation tables provided by the Group, 89 buildings and land improvements subject to valuationcorresponds to 96 buildings and land improvements in Russian legal opinion.
7. According to reconciliation tables provided by the Group, 9 land parcels subject to valuation corresponds to 35land plots in Russian legal opinion.
APPENDIX V PROPERTY VALUATION
— V-14 —
I.F.5.06(8)I.F.5.06(1)
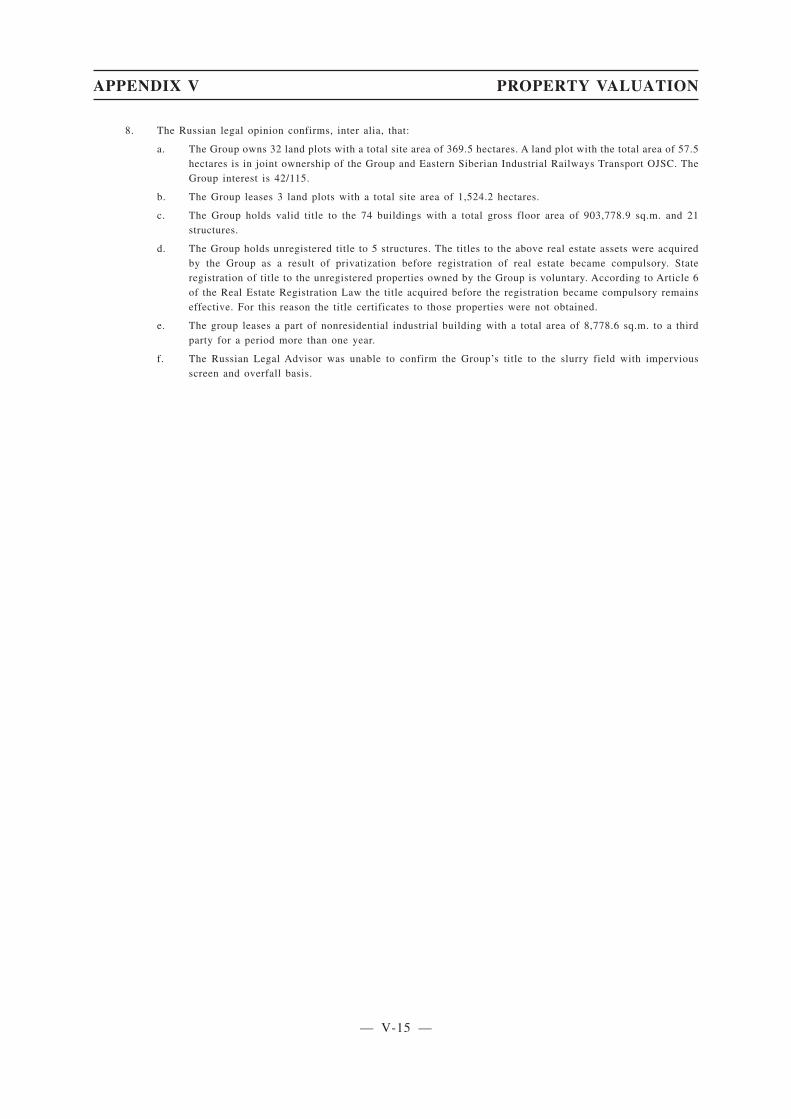
8. The Russian legal opinion confirms, inter alia, that:
a. The Group owns 32 land plots with a total site area of 369.5 hectares. A land plot with the total area of 57.5hectares is in joint ownership of the Group and Eastern Siberian Industrial Railways Transport OJSC. TheGroup interest is 42/115.
b. The Group leases 3 land plots with a total site area of 1,524.2 hectares.
c. The Group holds valid title to the 74 buildings with a total gross floor area of 903,778.9 sq.m. and 21structures.
d. The Group holds unregistered title to 5 structures. The titles to the above real estate assets were acquiredby the Group as a result of privatization before registration of real estate became compulsory. Stateregistration of title to the unregistered properties owned by the Group is voluntary. According to Article 6of the Real Estate Registration Law the title acquired before the registration became compulsory remainseffective. For this reason the title certificates to those properties were not obtained.
e. The group leases a part of nonresidential industrial building with a total area of 8,778.6 sq.m. to a thirdparty for a period more than one year.
f. The Russian Legal Advisor was unable to confirm the Group’s title to the slurry field with imperviousscreen and overfall basis.
APPENDIX V PROPERTY VALUATION
— V-15 —
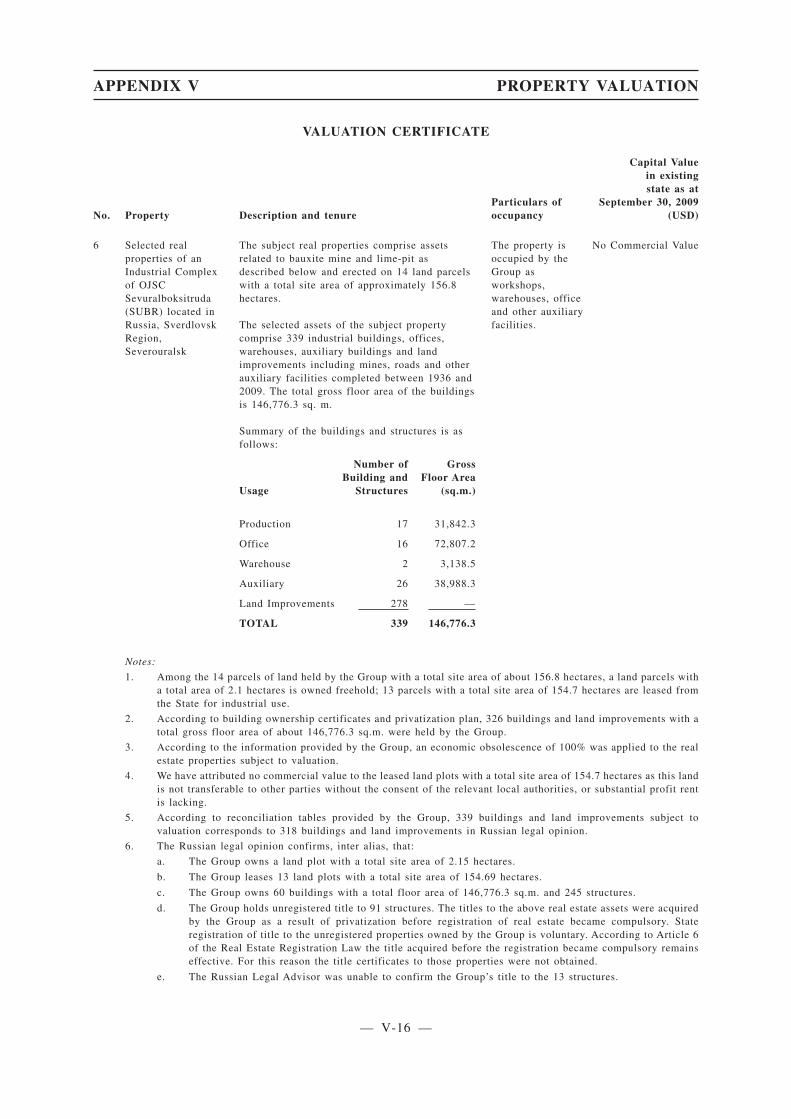
VALUATION CERTIFICATE
No. Property Description and tenureParticulars ofoccupancy
Capital Valuein existingstate as at
September 30, 2009(USD)
6 Selected realproperties of anIndustrial Complexof OJSCSevuralboksitruda(SUBR) located inRussia, SverdlovskRegion,Severouralsk
The subject real properties comprise assetsrelated to bauxite mine and lime-pit asdescribed below and erected on 14 land parcelswith a total site area of approximately 156.8hectares.
The selected assets of the subject propertycomprise 339 industrial buildings, offices,warehouses, auxiliary buildings and landimprovements including mines, roads and otherauxiliary facilities completed between 1936 and2009. The total gross floor area of the buildingsis 146,776.3 sq. m.
Summary of the buildings and structures is asfollows:
Number of GrossBuilding and Floor Area
Usage Structures (sq.m.)
Production 17 31,842.3
Office 16 72,807.2
Warehouse 2 3,138.5
Auxiliary 26 38,988.3
Land Improvements 278 —
TOTAL 339 146,776.3
The property isoccupied by theGroup asworkshops,warehouses, officeand other auxiliaryfacilities.
No Commercial Value
Notes:
1. Among the 14 parcels of land held by the Group with a total site area of about 156.8 hectares, a land parcels witha total area of 2.1 hectares is owned freehold; 13 parcels with a total site area of 154.7 hectares are leased fromthe State for industrial use.
2. According to building ownership certificates and privatization plan, 326 buildings and land improvements with atotal gross floor area of about 146,776.3 sq.m. were held by the Group.
3. According to the information provided by the Group, an economic obsolescence of 100% was applied to the realestate properties subject to valuation.
4. We have attributed no commercial value to the leased land plots with a total site area of 154.7 hectares as this landis not transferable to other parties without the consent of the relevant local authorities, or substantial profit rentis lacking.
5. According to reconciliation tables provided by the Group, 339 buildings and land improvements subject tovaluation corresponds to 318 buildings and land improvements in Russian legal opinion.
6. The Russian legal opinion confirms, inter alias, that:
a. The Group owns a land plot with a total site area of 2.15 hectares.
b. The Group leases 13 land plots with a total site area of 154.69 hectares.
c. The Group owns 60 buildings with a total floor area of 146,776.3 sq.m. and 245 structures.
d. The Group holds unregistered title to 91 structures. The titles to the above real estate assets were acquiredby the Group as a result of privatization before registration of real estate became compulsory. Stateregistration of title to the unregistered properties owned by the Group is voluntary. According to Article 6of the Real Estate Registration Law the title acquired before the registration became compulsory remainseffective. For this reason the title certificates to those properties were not obtained.
e. The Russian Legal Advisor was unable to confirm the Group’s title to the 13 structures.
APPENDIX V PROPERTY VALUATION
— V-16 —
I.F.5.06(8)I.F.5.06(1)
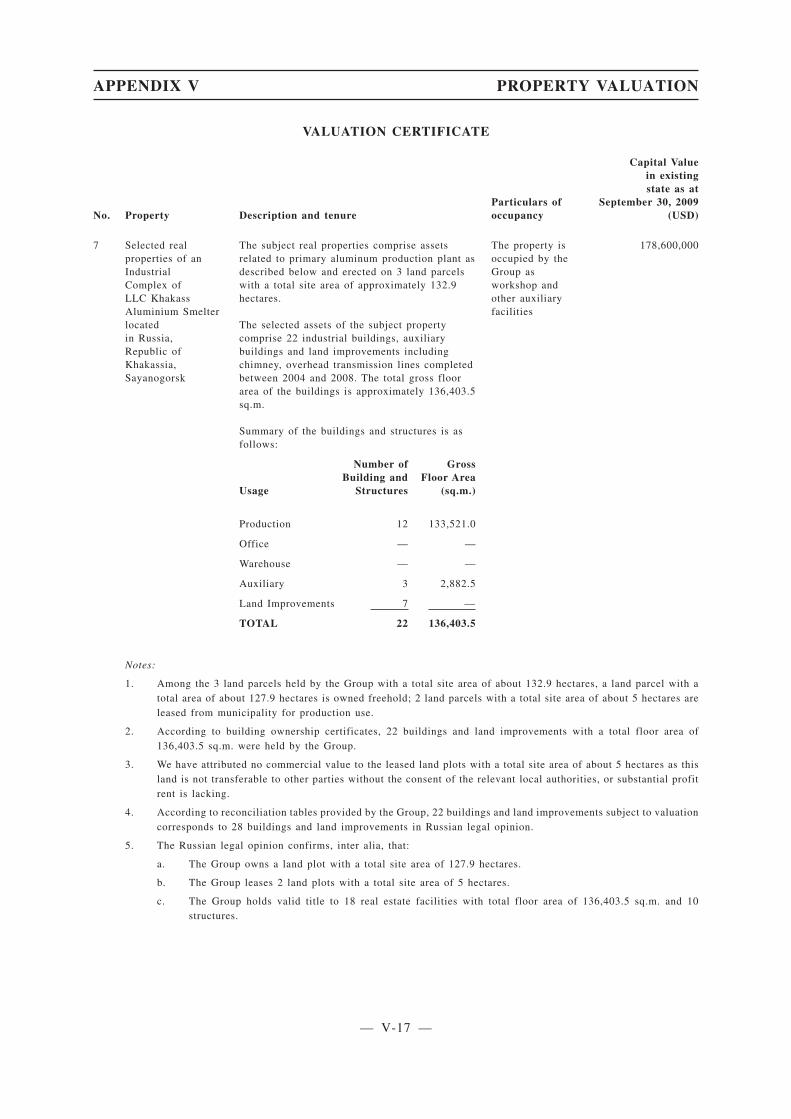
VALUATION CERTIFICATE
No. Property Description and tenureParticulars ofoccupancy
Capital Valuein existingstate as at
September 30, 2009(USD)
7 Selected realproperties of anIndustrialComplex ofLLC KhakassAluminium Smelterlocatedin Russia,Republic ofKhakassia,Sayanogorsk
The subject real properties comprise assetsrelated to primary aluminum production plant asdescribed below and erected on 3 land parcelswith a total site area of approximately 132.9hectares.
The selected assets of the subject propertycomprise 22 industrial buildings, auxiliarybuildings and land improvements includingchimney, overhead transmission lines completedbetween 2004 and 2008. The total gross floorarea of the buildings is approximately 136,403.5sq.m.
Summary of the buildings and structures is asfollows:
Number of GrossBuilding and Floor Area
Usage Structures (sq.m.)
Production 12 133,521.0
Office — —
Warehouse — —
Auxiliary 3 2,882.5
Land Improvements 7 —
TOTAL 22 136,403.5
The property isoccupied by theGroup asworkshop andother auxiliaryfacilities
178,600,000
Notes:
1. Among the 3 land parcels held by the Group with a total site area of about 132.9 hectares, a land parcel with atotal area of about 127.9 hectares is owned freehold; 2 land parcels with a total site area of about 5 hectares areleased from municipality for production use.
2. According to building ownership certificates, 22 buildings and land improvements with a total floor area of136,403.5 sq.m. were held by the Group.
3. We have attributed no commercial value to the leased land plots with a total site area of about 5 hectares as thisland is not transferable to other parties without the consent of the relevant local authorities, or substantial profitrent is lacking.
4. According to reconciliation tables provided by the Group, 22 buildings and land improvements subject to valuationcorresponds to 28 buildings and land improvements in Russian legal opinion.
5. The Russian legal opinion confirms, inter alia, that:
a. The Group owns a land plot with a total site area of 127.9 hectares.
b. The Group leases 2 land plots with a total site area of 5 hectares.
c. The Group holds valid title to 18 real estate facilities with total floor area of 136,403.5 sq.m. and 10structures.
APPENDIX V PROPERTY VALUATION
— V-17 —
I.F.5.06(8)I.F.5.06(1)
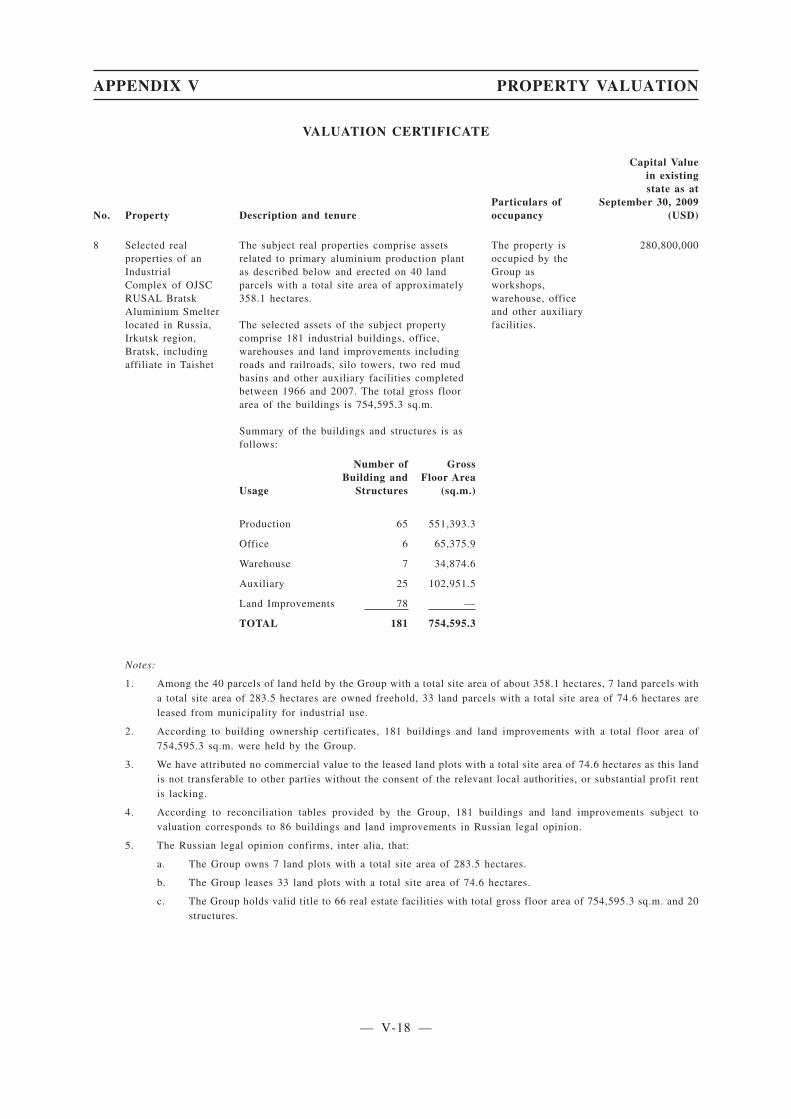
VALUATION CERTIFICATE
No. Property Description and tenureParticulars ofoccupancy
Capital Valuein existingstate as at
September 30, 2009(USD)
8 Selected realproperties of anIndustrialComplex of OJSCRUSAL BratskAluminium Smelterlocated in Russia,Irkutsk region,Bratsk, includingaffiliate in Taishet
The subject real properties comprise assetsrelated to primary aluminium production plantas described below and erected on 40 landparcels with a total site area of approximately358.1 hectares.
The selected assets of the subject propertycomprise 181 industrial buildings, office,warehouses and land improvements includingroads and railroads, silo towers, two red mudbasins and other auxiliary facilities completedbetween 1966 and 2007. The total gross floorarea of the buildings is 754,595.3 sq.m.
Summary of the buildings and structures is asfollows:
Number of GrossBuilding and Floor Area
Usage Structures (sq.m.)
Production 65 551,393.3
Office 6 65,375.9
Warehouse 7 34,874.6
Auxiliary 25 102,951.5
Land Improvements 78 —
TOTAL 181 754,595.3
The property isoccupied by theGroup asworkshops,warehouse, officeand other auxiliaryfacilities.
280,800,000
Notes:
1. Among the 40 parcels of land held by the Group with a total site area of about 358.1 hectares, 7 land parcels witha total site area of 283.5 hectares are owned freehold, 33 land parcels with a total site area of 74.6 hectares areleased from municipality for industrial use.
2. According to building ownership certificates, 181 buildings and land improvements with a total floor area of754,595.3 sq.m. were held by the Group.
3. We have attributed no commercial value to the leased land plots with a total site area of 74.6 hectares as this landis not transferable to other parties without the consent of the relevant local authorities, or substantial profit rentis lacking.
4. According to reconciliation tables provided by the Group, 181 buildings and land improvements subject tovaluation corresponds to 86 buildings and land improvements in Russian legal opinion.
5. The Russian legal opinion confirms, inter alia, that:
a. The Group owns 7 land plots with a total site area of 283.5 hectares.
b. The Group leases 33 land plots with a total site area of 74.6 hectares.
c. The Group holds valid title to 66 real estate facilities with total gross floor area of 754,595.3 sq.m. and 20structures.
APPENDIX V PROPERTY VALUATION
— V-18 —
I.F.5.06(8)I.F.5.06(1)

VALUATION CERTIFICATE
No. Property Description and tenureParticulars ofoccupancy
Capital Valuein existingstate as at
September 30, 2009(USD)
9 Selected realproperties of anIndustrial Complexof OJSC RUSALKrasnoyarskAluminium Smelterlocated in Russia,KrasnoyarskTerritory,Krasnoyarsk
The subject real properties comprise assetsrelated to primary aluminum production plant asdescribed below and erected on 2 land parcelswith a total site area of approximately 293.4hectares.
The selected assets of the subject propertycomprise 106 main industrial buildings,pumping and compressor stations, offices,warehouses and land improvements includingroads and railroads, chimneys and otherauxiliary facilities completed between 1961 and2008. The total gross floor area of the buildingsis about approximately 832,324.5 sq.m.
Summary of the buildings and structures is asfollows:
Number of GrossBuilding and Floor Area
Usage Structures (sq.m.)
Production 55 611,697.5
Office 8 49,513.8
Warehouse 12 45,794.2
Auxiliary 25 125,319.0
Land Improvements 6 —
TOTAL 106 832,324.5
The property isoccupied by theCompany asworkshops,warehouses, officeand other auxiliaryfacilities.
250,000,000
Notes:
1. Pursuant to ownership certificates, 2 land parcels of land held by the Group with a total site area of about 293.4hectares are owned freehold.
2. According to building ownership certificates, 104 buildings and structures with a total floor area of about830,512.9 sq.m. were held by the Group.
3. We have attributed no commercial value to the buildings with a total gross floor area of 1,811.6 sq.m. due to theinsufficient title proof to this buildings. We are of the opinion that the market value of these buildings as at thevaluation date would be USD 3,800,000 assuming all relevant title certificates have been obtained and registeredby the Group and the Group has legal rights to occupy, lease, mortgage or transfer these properties.
4. According to reconciliation tables provided by the Group, 106 buildings and land improvements subject tovaluation corresponds to 93 buildings and land improvements in Russian legal opinion.
5. The Russian legal opinion confirms, inter alia, that:
a. The Group owns 2 land plots with a total site area of 293.4 hectares.
b. The Group holds valid title to 87 buildings with a total floor area of 830,512.9 sq.m. and 4 landimprovements.
c. The Russian Legal Advisor was unable to confirm the Group’s title to 2 buildings with a total floor areaof 1,811.6 sq.m.
APPENDIX V PROPERTY VALUATION
— V-19 —
I.F.5.06(8)I.F.5.06(1)

VALUATION CERTIFICATE
No. Property Description and tenureParticulars ofoccupancy
Capital Valuein existingstate as at
September 30, 2009(USD)
10 Selected realproperties of anIndustrialComplex of OJSCNovokuznetskAluminium Smelterlocated in Russia,Kemerovo region,Novokuznetsk
The subject real properties comprise assetsrelated to primary aluminium production plantas described below and erected on 5 landparcels with a total site area of approximately156.7 hectares.
The selected assets of the subject propertycomprise 109 industrial buildings, warehouses,office buildings and land improvementsincluding roads and railroads, tanks, a red mudbasin, silo towers, and other auxiliary facilitiescompleted between 1942 and 2008. The totalgross floor area of the buildings isapproximately 313,616.3 sq.m.
Summary of the buildings and structures is asfollows:
Number of GrossBuilding and Floor Area
Usage Structures (sq.m.)
Production 39 211,770.7
Office 6 21,300.6
Warehouse 10 25,659.1
Auxiliary 17 54,885.9
Land Improvements 37 —
TOTAL 109 313,616.3
The property isoccupied by theGroup asworkshops,warehouse, officeand other auxiliaryfacilities.
65,800,000
Notes:
1. Among the 5 land parcels held by the Group with a total site area of about 156.7 hectares, 4 land parcels with atotal site area of 134.4 hectares are owned freehold, a land parcel with a total site area of 22.3 hectares is leasedfrom municipality for industrial use.
2. According to building ownership certificates, 109 buildings and land improvements with a total floor area of about313,616.3 sq.m. were held by the Group.
3. We have attributed no commercial value to the leased land plots with a total site area of 22.3 hectares as this landis not transferable to other parties without the consent of the relevant local authorities, or substantial profit rentis lacking.
4. According to reconciliation tables provided by the Group, 109 buildings and land improvements subject tovaluation corresponds to 90 buildings and land improvements in Russian legal opinion.
5. The Russian legal opinion confirms, inter alia, that:
a. The Group owns 4 land plots with a total site area of 134.4 hectares.
b. The Group leases a land plot with a total site area of 22.3 hectares.
c. The Group holds valid title to 67 real estate facilities with a total floor area of 313,616.3 sq.m. and 23structures.
APPENDIX V PROPERTY VALUATION
— V-20 —
I.F.5.06(8)I.F.5.06(1)

VALUATION CERTIFICATE
No. Property Description and tenureParticulars ofoccupancy
Capital Valuein existingstate as at
September 30, 2009(USD)
11 Selected realproperties of anIndustrial Complexof OJSC RUSALSayanogorskAluminium Smelterlocated in Russia,Republic ofKhakassia,Sayanogorsk
The subject real properties comprise assetsrelated to the primary aluminum productionplant as described below and erected on a landparcel with a site area of approximately 549.7hectares.
The selected assets of the subject propertycomprise 67 industrial buildings, warehouses,offices, auxiliary buildings, and landimprovements including chimneys completedbetween 1985 and 2000. The total gross floorarea of the buildings is approximately 637,791.7sq.m.
Summary of the buildings and structures is asfollows:
Number of GrossBuilding and Floor Area
Usage Structures (sq.m.)
Production 36 461,852.3
Office 11 69,669.7
Warehouse 5 29,580.1
Auxiliary 12 76,689.6
Land Improvements 3 —
TOTAL 67 637,791.7
The property isoccupied by theGroup asworkshops,warehouses, officeand other auxiliaryfacilities.
335,900,000
Notes:
1. A land parcel with a total site area of about 549.7 hectares is owned freehold.
2. According to building ownership certificates, 67 buildings and land improvements with a total gross floor area ofabout 637,791.7 sq.m. were held by the Group.
3. According to reconciliation tables provided by the Group, 67 buildings and land improvements subject to valuationcorresponds to 62 buildings and land improvements in Russian legal opinion.
4. The Russian legal opinion confirms, inter alia, that:
a. The Group owns a land plot with a total site area of 549.7 hectares.
b. The Group owns 61 buildings with total gross floor area of 637,791.7 sq.m. and 1 structure.
APPENDIX V PROPERTY VALUATION
— V-21 —
I.F.5.06(8)I.F.5.06(1)
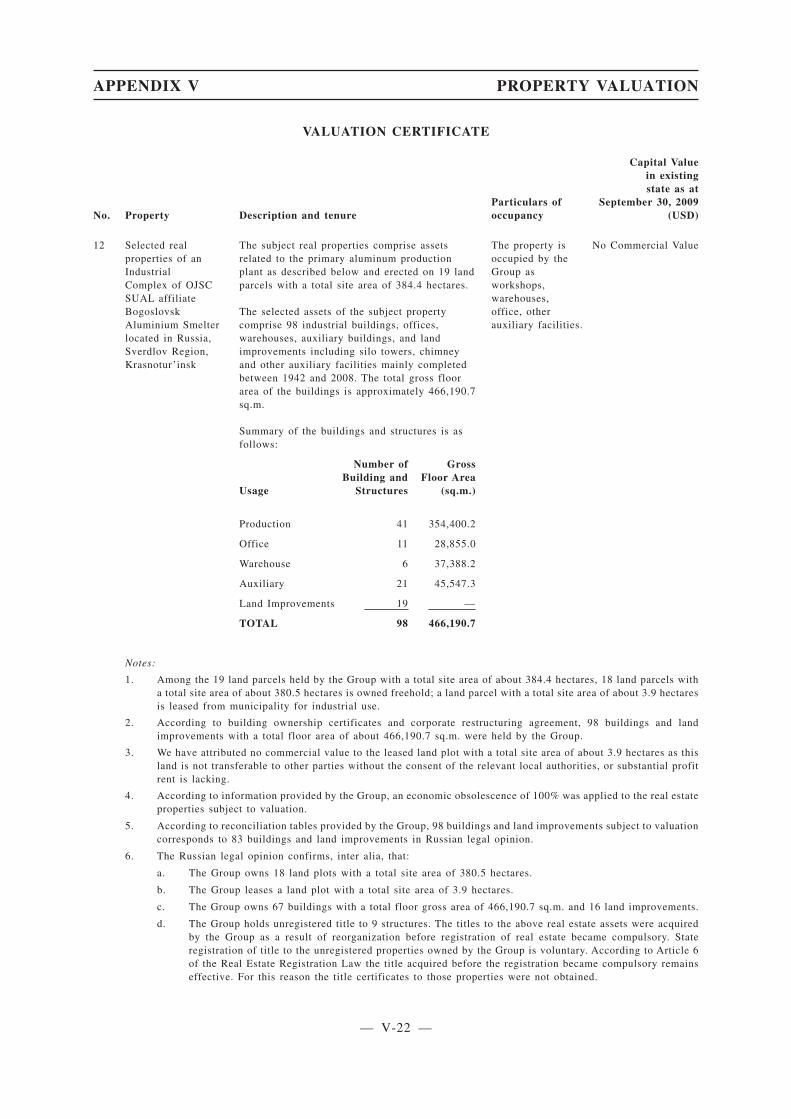
VALUATION CERTIFICATE
No. Property Description and tenureParticulars ofoccupancy
Capital Valuein existingstate as at
September 30, 2009(USD)
12 Selected realproperties of anIndustrialComplex of OJSCSUAL affiliateBogoslovskAluminium Smelterlocated in Russia,Sverdlov Region,Krasnotur’insk
The subject real properties comprise assetsrelated to the primary aluminum productionplant as described below and erected on 19 landparcels with a total site area of 384.4 hectares.
The selected assets of the subject propertycomprise 98 industrial buildings, offices,warehouses, auxiliary buildings, and landimprovements including silo towers, chimneyand other auxiliary facilities mainly completedbetween 1942 and 2008. The total gross floorarea of the buildings is approximately 466,190.7sq.m.
Summary of the buildings and structures is asfollows:
Number of GrossBuilding and Floor Area
Usage Structures (sq.m.)
Production 41 354,400.2
Office 11 28,855.0
Warehouse 6 37,388.2
Auxiliary 21 45,547.3
Land Improvements 19 —
TOTAL 98 466,190.7
The property isoccupied by theGroup asworkshops,warehouses,office, otherauxiliary facilities.
No Commercial Value
Notes:
1. Among the 19 land parcels held by the Group with a total site area of about 384.4 hectares, 18 land parcels witha total site area of about 380.5 hectares is owned freehold; a land parcel with a total site area of about 3.9 hectaresis leased from municipality for industrial use.
2. According to building ownership certificates and corporate restructuring agreement, 98 buildings and landimprovements with a total floor area of about 466,190.7 sq.m. were held by the Group.
3. We have attributed no commercial value to the leased land plot with a total site area of about 3.9 hectares as thisland is not transferable to other parties without the consent of the relevant local authorities, or substantial profitrent is lacking.
4. According to information provided by the Group, an economic obsolescence of 100% was applied to the real estateproperties subject to valuation.
5. According to reconciliation tables provided by the Group, 98 buildings and land improvements subject to valuationcorresponds to 83 buildings and land improvements in Russian legal opinion.
6. The Russian legal opinion confirms, inter alia, that:
a. The Group owns 18 land plots with a total site area of 380.5 hectares.
b. The Group leases a land plot with a total site area of 3.9 hectares.
c. The Group owns 67 buildings with a total floor gross area of 466,190.7 sq.m. and 16 land improvements.
d. The Group holds unregistered title to 9 structures. The titles to the above real estate assets were acquiredby the Group as a result of reorganization before registration of real estate became compulsory. Stateregistration of title to the unregistered properties owned by the Group is voluntary. According to Article 6of the Real Estate Registration Law the title acquired before the registration became compulsory remainseffective. For this reason the title certificates to those properties were not obtained.
APPENDIX V PROPERTY VALUATION
— V-22 —
I.F.5.06(8)I.F.5.06(1)

VALUATION CERTIFICATE
No. Property Description and tenureParticulars ofoccupancy
Capital Valuein existingstate as at
September 30, 2009(USD)
13 Selected realproperties of anIndustrial Complexof OJSC SUALaffiliate IrkutskAluminium Smelterlocated in Russia,Irkutsk region,Shelekhov
The subject real properties comprise assetsrelated to the primary aluminium productionplant as described below and erected on a landparcels with a site area of approximately 232.8hectares.
The selected assets of the subject propertycomprise 109 industrial buildings, offices,warehouses, auxiliary buildings, and landimprovements including roads, silo towers, ared mud basin and other auxiliary facilitiescompleted between 1956 and 2009. The totalgross floor area of the buildings isapproximately 448,272.5 sq.m.
Summary of the buildings and structures is asfollows:
Number of GrossBuilding and Floor Area
Usage Structures (sq.m.)
Production 38 356,039.8
Office 4 13,475.1
Warehouse 8 21,799.3
Auxiliary 15 56,958.3
Land Improvements 44 —
TOTAL 109 448,272.5
The property isoccupied by theGroup asworkshops,warehouse, office,and other auxiliaryfacilities.
105,300,000
Notes:
1. A land parcel with a total site area of about 232.8 hectares is owned freehold.
2. According to building ownership certificates, corporate restructuring agreement and real estate purchase and saleagreement, 107 buildings and land improvements with a total floor area of about 448,272.5 sq.m. were held bythe Group.
3. We have attributed no commercial value to 2 auxiliary facilities due to the insufficient title proof to it. We are ofthe opinion that the market value of these auxiliary facilities as of the valuation date would be USD840,000assuming all relevant title certificates have been obtained and registered by the Group and the Group has legalrights to occupy, lease, mortgage or transfer these properties.
4. According to the reconciliation tables provided by the Group, 109 buildings and land improvements subject tovaluation corresponds to 62 buildings and land improvements in Russian legal opinion.
5. The Russian legal opinion confirms, inter alia, that:
a. The Group owns a land plot with a total site area of 232.8 hectares.
b. The Group owns 45 buildings with a total floor area of 448,272.5 sq.m. and 15 land improvements.
c. The Group holds unregistered title to a building with floor area of 1,145.6 sq.m. and 2 land improvements.The title to the above real estate assets was acquired as a result of reorganization and by virtue of a realestate purchase and sale agreement before registration of real estate became compulsory. State registrationof title to the unregistered properties owned by the Group is voluntary. According to Article 6 of the RealEstate Registration Law the title acquired before the registration became compulsory remains effective. Forthis reason the title certificates to those properties were not obtained.
d. The Russian Legal Advisor was unable to confirm the Group’s title to 2 land improvements.
APPENDIX V PROPERTY VALUATION
— V-23 —
I.F.5.06(8)I.F.5.06(1)

VALUATION CERTIFICATE
No. Property Description and tenureParticulars ofoccupancy
Capital Valuein existingstate as at
September 30, 2009(USD)
14 Selected realproperties of anIndustrial Complexof OJSC PolevskoyCryolite Plantlocated in Russia,Sverdlovsk region,Polevskoy
The subject real properties comprise assetsrelated to the cryolite production plant asdescribed below and erected on 5 land parcelswith a total site area of approximately 410.9hectares.
The selected assets of the subject propertycomprise 38 industrial buildings, officesauxiliary buildings, warehouses and landimprovements including roads, tanks, red mudbasin and other auxiliary facilities completedbetween 1964 and 2002. The total gross floorarea of the buildings is approximately 66,012sq.m.
Summary of the buildings and structures is asfollows:
Number of GrossBuilding and Floor Area
Usage Structures (sq.m.)
Production 4 29,534.0
Office 4 6,535.0
Warehouse 5 17,702.4
Auxiliary 10 12,240.6
Land Improvements 15 —
TOTAL 38 66,012.0
The property isoccupied by theGroup asworkshops,warehouses,offices and otherauxiliary facilities.
3,600,000
Notes:
1. Among the 5 land parcels with a total site area of about 410.9 hectares, a land parcel with a total site area of about46.9 hectares is owned freehold; 4 land parcels with a total site area of about 364 hectares were granted to theGroup for use in perpetuity for industrial use.
2. According to building ownership certificates, 8 buildings and land improvements with a total gross floor area ofabout 32,861 sq.m. were held by the Group.
3. We have attributed no commercial value to the buildings and auxiliary facilities with a total floor area of about33,151 sq.m. due to the insufficient title proof to these buildings and auxiliary facilities. We are of the opinionthat the depreciated replacement cost of these buildings and auxiliary facilities as at the valuation date would beUSD66,000,000 assuming all relevant title certificates have been obtained and registered by the Group and theGroup has legal rights to occupy, lease, mortgage or transfer these properties.
4. We have attributed no commercial value to the land plots in perpetuity with a total site area of about 364 hectaresas this land is not transferable to other parties without the consent of the relevant local authorities.
5. According to reconciliation tables provided by the Group, 38 buildings and land improvements subject to valuationcorresponds to 36 buildings and land improvements in Russian legal opinion.
6. The Russian legal opinion confirms, inter alia, that:
a. The Group owns a land plot with a total site area of 46.9 hectares.
b. The Group holds a right of permanent (indefinite) use of 4 land plots with a total site area of 364 hectares.According to Article 20(4) of the Land Code of the Russian Federation the Group may not transact withthose land plots. Under the applicable Russian regulations, by January 1, 2010 the Group is required toeither purchase or lease them from the owner. However, even if those land plots would not be purchasedor leased by that date, the Group’s title of permanent (indefinite) use to land plots will remain effective.
APPENDIX V PROPERTY VALUATION
— V-24 —
I.F.5.06(8)I.F.5.06(1)

If the Group does not convert its title to the said land plots by January 1, 2011 a fine of up to RUB100,000may be imposed on it. However this limitation of the Group’s rights to those land plots does not affect theGroup’s right to sell, lease, mortgage or otherwise dispose of buildings and facilities situated on therespective land plots.
c. The Group holds valid title to 5 buildings with a total floor area of 32,861 sq.m. and a land improvement.
d. The Russian Legal Advisor was unable to confirm the Group’s title to 16 buildings with a total floor areaof 33,151 sq.m. and 14 land improvements.
APPENDIX V PROPERTY VALUATION
— V-25 —

VALUATION CERTIFICATE
No. Property Description and tenureParticulars ofoccupancy
Capital Valuein existingstate as at
September 30, 2009(USD)
15 Selected realproperties of anIndustrial Complexof OJSC South UralCryolite Plantlocated in Russia,Orenburg region,Kuvandyk
The subject real properties comprise assetsrelated to cryolite production plant as describedbelow and erected on 4 land parcels with a totalsite area of approximately 321.4 hectares.
The selected assets of the subject propertycomprise 28 industrial buildings, office,warehouses and land improvements includingred mud basin and other auxiliary facilitiescompleted between 1952 and 1992. The totalgross floor area of the buildings isapproximately 57,601.8 sq. m.
Summary of the buildings and structures is asfollows:
Number of GrossBuilding and Floor Area
Usage Structures (sq.m.)
Production 4 20,706.9
Office 1 5,533.3
Warehouse 1 759.0
Auxiliary 10 30,602.6
Land Improvements 12 —
TOTAL 28 57,601.8
The property isoccupied by theGroup asworkshops,offices,warehouses andother auxiliaryfacilities.
49,000,000
Notes:1. Pursuant to rental agreements, 4 land parcels with a total site area of about 321.4 hectares are leased from the State
for industrial use.2. According to building ownership certificates and privatization plan, 24 buildings with a total floor area of
52,182.8 sq.m. were held by the Group.3. We have attributed no commercial value to the building with a total floor area of approximately 5,419 sq.m. and
3 structures due to the insufficient title proof to these buildings and auxiliary facilities. We are of the opinion thatthe depreciated replacement cost of these buildings and auxiliary facilities as at the valuation date would be USD6,300,000 assuming all relevant title certificates have been obtained and registered by the Group and the Grouphas legal rights to occupy, lease, mortgage or transfer these properties.
4. We have attributed no commercial value to the leased land plots with a total site area of about 321.4 hectares asthis land is not transferable to other parties without the consent of the relevant local authorities, or substantialprofit rent is lacking.
5. According to reconciliation tables provided by the Group, 28 buildings and land improvements subject to valuationcorresponds to 28 buildings and land improvements in Russian legal opinion.
6. The Russian legal opinion confirms, inter alia, that:a. The Group leases 4 land plots with a total site area of 321.4 hectares.b. The Group owns 15 buildings with a total gross floor area of 52,182.8 sq.m. and 9 structures.c. The Group holds unregistered title to 13 buildings with a total floor area of 49,528.1 sq.m. and 9 structures.
The titles to the above real estate assets were acquired by the Group as a result of privatization beforeregistration of real estate became compulsory. State registration of title to the unregistered propertiesowned by the Group is voluntary. According to Article 6 of the Real Estate Registration Law the titleacquired before the registration became compulsory remains effective. For this reason the title certificatesto those properties were not obtained.
d. The Russian Legal Advisor was unable to confirm the Group’s title for a building with total gross floor areaof 5,419 sq.m. and 3 structures.
APPENDIX V PROPERTY VALUATION
— V-26 —
I.F.5.06(8)I.F.5.06(1)

VALUATION CERTIFICATE
No. Property Description and tenureParticulars ofoccupancy
Capital Valuein existingstate as at
September 30, 2009(USD)
16 An IndustrialComplex of BeiWangzhong Villagelocated inCuifeng Town,Lingshi County,Shanxi Province,The PRC
The subject property comprises a cathodeproduction plant erected on 2 parcels of landwith a total site area of approximately 27,964.1square meters.
The industrial complex comprises 21 industrialbuildings, administrative buildings, landimprovements including roads, chimney, fencingwall and other auxiliary facilities completedbetween 2003 and 2006. The total gross floorarea of the buildings is approximately 8,671square meters.
Summary of the buildings and structures is asfollows:
Number of GrossBuilding and Floor Area
Usage Structures (sq.m.)
Production 7 4,608
Office 1 667
Warehouse 3 1,904
Auxiliary 10 1,492
Land Improvements — —
TOTAL 21 8,671
The property wasoccupied by theGroup forindustrial purpose.
2,080,000
Notes:
1. Pursuant to a State-owned Land Use Certificate (國有土地使用證), Ling Guo Yong (2005) No. A0101276 issuedby People’s Government of Lingshi County (靈石縣人民政府) on December 22, 2005, the state-owned land userights of the property (“Land Parcel 1”) with a site area of 14,260.07 square metres are held by Shanxi RUSALCathode Co., Ltd. (山西俄鋁碳素有限公司) (“Shanxi RUSAL”) for a term expiring on September 22, 2035 forindustrial purpose.
2. Pursuant to a Collectively-owned Land Use Certificate (集體土地使用證), Ling Ji Yong (2005) No. B0106021issued by People’s Government of Lingshi County (靈石縣人民政府) on December 25, 2005, thecollectively-owned land use rights of the property (“Land Parcel 2”) with a site area of 13,704.03 square metresare held by Shanxi RUSAL for a term expiring on December 31, 2035 for industrial purpose.
3. Pursuant to the Building Ownership Rights Certificate (房屋所有權證), Lingshi County Fang Quan Zheng 2007Zi No. 00007656, building ownership rights of the property with a total gross floor area of 8,671 square metersall erected on Land Parcel 1 are held by Shanxi RUSAL.
4. Pursuant to the lease agreement (租用土地協議書) entered into between Shanxi RUSAL and Villagers’ Committeeof Beiwangzhong Cuifeng Town, Lingshi County (靈石縣翠峰鎮北王中村委) (“Villagers’ Committee”) onDecember 23, 2005, a parcel of land with a total site area of 27,964.1 square meters was rented by Shanxi Rusalfor a term of 30 years commencing from January 1, 2006 to December 31, 2035 at an annual rent of RMB 85,400,which is subject to adjustment for every 8 years.
5. The PRC legal opinion states, inter alia, that:
a. According to title certificates stated in Notes 1 and 2 above, Shanxi RUSAL is the user of the land parcelsof the property.
APPENDIX V PROPERTY VALUATION
— V-27 —
I.F.5.06(8)I.F.5.06(1)
b. In view of Shanxi RUSAL is the sole owner of the Land Parcel 1, Shanxi RUSAL is entitled to use, transfer,lease, mortgage or dispose of in other ways the said land use right in respect of the Land Parcel 1 of theproperty in accordance with the PRC Law within the terms specified in the relevant land use right certificatestated in Note 1 above. To the best of the legal adviser’s knowledge after due and careful enquiry, as at thedate of this opinion, the land use rights in respect of the Land Parcel 1 of the property are not subject toany mortgage.
c. In accordance with the PRC Land Administration Law, a collectively-owned land use rights is prohibitedfrom being granted, transferred, or leased for non-agricultural purpose. The Lease as mentioned in Note 4above may be regarded as invalid as it conflicts with the PRC Law. In addition, the Land AdministrationBureau of Lingshi County may order the Villagers’ Committee and Shanxi RUSAL to rectify the Leasewithin a specified time limit, confiscate illegal gains, and impose a fine on relevant parties. In accordancewith the existing PRC laws, the fine will range from 5% to 20% of the illegal gains. Based on our previouspractice, however, the fine is normally imposed on the landlord. In addition, pursuant to the ImplementingRules of the PRC Land Administration Law in Shanxi Province (《山西省實施<中華人民共和國土地管理法>辦法》) (the “Shanxi Rules”) promulgated on January 11, 1987 and amended on May 16, 2008,collectively-owned land (i.e. Land Parcel 2) can be used for non-agricultural purpose provided that the usershall apply with and obtain collectively-owned land use right certificate from governmental authorities atcounty level.
d. Although the legal adviser cannot rule out the possibility that the competent authority from central levelmay rectify the Shanxi Rules in the future, they are of the view that the risk of the Lease being ruled invalidis highly remote, given the fact that the lease of the said collectively-owned land was approved by thePeople’s Government of Lingshi County and Shanxi RUSAL has already obtained a collectively-owned landuse right certificate.
e. Shanxi RUSAL is the legal and beneficial owner of the aforementioned buildings. Shanxi RUSAL is entitledto use, transfer, lease, mortgage or dispose of in other ways the buildings of the property in accordance withthe PRC Law. To the best of the legal adviser’s knowledge after due and careful enquiry, as at the date ofthis opinion, the above buildings are not subject to any mortgage.
6. In the course of our valuation, we have attributed capital value to part of the property, which comprise Land Parcel1 and buildings with gross floor area of about 8,671 sq.m. erected on it. We have not attributed any value to LandParcel 2 as it is not freely transferable on the market.
APPENDIX V PROPERTY VALUATION
— V-28 —

VALUATION CERTIFICATE
No. Property Description and tenureParticulars ofoccupancy
Capital Valuein existingstate as at
September 30, 2009(USD)
17 An IndustrialComplex located inShangzhuangVillage,Xiaobai Town,Taigu County,Shanxi Province,The PRC
The subject property comprises a cathode planterected on a parcel of land with a site area ofapproximately 52,802.24 square meters.
The subject property comprises a number ofindustrial buildings, administrative buildings;land improvements including roads, fencing,tanks, water wells and other auxiliary facilitiescompleted between 2003 and 2007. The totalgross floor area of the buildings isapproximately 16,039 square meters.
Summary of the buildings and structures is asfollows:
Number of GrossBuilding and Floor Area
Usage Structures (sq.m.)
Production 10 10,237
Office 3 2,293
Warehouse 2 2,028
Auxiliary 14 1,481
Land Improvements — —
TOTAL 29 16,039
The land use rights of the property have beengranted for a term expiring on May 26, 2058.
The property isoccupied by theGroup asworkshop, office,warehouse andother auxiliaryfacilities.
2,900,000
Notes:
1. Pursuant to a Taigu County State Land Resources Bureau Construction Land Notice (太谷縣國土資源局建設用地通知書), Tai Guo Tu Yi (2008) No. 6 (太國土易(2008)6號), issued by Taigu County State Land Resources Bureau(太谷縣國土資源局) dated May 26, 2008, Shanxi Taigu Baoguang Carbon Co., Ltd. (山西省太谷縣寶光碳素有限公司) (“Taigu Baoguang”) had successfully bided the land use rights of the property with a site area of 52,802.24square metres at a consideration of RMB5,920,000 for industrial purpose.
2. Pursuant to a State-owned Land Use Rights Transfer Contract (國有土地使用權轉讓合同) entered into betweenTaigu Baoguang and Shanxi RUSAL Cathode Co., Ltd. (山西俄鋁碳素有限公司) (“Shanxi RUSAL”) dated June27, 2008, Shanxi RUSAL acquired the land use rights of the property from Taigu Baoguang at a consideration ofRMB5,920,000.
3. Pursuant to the State-owned Land Use Certificate (國有土地使用證), Tai Guo Yong (2008) No. 048 issued by thePeople’s Government of Taigu County (太谷縣人民政府) dated July 2, 2008, the land use rights of the propertywith a site area of 52,802.24 square meters are held by Shanxi RUSAL for industrial use for a term expiring onMay 26, 2058.
4. Pursuant to the Building Ownership Rights Certificate (房屋所有權證), Tai Quan Zheng Zi No. 0013643 issuedby the People’s Government of Taigu County (太谷縣人民政府) dated July 2, 2008, the building ownership rightsof the property with a total gross floor area of 16,038.56 square meters are held by Shanxi Rusal.
APPENDIX V PROPERTY VALUATION
— V-29 —
I.F.5.06(8)I.F.5.06(1)
5. The PRC legal opinion states, inter alia, that:
a. According to title certificate stated in Note 3 above, Shanxi RUSAL is the user of the land parcel of theproperty.
b. In view of Shanxi RUSAL is the sole owner of the land parcel of the property, Shanxi RUSAL is entitledto use, transfer, lease, mortgage or dispose of in other ways the said land use right in respect of the landparcel of the property in accordance with the PRC Law within the terms specified in the relevant land useright certificate stated in Note 3 above. To the best of the legal adviser’s knowledge after due and carefulenquiry, as at the date of this opinion, the land use rights in respect of the land parcel of the property arenot subject to any mortgage.
c. Shanxi RUSAL is the legal and beneficial owner of the aforementioned buildings. Shanxi RUSAL is entitledto use, transfer, lease, mortgage or dispose of in other ways the buildings of the property in accordance withthe PRC Law. To the best of the legal adviser’s knowledge after due and careful enquiry, as at the date ofthis opinion, the above buildings are not subject to any mortgage.
APPENDIX V PROPERTY VALUATION
— V-30 —

VALUATION CERTIFICATE
Group II — Property interests rented and occupied by the Group in Guinea
No. Property Description and tenureParticulars ofoccupancy
Capital Valuein existingstate as at
September 30, 2009(USD)
18 Selected realproperties of anIndustrial Complexof Compagnie desBauxite de Kindialocated in B.P.6505 Conakry,Simbaya,Commune deMatoto,ConakryRepublique deGuinee
The subject real properties comprise assetsrelated to the open pit mine, port, railway, andresidential facilities as described below anderected on a land parcel with a total site area ofapproximately 143 hectares.
The selected assets of the subject propertycomprise 8 industrial buildings, warehouses andland improvements including railways, roadsand berth, completed between 2001 and 2008.The total gross floor area of the buildings isapproximately 6,489 sq. m.
Summary of the buildings and structures is asfollows:
Number of GrossBuilding and Floor Area
Usage Structures (sq.m.)
Production 2 5,625.0
Office — —
Warehouse 2 864.0
Auxiliary — —
Land Improvements 4 —
TOTAL 8 6,489.0
The property isoccupied by theGroup asworkshop,warehouse andother auxiliaryfacilities.
No Commercial Value
Notes:
1. We have attributed no commercial value to a leased land, buildings, land improvements for the reason that theproperty is not allowed to transfer to other parties without the approval from the State. We are of the opinion thatthe depreciated replacement cost of the property (excluding the land) as at the valuation date would be USD59,148,000 assuming all relevant title certificates have been obtained.
2. The Guinean legal opinion confirms, inter alia, that:
a. the Guinean State is the sole proprietor of the facilities, infrastructures and equipment of the CBK complexthrough the State Company named SBK. As a result, RUSSAL through its Guinean subsidiary — the CBKis merely a tenant of the fixed assets under the conditions stipulated in the basic agreement dated 3November 2000.
b. The lease was concluded for duration of twenty-five years (Article 25 of the basic agreement). This leaseconfers on the CBK, by virtue of Article 5 of the basic agreement, the right to carry out all the industrialoperations of exploitation and commercialization within the limits set out in the said basic agreement.
c. Our opinion is that the CBK and or RUSSAL cannot form a mortgage on the properties of the SBK evenless to sell them or be able to dispose of them in whatever manner, owing to the fact that the State is thesole proprietor of these properties.
APPENDIX V PROPERTY VALUATION
— V-31 —
I.F.5.06(8)I.F.5.06(1)
PN 12
EXHIBIT CMethodology for Identifying Valuation Properties, Buildings and Improvements
APPENDIX V PROPERTY VALUATION
— V-32 —
Methodology for Identifying Valuation Properties, Buildings and Improvements
(A) Properties in the People’s Republic of China
Properties owned or leased (Properties) by the Company and its subsidiaries (Group) in thePeople’s Republic of China together with all buildings and improvements thereon will be subject tovaluation. Upon calculation it was found that such properties, buildings and improvements accountedfor 0.2% of the net book value of the Group’s real property.
(B) Properties with Crucial Facilities
Other Properties, on which the facilities which are the most important to its business have beenbuilt or are being built, were identified using the following method:
(1) Identify Distinct Business Units
(A) Identify the divisions which are critical to the business of the Group as the producerof primary aluminum (Critical Divisions). These would be the Alumina Division andthe Aluminum Division, accounting for about 98% of Group revenue. The divisionswhich represent non-core business of the Group, i.e. downstream operations,generating only about 2% of Group revenue are excluded.
(B) Identify all the distinct business operating units within such Critical Divisions of theGroup which are the most important in terms of production capacity, revenue,operating or non-operating status, and the Group’s plans regarding future use (DistinctBusiness Units). Such qualitative and quantitative metrics are applied on anon-cumulative basis in order to capture all potential higher production capacity andall lower cost higher margin operations. Upon testing aggregate production capacityand aggregate contribution to revenue, it was found that the 16 Distinct Business Unitsrepresented about 62% of alumina and about 90% of aluminum production capacity ofthe Group and that the revenue from the aluminum smelters operated by DistinctBusiness Units represented about 94% of total Group revenue.
(2) Identify all buildings and improvements located on the Properties of the Distinct BusinessUnits which are of the following nature (Core and Proximate Buildings and Improvements):
(A) for mines: (i) shafts and mine workings; (ii) collar houses; (iii) winder buildings; (iv)other buildings and improvements critical for production;
(B) for alumina refineries: (i) crushing and milling buildings; (ii) digestion buildings; (iii)red and white filtration buildings; (iv) evaporation buildings; (iv) slag storages; (v)chimney stacks; (vi) other buildings and improvements critical for production;
(C) for aluminium smelters: (i) pot rooms; (ii) foundry buildings; (iii) anode pasteproduction, anode baking and assembly production buildings; (iv) other buildings andimprovements critical for production;
APPENDIX V PROPERTY VALUATION
— V-33 —

(D) for cryolite plants: (i) furnaces building; (ii) hydrofluoric acid production building;(iii) gas purification facilities; (iv) aluminum sulfate production building; (iv) otherbuildings and improvements critical for production;
(3) Check what is the aggregate net book value of the Properties of all the Distinct BusinessUnits and the Core and Proximate Buildings and Improvements.
(C) Other Significant and Important Properties
Other Properties, which were identified as being properties of significant size or importance,using the following method:
(1) Identify all buildings and improvements located on the Properties of the Distinct BusinessUnits which support the operations of the Core and Proximate Buildings and Improvementsand are of the following nature (Additional Buildings and Improvements):
(A) for mining operations: (i) administrative buildings; (ii) locker rooms; (iii) mechanicalshop building; (iv) warehouses; and (v) other significant buildings and improvements;
(B) for alumina refineries: (i) boiler houses; (ii) administrative buildings; (iii) buildingsfor storage of raw materials and final products; (iv) red mud ponds; (v) coolingtowers; (vi) stacks; (vii) other significant buildings and improvements;
(C) for aluminium smelters: (i) boiler houses; (ii) slag storages; (iii) transformersubstations; (iv) railways; (v) repair shops buildings; (vi) stacks; (vii) othersignificant buildings and improvements;
(D) for cryolite plants: (i) administrative buildings; (ii) slime storage; (iii) warehouses;(iv) final product storage; (v) other significant buildings and improvements;
(2) Check what is the aggregate net book value of the Additional Buildings and Improvements.Upon calculation it was found that such buildings and improvements accounted for another18% of the net book value of the Group’s real property, making a total of 68.2% of the netbook value of the Group’s real property under valuation after adding the PRC Propertiesand the Properties and the Core and Proximate Buildings and Improvements described inparagraph (B)(3) above.
APPENDIX V PROPERTY VALUATION
— V-34 —

Details and description of properties and buildings that have not been valued
Usage of properties and buildings
Aggregate net book value (Note)
Number ofproperties and
buildings(Note)(US$)
% of theconsolidated
total assets ofthe Group
Smelters . . . . . . . . . . . . . . . . . . . . . . . . . . . . . . . 441,173,511 1.96% 9,711
Refineries . . . . . . . . . . . . . . . . . . . . . . . . . . . . . . 194,744,702 0.86% 5,290
Other Production Facilities in Current Use . . . . . . . . 101,578,489 0.45% 497
Non-Core Downstream Operations . . . . . . . . . . . . . . 101,332,113 0.45% 391
Production Facilities in the PRC . . . . . . . . . . . . . . . 0 0.00% 0
Production Facilities in Indefinite Suspension . . . . . . 0 0.00% 1,593
TOTAL . . . . . . . . . . . . . . . . . . . . . . . . . . . . . . . . 838,828,815 3.72% 17,482
Note: Based on the Company’s IFRS data as of September 30, 2009
Details and description of properties and buildings that had been valued
Usage of properties and buildings
Aggregate net book value (Note)
Number ofproperties and
buildings(Note)(US$)
% of theconsolidated
total assets ofthe Group
Smelters . . . . . . . . . . . . . . . . . . . . . . . . . . . . . . . 1,107,625,392 4.91% 831
Refineries . . . . . . . . . . . . . . . . . . . . . . . . . . . . . . 296,387,037 1.32% 585
Other Production Facilities in Current Use . . . . . . . . 0 0.00% 0
Non-Core Downstream Operations . . . . . . . . . . . . . . 0 0.00% 0
Production Facilities in the PRC . . . . . . . . . . . . . . . 4,662,109 0.02% 119
Production Facilities in Indefinite Suspension . . . . . . 0 0.00% 0
TOTAL . . . . . . . . . . . . . . . . . . . . . . . . . . . . . . . . 1,408,674,538 6.25% 1,535
Note: Based on the Company’s IFRS data as of September 30, 2009
Details and description of all properties and buildings of the Group
Usage of properties and buildings
Aggregate net book value (Note)
Number ofproperties and
buildings(Note)(US$)
% of theconsolidated
total assets ofthe Group
Smelters . . . . . . . . . . . . . . . . . . . . . . . . . . . . . . . 1,548,798,903 6.87% 10,542
Refineries . . . . . . . . . . . . . . . . . . . . . . . . . . . . . . 491,131,739 2.18% 5,875
Other Production Facilities in Current Use . . . . . . . . 101,578,489 0.45% 497
Non-Core Downstream Operations . . . . . . . . . . . . . . 101,332,113 0.45% 391
Production Facilities in the PRC . . . . . . . . . . . . . . . 4,662,109 0.02% 119
Production Facilities in Indefinite Suspension . . . . . . 0 0.00% 1,593
TOTAL . . . . . . . . . . . . . . . . . . . . . . . . . . . . . . . . 2,247,503,353 9.97% 19,017
Note: Based on the Company’s IFRS data as of September 30, 2009
APPENDIX V PROPERTY VALUATION
— V-35 —

The DirectorsUnited Company RUSAL LimitedWhiteley ChambersDon StreetSt. Helier, JerseyJE4 9WG
Hatch Associates Limited9th Floor, Portland House,Bressenden Place,London, SW1E 5BH,United Kingdomwww.hatch.ca
SRK Consulting (UK) Limited5th Floor, Churchill House,17 Churchill Way,Cardiff, CF10 2HHUnited Kingdomwww.srk.co.uk
Date: 30 September 2009
Dear Sirs,
Independent Technical Report for the mining and non-mining assets held by United CompanyRUSAL Limited and its subsidiaries
1. Introduction
1.1 Purpose of Report
This report has been prepared by Hatch Associates Limited (“Hatch”) and SRK Consulting (UK)Limited (“SRK”) for inclusion in the prospectus (the “Prospectus”) to be published by UnitedCompany RUSAL Limited (“UC RUSAL” or the “Company” or the “Group”) in connection witha global offer of ordinary shares and/or global depositary receipts representing shares (“GDRs”)in UC RUSAL to listing on one or more international stock exchanges (the “Listing”).
Hatch and SRK were instructed by the Directors of the Company to prepare a technical reportfor the bauxite, alumina, aluminium, aluminium raw materials, silicon, coal, energy anddownstream assets held by the Company and its subsidiaries (the “Group”). This report, whichsummarises the findings of Hatch’s and SRK’s respective reviews, has been prepared inaccordance with the recommendations for a technical report as set out in the Prospectus Directivein conjunction with the recommendations of the Committee of European Securities Regulators(“CESR”). Chapter 18 of Rules Governing the Listing of Securities on The Stock Exchange ofHong Kong Limited together with The Chapter 19 of the UK Listing Rules which were in forceuntil 1 July 2005, have been adhered to for the purposes of the reporting of this IndependentTechnical Report.
SRK has reviewed, but not recalculated, the practice and estimation methods undertaken by theCompany for reporting reserves and resources in accordance with the Former Soviet Union“Classification and Estimation Methods for Reserves and Resources”, last revised in 1981. Thisprocedure establishes the nature of evidence required to ensure compliance with the Committeeof Reserves of the Ministry of National Resources of the Russian Federation (the “GKZ”classification). Within this there are “Conditions for Estimation of Reserves and Resources”unique to each deposit.
APPENDIX VI INDEPENDENT TECHNICAL REPORT
— VI-1 —

SRK has reviewed, but not recalculated, the reserves and resources statements compiled by theGroup and has restated the resources and reserves in accordance with the Prospectus Directiveand the Prospectus Rules, in conjunction with the recommendations of CESR and in accordancewith the criteria for internationally recognised reserve and resource categories of the“Australasian Code for Reporting of Exploration Results, Mineral Resources and Ore Reserves”(December 2004) published by the Joint Ore Reserves Committee (the “JORC”) of theAustralasian Institute of Mining and Metallurgy (the “IMM”), the Australian Institute ofGeoscientists and the Minerals Council of Australia (the “JORC Code”).
In this report, all reserves and resources estimates initially prepared by the Company inaccordance with the GKZ Classification, have been substantiated by SRK through evidenceobtained from SRK site visits and observations, and supported by details of drilling results,analyses and other evidence and takes account of relevant information supplied by the Group’smanagement.
1.2 Capability and Independence
This report was prepared by Hatch and SRK as the signatories to this letter. Details of thequalifications and experience of the consultants who carried out the work are set out in AnnexA to this report.
Hatch and SRK are separate entities and each operate as independent technical consultantsproviding geology, mining, process engineering and valuation services to clients. Hatch and SRKhave received, and will receive, professional fees for the preparation of this report. However,neither Hatch nor SRK nor any of their respective directors, staff or sub-consultants whocontributed to this report have any interest in:
• the Company or any of its subsidiaries; or
• the assets reviewed; or
• the outcome of the Global Offer.
Drafts of this report were provided to the Group, but only for the purpose of confirming both theaccuracy of factual material and the reasonableness of assumptions relied upon in the report.
1.3 Scope of Work/Materiality/Limitations of Liability and Exclusions
This report contains the expression of the professional opinion of Hatch and SRK based onlimited information available and conditions existing at the time of preparation. This reportshould be read as a whole, and sections should not be read or relied upon out of context.
Hatch and SRK have independently reviewed and assessed the Group’s mining and non-miningassets by reviewing pertinent data, including resources, reserves, technology, manpowerrequirements, environmental issues, and the life-of-mine plans relating to productivity,production, operating costs, capital expenditures and revenues. This review and assessment hasbeen done in accordance with the scope of work and exclusions and limitations and on the basisof the materiality criteria set out in Annex B to this report.
Save for Section 2.1.2.1, Section 2.1.3.1, Section 2.1.4.1, Section 2.1.5.1, Section 2.1.6.1,Section 2.1.7.1, Section 2.2, Section 2.4.3, Section 3 and the attributable Appendices, for whichSRK takes responsibility, and Section 2.4.1, for which Hatch and SRK take joint responsibility,subject to the disclaimers, exclusions and limitations of liability contained in this Article 1.3, allopinions, findings and conclusions expressed in this report are solely those of Hatch and its
APPENDIX VI INDEPENDENT TECHNICAL REPORT
— VI-2 —
sub-consultants. All opinions, findings and conclusions expressed in Section 2.1.2.1, Section2.1.3.1, Section 2.1.4.1, Section 2.1.5.1, Section 2.1.6.1, Section 2.1.7.1, Section 2.2, Section2.4.3, Section 3 and the attributable Appendices are solely are those of SRK and itssub-consultants. Neither Hatch nor SRK accepts any responsibility or liability for the sectionsof this report that were prepared by the other party. This division of responsibility reflects therespective areas of expertise of Hatch and SRK. SRK is a consulting company providing acomprehensive range of services to resource industries. This includes assisting with mineralresource projects from exploration, development, exploitation through to closure. Specialising inthe traditional fields of geology, mining and infrastructure these are further enhanced withbio-physical and social services. SRK has experience in preparing independent technical reportsin support of public and private finance, and mergers and acquisitions. By contrast, Hatch’sprimary focus in the metals and mining sector is process design and engineering, process plantenvironmental management, financial evaluation, business consulting and project andconstruction management.
Save for any responsibility of experts responsible for a prospectus arising under Hong KongOrdinances, SECT 38C and SECT 342B and UK Listing Rules Chapter 5, 5.5.3R(2)(c) or (f),items 1.2 or 23.1 of Annex I and/or Annex X of the Commission Regulation (EC) 809/2004 orsection 40 of the Companies Ordinance to any person as and to the extent there provided, andsave for any responsibility that Hatch or SRK has expressly agreed in writing to assume, to thefullest extent permitted by law neither Hatch nor SRK assumes any responsibility and nor willHatch or SRK accept any liability to any other person for any loss suffered by any such otherperson as a result of, arising out of, or in connection with (a) this report or (b) their respectivestatements, required by and given solely for the purposes of complying with items 1.2 or 23.1of Annex I and/or Annex X to Commission Regulation (EC) 809/2004 and sections 38C and 342Bof the Companies Ordinance, consenting to its inclusion.
1.4 Inherent Risks
Mining and chemical and metallurgical processing are carried out in an environment where notall events are predictable.
Whilst an effective management team can, firstly, identify the known risks, and secondly, takemeasures to manage and mitigate these risks, there is still the possibility for unexpected andunpredictable events to occur. It is therefore not possible to remove all risks or state withcertainty that an event will not occur that may have a material impact on the operation of a mineor chemical or metallurgical processing operation.
1.5 Glossary of Terms
Defined and technical terms used in this report are set out in Annex C.
APPENDIX VI INDEPENDENT TECHNICAL REPORT
— VI-3 —

Table of Contents
1. Introduction . . . . . . . . . . . . . . . . . . . . . . . . . . . . . . . . . . . . . . . . . . . . . . . . . . . . . . . . VI-1
1.1 Purpose of Report . . . . . . . . . . . . . . . . . . . . . . . . . . . . . . . . . . . . . . . . . . . . . . . VI-1
1.2 Capability and Independence . . . . . . . . . . . . . . . . . . . . . . . . . . . . . . . . . . . . . . VI-2
1.3 Scope of Work/Materiality/Limitations of Liability and Exclusions . . . . . . . . . VI-2
1.4 Inherent Risks . . . . . . . . . . . . . . . . . . . . . . . . . . . . . . . . . . . . . . . . . . . . . . . . . . VI-3
1.5 Glossary of Terms . . . . . . . . . . . . . . . . . . . . . . . . . . . . . . . . . . . . . . . . . . . . . . . VI-3
2. Overview . . . . . . . . . . . . . . . . . . . . . . . . . . . . . . . . . . . . . . . . . . . . . . . . . . . . . . . . . . VI-15
2.1 General . . . . . . . . . . . . . . . . . . . . . . . . . . . . . . . . . . . . . . . . . . . . . . . . . . . . . . . . VI-152.1.1 Description of Assets . . . . . . . . . . . . . . . . . . . . . . . . . . . . . . . . . . . . . . . . VI-152.1.2 Management . . . . . . . . . . . . . . . . . . . . . . . . . . . . . . . . . . . . . . . . . . . . . . VI-192.1.3 Health and Safety . . . . . . . . . . . . . . . . . . . . . . . . . . . . . . . . . . . . . . . . . . VI-202.1.4 Transport . . . . . . . . . . . . . . . . . . . . . . . . . . . . . . . . . . . . . . . . . . . . . . . . . VI-242.1.5 Status of Environmental Compliance . . . . . . . . . . . . . . . . . . . . . . . . . . . . VI-252.1.6 Specific Risks and Future Opportunities . . . . . . . . . . . . . . . . . . . . . . . . . VI-342.1.7 Sales and Marketing . . . . . . . . . . . . . . . . . . . . . . . . . . . . . . . . . . . . . . . . VI-40
2.2 Mining Assets . . . . . . . . . . . . . . . . . . . . . . . . . . . . . . . . . . . . . . . . . . . . . . . . . . . VI-452.2.1 Bauxite Mines . . . . . . . . . . . . . . . . . . . . . . . . . . . . . . . . . . . . . . . . . . . . . VI-452.2.2 Nepheline Syenite/Limestone Mines . . . . . . . . . . . . . . . . . . . . . . . . . . . . . VI-452.2.3 Quartzite Mines . . . . . . . . . . . . . . . . . . . . . . . . . . . . . . . . . . . . . . . . . . . . VI-462.2.4 Fluorite Mine . . . . . . . . . . . . . . . . . . . . . . . . . . . . . . . . . . . . . . . . . . . . . . VI-462.2.5 Coal Mine . . . . . . . . . . . . . . . . . . . . . . . . . . . . . . . . . . . . . . . . . . . . . . . . VI-462.2.6 Mineral Resource and Ore Reserve Statement . . . . . . . . . . . . . . . . . . . . . VI-462.2.7 Production . . . . . . . . . . . . . . . . . . . . . . . . . . . . . . . . . . . . . . . . . . . . . . . . VI-502.2.8 Operating Costs . . . . . . . . . . . . . . . . . . . . . . . . . . . . . . . . . . . . . . . . . . . . VI-512.2.9 Capital Expenditure . . . . . . . . . . . . . . . . . . . . . . . . . . . . . . . . . . . . . . . . . VI-522.2.10 Mining Rights and Titles . . . . . . . . . . . . . . . . . . . . . . . . . . . . . . . . . . . . . VI-532.2.11 Mining Projects . . . . . . . . . . . . . . . . . . . . . . . . . . . . . . . . . . . . . . . . . . . . VI-54
2.3 Non-Mining Assets . . . . . . . . . . . . . . . . . . . . . . . . . . . . . . . . . . . . . . . . . . . . . . . VI-552.3.1 Alumina Division . . . . . . . . . . . . . . . . . . . . . . . . . . . . . . . . . . . . . . . . . . VI-552.3.2 Aluminium Division . . . . . . . . . . . . . . . . . . . . . . . . . . . . . . . . . . . . . . . . VI-582.3.3 Packaging Division . . . . . . . . . . . . . . . . . . . . . . . . . . . . . . . . . . . . . . . . . VI-672.3.4 Engineering and Construction Division . . . . . . . . . . . . . . . . . . . . . . . . . . VI-682.3.5 Power . . . . . . . . . . . . . . . . . . . . . . . . . . . . . . . . . . . . . . . . . . . . . . . . . . . VI-702.3.6 Projects . . . . . . . . . . . . . . . . . . . . . . . . . . . . . . . . . . . . . . . . . . . . . . . . . . VI-742.3.7 Costs . . . . . . . . . . . . . . . . . . . . . . . . . . . . . . . . . . . . . . . . . . . . . . . . . . . . VI-81
2.4 Conclusions . . . . . . . . . . . . . . . . . . . . . . . . . . . . . . . . . . . . . . . . . . . . . . . . . . . . VI-872.4.1 Joint Hatch and SRK Conclusions . . . . . . . . . . . . . . . . . . . . . . . . . . . . . . VI-872.4.2 Hatch Conclusions . . . . . . . . . . . . . . . . . . . . . . . . . . . . . . . . . . . . . . . . . . VI-872.4.3 SRK Conclusions . . . . . . . . . . . . . . . . . . . . . . . . . . . . . . . . . . . . . . . . . . . VI-88
3. Mining Operations . . . . . . . . . . . . . . . . . . . . . . . . . . . . . . . . . . . . . . . . . . . . . . . . . . . VI-88
3.1 Alpart Bauxite Mine . . . . . . . . . . . . . . . . . . . . . . . . . . . . . . . . . . . . . . . . . . . . . VI-883.1.1 Introduction . . . . . . . . . . . . . . . . . . . . . . . . . . . . . . . . . . . . . . . . . . . . . . . VI-883.1.2 History and Location . . . . . . . . . . . . . . . . . . . . . . . . . . . . . . . . . . . . . . . . VI-883.1.3 Geology . . . . . . . . . . . . . . . . . . . . . . . . . . . . . . . . . . . . . . . . . . . . . . . . . . VI-893.1.4 Mineral Resources and Ore Reserves . . . . . . . . . . . . . . . . . . . . . . . . . . . . VI-913.1.5 Mining Operations and Infrastructure . . . . . . . . . . . . . . . . . . . . . . . . . . . . VI-92
APPENDIX VI INDEPENDENT TECHNICAL REPORT
— VI-4 —

3.1.6 Environmental and Social Considerations . . . . . . . . . . . . . . . . . . . . . . . . . VI-933.1.7 Technical and Economic Assessment . . . . . . . . . . . . . . . . . . . . . . . . . . . . VI-933.1.8 Material Developments . . . . . . . . . . . . . . . . . . . . . . . . . . . . . . . . . . . . . . VI-943.1.9 Specific Risks and Future Opportunities . . . . . . . . . . . . . . . . . . . . . . . . . VI-94
3.2 Windalco Bauxite Mines . . . . . . . . . . . . . . . . . . . . . . . . . . . . . . . . . . . . . . . . . . VI-943.2.1 Introduction . . . . . . . . . . . . . . . . . . . . . . . . . . . . . . . . . . . . . . . . . . . . . . . VI-943.2.2 History and Location . . . . . . . . . . . . . . . . . . . . . . . . . . . . . . . . . . . . . . . . VI-953.2.3 Geology . . . . . . . . . . . . . . . . . . . . . . . . . . . . . . . . . . . . . . . . . . . . . . . . . . VI-953.2.4 Mineral Resources and Ore Reserves . . . . . . . . . . . . . . . . . . . . . . . . . . . . VI-963.2.5 Mining Operations and Infrastructure . . . . . . . . . . . . . . . . . . . . . . . . . . . . VI-983.2.6 Environmental and Social Considerations . . . . . . . . . . . . . . . . . . . . . . . . . VI-993.2.7 Technical and Economic Assessment . . . . . . . . . . . . . . . . . . . . . . . . . . . . VI-1003.2.8 Material Developments . . . . . . . . . . . . . . . . . . . . . . . . . . . . . . . . . . . . . . VI-1003.2.9 Specific Risks and Future Opportunities . . . . . . . . . . . . . . . . . . . . . . . . . VI-100
3.3 Kindia Bauxite Mine . . . . . . . . . . . . . . . . . . . . . . . . . . . . . . . . . . . . . . . . . . . . . VI-1013.3.1 Introduction . . . . . . . . . . . . . . . . . . . . . . . . . . . . . . . . . . . . . . . . . . . . . . . VI-1013.3.2 History and Location . . . . . . . . . . . . . . . . . . . . . . . . . . . . . . . . . . . . . . . . VI-1013.3.3 Geology . . . . . . . . . . . . . . . . . . . . . . . . . . . . . . . . . . . . . . . . . . . . . . . . . . VI-1023.3.4 Mineral Resources and Ore Reserves . . . . . . . . . . . . . . . . . . . . . . . . . . . . VI-1023.3.5 Mining Operations and Infrastructure . . . . . . . . . . . . . . . . . . . . . . . . . . . . VI-1043.3.6 Environmental and Social Considerations . . . . . . . . . . . . . . . . . . . . . . . . . VI-1063.3.7 Technical and Economic Assessment . . . . . . . . . . . . . . . . . . . . . . . . . . . . VI-1073.3.8 Material Developments . . . . . . . . . . . . . . . . . . . . . . . . . . . . . . . . . . . . . . VI-1083.3.9 Specific Risks and Future Opportunities . . . . . . . . . . . . . . . . . . . . . . . . . VI-108
3.4 Friguia Bauxite Mine . . . . . . . . . . . . . . . . . . . . . . . . . . . . . . . . . . . . . . . . . . . . . VI-1083.4.1 Introduction . . . . . . . . . . . . . . . . . . . . . . . . . . . . . . . . . . . . . . . . . . . . . . . VI-1083.4.2 History and Location . . . . . . . . . . . . . . . . . . . . . . . . . . . . . . . . . . . . . . . . VI-1093.4.3 Geology . . . . . . . . . . . . . . . . . . . . . . . . . . . . . . . . . . . . . . . . . . . . . . . . . . VI-1093.4.4 Mineral Resources and Ore Reserves . . . . . . . . . . . . . . . . . . . . . . . . . . . . VI-1103.4.5 Mining Operations and Infrastructure . . . . . . . . . . . . . . . . . . . . . . . . . . . . VI-1113.4.6 Environmental and Social Considerations . . . . . . . . . . . . . . . . . . . . . . . . . VI-1113.4.7 Technical and Economic Assessment . . . . . . . . . . . . . . . . . . . . . . . . . . . . VI-1123.4.8 Material Developments . . . . . . . . . . . . . . . . . . . . . . . . . . . . . . . . . . . . . . VI-1123.4.9 Specific Risks and Future Opportunities . . . . . . . . . . . . . . . . . . . . . . . . . VI-112
3.5 Guyana Bauxite Mine . . . . . . . . . . . . . . . . . . . . . . . . . . . . . . . . . . . . . . . . . . . . VI-1133.5.1 Introduction . . . . . . . . . . . . . . . . . . . . . . . . . . . . . . . . . . . . . . . . . . . . . . . VI-1133.5.2 History, Location . . . . . . . . . . . . . . . . . . . . . . . . . . . . . . . . . . . . . . . . . . . VI-1133.5.3 Geology . . . . . . . . . . . . . . . . . . . . . . . . . . . . . . . . . . . . . . . . . . . . . . . . . . VI-1143.5.4 Mineral Resources and Ore Reserves . . . . . . . . . . . . . . . . . . . . . . . . . . . . VI-1153.5.5 Mining Operations and Infrastructure . . . . . . . . . . . . . . . . . . . . . . . . . . . . VI-1173.5.6 Environmental and Social Considerations . . . . . . . . . . . . . . . . . . . . . . . . . VI-1183.5.7 Technical and Economic Assessment . . . . . . . . . . . . . . . . . . . . . . . . . . . . VI-1193.5.8 Material Developments . . . . . . . . . . . . . . . . . . . . . . . . . . . . . . . . . . . . . . VI-1193.5.9 Specific Risks and Future Opportunities . . . . . . . . . . . . . . . . . . . . . . . . . VI-120
3.6 North Ural Bauxite . . . . . . . . . . . . . . . . . . . . . . . . . . . . . . . . . . . . . . . . . . . . . . VI-1213.6.1 Introduction . . . . . . . . . . . . . . . . . . . . . . . . . . . . . . . . . . . . . . . . . . . . . . . VI-1213.6.2 History and Location . . . . . . . . . . . . . . . . . . . . . . . . . . . . . . . . . . . . . . . . VI-1213.6.3 Geology . . . . . . . . . . . . . . . . . . . . . . . . . . . . . . . . . . . . . . . . . . . . . . . . . . VI-1213.6.4 Mineral Resources and Ore Reserves . . . . . . . . . . . . . . . . . . . . . . . . . . . . VI-122
APPENDIX VI INDEPENDENT TECHNICAL REPORT
— VI-5 —
3.6.5 Mining Operations and Infrastructure . . . . . . . . . . . . . . . . . . . . . . . . . . . . VI-1223.6.6 Environmental and Social Considerations . . . . . . . . . . . . . . . . . . . . . . . . . VI-1233.6.7 Technical and Economic Assessment . . . . . . . . . . . . . . . . . . . . . . . . . . . . VI-1253.6.8 Material Developments . . . . . . . . . . . . . . . . . . . . . . . . . . . . . . . . . . . . . . VI-1263.6.9 Specific Risks and Future Opportunities . . . . . . . . . . . . . . . . . . . . . . . . . VI-126
3.7 Timan Bauxite Mine . . . . . . . . . . . . . . . . . . . . . . . . . . . . . . . . . . . . . . . . . . . . . VI-1273.7.1 Introduction . . . . . . . . . . . . . . . . . . . . . . . . . . . . . . . . . . . . . . . . . . . . . . . VI-1273.7.2 History and Location . . . . . . . . . . . . . . . . . . . . . . . . . . . . . . . . . . . . . . . . VI-1273.7.3 Geology . . . . . . . . . . . . . . . . . . . . . . . . . . . . . . . . . . . . . . . . . . . . . . . . . . VI-1273.7.4 Mineral Resources and Ore Reserves . . . . . . . . . . . . . . . . . . . . . . . . . . . . VI-1293.7.5 Mining Operations and Infrastructure . . . . . . . . . . . . . . . . . . . . . . . . . . . . VI-1313.7.6 Environmental and Social Considerations . . . . . . . . . . . . . . . . . . . . . . . . . VI-1313.7.7 Technical and Economic Assessment . . . . . . . . . . . . . . . . . . . . . . . . . . . . VI-1333.7.8 Material Developments . . . . . . . . . . . . . . . . . . . . . . . . . . . . . . . . . . . . . . VI-1343.7.9 Specific Risks and Future Opportunities . . . . . . . . . . . . . . . . . . . . . . . . . VI-134
3.8 Kiya Shaltyr Nepheline (Kiya Shaltyr and Mazulsky Mines) . . . . . . . . . . . . . . VI-1353.8.1 Introduction . . . . . . . . . . . . . . . . . . . . . . . . . . . . . . . . . . . . . . . . . . . . . . . VI-1353.8.2 History, and Location . . . . . . . . . . . . . . . . . . . . . . . . . . . . . . . . . . . . . . . VI-1353.8.3 Geology . . . . . . . . . . . . . . . . . . . . . . . . . . . . . . . . . . . . . . . . . . . . . . . . . . VI-1353.8.4 Mineral Resources and Ore Reserves . . . . . . . . . . . . . . . . . . . . . . . . . . . . VI-1363.8.5 Mining Operations and Infrastructure . . . . . . . . . . . . . . . . . . . . . . . . . . . . VI-1373.8.6 Environmental and Social Considerations . . . . . . . . . . . . . . . . . . . . . . . . . VI-1383.8.7 Technical and Economic Assessment . . . . . . . . . . . . . . . . . . . . . . . . . . . . VI-1393.8.8 Material Developments . . . . . . . . . . . . . . . . . . . . . . . . . . . . . . . . . . . . . . VI-1403.8.9 Specific Risks and Future Opportunities . . . . . . . . . . . . . . . . . . . . . . . . . VI-140
3.9 Bogatyr Coal Mine . . . . . . . . . . . . . . . . . . . . . . . . . . . . . . . . . . . . . . . . . . . . . . . VI-1413.9.1 Introduction . . . . . . . . . . . . . . . . . . . . . . . . . . . . . . . . . . . . . . . . . . . . . . . VI-1413.9.2 History and Location . . . . . . . . . . . . . . . . . . . . . . . . . . . . . . . . . . . . . . . . VI-1413.9.3 Geology . . . . . . . . . . . . . . . . . . . . . . . . . . . . . . . . . . . . . . . . . . . . . . . . . . VI-1413.9.4 Mineral Resources and Coal Reserves . . . . . . . . . . . . . . . . . . . . . . . . . . . VI-1423.9.5 Mining Operations and Infrastructure . . . . . . . . . . . . . . . . . . . . . . . . . . . . VI-1433.9.6 Environmental and Social Considerations . . . . . . . . . . . . . . . . . . . . . . . . . VI-1433.9.7 Technical and Economic Assessment . . . . . . . . . . . . . . . . . . . . . . . . . . . . VI-1453.9.8 Material Developments . . . . . . . . . . . . . . . . . . . . . . . . . . . . . . . . . . . . . . VI-1453.9.9 Specific Risks and Future Opportunities . . . . . . . . . . . . . . . . . . . . . . . . . VI-146
3.10 Cheremshansk Quartzite . . . . . . . . . . . . . . . . . . . . . . . . . . . . . . . . . . . . . . . . . . VI-1463.10.1 Introduction . . . . . . . . . . . . . . . . . . . . . . . . . . . . . . . . . . . . . . . . . . . . . . . VI-1463.10.2 History and Location . . . . . . . . . . . . . . . . . . . . . . . . . . . . . . . . . . . . . . . . VI-1463.10.3 Geology . . . . . . . . . . . . . . . . . . . . . . . . . . . . . . . . . . . . . . . . . . . . . . . . . . VI-1463.10.4 Mineral Resources and Ore Reserves . . . . . . . . . . . . . . . . . . . . . . . . . . . . VI-1473.10.5 Mining Operations and Infrastructure . . . . . . . . . . . . . . . . . . . . . . . . . . . . VI-1483.10.6 Environmental and Social Considerations . . . . . . . . . . . . . . . . . . . . . . . . . VI-1493.10.7 Technical and Economic Assessment . . . . . . . . . . . . . . . . . . . . . . . . . . . . VI-1493.10.8 Material Developments . . . . . . . . . . . . . . . . . . . . . . . . . . . . . . . . . . . . . . VI-1503.10.9 Specific Risks and Future Opportunities . . . . . . . . . . . . . . . . . . . . . . . . . VI-150
3.11 Glukhovsky Quartzite Mine . . . . . . . . . . . . . . . . . . . . . . . . . . . . . . . . . . . . . . . . VI-1503.11.1 Introduction . . . . . . . . . . . . . . . . . . . . . . . . . . . . . . . . . . . . . . . . . . . . . . . VI-1503.11.2 History and Location . . . . . . . . . . . . . . . . . . . . . . . . . . . . . . . . . . . . . . . . VI-1503.11.3 Geology . . . . . . . . . . . . . . . . . . . . . . . . . . . . . . . . . . . . . . . . . . . . . . . . . . VI-151
APPENDIX VI INDEPENDENT TECHNICAL REPORT
— VI-6 —

3.11.4 Mineral Resources and Ore Reserves . . . . . . . . . . . . . . . . . . . . . . . . . . . . VI-1523.11.5 Mining Operations and Infrastructure . . . . . . . . . . . . . . . . . . . . . . . . . . . . VI-1533.11.6 Environmental and Social Considerations . . . . . . . . . . . . . . . . . . . . . . . . . VI-1543.11.7 Technical and Economic Assessment . . . . . . . . . . . . . . . . . . . . . . . . . . . . VI-1553.11.8 Material Developments . . . . . . . . . . . . . . . . . . . . . . . . . . . . . . . . . . . . . . VI-1553.11.9 Specific Risks and Future Opportunities . . . . . . . . . . . . . . . . . . . . . . . . . VI-155
3.12 Yaroslavsky Fluorite Mine . . . . . . . . . . . . . . . . . . . . . . . . . . . . . . . . . . . . . . . . . VI-1563.12.1 Introduction . . . . . . . . . . . . . . . . . . . . . . . . . . . . . . . . . . . . . . . . . . . . . . . VI-1563.12.2 History and Location . . . . . . . . . . . . . . . . . . . . . . . . . . . . . . . . . . . . . . . . VI-1563.12.3 Geology . . . . . . . . . . . . . . . . . . . . . . . . . . . . . . . . . . . . . . . . . . . . . . . . . . VI-1563.12.4 Mineral Resources and Ore Reserves . . . . . . . . . . . . . . . . . . . . . . . . . . . . VI-1573.12.5 Mining Operations and Infrastructure . . . . . . . . . . . . . . . . . . . . . . . . . . . . VI-1583.12.6 Environmental and Social Considerations . . . . . . . . . . . . . . . . . . . . . . . . . VI-1623.12.7 Technical and Economic Assessment . . . . . . . . . . . . . . . . . . . . . . . . . . . . VI-1633.12.8 Material Developments . . . . . . . . . . . . . . . . . . . . . . . . . . . . . . . . . . . . . . VI-1633.12.9 Specific Risks and Future Opportunities . . . . . . . . . . . . . . . . . . . . . . . . . VI-163
4. Alumina Division . . . . . . . . . . . . . . . . . . . . . . . . . . . . . . . . . . . . . . . . . . . . . . . . . . . . VI-165
4.1 Queensland Alumina Ltd. . . . . . . . . . . . . . . . . . . . . . . . . . . . . . . . . . . . . . . . . . VI-1654.1.1 Introduction . . . . . . . . . . . . . . . . . . . . . . . . . . . . . . . . . . . . . . . . . . . . . . . VI-1654.1.2 History, Location and Infrastructure . . . . . . . . . . . . . . . . . . . . . . . . . . . . . VI-1654.1.3 Process Description . . . . . . . . . . . . . . . . . . . . . . . . . . . . . . . . . . . . . . . . . VI-1654.1.4 Environmental . . . . . . . . . . . . . . . . . . . . . . . . . . . . . . . . . . . . . . . . . . . . . VI-1664.1.5 Specific Risks and Future Opportunities . . . . . . . . . . . . . . . . . . . . . . . . . VI-168
4.2 Fria Alumina Refinery . . . . . . . . . . . . . . . . . . . . . . . . . . . . . . . . . . . . . . . . . . . . VI-1684.2.1 Introduction . . . . . . . . . . . . . . . . . . . . . . . . . . . . . . . . . . . . . . . . . . . . . . . VI-1684.2.2 History, Location and Infrastructure . . . . . . . . . . . . . . . . . . . . . . . . . . . . . VI-1684.2.3 Process Description . . . . . . . . . . . . . . . . . . . . . . . . . . . . . . . . . . . . . . . . . VI-1694.2.4 Environmental . . . . . . . . . . . . . . . . . . . . . . . . . . . . . . . . . . . . . . . . . . . . . VI-1704.2.5 Material Developments . . . . . . . . . . . . . . . . . . . . . . . . . . . . . . . . . . . . . . VI-1714.2.6 Specific Risks and Future Opportunities . . . . . . . . . . . . . . . . . . . . . . . . . VI-171
4.3 Aughinish Alumina . . . . . . . . . . . . . . . . . . . . . . . . . . . . . . . . . . . . . . . . . . . . . . . VI-1724.3.1 Introduction . . . . . . . . . . . . . . . . . . . . . . . . . . . . . . . . . . . . . . . . . . . . . . . VI-1724.3.2 History, Location and Infrastructure . . . . . . . . . . . . . . . . . . . . . . . . . . . . . VI-1734.3.3 Process Description . . . . . . . . . . . . . . . . . . . . . . . . . . . . . . . . . . . . . . . . . VI-1734.3.4 Environmental . . . . . . . . . . . . . . . . . . . . . . . . . . . . . . . . . . . . . . . . . . . . . VI-1744.3.5 Material Developments . . . . . . . . . . . . . . . . . . . . . . . . . . . . . . . . . . . . . . VI-1764.3.6 Specific Risks and Future Opportunities . . . . . . . . . . . . . . . . . . . . . . . . . VI-176
4.4 Eurallumina . . . . . . . . . . . . . . . . . . . . . . . . . . . . . . . . . . . . . . . . . . . . . . . . . . . . VI-1774.4.1 Introduction . . . . . . . . . . . . . . . . . . . . . . . . . . . . . . . . . . . . . . . . . . . . . . . VI-1774.4.2 History, Location and Infrastructure . . . . . . . . . . . . . . . . . . . . . . . . . . . . . VI-1774.4.3 Process Description . . . . . . . . . . . . . . . . . . . . . . . . . . . . . . . . . . . . . . . . . VI-1774.4.4 Environmental . . . . . . . . . . . . . . . . . . . . . . . . . . . . . . . . . . . . . . . . . . . . . VI-1784.4.5 Material Developments . . . . . . . . . . . . . . . . . . . . . . . . . . . . . . . . . . . . . . VI-1804.4.6 Specific Risks and Future Opportunities . . . . . . . . . . . . . . . . . . . . . . . . . VI-180
4.5 Alpart . . . . . . . . . . . . . . . . . . . . . . . . . . . . . . . . . . . . . . . . . . . . . . . . . . . . . . . . . VI-1814.5.1 Introduction . . . . . . . . . . . . . . . . . . . . . . . . . . . . . . . . . . . . . . . . . . . . . . . VI-1814.5.2 History, Location and Infrastructure . . . . . . . . . . . . . . . . . . . . . . . . . . . . . VI-1814.5.3 Process Description . . . . . . . . . . . . . . . . . . . . . . . . . . . . . . . . . . . . . . . . . VI-181
APPENDIX VI INDEPENDENT TECHNICAL REPORT
— VI-7 —
4.5.4 Environmental . . . . . . . . . . . . . . . . . . . . . . . . . . . . . . . . . . . . . . . . . . . . . VI-1824.5.5 Material Developments . . . . . . . . . . . . . . . . . . . . . . . . . . . . . . . . . . . . . . VI-1844.5.6 Specific Risks and Future Opportunities . . . . . . . . . . . . . . . . . . . . . . . . . VI-184
4.6 Windalco-Ewarton Works . . . . . . . . . . . . . . . . . . . . . . . . . . . . . . . . . . . . . . . . . VI-1854.6.1 Introduction . . . . . . . . . . . . . . . . . . . . . . . . . . . . . . . . . . . . . . . . . . . . . . . VI-1854.6.2 History, Location and Infrastructure . . . . . . . . . . . . . . . . . . . . . . . . . . . . . VI-1854.6.3 Process Description . . . . . . . . . . . . . . . . . . . . . . . . . . . . . . . . . . . . . . . . . VI-1864.6.4 Environmental . . . . . . . . . . . . . . . . . . . . . . . . . . . . . . . . . . . . . . . . . . . . . VI-1874.6.5 Material Developments . . . . . . . . . . . . . . . . . . . . . . . . . . . . . . . . . . . . . . VI-1884.6.6 Specific Risks and Future Opportunities . . . . . . . . . . . . . . . . . . . . . . . . . VI-188
4.7 Windalco-Kirkvine Works . . . . . . . . . . . . . . . . . . . . . . . . . . . . . . . . . . . . . . . . . VI-1894.7.1 Introduction . . . . . . . . . . . . . . . . . . . . . . . . . . . . . . . . . . . . . . . . . . . . . . . VI-1894.7.2 History, Location and Infrastructure . . . . . . . . . . . . . . . . . . . . . . . . . . . . . VI-1894.7.3 Process Description . . . . . . . . . . . . . . . . . . . . . . . . . . . . . . . . . . . . . . . . . VI-1904.7.4 Environmental . . . . . . . . . . . . . . . . . . . . . . . . . . . . . . . . . . . . . . . . . . . . . VI-1914.7.5 Material Developments . . . . . . . . . . . . . . . . . . . . . . . . . . . . . . . . . . . . . . VI-1924.7.6 Specific Risks and Future Opportunities . . . . . . . . . . . . . . . . . . . . . . . . . VI-192
4.8 Bogoslovsk Alumina Refinery . . . . . . . . . . . . . . . . . . . . . . . . . . . . . . . . . . . . . . VI-1934.8.1 Introduction . . . . . . . . . . . . . . . . . . . . . . . . . . . . . . . . . . . . . . . . . . . . . . . VI-1934.8.2 History, Location and Infrastructure . . . . . . . . . . . . . . . . . . . . . . . . . . . . . VI-1934.8.3 Process Description . . . . . . . . . . . . . . . . . . . . . . . . . . . . . . . . . . . . . . . . . VI-1944.8.4 Environmental . . . . . . . . . . . . . . . . . . . . . . . . . . . . . . . . . . . . . . . . . . . . . VI-1954.8.5 Material Developments . . . . . . . . . . . . . . . . . . . . . . . . . . . . . . . . . . . . . . VI-1964.8.6 Specific Risks and Future Opportunities . . . . . . . . . . . . . . . . . . . . . . . . . VI-196
4.9 Achinsk Alumina Refinery . . . . . . . . . . . . . . . . . . . . . . . . . . . . . . . . . . . . . . . . . VI-1974.9.1 Introduction . . . . . . . . . . . . . . . . . . . . . . . . . . . . . . . . . . . . . . . . . . . . . . . VI-1974.9.2 History, Location and Infrastructure . . . . . . . . . . . . . . . . . . . . . . . . . . . . . VI-1974.9.3 Process Description . . . . . . . . . . . . . . . . . . . . . . . . . . . . . . . . . . . . . . . . . VI-1974.9.4 Environmental . . . . . . . . . . . . . . . . . . . . . . . . . . . . . . . . . . . . . . . . . . . . . VI-1994.9.5 Material Developments . . . . . . . . . . . . . . . . . . . . . . . . . . . . . . . . . . . . . . VI-2014.9.6 Specific Risks and Future Opportunities . . . . . . . . . . . . . . . . . . . . . . . . . VI-201
4.10 Urals Alumina Refinery . . . . . . . . . . . . . . . . . . . . . . . . . . . . . . . . . . . . . . . . . . . VI-2014.10.1 Introduction . . . . . . . . . . . . . . . . . . . . . . . . . . . . . . . . . . . . . . . . . . . . . . . VI-2014.10.2 History, Location and Infrastructure . . . . . . . . . . . . . . . . . . . . . . . . . . . . . VI-2024.10.3 Process Description . . . . . . . . . . . . . . . . . . . . . . . . . . . . . . . . . . . . . . . . . VI-2024.10.4 Environmental . . . . . . . . . . . . . . . . . . . . . . . . . . . . . . . . . . . . . . . . . . . . . VI-2034.10.5 Material Developments . . . . . . . . . . . . . . . . . . . . . . . . . . . . . . . . . . . . . . VI-2054.10.6 Specific Risks and Future Opportunities . . . . . . . . . . . . . . . . . . . . . . . . . VI-205
4.11 Boxitogorsk Alumina Refinery . . . . . . . . . . . . . . . . . . . . . . . . . . . . . . . . . . . . . . VI-2054.11.1 Introduction . . . . . . . . . . . . . . . . . . . . . . . . . . . . . . . . . . . . . . . . . . . . . . . VI-2054.11.2 History, Location and Infrastructure . . . . . . . . . . . . . . . . . . . . . . . . . . . . . VI-2064.11.3 Process Description . . . . . . . . . . . . . . . . . . . . . . . . . . . . . . . . . . . . . . . . . VI-2064.11.4 Environmental . . . . . . . . . . . . . . . . . . . . . . . . . . . . . . . . . . . . . . . . . . . . . VI-2074.11.5 Material Developments . . . . . . . . . . . . . . . . . . . . . . . . . . . . . . . . . . . . . . VI-2084.11.6 Specific Risks and Future Opportunities . . . . . . . . . . . . . . . . . . . . . . . . . VI-208
4.12 Nikolaev Alumina Refinery . . . . . . . . . . . . . . . . . . . . . . . . . . . . . . . . . . . . . . . . VI-2094.12.1 Introduction . . . . . . . . . . . . . . . . . . . . . . . . . . . . . . . . . . . . . . . . . . . . . . . VI-2094.12.2 History, Location and Infrastructure . . . . . . . . . . . . . . . . . . . . . . . . . . . . . VI-209
APPENDIX VI INDEPENDENT TECHNICAL REPORT
— VI-8 —
4.12.3 Process Description . . . . . . . . . . . . . . . . . . . . . . . . . . . . . . . . . . . . . . . . . VI-2094.12.4 Environmental . . . . . . . . . . . . . . . . . . . . . . . . . . . . . . . . . . . . . . . . . . . . . VI-2104.12.5 Material Developments . . . . . . . . . . . . . . . . . . . . . . . . . . . . . . . . . . . . . . VI-2114.12.6 Specific Risks and Future Opportunities . . . . . . . . . . . . . . . . . . . . . . . . . VI-212
4.13 Zaporozhye Alumina Refinery . . . . . . . . . . . . . . . . . . . . . . . . . . . . . . . . . . . . . . VI-2124.13.1 Introduction . . . . . . . . . . . . . . . . . . . . . . . . . . . . . . . . . . . . . . . . . . . . . . . VI-2124.13.2 History, Location and Infrastructure . . . . . . . . . . . . . . . . . . . . . . . . . . . . . VI-2124.13.3 Process Description . . . . . . . . . . . . . . . . . . . . . . . . . . . . . . . . . . . . . . . . . VI-2134.13.4 Environmental . . . . . . . . . . . . . . . . . . . . . . . . . . . . . . . . . . . . . . . . . . . . . VI-2144.13.5 Material Developments . . . . . . . . . . . . . . . . . . . . . . . . . . . . . . . . . . . . . . VI-2154.13.6 Specific Risks and Future Opportunities . . . . . . . . . . . . . . . . . . . . . . . . . VI-215
5. Aluminium Division . . . . . . . . . . . . . . . . . . . . . . . . . . . . . . . . . . . . . . . . . . . . . . . . . . VI-216
5.1 Bratsk Aluminium Smelter . . . . . . . . . . . . . . . . . . . . . . . . . . . . . . . . . . . . . . . . VI-2165.1.1 Introduction . . . . . . . . . . . . . . . . . . . . . . . . . . . . . . . . . . . . . . . . . . . . . . . VI-2165.1.2 History, Location and Infrastructure . . . . . . . . . . . . . . . . . . . . . . . . . . . . . VI-2165.1.3 Process Description . . . . . . . . . . . . . . . . . . . . . . . . . . . . . . . . . . . . . . . . . VI-2175.1.4 Environmental . . . . . . . . . . . . . . . . . . . . . . . . . . . . . . . . . . . . . . . . . . . . . VI-2185.1.5 Material Developments . . . . . . . . . . . . . . . . . . . . . . . . . . . . . . . . . . . . . . VI-2195.1.6 Specific Risks and Future Opportunities . . . . . . . . . . . . . . . . . . . . . . . . . VI-220
5.2 Krasnoyarsk Aluminium Smelter . . . . . . . . . . . . . . . . . . . . . . . . . . . . . . . . . . . . VI-2205.2.1 Introduction . . . . . . . . . . . . . . . . . . . . . . . . . . . . . . . . . . . . . . . . . . . . . . . VI-2205.2.2 History, Location and Infrastructure . . . . . . . . . . . . . . . . . . . . . . . . . . . . . VI-2215.2.3 Process Description . . . . . . . . . . . . . . . . . . . . . . . . . . . . . . . . . . . . . . . . . VI-2215.2.4 Environmental . . . . . . . . . . . . . . . . . . . . . . . . . . . . . . . . . . . . . . . . . . . . . VI-2235.2.5 Material Developments . . . . . . . . . . . . . . . . . . . . . . . . . . . . . . . . . . . . . . VI-2235.2.6 Specific Risks and Future Opportunities . . . . . . . . . . . . . . . . . . . . . . . . . VI-224
5.3 Sayanogorsk Aluminium Smelter . . . . . . . . . . . . . . . . . . . . . . . . . . . . . . . . . . . . VI-2245.3.1 Introduction . . . . . . . . . . . . . . . . . . . . . . . . . . . . . . . . . . . . . . . . . . . . . . . VI-2245.3.2 History, Location and Infrastructure . . . . . . . . . . . . . . . . . . . . . . . . . . . . . VI-2245.3.3 Process Description . . . . . . . . . . . . . . . . . . . . . . . . . . . . . . . . . . . . . . . . . VI-2255.3.4 Environmental . . . . . . . . . . . . . . . . . . . . . . . . . . . . . . . . . . . . . . . . . . . . . VI-2265.3.5 Material Developments . . . . . . . . . . . . . . . . . . . . . . . . . . . . . . . . . . . . . . VI-2275.3.6 Specific Risks and Future Opportunities . . . . . . . . . . . . . . . . . . . . . . . . . VI-227
5.4 Novokuznetsk Aluminium Smelter . . . . . . . . . . . . . . . . . . . . . . . . . . . . . . . . . . . VI-2275.4.1 Introduction . . . . . . . . . . . . . . . . . . . . . . . . . . . . . . . . . . . . . . . . . . . . . . . VI-2275.4.2 History, Location and Infrastructure . . . . . . . . . . . . . . . . . . . . . . . . . . . . . VI-2285.4.3 Process Description . . . . . . . . . . . . . . . . . . . . . . . . . . . . . . . . . . . . . . . . . VI-2285.4.4 Environmental . . . . . . . . . . . . . . . . . . . . . . . . . . . . . . . . . . . . . . . . . . . . . VI-2305.4.5 Material Developments . . . . . . . . . . . . . . . . . . . . . . . . . . . . . . . . . . . . . . VI-2315.4.6 Specific Risks and Future Opportunities . . . . . . . . . . . . . . . . . . . . . . . . . VI-231
5.5 Irkutsk Aluminium Smelter . . . . . . . . . . . . . . . . . . . . . . . . . . . . . . . . . . . . . . . . VI-2325.5.1 Introduction . . . . . . . . . . . . . . . . . . . . . . . . . . . . . . . . . . . . . . . . . . . . . . . VI-2325.5.2 History, Location and Infrastructure . . . . . . . . . . . . . . . . . . . . . . . . . . . . . VI-2325.5.3 Process Description . . . . . . . . . . . . . . . . . . . . . . . . . . . . . . . . . . . . . . . . . VI-2335.5.4 Environmental . . . . . . . . . . . . . . . . . . . . . . . . . . . . . . . . . . . . . . . . . . . . . VI-2345.5.5 Material Developments . . . . . . . . . . . . . . . . . . . . . . . . . . . . . . . . . . . . . . VI-2355.5.6 Specific Risks and Future Opportunities . . . . . . . . . . . . . . . . . . . . . . . . . VI-235
APPENDIX VI INDEPENDENT TECHNICAL REPORT
— VI-9 —

5.6 Khakas Aluminium Smelter . . . . . . . . . . . . . . . . . . . . . . . . . . . . . . . . . . . . . . . . VI-2365.6.1 Introduction . . . . . . . . . . . . . . . . . . . . . . . . . . . . . . . . . . . . . . . . . . . . . . . VI-2365.6.2 History, Location and Infrastructure . . . . . . . . . . . . . . . . . . . . . . . . . . . . . VI-2365.6.3 Process Description . . . . . . . . . . . . . . . . . . . . . . . . . . . . . . . . . . . . . . . . . VI-2365.6.4 Environmental . . . . . . . . . . . . . . . . . . . . . . . . . . . . . . . . . . . . . . . . . . . . . VI-2375.6.5 Material Developments . . . . . . . . . . . . . . . . . . . . . . . . . . . . . . . . . . . . . . VI-2385.6.6 Specific Risks and Future Opportunities . . . . . . . . . . . . . . . . . . . . . . . . . VI-238
5.7 Bogoslovsk Aluminium Smelter . . . . . . . . . . . . . . . . . . . . . . . . . . . . . . . . . . . . . VI-2395.7.1 Introduction . . . . . . . . . . . . . . . . . . . . . . . . . . . . . . . . . . . . . . . . . . . . . . . VI-2395.7.2 History, Location and Infrastructure . . . . . . . . . . . . . . . . . . . . . . . . . . . . . VI-2395.7.3 Process Description . . . . . . . . . . . . . . . . . . . . . . . . . . . . . . . . . . . . . . . . . VI-2395.7.4 Environmental . . . . . . . . . . . . . . . . . . . . . . . . . . . . . . . . . . . . . . . . . . . . . VI-2415.7.5 Material Developments . . . . . . . . . . . . . . . . . . . . . . . . . . . . . . . . . . . . . . VI-2415.7.6 Specific Risks and Future Opportunities . . . . . . . . . . . . . . . . . . . . . . . . . VI-242
5.8 Volgograd Aluminium Smelter . . . . . . . . . . . . . . . . . . . . . . . . . . . . . . . . . . . . . . VI-2425.8.1 Introduction . . . . . . . . . . . . . . . . . . . . . . . . . . . . . . . . . . . . . . . . . . . . . . . VI-2425.8.2 History, Location and Infrastructure . . . . . . . . . . . . . . . . . . . . . . . . . . . . . VI-2435.8.3 Process Description . . . . . . . . . . . . . . . . . . . . . . . . . . . . . . . . . . . . . . . . . VI-2435.8.4 Environmental . . . . . . . . . . . . . . . . . . . . . . . . . . . . . . . . . . . . . . . . . . . . . VI-2445.8.5 Material Developments . . . . . . . . . . . . . . . . . . . . . . . . . . . . . . . . . . . . . . VI-2455.8.6 Specific Risks and Future Opportunities . . . . . . . . . . . . . . . . . . . . . . . . . VI-245
5.9 Urals Aluminium Smelter . . . . . . . . . . . . . . . . . . . . . . . . . . . . . . . . . . . . . . . . . VI-2465.9.1 Introduction . . . . . . . . . . . . . . . . . . . . . . . . . . . . . . . . . . . . . . . . . . . . . . . VI-2465.9.2 History, Location and Infrastructure . . . . . . . . . . . . . . . . . . . . . . . . . . . . . VI-2465.9.3 Process Description . . . . . . . . . . . . . . . . . . . . . . . . . . . . . . . . . . . . . . . . . VI-2465.9.4 Environmental . . . . . . . . . . . . . . . . . . . . . . . . . . . . . . . . . . . . . . . . . . . . . VI-2485.9.5 Material Developments . . . . . . . . . . . . . . . . . . . . . . . . . . . . . . . . . . . . . . VI-2485.9.6 Specific Risks and Future Opportunities . . . . . . . . . . . . . . . . . . . . . . . . . VI-249
5.10 Nadvoitsy Aluminium Smelter . . . . . . . . . . . . . . . . . . . . . . . . . . . . . . . . . . . . . . VI-2495.10.1 Introduction . . . . . . . . . . . . . . . . . . . . . . . . . . . . . . . . . . . . . . . . . . . . . . . VI-2495.10.2 History, Location and Infrastructure . . . . . . . . . . . . . . . . . . . . . . . . . . . . . VI-2505.10.3 Process Description . . . . . . . . . . . . . . . . . . . . . . . . . . . . . . . . . . . . . . . . . VI-2505.10.4 Environmental . . . . . . . . . . . . . . . . . . . . . . . . . . . . . . . . . . . . . . . . . . . . . VI-2515.10.5 Material Developments . . . . . . . . . . . . . . . . . . . . . . . . . . . . . . . . . . . . . . VI-2525.10.6 Specific Risks and Future Opportunities . . . . . . . . . . . . . . . . . . . . . . . . . VI-252
5.11 Kandalaksha Aluminium Smelter . . . . . . . . . . . . . . . . . . . . . . . . . . . . . . . . . . . VI-2535.11.1 Introduction . . . . . . . . . . . . . . . . . . . . . . . . . . . . . . . . . . . . . . . . . . . . . . . VI-2535.11.2 History, Location and Infrastructure . . . . . . . . . . . . . . . . . . . . . . . . . . . . . VI-2535.11.3 Process Description . . . . . . . . . . . . . . . . . . . . . . . . . . . . . . . . . . . . . . . . . VI-2545.11.4 Environmental . . . . . . . . . . . . . . . . . . . . . . . . . . . . . . . . . . . . . . . . . . . . . VI-2555.11.5 Material Developments . . . . . . . . . . . . . . . . . . . . . . . . . . . . . . . . . . . . . . VI-2555.11.6 Specific Risks and Future Opportunities . . . . . . . . . . . . . . . . . . . . . . . . . VI-256
5.12 Volkhov Aluminium Smelter . . . . . . . . . . . . . . . . . . . . . . . . . . . . . . . . . . . . . . . VI-2565.12.1 Introduction . . . . . . . . . . . . . . . . . . . . . . . . . . . . . . . . . . . . . . . . . . . . . . . VI-2565.12.2 History, Location and Infrastructure . . . . . . . . . . . . . . . . . . . . . . . . . . . . . VI-2575.12.3 Process Description . . . . . . . . . . . . . . . . . . . . . . . . . . . . . . . . . . . . . . . . . VI-2575.12.4 Environmental . . . . . . . . . . . . . . . . . . . . . . . . . . . . . . . . . . . . . . . . . . . . . VI-2585.12.5 Material Developments . . . . . . . . . . . . . . . . . . . . . . . . . . . . . . . . . . . . . . VI-2585.12.6 Specific Risks and Future Opportunities . . . . . . . . . . . . . . . . . . . . . . . . . VI-259
APPENDIX VI INDEPENDENT TECHNICAL REPORT
— VI-10 —

5.13 Alukom Taishet Aluminium Smelter . . . . . . . . . . . . . . . . . . . . . . . . . . . . . . . . . VI-2595.13.1 Introduction . . . . . . . . . . . . . . . . . . . . . . . . . . . . . . . . . . . . . . . . . . . . . . . VI-2595.13.2 History, Location and Infrastructure . . . . . . . . . . . . . . . . . . . . . . . . . . . . . VI-2605.13.3 Process Description . . . . . . . . . . . . . . . . . . . . . . . . . . . . . . . . . . . . . . . . . VI-2605.13.4 Environmental . . . . . . . . . . . . . . . . . . . . . . . . . . . . . . . . . . . . . . . . . . . . . VI-2615.13.5 Material Developments . . . . . . . . . . . . . . . . . . . . . . . . . . . . . . . . . . . . . . VI-2625.13.6 Specific Risks and Future Opportunities . . . . . . . . . . . . . . . . . . . . . . . . . VI-262
5.14 Taishet Aluminium Smelter Project . . . . . . . . . . . . . . . . . . . . . . . . . . . . . . . . . . VI-2625.14.1 Introduction . . . . . . . . . . . . . . . . . . . . . . . . . . . . . . . . . . . . . . . . . . . . . . . VI-2625.14.2 History, Location and Infrastructure . . . . . . . . . . . . . . . . . . . . . . . . . . . . . VI-2635.14.3 Process Description . . . . . . . . . . . . . . . . . . . . . . . . . . . . . . . . . . . . . . . . . VI-2645.14.4 Environmental . . . . . . . . . . . . . . . . . . . . . . . . . . . . . . . . . . . . . . . . . . . . . VI-2655.14.5 Material Developments . . . . . . . . . . . . . . . . . . . . . . . . . . . . . . . . . . . . . . VI-2655.14.6 Specific Risks and Future Opportunities . . . . . . . . . . . . . . . . . . . . . . . . . VI-266
5.15 Kubikenborg Aluminium . . . . . . . . . . . . . . . . . . . . . . . . . . . . . . . . . . . . . . . . . . VI-2665.15.1 Introduction . . . . . . . . . . . . . . . . . . . . . . . . . . . . . . . . . . . . . . . . . . . . . . . VI-2665.15.2 History, Location and Infrastructure . . . . . . . . . . . . . . . . . . . . . . . . . . . . . VI-2665.15.3 Process Description . . . . . . . . . . . . . . . . . . . . . . . . . . . . . . . . . . . . . . . . . VI-2675.15.4 Environmental . . . . . . . . . . . . . . . . . . . . . . . . . . . . . . . . . . . . . . . . . . . . . VI-2685.15.5 Material Developments . . . . . . . . . . . . . . . . . . . . . . . . . . . . . . . . . . . . . . VI-2695.15.6 Specific Risks and Future Opportunities . . . . . . . . . . . . . . . . . . . . . . . . . VI-269
5.16 Zaporozhye Aluminium Smelter . . . . . . . . . . . . . . . . . . . . . . . . . . . . . . . . . . . . VI-2705.16.1 Introduction . . . . . . . . . . . . . . . . . . . . . . . . . . . . . . . . . . . . . . . . . . . . . . . VI-2705.16.2 History, Location and Infrastructure . . . . . . . . . . . . . . . . . . . . . . . . . . . . . VI-2705.16.3 Process Description . . . . . . . . . . . . . . . . . . . . . . . . . . . . . . . . . . . . . . . . . VI-2705.16.4 Environmental . . . . . . . . . . . . . . . . . . . . . . . . . . . . . . . . . . . . . . . . . . . . . VI-2715.16.5 Material Developments . . . . . . . . . . . . . . . . . . . . . . . . . . . . . . . . . . . . . . VI-2725.16.6 Specific Risks and Future Opportunities . . . . . . . . . . . . . . . . . . . . . . . . . VI-273
5.17 ALSCON . . . . . . . . . . . . . . . . . . . . . . . . . . . . . . . . . . . . . . . . . . . . . . . . . . . . . . . VI-2735.17.1 Introduction . . . . . . . . . . . . . . . . . . . . . . . . . . . . . . . . . . . . . . . . . . . . . . . VI-2735.17.2 History, Location and Infrastructure . . . . . . . . . . . . . . . . . . . . . . . . . . . . . VI-2745.17.3 Process Description . . . . . . . . . . . . . . . . . . . . . . . . . . . . . . . . . . . . . . . . . VI-2745.17.4 Environmental . . . . . . . . . . . . . . . . . . . . . . . . . . . . . . . . . . . . . . . . . . . . . VI-2765.17.5 Material Developments . . . . . . . . . . . . . . . . . . . . . . . . . . . . . . . . . . . . . . VI-2765.17.6 Specific Risks and Future Opportunities . . . . . . . . . . . . . . . . . . . . . . . . . VI-277
5.18 Boguchansky Smelter Project . . . . . . . . . . . . . . . . . . . . . . . . . . . . . . . . . . . . . . VI-2775.18.1 Introduction . . . . . . . . . . . . . . . . . . . . . . . . . . . . . . . . . . . . . . . . . . . . . . . VI-2775.18.2 History, Location and Infrastructure . . . . . . . . . . . . . . . . . . . . . . . . . . . . . VI-2785.18.3 Process Description . . . . . . . . . . . . . . . . . . . . . . . . . . . . . . . . . . . . . . . . . VI-2785.18.4 Environmental . . . . . . . . . . . . . . . . . . . . . . . . . . . . . . . . . . . . . . . . . . . . . VI-2795.18.5 Material Developments . . . . . . . . . . . . . . . . . . . . . . . . . . . . . . . . . . . . . . VI-2795.18.6 Specific Risks and Future Opportunities . . . . . . . . . . . . . . . . . . . . . . . . . VI-280
6. Powder, Silicon, Secondary Aluminium and Raw Materials Facilities . . . . . . . . . . . VI-280
6.1 Krasnoturyinsk Powder Metallurgy . . . . . . . . . . . . . . . . . . . . . . . . . . . . . . . . . VI-2806.1.1 Introduction . . . . . . . . . . . . . . . . . . . . . . . . . . . . . . . . . . . . . . . . . . . . . . . VI-2806.1.2 History and Location . . . . . . . . . . . . . . . . . . . . . . . . . . . . . . . . . . . . . . . . VI-2806.1.3 Plant Description . . . . . . . . . . . . . . . . . . . . . . . . . . . . . . . . . . . . . . . . . . . VI-2816.1.4 Material Developments . . . . . . . . . . . . . . . . . . . . . . . . . . . . . . . . . . . . . . VI-281
APPENDIX VI INDEPENDENT TECHNICAL REPORT
— VI-11 —
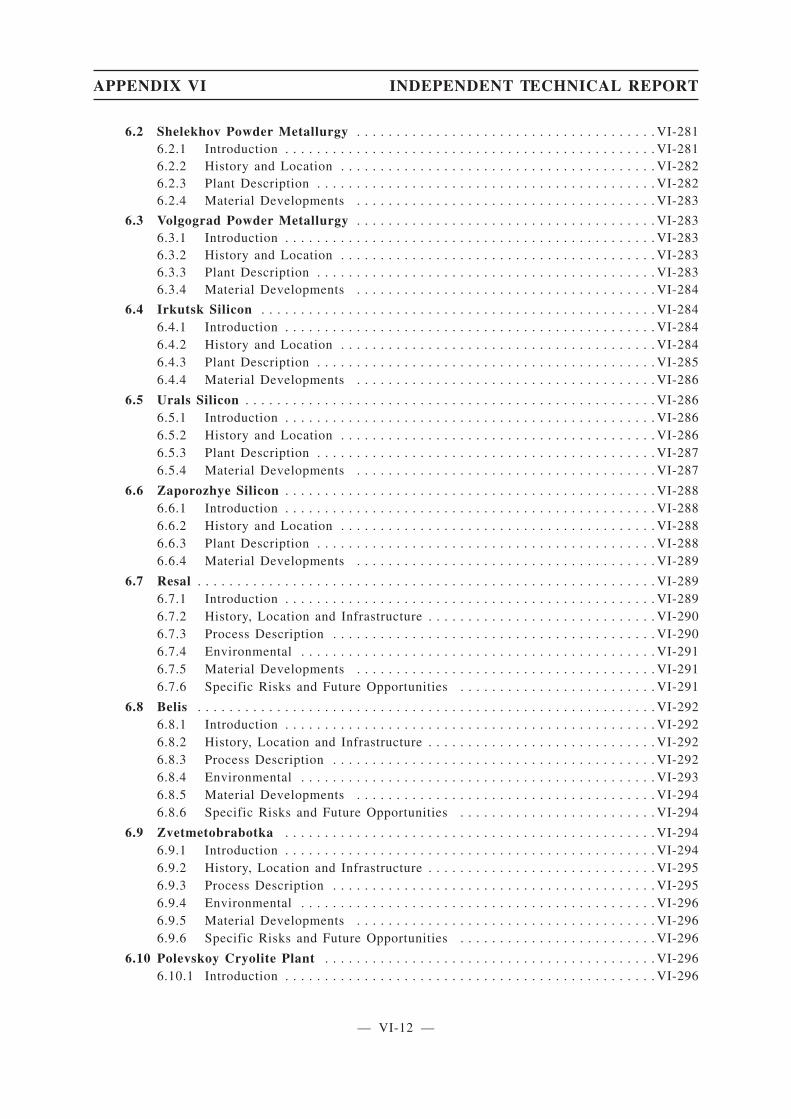
6.2 Shelekhov Powder Metallurgy . . . . . . . . . . . . . . . . . . . . . . . . . . . . . . . . . . . . . . VI-2816.2.1 Introduction . . . . . . . . . . . . . . . . . . . . . . . . . . . . . . . . . . . . . . . . . . . . . . . VI-2816.2.2 History and Location . . . . . . . . . . . . . . . . . . . . . . . . . . . . . . . . . . . . . . . . VI-2826.2.3 Plant Description . . . . . . . . . . . . . . . . . . . . . . . . . . . . . . . . . . . . . . . . . . . VI-2826.2.4 Material Developments . . . . . . . . . . . . . . . . . . . . . . . . . . . . . . . . . . . . . . VI-283
6.3 Volgograd Powder Metallurgy . . . . . . . . . . . . . . . . . . . . . . . . . . . . . . . . . . . . . . VI-2836.3.1 Introduction . . . . . . . . . . . . . . . . . . . . . . . . . . . . . . . . . . . . . . . . . . . . . . . VI-2836.3.2 History and Location . . . . . . . . . . . . . . . . . . . . . . . . . . . . . . . . . . . . . . . . VI-2836.3.3 Plant Description . . . . . . . . . . . . . . . . . . . . . . . . . . . . . . . . . . . . . . . . . . . VI-2836.3.4 Material Developments . . . . . . . . . . . . . . . . . . . . . . . . . . . . . . . . . . . . . . VI-284
6.4 Irkutsk Silicon . . . . . . . . . . . . . . . . . . . . . . . . . . . . . . . . . . . . . . . . . . . . . . . . . . VI-2846.4.1 Introduction . . . . . . . . . . . . . . . . . . . . . . . . . . . . . . . . . . . . . . . . . . . . . . . VI-2846.4.2 History and Location . . . . . . . . . . . . . . . . . . . . . . . . . . . . . . . . . . . . . . . . VI-2846.4.3 Plant Description . . . . . . . . . . . . . . . . . . . . . . . . . . . . . . . . . . . . . . . . . . . VI-2856.4.4 Material Developments . . . . . . . . . . . . . . . . . . . . . . . . . . . . . . . . . . . . . . VI-286
6.5 Urals Silicon . . . . . . . . . . . . . . . . . . . . . . . . . . . . . . . . . . . . . . . . . . . . . . . . . . . . VI-2866.5.1 Introduction . . . . . . . . . . . . . . . . . . . . . . . . . . . . . . . . . . . . . . . . . . . . . . . VI-2866.5.2 History and Location . . . . . . . . . . . . . . . . . . . . . . . . . . . . . . . . . . . . . . . . VI-2866.5.3 Plant Description . . . . . . . . . . . . . . . . . . . . . . . . . . . . . . . . . . . . . . . . . . . VI-2876.5.4 Material Developments . . . . . . . . . . . . . . . . . . . . . . . . . . . . . . . . . . . . . . VI-287
6.6 Zaporozhye Silicon . . . . . . . . . . . . . . . . . . . . . . . . . . . . . . . . . . . . . . . . . . . . . . . VI-2886.6.1 Introduction . . . . . . . . . . . . . . . . . . . . . . . . . . . . . . . . . . . . . . . . . . . . . . . VI-2886.6.2 History and Location . . . . . . . . . . . . . . . . . . . . . . . . . . . . . . . . . . . . . . . . VI-2886.6.3 Plant Description . . . . . . . . . . . . . . . . . . . . . . . . . . . . . . . . . . . . . . . . . . . VI-2886.6.4 Material Developments . . . . . . . . . . . . . . . . . . . . . . . . . . . . . . . . . . . . . . VI-289
6.7 Resal . . . . . . . . . . . . . . . . . . . . . . . . . . . . . . . . . . . . . . . . . . . . . . . . . . . . . . . . . . VI-2896.7.1 Introduction . . . . . . . . . . . . . . . . . . . . . . . . . . . . . . . . . . . . . . . . . . . . . . . VI-2896.7.2 History, Location and Infrastructure . . . . . . . . . . . . . . . . . . . . . . . . . . . . . VI-2906.7.3 Process Description . . . . . . . . . . . . . . . . . . . . . . . . . . . . . . . . . . . . . . . . . VI-2906.7.4 Environmental . . . . . . . . . . . . . . . . . . . . . . . . . . . . . . . . . . . . . . . . . . . . . VI-2916.7.5 Material Developments . . . . . . . . . . . . . . . . . . . . . . . . . . . . . . . . . . . . . . VI-2916.7.6 Specific Risks and Future Opportunities . . . . . . . . . . . . . . . . . . . . . . . . . VI-291
6.8 Belis . . . . . . . . . . . . . . . . . . . . . . . . . . . . . . . . . . . . . . . . . . . . . . . . . . . . . . . . . . VI-2926.8.1 Introduction . . . . . . . . . . . . . . . . . . . . . . . . . . . . . . . . . . . . . . . . . . . . . . . VI-2926.8.2 History, Location and Infrastructure . . . . . . . . . . . . . . . . . . . . . . . . . . . . . VI-2926.8.3 Process Description . . . . . . . . . . . . . . . . . . . . . . . . . . . . . . . . . . . . . . . . . VI-2926.8.4 Environmental . . . . . . . . . . . . . . . . . . . . . . . . . . . . . . . . . . . . . . . . . . . . . VI-2936.8.5 Material Developments . . . . . . . . . . . . . . . . . . . . . . . . . . . . . . . . . . . . . . VI-2946.8.6 Specific Risks and Future Opportunities . . . . . . . . . . . . . . . . . . . . . . . . . VI-294
6.9 Zvetmetobrabotka . . . . . . . . . . . . . . . . . . . . . . . . . . . . . . . . . . . . . . . . . . . . . . . VI-2946.9.1 Introduction . . . . . . . . . . . . . . . . . . . . . . . . . . . . . . . . . . . . . . . . . . . . . . . VI-2946.9.2 History, Location and Infrastructure . . . . . . . . . . . . . . . . . . . . . . . . . . . . . VI-2956.9.3 Process Description . . . . . . . . . . . . . . . . . . . . . . . . . . . . . . . . . . . . . . . . . VI-2956.9.4 Environmental . . . . . . . . . . . . . . . . . . . . . . . . . . . . . . . . . . . . . . . . . . . . . VI-2966.9.5 Material Developments . . . . . . . . . . . . . . . . . . . . . . . . . . . . . . . . . . . . . . VI-2966.9.6 Specific Risks and Future Opportunities . . . . . . . . . . . . . . . . . . . . . . . . . VI-296
6.10 Polevskoy Cryolite Plant . . . . . . . . . . . . . . . . . . . . . . . . . . . . . . . . . . . . . . . . . . VI-2966.10.1 Introduction . . . . . . . . . . . . . . . . . . . . . . . . . . . . . . . . . . . . . . . . . . . . . . . VI-296
APPENDIX VI INDEPENDENT TECHNICAL REPORT
— VI-12 —

6.10.2 History, Location and Infrastructure . . . . . . . . . . . . . . . . . . . . . . . . . . . . . VI-2976.10.3 Process Description . . . . . . . . . . . . . . . . . . . . . . . . . . . . . . . . . . . . . . . . . VI-2976.10.4 Environmental . . . . . . . . . . . . . . . . . . . . . . . . . . . . . . . . . . . . . . . . . . . . . VI-2976.10.5 Material Developments . . . . . . . . . . . . . . . . . . . . . . . . . . . . . . . . . . . . . . VI-2986.10.6 Specific Risks and Future Opportunities . . . . . . . . . . . . . . . . . . . . . . . . . VI-298
6.11 South Urals Cryolite Plant . . . . . . . . . . . . . . . . . . . . . . . . . . . . . . . . . . . . . . . . . VI-2996.11.1 Introduction . . . . . . . . . . . . . . . . . . . . . . . . . . . . . . . . . . . . . . . . . . . . . . . VI-2996.11.2 History, Location and Infrastructure . . . . . . . . . . . . . . . . . . . . . . . . . . . . . VI-2996.11.3 Process Description . . . . . . . . . . . . . . . . . . . . . . . . . . . . . . . . . . . . . . . . . VI-2996.11.4 Environmental . . . . . . . . . . . . . . . . . . . . . . . . . . . . . . . . . . . . . . . . . . . . . VI-3006.11.5 Material Developments . . . . . . . . . . . . . . . . . . . . . . . . . . . . . . . . . . . . . . VI-3016.11.6 Specific Risks and Future Opportunities . . . . . . . . . . . . . . . . . . . . . . . . . VI-301
6.12 Lingshi Cathode Plant . . . . . . . . . . . . . . . . . . . . . . . . . . . . . . . . . . . . . . . . . . . . VI-3026.12.1 Introduction . . . . . . . . . . . . . . . . . . . . . . . . . . . . . . . . . . . . . . . . . . . . . . . VI-3026.12.2 History, Location and Infrastructure . . . . . . . . . . . . . . . . . . . . . . . . . . . . . VI-3026.12.3 Process Description . . . . . . . . . . . . . . . . . . . . . . . . . . . . . . . . . . . . . . . . . VI-3036.12.4 Environmental . . . . . . . . . . . . . . . . . . . . . . . . . . . . . . . . . . . . . . . . . . . . . VI-3046.12.5 Material Developments . . . . . . . . . . . . . . . . . . . . . . . . . . . . . . . . . . . . . . VI-3056.12.6 Specific Risks and Future Opportunities . . . . . . . . . . . . . . . . . . . . . . . . . VI-305
6.13 Taigu Cathode Plant . . . . . . . . . . . . . . . . . . . . . . . . . . . . . . . . . . . . . . . . . . . . . VI-3056.13.1 Introduction . . . . . . . . . . . . . . . . . . . . . . . . . . . . . . . . . . . . . . . . . . . . . . . VI-3056.13.2 History, Location and Infrastructure . . . . . . . . . . . . . . . . . . . . . . . . . . . . . VI-3066.13.3 Process Description . . . . . . . . . . . . . . . . . . . . . . . . . . . . . . . . . . . . . . . . . VI-3066.13.4 Environmental . . . . . . . . . . . . . . . . . . . . . . . . . . . . . . . . . . . . . . . . . . . . . VI-3076.13.5 Material Developments . . . . . . . . . . . . . . . . . . . . . . . . . . . . . . . . . . . . . . VI-3076.13.6 Specific Risks and Future Opportunities . . . . . . . . . . . . . . . . . . . . . . . . . VI-308
7. Packaging Division . . . . . . . . . . . . . . . . . . . . . . . . . . . . . . . . . . . . . . . . . . . . . . . . . . . VI-308
7.1 ARMENAL . . . . . . . . . . . . . . . . . . . . . . . . . . . . . . . . . . . . . . . . . . . . . . . . . . . . . VI-3087.1.1 Introduction . . . . . . . . . . . . . . . . . . . . . . . . . . . . . . . . . . . . . . . . . . . . . . . VI-3087.1.2 History, Location and Infrastructure . . . . . . . . . . . . . . . . . . . . . . . . . . . . . VI-3087.1.3 Process Description . . . . . . . . . . . . . . . . . . . . . . . . . . . . . . . . . . . . . . . . . VI-3097.1.4 Environmental . . . . . . . . . . . . . . . . . . . . . . . . . . . . . . . . . . . . . . . . . . . . . VI-3107.1.5 Material Developments . . . . . . . . . . . . . . . . . . . . . . . . . . . . . . . . . . . . . . VI-3107.1.6 Specific Risks and Future Opportunities . . . . . . . . . . . . . . . . . . . . . . . . . VI-311
7.2 SAYANAL . . . . . . . . . . . . . . . . . . . . . . . . . . . . . . . . . . . . . . . . . . . . . . . . . . . . . . VI-3117.2.1 Introduction . . . . . . . . . . . . . . . . . . . . . . . . . . . . . . . . . . . . . . . . . . . . . . . VI-3117.2.2 History, Location and Infrastructure . . . . . . . . . . . . . . . . . . . . . . . . . . . . . VI-3127.2.3 Process Description . . . . . . . . . . . . . . . . . . . . . . . . . . . . . . . . . . . . . . . . . VI-3127.2.4 Environmental . . . . . . . . . . . . . . . . . . . . . . . . . . . . . . . . . . . . . . . . . . . . . VI-3137.2.5 Material Developments . . . . . . . . . . . . . . . . . . . . . . . . . . . . . . . . . . . . . . VI-3137.2.6 Specific Risks and Future Opportunities . . . . . . . . . . . . . . . . . . . . . . . . . VI-313
7.3 Urals Foil . . . . . . . . . . . . . . . . . . . . . . . . . . . . . . . . . . . . . . . . . . . . . . . . . . . . . . VI-3147.3.1 Introduction . . . . . . . . . . . . . . . . . . . . . . . . . . . . . . . . . . . . . . . . . . . . . . . VI-3147.3.2 History, Location and Infrastructure . . . . . . . . . . . . . . . . . . . . . . . . . . . . . VI-3147.3.3 Process Description . . . . . . . . . . . . . . . . . . . . . . . . . . . . . . . . . . . . . . . . . VI-3157.3.4 Environmental . . . . . . . . . . . . . . . . . . . . . . . . . . . . . . . . . . . . . . . . . . . . . VI-3167.3.5 Material Developments . . . . . . . . . . . . . . . . . . . . . . . . . . . . . . . . . . . . . . VI-3167.3.6 Specific Risks and Future Opportunities . . . . . . . . . . . . . . . . . . . . . . . . . VI-316
APPENDIX VI INDEPENDENT TECHNICAL REPORT
— VI-13 —
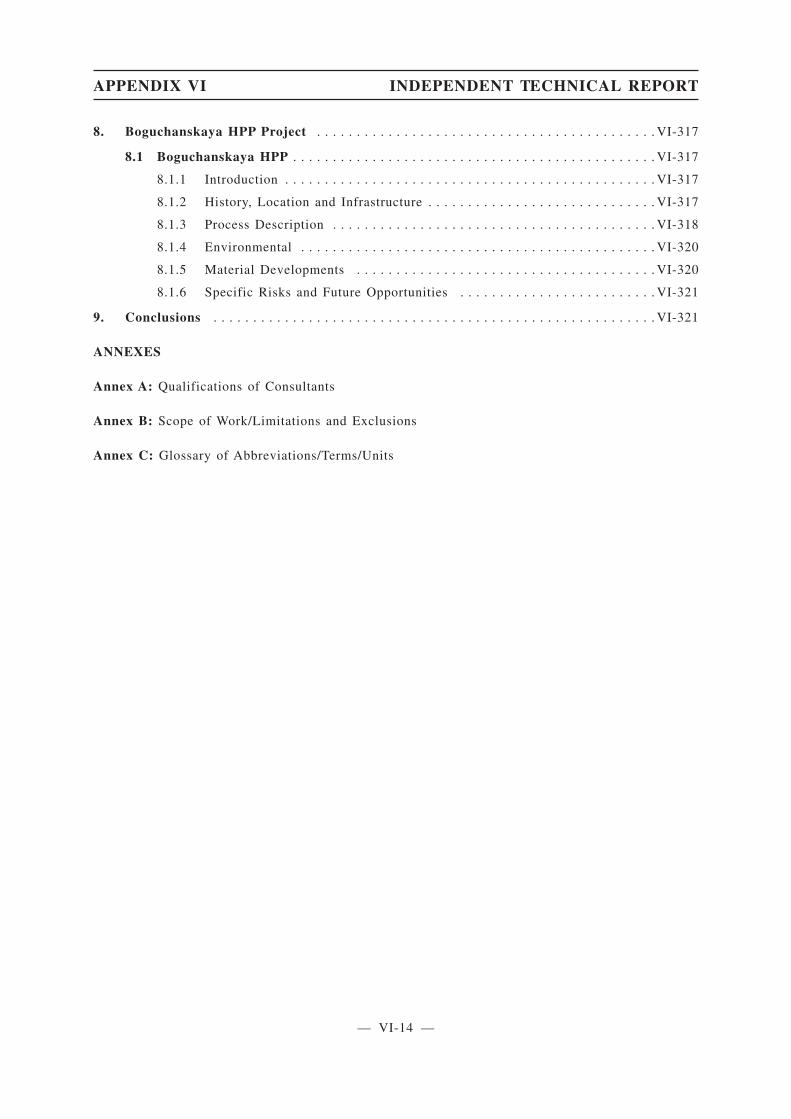
8. Boguchanskaya HPP Project . . . . . . . . . . . . . . . . . . . . . . . . . . . . . . . . . . . . . . . . . . . VI-317
8.1 Boguchanskaya HPP . . . . . . . . . . . . . . . . . . . . . . . . . . . . . . . . . . . . . . . . . . . . . . VI-317
8.1.1 Introduction . . . . . . . . . . . . . . . . . . . . . . . . . . . . . . . . . . . . . . . . . . . . . . . VI-317
8.1.2 History, Location and Infrastructure . . . . . . . . . . . . . . . . . . . . . . . . . . . . . VI-317
8.1.3 Process Description . . . . . . . . . . . . . . . . . . . . . . . . . . . . . . . . . . . . . . . . . VI-318
8.1.4 Environmental . . . . . . . . . . . . . . . . . . . . . . . . . . . . . . . . . . . . . . . . . . . . . VI-320
8.1.5 Material Developments . . . . . . . . . . . . . . . . . . . . . . . . . . . . . . . . . . . . . . VI-320
8.1.6 Specific Risks and Future Opportunities . . . . . . . . . . . . . . . . . . . . . . . . . VI-321
9. Conclusions . . . . . . . . . . . . . . . . . . . . . . . . . . . . . . . . . . . . . . . . . . . . . . . . . . . . . . . . VI-321
ANNEXES
Annex A: Qualifications of Consultants
Annex B: Scope of Work/Limitations and Exclusions
Annex C: Glossary of Abbreviations/Terms/Units
APPENDIX VI INDEPENDENT TECHNICAL REPORT
— VI-14 —
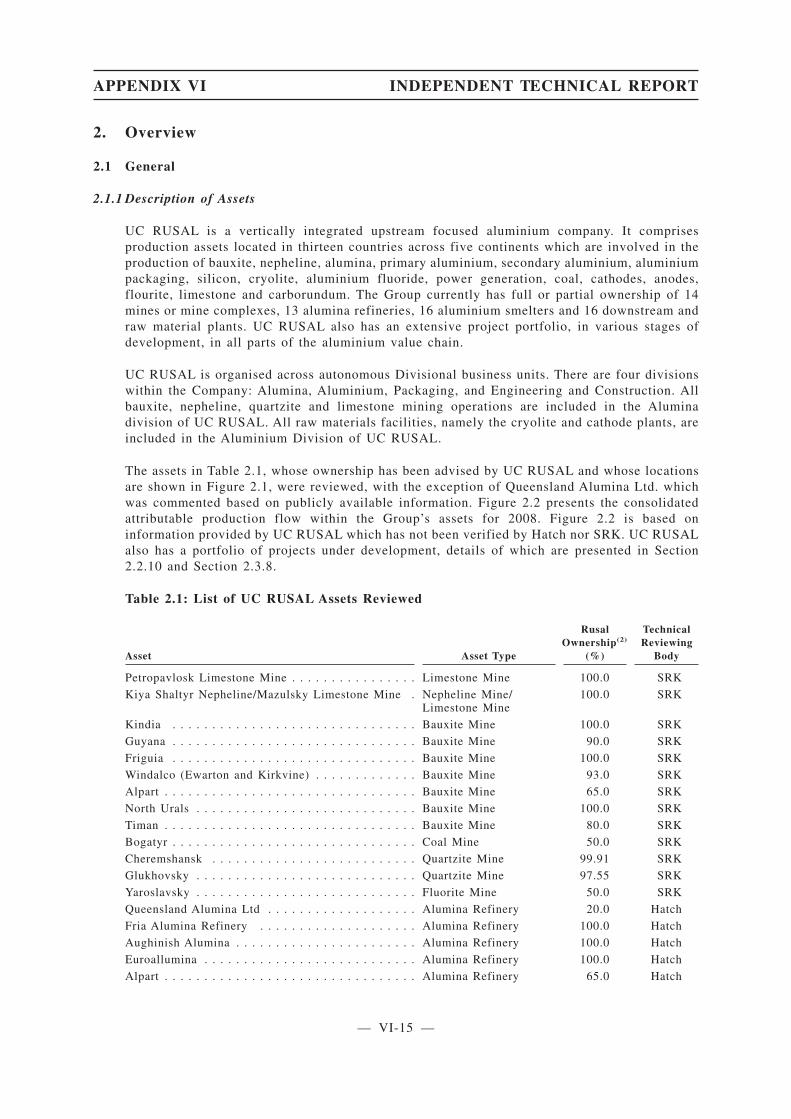
2. Overview
2.1 General
2.1.1 Description of Assets
UC RUSAL is a vertically integrated upstream focused aluminium company. It comprisesproduction assets located in thirteen countries across five continents which are involved in theproduction of bauxite, nepheline, alumina, primary aluminium, secondary aluminium, aluminiumpackaging, silicon, cryolite, aluminium fluoride, power generation, coal, cathodes, anodes,flourite, limestone and carborundum. The Group currently has full or partial ownership of 14mines or mine complexes, 13 alumina refineries, 16 aluminium smelters and 16 downstream andraw material plants. UC RUSAL also has an extensive project portfolio, in various stages ofdevelopment, in all parts of the aluminium value chain.
UC RUSAL is organised across autonomous Divisional business units. There are four divisionswithin the Company: Alumina, Aluminium, Packaging, and Engineering and Construction. Allbauxite, nepheline, quartzite and limestone mining operations are included in the Aluminadivision of UC RUSAL. All raw materials facilities, namely the cryolite and cathode plants, areincluded in the Aluminium Division of UC RUSAL.
The assets in Table 2.1, whose ownership has been advised by UC RUSAL and whose locationsare shown in Figure 2.1, were reviewed, with the exception of Queensland Alumina Ltd. whichwas commented based on publicly available information. Figure 2.2 presents the consolidatedattributable production flow within the Group’s assets for 2008. Figure 2.2 is based oninformation provided by UC RUSAL which has not been verified by Hatch nor SRK. UC RUSALalso has a portfolio of projects under development, details of which are presented in Section2.2.10 and Section 2.3.8.
Table 2.1: List of UC RUSAL Assets Reviewed
Asset Asset Type
RusalOwnership(2)
(%)
TechnicalReviewing
Body
Petropavlosk Limestone Mine . . . . . . . . . . . . . . . . Limestone Mine 100.0 SRK
Kiya Shaltyr Nepheline/Mazulsky Limestone Mine . Nepheline Mine/Limestone Mine
100.0 SRK
Kindia . . . . . . . . . . . . . . . . . . . . . . . . . . . . . . . Bauxite Mine 100.0 SRK
Guyana . . . . . . . . . . . . . . . . . . . . . . . . . . . . . . . Bauxite Mine 90.0 SRK
Friguia . . . . . . . . . . . . . . . . . . . . . . . . . . . . . . . Bauxite Mine 100.0 SRK
Windalco (Ewarton and Kirkvine) . . . . . . . . . . . . . Bauxite Mine 93.0 SRK
Alpart . . . . . . . . . . . . . . . . . . . . . . . . . . . . . . . . Bauxite Mine 65.0 SRK
North Urals . . . . . . . . . . . . . . . . . . . . . . . . . . . . Bauxite Mine 100.0 SRK
Timan . . . . . . . . . . . . . . . . . . . . . . . . . . . . . . . . Bauxite Mine 80.0 SRK
Bogatyr . . . . . . . . . . . . . . . . . . . . . . . . . . . . . . . Coal Mine 50.0 SRK
Cheremshansk . . . . . . . . . . . . . . . . . . . . . . . . . . Quartzite Mine 99.91 SRK
Glukhovsky . . . . . . . . . . . . . . . . . . . . . . . . . . . . Quartzite Mine 97.55 SRK
Yaroslavsky . . . . . . . . . . . . . . . . . . . . . . . . . . . . Fluorite Mine 50.0 SRK
Queensland Alumina Ltd . . . . . . . . . . . . . . . . . . . Alumina Refinery 20.0 Hatch
Fria Alumina Refinery . . . . . . . . . . . . . . . . . . . . Alumina Refinery 100.0 Hatch
Aughinish Alumina . . . . . . . . . . . . . . . . . . . . . . . Alumina Refinery 100.0 Hatch
Euroallumina . . . . . . . . . . . . . . . . . . . . . . . . . . . Alumina Refinery 100.0 Hatch
Alpart . . . . . . . . . . . . . . . . . . . . . . . . . . . . . . . . Alumina Refinery 65.0 Hatch
APPENDIX VI INDEPENDENT TECHNICAL REPORT
— VI-15 —
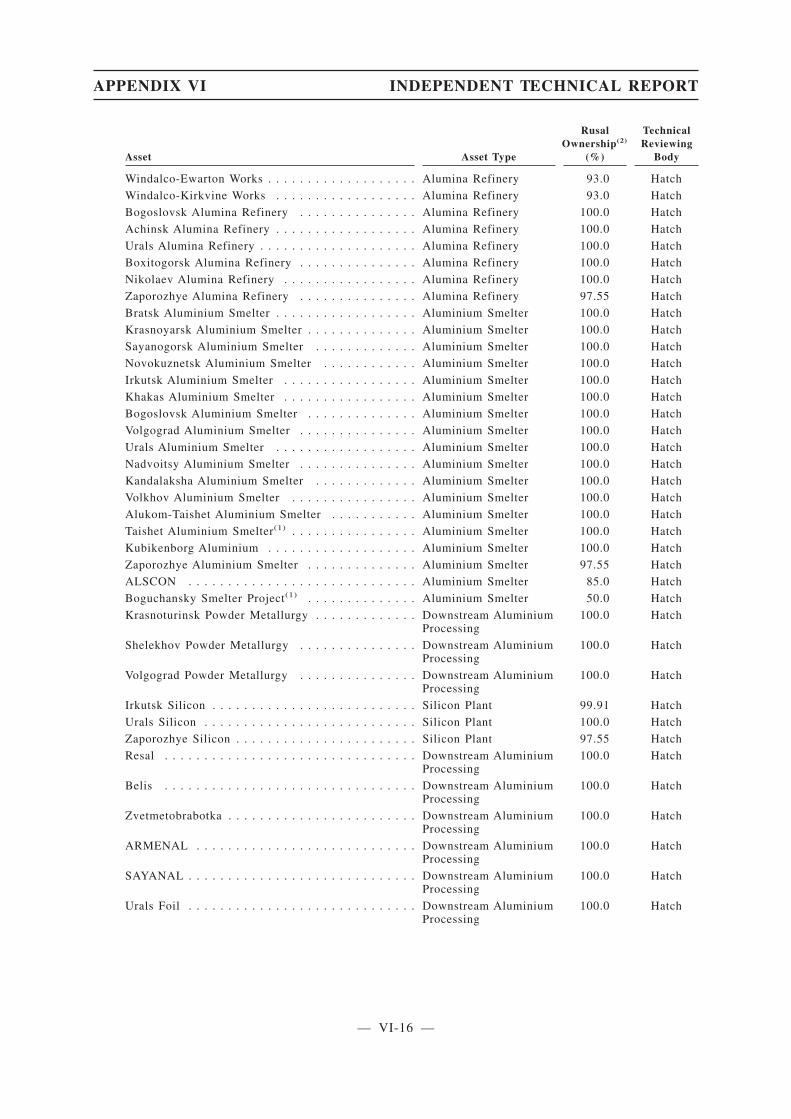
Asset Asset Type
RusalOwnership(2)
(%)
TechnicalReviewing
Body
Windalco-Ewarton Works . . . . . . . . . . . . . . . . . . . Alumina Refinery 93.0 Hatch
Windalco-Kirkvine Works . . . . . . . . . . . . . . . . . . Alumina Refinery 93.0 Hatch
Bogoslovsk Alumina Refinery . . . . . . . . . . . . . . . Alumina Refinery 100.0 Hatch
Achinsk Alumina Refinery . . . . . . . . . . . . . . . . . . Alumina Refinery 100.0 Hatch
Urals Alumina Refinery . . . . . . . . . . . . . . . . . . . . Alumina Refinery 100.0 Hatch
Boxitogorsk Alumina Refinery . . . . . . . . . . . . . . . Alumina Refinery 100.0 Hatch
Nikolaev Alumina Refinery . . . . . . . . . . . . . . . . . Alumina Refinery 100.0 Hatch
Zaporozhye Alumina Refinery . . . . . . . . . . . . . . . Alumina Refinery 97.55 Hatch
Bratsk Aluminium Smelter . . . . . . . . . . . . . . . . . . Aluminium Smelter 100.0 Hatch
Krasnoyarsk Aluminium Smelter . . . . . . . . . . . . . . Aluminium Smelter 100.0 Hatch
Sayanogorsk Aluminium Smelter . . . . . . . . . . . . . Aluminium Smelter 100.0 Hatch
Novokuznetsk Aluminium Smelter . . . . . . . . . . . . Aluminium Smelter 100.0 Hatch
Irkutsk Aluminium Smelter . . . . . . . . . . . . . . . . . Aluminium Smelter 100.0 Hatch
Khakas Aluminium Smelter . . . . . . . . . . . . . . . . . Aluminium Smelter 100.0 Hatch
Bogoslovsk Aluminium Smelter . . . . . . . . . . . . . . Aluminium Smelter 100.0 Hatch
Volgograd Aluminium Smelter . . . . . . . . . . . . . . . Aluminium Smelter 100.0 Hatch
Urals Aluminium Smelter . . . . . . . . . . . . . . . . . . Aluminium Smelter 100.0 Hatch
Nadvoitsy Aluminium Smelter . . . . . . . . . . . . . . . Aluminium Smelter 100.0 Hatch
Kandalaksha Aluminium Smelter . . . . . . . . . . . . . Aluminium Smelter 100.0 Hatch
Volkhov Aluminium Smelter . . . . . . . . . . . . . . . . Aluminium Smelter 100.0 Hatch
Alukom-Taishet Aluminium Smelter . . . . . . . . . . . Aluminium Smelter 100.0 Hatch
Taishet Aluminium Smelter(1) . . . . . . . . . . . . . . . . Aluminium Smelter 100.0 Hatch
Kubikenborg Aluminium . . . . . . . . . . . . . . . . . . . Aluminium Smelter 100.0 Hatch
Zaporozhye Aluminium Smelter . . . . . . . . . . . . . . Aluminium Smelter 97.55 Hatch
ALSCON . . . . . . . . . . . . . . . . . . . . . . . . . . . . . Aluminium Smelter 85.0 Hatch
Boguchansky Smelter Project(1) . . . . . . . . . . . . . . Aluminium Smelter 50.0 Hatch
Krasnoturinsk Powder Metallurgy . . . . . . . . . . . . . Downstream AluminiumProcessing
100.0 Hatch
Shelekhov Powder Metallurgy . . . . . . . . . . . . . . . Downstream AluminiumProcessing
100.0 Hatch
Volgograd Powder Metallurgy . . . . . . . . . . . . . . . Downstream AluminiumProcessing
100.0 Hatch
Irkutsk Silicon . . . . . . . . . . . . . . . . . . . . . . . . . . Silicon Plant 99.91 Hatch
Urals Silicon . . . . . . . . . . . . . . . . . . . . . . . . . . . Silicon Plant 100.0 Hatch
Zaporozhye Silicon . . . . . . . . . . . . . . . . . . . . . . . Silicon Plant 97.55 Hatch
Resal . . . . . . . . . . . . . . . . . . . . . . . . . . . . . . . . Downstream AluminiumProcessing
100.0 Hatch
Belis . . . . . . . . . . . . . . . . . . . . . . . . . . . . . . . . Downstream AluminiumProcessing
100.0 Hatch
Zvetmetobrabotka . . . . . . . . . . . . . . . . . . . . . . . . Downstream AluminiumProcessing
100.0 Hatch
ARMENAL . . . . . . . . . . . . . . . . . . . . . . . . . . . . Downstream AluminiumProcessing
100.0 Hatch
SAYANAL . . . . . . . . . . . . . . . . . . . . . . . . . . . . . Downstream AluminiumProcessing
100.0 Hatch
Urals Foil . . . . . . . . . . . . . . . . . . . . . . . . . . . . . Downstream AluminiumProcessing
100.0 Hatch
APPENDIX VI INDEPENDENT TECHNICAL REPORT
— VI-16 —

Asset Asset Type
RusalOwnership(2)
(%)
TechnicalReviewing
Body
Polevskoy Cryolite . . . . . . . . . . . . . . . . . . . . . . . Downstream AluminiumProcessing
94.17 Hatch
South Urals Cryolite . . . . . . . . . . . . . . . . . . . . . . Downstream AluminiumProcessing
93.49 Hatch
Lingshi Cathode Plant . . . . . . . . . . . . . . . . . . . . . Cathode Plant 100.0 Hatch
Taigu Cathode Plant . . . . . . . . . . . . . . . . . . . . . . Cathode Plant 100.0 Hatch
Boguchanskaya HPP(1) . . . . . . . . . . . . . . . . . . . . HydroelectricPower Plant
46.85 Hatch
Note:
(1) Assets currently under construction.
(2) Equity ownership as at 15 September 2009.
Figure 2.1: Map of UC RUSAL Assets(1)
(1) Excluding the quartzite, fluorite and coal mines.
APPENDIX VI INDEPENDENT TECHNICAL REPORT
— VI-17 —

Fig
ure
2.2:
UC
RU
SA
L20
08A
ggre
gate
Att
rib
uta
ble
Pro
du
ctio
n(1
)
Alu
min
a di
visi
onM
inin
g (p
rodu
ctio
n, a
ctua
l 200
8)A
lum
ina
Ref
inin
g (p
rodu
ctio
n, a
ctua
l 200
8)
Alu
min
ium
div
isio
nSm
elte
rs (
prod
uctio
n, a
ctua
l 200
8)
BrA
Z (
Rus
sia)
- 1
,002
.0 k
t T
hird
par
ties
sale
s1,
059.
4 kt
Thi
rd p
artie
s sa
les
5,56
3.2
ktT
hird
par
ties
sale
s4.
3 M
t
Alu
min
ium
to D
owns
trea
mow
n -
78.4
kt
KrA
Z (
Rus
sia)
- 1
,000
.1 k
t
SAZ
(R
ussi
a) -
537
.4 k
t
NkA
Z (
Rus
sia)
- 3
20.0
kt
KhA
Z (
Rus
sia)
- 2
97.0
kt
Als
con
(Nig
eria
) -
9.4
kt
BA
Z (
Rus
sia)
- 1
85.6
kt
VA
Z (
Rus
sia)
- 2
4.1
kt
VgA
Z (
Rus
sia)
- 1
66.3
kt
ZA
LK
(U
krai
ne)
- 11
2.8
kt
IrkA
Z (
Rus
sia)
- 3
57.6
kt
KA
Z (
Rus
sia)
- 7
5.0
kt
NA
Z (
Rus
sia)
- 8
1.0
kt
UA
Z (
Rus
sia)
- 1
33.6
kt
KU
BA
L (
Swed
en)
- 11
2.2
kt
TO
TA
LA
lum
iniu
m -
4,4
24.0
kt
Thi
rd p
artie
s pu
rcha
se2,
862.
7 kt
AT
(R
ussi
a) -
9.7
kt
Alu
min
a C
onsu
mpt
ion
own
- 6,
805.
9 kt
purc
hase
d- 1
,810
.4 k
t
AG
K (
Rus
sia)
-1,
069.
4 kt
NG
Z (
Ukr
aine
) -
1,44
6.0
kt
BG
Z (
Rus
sia)
-15
6.4
kt
Frig
uia
(Gui
nea)
- 5
93.4
kt
QA
L (
Aus
tral
ia)-
769.
0 kt
BA
Z (
Rus
sia)
- 1
,084
.1 k
t
ZA
LK
(U
krai
ne)
- 22
7.2
kt
UA
Z (
Rus
sia)
- 7
30.3
kt
Aug
inis
h(Ir
elan
d) -
1,8
89.7
kt
Eur
allu
min
a (I
taly
) -1
,045
.5 k
t
Win
dalc
o (J
amai
ca)
-1,1
58.6
kt
Alp
art (
Jam
aica
)-1,
073.
7 kt
CB
K (
Gui
nea)
- 3
,171
.7 k
t
BC
GI
(Guy
ana)
- 1
,633
.7 k
t
SUB
R(R
ussi
a) -
3,2
64.3
kt
Tim
an (
Rus
sia)
- 1
,939
.0 k
t
Frig
uia
(Gui
nea)
- 1
,989
.7 k
t
Alp
art (
Jam
aica
) -
2,63
4.3
kt
Win
dalc
o (J
amai
ca)-
3,1
33.8
kt
AG
K (
Rus
sia)
- 4
,760
.4 k
t
Bau
xite
(2)
Nep
helin
e O
re
TO
TA
LB
auxi
te -
17,
766.
4 kt
Nep
helin
e O
re -
4,7
60.4
kt
TO
TA
LA
lum
ina
- 11
,316
.8 k
t (3)
Thi
rd p
artie
s pu
rcha
se8,
822.
5 kt
Not
es: (
1) F
igur
e 2.
2 is
bas
ed o
n pr
oduc
tion
data
pro
vide
d by
UC
RU
SAL
whi
ch h
as n
ot b
een
veri
fied
by
Hat
ch a
nd S
RK
, alth
ough
the
figu
res
appe
ar to
be
reas
onab
le.
Doe
s no
t inc
lude
pro
duct
ion
from
sec
onda
ryal
umin
ium
pla
nts,
alu
min
ium
pow
der
plan
ts, r
aw m
ater
ial p
lant
s, f
oil m
ills,
qua
rtzi
te m
ines
, sili
con
plan
ts, c
oal,
cath
odes
, ano
de b
lock
s an
d an
ode
past
e pl
ants
. A
ggre
gate
attr
ibut
able
pro
duct
ion
calc
ulat
ed o
n eq
uity
owne
rshi
p in
tere
st a
s of
Sep
tem
ber
15 2
009,
with
the
exce
ptio
n of
the
follo
win
g pl
ants
whi
ch a
re p
rese
nted
on
a 10
0% p
lant
pro
duct
ion
basi
s: S
UB
R (
baux
ite),
Tim
an (
baux
ite),
ZA
LK
(al
umin
a), Z
AL
K (
alum
iniu
m)
and
AL
SCO
N (
alum
iniu
m).
(2)
Pro
duct
ion
mea
sure
d on
a w
et b
asis
, with
the
exce
ptio
n of
Alp
art a
nd W
inda
lco
whi
ch a
re s
how
n on
a d
ry b
asis
. (3
) I
nclu
des
73.4
kt f
rom
PG
Z r
efin
ery.
PG
Z is
no
long
er o
wne
d by
UC
RU
SAL
and
as
of M
ay 1
200
8 ha
s be
en e
xclu
ded
from
the
Gro
ups
asse
ts.
Bau
xite
own
- 16
,707
.0 k
tpu
rcha
sed
- 8,
822.
5 kt
Nep
helin
eow
n -
4,76
0.4
kt
APPENDIX VI INDEPENDENT TECHNICAL REPORT
— VI-18 —
2.1.2 Management
2.1.2.1 Mining Assets
During the reviews of the UC RUSAL mining assets and visits to their mining operations, SRK’sconsultants had the opportunity to meet and have discussions with numerous UC RUSALmanagement and technical staff. It is SRK’s opinion that the technical capabilities of the seniorengineering staff are sufficient for the mining operations. It is clear that they have the planningand implementation skills which are required to work towards achieving the annual targets andthe ability to assess the requirements for the longer term sustainability of production of rawmaterials. In all operations, a keen awareness and desire for improvements in environmental,health and safety issues to the benefit of the efficiency of the operations was apparent.
It is evident that there are different approaches of management in the various mining assets withsome being devolved and some being centralised. There is the opportunity to improve investmentplanning and procurement at some operations by decentralising the management to the operationsas well as there being additional opportunities in the improved central buying power of theenlarged UC RUSAL company. Some of the operations have the opportunity to reducemanagement structure, while some are more lean in terms of management. As with all operationson different continents with different methodologies, UC RUSAL faces challenges withintegrating the best practices of the various operations, in terms of management style andapproach, to realise the opportunities available.
The UC RUSAL operations will benefit from a more rigorous international approach in theintegrated longer term planning of the mines and their downstream processing facilities movingthe focus from annual planning to rolling 5 year plans within the framework of a Life of MinePlan (“LoMp”).
Training is a key element in mines and facilities in the Russian Federation and in particular foroverseas mines, where UC RUSAL has training programmes at all its operations. It is SRK’sopinion that the level of training is sufficient at all the mining assets.
The implementation of development projects also has its challenges which the integrated UCRUSAL is now considering. SRK is satisfied that within the current management and theirconsultants there are the skills to implement the proposed plans and the various projects andinitiatives as outlined in this report.
2.1.2.2 Non-Mining Assets
During this review, Hatch’s consultants were in regular contact and held numerous discussionswith UC RUSAL management at various levels. Based upon this contact and direct observationsof the operations, Hatch is satisfied that UC RUSAL’s current management has the skills requiredto implement the proposed production plans and initiatives outlined within this report.Furthermore, it was abundantly clear that during the historical review period the technical,financial, environmental and health and safety performance of the assets has improved.
UC RUSAL has, over the course of its creation and development, transformed significantly in toa large vertically integrated global mining and metals industry participant. As with any suchtransformation, UC RUSAL management must constantly strive to adapt to new pressures. TheGroup has shown it has the ability to successfully achieve this.
A key positive change and improvement has been the development of targeted managementincentives. Under previous regimes, management was generally measured only in relation toreaching pre-defined production targets. UC RUSAL has now introduced a Balanced Scorecard
APPENDIX VI INDEPENDENT TECHNICAL REPORT
— VI-19 —
approach to performance management which combines traditional physical production measureswith financial, environmental, health and safety and other non-financial key performanceindicators. Accordingly, since implementation of the Balanced Scorecard approach, there havebeen positive trends witnessed in these indicators.
2.1.3 Health and Safety
2.1.3.1 Mining Assets
UC RUSAL has a formal Health and Safety Policy and promotes health and safety awareness atthe mines and associated operations. Health and Safety have improved significantly in recentyears.
As evidenced at the visits by SRK, Health and Safety at all of the open-pit mining facilitiesgenerally met, or is working towards, accepted international norms, and training programmeswere in place to raise safety awareness and closely monitor occupational accidents.
The open-pit operations have good safety records. At the underground mining facilities at NorthUrals, there are challenging conditions with the operations being some 800 to 1,100 m belowsurface, with some areas of relatively poor ground conditions. Some safety standards arecurrently below internationally accepted norms. This has been identified and is being addressed.For example, underground infrastructure projects at North Urals, which include transportsystems, are expected to improve working conditions.
All of the mining facilities have on-site medical facilities for treatment of injury and illness.These facilities are adequately staffed and equipped.
The health and safety statistics for the mines are included in the numbers in Section 2.1.3.2.
2.1.3.2 Non-Mining Assets
UC RUSAL has a formal Health, Industrial & Fire Safety Policy which complies withinternational best practices with the goal of eliminating harm caused to employees at all stagesof its production activity. The Health and Safety awareness at the facilities has improvedsignificantly in recent years, and there is recognition from UC RUSAL management at all levelsthat safe working practices, environmental protection and efficient natural resource utilisationare fundamental to long-term business success. While Hatch has noted improvement at UCRUSAL’s facilities, health and safety still does remain below international best practices at somefacilities.
All managers are responsible for the continuous improvement of health and safety performancewithin their immediate area of control as well as within subordinate units. Management haveused external assistance from world recognised service providers such as DuPont and Det NorskeVeritas to develop Industrial & Fire Safety systems. Currently, 10 UC RUSAL facilities holdOHSAS 18001 Occupational Health & Safety certification. It is the objective of the Company toacquire OHSAS 18001 Occupational Health & Safety certification for all the operating facilities,although Hatch is not aware of any timeframe to complete this objective. All recordedoccupational injuries are investigated regardless of their gravity. This internal investigation doesnot replace investigations prescribed by law but is instead a parallel process. After completionof the internal investigations, all interested parties, including other operations, are informed ofactions planned to prevent similar accidents from occurring in the future. The employees are theninformed through information notices which have become part of the regular industrial & firesafety information exchange process.
APPENDIX VI INDEPENDENT TECHNICAL REPORT
— VI-20 —

The health and safety conditions at certain UC RUSAL Russian and Ukrainian plants are not upto international best-practice standards, reflecting their design and construction during aprevious regime that had different priorities. However, they are typical of other aged industrialfacilities within the former Soviet Union, Eastern Europe and Central Asia. During site visits inSeptember — October 2008 at certain facilities, Hatch observed tripping hazards, potential forhead injury, poor fall protection, poor machine guarding and poor procedures for movinghazardous liquids. Application of rules for Personal Protective Equipment (PPE) was haphazardin certain instances, and in particular a lack of eye protection was noted at certain facilities. Inaddition, signage and general communication fell below international best practice at manyfacilities in the Russian Federation and Ukraine.
The Group has undertaken significant effort in recent years to address such issues in conjunctionwith the modernisation of the assets and Hatch were informed that this will continue as required.UC RUSAL Health and Safety policy stipulates safety instructions and training for newemployees and daily safety inductions for shift workers, as well as requiring employees toundertake safety exams on a regular basis. The policy is based on a grievance mechanismallowing employees to contribute towards its continuous development by capturing health andsafety improvements from practical experience. UC RUSAL has recently completed severalmodernisation programmes of its assets. In addition to the benefits of higher production andimproved environmental performance, these programmes typically also focussed on reducingpotential safety hazards and on improvements in safety awareness of employees. Theseprogrammes include recently completed modernisations of Sayanogorsk Aluminium Smelter andKrasnoyarsk Aluminium Smelter. Additionally UC RUSAL has recently introduced theContinuous Production Improvement programmes at Bratsk Aluminium Smelter and SayanogorskAluminium Smelter, which include targeted improvements in health and safety and employeeresponsibility.
The majority of UC RUSAL’s facilities have on-site medical facilities for treating injuries andalleviating acute occupational illness symptoms. Where these facilities are not provided on-site,there is access to municipal clinics.
The Lost Time Injury Frequency Rate (LTIFR) is one of the statistics used to monitor safetyefficiency in the international metals and mining industry. The LTIFR is a measure of overallindustrial & fire safety performance, and indicates the frequency of Lost Time Injuries. WithinUC RUSAL the LTIFR is measured per 200,000 hours worked. Information provided by UCRUSAL, which has not been verified by Hatch, states that the LTIFR was constant at 0.22 in thefirst half 2009 and 0.23 in 2008, compared with 0.19 in 2007, 0.20 in 2006 and 0.25 in 2005.Table 2.2 and Figure 2.3 presents the LTIFR for the UC RUSAL group (all divisions, includingmining operations) and demonstrates that tangible effects of improvement were made from 2004to 2007 with respect to health and safety performance. However, there was a slight reversal inthe recent historical downward trend in the LTIFR in 2008, although this was followed by a slightreduction in the first half of 2009.
APPENDIX VI INDEPENDENT TECHNICAL REPORT
— VI-21 —
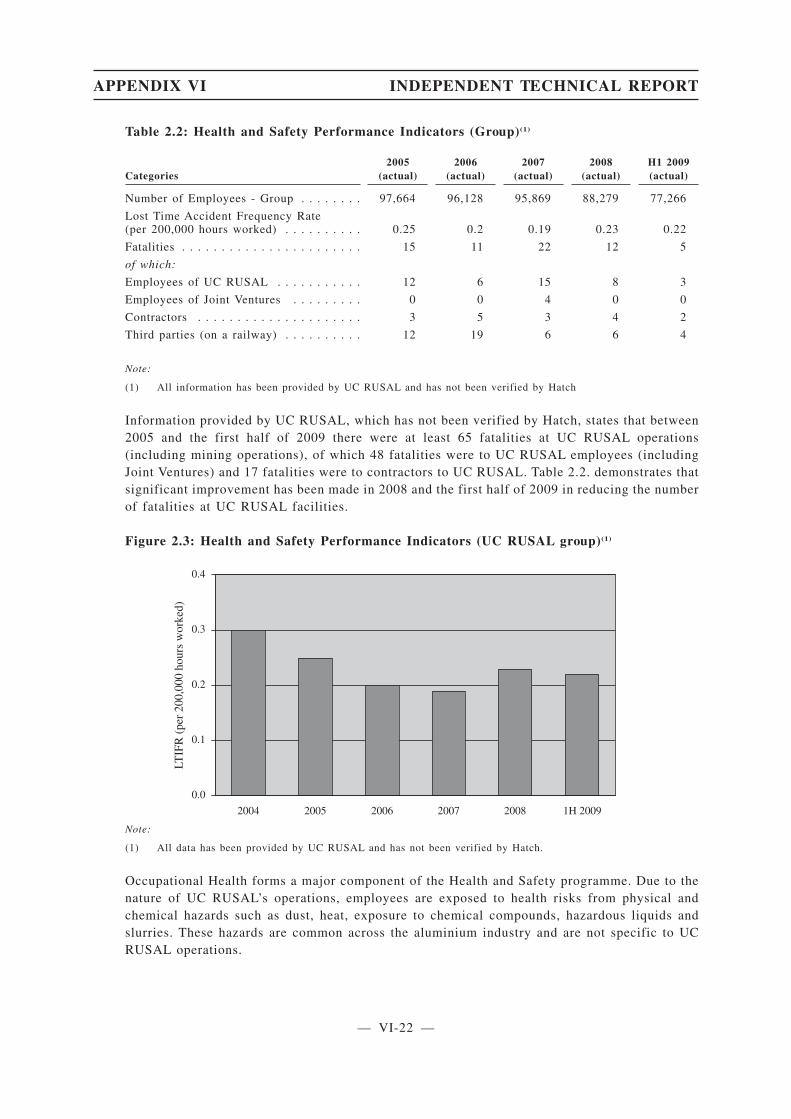
Table 2.2: Health and Safety Performance Indicators (Group)(1)
Categories2005 2006 2007 2008 H1 2009
(actual) (actual) (actual) (actual) (actual)
Number of Employees - Group . . . . . . . . 97,664 96,128 95,869 88,279 77,266
Lost Time Accident Frequency Rate(per 200,000 hours worked) . . . . . . . . . . 0.25 0.2 0.19 0.23 0.22
Fatalities . . . . . . . . . . . . . . . . . . . . . . . 15 11 22 12 5
of which:
Employees of UC RUSAL . . . . . . . . . . . 12 6 15 8 3
Employees of Joint Ventures . . . . . . . . . 0 0 4 0 0
Contractors . . . . . . . . . . . . . . . . . . . . . 3 5 3 4 2
Third parties (on a railway) . . . . . . . . . . 12 19 6 6 4
Note:
(1) All information has been provided by UC RUSAL and has not been verified by Hatch
Information provided by UC RUSAL, which has not been verified by Hatch, states that between2005 and the first half of 2009 there were at least 65 fatalities at UC RUSAL operations(including mining operations), of which 48 fatalities were to UC RUSAL employees (includingJoint Ventures) and 17 fatalities were to contractors to UC RUSAL. Table 2.2. demonstrates thatsignificant improvement has been made in 2008 and the first half of 2009 in reducing the numberof fatalities at UC RUSAL facilities.
Figure 2.3: Health and Safety Performance Indicators (UC RUSAL group)(1)
0.0
0.1
0.2
0.3
0.4
LTIF
R(p
er20
0,00
0ho
urs
wor
ked)
2004 2005 2006 2007 2008 1H 2009
Note:
(1) All data has been provided by UC RUSAL and has not been verified by Hatch.
Occupational Health forms a major component of the Health and Safety programme. Due to thenature of UC RUSAL’s operations, employees are exposed to health risks from physical andchemical hazards such as dust, heat, exposure to chemical compounds, hazardous liquids andslurries. These hazards are common across the aluminium industry and are not specific to UCRUSAL operations.
APPENDIX VI INDEPENDENT TECHNICAL REPORT
— VI-22 —
The major types of occupational diseases at UC RUSAL’s operations are respiratory diseases andfluorosis, but other occupation related impairments are experienced. Information provided by UCRUSAL, which has not been verified by Hatch, states that for all divisions of the Group, 184employees were newly diagnosed with an occupational health disease in 2008.
Hatch is unaware of any instances of worker litigation pertaining to occupational health issueswithin UC RUSAL, however, other companies in similar industries have experienced such cases,especially in Western countries. Employees in aluminium smelter potrooms face exposure tohydrogen fluoride gas and fluoride and fugitive dust. Those plants using Söderberg smeltingtechnology face more exposure than is the case in modern pre-bake smelting operations since thedust may contain Polycyclic Aromatic Hydrocarbons (PAHs). All employees of UC RUSALoperating in hazardous environments are provided with certified PPE in accordance with industryrequirements, which is expected to assist in the mitigation of long-term respiratory diseases.However, there have been occasions where personnel have suffered extended exposure topotroom environments without such PPE, and hence the task of UC RUSAL is to enforce thewearing of appropriate PPE by all employees.
No major occupational diseases have been associated with alumina refineries — bauxite andalumina dust is benign. However, caustic soda is an acute hazard as a result of chemical burn inthe case of exposure, especially to soft tissue. There is also the potential for hearing loss —which must be engineered out by enclosing offending equipment, and as a last resort designatingareas requiring PPE noise protection. These areas are predominantly powerhouses, aircompressors, mills and large fans.
Prevention of occupational diseases at UC RUSAL’s operations is primarily represented byinitiatives aimed at improving working conditions by reducing the impact of dust and substanceswhich may impact workers’ health. International Best Practice is elimination of chemical andphysical hazards by ventilation of work areas and capture of emissions. The use of PPE is usedas the last means of defence.
A key aim of UC RUSAL is to decrease exposure of its employees to fluoride emissions resultingfrom operation of Söderberg cells. UC RUSAL has developed a Clean Söderberg Technologywhich improves cell hooding efficiency and reduces fluoride emissions exiting to the potroomand impacting reduction area personnel working with cells and anode changing procedures.Hatch has been advised that approval has been granted to introduce the technology to fourpotrooms of Krasnoyarsk Aluminium Smelter. It is intend to expand its application to otheraluminium smelters, although this has yet to be approved. Within the scope of the samemodernisation programme, Krasnoyarsk Aluminium Smelter has switched to the use of anodeswith lower contents of sulphur. Finally, to improve indirect exposure to aluminium smeltingprocess contaminants, UC RUSAL has installed new dry scrubbing Gas Treatment Centres atKrasnoyarsk Aluminium Smelter to capture and treat fluoride emissions. UC RUSAL plans tointroduce similar measures at other aluminium smelters when temporarily suspendedmodernisation programmes are recommenced.
Generally, better management of health related issues is present at modern plants with lesseffective management at older facilities. This is mainly because modern equipment and facilitiesare designed with a higher degree of awareness of the importance of these issues. As the olderplants are modernised and awareness of these issues increases, it is expected that overallimprovements will follow.
APPENDIX VI INDEPENDENT TECHNICAL REPORT
— VI-23 —

2.1.4 Transport
2.1.4.1 Mining Assets
On-site mine transport of the ore predominantly relies on haul trucks which transport ore fromthe open-pit to the mine gate or to a railhead. Subsequently, the ore is reloaded to trains ondedicated railway lines, or on conveyor belts or aerial ropeways to the refinery complex or portloading facilities. In the underground mines, dedicated rail lines take the hoisted ore to theblending yards from where it is sent to various refineries by rail. In the case of the Guyanaoperations, the bauxite is also transported by barge.
The capital replacement programmes for mine transport that are in place are in most casesconsidered by SRK to be sufficient for the production targets to be met. In a number of mines,ongoing capital investment is required to replace and supplement current equipment, and ensurethat deeper ore and waste can be mined according to plan. UC RUSAL is conducting studiesregarding upgrading the transport equipment to take advantage of technological improvementswhere these can be achieved economically. The requirement for road access, and bridges, is mostevident at the Guinea operations, and the Jamaica suspended operations, in order to achieve LoMtargets.
The railway maintenance facilities inspected during the site visit were in good condition. Someoperations have restrictions on capacity due to a single track line and/or equipment constraints.However SRK confirms that the current LoMps do not exceed the current rail capacities.
Regarding the rail transport in Russia and former Soviet Union countries, UC RUSAL hasadvised that the current agreement (for UC RUSAL facilities) will continue through 2009. Thispredominantly affects the shipment of the aluminium division and is discussed in more detailunder the non-mining assets below.
In a few operations the raw ore requires transportation along privately owned rail lines or by useof leased equipment which has led in the past to relatively high transport costs.
Currently, costs to transport ore from the Kiya Shaltyr Nepheline Mine to the Achinsk AluminaRefinery are being reduced, actions have been developed and evaluation is underway.
2.1.4.2 Non-Mining Assets
UC RUSAL production facilities located in the Russian Federation rely almost entirely upon theRussian national railway network for the importing of raw materials and the exporting of finishedproducts. Russia is the world’s largest country, with much of its population separated by longdistances. Trunk road links are relatively poor throughout and therefore the entire country isheavily dependent upon the rail system for the movement of all types of freight.
As such, the rail network, although aging and not comparable with modern systems in terms ofequipment and signalling, has been maintained to a sufficient level to ensure a relatively efficienttransport link and reliable rail infrastructure.
The Russian rail network is largely controlled by Russian Railways, a wholly owned entity of theRussian Federation. Russian Railways was created in September 2003 as the successor to theMinistry of Railways and assumed all assets and operations of the former Ministry of Railways.Russian Railways currently has a monopoly on infrastructure, locomotives and most freightbusinesses and continues to be the main owner and provider of locomotives and rail cars withinthe Russian Federation.
APPENDIX VI INDEPENDENT TECHNICAL REPORT
— VI-24 —
Russian railway tariffs are currently regulated by the government and consist of two parts:infrastructure costs and carriage costs. Rail freight rates have increased in recent years,reflecting the reduction of subsidies and local cost inflation which is affecting all Russianindustries.
In 2004 RUSAL (prior to the formation of UC RUSAL) signed an agreement with RussianRailways for favourable tariffs on transportation of aluminium and its alloys, alumina, coke andpitch, fluorides and refractories. Under this agreement, the infrastructure component of therailway tariff for transportation on specified routes of certain materials was fixed in US dollarswith a fixed exchange rate of 30.6142 RUR/USD until December 2011, provided that increasingannual volume levels were met. The tariffs set by the 2004 agreement are currently applicableto the former RUSAL Russian aluminium smelters and alumina refineries. This agreement doesnot apply to the former SUAL facilities, which instead pay general tariff rates as set annually byRussian Railways. At the beginning of each year Russian Railways increase general tariffs by theexpected rate of price inflation for the forthcoming year. The expected inflation rate is based onthe forecast of the Russian Ministry of Economic Development. However, UC RUSAL advisedthat Russian Railways then subsequently calculates its own rate which in turn determines thetariff indexation. As a rule, the tariff indexation includes an investment component (to implementinvestment projects) in addition to the general inflation forecast which is based on the increasein the price of materials etc. At the end of the year the rates are retrospectively revised to reflectactual price inflation should inflation turn out higher than applied in the pricing formula for thatyear.
As UC RUSAL has grown internationally, ocean freight had become more important to theGroup’s supply chain. Due to the tonnages involved, UC RUSAL constituent companies havetraditionally not had any reported problems in securing competitive ocean freights and there isno reason to believe that this will change in the future. Hatch have no reason to believe,therefore, that UC RUSAL will be disadvantaged, compared with its industry peers, with regardto ocean-going freight rates.
2.1.5 Status of Environmental Compliance
2.1.5.1 Mining Assets
UC RUSAL has in place the required environmental permitting and licence requirements in thenumerous jurisdictions in which it operates its mines and associated infrastructure (Table 2.3).The significant majority of the operations are in full compliance with the local, regional andnational requirements. Whereas some improvements are required to attain current internationalcodes of practice, it is clear that on those properties which the Company has taken over in thelast few years, significant improvements have been made and in some instances UC RUSAL hasexceeded the legislated local/international requirements, both for projects as well as operations.Further improvements can be made including formal environmental social management and mineclosure planning. In many cases, the local management are developing these plans according tothe Company’s stated objectives.
Ongoing communication is maintained between the UC RUSAL management and the local,regional and national environmental authorities, with the result that UC RUSAL is generally ingood terms with their stakeholders.
The most significant environmental challenges at open-pit bauxite mines in the drierenvironments are related to dust and rehabilitation. In the majority of cases, UC RUSAL’srehabilitation programmes are up to date and in accordance with the regulatory authorities’requirements. In other areas, resettlement and long term social obligations pose potential risksto the operations, though progress is being made to address these challenges such as carrying outadditional consultation with the affected parties.
APPENDIX VI INDEPENDENT TECHNICAL REPORT
— VI-25 —

UC RUSAL has, with some of its international assets, inherited environmental problems in areasof historically less regulated mining, such as in Guyana. Here, the Company has the challengeto bring these operations up to its own standards and to the standards of environmentalcompliance agreements that form part of its mining contract. The Company has beenrehabilitating disturbed land in excess of that disturbed by its own operations, to steadily reducethe backlog of inherited environmental disturbance.
In UC RUSAL’s operations in the Russian Federation and former Soviet Union, the Companypolicy is in line with that of other national operators and aims to ensure compliance withlegislation and to limit emissions to the amounts stipulated in its permits. The older operationsgenerally do not have an OVOS (EIA) or ESIA, or formal management or closure plans. Thenewer operations and projects generally have followed more rigorous environmental assessmentprocesses.
In September 2008, UC RUSAL introduced a new operational policy “Assets Retirement andLand Rehabilitation: General Requirements and Guidelines for Liability Assessment”. The policyestablishes uniform approaches and requirements for rehabilitation of the disturbed lands at UCRUSAL production facilities in accordance with the UC RUSAL Environmental Policy which hasrecently been implemented. Accounting Policy and International Financial Reporting Standards(“IFRS”) are taken into account. Efforts and rehabilitation are actively ongoing and becoming amore integrated part of the operations. Aside from the estimated current environmental liabilitiesas of 1 July 2009, SRK has to date not reviewed any formal and completed closure plans takinginto account past and future planned disturbance and activities.
UC RUSAL’s accounting policy requires the recognition of provisions for the restoration andrehabilitation of each site when a legal or constructive obligation exists to dismantle the assetsand restore the site. The provision represents management’s best estimate of the value to retirethe assets as they exist at the time of estimation. This has been termed the Asset RetirementObligation (“ARO”). This ARO provision is periodically reviewed and updated. The ARO doesnot incorporate the terminal benefits, being costs related to the retrenchment of employees,which may include various aspects such as retraining. The ARO should not be understood to beequivalent to the mine closure cost at the end of the life of mine. The difference between AROand mine closure is the additional disturbance to come from future operations.
SRK believes that UC RUSAL has the corporate intent and capabilities to address challenges atthose assets that are currently not in compliance with their licence conditions and to address theabove considerations to achieve its objective of compliance with international standards. UCRUSAL has demonstrated their commitment to improvements through initiatives such as newenvironmental policies which have been implemented in 2009.
Four licences are currently “awaiting approval” as shown in Table 2.3. This forms part of theoperating practice and is further discussed in Section 2.1.5.2 as relates to Table 2.4.
In the case of North Urals, the operating company SUBR does not currently have the airemissions and waste licences in place. UC RUSAL is currently addressing this and some delayin doing so may result in fines being imposed up to a maximum of RUR 70,000. No additionalimpact is expected on the operation.
Table 2.3: UC RUSAL Mining Asset Environmental Compliance
Mining Asset Country Environmental permitWater
discharge Air emissions Waste
Bauxite
Alpart Jamaica Currently not required,controlled by Memorandumof Understanding withGovernment
Currentlyidle
Currentlyidle
Currentlyidle
APPENDIX VI INDEPENDENT TECHNICAL REPORT
— VI-26 —
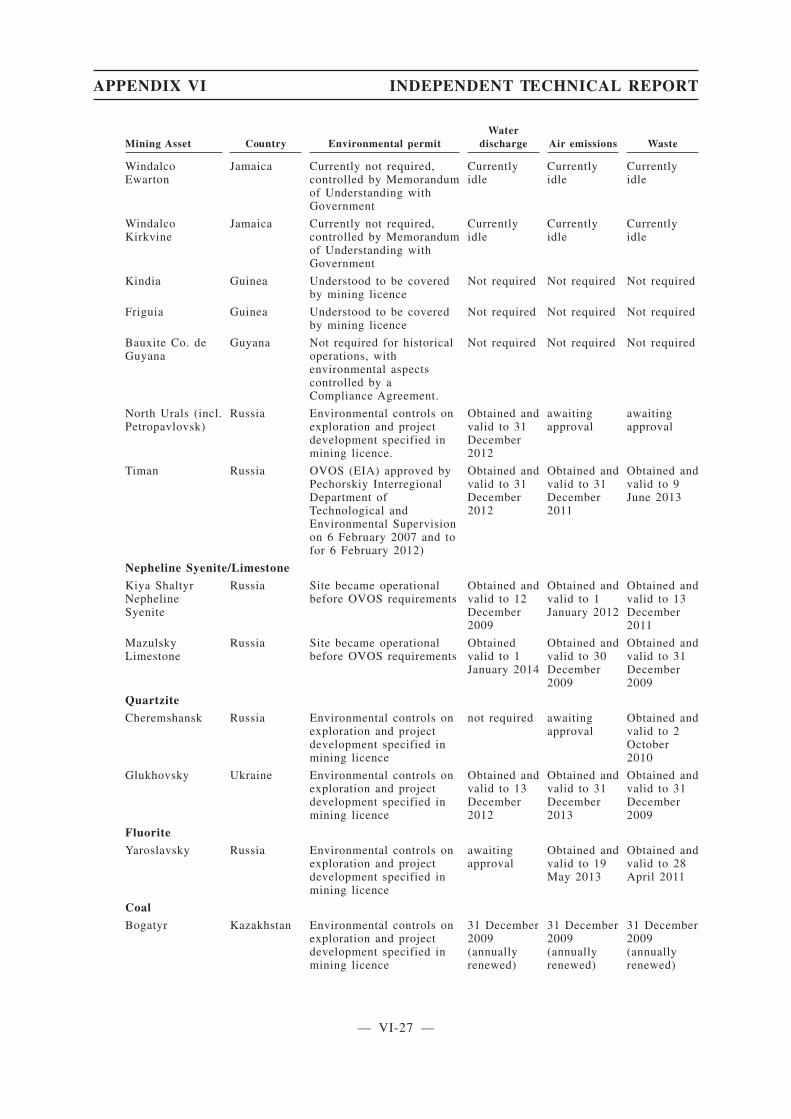
Mining Asset Country Environmental permitWater
discharge Air emissions Waste
WindalcoEwarton
Jamaica Currently not required,controlled by Memorandumof Understanding withGovernment
Currentlyidle
Currentlyidle
Currentlyidle
WindalcoKirkvine
Jamaica Currently not required,controlled by Memorandumof Understanding withGovernment
Currentlyidle
Currentlyidle
Currentlyidle
Kindia Guinea Understood to be coveredby mining licence
Not required Not required Not required
Friguia Guinea Understood to be coveredby mining licence
Not required Not required Not required
Bauxite Co. deGuyana
Guyana Not required for historicaloperations, withenvironmental aspectscontrolled by aCompliance Agreement.
Not required Not required Not required
North Urals (incl.Petropavlovsk)
Russia Environmental controls onexploration and projectdevelopment specified inmining licence.
Obtained andvalid to 31December2012
awaitingapproval
awaitingapproval
Timan Russia OVOS (EIA) approved byPechorskiy InterregionalDepartment ofTechnological andEnvironmental Supervisionon 6 February 2007 and tofor 6 February 2012)
Obtained andvalid to 31December2012
Obtained andvalid to 31December2011
Obtained andvalid to 9June 2013
Nepheline Syenite/Limestone
Kiya ShaltyrNephelineSyenite
Russia Site became operationalbefore OVOS requirements
Obtained andvalid to 12December2009
Obtained andvalid to 1January 2012
Obtained andvalid to 13December2011
MazulskyLimestone
Russia Site became operationalbefore OVOS requirements
Obtainedvalid to 1January 2014
Obtained andvalid to 30December2009
Obtained andvalid to 31December2009
Quartzite
Cheremshansk Russia Environmental controls onexploration and projectdevelopment specified inmining licence
not required awaitingapproval
Obtained andvalid to 2October2010
Glukhovsky Ukraine Environmental controls onexploration and projectdevelopment specified inmining licence
Obtained andvalid to 13December2012
Obtained andvalid to 31December2013
Obtained andvalid to 31December2009
Fluorite
Yaroslavsky Russia Environmental controls onexploration and projectdevelopment specified inmining licence
awaitingapproval
Obtained andvalid to 19May 2013
Obtained andvalid to 28April 2011
Coal
Bogatyr Kazakhstan Environmental controls onexploration and projectdevelopment specified inmining licence
31 December2009(annuallyrenewed)
31 December2009(annuallyrenewed)
31 December2009(annuallyrenewed)
APPENDIX VI INDEPENDENT TECHNICAL REPORT
— VI-27 —
2.1.5.2 Non-Mining Assets
Environmental permits
UC RUSAL operates facilities across a number of geographical locations. Rules and regulationsregarding environmental licences and permitted emission levels vary depending on localenvironmental legislation.
The majority of UC RUSAL assets are located in the Russian Federation. The RussianFederation, like many other jurisdictions, has rules limiting air, water and solid waste dischargesto the environment from industrial facilities. These limits, set for the obtainment ofenvironmental permits necessary for plant operations, are different from other guidelines interms of acceptable emissions levels. Environmental legislation is based on a number ofenvironmental principles contained in the Russian Constitution and enshrined in the RussianEnvironmental Protection Act. There are more than 20 environmental laws in the RussianFederation and more than 200 related environmental documents.
Following Russian legislation procedures, all industrial facilities must develop a MaximumPermissible Emissions (PDV) Draft based on substances emitted into air, Maximum PermissibleDischarge (PDS) Draft for water and Draft Waste Generation Standards and Waste DisposalLimits for solids (PNOOLR). These drafts are further submitted to the local authorities and formthe ground for issuing the environmental permit.
Basic payment rates are written into Russian legislation for the emission of one tonne of eachmatter. In cases where the quantity of contaminants released exceeds the set limits, the plant willbe required to make “environmental payments” calculated using the basic payment rates. A plantcan be awarded a temporary increase in the PDV/PDS called VDV/VDS (Temporary PermissibleEmissions/Discharge) although it must demonstrate initiatives to reduce future pollutants.
Environmental permits for each facility in the Russian Federation are awarded based on expectedproduction and therefore expected emission levels for the duration of the permit. The durationof environmental permits is identified individually for each production facility. Once the permithas expired, the facility is required to apply for a renewal by submitting a new application to thelocal State environmental authorities under the supervisory body of Rostekhnadzor. In the caseof a facility expanding production capacity prior to the end of an existing permit, and thereforeincreasing expected emission levels, a new permit must be obtained.
As a matter of practice a facility in the Russian Federation can operate without the requiredpermits while its application for relevant documentation to the State environmental authoritiesis under review. In Table 2.4 this situation is denoted “awaiting approval”. This is considered anormal practice and does not impose significant risk to the facility operations. The facility cancontinue operating without the required environmental permits during the entire permit renewalprocess. Though the Russian legislation provides that in such circumstances suspension ofoperations of the relevant facility may be imposed, such penalty is not usually applied inpractice. However, during the renewal period there is a risk of increased environmental paymentsfor emitted pollutants. However, these payments are made within limits established byenvironmental legislation and are not classified as environmental penalties or fines.
Table 2.4 presents the current permitting status at each UC RUSAL facility for solid, air andliquid emissions, as advised by UC RUSAL to Hatch.
APPENDIX VI INDEPENDENT TECHNICAL REPORT
— VI-28 —
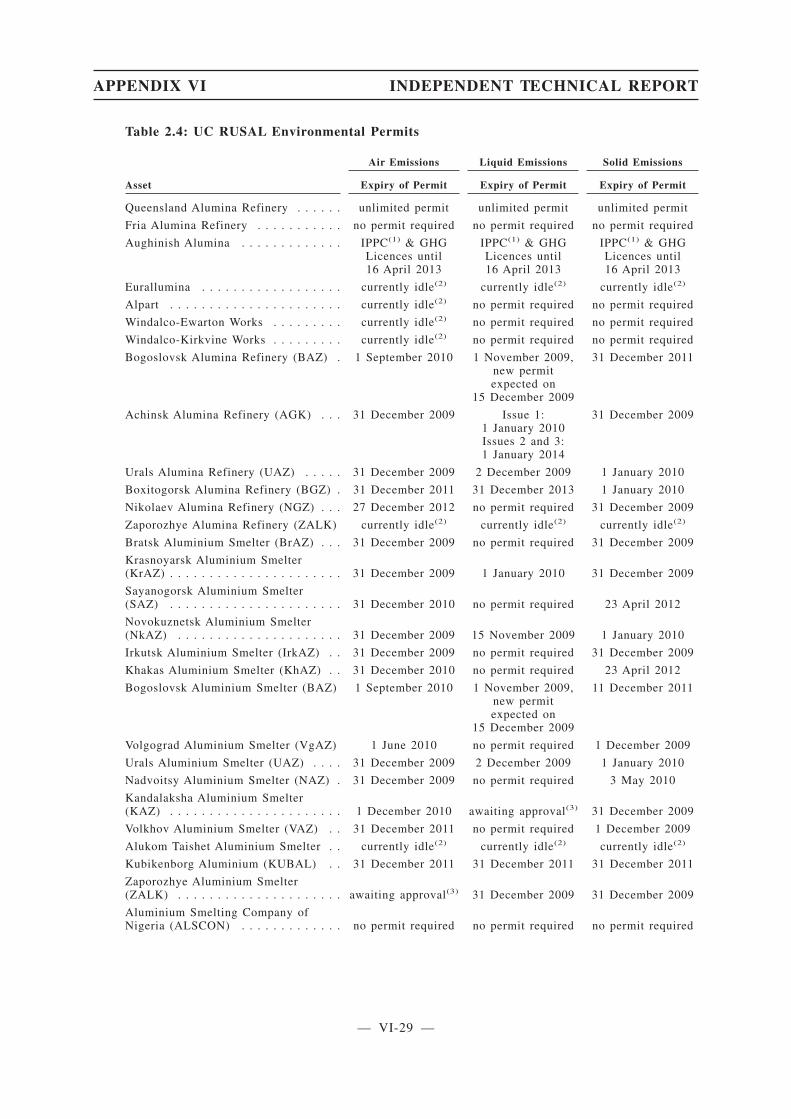
Table 2.4: UC RUSAL Environmental Permits
Air Emissions Liquid Emissions Solid Emissions
Asset Expiry of Permit Expiry of Permit Expiry of Permit
Queensland Alumina Refinery . . . . . . unlimited permit unlimited permit unlimited permit
Fria Alumina Refinery . . . . . . . . . . . no permit required no permit required no permit required
Aughinish Alumina . . . . . . . . . . . . . IPPC(1) & GHGLicences until16 April 2013
IPPC(1) & GHGLicences until16 April 2013
IPPC(1) & GHGLicences until16 April 2013
Eurallumina . . . . . . . . . . . . . . . . . . currently idle(2) currently idle(2) currently idle(2)
Alpart . . . . . . . . . . . . . . . . . . . . . . currently idle(2) no permit required no permit required
Windalco-Ewarton Works . . . . . . . . . currently idle(2) no permit required no permit required
Windalco-Kirkvine Works . . . . . . . . . currently idle(2) no permit required no permit required
Bogoslovsk Alumina Refinery (BAZ) . 1 September 2010 1 November 2009,new permitexpected on
15 December 2009
31 December 2011
Achinsk Alumina Refinery (AGK) . . . 31 December 2009 Issue 1:1 January 2010Issues 2 and 3:1 January 2014
31 December 2009
Urals Alumina Refinery (UAZ) . . . . . 31 December 2009 2 December 2009 1 January 2010
Boxitogorsk Alumina Refinery (BGZ) . 31 December 2011 31 December 2013 1 January 2010
Nikolaev Alumina Refinery (NGZ) . . . 27 December 2012 no permit required 31 December 2009
Zaporozhye Alumina Refinery (ZALK) currently idle(2) currently idle(2) currently idle(2)
Bratsk Aluminium Smelter (BrAZ) . . . 31 December 2009 no permit required 31 December 2009
Krasnoyarsk Aluminium Smelter(KrAZ) . . . . . . . . . . . . . . . . . . . . . . 31 December 2009 1 January 2010 31 December 2009
Sayanogorsk Aluminium Smelter(SAZ) . . . . . . . . . . . . . . . . . . . . . . 31 December 2010 no permit required 23 April 2012
Novokuznetsk Aluminium Smelter(NkAZ) . . . . . . . . . . . . . . . . . . . . . 31 December 2009 15 November 2009 1 January 2010
Irkutsk Aluminium Smelter (IrkAZ) . . 31 December 2009 no permit required 31 December 2009
Khakas Aluminium Smelter (KhAZ) . . 31 December 2010 no permit required 23 April 2012
Bogoslovsk Aluminium Smelter (BAZ) 1 September 2010 1 November 2009,new permitexpected on
15 December 2009
11 December 2011
Volgograd Aluminium Smelter (VgAZ) 1 June 2010 no permit required 1 December 2009
Urals Aluminium Smelter (UAZ) . . . . 31 December 2009 2 December 2009 1 January 2010
Nadvoitsy Aluminium Smelter (NAZ) . 31 December 2009 no permit required 3 May 2010
Kandalaksha Aluminium Smelter(KAZ) . . . . . . . . . . . . . . . . . . . . . . 1 December 2010 awaiting approval(3) 31 December 2009
Volkhov Aluminium Smelter (VAZ) . . 31 December 2011 no permit required 1 December 2009
Alukom Taishet Aluminium Smelter . . currently idle(2) currently idle(2) currently idle(2)
Kubikenborg Aluminium (KUBAL) . . 31 December 2011 31 December 2011 31 December 2011
Zaporozhye Aluminium Smelter(ZALK) . . . . . . . . . . . . . . . . . . . . . awaiting approval(3) 31 December 2009 31 December 2009
Aluminium Smelting Company ofNigeria (ALSCON) . . . . . . . . . . . . . no permit required no permit required no permit required
APPENDIX VI INDEPENDENT TECHNICAL REPORT
— VI-29 —

Air Emissions Liquid Emissions Solid Emissions
Asset Expiry of Permit Expiry of Permit Expiry of Permit
Krasnoturyinsk Powder Metallurgy . . . awaiting approval(3) no permit required 1 March 2011
Shelekhov Powder Metallurgy . . . . . . 31 December 2009 no permit required 1 January 2010
Volgograd Powder Metallurgy . . . . . . 6 August 2010 no permit required 1 October 2009
Irkutsk Silicon . . . . . . . . . . . . . . . . 31 December 2009 no permit required 22 February 2010
Urals Silicon . . . . . . . . . . . . . . . . . . 1 January 2010 no permit required 10 June 2010
Zaporozhye Silicon . . . . . . . . . . . . . currently idle(2) currently idle(2) currently idle(2)
Resal . . . . . . . . . . . . . . . . . . . . . . . 1 January 2011 no permit required 1 January 2012
Bellis . . . . . . . . . . . . . . . . . . . . . . . 30 September 2010 no permit required 31 December 2013
Zvetmetobrabotka . . . . . . . . . . . . . . 1 January 2014 no permit required awaiting approval(3)
ARMENAL . . . . . . . . . . . . . . . . . . . 25 December 2011 17 July 2010 no permit required
SAYANAL . . . . . . . . . . . . . . . . . . . 31 December 2009 no permit required 11 June 2013
Urals Foil . . . . . . . . . . . . . . . . . . . . awaiting approval(3) no permit required 15 April 2010
Polevskoy Cryolite Plant . . . . . . . . . . 19 December 2009 awaiting approval(3) 21 April 2010
South Urals Cryolite Plant . . . . . . . . awaiting approval(3) no permit required 15 December 2010
Lingshi Cathode Plant . . . . . . . . . . . 30 December 2010 no permit required no permit required
Taigu Cathode Plant . . . . . . . . . . . . . 15 June 2011 no permit required no permit required
Note:
(1) Unlimited Integrated Pollution Prevention and Control.
(2) Facility is currently idled. As such the permit is not currently required, but must be reapplied for once operationsrestart.
(3) Final Permit has been submitted for approval by the State environmental authorities. The facility is allowed tooperate with a temporary approved permit.
Alumina refinery air emissions
The principal air emissions of concern at alumina refineries are related to the fugitive dustcreated by materials handling. Typically bauxite unloading, stockpiles, crushing and transferoperations, residue disposal and alumina product transfer all generate non-point source dustemissions which can become a problem during high winds. These sources are difficult to manage,but best practices are to minimize exposed areas, keep stockpiles to a minimum and keep areaswhere material is exposed wetted to prevent dust generation. Bauxite and alumina can betransferred in enclosed conveyors, with dust collection at transfer points.
Other sources of air emissions are sinter kilns, calciner kilns and power plants. Particulatecapture is typically affected by electrostatic precipitators. The capture efficiency will usuallydepend on the age of the precipitator. SO2 emissions are controlled by the use of low sulphurfuel. Best practice is a modern precipitator or scrubber technology to significantly reduce pointsource emissions, both from raw materials handling and process off gases.
Site specific emission issues may occur with odour from release of complex organics (principallyfrom digester vents), and from caustic mists (principally from the Bayer plant flash tank relief).
A number of the Group’s plants have historically maintained capital investment in equipmentupgrades, but certain older plants in the Russian Federation and Ukraine have not benefited fromthe same historical level of environmental capital investments.
APPENDIX VI INDEPENDENT TECHNICAL REPORT
— VI-30 —

Alumina refinery liquid emissions
Liquid emissions from alumina refineries can be categorised as follows:
• Process effluents consisting of excess liquor from the process, including spills, andoverflows.
• Stormwater from the process plant area.
• Groundwater flowing through, or off, the plant site footprint.
• Red mud excess liquor discharging to environment.
• Stormwater from the red mud containment area, discharging to the environment.
• Groundwater under red mud containment flowing through the site or offsite.
In addition, liquid releases to the environment can occur from storage tank overflows or failures,where these are not bunded or otherwise contained.
Modern best practice for liquid effluent is zero liquid discharge during normal operations. Thisis achieved by:
1. Providing each process area within the plant with kerbed pad and internal drainagereporting to a spill collection sump. Any sump contents are recycled back to the process.
2. Stormwater from process areas also reports to this sump and is recycled as far as possible,depending on intensity and duration of storm. When the capacity of the internal recycle isexceeded during heavy rain events, the stormwater overflows to a site drainage systemwhich reports to a stormwater management pond. This pond is sized to contain run offresulting from significant storms. Exact capacity is sized based on consequences ofdischarge to downstream. These ponds are equipped with recycle pumps so that stormwatercan be returned for processing. (Stormwater run off is normally contaminated with somesoda and metals). Any stormwater that is unavoidably discharged to the environmentrequires treatment by neutralisation/precipitation.
3. Groundwater contamination is an issue that is currently receiving attention. The concretepads typically used for process areas are subject to corrosion from caustic and thusgroundwater under the plant can become contaminated. The problem can be managed duringinitial construction by installing an impervious barrier. However almost all existingrefineries are built without this feature due to their age and where groundwatercontamination is likely to be an issue in the long term, containment well point dewateringfollowed by recycle to the plant, or groundwater treatment before discharge to theenvironment is required.
4. Best practice is to recycle the liquor back to the plant to make use of the soda values andavoid liquor treatment costs, as treatment to neutralise/precipitate solids is required beforedischarge to the environment. Some facilities are designed with a layer of sand above theliner which drains to a recycle sump. This aids in the dewatering of the red mud.
5. Stormwater management requires containment of the excess run off in the red mud pondfollowed by gradual recycle back to the plant. Any excess stormwater to be discharged tothe environment requires treatment by neutralisation/precipitation.
APPENDIX VI INDEPENDENT TECHNICAL REPORT
— VI-31 —
6. Bauxite residue, which is commonly known as “red mud”, is a by-product of the Bayer andsintering process. Where groundwater is identified as being contaminated by seepage/leakage from red mud containment areas, the remedial action should be as indicated in item3 above. Modern red mud containment areas are typically installed with impervious liners(high-density polyethylene or similar) to prevent this issue.
Historically, in the Russian Federation, dried red mud was compacted to form an impermeableliner. This may represent a future liability of presently unknown magnitude for those red mudstorage areas that have followed this practice. However, all new red mud storage areas withinRussia are constructed using an impervious membrane.
Certain of UC RUSAL’s plants have legacy issues relating to red mud containment andassociated groundwater contamination issues. Management is aware of this and efforts areunderway to mitigate these legacy issues.
Alumina refinery solid emissions
Bauxite residue is chemically stable and is not defined as toxic. However, it is considered to bea low to medium hazard waste because of its corrosive nature. The amount of residue generatedby the Group’s operations per tonne of alumina produced varies greatly depending on the typeof bauxite used, from 0.3 tonnes for high grade bauxite to more than 2.5 tonnes for very lowgrade.
Key general concerns with respect to the operation of bauxite residue disposal facilities includethe following:
• Due to large production volumes, extensive areas of land are required for disposal, withcorresponding rehabilitation and closure requirements to ensure a stable landform in thelong term. In many cases the land is not able to be returned to its previous use.
• Seepage of alkaline liquor into the environment can impact on natural ecosystems andpotable water resources.
• Dust generated from red mud disposal facilities can be irritating due to its alkalinity andmay negatively impact on local residents and businesses.
• Disposal facilities typically contain large volumes of wet and soft materials that requirestringent engineering design and construction of containment embankments that oftenexceed 50 m in height to avoid the potential for catastrophic failure.
The alumina industry has long recognised that there is a need to improve residue disposaltechniques in order to reduce both the cost and environmental impact of bauxite residue disposalfacilities. As a result, there has been a move towards more economically efficient andenvironmentally acceptable disposal methods.
Current global (minimum) best practices can be summarized as follows:
1. The containment will be lined with a minimum of 0.5 m of mechanically compacted clay.Other types of acceptable liner systems are synthetic or composite liners which achieve atleast the same impermeability.
2. Installation of a base drainage system below the liner to reduce hydrostatic pressure on theliner.
3. Containment of stormwater for not less than the 1 in 25 year storm event.
APPENDIX VI INDEPENDENT TECHNICAL REPORT
— VI-32 —
4. Embankments designed for long term stability.
5. Buffer zone around facility.
6. Monitoring wells located on the perimeter to detect seepage/leakage.
7. Dust management by planting tree barriers and wetting of dry areas.
8. Improvements to low density deposition of bauxite residue are high rate thickeners toincrease density and reduce liquor content resulting in less land required. Further increasesin density can be achieved by filtration, however this is costly.
9. Rehabilitation and Closure plan prepared and budgeted from current income to providefunds at end of life of containment pond. (Sometimes known as Asset RetirementObligations).
10. Annual inspections by an independent third party.
Historically, in the Russian Federation, red mud after mechanical compaction was used as a linerto red mud containment areas. This is considered by the operations to be a sufficient barrier toprevent leakage and seepage from red mud containment facilities, although this is not consideredto be adequate elsewhere in the world. However, all new red mud storage areas within Russia areconstructed using an impervious membrane.
This may represent a future liability for the Russian Federation refineries. Refer to Section 4 foran overview of the alumina process residue disposal situation at individual UC RUSALrefineries.
Aluminium smelter air emissions
Air emissions from the primary aluminium smelting process include gaseous and particulatefluorides; alumina dust, coke dust, sulphur and carbon dioxides, tars, PAHs, carbon dust, fluxingemissions and carbon oxides. The potlines are the major source of air emissions, with the gaseousand particulate fluorides being of prime concern. Anode effects, caused by a temporaryinstability in the electrolytic smelting process, result in emissions of carbon tetrafluoride (CF4)and carbon hexafluoride (C2F6), which are greenhouse gases (GHG) of concern because of theirhigh “equivalent carbon dioxide” status. The above-referenced emissions from the aluminiumprocess can generally be classified as particulates or gases.
Limits and guidelines for the emissions from smelters generally relate to gaseous and particulate(dust) fluorides and Volatile Organic Compounds (VOC) emissions. Gaseous emissions arisingfrom anode effects are typically not included in limits and guidelines prescribed byenvironmental authorities since these situations are not considered to be representative of“normal” aluminium smelter operations.
Oxides of sulphur and nitrogen are generally produced in greater quantities in Söderberg cellsthan in pre-bake cells. These emissions have both a local and regional effect on vegetation andhuman health. Internationally, they are generally controlled by the use of specific mixes of cokesand pitches in the production of the anode or paste. Hydrogen fluoride is of major concern locallyto the smelters due to its effects on vegetation and consequent animal and human health and,following the Kyoto protocols and the Rio and Johannesburg Earth Summits, GHG emissions arenow of similar concern both locally and internationally.
APPENDIX VI INDEPENDENT TECHNICAL REPORT
— VI-33 —

CO2 is used as the base GHG emission measure. In the manufacturing of aluminium metal, largequantities of CO2 are produced both from non-hydro fuel power generation and from the processitself. In the smelter, approximately 3.6 tonnes of CO2 are produced from the cells for everytonne of aluminium produced. Of more importance though, from a GHG perspective is tominimize anode effects and the associated emission of the Perfluorocarbons (PFCs), C2F4 andC2F6. These gases cannot be captured by fume treatment plants, but their emissions can bedecreased by reducing anode effects with improved pot control systems.
The occurrence of anode effects, and thus the volume of PFCs released, is reduced when usingmodern pre-bake technology as compared with Söderberg technology. As discussed in Section2.3.2.1, a majority of UC RUSAL’s primary aluminium production uses Söderberg technologyand, as a result, PFC emissions and overall air emissions in general are higher than comparedwith the modern pre-bake technology.
There are, however, various specific capital investment programmes, which are being undertakenby UC RUSAL to improve the environmental performance of Söderberg technology, includingthe introduction of gas-scrubbing systems, electrostatic precipitators and point feeders. Thesemeasures are expected to reduce the risk of claims by the environment protection authorities forbreaching harmful air emissions limits and improve the ecological situation in the regionssurrounding the aluminium smelting facilities.
Aluminium smelter solid emissions
A significant solid waste from aluminium smelters is cathode waste shown as Spent Pot Lining(SPL) which is classified as a hazardous material. Internationally, SPL is currently stored inhazardous waste disposal sites pending developments in waste treatment and recoverytechniques. SPL has properties that can make it a valuable material for use in other processes,such as cement production, mineral wool production, low-grade coke production andconstruction.
Currently, the majority of UC RUSAL smelters store SPL in lined and enclosed landfill facilitiesadjacent to the plants with only a small portion of the material being utilised for other operations.Russian aluminium smelters previously sold part of the carbon from SPL to third parties, but thisis no longer typically practiced. In order to re-use SPL for needs of other industries, this materialhas to meet specific requirements related to its physical parameters. There is a plan to expandan existing SPL processing facility at Novokuznetsk Aluminium Smelter and develop a processto obtain a suitable material for the steel making industry based on the SPL waste accumulatedat other nearby Siberian smelters, including Sayanogorsk Aluminium Smelter, KhakasAluminium Smelter, Bratsk Aluminium Smelter and Krasnoyarsk Aluminium Smelter.
2.1.6 Specific Risks and Future Opportunities
2.1.6.1 Mining Assets
Specific Risks
• Legal, Political and Regulatory Risk — In the countries where UC RUSAL has operationsand projects, there is a degree of legal, political and regulatory risk such as changes to lawsor the judicial interpretation of laws, expropriation, changes in taxation or royalty regimes,non-issuance, and cancellation or revocation of permits or licences. Other large mining andmetal companies also operate in these same countries. The World Bank and IFC are alsooften involved in large resource projects and other capacity building, aid, infrastructurehealth and education projects which can confer stability on such countries.
APPENDIX VI INDEPENDENT TECHNICAL REPORT
— VI-34 —

• Freight and Transport — Regarding UC RUSAL’s mining operations in Russia, in-countrynational rail freight rates cannot be negotiated under long-term contracts at present.Without the ability to do this, mitigating rising freight rates in excess of those ratesforecast, is difficult. The locations of UC RUSAL’s overseas mines which do not have alocal refinery, and where the refineries which they feed are remote, are influenced by seafreight price changes. UC RUSAL is also at some risk of price increases where the rail linesor equipment do not belong to the Company. Tariffs are generally regulated by the State andthe Transport Ministry and UC RUSAL is continually negotiating with transport entities tosecure long-term agreements to manage the freight price risks.
• Social/Labour Risks — UC RUSAL operates in countries and areas with known historiesof social and labour disputes. Such disputes may continue to impact on a local and regionalbasis.
• Environmental Compliance and Liabilities — The significant majority of the mines arein compliance with environmental regulations. A few are not in compliance mainly due tohistoric liabilities. In some mines, environmental practices need to be improved to meetinternational standards. The current practice in Russia is that upon decommissioning of anasset, the land, facilities and the historical environmental liability revert to the State. Thispractice may at some point change in line with internationally accepted practice, putting theresponsibility for both environmental and social remediation onto UC RUSAL. In addition,all the projects and operations face the risk of increasing international attention on labourand community issues, which may result in increased regulatory and stakeholder pressurefor greater financial commitments in the future. Whilst a number of UC RUSAL’s mineshave communities which are largely dependent on the continuation of the operations fortheir sustainability, eventual closure of the mines may lead to liabilities not currentlyanticipated.
• Ore Reserve Risk for Continuity of Mining Operations — UC RUSAL currently has titleto JORC Code compliant bauxite Mineral Resources of approximately 1.8 billion tonnesincluding approximately 384 million tonnes of JORC Code compliant bauxite Ore Reservesof saleable grade. This is sufficient for medium to long term feed to most of the UC RUSALplants, a few of the Ore Reserves for specific UC RUSAL plants are only sufficient for alimited number of years. UC RUSAL is aware of these situations and has only short tomedium term programmes in place to continue to convert Mineral Resources to OreReserves and to increase their Mineral Resources through exploration to secure the longerterm future of the operations.
• Equipment Risk — A significant proportion of UC RUSAL’s mining equipment, althoughwell maintained, is ageing and has exceeded its expected technical or economical life. UCRUSAL annually allocates funds for sustaining capital for equipment replacement. UCRUSAL is pioneering the use of the high technology of surface miners for bauxite mining.Whereas this technology is improving, where the surface miners are proposed to be the soleor prime excavation method, there is a degree of risk regarding equipment availability.Further analysis and development is proposed by UC RUSAL to increase equipmentavailability. Whereas this, and the provision of backup equipment may mitigate much ofthis risk, there may be the requirement to provide for the alternative of conventional drilland blast excavation and/or additional surface mining units.
APPENDIX VI INDEPENDENT TECHNICAL REPORT
— VI-35 —

• Mines under Care and Maintenance — Operations at Alpart and Windalco have beensuspended and the mines (and refineries) placed under care and maintenance. This mayhave future implications on the respective licences held by UC RUSAL or its subsidiaries.
Future Opportunities
• UC RUSAL has the ability to secure and develop reliable, good quality, low cost suppliesof bauxite from its overseas and Russian mines which can support downstream refineriesand smelters either through the acquisition of others’ interests or by the nearby expansionof its existing mines by ways of exploration programmes. The Company continues activeexploration programmes to add to its Mineral Resource inventory of 1.8 billion tonnes andis continuously undertaking infill exploration work to convert its Mineral Resourceinventory to Ore Reserves.
• Development of Integrated Mines and Refineries — UC RUSAL is actively expanding itsportfolio of bauxite exploration projects in areas with significant potential and where minemouth alumina refineries could be established. In this way UC RUSAL would furtherconsolidate its strategic position.
• Increasing Ore Reserves — Most of UC RUSAL’s properties have significant MineralResources which may, with ongoing exploration, study and life of mine planning for eachoperation, be translated into Ore Reserves and hence prolong the life and quality of the feedto the alumina refineries and other mineral processing plants.
• Technology and Efficiency Improvements — The replacement of the ageing mining andtransport equipment with new equipment, and the introduction of new technologies canimprove efficiencies and provide an opportunity to reduce costs.
• Long-Term Mine Planning — Long-term mine planning and life of mine planning usingup to date computerised methods will allow improved capital investment planning,economic optimisation, flexibility and utilisation of the resources.
• Environmental Opportunities — The implementation of improved environmental andsocial management planning and the definition and implementation of integrated planningfor closure may mitigate the environmental risks and, in the long-term, improveefficiencies, reduce costs and create an improved culture and motivation of the workforce.
• Knowledge Transfer — The Company has developed specific know-how of miningbauxites in particular conditions. This knowledge can be transferred within the Companyand may result in improved mining efficiencies.
2.1.6.2 Non-Mining Assets
Specific Risks
Any organisation such as UC RUSAL which has inherited and procured a diverse range of agingassets in recent history would be expected to be subject to a range of technoeconomic andoperational risks. The following points illustrate the primary risk factors that may potentiallyaffect UC RUSAL should they arise:
• Energy Provision — The energy providers to UC RUSAL have, in some instances, asimilar aging group of energy generation facilities ranging from hydroelectric to gas andcoal fired power plants to nuclear facilities. Although they are known to have been designedwith redundancy provision in case of major breakdown or maintenance, it is difficult tomitigate against the risk of catastrophic failure to one or more of the energy providers’
APPENDIX VI INDEPENDENT TECHNICAL REPORT
— VI-36 —
installations. Depending upon the region and size of alternative network supply, this mayhave a material impact on UC RUSAL’s production. The incident at theSayano-Shushenskaya HPP on 17 August 2009 provides an example of the potential risksto the provision of energy to UC RUSAL facilities.
• Electrical Energy Pricing — The on-going deregulation within the Russian electricityindustry creates a risk of increased energy costs. This is balanced against the need for thegeneration and transmission companies to sell their product in isolated areas, and ofcompetition from energy providers in areas of more abundant energy supply. Ultimately,UC RUSAL may decide to develop more of its energy in-house which is normallyachievable at rates that enable economic aluminium production.
• Gas Market Deregulation — Gas prices in the Russian Federation are currently strictlyregulated by the State and are set at levels significantly lower than prices achieved byresident gas producers for exporting gas. The State has announced that these controls willbe lifted by 2011, allowing Russian gas suppliers to charge the same prices, minus a freightdifferential, to domestic and export customers. The end of regulated gas prices in theRussian Federation from 2011 creates the risk of higher energy prices, which couldnegatively impact UC RUSAL’s refining operations.
• Freight — Although the rail infrastructure in the Russian Federation has proved itselfcapable of transporting many million tonnes of material over large distances, much of thesystem is aging and requires sustaining capital expenditure in addition to upgrading ofrolling stock, signalling and other improvements. Historically, freight rates have beencomparatively cheap when benchmarked with other international rail systems. However,with potential deregulation and privatisation in addition to all the noted cost pressures,there is a risk that freight rates within the Russian Federation may increase at a rate greaterthan general price inflation.
• Labour Cost Inflation — Fluctuations in the Russian labour market could impact upon thecosts for recruiting and retaining skilled engineers, constructors and operators. Althoughthe market is currently depressed and labour is freely available, this may not be the caseover the next few years.
• Rising Capital Costs — The cost of building new alumina refining and aluminium smeltingcapacity has increased strongly worldwide in recent years. This is largely being driven bythe requirement to meet increasingly stringent environmental laws and regulations.However, bulk material labour and equipment costs represent good value at the presenttime, although this may not be the case over the next few years if global economiesrecovery more quickly than forecast. UC RUSAL developmental capital projects could alsobe subject to these pressures.
• Social/Labour Risk — UC RUSAL operates in areas with known histories of social andlabour disputes and this may have a negative impact on its operations should these bearrelevance to its operations and/or local areas.
APPENDIX VI INDEPENDENT TECHNICAL REPORT
— VI-37 —

• Environmental Compliance — UC RUSAL is subject to a broad range of increasinglystringent laws and regulations in each of the jurisdictions in which it has operations. Anychanges in such laws and regulations may significantly impact the costs of operations andin certain cases may impact the ability of UC RUSAL to continue operations at certainfacilities.
• Environmental Liabilities — The current practice in the Russian Federation is that upondecommissioning of an asset the land and facilities, including any historical environmentalliability, revert to the State. This practice may at some point change in line withinternationally accepted practice, putting the responsibility for both environmental andsocial remediation onto UC RUSAL. Generally, it is accepted that the cost ofdecommissioning a smelter and associated facilities is normally cash neutral due to theamount of aluminium, steel and land to be released. It is not possible without extensive,detailed evaluation, to mitigate the potential for long term environmental liabilities to beapplied to any site under UC RUSAL’s control.
• Asset Integrity — Many UC RUSAL assets are operating beyond their normal economiclife and consequently many buildings, structures and large items of equipment have farexceeded their original design life. While it is considered that all of UC RUSAL’s assetscan continue to operate in the medium term should sufficient sustaining capital be allocatedto each facility, structural or other failures could be possible which may affect productionof one or more production facilities within the group. However, UC RUSAL has advisedHatch that it maintains adequate levels of insurances against production losses due toinfrastructure or equipment failure.
• Natural Hazard Events — UC RUSAL operates in areas with known histories of naturalhazard events, such as hurricanes and earthquakes, and this may have a negative impact onits operations should these bear relevance to its operations and/or local areas. For example,UC RUSAL alumina refineries in Jamaica have been impacted to varying degrees andsuffered production losses through hurricane events in recent years. However, UC RUSALhas advised Hatch that it maintains adequate levels of insurances against production lossesdue to natural hazard events.
• Dependence on Bauxite Purchases — UC RUSAL currently procures a significant volumeof its bauxite requirements each year for its alumina refining operations. Eurallumina andAughinish Alumina are reliant on imported third party bauxite from one or more supplier.Nikolaev Alumina Refinery and Zaporozhye Alumina Refinery meet a portion of theirannual bauxite requirements through third party purchases. Queensland Alumina Ltd, inwhich UC RUSAL holds a minority stake, sources bauxite from the Weipa mine (not ownedby UC RUSAL). However, the supply of Weipa material is not considered a risk since theowner of the Weipa mine, Rio Tinto, is also the largest shareholder in Queensland AluminaLtd. Third party bauxite is predominantly sourced through long-term contracts, which areaugmented by occasional spot market purchases. UC RUSAL has a long-term strategy toreduce reliance on purchased bauxite through the development of the Dian-Dian project.Should there be any delays to these projects, this will maintain UC RUSAL’s significantexposure to the third party bauxite market and may potentially result in higher bauxitecosts.
• Legal, Political and Regulatory Risk — Like with any company operating in countrieswhere UC RUSAL has operations, UC RUSAL faces legal, political and regulatory risk suchas changes to laws and regulations or the judicial interpretation of laws, expropriation,changes in taxation or royalty regimes and non-issuance, cancellation or revocation ofpermits or licenses.
APPENDIX VI INDEPENDENT TECHNICAL REPORT
— VI-38 —
In addition to general risks, Hatch has identified risks which are specific to individual facilities.These are discussed in the relevant facility section of Sections 4 to 9 of this report.
Future Opportunities
Any organisation on the scale of UC RUSAL also has many opportunities open to it. The mainareas of opportunity include:
• Proprietary Smelting Technology — Many of the world’s largest aluminium companiesare actively developing their own specific form of technology, and UC RUSAL is noexception. UC RUSAL is in the process of developing new high amperage pre-baketechnology at Sayanogorsk Aluminium Smelter including RA-300M, RA-400 and plan toinstall RA-500 cells in the near future. The technology development has been reviewed withthe assistance of recognised industry experts and a variant of the RA-300 cell technologywas selected for the Khakas Aluminium Smelter. RA-500 is considered by Hatch to stillrequire significant development, however. The cell technology represents an intangibleasset which combined with the cell development experience at the Company is expected tobe used to support the development of new UC RUSAL smelters in the region and possiblyrevenue from additional technology sales to others. The provision of UC RUSALproprietary smelting technology was an important factor in securing partnership for theBoguchanskoye Energy and Aluminium Complex. Sayanogorsk Aluminium Smelterprovides a training ground for smelter operators ensuring that UC RUSAL employees areoperationally ready for the new smelter projects.
• Stranded Energy Utilisation — A long-term low cost energy supply is key to thedevelopment of all smelter projects. Russia is one of the few regions of the world withabundant energy supplies in the form of hydro, coal and gas. UC RUSAL, with its highlyprospective portfolio of smelter development projects is uniquely placed to take advantageof the stranded energy through long-term contracts and proposed power plant projects.
• Project Development Experience — The construction of IrkAZ-5 and Khakas AluminiumSmelter represent the first major aluminium capacity projects in the Russian Federationsince Sayanogorsk Aluminium Smelter was constructed in the 1980s. The IrkAZ-5 andKhakas Aluminium Smelter projects have provided an opportunity to demonstrate theinternal Engineering, Procurement and Construction Management (EPCM) capabilities ofUC RUSAL. The engineering, fabrication, construction and operations start-up experiencethat has been gained on these projects is intended to assist the portfolio of growth projects.UC RUSAL and its subsidiaries will have obtained significant expertise from the IrkAZ-5and Khakas Aluminium Smelter projects.
• Growth Projects — UC RUSAL has a number of attractive greenfield and brownfieldexpansion projects in various stages of development that are expected to provide significantfuture growth opportunities for the Company.
• Modernisation of Existing Facilities — In addition to the proprietary cell technology, UCRUSAL has developed stationary calciners, dry gas treatment centres, centralised aluminadistribution systems, point feeders, cell control systems, process control systems and acomprehensive range of other technologies that are expected to improve efficiency, reduceemissions, increase production, improve quality and reduce costs. The EngineeringTechnology Centre creates the opportunity to capture this “know how” and coordinate theimplementation across the UC RUSAL group companies.
• Aluminium Smelter Efficiency Upgrade — It is common within the aluminium industryto progressively increase line current. This is commonly referred to as production creep.UC RUSAL has performed a benchmarking exercise of their existing cell technologies with
APPENDIX VI INDEPENDENT TECHNICAL REPORT
— VI-39 —

other operations and has identified opportunities to increase metal production at severalfacilities at relatively low CAPEX. In addition, all smelter management teams are nowfocused on improving the cathode life of cells and reducing the cell turnaround time. Thesetwo important initiatives were observed at UC RUSAL smelters during the site visits. Theseprojects may assist in reducing OPEX of the existing operations under current input pricearrangements.
• Alumina Refinery Efficiency Upgrade — It is common within the alumina industry toprogressively increase alumina production by identifying and removing bottlenecks withinthe production process. The higher production delivered from a de-bottlenecking project istypically achieved at a lower capital expenditure per tonne of alumina than compared withbrownfield capacity expansion projects and may also contribute to reduction of operatingcosts. Ability to undertake debottlenecking initiatives were observed at UC RUSALrefineries during the site visits, and they may prove economic as suggested above.
• Product/Market Opportunities — Several opportunities present themselves at UCRUSAL facilities to enhance existing products or develop new product lines using existingor new technology. Such opportunities, where they exist, are discussed in the individualfacility descriptions in Sections 4 to 9.
• Overseas Opportunities — The Group has many overseas opportunities which may resultin obtaining reliable long-term, low cost supply of bauxite, alumina, anodes and cathodes.These are planned to further reduce operating costs and increase profitability.
• Synergies — There is potential for further synergy from the creation of UC RUSAL in2007. This includes improvements in supply chain management, the adoption of bestpractice operational and management techniques and implementation of projectoptimisation methods. The Company incorporates assets located throughout the world, andthis is expected to provide benefits through cross-education, information and experiencesharing.
• Vertical Integration — UC RUSAL is vertically integrated throughout the aluminiumsupply chain. This provides partial security of raw material supply and off-take for itsproduction.
• Strategic M&A — Consolidation of the global aluminium industry continues to offerattractive opportunities. UC RUSAL is a leading player in the global aluminium industryand is well positioned to add value through future merger and acquisition activity.
In addition to general opportunities, Hatch has identified opportunities which are specific toindividual facilities. These are discussed in the relevant facility section of Sections 4 to 9 of thisreport.
2.1.7 Sales and Marketing
2.1.7.1 Mining Assets
UC RUSAL uses the mined raw materials predominantly within its own downstream processingunits and has a number of internal departments and trading companies which conductinternational and in-Russia sales as well as raw material purchases. These are as follows:
• The Department for the Supply of Alumina and Bauxite is responsible for sales andpurchase of bauxite.
• The Department for Power Resources is responsible for sales of coal for power generation.
APPENDIX VI INDEPENDENT TECHNICAL REPORT
— VI-40 —
A number of the mining facilities deliver their raw materials directly to their downstreamprocessing units. In these cases, the mine is considered to be a cost centre of the integratedfacility and generally delivers the materials either at cost, or on a cost-plus margin basis. In someinstances the mine has a fixed or renewable contract in place with the receiving facility. Thesecontract transfer prices may be lower than the cost of producing the raw materials and deliveringthem to the transfer point.
Bauxite
UC RUSAL consumes all of the bauxite that it produces, with the exception of minor third partysales from time to time.
The following companies, which are integrated parts of UC RUSAL, are responsible for the salesof bauxite:
• RTI Limited: for Kindia bauxite.
• Trombetas purchases and resells bauxite.
• BCGI: Guyana.
• JSC Timan Bauxite: OAO Sevuralboksitruda for its own bauxites.
• UC ‘RUSAL-Trading House’ (sales to third parties inside Russia).
Nepheline Syenite and Limestone (AGK)
The Kiya Shaltyr Nepheline Syenite mine and the Mazulsky Limestone mine deliver all of theirproducts to the Achinsk Alumina Refinery. There is no external market for the nepheline syeniteand limestone other than as aggregate. The products from the Achinsk process include alkali saltsas well as alumina.
Quartzite and Silica
The Cheremshansk Quartzite Mine delivers the majority of its higher value products to theKremny plant, also named Irkutsk Silicon. A lesser tonnages of silica for smelting to siliconmetal is supplied to Kremny Ural, also named Uralsky Silicon. High quality quartzite (1 and 2grade) is supplied to Irkutsk Silicon, and Uralsky Silicon occasionally consumes quartzite of 3and 4 grade.
As of 2010, the Glukhovsky Quartzite Mine’s silica product, will be sold externally from UCRUSAL, under contract, yet to be agreed and signed. The silica was previously supplied to thenow closed UC RUSAL JSC Zaporozhnye Aluminium Industrial Complex, a subsidiary of JSCZALK.
Fluorite
UC RUSAL is 50% owner of the Yaroslavsky Fluorite mine. The other 50% owner is OOO RGRKwho is the managing entity. The Aluminium Division of UC RUSAL determines the requirementsof CaF2 for the UC RUSAL aluminium plants and places orders of between 100 and 110 ktpa,equating to some 94% of total production. The remaining product is sold primarily within Russia.
APPENDIX VI INDEPENDENT TECHNICAL REPORT
— VI-41 —

Coal
The coal from TOO Bogatyr Komir is sold to power plants located both in Kazakhstan andRussia. In 2008, 22 Mt of coal from the mine was sold to Russian power stations and 24 Mt soldto Kazakh power stations. Large system-forming power plants such as Reftinskaya GRES,Troitskaya GRES, Ekibastuzskaya GRES-1 and Ekibastuzskaya GRES-2 are among TOO BogatyrKomir’s customers.
2.1.7.2 Non-Mining Assets
Selling process
RUSAL Trading International (registered in Jersey with its office in Gibraltar) is the Principalfor international sales of products executed by RUSAL Marketing GmbH.
Rusal Marketing GmbH (located in Switzerland) acts as an undisclosed agent of RUSAL TradingInternational in respect to the sales of alumina and aluminium to third parties
UC RUSAL has several other non-resident trading companies which are involved in internaltransfers within the group related to alumina, namely Alumina and Bauxite Ltd. (Albaco), MontCervin Consultadoria e Servicos (Mont Cervin), Calibre Properties Worldwide Limited (Calibre)and UC RUSAL Alumina Jamaica II Holdings Ltd. (UC RUSAL Holding).
UC RUSAL has a number of trading companies which conduct aluminium sales, which include:
• RUSAL Marketing GmBH (located in Switzerland) acting as an undisclosed agentundertakes international sales (with the exception of CIS countries) of primary aluminium(ingots, sows and T-bars), aluminium alloys (wire rod, slabs, extrusion billets and a widevariety of primary foundry and secondary aluminium alloys) and foil. Silicon is also soldby RUSAL Marketing GmBH on behalf of Rusal Trading International.
• RUSAL America Corp. (located in the USA) is responsible for international sales ofprimary aluminium (ingots, sows and T-bars), and aluminium alloys (billets, slabs, primaryfoundry alloys and wire rod).
• RUSAL Trading International (located in the USA) is responsible for North American salesof primary aluminium products to CIS countries (with the exception of Belorussia).
• RUSAL Europe (located in Germany) was previously responsible for international sales offoil products to Europe, but is currently being wound-up in accordance with currentrestructuring plans.
• UC RUSAL — Trading House (located in the Russian Federation) is responsible fordomestic sales of primary aluminium (ingots, sows and T-bars), and aluminium alloys(billets, slabs, primary & secondary foundry alloys), foil, silicon and other aluminiumgoods, e.g. busbar and rod.
• Zaporozhye Aluminium Smelter is responsible for the sale of primary aluminium productsto Ukraine.
• SUAL-PM LLC is responsible for the sale of aluminium powder products.
APPENDIX VI INDEPENDENT TECHNICAL REPORT
— VI-42 —

Alumina
UC RUSAL has historically been a seller of alumina to third parties. Traded alumina was fromtwo sources; firstly, from the Company’s alumina trading activities, and secondly, from thesurplus of alumina produced internally by its refineries over the internal consumption of aluminafrom its aluminium smelters.
Historically, alumina has been sold through a mixture of spot and contracted sales.
UC RUSAL attributable alumina production in the first half of 2009 was not sufficient to meetthe alumina requirements of its aluminium smelters, thus requiring the net purchase of aluminafrom third parties.
Aluminium
UC RUSAL has a comprehensive strategy for sales and marketing of its primary aluminiumproduction built around two principles:
• Market driven approach — where the marketing function is driving the production functionin order to deliver the optimal product mix that maximises the profits and increases thesustainability of the company
• Balanced regional sales strategy which allows UC RUSAL to be represented in all majormarkets
• Targeting end-users as priority customers and utilising opportunities provided y tradingcompanies to sell the total volume of UC RUSAL’s production capacity.
UC RUSAL apply the following criteria in order to meet the above principles:
• Ensuring the entire annual production capacity is sold
• Optimising premiums
• Developing value added products
• Minimising risk
The first priority of the Company is to maximise the sale of Value Added Products (VAPs), suchas alloys, billets, slabs, wire rod and high purity aluminium, and then to sell the remainder asprimary metal (remelt ingot). UC RUSAL also considers the domestic market as a priorityregional market.
Over the past three years, the volume of VAPs produced by UC RUSAL has increased from 1,793kt in 2006, 2,086 kt in 2007 to 2,164 kt in 2008, as shown in Figure 2.4, highlighting thesuccessful implementation of this strategy. In terms of the percentage of UC RUSAL aggregateattributable saleable aluminium production, VAP’s comprised approximately 45 per cent of thetotal in 2006, 50 per cent in 2007, and 49 per cent in 2008. Combined with its strategy ofincreasing production of VAPs, UC RUSAL has successfully increased sales directly tocustomers, and in particular large and established aluminium processing companies, and reduceddeliveries onto the LME and sales to traders.
APPENDIX VI INDEPENDENT TECHNICAL REPORT
— VI-43 —

Figure 2.4: Output of Value Added Products(1)
0
500
1,000
1,500
2,000
2,500
3,000
2006 2007 2008
kt
Note:
(1) All data has been provided by UC RUSAL and has not been verified by Hatch.
UC RUSAL’s entire yearly production capacity is sold through a combination of annual contractsand spot sales. The Company plans to sell as much VAPs through annual contracts as possible,and around 50 to 80 per cent of the annual production volume of primary aluminium throughannual contracts. The balance is made through spot sales. The percentage of export metal soldon an annual basis is decided year by year, depending on demand forecasts and expectations forpremiums.
While UC RUSAL prioritises domestic sales over exports, the general low level of downstreamaluminium processing in Russia results in UC RUSAL exporting a high percentage of the outputof its Russian smelters. In 2008, UC RUSAL sales by geographic region were: Europe (48% oftotal), Asia (23% of total), CIS (23% of total) and the United States of America (8% of total).While UC RUSAL exports its goods throughout the world, the Company has stated the priorityof markets for sales of VAPs as follows (in order of priority): CIS, Europe, Asia and NorthAmerica. Within this stated aim UC RUSAL plans to maintain a presence in all markets to takeadvantage of evolving regional conditions, particularly in terms of premium maximization andlogistical issues but look for opportunities in other markets as well.
UC RUSAL sells primary aluminium based on a combination of the LME cash aluminium price(typically the average of the month) plus premium. The premium depends on the market, producttype, quality, brand reputation, terms of delivery, payment terms, quotation period, and currentmarket trends. The Company maintains a flexible approach to the setting of premiums, althoughit will attempt to fix premiums on an annual basis when particularly attractive terms are on offer.
All prices for Russian customers are limited in accordance with the document of the FAS (theFederal Anti-monopoly Service) of the Russian Federation.
Powder, Silicon, Secondary Aluminium and Raw Materials
The price for silicon metal for export sales is calculated on the basis of the existing marketsituation (supply/demand), production cost and the published price indicator of the market. Fordomestic sales, the price is calculated on the basis of published price indicators in major worldmarkets.
APPENDIX VI INDEPENDENT TECHNICAL REPORT
— VI-44 —
The price for aluminium powders is defined on the basis of LME quotations for the period, inaddition to a premium. The premium depends on the market, product type, quality, terms ofdelivery, payment terms, quotation period, and current market trends.
All prices for Russian customers are to be limited in accordance with the document of FAS(Federal Antimonopoly Services) of the Russian Federation.
The vast majority of aluminium fluoride and cryolite produced by UC RUSAL is consumedinternally by UC RUSAL aluminium smelters, although a small volume each year is typicallysold to the aluminium smelters located in Azerbaijan and Tajikistan.
The entire production of reduction cell lining products and cathode blocks from the Lingshi andTaigu cathode plants is used internally at UC RUSAL smelters in the Russian Federation andUkraine.
Packaging Division
UC RUSAL’s packaging operations export a significant proportion of output, with the remainderbeing consumed in Russia. During 2008, the Packaging Division shipped product to consumersin Europe, North and South America, Africa, Australia and the Middle East during this period.
The terms of sale for packaging products is typically based on the average LME cash aluminiumprice for the month proceeding the month of sale.
2.2 Mining Assets
2.2.1 Bauxite Mines
UC RUSAL has full or part ownership in five operating mine complexes and a further three mines(in Jamaica) on care and maintenance. UC RUSAL has additional projects which are at theexploration or feasibility study stage. The operating mines also have a number of projects inplace, with the goal of Mineral Resource and Ore Reserve accumulation.
A number of different types of bauxite deposits are mined. These include plateau and hillslopetypes which are generally soft rocks and covered by relatively shallow superficial deposits of afew metres or less such as Guinea; moderately deeply buried older and harder rock bauxites, suchas at Timan in Russia; and very deeply buried bauxites which have to be mined by undergroundmining methods, such as North Urals.
2.2.2 Nepheline Syenite/Limestone Mines
The alumina refinery at Achinsk located in Central Siberia has been utilising a process toproduce alumina from nepheline syenite since 1965. Aluminium-rich (approximately 26.5%Al2O3) nepheline syenite ore from the Kiya Shaltyr deposit is blended with limestone oreobtained from the Mazulsky open-pit in a ratio of approximately 5:7 respectively. The aim is toblend the continuous flow of the materials in such a manner that the chemistry of the feed to ahydro-chemical plant is uniform which then feeds to a sinter process for the subsequent winningof alumina. The mining is essentially conventional drill, blast, load and haul open-pit miningwith a degree of selectivity for grade requirements. The sensitivity of the Al2O3 grade in thenepheline syenite is quite high, and there has previously been a need to augment the nephelinegrade with bauxite (4% - 2007 from UC RUSAL’s Timan Bauxite Mine).
APPENDIX VI INDEPENDENT TECHNICAL REPORT
— VI-45 —
2.2.3 Quartzite Mines
The Cheremshansk Quartzite Mine exploits a very high quality quartzite to obtain very low ironsilica which is fed to UC RUSAL’s Irkutsk Silicon operation to produce silicon metal. Additionalhigher iron products and aggregate materials are produced as by-products, which from time totime have a market. The facility currently processes 200 ktpa of quartzite and has sales ofapproximately 120 ktpa of the specified silicon product grade, which is then transported by railto the facilities at Irkutsk.
The Glukhovsky Quartzite Mine similarly exploits a high grade resource of 20-90 mm lumpyquartzite suitable for silicon metal production at UC RUSAL’s Zaporozhny smelter complex andfor ferrosilicon production at Novolipetsk ferrosilicon plant. Up to 2008 the facility processedapproximately 250 kt of quartzite to produce 50-60 kt of 20-90 mm product per annum. Inaddition 0-20 mm quartzite has been sold to the construction industry. The Glukhovsky mine iscurrently suspended following the temporary closure of the ZALK silicon facilities. The mineplans to re-commence production in 2010 and is still in talks to finalise and secure the salesunder contract.
2.2.4 Fluorite Mine
The Yaroslavsky fluorite mine is 50% owned by UC RUSAL but managed by OOO RGRK. Itproduces FF-90 (90% CaF2) concentrate for use in UC RUSAL’s aluminium processes. Theoperation is a conventional drill, blast, load and haul open-pit operation with processing done bymeans of flotation to produce the concentrate. CaF2 production has been some 800 ktpa at 30%CaF2 with sales of 100 to 185 ktpa FF-90.
2.2.5 Coal Mine
The Bogatyr open-pit coal mine is managed and 50% owned by UC RUSAL. It produces high ashthermal coal. Approximately half the coal produced feeds power stations in Kazakhstan and theother half adjacent areas of Russia. Bogatyr is one of the largest coal mines worldwide, in termsof annual production and Mineral Resources. Bogatyr produces some 40 Mtpa coal.
2.2.6 Mineral Resource and Ore Reserve Statement
In presenting the Mineral Resource statement, the following points apply:
• UC RUSAL’s Mineral Resources are JORC Code compliant as reported herein by SRK. Thisfollows SRK’s review of the available data, conversion of the GKZ approved reserveswhere appropriate and confirming their potential economic extraction.
• Mineral Resources are inclusive of those Mineral Resources modified to produce OreReserves.
• The Mineral Resource statement presented herein is dated 1 July 2009 and has not beendepleted to reflect the publication date of the listing document.
APPENDIX VI INDEPENDENT TECHNICAL REPORT
— VI-46 —

Table 2.5: UC RUSAL Mineral Resources (1 July 2009)(1), (2), (3), (4), (5)
Mineral Resources
Mining Asset Measured Indicated Subtotal Inferred Total
Tonnage Al2O3 Tonnage Al2O3 Tonnage Al2O3 Tonnage Al2O3 Tonnage Al2O3
(MtDry) (%)
(MtDry) (%)
(MtDry) (%)
(MtDry) (%)
(MtDry) (%)
Bauxite
Kindia . . . . . . . . . . . . — — 37.9 39.5 37.9 39.5 61.6 37.8 99.5 38.5
Friguia . . . . . . . . . . . . 36.8 40.8 142.4 43.0 179.2 42.5 152.6 43.2 331.8 42.8
BCGI . . . . . . . . . . . . 3.6 51.5 41.3 58.0 44.9 57.5 4.2 52.7 49.1 57.1
North Urals . . . . . . . . . 11.8 55.4 180.4 55.2 192.3 55.2 113.5 55.7 305.7 55.4
Timan . . . . . . . . . . . . 113.1 49.4 67.1 49.9 180.2 49.6 — — 180.2 49.6
Alpart . . . . . . . . . . . . 15.2 43.0 40.7 40.7 55.9 41.3 38.0 45.3 94.4 42.9
Windalco-Ewarton . . . . . 17.1 42.3 18.2 42.4 35.3 42.4 11.2 43.6 46.5 42.7
Windalco-Kirkvine . . . . 11.6 42.5 27.5 42.1 39.1 42.2 0.5 43.6 39.6 42.2
Dian-Dian Project . . . . . 401.9 48.1 70.2 45.7 472.1 47.7 216.6 47.9 688.7 47.8
Total Bauxite . . . . . . . 611 47.7 626 48.1 1,237 47.9 598 46.9 1,835 47.6
Kiya Shaltyr Neph. Syen. — — 8.9 26.9 8.9 26.9 54.2 27.2 63.1 27.1
Tonnage CaO Tonnage CaO Tonnage CaO Tonnage CaO Tonnage CaO
(Mt) (%) (Mt) (%) (Mt) (%) (Mt) (%) (Mt) (%)
Limestone
Mazulsky (dedicated toKiya Shaltyr) . . . . . . . . — — 90.1 54.4 90.1 54.4 — — 90.1 54.4
Petropavlovsk . . . . . . . 15.6 55.0 6.9 54.9 22.5 54.9 — — 22.5 54.9
Tonnage SiO2 Tonnage SiO2 Tonnage SiO2 Tonnage SiO2 Tonnage SiO2
(Mt) (%) (Mt) (%) (Mt) (%) (Mt) (%) (Mt) (%)
Quartzite
Cheremshansk . . . . . . . 0.4 99.0 1.6 99.0 2.0 99.0 35.1 99.0 37.1 99.0
Glukhovsky . . . . . . . . . 1.1 99.0 7.9 99.0 9.0 99.0 0.3 99.0 9.3 99.0
Tonnage CaF2 Tonnage CaF2 Tonnage CaF2 Tonnage CaF2 Tonnage CaF2
(Mt) (%) (Mt) (%) (Mt) (%) (Mt) (%) (Mt) (%)
Fluorite
Yaroslavsky . . . . . . . . . 3.3 52.7 17.1 37.2 20.4 39.7 1.5 39.7 21.9 39.7
Tonnage Tonnage Tonnage Tonnage Tonnage
(Mt) (Mt) (Mt) (Mt) (Mt)
Coal
Bogatyr . . . . . . . . . . . 2,276 170 2,446 484 2,930
(1) The mines’ individual Mineral Resources are further details in Section 3 of this report.
(2) Mineral Resources are recorded on an unattributable basis, equivalent to 100% ownership.
(3) Mineral Resources tonnages include Ore Reserve tonnages presented in the Ore Reserve statement.
(4) Mineral Resources are reported as dry weight (excluding moisture).
(5) The alumina grades are presented as available alumina, as opposed to total alumina.
APPENDIX VI INDEPENDENT TECHNICAL REPORT
— VI-47 —

In presenting the Ore Reserve statement, the following points apply:
• UC RUSAL’s Ore Reserves are JORC Code compliant as reported here by SRK. SRK hasvisited UC RUSAL’s operations, and reviewed the historical and forecast production andcost data. SRK has further considered the mine plans supporting the Ore Reserves, andverified that they are technically achievable.
• For the bauxite Ore Reserves, SRK has tested the economics by considering the overallintegrated processes, starting with bauxite mining through to aluminium production. Thishas been deemed appropriate as the mine production is dependent on the downstreamupgrading. Mines will supply bauxite at varying costs, delivered to the respectiverefineries. It is possible that some of the mines deliver bauxite at a higher unit cost thanbauxite may be purchased at spot prices and these bauxite Ore Reserves may be replacedby more competitive producers.
• The Ore Reserves of the bauxite mines are hence dependent on revenues of aluminiumsales, along with limited alumina sales. Only minor third party bauxite sales have beenforecast, as this is all consumed downstream. SRK has used an aluminium price which hasbeen independently assessed and which it considers to be a market consensus forecast.
• The Ore Reserves for coal, quartzite, limestone, and fluorite, are dependent on revenuesgenerated from sales of those commodities, based on market consensus forecast prices, orprices stipulated under contracts.
• For commodities other than bauxite, SRK has considered the economics on a mine by minebasis.
• SRK has considered the operating costs of the mine, refineries, smelters including thetransport costs from mines to refineries and smelters, to the point of sales, includingroyalties at the mines, and head office costs in Moscow. SRK has excluded the closure costsof the assets, to cover both biophysical and terminal benefits liabilities. In addition to thecosts considered to confirm the Ore Reserves, it is recognised that UC RUSAL hasadditional costs, such as care and maintenance costs. These indirect costs are notattributable to the Ore Reserves and are not deemed material.
• The mine forecast operating costs which have been used, are best estimates based oncurrently available information. The costs for H2 2009 and beyond are similar to those ofH1 2009, which in turn are significantly lower than the precedent three years for a numberof mines, notably Timan, BCGI and North Urals. SRK finds a high degree of volatility inunit operating costs, since 2006, at some mines more than others. This impacts negativelyon the confidence which SRK attributes to the operating costs and is hence deemed to bean area of risk.
• The bauxite grades are presented throughout this report as available alumina, as opposedto total alumina. The available alumina grades will be affected on the receiving refineryprocess method. Hence a low, or high temperature Bayer, or sinter processing method wouldresult in different available alumina grade for the same bauxite ore.
• SRK has considered the capital costs required to sustain the operations, and expand thesewhere planned, at the mines, refineries and smelters. As a result of the global downturn, UCRUSAL has curtailed or deferred capital expenditure at its operations and projects. SRK isnot aware of how susceptible UC RUSAL’s capital expenditure plans are to changing in theshort or medium term.
APPENDIX VI INDEPENDENT TECHNICAL REPORT
— VI-48 —

• SRK considers UC RUSAL’s forecasts plans to be, as a minimum, equivalent to apre-feasibility level of study and that all technical disciplines are materially compliant withthis level of study. Further, UC RUSAL’s production plans are solely based on Measuredand Indicated Mineral Resource categories, and not Inferred Mineral Resources, as isexpected practice.
• The Ore Reserve statement presented herein is dated 1 July 2009 and has not been depletedto reflect the publication date of the listing document.
Additional information is given on the mines production and costs in Sections 2.2.6 to 2.2.8 andin Section 3 which describes their operations.
Table 2.6: UC RUSAL Ore Reserves (1 July 2009)(1), (2), (3), (4), (5), (6)
Ore Reserves
Mining Asset Proved Probable Total
Tonnage Al2O3 Tonnage Al2O3 Tonnage Al2O3
(Mt Dry) (%) (Mt Dry) (%) (Mt Dry) (%)
BauxiteKindia . . . . . . . . . . . . . — — 38.2 39.2 38.2 39.2Friguia . . . . . . . . . . . . . 37.3 40.0 77.8 41.7 115 41.1BCGI . . . . . . . . . . . . . . 2.3 49.7 3.3 52.3 5.6 51.2North Urals . . . . . . . . . 7.3 51.6 83.0 50.9 90.3 51.0Timan . . . . . . . . . . . . . 99.7 54.8 35.4 57.1 135 55.4Alpart . . . . . . . . . . . . . — — — — — —Windalco-Ewarton . . . . . — — — — — —Windalco-Kirkvine . . . . . — — — — — —Dian-Dian Project . . . . . — — — — — —Total Bauxite . . . . . . . . 147 50.8 238 46.9 384 48.4Kiya Shaltyr Neph. Syen. — — 8.7 26.3 8.7 26.3
Tonnage CaO Tonnage CaO Tonnage CaO
(Mt) (%) (Mt) (%) (Mt) (%)
LimestoneMazulsky (dedicated toKiya Shaltyr) . . . . . . . . — — 12.8 53.8 12.8 53.8Petropavlovsk . . . . . . . . 13 54 6 54 19 54
Tonnage SiO2 Tonnage SiO2 Tonnage SiO2
(Mt) (%) (Mt) (%) (Mt) (%)
QuartziteCheremshansk . . . . . . . . 0.2 99.0 0.8 99.0 1.0 99.0Glukhovsky . . . . . . . . . — — — — — —
Tonnage CaF2 Tonnage CaF2 Tonnage CaF2
(Mt) (%) (Mt) (%) (Mt) (%)
FluoriteYaroslavsky . . . . . . . . . — — 0.5 27.4 0.5 27.4
Tonnage Tonnage Tonnage
(Mt) (Mt) (Mt)
CoalBogatyr . . . . . . . . . . . . 288 742 1,030
APPENDIX VI INDEPENDENT TECHNICAL REPORT
— VI-49 —
(1) The mines’ individual Ore Reserves are further details in Section 3 of this report.
(2) Tonnages are based on ore mined as per UC RUSAL’s production plans.
(3) Ore Reserves are recorded on an unattributable basis, equivalent to 100% ownership.
(4) Ore Reserves are reported as dry weight (excluding moisture).
(5) The alumina grades are presented as available alumina, as opposed to total alumina.
(6) Kindia Ore Reserve tonnage is marginally higher than it equivalent Mineral Resource, as of result of the effectof loss and dilution.
2.2.7 Production
The production history is given in Table 2.7 below.
Table 2.7: Mining Production History - All assets(1)
Mining Asset Country
UCRUSALInterest 2006 2007 2008 H1 2009
(%) Total Total Total Att(2) Total
Bauxite (Mt wet)
Alpart . . . . . . . . . . Jamaica 65 5.0 4.5 5.0 3.2 0.4
Windalco-Ewarton . . Jamaica 93 2.3 2.0 2.1 2.0 0.1
Windalco-Kirkvine . . Jamaica 93 2.0 1.9 2.0 1.9 0.1
Kindia . . . . . . . . . . Guinea 100 3.1 3.0 3.2 3.2 1.4
Friguia . . . . . . . . . . Guinea 100 1.9 1.7 2.0 2.0 0.9
BCGI . . . . . . . . . . . Guyana 90 1.2 1.9 1.6 1.6 0.7
North Urals . . . . . . Russia 100 3.3 3.4 3.3 3.3 1.6
Timan . . . . . . . . . . Russia 80 2.4 1.9 1.9 1.9 1.0
Total (Mt wet) . . . . 21.1 20.4 21.1 19.1 6.1
Kiya ShaltyrNepheline Syenite . . Russia 100 5.1 4.9 4.8 4.8 2.2
Limestone (Mt)
Mazulsky (dedicatedto Kiya Shaltyr) . . . Russia 100 6.9 6.9 7.4 7.4 3.1
Petropavlovsk . . . . . Russia 100 1.0 1.0 1.0 1.0 0.4
Quartzite (kt)
Cheremshansk . . . . . Russia 99.91 208 199 230 230 95
Glukhovsky . . . . . . Ukraine 97.55 55 51 55 54 4
Fluorite (kt)
Yaroslavsky . . . . . . Russia 50 807 899 799 400 441
Coal (Mt)
Bogatyr . . . . . . . . . Kazakhstan 50 41.6 38.4 46.1 23.1 14.2
(1) Ownership as at 15 September 2009.
(2) The attributable production presented for 2008 for BCGI and Timan is based on consolidated production numbers,and therefore presented as 100% attributable, as opposed to UC RUSAL’s interest.
APPENDIX VI INDEPENDENT TECHNICAL REPORT
— VI-50 —
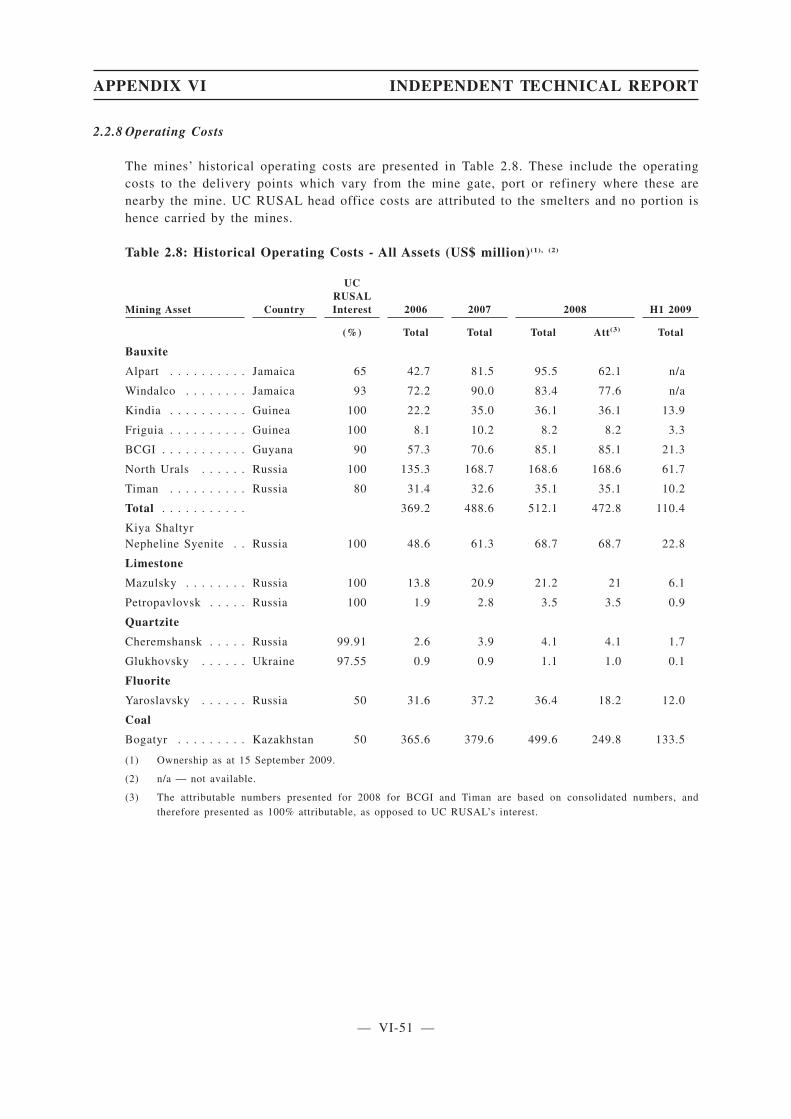
2.2.8 Operating Costs
The mines’ historical operating costs are presented in Table 2.8. These include the operatingcosts to the delivery points which vary from the mine gate, port or refinery where these arenearby the mine. UC RUSAL head office costs are attributed to the smelters and no portion ishence carried by the mines.
Table 2.8: Historical Operating Costs - All Assets (US$ million)(1), (2)
Mining Asset Country
UCRUSALInterest 2006 2007 2008 H1 2009
(%) Total Total Total Att(3) Total
Bauxite
Alpart . . . . . . . . . . Jamaica 65 42.7 81.5 95.5 62.1 n/a
Windalco . . . . . . . . Jamaica 93 72.2 90.0 83.4 77.6 n/a
Kindia . . . . . . . . . . Guinea 100 22.2 35.0 36.1 36.1 13.9
Friguia . . . . . . . . . . Guinea 100 8.1 10.2 8.2 8.2 3.3
BCGI . . . . . . . . . . . Guyana 90 57.3 70.6 85.1 85.1 21.3
North Urals . . . . . . Russia 100 135.3 168.7 168.6 168.6 61.7
Timan . . . . . . . . . . Russia 80 31.4 32.6 35.1 35.1 10.2
Total . . . . . . . . . . . 369.2 488.6 512.1 472.8 110.4
Kiya ShaltyrNepheline Syenite . . Russia 100 48.6 61.3 68.7 68.7 22.8
Limestone
Mazulsky . . . . . . . . Russia 100 13.8 20.9 21.2 21 6.1
Petropavlovsk . . . . . Russia 100 1.9 2.8 3.5 3.5 0.9
Quartzite
Cheremshansk . . . . . Russia 99.91 2.6 3.9 4.1 4.1 1.7
Glukhovsky . . . . . . Ukraine 97.55 0.9 0.9 1.1 1.0 0.1
Fluorite
Yaroslavsky . . . . . . Russia 50 31.6 37.2 36.4 18.2 12.0
Coal
Bogatyr . . . . . . . . . Kazakhstan 50 365.6 379.6 499.6 249.8 133.5
(1) Ownership as at 15 September 2009.
(2) n/a — not available.
(3) The attributable numbers presented for 2008 for BCGI and Timan are based on consolidated numbers, andtherefore presented as 100% attributable, as opposed to UC RUSAL’s interest.
APPENDIX VI INDEPENDENT TECHNICAL REPORT
— VI-51 —
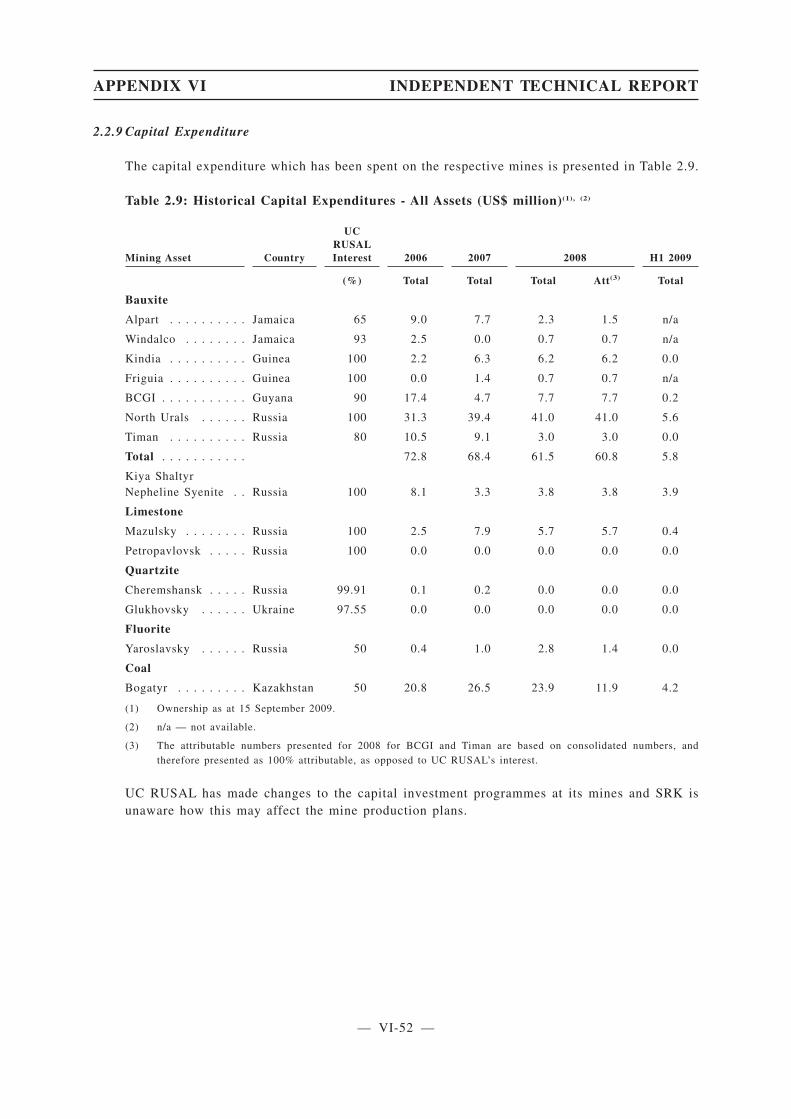
2.2.9 Capital Expenditure
The capital expenditure which has been spent on the respective mines is presented in Table 2.9.
Table 2.9: Historical Capital Expenditures - All Assets (US$ million)(1), (2)
Mining Asset Country
UCRUSALInterest 2006 2007 2008 H1 2009
(%) Total Total Total Att(3) Total
Bauxite
Alpart . . . . . . . . . . Jamaica 65 9.0 7.7 2.3 1.5 n/a
Windalco . . . . . . . . Jamaica 93 2.5 0.0 0.7 0.7 n/a
Kindia . . . . . . . . . . Guinea 100 2.2 6.3 6.2 6.2 0.0
Friguia . . . . . . . . . . Guinea 100 0.0 1.4 0.7 0.7 n/a
BCGI . . . . . . . . . . . Guyana 90 17.4 4.7 7.7 7.7 0.2
North Urals . . . . . . Russia 100 31.3 39.4 41.0 41.0 5.6
Timan . . . . . . . . . . Russia 80 10.5 9.1 3.0 3.0 0.0
Total . . . . . . . . . . . 72.8 68.4 61.5 60.8 5.8
Kiya ShaltyrNepheline Syenite . . Russia 100 8.1 3.3 3.8 3.8 3.9
Limestone
Mazulsky . . . . . . . . Russia 100 2.5 7.9 5.7 5.7 0.4
Petropavlovsk . . . . . Russia 100 0.0 0.0 0.0 0.0 0.0
Quartzite
Cheremshansk . . . . . Russia 99.91 0.1 0.2 0.0 0.0 0.0
Glukhovsky . . . . . . Ukraine 97.55 0.0 0.0 0.0 0.0 0.0
Fluorite
Yaroslavsky . . . . . . Russia 50 0.4 1.0 2.8 1.4 0.0
Coal
Bogatyr . . . . . . . . . Kazakhstan 50 20.8 26.5 23.9 11.9 4.2
(1) Ownership as at 15 September 2009.
(2) n/a — not available.
(3) The attributable numbers presented for 2008 for BCGI and Timan are based on consolidated numbers, andtherefore presented as 100% attributable, as opposed to UC RUSAL’s interest.
UC RUSAL has made changes to the capital investment programmes at its mines and SRK isunaware how this may affect the mine production plans.
APPENDIX VI INDEPENDENT TECHNICAL REPORT
— VI-52 —
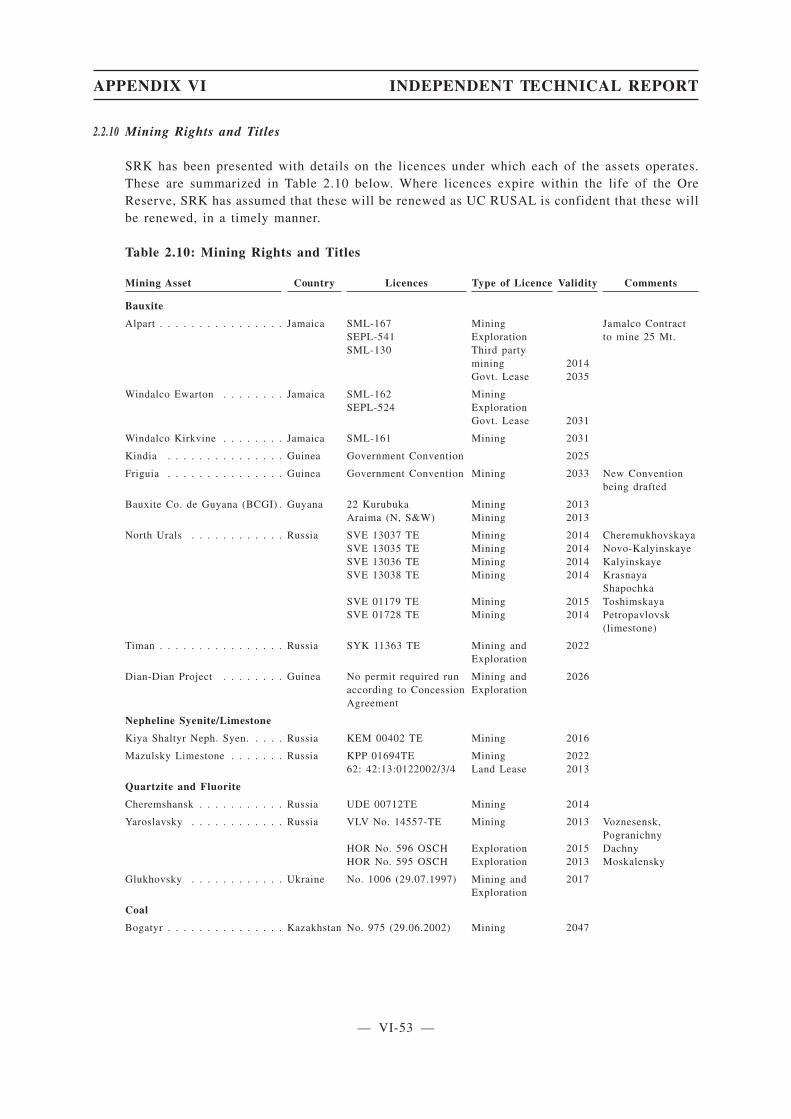
2.2.10 Mining Rights and Titles
SRK has been presented with details on the licences under which each of the assets operates.These are summarized in Table 2.10 below. Where licences expire within the life of the OreReserve, SRK has assumed that these will be renewed as UC RUSAL is confident that these willbe renewed, in a timely manner.
Table 2.10: Mining Rights and Titles
Mining Asset Country Licences Type of Licence Validity Comments
Bauxite
Alpart . . . . . . . . . . . . . . . . Jamaica SML-167SEPL-541SML-130
MiningExplorationThird partyminingGovt. Lease
20142035
Jamalco Contractto mine 25 Mt.
Windalco Ewarton . . . . . . . . Jamaica SML-162SEPL-524
MiningExplorationGovt. Lease 2031
Windalco Kirkvine . . . . . . . . Jamaica SML-161 Mining 2031
Kindia . . . . . . . . . . . . . . . Guinea Government Convention 2025
Friguia . . . . . . . . . . . . . . . Guinea Government Convention Mining 2033 New Conventionbeing drafted
Bauxite Co. de Guyana (BCGI) . Guyana 22 KurubukaAraima (N, S&W)
MiningMining
20132013
North Urals . . . . . . . . . . . . Russia SVE 13037 TESVE 13035 TESVE 13036 TESVE 13038 TE
SVE 01179 TESVE 01728 TE
MiningMiningMiningMining
MiningMining
2014201420142014
20152014
CheremukhovskayaNovo-KalyinskayeKalyinskayeKrasnayaShapochkaToshimskayaPetropavlovsk(limestone)
Timan . . . . . . . . . . . . . . . . Russia SYK 11363 TE Mining andExploration
2022
Dian-Dian Project . . . . . . . . Guinea No permit required runaccording to ConcessionAgreement
Mining andExploration
2026
Nepheline Syenite/Limestone
Kiya Shaltyr Neph. Syen. . . . . Russia KEM 00402 TE Mining 2016
Mazulsky Limestone . . . . . . . Russia KPP 01694TE62: 42:13:0122002/3/4
MiningLand Lease
20222013
Quartzite and Fluorite
Cheremshansk . . . . . . . . . . . Russia UDE 00712TE Mining 2014
Yaroslavsky . . . . . . . . . . . . Russia VLV No. 14557-TE
HOR No. 596 OSCHHOR No. 595 OSCH
Mining
ExplorationExploration
2013
20152013
Voznesensk,PogranichnyDachnyMoskalensky
Glukhovsky . . . . . . . . . . . . Ukraine No. 1006 (29.07.1997) Mining andExploration
2017
Coal
Bogatyr . . . . . . . . . . . . . . . Kazakhstan No. 975 (29.06.2002) Mining 2047
APPENDIX VI INDEPENDENT TECHNICAL REPORT
— VI-53 —

2.2.11 Mining Projects
2.2.11.1 Management of Development Projects
UC RUSAL follows a structured approach to the development of its projects from landacquisition, exploration, conceptual feasibility study, preliminary feasibility study through tofinal feasibility study and ultimately project implementation. The Engineering and ConstructionDivision of UC RUSAL is located in Moscow and local project offices are located in the projectregions and countries.
The various levels of feasibility studies are attained through the use of international and in-housespecialist consultants. The Company is fully conversant with the requirement for BankableFeasibility Studies for project finance. In the Russian Federation, the Technical and Economicstudies (“TEO”) and Environmental Impact Assessments (“EIA”) are required for obtainingpermits and licences.
The Mineral Resources and Ore Reserves of the projects are subject to classification asappropriate to the requirements of local jurisdiction and financing. International resource andreserve reporting codes such as the JORC Code are adhered to. In the Russian Federation, for incountry reserves, it is a requirement that the State Committee for Reserves (“GKZ”) approves the“reserves”.
All stages of the project’s implementation are subject to internal review and approval by theBoard of Directors of the Engineering and Construction Division, Management Board and Boardof Directors of UC RUSAL. In order to progress the project from the completion of the BankableFeasibility Study to the securing of funding for the project, a Front End Engineering and Design(“FEED”) period is undertaken.
UC RUSAL also co-operates with the State Inter-Departmental Commissions which includerepresentatives from external stakeholders such as JSC Russian Railways, and other governmentbodies, including power and water supply agencies. As the State Inter-Departmental Commissionis involved throughout the process, the final TEO and EIA will reflect their mutual decision.
2.2.11.2 Short-to-Medium Term Projects
All of the mine capital expenditure estimates below have been provided by UC RUSAL and,although they appear reasonable, have not been subject to independent verification or audit.
• North Urals Bauxite Mines — UC RUSAL is developing a number of projects at each ofthe four shaft sections of Cheremukhovskaya, Novo Kalyinskaye, Kalyinskaye andKrasnaya Shapochka to extend the mining life as well as support a production increase fromthe current level of 3.34 Mtpa (wet). An increase in production is planned to be effectedthrough an increase in mining at Cheremukhovskaya as well as the build-up to fullproduction at Novo Kalyinskaye in the future. The projects would extend the lowest levelof mining to some 1,400 m below surface. The current mining operations are 800 m to 1,100m below surface. Total capital expenditure for the 2008-2020 period is estimated atUS$251.4 m (including VAT), with US$50 m spent as of 1 July 2009. SRK has included thisproject in support of the Ore Reserves.
• Kindia Bauxite Mine — Mine production from Kindia 2 is anticipated to increase toapproximately 3,800 ktpa by 2012 to feed the planned increase in alumina production at theNikolaev Alumina Refinery. By 2011, with the exhaustion of the Debele ore reserves, thecrushing plant at Debele is due to be obsolete and is not planned for renewal. This requiresthat the production tonnage from the Kindia deposits will be mined entirely using Wirtgensurface miners which produce a sized product which does not require subsequent crushing.
APPENDIX VI INDEPENDENT TECHNICAL REPORT
— VI-54 —
Additional surface miners will be purchased. The longer term mining plan at Kindiarequires new access roads, rail links and a stockpile handling and loading station. Themining capital required during the period is US$76 m (including VAT), of which someUS$24 m (including VAT) has been spent to 1 July 2009. SRK has included this project tosupport the Ore Reserves.
2.2.11.3 Long-term Projects
UC RUSAL plans to increase bauxite, alumina and aluminium production over the long-termthrough a number of projects. The Company has a number of highly prospective bauxite deposits,refinery projects and smelter projects for production growth over the longer term. All of the minecapital expenditure estimates below have been provided by UC RUSAL and, although theyappear reasonable, have not been subject to independent verification or audit.
• Dian-Dian Bauxite Project — Dian-Dian is a greenfield project to be constructed inGuinea. The studies to date have identified Measured and Indicated Mineral Resourcescompliant with the JORC Code of 472.1 Mt with 47.7% Al2O3 and 1.5% silica. Theexpected volume of bauxite mined, subject to confirmation by additional studies is 13.1Mtpa (for alumina production) and 10 Mtpa (for export). A feasibility study has beenprepared by international consultants. The capital expenditure of the mining aspects of theproject has been estimated at US$425 m, which would include the development of the mineand mine related infrastructure.
• Guyana BCGI — The 22-Kurubuka Mine is scheduled to replace the depleted Ore Reservesof the current deposits. The planned production for BCGI is 2.4 Mtpa. The feasibility studyis currently on hold. The project will need the construction of access roads, crushingfacilities, barge loading facilities, overburden stripping and drainage. The capitalexpenditure for the project is currently estimated at US$59.3 m of which some US$0.6 m(incl VAT) has been spent to 1 July 2009.
2.3 Non-Mining Assets
2.3.1 Alumina Division
2.3.1.1 Alumina Refining Technology
The Bayer process is the most widely used and economical method of extracting pure aluminafrom mined bauxite. All alumina refineries in the world, excluding a small number of plants inChina and the Russian Federation, are Bayer process facilities.
The process was developed by Joseph Bayer and has changed very little since the first aluminarefinery was opened in 1893, although the application continues to be developed and improved.In broad terms, aluminium hydroxide (alumina) is first separated from impurities in the bauxiteore by dissolution into caustic soda. After the insoluble impurities have been removed, thealuminium hydroxide is precipitated in pure form.
The Bayer process is based on alkaline leaching, which provides efficient separation of aluminafrom iron materials. It has the disadvantage that silicates (the other main impurity in bauxite) canbe reactive, so the process works best when ores with low reactive silica are processed. Theseores are plentiful, but mainly located in the tropics. Many plants de-silicate after grinding toimprove efficiencies when using high silica bauxite as feed.
APPENDIX VI INDEPENDENT TECHNICAL REPORT
— VI-55 —

Strategic and economic factors have historically resulted in process development to enableextraction of alumina from domestic mineral resources in countries that do not have abundantsupply of good quality (high grade, low reactive silica) bauxite. In the former USSR, indigenousores with high reactive silica led to the development of a sintering process to extract more of thealumina and another process was developed to extract alumina from nepheline ore. Two UCRUSAL refineries apply the sinter process, namely Achinsk Alumina Refinery and BoxitogorskAlumina Refinery. A further three UC RUSAL refineries apply two methods of producingalumina, namely one production train is based on sintering and one production train is based onthe Bayer process. These plants are Ural Alumina Refinery, Bogoslovsk Alumina Refinery andZaporozhye Alumina Refinery.
All other UC RUSAL alumina refineries are based on the standard Bayer process. All UC RUSALalumina refineries process bauxite, with the exception of Achinsk Alumina Refinery which usesnepheline ore as the feedstock.
Cash operating costs at Bayer-sinter, sinter and nepheline processing plants are typically higherthan at plants utilising the standard Bayer process, mainly due to higher energy consumption.However, it remains commercially and economically viable to continue producing alumina withthese other process routes in the Russian Federation and Ukraine given the vertical integrationof the Company with its associated freight savings, comparatively low energy costs and fullydepreciated equipment.
UC RUSAL is progressively upgrading and modernising its alumina refining equipment toimprove the alumina quality, yield, physical properties and raw material consumption. UCRUSAL has developed its own proprietary stationary calciner, which has successfully beenoperating at Urals Alumina Refinery. UC RUSAL plans to progressively introduce this atadditional facilities, and has commenced a programme at Bogoslovsk Alumina Refinery,although construction works has temporarily been suspended. This process produces a higherquality alumina, with a low alpha content which is suitable for the high amperage pre-bakereduction technology. In addition, substantial work is being undertaken at some refineries toupgrade the precipitation and digestion circuits to replace equipment nearing the end of itsconventional economic life with a view to producing sandy grade alumina. These projects mayreduce operating costs at UC RUSAL alumina refineries and may also reduce operating costs andfluoride emissions at UC RUSAL aluminium smelters. UC RUSAL is also currently reviewingoptions to replace monohydrate bauxites with trihydrate bauxites with the potential forreductions in energy consumption and operating costs.
2.3.1.2 Alumina Refining
UC RUSAL has full or partial equity ownership of 13 alumina refineries. The Company is thecontrolling shareholder in all of these plants, with the exception of Queensland Alumina Ltd inwhich it holds a 20 per cent equity stake. The alumina assets of UC RUSAL are located in sevencountries; Russian Federation (four plants), Jamaica (three plants), Ukraine (two plants), Guinea(one plant), Ireland (one plant), Italy (one plant) and Australia (one plant).
Similar to other aluminium industry participants, UC RUSAL has since mid-2008 undertaken aprogramme to address a reduction in demand for its products. The programme resulted in the fullclosure or partial closure of a number of operating facilities. With regard to alumina refining, thefollowing operations remain fully idled as of 15 September 2009; Eurallumina, Alpart,Windalco-Ewarton, Windalco-Kirkvine and Zaporozhye Alumina Refinery.
Section 4 of this report describes in detail each of the alumina refining operations of UC RUSAL.
APPENDIX VI INDEPENDENT TECHNICAL REPORT
— VI-56 —
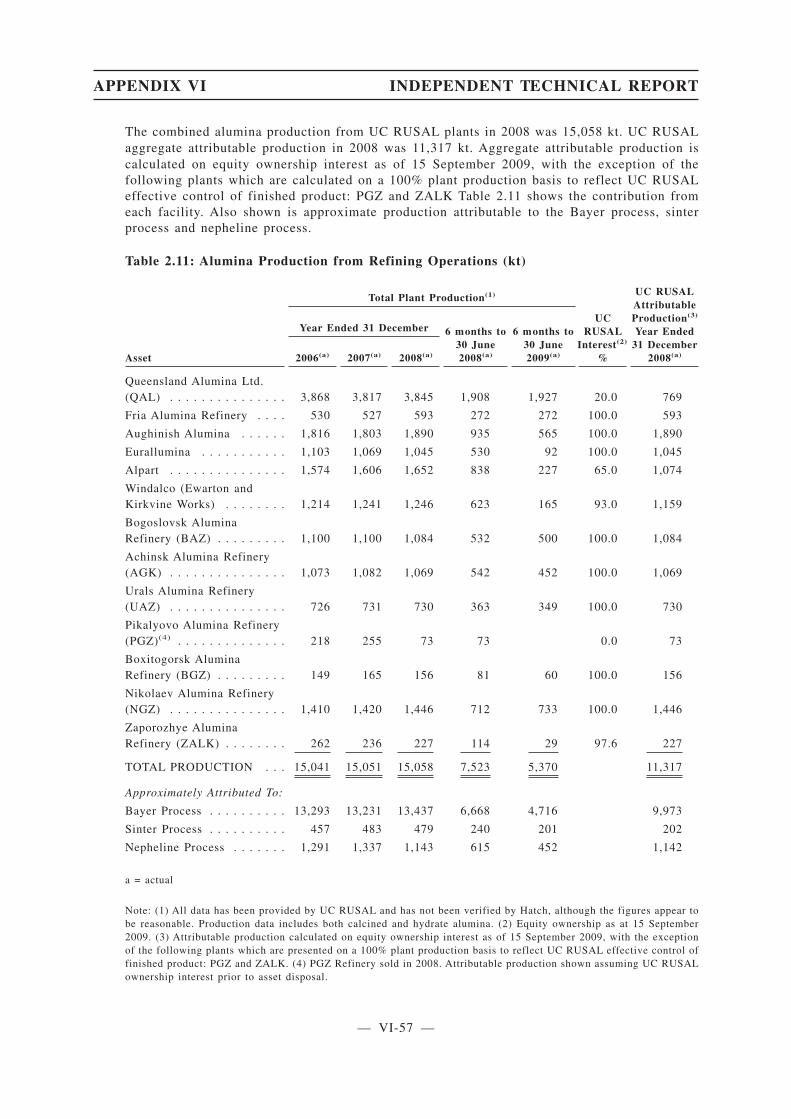
The combined alumina production from UC RUSAL plants in 2008 was 15,058 kt. UC RUSALaggregate attributable production in 2008 was 11,317 kt. Aggregate attributable production iscalculated on equity ownership interest as of 15 September 2009, with the exception of thefollowing plants which are calculated on a 100% plant production basis to reflect UC RUSALeffective control of finished product: PGZ and ZALK Table 2.11 shows the contribution fromeach facility. Also shown is approximate production attributable to the Bayer process, sinterprocess and nepheline process.
Table 2.11: Alumina Production from Refining Operations (kt)
Total Plant Production(1)
UCRUSAL
Interest(2)
%
UC RUSALAttributableProduction(3)
Year Ended31 December
2008(a)
Year Ended 31 December 6 months to30 June2008(a)
6 months to30 June2009(a)Asset 2006(a) 2007(a) 2008(a)
Queensland Alumina Ltd.(QAL) . . . . . . . . . . . . . . . 3,868 3,817 3,845 1,908 1,927 20.0 769
Fria Alumina Refinery . . . . 530 527 593 272 272 100.0 593
Aughinish Alumina . . . . . . 1,816 1,803 1,890 935 565 100.0 1,890
Eurallumina . . . . . . . . . . . 1,103 1,069 1,045 530 92 100.0 1,045
Alpart . . . . . . . . . . . . . . . 1,574 1,606 1,652 838 227 65.0 1,074
Windalco (Ewarton andKirkvine Works) . . . . . . . . 1,214 1,241 1,246 623 165 93.0 1,159
Bogoslovsk AluminaRefinery (BAZ) . . . . . . . . . 1,100 1,100 1,084 532 500 100.0 1,084
Achinsk Alumina Refinery(AGK) . . . . . . . . . . . . . . . 1,073 1,082 1,069 542 452 100.0 1,069
Urals Alumina Refinery(UAZ) . . . . . . . . . . . . . . . 726 731 730 363 349 100.0 730
Pikalyovo Alumina Refinery(PGZ)(4) . . . . . . . . . . . . . . 218 255 73 73 0.0 73
Boxitogorsk AluminaRefinery (BGZ) . . . . . . . . . 149 165 156 81 60 100.0 156
Nikolaev Alumina Refinery(NGZ) . . . . . . . . . . . . . . . 1,410 1,420 1,446 712 733 100.0 1,446
Zaporozhye AluminaRefinery (ZALK) . . . . . . . . 262 236 227 114 29 97.6 227
TOTAL PRODUCTION . . . 15,041 15,051 15,058 7,523 5,370 11,317
Approximately Attributed To:
Bayer Process . . . . . . . . . . 13,293 13,231 13,437 6,668 4,716 9,973
Sinter Process . . . . . . . . . . 457 483 479 240 201 202
Nepheline Process . . . . . . . 1,291 1,337 1,143 615 452 1,142
a = actual
Note: (1) All data has been provided by UC RUSAL and has not been verified by Hatch, although the figures appear tobe reasonable. Production data includes both calcined and hydrate alumina. (2) Equity ownership as at 15 September2009. (3) Attributable production calculated on equity ownership interest as of 15 September 2009, with the exceptionof the following plants which are presented on a 100% plant production basis to reflect UC RUSAL effective control offinished product: PGZ and ZALK. (4) PGZ Refinery sold in 2008. Attributable production shown assuming UC RUSALownership interest prior to asset disposal.
APPENDIX VI INDEPENDENT TECHNICAL REPORT
— VI-57 —
2.3.2 Aluminium Division
2.3.2.1 Aluminium Smelting Technology
The basis for all modern primary aluminium smelting plants is the Hall-Héroult Process,invented simultaneously in 1886 by Paul Héroult in France and Charles Martin Hall in the UnitedStates. Alumina is dissolved in an electrolytic bath of molten cryolite (sodium aluminiumfluoride) within a large carbon or graphite lined steel pot (cell). An electric current is passedthrough the electrolyte at low voltage but very high amperage, typically at around 350 kA atmodern facilities. The electric current flows between a consumable carbon anode (positive),made of petroleum coke and pitch, and a cathode (negative), formed by the thick carbon orgraphite lining of the pot. Molten aluminium is deposited at the bottom of the pot and is siphonedoff periodically, taken to a holding furnace where it is often blended to an alloy specification,purified and then generally cast. The carbon anode forms CO2 with the oxygen released by thereduction of alumina into aluminium, which is then exhausted along with fluoride gases, releasedby the molten cryolite, into the atmosphere. Modern smelters employ gas collection andscrubbing units whereby the fluoride gases are adsorbed into the alumina which is then fed backinto the process.
There are two main types of aluminium smelting technology, Söerberg and pre-bake. Theprincipal difference between the two is the type of anode used. Söderberg technology uses acontinuous anode which is delivered to the cell (pot) in the form of a solid paste, which meltsinto the form of the anode and then bakes in the cell prior to being consumed within the bath.Pre-bake technology uses multiple anodes in each cell, which are pre-baked in a separate facilityand attached to “rods” that suspend the anodes in the cell. New anodes are exchanged for spentanodes (“anode butts”) before being recycled into new anodes.
All new aluminium smelters constructed at the present time utilise pre-bake technology.Söderberg technology is considered outdated as a result of its lower operating efficiency, higherlabour requirements and the difficulty in containing emissions. There are two variants ofSöderberg smelting technology. The earliest variants are referred to as Horizontal Stud Söderberg(HSS) technology. The emissions to atmosphere are higher from this technology than VerticalStud Söderberg (VSS) technology. HSS cells remain in operation at Bogoslovsk AluminiumSmelter, Urals Aluminium Smelter, Nadvoitsy Aluminium Smelter, Novokuznetsk AluminiumSmelter, Kandalaksha Aluminium Smelter and Zaporozhye Aluminium Smelter.
A key feature of modern pre-bake technology is the ability to enclose each pot with respect togas emissions. Fugitive emissions from these cells are therefore very low, with less than 2 percent of the generated emissions escaping to the atmosphere, predominantly from where thecovers have to be removed for servicing the pot. The balance of the emissions is collected insidethe cell itself and carried away to very efficient central scrubbing systems which remove themajority of particulates and gases, most notably the fluoride emissions. Computer technologycontrols the process precisely, which minimises the occurrence of anode effects — the conditionwhich causes small quantities of PFCs to be produced.
In addition to lower direct emissions from the smelting process, pre-bake technology also resultsin lower electricity consumption as there is no requirement to bake the anode in situ. The averagenet (reduction area) consumption is approximately 15 MWh/tonne of aluminium for Söderbergtechnology, while most modern pre-bake facilities are as low as 13 MWh/tonne of aluminium.However, a Söderberg smelting plant does not require energy use within a dedicated anode plant,which creates a saving of 0.7 MWh/tonne of aluminium on the 15 MWh/tonne of aluminium thatit uses.
APPENDIX VI INDEPENDENT TECHNICAL REPORT
— VI-58 —
Approximately 14 per cent of world primary aluminium was produced from Söderberg pots in2008 and as such the technology still represents a significant proportion of operating capacity(source: International Aluminium Institute). In the case of UC RUSAL, attributable saleableprimary aluminium production from its smelter assets was 4,420 kt in 2008 of which 60 per centwas from VSS pots, 13 per cent from HSS pots and 27 per cent from pre-bake pots.
UC RUSAL’s Söderberg potlines still have many years of useful life ahead of them with thecorrect levels of sustaining capital investment applied, although in the medium to long-term, itmay become increasingly difficult to continue operating them due to the increasing constraintsof environmental legislation. UC RUSAL is therefore actively following a strategy ofconstructing new potlines using modern pre-bake technology whilst modernising as many of itsexisting Söderberg potlines as practical. There are several methods of improving the operationaland environmental performance of Söderberg pots which UC RUSAL is undertaking at itsfacilities. Operational and environmental performance have shown strong improvement at UCRUSAL smelters in recent years, although the extent to which improvement has been shownvaries by facility, depending upon whether HSS or VSS cells are installed.
The performance of UC RUSAL’s Söderberg cells has generally been, or is in the process ofbeing improved with the introduction of:
• wet or dry scrubbing technology for gases;
• alumina point-feeding systems;
• implementation of automated cell control systems;
• implementation of “dry” anode technology; and
• improved gas suction.
The additional environmental expenditure has primarily been financed through increases in linecurrent and hence metal production whilst reducing unit consumption of fluoride and aluminathrough improved gas scrubbing and in some cases higher electrical efficiency, saving energycosts.
The Engineering Technology Centre adjacent to Krasnoyarsk Aluminium Smelter has beenconducting research and trials to improve the environmental performance of C8-BM VSS cellsin a project referred to as Clean Söderberg Technology. The objective of the project is to improvethe environmental performance of the cells beyond the levels achieved through theimplementation of the above projects and finance the environmental expenditure throughadditional metal production through increased line current and current efficiency. The threemajor environmental projects include:
• cell hooding
• improved burner design
• colloidal anode paste technology
The increases in line current requires modifications to the cathode lining, increases in thediameter of the anode studs, modified bus bar layouts and improvements in the anode paste. Thedesign changes are represented in Figure 2.5.
APPENDIX VI INDEPENDENT TECHNICAL REPORT
— VI-59 —

Figure 2.5: The Clean C8-BM VSS Technology Cell
The project commenced in 2002, and there are currently five test cells in operation at theKrasnoyarsk Aluminium Smelter, operating at 180 kA, which incorporate the full range of cellmodifications that when combined constitute the Clean Söderberg Technology. A further 15 testcells each contain one or more of the modifications, but not all. The anode paste plant atKrasnoyarsk was modified in 2008 and is now capable of producing batches of colloidal anodepaste required for the technology to be applied in four potrooms (352 cells). Hatch has beenadvised that approval to expand the Clean Söderberg Technology programme to four potrooms(352 cells) has recently been approved.
UC RUSAL is in the process of further development to demonstrate that making theoperational/technical changes described above can reduce emissions from C8-BM VSS cells.Total fluoride emissions from C8-BM cells are currently around 1.6 kg/t Al under best practiceoperation. Early test work undertaken by UC RUSAL indicates that total fluoride emissions fromthis type of cell technology can be reduced to 1.0 kg/t Al. The Company has set an ultimate targetof reducing emissions from C8-BM cells to 0.6 kg/t Al. Hatch is aware that the Clean SöderbergTechnology project is in the early stages of development and has not been provided with anyinformation from UC RUSAL to demonstrate the likelihood of reducing fluoride emissions fromC8-BM cells to 0.6 kg/t Al.
The successful implementation of the Clean Söderberg Technology project could allow facilitiesthat have already been fully depreciated to continue production with low on-going capitalexpenditure and ongoing environmental approvals. However, development works are stillongoing and there has been no timetable set for the full-scale roll-out of Clean SöderbergTechnology.
UC RUSAL also have a development programme to convert older C2 and C3 VSS cells topre-bake cells and this is in the early stages of development at Novokuznetsk AluminiumSmelter. The basic cell design has been completed by RusEng, although plans for pilot-scaleimplementation in 2011 within an experimental area of one potline at NkAZ were postponed. Ifimplemented, the conversion would raise metal output from the cells through an increase in linecurrent to 167 kA, from the existing 143 kA, and at an improved current efficiency. This
APPENDIX VI INDEPENDENT TECHNICAL REPORT
— VI-60 —
programme may also be implemented at other UC RUSAL smelters upon successfuldemonstration of the technical, economic and environmental merits of this pre-bake conversion.This can therefore be considered as a long-term plan by UC RUSAL which enables their VSSfacilities to continue operation.
HSS cells are considered more of a concern as it is not possible to undertake the Clean SöderbergTechnology programme in the same way due to the configuration of these cells. UC RUSAL hasstated that it expects all HSS cells will be permanently closed in the coming few years. Thisprocess has already begun, with Potlines 2 and 3 at Urals Aluminium Smelter recently closed andshortly to be dismantled.
In terms of general development of technology, raising the line current is the main performanceindicator. Initially, low amperage technology of around 50 to 80 kA was possible. Later, whenthe electromagnetic and thermal characteristics were better understood, medium amperagetechnologies of approximately 160 kA to 220 kA were developed. Currently, magneticcompensation and state of the art computerised process control systems enable operation at lineamperages in excess of 300 kA in prebaked anode cells, termed high amperage technology.
Many of the world’s largest aluminium companies are actively developing their own specificform of pre-bake technology and UC RUSAL is no exception. UC RUSAL has a test section atUrals Aluminium Smelter which is operating in excess of 330 kA using technology developed bySibVAMI, the Company’s own technology company. The Engineering Technology Centre as partof the RUSAL Engineering Company has been developing new high amperage pre-baketechnology at Sayanogorsk Aluminium Smelter including a test section of sixteen RA-400 cellsand plans to install a test section of RA-500 cells in the near future. The technology developmenthas been reviewed with the assistance of recognised industry experts and a variant of the RA-300cell technology was selected for Khakas Aluminium smelter adjacent to the Sayanogorsk smelter.This new facility is now operating commercially at 320 kA. The pilot potroom at SayanogorskAluminium Smelter currently comprises five RA-300 cells designed for the development ofRA-300 technology at Khakas Aluminium Smelter and Boguchansky Aluminium Smelter.Another pilot potroom at Sayanogorsk Aluminium Smelter includes 16 RA-400 cells designed totest RA-400 technology for Taishet Aluminium Smelter. UC RUSAL is also planning to replacethe C-255 cells with eight RA-500 cells in the same pilot potroom at Sayanogorsk AluminiumSmelter. The successful development of Khakas Aluminium Smelter has demonstrated thepotential for the development of new smelters within UC RUSAL using high amperagetechnology, although it should be noted that RA-500 technology is considered by Hatch to stillrequire significant development.
The RA-300 test cells were first operational in December 2003 and the RA-400 test cells inDecember 2005. The development cycle for reduction technology is fairly slow in the aluminiumindustry, at least in the Western World, and the development of the RA-300 and RA-400technologies over a comparatively short period of time can be considered impressive. However,as the technology has not yet completed one full pot cycle on a commercial scale, the technologycannot be considered “mature” and therefore has a higher risk associated with it than othermature technologies in existence today. There are specific issues to a short development time:
• Firstly the achieved performance (specifically relating to current efficiency, anode effectrate and specific power consumption) is lower than current industry leading technologies.Conversely a potential for improvement exists; and
• Pot life has only been extrapolated from a few autopsies of voluntarily cut out cells. Thereis a risk that underestimated or undetected problems will surface as the cell ages.
APPENDIX VI INDEPENDENT TECHNICAL REPORT
— VI-61 —
Overall, the RA cell technology represents a significant intangible asset which combined with thecell development experience at SUAL (prior to the formation of UC RUSAL) is expected be usedto support the development of new UC RUSAL smelters.
2.3.2.2 Aluminium Smelting
UC RUSAL has full or partial equity ownership of 16 aluminium smelters (excluding facilitiescurrently under construction). The Company is the controlling shareholder in all of these plants.The aluminium smelting assets of UC RUSAL are located in four countries; Russian Federation(13 plants), Sweden (one plant), Ukraine (one plant) and Nigeria (one plant).
Similar to other aluminium industry participants, UC RUSAL has since mid-2008 undertaken aprogramme to address a reduction in demand for its products. The programme resulted in the fullclosure or partial closure of a number of operating facilities. With regard to aluminium smelting,the following operations remain fully idled as of 15 September 2009; Alukom Taishet AluminiumSmelter.
Section 5 of this report describes in detail each of the aluminium smelting operations of UCRUSAL.
The combined saleable aluminium production from UC RUSAL plants in 2008 was 4,424 kt. UCRUSAL aggregate attributable production in 2008 was 4,424 kt. Aggregate attributableproduction is calculated on equity ownership interest as of 15 September 2009, with theexception of the following plants which are calculated on a 100% plant production basis toreflect UC RUSAL effective control of finished product: ZALK and ALSCON. Table 2.12 showsthe contribution from each facility. Also shown is the approximate production attributable toSöderberg and pre-bake production technology.
APPENDIX VI INDEPENDENT TECHNICAL REPORT
— VI-62 —

Table 2.12: Saleable Aluminium Production from Smelting Operations (kt)
Total Plant Production(1)
UCRUSAL
Interest(2)
%
UC RUSALAttributableProduction(3)
Year Ended31 December
2008(a)
Year Ended 31 December 6 months to30 June2008(a)
6 months to30 June2009(a)Asset 2006(a) 2007(a) 2008(a)
Bratsk Aluminium Smelter(BrAZ) . . . . . . . . . . . . . . . 979 989 1,002 499 488 100.0 1,002Krasnoyarsk AluminiumSmelter (KrAZ) . . . . . . . . . 949 987 1,000 500 471 100.0 1,000Sayanogorsk AluminiumSmelter (SAZ) . . . . . . . . . . 523 533 537 268 261 100.0 537Novokuznetsk AluminiumSmelter (NkAZ) . . . . . . . . . 315 317 320 160 128 100.0 320Irkutsk Aluminium Smelter(IrkAZ) . . . . . . . . . . . . . . 297 297 358 165 169 100.0 358Khakas Aluminium Smelter(KhAZ) . . . . . . . . . . . . . . 1 173 297 148 147 100.0 297Bogoslovsk AluminiumSmelter (BAZ) . . . . . . . . . 184 184 186 93 62 100.0 186Volgograd AluminiumSmelter (VgAZ) . . . . . . . . . 158 162 166 83 73 100.0 166Urals Aluminium Smelter(UAZ) . . . . . . . . . . . . . . . 133 134 134 67 46 100.0 134Nadvoitsy AluminiumSmelter (NAZ) . . . . . . . . . 80 81 81 40 28 100.0 81Kandalaksha AluminiumSmelter (KAZ) . . . . . . . . . 74 75 75 37 28 100.0 75Volkhov Aluminium Smelter(VAZ) . . . . . . . . . . . . . . . 23 24 24 12 6 100.0 24Alukom Taishet AluminiumSmelter . . . . . . . . . . . . . . 10 11 10 5 2 100.0 10Kubikenborg Aluminium(KUBAL) . . . . . . . . . . . . . 117 122 112 58 33 100.0 112Zaporozhye AluminiumSmelter (ZALK) . . . . . . . . 113 113 113 57 36 97.6 113ALSCON . . . . . . . . . . . . . 0 0 9 2 2 85.0 9
TOTAL PRODUCTION . . . 3,958 4,202 4,424 2,196 1,980 4,424
Approximately Attributed To:HSS Technology . . . . . . . . 583 585 594 296 179 594VSS Technology . . . . . . . . 2,580 2,629 2,633 1,321 1,201 2,633Prebake Technology . . . . . . 795 987 1,197 579 599 1,197
a = actual
Note: (1) All data has been provided by UC RUSAL and has not been verified by Hatch, although the figures appear tobe reasonable. (2) Equity ownership as at 15 September 2009. (3) Attributable production calculated on equity ownershipinterest as of 15 September 2009, with the exception of the following plants which are presented on a 100% plantproduction basis to reflect UC RUSAL effective control of finished product: ZALK and ALSCON.
Table 2.13 shows the estimated saleable aluminium capacity and capacity utilisation of eachfacility. Saleable aluminium capacity is defined as the estimated volume of cast aluminium whichcould be produced at the facility within the period defined, irrespective of whether the plant isoperating or fully/partially idle. The estimate of saleable aluminium capacity can be consideredsubjective. The key determining factor is liquid aluminium capacity (i.e. the volume ofaluminium produced by the electrolytic pots), which is predominantly determined by the number
APPENDIX VI INDEPENDENT TECHNICAL REPORT
— VI-63 —

of installed pots, pot amperage and current efficiency. Saleable aluminium capacity is based onliquid aluminium capacity adjusted for melt loss and alloying/scrap additions. The estimatespresented in Table 2.13 show the capacity that is reasonably considered available for theproduction of saleable aluminium given the installed technology and equipment of that particularfacility.
Table 2.13 shows that UC RUSAL aluminium smelters generally operated at full or near-fullcapacity in the period 2006 to 2008. This level of capacity utilisation is considered normal forwell operated aluminium smelters. The reduction in capacity utilisation in the first half of 2009reflects the closure of smelting capacity as referred to above.
Table 2.13: Saleable Aluminium Capacity at Smelting Operations (kt)
Total Plant Saleable AluminiumCapacity(1)(2) Total Plant Capacity Utilisation
Year Ended 31 December 6 months to30 June2009(a)
Year Ended 31 December 6 months to30 June2009(a)Asset 2006(a) 2007(a) 2008(a) 2006(a) 2007(a) 2008(a)
Bratsk AluminiumSmelter (BrAZ) . . . . . 986 995 1,006 497 99.3% 99.4% 99.6% 98.1%KrasnoyarskAluminium Smelter(KrAZ) . . . . . . . . . . . 956 995 1,008 494 99.3% 99.2% 99.2% 95.4%SayanogorskAluminium Smelter(SAZ) . . . . . . . . . . . 527 538 542 265 99.3% 99.0% 99.1% 98.5%NovokuznetskAluminium Smelter(NkAZ) . . . . . . . . . . 318 320 322 170 99.2% 99.2% 99.3% 74.9%Irkutsk AluminiumSmelter (IrkAZ) . . . . . 299 300 360 225 99.3% 99.0% 99.3% 75.4%Khakas AluminiumSmelter (KhAZ) . . . . . 1 173 297 148 100.0% 100.0% 100.0% 99.9%Bogoslovsk AluminiumSmelter (BAZ) . . . . . 185 185 187 84 99.2% 99.3% 99.4% 73.6%Volgograd AluminiumSmelter (VgAZ) . . . . . 160 164 168 84 99.2% 99.0% 99.1% 87.1%Urals AluminiumSmelter (UAZ) . . . . . 133 134 134 78 99.5% 99.5% 99.4% 58.7%Nadvoitsy AluminiumSmelter (NAZ) . . . . . 81 81 81 38 99.2% 99.3% 99.6% 73.3%KandalakshaAluminium Smelter(KAZ) . . . . . . . . . . . 75 75 76 37 99.7% 99.7% 99.2% 75.3%Volkhov AluminiumSmelter (VAZ) . . . . . . 24 24 24 12 99.2% 99.1% 99.1% 46.6%Alukom TaishetAluminium Smelter . . 11 11 11 6 92.5% 99.3% 88.2% 35.7%KubikenborgAluminium (KUBAL) . 118 122 128 51 99.5% 99.9% 87.4% 65.3%Zaporozhye AluminiumSmelter (ZALK) . . . . 114 114 114 57 99.0% 99.1% 99.0% 63.5%ALSCON(3) . . . . . . . . n/a n/a 96 48 n/a n/a 9.8% 4.3%
TOTAL . . . . . . . . . . 3,987 4,233 4,556 2,293 99.3% 99.3% 97.1% 86.3%
a = actual
APPENDIX VI INDEPENDENT TECHNICAL REPORT
— VI-64 —
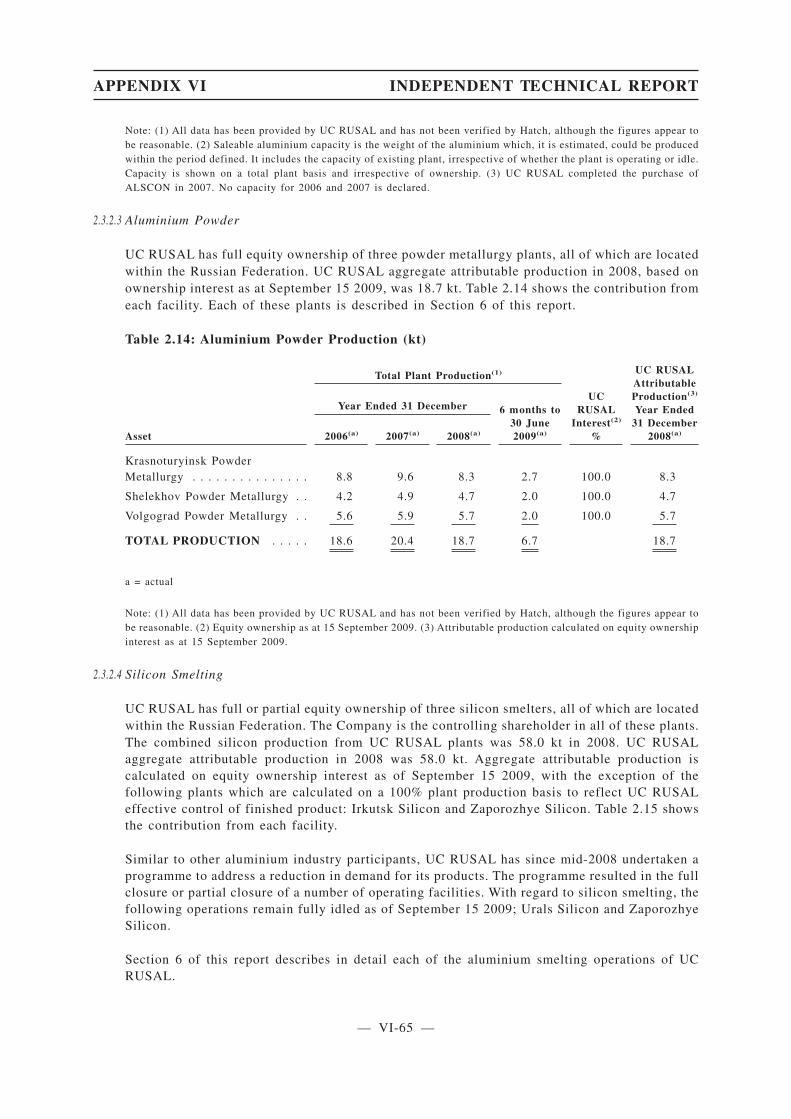
Note: (1) All data has been provided by UC RUSAL and has not been verified by Hatch, although the figures appear tobe reasonable. (2) Saleable aluminium capacity is the weight of the aluminium which, it is estimated, could be producedwithin the period defined. It includes the capacity of existing plant, irrespective of whether the plant is operating or idle.Capacity is shown on a total plant basis and irrespective of ownership. (3) UC RUSAL completed the purchase ofALSCON in 2007. No capacity for 2006 and 2007 is declared.
2.3.2.3 Aluminium Powder
UC RUSAL has full equity ownership of three powder metallurgy plants, all of which are locatedwithin the Russian Federation. UC RUSAL aggregate attributable production in 2008, based onownership interest as at September 15 2009, was 18.7 kt. Table 2.14 shows the contribution fromeach facility. Each of these plants is described in Section 6 of this report.
Table 2.14: Aluminium Powder Production (kt)
Total Plant Production(1)
UCRUSAL
Interest(2)
%
UC RUSALAttributableProduction(3)
Year Ended31 December
2008(a)
Year Ended 31 December 6 months to30 June2009(a)Asset 2006(a) 2007(a) 2008(a)
Krasnoturyinsk PowderMetallurgy . . . . . . . . . . . . . . . 8.8 9.6 8.3 2.7 100.0 8.3
Shelekhov Powder Metallurgy . . 4.2 4.9 4.7 2.0 100.0 4.7
Volgograd Powder Metallurgy . . 5.6 5.9 5.7 2.0 100.0 5.7
TOTAL PRODUCTION . . . . . 18.6 20.4 18.7 6.7 18.7
a = actual
Note: (1) All data has been provided by UC RUSAL and has not been verified by Hatch, although the figures appear tobe reasonable. (2) Equity ownership as at 15 September 2009. (3) Attributable production calculated on equity ownershipinterest as at 15 September 2009.
2.3.2.4 Silicon Smelting
UC RUSAL has full or partial equity ownership of three silicon smelters, all of which are locatedwithin the Russian Federation. The Company is the controlling shareholder in all of these plants.The combined silicon production from UC RUSAL plants was 58.0 kt in 2008. UC RUSALaggregate attributable production in 2008 was 58.0 kt. Aggregate attributable production iscalculated on equity ownership interest as of September 15 2009, with the exception of thefollowing plants which are calculated on a 100% plant production basis to reflect UC RUSALeffective control of finished product: Irkutsk Silicon and Zaporozhye Silicon. Table 2.15 showsthe contribution from each facility.
Similar to other aluminium industry participants, UC RUSAL has since mid-2008 undertaken aprogramme to address a reduction in demand for its products. The programme resulted in the fullclosure or partial closure of a number of operating facilities. With regard to silicon smelting, thefollowing operations remain fully idled as of September 15 2009; Urals Silicon and ZaporozhyeSilicon.
Section 6 of this report describes in detail each of the aluminium smelting operations of UCRUSAL.
APPENDIX VI INDEPENDENT TECHNICAL REPORT
— VI-65 —
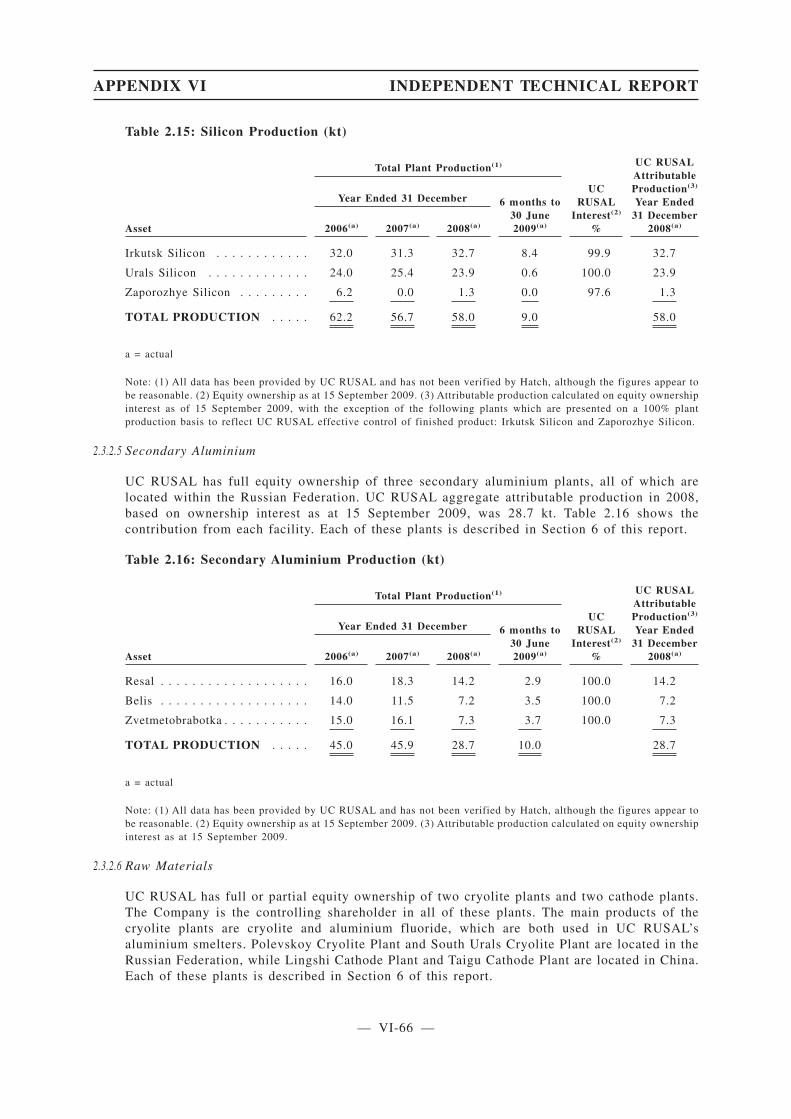
Table 2.15: Silicon Production (kt)
Total Plant Production(1)
UCRUSAL
Interest(2)
%
UC RUSALAttributableProduction(3)
Year Ended31 December
2008(a)
Year Ended 31 December 6 months to30 June2009(a)Asset 2006(a) 2007(a) 2008(a)
Irkutsk Silicon . . . . . . . . . . . . 32.0 31.3 32.7 8.4 99.9 32.7
Urals Silicon . . . . . . . . . . . . . 24.0 25.4 23.9 0.6 100.0 23.9
Zaporozhye Silicon . . . . . . . . . 6.2 0.0 1.3 0.0 97.6 1.3
TOTAL PRODUCTION . . . . . 62.2 56.7 58.0 9.0 58.0
a = actual
Note: (1) All data has been provided by UC RUSAL and has not been verified by Hatch, although the figures appear tobe reasonable. (2) Equity ownership as at 15 September 2009. (3) Attributable production calculated on equity ownershipinterest as of 15 September 2009, with the exception of the following plants which are presented on a 100% plantproduction basis to reflect UC RUSAL effective control of finished product: Irkutsk Silicon and Zaporozhye Silicon.
2.3.2.5 Secondary Aluminium
UC RUSAL has full equity ownership of three secondary aluminium plants, all of which arelocated within the Russian Federation. UC RUSAL aggregate attributable production in 2008,based on ownership interest as at 15 September 2009, was 28.7 kt. Table 2.16 shows thecontribution from each facility. Each of these plants is described in Section 6 of this report.
Table 2.16: Secondary Aluminium Production (kt)
Total Plant Production(1)
UCRUSAL
Interest(2)
%
UC RUSALAttributableProduction(3)
Year Ended31 December
2008(a)
Year Ended 31 December 6 months to30 June2009(a)Asset 2006(a) 2007(a) 2008(a)
Resal . . . . . . . . . . . . . . . . . . . 16.0 18.3 14.2 2.9 100.0 14.2
Belis . . . . . . . . . . . . . . . . . . . 14.0 11.5 7.2 3.5 100.0 7.2
Zvetmetobrabotka . . . . . . . . . . . 15.0 16.1 7.3 3.7 100.0 7.3
TOTAL PRODUCTION . . . . . 45.0 45.9 28.7 10.0 28.7
a = actual
Note: (1) All data has been provided by UC RUSAL and has not been verified by Hatch, although the figures appear tobe reasonable. (2) Equity ownership as at 15 September 2009. (3) Attributable production calculated on equity ownershipinterest as at 15 September 2009.
2.3.2.6 Raw Materials
UC RUSAL has full or partial equity ownership of two cryolite plants and two cathode plants.The Company is the controlling shareholder in all of these plants. The main products of thecryolite plants are cryolite and aluminium fluoride, which are both used in UC RUSAL’saluminium smelters. Polevskoy Cryolite Plant and South Urals Cryolite Plant are located in theRussian Federation, while Lingshi Cathode Plant and Taigu Cathode Plant are located in China.Each of these plants is described in Section 6 of this report.
APPENDIX VI INDEPENDENT TECHNICAL REPORT
— VI-66 —
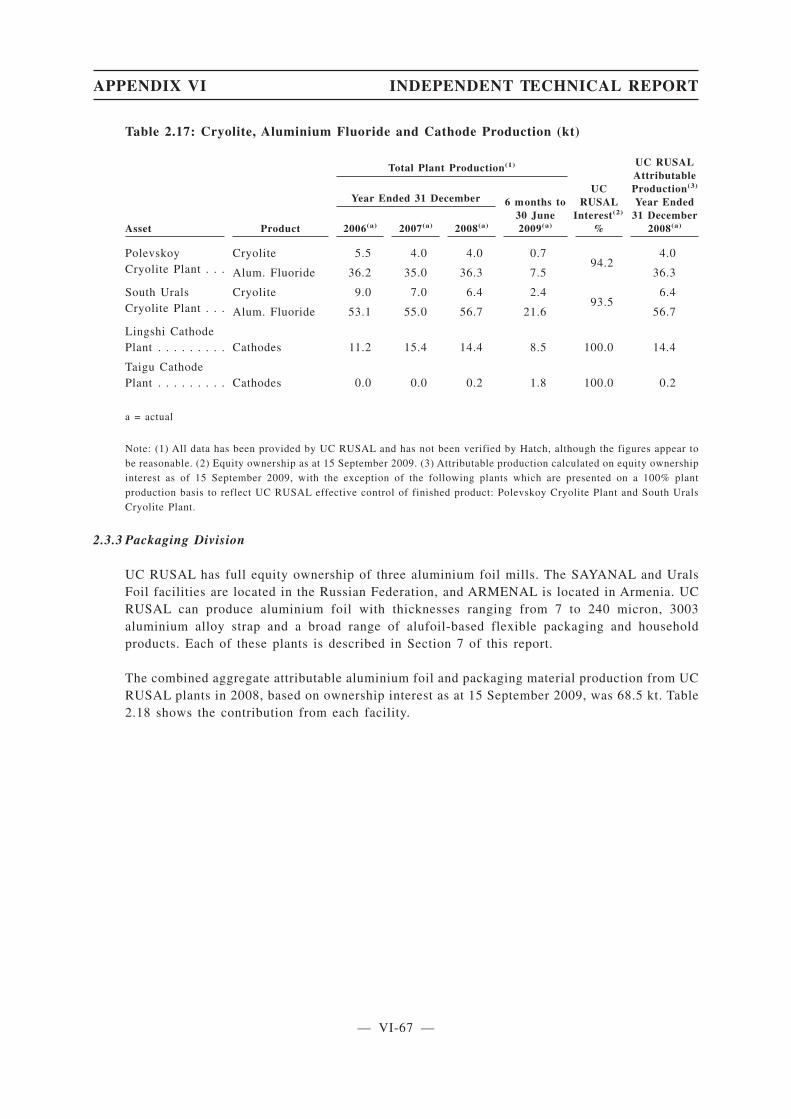
Table 2.17: Cryolite, Aluminium Fluoride and Cathode Production (kt)
Total Plant Production(1)
UCRUSAL
Interest(2)
%
UC RUSALAttributableProduction(3)
Year Ended31 December
2008(a)Asset Product
Year Ended 31 December 6 months to30 June2009(a)2006(a) 2007(a) 2008(a)
PolevskoyCryolite Plant . . .
Cryolite 5.5 4.0 4.0 0.794.2
4.0
Alum. Fluoride 36.2 35.0 36.3 7.5 36.3
South UralsCryolite Plant . . .
Cryolite 9.0 7.0 6.4 2.493.5
6.4
Alum. Fluoride 53.1 55.0 56.7 21.6 56.7
Lingshi CathodePlant . . . . . . . . . Cathodes 11.2 15.4 14.4 8.5 100.0 14.4
Taigu CathodePlant . . . . . . . . . Cathodes 0.0 0.0 0.2 1.8 100.0 0.2
a = actual
Note: (1) All data has been provided by UC RUSAL and has not been verified by Hatch, although the figures appear tobe reasonable. (2) Equity ownership as at 15 September 2009. (3) Attributable production calculated on equity ownershipinterest as of 15 September 2009, with the exception of the following plants which are presented on a 100% plantproduction basis to reflect UC RUSAL effective control of finished product: Polevskoy Cryolite Plant and South UralsCryolite Plant.
2.3.3 Packaging Division
UC RUSAL has full equity ownership of three aluminium foil mills. The SAYANAL and UralsFoil facilities are located in the Russian Federation, and ARMENAL is located in Armenia. UCRUSAL can produce aluminium foil with thicknesses ranging from 7 to 240 micron, 3003aluminium alloy strap and a broad range of alufoil-based flexible packaging and householdproducts. Each of these plants is described in Section 7 of this report.
The combined aggregate attributable aluminium foil and packaging material production from UCRUSAL plants in 2008, based on ownership interest as at 15 September 2009, was 68.5 kt. Table2.18 shows the contribution from each facility.
APPENDIX VI INDEPENDENT TECHNICAL REPORT
— VI-67 —

Table 2.18: Aluminium Foil and Packaging Production (kt)
Total Plant Production(1)
UC RUSALInterest(2)
%
UC RUSALAttributableProduction(3)
Year Ended31 December
2008(a)Asset
Year Ended 31 December 6 months to30 June2009(a)2006(a) 2007(a) 2008(a)
ARMENAL . . . . . . . . . . . . 0.9 12.3 12.9 9.7 100.0 12.9
SAYANAL . . . . . . . . . . . . . 38.3 39.5 40.6 14.4 100.0 40.6
Urals Foil . . . . . . . . . . . . . 15.6 16.1 15.0 5.1 100.0 15.0
TOTAL PRODUCTION . . . 54.8 67.8 68.5 29.1 68.5
a = actual
Note: (1) All data has been provided by UC RUSAL and has not been verified by Hatch, although the figures appear tobe reasonable. (2) Equity ownership as at 15 September 2009. (3) Attributable production calculated on equity ownershipinterest as at 15 September 2009.
2.3.4 Engineering and Construction Division
The Engineering and Construction Division provides a wide range of services within UCRUSAL, including technical support, engineering and construction operations. The divisionundertakes modernisation work of existing plants, including the programmes at BratskAluminium Smelter (which is temporarily suspended) and Krasnoyarsk Aluminium Smelter(completed in September 2009). The division also undertakes the construction of new facilities,including the on-going construction of Taishet Aluminium Smelter.
• Russian Engineering Company (RUS-Engineering) — RUS-Engineering organises,manages and administers the Engineering and Construction Division. RUS-Engineeringalso comprises the following units:
• Engineering and Technology Centre (ETC) — ETC is located in Krasnoyarsk and wasfounded by RUSAL in 2002. ETC is focused on the aluminium smelting assets of UCRUSAL, and in particular large-scale modernisation projects and the implementationof leading edge operational practices, including reducing the environmental impact ofUC RUSAL aluminium smelting operations. ETC is currently undertaking projectsaimed at increasing pot amperage and current efficiency, the installation of dry anodetechnology at Bratsk Aluminium Smelter and Krasnoyarsk Aluminium Smelter, andthe installation of dry gas scrubbers and automatic alumina feeder systems. ETCundertook the design and engineering of the RA-300 cell, which underwent testing atSayanogorsk Aluminium Smelter and is now fully implemented on a commercial scaleat Khakas Aluminium Smelter. The Boguchansky Aluminium Smelter, which iscurrently under construction, will use RA-300 technology. ETC started developmentof the RA-400 cell (to be operated at 400 kA) in 2004. UC RUSAL plans to implementthe RA-400 technology at Taishet Aluminium Smelter. ETC are now planning to testRA-500 technology (to be operated at 500 kA) at Sayanogorsk Aluminium Smelter.ETC are also currently investigating technology aimed at reducing greenhouse gasemissions and aluminium cash operating cost reductions. ETC has also undertakenmodernisation work in the casthouses of UC RUSAL smelters as part of the UCRUSAL strategy to increase the production of value-added casthouse products.
APPENDIX VI INDEPENDENT TECHNICAL REPORT
— VI-68 —
• In addition, RUS-Engineering undertakes the following activities;
- Maintenance and repair activities at UC RUSAL’s Russian alumina refineries andaluminium smelters, undertaken with resources located at each of thesefacilities.
- Feasibility studies (encompassing concept, pre-feasibility and feasibilitystudies) through its design institute in Krasnoyarsk.
- Engineering, Procurement, Construction and Management (EPCM) services fordevelopment and modernisation programmes.
• VAMI — VAMI is a large-scale operation that was founded in 1931 and was purchased byRUSAL in 2003 (prior to the formation of UC RUSAL). More than 40 facilities forproduction of alumina, aluminium, magnesium and carbon products have been constructedbased on VAMI design and engineering services. The majority of these facilities are locatedin the former Soviet Union, but exceptions include facilities constructed in countries suchas China, India, Turkey and Israel. VAMI offers experience and expertise in undertakingR&D, feasibility and engineering studies and engineering projects in the light metalsindustry, for both new and existing facilities. The core capabilities and recent technologyprocesses undertaken by VAMI include:
• equipment and technology for alumina production from the bauxite and nephelineresources of the former Soviet Union;
• modernisation of VSS and HSS smelting technology;
• development of 255 kA PFPB cells;
• busbar systems for aluminium smelters;
• process control systems for Söderberg and pre-bake cells;
• technology and equipment for magnesium production;
• engineering design and construction of new, and modernisation of existing, carbonplants, as well as carbon facilities at aluminium smelters; and
• environmental protection measures, including developments in gas dry scrubbingsystems and technology for removal of fine suspended matter, dissolved andemulsified oils.
• Glinozemservice — Glinozemservice was established in 2004 by RUSAL (prior to theformation of UC RUSAL) and undertakes all repair and maintenance services at AchinskAlumina Refinery, and for other plants as required.
• Timan Engineering — Timan Engineering provides the Engineering, Procurement,Construction and Management (EPCM) services for the Komi Alumina Project.
• Engineering and Construction Company (ECC) — ECC undertakes project and constructionmanagement of UC RUSAL facilities. ECC completed construction of Khakas AluminiumSmelter in 2006, the first major aluminium smelting capacity project in the RussianFederation for almost 20 years, and is also undertaking the construction of TaishetAluminium Smelter and Boguchansky Aluminium Smelter. The quality of the workmanship
APPENDIX VI INDEPENDENT TECHNICAL REPORT
— VI-69 —
at Khakas Aluminium Smelter is reasonable compared with Western Standards. It isanticipated that ECC will have learnt valuable lessons from the Khakas Aluminium Smelterproject and this is expected to provide much scope to build upon this experience duringconstruction of Taishet Aluminium Smelter and future UC RUSAL projects.
• Service Center Metallurg — Service Center Metallurg undertakes minor and major repairs,and maintenance of all equipment, at Nikolaev Alumina Refinery. It also provides servicesto other UC RUSAL assets, and cooperates with other industrial companies within Ukraineto supply cast products, as well as non-standard equipment and spare parts. Service CenterMetallurg was established as an independent entity in 2003, having previously been part ofNikolaev Alumina Refinery.
• SibVAMI — SibVAMI was established in 1959 as the Irkutsk branch of VAMI. SibVAMIundertakes development of projects in all parts and at all stages, from preparation oftechnical proposals and investment appraisal to submittal of detail documentation for bothindustrial and civil facilities to client. SibVAMI has licenses required for performance ofthe whole range of research, design and engineering services.
2.3.5 Power
The security of the electrical energy supply to any aluminium smelter is a major factor to beconsidered during the plant operations and power contract negotiations. Unexpected total loss ofpower for even relatively short durations of several hours can cause permanent damage to thecells, and in worst-cases, the liquid aluminium in the pots can freeze leading to the requirementfor major capital repair and the loss of smelter production for a long period.
All but one of UC RUSAL’s Russian Federation smelters are classified as Category One orCategory Two power users, i.e. they have at least two independent power transmission routes tothe smelter switchyard, each of which is capable of providing the full power requirements of thesmelter in the event of loss or damage to the other transmission line. The sole exception amongstthe Russian Federation smelters is Kandalaksha Aluminium Smelter, which does not have 100 percent redundancy. However, given the nature of the busbar supply from the adjacent power plantthe risk of business interruption is substantially mitigated.
Zaporozhye Aluminium Smelter, in Ukraine, has sufficient redundancy in power supply due toits two connections to different parts of the regional grid. ALSCON in Nigeria has a dedicatedgas-fired power plant. The power plant has been designed with (n+2) redundancy (i.e. the fullpower requirements of the smelter can be met under the scenario of two units being out ofoperation), the gas supply pipelines with (n+1) redundancy and additional back-up fuel supplyreflecting best practice.
There were 18 reported power outages at UC RUSAL smelters in 2008, however these weretypically for short time periods. Hatch was informed that aluminium production was unaffectedin 15 cases, which is consistent with the effects of short-term power losses at similar smeltersglobally.
In August 2009, a major accident occurred at the Sayano-Shushenskaya HPP in Siberia, whichwas the main supplier of electricity to Sayanogorsk Aluminium Smelter and Khakas AluminiumSmelter. Hatch understands that the accident resulted in the temporary loss of power toSayanogorsk Aluminium Smelter, Khakas Aluminium Smelter, SAYANAL and a reduction inpower supplies to Novokuznetsk Aluminium Smelter. Hatch understands that production at thesefacilities was not materially affected in the immediate aftermath of the accident as alternativesources of power were quickly identified. Hatch understands that both Sayanogorsk AluminiumSmelter and Khakas Aluminium Smelter, the two facilities most affected by the accident, arecurrently receiving power from the regional grid (“Siberian Power Pool”) and in particular the
APPENDIX VI INDEPENDENT TECHNICAL REPORT
— VI-70 —
regions of Krasnoyarsk and Kemerovo which form part of the Siberian Power Pool. UC RUSALhas stated that it does not expect aluminium production at Sayanogorsk Aluminium Smelter andKhakas Aluminium Smelter to be affected during the reconstruction of Sayano-ShushenskayaHPP, which the owners, RusHydro, expect to last for four years.
Table 2.19 details total AC electricity consumption at UC RUSAL aluminium smelters in 2008and the first half of 2009. The reported consumption figure includes power consumed by thesmelting pots, including a transformation loss from AC to DC power, and auxiliary electricityconsumption, for such areas as the casthouse, anode production process and lighting.
Table 2.19: Electrical Power Consumption at UC RUSAL Smelters in 2008 and H1 2009
2006(2) 2007 2008 H1 2009
Asset AC GWh AC GWh AC GWh AC GWh
Bratsk Aluminium Smelter . . . . . . . . . . 16,831 17,094 17,250 8,339Krasnoyarsk Aluminium Smelter . . . . . . 16,747 17,410 17,620 8,201Sayanogorsk Aluminium Smelter . . . . . . 8,735 8,969 9,054 4,331Novokuznetsk Aluminium Smelter . . . . . 5,232 5,315 5,381 2,113Irkutsk Aluminium Smelter. . . . . . . . . . n/a 4,866 5,918 2,691Khakas Aluminium Smelter . . . . . . . . . 34 2,731 4,564 2,139Bogoslovsk Aluminium Smelter . . . . . . n/a 3,195 3,214 1,027Volgograd Aluminium Smelter . . . . . . . n/a 2,664 2,733 1,204Urals Aluminium Smelter . . . . . . . . . . . n/a 2,430 2,443 757Nadvoitsy Aluminium Smelter . . . . . . . n/a 1,362 1,350 472Kandalaksha Aluminium Smelter . . . . . . n/a 1,281 1,284 473Volkhov Aluminium Smelter . . . . . . . . . n/a 382 385 96Alukom Taishet Aluminium Smelter. . . . 187 202 199 48Kubikenborg Aluminium . . . . . . . . . . . n/a 1,825 1,515 485Zaporozhye Aluminium Smelter . . . . . . n/a 1,975 1,953 646ALSCON . . . . . . . . . . . . . . . . . . . . . . n/a n/a n/a(3) 26TOTAL . . . . . . . . . . . . . . . . . . . . . . 47,765 71,700 74,862 33,047
Notes: (1) All data has been provided by UC Rusal and has not been verified by Hatch. (2) Electricity consumption in2006 was provided for former Rusal facilities only. (3) Electricity consumption at ALSCON in 2008 was not provided.This smelter accounted for 0.2% of UC RUSAL saleable aluminium production in 2008, and therefore is not considered
material.
The reduction in electrical power consumption at UC RUSAL smelters in the first half of 2009compared with 2008, on a pro rate basis, is due to production cutbacks at several facilities duringthis period.
The importance of a stable and secure electricity supply has resulted in the vast majority ofaluminium smelters in the world securing electricity under medium to long-term contracts. In theRussian Federation and Ukraine, it is current market practice and regulatory practice to have aguaranteed power supply contract(s) with annually negotiated power tariffs.
The majority of UC RUSAL’s smelters are in locations where there is no similar competitivedemand for the volume of electricity and thus the company can benefit from this “stranded”energy for the production of aluminium. In addition, these assets typically represent the bulk ofdemand for the power stations supplying them. Power stations situated in isolated locationswould find it virtually impossible to replace an aluminium smelter as a customer, due to thelimited availability of nearby large electricity consumers and the inability of the power grid totransport this electricity to more distant consumers. It is therefore clear that both powerproviders and UC RUSAL must engage in economic behaviour that is in their mutual interests.
APPENDIX VI INDEPENDENT TECHNICAL REPORT
— VI-71 —
Table 2.20 shows the electricity tariffs paid by UC RUSAL aluminium smelters in 2008 and thefirst half of 2009. These prices include a combination of transmission charges, capacity chargesand energy charges. All information on electricity contracts presented in this section has beenprovided by UC RUSAL and has not been verified by Hatch.
Table 2.20: Electrical Power Supply Tariffs at UC RUSAL Smelters, 2008 and H1 2009(1)
LocalCurrency 2006 2007 2008 H1 2009
Asset (LC)LC/
MWhUS$/
MWh(2)LC/
MWhUS$/
MWh(3)LC/
MWhUS$/
MWh(4)LC/
MWhUS$/
MWh(5)
Bratsk Aluminium Smelter . RUB 271 10.0 282 11.0 414 16.6 502 15.2
Krasnoyarsk Aluminium
Smelter. . . . . . . . . . . . . RUB 298 11.0 335 13.1 474 19.0 714 21.6
Sayanogorsk Aluminium
Smelter. . . . . . . . . . . . . RUB 262 9.6 331 12.9 482 19.4 550 16.6
Novokuznetsk Aluminium
Smelter. . . . . . . . . . . . . RUB 456 16.8 495 19.4 675 27.1 853 25.5
Irkutsk Aluminium Smelter . RUB n/a n/a 282 11.0 493 19.8 496 14.7
Khakas Aluminium
Smelter. . . . . . . . . . . . . RUB 409 15.1 339 13.3 478 19.2 596 18.0
Bogoslovsk Aluminium
Smelter. . . . . . . . . . . . . RUB n/a n/a 792 31.0 880 35.3 1170 33.8
Volgograd Aluminium
Smelter. . . . . . . . . . . . . RUB n/a n/a 1,122 43.9 1154 46.4 1053 31.8
Urals Aluminium Smelter . . RUB n/a n/a 780 30.5 891 35.8 1195 34.0
Nadvoitsy Aluminium
Smelter. . . . . . . . . . . . . RUB n/a n/a 593 23.2 957 38.4 902 27.5
Kandalaksha Aluminium
Smelter. . . . . . . . . . . . . RUB n/a n/a 469 18.3 774 31.1 742 22.5
Volkhov Aluminium
Smelter. . . . . . . . . . . . . RUB n/a n/a 643 25.1 936 37.6 638 19.1
Alukom Taishet Aluminium
Smelter. . . . . . . . . . . . . RUB 368 13.6 334 13.1 378 15.2 n/a n/a
Kubikenborg Aluminium . . USD n/a n/a 42.2 42.2 46.7 46.7 41.0 41.0
Zaporozhye Aluminium
Smelter. . . . . . . . . . . . . USD n/a n/a 51.9 51.9 68.1 68.1 49.3 49.3
ALSCON . . . . . . . . . . . USD n/a n/a n/a n/a n/a n/a 15.1 15.1
Notes: (1) All data has been provided by UC RUSAL and has not been verified by Hatch. (2) Converted from LC/MWhto US$/MWh at the exchange rate of 27.17 RUB/US$. (3) Converted from LC/MWh to US$/MWh at the exchange rateof 25.58 RUB/US$. (4) Converted from LC/MWh to US$/MWh at the exchange rate of 24.90. (5) Converted fromLC/MWh to US$/MWh using exchange rate from UC RUSAL Financial Model “Project Oysters DRAFT 090903.xls”
The energy supply to UC RUSAL smelters in the Russian Federation and the Ukraine can beconsidered in terms of three principle geographical regions:
• Siberia — The energy supply to Bratsk Aluminium Smelter, Krasnoyarsk AluminiumSmelter, Sayanogorsk Aluminium Smelter, Irkutsk Aluminium Smelter, Khakas AluminiumSmelter is substantially provided by low cost hydro-electric power. Novokuznetsk
APPENDIX VI INDEPENDENT TECHNICAL REPORT
— VI-72 —
Aluminium Smelter is substantially provided by coal-fired power stations. This energy is“stranded” with little competing demand and few options to export the energy via highvoltage transmission lines. The production of aluminium, which is essentially packagedenergy, is very well suited to exploiting this resource. On an aggregate attributable basis(refer to Table 2.12), UC RUSAL smelters located in the “Siberia” region produced 3,524kt of saleable aluminium in 2008 and accounted for approximately 79.7 per cent of totalsaleable aluminium production from UC RUSAL smelters in 2008. Aluminium smelters inthe “Siberia” region paid an aggregate attributable production-weighted average of 19.2US$/MWh for electricity in 2008.
• Urals — The energy supply to Urals Aluminium Smelter and Bogoslovsk AluminiumSmelter is substantially provided by coal and gas fired power plants. On an aggregateattributable basis, UC RUSAL smelters located in the “Urals” region produced 319 kt ofsaleable aluminium in 2008 and accounted for approximately 7.2 per cent of total saleablealuminium production from UC RUSAL smelters in 2008. Aluminium smelters in the“Urals” region paid an aggregate attributable production-weighted average of 35.5US$/MWh for electricity in 2008.
• European — Nadvoitsy Aluminium Smelter, Volkhov Aluminium Smelter and KandalakshaAluminium Smelter are located in regions with a combination of both strandedhydro-electric and nuclear power. In 2006 SUAL (prior to the formation of UC RUSAL)signed a memorandum with Rosatom for the long-term development of nuclear powerplants. This agreement may provide continued low cost energy supply to these smelters inthe future. Volgograd Aluminium Smelter and Zaporozhye Aluminium Smelter are the onlysmelters which operate in locations of high energy demand and regional power supplydeficits. Accordingly the pricing of energy for these two assets reflects the nature of thesupply/demand dynamics of those regions. On an aggregate attributable basis, UC RUSALsmelters located in the “European” region produced 459 kt of saleable aluminium in 2008and accounted for approximately 10.4 per cent of total saleable aluminium production fromUC RUSAL smelters in 2008. Aluminium smelters in the “European” region paid anaggregate attributable production-weighted average of 47.3 US$/MWh for electricity in2008.
In addition, Kubikenborg Aluminium paid 46.7 US$/MWh for electricity in 2008. No informationhas been provided on ALSCON electricity tariffs in 2008, although it should be noted that thisplant was attributable for only 0.2% of total saleable aluminium production from UC RUSALsmelters in 2008.
The Russian Federation electricity sector is undergoing major changes, with the break-up of theformer state-owned monopoly into generation, transmission, distribution and other units andeventual market liberalisation. The exact pricing structure for the industry once deregulation hasoccurred is difficult to determine, and there are a number of conflicting factors. Key challengesfor UC RUSAL are:
• the resultant change in the price mechanism exhibited in other countries following a periodof deregulation;
• the maturity profile of power assets, potentially current unsatisfactory financial returns,and the need for re-investment/re-construction;
• the future direction of natural gas, coal and uranium prices;
• the scale of the industrial market versus other users, and future demand trends; and
• locational issues.
APPENDIX VI INDEPENDENT TECHNICAL REPORT
— VI-73 —

Kubikenborg Aluminium and ALSCON have secured, longer term contracts with agreedcommercial terms. In respect of Kubikenborg Aluminium, there is a power contract to 2016which is indexed to Swedish consumer price inflation. The power pricing reflects a mixture ofboth hydro and nuclear power supply in Sweden. The power contract requires UC RUSAL tocontinue the commitment to convert the remaining Söderberg cells to pre-bake anode technology.In respect of ALSCON, UC RUSAL has recently agreed a long-term gas supply contract withNigerian Gas Company until 2025, although Hatch has concerns over the reliability of gas supplywithin this contracts (refer to Section 5.17.5).
2.3.6 Projects
2.3.6.1 Management of Development Projects
The project progression in UC RUSAL, from a concept to a fully committed project aims tofollow a structured approach. After initial definition of concept, a pre-feasibility study isprepared which determines the broad project scope, location, cost, technology and other keyparameters. Upon internal approval, this is then expanded into a Detailed Feasibility Study,commonly referred to as a TEO in Russia.
In addition to internal investment approval, projects in Russia also require permits and operatinglicences from State regulatory bodies. UC RUSAL also co-operates with the StateInter-Departmental Commissions which include representatives from external stakeholders suchas JSC Russian Railways, power, environment and other government bodies. As the StateInter-Departmental Commission is involved throughout the process, the Final Feasibility Studyand environmental impact assessment (EIA) will reflect their mutual decision.
At all stages of the projects implementation and key stages throughout the process, the projectis subject to internal review and approval by the Board of Directors of the Engineering andConstruction Division, Management Board and Board of Directors of UC RUSAL. Subject to theproject reaching internal investment hurdles, securing finance and obtaining key raw materialcontracts and permits, the project is committed and the construction phase commences. This dateis typically referred to as “financial close”.
In order to progress the project between the completion of the Detailed Feasibility Study andfinancial close, the project typically enters a Front End Engineering and Design (FEED) stage.This allows the engineering and procurement on many of the long-lead items and early sitepreparation works to be initiated, therefore fast-tracking the project progression upon anunconditional decision to proceed.
2.3.6.2 Short-to-Medium Term Projects
UC RUSAL has advised Hatch of a number of projects for production growth in theshort-to-medium term, defined as those projects that received UC RUSAL Board approval andwhich generally fall within a five-year time horizon. All of the CAPEX estimates below,including the spend to the date specified, if at all, are in real 2008 terms and have been providedby UC RUSAL and, although they appear reasonable, have not been subject to detailed estimatereview by Hatch, or independent verification or audit.
• IrkAZ-5 project refers to the construction of Potline 5 at Irkutsk Aluminium Smelter, whichis expected to provide an additional 169 ktpa of aluminium capacity at the nominal linecurrent of 300 kA. The new potline comprises 200 pots utilising high amperage pre-baketechnology developed by SibVAMI. Construction of IrkAZ-5 commenced in May 2005, andthe potline produced first metal in late 2007. Full commissioning of the potline is expectedby the end of 2009. The CAPEX of the project is currently estimated at US$617 million,including VAT, of which US$561 million had been spent as of 30 June 2009.
APPENDIX VI INDEPENDENT TECHNICAL REPORT
— VI-74 —
• Boguchanskoye Energy & Metallurgy Combine (BEMO) project involves theconstruction of a 588 ktpa greenfield aluminium smelter and 3,000 MW hydro power plant(HPP). BEMO is structured as a joint venture partnership between UC RUSAL andRusHydro. The joint-venture owns 100% of the aluminium smelter project, with thisequally divided between the joint venture partners. The joint-venture owns 93.7% of theHPP, with this share equally divided between the joint venture partners. The remaining ofthe HPP is owned by the government of the Russian Federation (2.9%) and othershareholders (3.4%). The aluminium smelter will be located at Karabula, in the Boguchanskdistrict of Krasnoyarsk Region, and have a capacity of 588 ktpa. UC RUSAL’s attributablecapacity based on its equity ownership will be 294 ktpa. The smelter is proposed to consistof two potlines (672 cells) of RA-300 technology at an amperage of 320 kA. A TechnologyAgreement has been signed with the joint venture partner to provide the mechanism for UCRUSAL to financially benefit from its ‘know how’. The smelter will be commissioned intwo stages. The first stage of commissioning is scheduled to be completed in 2012 and thesecond stage is scheduled for completion by end-2015. The Boguchanskaya HPP project isan initiative to construct a 3,000 MW HPP located 160 km from the site of the BoguchanskyAluminium Smelter. UC RUSAL owns a 46.85 per cent stake in the Boguchanskoye HPPproject. The project was approved in 1979 but construction stopped in 1992 due to lack offunding. Construction recommenced in 2006, with construction of the concrete gravity damand rockfill dam now underway. The commissioning of the first three turbines is scheduledfor December 2010. A further three turbines will be commissioned in 2011, and the finalthree turbines commissioned in 2012. The joint venture partners have signed an agreementfor the infrastructure requirements of the project (including power transmission lines, roadconstruction and bridges) to be financed by the Investment Fund of the Russian Federation.The CAPEX for the aluminium smelter (excluding facilities which it is currently believedwill be paid by the Russian government) is currently estimated at US$1,692 million,including VAT, and US$1,434 million, excluding VAT. UC RUSAL’s share of CAPEX willbe US$846 million, including VAT, and US$717 million, excluding VAT, based on 50 percent equity ownership of the aluminium smelter project. As of 30 June 2009, payments areUS$296 million, including VAT, and US$251 million, excluding VAT, for the aluminiumsmelter (entire plant basis). The CAPEX for the hydro power plant is currently estimatedat US$1,712 million, including VAT, and US$1,450 million, excluding VAT. UC RUSAL’sshare of CAPEX will be US$856 million, including VAT, and US$725 million, excludingVAT. As of 30 June 2009, payments are US$864 million, including VAT, and US$732million, excluding VAT, for the hydro power plant (entire plant basis).
• Taishet Aluminium Smelter project is a greenfield 750 ktpa aluminium smelter, which islocated approximately 10 km to the north-east of the existing Alukom Taishet AluminiumSmelter and immediately adjacent to the main East Siberian railway line. It is proposed touse UC RUSAL’s proprietary RA-400 smelting technology. Taishet Aluminium Smelter willinclude all associated facilities such as anode paste production, anode forming, anodebaking, potline services and metal casting facilities. The smelter will have access toelectrical energy from the Bratsk hydroelectric station and other local connections to theIrkustkenergo grid. A contract for electrical supply to 2021 has been agreed withIrkutskenergo. Preliminary groundworks commenced at the Taishet Aluminium Smelter sitein April 2007, and construction of the smelter has commenced. In late-2008 UC RUSALdecided to scale back construction activities at the smelter due to the prevailing economicclimate. First hot metal from the Taishet Aluminium Smelter is forecast for December 2011,with all cells started-up by the end of 2014 and full smelter production reached in 2015. Thetotal CAPEX for the aluminium smelter, excluding the anode plant, is currently estimatedat US$2,229 million, including VAT, and US$1,987 million, excluding VAT. As of 30 June2009, payments are US$576 million, including VAT, and US$495 million, excluding VAT.
APPENDIX VI INDEPENDENT TECHNICAL REPORT
— VI-75 —

• ALSCON was acquired by RUSAL (prior to the formation of UC RUSAL) in February 2007and is a reasonably modern aluminium smelter located in Nigeria. The smelter has beentroubled with respect to its operations, never having reached full capacity since it was firstcommissioned. The smelter first produced in 1997, but in June 1999, with only 25 per centof the plant started up and 45 kt of aluminium produced, a decision was taken by theprevious investors to close the smelter. It is the intention of UC RUSAL to use theoutstanding equipment, namely potshell, busbar, superstructures and pot tendingassemblies, to complete the two potlines and to modernise the pots with newly designed celllinings and a modern cell control system. In addition, the Imo River will need to be dredgedso as to accept 25 to 30 kt alumina vessels prior to the plant start up. The nominal plantcapacity is 197 ktpa, comprised of two potlines of 216 cells each. The first of the cells wasbrought into operation in February 2008. As of September 2009, 54 cells are reportedlyoperating. UC RUSAL plan to commission a further 54 cells by end-2010, to make a totalof 108 cells operational. The whole plant, 432 cells, is planned to be fully operational by2013. The CAPEX of the aluminium smelter is currently estimated at US$298 million, ofwhich US$76 million had been spent as of 30 June 2009.
• Kubikenborg Aluminium is currently implementing a major modernisation programme toconvert all of the Söderberg cells in Potline 2 to pre-bake cells. Associated project workson other facilities include an upgrade to the anode rodding shop, installation of both newand refurbished rectifier transformers and the erection of a modern GTC. Commissioningof the first 20 pre-bake cells occurred in June 2008, and all 262 cells are planned to becommissioned by the end of 2009. Hatch understands that the Swedish environmentalauthorities have ruled that Kubikenborg Aluminium must convert cells to pre-baketechnology or undergo closure for environmental reasons. As a result of the project, liquidaluminium capacity will increase by approximately 40 ktpa. The CAPEX of the project iscurrently estimated at US$283 million, including VAT, of which US$239 million had beenspent as of 30 June 2009.
• UC RUSAL is undertaking extensive modernisation programmes at several of itsaluminium smelters using VSS technology. Typically the scope of each programme includesprojects to improve environmental performance, increase metal production, reduce unitconsumption of raw materials, replace equipment at the end of its service life, improve theoperating environment for the workers and align the casthouse product capabilities with themarketing plan. The environmental scope of the modernisation projects includes conversionto dry anode technology, installation of dry scrubbers, modifications to the burners andinstallation of point feeding on all cells. The capital costs of such modernisationprogrammes including environmental expenditure are all intended to be financially justifiedthrough increases in metal production and improved premiums from value added products.
• The Krasnoyarsk Modernisation Programme commenced in 2004 and wascompleted in August 2009. The Modernisation Programme has benefited aluminiumproduction through the through the installation of additional cells and increasing linecurrent. The environmental scope of the Modernisation Project included theinstallation of 22 GTCs, conversion to dry anode technology, installation of dryscrubbers, modifications to the burners and installation of point feeding on all cells.The CAPEX of the project was US$305 million, including VAT, of which US$298million had been spent as of 30 June 2009.
• The Bratsk Modernisation Programme (Stage 1) commenced basic engineering in2007, although it has now been temporarily suspended. The plans for a significantupgrade of the smelter under the Modernisation Programme are similar to thoseimplemented at Krasnoyarsk Aluminium Smelter. The scope of the modernisationprogramme includes the addition of 64 new cells within the existing potrooms,
APPENDIX VI INDEPENDENT TECHNICAL REPORT
— VI-76 —

upgrading electrical equipment to increase the line current and the construction of dryscrubbers and point feeders on all potlines. It is planned that smelter capacity willprogressively increase to 1,044 ktpa within five years after recommencement of theModernisation Programme. The CAPEX of the project is currently estimated atUS$419 million, including VAT, of which US$26 million had been spent as of 30 June2009.
• In addition to the specific Modernisation Programmes referred to above, all smelterswith pre-bake, VSS and HSS cells are undergoing progressive modernisations as partof the planned annual sustaining capital programmes.
• Nikolaev Alumina Refinery expansion is scheduled to increase plant production from 1.4Mtpa to 1.7 Mtpa. Construction at the expansion project is progressing and expected toreach design capacity in 2011. The main scope of the project includes new railway tracks,upgrades to bauxite handling equipment, an update of the control system, fullimplementation of sweetening on all digestion trains, an additional mill (the seventh at theplant), two dedicated pre-desilication tanks, pumps directing the sweet bauxite slurry toflash tanks, and additional heat exchangers added to each of the autoclave banks, upgradeto security filters, addition of plate heat exchangers for cooling green liquor, fifteenmechanically agitated precipitators, five disk filters in the ‘white filtration area’,revamping of the evaporation area, and three new boilers and one steam turbine in thecaptive power plant. The CAPEX of the expansion project is currently estimated at US$155million, including VAT, of which US$125 million had been spent as of 30 June 2009.
2.3.6.3 Long-term Projects
UC RUSAL has advised Hatch of a number of projects for production growth in the long-term,defined as those projects with UC RUSAL Board pre-approval and which generally fall withinan eight year time horizon. All of the CAPEX estimates below are quoted in real 2008 terms andhave been provided by UC RUSAL and, although they appear reasonable, have not been subjectto detailed estimate review by Hatch, or, independent verification or audit. As the projectsprogress through detailed study and the capital approval process, further updates on the CAPEXare to be expected.
• The Fria expansion project is a brownfield expansion of Fria Alumina Refinery to 1,050ktpa of alumina. A detailed feasibility study on the expansion/modernisation of FriaAlumina Refinery has been completed. The project is currently on hold due to limitationsin power supply. Key areas for development include implementation of a new red mudsettling and washing system, implementation of a two-stage inter-stage cooling facility inprecipitation, addition of new precipitator tanks with mechanical agitation andimplementation of new equipment (such as mills, conveyor belts, pumps, calciner, bauxitestorage, etc.) as necessary to handle increased material flows. A further 10 m lift of DamNo. 3 in the residue disposal area would also be required. The CAPEX of the project iscurrently estimated at US$307 million, including VAT, of which US$17 million had beenspent as of 30 June 2009.
• Dian-Dian is a greenfield alumina refinery project which is planned for construction inGuinea, West Africa. A detailed feasibility study has been completed for a 5.1 Mtpa aluminarefinery including a power plant, railway, port and other associated infrastructure. Firstalumina is currently scheduled for 2015. The CAPEX for this project, includingdevelopment of the bauxite mine, is estimated at US$5,566 million, of which US$42 millionhad been spent as of 30 June 2009.
APPENDIX VI INDEPENDENT TECHNICAL REPORT
— VI-77 —

• The Bogoslovsk Modernisation Project relates to the existing alumina refinery and hasbeen in the planning stage since 2004. Bogoslovsk Alumina Refinery is currentlyimplementing the process modifications required to improve alumina quality. The processmodifications include reconstruction of sintering facilities, including reconstruction ofrotary kiln electrostatic precipitators and sinter kiln rotary coolers, and construction of a365 ktpa cyclone calciner to produce sandy product and reduce fuel consumption. Afeasibility study is currently ongoing with plans to increase production to 1,300 ktpa. Thetotal CAPEX is currently estimated at US$267 million for the refinery, including VAT.
• The Engineering Technology Centre adjacent to Krasnoyarsk Aluminium Smelter has beenconducting research and trials to improve the environmental performance of C8-BM VSScells in a project referred to as Clean Söderberg Technology (refer to Section 2.3.2.1). AllUC RUSAL employing C8-BM VSS cells, namely Krasnoyarsk Aluminium Smelter, BratskAluminium Smelter, Novokuznetsk Aluminium Smelter, Irkutsk Aluminium Smelter andVolgograd Aluminium Smelter, are anticipated to implement the Clean SöderbergTechnology project. The Clean Söderberg Technology project is anticipated to financiallyjustify the additional capital requirements through increased metal production at therespective plants. The additional metal production arising from the implementation of theproject is expected to be approximately 234 ktpa. The project is currently in thedevelopment and testing phase and is expected to be realised in the period 2012 to 2016.The estimated total CAPEX, excluding VAT, for undertaking the Clean SöderbergTechnology project and the additional production anticipated at each smelter is:
• Krasnoyarsk Aluminium Smelter: CAPEX of $136 million, including VAT. Anticipatedincrease in production of 85 ktpa.
• Bratsk Aluminium Smelter: CAPEX of $123 million, including VAT. Anticipatedincrease in production of 102 ktpa.
• Novokuznetsk Aluminium Smelter: CAPEX of $26 million, including VAT.Anticipated increase in production of 7 ktpa.
• Irkutsk Aluminium Smelter: CAPEX of $77 million, including VAT. Anticipatedincrease in production of 28 ktpa.
• Volgograd Aluminium Smelter: CAPEX of $8 million, including VAT. Anticipatedincrease in production of 12 ktpa.
• Urals Aluminium Smelter expansion project anticipates the modernisation and amperageincrease of all HSS cells employed at the smelter. The line load in pre-bake potrooms 1Nand 2N will be increased to 195-200 kA. The capacity of potrooms 1N and 2N will increaseby 14 ktpa to a total capacity of 83 ktpa. The total CAPEX is currently estimated at US$47million, including VAT.
• UAZ-300 project is an expansion of the existing Urals Alumina Refinery, which is expectedto add additional capacity of 300 ktpa through the decommissioning of approximately 200ktpa of old and inefficient facilities and the installation of approximately 500 ktpa of newcapacity for a final plant capacity of approximately 1,025 ktpa. The additional bauxitesupply is expected to be provided from the Timan Bauxite Mine. The total CAPEX iscurrently estimated at US$308 million for the refinery, including VAT.
APPENDIX VI INDEPENDENT TECHNICAL REPORT
— VI-78 —

• UC RUSAL is currently studying the option of converting older C-2 and C-3 VSS cellsto pre-bake technology. The project will improve the environmental performance of thecells. The estimated total CAPEX, excluding VAT, for undertaking the conversion projectat each smelter is:
• Novokuznetsk Aluminium Smelter: CAPEX of $296 million, including VAT.
• Volgograd Aluminium Smelter: CAPEX of $204 million, including VAT.
• Irkutsk Aluminium Smelter: CAPEX of $143 million, including VAT.
2.3.6.4 Long-term Prospects
Long-term prospects relate to project opportunities that are currently in the initial conceptualstages of development or require resolution of key issues. As such, the scope, schedule andrelated OPEX and CAPEX are less defined than the long-term projects referred to above. Thelong-term prospects include:
• UC RUSAL plans to construct a new 2.0 Mtpa alumina handling complex in the Port ofVanino. The new port handling terminal will be wholly owned by UC RUSAL and sized toaccommodate vessels up to 40,000 dwt, with total alumina storage facilities of 60,000tonnes. The new terminal will improve UC RUSAL’s ability to import alumina and transportit by rail to smelters in Siberia. Vanino is located on eastern seaboard of the RussianFederation, north of Vladivostok. Port of Vanino is classed as a medium sized seaport,however it currently has limited alumina handling and storage capacity (0.8 to 1.2Mtpa).The main storage and handling facilities to be provided at Vanino will comprise; berthsequipped with rail-mounted vacuum unloader, three storage silos, car loading station,conveyer systems for alumina handling from the berth to the warehouse and from thewarehouse to the car loading station, and general port facilities. A decision whether toundertake the project has been postponed since January 2009. The CAPEX of the projectis currently estimated at US$117 million, including VAT, of which US$1 million had beenspent as of 30 June 2009.
• UC RUSAL plans to construct a new alumina and aluminium handling complex in the Portof Ust Luga. Ust Luga is located on the Baltic Sea, approximately 50 km west of St.Petersburg. Port of Ust Luga is classed as a small seaport, but is currently undergoing amajor expansion programme. The new port terminal will be wholly owned and dedicated toUC RUSAL operations. A definitive size of the new terminal is yet to be finalised, howevercurrent plans are handling capacity for 3.5 Mtpa of alumina imports and 2.6 Mtpa ofaluminium exports. The commercial arrangements for ownership of the new terminal havenot been finalised, however it may comprise a three way agreement between UC RUSAL,Russian Railways and the port handling operator. The main storage and handling facilitiesto be provided as part of the project will comprise; berths equipped with a rail-mountedvacuum unloader, storage silos, packaged aluminium storage, container storage, railroadand car loading station, conveyer systems for alumina handling from the berth to thewarehouse and from the warehouse to the car loading station, and general port facilities. Aconceptual feasibility study on the project was completed in 2009. The CAPEX of theproject is currently estimated at US$296 million, including VAT.
• The Novokuznetsk coal fired power station is planned to take advantage of abundant coalresources in the Novokuznetsk region and supply electrical energy to the Novokuznetskaluminium smelter. It is planned to commence a feasibility study for the development of a600 MW power plant. The scope of the project may vary following the feasibility study.
APPENDIX VI INDEPENDENT TECHNICAL REPORT
— VI-79 —

• A pre-feasibility study has been completed on the Alpart Expansion project which isplanned to expand refinery capacity to 1,950 ktpa. The scope of the project is focused onboth increasing flow and yield through debottlenecking and including additional seedfiltration.
• Windalco Expansion refers to the expansion of the Windalco-Ewarton refinery by 500ktpa. A feasibility study has been completed, although it is understood that furtherdevelopment work is required to be undertaken. In addition UC RUSAL are studying theoption of constructing a coal fired heat and power plant to provide the steam and electricityrequirements of the Windalco-Ewarton refinery with benefits in the reduction of thealumina operating costs at the facility.
• At Queensland Alumina Ltd. potential exists for further capacity expansion of the refineryto 5 Mtpa or beyond should the owners unanimously agree.
• The Indonesia Alumina Refinery project includes the construction of a 3.5 Mtpa bauxitemine and a 1.2 Mtpa alumina refinery in Indonesia. Two potential locations are currentlybeing evaluated; one near the bauxite supply and one near the Pontianak Port. AMemorandum of Understanding to develop the project was signed in 2007 between UCRUSAL and PT Aneka Tambang (PT Antam). UC RUSAL owns 51 per cent of the project,while PT Antam owns the remaining 49 per cent. An independent evaluation of resourcesis currently being carried out on two bauxite deposits in West Kalimantan that are intendedto supply the alumina refinery, namely at Pantas and Munggu Pasir.
• The Sakhalin Energy and Metallurgical Complex project envisages the construction of agreenfield aluminium smelter of 380 ktpa capacity using UC RUSAL’s proprietary RA-400smelting technology. The smelter will be located at Uglegorsk, Sakhalin Island, located inthe far east of the Russian Federation. The project requires the construction of a greenfieldcoal fired power plant, which is currently planned to be constructed and operated by athird-party. UC RUSAL are considering supplying coal to the power plant from an adjacentopen-cut coal mine to provide additional assurance over electricity supply to the smelter.The smelter is planned to be located near a port 12 km from the coal deposit, providingaccess for raw materials and finished product. UC RUSAL has a Memorandum ofUnderstanding with the owner of the coal mine and has completed a conceptual feasibilitystudy.
• The Ekibastus Aluminium Smelter project is a plan to construct a greenfield aluminiumsmelter in the Kazakhstan Republic. The project envisages a smelter capacity of 375 ktpabased on UC RUSAL’s proprietary RA-400 smelting technology. It is intended that a fourthpower unit will be constructed at the GRES-2 coal-fired power station to provide dedicatedelectricity supply to the smelter. The additional power unit will be an equal joint venturebetween the government of the Kazakhstan Republic and UC RUSAL. A pre-feasibilitystudy into the Ekibastus Aluminium Smelter project has been completed.
• The Saratov Aluminium Smelter project envisages the construction of a greenfieldaluminium smelter of 1.05 Mtpa capacity using UC RUSAL’s proprietary RA-400 smeltingtechnology. The smelter will be located in Saratov region, located in the south-west of theRussian Federation. It is intended that two additional power units will be constructed at theBalakovskaya Nuclear Power Plant (Blocks 5 and 6) to meet the electricity requirements ofthe smelter. The Balakovskaya Nuclear Power Plant currently comprises four power unitswith the construction of Blocks 5 and 6 planned to provide an additional 2,000 MW ofelectricity supply. UC RUSAL are currently negotiating a long-term electricity supplyagreement with Rosatom, the owner of the Balakovskaya Nuclear Power Plant.
APPENDIX VI INDEPENDENT TECHNICAL REPORT
— VI-80 —
• The Far East Energy and Metallurgic Complex project envisages the construction of agreenfield aluminium smelter at Komsomolsk-na-Amure, near Port Vanino in Khabarovskregion. UC RUSAL has yet to commence conceptual studies on this project.
• The Kemerovo CHP Plant project is a plan to construct a coal-fired combined heat andpower (CHP) plant in Kemerovo region. A definitive power plant capacity is yet to befinalised, however current plans are for electricity generating capacity of 300-600 MW. Thepower plant will be fed from a coal mine located in the south of the Kemerovo region. UCRUSAL are currently negotiation with the regional government with a view to acquiring thecoal mine to provide security of raw material supply to the power plant. It is envisaged thatthe Kemerovo CHP Plant will supply electricity either to Novokuznetsk Aluminium Smelteror a new smelter in Kemerovo region (Kemerovo Aluminium Smelter).
• The Kemerovo Aluminium Smelter project envisages the construction of a greenfieldaluminium smelter in Kemerovo region supplied electricity from Kemerovo CHP Plant. Thesmelter size is contingent on the installed generating capacity of Kemerovo CHP Plant,however current plans are for aluminium capacity of 150-300 ktpa.
• The Sverdlovsk Aluminium Smelter project envisages the construction of a greenfieldaluminium smelter in Sverdlovsk region. UC RUSAL has yet to commence conceptualstudies on this project.
• The Libya Aluminium Smelter project is a plan to construct a greenfield aluminiumsmelter of 600 ktpa capacity using UC RUSAL’s proprietary RA-300 smelting technology.The smelter will be located in Libya, however the final site location is yet to be finalised.The project also includes the construction of a 1,500 MW dedicated gas-fired power plant.A Memorandum of Understanding to develop the project was signed in April 2008 betweenUC RUSAL and the Economic and Social Development Fund of Libya. UC RUSAL owns60 per cent of the project, with the Economic and Social Development Fund owning theremaining 40 per cent. UC RUSAL has completed a pre-feasibility study into the project.
2.3.7 Costs
2.3.7.1 Operating Costs
Hatch was provided with alumina and aluminium plant operating costs data by UC RUSAL.
The Alumina Cash Operating Cost represents the average cost of producing one tonne of alumina,excluding freight costs to point of sale, depreciation, amortisation, group overheads, butincluding selling costs. The UC RUSAL Alumina Cash Operating represents a production-weighted average of ex-works cash costs at UC RUSAL alumina refineries in the periodspecified.
The Aluminium Cash Operating Cost data provided represents the average cost of producing onetonne of aluminium product, excluding depreciation, amortisation, group overheads, butincluding selling and distribution costs to port for onward shipping. The UC RUSAL AluminiumCash Operating Cost represents a production-weighted average of Cash Operating Costs at UCRUSAL aluminium smelters in the period specified.
Aluminium Cash Operating data for 2006 and 2007 for each facility was not provided in a formatthat allowed direct comparison with data provided for the first half of 2009. The data providedfor the period 2006 and 2007 was at the level of consolidated UC RUSAL and did not permitreview, analysis and reconciliation for each facility.
Table 2.21 shows historical Cash Operating Costs for alumina refineries and aluminium smelters.
APPENDIX VI INDEPENDENT TECHNICAL REPORT
— VI-81 —

Table 2.21: Cash Operating Costs, 2006 — H1 2009(1)
Average Cash Operating Cost (US$/tonne)
Categories
Year Ended 31 December 6 months to30 June2009(a)2006(a) (2) 2007(a) 2008(a)
Alumina Refineries . . . . . . . . . . . . . . 225 285 349 249
Aluminium Smelters . . . . . . . . . . . . . . 1,488 1,778 1,915 1,402
a = actual
Note: (1) All data has been provided by UC RUSAL and has not been verified by Hatch. (2) 2006 data corresponds toformer RUSAL plants only.
Table 2.22 presents average Alumina Cash Operating Costs for each facility and the UC RUSALconsolidated average for the first half of 2009.
Table 2.22: Alumina Cash Operating Costs in H1 2009(1)
Asset
Total PlantProductionH1 2009, kt
UC RUSALinterest(2)
%
UC RUSALAttributableProduction(3)
AluminaCash CostH1 2009
($/t)
Queensland Alumina Ltd. (QAL) . . . . . . . . . 1,927 20.0 385 249
Fria Alumina Refinery . . . . . . . . . . . . . . . . 272 100.0 272 237
Aughinish Alumina . . . . . . . . . . . . . . . . . . 565 100.0 565 267
Eurallumina . . . . . . . . . . . . . . . . . . . . . . . 92 100.0 92 378
Alpart . . . . . . . . . . . . . . . . . . . . . . . . . . . 227 65.0 147 268
Windalco (Ewarton and Kirkvine Works) . . . . 165 93.0 153 261
Bogoslovsk Alumina Refinery (BAZ) . . . . . . 500 100.0 500 254
Achinsk Alumina Refinery (AGK) . . . . . . . . 452 100.0 452 177
Urals Alumina Refinery (UAZ) . . . . . . . . . . 349 100.0 349 261
Boxitogorsk Alumina Refinery (BGZ) . . . . . . 60 100.0 60 489
Nikolaev Alumina Refinery (NGZ) . . . . . . . . 733 100.0 733 261
Zaporozhye Alumina Refinery (ZALK) . . . . . 29 97.6 29 363
TOTAL . . . . . . . . . . . . . . . . . . . . . . . . . . 5,370 3,738 249
Note:
(1) All data has been provided by UC RUSAL and has not been verified by Hatch.
(2) Equity ownership as at 15 September 2009.
(3) Attributable production calculated on equity ownership interest as of 15 September 2009, with the exception ofthe following plants which are presented on a 100% plant production basis to reflect UC RUSAL effective controlof finished product: ZALK.
APPENDIX VI INDEPENDENT TECHNICAL REPORT
— VI-82 —

Figure 2.6 illustrates the historical breakdown of Alumina Cash Operating Costs by major costcomponent.
Figure 2.6: Average Alumina Cash Operating Costs, 2006 - H1 2009
Note: The sum of the cost components may not equal the total presented in Table 2.20 due to rounding. (1) 2006 datacorresponds to former RUSAL plants only.
Source: UC RUSAL
Table 2.23 presents average Aluminium Cash Operating Costs for each facility and the UCRUSAL consolidated average for the first half of 2009.
APPENDIX VI INDEPENDENT TECHNICAL REPORT
— VI-83 —
Table 2.23: Aluminium Cash Operating Costs in H1 2009(1)
Asset
Total PlantProductionH1 2009, kt
UC RUSALinterest(2)
%
UC RUSALAttributableProduction(3)
AluminiumCash CostH1 2009
($/t)
Bratsk Aluminium Smelter (BrAZ) . . . . . . . . 488 100.0 488 1,282
Krasnoyarsk Aluminium Smelter (KrAZ) . . . . 471 100.0 471 1,338
Sayanogorsk Aluminium Smelter (SAZ) . . . . 261 100.0 261 1,375
Novokuznetsk Aluminium Smelter (NkAZ) . . 128 100.0 128 1,433
Irkutsk Aluminium Smelter (IrkAZ) . . . . . . . 169 100.0 169 1,468
Khakas Aluminium Smelter (KhAZ) . . . . . . . 147 100.0 147 1,231
Bogoslovsk Aluminium Smelter (BAZ) . . . . . 62 100.0 62 1,597
Volgograd Aluminium Smelter (VgAZ) . . . . . 73 100.0 73 1,547
Urals Aluminium Smelter (UAZ) . . . . . . . . . 46 100.0 46 1,713
Nadvoitsy Aluminium Smelter (NAZ) . . . . . . 28 100.0 28 1,524
Kandalaksha Aluminium Smelter (KAZ) . . . . 28 100.0 28 1,523
Volkhov Aluminium Smelter (VAZ) . . . . . . . 6 100.0 6 1,770
Alukom Taishet Aluminium Smelter . . . . . . . 2 100.0 2 1,404
Kubikenborg Aluminium (KUBAL) . . . . . . . 33 100.0 33 2,115
Zaporozhye Aluminium Smelter (ZALK) . . . . 36 97.6 36 2,240
ALSCON . . . . . . . . . . . . . . . . . . . . . . . . . 2 85.0 2 3,916
TOTAL . . . . . . . . . . . . . . . . . . . . . . . . . . 1,980 1,980 1,402
Note: (1) All data has been provided by UC RUSAL and has not been verified by Hatch. (2) Equity ownership as at 15September 2009. (3) Attributable production calculated on equity ownership interest as of 15 September 2009, with theexception of the following plants which are presented on a 100% plant production basis to reflect UC RUSAL effectivecontrol of finished product: ALSCON and ZALK.
APPENDIX VI INDEPENDENT TECHNICAL REPORT
— VI-84 —
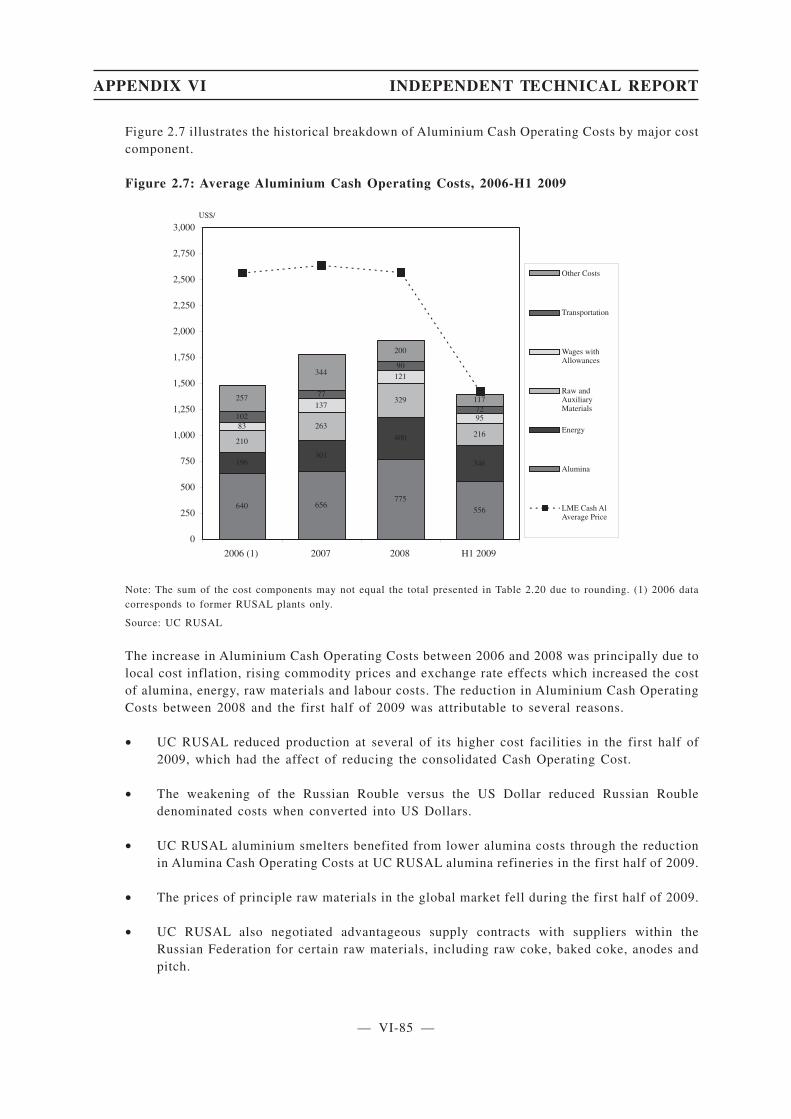
Figure 2.7 illustrates the historical breakdown of Aluminium Cash Operating Costs by major costcomponent.
Figure 2.7: Average Aluminium Cash Operating Costs, 2006-H1 2009
2006 (1) 2007 2008
656556
301346
263216
137
95
77
72
257
344
200
117
640775
196
400210
329
83
121
102
90
0
250
500
750
1,000
1,250
1,500
1,750
2,000
2,250
2,500
2,750
3,000
Other Costs
Transportation
Wages withAllowances
Raw andAuxiliaryMaterials
Energy
Alumina
LME Cash AlAverage Price
US$/
H1 2009
Note: The sum of the cost components may not equal the total presented in Table 2.20 due to rounding. (1) 2006 datacorresponds to former RUSAL plants only.
Source: UC RUSAL
The increase in Aluminium Cash Operating Costs between 2006 and 2008 was principally due tolocal cost inflation, rising commodity prices and exchange rate effects which increased the costof alumina, energy, raw materials and labour costs. The reduction in Aluminium Cash OperatingCosts between 2008 and the first half of 2009 was attributable to several reasons.
• UC RUSAL reduced production at several of its higher cost facilities in the first half of2009, which had the affect of reducing the consolidated Cash Operating Cost.
• The weakening of the Russian Rouble versus the US Dollar reduced Russian Roubledenominated costs when converted into US Dollars.
• UC RUSAL aluminium smelters benefited from lower alumina costs through the reductionin Alumina Cash Operating Costs at UC RUSAL alumina refineries in the first half of 2009.
• The prices of principle raw materials in the global market fell during the first half of 2009.
• UC RUSAL also negotiated advantageous supply contracts with suppliers within theRussian Federation for certain raw materials, including raw coke, baked coke, anodes andpitch.
APPENDIX VI INDEPENDENT TECHNICAL REPORT
— VI-85 —

• UC RUSAL benefited from improved operating efficiency through the reduction in the unitconsumption per tonne of aluminium produced of certain raw material inputs at certainfacilities.
• UC RUSAL took the decision at several aluminium smelters to reduce operating costs bynot relining reduction cells as they approached the end of their life or failed. This resultedin a significant reduction in UC RUSAL consolidated pot relining costs in the first half of2009. It should be noted that such a cost reduction is not sustainable over themedium-to-long term.
2.3.7.2 Capital Costs
Development Capital Expenditure
Developmental capital expenditure includes all projects which provide benefit through increasedproduction both at brownfield and greenfield sites. Table 2.24 presents historical developmentcapital expenditure for UC RUSAL alumina refineries and aluminium smelters.
UC RUSAL sharply reduced development capital expenditure in the first half of 2009 as itcancelled or temporarily suspended the majority of its major development projects. Thisapproach was common across the aluminium industry as a number of UC RUSAL’s peers alsoannounced delays or cancellations to development projects as a practical approach to reduce cashoutgoings during this period of economic uncertainty.
UC RUSAL has an extensive portfolio of development projects at various stages of development.Refer to Section 2.3.8.
Table 2.24: UC RUSAL Development Project CAPEX, 2006 — H1 2009
Developmental Capex ($US million, inc. VAT)(1)
Year Ended 31 December
Year Ended 31 December6 months to
30 June
2006(a)(2) 2007(a) 2008(a) 2009(a)
Alumina Refineries . . . . . . . . . . . . . . 163.7 172.0 127.2 2.4
Aluminium Smelters(3) . . . . . . . . . . . . 712.8 1,127.9 964.3 113.0
a = actualNote:(1) All data has been provided by UC RUSAL and has not been verified by Hatch.(2) Does not include former SUAL and Glencore assets.(3) Includes Boguchanskaya HPP.
Sustaining Capital Expenditure
Sustaining capital expenditure includes all costs related to the replacement of major items ofequipment, overhauls and environmental upgrades. All costs associated with the maintenance ofthe facilities by REC are not included, as they are included in operating costs.
UC RUSAL sharply reduced sustaining capital expenditure in the first half of 2009 in responseto the deteriorating market environment within the aluminium industry in this period. Thereduction in capital expenditure is consistent with the notion that sustaining capital projects ata particular facility can be deferred for a short period of time, although in order to maintain thefacility to ensure on-going efficient, safe and environmentally compliant operations, there willbe a requirement for the sustaining capital allocation to increase in subsequent years.
APPENDIX VI INDEPENDENT TECHNICAL REPORT
— VI-86 —

Table 2.25: UC RUSAL Sustaining CAPEX, 2006 — H1 2009
Sustaining Capex ($US million, inc. VAT)(1)
Year Ended 31 December
Year Ended 31 December6 months to
30 June
2006(a)(2) 2007(a) 2008(a) 2009(a)
Alumina Refineries(3) . . . . . . . . . . . . . 42.0 203.4 106.1 26.2
Aluminium Smelters(3) . . . . . . . . . . . . 79.5 180.5 82.2 6.2
a = actualNote:(1) All data has been provided by UC RUSAL and has not been verified by Hatch.(2) Does not include former SUAL and Glencore assets.(3) No breakdown was provided between smelter and refinery sustaining capital at the integrated operations of BAZ,
UAZ and ZALK. UC RUSAL advised Hatch for the purposes of this table to assume that total sustaining capitalat these facilities is divided approximately into alumina refinery (80%) and aluminium smelter (20%).
2.4 Conclusions
2.4.1 Joint Hatch and SRK Conclusions
Hatch and SRK jointly concluded that:
• Facilities generally appear to be well managed at an operating level.
• Management’s technical knowledge and understanding appear to be of a sufficient level tosupport short to medium term planning as appropriate.
• Material risks identified appear to be understood by plant management. Appropriate actionto mitigate these risks is either being taken or is under discussion.
• Long-term planning requires greater attention and focus.
2.4.2 Hatch Conclusions
Hatch concludes, from its specific scope of work, that:
• Ore processing, process and downstream plants and associated infrastructure appear to becapable of supplying products of the quality required to satisfy the relevant markets at theproduction levels planned by UC RUSAL, not withstanding the additional care andmaintenance requirements required for some of the more mature installations.
• Much progress has been made in the education of the whole workforce in improving safetyperformance, and the Company provides good training and support for workers safety andwelfare which should continue the improvement in these areas.
• Environmental issues appear to be managed in accordance with current local requirementsand there are no apparent issues that may materially impede production, subject to changesin regulations.
• Management operates a management accounting system based on SAP which is able toextract data and report in accordance with both Russian Accounting Standards and IFRS,where required. Management is able to monitor and forecast production and cost parameterswhich should provide more controllability and transparency as the organisation matures.
APPENDIX VI INDEPENDENT TECHNICAL REPORT
— VI-87 —

2.4.3 SRK Conclusions
SRK concludes, from its specific scope of work, that:
• Geological investigation and interpretation have been carried out according to the standardsrequired and are appropriate.
• The short term and annual mine plans appropriately consider geological and geotechnicalfactors to minimise mining hazards.
• The operating mining units are capable of continuing to supply products to satisfy thecurrent demands of the downstream refineries and plants and generally have the capacityto increase production given relatively modest capital investment.
• Operations at Alpart and Windalco have been suspended and the mines (and refineries)placed under care and maintenance. This may have future implications on the respectivelicences held by UC RUSAL or its subsidiaries.
• The Company would benefit from long term planning of its mineral assets which would addvalue in terms of increasing the Ore Reserves base and its flexibility to respond to changesin the market.
• The mine operating costs have on the whole decreased between 2008 and H1 2009, andsome substantially. UC RUSAL forecast operating costs are based on H1 2009 and are lowerin some cases. The volatility in operating costs between 2007, 2008, H1 2009 and H2 2009impacts on the confidence which SRK attributes to these forecasts.
• In general, UC RUSAL’s mining equipment (either in place or planned in the capitalforecasts) is suited to its mine plans and adequate for the production levels forecast.
• As a result of the global downturn, UC RUSAL has curtailed or deferred capital expenditureat its operations and projects. The effect of this in the short to medium term cannot bequantified, however may be significant, especially should capital expenditure cuts need tocontinue.
3. Mining Operations
3.1 Alpart Bauxite Mine
3.1.1 Introduction
SRK undertook a site visit to the Alpart Bauxite Mine in October 2008. The site visit report hassubsequently been revised and updated based upon data and information from UC RUSAL anddiscussions held with senior management in September 2009. However, SRK may not be fullyinformed of all changes which have taken place and hence some descriptions may be out of date.
In March 2009, operations at the mine and refinery were suspended and these were placed undercare and maintenance. SRK understands this to be due to the lack of demand and the drop inprices received on the open market for alumina.
3.1.2 History and Location
Aluminium Partners of Jamaica (“Alpart”), is situated on the Caribbean island of Jamaica, lyingsome 150 km south of Cuba and 160 km west of Haiti. The island measures 200 km from E toW and 65 km from N to S, and has a population of some 2.6 million.
APPENDIX VI INDEPENDENT TECHNICAL REPORT
— VI-88 —
Alpart is a joint venture between UC RUSAL and Hydro. The complex comprises an aluminarefinery, a shipping port (Port Kaiser) and a bauxite mine. The production volume of Alpart issome 1.65 Mt of alumina annually.
The terrain of Jamaica is mostly mountainous with narrow, discontinuous coastal plain. Therelief ranges from 0 m at the Caribbean sea level to 2,256 m at the peak in the Blue Mountain.Access to all mining areas is excellent via tarred roads, and the island is accessible by a numberof international flights via international airports.
The climate is tropical, hot and humid with temperate interior. The island has in the past beensubjected to hurricanes, and was particularly affected by hurricane Ivan in 2004. Temperaturesare fairly constant averaging around 26�C. The wind prevails from the east or northeast andbrings rains to the island with an average rainfall of 190-380 cm per annum.
Bauxite was discovered in the 1930s when a farmer sent soil for analysis as certain portions ofhis land failed to yield crops, and the result identified the high alumina in the soils.
Mining in the Alpart area commenced in the 1950s in the valley deposits located near to therefinery site. Valley deposit mining was abandoned in the 1970s due to processing issues relatingto the pisolites, lower available alumina and high SiO2 content, which resulted in higherprocessing costs and low alumina production. Production since has concentrated on the plateautype deposits.
Alpart currently holds one mining licence, SML-167 (Plateau, Essex Valley and Malvern), oneexploration licence SEPL-541 (Outside Valley), and has a contract agreement to mine portionsof a further licence SML-130 (Plateau) owned by third party company Jamalco. As far as SRKunderstands, these licences are all currently valid and are annually renewed with the JamaicanBauxite Institute (“JBI”).
The Jamalco agreement states 25 Mt (dry) to be mined up to 2014, with options for extensions.Excluding the Jamalco licence, some 55% of the surface rights within the Alpart licences areowned by either Alpart or the government which makes these areas immediately accessible formining. The remaining 45% is privately owned, and will require land acquisition and possibleresettlement of residents if economically viable before mining can commence.
In addition, Alpart has a signed 30-year agreement dated 2005 which obliges the government toguarantee suitable quantities and qualities of bauxite resource areas to meet the plantrequirements for the period of the agreement. This material cannot be reported as either MineralResource or Ore Reserve in accordance with the JORC Code.
3.1.3 Geology
Bauxite deposits are generally located across the central portion of the island and cover asignificant area of the land. The geology of the island comprises Cretaceous Basement complexof volcanic, volcaniclastics and intrusives, Post Cretaceous trough sediments, volcanic andintrusives and Tertiary white/yellow limestones which conformably overly the older rock typesand cover approximately 70% of the island.
Jamaican bauxites and bauxitic clays of commercial quality are deep red in colour, overlayTertiary white limestones and often occur in association with faulting of the limestone. Thefaulting resulting in major elevation differences allows the separation of the bauxites intoPlateau and Graben/Valley types. The deposits are overlain by an average of 0.6 m topsoil whichis kept and used for restoration.
APPENDIX VI INDEPENDENT TECHNICAL REPORT
— VI-89 —

Plateau type bauxites contain predominantly haematitic, gibbsitic bauxite (“THB”) with <3%goethite and <3% boehmite, whereas Graben/Valley type bauxites contain predominantlygibbsitic goethitic with >3% boehmite (“MHB”) as the gibbsite transforms to boehmiteconcurrently with the haematite to goethite transition.
The Jamaican bauxite deposit occurrences are strongly correlated with water tables lyingsignificantly below the surface and are found to lie on the karstic weathered surface of theTertiary limestones with an extremely sharp contact with no transition whatsoever. The origin ofthe bauxites is thought to have been from the bauxitisation of volcaniclastic material depositedsub-aerially which filled in the karstic topography.
Deposits exhibit considerable variations in size ranging from less than 1 wet tonne to in excessof 1,000 wet tonnes, down to maximum depths of around 40 m. The Graben/Valley type depositsare generally deeper than the Plateau types.
The SML-167 Plateau deposits comprise mature THB bauxites in pockets/lenses infilling thehigh relief karstic weathered limestones. The deposits average around 7,500 m2 in area, 3.4 mthickness, and 25,000 dry tonnes.
The SML-167 Essex Valley Graben/Valley deposits comprise MHB bauxites in pocket/lense typelow-elevation bauxites infilling low relief karstic surface. The deposits average around 13 m inthickness and are similar in size to the Plateau deposits averaging around 25,000 dry tonnes. Thebauxites may suffer in terms of processability due to high pisolite content and potentially higherHaematite/Goethite ratios.
The SML-167 Malvern Graben/Valley deposits comprise MHB bauxites, averaging around50,000 dry tonnes, but transform to more THB bauxites in the north.
The SML-130 Plateau deposits are owned by Jamalco, but extracted by Alpart, and comprisesmainly mature THB bauxites in overlapping pocket/blanket type infill in high relief karsticsurface, averaging 24,000 m2 in area, 4.3 m thick on average, but up to 20 m thick in places, and130,000 dry tonnes.
In addition, the SEPL-541 Outside Valley exploration permit contains MHB Graben/Valleybauxites, currently being explored, which average around 50,000 dry tonnes.
The Alpart bauxites typically have the following properties: bulk density of 1.75 t/m3, moisturecontent of around 21.4%, alumina content between 38-47%, and silica content between 1-8%.
The bauxites in Jamaica are very patchy, pocket-like and discontinuous, generally because of thehighly undulating and variable karstic weathered limestone footwall. The grade continuity is alsovariable within the pockets of bauxite, however the average chemistry and grade of individualdeposits in comparison with adjacent geologically separate deposits are very similar. Therefore,on a deposit-scale the grade continuity may be poor-moderate, but on a more regional scale,moderate-good. The Alpart deposits are generally much smaller in average tonnage whencompared to those deposits at Windalco.
However, the poor geological continuity is helped considerably by the fact that areas wherebauxite has “very high potential” to be found, it can be easily delineated from aerial/satelliteimagery, due to the fact that the deep red coloured bauxites are clearly visually distinguishablefrom the footwall limestones which are white in colour.
The THB and MHB bauxites at Alpart are blended together and processed in a high temperatureBayer process.
APPENDIX VI INDEPENDENT TECHNICAL REPORT
— VI-90 —

3.1.4 Mineral Resources and Ore Reserves
Resource estimates are undertaken using a combination of approaches mainly utilisingaerial/satellite photo imagery, outcrop mapping and continuous flight auger drilling. Bauxitetargets are initially identified from photo imagery as they are clearly visible due to the lack ofvegetative cover, following this surface mapping and ground truthing is undertaken which tendsto eliminate around 50% of the bauxite targets and finally auger drilling is undertaken on widegrids (approximately 100 m) stepping down eventually to 30 m and 15 m grids prior to mining.
Samples are collected from the auger drilling at 3 m intervals, with adjustments made to lengthsto enable them to tie in with reference bench elevation levels. Samples are reduced and preparedprior to analysis using standard accepted practices and are then analysed both elementally andmineralogically using X-Ray Fluorescence (“XRF”) and quantitative X-Ray Diffraction (“XRD”)techniques and bomb digest tests for available alumina and Reactive Silica (“RSI”). Qualitycontrol and quality assurance are monitored at the laboratory to a satisfactory level including theregular use of standards, duplicates and external laboratory checks.
Recent confirmatory drilling has been undertaken to confirm historical “book tonnages”calculated by previous owning companies and to calculate in-house resource estimates in a morerobust manner. This work has resulted in factors being calculated to adjust “book tonnages” tobe more in-line with current estimates.
Alpart’s Mineral Resources estimate is undertaken using a combined approach of GIS (ArcGIS),Microsoft Access Databases and Vulcan Mining Software. The methodology is fairly simple dueto the nature of the bauxites and follows a logical system. Deposit estimates of tonnages andgrade comprise both adjusted historical “book” estimates, recent Vulcan 3D estimates andestimates interpolated from surrounding deposits that have been explored in detail. The highestconfidence estimates completed in Vulcan, which reconcile well with the plant, are onlycomplete for a small percentage of the deposits, some three months in advance of mining.
The resultant resource/reserve information for all deposits is stored in ArcGIS with exportsproduced in Microsoft Excel format containing detailed information for every deposit, includingfields such as bauxite area, tonnages, grades, land-ownership status, drillhole information type,mining/restoration status, mined quantities, etc.
SRK comments that the geology and major controls of the bauxite are well understood enablingsufficient confidence in the modelling of the bauxite. The poor geological continuity due to thekarstic weathered footwall is counteracted somewhat by the visually clear contact between thedeep red bauxite and the white limestone footwall. The data quality and quantity is consideredsufficient for classification into the Measured, Indicated and Inferred Mineral Resourcecategories as defined by the JORC Code, especially given the good reconciliations.
In order to classify the Mineral Resources, SRK has assessed land-ownership, drilling status,drilling density and sterilisation, and only included deposits considered potentially economic byapplying cut-off grades (“CoG”) of >38% available alumina, <10% SiO2 and a minimum depositsize of 5,000 wet tonnes. Re-drilled drilling grids of 15 x 15 m are considered Measured MineralResource, 30 x 30 m or historical drilling as Indicated Mineral Resource and historical data >30x 30 m or interpolated from adjacent deposits as Inferred Mineral Resource. All tonnages arereported in dry metric in-situ tonnes without the application of any other “modifying factors”.
APPENDIX VI INDEPENDENT TECHNICAL REPORT
— VI-91 —

Table 3.1: Alpart Mineral Resource and Ore Reserve Statement (1 July 2009)(1), (2), (3), (4), (5)
Ore Reserve Mineral Resource
Tonnage Al2O3 SiO2 Tonnage Al2O3 SiO2
(Mt Dry) (%) (%) (Mt Dry) (%) (%)
Proved . . . . . . — — — Measured . . . . 15.2 43.0 2.4
Probable. . . . . — — — Indicated . . . . 40.7 40.7 2.2
Total . . . . . . . — — — Subtotal . . . . 55.9 41.3 2.3
Inferred . . . . . 38.0 45.3 2.0
Total . . . . . . 93.9 42.9 2.2
(1) All references to Mineral Resources and Ore Reserves are stated in accordance with the JORC Code.
(2) Mineral Resources and Ore Reserves are recorded on an unattributed, or 100% basis.
(3) Alumina grades are presented as available as opposed to total alumina.
(4) Silica grades are presented as reactive as opposed to total silica.
(5) Mineral Resources are inclusive of Ore Reserves.
No Ore Reserves are stated for Alpart as the operations have been suspended.
3.1.5 Mining Operations and Infrastructure
Until the suspension in March 2009, bauxite was mined from the Manchester Plateau anddelivered to the Refinery (situated in the Essex Valley) by means of a 17 km belt conveyor. Twogrades of bauxite were mined, MHB and THB, with the approximate feed mixture at 70% MHBand 30% THB. On the Manchester Plateau, there is a contractual arrangement between Alpart andJamalco for mining of up to 25 Mt of MHB and THB before 2014 from within the Jamalco licencearea.
In the years preceding 2005, the mine operations were undertaken by an international miningcontractor, but since liquidation of that company the mining has been undertaken mainly as anowner-miner operation.
The mining method is typical for Jamaica and is based upon truck/shovel operations. The miningis more onerous on the Manchester Plateau, as the average size of future pits is only 25,000 drytonnes, equivalent to only two to three days of production. The emphasis for mining is moredirected onto the access into the mining areas rather than actual production.
Selective mining techniques are used, and because of the variation in grades between deposits,bauxite is mined from several orebodies simultaneously. It is common to mine two or three pitsat the same time to provide more consistent grades for the blending processes, which take placeat the stockpile area. Mobile loaders feed blended bauxite from the stockpile onto the conveyorbelt and away to the processing plant approximately 17 km distant.
Local contractors are being used to mine small pits especially near to dwellings and localcommunities, also to rehandle and crush the rejected material from the seizer, at both loadingpoints.
Grade control at Alpart is undertaken in order for the processing plant to make adjustmentsrelating to the feed bauxite quality. No further in-pit sampling is undertaken, however samplesare collected from the cable belt on a routine basis and composited to provide three shift samplesa day. These samples are subjected to the same analysis as for standard auger drilling samples.It is understood that no further stockpile or blending sampling is undertaken on a routine basis.
APPENDIX VI INDEPENDENT TECHNICAL REPORT
— VI-92 —
3.1.6 Environmental and Social Considerations
The criteria used for the environmental and social assessment are those required by relevant hostcountry legislation and generally accepted practices in the mining industry. Jamaica’s NationalEnvironment Planning Agency (“NEPA”) is the executive agency responsible for protection ofthe environment and promotion of sustainable development. The other key players are theCommissioner of Mines and JBI both under the Ministry of Mining and Telecommunications.
UC RUSAL has a formal management system in place which is ISO 14001 accredited.
Mining is carried out in close proximity to human settlements therefore the key issues arefugitive dust, land acquisition, compensation and timely restoration of mined out land. Alpart isresponsible for management of environmental and social issues. The key programmes are landrehabilitation, land acquisition and compensation against impacts related to dust and noise.
Alpart appears to enjoy a good relationship with Government agencies; communication is goodand the mine is aware of likely changes in legislation that will affect it. Alpart also has regularmeetings with community representatives, and there is extensive support of communitydevelopment projects.
Alpart holds regular meetings with community representatives who constitute the AlpartCommunity Council. There is extensive support for community development projects focusingon education, sport, agriculture and general wellbeing of the community. Therefore the generalrisk of community displeasure is considered low except for community concern overresettlement.
Land negotiations are on a one to one basis rather than any collective of land owners, resultingin a situation where some landowners receive less compensation than others. In this respect thecurrent processes are not aligned with the internationally accepted resettlement action planprocess (IFC 2002).
Alpart has a large backlog of unrestored land (about 3,000 acres in the beginning of 2008) dueto a slower rate of restoration. Although Alpart has begun the process of clearing this backlogby bringing in contractors with additional equipment, it will take at least 3 years. Under theMining Regulations 1947 (as amended in 2005) the Government can penalise a mining companyif it fails to restore disturbed land within 3 years. Therefore if there are any further delays theycould lead to Government penalties.
Fugitive dust around the mine has led to complaints and was observed during the site visit.Although ambient air quality monitoring indicates compliance with the legal limits for the mine,it is expected that nuisance dust, particularly during the dry season, may lead to additional claimsfor compensation in highly populated areas.
The asset retirement obligation at 1 July 2009 has been estimated by UC RUSAL to beUS$22.5 m on an attributable basis. SRK has not reviewed this number, and is unaware of whatit includes. However it excludes terminal benefits associated with any eventual termination ofemployments. SRK has not seen a cost estimate for mine closure at the end of the life of the mine,including bio-physical costs and terminal benefits.
3.1.7 Technical and Economic Assessment
The following points are made in respect of the production and cost parameters in support of theOre Reserves:
• No Ore Reserve has been reported for Alpart due to the suspension of the operations inMarch 2009.
APPENDIX VI INDEPENDENT TECHNICAL REPORT
— VI-93 —

Table 3.2: Alpart historical production and cost statistics(1), (2), (3)
Statistics Units 2006 2007 2008 H1 2009
Production
Tonnage . . . . . . . . . . . (Mt wet) 4.99 4.48 4.98 0.37
Grade . . . . . . . . . . . . . (% Al2O3) 44.8 44.6 43.5 44.0
Factor . . . . . . . . . . . . . (tbauxite:talumina) 2.39 2.40 2.43 2.40
Expenditures
Cash operating cost . . . . (US$m) 42.7 81.5 95.5 n/a
Cash costs per unit . . . . (US$/t) 8.56 18.20 19.16 n/a
Capital expenditure . . . . (US$m) 9.0 7.7 2.3 n/a(1) Grades are given as available alumina.(2) All numbers are reported on a 100% attributable basis.(3) n/a — not available.
3.1.8 Material Developments
Since SRK’s site visit in October 2008, Alpart has been placed under care and maintenancefollowing suspension of the operations. The cost the care and maintenance programme associatedwith the mine, has been estimated at some US$0.1 m per annum.
3.1.9 Specific Risks and Future Opportunities
Specific risks to the operation include:
• Production Re-Start — a number of aspects may present risk if or when productionresumes.
• Land ownership and community issues on future mining areas, such as Malvern Plateau,mainly concerned with the purchase of properties within the “reserve area”. Historically,Alpart has successfully bought approximately 50% of the properties available. The concernover land owners rights and possible issues over resettlement issues are seen as minimal.There is a risk of a reserve shortfall if drilling in advance of mining and private landacquisitions are not done in timely manner.
• Government Intervention — The Government may intervene on mining rights if Alpartdoes not catch up on their restoration backlog.
• Processing of Future Reserves — Processability issues for pisolites at Alpart may lead tolower recovery. The Reserve base is mainly monohydrate whereas they are currentlyprocessing 2.3:1 split MHB:THB. Double digestion may be required in the future.
Future opportunities to the operation include:
• Ore Reserves — whilst no Ore Reserve has been reported, this is due to the state ofsuspended operation and no firm plan being in place for re-commencement of production.
3.2 Windalco Bauxite Mines
3.2.1 Introduction
SRK undertook a site visit to the Windalco Bauxite Mine in October 2008. The site visit reporthas subsequently been revised and updated based upon data and information from UC RUSALand discussions held with senior management in September 2009. However, SRK may not befully informed of all changes which have taken place and hence some descriptions may be outof date.
APPENDIX VI INDEPENDENT TECHNICAL REPORT
— VI-94 —

In March 2009, operations at the mine and refinery were suspended and these were placed undercare and maintenance. SRK understands this to be due to the lack of demand and the drop inprices received on the open market for alumina.
3.2.2 History and Location
West Indies Aluminium Company (“Windalco”) is situated on the Caribbean island of Jamaica,lying some 150 km south of Cuba and 160 km west of Haiti. The island measures 200 km fromE to W and 65 km from N to S, and has a population of some 2.6 million.
Windalco is a joint venture between UC RUSAL and the Government of Jamaica. Windalcocomprises two alumina refineries (Ewarton and Kirkvine works), a shipping port (Port Esquivel),and also bauxite mines in Swallenburgh (Ewarton) and Rusell Place (Kirkvine) and farms inManchester and St Ann. The production volume of the company is some 1.2 million tonnes ofalumina annually. Currently Windalco employs in excess of 1000 people.
The terrain of Jamaica is mostly mountainous with narrow, discontinuous coastal plain. Therelief ranges from 0 m at the Caribbean sea level to 2,256 m at the peak in the Blue Mountain.
The climate is tropical, hot and humid with temperate interior. The island has in the past beensubjected to hurricanes. Temperatures are fairly constant averaging around 26�C. The windprevails from the east or northeast and brings rains to the island with an average rainfall of190-380 cm per annum.
Bauxite was discovered in the 1930s when a farmer sent soil for analysis as certain portions ofhis land failed to yield crops, and the result identified the high alumina in the soils.
Mining in the Kirkvine area was initiated in the 1950s in the plateau deposits. Mining in theEwarton area was initiated in the 1960s.
Windalco currently holds two mining licences and one exploration licence. As far as SRKunderstands, these licences are all currently valid and are annually renewed with the JBI. Themajority of the surface rights for the Windalco licences are privately owned by third parties. Pastexperience has shown that the majority of these areas become available for mining upon timelysurface rights acquisition and residents resettlement.
Bauxite from both the Ewarton and Kirkvine operations are processed at their respectiverefineries. None of the bauxite is exported.
3.2.3 Geology
Bauxite deposits are generally located across the central portion of the island and cover asignificant area of the land. The Geology of the island comprises Cretaceous Basement complexof volcanic, volcaniclastics and intrusives, Post Cretaceous trough sediments, volcanic andintrusives and Tertiary white/yellow limestones which conformably overly the older rock typesand cover approximately 70% of the island.
Jamaican bauxites and bauxitic clays of commercial quality are deep red in colour, overlayTertiary white limestones and often occur in association with faulting of the limestone. Thefaulting resulting in major elevation differences allows the separation of the bauxites intoPlateau types and Graben/Valley types. The deposits are overlain by an average of 0.6 m topsoilwhich is kept and used for restoration.
Plateau type bauxites contain predominantly THB with <3% goethite and <3% boehmite, whereasGraben/Valley type bauxites contain predominantly MHB as the gibbsite transforms to boehmiteconcurrently with the haematite to goethite transition.
APPENDIX VI INDEPENDENT TECHNICAL REPORT
— VI-95 —
The Jamaican bauxite deposit occurrences are strongly correlated with water tables lyingsignificantly below the surface and are found to lie on the karstic weathered surface of theTertiary limestones with an extremely sharp contact with no transition whatsoever. The origin ofthe bauxites is thought to have been from the bauxitisation of volcaniclastic material depositedsub-aerially which filled in the karstic topography.
Deposits exhibit considerable variations in size ranging from less than 1 wet tonne to in excessof 1000 wet tonnes, down to maximum depths of around 40 m. The SML-162 Plateau andGraben/Valley deposits at Ewarton comprise mainly mature THB bauxites in overlappingpocket/blanket type infill in high and low relief karstic surface and average around 100,000 drytonnes in size.
The SML161 Plateau and Graben/Valley deposits at Kirkvine comprise mainly mature THBbauxites in overlapping pocket/blanket type infill in high and low relief karstic surface andaverage around 160,000 dry tonnes in size. The deposits have been mined considerably in thepast with remaining deposits mainly exhibiting a much higher haematite to goethite ratio(“HGR”) in remaining Resources and Reserves. This has caused issues with processability, withthe problem compounded by the lack of HGR information in some 95% of the data for theremaining Mineral Resources. The Windalco bauxites typically have the following properties:bulk density of 1.63 t/m3, moisture content of around 20%, alumina content between 38-52%, andsilica content between 2-8%.
In comparison with other bauxite deposits around the world, such as Guinea, Australia, Guyana,Russia, the bauxites in Jamaica are pocket-like and discontinuous, generally because of thehighly undulating and variable karstic weathered limestone footwall. The grade continuity is alsovariable within the pockets of bauxite, however the average chemistry and grade of individualdeposits in comparison with adjacent geologically separate deposits are very similar. Therefore,on a deposit-scale the grade continuity may be poor-moderate, but on a more regional scale,moderate-good. The Windalco deposits are generally much larger in average tonnage whencompared to those deposits at Alpart.
However, the poor geological continuity is offset considerably by the fact that areas wherebauxite has “very high potential” to be found, it can be easily delineated from aerial/satelliteimagery, due to the fact that the deep red coloured bauxites are clearly visually distinguishablefrom the footwall limestones which are white in colour.
The THB bauxites are amenable to low temperature Bayer processing whereas the MHB bauxiteto high temperature Bayer processing.
3.2.4 Mineral Resources and Ore Reserves
Mineral Resource estimates are undertaken using a combination of approaches mainly utilisingaerial/satellite photo imagery, outcrop mapping and continuous flight auger drilling. Bauxitetargets are initially identified from photo imagery as they are clearly visible by the lack ofvegetative cover, following this surface mapping and ground truthing is undertaken which tendsto eliminate around 50% of the bauxite targets and finally auger drilling is undertaken on widegrids (approximately 100 m) stepping down eventually to 30 m and 15 m grids prior to mining.
Samples are collected from the auger drilling at 3 m intervals, with adjustments made to lengthsto enable them to tie in with reference bench elevation levels. Samples are reduced and preparedprior to analysis using standard accepted practices and are then analysed both elementally andmineralogically using XRF and quantitative XRD techniques. Quality control and qualityassurance are monitored at the laboratory to a satisfactory level including the regular use ofstandards, duplicates and external laboratory checks.
APPENDIX VI INDEPENDENT TECHNICAL REPORT
— VI-96 —
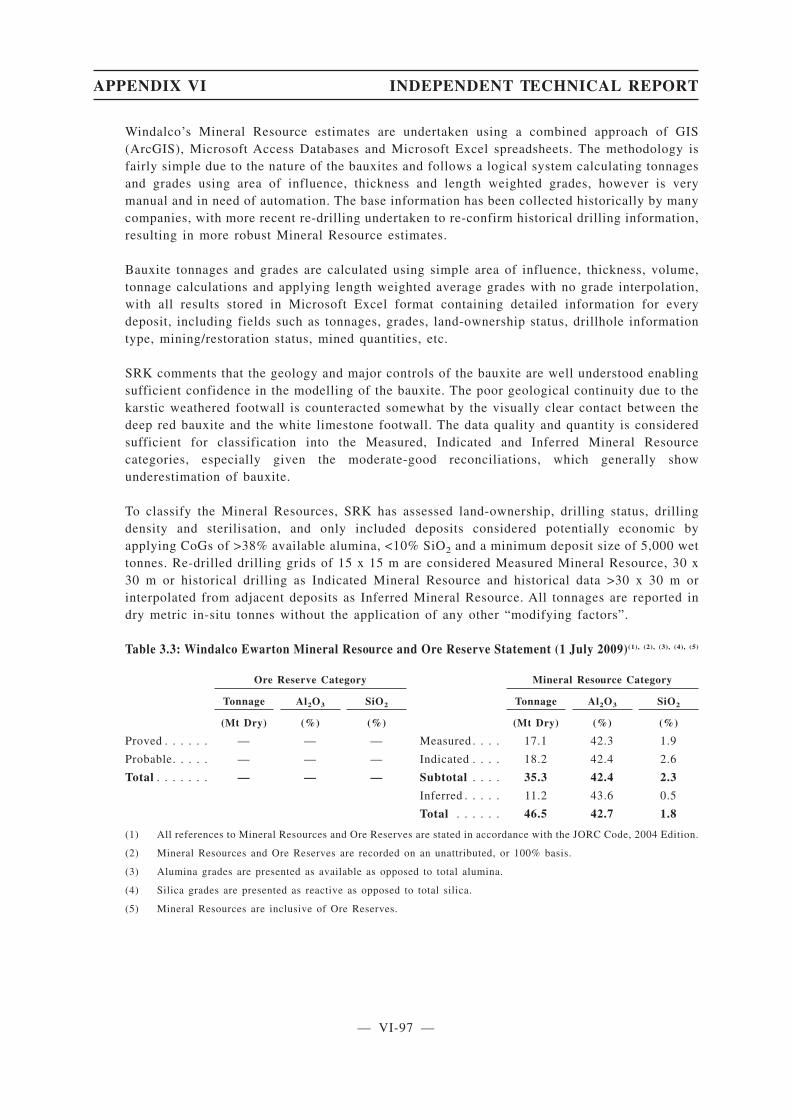
Windalco’s Mineral Resource estimates are undertaken using a combined approach of GIS(ArcGIS), Microsoft Access Databases and Microsoft Excel spreadsheets. The methodology isfairly simple due to the nature of the bauxites and follows a logical system calculating tonnagesand grades using area of influence, thickness and length weighted grades, however is verymanual and in need of automation. The base information has been collected historically by manycompanies, with more recent re-drilling undertaken to re-confirm historical drilling information,resulting in more robust Mineral Resource estimates.
Bauxite tonnages and grades are calculated using simple area of influence, thickness, volume,tonnage calculations and applying length weighted average grades with no grade interpolation,with all results stored in Microsoft Excel format containing detailed information for everydeposit, including fields such as tonnages, grades, land-ownership status, drillhole informationtype, mining/restoration status, mined quantities, etc.
SRK comments that the geology and major controls of the bauxite are well understood enablingsufficient confidence in the modelling of the bauxite. The poor geological continuity due to thekarstic weathered footwall is counteracted somewhat by the visually clear contact between thedeep red bauxite and the white limestone footwall. The data quality and quantity is consideredsufficient for classification into the Measured, Indicated and Inferred Mineral Resourcecategories, especially given the moderate-good reconciliations, which generally showunderestimation of bauxite.
To classify the Mineral Resources, SRK has assessed land-ownership, drilling status, drillingdensity and sterilisation, and only included deposits considered potentially economic byapplying CoGs of >38% available alumina, <10% SiO2 and a minimum deposit size of 5,000 wettonnes. Re-drilled drilling grids of 15 x 15 m are considered Measured Mineral Resource, 30 x30 m or historical drilling as Indicated Mineral Resource and historical data >30 x 30 m orinterpolated from adjacent deposits as Inferred Mineral Resource. All tonnages are reported indry metric in-situ tonnes without the application of any other “modifying factors”.
Table 3.3: Windalco Ewarton Mineral Resource and Ore Reserve Statement (1 July 2009)(1), (2), (3), (4), (5)
Ore Reserve Category Mineral Resource Category
Tonnage Al2O3 SiO2 Tonnage Al2O3 SiO2
(Mt Dry) (%) (%) (Mt Dry) (%) (%)
Proved . . . . . . — — — Measured . . . . 17.1 42.3 1.9
Probable. . . . . — — — Indicated . . . . 18.2 42.4 2.6
Total . . . . . . . — — — Subtotal . . . . 35.3 42.4 2.3
Inferred . . . . . 11.2 43.6 0.5
Total . . . . . . 46.5 42.7 1.8
(1) All references to Mineral Resources and Ore Reserves are stated in accordance with the JORC Code, 2004 Edition.
(2) Mineral Resources and Ore Reserves are recorded on an unattributed, or 100% basis.
(3) Alumina grades are presented as available as opposed to total alumina.
(4) Silica grades are presented as reactive as opposed to total silica.
(5) Mineral Resources are inclusive of Ore Reserves.
APPENDIX VI INDEPENDENT TECHNICAL REPORT
— VI-97 —

Table 3.4: Windalco Kirkvine Mineral Resource and Ore Reserve Statement (1 July 2009)(1), (2), (3), (4), (5)
Ore Reserve Category Mineral Resource Category
Tonnage Al2O3 SiO2 Tonnage Al2O3 SiO2
(Mt Dry) (%) (%) (Mt Dry) (%) (%)
Proved . . . . . . — — — Measured . . . . 11.6 42.5 2.1
Probable. . . . . — — — Indicated . . . . 27.5 42.1 2.0
Total . . . . . . . — — — Subtotal . . . . 39.1 42.2 2.0
Inferred . . . . . 0.5 43.6 1.8
Total . . . . . . 39.6 42.2 2.0
(1) All references to Mineral Resources and Ore Reserves are stated in accordance with the JORC Code, 2004 Edition.
(2) Mineral Resources and Ore Reserves are recorded on an unattributed, or 100% basis.
(3) Alumina grades are presented as available as opposed to total alumina.
(4) Silica grades are presented as reactive as opposed to total silica.
(5) Mineral Resources are inclusive of Ore Reserves.
3.2.5 Mining Operations and Infrastructure
The Windalco mining operations comprise two discrete areas, Ewarton and Kirkvine, which willbe discussed separately. Both operations are currently suspended.
Ewarton
In June 2006, a ten year mining contract was signed with Washington Group International for theexploration, drilling, mine development, post-mining reclamation and stockpile management.Windalco maintains responsibility for community relations and the long term mine plan.
The current mine operates on a full seven days a week schedule, utilising a 3-shift roster per day.The mining method is based on truck/shovel operation, with the bauxite mined from severalorebodies simultaneously.
No blasting is required of the bauxite and access to the bauxite is immediate from shallow pitsfollowing stripping of the thin topsoil by scrapers. The pits are generally shallow and are minedin 4.6 m lifts. The bauxite is loaded into haul trucks and dispatched to the stockpile.
Historically, the bauxite mined has been transported from the stockpile to the processing facilityby an aerial rope way, however due to increased tonnages beyond its capacity and congestion onpublic highways, an internal highway has been constructed through a fairly undulating terrain inorder to connect the stockpiles to the Ewarton alumina refinery. This road greatly improvesefficiency of hauling bauxite however faces its own challenges in terms of rock falls from slopesand contract miner discussions with regards to increased costs.
Haul trucks, including larger capacity road-trains are loaded by hydraulic excavator at thestockpiles for delivery to the plant. Auxiliary equipment is also available to provide permanentsupport to the mining, restoration and roads maintenance.
Grade control at Ewarton is undertaken in order for the processing plant to make adjustmentsrelating to the feed bauxite quality with samples being collected from the plant feed cable beltand going into the plant from the hopper on a routine basis. In addition, stockpiles are drilledand sampled twice a year. All of the grade control samples are subjected to the same analysis asfor standard auger drilling samples.
APPENDIX VI INDEPENDENT TECHNICAL REPORT
— VI-98 —

Kirkvine
Similarly to Ewarton, the mining method is based on conventional truck/shovel operations. Ingeneral, Kirkvine has a less variable quality parameter distribution in comparison to Ewarton,however, an increasing goethite-hematite ratio in planned and active mining areas has resultedin problems and required an extensive re-sampling programme to be initiated.
Mining and hauling is undertaken by contractor owned and operated equipment.
Mine operations are generally on a 5 day week 24 hr basis, but are restricted to a single shiftbasis where there is a proximity to local communities. Proximity to the mining of housing andcommunities is an issue at Kirkvine.
No overburden removal or blasting is required, and the small amount of topsoil is removed andstockpiled near the pit for further use in reclamation.
Ore is hauled to the stockpile in order to blend the bauxite and maintain the specified qualityparameters. Haul trucks or front end loaders feed directly into the reception hopper and onto thescreen and conveyor belt.
Grade control at Kirkvine follows the same general methodology as those employed at Ewarton.
SRK is confident that production levels can be maintained under the current working conditionsand production levels; however any significant increase in mine production may requireadditional transport equipment.
3.2.6 Environmental and Social Considerations
The criteria used for environmental and social assessment are those required by relevant hostcountry legislation and generally accepted practices in the mining industry. Jamaica’s NationalEnvironment Planning Agency is the executive agency responsible for protection of theenvironment and promotion of sustainable development. The other key players are theCommissioner of Mines and JBI both under the Ministry of Mining and Telecommunications.
UC RUSAL has a formal management system in place which is ISO 14001 accredited.
Mining is carried out in close proximity to human settlements therefore the key issues arefugitive dust, land acquisition, compensation and timely restoration of mined out land. Windalcois responsible for management of environmental and social issues. The main programmes areland rehabilitation, land acquisition and compensation against impacts related to dust and noise.
Windalco maintains consistent communication with relevant government agencies. It is aware oflikely changes in legislation that can affect them. Therefore the risk of new legislation orunexpected government enforcement is considered to be low.
Windalco supports community development projects in education, sport, agriculture and generalwellbeing. It spends approximately US$300 k per annum on local development projects with afurther US$100 k per annum spent on a corporate level on larger scale projects. Windalcoengages regularly with the stakeholders through the local community councils. The general riskof community displeasure is considered low.
Land negotiations are on a one to one basis rather than any collective of land owners, resultingin a situation where some landowners receive less compensation than others. In this respect thecurrent processes are not aligned with the internationally accepted resettlement action planprocess (IFC 2002).
APPENDIX VI INDEPENDENT TECHNICAL REPORT
— VI-99 —

Fugitive dust around the mines is likely to remain as a cause for complaints from theneighbouring communities. Although ambient air quality monitoring indicates compliance withthe legal limits for the mine, it is likely that nuisance dust, particularly during the dry season maylead to additional claims for compensation particularly at the Kirkvine operation.
The asset retirement obligation at 1 July 2009 has been estimated by UC RUSAL to beUS$14.67 m on an attributable basis. SRK has not reviewed this number, and is unaware of whatit includes. However it excludes terminal benefits associated with any eventual termination ofemployments. SRK has not seen a cost estimate for mine closure at the end of the life of the mine,including bio-physical costs and terminal benefits.
3.2.7 Technical and Economic Assessment
The following points are made in respect of the production and cost parameters in support of theOre Reserves:
• No Ore Reserve has been reported for Windalco due to the suspension of operations.
Table 3.5: Windalco historical production and cost statistics(1), (2), (3)
Statistics Units 2006 2007 2008 H1 2009
Production Ewarton
Tonnage . . . . . . . . . . . (Mt wet) 2.25 2.02 2.11 0.10
Grade . . . . . . . . . . . . . (% Al2O3) 42.6% 43.3% 43.4% 43.0%
Factor . . . . . . . . . . . . . (tbauxite:talumina) 2.88 2.56 2.58 2.59
Production Kirkvine
Tonnage . . . . . . . . . . . (Mt wet) 1.99 1.93 2.03 0.10
Grade . . . . . . . . . . . . . (% Al2O3) 42.5% 42.5% 42.5% 42.0%
Factor . . . . . . . . . . . . . (tbauxite:talumina) 2.85 2.75 2.70 2.78
Total expenditures
Cash operating cost . . . . (US$m) 72.2 90.0 83.4 n/a
Cash costs per unit . . . . (US$/t) 17.04 22.80 20.12 n/a
Capital expenditure . . . . (US$m) 2.5 0.0 0.7 n/a
(1) Grades are given as available alumina.
(2) All numbers are reported on a 100% attributable basis.
(3) n/a — not available.
3.2.8 Material Developments
Since SRK’s site visit in October 2008, Windalco has been placed under care and maintenancefollowing suspension of the operations. The cost of the care and maintenance programmeassociated with the mine, has been estimated at some US$0.072 m per annum.
3.2.9 Specific Risks and Future Opportunities
Specific risks at the Ewarton operation include:
• Production Re-Start — a number of aspects may present risk if or when productionresumes.
• Flooded Areas — Resource areas are affected by standing and artesian water.
APPENDIX VI INDEPENDENT TECHNICAL REPORT
— VI-100 —
Specific risks at the Kirkvine operation include:
• Production Re-Start — a number of aspects may present risk if or when productionresumes.
• Land ownership and community issues — Land ownership and community issues oncurrent areas such as Blue Mountain and future areas such as Coffee Grove.
• Bauxite Mineralogy — The quality of future bauxite reserves indicates an increasinghaematite/goethite ratio, which has a detrimental effect on the processing capability andcost profile. Much additional sampling is required to further improve the available data toassess the issue.
• Land Acquisition — The risk that sufficient land may not be acquired in time to ensureadequate drilling and testing of the potential resource base prior to mining. This iscompounded by an ad hoc land acquisition and resettlement process that has not beenformally agreed with affected communities.
• Government Intervention — The Government may intervene on mining rights if Alpartdoes not address their restoration backlog.
Specific future opportunities at the Ewarton and Kirkvine operations include:
• Ore Reserves — whilst no Ore Reserve has been reported, this is purely due to the stateof suspended operation and no firm plan being in place for re-commencement ofproduction.
3.3 Kindia Bauxite Mine
3.3.1 Introduction
SRK undertook a site visit to the Kindia Bauxite Mine in September 2008. The site visit reporthas subsequently been revised and updated based upon data and information from UC RUSALand discussions held with senior management in September 2009. However, SRK may not befully informed of all changes which have taken place and hence some descriptions may be outof date.
3.3.2 History and Location
The Kindia Mine (“Kindia”) in Guinea is operated by Compagnie des Bauxites de Kindia(“CBK”). The mine comprises of: bauxite mining facilities exploiting several mining areas; acrushing plant; a rail facility with two loading points at the mine, one off loading and a 130 kmsingle track rail line; the Simbaya site near Conakry with its main office facilities and railworkshops; and a port load out facility in Conakry. The state owned company, Société desBauxites de Guinée (“SBK”) owns the Kindia related equipment and infrastructure, including theSimbaya offices, the railway and port facilities. CBK rents and has the exclusive use of thesefixed and certain movable assets from SBK. CBK is required to hand back the property and assetson conclusion of their contract in 2025.
CBK is operating under a Convention signed in 1958 that has been amended from time to timeand currently includes numerous addendums and their appendices. It stipulates technical andeconomic operating conditions for the mine, the railway and the port. At present:
• CBK pays royalties of US$1/t of bauxite mined.
• CBK is subject to a zero corporate income tax rate on its profits.
APPENDIX VI INDEPENDENT TECHNICAL REPORT
— VI-101 —
• The Convention expires in 2025.
In 2008, it was reported that all Conventions in Guinea would be reviewed. This has not occurredas yet. CBK has a legal office in Conakry and maintains good working relations with variousGovernment departments and Ministries.
The bauxite is shipped predominantly to UC RUSAL’s Nikolaev refinery, Ukraine.
Bauxite extraction at Kindia began in 1974 after the Office des Bauxites de Kindia was formedin 1969 on a Soviet/Guinean agreement. CBK’s production began following the 2000 agreementbetween the Guinean government and CBK.
The Kindia deposits are located in southeast Guinea 90 km northeast of the capital, Conakry and32 km southwest of the local administrative town of Kindia.
The region is typified by hills and escarpments at about 750 m above sea level. Plateaus host theKindia bauxite deposits. The climate of Guinea is tropical with a dry season (November throughMarch) and a wet season (April through October). The heaviest rainfall of the wet season is inJune. Temperatures range from 11˚C to 35˚C.
3.3.3 Geology
The bauxite deposits formed as a result of tropical weathering of Silurian-Devonian clayeyschists, siltstones and mudstone and Mesozoic dolerites. The bauxite is generally found on hills,domes and slopes of the higher plateaus.
Average thicknesses of the bauxite deposits vary from 7 to 11 m, (and up to 32 m at Kobeletadue to tectonic influences during weathering). Total silica grades have a distinct increase ingrade towards the lower footwall contact. Only a thin, soil or occasional iron rich lateriticoverburden is present.
The samples are prepared and assayed routinely for total Al2O3, SiO2 and Fe2O3 on site usingtitration and photo-calorimetric techniques.
No formal quality control protocols are in place other then periodical sample duplicates sent toexternal laboratories and standard bauxite samples added into the sample stream, although noresults of this quality control has been received by SRK.
Density data is routinely recorded with densities seen to vary from around 1.8 to 1.98 t/m3.
Water content is also recorded, but no formal sampling programme is in place. Distinct seasonalvariations have been recorded with moisture content ranging from 6.5% in the dry season to13.5% in the wet season.
3.3.4 Mineral Resources and Ore Reserves
The majority of the Mineral Resource at Kindia has been calculated by polygonal methodswhereby each drillhole is given an average grade and thickness and an area of influence producedin the 1970s to GKZ standards.
The Balandougou deposit has been re-estimated using three dimensional digital software,although the official Mineral Resource figures are still taken from the 1970s GKZ reserveestimate.
APPENDIX VI INDEPENDENT TECHNICAL REPORT
— VI-102 —

New estimates are produced on an annual basis from these GKZ reserve estimate depleted to dateas well as increased from exploration results. SRK has reconciled the December 2008 resourceas well as production data from January to June 2009.
SRK has classified areas sampled on a 25 x 25 m grid as Indicated Mineral Resources. MeasuredMineral Resources have been reduced to Indicated Mineral Resources from due to the lack offormal quality control and density measurement procedures.
Kindia assays for total alumina grades rather than available alumina. Available alumina gradesare calculated by applying a downgrading factor of 15%. This is a simplistic conversionapproach. Whilst the total alumina grades are therefore deemed reasonably accurate, thecalculated available alumina grades are deemed inaccurate and as such have been rounded off.
Areas assayed on grids greater than 75 m have been classified as Inferred Mineral Resourceswhile the Fineralougan deposit, which only has visual occurrences of bauxite, has been leftunclassified.
Grade control sampling of stockpiles routinely takes place although no robust reconciliation dataexists. Instead, the original GKZ reserve figures for all deposits are depleted by tonnage of thematerial mined and the discrepancies are attributed to losses and dilution, therefore assuming“perfect” reserve estimation.
Ore Reserves
Ore Reserves have been calculated by subjecting Indicated Mineral Resource tonnages to averagelosses and dilution figures, by deposit, going back six years and have been separated into areasplanned for either drill and blast or Wirtgen mining. Where no data existed, a mine average wasused.
No minimum deposit size or maximum haulage distance was attributed.
Table 3.6: Kindia Mineral Resource and Ore Reserve Statement (1 July 2009)(1), (2), (3), (4), (5), (6), (7)
Ore Reserve Mineral Resource
Tonnage Al2O3 SiO2 Tonnage Al2O3 SiO2
(Mt Dry) (%) (%) (Mt Dry) (%) (%)
Proved . . . . . . — — — Measured . . . . — — —
Probable. . . . . 38.2 39.2 2.4 Indicated . . . . 37.9 39.5 2.3
Total . . . . . . . 38.2 39.2 2.4 Subtotal . . . . 37.9 39.5 2.3Inferred . . . . . 61.6 37.8 3.6
Total . . . . . . 99.5 38.5 3.1
(1) All references to Mineral Resources and Ore Reserves are stated in accordance with the JORC Code, 2004 Edition.
(2) Mineral Resources and Ore Reserves are recorded on an unattributed, or 100% basis.
(3) Alumina content is presented as available, as opposed to than total. Kindia’s available alumina grade is based onthe total alumina grade, which is then reduced by a straight 15%. Hence these are not assay grades, and theconversion method applied is very simplistic.
(4) Kindia’s silica content is presented as total, as opposed to reactive.
(5) Mineral Resources are inclusive of Ore Reserves.
(6) Kindia Ore Reserve tonnage is marginally higher than it equivalent Mineral Resource, as a result of the effect ofloss and dilution.
(7) The proportion of Ore Reserves contributed by Kindia 2 is approximately 89%.
APPENDIX VI INDEPENDENT TECHNICAL REPORT
— VI-103 —

3.3.5 Mining Operations and Infrastructure
Mining methods
Current production at CBK is planned at 2.4 Mtpa for 2010 potentially rising to 3.285 Mtpa by2011. Overburden stripping is low, averaging some 0.8 m, representing a stripping ratio of lessthan 0.2. Two mining methods are employed: conventional drilling and blasting (“D&B”); andsurface mining using Wirtgen surface miners. The mining method is chosen on an area by areabasis depending on a number of factors including: distance from plant; ore geometry; orehardness, etc. The Wirtgen miner produces a sized product which does not require crushing. Thedrill and blast ore has to be hauled to the crusher for size reduction before delivery to the port.The Wirtgen product is delivered to the Balandougou railhead for direct loading onto the trains.CBK’s intention is to move fully to surface mined ore by 2011.
• The drill and blast mining is mainly in the Central, North-West, Sankaren and EastDeposits. These generally dip steeper, or have uneven footwalls.
• The German manufactured Wirtgen surface miner is a non-blasting method of mining andis used particularly in the softer Balandougou deposits, the “safety pillars”, and remnantsof the Central deposits which are close to structures and habitation.
• The haul fleet at Kindia has recently been upgraded. The new Caterpillar trucks whichreplace the Belaz trucks can achieve 35 km/hr and have improved the haulage timessignificantly.
• The infrastructure for the Kindia Complex includes the mine, offices and workshops;crushing and train loading system at Debele; a rail yard, stocking/blending and loading areaat Balandougou crossing, including a rail track; the locomotive and rolling stockmaintenance facilities and main offices at Simbaya; and the port facilities including: railyard and train unloading station, stacker-reclaimer and stockpile/blending facilities,shiploader; and quay.
The main future mining considerations include:
• Implementation of Kindia II — The resources at Kindia offer a continuing opportunity forlow cost bauxite. The implementation of Kindia II and the exploitation of these resourcesis designed to secure the medium to long term future of the operations. The access road tothe Balandougou deposits is nearing completion and road haulage of the bauxite to theBalandougou loading station is planned for a production level of 3.8 Mtpa.
• Debele Loading Station — The capacity, throughput, and additional capital for loading andblending after the crusher is decommissioned in 2011 need to be ensured. The condition ofthe crusher loading station is poor with the loading silos being effectively out ofcommission. The EKT-5A shovel loader has very low mechanical availability and suffersfrom a spares shortage. Alternative loading is by a single excavator/loader shared betweenDebele and Balandougou. There is a single shunting locomotive which is shared betweenDebele and Balandougou.
• Crusher Obsolete by 2011 — The Debele crusher is proposed to be made obsolete by 2011and Wirtgen mining is proposed to be the sole method of mining which precludes the needfor drilling and blasting and crushing of the ore.
• Cessation of Drill and Blast Mining — The proposed cessation of drill and blast miningand the sole dependency on the surface miners introduces an element of risk. An optionwould be to introduce a mobile crusher(s) and continue with drill and blast for flexibility.
APPENDIX VI INDEPENDENT TECHNICAL REPORT
— VI-104 —

• Surface Mining — The increasing dependence on surface mining assumes a degree offurther development and improvements in maintenance, availability and utilisation of thesurface miner equipment.
• Balandougou — The loading station is small, limited to 22 wagons and would benefit froman increased stockpile area which currently is limited to 60 kt and restricts the loadingcapacity. An increase of 12 kt is possible with an increase in train length by 75 m whichis possible.
Infrastructure
The main infrastructure facilities for the operation include:
• Processing operation — The processing facilities comprise the crusher and rail load outfacility at Debele. The crusher is over 30 years old and is due to be made obsolete in 2011.The facilities were not inspected in detail but at the site visit appeared to be in relativelypoor condition and were in need of investment.
• Rail facilities and rolling stock —
� The 100 km rail link between the mine and port has 3 passing loops. The loops can take amaximum of 4 locos and 54 wagons. Currently the trains operate with 3 locos and 44wagons due to a shortage of wagons. 20 wagons are on order at US$144 k per wagondelivered from Ukraine.
� The total rail equipment comprises 168 x 50m3 (65 to 71 t) wagons and 15 locomotives ofUkrainian origin (13xTM2 and 2xTM18’s the latter newly acquired in 2007). Ancillaryequipment includes 10 flatbeds, 2 hopper dozers, 5 covered wagons and 1 x 25 t crane. Theserviceable life expectancy of locos is 35 years and 15 years for wagons. Current locoavailability is approximately 60% out of a rated availability of 84%.
� Maintenance facilities at Simbaya are of a good standard. A minimum of 4 locomotives areon maintenance per day. One locomotive was out of commission during the visit ofSeptember 2008. Spare parts procurement for the locos and wagons has suffered fromdelays.
� The rail facilities currently have a stated maximum potential capacity of 3.83 Mtpa. Thecurrent capacity is stated at 3.5 Mtpa. With the planned delivery of the 20 wagons the railcapacity will increase to 3.75 Mtpa. An additional 14 wagons would increase the railcapacity to between 4 and 4.25 Mtpa.
� The track is in reasonably good condition and the sustaining capex includes repair of 2 kmper annum.
� A derailment in September 2007 resulted in the decommissioning of 20 wagons. The recordover the past 15 years records six rail related incidents over the period.
� There are 6 bridges on the track. Specialist inspections are carried out periodically. Twobridges have recently been repaired. A third bridge is due for repair in 2009. The remainingbridges are in good condition.
� The unloading area at the Port is constrained due to the shunting area and the unloadingarea which is restricted to 11 wagons. Consideration is being given to a new shunting areacloser to the unloading station than the current shunting area which is 2 km distant which
APPENDIX VI INDEPENDENT TECHNICAL REPORT
— VI-105 —

impacts on the time to unload and thus the trains per day. Consideration is also being givento increase the number of wagons to be unloaded at a time from 11 to 19 by extending theloadout station. Braking efficiency on the locos however needs to be upgraded for thisoption to be successful.
� Public Safety statistics on the rail lines continues to be of concern due to trespass ofpedestrians on the line by the villagers along the rail corridor and in particular on theoutskirts of Conakry.
• Port Facilities —
� The CBK facility is a single berth which can take 40 kt ships and can accommodate a 11.5m and 9 m draught at high and low tide respectively. Currently 7-8 average boats per monthare loaded over 20 days loading with 10 days maintenance.
� The stated current throughput capacity at the port is 3.0 to 3.2 Mtpa with the mainconstraint being the unloading station.
� The stockpile capacity at the port is a total of 150 kt bauxite.
� A new shiploader with a capacity of 2,500 tph was installed in 2007. This is sufficient forthe planned throughput. The old shiploader is still installed and available as back-up.
� The stacker-reclaimer which feeds the shiploader, whilst still fit for duty is old, beingcommissioned in 1976 and last given a major overhaul in 1986. In 2008, UC RUSAL wasconsidering options for overhaul and upgrade of this equipment including the provision ofnew gearboxes.
� The quay wall is suffering from subsidence and its deterioration was affecting the tracks ofthe shiploader in 2008. Repairs are urgently required. The ownership of the quay restshowever with the Government of Guinea. UC RUSAL estimates that a period of 2-3 monthswould be required to effect repairs. Engineering Company UC RUSAL asked for plans andtiming in this regard and mitigation plans re port throughput during the repairs. A provisionof US$6.5 m is being made by UC RUSAL in respect of the quay repairs.
� The Government of Guinea Port Authority is planning a quay expansion which would havea benefit to CBK. The date for this expansion is not yet established.
� To achieve an increase of capacity of the port to 4 Mtpa would require reduced shunting andunloading time, increase in loader conveyor belt speed and reconfiguration. This isconsidered achievable given the required investment.
3.3.6 Environmental and Social Considerations
Environmental aspects are managed by a central team with environmental staff responsible at themine, Simbaya and the port. CBK has made significant improvements since 2000 and all sites arenow maintained to a high level in terms of health and safety and the working environment. Thesites are operated well in excess of the required codes. UC RUSAL has targeted implementationof: ISO 9001, ISO 14001 and OHSAS 18001.
Environmentally, the major issue at the sites is dust, particularly at the port. At the mine, dustarises continually from the surface miners and from truck haulage. Workers are provided withmasks while operating in any dusty conditions. At the port, dust is a major issue from the ship
APPENDIX VI INDEPENDENT TECHNICAL REPORT
— VI-106 —

loadout. The dust covers the infrastructure but most falls into the sea. The washdown dust andstormwater drainage is also discharged into the harbour. The loadout equipment is in the processof upgrading and replacement, but further work to control escape of bauxite to the harbour shouldbe considered.
There is a programme of rehabilitation at the mine sites, though a backlog of 331 ha exists. Underthe mining convention these areas are not the responsibility of UC RUSAL, however CBK hasan annual plan to rehabilitate them. There is a four year forward plan to rehabilitate large areaswhich includes experimental areas. Rehabilitation trees are grown and planted under contractwith local people. Current rehabilitation practices are not to international standards, however, theareas which have been rehabilitated for a few years have a good cover with trees a few metreshigh, and it is acknowledged that the land may be of more value to the locals than pre-miningin most cases.
All properties operated by UC RUSAL are on lease from the Government and have to be returnedto the Government at least in the state that they were taken over. There is no closure plan inplace, reportedly due to the long life of mine. There is no programme or plan of integration ofstaff should the mine close early, and staff would be laid off according to Guinean regulations.
There is a problem of locals operating adjacent to the railway line as it provides an easy accessroute across the country. UC RUSAL and the Government have an initiative to educate peoplein the schools and mosques about the dangers, as well as to remove people who build close tothe line. In 2006, 16 people were killed in accidents on the line. This number has been decreasedsince the programme started, to 3 fatalities in 2008.
The Government recently changed the retirement age from 55 to 60 for office workers and to 55for non office workers which resulted in recent social troubles. The reduction in retirees has alsoput some pressure on UC RUSAL to maintain higher levels of staff for five years as fewer areretiring.
The asset retirement obligation at 1 July 2009 has been estimated by UC RUSAL to be US$0.5m. SRK has not reviewed this number, and is unaware of what it includes. However it excludesterminal benefits associated with any eventual termination of employments. SRK has not seen acost estimate for mine closure at the end of the life of the mine, including bio-physical costs andterminal benefits.
3.3.7 Technical and Economic Assessment
The following points are made in respect of the production and cost parameters in support of theOre Reserves:
• The life of the mine supporting the Ore Reserve is 13 years.
• The production rate from 2011 onwards is 3.29 Mtpa.
• The operating costs include royalties and delivery to the port in Conakry.
• The economics have been verified based on an overall integrated flow of bauxite throughto aluminium, as described in Section 2.2.5.
APPENDIX VI INDEPENDENT TECHNICAL REPORT
— VI-107 —
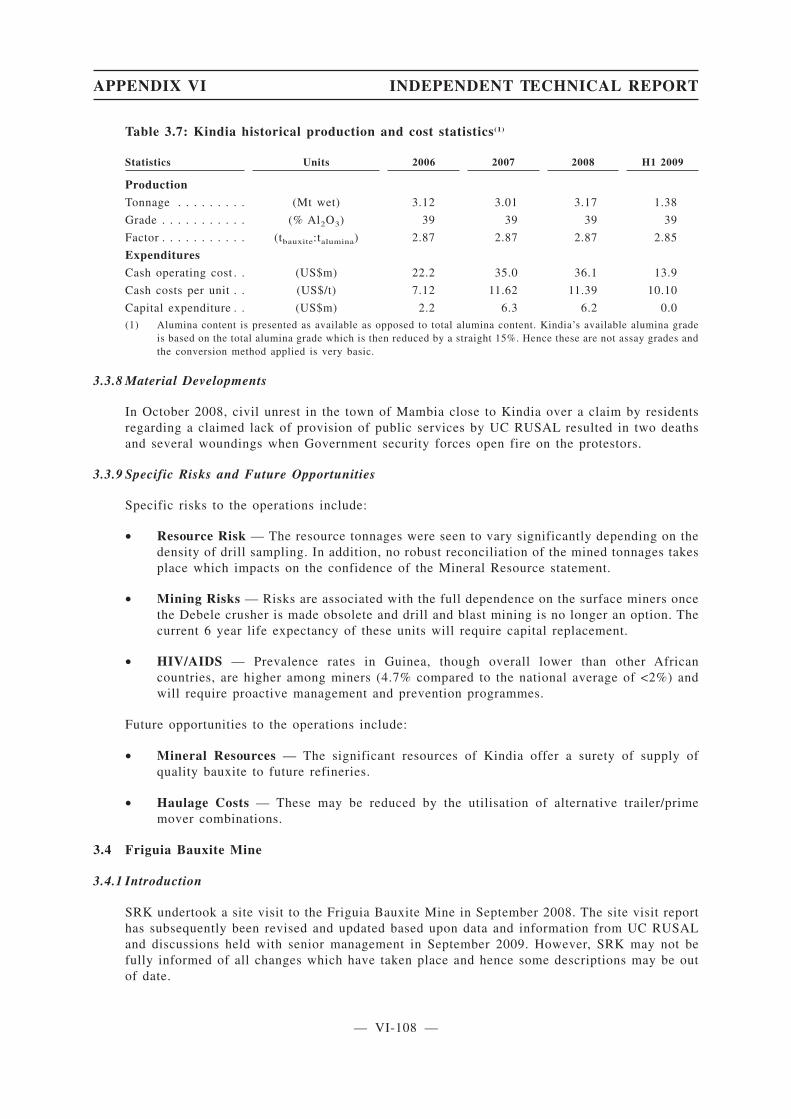
Table 3.7: Kindia historical production and cost statistics(1)
Statistics Units 2006 2007 2008 H1 2009
Production
Tonnage . . . . . . . . . (Mt wet) 3.12 3.01 3.17 1.38
Grade . . . . . . . . . . . (% Al2O3) 39 39 39 39
Factor . . . . . . . . . . . (tbauxite:talumina) 2.87 2.87 2.87 2.85
Expenditures
Cash operating cost . . (US$m) 22.2 35.0 36.1 13.9
Cash costs per unit . . (US$/t) 7.12 11.62 11.39 10.10
Capital expenditure . . (US$m) 2.2 6.3 6.2 0.0(1) Alumina content is presented as available as opposed to total alumina content. Kindia’s available alumina grade
is based on the total alumina grade which is then reduced by a straight 15%. Hence these are not assay grades andthe conversion method applied is very basic.
3.3.8 Material Developments
In October 2008, civil unrest in the town of Mambia close to Kindia over a claim by residentsregarding a claimed lack of provision of public services by UC RUSAL resulted in two deathsand several woundings when Government security forces open fire on the protestors.
3.3.9 Specific Risks and Future Opportunities
Specific risks to the operations include:
• Resource Risk — The resource tonnages were seen to vary significantly depending on thedensity of drill sampling. In addition, no robust reconciliation of the mined tonnages takesplace which impacts on the confidence of the Mineral Resource statement.
• Mining Risks — Risks are associated with the full dependence on the surface miners oncethe Debele crusher is made obsolete and drill and blast mining is no longer an option. Thecurrent 6 year life expectancy of these units will require capital replacement.
• HIV/AIDS — Prevalence rates in Guinea, though overall lower than other Africancountries, are higher among miners (4.7% compared to the national average of <2%) andwill require proactive management and prevention programmes.
Future opportunities to the operations include:
• Mineral Resources — The significant resources of Kindia offer a surety of supply ofquality bauxite to future refineries.
• Haulage Costs — These may be reduced by the utilisation of alternative trailer/primemover combinations.
3.4 Friguia Bauxite Mine
3.4.1 Introduction
SRK undertook a site visit to the Friguia Bauxite Mine in September 2008. The site visit reporthas subsequently been revised and updated based upon data and information from UC RUSALand discussions held with senior management in September 2009. However, SRK may not befully informed of all changes which have taken place and hence some descriptions may be outof date.
APPENDIX VI INDEPENDENT TECHNICAL REPORT
— VI-108 —

As of 1 September 2009, the Friguia mine and refinery have been taken over by the GuineanGovernment. The future ownership is currently unknown.
3.4.2 History and Location
Friguia Bauxite Mine is located on the Fouta Djalon plateau in the northwest of Guinea around105 km from Conakry, accessed by a tarred road and served by a 143 km dedicated rail link onwhich the processed alumina is transported to a dedicated port facility. The Friguia Bauxite Mineis operated by Friguia SA and has the capacity to produce over 2.5 Mtpa. The mine is integratedwith the adjacent Friguia Refinery which is wholly owned by UC RUSAL.
The Friguia area consists of plateaus and hills with elevations ranging from 300-350 m whichrise around 100 m above the lower plains. The climate of Guinea is tropical with two alternatingseasons, a dry season (November through March) and a wet season (April through October).
Exploration drilling was first conducted in the 1950s and later expanded upon in the 1970s. TheGuinean 1986 Mining Code, last amended in 1995, allows for large scale mining and is governedby a Convention between the Government of Guinea and the mining company.
Friguia SA is operating under a Convention signed in 1958 that has been amended from time totime and today includes numerous addendums and their appendices. The Convention expires in2009. The Company and the Government of Guinea are in dispute regarding the validity of thesale of the refinery to UC RUSAL in 2006. A new Convention will be required. SRK understandsthat two other mining companies have been granted rights which overlap the land under theConvention. At present:
• Friguia SA pays royalties of US$0.50/t of bauxite mined.
• Friguia SA is subject to a 30% corporate income tax rate on its profits.
• Friguia SA is subject to a Special Tax on export of 10% of the sales price of alumina FOBConakry, with a minimum of US$17.5/t.
SRK has been informed by Friguia SA that all payments and conditions under the Conventionhave been met up to date, and that the relevant technical requirements and costs have beenincluded in the operating budgets.
3.4.3 Geology
North-west Guinea forms part of the upper Proterozoic and Palaeozoic platform of North Africa.These have been interpreted as terrigenous sediments of Ordovician to Silurian age and in somelocations these are intruded by Triassic dolerite sills. All of these country rocks have beenheavily altered by tropical weathering. Bauxitisation is a function of bedrock composition,geomorphology and weathering. The bauxite is generally found on hills, domes and slopes of theupper plateaus in the region.
The bauxites of the Friguia region are classical plateau type and form a draped weathering profileacross the plateaus and hills with elevations up to 300-350 m. Thickness ranges from 6-15 m,while topsoil is limited to an average of 50 cm. With increasing depth through the profile, thebauxites grade from brown, ferruginous and indurate, to yellow, white or brown. Towards thefootwall contact the bauxites become more lateritic and richer in silica and are commonly visibledue to the sudden increase in Fe2O3 content.
APPENDIX VI INDEPENDENT TECHNICAL REPORT
— VI-109 —

Total available alumina and reactive silica are routinely assayed. Fe2O3 and deleterious materialsare only assessed during the early stages of exploration to determine a characteristic signaturefor each deposit. Traditional wet chemistry is used in the assaying of the bauxites. A standardquality control protocol is in place at the assaying laboratory to assess the feed to the refinery,chemical assaying and the crushing and milling. This includes internal and external controlsampling.
Zone 6 deposits have been excluded from the Mineral Resources due to their distant location anddue to some of the deposits lying outside the current Friguia lease area.
3.4.4 Mineral Resources and Ore Reserves
Grade control drilling is practiced on a 6 x 6 m grid during drill and blast mining to aid in theblending process, however data is rarely used to reconcile the estimated Mineral Resource or OreReserve. Careful records are kept for each deposit detailing their depletion and maincharacteristics, but reconciliation data is restricted to defining losses and dilution tonnages backcalculated from those tonnages received at the stockpiles, and therefore might not accuratelydefine the inaccuracies in estimation, particularly in assay grades.
In the derivation of Ore Reserves, SRK has reconciled historical production, along with lossesand dilution figures, against the GKZ reserves inventory produced by Pechiney in 1979 for eachdeposit and a LoMp provided to SRK during the mine visit in September 2008 to calculate arevised reserve tonnage. As the split between drill and blast and Wirtgen zones is not accuratelydefined, average figures have been used from both mining methods.
Table 3.8: Friguia Mineral Resource and Ore Reserve Statement (1 July 2009)(1), (2), (3), (4), (5)
Ore Reserve Mineral Resource
Tonnage Al2O3 SiO2 Tonnage Al2O3 SiO2
(Mt Dry) (%) (%) (Mt Dry) (%) (%)
Proved . . . . . . 37.3 40.0 0.9 Measured . . . . 36.8 40.8 0.9
Probable. . . . . 77.8 41.7 0.8 Indicated . . . . 142.4 43.0 0.8
Total . . . . . . . 115.1 41.1 0.8 Subtotal . . . . 179.2 42.5 0.8
Inferred . . . . . 152.6 43.2 0.7
Total . . . . . . 331.8 42.8 0.8
(1) All references to Mineral Resources and Ore Reserves are stated in accordance with the JORC Code, 2004 Edition.
(2) Mineral Resources and Ore Reserves are recorded on an unattributed, or 100% basis.
(3) Alumina grades are presented as available as apposed to total alumina.
(4) Silica grades are presented as reactive as opposed to total silica.
(5) Mineral Resources are inclusive of Ore Reserves.
The annual operating costs at Friguia may exceed the revenues for the alumina products on thebasis of the product prices which are fixed on an annual basis. Whereas it is expected that UCRUSAL will make a balancing provision and that the downstream profitability of the aluminiumproducts is ensured, there may be some risk that the Friguia alumina are higher cost than thoseon the open market and thus the Friguia bauxites may be at risk to being replaced by cheapersourced materials. The ability to issue an Ore Reserves statement in terms of JORC Codecompliancy for the Friguia bauxites assumes the downstream profitability of the Friguia alumina.
APPENDIX VI INDEPENDENT TECHNICAL REPORT
— VI-110 —

3.4.5 Mining Operations and Infrastructure
The Friguia Bauxite Mine operation has a capacity of approximately 2.5 Mtpa of run of mine ore.The historical production figures are approximately 1.9 Mt for 2008 and 0.85 Mt for H1 2009.There has been a shortfall of actual to planned bauxite production due to problems with the plantand power supply resulting in mine production stoppages.
The longer term production plan proposes that the production will increase to 3.75 Mtpa bauxite(1.05 Mtpa alumina) with an expansion of the plant. The Mineral Resource base at Friguia isconsidered to be able to respond to these levels, provided additional investment in miningequipment is made.
The mining of the Friguia deposits is essentially simple contour mining of the bauxite bearingsuperficial deposits on the plateaus and flanks of the hills. The mining methods employed atFriguia are: conventional drill and blast and mechanical surface miners (“SM”) using a singleWirtgen 2500 SM. All equipment is owned and operated by Friguia SA. The ratio of D&B to SMhas been increasing significantly from 45:55 in 2005, 53:47 in 2006, 62:38 in 2007 and 85:15for ytd August 2008. The latter figures reflect that the SM operations were becomingundermanned, underperforming and suffering from spares shortages and maintenance problems.During the visit in 2008, the Wirtgen was not in operation pending resolution of the problems.
For the conventional drill and blast methods the minimum mining thickness is 3 m. The topsoilwhich is generally less than 1 m thick is only preserved by dozing where consistently thickenough. The prime loaders are CAT992s with 6 m3 buckets. The haul trucks are 100 t, CAT777s.The equipment fleet is sufficient for the current production targets and mining areas, but as thedeposits near the plant become depleted, additional trucks will be required.
Whilst the equipment fleet is considered by SRK to be sufficient for the short term, a programmeof replacement of the ageing machines and additional new machines is required for the longerterm. An additional surface miner for a production increase is required.
Processing
The Friguia Bauxite Mine is vertically integrated with the adjacent Friguia Refinery to which allof its production is sent. This enhances the value of the Friguia bauxites. There are currently nofacilities to export bauxite at the mine or at the Conakry alumina loading point.
3.4.6 Environmental and Social Considerations
The most significant mining environmental issues are rehabilitation of the mined areas and dustduring mining and hauling. There are also some issues of proximity of mining to existingsettlements, with one village adjacent to the mining operations.
Mined land is being remediated immediately after mining with mango and acacia, and treegrowth appears to be reasonably good. SRK understands that under the mining convention forFriguia, rehabilitation of the formerly mined land is the responsibility of UC RUSAL. A largepart of those areas have been rehabilitated. A total of 601 ha have been disturbed and 441 ha havebeen rehabilitated to date. By 2009, all but the operating areas are expected to be restored. Themine also has 20 ha of experimental vegetation systems.
Environmental reporting is three monthly but focussed on rehabilitation. An independentenvironmental audit has been completed. The audits will be a regular item in future. Trainingsystems, working conditions and remuneration are based on similar systems to Kindia.
APPENDIX VI INDEPENDENT TECHNICAL REPORT
— VI-111 —

The asset retirement obligation at 1 July 2009 has been estimated by UC RUSAL to be US$1.13m. SRK has not reviewed this number, and is unaware of what it includes. However it excludesterminal benefits associated with any eventual termination of employments. SRK has not seen acost estimate for mine closure at the end of the life of the mine, including bio-physical costs andterminal benefits.
3.4.7 Technical and Economic Assessment
The following points are made in respect of the production and cost parameters in support of theOre Reserves:
• The life of the mine supporting the Ore Reserve is in excess of 25 years.
• The production rate is 2 Mtpa.
• The operating costs include royalties and delivery to the refinery.
• The economics have been verified based on an overall integrated flow of bauxite throughto aluminium, as described in Section 2.2.5.
Table 3.9: Friguia historical production and cost statistics(1), (2)
Statistics Units 2006 2007 2008 H1 2009
Production
Tonnage . . . . . . . . . . . (Mt wet) 1.85 1.71 1.99 0.85
Grade . . . . . . . . . . . . . (% Al2O3) 40.5 40.8 40.5 40.5
Factor . . . . . . . . . . . . . (tbauxite:talumina) 3.37 3.37 3.25 3.23
Expenditures
Cash operating cost . . . . (US$m) 8.1 10.2 8.2 3.3
Cash costs per unit . . . . (US$/t) 4.35 5.98 4.13 3.92
Capital expenditure . . . . (US$m) 0.0 1.4 0.7 n/a(1) Grades are given as available alumina.
(2) n/a — not available.
3.4.8 Material Developments
As of 1 September 2009, UC RUSAL is in dispute with the Government of Guinea over theownership of the Friguia mine and refinery. The Government is disputing the validity of the saledue to the purchase price paid by UC RUSAL.
Friguia has significantly reduced its operating costs in H1 2009. SRK has not reviewed the detailbehind the H1 2009 cost reductions, nor been able to assess the sustainability of such loweroperating costs into the future.
3.4.9 Specific Risks and Future Opportunities
Specific risks to the operations include:
• Ownership — The ownership of the Friguia mine and refinery is under dispute with theGuinean Government.
• New Convention — Terms of the new Mining Convention have not been determined todate. In addition, the Government has granted other mining companies tenure rights,overlapping with the area under the Convention.
APPENDIX VI INDEPENDENT TECHNICAL REPORT
— VI-112 —

• Geological risks — The assumption of a single bulk density figure of 2 t/m3 across alldeposits reduces the confidence in the resource and reserve figures.
• Remote Deposits — The lease area at Fria is very large and the deposits are becoming moreremote from the current plant location. Bauxite transport fleets and haulage costs can beexpected to increase with time. Additional infrastructure costs can be anticipated for roadsand bridges to access the deposits.
• Friguia Refinery — Decisions have to be made regarding the upgrading of the FriguiaRefinery to include up to date technologies and efficiencies. The Friguia Refinery costs arerelatively high, reducing the advantage of the low cost bauxites in terms of the integratedproduct.
• Tailings Dam — The tailings dam capacity is needed to be increased in the short to mediumterm as the present facility will be full by 2011. A 4 m raising of the dam wall would allowa 5 year extension of capacity. There are however technical and environmental issuesrelated to the raising of the existing dam and several options are under consideration.
• HIV/AIDS — Prevalence rates in Guinea, though overall lower than other Africancountries, are higher among miners (4.7% compared with the national average of <2%)which will require proactive management and prevention programmes.
Future opportunities to the operations include:
• The ability of the available deposits to satisfy increased production — The lead time toachieve higher production is relatively short.
• Improved Mine Planning and Optimisation — Computerisation and block modellingprovides the opportunity for more efficient utilisation of the Mineral Resources andreconciliation of Mineral Resources and Ore Reserves.
3.5 Guyana Bauxite Mine
3.5.1 Introduction
SRK undertook a site visit to the Guyana Bauxite Mine in October 2008. The site visit report hassubsequently been revised and updated based upon data and information from UC RUSAL anddiscussions held with senior management in September 2009. However, SRK may not be fullyinformed of all changes which have taken place and hence some descriptions may be out of date.
3.5.2 History, Location
Guyana is located in the north of South America bordering the Atlantic Ocean between Surinameand Venezuela. The mining operations are located some 200 km south of the capital Georgetown.The terrain of Guyana is mostly rolling highlands, low coastal plains and savannah in the south.The relief ranges from sea level to 2,835 m at the peak in Mount Roraima, and can be describedas comprising rolling highlands, low coastal plain and savannah in the south. The mining areacan be accessed via tarred roads and dirt roads.
The climate in Guyana can be described as equatorial-tropical, hot with an average temperatureof around 26oC, humid, and moderated by north-easterly winds. There are two main wet seasons,May to August and November to January, with average annual rainfall of over 2,500 mm. Thelast few years have been particularly wet in comparison with historical rainfall statistics whichhas caused operational difficulties.
APPENDIX VI INDEPENDENT TECHNICAL REPORT
— VI-113 —
Bauxite was first discovered in 1919 along the river/creek banks, with bauxite mining productionoccurring fairly continuously in the area from the 1940s up to the present day. The two mainbauxite deposit areas, Aroaima and Kwakwani, which have been operated both independently ofeach other as well as together, have been operated by a number of companies both private andgovernment owned, in addition to joint ventures. The current company Bauxite Company ofGuyana (“BCGI”) has been operating since 2006. BCGI is a joint venture between AroaimaMining Company Inc. (“AMC”) registered in Guyana (10% shareholder), and Bauxite & AluminaMining Venture Ltd. (“BAMV”) registered in Cyprus (90% shareholder), which is a subsidiarycompany 100% owned by UC RUSAL.
The mining assets comprise two main bauxite deposit areas, namely Kwakwani and Aroaima,each currently having single mining areas, with a crushing and barge loading facility atKwakwani to transport bauxite some 30 km to Aroaima where blending, drying and barge loadingfacilities are located to load dried bauxite onto barges for delivery to an offshore vessel loadingfacility located in New Amsterdam, located some 240 km upstream.
Mining licences are held for all of the operational areas, which are short-term, but are routinelyrenewed at the necessary time. In addition, exploration licences are held for a number ofdeposits.
Bauxite is currently exported and sold, principally as two different products, metallurgical gradebauxite and chemical grade bauxite. Existing contracts are in place which state bauxite tonnagesand qualities as well as transfer prices and conditions. BCGI predominantly sells/transfers itsbauxite to UC RUSAL’s refineries, however also sells bauxite to external companiesintermittently. SRK has reviewed these contracts and concludes that the saleable tonnages,quality, and prices are achievable from the operations.
3.5.3 Geology
The bauxite deposits of Guyana are located in the north western part of the country, with inexcess of 100 deposits discovered. The Guyana bauxite deposits take the form of irregular andlenticular deposits ranging in size from 100 kt up to in excess of 10 Mt. The deposits are overlainby significant thicknesses of overburden, often in excess of four times the thickness of thebauxite, comprising water-bearing sands, loams and clay.
The bauxite deposits found on the Guyanese Shelf, are of Tertiary Age, and formed as a resultof tropical weathering of Precambrian granite and gabbro-dolerite rocks and associated gneissesand mica schists. Under a coastal sea climate and lagoons, it is thought that large braided riversystems eroded the igneous material and re-deposited it into channel and pod like sedimentarystructures, were then subjected to continental uplift and tropical lateritic weathering resulting inthe bauxitisation process, leaching away iron minerals and silicates. The bauxites were thenpreserved by younger sands, loams and clays.
In general, the bauxites form blanket-like horizontal beds, with thicknesses varying between1.8-13.0 m, and generally sit on kaolinitic clays. The bauxites are overlain by argillaceous clays,sometimes sandy, which is 30-70 m thick, light brown sand (often loamy) which is 20-50 m thick,all covered by a 10-20 m thickness of white sands. The overlying sand horizons formgroundwater conduits in connection with surface water courses and therefore need to beunderstood fully in order to control water inflow into the excavations. The bauxite footwall isusually kaolinite clays up to 20 m thick extending into sands (main aquifer), saprolite zones upto 20 m thick and down into the underlying granite basement.
The bauxites vary in colour but are generally grey-yellow-cream-brown in colour, are layered instructure and range from soft to hard. In general, grey bauxites are softer, clayey and containlower iron, whereas darker brown bauxites are harder and contain more iron.
APPENDIX VI INDEPENDENT TECHNICAL REPORT
— VI-114 —
The bauxites typically have the following properties; bulk density with natural moisture of 2.04t/m3, moisture content ranging from 14-19%, aluminium content between 55-60%, silica contentbetween 2-7%, titanium oxide content between 2-6% and total iron between 1-10%.
The bauxites in the Aroaima area are generally less complex in terms of geological structure thanthose found in Kwakwani, where there are often multiple bauxite lenses, and assay definedcontacts with hanging wall and footwall contacts.
The mineralogy of the bauxites can be described as fairly simple, being predominantly trihydrategibbsite, the main aluminous mineral, followed by silica contained in kaolinite and ironcontained in haematite and crystalline silica in quartz. Most Guyana bauxites also contain someminor boehmite, anatase, rutile and alumogoethite. Re-silicification of the bauxite has takenplace near to ground water sources converting the bauxite to kaolinite.
The bauxite can be categorised into two main types based upon metallurgical properties, that ismetallurgical grade bauxite (M1, M2 and M3), and chemical grade bauxite (C1 and C2), bothtypes being defined by specific Al2O3, SiO2 and Fe2O3 and moisture contents as specified by thebauxite receiving processing plants.
In general, the geological continuity is good and the deposits very large in terms of tonnage whencompared with the nearby Jamaican bauxites, with moderate grade continuity in the horizontalplane but more irregular grade fluctuations vertically through the banded layers within thebauxites.
3.5.4 Mineral Resources and Ore Reserves
The Mineral Resource estimation procedures follow a combination of approaches including both3D estimates using Mining Software and basic polygonal methods using Microsoft Excel, all ofwhich based almost entirely on borehole sample data.
Exploration at the bauxite areas generally follows the following key stages; reconnaissancedrilling, early stage exploration drilling at 490 x 490 m spacing, exploration drilling at 245 x 245m, detailed drilling at 120 x 120 m and 60 x 60 m spacing, and infill/production drilling at 20x 20 m spacing on stripped bauxite exposures for short-term mine planning. Topographic surveysare routinely undertaken using differential GPS equipment, and have been undertaken acrossdeposit areas actively operational.
The drilling methodologies historically and currently employed utilise chisel/tri-cone drillingdown to hanging wall clay marker horizons, followed by conventional double-tube core (50 mmcore diameter), drilling for recovery of bauxite samples, with casing of overlying soft sedimentsto avoid possible contamination. Samples are collected at 0.61 m intervals (2 ft).
Samples are sent to the on-site laboratory for preparation and analysis, located in Aroaima. Thereis also a small laboratory located at Kwakwani. The samples are split using both cone andquartering and Jones-riffle splitting methods, and crushed using conventional jaw crushers andthen milled. Analysis comprises wet chemistry methods for SiO2, Fe2O3, TiO2 and Loss onIgnition (“LOI”) and bomb digest testwork using low temperature Bayer conditions for availablealumina and reactive silica. There is no analysis for Al2O3. SRK has not undertaken a detailedQuality Assurance/Quality Control (“QAQC”) audit, however understands that routine QAQCsamples are introduced and provide acceptable cross-checks of analysis accuracy, precision, andrepeatability.
The density factor applied to historical tonnage estimates is 2.03 t/m3 for wet tonnes and 1.71t/m3 for dry tonnes, applying 18.5% moisture content.
APPENDIX VI INDEPENDENT TECHNICAL REPORT
— VI-115 —

BCGI’s Mineral Resource estimates have been undertaken using different methods including 3Dmodels completed in Surpac Mining Software incorporating statistical, geostatistical and blockmodelling, 2D models created using computerised contour polygonal methods by RussianInstitutes and historical estimates completed by previous companies calculating tonnages andgrades using area of influence, thickness and length weighted grades.
The highest confidence estimates completed in Surpac have only been completed for the Westdeposit, with the less confident Russian contour estimate for the 22-Kurubuka deposit and theleast confident remaining deposits calculated using conventional mathematical techniques. The22-Kurubuka deposit has been included in the Mineral Resource estimate, with 30 Mt (dry) inthe Indicated category.
SRK comments that the geology and major controls of the bauxite are well understood enablingsufficient confidence in the modelling of the bauxite. The data quality and quantity is consideredsufficient for classification into the Measured, Indicated and Inferred Mineral Resourcecategories in accordance with the JORC Code.
SRK has assessed land-ownership, exploration history, drilling density, quality of estimation andsterilisation, and only included deposits considered potentially economic by applying CoGs of>38% available alumina, <10% SiO2 and a stripping ratio of less than 8 m3/t. SRK has excludedtwo deposits from the current Mineral Resources, namely the 28-Kurubuka and the 29-MoraCreek deposits, which contain very sparse sampling information and high stripping ratios. Thesedeposits require further exploration to be JORC Code compliant Mineral Resources. In additionSRK has not included any Mineral Resource for Block 5 NE for which, although planned to bemined in the near future, the licence is not currently held by BCGI.
SRK has categorised deposits in the Aroaima area with 60 x 60 m drill grid or less as MeasuredMineral Resource (West deposit). The complex Kwakwani area and the Aroaima area, which havebeen drilled on a maximum of 120 x 120 m drill grid are categorised as Indicated MineralResource. Those deposits with very few boreholes to a maximum of 300 x 300 m drill grid arecategorised as Inferred Mineral Resource. All tonnages are reported without the application ofany other “modifying factors”.
The Mineral Resource and Ore Reserve statement has been achieved by depleting the 2008numbers by the production tonnages excavated in the interim period. In deriving the MineralResource and Ore Reserve, SRK has adopted a conservative approach.
Table 3.10: BCGI Mineral Resource and Ore Reserve Statement (1 July 2009)(1), (2), (3), (4). (5)
Ore Reserve Mineral Resource
Tonnage Al2O3 SiO2 Tonnage Al2O3 SiO2
(Mt Dry) (%) (%) (Mt Dry) (%) (%)
Proved . . . . . . 2.3 49.7 5.8 Measured . . . . 3.6 51.5 5.8
Probable. . . . . 3.3 52.3 6.5 Indicated . . . . 41.3 58.0 5.1
Total . . . . . . . 5.6 51.2 6.2 Subtotal . . . . 44.9 57.5 5.2
Inferred . . . . . 4.2 52.7 5.0
Total . . . . . . 49.1 57.1 5.1
(1) All references to Mineral Resources and Ore Reserves are stated in accordance with the JORC Code, 2004 Edition.
(2) Mineral Resources and Ore Reserves are recorded on an unattributed, or 100% basis.
(3) Alumina grades are presented as available as opposed to total alumina.
(4) Silica grades are presented as reactive as opposed to total silica.
(5) Mineral Resources are inclusive of Ore Reserves.
APPENDIX VI INDEPENDENT TECHNICAL REPORT
— VI-116 —
To convert the Mineral Resources into Ore Reserves, SRK has applied modifying factorssupported by information reviewed, the observations of mining activities, and SRK’s experience.
SRK considers that the number of detailed studies covering the required technical areas relatingto an international standard Pre-Feasibility Study level or greater is insufficient, and thereforecannot yet convert certain deposits within the Measured and Indicated Mineral Resourcecategories to Ore Reserves. SRK only considers the West deposit and stockpiles, which areplanned to be mined and have sufficient technical studies, to be converted to Ore Reserves.
BCGI states dilution and losses to be 5% for each, which SRK considers to be adequate giventhe geological continuity, and in addition has applied the historical 0.5% diluting grade for SiO2.Once the technical work for Kwakwani has been completed it is likely that the dilution and lossesapplied may need to be modified, given the lack of a visually distinguishable contact at thefootwall and hanging wall. No dilution has been applied to the stockpiles, however a 5% loss hasbeen applied to material left at the base of the stockpiles to avoid dilution.
3.5.5 Mining Operations and Infrastructure
Mining operations are conducted in two areas denoted as the West pit in the Aroaima area andacross the river in the 16-Bissaruni deposit in the Kwakwani area, with very limited productionfrom stockpiles, both of which are accessible by a network of haul roads and a river crossing.
Stripping operations in both areas utilise hydraulic excavators, free digging, which load into 40t and 50 t trucks. Soils are dozed, loaded and transported to localised dumps for later restoration.The overburden excavation and bauxite extraction is conducted by the same excavators, with thein-situ material being loosened by ripping and in some cases where the bauxite is iron-rich, itis blasted.
In the West deposit, following stripping, bauxite is transported directly to the plant stockpile atAroaima ready for blending, crushing using a rolls crusher and drying. The material is crushedand stockpiled ready for blending with bauxite from the Kwakwani deposits.
Bauxite from the Kwakwani deposit, 16-Bissaruni, is taken to an intermediary stockpile, some1.5 km outside of the working area. The bauxite is stockpiled by grade and characteristic, andgrade control sampled to determine the required blending. The ore is subsequently transportedto a further intermediate stockpile at the waterfront for further crushing and barge out loading.It is then transported to the wobble crusher and onto river barges, via conveyors and shipped tothe Aroaima drying facility. Here the bauxite is offloaded using a dragline and front-end loadersand delivered to the stockpiles located near the dryers ready for blending.
The mining and plant operations are planned for continuous operation. The plant operates a2-shift work schedule of 12 hours for 365 days per annum, however very rarely runs continuouslydue to weather conditions. The operations and productivity are heavily affected by wet weatherduring the rainy season, which generally results in the planned quantities of material mined neverreaching the planned levels.
Grade control sampling is undertaken within the open-pits, at the dryer and on the barges, all ofwhich ensuring barge tonnages and grade are in specification. Unfortunately, due to a lack ofavailable bauxite for blending, a number of barges have been out of specification. SRKrecommends that stockpiles inventories are re-established to ensure sufficient material forblending in the future.
APPENDIX VI INDEPENDENT TECHNICAL REPORT
— VI-117 —

Geotechnical and hydrological/hydrogeological conditions have a great impact on the miningactivities, due to a combination of the overlying sands which are instable and act as an aquiferand the closeness on surface water courses which are hydraulically connected to the overlyingsands. The current mining methods do not address these conditions and as a result, there aredangerous mining conditions and large water inflows into the pits. These issues need to beaddressed as a matter of urgency.
Short-Medium term mine planning is done annually using Surpac Mining Software.
Blending is undertaken using front-end loaders, following a relatively detailed blendingschedule. Blending operations are essentially live, and modified following laboratory resultsfrom samples collected as material is fed onto the barges.
Drying of the bauxite is achieved through two rotary kilns, with capacities ranging between150-250 tph, dependent on whether the bauxite is metallurgical grade with 8-10% moisture orchemical grade which is required to be 5%. The kilns combined capacity is 2.5 Mtpa.
Following drying, the material is loaded onto Oldendorf 4,000-6,000 t barges using shiploaderconveyors and transfer equipment, and transported some 140 km upstream from Aroaima to theBerbice River Loading Basin near New Amsterdam, where the barges unload onto ships rangingin capacity from 26,000-38,000 t.
3.5.6 Environmental and Social Considerations
BCGI mining operations are located in a highly diverse flora and fauna area. The main waterbody within the mine area is the Berbice River. Local communities use water from KonkoureRiver for fishing, washing, swimming, agriculture, and laundering. The Berbice River providestransport for local people and it is navigable from the project area to the Atlantic Ocean.
There are four communities in the area of influence of the mining operations Kwakwani,Aroaima, Ladernville and Mapletown. Most agricultural production of the communities consistsof subsistence farming. The area on the right bank of the Berbice River is almost inhibited withthe only village of Hururu which is an Amerindian tribe. The rest of villages on the left riverbank were formed to accommodate employees and are strongly dependent on the bauxite mine.
All aspects of BCGI’s mining operations are regulated by the regulations of Guyana. Miningactivities in Kwakwani are regulated by Special Mining Permit No. 3 (2006) which requiresBCGI to use its best efforts to minimise the negative impacts on forest, land, wildlife and humansettlements and also requires reforestation and protection of land in accordance with the standardinternational mining practice. Additionally, there is a Compliance Agreement signed in 2006between BCGI and the Guyanese Environmental Protection Agency (“EPA”). This agreement hasstipulated a number of actions to be undertaken by BCGI at its existing operations within aperiod of 1 year. According to the last Compliance Monitoring Report (September 2009)submitted to the EPA by BCGI’s external consultant, there are still a number of areas whereBCGI is not compliant with the Compliance Agreement. In that respect there is significantelement of non compliance although the EPA has extended the compliance schedule. There areno other environmental permits required for BCGI operations.
The Environmental Protection Act in Guyana has also established the requirement for theEnvironmental and Social Impact Assessment (“ESIA”) in 1996. ESIAs for Aroaima andKwakwani have not been compiled as the mining operations started before the establishment ofthe legislation.
APPENDIX VI INDEPENDENT TECHNICAL REPORT
— VI-118 —
There is no closure and rehabilitation plan in place although it is reported that the plan is beingprepared by BCGI. Under the Special Mining Permit No. 3 (2006) and Compliance Agreement2006, a rehabilitation and closure plan is required at BCGI. The BCGI closure anddecommissioning plan has been submitted to EPA and is awaiting approval. The estimation of thetotal rehabilitation requirements for the mine has not been established nor estimated.
BCGI does not have formal systems to manage the environmental and social aspects. Currentlyan annual environmental and social management programme has been established by UC RUSALfor mitigation of the identified social and environmental risks and impacts; however the miningoperations do not have site specific environmental and social programmes and action plans basedon the outcome of community consultations.
The key environmental issues of BCGI are the absence of rehabilitation plans, waste watermanagement, waste management, stakeholder engagement plan and community developmentplans.
The asset retirement obligation at 1 July 2009 has been estimated by UC RUSAL to beUS$3.7 m on an attributable basis. SRK has not reviewed this number, and is unaware of whatit includes. However it excludes terminal benefits associated with any eventual termination ofemployments. SRK has not seen a cost estimate for mine closure at the end of the life of the mine,including bio-physical costs and terminal benefits.
3.5.7 Technical and Economic Assessment
The following points are made in respect of the production and cost parameters in support of theOre Reserves:
• The life of the mine supporting the Ore Reserve is approximately 6 years.
• The production rate 1.4 Mtpa until 2010 then reducing to 870 ktpa.
• The operating costs include royalties and transport cost to the port.
• The economics have been verified based on an overall integrated flow of bauxite throughto aluminium, as described in Section 2.2.5.
Table 3.11: BCGI historical production and cost statistics(1), (2)
Statistics Units 2006 2007 2008 H1 2009
Production
Tonnage . . . . . . . . . (Mt wet) 1.25 1.89 1.61 0.71
Grade . . . . . . . . . . . (% Al2O3) 52.1 52.1 50.1 50.3
Factor . . . . . . . . . . . (tbauxite:talumina) 2.38 2.37 2.39 2.34
Expenditures
Cash operating cost . . (US$m) 57.3 70.6 85.1 21.3
Cash costs per unit . . (US$/t) 45.93 37.36 53.01 29.82
Capital expenditure . . (US$m) 17.4 4.7 7.7 0.2(1) Grades are given as available alumina.(2) All numbers are reported on a 100% attributable basis.
3.5.8 Material Developments
BCGI has significantly reduced its operating costs in H1 2009. SRK has not reviewed the detailbehind the H1 2009 cost reductions, nor been able to assess the sustainability of such loweroperating costs into the future.
APPENDIX VI INDEPENDENT TECHNICAL REPORT
— VI-119 —
3.5.9 Specific Risks and Future Opportunities
Specific risks to the operation include:
• Ore Reserve Shortage — The mine plan, and hence Ore Reserve, currently only covers 6years of production.
• Mining and Exploration Licence Renewals — BCGI should progress on licence terms andensure renewal applications are submitted in a timely manner.
• Under-exploiting of Exploration Potential — The areas surrounding the deposits havehuge potential to yield additional deposits and there is much historical exploration datacovering them which is held on site, however no exploration licences are held for them andthey are in danger of beyond lost to competing companies, as was the recent example of thelicence at Tarakuli, with over 65 Mt of bauxite, which has been taken by BHP Billiton.
• Mining Licence Compliance — The mining licence could be suspended if BCGI does notimprove compliance with the environmental Compliance Agreement however, SRK has noreason to suspect that this will happen if planned improvements are implemented.
• Geotechnical and Hydrological/Hydrogeological Issues — The mining operations at bothBissaruni and the West pit are nowhere close to optimal in terms of slope angles and waterinflow/dewatering. Detailed engineering solutions to the issues are available in on-sitetechnical reports however are not being followed.
• Environmental and Social Issues — Whilst BCGI have completed most of the majoractivities under the compliance schedule, some non-compliance issues remain.
• Health and Safety — The instability of overhanging overburden/sand faces apparentduring the SRK site visit are considered a major health and safety hazard, and slopes shouldbe scaled back and the slope angles reduced immediately in order to avoid a potentialfailure which could endanger human life.
Future opportunities to the operations include:
• Block 5 NE — This deposit in the Kwakwani deposit area is located favourably nearexisting infrastructure, to provide additional Ore Reserve in the short-term to make up anyshortfall of bauxite.
• General Additional Resources — There are deposits in the area of sufficient size, qualityand strip ratios to maintain mining in the area for a number of years. There is also goodpotential for other deposits near Linden and Ituni to be developed, as well as the possibilityof a processing facility.
• Current Studies — The 22-Kurubuka project is planned to be in operation once thetechnical studies required have been completed.
• Regional Resource Potential — The area has excellent potential for bauxite resources butrequires further technical studies along with a further reduction of high freight/shippingcosts in order to become more economical to extract. The bauxite in the area is world classin terms of its quality and in SRK’s opinion is underdeveloped in comparison with otherbauxite areas around the world.
APPENDIX VI INDEPENDENT TECHNICAL REPORT
— VI-120 —

3.6 North Urals Bauxite
3.6.1 Introduction
SRK undertook a site visit to the North Urals Bauxite Mine in September 2008. The site visitreport has subsequently been revised and updated based upon data and information from UCRUSAL and discussions held with senior management in September 2009. However, SRK maynot be fully informed of all changes which have taken place and hence some descriptions maybe out of date.
3.6.2 History and Location
Mining at the North Urals bauxite operations (“SUBR”) has been continuous since 1938. TheSUBR bauxite mining area consists of seven underground deposits and a surface deposit. SUBRcurrently mines the Krasnaya Shapochka, Kalyinskaye, Novo-Kalyinskaye andCheremukhovskaya deposits from underground, and the Toshimskaya deposit from a series ofopen pits. The Toshimskaya open pits are located some 160 km north of the underground mines.There is also a limestone quarry at Petropavlovsk, adjacent to the town of Severouralsk.
The North Urals bauxite and limestone deposits are located on the Eastern slopes of the UralMountains, at 60º90” N latitude and 59º31” longitude, some 400 km north of Ekaterinburg. Thearea is hilly, with a relief of 400 to 900 m, with peaks separated by swamp dominateddepressions. The area closest to the mines has a limited relief of between 190-200 m. The climateof the area is continental, with minimum winter temperatures of -53ºC, and maximum summertemperatures of +38ºC. The average temperature is -1�C, and there are typically 180-200 days ofsub-zero temperatures per year. The annual precipitation is 480 mm, which mainly occurs duringthe summer.
SUBR has mining authorizations for limestone and bauxite mining operations, as well as surfacerights.
3.6.3 Geology
The North Urals bauxite and limestone deposits are located on the north-south trending Tagilskymegasyncline. The area is characterised by intrusive and pyroclastic rocks, with widelydeveloped Silurian and Devonian carbonate sediments. The bauxite deposits are located in twomain zones, to the west (Petropavlovskaya) and the east (Turninskaya) of theKrutolovsko-Konovalovsky thrust fault. The highest quality bauxite deposits are located withinthe Petropavlovskaya region.
The underground bauxites strike approximately north-south and outcrop along a strike length ofapproximately 35 km, except for a 3.5 km gap caused by a strike slip fault. The down dip extentof the bauxite is currently unknown, but bauxite has been intercepted at depths of 2 km. Thebauxites dip 25� to 35� towards the east and vary in thickness from 1-35 m averaging between4.5-7.8 m for all deposits. The underground orebodies are stratiform and tabular, with a relativelyflat hanging wall. The relief of the footwall is complex, and therefore impacts on the geologicalcontinuity of the deposit. The Toshimskaya open-pit deposits differ from the undergrounddeposits in that the footwall contact is more regular.
The North Urals bauxite is good quality bauxite, with a high Al2O3 content between 53.4% and58.2% and low SiO2 content between 1.5% and 4.7%. The main contaminants in the bauxite areCaO (between 1.9% and 4.0%) and sulphur (between 0.1% and 1.3%). The mineralogy of thebauxite also changes across the individual deposits.
APPENDIX VI INDEPENDENT TECHNICAL REPORT
— VI-121 —
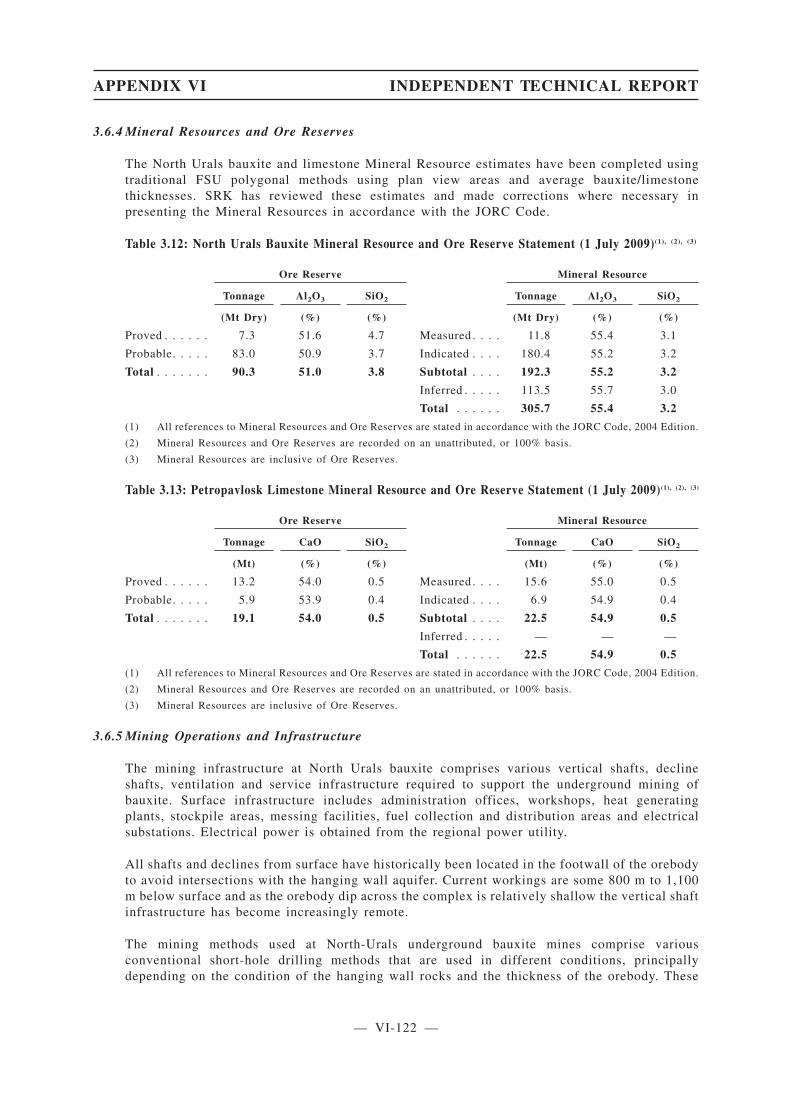
3.6.4 Mineral Resources and Ore Reserves
The North Urals bauxite and limestone Mineral Resource estimates have been completed usingtraditional FSU polygonal methods using plan view areas and average bauxite/limestonethicknesses. SRK has reviewed these estimates and made corrections where necessary inpresenting the Mineral Resources in accordance with the JORC Code.
Table 3.12: North Urals Bauxite Mineral Resource and Ore Reserve Statement (1 July 2009)(1), (2), (3)
Ore Reserve Mineral Resource
Tonnage Al2O3 SiO2 Tonnage Al2O3 SiO2
(Mt Dry) (%) (%) (Mt Dry) (%) (%)
Proved . . . . . . 7.3 51.6 4.7 Measured . . . . 11.8 55.4 3.1
Probable. . . . . 83.0 50.9 3.7 Indicated . . . . 180.4 55.2 3.2
Total . . . . . . . 90.3 51.0 3.8 Subtotal . . . . 192.3 55.2 3.2
Inferred . . . . . 113.5 55.7 3.0
Total . . . . . . 305.7 55.4 3.2
(1) All references to Mineral Resources and Ore Reserves are stated in accordance with the JORC Code, 2004 Edition.
(2) Mineral Resources and Ore Reserves are recorded on an unattributed, or 100% basis.
(3) Mineral Resources are inclusive of Ore Reserves.
Table 3.13: Petropavlosk Limestone Mineral Resource and Ore Reserve Statement (1 July 2009)(1), (2), (3)
Ore Reserve Mineral Resource
Tonnage CaO SiO2 Tonnage CaO SiO2
(Mt) (%) (%) (Mt) (%) (%)
Proved . . . . . . 13.2 54.0 0.5 Measured . . . . 15.6 55.0 0.5
Probable. . . . . 5.9 53.9 0.4 Indicated . . . . 6.9 54.9 0.4
Total . . . . . . . 19.1 54.0 0.5 Subtotal . . . . 22.5 54.9 0.5
Inferred . . . . . — — —
Total . . . . . . 22.5 54.9 0.5
(1) All references to Mineral Resources and Ore Reserves are stated in accordance with the JORC Code, 2004 Edition.
(2) Mineral Resources and Ore Reserves are recorded on an unattributed, or 100% basis.
(3) Mineral Resources are inclusive of Ore Reserves.
3.6.5 Mining Operations and Infrastructure
The mining infrastructure at North Urals bauxite comprises various vertical shafts, declineshafts, ventilation and service infrastructure required to support the underground mining ofbauxite. Surface infrastructure includes administration offices, workshops, heat generatingplants, stockpile areas, messing facilities, fuel collection and distribution areas and electricalsubstations. Electrical power is obtained from the regional power utility.
All shafts and declines from surface have historically been located in the footwall of the orebodyto avoid intersections with the hanging wall aquifer. Current workings are some 800 m to 1,100m below surface and as the orebody dip across the complex is relatively shallow the vertical shaftinfrastructure has become increasingly remote.
The mining methods used at North-Urals underground bauxite mines comprise variousconventional short-hole drilling methods that are used in different conditions, principallydepending on the condition of the hanging wall rocks and the thickness of the orebody. These
APPENDIX VI INDEPENDENT TECHNICAL REPORT
— VI-122 —
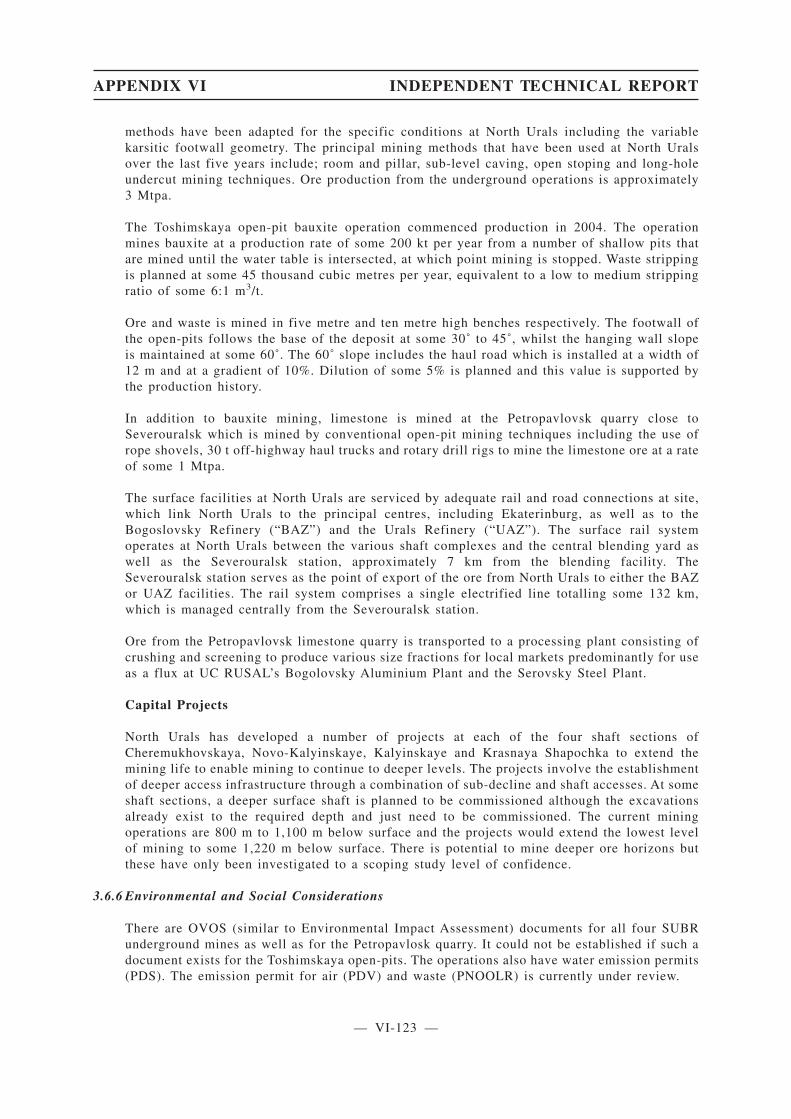
methods have been adapted for the specific conditions at North Urals including the variablekarsitic footwall geometry. The principal mining methods that have been used at North Uralsover the last five years include; room and pillar, sub-level caving, open stoping and long-holeundercut mining techniques. Ore production from the underground operations is approximately3 Mtpa.
The Toshimskaya open-pit bauxite operation commenced production in 2004. The operationmines bauxite at a production rate of some 200 kt per year from a number of shallow pits thatare mined until the water table is intersected, at which point mining is stopped. Waste strippingis planned at some 45 thousand cubic metres per year, equivalent to a low to medium strippingratio of some 6:1 m3/t.
Ore and waste is mined in five metre and ten metre high benches respectively. The footwall ofthe open-pits follows the base of the deposit at some 30˚ to 45˚, whilst the hanging wall slopeis maintained at some 60˚. The 60˚ slope includes the haul road which is installed at a width of12 m and at a gradient of 10%. Dilution of some 5% is planned and this value is supported bythe production history.
In addition to bauxite mining, limestone is mined at the Petropavlovsk quarry close toSeverouralsk which is mined by conventional open-pit mining techniques including the use ofrope shovels, 30 t off-highway haul trucks and rotary drill rigs to mine the limestone ore at a rateof some 1 Mtpa.
The surface facilities at North Urals are serviced by adequate rail and road connections at site,which link North Urals to the principal centres, including Ekaterinburg, as well as to theBogoslovsky Refinery (“BAZ”) and the Urals Refinery (“UAZ”). The surface rail systemoperates at North Urals between the various shaft complexes and the central blending yard aswell as the Severouralsk station, approximately 7 km from the blending facility. TheSeverouralsk station serves as the point of export of the ore from North Urals to either the BAZor UAZ facilities. The rail system comprises a single electrified line totalling some 132 km,which is managed centrally from the Severouralsk station.
Ore from the Petropavlovsk limestone quarry is transported to a processing plant consisting ofcrushing and screening to produce various size fractions for local markets predominantly for useas a flux at UC RUSAL’s Bogolovsky Aluminium Plant and the Serovsky Steel Plant.
Capital Projects
North Urals has developed a number of projects at each of the four shaft sections ofCheremukhovskaya, Novo-Kalyinskaye, Kalyinskaye and Krasnaya Shapochka to extend themining life to enable mining to continue to deeper levels. The projects involve the establishmentof deeper access infrastructure through a combination of sub-decline and shaft accesses. At someshaft sections, a deeper surface shaft is planned to be commissioned although the excavationsalready exist to the required depth and just need to be commissioned. The current miningoperations are 800 m to 1,100 m below surface and the projects would extend the lowest levelof mining to some 1,220 m below surface. There is potential to mine deeper ore horizons butthese have only been investigated to a scoping study level of confidence.
3.6.6 Environmental and Social Considerations
There are OVOS (similar to Environmental Impact Assessment) documents for all four SUBRunderground mines as well as for the Petropavlosk quarry. It could not be established if such adocument exists for the Toshimskaya open-pits. The operations also have water emission permits(PDS). The emission permit for air (PDV) and waste (PNOOLR) is currently under review.
APPENDIX VI INDEPENDENT TECHNICAL REPORT
— VI-123 —

None of the mining sites are located on, or next to any protected areas. There are a number ofsettlements and villages in close proximity to the mining operations that could be impacted onin terms of noise, dust, light pollution and traffic.
There is no formal environmental management system in place, however they are planning toimplement OHSAS 18001 (Safety & Health Management) and ISO14001 (EnvironmentalManagement) systems in the future. The current thinking is to implement these during 2011;however, planning for the implementation of these systems has not yet started.
The hydrogeological conditions of the underground mining areas at SUBR are complex. They arecharacterised by high karstic content and water bearing rocks. Mining is thus accompanied by therisk of sudden water flow into the mines. The water regime is however well understood and thesystems in place are well managed. However a concern has been expressed that the currentbudgets are insufficient to upgrade, maintain and improve the reliability of the current protectionsystems.
There are four mine waste water treatment facilities. The treatment plants essentially employ afirst stage settling process in large surface settling dams and a second filtration step. Theincoming water prior to settlement and filtration typically is not clear and has elevated chemicaloxygen demand (“COD”), total suspended solids (“TSS”), sulphate, calcium, chloride andsuspended oil concentrations. The filtered water is discharged into the Vagran River. Samplingis done upstream and downstream of the discharge point. The key parameters that are improveddue to the water treatment process include: odour, COD, TSS and iron.
Approximately 20 old waste rock dumps exist along the length of the strike. The dumps aregenerally located close to the production shafts. During 2006 two waste rock dumps at KrasnayaShapochka were rehabilitated. However, no shaping or rehabilitation of any of the other dumpsis currently taking place. Some vegetation such as pine and birch trees have started to establishon some dumps, but it is not wide-spread.
The Petropavlovsk limestone quarry is located 1 km south of the town of Severouralsk. The mainenvironmental impact when mining limestone occurs due to the release of dust to air duringblasting, extraction and loading operations, stockpiling of ore and dumping of waste rock.Further dust emissions occur during rock transportation to the grinding-sorting plant. It wasreported that the maximum permissible air emissions are not exceeded in the residentialcommunities close to the quarry or at the border of the sanitary-protective area.
The Toshimskaya open-pit operation mines bauxite from a number of shallow pits. The total areaof the operations is 113.7 ha. The open-pits are rehabilitated concurrently with the miningoperations and the rehabilitation costs are included in the mining costs. No pit has yet been fullyrehabilitated, but there is sufficient evidence from the site visit that rehabilitation of some of themined-out pits have commenced.
Overall, the SUBR operations appear to be in material compliance with Russian Federationenvironmental requirements. There may be areas of non-compliance but these are not material tothe outcome of this review. The SUBR operations in most respects do not comply with theEquator Principles for Financial Institutions and there are also some gaps in terms of compliancewith the IFC EHS Standards. Despite these areas of non-compliance environmental practices atthe SUBR operations appear to be to a high standard, especially in terms of housekeeping andgeneral environmental practices, even though no formal Environmental Management System(“EMS”) is in place.
The key environmental issues for these operations are the ongoing management, treatment anddischarge of excess water and the eventual rehabilitation of the waste rock dumps and demolitionof mining infrastructure. There will be a significant cost associated with the final rehabilitation
APPENDIX VI INDEPENDENT TECHNICAL REPORT
— VI-124 —
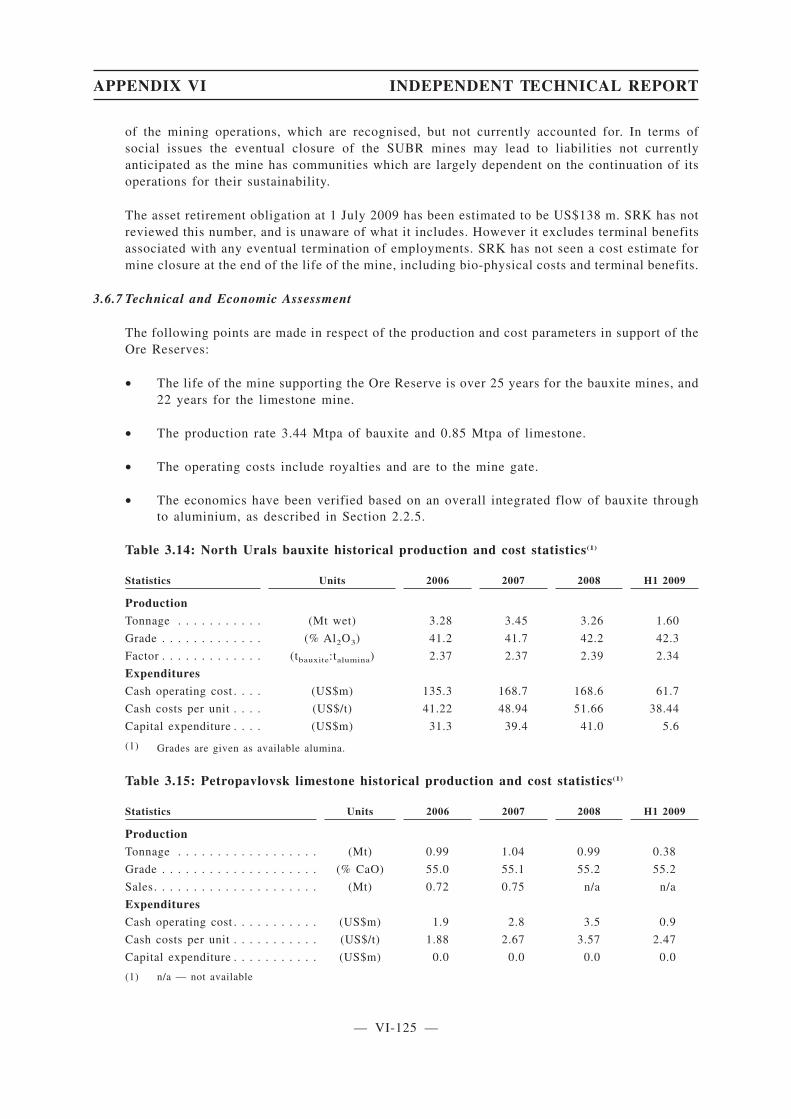
of the mining operations, which are recognised, but not currently accounted for. In terms ofsocial issues the eventual closure of the SUBR mines may lead to liabilities not currentlyanticipated as the mine has communities which are largely dependent on the continuation of itsoperations for their sustainability.
The asset retirement obligation at 1 July 2009 has been estimated to be US$138 m. SRK has notreviewed this number, and is unaware of what it includes. However it excludes terminal benefitsassociated with any eventual termination of employments. SRK has not seen a cost estimate formine closure at the end of the life of the mine, including bio-physical costs and terminal benefits.
3.6.7 Technical and Economic Assessment
The following points are made in respect of the production and cost parameters in support of theOre Reserves:
• The life of the mine supporting the Ore Reserve is over 25 years for the bauxite mines, and22 years for the limestone mine.
• The production rate 3.44 Mtpa of bauxite and 0.85 Mtpa of limestone.
• The operating costs include royalties and are to the mine gate.
• The economics have been verified based on an overall integrated flow of bauxite throughto aluminium, as described in Section 2.2.5.
Table 3.14: North Urals bauxite historical production and cost statistics(1)
Statistics Units 2006 2007 2008 H1 2009
Production
Tonnage . . . . . . . . . . . (Mt wet) 3.28 3.45 3.26 1.60
Grade . . . . . . . . . . . . . (% Al2O3) 41.2 41.7 42.2 42.3
Factor . . . . . . . . . . . . . (tbauxite:talumina) 2.37 2.37 2.39 2.34
Expenditures
Cash operating cost . . . . (US$m) 135.3 168.7 168.6 61.7
Cash costs per unit . . . . (US$/t) 41.22 48.94 51.66 38.44
Capital expenditure . . . . (US$m) 31.3 39.4 41.0 5.6
(1) Grades are given as available alumina.
Table 3.15: Petropavlovsk limestone historical production and cost statistics(1)
Statistics Units 2006 2007 2008 H1 2009
Production
Tonnage . . . . . . . . . . . . . . . . . . (Mt) 0.99 1.04 0.99 0.38
Grade . . . . . . . . . . . . . . . . . . . . (% CaO) 55.0 55.1 55.2 55.2
Sales . . . . . . . . . . . . . . . . . . . . . (Mt) 0.72 0.75 n/a n/a
Expenditures
Cash operating cost . . . . . . . . . . . (US$m) 1.9 2.8 3.5 0.9
Cash costs per unit . . . . . . . . . . . (US$/t) 1.88 2.67 3.57 2.47
Capital expenditure . . . . . . . . . . . (US$m) 0.0 0.0 0.0 0.0
(1) n/a — not available
APPENDIX VI INDEPENDENT TECHNICAL REPORT
— VI-125 —

3.6.8 Material Developments
North Urals has significantly reduced its operating costs in H1 2009. SRK has not reviewed thedetail behind the H1 2009 cost reductions, nor been able to assess the sustainability of such loweroperating costs into the future. Similarly, the reduction in capital expenditure H1 2009 and theinvestment programme going forward has not been assessed by SRK as to its impact on thesustainability of the North Urals operations.
3.6.9 Specific Risks and Future Opportunities
Specific risks to the operations include:
• Operating Costs — as mining progresses deeper mining costs are likely to increase throughadditional access and groundhandling infrastructure required to be operated as well aslonger development access to the orebody, extra travelling time to and from the workplaces, additional pumping costs and increased ventilation requirements. Improvements inproductivity and design as well as locating access and groundhandling infrastructure closerto the orebody can mitigate this risk to a certain extent.
• Seismic Events — as mining progresses deeper there is a likely increase in seismicity andseismic induced falls of ground and support problems. This can be mitigated by a focus onmore conservative regional and stope support design parameters.
• Project Capital — the continuation of mining from 2011 is based on the successfulcompletion of major capital projects at each of the shafts. There is a risk that the projectsmight be delayed or require more capital expenditure to complete than currently envisaged.
Specific opportunities to the operations include:
• Mining Methods — an increase in mechanisation if based on an appropriate and revisedmine design might lead to reduced operating costs and improved productivity and reducethe number of work places and development requirements.
• Productivity Improvements — productivity improvements in terms of mining andmanpower efficiency, increased tonnage per development metre, concentration of workings,etc could lead to cost savings.
• Underground Transport — an investment in more modern and perhaps larger horizontaltransport equipment focused on dedicated haulage levels would lead to lower operatingcosts;
• Production Capacity — there may be an opportunity to increase production capacity at themine considering the volume of Ore Reserves although this is dependent on marketconditions for the product.
• Ore Reserves — as the bauxite deposit at each of the shaft sections extends below the leveldefined as part of the capital projects that support the current Ore Reserves there is anopportunity to increase the reserves through investigation of additional shaft deepeningprojects.
APPENDIX VI INDEPENDENT TECHNICAL REPORT
— VI-126 —
3.7 Timan Bauxite Mine
3.7.1 Introduction
SRK undertook a site visit to the Timan Bauxite Mine in September 2008. The site visit reporthas subsequently been revised and updated based upon data and information from UC RUSALand discussions held with senior management in September 2009. However, SRK may not befully informed of all changes which have taken place and hence some descriptions may be outof date.
3.7.2 History and Location
The Timan Bauxite Mine is located in the Komi Republic of the Russian Federation, and isoperated by Timan Bauxite and owned by UC RUSAL. It is located some 1,200 km north-eastof Moscow and is approximately 200 km north-west of the city of Ukhta. The mine is accessedby both surfaced and un-surfaced road and by a purpose built railway both 150 km from the mainroad and the main Moscow-Vorkuta rail line.
The climate in the area is characterised by long cold winters, and short warm summers, withaverage temperatures ranging from -20�C in the winter to +15�C in the summer. The terraincomprises gently undulating and rolling hills, covered mainly by forests and “taiga” marshland.
The Timan bauxite deposits have been rigorously explored between 1971 and 1989 by the UkhtaGeological Survey Expedition. The Russian State Commission of Reserves (GKZ) approved theirresources and reserves at various stages of the project between 1977 and 2001. The operationsbegan at the Timan Bauxite Mine in 1998 and the open-pit mining operations commenced in1999.
The bauxite deposits cover an area approximately 20 km long and 6 km wide, and comprise fourmain deposit areas: Vezhayu-Vorykvinskoye, which is currently being exploited (Central),Verkhne-Schugorskoye (North beds and South beds), Verkhne-Vorykvinskaya (West beds); andVostochnoye (East). All of the deposits with the exception of the Vezhayu-Vorykvinskoyedeposit, are fairly simple single-lense, blanket like bauxite deposits.
An overall licence covers all of the deposit areas, with a specific mining licence covering certainorebodies within the deposit area planned to be mined first. It is understood that the licence toextract bauxite will expire in 2014, however it is considered that it will be renewed uponapplication at the appropriate time.
The operation is currently mining bauxite at approximately 2.4 Mtpa and the bauxite is exportedand sold to UC RUSAL’s refineries: UAZ, BAZ alumina refineries and in recent years to theAchinsk Complex to augment the reducing Al2O3 grade of the Kiya Shaltyr nepheline syenitefeed. These plants accept both Bayer and Sinter quality bauxite, the sinter process allowing muchhigher silica bauxite. SRK has reviewed these contracts and conclude that the saleable tonnages,quality, and prices are achievable from the operations and that they guarantee the sale of thebauxite for the foreseeable future at reasonable market prices.
3.7.3 Geology
The bauxites at Timan are distinctly different from the majority of the world’s bauxite depositsand reserves as they formed in a karstic weathering environment, are older, more deeply buried,have an unusual mineralogy, are predominantly boehmitic and in places indicate only partialbauxitisation with multiple, stacked/overlapping bauxite lenses.
APPENDIX VI INDEPENDENT TECHNICAL REPORT
— VI-127 —

The deposits lie along the flanks of a regional scale anticlinal structure, having formed from thetropical and intensive karstic weathering of underlying Pre-Cambrian dolomitic and clay-bearingrocks. Later overlying basalts have altered the bauxite mineralogy in places. The weathering,occurring in the Devonian period resulted in the creation of a highly undulating karstictopography and removed most of the carbonate from the basement rocks, resulting in a layer richin alumina and silica minerals. This layer was then subjected to more intense weathering withmuch rainfall and water table fluctuations resulting in the bauxitisation and resultant bauxitedeposits.
The bauxites are overlain by mudstones and sandstones deposited at the end of the Devonian.Carboniferous and Cretaceous sediments, mainly carbonates, were then deposited andQuaternary, continental sediments, comprising river deposits only a few metres thick, weredeposited over the sequence, which, by this time, had been slightly folded and faulted. Thebauxites are buried by up to 400 m of cover and are exploitable by open-pits down toapproximately 200 m.
The majority of the bauxites are fairly continuous undulating layers of simple structure and fairlyhomogenous grade, however, the Schugorskoye North beds are much more complex withmultiple lenses and poorer continuity but up to 100 m thick. The highest quality bauxite issituated in the core of the bauxite layers with lower quality above and below and on the fringes.The thickness of the bauxite layer averages from 4 to 11 m for individual lenses. The depositareas comprise up to six individual deposits averaging around 1.5 km in length along strike andapproximately 0.5 km across strike.
The mineralogy is relatively unusual as monohydrate boehmite is the principle aluminousmineral with very low gibbsite, with minor diaspore and chamosite, as well as the more usualkaolinite and haematite. Boehmite is expected to dissolve completely in the Bayer processingmethod. Diaspore has the same composition as boehmite, but dissolves incompletely, especiallywhen present in proportions over 5%. Kaolinite is digested in the Bayer process, but its silica andalumina react with the caustic soda forming an insoluble desilication product which goes towaste as red mud residue. Half of the chamosite is digested and half reports to the red mud. Inertquartz makes up around 0.2% and reports to the red mud. Haematite and goethite, assumed tocontain no alumina, also report to the red mud.
The bauxite can be categorised into two main bauxite types for export, dependent upon the silicagrade, Bayer grade being typically less than 6% SiO2 and greater than 49% Al2O3 and Sintergrade greater than 6% SiO2 and >44% Al2O3, but less than 12% SiO2.
In general, with the exception of the more complex multi-lense Verkhne-Schugorskoye Northbeds, the geological and grade continuity is moderate-good, with typical grade continuity alongstrike and less so across strike. Vertically within the bauxite horizon the grade has a distinctprofile with lower alumina and higher silica at the hanging wall and footwall contacts, and a highalumina and low silica central core. Within the Russian GKZ system of classification, theVerkhne-Schugorskoye North beds are categorised as Type III complexity and the other depositsType II.Potential areas for additional Mineral Resource exist, namely the Svetlinskoye,Valodinskoye and Zaostrovskoye groups which are situated to the northwest of theVezhayu-Vorykvinskoye group of deposits. Some of these areas have been recently explored,however are currently on hold.
APPENDIX VI INDEPENDENT TECHNICAL REPORT
— VI-128 —
3.7.4 Mineral Resources and Ore Reserves
The project area has been investigated extensively over the past 30 years resulting in a largequantity of data. Some 5,000 boreholes have been drilled, with over 63,000 samples analysedusing wet chemistry techniques for oxide chemistry. Topographic surveys have been undertakencovering the whole project area to an appropriate level of detail for resource definition, and allsample locations surveyed. All data collected has been reviewed and approved by the RussianState Reserves committee.
The drill spacing across the deposits varies, but in general some 15% of the deposits are drilledat 50 x 50 m or 100 x 50 m (GKZ “B” category), some 85% of the deposits at either 142 x 142m or 100 x 50 m or 200 x 200 m (GKZ “C1” Category) and some 5% at 200 x 200 m minimumspacing (GKZ “C2” Category).
Almost the entire drillhole and sample database was compiled historically, using single-tubeconventional core drilling (89 mm core diameter), methodologies with acceptable core recovery,and has since been electronically captured and validated. Samples were historically collectedusing standard methodologies at 1 to 2 m intervals, and were prepared in state run facilities usingappropriate techniques for splitting, crushing and milling. Three different types of analysis havebeen undertaken, brief chemical analysis of only the major oxides, full chemical analysis of allmajor oxides, and trace element analysis, all of which use wet chemistry titration methodologies.
Although SRK has not undertaken a review of the historical QAQC data, the quality of thehistorical laboratory assays and exploration drilling and sampling information has been checkedas part of a SRK study undertaken in 2004 involving the drilling of 68 confirmatory diamondboreholes totalling 5,330 m; geological logging and sampling were supervised by SRK; and abauxite characterisation testwork programme was carried out at CSIRO in Perth, Australia.
Different density factors are applied to the different deposit areas, ranging between 2.25 and 2.45t/m3 on a wet basis, with moisture contents ranging between 11% and 17%.
SRK comments that the geology and major controls of the bauxite are well understood enablingsufficient confidence in the modelling of the bauxite. The data quality and quantity is consideredsufficient for classification into the Measured, Indicated and Inferred Mineral Resourcecategories in accordance with the JORC Code.
The Mineral Resource statements presented here have been reported from the approved GKZestimates, with deductions for depletion of mining at the average grade, as is common practicefor GKZ reserves. Estimates of tonnage and grade for each of the deposits were derived throughthe use of manual ‘polygonal’ methods. This involved the production of sectional interpretationsof the bauxite horizons outlining the drillhole intersections satisfying the chemical criteria ofBayer and Sinter quality bauxite as stated above in addition to a minimum Al2O3 to SiO2 ratioof 3 (“MSI”), and where bauxite thickness exceeds 1.5 m. These were then projected onto planview where polygonal blocks were delineated. Average thickness values and length-weightedgrades were then calculated and applied to each of these blocks. Blocks with greater than a 20:1strip ratio cut-off were then subtracted from the total.
The mining operations are planned via a computerised geological modelling and mine planningpackage, Mineframe, in order to estimate more accurately the Mineral Resource using infilldrilling data and to allow more efficient short-term mine planning.
APPENDIX VI INDEPENDENT TECHNICAL REPORT
— VI-129 —
In order to classify the Mineral Resource in accordance with the JORC Code, SRK has assessedland-ownership, exploration history, drilling density, quality of estimation and sterilisation andaccepted the GKZ criteria relating to quality, minimum mining thickness and strip ratio. With theexception of the Verkhne-Schugorskoye North beds, SRK considers the B category blocks(drilled up to 100 x 50 m) and C1 blocks (up to 200 x 200 m) to be reportable as MeasuredMineral Resource, and C2 blocks (>200 x 200 m, <400 x 400 m) as Indicated Mineral Resourceaccording to the JORC Code. For the Verkhne-Schugorskoye North beds all of the B and C1
blocks have been re-classified as Indicated Mineral Resource, due to the geological complexityof the bauxite.
SRK has reduced the UC RUSAL Mineral Resource and Ore Reserve by some 20 Mt wet (16 MtBayer, 4 Mt Sinter) to account for bauxite within the river protection zone, affecting theVezhayu-Vorykvinskoye deposit. In addition, SRK has checked the GKZ resource estimatesagainst the SRK Mineral Resource estimate produced using 3D software modelling approachusing similar criteria, which demonstrates the GKZ estimates to be robust.
To convert the Mineral Resource into Ore Reserve, SRK has applied modifying factors supportedby information reviewed, the observations of mining activities, and SRK’s experience. SRKconsiders there to be sufficient detailed technical studies and mining operations to allow theMineral Resource to be converted to Ore Reserve following the application of the modifyingfactors, with the exception of Vostochnoye bauxite at depth suitable for underground mining,which has not been planned to sufficient detail to be economic to warrant transferral.
Timan states dilution and losses to be 5% and 6% respectively, which SRK considers adequategiven the geological continuity and as the hanging wall and footwall contacts are not easy tovisually define and can only be defined by chemical analysis. SRK has not applied a dilutinggrade to the Ore Reserve.
The Mineral Resource and Ore Reserve statement has been prepared by depleting the 2008statement by the production tonnages excavated during the 12 month period. Records obtainedfrom UC RUSAL have presented the grades for both Bayer and Sinter bauxites but no split oftonnages. Therefore in deriving the Mineral Resource and Ore Reserve figures, SRK has adopteda conservative approach.
Table 3.16: Timan Bauxite Mineral Resource and Ore Reserve Statement (1 July 2009)(1), (2), (3), (4), (5)
Ore Reserve Mineral Resource
Tonnage Al2O3 SiO2 Tonnage Al2O3 SiO2
(Mt Dry) (%) (%) (Mt Dry) (%) (%)
Proved . . . . . . 99.7 54.8 8.3 Measured . . . . 113.1 49.4 7.4
Probable. . . . . 35.4 57.1 7.2 Indicated . . . . 67.1 49.9 6.9
Total . . . . . . . 135.1 55.4 8.0 Subtotal . . . . 180.2 49.6 7.2
Inferred . . . . . 0.0 0.0 0.0
Total . . . . . . 180.2 49.6 7.2
(1) All references to Mineral Resources and Ore Reserves are stated in accordance with the JORC Code, 2004 Edition.
(2) Mineral Resources and Ore Reserves are recorded on an unattributed, or 100% basis.
(3) Alumina grades are presented as available as opposed to total alumina.
(4) Silica grades are presented as reactive as opposed to total silica.
(5) Mineral Resources are inclusive of Ore Reserves.
APPENDIX VI INDEPENDENT TECHNICAL REPORT
— VI-130 —

3.7.5 Mining Operations and Infrastructure
Mining activities are currently conducted only within the Vezhayu-Vorykvinskoye deposit area,within orebodies 1, 2 and 3.
Conventional open-pit mining techniques are currently employed, with the overburden excavatedin 10 m benches, and with bauxite generally mined in 5 m benches following blasting. Excavatorsload the waste into 40 t dump trucks that transport the material to both external and internalwaste dumps. The bauxite is taken to the blending yard adjacent to the railhead, where it ishomogenised and blended.
The mine is currently trialling surface mining equipment, the Wirtgen SMs, as employed in UCRUSAL’s Guinea operations, in order to improve vertical selectivity of the bauxite and to reduceoperating costs associated with drilling, blasting and crushing. It is envisaged that the oneoperating surface miner will be able to operate at 250-300 ktpa, mining 0.5 m layers within morecontiguous blocks of bauxite.
There are numerous open-pits planned over the life of the mine and several of these may needto be mined concurrently to ensure a consistent feed grade. In particular, the mining may berequired to be scheduled to blend the silica content of the Bayer ore from the average of thedeposits of 10% SiO2 to approximately 8.2% SiO2. Pit depths vary from 25 m to almost 200 m.Future open-pit mining, particularly in the deeper pits will require dewatering, and as per thecurrent operations, surface water diversion ditches required to control surface water inflows.Development of haul roads to access new mining areas is undertaken in advance of bauxiterequirement.
The mining operations are planned for continuous operations, operating a 2-shift work scheduleof 12 hours for 365 days per annum. The operations are affected a great deal by the very coldwinters and heavy snowfall, with winter operations focussing on stripping as opposed to bauxitemining. The current mining activities and equipment are designed for an annual miningproduction of 2 Mtpa.
Grade control sampling is undertaken within the open-pits in the form of 25 x 25 m cored infilldrilling, sampling of all blasthole cuttings from a mining block, and sampling of the stockpilesprior to loading the rail wagons. A number of stockpiles are used for blending and the materialthoroughly homogenised, and partially crushed mechanically, in order to ensure export graderequirements are met. Preparation and analysis of grade control samples is undertaken in theon-site laboratory which uses appropriate methodologies and equipment.
Timan produces both Bayer and Sinter grade bauxite, generally ranging 48 to 49%, and 46 to 47%Al2O3 respectively, and 7.0 to 7.5% and 11.0 to 11.5% SiO2 respectively.
The current mining plan is to continue exporting bauxite from the mine in accordance withcontracts for existing UC RUSAL refineries receiving both Bayer and Sinter quality bauxite.
3.7.6 Environmental and Social Considerations
As part of the due diligence investigation undertaken for Timan, the environmental and socialaspects of the mine have been assessed. This included assessment of compliance with the EquatorPrinciples and in-country legislation, environmental management systems, and identification ofmaterial issues.
Mining currently takes place in the central area in Pits 1, 2 and 3 and this will continue forapproximately the next 10 years. The maximum depth of the pits is 36 m and will not extend tobelow the water table. Peripheral drains collect storm water which is then drained to theenvironment. Dirty water in the pits is settled in a settling pond before being discharged to themarsh land.
APPENDIX VI INDEPENDENT TECHNICAL REPORT
— VI-131 —

There is an external dump which has been subject to re-vegetation trials since 1999 when miningstarted by the Institute of Biology of the Russian Academy of Science. The rehabilitationprogram has been developed as a part of overall project design and asset retirement obligationupdated annually. The new-developing deposit areas are provided with the local closure plans inaccordance with new procedure. All domestic and industrial waste is taken to the Polygon wastedisposal facility. This comprises a double HDPE lined disposal facility, an incinerator and watertreatment plant.
Timan mine is located in an unpopulated area of the Komi Republic in the Russian Federation.The area is covered by coniferous forests alternating with swamps within a harsh climaticenvironment with annual average temperatures of below 0�C. The Vorykva River (a tributary ofthe River Vym), Chernuy Stream and their tributaries form the hydrological network of the minelicence area. The rivers Vym and Vorykva and their tributaries are spawning rivers and have thehighest category of importance in accordance with the Russian fishery river classification. Thegroundwater table is close to the ground surface in the lower lying ground but up to 50 m belowsurface on the higher ground.
The nearest settlements, Levkinskaya and Ust-Tzilma, are located 40 km and 120 km from thesite, respectively. The economy of the region is mainly based on timber felling with some lightand engineering industry. Areas beyond the existing mining operations remain in relativelypristine condition.
The Russian OVOS process was undertaken during 2006 for the proposed expansion of themining activities. This OVOS was approved by the Pechorskiy Interregional Department ofTechnological and Environmental Supervision and is valid until 6 February 2012.
SRK assessed the Timan mine in terms of their compliance with the Equator Principles dated July2006 and they are found to be compliant or partially compliant to most of the EPs.
An international ESIA process was undertaken in 2004 according to the International FinanceCorporation Performance Standards and in 2006 the Russian OVOS process was undertaken forthe proposed expansion of the mining activities. The recommendations of the approved OVOSof 2006 are however not yet fully being implemented in accordance with accepted internationalpractice.
The “Komi Aluminium” environmental, health, safety and community policy was put into placein November 2005. The establishment of an EMS is one of the key issues of the policy, and thissystem has been put into place at the mine. Timan mine also has a programme in place to achieveaccreditation on ISO9001 and ISO14001.
An Environmental and Social Due Diligence audit was conducted in 2003 as a requirement of theIFC and European Bank for Reconstruction and Development (“EBRD”) prior to extending a loanfor the expansion of the mine from 1.5 to 2.5 Mtpa. For a further proposed expansion to 6 Mtpa,the international ESIA process was undertaken in 2004 which included a public consultationprocess. In 2006 the Russian OVOS process was followed for the proposed expansion of themining activities. SRK however understands that the proposed expansions have not yet beenfinalised or implemented.
Timan provides environmental monitoring in accordance with a programme designed for 2002 to2011. Monitoring consists of several aspects which are provided by different contractors. Themonitoring is extensive and comprehensive and there is a clear intention to manage these aspectsof the environment. The company ‘Geology1’ provides surface water and groundwatermonitoring. Annual monitoring reports of aquatic fauna are provided by the Institute of Biology.Although the water quality of the watercourses corresponds with Russian normative requirements
APPENDIX VI INDEPENDENT TECHNICAL REPORT
— VI-132 —
for the fishery status, recent investigations identified negative impacts of the mine on the fishpopulation of the Vorykva River. Annual monitoring reports of terrestrial fauna and flora are alsoprovided by the Institute of Biology which includes monitoring of landscape disturbance, soils,flora, fauna, rehabilitated areas, air emissions (snow cover sampling) and radiation levels.
Environmental measure programmes are developed annually.
Material issues identified which may pose a risk to the Timan mine include impacts on waterresources and aquatic fauna; closure and rehabilitation; and environmental monitoring.
In the case of expansion of the open-pits, a significant impact may be expected on thegroundwater and surface water regimes, some of which are protected. The impacts on the riversmay be caused by both changing the hydrogeological regime and discharging of mine dewateringpotentially impacting the water quality and temperature regimes and consequently affecting thesensitive aquatic ecology of the area. An effective pre-dewatering system and associated watermanagement system, permitting and discharge requirements to the Vorykva River and othercatchments need to be planned and developed when mining is executed below the natural levelof water. In addition, careful control of water volumes, suspended solids, water chemistry andtemperature would be required to avoid environmental impacts. In this regard UC RUSAL isreportedly carrying out detailed engineering plans for the dewatering facilities to be ready in2008.
Environmental monitoring is undertaken but requires a more integrated, systematic approach toprogramming of data collection, analysis, scheduling, methodology, and location of measurementpoints. Whilst monitoring results are reflected in high level management reports, it is not clearwhether the results are acted upon in the short term by the mine staff.
The asset retirement obligation at 1 July 2009 has been estimated by UC RUSAL to beUS$8.3 m on an attributable basis. SRK has not reviewed this number, and is unaware of whatit includes. However it excludes terminal benefits associated with any eventual termination ofemployments.
During 2007, closure costs were determined in the mine extension project as about US$23.6 m.A more clear and strategic future plan with regards to environmental rehabilitation andretrenchment of employees at mine closure, is still required.
3.7.7 Technical and Economic Assessment
The following points are made in respect of the production and cost parameters in support of theOre Reserves:
• The life of the mine supporting the Ore Reserve is over 25 years.
• The production rate remains more or less constant over the life of mine at 2 Mtpa.
• The operating costs include royalties and are to the mine gate.
• The economics have been verified based on an overall integrated flow of bauxite throughto aluminium, as described in Section 2.2.5.
APPENDIX VI INDEPENDENT TECHNICAL REPORT
— VI-133 —

Table 3.17: Timan historical production and cost statistics(1), (2)
Statistics Units 2006 2007 2008 H1 2009
Production
Tonnage . . . . . . . . . . . (Mt wet) 2.39 1.92 1.94 0.97
Grade . . . . . . . . . . . . . (% Al2O3) 49.3 49.2 49.1 48.9
Factor . . . . . . . . . . . . . (tbauxite:talumina) 3.01 3.12 3.10 3.09
Expenditures
Cash operating cost . . . . (US$m) 31.4 32.6 35.1 10.2
Cash costs per unit . . . . (US$/t) 13.14 16.97 18.11 10.51
Capital expenditure . . . . (US$m) 10.5 9.1 3.0 0.0
(1) Grades are given as available alumina.
(2) All numbers are reported on a 100% attributable basis.
3.7.8 Material Developments
The planned increase in production and the development of the Sosnogorsk Refinery has beendeferred.
Timan has significantly reduced its operating costs in H1 2009. SRK has not reviewed the detailbehind the H1 2009 cost reductions, nor been able to assess the sustainability of such loweroperating costs into the future.
3.7.9 Specific Risks and Future Opportunities
Specific risks to the operations include:
• Mining Control — The ability to continue to differentiate and separate the high and lowgrade Bayer and Sinter bauxite and waste in the open-pits will require the ability toselectively mine at the hanging wall and footwall contacts and with close mining control.
• Preferential High Grading — The deposits are zoned with high and lower grade areas.Poor mining could result in high grade and quality bauxite being mined preferentially. Ifthis practice is ongoing, it will impact on the overall Ore Reserve, reducing either theaverage grade and quality or tonnage of the remaining bauxite. This may furthercompromise the Ore Reserve if the economic viability is affected.
• Winter/Summer Bauxite production difficulties — The ability to optimise winter andsummer mining production given the difficulties during both seasons and the thaw, andability to smooth out the production programme to match consumer demand.
• Dust Suppression — Improvement of dust suppression during summer months.
• Dewatering — Effective and timely pre-mining dewatering is required to avoid largeinflows and very difficult working conditions, when mining is executed below the naturallevel of water. In this regard UC RUSAL is carrying out detailed engineering for thedewatering facilities to be ready by 2008.
• Personnel Issues — Management of the loss of skilled personnel to local oil and gasindustry, and keeping of experienced staff.
• Environmental Management — The ESIA recommendations have yet to be implementedin accordance with accepted international practice.
APPENDIX VI INDEPENDENT TECHNICAL REPORT
— VI-134 —

Future opportunities to the operations include:
• Basalt — A basalt deposit overlies the bauxite in a number of the proposed open-pits whichcould be sold into the local market. The realisation of revenue from the sale of the basalthas the potential to offset overburden stripping costs and thereby increase the economicreserves.
• Surface Miner Equipment — Opportunity to improve mining operations and efficienciesthrough a successful implementation of surface miner equipment.
• Underground Potential — There are bauxite deposits which have potential forunderground extraction at the Vostochnoye deposit.
• Regional Resources — There are additional bauxite deposits in the region which couldprovide additional resources.
3.8 Kiya Shaltyr Nepheline (Kiya Shaltyr and Mazulsky Mines)
3.8.1 Introduction
SRK undertook a site visit to the Kiya Shaltyr Nepheline Syenite Mine in October 2008. The sitevisit report has subsequently been revised and updated based upon data and information from UCRUSAL and discussions held with senior management in September 2009. However, SRK maynot be fully informed of all changes which have taken place and hence some descriptions maybe out of date.
3.8.2 History, and Location
The Achinsk Alumina Refinery, near Krasnoyarsk in southern Siberia produces alumina fromnepheline syenite as opposed to bauxite. The refinery is situated on the Yenisei River next to thetown of Achinsk. It has been in operation since 1970.
Aluminium-rich (approximately 27% Al2O3) nepheline syenite is mined from the Kiya Shaltyropen-pit, located in the Kuznetsk Alatau mountain range of southern Siberia, a little over 250 kmto the north of the refinery and connected to Achinsk by rail and road. Production commencedin 1963.
The process also requires limestone which is obtained from the Mazulsky open-pit that is locatedadjacent to the alumina refinery. The nepheline syenite ore from the Kiya Shaltyr deposit isblended with limestone obtained from the Mazulsky open-pit.
With both mines located west of Krasnoyarsk in southern Siberia, the climate is continental withhot summers and very cold winters. Kiya Shaltyr is located in mountainous terrain at theelevation above 1,000 m with a climate typical of alpine area, with long periods of snow cover.The average temperature at the Kiya Shaltyr is -2.7�C with a minimum and maximum of -52�Cand 31�C respectively. Rainfall averages 930 mm and ranges on a monthly basis from 690 mmto 1,350 mm. The average number of days per year with snow on the ground is 140. Mazulskyis located on a plain at an elevation of 365 m. The average air temperature in January is -20�Cand in July, 18�C.
3.8.3 Geology
The Kiya Shaltyr nepheline syenite deposit contains approximately 25% feldspar and 55%nepheline. The nepheline bearing intrusion is a wedge-shaped mass which becomes narrower asit is traced downwards and eventually pinches out. The intrusion transects and metamorphosesthe sediments of Lower Cambrian and is itself Lower-Middle Devonian (388 million years) inage. It is roughly U-shaped in plan and is about 2.3 km long and 20 to 220 m wide, having anaverage thickness of about 120 m.
APPENDIX VI INDEPENDENT TECHNICAL REPORT
— VI-135 —

Information from sampling in the pit suggests a patchy and irregular central core to the depositwith an alumina in excess of 27.5%, surrounded by rock with grades of between 26.5% and27.5% and near the contacts with the country rock patches of rock with an alumina content ofless than 26.5%. A zonation of the deposit may therefore be present.
Dykes divide the orebody with dense grid both along the strike and transverse to it. They rangein thickness from five metres or more to small swarms of thin intrusions and constitute more than7% of the orebody. All the dykes have clear contacts with the ore, but during collective extractionit is quite difficult to distinguish the dykes from ore which leads to dilution. The variation in thegrade of the ore is due almost entirely to differentiation in the deposit itself, together withcontamination from dykes.
The Mazulsky limestone deposit is a fault-bounded limestone within the Lower CambrianUsinskaya Suite of rocks. The sequence consists of a mixture of sedimentary rocks of varioustypes together with pyroclastic deposits. The limestones which are mined are overall relativelypure, with small-scale variations which affect the extraction of low silica and sulphur limestonefor the sinter process. The variation in the chemistry of the material is caused by dykes ofigneous material, quartz-rich areas, karst and brecciated zones with high sulphide and ironhydroxides. Experience in the quarry has suggested that 71% of the stone is limestone with anacceptable grade. The target grade for the sintering process is limestone with a silica content ofless than 2% and a SO3 content less than 0.4%. All the zones of off-grade limestone, are verycomplex in shape and difficult to model hence extraction planning and the in-pit blending, isbased on blasthole sampling.
3.8.4 Mineral Resources and Ore Reserves
The Kiya Shaltyr nepheline syenite deposit and Mazulsky limestone deposit Mineral Resourceestimates have been completed using traditional FSU polygonal methods using plan view areasand average deposit thicknesses. SRK has reviewed these estimates and made corrections wherenecessary in presenting the Mineral Resource and Ore Reserve in accordance with the JORCCode below.
Table 3.18: Kiya Shaltyr Mineral Resource and Ore Reserve Statement (1 July 2009)(1), (2), (3), (4), (5)
Ore Reserve Mineral Resource
Tonnage Al2O3 SiO2 Tonnage Al2O3 SiO2
(Mt Dry) (%) (%) (Mt Dry) (%) (%)
Proved . . . . . . — — — Measured . . . . — — —Probable. . . . . 8.7 26.3 40.2 Indicated . . . . 8.9 26.9 40.3Total . . . . . . . 8.7 26.3 40.2 Subtotal . . . . 8.9 26.9 40.3
Inferred . . . . . 54.2 27.2 40.3Total . . . . . . 63.1 27.1 40.3
(1) All references to Mineral Resources and Ore Reserves are stated in accordance with the JORC Code, 2004 Edition.
(2) Mineral Resources and Ore Reserves are recorded on an unattributed, or 100% basis.
(3) Alumina grades are presented as available as opposed to total alumina.
(4) Silica grades are presented as reactive as opposed to total silica.
(5) Mineral Resources are inclusive of Ore Reserves.
Due to the wide spacing of the original exploration drilling at Kiya Shaltyr SRK considers thissufficient only to support an Inferred Mineral Resource estimate. SRK has however utilised theresults of the current infill and blast hole drilling and sampling to classify the material up to 30m below the current open-pit as an Indicated Mineral Resource. The company is planning tocomplete an exploration programme in 2009 and 2010 at a closer drill hole spacing to improvethe knowledge of the deposit at depth.
APPENDIX VI INDEPENDENT TECHNICAL REPORT
— VI-136 —

The Ore Reserves defined by SRK for the Mazulsky mine have been determined according to thequantum of Ore Reserves defined by SRK for the Kiya Shaltyr mine on a ratio of 60% limestoneto 40% nepheline syenite in accordance with the process requirement of the Achinsk Refinery.
Table 3.19: Mazulsky Mineral Resource and Ore Reserve Statement (1 July 2009)(1), (2), (3)
Ore Reserve Mineral Resource
Tonnage CaO SiO2 Tonnage CaO SiO2
(Mt) (%) (%) (Mt) (%) (%)
Proved . . . . . . — — — Measured . . . . — — —
Probable. . . . . 12.8 53.8 1.7 Indicated . . . . 90.1 54.4 1.0
Total . . . . . . . 12.8 53.8 1.7 Subtotal . . . . 90.1 54.4 1.0
Inferred . . . . . 0.0 0.0 0.0
Total . . . . . . 90.1 54.4 1.0
(1) All references to Mineral Resources and Ore Reserves are stated in accordance with the JORC Code, 2004 Edition.
(2) Mineral Resources and Ore Reserves are recorded on an unattributed, or 100% basis.
(3) Mineral Resources are inclusive of Ore Reserves.
3.8.5 Mining Operations and Infrastructure
Kiya Shaltyr utilises conventional open-pit mining techniques comprising drilling and blastingfollowed by loading and hauling utilising excavators and rope shovels in conjunction with 90 tand 120 t haul trucks. The ore is extracted from a single open-pit and transported to the primarycrusher whilst waste is taken to one of five active dumps located adjacent to the pit in the southand north. The pit bottom is currently at the 690 mL and some 310 m in depth. Pit slopes areinclined at some 65º and 52º at the east and west walls respectively. The pit is dewatered usinga central sump and pumps
From blasthole sampling the ore is classified into three grade and quality categories: low grade<25% Al2O3, medium grade 25-27% Al2O3, and high grade >27% Al2O3 and blended duringmining to maintain a planned grade of 26.6% Al2O3. Low grade material from dykes and fromlow grade zones is stockpiled separately.
The blended ore is delivered to a housed crushing and storage facility where the ore is reducedby the primary crusher to less than 300 mm and stockpiled prior to being loaded into 60 t railwagons and transported some 265 km to Achinsk. The main line is state owned whilst two 10 kmaccess spurs at each end are owned by a private company. Rail transport costs are a significantcomponent of overall operating costs. Power is obtained from the regional Krasnoyarsk powerutility.
The Mazulsky limestone quarry also utilises conventional open-pit mining techniquescomprising drilling and blasting followed by loading and hauling utilising rope shovels inconjunction with 40 t and 55 t haul trucks. The limestone is extracted from a single open-pit andtransported to the primary crusher some 5 to 6 km from the pit whilst waste is taken to adjacentdumps. The quality of the limestone is determined by blast hole sampling. Approximately 71%of the material is good quality limestone. The pit bottom is currently at the 125 mL and some240 m in depth. Pit slopes are inclined at some 42º, 36º and 35º at the south, west and east wallsrespectively. The pit is dewatered using a central sump and pumps. It is intended to deepen thefinal open pit to the 5 mL and an exploration programme is currently being undertaken.
As Mazulsky is located adjacent to the Achinsk plant, power and services are managed as partof an integrated facility.
APPENDIX VI INDEPENDENT TECHNICAL REPORT
— VI-137 —

Processing Operations
The raw materials for the Achinsk plant are an integral part of the manufacturing process and theprincipal objective is to extract and blend the continuous flow of all the materials in such amanner that the chemistry of the feed to the hydro-chemical plant is uniform. The nephelinesyenite produced from Kiya Shaltyr is transported to Achinsk where it is mixed with pre-blendedlimestone prior to comminution in a wet mill. On occasion siliceous bauxite imported from UCRUSAL’s Timan mine is added in order to compensate for lower than targeted alumina contentof the nepheline syenite. The pulp from the mill passes through a coal-fired sinter kiln where theintake temperature ranges from 1,500�C to 1,600�C. Reaction between the limestone andnepheline takes place at 1,300�C and the product is a sinter cake of essentially beta dicalciumsilicate and sodium and potassium aluminate together with any impurities present.
The dicalcium silicate is available for manufacture into Portland cement. The cement circuit hasbeen sold to third parties. The impure dicalcium silicate, known as belite, is currently dischargedto the slimes dam.
3.8.6 Environmental and Social Considerations
The total disturbed pit and waste rock dump area at Kiya Shaltyr is 673 ha and at Mazulsky is568 ha. There are three tailings storage facilities (“TSFs”) for the refinery tailings, namely Dams1, 2 and 3. Dam 1, the oldest has an area of 195 ha and is 98 m high and Dam 2 comprises 115ha and will reach a final height of 68 m. Dam 3 is new and has an area of 160 ha.
The environmental performance of the Kiya Shaltyr and Mazulsky operations is regulated byboth the federal and district of Krasnoyarsk governments. These operations appear to be inmaterial compliance with Russian Federation environmental requirements. Statutory waterdischarge (PDS), air emission (PDV) and waste disposal (PNLOOR) permits for both operationsare in place. The Mazulsky operation pays a quarterly fine for non-compliance of one of theparameters in the water discharge limit (US$20,800 for 2008 for both the refinery and thelimestone mine). Environment Impact Assessments were not compiled for either operation priorto their establishment in 1963. Neither were OVOS documents compiled post the establishmentof the operations. Based on current environmental laws there is little risk of closing the operationas a result of environmental non-compliance. The entire complex (refinery, Mazulsky and KiyaShaltyr) has been certified to ISO14001:2004 by Det Norske Veritas in 2007.
Even though the waste dumps and tailings storage facilities are non-acid generating, salts andheavy metals may be an issue in the long-term. The results of background and monitoringboreholes indicate that the water in the vicinity of the dumps and tailings facilities is notdrinking water quality.
All waste dumps are reclaimed progressively according to an agreed programme with therelevant authorities. At Kiya Shaltyr nearly 21 ha was rehabilitated and approved during 2007and at Mazulsky 8 ha was rehabilitated and approved. Despite the on-going rehabilitation thereare still large areas of waste rock dumps that remain un-rehabilitated.
No rehabilitation of any of the tailings dams has commenced. Tests have been conducted todetermine the technical specifications for the final rehabilitation of the dams. Currently a claylayer to cover the dams is planned followed by topsoil and revegetation. It was mentioned thatthe rehabilitation of the current dams (1 and 2) has been estimated at US$7 m.
APPENDIX VI INDEPENDENT TECHNICAL REPORT
— VI-138 —
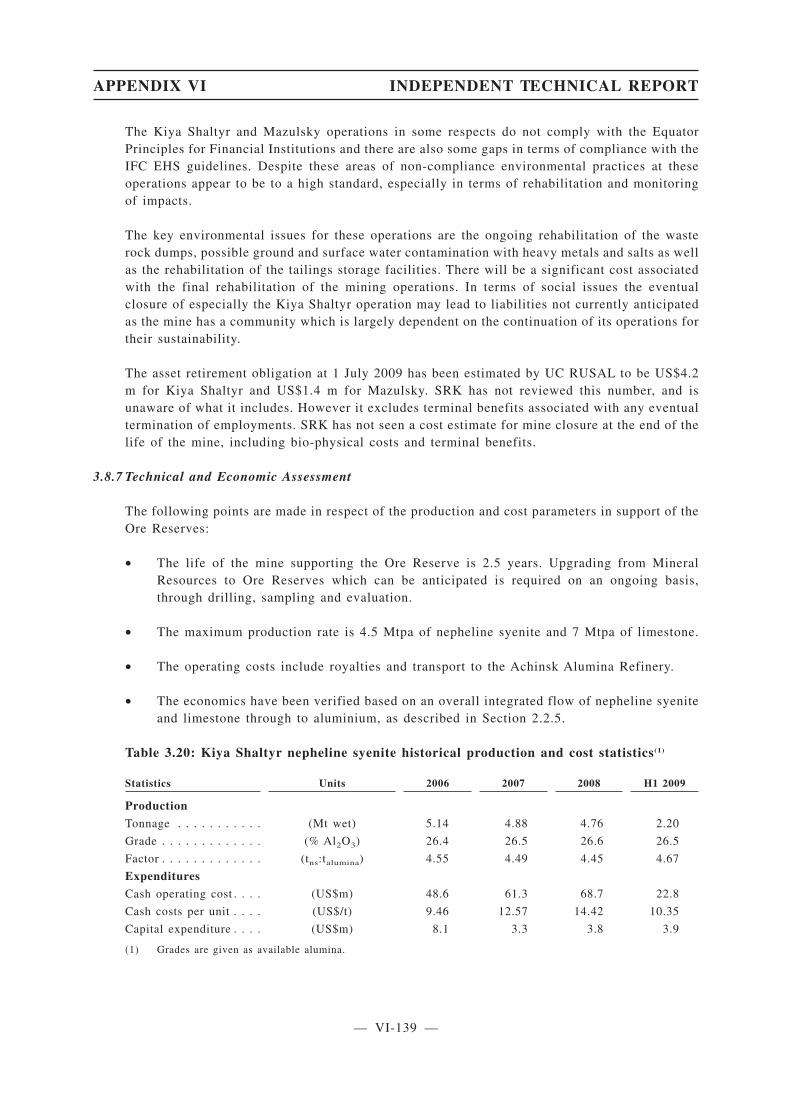
The Kiya Shaltyr and Mazulsky operations in some respects do not comply with the EquatorPrinciples for Financial Institutions and there are also some gaps in terms of compliance with theIFC EHS guidelines. Despite these areas of non-compliance environmental practices at theseoperations appear to be to a high standard, especially in terms of rehabilitation and monitoringof impacts.
The key environmental issues for these operations are the ongoing rehabilitation of the wasterock dumps, possible ground and surface water contamination with heavy metals and salts as wellas the rehabilitation of the tailings storage facilities. There will be a significant cost associatedwith the final rehabilitation of the mining operations. In terms of social issues the eventualclosure of especially the Kiya Shaltyr operation may lead to liabilities not currently anticipatedas the mine has a community which is largely dependent on the continuation of its operations fortheir sustainability.
The asset retirement obligation at 1 July 2009 has been estimated by UC RUSAL to be US$4.2m for Kiya Shaltyr and US$1.4 m for Mazulsky. SRK has not reviewed this number, and isunaware of what it includes. However it excludes terminal benefits associated with any eventualtermination of employments. SRK has not seen a cost estimate for mine closure at the end of thelife of the mine, including bio-physical costs and terminal benefits.
3.8.7 Technical and Economic Assessment
The following points are made in respect of the production and cost parameters in support of theOre Reserves:
• The life of the mine supporting the Ore Reserve is 2.5 years. Upgrading from MineralResources to Ore Reserves which can be anticipated is required on an ongoing basis,through drilling, sampling and evaluation.
• The maximum production rate is 4.5 Mtpa of nepheline syenite and 7 Mtpa of limestone.
• The operating costs include royalties and transport to the Achinsk Alumina Refinery.
• The economics have been verified based on an overall integrated flow of nepheline syeniteand limestone through to aluminium, as described in Section 2.2.5.
Table 3.20: Kiya Shaltyr nepheline syenite historical production and cost statistics(1)
Statistics Units 2006 2007 2008 H1 2009
Production
Tonnage . . . . . . . . . . . (Mt wet) 5.14 4.88 4.76 2.20
Grade . . . . . . . . . . . . . (% Al2O3) 26.4 26.5 26.6 26.5
Factor . . . . . . . . . . . . . (tns:talumina) 4.55 4.49 4.45 4.67
Expenditures
Cash operating cost . . . . (US$m) 48.6 61.3 68.7 22.8
Cash costs per unit . . . . (US$/t) 9.46 12.57 14.42 10.35
Capital expenditure . . . . (US$m) 8.1 3.3 3.8 3.9
(1) Grades are given as available alumina.
APPENDIX VI INDEPENDENT TECHNICAL REPORT
— VI-139 —
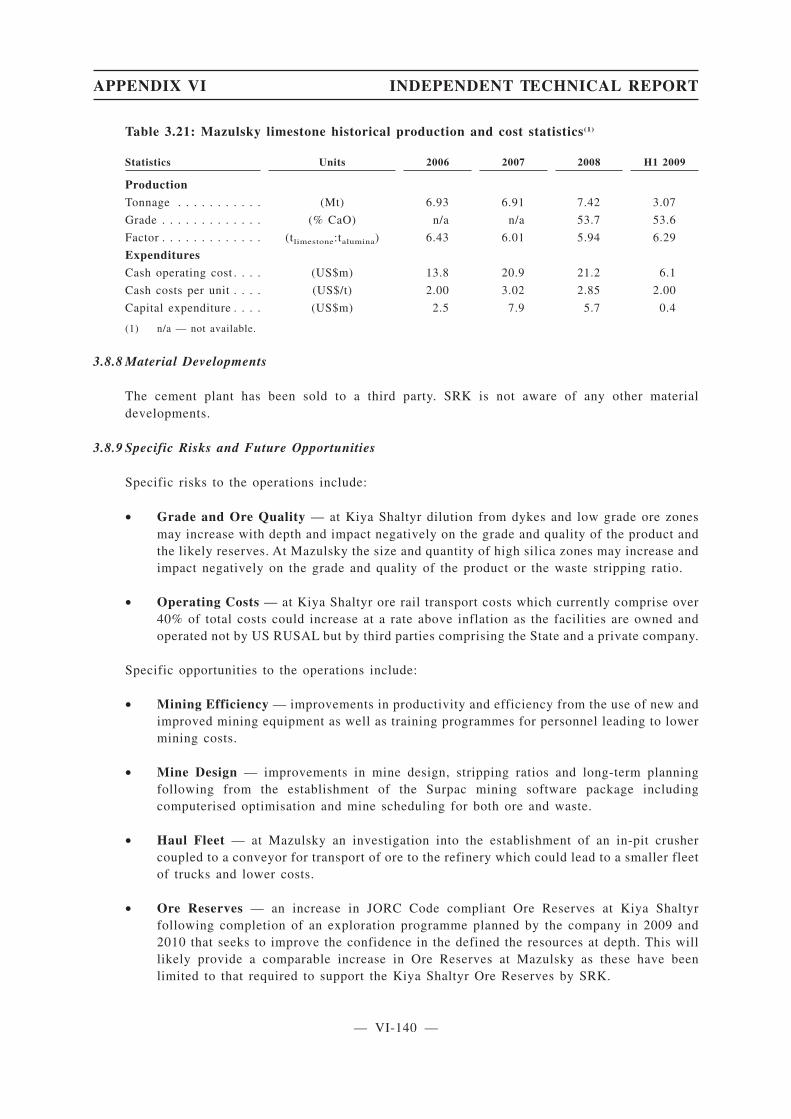
Table 3.21: Mazulsky limestone historical production and cost statistics(1)
Statistics Units 2006 2007 2008 H1 2009
Production
Tonnage . . . . . . . . . . . (Mt) 6.93 6.91 7.42 3.07
Grade . . . . . . . . . . . . . (% CaO) n/a n/a 53.7 53.6
Factor . . . . . . . . . . . . . (tlimestone:talumina) 6.43 6.01 5.94 6.29
Expenditures
Cash operating cost . . . . (US$m) 13.8 20.9 21.2 6.1
Cash costs per unit . . . . (US$/t) 2.00 3.02 2.85 2.00
Capital expenditure . . . . (US$m) 2.5 7.9 5.7 0.4
(1) n/a — not available.
3.8.8 Material Developments
The cement plant has been sold to a third party. SRK is not aware of any other materialdevelopments.
3.8.9 Specific Risks and Future Opportunities
Specific risks to the operations include:
• Grade and Ore Quality — at Kiya Shaltyr dilution from dykes and low grade ore zonesmay increase with depth and impact negatively on the grade and quality of the product andthe likely reserves. At Mazulsky the size and quantity of high silica zones may increase andimpact negatively on the grade and quality of the product or the waste stripping ratio.
• Operating Costs — at Kiya Shaltyr ore rail transport costs which currently comprise over40% of total costs could increase at a rate above inflation as the facilities are owned andoperated not by US RUSAL but by third parties comprising the State and a private company.
Specific opportunities to the operations include:
• Mining Efficiency — improvements in productivity and efficiency from the use of new andimproved mining equipment as well as training programmes for personnel leading to lowermining costs.
• Mine Design — improvements in mine design, stripping ratios and long-term planningfollowing from the establishment of the Surpac mining software package includingcomputerised optimisation and mine scheduling for both ore and waste.
• Haul Fleet — at Mazulsky an investigation into the establishment of an in-pit crushercoupled to a conveyor for transport of ore to the refinery which could lead to a smaller fleetof trucks and lower costs.
• Ore Reserves — an increase in JORC Code compliant Ore Reserves at Kiya Shaltyrfollowing completion of an exploration programme planned by the company in 2009 and2010 that seeks to improve the confidence in the defined the resources at depth. This willlikely provide a comparable increase in Ore Reserves at Mazulsky as these have beenlimited to that required to support the Kiya Shaltyr Ore Reserves by SRK.
APPENDIX VI INDEPENDENT TECHNICAL REPORT
— VI-140 —

3.9 Bogatyr Coal Mine
3.9.1 Introduction
SRK undertook a site visit to the Bogatyr Coal Mine in October 2008. The site visit report hassubsequently been revised and updated based upon data and information from UC RUSAL anddiscussions held with senior management in September 2009. However, SRK may not be fullyinformed of all changes which have taken place and hence some descriptions may be out of date.
3.9.2 History and Location
Exploration of the Ekibastuz basin commenced in 1948. The basin was divided into 12prospecting sectors. Severny commenced operations in 1955 and Bogatyr in 1970. Between 1955and 1998 approximately 2 billion tonnes of coal has been extracted from the area. The remainingbalance of coal has been reported at some 10.7 billion tonnes. The two mines, Bogatyr andSeverny are distinct production units within the same coal measures and are operated by thelargest Kazakh coal mining company TOO Bogatyr Komir.
Both mines have the licence to exploit coal resources above the -200 m elevation within its coalfields.
Location
The Bogatyr and Severny open-pit coal mines are located on the southern, western and northernflanks of the Ekibastuz coal basin to the east of the town of Ekibastuz in the Pavlodar Oblast ofthe Republic of Kazakhstan, some 130 km south west of the oblast centre, Pavlodar. In additionto Bogatyr and Severny another mining operation, Vostochny, is currently working adjacentsectors of the Ekibastuz deposit to the northeast by open-pit methods.
The climate of the region is sharply continental with a harsh winter and hot summer. The meantemperature in the hottest month, July, and the coldest month, January, are 21.5˚C and -18.5˚Cwith maximum +40˚C and minimum -43˚C respectively. The snow cover lasts for 150 days. Thesoil freezes to a depth of 2.5 to 3.0 m. The mean annual quantity of precipitation is 220 mm.Southwest and west winds predominate, the mean annual wind speed is 4.2 m/s, with a maximumof 25 m/s.
3.9.3 Geology
The Ekibastuz coal deposit forms part of an elongated asymmetrical Basin, the long axis ofwhich, over the coal measures, extends from the northwest to the southeast for some 12 km andreaches a maximum width of some 6.0 km. Dips are variable, being gentler, from 10º to 20º onthe north west and south east limbs and steeper, from 65º to 90º on the north east and south westlimbs. In the north east the basin is limited by a large fault with a throw of some 400 m. Awayfrom the limbs towards the basin axis dips are gentle and near horizontal. The coals are hard,humic, high ash coals and are Carboniferous in age. There are four main seams in the deposit ofwhich the upper three, seams 1, 2 and 3 are considered economic and currently worked. The threeseams vary slightly in quality and it is necessary to blend them in order to meet market qualityspecifications. Typical analyses are shown below.
APPENDIX VI INDEPENDENT TECHNICAL REPORT
— VI-141 —

Table 3.22: Bogatyr Coal Quality
Seam
Ash content (%) Minimumcalorific
value(kcal/kg)
Volatilecontent
(%)
Sulphurcontent
(%)
BulkDensity ofROM coal,
(t/m3)
Internalwaste Ash
(%)In situ
clean coalROM coal
product
1 . . . . . . . . 32.0 34.9 4640 27.6 0.50 1.54 64.2
2 . . . . . . . . 31.6 37.0 4470 25.6 0.52 1.56 65.0
1+2. . . . . . . 31.8 36.3 4540 26.3 0.51 1.55 64.9
3 . . . . . . . . 40.9 46.9 3600 26.5 0.47 1.69 64.0
1+2+3 . . . . . 36.8 42.4 3970 26.6 0.48 1.64 64.1
3.9.4 Mineral Resources and Coal Reserves
The Bogatyr Coal Mine is the world’s largest coal mine. SRK considers that the Exploration ofthe Bogatyr and Severny sectors of the Ekibastuz basin has been extensive and thoroughlycarried out by experienced geological personnel working to established procedures andstandards. SRK believes that the traditional paper based modelling and resource evaluationprocedures used are valid and have again been followed closely by experienced and ablepersonnel. SRK notes however that the GKZ reserves as stated are equivalent to resources asusually understood in international standards of reporting and also notes that these GKZ reservesdo not include some higher ash material which is inevitably mined along with coal andconsequently there are modifying factors applied to ROM production figures in order to depletethe GKZ reserve base. SRK’s Mineral Resource statement is shown in Table 3.23.
Table 3.23: Bogatyr Mineral Resource and Coal Reserve Statement (1 July 2009)(1), (2), (3)
Coal Reserve Mineral Resource
Tonnage Tonnage
(Mt) (Mt)
Proved . . . . . . . . . . . . . . . . . . 288 Measured . . . . . . . . . . . . . . . . 2,276Probable . . . . . . . . . . . . . . . . . 742 Indicated . . . . . . . . . . . . . . . . 170Total . . . . . . . . . . . . . . . . . . . 1,030 Subtotal . . . . . . . . . . . . . . . . 2,446
Inferred . . . . . . . . . . . . . . . . . 484Total . . . . . . . . . . . . . . . . . . 2,930
(1) All references to Mineral Resources and Coal Reserves are stated in accordance with the JORC Code, 2004Edition.
(2) Mineral Resources and Coal Reserves are recorded on an unattributed, or 100% basis.(3) Mineral Resources are inclusive of Coal Reserves.
The current government approved licence allows exploiting Bogatyr and Severny open-pit minesto the minus 200 m elevation pit bottom and Coal Reserve estimation is reported to that depth.
TOO Bogatyr Komir reports reserves in accordance with the GKZ classification, which do notcomply with JORC classified Coal Reserves.
SRK has reviewed the production schedule along with geological cross sections, pit status maps,and the 2045 Bogatyr-Severny ultimate pit design. It has been indicated to SRK that in order toachieve the required product blend beyond 2009 further advance overburden stripping will berequired. SRK agrees that the coal production plan is achievable.
There is potential to increase the current size final pit by steepening the pit walls.
The life of mine plan used to support the Coal Reserves extends to 2029, running for a periodof 20 years beginning 2010.
APPENDIX VI INDEPENDENT TECHNICAL REPORT
— VI-142 —
3.9.5 Mining Operations and Infrastructure
Mining at Bogatyr and Severny is accomplished entirely with open-pit mining methods. A mixof bucket-wheel excavator (“BWE”)/conveyor, shovel/truck and shovel/railway excavation andtransport methods is employed in both mines. Major modernisation schemes for coal extractionwere recently introduced on the sites and should be completed by 2012 in Bogatyr and 2020 inSeverny. All coal on Severny and approximately 30% on Bogatyr is currently being excavated byshovel and truck and tipped in a 350,000 t blending stockpile at Severny and 2 x 350,000 tstockpiles at Bogatyr. The schemes afford the opportunity for improvements in efficiency and fora production of a cleaner more consistent product.
Both mines are mining three coal seams with a total thickness approaching 170 m including anapproximately 10 m thick high ash rock parting between seam 2 and 3. Coal mining has currentlyprogressed to the -55 m elevation in Bogatyr and -30 m elevation in Severny, although some coalremains above this elevation. The coal benches are designed at a height of 25 m and workingwidth of 50 m for BWE and 15 m height/10 m width for shovels.
High output bucket wheel excavators were developed for coal extraction and started work during1969 and the early 1970s. The excavators were designed with outputs of 4,500 t/hr and a workingbench height of 28 m.
At Bogatyr six SRs (k) 2000 BWEs are currently employed: two for coal digging and four forcoal blending and stockpile loading. One BWE is working with the inter-level SFB-R(K)-1800.25 stage loader at the coal stockpile located within the syncline axis at the south endof Coal Field 6. At Severny one BWE is utilized for coal stockpile blending/loading operations.These machines have been used to load the majority of coal until very recently. As the depth ofthe sites increased, the rail transport system has become very complex with numerous trafficdirection changes. On Severny for example, there was 350 km of rail track with several shuntingyards before the phased improvements started. Rotary excavators efficiency is limited toapproximately 20% of the time due to the availability of trains. The static nature of the railsystem also makes it difficult to introduce blending of the three seams.
All coal and 90% of overburden is blasted. Overburden is excavated by draglines and ropeshovels loading rail wagons. The plan is to continue the current system for overburdenexcavation. The system is relatively inefficient and the equipment is old. Shovels loadoverburden onto trains for approximately 40% of available time. Internal overburden tipping isprogressively being introduced onto both sites to improve efficiency with shorter haul lengths.Coal seams were sealed for conservation in preparation for internal tipping which hascommenced to a limited extent. The internal dumps are temporary and will be re-lifted in thefuture to exploit the remaining reserves. Internal tipping will improve overburden excavationefficiency by reducing haul lengths and hence the number of trains, locomotives and length ofrailtrack required. It will also reduce the environmental impact of coal burning in external tips.Internal tipping will not negate the fact that substantial investment will be required formaintenance and to improve the overburden equipment currently in operation. There is a gradualincrease in the ratio of waste to coal, from 0.83 m3/t to some 1.5 m3/t over the next 20 years,which will also require future investment.
3.9.6 Environmental and Social Considerations
The environmental review assessed material risks and determined environmental constraints andcompliance issues that may impact on the current and future operation of the project. During thesite visit, environmental management strategies, controls and issues were discussed with sitestaff, the mining operations and surrounding area was viewed, physical water managementstructures monitoring locations and discharge areas were visited, as were the waste rock andother disposal areas, and areas of progressive reclamation and mine closure.
APPENDIX VI INDEPENDENT TECHNICAL REPORT
— VI-143 —

The Bogatyr/Severny mine is operated by TOO Bogatyr Komir is located next to the town ofEkibastuz (east boundary of the residential area is about 800 m from Severny pit wall) in theEkibastuz region of the Pavlodar Oblast, north-east Kazakhstan. Ekibastuz Town has apopulation of about 100,000 people.
The operation predates the OVOS process and consequently neither an OVOS nor any pre-miningenvironmental baseline data are available for the mining area. Whilst restricted to the localimpacts from the change in technology, an OVOS had been prepared for the feasibility study toutilize an auto-conveyor for coal grade averaging system within the Bogatyr open-pit. ThatOVOS was approved by the Ministry of Energy and Mineral Resources.
Operational permits are required for activities likely to result in environmental pollution such asair emissions, water discharges and waste disposal. These permits are provided by theEnvironmental Authority on a regular basis, with a validity period of between 1 and 5 years.Permits are obtained by calculating the assumed air emissions, water discharges and wasteproduction in accordance with state approved methods. These are submitted together with theapplication for the permissions.
Whilst the operation has all the necessary permissions to continue operating, effluent comprisingmine water and treated sewage water discharged to two saline likes regularly exceed the permitlimits set for discharge water quality to these lakes. Concentration limits have been (and continueto be) exceeded every reporting year since 2004 for a number of dissolved parameters includingcopper, nickel, molybdenum and ammonia amongst others. Water quality impacts on groundwaterresources have not been defined. Mining operations have also led to air quality impacts. Mostsignificantly dust emissions have exceeded permit levels at the protection zone boundary. Inaddition, spontaneous combustion of carboniferous waste and spoils represent a significantchallenge at the site. Areas that are burning are being covered with soil and compacted toextinguish the fires.
In 2006 TOO Bogatyr Komir obtained ISO 14001:2004 certification and has a documentedenvironmental management system.
In accordance with Kazakh legislation, TOO Bogatyr Komir developed a conceptual closure planand established a closure fund (Liquidation Fund) to provide for closure and rehabilitationfinancing. Provisions for the closure fund are included in the mining costs at a rate of 0.1% ofcoal sales, which would based on current estimates amount to about US$6,8 m at the end ofmining licence period (2047). SRK notes that that the mining licence specifies that, should thesum contained in the closure fund be insufficient for closure and rehabilitation, TOO BogatyrKomir will be liable for any additional costs to complete the closure of the mine site. It is SRK’sunderstanding that money from the closure fund is already being used to finance currentrehabilitation activities which does not contradict Kazakh legislation or licence requirements asspecial approval from the Ministry of Energy and Mineral Resources has been granted.
The Environmental Department is responsible for the environmental monitoring and managementactivities and comprises seven specialists who report to the Technical Director.
Whilst current rehabilitation works began in 2003 and according to the operation is consideredto be almost complete for the Severny and Zapadnuy waste rock dumps (an area of 1,930 ha intotal), rehabilitation work is occurring on an ad-hoc basis with no apparent design specification.Even though these works have been accepted as complete by the authority (state commissionwhich includes inspectors from different state authorities), large areas of these dumps remainuncovered with no growth medium to sustain vegetation. SRK estimates that the potential closureliability of the areas that have been partially rehabilitated may be in the order of US$45 m toUS$55 m. Closure costs that may be associated with the remainder of the waste rock dump areas
APPENDIX VI INDEPENDENT TECHNICAL REPORT
— VI-144 —
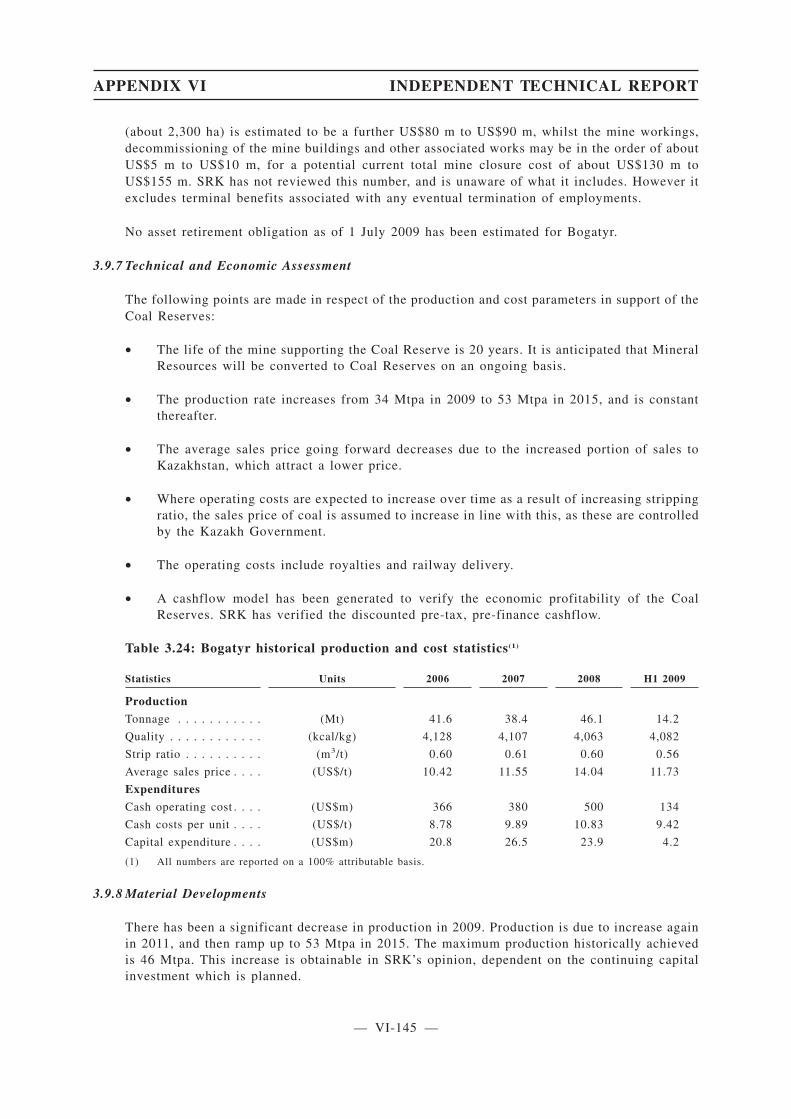
(about 2,300 ha) is estimated to be a further US$80 m to US$90 m, whilst the mine workings,decommissioning of the mine buildings and other associated works may be in the order of aboutUS$5 m to US$10 m, for a potential current total mine closure cost of about US$130 m toUS$155 m. SRK has not reviewed this number, and is unaware of what it includes. However itexcludes terminal benefits associated with any eventual termination of employments.
No asset retirement obligation as of 1 July 2009 has been estimated for Bogatyr.
3.9.7 Technical and Economic Assessment
The following points are made in respect of the production and cost parameters in support of theCoal Reserves:
• The life of the mine supporting the Coal Reserve is 20 years. It is anticipated that MineralResources will be converted to Coal Reserves on an ongoing basis.
• The production rate increases from 34 Mtpa in 2009 to 53 Mtpa in 2015, and is constantthereafter.
• The average sales price going forward decreases due to the increased portion of sales toKazakhstan, which attract a lower price.
• Where operating costs are expected to increase over time as a result of increasing strippingratio, the sales price of coal is assumed to increase in line with this, as these are controlledby the Kazakh Government.
• The operating costs include royalties and railway delivery.
• A cashflow model has been generated to verify the economic profitability of the CoalReserves. SRK has verified the discounted pre-tax, pre-finance cashflow.
Table 3.24: Bogatyr historical production and cost statistics(1)
Statistics Units 2006 2007 2008 H1 2009
Production
Tonnage . . . . . . . . . . . (Mt) 41.6 38.4 46.1 14.2
Quality . . . . . . . . . . . . (kcal/kg) 4,128 4,107 4,063 4,082
Strip ratio . . . . . . . . . . (m3/t) 0.60 0.61 0.60 0.56
Average sales price . . . . (US$/t) 10.42 11.55 14.04 11.73
Expenditures
Cash operating cost . . . . (US$m) 366 380 500 134
Cash costs per unit . . . . (US$/t) 8.78 9.89 10.83 9.42
Capital expenditure . . . . (US$m) 20.8 26.5 23.9 4.2
(1) All numbers are reported on a 100% attributable basis.
3.9.8 Material Developments
There has been a significant decrease in production in 2009. Production is due to increase againin 2011, and then ramp up to 53 Mtpa in 2015. The maximum production historically achievedis 46 Mtpa. This increase is obtainable in SRK’s opinion, dependent on the continuing capitalinvestment which is planned.
APPENDIX VI INDEPENDENT TECHNICAL REPORT
— VI-145 —

3.9.9 Specific Risks and Future Opportunities
SRK sees no specific risks. Specific opportunities to the operations include:
• Operating Cost — significant investment in new equipment is expected to reduce the unitoperating cost.
• Coal Reserves — can easily be increased over time as these are depleted, as long as theprofitability of the operation continues.
• Mineral Resources — have the potential to increase, whilst currently limited to a depth of200 m.
3.10 Cheremshansk Quartzite
3.10.1 Introduction
SRK undertook a site visit to the Cheremshansk Quartzite Mine in October 2008. The site visitreport has subsequently been revised and updated based upon data and information from UCRUSAL and discussions held with senior management in September 2009. However, SRK maynot be fully informed of all changes which have taken place and hence some descriptions maybe out of date.
3.10.2 History and Location
The Cheremshansk Quartzite operations are situated 17 km north of the town of Tourantaevo, inthe Buryat Republic of the Russian Federation in the Pribaikal region 55 km north of Ulan-Udethe capital of the Buryat Republic and the nearest airport. A railhead facility through which theore is transported is situated at Mostovoi, 56 km by road from Tourantaevo. The facility currentlyprocesses 200 ktpa of high quality quartzite and has sales of approximately 120 ktpa of very lowiron silica to UC RUSAL’s ZAO Kremny Irkutsk silicon operation.
The mine area is in hilly/mountainous forested terrain at an elevation between 1,300 and 1,500m. The current pit and plant are situated on a ridge and watershed, with the main offices in thetown of Tourantaevo (pop. 10,000). The area around the town is predominantly agricultural. Theclimate is continental with summer and winter temperatures ranging from 35� to -45�C.
Production at the Cheremshansk deposit commenced in 1992 from Mine Sector 2 and reached apeak of 261 ktpa in 2003. Since 2004 the market for the higher iron and lower quality silica hasbecome less viable, and the production has been reduced to approximately 200 ktpa whichprovides approximately 110 ktpa low iron products for the ZOA Kremny silicon smelter inIrkutsk.
3.10.3 Geology
The Cheremshansk deposit is hosted by a series of Devonian metamorphosed sandstones, withsecondary silification. The sandstones are folded into a broad anticline, with a steeply dippingsouth east limb, and a flatter southwest limb. The southwest limb has been later intruded bygranitoids. The whole structure has been displaced by later faulting, which disrupts thegeological continuity of the deposit, and splits into a series of fault blocks. The sandstones aretypically 30 to 50 m wide, and cover a total strike length of 10 km. The footwall country rocksare predominantly schists and the hanging wall rocks are quartzite schists overlain by dolomite.
The average grade of the deposits is 99.2% silica and less than 0.3% Fe2O3. Low iron material(<0.06% Fe2O3) is selectively mined. The iron is chemically locked within the silica andgenerally away from faults and other structural features. The main area for production is
APPENDIX VI INDEPENDENT TECHNICAL REPORT
— VI-146 —

associated with the upper part of the sandstone unit, in close contact with the overlying carbonatesediments. The chemical composition of the sandstones is typically high silica (98.2% to 99.8%),with variable Al2O3, Fe2O3, TiO2 and CaO contents. The deposit is crosscut by later magmaticdykes, which are often highly altered.
3.10.4 Mineral Resources and Ore Reserves
The exploration and definition of the Cheremshansk Quartzite deposits were done by means ofdrilling, trenching and an underground exploration adit according to GKZ guidelines.
Exploration was undertaken between 1967 and 1971, by the Buryat District GeologicalDepartment. The most recent reserve estimate, as approved by the GKZ was undertaken in 1972.
The methodology used is consistent with other GKZ approved estimates, being based onsectional interpretations cut across the deposit, intersecting the drilling. Blocks were thendefined within the sectional interpretations, and an average length weighted grade determined foreach block. The block grades and tonnages are then split by classification, and summed toproduce a total for the deposit. The density values used in the Mineral Reserve estimate werederived from a combination of laboratory testing and bulk density determinations. The densityof the ore used is 2.6 t/m3, and a moisture content of 0.3%.
The Cheremshansk deposit is classed as being Class 2 in terms of complexity, with the averagedrillhole spacings for each category being defined by the GKZ. SRK has re-classified the GKZapproved reserves in accordance with the JORC Code.
The bench plans, demonstrating the classified blocks have been reviewed by SRK.
The geology and major controls on the mineralisation appear to be well understood, aiding theability to appropriately model the deposit. SRK considers that the data quantity and quality issufficient for the reporting of JORC Code compliant Mineral Resources, classified in theMeasured, Indicated and Inferred Mineral Resource categories.
The pit is currently planned to a depth of 60 m. Should the pit be deepened, more exploration,in the form of in-pit drilling, would need to be undertaken.
The GKZ reserve has been defined by using the method of vertical sections and areas within thedefined geological model. SRK has depleted the 1 January 2009 5GR statement by the 2009production to 30 June 2009 and presented the Mineral Resources as at 1 July 2009.
There are three mining sectors of suitable quantity. Only Sector 2 is currently in operation. Gradecontrol, in the form of drilling, trenching and sampling is undertaken for one year’s productionin advance of mining. This is typically a single bench of the Sector 2 pit. SRK has classified thismaterial as a Measured Mineral Resource. The remainder of the quartzite in Sector 2 is classifiedas an Indicated Mineral Resource. The additional 35.1 Mt in Sectors 1 and 4 are classified asInferred Mineral Resources. The GKZ classified C2 material has not been classified inaccordance with the JORC Code as SRK considers the drill spacing is insufficient to define thegeological and grade continuity within the deposit.
The orebody is open at depth and it can be expected that similar quality and quantities ofquartzite will persist to some depths below the Mineral Resource defined to date. The abovematerial represents the total amount of silica material available for use in the glass, silicon,silicon carbide and sand moulding industries as defined by GKZ. The material suitable for siliconmanufacture is only a proportion of the total Mineral Resource.
APPENDIX VI INDEPENDENT TECHNICAL REPORT
— VI-147 —
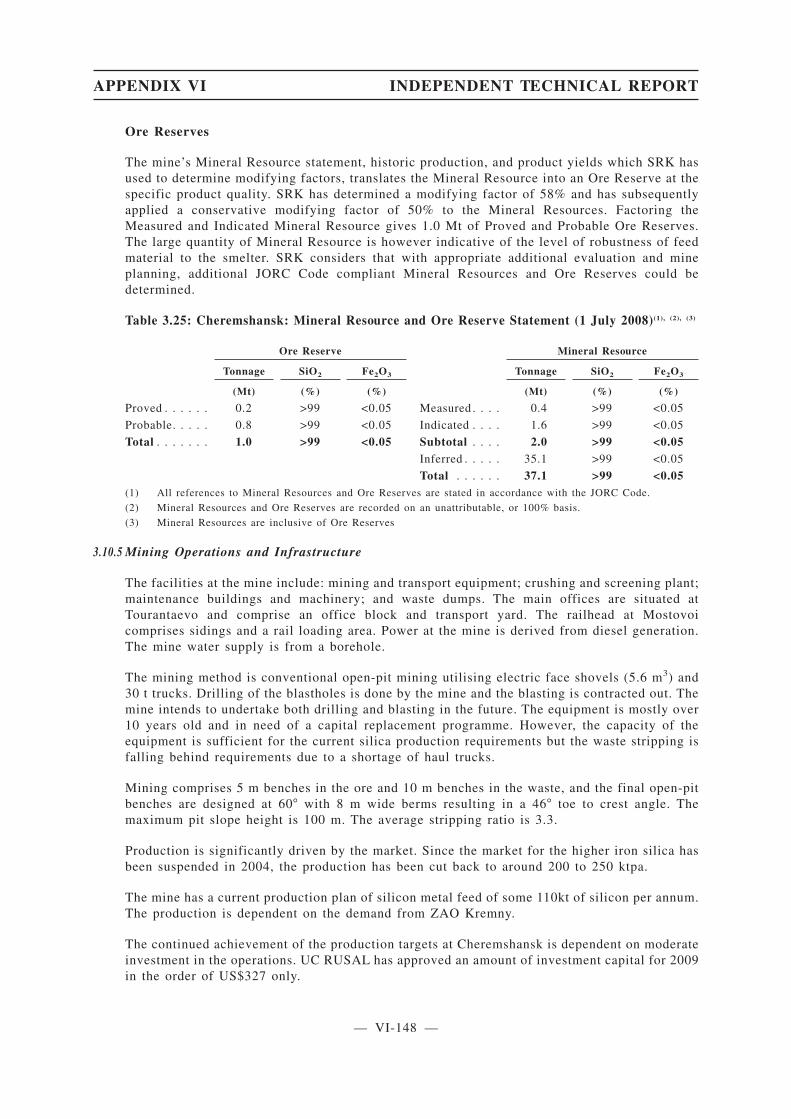
Ore Reserves
The mine’s Mineral Resource statement, historic production, and product yields which SRK hasused to determine modifying factors, translates the Mineral Resource into an Ore Reserve at thespecific product quality. SRK has determined a modifying factor of 58% and has subsequentlyapplied a conservative modifying factor of 50% to the Mineral Resources. Factoring theMeasured and Indicated Mineral Resource gives 1.0 Mt of Proved and Probable Ore Reserves.The large quantity of Mineral Resource is however indicative of the level of robustness of feedmaterial to the smelter. SRK considers that with appropriate additional evaluation and mineplanning, additional JORC Code compliant Mineral Resources and Ore Reserves could bedetermined.
Table 3.25: Cheremshansk: Mineral Resource and Ore Reserve Statement (1 July 2008)(1), (2), (3)
Ore Reserve Mineral Resource
Tonnage SiO2 Fe2O3 Tonnage SiO2 Fe2O3
(Mt) (%) (%) (Mt) (%) (%)
Proved . . . . . . 0.2 >99 <0.05 Measured . . . . 0.4 >99 <0.05
Probable. . . . . 0.8 >99 <0.05 Indicated . . . . 1.6 >99 <0.05
Total . . . . . . . 1.0 >99 <0.05 Subtotal . . . . 2.0 >99 <0.05Inferred . . . . . 35.1 >99 <0.05
Total . . . . . . 37.1 >99 <0.05(1) All references to Mineral Resources and Ore Reserves are stated in accordance with the JORC Code.
(2) Mineral Resources and Ore Reserves are recorded on an unattributable, or 100% basis.
(3) Mineral Resources are inclusive of Ore Reserves
3.10.5 Mining Operations and Infrastructure
The facilities at the mine include: mining and transport equipment; crushing and screening plant;maintenance buildings and machinery; and waste dumps. The main offices are situated atTourantaevo and comprise an office block and transport yard. The railhead at Mostovoicomprises sidings and a rail loading area. Power at the mine is derived from diesel generation.The mine water supply is from a borehole.
The mining method is conventional open-pit mining utilising electric face shovels (5.6 m3) and30 t trucks. Drilling of the blastholes is done by the mine and the blasting is contracted out. Themine intends to undertake both drilling and blasting in the future. The equipment is mostly over10 years old and in need of a capital replacement programme. However, the capacity of theequipment is sufficient for the current silica production requirements but the waste stripping isfalling behind requirements due to a shortage of haul trucks.
Mining comprises 5 m benches in the ore and 10 m benches in the waste, and the final open-pitbenches are designed at 60� with 8 m wide berms resulting in a 46� toe to crest angle. Themaximum pit slope height is 100 m. The average stripping ratio is 3.3.
Production is significantly driven by the market. Since the market for the higher iron silica hasbeen suspended in 2004, the production has been cut back to around 200 to 250 ktpa.
The mine has a current production plan of silicon metal feed of some 110kt of silicon per annum.The production is dependent on the demand from ZAO Kremny.
The continued achievement of the production targets at Cheremshansk is dependent on moderateinvestment in the operations. UC RUSAL has approved an amount of investment capital for 2009in the order of US$327 only.
APPENDIX VI INDEPENDENT TECHNICAL REPORT
— VI-148 —
The overburden stripping is contained in 7 approved waste dumps on the periphery of theexcavation with a total capacity sufficient for a total waste volume of 7.5 to 8 Mm3. About 50%of the waste volume space has been used to date.
Processing operation
The processing facilities at the mine comprise crushing and screening of the various producttypes to achieve the required specification.
3.10.6 Environmental and Social Considerations
The mine is under the jurisdiction of the regional and national regulatory framework.Permissions are renewed annually, or longer. No specific conditions were attached other thanmonitoring. No non-compliances were noted.
The mine is remote from habitation with the nearest village 10 km away. The major aspect forcontrol is silica dust which could present a health risk. The personnel are fully health screenedon an annual basis. No instances of silicosis have been recorded. There is no dust monitoring butall inspections undertaken have been within limits. The mine is dry and the rainfall low and waterdischarge is not material.
No provision to cover the costs of closure has been made historically. A closure fund is howeversaid to have commenced since 2005/6. There is no legal requirement for ongoing rehabilitation.Closure costs may be limited to the need to re-contour the waste dumps and remove the plantfacilities.
The asset retirement obligation at 1 July 2009 has been estimated by UC RUSAL to be US$0.17m to re-contour the waste dumps and remove the plant facilities. SRK has not reviewed thisnumber. However it excludes terminal benefits associated with any eventual termination ofemployments. SRK has not seen a cost estimate for mine closure at the end of the life of the mine,including bio-physical costs and terminal benefits.
3.10.7 Technical and Economic Assessment
The following points are made in respect of the production and cost parameters in support of theOre Reserves:
• The life of the mine supporting the Ore Reserve is 5.5 years.
• The production rate 210 ktpa.
• The average sales price going forward is RUR650/t, which equals US$20.4/t at theexchange rate of 31.9RUR:US$ as at 1 September 2009.
• The operating costs include royalties and railway delivery.
• A cashflow model has been generated to verify the economic profitability of the OreReserves. SRK has verified the discounted pre-tax, pre-finance cashflow.
APPENDIX VI INDEPENDENT TECHNICAL REPORT
— VI-149 —
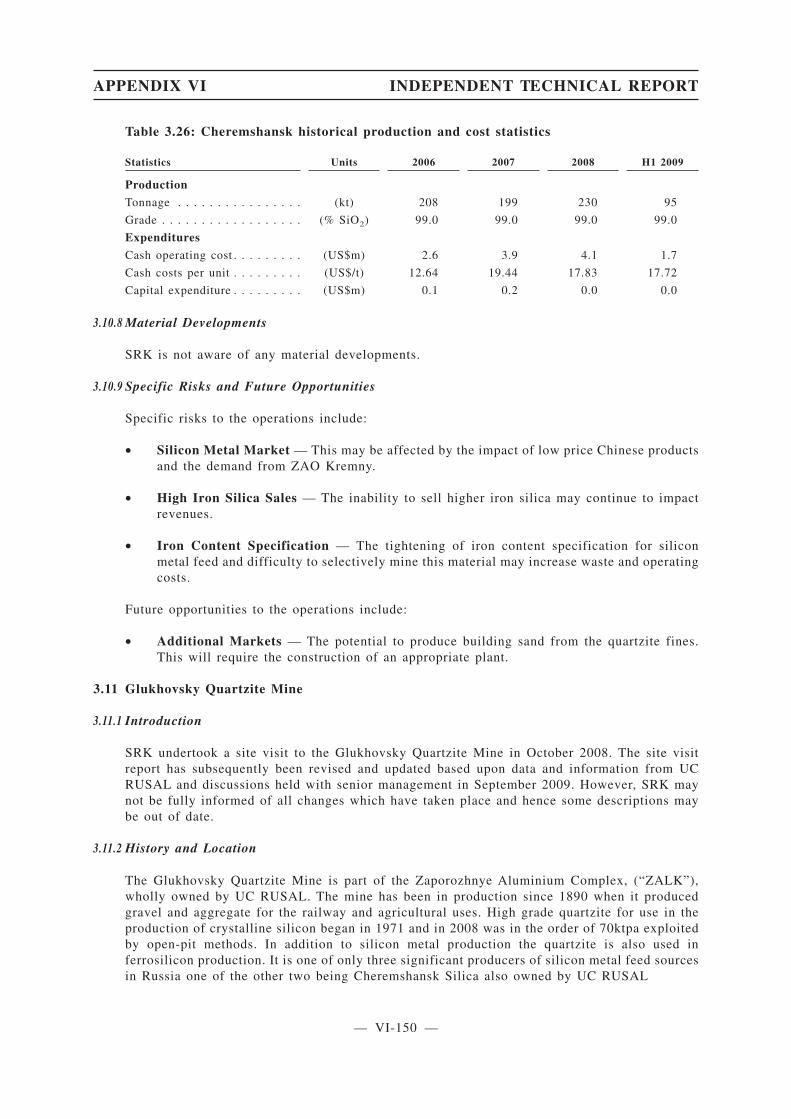
Table 3.26: Cheremshansk historical production and cost statistics
Statistics Units 2006 2007 2008 H1 2009
Production
Tonnage . . . . . . . . . . . . . . . . (kt) 208 199 230 95
Grade . . . . . . . . . . . . . . . . . . (% SiO2) 99.0 99.0 99.0 99.0
Expenditures
Cash operating cost . . . . . . . . . (US$m) 2.6 3.9 4.1 1.7
Cash costs per unit . . . . . . . . . (US$/t) 12.64 19.44 17.83 17.72
Capital expenditure . . . . . . . . . (US$m) 0.1 0.2 0.0 0.0
3.10.8 Material Developments
SRK is not aware of any material developments.
3.10.9 Specific Risks and Future Opportunities
Specific risks to the operations include:
• Silicon Metal Market — This may be affected by the impact of low price Chinese productsand the demand from ZAO Kremny.
• High Iron Silica Sales — The inability to sell higher iron silica may continue to impactrevenues.
• Iron Content Specification — The tightening of iron content specification for siliconmetal feed and difficulty to selectively mine this material may increase waste and operatingcosts.
Future opportunities to the operations include:
• Additional Markets — The potential to produce building sand from the quartzite fines.This will require the construction of an appropriate plant.
3.11 Glukhovsky Quartzite Mine
3.11.1 Introduction
SRK undertook a site visit to the Glukhovsky Quartzite Mine in October 2008. The site visitreport has subsequently been revised and updated based upon data and information from UCRUSAL and discussions held with senior management in September 2009. However, SRK maynot be fully informed of all changes which have taken place and hence some descriptions maybe out of date.
3.11.2 History and Location
The Glukhovsky Quartzite Mine is part of the Zaporozhnye Aluminium Complex, (“ZALK”),wholly owned by UC RUSAL. The mine has been in production since 1890 when it producedgravel and aggregate for the railway and agricultural uses. High grade quartzite for use in theproduction of crystalline silicon began in 1971 and in 2008 was in the order of 70ktpa exploitedby open-pit methods. In addition to silicon metal production the quartzite is also used inferrosilicon production. It is one of only three significant producers of silicon metal feed sourcesin Russia one of the other two being Cheremshansk Silica also owned by UC RUSAL
APPENDIX VI INDEPENDENT TECHNICAL REPORT
— VI-150 —

The mine operates under Rights of Use of the Subsoil Permit 1006 granted in 1997 byGoskomtechnologie of Ukraine, valid for 20 years until 2017. The Glukhovsky quartzite mine islocated in Sumy Region in north-eastern Ukraine. The operations are located at Banichiapproximately 45 km from the town of Glukhov. Access to the town of Glukhov is by high qualitynational roads and to the deposit by good secondary roads. The deposit is served by a railheadwhich is connected to the national rail network via a 20 km long line.
The region is typically low lying arable farmland. The deposit is an area of higher relief risingto 50 m above the plains and approximately 150 m elevation. The climate is continental withsummer and winter temperatures ranging from 35�C to -30�C. Two significant rivers are in thevicinity of the mine, namely R. Esman and R. Kleven.
Production of 20 to 90 mm lump product which is preferred by the silicon plants ranged between40 to 70 ktpa from 2000 to 2006. In 2006 to June 2008 shipment was suspended due to cheapersilicon metal produced in China. Until early 2009 the production was at low levels and inFebruary 2009 it was again suspended due to the closure of the ZALK silicon facility. The mineplans to secure local agreements and recommence production in 2010.
3.11.3 Geology
The Banichsky deposit, which the Glukovsky mine current exploits, was first discovered in 1890.Subsequently extensive exploration has been carried out. The first phase of exploration wasundertaken in 1928. Exploration continued until 1962 when a total of 138 boreholes and 68 shaftshad intersected the relevant quartzite mineralisation. In 1964, a review was undertaken by theDnepropetrovsky Geological Mission, with quartzites being used for the production ofcrystalline silicon. Between 1965 and 1968, additional preliminary exploration was undertakenon the north-eastern part of the deposit, and the resource was re-estimated for crystalline siliconproduction. An additional 112 drillholes were drilled and 624 samples taken for chemicalanalyses. The reserve estimate was approved by the GKZ in 1968.
More detailed operational exploration was carried out in 1971 and 1974, for both building stone,and as a source for crystalline silica. The final phase of exploration was in 1980 to 1982, whichwas undertaken as part of a review of the deposit and mining operations. The most recent updateof the GKZ reserve estimate was completed in 1984.
The Banichsky deposit is hosted by the Palaeogene Buchaksky Suite. The majority of thequartzites occur in the upper portion of the Lower Buchaksky Suite consisting of quartz sands,forming uneven, tabular, lens like occurrences.
The deposit is split into two distinct areas, namely the North-eastern, and the Southern. TheNorth-eastern zone is currently the focus of production. The North-eastern area has a shallow tohorizontal dip. The quartzite bearing sandstones are typically 600 m wide, and continue for astrike length in excess of 2 km. The Southern area strikes south-east also with a shallow dip. Thewidth varies between 400 and 600 m, with a strike length of approximately 1 km.
Within the sand units, the distribution of the quartzite lenses is complex. The shape of theindividual quartzite units varies from small ellipsoidal bodies through to large, tabular lens likeunits. The thicknesses of the individual quartzite lenses are also highly variable. Thicknesses ofthe quartzite units are typically between 0.3 to 0.5 m to 5 m or more, and the sands, between 0.5to 4 m.
The contacts between the sand dominated host and quartzite lenses is very sharp. The contactsbetween the underlying and overlying sediments and the Buchaksky Suite are also relativelysharp, and are clearly defined during mining operations.
APPENDIX VI INDEPENDENT TECHNICAL REPORT
— VI-151 —
The mineralogy of the quartzite units is relatively consistent. There are four main “classes” ofquartzite, determined by the SiO2, Al2O3, Fe2O3 and CaO content. These are derived fromchemical analyses undertaken during the exploration and later approval of the GKZ reserves.Typically, TiO2 values are relatively constant at 0.15%.
3.11.4 Mineral Resources and Ore Reserves
The most recent reserve estimate, as approved by the GKZ was undertaken in 1984. Explorationwas undertaken in a number of phases. The most recent phase, which resulted in the approval ofthe current estimate in 1984, was undertaken by the Southern Ukrainian Geological Survey(“Ukryuzhgeologiya”), with drilling, sampling and geological interpretation being carried out bygeologists from Ukryuzhgeologiya.
The historical QAQC procedures are based on both internal and external duplicates. Internalduplicates are duplicates that were sent to the same laboratory, and external duplicates, send toa separate laboratory for a check on the accuracy of the internal laboratory.
The reserves, approved by the GKZ in 1984 uses methodology consistent with other GKZapproved estimates, being based on sectional interpretations of the amount of quartzitedetermined using a combination of the drillhole data, shaft data, and geological mapping on theexposed benches. The sectional interpretations are transferred onto bench plans, and the marginsof the blocks determined by the drillhole spacing. The area of each block is then measured fromthe bench plans, and multiplied by the average thickness derived from the sectionalinterpretation. A constant density value of 2.5 t/m3 based on 1980s testwork is then used toestimate the tonnage for each block.
The grade estimation is also undertaken from sectional and bench plan interpretations. The assaygrades for each drillhole or shaft within each defined block are weighted by the length of thedrillhole, and averaged across the block to give a global block grade.
The block grades and tonnages are then split by classification, and summed to produce a totalfor the deposit.
Typically, the total amount of quartzite recovered from each block of sandstone is approximately50%. The yield of quartzite from the sandstone is also estimated for each block. UC RUSALreports that the actual quartzite tonnage is typically within 10% of the estimated quartzitecontent, indicating a relatively good reconciliation between the actual and estimated tonnages.
SRK has re-classified the GKZ approved reserves in accordance with the JORC Code. The benchplans, demonstrating the classified blocks have been reviewed by SRK, and a classification ofMeasured, Indicated and Inferred Mineral Resources has been applied. Overall, blocks which areclassified as Category B have been re-classified as Measured Mineral Resources, C1 as IndicatedMineral Resources, and C2 as Inferred Mineral Resources.
In addition to the On-Balance reserves, Glukovsky also has a small quantity of Off-Balancereserves in the southern part of the deposit. These blocks have been classified as Off-Balance asthey currently lie beneath a small settlement. No grade estimates for these blocks have beenprovided to SRK, and so have been excluded from the Mineral Resource inventory.
The mine’s Mineral Resource statements, historic production, and product yields can be used todetermine modifying factors to translate the Mineral Resources into Ore Reserves at the specificproduct quality. However, as the ZALK facility is currently closed and until the terms of a newcontract and product specification with NovoLipetsk Steel are subject to completion, it is notappropriate to state Ore Reserves.
APPENDIX VI INDEPENDENT TECHNICAL REPORT
— VI-152 —
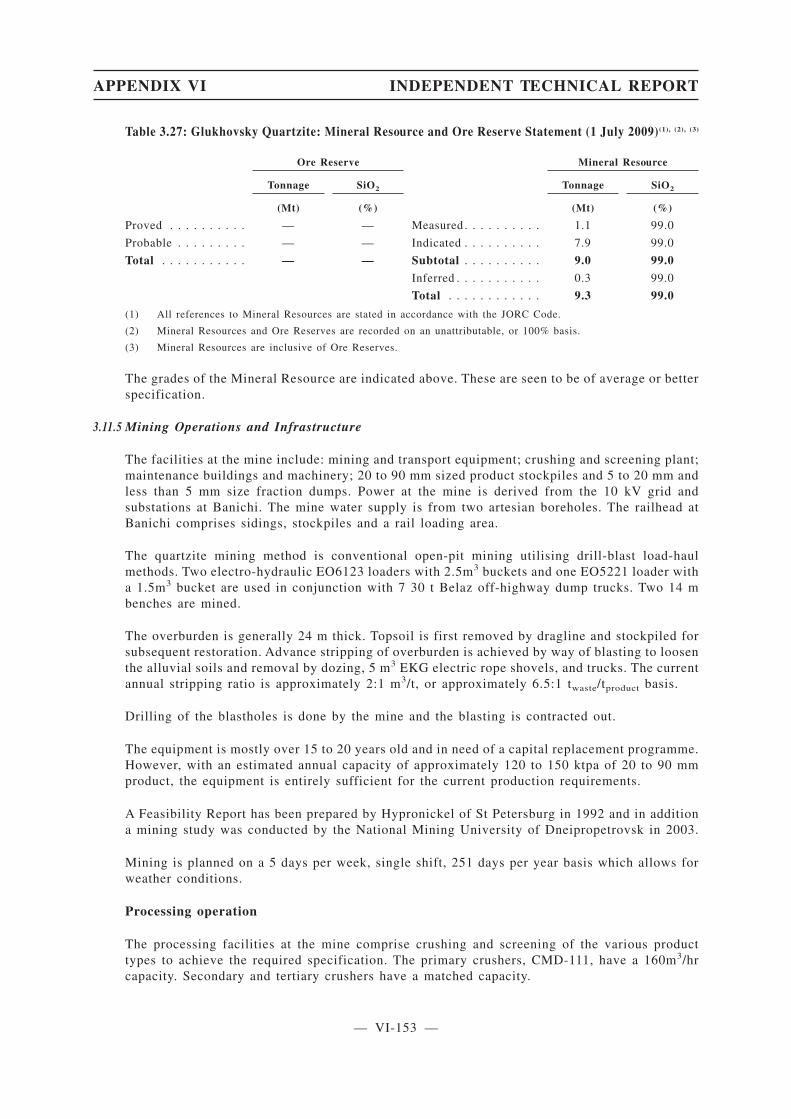
Table 3.27: Glukhovsky Quartzite: Mineral Resource and Ore Reserve Statement (1 July 2009)(1), (2), (3)
Ore Reserve Mineral Resource
Tonnage SiO2 Tonnage SiO2
(Mt) (%) (Mt) (%)
Proved . . . . . . . . . . — — Measured . . . . . . . . . . 1.1 99.0
Probable . . . . . . . . . — — Indicated . . . . . . . . . . 7.9 99.0
Total . . . . . . . . . . . — — Subtotal . . . . . . . . . . 9.0 99.0
Inferred . . . . . . . . . . . 0.3 99.0
Total . . . . . . . . . . . . 9.3 99.0
(1) All references to Mineral Resources are stated in accordance with the JORC Code.
(2) Mineral Resources and Ore Reserves are recorded on an unattributable, or 100% basis.
(3) Mineral Resources are inclusive of Ore Reserves.
The grades of the Mineral Resource are indicated above. These are seen to be of average or betterspecification.
3.11.5 Mining Operations and Infrastructure
The facilities at the mine include: mining and transport equipment; crushing and screening plant;maintenance buildings and machinery; 20 to 90 mm sized product stockpiles and 5 to 20 mm andless than 5 mm size fraction dumps. Power at the mine is derived from the 10 kV grid andsubstations at Banichi. The mine water supply is from two artesian boreholes. The railhead atBanichi comprises sidings, stockpiles and a rail loading area.
The quartzite mining method is conventional open-pit mining utilising drill-blast load-haulmethods. Two electro-hydraulic EO6123 loaders with 2.5m3 buckets and one EO5221 loader witha 1.5m3 bucket are used in conjunction with 7 30 t Belaz off-highway dump trucks. Two 14 mbenches are mined.
The overburden is generally 24 m thick. Topsoil is first removed by dragline and stockpiled forsubsequent restoration. Advance stripping of overburden is achieved by way of blasting to loosenthe alluvial soils and removal by dozing, 5 m3 EKG electric rope shovels, and trucks. The currentannual stripping ratio is approximately 2:1 m3/t, or approximately 6.5:1 twaste/tproduct basis.
Drilling of the blastholes is done by the mine and the blasting is contracted out.
The equipment is mostly over 15 to 20 years old and in need of a capital replacement programme.However, with an estimated annual capacity of approximately 120 to 150 ktpa of 20 to 90 mmproduct, the equipment is entirely sufficient for the current production requirements.
A Feasibility Report has been prepared by Hypronickel of St Petersburg in 1992 and in additiona mining study was conducted by the National Mining University of Dneipropetrovsk in 2003.
Mining is planned on a 5 days per week, single shift, 251 days per year basis which allows forweather conditions.
Processing operation
The processing facilities at the mine comprise crushing and screening of the various producttypes to achieve the required specification. The primary crushers, CMD-111, have a 160m3/hrcapacity. Secondary and tertiary crushers have a matched capacity.
APPENDIX VI INDEPENDENT TECHNICAL REPORT
— VI-153 —

The quality of the product is dependent on the size fraction. The natural dispensation of thematerials is such that the sand and finer fraction which occur naturally in the lenses, have thehigher iron, CaO and alumina percentages and the hard lumpy materials are at or better thanspecification. Little blending is required in the pit and there is little grade control and littlesampling required at the plant to ensure specification is maintained.
Rail Loadout facilities, Locomotives and Rolling Stock
The 20-90 mm product is transported by conveyor to the rail load out silos. The operation ownstwo TGK-2 diesel locomotives. One is used for shunting and the other for transport of the wagonsto the Glukhov rail station for onward transport to customers. The wagons are average 69 tcapacity.
3.11.6 Environmental and Social Considerations
The Glukhovsky Quartzite Mine is located between the villages of Banichi and Peremoga,adjacent the main road that links the two villages. Housing has developed along the main roadso that the stretch of road between next to the mine is populated.
The mine site comprises an open-pit mining area, a crusher plant, a railway spur with storagesilos for the crushed product and the ancillary mine offices and work shop area where the miningfleet is maintained. The open-pit mine is about 1 to 1.5 km from the road, whereas the crusherplant and rail sidings are located about 400 m from the main road.
The nearest watercourse is a major river that is about 2 km to the west of the mine site, with nodirect surface connection to the mining area.
The environmental review assessed environmental liabilities and determined environmentalconstraints and compliance issues or risks that may impact on the current and future operationof the project, environmental management strategies, controls, monitoring, permits andenvironmental management procedures.
The operation has the necessary permissions to continue operating. Whilst water quality impactson groundwater resources have not been defined, the risk of any such impacts is considered low.Mining operations cause air quality impacts. Most significantly dust emissions may exceedpermissible levels within the workplace. Monitoring of dust concentrations are not beingundertaken at the protection zone boundary or at the local settlements which may pose a latentrisk to the operations.
The mine employs altogether about 108 employees. The employees are included in ZALK’scollective employee agreement.
Fugitive dust is not being monitored at the perimeter of the buffer zone nor within the localvillage. Whilst it is understood that a number of people that live in these houses work at the mine,verification of fugitive dust concentrations at these locations should be established, especiallyduring dry periods, to ensure that the public health is not at risk.
Although the operation has a positive attitude to health and safety issues, it does not fullyimplement or enforce measures amongst the workforce to maximise the benefits from health andsafety programmes. Consequently Glukhovsky does not fully comply with international practice.
While the current rehabilitation is progressing well and the success is good, the operation has notdeveloped a conceptual closure plan for the final landform. As such, the operation may be at riskto increased closure costs due to unsuitable final slopes and incomplete backfilling of the finalvoid.
APPENDIX VI INDEPENDENT TECHNICAL REPORT
— VI-154 —
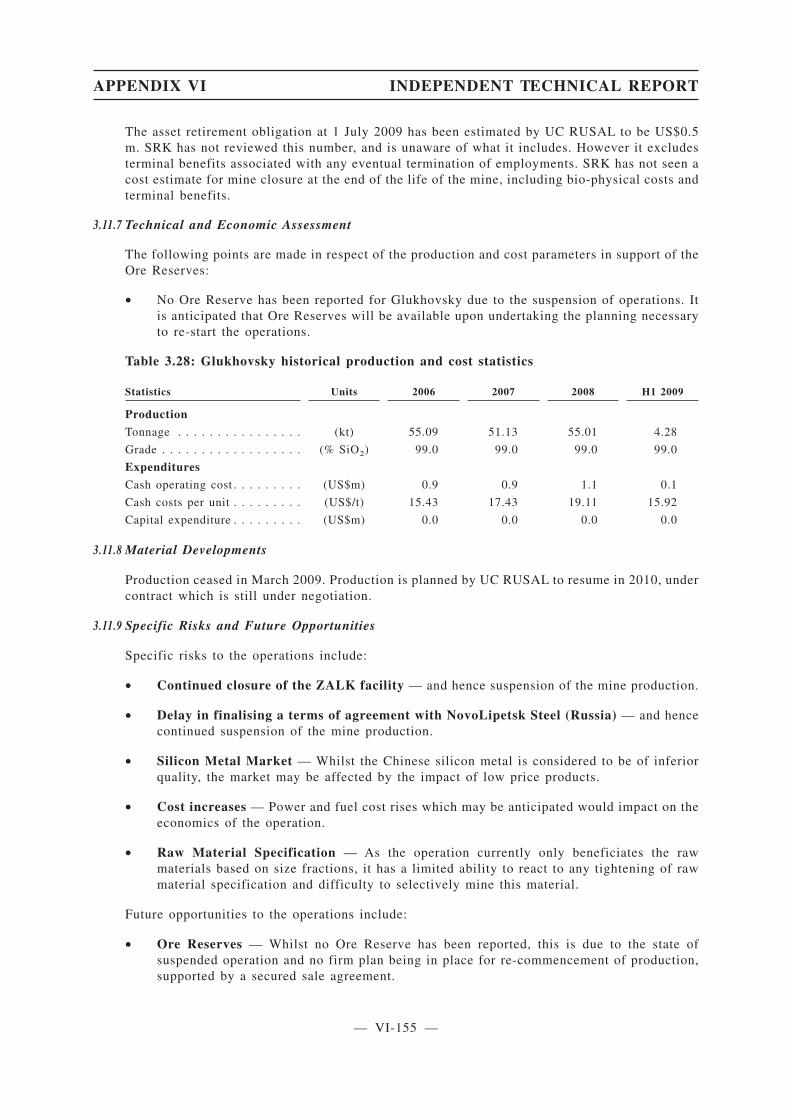
The asset retirement obligation at 1 July 2009 has been estimated by UC RUSAL to be US$0.5m. SRK has not reviewed this number, and is unaware of what it includes. However it excludesterminal benefits associated with any eventual termination of employments. SRK has not seen acost estimate for mine closure at the end of the life of the mine, including bio-physical costs andterminal benefits.
3.11.7 Technical and Economic Assessment
The following points are made in respect of the production and cost parameters in support of theOre Reserves:
• No Ore Reserve has been reported for Glukhovsky due to the suspension of operations. Itis anticipated that Ore Reserves will be available upon undertaking the planning necessaryto re-start the operations.
Table 3.28: Glukhovsky historical production and cost statistics
Statistics Units 2006 2007 2008 H1 2009
Production
Tonnage . . . . . . . . . . . . . . . . (kt) 55.09 51.13 55.01 4.28
Grade . . . . . . . . . . . . . . . . . . (% SiO2) 99.0 99.0 99.0 99.0
Expenditures
Cash operating cost . . . . . . . . . (US$m) 0.9 0.9 1.1 0.1
Cash costs per unit . . . . . . . . . (US$/t) 15.43 17.43 19.11 15.92
Capital expenditure . . . . . . . . . (US$m) 0.0 0.0 0.0 0.0
3.11.8 Material Developments
Production ceased in March 2009. Production is planned by UC RUSAL to resume in 2010, undercontract which is still under negotiation.
3.11.9 Specific Risks and Future Opportunities
Specific risks to the operations include:
• Continued closure of the ZALK facility — and hence suspension of the mine production.
• Delay in finalising a terms of agreement with NovoLipetsk Steel (Russia) — and hencecontinued suspension of the mine production.
• Silicon Metal Market — Whilst the Chinese silicon metal is considered to be of inferiorquality, the market may be affected by the impact of low price products.
• Cost increases — Power and fuel cost rises which may be anticipated would impact on theeconomics of the operation.
• Raw Material Specification — As the operation currently only beneficiates the rawmaterials based on size fractions, it has a limited ability to react to any tightening of rawmaterial specification and difficulty to selectively mine this material.
Future opportunities to the operations include:
• Ore Reserves — Whilst no Ore Reserve has been reported, this is due to the state ofsuspended operation and no firm plan being in place for re-commencement of production,supported by a secured sale agreement.
APPENDIX VI INDEPENDENT TECHNICAL REPORT
— VI-155 —
• Re-commencement of Production — SRK highlights the following:
• Potential to Increase Production — The operation has the capacity to react to an increasein production with a moderate investment programme.
• Improved Mining Techniques — Fragmentation of the hard quartzites may be improvedby varying the blast design with a consequent reduction of excavation costs, crusher powercosts and wear and tear and maintenance costs on the load and haul and crushing equipment.
• Additional Markets — The steel market requires lower specification feed as compared tothe silicon market. There is the potential to improve sales of construction materials fromthe quartzite fines.
3.12 Yaroslavsky Fluorite Mine
3.12.1 Introduction
SRK undertook a site visit to the Yaroslavsky Fluorite Mine in October 2008. The site visit reporthas subsequently been revised and updated based upon data and information from UC RUSALand discussions held with senior management in September 2009. However, SRK may not befully informed of all changes which have taken place and hence some descriptions may be outof date.
3.12.2 History and Location
The Yaroslavsky deposit is the largest fluorite deposit in the world and OOO “RGRK” (RussianOre Mining Company), founded in 2005, is the largest producer of fluoride in Russia. UCRUSAL is a 50% shareholder in Yaroslavsky. The management of the operation is undertaken byRGRK. UC RUSAL receives over 90% of the mine production and also participates in theprofitability of RGRK by way of dividends. Concentrate production at Yaroslavsky commencedin 1964.
The Yaroslavsky operation is located in the Primorsky Krai Region of eastern Russia. It issituated some 250 km from the regional capital of Vladivostok. The complex is situated in thetown of Voznesensky (pop. 9,000) which is some 50 km from the important regional city ofYussonski. The complex is accessed by national roads and has a railhead which links with theTrans-Siberian Railway System.
The region is typically low relief farmland and grassland to moderate relief rolling hills. Theelevation is between 50 m and 150 m above mean sea level. The climate is temperate, continentalwith the temperatures ranging from +35�C in summer (June to August) to -20�C in the winter.
3.12.3 Geology
The Yaroslavsky Fluorite Mine currently exploits two separate deposits, Voznesensky andPogranichny. The Voznesensky deposit is located within the hinge zone of an anticline, hostedby the limestones of the Volkushinskaya Suite. The total strike length for the deposit is 1,200 m,a maximum thickness of 200 m, and vertical depth of 500 m. The Pogranichny deposit is locatedon the north-west limb of a large syncline, striking north-west, and a 50� to 60� dip towards thesouth-west. The deposit is hosted by a single metasomatic unit, with a maximum thickness of 300m, strike length of 600 m, and vertical thickness of approximately 800 m. A total of 18 individualzones within the metasomatic unit have been identified, split into two areas, by a large, diagonalfault, namely the South-Eastern and the North-Western areas.
APPENDIX VI INDEPENDENT TECHNICAL REPORT
— VI-156 —
The Voznesensky deposit also hosts a skarn type zinc deposit in the northern part of the deposit.The total strike length of the zinc mineralisation is in the region of 100 m, with thicknessesvarying from 5 to 35 m dipping at 70� to 80� towards the east. The zinc mineralisation ispredominantly sphalerite, and has an average grade of 6.63%. Along with the sphalerite isfluorite, with minor molybdenum, tungsten, pyrite and cassiterite.
Pogranichny also hosts tantalum and niobium mineralisation below the fluorite mineralisation.Its thickness varies from 70 to 80 m in the north, to approximately 15 m in the south. The averagethickness is up to approximately 40 m, and has been intersected at 250 m below topography. Thetantalum and niobium grade appears to decrease with depth.
3.12.4 Mineral Resources and Ore Reserves
The most recent reserve estimates, as approved by the GKZ were undertaken in 1985 forVoznesensky and in 2004 for Pogranichny. Exploration was undertaken between 1948 and 1985.The original resource estimate was undertaken from core drill sampling, with whole core samplestaken for analysis. Current sampling methodologies are based on in-pit drilling, using a blastholerig. Drillholes are drilled on two grid spacings, 15 x 15 m and 5 x 5 m. For 5 m sub-benches,10 m holes are drilled, with two samples taken. If the bench is to be mined in full, i.e. 10 m high,a 20 m hole is drilled, with two samples taken. Samples are collected from the drill cone usinga specially designed catcher, which placed next to the hole collar before drilling commences.After each 5 or 10 m sample, the catcher is removed, and the collected sample sent for assay.Assaying of the sample is undertaken in-house, using wet chemistry methods. A duplicate sampleis retained by the on-site staff, and check assays are re-submitted to the internal laboratory, aswell as being sent to an external laboratory as a further check
Reserves methodologies for the deposits are consistent with other GKZ approved estimates,being based on sectional interpretations cut across the deposit, intersecting the drilling. Blockswere then defined within the sectional interpretations, and an average length weighted gradedetermined for each block. The block grades and tonnages are then split by classification, andsummed to produce a total for the deposit. The density values used in the GKZ reserve estimatewere derived from a combination of laboratory testing and bulk density determinations.
The deposits are classed as being Class 2 in terms of complexity, with the average drillholespacing for each category being defined by the GKZ. SRK has re-classified the GKZ approvedreserves in accordance with the JORC Code. The sectional interpretations, demonstrating theclassified blocks, have been reviewed by SRK, and a classification of Measured, Indicated andInferred Mineral Resources has been applied. Overall, blocks which are classified as CategoryB have been re-classified as Measured Mineral Resources, C1 as Indicated Mineral Resources,and C2 as Inferred Mineral Resources.
The geology and major controls on the mineralisation appear to be well understood, aiding theability to appropriately model the deposit. SRK considers that the data quantity and quality issufficient for the reporting of JORC Code compliant Mineral Resources, classified in theMeasured, Indicated and Inferred categories.
The fluorite Mineral Resource is presented above a cut-off grade of 20% CaF2, in line with theGKZ reserve estimate.
The GKZ reserve estimates also include zinc, niobium and tantalum. SRK has not reviewed thegeology, reserve estimation methodology, or classification for these deposits, and so has notre-classified in accordance with the JORC Code. RGRK produces zinc concentrate from the zinc
APPENDIX VI INDEPENDENT TECHNICAL REPORT
— VI-157 —

rich ores on a campaign basis and receive revenues for these products. No zinc concentrate hashowever been produced for the current year 2009. SRK has not reviewed the size, grade ormanagement of the stockpiles. The stockpiles have been excluded from the Mineral Resourcestatement.
Ore Reserves
The Mineral Resources for the two deposits require to be evaluated separately as differentconditions apply particularly regarding the current situations.
Voznesensky
The accessible ore at Voznesensky is limited to that in the bottom of the main pit and in thenorthern extension. To access additional ore in the main pit a major waste pushback is required.The pushback will require a significant capital investment programme or a contract for wastemining.
SRK considers that the JORC Code compliant Ore Reserves are limited to approximately 800 ktwhich equates to the accessible material at reasonable strip ratios.
Pogranichny
Pogranichny mineralisation is lower grade and more difficult to process. This ore is usuallyblended with Voznesensky ore. Deeper Pogranichny Mineral Resources require additional landacquisition and a large pushback, permitting and capital investment. In addition, the materialmay not achieve a 90% CaF2 product which will put the sales at risk.
A technical-economic study is required before further Ore Reserves are stated.
Table 3.29: Yaroslavsky Mineral Resource and Ore Reserve Statement (1 July 2009)(1), (2), (3)
Ore Reserve Mineral Resource
Tonnage CaF2 Tonnage CaF2
(Mt) (%) (Mt) (%)
Proved Measured
Voznesensky . . . . . . — — Voznesensky . . . . . 1.8 56.8
Pogranichny . . . . . . — — Pogranichny . . . . . 1.5 48.0
Probable Indicated
Voznesensky . . . . . . 0.50 27.4 Voznesensky . . . . . 10.3 40.2
Pogranichny . . . . . . — — Pogranichny . . . . . 6.8 32.7
Total . . . . . . . . . . . . 0.50 27.4 Subtotal . . . . . . . . . 20.4 39.7
Inferred
Voznesensky . . . . . 0.8 44.2
Pogranichny . . . . . 0.7 34.9
Total . . . . . . . . . . . 21.9 39.7(1) All references to Mineral Resources are stated in accordance with the JORC Code.
(2) Mineral Resources and Ore Reserves are recorded on an unattributable, or 100% basis.
(3) Mineral Resources are inclusive of Ore Reserves.
3.12.5 Mining Operations and Infrastructure
The operations at Yaroslavsky comprise: two open-pit mines, a milling and concentrating plantand tailings pond and clarifying pond; a drying plant; a power plant and workshops.
APPENDIX VI INDEPENDENT TECHNICAL REPORT
— VI-158 —

Voznesensky Open-Pit
The Voznesensky pit is mined by conventional drill and blast, truck and shovel methods usingelectric or diesel-hydraulic shovels and Belaz haul trucks. The current pit depth is 220 m (120m bmsl) of a final pit depth of 240 m for the current pushback. The ultimate pit depth is estimatedat 340 m (240 m bmsl).
The maximum annual ore tonnage historically mined from Voznesensky was 1.6 Mt in 1985.During its peak production period 1979 to 1991 ore tonnages averaged 1.1 Mtpa and wastestripping was 6 to 12 Mtpa. The maximum tonnage moved in a year was 13 Mt in 1988. Theaverage stripping ratio during this period was 7.25 t/t, or 2.7 m3/t.
The short term ore production from Voznesensky will be sourced from the 150 kt remaining atthe pit bottom and some 700 kt from the northern extension. The longer term future ofVoznesensky will require 2 to 4 major waste pushbacks totalling in the order of 100 Mt.
Pogranichny Open-Pit
The Pogranichny operation is also conventional drill and blast. The current pit depth is 45 m, 55m amsl, and is planned to be excavated to 150 m bmsl. The maximum ore production atPogranichny was reached in 2005 when 822 ktpa was mined. The Pogranichny materialsencountered to date have been relatively soft rocks as compared to the hard rock at Voznesensky.Clay materials in the Pogranichny waste have an adverse impact on the process recovery.
A total of 13 discrete bodies have been defined, separated by waste. The mining therefore hasto be more selective to avoid dilution and ore loss. The grade of the Pogranichny ore was seento drop to 26.2% CaF2 in 2007 from 36.7% CaF2 in 2006. The grade recovered to 32.7% CaF2
in 2008 H1.
To access the remaining 9 Mt of fluorite Mineral Resources the pit will require a major pushbackin the order of over 20 Mt to expose the lower ore reserves. Some 27 local residential propertieswill have to be removed in this case.
Blending, Crushing and Plant Feed
The Pogranichny deposits require to be blended with those from Voznesensky for ease ofprocessing and recovery to meet a 90% CaF2 product. A minimum of 30% Voznesensky blend isstated as a general requirement.
Blending of the run of mine ore is done in blending beds. There are stockpiles of special orematerials which are fed to the blend. Blending is done on CaF2 grade, CaCO3 content andCaF2:CaCO3 ratio, and clay content. Multi-layer blending techniques are used. The reagentregime is selected depending on the results of tests on representative samples of the blended pile.
The ore is fed to the primary crusher installed in 1986. The crusher feeds twin stocking gallerieseach with a 50 kt capacity which are alternately filled and delivered to the plant.
The current production tonnage and grade is impacted on due to the lack of Voznesensky ore andthe lower grade and process difficulties of the Pogranichny ore. Currently, and for the past threeyears, the run of mine tonnage has been augmented by ore from stockpiles.
APPENDIX VI INDEPENDENT TECHNICAL REPORT
— VI-159 —

Overall Mining and Planning
The maximum material which may be mined annually with the current equipment with generalrepairs and maintenance is in the order of 4 Mt. The mine has generated a capital investment planfor mining and ancillary equipment based on a steady state production of 1.25 Mtpa CaF2. UCRUSAL does not consider that this reflects their anticipated CaF2 requirements and would likelyneed to be revised unless additional offtake agreements are obtained by RGRK.
A long term mine planning exercise was carried out for the mine in 2006 and in 2003 the TEOconditions were also reported upon by NTC. NTC utilized Datamine software for the planningprocess. The mine has determined a long term plan based on the NTC work. This will require tobe updated with current parameters.
The following is extracted from the RGRK long term plan which extends to 2026, however thisplan has yet to be agreed between the owners:
• Ore production is 1 to 1.25 Mtpa, and 220 to 250 ktpa concentrate predominantly fromPogranichny until 2016, when the waste stripping has exposed more Voznesensky ore.
• The grades of CaF2 are seen to reduce to 28 to 30%, the recovery to reduce to 54% and thequality of the CaF2 concentrate is expected to be 88% CaF2 (and not 90%) which hasimplications to the saleability of the products.
Waste dumps
Approximately 200 Mt of waste has been extracted from the pits since 1960 and has been dumpedin the vicinity of the operations.
Whilst there is sufficient dump capacity for the short term more dumping facilities need to beapproved for the medium to long term. These are in the order of an additional 150 Mt over thecurrent long term plan. The requirements for the additional land allotment and the waste dumpdevelopment schedule have been defined. The approvals for the land allotment need to beaddressed in the short term by RGRK.
Infrastructure
The infrastructure includes the following facilities:
• Steam plant — Oil Fired: 2 x Steam boilers; 1 x DKVR 20/13 -4 units 1964/5); 1 x KE35/14— 5 units 1975-80.
• Transformer substation (1983).
• Transport department.
• Mechanical repair and maintenance workshops.
• Electrical workshops.
• Locomotive department: including railway loadout and shipment, railway repair andmaintenance, rolling equipment repair.
• Central Laboratory, Instrumentation and Systems Control.
Power for the plant and township is supplied by the Far East Energy Company.
APPENDIX VI INDEPENDENT TECHNICAL REPORT
— VI-160 —
Water for potable use and for the boilers is pumped from the River Ilistaya under permitNo.25-20.03.07001-R-DZVO-C-2009-00138/00 dated 30.06.2009 at a rate of 35 m3/hr in summerand 200 m3/hr in winter.
Water for the plant is obtained from the clarifying pond after decantation from the tailings pond.
Processing
The processing facilities at the mine comprise of:
• Crushing and milling circuits.
• Flotation plants (two separate circuits).
• Drying plant.
• Tailings ponds and water dam.
The milling capacity is 1.5 Mtpa when all 12 mills are currently in operation. 8 mills are inoperation with a capacity of 1 Mtpa. One mill has been stripped for parts. Capital investment isneeded to restart the other 3 mills.
The concentrator comprises of floatation, thickening, filtering and drying.
The long term plan indicates average CaF2 recoveries at 54% and yields of 16% depending ongrade. These require to be verified before acceptance as a basis for investment. Recovery of theCaF2 from the ore in 2009 was approximately 42.2% average. The current 2009 yield of the oreto the final FF-90 product is approximately 13% as compared to 27% in 2004.
The primary crushed ore received is washed and screened to remove clay. It is then secondarycrushed to 16 to 20 mm then milled to 40 microns, then dosed with reagent.
The flotation capacity is currently 250 ktpa based on an 180 ktpa capacity in the main flotationunit (6.3 x 180 cells, 128 working) and 70 ktpa in a secondary flotation unit (3.2x128 cells; 110working). The reagent is heated to 25�C during the winter months (October to April). Theflotation has 11 cycles and concentrates the CaF2 grade to a design grade of 90-92%. Thesecondary flotation unit can be switched to zinc flotation.
The product is vacuum filtered to between 10�C and 12�C then thermally dried in a kiln fuelledby residual oil products and transported pneumatically to two silos each of 8 kt capacity.
The dried products are either briquetted or loaded directly into wagons to be transported.
Waste Products
Gas Products: The residual gases from the drying process are dry gas cleaned in dust scrubbersand wet gas washed to remove the remnants of the CaF2 concentrate and spent oil.
Tailings: The tailings are transported by hydraulic transport via a pipeline to a tailings pond of22 Mm3 capacity. Water from the tailings pond is decanted to a large water retention/clarificationpond. Both impoundment walls are constructed of waste rockfill with clay cores. Theimpoundments are unlined. Raising of the tailings wall by 5 m is scheduled in 2011. The annualdisposal of tailings is 575 ktpa on the basis of 1,250 ktpa ore production and a 54% recovery.The raising of the wall by 5 m thus increases the capacity by 4 Mt of tailings or 7 years. Aminimum 4 m freeboard is maintained. The supernatant water is decanted via a single decanttower. An emergency spillway is present. The water is recycled for use in the processing plant.
APPENDIX VI INDEPENDENT TECHNICAL REPORT
— VI-161 —

3.12.6 Environmental and Social Considerations
The mine is under the jurisdiction of the regional and national regulatory framework.Permissions are renewed annually, or longer. No non-compliances were noted associated with theenvironmental permit.
Health and Safety
RGRK operates a formal health and safety management system, overseen by a designated Healthand Safety manager. Internal investigations of every occupational injury, accident and incidentare conducted with actions to prevent similar accidents from occurring in the future. Detailedstatistics are kept for all injuries by category.
The mine currently runs on-site medical facilities for treating injuries and alleviatingoccupational illness symptoms.
Medical examinations of the RGRK employees are carried out on an annular basis. Two cases offluorosis have been diagnosed in the past 3 years.
Regulatory requirements
The licences and permits cover all of the aspects of the facilities.
Environmental and Social Context
The mine is adjacent to the town of Yaroslavsky which currently has a population ofapproximately 12,000. The township and its services and infrastructure were developedspecifically for the mineworkers and their families. All of the mineworkers reside in the town.All of the facilities are now privately owned. RGRK supports the local and regional facilities innumerous ways. Yaroslavsky is the significant employer in the local area and essentially supportsthe community and the local businesses.
Environmental and Social Management
The recent studies of the continuation of the operations have addressed environmental impactsand management to a significant degree within the framework of the national and regionalrequirements. RGRK however has yet to define and implement an integrated Environmental andSocial Management Plan The formulation of objectives and the integration of the currentactivities into an recognised structure and framework can achieve an international standard whencombined with appropriate staffing, financing and future planning.
Material Issues
The relocation or compensation for property owners of 27 houses prior to the mining of thePogranichny is still outstanding.
An environmental and social management plan needs to be completed together withrehabilitation and closure planning.
SRK has not seen an asset retirement obligation, or mine closure estimate.
APPENDIX VI INDEPENDENT TECHNICAL REPORT
— VI-162 —

3.12.7 Technical and Economic Assessment
The following points are made in respect of the production and cost parameters in support of theOre Reserves:
• The production is 0.5 Mt during H2 2009, at which point there are no further Ore Reserves.In order to convert Mineral Resources in to Ore Reserves, a waste pushback of the sidewallis needed to expose more ore at Voznesensky and to a lesser extent at Pogranichny.
• The average sales price for H2 2009 is US$212/t.
• The world prices of 90% CaF2 concentrate (FF-90) over the previous 2 years are stated byUC RUSAL at US$370-450/t. Mongolian prices are stated by UC RUSAL to beUS$230-290/t and Chinese at US$400/t. UC RUSAL quoted that the price paid by them in2008 was RUR5110/t or US$186/t at an exchange rate of 27.5RUR to US$. This indicatesprofitability up to 2006/7 but appears insufficient to cover costs in 2008. As UC RUSALtakes some 90% of the production of RGRK, the prices agreed would require to cover theoperating costs or otherwise the enterprise would be non profitable.
• A cashflow model has been generated to verify the economic profitability of the OreReserves. SRK has verified the discounted pre-tax, pre-finance cashflow.
Table 3.30: Yaroslavsky historical production and cost statistics(1)
Statistics Units 2006 2007 2008 H1 2009
Production
Tonnage . . . . . . . . . . . . . . . . (kt) 806.8 899.1 799.3 441.3
Grade . . . . . . . . . . . . . . . . . . (% CaF2) 36 31 30 29
Concentrate sold . . . . . . . . . . . (kt) 184.6 141.4 121.8 58.8
Expenditures
Cash operating cost . . . . . . . . . (US$m) 31.6 37.2 36.4 12.0
Cash costs per unit(1) . . . . . . . (US$/t) 171.4 263.0 299.1 203.8
Capital expenditure . . . . . . . . . (US$m) 0.4 1.0 2.8 0.0(1) Cash costs are per tonne of fluorite concentrate
3.12.8 Material Developments
SRK is unaware of any significant changes in the operation.
3.12.9 Specific Risks and Future Opportunities
Specific risks to the RGRK operations include:
• Fluorite Market — The fluorite market is relatively small and competitive. Consistentlyhigh quality products particularly from Mongolia compete with the Yaroslavsky fluorite.UC RUSAL purchases from these markets in addition to Yaroslavsky.
• Lack of Surety of production — The CaF2 offtake and production is driven by UC RUSALwho takes over 90% of the production. UC RUSAL’s aluminium production, the quality ofthe Yaroslavsky products and the price of the Yaroslavsky CaF2 will be critical. If UCRUSAL significantly reduces their purchase of CaF2 from RGRK, the economics of theoperations may need to be re-assessed.
• Quality of Concentrate — The non achievement of quality of the CaF2 to a 90% gradewhich Yarislavsky has recently experienced is a threat to RGRK’s market position.
APPENDIX VI INDEPENDENT TECHNICAL REPORT
— VI-163 —
• Ore Grade and CaF2 Quality — The CaF2 quality issues appear to relate to the ore typeand lower grades from Pogranichny and the higher quantities of silica which are reportingwith the ore due to dilution. Further testwork to determine the source of the deleteriousminerals should enable the optimisation of the product FF-90 quality.
• Investment —
• Overburden Stripping Requirement — Considerable investment in waste strippingis urgently required for the higher grade, good processable Voznesensky ore. The lackof overburden stripping over recent years has resulted in limiting the available ore andhas impacted upon recoveries. 10s of millions of dollars of waste stripping andassociated mining and hauling equipment is required in the short to medium term.
• Mining Equipment Investment — The current equipment especially the electricshovels lack the flexibility for selective mining which is needed for effective miningthe Pogranichny deposits.
• Tailings Dam Raising — The tailings dam requires to be raised by 5 m in 3 to 5 yearstime.
• Process Equipment Investment — Much of the process plant equipment is old andis in need of repair.
• Lack of Investment — Continued lack of investment will further jeopardise thefuture economics of the enterprise.
• Costs — The processing costs per tonne of ore processed and concentrate produced hasrisen sharply in 2008 in Rouble terms. This needs to be assessed in more detail. The costsper tonne of CaF2 to UC RUSAL may have to similarly increase.
• Specific cost items — These include: General management and tax; power, and wastestripping,
• Environmental Costs — Higher environmental costs are indicated for the futureoperations.
• Economic Assessment — The economics of the operations in the short, medium and longterm may be doubtful and require being reviewed using updated parameters.
• Land Acquisition —
• Additional land is required for the pushback of the Pogranichny pit to access the lowerore.
• Additional dumping space is required for the future operations.
Future opportunities to the Yaroslavsky operations include:
• Reduction of Dilution — A reduction in dilution during the mining of the Pogranichnydeposits will improve process recoveries. This could be achieved by using miningequipment better capable of selective mining.
• New equipment — Appropriate investment in new equipment will improve efficiencies andcosts.
• Process Improvements — Further studies may allow improvements in process recoveriesand costs.
APPENDIX VI INDEPENDENT TECHNICAL REPORT
— VI-164 —
• Strategic Resources — Yaroslavsky has some of the largest quantity of fluoritemineralisation worldwide. It can be considered a strategic resource which should betechnically and economically assessed.
4. Alumina Division
4.1 Queensland Alumina Ltd.
4.1.1 Introduction
UC RUSAL is a minority shareholder in Queensland Alumina Ltd. (QAL). Hatch was requestedby UC RUSAL not to visit the facility and to provide an assessment based only on publiclyavailable documentation. As such this is the basis for all information presented in Section 4.1.
4.1.2 History, Location and Infrastructure
Queensland Alumina Ltd. is located at Gladstone on the east coast of Australia, approximately450 km north of Brisbane, the Queensland state capital. Queensland Alumina Ltd. commencedoperations in 1967 with a capacity of 720 ktpa. The refinery underwent three major plantexpansions to reach 2.4 Mtpa of alumina capacity by 1973, followed by a productivity expansionin 1984 to reach 2.7 Mtpa. Subsequent expansions and debottlenecking have increased capacityto approximately 4.0 Mtpa in 2008.
Queensland Alumina Ltd produces alumina on a toll basis for its two shareholding companies,Rio Tinto Alcan (80 per cent share) and UC RUSAL (20 per cent share). Each supplies therefinery with bauxite from the Weipa mine in return for product alumina in proportion to theirequity in the refinery. The attributable annual production for UC RUSAL was 769 kt in 2008.
The refinery covers 80 hectares of a 400-hectare site located beside the harbour on the southeastside of Gladstone. A wharf and storage facilities are adjacent to the plant on South Trees Island,connected by a causeway bridge. The city of Gladstone, with a population of approximately30,000 people, is a major seaport handling in excess of 75 Mtpa bulk cargo, including export of55 Mtpa of coal and import of 13 Mtpa of bauxite for Queensland Alumina Ltd. and Rio TintoAluminium.
4.1.3 Process Description
Design of the initial plant and expansions up to 1973 were based largely on Kaiser AluminiumBayer process technology, including Kaiser high temperature digestion technology.
• Bauxite is shipped from the Weipa mine in North Queensland in four 70,000 DWT purposebuilt, coal-fired ships owned by the refinery but operated under contract by ASP ShipManagement Group.
• Bauxite feed to the refinery is wet ground to the required size for digestion in combinedrod/ball mills. Eight of the nine installed mills for monohydrate bauxite are operational atany one time. Ground bauxite slurry is heated to 100�C by direct steam injection and storedin mechanically agitated slurry tanks for a minimum of eight hours to achieve desilicationof the slurry.
• Caustic liquor required for digestion is heated in shell and tube heat exchangers in what isknown as “dual stream” digestion. Desilicated bauxite slurry, hot caustic liquor andhigh-pressure steam are injected into digester vessels on each digestion unit to achieve arequired digestion temperature of 255�C.
APPENDIX VI INDEPENDENT TECHNICAL REPORT
— VI-165 —

• After digestion, the digested slurry is cooled in 10 flash stages to atmospheric temperatureand pressure. Recovered flash steam is used to heat incoming caustic liquor. In the bauxitesweetening process installed in 1988, ground and desilicated Weipa trihydrate bauxite isadded to the sixth flash stage, giving up to 25 per cent increase in production.
• Red mud in the digested slurry is separated from the pregnant liquor in five mud settlers(three operating, two spare). Underflows from mud settlers are combined and pumped tothree counter-current red mud washing trains, each with five stages arranged in series, allof which are normally in operation. Following washing to recover caustic soda, red mud isreslurried with seawater and pumped to storage ponds located on Boyne Island, 10 km southof the refinery.
• Pregnant liquor overflowing mud settlers is filtered using 30-35 of 42 installed horizontalpressure “Kelly Filters” to remove fine suspended red mud residue. Pregnant liquor is thencooled to the precipitation fill temperature of 76�C by either vacuum flash cooling in shelland tube heat exchangers or in plate heat exchangers, cooling against cold spent liquor.
• The precipitation circuit consists of nine trains, each with 11 or 12 precipitators, with 106in total. Precipitators are predominately mechanically agitated with draft tubes, while thelast two precipitators in four of the trains are air agitated. Fine and coarse seed are addedto the precipitators to initiate and assist hydrate precipitation. An “interstage cooling” stepafter the fourth precipitator in each train is used to further increase precipitation of hydrate.
• Precipitated hydrate is classified in a system of primary-secondary gravity classifiers,supplemented by hydro-cyclones, and finally by hydrate thickeners. Primary classifieroverflow flows under gravity to secondary classifiers. Secondary classifier underflow ispumped via seed slurry surge tanks back into the precipitation trains. Secondary classifieroverflow reports to the hydrate thickeners. Hydrate thickener underflow is pumped to thefine seed filters, washed to remove contaminants, reslurried and returned to the firstprecipitator tanks.
• Hydrate thickener overflow is spent liquor, which is heated against incoming pregnantliquor and returned to digestion to be concentrated in ten to eleven operating evaporators(12 units installed).
• Product hydrate is pumped through either thickening cyclones or hydrate storage tanks inthe calcination area, before being pumped to the product pan filters where a further threestage counter-current wash is applied on pan filters.
• Calcination of product alumina is accomplished in four static calciners comprising oneLurgi circulating fluid bed unit and three FLS flash calciner units installed in 2002. Eachcalciner is fitted with baghouse dust collection systems to reduce particulate aluminaemissions to less than 20 mg/Nm3, well within environmental licence limits.
Steam for the refinery is generated in seven coal-fired pressure boilers (all of which werecommissioned between 1967 and 1973) and one gas-fired boiler (commissioned in 2007). Therefinery consumes around 90 MW of electrical power, of which 17 MW is typically generatedinternally and the remainder sourced from the Queensland state grid. New emergency dieselgenerators were commissioned late 2006, replacing 40-year old units to provide up to 12 MW ofemergency standby power to essential services within two minutes of a grid outage.
4.1.4 Environmental
Queensland Alumina Ltd. has achieved ISO 14001 environmental management certification.
APPENDIX VI INDEPENDENT TECHNICAL REPORT
— VI-166 —

Queensland Alumina Ltd. includes two mud storage ponds. The original pond covering 350hectares was in operation from 1967 to the 1980s upon which it was rehabilitated with grass andtrees. A second 800 hectare pond commenced operation in the 1980s.
Disposal of mud within the ponds is currently being upgraded by conversion to dense stackingof red mud and using dried red mud to progressively raise embankment walls, employingupstream construction techniques. The first pond will be recommissioned as part of this upgradeto provide mud storage capacity for a further 50 years of operation of the refinery within theexisting 1,150 hectare footprint of the two mud ponds.
Queensland Alumina Ltd. mud disposal operations utilise seawater to dilute mud from thewashers prior to pumping to the storage ponds. This has the advantage of neutralising residualcaustic soda in the mud so that mud and water within the mud pond are only slightly elevatedby approximately 0.3-0.5 pH units above surrounding tidal estuaries. Any groundwater seepageinto the estuarine environment has minimal impact since water quality within the ponds is similarto that in the estuary. Excess water discharged from ponds to the estuary is licensed and subjectto a measurement and control program approved by the Queensland Environmental ProtectionAgency.
Dust generation from any areas of exposed red mud is suppressed by water spraying.
The coal-fired boilers generate around 300 kt of coal ash each year, which is reslurried withseawater and pumped to ash ponds adjacent to the refinery. Water outfall from these ponds to theharbour is licensed and subject to measurement and a control program approved by theQueensland Environmental Protection Agency.
Boreholes have been drilled around the refinery to monitor leakage of caustic soda throughconcrete slabs. Results show minimal ingress into the groundwater that tends to be seawater inany case. Storage tanks on South Trees Island for caustic soda and heavy fuel oil (still used inboilers and by a commercial ship bunkering service) are bunded to prevent escape of storedcontents to the harbour in the advent of a tank rupture or leak. Tank walls and floors are nowperiodically checked for corrosion following minor leakage several years ago. Seawater reactsand neutralises any caustic soda that may leach into the ground.
A number of projects have been completed to reduce or eliminate air emissions and impacts onthe Gladstone community located downwind of the refinery. The calcination section was fullyconverted to natural gas, eliminating sulphur emissions from the heavy fuel oil used for manyyears. Burnt lime supply was outsourced in 2006 and two rotary kilns used to burn limestonewere demolished, eliminating a source of particulate emissions. Electrostatic precipitators on theseven coal fired boilers were replaced by baghouse dust collectors, reducing particulateemissions. Nine rotary kilns used to calcine product alumina were replaced by more energyefficient FLS static calciners and fitted with baghouse dust collectors, reducing particulateemissions. The alumina ship loader has been recently upgraded. Thermal oxidiser facilities havereduced odour emissions from the digestion area by 40 per cent. Further odour reduction projectsare under investigation. A buffer zone was established between the refinery and adjacentresidential areas and a program to plant 15,000 trees implemented. All boiler and calciner stacksand alumina transfer systems are licensed and subject to measurement and control programsapproved by the Queensland Environmental Protection Agency.
Stormwater run off from the refinery or any process spills that overflow slabs are captured in twoponds and progressively returned to the refinery. Any excess run off due to extended heavy rainpasses through two neutralising ponds where it is reacted with seawater prior to flowing to theadjacent harbour. The outfalls are licensed by the Queensland Environmental Protection Agency.
APPENDIX VI INDEPENDENT TECHNICAL REPORT
— VI-167 —
4.1.5 Specific Risks and Future Opportunities
Specific Risks
• Asset Integrity — Major maintenance and sustaining capital expenditure programs havebeen implemented to replace aging plant and equipment. The refinery has experienced anumber of equipment and power failures over recent years that impacted production, forexample causing the loss of around 80 kt of alumina production in 2006. These types ofissues are to be expected with an aging refinery such as Queensland Alumina Ltd., butshould not cause major losses provided long-term maintenance and capital replacementprograms are continued. A 10-year electrical program developed as a component of a30-year maintenance plan for the refinery is progressively replacing unreliable electricalequipment and systems.
• Labour Supply — Gladstone is a relatively small labour market, given the concentrationof major industrial facilities that operate in the region. Ongoing growth of the regionalindustrial base since the 1980s has placed pressure on retention of skilled members of theworkforce at the refinery. This growth is expected to continue into the foreseeable futuremaking it essential to continue recruitment, training and development programs already inplace for apprentices, trades people, plant operators, supervision and the management team.
Future Opportunities
• Capacity Expansion — Potential exists for further capacity expansion of the refinery to 5Mtpa or beyond should the owners unanimously agree. At Queensland Alumina Ltd., allexecutive Committee decisions are required to be unanimous.
4.2 Fria Alumina Refinery
4.2.1 Introduction
Hatch undertook a site visit to Fria Alumina Refinery in October 2008. This Section 4.2 hassubsequently been revised and updated based upon data and information from UC RUSAL anddiscussions held with senior management in September 2009. With reference to the followingsections, please note;
• Section 4.2.2 — Updated with data and information as of September 2009,
• Section 4.2.3 — Process Description as of October 2008,
• Section 4.2.4 — Environmental Status as of October 2008,
• Section 4.2.5 — Material Developments at the facility between October 2008 andSeptember 2009, and
• Section 4.2.6 — All previous Specific Risks and Opportunities noted in October 2008together with any changes following new data and information provision.
4.2.2 History, Location and Infrastructure
Fria Alumina Refinery, located at the town of Fria in the Republic of Guinea, is approximately160 km northeast of the capital and main port Conakry. The region of Fria has a population ofapproximately 45,000 people and Conakry has a population of just over one million. The refinerywas commissioned in 1960 by Pechiney and is serviced by road and a dedicated railway.
APPENDIX VI INDEPENDENT TECHNICAL REPORT
— VI-168 —

In 1997, Pechiney and its partners decided to leave the refinery to the Guinean government. In2000 a group of investors leased the refinery assets from the Guinean government and controlledthe operation of the refinery through Alumina Company of Guinea (ACG). In December 2002,RUSAL acquired a majority interest in ACG from these investors. In April 2006, RUSAL (priorto the formation of UC RUSAL) fully acquired ACG from the government of Guinea Republic,including the mine, refinery, railway and port.
The alumina precipitation and classification circuit at the Fria refinery was modified in the 1980sto improve product quality, and ‘semi-sandy’ alumina was produced at a rate of 640 ktpa. Friaproduction in 2004 was 778 kt although a much lower grade ‘floury’ alumina was produced. Plantproduction fell to 530 kt in 2006 reflecting a shortage of power supply after a legacy ofunderinvestment following the previous ownership changes. Production has recoveredmoderately to 593 kt in 2008.
4.2.3 Process Description
Fria Alumina Refinery uses a very simple variant of the Bayer Process. The key elements of theBayer process as applied at Fria are the low temperature atmospheric digestion of alumina, andthe two-stage, seeded precipitation of alumina. The use of atmospheric digestion limits thedegree of alumina super-saturation that can be achieved in the digestion slurry and without a highdegree of super-saturation, ‘sandy alumina’, the standard for modern refineries cannot beachieved.
The Bayer process technology as applied at Fria is described as follows:
• Bauxite is delivered from the nearby mining operations to the refinery by truck and iscrushed by one double roll primary crusher. The crushed bauxite is transported by conveyorbelt to either the bauxite grinding area or to the bauxite reserve stockpiles.
• Bauxite is mixed with caustic liquor and wet-ground in rod mills. There are three rod millsat the refinery. Normally two mills are in operation and open circuit grinding is used.
• The slurry from grinding is mixed with more caustic liquor and is then pumped to thedigestion area. Digestion consists of two units, with each unit consisting of eight digestiontanks. Steam from the power plant is used in the first six tanks of each unit to indirectlyheat the slurry close to its atmospheric boiling point of 108�C.
• The digested slurry is pumped to one hydro-separator, which removes the coarse sandfraction from the digester effluent. The sand is then washed separately in rake classifiersto recover caustic liquor and is pumped to the end of the red mud washing circuit.
• The overflow from the hydro-separator is mixed with the overflow from the first red mudwasher and is pumped to the post-desilication section. Desilication is achieved in fiveagitated, indirectly steam heated tanks per unit. The slurry from post-desilication is pumpedto the red mud settlers.
• Red mud settling and washing is achieved in two units, each consisting of four flat bottomsettlers and ten washers. Synthetic flocculants are used to facilitate the separation of redmud from the supernatant pregnant liquor. The red mud is pumped to the red mud disposalarea for storage.
• The liquor overflowing the red mud settlers is pumped to the red filtration area where twounits of six horizontal ‘Kelly’ pressure leaf filters are used to remove the fine suspendedsolids from the liquor. This liquor is now known as pregnant liquor and is pumped to theheat interchange area.
APPENDIX VI INDEPENDENT TECHNICAL REPORT
— VI-169 —

• In the heat interchange area, the pregnant liquor is cooled from 105�C to between 65 and70�C by indirect contact with spent liquor in heat exchangers. The cooled pregnant liquoris then pumped to the precipitation area.
• The precipitation area consists of two units, each of 14 air agitated tanks and twomechanically agitated precipitator tanks. Fine seed hydrate is added to the firstprecipitation tanks, known as agglomeration tanks, to initiate the hydrate precipitationprocess. Hydrate slurry then flows to the ‘growth’ precipitation tanks where coarse hydrateseed is added, and sufficient residence time allowed for more hydrate to precipitate fromsolution.
• Hydrate slurry from the precipitation circuit is then treated in a system of pre-classifiertanks and Turbiflux classifiers to produce fine seed, coarse seed and product hydrate. Theseed and product hydrate are filtered on a combination of disc and drum vacuum filters.
• The washed product hydrate cake is calcined to form alumina in the three rotary kilnson-site.
• The spent liquor filtered from the seed and product hydrate filtrate is concentrated byevaporation and returned to the grinding and digestion stages.
• Fria Alumina Refinery has a captive power plant that supplies electricity and steam to therefinery and the town of Fria. As there is no standby power source via an external grid, thepower plant is critical to the refinery and must be operational at all times. ACG is focussingon modernisation and repairs to the steam and electricity generating capacity and expansionof red mud storage capacity.
4.2.4 Environmental
Red mud is directed to a disposal area located 4.5 km to the south of the refinery. The red mudfacility consists of upper and lower dams, Dam No. 1 and Dam No. 3, respectively. Dam No. 2is now completely submerged. Dam No. 3 was constructed in 1992 using earth and rock-fillmethods. Dam No. 1 was breached in 1993 and failed again at the start of the rain season in 2007before repairs could be completed. Dam safety reviews are not routinely undertaken by ACG.Completion of Dam No. 1 repairs and a 4 m raise for Dam No. 3 will, in tandem, extend the lifeof the residue storage area by 9 years. Capital budget has been allocated for both themodifications to Dam No. 1 and an engineering study for Dam No. 3.
Dam No. 3 is located in a valley with an estimated catchment area of 160 hectares and itempounds 1.8 Mm3 of water. There is no recycle of process water from the mud lake. During thewet season, fine sediment and supernatant liquor discharges over the main dam spillway, downthe Dotte River and into the Konkoure River. The spillway is designed to pass the 100-yearrainfall event. Effluent is monitored and tracked against internal targets of 3 g/L soda and amaximum pH of 12. Although these targets were not exceeded in the data reviewed from 2008,the environmental consequence of releasing effluent at these levels, is nonetheless, severe. Thereis no installed neutralization or treatment capability and the only current recourse to reduceenvironmental impact is to improve performance in the mud washing circuit. Fria AluminaRefinery has made advances in this area, lowering the soda content in the mud residue from 6-7g/L in 2007 to approximately 5 g/L in 2008.
Process spills and site drainage exits the refinery in five distinct channels, reporting to a commonoutfall ditch which transports the wastewater, untreated, to the river. Equipment foundations arecracked in several places and do not represent a suitable barrier to minimize groundwatercontamination. High pH and presence of soda has been observed at the piezometer downstreamof the refinery.
APPENDIX VI INDEPENDENT TECHNICAL REPORT
— VI-170 —
Alumina dust emissions at the port are high which is an issue given the housing which surroundsthe port. Replacement of the loading spout on the alumina ship loader and upgrades for thebaghouses and dust capturing systems of the conveyors, completed in 2008, will remedy someof these concerns. The calciner electrostatic precipitators have also been upgraded to reducealumina dust emissions.
Boiler operation is controlled by monitoring of combustion gases (O2 and CO). The installedopacity instruments are not functional and there is no continuous air monitoring of the acid gasconcentrations, NOx and SOx. The boilers and kilns all burn fuel oil with a typical sulphurcontent of 2.5 per cent (maximum permissible is 3.5 per cent). Some reduction in gas emissionshas been realized by an energy efficiency initiative that uses waste heat to preheat hydrate goingto two of the three kilns, lowering the fuel consumption from 98 kg/t of alumina to 92 kg/t.Boiler No. 3 was destroyed by an explosion in 2006 and will be replaced by a new boileremploying NOx abatement technologies. The refinery has no other plans to reduce NOxemissions. The most recent measurements of stack emissions from Boiler No. 1, taken in 2007and corrected for dilution air, exceeded World Bank standards for NOx (482 mg/Nm3 comparedto 460 mg/Nm3) and SOx (2694 mg/Nm3 versus 2000 mg/Nm3).
Fria Alumina Refinery is engaged in an ongoing programme to eliminate PCBs from site. In2007, 45 tonnes of PCBs were sent from the refinery to France for utilisation at the ‘Tredi’ plantin Saint Vulba. Destruction of the remaining 30,000 litres of PCB contaminated transformer oilis to be completed in 2009-2010 and disposal as scrap of contaminated equipment is scheduledfor 2011-2014.
4.2.5 Material Developments
This section presents material changes to the facility since the site visit was undertaken inOctober 2008. The updated information was presented to Hatch through meetings with UCRUSAL in Moscow and has not been validated through an additional site visit. We have no reasonto believe that the information provided is not a true and fair reflection of developments at thefacility.
UC RUSAL has advised that there have been no material changes to the physical equipment/plantat the facility. Production at the refinery was temporarily reduced by 50 per cent of the installedcapacity in July 2009 to correct an internal UC RUSAL over supply of alumina. UC RUSAL hasadvised Hatch that the idled capacity was subsequently restarted in August 2009.
UC RUSAL has advised that destruction of the remaining 30,000 litres of PCB contaminatedtransformer oil has been postponed and is now due for completion in 2010-2011 and disposal asscrap of contaminated equipment is scheduled for 2012-2014.
4.2.6 Specific Risks and Future Opportunities
Specific Risks
• Asset Integrity — In recent years, the captive power plant has experienced a number ofincidents resulting in power failures, which has led to damage of equipment and the lossof alumina production. The incidents have occurred as a result of operator error and thegeneral poor condition of the power plant. To mitigate this risk, the power plant is currentlyundergoing a modernisation programme which is due to be completed in 2010.
APPENDIX VI INDEPENDENT TECHNICAL REPORT
— VI-171 —
• Environmental Regulation — The “Code Sur la Protection et la Mise en Valeur del’Environnement” of the Republic of Guinea currently imposes no quantitative dischargecriteria on the operations of the alumina refinery. Bringing the refinery in line with thestandards required by the World Bank would require significant investment. In particular,acid gas emissions and caustic losses to surface and groundwater would need to beaddressed.
• Social/Labour Risk — The refinery currently provides electricity and water to the town ofFria, a precedent established by previous owners. As the town has grown, the commitmenthas increased and disengagement of these services from the refinery will be verychallenging. UC RUSAL continues to actively support the social infrastructure in the Friatown. Social unrest is prevalent throughout Guinea and in the locality, and there have beenseveral work disruptions relating to labour activity in recent years.
• Health and Safety — The railway from the refinery to the port passes through Conakry. Asthe capital has grown, so has the population living alongside the railway for the first 23 km.Investment in railway improvements in recent years has included elevated pedestriancrossings, barriers at road crossings, signage and a locomotive to conduct track conditionassessments. There are now 46 controlled access points along the rail line. Effort has alsobeen expended to educate the population on the dangers associated with the railway andvillagers have been appointed as local “captains” to better enforce the safety message. Thenumber of fatalities and injuries on the railway involving the public is decreasing followingthese improvements.
Future Opportunities
• Capacity Expansion — The Fria expansion project is a brownfield expansion of FriaAlumina Refinery to 1,050 ktpa of alumina. A detailed feasibility study on theexpansion/modernisation of Fria Alumina Refinery has been completed. The project iscurrently on hold. Key areas for development include implementation of a new red mudsettling and washing system, implementation of a two-stage inter-stage cooling facility inprecipitation, addition of new precipitator tanks with mechanical agitation andimplementation of new equipment (such as mills, conveyor belts, pumps, calciner, bauxitestorage, etc.) as necessary to handle increased material flows. A further 10 m lift of DamNo. 3 in the residue disposal area would also be required.
4.3 Aughinish Alumina
4.3.1 Introduction
Hatch undertook a site visit to Aughinish Alumina in October 2008. This Section 4.3 hassubsequently been revised and updated based upon data and information from UC RUSAL anddiscussions held with senior management in September 2009. With reference to the followingsections, please note;
• Section 4.3.2 — Updated with data and information as of September 2009,
• Section 4.3.3 — Process Description as of October 2008,
• Section 4.3.4 — Environmental Status as of October 2008,
• Section 4.3.5 — Material Developments at the facility between October 2008 andSeptember 2009, and
• Section 4.3.6 — All previous Specific Risks and Opportunities noted in October 2008together with any changes following new data and information provision.
APPENDIX VI INDEPENDENT TECHNICAL REPORT
— VI-172 —
4.3.2 History, Location and Infrastructure
Aughinish Alumina is situated on Aughinish Island on the south side of the Shannon estuarybetween Askeaton and Foynes, 32 km downstream from Limerick City, Ireland. AughinishAlumina commenced production in 1983. Aughinish Alumina is served with a captive deep-waterterminal in the Shannon Estuary for the import of raw materials and export of finished product.
Aughinish Alumina had an initial rated capacity of 800 ktpa of alumina. The capacity of therefinery has since increased through a combination of continuous improvements in the installedequipment, process improvements, modifications and expansions. Production at AughinishAlumina was 1,890 kt in 2008.
4.3.3 Process Description
Bauxite is shipped to Aughinish Alumina in bulk ore carriers from Compagnie des Bauxites deGuinea (CBG), in Guinea, and Mineracao Rio do Norte (MRN), in Brazil.
The Aughinish refinery was designed by Alcan International, using Kaiser high temperaturedigestion technology and Alcan technology in the remainder of the refinery. The exception is thealumina calciners which are an early model of the Alcoa Fluid Flash Calciner. In 2002, a “bauxitesweetening” process was added to the refinery to increase alumina production.
• The bauxite feed to the refinery is wet ground to the required size for digestion in combinedrod/ball mills. All of the four installed mills are operated to achieve the current productionrate.
• The ground bauxite slurry is heated to 100�C by direct steam injection and stored in slurrystorage tanks to achieve desilication of the slurry. There are four pre-desilication tanksinstalled, with three used at any one time. After pre-desilication, the ground bauxite slurryis injected into the digesters.
• The caustic liquor required for digestion is heated in a series of shell and tube heatexchangers, in what is known as “dual stream” digestion. The ground bauxite slurry, hotcaustic liquor and high pressure steam is injected into the digester vessels arranged in asingle train to achieve the required digestion temperature of 250�C.
• After digestion, the digested slurry is cooled in 10 flash stages to atmospheric temperatureand pressure. The recovered flash steam is used to heat the incoming caustic liquor.
• In the bauxite sweetening process, separately ground and desilicated MRN bauxite is addedto the eighth flash stage, giving an increase in production.
• After digestion, the sand component of the red mud is separated in hydro-separators,followed by washing of the sand in screw classifiers. The remaining red mud is thenseparated from the pregnant liquor in two decanter units which are arranged in parallel.
• The underflow from the decanters is combined and pumped to three red mud washersarranged in series, and then to eight rotary drum filters in parallel to recover the remainingcaustic liquor and provide a high solids concentration red mud for stacking in the red mudarea.
• Pregnant liquor overflowing the decanters is drains through gravity sand filters to removefine suspended red mud residue. Pregnant liquor is then cooled to the precipitation filltemperature of 85�C by vacuum flash cooling. A further stage of cooling of the pregnantliquor is achieved in plate heat exchangers against spent liquor.
APPENDIX VI INDEPENDENT TECHNICAL REPORT
— VI-173 —

• Precipitation is commenced in two units, each with three agglomerators, with the additionof fine seed. Precipitation is completed in two units, each of 12 growth precipitators, within-tank cooling on three tanks. All precipitators are mechanically agitated.
• Precipitated hydrate is classified in a system of primary and secondary gravity classifiers,supplemented by hydro-cyclones and finally by hydrate thickeners. Underflow from two ofthe three installed primary classifiers is pumped to the product hydrate filtration area.
• Primary classifier overflow is pumped to the secondary classifiers. Secondary classifierunderflow is pumped to coarse seed filtration and filtered on two of the three installed discfilters before being returned to the growth precipitators. Secondary classifier overflowreports to the hydrate thickeners.
• Hydrate thickener underflow is pumped to the fine seed filters and filtered on one of thetwo installed disc filters, reslurried and returned to the agglomerators. Hydrate thickeneroverflow is spent liquor, which is heated and returned to digestion and grinding.
• Product hydrate is filtered and washed in three counter-current stages ending in pan filters,to provide a low moisture hydrate cake as feed to calcination. Calcination is achieved inthree Alcoa Fluid Flash Calciners which have been heavily modified from their originaldesign.
Since mid 2007 a significant source of production “opportunity loss” in sand filtration has beenremoved by the implementation of successful R&D work. Eight of the sixteen installed gravitysand filters have been converted to an improved filtration media. Significant improvement in thefiltration rate and online time has been achieved. A further significant improvement in theefficiency of the digestion plant has been achieved by the implementation of a process additiveto reduce heat exchanger scaling. A significant reduction in steam demand and hence energyconsumption has been experienced.
Aughinish Alumina now sources all its electricity and steam requirements from a gas-firedcaptive combined heat and power (CHP) plant which was commissioned in January 2006. TheCHP plant contains two gas turbines and two waste heat recovery boilers. The plant produces 150MW of electricity, of which approximately 40 MW is consumed by the refinery and the balancesupplied to the local grid. The total 300 tph of steam produced by the CHP plant is used by therefinery.
4.3.4 Environmental
Aughinish Alumina has achieved ISO 14001 environmental management certification. Inaddition, Aughinish have achieved Danish Standard DS 2403 for energy management.
Regulatory approval in the form of a revised Integrated Pollution Prevention and Control licence(register number P0035-04) was granted in April 2008 for an extension to the bauxite residuedisposal area. The current area (Phase 1) occupies an area of 103 hectares. The new disposal area(Phase 2) will include an extension to Phase 1 with an additional area of 78 hectares. The Phase2 disposal area extends from Aughinish Island onto the mainland, increasing the potential forcontamination of the nearby groundwater aquifer and, thus, the sensitivity to this approach.Geomembrane liner material will be employed to assure containment of caustic liquors.Additional protection will be afforded by the IPPC licence condition requiring partialneutralisation of the red mud deposited in the Phase 2 area by January 2012. Studies have alsobeen conducted to verify that the direction of groundwater flow is inwards from neighbouringlands to the Phase 2 site. After the planned expansion is complete, sufficient red mud storage willbe made available for operation until 2026, given an assumed alumina production rate of 1.95Mtpa. Both the Phase 1 and Phase 2 areas will remain as active disposal areas. Development ofthe Phase 2 bauxite residue disposal area has actively commenced.
APPENDIX VI INDEPENDENT TECHNICAL REPORT
— VI-174 —

Oxalate salt cake is currently co-disposed in the bauxite residue disposal area and is covered bythe environmental permit despite being classed as a hazardous waste. In the future, oxalate saltcake would continue to be disposed only in the Phase 1 disposal area.
Leakage from the bauxite residue disposal area stormwater pond has been identified by thepresence of high pH water at two observation wells (OW) located on the pond’s northern edge.Originally, the sides of the pond were lined with a low permeability material but the pond basewas unlined, relying on compacted estuarine deposits to form a barrier. In 2007, repairs wereundertaken to the damaged liner on the northern side while also extending the lining to the baseof the 6.5 hectare pond. Subsequently, the pH readings at OW1 and OW2 have trended towards9 from the measured values of 11.5 and 12.4, respectively, in 2006.
Spillage of caustic liquors has resulted in past contamination of natural soils and groundwater.Four of 14 estuarine streams that are monitored on the plant foreshore indicate a pH greater thannine. Of these, the two highest flow streams are intercepted and treated. The remaining twostreams are low flow and are not expected to impact the environment. Aughinish Alumina alsoroutinely samples groundwater from 39 plant locations, including wells at the North Pond andSouth Pond. The strategy to minimize further potential contamination of the groundwater aquiferincludes ongoing investment in a program to line process bunds and drains with steel, whilereducing incidences of tank overflows through effective controls and alarming.
Stormwater containment from the bauxite residue disposal area and plant area is to be upgradedto a 1-in-200 year design event as a condition of the new Integrated Pollution Prevention andControl (IPPC) Licence. The East Pond and West Pond which receive site drainage will overtopunder the design event condition if the discharge pump systems are unavailable for any reason,representing a potential source of soil contamination.
Dust generation from the bauxite residue disposal area is suppressed by spraying. A projectundertaken in 2007 addressed a significant contributor to dust emissions by replacing theconveyor belt feeder for alumina loading at the port with enclosed air slides, whilesimultaneously installing a high capacity ventilation fan. Continued effort in 2008 will focus onthe jetty feed system from Tower 1 on the inner berth. Dust deposition rates measured at severaldust gauges are well below levels predicted to cause nuisance.
Energy usage at Aughinish has been improved through the use of an antiscalant in digestion,lowering total energy consumption to a world class level of approximately 10 GJ/t. Air emissionshave been significantly improved through the use of low sulphur heavy fuel oil in the three plantboilers and the installation of two CHP gas-fired turbines in 2006. Through participation in theNational Emission Reduction Plan, Aughinish is exempt from more restrictive NOx emissionlimit values that would have otherwise applied as of January 2008. However, the successfulretrofit in 2007 of one of the plant boilers with a low NOx, high combustion efficiency burneroffers a proven solution if further NOx emission reductions become necessary. Aughinish hasalso explored emissions trading with the Electricity Supply Board, and has the opportunity toexchange SOx credits for NOx.
Plant condensate is not recovered at present and is a major contributor to the total flow of500-600 tph of industrial effluent. Attempts to recover condensate in the past have resulted indamage to the boilers. A dissolved air flotation treatment approach has been piloted successfullybut will not be implemented immediately. Ultimately, the condensate recovery project isenvisioned to accomplish the secondary objective of decreasing reliance on water from the localcounty council, where supply restrictions can be anticipated as the local population expands.Pressure on the council water supply has temporarily abated as a result of the reduction in steamuse from 550 tph to 450 tph in connection with the use of the additive in digestion.
APPENDIX VI INDEPENDENT TECHNICAL REPORT
— VI-175 —
All storage tanks are locally bunded with the exception of the diesel tanks. These tanks aredouble-skinned and have been accepted by the Environmental Protection Agency. The only EPAaudit non-compliance since 2006 was in relation to the testing frequency for bund integrity. Thisis viewed to be relatively inconsequential and is being addressed.
There were 21 complaints made in relation to the Aughinish operations in 2007, most withrespect to air quality and all but two were submitted by a single individual. All complaints havebeen duly investigated and reported to the EPA.
4.3.5 Material Developments
This section presents material changes to the facility since the site visit was undertaken inOctober 2008. The updated information was presented to Hatch through meetings with UCRUSAL in Moscow and has not been validated through an additional site visit. We have no reasonto believe that the information provided is not a true and fair reflection of developments at thefacility.
UC RUSAL has advised that there have been no material changes to the physical equipment/plantat the facility.
Aughinish Alumina is currently operating below its full production capacity following theclosure of capacity implemented in the first quarter of 2009. UC RUSAL attributed the closureto a strategic decision based on reduced demand for alumina from its aluminium smelters and theglobal market and as part of a programme to reduce consolidated operating expenditure. Hatchwas advised that UC RUSAL are currently in the process of restarting the idled capacity andexpect to complete this process by end-2009.
UC RUSAL has advised that in 2008 there were six complaints made in relation to AuginishAlumina operations with respect to air quality.
4.3.6 Specific Risks and Future Opportunities
Specific Risks
• Mineral Tailings Directive — A Mineral Tailings Directive is being developed by theEuropean Union which may necessitate formal, annual tailings reviews. Aughinish Aluminaalready operate the bauxite residue disposal area responsibly and, in the most probableoutcome, should not expect much change apart from additional reporting requirements anda one-time characterization of the leaching characteristics of the red mud.
Future Opportunities
• Production Creep — There is potential to address areas of opportunity loss within therefinery, such as calcination capacity (Calciner 3 capacity upgrade), hydrate washing andhydrate transfer to calcination capacity. If implemented these projects may lead to overallhigher refinery production.
• R&D Programme — Aughinish Alumina has an R&D programme which is supported byextensive links with the Irish Government, Limerick University and industry bodies. Therefinery has successfully obtained external funding for a variety of research activities. Theprogramme has led to enhancements in the operation of the refinery, especially in the areasof digestion and calcination. There is an opportunity for similar enhancements to beresearched by Aughinish Alumina for implementation at other UC RUSAL aluminarefineries.
APPENDIX VI INDEPENDENT TECHNICAL REPORT
— VI-176 —

• Greenhouse Gas Emissions — Aughinish Alumina participates in the European UnionEmissions Trading Scheme and they are poised to receive emissions credits for at least thenext five years. Although a national carbon tax is predicted for Ireland, Aughinishanticipate being exempt by virtue of participation in the EU program. The greenhouse gascredits have a real economic value and the refinery expects to have approximately 100 ktin credits annually.
4.4 Eurallumina
4.4.1 Introduction
Hatch undertook a site visit to Eurallumina in October 2008. This Section 4.4 has subsequentlybeen revised and updated based upon data and information from UC RUSAL and discussions heldwith senior management in September 2009. With reference to the following sections, pleasenote;
• Section 4.4.2 — Updated with data and information as of September 2009,
• Section 4.4.3 — Process Description as of October 2008,
• Section 4.4.4 — Environmental Status as of October 2008,
• Section 4.4.5 — Material Developments at the facility between October 2008 andSeptember 2009, and
• Section 4.4.6 — All previous Specific Risks and Opportunities noted in October 2008together with any changes following new data and information provision.
4.4.2 History, Location and Infrastructure
Eurallumina is located in Portoscuso, Italy, on the southwest coast of Sardinia. The refinerycommenced production in 1973.
The refinery had an initial rated capacity of 600 ktpa of alumina, but a subsequent series ofmodifications and improvements have lifted present production capacity to approximately 1,100ktpa.
Eurallumina has achieved OHSAS 18001 Occupational Heath and Safety certification.
The facility is currently not operational and is under care and maintenance. Refer to Section4.4.5.
4.4.3 Process Description
In 2008 Eurallumina will be supplied with bauxite predominantly from the Weipa mine inAustralia (92 per cent), and from the Kindia mine in Guinea (eight per cent). Steam for therefinery is generated in three high sulphur fuel oil fired boilers. Sumitomo flue gasdesulphurisation technology is applied to reduce emissions of sulphur oxides to below permittedlevels. All electricity supply to the refinery comes from the Italian national grid.
Eurallumina currently produces alumina on a toll basis for UC RUSAL, who supplies the refinerywith bauxite in return for the finished alumina product.
The digestion area of Eurallumina is based on Kaiser high temperature technology.
• The bauxite feed to the refinery is wet ground to the required size for digestion in dualchamber mills, with different sized grinding balls in each chamber.
APPENDIX VI INDEPENDENT TECHNICAL REPORT
— VI-177 —

• The ground bauxite slurry is heated to 100�C by direct steam injection, and stored in slurrystorage tanks to achieve desilication of the slurry. There are four pre-desilication tanksinstalled, with two operational at any one time. After pre-desilication, the ground bauxiteslurry is injected into the digesters.
• The caustic liquor required for digestion is heated in a series of shell and tube heatexchangers. The ground bauxite slurry, hot caustic liquor and high pressure steam isinjected into the digester vessels arranged in a single train to achieve the required digestiontemperature of 250�C.
• After digestion, the digested slurry is cooled in 10 flash stages to atmospheric temperatureand pressure. The recovered flash steam is used to heat the incoming caustic liquor.
• After digestion, the sand component of the red mud is separated in cyclones, followed bywashing of the mud in rake classifiers. The remaining red mud is then separated from thepregnant liquor in two units of settlers (three installed, with one on standby). The underflowfrom the settlers is combined and pumped to five red mud washers arranged in series. Thered mud is then filtered on four rotary drum filters in parallel to recover the remainingcaustic liquor.
• Pregnant liquor overflowing the settlers is filtered using 12 (with nine operational at anyone time) horizontal pressure “Kelly Filters” to remove fine suspended red mud residue.Pregnant liquor is then cooled to the precipitation fill temperature of 74�C by vacuum flashcooling, against cold spent liquor in shell and tube heat exchangers.
• The precipitation circuit consists of three units, each with 12 precipitators. The first 10precipitators on each unit are mechanically agitated with draft tubes, while the last two oneach unit are air agitated. Fine and coarse seed are added to the precipitators to initiate andassist hydrate precipitation. After the fourth precipitator in each unit, an “interstagecooling” step is used to further increase the precipitation of hydrate.
• Precipitated hydrate is classified in a system of primary and secondary gravity classifiers,supplemented by hydro-cyclones, and finally by hydrate thickeners. Primary classifieroverflow flows by gravity to the secondary classifiers. Secondary classifier underflow ispumped to one coarse seed filter on top of each precipitator unit. Secondary classifieroverflow reports to the hydrate thickeners. Hydrate thickener underflow is pumped to thefine seed filters and filtered, reslurried and returned to the first precipitator tanks. Fine seedis washed to remove sodium oxalate contamination. Hydrate thickener overflow is spentliquor, which is heated and returned to digestion and grinding. Spent liquor is concentratedin two evaporator units of the three units installed. The third evaporator unit has beendecommissioned.
• Product hydrate is washed in hydrate washing tanks in the classification area, before beingpumped to the product pan filters where a further three stage counter-current wash isapplied on the filters.
• Calcination is achieved in two FFE rotary kilns. A third rotary kiln has been modified intoa gas suspension calciner for improved fuel efficiency.
4.4.4 Environmental
Eurallumina has achieved ISO 14001 environmental management certification.
Red mud was disposed at sea for a brief period at the commencement of plant operationsfollowed by an interval (1973-1977) of disposal in the temporary “Su Stangioni” facility. Theoriginal bauxite residue disposal area at Eurallumina was commissioned in 1977 and occupies a
APPENDIX VI INDEPENDENT TECHNICAL REPORT
— VI-178 —

combined 120 hectares between Part A and Part B. Approval was granted in 2007 to expand thebauxite residue storage capacity. This will be partly achieved via a raise of the dam crest in theoriginal disposal area from the current elevation of 25 m to an ultimate elevation of 36 m. Anadditional 52 hectares of land has also been allocated (Part C), with storage subdivided betweennorthern and southern sections. Residue deposition in this area has already commenced. Futurestage lifts of the dams in Parts A, B and C are planned such that new residue disposal capacityis provided shortly before it is required. The disposal capacity for bauxite residue will beexhausted by 2017 at the projected production rates. Oxalate salt cake is co-disposed with thered mud in all parts of the bauxite residue disposal areas.
The initial dam of 10 m height in the original basin was not clay lined, although subsequent liftshave incorporated clay lining of the basin walls. A compacted clay layer of 1 m thickness willalso be used to seal the walls and floor of the new basin. The risk of groundwater contaminationfrom present and future residue disposal is also limited by the permit requirement that red mudbe partially neutralised to a pH of less than 11 prior to discharge to the storage basin. Roughly45 per cent of the red mud is neutralized using the Sumitomo technology and acid is used for theremainder.
Much of the temporary Su Stangioni residue disposal area has been transferred to other tenantsin the industrial complex where Eurallumina is situated. Eurallumina only retains responsibilityfor a small portion of the land contaminated as a result of previous actions. Commitment hasbeen given to rehabilitate this land, converting it to a stormwater and recycle water pond. Thiswork has not yet commenced.
Closure plans for the bauxite residue disposal area are well developed and feature a 1 m coverusing blended red mud and soil underneath a 0.5 m layer of topsoil. The exterior sidewalls of thebasin have been attractively revegetated, demonstrating viability of the rehabilitation methods.Mud storage has not been a source of any local complaints.
Groundwater and surficial wells at the perimeter of the bauxite residue disposal area andthroughout the plant site exhibit high conductivity and pH levels in excess of nine. Wells at theboundary of the industrial estate also show metal contamination in the groundwater which ismost likely traced to other occupants of the industrial estate. A coordinated remediation approachinvolving all industries in the Portovesme area has been defined, consisting of a hydraulic barrierformed by 84 wells at the estate perimeter and accompanied by a centralized water treatmentplant. However, this awaits implementation as the plan has not yet been ratified by the localauthorities. Eurallumina has advanced work on a system of 24 wells at the refinery perimeter toprevent the migration of contaminated groundwater away from the plant boundary.
There is no discharge of wastewater from the plant. Water is recycled from the bauxite residuestorage area for use primarily in the wash circuit and Sumitomo air emission abatementequipment.
Air emissions from the boilerhouse and three rotary kilns are regulated for particulates, NOx andSOx. Sumitomo desulphurisation units were installed in 2000 at the combined emission pointsfor the boilers and the kilns to address elevated sulphur oxides concentrations resulting from theburning of high sulphur fuel oil. Uptimes on the Sumitomo units are approximately 85 per cent.Since June 2007, Eurallumina has met the requirement of the regional authorities to burn lowsulphur fuel oil (LSFO) during shutdowns of the Sumitomo units with the exception of July 2008when an unplanned maintenance outage coincided with supply problems for low sulphur fuel.Final action by the regional authority in response to this violation has not yet been taken.Eurallumina are also engaged in dialogue with the authority on a point of interpretation of thepermit condition and do not currently switch to LSFO when performing maintenance on thegas-gas heat exchangers that are connected to the Sumitomo units.
APPENDIX VI INDEPENDENT TECHNICAL REPORT
— VI-179 —

Data from 2008 indicates a persistent difficulty in meeting the 650 mg/Nm3 discharge limit forNOx at the boiler stack. Eurallumina claim that the problem relates to calibration of the gasanalyzers, and this explanation has been accepted thus far by the regional authority.Instrumentation capable of providing reliable stack monitoring data must be located andinstalled.
An asymmetric bucket telescopic chute was added in 2000 to the original air slide conveyorsystem for alumina loading at the port. The bauxite unloading hopper has also been fitted withan enclosure and spray system for use when handling Kindia bauxite. These measures haveresolved previous issues relating to dusting, which had resulted in complaints from theneighbouring coal-fired power plant. The berth for alumina loading is now exceptionally clean.
4.4.5 Material Developments
This section presents material changes to the facility since the site visit was undertaken inOctober 2008. The updated information was presented to Hatch through meetings with UCRUSAL in Moscow and has not been validated through an additional site visit. We have no reasonto believe that the information provided is not a true and fair reflection of developments at thefacility.
UC RUSAL has advised that there have been no material changes to the physical equipment/plantat the facility.
Eurallumina is currently not operational following the full closure of the plant implemented inthe first quarter of 2009. UC RUSAL attributed the closure to a strategic decision based onreduced demand for alumina from its aluminium smelters and the global market and as part ofa programme to reduce consolidated operating expenditure. Hatch was advised that UC RUSALview the current full plant closure as temporary and that the plant is the subject of continuousreview and monitoring to determine an optimal time for restart. The idled production capacityis currently under care and maintenance.
4.4.6 Specific Risks and Future Opportunities
Specific Risks
• Groundwater Alkaline Concentration — Groundwater at the perimeter of the red muddisposal area and throughout the plant site exhibits a high pH and needs to be contained.There is a requirement for preventative action to be taken jointly by Eurallumina and othernearby industrial operations. Resolution of groundwater contamination issues requirescooperation from other local industries. UC RUSAL has advised Hatch that the localauthorities have approved a hydraulic barrier strategy.
• Future Bauxite Residue Disposal Area — The storage capacity of the present bauxiteresidue storage area will be exhausted by 2017. Preliminary options for future disposalareas increase the environmental risk by either being further away from the refinery andrequiring higher pumping pressure or by being closer to the sea with the associatedpotential for marine contamination.
Future Opportunities
• Efficiency Upgrade — There is potential to reduce operating costs through sourcing ofalternative bauxite supplies in the future.
APPENDIX VI INDEPENDENT TECHNICAL REPORT
— VI-180 —

• Bauxite Supply Change — There is a strategic aim at Eurallumina to reduce the relianceon Weipa bauxite. Weipa bauxite is expensive to procure, transport and process. The plantwas previously capable of processing 30 per cent Kindia bauxite, however, capital wasspent in 2008 to upgrade process facilities to enable the percentage of Kindia bauxite to beincreased to 40 per cent. Further engineering work is planned to examine the equipmentchanges needed to process an increase to 100 per cent Kindia bauxite.
• Combined Heat and Power Plant (CHP) — Escalating fuel oil and electricity costs aremajor contributors to the high unit production cost at Eurallumina. There is a conceptualplan to take advantage of Algerian natural gas, which is potentially available from 2011.
4.5 Alpart
4.5.1 Introduction
Hatch undertook a site visit to Alpart in October 2008. This Section 4.5 has subsequently beenrevised and updated based upon data and information from UC RUSAL and discussions held withsenior management in September 2009. With reference to the following sections, please note;
• Section 4.5.2 — Updated with data and information as of September 2009,
• Section 4.5.3 — Process Description as of October 2008,
• Section 4.5.4 — Environmental Status as of October 2008,
• Section 4.5.5 — Material Developments at the facility between October 2008 andSeptember 2009, and
• Section 4.5.6 — All previous Specific Risks and Opportunities noted in October 2008together with any changes following new data and information provision.
4.5.2 History, Location and Infrastructure
Alpart is situated in the plains of St. Elizabeth, some 5 km from the village of Nain in Jamaica.As with other refineries in Jamaica, the refinery is surrounded by agricultural activities, bothsmall scale and large scale farming and growing residential areas. UC RUSAL currently owns 65per cent of Alpart. The remaining 35 per cent is owned by Norsk Hydro.
Port Kaiser services Alpart for the movement of bulk materials, primarily alumina, fuel oil andcaustic. A private 15 km rail line links the plant to the port. Alumina and caustic are moved byrail; whereas fuel oil is pumped to the plant.
Alumina production at the Alpart refinery commenced in 1968. Alpart initially had a nameplatecapacity of 860 ktpa of alumina, which has since increased to approximately 1,650 ktpafollowing successive expansions. The actual production rate in 2008 (based on 100 per cent ofthe refinery production) was 1,652 kt.
The facility is currently not operational and is under care and maintenance. Refer to Section4.5.5.
4.5.3 Process Description
The refinery operates the sweetening process, where bauxite rich in mono-hydrate bauxite(MGB) is digested at a high temperature (242oC) and, in the depressurising flash tank train,bauxite rich in tri-hydrate bauxite (TGB) is used to increase, hence sweeten, the alumina insolution.
APPENDIX VI INDEPENDENT TECHNICAL REPORT
— VI-181 —
Bayer process
• Bauxite is mined and transported by cable belt to the plant in campaigns of MGB and TGB,where the two grades of bauxite are kept separate as much as possible. From the coveredbauxite stockpile, the MGB is pushed into hoppers. A wobbler feeder removes limestonegreater than approximately six inches, prior to feeding the bauxite to a mill. TGB alsopasses through a wobbler feeder, feeding a rod mill. Mill oversize is removed by conveyor,the tramp iron removed by magnetic separator, the mill oversize re-slurried in spent liquorand the limestone particles rejected to ground.
• The MGB and TGB slurries are heated and pre-desilicated in separate trains of atmospherictanks. Spent liquor is heated in 11 stages, with the last stage of heating fed by direct steaminjection from the first flash tank. The heated spent liquor and the MGB bauxite slurry arecombined in digesters and steam is injected to raise the temperature to 242oC, where thegibbsite and boehmite are leached from the bauxite. The MGB digested slurry is thendepressurised in 11 stages of flashing, with the flash steam heating the incoming spentliquor. TGB bauxite is injected to the sixth flash tank, so that there is sufficient time todissolve the gibbsite.
• The digested slurry is pumped through cyclones, with coarse material (sand) discharging toa sand classifier and the degritted slurry passing to the liquor decanters. The sand is washedwith condensate and dumped into the waste tank. The red mud is separated from the liquorin thickeners, and the overflow liquor is pumped to the polishing filtration stage. Theunderflow, red mud, is washed in two trains, each of 10 counter-current washing stages.Mud from the last washing stage is pumped to the waste tank, where it is combined withsand, calcium oxalate slurry and spent acid, and is then pumped to the red mud disposalarea.
• The filtrate liquor is cooled, and the alumina tri-hydrate is precipitated onto seed, whichhad been previously precipitated. The solids are then separated into different size fractions— product size, coarse seed, and fine seed, with the seed being returned for furtherprecipitation. The spent liquor which has been stripped of its alumina, is heated, evaporatedand returned to the digestion circuit.
• The product size alumina tri-hydrate is filtered, washed with hot water, and fed to calciners.Calcination is carried out in three rotary kilns and two newer, more efficient stationaryLurgi calciners. The alumina is stored in bins, loaded in hoppers and transported by rail toPort Kaiser.
In the dedicated co-generating powerhouse, well water is treated, and passed through heavy fueloil-fired boilers. There are four boilers and four turbo-generators, two of which are providedwith condensers to balance the swings in electrical demand. The extracted steam is exportedprimarily to the digestion and evaporation sections, and the condensate returned to thepowerhouse. There is no connection to the national grid. Compressors provide air for generalplant consumption and for instruments.
Make-up water for the plant is provided by wells, which tap the underground aquifer.
4.5.4 Environmental
Red mud has been disposed in an enclosed valley, referred to as the South Lake, since theinception of operations. The West Lake extension was constructed in 1992 to provide additionalstorage capacity. The total residue area now occupies a land area of 350 ha. A spillway was addedin the aftermath of a dam failure suffered during Hurricane Ivan in 2004, to divert run-off fromthe mud lake to the environment in times of excessive rainfall. Several action items have arisen
APPENDIX VI INDEPENDENT TECHNICAL REPORT
— VI-182 —
from the 2007 dam stability assessment, including the requirement to improve the North Damfactor of safety by re-grading on the downstream side and lowering the water table to relieve highpore water pressures. Without stabilization, the potential exists for total dam failure and anyseismic event would likely be catastrophic.
Operation of the residue disposal area is governed by Natural Resources Conservation Authoritypermit 02P95, granted in 1998. A specific requirement of the permit is for a surge basin to collectand recycle rain runoff water from the mud impoundment for a rainfall return event of fifty years.Ten environmentally reportable incidences of surge basin overflows or other liquor losses fromthe Residue Disposal Area (RDA) were noted in 2007, indicating the inadequacy of the currentlyinstalled containment volume. Partial improvement has been achieved in 2008 throughprocedural changes, resulting in only one reportable overflow as of October 2008. However,much of the reduction in frequency of environmental events is attributable to decreased severityin rainfall patterns. Investment is needed for surge basin improvements. The permit for operationof the RDA is due for re-issue and measures for better containment of alkaline water are expectedto be mandated. Some gains in containment may be realized via diverting unaffected rainwaterrunoff away from the RDA catchment basin.
Plant drains, some of which are unsealed, are directed to unsealed collection ponds, and returnedto the plant. Sealing of the plant drains and equipment foundations, focusing initially on theclarification area, is included in the capital plan. Groundwater and surface water quality ismonitored in several locations surrounding the plant and red mud disposal areas. The plant wells(Nos. 1, 3 and 5) located closest to the northern edge of the refinery exhibit alkalinecontamination with pH greater than 11 and sodium concentrations above 1000 mg/L. TheDoncaster monitoring well on the southern boundary of South Lake has also detected causticcontamination beginning in mid-2007. Caustic contamination of the groundwater aquiferunderlying the North Lake, a decommissioned mud disposal area, has steadily decreased over thepast decade.
Alpart is unable to use the condensate recovered from digestion to supply make-up water to the1500 psig boilers due to the stringent water quality demands, especially with regards to silicaconcentration. The condensate, flowing at approximately 2000 gpm, is currently disposed of,after a heat recovery step by injection, into fissures in the rock underlying the site. A treatabilitystudy is underway to evaluate options and costs to produce water suitable for boiler feed.
Incidents of caustic vapour emissions primarily occur from the high temperature digestion unit.These have been minimized through modifications to the vent arrangement and addition of drifteliminators to the blow-off tank on one digestion train and the installation of a control valve todampen pressure surges in the other train.
Dust emissions from the calcination area, the powerhouse and from the mud lakes have been thecause of complaints from the community. A “marsh buggy” was purchased in 2008 to assist withdust control in the mud disposal area by keeping the surface moist. Jamaican bauxite typicallycontains above average mercury content, which is emitted to atmosphere during the aluminarefining process. Methods to reduce the emission of mercury at Alpart are being investigated.
Dust emissions, especially during alumina ship loading, are a cause for concern, and are thesource of complaints from a small fishing village to the west of the port. Severe damage to thepier was sustained in the 2005 hurricane season, which led to alumina shipments being suspendedand production at the plant curtailed, until repairs to the pier were completed.
Jamaican regulations define ambient air quality standards for total suspended particulates,carbon monoxide, ozone and the acid gases (SOx and NOx). There are no ambient air qualityissues at any of the monitoring stations situated at strategic locations surrounding the refinery.The only parameter with a defined limit for point source stack emissions is opacity. Alpart has
APPENDIX VI INDEPENDENT TECHNICAL REPORT
— VI-183 —
experienced intermittent compliance problems with the 20 per cent opacity limit on variousstacks. A maximum sulphur content of three per cent is specified for the fuel oil. In accordancewith emerging legislation, all Jamaican refineries have been required to submit applications forAir Pollutant Discharge Licences. For Alpart, it is anticipated that continuous particulatemonitoring will be required for each of the nine stacks (four boilers and five calciners).Additionally, the dust emission abatement systems for the calciners and silos will requirerehabilitation or upgrade and alumina losses during ship loading at the port must be addressed.
Bunds surrounding the liquid storage tanks appear to be inadequate, with visible signs of erosionin the bund floor. Surface oil is visible in the pond adjacent to the diesel storage tanks and railcarunloading area.
Asbestos has been identified in vessels and pipes. About 45 per cent of the asbestos originallyidentified has been bagged and stored in containers, and the containers are to be buried. Theremaining asbestos in the plant is to be removed in 2009.
4.5.5 Material Developments
This section presents material changes to the facility since the site visit was undertaken inOctober 2008. The updated information was presented to Hatch through meetings with UCRUSAL in Moscow and has not been validated through an additional site visit. We have no reasonto believe that the information provided is not a true and fair reflection of developments at thefacility.
UC RUSAL has advised that there have been no material changes to the production technologyand process employed at the refinery.
Alpart is currently not operational following the closure of one-half of the plant in the firstquarter of 2009 and the closure of the remainder of the plant in the second quarter of 2009. UCRUSAL attributed the closure to a strategic decision based on reduced demand for alumina fromits aluminium smelters and the global market and as part of a programme to reduce consolidatedoperating expenditure. Hatch was advised that UC RUSAL view the current full plant closure astemporary and that the plant is the subject of continuous review and monitoring to determine anoptimal time for restart. The idled production capacity is currently under care and maintenance.
UC RUSAL has advised that Alpart has achieved ISO 14001 environmental managementcertification.
4.5.6 Specific Risks and Future Opportunities
Specific Risks
• Groundwater Contamination — The incidences of soda contamination of the surroundinggroundwater may lead to more restrictions on discharges and the requirement for a sealedmud disposal area with adequate runoff containment. Renewal of the licence for the residuedisposal area is expected to be granted conditionally on improvements in this regard.
• Bauxite Quality — Decreasing alumina content as well as increasing silica content in thebauxite feed are expected to adversely impact production in the future. An increasingamount of bauxite from Windalco may also be processed which contains a hard to settlemineral called goethite. Increasing silica content will also increase the chemical soda lossesfrom the refinery. These issues will also tend to increase the mud factor. Projects havecommenced to modify the mud washing circuit to cope with the change in bauxite quality.
APPENDIX VI INDEPENDENT TECHNICAL REPORT
— VI-184 —

• Trade Effluent Standards — The generic Jamaican National Trade Effluent Standardsspecify limits for sodium (100 mg/L) and sulphate (250 mg/L). Compliance with theselimits would be onerous for the bauxite industry if these limits were enforced.
Future Opportunities
• Capacity Expansion — A pre-feasibility study has been completed on the Alpart Expansionproject which is planned to expand refinery capacity to 1,950 ktpa. The scope of the projectis focused on both increasing flow and yield through debottlenecking and includingadditional seed filtration.
4.6 Windalco-Ewarton Works
4.6.1 Introduction
Hatch undertook a site visit to Windalco-Ewarton in October 2008. This Section 4.6 hassubsequently been revised and updated based upon data and information from UC RUSAL anddiscussions held with senior management in September 2009. With reference to the followingsections, please note;
• Section 4.6.2 — Updated with data and information as of September 2009,
• Section 4.6.3 — Process Description as of October 2008,
• Section 4.6.4 — Environmental Status as of October 2008,
• Section 4.6.5 — Material Developments at the facility between October 2008 andSeptember 2009, and
• Section 4.6.6 — All previous Specific Risks and Opportunities noted in October 2008together with any changes following new data and information provision.
4.6.2 History, Location and Infrastructure
The Windalco-Ewarton Works is equidistant from the capital, Kingston and a major tourist resort,Ocho Rios. The refinery is located approximately 10 km north of the market town of Linstead,and approximately 5 km south of the town of Ewarton. The refinery is surrounded by agriculturalactivities, both small scale and large scale farming, and growing residential areas.
Windalco have obtained the rights to use the ‘bauxite corridor’ of the state-owned railway line,approximately 120 km in length, which connects Ewarton Works, Port Esquivel and KirkvineWorks. The rail line is operated and maintained for Windalco’s operations alone, with a fleet oflocomotives and rail cars used to move alumina, caustic, fuel oil and lime between the threelocations.
Windalco owns, maintains and operates Port Esquivel, which handles alumina storage andloading, and caustic and fuel oil storage and off-loading.
A major road connecting the capital to the north coast, via the Rio Cobre gorge, passes throughEwarton.
Alumina production at Windalco-Ewarton Works commenced in 1959, with the commissioningof the first digester unit. The current nominal capacity of Windalco-Ewarton Works isapproximately 650 ktpa.
APPENDIX VI INDEPENDENT TECHNICAL REPORT
— VI-185 —
The facility is currently not operational and is under care and maintenance. Refer to Section4.6.5.
4.6.3 Process Description
The refinery operates a low temperature Bayer digestion process, capable of extracting only thegibbsitic alumina from the bauxite.
Bayer process
• Bauxite is mined from the integrated Ewarton bauxite mines and transported to the plant bytruck on a dedicated system of private haul roads.
• From the plant stockpile, bauxite is pushed into dedicated panfeeders, which feed five ballmills, where the bauxite is slurried with spent liquor. The bauxite slurry is heated andpre-desilicated in a series of atmospheric tanks. Bauxite slurry fed to one digestion unit ofthe refinery (50 per cent of the total slurry) is preheated using a system of Indirect BauxiteSlurry Heating (IBSH). This recently installed system has reduced energy consumption andcaustic losses due the reduction in water input to the refinery, compared with the directsteam injection previously used on this unit.
• Spent liquor is heated in four stages of heating, with the final stage being fed with exhauststeam from the dedicated co-generating powerhouse. The heated spent liquor and thebauxite slurry are combined in digesters at 135oC, where the gibbsite is leached from thebauxite. The digested slurry is then depressurised in three stages of flashing, with the flashsteam heating the incoming spent liquor.
• Red mud is separated from the solution, supersaturated in alumina, in conventional liquordecanters, and the overflow liquor is pumped to the polishing filtration stage. Theunderflow, red mud, is washed in a series of counter-current washing stages, consistingtypically of three thickeners per stage. The last stage(s) of mud washing is accomplishedin four deep thickeners, which serve to produce a mud with the consistency desired fordisposal. The mud is then pumped to the red mud disposal area.
• The filtrate liquor is cooled, and the alumina tri-hydrate is precipitated onto seed, whichhad been previously precipitated. The solids are then separated into different size fractions— product size, coarse seed, and fine seed, with the seed being returned for furtherprecipitation. The spent liquor, which has been stripped of its alumina, is heated,evaporated and returned to the digestion circuit.
• The product size alumina tri-hydrate is filtered, washed with hot water, and calcined toform alumina. The alumina is stored in bins, transported in rail cars to the dedicated port,and then shipped to its destination.
In the dedicated co-generating powerhouse, well water is treated, and passed through heavy fueloil-fired boilers. The superheated steam from the boilers is then passed through turbo-generators,with extraction of steam at two intermediate pressures. A condensing turbine is provided tobalance the swings in electrical demand. The extracted steam is exported primarily to thedigestion and evaporation sections, and the condensate returned to the powerhouse. Stand-bypower is provided by diesel generators, and there is a connection to the national grid.Compressors provide air for general plant consumption and for instruments.
Make-up water for the plant is provided by wells, which tap the underground aquifer.
APPENDIX VI INDEPENDENT TECHNICAL REPORT
— VI-186 —
4.6.4 Environmental
Windalco-Ewarton Works has achieved ISO 14001 environmental management certification.
Following the start-up of Ewarton Works, mud was originally disposed of in a natural valley,which was enclosed for this purpose. In 1976 (prior to UC RUSAL interest in the refinery), sodacontamination of the surrounding groundwater streams was acknowledged by the owners. Theunused mud pond, Mount Rosser, which is to be remediated by its former owners, continues tocontribute to a higher than background level of soda in surrounding water streams. In 1980, theGovernment of Jamaica approved Mud Stacking and Drying Technology, which consisted ofthickened tailings treated in the novel deep thickeners and distribution of the mud in thin layerson a gently sloped terrain to enhance solar drying. The disposal area, which was constructed atCharlemont, includes a sealed mud stack of approximately 100 hectares, collection of theeffluent and rainwater run-off in a sealed holding pond and return of the pond water to the plant.The design intent of the holding pond is to provide containment of the 50-year return periodrainfall event. However, effluent has overtopped the pond dams roughly at two year frequency,resulting in uncontrolled release of high pH pond water to the environment. Improvedcontainment of pond water is required to meet the design objective and avoid environmentalconsequence.
Dust and odour from the mud disposal area have been the subject of complaints from thecommunity. Sprinkler systems have been installed to reduce incidences of dusting. The activeresidue disposal area appears to be well managed and is monitored annually for stability andphreatic surface levels within the embankment.
Groundwater and underground water is sampled and monitored in several locations surroundingthe plant and red mud disposal areas. Soda contamination at Wells 1, 2 and 3, adjacent to theplant, have shown an increase in recent years, although this increase in soda contamination hasnot been observed at other, more distant monitoring stations. Water from these contaminatedwells is pumped to the plant or to the mud stacking site.
The majority of plant drains are directed to a small sump at the western section of the plant, andto a larger sump at the eastern section of the plant. The effluent is normally returned to the plantwith a provision for neutralization in the event of overtopping. Aqueous waste streams from thepowerhouse, including acidic water generated from condensate washes of the air preheaterbaskets, flows to the north drain and leaves the site without undergoing treatment. Redirectionof the north drain to one of the sumps is needed to eliminate this routine discharge ofcontaminated surface water.
Calcination capacity is a bottleneck for Ewarton operations, resulting in on-site storage ofhydrate and pressure on the regular maintenance schedule for the rotary kilns. In particular, thesatellite cooler sections are in poor repair and are a source of significant particulate emissions.
Jamaican regulations define ambient air quality standards for total suspended particulates,carbon monoxide, ozone and the acid gases (SOx and NOx). Some particulate air quality issueshave been reported at monitoring stations surrounding the refinery and the hourly target sulphurdioxide concentration was exceeded once at Orangefield in March 2008. Ambient air quality isa product of several factors, not all of which are within the control of the refinery. Ewarton hasbeen in full and constant compliance with the limit placed on maximum sulphur content (threeper cent) in the fuel oil.
The only parameter with a defined limit for point source stack emissions is opacity. All threerotary kilns met the 20 per cent opacity target for greater than 80 per cent of measurements in2007. Some investment in the kiln emission abatement systems is needed to ensure greater
APPENDIX VI INDEPENDENT TECHNICAL REPORT
— VI-187 —

compliance with the regulations. In accordance with emerging legislation, all Jamaican refinerieshave been required to submit applications for Air Pollutant Discharge Licences. Initially, it isexpected that additional stack monitoring equipment will be required, with other advancementsto follow.
Jamaican bauxite typically contains above average mercury content, which is emitted toatmosphere during the alumina refining process. There are no programs to reduce the emissionof mercury at Windalco-Ewarton, although such remedial practices can be achieved at relativelylow capital expenditure. Such programmes have been successfully demonstrated at other aluminarefineries.
Bunding for chemical storage tanks at Ewarton is not acceptable. The caustic and sulphuric acidstorage tanks are not bunded. Fuel oil storage tanks are contained by an earthen bund with aconcrete foundation but unsealed side walls.
4.6.5 Material Developments
This section presents material changes to the facility since the site visit was undertaken inOctober 2008. The updated information was presented to Hatch through meetings with UCRUSAL in Moscow and has not been validated through an additional site visit. We have no reasonto believe that the information provided is not a true and fair reflection of developments at thefacility.
UC RUSAL has advised that there have been no material changes to the physical equipment/plantat the facility.
Windalco-Ewarton is currently not operational following the full closure of the plantimplemented in the first quarter of 2009. UC RUSAL attributed the closure to a strategic decisionbased on reduced demand for alumina from its aluminium smelters and the global market and aspart of a programme to reduce consolidated operating expenditure. Hatch was advised that UCRUSAL view the current full plant closure as temporary and that the plant is the subject ofcontinuous review and monitoring to determine an optimal time for restart. The idled productioncapacity is currently under care and maintenance.
Hatch was advised that work on expanding the red mud disposal area has continued throughoutthe closure of the refinery to ensure a smooth restart of alumina production operations in thefuture.
4.6.6 Specific Risks and Future Opportunities
Specific Risks
• Groundwater Contamination — The incidences of soda contamination of the surroundinggroundwater may lead to more restrictions on discharges. In particular, there has been anupward trend in soda contamination at Wells 1, 2 and 3 (adjacent to the plant) and frequentovertopping of the stormwater pond at the RDA.
• Bauxite Quality — Declining alumina content in the bauxite feed and the presence of hardto process goethite in the ore, will provide challenges to any future increase in productionrate.
• Residue Disposal Area — UC RUSAL has advised that the dam at the residue storage areais being lifted by 3m which will provide storage for an additional five years of operation.Beyond this period, a modified approach to residue storage will be required. The refineryhas already identified a strategy to permit continued operation using the same RDAfootprint.
APPENDIX VI INDEPENDENT TECHNICAL REPORT
— VI-188 —
• Trade Effluent Standards — The generic Jamaican National Trade Effluent Standardsspecify limits for sodium (100 mg/L) and sulphate (250 mg/L). Compliance with theselimits would be onerous for the bauxite industry if these limits were enforced.
• Safety and Housekeeping — There is an excessive amount of redundant equipment left inplace at the refinery. There is also evidence of excessive process spills, particularly in thegrinding and precipitation areas. While the age of the refinery, and batch, air agitated natureof the precipitation process explain some of this spillage, the level of housekeeping andspills management observed was exceedingly poor.
Future Opportunities
• Process Efficiency — Indirect Bauxite Slurry Heating has been applied to one digestionunit, which processes 50 per cent of the total bauxite slurry. Application of this technologyto the remaining digestion unit would give the potential to further reduce energy and causticsoda consumption.
• Capacity Expansion — A feasibility study has been completed to expand the refinery by500 ktpa, although it is understood that further development work is required to beundertaken.
• Coal fired Power Plant — UC RUSAL are currently studying the option of constructinga coal fired heat and power plant to provide the steam and electricity requirements of theEwarton refinery, with benefits in the reduction of alumina operating costs at the plant.
4.7 Windalco-Kirkvine Works
4.7.1 Introduction
Hatch undertook a site visit to Windalco-Kirkvine in October 2008. This Section 4.7 hassubsequently been revised and updated based upon data and information from UC RUSAL anddiscussions held with senior management in September 2009. With reference to the followingsections, please note;
• Section 4.7.2 — Updated with data and information as of September 2009,
• Section 4.7.3 — Process Description as of October 2008,
• Section 4.7.4 — Environmental Status as of October 2008,
• Section 4.7.5 — Material Developments at the facility between October 2008 andSeptember 2009, and
• Section 4.7.6 — All previous Specific Risks and Opportunities noted in October 2008together with any changes following new data and information provision.
4.7.2 History, Location and Infrastructure
The Windalco-Kirkvine Works is situated in Jamaica, in the hilly regions of the centre of theisland. The refinery is some 15 km from Mandeville, approximately 400 meters above sea level.
Windalco have obtained the rights to use the ‘bauxite corridor’ of the state-owned railway line,approximately 120 km in length, which connects Kirkvine Works, Port Esquivel and EwartonWorks. The rail line is operated and maintained for Windalco’s operations alone, with a fleet oflocomotives and rail cars used to move alumina, caustic, fuel oil and lime between the threelocations.
APPENDIX VI INDEPENDENT TECHNICAL REPORT
— VI-189 —
Windalco owns, maintains and operates Port Esquivel, which handles alumina storage andloading, and caustic and fuel oil storage and off-loading. The major east-west road passes byWindalco-Kirkvine.
The Kirkvine Works started production in 1953 as a pilot plant and has gradually increasedproduction to a nominal alumina capacity of 600 ktpa, following plant reinforcement andoperational improvements since first commissioning.
The facility is currently not operational and is under care and maintenance. Refer to Section4.7.5.
4.7.3 Process Description
The refinery operates a low temperature Bayer digestion process, capable of extracting only thegibbsitic alumina from the bauxite, and is similar to Windalco’s Ewarton Works.
Bayer process
• Bauxite is mined from the integrated Kirkvine bauxite mines and transported to the plantby truck on private haul roads.
• From the plant stockpile, bauxite is pushed into dedicated panfeeders, which feed five ballmills, where the bauxite is slurried with spent liquor. The bauxite slurry is heated andpre-desilicated in a series of atmospheric tanks. Spent liquor is heated in four stages ofheating, with the final stage being fed with exhaust steam from the dedicated co-generatingpowerhouse. The heated spent liquor and the bauxite slurry are combined in digesters at135oC, where the gibbsite is leached from the bauxite. The digested slurry is thendepressurised in three stages of flashing, with the flash steam heating the incoming spentliquor. Digested slurry is pumped through cyclones, with coarse material (sand) dischargingto a sand classifier, and the degritted slurry passing to the liquor decanters. The sand iswashed with condensate and trucked to an industrial disposal site.
• Red mud is separated from the solution, supersaturated in alumina, in conventional liquordecanters, and the overflow liquor is pumped to the polishing filtration stage. Theunderflow, red mud, is washed in a series of counter-current washing stages, consistingtypically of three thickeners per stage. The last stage(s) of mud washing is accomplishedin four deep thickeners, which serve to produce a mud with the consistency desired fordisposal. The mud is then pumped to the red mud disposal area, using positive displacement(Geho) pumps.
• The filtrate liquor is cooled, and the alumina tri-hydrate is precipitated onto seed, whichhad been previously precipitated. The solids are then separated into different size fractions— product size, coarse seed, and fine seed, with the seed being returned for furtherprecipitation. The spent liquor, which has been stripped of its alumina, is heated,evaporated and returned to the digestion circuit.
• The product size alumina tri-hydrate is filtered, washed with hot water, and calcined toform alumina in three rotary kilns, two retrofitted with cyclones. The alumina is stored inbins, transported in rail cars to the dedicated port, and then shipped to its destination.
In the dedicated co-generating powerhouse, well water is treated, and passed through heavy fueloil-fired boilers. The superheated steam from the boilers is then passed through turbo-generators,with extraction of steam at two intermediate pressures. A condensing turbine is provided to
APPENDIX VI INDEPENDENT TECHNICAL REPORT
— VI-190 —
balance the swings in electrical demand. The extracted steam is exported primarily to thedigestion and evaporation sections, and the condensate returned to the powerhouse. Stand-bypower is provided by diesel generators, and there is also a connection to the national grid.Compressors provide air for general plant consumption and for instruments.
Make-up water for the plant is provided by wells, which tap the underground aquifer.
4.7.4 Environmental
Windalco-Kirkvine Works has achieved ISO 14001 environmental management certification.
At Kirkvine Works, red mud is disposed of in the Battersea Mud Lake, a previously mined outarea, situated in a limestone cavity. Battersea Mud Lake is bordered by a main road to the east,steep limestone hill to the south and a limestone barrier to the north. A good portion of the westend of the depression has become a municipal dump for the city of Mandeville and surroundingareas. Therefore, the potential for expanding the Battersea Mud Lake to the west is unlikely.Additional residue storage is being provided by increasing the depth of mud deposition behindinternal dykes. The mud surface is tapered from east to west, with a pervious barrier separatingthe 78 ha mud bed from an 18 ha effluent holding cell. The western dams are lined withgeotextile. Provision is made for spraying water from the three central discharge towers for dustsuppression.
There has been minimal return of water to the plant from the Battersea effluent holding cell. Itis evident that infiltration of the water, which typically has a soda content of 30 g/L, must beoccurring. No groundwater monitoring wells or boreholes are installed at the perimeter of theRDA, making it difficult to determine the exact direction of contaminant flow escaping from theholding cell. Recent monitoring data from the borehole at Russell Place has revealed anincreasing trend in sodium concentration and pH. The government is aware of this issue and canbe expected to take action.
The last dam stability assessment for Battersea was completed in 1988 but annual integrityinspections of the mud area are undertaken by an independent external consultant. The twonegative findings from the last inspection concerned seepage and erosion control.
Calcium oxalate is disposed temporarily in a sealed area, and the supernatant filtered andcollected in a sealed holding pond. Effluent from the pond can be returned to the plant. After thecalcium oxalate has been leached free of soluble oxalate and soda, it is dug up and trucked toanother sealed site, where, after testing, the rain water runoff is discharged to the environment.
Solid waste from the plant, primarily sand, and scale/mucking from vessels, is stored on anindustrial dump site — a mined-out area, which had been filled with red mud. There is noprovision to return rainwater run-off from the industrial dump to the plant.
Plant drains are directed to the unsealed East and West Ponds, and then to the environment. Waterreleases from both ponds are alkaline in nature, with a pH of greater than 10 and are ofenvironmental consequence. Spent acids from the utilities area are also discharged to the WestPond, resulting in sulphate concentrations of nearly 350 mg/L. Reducing the pH and saltconcentrations of process-affected surface water leaving the site should be a priority for theKirkvine-Works.
The refinery has struggled to comply with regulated opacity limits for point sources, particularlyat the lime kiln and calciner No. 2 stacks. As with the other Jamaican refineries, Kirkvine Workshas submitted an application for an Air Pollutant Discharge Licence. Initially, the licencerequirements are expected to include improved monitoring and more regular reporting withoutchanges to gaseous emission levels.
APPENDIX VI INDEPENDENT TECHNICAL REPORT
— VI-191 —

Odour from the red mud disposal area has been the cause of a few complaints from thecommunity and may be aggravated by the proximity of the municipal waste dump. The refineryalso receives complaints from the community in relation to corrosion of roofing materials andhas engaged in a program to replace galvanized sheeting with more resistant aluminium.
Bunds surrounding the liquid storage tanks at Kirkvine Works and Port Esquivel appear to beadequate and in good repair.
The conveyor belt for the alumina shiploader at Port Esquivel suffered fire damage in 2004 andhas subsequently been repaired without restoring the top enclosure, which caused operatingdifficulties. Some fugitive dust issues remain, especially during alumina ship loading and railcaroffloading in the company of high winds. The shiploader chute was replaced in 2008. Furthercauses of dusting are to be addressed by installing baffles or cascades at the conveyor transferpoints and hopper.
4.7.5 Material Developments
This section presents material changes to the facility since the site visit was undertaken inOctober 2008. The updated information was presented to Hatch through meetings with UCRUSAL in Moscow and has not been validated through an additional site visit. We have no reasonto believe that the information provided is not a true and fair reflection of developments at thefacility.
UC RUSAL has advised that there have been no material changes to the physical equipment/plantat the facility.
Windalco-Kirkvine is currently not operational following the full closure of the plantimplemented in the second quarter of 2009. UC RUSAL attributed the closure to a strategicdecision based on reduced demand for alumina from its aluminium smelters and the globalmarket and as part of a programme to reduce consolidated operating expenditure. Hatch wasadvised that UC RUSAL view the current full plant closure as temporary and that the plant is thesubject of continuous review and monitoring to determine an optimal time for restart. The idledproduction capacity is currently under care and maintenance.
4.7.6 Specific Risks and Future Opportunities
Specific Risks
• Battersea Mud Lake Groundwater Contamination — The negligible return of pond waterfrom the mud disposal area may provoke the Government of Jamaica to mandate morestringent measures to collect and return the effluent.
• Variable Bauxite Specification — There have been wide variations in the processabilityof Blue Mountain orebody at the Kirkvine refinery, ascribed to the goethite content of thebauxite. If these variations persist, the production capability of Kirkvine Works may varyfrom month to month. Plant management is aware of this variability and are working withflocculant suppliers and academia to understand and mitigate the risk.
• Bauxite Quality — Declining alumina content in the bauxite feed and the presence of hardto process goethite in the ore, will provide challenges to any future increase in productionrate.
• Trade Effluent Standards — The generic Jamaican National Trade Effluent Standardsspecify limits for sodium (100 mg/L) and sulphate (250 mg/L). Compliance with theselimits would be onerous for the bauxite industry if these limits were enforced.
APPENDIX VI INDEPENDENT TECHNICAL REPORT
— VI-192 —
• Safety and Housekeeping — There are items of redundant equipment left in place at therefinery. There is also evidence of excessive spills in some areas. While the age of therefinery and the type of technology employed explain some of this spillage, the level ofhousekeeping and spills management observed was poor.
Future Opportunities
No specific opportunities material to the future operation of this facility have been identified.
4.8 Bogoslovsk Alumina Refinery
4.8.1 Introduction
Hatch undertook a site visit to Bogoslovsk Alumina Refinery in September 2008. This Section4.8 has subsequently been revised and updated based upon data and information from UCRUSAL and discussions held with senior management in September 2009. With reference to thefollowing sections, please note;
• Section 4.8.2 — Updated with data and information as of September 2009,
• Section 4.8.3 — Process Description as of September 2008,
• Section 4.8.4 — Environmental Status as of September 2008,
• Section 4.8.5 — Material Developments at the facility between September 2008 andSeptember 2009, and
• Section 4.8.6 — All previous Specific Risks and Opportunities noted in September 2008together with any changes following new data and information provision.
4.8.2 History, Location and Infrastructure
The Bogoslovsk Alumina Refinery and Bogoslovsk Aluminium Smelter complex covers an areaof 143 hectares and is situated to the north of the town of Krasnoturinsk, which has around70,000 inhabitants. Krasnoturinsk is located in the Ural Mountains, approximately 370 km to thenorth of the major city of Ekaterinburg in the Sverdlovsk region. The complex dominates thetown, both physically and economically, and it has a heavy direct influence on almost all social,cultural and recreational affairs.
Construction of the Bogoslovsk Alumina Refinery and Bogoslovsk Aluminium Smelter complexat Krasnoturinsk began in 1941, and the refinery facilities were commissioned in 1945. TheBogoslovsk Alumina Refinery was constructed to take advantage of local bauxite from the NorthUrals deposits, from mine works located within 40 km of the smelter site.
The Bogoslovsk complex incorporates its own railway stations. The Bogoslovsk complex owns,operates and maintains the track on-site, together with its own shunting locomotives and rollingstock.
The plant also considers that the national railway system is comfortably capable ofaccommodating any foreseeable increases in rail traffic movements arising from productionincrements at the refinery and/or smelter.
The current alumina capacity of the Bogoslovsk Alumina Refinery is approximately 1,100 ktpa.
APPENDIX VI INDEPENDENT TECHNICAL REPORT
— VI-193 —
4.8.3 Process Description
The refinery runs a mixed parallel Bayer/sinter process, sinter bauxite comprises 20 per cent ofthe total feed and Bayer bauxite comprises 80 per cent. Bauxite is transported by rail from theTiman and North Urals bauxite mines. The North Urals mine supplies mainly Bayer grade bauxiteand the sinter grade material is selected from the non Bayer grade ore. Both Bayer and sinterfeeds contain controlled amounts of Timan bauxite to optimise the overall cost.
Bayer process
The refinery uses a 235�C Bayer digestion process that accounts for 80 per cent of the aluminaproduction.
• After unloading, Bayer grade bauxite (SUBR/Timan blend) is crushed and sorted intooperating and reserve stockpiles. Blended bauxite is mixed with caustic liquor andwet-ground in ball mills. The slurry is then held for desilication of the bauxites and thealumina minerals are then leached from the milled ore in a series of pressure autoclavesusing caustic liquor at a temperature of 235�C. There are 12 digestion units containing eightto nine autoclaves per unit.
• Inert minerals including iron and titanium pass through the digestion process virtuallyunchanged and form part of the digester residue. After depressurisation, the digested slurryis transferred to multi-chamber type mud settlers where the residual solids are separatedfrom the alumina-rich liquor. The refinery has four settler units, each with three thickeners.The settled residue is then washed with water to recover alumina and soda values from theresidue, prior to being pumped to the residue disposal area. The refinery has four mudwashing lines, each containing four to five washers.
• The pregnant liquor overflowing the mud settlers contains fine residual solids that areremoved from the liquor by 15 security pressure filters. The filtered pregnant liquor is thencooled and pumped to precipitation. Hydrate crystallisation occurs as the slurry overflowsfrom tank to tank in the precipitation circuit. The precipitation area consists of seven linescontaining 12 x 1,000 m3 precipitator tanks each and another three lines containing 12 to13 x 1,800 m3 precipitator tanks. Hydrate solids from the final precipitation tanks areseparated in multi-chamber thickeners. The hydrate is filtered using vacuum disc filters anda portion of hydrate is returned to the front end precipitators as seed.
• Bauxite from the North Urals mine contains high carbonate and high sulphate requiring thatthat sodium sulphate and sodium carbonate must be removed from the liquor by salting-outevaporation. Crystallised sodium sulphate is separated and sold externally while the sodiumcarbonate is recovered for use as an alkali source in the sinter process.
Sintering process
The sinter process operates in parallel with the Bayer process and is used to treat bauxite thathas a comparatively low alumina to silica ratio. Such bauxite is not suitable for standard Bayerprocessing due to the high caustic soda consumption that would result from processing the highreactive silica bauxite using the Bayer hydro-metallurgical route.
• Crushed blended high silica bauxite is mixed with lime, the sodium carbonate produced inthe Bayer evaporation section and fresh caustic liquor. The controlled mixture is thensubjected to wet grinding in ball mills prior to feeding into six parallel sintering kilns,where a solid clinker consisting of soluble sodium aluminate and non-soluble iron, titaniaand silicate minerals is produced.
APPENDIX VI INDEPENDENT TECHNICAL REPORT
— VI-194 —
• The sinter clinker is first milled then leached in hot water, where the solid sodiumaluminate is dissolved into solution. The aluminate slurry leachate is then desilicated.Further processing of the residue slurry is similar to the Bayer process. The sinter leachresidue is separated from the pregnant liquor using multi-chamber settlers, washed withwater and pumped to the residue disposal area.
• The pregnant liquor is filtered, vacuum cooled and seeded to initiate crystallisation ofhydrate. Similar to the Bayer circuit, the hydrate is filtered, with the major portion of thesinter circuit cake being returned to the Bayer precipitators as seed.
Calcination and evaporation
• The hydrate produced in the Bayer and sinter processes is filtered and washed with wateron vacuum drum filters in three stages. The spent liquor is concentrated by evaporation.Sodium sulphate and sodium carbonate are salted out with the carbonate being fed as thealkali source for sintering. The concentrated spent liquor is returned to the grinding anddigestion stages of the Bayer process.
• The washed hydrate cake is calcined in seven rotary kilns to produce alumina.
The Bogoslovsk Alumina Refinery consumes around 40 MW of electricity from the regional grid,which is operated by Sverdloskenergo. The Bogoslovsk thermal power station is located adjacentto the Alumina and Aluminium complex in Krasnoturinsk and produces 85 MW of electricalpower, plus steam and hot water for the town and the alumina refinery. The calciner and sinteringkilns are fired by natural gas.
4.8.4 Environmental
Bogoslovsk Alumina Refinery has achieved ISO 14001 environmental management certification.
Atmospheric emissions from alumina calcination include alumina dust and combustion gases. Adedicated Electrostatic Precipitator (ESP) with a claimed efficiency of 98 per cent is used toremove particulate emissions from each of the six calciners. The ESP requires a significantamount of maintenance and capital investment to ensure an adequate level of performance. In aneffort to improve air emissions from the refinery, various facility upgrades have been undertaken.A new 1 ktpd cyclone calciner is currently under construction to replace two of the existingrotary kilns, which should reduce particulate air emissions by approximately five per cent.Cyclones with more efficient ESPs were installed at three sinter kilns from 2001 to 2006. Aproject to undertake similar replacements for the remaining three kilns by 2014 has not yet beenimplemented.
Bauxite residue is produced as a waste product from both the Bayer Process and the sinteringprocess at the rate of approximately 1.6 tonnes per tonne of alumina produced. The refinery isresponsible for two residue disposal areas. Pond No. 1 (129 ha) was commissioned in 1953 anddecommissioned in 1982. It is now partially re-vegetated and covered with a cap of waste rock.The refinery continues to monitor the area. Pond No. 2 (252 ha) was commissioned in 1982 andconsists of a single active cell. It will reach capacity in 2012 and is in the process of beingexpanded with the addition of a new 190 ha area. Additional storage will also be provided byextending the height of the existing storage area. These expansions are expected to provideresidue storage capacity until 2031. In addition, an earlier disposal area was operated from 1945to 1953. This has subsequently been revegetated and returned to the State.
Pond No. 2 incorporates a compacted clay liner, but does not incorporate a synthetic liner orunderdrainage collection system. The new area will have the same construction. This type ofliner system does not meet international best practice for containment of alkaline process liquor.Shallow seepage is intercepted by a collection ditch constructed around the perimeter of thestorage. Seepage water is recovered and returned to the disposal area.
APPENDIX VI INDEPENDENT TECHNICAL REPORT
— VI-195 —
Water entering Pond No. 2 is collected in two decants and discharged to a clay lined settlingpond. The water is then pumped back to the plant for re-use in the refinery process circuit. A newclay lined settling pond will be constructed for use by the new Pond No. 2 area, which willoperate in a similar manner.
Specialist stability reviews are conducted at quarterly intervals by an external consultant and arereported annually. Dust generation from the decommissioned Pond No. 2 is managed by theplacement of a layer of rock over the surface. There is no formal dust suppression systeminstalled on the active disposal area.
Groundwater monitoring wells are installed at 11 locations around the residue areas. Samples areanalysed at regular intervals and the results are included in site environmental reports. Therefinery advises that contaminant levels measured in the wells are within allowable limits.
The residue is pumped from the plant along two (one duty, one standby) above ground steelpipelines. There is a procedure for re-direction of slurry along the standby pipeline in the eventof pipe failure, however there is no bunding or other provisions to prevent spillage in the caseof failure. The absence of engineered spill containment for pipelines to and from the refinery hasthe potential to allow the uncontrolled discharge of alkaline slurry and liquor to the surroundingenvironment.
The plant also operates an industrial waste disposal area on the site of an old clay quarry. Thisarea takes construction wastes and other non-domestic waste from the plant at a rate of 15 ktpa.This area has now reached capacity and funds have been allocated for rehabilitation. A new wastefacility has been constructed and will be commissioned in 2009. The new facility has beenconstructed with a synthetic liner system to limit contamination.
Water is supplied to the plant from groundwater wells and from the Turya River. Stormwaterfrom the refinery area and effluent discharged from the refinery are collected, neutralised withacid and sent to a settling pond before being discharged to the river. Solids from the settling pondare dredged every 10 years and disposed of in the residue storage area. Discharges to the riverexceed the limits for aluminium and fluoride leading to environmental penalty payments. In2006, a project was approved to implement a closed water circuit at the plant, however thisproject was suspended before completion and the funds necessary for completion are notincluded in the 2009 budget.
4.8.5 Material Developments
This section presents material changes to the facility since the site visit was undertaken inSeptember 2008. The updated information was presented to Hatch through meetings with UCRUSAL in Moscow and has not been validated through an additional site visit. We have no reasonto believe that the information provided is not a true and fair reflection of developments at thefacility.
UC RUSAL has advised that there have been no material changes to the physical equipment/plantat the facility. Work on the Bogoslovsk Modernisation Project is reportedly currently suspended.
4.8.6 Specific Risks and Future Opportunities
Specific Risks
No specific risks material to the future operation of this facility have been identified.
APPENDIX VI INDEPENDENT TECHNICAL REPORT
— VI-196 —
Future Opportunities
• Capacity Expansion — At Bogoslovsk Alumina Refinery a project commenced to increaseproduction to 1,300 ktpa. This is to be achieved by replacing 96 of the air agitatedprecipitators with 48 new higher capacity precipitators with mechanical agitators, but onlysix of the new precipitators were installed before the project was suspended. An opportunityexists to recommence this project.
4.9 Achinsk Alumina Refinery
4.9.1 Introduction
Hatch undertook a site visit to Achinsk Alumina Refinery in September 2008. This Section 4.9has subsequently been revised and updated based upon data and information from UC RUSALand discussions held with senior management in September 2009. With reference to the followingsections, please note;
• Section 4.9.2 — Updated with data and information as of September 2009,
• Section 4.9.3 — Process Description as of September 2008,
• Section 4.9.4 — Environmental Status as of September 2008,
• Section 4.9.5 — Material Developments at the facility between September 2008 andSeptember 2009, and
• Section 4.9.6 — All previous Specific Risks and Opportunities noted in September 2008together with any changes following new data and information provision.
4.9.2 History, Location and Infrastructure
Achinsk Alumina Refinery is located in Siberia approximately 170 km to the west of the regionalcapital Krasnoyarsk, adjacent to the Chulym River. The refinery commenced operation in April1970.
The refinery was initially designed to produce 900 ktpa of alumina, with plant capacity nowhaving risen to almost 1,100 ktpa following a series of modifications and improvementsundertaken since 2000. Achinsk Alumina Refinery produced 1,069 kt in 2008. The Achinskrefinery also produces sodium carbonate, potassium carbonate and potassium sulphate asby-products.
Achinsk Alumina Refinery has achieved OHSAS 18001 Occupational Heath and Safetycertification.
4.9.3 Process Description
Alumina is produced at the Achinsk refinery using nepheline ore. Nepheline is asodium/potassium alumino-silicate. Approximately 4.2 tonnes of nepheline are sintered with sixtonnes of limestone to produce one tonne of alumina. The main consumers of Achinsk aluminaare Krasnoyarsk Aluminium Smelter and Bratsk Aluminium Smelter.
• Nepheline is sourced from the Kiya Shaltyr Nepheline Mine. The ore is transported 280 kmby rail and is unloaded into primary ore crushers upon arrival at Achinsk. Limestone istransported to the refinery in dump trucks from the nearby Mazulsky limestone quarry
APPENDIX VI INDEPENDENT TECHNICAL REPORT
— VI-197 —

which is owned by the refinery. At current extraction rates, the limestone mine resourcesare expected to last until 2030. The bulk of the limestone is crushed, milled and mixed withnepheline to produce the sinter kiln feed. A smaller portion of limestone is calcined toquicklime and is then slaked to produce milk of lime for the desilication reaction.
• Nepheline ore is fed by conveyor to the medium and fine crushing facility with intermediatecrushing in an open cycle, then by conveyors either to the ore storage and blendingstockyard or directly to bins over the mills. Nepheline ore (four stages) and limestone (twostages) are wet ground using alkali solutions. The addition of lime binds most of the silicaas dicalcium silicate in the clinker. First and third stage mills are charged with steel ballswhereas second and fourth stage mills are charged with rods. The feedstock is fed after thegrinding circuits. All feedstock blending, as well as receiving and blending of alkali/sodasolutions and grey mud is undertaken in adjustment tanks.
• The sintering process is the main process that determines the capacity of aluminaproduction. Nepheline-limestone-alkakli feedstock is prepared and heat-treated in sinteringkilns to produce a clinker containing 15-16 per cent alumina. The sinter from the kilns iscooled and fed to fine crushing and is then transferred to five silos in the chemicalhydrology shop.
• A portion of the sinter cake (60 per cent) is milled and digested (converted tosodium/potassium aluminate solution) in three rod mills followed by ten vertical agitateddigesters. This digester effluent is then sent to 32 thickeners where the nepheline sludge isseparated from the green liquor. The mill discharge is followed by washing in verticalseparator units and in four thickener lines. Washed sludge is additionally milled in ballmills before disposal or reuse in other applications. The remaining portion of cake (40 percent) is digested in nine tubular digesters and rod mills. The digester effluent is then sentto 22 thickeners and 13 filters where the nepheline sludge is separated from the green liquorand washed before disposal or reuse in other applications.
• Approximately 500 ktpa of the nepheline sludge waste is sold as a feedstock to the Achinskcement plant. Approximately 100 ktpa is used by the refinery for the manufacture of bricksand a proportion is used as basecourse in road construction. Sludge is pumped to the storagefacility as 20 per cent solid slurry. Supernatant water is decanted and pumped back to therefinery for reuse in the process.
• Aluminate liquor produced as a result of cake digestion is pumped to desilication, whichis carried out in eight autoclave banks. Desilicated liquor is sent via thickeners to filters.
• Following thickening and filtration, the desilicated liquor is divided into two flows.Aluminate liquor of the soda branch line is carbonated by CO2 gas from the sinteringprocess in carboniser banks of 600 m3 each, where alumina hydrate precipitates. Afterthickening, the hydrate slurry is pumped as seed to the soda-alkali branch line. Thecarbonate liquor is filtered and pumped to feedstock preparation and soda production.Aluminate liquor of the soda-alkali branch line undergoes partial carbonation inprecipitators. The thickened hydrate slurry of the soda-alkali branch line is sent for washingin drum-type vacuum filters, whereas the soda-alkali liquor is sent to cake digestion.Washed hydrate is conveyed to calcination directly or via hydrate storage.
• The washed hydrate is fed by conveyors to four calcining kilns, where it is calcined at 1200to 1250ºC (fuel oil firing), cooked in fluidised-bed coolers and conveyed by pneumatictransport to eight finished product silos of 2,000 tonnes each. The alumina product is loadedto hopper cars or tank cars for transport.
APPENDIX VI INDEPENDENT TECHNICAL REPORT
— VI-198 —
Calcined soda (soda ash) and mineral fertilizers (potash, potassium sulphate) are produced fromthe carbonate liquor for alumina production. The design capacity is approximately 595 ktpa ofsoda ash, 19 ktpa of potash and 26 ktpa of potassium sulphate. However, these capacities dependdirectly on the tonnage of alumina production.
• Carbonate liquors from alumina production undergo neutralisation of bicarbonates bycaustic liquor, followed by evaporation, where monohydrate soda precipitates.Monohydrate soda is separated from its mother liquor in centrifuges, calcined in two drumdryers and then conveyed by pneumatic transport to storage silos.
• The mother liquor is pumped to double-stage vacuum crystallisation where potassiumsulphate precipitates. Potassium sulphate is separated from the liquor, dried in four dryersand conveyed to the finished product silo.
• After potassium sulphate precipitates, the mother liquor is evaporated to precipitateanhydrous soda solids. After separation by centrifuges the soda is dried in drum dryersalong with monohydrate soda. The mother liquor is evaporated to precipitate binary salt.Separated binary salt is returned to the monohydrate soda precipitation storage, and thepurified liquor is sent for potash evaporation. The mother liquor is evaporated and sent totwo-stage crystalliser for potash precipitation. Potash, after separation from the liquor inthe centrifuges, is calcined in two drum dryers, packed in bags and sent to the finishedproduct storage.
The Achinsk refinery produces 85 per cent of its required electricity from a captive thermalpower plant, which also meets the refinery and the town’s steam and hot water requirements.Steam is extracted at two pressure levels for refinery steam supply and at two pressure levels forheating hot water. Five of the turbines are equipped with surface condensers that receivecirculating cooling water via wooden cooling towers. The power plant is now being fired withinexpensive low grade coal. The power station is ageing and requires considerable ongoinginvestment to maintain operations, however it has a modern and efficient control system on bothboilers and turbine alternators.
The refinery also purchases power from the local grid to supplement their supply. The plant isinstalling a new 90 MW steam turbine to increase power generation on-site. This new steamturbine alternator (number 7) will be commissioned in 2009. This project will result in increasedelectric power output to meet all of the refinery’s demand. Fly ash and Electrostatic Precipitator(ESP) dust is slurried and pumped to the nepheline sludge storage.
Total water intake from the river is 100 megalitres per year for the refinery. This includes thewater supply for the township of around 15 megalitres per year.
4.9.4 Environmental
Achinsk Alumina Refinery has achieved ISO 14001 environmental management certification.
There are currently two nepheline sludge storage facilities at the Achinsk Alumina Refinery.Pond No. 1 and Pond No. 2 are located adjacent to each other. Pond No. 1 was commissionedin 1969 and has an area of 190 ha. The facility was constructed with a basal low permeabilityclay liner. Pond No. 1 has reached its design capacity and is no longer in operation. Pond No.1 is approximately 105 m in height. Trials and investigations are currently underway torehabilitate Pond No. 1. The topsoil from stripping of the limestone quarry would be used torehabilitate and revegetate the storage. Apart from a small trial area, there has been no large scalerehabilitation work conducted to date, and the overall feasibility and viability of rehabilitationhas not been confirmed.
APPENDIX VI INDEPENDENT TECHNICAL REPORT
— VI-199 —
Pond No. 2 was commissioned in 2004 and has an area of 115 ha. It is understood that the facilityis constructed with a basal 1 mm synthetic (HDPE) liner. Pond No. 2 currently receivesapproximately 5.9 Mtpa of sludge (with the remaining 600 ktpa diverted for cement manufactureand other uses), as well as fly ash from the power plant and other minor blowdowns from theplant. The nepheline sludge consists mainly of dicalcium silicate hydrate and has a pH of 11. UCRUSAL advises that a sample of the sludge was sent for environmental analysis in Moscow andthat the analyses concluded that the sludge is of low level hazard to humans. However, it is notedthat the elevated pH would cause irritation to humans if contacted, and seepage from the storagehas the potential to impact underlying ground and surface waters.
The sludge is a sandy material that becomes cemented following deposition. For this reason, dustgeneration from the storage is not considered to be an issue. Slurry is pumped to the storagefacility via above ground pipelines. These are not bunded or otherwise contained, allowing thepotential for discharge of slurry to the local environment in the case of pipeline failure.
Seepage water from both Pond No. 1 and Pond No. 2 is collected in a channel around theperimeter of the ponds and is recycled back to the process. Achinsk Refinery advises thatmonitoring wells around the sludge storage facilities indicate that seepage has not adverselyimpacted groundwater.
Supernatant water draining from the deposited sludge slurry is decanted and pumped back to therefinery for reuse in the process.
Pond No. 2 has approximately 4.5 years of storage capacity remaining and therefore, additionalcapacity will be required in 2013. Achinsk Refinery is currently working with VAMI on thedesign and location for a new sludge storage facility. It was observed that adequate land isavailable for expansion of the sludge storage facility and it is assumed that the new facility willalso be constructed with a low permeability synthetic liner to minimise seepage.
Pond No. 3 acts as a cooling pond for the power plant. Cooling water for the power plant is takenfrom the Chulym River and is used once before discharging to Pond No. 3. The water is thenreturned to the Chulym River. Achinsk Refinery advises that the water discharged back to theriver meets the required environmental standards.
Stormwater from the plant site is collected in a drainage system and is sent to Pond No. 2. Thiswater is subsequently recycled back to the process.
At the refinery, there are 182 licensed point source air emissions locations and 30 fugitiveemission sources. All 182 sources are sampled regularly.
The Achinsk refinery currently has five Unitherm units for the combustion of coal at the sinteringkilns. These five units reduce coal consumption by 2.5 per cent and lower nitrogen oxideemissions by 36 per cent. The plant has the opportunity to install these units on the remainingseven sintering kilns.
A new ESP has been installed and is currently being commissioned.
Based upon the information provided, the Achinsk Refinery has received the requiredenvironmental permits for emissions to the environment. Achinsk advises that the refineryemissions comply with the permitted levels with the exception of sulphide levels withingroundwater at the Mazulski limestone quarry, which exceed the allowable levels.
APPENDIX VI INDEPENDENT TECHNICAL REPORT
— VI-200 —

4.9.5 Material Developments
This section presents material changes to the facility since the site visit was undertaken inSeptember 2008. The updated information was presented to Hatch through meetings with UCRUSAL in Moscow and has not been validated through an additional site visit. We have no reasonto believe that the information provided is not a true and fair reflection of developments at thefacility.
UC RUSAL has advised that there have been no material changes to the production technologyand process employed at the refinery.
4.9.6 Specific Risks and Future Opportunities
Specific Risks
• Rehabilitation of Nepheline Sludge Storage Facilities — This is expected to requireongoing capital expenditure. However, the future action plan for rehabilitation of Pond No1 has already been agreed with the regional environmental authorities.
Future Opportunities
• Product Quality — Alumina produced at Achinsk has a broad particle size distribution,which poses challenges for the aluminium smelters. Reducing the minus 45 and plus 125micron material products to 10 per cent maximum each would greatly improve operatingparameters of the reduction cells receiving Achinsk alumina. A research project involvingthe potential for a new hydrodynamic sizing device invented by VAMI has been initiated,which would improve the particle size distribution without compromising outputproduction capacity.
• By-Product Sales — Nepheline sludge has many possible uses including; a raw material forthe manufacture of Portland cement, white silicate bricks, road construction, filling ofunderground mines in permafrost areas and as an additive to local acidic soils forneutralisation. The Achinsk refinery is investigating the economic feasibility of these uses.At present, the refinery operates a white silicate brick plant on the site. Approximately 100ktpa of sludge is used in brick manufacture and road construction. The previouslymothballed cement plant was restarted in 2008 and by September 2008 was utilising around500 ktpa of sludge. It is understood that the cement can be sold profitably to theconstruction industry within a radius of 300 km from the refinery. An increase in the re-useof the sludge will provide a number of economic benefits to the refinery, such as reducedcapital and operating costs for the sludge disposal facility, as well as producing incomefrom sales of the sludge. However, the re-use rates for the sludge will need to increasesignificantly above the rate of approximately 9.2 per cent in September 2008 to have amaterial impact.
4.10 Urals Alumina Refinery
4.10.1 Introduction
Hatch undertook a site visit to Urals Alumina Refinery in September 2008. This Section 4.10 hassubsequently been revised and updated based upon data and information from UC RUSAL anddiscussions held with senior management in September 2009. With reference to the followingsections, please note;
• Section 4.10.2 — Updated with data and information as of September 2009,
• Section 4.10.3 — Process Description as of September 2008,
APPENDIX VI INDEPENDENT TECHNICAL REPORT
— VI-201 —

• Section 4.10.4 — Environmental Status as of September 2008,
• Section 4.10.5 — Material Developments at the facility between September 2008 andSeptember 2009, and
• Section 4.10.6 — All previous Specific Risks and Opportunities noted in October 2008together with any changes following new data and information provision.
4.10.2 History, Location and Infrastructure
The Urals Alumina Refinery is situated in the town of Kamensk-Uralsky, which has around200,000 inhabitants. Kamensk-Uralsky is the third largest conurbation within the SverdlovskRegion, and is located 100 km to the south-east of the major city of Ekaterinburg.
Construction of the Urals Alumina Refinery and Urals Aluminium Smelter complex atKamensk-Uralsky began in 1931. The facilities were commissioned in 1939 and there weresignificant increases in production over the period 1940-1945 and in the 1960’s. The UralsAlumina Refinery is one of the oldest refineries in the world still in operation.
The current alumina capacity of Urals Alumina Refinery is approximately 730 ktpa.
4.10.3 Process Description
The refinery incorporates a classic parallel Bayer/sinter process. This incorporates both a 235�CBayer digestion process and a parallel sintering process that uses the solid phase sodiumcarbonate extracted from the Bayer circuit in the sinter kilns. The sinter process section of therefinery was commissioned in 1964.
Bayer process
• Bauxite is transported by rail from the Middle Timan and North Urals bauxite mines.
• Blended bauxite is mixed with caustic liquor and wet-ground in comminution mills. Thealumina minerals are leached from the milled ore in a series of pressure autoclaves usingcaustic soda liquor at a temperature of approximately 235�C. There are nine digestion lineswith each line containing eight autoclaves. The North Urals and Timan bauxites requireelevated temperatures and pressures for efficient extraction of the boehmitic/diasporicminerals. The recent introduction of Timan bauxite has increased the required maintenancein digestion due to increased rates of scale formation. Plant staff indicated that autoclaveswere previously in operation for six months before mechanical de-scaling was required,however, with the introduction of Timan bauxite, autoclave de-scaling is now requiredevery three months. The autoclaves and slurry preheaters have also now been fitted with alevel control and gas extraction system that vents the excessive volumes of methane andhydrogen liberated from the Timan bauxite in the autoclaves.
• Inert minerals pass through the digestion process in solid phase and form the bulk of theresidue waste stream. After depressurisation, the digested slurry is diluted and transferredto multi-chamber type mud settlers where the residue solids are separated from thealumina-rich liquor by gravity sedimentation. The Urals Alumina Refinery has four settlerlines, each with three thickeners per line. The settled residue is washed with water torecover alumina and soda from the residue and is then pumped to the residue disposal area.The refinery has six CCD washer units, with each unit containing four or five washers.
• The pregnant liquor overflowing the mud settlers contains fine solids that are removed fromthe liquor by 14 security pressure filters. Filtered pregnant liquor is then cooled andpumped to precipitation. Cooling the pregnant liquor increases its alumina supersaturationsuch that, when seeded with previously precipitated hydrate, it initiates the crystallisationof new hydrate from the incoming pregnant liquor.
APPENDIX VI INDEPENDENT TECHNICAL REPORT
— VI-202 —

• The precipitation facilities have been upgraded and expanded several times and there is arange of precipitation units in operation. The most recent upgrade was in 2001 when 16mechanically agitated tanks were commissioned.
• Hydrate solids from the final precipitation tank are separated by gravity sedimentation andclusters of hydrocyclones. The hydrate is filtered using vacuum disc filters and a portionof the hydrate is returned to the precipitators as seed.
• Bauxite from the North Urals mine contains high carbonate and sulphate, which areseparated from the liquor as soda salts by deep salting-out evaporation and crystallisation.The Timan bauxite also causes some contamination of the liquor with organics, which areremoved with the solid phase sodium carbonate. The organics are then destroyed when thecarbonate is added to the sinter kilns.
Sintering/thermal causticisation process
• The sinter process is used to treat lower grade bauxites having a low total alumina to totalsilica ratio. The sinter process also assists in recovering the soda values associated with thehigh carbonate content of the North Urals bauxite. Crushed blended bauxite is mixed withthe sodium carbonate produced in the Bayer side and is then ground in ball mills. The wetblend is fed to one of three sintering kilns, where the bauxite and soda are converted at1,200�C to a solid clinker consisting of water soluble sodium aluminate and a non-solubleresidue.
• The clinker is ground and leached to solubilise the sodium aluminate. The leached slurryis then desilicated at 103 to 105�C. Further processing of the residue sinter slurry is similarto the Bayer process. Solid residue is separated from the pregnant liquor usingmulti-chamber settlers. The residue is then washed in several stages and pumped as slurryto the disposal area.
• The pregnant liquor overflowing the settlers is filtered and vacuum flash cooled prior toseeding and crystallisation of hydrate. The sinter derived hydrate is filtered and a portionis returned to the precipitators as seed.
Calcination and evaporation
• The hydrate produced in the Bayer process is filtered and washed on vacuum drum filters.The spent liquor filtrate is concentrated by evaporation, and sodium sulphate and sodiumcarbonate solids are separated from the concentrated liquor. The concentrated spent liquoris returned to the grinding and digestion stages of the Bayer process. The washed hydratecake is calcined to alumina in six parallel rotary kilns plus the recently added stationary gassuspension calciner of around 600 tpd capacity.
The thermal energy (steam and hot water) demand of the plant is met by one external supplier,“TGK9”. Electricity is supplied by the regional grid.
4.10.4 Environmental
Urals Alumina Refinery has achieved ISO 14001 environmental management certification.
The majority of operating plant buildings within Urals Alumina Refinery are constructed withconcrete floors and utilise drains within the floor to capture spills and transfer them to collectionsumps.
APPENDIX VI INDEPENDENT TECHNICAL REPORT
— VI-203 —
Bauxite residue is produced from the refinery as a waste product from both the Bayer process andthe sintering process. The Urals Alumina Refinery has three bauxite residue disposal areaslocated approximately 6 km from the refinery. The oldest (Pond No. 1) was closed in 1964 andhas been revegetated. Pond No. 2 and Pond No. 3 are both currently active.
Pond No. 2 is used only during the summer months as the embankment has a narrow cross sectionand would be subject to instability should seepage water freeze within the embankment. PondNo. 2 consists of two areas. Area 1 is currently inactive but will recommence operation in thesummer of 2009 for a period of four years. During this time Area 2 will be raised by 6 m to thesame height as Area 1. Area 2 is then expected to be used for an additional 20 years. The outerembankments of Pond No. 2 are being progressively rehabilitated and revegetated and it isunderstood that the refinery has allocated funds to continue progressive rehabilitation for anotherseven years.
Pond No. 3 consists of three areas. Area 1 has reached capacity and is not currently operational.Following drying and consolidation of the stored residue, the embankment will be raised andresidue deposition will recommence in the future. Area 2 is active and is used for residue storageduring the winter months. Area 2 is expected to reach capacity by 2013. Area 3 is currently beingconstructed and is expected to be commissioned in 2013. It was noted that at the time of the sitevisit, the floor of Area 3 was close to the natural water table.
Expressed water from the deposited residue is decanted to a secondary (unlined) settling pondwhich collects the decant water from Pond No. 2 and Pond No. 3. Water is subsequently pumpedback to the refinery for use in the washing circuit. The refinery advised that the liquor has a pHof 11.
Both Pond No. 2 and Pond No. 3 are constructed with a liner formed of compacted residuematerial to reduce seepage losses, but do not incorporate a compacted clay liner, synthetic lineror underdrainage collection system in their construction. This type of liner system does not meetinternational best practice for containment of alkaline process liquor. Both ponds are surroundedby an unlined perimeter ditch to intercept seepage which is recovered and returned to the residuearea. Monitoring wells are installed at six locations around the perimeter and are sampledmonthly during the summer. The refinery advises that water sampling does not showcontamination outside allowable limits.
Slurry and return water pipelines between the residue storage facility and the refinery are notbunded and no provision for containment of spills was observed. The absence of engineered spillcontainment for pipelines to and from the refinery has the potential to allow the uncontrolleddischarge of alkaline slurry and liquor to the surrounding environment.
Other industrial wastes from the plant are either taken to a licensed waste area for disposal, arerecycled back to the process (reduction plant sludges), or are sold to local recycling companies(i.e. oils).
Particulate emissions from the sintering kilns substantially exceed the permitted levels.According to environmental personnel, the plant has plans to upgrade this equipment to meetpermitted discharge levels.
Much of the water used at the site is recycled, however there are two industrial discharge pointsto the Iset River. These discharges contain plant stormwater, ingot cooling water, sump water andcooling water from a variety of sources. Neither of the discharge points meet the permitted limitsfor iron and aluminium as well as various other parameters. The refinery plans to implement a
APPENDIX VI INDEPENDENT TECHNICAL REPORT
— VI-204 —
project in 2009 to divert 86 per cent of this discharge water to the residue storage facility(ultimately to be recycled back to the process). This water will replace a correspondingpercentage of fresh make up water and will reduce environmental levies payable byapproximately eight per cent.
4.10.5 Material Developments
This section presents material changes to the facility since the site visit was undertaken inSeptember 2008. The updated information was presented to Hatch through meetings with UCRUSAL in Moscow and has not been validated through an additional site visit. We have no reasonto believe that the information provided is not a true and fair reflection of developments at thefacility.
UC RUSAL has advised that there have been no material changes to the physical equipment/plantat the facility.
4.10.6 Specific Risks and Future Opportunities
Specific Risks
No specific risks material to the future operation of this facility have been identified.
Future Opportunities
• Sandy Alumina — The Urals Alumina Refinery may improve the flowability and reducethe dustiness of their product by producing sandy alumina. The plant hopes to achieve thiswith a number of initiatives in the digestion process and by optimizing the precipitationcircuit. The capital required for these proposed modifications is unknown.
• Feedstock Management — The proportion of Timan bauxite input has increased in recentyears and additional care musk be taken with the variable zinc, sulphur and chamositecomponents in the Middle Timan ores. Various measures to handle additional Timan bauxiteare being pursued and the refinery has the opportunity to better control impurities throughthe use of additives at various stages of the process and by upgrading the polishing filters.
• Replacement of Lime Kiln — The Urals Alumina Refinery has the opportunity todecommission the lime kiln by purchasing lime from SUBR. This will reduce operationalcosts and eliminate emissions from the kiln.
4.11 Boxitogorsk Alumina Refinery
4.11.1 Introduction
Hatch undertook a site visit to Boxitogorsk Alumina Refinery in October 2008. This Section 4.11has subsequently been revised and updated based upon data and information from UC RUSALand discussions held with senior management in September 2009. With reference to the followingsections, please note;
• Section 4.11.2 — Updated with data and information as of September 2009,
• Section 4.11.3 — Process Description as of October 2008,
• Section 4.11.4 — Environmental Status as of October 2008,
• Section 4.11.5 — Material Developments at the facility between October 2008 andSeptember 2009, and
APPENDIX VI INDEPENDENT TECHNICAL REPORT
— VI-205 —
• Section 4.11.6 — All previous Specific Risks and Opportunities noted in October 2008together with any changes following new data and information provision.
4.11.2 History, Location and Infrastructure
Boxitogorsk Alumina Refinery is located in Boxitogorsk in Leningrad Region of the RussianFederation, approximately 240 km from St. Petersburg. The local township of approximately17,000 people exists predominantly because of the refinery, which also supplies domestic heatingto the township.
Construction of the alumina refinery began in the 1930’s and first alumina was produced in 1938.During World War Two the refinery equipment was removed to the Urals. The originalequipment, which is still in operation today, was returned from the Urals and recommissioned atBoxitogorsk in 1954.
The entire plant site is owned by Boxitogorsk Alumina Refinery, although some areas within itsboundaries have been leased to local transport companies.
Boxitogorsk Alumina Refinery produced the equivalent of 156 kt of alumina in 2008; aroundone-half as alumina hydrate, and the balance in speciality alumina and for fusing into corundum.Boxitogorsk Alumina Refinery supplies the majority of the corundum consumed in Russia andit also exports corundum products to other countries.
4.11.3 Process Description
Boxitogorsk Alumina Refinery originally processed bauxite from the nearby Tikhvin mine, butthis supply has been exhausted. Recently, the refinery has processed bauxites from North Onegaand Timan mines. Timan bauxite is expected to be the sole source of bauxite for at least the nextfour years.
• All raw materials arrive by rail and most products are dispatched on the same rail system.The refinery owns 52 km of rail track within its boundaries, together with a fleet oflocomotives and rail wagons.
• Bauxite, limestone, coal and coke are crushed, and then milled with caustic liquor from theevaporation area.
• The milled slurry is reacted in seven sintering kilns at 1250�C. The clinker leaving the millscontains solid phase sodium aluminate, sodium ferrite and dicalcium silicate. The kilnshave been retrofitted with dust collection systems (cyclones, ESPs and scrubbers).
• The clinker from sintering is sized, with finer material being processed in a vertical digesterand coarser, 1.0 to 8.0 mm, material being sent to the belt percolation digester. Oversizematerial is returned to the crushing circuit.
• The inert material from the leach circuit is pumped to the tailings facility. The leachate isdesilicated in two stages, and the desilicated liquor filtered.
• Hydrate is precipitated from the alumina-laden filtrate by sparging with the CO2 rich offgases from four of the sinter kilns.
• Hydrate solids from the final precipitation tank are separated in thickeners. The hydrate isthen filtered and a portion of hydrate is returned to the precipitators as seed.
• The remaining hydrate is separated, washed on filters, and split based on product demand.
APPENDIX VI INDEPENDENT TECHNICAL REPORT
— VI-206 —
• The three product rotary kilns have been retrofitted with dust collection systems (cyclonesand ESPs).
• Seven evaporator batteries are used to concentrate the caustic liquors.
The corundum plant (built in 1961) consists of four 6.6 MW electric arc furnaces, followed bya number of stages of crushing, grinding, classification and drying processes. More than 90different corundum products are made (ranging between 50 mm and 1 micron size). In 2007,Boxitogorsk Alumina Refinery sold 66,000 tonnes of corundum products.
A captive power plant supplies around one-half of the electricity requirements of BoxitogorskAlumina Refinery and the full requirements of steam and heat. The balance of electricity issourced from the local grid operated by Lenergo.
The captive power plant includes six boilers of 75 tph steam capacity and three steam turbinesrated at 13 MW. No off-gas treatment equipment is installed. Prior to 1994, the boilers were firedwith coal or fuel oil. Since then, natural gas has been used for power production, as well as inthe sintering and calcining kilns. This has lead to a significant improvement in air quality. Thewinter can be very cold with temperatures down to -42�C, so the government has insisted on therealways being a source of energy backup (fuel oil) to sustain the district heating requirements, incase of gas supply shortages.
4.11.4 Environmental
There have been two bauxite residue storages in operation during the operating life of theBoxitogorsk Alumina Refinery. The first (Storage No. 1), started receiving residue from thesintering process in 1954, and was subsequently revegetated and given back to the state. At thetime of the visit, the majority of the residue materials from Storage No. 1 had been quarried foruse in local road construction and for fill embankments along some of the refineries railwaylines.
The second residue storage (Storage No. 2) was commissioned in 1968 and remains in operationtoday. The current crest level is some 49 m above natural surface. At the time of construction noformal liner system was installed, however site personnel indicated the presence of naturallyoccurring clay soils below the storage.
It is proposed to raise the facility an additional 8 m, or to a final height of 57 m above naturalsurface which will extend the life by approximately seven years. Supernatant water within thestorage pond is led to a series of unlined perimeter channels surrounding the facility, collectedin a sump and is then pumped back to the plant. The most recent specialist stability review wascarried out in 2004 by the St. Petersburg Polytechnical University. The results from the analysisindicate satisfactory stability of the storage based on Russian guidelines and assuming currentoperations. Dusting does not seem to be a problem, possibly due to the gravely consistency ofthe residue materials.
The fuel oil tanks are currently lined with a natural clay seal with earthfill perimeter bunding.
Boxitogorsk Alumina Refinery has one main water discharge which is directed into thePyardomlya River which in-turn flows to the Volozhba River. This discharge consists of plantstormwater and industrial water which is passed through three settling ponds. Hatch was advisedthat the discharge regularly exceeds permitted limits of aluminium, iron, suspended solids, oiland grease. The refinery is currently planning to eliminate discharge into the local river systemsand recycle wastewater back to the plant. To date, capital budget allocation for thisenvironmental project is still under consideration.
APPENDIX VI INDEPENDENT TECHNICAL REPORT
— VI-207 —
Stormwater from the bauxite, limestone, coal and the coke unloading and storage areas iscollected in ditches and flows to a local creek with no treatment. This is not considered to be bestpractice and as a minimum, settling of solids should be provided in order to minimize the impactto the local environment.
At the refinery there are a total of 220 point source and fugitive air emission sources. Thesintering kilns, calcining kilns and the power plant represent the highest emitters.
The majority of operating plant buildings within the refinery are constructed with concrete floorsand utilize drains within the floor to capture spills and transfer them to collection sumps. A tourof the Boxitogorsk Alumina Refinery revealed many areas of the plant where equipment wasleaking solution onto the floor. The floors and buildings appear to be in poor shape.
4.11.5 Material Developments
This section presents material changes to the facility since the site visit was undertaken inOctober 2008. The updated information was presented to Hatch through meetings with UCRUSAL in Moscow and has not been validated through an additional site visit. We have no reasonto believe that the information provided is not a true and fair reflection of developments at thefacility.
Production at the refinery was reduced by approximately 40 per cent of the installed capacityduring the majority of the first half of 2009. UC RUSAL attributed the closure to a strategicdecision based on reduced demand for alumina from its aluminium smelters and the globalmarket and as part of a programme to reduce consolidated operating expenditure. UC RUSALadvised Hatch that the idled capacity was subsequently restarted in June 2009.
4.11.6 Specific Risks and Future Opportunities
Specific Risks
• Asset Integrity/Health and Safety — A program of equipment replacement may be neededin key areas for the refinery to operate safely and consistently into the future.
• Environment — Based on international standards for stability of tailings impoundments,the Boxitogorsk Storage No. 2 may require some form of stabilisation before closure andhandover to the local authorities. Within the plant fence, bunding of storage tanks isinadequate, and the concrete floors may not provide an adequate seal against causticleakage. Aqueous discharges from the industrial complex exceed permitted impurity levels.
• Labour/Social — The refinery is the main employer in the town, as well as supplyingdistrict heating requirements. Any disruption to employment in the refinery has a largeimpact on the township.
Future Opportunities
• Sale of residue materials — The refinery has engaged the services of VAMI to investigatethe potential to sell residue materials to local cement manufacturers and as engineering fillfor road construction.
• Reorganization — The maintenance services are presently provided by BoxitogorskAlumina Refinery. There is a plan to outsource the maintenance services to a separate UCRUSAL owned entity.
APPENDIX VI INDEPENDENT TECHNICAL REPORT
— VI-208 —
4.12 Nikolaev Alumina Refinery
4.12.1 Introduction
Hatch undertook a site visit to Nikolaev Alumina Refinery in October 2008. This Section 4.12has subsequently been revised and updated based upon data and information from UC RUSALand discussions held with senior management in September 2009. With reference to the followingsections, please note;
• Section 4.12.2 — Updated with data and information as of September 2009,
• Section 4.12.3 — Process Description as of October 2008,
• Section 4.12.4 — Environmental Status as of October 2008,
• Section 4.12.5 — Material Developments at the facility between October 2008 andSeptember 2009, and
• Section 4.12.6 — All previous Specific Risks and Opportunities noted in October 2008together with any changes following new data and information provision.
4.12.2 History, Location and Infrastructure
Nikolaev Alumina Refinery, commissioned in 1980, is located on the Yuzny (Southern) BugRiver, approximately 30 km upstream of the Black Sea coast of Ukraine. The town centre ofNikolaev is located approximately 25 km away and has a population of approximately 510,000people.
Nikolaev Alumina Refinery had an original design capacity of 1,000 ktpa of alumina. SinceRUSAL acquired ownership of the refinery in 2000, (prior to the formation of UC RUSAL), aseries of upgrades and modernisations has steadily increased the alumina capacity. NikolaevAlumina Refinery produced 1,446 kt of alumina in 2008. The refinery area covers 480 hectaresand includes a hydrometallurgical facility to produce gallium metal.
Nikolaev Alumina Refinery has achieved OHSAS 18001 Occupational Heath and Safetycertification.
4.12.3 Process Description
The Nikolaev Alumina Refinery incorporates Bayer process technology with high temperaturedigestion from Pechiney (now Rio Tinto Alcan):
• Bauxite is presently obtained from Kindia, Guyana, and Weipa. Commencing in 2010,bauxite will be sourced only from Kindia and Guyana. The ore is transported in vessels upto 50-60 kt in size, to the unloading port at the refinery site.
• The bauxite is crushed and mixed with hot caustic liquor, wet-ground in ball mills andpredesilicated. Following predesilication, the bauxite slurry is digested at 210 to 230�Cwith caustic liquor.
• The digested slurry (blow-off slurry) is fed to mud settlers where the residue solids areseparated from the alumina-rich liquor by gravity sedimentation. The mud is washed withwater in a six stage counter-current decantation circuit.
APPENDIX VI INDEPENDENT TECHNICAL REPORT
— VI-209 —
• Two deep thickeners were commissioned in 2007 for pretreating the washed mud prior todisposal. Positive displacement pumps (Wirth) direct undiluted mud at 50 per cent w/wsolids to the red mud disposal area for wet stacking.
• The settler overflow is filtered; the filtered pregnant liquor is cooled and pumped toprecipitation. By the end of 2006, all precipitators had been converted from air agitation tomechanical agitation.
• Hydrate solids from the final precipitation tank are separated in thickeners. The hydrate isthen filtered and a portion of hydrate is returned to the precipitators as seed.
• The remaining portion of hydrate is filtered, washed and calcined to form alumina. Thereare four 850 tpd Lurgi fluidised stationary calciners in operation. A fifth stationary calcinerof 1500 tpd was commissioned in 2005. All are fired with natural gas, with heavy fuel oilas backup, and are fitted with modern dust collection systems.
• Overflow from the hydrate thickeners is evaporated and returned to the digestion area.
• Alumina product is directed to the UC RUSAL owned smelters, in particular Krasnoyarskand Sayanogorsk Aluminium Smelters, and is typically shipped out by train in winter andby barge in summer. Nikolaev alumina meets Russian “GOST” standards, and is expectedto remain compliant after the expansion to 1.7 Mtpa is completed.
Nikolaev produces 13 tonnes of high purity gallium per year in a dedicated plant, which is nearly20 per cent of world demand. The technology for gallium production was developed in-house.
Nikolaev Alumina Refinery sources approximately two-thirds of its electricity requirements fromthe national grid, with the balance from the refinery’s own generating facility. Under normaloperating conditions, the Nikolaev Alumina Refinery’s power station operates in parallel with theregional grid, supplying incremental power and acting as an emergency back-up. The powerstation generates all of the steam requirements for the refinery. The main fuel used by the captivepower station is natural gas, with heavy fuel oil used for standby supply.
4.12.4 Environmental
Nikolaev Alumina Refinery has achieved ISO 14001 environmental management certification.
From commissioning through to late 2007, the refinery discharged bauxite residue (red mud) toa storage facility approximately 500 m south of the plant (Slurry Dam No. 1). As of November2007, residue deposition started in a second storage facility (Residue Drying Area No. 2) some3 km south of the plant.
Slurry Dam No. 1 is divided into two cells; Cell A has a mud surface area of approximately 54ha, and Cell B has a mud surface area of approximately 86 ha. The southern and westernperimeter walls of the dam are constrained by the banks of the Yuzny Bug River. The residuestorage facility reached its final capacity of 25.3 Mm3 in November 2007, and is no longer usedfor mud deposition. The perimeter embankments comprise asphaltic concrete seals. The basinfloor construction utilizes a dual 0.2mm thick synthetic liner with a 0.5m thick sandunderdrainage system. There are eight recovery/monitoring wells on the dam perimeter to returnpotentially contaminated seepage water to the system.
The latest closure plan for Slurry Dam No. 1 involves capping of Cell B using a layer of sand,clay and topsoil. Cell A will be used for process water storage from the plant and for thecontainment of decant, underdrainage and surface drainage from the Residue Drying Area No. 2facility. Final closure planning is currently underway with detailed design expected to commencein 2009. Nikolaev envisage to have completed the rehabilitation work within four years ofcommencing construction.
APPENDIX VI INDEPENDENT TECHNICAL REPORT
— VI-210 —
Residue Drying Area No. 2 is divided into three equally sized cells with a combined mud dryingarea of approximately 112 ha. Containment of the slurry is achieved by a natural clay seal, dual1 mm thick synthetic liner system with a geotextile layer. Pressure heads on the liner arecontrolled via a 0.5 m thick sand underdrainage layer which discharges via gravity to an externalsump. When full, Residue Drying Area No. 2 will hold 27.8 Mm3 of residue mud at a projectedaverage solids content in excess of 70 per cent. Compared with conventional wet depositionmethods, the footprint area required for storage will be reduced, and therefore exposure ofgroundwater to contamination and final rehabilitation costs may also be reduced. A permit formud disposal has been obtained from the Ministry of Environmental Protection of the Nikolaevregion and is renewed annually.
The capacity of the facility will be gradually increased by incorporating upstream constructionmethods, whereby dried mud may be harvested and used to increase the height of the perimeterembankments.
The 3.6 km residue transport pipeline is flanged and traverses property which is not owned byNikolaev Alumina Refinery. Based on site observations the pipeline has been designed andconstructed to a high standard.
In 2007, Nikolaev Alumina Refinery sold 256 kt of red mud. This material is currently quarriedfrom Slurry Dam No. 1, Cell B.
The only recent violation of environmental permit conditions relates to airborne dust from SlurryDam No. 1. This incident occurred in January 2006 and has been linked to specific and irregularfrost conditions. Monitoring activity has been increased in the aftermath of the January 2006incident. The design of the dust suppression system has been updated for Residue Drying AreaNo. 2. The probability of dust generation within the new dry stacking facility is likely to behigher than for Slurry Dam No. 1, as the residue materials are encouraged to dry and aretherefore more susceptible to wind erosion. No dust suppression system was evident at the portor ore stockpile areas. In addition, the plant uses vertical type lime kilns. The kiln loadingsystems are unsuppressed and also prone to dust emissions.
Groundwater quality is not actively monitored within the plant footprint. Spills are effectivelysegregated from stormwater and returned to the process via local area sumps. However, concreteslab construction appears to have been used in several locations and it is considered unlikely thatthese will provide a complete seal, although the containment below the precipitator area includesa concrete slab and synthetic liner system. It is recommended that Nikolaev Alumina Refineryextend the existing groundwater monitoring programme at the plant perimeter so as to alsoencompass some characterization of the groundwater within the production area. Wells locatedat the plant perimeter are used to supply potable water to the plant site and are monitoredannually for signs of contamination. Groundwater characterisation within the plant boundary isa critical early warning system and effectively reduces liability in event of potentialcontamination resulting from refinery operations.
With the exception of sanitary waste, which is delivered to a local treatment plant, NikolaevAlumina Refinery operates as a zero liquid discharge system. A Sewage Treatment Plant atNikolaev Alumina Refinery is due to commence operations in 2009.
4.12.5 Material Developments
This section presents material changes to the facility since the site visit was undertaken inOctober 2008. The updated information was presented to Hatch through meetings with UCRUSAL in Moscow and has not been validated through an additional site visit. We have no reasonto believe that the information provided is not a true and fair reflection of developments at thefacility.
APPENDIX VI INDEPENDENT TECHNICAL REPORT
— VI-211 —

UC RUSAL advised that it has completed construction of the equipment and facilities for theexpansion of plant capacity to 1.7 Mtpa. Only approximately one-third of the additional capacityis currently being utilised due reduced demand for alumina from within UC RUSAL and theglobal market.
4.12.6 Specific Risks and Future Opportunities
Specific Risks
• Electricity/Natural Gas Unit Pricing — Electrical supply is in the process of beingderegulated in the Ukraine, and so there is uncertainty in the unit pricing and an inabilityto set up long term contracts.
• Security of Gas Supply — There was an interruption in the supply of natural gas in 2006and future interruptions cannot be ruled out in the region. However, the refinery holdssufficient back-up fuel-oil storage onsite to fire the boilerhouse and calciners for aroundone week, which would maintain production at levels up to 1.4 Mtpa. The balance of theplant capacity of 1.7 Mtpa is potentially under threat since the boilers added in the recentexpansion are not capable of being fired with fuel-oil.
Future Opportunities
• Capacity Expansion — The Nikolaev Alumina Refinery third phase expansion project aimsto increase plant production from 1.7 Mtpa to 2.0 Mtpa. A detailed feasibility study has notyet been performed on this project and will be considered following the expansion projectto 1.7 Mtpa.
4.13 Zaporozhye Alumina Refinery
4.13.1 Introduction
Hatch undertook a site visit to Zaporozhye Alumina Refinery in September 2008. This Section4.13 has subsequently been revised and updated based upon data and information from UCRUSAL and discussions held with senior management in September 2009. With reference to thefollowing sections, please note;
• Section 4.13.2 — Updated with data and information as of September 2009,
• Section 4.13.3 — Process Description as of September 2008,
• Section 4.13.4 — Environmental Status as of September 2008,
• Section 4.13.5 — Material Developments at the facility between September 2008 andSeptember 2009, and
• Section 4.13.6 — All previous Specific Risks and Opportunities noted in September 2008together with any changes following new data and information provision.
4.13.2 History, Location and Infrastructure
Construction of the Zaporozhye Alumina and Aluminium complex began in 1930, withcommissioning of the Zaporozhye Alumina Refinery in 1934, one year after the start ofZaporozhye Aluminium Smelter. After World War Two, the plant was virtually rebuilt in 1956.
APPENDIX VI INDEPENDENT TECHNICAL REPORT
— VI-212 —

Zaporozhye is a heavily industrialised city of approximately 850,000 people located in the southeast of Ukraine, approximately 600 km south of Kiev. The city is located on the Dnieper Riverand is partly supplied by electricity generated from the Dneproges hydroelectric power stationwhich dams the river at Zaporozhye.
Zaporozhye Alumina Refinery produced 227 kt of alumina in 2008.
The facility is currently not operational and is under care and maintenance. Refer to Section4.13.5.
4.13.3 Process Description
Zaporozhye Alumina Refinery incorporates the Bayer digestion process (high and lowtemperature variants) in addition to a sintering process.
Bayer process
• Bauxite is currently and will continue to be predominantly supplied from Guinea(Companie des Bauxites de Kindia), and Guyana, with smaller quantities supplied fromAustralia, the former Yugoslavia and India. Bauxite is transported by vessels up to 50-60kt in size to the port at Nikolaev, Ukraine and is then transhipped in 2,500 to 5,000-tonnebarges via the Dnieper River and finally rail transported from the Zaporozhye port over theshort distance to the plant site.
• Blended bauxite is mixed with caustic liquor and wet-ground in ball mills in a closedcircuit. The alumina-bearing minerals are leached from the bauxite ore in four trains ofpressure autoclaves using caustic soda liquor at elevated temperatures. There are a total of30 autoclaves (one bank of eight, one bank of ten, and two banks normally with sixautoclaves). These can be rearranged as required. Gibbsitic ores are digested atapproximately 150�C. Boehmitic and diasporic ores are digested at approximately 210�C inone of the larger banks.
• After depressurisation, the digested slurry is diluted and transferred to mud settlers wherethe residue solids are separated from the alumina-rich liquor by gravity sedimentation. Therefinery has a single washer train containing a settler and five washing stages. Burnt limefrom a vertical shaft furnace is slaked and added to the overflow from the second washer(chemical causticisation) to convert sodium carbonate back to caustic.
• The pregnant liquor overflowing the mud settlers is directed to security filtration. Thefiltered pregnant liquor is then cooled and pumped to the precipitation area.
• Out of the 30 cone bottom precipitators, 18 have been converted from air to mechanicalagitation using Russian designed agitators. Hydrate solids from the final precipitation tankare separated by gravity sedimentation and tray thickeners. The hydrate is filtered usingvacuum drum filters and a portion of hydrate is returned to the agglomerators and growthprecipitators.
• Some carbonate is separated as soda salts by deep evaporation and crystallisation and issent to the sintering process for recovery of soda (thermal causticisation).
Sintering/thermal causticisation process
• The sintering process is used to treat bauxite with a low alumina-to-silica ratio. Crushedblended bauxite is mixed with soda ash, and evaporated Bayer liquor and ground in ballmills. The wet blend is fed to one of two sintering kilns, where the bauxite and soda areconverted at 900�C to a solid clinker consisting of soluble sodium aluminate andnon-soluble residue.
APPENDIX VI INDEPENDENT TECHNICAL REPORT
— VI-213 —
• The clinker is ground and leached to solubilise the sodium aluminate. The leach slurry isthen sent to the Bayer circuit “red mud” washers, so that alumina values can be separatedfrom the residue solids.
Calcination and evaporation
• The hydrate produced in the Bayer and sintering processes is filtered and washed usingthree stages of vacuum drum filters. The washed hydrate cake is calcined to form aluminain the four rotary kilns.
• Special aluminas are made just before a rotary kiln is due for maintenance, due to the hardburning required.
• Spent liquor is concentrated in five batteries of evaporators. A sodium carbonate salt isremoved from the liquor with the concentrated liquor being returned to the grinding anddigestion stages of the Bayer process. Evaporation accounts for 80 per cent of the refinerysteam usage, and there are initiatives to reduce this consumption by upgrading theevaporators from 3-effect to 4-effect.
The thermal energy (steam and hot water) demand of Zaporozhye Alumina Refinery is met by aninternal gas fired power station with back-up heavy fuel oil supply. This powerhouse alsosupplies a significant portion of the refinery’s electrical power. Zaporozhye Alumina Refineryalso supplies the heating requirements for a small residential area (approximately 200-300citizens) and some auxiliary industrial companies.
4.13.4 Environmental
Zaporozhye Alumina Refinery has achieved ISO 14001 environmental management certification.
Until 1983, Zaporozhye Alumina Refinery disposed of bauxite residue at a storage facilitylocated adjacent to Zaporozhstal Steel Works, approximately 1.5 km from the refinery. In the pastfive years, Zaporozhye has not deposited red mud into this emergency facility. Surface waterfrom this storage facility is decanted and discharged directly to the Dnieper River, which isimmediately downstream.
In 1983, Red Mud Pond No. 2, a new residue storage facility covering a total area ofapproximately 70 ha with an available mud drying area of 51.5 ha, providing a useful storagecapacity of 8.5 Mm3 was commissioned. Red Mud Pond No. 2 is located 42 km from the refinery.Almost 70 per cent of the pipeline is buried and it is therefore difficult to carry out routineinspections. The slurried red mud is discharged from the southern embankment, and settlesrapidly after discharge, forming a gently sloping beach which confines the decant pond to thenorthern sector of the storage. The deposition methods adopted by Zaporozhye ensure gooddecant management while reducing the potential for contaminant seepage through theembankment and improving embankment stability.
It is considered that the design of Red Mud Pond No. 2 meets international standards forcontainment of alkaline liquor. The effluent storage adjacent to Red Mud Pond No. 2 operatedby the steel works may not be built to the same standards and could be responsible forgroundwater contamination requiring Zaporozhye Alumina Refinery to demonstrate to regulatoryauthorities that their facility is not responsible. Comprehensive monitoring undertaken byZaporozhye Alumina Refinery should serve to reduce this risk.
Based on forecast alumina production rates, it is expected that Red Mud Pond No. 2 will reachfull capacity in 2014. A number of options are being considered to provide residue storagebeyond 2014. These include raising the dam crest of Red Mud Pond No. 2 by between 3 m to 8m to extend the facility life by up to 12 years or adapting a mined out quarry approximately 20km from the plant to receive the residue material.
APPENDIX VI INDEPENDENT TECHNICAL REPORT
— VI-214 —
A small scale study to evaluate the use of red mud in the cement and steel industries has beencompleted. This study is on-going and if successful could lead to the sale of up to 150 kt of mudper annum.
Wastewater characteristics are regulated at the point of discharge from Zaporozhye AluminaRefinery. Treatment for oil and sediment removal is conducted by the neighbouring Ukrgraphiteplant before final discharge to the Dnieper River.
All buildings associated with production are covered, simplifying the segregation of stormwaterfrom process affected waters. A total of 22 wells are installed throughout the plant area and theseare sampled regularly to assess the impact of operations on groundwater quality. Contaminationhas been detected at some well locations although the source has not been identified.
The refinery boilers are not equipped with any additional emission abatement systems. ESP’s areinstalled on the sintering and alumina kilns.
Plant instrumentation and control systems are extremely outdated and are not linked to a centralDCS system. This compromises the ability to detect environmental excursions and evolvingunsafe situations. This lack of appropriate alarm functionality jeopardises the ongoingincident-free operation of the facility.
4.13.5 Material Developments
This section presents material changes to the facility since the site visit was undertaken inSeptember 2008. The updated information was presented to Hatch through meetings with UCRUSAL in Moscow and has not been validated through an additional site visit. We have no reasonto believe that the information provided is not a true and fair reflection of developments at thefacility.
UC RUSAL has advised that there have been no material changes to the physical equipment/plantat the facility.
Zaporozhye Alumina Refinery is currently not operational following the full closure of the plantimplemented in the first quarter of 2009. UC RUSAL attributed the closure to a strategic decisionbased on reduced demand for alumina from its aluminium smelters and the global market and aspart of a programme to reduce consolidated operating expenditure. Hatch was advised that UCRUSAL view the current full plant closure as temporary and that the plant is the subject ofcontinuous review and monitoring to determine an optimal time for restart. The idled productioncapacity is currently under care and maintenance.
4.13.6 Specific Risks and Future Opportunities
Specific Risks
• Location of Red Mud Pond — Red Mud Pond No. 2 is located 42 km away from the plantand there is a risk that pipeline damage along the transfer route may result in anenvironmentally significant contamination.
• Reliance on Third Parties — Wastewater is discharged for treatment at the Ukrgraphiteand Zaporozhye Ferroalloy plants.
APPENDIX VI INDEPENDENT TECHNICAL REPORT
— VI-215 —
Future Opportunities
• Product/Market Opportunities — Zaporozhye Alumina Refinery has the opportunity tothicken or filter some of the red mud generated in the refinery, before sale to the cement,iron and steel industries.
5. Aluminium Division
5.1 Bratsk Aluminium Smelter
5.1.1 Introduction
Hatch undertook a site visit to Bratsk Aluminium Smelter in September 2008. This Section 5.1has subsequently been revised and updated based upon data and information from UC RUSALand discussions held with senior management in September 2009. With reference to the followingsections, please note;
• Section 5.1.2 — Updated with data and information as of September 2009,
• Section 5.1.3 — Process Description as of September 2008,
• Section 5.1.4 — Environmental Status as of September 2008,
• Section 5.1.5 — Material Developments at the facility between September 2008 andSeptember 2009, and
• Section 5.1.6 — All previous Specific Risks and Opportunities noted in September 2008together with any changes following new data and information provision.
5.1.2 History, Location and Infrastructure
Bratsk Aluminium Smelter is located approximately 15 km by road from the town of Bratsk inIrkutsk Region. Chekanovsky, a small village of approximately 1,425 inhabitants, is locatedclose to the smelter and under a federal plan the residents will be relocated to a residential areato be built by the smelter, near Bratsk for health and safety reasons. This residential area iscurrently being designed and is scheduled for completion by 2012.
Bratsk is a town of approximately 260,000 people, and has several other heavy industriesincluding a pulp and cardboard mill and the hydroelectric power station from which the smeltersources its power. Bratsk has a domestic airport with scheduled flights to other major cities inthe Russian Federation. The smelter has direct rail links to the nearby trans-Siberian rail system,providing excellent means for materials transportation.
The smelter site covers 465 hectares and adjoins a ferro alloy production plant which until April2004 was also part of the Bratsk Aluminium Smelter complex but is now a separate legal entitynot linked to UC RUSAL.
Bratsk Aluminium Smelter commenced operations in 1966 and is the largest capacity smelter inthe world, producing 1,002 kt of saleable aluminium in 2008.
Bratsk Aluminium Smelter has achieved OHSAS 18001 Occupational Heath and Safetycertification.
APPENDIX VI INDEPENDENT TECHNICAL REPORT
— VI-216 —

5.1.3 Process Description
Bratsk Aluminium Smelter comprises 13 potlines, configured as 25 potrooms, 24 of which arevery similar in type. Potroom 25 was constructed in 1999 to fit within an existing building,previously used for production of high purity aluminium. The average line current across thesmelter is 164 kA. The potlines are summarised as follows:
• Potlines 1 to 12 are each configured as two potrooms (Potrooms 1 to 24) with each potroomcontaining either 90 or 94 cells laid in an end-to-end arrangement, operating atapproximately 168 to 170 kA; and
• Potline 25 is configured as a single potroom containing 142 cells laid in an end-to-endarrangement, operating at approximately 110 kA. The cells in Potroom 25 are smaller insize than those of the other potrooms.
The smelter site is divided into three reduction ‘plants’ for administrative and operationalpurposes. Potrooms 1 to 8 form Plant No. 1, Potrooms 9 to 16 form Plant No. 2, and Potrooms17 to 25 form Plant No. 3. All cells are of VAMI VSS design and the potrooms are of two-storey,single bay construction.
Cells within Potrooms 1 to 8 and Potrooms 13 to 24 are tended via gantry-mounted equipmentwhich straddle cells and run along the length of the potrooms on rails to perform crust breakingand alumina feeding operations. Alumina is fed to the gantry daybin via silos external to thepotrooms. In the remaining potrooms, alumina is fed using wheeled vehicles charged from fillingstations located in the central passageways. Bath material is fed to the pots using mobilevehicles. Overhead process cranes are used in all potrooms to pull and reset the studs.
The anode paste production facilities include four coke calciners and six processing lines eachincorporating hammer mills, roll crushers, ball mills, pre-heaters, proportioners, paste mixersand pelletising baths.
The smelter has three casthouses, one for each reduction plant. Hot metal is siphoned from thecells and transported to the casthouses in 5-tonne ladles. The casthouses specialise in thefollowing products:
• Casthouse 1 produces 15 kg ingots (un-alloyed), electrical wire rod (9.5-33 mm diameter),wire rod (11.5 to 14.5 mm), T-bars (750 kg), and small quantities of strip for cathodeflexible connections. A new container-loading terminal within an annex to the casthousewas commissioned in July 2006.
• Casthouse 2 produces 15 kg ingots (un-alloyed and A380.1), T-bars (750 kg), and anodestud conductors for the smelter’s own use.
• Casthouse 3 produces T-bars (750 kg) and slabs/rolling block (3000, 5000 and 8000 series).Casthouse 3 is the largest of the casthouses at the smelter and has the most modern castingequipment, with a new 80 t furnace and Vertical Direct Chill (VDC) caster beingcommissioned in May 2007 from a reputable Western supplier.
All process raw materials are received by rail. The smelter is located on theBAM-Baikalo-Amurskay railway. Alumina is sourced from within UC RUSAL from a variety ofrefineries, namely Achinsk Alumina Refinery, Fria Alumina Refinery, Nikolaev AluminaRefinery and Queensland Alumina Ltd. and is also procured externally from Pavlodar AluminaRefinery in Kazakhstan. Approximately 80 to 85 per cent of alumina is imported from theoverseas refineries.
APPENDIX VI INDEPENDENT TECHNICAL REPORT
— VI-217 —

Green petroleum coke is supplied from oil refineries at Angarsk and Perm within the RussianFederation, and also from China.
Coal-tar pitch is received in solid granulated form in one-tonne bags and in liquid form in heatedrail tankers, predominantly from Russia and Ukraine. All of the high temperature pitch is sourcedfrom Magnitogorsk. Cathode blocks are sourced from China, internally from Lingshi CathodePlant and also from Elkem China.
At Bratsk Aluminium Smelter there is no spare calcination capacity. Therefore, when any of thecalciners are shut down for maintenance, Bratsk Aluminium Smelter has an internal contract forperiodic delivery of calcined coke from Krasnoyarsk Aluminium Smelter.
Bratsk Aluminium Smelter receives power directly from the Bratsk hydroelectric power station(operated by Irkutskenergo), which is connected to the Irkutsk grid. The smelter receives powerthrough nine of 12 dedicated 220 kV transmission lines, hence there is redundant capacity thatcould be utilised in the future. In addition, there are two 500 kV power lines to the smelterdirectly from the main Bratsk switch station that can also be used for provision of energy supply.The Bratsk hydroelectric power station operates at below full capacity and it is claimed there isapproximately 12 million MWh of spare power generating capacity in the region. The BratskAluminium Smelter consumes approximately 75 per cent of the power generated from the powerstation and is thus a principal customer of the facility.
Originally the potlines were equipped with 8 x 22 kA rectifiers, with the exception of Potroom25 which is equipped with 5 x 22 kA units with additional support through a connection toPotroom 24. The rectifier transformers were rated to 450 V in Potrooms 13 to 16, 750 V inPotroom 25 and 850 V in the remainder of the potlines. However, the smelter has since made anumber of replacements and 24 of the original rectifiers have been replaced with larger 32 kAunits to support a general line current increase to 175 kA. There are 48 main step-downtransformers and three spares. Substantial rectifier and electrical equipment upgrades will occurin the potrooms as part of the Bratsk Modernisation Programme.
The senior management at Bratsk Aluminium Smelter are in the process of implementing a newmanagement structure and business system to improve the plant efficiency and workingconditions of all employees. The changes involve a reduction in the number of intermediatemanagers/supervisors, worker training programmes, changes in shift patterns, greatermechanisation and improved salary conditions for the remaining workforce. It is expected thatthe changes will result in an increase in aluminium production efficiency to 250 t per person by2010.
5.1.4 Environmental
Bratsk Aluminium Smelter has achieved ISO 14001 environmental management certification.
There have been several environmental upgrades implemented at Bratsk Aluminium Smelter inrecent times. The plant has been fully converted to dry anode paste resulting in a decrease inemissions of benzapyrene and tars. Additionally, improvements have been made to the fumecombustion systems on the cells. Stud-hole plugs have been tested as part of the modernisationproject. They will be introduced throughout the plant in 2009. This activity will lead to areduction in emissions of anode gas into the potroom vents.
Gases from all potrooms, except for one-half of Potrooms 7 and 8, are first treated byElectrostatic Precipitators (ESP), or a wet form of ESP scrubbing, to remove particulatesfollowed by a series of wet scrubbers (two operating and one on stand-by) connected to a stackof 80 m height. The Bratsk Aluminium Smelter has plans to install 25 new dry scrubbers as partof the Bratsk Modernisation Programme, and a decision whether to continue the use of theexisting wet scrubber systems in addition to the dry systems will be made shortly.
APPENDIX VI INDEPENDENT TECHNICAL REPORT
— VI-218 —
The majority of solid waste produced by the plant is in the form of Spent Pot Lining (SPL). Thisis sent to special disposal areas located 5 km outside of the plant boundaries, with the exceptionof some of the carboniferous material which is crushed, graded and sold to steel industriesmainly in the Urals region. The disposal areas are lined with clay to form a semi-imperviousbarrier and thus there will be some seepage of effluent into local groundwater. It is predicted thatthe existing waste disposal areas can continue to operate until 2013, at which time they will befull. However, within the Bratsk Modernisation Programme, it is proposed to construct a newwaste disposal area which will give Bratsk Aluminium Smelter the opportunity to operate adisposal area in line with current industry practice.
The tails from the wet scrubbing systems discharge into settlement ponds to remove the solidsfrom the liquor. There are currently two such ponds offsite which are clay lined and thereforesemi-impervious to their contents. An early settlement pond was recultivated and returned to thecity in July 2005. The volume of the two existing ponds is expected to be sufficient to meet theplant requirements for the next four years, however the forthcoming Bratsk ModernisationProgramme, with the installation of dry scrubbers, will limit the volume of tails discharge andthere may be sufficient capacity in the existing systems.
Although the potroom environment was reasonable in all potrooms, a reduction in dust levels isexpected upon conversion of all potlines to point-feeding, to be carried out as part of theforthcoming Bratsk Modernisation Programme. At present only cells in Potroom 20 and Potroom25 are equipped with alumina point feeders.
5.1.5 Material Developments
This section presents material changes to the facility since the site visit was undertaken inSeptember 2008. The updated information was presented to Hatch through meetings with UCRUSAL in Moscow and has not been validated through an additional site visit. We have no reasonto believe that the information provided is not a true and fair reflection of developments at thefacility.
UC RUSAL has advised that there have been no material changes to the physical equipment/plantat the facility.
In January 2009 UC RUSAL took the decision to reduce operating costs at the facility by notrelining reduction cells as they approached the end of their life or failed. This approach resultedin marginally lower production in the first half of 2009 compared with expected production hadthe cell relining schedule been followed.
UC RUSAL advised Hatch that by May 2009 all failed cells had been relined and wereoperational and that the facility was restored to full operational level.
Hatch has been advised that the Bratsk Modernisation Programme has been temporarilysuspended. Instead UC Rusal has begun implementation of a Continuous ProductionImprovement Programme at the smelter. UC Rusal advised that this programme is aimed atachieving similar environmental goals as the suspended Bratsk Modernisation Programme, inparticular, it intends to decrease potroom roof emissions and the amount of anode effects.However, this programme does not include installation of new dry scrubbing Gas TreatmentCentres, and therefore in Hatch’s opinion is unlikely to result in similar environmental benefitsto the Bratsk Modernisation Programme.
UC RUSAL has advised that Bratsk Aluminium Smelter has recalculated the volume of SPLcurrently stored in the disposal area and now believes that the existing waste disposal area cancontinue to operate until 2012.
APPENDIX VI INDEPENDENT TECHNICAL REPORT
— VI-219 —

5.1.6 Specific Risks and Future Opportunities
Specific Risks
• Asset Integrity — The Bratsk Modernisation Programme does not include the likelyrequirement to replace many of the stud pulling cranes over the next few years. Of the 101cranes installed in the plant (four in each of Potrooms 1 to 24 and five in Potroom 25) onlysix have been replaced (three in both 1999 and 2004). With completion of the constructionof the smelter in 1976, this means that more than 90 of the cranes are at least 30 years old.
• Environmental Penalties — Bratsk Aluminium Smelter is located to the North of the LakeBaikal and is included in the area of high environmental sensitivity, which results in higherpenalties compared with UC RUSAL aluminium smelters. The Bratsk ModernisationProgramme is planned to decrease smelter fluoride emissions through installation of newdry scrubbing Gas Treatment Centres. The temporary suspension of this programme maypotentially result in increased environmental fines for air contamination. UC RUSAL hasadvised the local and regional environmental administration of the temporary suspension ofthe Modernisation Programme.
Future Opportunities
• Modernisation Programme (1) — The Bratsk Modernisation Programme can be resumedfollowing the current temporary suspension. The opportunity exists in restarting The BratskModernisation programme which is proposed to decrease emissions to State agreed levels(excluding fluoride and benzyprene). The plans for a significant upgrade of the smelterunder the Modernisation Programme are similar to that implemented at KrasnoyarskAluminium Smelter. Bratsk Aluminium Smelter and Krasnoyarsk Aluminium Smelter aresimilar in terms of layout and potroom design, and both were constructed as a single projectwith a five-year delay. The scope of the Bratsk modernisation programme includes theaddition of 64 new cells within the existing potrooms, upgrading electrical equipment toincrease the line current and the construction of dry scrubbers and point feeders on allpotlines. An opportunity has been identified to increase the plant capacity at BratskAluminium Smelter as a result of the modernisation. This would offset some of the costsof the necessary environmental improvements. The additional creep is scheduled to beprogressively realised in the in five years after commencement of the Bratsk ModernisationProgramme.
• Modernisation Programme (2) — Stage 2 of the Bratsk Modernisation Programme isproposed to further improve the technological process and decrease all emissions to Stateagreed levels (Clean Söderberg Technology). The second stage of the modernisationprogramme will comprise secondary hoods for all cells, colloidal anodes for all potlines andan extraction system for gas tar emissions during stud changing operation for all cells.
5.2 Krasnoyarsk Aluminium Smelter
5.2.1 Introduction
Hatch undertook a site visit to Krasnoyarsk Aluminium Smelter in September 2008. This Section5.2 has subsequently been revised and updated based upon data and information from UCRUSAL and discussions held with senior management in September 2009. With reference to thefollowing sections, please note;
• Section 5.2.2 — Updated with data and information as of September 2009,
APPENDIX VI INDEPENDENT TECHNICAL REPORT
— VI-220 —
• Section 5.2.3 — Process Description as of September 2008,
• Section 5.2.4 — Environmental Status as of September 2008,
• Section 5.2.5 — Material Developments at the facility between September 2008 andSeptember 2009, and
• Section 5.2.6 — All previous Specific Risks and Opportunities noted in September 2008together with any changes following new data and information provision.
5.2.2 History, Location and Infrastructure
Krasnoyarsk Aluminium Smelter is located on the outskirts of the city of Krasnoyarsk and wascommissioned in 1964. Krasnoyarsk is a major city in Siberia with well-developed infrastructureand a population of around 1,000,000. The town is located on the trans-Siberian railway andother major rail routes, providing good rail access for the supply of raw materials and deliveryof finished products.
Krasnoyarsk Aluminium Smelter produced 1,000 ktpa of saleable aluminium in 2008, and iscurrently the second largest aluminium smelter in the world.
Krasnoyarsk Aluminium Smelter has achieved OHSAS 18001 Occupational Heath and Safetycertification.
5.2.3 Process Description
Krasnoyarsk Aluminium Smelter is currently in the final stages of a large scale ModernisationProgramme, the scope of which included significant environmental upgrades including aluminapoint feeding, construction of new dry-scrubbing GTCs and conversion of the Söderberg cells todry anode technology. The environmental expenditure is recovered through increased metalproduction from the installation of 72 additional cells, plus an increase in potline current. TheModernisation Programme is now substantially complete with only a few projects extending into2009.
The smelter comprises 15 reduction potlines configured in the form of 24 separate potrooms. Thesmelter employs mainly Söderberg technology, with a total of 1,954 cells of VSS design in 21potrooms. All the VSS cells are type C-8BM (VAMI design) configured in an end-to-endarrangement with two facing rows of pots in each potroom.
The smelter also has 279 PFPB cells (VAMI design) in three potrooms, configured in anend-to-end arrangement, with 94 C160M4 cells and 184 C125/C120 cells. There are also 75pre-bake ‘refining’ cells of a different design producing high-purity metal (>99.97 per cent Al).The Söderberg cells operate at an average of 175 kA and the pre-bake cells at an average of 157kA. All Söderberg cells at the plant have now been retro-fitted with point-feeders.
Organisationally, the reduction lines are divided into three production “areas”:
• Production Area 1 contains VSS Potrooms 1 to 6, PFPB potrooms 7, 8 and 26 and therefining cells;
• Production Area 2 contains VSS Potrooms 9 to 16; and
• Production Area 3 contains VSS Potrooms 17 to 23.
APPENDIX VI INDEPENDENT TECHNICAL REPORT
— VI-221 —

A single paste plant located on-site produces the anode paste requirement for the VSS cells. Allpaste lines have been modernised and converted to dry anode technology. The anodes for thepre-bake cells are purchased from Chinese suppliers, and will be supplemented by up to 50,000tpa (approximately 10 per cent) from Sayanogorsk Aluminium Smelter following the rebuild ofthe SAZ No. 1 baking furnace next year. The pre-bake anodes are rodded at the KrasnoyarskAluminium smelter and the anode butts are returned either to Sayanogorsk Aluminium Smelterfor reprocessing or sold to local metallurgical plants as a process raw material.
Krasnoyarsk Aluminium Smelter has three casthouses which service the three production areas.The vast majority of the metal produced at the smelter is T-bar, with ingot, slab and alloys alsoproduced. The casthouse equipment consists of a range of furnaces with capacities ranging from10-tonne to 100-tonne, VDC casters for the production of T-Bar and slab (with slab saws), ingotcasters and re-melt furnaces. Casthouse No. 3 has recently undergone a modernisationprogramme to align the product mix to the marketing strategy and install higher capacityequipment to manage the increased metal production. The most recent equipment added is a largemodern VDC casting centre capable of producing rolling slab in lengths of up to 11.5m, whichwas commissioned in December 2007.
All raw materials are received by rail via the trans-Siberian rail network. KrasnoyarskAluminium Smelter receives its alumina by rail from various refineries, namely the AchinskAlumina Refinery, Bogoslovsk Alumina Refinery and Pavlodar Alumina Refinery. Additionally,minor quantities of alumina are sourced from the RUSAL refineries in Europe and the WestIndies. Pitch and coke is delivered by rail from a variety of sources within the Russian Federationand China.
Electric power for the Krasnoyarsk smelter is provided from the OAO Krasnoyarskenergo grid.The grid supply includes the Krasnoyarskaya hydroelectric power station, situated on the YeniseiRiver approximately 45 km from the plant, plus other coal-fired power stations in the region.
The current power requirement of the smelter is 1,986 MW. The total installed capacity of theKrasnoyarsk hydroelectric power station is 6,000 MW consisting of 12 turbines rated at 500 MWeach. The capacity of the power station is well in excess of local requirements and normally onlysix or seven of the turbines are in operation depending on demand and the water level in the dam.If required, Krasnoyarskenergo is able to import energy via the interconnected Siberian 500 kVdistribution grid. There is also the coal-fired power station ‘Krasnoyarsk-500’ located within onekilometre of the smelter boundary.
The smelter is connected to an adjacent grid substation. The substation is connected by four 220kV lines direct from the hydroelectric power station. These transmission lines are routedseparately; two are carried along the north bank of the river and two on the south bank.
In addition there are a further three 220 kV lines which connect to the Siberian 500 kV grid. Thegrid provides a robust interconnection with the Krasnoyarskaya and Bratsk power stationsproviding a high degree of security of supply.
All power to the plant is provided at 10 kV through 16 step-down transformers. The 10 kV isdistributed throughout the plant by a complex series of busbars to the potroom transformer/rectifier substations. The scope of the Modernisation Programme included the replacement ofmany transformers and rectifiers to facilitate the increase in line current.
APPENDIX VI INDEPENDENT TECHNICAL REPORT
— VI-222 —

5.2.4 Environmental
Krasnoyarsk Aluminium Smelter has achieved ISO 14001 environmental managementcertification.
Management at Krasnoyarsk Aluminium Smelter has a clearly defined strategy for significantlyreducing the environmental emissions of the smelter through the Modernisation Programme. Thelocation of the smelter on the outskirts of the city of Krasnoyarsk dictates stringentenvironmental requirements and monitoring, which are being addressed as part of theModernisation Programme.
The scope of the Modernisation Programme included the installation of 23 dry scrubbers toreplace low-efficiency electrostatic precipitators. The existing wet scrubbers continue to be usedon the dry scrubber exhaust gases for polishing and SO2 removal. The dry scrubbers have beenprogressively installed and this process is expected to be completed in early 2009. To date, allof the new scrubbers have been commissioned and 21 are now fully operational. The modernisedGTCs provide sufficient redundancy, with the fluorinated alumina obtained re-used in thepotrooms thus reducing overall fluorides consumption. The design and technology for the dryscrubbers was provided by an experienced European company.
In the potrooms, the VSS pots are all now equipped with alumina point feeding systems. This willlead to improved air quality in the potrooms and reduce the dust and fluoride emissions from theVSS pots.
In principle, all water from the wet scrubbing systems and storm water ponds is collected andre-used in the plant. The only discharge is sanitary waste water that is treated by the municipalsystems. The tailing ponds for the wet scrubbers are being lined with both clay and animpermeable membrane including a programme to address previously unlined ponds from earlysmelter operations.
Spent Pot Lining (SPL) is stored in a specially designed landfill 15 km east of the smelter inaccordance with Russian Federation regulations.
5.2.5 Material Developments
This section presents material changes to the facility since the site visit was undertaken inSeptember 2008. The updated information was presented to Hatch through meetings with UCRUSAL in Moscow and has not been validated through an additional site visit. We have no reasonto believe that the information provided is not a true and fair reflection of developments at thefacility.
UC RUSAL has advised that there have been no material changes to the physical equipment/plantat the facility, with the exception of the equipment/plant upgraded and/or modernised as part ofthe Krasnoyarsk Modernisation Programme, which was completed in September 2009. Theenvironmental scope of the Modernisation Programme included the conversion to dry anodetechnology, installation of dry scrubbers, modifications to the burners and installation of pointfeeding on all cells. The production creep associated with the Modernisation Programme hasbeen realised through the installation of additional cells and increasing line current. UC RUSALhas advised that all GTCs have been commissioned and are currently in operation.
In January 2009 UC RUSAL took the decision to reduce operating costs at the facility by notrelining reduction cells as they approached the end of their life or failed. This approach resultedin marginally lower production in the first half of 2009 compared with expected production hadthe cell relining schedule been followed.
APPENDIX VI INDEPENDENT TECHNICAL REPORT
— VI-223 —

UC RUSAL advised Hatch that it has formed plans to recommence the relining of cells.
Hatch has been advised that trials of the Clean Söderberg Technology on five cells in Potroom5 have been successfully implemented, and that the technology was introduced to all Söderbergcells of Potroom 5 as of the beginning of 2009.
5.2.6 Specific Risks and Future Opportunities
Specific Risks
• Third-party Power Equipment — The smelter power is received directly from the localgrid switchyard, which is located immediately adjacent to the smelter. Although there havebeen no significant power outages, there is some concern by smelter personnel over thecondition of the equipment in this substation. The local grid provider has developed amodernisation programme for the substation, including the erection of another two 185 MWtransmission lines from the nearby Krasnoyarsk-500 power station, but this is not expectedto be implemented for another three to five years.
Future Opportunities
• Clean Söderberg Technology — A potential opportunity exists to implement the CleanSöderberg Technology programme at Krasnoyarsk Aluminium Smelter, to further reducepotroom emissions. This relates to the use of ‘colloidal’ anode paste (with lower pitchcontent) within the Söderberg reduction cells. Potroom 5 is currently using this technology,and if successful it could be extended to all other Söderberg cells at KrAZ and also at otherRUSAL smelters with Söderberg potlines.
5.3 Sayanogorsk Aluminium Smelter
5.3.1 Introduction
Hatch undertook a site visit to Sayanogorsk Aluminium Smelter in September 2008. This Section5.3 has subsequently been revised and updated based upon data and information from UCRUSAL and discussions held with senior management in September 2009. With reference to thefollowing sections, please note;
• Section 5.3.2 — Updated with data and information as of September 2009,
• Section 5.3.3 — Process Description as of September 2008,
• Section 5.3.4 — Environmental Status as of September 2008,
• Section 5.3.5 — Material Developments at the facility between September 2008 andSeptember 2009, and
• Section 5.3.6 — All previous Specific Risks and Opportunities noted in September 2008together with any changes following new data and information provision.
5.3.2 History, Location and Infrastructure
Sayanogorsk Aluminium Smelter is located on the outskirts of the town of Sayanogorsk,Khakasia Republic in southern Siberia, approximately 75 km south of the regional capital cityof Abakan. Sayanogorsk has a population of approximately 60,000 and is located next to theYenesei River. The town has good rail access for the supply of raw materials and delivery offinished products.
APPENDIX VI INDEPENDENT TECHNICAL REPORT
— VI-224 —
The smelter produced first metal in 1985 and subsequent modernisations and expansions havelifted present production capacity to approximately 537 ktpa of saleable aluminium in 2008.
Sayanogorsk Aluminium Smelter has achieved OHSAS 18001 Occupational Heath and Safetycertification.
5.3.3 Process Description
The smelter is a relatively modern aluminium production facility, which utilises pre-baked anodetechnology throughout. Sayanogorsk Aluminium Smelter is currently in the final stages of a largescale Modernisation Programme which commenced in 2004. The scope of the ModernisationProgramme included; significant modernisation of the casting equipment, trial sections of newRUSAL Aluminium (RA) smelting technology cells, compensating busbar, modifications to theanode length, increasing the anode stud diameter, control systems and replacing transformerrectifiers. The Modernisation Programme is scheduled for completion in 2009.
The Sayanogorsk smelter comprises four reduction potlines configured in the form of eightseparate potrooms and a small pilot potroom. The smelter uses Point Feed Pre Bake (PFPB)technology supplied by VAMI and additional tests cells of RA smelting technology. The smeltingprocess characteristics are summarised below:
• Potline 1 comprises 204 cells, with 102 cells each in Potrooms 1 and 2. Potroom 1 contains99 type C-175 cells plus three type C-190 cells, all arranged end-to-end. Potroom 2 issimilar to Potroom 1, but contains 58 type C-175 and 44 type C-190 cells. The C-190 cellsin both potrooms operate with the assistance of a booster rectifier;
• Potline 2 contains 204 cells, with 102 cells each in Potrooms 3 and 4. All cells in Potline2 are of type C-175 arranged end-to-end;
• Potline 3 contains 164 cells, with 82 cells each in Potrooms 5 and 6. All cells in Potline 3are type C-255 arranged side-by-side;
• Potline 4 contains 179 cells, with 89 cells in Potroom 7 and 90 cells in Potroom 8. All cellsin Potline 4 are type C-255 arranged side-by-side with the exception of a test section of fivecells in Potroom 8 of RA-320 and four cells of C-280 technology; and
• The pilot potroom contains 16 cells of RA-400 design and seven cells of C-255 design. Atthe time of the site visit, eight of the RA-400 cells were in operation and the remainingeight cells were under construction. These latest eight cells are configured to the exactdesign as will be used for the new Taishet smelter. It is intended to replace the C-255 cellsin this experimental room with a trial section of RUSAL’s latest technology development,the RA-500 cell, in 2009.
The C-175, C-190 and C-255 cells were initially designed to operate at 175 kA, 190 kA and 255kA, respectively. At present the cells are operating at 207 kA (C-175), 219 kA(C-190), andbetween 296 kA and 306 kA (C-255). The plant management has increased the potline current andhence Sayanogorsk smelter production over recent years.
All potrooms have four cranes with three in operation and one on standby or in plannedmaintenance. The cranes are used in all potlines to tap liquid metal, change anodes, side breakcells where required and distribute anode cover material.
Sayanogorsk Aluminium Smelter has one casthouse. Metal is produced as ingot, T-bar, rollingslab and extrusion billet. In addition, liquid aluminium is transferred to SAYANAL, which islocated adjacent to the Sayanogorsk smelter. The casthouse has been significantly modernisedover recent years to produce valued added products aligned to RUSAL’s marketing strategy.
APPENDIX VI INDEPENDENT TECHNICAL REPORT
— VI-225 —

Sayanogorsk Aluminium Smelter is supplied alumina from Nikolaev Alumina Refinery. Aluminais received at the site in two rail handling units and then transported to potroom storage silosthrough a pneumatic transport system.
The Sayanogorsk smelter has its own carbon facilities including a recently constructed bakingfurnace (No. 3) for Khakas Aluminium Smelter. The expanded carbon plant produces sufficientquantities of anodes to meet the requirements of Sayanogorsk Aluminium Smelter, KhakasAluminium Smelter and also the pre-bake potlines of the Krasnoyarsk Aluminium Smelter. Thegreen anode plant consists of three paste production lines of around 120 ktpa nominal capacityeach. Anode baking is performed in three furnaces which are located side-by-side.
The smelter receives the required pitch from suppliers within the Russian Federation and cokefrom a variety of suppliers in the Russian Federation and China.
Electric power for Sayanogorsk Aluminium Smelter is provided via the Khakassenergo grid fromthe Sayano-Shushenskaya hydroelectric power station, situated on the Yenisei Riverapproximately 50 km from the plant. The Sayanogorsk smelter purchases electrical energy fromKhakasenergo, the regional power supply company.
The power requirement of the smelter at current production levels is 1,023 MW. The totalinstalled capacity of the power station is 6,400 MW. The capacity of the power stationsignificantly exceeds local requirements and only a portion of the turbines are used duringnormal operation, depending on demand and the water level in the dam.
The smelter is fed by 220 kV lines direct from the hydroelectric power station. This provides arobust interconnection with the Khakassenergo grid ensuring a high degree of security of supply.
All power to the plant is provided at 20 kV and is distributed throughout the plant by a seriesof busbars to the transformer/rectifier substations. As part of the Sayanogorsk ModernisationProgramme the transfer rectifiers have been upgraded to support the line current increases whichhave occurred over recent years.
5.3.4 Environmental
Sayanogorsk Aluminium Smelter has achieved ISO 14001 environmental managementcertification.
All the potrooms at Sayanogorsk Aluminium Smelter have dry scrubbers and the performance ofthe environmental systems is good.
The two baking furnaces No. 1 & 2 at SAZ are equipped with wet-scrubbing Fume TreatmentCentres (FTCs). A complex comprising three adjacent FTCs was initially constructed at the headof BFs 1 & 2, with one section deliberately left incomplete, since the intention at that time wasto add a future third baking furnace of a similar design. However, the No. 3 baking furnacerecently added under the Khakas Smelter project is of a more modern design with its owndry-scrubbing FTC, and therefore the ducts from BFs 1 & 2 have now been combined to provideadditional standby capacity within the wet-scrubbing FTCs.
As part of the Sayanogorsk Modernisation Programme, the process control equipment of the dryscrubbers was replaced by a new modern fluoride emissions monitoring system. The reliabilityof the gas cleaning centre has been improved and this is expected to ensure the smelter’s goodenvironmental performance can be maintained in the future.
APPENDIX VI INDEPENDENT TECHNICAL REPORT
— VI-226 —
5.3.5 Material Developments
This section presents material changes to the facility since the site visit was undertaken inSeptember 2008. The updated information was presented to Hatch through meetings with UCRUSAL in Moscow and has not been validated through an additional site visit. We have no reasonto believe that the information provided is not a true and fair reflection of developments at thefacility.
UC RUSAL has advised that there have been no material changes to the physical equipment/plantat the facility.
In August 2009, a major accident occurred at the Sayano-Shushenskaya HPP in Siberia, whichwas the main supplier of electricity to Sayanogorsk Aluminium Smelter and resulted in thetemporary loss of power to the smelter. Hatch understands that production at the smelter was notmaterially affected in the immediate aftermath of the accident as alternative sources of powerwere quickly identified. Hatch understands that Sayanogorsk Aluminium Smelter is currentlyreceiving power from the regional grid (“Siberian Power Pool”) and in particular the regions ofKrasnoyarsk and Kemerovo which form part of the Siberian Power Pool. UC RUSAL has statedthat it does not expect aluminium production at Sayanogorsk Aluminium Smelter to be affectedduring the reconstruction of Sayano-Shushenskaya HPP, which the owners, RusHydro, expect tolast for four years.
5.3.6 Specific Risks and Future Opportunities
Specific Risks
• Power Supply — UC Rusal has advised that the accident at Sayano-Shushenskaya HPP inAugust 2009 will not affect future production and that alternative sources of power supplyhave been secured. However, Hatch was not provided with details of the new powerarrangements and thus can not confirm their validity.
Future Opportunities
• Modernisation Programme — Management at the Sayanogorsk Aluminium Smelter areimplementing a clearly defined strategy for improving the financial and non-financial keyperformance indicators of the smelter, which commenced in 2004 and will continue until2009. The scope of modernisation works was related to increased metal production,reduction in emissions, reduction in unit consumption of raw materials and increasedcapacity and flexibility of the casthouse.
5.4 Novokuznetsk Aluminium Smelter
5.4.1 Introduction
Hatch undertook a site visit to Novokuznetsk Aluminium Smelter in September 2008. ThisSection 5.4 has subsequently been revised and updated based upon data and information from UCRUSAL and discussions held with senior management in September 2009. With reference to thefollowing sections, please note;
• Section 5.4.2 — Updated with data and information as of September 2009,
• Section 5.4.3 — Process Description as of September 2008,
• Section 5.4.4 — Environmental Status as of September 2008,
APPENDIX VI INDEPENDENT TECHNICAL REPORT
— VI-227 —

• Section 5.4.5 — Material Developments at the facility between September 2008 andSeptember 2009, and
• Section 5.4.6 — All previous Specific Risks and Opportunities noted in September 2008together with any changes following new data and information provision.
5.4.2 History, Location and Infrastructure
Novokuznetsk Aluminium Smelter is located in Novokuznetsk, which is a major city in centralsouthern Siberia with a population of approximately 630,000 people. The city is situated in theKemerovo Region and stands on the Tom River.
Novokuznetsk Aluminium Smelter comprises two separate and relatively independent smeltersites, although for management, sales and accounting purposes the sites are considered to be oneintegrated smelter operation. Construction of Site 1 of the Novokuznetsk smelter (hereinafterreferred to as NkAZ-1) commenced in 1939 and first metal was produced in January 1943.Completion of the construction of all facilities of NkAZ-1, together with full metal production,was achieved in 1957. Site 2 of the Novokuznetsk smelter (hereinafter referred to as NkAZ-2),which is located approximately 1.6 km from NkAZ-1, produced its first metal in 1959.Completion of all facilities of NkAZ-2 and full metal production was achieved in 1966.
NkAZ-1 and NkAZ-2 produce approximately 102 ktpa and 218 ktpa (total 320 ktpa),respectively, of saleable aluminium. Novokuznetsk Aluminium Smelter produced 320 kt ofsaleable aluminium in 2008.
Novokuznetsk Aluminium Smelter has achieved OHSAS 18001 Occupational Heath and Safetycertification.
NkAZ-1 is currently not operational and is under care and maintenance. Refer to Section 5.4.5.
5.4.3 Process Description
Each of the two smelter sites has its own anode paste production facility. Calcined coke for thetwo paste plants is delivered by rail directly into the coke storage buildings. Historically,suppliers within the Russian Federation and China have been used, but the plant is currentlyprocuring all its coke from the USA, India and Argentina. Pitch is delivered from theWest-Siberian Metallurgy Plant located in Novokuznetsk and it is shipped to the smelter viarailway in a liquid form.
Each of the two production sites at Novokuznetsk Aluminium Smelter has a dedicated casthouse;Casthouse 1 at NkAZ-1 and Casthouse 2 at NkAZ-2. Casthouse 1 can produce ingots, billets andsimple alloys. Most alloyed products from Novokuznetsk Aluminium Smelter are produced inCasthouse 2 at NkAZ-2 which has recently been modernised.
Until early 2008, NkAZ was supplied with alumina exclusively from the Pavlodar AluminaRefinery. However, NkAZ now receives 48 per cent of its alumina requirements from the UCRUSAL Urals refinery at Kamensk-Uralsky, and the balance from Pavlodar.
The main smelter management and administration offices are all located at the NkAZ-1 site.
Annual energy consumption for the smelter (NkAZ-1 and NkAZ-2) at the present time isapproximately 5,381 GWh, at an average power requirement of 614 MW for the combinedsmelting facilities.
APPENDIX VI INDEPENDENT TECHNICAL REPORT
— VI-228 —

The main differences between the NkAZ-1 and NkAZ-2 sites are detailed below.
Site NkAZ-1
NkAZ-1 comprises Potlines 2, 4 and 5 of Novokuznetsk Aluminium Smelter (five potrooms intotal). All cells of NkAZ-1 employ VAMI HSS technology. The smelting process characteristicsare summarised below:
• Potline 2 comprises a single potroom (Potroom 2) of 76 cells. Potroom 1 used to form partof an electrical circuit with Potroom 2, but was permanently decommissioned in 1993 forenvironmental reasons. Potroom 2 employs an early variant of VAMI HSS technologytermed BT-82 which was initially designed to operate at 82 kA, but is currently operatingat approximately 88 kA; and
• Potline 4 (Potrooms 3 and 4) and Potline 5 (Potrooms 5 and 6) comprise 168 and 160 cellsrespectively, all of VAMI HSS BT-87 technology. The BT-87 cell was initially designed tooperate at 87 kA, but is currently operating at approximately 104 kA. All cells of Potline5 are equipped with an automatic alumina distribution system with point feeders.
Pot relining operations are carried out in-situ in all potrooms.
Casthouse 1 can produce only simple 1XXX series alloys, mainly in the form of 15 kg ingots,750 kg T-bars, round billets up to 248 mm diameters and 100x100 mm square bars.
NkAZ-1 is connected to the power grid through four independent high voltage lines at 110 kV,all of which are used under normal operation and any three of which are required to maintain thesmelter’s full production.
Site NkAZ-2
NkAZ-2 comprises Potlines 6, 7 and 8 of Novokuznetsk Aluminium Smelter (six potrooms intotal). All 531 cells of NkAZ-2 employ VAMI VSS technology, arranged end-to-end. Thesmelting process characteristics are summarised below:
• Potline 6 (Potrooms 7 & 8) comprises 168 VAMI VSS C-2 cells operating at approximately143 kA.
• Potline 7 (Potrooms 9 & 10) comprises 183 VAMI VSS C-3 cells operating at approximately142 kA.
• Potline 8 (Potrooms 11 & 12) comprises 180 VAMI VSS C-8BM cells operating atapproximately 173 kA.
Digout of failed cells is carried out in-situ, and then the empty shell is removed by overheadcrane and immediately replaced by a spare (repaired) shell, before being re-lined in-situ. Theoverhead crane and building structure are of insufficient load capacity to remove or replace alined pot.
Within Casthouse 2, there are two rail-loading terminals for product export; one for normalwagons and the other for freight containers. Casthouse 2 has recently been modernised includinga Brochot automated line for the production of 15 kg and 22.5 kg ingots, plus a Wagstaff VDCcasting machine for billet, incorporating in-line metal treatment facilities plus a Hertwichcontinuous homogenising and sawing plant for extrusion billet of 6XXX series alloys. The new
APPENDIX VI INDEPENDENT TECHNICAL REPORT
— VI-229 —

Wagstaff equipment can produce billets up to 7.5 m in length. The new ingot line reached itsdesign capacity in early 2007 after a nine-month development period. The new VDC caster andhomogeniser were commissioned in December 2007, and are currently operating close to theirnameplate capacities.
At the present time, alloy production at NkAZ-2 is approximately 53 ktpa.
The anode paste facility at NkAZ-2 consists of three lines and makes several grades of paste foruse within all NkAZ-2 potlines. The paste plant produces these paste grades utilising lowtemperature pitch. Stud paste is not produced at the plant, but is procured from the KrasnoyarskAluminium smelter.
NkAZ-2 is connected to the power grid through eight independent high voltage lines at 10 kV,seven of which are used any one time and six of which are need to support smelter fullproduction. The power grid is connected to several power plants, providing further reliability ofpower supply.
5.4.4 Environmental
Novokuznetsk Aluminium Smelter has achieved ISO 14001 environmental managementcertification.
Site NkAZ-1
Potroom 2 currently has no off-gas treatment facilities. Fume is drawn off, ducted under the cellsand vented to atmosphere via a 120 m high stack. The construction of a new wet scrubbingsystem for this potroom is in progress and completion is scheduled for 2009.
Potrooms 3, 4 and 5 of Potlines 4 and 5 are all connected to wet-scrubbing facilities, viaductwork drawing fumes off the top of the cells.
It is several years since any coke calcination has been carried out at NkAZ-1, since all petroleumcoke is now received in the pre-calcined condition. The calcined coke reclaimed from storage isdried before reaching the paste mixers, using a hot-air generator in a rotary oven. The dryingsystem is provided with cyclonic dust control which removes around 80 per cent of particulates.
There are no plans to decommission the calciner stream, since the entire NkAZ-1 paste plantmust be decommissioned before 2010 to comply with the agreed environmental programme. Thepaste requirements of the NKAZ-1 smelter must then be accommodated by the NkAZ-2 pasteplant, which should be possible as the NkAZ-2 potlines will commence conversion to pre-bakeanodes in the same timeframe. It is understood that the NkAZ-2 pre-bake anode requirementswill be outsourced.
Site NkAZ-2
Potlines 6, 7 and 8 are fitted with gas treatment facilities using four wet scrubbers per potlineand Potline 8 incorporates an additional electrostatic precipitator for particulates. In Potlines 6and 7, the gas offtake is via ductwork at the top of the cells, while Potline 8 has fume extractionducted down to the basement of the cells.
All scrubbers employ a counter-flow arrangement. Scrubbers are bypassed during maintenanceand the fumes are directly discharged into the atmosphere. This situation is currently beingremedied by the installation of additional standby equipment, to permit fume scrubbing tocontinue when the main facilities are shut down for maintenance.
APPENDIX VI INDEPENDENT TECHNICAL REPORT
— VI-230 —
According to the approved environmental programme, the NkAZ-2 plant is obliged todecommission all of its existing (Söderberg) capacity by 2014, and to have fully converted allpotlines to pre-bake anode technology by that date.
The coke calcination kiln in the anode paste plant at NkAZ-2 was decommissioned in 2007, andall coke delivered to the site is pre-calcined. A new hot-gas generator is now used with the oldrotary cooler to remove moisture from the calcined coke ahead of process mixing in the pasteplant. The gases are cleaned of particulates by passage through an electrostatic precipitator.However, there are no scrubbing facilities to remove noxious chemicals from the paste fumes orthe liquid pitch circuit.
5.4.5 Material Developments
This section presents material changes to the facility since the site visit was undertaken inSeptember 2008. The updated information was presented to Hatch through meetings with UCRUSAL in Moscow and has not been validated through an additional site visit. We have no reasonto believe that the information provided is not a true and fair reflection of developments at thefacility.
UC RUSAL has advised that there have been no material changes to the physical equipment/plantat the facility.
Novokuznetsk Aluminium Smelter is currently operating below its full production capacityfollowing the full closure of the NkAZ-1 production facilities in April 2009. UC RUSALattributed the closure to a strategic decision based on reduced demand for aluminium from theglobal market and as part of a programme to reduce consolidated operating expenditure. Hatchwas advised that UC RUSAL view the closure of NkAZ-1 as temporary and that facility is thesubject of continuous review and monitoring to determine an optimal time for restart. The idledproduction capacity is currently under care and maintenance.
In December 2008 UC RUSAL took the decision to delay relining 15 reduction cells that hadfailed. This approach resulted in marginally lower production in the first half of 2009 at NkAZ-2compared with expected production had the cell relining schedule been followed. UC RUSALadvised Hatch that these 15 cells had subsequently been relined during the second quarter of2009, and that all cells had returned to operation by the end of the quarter.
5.4.6 Specific Risks and Future Opportunities
Specific Risks
• Environmental Constraints — The environmental improvement programme as agreedbetween the Novokuznetsk Aluminium Smelter and the local environmental agency requiresthat the majority of the existing operational process equipment, particularly at NkAZ-1, betotally decommissioned before 2014. A long-term plan for the upgrade of the entire smeltermust therefore be fully approved and implemented as soon as possible.
Future Opportunities
• Clean Söderberg Technology — A potential opportunity exists to implement RUSAL’sClean Söderberg Technology programme at Novokuznetsk Aluminium Smelter, on theC-8BM VSS cells of Potline 8 at NkAZ-2. This technology is currently being trialled at theKrasnoyarsk Aluminium smelter.
APPENDIX VI INDEPENDENT TECHNICAL REPORT
— VI-231 —
• Prebake Conversion — It is intended to convert five cells within the east side of Potroom10 (of Potline 7 at NkAZ-2) to pre-bake anode technology, as a pilot for a potential futurefull-scale conversion. The project includes a new pot control system, alumina feed systemand dry-scrubber GTC section. UC RUSAL expect the new pre-bake cells to operate at 167kA, compared with the 142 kA of the existing C-3 cells, and therefore a 25 per cent increasein metal production per cell is expected if a full-scale implementation project was toproceed.
• Increased Alloy Production — With the recent commissioning of new casthouseequipment at NkAZ-2, it is intended to increase the production of alloys in future years.
5.5 Irkutsk Aluminium Smelter
5.5.1 Introduction
Hatch undertook a site visit to Irkutsk Aluminium Smelter in September 2008. This Section 5.5has subsequently been revised and updated based upon data and information from UC RUSALand discussions held with senior management in September 2009. With reference to the followingsections, please note;
• Section 5.5.2 — Updated with data and information as of September 2009,
• Section 5.5.3 — Process Description as of September 2008,
• Section 5.5.4 — Environmental Status as of September 2008,
• Section 5.5.5 — Material Developments at the facility between September 2008 andSeptember 2009, and
• Section 5.5.6 — All previous Specific Risks and Opportunities noted in September 2008together with any changes following new data and information provision.
5.5.2 History, Location and Infrastructure
Irkutsk Aluminium Smelter is situated 3 km from the town of Shelekhov, approximately 22 kmto the north-west of the city of Irkutsk. Shelekhov has a population of just 57,000 people, butIrkutsk is a major city with around 635,000 inhabitants and many other large industrial facilities.The city of Irkutsk is located on the Angara River at the southern end of Lake Baikal, an areaof world environmental significance.
The total area of the smelter site is 236 hectares. The trans-Siberian railway runs 2 km east ofthe facility, providing excellent transport links for all the material flows to and from the plant.The smelter is located adjacent to a metals powder plant, a silicon plant and a cable factory(aluminium and copper).
Irkutsk Aluminium Smelter commenced operations in 1962 and has undergone a series ofmodifications, expansions and capacity creep since that time. The original ‘nameplate’ capacitywas 247 ktpa, however Irkutsk Aluminium Smelter produced 358 ktpa of saleable aluminium in2008.
APPENDIX VI INDEPENDENT TECHNICAL REPORT
— VI-232 —

5.5.3 Process Description
The existing smelting facilities comprise five potlines of two potrooms each (ten potrooms intotal). Potline 2 is the oldest and is of “single storey” design. The other potlines are of basementdesign with the operating floor approximately four metres above local grade level. VSStechnology of VAMI design is used for Potrooms 1-8 of the smelter, except for Potroom 4(Potline 2) which also houses a pilot section of 13 pre-bake cells. Pre-baked anode technologyof SibVAMI design is used for Potrooms 9 and 10. Potline 5 was started-up at the end of 2007.The smelting process characteristics are summarised below:
• Potrooms 1, 2 and 8 are equipped with VAMI C-8B type cells with composite steel-and-aluminium studs and operate at approximately 164 kA;
• Potrooms 3 and 4 are equipped with VAMI C-2 and C-3 cells using cylindrical steel studswith copper shells operating at 135 kA. The 13 SibVAMI pre-bake cells in Potroom 4operate in a booster section at 140 kA, complete with autonomous gas scrubber. Anodes forthe pre-bake cells are imported from China;
• Potrooms 5, 6, 7 are equipped with VAMI C-8B-M cells with composite steel-and-aluminium studs and operate at approximately 164 kA. Potroom 6 also contains a block ofsix test cells with point feeders operating at 170 kA.
• Potrooms 9 and 10 are equipped with SibVAMI OA-300M2 pre-baked anode cells and at thetime of the site visit, 101 cells were in operation at 300 kA. The potroom buildings havebeen substantially completed and all cells and busbars have been installed. The potlinecontains a total of 200 modern pre-baked centre-feed cells in two parallel potrooms of 100cells each. Initially the cells will operate at 300 kA although it is expected that 330 kA willbe achievable after a short period (this was achieved on a pilot plant at Urals AluminiumSmelter). At 300 kA, the IrkAZ-5 potline is expected to produce around 169 ktpa. ThePotline is equipped with Pot Tending Machines by ISL for maintenance and Metal TappingCranes. Other associated project facilities include a new rodding shop and additionalcasting facilities, i.e. the installation of four 60-tonne holding furnaces and two ingotcasting lines within existing plant buildings.
Around 100 of the total of 705 Söderberg cells are currently equipped with plant-designed pointfeeders. Although a certain number of unresolved issues remain, for instance the difficulty ofhandling floury alumina, these cells operate with higher current efficiency and lower emissionsof dust and fluorides.
All routine cell maintenance activities of Söderberg Potlines are manual operations and relativelylabour intensive. Crust breaking and alumina feeding operations are carried out using bespokevehicles. Anode studs are serviced from above using overhead cranes, which are also employedto charge the continuous anodes with fresh paste via bins lifted from the operating floor andsuspended on the crane hooks. Fourteen anode stud cranes at the end of their service life arecurrently scheduled for replacement.
A single paste plant located on-site produces most of the anode material required for the smelter.However, due to capacity limitations of the on-site paste production facilities, some additionalanode paste is imported from the Bogoslovsk Aluminium Smelter.
There are two casthouses on-site; the “Casting Rolling Shop” and the “Electrical Cast House”.The “Electrical Cast House” is the smaller of the two on-site cast houses and is dedicated to ingotproduction, cooling and storage. Alloys are produced within this shop. The “Casting RollingShop” is made up of several bays and annexes and contains equipment for wire rod production,ingot casting, strip casting and VDC billet and busbar products. The busbar for the Irkutsk
APPENDIX VI INDEPENDENT TECHNICAL REPORT
— VI-233 —
Aluminium Smelter Potline 5 was cast in this shop. Additionally, this shop contains an annex forservicing the wire rod production machinery and for ladle maintenance. Much of this area isdesignated for use in the construction of new casting facilities to receive metal from Potline 5.
Irkutsk Aluminium Smelter receives its alumina by rail from Achinsk, Pavlodar and BogoslovskAlumina Refineries. Previously, alumina was also received from Urals Alumina Refinery. Pitchand coke is supplied by rail from a variety of sources within the Russian Federation. Baked anodeblocks for the new Potline 5 are supplied from China and delivered to the smelter by rail.
Irkutsk Aluminium Smelter is currently served by two load/unload railway stations locatedadjacent to the production facilities (Zavodskaya and Goncharovo). In addition, a new containerterminal was commissioned in 2005 enabling the smelter to increase container shipping from 134per month to 730 per month. The trans-Siberian railway is currently under-utilised and cancomfortably accommodate any foreseen increase in rail traffic movements arising from anincrease in production at Irkutsk Aluminium Smelter.
Electrical power for the smelter is provided from three primary sources: the Irkutsk hydroelectricplant, the Novo-Irkutskaya thermal coal plant located adjacent to the smelter and the 500 kVIrkutskenergo grid. The grid is supplied by three primary hydroelectric plants at Irkutsk, Bratskand Ustilimsk and supplemented by a series of smaller hydroelectric and thermal power stationslocated around the province.
Irkutsk Aluminium Smelter is connected at three points on the Irkutskenergo grid system, via theShelekhovo substation:
• 110 kV transmission lines directly from the Irkutsk Hydro (Angara) hydroelectric plantlocated on the outskirts of Irkutsk around 18 km east of the plant;
• 220 kV transmission lines directly from the Novo-Irkutsk thermoelectric power stationlocated around 16 km east of the plant; and
• 220 kV transmission lines from the Ustilimsk-Bratsk-Angarsk 500 kV main grid line via the500/220 kV switchyard at Angarsk, around 40 km to the west of the plant.
The electrical transmission lines for power supply to Potline 5 have been upgraded.
5.5.4 Environmental
Irkutsk Aluminium Smelter has achieved ISO 14001 environmental management certification.
Environmental monitoring is performed on-site and in the local community (Shelekhov) by boththe plant and other environmental agencies. The staff and community in the region are aware thatthey are close to the ecologically significant area around Lake Baikal and as a result need toperform to stringent environmental standards.
The pot gases from Potlines 1, 3 and 4 are all processed through wet scrubbers and electrostaticprecipitators. Potline 2 off-gases are treated via a wet scrubbing system, reducing the emissionsof fluorides, SO2, benzopyrene compounds and dust. Over recent years, the wet scrubbers andelectrostatic precipitators have been upgraded. Potline 5 is a pre-baked potline and is beingconstructed with modern dry scrubbing gas treatment.
Replacement of the gas burners and installation of secondary hoods for Potlines 1, 3 and 4 isproposed during the period 2009 to 2012. Conversion of the wet scrubbers to a dry scrubbersystem for these Potlines is also proposed from 2011 to 2013. UC RUSAL are planning to convertPotline 2 into a modern high amperage PFPB technology using dry scrubbing gas treatment in2011.
APPENDIX VI INDEPENDENT TECHNICAL REPORT
— VI-234 —

In the medium to long-term, the opportunity exists to further reduce fluoride and PFC emissionsfrom the Söderberg cells by completing the installation of point feeders. Potroom 4 of Potline2 has been equipped with an alumina point feeder system. Potroom 3 of Potline 2 will beequipped with a point feeder system during the period 2009 to 2010. Existing Potlines 1, 3 and4 are planned to be equipped with point feeder systems from 2010 to 2012.
Spent electrolyte is recycled and used to line new cells while spent carbon-based and reactedmaterials are sent to landfill in a site with a water-tight barrier. Tailings from the GTC webscrubbers are first processed to extract cryolite, and are then sent to Waste Area No 2. Waste AreaNo. 2 is expected to reach its capacity in 2010. A new waste storage area (Area No. 3) is plannedand construction will be completed in 2010. This is expected to provide an additional 350,000m3
of storage capacity.
5.5.5 Material Developments
This section presents material changes to the facility since the site visit was undertaken inSeptember 2008. The updated information was presented to Hatch through meetings with UCRUSAL in Moscow and has not been validated through an additional site visit. We have no reasonto believe that the information provided is not a true and fair reflection of developments at thefacility.
UC RUSAL has advised that there have been no material changes to the physical equipment/plantat the facility. with the exception of the equipment/plant forming the IrkAZ-5 project. Hatch wasadvised that 154 cells of IrkAZ-5 are currently operational, with the remaining 46 cells of theprojected planned to be commissioned by the end of 2009.
Irkutsk Aluminium Smelter is currently operating below its full production capacity followingthe closure of Potline 2 in February 2009. UC RUSAL attributed the closure to a strategicdecision based on reduced demand for aluminium from the global market and as part of aprogramme to reduce consolidated operating expenditure. Hatch was advised that UC RUSALview the closure of Potline 2 as temporary and that the potline is the subject of continuous reviewand monitoring to determine an optimal time for restart. The idled production capacity iscurrently under care and maintenance.
5.5.6 Specific Risks and Future Opportunities
Specific Risks
No specific risks material to the future operation of this facility have been identified.
Future Opportunities
• Clean Söderberg Technology — A potential opportunity exists to implement the CleanSöderberg Technology programme at Irkutsk Aluminium Smelter (e.g. use of point feeders).
• Efficiency Upgrade — The operations team at Irkutsk Aluminium Smelter are focused onstrategic initiatives to increase line current and cell life of the existing Söderberg potlines.The approved investment programme includes expenditure to upgrade rectifiers for Potlines1, 3 and 4 to facilitate the line current increase. Calculations performed by SibVAMIindicate that line current can be increased with changes to cathode lining, anode casing,modification to the bath chemistry and implementation of dry colloidal anode paste. Overthe past 10 years, a systematic programme was carried out to investigate unexpected potfailures. Design changes were made, improvements to quality control of the potconstruction were implemented and start-up procedures were modernised, resulting in asignificant decrease of early pot failures and an increase in average pot life.
APPENDIX VI INDEPENDENT TECHNICAL REPORT
— VI-235 —

5.6 Khakas Aluminium Smelter
5.6.1 Introduction
Hatch undertook a site visit to Khakas Aluminium Smelter in July 2009. This Section 5.6 hassubsequently been revised and updated based upon data and information from UC RUSAL anddiscussions held with senior management in September 2009. With reference to the followingsections, please note;
• Section 5.6.2 — Updated with data and information as of September 2009,
• Section 5.6.3 — Process Description as of July 2009,
• Section 5.6.4 — Environmental Status as of July 2009,
• Section 5.6.5 — Material Developments at the facility between July 2009 and September2009, and
• Section 5.6.6 — All previous Specific Risks and Opportunities noted in July 2009 togetherwith any changes following new data and information provision.
5.6.2 History, Location and Infrastructure
Khakas Aluminium Smelter is located within the site boundaries of the Sayanogorsk AluminiumSmelter. In substance the Khakas Aluminium Smelter could be regarded as an expansion of theSayanogorsk smelter, but it has been structured as a stand-alone legal entity for project financingpurposes. The operations and management personnel at the smelter are the same, however foraccounting purposes both operations report their costs separately.
The project was implemented as an Engineering, Procurement and Construction Management(EPCM) contract between RUSAL (prior to the formation of UC RUSAL) and its ownEngineering and Construction Company (ECC).
Construction of the Khakas Aluminium Smelter began in March 2005. Preheating of the first potbegan in late-November 2006, and the last pot was started up in October 2007. The potlinereached full capacity in February 2008 and produced 297 kt during 2008.
The Khakas smelter uses RUSAL’s RA-300 cell technology. The Khakas smelter project includeda new casthouse dedicated to the solidification of metal from the Khakas potline. The thirdbaking furnace on the site was also constructed as part of the Khakas smelter project. However,all green anode production and anode rodding operations are carried out within the existingSayanogorsk smelter facilities.
Khakas Aluminium Smelter has achieved OHSAS 18001 Occupational Heath and Safetycertification.
5.6.3 Process Description
The smelter consists of one potline (with two potrooms of 168 cells each) with a total of 336installed RA-300 cells, currently operating at 320 kA. Each potroom includes 11 Pot TendingAssemblies (10 for normal operation and one spare), one transfer gantry, one cathode removalcrane and utilises 10-tonne metal tapping ladles. The potrooms are connected via threepassageways permitting the early start-up of first metal. The smelter sources its alumina fromQueensland Alumina Ltd.
APPENDIX VI INDEPENDENT TECHNICAL REPORT
— VI-236 —
The Khakas smelter has a single anode baking furnace which, combined with the two existingfurnaces and green anode plant at Sayanogorsk Aluminium Smelter, is sufficient to meet therequirements of the smelter and provide sufficient redundancy for future modernisation works.
Khakas Aluminium Smelter has a single casthouse and all the casting equipment is new. Thecasthouse can currently produce standard unalloyed aluminium as 22.5 kg ingots, from twocasting lines, plus T-bars from a horizontal direct-chill (HDC) casting machine. The HDC castingcentre is the only such machine within Russia, and if it were equipped with appropriate toolingit would have considerable flexibility to produce several other products, such as long lengths ofbusbars.
Khakas Aluminium Smelter has a total electrical loading of 522 MW at full capacity. Electricityfor the smelter is generated by the Sayano-Shushenskaya hydroelectric plant (ownedindependently of UC Rusal), some 67 km from the smelter. Two 35 km-long 500kV transmissionlines feed the SAZ off-site substation “Oznachennoe-500” from the hydroelectric power stationand a single 500kV transmission line continues a further 32km to “Alyuminievaya”, a newoff-site substation that was constructed to feed KhAZ. A single 500kV transmission line of 55km also connects “Alyuminievaya” to the “Abakan-500” substation which is linked to theregional transmission grid.
The smelter is supplied with electricity via four 220 kV power lines from Alyuminievaya. Anadditional 220 kV link line interconnects the Khakas Aluminium Smelter and SayanogorskAluminium Smelter supply lines, a further measure aimed at ensuring continuity of supply incase of disruption to either plant. It is understood that the transmission lines bringing electricalenergy from the Sayano-Shushenskaya hydroelectric plant to KhAZ, and its own electricalswitchyard, are relatively independent of SAZ’s similar equipment.
The smelter potline is fed via a series of five transformer-rectifiers, each with a design rating of80 kA and 1,500 V. Although all five are normally in constant operation, at below their ratedcapacity, any four transformer-rectifiers could handle the full potline demand in the event of afailure of one unit. The transformer-rectifiers are made by AREVA and plant personnel haveindicated that they are generally performing well.
5.6.4 Environmental
Khakas Aluminium Smelter has achieved ISO 14001environmental management certification.
Khakas Aluminium Smelter is a modern facility employing pre-bake technology and excellentenvironmental control.
Two GTCs collect and treat off-gas from the potrooms and discharge the cleaned gas toatmosphere. As with most modern pre-bake smelters, the GTCs use the dry alumina scrubbingprocess that has high removal efficiencies for both gaseous and particulate fluorides and otherparticulates.
A single FTC treats the off-gas from the anode baking furnace No. 3 and discharges the cleanedgas to the atmosphere. Similar to the GTCs, the FTC uses a dry alumina scrubbing process whichhas high removal efficiencies of fluorides and particulates. The furnace fumes first pass througha cooler to condense tar, which is also removed by the FTC bags.
The GTCs provided on the potline and the FTC of the new baking furnace No. 3 at KhakasAluminium Smelter represent the best technology (currently available) for smelter gaseousemissions control.
APPENDIX VI INDEPENDENT TECHNICAL REPORT
— VI-237 —

5.6.5 Material Developments
This section presents material changes to the facility since the last site visit was undertaken inJuly 2009. The updated information was presented to Hatch through meetings with UC RUSALin Moscow and has not been validated through an additional site visit. We have no reason tobelieve that the information provided is not a true and fair reflection of developments at thefacility.
UC RUSAL has advised that there have been no material changes to the physical equipment/plantat the facility.
In August 2009, a major accident occurred at the Sayano-Shushenskaya HPP in Siberia, whichwas the main supplier of electricity to Khakas Aluminium Smelter and resulted in the temporaryloss of power to the smelter. Hatch understands that production at the smelter was not materiallyaffected in the immediate aftermath of the accident as alternative sources of power were quicklyidentified. Hatch understands that Khakas Aluminium Smelter is currently receiving power fromthe regional grid (“Siberian Power Pool”) and in particular the regions of Krasnoyarsk andKemerovo which form part of the Siberian Power Pool. UC RUSAL has stated that it does notexpect aluminium production at Khakas Aluminium Smelter to be affected during thereconstruction of Sayano-Shushenskaya HPP, which the owners, RusHydro, expect to last forfour years.
5.6.6 Specific Risks and Future Opportunities
Specific Risks
• Reduction Technology Risk — Khakas Aluminium Smelter is a new facility and is the firstsmelter to enter full commercial production using UC RUSAL RA-300 technology.However, the RA-300 development is a direct descendant of the VAMI C-255 cell designas has been used within two potlines (334 cells) at the adjacent Sayanogorsk smelter sincethe mid 1990s. The C-255 cells at Sayanogorsk are currently operating at over 300 kA. Thedevelopment of the RA-300 technology over a comparatively short period of time can beconsidered impressive. However, the technology, especially for operation at 320 kA, cannotyet be considered “mature” (see Section 2.3.2.1). Pot life has only been extrapolated froma few autopsies of voluntarily cut out cells. There is a risk that with a sample of 336 cells,undetected or underestimated problems may surface. Additionally, independently of the cellamperage, the hardware components of the RA-300 cell have not been proven for long-termoperation. This can have an impact on maintenance costs. However, it should be noted thatthe first KhAZ cells have now been in operation for almost three years, operations arereportedly stable and there have been no cell failures.
• Power Supply — UC Rusal has advised that an accident at the Sayano-ShushenskayaHydro Power Plant will not affect smelter production and that alternative sources of powersupply have been secured. However, Hatch was not provided with details of the new powerarrangements and thus can not confirm their validity.
Future Opportunities
No specific opportunities material to the future operation of this facility have been identified.
APPENDIX VI INDEPENDENT TECHNICAL REPORT
— VI-238 —

5.7 Bogoslovsk Aluminium Smelter
5.7.1 Introduction
Hatch undertook a site visit to Bogoslovsk Aluminium Smelter in September 2008. This Section5.7 has subsequently been revised and updated based upon data and information from UCRUSAL and discussions held with senior management in September 2009. With reference to thefollowing sections, please note;
• Section 5.7.2 — Updated with data and information as of September 2009,
• Section 5.7.3 — Process Description as of September 2008,
• Section 5.7.4 — Environmental Status as of September 2008,
• Section 5.7.5 — Material Developments at the facility between September 2008 andSeptember 2009, and
• Section 5.7.6 — All previous Specific Risks and Opportunities noted in September 2008together with any changes following new data and information provision.
5.7.2 History, Location and Infrastructure
The Bogoslovsk Alumina Refinery and Bogoslovsk Aluminium Smelter complex covers an areaof 143 hectares and is situated to the north of the town of Krasnoturinsk, which has around70,000 inhabitants. Krasnoturinsk is located in the Ural Mountains, approximately 370 km to thenorth of the major city of Ekaterinburg in the Sverdlovsk region. The complex dominates thetown, both physically and economically, and it has a heavy direct influence on almost all social,cultural and recreational affairs.
Construction of the Bogoslovsk Alumina Refinery and Bogoslovsk Aluminium Smelter complexat Krasnoturinsk began in 1941, and the smelting facilities were commissioned in May 1945. TheBogoslovsk Alumina Refinery was constructed to take advantage of local bauxite from the NorthUrals deposits, from mine works located within 40 km of the smelter site.
The Bogoslovsk complex incorporates its own railway stations. The Bogoslovsk complex owns,operates and maintains the track on-site, together with its own shunting locomotives and rollingstock.
Aluminium production at Bogoslovsk Aluminium Smelter has increased by around 25 per centbetween 1997 and 2002, with a steady annual growth rate during that period. The ‘nameplate’capacity of Bogoslovsk Aluminium Smelter was 153 ktpa, however the smelter produced 186 ktof saleable aluminium in 2008 and has been producing at around this level since 2002. However,the limits of production increase as a result of capacity creep have been reached and it isaccepted that any further growth in production may only be achievable with major capitalexpenditure.
5.7.3 Process Description
The smelting facilities consist of five potlines. Potlines 1 to 4 are very similar, arranged parallelto each other, with Casthouse No. 1 located centrally between Potlines 2 and 3. The fifth potlinecontains more cells than the others and was built in 1955. It is generally referred to as Potline6, and is therefore designated as such within this report. It is located in another plant area, remotefrom the other potlines and has its own dedicated Casthouse, No. 2.
APPENDIX VI INDEPENDENT TECHNICAL REPORT
— VI-239 —

All five potlines employ VAMI HSS reduction technology. Potlines 1 to 4 are similar in designand each comprises 160 cells arranged end-to-end in a single potroom of four rows of cells andoperates at approximately 80 kA. Potline 6, currently operating at 95 kA, comprises 184 cellsarranged end-to-end within two parallel potroom buildings of two rows of cells each. All cellswithin Potlines 1 to 4 are linked to a modern computerised control system (‘Elektra 160’) withina centralised control room. An identical control system is also provided for the remote Potline6.
In 2006, 172 out of the total of 824 cells at the smelter were relined by a sub-contractor operatingon-site. The average cell life is currently estimated at around 64 months. The BogoslovskAluminium Smelter is aiming for a cell life of 75 months and claim they would already be veryclose to achieving this value, but for problems encountered with batches of poor quality cathodeand sidewall blocks supplied to the plant for relining operations in 2004. As a result of theseproblems, many of the cells which were rebuilt in 2004 and 2005 have since been rebuilt again,some lasting less than one year in service, and this factor is blamed for the relatively highnumber of cell rebuilds necessary in 2006 and 2007. However, Bogoslovsk Aluminium Smelterhas advised that all quality problems with cathode blocks received from the Chelyabinsk planthave now been resolved.
Four cells in each of Potlines 3 and 4 were equipped with alumina point feeders in 2007.However, this trial has since been stopped and the alumina feeding returned to manual operationsfor these cells since point feeding of the “floury” alumina supplied to the smelter led to reducedcurrent efficiency.
Alumina and anode paste blocks are loaded to the cells using overhead cranes. Several craneshave recently been replaced under a development programme, and no further replacements areplanned at the present time. Pulling and re-setting of the horizontal studs is carried out bypneumatically operated wheeled vehicles.
The anode paste production facilities (dating from 1953) at Bogoslovsk Aluminium Smelter havea nameplate capacity of around 150 ktpa, however the smelter plans to produce 135 kt of pastein 2008. Anode paste used within the potroom cells is cast in the form of 1,350 kg blocks.Approximately, 1,500 t/month of surplus anode paste is exported to Irkutsk Aluminium Smelterand 2,200 t/month is exported to Urals Aluminium Smelter.
The two casthouses at the facility produce 600 kg T-bar sections in 600 mm lengths, 15 kg ingotusing semi-automated chain casters, sacrificial anodes (Al-Mg-Zn alloy) for steelwork protectionin the oil/gas, offshore and marine industries, and lengths of busbar for the smelter’s own use.Casthouse No. 1 produces ingots from both primary aluminium and around eight per cent of totalproduction from an Al-Si alloy, for automotive castings. T-bar sections are cast on VDCmachines — although the regular T-bar products are only 600 mm in length, the machines havethe capacity to produce cast lengths up to 2,500 mm. Casthouse No. 2 is much smaller andproduces only primary aluminium in 15 kg ingot form. Approximately 800 t/month of aluminiumin the form of 15 kg ingots is transported to the Bogoslovsk Aluminium Powder Plant, a distanceof 2.5 km away.
Bogoslovsk Aluminium Smelter receives its pitch and coke by rail. The plant consumes liquidand solid pitch in roughly equal quantities. Around 70 per cent of the coke used in the plant issupplied in the calcined condition, but the balance is supplied ‘green’ and is calcined on-site inthe smelter’s two rotary kilns. Liquid pitch and green coke are supplied from Chelyabinsk,Magnitogorsk and Zaporozhye. Calcined coke is supplied by Severstal (Chelyabinsk) andZaporozhye. High-temperature solid pitch is received in granular form from sources withinChina.
APPENDIX VI INDEPENDENT TECHNICAL REPORT
— VI-240 —
Alumina from the adjacent Bogoslovsk Alumina Refinery is used within the smelter, andtherefore there is no need for major infrastructure to support transportation and offloadingoperations, or for separate large alumina storage facilities. This provides a major positive effecton the transfer cost of alumina to the smelter.
Bogoslovsk Aluminium Smelter is currently supplied with approximately 453 MW from theregional grid through a number of contracts with independent generating companies. Around 360MW is used directly in the potlines.
The four main substations within the Bogoslovsk complex are fed at 110 kV from theKrasnoturinsk switchyard located at a distance of 3.2 km from the plant. This switchyard issupplied from the regional grid system. There are five main power stations supplying the grid,one of which (Serov) is a direct connection to the Krasnoturinsk switchyard at 110 kV.
Much of the electrical equipment at the Bogoslovsk Aluminium Smelter is aging, and thereforethere is an on-going programme to replace several potline rectifiers between 2007 and 2009.
5.7.4 Environmental
Bogoslovsk Aluminium Smelter has achieved ISO 14001 environmental managementcertification.
Potlines 1, 2 and 6 are currently the only Potlines equipped with GTCs. Potlines 1 and 2 areventilated through a wet scrubbing system installed between the two buildings. Soda ash solutionis used as a scrubbing agent. Potline 6 has its own dry scrubbing system, designed by VAMI andcommissioned in 2004 using alumina as a dry-scrubbing agent. Fluorinated alumina obtained inthe dry scrubber provides 100 per cent of the feed to the cells of Potline 6.
All cells are provided with roller-shutter doors on all four sides, which partially aids thecontainment of fume emissions. Potlines 3 and 4 are currently ventilated with the gases drawndown from the cells to a central collection ductwork system below the potroom operating floorlevel, but these collected gases are not scrubbed or treated in any way. The air quality in all thepotlines is extremely poor indicating insufficient building ventilation and unsatisfactory gascollection from the operating HSS cells. The ventilation supplied to the pots is inadequate dueto the outdated Potroom design, resulting in a dusty and fume-laden working environment.
Most of the spent pot lining materials is recycled to the alumina production process. Someresidues classified as moderately hazardous are disposed of in an approved landfill site.
The environmental sanitary zone between the site boundary and the town of Krasnoturinsk wasestablished in accordance with the sanitary norms prevailing during the 1970s, which is still thebasis of the plant’s compliance. Current sanitary norms would require an increased distancebetween the site and town boundaries, but it is recognised this is not practical for Bogoslovsky.
5.7.5 Material Developments
This section presents material changes to the facility since the site visit was undertaken inSeptember 2008. The updated information was presented to Hatch through meetings with UCRUSAL in Moscow and has not been validated through an additional site visit. We have no reasonto believe that the information provided is not a true and fair reflection of developments at thefacility.
UC RUSAL has advised that there have been no material changes to the physical equipment/plantat the facility.
APPENDIX VI INDEPENDENT TECHNICAL REPORT
— VI-241 —

Bogoslovsk Aluminium Smelter is currently operating below its full production capacityfollowing the closure of Potline 6 in the first quarter of 2009. UC RUSAL attributed the closureto a strategic decision based on reduced demand for aluminium from the global market and aspart of a programme to reduce consolidated operating expenditure. Hatch was advised that UCRUSAL view the closure of Potline 6 as temporary and that the potline is the subject ofcontinuous review and monitoring to determine an optimal time for restart. The idled productioncapacity is currently under care and maintenance.
In the first half of 2009 UC RUSAL took the decision to reduce operating costs at the facilityby not relining reduction cells as they approached the end of their life or failed. This approachresulted in marginally lower production in the first half of 2009 compared with expectedproduction had the cell relining schedule been followed. UC RUSAL advised Hatch that it hasformed plans to recommence the relining of cells.
5.7.6 Specific Risks and Future Opportunities
Specific Risks
• Flooding — From several previous audits of the Bogoslovsky facility, before it wasacquired by UC Rusal, Hatch was informed of instances of flooding at the plant in the1980s/1990s. However, the plant’s safety ‘passport’ as approved in 2006 by the Ministry ofEmergency of Russia specifically states the site to be free from risk of flooding.
• Long Term Operation of Potlines 3 and 4 — It has previously been demonstrated that anincrease in the Potroom ventilation rates and the installation of an additional gas treatmentsystem on Potlines 3 and 4 is not feasible. As a consequence, the smelter is currentlyexpected to cease production completely from Potlines 3 and 4 in 2013. This date is aconcession by the regulators, recently granted to extend the 2009 date originally imposedfor ceasing production from Potlines 3 and 4. The decommissioning of Potlines 3 and 4would decrease the total smelter aluminium production by approximately 68 ktpa, with acorresponding decrease in sales revenues. Similarly, the smelter is expected todecommission its entire anode paste production facilities in 2013, and this is likely toincrease the operating costs of the smelter since anode materials for the remaining potlineswould then have to be imported. Closure of the paste plant would also result in a decreasein the Bogoslovksy smelter revenues since its excess paste production is currently sold toother smelters.
Future Opportunities
No specific opportunities material to the future operation of this facility have been identified.
5.8 Volgograd Aluminium Smelter
5.8.1 Introduction
Hatch undertook a site visit to Volgograd Aluminium Smelter in September 2008. This Section5.8 has subsequently been revised and updated based upon data and information from UCRUSAL and discussions held with senior management in September 2009. With reference to thefollowing sections, please note;
• Section 5.8.2 — Updated with data and information as of September 2009,
• Section 5.8.3 — Process Description as of September 2008,
• Section 5.8.4 — Environmental Status as of September 2008,
APPENDIX VI INDEPENDENT TECHNICAL REPORT
— VI-242 —

• Section 5.8.5 — Material Developments at the facility between September 2008 andSeptember 2009, and
• Section 5.8.6 — All previous Specific Risks and Opportunities noted in September 2008together with any changes following new data and information provision.
5.8.2 History, Location and Infrastructure
Volgograd Aluminium Smelter is located on the outskirts of the city of Volgograd. The city haswell developed infrastructure and a population of around one million inhabitants. In addition toVolgograd Aluminium Smelter, Volgograd supports many other large industrial facilities,including machine building, shipbuilding, metallurgical, petrochemical and chemical industries.
Construction of the smelter began in 1955 and first production was achieved in 1959.
Plant capacity at Volgograd Aluminium Smelter has increased progressively in recent years andthe facility produced 166 ktpa of saleable aluminium in 2008.
5.8.3 Process Description
Volgograd Aluminium Smelter comprises three potlines configured in the form of five separatepotrooms, numbers 2 to 6. Potroom 1 was closed in 1990 and is now used as a general warehouse.The smelter employs a total of 414 cells of VSS design. Potline 1 (82 cells) are of cell type C-2operating at around 141 kA while the cells of Potline 2 (164 cells) are of type C-3 and areoperating at around 141 kA. The operating level of these potrooms is at floor level and forcedair cooling of the cathode shell and busbar is provided by a system of ventilation ducts andchannels. The ventilation fans and cooling ducts on Potline 1 have recently been modernised andthere is an on-going programme to modernise the ventilation fans and cooling ducts on Potline2.
Potline 3 (168 cells) is of cell type C8B-M operating at 167 kA. The operating level of thesepotrooms is around four meters above ground, providing natural ventilation to the pots and theworking environment inside the potroom.
All cells at the smelter are equipped with Toxsoft computerised process control (TROLL). Thesmelter has also been trialing an automated alumina point feeding system provided by Toxsoft.There are currently 25 cells operating with the point feeder system which have been in operationsince 2001.
The existing counterforce clamp cathode shells at Volgograd Aluminium Smelter are beingprogressively replaced by a stronger monocoque ribbed cathode shell. A programme to increasethe height of the anode and anode stud and also conversion to a dryer anode paste has recentlybeen completed, which has resulted in reduced emissions of volatile hydrocarbons from theanode paste. The busbars in Potline 3 are currently being upgraded to facilitate an increase in linecurrent.
The smelter has an anode paste plant designed by VAMI which was commissioned in 1964. In1992 the paste plant was reconstructed by a Finnish company. The smelter previously sourcedgreen coke for calcination in the paste plant area, however, the calciners were permanentlyclosed in 1998 and since then the smelter has exclusively purchased calcined petroleum coke.After drying, the coke is crushed and graded into five fractions. The coke is preheated and mixedin one of two independent paste lines. The pre-heater and paste mixer have been converted tooperation using a hot temperature medium. The paste production is operated in a batch process
APPENDIX VI INDEPENDENT TECHNICAL REPORT
— VI-243 —
to produce three different paste types. The paste plant has a capacity of 80 ktpa of anode pastewhich is sufficient to meet the current requirements of the smelter. Calcined petroleum coke hashistorically been sourced from suppliers in China, Libya, Kazakhstan and Romania, while pitchis procured from a Ukrainian supplier.
Volgograd Aluminium Smelter has two casthouses which service the potrooms. The metal cast isin the form of extrusion billet, T-bar, ingot and alloys.
Volgograd Aluminium Smelter receives its alumina from Nikolayev Alumina Refinery by rail,with occasional shipments by water. The smelter has ten alumina silos, with a combinedmaximum storage capacity of 22,000 tonnes of alumina, equivalent to approximately 25 days ofproduction. Alumina is received at the site in a rail handling unit and is then transported topotroom storage silos through a pneumatic transport system. The alumina is then delivered tocells using wheel mounted transport vehicles.
Volgograd Aluminium Smelter currently consumes around 314 MW of electricity. The smeltersources electricity from the federal wholesale energy market through a number of contracts withindividual generating companies and through spot purchases. The major source of electricitygeneration in the region is Volzhskaya hydroelectric power station, located around 7 km from thesmelter on the Volga River.
The smelter is connected to the Aliuminievaya substation of the Federal Grid Company whichoperates and maintains the transmission lines in the region. The substation is connected to theVolzhskaya hydro-electric power station by three 220 kV lines and the Gumrak substation viatwo 220 kV lines. The connection between the substation and the smelter is via eight 10 kVbusbars, which is operated by Volgograd Energo who lease the connection from the Federal GridCompany.
5.8.4 Environmental
Volgograd Aluminium Smelter has achieved ISO 14001 environmental management certification.
The prevailing winds are from the North East, parallel to the orientation of the potrooms andwould direct a relatively concentrated emission plume across the city to the South West. Thesmelter has an area of 190 ha and a 2,000 m regulated buffer zone within a total area of 22,341ha. Significant efforts to establish a forest on the grasslands has been achieved with 80 per centof the area planted with trees. Due to occasional exceedences of ground level concentration inthe regulated zone, an environmental improvement plan was agreed with regional authorities.Since the commissioning of the first VAMI designed alumina dry scrubber in June 2008, asignificant reduction in fluoride has been achieved and together with a wet system for sulphurdioxide, the smelter is currently within compliance. A review of the Environmental Permit willbe conducted by government agencies in 2009. In this regard, the current budget data forcompliance beyond 2008 is not valid.
In 2001, Volgograd Aluminium Smelter developed and partially implemented a programme ofmodernising its obsolete and low capture efficiency environmental facilities. Under the scope ofthis programme two main stacks of the existing gas treatment facilities were replaced, forcedventilation stations were installed on Potline 1 and new UV decomposers for benzopyrenecompounds were tested successfully.
In order to further reduce pollutant emissions and increase the efficiency of the existing gastreatment facilities a programme is underway to install forced ventilation for Potline 2 and equipall the gas discharge ducting with UV decomposers for benzopyrene compounds.
APPENDIX VI INDEPENDENT TECHNICAL REPORT
— VI-244 —
In addition, the completed conversion to dryer anode paste and the implementation of aluminapoint feeders is expected to reduce electrolytic cell air emissions.
Spent potlining is disposed offsite approximately 10 km from the smelter. The site consists of aseries of shallow ravines and has been used over the duration of the smelter life. The currentdumps are progressively covered with soil and grassed. Monitoring bores are installed andmonitored for fluoride but not cyanide. The disposal site will be returned to the local authorityafter rehabilitation. No data exists on groundwater flows.
The site maintains a well equipped environmental laboratory that is certified and accredited.
5.8.5 Material Developments
This section presents material changes to the facility since the site visit was undertaken inSeptember 2008. The updated information was presented to Hatch through meetings with UCRUSAL in Moscow and has not been validated through an additional site visit. We have no reasonto believe that the information provided is not a true and fair reflection of developments at thefacility.
UC RUSAL has advised that there have been no material changes to the physical equipment/plantat the facility.
In the first quarter of 2009 UC RUSAL took the decision to reduce operating costs at the facilityby not relining reduction cells as they approached the end of their life or failed. This approachresulted in marginally lower production in the first half of 2009 compared with expectedproduction had the cell relining schedule been followed. UC RUSAL advised Hatch that it hasformed plans to recommence the relining of cells.
UC RUSAL has advised that Volgograd Aluminium Smelter has successfully obtained a permitfor air emissions which is valid until June 1 2010.
5.8.6 Specific Risks and Future Opportunities
Specific Risks
No specific risks material to the future operation of this facility have been identified.
Future Opportunities
• Modernisation Programme — Volgograd Aluminium Smelter has the opportunity tocomplete the upgrade of all 414 cells to point-feeding technology and to upgrade tocentralised alumina distribution. A successful implementation of this programme couldreduce the manual labour input required, increase current efficiency and allow for anincrease in potline amperage. The anode effect rate would also be expected to decrease,which will reduce PFC emissions. Dust and fluoride emissions would also be expected todecrease due to a reduction of manual interventions on the cells.
• Product/Market Opportunities — Volgograd Aluminium Smelter has the opportunity toincrease production of value-added products such as extrusion billets. This can beimplemented through installation of a second homogenization furnace and a secondbillet-cutting line. The opportunity also exists to take advantage of the under-usedsecondary aluminium processing capacity existing in the former Potroom 8.
• Clean Söderberg Technology — A potential opportunity exists to implement the CleanSöderberg Technology programme at Volgograd Aluminium Smelter.
APPENDIX VI INDEPENDENT TECHNICAL REPORT
— VI-245 —
• Outsourcing — The smelter is located in an area with developed outsource servicesproviding the opportunity to outsource the electrical, mechanical, civil and structuralworkshops at the smelter. For example, relining activities are currently being divested to asubsidiary.
5.9 Urals Aluminium Smelter
5.9.1 Introduction
Hatch undertook a site visit to Urals Aluminium Smelter in September 2008. This Section 5.9 hassubsequently been revised and updated based upon data and information from UC RUSAL anddiscussions held with senior management in September 2009. With reference to the followingsections, please note;
• Section 5.9.2 — Updated with data and information as of September 2009,
• Section 5.9.3 — Process Description as of September 2008,
• Section 5.9.4 — Environmental Status as of September 2008,
• Section 5.9.5 — Material Developments at the facility between September 2008 andSeptember 2009, and
• Section 5.9.6 — All previous Specific Risks and Opportunities noted in September 2008together with any changes following new data and information provision.
5.9.2 History, Location and Infrastructure
The Urals Aluminium Smelter is situated in the town of Kamensk-Uralsky, which has around200,000 inhabitants. Kamensk-Uralsky is the third largest conurbation within the SverdlovskRegion, and is located 100 km to the south-east of the major city of Ekaterinburg.
Construction of the Urals Alumina Refinery and Urals Aluminium Smelter complex atKamensk-Uralsky commenced in 1931, and the facilities were commissioned in 1939.
The Urals Aluminium Smelter is currently served by two load/unload railway stations, which areunderstood to be readily capable of handling increased supplies and deliveries as a result of anyplant expansion. The plant owns, operates and maintains around 86 km of its own track togetherwith its own shunting locomotives and rolling stock.
Plant capacity has increased progressively since start-up and the facility produced 134 ktpa ofsaleable aluminium in 2008.
5.9.3 Process Description
The Urals Aluminium Smelter was initially constructed with four Söderberg Potlines. Theoriginal Potlines 1 and 4 have now been demolished and a new potline constructed usingpre-bake technology, designated as the new Potline 1. Potline 1 demolition and constructionworks commenced in 1987 and the first 40 cells of the potline were commissioned in 1994. Thesmelting process characteristics are summarised below:
• Potline 1 contains 162 cells (84 in Potroom 1 and 78 in Potroom 2. The pre-bake reductiontechnology employed is VAMI OA160 with a nominal design current of 160 kA, althoughthe line is now operating at 169 kA. A total of 58 cells were equipped with point feedersystems in Potroom 2. However, only 20 are currently in operation since point feeding ofthe “floury” alumina processed the smelter led to reduced current efficiency.
APPENDIX VI INDEPENDENT TECHNICAL REPORT
— VI-246 —

• Potlines 2 and 3 are older and both utilise 1930’s VAMI HSS technology, operating atapproximately 77 kA. Potline 2 comprises 128 cells arranged end-to-end in two potrooms,each with four rows of 16 cells in two-bay buildings. Potline 3 is similar in layout but eachpotroom contains four rows of 18 cells for a total of 144 cells in the Potline.
Cell tending operations are predominantly manual, special alumina vehicles are used for loadingalumina into the cells within the potroom. Anode changing is carried out using overhead processcranes.
There is no cathode repair shop provided at the smelter and therefore spent cells are not removedfrom the potrooms. During rebuild operations in the pre-bake Potline 1, the spent cell is liftedfrom its position by the cathode removal crane and taken to one end of the potroom building,where the cell lining is demolished and rebuilt before the fresh cell is returned to its location.Within the HSS Potlines 2 and 3, cells are demolished and rebuilt in-situ at their location in thepotrooms. Average cell life across the plant appears to be relatively low, at 49 months for thepre-bake and 52 months for the HSS cells. Cathode blocks are currently procured from the carbonfactory at Ukrgraphite, Zaporozhye (Ukraine).
Urals Aluminium Smelter also hosts a pilot potroom with six modern high-amperage SibVAMIdesigned cells arranged side-by-side in a single row. These test cells have been operating sinceApril 2005, in a modern purpose-built building of around 80 m in length. Designated as OA300,and initially designed for operation at 300 kA, the test cells have been operating at 336 kA sinceApril 2008. These are the same cells which are installed in the new Potline 5 at the IrkutskAluminium Smelter (IrkAZ-5). The pilot plant has its own dry scrubber system and a centralisedlow-velocity pneumatic alumina distribution system. Cells are tended by a single modernoverhead pot tending machine from the Czech Republic, which is itself being trialled within theplant. The pilot facility is the R&D centre for the evolution of this new pot technology, and newtransformers are being installed at the present time to further increase the cell amperage to 350kA. This is expected to be achieved by Stage 9 of the amperage creep project, however there isno fixed date for achieving this cell amperage as yet.
There is no anode paste or pre-bake anode production facilities at Urals Aluminium Smelter. Theold anode paste plant was decommissioned in the early 1990s as part of a series of environmentalcontrol measures. Söderberg anode paste was previously supplied from China but is nowprocured from Bogoslovsk Aluminium Smelter.
Pre-bake anodes are imported from China (from up to four different plants) and rodded on-sitein one of the old paste plant buildings, which is also used for the construction of cathode blockassemblies used for cell rebuilding. Two 2.5-tonne capacity induction furnaces melt the cast-ironrequired for both anode rodding and cathode sealing operations. An oven is provided to preheatanode and cathode blocks, and also the steel collector bars required for cathode block assembly.Spent anodes returned from the potroom are processed within the same shop, where butt andthimble stripping presses are provided for recycling of the anode rods. The anode rodding andrecycling facilities can process 45 units per eight hour shift.
The Urals Aluminium Smelter has two casthouses, the first is situated to the south of the newPotline 1 and the second is located between Potlines 2 and 3. Casthouse No. 1 is the older of thetwo and casts the metal from Potroom 1 of Potline 1, all four potrooms of Potlines 2 and 3 andalso from the pilot plant. Casthouse No. 1 produces A356 alloy ingots from four casting conveyorlines, each coupled to its own electrically-heated tilting furnace of around 10-tonne capacity, andprimary T-bar sections cast in VDC machines fed from a single stationary 18-tonne electricholding furnace.
APPENDIX VI INDEPENDENT TECHNICAL REPORT
— VI-247 —

Casthouse No. 2 is dedicated to servicing Potroom 2 of Potline 1 and produces metal in ingot andslab form, in addition to delivering 1,200 tonnes of liquid aluminium per month to the nearbyKamensk-Uralsky Metallurgical plant. Rolling slab of 1,270 x 350 mm cross-section is producedfrom twin VDC casters, with the maximum slab length limited by the overhead crane liftingcapacity of 3,500 kg. The VDC casters are fed from a 20-tonne stationary furnace. Ingots ofalloys A5 and A85 are produced from three casting conveyors coupled to three holding furnaces,two stationary of 12-tonne capacity and one tilting of 9-tonne capacity.
Alumina is sourced from the adjacent Urals Alumina Refinery and stored in relatively small siloslocated between the Potrooms. Larger storage facilities are not required due to the closeproximity of the supply. This integrated alumina supply gives a security to both physicalprovision of alumina and to cost implications. Surplus alumina is transported to a number of UCRUSAL smelter plants in Siberia.
Urals Aluminium Smelter is currently supplied with approximately 325 MW from the local grid,which was previously operated by Sverdloskenergo, and is fed from a high-capacity switchyardlocated around 2 km from the complex. This switchyard is a node point on the grid systemconnecting several supply lines with regional thermal and nuclear power plants.
5.9.4 Environmental
Urals Aluminium Smelter has achieved ISO 14001 environmental management certification.
Urals Aluminium Smelter completed the commissioning of the new pre-bake Potline 1 inDecember 2003, which replaced the old HSS Potlines 1 and 4. One-half of the new potline isequipped with a dry scrubber and the other half with both dry and wet scrubbing. The new GTCsreduce the fluorides released to the atmosphere and result in a decrease of fresh fluoride saltsrequired in the pots.
Off-gas from Potrooms 3 and 4 (Potline 2) is currently drawn off the pots and discharged to a120 m high stack, although the collected gases are not scrubbed or treated in any way. A wetscrubbing system is installed on Potrooms 5 and 6 (Potline 3), however only 50 per cent of cellsin these Potrooms are treated as the wet scrubber for the remaining cells is in poor condition andcannot be used. The scrubber effluent is treated and thickened and the collected material isrecycled to the smelting cells to minimise fresh cryolite requirements.
Potrooms 5 and 6 have no ventilation grating at floor level and the air quality is poor, althoughnot noticeably different from that of Potrooms 3 and 4 which have a forced ventilation systemwhich aims to improve air quality in the Potrooms.
SPL generated by the smelter is stored in an approved designated site outside Kamensk-Uralsky.
Studies are currently being undertaken into the best available scrubbing mechanisms for thetreatment of cell off-gases.
5.9.5 Material Developments
This section presents material changes to the facility since the site visit was undertaken inSeptember 2008. The updated information was presented to Hatch through meetings with UCRUSAL in Moscow and has not been validated through an additional site visit. We have no reasonto believe that the information provided is not a true and fair reflection of developments at thefacility.
APPENDIX VI INDEPENDENT TECHNICAL REPORT
— VI-248 —

UC RUSAL has advised that there have been no material changes to the physical equipment/plantat the facility, with the exception of the following.
Urals Aluminium Smelter is currently operating below its full production capacity following theclosure of Potline 2 and Potline 3 in the second quarter of 2009. UC RUSAL attributed theclosure to a strategic decision based on reduced demand for aluminium from the global marketand as part of a programme to reduce consolidated operating expenditure. Hatch was advised thatUC RUSAL view the closure of these potlines as permanent and the process of dismantling thecells will begin shortly.
The operating capacity of Urals Aluminium Smelter is now approximately 69 ktpa following thepermanent closure of Potline 2 and Potline 3.
5.9.6 Specific Risks and Future Opportunities
Specific Risks
• Energy Costs — Energy costs within the Urals region are significantly higher than energyfrom hydropower as used by many of the UC RUSAL Siberian smelters. Full de-regulationof the Federal energy sector is expected to take place by 2011.
Future Opportunities
• Technology Development — Six cells in the OA300 pilot plant have been operatingsatisfactorily since April 2005. At that time, the test potline was started at 300 kA, howeversince April 2008 the cells have been operating at 336 kA. New transformers are beingcommissioned at the present time and should shortly permit the line current of these pilotcells to be increased to 350 kA. A cell autopsy on one of the units was completed in 2008and satisfactory results were obtained concerning the performance of the lining.
• Efficiency Upgrade (1) — Operating experience has shown that pots of the pre-bakePotline 1 are at their limits of magnetic stability and heat balance. However, calculationsperformed by SibVAMI indicate that the line current could be increased if modifications tothe busbar system and the lining design are implemented. Urals Aluminium Smelter hastherefore developed a project to redesign the cell lining to incorporate graphitised cathodes,fit a new design of point feeder, modernise the pot control system and hence increase theline current to 175 kA on approximately 100 cells. Additional benefits would be anincreased cell life (from three to five years) and reduced energy consumption. This projecthas no fixed implementation programme and if this work is to go ahead, it would takeapproximately 3-4 years to make the necessary pot design modifications and is expected toresult in an additional 4.3 ktpa of metal production.
• Efficiency Upgrade (2) — It is likely that cell life across the plant can be increased in thefuture by the use of higher quality pot lining materials and improved cell repair and start-upprocedures.
5.10 Nadvoitsy Aluminium Smelter
5.10.1 Introduction
Hatch undertook a site visit to Nadvoitsy Aluminium Smelter in September 2008. This Section5.10 has subsequently been revised and updated based upon data and information from UCRUSAL and discussions held with senior management in September 2009. With reference to thefollowing sections, please note;
• Section 5.10.2 — Updated with data and information as of September 2009,
APPENDIX VI INDEPENDENT TECHNICAL REPORT
— VI-249 —
• Section 5.10.3 — Process Description as of September 2008,
• Section 5.10.4 — Environmental Status as of September 2008,
• Section 5.10.5 — Material Developments at the facility between September 2008 andSeptember 2009, and
• Section 5.10.6 — All previous Specific Risks and Opportunities noted in September 2008together with any changes following new data and information provision.
5.10.2 History, Location and Infrastructure
Nadvoitsy Aluminium Smelter is located in Nadvoitsy, a small and relatively remote town witha total population of around 8,000 people. Nadvoitsy is situated in the Segezha Region of theRepublic of Karelia and is approximately midway between St. Petersburg and Murmansk.
The project plan for the smelter construction was developed in 1948, first metal from the plantwas produced in 1954 and full commissioning of the facility was completed in 1964.
Alumina, baked anodes, anode paste and other raw materials and feedstock are delivered to theNadvoitsy aluminium smelter by rail. The rail link is robust allowing supply from either northor south and has reportedly never been a cause for delay in the history of the plant. TheNadvoitsy Aluminium Smelter owns, operates and maintains the entire railway track on-site,together with the 1.2 km feeder section to the mainline. The plant owns its own shuntinglocomotives but no rolling stock. Trains are received and dispatched to and from the national railsystem at the battery limits of the smelter’s track length.
In the summer months some of the metal product is trucked to a nearby canal port for export toSt. Petersburg, Murmansk or the hinterland. The inland waters are navigable via the BelamorBaltic canal as far as the Caspian and Black Seas. In the winter months, the canals are frozen andproduct is exported by rail only.
Nadvoitsy Aluminium Smelter had an original design capacity of 60 ktpa with operation at a linecurrent of 64 kA. A series of process improvements resulted in the plant producing 81 kt ofsaleable aluminium product in 2008.
5.10.3 Process Description
There are two potlines at Nadvoitsy Aluminium Smelter. Initially, both of the lines housed VAMIHSS technology, however some of the cells in Potline 2 have now been converted to pre-baketechnology.
• Potline 1 (Potrooms 1 and 2) contains 178 cells of VAMI HSS technology, operating at 83kA. Toxsoft point-feeders and a centralised alumina distribution system have been installedon 19 trial HSS cells. Nadvoitsy Aluminium Smelter has an approved budget for expandingthe trial section to 35 cells.
• Potline 2 (Potrooms 3 and 4) contains 180 cells, 98 of which have been converted topre-bake cells of Kaiser design, which are fully automated with point feeding for bothalumina and fluoride. The 98 pre-bake cells are currently operating at 90 kA while theremaining 82 HSS cells are operating at 83 kA. In addition, 16 of the pre-bake cells operatewith a centralised alumina distribution system using a low pressure air slide.
Alumina, delivered by bottom dump rail cars, is stored in four 2,000-tonne capacity silosproviding 16 operating days of buffer capacity. The smelter’s alumina requirements are met fromBogoslovsk Alumina Refinery, Aughinish Alumina and Alpart.
APPENDIX VI INDEPENDENT TECHNICAL REPORT
— VI-250 —

There are comprehensive repair and manufacturing facilities at the plant. Nadvoitsy AluminiumSmelter has its own small iron foundry on-site, located in the disused aluminium powdermanufacturing building, and at present the pre-bake anode blocks are rodded in this buildingusing molten cast-iron. Cathode blocks for both pre-bake and HSS cells are also sealed usingcast-iron. This facility would require expansion when the remainder of the cells are converted topre-bake design.
There are no anode paste or block production facilities at the smelter, and instead paste materialsfor the Söderberg cells are sourced from Chinese and Norwegian sources. Anodes for thepre-bake cells are procured from Chinese suppliers.
All HSS cathode shells at Nadvoitsy Aluminium Smelter have been converted from thecounterforce design to a stronger monocoque shell. The benefits of this decision are manifestedin the shorter cell turnaround times, lower relining costs and increased cell life.
The smelter has a single casthouse which includes facilities for the production of commercialpurity and foundry alloy ingot and more recently foundry alloy T-bar. The 2005 casthouseupgrade project installed a modern VDC casting station for the production of foundry alloyT-Bar. The new VDC facilities include two magnetically stirred furnaces for efficient alloypreparation. The majority of production is commercial purity ingot (74,300 tpa). A smallproportion of alloy ingot (6,400 tpa) is also produced, and the balance of production is alloyedT-bar (200 tpa).
Nadvoitsy Aluminium Smelter takes 170 MW of electrical energy from the regional grid, whichis operated by Karelenergo. All power is received at the plant via four 110 kV lines from thenearby Karelenergo switchyard, located at Kamenniy Bor approximately 6.3 km from the plant.
The smelter is strategically located to take advantage of the hydroelectric plants located on theVyg River system. The five hydroelectric plants have an installed capacity of 243 MW and formpart of the Karelenergo grid. The Karelenergo grid includes additional hydroelectric stations anda thermal power plant. However, due to high energy demand within the Karelenergo grid,approximately 40 per cent of the energy is imported from the adjacent Kolenergo grid.
5.10.4 Environmental
Nadvoitsy Aluminium Smelter has achieved ISO 14001 environmental management certification.The smelter currently operates under a “Temporarily Approved Emissions Permit” on an annualbasis.
Potline 1 previously had a GTC which employed wet-scrubbing, but the equipment wasproblematic and emitted vapours which were considered to be more damaging to the environmentthan having no fume treatment facility at all. The GTC was demolished in the mid 1980s, andat that time it was intended to replace it with a facility of a modified design. However, althoughconstruction work was started, it was abandoned shortly afterwards and since that time there hasbeen no environmental control of Potline 1. All pot off-gases are simply drawn off and emittedto atmosphere via a 120-metre stack.
Gas treatment of Potline 2 comprised a wet scrubbing facility, however due to maintenance andoperational limitations it was shut down in 2007. The UV benzopyrene decomposition unitsremain installed and are in operation downstream of the wet scrubber. The decision has beenmade to build a dry scrubbing system, and nearly one-half the duct work has been completed. Thecurrent schedule for the project estimates that commissioning will occur in 2014. Afterdemolition of the wet scrubber and until start up of the new dry scrubber, Potline 2 will have onlythe UV units for gas cleaning.
APPENDIX VI INDEPENDENT TECHNICAL REPORT
— VI-251 —

Nadvoitsy Aluminium Smelter has agreed with the local environmental agency that the on-goingmodernisation of the potrooms ventilation and ducting systems, construction of the dry scrubbingfacility on Potline 2 and continued operation of UV units for benzopyrene emissionsdecomposition will continue. The smelter considers that the use of Elkem’s high-temperatureanode paste significantly reduces hydrocarbon emissions from the HSS cells, and this is reflectedin the environmental agency’s approach.
Spent pot lining is stored on-site in a dedicated dump area which has been operated since 1987.Monitoring of fluoride levels in groundwater over the past five years has shown increasingcontamination levels, up from 0.58 to 12 mg/l, however there is no data on groundwater flowsto assess the potential impact of seepage. In addition, cyanide levels are not monitored so the fullrisk of the spent potlining leachate cannot be assessed. The facility will reach its approved heightand volume within the next two years. A second area is partly excavated, however the proposeddesign of the liner system will need to be externally approved.
5.10.5 Material Developments
This section presents material changes to the facility since the site visit was undertaken inSeptember 2008. The updated information was presented to Hatch through meetings with UCRUSAL in Moscow and has not been validated through an additional site visit. We have no reasonto believe that the information provided is not a true and fair reflection of developments at thefacility.
UC RUSAL has advised that there have been no material changes to the physical equipment/plantat the facility.
Nadvoitsy Aluminium Smelter is currently operating below its full production capacity followingthe closure of all 98 pre-bake cells of Potline 4 in the first quarter of 2009. UC RUSAL attributedthe closure to a strategic decision based on reduced demand for aluminium from the globalmarket and as part of a programme to reduce consolidated operating expenditure. Hatch wasadvised that UC RUSAL view the capacity closure as temporary and that the cells are the subjectof continuous review and monitoring to determine an optimal time for restart. The idledproduction capacity is currently under care and maintenance.
In the first half of 2009 UC RUSAL took the decision to reduce operating costs at the facilityby not relining reduction cells as they approached the end of their life or failed. This approachresulted in marginally lower production in the first half of 2009 compared with expectedproduction had the cell relining schedule been followed. UC RUSAL advised Hatch that it hasformed plans to recommence the relining of cells.
5.10.6 Specific Risks and Future Opportunities
Specific Risks
No specific risks material to the future operation of this facility have been identified.
Future Opportunities
• Modernisation Programme — Nadvoitsy Aluminium Smelter has the opportunity toconvert the remaining HSS cells to pre-bake technology, although economic viability ofsuch a project has yet to be studied. Alternatively, converting the remainder of the HSScells to point-feeding will potentially reduce emissions and increase production.
APPENDIX VI INDEPENDENT TECHNICAL REPORT
— VI-252 —

• Product/Market Opportunities — Nadvoitsy Aluminium Smelter casthouse facilitiesinclude modern facilities for the production of foundry alloy T-bar, a value added product.The inherent value in the installed facilities could be unlocked if marketing contracts forthis product were established.
• Outsourcing — In an attempt to reduce employee numbers and operating costs, plantmanagement at Nadvoitsy Aluminium Smelter are exploring plans to outsource severalnon-production functions at the smelter, including pot relining, mechanical equipmentmaintenance and buildings maintenance.
5.11 Kandalaksha Aluminium Smelter
5.11.1 Introduction
Hatch undertook a site visit to Kandalaksha Aluminium Smelter in September 2008. This Section5.11 has subsequently been revised and updated based upon data and information from UCRUSAL and discussions held with senior management in September 2009. With reference to thefollowing sections, please note;
• Section 5.11.2 — Updated with data and information as of September 2009,
• Section 5.11.3 — Process Description as of September 2008,
• Section 5.11.4 — Environmental Status as of September 2008,
• Section 5.11.5 — Material Developments at the facility between September 2008 andSeptember 2009, and
• Section 5.11.6 — All previous Specific Risks and Opportunities noted in September 2008together with any changes following new data and information provision.
5.11.2 History, Location and Infrastructure
Kandalaksha Aluminium Smelter is located at the town and seaport of Kandalaksha. The town issituated at the top of Kandalaksha Bay within the White Sea, inside the Arctic Circle and some250 km south (overland) from the major city and seaport of Murmansk on the Barents Sea.Despite its latitude, due to the gulf stream flow across the North Atlantic and into the BarentsSea, Murmansk is accessible to all types of vessels at all times of the year.
The plant is located at the edge of the town of Kandalaksha, which has witnessed a decline inpopulation from 75,000 inhabitants ten years ago to around 37,000 currently. For its output andcompared to modern smelters, Kandalaksha Aluminium Smelter has a large workforce and isactively engaged in employee training and community development programmes.
Initial construction works began at the smelter site in 1939, but were postponed during thewartime years (1941 to 1945). The plant was eventually completed and commissioned in 1951.
The Kandalaksha Aluminium Smelter receives all raw materials and operating supplies via therail line which extends north to the port of Murmansk and south to St. Petersburg. The smelterincorporates its own railway stations, which are readily capable of handling increased suppliesand deliveries as a result of any future plant expansion, with only minor additions to track lengthand layout. The plant owns, operates and maintains around 1.7 km of track on-site, together withits own shunting locomotives. The rail system has a long track record of reliably servicing thesmelter and even with the occurrence of a derailment or similar event, the smelter couldimmediately access supplies from either north or south, whichever was unaffected by theincident.
APPENDIX VI INDEPENDENT TECHNICAL REPORT
— VI-253 —
Kandalaksha is also a large seaport, but the bay enclosed by the mainland and the Kola Peninsulais usually completely frozen from December to March, and therefore year-round access is onlypossible if icebreaker vessels are employed during the winter months.
Kandalaksha Aluminium Smelter had an initial design capacity of 54 ktpa of primary aluminium.Plant capacity has increased progressively since start-up and the facility produced 75 kt ofsaleable aluminium in 2008. Other than ongoing incremental improvement, no immediate plansfor capacity growth are proposed.
5.11.3 Process Description
The smelter contains two potlines, both employing VAMI HSS technology. Potline 1 comprises168 cells in side-by-side design, while Potline 2 houses 162 cells in an end-to-end arrangement.The operating characteristics of the two potlines are similar despite the different potarrangements. All 330 cells operate at approximately 86 kA.
In the late 1990s, the smelter designed a plan to convert all cells to pre-bake technologyoperating at line amperage of 110 kA. As a trial, five cells in Potroom 2 were converted topre-bake cells of VAMI design in 2000, operating at approximately 95 kA. However, the projectwas suspended on economic grounds, and instead, these five cells were closed in 2005 andconverted back to the original HSS cell design.
In 2005 all cathode shells at Kandalaksha Aluminium Smelter were converted from thecounterforce design to a stronger monocoque shell also increasing the size of both the anode andcathode. The benefits of this decision are manifested in the shorter cell turnaround times, lowerrelining costs, increased cell life, increased amperage and hence higher production rates.
Kandalaksha Aluminium Smelter has developed its own prototype crust breaker and point feederdesign for the HSS cells, and this equipment has been fitted to 35 cells in Potline 2. Althoughthere is potential in the future to install point feeders on all pots, this project has not progressed.The main benefit would be tighter control of bath chemistry with potential improvements incurrent efficiency, but also lower emissions and improved workplace conditions due to reducedfugitive emissions.
Kandalaksha Aluminium Smelter receives alumina supplies from the Bogoslovsk AluminaRefinery, Aughinish Alumina and Alpart. Anode paste briquettes are sourced from a Chinesesupplier and Elkem (shipped from Norway). Paste is imported by rail in bags and is stored on-sitein the open, with stocks kept above the minimum defined level. While the Norwegian paste offersimprovements in specific energy consumption and paste consumption, the higher cost has seenKandalaksha increasingly move towards the Chinese material.
The smelter has a single casthouse capable of producing T-bar, billet and wire rod. T-bar formsthe bulk of production, with billet and wire rod forming the balance. Modern Air Slip castingtooling is used for billet production but the remainder of the equipment is of a dated design withthe exception of the wire casting facility.
Kandalaksha Aluminium Smelter has a requirement for 150 MW of power, which is fed via fourtransmission lines feeding the smelter. Two of these are 10 kV busbars directly from the NIVAGES-3 hydroelectric power station, located around 1.4 km from the smelter. These busbars arefully enclosed within a brick structure between the smelter and the power station. The other twolines are connected directly to the Kolenergo grid and supply power at 110 kV. Kolenergogenerates most of its electricity from the Kolskaya nuclear power station and a number ofhydroelectric plants, augmented by a small amount of thermal generation.
APPENDIX VI INDEPENDENT TECHNICAL REPORT
— VI-254 —
Kandalaksha Aluminium Smelter can maintain normal operations when taking power from threetransmission lines only. Given the secure nature of the busbar between the smelter and NIVAGES-3, it is unlikely that adverse weather conditions (e.g. high winds) will compromise thesecurity of this supply which can provide up to 80 per cent of the smelter power requirement inthe event that the remaining two transmission lines are interrupted. The substation is beingupgraded with modern gas switches to replace the original oil switches posing fire hazards. Aircooling has been implemented in the substation to reduce water consumption.
5.11.4 Environmental
Kandalaksha Aluminium Smelter has achieved ISO 14001 environmental managementcertification.
The smelter site covers an area of approximately 38 hectares and has been designed to containall surface water flows via an underground drainage system to a sump and settling prior todischarge to a creek. A regulated buffer zone of 1000 m radius from the site centre is monitoredfor environmental impact reporting. Five houses are within this zone. The smelter is proposingto reduce this zone (to 850 m) due to the improvements in emission control.
Kandalaksha Aluminium Smelter has completed a two stage programme on modernising its gastreatment facilities in 2002 and 2005. The scope of this programme included the installation ofductwork to exhaust fumes from the all the electrolytic cells and connection to pulsed airbaghouse dry gas scrubbing systems using alumina as the adsorbent for fluoride gas. Equippingthe building with sidewall ventilation increased air circulation and improved working conditionsin the potline building. The dry scrubbing units are estimated to reduce the gaseous fluoridereleased to the atmosphere by more than 98 per cent, as well as providing a reduction in theemission of tars, PAHs and anode dust.
In order to further reduce the dust emissions in the potrooms and fluoride pollutants released tothe atmosphere, Kandalaksha Aluminium Smelter is currently conducting a study onimplementing alumina point-feeders and a centralised alumina distribution system throughoutthe potrooms.
Spent pot lining, cathode carbon, bricks, and anode carbon butts together with othercontaminated Class 3 and Class 4 wastes are currently disposed under contract at an offsitefacility owned and managed by the municipal government. It is proposed to reduce dependencyon this facility in the future, with a plan to send the carbonaceous waste to a steelworks. Therefractory bricks will continue to be placed in the municipal dump. Other smelter waste is alsosent to a separate municipal dump.
5.11.5 Material Developments
This section presents material changes to the facility since the site visit was undertaken inSeptember 2008. The updated information was presented to Hatch through meetings with UCRUSAL in Moscow and has not been validated through an additional site visit. We have no reasonto believe that the information provided is not a true and fair reflection of developments at thefacility.
UC RUSAL has advised that there have been no material changes to the physical equipment/plantat the facility.
Kandalaksha Aluminium Smelter is currently operating below its full production capacityfollowing the closure of 72 cells in the first quarter of 2009. UC RUSAL attributed the closureto a strategic decision based on reduced demand for aluminium from the global market and as
APPENDIX VI INDEPENDENT TECHNICAL REPORT
— VI-255 —
part of a programme to reduce consolidated operating expenditure. Hatch was advised that UCRUSAL view the capacity closure as temporary and that the cells are the subject of continuousreview and monitoring to determine an optimal time for restart. The idled production capacityis currently under care and maintenance.
5.11.6 Specific Risks and Future Opportunities
Specific Risks
• Emission Targets — Since the commissioning of the fume treatment plants, the massemission of gaseous fluoride has been reduced to the current level, ranging between 70 to80 tonnes per annum in 2007 and 2008. Since only 15 per cent of the mass emission iscaptured by the scrubber units, the challenge remains to reduce the fugitive emissions frompots exiting the potroom roof. The target mass emission set for the smelter in the nextbudget period to 2012 is 44.4 tonnes per annum gaseous HF. To achieve this target, theimprovement will need to come from the fugitive emission sources. The necessary 50 percent reduction in the fugitive emission rate from the potroom can not be achieved withoutsignificant changes to the pot technology. It is assumed that installing point feeders wouldcontribute to this reduction in emissions, however the design of the fume extraction systemand shutters on the pots would also need reviewing to minimise both fugitive gas and dustemissions.
• Dumpsite Liability — Although the municipal government currently “owns” the spent potlining dumpsite, there may be a future need for the smelter to assist in managing thepotential impact on local groundwater through leaching of soluble fluoride and cyanidefrom the dump. Therefore, the future liability for the dumpsite needs to be considered.
Future Opportunities
• Buffer Zone Area — At present, the Kandalaksha Aluminium Smelter observes a regulatedbuffer zone of 1000 m radius around the plant which includes five residences which areconsidered “at risk” of impact. Since the zone of impact of emissions has now been reducedwith a ten fold reduction in fluoride, there is an opportunity to reduce this designated bufferzone area.
5.12 Volkhov Aluminium Smelter
5.12.1 Introduction
Hatch undertook a site visit to Volkhov Aluminium Smelter in September 2008. This Section 5.12has subsequently been revised and updated based upon data and information from UC RUSALand discussions held with senior management in September 2009. With reference to the followingsections, please note;
• Section 5.12.2 — Updated with data and information as of September 2009,
• Section 5.12.3 — Process Description as of September 2008,
• Section 5.12.4 — Environmental Status as of September 2008,
• Section 5.12.5 — Material Developments at the facility between September 2008 andSeptember 2009, and
• Section 5.12.6 — All previous Specific Risks and Opportunities noted in September 2008together with any changes following new data and information provision.
APPENDIX VI INDEPENDENT TECHNICAL REPORT
— VI-256 —
5.12.2 History, Location and Infrastructure
The Volkhov Aluminium Smelter and the town of Volkhov are located on the Volkhov River inLeningrad Region, approximately 125 km east of St. Petersburg. The city of Volkhov hasapproximately 48,600 inhabitants.
Construction of the Volkhov Alumina and Aluminium complex, the first aluminium productionfacility in the former USSR, began in 1931, with the smelting facilities commissioned in May1932. The smelter was built to take advantage of the first hydroelectric power station in theformer Soviet Union. This hydroelectric facility was built on the Volkhov River and dates backto 1926.
Volkhov Alumina Refinery has been closed for more than a decade, while other facilitiesproducing a variety of chemical products, were sold by SUAL (prior to the formation of UCRUSAL) to Metakhim in October 2004. Volkhov Aluminium Smelter and Metakhim’s assets arelocated on the same site, with common access and shared facilities. Volkhov Aluminium Smeltersources a number of services from Metakhim, including repairs of major equipment, road and railmaintenance within the site boundary, laboratory services, water and compressed air provision,fire protection, canteen facilities, administration offices and waste services (including disposalof spent pot lining).
Volkhov Aluminium Smelter produced 24 ktpa of saleable aluminium in 2008.
5.12.3 Process Description
The smelter is comprised of one potline. Cells are located in two identical potrooms with 80 cellsper potroom. The potline presently operates at approximately 56 kA. Originally based on aPechiney pre-bake design, the cells underwent modernisation in 1998. All routine cellmaintenance activities are manual operations and are labour intensive. Crust breaking andalumina feeding operations are carried out using specially designed vehicles manufactured in the1960s.
Forty cells were equipped with Toxsoft centralised alumina distribution and computerisedprocess control (TROLL) during 2006 and 2007, with four of the cells further equipped withalumina point-feeders. A plan was formulated to convert all cells to computer control, centralisedalumina distribution and point-feeding, however, this has yet to be implemented.
Volkhov Aluminium Smelter operates a rodding shop to assemble and dissemble the pre-bakeanode assemblies. Pre-baked anode blocks are supplied from UC RUSAL’s carbon anodeproduction facilities in China; Lingshi Cathode Plant and Taigu Cathode Plant. The smeltertypically keeps sufficient stocks of anode blocks to sustain aluminium production at currentlevels for two months. Levels of mechanisation in the anode rodding shop are relatively low withmany operations carried out manually or using basic tools and equipment.
Volkhov Aluminium Smelter is midway through a programme of modifying anode design, whichwill result in a reduction in anodes per cell from 14 to eight. The modification results in loweranode current density which allows for an increase in current amperage, and thereforemoderately higher aluminium production per cell.
The smelter has a single casthouse with an overall capacity of 58 ktpa, which is significantly inexcess of current potline capacity. The casthouse can produce 2.5-metre long rolling slab,750-1,000 kg T-bar sections, 175 and 205 mm diameter round billets and 15 kg ingots. Currentproduction is exclusively in the form of 750 kg T-bars.
APPENDIX VI INDEPENDENT TECHNICAL REPORT
— VI-257 —

The smelter previously received all alumina by rail from Pikalyovo Alumina Refinery. Suppliesfrom Pikalyovo Alumina Refinery terminated in August 2008 following the sale of the refineryby UC RUSAL. Since August 2008 the Volkhov Aluminium Smelter has received all alumina byrail from Urals Alumina Refinery, located approximately 2,000 km south-east of the smelter. Thesmelter has two alumina storage silos, which have a combined capacity sufficient to sustainaluminium production at current levels for 15 days.
Volkhov Aluminium Smelter currently consumes around 45 MW of electricity, which is suppliedby Petersburg Sales Company (PSK) via two 110 kV power lines (Volkhov 4 and Volkhov 8) andfour 10 kV cable lines (Volkhov 1, Volkhov 2, Volkhov 3 and Volkhov 4) from the regional grid.The 110 kV lines are connected to the main step-down substation. Cable lines Volkhov 1 andVolkhov 2 are connected to the rectifier substation switchyard. Lines Volkhov 3 and Volkhov 4(10 kV) are connected to the main plant feeder distribution substation. The potline power supplyis provided via lines Volkhov 1 and Volkhov 2, although if required power can also be providedfrom the other four lines. The potline is fed by eight transformer/rectifiers each rated at 10 kA,of which seven are used for normal operation and one is held in reserve.
5.12.4 Environmental
Volkhov Aluminium Smelter has achieved ISO 14001 environmental management certification.
Volkhov Aluminium Smelter is surrounded by residential areas and businesses, and as a result,special attention is paid to monitoring of plant emissions. The Volkhov smelter contracts anexternal specialist organisation to conduct air monitoring in residential areas within 500 m of theplant. Dispersion modelling is carried out by the government to establish compliance within thebuffer zone.
The potline has used pre-bake anode technology since its inception, and the pots are generallywell hooded with particulate and fluoride control on the collected gas stream. VolkhovAluminium Smelter is currently constructing a dry gas scrubber system of proven SibVAMIdesign which is scheduled to be commissioned in 2010. This will be installed in place of theexisting electrostatic precipitators and wet scrubbers that were commissioned in the 1970’s andare not capable of keeping emissions within target limits.
Waste materials, excluding anode butts, are disposed of at facilities owned and operated byMetakhim under a contract arrangement. Uncleaned anode butts are sold to other metallurgicalindustries. Ownership and maintenance of other waste disposal facilities, including the originalalumina refinery bauxite residue disposal has also been transferred to Metakhim. Spent potliningis also disposed at a Metakhim site by smelter dump trucks under contract.
The site is drained via underground pipes and directed to a wastewater treatment settling pondat Metakhim. The smelter has a contract stating the volume and quality of wastewater received.Similarly, process and cooling water is supplied by Metakhim under contract. Sewage isdischarged separately to a common system.
5.12.5 Material Developments
This section presents material changes to the facility since the site visit was undertaken inSeptember 2008. The updated information was presented to Hatch through meetings with UCRUSAL in Moscow and has not been validated through an additional site visit. We have no reasonto believe that the information provided is not a true and fair reflection of developments at thefacility.
UC RUSAL has advised that there have been no material changes to the physical equipment/plantat the facility.
APPENDIX VI INDEPENDENT TECHNICAL REPORT
— VI-258 —
Volkhov Aluminium Smelter is currently operating below its full production capacity followingthe closure of 80 cells in the first quarter of 2009. UC RUSAL attributed the closure to a strategicdecision based on reduced demand for aluminium from the global market and as part of aprogramme to reduce consolidated operating expenditure. Hatch was advised that UC RUSALview the capacity closure as temporary and that the cells are the subject of continuous review andmonitoring to determine an optimal time for restart. The idled production capacity is currentlyunder care and maintenance.
UC RUSAL advised that it had negotiated a favourable energy tariff for the smelter for thesecond half of 2009. However, Hatch has not been provided with any details on how VolkhovAluminium Smelter has achieved favourable energy tariffs, and therefore we can not confirm thisstatement.
5.12.6 Specific Risks and Future Opportunities
Specific Risks
• Labour Risk — Volkhov Aluminium Smelter has historically experienced a shortage ofskilled labour supply. The smelter operates in a region where there is significantcompetition for labour resources, from both other industrial facilities in the Leningradregion and the employment opportunities in the nearby city of St. Petersburg. Although thelabour market is currently depressed, the smelter may face pressure to retain its current costbase with respect to labour should the economic situation improve.
Future Opportunities
• Modernisation Programme (1) — Volkhov Aluminium Smelter has the opportunity toincrease cell amperage from 56 kA to at least 75 kA by undertaking a modernisation of thecell design, increasing anode size and raising current efficiency. If realised, this programmewould increase smelter production by around one-third, reduce specific power consumptionand reduce labour requirements.
• Modernisation Programme (2) — Volkhov Aluminium Smelter has the opportunity tocomplete the upgrade of all 160 cells to computer control, centralised alumina distributionand point-feeding. A successful implementation of this programme could reduce the manuallabour input required, increase current efficiency and allow for an increase in potlineamperage. The anode effect rate would also be expected to decrease, which will reduce PFCemissions. Dust and fluoride emissions would also be expected to decrease due to areduction of manual interventions on the cells.
5.13 Alukom Taishet Aluminium Smelter
5.13.1 Introduction
Hatch undertook a site visit to Alukom Taishet Aluminium Smelter in September 2008. ThisSection 5.13 has subsequently been revised and updated based upon data and information fromUC RUSAL and discussions held with senior management in September 2009. With reference tothe following sections, please note;
• Section 5.13.2 — Updated with data and information as of September 2009,
• Section 5.13.3 — Process Description as of September 2008,
• Section 5.13.4 — Environmental Status as of September 2008,
APPENDIX VI INDEPENDENT TECHNICAL REPORT
— VI-259 —

• Section 5.13.5 — Material Developments at the facility between September 2008 andSeptember 2009, and
• Section 5.13.6 — All previous Specific Risks and Opportunities noted in September 2008together with any changes following new data and information provision.
5.13.2 History, Location and Infrastructure
Alukom Taishet Aluminium Smelter is a relatively small smelter operation, located on theoutskirts of Taishet in the Irkutsk region of the Russian Federation, situated approximatelymidway between Bratsk and Krasnoyarsk. Taishet is a town of approximately 45,000 people.
Taishet stands on the trans-Siberian rail route and is a major maintenance centre for the staterailway company, with large locomotive and wagon repair facilities. Taishet also stands at thehead of the Siberia-Pacific oil pipeline currently under construction, and is expected to host alarge pumping station. Other important local industries are timber processing and a bread factory.Unemployment levels in the town are reportedly high.
The plant was constructed by Alukom Invest between 2000 and 2002, and commenced metalproduction in early 2003. The intention of the original investors was to establish a pilot plantahead of constructing a full-scale aluminium smelter on a nearby site. The pilot plant was erectedwith several main aims; to prove the pre-bake reduction technology to be employed in thesmelter, to train local people in aluminium smelter operations, to manufacture the busbar for theconstruction of the full-scale smelter, and to provide the bath necessary to start-up the full-scalesmelter.
RUSAL (prior to the formation of UC RUSAL) first acquired an interest in the Alukom smelterin April 2003, and in June 2006 RUSAL secured 100 per cent ownership of the plant. Formallyknown as the Aluminium Company of Taishet, the plant is still commonly referred to as AlukomTaishet. The plant is now operated as an affiliate company of the much larger Bratsk AluminiumSmelter.
The design production capacity of the smelter is 11.4 ktpa of saleable aluminium, and the plantproduced 10 kt of saleable aluminium in 2008.
Alukom Taishet Aluminium Smelter has achieved OHSAS 18001 Occupational Heath and Safetycertification.
The facility is currently not operational and is under care and maintenance. Refer to Section5.13.5.
5.13.3 Process Description
Alukom Taishet Aluminium Smelter is constructed entirely within a suite of older buildingsremaining from a previous enterprise that operated on the site, which is understood to have beena manufacturing facility for the fabrication of concrete railway sleepers and other pre-castconcrete structures and components.
The single Alukom Taishet smelter potline comprises 32 cells laid end-to-end in two rows of 16,housed within a single potroom building and utilising pre-bake technology designed by AlkoRus(understood to be a spin-off company of VAMI in St Petersburg) for operations at 130 kA. Thepotline currently operates at 135 kA and is equipped with an automatic cell control system,designed by AvTek in Krasnoyarsk.
APPENDIX VI INDEPENDENT TECHNICAL REPORT
— VI-260 —
Cell tending operations for alumina charging, application of anode cover material, formation oftapping holes and crust-breaking around the anode prior to removal, are all carried out byspecialist wheeled vehicles. Overhead cranes are used to remove the anodes during changingoperations and also to handle the 5-tonne tapping crucibles for siphoning of liquid metal.
The anode change cranes in the potroom are multi-functional and are rated for a maximumcapacity of 24 tonnes. During cell capital repairs, the pot contents of the spent cell are dug-outin-situ, the potshell removed by the crane and then immediately replaced with a spare emptyshell. Pot re-lining is then carried out in-situ in the potrooms and the removed shell is cleanedand repaired in an area external to the potroom ready for the next pot failure. The cycle time fromcell switch-off to switch-on is 20 to 22 days. In the five years of operations to date, Hatch wasinformed that nine of the 32 cells have been relined. At the time of the site visit, a further twoof the 32 cells were not operating and undergoing reline works.
Pre-baked anode blocks are sourced from China, and the butts are currently treated as waste withno residual value, although it is intended to sell this material to nearby enterprises in the futureas a low-grade fuel. Stocks of around 800 anode blocks, sufficient for more than two monthsoperation, are held at the smelter. Anode rodding facilities provided on-site include a hydraulicbutt stripping press, hydraulic thimble stripping press, 2 x 250 kg cast-iron induction furnacesand eight double-assembly mating fixtures for manual rodding of up to 16 anodes at a time.
The casthouse contains a single eight-tonne electrically-fired furnace, a semi-automatic chaincaster for 15 kg ingot and a second-hand VDC machine (from Bratsk Aluminium Smelter), whichwas originally intended to produce the busbar materials for the full-scale smelter but has neverbeen commissioned. Ingots of A7, A7A and A8 grade material are produced for sale within theUC RUSAL trading group.
Alumina is currently sourced from the Pavlodar Alumina Refinery in Kazakhstan, although thereare recognised problems with the material’s suitability for the Taishet cells due to it being toofloury. Last year, sandy alumina from Queensland Alumina Ltd was used which resulted inimproved operational performance, but as the alumina supply chain is the responsibility ofRUSAL’s centralised procurement group, the very small Taishet smelter has little influence overits raw material source. There is 2,000 tonnes of alumina storage on-site (4 x 500-tonne silos),and Hatch was informed that stock levels are always maintained at a minimum of 800 tonnes,sufficient for around 20 days operation.
A bath crushing plant is provided on-site, in which bath from the potrooms and bath removedfrom the anode butts is crushed and milled for re-use in the reduction process.
Laboratory facilities are provided at the smelter site to analyse bath chemistry and metalcomposition. Anode quality testing is performed at Krasnoyarsk.
5.13.4 Environmental
Alukom Taishet Aluminium Smelter has achieved ISO 14001 environmental managementcertification.
Alukom Taishet operates its own laboratory, which includes equipment for the monitoring of thegas from the dry scrubber stack, and is also equipped with hand-held analysers for measuringpotroom and local air quality. The smelter also operates a mobile laboratory, which is used toverify emissions compliance at various locations throughout the town in conjunction with thelocal environmental agency.
APPENDIX VI INDEPENDENT TECHNICAL REPORT
— VI-261 —

All cells are equipped with point feeders and are fully-hooded to decrease potroom emissions.The pot off-gas is treated in a dry scrubber GTC of SibVAMI design. The treated gases areemitted to the atmosphere via a single stack of 60 m height. During the site visit, no visible fumewas being emitted from the GTC stack.
The plant has no facilities for solid waste disposal on-site. SPL carbonaceous and refractorymaterials are both treated as landfill in the municipal waste disposal area.
Dross from ladle and furnace skimming is recycled back to the reduction cells. Crust bathremoved from spent anodes is crushed and milled in the smelter’s own bath treatment facility,and recycled back to the process. Anode butts are consumed as fuel in local ferrous metallurgyplants. Cast iron thimbles from the spent anode butts are stripped by the press and remelted inthe induction furnace for re-use.
5.13.5 Material Developments
This section presents material changes to the facility since the site visit was undertaken inSeptember 2008. The updated information was presented to Hatch through meetings with UCRUSAL in Moscow and has not been validated through an additional site visit. We have no reasonto believe that the information provided is not a true and fair reflection of developments at thefacility.
UC RUSAL has advised that there have been no material changes to the physical equipment/plantat the facility.
Alukom Taishet Aluminium Smelter is currently not operational following the full closure of theplant implemented in April 2009. UC RUSAL attributed the closure to a strategic decision basedon reduced demand for aluminium from the global market and as part of a programme to reduceconsolidated operating expenditure. Hatch was advised that UC RUSAL view the plant closureas temporary and that the facility is the subject of continuous review and monitoring to determinean optimal time for restart. The idled production capacity is currently under care andmaintenance.
5.13.6 Specific Risks and Future Opportunities
Specific Risks
• Lack of Rectifier Redundancy — There are four rectifier transformers installed for thepotline, and all four are required to be operating simultaneously to maintain the smelter’smetal output at full capacity. During routine maintenance of a rectifier unit, potline poweris therefore significantly reduced, although this event is manageable for short periods.However, should a rectifier unit develop a major fault, then metal output would be reducedand the reduction cells exposed to a low-power regime for a long period, which couldadversely affect the cell life.
Future Opportunities
No specific opportunities material to the future operation of this facility have been identified.
5.14 Taishet Aluminium Smelter Project
5.14.1 Introduction
Hatch undertook a site visit to Taishet Aluminium Smelter Project in September 2008. ThisSection 5.14 has subsequently been revised and updated based upon data and information fromUC RUSAL and discussions held with senior management in September 2009. With reference tothe following sections, please note;
APPENDIX VI INDEPENDENT TECHNICAL REPORT
— VI-262 —
• Section 5.14.2 — History, Location and Infrastructure as of September 2008,
• Section 5.14.3 — Process Description as of September 2008,
• Section 5.14.4 — Environmental Status as of September 2008,
• Section 5.14.5 — Material Developments at the facility between September 2008 andSeptember 2009, and
• Section 5.14.6 — All previous Specific Risks and Opportunities noted in September 2008together with any changes following new data and information provision.
5.14.2 History, Location and Infrastructure
The new Taishet Aluminium Smelter (TaAZ) is an active project currently being implementedaround 8 km from the centre of the town of Taishet in the Irkutsk Region of the RussianFederation. Taishet is also home to the existing UC RUSAL Alukom Taishet Aluminium Smelter,described in section 5.13 of this report. Although this operational facility is much smaller thanthe new Taishet Aluminium Smelter under construction, its presence can be considered of valueto the new smelter, both in terms of local smelter operating experience and also to provide liquidelectrolyte and liquid aluminium metal to assist with starting up the first cells of the new smelter.
Taishet stands on the trans-Siberian rail route and as part of the Taishet Aluminium project abranch interconnection with the existing main railway line will be constructed for transport ofall incoming raw materials and outgoing casthouse products by rail.
The forecast metal production from the smelter, which is being constructed as a single-phaseproject, is in excess of 750 ktpa, which represents a significant capital investment and thus itstimely construction within budget holds many challenges. First hot metal from the TaishetAluminium Smelter is now forecast for December 2011, with all cells started-up by the end of2013 and full smelter production reached during the first quarter of 2014. The smelter is expectedto employ around 3,200 personnel when fully operational.
The project is being implemented by UC RUSAL’s own engineering and construction company,which is executing the project on an EPCM basis. There are no turnkey packages on the project,with all construction and erection works carried out under the direct control of the EPCMcontractor, although many sub-contractors will provide the necessary specialist process designand equipment for the smelter.
Out of the total of approximately 360 UC RUSAL EPCM staff who will be engaged on theproject, Hatch was advised that around 260 have previously been involved with the constructionof the recent Khakas Aluminium Smelter project, and hence UC RUSAL considers they havesufficient relevant experience to successfully implement this much larger greenfield project.
Preliminary groundworks commenced at the Taishet Aluminium Smelter site in April 2007, andconstruction of the smelter was well under way when the review visit was undertaken inSeptember 2008, at which time the following progress had been made:
• Eight out of the 13 modules comprising the construction camp had been erected. Eachmodule contains accommodation and messing facilities for up to 248 people.
• There are currently around 2,000 construction workers on the site, 1,600 of them on regulardayshifts and the balance working during the night. Work is continuing seven days perweek. The number of workers on-site will peak at around 5,200 during the summer of 2009.
APPENDIX VI INDEPENDENT TECHNICAL REPORT
— VI-263 —
• There are two concrete batching plants on-site producing a total of 130 m3/hr of all gradesof concrete. Pre-cast elements are widely used in the construction of the smelter buildings,but are not cast at the project site. Over 40,000 m3 of concrete has already been placed, andthe project is forecasting 10-12,000 m3 per month for the foreseeable future.
• Steelwork erection for all four potroom buildings had commenced, and around 20 columnsfor each room had been erected, with several roof truss sections also erected at Potroom 2.
• The casthouse steelwork and cladding was substantially complete, as was the rodded anodestorage building and the two main storage warehouses (one heated and one unheatedbuilding). Foundations were being prepared for the first of the casthouse furnaces.
• Piles were being sunk for the rectifier transformer bays.
• The ground was being prepared for the baking furnaces and other anode productionfacilities.
• The permanent smelter boundary walls were being erected, from pre-cast concreteelements.
• One of the two administration buildings to be provided at the site is substantially complete,and is expected to be functional at the end of 2008.
• Contracts have already been awarded for all major process equipment, including rectifiers,GTCs, potshells, superstructures and busbars.
• Offsite, electricity pylons had been erected to within a few kilometres of the smelterboundaries.
• Also off-site, a branch line from the railway mainline had been connected, and someconstruction supplies have already been delivered to the site by rail.
Hatch personnel had previously made a visit to the Taishet Aluminium Smelter project site inApril 2007, at the time of the preliminary earthworks, and the project progress made since thattime can be considered as very impressive.
However, at the time of the Hatch visit, the new smelter had been expected to start-up during thespring of 2010, and so the dates quoted above represent a delay of around 18 months from theinitial expectations. Current world economic and market conditions are blamed for this delay inproject implementation, which was announced in October 2008, after the time of the Hatch visit.
5.14.3 Process Description
The new Taishet Aluminium Smelter will comprise two potlines, each with two potroomscontaining 168 cells (a total 672 cells) of UC RUSAL’s RA-400 design. Four GTCs of moderndesign will be provided to treat the pot off-gases.
The smelter will produce its own baked anodes on-site, from a single green anode plant and threeanode baking furnaces. Each baking furnace will comprise 64 sections of eight pits, with 18anode blocks per pit, and will run four fires. The design of the bake furnaces is based upon thatrecently built at the Khakas Aluminium Smelter, but with an additional pit per section. It isintended that the smelter will be started-up using imported anodes until such time as its ownanode production facilities will be commissioned.
APPENDIX VI INDEPENDENT TECHNICAL REPORT
— VI-264 —
When operational, the Taishet Aluminium Smelter carbon production facilities will have thecapacity to produce 630 ktpa of baked anodes. The Taishet smelter will require 450 ktpa for itsown aluminium production, and the balance of 180 ktpa will supply anodes for the pre-bakepotlines of the Irkutsk and Krasnoyarsk Aluminium Smelters.
Electrical energy for the smelter will be provided from a new Irkutskenergo substation locatedadjacent to the project site. Power will be received at this local plant substation from an existingmajor switchyard located some 10 km away, via 4 x 500kV new transmission lines carried by twosets of pylons. Irkutskenergo is contracted to provide the first block of permanent smelter powerin December 2009. Power will be fed to each potline via 6 x 85 kA rectifier-transformers ratedat 1,575 V, with five rectifier units in service at any time, plus one on standby.
The casthouse equipment for metal solidification will include three ingot casting lines and twovertical direct-chill (VDC) casting centres. Liquid metal will be held and prepared in 10 x 65tonne and 4 x 85 tonne tilting furnaces.
The anode baking and casthouse metal furnaces will both be fired by heavy fuel oil.
The Taishet Aluminium Smelter project also includes construction of;
• an anode rodding shop, capital repair shops, bath recycling plant, raw materials offloadingand storage facilities, plus other ancillary shops;
• four residential apartment blocks, each of 15,000 m2 living area, in a nearby developmentto house some of the operating personnel;
• tens of kilometres of railway track around the smelter site, plus a branch interconnectionwith the existing main railway line for transport of raw materials and products by rail; and
• new wells sunk within the smelter boundaries to source the smelter’s water requirements,and a self-contained sewage treatment plant.
5.14.4 Environmental
When completed, Taishet Aluminium Smelter will be a modern facility employing pre-baketechnology and excellent environmental control. All four Potrooms at Taishet will have a GTCinstalled to collect and treat off-gas from the potrooms and discharge the cleaned gas toatmosphere. All GTCs will be provided by Solios Environmental and are of dry scrubbertechnology.
In addition, a single FTC will be constructed to treat the off-gas from the three anode bakingfurnaces.
5.14.5 Material Developments
This section presents material changes to the facility since the site visit was undertaken inSeptember 2008. The updated information was presented to Hatch through meetings with UCRUSAL in Moscow and has not been validated through an additional site visit. We have no reasonto believe that the information provided is not a true and fair reflection of developments at thefacility.
UCR advised of no material changes to the planned smelter technology as described in Section5.18.3.
Refer to Section 2.3.7.2 for the current status of the Taishet Aluminium Smelter project.
APPENDIX VI INDEPENDENT TECHNICAL REPORT
— VI-265 —

5.14.6 Specific Risks and Future Opportunities
Specific Risks
• Asset Integrity — The Taishet Aluminium Smelter is a new greenfield facility underconstruction and will be the first smelter to enter full commercial production using UCRUSAL’s RA-400 technology. The development of the RA-series technology over acomparatively short period of time can be considered impressive. However, the technologycannot yet be considered proven, and even the RA-300 cells at the Khakas AluminiumSmelter have not been in operation long. At present, the only operational cells usingRA-400 technology are the 16 units on test within the experimental potroom at theSayanogorsk Aluminium Smelter. The oldest cell was started up in December 2005, andmost cells are considerably younger. Additionally, independently of the cell amperage, thehardware components of the RA-400 cell have not been proven for commercial operations.This could have an impact on maintenance costs.
Future Opportunities
No specific opportunities material to the future operation of this facility have been identified.
5.15 Kubikenborg Aluminium
5.15.1 Introduction
Hatch undertook a site visit to Kubikenborg Aluminium Smelter in October 2008. This Section5.15 has subsequently been revised and updated based upon data and information from UCRUSAL and discussions held with senior management in September 2009. With reference to thefollowing sections, please note;
• Section 5.15.2 — Updated with data and information as of September 2009,
• Section 5.15.3 — Process Description as of October 2008,
• Section 5.15.4 — Environmental Status as of October 2008,
• Section 5.15.5 — Material Developments at the facility between October 2008 andSeptember 2009, and
• Section 5.15.6 — All previous Specific Risks and Opportunities noted in October 2008together with any changes following new data and information provision.
5.15.2 History, Location and Infrastructure
Kubikenborg Aluminium is located within a sheltered inlet on the eastern coast of the Gulf ofBothnia, approximately 400 km north of Stockholm in Sweden. The plant is only a fewkilometres from the centre of the town of Sundsvall, a conurbation of around 100,000inhabitants.
Sundsvall is the largest cultural and economic centre in its region, has good road, rail and airlinks with the Swedish capital Stockholm, and contains several other significant manufacturingfacilities including an industrial chemicals complex and three paper mills.
APPENDIX VI INDEPENDENT TECHNICAL REPORT
— VI-266 —

Kubikenborg Aluminium first produced aluminium in 1942 from a 1.6 ktpa capacity pre-bakedtechnology plant, however, this was plant was subsequently closed in 1946. A second-hand, 14ktpa HSS technology smelter was subsequently acquired from Canada and shipped toKubikenborg Aluminium in 1947 which later became known as Plant 1. In the 1960’s, Plant 2 wasconstructed consisting of Alusuisse VSS technology. In 1986, Plant 1 was converted to KaiserP86 technology.
Alumina, and until recently calcined coke and granulated solid pitch, is imported via thesmelter’s own dedicated berth, which includes a travelling vacuum ship unloader capable ofunloading at around 140 tph from supply vessels up to 25-kt deadweight. Conveyor belts transferthe imported materials to on-site storage facilities.
Finished metal leaves the smelter either by truck or rail.
Kubikenborg Aluminium had capacity to produce around 104 ktpa of liquid aluminium prior tothe onset of the pot conversion programme (described below). Additionally the smelter processesaround 20 ktpa of remelt ingot imported from UC RUSAL smelters in Russia, resulting in totalsaleable aluminium capacity of around 124 ktpa.
5.15.3 Process Description
The smelter comprises two plant areas. Plant 1 contains a single potline (Potline 1) with 56 cellsarranged side-by-side in two parallel potrooms of 28 cells each, utilising pre-bake technology ofa modified Kaiser P86 design and operating at 152 kA. This potline produces around 24 ktpa ofliquid aluminium.
Plant 2 contains two potlines (Potlines 2A and 2B). Kubikenborg Aluminium is currentlyimplementing a major modernisation project in Plant 2. Potline 2A contains 120 cells in a singlepotroom. Potline 2B is slightly larger and contains 142 cells in a single potroom. Previously thecells in Potline 2A and 2B were of Alusuisse VSS design arranged end-to-end and operating at118 kA, with total capacity of the potline around 80 ktpa. The modernisation project involvesconverting all the VSS cells to pre-bake technology. The new cells will be virtually identical tothe Kaiser P86 cells used in Potline 1, but arranged end-to-end to minimise reconstruction worksand facilitate easier installation as the Söderberg cells are removed. Other principal componentsof the modernisation project include an upgrade to the anode rodding shop, installation of bothnew (three) and refurbished rectifier transformers and the erection of a modern dry gas scrubberGTC from a reputable Western supplier. The modernisation project is being managed by anIcelandic engineering company, which has experience with previous capital projects ataluminium smelters in Iceland.
The VSS cells in Potline 2A have been completely removed and the new pre-bake cells are beinginstalled. In June 2008 the first 20 converted cells in Potline 2A were commissioned and haveexceeded expected operating performance to date. The smelter planned to commission a further20 cells in September/October 2008, however only 12 of these cells were commissioned due toan incident resulting in the complete loss of a new rectifier transformer. The rectifier transformerwill be sent back to the manufacturer’s (Areva) facility in Germany for examination and repair.Thus, at the time of the Hatch visit (October 2008), 32 converted cells in Potline 2A were inoperation, while all 142 VSS cells in Potline 2B remain operational prior to the cell conversionprocess beginning in this potline.
The temporary loss of one of the new rectifier transformers is unlikely to impact on the currentplan to complete the modernisation programme, including the conversion of all 262 cells inPotlines 2A and 2B by June 2009. The start-up of these cells is planned for late 2009.
APPENDIX VI INDEPENDENT TECHNICAL REPORT
— VI-267 —
When complete, the modernisation project is expected to result in the liquid aluminium capacityof Potlines 2A and 2B increasing from a combined 80 ktpa to 120 ktpa, and total plant liquidaluminium capacity rising to 144 ktpa. With the addition of remelt ingot, the plant will havecapacity to produce around 160 ktpa of saleable aluminium product.
The smelter has a single casthouse that produces value-added products sold mainly to WesternEuropean customers. The casthouse is equipped with five holding/melting furnaces, three VDCcasting stations, two continuous homogenising furnaces and three batch homogenising furnaces.Around 80 per cent of casthouse production is in the form of extrusion billet, up to 9m in length,with rolling slab making up the remainder. Alloying materials are combined with the liquidaluminium produced at the smelter and remelt ingot, to produce a number of specialist alloycompositions within the casthouse. All production is in the form of value added products for saleto the European market.
Kubikenborg Aluminium currently procures pre-baked anodes from a single supplier in China.These are shipped from China to Tunadal port, located approximately 15 km from the smelter,and then transported by road to the smelter site. These anodes are rodded at the smelter in therodding shop, which is being upgraded as part of the current modernisation project. Anode pastefor the HSS cells was produced at the smelter until immediately prior to the Hatch visit. Plantmanagement had determined that sufficient stocks of anode paste had accumulated at the smelterfor the remaining requirements of the HSS cells and as a consequence, the anode pasteproduction facility was permanently closed in October 2008.
Alumina is principally sourced from Aughinish Alumina, which is augmented by occasionaldeliveries from UC RUSAL’s alumina refineries in Jamaica. The plant has six alumina storagesilos with a combined capacity of almost 100 kt, allowing alumina from different sources to bestored separately. Normally a minimum of 22 kt of alumina stock is maintained, equivalent toaround 40 days worth of consumption.
Kubikenborg Aluminium consumes around 205-220 MW of electricity. The smelter is connectedto the regional electricity grid, which is operated by E.on, with sufficient redundancy to maintainfull metal production should any of the transmission lines to the smelter fail. Electrical energyin Sweden is generated from nuclear and hydroelectric power plants, with an approximate equalsplit. Kubikenborg Aluminium buys power from Vattenfall, one of three major generatingcompanies in Sweden. The power contract is for the period 2008 to 2016, and is conditional onthe pre-bake conversion project being completed. The previous contract between KubikenborgAluminium and Vattenfall related electricity prices to LME aluminium prices. The currentcontract is based on a fixed price during the contractual period with defined escalation factorsnot related to aluminium prices.
5.15.4 Environmental
Kubikenborg Aluminium has achieved ISO 14001 environmental management certification.
In recent years, environmental pressures upon Söderberg smelters operating in Western Europehave forced many to be closed or converted to cleaner technology. Kubikenborg Aluminium hastherefore been pressured into converting its Söderberg technology in Plant 2 to pre-bake anodetechnology. The current environmental permit is contingent upon this project being completed bythe end of 2009 and this is considered achievable, with current completion of constructionscheduled for mid-2009.
Plant 1 has dry scrubber GTC’s and also a wet scrubber fitted for sulphur dioxide removal. Plant2 has a recently commissioned dry and wet scrubber combination provided as part of theconversion project described above.
APPENDIX VI INDEPENDENT TECHNICAL REPORT
— VI-268 —

All wet scrubbers employed at the smelter utilise seawater as the scrubbing medium, operatingon a one-pass total loss basis and with no subsequent filtration or water treatment. A total ofaround 6,500 cubic metres per hour of seawater is pumped through the scrubbers and thendischarged back to the sea. Once the Söderberg technology is fully decommissioned, there willbe almost no sediment produced, composed of alumina and tars, which is currently removed fromthe lagoons on a weekly basis and sent to a local waste facility.
The local waste facility is part owned by Kubikenborg Aluminium, along with two other localindustrial waste producers. The permit allows for the smelter to dispose of up to 10 kt per annumof hazardous waste, including SPL, and up to 25 kt per annum of non-hazardous waste. However,new European Regulations concerning fluorides effectively mean that as of the end of 2008, SPLwill no longer be allowed to be disposed of in the facility. Kubikenborg Aluminium has thereforeagreed a long-term contract with a company based in Norway for the receipt, reprocessing andsafe disposal of their SPL waste from the end of 2008.
The anode paste plant has now been fully decommissioned as part of the modernisation projectand therefore emission control of the volatile gases produced as part of the paste productionprocess is no longer required. If paste production was ever to continue at KubikenborgAluminium, it is considered that additional capital investment will be required in furtherenvironmental control measures.
5.15.5 Material Developments
This section presents material changes to the facility since the site visit was undertaken inOctober 2008. The updated information was presented to Hatch through meetings with UCRUSAL in Moscow and has not been validated through an additional site visit. We have no reasonto believe that the information provided is not a true and fair reflection of developments at thefacility.
UC RUSAL has advised that there have been no material changes to the physical equipment/plantat the facility, with the exception of the plant/equipment connected to the pot conversionprogramme.
Hatch was advised that the pot conversion programme has continued, with all cells in Potline 2Anow converted to pre-bake technology. The conversion process in Potline 2B began in August2009, and is currently planned to be completed by the end of 2009.
5.15.6 Specific Risks and Future Opportunities
Specific Risks
• Casting Capacity — The Kubikenborg Aluminium casthouse, although very effective andefficient in terms of value added metal production, is relatively small and has an inefficientmetal flow configuration and limited spare capacity for both planned and unplannedstoppages. Upon completion of the pre-baked cell conversion project, the plant productionwill be equivalent to the total theoretical casthouse capacity leaving no spare capacity forstoppages. Although it will always be possible to solidify metal in an emergency situationmanually (using various moulds), this contingency plan is not recommended for such acritical activity, and does not normally result in a readily saleable product. The plant andUC RUSAL are aware of this problem and are exploring ways of mitigating this risk.
Future Opportunities
No specific opportunities material to the future operation of this facility have been identified.
APPENDIX VI INDEPENDENT TECHNICAL REPORT
— VI-269 —
5.16 Zaporozhye Aluminium Smelter
5.16.1 Introduction
Hatch undertook a site visit to Zaporozhye Aluminium Smelter in September 2008. This Section5.16 has subsequently been revised and updated based upon data and information from UCRUSAL and discussions held with senior management in September 2009. With reference to thefollowing sections, please note;
• Section 5.16.2 — Updated with data and information as of September 2009,
• Section 5.16.3 — Process Description as of September 2008,
• Section 5.16.4 — Environmental Status as of September 2008,
• Section 5.16.5 — Material Developments at the facility between September 2008 andSeptember 2009, and
• Section 5.16.6 — All previous Specific Risks and Opportunities noted in September 2008together with any changes following new data and information provision.
5.16.2 History, Location and Infrastructure
Construction of the Zaporozhye Alumina and Aluminium complex began in 1930, withcommissioning of the aluminium smelting facilities in 1933. Zaporozhye Alumina andAluminium also comprises alumina refining and silicon metal production facilities. The complexlocation was chosen to take advantage of the Dneproges hydroelectric power station, which islocated near to the smelter on the Dnieper River.
The Zaporozhye Alumina and Aluminium complex is situated in the city of Zaporozhye, locatedin the south east of Ukraine, approximately 600 km south-east of Kiev. Although today it isconsidered undesirable to locate a smelter within a city, there are other examples where this hasbeen done and once established, local residents and authorities learn to live with the plant’sexistence. The city, which has approximately 850,000 inhabitants, is heavily industrialised andhome to several other metallurgical operations in addition to Zaporozhye Alumina andAluminium, including a number of steel facilities.
Zaporozhye came under heavy attack during World War Two, and many of the facilities at thecomplex were relocated to the Urals region and subsequently used in the construction of otherplants. The building structures and facilities that were not removed were severely damaged,necessitating major reconstruction work. The reconstructed Zaporozhye Aluminium Smelterreopened in 1949.
Zaporozhye Aluminium Smelter currently has a capacity of 114 ktpa of casthouse productsincluding aluminium alloys.
Zaporozhye Aluminium Smelter has achieved OHSAS 18001 Occupational Heath and Safetycertification.
5.16.3 Process Description
The smelter comprises four potlines, with two potrooms in each. Each potline contains 152 cellsof VAMI HSS technology operating at approximately 72-73 kA. The cells are in end-to-endarrangement. Between 2003 and 2005 Potlines 1 and 4 had the Toxsoft TROLL process controlsystem installed. Plans to retrofit this system to Potlines 2 and 3 were postponed due to a lackof finance, although the plant intends to complete this project as soon as possible.
APPENDIX VI INDEPENDENT TECHNICAL REPORT
— VI-270 —

In 2005 Zaporozhye Aluminium Smelter began a programme of converting all pots shells fromthe counterforce design to a stronger monocoque rib-type shell. Each pot is upgraded after beingtaken out of service. As of September 2008 the smelter had converted 409 of the 608 cells. Thebenefits of this decision should be manifested in shorter cell turnaround times, lower reliningcosts, increased cell life and a lower required metal pad in each cell. A natural gas system isbeing installed progressively to the potlines in order to have computer-controlled pre-heating ofthe cathodes upon start-up in order to increase their operating life. Gas lines have been installedon five potrooms (Potrooms 1-5) and installation in the remaining potrooms is on-going.
Alumina from the adjacent refinery is used within the smelter, and therefore there is no need formajor infrastructure to support transportation and offloading operations, or for separate largealumina storage facilities. This provides a major positive effect on the transfer cost of aluminato the smelter.
Anode paste is procured under an annually renewed contract with Ukrgraphite, an independentcompany located adjacent to the Zaporozhye Alumina and Aluminium complex. The anode pastefacilities initially belonged to the smelter, but were sold off in the 1960s. The anode paste isdelivered by rail to a warehouse at Zaporozhye Aluminium Smelter and then transported by truckto the potlines. The smelter has maximum storage capacity of anode paste of 2,200 tonnes,equivalent to around 13 days worth of consumption.
The smelter has three casthouses. Primary ingot forms the bulk of production, with aluminiumalloys, wire rod, billet and T-bar also produced. Casthouse 1 produces primary ingot, billet andT-bar. Casthouse 2 produces aluminium alloy in the form 600 kg T-bars and 15 kg ingot.Casthouse 3 was commissioned in 1999 and houses a modern continuous wire-rod caster ofItalian design. The capacities of the casthouse are more than sufficient to cater for redundancyof equipment whilst solidifying the product from the smelting areas.
The Zaporozhye Alumina and Aluminium complex owns, operates and maintains around 27.2 kmof railway track on-site, together with seven shunting locomotives and 142 units of rolling stock(dump cars, open cars, cement cars, flat cars and hopper cars).
Maximum power demand for the Zaporozhye Alumina and Aluminium complex reachesapproximately 280 MW, of which 240 MW is used directly by the smelting facilities. Thecomplex is supplied electricity through contracts with Zaporozhye Oblenergo. The complex isconnected to the Aliuminievaya substation, which is fed by two 154 kV transmission linesdirectly from the Dniproges 2 hydroelectric power station and two 154 kV lines from theZaporozhye municipality substation, which also supplies other electricity consumers inZaporozhye. These transmission lines and substations are owned by Zaporozhye Oblenergo. TheZaporozhye substation is connected to the Ukraine national grid.
The Dniproges 2 power station, owned by Dneperenergo, only operates at periods of peakelectricity demand and therefore the smelter is supplied electricity predominantly from thenational gird via the Zaporozhye substation. Thermal and nuclear power form the bulk ofgeneration in Ukraine, with a small contribution from hydro and wind power. Power supply tothe smelter is secure due to redundancy of supply in the transmission system.
5.16.4 Environmental
Zaporozhye Aluminium Smelter has achieved ISO 14001 environmental managementcertification.
All potlines currently employ wet GTCs whereby the fumes are ducted beneath the potroom floorand directed to a facility where soda ash solution is used as the scrubbing agent. The resultingslimes are discharged through an open channel into an 80 ha slime deposition pond belonging to
APPENDIX VI INDEPENDENT TECHNICAL REPORT
— VI-271 —
a steelworks and a fee is paid for this facility. The gas treatment equipment is properlymaintained; however there is no equipment redundancy available, except at Potline 3, whichresults in the by-passing of the wet scrubbers during the maintenance period and discharging theuntreated off-gases through the 120 m stacks.
A pilot type dry GTC was commissioned in 1996 whereby the fumes from 20 cells from Potroom1 are ducted from the top of the cells to an adjacent dry scrubbing facility utilising alumina asthe scrubbing agent. This facility is effective for emission control however the attrition rate onthe alumina presents dusting issues within the potroom.
Fluoride emissions to air of Zaporozhye Aluminium Smelter are above those specified by bothInternational and Ukrainian National standards. However Zaporozhye Aluminium Smelter hasagreed with local authorities that by 2011 it will be in compliance, although currently the smelteris re-negotiating long-term environmental compliance to 2017.
Zaporozhye Aluminium Smelter has two options to reduce the emissions to acceptable levels andachieve compliance. The shorter time frame option is to upgrade the fume collection and wetscrubbing facilities, including fluoride recovery. The second, longer term option is to continueto develop an alumina dry gas scrubbing system and significantly improve gas collection frompots together with alumina point-feeders.
These projects are not currently in UC RUSAL’s expenditure plans, although a feasibility studyon the wet scrubber retrofit with improved sprayers, addition of flocculants, and recoveringactivated alumina from the sludge is in advanced design stages and could be commenced withinthe required time frame.
Air quality within the potrooms is currently poor indicating insufficient building ventilation andunsatisfactory hooding efficiency of the operating HSS cells. Upgrades to the cathode shell andanode casing are being implemented through the capital repair program. This will improve thegas collection efficiency of the cells.
Spent pot lining is deposited in the local municipal dump. Previous arrangements with localindustries to accept the carbon have stopped as the material was found to be unacceptable.
5.16.5 Material Developments
This section presents material changes to the facility since the site visit was undertaken inSeptember 2008. The updated information was presented to Hatch through meetings with UCRUSAL in Moscow and has not been validated through an additional site visit. We have no reasonto believe that the information provided is not a true and fair reflection of developments at thefacility.
UC RUSAL has advised that there have been no material changes to the physical equipment/plantat the facility.
Zaporozhye Aluminium Smelter is currently operating below its full production capacityfollowing the closure of Potline 1, Potline 2 and Potline 3 in the second quarter of 2009. UCRUSAL attributed the closure to a strategic decision based on reduced demand for aluminiumfrom the global market and as part of a programme to reduce consolidated operating expenditure.Hatch was advised that UC RUSAL view the closure of these potlines as temporary and that thepotlines are the subject of continuous review and monitoring to determine an optimal time forrestart. The idled production capacity is currently under care and maintenance.
APPENDIX VI INDEPENDENT TECHNICAL REPORT
— VI-272 —
5.16.6 Specific Risks and Future Opportunities
Specific Risks
• Electricity Prices — Electrical energy pricing within Ukraine is not beneficial to thealuminium industry. Until 2005, the local Government provided an LME aluminiumprice-linked power contract, however this no longer applies and the power cost forZaporozhye Aluminium Smelter is significantly higher when compared with the globalaluminium industry. Unless more favourable power tariffs are secured and plantoptimisation and high value products are pursued, it is unlikely that the facility will becomeprofitable as a stand alone entity.
Future Opportunities
• Efficiency Upgrade (1) — Zaporozhye Aluminium Smelter is currently using relativelylow quality supplies of alumina and anode paste. In addition, cathode blocks used for liningthe cells are of lower grade than optimal for use at the smelter. An improvement in thequality of alumina and anode paste, and/or optimisation of cathode block design, couldresult in improved current efficiency, lower energy consumption and increased metalproduction.
• Efficiency Upgrade (2) — Zaporozhye Aluminium Smelter has the opportunity to reduceenergy consumption by undertaking a programme to retrofit cell design to reduce electricalresistance.
• Product/Market Opportunities — In 1993 a project was conceived to equip the plant withfoil production facilities, covering the complete technology cycle of foil production fromthe melting and casting of aluminium strip, through to final foil production. However, onlythe first phase of the plant — the aluminium strip production facility with capacity of 30.0ktpa — was completed. This facility was commissioned in 2000, but only produced for ashort period of time and has remained idled ever since. All equipment for the second phaseof development of the foil plant, namely electric annealing, slitting and cold rollingfacilities of 27.6 ktpa capacity, and for the third phase, namely two foil rolling mills witha combined capacity of 9.6 ktpa of foil, were delivered to the smelter site in 1997/1998 buthave remained boxed-up and unassembled. Fata Hunter, the equipment supplier, havevisited the smelter and confirmed that all equipment required for foil production is at thesmelter and appears in good condition. The buildings of the foil plant belong to the smelter,however all equipment is owned by the Ukraine government. UC RUSAL has heldnegotiations with the Ukrainian government to purchase the equipment, however thesituation remains unresolved due to frequent changes of government in Ukraine and highpower prices paid by the smelter. There is an opportunity to complete assembly of the foilproduction facilities to supply foil to the Ukrainian and international markets should theseoutstanding issues be resolved.
5.17 ALSCON
5.17.1 Introduction
Hatch undertook a site visit to ALSCON Aluminium Smelter in October 2008. This Section 5.17has subsequently been revised and updated based upon data and information from UC RUSALand discussions held with senior management in September 2009. With reference to the followingsections, please note;
• Section 5.17.2 — Updated with data and information as of September 2009,
APPENDIX VI INDEPENDENT TECHNICAL REPORT
— VI-273 —
• Section 5.17.3 — Process Description as of October 2008,
• Section 5.17.4 — Environmental Status as of October 2008,
• Section 5.17.5 — Material Developments at the facility between October 2008 andSeptember 2009, and
• Section 5.17.6 — All previous Specific Risks and Opportunities noted in October 2008together with any changes following new data and information provision.
5.17.2 History, Location and Infrastructure
The ALSCON smelter is located in Ikot Abasi in the Akwa Ibom State of Nigeria and is referredto as ALSCON (Aluminium Smelter Company of Nigeria). The ALSCON project was conceivedin 1981 by the Federal Government of Nigeria, to be built in the south east region of Nigeria totake advantage of the abundant gas reserves, which were otherwise being flared to atmosphere.Construction work commenced in April 1990, on a turnkey basis by Ferrostaal A G of Germany,with Reynolds International of the USA as technology provider.
ALSCON consists of an aluminium smelter with an integrated carbon anode manufacturing plant,casthouse, gas-fired power station, navigable channel, harbour facility, laboratory, maintenanceworkshops, warehouse and four villages in which to house the workforce.
ALSCON produced first metal in October 1997, however, in June 1999, with only 25 per centof the plant started up and 45 kt of aluminium produced, a decision was taken to shut down thesmelter for lack of working capital. ALSCON remained shutdown (although maintained) untilbeing restarted in February 2008.
In February 2007, RUSAL (prior to the formation of UC RUSAL) acquired shares in ALSCONwith other minority shareholders remaining, namely the Nigerian Government and Ferrostaal.UC RUSAL has purchased the outstanding equipment, namely potshells, busbar, superstructuresand pot tending assemblies, to complete the two Potlines and has modernised the pots with anewly designed cell lining, which is understood to be capable of operating at 200 kA with a largeranode.
The first of the newly designed cells was brought into operation in February 2008 and by August2008 there were 52 cells in operation. At this time there was a major incident in the power plant,which resulted in 48 cells being shut down. Currently there are 54 cells in operation at thesmelter.
The Imo River requires dredging, along with the removal of numerous large sunken items andall raw materials are being imported through a private dock at Port Harcourt in large bags. Apermit has now been issued by the appropriate authority to dredge the channel, so as to accept20 to 25-kt alumina vessels.
ALSCON has a design capacity of 197 ktpa at 168 kA operation.
5.17.3 Process Description
The plant, which previously used Reynolds P20S PFPB anode reduction technology, operating at168 kA, consists of:
• Two Potlines each having 216 pots with attendant anode manufacturing and metal castingfacilities;
APPENDIX VI INDEPENDENT TECHNICAL REPORT
— VI-274 —

• 540 MW gas-fired power plant, comprising of six gas turbines each with a nominal capacityof 90 MW;
• Harbour, on the Imo River, with ship unloading facilities for alumina, petroleum coke, andgeneral cargo, storage silos for coke and alumina together with warehousing facilities forfinished product prior to shipment; and
• Four villages with schooling and medical facilities to accommodate the workforce.
The pots are fully enclosed PFPB cells with each group of 108 cells being exhausted to anABB/Flakt GTC utilising alumina as the scrubbing agent. The cells are serviced by six NOELLPot Tending Machines which carry out anode changing and tapping, and two pot removal craneswhich traverse each end of the four Potrooms. Each cell is controlled by a micro processor whichcaries out numerous functions including alumina feed control and cell voltage control. Failedcells are de-lined and relined in a purpose built facility on-site and the spent potlining materialis temporally stored in a site warehouse. As a result of numerous early cell failures the warehouseis now full and failed cells are being stored in Potline 2 until a permit is issued to use afit-for-purpose landfill site approximately 25 km away from the smelter site. The permit is beingprogressed.
The anode manufacturing and rodding facility was built by KHD of Germany. Both of thesefacilities are capable of producing 150 per cent of the plant’s requirements, as is the anodebaking facility which consists of two closed top Reidhammer furnaces. At the time of the sitevisit, only the anode rodding facility was operational and baked anodes were being purchased(15,000) from China for operation and start-up. The anode plant appears to be well maintainedand ready for operation.
The casthouse consists of three 20 tph ingot casting lines with 30-tonne capacity attendantfurnaces, and is capable of handling 420 ktpa, twice the present plant capacity. A VDC castingmachine supported by two 40-tonne furnaces and a continuous homogenising furnace is alsoavailable but only the casting furnaces have been installed and the civil work completed. A sowcasting line is also available for emergencies, with a capacity of 200 tpd. Only one ingot castingline is required at the present production level and the other two are being maintained in astand-by operational mode.
The smelter has a full fleet of mobile equipment to transport rodded anodes, butts, liquid andsolid metal and raw materials. It also has servicing facilities and a fully equipped machine shopand laboratory.
Potline power is provided by four 55 kA transformer/rectifiers, only three of which are requiredto provide the full Potline load. Alstom has recently carried out a full evaluation of the conditionof the gas turbines (GT) and a maintenance contract is being progressed with them. At the timeof the site visit, one GT was in operation, minor maintenance is required on three GT’s and majormaintenance on two GT’s. UC RUSAL are presently negotiating with ABB for a maintenancecontract to cover the whole power area, but there are some security issues.
ALSCON power is supplied by six ABB 13D gas turbines each capable of producing 90 MW.With the smelter fully operational, four units will be required with one on stand-by and one inmaintenance. The burners are dual fuel and can be fired on gas or oil or a mixture, and there isoil storage capacity for 10 to 12 days operation in the event of an interruption in the gas supply.Since the plant has restarted, there has only been one interruption, which was for a period ofthree days. There are at present three million litres of diesel in storage with a maximum storagecapacity of 20 million litres or 12 days at full operation. The plant is also provided with a coldstart diesel generator.
APPENDIX VI INDEPENDENT TECHNICAL REPORT
— VI-275 —

The harbour facilities, approximately 5 km from the smelter, are complete and connected byprivate road to the smelter site. After dredging, the Imo River was thought to be capable ofaccommodating 20 to 25-kt vessels, however a bathymetric survey carried out one year afterdredging showed that further dredging was required, along with the removal of numerous largesunken objects. A single conveyor runs from the port to the smelter site and is used to transportboth coke and alumina to their respective on-site storage silos. In the event of a prolongedbreakdown of the conveyor, provision has been made at the port and smelter site to handle thetransfer of these materials by road tanker and a number of such tankers are available on-site.Additional alumina and coke silos are located at the smelter site along with warehousing for solidpitch. This facility appears to be well maintained and ready for operation.
5.17.4 Environmental
The environmental regulation in Nigeria is to the highest international standards reflecting theinfluence of the international oil companies operating in the region. As per Nigerian legislation,every two years enterprises must undergo environmental audits implemented by the Ministry ofEnvironment which issues a general environmental permit for operations. Following theenvironmental audit in February 2008, ALSCON holds a permit for both the smelter site andtownships. Following requirements of a provisional environmental permit, an independent baseline audit was implemented in October 2007 to allow dredging works of the Imo River.
SPL from previous operations is currently stored in several warehouses on-site, one of which isfull. The feasibility study and the EIA for the landfill project where the SPL will be stored havecommenced, and at the moment public consultations are being held. Due to the most favourablegroundwater conditions, the sanitary landfill will be located 26 km from the smelter site and willalso comprise sections for disposal of other industrial and household wastes. SPL will betransported to the specially engineered landfill after each wet season.
The environmental controls and design of the smelter are modern, reflecting the recent designand construction of the smelter by Ferostaal and Reynolds. The smelter includes four moderndry-scrubbing GTCs of ABB/ALSTOM design, commissioned in 1997, and baghouses andelectrostatic precipitators as required. To meet production rates, only one GTC is currently inoperation. The other GTCs are currently being inspected before they are introduced intooperation. It is considered that the smelter would further benefit from continuous monitoringdevices installed on the emission stacks and a modern FTP on the bake furnace.
Aluminium dross, used oil and batteries are sold externally. Crushed bath and pig iron fromanode studs are reused in the production process.
5.17.5 Material Developments
This section presents material changes to the facility since the site visit was undertaken inOctober 2008. The updated information was presented to Hatch through meetings with UCRUSAL in Moscow and has not been validated through an additional site visit. We have no reasonto believe that the information provided is not a true and fair reflection of developments at thefacility.
As of September 2009, 54 cells are reportedly operating at ALSCON. UC RUSAL plan tocommission a further 54 cells by end-2010, to make a total of 108 cells operational. The wholeplant, 432 cells, is planned to be fully operational by 2013.
APPENDIX VI INDEPENDENT TECHNICAL REPORT
— VI-276 —

5.17.6 Specific Risks and Future Opportunities
Specific Risks
• Social/Labour Risk (1) — ALSCON is located in Aqua Ibom state, which together with theBayelsa, Delta and Rivers states forms the Niger River estuary. In recent years there havebeen many incidents of kidnapping of expatriates in these states and theft of oil cargos. OnJune 3 2007, a group of militants attacked a residential community of UC RUSAL’semployees in the southern part of Ikot Abasi. Six people were kidnapped, while the driver,who worked for ALSCON, was shot dead. Additionally, on 20 December 2008, two UCRUSAL employees were abducted from the site. Whilst the majority recognise theimportance of the smelter operation to their economic development, there is a sustainedhigh risk of kidnapping and theft of aluminium by minority groups. The personnel securityissue presents a significant risk to attracting and retaining skilled expatriate personnel andhence to future smelter operations.
• Social/Labour Risk (2) — Host communities in the region have high expectations from thesmelter. ALSCON will be a major employer for local communities where unemploymentlevels are high. The key development issues to be addressed are the provision of electricity,water and social projects including employment, supporting local contractors and socialinfrastructure projects. In December 2006, there was a strike by local communities inrelation to the provision of electricity, which prevented access to the smelter. Addressingthe concerns of local communities is essential for the future operation of ALSCON.
• Reliability of Gas Supply — It is essential for the success of this plant that it receives gassupplies without interruption and that these gas supplies are available for the next 20 yearsor more. The limit of the current gas supply contract will allow the operation of only 54cells out of the total of 432 at the smelter. In addition, the plant continues to experience gasoutages of varying duration. Clearly the smelter requires gas supplies to be withoutinterruption except in the most exceptional circumstances. It is recommend that assurancesare sought from NGC that they have sufficient gas supplies connected to the transmissionsystem to ensure stable and continuous gas supplies. However, UC RUSAL has advisedHatch that the terms of the gas supply agreement with NGC provides for a ramp-up in gasavailability sufficient to allow the smelter to reach full production in 2011.
Future Opportunities
No specific opportunities material to the future operation of this facility have been identified.
5.18 Boguchansky Smelter Project
5.18.1 Introduction
Hatch undertook a site visit to Boguchansky Smelter Project in October 2008. This Section 5.18has subsequently been revised and updated based upon data and information from UC RUSALand discussions held with senior management in September 2009. With reference to the followingsections, please note;
• Section 5.18.2 — History, Location and Infrastructure as of October 2008,
• Section 5.18.3 — Process Description as of October 2008,
• Section 5.18.4 — Environmental Status as of October 2008,
• Section 5.18.5 — Material Developments at the facility between October 2008 andSeptember 2009, and
APPENDIX VI INDEPENDENT TECHNICAL REPORT
— VI-277 —
• Section 5.18.6 — All previous Specific Risks and Opportunities noted in October 2008together with any changes following new data and information provision.
5.18.2 History, Location and Infrastructure
The Boguchansky Aluminium Smelter project involves the construction of a 588 ktpa greenfieldaluminium smelter on a 230 hectare site, located approximately 8 km to the south-east of thesettlement of Tayozhny in the Krasnoyarsk Region, and approximately 160 km (212 km by road)from the new Boguchanskaya hydroelectric power plant (HPP).
When operational, the electrical energy requirements of the smelter will be supplied from theBoguchanskaya HPP, which is also under construction at the present time. The smelter and HPP(described in Section 9) are linked UC RUSAL projects and are sometimes collectively referredto as the Boguchanskoye Energy & Metallurgy Combine (BEMO) Project.
The project is being implemented as an equal-share joint venture between RAO EES(Hydro-OGK) and UC RUSAL, and therefore UC RUSAL’s share of the production capacity willbe 294 ktpa.
The aluminium smelter is around 12 km from the railway station and terminal at Karabula, nearTayozhny, which has road and rail links (both passenger and freight trains) to the major Siberiancity of Krasnoyarsk. The Boguchansky region currently has a total population of around 50,000.
Two 160 km long 500 kV high voltage (HV) transmission lines will connect the 500 kVBoguchanskaya HPP switchyard to the Angara 500/220 kV sub-station located near BoguchanskyAluminium Smelter. Five 220 kV lines will connect the Angara 500/220 kV sub-station to thesmelter.
UC RUSAL has signed an agreement for the infrastructure requirements of the project (includingpower transmission lines, road construction and bridges) to be financed by the Investment Fundof the Russian Federation.
The smelter will be serviced by a new railway station, ‘Zavodskaya’, for which site clearing hascommenced.
The project will be executed under an EPCM arrangement, with UC RUSAL’s own engineeringand construction divisions carrying out the works. The total number of workers duringconstruction is estimated at 3,460, of which 170 people are currently working in the EPCMgroup. Up to 2,000 workers will be housed in a construction camp to be built as part of theproject.
Basic engineering for the project started at the end of 2006 and on May 15, 2007, the Governorof Krasnoyarsk placed the foundation “first stone” for the project. The Boguchansky AluminiumSmelter project construction timeline is scheduled from 2007 to 2012. The first pots arescheduled for start-up in December 2010 with project completion in October 2012, although fullproduction from the smelter will not be achieved until 2013.
During construction, power will be provided from a 10 kV overhead transmission line fromKarabula. The electrical energy demand during construction and commissioning is approximately14 MW.
5.18.3 Process Description
The new Boguchansky Aluminium Smelter project will comprise two potlines each of 336 cells,and each potline consisting of two parallel potrooms containing 168 cells. The length of eachpotroom will be approximately1.2 km.
APPENDIX VI INDEPENDENT TECHNICAL REPORT
— VI-278 —
The potline will utilise UC RUSAL’s own RA-300 prebake reduction technology, initiallyoperating at 320 kA. The technology and potroom configuration will be very similar to that ofthe Khakas smelter which recently reached full production at Sayanogorsk.
Potline gases will be dry scrubbed in modern gas treatment centres (GTCs) with the maintechnological and process components provided by Solios Environmental of France.
The smelter casthouse will contain nine holding furnaces with capacities of between 60 and 85tonnes, servicing 3 x 25 tph ingot chain caster machines and two vertical direct chill (VDC)casting machines each of 29 tph capacity. The forecast production mix from the casthouse isapproximately 45 per cent T-bar and 55 per cent of 22.5 kg ingot.
Carbon anodes will be produced on site within an anode paste plant comprising two paste lineseach of 30 tph throughput. Green anodes from the paste plant will be baked in two open-top typefurnaces each of 64 sections and operating with four fires. Fume treatment facilities will beprovided for the furnaces.
A rodding shop will be provided to assemble fresh anodes, disassemble spent anodes and to crushand grade the recovered electrolyte and carbon materials for recycling in the reduction process.
Carbon area storage facilities will be provided for process raw materials, including coal-tar pitchin both liquid and solid forms. Covered storage will also be provided for green, baked and roddedanodes.
The project also includes the construction of a housing complex, comprising an area of 146,000m2, which comprises living accommodation, a school, sport complex and associatedinfrastructure.
5.18.4 Environmental
All permits and approvals have been secured. No environmental problems are foreseen at thisstage.
When completed, the Boguchansky Aluminium Smelter will be a modern facility employingpre-bake technology and excellent environmental control. All four Potrooms at Boguchansky willhave a GTC installed to collect and treat off-gas from the potrooms and discharge the cleanedgas to atmosphere. All GTCs will be provided by Solios Environmental and are of dry scrubbertechnology.
In addition, a single FTC will be constructed to treat the off-gas from the three anode bakingfurnaces.
5.18.5 Material Developments
This section presents material changes to the facility since the site visit was undertaken inOctober 2008. The updated information was presented to Hatch through meetings with UCRUSAL in Moscow and has not been validated through an additional site visit. We have no reasonto believe that the information provided is not a true and fair reflection of developments at thefacility.
UCR advised of no material changes to the planned smelter technology as described in Section5.18.3, with the exception of the following. The project scope has been amended and no longerincludes plans to construct a carbon anode plant at the smelter facility. It is currently planned toimport all required carbon anodes for the smelter from china.
Refer to Section 2.3.7.2 for the current status of the Boguchansky Aluminium Smelter project.
APPENDIX VI INDEPENDENT TECHNICAL REPORT
— VI-279 —

5.18.6 Specific Risks and Future Opportunities
Specific Risks
• Project Schedule — Delays in the erection and commissioning of the 500 kV transmissionlines from the Boguchanskaya HPP would affect the delivery of power to the BoguchanskyAluminium Smelter, and hence delay the smelter start-up and operations. Progress on thesethird-party works must be carefully monitored, since these construction activities areoutside of the direct control of UC RUSAL’s project management.
• Asset Integrity — The Boguchansky Aluminium Smelter will be only the second smelterto enter full commercial production using RA-300 technology, the first being the KhakasAluminium Smelter and which reached full production levels as recently as February 2008.The development of the RA-300 technology over a comparatively short period of time canbe considered impressive. However, the technology, especially for operation at 320 kA,cannot yet be considered “mature” (see Section 2.3.2.1). Pot life has only been extrapolatedfrom a few autopsies of voluntarily cut-out cells. There is a risk that with a sample of 336cells, undetected or underestimated problems may surface. Additionally, independently ofthe cell amperage, the hardware components of the RA-300 cell have not been proven forlong-term operation. This can have an impact on maintenance costs. However, it should benoted that the first Khakas Aluminium Smelter RA-300 cells have now been in operationfor almost three years, operations are reportedly stable and there have been no cell failures.
Future Opportunities
No specific opportunities material to the future operation of this facility have been identified.
6. Powder, Silicon, Secondary Aluminium and Raw Materials Facilities
6.1 Krasnoturyinsk Powder Metallurgy
6.1.1 Introduction
Hatch undertook a site visit to Krasnoruryinsk Powder Metallurgy in September 2008. ThisSection 6.1 has subsequently been revised and updated based upon data and information from UCRUSAL and discussions held with senior management in September 2009. With reference to thefollowing sections, please note;
• Section 6.1.2 — Updated with data and information as of September 2009,
• Section 6.1.3 — Process Description as of September 2008,
• Section 6.1.4 — Environmental Status as of September 2008,
• Section 6.1.5 — Material Developments at the facility between September 2008 andSeptember 2009, and
• Section 6.1.6 — All previous Specific Risks and Opportunities noted in September 2008together with any changes following new data and information provision.
6.1.2 History and Location
Krasnoturyinsk Powder Metallurgy (SUAL-PM Ltd Branch SUAL-PM-Krasnoturinsk) is locatednear the Bogoslovsk Alumina Refinery and Bogoslovsk Aluminium Smelter complex inKrasnoturyinsk, approximately 370 km from Ekaterinburg. The plant was commissioned in 1958and has operated as a separate entity to Bogoslovsk Alumina and Aluminium since 2005.Krasnoturyinsk Powder Metallurgy has a nameplate capacity of 19.5 ktpa. The plant produced8.3 kt of aluminium powder in 2008.
APPENDIX VI INDEPENDENT TECHNICAL REPORT
— VI-280 —
6.1.3 Plant Description
The plant comprises three main production areas, namely;
• Aluminium powder and paste production,
• Air separation unit (nitrogen and oxygen production), and;
• Metal packaging manufacturing for finished products (50 litres)
Primary aluminium is supplied to the plant from the Bogoslovsk Aluminium Smelter. Electricityis also supplied from the smelter site. Approximately 10 per cent of secondary aluminium is usedin the manufacturing process with the secondary aluminium being imported from sources outsideKrasnoturyinsk.
The powder plant comprises a total of four spray plants with reverberatory furnaces (bathcapacity of 9 tonnes each), housed in a two-storey building. The kilns are located on the secondfloor and the powder bagging area on the first floor. Off-gases are passed through a cyclone,multicyclone and an oil filter before being discharged to atmosphere. At present, two furnacesare in daily operation. One furnace is used as a stand-by and the remaining furnace is underrepair.
Aluminium ingots, of 15 kg size are fed into the kiln and nitrogen and oxygen are injected intothe molten metal to atomise the aluminium. The atomised aluminium is then sprayed into adischarge chamber were it cools and settles into the collection cone. The powder is then sieved.At this point some of the product is packaged as a finished product, while the remainder istransported to the ball mill area for grinding to powders and pastes, or to the sieve section forproducing powders of the correct grain size. The plant has a total of 15 ball mills. The powderis packed into sealed 50 litre drums, Flexible Intermediate Bulk Containers (FIBCs, commonlyknown as ‘big-bags’) or 200 litre drums prior to shipment. The plant produces its own 50 litredrums for storing the finished product. Up to 15,000 drums per month are produced by the plant.
The plant produces its own nitrogen gas by separating air into nitrogen and oxygen. The nitrogenis returned to the process and the oxygen is sold locally.
Krasnoturyinsk Powder Metallurgy advised that the plant complies with all environment permitsfor emissions and waste disposal. The majority of waste from the plant is recycled and/or sold.
Although the process involves highly explosive materials handling, due to the high standards ofhealth and safety, the last major incident occurred at this facility back in 1978.
6.1.4 Material Developments
This section presents material changes to the facility since the site visit was undertaken inSeptember 2008. The updated information was presented to Hatch through meetings with UCRUSAL in Moscow and has not been validated through an additional site visit. We have no reasonto believe that the information provided is not a true and fair reflection of developments at thefacility.
UC RUSAL has advised that there have been no material changes to the physical equipment/plantat the facility.
6.2 Shelekhov Powder Metallurgy
6.2.1 Introduction
Hatch undertook a site visit to Shelekhov Powder Metallurgy in September 2008. This Section6.2 has subsequently been revised and updated based upon data and information from UCRUSAL and discussions held with senior management in September 2009. With reference to thefollowing sections, please note;
APPENDIX VI INDEPENDENT TECHNICAL REPORT
— VI-281 —
• Section 6.2.2 — Updated with data and information as of September 2009,
• Section 6.2.3 — Process Description as of September 2008,
• Section 6.2.4 — Environmental Status as of September 2008,
• Section 6.2.5 — Material Developments at the facility between September 2008 andSeptember 2009, and
• Section 6.2.6 — All previous Specific Risks and Opportunities noted in September 2008together with any changes following new data and information provision.
6.2.2 History and Location
The Shelekhov Powder Metallurgy plant is situated in the town of Shelekhov, around 22 km tothe south-west of the city of Irkutsk. Established in 1976 as Department of Powder Metallurgyof Irkutsk Aluminium Smelter, the facility was re-organised into a separate company inDecember 1998.
The trans-Siberian railway runs 2 km east of the site, providing good transport links for theimport of necessary materials and supplies and the export of products. The main raw materialinput though is in the form of liquid aluminium sourced from the nearby Irkutsk AluminiumSmelter.
Shelekhov Powder Metallurgy produced 4.7 kt of aluminium powder in 2008. There are no largescale expansion plans for the Shelekhov Powder Metallurgy plant. At present, the plant operatesat 60 per cent of its production capacity.
6.2.3 Plant Description
The plant produces up to two dozen products, primarily for the export market. Powderedaluminium is used by a number of different industries including ferrous metallurgy, refractory,paints, chemical, oil, rubber, construction and military.
Liquid (primary) aluminium is delivered from Irkutsk smelter in 4-tonne ladles and loaded intokilns. Five kilns are installed, four are operational and one is under repair. To produce dopedaluminium powders, the aluminium is pre-alloyed with silicon and/or titanium and sprayed intoa water-cooled dust settling chamber. Nitrogen is injected into the molten metal to atomise thealuminium. The aluminium powder is then collected at the base of the settling chamber andclassified by screens. The grain size of the aluminium powder is controlled by the apertureopening of the nitrogen injection nozzle, the pressure of the nitrogen and the metal temperature.The dispersibility of the aluminium powder is controlled by several parameters, including thepressure and temperature of the nitrogen, the metal temperature, the nozzle design etc. Thefinished product is then stored in 50 or 200 litre cylindrical drums, or FIBCs (big-bags)
Spherical, tear-shaped, lamellar and flat (flakes) powder are produced by the plant. Flat powderis mechanically crushed by a ball rolling mill. This produces a “sticky” powder that is used inthe construction industry as a concrete admixture. To produce the aluminium powder, the crudeproduct is milled with hydrocarbon additives, to form a powder product which is used as agasifier in cell concrete production. The plant has its own laboratory which carries tests forparticle size distribution, granular structure chemical composition and other product parameters.
Shelekhov Powder Metallurgy has achieved ISO 14001 environmental management certification.
The plant produces very little waste products. Approximately 30 tonnes of dross is producedannually, which is either sold and/or recycled within UC RUSAL.
APPENDIX VI INDEPENDENT TECHNICAL REPORT
— VI-282 —
Power for the plant is provided from the Irkutsk Aluminium Smelter site.
6.2.4 Material Developments
This section presents material changes to the facility since the site visit was undertaken inSeptember 2008. The updated information was presented to Hatch through meetings with UCRUSAL in Moscow and has not been validated through an additional site visit. We have no reasonto believe that the information provided is not a true and fair reflection of developments at thefacility.
UC RUSAL has advised that there have been no material changes to the physical equipment/plantat the facility.
6.3 Volgograd Powder Metallurgy
6.3.1 Introduction
Hatch undertook a site visit to Volgograd Powder Metallurgy in September 2008. This Section6.3 has subsequently been revised and updated based upon data and information from UCRUSAL and discussions held with senior management in September 2009. With reference to thefollowing sections, please note;
• Section 6.3.2 — Updated with data and information as of September 2009,
• Section 6.3.3 — Process Description as of September 2008,
• Section 6.3.4 — Environmental Status as of September 2008,
• Section 6.3.5 — Material Developments at the facility between September 2008 andSeptember 2009, and
• Section 6.3.6 — All previous Specific Risks and Opportunities noted in September 2008together with any changes following new data and information provision.
6.3.2 History and Location
The Volgograd Powder Metallurgy facility is situated together with the UC RUSAL VolgogradAluminium Smelter, on the outskirts of the city of Volgograd. The plant began operations in1961.
Volgograd Powder Metallurgy produced 5.7 kt of aluminium powder in 2008. The facility sourcesits aluminium raw material from Volgograd Aluminium Smelter in ingot form. Volgograd PowderMetallurgy produces aluminium powders, different grain size and chemistry powders, powdersand granules of high purity.
6.3.3 Plant Description
Powdered aluminium is used by a number by different industries including chemical, oil, rubber,construction and military. At present the plant produces up to 30 types of powders.
In recent years, the facility has been the only plant in Russia producing complex powders fromAl-based alloys (Al-Ti, Al-Mo-Zr-Ni, Al-Mg, Al-Si-Ni, Al-Zn).
Finished product is packed into steel drums or FIBCs (big-bags). The plant manufactures its onlypackaging drums.
APPENDIX VI INDEPENDENT TECHNICAL REPORT
— VI-283 —

The plant produces powders in a nitrogen environment generated from its own air separationunit. This also produces oxygen which is then sold locally.
The plant has its own laboratory which carries out tests for particle size distribution, granularstructure and chemical composition.
6.3.4 Material Developments
This section presents material changes to the facility since the site visit was undertaken inSeptember 2008. The updated information was presented to Hatch through meetings with UCRUSAL in Moscow and has not been validated through an additional site visit. We have no reasonto believe that the information provided is not a true and fair reflection of developments at thefacility.
UC RUSAL has advised that there have been no material changes to the physical equipment/plantat the facility.
6.4 Irkutsk Silicon
6.4.1 Introduction
Hatch undertook a site visit to Irkutsk Silicon in September 2008. This Section 6.4 hassubsequently been revised and updated based upon data and information from UC RUSAL anddiscussions held with senior management in September 2009. With reference to the followingsections, please note;
• Section 6.4.2 — Updated with data and information as of September 2009,
• Section 6.4.3 — Process Description as of September 2008,
• Section 6.4.4 — Environmental Status as of September 2008,
• Section 6.4.5 — Material Developments at the facility between September 2008 andSeptember 2009, and
• Section 6.4.6 — All previous Specific Risks and Opportunities noted in September 2008together with any changes following new data and information provision.
6.4.2 History and Location
The Irkutsk Silicon plant is located adjacent to the Irkutsk Aluminium Smelter in the town ofShelekhov.
Irkutsk Silicon is the largest silicon production facility in the Russian Federation and has beenin operation since 1981. The silicon plant was formerly under the management of IrkutskAluminium Smelter, but was incorporated as an independent entity in August 1998. Themaximum production capacity of the plant with all furnaces operational is reported to be 42 ktpaof silicon metal, although production in 2008 only reached 32.7 kt. Of the total production in2008, approximately 6 ktpa was consumed in the production of high silicon aluminium alloys byRussian aluminium smelters.
APPENDIX VI INDEPENDENT TECHNICAL REPORT
— VI-284 —
6.4.3 Plant Description
The plant produces both metallurgical and chemical grades of silicon. Metallurgical grade siliconis predominantly used for alloying of aluminium. Chemical grade material is more pure and isused as a process ingredient in various industries, including micro-electronics. Irkutsk Silicon isthe only plant in the Russian Federation producing chemical grade silicon, which commands ahigher price than metallurgical metal and therefore the future company strategy is to increaseproduction of chemical grade silicon.
Irkutsk Silicon owns and operates its own quartzite mine at Cheremshansk, located 500 km to theeast of the plant, from where it receives the quartzite required for its entire production.
The Irkutsk Silicon plant comprises two independent streams (lines) for silicon production, eachwith its own materials import and storage, blending, electric-arc furnaces, casting, crushing,screening and bagging facilities. Line 1 comprises four 16.5 MVA electric-arc furnaces(numbered 1 to 4), commissioned in 1981. Currently all four furnaces are operational. Line 2comprises two 25 MVA electric-arc furnaces (numbered 5 and 6), commissioned in 1988. Atpresent only furnace No. 6 is operational. Furnace No. 5 requires a major overhaul and approvalof the capital programme to carry out the necessary repairs is awaited from UC RUSAL.
Silicon production is a continuous process in which raw materials, blended with reducing agents,are fed into the top of the furnace and the molten product is tapped from the bottom. At theIrkutsk Silicon plant, the furnace tapping temperature is approximately 1,750�C.
Refining of the silicon metal is carried out within the tapping crucibles by introducing oxygenvia nozzles at the bottom of the crucible, to oxidise entrained aluminium and calcium and forma slag. The capacity of each tapping crucible is approximately 3.5-tonnes.
The contents of the crucibles are poured into flat, open moulds of 300 kg capacity to form asilicon slab approximately 150 mm thick. Prior to pouring, the surfaces of the mould are coatedwith silicon fines from the crusher, which acts as a mould release agent. After being allowed tocool naturally, the moulds are emptied using cranes which tip the moulds into large bins. Thesilicon slab is subsequently fed into a jaw crusher located below ground level. After crushing,product is conveyed to the screening and bagging station where it is graded and bagged forshipment in Flexible Intermediate Bulk Containers (FIBCs, commonly known as ‘big-bags’).
Including all equipment and ancillaries, the total electrical power demand of the plant is 60 MW.Electrical power is supplied from the Irkutskenergo grid system, with connection via the IrkutskAluminium Smelter switchyard.
All furnaces are hooded and off-gases directed to one of the three wet scrubbers using soda ashas the scrubbing agent. The pregnant scrubbing liquor is pumped to a storage facility, whereclarified water is returned to the scrubber in a closed system. Whilst effective at reducingemissions of sulphur dioxide and silicon oxide dust, the wet scrubbers are very energy intensiveand hence operating costs are higher than if a dry scrubbing system was utilised. A feasibilitystudy is currently being performed to replace the wet scrubbers with a dry scrubber system. Itis proposed to introduce dry scrubbers for furnaces 5 and 6 by 2010. Following successfulcommissioning, dry scrubbers will be introduced for furnaces 1, 2, 3 and 4. The dry scrubbersystem would allow the silicon dust to be recovered and sold as a by-product.
A new waste area within the plant boundaries has recently been added for the disposal of slagfrom the refining process.
The silicon plant is equipped with a laboratory which carries out analysis of acidity levels,together with the content of iron, chlorides, nitrates, nitrites, sulphates, fluoride in solutions andalso silicon oxide in dust.
APPENDIX VI INDEPENDENT TECHNICAL REPORT
— VI-285 —

Irkutsk Silicon has obtained the required environmental permit for air emissions andtransportation and storage of dangerous waste products. Irkutsk Silicon plant managementadvised that all emissions comply with the permitted limits.
6.4.4 Material Developments
This section presents material changes to the facility since the site visit was undertaken inSeptember 2008. The updated information was presented to Hatch through meetings with UCRUSAL in Moscow and has not been validated through an additional site visit. We have no reasonto believe that the information provided is not a true and fair reflection of developments at thefacility.
UC RUSAL has advised that there have been no material changes to the physical equipment/plantat the facility.
Irkutsk Silicon is currently producing below recent historical levels following the closure ofFurnace 1 in the first quarter of 2009. UC RUSAL attributed the closure to a strategic decisionbased on reduced demand for silicon. Hatch was advised that UC RUSAL view the closure ofFurnace 1 as temporary and that facility is the subject of continuous review and monitoring todetermine an optimal time for restart.
6.5 Urals Silicon
6.5.1 Introduction
Hatch undertook a site visit to Urals Silicon in September 2008. This Section 6.5 hassubsequently been revised and updated based upon data and information from UC RUSAL anddiscussions held with senior management in September 2009. With reference to the followingsections, please note;
• Section 6.5.2 — Updated with data and information as of September 2009,
• Section 6.5.3 — Process Description as of September 2008,
• Section 6.5.4 — Environmental Status as of September 2008,
• Section 6.5.5 — Material Developments at the facility between September 2008 andSeptember 2009, and
• Section 6.5.6 — All previous Specific Risks and Opportunities noted in September 2008together with any changes following new data and information provision.
6.5.2 History and Location
Urals Silicon is located at the Urals Alumina Refinery and Urals Aluminium Smelter complex inKamensk-Uralsky, approximately 100 km from Ekaterinburg. The original works wereconstructed in 1941; however, this part of the plant is no longer used. The current silicon plantcomprises six electric-arc furnaces, four of which were constructed in 1958 and a further twofurnaces were added between 1958 and 1968. The silicon plant was formerly under themanagement of Urals Alumina and Aluminium but was incorporated as an independent entity inAugust 1998, prior to being purchased by UC RUSAL.
Urals Silicon produces only metallurgical grades of silicon which are predominantly used in thealloying of aluminium for the engineering and aviation end-use markets. No additional refiningequipment has been installed to produce chemical grades of silicon.
APPENDIX VI INDEPENDENT TECHNICAL REPORT
— VI-286 —
The plant has a maximum installed production capacity of approximately 28 ktpa. The UralsSilicon plant produced 23.9 kt in 2008. The facility procures the required quartzite raw materialfrom the PervoUralsk mine, located near to Ekaterinburg. This mine is independently owned andoperated, and is not a UC RUSAL asset. The mine only supplies quartzite to the Urals Siliconplant.
All other raw materials necessary for production are supplied from sources within a few hundredkilometres of the plant. Charcoal is received from two major and three minor suppliers, as theplant wishes to support small local producers. Coal is imported from Kazakhstan and petroleumcoke from the Perm region of the Russian Federation. Furnace electrodes are manufactured at theNovocherkask electrode plant.
The facility is currently not operational. Refer to Section 6.5.5.
6.5.3 Plant Description
The Urals Silicon plant comprises a single production line for silicon production, with six 6.5MVA electric-arc furnaces. The plant is the oldest in the Russian Federation. At the time of thesite visit all six furnaces were in operation. Each furnace is given a major overhaul once everyfour years, which takes approximately one month to complete.
Silicon production is a continuous process in which the blended raw materials are fed into thetop of the furnace and the molten product is tapped from the bottom. Automatic control ofmaterial blending was introduced in 2005 to improve the quality and efficiency of the process.The furnace tapping temperature at the Urals Silicon plant is in the region of 1,500�C.
Molten metal from the furnaces is discharged directly into open moulds of 1,500 kg capacity toform a silicon slab approximately 500 mm thick. Three moulds are cast per furnace per shift.Prior to pouring, the surfaces of the mould are coated with silicon fines from the crusher, whichacts as a mould release agent. After being allowed to cool naturally, the moulds are emptied andthe silicon slab is subsequently fed into a jaw crusher. After crushing, the product is conveyedto the screening and bagging station where it is graded and bagged for shipment.
Urals Silicon secures all electrical power via the Urals Alumina Refinery and Aluminium Smeltercomplex.
Off-gases are collected from the open-furnace area and vented to atmosphere via six chimneys(ranging in height from 45 to 50 m) without treatment. A wet scrubber system was installed atthe site in 1968, however, this system was used for less than a year as the waste slime wasdifficult to treat and dispose-of. There are currently no gas treatment facilities at the plant,although a gas cleaning project has been approved within the company and is being reviewed bythe State environment department. The gas cleaning facility will consist of two dry scrubbers(three furnaces per scrubber) with the equipment supplied by a Chinese company and is expectedto reduce emissions of silicon oxide dust and other particulates. The gas treatment facility isplanned to be commissioned by 2010.
There are no laboratory facilities at the Urals Silicon site. Samples are taken daily and tested atthe laboratory facilities located at the Urals Aluminium Smelter plant site.
6.5.4 Material Developments
This section presents material changes to the facility since the site visit was undertaken inSeptember 2008. The updated information was presented to Hatch through meetings with UCRUSAL in Moscow and has not been validated through an additional site visit. We have no reasonto believe that the information provided is not a true and fair reflection of developments at thefacility.
APPENDIX VI INDEPENDENT TECHNICAL REPORT
— VI-287 —

UC RUSAL has advised that there have been no material changes to the physical equipment/plantat the facility.
Urals Silicon is currently not operational following the full closure of the plant implemented inthe first quarter of 2009. UC RUSAL attributed the closure to a strategic decision based onreduced demand for silicon. Hatch was advised that UC RUSAL view the closure of the facilityas temporary and that the facility is the subject of continuous review and monitoring to determinean optimal time for restart.
6.6 Zaporozhye Silicon
6.6.1 Introduction
Hatch undertook a site visit to Zaporozhye Silicon in September 2008. This Section 6.6 hassubsequently been revised and updated based upon data and information from UC RUSAL anddiscussions held with senior management in September 2009. With reference to the followingsections, please note;
• Section 6.6.2 — Updated with data and information as of September 2009,
• Section 6.6.3 — Process Description as of September 2008,
• Section 6.6.4 — Environmental Status as of September 2008,
• Section 6.6.5 — Material Developments at the facility between September 2008 andSeptember 2009, and
• Section 6.6.6 — All previous Specific Risks and Opportunities noted in September 2008together with any changes following new data and information provision.
6.6.2 History and Location
The Zaporozhye Silicon plant is located at the Zaporozhye Alumina and Aluminium complex inthe city of Zaporozhye, located in the south east of Ukraine, approximately 600 km south ofKiev.
The Zaporozhye Silicon facility was commissioned in 1938, but was closed followingZaporozhye coming under heavy attack during World War Two. Many of the facilities atZaporozhye Silicon were relocated to the Urals region and subsequently used in the constructionof other plants. The building structures and facilities that were not removed were severelydamaged, necessitating major reconstruction work. The reconstructed Zaporozhye Siliconfacility reopened in 1958.
Zaporozhye Silicon plant produced 1.3 kt of silicon in 2008.
The facility is currently not operational. Refer to Section 6.5.5.
6.6.3 Plant Description
Zaporozhye Silicon can produce metallurgical grades of silicon. No additional refiningequipment has been installed to produce chemical grades of silicon.
Silicon production is a continuous process in which raw materials, blended with reducing agents,are fed into the top of the furnace and the molten product is tapped from the bottom. AtZaporozhye Silicon plant, furnace tapping temperature is in the order of 2,000�C.
APPENDIX VI INDEPENDENT TECHNICAL REPORT
— VI-288 —
The facility comprises six electric-arc furnaces for silicon production. Furnaces 1 and 2 are ratedat 6.5 MW, while Furnaces 3 to 6 are rated at 16.5 MW. Furnaces 3 to 6 have been mothballedfor an extended period. Furnaces 1 and 2 were closed in 2007, before Furnace 1 wasrecommissioned in September 2008. Furnace 2 is currently undergoing repairs in preparation fora planned restart in October 2008. There are no current plans to restart Furnaces 3 to 6.
A dry scrubber for Furnaces 1 and 2 is under construction and is due to be operational fromNovember 2009. This facility includes cyclonic separators and a baghouse that will allowrecovery of ultrafine silicon powders as a value added product. Furnaces 3 and 4 are equippedwith wet scrubbers to treat the off-gasses, with an additional step of dust removal using abaghouse. Furnaces 5 and 6 are connected to a wet scrubber only. When the furnaces areoperational the wet scrubber wastewaters are discharged through an open channel to a settlingpond at the adjacent steelworks.
Electrodes for silicon production are procured from Ukrgraphite, an independent companylocated adjacent to the Zaporozhye Alumina and Aluminium complex.
The silicon facility secures all electrical power via the Zaporozhye Alumina and Aluminiumcomplex with two dedicated transformers.
6.6.4 Material Developments
This section presents material changes to the facility since the site visit was undertaken inSeptember 2008. The updated information was presented to Hatch through meetings with UCRUSAL in Moscow and has not been validated through an additional site visit. We have no reasonto believe that the information provided is not a true and fair reflection of developments at thefacility.
UC RUSAL has advised that there have been no material changes to the physical equipment/plantat the facility.
Zaporozhye Silicon is currently not operational following the full closure of the plantimplemented in December 2008. UC RUSAL attributed the closure to a strategic decision basedon reduced demand for silicon. Hatch was advised that UC RUSAL view the closure of thefacility as temporary and that the facility is the subject of continuous review and monitoring todetermine an optimal time for restart.
6.7 Resal
6.7.1 Introduction
Hatch undertook a site visit to Resal in October 2008. This Section 6.7 has subsequently beenrevised and updated based upon data and information from UC RUSAL and discussions held withsenior management in September 2009. With reference to the following sections, please note;
• Section 6.7.2 — Updated with data and information as of September 2009,
• Section 6.7.3 — Process Description as of October 2008,
• Section 6.7.4 — Environmental Status as of October 2008,
• Section 6.7.5 — Material Developments at the facility between October 2008 andSeptember 2009, and
• Section 6.7.6 — All previous Specific Risks and Opportunities noted in October 2008together with any changes following new data and information provision.
APPENDIX VI INDEPENDENT TECHNICAL REPORT
— VI-289 —
6.7.2 History, Location and Infrastructure
Resal is located in the town of Novosemeykino in the Krasnoyarsk district of Samara region,approximately 35 km northeast of Samara.
The facility is housed on the site of a former sulphur plant where sulphur powder and sulphuricacid were manufactured from 1961 until closure in 1994. The Resal plant is also responsible fora solid waste dump in a neighbouring district. This dump, the original mine site for the sulphurplant, has been prepared to accept exhausted dross salts until recycling facilities and processingplant is available to process these solid materials. The Resal aluminium recycling facility startedin 1994 when the then owners, a local company with a Spanish partner, installed equipment fora dross and scrap reprocessing plant.
Resal recycles scrap aluminium and dross from the UC RUSAL group and other third parties intoaluminium sows of 550 kg each. Resal production in 2008 was 14.2 kt.
6.7.3 Process Description
The plant site consists of a scrap receiving area, open and undercover scrap storage areas, twomeltshops, a dross concentrator and crusher, maintenance workshops, office block, laboratory,finished goods warehouse and intermediate solid waste dump. The scrap receiving area isadjacent to the local railway network that services the plant and this is the primary delivery routefor materials to the plant site. Only scrap which is certified free from contaminants such asradiation and explosive residues is accepted for processing. When received on-site, the scrap issegregated and stored according to its type, either undercover in the case of salt dross, machinedchips, swarf, foil, used beverage cans and press off cuts or in the open storage area for furtherprocessing as is the case for large boulders of high metal content dross. Modern mobileequipment is used to transport materials on-site.
Of the two meltshops at Resal, the first handles scrap metallic aluminium swarf, foils and pressoff cuts and consists of one gas fired remelt rotary furnace of 25-tonne capacity serviced by areceiving hopper with inclined loading conveyer and vibratory feed chute to load the charge. Theliquid aluminium produced is cast into sows of approximately 550 kg in a semi automatic mouldstation under the furnace. The furnace and associated support equipment is in reasonable order.Regular replacement of refractory linings is undertaken and preventative maintenance of highwearing areas is conducted during a monthly downtime campaign with annual re-bricking of thefurnace barrel. The gas treatment plant for this furnace is relatively modern and complies withlocal standards, however the plant may not be adequate for higher production levels and mayneed an overhaul.
The second meltshop handles heavier metallic dross and concentrated salt dross in a 12-tonnecapacity gas fired Altek tilting barrel furnace. A removable vibratory charging conveyor servicesthe furnace and the melt is poured into sows of approximately 550 kg arranged in a manualcasting station around an exit trough. The Altek furnace and support equipment is in reasonableorder. Regular replacement of the castable refractory is undertaken and preventative maintenancein high wear areas is conducted during the monthly downtime campaign and annual reline of thefurnace barrel. Production and ergonomic improvements are planned for this casting station tomake it semi-automatic and increase capacity. The gas treatment plant for the Altek furnace isknown by site management to be sub standard and its replacement is also proposed to reduceemissions and improve furnace performance.
The ventilation of the building interior in both meltshops is poor. UC RUSAL is aware of thissituation and is preparing cost estimates for an appropriate ventilation system.
APPENDIX VI INDEPENDENT TECHNICAL REPORT
— VI-290 —
Salt dross from other UC RUSAL operations is received on-site and this material is processedin the concentrator/crusher to increase the aluminium content of the charge prior to processingin the Altek furnace. Residual salt slag that cannot be further concentrated in the existing plantis disposed of as a solid waste in the offsite dump, but is stored with a view to processing thematerial in the future. A preliminary feasibility has been undertaken to develop furthercapabilities in processing salt dross materials for UC RUSAL and external clients from this site.
Aluminium ingots produced by Resal are coded for sale according to metal purity and heatnumbers have traceability. Spectrometer testing is performed in the plant laboratory on regularlycalibrated equipment that is in good order but not of latest generation.
6.7.4 Environmental
A German “DISA” gas treatment system is used to process the exhaust fumes from the remeltfurnace to prevent air pollution and the collected baghouse residue is disposed offsite in the solidwaste dump. The Altek furnace has a gas treatment system of local design that is not adequatefor purpose and its replacement has been identified by Resal management. The site complies withlocal environmental regulations.
The plant site is aging and has been used for chemical processing for over 30 years. The typeof former chemical operations on this site is usually associated with serious pollutants andhazardous materials. Several of the buildings on-site are degraded, not suitable or in a dangerouscondition due to previous activities and it is intended for them to be demolished. The space freedup will allow expansion of scrap holding areas which have been identified as needing expansionto allow for any increase in production.
The previous mine site that supported the processing plant is now used as the waste dump forexhausted salt slag. The dump area has been prepared with a clay barrier and watercourse andis monitored for ammonia emissions as part of the site permits for operation. Adjacent to theResal plant, but not part of it, is a boiler plant. Several main lines from this plant pass throughResal and have degraded lagging. Some repairs have been completed recently but furtherimprovements are expected to be completed by the owner of the adjacent facility.
6.7.5 Material Developments
This section presents material changes to the facility since the site visit was undertaken inOctober 2008. The updated information was presented to Hatch through meetings with UCRUSAL in Moscow and has not been validated through an additional site visit. We have no reasonto believe that the information provided is not a true and fair reflection of developments at thefacility.
UC RUSAL has advised that there have been no material changes to the physical equipment/plantat the facility.
6.7.6 Specific Risks and Future Opportunities
Specific Risks
No specific risks material to the future operation of this facility have been identified.
Future Opportunities
• Product/Market Opportunities — The Resal site is well suited to expansion of thereprocessing and recycling facility for aluminium dross and slag from the rotary kilns, otherUC RUSAL plants and external third party clients, by replacing the existingconcentrator/crusher with one of modern design, greater throughput and a scrubber and
APPENDIX VI INDEPENDENT TECHNICAL REPORT
— VI-291 —

salt-reduction system for future recycling. An expansion of the existing product range toinclude high purity premium value alloys and small ingots to service known markets can beundertaken with the purchase of a degasser, filter, mixing furnace and continuous caster.The proposed upgrade of the furnace gas treatment systems should include allowances fora scrap drying and pre-heating stations that would use waste heat from the furnace exhaust,to reduce the energy input of the transformation process and increase operator safety duringloading operations. Improved troughing systems between furnaces would further reduceprocess heat losses, lower energy inputs and improve operator safety. The consolidation ofthe scrap market in the Russian Federation should provide additional opportunity for thisplant. Another significant opportunity for Resal is the potential to build up the ability torecycle exhausted salts both internally generated and as supplied by others. This activity iswell suited to the site and is a complimentary activity to the extraction of the remainingmetal from low grade feedstocks such as dross and slag.
6.8 Belis
6.8.1 Introduction
Hatch undertook a site visit to Belis in October 2008. This Section 6.8 has subsequently beenrevised and updated based upon data and information from UC RUSAL and discussions held withsenior management in September 2009. With reference to the following sections, please note;
• Section 6.8.2 — Updated with data and information as of September 2009,
• Section 6.8.3 — Process Description as of October 2008,
• Section 6.8.4 — Environmental Status as of October 2008,
• Section 6.8.5 — Material Developments at the facility between October 2008 andSeptember 2009, and
• Section 6.8.6 — All previous Specific Risks and Opportunities noted in October 2008together with any changes following new data and information provision.
6.8.2 History, Location and Infrastructure
Belis is located in the town of Belaya Kalitva in Rostov region, approximately 160 km northeastof Rostov. The plant is housed on a greenfield site that was built as a scrap reprocessing facilityin post Soviet times. RUSAL (prior to the formation of UC RUSAL) took ownership of thisfacility in late 2006.
Belis is serviced by good federal roads.
Belis reprocesses prime scrap from automotive, used beverage cans, compacted foil mill wastes,aluminium butts and domestic waste from third parties and small ingots (7 to 15 kg) from UCRUSAL smelters into graded alloy ingots of 7 to 15 kg, lower purity non alloyed sows ofapproximately 550 kg each and cast alloy billets for the extrusion industry. The alloy billets areonly made from prime material from UC RUSAL smelters. Belis produced 11.5 kt of product in2007.
6.8.3 Process Description
Belis consists of a scrap receiving area alongside the main entry to the plant, one meltshop withtwo barrel furnaces, three hearth furnaces, one homogenizing furnace, one cooling furnace andone direct chill casting station, a dross sieve, warehouse, laboratory and offices. Testing forradiation is carried out on the weighbridge for each load delivered using calibrated equipment.
APPENDIX VI INDEPENDENT TECHNICAL REPORT
— VI-292 —

Scrap certified free from contaminants such as radiation and explosive residues is accepted forprocessing. When received on-site, scrap is segregated outdoors then stored according to type inan undercover bunkered storage area. The scrap handling process at Belis has been recentlyimproved with hardstand expansion, bunker construction, plant roof and weighbridge repairs.The furnace charge is transferred from the undercover area to a holding area adjacent to thefurnace to dry before use. Modern mobile equipment is used to transport materials on-site.
The meltshop has two main areas. The first area processes scrap feedstock with a high metallicpercentage and consists of two melting furnaces of 10-tonne capacity each serviced by chargecars and overhead cranes, one rotary furnace, two mixers and two casting stations. The liquidaluminium produced is fed via refractory lined troughs into either one of two manual castingstations to produce alloyed ingots of 7 to 15 kg or 550 kg sows. The equipment in this meltshopis in reasonable order and housekeeping is good. A comprehensive preventative maintenanceprogram is in place, including monthly downtime for minor work, and less frequent outages formajor refractory re-bricking. Remnants of the original building ventilation system are stillevident, however more effective fume extraction for the furnaces is planned and equipment ison-site for this project. There is a relatively modern gas treatment plant with wet scrubber ofunknown make connected to the furnaces in this building. Emissions from this treatment plantcomply with local regulations.
The second meltshop area handles lower grade materials such as heavier metallic dross and somesalt dross in a 5-tonne capacity tilting barrel furnace. The furnace is serviced by a manuallyloaded, removable vibratory charging car and the melt is poured into 550 kg moulds arranged ina manual casting station around an exit trough. The furnace and support equipment is inreasonable order and regular replacement of the refractory, along with preventative maintenanceis completed through monthly downtime and an annual shutdown. Improvements are planned forthe casting station to make it semi-automatic and improve throughput. Improvements to thebuilding ventilation in this area of the Belis plant will be actioned when proposed upgrades tothe furnace exhaust system prior to the scrubber and gas treatment system are carried out.
Adjacent to the meltshop area is the direct chill casting station for production of extrusionbillets. The melting furnace for the casting station is loaded with high purity primary aluminiumingot butt ends from UC RUSAL smelters. Alloying is undertaken in the furnace and the materialis degassed and filtered in new equipment. An upgrade of the metal filtering and degassing unitshas recently been completed. The casting station features a rope controlled casting platen andimprovements to the winching system are proposed to address quality issues. A water purificationunit to improve cast quality, reduce water usage and bacterial bloom in warmer months isplanned. Changes to thermocouples, their arrangement and the furnace control system for boththe homogenizing furnace and cooling furnace is also planned to improve quality. Both furnacesare stated to have good heat distribution qualities and no significant distortions were noticed. Anautomated billet cut off saw, marking and banding machine with ultrasonic porosity detection isplanned for the area to improve workflow in the billet casting plant. The saw blades have beenupgraded to improve output.
The products processed at this site are coded according to alloy and purity. All heat numbers aretested in the on-site laboratory. The laboratory equipment is latest generation, near new, in goodorder and regularly calibrated.
6.8.4 Environmental
All environmental permits and the monitoring of them comply with local requirements. The Belisfacility is relatively new and has no known legacy conditions. Waste materials such as salt drossis disposed of in a separate waste facility 17 km from the plant. This three-hectare site is underthe control of the Belis plant and has an exploitation permit with a 49-year validity. An externalinspection every three months verifies that the waste disposal site conforms to the localregulations.
APPENDIX VI INDEPENDENT TECHNICAL REPORT
— VI-293 —
6.8.5 Material Developments
This section presents material changes to the facility since the site visit was undertaken inOctober 2008. The updated information was presented to Hatch through meetings with UCRUSAL in Moscow and has not been validated through an additional site visit. We have no reasonto believe that the information provided is not a true and fair reflection of developments at thefacility.
UC RUSAL has advised that there have been no material changes to the physical equipment/plantat the facility.
6.8.6 Specific Risks and Future Opportunities
Specific Risks
No specific risks material to the future operation of this facility have been identified.
Future Opportunities
• Efficiency Upgrade — The site is further extending the material receipt and holding areas.Automated charge loading equipment is proposed to improve operator safety and capacity.Exhaust systems improvements will allow production increases and improve operatorconditions.
• Product/Market Opportunities (1) — The addition of a modern mixing furnace, degasser,metal filtration and continuous caster at Belis would expand the product range to highpurity alloys which may attract a selling premium.
• Product/Market Opportunities (2) — The development of the scrap market in the RussianFederation should provide opportunity for Belis.
6.9 Zvetmetobrabotka
6.9.1 Introduction
Hatch undertook a site visit to Zvetmetobrabotka in October 2008. This Section 6.9 hassubsequently been revised and updated based upon data and information from UC RUSAL anddiscussions held with senior management in September 2009. With reference to the followingsections, please note;
• Section 6.9.2 — Updated with data and information as of September 2009,
• Section 6.9.3 — Process Description as of October 2008,
• Section 6.9.4 — Environmental Status as of October 2008,
• Section 6.9.5 — Material Developments at the facility between October 2008 andSeptember 2009, and
• Section 6.9.6 — All previous Specific Risks and Opportunities noted in October 2008together with any changes following new data and information provision.
APPENDIX VI INDEPENDENT TECHNICAL REPORT
— VI-294 —
6.9.2 History, Location and Infrastructure
Zvetmetobrabotka is located in the town of Goratkiniel in the Alexievka district of Samararegion, approximately 30 km northeast of Samara. The plant is housed on a greenfield site thatwas built as a scrap reprocessing facility 10 years ago. All management of this facility is basedat the neighbouring Resal plant. RUSAL (prior to the formation of UC RUSAL) took ownershipof this facility in late 2006.
A small road connects Zvetmetobrabotka to the main federal road. This road is singlecarriageway and in poor condition but is typical of secondary roads in the region.
Zvetmetobrabotka reprocesses prime scrap from automotive, architectural panelling, extrusionwastes and other sources into both graded alloy ingots of 5 to 7 kg and into lower purity nonalloyed sows of approximately 550 kg each. Some dross and slag is processed at the facility.Zvetmetobrabotka produced 16 kt of product in 2007.
6.9.3 Process Description
The plant consists of a scrap receiving area adjacent to the main plant entry, two meltshops, acrusher/magnetic separator, administration offices and a finished goods warehouse. Testing forradiation is carried out on the weighbridge for each load delivered using calibrated equipment.Only scrap certified free from contaminants such as radiation and explosive residues is acceptedfor processing. After receipt, the scrap is segregated and stored undercover according to type.Some low grade scrap is processed through a magnetic separator and a crusher to remove ferrousmaterials. When required, the charge is transferred from the storage area to holding areasadjacent to the furnaces to dry. Modern mobile equipment is used to transport materials on-site.
Of the two meltshops on-site, the first handles scrap feedstock with a high metallic percentageand consists of three melting furnaces of 10-tonne capacity each serviced by charge cars andoverhead cranes. The stationary furnaces are charged through hearths with doors and each chargeis approximately 1.5 tonnes. Liquid aluminium is fed via refractory lined troughs into one of twocontinuous casters to produce alloyed ingots of 5 to 7 kg or into a mixing furnace which is usedwhen complex alloys are produced. The mixing furnace in turn feeds a continuous caster. Allfurnaces and associated support equipment in this meltshop are in reasonable order, and acomprehensive preventative maintenance program is in place including monthly downtime forminor repairs and less frequent longer outages for such things as major refractory repair.Building ventilation is poor and is made worse by the ineffective fume extraction for thefurnaces. The gas treatment plant is not suitable. UC RUSAL is aware of this situation and ispreparing cost estimates for an appropriate system and while current emissions comply with localregulations, increased production levels or improved emissions will not be possible until the gastreatment plant is replaced.
The second meltshop handles lower grade materials such as lumpy metallic dross and some saltdross in a 5-tonne capacity tilting barrel furnace. The furnace is serviced by a travellingvibratory charging car. Liquid aluminium is poured into sows of approximately 550 kg in amanual casting station around an exit trough from the furnace. The furnace and supportequipment is in reasonable order and a comprehensive preventative maintenance program is inplace including monthly downtime for minor repairs and less frequent longer outages for suchthings as major refractory repair. Improvements are planned for the casting station to make itsemi-automatic and increase throughput. Building ventilation in this plant is sub standard andfurnace exhaust fumes are not effectively captured, scrubbed or treated. Local management areaware of these issues and are submitting cost estimates to UC RUSAL for projects to installappropriate building ventilation and furnace gas treatment systems.
APPENDIX VI INDEPENDENT TECHNICAL REPORT
— VI-295 —

Ingots produced at this site are coded according to alloy and purity. Production is tested onregularly calibrated laboratory equipment that is in good order and of latest generation.
6.9.4 Environmental
All environmental permits and the monitoring of them comply with local requirements.
The Zvetmetobrabotka plant site is 10 years old and has no known legacy condition. Wastematerials such as salt dross are disposed of in the Resal waste facility approximately 10 km away.The gas treatment systems for the plant are not adequate and need replacement.
6.9.5 Material Developments
This section presents material changes to the facility since the site visit was undertaken inOctober 2008. The updated information was presented to Hatch through meetings with UCRUSAL in Moscow and has not been validated through an additional site visit. We have no reasonto believe that the information provided is not a true and fair reflection of developments at thefacility.
UC RUSAL has advised that there have been no material changes to the physical equipment/plantat the facility.
6.9.6 Specific Risks and Future Opportunities
Specific Risks
No specific risks material to the future operation of this facility have been identified.
Future Opportunities
• Efficiency Upgrade — Improved troughing systems between furnaces will reduce processheat loss, lower energy inputs and improve operator safety. The new gas treatment systemsshould consider including scrap preheating and drying stations to further reduce energyinputs.
• Product/Market Opportunities (1) — The addition of a mixing furnace, degasser andmetal filtration system at Zvetmetobrabotka would expand the product range to higherpurity alloys which may attract a selling premium.
• Product/Market Opportunities (2) — The development of the scrap market in the RussianFederation should provide opportunity for Zvetmetobrabotka.
6.10 Polevskoy Cryolite Plant
6.10.1 Introduction
Hatch undertook a site visit to Polevskoy Cryolite Plant in September 2008. This Section 6.10has subsequently been revised and updated based upon data and information from UC RUSALand discussions held with senior management in September 2009. With reference to the followingsections, please note;
• Section 6.10.2 — Updated with data and information as of September 2009,
• Section 6.10.3 — Process Description as of September 2008,
• Section 6.10.4 — Environmental Status as of September 2008,
APPENDIX VI INDEPENDENT TECHNICAL REPORT
— VI-296 —

• Section 6.10.5 — Material Developments at the facility between September 2008 andSeptember 2009, and
• Section 6.10.6 — All previous Specific Risks and Opportunities noted in September 2008together with any changes following new data and information provision.
6.10.2 History, Location and Infrastructure
The Polevskoy Cryolite Plant is situated just south of Polevskoy, 80 km south of Ekaterinburgin the Sverdlovsk region of the Urals. The original plant was built in 1906 to produce sulphuricacid. The first cryolite was produced in 1933 following the rebuilding of the plant. A furtherfacilities rebuild, virtually from scratch, was undertaken in 1974 to produce cryolite andaluminium fluoride for aluminium smelters. This latest rebuild forms the basis of the currentfacilities.
The main products of Polevskoy Cryolite Plant are cryolite and aluminium fluoride (AlF3), whileadditional products include hydrofluoric acid, sodium fluoride and aluminium sulphate. Theplant produces all its chemical products from externally sourced raw materials and all processesare conducted on the one production site. The main aluminium fluoride process is an equivalentversion of the wet process used at the South Urals Cryolite facility.
Polevskoy Cryolite Plant produced 36.3 kt of aluminium fluoride and 4 kt of cryolite in 2008.
6.10.3 Process Description
The major raw materials involved in the production of aluminium fluoride are fluorsparconcentrate (CaF2), sulphuric acid, aluminium hydroxide and sodium carbonate.
The fluorspar concentrate is purchased from RGRK (Russian Ore Mining Company), where it ismined in the far east of Russia. RGRK is partially owned by UC RUSAL. The quality of theconcentrate from RGRK has decreased over the past 10 years and in 2006 and 2007 the RGRKconcentrate was supplemented with higher grade fluorspar concentrate from Mongolia. Thisraised the average grade to 92.6 per cent CaF2 in both of those years. UC RUSAL conducted adetailed study to determine the optimal use of the higher grade and higher priced Mongolianmaterial and concluded that the most favourable outcome was to direct all of the Mongolianconcentrate to the South Urals plant, requiring Polevskoy to revert to processing only the lowergrade RGRK concentrate, currently at 87.9 per cent CaF2.
The plant has six rotary kilns, three for the fluorspar reaction with sulphuric acid and threedrying kilns for cryolite and aluminium fluoride products. Only two kilns of each type arerequired for current production rates. Therefore, one kiln in each of the acid and fluoride sectionshas been semi-permanently mothballed as a result.
The acid kilns and AlF3 dryers, plus the grinding mills, extraction fans and vacuum filters, werepurchased from outside companies. The balance of the plant was fabricated and constructedin-house by the internal workshops. This includes all the reaction columns, absorption columns,mixing vessels, storage vessels, silos and associated pipework. Most of the equipment is ofstraight forward construction using mild steel shells with rubber linings and supplemented withcarbon blocks to contain the acidic solutions.
While of somewhat smaller scale, the process and the equipment in which it is conducted areessentially identical to those of the South Urals works.
6.10.4 Environmental
The plant has a gas cleaning system to treat the off gases from the process. The plant holdsenvironmental permits and advises that air emissions fall within the permissible levels.Environmental penalties for emissions from the plant may increase in the future due to morestringent regulations and revised measurement procedures.
APPENDIX VI INDEPENDENT TECHNICAL REPORT
— VI-297 —

In general, the plant is in poor condition and many of the pipelines and storage tanks showevidence of structural deterioration. In particular, the two operational hydrofluoric acid storagetanks are not adequately bunded, potentially allowing the release of acid to the surrounding areain the case of failure. The refinery advises that another four hydrofluoric acid tanks havepreviously been decommissioned due to past failures. Many of the surfaces within the plant areunsealed or have broken pavements, providing pathways to the underlying soil and groundwaterin the event of spillage of hazardous liquids. Some of these issues are being addressed within thecurrent upgrade project as described below.
The Polevskoy Cryolite plant produces calcium sulphate sludge as a waste product. The wasteis discharged as slurry to storage facilities located adjacent to the plant. The plant has two sludgestorages; Pond No. 1 and Pond No. 2. Pond No. 1 has reached its maximum design height andis being progressively rehabilitated. Some sludge will continue to be discharged into Pond No.1 as part of the rehabilitation works, however the majority of current and future sludge storagewill be within Pond No. 2. Water discharged to the pond is recovered and returned to the plantfor reuse in the process. The recovered water contains high levels of fluoride, but has a pH ofapproximately 6.5-7.0 (essentially neutral). Both sludge storages are equipped with seepageinterception and recovery systems as well as groundwater monitoring wells. The plant isimplementing a project to improve the water recovery and management system at the storagesthrough upgrading and modification of the existing system. This will reduce the potential forseepage of contamination to groundwater and adjacent surface water bodies.
Acid effluent from the plant is collected and neutralised with lime before being discharged to anunlined settling pond. It is understood that seepage from the settling pond is impacting on groundand surface water. For this reason, the plant implemented a project in 2006 to relocate andupgrade the neutralisation plant, and following this, to decommission and rehabilitate the settlingpond. The project is scheduled for completion in 2015. This project will serve to reduce theoverall environmental impact of the plant.
6.10.5 Material Developments
This section presents material changes to the facility since the site visit was undertaken inSeptember 2008. The updated information was presented to Hatch through meetings with UCRUSAL in Moscow and has not been validated through an additional site visit. We have no reasonto believe that the information provided is not a true and fair reflection of developments at thefacility.
UC RUSAL has advised that there have been no material changes to the physical equipment/plantat the facility.
Polevskoy Cryolite Plant is currently producing below recent historical levels following theclosure of two kilns in the first quarter of 2009. UC RUSAL attributed the closure to a strategicdecision based on reduced demand for cryolite and aluminium fluoride. Hatch was advised thatUC RUSAL view the closure of the kilns as temporary and that the kilns are the subject ofcontinuous review and monitoring to determine an optimal time for restart.
6.10.6 Specific Risks and Future Opportunities
Specific Risks
No specific risks material to the future operation of this facility have been identified.
APPENDIX VI INDEPENDENT TECHNICAL REPORT
— VI-298 —
Future Opportunities
• Drying Oven Upgrade — A retrofit program is underway to protect against pyrohydrolysisof the product at the hot end of the kiln. As demonstrated at the South Urals plant and atone Polevskoy oven that has been retrofitted, the reversion of AlF3 to alumina and HF canbe dramatically reduced. This will reduce the alumina impurity in the product and can resultin a slight reduction in the consumption of raw materials per tonne of AlF3 produced.
6.11 South Urals Cryolite Plant
6.11.1 Introduction
Hatch undertook a site visit to South Urals Cryolite Plant in September 2008. This Section 6.11has subsequently been revised and updated based upon data and information from UC RUSALand discussions held with senior management in September 2009. With reference to the followingsections, please note;
• Section 6.11.2 — Updated with data and information as of September 2009,
• Section 6.11.3 — Process Description as of September 2008,
• Section 6.11.4 — Environmental Status as of September 2008,
• Section 6.11.5 — Material Developments at the facility between September 2008 andSeptember 2009, and
• Section 6.11.6 — All previous Specific Risks and Opportunities noted in September 2008together with any changes following new data and information provision.
6.11.2 History, Location and Infrastructure
The South Urals Cryolite Plant is situated in the town of Kuvandyk, 200km south-east ofOrenburg in the Orenburg region of the Russian Federation. The plant was commissioned inNovember 1954 to produce both cryolite and boric acid. In 2004, the boric acid plant wasdecommissioned. The boric acid plant buildings and equipment remain and are available for useas storage or for future plant installations.
The South Urals Cryolite Plant produces two main products, cryolite and aluminium fluoride(AlF3). Sodium fluoride may also be produced as required. The majority of the aluminiumfluoride produced is transferred to aluminium smelters within the UC RUSAL network asmake-up for bath volume and chemistry control. Aluminium fluoride is produced at 96 per centpurity, which is a high quality by world standards. It surpasses the purity of aluminium fluorideproduced by the Davy dry process.
The demand for cryolite has decreased in recent years and this has resulted in a major changein production levels. In 2008 the South Urals Cryolite plant produced 6.4 kt of cryolite and 56.7kt of aluminium fluoride.
It should be noted that the kilns were down for major maintenance work during the 2008 site visitand therefore, the plant operations were not observed.
6.11.3 Process Description
The major raw materials involved in the production process at South Urals Cryolite Plant arefluorspar, sulphuric acid, sodium carbonate, calcium carbonate and aluminium hydroxide.Fluorspar is purchased from long-time supplier RGRK (Russian Ore Mining Company) and since
APPENDIX VI INDEPENDENT TECHNICAL REPORT
— VI-299 —

2007, from a Mongolian supplier of higher grade fluorspar (95 per cent CaF2). The decreasingquality of the RGRK fluorspar had resulted in increased reagent usage and increased operatingcost. The current feed at South Urals is a 50/50 by weight blend of RGRK and Mongolianfluorspar flotation concentrate, having an average grade of 91.6 per cent CaF2.
South Urals Cryolite Plant has four rotating kilns, two for the fluorspar reaction with sulphuricacid and two drying kilns for cryolite and aluminium fluoride. The sulphuric acid reaction kilnswere shipped to the plant from Germany as part of the World War Two reparations. Only minorupgrades have been undertaken on these furnaces and the current controls system dates back tothe 1950’s. Very little of the processing equipment was purchased externally and most of theplant was designed, fabricated and erected in-house by the internal workshops at Kuvandyk. Theplant is of simple construction, with mild steel shells lined with elastomer products for vessels,tanks and piping containing acidic gases and solutions.
The initial reaction is performed in rotating kilns, with fluorspar and sulphuric acid being mixedin the presence of natural gas. The kilns are lined with refractory brick and carbon plates, toprevent heat losses and internal corrosion. The reaction is exothermic and hydrofluoric acidcomes off as a gas, which is captured in absorption columns and stored for the next operation.
Cryolite and aluminium fluoride are produced from the 26 per cent aqueous hydrofluoric acid(HF) in agitated reaction vessels. The resulting sludge is filtered through vacuum filters toseparate out the product. The aluminium fluoride slurry is dried in rotating kilns from which a95 per cent pure AlF3 results.
Cryolite is produced by neutralising flurosilicic acid (H2SiF6) with a solution containing sodiumcarbonate and aluminium hydroxide. The neutralised solution is evaporated and solid phasecryolite is crystallised out. A thickener yields a cryolite paste in the underflow and a cryolitespent liquor in the overflow. The paste is dried in a hollow drying system to reduce free moistureonly.
Products are either packed into bags or loaded into bulk tankers for transportation, depending oncustomer requirements.
6.11.4 Environmental
South Urals Cryolite Plant operates under the philosophy of zero liquid discharge. Waterdischarged to the calcium sulphate slurry storage is recovered and returned to the plant forre-slurrying of the gypsum waste, milk of lime preparation, floor washing, etc. Data provided bythe plant indicated that there are high levels of fluoride in captured stormwater and waterreturned from the gypsum slurry storage. Data on sulphide levels in the water was not provided,however the water has a pH of around 6.8, and is therefore essentially neutral.
The plant has a gas cleaning plant to treat the off gases from the process. The plant holdsenvironmental permits and advised that air emissions fall within the permissible levels. The plantproposes to upgrade the current foam gas cleaning plant to further reduce emissions. However,newer technology would be required to meet world best practice for the reduction of emissions.
There is one active calcium sulphate sludge storage located at the site (Pond No. 2) and an older,currently inactive storage (Pond No. 1). In addition there are three decommissioned slurrystorages that were used for the boric acid plant and operation prior to 1971. These storages havebeen covered and revegetated.
Pond No. 1 (114 ha) and Pond No. 2 (78 ha) are located 1.5 km north-west and 2.5 km north ofthe plant respectively. Pond No. 1 was commissioned in 1971 and has reached capacity. It iscurrently used to collect stormwater runoff from the plant site and to provide additional surface
APPENDIX VI INDEPENDENT TECHNICAL REPORT
— VI-300 —
area for evaporation. Evaporative sprays are used on both storages during the summer months toevaporate excess stormwater generated during the spring thaw runoff. Pond No. 2 wascommissioned in 1987 and is expected to reach the capacity of the current embankment in late2011. Capital works for 2009 include the commencement of the construction of a 2 membankment lift to Pond No 2, which will extend the service life of the facility to 2014-2015.Pond No.1 could be similarly extended to provide additional capacity, dependent on confirmationof geotechnical stability.
A key issue for the plant is that due to the large surface area and valley catchments, considerablemanagement and expense is required to prevent a net accumulation of water within the storages,particularly during the spring thaw. This reduces the storage area available for solid waste andincreases the overall cost of waste disposal. The plant is currently preparing an application to theauthorities for the treatment (reduction in fluoride and sulphide levels until fish-breeding normsare achieved) and discharge of surplus water from the site during the spring thaw. If successful,it would improve the overall water balance at the site and therefore the efficiency of the sludgestorage. It is understood that there is no current budget provision for closure and rehabilitationof the sludge storages.
Both ponds have seepage collection drains which intercept and return water back to the sludgestorage and groundwater quality is regularly sampled and tested from downstream monitoringwells. It is understood that both Ponds No. 1 and No. 2 are inspected bi-annually by theauthorities in the Russian Federation.
Hatch was not provided with information on the mothballed boric acid plant and therefore anenvironmental assessment of this facility is not possible.
6.11.5 Material Developments
This section presents material changes to the facility since the site visit was undertaken inSeptember 2008. The updated information was presented to Hatch through meetings with UCRUSAL in Moscow and has not been validated through an additional site visit. We have no reasonto believe that the information provided is not a true and fair reflection of developments at thefacility.
UC RUSAL has advised that there have been no material changes to the physical equipment/plantat the facility.
6.11.6 Specific Risks and Future Opportunities
Specific Risks
• Acid Storage — The plant currently has many old acid storage tanks containing sulphuricand hydrofluoric acid. The hydrofluoric acid tanks have no secondary containment and thesulphuric acid tanks have only containment for small spill volumes. Given the corrosivenature of these acids and the potential environmental liability if a tank were to leak,secondary containment of these tanks is recommended.
• Rehabilitation of Sludge Storages — The plant has not commenced progressiverehabilitation of the sludge storages, but preparations are currently in progress. As thesludge and associated liquor has a high fluoride content, extensive rehabilitation work willultimately be required to ensure that the storages do not provide an ongoing source ofsurface and groundwater contamination.
APPENDIX VI INDEPENDENT TECHNICAL REPORT
— VI-301 —
Future Opportunities
• Sludge Storage Water — If the plant is successful in its application for the treatment andrelease of surplus water from the sludge storages, the overall plant water balance will beimproved and the storages will operate more efficiently, with a corresponding reduction infinal rehabilitation costs.
• Sulphuric Acid Production — South Urals are planning the installation of their ownsulphuric acid plant to fully supply both the South Urals and Polevskoy plants. Sulphurwould be sourced from local oil and gas or non-ferrous processing facilities. The acid plantwould also generate 6.6 MW of electricity and sufficient thermal energy to provide theenergy requirements for the plant. The project has not yet been approved.
6.12 Lingshi Cathode Plant
6.12.1 Introduction
Hatch undertook a site visit to Lingshi Cathode Plant in October 2008. This Section 6.12 hassubsequently been revised and updated based upon data and information from UC RUSAL anddiscussions held with senior management in September 2009. With reference to the followingsections, please note;
• Section 6.12.2 — Updated with data and information as of September 2009,
• Section 6.12.3 — Process Description as of October 2008,
• Section 6.12.4 — Environmental Status as of October 2008,
• Section 6.12.5 — Material Developments at the facility between October 2008 andSeptember 2009, and
• Section 6.12.6 — All previous Specific Risks and Opportunities noted in October 2008together with any changes following new data and information provision.
6.12.2 History, Location and Infrastructure
The Lingshi cathode plant of the Shanxi RUSAL Cathode Co. Ltd. is located in the county ofLingshi, 160 km south of the Shanxi province capital city of Taiyuan, China. The population ofLingshi is approximately 200,000 people and is located at the heart of a region rich in coalresources, including coking facilities and power plants. The area is next to a major highway, partof a large array of modern and high-quality roads, and is also serviced by rail.
The Lingshi cathode facility is completely enclosed by other facilities on three sides and by ariver on the fourth side, so there is no room for expansion. Future growth can only be achievedthrough acquisition of other local plants.
The Lingshi cathode facility was wholly acquired by Rusal China Limited (prior to the formationof UC RUSAL) from a Chinese company in August of 2005. The plant and its equipment werenew in 2002 and operated for two years under its previous owners.
Both Lingshi and the nearby Taigu plant (120 km away) share common management, includingindustrial relations, raw material procurement and sales to internal UC RUSAL plants of thefinished goods.
APPENDIX VI INDEPENDENT TECHNICAL REPORT
— VI-302 —
Lingshi is dedicated to the manufacture of aluminium reduction cell lining and cathode blocks.The Lingshi facility has a capacity of 15 ktpa, with 72 per cent of production for cathode blocksand 28 per cent of production for side and corner blocks. All the production is semi-graphitic,with a nominal graphite content of 30 per cent and is manufactured for internal use by UCRUSAL aluminium smelters in the Russian Federation and Ukraine.
6.12.3 Process Description
Raw materials for both the Lingshi and Taigu plants are procured under common contracts. Thekey product ingredients are coal, graphite and liquid pitch.
• Coal is procured in 50kg bags from the Taixi Coal Plant in Ningxia Province under acontract that is renewed monthly due to fluctuating prices.
• Graphite arrives monthly in 35kg bags from five small suppliers located in Henan andHebei Provinces.
• Pitch is procured locally from the Jinyuan Company and delivered to each facility by tanktruck in liquid form.
Given the high availability of these materials in the region, raw materials shortages are unlikely.All raw materials are subject to quality inspection and testing, both at the manufacturers and theUC RUSAL plants to ensure specification compliance.
The plant uses coke gas for both the baking furnace and the oil heating system. The coke gas isprocured under contract from a coking facility located next to the plant. This contract has beenin place for approximately two years and is a significant improvement over the previous on-sitegeneration of gas from coal as the contract ensures lower cost and higher reliability tied withpenalties for supply interruptions. However, the on-site facilities are still operable.
In the dry material processing area, dry mix composed of coal, graphite, and recycled scrap ismade using eight dry fractions of different sizing, manufactured through a set of screens andcrushers. A dry batch is initiated by filling a hopper with the desired quantity of each dryfraction, with each fraction weight being controlled to an accuracy of 0.1 per cent by the use ofload cells. Proper sizing and proportion is controlled through test sampling of each fraction onceper shift. The basic dry mix recipe is 45 per cent coal, 29.3 per cent graphite, and 25.7 per centbaked scrap material. For certain batches, an additional 10 to 12 per cent unbaked scrap materialmay be added.
Two shops, (numbers 1 and 2) are used to produce the final block paste mixture and formedblocks. These two shops have a total of nine 2,000 kg batch mixers and two similar formers. Eachformer uses an excentrics system to induce a vertical vibration and a cover weight attached totwo large hydraulic cylinders to apply pressure on the carbon paste while vibrating.
Area number 1 is next to the dry mix area and has a total of five batch paste mixers. A hopperis used to transport the dry mix into the batch mixers where it is preheated. Following this step,20 per cent pitch at a minimum temperature of 165�C is added with mixing continuing at a finalminimum mix temperature of 155�C. Area 1 has a single paste cooler and former. Typically, fourmixers are operated with one kept in reserve. The area 1 mix cooling and forming producesblocks measuring 585mm x 445mm x 3.6m.
APPENDIX VI INDEPENDENT TECHNICAL REPORT
— VI-303 —
Area number 2 is remote from the dry mix area, so the dry mix is transported by mobileequipment. This area has four batch mixers and a single paste cooler and former, operating at thesame parameters as area 1. Typically, three mixers are operated with one kept in reserve. The area2 mix forming produces longer blocks measuring 585mm x 445mm x 4.2m. Each forming areahas a local block cooling pond.
An 18-section, open top type furnace is used to calcine the unbaked blocks. Each section has fivepits which can be loaded with 13 green cathode blocks. Coke is used as the pit packing material.Total fire time for the blocks is 480 hours, consisting of 404 hours of controlled ramp up fromambient to 1000�C and 76 hours soak time at 1050�C. Additionally, there are 270 hours ofcontrolled cool down to ambient. The plant is developing a means to lower the furnace fire cycletime, thereby increasing on-site block calcining capacity by up to 25 per cent.
The present baking furnace capacity is 12.2 ktpa. For the current plant finished output of 13 ktpa,the total requirement for baked cathodes is 20.5 ktpa (before machining and finishing); therefore,the Lingshi cathode facility sub-contracts the baking of up to 8.3 ktpa to nearby calciningcompanies. These contractors are under a quality-driven contract that ensures the Lingshicathode facility will have full control over the quality of the baked cathode blocks they areprovided.
The machine shop area contains equipment used to machine the cathode side and corner blocksand bottom blocks to the precise dimensions required. Fifteen of these machines were alreadyinstalled when Rusal China Limited acquired the plant, with two more purchased and installedin 2006 as part of the capital expenditure program intended at improving the plant’s efficiency.The machine shop capacity is 17.5 ktpa.
Quality testing of raw materials, intermediate process steps, and most finished product tests ofcritical criteria are performed at the on-site laboratory. All finished products are tested forphysical and chemical properties and dimensional adherence to the sizing specifications aftermachining. The Zhen Zhou Light Metal Institute laboratory facility is contracted to perform theanalysis of those properties for which the plants laboratory is not equipped. Following finalquality testing and packaging, all products are trucked to a rail load out 5 km from the plant, fortransport to UC RUSAL smelters in Russia and Ukraine.
6.12.4 Environmental
Shanxi RUSAL Cathode Co. Ltd. Cathode Plant has achieved ISO 14001 environmentalmanagement certification.
The Lingshi cathode facility is permitted for air emissions, water pollution and noise andcurrently conforms to all Chinese and provincial regulations. The main air pollution source isfrom the bake furnace exhaust gas. A modern electrostatic precipitator was installed in 2004 aftermandatory requirement from the government authorities. A second electrostatic precipitator wasrecently added to further improve the scrubbing efficiency. An ash monitoring station is locatedon the exhaust stack. A series of collection hoods and ducts capture the pitch fume emissions atvarious process locations and transport the fumes to the electrostatic precipitator inlet forscrubbing.
By the very nature of the process, carbon dust generation is very high at the cathode machiningshop. Each machine is equipped with dust collection ducts which perform well, and capture themajority of the dust.
APPENDIX VI INDEPENDENT TECHNICAL REPORT
— VI-304 —
6.12.5 Material Developments
This section presents material changes to the facility since the site visit was undertaken inOctober 2008. The updated information was presented to Hatch through meetings with UCRUSAL in Moscow and has not been validated through an additional site visit. We have no reasonto believe that the information provided is not a true and fair reflection of developments at thefacility.
UC RUSAL has advised that there have been no material changes to the physical equipment/plantat the facility.
Hatch was advised that Shanxi RUSAL Cathode Co. Ltd. was ordered by the environmentalprotection bureau of Lingshi County to rectify the non-stack discharge of dust and benzopyrenefrom the facility. UC RUSAL confirmed that the required equipment for compliance to beachieved will be installed by 20 December 2009 as requested by the Lingshi County authorities.
UC RUSAL has advised that Shanxi RUSAL Cathode Co. Ltd. is obliged to remove its bakingfurnaces to an alternative location out of Lingshi County before 31 October 2010. The request,Lingshi County Government, it due to the launch of the Government Programme ‘Blue Sky —Blue Water’ aimed at improving environmental conditions in the local region. UC RUSAL hasadvised that plant management is considering moving baking furnaces to Boguan plant, alsoowned by UC RUSAL.
6.12.6 Specific Risks and Future Opportunities
Specific Risks
No specific risks material to the future operation of this facility have been identified.
Future Opportunities
• Raw Material Supply — The current nature of raw material procurement at Lingshi istypical in China, with short-term contracts being renegotiated with the same supplier. UCRUSAL acknowledge that this is a significant opportunity to reduce the cost of rawmaterials and has plans to raise competition among multiple suppliers and negotiate lowerprices through long-term contracts.
• Production Opportunities — There is potential to produce cathode blocks with higher percent graphite composition. A programme exists to test preliminary groove formation priorto baking, which could reduce waste and save on machining time. The faster furnace firingtime tests could also increase production for the plant since this is an area restricting totalplant output.
• Removal of Baking Furnaces — The Lingshi County Government has launched theprogramme ‘Blue Sky — Blue Water’ aimed at improving environmental conditions in thelocal region. As part of this programme, Lingshi Cathode Plant is obliged to remove bakingfurnaces outside of the Lingshi County before 31 October 2010. This may potential resultin a suspension of cathode production at the plant.
6.13 Taigu Cathode Plant
6.13.1 Introduction
Hatch undertook a site visit to Taigu Cathode Plant in October 2008. This Section 6.13 hassubsequently been revised and updated based upon data and information from UC RUSAL anddiscussions held with senior management in September 2009. With reference to the followingsections, please note;
APPENDIX VI INDEPENDENT TECHNICAL REPORT
— VI-305 —
• Section 6.13.2 — Updated with data and information as of September 2009,
• Section 6.13.3 — Process Description as of October 2008,
• Section 6.13.4 — Environmental Status as of October 2008,
• Section 6.13.5 — Material Developments at the facility between October 2008 andSeptember 2009, and
• Section 6.13.6 — All previous Specific Risks and Opportunities noted in October 2008together with any changes following new data and information provision.
6.13.2 History, Location and Infrastructure
The Taigu cathode facility of the Shanxi RUSAL Cathode Company is located in the county ofTaigu, 80 km from the Shanxi province capital city of Taiyuan, China. The population of TaiguCounty is approximately 280,000 people. The county is near to a major highway and is alsoserviced by rail.
The Taigu plant is approximately 120 km from Lingshi, another Shanxi RUSAL Cathode Co.,Ltd. plant.
The Taigu facilities were constructed in 2001 and were acquired by Shanxi RUSAL Cathode Co.Ltd. from a Chinese company in August 2008. The plant is in the process of modernizing theblock machining and packaging area, with completion scheduled for November 2008. The Taigufacilities are adjacent to farmland, offering room for expansion. All material transport into andout of the plant is by truck.
Taigu is dedicated to the manufacture of aluminium reduction cell lining and cathode blocks.Total plant capacity is 9.6 ktpa with 75 per cent of production for cathode blocks and 25 per centof production for side blocks. All the production is semi-graphitic, with a nominal graphitecontent of 30 per cent and is manufactured for internal use by UC RUSAL aluminium smeltersin the Russian Federation and Ukraine.
6.13.3 Process Description
Raw material storage at Taigu includes two 15-tonne pitch tanks, and a dry storage area wherethe bags of coal and graphite are stored at an average quantity of 200 tonnes each. Although morearea is available for the bagged material, it is not required at current production levels and is nota limiting production factor.
Taigu has a single dry paste ingredient mixer, where sized and weight-proportioned coal,graphite, and unbaked and baked scrap are pre-mixed. This step is followed by transport to thesix batch mixers. In the batch mixers, pitch is added and the material is mixed at a temperatureof 130�C to 140�C.
After mixing, the green paste is dumped in a transport hopper and carried by the overhead craneto an elevated mixer/cooler unit. Here the hot paste is further mixed and cooled to 100�C, whichis the desired forming temperature. Once the cooling step is complete, the paste is dumped ontoa belt conveyor and delivered to a nearby vibrating press block former. The plant has one formerpress in operation. A second former is available if needed, but will require some rework. Afterbeing formed and cooled in the water pond, the blocks are stored on the shop floor prior totransport to the bake area. The total capacity of the mixing/forming area is 32 ktpa, whichassumes the second former is made operational.
APPENDIX VI INDEPENDENT TECHNICAL REPORT
— VI-306 —
The Taigu plant has two open-top type bake furnaces, numbers 1 and 2. Furnace No. 1 is a 14section furnace with 4 pits per section. Each pit can pack 10 blocks. The capacity of this furnaceis approximately 7 ktpa. Furnace No. 2 can produce an additional 8 ktpa and has a pit capableof holding 9 blocks, with 10 sections and 9 pits per section. Furnaces 1 and 2 therefore have atotal baking capacity of approximately 15 ktpa of baked blocks. Each furnace uses coal gas fromits adjacent coal gas generation station for fuel, as no natural gas is available at the plant site.Total fire time for the blocks is 508 hours, consisting of 460 hours of controlled ramp up fromambient to 1000�C and 48 hours soak time at 1000�C. Additionally, there are 144 hours ofcontrolled cool down to ambient.
The machining operation generates approximately 36.5 per cent waste to scrap generation fromthe milling/cutting process. The shop has five 5-tonne overhead bridge cranes for producthandling and equipment maintenance. The new machining area will have 11 pieces of newequipment plus 4 pieces of original equipment dedicated to this operation. Total capacity of thenew machining area is 18 ktpa of finished product, but is currently operating at about 9.6 ktpadue to the 15 ktpa capacity limits of the baking operation.
Quality testing of raw materials, intermediate process steps, and most finished product tests ofcritical criteria are performed at the on-site laboratory. All finished products are tested forphysical and chemical properties and dimensional adherence to the sizing specifications aftermachining. The Zhen Zhou Light Metal Institute laboratory facility is contracted to perform theanalysis of those properties for which the plants laboratory is not equipped. Following finalquality testing and packaging, all products are trucked to a rail load out 20 km from the plant,for transport to UC RUSAL smelters in Russia and Ukraine.
6.13.4 Environmental
The Taigu facility is permitted for air emissions, water pollution and noise and currentlyconforms to all Chinese and provincial regulations. Auditing is performed annually. The main airpollution source is from the bake furnace exhaust gases.
By the very nature of the process, carbon dust generation is very high in a cathode machiningshop. Each machine in the rebuilt shop is equipped with dust collection ducts and hoodsconnected to local dust collectors and separators.
6.13.5 Material Developments
This section presents material changes to the facility since the site visit was undertaken inOctober 2008. The updated information was presented to Hatch through meetings with UCRUSAL in Moscow and has not been validated through an additional site visit. We have no reasonto believe that the information provided is not a true and fair reflection of developments at thefacility.
UC RUSAL has advised that there have been no material changes to the physical equipment/plantat the facility.
Hatch was advised that Taigu Cathode Plant has not yet received the approved environmentalimpact assessment required for the completed modernisation project. We understand that theenvironmental impact assessment report has been prepared and already approved by TaiguCounty and Zhen Zhou town and is now pending approval by the Shanxi authorities.
APPENDIX VI INDEPENDENT TECHNICAL REPORT
— VI-307 —

6.13.6 Specific Risks and Future Opportunities
Specific Risks
No specific risks material to the future operation of this facility have been identified.
Future Opportunities
• Raw Material Supply — The current nature of raw material procurement at Taigu is typicalin China, with short-term contracts being renegotiated with the same supplier. UC RUSALacknowledge that this is a significant opportunity to reduce the cost of raw materials andhas plans to raise competition among multiple suppliers and negotiate lower prices throughlong-term contracts.
• Furnace Capacity — The bake furnace capacity is currently the limiting production factorfor Taigu. The addition of three furnaces and air control may potentially allow plantcapacity to increase to 20 ktpa.
7. Packaging Division
7.1 ARMENAL
7.1.1 Introduction
Hatch undertook a site visit to ARMENAL in October 2008. This Section 7.1 has subsequentlybeen revised and updated based upon data and information from UC RUSAL and discussions heldwith senior management in September 2009. With reference to the following sections, pleasenote;
• Section 7.1.2 — Updated with data and information as of September 2009,
• Section 7.1.3 — Process Description as of October 2008,
• Section 7.1.4 — Environmental Status as of October 2008,
• Section 7.1.5 — Material Developments at the facility between October 2008 andSeptember 2009, and
• Section 7.1.6 — All previous Specific Risks and Opportunities noted in October 2008together with any changes following new data and information provision.
7.1.2 History, Location and Infrastructure
The ARMENAL foil mill located in the city of Yerevan, in the Republic of Armenia, is one ofthe largest manufacturing enterprises in Armenia. Yerevan has a population of approximately 1.3million people. The plant is located adjacent to the city and is surrounded by light industry andresidential areas.
ARMENAL is situated on the site of the former Kanakersk Aluminium Smelter which wasconstructed in 1944 and was commissioned in 1950. The smelter was closed in the 1970’s forenvironmental considerations, while the Kanaker Foil Mill, which commenced production on aportion of the smelter site in 1957, continued to operate and grew into one of the largestindustrial facilities in Armenia. However, the Kanaker mill was forced to close down due to theeconomic depression following the break up of the former Soviet Union.
APPENDIX VI INDEPENDENT TECHNICAL REPORT
— VI-308 —

ARMENAL commenced production in July 2000, just two months after RUSAL’s partialacquisition of the plant (prior to the formation of UC RUSAL). The mill incurred productionproblems and high costs early in its operation; and in January 2003 the government of Armeniaand RUSAL signed an agreement of cooperation where RUSAL eventually became the soleowner of ARMENAL and also guaranteed to undertake an extensive retrofit of the plant.
In 2003, RUSAL engaged German mill engineering firm Achenbach to undertake the ARMENALretrofitting programme and the first stage was completed in December 2005. The final stage,completed in October 2006, has resulted in the installation of continuous casting machines andfull retrofitting of the breakdown mill. The foil rolling mills have also been equipped withmodern monitoring tools and latest generation process control systems.
In 2008 ARMENAL produced 13 kt of product in 2008.
7.1.3 Process Description
ARMENAL processes primary aluminium ingots from Bratsk Aluminium Smelter andNovokuznetsk Aluminium Smelter and alloying elements from other UC RUSAL facilities andthird party suppliers. The facility consists of a meltshop, casting area and breakdown mill shop,foil mill area, roll grinding workshop and general workshop, splitting and slitting area,packaging area, administrative offices and finished goods warehouse.
Ingot and compacted process scrap is melted in one of eight induction furnaces of 6-tonnecapacity each. The induction furnaces are not of recent design and do not have fume extractionfitted even though it is shown as part of the furnace design. Liquid aluminium is transferred bytractor and ladle car from the separate meltshop to one of three receiving furnaces in the casterarea before being distributed to one of the three mixing/holding furnaces for alloy refinement.From the holding furnaces, the melt passes through degassing and metal filtration units beforeentering one of two horizontal “Super-Caster” machines or a vertical “Super-Caster” machine toproduce a blank 6.5 mm thick and 1540 to 1670 mm wide. All three “Super-Caster” machineson-site are operational. The third vertical caster was commissioned in August 2007 and allmachines feature the latest generation of process control upgrades.
The cooled coils of cast blank are transferred to a breakdown mill, which was constructed in theSoviet Union in the 1970’s and subsequently rebuilt by Achenbach in 2004, where they arereduced in gauge during multiple passes. The breakdown mill has a nameplate capacity of 75ktpa. A kerosene based oil rolling emulsion is used and the emulsion is processed in a closed loopvia a new Schneider paper filter. Coolant condition is monitored daily and when exhausted, isrecycled offsite by a third party. The mill has latest generation shape and gauge control, sidetrimming and semi-automatic threading equipment. Sundry spool and coil handling equipment,including the overhead building crane that services this mill, are modern and in excellentnear-new condition. The entry despooler is new, has side shifting capabilities and is due forcommissioning in 2008. An intermediate annealing station consisting of five controlledatmosphere electric furnaces with a cross travel coil car and handling equipment complementsthe breakdown process. The control systems for these furnaces have been rebuilt and are of latestdesign.
There are six Achenbach foil mills at ARMENAL and they are roughing (two), universal (two)or finishing mills (two). During 2004 these mills were completely mechanically rebuilt and fittedwith Achenbach shape and gauge control systems. All mills have automated roll changingequipment, are fitted with automatic CO2 fire safety systems and are connected to a commonexhaust fume system with scrubber. Trimmings from the finishing foil mills are collected by apneumatic conveying system and are compacted in a modern automated scrap press. Theroughing mills are supplemented by a new scrap press which is loaded manually. There are twodoubling machines in the foil area and one finishing mill is fitted with twin entry mandrels. The
APPENDIX VI INDEPENDENT TECHNICAL REPORT
— VI-309 —
foil mills have a common lubricant system, which is kerosene based and is filtered in a closedsystem with an automatic CO2 fire protection system. Finished foil product thickness of 6 to 9microns is produced at ARMENAL. The mill equipment remains in near-new condition and ismaintained by UC RUSAL and Achenbach technicians. The other mill support plant ismaintained by UC RUSAL technicians and offsite third party contractors.
The finishing area consists of three separating and splitting lines that are serviced by anautomatic loading and unloading gantry with spool collection station. Adjacent to this, are sixcutting and slitting lines which are well laid out and serviced by an overhead crane. All cranesin the finishing area are being upgraded to remove the cabin and incorporate pendant controls.This project is partially complete. Installation of a new separating/slitting line has beencompleted. Alongside this equipment is the final heat treatment area for the foil. There are a totalof seven nitrogen atmosphere foil furnaces of modern design with current process controlequipment and of these, two are not normally used but are capable of running when productionlevels rise. The furnaces are serviced by coil cars and overhead cranes. The packing area is fedfrom the finishing area and all goods are securely packed in wooden crates for markets that areaccessed by both road and rail. A semi-automated weighing and labelling system has beeninstalled in a prepared area near the finishing line. The current packing area will just be able tosupport the plant until the nameplate capacity is reached.
7.1.4 Environmental
The Yerevan area has been inhabited for over 2,000 years and sits in a valley surrounded bymountains and any effect on the population from pollution is significant. For this reason,ARMENAL has a management-enforced ecological passport for the site to preserve theenvironment around Yerevan. Water quality monitoring has resumed after the reconstruction ofthe mill and is conducted regularly. Recently, workplace testing of building air quality, noise andtask lighting levels has commenced and the first set of results were recorded. Air emissions arecontrolled at the breakdown and foil mills by new scrubbers of modern design installed duringthe mill upgrades. It is planned to record air emissions when the appropriate testing equipmentis delivered. There are long term plans to raise the level of compliance from local to internationalrequirements. The plant complies with all Armenian environmental legislation and regulations.
7.1.5 Material Developments
This section presents material changes to the facility since the site visit was undertaken inOctober 2008. The updated information was presented to Hatch through meetings with UCRUSAL in Moscow and has not been validated through an additional site visit. We have no reasonto believe that the information provided is not a true and fair reflection of developments at thefacility.
UC RUSAL has advised that there have been no material changes to the physical equipment/plantat the facility, with the exception that the modernisation programme at ARMENAL has now beencompleted with the plant’s capacity expanded to 25 ktpa. UC RUSAL has also stated that abottleneck at the breakdown mill has been eliminated.
ARMENAL operated below full capacity during the first half of 2009 due to the weakenvironment and reduced demand for its product. Hatch was advised that full capacity productionlevels were restored in June 2009.
APPENDIX VI INDEPENDENT TECHNICAL REPORT
— VI-310 —
7.1.6 Specific Risks and Future Opportunities
Specific Risks
• Labour Risk —The operating staff at ARMENAL are young and relatively inexperiencedfollowing their recruitment over the previous three years. However, it should be noted thatthey are well supported by technical staff from machine suppliers and key personnel havehad extended training at other UC RUSAL foil mills. Training programs and the attentionto specific quality problems are being addressed by the plant and UC RUSAL.
• Logistics — Restricted transport through Georgia and some of the Russian ports is aproblem acknowledged by the government. Improvements have been addressed at thehighest level and now a number of ports and links are used through Iran and Turkey to goodeffect. Transport via rail and road with containerised deliveries has evolved as the mostsuccessful method.
Future Opportunities
• Efficiency Upgrade — Improving the existing induction furnace process control systemmay reduce energy consumption, as would attention to heat loss areas during melt transferto the receiving furnaces in the casting area. Efforts are also underway to improve overallplant yield and UC RUSAL is dedicating specialist resources to drive this necessaryimprovement.
• Product/Market Opportunities (1) — The ARMENAL mill is currently producing 6 to 9micron foil. Technical competence is also being gained in heavier 38-micron foils which arepopular with yogurt manufacturers and this market will provide opportunity forARMENAL.
• Product/Market Opportunities (2) — Some markets are open to ARMENAL that areclosed to its competitors, such as the near eastern markets of Iran and Kazakhstan, andtherefore provide opportunity that competing producers may not be able to access.
7.2 SAYANAL
7.2.1 Introduction
Hatch undertook a site visit to SAYANAL in October 2008. This Section 7.2 has subsequentlybeen revised and updated based upon data and information from UC RUSAL and discussions heldwith senior management in September 2009. With reference to the following sections, pleasenote;
• Section 7.2.2 — Updated with data and information as of September 2009,
• Section 7.2.3 — Process Description as of October 2008,
• Section 7.2.4 — Environmental Status as of October 2008,
• Section 7.2.5 — Material Developments at the facility between October 2008 andSeptember 2009, and
• Section 7.2.6 — All previous Specific Risks and Opportunities noted in October 2008together with any changes following new data and information provision.
APPENDIX VI INDEPENDENT TECHNICAL REPORT
— VI-311 —
7.2.2 History, Location and Infrastructure
SAYANAL is located in Sayanogorsk, in Khakasia Republic of southern Siberia, approximately75 km south of the regional capital city of Abakan. Sayanogorsk has a population of around60,000 and is located next to the Yenesei River.
SAYANAL (formerly known as Sayansk Foil Mill) was commissioned in 1995, has a nameplatecapacity of 40 ktpa and is the largest producer of foil and foil-based packing materials in theRussian Federation. The plant was built according to an agreement between SayanogorskAluminium Smelter, Italian machinery manufacturer FATA Hunter and Reynolds MetalsCompany (USA).
7.2.3 Process Description
The SAYANAL meltshop uses molten aluminium as the initial raw material for foil production,which is delivered from the adjacent Sayanogorsk Aluminium Smelter, as well as recyclinguncoated scrap from its own production. Additional melting of primary ingot is undertaken butno external secondary recycled material is used in the process. The melt is prepared in one ofthree melting furnaces and undergoes refining by degassing and filtration before the addition ofalloying elements. The material is then transferred to one of three holding furnaces until use.From the holding furnaces, the melt then transfers to one of three horizontal “Super-Caster”machines for production of a blank 6 to 10 mm thick and 1300 to 1650 mm wide which is rolledinto coils. Two of these machines are equipped with latest generation control systemsimplemented during an upgrade in 2005/2006. The third caster had a similar upgrade of itscontrol system in 2007. The casting area is currently operating at full capacity.
In the preparation area, cooled coils are transferred to a FATA Hunter breakdown mill where theyare reduced in gauge during multiple passes. The breakdown mill has an early generation gaugemeasurement and shape control system which is now obsolete. Replacement will be required toimprove productivity and prevent an emergency situation since spares are not available. An oilemulsion is used for lubrication and cooling, the fluid is processed in a closed loop via aSchneider paper filter. The coolant condition is monitored daily on all mills to maintain correctoperational properties. An intermediate annealing station consisting of three controlledatmosphere furnaces and handling equipment compliments the breakdown process. One of thefurnaces is new and was commissioned in 2007.
In the foil mill area, material is further processed in one of four FATA Hunter foil mills. The millsare either roughing (one), universal (one) or finishing (two) and are equipped with shape andgauge control. Two mills will eventually require gauge control upgrades as the system installedis not current and any spares required are not readily available. One mill has a later generationAchenbach shape and gauge control system installed during an upgrade in 2004. The foil millsuse a kerosene-based lubricant which is filtered in a closed system. The coolant condition ismonitored daily to maintain correct operational properties. All mills are fitted with CO2 firesafety systems and are connected to an exhaust fume system fitted with scrubbers. Finishedproduct thicknesses of 0.006 to 0.6 mm are produced from the mills. The mill equipment is ingood condition and is well maintained by specialists. The mill plant is adequately maintained bytechnicians using well-equipped workshops on-site.
The finishing area adjacent to the foil mills consists of 12 annealing furnaces with handlingequipment, separation, cutting and slitting lines and rewind machinery. All equipment is in goodorder and one separation/slitting machine was fully refurbished during 2007. The foil in this areais either prepared to customer specified dimensions for uncoated product or into sizes to suit theequipment in the converting area where further processing takes place.
APPENDIX VI INDEPENDENT TECHNICAL REPORT
— VI-312 —

The converting area consists of machinery that performs the following operations on foil andfoil-based combined packaging materials: backing, lamination, gravure printing, japanning,painting, and embossing. The printing equipment consists of a six-colour machine and aneight-colour machine. All printing and embossing rolls are prepared on-site with sophisticatedequipment of recent design. The chrome plating tanks were replaced in 2007 and are of latestdesign. All equipment in the converting area is protected by a CO2 fire suppression system. Thearea is well ventilated and lit. The machinery is comprehensively serviced by exhaust ductingthat is adequate for purpose.
7.2.4 Environmental
SAYANAL has achieved ISO 14001 environmental management certification.
SAYANAL uses some potential pollutants such as rolling oil Kerosene emulsion, lacqueringproducts and chemicals necessary for printing. The solid and liquid wastes are well isolated andstored in dedicated areas. Permits were granted for atmospheric emission, waste disposal, solidand liquid, and for handling dangerous waste. A solid and liquid waste handling improvement andcontrol plan is in place. The plant has been accredited to internally manage kerosene disposal.
The emissions to atmosphere are monitored and controlled to comply with regulations. The plantis equipped with modern mechanisms for collection and treatment of harmful gases, as well aslocal treatment facilities for purification and processing of water.
Coated scrap created during processing is transferred to other UC RUSAL sites that have theequipment to reclaim materials safely.
7.2.5 Material Developments
This section presents material changes to the facility since the site visit was undertaken inOctober 2008. The updated information was presented to Hatch through meetings with UCRUSAL in Moscow and has not been validated through an additional site visit. We have no reasonto believe that the information provided is not a true and fair reflection of developments at thefacility.
UC RUSAL has advised that there have been no material changes to the physical equipment/plantat the facility.
SAYANAL operated below full capacity during the first half of 2009 due to the weakenvironment and reduced demand for its product. Hatch was advised that full capacity productionlevels were restored in June 2009.
7.2.6 Specific Risks and Future Opportunities
Specific Risks
No specific risks material to the future operation of this facility have been identified other thanthe need to ensure the remaining control systems are updated in an appropriate timeframe andthat critical spares procurement is completed as part of the capital plan.
Future Opportunities
• Capacity Expansion — SAYANAL is a well established business with significant marketpresence. Effort is being made to increase the nameplate capacity by modernising theprocess control of several machines and preserving the condition of others. Latesttechnology has been incorporated into the recent rebuild of the third caster and similarimprovements are planned for the other two casters. These improvements will increase thecasting capacity of SAYANAL significantly.
APPENDIX VI INDEPENDENT TECHNICAL REPORT
— VI-313 —

• Product/Market Opportunities — The development of the domestic market in the RussianFederation should provide opportunity for this plant and recent markets such as 38-micronfoil to service yogurt manufacturers have been penetrated using the existing equipment atSAYANAL which is capable of producing this thickness. Market size is expected to growin the Russian Federation and other CIS states and at present approximately 40 per cent offoil consumed in the Russian Federation is imported.
7.3 Urals Foil
7.3.1 Introduction
Hatch undertook a site visit to Urals Foil in October 2008. This Section 7.3 has subsequentlybeen revised and updated based upon data and information from UC RUSAL and discussions heldwith senior management in September 2009. With reference to the following sections, pleasenote;
• Section 7.3.2 — Updated with data and information as of September 2009,
• Section 7.3.3 — Process Description as of October 2008,
• Section 7.3.4 — Environmental Status as of October 2008,
• Section 7.3.5 — Material Developments at the facility between October 2008 andSeptember 2009, and
• Section 7.3.6 — All previous Specific Risks and Opportunities noted in October 2008together with any changes following new data and information provision.
7.3.2 History, Location and Infrastructure
Urals Foil is situated within a larger site at Mikhailovsk in Sverdlovsk region, 120 km southwestof Ekaterinburg. The site has been used since 1808 when it was started as a family businessproducing non-ferrous alloys. In the 1930’s, the plant was changed to encompass non-ferrousrolling and was further expanded during the Second World War, when some equipment wasrelocated to the Urals. At this stage it was reoriented towards aluminium rolling.
The aluminium foil plant (plant “No. 5”) is the most recent area of the total site, with theequipment being installed in the early 1980s. After bankruptcy problems which resulted in theplant being closed for a few months in 1999, plant No. 5 was started up again in 2000 butunderwent a subsequent bankruptcy in 2003 before being acquired by SUAL in 2003 (prior to theformation of UC RUSAL). Foil plant No. 5 is the only major plant currently operating on theoriginal industrial site — some minor enterprises are present but are unrelated to the Urals Foilorganisation. The services required for the operation of plant No. 5 such as heating, compressedair, water etc. are still used and the portion of the original industrial site that houses the foilrolling facility and this associated infrastructure is owned by UC RUSAL.
There has been a strong increase in production at Urals Foil since the late 1990s, with outputrising from 368 tonnes in 1999 to 15 kt in 2008. This is considered to be the current maximumcapacity of Urals Foil. Under the current product mix, maximum capacity is defined by the limitsof strip caster production and the foil annealing furnace capacity.
APPENDIX VI INDEPENDENT TECHNICAL REPORT
— VI-314 —
7.3.3 Process Description
The Urals Foil plant covers the complete technology cycle of foil production from the meltingand casting of aluminium strip, through to final foil production. Until 2006, aluminium supplywas mostly from Urals Aluminium Smelter, in the form of primary ingots augmented with a smallvolume of aluminium alloy. Since 2007 aluminium has been supplied predominantly by IrkutskAluminium Smelter and Bogoslovsk Aluminium Smelter. It is intended to limit the portion ofaluminium supplied from the Bogoslovsk smelter to approximately 30 per cent due to productionrequirements and chemical composition. Some secondary aluminium is purchased from outsidethe UC RUSAL group. A wide number of secondary aluminium suppliers are available to UCRUSAL, and thus no raw material supply problems are foreseen.
Urals Foil specialises in the production of technical foil (for heat exchangers, cable sheath andconstruction) and packaging foil (for packaging and storage of food, confectionery anddisposable food containers).
The main areas of the plant are the meltshop, preparation area and foil rolling area. The meltshophas two main casting lines, each served by two 6-tonne induction furnaces and two 16-tonnemixers or holding furnaces. Another induction furnace is used for remelting internal scrap. Asidefrom aluminium ingots, other raw materials used include aluminium alloys with silicon andtitanium-boride. There are currently two remaining operational vertical thin strip casters (of thethree originally installed and commissioned in 1984). These casters are inefficient whencompared with modern horizontal drum-type aluminium strip casters and currently limit outputfrom the facility. Adjacent to the two operational furnaces the third casting line has undergonemechanical refurbishment to increase casting capacity. The electrical control system is nonexistent and the funds required to complete this project have not yet been approved by UCRUSAL. The casting area is currently running at full capacity.
The preparation area has a breakdown mill of Soviet design which was built in 1977 in Ukraine.Cast coils are cold rolled to 0.3 to 0.6 mm on this mill, ready for foil rolling. The mill is run atlow speeds, has manual strip threading and is not equipped with modern shape controlcapabilities. The breakdown mill accounts for approximately one-half of all non-conformingmaterial processed, with mechanical damage, lubricant type and controls cited as issues affectingproductivity and quality. The rolling coolant is regularly contaminated with fluids and greaseswhich leak from the hydraulic equipment overhead and management of the condition of thecoolant is difficult. The rolling process also creates condensation that builds up within the milland the current fume hooding to remove condensation and prevent surface stains needsimprovement. The breakdown mill is in need of refurbishment. Depending on alloy, coils mayrequire annealing prior to rolling in the breakdown mill. Other equipment in the area includesa continuous annealing line with side trimming and slitting capabilities. A partially installed butnever commissioned cut-to-length line, also in the preparation area, is not suited to the currentproduct mix and Urals Foil management team do not believe they can competitively produceproducts from it. Removal of the unused equipment is planned should funds become available forthis purpose.
The foil rolling area has five Achenbach foil rolling mills. Four are currently in operation, withone mill having undergone a complete electrical modernisation with a new ABB control system.A shape meter and automatic shape control system was also installed on this mill. The fifth millis not required at present and would require repair and modernisation before operation couldcommence as it has been used as a source of spare parts. The foil mills are connected to acommon fume exhaust system with scrubber and there is a CO2 fire suppression system in thefoil mill area. Double foil winding equipment, slitting and rewinding equipment as well as Ebnerannealing furnaces and packaging facilities are housed adjacent to the foil mills. The equipmentin this part of the plant is of good quality and appears to be capable of producing the necessary
APPENDIX VI INDEPENDENT TECHNICAL REPORT
— VI-315 —
product quality but is expected to require increasing maintenance to sustain its condition. Amodernization program for the electrics and controls of the foil mills would be required toprevent emergency repairs, as many of the components on the mill for process control, gauge andshape control are no longer available.
The main buildings housing the core facilities are in reasonable condition and the roof wasrepaired in 2007 to maintain integrity against the elements particularly above the casthouse.Insulation in the main plant basement has also been improved. A refurbishment of the office andplant would be required to bring it to the standard of other UC RUSAL sites. The surroundingbuildings, which are remnants of the previous industrial complex and are now owned by others,are largely in a derelict state.
7.3.4 Environmental
Urals Foil uses very few potential pollutants, with the rolling oil emulsions being the worst. Thewater-based oil emulsion from the breakdown mill is cleaned in a dedicated filter system. Correctoperational properties for the emulsion are maintained by regular monitoring and the system istopped up to account for process loss, but is generally considered to be a closed loop operation.The foil mills use a kerosene-based oil emulsion which is also housed in a closed loop. A French“Air-Pure” system is used to clean the fumes from the foil mills to prevent air pollution and thecollected residue is disposed offsite. The mixing furnaces have a ventilation system that ismanually started and automatically stopped when required for process operations.
The overall site is aging and has been used for metal processing for almost 200 years. However,the type of former operations in this plant is not usually associated with major serious pollutantsother than hazardous construction materials such as asbestos etc. which were commonly used inthe past. An expansion of the monitoring system for air emissions is planned during 2009.Generally, the licences necessary to operate the site are current, with one outstanding which hasbeen preliminarily approved by the regulators.
7.3.5 Material Developments
This section presents material changes to the facility since the site visit was undertaken inOctober 2008. The updated information was presented to Hatch through meetings with UCRUSAL in Moscow and has not been validated through an additional site visit. We have no reasonto believe that the information provided is not a true and fair reflection of developments at thefacility.
UC RUSAL has advised that there have been no material changes to the physical equipment/plantat the facility.
Urals Foil operated below full capacity during the first half of 2009 due to the weak environmentand reduced demand for its product. Hatch was advised that full capacity production levels wererestored in May 2009.
7.3.6 Specific Risks and Future Opportunities
Specific Risks
• Asset Integrity — A significant risk for Urals Foil is that insufficient sustaining capital isallocated to maintain the current state. Insufficient funding would limit the plants abilityto maintain quality and throughput. There are several partially executed projects whichrequire funds to allow their completion including the third caster, upgraded dispatch areacrane and additional annealing furnaces. The breakdown mill requires refurbishment andthis should be included in future capital investment projects.
APPENDIX VI INDEPENDENT TECHNICAL REPORT
— VI-316 —
Future Opportunities
• Capacity Expansion — The plant is at full capacity and a project to increase the totaloutput of the plant to 25 ktpa has been developed. This development opportunity will beconsidered through UC RUSAL’s investment appraisal process and the total scope wouldinclude the completion of a third caster, two foil furnaces, breakdown mill upgrade andslitting line upgrade. The plant is limited by the process control systems and would alsorequire upgrades to these. The mechanical strip handling and coolant system of thebreakdown mill limit throughput and an upgrade is recommended, as the breakdown millwill become the limiting factor once a third caster is operational.
8. Boguchanskaya HPP Project
8.1 Boguchanskaya HPP
8.1.1 Introduction
Hatch undertook a site visit to Boguchanskaya HPP in October 2008. This Section 8.1 hassubsequently been revised and updated based upon data and information from UC RUSAL anddiscussions held with senior management in September 2009. With reference to the followingsections, please note;
• Section 8.1.2 — Updated with data and information as of September 2009,
• Section 8.1.3 — Process Description as of October 2008,
• Section 8.1.4 — Environmental Status as of October 2008,
• Section 8.1.5 — Material Developments at the facility between October 2008 andSeptember 2009, and
• Section 9.1.6 — All previous Specific Risks and Opportunities noted in October 2008together with any changes following new data and information provision.
8.1.2 History, Location and Infrastructure
The Boguchanskaya hydroelectric power plant (HPP) is the fourth and the last downstream HPPon the Angara River which drains Lake Baikal in Central Siberia. The upstream HPPs (alreadyin operation) include: Irkutsk (660 MW — commissioned in 1959), Bratsk (4,500 MW —commissioned in 1967) and Ust-Ilimsk (3,840 MW — commissioned in 1980). The plants are ona cascade type hydroelectric power system.
Design studies for the Boguchanskaya HPP were performed by USSR state institutes during the1960s. The project was approved in 1979 and construction started in 1980. In 1987, the AngaraRiver was diverted with the construction of a cofferdam and main spillway. In 1992, constructionstopped due to lack of funds. Between 2005 and 2006, a Detailed Feasibility Study wasconducted by Coyne et Bellier for the preferred project alternative. Construction restarted in2006 and it is anticipated that the first three turbines will be on line in December 2010, thesecond three turbines will be on line during 2011 and the remaining three turbines are expectedto be commissioned in late 2012.
APPENDIX VI INDEPENDENT TECHNICAL REPORT
— VI-317 —
8.1.3 Process Description
Boguchanskaya HPP, looking downstream (from left to right banks), consists of a concretegravity dam, 756 m long and 90 m high (maximum), including a non-overflow section 154 mlong, a nine-bay water intake structure 270 m long, a 10-opening spillway 200 m long, a 22 mwide lock section and a 110 m long transition (concrete/rockfill) section. The total concretevolume of the dam is 2.84x10⁶ m3, of which 2x10⁶ m3 is already in place and the remainingvolume of 0.84x10⁶ m3 is required to complete the structure at crest elevation 214 m in 2012.
There is also a rockfill dam, approximately 1,900 m long and 79 m high (maximum). The coreof the rockfill dam is made of a compacted asphalt-concrete diaphragm surrounded by transitionand filter materials. The dam crest is 15 m wide. The drainage and grouting gallery is locatedat the downstream side of the central core. The total material volume of the dam is 22.4x10⁶ m3,of which 15x106 m3 is already in place and the remaining volume of 7.4x10⁶ m3 is required tocomplete the structure at crest elevation 212 m in 2011.
The powerhouse with an installed capacity of 3,000 MW will be located at the toe of the dam.The powerhouse consists of nine (340 MW capacity each) Francis vertical hydraulic turbinescoupled to umbrella type, salient pole hydro generators. Eight spiral cases (600 tonnes each) areinstalled of which six are encased with concrete (6000 m3 of concrete per spiral caseencasement).
The water intake to each of the turbine units will be through a sliding intake gate, one per unit(two openings per unit) and steel penstocks of 10 m diameter and 90 m long. The civil works forthe intake gates, emergency drop gates and second spillway gates are currently in progress.
The turbine runner and turbine shaft for the first unit, weighing 160 tonnes and 82.5 tonnesrespectively, were delivered to site in August 2008, after being shipped from the LMZ plant inSt. Petersburg. Each turbine runner carries 11 blades and is designed to operate at a peakefficiency of 96.2 per cent at a net head of 62.5 m. Model tests have been carried out in the LMZlaboratories and absolute efficiency tests are scheduled during the commissioning of Units 1, 2and 3. Guarantees against cavitation for the turbine runner have also been provided at thefollowing specific net heads:
• 40 m, low elevation of 147 m at 162 MW turbine output for a maximum period of 20 days
• 65 m, intermediate elevation of 185 m at 162 MW turbine output
• 65.5 m normal elevation of 65.6 m at 340 MW turbine output.
Turbine auxiliary systems will be self-lubricating type using PTFE grade separator films inbushings. Turbine bearings will be of babbit oil filled type. Detailed engineering for thesecomponents is in progress and was reported as 60 per cent complete.
Generators rated at 340 MW, 0.9 pf, 50 Hz, 15.75 kV, will be supplied by the Electrosilla plantin St. Petersburg. The generator housing will be supplied to site in sections. Stator cores andwindings will be installed in situ. Generator rotor rims will be assembled on-site and poles willbe mounted over the rotor rim in a special installation area in the erection bay of the powerhouse.While an assembled stator will weigh 476 tonnes, the total weight of the assembled rotor will be957 tonnes and therefore will be the largest single heavy piece of equipment installed as part ofthe project. Evaluations are underway for the procurement of the generator exciters fromperspective suppliers such as Basler, ABB etc and a decision on the selected supplier is expectedshortly. Detailed engineering for the above components is in progress and was reported as 60 percent complete.
APPENDIX VI INDEPENDENT TECHNICAL REPORT
— VI-318 —
A 2x500 tonne electrical overhead travelling crane with two main 500-tonne hoists and 10-tonneauxiliary hoists will be provided at the powerhouse. In addition, intake and draft tube cranes willbe provided. The overhead and gantry cranes are due to arrive on-site by the end of 2008. Civilwork required for installation of these cranes is in the design and implementation stage.
The station services will consist of electrical and mechanical services suitably rated for a typicalmodern hydroelectric plant. The engineering department has decided to procure a 220 Vdc, 400APh battery bank and charger system to supply sufficient power for one hour to start any unitin a complete shutdown (black start) of the plant. Other options such as the installation ofsuitably rated diesel generators to provide black start capability could be assessed, knowing theremoteness of the Boguchanskaya HPP and the requirement for reliability of power to theBoguchansky Aluminium Smelter. Detailed engineering for the electrical and mechanicalservices was reported as 55-60 per cent complete.
The unit transformers have been ordered from the Zabaroski Transformer plant in Ukraine. Thetransformers will be installed in outdoor recesses along the upstream side of the powerhouse. Nospare transformer is proposed. The first three phase transformer is expected to be delivered tosite in December 2008.
The 500 kV and 220 kV switchyards will be located on the east bank of the river, up-stream ofthe powerhouse. The updated single line diagram indicates that the 500 kV switchyard isdesigned with a circuit breaker busbar switching scheme. This will facilitate switching of Units1 to 6 powerhouse generators and three transmission lines, with Units 1 to 4 and Units 5 to 6connected in a breaker and a third, and a breaker and a half, switching schemes respectively. The220 kV switchyard is designed with a breaker and a half scheme to facilitate switching of Units7 to 9 powerhouse generators. The switchyard also contains four transmission lines, two autotransformer feeders for interconnection with the 500 kV switchyard and two bus-tie breakers.The 500 kV and 220 kV switchyards will be built with sulphur hexafluoride gas (SF6) insulatedswitchgear (GIS) and will include 500 kV gas insulated bus ducts to connect the GIS yard to thebushing of the aerial lines and the 500/220 kV auto-transformers. Detailed engineering for the500 kV and 220 kV switchyards was reported as 55-60 per cent complete.
Two 160 km 500 kV high voltage (HV) transmission lines will connect the 500 kVBoguchanskaya HPP switchyard to the Angara 500/220 kV sub-station located near BoguchanskyAluminium Smelter. The Angara 500/220 kV sub-station will be built near Tayozhny settlementin the region of Krasnoyarsk. The lines are expected to be commissioned between August andSeptember 2010. However, the project has no jurisdiction over this completion schedule. A third500 kV HV transmission line, of 380 km length, is scheduled to be commissioned in 2012,connecting the 500 kV Boguchanskaya HPP switchyard to the existing 500 kV Siberian powergrid, at Taishet 500 kV sub-station. In addition, to ensure reliability of supply to theBoguchansky Aluminium Smelter, two 500 kV HV transmission lines are scheduled forcompletion in 2010 connecting the Angara 500 kV sub-station to the existing sub-station locatedat Kamala-1 (350 km long).
There was no evidence of installation works for the transmission lines during the site visit.
Five new 220 kV, HV transmission lines will connect the Angara 500/220 kV sub-station to theproposed Boguchansky Aluminium Smelter switchyard (3 km long).
APPENDIX VI INDEPENDENT TECHNICAL REPORT
— VI-319 —
8.1.4 Environmental
A Social and Environmental Impact Assessment (SEIA) was completed in 2007 for an upstreamreservoir water level at elevation 185 m. This SEIA is currently being expanded to include areservoir water level up to elevation 208 m. Completion of the expanded SEIA is planned for theend of 2009. It was also reported that all resettlement issues are being addressed and thatapproximately 4,500 people living in the upstream region will be relocated due to flooding of theBoguchanskaya HPP reservoir. All permits and approvals are secured and no environmentalproblems are foreseen.
8.1.5 Material Developments
This section presents an update on construction progress. The updated information was presentedto Hatch through meetings with UC RUSAL in Moscow and has not been validated through anadditional site visit. We have no reason to believe that the information provided is not a true andfair reflection of recent developments.
UC RUSAL advised that the project works have continued throughout the economic downturn inthe first half of 2009 and have now accelerated partially to replace the loss of electricity supplyfrom Sayano-Shushenskaya HPP due to the accident at this facility in August 2009.
Hatch has been advised that most long-term contracts with the vendors have been awarded. Inaddition, engineering design of the construction equipment is now complete, concrete damdesign is 85 per cent complete, rockfill dam design is 95 per cent complete and powerhousedesign is 70 per cent complete.
As confirmed by UC RUSAL, since the last site visit the following material changes have takenplace:
• Average level of the concrete dam is currently 196 m, in some places up to 208 m;
• Average level of rockfill dam is currently 190 m;
• The installation of the last spiral case is planned to start in September 2009;
• The detailed engineering of the turbine auxiliary systems and turbine bearings iscompleted;
• The procurement contract for generator exciters has been signed with ABB, detailedengineering of these components is about 70 per cent complete;
• A 2x525 tonne electrical overhead travelling crane with two main 525-tonne hoists and10-tonne auxiliary hoists for the powerhouse have been delivered to the site. The gantry andoverhead cranes are already on site, and the preparation for their installation is under way;
• Three step-up transformers and four phases of autotransformer have already been deliveredto the site;
• Detailed engineering for the 500 kV and 220 kV switchyards is 80-90 per cent complete;
• The 160 km 500 kV high voltage (HV) transmission lines are scheduled to be commissionedbetween August and September 2010. Even though the Boguchanskaya HPP project has nojurisdiction over this completion schedule, the state has guaranteed that these works will becompleted on time. Currently one of 550 kV HV transmission lines is 55 per cent complete,and the Angara 500/220 kV sub-station is 30 per cent complete;
APPENDIX VI INDEPENDENT TECHNICAL REPORT
— VI-320 —

• The powerhouse building structural components are on site and partially installed.
Hatch has not been able to verify these developments and as such we can not reconfirm theirvalidity.
8.1.6 Specific Risks and Future Opportunities
Specific Risks
• Project Schedule — The process of engineering and construction operating in parallelcould lead to rework and result in delays. Delays in the award of equipment procurementcontracts could delay commissioning of the first three units currently scheduled forDecember 2010.
Future Opportunities
No specific opportunities material to the future operation of this facility have been identified.
9. Conclusions
Hatch Declaration
We are responsible for this report relating to the scope of work shown in Appendix B and declarethat we have taken all reasonable care to ensure that the information contained in this report is,to the best of our knowledge, in accordance with the facts and contains no omission likely toaffect its import.
Yours FaithfullyHatch Associates Limited
SRK Declaration
We are responsible for this report relating to the scope of work shown in Appendix B and declarethat we have taken all reasonable care to ensure that the information contained in this report is,to the best of our knowledge, in accordance with the facts and contains no omission likely toaffect its import.
Yours FaithfullySRK Consulting (UK) Limited
APPENDIX VI INDEPENDENT TECHNICAL REPORT
— VI-321 —
Annex AQualifications of Consultants
HATCH
Julian Clark — Regional Director Light Metals, Hatch and Director, Hatch Consulting —Bachelor of Engineering (Mech Eng, Hons), Chartered Engineer (UK), Member of the Institutionof Mechanical Engineers (UK).
Julian is a Chartered mechanical engineer with approximately 17 years experience in large-scaleinternational project development and construction including alumina refineries and aluminiumsmelters. He has considerable experience in high level project reviews, due diligence assignments andcompetent person’s reports involving an array of mining and metallurgical industries, in addition todetailed knowledge of metallurgical markets and financial modelling and transactions.
For this report, Julian was the project director and reviewer, in addition to leading several of the sitevisits to Russian aluminium plants.
David Morton — Senior Consultant, Hatch Light Metals Europe — Bachelor of Engineering(Mech Eng, First Class Hons), Chartered Engineer (UK), Member of the Institution ofEngineering Designers (UK).
David is a Chartered mechanical engineer with 25 years experience in the design and projectmanagement of industrial plant and equipment. He has been involved in numerous aluminium smelterconstruction, development and study projects and has worked extensively in Russia including themodernisation and upgrade projects for Söderberg and pre-bake smelter projects. Recently he hasworked on the development of both greenfield and brownfield smelter projects in Africa, the MiddleEast and Iceland.
James Salter — Senior Economist, Hatch Light Metals Europe — Bachelor of Science(Economics, Hons), Master of Science (Economics).
James has over 10 years experience as a senior metals economist. James has extensive knowledge ofall economic aspects of the alumina/aluminium industries, earned during his time at Hatch andprevious employment at industry research houses, CRU and MBR. James has recently been involvedin the appraisal of a number of smelters and refineries across the globe for financing purposes in aproject manager capacity.
Richard Black — HNC Chemistry, HNC Chemical Engineering
Richard has 40 years experience in the primary sector of the aluminium industry, in positions rangingfrom process Engineer to Operations Director, working on three continents. He has been involved inthree greenfield plant start ups, two of which he was project manager of and in addition he was theProject Development Manager of the Sohar Smelter Project in the Sultanate of Oman which iscurrently under construction. He is at present a member of the project steering committee for the SoharSmelter Project. Richard has also worked as an independent consultant on technology evaluation,smelter due diligence and trouble shooting around the world, namely in Russia, China, Nigeria,Bahrain, India, Ghana and Europe.
David Walker — Senior Alumina Consultant, Hatch Light Metals Australia — Bachelor ofEngineering (Chem Eng).
David has 40 years experience in the bauxite and alumina industry with particular emphasis on Bayertechnology including process optimisations, troubleshooting and refinery design. He has worked withseveral major alumina producers and has been involved in process engineering of alumina refineriesfor the past 20 years.
APPENDIX VI INDEPENDENT TECHNICAL REPORT
— VI-322 —

Vyacheslav Vesselkov — Chief Project Engineer Hatch Russia - Graduate Diploma (Mechanical)(Irkutsk Politechnical Institute, 1974), Actual member (academician) of International Academyof Ecology and Life Protection Sciences.
Vyacheslav has more than 35 years experience in the scientific-research, design, engineering,construction and operation of aluminium and silicon processing facilities. He has extensive experiencein engineering design and construction of industrial projects in Russia and in other countries(aluminium smelters, silicon plants, productions of prebaked anodes). Vyacheslav worked for SibVamifor 37 years, in particular, in the position of its Managing Director from 1994 to 2007. In recent yearsVyacheslav has managed the process design and construction of a number of aluminium smelters inRussia, Ukraine, and Kazakhstan. These include the modernisation of Bratsk Aluminium Smelter,expansion of Urals and Irkutsk aluminium smelters, and the feasibility study for Ekibastus aluminiumsmelter.
Donald Gibson — President, Gibson Engineering & Technology, Incorporated; Bachelor ofMechanical Engineering; Master of Business Administration
Don has 34 years experience in the aluminium industry. Prior to forming a company specializing inthe feasibility review, planning and construction administration of major capital projects for thealuminium industry, he was the Engineering Manager for Kaiser Aluminum International. Hisexperience includes staff engineering management, project management of major smelter expansionsand team leader of reduction cell development, including the cell design implemented for theSöderberg to Prebake conversion at RUSAL’s Nadvoitsy smelter. He holds two patents on technologycurrently in use for the improvement of the anode bake process.
Kishen Bhan — Project Manager and Senior Electrical Engineer — Bachelor of ElectricalEngineering (Hons), Member of Professional Engineers of Ontario and Institute of Electrical andElectronics Engineers (IEEE)
Kishen is an electrical engineer with over 32 years of experience, including the last 18 years directlyin the field of hydroelectric and thermal power plant engineering, design, project management, duediligence, asset management, consulting and upgrade of electric power generation, substation andpower distribution systems, construction supervision and management, start-up and commissioning forseveral hydroelectric facilities and industrial switchgear and controls in Canada and overseas.
Michael Goodwin — Senior Rolling Mill Engineer, Hatch Light Metals Australia — B Tech(Engineering and Management), Associate Diploma in Mechanical Engineering, MechanicalEngineering Certificate, Toolmaking Trade Certificate.
Michael has 30 years broad base tooling, manufacturing, design and project experience including over15 years experience in aluminium and steel rolling mills, oil and gas wellhead and valve production.Michael has also contributed to due diligence assignments and competent persons reports in thedownstream aluminium industry.
Dr. David Chinloy — Senior Process Consultant, Hatch Light Metals Canada — Bachelor ofScience (Chem. Eng, First Class Hons), Master of Arts (Chem. Eng.), Ph.D. (Chem. Eng.).
David has over 30 years experience in the bauxite and alumina industry, in the plant, in research anddevelopment, and in engineering. He has knowledge of the fundamental science of the Bayer process,as well as the day-to-day operations. He has published papers on the Bayer process, and holds severalpatents. He has worked in alumina refineries throughout the world, from front-end engineeringthrough to commissioning.
APPENDIX VI INDEPENDENT TECHNICAL REPORT
— VI-323 —
Fadi Chidiac — Manager Hydroelectric Projects, Hatch Energy Canada — B.A.Sc.Thermodynamic and Energetic, 1976 — B.A.Sc. Civil Engineering, 1978 — M.A.Sc. and D.E.A.Structural Engineering, 1979 — Member of Professional Engineers of Ontario, Order ofEngineers of Quebec, Association of Civil Engineers of France.
Fadi is a Hydropower Engineer with over 25 years experience in the design, design management,rehabilitation and construction of water retaining structures and hydroelectric projects both in Canadaand overseas. His most recent experience includes a review of design concepts and conceptoptimization, preparation of tender design through detail design, construction and rehabilitation of a450 MW hydroelectric project.
Dr Mark Dupuis — External Consultant, GeniSim Inc.
Dr. Marc Dupuis is a consultant specialized in the applications of mathematical modelling for thealuminium industry since 1994, the year when he founded his own consulting company GeniSim Inc.Before that, he graduated with a Ph.D. in chemical engineering from Laval University in Quebec Cityin 1984, and then worked 10 years as a research engineer for Alcan International.
His main research interests are the development of mathematical model of the Hall-Héroult celldealing with the thermo-electric, thermo-mechanic, electro-magnetic and hydrodynamic aspect of theproblem. He was also involved in the design of experimental high amperage cells and the retrofit ofmany existing cell technologies.
Ron Adlam BSc, MSc (Hons)
Ron Adlam has 20 years experience in design, project management, geotechnical investigation andconstruction management for commercial and mine infrastructure developments and has post graduatequalifications in engineering geology. He has undertaken numerous projects involving design andconstruction of bulk earthworks, tailings storages, water and effluent storages, landfills, watersupplies, mineral processing plant sites, roads, pipelines, contaminated sites and wastewater treatmentplants. He has specific expertise in residue and solid waste disposal design, residue disposal operation,low permeability liner systems, preparation of technical specifications, qualitative risk assessment,environmental risk assessment, contract administration, construction documentation and relatedproject management and has managed multidisciplinary design and construction teams for a widevariety of projects.
Ian Moller, Regional Director — Asia Pacific, Hatch Environment and Community Interface -Associate Diploma of Applied Biology, Royal Melbourne Institute of Technology, 1976, Bachelorof Applied Science (Applied Biology), Royal Melbourne Institute of Technology, 1978, GraduateDiploma in Management, University College of Central Queensland, 1989
In the Aluminium industry, Mr. Moller’s key experience and training is in the field of environment,health, safety and community management of major industrial, infrastructure and developmentprojects. He has extensive experience in the aluminium smelting industry, with 15 years at Comalcosites in Australia and New Zealand and periodic consulting projects involving light metals industryuntil the present. His fields of specialty include, impact assessment studies, facility auditing,industrial processes and emissions monitoring, ambient environmental impact monitoring,environmental health and safety and waste management. Ian has five published papers relating toenvironmental impacts of smelters.
Boris Lankov — Lead Engineer Hatch Russia — Engineer of Metallurgy, PhD in Engineering(Moscow Institute of Steel and Alloys)
Boris has more than 20 years of experience in areas including the beneficiation of copper-nickelsulfide ore, manganese ore, bacterial pressure leaching of magnetic pyrite concentrates, metallurgicalprocessing of secondary aluminium, copper, lead, and aluminium wire rod production. His most recentexperience includes turnkey production organisation; market analysis and business planning and siteselection. He has been a Lead Engineer at Ozernoe Lead-Zinc Project in Russia.
APPENDIX VI INDEPENDENT TECHNICAL REPORT
— VI-324 —
Paul Relton — Senior Engineering Consultant (London) - Bachelor of Science (CivilEngineering), Master of Science (Water Resources), Chartered Engineer (UK), Member of theInstitution of Civil Engineers (UK).
Paul is a Chartered Civil Engineer with over 22 years of industry experience, specializing inInfrastructure and Construction. Paul has undertaken a wide variety of project roles including businessdevelopment, project management, design management and contract administration for major coal, railand civil infrastructure projects and metals and mining projects. He has previously been involved ina number of alumina refinery and smelter projects in Africa and South America.
Stephen Daughney — Technical Director — Hatch Water, Americas, Hatch InfrastructureCanada — Bachelor of Applied Sciences (Chem Eng).
Steve has 15 years of experience in the water treatment and environmental fields, primarily withinindustry. He has been responsible for process design and project management of several large capitalprojects with the focus on improving environmental emissions performance. He is currently involvedwith a comprehensive water management evaluation for an alumina refinery in South America.
Julie Ward — Senior Consultant, Hatch Consulting Canada — Bachelor of Engineering (Civil),Master of Business Administration.
Julie is a Senior Consultant with the Investment and Business Planning group in Canada. She has morethan 10 years consulting experience in a variety of industries and has experience in managementconsulting covering strategy development and implementation, performance improvement, duediligence, post merger integration and organizational effectiveness. She has also been involved inproject management and has completed engineering design on multiple global mining and metalsprojects, including base metals, aluminium and precious metals. Most recently, Julie has led duediligence studies in the metals and energy sectors on behalf of financial institutions and investors.
Pavlo Bodak — Director of Industrial Minerals Business Unit, Hatch Russia — PhD, M. Eng.Chem. (Honours).
Pavlo has over 10 years experience in operations review, process design development, mass andenergy balancing, flowsheet design, environmental issues, process economics and projectmanagement, in particular, EPCM. His recent experience includes management of Alcoa’s SustainingCapital program at the Fjardaal smelter; due diligence and contribution to the preparation of aCompetent Persons Report.
Andrew Bodley — Geotechnical Consultant, Hatch Infrastructure Australia — Bachelor ofEngineering (Civil, First Class Hons), Master of Engineering Science (Geotechnical), Member ofthe Institute of Engineers Australia, Member of Geomechanics Society Australia.
Andrew has postgraduate qualifications in geotechnical engineering with over seven years experiencein all facets of geotechnics in both the public and mining sectors. Andrew has extensive experiencein the analysis and design of residue impoundment to contain red mud produced from the Aluminarefining process. He has been involved in the review and design for Alcoa World Alumina’s residuesites in West Australia on and off for the last 8 years. His particular focus has been the investigationand design for upstream embankment raises on the soft residue mud and investigation of sites forproposed greenfields residue areas. Andrew has also been heavily involved in the long term planningfor Alcoa’s Western Australian Residue facilities and numerous soft soil investigations for their annualupstream embankment construction projects.
APPENDIX VI INDEPENDENT TECHNICAL REPORT
— VI-325 —
Anastasia Kazakova — Senior Consultant, Hatch Light Metals Russia - MPhil in Engineering forSustainable Development (University of Cambridge, UK), Advanced Diploma in EnvironmentalScience (MSU n.a. M.V. Lomonosov) (Hons).
Anastasia is an environmental and sustainable development specialist recently graduated from theUniversity of Cambridge, where she researched sustainable sourcing and stewardship of aluminiumthroughout its lifecycle. She has completed several papers and studies comparing environmentallegislation and environmental performance of several companies. Her most recent experience includescontribution to Minerals Expert and Competent Persons Reports, as well as due diligence of aluminarefineries and aluminium smelters in Russia, Guinea, Nigeria, and Bosnia. She speaks Russian,English and French fluently.
Vivienne Tieu — Consultant, Hatch Consulting — Bachelor of Engineering (Chem Eng, Hons),Bachelor of Science (Chemistry).
Vivienne has four years of experience as a plant metallurgist in various BHP Billiton copper, nickel,uranium, gold and silver processing operations. She has practical experience in a number ofconcentrating, smelting and refining processes. In addition to her operational knowledge she hasextensive experience in laboratory test work design, statistical metallurgical modelling, projectfinance evaluation, and project delivery utilizing six sigma methodologies. Since joining Hatch shehas been involved in a number of technical operation reviews, market studies and cost benchmarkingexercises
Nerida Stacy — Consulting Analyst, London — Bachelor of Engineering (Chemical), Bachelor ofEconomics
Nerida has four years experience as an analyst and was involved in a number of due diligence projectsin both the mining and infrastructure areas during her employment with Connell Hatch in Australia.Nerida also has experience in the financial modelling of projects across a range of industries.
SRK
McCracken, Allan — BSc. Principal Geotechnical Engineer
Allan is a chartered engineer who has 28 years of experience in mining and excavation engineering,has consulted to over 250 mine properties worldwide and specialises in geotechnical risk assessmentin open pit and underground mining, mining method selection, geotechnical design optimisation androck support design.
Anderson, Sabine — MEng. Senior Mining Engineer
Sabine has ten years experience in underground and surface mining and performs technical assessmentof exploration and mining projects, in support of acquisitions, debt and equity finance. Her experienceincludes project evaluation, economic analysis, multi-disciplinary due diligence, project managingnumerous commissions, and performing scoping and pre-feasibility studies.
Campodonic, Mark — MSc. Principal Resource Geologist
Specialising in the exploration, development and mining of bauxite deposits, Mark has over 9 yearsof international experience generating technical-economic models, geological modelling, producingresource/reserve estimates for feasibility studies, auditing mining operations for competent person’sreports and stock exchange listings, technical reviews, as well as project managing explorationprogrammes and scoping and pre-feasibility studies.
APPENDIX VI INDEPENDENT TECHNICAL REPORT
— VI-326 —
Fox, Nick — MSc. Senior Resource Geologist
Nick joined SRK in 2004 after two years of mining industry experience and four years in finance.Nick’s responsibilities include generating and auditing technical-economic models for feasibilitystudies, stock exchange listing valuations and raising finance, databasing, QA/QC, geologicalmodelling, and producing and reviewing resource/reserve estimates.
Gilbertson, James — MSc. Resource Geologist
James’ has experience in resource estimates planning, implementing and supervising mineralexploration, the auditing of geological models, the design of resource drilling programs, theimplementation of future mine planning issues, QA/QC management, and local/national governmentrelationships.
Polonyankin, Alexander — MSc. Senior Resource Geologist
At SRK (Russia), Alexander has been project manager of several resource audits. He has over 10 yearsof experience in mining industry, having worked as an exploration geologist, a mine geologist at anopen pit gold mine, as a gemologist for a jewellery company and as a resource modeling geologist ata large iron ore company.
Roberts, Lucy — PhD. Senior Resource Geologist
Lucy has extensive knowledge of geological and mine planning software including Gemcom, Whittleand Isatis geostatistical. After completing a PhD in Geostatistics and joining SRK in 2006, she hasundertaken resource estimates for precious metals, gemstone and bulk commodity projects andprovided key input for Competent Persons’ Reports for various international exchanges.
Bright, Paul — BSc. Principal Geologist
Paul has over thirty years experience in mining and exploration. Paul has worked as a geologist on arange of exploration projects. At SRK Paul has headed a CAD department as well as undertaken duediligence, expert witness and other geological project work, which has included resource and reserveaudits, pre-feasibility studies and competent person’s reports.
Cremin, Sean — BSc. Principal Mining Engineer
After more than 30 years within the mining industry, Sean experience includes competent personsreporting and due diligence appraisal, practical auditing and strategic advice, scoping and feasibilitystudies, and various technical audits throughout the World.
Miles, John — MSc. Associate Principal Mining Engineer
John has 23 years of experience in mining, having been employed by a number of gold and diamondmining operations in various technical and managerial positions of responsibility. In the nine yearsworking for SRK John has been involved in due diligence reviews, feasibility investigations, technicaldesign and mining evaluations for open pit and underground projects.
Woolliscroft, Jon — BEng. Associate Principal Mining Engineer
Jon is a former regional operations manager and assistant chief production manager for the BritishCoal Opencast Executive (BCO) in South Wales. Since 1995 he has acted as a freelance consultant foropencast mine development, land restoration and coal bed methane development and has more recentlyundertaken resource and reserve audits, due diligence, pre-feasibility studies, design and planning foropen pits and provided operational assistance.
APPENDIX VI INDEPENDENT TECHNICAL REPORT
— VI-327 —
Connelly, Richard — MSc. Principal Hydrogeologist
Richard has more than 39 years experience in mining hydrogeology and geological engineering. Hespecialises in integrated water management for open pit and underground mines including minedewatering and slope depressurisation, water supply, ground water pollution, acid mine drainage andground water recovery after closure and Environmental Audits.
Goran Andric — BSc. Senior Mining Eng
Goran has over 16 years of experience in open pit coal mining industry. His extensive coal knowledgecomes from his operational experience as Chief Engineer at Kolubara Coal Mines (Serbia) and MineSuperintendent at Falls Mountain Coal (western Canada). He has participated in several engineeringstudies on coal projects in Serbia, Canada and South Africa.
Chapman, John — BSc. Principal Geoenvironmental Consultant
John is a recognized as an expert in acid mine drainage assessment, prediction and control. Workingat SRK (Australia) he gained international experience ranging from research and development workcompleted in biological engineering and bio-leaching, to site assessment, reaction pathway modeling,and site reclamation.
Peralta, Helen — MSc. Senior Environmental Consultant
Helen has over 10 years experience in the mining and energy industry. Her responsibilities includebaseline and environmental impact studies, development of closure plans, environmental auditing anddue diligence projects for international financial institutions. Helen has managed and implementedintegrated safety, health and environmental management systems.
Pollhammer, Linda — BSc. Environmental Scientist
Linda has 6 years experience as an environmental scientist. She spent 4 years with GCS EnvironmentalConsultants in South Africa working in the water use authorization and management unit. Shecurrently contributes to environmental and social impact assessments, baseline studies and supportsthe geo-environmental team in a wide range of capacities.
Moors, Inge — MSc. Mining Engineer
Inge specialises in all aspects of mineral economics. After joining SRK in 2007, she has been directlyinvolved in various due diligence studies with specific focus on mineral experts’ reports for theLondon Stock Exchange. She is responsible for the development of Financial Models for scoping,pre-feasibility and feasibility studies.
Polutornaya, Svetlana — PhD. Mining Economist
Svetlana has experience as a mining economist and in financial mine evaluation and has beendeveloping cost databases for pre-feasibility and feasibility studies at SRK (Russia). She graduatedfrom Moscow State Mining University and has a PhD in economics.
APPENDIX VI INDEPENDENT TECHNICAL REPORT
— VI-328 —

Annex BScope of work/Limitations and Exclusions
Scope of work
The following Scope of Work is an extract from Schedule 1 of the Services Agreements between Hatchand UC RUSAL and SRK and UC RUSAL, effective November 15 2008 and from Hatch and SRKletter proposal, titled ‘Finalisation of Kandinsky 2 Mineral Expert report for Initial Public Offeringof UC Rusal’ dated 27 August 2009.
QUOTE (From Schedule 1 of the Services Agreement between Hatch and UC RUSAL and SRK andUC RUSAL, dated November 15 2008)
SCHEDULE 1 - SCOPE OF WORK
1.0 Introduction
This Schedule 1 sets out the Services which Hatch and SRK agree to provide in connection withthe admission of the ordinary shares and/or global depositary receipts representing shares(“GDRs”) in United Company RUSAL Limited (the “Client”) to listing on one or moreinternational stock exchanges (the “Listing”).
In connection with the Listing, a mineral expert’s report (the “MER” or the “Mineral Expert’sReport”) is intended to be prepared by Hatch and SRK for all the major assets that will be heldby the Client and/or its subsidiaries at the time of Listing.
Hatch and SRK are preparing the Mineral Expert’s Report to be addressed to the Board ofDirectors of the Client. SRK is reporting on the mining assets of the Client and will takeresponsibility for the sections of the Mineral Expert’s Report it produces. Hatch is reporting onthe non-mining assets of the Client and will take responsibility for the sections of the MineralExpert’s Report that it has prepared. In order to achieve this, a detailed audit of these assets mustbe undertaken, utilising an experienced team of industry professionals including geologists,mining engineers, process engineers, environmental engineers, expert technology consultantsand industry economists. The responsibility statements of Hatch and SRK together will cover theentire Mineral Expert’s Report.
The recommendations for a Mineral Expert’s Report are detailed in CESR documentation as areport from a suitably qualified and experienced independent expert. The content of the expertreport, including the appropriate definitions, should be agreed with the competent authority”.This will be carried out, however, for the purposes of the Services Agreement, and the scope andcosts presented are based upon advice from the Client and their advisers that Chapter 19 of theUK Listing Rules which were in force until July 1st, 2005 (the “previous UK Listing Rules”)should be adhered to for the purposes of this engagement, together with Chapter 18 of RulesGoverning the Listing of Securities on The Stock Exchange of Hong Kong Limited (the “HKListing Rules”).
Since Hatch are reporting on the non-mining assets of the Client, the requirements of Chapter 19of the previous UK Listing Rules and Chapter 18 of the HK Listing Rules will be expanded toundertake an independent review of non-mining assets to industry-acceptable standards,including analysis and verification of the business plan by evaluating supporting documents andreports, including plant design and engineering diagrams, process flow sheets, material flowsheets, and operations reports to confirm the competitive, technical, managerial and financialperformance of the Client. This scope of work outlines the work to be undertaken in order tosupport the eventual Listing.
APPENDIX VI INDEPENDENT TECHNICAL REPORT
— VI-329 —
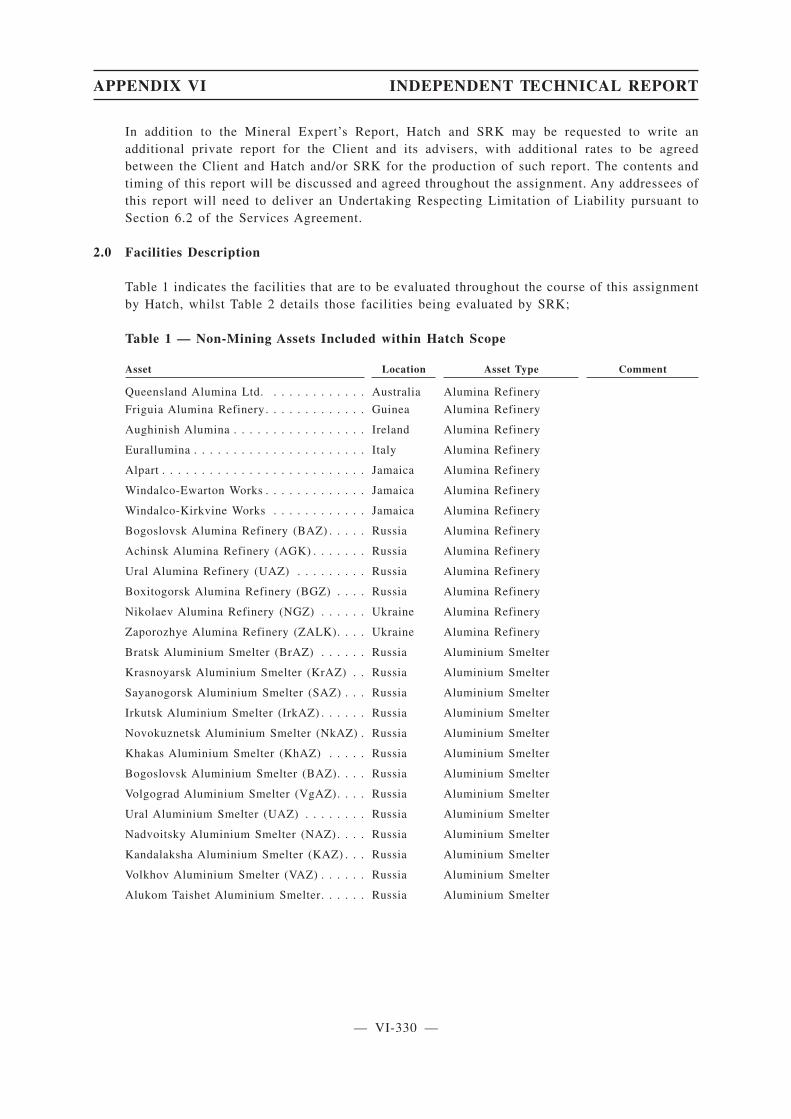
In addition to the Mineral Expert’s Report, Hatch and SRK may be requested to write anadditional private report for the Client and its advisers, with additional rates to be agreedbetween the Client and Hatch and/or SRK for the production of such report. The contents andtiming of this report will be discussed and agreed throughout the assignment. Any addressees ofthis report will need to deliver an Undertaking Respecting Limitation of Liability pursuant toSection 6.2 of the Services Agreement.
2.0 Facilities Description
Table 1 indicates the facilities that are to be evaluated throughout the course of this assignmentby Hatch, whilst Table 2 details those facilities being evaluated by SRK;
Table 1 — Non-Mining Assets Included within Hatch Scope
Asset Location Asset Type Comment
Queensland Alumina Ltd. . . . . . . . . . . . . Australia Alumina Refinery
Friguia Alumina Refinery . . . . . . . . . . . . . Guinea Alumina Refinery
Aughinish Alumina . . . . . . . . . . . . . . . . . Ireland Alumina Refinery
Eurallumina . . . . . . . . . . . . . . . . . . . . . . Italy Alumina Refinery
Alpart . . . . . . . . . . . . . . . . . . . . . . . . . . Jamaica Alumina Refinery
Windalco-Ewarton Works . . . . . . . . . . . . . Jamaica Alumina Refinery
Windalco-Kirkvine Works . . . . . . . . . . . . Jamaica Alumina Refinery
Bogoslovsk Alumina Refinery (BAZ) . . . . . Russia Alumina Refinery
Achinsk Alumina Refinery (AGK) . . . . . . . Russia Alumina Refinery
Ural Alumina Refinery (UAZ) . . . . . . . . . Russia Alumina Refinery
Boxitogorsk Alumina Refinery (BGZ) . . . . Russia Alumina Refinery
Nikolaev Alumina Refinery (NGZ) . . . . . . Ukraine Alumina Refinery
Zaporozhye Alumina Refinery (ZALK). . . . Ukraine Alumina Refinery
Bratsk Aluminium Smelter (BrAZ) . . . . . . Russia Aluminium Smelter
Krasnoyarsk Aluminium Smelter (KrAZ) . . Russia Aluminium Smelter
Sayanogorsk Aluminium Smelter (SAZ) . . . Russia Aluminium Smelter
Irkutsk Aluminium Smelter (IrkAZ) . . . . . . Russia Aluminium Smelter
Novokuznetsk Aluminium Smelter (NkAZ) . Russia Aluminium Smelter
Khakas Aluminium Smelter (KhAZ) . . . . . Russia Aluminium Smelter
Bogoslovsk Aluminium Smelter (BAZ). . . . Russia Aluminium Smelter
Volgograd Aluminium Smelter (VgAZ). . . . Russia Aluminium Smelter
Ural Aluminium Smelter (UAZ) . . . . . . . . Russia Aluminium Smelter
Nadvoitsky Aluminium Smelter (NAZ) . . . . Russia Aluminium Smelter
Kandalaksha Aluminium Smelter (KAZ) . . . Russia Aluminium Smelter
Volkhov Aluminium Smelter (VAZ) . . . . . . Russia Aluminium Smelter
Alukom Taishet Aluminium Smelter. . . . . . Russia Aluminium Smelter
APPENDIX VI INDEPENDENT TECHNICAL REPORT
— VI-330 —

Asset Location Asset Type Comment
Kubikenborg Aluminium (KUBAL) . . . . . . Sweden Aluminium Smelter
Zaporozhye Aluminium Smelter (ZALK) . . Ukraine Aluminium Smelter
ALSCON . . . . . . . . . . . . . . . . . . . . . . . . Nigeria Aluminium Smelter
Krasnoturyinsk Powder Metallurgy . . . . . . Russia Downstream Processing
Shelekhov Powder Metallurgy. . . . . . . . . . Russia Downstream Processing
Volgograd Powder Metallurgy . . . . . . . . . . Russia Downstream Processing
Kremniy . . . . . . . . . . . . . . . . . . . . . . . . Russia Silicon Smelter
Kremniy Ural . . . . . . . . . . . . . . . . . . . . . Russia Silicon Smelter
Resal . . . . . . . . . . . . . . . . . . . . . . . . . . Russia Secondary AluminiumPlant
Bellis . . . . . . . . . . . . . . . . . . . . . . . . . . Russia Secondary AluminiumPlant
Zvetmetobrabotka . . . . . . . . . . . . . . . . . . Russia Secondary AluminiumPlant
ARMENAL . . . . . . . . . . . . . . . . . . . . . . Armenia Packaging MaterialPlant
SAYANAL . . . . . . . . . . . . . . . . . . . . . . . Russia Packaging MaterialPlant
Rusal SAYANAL Foil . . . . . . . . . . . . . . . Russia Packaging MaterialPlant
Ural Foil . . . . . . . . . . . . . . . . . . . . . . . . Russia Packaging MaterialPlant
Polevsk Cryolite Plant . . . . . . . . . . . . . . . Russia Cryolite Production
South Urals Cryolite Plant . . . . . . . . . . . . Russia Cryolite Production
Shanxi Rusal Cathode Company . . . . . . . . China Cathode Production
Baoguan Cathode Plant . . . . . . . . . . . . . . China Cathode Production
Taishet Aluminium Smelter . . . . . . . . . . . Russia Smelter
Boguchanskaya aluminium Smelter andHydro Power Plant . . . . . . . . . . . . . . . . . Russia Smelter/Power plant
APPENDIX VI INDEPENDENT TECHNICAL REPORT
— VI-331 —

Table 2 — Mining Assets Included in SRK Scope
Asset Location Asset Type Comment
Compagnie des Bauxites de Kindia (CBK) . Guinea Bauxite Mine Complex Plus Kindia 2Project
Bauxite Company of Guyana Inc (BCGI) . . Guyana Bauxite Mine Complex
Alpart Bauxite Mine . . . . . . . . . . . . . . . . Jamaica Bauxite Mine Complex Plus Alpartexpansion project
Windalco-Ewarton Bauxite Mine . . . . . . . . Jamaica Bauxite Mine Complex Plus Windalcoexpansion project
Windalco-Kirkvine Bauxite Mine . . . . . . . Jamaica Bauxite Mine Complex
Timan Bauxite Mine . . . . . . . . . . . . . . . . Russia Bauxite Mine Complex Plus Timanexpansion project
North Urals Bauxite Mine . . . . . . . . . . . . Russia Bauxite Mine Complex Plus SUBR project
Kiya Shaltyr Nepheline Mine . . . . . . . . . . Russia Nepheline MineComplex
Cheremshansk Quartzite Mine. . . . . . . . . . Russia Quartzite Mine
Glukhovskiy Quarzite Mine . . . . . . . . . . . Ukraine Quartzite Mine
Bogatyr Coal Mine . . . . . . . . . . . . . . . . . Kazakhstan Coal Mine
Mazulski Limestone Mine . . . . . . . . . . . . Russia Limestone Mine
Petropavlovsk Limestone Mine . . . . . . . . . Russia Limestone Mine
Friguia Bauxite Mine . . . . . . . . . . . . . . . Guinea Bauxite Mine Complex Plus Friguiaexpansion project
Yaroslavski Ore Mining Company . . . . . . . Russia Fluorspar Mine/Complex
Mining Projects
Dian-Dian . . . . . . . . . . . . . . . . . . . . . . . Guinea Greenfield Bauxite/Alumina complex
No visit, ReviewFeasibility Studyonly
Kurubuka 22 . . . . . . . . . . . . . . . . . . . . . Guyana Greenfield BauxiteMine
No visit, reviewavailablepre-feasibilitydocuments only
The Client may reasonably add additional properties to the lists set out in Tables 1 and 2 above,in addition to potential capital project development sites, by agreement with Hatch and/or SRK,subject to schedule and cost estimate changes.
3.0 Included in the Scope of Work
Hatch, together with SRK, will produce a comprehensive Mineral Expert’s Report on the assetslisted in Section 2.0.
A Request for Information (“RFI”) document will be issued to the Client prior to the site visitto allow ample time for the Client to send initial information and prepare for the site visits
The RFI will assume that the information as requested is made available to the team membersin a format which enables ready assessment of the relative factors. It assumes that suitable accessto key members of the management group will be given to the site evaluation team and that thesepersons will be willing to disclose the necessary information at that time and post visit viaadditional requests for information, as required. It is further assumed that the information willbe of a suitable quality, enabling satisfactory appraisal by the relevant qualified personnel.
APPENDIX VI INDEPENDENT TECHNICAL REPORT
— VI-332 —

Table 3 shows the division of responsibility among Hatch and SRK for addressing the scope ofwork in respect of the Client’s mining and non-mining assets.
Appendix 1 to the Services Agreement sets forth a preliminary planning schedule in order toachieve the site visits and complete the Mineral Expert’s Report for submission on 25 March2009 which is the date to which the currently estimated fees and expenses are calculated. Hatchand SRK shall remain committed and available for the IPO process after this date (such asresponding to any queries/comments that may be raised by the relevant listing authorities),subject to the written request by the Client. However at the present time it is only possible toestimate input to this date due to uncertainties in the process thereafter. The schedule shown inAppendix 1 may be revised when mutually agreed by the Client, Hatch and SRK.
Table 3 — Scope of Work and Responsibility
MINERAL EXPERT’S REPORT IN RESPECT OF THE BAUXITE,ALUMINA, ALUMINIUM AND COAL/ENERGY ASSETS OF THE CLIENT Mining Non-Mining
Description of Resources and Reservesthe nature and extent of the Client’s rights of exploration and extractionand a description of the properties to which the rights attach. Details ofthe duration and other principal terms and conditions of the concessionsincluding relevant legislation, environmental and rehabilitationrequirements, abandonment costs and any necessary licenses andconsents including planning permission . . . . . . . . . . . . . . . . . . . . . . SRK n/ageological characteristics of the occurrence of the reserves, the type ofdeposit, its dimensions and grade distribution . . . . . . . . . . . . . . . . . . SRK n/amethods/exploration techniques to be employed for exploration andextraction, and where appropriate the mineral and metallurgical processesto be employed . . . . . . . . . . . . . . . . . . . . . . . . . . . . . . . . . . . . . . . SRK n/a
Maps and plansmaps, sections and plans demonstrating for each major property or fieldits location, the nature and extent of workings thereon and its principalgeological characteristics . . . . . . . . . . . . . . . . . . . . . . . . . . . . . . . . SRK n/asurface location plan showing boreholes, sample pits, trenches and otherevidence . . . . . . . . . . . . . . . . . . . . . . . . . . . . . . . . . . . . . . . . . . . SRK n/a
Reservesan estimate of the volume, tonnage in place and grades, as appropriate,each split between proven and probable reserves . . . . . . . . . . . . . . . . SRK n/amethod by which the reserves were estimated . . . . . . . . . . . . . . . . . . SRK n/aexpected recovery and dilution factors . . . . . . . . . . . . . . . . . . . . . . . SRK n/awhere appropriate, mineral processing and metallurgical recovery factorsand grades, with evidence in support thereof, or recovery factors withrespect to mineral reserves in place on a deposit by deposit basis, togetherwith the expected period of working . . . . . . . . . . . . . . . . . . . . . . . . SRK HATCHexpected extraction tonnage or volume . . . . . . . . . . . . . . . . . . . . . . . SRK n/awhere relevant, processing volumes or tonnages together with the otherprincipal assumptions relating to forecast revenues and operating costs . SRK HATCHif there are mineral resources which have not been sufficiently appraisedto demonstrate them as proven or probable reserves, a separate statementof such mineral resources classified into measured, indicated and inferredmineral resources . . . . . . . . . . . . . . . . . . . . . . . . . . . . . . . . . . . . . SRK n/a
APPENDIX VI INDEPENDENT TECHNICAL REPORT
— VI-333 —

MINERAL EXPERT’S REPORT IN RESPECT OF THE BAUXITE,ALUMINA, ALUMINIUM AND COAL/ENERGY ASSETS OF THE CLIENT Mining Non-Mining
Long term prospectsdetails of any mineral resources or non-mining investments relevant tothe long term future of the Client . . . . . . . . . . . . . . . . . . . . . . . . . . SRK HATCH
Nature of evidencethe nature of any geophysical and geological evidence used in theestimation of the mineral resources and ore reserves . . . . . . . . . . . . . SRK n/asummarised details of the geophysical and geological evidence includinginformation on quality control procedures . . . . . . . . . . . . . . . . . . . . . SRK n/athe results of drilling and sampling, stating the number of holes drilled(including its distribution), sample pits or trenches and their location,with a description of their current status. . . . . . . . . . . . . . . . . . . . . . SRK n/athe names of the organisations that carried out the investigation andanalysis . . . . . . . . . . . . . . . . . . . . . . . . . . . . . . . . . . . . . . . . . . . . SRK n/a
Production scheduleproduction policy, including production rates of sites, mines, wells (atleast for the past three years) and non-mining assets where production hasalready been commenced . . . . . . . . . . . . . . . . . . . . . . . . . . . . . . . . SRK HATCHestimated production rates relating to new mines, or reworkings, or newdrilling, or work-overs . . . . . . . . . . . . . . . . . . . . . . . . . . . . . . . . . . SRK n/aestimate of the working lives and degree of depletion of each majorproperty . . . . . . . . . . . . . . . . . . . . . . . . . . . . . . . . . . . . . . . . . . . . SRK n/aan assessment of the expertise of the technical staff being or to beemployed (including the number of experts involved in each of the mines) SRK HATCHan indication of the bases on which these estimates have been arrived at. SRK HATCHan assessment of product quality and mix . . . . . . . . . . . . . . . . . . . . . n/a HATCH
Commencement of workingthe date(s) on which commercial extraction by the applicant wascommenced, or is expected to commence, on each major property . . . . SRK n/a
Progress of workingsan indication of the progress of actual working, including analysis (bothin narrative an numerical form) of previous exploration, development andextraction carried out on the relevant properties or fields . . . . . . . . . . SRK n/a
Forecast extraction ratescomment on the reasonableness of the directors’ forecasts (if any) of therate(s) of extraction of the major properties or fields . . . . . . . . . . . . . SRK HATCH
Valuation of reservesan estimate of net present value (or a valuation arrived at on analternative basis, with an explanation of the basis and of the reasons foradopting it) of proven and probable reserves (financial analysis by Hatch,based upon the Client’s mining plan as adjusted by SRK to definerelevant reserves and resources figures, with relevant inputs for bauxitecost and processing technical data). Note 1 . . . . . . . . . . . . . . . . . . . . SRK HATCHthe principal assumptions on which the valuation of proven and probablereserves is based . . . . . . . . . . . . . . . . . . . . . . . . . . . . . . . . . . . . . SRK n/ainformation to demonstrate the sensitivity to changes in the principalassumptions (split between resource modelling and financial analysis asnoted two points above) . . . . . . . . . . . . . . . . . . . . . . . . . . . . . . . . . SRK HATCH
APPENDIX VI INDEPENDENT TECHNICAL REPORT
— VI-334 —

MINERAL EXPERT’S REPORT IN RESPECT OF THE BAUXITE,ALUMINA, ALUMINIUM AND COAL/ENERGY ASSETS OF THE CLIENT Mining Non-Mining
Plant and equipmentcommentary on the type, extent and condition of plant and equipmentwhich is of material significance to the Client’s operations and which iscurrently in use on the Client’s major properties or fields . . . . . . . . . . SRK HATCHinformation on additional plant and equipment which will be required toachieve the forecast rates of extraction/production (including an estimateof the relevant costs and of the cost of maintaining and repairing all plantand equipment) . . . . . . . . . . . . . . . . . . . . . . . . . . . . . . . . . . . . . . . SRK HATCH
Valuation of planta valuation (made on an existing use basis within six months of the dateof publication of the Listing Particulars) of the plant and equipmentowned by the Client currently in use for exploration or extraction andprocessing of mineral reserves, save that a valuation is not required if astatement is made confirming that either: Note 1directors do not consider that plant and equipment to be of materialimportance to an investor’s assessment of the Client’s operations; orthe valuation of the plant and equipment has been included in the netpresent valuation of the reserves . . . . . . . . . . . . . . . . . . . . . . . . . . . SRK HATCH
Human resourcesan assessment of the expertise of the management, technical staff andgeneral workforce being or to be employed. . . . . . . . . . . . . . . . . . . . SRK HATCH
Special factorsa statement setting out any additional information required for a properappraisal of any special factors affecting the exploration or extraction orprocessing businesses of the Client, including difficulties of access to, orin recovery of, mineral reserves on properties where the Client hasextraction rights, and special circumstances, such as difficulties intransporting or marketing the extracts which may affect the commercialviability of the project, or an appropriate negative statement . . . . . . . . SRK HATCH
Other former-Chapter 19 requirementsany other information or analysis required by former-Chapter 19 of theListing Rules or otherwise for the purposes of the relevant listingauthorities . . . . . . . . . . . . . . . . . . . . . . . . . . . . . . . . . . . . . . . . . . SRK n/a
Note 1 — Should the valuation be required in the MER, Hatch and SRK will require specific validation of non-technicalinputs which are beyond the scope of expertise. Please refer to specific exclusion in Section 4.0
Deliverables/Output
The Mineral Expert’s Report will be presented in hard copy format on plain A4 paper and on acomputer disk using Microsoft compatible word-processing software. Subject to satisfactoryapproval of draft report, a final report will be issued in the same format. All documents will bepresented in English.
The proposed format of these documents will be subject to confirmation by the Client prior tothe site visits, however previously issued reports will be used as the basis.
APPENDIX VI INDEPENDENT TECHNICAL REPORT
— VI-335 —
Hatch, together with SRK, will produce a single Mineral Expert’s Report for inclusion within oneor more prospectuses (the “Prospectus”) of the Client for the purposes of Listing, covering allthe assets listed in Tables 1 and 2, together with any additional properties as may reasonably beadded by the Client under Section 2. Hatch agree that they will allow the Client and their advisersto comment on the Mineral Expert’s Report and also understand that a draft form of the MineralExpert’s Report will be commented upon by the relevant listing authorities. In particular Hatch,together with SRK, will discuss and agree with the Client and/or its advisers the format andcontent of the Mineral Expert’s Report, prior to the site visits, in the interests of ensuringconsistency across the Mineral Expert’s Report to be included in the Prospectus and compliancewith the listing requirements of the relevant listing authorities. Hatch and SRK agree that theywill assist, from time to time, the Client in responding to any queries/comments that may beraised by the relevant listing authorities in relation to the Mineral Expert’s Report.
Hatch and SRK also agree that, subject to the terms of the Services Agreement (including Section6.2), copies of the Mineral Expert’s Report can be made available to the Client’s legal adviser,the sponsor’s legal adviser and financial advisers and such other persons as the Client reasonablyrequires and may be may be addressed to and can be relied upon by such persons.
4.0 Excluded from the Scope of Work
Should an NPV valuation of the Client be required in the Mineral Expert’s Report or any privatereport to the Client and its advisers, we will require 3rd Party verification of the following:
• 3rd party verification of the base year inputs — reconciliation to audited financialstatements;
• Provision of aluminium, alumina, coal, downstream commodity prices — to be provided byan independent market consultant, although Hatch and/or SRK shall promptly notify theClient should any such price seem unreasonable, given industry consensus and/or Hatchand/or SRK’s professional judgement;
• Effective ownership of assets — to be provided by the Client’s legal advisors, or qualifiedby Hatch and/or SRK, as applicable, as to the source of the ownership data;
• Effective tax rate — to be provided by Client tax advisors;
• Exchange Rate/Inflation/Discount Rate — to be provided by the Client’s financial advisors— no real long term reduction in costs;
UNQUOTE
QUOTE (From Hatch and SRK letter proposal, titled ‘Finalisation of Kandinsky 2 MineralExpert report for Initial Public Offering of UC Rusal’, dated 27 August 2009)
Scope of work
The Kandinsky 2 Mineral Expert Report (MER) was prepared in draft form in late 2008. UCRUSAL are now requesting that Hatch and SRK finalise this report with information as of 30June 2009 plus any material changes up to the present.
APPENDIX VI INDEPENDENT TECHNICAL REPORT
— VI-336 —
UNQUOTE
Limitations and exclusions
Although Hatch and SRK have taken all reasonable care to ensure that the information containedin this report is in accordance with the facts and contains no omissions likely to affect its import,much of this report is based on historical information (e.g., financial information, plant operatingand maintenance data, health and safety statistics, emissions data) and legal information (e.g.,information respecting permits, licenses and approvals, title to properties, ownership interests infacilities, legal agreements and tax and royalty rates) provided by UC RUSAL and third partieson behalf of UC RUSAL. Although Hatch and SRK have no reason to believe that there are anyerrors, omissions or misrepresentations in such information, it is not possible for Hatch or SRKto verify that no such errors, omissions or misrepresentations exist. Accordingly, neither Hatchnor SRK accept any responsibility or liability for any errors, omission or misrepresentations thatcould not have been discovered through the exercise of reasonable care in the gathering andevaluation of the information provided by or on behalf of UC RUSAL.
The technical report is predominantly based on information provided by UC RUSAL at the timeof site visits during September to October 2008 and meetings with UC RUSAL in Moscow duringNovember to December 2008, in addition to advice on material changes to the data andinformation made available to Hatch and/or SRK before 23 September 2009. Between that dateand the date of this report UC RUSAL has not advised Hatch or SRK of any additional materialchange, or event likely to cause any material change to the information provided by UC RUSALor on its behalf for the purpose of the preparation of this report.
The work undertaken for this report is a technical review of the information obtained by Hatchand SRK together with such inspections as each of Hatch and SRK considered appropriate. Thisreport does not express any legal opinion and does not constitute legal advice.
APPENDIX VI INDEPENDENT TECHNICAL REPORT
— VI-337 —

Annex CGlossary of Abbreviations/Terms/Units
Glossary of Abbreviations
$/t United States Dollars per tonne
ACG Alumina Company of Guinea
Al Aluminium
AlF3 Aluminium Fluoride
Al2O3 Alumina
C1, 2 Chemical grade bauxites
CAPEX Capital Expenditure
CBG Compagnie des Bauxites de Guinea
CCD Counter current decantation
CHP Combined Heat and Power Plant
CIS Commonwealth of Independent States
CO Carbon Monoxide
CO2 Carbon Dioxide
C2F4 Tetrafluoroethylene
C2F6 Hexafluroethane
CF4 Carbon Tetrafluoride
DC Direct Current
DCF Discounted Cash Flow
DCS Distributed Control System
DWT Deadweight Tonne
ECC Engineering and Construction Company
EIA Environmental Impact Assessment
EPA Environmental Protection Agency
EPCM Engineering, Procurement and Construction Management
APPENDIX VI INDEPENDENT TECHNICAL REPORT
— VI-338 —

ESP Electrostatic Precipitator
ETC Engineering and Technology Centre
FEED FFE Front End Engineering and Design FFE Minerals, (theminerals processing arm of FLSmidth)
FIBC Flexible Intermediate Bulk Containers
FS Feasibility Study
FTP Fume Treatment Plant
GIS Insulted Switchgear
GHG Greenhouse Gas
GOST Technical standards maintained by the Euro-Asian Councilfor Standardization, Metrology and Certification (EASC)
GT Gas Turbine
GTC Gas Treatment Centre
HDC Horizontal Direct-Chill
HDPE High Density Polyethylene
HF Hydrogen Fluoride
HPP Hydroelectric Power Plant
HSS Horizontal Stud Söderberg
HV High Voltage
IBSH Indirect Bauxite Slurry Heating
IPPC Integrated Pollution Prevention and Control
ISO International Standards Organisation
JORC Joint Ore Reserves Committee of the Australian Institute ofMining and Metallurgy
JSC Joint Stock Company
LME London Metal Exchange
LSFO Low Sulphur Fuel Oil
LTIFR Lost Time Injuries Frequency Rate
APPENDIX VI INDEPENDENT TECHNICAL REPORT
— VI-339 —

M1, 2, 3 Metallurgical grade bauxites
Mg Magnesium
MHA Monohydrate Alumina
MHB Monohydrate Bauxite
MRN Mineracao Rio do Norte
NaOH Caustic Soda
NGC Nigeria Gas Company
NOC National Oil Company
NOx Nitrogen Oxides
Ni Nickel
OPEX Operating expenditure
OHSAS Occupational Health and Safety Assessment Series
OW Observation Well
O2 Oxygen
P2O5 Phosphorous oxide
PCB Polychlorinated biphenyl
PDS Maximum Permissible Discharge (for water)
PDV Permitted Limit Value of Emissions
PFC Perfluorocarbon
PFPB Point Feed Pre Bake
PNOOLR Draft Waste Generation Standards and Waste DisposalLimits (for solids)
PPE Personal Protective Equipment
pH A measure of the acidity or alkalinity of a solution
PTFE Polytetrafluoroethylene
QA/QC Quality Assessment/Quality Control
R&D Research and Development
APPENDIX VI INDEPENDENT TECHNICAL REPORT
— VI-340 —

RDA Residue Disposal Area
RGRK Russian Ore Mining Company
Rosatom Federal Agency for Atomic Energy
SO2 Sulphur Dioxide
Si Silicon
SibVAMI Siberian Scientific and Research, Construction and DesignInstitute
SIP Siberia Industrial Park
SPL Spent Pot Lining
SUAL Siberia-Urals Aluminium Company
TEO Construction Feasibility Study
The Company UC RUSAL
The Group UC RUSAL
THB Tri-Hydrate Bauxite
UC RUSAL United Company RUSAL
US United States of America
UV Ultraviolet
USD United States Dollar
USSR Union of Soviet Socialist Republics
VAMI All-Russia National Aluminium and Magnesium Institute
VAP Value Added Product
VDC Vertical Direct Chill
VDV Temporary Limit Value of Emissions
VDS Temporary Limit Value of Discharge
VOC Volatile Organic Compounds
VSS Vertical Stud Söderberg
APPENDIX VI INDEPENDENT TECHNICAL REPORT
— VI-341 —

Glossary of Terms
Alkali Salts Salts which contain one or more hydroxide ions.
Alumina Any of several forms of aluminium oxide, Al2O3, occurringnaturally as corundum.
Available Alumina The quantity of aluminium oxide available to be convertedto alumina during processing. This is dependent on themineralogy of the bauxite and the processing methodology.
Assay Chemical analysis of mineral samples to determine themetal content.
Auger Drilling A method of drilling in which penetration is accomplishedby the cutting or gouging action of chisel-type cuttingedges forced into the substance by rotation of the auger bit.
Bauxite The principal ore of aluminium composed mainly ofhydrous aluminium oxides and aluminium hydroxides.
Bayer process A method of producing alumina from bauxite by heating itin a sodium hydroxide solution.
Bench The horizontal step or floor along which coal, ore stone, oroverburden is mined.
Blasthole A hole drilled in a material to be blasted, for the purposeof containing an explosive charge.
Boehmite An aluminium oxide hydroxide (AlO(OH)) mineral, acomponent of the aluminium ore bauxite. It is dimorphouswith diaspore.
Capital Expenditure Expenditures incurred during the process of commencing,expanding or sustaining production.
Conveyor Belt A mechanical apparatus consisting of a continuous movingbelt that transports materials from one place to another.
Crushing Size reduction into relatively coarse particles by stamps,crushers, or rolls.
Cut-off grade The lowest grade of mineralized material that qualifies asore in a given deposit; rock of the lowest assay included inan ore estimate.
APPENDIX VI INDEPENDENT TECHNICAL REPORT
— VI-342 —

Dilution The contamination of ore with barren or grade bearing wallrock in stoping. The assay of the ore after mining isfrequently lower than when sampled in place. Dilutionrelates to the proportion of waste that is contained in theRun-of-Mine ore delivered to the metallurgical processingplant. Dilution relates to diluting tonnage expressed as apercentage of in-situ ore mined.
Diluting grade The grade of the diluting material.
Dip The angle at which a bed, stratum, or vein is inclined fromthe horizontal, measured perpendicular to the strike and inthe vertical plane.
EMS Environmental Management System
Exploration The search for coal, mineral, or ore by (1) geologicalsurveys; (2) geophysical prospecting (may be ground,aerial, or both); (3) boreholes and trial pits; or (4) surfaceor underground headings, drifts, or tunnels. Explorationaims at locating the presence of economic deposits andestablishing their nature, shape, and grade, and theinvestigation may be divided into (1) preliminary and (2)final.
Fault A fracture or a fracture zone in crustal rocks along whichthere has been displacement of the two sides relative to oneanother parallel to the fracture. The displacement may be afew inches or many miles long.
Footwall The part of the country rock that lies below the ore deposit.
Goethite A common weathering product of iron-bearing minerals;precipitates in bogs and springs; a major constituent oflimonite and gossans, and a source of iron and a yellowochre pigment.
Grade The relative quantity or the percentage of ore-mineral ormetal content in an orebody.
Grade Control The process of monitoring the estimation of grade in themining operation by comparison of estimates based onexploration drilling, infill drilling, blast-hole sampling andmining/milling reconciliation exercises.
Haematite The most widely mined ore of iron; in sedimentary rocks,Precambrian banded iron formations (including theirmetamorphosed equivalents), oolitic ironstones,contact-metamorphic deposits, commonly by alteration ofmagnetite; may be of secondary origin, having formed byoxidation and decomposition of iron silicates andcarbonates; also occurs as a primary mineral in veins andreplacement deposits associated with igneous intrusions.
APPENDIX VI INDEPENDENT TECHNICAL REPORT
— VI-343 —
Hangingwall The overlying side of an orebody, fault, or mine working,esp. the wall rock above an inclined vein or fault.
Indicated Mineral Resources That part of a Mineral Resource for which tonnage,densities, shape, physical characteristics, grade andmineral content can be estimated with a reasonable level ofconfidence. It is based on exploration, sampling and testinginformation gathered through appropriate techniques fromlocations such as outcrops, trenches, pits, workings anddrillholes. The locations are too widely or inappropriatelyspaced to confirm geological and/or grade continuity butare spaced closely enough for continuity to be assumed.
Inferred Mineral Resources That part of a Mineral Resource for which tonnage, gradeand mineral content can be estimated with a low level ofconfidence. It is inferred from geological evidence andassumed but not verified geological and/or gradecontinuity. It is based on information gathered throughappropriate techniques from locations such as outcrops,trenches, pits, workings and drill holes which may belimited or of uncertain quality and reliability.
JORC Code The 2004 Australasian Code for Reporting of ExplorationResults, Mineral Resources and Ore Reserves as publishedby the Joint Ore Reserves Committee of the AustralasianInstitute of Mining and Metallurgy, Australian Institute ofGeoscientists and Minerals Council of Australia.
Kaolinite A clay mineral which is usually the result of argillicalteration of feldspars.
Karst A topography characterized by caves, sinkholes,disappearing streams, and underground drainage. Karstforms when groundwater dissolves pockets of limestone,dolomite, or gypsum in bedrock.
Karstic Geological formation which displays karst features.
Lenses Geological bodies that are thick in the middle and thin atthe edge.
Limestone Sedimentary rock consisting chiefly (more than 50% byweight or by area percentages under the microscope) ofcalcium carbonate, primarily in the form of the mineralcalcite, and with or without magnesium carbonate; specif.a carbonate sedimentary rock containing more than 95%calcite and less than 5% dolomite.
Lithology Description of the characteristics of rocks.
APPENDIX VI INDEPENDENT TECHNICAL REPORT
— VI-344 —

Measured Mineral Resources That part of a Mineral Resource for which tonnage,densities, shape, physical characteristics, grade andmineral content can be estimated with a high level ofconfidence. It is based on detailed and reliable exploration,sampling and testing information gathered throughappropriate techniques from locations such as outcrops,trenches, pits, workings and drill holes. The locations arespaced closely enough to confirm geological and gradecontinuity.
Mill 1. A mineral treatment plant in which crushing, wetgrinding, and further treatment of ore is conducted. Also,separate components, such as ball mill, hammer mill, androd mill. 2. A preparation facility within which metal ore iscleaned, concentrated, or otherwise processed before it isshipped to the customer, refiner, smelter, or manufacturer.A mill includes all ancillary operations and structuresnecessary to clean, concentrate, or otherwise process metalore, such as ore and gangue storage areas and loadingfacilities.
Mineral Resource A concentration or occurrence of material of intrinsiceconomic interest in or on the Earth’s crust in such form,quality and quantity that there are reasonable prospects foreventual economic extraction. The location, quantity,grade, geological characteristics and continuity of aMineral Resource are known, estimated or interpreted fromspecific geological evidence and knowledge. MineralResources are sub-divided, in order of increasinggeological confidence, into Inferred, Indicated andMeasured categories.
Mining Assets The mines, projects, stand-alone exploration projects andthe regional exploration campaigns.
Modifying Factors The term ‘Modifying Factors’ is defined to include mining,metallurgical, economic, marketing, legal, environmental,social and governmental considerations.
Nepheline Syenite Nepheline syenite is a medium to coarse-grained, light- tomedium-gray, igneous rock that is composedpredominantly of a silicate mineral called orthoclase(KAlSi3O8) and has a granite-like appearance.
Open pit A mine working or excavation open to the surface.
Operating Expenditure Expenditures necessary to support annual production.
APPENDIX VI INDEPENDENT TECHNICAL REPORT
— VI-345 —

Ore The naturally occurring material from which a mineral orminerals of economic value can be extracted profitably orto satisfy social or political objectives. The term isgenerally but not always used to refer to metalliferousmaterial, and is often modified by the names of thevaluable constituent; e.g., iron ore.; ore mineral.
Orebody The volume of rock containing the Mineral Resource.
Ore Reserve The economically mineable part of a Measured and/orIndicated Mineral Resource. It includes diluting materialsand allowances for losses, which may occur when thematerial is mined. Appropriate assessments and studieshave been carried out, and include consideration of andmodification by realistically assumed mining,metallurgical, economic, marketing, legal, environmental,social and governmental factors. These assessmentsdemonstrate at the time of reporting that extraction couldreasonably be justified. Ore Reserves are sub-divided inorder of increasing confidence into Probable Ore Reservesand Proved Ore Reserves.
Potline A row of electrolytic cells used in the production ofprimary aluminium.
Probable Ore Reserves The economically mineable part of an Indicated, and insome circumstances, a Measured Mineral Resource. Itincludes diluting materials and allowances for losses whichmay occur when the material is mined. Appropriateassessments and studies have been carried out, and includeconsideration of and modification by realistically assumedmining, metallurgical, economic, marketing, legal,environmental, social and governmental factors. Theseassessments demonstrate at the time of reporting thatextraction could reasonably be justified. A Probable OreReserve has a lower level of confidence than a Proved OreReserve but is of sufficient quality to serve as the basis fora decision on the development of the deposit.
Proved Ore Reserves A ‘Proved Ore Reserve’ is the economically mineable partof a Measured Mineral Resource. It includes dilutingmaterials and allowances for losses which may occur whenthe material is mined. Appropriate assessments and studieshave been carried out, and include consideration of andmodification by realistically assumed mining,metallurgical, economic, marketing, legal, environmental,social and governmental factors. These assessmentsdemonstrate at the time of reporting that extraction couldreasonably be justified. A Proved Ore Reserve representsthe highest confidence category of reserve estimate. Thestyle of mineralisation or other factors could mean thatProved Ore Reserves are not achievable in some deposits.
APPENDIX VI INDEPENDENT TECHNICAL REPORT
— VI-346 —
Quartzite A metamorphic rock type formed predominantly ofrecrystallised quartz.
Real Removal of the effect of inflation.
Refinery An electrolytic or chemical facility producing pure metals.
Shaft A near-vertical mine entry of limited area constructed toaccess underground workings or to provide ventilation.
Shovel Any bucket-equipped machine used for digging andloading earthy or fragmented rock materials.
Silicious Containing abundant silica.
Stockpile An accumulation of ore or mineral built up when demandslackens or when the treatment plant or beneficiationequipment is incomplete or temporarily unequal tohandling the mine output; any heap of material formed forloading or other purposes.
Strike The course or bearing of the outcrop of an inclined bed,vein, or fault plane on a level surface; the direction of ahorizontal line perpendicular to the direction of the dip.
Stripping ratio The unit amount of spoil or overburden that must beremoved to gain access to a unit amount of ore or mineralmaterial.
Waste Rock which is does not contain economic concentrations ofminerals.
APPENDIX VI INDEPENDENT TECHNICAL REPORT
— VI-347 —

Glossary of Units
ºC degrees Celsius
A amperes
bara Bar atmosphere (1 bar = 105N/m2)
barg Bar gauge (1 bar = 105N/m2)
Cal calorie (1 cal = 4.19 Joule)
g gramme
GJ Giga Joule
g/l grammes per litre
h hour
ha hectare
Kg/cell/day kilogrammes per cell per day
Kg/tAL kilogrammes per tonne of aluminium
kg.std.fuel/t kilogrammes of standard fuel per tonne
kt kilo-tonnes
ktpa kilo-tonnes per annum
ktpd kilo-tonnes per day
kV kilo-Volt
L litre
m metre
mg milligram
Nm3 normal cubic metres per hour
Mt million tonnes
Mtpa million tonnes per annum
N Newton
t tonne
APPENDIX VI INDEPENDENT TECHNICAL REPORT
— VI-348 —
tpa tonnes per annum
tph tonnes per hour
tpd tonnes per day
V volt
W watt
APPENDIX VI INDEPENDENT TECHNICAL REPORT
— VI-349 —
Prefixes
G Giga (109-1,000,000,000)
M Mega (106-1,000,000)
k kilo (103-1,000)
c centi (10-2-0.01)
m milli (10-3-0.001)
� micro (10-6-0.000001)
APPENDIX VI INDEPENDENT TECHNICAL REPORT
— VI-350 —
APPENDIX VI INDEPENDENT TECHNICAL REPORT
Hatch Associates Limited9th Floor, Portland House, Bressenden Place
London, England SW1E 5BHTel. +44 207 906 5100 � Fax: +44 207 963 0972
Supplementary Letter to the Independent Technical Report prepared by Hatch and SRK dated 30 September 2009
24th December 2009
The Board of Directors United Company RUSAL Limited
Dear Sirs,
United Company RUSAL Limited (the “Company”)
We refer to the prospectus dated 31st December 2009 (the “Prospectus”) in connection with the Company's global
offering and the proposed listing of its shares on the Main Board of the Stock Exchange of Hong Kong Limited,
which includes the Independent Technical Report.
To Hatch’s knowledge, as informed by the Company, there have been no material changes deviating from the
Company’s plans, since 30 September 2009 up till the date of the Prospectus, in respect of the assets, projects and
associated technical aspects reviewed by Hatch (and as described in the Independent Technical Report, Section
1.3, or of any matter which would affect the content of the Independent Technical Report as published in the
Prospectus, other than the below updated UC RUSAL Environmental Permits as at 15 December 2009. This
table excludes mining assets, which have been reviewed separately by SRK.
— VI-351 —
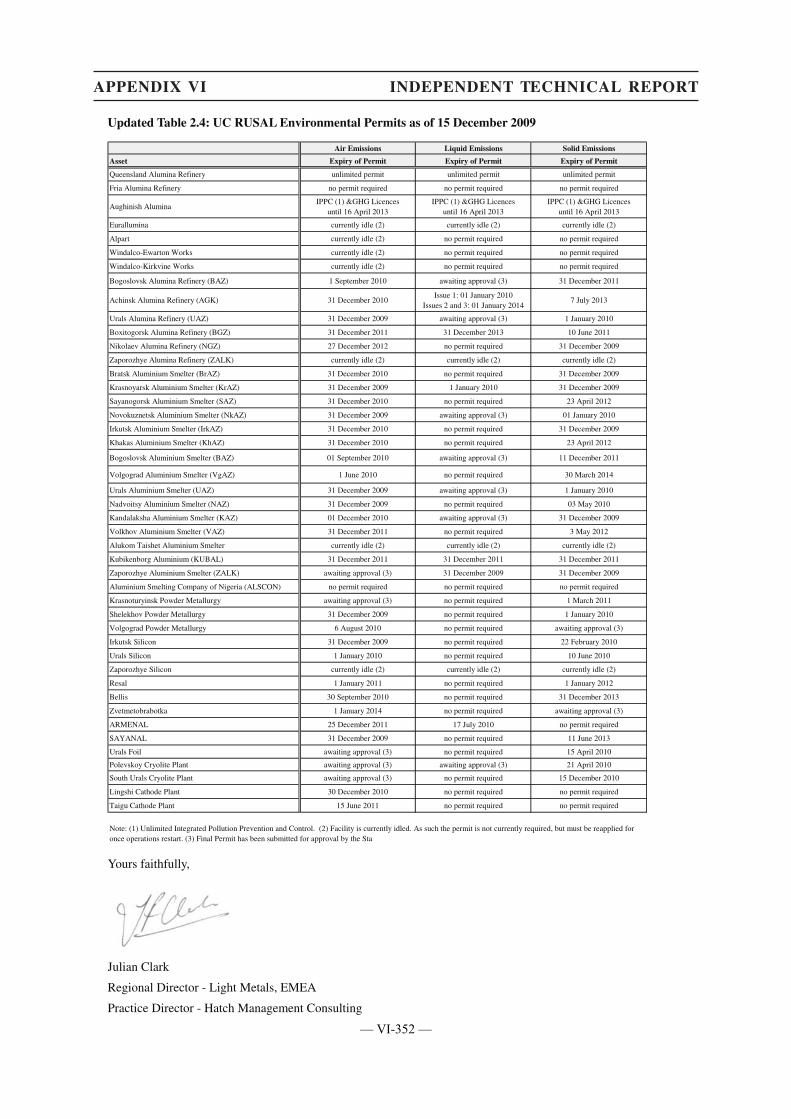
APPENDIX VI INDEPENDENT TECHNICAL REPORT
Updated Table 2.4: UC RUSAL Environmental Permits as of 15 December 2009
Air Emissions Liquid Emissions Solid Emissions
Asset Expiry of Permit Expiry of Permit Expiry of Permit
Queensland Alumina Refinery unlimited permit unlimited permit unlimited permit
Fria Alumina Refinery no permit required no permit required no permit required
Aughinish AluminaIPPC (1) &GHG Licences
until 16 April 2013IPPC (1) &GHG Licences
until 16 April 2013IPPC (1) &GHG Licences
until 16 April 2013
Eurallumina currently idle (2) currently idle (2) currently idle (2)
Alpart currently idle (2) no permit required no permit required
Windalco-Ewarton Works currently idle (2) no permit required no permit required
Windalco-Kirkvine Works currently idle (2) no permit required no permit required
Bogoslovsk Alumina Refinery (BAZ) 1 September 2010 awaiting approval (3) 31 December 2011
Achinsk Alumina Refinery (AGK) 31 December 2010Issue 1: 01 January 2010
Issues 2 and 3: 01 January 20147 July 2013
Urals Alumina Refinery (UAZ) 31 December 2009 awaiting approval (3) 1 January 2010
Boxitogorsk Alumina Refinery (BGZ) 31 December 2011 31 December 2013 10 June 2011
Nikolaev Alumina Refinery (NGZ) 27 December 2012 no permit required 31 December 2009
Zaporozhye Alumina Refinery (ZALK) currently idle (2) currently idle (2) currently idle (2)
Bratsk Aluminium Smelter (BrAZ) 31 December 2010 no permit required 31 December 2009
Krasnoyarsk Aluminium Smelter (KrAZ) 31 December 2009 1 January 2010 31 December 2009
Sayanogorsk Aluminium Smelter (SAZ) 31 December 2010 no permit required 23 April 2012
Novokuznetsk Aluminium Smelter (NkAZ) 31 December 2009 awaiting approval (3) 01 January 2010
Irkutsk Aluminium Smelter (IrkAZ) 31 December 2010 no permit required 31 December 2009
Khakas Aluminium Smelter (KhAZ) 31 December 2010 no permit required 23 April 2012
Bogoslovsk Aluminium Smelter (BAZ) 01 September 2010 awaiting approval (3) 11 December 2011
Volgograd Aluminium Smelter (VgAZ) 1 June 2010 no permit required 30 March 2014
Urals Aluminium Smelter (UAZ) 31 December 2009 awaiting approval (3) 1 January 2010
Nadvoitsy Aluminium Smelter (NAZ) 31 December 2009 no permit required 03 May 2010
Kandalaksha Aluminium Smelter (KAZ) 01 December 2010 awaiting approval (3) 31 December 2009
Volkhov Aluminium Smelter (VAZ) 31 December 2011 no permit required 3 May 2012
Alukom Taishet Aluminium Smelter currently idle (2) currently idle (2) currently idle (2)
Kubikenborg Aluminium (KUBAL) 31 December 2011 31 December 2011 31 December 2011
Zaporozhye Aluminium Smelter (ZALK) awaiting approval (3) 31 December 2009 31 December 2009
Aluminium Smelting Company of Nigeria (ALSCON) no permit required no permit required no permit required
Krasnoturyinsk Powder Metallurgy awaiting approval (3) no permit required 1 March 2011
Shelekhov Powder Metallurgy 31 December 2009 no permit required 1 January 2010
Volgograd Powder Metallurgy 6 August 2010 no permit required awaiting approval (3)
Irkutsk Silicon 31 December 2009 no permit required 22 February 2010
Urals Silicon 1 January 2010 no permit required 10 June 2010
Zaporozhye Silicon currently idle (2) currently idle (2) currently idle (2)
Resal 1 January 2011 no permit required 1 January 2012
Bellis 30 September 2010 no permit required 31 December 2013
Zvetmetobrabotka 1 January 2014 no permit required awaiting approval (3)
ARMENAL 25 December 2011 17 July 2010 no permit required
SAYANAL 31 December 2009 no permit required 11 June 2013
Urals Foil awaiting approval (3) no permit required 15 April 2010
Polevskoy Cryolite Plant awaiting approval (3) awaiting approval (3) 21 April 2010
South Urals Cryolite Plant awaiting approval (3) no permit required 15 December 2010
Lingshi Cathode Plant 30 December 2010 no permit required no permit required
Taigu Cathode Plant 15 June 2011 no permit required no permit required
Note: (1) Unlimited Integrated Pollution Prevention and Control. (2) Facility is currently idled. As such the permit is not currently required, but must be reapplied for once operations restart. (3) Final Permit has been submitted for approval by the Sta
Yours faithfully,
Julian Clark
Regional Director - Light Metals, EMEA
Practice Director - Hatch Management Consulting
— VI-352 —
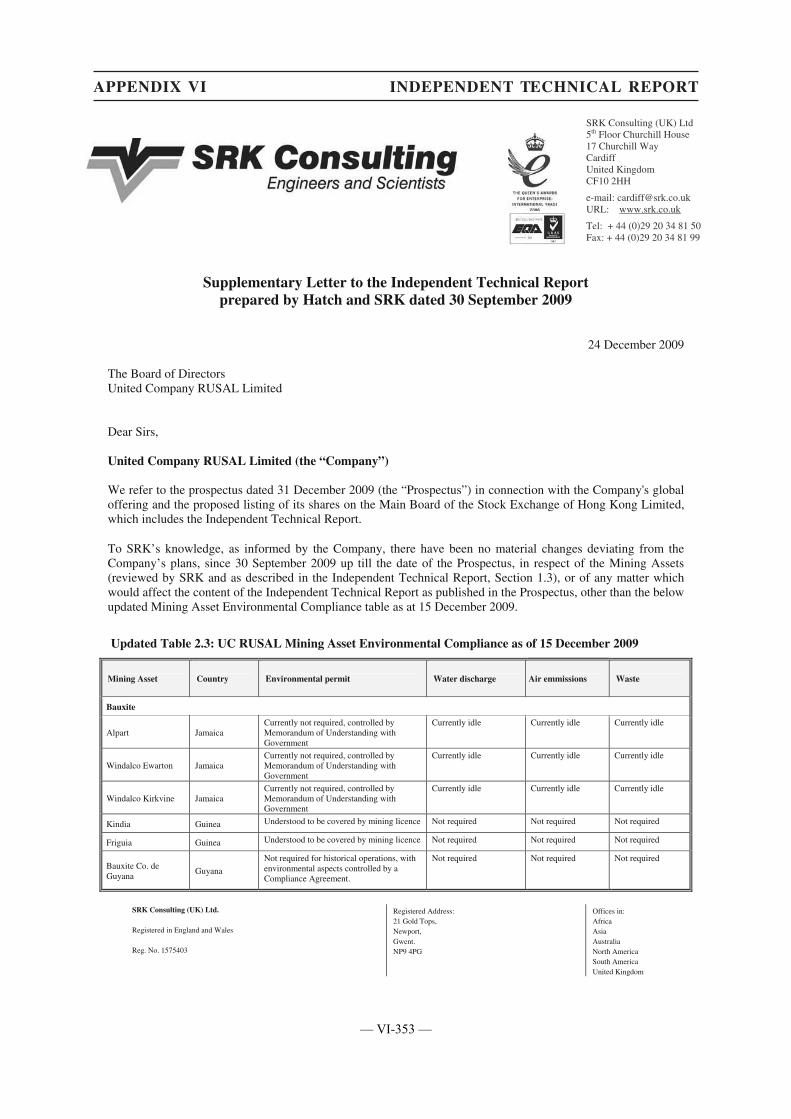
APPENDIX VI INDEPENDENT TECHNICAL REPORT
SRK Consulting (UK) Ltd 5th Floor Churchill House 17 Churchill Way Cardiff United Kingdom CF10 2HH
e-mail: [email protected] URL: www.srk.co.uk
Tel: + 44 (0)29 20 34 81 50 Fax: + 44 (0)29 20 34 81 99
Supplementary Letter to the Independent Technical Report prepared by Hatch and SRK dated 30 September 2009
24 December 2009 The Board of Directors United Company RUSAL Limited Dear Sirs, United Company RUSAL Limited (the “Company”)
We refer to the prospectus dated 31 December 2009 (the “Prospectus”) in connection with the Company's global offering and the proposed listing of its shares on the Main Board of the Stock Exchange of Hong Kong Limited, which includes the Independent Technical Report.
To SRK’s knowledge, as informed by the Company, there have been no material changes deviating from the Company’s plans, since 30 September 2009 up till the date of the Prospectus, in respect of the Mining Assets (reviewed by SRK and as described in the Independent Technical Report, Section 1.3), or of any matter which would affect the content of the Independent Technical Report as published in the Prospectus, other than the below updated Mining Asset Environmental Compliance table as at 15 December 2009.
Updated Table 2.3: UC RUSAL Mining Asset Environmental Compliance as of 15 December 2009
Mining Asset Country Environmental permit Water discharge Air emmissions Waste
Bauxite
Alpart Jamaica Currently not required, controlled by Memorandum of Understanding with Government
Currently idle Currently idle Currently idle
Windalco Ewarton Jamaica Currently not required, controlled by Memorandum of Understanding with Government
Currently idle Currently idle Currently idle
Windalco Kirkvine Jamaica Currently not required, controlled by Memorandum of Understanding with Government
Currently idle Currently idle Currently idle
Kindia Guinea Understood to be covered by mining licence Not required Not required Not required
Friguia Guinea Understood to be covered by mining licence Not required Not required Not required
Bauxite Co. de Guyana
Guyana
Not required for historical operations, with environmental aspects controlled by a Compliance Agreement.
Not required Not required Not required
SRK Consulting (UK) Ltd. Registered in England and Wales Reg. No. 1575403
Registered Address: 21 Gold Tops, Newport, Gwent. NP9 4PG
Offices in: Africa Asia Australia North America South America United Kingdom
— VI-353 —

APPENDIX VI INDEPENDENT TECHNICAL REPORT
Mining Asset Country Environmental permit Water discharge Air emmissions Waste
Bauxite
North Urals (incl. Petropavlovsk)
Russia Environmental controls on exploration and project development specified in mining licence.
Obtained and valid to 31 December 2012
awaiting approval awaiting approval
Timan Russia
OVOS (EIA) approved by Pechorskiy Interregional Department of Technological and Environmental Supervision on 6 February 2007 and to for 6 February 2012)
Obtained and valid to 31 December 2012
Obtained and valid to 31 December 2011
Obtained and valid to 9 June 2013
Nepheline Syenite/Limestone
Kiya Shaltyr Nepheline Syenite
Russia Site became operational before OVOS requirements
awaiting approval Obtained and valid to 1 January 2012
Obtained and valid to 13 December 2011
Mazulsky Limestone Russia
Site became operational before OVOS requirements
Obtained and valid to 1 January 2014
Obtained and valid to 30 December 2009
Obtained and valid to 31 December 2009
Quartzite
Cheremshansk Russia Environmental controls on exploration and project development specified in mining licence
Not required
Obtained and valid to 3 November 2014 Obtained and valid to
2 October 2010
Glukhovsky Ukraine Environmental controls on exploration and project development specified in mining licence
Obtained and valid to 13 December 2012
Obtained and valid to 31 December 2013
Obtained and valid to 31 December 2009
Fluorite
Yaroslavsky Russia Environmental controls on exploration and project development specified in mining licence
awaiting approval Obtained and valid to 19 May 2013
Obtained and valid to 28 April 2011
Coal
Bogatyr Kazakhstan Environmental controls on exploration and project development specified in mining licence
31 December 2009 (annually renewed)
31 December 2009 (annually renewed)
31 December 2009 (annually renewed)
Yours faithfully For and on behalf of SRK Consulting (UK) Limited Allan McCracken Director
— VI-354 —

Set out below is a summary of certain provisions of the Memorandum and Articles of theCompany and of certain aspects of Jersey company law.
The Company was incorporated in Jersey as a private company with limited liability on 26October 2006 under the Jersey Companies Law. The Memorandum and the Articles comprise itsconstitution.
1 MEMORANDUM OF ASSOCIATION
1.1 The Memorandum was adopted on 26 December 2009 with effect from the admission of Sharesto trading on the Main Board of the Hong Kong Stock Exchange and states, inter alia, that:
(a) the name of the Company is United Company RUSAL plc;
(b) the liability of each member arising from his holding of a share in the Company is limitedto the amount (if any) unpaid on it;
(c) the Company has unrestricted corporate capacity;
(d) the Company is a par value company; and
(e) the Company is a public company.
1.2 The Company may by special resolution alter its Memorandum.
2 ARTICLES OF ASSOCIATION
The Articles were adopted on 24 November 2009 with effect from the admission of Shares totrading on the Main Board of the Hong Kong Stock Exchange. The following is a summary of certainprovisions of the Articles:
2.1 Directors
(a) Power to allot and issue shares and warrants
(i) Without prejudice to any special rights for the time being conferred on the holders of anyshares or class of shares, any share or class of shares in the capital of the Company maybe issued with such preferred, deferred or other special rights or such restrictions whetherin regard to dividends, return of capital, voting or otherwise as the Company may from timeto time by ordinary resolution determine. The Directors may issue warrants to subscribe forany class of shares or other securities of the Company, which warrants may be issued onsuch terms as the Directors may from time to time determine.
(ii) Subject to the provisions of the Jersey Companies Law, the Company may from time totime:
(A) issue; or
(B) convert any existing non-redeemable shares (whether issued or not) into,
shares which are to be redeemed or are liable to be redeemed at the option of the Companyor at the option of the holder thereof and on such terms and in such manner as may bedetermined by special resolution.
APPENDIX VII SUMMARY OF THE CONSTITUTION OF THE COMPANY ANDJERSEY COMPANIES LAW
— VII-1 —
App1A-5App1A-6App1A-7IP.08(3)IP.10(2)3rd Sch-29S342(1)(a)(i)8.02
App1A-7S342(1)(a)(i)
App3-6(1)
App3-8(1)App3-8(2)
(iii) Subject to the provisions of the Articles and any direction that may be given by theCompany in general meeting and where applicable the rules of any Designated StockExchange (as defined in the Articles), the unissued shares for the time being in the capitalof the Company shall be at the disposal of the Directors who may allot, grant options overor otherwise dispose of them to such persons at such times and generally on such terms andconditions as they think fit.
(iv) Subject to the Jersey Companies Law, the Companies (Uncertificated Securities) (Jersey)Order 1999, as amended, and the Listing Rules and requirements of the HKSE, theDirectors may permit any class of shares to be held in uncertificated form and to betransferred by means of a relevant system and may revoke any such permission.
(b) Power to dispose of the assets of the Company or any subsidiary
There are no specific provisions in the Articles relating to the disposal of the assets of theCompany or any of its subsidiaries. The business of the Company shall be managed by the Directorswho may pay all expenses incurred in promoting and registering the Company and may exercise allsuch powers of the Company as are not by the Jersey Companies Law or the Articles required to beexercised by the Company in general meeting.
(c) Compensation or payments for loss of office
The Directors shall obtain the approval of the Company in general meeting before making anypayment to any Director or past Director of the Company by way of compensation for loss of office,or as consideration for or in connection with his retirement from office (not being payment to whichthe Director is contractually entitled).
(d) Loans to Directors
There are comprehensive provisions in the Articles prohibiting the making of loans to Directors.
(e) Giving of financial assistance to purchase the shares of the Company or any of its subsidiaries
The Company may give financial assistance for the purpose of or in connection with a purchasemade or to be made by any person of any shares in the Company in any manner authorised or notprohibited by the Jersey Companies Law, provided always that for so long as the shares are listed onthe HKSE , any such provision of financial assistance shall also comply with the requirements of theCompanies Ordinance (Cap.32 of the Laws of Hong Kong) from time to time in force as if theCompany was incorporated in Hong Kong unless the HKSE waives this requirement for companiesincorporated outside Hong Kong (in which case the Company shall then comply with the requirementsof the HKSE from time to time in force, if any).
(f) Disclosure of interests in contracts with the Company or any of its subsidiaries
(i) A Director who, to his knowledge, is in any way (directly or indirectly) interested in anycontract, arrangement, transaction or proposal to be entered into or proposed to be enteredinto by the Company and such interest conflicts or may conflict to a material extent withthe interests of the Company shall declare the nature of his interest at the earliest meetingof the Directors at which it is practicable for him to do so, either specifically or by way ofa general notice in writing delivered to the secretary, at the earliest meeting of the Directorsafter he knows that he is or has become so interested.
APPENDIX VII SUMMARY OF THE CONSTITUTION OF THE COMPANY ANDJERSEY COMPANIES LAW
— VII-2 —
App13B-5(4)
App13B-5(2)
App1A-7(1)
App13B-5(3)

(ii) For the purpose of the above:
(A) a general notice given to the Directors by a Director that he is to be regarded as havingan interest (of the nature and extent specified in the notice) in any contract,transaction, arrangement or proposal in which a specified person or class of personsis interested shall be deemed to be a sufficient disclosure under the Articles in relationto such contract, transaction, arrangement or proposal; and
(B) an interest of which a Director has no knowledge and of which it is unreasonable toexpect him to have knowledge shall not be treated as an interest of his.
(iii) Save in limited circumstances, a Director shall not vote on (nor shall he be counted in thequorum in relation to) any resolution of the Directors or of a committee of the Directorsconcerning any contract, transaction, arrangement, or any other proposal whatsoever towhich the Company is or is to be a party and in which he or any of his associates has aninterest which is to his knowledge a material interest otherwise than by virtue of hisinterests in shares or debentures or other securities of or otherwise in or through theCompany.
(g) Remuneration
(i) The Directors shall be entitled to such remuneration as the Directors may determine subjectto any limitation as the Company may by ordinary resolution determine.
(ii) The Directors shall be paid out of the funds of the Company their travelling hotel and otherexpenses properly and necessarily incurred by them in connection with their attendance atmeetings of the Directors or members or otherwise in connection with the discharge of theirduties.
(h) Retirement, appointment and removal
(i) Any Director holding office prior to the adoption of the Articles shall continue to holdoffice until he resigns or is disqualified or removed in accordance with the provisions ofthe Articles.
(ii) The Directors shall have power at any time and from time to time to appoint any person(other than one disqualified or ineligible by law to act as a director of a company) to be aDirector either to fill a casual vacancy or as an addition to the existing Directors providedthat the appointment does not cause the number of Directors to exceed any number fixedby or in accordance with the Articles as the maximum number of Directors. Any Directorso appointed shall hold office until the next following annual general meeting of theCompany and shall then be eligible for re-election at such meeting (but shall not be takeninto account in determining the Directors or the number of Directors who are to retire byrotation).
(iii) The Company may by ordinary resolution:
(A) appoint any person (other than one disqualified or ineligible by law to act as a directorof a company) as a Director; and
(B) remove any Director from office before the expiration of his period in office (withoutprejudice to a claim for damages for breach of contract or otherwise).
APPENDIX VII SUMMARY OF THE CONSTITUTION OF THE COMPANY ANDJERSEY COMPANIES LAW
— VII-3 —
App3-4(1)
App1A-7(2)3rd Sch-5
App1A-7(4)
App3-4(2)
App3-4(3)
App13B-5(1)
(iv) The office of a Director shall be vacated if the Director:
(A) resigns his office by notice to the Company;
(B) ceases to be a Director by virtue of any provision of the Jersey Companies Law or hebecomes prohibited or disqualified by law from being a Director;
(C) becomes bankrupt or makes any arrangement or composition with his creditorsgenerally;
(D) becomes of unsound mind; or
(E) is removed from office by ordinary resolution.
(v) There is no shareholding qualification for Directors nor is there any specified age limit forDirectors.
(vi) At every annual general meeting one-third of the Directors or, if their number is not threeor a multiple of three, the number nearest to one-third shall retire from office; but if anyDirector has at the start of the annual general meeting been in office for three years or moresince his last appointment or re-appointment, he shall retire at that annual general meeting.
(vii) Subject to the provisions of the Jersey Companies Law and the Articles, the Directors toretire by rotation shall be, first, those who wish to retire and not be re-appointed to office,and, second, those who have been longest in office since their last appointment orre-appointment. As between persons who became or were last re-appointed directors on thesame day those to retire shall (unless they otherwise agree among themselves) bedetermined by lot. The Directors to retire on each occasion (both as to number and identity)shall be determined by the composition of the Directors at the date of the notice conveningthe annual general meeting. No Director shall be required to retire or be relieved fromretiring or be retired by reason of any change in the number or identity of the Directors afterthe date of the notice but before the close of the meeting.
(viii) If the Company does not fill the vacancy at the meeting at which a Director retires byrotation or otherwise, the retiring Director shall, if willing to act, be deemed to have beenre-appointed unless at the meeting it is resolved not to fill the vacancy or unless aresolution for the re-appointment of the Director is put to the meeting and lost.
(ix) No person other than a Director retiring by rotation shall be appointed a Director at anygeneral meeting unless he is recommended by the Directors or during a period, being notless than seven days, between a day that is not less than seven days before the dateappointed for the meeting and the day after the despatch of the notice of such meeting,notice by a Member qualified to vote at the meeting (not being the person to be proposed)has been received by the Company of the intention to propose that person for appointmentstating the particulars which would, if he were so appointed, be required to be included inthe Company’s register of Directors, together with notice by that person of his willingnessto be appointed.
(x) Any one or more members holding not less than 5 (five) per cent of the paid up capital ofthe Company carrying the right of voting at general meetings of the Company (a“proposer”) shall at all times have the right, by written notice to the Company, to proposeone or more persons to be considered for nomination or recommendation by the Directorsas a Director or to be considered as a suitable nominee as a director of the board of directors
APPENDIX VII SUMMARY OF THE CONSTITUTION OF THE COMPANY ANDJERSEY COMPANIES LAW
— VII-4 —
App1A-7(4)
App3-4(4),4(5)
of a subsidiary of the Company (a “proposal”). A proposal shall state the particulars whichwould, if that person were to be appointed, be required to be included in the Company’sregister of Directors (or that of the relevant subsidiary), together with notice by that personof his willingness to be appointed.
(i) Borrowing powers
The Directors may exercise all such powers of the Company as are not by the Jersey CompaniesLaw or the Articles required to be exercised by the Company in general meeting. As set out in theMemorandum, the Company has unrestricted corporate capacity.
(j) Delegation of powers
The Directors may delegate any of their powers to committees consisting of such Director orDirectors or such other persons as they think fit. The Directors shall establish an executive committee.Subject to the Law, the executive committee (or any manager or managers to whom the executivecommittee has delegated authority) may resolve and carry into effect any matter involving an outlayof no more than US$75 million (except a transaction involving a controlled interest of any member)without further authority from the Directors, and shall also be responsible for implementing mattersalready approved by the Directors.
(k) Quorum for board meetings
The quorum necessary for the transaction of the business of the Directors may be fixed by theDirectors and unless so fixed at any other number shall be two provided that, where at least twoDirectors have been appointed, whether before or after the adoption of the Articles, who were initiallyproposed in a proposal by proposers (as such terms are set out in paragraph 2(h)(x) above), whetherbefore or after the adoption of the Articles, then the quorum shall consist of an aggregate number ofDirectors (or their alternates) equal to such number representing one Director so appointed by eachproposer unless any such Director is prohibited from voting for any reason in which case the quorumshall be reduced accordingly provided that the quorum shall not be less than two. In the event that aquorum is not present at a duly convened meeting, then such meeting shall be adjourned for at leastten business days and each Director shall be notified of the time, date and place for the reconvenedmeeting and the quorum at such meeting, in the event that all Directors have been duly notified of thetime, date and place for the reconvened meeting, shall be two Directors howsoever appointed. Analternate Director shall be counted in a quorum but so that not less than two individuals will constitutethe quorum. A resolution in writing signed by a majority of the Directors entitled to receive notice ofa meeting of Directors or of a committee of Directors provided that such resolution is signed by atleast one Director appointed by each proposer shall be valid and effectual as if it had been passed ata meeting of the Directors or of a committee of Directors duly convened and held.
2.2 Alterations to constitutional documents
The Articles state that the Memorandum and the Articles are only capable of being amended bythe passing of a special resolution.
2.3 Variation of rights of existing shares or classes of shares
Whenever the capital of the Company is divided into different classes of shares the special rightsattached to any class may (unless otherwise provided by the terms of issue of the shares of that class)be varied or abrogated either whilst the Company is a going concern or during or in contemplation ofa winding up with the consent in writing of the holders of three-fourths of the issued shares of thatclass or with the sanction of a special resolution passed at a separate meeting of the holders of sharesof that class.
APPENDIX VII SUMMARY OF THE CONSTITUTION OF THE COMPANY ANDJERSEY COMPANIES LAW
— VII-5 —
App1A-7(3)3rd Sch-22
App13B-1
App1A-7(6)App1A-25(3)App13B-2(1)

2.4 Special resolutions - majority required
A special resolution is defined in the Articles as a resolution of the Company passed as a specialresolution by a majority of not less than three quarters of members who (being entitled to do so) votein person, or by proxy, at a general meeting of the Company of which not less than twenty-one cleardays’ notice, specifying the intention to propose the special resolution, has been given. Provided that,if it is so agreed by a majority in number of the members having the right to attend and vote at suchmeeting upon the resolution, being a majority together holding not less than ninety-five per cent. ofthe total voting rights of the members who have that right a resolution may be proposed and passedas a special resolution at a meeting at which less than twenty-one clear days’ notice has been givenin accordance with the Jersey Companies Law.
2.5 Voting rights (generally and on a poll)
(a) Subject to any special rights restrictions or prohibitions as regards voting for the time beingattached to any shares as may be specified in the terms of issue thereof or the Articles:
(i) on a show of hands, every member present in person shall have one vote and everyproxy who has been appointed by a member entitled to vote on the resolution has onevote (except where multiple proxies have been appointed by a member); and
(ii) on a poll, every member present in person or by proxy shall have one vote for eachshare of which he is the holder.
(b) In the case of joint holders of any share such persons shall not have the right of votingindividually in respect of such share but shall elect one of their number to represent themand to vote whether personally or by proxy in their name. In default of such election theperson whose name appears first in order in the register in respect of such share shall bethe only person entitled to vote in respect thereof.
(c) No member shall be entitled to vote at any general meeting unless all calls or other sumspresently payable by him in respect of shares in the Company of which he is holder or oneof the joint holders have been paid.
(d) Where any shares of the Company are held in trust for the Company, such shares shall not,for so long as they are so held, confer any right to vote at meetings of the Company.
(e) For as long as the shares of the Company are admitted to trading on the Hong Kong StockExchange, at any general meeting a resolution put to the meeting shall be decided in themanner as prescribed in the Listing Rules (i.e. on a poll).
(f) Where any member under the Listing Rules is required to abstain from voting on anyparticular resolution or is restricted to voting only for or only against any particularresolution, any votes cast by or on behalf of such member in contravention of suchrequirement or restriction shall not be counted.
APPENDIX VII SUMMARY OF THE CONSTITUTION OF THE COMPANY ANDJERSEY COMPANIES LAW
— VII-6 —
App1A-25(1)App1A-25(2)
App3-14
2.6 Requirements for annual general meetings
The Company shall in each calendar year hold a general meeting as its annual general meetingat such time and place as may be determined by the Directors. Not more than fifteen months (or suchlonger period as the Designated Stock Exchange or the Jersey Companies Law may authorise) shallelapse between subsequent annual general meetings.
2.7 Accounts and audit
(a) The Company shall keep accounting records, prepared in accordance with and subject to theprovisions of the Jersey Companies Law, which are sufficient to show and explain theCompany’s transactions and are such as to disclose with reasonable accuracy at any timethe financial position of the Company at that time and enable the Directors to ensure thatany accounts prepared by the Company comply with requirements of the Jersey CompaniesLaw and International Financial Reporting Standards.
(b) The Directors shall prepare accounts of the Company made up to such date in each year asthe Directors shall from time to time determine in accordance with and subject to theprovisions of the Jersey Companies Law and International Financial Reporting Standards.
(c) No member shall (as such) have any right to inspect any accounting records or other bookor document of the Company except as conferred by the Jersey Companies Law orauthorised by the Directors or by ordinary resolution of the Company.
(d) Subject to the Jersey Companies Law, copies of either (i) the Company’s balance sheet(including every document required by the Jersey Companies Law to be annexed thereto)and profit and loss account, together with a copy of the Directors’ report for that financialyear and the auditors’ report on those accounts, or (ii) the summary financial report shall,at least twenty-one clear days before the date of the meeting at which copies of thosedocuments are to be laid in accordance with the provisions of the Jersey Companies Law,be delivered or sent by post to every member and to every holder of the Company’sdebentures of whose address the Company is aware and to every other person who isentitled to receive notice of meetings of the Company under the provisions of the JerseyCompanies Law or the Articles, or in the case of joint holders of any share or debenture toone of the joint holders. Copies need not be sent to a person for whom the Company doesnot have a current address.
(e) The Directors or the Company by ordinary resolution shall appoint auditors to hold officeuntil the conclusion of the next annual general meeting for any period or periods to examinethe accounts of the Company and to report thereon in accordance with the Jersey CompaniesLaw. A Director, officer or any employee of such Director and officer shall not be appointedthe auditors of the Company.
2.8 Notice of meetings and business to be conducted thereat
(a) Notice of meetings
(i) At least twenty-one clear days’ notice shall be given of every annual general meeting andof every general meeting called for the passing of a special resolution and at least fourteenclear days’ notice shall be given of all other general meetings.
APPENDIX VII SUMMARY OF THE CONSTITUTION OF THE COMPANY ANDJERSEY COMPANIES LAW
— VII-7 —
App13B-4(2)
App13B-4(1)
App13B-4(2)
App3-5App13B-3(3)
App13B-1, 3(1)
(ii) A meeting of the Company shall notwithstanding that it is called by shorter notice than thatspecified above be deemed to have been duly called if it is so agreed in the case of anannual general meeting by all the members entitled to attend and vote thereat and in thecase of any other meeting by a majority in number of the members having a right to attendand vote at the meeting being a majority together holding not less than ninety-five per centin nominal value of the shares giving that right.
(iii) Every notice shall specify the place the day and the time of the meeting and the generalnature of the business to be transacted and in the case of an annual general meeting shallspecify the meeting as such.
(iv) Subject to the provisions of the Articles and to any restrictions imposed on any shares,notice of every general meeting shall be given to all the members, to all persons entitledto a share in consequence of the death, bankruptcy or incapacity of a member, to theauditors (if any) and to every Director who has notified the secretary in writing of his desireto receive notice of general meetings.
(v) In every notice calling a meeting of the Company there shall appear with reasonableprominence a statement that a member entitled to attend and vote is entitled to appoint oneor more proxies to attend and vote instead of him and that a proxy need not also be amember.
(vi) The accidental omission to give notice of a meeting to or the non-receipt of notice of ameeting by any person entitled to receive notice shall not invalidate the proceedings at thatmeeting.
(vii) Where the Company gives notice of its intention to move a resolution at a general meetingof the Company or a meeting of any class of members, the notice shall include or beaccompanied by a statement containing such information and explanation, if any, as isreasonably necessary to indicate the purpose of the resolution and disclosing any materialinterests of any Director in the matter dealt with by the resolution so far as the resolutionaffects those interests differently from the interests of other members.
(b) business of general meetings
The business of an annual general meeting shall be to receive and consider the accounts of theCompany and the reports of the Directors and auditors, to elect Directors (if proposed), to electauditors and fix their remuneration, to sanction a dividend (if thought fit so to do) and to transact anyother business of which notice has been given.
2.9 Transfer of shares
(a) Save as otherwise permitted under the provisions of the Jersey Companies Law, all transfersof shares shall be affected using an instrument of transfer. The instrument of transfer of anyshare shall be in writing in any usual common form or in any form approved by the HKSEor any form approved by the Directors and may be under hand or, if the transferor or thetransferee is a clearing house or its nominee(s) by hand or machine imprinted signature orby such other manner of execution as the board of Directors may approve from time to time.The instrument of transfer of any share shall be signed by or on behalf of the transferor andin the case of an unpaid or partly paid share by the transferee. The transferor shall bedeemed to remain the holder of the share until the name of the transferee is entered in theregister of members in respect thereof. A Shareholder may transfer all or any uncertificatedShares in accordance with the Companies (Uncertificated Securities) (Jersey) Order 1999,as amended.
APPENDIX VII SUMMARY OF THE CONSTITUTION OF THE COMPANY ANDJERSEY COMPANIES LAW
— VII-8 —
App13B-2(2)
App1A-7(8)
(b) Fully paid shares of the Company shall be free from any restriction on transfer (exceptwhere permitted by the Designated Stock Exchange) and shall also be free from all liens.The Directors may in their absolute discretion and without assigning any reason thereforrefuse to register the transfer of a certificated share which is not fully paid up includingwithout limitation a transfer of such shares to a person of whom they do not approve anda transfer of a certificated share on which the Company has a lien. The Directors may alsorefuse to register the transfer of a share unless the instrument of transfer is lodged at theCompany’s registered office or at such other place as the Directors may appointaccompanied by the certificate for the shares to which it relates and such other evidence asthe Directors may reasonably require to show the right of the transferor to make thetransfer, is in respect of only one class of shares and is in favour of not more than fourtransferees.
(c) If the Directors refuse to register a transfer of a share they shall within two months afterthe date on which the instrument of transfer was lodged with the Company send to theproposed transferor and transferee notice of the refusal.
(d) The registration of transfers of shares or of transfers of any class of shares may besuspended at such times and for such periods as the Directors may determine, providedalways that such registration shall not be suspended for more than thirty days in anycalendar year. Unless otherwise permitted by the Companies (Uncertificated Securities)(Jersey) Order 1999, as amended, the Company may not close any register relating to aparticipating security without the consent of the approved operator of the relevant system.
(e) Unless otherwise decided by the Directors in their sole discretion no fee shall be chargedin respect of the registration of any instrument of transfer or other document relating to oraffecting the title to any share. To the extent that the Directors decide to charge a fee inrespect of the registration, the fee shall be the same or less than the maximum amountprescribed by the Designated Stock Exchange from time to time.
(f) In respect of any allotment of any share the Directors shall have the same right to declineto approve the registration of any renouncee of any allottee as if the application to allot andthe renunciation were a transfer of a share under the Articles.
2.10 Power for the Company to purchase its own shares
Subject to the provisions of the Jersey Companies Law, the Company may purchase its ownshares (including redeemable shares) in any manner authorised or not prohibited by the JerseyCompanies Law, provided always that for so long as the shares are listed on the HKSE, any suchpurchase shall also comply with the requirements of the Companies Ordinance (Cap.32 of the Lawsof Hong Kong) from time to time in force as if the Company was incorporated in Hong Kong unlessthe HKSE waives this requirement for companies incorporated outside Hong Kong (in which case theCompany shall then comply with the requirements of the HKSE from time to time in force, if any).
2.11 Power for any subsidiary of the Company to own shares in the Company
There are no provisions in the Articles relating to ownership of shares in the Company by asubsidiary.
2.12 Dividends and other methods of distribution
(a) Subject to the provisions of the Jersey Companies Law, the Company may by ordinaryresolution declare dividends in accordance with the respective rights of the members but nodividend shall exceed the amount recommended by the Directors. The Directors may also
APPENDIX VII SUMMARY OF THE CONSTITUTION OF THE COMPANY ANDJERSEY COMPANIES LAW
— VII-9 —
App3-1(2)
App3-1(3)
App3-1(3)
App3-1(1)
App1A-7(9)
App1A-16App1A-7(7)
if they think fit from time to time pay to the members such interim dividends as they maydetermine. If at any time the share capital of the Company is divided into different classesthe Directors may pay such interim dividends in respect of those shares which confer on theholders thereof deferred or non-preferred rights as well as in respect of those shares whichconfer on the holders thereof preferential rights with regard to dividend. Furthermore, theDirectors may also pay half-yearly or at other suitable intervals to be settled by them anydividend which may be payable at a fixed rate. Provided the Directors act bona fide theyshall not incur any personal liability to the holders of shares conferring a preference for anydamage that they may suffer by reason of the payment of an interim dividend on any shareshaving deferred or non-preferred rights.
(b) Subject to any particular rights or limitations as to dividend for the time being attached toany shares as may be specified in the Articles or upon which such shares may be issued,all dividends shall be declared apportioned and paid pro rata according to the amounts paidup on the shares on which the dividend is paid (otherwise than in advance of calls) providedthat if any share is issued on terms providing that it shall rank for dividend as if paid up(in whole or in part) or as from a particular date (either past or future) such share shall rankfor dividend accordingly.
(c) The Directors may before recommending any dividend set aside such sums as they thinkproper as a reserve or reserves which shall at the discretion of the Directors be applicablefor any purpose to which such sums may be properly applied and pending such applicationmay at the like discretion be employed in the business of the Company or be invested insuch investments as the Directors may from time to time think fit. The Directors may carryforward to the account of the succeeding year or years any balance which they do not thinkfit either to dividend or to place to reserve.
(d) A general meeting declaring a dividend may upon the recommendation of the Directorsdirect that payment of such dividend shall be satisfied wholly or in part by the distributionof specific assets and in particular of paid-up shares or debentures of any other companyand the Directors shall give effect to such resolution. Where any difficulty arises in regardto the distribution the Directors may settle the same as they think expedient.
(e) Any resolution declaring a dividend on the shares of any class whether a resolution of theCompany in general meeting or a resolution of the Directors or any resolution of theDirectors for the payment of a fixed dividend on a date prescribed for the payment thereofmay specify that the same shall be payable to the persons registered as the holders of sharesof the class concerned at the close of business on a particular date notwithstanding that itmay be a date prior to that on which the resolution is passed (or as the case may be thatprescribed for payment of a fixed dividend) and thereupon the dividend shall be payable tothem in accordance with their respective holdings so registered but without prejudice to therights inter se in respect of such dividend of transferors and transferees of any shares of therelevant class.
(f) The Directors may deduct from any dividend or other monies payable to any member on orin respect of a share all sums of money (if any) presently payable by him to the Companyon account of calls or otherwise in relation to the shares of the Company.
(g) All unclaimed dividends may be invested or otherwise made use of by the Directors for thebenefit of the Company until claimed. No dividend shall bear interest as against theCompany. Any dividend which has remained unclaimed for a period of ten years from thedate of declaration thereof shall if the Directors so resolve be forfeited and cease to remainowing by the Company and shall thenceforth belong to the Company absolutely.
APPENDIX VII SUMMARY OF THE CONSTITUTION OF THE COMPANY ANDJERSEY COMPANIES LAW
— VII-10 —
App1A-7(7)App3-3(2)
2.13 Proxies
(a) On a show of hands or a poll votes may be given either personally or by proxy. TheDirectors may at the expense of the Company send by post or otherwise to the membersinstruments of proxy (with or without provision for their return prepaid) for use at anygeneral meeting or at any separate meeting of the holders of any class of shares of theCompany either in blank or nominating in the alternative any one or more of the Directorsor any other persons. A member may appoint more than one proxy to attend on the sameoccasion provided that each such proxy is appointed to exercise the rights attached to adifferent share or shares held by that member. If for the purpose of any meeting invitationsto appoint as proxy a person or one or more of a number of persons specified in theinvitations are issued at the Company’s expense they shall be issued to all (and not to someonly) of the members entitled to be sent a notice of the meeting and to vote thereat byproxy.
(b) The instrument appointing a proxy shall be in writing in any common form or as approvedby the Directors and shall be under the hand of the appointer or of his attorney dulyauthorised in writing or if the appointer is a corporation either under seal or under the handof a duly authorised officer, attorney or other representative. A proxy need not be a member.The instrument appointing a proxy and the power of attorney or other authority (if any)under which it is signed or a notarially certified copy of that power or authority shall:
(i) be deposited at the registered office of the Company or at such other place as isspecified for that purpose by the notice convening the meeting not less thanforty-eight hours before the time for holding the meeting or adjourned meeting atwhich the person named in the instrument proposes to vote;
(ii) in the case of a poll taken more than forty-eight hours after it is demanded, bedeposited as aforesaid after the poll has been demanded and not less than twenty-fourhours before the time appointed for taking the poll; or
(iii) where the poll is not taken forthwith but is taken not more than forty-eight hours afterit was demanded, be delivered at the meeting at which the poll was demanded to thechairman or the secretary or to any Director.
(c) An instrument of proxy which is not deposited in the manner so required shall be valid onlyif it is approved by all the other members who are present at the meeting.
(d) Unless the contrary is stated thereon the instrument appointing a proxy shall be as valid aswell for any adjournment of the meeting as for the meeting to which it relates. In addition,a proxy or proxies representing either a member who is an individual or a member whichis a corporation shall be entitled to exercise the same powers on behalf of the memberwhich he or they represent as such member could exercise. A vote given in accordance withthe terms of an instrument of proxy shall be valid notwithstanding the previous death orinsanity of the principal or revocation of the proxy or of the authority under which theproxy was executed, provided that no notice in writing of such death, insanity or revocationshall have been received by the Company at its registered office before the commencementof the meeting or adjourned meeting at which such vote is cast.
APPENDIX VII SUMMARY OF THE CONSTITUTION OF THE COMPANY ANDJERSEY COMPANIES LAW
— VII-11 —
App3-11(1)
App3-11(2)
2.14 Calls on shares and forfeiture of shares
(a) Calls on shares
(i) The Directors may subject to the provisions of the Articles and to any conditions ofallotment from time to time make calls upon the members in respect of any monies unpaidon their shares (whether on account of the nominal value of the shares or by way ofpremium) and each member shall (subject to being given at least fourteen clear days’ noticespecifying the time or times and place of payment) pay to the Company at the time or timesand place so specified the amount called on his shares. A call may be required to be paidby instalments. A call may before receipt by the Company of any sum due thereunder berevoked in whole or in part and payment of a call may be postponed in whole or in part.A person upon whom a call is made shall remain liable for calls made upon himnotwithstanding the subsequent transfer of the shares in respect whereof the call was made.A call shall be deemed to have been made at the time when the resolution of the Directorsauthorising the call was passed. The joint holders of a share shall be jointly and severallyliable to pay all calls and all other payments to be made in respect of such share.
(ii) If a sum called in respect of a share is not paid before or on the day appointed for paymentthereof the person from whom the sum is due may be required to pay interest on the sumfrom the day appointed for payment thereof to the time of actual payment at a ratedetermined by the Directors but the Directors shall be at liberty to waive payment of suchinterest wholly or in part.
(iii) Any sum which by or pursuant to the terms of issue of a share becomes payable uponallotment or at any fixed date whether on account of the nominal value of the share or byway of premium shall for the purposes of the Articles be deemed to be a call duly made andpayable on the date on which by or pursuant to the terms of issue the same becomes payableand in case of non-payment all the relevant provisions of the Articles as to payment ofinterest, forfeiture, surrender or otherwise shall apply as if such sum had become due andpayable by virtue of a call duly made and notified.
(iv) The Directors may on the issue of shares differentiate between the holders as to the amountof calls to be paid and the times of payment.
(v) The Directors may if they think fit receive from any member an advance of monies whichhave not yet been called on his shares or which have not yet fallen due for payment. Suchadvance payments shall, to their extent, extinguish the liability in respect of which they arepaid. The Company may pay interest on any such advance, at such rate as the Directorsthink fit, for the period covering the date of payment to the date when the monies wouldhave been due had they not been paid in advance. For the purposes of entitlement todividends, monies paid in advance of a call or instalment shall not be treated as paid untilthe due date.
(b) forfeiture of shares
(i) If a member fails to pay any call or instalment of a call on or before the day appointed forpayment thereof the Directors may at any time thereafter during such time as any part ofsuch call or instalment remains unpaid serve a notice on him requiring payment of so muchof the call or instalment as is unpaid together with any interest which may have accrued andany costs, charges and expenses which may have been incurred by the Company by reasonof such non-payment. The notice shall name a further day (not earlier than the expirationof fourteen clear days from the date of service of such notice) on or before which the
APPENDIX VII SUMMARY OF THE CONSTITUTION OF THE COMPANY ANDJERSEY COMPANIES LAW
— VII-12 —
App3-3(1)

payment required by the notice is to be made and the place where payment is to be madeand shall state that in the event of non-payment at or before the time appointed and at theplace appointed the shares in respect of which the call was made will be liable to beforfeited.
(ii) If the requirements of any such notice as aforesaid are not complied with any share inrespect of which such notice has been given may at any time thereafter before payment ofall calls and interest due in respect thereof has been made be forfeited by a resolution ofthe Directors to that effect and such forfeiture shall include all dividends which shall havebeen declared on the forfeited shares and not actually paid before the forfeiture.
(iii) A forfeited or surrendered share shall become the property of the Company and may besold, re-allotted or otherwise disposed of either to the person who was before forfeiture orsurrender the holder thereof or entitled thereto or to any other person upon such terms andin such manner as the Directors think fit and at any time before a sale, re-allotment or otherdisposition the forfeiture or surrender may be cancelled on such terms as the Directors thinkfit.
(iv) A member whose shares have been forfeited or surrendered shall cease to be a member inrespect of the forfeited or surrendered shares and shall (if he has not done so already)surrender to the Company for cancellation the certificate for the shares forfeited orsurrendered. Notwithstanding the forfeiture or the surrender such member shall remainliable to pay to the Company all monies which at the date of forfeiture or surrender werepresently payable by him in respect of those shares with interest thereon at the rate at whichinterest was payable before the forfeiture or surrender or at such rate as the Directors maydetermine from the date of forfeiture or surrender until payment, provided that theDirectors may waive payment wholly or in part or enforce payment without any allowancefor the value of the shares at the time of forfeiture or surrender or for any considerationreceived on their disposal.
2.15 Inspection of register of members
The register of members and any overseas branch register of members as the case may be, shallbe open to inspection by the members and other persons in accordance with the Jersey Companies Law.Subject to applicable law, the register of members including any overseas or local or other branchregister of members may, after notice has been given by advertisement in an appointed newspaper orany other newspapers in accordance with the requirements of the Designated Stock Exchange, beclosed at such times or for such periods not exceeding in the whole thirty (30) days in each year asthe Directors may determine and either generally or in respect of any class of shares. The period of30 days may be subsequently extended in respect of any year in relation to the register of membersby an ordinary resolution passed at a general meeting of the Company in that year, provided that thesaid period shall not be extended beyond 60 days in any year. The Company shall, on demand, furnishany person seeking to inspect the register of members or part of the register of members which isclosed with a certificate under the hand of the secretary stating the period for which, and by whoseauthority, it is closed.
APPENDIX VII SUMMARY OF THE CONSTITUTION OF THE COMPANY ANDJERSEY COMPANIES LAW
— VII-13 —
App3-7(1)App13B-3(2)
2.16 Quorum for meetings and separate class meetings
(a) No business shall be transacted at any general meeting except the adjournment of themeeting unless a quorum of members is present at the time when the meeting proceeds tobusiness. Such quorum shall consist of not less than two members present together holdingnot less than 50% of the total voting rights of the members but so that not less than twoindividuals will constitute the quorum.
(b) To every separate meeting of the holders of a class of shares all the provisions of theArticles and of the Jersey Companies Law relating to general meetings of the Company orto the proceedings thereat shall apply mutatis mutandis except that the necessary quorumshall be two persons holding or representing at least one-third in nominal amount of theissued shares of that class but so that if at any adjourned meeting of such holders a quorumas above defined is not present those holders who are present shall be a quorum.
2.17 Rights of the minorities in relation to fraud or oppression
There are no provisions in the Articles relating to rights of minority shareholders in relation tofraud or oppression. However, certain remedies are available to shareholders of the Company underJersey law, as summarised in paragraph 3.6 of this Appendix.
2.18 Procedures on liquidation
(a) Subject to any particular rights or limitations for the time being attached to any shares asmay be specified in the Articles or upon which such shares may be issued if the Companyis wound up, the assets available for distribution among the members shall be applied firstin repaying to the members the amount paid up on their shares respectively and if suchassets shall be more than sufficient to repay to the members the whole amount paid up ontheir shares the balance shall be distributed among the members in proportion to the amountwhich at the time of the commencement of the winding up had been actually paid up ontheir said shares respectively.
(b) If the Company is wound up, the Company may with the sanction of a special resolutionand any other sanction required by the Jersey Companies Law divide the whole or any partof the assets of the Company among the members in specie and the liquidator or where thereis no liquidator the Directors may for that purpose value any assets and determine how thedivision shall be carried out as between the members or different classes of members andwith the like sanction vest the whole or any part of the assets in trustees upon such trustsfor the benefit of the members as the liquidator or the Directors (as the case may be) withthe like sanction determine but no member shall be compelled to accept any assets uponwhich there is a liability.
2.19 Other provisions material to the Company or its shareholders
(a) alteration of share capital
(i) The Company may by special resolution:
(A) increase its share capital by such sum to be divided into shares of such amount andin such currency or currencies as the resolution prescribes;
(B) consolidate and divide all or any of its share capital into shares of larger amount thanits existing shares;
APPENDIX VII SUMMARY OF THE CONSTITUTION OF THE COMPANY ANDJERSEY COMPANIES LAW
— VII-14 —
App3-6(2)
(C) convert all or any of its fully paid shares into stock, and reconvert that stock into fullypaid shares of any denomination;
(D) subject to the provisions of the Jersey Companies Law, sub-divide its shares, or anyof them, into shares of smaller amount than is fixed by the Memorandum and theresolution may determine that, as between the shares resulting from the sub-division,any of them may have any preference or advantage as compared with the others;
(E) subject to the provisions of the Jersey Companies Law convert or denominate any ofits shares the nominal value of which is expressed in one currency into shares of anominal value of another currency; and
(F) cancel shares which, at the date of the passing of the resolution, have not been takenor agreed to be taken by any person and diminish the amount of its share capital bythe amount of the shares so cancelled.
(ii) Any new shares created on an increase or other alteration of share capital shall be issuedupon such terms and conditions as the Company may by ordinary resolution determine.
(iii) Subject to the provisions of the Jersey Companies Law, the Company may by specialresolution reduce its share capital and its share premium account in any way.
(b) Lien
(i) The Company shall have a first and paramount lien on every share (not being a fully paidshare) for all monies (whether presently payable or not) called or payable at a fixed timein respect of that share and the Company shall also have a first and paramount lien on allshares (other than fully paid shares) registered in the name of a single member for all thedebts and liabilities of such member or his estate to the Company whether the period forthe payment or discharge of the same shall have actually commenced or not andnotwithstanding that the same are joint debts or liabilities of such member or his estate andany other person whether a member or not. The Company’s lien (if any) on a share shallextend to all dividends or other monies payable thereon or in respect thereof. The Directorsmay resolve that any share shall for such period as they think fit be exempt from suchprovisions.
(ii) The Company may sell in such manner as the Directors think fit any shares on which theCompany has a lien but no sale shall be made unless the monies in respect of which suchlien exists or some part thereof are or is presently payable nor until fourteen clear days haveexpired after a notice stating and demanding payment of the monies presently payable andgiving notice of intention to sell in default shall have been served on the holder for the timebeing of the shares or the person entitled thereto by reason of the death, bankruptcy orincapacity of such holder.
(iii) The net proceeds of such sale after payment of the costs of such sale shall be applied in ortowards payment or satisfaction of the debt or liability in respect of which the lien existsso far as the same is presently payable and any residue shall (subject to a like lien for debtsor liabilities not presently payable as existed upon the shares prior to the sale) be paid tothe person entitled to the shares at the time of the sale.
APPENDIX VII SUMMARY OF THE CONSTITUTION OF THE COMPANY ANDJERSEY COMPANIES LAW
— VII-15 —
(c) Untraceable members
(i) Subject to the Companies (Uncertificated Securities) (Jersey) Order 1999, as amended, theCompany shall have the power to sell, in such manner as the Directors think fit, any sharesof a member who is untraceable, but no such sale shall be made unless:
(A) all cheques or warrants in respect of dividends of the shares in question, being not lessthan three in total number, for any sum payable in cash to the holder of such sharesin respect of them sent during the relevant period (which is the period commencingtwelve years before the date of publication of the advertisement referred to at (C)below and ending at the expiry of the period referred to at (C) below) in the mannerauthorised by the Articles have remained uncashed;
(B) so far as it is aware at the end of the relevant period, the Company has not at any timeduring the relevant period received any indication of the existence of the member whois the holder of such shares or of a person entitled to such shares by death, bankruptcyor operation of law; and
(C) the Company, if so required by the Listing Rules has given notice to, and causedadvertisement in newspapers in accordance with the requirements of, the DesignatedStock Exchange to be made of its intention to sell such shares in the manner requiredby the Designated Stock Exchange, and a period of three months or such shorterperiod as may be allowed by the Designated Stock Exchange has elapsed since thedate of such advertisement.
(ii) The net proceeds of the sale will belong to the Company and upon receipt by the Companyof such net proceeds it shall become indebted to the former member for an amount equalto such net proceeds. No trust shall be created in respect of such debt and no interest shallbe payable in respect of it and the Company shall not be required to account for any moneyearned from the net proceeds which may be employed in the business of the Company oras it thinks fit. Any such sale shall be valid and effective notwithstanding that the memberholding the shares sold is dead, bankrupt or otherwise under any legal disability orincapacity.
(d) Capitalisation of profits
The Directors may with the authority of an ordinary resolution of the Company:
(i) subject as provided below, resolve that it is desirable to capitalise any undistributed profitsof the Company (including profits carried and standing to any reserve or reserves) notrequired for paying any fixed dividends on any shares entitled to fixed preferentialdividends with or without further participation in profits or to capitalise any sum carriedto reserve as a result of the sale or revaluation of the assets of the Company (other thangoodwill) or any part thereof or to capitalise any sum standing to the credit of theCompany’s share premium account or capital redemption reserve fund;
(ii) appropriate the profits or sum resolved to be capitalised to the members in the proportionin which such profits or sum would have been divisible amongst them had the same beenapplicable and had been applied in paying dividends and to apply such profits or sum ontheir behalf either in or towards paying up any amount for the time being unpaid on anyshares held by such members respectively or in paying up in full either at par or at such
APPENDIX VII SUMMARY OF THE CONSTITUTION OF THE COMPANY ANDJERSEY COMPANIES LAW
— VII-16 —
App3-13(1),13(2)(a),(2)(b)
premium as the said resolution may provide any unissued shares or debentures of theCompany such shares or debentures to be allotted and distributed credited as fully paid upto and amongst such members in the proportions aforesaid or partly in one way and partlyin the other provided that the share premium account and the capital redemption reservefund and any unrealised profits may for these purposes only be applied in the paying up ofunissued shares to be allotted to members credited as fully paid up;
(iii) make all appropriations and applications of the profits or sum resolved to be capitalisedthereby and all allotments and issues of fully paid shares or debentures if any and generallyshall do all acts and things required to give effect thereto with full power to the Directorsto make such provision by the issue of certificates representing part of a shareholding orfractions of shares or by payments in cash or otherwise as they think fit in the case of sharesor debentures becoming distributable in fractions; and
(iv) authorise any person to enter on behalf of all the members entitled to the benefit of suchappropriations and applications into an agreement with the Company providing for theallotment to them respectively credited as fully paid up of any further shares or debenturesto which they may be entitled upon such capitalisation and any agreement made under suchauthority shall be effective and binding on all such members.
(e) Indemnity of directors
(i) In so far as the Jersey Companies Law allows, every present or former director, secretaryor liquidator of the Company shall be indemnified out of the assets of the Company againstany loss or liability incurred by him by reason of being or having been such an individual.
(ii) The Directors may without sanction of the Company in general meeting authorise thepurchase or maintenance by the Company for any such individual or former individual ofany such insurance as is permitted by the Jersey Companies Law in respect of any liabilitywhich would otherwise attach to such individual or former individual.
(f) Director’s qualification shares
A director need not be a member of the Company.
(g) Corporate members
If a clearing house (or its nominee(s)), being a corporation, is a member, it may authorise suchpersons as it thinks fit to act as its representatives at any meeting of the Company or at any meetingof any class of members provided that, if more than one person is so authorised, the authorisation shallspecify the number and class of shares in respect of which each such representative is so authorised.Each person so authorised shall be deemed to have been duly authorised without further evidence ofthe facts and be entitled to exercise the same rights and powers on behalf of the clearing house (orits nominee(s)) as if such person was the registered holder of the shares in the Company held by theclearing house (or its nominee(s)) including the right to vote individually on a show of hands.
APPENDIX VII SUMMARY OF THE CONSTITUTION OF THE COMPANY ANDJERSEY COMPANIES LAW
— VII-17 —
App1A-7(5)
App13B-6

3 JERSEY COMPANY LAW
The Company is incorporated in Jersey subject to the Jersey Companies Law and, therefore,operates subject to Jersey law. Set out below is a summary of certain provisions of Jersey companylaw, although this does not purport to contain all applicable qualifications and exceptions or to be acomplete review of all matters of Jersey company law and taxation, which may differ from equivalentprovisions in jurisdictions with which interested parties may be more familiar:
3.1 Operations
(a) The Company is restricted from trading in Jersey insofar as, if it wanted to carry outbusiness activities in Jersey (including, in particular, employing staff in Jersey), it mayneed to obtain a licence pursuant to the Regulation of Undertakings and Development(Jersey) Law 1973, as amended.
(b) The Company is required to file an annual return each year with the Jersey Registrar ofCompanies. The current filing fee is £150.
3.2 Share capital
(a) Alteration of share capital
The Articles provide substantially similar provisions in relation to alteration of share capital asthose set out in the Jersey Companies Law.
(b) Share premium accounts
(i) The Jersey Companies Law sets out what is meant by share premium and what sharepremium may be used for. If the Company allots shares at a premium (whether for cash orotherwise) where the premiums arise as a result of the issue of a class of limited shares, asum equal to the aggregate amount or value of those premiums shall be transferred, as andwhen the premiums are paid up, to a share premium account for that class.
(ii) A share premium account may be applied by the Company for any of the followingpurposes:
(A) in paying up unissued shares to be allotted to members as fully paid bonus shares;
(B) in writing off the Company’s preliminary expenses;
(C) in writing off the expenses of and any commission paid on any issue of shares of theCompany;
(D) in the redemption or purchase of shares under Part 11 of the Jersey Companies Law(Redemption and Purchase of Shares); and
(E) in the making of a distribution in accordance with Part 17 of the Jersey CompaniesLaw.
(iii) Subject to the above, the provisions of the Jersey Companies Law relating to the reductionof the Company’s share capital apply as if each of its share premium accounts were part ofits paid up share capital.
(iv) The Company may also make a distribution in accordance with Part 17 of the JerseyCompanies Law (Distributions) from a share premium account (see 3.5 (Dividends anddistributions) below).
APPENDIX VII SUMMARY OF THE CONSTITUTION OF THE COMPANY ANDJERSEY COMPANIES LAW
— VII-18 —
IP10(3)

(c) Reductions of capital
The Jersey Companies Law provides that, subject to confirmation by the Royal Court of Jerseyexcept in certain limited circumstances, the Company may by special resolution reduce its capitalaccounts in any way. The redemption, purchase or cancellation by a Jersey company of its shares underPart 11 of the Jersey Companies Law is not, for the purposes of Part 12 of the Jersey Companies Law,a reduction of capital.
(d) Variation of rights
The Jersey Companies Law provides for variation of class rights in accordance with the Articlesor, where this is not specified in the Articles, with the consent in writing of holders of not less than2/3rds in nominal value of the issued shares of that class or by a special resolution of the membersof that class. The Articles provide for a higher majority for written consent by holders of three-fourthsof the issued shares of the class.
(e) Treasury shares
The Jersey Companies Law provides that the Company may hold as treasury shares any of thelimited shares that it has redeemed or purchased under the Jersey Companies Law, to the extent thatit is not prohibited by the Memorandum or Articles and it is authorised by a resolution of the Companyto hold shares as treasury shares.
3.3 Financial assistance to purchase shares of a company or its holding company
There is no specific restriction under the Jersey Companies Law on the provision of financialassistance by the Company to another person for the purchase of, or subscription for, its own or itsholding company’s shares. However, the Articles contain a prohibition on financial assistance (asmentioned above). Accordingly, subject to the restrictions under the Articles, the Company mayprovide financial assistance if the Directors of the Company consider, in discharging their fiduciaryduties, that such assistance can properly be given. The Directors will need to be mindful of theirstatutory obligations in relation to making distributions (as set out below) if any financial assistanceis made by way of a payment to a member in their capacity as a member and such payment constitutesa distribution of the Company’s assets.
3.4 Purchase of shares and warrants by a company and its subsidiaries
(a) Redemptions
(i) Subject to the provisions of the Jersey Companies Law, the Company may, if authorised bythe Articles (which it is), issue or convert existing non-redeemable limited shares, whetherissued or not, into, limited shares which are to be redeemed, or are liable to be redeemed,either in accordance with their terms or at the option of the Company or the shareholder.The Articles provide for the issue of redeemable shares (or conversion of non-redeemableshares) on such terms and in such manner as may be determined by special resolution.
(ii) The redeemable limited shares of the Company shall be capable of being redeemed fromany source, but only if they are fully paid up.
(iii) The redeemable limited shares are not capable of being redeemed unless all the directorsof the Company who authorise the redemption make a statement as to the solvency of theCompany at the time of redemption which is forward looking for a twelve month periodfollowing the redemption.
APPENDIX VII SUMMARY OF THE CONSTITUTION OF THE COMPANY ANDJERSEY COMPANIES LAW
— VII-19 —
(iv) Any shares redeemed under the Jersey Companies Law (other than shares that are,immediately after being purchased or redeemed, held as treasury shares) are treated ascancelled on redemption.
(b) Share purchases
(i) In addition, the Company may purchase its own shares (including any redeemable shares).Such a purchase shall be sanctioned by a special resolution of the Company.
(ii) If the shares are to be purchased otherwise than on a stock exchange, they may only bepurchased in pursuance of a contract approved in advance by a resolution of the Companyand they shall not carry the right to vote on the resolution sanctioning the purchase orapproving the contract.
(iii) If the shares are to be bought on a stock exchange, the resolution authorising the purchaseshall specify the maximum number of shares to be purchased, the maximum and minimumprices which may be paid for them and a date, not being later than 18 months after thepassing of the resolution, on which the authority to purchase is to expire.
(iv) A purchase also requires the authorising Directors to make a solvency statement in the sameterms as that required for a redemption.
(c) Warrants
The Jersey Companies Law does not contain provisions relating to the issue, redemption orpurchase of share warrants although the Articles provide that the Directors may issue warrants tosubscribe for any class of shares or other securities of the Company, which warrants may be issuedon such terms as the Directors may from time to time determine.
3.5 Dividends and distributions
Pursuant to the Jersey Companies Law, the Company may make a distribution at any time whichshall be debited to the share premium account or any other account other than the capital redemptionreserve or nominal capital account provided that the Directors authorising the distribution make astatement as to the solvency of the Company immediately following payment of the distribution whichis forward looking for a twelve month period following the payment in the form set out in the JerseyCompanies Law.
3.6 Protection of minorities
(a) The principle under English case law that, if any wrong is done to a company (e.g. if thedirectors have acted in breach of duty in some way), the proper claimant in any legal actionfor breach of such duty is the company itself has been held to form a part of Jersey law.However, in exceptional situations a minority shareholder is permitted to bring a derivativeaction in a company’s name, and on a company’s behalf, in particular where:
(i) the majority cannot ratify what has been done (e.g. where the company acts illegallyor where a resolution has been improperly passed); or
(ii) where it would be unfair not to allow a derivative action (e.g. where there exists fraudon the minority or unfairly prejudicial conduct of the directors or the majorityshareholder(s)).
APPENDIX VII SUMMARY OF THE CONSTITUTION OF THE COMPANY ANDJERSEY COMPANIES LAW
— VII-20 —

(b) Under the Jersey Companies Law, a member of the Company may apply to the Royal Courtof Jersey for an order that the Company’s affairs are being or have been conducted in amanner which is unfairly prejudicial to the interests of its members generally or of somepart of its members (including at least the member) or that an actual or proposed act oromission of the Company (including an act or omission on its behalf) is or would be soprejudicial. If the Royal Court of Jersey is satisfied that such an application is wellfounded, it may make such order as it thinks fit for giving relief in respect of the matterscomplained of.
(c) Under the Jersey Companies Law, inspectors may be appointed to investigate the affairs ofthe Company, whether or not the Company is being wound up, on the following basis:
(i) The Minister for Economic Development (the “Minister”) or the Jersey FinancialServices Commission (the “Commission”) may appoint one or more competentinspectors to investigate the affairs of the Company and to report on them as theMinister or the Commission may direct.
(ii) The appointment may be made on the application of the registrar, the Company or amember, officer or creditor of the Company.
(iii) The Minister or the Commission may, before appointing inspectors, require theapplicant, other than the registrar, to give security, to an amount not exceeding£10,000 or such other sum as may be prescribed for payment of the costs of theinvestigation.
(d) Any member of the Company may apply to the Royal Court of Jersey to wind the Companyup on just and equitable grounds.
3.7 Management
Except in relation to distributions as mentioned above, the Jersey Companies Law contains nospecific restrictions on the power of the Directors to dispose of the assets of the Company. However,under the Jersey Companies Law, the Directors, in exercising their powers and discharging theirduties, must (a) act honestly and in good faith with a view to the best interests of the Company; and(b) exercise the care, diligence and skill that a reasonably prudent person would exercise incomparable circumstances. Under the Jersey Companies Law, a Director will not be held to havebreached his duties if all of the members of the Company authorise or ratify his act or omission andafter the act or omission the Company will be able to discharge its liabilities as they fall due.
3.8 Accounting and auditing requirements
Under the Jersey Companies Law, the Company must keep accounting records which aresufficient to show and explain its transactions and are such as to disclose with reasonable accuracy,at any time, the financial position of the Company. Accounts must be prepared in accordance withgenerally accepted accounting principles and audited accounts must show a true and fair view of, orbe presented fairly in all material respects, so as to show the company’s profit or loss for the periodcovered by the accounts and the state of its affairs at the end of the period.
3.9 Exchange control
There are no exchange control regulations or currency restrictions under Jersey law.
APPENDIX VII SUMMARY OF THE CONSTITUTION OF THE COMPANY ANDJERSEY COMPANIES LAW
— VII-21 —

3.10 Taxation
(a) Jersey taxation legislation provides that the general basic rate of income tax on the profitsof companies regarded as resident in Jersey or having a permanent establishment in Jerseywill be zero per cent and that only a limited number of financial services companies shallbe subject to income tax at a rate of ten per cent. There is no capital gains tax in Jersey.
(b) A 3% sales tax is generally paid in Jersey on the sale or exchange of goods and servicesused in Jersey. All businesses with a 12-month taxable turnover in excess of £300,000 must,by Jersey law, register for this tax. For so long as the Company is an international serviceentity within the meaning of the Goods and Services (Jersey) Law 2007, having satisfiedthe requirements of the Goods and Services Tax (International Services Entities) (Jersey)Regulations 2008, as amended, a supply of goods or of a service made by or to the Companyshall not be a taxable supply for the purposes of Jersey law.
3.11 Stamp duty on transfers
There is no stamp duty payable in Jersey on transfers of shares in a Jersey company.
3.12 Loans to directors
There is no express provision in the Jersey Companies Law prohibiting the making of loans bythe Company to any of the Directors. However, the Articles include comprehensive prohibitions onloans to Directors.
3.13 Inspection of corporate records
Under the Jersey Companies Law, the Company’s register of members shall during businesshours be open to the inspection of a member of the Company without charge and may, on the paymentof such sum (if any), not exceeding the published maximum, as the Company may require and onsubmission to the Company of a declaration under the Jersey Companies Law (as to the use of thecopy) require a copy of the register and the Company shall, within 10 days after receipt of the paymentand the declaration, cause the copy so required to be available at the place where the register is keptfor collection by that person during business hours.
3.14 Winding up
(a) The Company may be placed into liquidation under Jersey law by a summary or creditors’winding up, by order of the Royal Court of Jersey on just and equitable grounds orfollowing a declaration “en désastre” by the Royal Court of Jersey pursuant to Jerseybankruptcy law.
(b) The Company may be wound up summarily if the company is solvent and the Directorsmake a statement to that effect. The winding up would commence upon the memberspassing a special resolution to wind the Company up summarily.
(c) A creditors’ winding up would commence if the members passed a special resolution towind the Company up by way of creditors’ winding up or if the Company is beingsummarily wound up and becomes insolvent. The Jersey Companies Law set outcomprehensive provisions with regard to, amongst other things, meetings of creditors andprocedures thereat, appointment, powers and duties of liquidators, the involvement of theRoyal Court of Jersey and the disposal and clawback of the Company’s property. Pursuantto the Jersey Companies Law, a liquidator must report possible criminal offences relatingto the Company, those involved with it or the Directors. As soon as the affairs of the
APPENDIX VII SUMMARY OF THE CONSTITUTION OF THE COMPANY ANDJERSEY COMPANIES LAW
— VII-22 —
Company in a creditors’ winding up were fully wound up, the liquidator would make up anaccount of the winding up, showing how it had been conducted and the Company’s propertyhad been disposed of, and thereupon call a general meeting of the Company and a meetingof the creditors for the purpose of laying the account before the meetings and giving anexplanation of it.
(d) Jersey bankruptcy law allows for the Company to be declared “en désastre” by the RoyalCourt of Jersey upon an application by the Company or by a creditor with a claim of notless than £3,000 against the Company and if the Royal Court of Jersey considers it just andequitable to do so. The Company would have the ability to recall the declaration if it wasnot insolvent (i.e. not unable to pay its debts as they fell due). The Royal Court of Jerseywould, on such a declaration, appoint the Viscount of Jersey to administer the liquidationof the Company and all the property and assets of the Company would vest in the Viscount.The Viscount has similar powers to a liquidator under a creditor’s winding up. In a désastre,the first duty of the Viscount is to liquidate the estate for the benefit of the creditors whoprove their claims. Co-extensive with the Viscount’s duty to protect and realise theCompany’s property would be a duty requiring him to investigate the circumstances givingrise to the désastre. The Viscount also has a duty to report possible misconduct. TheViscount would have an obligation to supply all the creditors with a report and accountsrelating to the désastre when he had realised all the Company’s property.
3.15 Reconstructions
Under the Jersey Companies Law, the Company has the power to compromise with creditors andmembers. Where a compromise or arrangement is proposed between the Company and its creditors,or a class of them, or between the Company and its members, or a class of them, the Royal Court ofJersey may on the application of the Company or a creditor or member of it or, in the case of theCompany being wound up, of the liquidator, order a meeting of the creditors or class of creditors, orof the members of the Company or class of members (as the case may be), to be called in a manneras the Royal Court of Jersey directs. If a majority in number representing:
(a) 3/4ths in value of the creditors or class of creditors; or
(b) 3/4ths of the voting rights of the members or class of members,
as the case may be, present and voting either in person or by proxy at the meeting, agree to acompromise or arrangement, the compromise or arrangement, if sanctioned by the Royal Court ofJersey, is binding on:
(a) all creditors or the class of creditors; or
(b) all the members or class of members,
as the case may be and also on the Company or, in the case of the Company in the course of beingwound up, on the liquidator and contributories of the Company.
3.16 Compulsory acquisition
(a) Under the Jersey Companies Law, if, following a takeover offer (which is defined as “anoffer to acquire all the shares, or all the shares of any class or classes, in a company (otherthan shares which at the date of the offer are already held by the offeror), being an offeron terms which are the same in relation to all the shares to which the offer relates”), anofferor has acquired or contracted to acquire not less than nine-tenths in value of the sharesto which the offer relates, the offeror may give notice, in accordance with the Jersey
APPENDIX VII SUMMARY OF THE CONSTITUTION OF THE COMPANY ANDJERSEY COMPANIES LAW
— VII-23 —
Companies Law to the holders of those shares to which the offer relates which the offerorhas not acquired or contracted to acquire, that it desires to acquire those shares. Subject tothe provisions of the Jersey Companies Law, upon service of the notice by the offeror, itshall become entitled and be bound to acquire the shares. A minority shareholder also hasa right, pursuant to the Jersey Companies Law, to be bought out by an offeror.
(b) Where a notice is given under the Jersey Companies Law to the holder of any shares theRoyal Court of Jersey may, on an application made by the shareholder within 6 weeks fromthe date on which the notice was given, order that the offeror shall not be entitled and boundto acquire the shares or specify terms of acquisition different from those of the offer.
3.17 Indemnification
(a) Subject to the exceptions in (b) below, the Jersey Companies Law prohibits any provisionwhether contained in the Articles or in a contract with the Company or otherwise wherebythe Company or any of its subsidiaries or any other person, for some benefit conferred ordetriment suffered directly or indirectly by the Company, agrees to exempt any personfrom, or indemnify him against, any liability which by law would otherwise attach to himby reason of the fact that he is or was an officer of the Company.
(b) The above prohibitions do not apply to a provision for exempting a person from orindemnifying him against:
(i) any liabilities incurred in defending any proceedings (whether civil or criminal):
(A) in which judgment is given in his favour or he is acquitted; or
(B) which are discontinued otherwise than for some benefit conferred by him or onhis behalf or some detriment suffered by him; or
(C) which are settled on terms which include such benefit or detriment and, in theopinion of a majority of the Directors (excluding any Director who conferredsuch benefit or on whose behalf such benefit was conferred or who suffered suchdetriment), he was substantially successful on the merits in his resistance to theproceedings;
(ii) any liability incurred otherwise than to the Company if he acted in good faith with aview to the best interests of the Company; or
(iii) any liability incurred in connection with an application made under the JerseyCompanies Law in which relief is granted to him by the Royal Court of Jersey; or
(iv) any liability against which the Company normally maintains insurance for personsother than Directors.
4 GENERAL
Ogier, the Company’s legal counsel on Jersey law, have sent to the Company a letter of advicesummarising certain aspects of Jersey Islands company law . This letter, together with a copy of theJersey Companies Law, is available for inspection as referred to in the paragraph headed “DocumentsAvailable for Public Inspection” in Appendix IX to this prospectus. Any person wishing to have adetailed summary of Jersey company law or advice on the differences between it and the laws of anyjurisdiction with which he is more familiar is recommended to seek independent legal advice.
APPENDIX VII SUMMARY OF THE CONSTITUTION OF THE COMPANY ANDJERSEY COMPANIES LAW
— VII-24 —
A. FURTHER INFORMATION ABOUT THE GROUP
1. Incorporation of the Company
The Company was incorporated under the name of “United Company RUSAL Limited” in Jerseyunder the Jersey Companies Law with registered number 94939 as a company with limited liability on26 October 2006. The Company has established a principal place of business in Hong Kong at 15thFloor, Entertainment Building, 30 Queen’s Road Central, Hong Kong and was registered with theRegistrar of Companies in Hong Kong on 17 December 2009 as a non-Hong Kong company under PartXI of the Companies Ordinance. Wong Po Ying, Aby of Flat 7A, Block 26, South Horizons, Apleichau,Hong Kong, has been appointed as the authorised representative of the Company for the acceptanceof service of process and notices on behalf of our Company in Hong Kong.
The Shareholders of the Company have by resolution dated 26 December 2009 resolved that theCompany will be renamed as United Company RUSAL plc, with effect from the admission of theShares to trading on the Hong Kong Stock Exchange. The change of the Company’s name is subjectto the registration of the change of the name becoming effective in Jersey and the registration of thechange of the Company’s name under Part XI of the Companies Ordinance. The Company will publishan announcement on the change of name and the arrangements for the exchange of share certificates,if any, as soon as practicable after the new name has been registered and the registration has takeneffect.
As the Company is incorporated in Jersey, its corporate structure and Articles of Association aresubject to the relevant laws and regulations of Jersey. A summary of the relevant laws and regulationsof Jersey and of the Articles of Association is set out in the section headed “Summary of theConstitution of the Company and Jersey Companies Law” in Appendix VII to this prospectus.
2. Changes in share capital of the Group
The Company
The Company was incorporated with an authorised share capital of US$10,000 ordinary sharesof US$1.00 each, of which one subscriber share was issued on incorporation to each of OgierNominees (Jersey) Limited and Reigo Nominees (Jersey) Limited. On 27 October 2006, these twoshares were transferred to En+ for US$1.00 each. On 2 March 2007, 6,598 shares were issued to En+and on 26 March 2007, 2,200 shares were allotted to SUAL Partners and 1,200 shares were allottedto Amokenga Holdings. On 8 April 2008, the authorised share capital of the Company was increased,by special resolution for the creation of 1,628 new ordinary shares of US$1.00 each, to 11,628ordinary shares of US$1.00 each. These 1,628 new ordinary shares were allotted to Onexim on 24April 2008. On 1 December 2009, the authorised share capital was increased to 13,500 ordinary sharesof US$1.00 each and on 7 December 2009, 742 new ordinary shares were allotted to Onexim. On 24December 2009, the entire authorised and issued share capital of the Company was subdivided by thedivision of the nominal share capital of each ordinary share from US$1.00 each to US$0.01 eachthereby increasing the number of authorised ordinary shares to 1,350,000 and the issued ordinaryshares to 1,237,000.
Immediately following completion of the Global Offering (but not taking into account any Shareswhich may be allotted and issued pursuant to the exercise of the Over-allotment Option) and theCapitalisation Issue, the issued share capital of the Company will be US$151,363,636.46 divided into15,136,363,646 Shares, all fully paid or credited as fully paid and 4,863,636,354 Shares will remainunissued.
Other than pursuant to the exercise of the Over-allotment Option or in connection with anyconversion of warrants into Shares in connection with the Group’s debt restructuring arrangements orin connection with any management compensation or incentivisation schemes or agreements, asdisclosed in this prospectus, there is no intention to issue any of the authorised but unissued sharecapital of the Company.
APPENDIX VIII STATUTORY AND GENERAL INFORMATION
— VIII-1 —
App1A-5App1A-6App1A-29(2)Rule 8.02S.342(1)3rd Sch-21
Save for aforesaid and as mentioned in the subsection headed “Resolutions in Writing of ourShareholders passed on 26 December 2009” below, there has been no alteration in the share capitalof the Company since its incorporation.
Our subsidiaries
The list of our material subsidiaries is set out in the section headed “Appendix I — Accountants’Report” to this prospectus.
3. Resolutions in Writing of the Shareholders passed on 26 December 2009
Pursuant to the written resolutions passed by the Shareholders on 26 December 2009:
(a) simultaneously with the admission of Shares to trading on the Main Board of the StockExchange, the authorised share capital of the Company increased from US$13,500comprising 1,350,000 ordinary shares of US$0.01 each to US$200,000,000 comprising20,000,000,000 ordinary shares of US$0.01 each;
(b) conditional upon the conditions for completion of the Global Offering being fulfilled and(i) the Listing Committee of the Hong Kong Stock Exchange granting the listing of, andpermission to deal in, the Shares in issue and to be issued as mentioned in this prospectusand (ii) the obligations of the Underwriters under the International Placing Agreementbecoming unconditional and not being terminated in accordance with the terms of theInternational Placing Agreement or otherwise, in each case on or before the date falling 30days after the date of this prospectus:
(1) the Global Offering and the Directors were authorised to allot and issue, and toapprove the transfer of, such number of Shares in connection with the Global Offeringand any exercise of the Over-allotment Option as they see fit, on and subject to theterms and conditions stated in this prospectus;
(2) a general unconditional mandate was given to the Directors to allot, issue and dealwith Shares (otherwise than pursuant to, or in consequence of, the Global Offering, arights issue or pursuant to the exercise of any subscription rights which may begranted under any scrip dividend scheme or similar arrangements, any adjustment ofrights to subscribe for shares under options and warrants or a special authority grantedby the shareholders) with an aggregate nominal value of not more than the sum of:
— 20% of the aggregate nominal value of the share capital of the Company in issueimmediately following completion of the Global Offering before any exercise ofthe Over-allotment Option; and
— the aggregate nominal value of the share capital of the Company repurchased byus (if any);
(3) subject to the Jersey Companies Law, a general unconditional mandate was given tothe Directors to exercise all the powers of the Company to repurchase Shares to belisted on the Hong Kong Stock Exchange with a total nominal value of not more than10% of the aggregate nominal value of the Company’s share capital in issueimmediately following completion of the Global Offering before any exercise of theOver-allotment Option at:
(i) a maximum price (exclusive of expenses) for each Share of an amount equal to105 per cent of the average of the middle market quotations as derived from theMain Board of the Hong Kong Stock Exchange for such Shares for the fivebusiness days immediately preceding the date of purchase; and
APPENDIX VIII STATUTORY AND GENERAL INFORMATION
— VIII-2 —
App1A-29(1)
17.02(1)(a)
(ii) a minimum price (exclusive of expenses) for each share of the nominal amountof the Share purchased; and
(4) the general unconditional mandate as mentioned in paragraph (2) above was extendedby the addition to the aggregate nominal value of the Shares which may be allotted andissued or agreed to be allotted and issued by the Directors pursuant to such generalmandate of an amount representing the aggregate nominal value of the Sharespurchased by the Company pursuant to the mandate to repurchase Shares referred toin paragraph (3) above.
Each of the general mandates referred to in paragraphs (2) and (3) above will remain ineffect until whichever is the earliest of (i) in respect of paragraph (3) only, the date falling18 months from the date of the passing of the relevant resolution; (ii) the conclusion of thenext annual general meeting of our Company; (iii) the expiration of the period within whichthe next annual general meeting of our Company is required to be held by any applicablelaw or the Articles of Association of our Company; or (iv) the time when such mandate isrevoked or varied by a special resolution of the Shareholders of the Company in a generalmeeting.
4. Repurchase of the Company’s own Shares
This section includes information relating to the repurchase of the Company’s Shares, includinginformation required by the Hong Kong Stock Exchange to be included in this prospectus concerningsuch repurchase.
(a) Relevant Legal and Regulatory Requirements
The Listing Rules permit the Shareholders to grant to the Directors a general mandate torepurchase the Shares that are listed on the Hong Kong Stock Exchange. Such mandate is required tobe given by way of an ordinary resolution passed by our Shareholders in a general meeting. However,the Jersey Companies Law requires the Shareholders to pass a special resolution to authorise sharerepurchases.
(b) Shareholders’ Approval
All proposed repurchases of Shares (which must be fully paid up) must be approved in advanceby special resolutions of our shareholders in a general meeting, either by way of general mandate orby specific approval of a particular transaction.
On 26 December 2009, the Directors were granted a general unconditional mandate to repurchaseup to 10% of the aggregate nominal value of the share capital of the Company in issue immediatelyfollowing completion of the Global Offering on the Hong Kong Stock Exchange, before any exerciseof the Over-allotment Option, subject to a minimum and maximum price. This mandate will remainin effect until whichever is the earliest of (i) the date falling 18 months from the date of the passingof the resolution; (ii) the conclusion of the next annual general meeting of the Company; (iii) theexpiration of the period within which the next annual general meeting of the Company is required tobe held by any applicable law or the Articles of Association of the Company; or (iv) the time whensuch mandate is revoked or varied by a special resolution of the shareholders of the Company in ageneral meeting (the “Relevant Period”).
(c) Source of Funds
The repurchase of the Shares listed on the Hong Kong Stock Exchange must be funded from thefunds legally available for the purpose in accordance with the Memorandum of Association andArticles of Association and the applicable laws of Jersey. The Company may not repurchase the Shares
APPENDIX VIII STATUTORY AND GENERAL INFORMATION
— VIII-3 —
Rule 10.06(1)(a)(ii)Rule 10.06(1)(b)(i)
on the Hong Kong Stock Exchange for consideration other than cash or for settlement otherwise thanin accordance with the trading rules of the Hong Kong Stock Exchange. Subject to the foregoing, theCompany may make repurchases with funds which would otherwise be available for dividend ordistribution or out of an issue of new Shares for the purpose of the repurchase.
(d) Reasons for Repurchases
The Directors believe that it is in the Company’s and the Shareholders’ best interests for theDirectors to have general authority to execute repurchases of the Shares in the market. Suchrepurchases may, depending on market conditions and funding arrangements at the time, lead to anenhancement of the net asset value per Share and/or earnings per Share and will only be made wherethe Directors believe that such repurchases will benefit the Company and the shareholders.
(e) Funding of Repurchases
In repurchasing securities, the Company may only apply funds legally available for such purposein accordance with the Memorandum of Association and Articles of Association and the Listing Rules.
On the basis of the current financial position of the Company as disclosed in this prospectus andtaking into account the current working capital position of the Company, the Directors believe that,if the repurchase mandate were to be exercised in full, it might have a material adverse effect on theworking capital and/or the gearing position as compared with the position disclosed in this prospectus.However, the Directors do not propose to exercise the repurchase mandate to such an extent as would,in the circumstances, have a material adverse effect on the working capital requirements of theCompany or the gearing levels which in the opinion of the Directors are from time to time appropriatefor us.
(f) Status of Repurchased Shares
All repurchased Shares (whether effected on the Hong Kong Stock Exchange or otherwise) willbe automatically delisted and the certificates for those Shares must be cancelled and destroyed. Underthe Jersey Companies Law, a company’s repurchased shares (other than shares that are, immediatelyafter being purchased or redeemed, held as treasury shares) shall be treated as cancelled and theamount of the company’s issued share capital shall be diminished by the nominal value of therepurchased shares accordingly although the authorised share capital of the company will not bereduced.
(g) Suspension of Repurchase
Pursuant to the Hong Kong Listing Rules, the Company may not make any repurchase of Sharesafter a price sensitive development has occurred or has been the subject of a decision until such timeas the price sensitive information has been made publicly available. In particular, under therequirements of the Hong Kong Listing Rules in force as of the date hereof, during the period of onemonth immediately preceding the earlier of: (i) the date of the Board meeting (as such date is firstnotified to the Hong Kong Stock Exchange in accordance with the Listing Rules) for the approval ofthe Company’s results for any year, half year, quarterly or any other interim period (whether or notrequired under the Listing Rules); and (ii) the deadline for the Company to publish an announcementof the Company’s results for any year or half-year under the Hong Kong Listing Rules, or quarterlyor any other interim period (whether or not required under the Hong Kong Listing Rules), and in eachcase ending on the date of the results announcement, the Company may not repurchase Shares on theHong Kong Stock Exchange unless the circumstances are exceptional.
APPENDIX VIII STATUTORY AND GENERAL INFORMATION
— VIII-4 —
Rule 10.06 (1)(b)(ii)
Rule 10.06(1)(b)(iii)
Rule 10.06 (1)(b)(iv)
Rule 10.06(5)

(h) Procedural and Reporting Requirements
As required by the Hong Kong Listing Rules, repurchases of Shares on the Hong Kong StockExchange or otherwise must be reported to the Hong Kong Stock Exchange not later than 30 minutesbefore the earlier of the commencement of the morning trading session or any pre-opening session onthe Hong Kong Stock Exchange business day following any day on which the Company may make apurchase of Shares. The report must state the total number of Shares purchased the previous day, thepurchase price per Share or the highest and lowest prices paid for such purchases. In addition, theCompany’s annual report is required to disclose details regarding repurchases of Shares made duringthe year, including a monthly analysis of the number of shares repurchased, the purchase price perShare or the highest and lowest price paid for all such purchases, where relevant, and the aggregateprices paid.
(i) Connected Persons
A company is prohibited from knowingly repurchasing securities on the Hong Kong StockExchange from a connected person and a connected person shall not knowingly sell its securities tothe company on the Hong Kong Stock Exchange.
(j) Share Capital
The exercise in full of the current repurchase mandate, on the basis of 15,136,363,646 Shares inissue immediately after completion of the Global Offering and the Capitalisation Issue before anyexercise of the Over-allotment Option, could accordingly result in up to 1,513,636,364 Shares beingrepurchased by the Company during the Relevant Period.
(k) General
None of the Directors nor, to the best of their knowledge having made all reasonable enquiries,any of their associates (as defined in the Listing Rules) currently intends to sell any of their Sharesto the Company or its subsidiaries.
The Directors have undertaken to the Hong Kong Stock Exchange that, so far as the same maybe applicable, they will exercise the repurchase mandate in accordance with the Listing Rules, theMemorandum of Association and Articles of Association, the Jersey Companies Law and any otherapplicable laws of Jersey.
If, as a result of any repurchase of the Company’s Shares, a shareholders’ proportionate interestin our voting rights is increased, such increase will be treated as an acquisition for the purposes ofthe Hong Kong Code on Takeovers and Mergers. Accordingly, a shareholder or a group of shareholdersacting in concert could obtain or consolidate control of the Company and become obliged to make amandatory offer in accordance with rule 26 of the Hong Kong Code on Takeovers and Mergers. TheDirectors are not aware of any consequences of repurchases which would arise under the Hong KongCode on Takeovers and Mergers.
No connected person as defined by the Listing Rules has notified the Company that he or it hasa present intention to sell his or its Shares to the Company, or has undertaken not to do so, if therepurchase mandate is exercised.
APPENDIX VIII STATUTORY AND GENERAL INFORMATION
— VIII-5 —
Rule 10.06(1)(b)(ix)
Rule 10.06 (1)(b)(i)
Rule 10.06 (1)(b)(v)
Rule 10.06 (1)(b)(vi)
Rule 10.06(1)(b)(vii)Rule 10.06 (1)(b)(ix)
Rule 10.06(1)(b)(vii)

B. FURTHER INFORMATION ABOUT THE BUSINESS OF THE GROUP
1. Summary of material contracts
The Group has entered into the following contracts (not being contracts entered into in theordinary course of business) within the two years immediately preceding the date of this prospectusthat are or may be material:
(a) A guarantee agreement dated 2 December 2009 (the “Guarantee Agreement”) entered intobetween the Company, the original guarantors named therein including RUSAL Armenal,CJSC, Bencroft Financial Ltd., Tameko Developments Inc., United Company RUSALAluminium Limited (formerly known as W.A.C. Worldwide Aluminum Co Ltd.), RTILimited (formerly known as Rusal Trading International Ltd.), RUSAL Limited (formerlyknown as Rusal Holding Limited), the Company, Eurallumina SpA, Noirieux-ConsultadoriaE Serviços Sociedade Unipessoal Lda, Khakas Aluminium Smelter, LLC, RUSAL BratskOJSC, RUSAL Krasnoyarsk OJSC, RUSAL Novokuznetsk OJSC, RUSAL SayanogorskOJSC, RUSAL Taishet LLC, Russian Aluminium OJSC, Siberian-Urals AluminiumCompany OJSC (or OJSC SUAL), United Company RUSAL-Trading House OJSC(formerly known as OJSC Russian Aluminium Management), Kubikenborg Aluminium AB,RS International GmbH (formerly known as Rusal Services GmbH), RUSAL MarketingGmbH, Aluminum Group Ltd., United Company Rusal Alumina Limited (formerly knownas Worldwide Alumina (Cyprus) Co Ltd.), United Company RUSAL Foil Limited, UnitedCompany RUSAL Energy Limited, Limerick Alumina Refining Limited, Friguia S.A.,RUSAL Achinsk, OJSC, Mykolayiv Alumina Refinery Company Limited, Rusal FinancialCenter Limited and Bauxite & Alumina Mining Venture Limited (the “OriginalGuarantors” and each of them “Original Guarantor”), and BNP Paribas (Suisse) SA (assecurity agent) pursuant to which, among others, each Original Guarantor guarantees to theSecurity Agent the punctual performance by each other Original Guarantor of certainOriginal Guarantor’s obligations under the Guarantee Agreement and the punctualperformance by the Company of certain obligations of the Company under the GuaranteeAgreement;
(b) A master warrant agreement dated 7 December 2009 between the Company and thewarrantholders named therein including ABN AMRO Bank N.V., Banca Nazionale delLavoro S.p.A., Banco Bilbao Vizcaya Argentaria S.A., London Branch, Banco Finantia SA,Bank of Baroda, London, Bank of China (Eluosi), Bank of Taiwan, Offshore BankingBranch, Banque Cantonale Vaudoise, Barclays Bank plc, BAWAG P.S.K. Bank für Arbeitund Wirtschaft und Österreichische Postsparkasse Aktiengesellschaft, Bayerische Hypo-und Vereinsbank AG, Bayerische Landesbank, BBVA Ireland p.l.c., Black Sea Trade andDevelopment Bank, BlueCrest Mercantile BV, BNP Paribas (Suisse) SA, Calyon, ChangHwa Commercial Bank Ltd, Offshore Banking Branch, China Development BankCorporation, Citibank N.A., Bahrain Branch, Citibank N.A., London Branch,Commerzbank (Eurasia) SAO, CREDIT SUISSE AG, DekaBank Deutsche GirozentraleLuxembourg S.A. + Credits Luxembourg, Deutsche Bank AG, Amsterdam Branch, DZBANK AG Deutsche Zentral-Genossenschaftsbank, Frankfurt am Main, Erste Group BankAG, First Commercial Bank, GarantiBank International N.V., HSBC Bank plc, HSBC Bankplc, Investment Banking Division, HSH Nordbank AG, London Branch, ICICI Bank EurasiaLLC, IKB Deutsche Industriebank AG, ING Bank N.V., Intesa Sanpaolo, London Branch,Intesa Sanpaolo, Paris Branch, Joint-Stock company “Banque Societe Generale Vostok”,JPMorgan Securities Ltd, KBC Bank NV, KBC Finance Ireland, KfW IPEX-Bank GmbH,Landesbank Baden-Württemberg, Medicapital Bank Plc, Mega International CommercialBank, Mizuho Corporate Bank, Ltd., MKB BANK ZRT., Morgan Stanley & Co.International PLC, N M Rothschild & Sons Limited, Natixis, Norddeutsche LandesbankLuxembourg S.A., Nordea Bank AB (Publ.), OJSC Nordea Bank (formerly known as JSB
APPENDIX VIII STATUTORY AND GENERAL INFORMATION
— VIII-6 —
App1A-523rd Sch-17

“ORGRESBANK”), Coöperatieve Centrale Raiffeisen-Boerenleenbank B.A., RaiffeisenLandesbank Oberösterreich AG (Linz), Raiffeisen Zentralbank ÖsterreichAktiengesellschaft, Savings Bank of the Russian Federation (Sberbank), SkandinaviskaEnskilda Banken AB (publ), SOCIETE GENERALE, Standard Chartered Bank, State Bankof India, Antwerp, Sumitomo Mitsui Banking Corporation, Sumitomo Mitsui BankingCorporation Europe Limited, The Bank of Tokyo-Mitsubishi UFJ, Ltd., The ShanghaiCommercial & Savings Bank Ltd., Offshore Banking Branch, UBS AG, London Branch,VTB Bank (Deutschland) AG, VTB Bank (France) SA, VTB Capital plc (formerly VTBBank Europe plc), WestLB AG, ZAO Raiffeisenbank and ZAO Unicredit Bank setting outthe terms and conditions on which the Company will issue the fee warrants and equitycompensation warrants and related matters;
(c) An international override agreement dated 7 December 2009 (the “International OverrideAgreement”) entered into between the Company, the companies listed in Part I of ScheduleI therein (as borrowers) (the “Borrowers”) including RUSAL Armenal CJSC, TamekoDevelopments Inc., United Company RUSAL Aluminium Limited (formerly known asW.A.C. Worldwide Aluminum Co Limited), the Company, Eurallumina SpA,Noirieux-Consultadoria E Serviços Sociedade Unipessoal, Lda, Khakas Aluminium SmelterLLC, Boguchansk Aluminium Smelter CJSC, RUSAL Bratsk OJSC, RUSAL KrasnoyarskOJSC, RUSAL Sayanogorsk OJSC, RUSAL Taishet LLC, Siberian-Urals AluminiumCompany OJSC (or OJSC SUAL) and Kubikenborg Aluminium AB, the companies listed inPart I of Schedule I therein (as guarantors) (the “Original Guarantors”) including RUSALArmenal CJSC, Bencroft Financial Ltd., Tameko Developments Inc., United CompanyRUSAL Aluminium Limited (formerly known as W.A.C. Worldwide Aluminum CoLimited), RTI Limited (formerly known as Rusal Trading International Ltd.), RUSALLimited (formerly known as Rusal Holding Limited), the Company, Eurallumina SpA,Noirieux-Consultadoria E Serviços Sociedade Unipessoal Lda, Khakas Aluminium SmelterLLC, RUSAL Bratsk OJSC, RUSAL Krasnoyarsk OJSC, RUSAL Novokuznetsk OJSC,RUSAL Sayanogorsk OJSC, RUSAL Taishet LLC, Russian Aluminium OJSC,Siberian-Urals Aluminium Company OJSC (or OJSC SUAL), United CompanyRUSAL-Trading House OJSC (formerly known as OJSC Russian Aluminium Management),Kubikenborg Aluminium AB, RS International GmbH (formerly known as Rusal ServicesGmbH), RUSAL Marketing GmbH, Aluminum Group Ltd., United Company Rusal AluminaLimited (formerly known as Worldwide Alumina (Cyprus) Co Ltd.), United CompanyRUSAL Foil Limited, United Company RUSAL Energy Limited, Limerick AluminaRefining Limited, Friguia S.A., RUSAL Achinsk, OJSC, Mykolayiv Alumina RefineryCompany Limited, Rusal Financial Center Limited and Bauxite & Alumina Mining VentureLimited (the Borrowers and Original Guarantors, collectively, the “Original Obligors”),the financial institutions listed in Part III of Schedule I therein (as lenders) (the “FinancialInstitutions”) including DekaBank Deutsche Girozentrale Luxembourg S.A., LandesbankBaden-Württemberg, BBVA, Erste Group Bank AG, Sumitomo Mitsui BankingCorporation, Morgan Stanley, The Bank of Tokyo-Mitsubishi UFJ, Ltd., HSBC Bank plc,HSBC Bank plc, Investment Banking, Intesa Sanpaolo Bank Ireland PLC, Intesa Sanpaolo,London Branch, Banco Finantia SA, Calyon, NATIXIS, ING Bank N.V., BAWAG P.S.K.Bank für Arbeit und Wirtscharft und Österreichische Postsparkasse Aktiengesellschaft,Mizuho, Commerzbank Aktiengesellschaft, Bayerische Landesbank, KBC Bank NV, IKBDeutsche Industriebank AG, Credit Suisse, DZ BANK AG DeutscheZentral-Genossenschaftsbank, Frankfrut am Main, Raiffeisen Zentralbank ÖsterreichAktiengesellschaft, BNP Paribas (Suisse) SA, KfW IPEX-Bank GmbH, ABN AMRO BankN.V., VTB Bank (Deutschland) AG, Raiffeisen Landesbank Oberösterreich AG Linz,Citibank, Bahrain Branch, N M Rothschild & Sons Limited, HSH Nordbank AG, LondonBranch, Coöperatieve Centrale Raiffeisen-Boerenleenbank B.A., Norddeutsche LandesbankLuxembourg S.A., Banque Cantonale Vaudoise, State Bank of India, ICICI Bank EurasiaLLC, Mega International Commercial Bank, Medicapital Bank, MKB Bank Zrt., Bayerische
APPENDIX VIII STATUTORY AND GENERAL INFORMATION
— VIII-7 —
Hypo-und Vereinsbank AG, Barclays, Citibank, London Branch, Natixis, Societe Generale,J.P. Morgan Chase Bank, N.A., UBS AG, London Branch, China Development Bank, BNPParibas SA, BBVA Ireland plc, BTMU (Europe) Limited, Sumitomo Mitsui BankingCorporation Europe Limited, Intesa Sanpaolo, Paris Branch, Deutsche Bank AG,Amsterdam Branch, West LB AG, BlueCrest Mercantile BV, Bank of China, SumitomoMitsui Banking Corp, Shanghai Commercial Bank, Bank of Baroda, VTB Capital plc(formerly VTB Europe plc), Chang Hwa Commercial Bank, Offshore Banking Branch, FirstCommercial Bank, GarantiBank International N.V., Bank of Taiwan, SkandinaviskaEnskilda Banken AB (publ), Sberbank, ING Bank (EURASIA) ZAO, KBC Finance Ireland,Banque Societe Generale Vostok, Standard Chartered Bank, NORDEA BANK AB (Publ.),OJSC Nordea Banks (formerly JSB “ORGRESBANK”), VTB Bank (France) SA, Black SeaTrade and Development Bank, BNP Paribas ZAO, ZAO Unicredit Bank, ZAORaiffeisenbank, WestLB AG, OJSC Nordea Bank, Banca Nazionale del Lavoro S.p.A.,Commerzbank (Eurasija) SAO and Banco Nazionale del Lavoro S.p.A., the facilityrepresentatives listed in Part IV of Schedule 1 therein (the “Facility Representatives”)including Natexis Banques Populaires, ABN AMRO Bank N.V. (London Branch), BNPParibas SA, Morgan Stanley International Limited, BNP Paribas, Barclays Bank PLC,Bayerische Hypo- und Vereinsbank AG, ING Bank NV, Standard Chartered Bank andBayerische Landesbank, the existing security agents listed in Part V of Schedule 1 therein(the “Existing Security Agents”) including Natexis Banques Populaires, ABN AMRO BankN.V., London Branch, BNP Paribas SA, Bayerische Hypo-und Vereinsbank AG andStandard Chartered Bank and BNP Paribas (Suisse) SA (as administrative agent andsecurity agent) pursuant to which during the override period, the Financial Institution andany person which has become a party pursuant to the terms of the International OverrideAgreement agreed to continue to make available their facilities and amend, vary, modify,waive, override, replace and supplement certain terms of the existing finance documents.
(d) An intercreditor agreement dated 7 December 2009 (the “Intercreditor Agreement”)entered into between the Company, the Original Obligors, the Financial Institutions, theFacility Representatives, the Existing Security Agents and BNP Paribas (Suisse) SA (asadministrative agent and security agent) which governed the intercreditor relations duringthe term of the International Override Agreement, including in relation to enforcement ofsecurity, the taking of any enforcement actions against the Company and certain of itssubsidiaries and sharing of proceeds.
(e) An instrument constituting warrants to subscribe for Shares in the Company dated 7December 2009 setting out the terms of fee warrants to subscribe for shares in theCompany, made by way of deed by the Company;
(f) A cornerstone placing agreement dated 23 December 2009 entered into between theCompany, Kuok Hock Nien, BNP Paribas Capital (Asia Pacific) Limited, Credit Suisse(Hong Kong) Limited, BOCI Asia Limited and Merrill Lynch International pursuant towhich Kuok Hock Nien agreed to subscribe for such number of Offer Shares (in the formof Shares) (rounded down to the nearest board lot) as may be purchased with the Hong Kongdollar equivalent of US$2,000,000 at the Offer Price;
(g) A cornerstone placing agreement dated 23 December 2009 entered into between theCompany, Kerry Trading Co. Limited (“Kerry Trading”), BNP Paribas Capital (AsiaPacific) Limited, Credit Suisse (Hong Kong) Limited, BOCI Asia Limited and MerrillLynch International pursuant to which Kerry Trading agreed to subscribe for such numberof Offer Shares (in the form of Shares) (rounded down to the nearest board lot) as may bepurchased with the Hong Kong dollar equivalent of US$9,000,000 at the Offer Price;
APPENDIX VIII STATUTORY AND GENERAL INFORMATION
— VIII-8 —
(h) A cornerstone placing agreement dated 23 December 2009 entered into between theCompany, Cloud Nine Limited (“Cloud Nine”), BNP Paribas Capital (Asia Pacific) Limited,Credit Suisse (Hong Kong) Limited, BOCI Asia Limited and Merrill Lynch Internationalpursuant to which Cloud Nine agreed to subscribe for such number of Offer Shares (in theform of Shares) (rounded down to the nearest board lot) as may be purchased with the HongKong dollar equivalent of US$4,500,000 at the Offer Price;
(i) A cornerstone placing agreement dated 23 December 2009 entered into between theCompany, Twin Turbo Limited (“Twin Turbo”), BNP Paribas Capital (Asia Pacific)Limited, Credit Suisse (Hong Kong) Limited, BOCI Asia Limited and Merrill LynchInternational pursuant to which Twin Turbo agreed to subscribe for such number of OfferShares (in the form of Shares) (rounded down to the nearest board lot) as may be purchasedwith the Hong Kong dollar equivalent of US$4,500,000 at the Offer Price;
(j) A cornerstone placing agreement dated 25 December 2009 entered into between theCompany, State Corporation “Bank for Development and Foreign Economic Affairs(Vnesheconombank)” (“VEB”), BNP Paribas Capital (Asia Pacific) Limited, Credit Suisse(Hong Kong) Limited, BOCI Asia Limited and Merrill Lynch International pursuant towhich VEB agreed to subscribe for 477,090,000 Offer Shares at the Offer Price;
(k) A cornerstone placing agreement dated 25 December 2009 entered into between theCompany, NR Investments Limited (“NR Investments”), BNP Paribas Capital (Asia Pacific)Limited, Credit Suisse (Hong Kong) Limited, BOCI Asia Limited and Merrill LynchInternational pursuant to which NR Investments agreed to subscribe for (i) such number ofOffer Shares (in the form of Shares) (rounded down to the nearest board lot) as may bepurchased with the Hong Kong dollar equivalent of US$50,000,000 at the Offer Price, andsuch number of Global Depositary Receipts (rounded down to the nearest whole number ofGlobal Depositary Receipts) as may be purchased with US$50,000,000 at the Offer Priceor (ii) if the Global Depositary Receipts are not listed on the Professional Segment ofEuronext Paris on the Listing Date, such number of Offer Shares (in the form of Shares)rounded down to the nearest board lot) as may be purchased with the Hong Kong dollarequivalent of US$100,000,000 at the Offer Price; and
(l) A cornerstone placing agreement dated 28 December 2009 entered into between theCompany, Paulson & Co. Inc. (“Paulson”), BNP Paribas Capital (Asia Pacific) Limited,Credit Suisse (Hong Kong) Limited, BOCI Asia Limited and Merrill Lynch Internationalpursuant to which Paulson agreed to subscribe for such number of Offer Shares (in the formof Shares) (rounded down to the nearest board lot) as may be purchased with HK$775million (which is equivalent to US$100 million at the exchange rate of US$1.00 =HK$7.75) at the Offer Price.
APPENDIX VIII STATUTORY AND GENERAL INFORMATION
— VIII-9 —
2. Intellectual property rights
As of the Latest Practicable Date, the Group has registered or has applied for the registration ofthe following intellectual property rights.
A. Trademarks
As at the Latest Practicable Date, the Group is the registered owner of the following trademarksthat are material to the operation of its business:
List of Registered Material Trademarks as of the Latest Practicable Date
NoMaterial
TrademarkRegistration
number Country* ClassesRegistration
period Registered owner
1 798187 Madrid registration forthe following countries:AM, AZ, BY, CZ, KG,KZ, LV, MD, PL, SK,TJ, UA EE, GE, JP, LT,TM, UZ
1, 2, 6, 7,12, 16, 21
10 yearsstarting from21 January2003
OJSC “United CompanyRUSAL-Trading House”
2 798186 Madrid registration forthe following countries:KZ, TJ EE, GE, JP, LT,TM, UZ AM, AZ, BY,CZ, KG, LV, MD, PL,SK, UA
1, 2, 6, 7,12, 16, 21
10 yearsstarting from21 January2003
OJSC “United CompanyRUSAL-Trading House”
3 805432 Madrid registration forthe following countries:KZ, TJ AU, EE, GE, JP,LT, TM, TR, UZ AM,AZ, BY, CH, CN, CZ,KG, LV, MD, PL, SK,UA, VN
1, 2, 6, 7,12, 16, 21
10 yearsstarting from21 January2003
OJSC “United CompanyRUSAL-Trading House”
4 798188 Madrid registration forthe following countries:KZ, TJ AU, EE, GE, JP,LT, TM, UZ AM, AZ,BY, CN, CZ, KG, LV,MD, PL, SK, UA
1, 2, 6, 7,12, 16, 21
10 yearsstarting from21 January2003
OJSC “United CompanyRUSAL-Trading House”
5 788131 Madrid registration forthe following countries:KZ, TJ AU, EE, GE, JP,LT, TM, UZ AM, AZ,BY, CN, CZ, KG, LV,MD, PL, SK, UA
1, 2, 6, 7,12, 16, 17,21
10 yearsstarting from5 August2002
OJSC “United CompanyRUSAL-Trading House”
APPENDIX VIII STATUTORY AND GENERAL INFORMATION
— VIII-10 —
App1A-28(4)

NoMaterial
TrademarkRegistration
number Country* ClassesRegistration
period Registered owner
6 813004 Madrid registration forthe following countries:DZ, EG, KZ, LR, SD,TJ AG, AU, DK, EE,FI, GB, GE, GR, IE, IS,JP, LT, NO, SE, SG,TM, TR, UZ, ZM AL,AM, AT, AZ, BA, BG,BT, BX, BY, CH, CN,CU, CZ, DE, ES, FR,HR, HU, IT, KE, KG,KP, LI, LS, LV, MA,MC, MD, MK, MN,MZ, PL, PT, RO, RS,SI, SK, SL, SM, SZ,UA, VN GB, IE, SG
1, 6, 35,40, 42
10 yearsstarting from27 March2003
OJSC SUAL
7 2701068 European Communitytrademark
1, 6, 7, 12,16, 21
10 yearsstarting from16 May 2002
OJSC “United CompanyRUSAL-Trading House”
8 2721348 European Communitytrademark
1, 6, 7, 12,16, 21
10 yearsstarting from29 May 2002
OJSC “United CompanyRUSAL-Trading House”
9 2721355 European Communitytrademark
1, 6, 7, 12,16, 21
10 yearsstarting from29 May 2002
OJSC “United CompanyRUSAL-Trading House”
10 2736908 European Communitytrademark
1, 6, 7, 12,16, 21
10 yearsstarting from13 June 2002
OJSC “United CompanyRUSAL-Trading House”
11 227928 Russia 1, 2, 4, 6,7, 8, 9, 10,11, 12, 13,14, 16, 18,19, 20, 21,25, 26, 27,28, 29, 30,32, 33, 34,43, 44, 45
10 yearsstarting from21 January2002
OJSC “United CompanyRUSAL-Trading House”
12 227929 Russia 1, 2, 4, 6,7, 8, 9, 10,11, 12, 13,14, 16, 18,19, 20, 21,25, 26, 27,28, 29, 30,32, 33, 34,43, 44, 45
10 yearsstarting from21 January2002
OJSC “United CompanyRUSAL-Trading House”
APPENDIX VIII STATUTORY AND GENERAL INFORMATION
— VIII-11 —
NoMaterial
TrademarkRegistration
number Country* ClassesRegistration
period Registered owner
13 227930 Russia 1, 2, 4, 6,7, 8, 9, 10,11, 12, 13,14, 16, 18,19, 20, 21,25, 26, 27,28, 29, 30,32, 33, 34,43, 44, 45
10 yearsstarting from21 January2002
OJSC “United CompanyRUSAL-Trading House”
14 227931 Russia 1, 2, 4, 6,7, 8, 9, 10,11, 12, 13,14, 16, 18,19, 20, 21,25, 26, 27,28, 29, 30,32, 33, 34,43, 44, 45
10 yearsstarting from21 January2002
OJSC “United CompanyRUSAL-Trading House”
15 218285 Russia 1, 2, 3, 4,5, 6, 7, 8,9, 10, 11,12, 13, 14,15, 16, 17,18, 19, 20,21, 22, 23,24, 25, 26,27, 28, 29,30, 31, 32,33, 34, 35,36, 37, 38,39, 40, 41,42, 43, 44,45
10 yearsstarting from21 January2002
OJSC “United CompanyRUSAL-Trading House”
16 154226 Russia 1, 6, 40,42
20 yearsstarting from22 November1996
OJSC SUAL
17 03329803 USA 6, 7, 12,16, 17, 21
10 yearsstarting from22 July 2002
OJSC “United CompanyRUSAL-Trading House”
18 02839545 USA 6, 7, 12,16, 17, 21
10 yearsstarting from22 July 2002
OJSC “United CompanyRUSAL-Trading House”
19 02839544 USA 6, 7, 12,16, 17, 21
10 yearsstarting from22 July 2002
OJSC “United CompanyRUSAL-Trading House”
20 02999609 USA 1, 6, 21,35, 40, 42
10 yearsstarting from23 May 2003
JSC “Siberian-UralsAluminum Company”
APPENDIX VIII STATUTORY AND GENERAL INFORMATION
— VIII-12 —

NoMaterial
TrademarkRegistration
number Country* ClassesRegistration
period Registered owner
21 (A)
(B)
301252467 HK 1, 2, 6, 7,12, 16, 21
Due forrenewal by4 December2018
OJSC “United CompanyRUSAL-Trading House”
22 (A)
(B)
(C)
(D)
301255833 HK 1, 2, 6, 7,12, 16, 21
Due forrenewal by10 December2018
OJSC “United CompanyRUSAL-Trading House”
23 (A)
(B)
301252476 HK 1, 2, 6, 7,12, 16, 21
Due forrenewal by4 December2018
OJSC “United CompanyRUSAL-Trading House”
* Note The abbreviations for country names used in the table are:
DZ — Algeria; EG — Egypt; KZ — Kazakhstan; LR — Liberia; SD — Sudan; TJ — Tajikistan; AG — Antiguaand Barbuda; AU — Australia; DK — Denmark; EE — Estonia; FI — Finland; GB — United Kingdom; GE —Georgia; GR — Greece; IE — Ireland; IS — Iceland; JP — Japan; LT — Lithuania; NO — Norway; SE — Sweden;SG — Singapore; TM — Turkmenistan; TR — Turkey; UZ — Uzbekistan; ZM — Zambia; AL — Albania; AM— Armenia; AT — Austria; AZ — Azerbaijan; BA — Bosnia and Herzegovina; BG — Bulgaria; BT — Bhutan;BX — Benelux (being Belgium, the Netherlands and Luxembourg); BY — Belarus; CH — Switzerland; CN —China; CU — Cuba; CZ — Czech Republic; DE — Germany; ES — Spain; FR — France; HR — Croatia; HU —Hungary; IT — Italy; KE — Kenya; HK — Hong Kong; KG — Kyrgyzstan; KP — Democratic People’s Republicof Korea; LI — Liechtenstein; LS — Lesotho; LV — Latvia; MA — Morocco; MC — Monaco; MD — Moldova,Republic of; MK — Macedonia, The former Yugoslav Republic of; MN — Mongolia; MZ — Mozambique; PL —Poland; PT — Portugal; RO — Romania; RS — Serbia; SI — Slovenia; SK — Slovakia; SL — Slovenia; SM —San Marino; SZ — Swaziland; USA — United States of America; UA — Ukraine; VN — Viet Nam; GB — UnitedKingdom; IE — Ireland; and SG — Singapore.
B. Domain Names
As at the Latest Practicable Date, the Group has registered the following domain names that arematerial to the operation of its business:
No. Material Domain Name Registered Owner Expiration date
1 rusal.ch ALUMTRADE Limited 1 May 2010
2 rusal.it ALUMTRADE Limited 7 May 2010
3 sual-international.ru OJSC “United Company RUSAL — Trading House” 24 January 2010
APPENDIX VIII STATUTORY AND GENERAL INFORMATION
— VIII-13 —

No. Material Domain Name Registered Owner Expiration date
4 sualinternational.ru OJSC “United Company RUSAL — Trading House” 24 January 2010
5 rusalgm.ru OJSC “United Company RUSAL — Trading House” 14 February 2010
6 russal.ru OJSC “United Company RUSAL — Trading House” 14 February 2010
7 russianalum.ru OJSC “United Company RUSAL — Trading House” 15 February 2010
8 rusaluminium.ru OJSC “United Company RUSAL — Trading House” 16 February 2010
9 russian-aluminium.ru OJSC “United Company RUSAL — Trading House” 16 February 2010
10 boulygine.ru OJSC “United Company RUSAL — Trading House” 19 February 2010
11 rusalgm.com OJSC “United Company RUSAL — Trading House” 19 February 2010
12 bulygin.ru OJSC “United Company RUSAL — Trading House” 20 February 2010
13 rusal.org OJSC “United Company RUSAL — Trading House” 21 February 2010
14 agk.ru OJSC “United Company RUSAL — Trading House” 1 March 2010
15 kesmsk.ru OJSC “United Company RUSAL — Trading House” 6 March 2010
16 saz2.ru OJSC “United Company RUSAL — Trading House” 7 April 2010
17 veritum.ru OJSC “United Company RUSAL — Trading House” 14 April 2010
18 resal.ru OJSC “United Company RUSAL — Trading House” 30 April 2010
19 rual.ru OJSC “United Company RUSAL — Trading House” 1 May 2010
20 rusal.ru OJSC “United Company RUSAL — Trading House” 1 May 2010
21 al2all.ru OJSC “United Company RUSAL — Trading House” 24 May 2010
22 al4all.ru OJSC “United Company RUSAL — Trading House” 24 May 2010
23 aluminum.ru OJSC “United Company RUSAL — Trading House” 4 June 2010
24 sual.ru OJSC “United Company RUSAL — Trading House” 4 June 2010
25 parkdruzei.ru OJSC “United Company RUSAL — Trading House” 9 June 2010
26 parkproektov.ru OJSC “United Company RUSAL — Trading House” 9 June 2010
27 glinozemtrade.ru OJSC “United Company RUSAL — Trading House” 22 June 2010
28 ramanagement.ru OJSC “United Company RUSAL — Trading House” 22 June 2010
29 komiproject.com OJSC “United Company RUSAL — Trading House” 28 June 2010
30 komiproject.ru OJSC “United Company RUSAL — Trading House” 28 June 2010
31 alumisha.ru OJSC “United Company RUSAL — Trading House” 26 July 2010
32 sayana.ru OJSC “United Company RUSAL — Trading House” 1 August 2010
33 aluminakomi.ru OJSC “United Company RUSAL — Trading House” 10 August 2010
34 aluminiumkomi.ru OJSC “United Company RUSAL — Trading House” 10 August 2010
35 komialumina.ru OJSC “United Company RUSAL — Trading House” 10 August 2010
36 komialuminium.ru OJSC “United Company RUSAL — Trading House” 10 August 2010
37 komialuminum.ru OJSC “United Company RUSAL — Trading House” 10 August 2010
38 sual-group.ru OJSC “United Company RUSAL — Trading House” 10 August 2010
39 sualgroup.ru OJSC “United Company RUSAL — Trading House” 10 August 2010
40 rshg.ru OJSC “United Company RUSAL — Trading House” 7 September 2010
41 aluminiumleader.com OJSC “United Company RUSAL — Trading House” 2 October 2010
42 rusengineering.ru OJSC “United Company RUSAL — Trading House” 24 October 2010
43 sual-holding.ru OJSC “United Company RUSAL — Trading House” 27 October 2010
44 it-force.ru OJSC “United Company RUSAL — Trading House” 14 November 2010
45 it4com.ru OJSC “United Company RUSAL — Trading House” 14 November 2010
46 aluminum.su OJSC “United Company RUSAL — Trading House” 27 November 2010
47 rusal.su OJSC “United Company RUSAL — Trading House” 27 November 2010
48 ucrusal.ru OJSC “United Company RUSAL — Trading House” 27 November 2010
49 alkomi.ru OJSC “United Company RUSAL — Trading House” 30 November 2010
APPENDIX VIII STATUTORY AND GENERAL INFORMATION
— VIII-14 —
No. Material Domain Name Registered Owner Expiration date
50 alumko.ru OJSC “United Company RUSAL — Trading House” 30 November 2010
51 koalum.ru OJSC “United Company RUSAL — Trading House” 30 November 2010
52 komial.ru OJSC “United Company RUSAL — Trading House” 30 November 2010
53 rusalum.ru OJSC “United Company RUSAL — Trading House” 10 December 2010
54 ucrusal.com OJSC “United Company RUSAL — Trading House” 28 December 2010
55 unitedcompanyrusal.ru OJSC “United Company RUSAL — Trading House” 28 December 2010
56 acg.com.gn RUSAL Global Management B.V. N/A
57 rual.com RUSAL Global Management B.V. 15 January 2010
58 rusal.com.jm RUSAL Global Management B.V. 13 May 2010
59 rusal.md RUSAL Global Management B.V. 10 June 2010
60 ucr.md RUSAL Global Management B.V. 10 June 2010
61 ucrusal.md RUSAL Global Management B.V. 10 June 2010
62 rusal.vn RUSAL Global Management B.V. 8 September 2010
63 rusal.sg RUSAL Global Management B.V. 8 September 2010
64 rusal.hk RUSAL Global Management B.V. 8 September 2010
65 rusal.com.hk RUSAL Global Management B.V. 11 September 2010
66 al2all.com RUSAL Global Management B.V. 23 May 2011
67 rusal.vg RUSAL Global Management B.V. 10 June 2011
68 ucr.vg RUSAL Global Management B.V. 10 June 2011
69 ucrusal.vg RUSAL Global Management B.V. 10 June 2011
70 rusal.com RUSAL Global Management B.V. 6 July 2011
71 rti.gi RUSAL Trading International Gibraltar Ltd 26 November 2010
C. Patents
As at the Latest Practicable Date, the Group has registered the following patents that are materialto the operation of its business:
List of patents covering RA-300 technology
No. Description TypePatent No.
Registration date Registration periodRegistered
owner
1 Compensation apparatus Inventionpatent
2237752 dated10 October 2004
20 years starting from20 June 2003
LLC RUSEngineering
2 Cathode aluminium cell lining Inventionpatent
2266983 dated27 December 2005
20 years starting from16 March 2004
LLC RUSEngineering
3 Method for controlling aluminapoint feeding into cells
Inventionpatent
2233914 dated8 August 2004
20 years starting from29 April 2003
LLC RUSEngineering
4 Two-level automated aluminiumelectrolysis control system
Utilitymodelpatent
38767 dated10 July 2004
10 years starting from16 March 2004
LLC RUSEngineering
5 Apparatus for compensatingmagnetic fields induced by anadjacent string of series-connectedhigh-capacity cells
Inventionpatent
2316619 dated10 February 2008
20 years starting from18 April 2006
LLC RUSEngineering
6 Busbar for high-capacity aluminiumcells
Inventionpatent
2328555 dated10 July 2008
20 years starting from25 July 2006
LLC RUSEngineering
APPENDIX VIII STATUTORY AND GENERAL INFORMATION
— VIII-15 —

No. Description TypePatent No.
Registration date Registration periodRegistered
owner
7 Busbar for aluminium cells arrangedside by side within a potroom
Inventionpatent
2303657 dated27 July 2008
20 years starting from27 February 2007
LLC RUSEngineering
8 Apparatus for gas removal from analuminium cell
Inventionpatent
2316620 dated10 February 2008
20 years starting from18 April 2006
LLC RUSEngineering
9 Aluminium cell cathode Inventionpatent
2321683 dated10 April 2008
20 years starting from23 May 2006
LLC RUSEngineering
10 Aluminium cell cathode shell Inventionpatent
2320781 dated27 March 2008
20 years starting from23 May 2006
LLC RUSEngineering
11 Aluminium cell cathode liningmethod
Inventionpatent
2294403 dated27 February 2007
20 years starting from22 June 2005
LLC RUSEngineering
12 Method for forming seamless lininglayers in aluminium cells andapparatus for performing the same
Inventionpatent
2296819 dated10 April 2007
20 years starting from17 August 2005
LLC RUSEngineering
13 Contact connection of apower-supply circuit to a cathodecompartment of an cell
Inventionpatent
2318926 dated10 March 2008
20 years starting from22 December 2005
LLC RUSEngineering
14 Aluminium cell cathode Inventionpatent
2299277 dated20 May 2007
20 years starting from22 June 2005
LLC RUSEngineering
15 Method for baking bottoms ofaluminium cells
Inventionpatent
2318920 dated10 March 2008
20 years starting from26 April 2006
LLC RUSEngineering
16 Method for replacing anodes inhigh-capacity aluminium cellsequipped with pre-baked anodes
Inventionpatent
2281348 dated10 August 2006
20 years starting from14 December 2004
LLC RUSEngineering
17 Method for baking bottoms ofaluminium cells
Inventionpatent
2303653 dated27 July 2007
20 years starting from17 August 2005
LLC RUSEngineering
18 Method for aluminium cell start-uppreparation
Inventionpatent
2307878 dated10 October 2007
20 years starting from22 December 2005
LLC RUSEngineering
19 Method for measuring the thicknessof the molten aluminium layer onthe bottom of an cell
Inventionpatent
2307880 dated10 October 2007
20 years starting from22 December 2005
LLC RUSEngineering
20 Method for eliminating anodeeffects
Inventionpatent
2285755 dated20 October 2006
20 years starting from05 April 2005
LLC RUSEngineering
21 Anode superstructure for cellsequipped with pre-baked anodes
Inventionpatent
2328553 dated10 July 2008
20 years starting from22 August 2006
LLC RUSEngineering
22 Anode superstructure for aluminiumcells
Inventionpatent
2338010 dated27 October 2007
20 years starting from30 August 2006
LLC RUSEngineering
23 Contact clamps for cells equippedwith pre-baked anodes
Inventionpatent
2153028 dated27 April 1999
20 years starting from12 April 1999
OJSC RUSALVAMI
24 Anode superstructure for aluminiumcells
Inventionpatent
2214481 dated6 May 2002
20 years starting from06 May 2002
OJSC RUSALVAMI
25 Anode superstructure for aluminiumcells
Inventionpatent
2214482 dated6 May 2002
20 years starting from06 May 2002
OJSC RUSALVAMI
26 Anode superstructure for aluminiumcells
Inventionpatent
2224052 dated27 May 2002
20 years starting from27 May 2002
OJSC RUSALVAMI
APPENDIX VIII STATUTORY AND GENERAL INFORMATION
— VIII-16 —
List of patents covering the RA-400 technology
No. Description TypePatent No.
Registration date Registration periodRegistered
owner
1 Compensation apparatus Inventionpatent
2237752 dated10 October 2004
20 years starting from23 June 2003
LLC RUSEngineering
2 Cathode aluminium cell lining Inventionpatent
2266983 dated27 December 2005
20 years starting from16 March 2004
LLC RUSEngineering
3 Aluminium cell cathode shell Inventionpatent
2214480 dated20 October 2003
20 years starting from15 July 2002
LLC RUSEngineering
4 Method for controlling aluminapoint feeding into cells
Inventionpatent
2233914 dated8 August 2004
20 years starting from29 April 2003
LLC RUSEngineering
5 Two-level automated aluminiumelectrolysis control system
Utilitymodelpatent
38767 dated10 July 2004
10 years starting from16 March 2004
LLC RUSEngineering
6 Method for replacing anodes inhigh-capacity aluminium cellsequipped with pre-baked anodes
Inventionpatent
2281348 dated10 August 2006
20 years starting from14 December 2004
LLC RUSEngineering
7 Apparatus for compensatingmagnetic fields induced by anadjacent string of series-connectedhigh-capacity cells
Inventionpatent
2316619 dated10 February 2008
20 years starting from18 April 2006
LLC RUSEngineering
8 Busbar for high-capacity aluminiumcells
Inventionpatent
2328555 dated10 July 2008
20 years starting from25 July 2006
LLC RUSEngineering
9 Busbar for aluminium cells arrangedside by side within a potroom
Inventionpatent
2303657 dated27 July 2007
20 years starting from27 February 2007
LLC RUSEngineering
10 Apparatus for gas removal fromaluminium cells
Inventionpatent
2316620 dated10 February 2008
20 years starting from18 April 2006
LLC RUSEngineering
11 Aluminium cell cathode Inventionpatent
2321683 dated10 April 2008
20 years starting from23 May 2006
LLC RUSEngineering
12 Aluminium cell cathode shell Inventionpatent
2320781 dated27 March 2008
20 years starting from23 May 2006
LLC RUSEngineering
13 Aluminium cell cathode liningmethod
Inventionpatent
2294403 dated27 February 2007
20 years starting from22 June 2005
LLC RUSEngineering
14 Method for forming seamless lininglayers in aluminium cells andapparatus for performing the same
Inventionpatent
2296819 dated10 April 2007
20 years starting from17 August 2005
LLC RUSEngineering
15 Aluminium cell cathode Inventionpatent
2299277 dated20 May 2007
20 years starting from22 June 2005
LLC RUSEngineering
16 Method for baking bottoms ofaluminium cells
Inventionpatent
2303653 dated27 July 2007
20 years starting from17 August 2005
LLC RUSEngineering
17 Method for aluminium cell start-uppreparation
Inventionpatent
2307878 dated10 October 2007
20 years starting from22 December 2005
LLC RUSEngineering
18 Method for measuring the thicknessof the molten aluminium layer onthe bottom of a cell
Inventionpatent
2307880 dated10 October 2007
20 years starting from22 December 2005
LLC RUSEngineering
19 Method for eliminating anodeeffects
Inventionpatent
2285755 dated20 October 2006
20 years starting from05 April 2005
LLC RUSEngineering
APPENDIX VIII STATUTORY AND GENERAL INFORMATION
— VIII-17 —
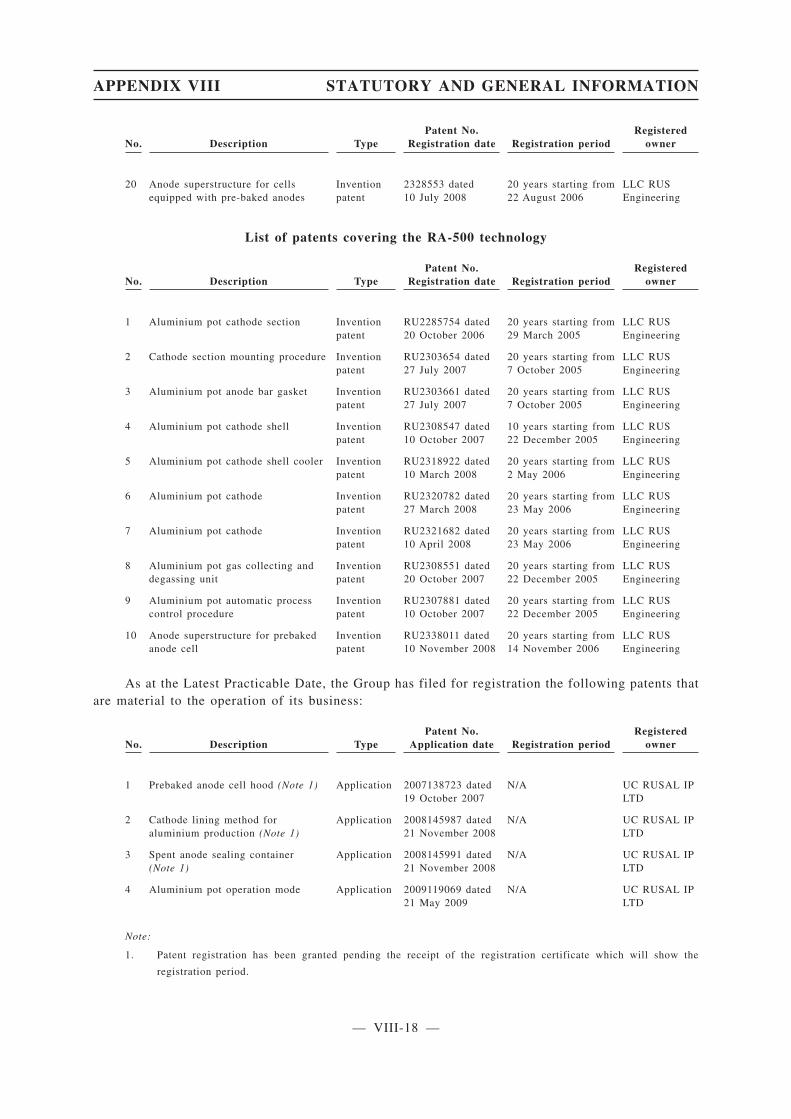
No. Description TypePatent No.
Registration date Registration periodRegistered
owner
20 Anode superstructure for cellsequipped with pre-baked anodes
Inventionpatent
2328553 dated10 July 2008
20 years starting from22 August 2006
LLC RUSEngineering
List of patents covering the RA-500 technology
No. Description TypePatent No.
Registration date Registration periodRegistered
owner
1 Aluminium pot cathode section Inventionpatent
RU2285754 dated20 October 2006
20 years starting from29 March 2005
LLC RUSEngineering
2 Cathode section mounting procedure Inventionpatent
RU2303654 dated27 July 2007
20 years starting from7 October 2005
LLC RUSEngineering
3 Aluminium pot anode bar gasket Inventionpatent
RU2303661 dated27 July 2007
20 years starting from7 October 2005
LLC RUSEngineering
4 Aluminium pot cathode shell Inventionpatent
RU2308547 dated10 October 2007
10 years starting from22 December 2005
LLC RUSEngineering
5 Aluminium pot cathode shell cooler Inventionpatent
RU2318922 dated10 March 2008
20 years starting from2 May 2006
LLC RUSEngineering
6 Aluminium pot cathode Inventionpatent
RU2320782 dated27 March 2008
20 years starting from23 May 2006
LLC RUSEngineering
7 Aluminium pot cathode Inventionpatent
RU2321682 dated10 April 2008
20 years starting from23 May 2006
LLC RUSEngineering
8 Aluminium pot gas collecting anddegassing unit
Inventionpatent
RU2308551 dated20 October 2007
20 years starting from22 December 2005
LLC RUSEngineering
9 Aluminium pot automatic processcontrol procedure
Inventionpatent
RU2307881 dated10 October 2007
20 years starting from22 December 2005
LLC RUSEngineering
10 Anode superstructure for prebakedanode cell
Inventionpatent
RU2338011 dated10 November 2008
20 years starting from14 November 2006
LLC RUSEngineering
As at the Latest Practicable Date, the Group has filed for registration the following patents thatare material to the operation of its business:
No. Description TypePatent No.
Application date Registration periodRegistered
owner
1 Prebaked anode cell hood (Note 1) Application 2007138723 dated19 October 2007
N/A UC RUSAL IPLTD
2 Cathode lining method foraluminium production (Note 1)
Application 2008145987 dated21 November 2008
N/A UC RUSAL IPLTD
3 Spent anode sealing container(Note 1)
Application 2008145991 dated21 November 2008
N/A UC RUSAL IPLTD
4 Aluminium pot operation mode Application 2009119069 dated21 May 2009
N/A UC RUSAL IPLTD
Note:
1. Patent registration has been granted pending the receipt of the registration certificate which will show the
registration period.
APPENDIX VIII STATUTORY AND GENERAL INFORMATION
— VIII-18 —
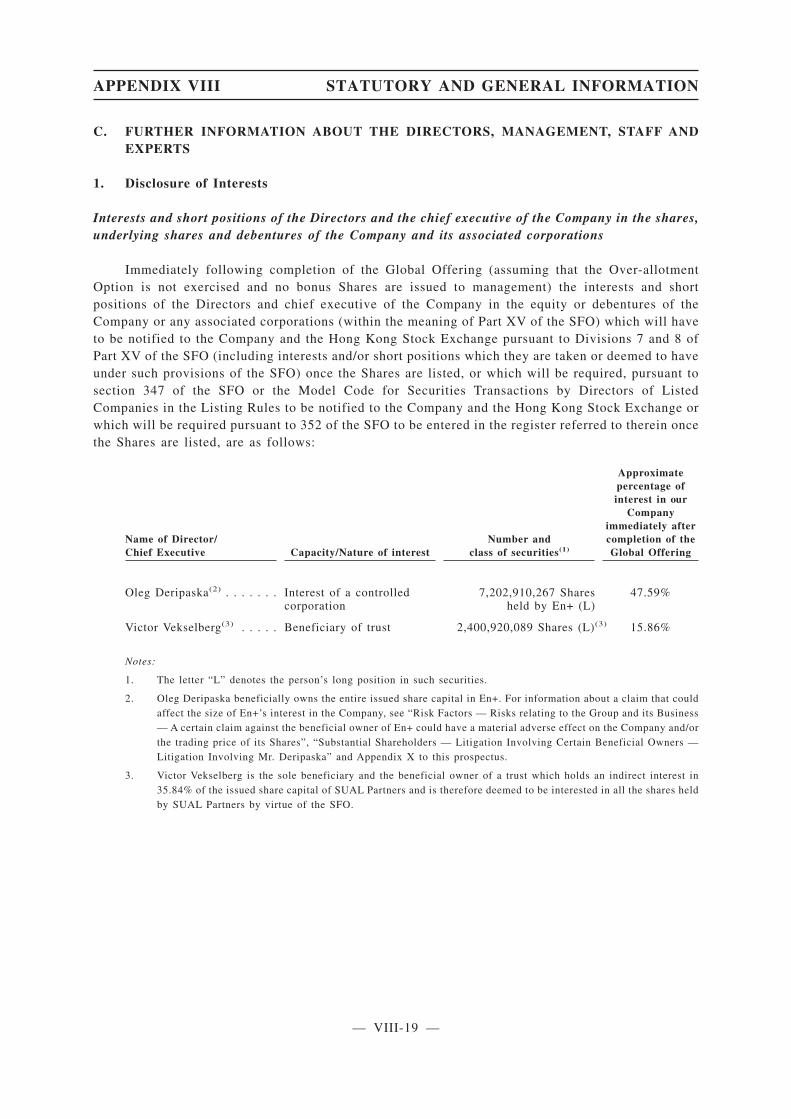
C. FURTHER INFORMATION ABOUT THE DIRECTORS, MANAGEMENT, STAFF ANDEXPERTS
1. Disclosure of Interests
Interests and short positions of the Directors and the chief executive of the Company in the shares,underlying shares and debentures of the Company and its associated corporations
Immediately following completion of the Global Offering (assuming that the Over-allotmentOption is not exercised and no bonus Shares are issued to management) the interests and shortpositions of the Directors and chief executive of the Company in the equity or debentures of theCompany or any associated corporations (within the meaning of Part XV of the SFO) which will haveto be notified to the Company and the Hong Kong Stock Exchange pursuant to Divisions 7 and 8 ofPart XV of the SFO (including interests and/or short positions which they are taken or deemed to haveunder such provisions of the SFO) once the Shares are listed, or which will be required, pursuant tosection 347 of the SFO or the Model Code for Securities Transactions by Directors of ListedCompanies in the Listing Rules to be notified to the Company and the Hong Kong Stock Exchange orwhich will be required pursuant to 352 of the SFO to be entered in the register referred to therein oncethe Shares are listed, are as follows:
Name of Director/Chief Executive Capacity/Nature of interest
Number andclass of securities(1)
Approximatepercentage ofinterest in our
Companyimmediately aftercompletion of theGlobal Offering
Oleg Deripaska(2) . . . . . . . Interest of a controlledcorporation
7,202,910,267 Sharesheld by En+ (L)
47.59%
Victor Vekselberg(3) . . . . . Beneficiary of trust 2,400,920,089 Shares (L)(3) 15.86%
Notes:
1. The letter “L” denotes the person’s long position in such securities.
2. Oleg Deripaska beneficially owns the entire issued share capital in En+. For information about a claim that couldaffect the size of En+’s interest in the Company, see “Risk Factors — Risks relating to the Group and its Business— A certain claim against the beneficial owner of En+ could have a material adverse effect on the Company and/orthe trading price of its Shares”, “Substantial Shareholders — Litigation Involving Certain Beneficial Owners —Litigation Involving Mr. Deripaska” and Appendix X to this prospectus.
3. Victor Vekselberg is the sole beneficiary and the beneficial owner of a trust which holds an indirect interest in35.84% of the issued share capital of SUAL Partners and is therefore deemed to be interested in all the shares heldby SUAL Partners by virtue of the SFO.
APPENDIX VIII STATUTORY AND GENERAL INFORMATION
— VIII-19 —
App1A-45(1), (2)
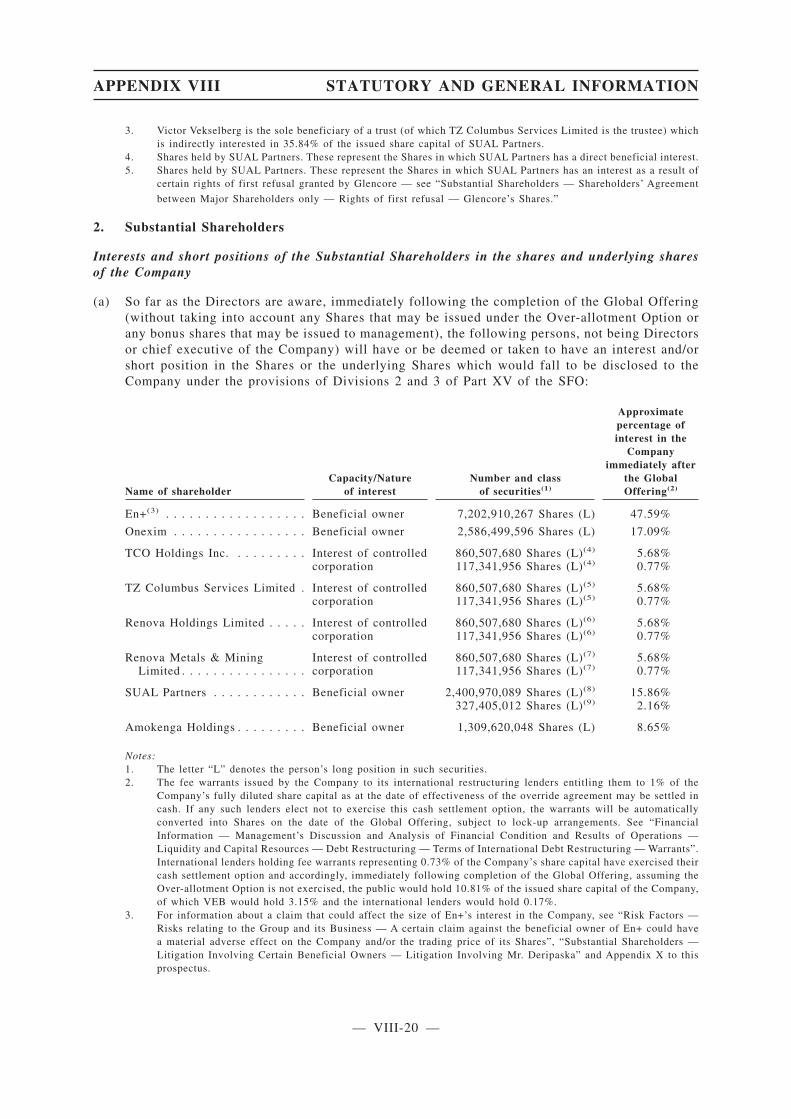
3. Victor Vekselberg is the sole beneficiary of a trust (of which TZ Columbus Services Limited is the trustee) whichis indirectly interested in 35.84% of the issued share capital of SUAL Partners.
4. Shares held by SUAL Partners. These represent the Shares in which SUAL Partners has a direct beneficial interest.5. Shares held by SUAL Partners. These represent the Shares in which SUAL Partners has an interest as a result of
certain rights of first refusal granted by Glencore — see “Substantial Shareholders — Shareholders’ Agreement
between Major Shareholders only — Rights of first refusal — Glencore’s Shares.”
2. Substantial Shareholders
Interests and short positions of the Substantial Shareholders in the shares and underlying sharesof the Company
(a) So far as the Directors are aware, immediately following the completion of the Global Offering(without taking into account any Shares that may be issued under the Over-allotment Option orany bonus shares that may be issued to management), the following persons, not being Directorsor chief executive of the Company) will have or be deemed or taken to have an interest and/orshort position in the Shares or the underlying Shares which would fall to be disclosed to theCompany under the provisions of Divisions 2 and 3 of Part XV of the SFO:
Name of shareholderCapacity/Nature
of interestNumber and class
of securities(1)
Approximatepercentage ofinterest in the
Companyimmediately after
the GlobalOffering(2)
En+(3) . . . . . . . . . . . . . . . . . . Beneficial owner 7,202,910,267 Shares (L) 47.59%
Onexim . . . . . . . . . . . . . . . . . Beneficial owner 2,586,499,596 Shares (L) 17.09%
TCO Holdings Inc. . . . . . . . . . Interest of controlledcorporation
860,507,680 Shares (L)(4)
117,341,956 Shares (L)(4)5.68%0.77%
TZ Columbus Services Limited . Interest of controlledcorporation
860,507,680 Shares (L)(5)
117,341,956 Shares (L)(5)5.68%0.77%
Renova Holdings Limited . . . . . Interest of controlledcorporation
860,507,680 Shares (L)(6)
117,341,956 Shares (L)(6)5.68%0.77%
Renova Metals & MiningLimited . . . . . . . . . . . . . . . .
Interest of controlledcorporation
860,507,680 Shares (L)(7)
117,341,956 Shares (L)(7)5.68%0.77%
SUAL Partners . . . . . . . . . . . . Beneficial owner 2,400,970,089 Shares (L)(8)
327,405,012 Shares (L)(9)15.86%
2.16%
Amokenga Holdings . . . . . . . . . Beneficial owner 1,309,620,048 Shares (L) 8.65%
Notes:1. The letter “L” denotes the person’s long position in such securities.2. The fee warrants issued by the Company to its international restructuring lenders entitling them to 1% of the
Company’s fully diluted share capital as at the date of effectiveness of the override agreement may be settled incash. If any such lenders elect not to exercise this cash settlement option, the warrants will be automaticallyconverted into Shares on the date of the Global Offering, subject to lock-up arrangements. See “FinancialInformation — Management’s Discussion and Analysis of Financial Condition and Results of Operations —Liquidity and Capital Resources — Debt Restructuring — Terms of International Debt Restructuring — Warrants”.International lenders holding fee warrants representing 0.73% of the Company’s share capital have exercised theircash settlement option and accordingly, immediately following completion of the Global Offering, assuming theOver-allotment Option is not exercised, the public would hold 10.81% of the issued share capital of the Company,of which VEB would hold 3.15% and the international lenders would hold 0.17%.
3. For information about a claim that could affect the size of En+’s interest in the Company, see “Risk Factors —Risks relating to the Group and its Business — A certain claim against the beneficial owner of En+ could havea material adverse effect on the Company and/or the trading price of its Shares”, “Substantial Shareholders —Litigation Involving Certain Beneficial Owners — Litigation Involving Mr. Deripaska” and Appendix X to thisprospectus.
APPENDIX VIII STATUTORY AND GENERAL INFORMATION
— VIII-20 —
App1A-45(2)
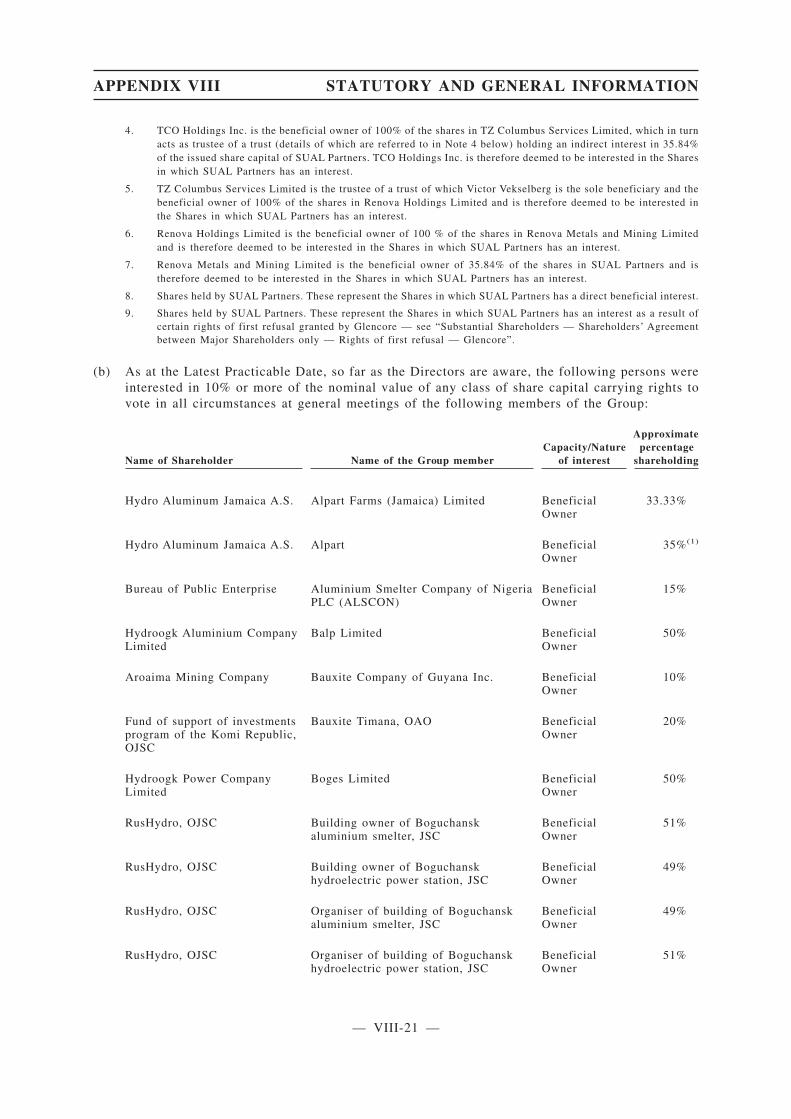
4. TCO Holdings Inc. is the beneficial owner of 100% of the shares in TZ Columbus Services Limited, which in turnacts as trustee of a trust (details of which are referred to in Note 4 below) holding an indirect interest in 35.84%of the issued share capital of SUAL Partners. TCO Holdings Inc. is therefore deemed to be interested in the Sharesin which SUAL Partners has an interest.
5. TZ Columbus Services Limited is the trustee of a trust of which Victor Vekselberg is the sole beneficiary and thebeneficial owner of 100% of the shares in Renova Holdings Limited and is therefore deemed to be interested inthe Shares in which SUAL Partners has an interest.
6. Renova Holdings Limited is the beneficial owner of 100 % of the shares in Renova Metals and Mining Limitedand is therefore deemed to be interested in the Shares in which SUAL Partners has an interest.
7. Renova Metals and Mining Limited is the beneficial owner of 35.84% of the shares in SUAL Partners and istherefore deemed to be interested in the Shares in which SUAL Partners has an interest.
8. Shares held by SUAL Partners. These represent the Shares in which SUAL Partners has a direct beneficial interest.
9. Shares held by SUAL Partners. These represent the Shares in which SUAL Partners has an interest as a result ofcertain rights of first refusal granted by Glencore — see “Substantial Shareholders — Shareholders’ Agreementbetween Major Shareholders only — Rights of first refusal — Glencore”.
(b) As at the Latest Practicable Date, so far as the Directors are aware, the following persons wereinterested in 10% or more of the nominal value of any class of share capital carrying rights tovote in all circumstances at general meetings of the following members of the Group:
Name of Shareholder Name of the Group memberCapacity/Nature
of interest
Approximatepercentage
shareholding
Hydro Aluminum Jamaica A.S. Alpart Farms (Jamaica) Limited BeneficialOwner
33.33%
Hydro Aluminum Jamaica A.S. Alpart BeneficialOwner
35%(1)
Bureau of Public Enterprise Aluminium Smelter Company of NigeriaPLC (ALSCON)
BeneficialOwner
15%
Hydroogk Aluminium CompanyLimited
Balp Limited BeneficialOwner
50%
Aroaima Mining Company Bauxite Company of Guyana Inc. BeneficialOwner
10%
Fund of support of investmentsprogram of the Komi Republic,OJSC
Bauxite Timana, OAO BeneficialOwner
20%
Hydroogk Power CompanyLimited
Boges Limited BeneficialOwner
50%
RusHydro, OJSC Building owner of Boguchanskaluminium smelter, JSC
BeneficialOwner
51%
RusHydro, OJSC Building owner of Boguchanskhydroelectric power station, JSC
BeneficialOwner
49%
RusHydro, OJSC Organiser of building of Boguchanskaluminium smelter, JSC
BeneficialOwner
49%
RusHydro, OJSC Organiser of building of Boguchanskhydroelectric power station, JSC
BeneficialOwner
51%
APPENDIX VIII STATUTORY AND GENERAL INFORMATION
— VIII-21 —

Name of Shareholder Name of the Group memberCapacity/Nature
of interest
Approximatepercentage
shareholding
The Bank of New York MellonInternational Nominees, holderand depository of MMC NorilskNickel OJSC’s ADR programme
MMC Norilsk Nickel, OJSC BeneficialOwner
25.4%
Potanin V.O. MMC Norilsk Nickel, OJSC BeneficialOwner
25%
Rio Tinto Alcan Queensland Alumina Limited BeneficialOwner
80%
Mr. Gorbachevsky VladimirPetrovich
Uralaluminium, OAO BeneficialOwner
15%
OJSC Samruk-Energo LLP Bogatyr Trans Interest in aControlledCorporation
50%(2)
Obermero Limited YaGRK Limited Interest in aControlledCorporation
50%(3)
Notes:
(1) This entity is set up as a partnership and it does not have share capital.
(2) Bogatyr Komir Limited Liability Partnership is a wholly owned subsidiary of Form Muider B.V. which in turn isheld as to 50% by Samruk — Energo Joint Stock Company.
(3) YaGRK Limited is a wholly-owned subsidiary of Cripple Creek Limited which in turn is held as to 50% by
Obermero Limited.
3. Particulars of service contracts
A. Executive Directors
Each of the executive Directors has agreed to act as executive Director with effect from theirrespective dates of appointment with no fixed term agreed which may be terminated in accordancewith the terms of their respective employment contracts. The appointment of each executive Directoris subject to the provisions of retirement and rotation of Directors under the Articles of Association.
B. Non-executive Directors and Independent Non-executive Directors
Each of the non-executive Directors and the independent non-executive Directors has signed anappointment letter with our Company with effect from their respective dates of appointment with nofixed term agreed. Appointment of non-executive Directors may be terminated by the non-executiveDirector by giving one month’s notice of termination and/or otherwise in accordance with the Articlesof Association. Appointment of independent non-executive Directors may be terminated by theCompany or the independent non-executive Director by giving one month’s notice of terminationand/or otherwise in accordance with the Articles of Association. Each of the non-executive Directorsand the independent non-executive Directors is entitled to a fixed director’s fee. The appointment ofeach non-executive Director and independent non-executive Director is subject to the provisions ofretirement and rotation of Directors under the Articles of Association.
APPENDIX VIII STATUTORY AND GENERAL INFORMATION
— VIII-22 —
App1A-46(1)

None of our Directors has or is proposed to have a service contract with any member of ourGroup (other than contracts expiring or determinable by the employer within one year without thepayment of compensation other than the statutory compensation).
4. Directors’ remuneration
The aggregate amount of remuneration (including fees, salaries, contributions to pensionschemes, housing allowances and other allowances and benefits in kind and discretionary bonuses)which has been paid to the Directors for the years ended 31 December 2006, 2007 and 2008 and sixmonths ended 30 June 2009 was approximately US$18.9 million, US$22.0 million, US$14.1 millionand US$0.8 million, respectively.
It is estimated that remuneration and benefits in kind equivalent to approximately US$10.4million in aggregate will be paid and granted to our Directors by us in respect of the financial yearending 31 December 2009 under arrangements in force at the date of this prospectus.
5. Fees or commissions received
Save as disclosed in this prospectus, none of our Directors or any of the persons whose namesare listed in the paragraph headed “Consents” in this Appendix VIII had received any commissions,discounts, agency fee, brokerages or other special terms in connection with the issue or sale of anycapital of any member of our Group from our Group within the two years preceding the date of thisprospectus.
6. Disclaimers
Save as disclosed in this prospectus:
(a) none of the Directors or any of the parties listed in the section headed “D. OtherInformation — 9. Consents” in this Appendix has any direct or indirect interest in thepromotion of, or in any assets which have been, within the two years immediately precedingthe date of this prospectus, acquired or disposed of by or leased to any member of the Groupor are proposed to be acquired or disposed of by or leased to any member of the Group;
(b) none of the Directors is materially interested in any contract or arrangement subsisting atthe date of this prospectus which is significant in relation to the business of the Group takenas a whole;
(c) no share or loan capital of the Company or any of its subsidiaries is under option or isconditionally or unconditionally agreed to be put under option; and
(d) none of the Directors, their respective associates or shareholders of the Company isinterested in more than 5.0% of the issued share capital of the Company has any interestsin the five largest end-user customer of our Group.
APPENDIX VIII STATUTORY AND GENERAL INFORMATION
— VIII-23 —
App1A-46(3)
3rd Sch-14App1A-13
App1A-9(1)App1A-47(1)3rd Sch-19
App1A-47(2)
App1A-28(1)(b)(v)
App1A-28(1)(b)(v)

D. OTHER INFORMATION
1. Estate Duty
The Directors have been advised that no material liability for estate duty would be likely to fallupon any member of the Group.
2. Litigation
Save and except as disclosed in the section “Business”, and “Substantial Shareholders —Litigation Involving Certain Beneficial Owners”, as at the Latest Practicable Date, the Group is notaware of any other litigation or arbitration proceedings of material importance pending or threatenedagainst the Group or any of its directors that could have a material adverse effect on the Group’sfinancial condition or results of operations.
3. Interruptions
There have been no interruptions in the business of the Group which may have or have had asignificant effect on the financial position of the Group in the last 12 months.
4. Joint Sponsors
The Joint Sponsors have made an application on behalf of our Company to the Listing Committeeof the Stock Exchange for a listing of, and permission to deal in, all the Shares in issue and to beissued as mentioned in this prospectus (including any Shares which may fall to be issued pursuant tothe exercise of the Over-allotment Option).
Credit Suisse (Hong Kong) Limited is not acting as an independent Sponsor. Credit Suisse (HongKong) Limited affiliates have business relationships, including but not limited to, lending, financialadvisory, investment advisory and strategic relationship with the Company, its directors, substantialshareholders and/or their respective associates which Credit Suisse (Hong Kong) Limited believesmight, taken together, reasonably give rise to a perception that its independence would be so affectedand, as a result would not be independent for Listing Rule purposes under Rule 3A.07(10) of theListing Rules.
5. Preliminary expenses
The Company has not incurred any preliminary expenses in relation to the Global Offering.
6. Promoter
The Company has no promoter for the purpose of the Listing Rules. Save as disclosed in thisprospectus, within the two years immediately preceding the date of this prospectus, no cash, securitiesor other benefit has been paid, allotted or given nor are any proposed to be paid, allotted or given toany promoters in connection with the Global Offering and the related transactions described in thisprospectus.
7. Taxation of Holders of Shares
(a) Hong Kong
The sale, purchase and transfer of Shares registered with the Company’s Hong Kong branchregister of members will be subject to Hong Kong stamp duty and the current rate charged on eachof the purchaser and seller is 0.1% of the consideration of, or if higher, the fair value of the Shares
APPENDIX VIII STATUTORY AND GENERAL INFORMATION
— VIII-24 —
App1A-10
3rd Sch-15App1A-20(1)
App1A-8(1)

being sold or transferred. Profits from dealings in the Shares arising in or derived from Hong Kongmay also be subject to Hong Kong profits tax for persons who carry on a business of trading or dealingin securities in Hong Kong. No Hong Kong stamp duty will be levied on the transfer of shares thatare registered on a share register outside Hong Kong.
(b) Jersey
No stamp duty is payable in Jersey on the transfer of shares in a Jersey company. There is nocapital gains tax in Jersey.
(c) Consultation with Professional Advisers
Intending holders of the Shares are recommended to consult their professional advisers if theyare in doubt as to the taxation implications of subscribing for, purchasing, holding or disposing of ordealing in the Shares. It is emphasized that none of the Company, the Directors or the other partiesinvolved in the Global Offering can accept responsibility for any tax effect on, or liabilities of, holdersof Shares resulting from their subscription for, purchase, holding or disposal of or dealing in Sharesor exercise of any rights attaching to them.
8. Qualifications of experts
The qualifications of the experts (as defined under the Listing Rules and the Hong KongCompanies Ordinance) who have given their opinions or advice in this prospectus are as follows:
Name Qualifications
BNP Paribas Capital (Asia Pacific)Limited
Licensed corporation under the SFO to conducttype 1 (dealing in securities) and type 6(advising on corporate finance) regulatedactivities as defined under the SFO
Credit Suisse (Hong Kong) Limited Licensed corporation under the SFO for Type 1(dealing in securities), Type 2 (dealing infutures contracts), Type 4 (advising onsecurities), Type 5 (advising on futurescontracts), Type 6 (advising on corporatefinance) and Type 7 (providing automatedtrading services) regulated activities as definedunder the SFO
Ogier Qualified Jersey Lawyers
Egorov, Puginsky, Afanasiev and Partners Qualified Russian Lawyers
Junhe Law Offices Qualified PRC Lawyers
Cabinet D’Avocats “BAO & Fils” Qualified Guinea Lawyers
Asters Law Firm Qualified Ukraine Lawyers
APPENDIX VIII STATUTORY AND GENERAL INFORMATION
— VIII-25 —
App1A-9(1)
Name Qualifications
KPMG Certified Public Accountants
ZAO KPMG Member of The Chamber of Auditors of Russia
American Appraisal Property Valuer
Hatch Associates Limited Technical Advisor
SRK Technical Advisor
CRU Technical Advisor
9. Consents
Each of the Joint Sponsors, KPMG and ZAO KPMG as joint reporting accountants, AmericanAppraisal as property valuer, Hatch, SRK and CRU as technical advisers, Ogier as legal advisers onJersey law, Egorov, Puginsky, Afanasiev and Partners as legal advisers on Russian law, Junhe LawOffices as legal advisers on PRC law, Cabinet D’Avocats “BAO & Fils” as legal advisers on Guinealaw and Asters Law Fim as legal advisers on Ukraine law has given and has not withdrawn itsrespective written consents to the issue of this prospectus with the inclusion of their reports and/orletters and/or valuation certificates and/or the references to their names included herein in the formand context in which they are respectively included.
Save as disclosed in this prospectus, none of the experts named above has any shareholdinginterests in any member of the Group or the right (whether legally enforceable or not) to subscribe foror to nominate persons to subscribe for securities in any member of the Group.
10. Binding effect
This prospectus shall have the effect, if an application is made in pursuant hereof, of renderingall persons concerned bound by all the provisions (other than the penal provisions) of sections 44Aand 44B of the Hong Kong Companies Ordinance so far as applicable.
11. Financial adviser
N M Rothschild & Sons (Hong Kong) Limited (“Rothschild”) has been appointed by theCompany as the financial adviser in respect of the Global Offering. The appointment of Rothschildwas not made pursuant to the requirements of the Listing Rules, and the appointment of Rothschildis separate and distinct from the appointment of the Joint Sponsors (which is required to be made byus pursuant to the Listing Rules). The Joint Sponsors are responsible for fulfilling their duties assponsors to the Company’s application for listing on the Stock Exchange, and the Joint Sponsors havenot relied on any of the work performed by Rothschild in fulfilling those duties. Rothschild’s role inthe Global Offering is different from that of the Joint Sponsors in that it focuses on providing generalcorporate finance advice to the Company on matters relating to the Listing and the Global Offering.Rothschild is a corporation licensed under the SFO to conduct Type 1 (dealing in securities), Type 4(advising on securities) and Type 6 (advising on corporate finance) regulated activities under the SFO.
APPENDIX VIII STATUTORY AND GENERAL INFORMATION
— VIII-26 —
App1A-9(1)-(3)S.342B
App1A-9(1)
12. Compliance Adviser
The Company will appoint Somerley Limited as its compliance adviser pursuant to Rule 3A.19of the Listing Rules. Pursuant to Rule 3A.23 of the Listing Rules, the compliance adviser will advisethe Company on the following circumstances:
• before the publication of any regulatory announcement, circular or financial report;
• where a transaction, which might be a notifiable or connected transaction, is contemplatedincluding share issues and share repurchases;
• where the Group propose to use the proceeds of the Global Offering in a manner differentfrom that detailed in this prospectus or where our business activities, developments orresults deviate from any estimate, or other information in this prospectus; and
• where the Hong Kong Stock Exchange makes an inquiry of the Company regarding unusualmovements in the price or trading volume of the Shares.
The term of the appointment shall commence on the Listing Date and end on the date on whichthe Company distribute its annual report in respect of its financial results for the first full financialyear commencing after the Listing Date and such appointment may be subject to extension by mutualagreement.
13. Bilingual Prospectus
The English language and Chinese language versions of this prospectus are being publishedseparately in reliance upon the exemption provided by section 4 of the Exemption Notice.
APPENDIX VIII STATUTORY AND GENERAL INFORMATION
— VIII-27 —
DOCUMENTS DELIVERED TO THE REGISTRAR OF COMPANIES
The documents attached to a copy of this prospectus and delivered to the Registrar of Companiesin Hong Kong for registration were (i) the statement of adjustments issued by KPMG and ZAO KPMGon the figures shown in the Accountants’ Report of the Group; (ii) copies of each of the materialcontracts referred to the section headed “Further Information About the Business of the Group” in“Appendix VIII — Statutory and General Information” to this prospectus; and (iii) the writtenconsents referred to in paragraph (q) of this Appendix.
A copy of this prospectus, signed by or on behalf of all of the Directors, together with signedcopies of any reports included in or attached to the prospectus and such other particulars as theregistrar may require have been delivered to the registrar of companies in Jersey.
DOCUMENTS AVAILABLE FOR INSPECTION
Copies of the following documents will be available for inspection at the office of Sidley Austinat Level 39, Two International Finance Centre, 8 Finance Street, Central, Hong Kong during normalbusiness hours up to and including 27 January 2010:
(a) the Memorandum of Association and the Articles of Association of the Company;
(b) the accountants’ report issued by ZAO KPMG and KPMG, the text of which is set out inAppendix I;
(c) the statement of adjustments issued by ZAO KPMG and KPMG on the figures shown in theAccountants’ Report of the Group and giving the reasons thereto;
(d) the letter in relation to unaudited pro forma financial information, the text of which is setout in Appendix III;
(e) the letters from the Joint Reporting Accountants and the Joint Sponsors in relation to theprofit forecast, the texts of which are set out in Appendix IV;
(f) the letter, summary of values and valuation certificates relating to the Company’s propertyinterests that are subject to valuation prepared by American Appraisal, the texts of whichare set out in Appendix V;
(g) the full valuation report in respect of the valuation properties in English only;
(h) the Russian legal opinions issued by Egorov, Puginsky, Afanasiev and Partners theCompany’s legal advisers on Russian law in respect of certain property interests of theGroup;
(i) the letter prepared by Ogier, the Company’s legal counsel on Jersey law, summarisingcertain aspects of the Jersey Companies Law referred to in Appendix VII;
(j) the legal opinion issued by Junhe Law Offices, the legal advisers to the Company as to PRClaw in respect of, among other things, property matters of our Group in the PRC;
(k) the legal opinion issued by Cabinet D’Avocats “BAO & Fils”, the legal advisers to theCompany as to Guinea law in respect of, among other things, property matters of our Groupin Guinea;
APPENDIX IX DOCUMENTS DELIVERED TO THE REGISTRAR OFCOMPANIES AND AVAILABLE FOR INSPECTION
— IX-1 —
Q69(ii)
App1A-53
App1A-53(1)19.10(6)App1A-53(3)App1A-53(4)

(l) the legal opinion issued by Asters Law Firm, the legal advisers to the Company as toUkraine law in respect of, among other things, property matters of our Group in Ukraine;
(m) the Jersey Companies Law;
(n) the independent technical report issued by Hatch Associates Limited and SRK, the text ofwhich is set out in Appendix VI;
(o) the independent assessment report issued by CRU in relation to the aluminium and aluminamarket as referred to in the section headed “Industry and Market Overview” of theprospectus;
(p) the material contracts referred to in paragraph B of Appendix VIII;
(q) the written consents referred to in paragraph D of Appendix VIII; and
(r) High Court decision dated 3 July 2008 in Cherney v. Deripaska [2008] EWHC 1530(Comm).
APPENDIX IX DOCUMENTS DELIVERED TO THE REGISTRAR OFCOMPANIES AND AVAILABLE FOR INSPECTION
— IX-2 —
App1A-53(2)

The following are extracts from the decision of the High Court in Cherney v. Deripaska [2008]EWHC 1530 (Comm) dated 3 July 2008. The full decision is on public display and can be found at<www.bailii.org/ew/cases/EWHC/Comm/2008/1530.html>.
Neutral Citation Number: [2008] EWHC 1530 (Comm)
Case No: 2006 FOLIO 1218
IN THE HIGH COURT OF JUSTICEQUEEN’S BENCH DIVISIONCOMMERCIAL COURT
Royal Courts of JusticeStrand, London, WC2A 2LL
Date: 03/07/2008
Before:
MR JUSTICE CHRISTOPHER CLARKE
- - - - - - - - - - - - - - - - - - - - -
Between:
MICHAEL CHERNEY- and -
OLEG VLADIMIROVICH DERIPASKA
Claimant
Defendant
- - - - - - - - - - - - - - - - - - - - -
- - - - - - - - - - - - - - - - - - - - -
Geoffrey Vos QC & David Lord (instructed by Dechert LLP) for the ClaimantRoger Stewart QC, Nick Cherryman & Graham Chapman
(instructed by Bryan Cave) for the Defendant
Hearing dates: 30th April & 1st May 2008
- - - - - - - - - - - - - - - - - - - - -
Judgment
MR JUSTICE CHRISTOPHER CLARKE :
1. This is an application for permission to serve the claim form on Mr Oleg Deripaska, thedefendant, out of the jurisdiction. The original claim form was issued on 24th November 2006.It was purportedly served on Mr Deripaska by service on a security guard at his house inBelgrave Square on 26th November 2006. In a judgment of 3rd May 2007 Langley, J decided thatMr Deripaska had not been properly served and that the Court had no jurisdiction to try the claimunder Article 2 of Council Regulation (EC) 44/201 (the “Jurisdiction Regulation”) because MrDeripaska was not domiciled in England & Wales. He also refused (a) to dispense with serviceof the claim form; (b) to extend time for its service and (c) to grant permission to appeal.
[Paragraphs 2 to 4 intentionally omitted.]
APPENDIX X EXTRACTS FROM CHERNEY V. DERIPASKA[2008] EWHC 1530 (COMM)
— X-1 —
The claimant’s case
5. The claimant is Mr Michael Cherney. He claims that he was a partner of Mr Deripaska, in abusiness whose principal asset was a large interest in an aluminium company — OJSC UnitedCompany Siberian Aluminium (“Sibal”). He and Mr Deripaska each had, he says, a 40% ultimatebeneficial interest in Sibal. In about late 2000 or 2001 a merger took place between Sibal andan aluminium business called Sibneft, owned by Mr Roman Abramovich, Mr Boris Berezovskyand Mr Badri Patarkatsishvili. Sibal and Sibneft transferred their assets to a company calledRussian Aluminium (“Rusal”), in which Sibal and Sibneft took a 50% interest. As a result hebecame entitled to a 20% (40% of 50%) share in Rusal, the world’s largest aluminium producer.
6. In March 2001 he and Mr Deripaska met at an hotel in London. They then entered into anagreement, principally contained in two written documents. Under the first document MrDeripaska agreed to pay Mr Cherney $ 250 million up front for his shareholding in Sibal. Underthe second Mr Deripaska undertook (a) to hold 20% of the shares in Rusal on trust for MrCherney, (b) to sell them between 10th March 2005 and 10th March 2007; and (c) to account toMr Cherney for the proceeds of these sales, minus the $ 250,000,000. It was also orally agreedthat the agreement would be governed by English law and be subject to English jurisdiction. Itis not suggested that, in the absence of that agreement the agreement is governed by English law.
7. Subsequently there was a merger of Rusal and two companies named Sual and Glencore to formUnited Company Rusal (“UCR”). The former shareholders of Rusal hold 66% of UCR. The effectof that, according to Mr Cherney, is that Mr Deripaska holds 20% of 66% i.e.13.2% of UCR ontrust for him. He claims declarations to give effect to his trust claims, an order that Mr Deripaskasell or procure the sale of 20% of Rusal and 13.2% of UCR and account to him for the proceeds,and damages.
8. It is common ground that the $ 250,000,000 has been paid, that Mr Deripaska does not acceptthat he has any obligation towards Mr Cherney in respect of 40% of the shares in Sibal, 20% ofthe shares in Rusal, or 13.2% of the shares in UCR, and that he has not accounted to Mr Cherneyfor any proceeds of any sale of shares in Rusal.
Mr Deripaska’s position
9. Mr Deripaska denies that he was ever a partner, in any normally accepted commercial meaningof the word, with Mr Cherney in the aluminium, or any other, business. He agrees that at ameeting at the Lanesborough Hotel on 10th March 2001 he signed the first of the two documentsrelied on by Mr Cherney, which provided for the payment of $ 250,000,000. That payment wasmade, he claims, because Mr Cherney, together with Mr Anton Malevsky (“Mr Malevsky”), wasengaged in a “protection” racket in relation to what was Mr Deripaska’s business. The $250,000,000 was paid in order to buy Mr Cherney off. The second document, which deals withthe shares in Rusal, was not produced at the meeting, nor was it intended to be part of anyagreement with Mr Cherney. It was a proposal to be put forward to Mr Malevsky.
[Paragraphs 10 to 44 intentionally omitted.]
The factual dispute
45. The factual background of this case is lengthy5, complex and in large measure in dispute. In theparagraphs that follow I set out so much of the account of events given by or on behalf of theclaimant together with the response of the defendant as is necessary to determine the matters inissue on this application.
5 The evidence extends to sixteen lever arch files, which the parties estimated would require 2 — 2.5 days to read.
APPENDIX X EXTRACTS FROM CHERNEY V. DERIPASKA[2008] EWHC 1530 (COMM)
— X-2 —
46. Michael Cherney was borne in the Ukraine and grew up in Uzbekistan. He has two brothers, oneof whom is Lev Cherney. He claims to have had significant influence and vast contacts ingovernment circles which were completely transformed when Mr Putin came to power in Russia.He had lost such influence by 20016. He left the former territory of the USSR with his familyin 1991 to live in the West. He stopped visiting the territory of the former USSR in 1994 as aresult of fears for his safety, save for the Ukraine which he started to revisit in 2003. In 1994allegations started to be made in the Russian press that he had links to organised crime.Following the election of Mr Yel’tsin as President in the middle of 1996 for a second term (MrCherney being connected with the opposition) there was an organised press campaign stating thathe was connected with the mafia. At the end of 1993 and in 1994 and 1995 (and subsequently)he was warned by people with connections to the Russian security service, including retiredpersonnel, that there were threats to his safety. He emigrated to Israel in 1994 and claimed Israelicitizenship.
47. In 1995 an attempt was made to assassinate him in Israel. It appeared from the trial of two ofhis would-be assassins and from what the Israeli police told him that a Russian business crimegroup, possibly connected to the Russian secret services, contacted an Israeli privateinvestigation firm to kill him. That firm hired a would-be assassin who was in fact a policeinformant. Two former military intelligence officers were sentenced to prison. A third man, whowas the go-between, fled to Russia.
48. In a statement to the Swiss authorities made in 1997 Mr Cherney said that the “contract” [to killhim] referred to in a press article related both to him and Mr Malevsky and was in relation tobusiness negotiated in Russia. In 2007 the Russian media in Israel published an article reportingthat a private investigation firm had staged an attempt to assassinate him and had discovered thatit would be very easy to do. Two private investigators have recently been arrested in Israel onsuspicion of illegally phone tapping calls to gather information about him.
49. According to Mr Cherney’s evidence he is an unconventional businessman, who delegated dayto day management to his trusted partners, as was, in any event necessary after he had left forthe West in 1991. He did not retain or receive much in the way of routine documentation. Furtherthe conclusion of deals for enormous sums on a handshake or primitive agreement was a commonfeature of business life in the former Soviet Union in the 1990s.
50. Oleg Deripaska is said by Mr Cherney to have been his protégé, and the recipient of his trust.He is now, on any view, one of the modern Russian business elite. According to Mr Cherney heis part of former President Putin’s close circle and one of his unofficial confidants and advisers,having been close to the family of Boris Yel’tsin. He is married to the stepdaughter of thedaughter of former President Yel’tsin, whom he married in 2001 after Mr Yel’tsin left office andbefore her father, who was Mr Yelt’tsin’s chief of staff, married President Yelt’tsin’s daughter.Mr Cherney claims that Mr Deripaska is one of the most influential people in Russia having vastcontacts and people he can trust in various positions of power which he successfully uses topromote his interests. Mr Deripaska accepts that he is a prominent businessman but not that heoccupies some special unofficial position within the Russian government.
51. In 1989 Mr Cherney started to trade in metals and raw materials in partnership with a companycalled Trans Commodities Ltd. That partnership ended in 1992 at which point he entered intopartnership with a Mr Iskander Makhmoudov, his manager. Originally the partnership was 70/30
6 This claim may be contrasted with an interview he gave to Vedemosti, a leading Russian business paper, on 2nd November2000 in which, when asked “Did you really not play politics, not use ties for the development of your business?”, hereplied that he only knew one politician — former vice-premier Oleg Soskovetz — who promised a copper export licenceand then never provided it.
APPENDIX X EXTRACTS FROM CHERNEY V. DERIPASKA[2008] EWHC 1530 (COMM)
— X-3 —
in Mr Cherney’s favour but later became 50/50, with some of Mr Makhmoudov’s half beingshared with two junior partners. I call this “the Makhmudov/Cherney joint venture”. Thepartnership owned companies and assets in the business of the processing and sale of copper, thesale and purchase of commodities and raw material in ferrous and non ferrous metallurgy, andlater energy resources, engineering, ports etc.
52. Mr Cherney also started to create corporate structures in Liechtenstein, Switzerland, Cyprus andother countries. For this purpose he made use of the services of a Liechtenstein professionalfiduciary called Prasidial Anstalt and, later its subsidiary, Syndikus Treuhandanstalt(“Syndikus”), where the relevant individuals were Messrs Staeger, Domenjoz, and Wyss; and ofone Joseph Karam, a former banker, of Switzerland. .
53. In 1992 Mr Cherney and his brother, Lev, began to work in the aluminium business on a 50/50basis with a company called Trans World Group, which was controlled by two brothers, Davidand Simon Reuben. TWG was involved in the supply of alumina ore from two refineries in theCIS to four smelters in Russia, of which the joint venture obtained control.
54. Mr Cherney first met Mr Deripaska at the end of 1993 or the beginning of 1994 at an event atthe Dorchester Hotel. He was impressed by him. He thought that he might be suitable as hismanager and, later, as one of the partners in his future business. They became partners in aproject to buy a share in the Sayansky Aluminium Plant (“Saaz”) in Hakassia. I call this “theCherney/Deripaska joint venture”. The venture began to invest, with finance provided orprocured by Mr Cherney, in various projects. But its core business was its interest in Saaz. MrDeripaska was not then in a position to acquire any substantial interest in Saaz on his own.Subsequently the venture acquired interests in aviation, car manufacture, and hydro-energy.
55. The agreement was that all the companies involved in the project, of both parties, wouldeventually be merged into one structure and that, so long as the joint venture continued, MrDeripaska could not participate in any other business, although Mr Cherney could7.
56. A large stake in Saaz was acquired by TWG and the Cherney/Deripaska joint venture, actingtogether, and the beneficial interest in the shares was held, as to 50% for TWG, as to 25% forMr Cherney and 25% for Mr Deripaska. I refer to the beneficial interest in this and othercorporations because the ownership structure of the businesses in both theMakhmoudov/Cherney joint venture and the Cherney/Deripaska joint venture involved a chain ofdifferent companies and other entities.
57. At the end of 1994 Mr Deripaska became General Manager of the Sayansky plant, partly as aresult of Mr Cherney persuading the Ministry of Metallurgy, who at that stage had anapproximate 20% interest in Saaz, to vote for his appointment.
7 But in proceedings before a Swiss Investigating Magistrate in June 2004 Mr Cherney is recorded as saying that he“...never had significant business interests with [Mr Deripaska], apart from the shares which we had bought togetherfor these aluminium plants”. Mr Cherney’s explanation is that that was true because the aluminium business was by farthe largest of their joint interests and the non aluminium interests were, as he understood, owned by and part of thealuminium business or at least were acquired and developed with profits derived from the aluminium business.
APPENDIX X EXTRACTS FROM CHERNEY V. DERIPASKA[2008] EWHC 1530 (COMM)
— X-4 —
Mr Deripaska’s account of his investment in Saaz
58. According to Mr Deripaska Mr Cherney never provided him with any funds to purchase sharesin Saaz or any other entity8. He began to purchase shares in Saaz in 1993 and was by 1994 itslargest private shareholder. He continued to purchase shares thereafter together with TWG butthe shares that they each purchased were financed by them separately and accounted forseparately.
59. He was elected General Manager of Saaz in November 1994. At that time the aluminium businessin Russia was the subject of often violent struggles for control by factions that were sometimesconnected to organised crime groups (“OCG”), which in turn had contacts with corrupt membersof the security services and government ministries9. These struggles became known as the“Aluminium Wars”, in which the gangs killed off their competitors or rivals in large numbers inlawless areas of Russia where the aluminium plants were located.
60. Immediately after his election he received the first of a number of death threats, initially fromthe head of the local OCG. An unsuccessful attempt was made to assassinate his deputy. One suchOCG was the Ismailovo organisation headed by Mr Malevsky. Ismailovo is an area in the northof Moscow with at least five hotels and huge outdoor markets. According to Mr Deripaska, MrCherney was closely involved with Mr Malevsky (a veteran of the Soviet invasion ofAfghanistan) and was part of the Ismailovo group, of which, according to Professor Shelley, hewas one of the leaders. This group was engaged in providing “protection” to businesses in returnfor a share in their profits. Legitimate businesses had little option but to accept such“protection”. In turn, according to Professor Shelley, Mr Cherney and Mr Malevsky enjoyed theprotection of Oleg Soskovets, who was first Minister of Metallurgy and then First DeputyRussian Prime Minister and other important officials.
Developments in the mid 1990s
61. In about 1995-1996 Mr Cherney, so he says, entrusted Mr Deripaska with the management of allhis business interests in the Cherney/Deripaska joint venture. Mr Deripaska was introduced toSyndikus and Mr Karam and was authorised to give instructions to Syndikus in relation to themanagement of the business of the joint venture and their mutual assets. This was in partnecessary because at this time Mr Cherney was unable to enter Liechtenstein save for limitedpurposes. Mr Deripaska was granted the widest authority by Mr Cherney, particularly in theappointment of representatives, lawyers, and directors of relevant companies. Ms Skir, MrCherney’s personal assistant, confirms that between 1994 and 1997 Mr Deripaska came to visit
8 In evidence given in an Irish action in April 2000 Lev Cherney asserted that TWG provided the necessary funds for thepurchase of shares in Saaz, which Mr Deripaska describes as equally false. In the same statement Lev Cherney states thatMichael Cherney had told him (apparently in early 1995) that he owned or was entitled to 1/3rd of MrDeripaska’shareholding in Saaz. Mr Cherney says that the proper percentage is 50%.
9 A witness statement from Professor Louise Shelley, a distinguished expert on organised crime in the former Soviet Unionsets out in considerable detail the development of OCGs from the time of the 1917 revolution and the provision by themof “krysha” = literally “roof”, actually protection, initially to illicit private enterprise which used state owned materialsand facilities (with the assistance of a network of corrupt government and party officials) and then to newly privatisedbusinesses. The process became more sophisticated. Instead of cash the OCG took a financial interest in the business“protected” under a “silovoe partnerstvo” or “enforcement partnership”.
APPENDIX X EXTRACTS FROM CHERNEY V. DERIPASKA[2008] EWHC 1530 (COMM)
— X-5 —
Mr Cherney in Israel about every two or three months and they spoke frequently on the telephoneand communicated by fax. Mr Deripaska was treated as a member of the family when he cameto Israel, appeared originally to be an employee, and was very respectful to Mr Cherney; andlater appeared to be a partner.
62. In 1997 there was a serious conflict between TWG and Mr Deripaska in relation to his powersas CEO of Saaz. Mr Cherney supported Mr Deripaska. As a result Mr Cherney sold his 25% sharein TWG for $ 410 million10. Mr Deripaska claims that the conflict had nothing to do with MrCherney supporting him. It arose because TWG regarded its connection with Mr Cherney asseriously damaging because of the constant allegations in the press of Mr Cherney’s link toorganised crime.
The first merger: The Makhmudov/Cherney joint venture and the Cherney/Deripaska jointventure.
63. In 1997 Messrs Cherney, Deripaska and Makhmoudov agreed to merge all the businesses that MrCherney jointly owned with either Mr Deripaska or Mr Makhmudov into one structure. Theinterests of the trio were to be held through Liechtenstein Foundations: the Galenit Foundationfor Mr Cherney; the Cole Foundation for Mr Deripaska; and the Witestone Foundation for MrMakhmoudov. Those foundations were jointly to own (in differing proportions): (a) theMeganetti Foundation, which would primarily hold the former Cherney/Makhmoudov interests;and (b) the Radom Foundation (“Radom”), which would hold the former Cherney/Deripaskainterests.
64. According to Mr Cherney the original owners of Radom were himself, Mr Deripaska and MrMakhmoudov. But Mr Makhmoudov had no beneficial interest in Radom and always held hislegal interest on Mr Cherney’s behalf. He had a nominee interest because Mr Cherney had hopedthat he and Mr Deripaska would work together, in which case he would have had a beneficialinterest. This plan did not work out and Mr Makhmoudov left Radom. A document dated 31stOctober 1997, signed by Mr Cherney, Mr Makhmoudov, and Mr Deripaska shows the ownershipof the Radom Line as shared 50/50 between the Cole and Galenit Foundations (i.e. Mr Deripaskaand Mr Cherney) and the ownership of the Meganetty (sic) Line shared 50/50 between Galenitand Witestone (i.e. Mr Cherney and Mr Makhmoudov). By a document dated 9th April 1998 MrMakhmoudov confirmed that he had no interest in Radom from that date.
65. Nevertheless, by a document dated 18th May 1998 Mr Deripaska confirmed to Syndikus that theownership of Radom was as follows: Deripaska 40%; Cherney 30%; Makhmudov 10%; AndreiMalevsky (Mr Malevsky’s brother) 10%; and Popov 10%. On a fax from Syndikus dated 20thMay Mr Cherney confirmed these shareholdings. This position was reflected in Syndikus’records thereafter11.
66. According to Mr Cherney it was Mr Deripaska who recommended Mr Andrei Malevsky (asrequested by Mr Anton Malevsky, his brother) and Mr Popov as minority partners and “as theywere influential people”, as Mr Deripaska stated them to be, he had little choice but to agree.
10 Mr Cherney has produced what purports to be an agreement between the Cherney and Reuben brothers in which he sells25% of Trans-World Metals S.A. for $ 300million. He says he received $ 410 million.
11 There are also two earlier documents signed by Mr Cherney in which the interests in Radom are said to be (a) Deripaska45%; Cherney 35%; Makhmoudov 10%; Malevsky 10% and (b) Deripaska 45%, Cherney 45% and Malevsky 10%.
APPENDIX X EXTRACTS FROM CHERNEY V. DERIPASKA[2008] EWHC 1530 (COMM)
— X-6 —

67. Mr Deripaska claims that Mr Cherney knew both Mr Malevsky, by which he means AntonMalevsky, the gang leader, and Mr Popov, and introduced Mr Malevsky to him (i.e. MrDeripaska) in Israel in 1995. Mr Malevsky had moved to Israel that year, where he bought ahouse close to Mr Cherney12. The evidence of Professor Shelley is that Mr Popov was one of theleaders of the Podolsk crime group, a ruthless criminal gang in central Moscow. Information tothe same effect appears in a Swiss Federal police report of 10th August 200013.
68. Mr Cherney stated in an interview with Konstatin Borovoy that he had met Mr Malevsky in 1993and he said much the same in a declaration to the Swiss police in November 1996. In the samestatement he described his friendly relationship with Mr Popov, who was staying at the hotel inGeneva where Mr Cherney was arrested.
69. Mr Cherney accepts that he knew both Mr Malevsky and Mr Popov before Mr Deripaska did.What happened was that after Mr Deripaska met Mr Malevsky they became friends and metregularly in Moscow and elsewhere. The same happened with Mr Popov, who is the godfather ofMr Deripaska’s daughter. It was in that context that Mr Deripaska recommended Malevsky andPopov as partners. He, himself did not see Mr Malevsky after about 1997, although he spoke tohim occasionally by telephone; whereas, when Mr Malevsky was required to leave Israel in 1997he spent a considerable amount of time at Mr Deripaska’s invitation at a house owned by MrDeripaska in Russia on Mr Deripaska’s estate. Mrs Malevsky confirms this to be so. For sixmonths her husband and Mr Deripaska spent a lot of time together; and the two of them, herselfand Mr Deripaska’s then girlfriend socialised.
70. Mr Deripaska appears to have sought to hide any connection with Mr Malevsky from a SwissInvestigating Magistrate. On 17th February 2005 he told him:
“I know this person [Mr Malevsky] only by name. I have seen his name in the press”.
71. Mrs Malevsky says that this statement is completely untrue and, in the light of her evidence, thatseems likely to be so. She also states that the accusation that her husband was involved inorganised crime is completely false.
72. According to Mr Cherney at the time of the agreement reached in March 2001 Radom wasbeneficially owned in the following proportions:
Mr Cherney 40%
Mr Deripaska 40%
Mr Malevsky 10%
Mr Popov 10%
I call these “the group of four”.
12 In 1997 or 1998 Mr Malevsky was deprived of his Israeli citizenship and deported on the grounds that he had not reportedon his citizenship application that he had been on a criminal wanted list and on the basis of confidential informationobtained by the police.
13 This report was later held by the Swiss Federal Supreme Court to be one of several documents that did not provide “anytangible element of proof to support the allegations made therein”.
APPENDIX X EXTRACTS FROM CHERNEY V. DERIPASKA[2008] EWHC 1530 (COMM)
— X-7 —
TWG and Lev Cherney sell out to the shareholders of Sibneft
73. In 1999 TWG (i.e. David and Simon Reuben) and Lev Cherney agreed to sell their aluminiumbusiness in Russia to the shareholders of Sibneft. Sibneft was a group controlled by RomanAbramovich, Boris Berezovsky and Badri Patarkatsishvili.
Reorganisation of the Cherney/Deripaska joint venture
74. A meeting took place in Paris on 23rd April 1999. Mr Cherney and Mr Deripaska were there, aswas Mr Todor Batkov, Mr Cherney’s Bulgarian lawyer since 1996, together with representativesof Syndikus and others. Confirmation was given that the shareholding in Radom remainedunchanged from what Syndikus had previously been told. (The note does not state what thatshareholding was, but, according to Mr Domenjoz, the position as reflected in Syndikus’ recordswas as in the fax of 20th May 1998).
75. A decision was made to structure the business into four lines under one parent, namely (a)offshore tolling companies; (b) onshore trading companies; (c) Rostar Holding S.A., aLuxembourg company, which would primarily be engaged in the production of cans; (d)ownership of, or 75% or more participation in, about 10 Russian plants. The intention was thatthe plants should all be merged within a year into a new group to be called Sibal. All companiescreated as the result of the restructuring were ultimately to be owned by the owners of Radom.
76. On 26th April 1999, pursuant to the Paris meeting, Mr Deripaska sent a letter to Syndikus settingout the proposed new structure. There was to be a Luxembourg parent company called AlincorS.A., which was to have 4 Luxembourg subsidiaries as follows:
a) Rostar Holding S.A. , holding Rostar, a Russian company;
b) Altechnology Invest Holdings S.A.: holding Benet Invest & Trade and the tollingcompanies;
c) Almetaltrade Holding S.A.: holding the trading companies in the UK, Germany, USA,China and Cyprus;
d) Intermetal Investment Holding S.A.: holding participations in Russian enterprises of theSiberian Aluminium Group and enterprises in other countries.
77. The structure was set out in an attached diagram in English. The minutes of the 23rd Aprilmeeting had recorded that Mr Deripaska was to deliver to Syndikus an English version of the“Holding Structure in the Russian Federation” in addition to the Russian version alreadyprovided.
78. A note from Mr Stalbek Mishakov, Mr Deripaska’s legal adviser, made it clear that the shares inAlincor were in due course to be transferred to the shareholders of Radom i.e. for the benefit ofthe group of four.
79. Between 1998 and 2000 the joint businesses continued to develop in several fields. Mr Deripaskacreated new companies in Russia, the CIS and other countries. A decision was made to have themain managing company in Cyprus and Mr Deripaska chose NFM Holding Limited, which in2002 was renamed Bazovy Element Ltd. He then started to move companies into place under thatcompany. Upon completion of the process these companies were to form part of the RadomGroup.
APPENDIX X EXTRACTS FROM CHERNEY V. DERIPASKA[2008] EWHC 1530 (COMM)
— X-8 —

80. At the end of July 1999 United Company Siberian Aluminium — “Sibal” — was formed by themerger of six entities controlled or owned by the group of four. Its core asset was Saaz.According to Mr Cherney, Sibal was effectively owned and controlled by Radom, although he isunaware as to the precise route by which that is so. The researches of Mr Batkov into recordsof the shareholding in Sibal at various times are said by him to support his understanding thatSibal was controlled by Mr Cherney and Mr Deripaska through the Radom Group14.
The second merger: Sibal and Sibneft
81. In 2000 negotiations began for the merger of Sibal and Sibneft. The idea was that Sibal andSibneft would contribute all of their aluminium assets to a company called Russian Aluminium(Russky Aluminy) — “Rusal”. Because Sibal was smaller it was to pay Sibneft about $ 575million15.
82. In March 2000, according to the evidence of Mr Berezovsky, a meeting took place at theDorchester Hotel in London attended by Mr Berezovsky, Mr Abramovich and MrPatarkatsishvili, and Mr Deripaska. It was acknowledged that Mr Abramovich would hold a 25%share of Rusal beneficially and 25% as trustee for Mr Berezovsky and Mr Patarkatsishvili.According to Mr Berezovsky, Mr Deripaska did not (at the meeting or thereafter) hide the factthat Mr Cherney was his partner. Mr Abramovich expressed the view that, given Mr Berezovsky’spolitical activism, his name should not appear on any of the formal documents in relation toRusal, and Mr Berezovsky agreed that Mr Abramovich’s name would appear representing hisown interests and those of the two others. He assumed that Mr Cherney’s name did not appearthere for political reasons also.
83. Mr Deripaska’s evidence is that he said nothing at the Dorchester meeting to the effect that MrCherney was his partner, because he was not. The names appearing on the legal documents wereprimarily those of the companies involved with some mutual guarantees from himself and MrAbramovich. There was no discussion with Mr Deripaska’s lawyers about the appearance of MrBerezovsky’s or Mr Cherney’s name in the documents.
84. Mr Deripaska also draws attention to the fact that the original pleading in Mr Berezovsky’sParticulars of Claim in his action against Mr Abramovich, in respect of which the statement oftruth is dated 6th September 2007, stated that at the Dorchester meeting it was agreed that MrDeripaska should own 50% of the shares in Rusal; and that it was not until 8th January 2008 thatthe particulars were amended to assert that 50% of the new company would be owned by MrDeripaska and his partners, Mr Cherney being one of them.
85. According to Mr Cherney, in the second half of 2000 Mr Deripaska showed him a draft of theproposed merger between Sibal and Sibneft, which was governed by English law and subject toLCIA arbitration. Mr Cherney and Mr Deripaska agreed that Mr Deripaska would sign it onbehalf of the group of four, and Mr Deripaska later said that he had signed it. But when MrCherney asked for a copy of the signed agreement Mr Deripaska told him that a copy could notbe produced until the competition authorities approved it. At a meeting in Israel in 2001 MrDeripaska said that the agreement was confidential and that the parties had decided that theirrespective lawyers would keep it in their safes.
14 The labyrinthine company structure makes it somewhat difficult to follow the route by which that is so.15 This was my understanding of the position. However, after seeing the judgment in draft, the parties informed me that
they are agreed that this is inaccurate; but that the true position is complex and they have different cases as to what thatposition is. In those circumstances this paragraph should be read as my (erroneous) understanding and not as any formof finding.
APPENDIX X EXTRACTS FROM CHERNEY V. DERIPASKA[2008] EWHC 1530 (COMM)
— X-9 —

86. Rusal was registered on 25th December 2000. By March 2001 the necessary State approval forthe merger had been obtained and formal approval from the competition authorities was awaited.According to Mr Cherney, Mr Deripaska told him that the new partners and some importantofficials in Russia did not want Mr Cherney’s name to be in the Rusal foundation documents orthose of the companies affiliated with it because of the political risk, Mr Cherney being acontroversial figure and associated with the wrong political faction. He also told him that thenames of Mr Berezovsky and Mr Patarkatsishvili were similarly to be omitted. Mr Cherneyreluctantly agreed to this, Mr Deripaska assured him that, after the creation of Rusal and thereceipt of all necessary licences and permits, their group would receive 50% of Rusal, whichwould give Mr Cherney 20% of it.
The meeting at the Lanesborough hotel
Mr Cherney’s account
87. Mr Cherney and Mr Deripaska met at the Lanesborough hotel on 10th March 2001. This was oneof their regular meetings to discuss business. Mr Deripaska reported on the course of theSibal/Sibneft merger. Mr Deripaska said that he and Mr Abramovich would jointly manage thecompany and that he, on behalf of both groups, would be in charge of Rusal’s day to daymanagement and strategy. They went through various documents which Mr Deripaska hadbrought relating to the merger.
88. When Mr Cherney asked whether it would be possible to pay out a dividend from the jointbusiness Mr Deripaska said that if he, Mr Cherney, wanted money, why was he offering to sellhis business interests to third parties and not to him. Mr Deripaska then offered to make anadvance payment of $ 250 million and promised that he would hold 20% of the shares in Rusal(to which Mr Cherney would shortly be entitled by reason of his 40% ownership of Radom) intrust for Mr Cherney, and would continue to manage the companies and assets of the aluminiumbusiness of the Radom group. He would sell Mr Cherney’s 20% of the shares in Rusal between10th March 2005 and 10th March 2007 and account to Mr Cherney for the proceeds of these salesless the $ 250,000,000. Mr Cherney agreed to this.
89. Mr Cherney asked Mr Deripaska where any disputes would be dealt with and Mr Deripaskareplied that they would be dealt with in England according to English law, as had been agreedwith Mr Abramovich.
90. Mr Deripaska then started to type up an agreement in Russian on his lap top. He produced adocument which included the following in translation16:
“ AGREEMENT NO 1 10th March 2001
This agreement has been concluded between M Cherney, hereinafter the First Party, on theone hand, and O. Deripaska, hereinafter the Second Party, on the other hand.
I. Object of the Agreement
This agreement shall regulate:
1. Questions of the management of shares in [Sibal] belonging to the First Party;
2. the repayment of the debt of [Sibal] to the First Party.
16 Neither this translation nor that in paragraph 92 are agreed.
APPENDIX X EXTRACTS FROM CHERNEY V. DERIPASKA[2008] EWHC 1530 (COMM)
— X-10 —

II. Implementation of the Agreement
For the purposes of implementing this agreement, the Parties shall undertake the following:
1. The First Party shall sell 17.5% of the shares in [Sibal] to the Second Party at apreliminary price of $ 100,000,000;
2. Payment for the shares shall take place within one year from the signing of thisAgreement;
3. The Second Party shall ensure that the debt of [Sibal] to the company Bluzwed isrepaid to a total sum of $ 150,000,000, including interest, which is for the benefit ofthe First Party 17;
4. The repayment of the debt shall take place within one year from the moment of signingof this Agreement;
In the event of the fulfilment of the payment conditions listed in points 1 -4, the First Partyshall assign to the Second Party the right to settle of all obligations which [Sibal] has tothird parties”.
91. Why Mr Deripaska chose to refer to 17.5% or provide for payment of $ 250,000,000 is unclear.Mr Cherney’s case is that he had no idea and was interested only in the ultimate result i.e. whatwas to happen about the 20% in Rusal. Mr Cherney asked where was the reference to his 20%interest in Rusal and the other agreed terms such as the future payment for that 20%. MrDeripaska expressed reluctance to give a more detailed description of the agreement, repeatedthat Mr Cherney’s name should not be linked to the Rusal transaction, and said that he had givenhis word to the new partners that he would ensure that that was so. However, when Mr Cherneyinsisted, Mr Deripaska agreed to put in writing the missing terms.
92. At this stage Mr Cherney left the hotel to meet his wife, agreeing to meet for lunch later. Whenhe and Mr Deripaska met for lunch Mr Deripaska brought with him a document in Russian whichreads, in translation:
“Supplement No 1
In fulfilment of Agreement No 1 dated 10th March 2001, the Parties have agreed on thefollowing. The Second party must begin to sell shares in the company [Rusal] to third partieswithin three years from the moment of the beginning of the fulfilment, but not later than fiveyears after the complete fulfilment of the Agreement18; the Second party shall pay the First Partya sum equal to (Z*20-$250,000,000), where Z is the cost of one per cent of the shares of thecompany [Rusal]. If in the course of three years, several deals are concluded for the sale ofshares to third parties, Z shall be calculated as the average for all the sale deals up to the saleof 20% of the shares.
The Second Party shall pay the First Party the sum due to him within six months of the momentthe shares are sold”.
17 There is a dispute as to whether Bluzwed was Mr Cherney’s or Mr Deripaska’s company. The agreement plainlycontemplated that the repayment to Bluzwed would be for Mr Cherney’s benefit.
18 i.e. between 10th March 2005 and 10th March 2007. The first agreement was not due to be fulfilled until 10th March2002.
APPENDIX X EXTRACTS FROM CHERNEY V. DERIPASKA[2008] EWHC 1530 (COMM)
— X-11 —
93. Mr Cherney noticed the omission of any reference to disputes being dealt with in England underEnglish law but, being eager to get the document finalised, and trusting Mr Deripaska, did notpress for inclusion of these terms in the documents.
94. After lunch they returned to the hotel. Mr Deripaska had already printed out and placed on a tablea number of sets of both of the documents which he had already signed. Mr Cherney signed twosets of such documents. He gave one of the sets back to Mr Deripaska and took the other set thathe had signed along with the other remaining sets on the table. Mr Deripaska assured Mr Cherneythat he would perform everything as had been agreed. They shook hands and parted.
Mr Deripaska’s account
95. According to Mr Deripaska the meeting at the Lanesborough hotel was not one of a number ofregular meetings. It followed an earlier unpleasant meeting in Moscow in March 2001 betweenhimself and Mr Malevsky when he told Mr Malevsky that he wanted to end Mr Malevsky and MrCherney’s “protection” of his business. They agreed a final global payment which includedpayments to Mr Malevsky and his Russian associates and a payment of $ 250,000,000 to MrCherney and his associates. On 10th March Mr Deripaska flew to London in a chartered planewith Agreement No 1 which had been was drafted by him in Moscow and, so far as he recalls,was not corrected at the hotel. He flew back the same afternoon and had no recollection oflunching with Mr Cherney.
96. The charter invoice and hotel documentation reveal that Mr Deripaska did, indeed, fly fromMoscow and back; and that he arrived at the hotel at 0910 and his room was checked as clearedat 1529.
97. Supplement No 1 was not discussed at the meeting on 10th March 2001 nor was it shown to MrCherney. Supplement No 1 was a document which Mr Deripaska drafted in Moscow as an outlineproposal to Mr Malevsky following the meeting with him in Moscow. It formed the basis ofdiscussions with Mr Malevsky there a few days after that meeting. Mr Deripaska had no idea howMr Cherney got hold of it. Mr Malevsky died in a parachuting accident in South Africa in late2001.
98. Nor did Mr Deripaska discuss, much less agree, anything to do with English law or Englishjurisdiction on 10th March 2001 or at any other time. The suggestion that Mr Cherney would everconcern himself with such matters is ridiculous. (Mr Cherney asserts that, whereas someonemight be indifferent to questions of law and jurisdiction if no question of safety was involved,he was not prepared, as Mr Deripaska, knew, to have to go to a country where he would not besafe).
99. Mr Deripaska draws attention to the fact that, in his examination before the Swiss Magistrate on21st February 2004 Mr Cherney is recorded as saying (in translation):
“Maitre Hunziker asks me if I still maintain any interest, direct or indirect, in the company[Rusal]. I reply in the negative. All I have done was to sell my shares in the Russian plantsthat I used to own, I do not know through which intermediary this was done”.
100. However, in a later interview with the Magistrate on 21st June 2004, Mr Cherney stated that hesold “some shares to [Mr Deripaska], but that took longer, up to 2001. For the second instalmentI have never received the full payment and the contract is still in force”.
Events after the alleged agreement
101. There seems no doubt that $ 250,000,000 was paid to or for the benefit of Mr Cherney. On 8thOctober 2001 Siberian Investment Company (“SIC”), a share holder in Sibal, sold a 17.5%shareholding therein (10,482,965,692 10 kopek shares) to Hillgate Financial Corp (“Hillgate”),
APPENDIX X EXTRACTS FROM CHERNEY V. DERIPASKA[2008] EWHC 1530 (COMM)
— X-12 —

a company in the Radom Group for 1,747,176,180 roubles. On 14th November 2001 Hillgate soldthat shareholding to G.S.A. Cyprus Ltd (“GSA”) for $ 150,335,560. SIC, Hillgate, and GSA wereall controlled by Mr Deripaska. The result of these transactions was that Hillgate made about $91,000,000. On 21st January 2002 Mr Batkov, Mr Cherney’s Bulgarian lawyer, was appointedHillgate’s sole director as a result of which Mr Cherney was able to receive the $ 91,000,000.
102. The second half of the payments was not effected by way of loan repayment to Bluzwed asenvisaged in Agreement No 1. On 8th April 2002 Radom loaned Hillgate $ 129,043,495.28. Thatwas loaned back by Hillgate to NFM Holding Ltd, the holding company established by MrDeripaska. (This is odd if, as Mr Deripaska claims, he was buying Mr Cherney off). In the courseof 2002 the loan was repaid to Hillgate, of which Mr Cherney now had effective control. On 18thFebruary 2004 Radom waived its right to enforce the loan against Hillgate. The balance was paidby various payments at Mr Cherney’s request by way of offset.
103. In around July 2002 Mr Mishakov, Mr Deripaska’s legal advisor provided Mr Cherney’s Cypriotaccountant, Mr George Philipides, with two draft documents. The first was a Call OptionAgreement, expressed to be dated 20th September 1999 in which Mr Cherney granted MrDeripaska a call option to purchase 10,482,965,692 shares in Sibal for $ 150,335,560. Thesecond was dated 2nd February 2000 and purported to record the sale of those shares pursuantto the option. The documents were supposed to be necessary for the purpose of the audit of Rusal.When Mr Philipides pointed out that these documents19 did not reflect the agreement to pay 20%of the value of Rusal less $ 250,000,000, Mr Mishakov, in an e-mail of July 11th 2002, noted hiscomments and said that he would revert. So far as the evidence reveals he never did so. If, asMr Deripaska claims, there was never any agreement about the 20%, I find this a most surprisingomission.
104. Mr Cherney’s evidence was that when he telephoned Mr Deripaska about the two draftdocuments he said that his lawyer had made a mistake and “we should forget about it”. MrDeripaska’s evidence is that these documents said nothing about Mr Cherney’s 20% interest inRusal because he did not have one.
Changes in Sibneft
105. According to Mr Berezovsky in June 2001 he and Mr Patarkatsishvili agreed to sell their interestsin Sibneft to Mr Abramovich and his nominees at a substantial undervalue.
Alleged recognition by Mr Deripaska of Mr Cherney’s 20% interest in Rusal.
106. According to Mr Cherney he was approached in the second half of 2002 by Mr GregoryLoutchansky in relation to a substantial business proposition. He told Mr Loutchansky to ask MrDeripaska if he could lend him money on account of his 20% interest in Rusal. Mr Deripaskalater telephoned Mr Cherney and expressed anger that Mr Cherney had mentioned theiragreement to a third party.
107. Mr Cherney also asked Mr Makhmoudov to liaise with Mr Deripaska with a view to obtaininga more comprehensive agreement with Mr Deripaska. Mr Makhmoudov told Mr Cherney that hehad instructed lawyers to draft a more conventional agreement and that a draft had been sent to
19 Mr Philipides referred to an agreement date 1 March 2001 and a subsequent amendment of 10 March 2001. Why he wrote“1 March” is unclear. Since it is agreed that the first agreement was made on 10th March 2001 it seems likely to be atypographical error.
APPENDIX X EXTRACTS FROM CHERNEY V. DERIPASKA[2008] EWHC 1530 (COMM)
— X-13 —
Mr Deripaska. Mr Deripaska telephoned Mr Cherney and reminded him that their agreement wasconfidential and should not be disclosed to third parties, and that he should rely on him toperform his obligations. Mr Deripaska’s evidence is that he was unaware of any such draftagreement.
2003 Sual offers $ 3 billion for 50% of Rusal
108. In 2003 a company named Sual offered, through intermediaries, to pay $ 3 billion for Mr Cherneyand Mr Deripaska’s 50% interest in Rusal. (It seems that by now Mr Deripaska had bought outthe interests of the two minority partners). Mr Cherney telephoned Mr Deripaska and asked himto consider the offer. Mr Deripaska refused to sell. He said that he would comply withSupplement No 1 in due course. Mr Deripaska was planning to buy the Abramovich group’s 50%of shares in Rusal.
109. Mr Cherney later sent to Mr Deripaska a document headed “Supplement” with a view toaccelerating Mr Deripaska’s obligation to buy out Mr Cherney’s share in Rusal. It read (intranslation):
“SUPPLEMENT
1. Party 2, before 31 March 2003, should perform assessment of [Rusal] including all thecompany assets. Starting from 1 April 2003, Party 2 should perform all necessary steps inorder to realise the 20% stake of shares owned by Party 1 at the price at the time of sale,or in order to achieve a better result, all 50% joint stake of shares owned by Sibal.
2. Each party has a right to acquire the partner’s shares at a price calculated on the basis ofthe offer price established with a third party in relation to the whole joint 50% stake”
Mr Deripaska called Mr Cherney and assured him that, although he refused to accept theSupplement, he would perform his obligations, for which there was still time.
Mr Abramovich sells 25% of Rusal to Mr Deripaska
110. In September 2003 Mr Abramovich sold his 25% of Rusal to Mr Deripaska or companiescontrolled by him. As a result Mr Berezovsky and Mr Patarkatsishvili became minorityshareholders.
Mr Berezovsky and Mr Patarkatsishvili sell 25% of Rusal to Mr Deripaska
111. In October 2004 Mr Berezovsky and Mr Patarkazishvilli sold their 25% shareholding in Rusalto Mr Deripaska in an agreement with an English choice of law and jurisdiction clause. MrDeripaska says that there was no agreement which contained such a clause. He says that MrPatarkatsishvili confirmed that he was the sole ultimate beneficial owner of the 25% thenacquired. Mr Berezovsky claims that Mr Patarkatsishvili told him that Mr Deripaska insisted asa condition of the sale that the transaction should be in Mr Patarkazishvilli’s name alone and that,in the interests of completing the sale he agreed to that. But Mr Deripaska knew perfectly wellthat he, Mr Berezovsky, held a 12.5% beneficial interest in Rusal.
Further communications between Mr Cherney and Mr Deripaska
112. According to Mr Cherney Mr Deripaska would tell Mr Popov, Mr Makhmoudov and MrLoutchansky that Mr Cherney had nothing to worry about. He met Mr Deripaska at the Ana GrandHotel in Vienna at the end of 2003 or the beginning of 2004. He showed him Supplement No 1and said that, if possible, he would like to receive the value of 20% of Rusal. Mr Deripaskareplied that there was nothing to worry about and “we still have time”. In January 2005 Mr
APPENDIX X EXTRACTS FROM CHERNEY V. DERIPASKA[2008] EWHC 1530 (COMM)
— X-14 —

Cherney met Mr Deripaska in Kiev. Mr Deripaska told him that he hoped to reach a settlementshortly of the litigation in which he was engaged with TWG and would then address hisobligations to Mr Cherney. He asked how much Mr Cherney wanted for his share in Rusal. MrCherney said he wanted to know the value of 100% of Rusal and would then make him an offer.Mr Deripaska exploded and asked why he should pay such a potentially huge sum calculated byreference to the total value of the business when he had only paid Mr Berezovsky and MrPatarkatsishvili about $ 450,000,000 for their 25% share of Rusal. Mr Cherney reminded him thathe, Mr Deripaska, had paid $ 1.7 billion for Mr Abramovich’s 25% share and referred to Sual’soffer. Mr Deripaska said he would discuss the issue again after he had reached agreement withTWG.
113. Mr Deripaska’s evidence is that whenever he met Mr Cherney after March 2001 he made it clearthat he did not regard himself as having any obligations towards him and that there was nothingto discuss. Statements to that effect have regularly been made by him or on his behalf. In January2005 a spokesman for his management company was quoted in Vedomosti, a Russian businessdaily, as saying that Mr Cherney had never been among the shareholders of Sibal. In April 2006a representative of that company was quoted as saying that Rusal had no unsettled financialobligations towards anyone. In July 2006 Mr Deripaska was reported as saying that he owed MrCherney nothing, In July 2007 he told the Financial Times that he had never worked inpartnership with Mr Cherney.
Mr Cherney’s claims
114. On 14th May 2006 Mr Cherney’s Israeli lawyers, Dr J Weinroth & Co, wrote to Mr Deripaska.The letter referred to Agreement No I and Annex No 1 of March 2001 which “you drafted andthereafter signed” and attached a copy of each of the two documents. The copy of Agreement No1 bore the signatures of both parties. The copy of Annex No 1 (i.e. Supplement No 1) bore onlyMr Deripaska’s signature. The letter of 14th May referred to meetings between Mr Deripaska andMr Cherney to discuss the performance of the agreement in Israel in 2002, Vienna during 2003and 2004, and Kiev in 2005 as well as telephone calls and “a number of meetings between youand persons on behalf of Mr Chernoy in Moscow”, during which meetings Mr Deripaskapromised that it was only a matter of time before he would begin to fulfil his obligations and thathe was examining the best ways to do so. The letter requested commencement of the repaymentof the $ 3 billion in respect of Mr Cherney‘s 20% interest in Rusal. No reply was ever sent.
The merger of Rusal, Sual and Glencore
115. In March 2007 a merger took place between Rusal, Sual and Glencore to form UCR. As a resultof the merger Rusal’s shareholders became the ultimate beneficial owners of 66% of UCR.
Reasonable prospect of success
116. I am satisfied that Mr Cherney has a reasonable prospect of success in respect of his claim. Iconsider the nature of the claim in more detail in paragraphs 136-8 below.
Good arguable case
117. The next question is whether Mr Cherney has established a “good arguable case” that his claimfalls within one or more of the types of claim specified in CPR 6.20. That involves determiningwhether or not he has a good arguable case (a) that the agreement for the breach of which he sueswas made; and (b) that it was made in England; or (c) it is governed by English law; or (d) thatit was a term of the agreement that disputes should be determined in England. It is commonground that, if an agreement was made as alleged it was made in London. Otherwise (a), (c) and(d) are in dispute.
APPENDIX X EXTRACTS FROM CHERNEY V. DERIPASKA[2008] EWHC 1530 (COMM)
— X-15 —

The type of “agreement” made
118. As to (a) the dispute is as to whether an agreement was made as described by Mr Cherney,including both Agreement No 1 and Supplement No 1, by which Mr Deripaska was to sell a 20%interest in Rusal and account to Mr Cherney for the price (less $ 250 million); or whether, as MrDeripaska says, Supplement No 1 was never agreed at all, and Agreement No 1 was in reality avehicle for the payment of protection money, Mr Cherney having no interest, legal or equitable,direct or indirect, in Saaz, Sibal, or Rusal.
119. I cannot and do not purport to determine who is right on this. One side or other is plainly tellinglies on a grand scale. But I am satisfied that, on the material presently before me, Mr Cherneyhas a good arguable case on this point, in the sense that he has a strong argument and that, insofaras any judgment can be made on present material, he has much the better side of the argument.I say that for a number of reasons.
120. Firstly, the account which Mr Cherney gives, both as to the background to and the making of theagreement, and what happened thereafter is detailed and plausible and consistent withcontemporaneous documentary material.
121. Secondly, if Mr Deripaska was never a partner with Mr Cherney in any shape or form and neveragreed to do anything with any interest of Mr Cherney in Sibal, or Rusal, because Mr Cherneyhad none, it is somewhat curious that Mr Deripaska should have chosen to cloak the parties’ trueagreement in the form of a sale by Mr Cherney of shares in Sibal. It is equally, if not more,curious that he should have used as a proposed means of buying off Mr Malevsky a documentwhich (a) says nothing about Mr Malevsky and (b) is expressed to be a supplement to and infulfilment of Agreement No 1, to which Mr Malevsky was not a party, and of which it is notapparent that he ever received a copy, in which Mr Deripaska agrees to sell shares in Rusal andaccount for the proceeds to Mr Cherney. It is also curious that Supplement No 1 should bear thesame date as Agreement No 1.
122. Thirdly, Mr Deripaska’s evidence in relation to Supplement No 1 is scant. Nor is there anyexplanation as to how Mr Cherney might have got hold of Supplement No 1, if it was not at themeeting on 10th March 2001, or signed it when it was on top of Agreement no 1.
123. Fourthly, there are documents which, or the failure to reply to which, provide support to MrCherney’s claims including:
(a) the document of 18th May 1998 (see paragraph 65);
(b) Syndikus’ note of the meeting of 23rd April 1999 (see paragraph 74);
(c) the diagram of the proposed corporate structure (page 15 of MC1: see paragraph 77);
(d) Mr Deripaska’s letter of 26th April 1999 (see paragraph 76);
(e) Mr Philipides’ e-mail of 11th July 2002 and Mr Mishakov’s reply, and the absence of anywritten denial of the applicability of Supplement No 1 thereafter (see paragraph 103);
(f) the further “Supplement” (see paragraph 109);
(g) Dr Weinroth’s letter (see paragraph 114). Mr Deripaska‘s evidence is that he saw no reasonto dignify Mr Cherney’s unfounded claims with a reply. Since, however, this was a claimworth several billion dollars, some reply might be expected, at any rate if it was bad. MrDeripaska certainly asked his English solicitors for advice about it: see paragraph 92 of MrHauser’s witness statement.
APPENDIX X EXTRACTS FROM CHERNEY V. DERIPASKA[2008] EWHC 1530 (COMM)
— X-16 —
124. In addition to the above:
a) On 9th February 2002 Mr Harari, Mr Deripaska’s Swiss attorney, wrote to the SwissInvestigating Judge a letter in which he said:
“In 2001 Mr Deripaska purchased the economic rights which Mr Michael Cherney ownedin the Sayansk factory”
b) On 17th February 2005 Mr Deripaska said in an interview with the Magistrate:
“�.the repurchase which I made in 2001 was�.for the economic rights on the Sayansk plant.When I say economic rights, I mean the shares of the company which owns this plant”
c) It is noticeable that, in the same interview, Mr Deripaska was asked to be more preciseabout extortion attempts made against him. He referred to threats made to him a man calledTatarenkov when he was the general manager of the Sayansk plant. He did not suggest thatMr Cherney was an extortioner.
d) A report by the United Overseas Bank of their visit to the Sayansk plant on 22nd November1995 records that they met Messrs Bulygin, Deripaska and Karam and learnt that theshareholdings in the plant were, as to 60%, TWM and the “Michael Cherney” group and thatall management was concentrated in the hands of the “Cherney” group via Mr Deripaska.The report contains no reference to Mr Deripaska being a shareholder;
e) A report of a visit of the directors of Syndikus in November 1997 to various Russianbusinesses, which was to be copied to the Cole, Witestone and Galenit Foundations, states:
“Our clients M.C., O.D., and I.M. jointly own approximately 51% of the plant. 35% of theplant belongs to the brother of M.C. (L.C. with his partners), and the rest is owned byminority shareholders and partially by employees”.
The report also reveals that “our clients” were entitled to about 35% in a power plantsupplied with waste heat from the factory, a significant interest in an aluminium foilfactory, 100% of a copper refining plant at Yekaterinburg; and 100% of the Rostar canningfactory. It also reveals that at a lunch in Moscow I.M. claimed that he and his two partnerscontrolled over 15 of the 200 largest Russian firms.
f) A memorandum of a meeting of 14th December 1998 shows Mr Deripaska introducing MrMishakov as the new lawyer for the group. A Syndikus memorandum of 5th July 1999records Mr Mishakov discussing with Syndikus the holdings of various companiesincluding Alnicor and that
“In the long term the company intends to be listed on the stock exchange. As not all thebeneficiaries of Radom Foundation wish to be mentioned, Iskander Makhmoudov and PavelEsoubov will hold in trust 50% each of the shares of Alincor for the others when it comesto making the beneficiaries publicly known”
125. Fifthly, there is the evidence of various professionals. Mr Jean-Pierre Domenjoz of Syndikusstates that Mr Cherney and Mr Deripaska were partners in the Russian aluminium business heldas part of the Radom Group in which they were both interested. He attests to the restructuringof Mr Cherney’s interests in 1997 arising from the introduction of new partners. He produces anumber of documents signed by Mr Deripaska in which Mr Cherney or his foundation (Galenit)is expressed to have between a 30% and a 50% interest in Radom, which, as Mr Deripaska’s letterof 26th April 1999 shows, was to be the parent of the group including Sibal. Syndikus plainly
APPENDIX X EXTRACTS FROM CHERNEY V. DERIPASKA[2008] EWHC 1530 (COMM)
— X-17 —
treated Mr Cherney as one of the joint owners of Radom. Mr Domenjoz understood Mr Cherneyto be the senior partner in the businesses under both the Meganetti and the Radom lines, and MrDeripaska to be the day to day manager of the business under the Radom line. On August 10th2001 Syndikus sent a fax to Mr Mishakov pointing out that:
“As you know Radom Foundation is hold [sic] by five different parties and we need a letterfrom each party giving us the order and authorisation to liquidate Radom Foundation”.
In a fax of 18th February 2003 Mr Deripaska referred to himself as “one of the beneficiaries ofRadom Foundation”.
126. Mr Batkov’s evidence is that he met Deripaska more than 10 times between 1996 and 2001, oneof which was at the meeting in Paris of 23rd April 1999. On the first occasion he understood MrDeripaska to be managing Mr Cherney’s aluminium business. Later Mr Cherney said that theywere equal partners and Mr Deripaska treated Mr Cherney as if he was in practice the seniorpartner.
127. In October 2001 Mr Cherney commissioned Mr Philipides to research his financial history witha view to providing independent confirmation of the legitimate source of his wealth. Mr Cherneythen explained to him that he effectively owned 50% of Sibal through a structure operated by MrDeripaska and that earlier in the year he had come to an agreement with the latter to sell hisinterest for approximately $ 450 million (his then assessment of its value), that he was to be paidpartly up front within a year and partly from the future proceeds of a 20% sale in Rusal. He saysthat his subsequent investigations e.g. with Mr Domenjoz of Syndikus and Mr Joseph Karamrepeatedly confirmed that Mr Cherney had been in partnership with Mr Deripaska for thealuminium side of the business and with Mr Makhmoudov for the copper side. In addition MrCherney put him in touch with Mr Pavel Ezoubov, Mr Deripaska’s cousin, and Mr Mishakov, hislegal advisor. On 21st November 2001 Mr Ezoubov sent Mr Domenjoz a fax on Radom paperstating that he has been told that “MC and OD agreed to make an audit of Radom Foundationand I was supplied with the letter from MC ... with request to inform you that he wants that itwill be audited by “Horworth Philipides & Partners” and he asks from you all possible help inthat thing”.
128. On 22nd January 2002 Mr Mishakov met Mr Philipides at Rusal’s office in Moscow. On 15thNovember 2001 Mr Philipides had sent Mr Mishakov an e-mail setting up the meeting in whichhe had asked for a list of all investments held by Mr Cherney in “aluminium and other jointbusinesses”. At the meeting, according to Mr Philipides, Mr Mishakov confirmed that MrCherney was until about a year before Mr Deripaska’s partner in owning Sibal; that Mr Deripaskastarted out as Mr Cherney’s assistant and eventually took over; that the operations of Sibal weredelegated to Mr Deripaska; and that Mr Cherney advised on strategy but otherwise was reallyonly a financier. He, Mr Mishakov, was aware that a buyout had been agreed and that Mr Cherneyhad effectively divested himself of any interest in the group. He said that Mr Cherney was anhonourable business man who made one mistake which was to leave Russia and leave himselfexposed to the mercy of anybody who wanted to gain control of his business.
129. Sixthly, there is evidence which tends to support the claim that both Agreement No 1 andSupplement No 1 were executed by the parties in March 2001. In 2008 Mr Robert Radley, anexperienced forensic expert, examined the originals of Agreement No 1 and Supplement No 1,which were in the possession of Mr Cherney’s solicitors. His report of 2nd April 2008 revealsthat the dates and signatures on both Agreement and Supplement were completed with the sameblue ballpoint ink, with similar ink flow onto the paper, and with similar defects in the lay downof the ink, save that Mr Cherney’s signature on the Supplement was completed with a differentblue ballpoint ink. In other words Mr Deripaska signed Agreement No 1 and Supplement No 1
APPENDIX X EXTRACTS FROM CHERNEY V. DERIPASKA[2008] EWHC 1530 (COMM)
— X-18 —

with the same pen. Further, ESDA examination revealed that the original Supplement was signedby Mr Cherney when it was resting on Agreement No 1. This is consistent with both documentshaving been signed on the same occasion. Why Mr Cherney should have signed the Supplementwith a different pen is unknown but I do not regard that as a circumstance that justifies aconclusion that the Supplement did not come into existence in the circumstances described byhim.
130. The report also reveals, in agreement with the opinion of Dr Giles, instructed for Mr Deripaska,that the copy of the supplement signed only by Mr Deripaska attached to Dr Weinroth’s letter ofMay 2006, has Mr Deripaska’s signature in the same position as that in which it appears in (a)the original Supplement No 1, as inspected by Bryan Cave LLP, Mr Deripaska’s solicitors, at theoffices of Stephenson Harwood, Mr Cherney’s then solicitors; (b) the copies of Supplement No1 with two signatures (“the copies”) exhibited to the statements of Mr Cherney and Mr Batkov;and (c) the copy signed only by Mr Deripaska attached to Dr Weinroth’s letter. Mr Radleyconfirms that the original Supplement No 1 was the master document that has given rise to thecopies. Accordingly Mr Cherney must have signed the original of the Supplement after it hadbeen signed by Mr Deripaska. This, however, establishes no more than that someone took a copyof the original supplement bearing Mr Deripaska’s signature alone before Mr Cherney signed it.
131. Ms Skir states that, when Mr Cherney returned to Israel from England in March 2001, he gaveher a package of documents which she placed in the office safe. Mr Cherney later asked her tocopy the package. This was on some date before 26th March 2001 when the Israeli policeconducted a search of the office. Whilst copying the documents she became aware that thepackage contained (a) an agreement and a supplement in Russian, each signed by both MrCherney and Mr Deripaska, and (b) an additional copy of Supplement No 1 signed only by MrDeripaska. She gave the documents in the package to Mr Cherney and put the copies in the safe.The Israeli police took the copies in the safe on 26th March, eventually returning them about sixmonths later.
132. Mr Cherney’s evidence is that, so far as Supplement No 1 is concerned, he signed two sets oforiginals. He brought back to Israel one of the original sets signed by both parties along withvarious other documents which included the copy of Supplement No 1 signed only by MrDeripaska, which he later passed to Dr Weinroth. At the end of March 2001 he gave the twosigned originals to Mr Batkov. Mr Batkov confirms that he received the two signed originalstowards the end of March 2001 and retained them until they were provided to StephensonHarwood (and thence to Dechert LLP). On Mr Deripaska’s case no version of Supplement No 1containing Mr Cherney’s signature was, so far as he is aware, in existence in March 2001.
133. Seventhly, I note that on 9th February 2007 Tomlinson, J was told by Mr Roger Stewart QC, forMr Deripaska, that it was common ground that the first agreement was signed in London but thatthe status of the second one was still being investigated. I find the vagueness of Mr Deripaska’slawyers’ then understanding of his position difficult to square with the robust assertion now madethat Supplement No 1 was a proposal for buying off Mr Malevsky — a position which, if true,must have been apparent since 2001.
134. Eighthly, I do not regard it as suspicious that there were two documents rather than a single one,in the first of which Mr Deripaska was content for Mr Cherney’s name to appear. The firstagreement could be represented as terminating Mr Cherney’s involvement with Sibal. It is thesecond which may be regarded as confirming the link between Mr Cherney and Rusal, a linkwhich Mr Deripaska, on one view of the evidence, was reluctant to have patent.
APPENDIX X EXTRACTS FROM CHERNEY V. DERIPASKA[2008] EWHC 1530 (COMM)
— X-19 —
135. I have been constrained to deal with these matters in some detail because of the contention ofthe defendant that it is necessary for Mr Cherney to satisfy the Canada Trust gloss. I repeat,however, that these are not findings of fact against Mr Deripaska. Any such findings are theprovince of the trial judge who will make them in the light of the totality of the evidence beforehim or her. Had I been unable to reach a conclusion as to which side had the better of theargument in relation to the making of the agreement relied on I would have held that Mr Cherneyhad not established a sufficiently good arguable case to justify granting him permission to servethe claim form out of the jurisdiction.
[Paragraphs 136 to 138 intentionally omitted.]
English law and jurisdiction
139. I turn to consider whether Mr Cherney has a good arguable case that the agreement that he madewas orally agreed to be subject to English law and jurisdiction. Mr Stewart submits that both ofthose suggestions are implausible. Since Mr Cherney is not a man concerned with details but only“crucial issues” it is unlikely that he would have concerned himself with questions of forum andlaw. If any such agreement had been made it would have been recorded. If the agreement was thatdisputes would be dealt with in England “as had been agreed with Mr Abramovich” theagreement would be for LCIA arbitration as that is what had been agreed with him. It is also tobe noted that in the original Particulars of Claim filed in November 2006 the pleading was thatit was expressly agreed that “English law would govern the relations between the parties inrespect of the agreement”. No reference was made to an agreement on English jurisdiction (curialor arbitral).
140. Mr Vos submits that it is entirely understandable that Mr Cherney should seek to agree Englishlaw and jurisdiction given his obvious unwillingness to return to Russia. He further points outthat Mr Deripaska has often agreed English law and either English jurisdiction or arbitration.Thus the draft merger agreement between Sibal and Sibneft provided for English law and LCIAarbitration. The Loan Agreement between Radom Foundation and Hillgate of 8th April 2002 andbetween NFM Holding and Hillgate of 9th April 2002 were also subject to English Law and LCIAArbitration. The draft Call Option Agreement and Share Purchase and Sale Agreement (seeparagraph 103 above) were subject to English law and arbitration in the former and English lawand UNCITRAL arbitration in London in the latter.
141. On this issue (which, again, I cannot and do not purport to determine) it seems to me that MrDeripaska has the better side of the argument and, on the question of English jurisdiction, muchthe better side. Mr Cherney is avowedly not a man for detail. Choice of forum and law wouldseem to me a detail with which he would not normally concern himself. (According to Mr Hauserit is not a matter with which Mr Deripaska would normally concern himself either). If, as issuggested, this was something of particular significance because of his reluctance or refusal togo back to Russia, one would expect it to have been recorded. Mr Cherney, on his account, askedfor the documents to record the agreement about his 20% interest in Rusal and could have askedthat it record their agreement on English law and jurisdiction. The alleged agreement could havebeen quite briefly recorded and even added in manuscript. It is, also, noticeable that no mentionwas made of the alleged oral agreement on English law in the letter before action from DrWeinroth.
142. Mr Cherney’s evidence is that he spotted the omission but did not raise it because he was eagerto get the document finalised and had Mr Deripaska’s verbal assurance. That may be so; but itis not particularly convincing. Further, the failure to plead an agreement as to Englishjurisdiction until December 2007 casts considerable doubt on whether that was ever agreed. Iaccept that witnesses often leave something out when recounting what has happened, and that
APPENDIX X EXTRACTS FROM CHERNEY V. DERIPASKA[2008] EWHC 1530 (COMM)
— X-20 —
language difficulties may contribute to that. Even so I find it highly surprising that Mr Cherney’sexperienced former solicitors do not seem to have understood from him that English jurisdictionhad been agreed. No such suggestion was ever made to Tomlinson, J, Langley, J or Longmore,LJ and, if there was an agreement on English jurisdiction, an entirely unnecessary case was runon the question of Mr Cherney’s domicile. No explanation has been given in any statements asto how the jurisdiction issue only came to be remembered or put forward later.
143. The fact that Mr Deripaska, or, more accurately, his lawyers have included English law andarbitration clauses in agreements does not go much further than to show that he is not averse tohaving some disputes determined in this manner. It does not, however, sit well with the avermentthat what Mr Deripaska agreed was English jurisdiction. If the question of where any disputewould be determined was addressed, it would seem more likely that the parties, or at any rate MrDeripaska, would choose arbitration, which was the form of dispute resolution usually adoptedby him.
144. In short, I am not satisfied, on the material before me, that Mr Cherney has a good arguable casethat there was an oral agreement as to English law and jurisdiction in that I am not satisfied thaton either of those issues he has either much the better or even the better side of the argument;and on the jurisdiction issue I am satisfied that Mr Deripaska has much the better side of theargument.
[Paragraphs 145 to 196 intentionally omitted.]
Discussion on forum conveniens
197. If there was no question of Mr Cherney not getting a fair trial in Russia and no doubt but thathe would, if necessary, pursue his claim in the Russian Courts, or could reasonably be expectedto do so, Mr Cherney would fail to establish that England was the proper forum for the trial ofthis dispute. The alleged agreement, if made, was made in England. There may have been anagreement that it would be governed by English law but, on the present material Mr Deripaskahas the better side of the argument on that. The claim relates to a substantial stake in a majorRussian aluminium business. Whether any agreement is found to have been made as alleged isin large measure dependant on whether or not the parties were partners in business or extortionerand victim. The answer to that depends, in part, on what happened in the relevant part of thealuminium business in Russia between 1993 and 2001. Any evidence on that topic is likely tocome predominantly from Russians, who are likely to want to give evidence in Russian, or fromRussian documents. Russia has an operating legal system of which Mr Cherney can avail himself.
198. It is, however, apparent to me that, if this claim is not allowed to proceed in England, it will notproceed in Russia. It is unrealistic to suppose that Mr Cherney’s claim could be prosecuted withany hope of success without his giving oral evidence and he will not return there for threereasons. Firstly, he fears for his life; secondly, he fears that he may be arrested on what he claimswould be trumped up charges; thirdly, he does not believe that he will get a fair trial. I have,therefore, to consider what significance if any, should attach to the fact that a trial in Russia will,in all probability never take place. That must depend on the extent to which any of Mr Cherney’sfears are justified and whether, even if justified, they afford any reason for having a trial not inRussia but in England.
[Paragraphs 199 to 263 intentionally omitted.]
APPENDIX X EXTRACTS FROM CHERNEY V. DERIPASKA[2008] EWHC 1530 (COMM)
— X-21 —

Conclusion
264. Taking all those considerations into account, I am persuaded that the risks inherent in a trial inRussia (assassination, arrest on trumped up charges and lack of a fair trial) are sufficient to makeEngland the forum in which the case can most suitably be tried in the interests of both partiesand the ends of justice and, accordingly, the proper place for the determination of this claim.
265. I shall, therefore, give permission for the claim form to be served outside the jurisdiction.
APPENDIX X EXTRACTS FROM CHERNEY V. DERIPASKA[2008] EWHC 1530 (COMM)
— X-22 —

(根據澤西島法律註冊成立的有限公司)股份代號: 486
全球發售
聯席保薦人、全球協調人及賬簿管理人
聯席賬簿管理人
財務顧問
UNITED COMPANY RUSAL LIMITED
UN
ITED
CO
MPA
NY
RU
SAL LIM
ITED
UNITED COMPANY RUSAL LIMITED