United Bank Limited - UBL Digital
45
United Bank Limited UNCONSOLIDATED CONDENSED INTERIM FINANCIAL STATEMENTS FOR THE SIX MONTHS ENDED June 30, 2021 (Un-audited)
-
Upload
khangminh22 -
Category
Documents
-
view
1 -
download
0
Transcript of United Bank Limited - UBL Digital

United Bank LimitedUNCONSOLIDATED CONDENSED
INTERIM FINANCIAL STATEMENTS
FOR THE SIX MONTHS ENDED
June 30, 2021
(Un-audited)

UNITED BANK LIMITED
DIRECTORS’ REPORT TO THE MEMBERS
Directors’ Report H1 2021 P a g e | 1
On behalf of the Board of Directors, we are pleased to present the financial statements of United
Bank Limited (UBL) for the half year ended June 30, 2021.
Performance Overview
On a standalone basis, UBL recorded Profit Before Tax (PBT) of Rs. 25.9 billion for the half year ended
June 30, 2021, a strong growth of 37% year on year. On a quarter on quarter basis, the bank
recorded a strong growth in PBT of 12% Q2’21 versus Q1’21.
UBL’s gross revenues stood at Rs. 46.5 billion for H1’21 (H1’20: Rs. 48.0 billion). Net mark-up income
was recorded at Rs. 35.1 billion for H1’21 (H1’20: Rs. 39.1 billion). The bank recorded non-markup
income of Rs. 11.4 billion for H1’21, an increase of 28% over H1’20, owing mainly to capital gains
realized on foreign bonds as well as strong growth in all major fee lines.
The bank’s operating expenses stood at Rs. 20.2 billion for H1’21, a growth of 5% over H1’20. Cost to
income ratio remained lean at 43% for H1’21 as against 40% in the corresponding period of last year.
The bank recorded a net provision reversal of Rs. 87 million in H1’21 against a net provision charge of
Rs. 9.4 billion in H1’20, owing mainly to sustained recovery efforts within both the domestic and
international segments.
Financial Highlights
On a standalone basis, UBL recorded Profit After Tax (PAT) of Rs. 15.0 billion for H1’21 versus a PAT
of Rs. 11.4 billion for H1’20, a strong growth of 32% year on year. Earnings per share (EPS) was
measured at Rs. 12.25 for H1’21 (H1’20: Rs. 9.31).
On a consolidated basis, UBL recorded PAT of Rs. 15.0 billion (H1’20: Rs. 10.7 billion). The
consolidated EPS was measured at Rs. 12.24 for H1’21 (H1’20: Rs. 8.94).
Net Markup Income
Net markup income was recorded at Rs. 35.1 billion for H1’21, 10% lower on a year on year basis.
The bank’s markup earning assets averaged Rs. 1.8 trillion in H1’21, growing by 11% year on year.
Bank level Net interest margin (NIM) was measured at 3.9% for H1’21 (H1’20: 5.0%). In order to
support the economy during the pandemic, the State Bank of Pakistan (SBP) reduced the policy rate
from 13.25% at Dec’19 to 7.00% by Jun’20. The average interest rates stood close to 11.0% in H1’20
versus 7.0% in H1’21, due to which higher net markup income was earned in the corresponding
period of last year.

UNITED BANK LIMITED
DIRECTORS’ REPORT TO THE MEMBERS
Directors’ Report H1 2021 P a g e | 2
Domestic deposits averaged Rs. 1.4 trillion in H1’21, with one of the highest portfolio growth levels
achieved of 20%. Domestic CASA deposits averaged Rs. 1.2 trillion for H1’21, a growth of 19% year on
year, with an incremental increase in the base of Rs. 195 billion. The average CASA to total deposits
ratio was measured at 85.1% in H1’21 (H1’20: 85.5%). The Branch banking segment continued to
actively solicit new relationships as it added approximately 290,000 new current account
relationships in H1’21 as against 231,000 current account relationships on boarded in the
corresponding period of last year. This led to average current deposits growing by 22% year on year
to Rs. 618 billion in H1’21, and resultantly, the average current to total deposits ratio improved to
43% in H1’21 from 42% in H1’20. The domestic portfolio of savings accounts averaged Rs. 603 billion
in H1’21, recording a strong growth of 16% year on year. The steady build-up in low cost deposits as
well as a sharp reduction in the policy rate led to the domestic cost of deposits declining to 3.4% in
H1’21 from 5.5% in H1’20.
On the asset side, bank level performing advances averaged Rs. 537 billion for H1’21 (H1’20: Rs. 605
billion), while domestic performing advances averaged Rs. 436 billion for H1’21 (H1’20: Rs. 484
billion). Maintaining strong focus on asset quality, the domestic corporate loan book averaged Rs.
355 billion for H1’21, down 13% year on year. Consumer loans averaged Rs. 19 billion for H1’21,
growing by 9% year on year, driven mainly by growth in the secured autos segment. The Islamic loan
book is up 58% year on year in averages, being recorded at Rs. 31 billion for H1’21. Within UBL
International, the bank has significantly de-risked its balance sheet as the average performing loan
book reduced from USD 758 million in H1’20 to USD 644 million in H1’21, a decline of 15% year on
year.
The bank’s markup earning investments averaged Rs. 1.2 trillion for H1’21, growing by growth of 26%
over H1’20. The domestic government securities portfolio earned the bank a healthy yield of over
8.0% during the period under review. UBL International’s foreign bonds portfolio averaged USD 735
million, growing by 10% year on year, yielding 5.3% in H1’21.
Non-Markup Income
The bank earned non-markup income of Rs. 11.4 billion in H1’21, an increase of 28% year on year
and contributed 25% of the total revenues of the bank in H1’21 (H1’20: 19%).
Fees and commission income of Rs. 6.6 billion was earned in H1’21, a growth of 26% compared to
last year. This performance was driven by the domestic franchise which recorded a strong 35%
growth in fee revenues in H1’21 versus H1’20.
Customer fees from branch banking operations stood at Rs. 820 million for H1’21, largely in line with
revenues earned last year. UBL maintained its leadership position in the domestic home remittances
space with a market share of over 20%. As a result, commission income from home remittances of
Rs. 841 million was earned in H1’21, up 12% year on year.

UNITED BANK LIMITED
DIRECTORS’ REPORT TO THE MEMBERS
Directors’ Report H1 2021 P a g e | 3
The bank maintained its momentum within the bancassurance business as premium volumes of Rs.
1.8 billion were underwritten in H1’21, an increase of 81% over H1’20. Bancassurance commissions
stood at Rs. 883 million in H1’21, a strong growth of 84% year on year. With business momentum
picking up, income from debit and credit card fees of Rs. 1.1 billion was earned in H1’21 (H1’20: Rs.
690 million). The bank earned investment banking fees of Rs. 343 million in H1’21 versus Rs. 85
million in H1’20, led by corporate mandates for debt arrangement and advisory services.
Commission income from cash management was recorded at Rs. 462 million for H1’21, growing by
24% year on year.
The bank earned foreign exchange income of Rs. 1.2 billion in H1’21 (H1’20: Rs. 1.7 billion). Dividend
income of Rs. 881 million was recorded for H1’21, an increase of 11% year on year, with improved
payouts from fertilizer and energy stocks as well group entities. The bank realized capital gains of Rs.
2.5 billion in H1’21 (H1’20: Rs. 676 million), primarily on the timely sale of foreign debt securities.
Provisions and loan losses
UBL recorded a net provision reversal of Rs. 87 million for H1’21 as against a net provision charge of
Rs. 9.4 billion in the corresponding period of last year.
Bank level non-performing loans (NPLs) stood at Rs. 82.1 billion at Jun’21, compared to Rs. 83.6
billion at Dec’20, reducing by Rs. 1.6 billion. Bank level asset quality improved marginally from 13.7%
at Dec’20 to 12.9% at Jun’21, while specific coverage was enhanced from 85.8% at Dec’20 to 86.7%
at Jun’21.
UBL Domestic
Gross advances for the domestic bank stood at Rs. 479 billion at Jun’21 (Dec’20: Rs. 458 billion), and
constituted over 75% of the bank’s total portfolio. Domestic NPLs reduced by nearly Rs. 1.0 billion
since Dec’20, from Rs. 28.7 billion at Dec’20 to Rs. 27.8 billion at Jun’21.
The domestic bank recorded net provision reversals of Rs. 1.1 billion for H1’21 versus a net provision
charge of Rs. 1.1 billion in H1’20. Domestic bank’s asset quality improved from 6.3% at Dec’20 to
5.8% at Jun’21.
UBL International
UBL International’s NPLs have remained largely unchanged at USD 344.6 million at Jun’21 (Dec’20:
USD 343.3 million). A net provision charge of USD 6.6 million was recorded for H1’21 against a net
provision charge of USD 52.0 million in H1’20. Specific coverage was enhanced from 85.9% at Dec’20
to 86.3% at Jun’21. Furthermore, specific coverage with Forced Sale Value (FSV) of mortgaged
properties and cash collateral stood at 94.8% at Jun’21 (Dec’20: 95.5%, refer to note 10.3.2 to the
financial statements).

UNITED BANK LIMITED
DIRECTORS’ REPORT TO THE MEMBERS
Directors’ Report H1 2021 P a g e | 4
Cost management
Improving operational efficiencies remains a key focus for UBL. The bank is continually striving to
optimize its cost base, while improving service delivery through investment in IT as well as expanding
capacity across the branch network.
UBL’s operating expenses were recorded at Rs. 20.2 billion for H1’21, with growth contained at 5%
year on year. Employee compensation was recorded at Rs. 8.3 billion for H1’21, an increase of 4%
year on year. Property expenses were recorded at Rs. 3.2 billion for H1’21, largely in line with last
year. IT expenses were recorded at Rs. 2.1 billion, up 8% over H1’20. Other operating expenses were
recorded at Rs. 6.6 billion for H1’21, an increase of 8% year on year, mainly due to higher sales
commissions and increased business volumes as economic activity builds up to pre COVID levels.
Balance Sheet management
UBL’s balance sheet stood at Rs. 2.4 trillion, growing by 17% since Dec’20. Bank level deposits grew
by 13% over Dec’20 to Rs. 1.85 trillion. This performance is led by the Branch Banking Group as
domestic deposits stood at Rs. 1.6 trillion, growing by 16% over Dec’20, which enabled the bank to
record an average market share of 8.3% of total banking sector deposits for H1’21, improving from
an average market share of 8.0% for H1’20. Domestic current deposits closed Jun’21 at Rs. 715
billion, growing by a strong 16% over Dec’20, while the saving portfolio stood at Rs. 701 billion,
increasing by 18%. This enabled the bank to improve its CASA to total deposits ratio from 85.2% at
Dec’20 to 86.2% at Jun’21. UBL International’s deposits stood at USD 1.3 billion at Jun’21, a slight
decline of 5% since Dec’20.
Bank level net advances closed at Rs. 557 billion as at Jun’21 (Dec’20: Rs. 530 billion).. Our lending
strategy is aimed at ensuring efficient allocation of capital while maximizing overall returns from
relationships. Domestic performing advances stood at Rs. 451 billion, growing by 5% since Dec’20.
The bank is aggressively looking to expand within the Islamic banking space as performing advances
stood at Rs. 43 billion, increasing more than two-folds over the Dec’20 levels of Rs. 21 billion. UBL
International’s net advances stood at USD 655 million at Jun’21, an increase of 8% over Dec’20, with
growth mainly within trade based and FI lending in line with the bank’s strategy.
Bank level investments stood at Rs. 1.46 trillion at Jun’21, an increase of 29% over Dec’20. Excess
liquidity is primarily deployed in government securities within UBL Domestic, as Rs. 209 billion is
invested in fixed income PIBs, Rs. 408 billion invested in floating rate PIBs and Rs. 633 billion invested
in treasury bills. In the current interest rate environment, the investments strategy is aimed at
maintaining stable margins across a well-diversified mix of shorter and longer tenor instruments.

UNITED BANK LIMITED
DIRECTORS’ REPORT TO THE MEMBERS
Directors’ Report H1 2021 P a g e | 5
Capital Ratios
The bank seeks to maintain a strong capital base that provides a solid foundation for future growth
initiatives as well as maintaining adequate buffers over regulatory requirements.
UBL has been designated a Domestic Systemically Important Bank (D-SIB) by the SBP. This
designation initially required the bank to hold an additional 1.5% Higher Loss Absorbency (HLA)
Surcharge, over and above the applicable minimum capital adequacy ratio (CAR) limit in 2019, on
both a standalone and consolidated basis. However, SBP reduced the HLA surcharge by 50 bps to
1.0% effective March 2020 as per their latest D-SIB designation.
SBP has also provided regulatory relief post COVID-19 to support the banking sector in extending
credit facilities to its customers. In this respect, SBP has reduced the Capital Conservation Buffer
(CCB) from its existing level of 2.5% to 1.5%, for the time being till further instructions are issued.
Thus, the minimum CAR requirement for UBL stood at 12.5% (including the HLA Surcharge of 1.0%)
as at June 30, 2021.
The overall CAR stood at 23.5% at Jun’21 (Dec’20: 24.4%), a buffer of 11.0% over the minimum
regulatory requirement of 12.5%. The Common Equity Tier 1 (CET-1) ratio stood at 16.4% at Jun’21
(Dec’20: 17.0%). Total Tier 1 Capital ratio was measured at 17.7% at Jun’21 (Dec’20: 18.4%).
The Board of Directors of UBL declared an interim cash dividend of Rs. 4.0 per share in their meeting
in Karachi held on August 6, 2021, along with the results for the half year ended June 30, 2021.
Economy Review
The country is well on its way to economic recovery following the outbreak of the COVID pandemic in
Q1’20. The resumption of industrial activity across the country is supporting employment levels
driven by a more favorable business environment. The government’s nation-wide vaccination drive is
picking up momentum in a bid to protect its citizens. GDP growth rate was recorded at 3.9% for
FY’21 (FY’20: negative 0.5%) a notable achievement in light of the challenges faced during the period.
However, the threat of a prolonged fourth wave of the pandemic due to the spread of new variants
may impact this nascent recovery. Furthermore, the country is still in the midst of an IMF program
which has tough conditions, which are likely to challenge the existing growth oriented policy
measures of the government.
Controlling inflation levels continues to be a major challenge for the incumbent government. Policy
measures require the right balance between monetary stimulus, maintaining fiscal discipline and
ensuring that overall price levels remain contained. The Consumer Price Index (CPI) stood at 9.7% for

UNITED BANK LIMITED
DIRECTORS’ REPORT TO THE MEMBERS
Directors’ Report H1 2021 P a g e | 6
the month of Jun’21, down 120 bps month on month mainly due to a reduction in the price levels of
food items, while average inflation for FY’21 was measured at 8.9% versus 10.8% in FY’20.
On the external front, the country’s balance of payment position has been largely favorable,
primarily on the back of strong growth in home remittance flows, which reached a record high of
USD 29.4 billion in FY’21 registering a growth of 27% year on year. However, the trade deficit
continues to be impacted by increase in imports of capital goods, industrial materials, food and
commodity items. Furthermore, oil prices have increased by over 90% since Jun’20, which added
significant pressure on the current account position. The current account recorded a deficit of USD
1.9 billion for FY’21 versus a deficit of USD 4.4 billion in the corresponding period of last year. The
country’s imports stood at USD 56.4 billion for FY’21, an increase of 26.6% year on year while exports
for FY’21 stood at USD 25.3 billion, up 18.3% year on year.
The country also ventured into international markets with multiple new Eurobond issues worth USD
3.5 billion in 2021. Furthermore, the momentum continued within SBP’s ‘Roshan Digital’ initiative for
overseas Pakistanis as funds in excess of USD 1.5 billion have been mobilized till Jun’20. These
positive developments were also reflected in the domestic FX markets as the PKR appreciated by
1.4% against the USD since Dec’20, closing at Rs. 157.54. However, the exchange rate has
experienced some pressures post June 30, 2021, with the exchange rate hovering over the Rs. 160
level. Overall, FX reserves have increased by 18.9% since Dec’20, standing at USD 24.4 billion at
Jun’21. The country’s capital markets maintained stable volumes and valuation trends in the first half
of 2021 as the KSE-100 index closed at 47.4 k points at Jun’21, up 8% since Dec’20.
Deposits for the banking sector stood at Rs. 19.8 trillion at Jun’21, up 11% since Dec’20, while
banking sector advances closed at Rs. 9.0 trillion at Jun’21, up 6% over Dec’20. Non-performing loans
for the banking industry stood at Rs. 850 billion at Mar’21, 3% above Dec’20, as the asset quality
deteriorated slightly from 9.2% at Dec’20 to 9.3% at Mar’21.
UBL International
The economic recovery within the GCC has started to build some momentum with demand picking
up as the vaccination drive continues across the region. The OPEC member countries decision to
maintain production cuts has resulted in a significant pick up in the global oil prices, which will
support economic recovery in the near term. Within UBL International, the bank aims to maintain its
business model on the foundations of a stable base of core deposits. On the asset side, lending
remains selective, confined to existing quality relationships, with close oversight to contain any new
NPL formation. The bank is also actively pursuing more trade based financing opportunities as well as
looking to expand its FI lending book. Excess liquidity is primarily deployed in sovereign debt
securities with an aim to maintain healthy net interest margins. Furthermore, the bank is actively

UNITED BANK LIMITED
DIRECTORS’ REPORT TO THE MEMBERS
Directors’ Report H1 2021 P a g e | 7
looking to exit non-core jurisdictions and re-allocate capital to more profitable regions and business
opportunities. As part of the global realignment strategy, the bank intends to voluntarily wind up its
wholly owned subsidiary, UBL (Switzerland) AG, subject to relevant legal and regulatory approvals.
UBL International’s deposits averaged USD 1.3 billion for H1’21 (H1’20: USD 1.5 billion). Cost of
deposits was reduced from 1.8% in H1’20 to 1.2% in H1’21. Performing advances averaged USD 644
million for H1’21, declining by 15% over H1’20. The investment portfolio, comprising mainly of
sovereign bonds, averaged USD 757 million, earning the bank a healthy yield of 5.5% during H1’21.
This performance enabled UBL International to record a PBT of USD 19.1 million for the half year
ended June 30, 2021 (H1’20: Loss before tax of USD 38.1 million).
Credit Rating
VIS Credit Rating Company Limited (VIS) re-affirmed the entity ratings of UBL at ‘‘AAA / A-1+” (Triple
A / A-One Plus) on June 30, 2021. Furthermore, UBL’s Additional Tier-1 (ADT-1) TFC has also been re-
affirmed at ‘AA+’ (Double A plus). Outlook on the assigned ratings are ‘Stable’.
Awards and Recognition
UBL was declared Pakistan’s Best Digital Bank for the second year in a row by Asiamoney, an
associate of Euromoney. The awards recognize UBL’s leading role as one of the most progressive
and innovative banks in the country. The adoption of a forward looking digital strategy has resulted
in the bank maintaining its market penetration while developing innovative solutions for the future.
UBL was recognized as the “Bank of the Year 2020 - Pakistan” at the Banker Awards. The Banker, is
an affiliate of the Financial Times UK and is the world’s leading financial publication. One of the most
prestigious titles in the global banking industry, the Banker Awards recognize excellence in
performance, adding customer value, innovation and leadership in society. UBL won the award, for
the fourth time within a decade, as a result of its contribution, during extraordinary times during the
current pandemic, while expanding the scope of financial services in Pakistan as a core strategy and
spearheading innovation in the local banking industry.
UBL was declared the 'Best Digital Bank' at the 2020 Pakistan Banking Awards. The award recognizes
UBL work on ventures to bring about many customer centric technological offerings, and honors
UBL's position as Pakistan's leading progressive and innovative Bank.
UBL was also awarded the “Best Mobile App” and “Best Emerging Technology” awards at the
prestigious Pakistan Digital Awards 2021. The award recognizes outstanding innovation and creativity
of the best digital professionals and companies in the country.
UNITED BANK LIMITED
DIRECTORS’ REPORT TO THE MEMBERS
Directors’ Report H1 2021 P a g e | 8
Future Outlook
Being one of the biggest financial institutions of the country, UBL will continue to play a leading role
to broaden the scope of financial services across the country. Branch Banking Group remains the
core of the UBL franchise where the aim is to expand our active customer base and offer innovative
solutions to fulfill the needs of an emerging economy. As part of improving service levels, the bank is
re-investing in its network and people while setting significantly higher standards for per branch
deposits and profitability. Our award winning digital products continue to support the network in
providing innovative solutions in a secure and convenient manner to an ever growing customer base.
As recovery picks up, the bank is actively looking to extend credit, within established as well as
emerging sectors, while maintaining an efficient RWA profile. Improving the compliance culture in
line with best practices remains a key strategic priority. UBL’s most valuable asset are its people, and
the bank remains committed to invest in their growth and development.
Acknowledgements
In the end, on behalf of the board of director’s, we would like to express our gratitude to UBL
shareholders and customers for their continued trust in the UBL brand. We value the
commitment and dedication with which our staff continues to perform, particularly during this
challenging period, ensuring uninterrupted services across all touchpoints. We would also like to
extend our appreciation to the Government of Pakistan, the State Bank of Pakistan, the Securities
and Exchange Commission of Pakistan and other regulatory bodies for their continuous guidance
and support.
Shazad G. Dada Arshad Ahmad Mir
President & CEO Director
Karachi,
August 6, 2021

UNCONSOLIDATED CONDENSED INTERIM STATEMENT OF FINANCIAL POSITIONAS AT JUNE 30, 2021
(Un-audited) (Audited) June 30,
2021
December 31,
2020
ASSETS
Cash and balances with treasury banks 6 245,296,668 250,838,052
Balances with other banks 7 20,658,741 13,888,765
Lendings to financial institutions 8 21,734,325 19,959,132
Investments 9 1,457,482,781 1,128,674,494
Advances 10 557,240,340 530,279,496
Fixed assets 11 51,321,573 51,207,703
Intangible assets 12 1,741,813 1,829,211
Deferred tax assets 13 6,487,373 6,399,267
Other assets 14 36,320,098 46,507,193
2,398,283,712 2,049,583,313
LIABILITIES
Bills payable 16 31,794,022 29,733,813
Borrowings 17 263,712,120 128,987,415
Deposits and other accounts 18 1,849,832,299 1,640,211,901
Liabilities against assets subject to finance lease - -
Subordinated debt 19 10,000,000 10,000,000
Deferred tax liabilities - -
Other liabilities 20 61,248,390 56,577,277
2,216,586,831 1,865,510,406
NET ASSETS 181,696,881 184,072,907
REPRESENTED BY:
Share capital 12,241,797 12,241,797
Reserves 63,167,322 62,274,068
Surplus on revaluation of assets 21 27,374,984 27,640,579
Unappropriated profit 78,912,778 81,916,463
181,696,881 184,072,907
CONTINGENCIES AND COMMITMENTS 22
The annexed notes from 1 to 41 form an integral part of these unconsolidated condensed interim financial statements.
Aameer Karachiwalla Shazad G. Dada Shazia Syed Arshad Ahmad Mir Sir Mohammed Anwar Pervez, OBE, HPk
Chief Financial Officer President & Director Director Chairman
Chief Executive Officer
--------------------------------- (Rupees in '000) ---------------------------------
Note

UNCONSOLIDATED CONDENSED INTERIM PROFIT AND LOSS ACCOUNT (UN-AUDITED)
FOR THE SIX MONTHS ENDED JUNE 30, 2021
Note
Mark-up / return / interest earned 24 35,925,457 43,067,661 67,751,048 86,448,014
Mark-up / return / interest expensed 25 17,694,416 21,289,376 32,662,142 47,327,204
Net mark-up / interest income 18,231,041 21,778,285 35,088,906 39,120,810
Non mark-up / interest income
Fee and commission income 26 3,564,368 2,261,860 6,604,890 5,248,309
Dividend income 628,742 399,431 881,158 793,328
Foreign exchange income 710,330 1,000,193 1,194,558 1,732,617
Income / (loss) from derivatives 1,504 (2,234) 8,758 (13,508)
Gain on securities - net 27 677,562 334,118 2,544,500 676,337
Other income 28 63,606 269,359 195,629 491,513
Total non mark-up / interest income 5,646,112 4,262,727 11,429,493 8,928,596
Total Income 23,877,153 26,041,012 46,518,399 48,049,406
Non mark-up / Interest expenses
Operating expenses 29 10,345,999 9,689,626 20,198,825 19,163,219
Workers' Welfare Fund 272,283 280,975 517,178 499,275
Other charges / (reversals) 30 14,947 (28,706) 39,494 152,333
Total non mark-up / interest expenses 10,633,229 9,941,895 20,755,497 19,814,827
Profit before provisions 13,243,924 16,099,117 25,762,902 28,234,579
(Reversals) / provisions and write-offs - net 31 (441,467) 5,729,367 (87,396) 9,429,821
PROFIT BEFORE TAXATION 13,685,391 10,369,750 25,850,298 18,804,758
Taxation 32 6,092,761 4,028,953 10,852,991 7,403,980
PROFIT AFTER TAXATION 7,592,630 6,340,797 14,997,307 11,400,778
Earnings per share - basic and diluted 33 6.20 5.18 12.25 9.31
The annexed notes from 1 to 41 form an integral part of these unconsolidated condensed interim financial statements.
Aameer Karachiwalla Shazad G. Dada Shazia Syed Arshad Ahmad Mir Sir Mohammed Anwar Pervez, OBE, HPk
Chief Financial Officer President & Director Director Chairman
Chief Executive Officer
-------------- (Rupees in '000) --------------
----------- (Rupees) -----------
April - June
2021
January -
June 2020
January -
June 2021
April - June
2020

UNCONSOLIDATED CONDENSED INTERIM STATEMENT OF COMPREHENSIVE INCOME (UN-AUDITED)
FOR THE SIX MONTHS ENDED JUNE 30, 2021
Profit after taxation for the period 7,592,630 6,340,797 14,997,307 11,400,778
Other comprehensive income
Items that may be reclassified to profit and loss account
in subsequent periods
Effect of translation of net investment in foreign branches 1,168,238 180,368 (606,477) 2,771,342
Movement in surplus / (deficit) on revaluation of
investments - net of tax 1,358,115 7,808,347 (240,412) 1,905,668
2,526,353 7,988,715 (846,889) 4,677,010
Items that will not be reclassified to profit and loss
account in subsequent periods
Remeasurement loss on defined benefit
obligations - net of tax - (835,581) - (1,355,438)
Movement in surplus on revaluation of fixed
assets - net of tax 495 (99) (237) 1,123
Movement in surplus on revaluation of non-banking assets
- net of tax 219 (920) 219 (920)
714 (836,600) (18) (1,355,235)
Total comprehensive income for the period 10,119,697 13,492,912 14,150,400 14,722,553
The annexed notes from 1 to 41 form an integral part of these unconsolidated condensed interim financial statements.
Aameer Karachiwalla Shazad G. Dada Shazia Syed Arshad Ahmad Mir Sir Mohammed Anwar Pervez, OBE, HPk
Chief Financial Officer President & Director Director Chairman
Chief Executive Officer
January -
June 2020
January -
June 2021
April - June
2020
April - June
2021
--------------------------------- (Rupees in '000) ---------------------------------

UNCONSOLIDATED CONDENSED INTERIM STATEMENT OF CHANGES IN EQUITY (UN-AUDITED)
FOR THE SIX MONTHS ENDED JUNE 30, 2021
Investments Fixed assets
Non-
banking
assets
Balance as at December 31, 2019 (Audited) 12,241,797 26,143,887 33,175,725 653,502 25,152,570 31,071 71,670,331 169,068,883
Total comprehensive income for the six months ended June 30, 2020
Profit after taxation for the six months ended June 30, 2020 - - - - - - 11,400,778 11,400,778
Other comprehensive income - net of tax - 2,771,342 - 1,905,668 1,123 (920) (1,355,438) 3,321,775
Total comprehensive income for the six months ended June 30, 2020 - 2,771,342 - 1,905,668 1,123 (920) 10,045,340 14,722,553
Transfer to statutory reserve - - 1,140,078 - - - (1,140,078) -
Transfer from surplus on revaluation on disposal to unappropriated
profit - net of tax - - - - (110,838) (13,897) 124,735 -
Transfer from surplus on revaluation of fixed assets to unappropriated
profit - net of tax - - - - (25,774) - 25,774 -
Transactions with owners for the six months ended June 30, 2020
Final cash dividend - December 31, 2019 declared subsequent to the
year end at Rs. 4.0 per share - - - - - - (4,896,719) (4,896,719)
Interim cash dividend - March 31, 2020 declared at Rs.2.5 per share - - - - - - (3,060,449) (3,060,449)
Balance as at June 30, 2020 (Un-audited) 12,241,797 28,915,229 34,315,803 2,559,170 25,017,081 16,254 72,768,934 175,834,268
Total comprehensive income for the six months ended
December 31, 2020
Profit after taxation for the six months ended December 31, 2020 - - - - - - 9,498,005 9,498,005
Other comprehensive income - net of tax - (1,906,764) - 95,762 (720) (1) 552,357 (1,259,366)
Total comprehensive income for the six months ended
December 31, 2020 - (1,906,764) - 95,762 (720) (1) 10,050,362 8,238,639
Transfer from surplus on revaluation on disposal to unappropriated
profit - net of tax - - - - (5,508) (15,340) 20,848 -
Transfer to statutory reserve - - 949,800 - - - (949,800) -
Transfer from surplus on revaluation of fixed assets to unappropriated
profit - net of tax - - - - (26,119) - 26,119 -
Transactions with owners for the six months ended
December 31, 2020 - - - - - - - -
Balance as at December 31, 2020 (Audited) 12,241,797 27,008,465 35,265,603 2,654,932 24,984,734 913 81,916,463 184,072,907
Total comprehensive income for the six months ended
June 30, 2021
Profit after taxation for the six months ended June 30, 2021 - - - - - - 14,997,307 14,997,307
Other comprehensive income - net of tax - (606,477) - (240,412) (237) 219 - (846,907)
Total comprehensive income for the six months ended June 30, 2021 - (606,477) - (240,412) (237) 219 14,997,307 14,150,400
Transfer from surplus on revaluation on disposal to unappropriated
profit - net of tax - - - - (2,641) - 2,641 -
Transfer to statutory reserve - - 1,499,731 - - - (1,499,731) -
Transfer from surplus on revaluation of fixed assets to unappropriated
profit - net of tax - - - - (22,524) - 22,524 -
Transactions with owners for the half year ended June 30, 2021
Final cash dividend - December 31, 2020 declared subsequent to the
year end at Rs.9.5 per share - - - - - - (11,629,707) (11,629,707)
Interim cash dividend - March 31, 2021 declared at Rs.4.0 per share - - - - - - (4,896,719) (4,896,719)
Balance as at June 30, 2021 (Un-audited) 12,241,797 26,401,988 36,765,334 2,414,520 24,959,332 1,132 78,912,778 181,696,881
The annexed notes from 1 to 41 form an integral part of these unconsolidated condensed interim financial statements.
Aameer Karachiwalla Shazad G. Dada Shazia Syed Arshad Ahmad Mir Sir Mohammed Anwar Pervez, OBE, HPk
Chief Financial Officer President & Director Director Chairman
Chief Executive Officer
----------------------------------------------------------------------------------------------------- (Rupees in '000) -----------------------------------------------------------------------------------------------------
Share
Capital
Capital reserve -
exchange
translation
Statutory
reserve
Surplus / (Deficit) on revaluation
Unappro-
priated profitTotal

UNCONSOLIDATED CONDENSED INTERIM CASH FLOW STATEMENT (UN-AUDITED)
FOR THE SIX MONTHS ENDED JUNE 30, 2021
CASH FLOW FROM OPERATING ACTIVITIES
Profit before taxation 25,850,298 18,804,758
Less: Dividend income (881,158) (793,328)
24,969,140 18,011,430
Adjustments:
Depreciation on fixed assets 1,387,570 1,370,224
Depreciation on Islamic financing against leased assets (Ijarah) 84,917 124,174
Depreciation on right-of-use assets 924,501 977,682
Amortisation 380,843 383,908
Workers' Welfare Fund 517,178 499,275
Provision for retirement benefits 471,713 506,526
Provision for compensated absences 86,226 92,549
Provision against loans and advances - net 452,208 9,310,888
Reversal of provision for diminution in value of investments - net (714,640) (416,765)
(Reversal) / provision against off balance sheet items (330,661) 214,965
Interest expense on lease liability against right-of-use assets 473,603 584,330
Gain on sale of operating fixed assets - net (4,721) (50,191)
Gain on sale of ijarah assets - net (3,222) (548)
Gain on sale of non-banking asset - (223,054)
Bad debts written-off directly 20,382 38,618
Unrealized gain on revaluation of investments classified as held for trading (5,006) (14,504)
Other provisions & write-offs 485,315 282,115
4,226,206 13,680,192
29,195,346 31,691,622
(Increase) / Decrease in operating assets
Lendings to financial institutions (1,775,193) 12,027,104
Held for trading securities (62,057,326) 62,512,826
Advances (27,536,716) 41,777,254
Other assets (excluding advance taxation) 3,847,752 2,562,798
(87,521,483) 118,879,982
Increase in operating liabilities
Bills payable 2,060,209 4,297,093
Borrowings 134,724,705 1,097,319
Deposits and other accounts 209,620,398 121,613,145
Other liabilities (excluding current taxation) 2,858,965 (13,089,564)
349,264,277 113,917,993
290,938,140 264,489,597
Payments on account of staff retirement benefits (1,714,702) (1,218,999)
Income taxes paid (5,006,930) (1,167,349)
Net cash flow generated from operating activities 284,216,508 262,103,249
CASH FLOW FROM INVESTING ACTIVITIES
Net investments in available for sale securities (209,399,726) (267,130,129)
Net investments in held to maturity securities (56,825,708) 28,505,850
Net investments in subsidiaries and associates (200,000) -
Dividend income received 904,124 667,607
Investment in fixed assets and intangible assets (1,844,447) (1,671,800)
Sale proceeds from disposal of fixed assets 11,958 163,871
Sale proceeds from disposal of ijarah assets 21,587 952
Effect of translation of net investment in foreign branches (606,477) 2,771,342
Net cash flow used in investing activities (267,938,689) (236,692,307)
CASH FLOW FROM FINANCING ACTIVITIES
Payment of lease liability against right-of-use assets (1,195,507) (1,006,745)
Dividends paid (13,853,720) (6,494,483)
Net cash flow used in financing activities (15,049,227) (7,501,228)
Increase in cash and cash equivalents 1,228,592 17,909,714
Cash and cash equivalents at the beginning of the period 264,726,817 256,590,772
Cash and cash equivalents at the end of the period 265,955,409 274,500,486
The annexed notes from 1 to 41 form an integral part of these unconsolidated condensed interim financial statements.
Aameer Karachiwalla Shazad G. Dada Shazia Syed Arshad Ahmad Mir Sir Mohammed Anwar Pervez, OBE, HPk
Chief Financial Officer President & Director Director Chairman
Chief Executive Officer
-------------- (Rupees in '000) --------------
January - June
2021
January - June
2020
.
NOTES TO AND FORMING PART OF THE UNCONSOLIDATED CONDENSED INTERIM FINANCIAL STATEMENTS (UN-AUDITED)
FOR THE SIX MONTHS ENDED JUNE 30, 2021
1. STATUS AND NATURE OF BUSINESS
The aforementioned transfer of shareholding did not have any effect on the ultimate beneficial ownership of the Bank.
2. BASIS OF PRESENTATION
2.1
2.2
2.3
3. STATEMENT OF COMPLIANCE
3.1
-
-
- Provisions of and directives issued under the Banking Companies Ordinance, 1962;
- Provisions of and directives issued under the Companies Act, 2017; and
-
The Bank was a subsidiary of Bestway (Holdings) Limited which is a wholly owned subsidiary of Bestway Group Limited
incorporated in United Kingdom.
The Bank's ordinary shares are listed on Pakistan Stock Exchange (PSX). Its Global Depository Receipts (GDRs) are on
the list of the UK Listing Authority and the London Stock Exchange Professional Securities Market. These GDRs are also
eligible for trading on the International Order Book System of the London Stock Exchange. Further, the GDRs constitute an
offering in the United States only to qualified institutional buyers in reliance on Rule 144A under the US Securities Act of
1933 and an offering outside the United States in reliance on Regulation S.
These unconsolidated condensed interim financial statements have been prepared in conformity with the format of interim
financial statements prescribed by the State Bank of Pakistan (SBP) vide BPRD Circular No. 5 dated March 22, 2019.
United Bank Limited (the Bank) is a banking company incorporated in Pakistan and is engaged in commercial banking and
related services. The Bank's registered office and principal office are situated at UBL Building, Jinnah Avenue, Blue Area,
Islamabad and at UBL Head Office, I. I. Chundrigar Road, Karachi respectively. The Bank operates 1,348 (December 31,
2020: 1,356) branches inside Pakistan including 100 (December 31, 2020: 100) Islamic Banking branches and 2
(December 31, 2020: 2) branches in Export Processing Zones. The Bank also operates 13 (December 31, 2020: 14)
branches outside Pakistan.
During the period, an internal reorganization exercise was undertaken by the Bestway Group by virtue of which Bestway
(Holdings) Limited has transferred its entire shareholding of 51.6 percent in the Bank to a new Company “Bestway
International Holdings Limited” (BIHL) on March 19, 2021. BIHL is a wholly owned subsidiary of the newly incorporated
Bestway Group Limited (BGL). Both BIHL and BGL have been incorporated in Guernsey.
Key financial figures of the Islamic Banking branches are disclosed in note 38 to these unconsolidated condensed interim
financial statements.
These unconsolidated condensed interim financial statements of the Bank have been prepared in accordance with the
accounting and reporting standards as applicable in Pakistan for interim financial reporting. The accounting and reporting
standards as applicable in Pakistan for interim financial reporting comprise of:
International Accounting Standard (IAS) 34, Interim Financial Reporting, issued by the International Accounting
Standards Board (IASB) as notified under the Companies Act, 2017;
Islamic Financial Accounting Standards (IFAS) issued by the Institute of Chartered Accountants of Pakistan as are
notified under the Companies Act, 2017;
Directives issued by the State Bank of Pakistan (SBP) and the Securities and Exchange Commission of Pakistan
(SECP).
Whenever the requirements of the Banking Companies Ordinance, 1962, the Companies Act, 2017 or the directives issued
by the SBP and the SECP differ with the requirements of IAS 34 or IFAS, the requirements of the Banking Companies
Ordinance, 1962, the Companies Act, 2017 and the said directives prevail.
In accordance with the directives of the Federal Government regarding the shifting of the banking system to Islamic modes,
SBP has issued various circulars from time to time. Permissible forms of trade-related modes of financing includes
purchase of goods by banks from customers and immediate resale to them at appropriate mark-up in price on deferred
payment basis. The purchase and resale arising under these arrangements are not reflected in these unconsolidated
condensed interim financial statements as such, but are restricted to the amount of facility actually utilized and the
appropriate portion of mark - up thereon. However, the Islamic Banking branches of the Bank have complied with the
requirements set out under the Islamic Financial Accounting Standards (IFAS), issued by the Institute of Chartered
Accountants of Pakistan (ICAP) as are notified under the provisions of Companies Act, 2017.
6

.
NOTES TO AND FORMING PART OF THE UNCONSOLIDATED CONDENSED INTERIM FINANCIAL STATEMENTS (UN-AUDITED)
FOR THE SIX MONTHS ENDED JUNE 30, 2021
3.2
3.3
3.4
3.5
3.6
3.7 Standards, interpretations of and amendments to accounting and reporting standards that are not yet effective
4. SIGNIFICANT ACCOUNTING POLICIES AND FINANCIAL RISK MANAGEMENT
4.1
4.2
5. BASIS OF MEASUREMENT
5.1
The SECP vide its notification SRO 633 (I)/2014 dated 10 July 2014, adopted IFRS 10 effective from the periods starting
from June 30, 2014. However, vide its notification SRO 56 (I)/2016 dated January 28, 2016, it has been notified that the
requirements of IFRS 10 and section 228 of the Companies Act, 2017 will not be applicable with respect to the investment
in mutual funds established under trust structure.
These unconsolidated condensed interim financial statements have been prepared under the historical cost convention
except that certain operating fixed assets / non-banking assets acquired in satisfaction of claims have been stated at
revalued amounts, certain investments and derivative financial instruments have been stated at fair value and net
obligations in respect of defined benefit schemes are carried at their present values.
There are certain other new amendments that are mandatory for the Bank's accounting periods beginning on or after
January 1, 2022, but are considered not to be relevant or will not have any significant effect on the Bank's operations and
are, therefore, not detailed in these unconsolidated condensed interim financial statements.
The financial risk management objectives and policies adopted by the Bank are consistent with those disclosed in the
unconsolidated financial statements for the year ended December 31, 2020.
The accounting policies adopted in the preparation of these unconsolidated condensed interim financial statements are
consistent with those applied in the preparation of the unconsolidated financial statements of the Bank for the year ended
December 31, 2020.
IFRS 9 has been applicable in several overseas jurisdictions from January 1, 2018. Accordingly, the requirements of this
standard are incorporated in the Bank’s unconsolidated condensed interim financial statements for the jurisdictions where
IFRS 9 has been adopted. As per the SBP's BPRD Circular Letter no. 24 dated July 05, 2021, the implementation of IFRS
9 to banks in Pakistan has been deferred to accounting periods beginning on or after January 1, 2022. Meanwhile, the
banks are required to submit IFRS 9 compatible pro forma financial statements for year ending December 31, 2021 and
perform parallel run of IFRS 9 on quarterly basis. Further, the SBP will provide a timeline by December 2021 for absorption
of "Expected Credit Loss" (ECL), for Capital Adequacy Ratio (CAR) purposes, after assessment / evaluation of pro forma
financial statements.
These unconsolidated condensed interim financial statements represent the separate condensed interim financial
statements of the Bank. The consolidated condensed interim financial statements of the Bank and its subsidiary companies
are presented separately.
The SBP vide BSD Circular letter No. 10, dated August 26, 2002 has deferred the applicability of International Accounting
Standard 39, Financial Instruments: Recognition and Measurement and International Accounting Standard 40, Investment
Property for banking companies till further instructions. Moreover, SBP vide BPRD circular no. 4, dated February 25, 2015
has deferred the applicability of Islamic Financial Accounting Standards (IFAS) 3, Profit and Loss Sharing on Deposits.
Further, according to the notification of the SECP issued vide SRO 411(I)/2008 dated April 28, 2008, International Financial
Reporting Standard (IFRS) 7, Financial Instruments: Disclosures has not been made applicable for banks. Accordingly, the
requirements of these standards have not been considered in the preparation of these unconsolidated condensed interim
financial statements. However, investments have been classified and valued in accordance with the requirements of
various circulars issued by the SBP.
The disclosures made in these unconsolidated condensed interim financial statements have been limited based on a
format prescribed by the SBP vide BPRD Circular Letter No. 5 dated March 22, 2019 and IAS 34, Interim Financial
Reporting. They do not include all the disclosures required for annual financial statements, and these unconsolidated
condensed interim financial statements should be read in conjunction with the unconsolidated financial statements of the
Bank for the year ended December 31, 2020.
There are certain amendments to existing accounting and reporting standards that have become applicable to the Bank for
accounting periods beginning on or after January 1, 2021. These are either considered to not be relevant or do not have
any significant impact on these unconsolidated condensed interim financial statements.
Standards, interpretations of and amendments to accounting and reporting standards that are effective in the
current period
7

NOTES TO AND FORMING PART OF THE UNCONSOLIDATED CONDENSED INTERIM FINANCIAL STATEMENTS (UN-AUDITED)
FOR THE SIX MONTHS ENDED JUNE 30, 2021
5.2 Critical accounting estimates and judgments
(Un-audited) (Audited)
June 30,
2021
December 31,
2020
6. CASH AND BALANCES WITH TREASURY BANKS
In hand
Local currency 17,617,717 20,776,101
Foreign currencies 7,590,632 12,098,863
25,208,349 32,874,964
With State Bank of Pakistan in
Local currency current accounts 72,133,793 75,604,954
Foreign currency current accounts 4,531,712 4,420,727
Foreign currency deposit accounts 8,123,863 7,767,517
84,789,368 87,793,198
With other central banks in
Foreign currency current accounts 27,209,367 28,800,193
Foreign currency deposit accounts 8,085,347 6,869,307
35,294,714 35,669,500
With National Bank of Pakistan in local currency current accounts 96,326,585 92,628,531
Prize Bonds 3,677,652 1,871,859
245,296,668 250,838,052
7. BALANCES WITH OTHER BANKS
In Pakistan
In deposit accounts 3,000,000 2,000,000
Outside Pakistan
In current accounts 7,505,530 7,354,534
In deposit accounts 10,153,211 4,534,231
17,658,741 11,888,765
20,658,741 13,888,765
8. LENDINGS TO FINANCIAL INSTITUTIONS
Call / clean money lending - 10,500,000
Repurchase agreement lendings (Reverse Repo) 21,734,325 -
Bai Muajjal receivable
- with State Bank of Pakistan - 6,433,114
- with other financial institutions - 3,026,018
- 9,459,132
21,734,325 19,959,132
The preparation of these unconsolidated condensed interim financial statements in conformity with the accounting and
reporting standards as applicable in Pakistan requires management to make judgments, estimates and assumptions that
affect the reported amounts of assets and liabilities and income and expenses. It also requires management to exercise
judgment in the application of its accounting policies. The estimates and assumptions are based on historical experience
and various other factors that are believed to be reasonable under the circumstances. These estimates and assumptions
are reviewed on an ongoing basis. Revisions to accounting estimates are recognised in the period in which the estimate
is revised if the revision affects only that period, or in the period of revision and future periods if the revision affects both
current and future periods.
The significant judgments made by management in applying its accounting policies and the key sources of estimation
uncertainty were the same as those applied to the unconsolidated financial statements of the Bank for the year ended
December 31, 2020.
-------------- (Rupees in '000) --------------
8

NOTES TO AND FORMING PART OF THE UNCONSOLIDATED CONDENSED INTERIM FINANCIAL STATEMENTS (UN-AUDITED)
FOR THE SIX MONTHS ENDED JUNE 30, 2021
9. INVESTMENTS
9.1 Investments by type
Held for trading securities
Market Treasury Bills 65,066,792 - 5,006 65,071,798 3,009,238 - 228 3,009,466
Available for sale securities
Market Treasury Bills 568,391,131 - 245,214 568,636,345 341,885,979 - 238,363 342,124,342
Pakistan Investment Bonds - fixed 43,914,994 - (77,655) 43,837,339 76,334,054 - 333,950 76,668,004
Pakistan Investment Bonds - floaters 365,457,101 - (1,286,525) 364,170,576 340,678,646 - (2,569,332) 338,109,314
Government of Pakistan Eurobonds 23,564,640 (290,271) 881,753 24,156,122 24,216,628 (105,010) 1,126,146 25,237,764
Government of Pakistan Sukuk 25,602,301 (2,332) 91,324 25,691,293 23,232,221 (8,713) (50,261) 23,173,247
Government of Pakistan Mudarabah Pool 1,138,873 - - 1,138,873 466,435 - - 466,435
Corporate Sukuks 1,220,000 - - 1,220,000 1,220,000 - - 1,220,000
Ordinary shares of listed companies 13,918,677 (4,887,512) 3,294,757 12,325,922 13,345,156 (5,479,476) 2,517,580 10,383,260
Preference shares 36,667 - - 36,667 36,667 - - 36,667
Ordinary shares of unlisted companies 790,495 (52,989) 16 737,522 808,294 (134,392) 36 673,938
Investment in REIT 458,590 - 834 459,424 458,590 - (16,676) 441,914
Investment in Mutual Fund 250,000 - (28,115) 221,885 250,000 - (21,482) 228,518
Term Finance Certificates 782,335 (161,996) - 620,339 662,335 (162,033) - 500,302
Foreign bonds - sovereign 43,240,040 (571,385) 765,188 43,433,843 53,560,498 (909,881) 2,494,807 55,145,424
Foreign bonds - others 2,159,398 (18,307) 71,438 2,212,529 4,494,088 (24,002) 299,217 4,769,303
1,090,925,242 (5,984,792) 3,958,229 1,088,898,679 881,649,591 (6,823,507) 4,352,348 879,178,432
Held to maturity securities
Market Treasury Bills 2,302,818 - - 2,302,818 2,696,727 - - 2,696,727
Pakistan Investment Bonds - fixed 164,631,960 - - 164,631,960 160,738,122 - - 160,738,122
Pakistan Investment Bonds - floaters 42,574,919 - - 42,574,919 - - - -
Government of Pakistan Eurobonds 9,343,334 (127,403) - 9,215,931 9,383,208 (45,483) - 9,337,725
Government of Pakistan Sukuk 812,095 (3,823) - 808,272 824,745 (3,374) - 821,371
Bai Muajjal with Government of Pakistan 38.2.1 31,115,551 - - 31,115,551 29,569,648 - - 29,569,648
Term Finance Certificates 7,084,206 (69,951) - 7,014,255 4,516,483 (69,951) - 4,446,532
Corporate Sukuks 11,429,759 (50,934) - 11,378,825 12,022,820 (57,846) - 11,964,974
Participation Term Certificates 437 (437) - - 437 (437) - -
Debentures 2,266 (2,266) - - 2,266 (2,266) - -
Corporate Bond 1,059,404 (14,421) - 1,044,983 - - - -
Foreign bonds - sovereign 26,921,077 (560,318) - 26,360,759 21,361,427 (628,582) - 20,732,845
Foreign bonds - others 1,941,765 (17,816) - 1,923,949 1,261,784 (23,219) - 1,238,565
CDC SAARC Fund 342 - - 342 347 - - 347
299,219,933 (847,369) - 298,372,564 242,378,014 (831,158) - 241,546,856
Associates
UBL Financial Sector Fund 350,000 - - 350,000 150,000 - - 150,000
UBL Insurers Limited 240,000 - - 240,000 240,000 - - 240,000
Khushhali Bank Limited 9.4 832,485 - - 832,485 832,485 - - 832,485
1,422,485 - - 1,422,485 1,222,485 - - 1,222,485
Subsidiaries
United National Bank Limited (UBL UK) 2,855,223 - - 2,855,223 2,855,223 - - 2,855,223
UBL (Switzerland) AG - - - - 589,837 - - 589,837
UBL Fund Managers Limited 100,000 - - 100,000 100,000 - - 100,000
United Executors and Trustees
Company Limited 9.6 30,100 - - 30,100 30,100 - - 30,100
2,985,323 - - 2,985,323 3,575,160 - - 3,575,160
Discontinued operations
UBL Bank (Tanzania) Limited 9.7 1,831,006 (1,688,911) - 142,095 1,831,006 (1,688,911) - 142,095
UBL (Switzerland) AG 9.8 589,837 - - 589,837 - - - -
Total Investments 1,462,040,618 (8,521,072) 3,963,235 1,457,482,781 1,133,665,494 (9,343,576) 4,352,576 1,128,674,494
------------------------------------------------------------------------------------------- (Rupees in '000) -------------------------------------------------------------------------------------------
June 30, 2021 (Un-audited) December 31, 2020 (Audited)
Cost /
Amortised
cost
Provision
for
diminution
Surplus /
(Deficit)
Carrying
Value
Cost /
Amortised
cost
Provision
for
diminution
Surplus /
(Deficit)
Carrying
ValueNote
9

NOTES TO AND FORMING PART OF THE UNCONSOLIDATED CONDENSED INTERIM FINANCIAL STATEMENTS (UN-AUDITED)
FOR THE SIX MONTHS ENDED JUNE 30, 2021
(Un-audited) (Audited)
Note June 30,
2021
December
31, 2020 9.1.1 Investments given as collateral - at market value
Market Treasury Bills 43,952,534 59,846,168
Pakistan Investment Bonds - fixed 2,081,906 -
Pakistan Investment Bonds - floaters 120,696,000 -
166,730,440 59,846,168
9.2 Provision for diminution in value of investments
9.2.1 Opening balance 9,343,576 9,117,891
Exchange adjustments (26,480) 34,098
Charge / (reversals)
Charge for the period / year 282,804 853,323
Reversals for the period / year (997,444) (511,772)
31 (714,640) 341,551
Amounts written off (81,384) (149,964)
Closing balance 9.5 8,521,072 9,343,576
9.2.2 Particulars of provision against debt securities
Category of classification
Domestic
Loss 285,584 285,584 292,496 292,496
9.3
9.4
9.5
9.6
9.7
9.8
------- (Rupees in '000) -------
June 30, 2021 December 31, 2020
----------------------------- (Rupees in '000) -------------------------
Non performing
investment (NPI)Provision
Non performing
investment (NPI)Provision
The shareholders of the Bank have approved the decision to voluntarily and orderly wind up UBL (Switzerland) AG, a
wholly owned subsidiary of the Bank in the Extra Ordinary General Meeting (EOGM) of shareholders held on August 06,
2021. This decision is in line with the Bank’s strategy to exit from non-core markets. The winding up is subject to fulfilment
of relevant legal and regulatory requirements both in Pakistan and Switzerland.
The shareholders of the Bank, in their annual general meeting held on March 27, 2020, resolved to wind up “United
Executors and Trustees Company Limited”, a wholly owned subsidiary of the Bank. Accordingly, a special resolution was
passed on March 19, 2021 by the shareholders of “United Executors and Trustees Company Limited” to appoint
liquidators and voluntarily wind up the company. The liquidators will conclude the process of voluntary winding-up as per
the requirements of applicable laws and regulations.
UBL Bank (Tanzania) Limited ("UBTL") is a wholly owned subsidiary of United Bank Limited. UBTL sold materially all of its
assets and liabilities held as at October 31, 2019, including the loans and advances and deposit book to EXIM Bank
Tanzania Limited ("Exim"), in line with the Asset and Liabilities Purchase Agreement signed on May 22, 2019. The control
of these assets and liabilities was transferred to Exim effective from November 1, 2019. The Banking operations of the
subsidiary ceased on November 1, 2019. UBTL is in process of winding up and voluntary liquidation.
(Audited)(Un-audited)
The market value of securities classified as held-to-maturity as at June 30, 2021 amounted to Rs. 301,982.991 million
(December 31, 2020: Rs. 246,788.536 million).
This represents the Bank's subscription towards the paid-up capital of Khushhali Bank Limited. Pursuant to section 10 of
the Khushhali Bank Ordinance, 2000, strategic investors including the Bank cannot sell or transfer their investment before
a period of five years that has expired on October 10, 2005. Thereafter, such sale / transfer would be subject to the prior
approval of the SBP. However, these shares are still appearing as frozen as no approval has been obtained by the Bank
to unfreeze these shares.
Provision against investments includes expected credit loss under IFRS 9 amounting to Rs: 1,606.092 million (December
31, 2020 Rs. 1,748.301 million) for overseas branches.
10

NOTES TO AND FORMING PART OF THE UNCONSOLIDATED CONDENSED INTERIM FINANCIAL STATEMENTS (UN-AUDITED)
FOR THE SIX MONTHS ENDED JUNE 30, 2021
10. ADVANCES
Note
(Un-audited) (Audited) (Un-audited) (Audited) (Un-audited) (Audited)
June 30,
2021
December
31, 2020
June 30,
2021
December
31, 2020
June 30,
2021
December
31, 2020
Loans, cash credits, running
finances, etc. 468,981,088 474,312,018 79,387,208 80,691,738 548,368,296 555,003,756
Islamic financings and related
assets 38.3 43,489,775 20,542,257 95,273 107,478 43,585,048 20,649,735
Bills discounted and purchased 40,557,006 30,828,990 2,574,662 2,824,527 43,131,668 33,653,517
Advances - gross 553,027,869 525,683,265 82,057,143 83,623,743 635,085,012 609,307,008
Provision against advances
- Specific - - (71,166,060) (71,755,668) (71,166,060) (71,755,668)
- General (6,678,612) (7,271,844) - - (6,678,612) (7,271,844)
10.3 (6,678,612) (7,271,844) (71,166,060) (71,755,668) (77,844,672) (79,027,512)
Advances - net of provision 546,349,257 518,411,421 10,891,083 11,868,075 557,240,340 530,279,496
(Un-audited) (Audited)
June 30,
2021
December
31, 2020
10.1 Particulars of advances - gross
In local currency 472,628,812 453,024,198
In foreign currencies 162,456,200 156,282,810
635,085,012 609,307,008
10.2
Domestic
Other Assets Especially Mentioned* 153,143 527 189,538 497
Substandard 2,525,259 624,336 2,690,171 662,589
Doubtful 685,672 341,615 1,599,695 798,209
Loss 24,398,551 23,318,137 24,259,582 23,164,558
27,762,625 24,284,615 28,738,986 24,625,853
Overseas
Not past due but impaired** 4,090,173 1,993,065 5,820,717 2,681,378
Overdue by:
Upto 90 days 3,250,055 1,670,741 1,064,806 135,443
91 to 180 days 1,806,307 819,681 5,232,868 4,695,361
181 to 365 days 511,681 511,694 6,841,381 6,407,521
˃ 365 days 44,636,302 41,886,264 35,924,985 33,210,112
54,294,518 46,881,445 54,884,757 47,129,815
Total 82,057,143 71,166,060 83,623,743 71,755,668
* The other assets especially mentioned category pertains to agricultural finance and advances to small enterprises.
** Not past due but impaired category mainly represents restructured exposure.
Total
---------------------------------------------- (Rupees in '000) --------------------------------------------------------
Performing Non-performing
Advances include Rs. 82,057.143 million (December 31, 2020: Rs. 83,623.743 million) which have been placed under non-
performing status as detailed below:
June 30, 2021 December 31, 2020
--------------------------------------------------------------------------- (Rupees in '000) ---------------------------------------------------------------------------
------- (Rupees in '000) -------
(Un-audited) (Audited)
Category of ClassificationNon-
Performing
Loans
Provision
Non-
Performing
Loans
Provision
11
NOTES TO AND FORMING PART OF THE UNCONSOLIDATED CONDENSED INTERIM FINANCIAL STATEMENTS (UN-AUDITED)
FOR THE SIX MONTHS ENDED JUNE 30, 2021
10.3 Particulars of provision against advances
Note Specific General Total Specific General Total
Opening balance 71,755,668 7,271,844 79,027,512 63,615,915 3,501,359 67,117,274
Exchange adjustments (581,513) (293,697) (875,210) 917,623 155,659 1,073,282
Charge / (reversals)
Charge for the period / year 2,833,680 185,587 3,019,267 14,394,123 3,623,212 18,017,335
Reversals for the period / year (1,847,543) (485,122) (2,332,665) (1,805,805) (8,386) (1,814,191)
31 986,137 (299,535) 686,602 12,588,318 3,614,826 16,203,144
Amounts written off (994,232) - (994,232) (5,282,212) - (5,282,212)
Amounts charged off -
agriculture financing - - - (80,974) - (80,974)
Transfers out - net - - - (3,002) - (3,002)
Closing balance 71,166,060 6,678,612 77,844,672 71,755,668 7,271,844 79,027,512
10.3.1
10.3.2
10.3.3
(Un-audited) (Audited)
Note
11. FIXED ASSETS
Capital work-in-progress 11.1 748,125 447,893
Property and equipment 43,937,862 44,075,077
Right-of-use assets 6,635,586 6,684,733
51,321,573 51,207,703
11.1 Capital work-in-progress
Civil works 360,692 270,445
Equipment 387,433 177,448
748,125 447,893
------- (Rupees in '000) -------
The Bank has availed the benefit of Forced Sale Value (FSV) of certain mortgaged properties held as collateral against
non-performing domestic advances as allowed under BSD Circular 1 of 2011. Had the benefit under the said circular not
been taken by the Bank, the specific provision against non-performing domestic advances would have been higher by
Rs. 4.758 million (December 31, 2020: Rs. 18.337 million). The FSV benefit availed is not available for the distribution of
cash or stock dividend to shareholders.
December
31, 2020
June
30, 2021
The Bank has also availed FSV benefit of certain mortgaged properties held as collateral against non-performing
advances of overseas branches in accordance with the applicable regulation in the respective countries where the
branches operate. Had the benefit not been taken by the Bank, the specific provision against non-performing advances
would have been higher by Rs. 3,338.496 million (December 31, 2020: Rs. 3,951.861 million) for the overseas branches.
As a result of COVID-19, the SBP has allowed certain relaxations including deferment of principal payment, rescheduling
/ restructuring of principal and mark-up, extension and timeline of provisioning against trade bills while maintaining the
customer status as "regular". These have been considered while determining the provisioning requirements on a time
based criteria.
June 30, 2021 (Un-audited) December 31, 2020 (Audited)
--------------------------------------------------------------------------- (Rupees in '000) ---------------------------------------------------------------------------
General provision represents provision amounting to Rs. 344.124 million (December 31, 2020: Rs. 319.955 million)
against consumer finance portfolio as required by the Prudential Regulations issued by the SBP and Rs. 6,334.488
million (December 31, 2020: Rs. 6,951.889 million) pertaining to overseas advances to meet the requirements of the
regulatory authorities of the respective countries in which the overseas branches operate and on account of IFRS 9.
12

NOTES TO AND FORMING PART OF THE UNCONSOLIDATED CONDENSED INTERIM FINANCIAL STATEMENTS (UN-AUDITED)
FOR THE SIX MONTHS ENDED JUNE 30, 2021
11.2 Additions to fixed assets
The following additions have been made to fixed assets during the period:
Capital work-in-progress - net additions 300,231 60,652
Property and equipment
Leasehold Improvement 202,835 182,986
Furniture and fixture 50,039 40,266
Electrical office and computer equipment 910,018 490,618
Vehicles 109,027 -
1,271,919 713,870
1,572,150 774,522
11.3 Disposal of fixed assets
The net book value of fixed assets disposed off during the period is as follows:
Leasehold land & Building on leasehold land 4,726 110,839
Leasehold Improvement 91,808 1,352
Furniture and fixture 565 755
Electrical office and computer equipment 911 1,713
Vehicles 2,374 422
100,384 115,081
11.4 Additions to right-of-use assets 1,355,664 888,093
11.5 Derecognition of right-of-use assets 522,246 477,022
(Un-audited) (Audited)
June
30, 2021
December
31, 2020
12. INTANGIBLE ASSETS
Capital work-in-progress 372,080 190,355
Intangible assets 1,369,733 1,638,856
1,741,813 1,829,211
January -
June 2021
January -
June 2020
12.1 Additions to intangible assets
The following additions have been made to directly purchased intangible:
Capital work-in-progress - net additions / (transfers) 181,725 (92,743)
Additions have been made to directly purchased intangible
assets during the period: 114,368 522,183
(Un-audited) (Audited)
NoteJune
30, 2021
December
31, 2020
13. DEFERRED TAX ASSETS
Deferred tax assets 13.1 6,487,373 6,399,267
(Un-audited)
------- (Rupees in '000) -------
------- (Rupees in '000) -------
(Un-audited)
January -
June 2021
January -
June 2020
------- (Rupees in '000) -----
------- (Rupees in '000) -------
13

NOTES TO AND FORMING PART OF THE UNCONSOLIDATED CONDENSED INTERIM FINANCIAL STATEMENTS (UN-AUDITED)
FOR THE SIX MONTHS ENDED JUNE 30, 2021
13.1 Movement in temporary differences during the period
Deductible temporary differences on
- Post retirement employee benefits 1,381,087 (951) - 1,380,136
- Provision against advances, off balance sheet etc. 6,390,263 (408,450) - 5,981,813
- Workers' Welfare Fund 1,833,191 201,699 - 2,034,890
9,604,541 (207,702) - 9,396,839
Taxable Temporary Differences on
- Surplus on revaluation of fixed assets / non-banking assets (646,666) 16,393 1,268 (629,005)
- Surplus on revaluation of investment (1,697,416) - 153,707 (1,543,709)
- Accelerated tax depreciation (729,569) 159,948 - (569,621)
- Others (131,623) - (35,508) (167,131)
(3,205,274) 176,341 119,467 (2,909,466)
6,399,267 (31,361) 119,467 6,487,373
Deductible temporary differences on
- Post retirement employee benefits 837,307 30,335 513,445 1,381,087
- Provision against advances, off balance sheet etc. 3,291,876 3,098,387 - 6,390,263
- Workers' Welfare Fund 1,495,858 337,333 - 1,833,191
5,625,041 3,466,055 513,445 9,604,541
Taxable Temporary Differences on
- Surplus on revaluation of fixed assets / non-banking assets (739,593) 33,079 59,848 (646,666)
- Surplus on revaluation of investment (417,813) - (1,279,603) (1,697,416)
- Accelerated tax depreciation (1,147,656) 418,087 - (729,569)
- Others (19,815) - (111,808) (131,623)
(2,324,877) 451,166 (1,331,563) (3,205,274)
3,300,164 3,917,221 (818,118) 6,399,267
Note (Un-audited) (Audited)
14. OTHER ASSETS
Income / mark-up accrued in local currency - net of provision 21,186,728 21,075,804
Income / mark-up accrued in foreign currencies - net of provision 14.1 1,971,664 2,117,215
Advance taxation - net of provision for taxation 14.2 40,127 5,921,083
Receivable from staff retirement fund 74,054 24,160
Receivable from other banks against telegraphic transfers and demand drafts 22,359 110,689
Unrealized gain on forward foreign exchange contracts 1,204,076 2,703,865
Rebate receivable - net 307,859 631,410
Suspense accounts 66,215 51,215
Stationery and stamps on hand 197,125 169,311
Non-banking assets acquired in satisfaction of claims 241,683 241,683
Advances, deposits, advance rent and other prepayments 2,178,930 916,276
Acceptances 5,708,132 10,505,651
Dividend Receivable 195,008 217,974
Receivable against IBFT, ATM and other settlements - net 853,694 -
Commission Receivable - Branchless Banking 653,017 658,524
Receivable against fraud & forgery and looted notes 583,132 586,929
Others 2,088,372 2,006,747
37,572,175 47,938,536
Provision held against other assets 14.3 (1,214,070) (1,392,976)
Other assets - net of provisions 36,358,105 46,545,560
Deficit on revaluation of non-banking assets acquired in
satisfaction of claims (38,007) (38,367)
Other assets - total 36,320,098 46,507,193
Recognised in
profit and loss
account
At January 1, 2020
------------------------------------------------- (Rupees in '000) -------------------------------------------------
Recognised in OCIAt December 31,
2020
June 30, 2021 (Un-Audited)
December 31, 2020 (Audited)
------------------------------------------------- (Rupees in '000) -------------------------------------------------
At January 01,
2021
Recognised in
profit and loss
account
Recognised in OCI At June 30, 2021
------- (Rupees in '000) -------
December
31, 2020
June 30,
2021
14

NOTES TO AND FORMING PART OF THE UNCONSOLIDATED CONDENSED INTERIM FINANCIAL STATEMENTS (UN-AUDITED)
FOR THE SIX MONTHS ENDED JUNE 30, 2021
14.1
14.2
(Un-audited) (Audited)
Note
14.3 Provision held against other assets
Advances and other receivables 54,108 84,272
Fraud & forgery and looted notes 604,364 626,435
Others 555,598 682,269
1,214,070 1,392,976
14.3.1 Movement of provision held against other assets
Opening balance 1,392,976 1,271,877
Exchange adjustments (11,571) 655
Charge / (reversals)
Charge for the period / year 26,768 249,664
Reversals for the period / year (125,306) (94,809)
31 (98,538) 154,855
Amounts written off (30,184) (37,656)
Transfers (out) / in - net (38,613) 3,245
Closing balance 1,214,070 1,392,976
15. CONTINGENT ASSETS
There were no contingent assets as at the statement of financial position date.
The income tax authorities have issued amended assessment orders for the tax years 2003 to 2020, and created additional
tax demands (including disallowances of provisions made prior to Seventh Schedule) of Rs.13,752 million (December 31,
2020: Rs.11,610 million). The Bank has filed appeals before the various appellate forums against these amendments.
Where the appellate authorities have allowed relief on certain issues, the assessing authorities have filed appeals before
higher appellate forums. Where the appellate authorities have not allowed relief the Bank has filed appeals before higher
appellate forums. The management of the Bank is confident that the appeals will be decided in favor of the Bank.
The Income Tax returns of the Bank have been filed up to the tax year 2020 (accounting year ended December 31, 2019)
and were deemed to be assessed under section 120 of the Income Tax Ordinance, 2001 (Ordinance).
This includes unrealised mark-up held in suspense amounting to Rs. 14,852.074 million (December 31, 2020: Rs.
13,639.898 million) kept against non-performing overseas advances / investment as per the requirements of the regulatory
authorities of the respective countries in which the overseas branches operate.
The tax returns for Azad Kashmir (AK) and Gilgit Baltistan (GB) Branches have been filed upto the tax year 2020 (financial
year 2019) under the provisions of section 120(1) read with section 114 of the Ordinance and in compliance with the terms
of the agreement between banks and the Azad Kashmir Council in May 2005. The returns filed are considered as deemed
assessment orders under the law.
--------------------------------- (Rupees in '000) ---------------------------------
The Bank has received corrective tax assessment of QAR 1 M (Rs: 42.551 million) from the General tax Authority (GTA) in
respect of tax year 2004 with no supporting calculations from GTA. Management has requested details for 2004
assessment from GTA, however to date no response has been received. Management is confident that the matters will be
decided in favour of the Bank and the possibility of any outcome against it is remote.
The tax returns for Yemen have been filed upto the year ended December 31, 2019 and for UAE and Qatar branches upto
the year ended December 31, 2020 under the provisions of the laws prevailing in the respective countries, and are deemed
as assessed unless opened for reassessment.
The tax authorities have also carried out monitoring for Federal Excise Duty, Sales tax and withholding taxes covering
period from years ended 2005 to 2019. Consequently various addbacks and demands were raised creating a total demand
of Rs. 2,467 million (December 31, 2020: Rs. 1,274 million). The Bank has filed appeals against all such demands and is
confident that these would be decided in the favor of the Bank.
June 30,
2021
December
31, 2020
15

NOTES TO AND FORMING PART OF THE UNCONSOLIDATED CONDENSED INTERIM FINANCIAL STATEMENTS (UN-AUDITED)
FOR THE SIX MONTHS ENDED JUNE 30, 2021
(Un-audited) (Audited)
16. BILLS PAYABLE
In Pakistan 30,886,817 28,820,012
Outside Pakistan 907,205 913,801
31,794,022 29,733,813
17. BORROWINGS
Secured
Borrowings from the State Bank of Pakistan under:
Export refinance scheme 33,443,583 30,724,174
Long term financing facility 21,272,946 22,243,644
Refinance scheme for payment of wages and salaries 4,611,535 5,587,037
Renewable energy scheme 239,851 146,985
Temporary economic refinance scheme 3,996,989 307,540
Other Borrowings 453,092 464,621
64,017,996 59,474,001
Repurchase agreement borrowings 172,698,967 59,835,819
236,716,963 119,309,820
Unsecured
Call borrowings 25,290,923 2,397,485
Overdrawn nostro accounts 837,744 356,029
Money market deals 866,490 6,924,081
26,995,157 9,677,595
263,712,120 128,987,415
18. DEPOSITS AND OTHER ACCOUNTS
In Local
Currency
In Foreign
CurrenciesTotal
In Local
Currency
In Foreign
CurrenciesTotal
Customers
Fixed deposits 165,704,035 118,301,677 284,005,712 171,340,589 123,785,587 295,126,176
Savings deposits 612,040,337 47,619,222 659,659,559 509,712,356 48,079,084 557,791,440
Sundry deposits 24,630,724 1,128,624 25,759,348 5,022,037 1,750,251 6,772,288
Margin deposits 3,891,316 1,885,453 5,776,769 3,833,926 3,164,625 6,998,551
Current accounts - remunerative 1,978,906 3,161,803 5,140,709 1,387,144 5,240,221 6,627,365
Current accounts - non-remunerative 629,793,467 113,133,250 742,926,717 549,419,858 111,464,961 660,884,819
1,438,038,785 285,230,029 1,723,268,814 1,240,715,910 293,484,729 1,534,200,639
Financial Institutions
Current deposits 22,475,062 1,490,512 23,965,574 20,978,533 1,941,161 22,919,694
Savings deposits 59,944,811 263,591 60,208,402 56,409,524 42,544 56,452,068
Term deposits 40,850,400 1,539,109 42,389,509 25,207,956 1,431,544 26,639,500
123,270,273 3,293,212 126,563,485 102,596,013 3,415,249 106,011,262
1,561,309,058 288,523,241 1,849,832,299 1,343,311,923 296,899,978 1,640,211,901
18.1
June 30,
2021
December 31,
2020
--------------------------------- (Rupees in '000) ---------------------------------
June 30, 2021 (Un-audited) December 31, 2020 (Audited)
--------------------------------------------------------------------------------- (Rupees in '000) --------------------------------------------------------------------------------
Deposits eligible to be covered under insurance arrangements in accordance with DPC Circular No. 04 dated June 22,
2018 amounted to Rs.1,048,412.550 million (December 31, 2020: Rs 991,687.959 million).
16

NOTES TO AND FORMING PART OF THE UNCONSOLIDATED CONDENSED INTERIM FINANCIAL STATEMENTS (UN-AUDITED)
FOR THE SIX MONTHS ENDED JUNE 30, 2021
19. SUBORDINATED DEBT
Salient features of the ADT 1 issue are as follows:-
Note (Un-audited) (Audited)
20. OTHER LIABILITIES
Mark-up / return / interest payable in local currency 13,123,745 11,628,846
Mark-up / return / interest payable in foreign currencies 570,086 1,306,907
Accrued expenses 3,158,889 4,052,238
Branch adjustment account 134,380 105,228
Payable against purchase of securities 142,027 -
Deferred income 929,270 882,954
Unearned commission and income on bills discounted 319,131 437,621
Provision against off - balance sheet obligations 20.1 716,047 1,065,233
Unrealized loss on forward foreign exchange contracts 1,380,183 3,318,593
Trading liabilities 9,603,973 -
Payable to staff retirement fund 131,457 1,122,023
Deferred liabilities 3,635,944 3,752,247
Workers' Welfare Fund payable 5,017,668 4,700,490
Liabilities against IBFT, ATM and other settlements - net - 1,199,242
Insurance payable against consumer assets 657,347 615,406
Dividend payable 3,030,284 357,578
Acceptances 5,708,132 10,505,651
Lease liability under IFRS 16 7,886,224 7,776,503
Levies and taxes payable 3,483,063 2,666,232
Others 1,620,540 1,084,285
61,248,390 56,577,277
Issue Date January 29, 2019
Unsecured
------- (Rupees in '000) -------
December 31,
2020
June 30,
2021
Mark-up rate The TFCs shall carry mark-up at the rate of 3 Month KIBOR + 1.55%.
Loss absorbency clause
Lock-in clause
Call optionThe Bank may, at its sole discretion, call the TFCs, at any time after five years from the Issue
Date subject to the prior approval of the SBP.
Mark-up on the TFCs shall only be paid from the current year's earnings and if the Bank is fully
compliant with SBP’s Minimum Capital Requirement (MCR), Capital Adequacy Ratio (CAR) and
Liquidity Ratio (LR) requirements.
The TFCs shall, at the discretion of the SBP, be either permanently converted into ordinary
shares or permanently written off (partially or in full) pursuant to the loss absorbency clause as
stipulated in the “Instructions for Basel III Implementation in Pakistan” issued vide BPRD
Circular No. 6 dated August 15, 2013.
Security
Mark-up payment
frequencyProfit / Mark-up shall be payable quarterly in arrears, on a non-cumulative basis
Rating
Tenor
The Bank has issued fully paid up, rated, listed, perpetual, unsecured, subordinated, non-cumulative and contingent
convertible debt instruments in the nature of Term Finance Certificates (TFCs) under Section 66 of the Companies Act,
2017 which qualify as Additional Tier I Capital as outlined by State Bank of Pakistan (SBP) under BPRD Circular No. 6
dated August 15, 2013.
“AA+” (Double A Plus) by JCR-VIS Credit Rating Company Limited
Perpetual (i.e. no fixed or final redemption date)
Rs. 10,000 millionIssue Size
17

NOTES TO AND FORMING PART OF THE UNCONSOLIDATED CONDENSED INTERIM FINANCIAL STATEMENTS (UN-AUDITED)
FOR THE SIX MONTHS ENDED JUNE 30, 2021
Note (Un-audited) (Audited)
20.1 Provision against off-balance sheet obligations
Opening balance 1,065,233 622,264
Exchange adjustment (18,525) 11,220
Charge / (reversals)
Charge for the period / year 5,266 568,987
Reversals for the period / year (335,927) (137,238)
31 (330,661) 431,749
Closing balance 716,047 1,065,233
21. SURPLUS ON REVALUATION OF ASSETS
Surplus arising on revaluation of assets
Available for sale securities 9.1 3,958,229 4,352,348
Fixed assets 25,587,613 25,630,817
Non-banking assets acquired in satisfaction of claims 1,856 1,496
29,547,698 29,984,661
Less: Deferred tax liability on revaluation of:
Available for sale securities 1,543,709 1,697,416
Fixed assets 628,281 646,083
Non-banking assets acquired in satisfaction of claims 724 583
2,172,714 2,344,082
27,374,984 27,640,579
22. CONTINGENCIES AND COMMITMENTS
Guarantees 22.1 144,360,746 147,936,161
Commitments 22.2 930,927,752 891,767,423
Other contingent liabilities 22.3 15,872,321 15,539,628
1,091,160,819 1,055,243,212
22.1 Guarantees:
Financial guarantees 43,401,076 43,027,825
Performance guarantees 100,959,670 104,908,336
144,360,746 147,936,161
22.2 Commitments:
Documentary credits and short-term trade-related transactions
- letters of credit 196,084,599 137,787,140
Commitments in respect of:
- forward foreign exchange contracts 22.2.2 618,694,809 635,597,333
- forward Government securities transactions 22.2.3 707,328 -
- derivatives - FX options 22.2.4 2,338,968 -
- forward lending 22.2.5 109,818,687 115,451,442
- operating leases 22.2.6 151,022 55,009
Commitments for acquisition of operating fixed assets 22.2.7
- Fixed assets 2,230,323 2,038,561
- Intangible 902,016 837,938
930,927,752 891,767,423
June 30,
2021
December 31,
2020
------- (Rupees in '000) -------
18

NOTES TO AND FORMING PART OF THE UNCONSOLIDATED CONDENSED INTERIM FINANCIAL STATEMENTS (UN-AUDITED)
FOR THE SIX MONTHS ENDED JUNE 30, 2021
22.2.1 Commitments to extend credit
Note (Un-audited) (Audited)
22.2.2 Commitments in respect of forward foreign exchange contracts
Purchase 338,686,761 342,792,602
Sale 280,008,048 292,804,731
22.2.3 Commitments in respect of forward government securities transactions
Purchase 707,328 -
Sale - -
22.2.4 Commitments in respect of derivatives
FX options - purchased 1,169,484 -
FX options - sold 1,169,484 -
22.2.5 Commitments in respect of forward lending
Undrawn formal standby facilities, credit lines and
other commitments to lend 22.2.5.1 60,644,632 57,591,623
Others 49,174,055 57,859,819
109,818,687 115,451,442
22.2.5.1
(Un-audited) (Audited)
22.2.6 Commitments in respect of operating leases
Not later than one year 150,770 50,579
Later than one year and not later than five years 22 4,197
Later than five years 230 233
151,022 55,009
22.2.7 Commitments in respect of capital expenditure 3,132,339 2,876,499
22.3 Other contingent liabilities
22.3.1 Claims against the Bank not acknowledged as debts 11,783,017 11,450,325
June 30,
2021
December 31,
2020
December 31,
2020
June 30,
2021
The Bank makes commitments to extend credit in the normal course of its business but these being revocable
commitments do not attract any significant penalty or expense if the facility is unilaterally withdrawn.
Based on legal advice and / or internal assessments, management is confident that the matters will be decided in the
Bank's favour and the possibility of any outcome against the Bank is remote and accordingly no provision has been made
in these unconsolidated condensed interim financial statements.
These mainly represent counter claims filed by the borrowers for restricting the Bank from disposal of assets (such as
mortgaged / pledged assets kept as security).
These represent commitments that are irrevocable because they cannot be withdrawn at the discretion of the bank
without the risk of incurring significant penalty or expense.
------- (Rupees in '000) -------
------- (Rupees in '000) -------
19

NOTES TO AND FORMING PART OF THE UNCONSOLIDATED CONDENSED INTERIM FINANCIAL STATEMENTS (UN-AUDITED)
FOR THE SIX MONTHS ENDED JUNE 30, 2021
22.3.2
22.3.3 For contingencies relating to taxation, refer note 14.2.
23. DERIVATIVE INSTRUMENTS
Product analysis
Counterparties
Total
Hedging 1,169,484 - 707,328 (183) - - 1,876,812 (183)
Market making 1,169,484 - - - - - 1,169,484 -
2,338,968 - 707,328 (183) - - 3,046,296 (183)
Counterparties
Total
Hedging - - - - - - - -
Market making - - - - - - - -
- - - - - - - -
24. MARK-UP / RETURN / INTEREST EARNED
On:
Loans and advances 18,620,914 32,357,771
Investments 48,166,699 52,367,899
Lendings to financial institutions 722,797 1,370,790
Balances with banks 240,638 351,554
67,751,048 86,448,014
25. MARK-UP / RETURN / INTEREST EXPENSED
On:
Deposits 25,814,351 35,278,389
Borrowings 4,382,104 8,870,607
Subordinated debt 441,847 652,061
Cost of foreign currency swaps against foreign currency deposits / borrowings 1,550,237 1,941,817
Lease liability under IFRS 16 473,603 584,330
32,662,142 47,327,204
FX options
Notional
principal
Mark to
Market LossNotional principal
Mark to Market
Gain / (Loss)
TotalFX options
Notional
principal
January -
June 2021
------- (Un-audited) -------
------------------------------------------------------------------------------------------------------------ (Rupees in '000) ------------------------------------------------------------------------------------------------------------
During 2016, penalties amounting to Rs. 4.089 billion were levied by the FE Adjudication Court of the State Bank of
Pakistan relating to alleged contraventions of the requirements of foreign exchange regulations with respect to issuance
and certification of E-Forms by the Bank to certain customers (exporters) who failed to submit the export documents there
against. Consequently, foreign exchange on account of export proceeds have not been repatriated. The Bank maintains
that it fully discharged its liability, in accordance with the law and has filed a civil suit in the High Court of Sindh challenging
the levy of the penalty. The High Court has granted a stay on action being taken against the Bank. The management,
based on the advice from legal counsel, is confident that the view of the Bank will prevail and the Bank will not be exposed
to any loss on this account.
Mark to
Market Loss
Notional
principal
Mark to
Market LossNotional principal
Mark to Market
Gain / (Loss)
Notional
principal
Mark to
Market Gain
Notional
principal
Forward purchase contracts
of government securities
Forward sale contracts of
government securities
June 30, 2021 (Un-Audited)
December 31, 2020 (Audited)
------------------------------------------------------------------------------------------------------------ (Rupees in '000) ------------------------------------------------------------------------------------------------------------
Forward purchase contracts
of government securities
Notional
principal
Mark to
Market Gain
Mark to
Market Loss
------- (Rupees in '000) -------
January -
June 2020
Forward sale contracts of
government securitiesTotal
20

NOTES TO AND FORMING PART OF THE UNCONSOLIDATED CONDENSED INTERIM FINANCIAL STATEMENTS (UN-AUDITED)
FOR THE SIX MONTHS ENDED JUNE 30, 2021
Note
26. FEE AND COMMISSION INCOME
Branch banking customer fee 820,291 824,344
Consumer finance related fee 479,126 425,798
Card related fees (debit and credit cards) 1,135,999 690,363
Investment banking fee 343,216 85,319
Financial Institution rebate / commission 156,835 139,349
Corporate service charges / facility fee 376,681 185,604
Commission on trade 320,007 348,756
Commission on guarantees 275,578 356,906
Commission on cash management 461,703 373,443
Commission on remittances including home remittances - net 1,110,448 1,092,127
Commission on bancassurance 882,534 478,967
Commission on Benazir Income Support Program - 38,359
Rent on lockers 95,652 93,817
Others 146,820 115,157
6,604,890 5,248,309
27. GAIN ON SECURITIES - NET
Realised 27.1 2,539,494 661,833
Unrealised - held for trading 9.1 5,006 14,504
2,544,500 676,337
27.1 Realised gain on:
Federal Government securities 790,970 342,851
Shares 298,863 (164,582)
Foreign securities 1,449,227 487,178
Other Securities 434 (3,614)
2,539,494 661,833
28. OTHER INCOME
Charges recovered 130,948 115,912
Rent on properties 40,072 25,740
Gain on sale of operating fixed assets - net 4,721 50,191
Gain on sale of Ijarah assets - net 3,222 548
Gain on disposal of non-banking assets - net - 223,054
Gain on trading liabilities - net 16,666 76,068
195,629 491,513
------- (Rupees in '000) -------
------- (Un-audited) -------
January -
June 2021
January -
June 2020
21

NOTES TO AND FORMING PART OF THE UNCONSOLIDATED CONDENSED INTERIM FINANCIAL STATEMENTS (UN-AUDITED)
FOR THE SIX MONTHS ENDED JUNE 30, 2021
29. OPERATING EXPENSES
Total compensation expense 8,255,548 7,970,879
Property expense
Rent and taxes 538,405 498,705
Insurance 102,205 92,220
Utilities cost 661,737 603,043
Security 502,727 509,719
Repair and maintenance 82,383 65,150
Depreciation 399,330 391,604
Depreciation - right-of-use assets 924,501 977,682
Others 30,277 27,729
3,241,565 3,165,852
Information technology expenses
Software maintenance 793,690 675,495
Hardware maintenance 177,794 136,081
Depreciation 385,638 388,336
Amortisation 380,843 383,908
Network charges 356,445 352,267
2,094,410 1,936,087
Other operating expenses
Directors' fees and allowances 34,050 49,749
Fees and allowances to Shariah Board 4,818 4,560
Legal and professional charges 242,328 290,252
Commission paid to branchless banking agents 207,616 186,004
Commission paid to sales force 624,849 482,679
Outsourced service costs 631,486 670,712
Travelling and conveyance 45,452 48,115
Clearing charges 89,830 121,421
Depreciation - others 602,602 590,284
Depreciation on Islamic financing against leased assets 84,917 124,174
Training and development 9,090 19,022
Postage and courier charges 163,482 127,037
Communication 224,631 223,969
Stationery and printing 376,288 258,914
Marketing, advertisement and publicity 249,781 196,733
Donations 71,096 240,980
Auditors' remuneration 36,945 41,397
Insurance 46,492 96,534
Deposit Protection Premium 793,350 683,778
Cash transportation and sorting charges 414,374 372,220
Entertainment 73,243 61,800
Vehicle expenses 46,818 46,365
Subscription 47,045 48,359
Office running expenses 75,862 83,908
Banking service charges 927,806 762,884
Repairs and maintenance 335,353 207,062
Cartage, freight and conveyance 23,070 19,336
Zakat paid by overseas branch 6,406 7,369
Brokerage expenses 9,794 13,296
Miscellaneous expenses 108,428 11,488
6,607,302 6,090,401
20,198,825 19,163,219
30. OTHER CHARGES
Penalties imposed by the SBP 28,179 152,252
Other penalties 11,315 81
39,494 152,333
------- (Un-audited) -------
January -
June 2021
January -
June 2020
------- (Rupees in '000) -------
22
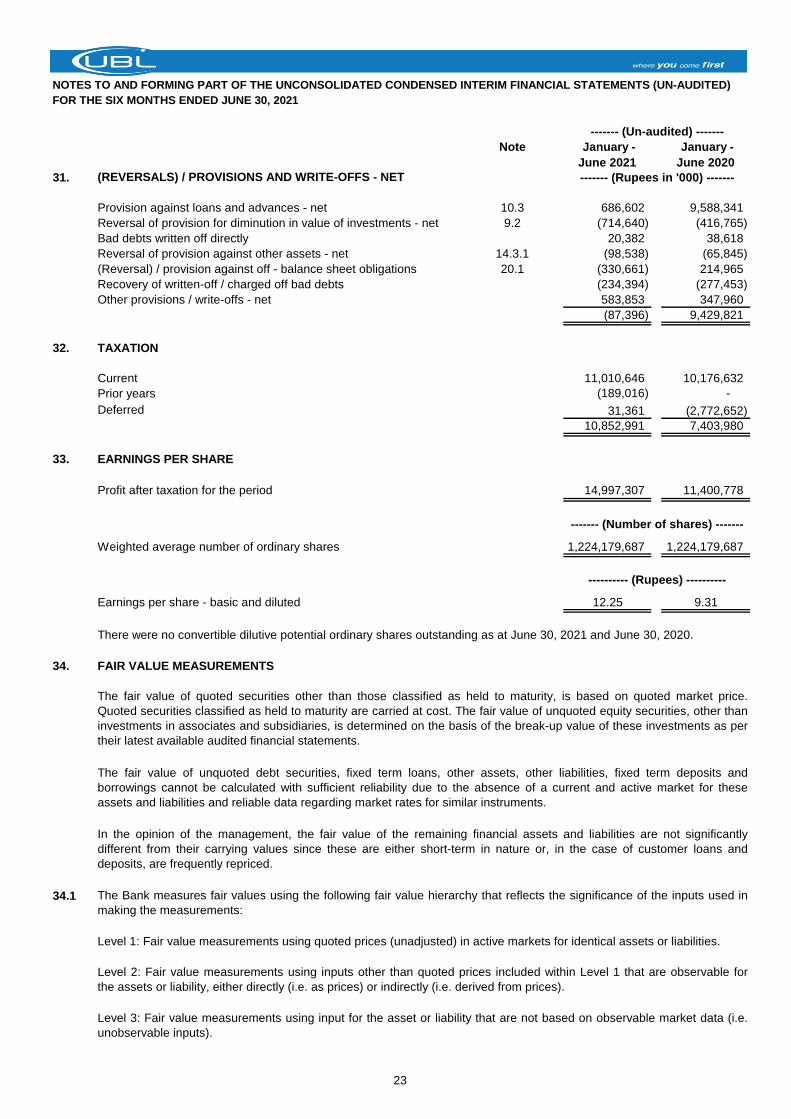
NOTES TO AND FORMING PART OF THE UNCONSOLIDATED CONDENSED INTERIM FINANCIAL STATEMENTS (UN-AUDITED)
FOR THE SIX MONTHS ENDED JUNE 30, 2021
Note
31. (REVERSALS) / PROVISIONS AND WRITE-OFFS - NET
Provision against loans and advances - net 10.3 686,602 9,588,341
Reversal of provision for diminution in value of investments - net 9.2 (714,640) (416,765)
Bad debts written off directly 20,382 38,618
Reversal of provision against other assets - net 14.3.1 (98,538) (65,845)
(Reversal) / provision against off - balance sheet obligations 20.1 (330,661) 214,965
Recovery of written-off / charged off bad debts (234,394) (277,453)
Other provisions / write-offs - net 583,853 347,960
(87,396) 9,429,821
32. TAXATION
Current 11,010,646 10,176,632
Prior years (189,016) -
Deferred 31,361 (2,772,652)
10,852,991 7,403,980
33. EARNINGS PER SHARE
Profit after taxation for the period 14,997,307 11,400,778
Weighted average number of ordinary shares 1,224,179,687 1,224,179,687
Earnings per share - basic and diluted 12.25 9.31
34. FAIR VALUE MEASUREMENTS
34.1
Level 1: Fair value measurements using quoted prices (unadjusted) in active markets for identical assets or liabilities.
The Bank measures fair values using the following fair value hierarchy that reflects the significance of the inputs used in
making the measurements:
Level 2: Fair value measurements using inputs other than quoted prices included within Level 1 that are observable for
the assets or liability, either directly (i.e. as prices) or indirectly (i.e. derived from prices).
Level 3: Fair value measurements using input for the asset or liability that are not based on observable market data (i.e.
unobservable inputs).
------- (Un-audited) -------
The fair value of quoted securities other than those classified as held to maturity, is based on quoted market price.
Quoted securities classified as held to maturity are carried at cost. The fair value of unquoted equity securities, other than
investments in associates and subsidiaries, is determined on the basis of the break-up value of these investments as per
their latest available audited financial statements.
The fair value of unquoted debt securities, fixed term loans, other assets, other liabilities, fixed term deposits and
borrowings cannot be calculated with sufficient reliability due to the absence of a current and active market for these
assets and liabilities and reliable data regarding market rates for similar instruments.
In the opinion of the management, the fair value of the remaining financial assets and liabilities are not significantly
different from their carrying values since these are either short-term in nature or, in the case of customer loans and
deposits, are frequently repriced.
There were no convertible dilutive potential ordinary shares outstanding as at June 30, 2021 and June 30, 2020.
------- (Number of shares) -------
---------- (Rupees) ----------
------- (Rupees in '000) -------
January -
June 2021
January -
June 2020
23
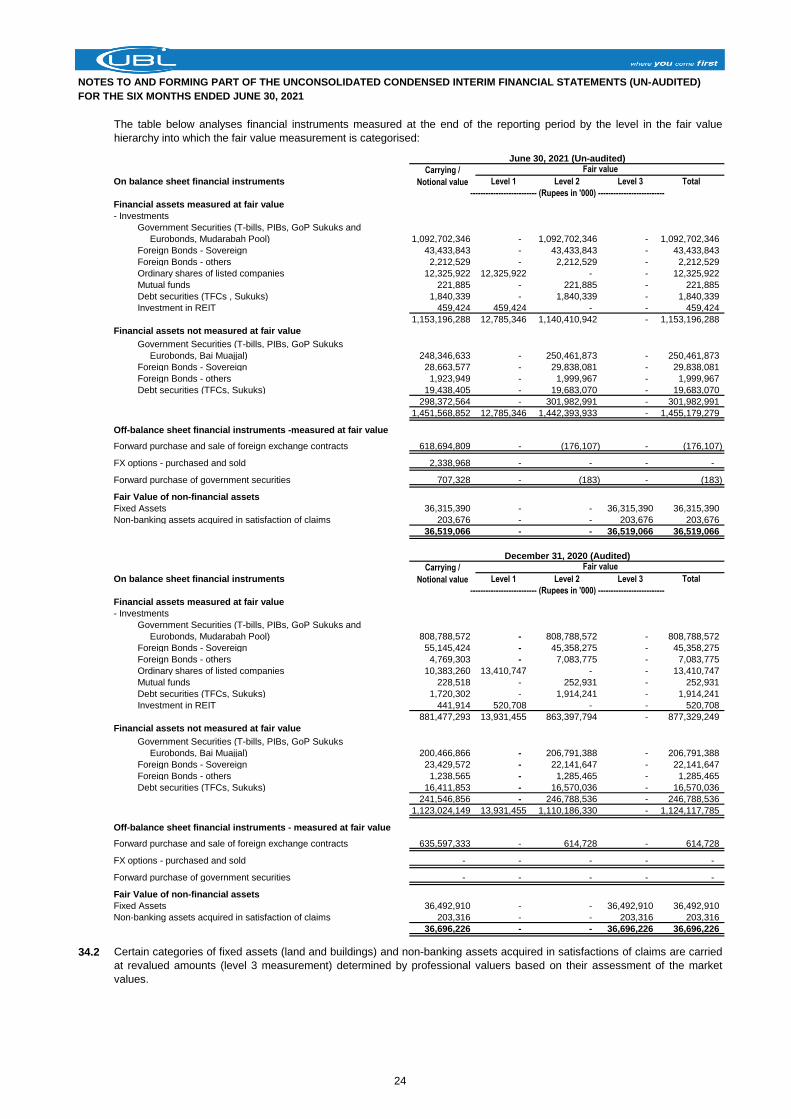
NOTES TO AND FORMING PART OF THE UNCONSOLIDATED CONDENSED INTERIM FINANCIAL STATEMENTS (UN-AUDITED)
FOR THE SIX MONTHS ENDED JUNE 30, 2021
On balance sheet financial instruments Level 1 Level 2 Level 3 Total
Financial assets measured at fair value
- Investments
Government Securities (T-bills, PIBs, GoP Sukuks and
Eurobonds, Mudarabah Pool) 1,092,702,346 - 1,092,702,346 - 1,092,702,346
Foreign Bonds - Sovereign 43,433,843 - 43,433,843 - 43,433,843
Foreign Bonds - others 2,212,529 - 2,212,529 - 2,212,529
Ordinary shares of listed companies 12,325,922 12,325,922 - - 12,325,922
Mutual funds 221,885 - 221,885 - 221,885
Debt securities (TFCs , Sukuks) 1,840,339 - 1,840,339 - 1,840,339
Investment in REIT 459,424 459,424 - - 459,424
1,153,196,288 12,785,346 1,140,410,942 - 1,153,196,288
Financial assets not measured at fair value
Government Securities (T-bills, PIBs, GoP Sukuks
Eurobonds, Bai Muajjal) 248,346,633 - 250,461,873 - 250,461,873
Foreign Bonds - Sovereign 28,663,577 - 29,838,081 - 29,838,081
Foreign Bonds - others 1,923,949 - 1,999,967 - 1,999,967
Debt securities (TFCs, Sukuks) 19,438,405 - 19,683,070 - 19,683,070
298,372,564 - 301,982,991 - 301,982,991
1,451,568,852 12,785,346 1,442,393,933 - 1,455,179,279
Off-balance sheet financial instruments -measured at fair value
Forward purchase and sale of foreign exchange contracts 618,694,809 - (176,107) - (176,107)
FX options - purchased and sold 2,338,968 - - - -
Forward purchase of government securities 707,328 - (183) - (183)
Fair Value of non-financial assets
Fixed Assets 36,315,390 - - 36,315,390 36,315,390
Non-banking assets acquired in satisfaction of claims 203,676 - - 203,676 203,676
36,519,066 - - 36,519,066 36,519,066
On balance sheet financial instruments Level 1 Level 2 Level 3 Total
Financial assets measured at fair value
- Investments
Government Securities (T-bills, PIBs, GoP Sukuks and
Eurobonds, Mudarabah Pool) 808,788,572 - 808,788,572 - 808,788,572
Foreign Bonds - Sovereign 55,145,424 - 45,358,275 - 45,358,275
Foreign Bonds - others 4,769,303 - 7,083,775 - 7,083,775
Ordinary shares of listed companies 10,383,260 13,410,747 - - 13,410,747
Mutual funds 228,518 - 252,931 - 252,931
Debt securities (TFCs, Sukuks) 1,720,302 - 1,914,241 - 1,914,241
Investment in REIT 441,914 520,708 - - 520,708
881,477,293 13,931,455 863,397,794 - 877,329,249
Financial assets not measured at fair value
Government Securities (T-bills, PIBs, GoP Sukuks
Eurobonds, Bai Muajjal) 200,466,866 - 206,791,388 - 206,791,388
Foreign Bonds - Sovereign 23,429,572 - 22,141,647 - 22,141,647
Foreign Bonds - others 1,238,565 - 1,285,465 - 1,285,465
Debt securities (TFCs, Sukuks) 16,411,853 - 16,570,036 - 16,570,036
241,546,856 - 246,788,536 - 246,788,536
1,123,024,149 13,931,455 1,110,186,330 - 1,124,117,785
Off-balance sheet financial instruments - measured at fair value
Forward purchase and sale of foreign exchange contracts 635,597,333 - 614,728 - 614,728
FX options - purchased and sold - - - - -
Forward purchase of government securities - - - - -
Fair Value of non-financial assets
Fixed Assets 36,492,910 - - 36,492,910 36,492,910
Non-banking assets acquired in satisfaction of claims 203,316 - - 203,316 203,316
36,696,226 - - 36,696,226 36,696,226
34.2
-------------------------- (Rupees in '000) --------------------------
The table below analyses financial instruments measured at the end of the reporting period by the level in the fair value
hierarchy into which the fair value measurement is categorised:
June 30, 2021 (Un-audited)
Carrying /
Notional value
Fair value
December 31, 2020 (Audited)
Carrying /
Notional value
Fair value
-------------------------- (Rupees in '000) --------------------------
Certain categories of fixed assets (land and buildings) and non-banking assets acquired in satisfactions of claims are carried
at revalued amounts (level 3 measurement) determined by professional valuers based on their assessment of the market
values.
24

NOTES TO AND FORMING PART OF THE UNCONSOLIDATED CONDENSED INTERIM FINANCIAL STATEMENTS (UN-AUDITED)
FOR THE SIX MONTHS ENDED JUNE 30, 2021
34.3 Valuation techniques used in determination of fair values within level 2 and level 3.
Debt Securities
Derivatives
The fair valuation techniques include forward pricing and swap models using present value calculations.
Fixed assets and non-banking assets acquired in satisfaction of claims
35. SEGMENT INFORMATION
35.1 Segment details with respect to business activities
Profit and Loss Account
Net mark-up / return / profit 11,746,753 36,866,641 (18,942,711) 1,917,490 3,794,060 (293,327) 35,088,906
Inter segment (expense) / revenue - net (9,699,132) (33,307,860) 39,935,709 - - 3,071,283 -
Non mark-up / return / interest income 1,582,025 1,711,348 4,522,136 169,940 2,871,976 572,068 11,429,493
Total Income 3,629,646 5,270,129 25,515,134 2,087,430 6,666,036 3,350,024 46,518,399
Segment direct expenses 599,967 314,245 13,045,262 897,707 2,332,203 3,566,113 20,755,497
Inter segment expense allocation 252,943 40,337 3,048,057 - 307,437 (3,648,774) -
Total expenses 852,910 354,582 16,093,319 897,707 2,639,640 (82,661) 20,755,497
(Reversals) / provision and write-offs - net (132,311) (591,454) (407,642) (2,966) 1,031,493 15,484 (87,396)
Profit before taxation 2,909,047 5,507,001 9,829,457 1,192,689 2,994,903 3,417,201 25,850,298
Profit and Loss Account
Net mark-up / return / profit 23,018,771 36,409,262 (26,043,876) 2,007,256 4,050,432 (321,035) 39,120,810
Inter segment (expense) / revenue - net (18,418,839) (34,105,391) 48,931,336 - - 3,592,894 -
Non mark-up / return / interest income 1,023,820 1,843,874 3,568,078 105,713 1,181,588 1,205,523 8,928,596
Total Income 5,623,752 4,147,745 26,455,538 2,112,969 5,232,020 4,477,382 48,049,406
Segment direct expenses 579,258 243,183 11,997,202 882,422 2,754,969 3,357,793 19,814,827
Inter segment expense allocation 190,466 34,880 2,307,653 - 255,361 (2,788,360) -
Total expenses 769,724 278,063 14,304,855 882,422 3,010,330 569,433 19,814,827
Provision / (Reversals) and write-offs - net 88,065 155,374 856,191 4,939 8,310,916 14,336 9,429,821
Profit before taxation 4,765,963 3,714,308 11,294,492 1,225,608 (6,089,226) 3,893,613 18,804,758
Corporate /
Commercial
Banking
Treasury Branch Banking
For the six months ended June 30, 2020 (Un-audited)
-------------------------------------------------------- (Rupees in '000) --------------------------------------------------------
The fair value of Federal Government securities is determined using the prices / rates available on Mutual Funds Association
of Pakistan (MUFAP) and the fair value of other corporate and foreign government securities is determined using the rates
from Reuters / Bloomberg.
Land, buildings and non-banking assets acquired in satisfaction of claims are revalued on a periodic basis using professional
valuers. The valuation is based on their assessment of the market value of the assets. The effect of changes in the
unobservable inputs used in the valuations cannot be determined with certainty. Accordingly, a qualitative disclosure of
sensitivity has not been presented in these unconsolidated condensed interim financial statements.
For the six months ended June 30, 2021 (Un-audited)
International
branch
operations
Others Total
-------------------------------------------------------- (Rupees in '000) --------------------------------------------------------
Islamic
Banking
Treasury
International
branch
operations
Corporate /
Commercial
Banking
Branch Banking TotalOthersIslamic
Banking
25

NOTES TO AND FORMING PART OF THE UNCONSOLIDATED CONDENSED INTERIM FINANCIAL STATEMENTS (UN-AUDITED)
FOR THE SIX MONTHS ENDED JUNE 30, 2021
Statement of financial position
Cash & Bank balances 9,515 79,563,460 120,701,478 12,368,881 52,524,357 787,718 265,955,409
Investments 7,503,061 1,262,799,248 - 68,539,121 113,080,763 5,560,588 1,457,482,781
Net inter segment lending - - 1,325,910,472 30,847,176 - 85,877,346 1,442,634,994
Lendings to financial institutions - 21,734,325 - - - - 21,734,325
Advances - performing 357,454,663 16,939 43,424,604 43,456,874 95,822,270 6,173,907 546,349,257
Advances - non-performing net of provision 2,907,797 - 547,031 8,832 7,413,073 14,350 10,891,083
Others 9,497,782 16,100,463 15,152,667 2,580,305 11,385,322 41,154,318 95,870,857
Total Assets 377,372,818 1,380,214,435 1,505,736,252 157,801,189 280,225,785 139,568,227 3,840,918,706
Borrowings 55,761,710 179,699,106 4,559,481 3,696,805 19,995,018 - 263,712,120
Subordinated debt - - - - - 10,000,000 10,000,000
Deposits and other accounts 48,779,096 134,986 1,450,404,464 143,200,166 207,000,082 313,505 1,849,832,299
Net inter segment borrowing 257,031,378 1,184,593,196 - - 1,010,420 - 1,442,634,994
Others 13,969,542 11,201,953 45,315,747 4,942,051 4,693,095 12,920,024 93,042,412
Total Liabilities 375,541,726 1,375,629,241 1,500,279,692 151,839,022 232,698,615 23,233,529 3,659,221,825
Equity 1,831,092 4,585,194 5,456,560 5,962,167 47,527,170 116,334,698 181,696,881
Total Equity & liabilities 377,372,818 1,380,214,435 1,505,736,252 157,801,189 280,225,785 139,568,227 3,840,918,706
Contingencies and Commitments 365,216,743 198,404,513 29,959,047 30,665,208 464,452,076 2,463,232 1,091,160,819
Statement of financial position
Cash & Bank balances 5,833 81,844,130 122,637,049 12,061,714 47,378,919 799,172 264,726,817
Investments 4,803,162 932,393,450 - 62,729,601 123,251,328 5,496,953 1,128,674,494
Net inter segment lending - - 1,139,940,361 7,997,409 - 77,017,055 1,224,954,825
Lendings to financial institutions - - - 19,959,132 - - 19,959,132
Advances - performing 360,426,353 - 41,532,652 20,521,606 89,119,069 6,811,741 518,411,421
Advances - non-performing net of provision 3,287,884 - 802,173 16,551 7,754,943 6,524 11,868,075
Others 14,416,544 16,648,272 14,968,909 1,705,673 13,301,659 44,902,317 105,943,374
Total Assets 382,939,776 1,030,885,852 1,319,881,144 124,991,686 280,805,918 135,033,762 3,274,538,138
Borrowings 51,240,762 60,191,848 4,600,487 3,632,752 9,321,566 - 128,987,415
Subordinated debt - - - - - 10,000,000 10,000,000
Deposits and other accounts 50,351,838 132,797 1,257,985,091 111,478,161 220,015,338 248,676 1,640,211,901
Net inter segment borrowing 263,282,545 960,917,205 - - 755,075 - 1,224,954,825
Others 13,412,717 3,328,909 47,513,400 4,811,546 6,305,922 10,938,596 86,311,090
Total Liabilities 378,287,862 1,024,570,759 1,310,098,978 119,922,459 236,397,901 21,187,272 3,090,465,231
Equity 4,651,914 6,315,093 9,782,166 5,069,227 44,408,017 113,846,490 184,072,907
Total Equity & liabilities 382,939,776 1,030,885,852 1,319,881,144 124,991,686 280,805,918 135,033,762 3,274,538,138
Contingencies and Commitments 349,133,005 285,716,584 13,182,354 5,991,566 398,498,688 2,721,015 1,055,243,212
As at June 30, 2021 (Un-audited)
Corporate /
Commercial
Banking
Others
-------------------------------------------------------- (Rupees in '000) --------------------------------------------------------
TotalTreasury Branch BankingIslamic
Banking
International
branch
operations
As at December 31, 2020 (Audited)
-------------------------------------------------------- (Rupees in '000) --------------------------------------------------------
Others Total
Corporate /
Commercial
Banking
Treasury Branch BankingIslamic
Banking
International
branch
operations
26

NOTES TO AND FORMING PART OF THE UNCONSOLIDATED CONDENSED INTERIM FINANCIAL STATEMENTS (UN-AUDITED)
FOR THE SIX MONTHS ENDED JUNE 30, 2021
36. RELATED PARTY TRANSACTIONS
The Bank has related party transactions with its associates, subsidiary companies, employee benefit plans and its Directors and Key Management Personnel.
Statement of financial position
----------------------------------------------------------------------------------------------------------------------- (Rupees in '000) -----------------------------------------------------------------------------------------------------------------------
Balances with other banks
In current accounts - - - 1,360,706 - - - - - 1,482,280 - -
In deposit accounts - - - 1,732,967 - - - - - - - -
- - - 3,093,673 - - - - - 1,482,280 - -
Investments
Opening balance - - - 5,406,166 1,582,485 3,997,489 - - - 5,406,166 1,582,485 3,943,202
Investment made during the period / year - - - - 200,000 2,563,634 - - - - - 54,287
Investment disposed / written off during
the period / year - - - - - (150,820) - - - - - -
Closing balance - - - 5,406,166 1,782,485 6,410,303 - - - 5,406,166 1,582,485 3,997,489
Provision for diminution in value of investments - - - 1,688,911 - 1,434,287 - - - 1,688,911 - 1,544,596
Provision written off - - - - - 77,606 - - - - - -
Advances
Opening balance - 10 237,861 - - 9,365,687 - 4,624 220,133 - 2,155,149 12,715,998
Addition during the period / year - 191 25,357 - - 17,381,345 - 838 72,462 - - 16,398,899
Repaid during the period / year - (156) (22,391) - - (23,384,746) - (5,452) (68,603) - (152,755) (19,749,210)
Transfer in - net / (write-off) - - - - - - - - 13,869 - (2,002,394) -
Closing balance - 45 240,827 - - 3,362,286 - 10 237,861 - - 9,365,687
Parent ParentOther related
parties
The Bank enters into transactions with related parties in the ordinary course of business and on substantially the same terms as for comparable transactions with person of similar standing.
Contributions to and accruals in respect of staff retirement benefits and other benefit plans are made in accordance with the actuarial valuations / terms of the contribution plan. Remuneration to
the executives / officers is determined in accordance with the terms of their appointment.
Other related
partiesDirectors
Key
manage-ment
personnel
Subsidiaries Associates
June 30, 2021 (Un-Audited) December 31, 2020 (Audited)
Directors
Key
manage-
ment
personnel
Details of transactions with related parties during the period / year, other than those which have been disclosed elsewhere in these unconsolidated condensed interim financial statements, are as
follows:
Subsidiaries Associates
27

NOTES TO AND FORMING PART OF THE UNCONSOLIDATED CONDENSED INTERIM FINANCIAL STATEMENTS (UN-AUDITED)
FOR THE SIX MONTHS ENDED JUNE 30, 2021
Statement of financial position
Other Assets
Interest mark-up accrued - - - 2,648 31,617 38,294 - - - - 4,282 232,471
Receivable from staff retirement fund - - - - - 74,054 - - - - - 24,160
Advances, Deposits & Prepayments - - - - - - - - - - - 63,634
Prepaid insurance - - - - 283,322 - - - - - 1,002 -
Dividend Receivable - - - 87,555 - - - - - - - 104,215
Other receivable - - - 12,348 - - - - - 11,983 - 30,164
Provision against other assets - - - - - - - - - - - 30,164
Provision written off - - - - - 30,164 - - - - - -
Borrowings
Opening balance - - - 1,598,323 - - - - - - - -
Borrowings during the period / year - - - 1,639,983 - 488,300 - - - 1,760,102 - 1,538,000
Settled during the period / year - - - (2,293,056) - (288,300) - - - (161,779) - (1,538,000)
Closing balance - - - 945,250 - 200,000 - - - 1,598,323 - -
Deposits and other accounts
Opening balance - 6,431,790 62,761 281,016 2,478,432 16,511,019 - 8,679,450 49,368 211,870 6,502,931 11,346,752
Received during the period / year 100,712 52,791,437 444,941 10,480,245 72,092,144 187,065,785 - 29,415,769 1,265,710 15,708,641 144,141,551 177,627,329
Withdrawn during the period / year (79,496) (52,378,802) (461,314) (10,454,718) (72,660,872) (187,249,989) - (31,659,519) (1,192,377) (15,639,495) (148,166,050) (172,469,603)
Transfer (out) / in - net - - - - - - - (3,910) (59,940) - - 6,541
Closing balance 21,216 6,844,425 46,388 306,543 1,909,704 16,326,815 - 6,431,790 62,761 281,016 2,478,432 16,511,019
Other Liabilities
Interest / mark-up payable on deposits and
borrowings - 82,400 - 36 5,480 284,590 - 39,335 210 1,182 7,651 115,024
Payable to staff retirement fund - - - - - 131,457 - - - - - 1,122,023
Dividend Payable 2,526,916 80,633 862 - 21,844 389,261 - - - - - -
Unearned income - - - 371 - 7,145 - - - 1,485 - -
Other Payable - - - - 23,107 - - 3,900 - - 22,353 -
Contingencies and Commitments
Letter of guarantee - - - 10,862 - - - - - 11,053 - 4,360
Forward foreign exchange contracts purchase - - - 2,447,347 - - - - - 1,777,719 - -
Forward foreign exchange contracts sale - - - 2,442,614 - - - - - 1,758,178 - -
Parent Parent
----------------------------------------------------------------------------------------------------------------------- (Rupees in '000) -----------------------------------------------------------------------------------------------------------------------
Key
manage-
ment
personnel
Subsidiaries AssociatesOther related
partiesDirectorsDirectors
Key manage-
ment
personnel
Subsidiaries
December 31, 2020 (Audited)
AssociatesOther related
parties
June 30, 2021 (Un-Audited)
28

NOTES TO AND FORMING PART OF THE UNCONSOLIDATED CONDENSED INTERIM FINANCIAL STATEMENTS (UN-AUDITED)
FOR THE SIX MONTHS ENDED JUNE 30, 2021
Profit and loss account
Income
Mark-up / return / interest earned - - 6,747 2,648 18,352 383,939 - - 8,299 61,733 25,598 792,973
Commission / charges recovered 22 224 1,064 758 15,515 12,607 - 46 1,687 475 11,170 10,137
Dividend income - - - 434,866 11,841 71,079 - - - 379,039 18,472 139,868
Net gain on sale of securities - 78 - - - - - - - - - -
Other income - - 2,374 1,114 - 10,718 - - 7,166 - - 9,215
Reversal of Provision - - - - - 32,703 - - - - 152,755 -
Switch revenue - - - - - 119,796 - - - - - 104,302
Management fee - - - 7,485 - - - - - 689 - -
Expense
Mark-up / return / interest paid 269 185,727 224 921 48,666 438,176 - 99,948 458 7,489 277,728 192,264
Remuneration paid - - 612,851 - - - - - 467,398 - - -
Post employment benefits - - 13,163 - - - - - 11,376 - - -
Non-executive directors' fee and allowances - 34,050 - - - - - 49,749 - - - -
Net charge for defined contribution plans - - - - - 197,059 - - - - - 180,145
Charge for defined benefit plans - - - - - 159,695 - - - - - 167,442
Other expenses - - - - - 64,497 - - - - - 21,942
Clearing Charges - - - - - 67,645 - - - - - 64,874
Seminar and Membership fees - - - - - 6,541 - - - - - 1,298
Membership, Subscription , Sponsorship
and maintenance charges - - - - - 39,827 - - - - - 400
Custody Charges - - - - - 1,485 - - - - - 2,189
Insurance premium paid - - - - 462,810 - - - - - 514,302 -
Insurance claims settled - - - - 244,459 - - - - - 183,804 -
36.1 As disclosed in note 9.8, with reference to the orderly winding up of UBL (Switzerland) AG, during the period ended June 30, 2021, UBL – UAE branch has acquired certain exposures relating to
bills discounting from UBL (Switzerland) AG. These transactions have not resulted in any kind of exposure between UBL – UAE and UBL (Switzerland) AG and are hence not presented in the
above disclosure.
ParentParent
For the six months ended June 30, 2020 (Un-audited)For the six months ended June 30, 2021 (Un-audited)
----------------------------------------------------------------------------------------------------------------------- (Rupees in '000) -----------------------------------------------------------------------------------------------------------------------
Other related
partiesDirectors
Key manage-
ment
personnel
Subsidiaries AssociatesOther related
partiesDirectors
Key
manage-
ment
personnel
Subsidiaries Associates
29

NOTES TO AND FORMING PART OF THE UNCONSOLIDATED CONDENSED INTERIM FINANCIAL STATEMENTS (UN-AUDITED)
FOR THE SIX MONTHS ENDED JUNE 30, 2021
(Un-audited) (Audited)
37. CAPITAL ADEQUACY, LEVERAGE RATIO & LIQUIDITY REQUIREMENTS
Minimum Capital Requirement (MCR):
Paid-up capital (net of losses) 12,241,797 12,241,797
Capital Adequacy Ratio (CAR):
Eligible Common Equity Tier 1 (CET 1) Capital 125,379,088 126,860,060
Eligible Additional Tier 1 (ADT 1) Capital 9,834,387 9,934,770
Total Eligible Tier 1 Capital 135,213,475 136,794,830
Eligible Tier 2 Capital 44,289,520 45,102,462
Total Eligible Capital (Tier 1 + Tier 2) 179,502,995 181,897,292
Risk Weighted Assets (RWAs):
Credit Risk 537,623,663 532,509,650
Market Risk 68,131,390 54,441,838
Operational Risk 157,614,605 157,614,605
Total 763,369,658 744,566,093
Common Equity Tier 1 Capital Adequacy Ratio 16.42% 17.04%
Tier 1 Capital Adequacy Ratio 17.71% 18.37%
Total Capital Adequacy Ratio 23.51% 24.43%
(Un-audited) (Audited)
Leverage Ratio (LR):
Eligible Tier-1 Capital 135,213,475 136,794,830
Total Exposures 2,979,304,502 2,456,802,603
Leverage Ratio 4.54% 5.57%
Liquidity Coverage Ratio (LCR):
Total High Quality Liquid Assets 1,055,220,404 1,035,616,032
Total Net Cash Outflow 317,503,108 324,975,005
Liquidity Coverage Ratio 332.35% 318.68%
Net Stable Funding Ratio (NSFR):
Total Available Stable Funding 1,968,023,129 1,714,566,321
Total Required Stable Funding 864,803,727 770,865,635
Net Stable Funding Ratio 227.57% 222.42%
------- (Rupees in '000) -------
Furthermore, under the SBP’s Framework for Domestic Systemically Important Banks (D-SIBs) introduced vide BPRD Circular
No. 04 of 2019 dated April 13, 2019, UBL has been designated as a D-SIB. In line with this framework, the Bank is required to
meet the Higher Loss Absorbency (HLA) capital charge of 1.0%, in the form of Additional CET 1 capital, on a standalone as
well as consolidated level during 2020. As per SBP’s designation of D-SIBs for the year 2020, the HLA capital charge is
required to be maintained by UBL is 1.0% and will remain effective till next D-SIB designation is announced by the State Bank
of Pakistan.
December 31,
2020
June 30,
2021
December 31,
2020
June 30,
2021
------- (Rupees in '000) -------
The SBP through its BSD Circular No. 07 dated April 15, 2009 has prescribed the minimum paid-up capital (net of
accumulated losses) for Banks to be raised to Rs.10,000 million by the year ending December 31, 2015. The paid-up capital of
the Bank for the year ended June 30, 2021 stood at Rs.12,241.797 million (Dec 2020: Rs.12,241.797 million) and is in
compliance with SBP requirements. Banks are also required to maintain a minimum Capital Adequacy Ratio (CAR) of 10.0%
plus capital conservation buffer of 2.5% and High Loss Absorbency Requirement of 1.0% of the risk weighted exposures of the
Bank.
Under the current capital adequacy regulations, credit risk and market risk exposures are measured using the Standardized
Approach and operational risk is measured using the Basic Indicator Approach. Credit risk mitigants are applied against the
Bank’s exposures based on eligible collateral under comprehensive approach.
In order to dampen the effects of COVID-19, the State Bank of Pakistan under BPRD Circular Letter No. 12 of 2020 has given
a regulatory relief and reduced the Capital Conservation Buffer (CCB) as prescribed vide BPRD Circular No. 6 of August 15,
2013, for the time being, from its existing level of 2.5% to 1.5%, till further instructions.
Further, under Basel III instructions, Banks are also required to maintain a Common Equity Tier 1 (CET 1) ratio and Tier 1 ratio
of 6.0% and 7.5%, respectively, as at December 31, 2020. The Bank is fully compliant with prescribed ratios as the Bank’s
CAR is 23.5% whereas CET 1 and Tier 1 ratios stood at 16.4% and 17.7% respectively.
30
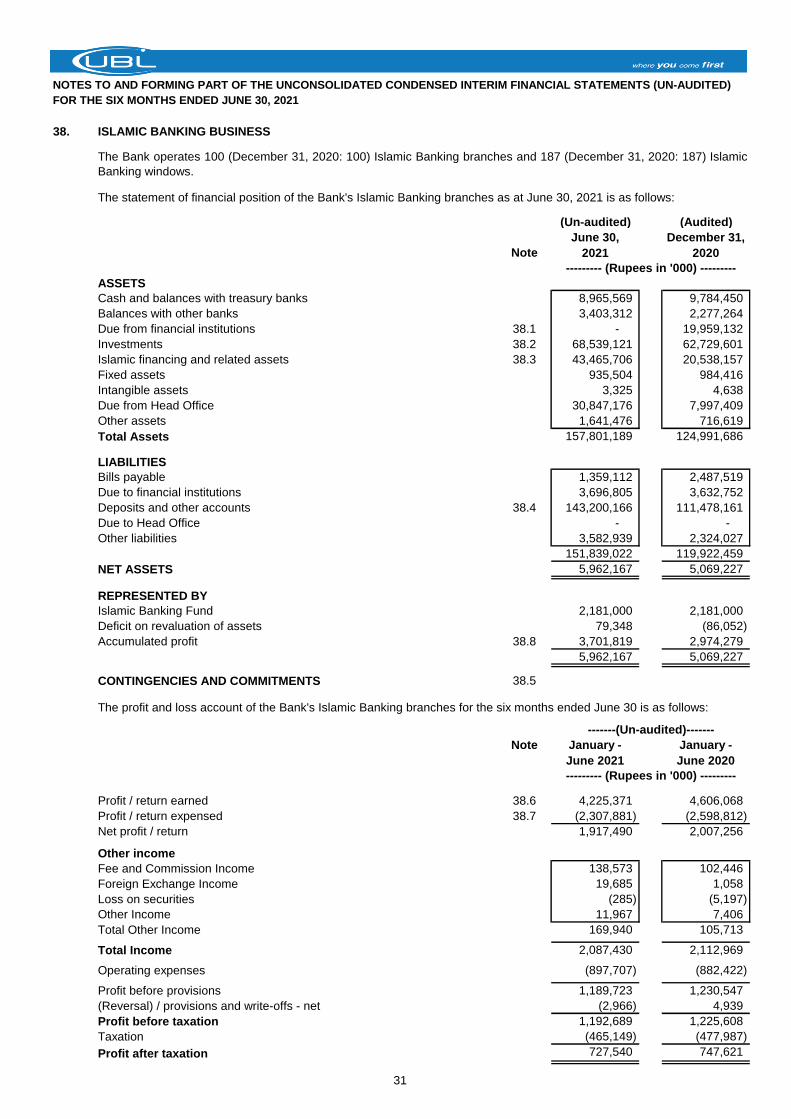
NOTES TO AND FORMING PART OF THE UNCONSOLIDATED CONDENSED INTERIM FINANCIAL STATEMENTS (UN-AUDITED)
FOR THE SIX MONTHS ENDED JUNE 30, 2021
38. ISLAMIC BANKING BUSINESS
The statement of financial position of the Bank's Islamic Banking branches as at June 30, 2021 is as follows:
(Un-audited) (Audited)
Note
ASSETS
Cash and balances with treasury banks 8,965,569 9,784,450
Balances with other banks 3,403,312 2,277,264
Due from financial institutions 38.1 - 19,959,132
Investments 38.2 68,539,121 62,729,601
Islamic financing and related assets 38.3 43,465,706 20,538,157
Fixed assets 935,504 984,416
Intangible assets 3,325 4,638
Due from Head Office 30,847,176 7,997,409
Other assets 1,641,476 716,619
Total Assets 157,801,189 124,991,686
LIABILITIES
Bills payable 1,359,112 2,487,519
Due to financial institutions 3,696,805 3,632,752
Deposits and other accounts 38.4 143,200,166 111,478,161
Due to Head Office - -
Other liabilities 3,582,939 2,324,027
151,839,022 119,922,459
NET ASSETS 5,962,167 5,069,227
REPRESENTED BY
Islamic Banking Fund 2,181,000 2,181,000
Deficit on revaluation of assets 79,348 (86,052)
Accumulated profit 38.8 3,701,819 2,974,279
5,962,167 5,069,227
CONTINGENCIES AND COMMITMENTS 38.5
The profit and loss account of the Bank's Islamic Banking branches for the six months ended June 30 is as follows:
Note January -
June 2021
January -
June 2020
Profit / return earned 38.6 4,225,371 4,606,068
Profit / return expensed 38.7 (2,307,881) (2,598,812)
Net profit / return 1,917,490 2,007,256
Other income
Fee and Commission Income 138,573 102,446
Foreign Exchange Income 19,685 1,058
Loss on securities (285) (5,197)
Other Income 11,967 7,406
Total Other Income 169,940 105,713
Total Income 2,087,430 2,112,969
Operating expenses (897,707) (882,422)
Profit before provisions 1,189,723 1,230,547
(Reversal) / provisions and write-offs - net (2,966) 4,939
Profit before taxation 1,192,689 1,225,608
Taxation (465,149) (477,987)
Profit after taxation 727,540 747,621
The Bank operates 100 (December 31, 2020: 100) Islamic Banking branches and 187 (December 31, 2020: 187) Islamic
Banking windows.
--------- (Rupees in '000) ---------
--------- (Rupees in '000) ---------
December 31,
2020
June 30,
2021
-------(Un-audited)-------
31

NOTES TO AND FORMING PART OF THE UNCONSOLIDATED CONDENSED INTERIM FINANCIAL STATEMENTS (UN-AUDITED)
FOR THE SIX MONTHS ENDED JUNE 30, 2021
38.1 Due from Financial Institutions
Musharakah - - - 6,000,000 - 6,000,000
Mudarabhah - - - 4,500,000 - 4,500,000
Bai Muajjal:
with State Bank of Pakistan - - - 6,433,114 - 6,433,114
with other Financial Institution - - - 3,026,018 - 3,026,018
- - - 19,959,132 - 19,959,132
38.2 Investments by segments
Federal Government Securities
- Ijarah Sukuks 23,995,452 - 79,348 24,074,800 19,992,452 - (86,052) 19,906,400
- Government of Pakistan Mudarabah Pool 1,138,873 - - 1,138,873 466,435 - - 466,435
- Bai muajjal with Govt. of Pakistan 38.2.1 31,115,551 - - 31,115,551 29,569,648 - - 29,569,648
56,249,876 79,348 56,329,224 50,028,535 - (86,052) 49,942,483
Non Government Debt Securities
- Listed 700,000 - - 700,000 450,000 - - 450,000
- Unlisted 11,509,897 - - 11,509,897 12,337,118 - - 12,337,118
12,209,897 - - 12,209,897 12,787,118 - - 12,787,118
Total Investments 68,459,773 - 79,348 68,539,121 62,815,653 - (86,052) 62,729,601
(Un-audited) (Audited)
38.2.1 Bai Muajjal with Government of Pakistan
Bai Muajjal Investment 33,031,000 33,031,000
Less: Deferred Income (1,915,449) (3,461,352)
Bai Muajjal Investment - net 31,115,551 29,569,648
38.3 Islamic financing and related assets
Ijarah 442,864 440,754
Murabahah 446,893 272,766
Musharakah 19,996,158 8,392,690
Diminishing Musharakah 14,649,370 6,754,380
Istisna 61,507 39,584
Islamic Export Refinance scheme - Musharakah 2,839,544 2,989,544
Advances against Islamic assets
Advances against Ijarah 24,271 77,190
Advances for Diminishing Musharakah 2,953,290 410,595
Advances for Murabahah 18,459 33,427
Advances agaisnt Mera Pakistan Mera Ghar 77,788 459
Advances against Islamic Temporary Economic Refinance Scheme 345,640 -
Advances for Istisna Islamic Export Refiance Scheme 452,749 456,623
Advances for Istisna 477,763 148,586
Inventory related to Islamic financing - Istisna 329,866 296,918
Profit and other receivables against financings 468,886 336,219
Gross Islamic financing and related assets 43,585,048 20,649,735
Less: Provision against Islamic financings
- Specific (86,441) (90,927)
- General (32,901) (20,651)
(119,342) (111,578)
Islamic financing and related assets - net of provision 43,465,706 20,538,157
------------------------------------- (Rupees in '000) -------------------------------------
December
31, 2020
June
30, 2021
Provision for
diminution Surplus
Carrying
Value
Cost /
Amortised
cost
Provision for
diminution Deficit Carrying Value
----------------------------------------------------------------------------------------- (Rupees in '000) -----------------------------------------------------------------------------------------
Cost /
Amortised
cost
June 30, 2021 (Un-Audited) December 31, 2020 (Audited)
--------------------------------------------------------------- (Rupees in '000) ---------------------------------------------------------------
June 30, 2021 (Un-Audited) December 31, 2020 (Audited)
In Local
Currency
In Foreign
CurrenciesTotal
In Local
Currency
In Foreign
CurrenciesTotal
32
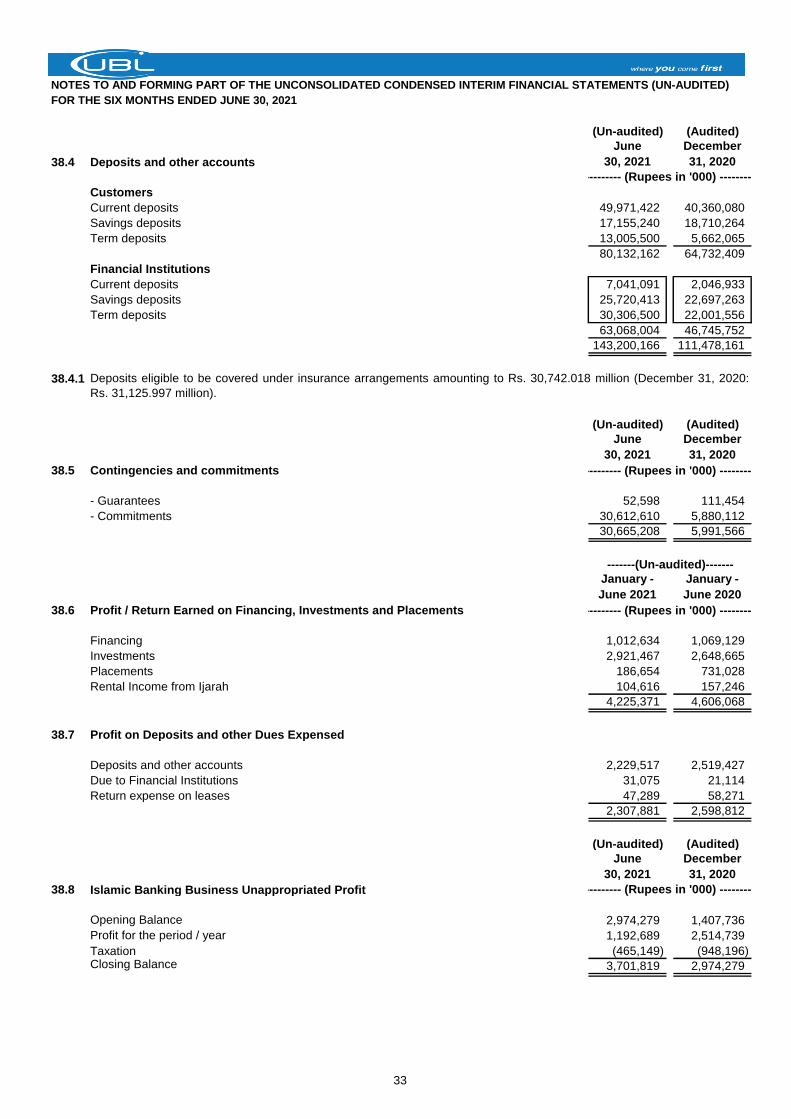
NOTES TO AND FORMING PART OF THE UNCONSOLIDATED CONDENSED INTERIM FINANCIAL STATEMENTS (UN-AUDITED)
FOR THE SIX MONTHS ENDED JUNE 30, 2021
(Un-audited) (Audited)
38.4 Deposits and other accounts
Customers
Current deposits 49,971,422 40,360,080
Savings deposits 17,155,240 18,710,264
Term deposits 13,005,500 5,662,065
80,132,162 64,732,409
Financial Institutions
Current deposits 7,041,091 2,046,933
Savings deposits 25,720,413 22,697,263
Term deposits 30,306,500 22,001,556
63,068,004 46,745,752
143,200,166 111,478,161
38.4.1
(Un-audited) (Audited)
38.5 Contingencies and commitments
- Guarantees 52,598 111,454
- Commitments 30,612,610 5,880,112
30,665,208 5,991,566
January -
June 2021
January -
June 2020
38.6 Profit / Return Earned on Financing, Investments and Placements
Financing 1,012,634 1,069,129
Investments 2,921,467 2,648,665
Placements 186,654 731,028
Rental Income from Ijarah 104,616 157,246
4,225,371 4,606,068
38.7 Profit on Deposits and other Dues Expensed
Deposits and other accounts 2,229,517 2,519,427
Due to Financial Institutions 31,075 21,114
Return expense on leases 47,289 58,271
2,307,881 2,598,812
(Un-audited) (Audited)
38.8 Islamic Banking Business Unappropriated Profit
Opening Balance 2,974,279 1,407,736
1,192,689 2,514,739
Taxation (465,149) (948,196)Closing Balance 3,701,819 2,974,279
Deposits eligible to be covered under insurance arrangements amounting to Rs. 30,742.018 million (December 31, 2020:
Rs. 31,125.997 million).
June
30, 2021
December
31, 2020
------------------------------------- (Rupees in '000) -------------------------------------
June
30, 2021
December
31, 2020
------------------------------------- (Rupees in '000) -------------------------------------
Profit for the period / year
June
30, 2021
December
31, 2020
------------------------------------- (Rupees in '000) -------------------------------------
-------(Un-audited)-------
------------------------------------- (Rupees in '000) -------------------------------------
33

NOTES TO AND FORMING PART OF THE UNCONSOLIDATED CONDENSED INTERIM FINANCIAL STATEMENTS (UN-AUDITED)
FOR THE SIX MONTHS ENDED JUNE 30, 2021
38.9 Disclosures for profit and loss distribution and pool management
General Pool(s)
IERS Pool(s)
Treasury Pool(s)
Special Pool(s)
Equity Pool(s)
The risk characteristics of pools
All other assets including fixed assets, advance against financing and subsidized financing to Bank's employees are tagged
to equity pool. To safeguard the interest of customers, all high risk investments are done through equity pool. The Holding
company as Mudarib in the general pools is responsible for financing costs / assets such as land, building, furniture,
fixtures, computers and IT system from its own sources / equity.
During the period, the Bank has given General Hiba to the depositors in General and specific pool, keeping in view the
prescribed guidelines of Pool Management provided by the SBP. However, Hiba is given at the sole discretion of the Bank
without any contractual commitment with the depositors.
The Mudarib’s share on Deposits for the period ended June 30, 2021 is Rs.1,580.106 million (45.14% of distributable profit
of Mudarabah Pool). of this, an amount of Rs.345.504 million (21.87% of Mudarib share) was distributed back to depositors
as Hiba. The rate of profit earned on average earning assets was 9.12% per annum and the rate of profit paid on average
deposits was 5.90% per annum.
The risk characteristics of each pool mainly depends on the assets and liability profile of the pool. As per the Bank 's policy,
relatively low risk / secured financing transactions and assets are allocated to the pool. The Bank maintains General Pools,
Special Pools, IERS pool and Equity pool. All pools are exposed to general credit risk, asset ownership risk and Profit rate
risk of underlying assets involved.
The Bank operates general and special pools for deposits and inter-bank funds accepted / acquired under Mudarabah,
Wakalah and Musharakah modes.
Under the General deposits pools, the Bank accepts funds on Mudarabah basis from depositors (Rab-ul-Maal) where the
Bank acts as Manager (Mudarib) and invests the funds in the Shariah Compliant modes of financing, investments and
placements. When utilising investing funds, the Bank prioritizes the funds received from depositors over the funds
generated from own sources after meeting the regulatory requirement relating to such deposits.
Specific pools are operated for funds acquired / accepted from the Corporate Customers, other banks and State Bank of
Pakistan for liquidity management and Islamic Export Refinance to the Bank's customers respectively under the
Musharakah/ Mudarabah / Wakalah modes.
For General Pools, the Bank allocates PKR financing to Corporate, SMEs and Consumer Finance customers in diversified
sectors and avenues of the economy / business and Investments in Sovereign Guarantee Sukuk, Corporate Sukuk, Bai
Muajjal with Government of Pakistan, are also done through General Pools. All remunerative deposits are tagged to these
general pools and their funds generated from the depositors are invested on priority basis.
The IERS pool assets comprise of Sovereign Guarantee Sukuk, and financing to Corporate Customers and exporters as
allowed under the applicable laws and regulations, and as such are exposed to lower credit risk. The Musharakah with SBP
under IERS is tagged to the IERS pool.
The Treasury pool assets generally comprise of Sovereign Guarantee Sukuk and financing under Diminishing Musharakah,
Ijarah facility and the related liability of the Treasury pool comprise of Musharakah / Wakalah / Mudarabah from financial
institutions. These pools are created to meet the liquidity requirements of the Holding company.
Separate pool(s) are created where the customers desire to invest in high yield assets. The rate of these pool(s) are higher
than the general pool depending on the assets. In case of loss in special pool, the loss will be borne by the special pool
members. The net return on the pool is arrived at after deduction of direct costs from the gross return earned on the pool.
From the net return, profit is paid to the Mudarib in the ratio of the Mudarib’s equity in the pool to the total pool. The
balance represents the distributable profit.
34

NOTES TO AND FORMING PART OF THE UNCONSOLIDATED CONDENSED INTERIM FINANCIAL STATEMENTS (UN-AUDITED)
FOR THE SIX MONTHS ENDED JUNE 30, 2021
The Parameters used for allocation of profit, expenses and provisions to the Pool
- The profit of each deposit pool is calculated on all the remunerative assets booked by utilising the funds from the pool.
-
- No expense of general or administrative nature is charged to the pools.
-
-
-
The Bank managed following pools during the period.
% % Rupees in '000 % % Rupees in '000
ADMA Pools 6 Mudarbaha Monthly 7.17% 48.62% 22,917 6% 52.79% 12,099
Special Pools 60 Mudarbaha Monthly 8.51% 34.91% 391,978 6.73% 38.12% 149,437
IERS Pools 12 Musharkah Monthly 6.40% 84.19% 166,621 2.00% 0.00% -
FCY Pools 6 Mudarbaha Monthly 1.75% 50.00% 788 1.06% 0.00% -
General Pools 6 Mudarbaha Monthly 9.46% 50.00% 1,165,211 5.48% 15.79% 183,968
% % Rupees in '000 % % Rupees in '000
ADMA Pools 6 Mudarabah Monthly 5.29% 50.00% 3,713 3% 16.55% 615
Special Pools 60 Mudarabah Monthly 12.45% 28.45% 355,547 9.94% 31.50% 112,006
IERS Pools 12 Musharkah Monthly 4.94% 86.89% 139,090 2.00% 0.00% -
General Pools 6 Mudarabah Monthly 11.90% 50.00% 1,087,379 7.71% 29.62% 322,032
(Un-audited) (Audited)
38.10 Deployment of Mudarabah based deposits by class of business
Chemical and pharmaceuticals 2,484,304 2,230,052
Agri business 20,437,489 8,745,482
Textile 2,380,905 1,991,142
Financial 3,952,240 13,335,120
Food industries 307,494 318,037
Plastic 299,229 299,263
Individuals 6,847,823 1,981,422
Production and Transmission of energy 18,742,631 13,496,129
Government of Pakistan Securities 56,329,223 59,401,615
Others 3,746,145 3,817,471
115,527,483 105,615,733
December
31, 2020
Nature of
Pool
Percentage of
Mudarib share
transferred
through Hiba
Average
profit rate /
return
distributed
Amount of
Mudarib share
transferred
through Hiba
Profit rate and
weightages
announce-
ment period
Average
profit rate
earned
Profit
Sharing ratio
Mudarib fee /
Musharakah
share /
Wakalah Fee
The profit of the pool is shared between equity and Rab-ul-Maal of the pool on the basis of Musharakah at gross level
(before charging of mudarib fee) as per the investment ratio of the equity.
The profit of the pool is shared among the members of the pool on pre-defined mechanism based on the weightages
announced before the profit calculation period after charging of mudarib fee.
For the six months period ended June 30, 2021 (Un-Audited)
No of Pools
Mudarib fee /
Musharakah
share /
Wakalah Fee
Average
profit rate /
return
distributed
Amount of
Mudarib share
transferred
through Hiba
Nature of
Pool
Profit rate and
weightages
announce-
ment period
Average
profit rate
earned
Profit
Sharing ratio
Percentage of
Mudarib share
transferred
through Hiba
For the six months period ended June 30, 2020 (Un-Audited)
No of Pools
-------Rupees in '000-----
June 30,
2021
Profit of pool is calculated after deduction of expenses directly incurred in earning the income of such pool, the directly
related costs comprise of depreciation on ijarah assets, takaful premium, amortisation of premium on investment etc.
No provisions against any non-performing asset of the pool is passed on to the pool except on the actual loss / write-off
of such non-performing asset.
35

NOTES TO AND FORMING PART OF THE UNCONSOLIDATED CONDENSED INTERIM FINANCIAL STATEMENTS (UN-AUDITED)
FOR THE SIX MONTHS ENDED JUNE 30, 2021
39. NON-ADJUSTING EVENT AFTER THE BALANCE SHEET DATE
40. GENERAL
40.1 Comparatives
40.2 Figures have been rounded off to the nearest thousand rupees unless otherwise stated.
41. DATE OF AUTHORISATION
Aameer Karachiwalla Shazad G. Dada Shazia Syed Arshad Ahmad Mir Sir Mohammed Anwar Pervez, OBE, HPk
Chief Financial Officer President & Director Director Chairman
Chief Executive Officer
The Board of Directors in its meeting held on August 06, 2021 has declared an interim cash dividend in respect of quarter
ended June 30, 2021 of Rs. 4.0 per share (June 30, 2020: Rs. nil per share). These unconsolidated condensed interim
financial statements for the six months ended June 30, 2021 do not include the effect of these appropriations which will be
accounted for subsequent to the period end.
Comparative information has been reclassified, rearranged or additionally incorporated in these unconsolidated condensed
interim financial statements for the purposes of better presentation.
These unconsolidated condensed interim financial statements were authorised for issue on August 06, 2021 by the Board
of Directors of the Bank.
36
![Untitled - Jurnal - Univ. Bandar Lampung [UBL]](https://static.fdokumen.com/doc/165x107/63150beec72bc2f2dd04947c/untitled-jurnal-univ-bandar-lampung-ubl.jpg)


![Download this - Jurnal - Univ. Bandar Lampung [UBL]](https://static.fdokumen.com/doc/165x107/6314115c15106505030b3038/download-this-jurnal-univ-bandar-lampung-ubl.jpg)