
ubl financial planning fund - Pakistan Stock Exchange
76
10 UBL FINANCIAL PLANNING FUND Regular way contracts Initial recognition and measurement Subsequent measurement a) Investments 'at fair value through profit or loss' b) Loans and receivables Impairment 4.3 Derecognition Investments are derecognised when the rights to receive cash flows from the investments have expired or have been transferred and the Fund has transferred substantially all risks and rewards of ownership. The Fund assesses at each reporting date whether there is objective evidence that the investments or a group of investments are impaired. The carrying value of the Fund's assets are reviewed at each reporting date to determine whether there is any indication of impairment. If any such indication exists, the recoverable amount of such assets is estimated. An impairment loss is recognised whenever the carrying value of an asset exceeds its recoverable amount. The amount of provision for certain debt securities is determined based on the provisioning criteria specified by the SECP. For certain other investments, a provision for impairment is established when there is objective evidence that the Fund will not be able to collect all amounts due according to the original terms. The provision against those amounts is made as per the provisioning policy duly formulated and approved by the Board of Directors of the Management Company in accordance with the requirements of the SECP. Net gains and losses arising from changes in the fair value of available for sale financial assets are recognised in unitholders' fund through other comprehensive income until these are derecognised or impaired. At this time, the cumulative gain or loss previously recognised in unitholders' fund is shown in the income statement. Subsequent to initial recognition investments classified as loans and receivables are carried at amortised cost using the effective interest method. Gains or losses on these instruments are also recognised in the income statement when the investments carried at amortised cost are derecognised or impaired. Subsequent to initial recognition, investments 'at fair value through profit or loss' and investments classified as 'available for sale' are valued as follows: Net gains and losses arising from changes in the fair value and on sale of investments at fair value through profit or loss are taken to the 'income statement'. Net gains and losses arising from changes in the fair value of available for sale financial assets are recognised in unitholders' fund through other comprehensive income until these are derecognised or impaired. At this time, the cumulative gain or loss previously recognised in unitholders' fund is shown in the income statement. Regular purchases and sales of investments are recognised on the trade date - the date on which the Fund commits to purchase or sell the asset. Investments are initially recognised at fair value plus transaction costs except for investments carried at fair value through profit or loss. Investments carried at fair value through profit or loss are initially recognised at fair value and transaction costs are expensed in the income statement.
-
Upload
khangminh22 -
Category
Documents
-
view
2 -
download
0
Transcript of ubl financial planning fund - Pakistan Stock Exchange
10 UBL FINANCIAL PLANNING FUND
Regular way contracts
Initial recognition and measurement
Subsequent measurement
a) Investments 'at fair value through profit or loss'
b) Loans and receivables
Impairment
4.3 Derecognition
Investments are derecognised when the rights to receive cash flows from the investments have expired orhave been transferred and the Fund has transferred substantially all risks and rewards of ownership.
The Fund assesses at each reporting date whether there is objective evidence that the investments or agroup of investments are impaired. The carrying value of the Fund's assets are reviewed at each reportingdate to determine whether there is any indication of impairment. If any such indication exists, therecoverable amount of such assets is estimated. An impairment loss is recognised whenever the carryingvalue of an asset exceeds its recoverable amount.
The amount of provision for certain debt securities is determined based on the provisioning criteriaspecified by the SECP.
For certain other investments, a provision for impairment is established when there is objective evidencethat the Fund will not be able to collect all amounts due according to the original terms. The provisionagainst those amounts is made as per the provisioning policy duly formulated and approved by the Boardof Directors of the Management Company in accordance with the requirements of the SECP.
Net gains and losses arising from changes in the fair value of available for sale financial assets arerecognised in unitholders' fund through other comprehensive income until these are derecognised orimpaired. At this time, the cumulative gain or loss previously recognised in unitholders' fund is shownin the income statement.
Subsequent to initial recognition investments classified as loans and receivables are carried atamortised cost using the effective interest method.
Gains or losses on these instruments are also recognised in the income statement when theinvestments carried at amortised cost are derecognised or impaired.
Subsequent to initial recognition, investments 'at fair value through profit or loss' and investmentsclassified as 'available for sale' are valued as follows:
Net gains and losses arising from changes in the fair value and on sale of investments at fair valuethrough profit or loss are taken to the 'income statement'.
Net gains and losses arising from changes in the fair value of available for sale financial assets arerecognised in unitholders' fund through other comprehensive income until these are derecognised orimpaired. At this time, the cumulative gain or loss previously recognised in unitholders' fund is shownin the income statement.
Regular purchases and sales of investments are recognised on the trade date - the date on which theFund commits to purchase or sell the asset.
Investments are initially recognised at fair value plus transaction costs except for investments carried atfair value through profit or loss. Investments carried at fair value through profit or loss are initiallyrecognised at fair value and transaction costs are expensed in the income statement.

11 UBL FINANCIAL PLANNING FUND
4.4 Financial instruments
4.5 Offsetting of financial assets and liabilities
4.6 Preliminary expenses and floatation costs
4.7 Issuance and redemption of units
4.8 Provisions
4.9 Distribution to unit holders
4.10 Net assets value per unit
All the financial assets and financial liabilities are recognized at the time when the Fund becomes a partyto the contractual provisions of the instrument. Financial assets are derecognized when the contractualrights to receive cash flows related to the asset expire. Financial liabilities are derecognized when theyare extinguished, that is, when the obligation specified in the contract is discharged, cancelled, orexpired. Any gain or loss on derecognition of the financial assets and financial liabilities is taken to theincome statement in the period in which it arises.
A financial liability is derecognised when the obligation under the liability is discharged or cancelled orexpired.
Financial assets and financial liabilities are offset and the net amount is reported in the statement ofassets and liabilities when there is a legally enforceable right to set off the recognised amounts and thereis an intention to settle on a net basis or realise the assets and settle the liabilities simultaneously.
The Fund has recorded all expenses incurred in connection with the incorporation, registration,establishment and authorization of the Fund as preliminary expenses and floatation costs which are to beamortized by the Fund over a period of five years commencing from respective period of each plan,stated in note 1.6, in accordance with the Trust Deed and the NBFC Regulations. Such expenses andcosts will be shared by the allocation plans available at the time of initial offering of the Fund.
Units are allocated at the offer price prevalent on the day on which applications for purchase of units arereceived (however, units are issued on the receipt of cash / realization of cheques). The offer pricerepresents the net asset value per unit at the end of the business day plus allowable sales load, ifapplicable. Issue of units is recorded on acceptance of application for sale.
Units redeemed are recorded at the redemption price, applicable to units for which the Fund receivesredemption applications during business hours of that day. The redemption price represents the netasset value per unit at the end of the business day less duties, taxes, charges on redemption andprovision for transaction costs, if applicable. Redemption of units is recorded on acceptance ofapplication for redemption.
Provisions are recognised when the Fund has a present legal or constructive obligation as a result ofpast events, it is probable that an outflow of resources embodying economic benefits will be required tosettle the obligation and a reliable estimate of the amount of obligation can be made. Provisions areregularly reviewed and adjusted to reflect the current best estimates.
Distribution to unit holders is recognized when they are declared and approved by the Board of Directorsof the Management Company (BOD) in their meeting, or upon declaration and approval by the ChiefExecutive Officer on behalf of the BOD.
The Net Assets Value (NAV) per unit, as disclosed in the statement of assets and liabilities, is calculatedby dividing the net assets of the Fund by the number of units in issue at the period end.

12 UBL FINANCIAL PLANNING FUND
4.11 Taxation
4.12 Revenue recognition
Gains / (losses) arising on sale of investments is accounted for in the year in which it arises.
Mark-up on bank balances and term deposits is recorded on accrual basis.
4.13 Foreign currency transactions
4.14 Cash and cash equivalents
5. ACCOUNTING ESTIMATES AND JUDGEMENTS
6.
Effective date (annual periods beginning
Standard or Interpretation on or after)
IFRS 3 Definition of a Business (Amendments) January 01, 2020
IFRS 3 Business Combinations: Previously held interests in a joint operation January 01, 2019
The following standards, amendments and interpretations with respect to the approved accounting standards asapplicable in Pakistan would be effective from the dates mentioned below against the respective standard orinterpretation:
The preparation of financial statements requires management to make judgments, estimates and assumptionsthat effect the application of policies and reported amounts of assets and liabilities, income and expenses. Theestimates and associated assumptions are based on historical experience and various other factors that arebelieved to be reasonable under the circumstances, the result of which form the basis of making judgmentsabout carrying values of assets and liabilities. The estimates and underlying assumptions are reviewed on anongoing basis.
Judgments made by management in the application of accounting policies that have significant effect on thefinancial statements and estimates with a significant risk of material adjustment are explained in notes 4.1 and4.2.
STANDARDS, INTERPRETATIONS AND AMENDMENTS TO APPROVED ACCOUNTING STANDARDSTHAT ARE NOT YET EFFECTIVE
Cash and cash equivalents comprise balances with banks and short-term highly liquid investments withoriginal maturities of three months or less. Cash and cash equivalents are carried in the statement ofassets and liabilities at nominal values.
The Fund is exempt from taxation under clause 99 of Part I of the 2nd Schedule of the Income TaxOrdinance, 2001, subject to the condition that not less than 90% of its accounting income excludingrealized and unrealized capital gains for the year is distributed amongst the Fund’s unit holders. TheFund is also exempt from the provision of Section 113 (minimum tax) under clause 11A of Part IV of theSecond Schedule to the Income Tax Ordinance, 2001.
Unrealised gain / (loss) on revaluation of investments classified as 'financial assets at fair value throughprofit or loss' is included in the income statement in the year in which it arises.
Unrealised gain / (loss) on revaluation of investments classified as ‘available-for-sale’ is included in unitholders' fund through other comprehensive income in the year in which it arises.
Foreign currency transactions are translated into the functional currency using the exchange ratesprevailing at the date of the transactions. Foreign exchange gains and losses resulting from thesettlement of such transactions and from the translation of monetary assets and liabilities denominated inforeign currencies at the year end exchange rates are recognised in the income statement.

13 UBL FINANCIAL PLANNING FUND
Effective date (annual periods beginning
Standard or Interpretation on or after)
IFRS 4 Insurance Contracts: Applying IFRS 9 Financial Instruments with IFRS 4 Insurance Contracts (Amendments) January 01, 2019
IFRS 9 Prepayment Features with Negative Compensation (Amendments) January 01, 2019
IFRS 10 Consolidated Financial Statements and IAS 28 Investmentin Associates and Joint Ventures - Sale or Contribution of Assetsbetween an Investor and its Associate or Joint Venture (Amendment) Not yet finalised
IFRS 11 Joint Arrangements: Previously held interests in a joint operation January 01, 2019
IFRS 16 Leases January 01, 2019
IAS 1/ IAS 8 Definition of Material (Amendments) January 01, 2020
IAS 12 Income Taxes: Income tax consequences of payments on financial instruments classified as equity January 01, 2019
IAS 19 Plan Amendment, Curtailment or Settlement (Amendments) January 01, 2019
IAS 23 Borrowing Costs - Borrowing costs eligible for capitalisation January 01, 2019
IAS 28 Long-term Interests in Associates and Joint Ventures (Amendments) January 01, 2019
IFRIC 23 Uncertainty over Income Tax Treatments January 01, 2019
IASB Effective date (annual periods
Standards beginning on or after)
IFRS 14 – Regulatory Deferral Accounts January 01, 2016
IFRS 17 - Insurance Contracts January 01, 2021
The IASB has also issued the revised Conceptual Framework for Financial Reporting (the ConceptualFramework) in March 2018 which is effective for annual periods beginning on or after January 01, 2020 forpreparers of financial statements who develop accounting policies based on the Conceptual Framework. Therevised Conceptual Framework is not a standard, and none of the concepts override those in any standard orany requirements in a standard. The purpose of the Conceptual Framework is to assist IASB in developingstandards, to help preparers develop consistent accounting policies if there is no applicable standard in placeand to assist all parties to understand and interpret the standards.
Further, following new standards have been issued by IASB which are yet to be notified by the SECP for thepurpose of applicability in Pakistan.
The above standards and amendments are not expected to have any material impact on the Fund's financialstatements in the period of initial application.
In addition to the above standards and amendments, improvements to various accounting standards have alsobeen issued by the IASB in December 2017. Such improvements are generally effective for accounting periodsbeginning on or after January 01, 2019 respectively. The Fund expects that such improvements to thestandards will not have any impact on the Fund's financial statements in the period of initial application.

14 UBL FINANCIAL PLANNING FUND
UBL Active Principal
Preservation Plan I
UBL Active Principal
Preservation Plan II
UBL Active Principal
Preservation Plan III Total
UBL Active Principal
Preservation Plan I
UBL Active Principal
Preservation Plan II Total
Note
7. BANK BALANCES
Bank accounts - saving 7.1 1,195 521 1,751 3,467 749 80 829
7.1
8. INVESTMENT
Investments by Category
8.1 At fair value through profit or loss
Units of mutual funds 8.1.1 168,177 177,306 190,265 535,748 172,638 207,715 380,353
8.2 At Amortised Cost
Term Deposits Receipts 8.2.1 - 132,531 - 132,531 - 124,210 124,210
168,177 309,837 190,265 535,748 172,638 331,925 504,563
June 30, 2018
These carry mark-up at the rates ranging from 8% to 8.25% (June 30, 2018: 4.5%) per annum and maintained with United Bank Limited (a related party). (June30, 2018: Rs.0.84)
June 30, 2019
--------------------------- (Rupees in '000) --------------------------- --------------- (Rupees in '000) ---------------
15 UBL FINANCIAL PLANNING FUND
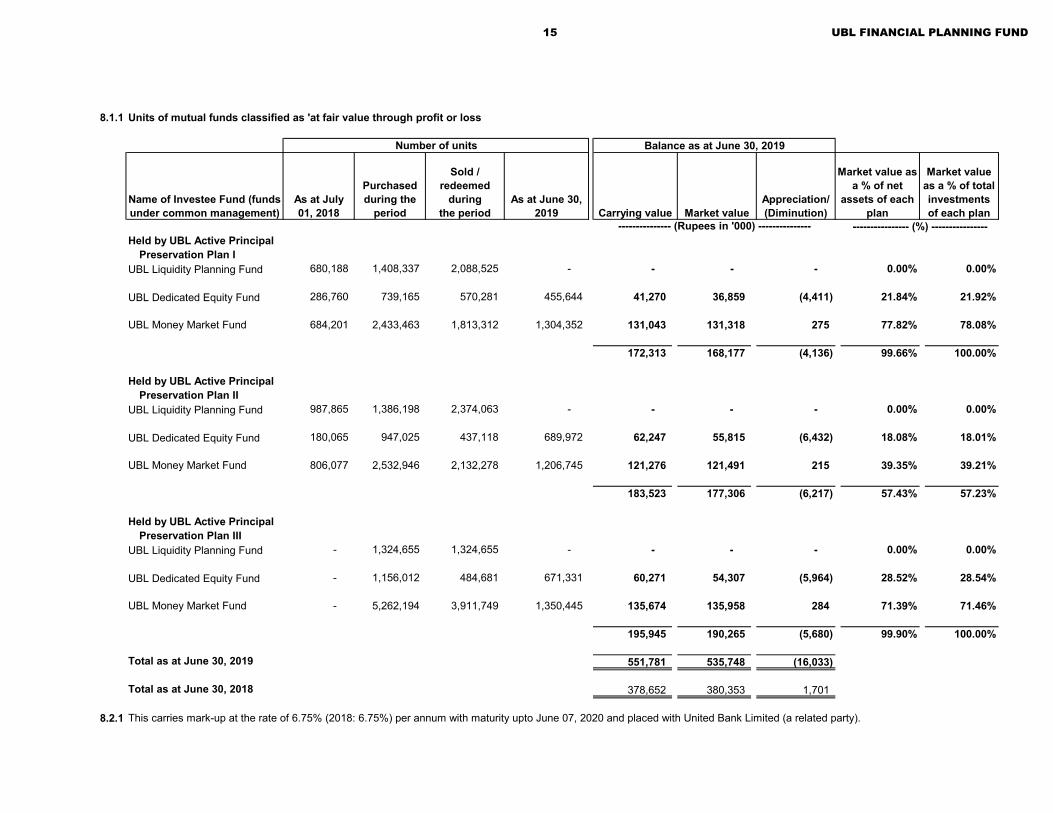
8.1.1 Units of mutual funds classified as 'at fair value through profit or loss
Held by UBL Active Principal Preservation Plan I
UBL Liquidity Planning Fund 680,188 1,408,337 2,088,525 - - - - 0.00% 0.00%
UBL Dedicated Equity Fund 286,760 739,165 570,281 455,644 41,270 36,859 (4,411) 21.84% 21.92%
UBL Money Market Fund 684,201 2,433,463 1,813,312 1,304,352 131,043 131,318 275 77.82% 78.08%
172,313 168,177 (4,136) 99.66% 100.00%
Held by UBL Active Principal Preservation Plan II
UBL Liquidity Planning Fund 987,865 1,386,198 2,374,063 - - - - 0.00% 0.00%
UBL Dedicated Equity Fund 180,065 947,025 437,118 689,972 62,247 55,815 (6,432) 18.08% 18.01%
UBL Money Market Fund 806,077 2,532,946 2,132,278 1,206,745 121,276 121,491 215 39.35% 39.21%
183,523 177,306 (6,217) 57.43% 57.23%
Held by UBL Active Principal Preservation Plan III
UBL Liquidity Planning Fund - 1,324,655 1,324,655 - - - - 0.00% 0.00%
UBL Dedicated Equity Fund - 1,156,012 484,681 671,331 60,271 54,307 (5,964) 28.52% 28.54%
UBL Money Market Fund - 5,262,194 3,911,749 1,350,445 135,674 135,958 284 71.39% 71.46%
195,945 190,265 (5,680) 99.90% 100.00%
Total as at June 30, 2019 551,781 535,748 (16,033)
Total as at June 30, 2018 378,652 380,353 1,701
8.2.1 This carries mark-up at the rate of 6.75% (2018: 6.75%) per annum with maturity upto June 07, 2020 and placed with United Bank Limited (a related party).
Market value as a % of total investments of each plan
Market value as a % of net
assets of each plan
---------------- (%) ----------------
Balance as at June 30, 2019
Name of Investee Fund (funds under common management)
--------------- (Rupees in '000) ---------------
Number of units
Sold / redeemed
during the period
Appreciation/ (Diminution)
As at June 30, 2019 Carrying value Market value
As at July 01, 2018
Purchased during the
period

16 UBL FINANCIAL PLANNING FUND
UBL Active Principal
Preservation Plan I
UBL Active Principal
Preservation Plan II
UBL Active Principal
Preservation Plan III Total
UBL Active Principal
Preservation Plan I
UBL Active Principal
Preservation Plan II Total
Note9. MARK UP AND OTHER RECIEVABLES
Mark-up receivable on bank accounts 9.1 46 23 21 90 87 - 87 Balance held in collection account - 165 - 165 - 165 165
46 188 21 255 87 165 252
9.1 This represents receivable on bank balance maintained with United Bank Limited (a related party).
10. ADVANCE TAX
UBL Active Principal
Preservation Plan I
UBL Active Principal
Preservation Plan II
UBL Active Principal
Preservation Plan III Total
UBL Active Principal
Preservation Plan I
UBL Active Principal
Preservation Plan II Total
Note11. PRELIMINARY EXPENSES
AND FLOATATION COSTS
Preliminary expenses and floatation costs 11.1 425 425 - 850 - - - Amortization during the period (258) (221) - (479) - - -
167 203 - 370 - - -
11.1
June 30, 2019 June 30, 2018
The income of the Fund is exempt from tax under clause 99 of Part I of the Second Schedule of the Income Tax Ordinance, 2001 (ITO 2001). Further, the Fund is exempt under clause 47(B)of Part IV of Second Schedule of ITO 2001 from withholding of tax under section 150 and 151 of ITO 2001. The Federal Board of Revenue through a circular “C. No. 1 (43) DG (WHT)/ 2008-Vol.II- 66417-R” dated May 12, 2015, made it mandatory to obtain exemption certificates under section 159 (1) of the ITO 2001 from Commissioner Inland Revenue (CIR). Prior to receivingtax exemption certificate(s) from CIR various withholding agents have deducted advance tax under section 150 and 151 of ITO 2001. The management is confident that the same shall berefunded after filing Income Tax Return for Tax Year 2019.
-------------------------------------------------------------- (Rupees in '000) --------------------------------------------------------------
The Fund has recorded all expenses incurred in connection with the incorporation, registration, establishment and authorization of the Fund as preliminary expenses and floatationcosts which are to be amortized by the Fund over a period of two years commencing from respective period of each plan in accordance with the Trust Deed and the NBFC Regulations.
June 30, 2019 June 30, 2018
-------------------------------------------------------------- (Rupees in '000) --------------------------------------------------------------

17 UBL FINANCIAL PLANNING FUND
UBL Active Principal
Preservation Plan I
UBL Active Principal
Preservation Plan II
UBL Active Principal
Preservation Plan III Total
UBL Active Principal
Preservation Plan I
UBL Active Principal
Preservation Plan II Total
12. PAYABLE TO THE MANAGEMENT COMPANY Note
Remuneration payable 12.1 - 102 - 102 - 81 81 Sales tax on remuneration payable 12.2 - 13 - 13 - 11 11 Sales load payable - - - - 113 2,902 3,015 Allocated expenses payable 12.3 14 26 16 56 29 28 57 Other payables 449 430 5 884 24 5 29
463 570 21 1,054 166 3,027 3,193
12.1
12.2 Sales tax at the rate of 13% on gross value of management fee is applied under the provisions of Sindh Sales Tax on Services Act, 2011.
12.3
UBL Active Principal
Preservation Plan I
UBL Active Principal
Preservation Plan II
UBL Active Principal
Preservation Plan III Total
UBL Active Principal
Preservation Plan I
UBL Active Principal
Preservation Plan II Total
13. PAYABLE TO THE TRUSTEE Note
Remuneration payable 13.1 14 26 16 56 13 25 38 Sales tax on remuneration payable 13.2 2 3 2 7 2 3 5
16 29 18 63 15 28 43
13.1
Net assets Tariff per annum
Up to Rs.1,000 million 0.1% of net assets of each PlanOn an amount exceeding Rs.1,000 million Rs.1.0 million plus 0.075% p.a. of the net assets of each plan on an amount exceeding Rs.1,000 millionOn an amount exceeding Rs.6,000 million Rs.5.9 million plus 0.06% p.a. of net assets of each plan, on an amount exceeding Rs.6,000 million
13.2 Sales tax at the rate of 13% on the remuneration of the Trustee is applied under the provisions of Sindh Sales Tax on Services Act, 2011.
-------------------------------------------------------------- (Rupees in '000) --------------------------------------------------------------
As per the Offering Document of the Plans, no management fee shall be charged if the investment is made in the underlying Scheme of the Management Company. However, 1%management fee shall be charged if the investment is made in saving accounts and term deposits. Accordingly, the Management Company has charged 1% per annum of the termdeposit receipt placed only in case of UBL Active Principal Preservation Plan II. No management fee is being charged in UBL Active Principal Preservation Plan I & UBL ActivePrincipal Preservation Plan III as no investment is made in term deposits by both plans.
June 30, 2019 June 30, 2018
As per regulation 60(3)(s) of amended NBFC Regulations dated November 25, 2015, fee and expenses pertaining to registrar services, accounting, operation and valuation servicesrelated to a Collective Investment Scheme (CIS) are chargeable to the scheme, maximum up to 0.1% of the average annual net assets or the actual cost, whichever is lower.Accordingly, the Management Company has charged 0.1% of the average annual net assets with effect, being lower.
The Trustee is entitled to a monthly remuneration for services rendered to the Fund under the provisions of the Trust Deed and the Offering Document as per tariff specified therein,based on the daily net asset value of the Fund. The remuneration is paid to the Trustee on a monthly basis in arrears. The tariff structure is applicable to the Fund in respect of thetrustee fee for the year ended June 30, 2019 is as follows:
June 30, 2019 June 30, 2018
-------------------------------------------------------------- (Rupees in '000) --------------------------------------------------------------
18 UBL FINANCIAL PLANNING FUND
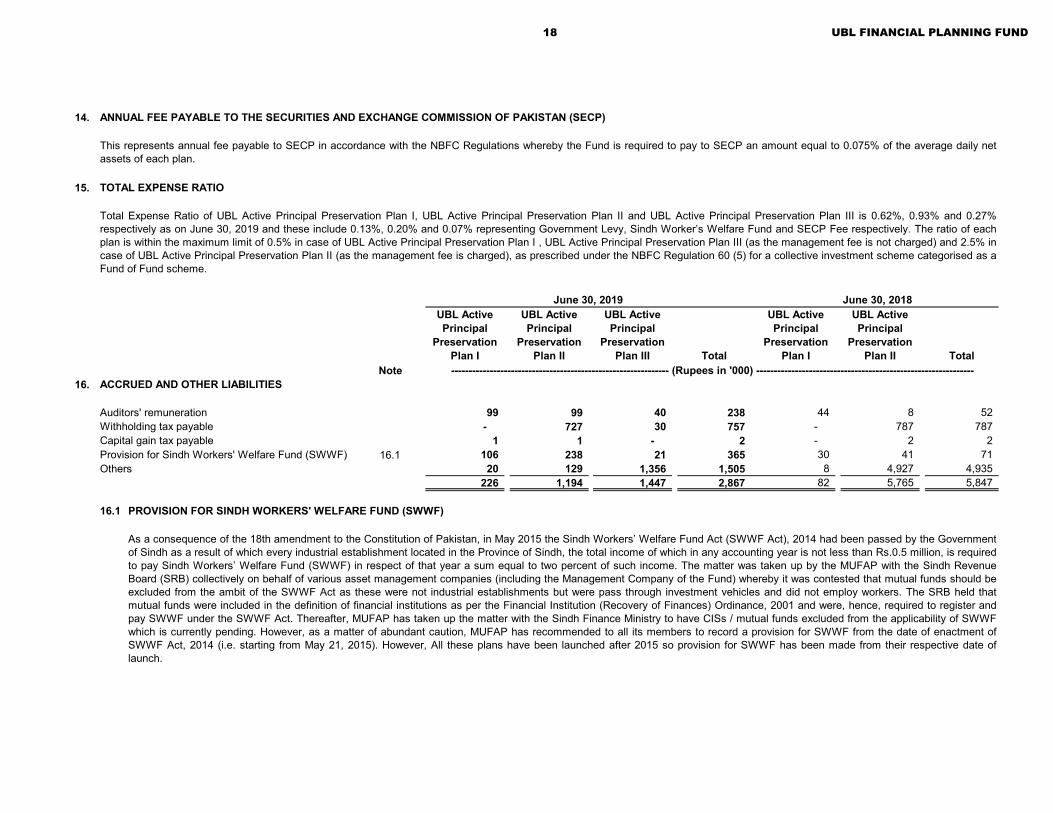
14. ANNUAL FEE PAYABLE TO THE SECURITIES AND EXCHANGE COMMISSION OF PAKISTAN (SECP)
15. TOTAL EXPENSE RATIO
UBL Active Principal
Preservation Plan I
UBL Active Principal
Preservation Plan II
UBL Active Principal
Preservation Plan III Total
UBL Active Principal
Preservation Plan I
UBL Active Principal
Preservation Plan II Total
Note16. ACCRUED AND OTHER LIABILITIES
Auditors' remuneration 99 99 40 238 44 8 52 Withholding tax payable - 727 30 757 - 787 787 Capital gain tax payable 1 1 - 2 - 2 2 Provision for Sindh Workers' Welfare Fund (SWWF) 16.1 106 238 21 365 30 41 71 Others 20 129 1,356 1,505 8 4,927 4,935
226 1,194 1,447 2,867 82 5,765 5,847
16.1 PROVISION FOR SINDH WORKERS' WELFARE FUND (SWWF)
June 30, 2018
-------------------------------------------------------------- (Rupees in '000) --------------------------------------------------------------
As a consequence of the 18th amendment to the Constitution of Pakistan, in May 2015 the Sindh Workers’ Welfare Fund Act (SWWF Act), 2014 had been passed by the Governmentof Sindh as a result of which every industrial establishment located in the Province of Sindh, the total income of which in any accounting year is not less than Rs.0.5 million, is requiredto pay Sindh Workers’ Welfare Fund (SWWF) in respect of that year a sum equal to two percent of such income. The matter was taken up by the MUFAP with the Sindh RevenueBoard (SRB) collectively on behalf of various asset management companies (including the Management Company of the Fund) whereby it was contested that mutual funds should beexcluded from the ambit of the SWWF Act as these were not industrial establishments but were pass through investment vehicles and did not employ workers. The SRB held thatmutual funds were included in the definition of financial institutions as per the Financial Institution (Recovery of Finances) Ordinance, 2001 and were, hence, required to register andpay SWWF under the SWWF Act. Thereafter, MUFAP has taken up the matter with the Sindh Finance Ministry to have CISs / mutual funds excluded from the applicability of SWWFwhich is currently pending. However, as a matter of abundant caution, MUFAP has recommended to all its members to record a provision for SWWF from the date of enactment ofSWWF Act, 2014 (i.e. starting from May 21, 2015). However, All these plans have been launched after 2015 so provision for SWWF has been made from their respective date oflaunch.
This represents annual fee payable to SECP in accordance with the NBFC Regulations whereby the Fund is required to pay to SECP an amount equal to 0.075% of the average daily netassets of each plan.
Total Expense Ratio of UBL Active Principal Preservation Plan I, UBL Active Principal Preservation Plan II and UBL Active Principal Preservation Plan III is 0.62%, 0.93% and 0.27%respectively as on June 30, 2019 and these include 0.13%, 0.20% and 0.07% representing Government Levy, Sindh Worker’s Welfare Fund and SECP Fee respectively. The ratio of eachplan is within the maximum limit of 0.5% in case of UBL Active Principal Preservation Plan I , UBL Active Principal Preservation Plan III (as the management fee is not charged) and 2.5% incase of UBL Active Principal Preservation Plan II (as the management fee is charged), as prescribed under the NBFC Regulation 60 (5) for a collective investment scheme categorised as aFund of Fund scheme.
June 30, 2019
19 UBL FINANCIAL PLANNING FUND
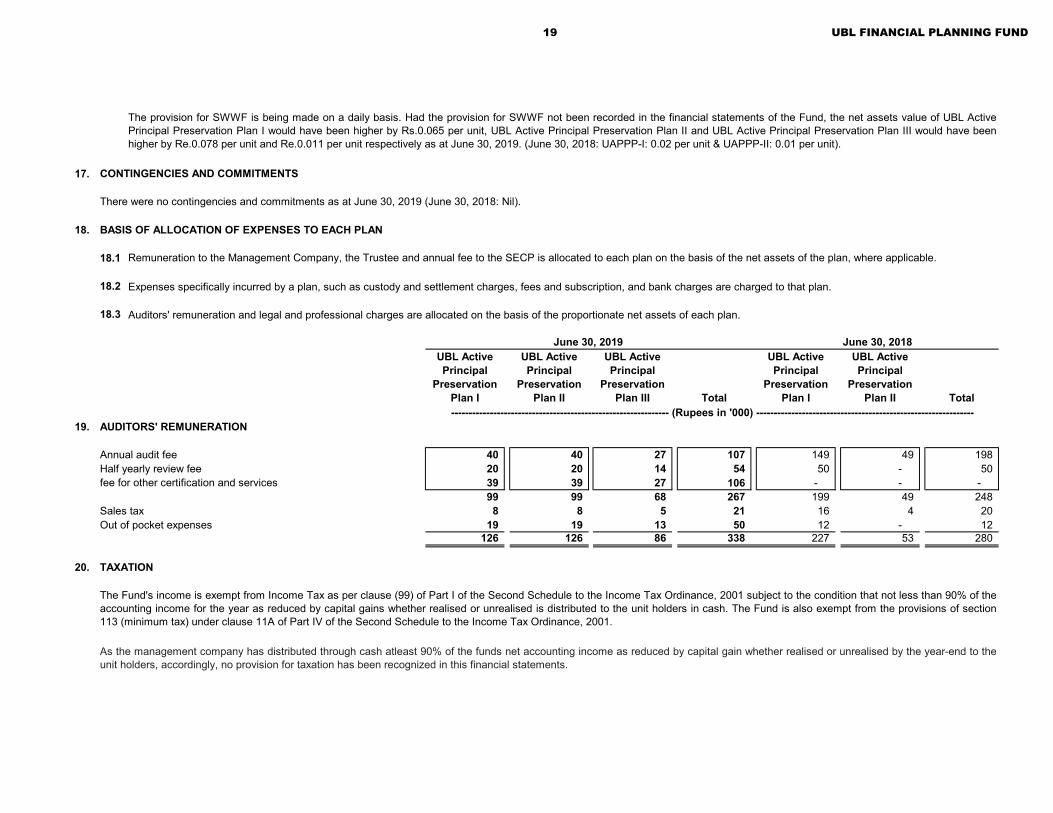
17. CONTINGENCIES AND COMMITMENTS
There were no contingencies and commitments as at June 30, 2019 (June 30, 2018: Nil).
18. BASIS OF ALLOCATION OF EXPENSES TO EACH PLAN
18.1 Remuneration to the Management Company, the Trustee and annual fee to the SECP is allocated to each plan on the basis of the net assets of the plan, where applicable.
18.2 Expenses specifically incurred by a plan, such as custody and settlement charges, fees and subscription, and bank charges are charged to that plan.
18.3 Auditors' remuneration and legal and professional charges are allocated on the basis of the proportionate net assets of each plan.
UBL Active Principal
Preservation Plan I
UBL Active Principal
Preservation Plan II
UBL Active Principal
Preservation Plan III Total
UBL Active Principal
Preservation Plan I
UBL Active Principal
Preservation Plan II Total
19. AUDITORS' REMUNERATION
Annual audit fee 40 40 27 107 149 49 198 Half yearly review fee 20 20 14 54 50 - 50 fee for other certification and services 39 39 27 106 - - -
99 99 68 267 199 49 248 Sales tax 8 8 5 21 16 4 20 Out of pocket expenses 19 19 13 50 12 - 12
126 126 86 338 227 53 280
20. TAXATION
June 30, 2019 June 30, 2018
-------------------------------------------------------------- (Rupees in '000) --------------------------------------------------------------
The Fund's income is exempt from Income Tax as per clause (99) of Part I of the Second Schedule to the Income Tax Ordinance, 2001 subject to the condition that not less than 90% of theaccounting income for the year as reduced by capital gains whether realised or unrealised is distributed to the unit holders in cash. The Fund is also exempt from the provisions of section113 (minimum tax) under clause 11A of Part IV of the Second Schedule to the Income Tax Ordinance, 2001.
As the management company has distributed through cash atleast 90% of the funds net accounting income as reduced by capital gain whether realised or unrealised by the year-end to theunit holders, accordingly, no provision for taxation has been recognized in this financial statements.
The provision for SWWF is being made on a daily basis. Had the provision for SWWF not been recorded in the financial statements of the Fund, the net assets value of UBL ActivePrincipal Preservation Plan I would have been higher by Rs.0.065 per unit, UBL Active Principal Preservation Plan II and UBL Active Principal Preservation Plan III would have beenhigher by Re.0.078 per unit and Re.0.011 per unit respectively as at June 30, 2019. (June 30, 2018: UAPPP-I: 0.02 per unit & UAPPP-II: 0.01 per unit).

20 UBL FINANCIAL PLANNING FUND
21. TRANSACTIONS WITH CONNECTED PERSONS / RELATED PARTIES
UBL Active Principal Preservation Plan I
Transactions during the periodMark-up on bank accounts - 164 - - - - Bank and other charges - 7 - - - - Units issued - - - - - - Bonus units issued - - - - - - Units redeemed - - - - - - Remuneration (Inclusive of SST) - - 195 - - - Allocated expenses 172 - - - - - Purchase of investment - - - 449,009 - - Sale of investment - - - 457,655 - - Dividend received - - - 74 - -
Balances heldUnits held (units in '000) - - - - - 535 Units held (Rupees in '000) - - - - - 55,159 Term Deposit Receipt (TDR) - - - - - - Bank balances - 1,195 - - - - Remuneration payable - - 16 - - - Allocated expenses payable 14 - - - - - Other payable 449 - - - - - Units of mutual funds held - - - 168,177 - - Sales load payable - - - - - - Mark-up receivable - 46 - - - -
As at June 30, 2019
Connected persons / related parties comprise of United Bank Limited (Holding Company of the Management Company), UBLFund Managers Limited (Management Company), Al-Ameen Financial Services (Private) Limited, being entity under thecommon management or directorship, Central Depository Company of Pakistan Limited as trustee of the Fund, the directorskey management personnel and other associated undertakings and connected persons. Connected persons also include anyperson beneficially owing directly or indirectly 10% or more of the units in the issue / net assets of the Fund.
Transactions with connected persons essentially comprise sale and redemption of units, fee on account of managing theaffairs of the Fund, other charges, sale and purchase of investments and distribution payments to connected persons. Thetransactions with connected persons are in the normal course of business, at contracted rates and at terms determined inaccordance with market rates.
Remuneration payable to the Management Company and the Trustee is determined in accordance with the provision of theNBFC Rules, NBFC Regulations and constitutive documents of the Fund respectively.
Details of transactions and balances at period end with related parties / connected persons, other than those which havebeen disclosed elsewhere in these financial statements, are as follows:
Management company
Associated companies Trustee
Funds under common
management
Directors and key
executives
Other connected persons /
related parties
----------------------------------------- (Rupees in '000) -----------------------------------------
For the period ended June 30, 2019

21 UBL FINANCIAL PLANNING FUND
UBL Active Principal Preservation Plan II
Transactions during the periodIncome from term
deposit receipt (TDR) - 8321 - - - - Mark-up on bank accounts - 68 - - - - Bank and other charges - 7 - - - - Units issued - - - - - 1,243 Bonus units issued - - - - - - Units redeemed - - - - - - Remuneration (Inclusive of SST) 1,397 - 362 - - - Allocated expenses 320 - - - - - Purchase of investment - - - 490,316 - - Sale of investment - - - 523,368 - - Dividend paid - - - - - 1,421 Dividend received - - - 711 - -
Balances heldUnits held (units in '000) - - - - - 635 Units held (Rupees in '000) - - - - - 64,435 Term Deposit Receipt (TDR) - 132,531 - - - - Bank balances - 521 - - - - Remuneration payable 115 - 29 - - - Allocated expenses payable 26 - - - - - Other payable 430 - - - - - Units of mutual funds held - - - 177,306 - - Sales Load payable - - - - - - Mark-up receivable - 23 - - - - Mark-up receivable on TDR - 8,868 - - - -
UBL Active Principal Plan III
Transactions during the periodMark-up on bank accounts - 73 - - - - Bank and other charges - 6 - - - - Units issued - - - - - 40,105 Bonus units issued - - - - - - Units redeemed - - - - - - Remuneration (inclusive of SST) - - 157 - - - Allocated expenses 139 - - - - - Purchase of investment - - - 777,013 - - Sale of investment - - - 587,911 - - Dividend paid - - - - - 44 Dividend received - - - - - -
----------------------------------------- (Rupees in '000) -----------------------------------------
Funds under common
management
Directors and key
executives
Other connected persons /
related parties
----------------------------------------- (Rupees in '000) -----------------------------------------
Management company
Associated companies Trustee
Funds under common
management
Directors and key
executives
Other connected persons /
related parties
For the period ended June 30, 2019
As at June 30, 2019
Management company
Associated companies Trustee
For the period ended June 30, 2019

22 UBL FINANCIAL PLANNING FUND
Balances heldUnits held (units in '000) - - - - - 391 Units held (Rupees in '000) - - - - - 39,226 Term Deposit Receipt (TDR) - - - - - - Bank balances - 1,751 - - - - Remuneration payable - - 18 - - - Allocated expenses payable 16 - - - - - Other payable 5 - - - - - Units of mutual funds held - - - 190,265 - - Sales load payable - 1,300 - - - - Mark-up receivable - 21 - - - - Mark-up receivable on TDR - - - - - -
UBL Active Principal Preservation Plan I
Transactions during the periodMark-up on bank accounts - 88 - - - - Bank and other charges - 6 - - - 22 Units issued - - - - - 55,319 Remuneration (Inclusive of SST) - - 67 - - - Allocated expenses 62 - - - - - Purchase of investment - - - 639,801 - - Sale of investment - - - 468,842 - -
Balances held Units held (units in '000) - - - - - 535 Units held (Rupees in '000) - - - - - 53,971 Bank balances - 749 - - - - Remuneration payable - - 15 - - - Sales load payable 113 7 - - - - Allocated expenses payable 29 - - - - - Other payable 24 - - - - - Mark-up receivable - 88 - - - - Units of mutual funds held - - - 172,638 - -
----------------------------------------- (Rupees in '000) -----------------------------------------
Management company
Associated companies Trustee
Funds under common
management
Directors and key
executives
Other connected persons /
related parties
----------------------------------------- (Rupees in '000) -----------------------------------------
Management company
Associated companies Trustee
Funds under common
management
Directors and key
executives
As at June 30, 2019
For the period from February 28, 2018 to June 30, 2018
As at June 30, 2018
Other connected persons /
related parties

23 UBL FINANCIAL PLANNING FUND
UBL Active Principal Preservation Plan II
Transactions during the periodIncome from term deposit
receipt (TDR) - 547 - - - - Bank charges - 2 - - - - Units issued - - - - - 64,387 Units redeemed - - - - - - Remuneration (inclusive of SST) 92 - 29 - - - Allocated expenses 28 - - - - - Purchase of investment - - - 935,673 - - Sale of investment - - - 730,311 - -
Balances held Units held (units in '000) - - - - - 623 Units held (Rupees in '000) - - - - - 62,694 Bank balances - 80 - - - - Term deposit receipt (TDR) - 124,210 - - - - Remuneration payable 81 - 28 - - - Sales load payable 2,902 4,927 - - - - Allocated expenses payable 28 - - - - - Other payable 5 - - - - - Units of mutual funds held - - - 207,715 - - Mark-up receivable on term
deposit receipt (TDR) - 547 - - - -
22. FINANCIAL RISK MANAGEMENT
22.1
22.2 Market risk
(i) Interest rate risk
a) Sensitivity analysis of variable rate instruments
b) Sensitivity analysis of fixed rate instruments
----------------------------------------- (Rupees in '000) -----------------------------------------
For the period from May 31, 2018 to June 30, 2018
As at June 30, 2018
Management company
Associated companies Trustee
Funds under common
management
Directors and key
executives
Other connected persons /
related parties
Yield / interest rate sensitivity position for on balance sheet financial instruments is based on the earlier ofcontractual repricing or maturity date. The composition of the fund investment may change over time.Accordingly, the sensitivity analysis prepared as at June 30, 2019 is not necessarily indicative of the impacton the Fund's net assets of future movements in interest rates.
The Fund’s objective in managing risks is the creation and protection of Unit holders’ value. Risk is inherent in theFund’s activities, but it is managed through monitoring and controlling activities which are primarily set up to beperformed based on limits established by the Management Company, Fund's constitutive documents and theregulations and directives of the SECP. These limits reflect the business strategy and market environment of theFund as well as the level of the risk that Fund is willing to accept. The Board of Directors of the ManagementCompany supervises the overall risk management approach within the Fund. The Fund is exposed to market risk,credit risk and liquidity risk arising from the financial instruments it holds.
Market risk is the risk that the fair value or future cash flows of financial instruments will fluctuate due to changes inmarket variables such as profit rates, foreign exchange rates and equity securities prices.
Interest rate risk is the risk that the fair value or future cashflows of a financial instrument will fluctuate because ofchanges in market interest rates.
Presently, the Fund does not hold any variable profit based investment except balances with banks in depositaccount exposing the Fund to cash flow profit rate risk. The Fund is also exposed to mark-up rate risk onbank deposits. In case of 100 basis points increase / decrease in KIBOR at year end, the net assetsattributable to unit holders of the Fund and net income for the year would be higher / lower by Rs. 0.034(2018: Rs.0.082) million.
As at June 30, 2019, the Fund holds term deposit receipt (TDR) which is classified as 'loans and receivables',exposing the Fund to fair value interest rate risk. In case of 100 basis points increase / decrease in interestrates at period end, the net income for the period and net assets would be higher / lower by Rs.1.24 million(2018: Rs.1.24 million).

24 UBL FINANCIAL PLANNING FUND
On-balance sheet Upto three
months
More than three months and up to
one yearMore than one year
Upto three months
More than three months and up to
one yearMore than one year
Upto three months
More than three months and up
to one yearMore than one year
financial instruments
Financial assetsBank balances 8.00-8.25 1,195 - - - 521 - - 165 1,751 - - - 3,632 Investments 6.75 - - - 168,177 - - 132,531 177,306 - - - 190,265 668,279 Mark-up and other receivables - - - 46 - - - 188 - - - 21 255
1,195 - - 168,223 521 - 132,531 177,659 1,751 - - 190,286 672,167
Financial liabilitiesPayable to the Management Company - - - 463 - - - 570 - - - 21 1,054 Payable to the Trustee - - - 14 - - - 26 - - - 16 56 Accrued and other liabilities - - - 111 - - - 220 - - - 1,391 1,722
- - - 588 - - - 816 - - - 1,428 2,832
On-balance sheet gap 1,195 - - 167,635 521 - 132,531 176,843 1,751 - - 188,859 669,334
There is no off-balance sheet financial instrument that exist as on June 30, 2019.
Upto three months
More than three months and up to
one yearMore than one year
Upto three months
More than three months and up
to one yearMore than one year
On-balance sheet financial instruments
Financial assetsBank balances 4.00-7.50 749 - - - 80 - - - 749 Investments 6.75 - - - 172,638 - - 124,210 207,715 172,638 Mark-up and other receivables - - - 87 - - - 713 87
749 - - 172,725 80 - 123,662 208,428 173,474
Financial liabilitiesPayable to the Management Company - - - 166 - - - 3,016 166 Payable to the Trustee - - - 13 - - - 25 13 Accrued and other liabilities - - - 49 - - - 4,934 49
- - - 228 - - - 7,975 228
On-balance sheet gap 749 - - 172,497 80 - 123,662 200,453 173,246
There is no off-balance sheet financial instrument that exist as on June 30, 2018.
22.3
22.4
UBL Active Principal Preservation Plan I
UBL Active Principal Preservation Plan II
UBL Active Principal Preservation Plan III
Price risk
Foreign currency risk
Foreign currency risk is the risk that the fair value or future cash flows of a financial instrument will fluctuate because of changes in foreign exchange rates. The Fund, at present, is not exposed to foreign currency risk as all transactions were carried out in Pak Rupee.
Total
The plan is exposed to equity price risk because of units of mutual funds held and classified on the balance sheet as 'at fair value through profit or loss - held-for-trading'. In case of 5% increase / decrease in net assets value (NAV) of the said mutual funds on June 30, 2019,the net assets relating to the plan and total net assets of the Fund would increase / decrease by Rs.9.51 million (June 30, 2018: Rs.Nil).
June 30, 2018
-------------------------------------------------------------------------------------------- (Rupees in '000) --------------------------------------------------------------------------------------------
The analysis is based on the assumption that the net assets value increased / decreased by 5% with all other variables held constant and all the plans' equity instruments moved according to the historical correlation with the net assets value of mutual funds. This representsmanagement's best estimate of a reasonable possible shift in the net assets value of the mutual funds. The composition of the each plan's investment portfolio and the correlation thereof to the net assets value of the mutual funds, is expected to change over time.Accordingly, the sensitivity analysis prepared as of June 30, 2019 is not necessarily indicative of the effect on the each plan's net assets of future movements in net assets value of the mutual funds.
Total ------------------------------------------------------------------------------------------------------------------------------ (Rupees in '000) ------------------------------------------------------------------------------------------------------------------------------
Price risk is the risk that the value of the financial instrument may fluctuate as a result of changes in market prices (other than those arising from currency risk or interest rate risk) whether those changes are caused by factors specific to the individual financial instrument or itsissuer, or factors affecting all similar financial instrument traded in the market.
The plan is exposed to equity price risk because of units of mutual funds held and classified on the balance sheet as 'at fair value through profit or loss - held-for-trading'. In case of 5% increase / decrease in net assets value (NAV) of the said mutual funds on June 30, 2019,the net assets relating to the plan and total net assets of the Fund would increase / decrease by Rs.8.41 million (June 30, 2018: Rs.8.63 million).
The plan is exposed to equity price risk because of units of mutual funds held and classified on the balance sheet as 'at fair value through profit or loss - held-for-trading'. In case of 5% increase / decrease in net assets value (NAV) of the said mutual funds on June 30, 2019,the net assets relating to the plan and total net assets of the Fund would increase / decrease by Rs.8.87 million (June 30, 2018: Rs.10.39 million).
Interest rate
UBL Active Principal Preservation Plan I UBL Active Principal Preservation Plan II UBL Active Principal Preservation Plan IIIExposed to yield / interest rate risk Not exposed
to yield / interest rate
risk
Exposed to yield / interest rate risk Not exposed to yield /
interest rate risk
Exposed to yield / interest rate risk
Interest rate
June 30, 2019
Not exposed to yield /
interest rate risk
Exposed to yield / interest rate riskUBL Active Principal Preservation Plan I
Not exposed to yield / interest
rate risk
Not exposed to yield / interest
rate risk
UBL Active Principal Preservation Plan IIExposed to yield / interest rate risk

25 UBL FINANCIAL PLANNING FUND
22.5 Credit risk
Bank balances 1,195 521 1,751 3,467 Term deposit receipts - 132,531 - 132,531 Investments 168,177 177,306 190,265 535,748 Mark-up and other receivables 46 188 21 255
169,418 310,546 192,037 672,001 All deposits with banks are highly rated and risk of default is considered minimal.
Bank balances 749 80 829 Term deposit receipts - 123,662 123,662 Investments 172,638 207,715 380,353 Mark-up and other receivables 87 713 800
173,474 332,170 505,644 All deposits with banks are highly rated and risk of default is considered minimal.
The analysis below summarises the credit rating quality of the Fund's financial assets as at June 30, 2019:Ratingagency ----- (%) -----
Bank balances by rating categoryAAA 100%
The analysis below summarises the credit rating quality of the Fund's financial assets as at June 30, 2018:
AAA PACRA 93.16%AA JCR-VIS 6.84%Total 100%
UBL Active Principal
Preservation Plan III
Concentration of credit risk exists when changes in economic or industry factors affect the group of counterparties whose aggregate credit exposure is significant in relation to the Fund’s total creditexposure. The Fund’s portfolio of financial assets is broadly diversified and transactions are entered into with diverse credit worthy counterparties thereby mitigating any significant concentration ofcredit risk.
-------------------------- (Rupees in '000) --------------------------
----------------- (Rupees in '000) -----------------
Credit risk is the risk that the counterparty to a financial instrument will cause a financial loss to the Fund by failing to discharge its obligation. The Fund’s policy is to enter into financial contracts withreputable counter parties in accordance with the internal guidelines, offering document and regulatory requirements. The table below analyses the Fund's maximum exposure to credit risk:
UBL Active Principal
Preservation Plan I
UBL Active Principal
Preservation Plan II Total
June 30, 2019
June 30, 2018UBL Active Principal
Preservation Plan I
UBL Active Principal
Preservation Plan II Total

26 UBL FINANCIAL PLANNING FUND
22.6 Liquidity risk
Financial liabilitiesPayable to the Management
Company 463 - - 570 - - 21 - - 1,054 Payable to the Trustee 14 - - 26 - - 16 - - 56 Accrued and other liabilities 20 91 - 140 80 - 1,356 35 - 1,722
497 91 - 736 80 - 1,393 35 - 2,832
Financial liabilitiesPayable to the Management Company 166 - - 3,016 - - 3,182 Payable to the Trustee 13 - - 25 - - 38 Accrued and other liabilities 8 41 - 4,927 7 - 4,983
187 41 - 7,968 7 - 8,203
22.7 Unit holders' fund risk management
Liquidity risk is defined as the risk that the Fund will encounter difficulty in meeting obligations associated with financial liabilities. Liquidity risk arises because of the possibility that the Fund could berequired to pay its liabilities earlier than expected. The Fund is exposed to cash redemptions of its redeemable units on a regular basis. Units are redeemable at the unit holder’s option based on theFund’s net asset value per unit at the time of redemption calculated in accordance with the Fund’s constitutive documents.
In order to manage the Fund’s overall liquidity, the Fund has the ability to withhold daily redemption requests in excess of ten percent of the units in issue and such request would be treated asredemption requests qualifying for being processed on the next business day. Such procedure would continue until the outstanding redemption requests come down to a level below ten percent of theunits then in issue. The Fund did not withhold any significant redemption during the period. Further, the Fund also has the ability to suspend redemption of units with approval of Board of Directors ofthe Management Company in extraordinary circumstances.
The table below analyses the all plans' financial liabilities into relevant maturity groupings based on the remaining period at the end of the reporting period to the contractual maturity date. The amountsin the table are the contractual undiscounted cash flows.
The Fund's capital is represented by redeemable units. The Fund is required by the NBFC Regulations, to maintain a minimum fund size of Rs.100 million, to be maintained all the time during the life ofthe scheme. The units issued by the Fund provides an investor with the right to require redemption for cash at a value proportionate to the unit holder's share in the Fund's net assets at the redemptiondate.
The Fund's objective in managing the unit holders' fund is to ensure a stable base to maximise returns to all investors and to manage liquidity risk arising from redemption. In accordance with the riskmanagement policies, the Fund endeavours to invest the subscriptions received in appropriate investments while maintaining sufficient liquidity to meet redemption, such liquidity being augmented bydisposal of investments.
Total----------------------------------------------------------------------------------- (Rupees in '000) -----------------------------------------------------------------------------------
UBL Active Principal Preservation Plan III
Upto one month
UBL Active Principal Preservation Plan I UBL Active Principal Preservation Plan II
More than three months and upto one
year
More than one month upto
three months
More than three months and upto one
year
----------------------------------------------------------- (Rupees in '000) -----------------------------------------------------------
June 30, 2019
June 30, 2018
Total
UBL Active Principal Preservation Plan I
More than three months and upto one
yearUpto one
month
More than one month upto
three months
More than three months and upto one
yearUpto one
month
More than one month upto
three months
UBL Active Principal Preservation Plan II
Upto one month
More than one month upto
three months
More than three months and upto one
yearUpto one
month
More than one month upto
three months

27 UBL FINANCIAL PLANNING FUND
22.8 Operational risk
-
- requirements for the reconciliation and monitoring of transactions;
- compliance with regulatory and other legal requirements;
- documentation of controls and procedures;
-
- ethical and business standards; and
- risk mitigation, including insurance where this is effective.
23. Fair value of financial instruments
Level 1:
Level 2:
Level 3:
Financial assets which are tradable in an open market are revalued at the market prices prevailing on thestatement of assets and liabilities date. The estimated fair value of all other financial assets and financialliabilities is considered not significantly different from book value.
Fair value measurements using inputs other than quoted prices included within Level 1 that areobservable for the asset or liability, either directly (i.e. as prices) or indirectly (i.e. derived fromprices).
Fair value measurements using inputs for the asset or liability that are not based on observablemarket data (i.e. unobservable inputs).
Operational risk is the risk of direct or indirect loss arising from a wide variety of causes associated withthe processes, technology and infrastructure supporting the Fund’s operations either internally withinthe Fund or externally at the Fund’s service providers, and from external factors other than credit,market and liquidity risk such as those arising from legal and regulatory requirements and generallyaccepted standards of investment management behaviour. Operational risk arise from all of the Fund’sactivities.
The Fund’s objective is to manage operational risk so as to balance limiting of financial losses anddamage to its reputation with achieving its investment objective of generating returns for investors.
The primary responsibility for the development and implementation of controls over operational riskrests with the board of directors. This responsibility encompasses the controls in the following areas:
IFRS 13 - 'Fair Value Measurement' establishes a single source of guidance under IFRS for all fair valuemeasurements and disclosures about fair value measurement where such measurements are required aspermitted by other IFRSs. It defines fair value as the price that would be received to sell an asset or paid totransfer a liability in an orderly transaction between market participants at the measurement date (i.e. an exitprice).
requirements for appropriate segregation of duties between various functions, roles andresponsibilities;
requirements for the periodic assessment of operational risk faced, and the adequacy of controlsand procedures to address the risk identified;
Fair value measurements using quoted prices (unadjusted) in active markets for identical assets orliabilities.

28 UBL FINANCIAL PLANNING FUND
Level 1 Level 2 Level 3 Total
As at June 30, 2019
Financial assets measured at fair valueInvestments (Mutual Funds) 535,748 - - 535,748
Level 1 Level 2 Level 3 Total
As at June 30, 2018
Financial assets measured at fair valueInvestments (Mutual Funds) 380,353 - - 380,353
24. SUPPLEMENTARY NON-FINANCIAL INFORMATION
25. GENERAL
25.1 Figures have been rounded off to the nearest thousand rupee.
25.2
26. DATE OF AUTHORISATION FOR ISSUE
______________________ ____________ _____________________Chief Executive Officer Director Chief Financial Officer
(Management Company)For UBL Fund Managers Limited
The information regarding unit holding pattern, members of the Investment Committee, fund manager,meetings of the Board of Directors of the Management Company and rating of the Fund and the ManagementCompany has been disclosed in Annexure I to the financial statements.
Earnings per unit has not been disclosed as in the opinion of the Management Company, determination of the cumulative weighted average number of outstanding units is not practicable.
These financial statements were authorized for issue by the Board of Directors of the Management Companyon _____________________.
Fair Value
Fair Value
The table below analyse financial instruments measured at the end of the financial year by the level in the fairvalue hierarchy into which the fair value measurement is categorised:
---------------------- (Rupees in '000) ----------------------
---------------------- (Rupees in '000) ----------------------
SDSDSD
ayousuf
Typewritten Text
ayousuf
Typewritten Text
ayousuf
Typewritten Text
30-AUG-2019
ayousuf
Typewritten Text
ayousuf
Typewritten Text
INVESTMENT OBJECTIVE
Management Company UBL Fund Managers Limited
Trustee Central Depository Company of Pakistan Limited99-B, Block-B, S.M.C.H.S., Main Shahra-e-Faisal,Karachi. Tel: (9221) 111-111-500
Distribution Company United Bank Limited
Auditor KPMG - Taseer Hadi & Co
JS Bank Limited Soneri Bank LimitedSoneri Bank Limited
Management Co.Rating AM1 (JCR‐VIS)
USSFUBL Special Savings Fund
UBL Special Savings Fund shall be an open-end Capital Protected Fund that aims to not only provide itsunitholders capital preservation but competitive regular returns from a portfolio of fixed income investments inline with the risk tolerance of the Investor.
(for detail of others, please visit our website: www.ublfunds.com.pk)
Bankers

FMR – USSP I 1
Fund Manager’s Report – UBL Financial Planning Fund
UBL Special Savings Plan ‐ I (USSP‐I)
I. Description of the Collective Investment Scheme category and type
Capital protected Scheme / Open-end
II. Statement of Collective Investment Scheme’s investment objective The “UBL Special Savings Plan‐I (USSP‐I)” is an Allocation Plan under “UBL Special Savings Fund”. The objective is to earn competitive regular return with capital preservation for unit holders who hold their investment for thirty six (36) Months from commencement of life of plan
III. Explanation as to whether the Collective Investment Scheme achieved its stated objective The fund achieved its stated objective
IV. Statement of benchmark(s) relevant to the Collective Investment Scheme Average of 6M PKRV rates.
V. Comparison of the Collective Investment Scheme’s performance during the period compared with the said benchmarks
i) Description of the strategies and policies employed during the period under review in relation to the Collective Investment Scheme’s performance During the period under review, the Fund had a return of 5.46%. The fund had an exposure of over 90% in PIBs during the period. Net assets of the fund were PKR 460 mn at the end of FY19. Disclosure of the Collective Investment Scheme’s asset allocation as at the date of the report and particulars of significant changes in asset allocation since the last report (if applicable)
Asset Allocation (% of Total Assets) Jun-18 Jun-19 Placements with banks 0% 0% PIB 0% 91% GOP Ijarah Sukuk 0% 0% Reverse Repo 0% 0% T-Bills 0% 0% Cash 0% 5% Others 0% 4%
Monthly Yield Jul'18 Aug'18 Sep'18 Oct'18 Nov'18 Dec'18 Jan'19 Feb'19 Mar'19 Apr'19 May'19 Jun'19 FYTDUSSP-I - - - - 6.55% 8.54% 29.19% 2.64% 5.20% 14.84% -18.73% 1.84% 5.46%Benchmark - - - - 9.69% 10.44% 10.51% 10.63% 10.78% 11.07% 11.89% 12.83% 11.02%
Leverage 0% 0%

FMR – USSP I 2
ii) Analysis of the Collective Investment Scheme’s performance
iii) Changes in total NAV and NAV per unit since the last review period or since commencement (in case of newly established Collective Investment Schemes
Net Asset Value NAV per unit 30-Jun-19 09-Nov-18 Change 30-Jun-19 09-Nov-18 Change
Rupees (000) % Rupees % 459,720 202,369 127.17 97.6060 100.00 (2.39)
iv) Disclosure on the markets that the Collective investment Scheme has invested in including - review of the market(s) invested in and returns during the period The fund is an Allocation Plan under the “UBL Financial Planning Fund” that actively invests between Conventional Equities and Money Market/ Income funds based on the Fund Manager’s outlook on the asset classes. Thus, the underlying assets of UAPPP‐I are equity and money-market CIS and the market reviews are as follows:
Debt Market Review for FY19
In twelve PIB auctions for FY19 conducted during the year, the government raised PKR ~871bn (PKR ~102 bn in FY18) against target of PKR 800bn. Consequently, outstanding amount for the PIBs in the market increased to PKR 769 bn. Participation in the auctions was largely skewed towards three and five year paper. Cut off yields in June auction increased to 13.69%, 13.80% and 13.70% for three, five and ten year PIB instruments respectively.
The yield curve based on government securities of various maturities has shifted upwards in line with the ongoing increasing discounts rates. Yield on 3M, 6M and 12M T-Bills increased by 5.97%, 5.95% and 5.94%, respectively. Similarly, yield on 3-year, 5-year and 10-year bonds increased 5.56%, 5.10% and 4.69%, respectively. Given the flat yield curve environment, spread between annualized yields of 1-year T-bills (13.13% p.a.) and 10-year PIBs (13.72% p.a.) narrowed at 0.59% as of 30 June 2019.
FY'19 Return: 5.46%Standard Deviation (12m trailing): n/aSharpe Ratio (12m trailing): n/a

FMR – USSP I 3
period; and
- statement of effects on the NAV before and after distribution is made
VII. Description and explanation of any significant changes in the state of affairs of the Collective Investment Scheme during the period and up till the date of the manager’s report, not otherwise disclosed in the financial statements There were no significant changes in state of affairs of the scheme.
VIII. Breakdown of unit holdings by size
Range of Units Number of Investors
USSP I
0.0001 - 9,999.9999 148
10,000.0000 - 49,999.9999 98
50,000.0000 - 99,999.9999 9
100,000.0000 - 499,999.9999 8
500,000.0000 & Above
Total 268
IX. Disclosure on unit split (if any), comprising:- There were no unit splits during the period.
X. Disclosure of circumstances that materially affect any interests of unit holders Investment are subject to credit and market risk.
XI. Disclosure if the Asset Management Company or its delegate, if any, receives any soft commission (i.e. goods and services) from its broker(s) or dealer(s) by virtue of transactions conducted by the Collective Investment Scheme. No soft commissions are received by the AMC from its brokers or dealers by virtue of transactions conducted by the Collective Investment Scheme.
Distribution Per unit
Declared on Bonus Cash Per Unit Cum NAV Ex NAV Rupees (000) --------------- Rupees ---------------
21 Dec 2018 - 5,203 .8513 100.8513 100.00
24 June 2019 - 23,724 4.9878 102.5778 97.59
VI. Disclosure on distribution (if any), comprising:-
- particulars of income distribution or other forms of distribution made and proposed during the

FMR – USSP-II
Fund Manager’s Report – UBL Financial Planning Fund
UBL Special Savings Plan ‐ II (USSP‐II)
I. Description of the Collective Investment Scheme category and type
Capital protected Scheme / Open-end
II. Statement of Collective Investment Scheme’s investment objective The “UBL Special Savings Plan II (USSP II)” is an Allocation Plan under “UBL Special Savings Fund”. The objective is to earn competitive regular return with capital preservation for unit holders who hold their investment for thirty six (36) Months from commencement of life of plan.
III. Explanation as to whether the Collective Investment Scheme achieved its stated objective The fund achieved its stated objective
IV. Statement of benchmark(s) relevant to the Collective Investment Scheme Average of 6M PKRV rates.
V. Comparison of the Collective Investment Scheme’s performance during the period compared with the said benchmarks
VI. Description of the strategies and policies employed during the period under review in relation to the Collective Investment Scheme’s performance The Fund was launched on 5-Feb-‘19. During the period, the Fund generated 3.56% return. Net assets of the fund stood at PKR 902 mn at FY19 end. Disclosure of the Collective Investment Scheme’s asset allocation as at the date of the report and particulars of significant changes in asset allocation since the last report (if applicable)
Asset Allocation (% of Total Assets) Jun-18 Jun-19 Placements with banks 0% 0% PIB 0% 90% GOP Ijarah Sukuk 0% 0% Reverse Repo 0% 0% T-Bills 0% 0% Cash 0% 4% Others 0% 6%
Monthly Yield Jul'18 Aug'18 Sep'18 Oct'18 Nov'18 Dec'18 Jan'19 Feb'19 Mar'19 Apr'19 May'19 Jun'19 FYTDUSSP-II - - - - - - - 9.37% 14.15% 16.30% -18.18% 1.84% 3.56%Benchmark - - - - - - - 10.63% 10.78% 11.07% 11.89% 12.83% 11.47%
Leverage 0% 0%

FMR – USSP-II
i) Analysis of the Collective Investment Scheme’s performance
ii) Changes in total NAV and NAV per unit since the last review period or since commencement (in case of newly established Collective Investment Schemes
Net Asset Value NAV per unit 30-Jun-19 05-Feb-19 Change 30-Jun-19 05-Feb-19 Change
Rupees (000) % Rupees % 901,819 12,063 7,376 97.4116 100.00 (2.59)
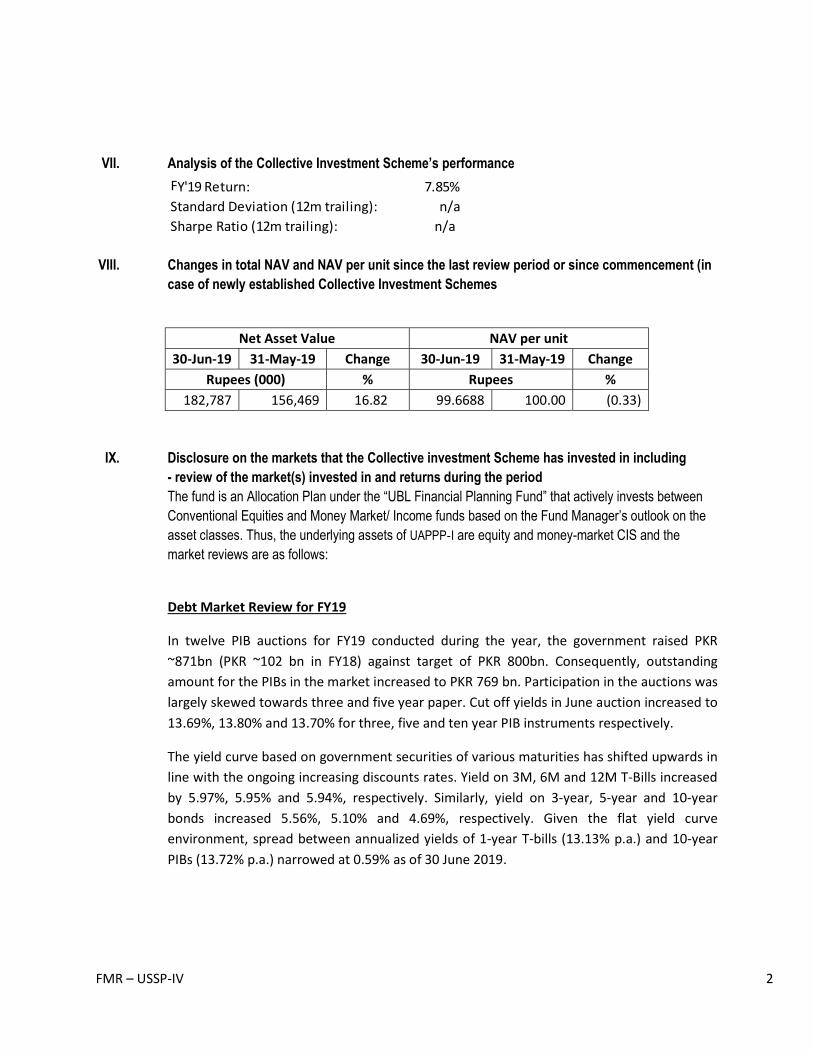
iii) Disclosure on the markets that the Collective investment Scheme has invested in including - review of the market(s) invested in and returns during the period The fund is an Allocation Plan under the “UBL Financial Planning Fund” that actively invests between Conventional Equities and Money Market/ Income funds based on the Fund Manager’s outlook on the asset classes. Thus, the underlying assets of UAPPP‐I are equity and money-market CIS and the market reviews are as follows:
Debt Market Review for FY19
In twelve PIB auctions for FY19 conducted during the year, the government raised PKR ~871bn (PKR ~102 bn in FY18) against target of PKR 800bn. Consequently, outstanding amount for the PIBs in the market increased to PKR 769 bn. Participation in the auctions was largely skewed towards three and five year paper. Cut off yields in June auction increased to 13.69%, 13.80% and 13.70% for three, five and ten year PIB instruments respectively.
The yield curve based on government securities of various maturities has shifted upwards in line with the ongoing increasing discounts rates. Yield on 3M, 6M and 12M T-Bills increased by 5.97%, 5.95% and 5.94%, respectively. Similarly, yield on 3-year, 5-year and 10-year bonds increased 5.56%, 5.10% and 4.69%, respectively. Given the flat yield curve environment, spread between annualized yields of 1-year T-bills (13.13% p.a.) and 10-year PIBs (13.72% p.a.) narrowed at 0.59% as of 30 June 2019.
FY'19 Return: 3.56%Standard Deviation (12m trailing): n/a
FMR – USSP-II
FMR – USSP-II
period; and
- statement of effects on the NAV before and after distribution is made
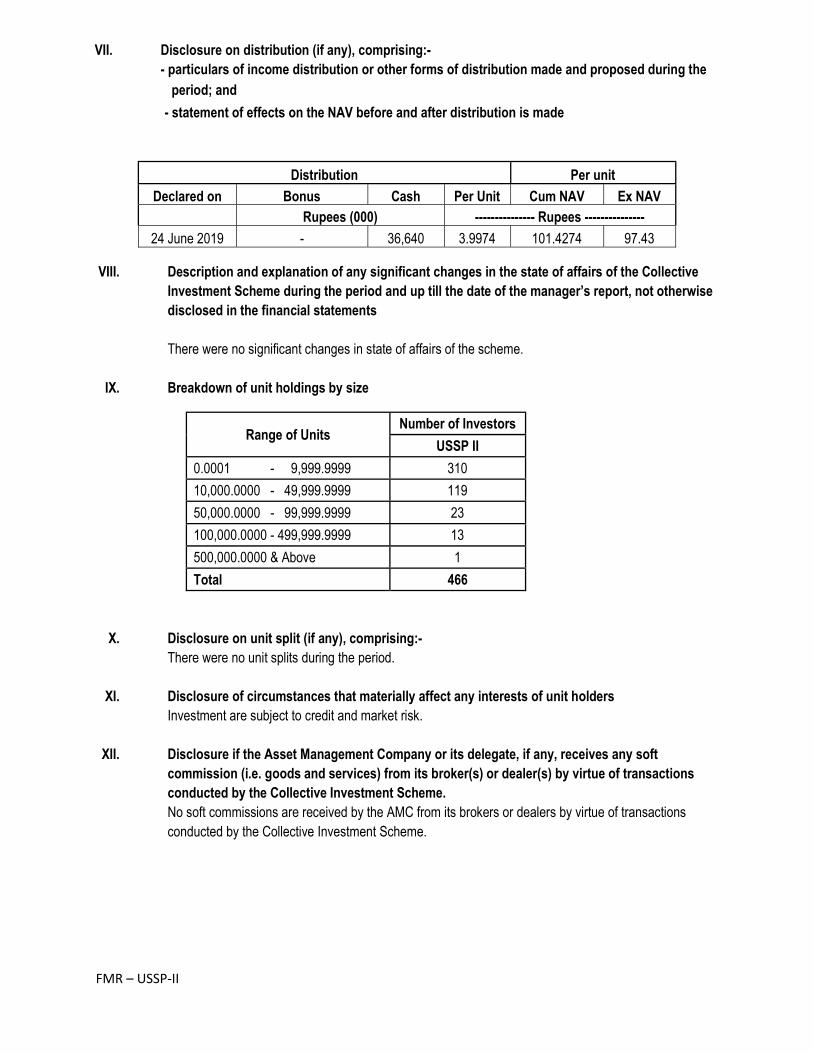
VIII. Description and explanation of any significant changes in the state of affairs of the Collective Investment Scheme during the period and up till the date of the manager’s report, not otherwise disclosed in the financial statements
There were no significant changes in state of affairs of the scheme.
IX. Breakdown of unit holdings by size
Range of Units Number of Investors
USSP II
0.0001 - 9,999.9999 310
10,000.0000 - 49,999.9999 119
50,000.0000 - 99,999.9999 23
100,000.0000 - 499,999.9999 13
500,000.0000 & Above 1
Total 466
X. Disclosure on unit split (if any), comprising:- There were no unit splits during the period.
XI. Disclosure of circumstances that materially affect any interests of unit holders Investment are subject to credit and market risk.
XII. Disclosure if the Asset Management Company or its delegate, if any, receives any soft commission (i.e. goods and services) from its broker(s) or dealer(s) by virtue of transactions conducted by the Collective Investment Scheme. No soft commissions are received by the AMC from its brokers or dealers by virtue of transactions conducted by the Collective Investment Scheme.
Distribution Per unit
Declared on Bonus Cash Per Unit Cum NAV Ex NAV Rupees (000) --------------- Rupees ---------------
24 June 2019 - 36,640 3.9974 101.4274 97.43
VII. Disclosure on distribution (if any), comprising:- - particulars of income distribution or other forms of distribution made and proposed during the

FMR – USSP III 1
Fund Manager’s Report – UBL Financial Planning Fund
UBL Special Savings Plan ‐ III (USSP III)
I. Description of the Collective Investment Scheme category and type
Capital protected Scheme / Open-end
II. Statement of Collective Investment Scheme’s investment objective The “UBL Special Savings Plan III (USSP III)” is an Allocation Plan under “UBL Special Savings Fund”. The objective is to earn competitive regular return with capital preservation for unit holders who hold their investment for thirty six (36) Months from commencement of life of plan.
III. Explanation as to whether the Collective Investment Scheme achieved its stated objective The fund achieved its stated objective
IV. Statement of benchmark(s) relevant to the Collective Investment Scheme Average of 6M PKRV rates.
V. Comparison of the Collective Investment Scheme’s performance during the period compared with the said benchmarks
VI. Description of the strategies and policies employed during the period under review in relation to the Collective Investment Scheme’s performance During the period under review, the Fund had a return of 2.52%. Fund size was PKR 265 mn at the end of FY19. Disclosure of the Collective Investment Scheme’s asset allocation as at the date of the report and particulars of significant changes in asset allocation since the last report (if applicable)
Asset Allocation (% of Total Assets) Jun-18 Jun-19 Placements with banks 0% 0% PIB 0% 96% GOP Ijarah Sukuk 0% 0% Reverse Repo 0% 0% T-Bills 0% 0% Cash 0% 0% Others 0% 4%
Monthly Yield Jul'18 Aug'18 Sep'18 Oct'18 Nov'18 Dec'18 Jan'19 Feb'19 Mar'19 Apr'19 May'19 Jun'19 FYTDUSSP-III - - - - - - - - - 7.54% -1.75% 4.76% 2.52%Benchmark - - - - - - - - - 11.06% 11.89% 12.83% 12.11%
Leverage 0% 0%

FMR – USSP III 2
VII. Analysis of the Collective Investment Scheme’s performance
VIII. Changes in total NAV and NAV per unit since the last review period or since commencement (in case of newly established Collective Investment Schemes
Net Asset Value NAV per unit 30-Jun-19 17-Apr-19 Change 30-Jun-19 17-Apr-19 Change
Rupees (000) % Rupees % 264,825 1500 17,556 98.8607 100.00 (1.14)
IX. Disclosure on the markets that the Collective investment Scheme has invested in including - review of the market(s) invested in and returns during the period The fund is an Allocation Plan under the “UBL Financial Planning Fund” that actively invests between Conventional Equities and Money Market/ Income funds based on the Fund Manager’s outlook on the asset classes. Thus, the underlying assets of UAPPP‐I are equity and money-market CIS and the market reviews are as follows:
Debt Market Review for FY19
In twelve PIB auctions for FY19 conducted during the year, the government raised PKR ~871bn (PKR ~102 bn in FY18) against target of PKR 800bn. Consequently, outstanding amount for the PIBs in the market increased to PKR 769 bn. Participation in the auctions was largely skewed towards three and five year paper. Cut off yields in June auction increased to 13.69%, 13.80% and 13.70% for three, five and ten year PIB instruments respectively.
The yield curve based on government securities of various maturities has shifted upwards in line with the ongoing increasing discounts rates. Yield on 3M, 6M and 12M T-Bills increased by 5.97%, 5.95% and 5.94%, respectively. Similarly, yield on 3-year, 5-year and 10-year bonds increased 5.56%, 5.10% and 4.69%, respectively. Given the flat yield curve environment, spread between annualized yields of 1-year T-bills (13.13% p.a.) and 10-year PIBs (13.72% p.a.) narrowed at 0.59% as of 30 June 2019.
FY'19 Return: 2.52%Standard Deviation (12m trailing): n/aSharpe Ratio (12m trailing): n/a

FMR – USSP III 3
period; and
- statement of effects on the NAV before and after distribution is made
XI. Description and explanation of any significant changes in the state of affairs of the Collective Investment Scheme during the period and up till the date of the manager’s report, not otherwise disclosed in the financial statements There were no significant changes in state of affairs of the scheme.
XII. Breakdown of unit holdings by size
Range of Units Number of Investors
USSP-III
0.0001 - 9,999.9999 99
10,000.0000 - 49,999.9999 39
50,000.0000 - 99,999.9999 2
100,000.0000 - 499,999.9999 2
500,000.0000 & Above 1
Total 143
XIII. Disclosure on unit split (if any), comprising:- There were no unit splits during the period.
XIV. Disclosure of circumstances that materially affect any interests of unit holders Investment are subject to credit and market risk.
XV. Disclosure if the Asset Management Company or its delegate, if any, receives any soft commission (i.e. goods and services) from its broker(s) or dealer(s) by virtue of transactions conducted by the Collective Investment Scheme. No soft commissions are received by the AMC from its brokers or dealers by virtue of transactions conducted by the Collective Investment Scheme.
Distribution Per unit
Declared on Bonus Cash Per Unit Cum NAV Ex NAV Rupees (000) --------------- Rupees ---------------
28 June 2019 - 4,412 1.6531 100.6057 98.9526
X. Disclosure on distribution (if any), comprising:-
- particulars of income distribution or other forms of distribution made and proposed during the

FMR – USSP-IV 1
Fund Manager’s Report – UBL Financial Planning Fund
UBL Special Savings Plan ‐ IV (USSP‐IV)
I. Description of the Collective Investment Scheme category and type
Capital protected Scheme / Open-end
II. Statement of Collective Investment Scheme’s investment objective The “UBL Special Savings Plan IV (USSP IV)” is an Allocation Plan under “UBL Special Savings Fund”. The objective is to earn competitive regular return with capital preservation for unit holders who hold their investment for twenty four (24) Months from commencement of life of plan.
III. Explanation as to whether the Collective Investment Scheme achieved its stated objective The fund achieved its stated objective
IV. Statement of benchmark(s) relevant to the Collective Investment Scheme Average of 6M PKRV rates.
V. Comparison of the Collective Investment Scheme’s performance during the period compared with the said benchmarks
VI. Description of the strategies and policies employed during the period under review in relation to the Collective Investment Scheme’s performance During the period under review, the Fund had a return of 7.85%. Fund size stood at PKR 183 mn at the period end. Disclosure of the Collective Investment Scheme’s asset allocation as at the date of the report and particulars of significant changes in asset allocation since the last report (if applicable)
Asset Allocation (% of Total Assets) Jun-18 Jun-19 Placements with banks 0% 0% PIB 0% 71% GOP Ijarah Sukuk 0% 0% Reverse Repo 0% 0% T-Bills 0% 0% Cash 0% 20% Others 0% 9%
Monthly Yield Jul'18 Aug'18 Sep'18 Oct'18 Nov'18 Dec'18 Jan'19 Feb'19 Mar'19 Apr'19 May'19 Jun'19 FYTDUSSP-IV - - - - - - - - - - 11.81% 7.72% 7.85%Benchmark - - - - - - - - - - 12.80% 12.83% 12.83%
Leverage 0% 0%
FMR – USSP-IV 2
VII. Analysis of the Collective Investment Scheme’s performance
VIII. Changes in total NAV and NAV per unit since the last review period or since commencement (in case of newly established Collective Investment Schemes
Net Asset Value NAV per unit 30-Jun-19 31-May-19 Change 30-Jun-19 31-May-19 Change
Rupees (000) % Rupees % 182,787 156,469 16.82 99.6688 100.00 (0.33)
IX. Disclosure on the markets that the Collective investment Scheme has invested in including - review of the market(s) invested in and returns during the period The fund is an Allocation Plan under the “UBL Financial Planning Fund” that actively invests between Conventional Equities and Money Market/ Income funds based on the Fund Manager’s outlook on the asset classes. Thus, the underlying assets of UAPPP‐I are equity and money-market CIS and the market reviews are as follows:
Debt Market Review for FY19
In twelve PIB auctions for FY19 conducted during the year, the government raised PKR ~871bn (PKR ~102 bn in FY18) against target of PKR 800bn. Consequently, outstanding amount for the PIBs in the market increased to PKR 769 bn. Participation in the auctions was largely skewed towards three and five year paper. Cut off yields in June auction increased to 13.69%, 13.80% and 13.70% for three, five and ten year PIB instruments respectively.
The yield curve based on government securities of various maturities has shifted upwards in line with the ongoing increasing discounts rates. Yield on 3M, 6M and 12M T-Bills increased by 5.97%, 5.95% and 5.94%, respectively. Similarly, yield on 3-year, 5-year and 10-year bonds increased 5.56%, 5.10% and 4.69%, respectively. Given the flat yield curve environment, spread between annualized yields of 1-year T-bills (13.13% p.a.) and 10-year PIBs (13.72% p.a.) narrowed at 0.59% as of 30 June 2019.
FY'19 Return: 7.85%Standard Deviation (12m trailing): n/aSharpe Ratio (12m trailing): n/a
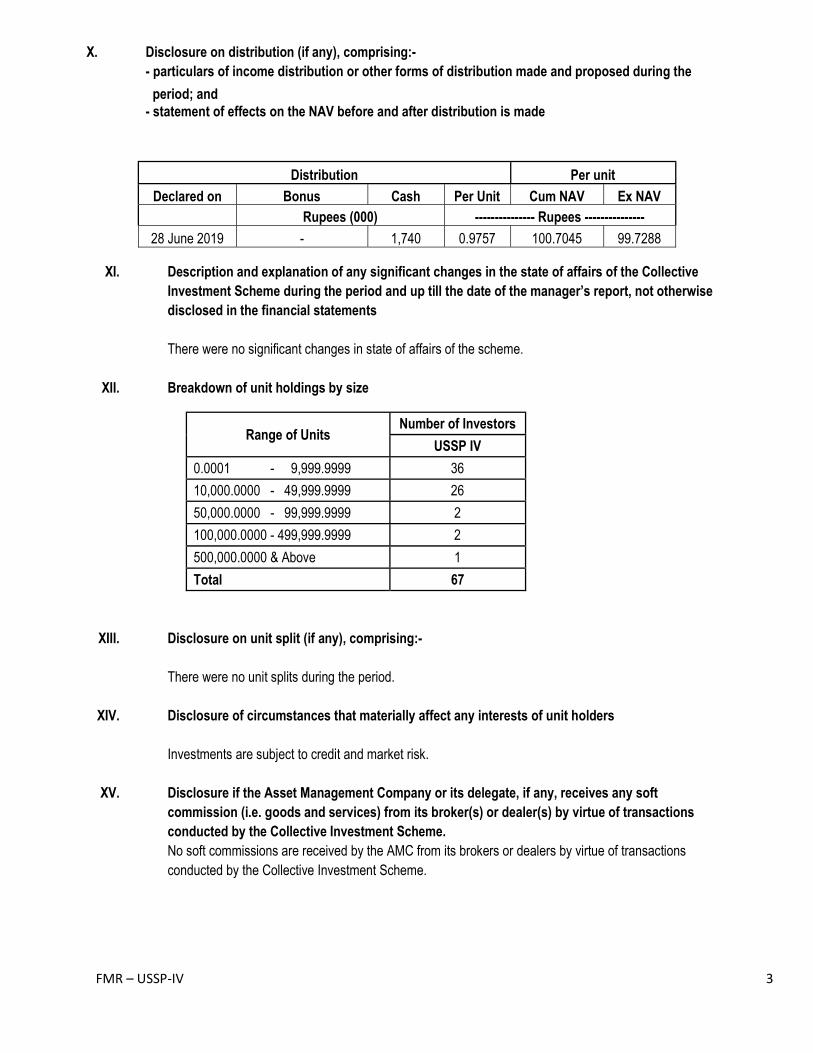
FMR – USSP-IV 3
period; and - statement of effects on the NAV before and after distribution is made
XI. Description and explanation of any significant changes in the state of affairs of the Collective Investment Scheme during the period and up till the date of the manager’s report, not otherwise disclosed in the financial statements There were no significant changes in state of affairs of the scheme.
XII. Breakdown of unit holdings by size
Range of Units Number of Investors
USSP IV
0.0001 - 9,999.9999 36
10,000.0000 - 49,999.9999 26
50,000.0000 - 99,999.9999 2
100,000.0000 - 499,999.9999 2
500,000.0000 & Above 1
Total 67
XIII. Disclosure on unit split (if any), comprising:- There were no unit splits during the period.
XIV. Disclosure of circumstances that materially affect any interests of unit holders Investments are subject to credit and market risk.
XV. Disclosure if the Asset Management Company or its delegate, if any, receives any soft commission (i.e. goods and services) from its broker(s) or dealer(s) by virtue of transactions conducted by the Collective Investment Scheme. No soft commissions are received by the AMC from its brokers or dealers by virtue of transactions conducted by the Collective Investment Scheme.
Distribution Per unit
Declared on Bonus Cash Per Unit Cum NAV Ex NAV Rupees (000) --------------- Rupees ---------------
28 June 2019 - 1,740 0.9757 100.7045 99.7288
X. Disclosure on distribution (if any), comprising:-
- particulars of income distribution or other forms of distribution made and proposed during the
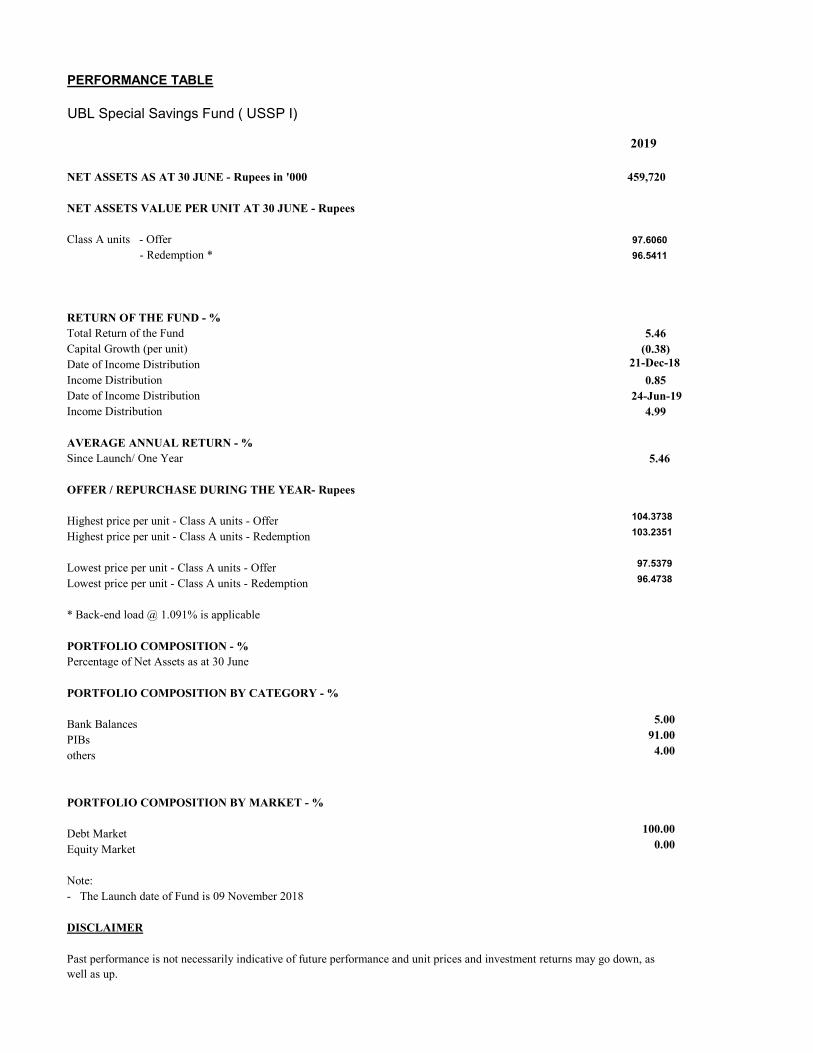
PERFORMANCE TABLE
UBL Special Savings Fund ( USSP I)
2019
NET ASSETS AS AT 30 JUNE - Rupees in '000 459,720
NET ASSETS VALUE PER UNIT AT 30 JUNE - Rupees
Class A units - Offer 97.6060
- Redemption * 96.5411
RETURN OF THE FUND - %Total Return of the Fund 5.46 Capital Growth (per unit) (0.38) Date of Income Distribution 21-Dec-18
Income Distribution 0.85 Date of Income Distribution 24-Jun-19Income Distribution 4.99
AVERAGE ANNUAL RETURN - %Since Launch/ One Year 5.46
OFFER / REPURCHASE DURING THE YEAR- Rupees
Highest price per unit - Class A units - Offer 104.3738
Highest price per unit - Class A units - Redemption 103.2351
Lowest price per unit - Class A units - Offer 97.5379
Lowest price per unit - Class A units - Redemption 96.4738
* Back-end load @ 1.091% is applicable
PORTFOLIO COMPOSITION - %Percentage of Net Assets as at 30 June
PORTFOLIO COMPOSITION BY CATEGORY - %
Bank Balances 5.00
PIBs 91.00
others 4.00
PORTFOLIO COMPOSITION BY MARKET - %
Debt Market 100.00
Equity Market 0.00
Note:- The Launch date of Fund is 09 November 2018
DISCLAIMER
Past performance is not necessarily indicative of future performance and unit prices and investment returns may go down, as well as up.
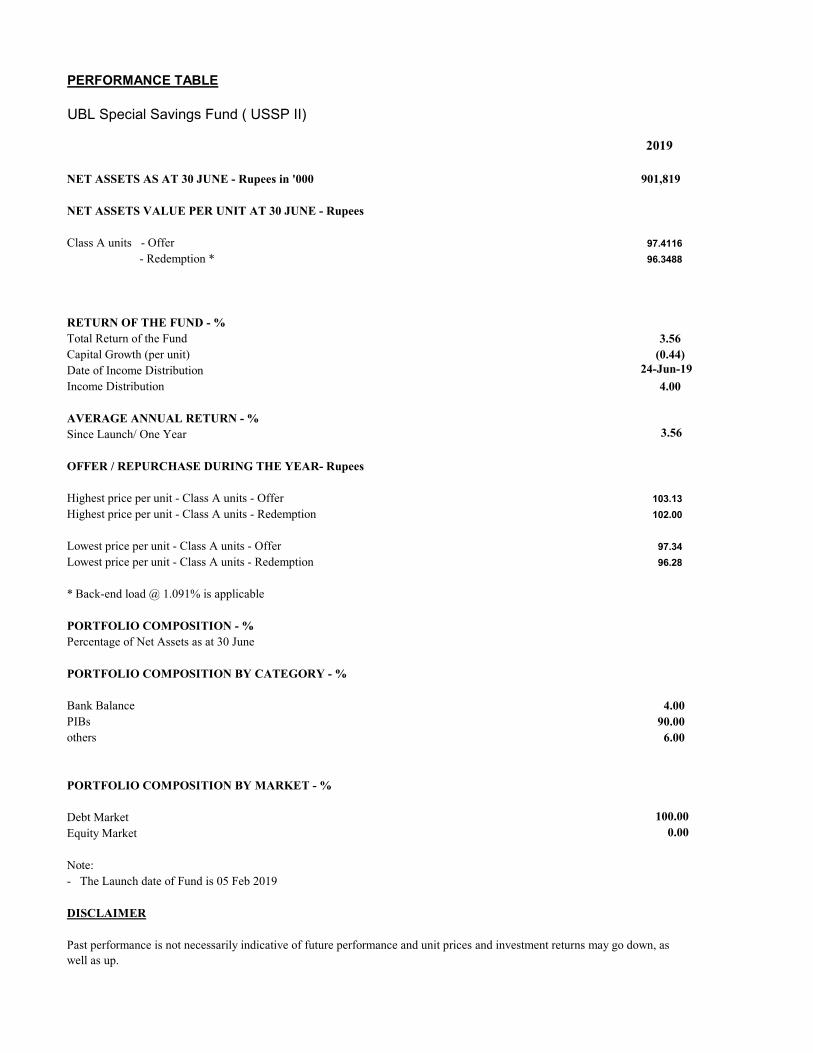
PERFORMANCE TABLE
UBL Special Savings Fund ( USSP II)
2019
NET ASSETS AS AT 30 JUNE - Rupees in '000 901,819
NET ASSETS VALUE PER UNIT AT 30 JUNE - Rupees
Class A units - Offer 97.4116
- Redemption * 96.3488
RETURN OF THE FUND - %Total Return of the Fund 3.56 Capital Growth (per unit) (0.44) Date of Income Distribution 24-Jun-19
Income Distribution 4.00
AVERAGE ANNUAL RETURN - %Since Launch/ One Year 3.56
OFFER / REPURCHASE DURING THE YEAR- Rupees
Highest price per unit - Class A units - Offer 103.13
Highest price per unit - Class A units - Redemption 102.00
Lowest price per unit - Class A units - Offer 97.34
Lowest price per unit - Class A units - Redemption 96.28
* Back-end load @ 1.091% is applicable
PORTFOLIO COMPOSITION - %Percentage of Net Assets as at 30 June
PORTFOLIO COMPOSITION BY CATEGORY - %
Bank Balance 4.00PIBs 90.00others 6.00
PORTFOLIO COMPOSITION BY MARKET - %
Debt Market 100.00
Equity Market 0.00
Note:- The Launch date of Fund is 05 Feb 2019
DISCLAIMER
Past performance is not necessarily indicative of future performance and unit prices and investment returns may go down, as well as up.

PERFORMANCE TABLE
UBL Special Savings Fund ( USSP III)
2019
NET ASSETS AS AT 30 JUNE - Rupees in '000 264,825
NET ASSETS VALUE PER UNIT AT 30 JUNE - Rupees
Class A units - Offer 98.8607
- Redemption * 97.7821
RETURN OF THE FUND - %Total Return of the Fund 2.52 Capital Growth (per unit) 0.87 Date of Income Distribution 28-Jun-19Income Distribution 1.65
AVERAGE ANNUAL RETURN - %Since Launch/ One Year 2.52
OFFER / REPURCHASE DURING THE YEAR- Rupees
Highest price per unit - Class A units - Offer 100.76
Highest price per unit - Class A units - Redemption 99.66
Lowest price per unit - Class A units - Offer 98.79
Lowest price per unit - Class A units - Redemption 97.71
* Back-end load @ 1.091% is applicable
PORTFOLIO COMPOSITION - %Percentage of Net Assets as at 30 June
PORTFOLIO COMPOSITION BY CATEGORY - %
Bank Balances 0.00PIBs 96.00others 4.00
PORTFOLIO COMPOSITION BY MARKET - %
Debt Market 100.00Equity Market 0.00
Note:- The Launch date of Fund is 17 April 2019
DISCLAIMER
Past performance is not necessarily indicative of future performance and unit prices and investment returns may go down, as well as up.

PERFORMANCE TABLE
UBL Special Savings Fund ( USSP IV)
2019
NET ASSETS AS AT 30 JUNE - Rupees in '000 182,787
NET ASSETS VALUE PER UNIT AT 30 JUNE - Rupees
Class A units - Offer * 101.3582
- Redemption 99.6688
RETURN OF THE FUND - %Total Return of the Fund 7.85 Capital Growth (per unit) 6.87 Date of Income Distribution 28-Jun-19
Income Distribution 0.98
AVERAGE ANNUAL RETURN - %Since Launch/ One Year 7.85
OFFER / REPURCHASE DURING THE YEAR- Rupees
Highest price per unit - Class A units - Offer 102.41
Highest price per unit - Class A units - Redemption 100.70
Lowest price per unit - Class A units - Offer 101.30
Lowest price per unit - Class A units - Redemption 99.61
* Front-end load upto 2% is applicable
PORTFOLIO COMPOSITION - %Percentage of Net Assets as at 30 June
PORTFOLIO COMPOSITION BY CATEGORY - %
Bank Balances 20.00PIBs 71.00others 9.00
PORTFOLIO COMPOSITION BY MARKET - %
Debt Market 100.00Equity Market 0.00
Note:- The Launch date of Fund is 30 May 2019
DISCLAIMER
Past performance is not necessarily indicative of future performance and unit prices and investment returns may go down, as well as up.

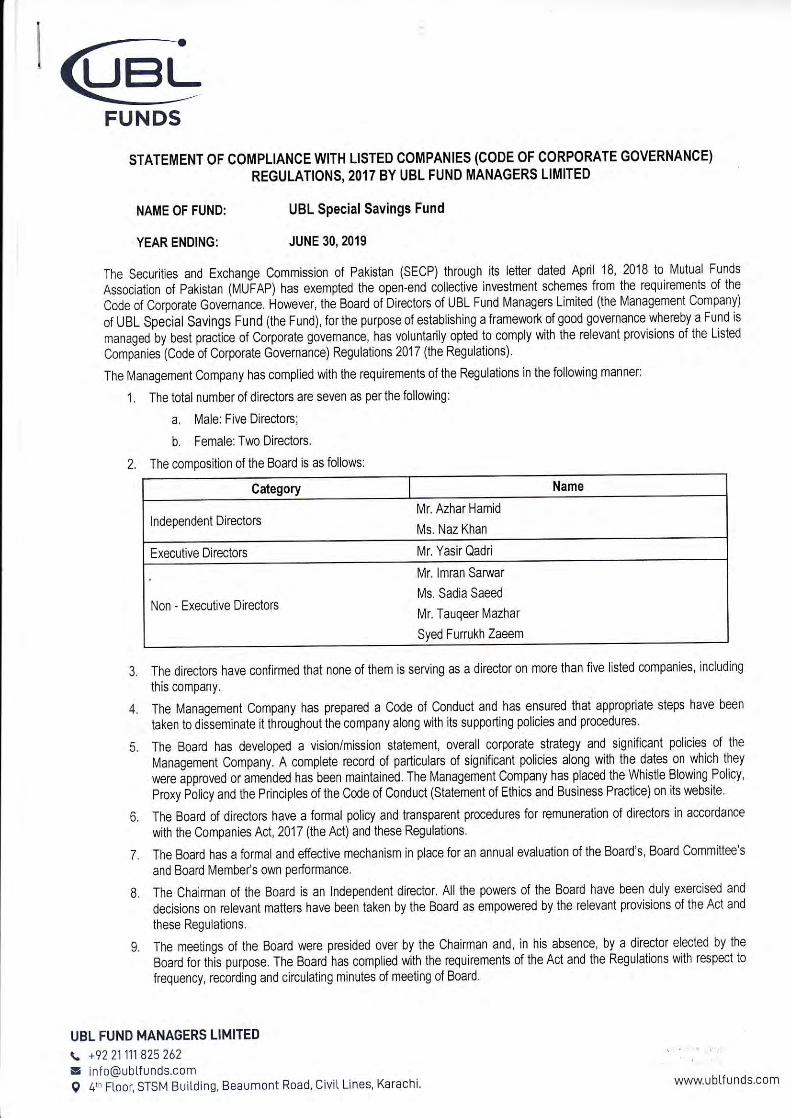
FUNDS
NAME OF FUND:
YEAR ENDING:
STATEMENT OF COMPLIANCE WTH LISTED COMPANIES (CODE OF CORPORATE GOVERNANCE)
REGULATIONS,20lT BY UBL FUND MANAGERS LIMITED
UBL Special Savings Fund
JUNE 30, 2019
3.
6.
7.
8
The Securifles and Exchange Commission of Pakistan (SECP) through its letter dated April 18, 2018 to Mutual Funds
Association of pakistan (N4U}AP) has exempted the open-end collective investment schemes from the requirements of the
Code of Corporate Gor"mance. However, the Board of Directors of UBL Fund Managers Limited (the lVanagement Company)
of UBL Special Savings Fund (the Fund), for the purpose of establishing a framework of good governance whereby a Fund is
managed by best praciice of Coiporate govemance, has voluntarily opted to comply with the relevant provisions of the Listed
Companies (Code of Corporate Governance) Regulations 2017 (the Regulations)
The l\,4anagement company has complied with the requirements of the Regulations in the following manner:
1 . The total number of directors are seven as per the following:
a, l\4ale: Five Directors,
b. Female:TwoDirectors.
2. The composition of the Board is as follows:
Category Name
Independent DirectorsMr. Azhar Hamid
Ms. Naz Khan
Executive Directors l\4r, Yasir Qadri
Mr, lmran Saruar
Ms. Sadia Saeed
l\4r. Tauqeer l\,4azhar
Syed Furrukh Zaeem
Non - Executive Directors
UBL FUND MANAGERS LIMITED
4.
5.
The directors have confirmed that none of them is serving as a director on more than five listed companies, including
this company.
The l\,4anagement Company has prepared a Code of Conduct and has ensured that appropriate steps have been
taken to diiseminate it throughout the company along with its supporting policies and procedures.
The Board has developed a vision/mission statement, overall corporate strategy and slgnificant policies of the
l\Ianagement Company. A complete record of particulars of significant policies along with the dates on which they
were ipproved or amended has been maintained. The l\4anagement Company has placedlhe Whistle Blowing Policy,
proxy policy and the Principles of the Code of Conduct (Statement of Ethics and Business Practice) on its website
The Board of directors have a formal policy and transparent procedures for remuneration of directors in accordance
with the Companies Act, 2017 (the Aci) and these Regulations.
The Board has a formal and effective mechanism in place for an annual evaluation of the Board's, Board Committee's
and Board Membe/s own performance,
The Chairman of the Board is an lndependent director. All the powers of the Board have been duly exercised and
decisions on relevant matters have been taken by the Board as empowered by the relevant provisions of the Act and
these Regulations.
The meetings of the Board were presided over by the Chairman and, in his absence, by a director elected by the
Board for this purpose. The Board has complied with the requirements of the Act and the Regulations with respect to
frequency, recording and circulating minutes of meeting of Board
vI
+92 21 111 825 262
[email protected] FLoor, STSM Buitding, Beaumont Road, CiviL Lines, Karachi www.ubtf unds.com

FUNDS
10. Following directors and executives have acquired the prescribed Dlrector Training Program (DTP) certification:
Directors
a. Mr. lmran SaMar
b. Mr. Tauqeer Mazhar
c. Mr, Yasir Qadri
d. Ms. Naz Khan
e. Ivls. Sadia Saeed
f. Syed Furrukh Zaeem
Executives
a. S.M, AIY Osman
b. Mr. Amin Gulamani
c. l\4r. Ammar Valika
d, l\,4r. Hadi Hassan lVukhi
e. l\4r. Umair Ahmed
f. Mr. Zeeshan Quddus
ll.TheBoardhasapprovedappointmentofCFo,CompanySecretaryandHeadoflnterna|Audit,includingtheirremuneration unO t rr. unO .oniitior, .t .rpf.Vir.rt .'.d comptieO witn retevant requirements of the Regulations
12. CfOand CEO duly endorsed the financial statements before approval ofthe Board'
13'TheBoardhasformedcommitteescomprisingofmembersgivenbelow'TheBoardAuditCommitteeandtheBoard- Uumin nesource & Compensatlon Commited are chaired by separate lndependent directors:
a. Board Audit Committee
i, lVls Naz Khan (Chair),
ii, Mr' lmran Sar\rvar,
lii. l\.4s, Sadia Saeed,
iv. l\,4r, Tauqeer Mazhar'
b. Board Human Resource & Compensation Committee
i. l\,4r, Azhar Hamid (Chairman),
ii. Ms. Naz Khan,
iii. Ms. Sadia Saeed,
iv. SYed Furrukh Zaeem,
v, Mr. Yaslr Qadri,
c. Board Risk & Compliance Committee
i Mr. lmran Sarwar (Chairman)'
ii. Mr, Azhar Hamid,
iii. SYed Furrukh Zaeem,
iv Mr' Tauqeer l\/lazhar,
v, Mr. Yasir Qadri
14. The Terms of Reference of the aforesaid committees have been formed, documented and advised to the committee
for compllance,
UBL FUND MANAGERS LIMITED
\ +92 21111825 262
v info@ubtf unds.com
I i"iioor SfSf'l Buitding, Beaumont Road, Civil Lines' Karachi'www.ubtf unds.com

FUNDS
The frequency of meetings of the Committee were as per following:
a. Board Audit Committee : Quarterly l\ileeting-6 meetings held
b. Board Human Resource & Compensation Committeer 4 meetings held
c. Board Risk & Compliance Committee: Quarterly Meeting-4 meetings held
The Board has set up an independent and effective intemal audit function and the audit personnel are suitablyqualified and experienced for the purpose and are conversant with the policies and procedures of the l\,4anagement
Company.
The statutory auditors of the Fund have conirmed that they have been given a satisfactory rating under the quality
control review program of the Institute of Chartered Accountants of Pakistan (ICAP) and registered with AuditOversight Board of Pakistan, that they or any of lhe patuers of the firm, their spouses and minor children do not hold
units of the Fund and that the firm and all its partners are in compliance with lnternational Federation of Accountants(IFAC) guidelines on code of ethics as adopted by the ICAP.
The Board Audit Committee recommends to the Board of directors the appointment of external auditors, their removal,
audit fees, the provision of any service permissible to be rendered to the fund by the external auditors in addition toaudit of its financial statements.
The statutory auditors or the persons associated with them have not been appointed to provide other services except
in accordance with the Act, these regulations or any other regulatory requirement and the auditors have confirmed thatthey have observed IFAC guidelines in this regard,
We confirm that any other significant requirements of the Regulations have been complied with.
Karachi,
Dated: August 30, 2019
UBL FUND MANAGERS LIMITED
+92 21 111 825 262
inf o@ubtf unds.com41h Floor, STSN4 Buitding, Beaumont Road, CiviI Lines, Karachi.
15
'16.
17.
18.
19,
www.ublf unds.com


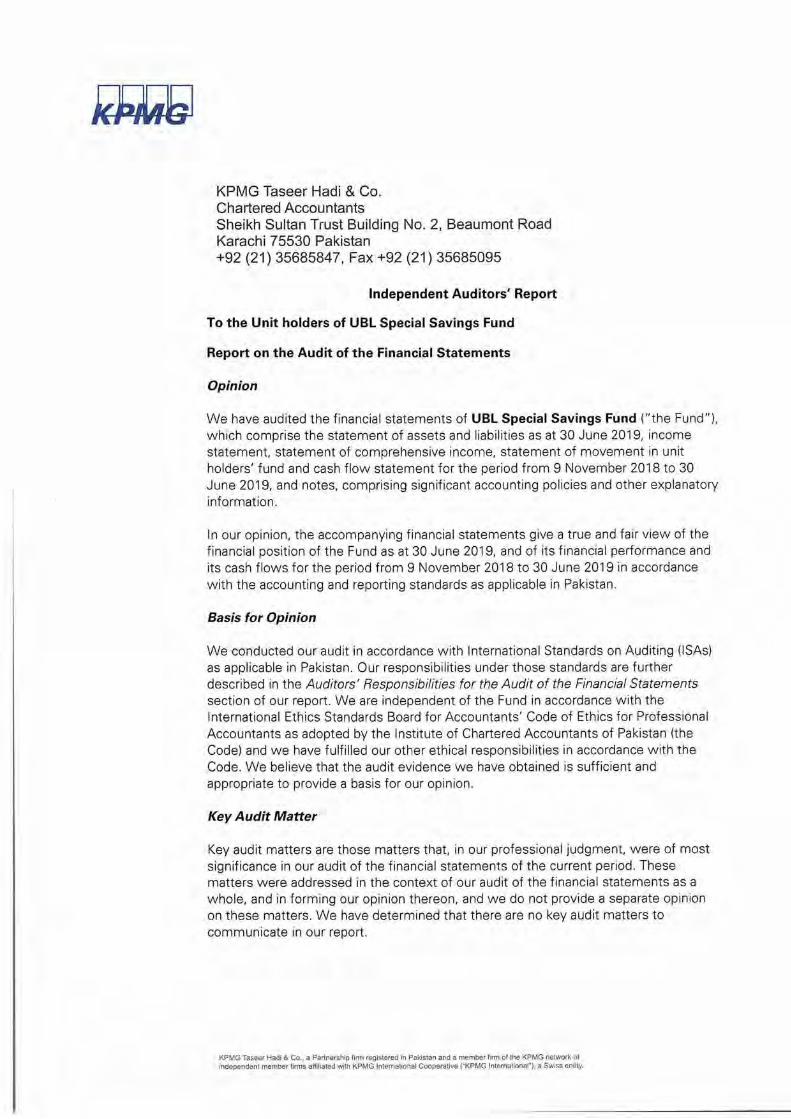


UBL Special Savings Fund Statement of Assets and Liabilities As at 30 June 2019
USSP-I USSP-II USSP-III USSP-IV TotalNote
AssetsBank balances 4 23,311 39,497 543 37,274 100,625 Investments 5 426,850 840,705 255,564 130,003 1,653,122 Profit receivables 6 16,294 33,486 11,179 6,212 67,171 Prepayments and other receivables 7 - 22,152 191 9,894 32,237 Preliminary expenses and floatation cost 8 890 - - - 890 Advance tax 9 214 39 36 3 292 Total assets 467,559 935,879 267,513 183,386 1,854,337
LiabilitiesPayable to the Management Company 10 2,447 983 1,957 219 5,606 Payable to Central Depository Company of Pakistan
Limited - Trustee 11 40 77 22 14 153 Payable to Securities and Exchange Commission of
Pakistan 12 229 213 23 10 475 Dividend payable - 627 - - 627 Accrued expenses and other payables 13 5,123 32,160 686 356 38,325 Total liabilities 7,839 34,060 2,688 599 45,186
Net assets 459,720 901,819 264,825 182,787 1,809,151
Unit holders' fund (as per statement attached) 459,720 901,819 264,825 182,787 1,809,151
Contingencies and commitments 17
Number of units in issue 4,709,959 9,257,824 2,678,767 1,833,947
Net assets value per unit 97.6060 97.4116 98.8607 99.6688
The annexed notes 1 to 30 form an integral part of these financial statements.
____________________Chief Executive Officer
____________________ Chief Financial Officer
(Management Company)
2019
------------------------------------------ (Rupees in '000) --------------------------------------------------
For UBL Fund Managers Limited
--------------------------- (Number of units) ---------------------------
------------------------------- (Rupees in '000) -------------------------------
_____________ Director
SD SD SD

UBL Special Savings Fund Income StatementFor the period from 09 November 2018 to 30 June 2019
USSP-I USSP-II USSP-III USSP-IVNote
IncomeMarkup on bank deposits and mark-up / return on
investments calculated using the effectiveinterest method 14 35,022 34,149 3,755 1,759 74,685
Realised loss on sale of investments 15 (1,503) (1,071) - - (2,574)Other income 357 350 114 - 821
33,876 33,428 3,869 1,759 72,932
ExpensesRemuneration of the Management Company 10.1 3,061 2,838 306 137 6,342Sindh sales tax on the Management Company's
remuneration 398 369 40 18 825Selling and marketing expenses 10.2 636 - - - 636Remuneration of Central Depository Company of
Pakistan Limited - Trustee 332 296 31 13 672Annual fee of Securities and Exchange
Commission of Pakistan 12 229 213 23 10 475Auditors' remuneration 16 265 50 17 6 338Formation cost 241 - - - 241Bank charges 11 10 6 2 29Listing fees 17 7 2 1 27Legal and professional charges 74 30 10 4 118Brokerage expenses 11 76 - - 87Other expenses 3 11 - - 14Total operating expenses 5,278 3,900 435 191 9,804
Net income from operating activities 28,598 29,528 3,434 1,568 63,128
Provision for Sindh Workers' Welfare Fund 13.1 (561) (580) (68) (31) (1,240)
Net income for the period before taxation 28,037 28,948 3,366 1,537 61,888
Taxation 20 - - - - -
Net income for the period after taxation 28,037 28,948 3,366 1,537 61,888
Allocation of net income for the period aftertaxation
Net income for the period after taxation 28,037 28,948 3,366 1,537 61,888 Income already paid on units redeemed (1,133) (221) (3) (25) (1,382) Accounting income available for distribution 26,904 28,727 3,363 1,512 60,506
Accounting income available for distribution- Relating to capital gains - - - - - - Excluding capital gains 26,904 28,727 3,363 1,512 60,506
26,904 28,727 3,363 1,512 60,506
The annexed notes 1 to 30 form an integral part of these financial statements.
____________________ _____________ ____________________Chief Executive Officer Director Chief Financial Officer
(Management Company)
For the period from 30 May
2019 to 30 June 2019
Total
---------------------------------------------------------- (Rupees in '000) ----------------------------------------------------------
For UBL Fund Managers Limited
For the period from 09
November 2018 to 30 June 2019
For the period from 05
February 2019 to 30 June 2019
For the period from 17 April
2019 to 30 June 2019
SD SDSD
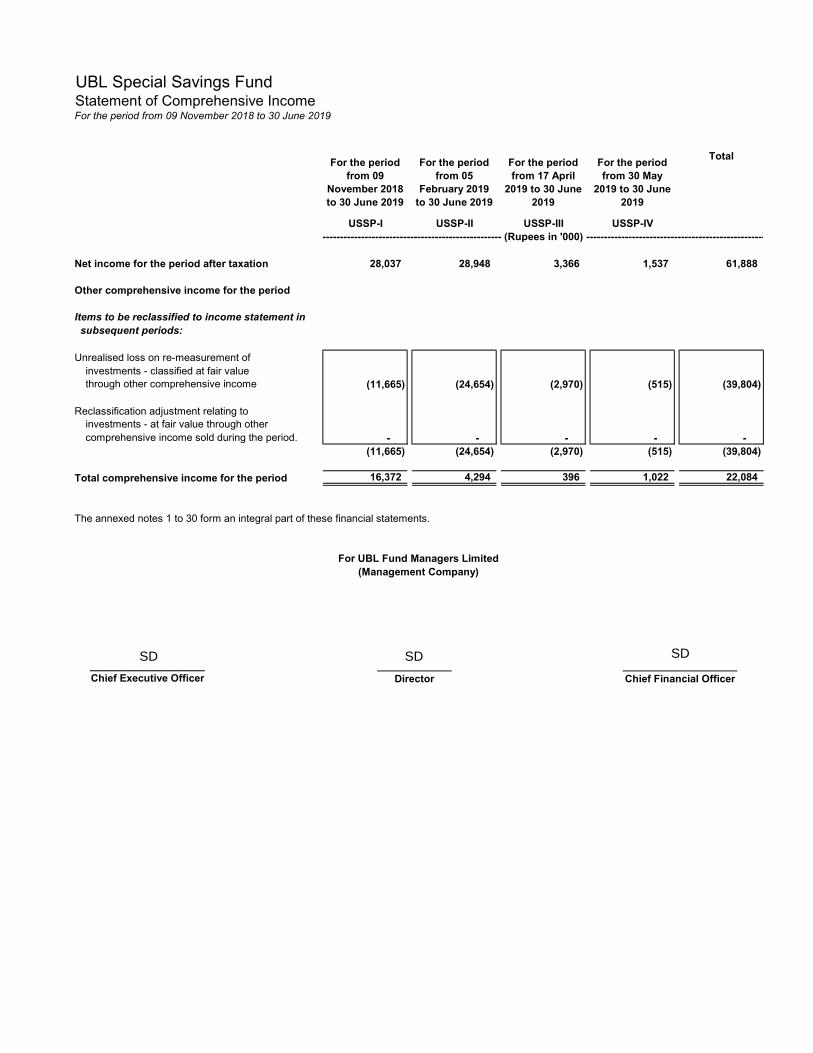
UBL Special Savings Fund Statement of Comprehensive IncomeFor the period from 09 November 2018 to 30 June 2019
USSP-I USSP-II USSP-III USSP-IV
Net income for the period after taxation 28,037 28,948 3,366 1,537 61,888
Other comprehensive income for the period
Items to be reclassified to income statement in subsequent periods:
Unrealised loss on re-measurement ofinvestments - classified at fair valuethrough other comprehensive income (11,665) (24,654) (2,970) (515) (39,804)
Reclassification adjustment relating toinvestments - at fair value through othercomprehensive income sold during the period. - - - - -
(11,665) (24,654) (2,970) (515) (39,804)
Total comprehensive income for the period 16,372 4,294 396 1,022 22,084
The annexed notes 1 to 30 form an integral part of these financial statements.
_____________ ____________________ Director Chief Financial Officer
____________________Chief Executive Officer
For UBL Fund Managers Limited(Management Company)
For the period from 05
February 2019 to 30 June 2019
For the period from 17 April
2019 to 30 June 2019
For the period from 30 May
2019 to 30 June 2019
Total
---------------------------------------------------------- (Rupees in '000) ----------------------------------------------------------
For the period from 09
November 2018 to 30 June 2019
SD SD SD

UBL Special Savings Fund Statement of Movement in Unit Holders' FundFor the period from 09 November 2018 to 30 June 2019
Capitalvalue
Undistributedincome
Unrealised diminution on revaluation of
fair value through OCI
Total Capitalvalue
Undistributedincome
Unrealised diminution on revaluation of
fair value through OCI
Total Capitalvalue
Undistributedincome
Unrealised diminution on revaluation of
fair value through OCI
Total Capitalvalue
Undistributedincome
Unrealised diminution on revaluation of
fair value through OCI
Total Capitalvalue
Undistributedincome
Unrealised diminution on revaluation of
fair value through OCI
Total
Issuance of 7,176,966, 9,414,054, 2,683,758, and 1,877,650 units
- Capital value 717,697 - - 717,697 941,405 - 941,405 268,376 - - 268,376 187,765 - - 187,765 2,115,243 - - 2,115,243- Element of income during the period relating to other comprehensive income (2) - - (2) 448 - - 448 (770) - - (770) (55) - - (55) (379) - - (379) relating to net income for the period after taxation 2,079 - - 2,079 8,288 - - 8,288 1,737 - - 1,737 184 - - 184 12,288 - - 12,288Total proceeds on issuance of units 719,774 - - 719,774 950,141 - - 950,141 269,343 - - 269,343 187,894 - - 187,894 2,127,152 - - 2,127,152
Redemption of 2,467,008, 156,230, 4,992, and 43,703 units
- Capital value (246,701) - - (246,701) (15,623) - - (15,623) (499) - - (499) (4,370) - - (4,370) (267,193) - - (267,193)- Element of income during the period relating to other comprehensive income (306) - - (306) 17 - - 17 1 - - 1 (5) - - (5) (293) - - (293) relating to net income for the period after taxation 641 (1,133) - (492) (149) (221) - (370) (1) (3) - (4) 11 (25) - (14) 502 (1,382) - (880)Total payments on redemption of units (246,366) (1,133) - (247,499) (15,755) (221) - (15,976) (499) (3) - (502) (4,364) (25) - (4,389) (266,984) (1,382) - (268,366)
Total comprehensive income for the period - 28,037 (11,665) 16,372 - 28,948 (24,654) 4,294 - 3,366 (2,970) 396 - 1,537 (515) 1,022 - 61,888 (39,804) 22,084
Distribution during the period
- UBL Special Savings Plan I @ Rs. 0.8513 per unit paid on 21 December 2018 (2,079) (3,124) - (5,203) - - - - - - - - - - - - (2,079) (3,124) - (5,203)
- UBL Special Savings Plan I @ Rs. 4.9878 per unit paid on 24 June 2019 (80) (23,644) - (23,724) - - - - - - - - - - - - (80) (23,644) - (23,724)
- UBL Special Savings Plan II @ Rs. 3.9974 per unit paid on 24 June 2019 - - - - (8,937) (27,703) - (36,640) - - - - - - - - (8,937) (27,703) - (36,640)
- UBL Special Savings Plan III @ Rs. 1.6531 per unit paid on 28 June 2019 - - - - - - - - (989) (3,423) - (4,412) - - - - (989) (3,423) - (4,412)
- UBL Special Savings Plan IV @ Rs. 0.9757 per unit paid on 28 June 2019 - - - - - - - - - - - - (150) (1,590) - (1,740) (150) (1,590) - (1,740)
Net income for the period less distribution (2,159) 1,269 (11,665) (12,555) (8,937) 1,245 (24,654) (32,346) (989) (57) (2,970) (4,016) (150) (53) (515) (718) (12,235) 2,404 (39,804) (49,635)
Net assets at end of the period 471,249 136 (11,665) 459,720 925,449 1,024 (24,654) 901,819 267,855 (60) (2,970) 264,825 183,380 (78) (515) 182,787 1,847,933 1,022 (39,804) 1,809,151
Accounting income available for distribution :- Relating to capital gains - - - - - - Excluding capital gains 26,904 28,727 3,363 1,512 60,506
26,904 28,727 3,363 1,512 60,506Distribution during the period
- UBL Special Savings Plan I @ Rs. 0.8513 per unit paid on 21 December 2018 (3,124) - - - (3,124)
- UBL Special Savings Plan I @ Rs. 4.9878 per unit paid on 24 June 2019 (23,644) - - - (23,644)
- UBL Special Savings Plan II @ Rs. 3.9974 per unit paid on 24 June 2019 - (27,703) - - (27,703)
- UBL Special Savings Plan III @ Rs. 1.6531 per unit paid on 28 June 2019 - - (3,423) - (3,423)
- UBL Special Savings Plan IV @ Rs. 0.9757 per unit paid on 28 June 2019 - - - (1,590) (1,590)
Undistributed income carried forward 136 1,024 (60) (78) 1,022
Undistributed income carried forward comprise of :- Realised income 136 1,024 (60) (78) 1,022- Unrealised income - - - - -
136 1,024 (60) (78) 1,022
(Rupees)
Net assets value per unit at end of the period 97.6060 97.4116 98.8607 99.6688
The annexed notes 1 to 30 form an integral part of these financial statements.
Director Chief Financial Officer
-----------------------------USSP-I-------------------------------------
------------------------------------------------- (Rupees in '000) -------------------------------------------------
For UBL Fund Managers Limited
Chief Executive Officer
Total
------------------------------------------------- (Rupees in '000) -------------------------------------------------
For the period from 30 May 2019 to
30 June 2019
____________________
------------------------------------------------- (Rupees in '000) -------------------------------------------------
-----------------------------USSP-IV-------------------------------------
(Management Company)
------------------------------------------------- (Rupees in '000) -------------------------------------------------
-----------------------------USSP-III------------------------------------------------------------------USSP-II-------------------------------------
------------------------------------------------- (Rupees in '000) -------------------------------------------------
___________________
For the period from 09 November 2018 to
30 June 2019
For the period from 17 April 2019 to
30 June 2019
For the period from 05 February 2019 to
30 June 2019
_____________SDSDSD

UBL Special Savings Fund Cash Flow StatementFor the period from 09 November 2018 to 30 June 2019
USSP-I USSP-II USSP-III USSP-IVNote
CASH FLOWS FROM OPERATING ACTIVITIESNet income for the period before taxation 28,037 28,948 3,366 1,537 61,888
Adjustments for non cash and other items:Markup on bank deposits and mark-up / return
on investments calculated using the effective
interest method (17,824) (14,902) (2,142) (1,273) (36,141)
Provision for Sindh Workers' Welfare Fund 561 580 68 31 1,240
Formation cost 241 - - - 241
Realised loss on sale of investments 1,503 1,071 - - 2,574
(15,519) (13,251) (2,074) (1,242) (32,086) Net cash generated from operations before
working capital changes 12,518 15,697 1,292 295 29,802
Working capital changesMovement in working capitalInvestments (431,226) (857,068) (257,633) (130,229) (1,676,156) Prepayments and other receivables - (22,152) - - (22,152) Preliminary expenses and floatation cost (1,131) - - - (1,131)
Profit receivable on PIBs (16,218) (33,272) (10,396) (5,283) (65,169) Advance tax (214) (39) (36) (3) (292)
Payable to the Management Company 2,447 983 1,957 219 5,606
Payable to Central Depository Company of
Pakistan Limited - Trustee 40 77 22 14 153
Payable to Securities and Exchange
Commission of Pakistan 229 213 23 10 475
Dividend payable - 627 - - 627
Accrued expenses and other payables 4,562 31,580 618 325 37,085 (441,511) (879,051) (265,445) (134,947) (1,720,954)
Profits received during the period 8,956 5,324 458 54 14,792 Net cash flows used in operating activities (420,037) (858,030) (263,695) (134,598) (1,676,360)
CASH FLOWS FROM FINANCING ACTIVITIES
Proceeds from issuance of units 18 717,615 941,206 268,163 177,851 2,104,835 Payments on redemption of units 18 (247,499) (15,976) (502) (4,389) (268,366) Total distribution to unit holders (26,768) (27,703) (3,423) (1,590) (59,484) Net cash flows generated from financing activities 443,348 897,527 264,238 171,872 1,776,985
Cash and cash equivalents at end of the period 23,311 39,497 543 37,274 100,625
CASH AND CASH EQUIVALENTS
Bank balances 23,311 39,497 543 37,274 100,625
The annexed notes 1 to 30 form an integral part of these financial statements.
____________________ _____________Chief Executive Officer Director
____________________
Chief Financial Officer
For UBL Fund Managers Limited
(Management Company)
For the period from 09
November 2018 to 30 June 2019
For the period from 05
February 2019 to 30 June 2019
For the period from 17 April
2019 to 30 June 2019
For the period from 30 May
2019 to 30 June 2019
Total
---------------------------------------------------------- (Rupees in '000) ----------------------------------------------------------
SDSD
SD SD SD

UBL Special Savings FundNotes to the Financial StatementsFor the period from 09 November 2018 to 30 June 2019
1. LEGAL STATUS AND NATURE OF BUSINESS
UBL Special Savings Fund (the Fund) was established under the Non Banking Finance Companies (Establishment & Regulation)Rules, 2003 (the NBFC Rules) and Non-Banking Finance Companies and Notified Entities Regulations, 2008 (NBFC Regulations)and was approved as an open end mutual fund by the Securities and Exchange Commission of Pakistan ("SECP"). It wasconstituted under a Trust Deed, dated 19 October 2018 between UBL Fund Managers Limited (a wholly owned subsidiary companyof United Bank Limited) as the Management Company and Central Depository Company of Pakistan Limited ("CDC") as the Trustee.The registered office of the Management Company is situated at 4th Floor STSM Building, Beaumont Road, Civil Lines Karachi. TheFund commenced its operations from 09 November 2018.
The Fund has been categorized by the Management Company as Capital protected fund. The Fund consists of four plans namely,UBL Special Savings Fund - Plan I ("USSP I"), UBL Special Savings Fund - Plan II ("USSP II"), UBL Special Savings Fund - Plan III("USSP III") and UBL Special Savings Fund - Plan IV ("USSP IV"). The investment objectives of each plan is as follows:
The "UBL Special Savings Plan-I (USSP-I)" shall be an open-end Capital Protected Fund that aims to not only provide its unit-holderscapital preservation but competitive regular returns from a portfolio of fixed income investments in line with the risk tolerance of theInvestor.
The “UBL Special Savings Plan-II (USSP-II)” is an allocation plan under “UBL Special Savings Fund” with an objective to earncompetitive regular return with capital preservation for unit holders who held their investment within Plan for thirty six (36) months& beyond from (commencement of life of Plan)
The “UBL Special Savings Plan-III (USSP-III)” is an allocation plan under “UBL Special Savings Fund” with an objective to earncompetitive regular return with capital preservation for unit holders who held their investment within Plan for thirty six (36) months& beyond from (commencement of life of Plan)
The “UBL Special Savings Plan-IV (USSP-IV)” is an allocation plan under “UBL Special Savings Fund” with an objective to earncompetitive regular return with capital preservation for unit holders who held their investment within Plan for twenty four (24)months & beyond from (commencement of life of Plan)
Title to the assets of the Fund are held in the name of Central Depository Company of Pakistan Limited as the Trustee of the Fund.
2. BASIS OF PREPARATION
2.1 Statement of compliance
These financial statements have been prepared in accordance with the accounting and reporting standards as applicable inPakistan. The accounting and reporting standards applicable in Pakistan comprise of:
- International Financial Reporting Standards (IFRS Standards) issued by the International Accounting Standards Board (IASB) asnotified under the Companies Act, 2017;
- Provisions of and directives issued under the Companies Act, 2017 along with part VIIIA of the repealed Companies Ordinance,1984; and
- Non-Banking Finance Companies (Establishment and Regulations) Rules, 2003 (the NBFC Rules) and Non-Banking FinanceCompanies and Notified Entities Regulations, 2008 (the NBFC Regulations).
Where provisions of and directives issued under the Companies Act, 2017, part VIIIA of the repealed Companies Ordinance, 1984,the NBFC Rules and the NBFC Regulations differ from the IFRS Standards, the provisions of and directives issued under theCompanies Act, 2017, part VIIIA of the repealed Companies Ordinance, 1984, the NBFC Rules and the NBFC Regulations havebeen followed.
The Fund is an open end mutual fund, listed on the Pakistan Stock Exchange Limited. Units of the Fund are offered for public subscription on a continuous basis. The units are transferable and can be redeemed by surrendering them to the Fund at the option of the unit holder.
2.2 Standards, interpretations and amendments to accounting and reporting standards, that are not yet effective:
The following International Financial Reporting Standards (IFRS Standards) as notified under the Companies Act, 2017 and theamendments and interpretations thereto will be effective for accounting periods beginning on or after 01 July 2019:
- IFRIC 23 ‘Uncertainty over Income Tax Treatments’ (effective for annual periods beginning on or after 01 January 2019), clarifiesthe accounting for income tax when there is uncertainty over income tax treatments under IAS 12. The interpretation requires theuncertainty over tax treatment be reflected in the measurement of current and deferred tax. The application of interpretation isnot likely to have an impact on Fund’s financial statements.
- IFRS 16 ‘Leases’ (effective for annual periods beginning on or after 01 January 2019). IFRS 16 replaces existing leasingguidance, including IAS 17 ‘Leases’, IFRIC 4 ‘Determining whether an Arrangement contains a Lease’, SIC-15 ‘OperatingLeases - Incentives’ and SIC-27 ‘Evaluating the Substance of Transactions Involving the Legal Form of a Lease’. IFRS 16introduces a single, on-balance sheet lease accounting model for lessees. A lessee recognizes a right-of-use asset representingits right to use the underlying asset and a lease liability representing its obligation to make lease payments. There arerecognition exemptions for short-term leases and leases of low-value items. Lessor accounting remains similar to the currentstandard i.e. lessors continue to classify leases as finance or operating leases. The application of the standard is not likely tohave an impact on Fund’s financial statements.
- Amendment to IFRS 9 ‘Financial Instruments’ – Prepayment Features with Negative Compensation (effective for annual periodsbeginning on or after 01 January 2019). For a debt instrument to be eligible for measurement at amortised cost or FVOCI, IFRS 9requires its contractual cash flows to meet the SPPI criterion – i.e. the cash flows are ‘solely payments of principal andinterest’. Some prepayment options could result in the party that triggers the early termination receiving compensation from theother party (negative compensation). The amendment allows that financial assets containing prepayment features with negativecompensation can be measured at amortised cost or at fair value through other comprehensive income (FVOCI) if they meet theother relevant requirements of IFRS 9. The application of amendment is not likely to have an impact on Fund’s financialstatements.
- Amendment to IAS 28 ‘Investments in Associates and Joint Ventures’ - Long Term Interests in Associates and Joint Ventures(effective for annual periods beginning on or after 01 January 2019). The amendment will affect companies that finance suchentities with preference shares or with loans for which repayment is not expected in the foreseeable future (referred to aslong-term interests or ‘LTI’). The amendment and accompanying example state that LTI are in the scope of both IFRS 9 and IAS28 and explain the annual sequence in which both standards are to be applied. The amendments are not likely to have an impacton Fund’s financial statements.
- Amendments to IAS 19 ‘Employee Benefits’- Plan Amendment, Curtailment or Settlement (effective for annual periods beginningon or after 01 January 2019). The amendments clarify that on amendment, curtailment or settlement of a defined benefit plan, acompany now uses updated actuarial assumptions to determine its current service cost and net interest for the period; and theeffect of the asset ceiling is disregarded when calculating the gain or loss on any settlement of the plan and is dealt withseparately in other comprehensive income. The application of amendments is not likely to have an impact on Fund’s financialstatements.
- Amendment to IFRS 3 ‘Business Combinations’ – Definition of a Business (effective for business combinations for which theacquisition date is on or after the beginning of annual periods beginning on or after 01 January 2020). The IASB has issuedamendments aiming to resolve the difficulties that arise when an entity determines whether it has acquired a business or agroup of assets. The amendments clarify that to be considered a business, an acquired set of activities and assets mustinclude, at a minimum, an input and a substantive process that together significantly contribute to the ability to create outputs.The amendments include an election to use a concentration test. The standard is effective for transactions in the future andtherefore would not have an impact on past financial statements.
- Amendments to IAS 1 Presentation of Financial Statements and IAS 8 Accounting Policies, Changes in Accounting Estimatesand Errors (effective for annual periods beginning on or after 01 January 2020). The amendments are intended to make thedefinition of material in IAS 1 easier to understand and are not intended to alter the underlying concept of materiality in IFRSStandards. In addition, the IASB has also issued guidance on how to make materiality judgments when preparing their generalpurpose financial statements in accordance with IFRS Standards.
- On 29 March 2018, the International Accounting Standards Board (the IASB) has issued a revised Conceptual Framework forFinancial Reporting which is applicable immediately contains changes that will set a new direction for IFRS in the future. TheConceptual Framework primarily serves as a tool for the IASB to develop standards and to assist the IFRS InterpretationsCommittee in interpreting them. It does not override the requirements of individual IFRSs and any inconsistencies with therevised Framework will be subject to the usual due process – this means that the overall impact on standard setting may takesome time to crystallise. The companies may use the Framework as a reference for selecting their accounting policies in theabsence of specific IFRS requirements. In these cases, entities should review those policies and apply the new guidanceretrospectively as of 01 January 2020, unless the new guidance contains specific scope outs.
- Annual Improvements to IFRS Standards 2015–2017 Cycle - the improvements address amendments to following accountingand reporting standards:

- IFRS 3 Business Combinations and IFRS 11 Joint Arrangement - the amendment aims to clarify the accounting treatmentwhen a company increases its interest in a joint operation that meets the definition of a business. A company remeasures itspreviously held interest in a joint operation when it obtains control of the business. A company does not remeasure itspreviously held interest in a joint operation when it obtains joint control of the business.
- IAS 12 Income Taxes - the amendment clarifies that all income tax consequences of dividends (including payments onfinancial instruments classified as equity) are recognized consistently with the transaction that generates the distributableprofits.
- IAS 23 Borrowing Costs - the amendment clarifies that a company treats as part of general borrowings any borrowingoriginally made to develop an asset when the asset is ready for its intended use or sale.
The above amendments are effective from annual periods beginning on or after 01 July 2019 and are not likely to have an impacton Fund’s financial statements.
2.3 Critical accounting estimates and judgments The preparation of financial statements in conformity with accounting and reporting standards as applicable in Pakistan requiresmanagement to make judgments, estimates and assumptions that affect the application of accounting policies and the reportedamounts of assets, liabilities, income and expenses. The estimates and associated assumptions are based on historical experienceand various other factors that are believed to be reasonable under the circumstances, the results of which form the basis of makingthe judgments about the carrying values of assets and liabilities that are not readily apparent from other sources. Actual results maydiffer from these estimates.
The estimates and underlying assumptions are reviewed on an ongoing basis. Revisions to accounting estimates are recognized inthe period in which the estimates are revised if the revision affects only that period, or in the period of the revision and futureperiods if the revision affects both current and future periods. The areas where various assumptions and estimates are significant tothe Fund's financial statements or where judgment was exercised in the application of accounting policies are given below:
a) Judgments
Information about judgments made in applying accounting policies that have the most significant effects on the amountsrecognised in the financial statements is included in note 3.2.1 - Regarding the classification of investments.
b) Assumptions and estimation uncertainties
Information about assumptions and estimation uncertainties that have a significant risk of resulting in a material adjustment inthe financial statements for the period ended 30 June 2019 is included in the following notes:
- Notes 3.2.3 and 3.2.4 - Valuation of investments- Notes 3.2.5 Impairment of financial assets and other assets
2.4 Basis of measurement
These financial statements have been prepared under the historical cost convention except for the investments which are stated atfair value.
2.5 Functional and presentation currency
These financial statements are presented in Pak Rupees which is the functional and presentation currency of the Fund. All amountshave been rounded to the nearest thousand, unless otherwise stated.
3. SIGNIFICANT ACCOUNTING POLICIES
The management has adopted the following significant policies for the preparation of these financial statements:
3.1 Cash and cash equivalents
Cash and cash equivalents are carried in the Statement of Assets and Liabilities at amortised cost. These comprise of depositswith banks and highly liquid investments with original maturities of three months or less and that are readily convertible to knownamounts of cash, are subject to an insignificant risk of changes in value and are held for the purpose of meeting short term cashcommitments rather than for investments for other purposes.

3.2 Financial assets
3.2.1 Classification
On initial recognition, a financial asset is classified as measured at: amortised cost, FVOCI or FVTPL.
A financial asset is measured at amortised cost if it meets both of the following conditions and is not designated as at FVTPL:
- it is held within a business model whose objective is to hold assets to collect contractual cash flows; and- its contractual terms give rise on specified dates to cash flows that are solely payments of principal and interest on the principal
amount outstanding.
A debt security is measured at FVOCI if it meets both of the following conditions and is not designated as at FVTPL:
- it is held within a business model whose objective is achieved by both collecting contractual cash flows and selling financialassets; and
- its contractual terms give rise on specified dates to cash flows that are solely payments of principal and interest on theprincipal amount outstanding.
All financial assets not classified as measured at amortised cost or FVOCI as described above are measured at FVTPL. On initialrecognition, the Fund may irrevocably designate a financial asset that otherwise meets the requirements to be measured atamortised cost or at FVOCI as at FVTPL if doing so eliminates or significantly reduces an accounting mismatch that wouldotherwise arise.
Business model assessment
The Fund makes an assessment of the objective of a business model in which an asset is held at a portfolio level because thisbest reflects the way the business is managed and information is provided to management. The information considered includes:
- the stated policies and objectives for the portfolio and the operation of those policies in practice. In particular, whethermanagement’s strategy focuses on earning contractual interest revenue, maintaining a particular interest rate profile orrealising cash flows through the sale of the assets;
- how the performance of the portfolio is evaluated and reported to the Fund’s management;
- the risks that affect the performance of the business model (and the financial assets held within that business model) andits strategy for how those risks are managed;
- how managers of the business are compensated (e.g. whether compensation is based on the fair value of the assetsmanaged or the contractual cash flows collected); and
- the frequency, volume and timing of sales in prior periods, the reasons for such sales and its expectations about future salesactivity. However, information about sales activity is not considered in isolation, but as part of an overall assessment of howthe Fund’s stated objectives for managing the financial assets are achieved and how cash flows are realised.
Financial assets that are held for trading or managed and whose performance is evaluated on a fair value basis are measured atFVTPL because they are neither held to collect contractual cash flows nor held both to collect contractual cash flows and to sellfinancial assets.

Assessment of whether contractual cash flows are solely payments of principal and interest
For the purposes of this assessment on debt securities, ‘principal’ is defined as the fair value of the financial asset on initialrecognition. ‘Interest’ is defined as consideration for the time value of money and for the credit risk associated with the principalamount outstanding during a particular period of time and for other basic lending risks and costs (e.g. liquidity risk and
administrative costs), as well as profit margin.
In assessing whether the contractual cash flows are SPPI, the Fund considers the contractual terms of the instrument. Thisincludes assessing whether the financial asset contains a contractual term that could change the timing or amount ofcontractual cash flows such that it would not meet this condition. In making the assessment, the Fund considers:
- contingent events that would change the amount and timing of cash flows;- leverage features;- prepayment and extension terms;- terms that limit the Fund’s claim to cash flows from specified assets (e.g. non-recourse loans); and- features that modify consideration of the time value of money (e.g. periodical reset of interest rates).
3.2.2 Regular way contracts
Regular purchases and sales of financial assets are recognised on the trade date - the date on which the Fund commits to purchase
or sell the asset.
3.2.3 Initial recognition and measurement
Financial assets are recognised at the time the Fund becomes a party to the contractual provisions of the instruments. These areinitially recognised at fair value plus transaction costs except for financial assets carried at fair value through profit or loss. Financialassets carried at fair value through profit or loss are initially recognised at fair value and transaction costs associated with thesefinancial assets are charged to the Income Statement.
3.2.4 Subsequent measurement
The following accounting policies apply to the subsequent measurement of financial assets:
Financial assets at FVTPL These assets are subsequently measured at fair value. Net gains and losses, including any profit/ markup or dividend income, are recognised in income statement.
Financial assets at These assets are subsequently measured at amortised cost using the effective interest method.amortised cost The amortised cost is reduced by impairment losses. Profit / markup income, foreign exchange
gains and losses and impairment are recognised in income statement.
Debt securities at FVOCI These assets are subsequently measured at fair value. Profit / markup income calculated using theeffective interest method, foreign exchange gains and losses and impairment are recognised inincome statement. Other net gains and losses are recognised in OCI. On derecognition, gains andlosses accumulated in OCI are reclassified to income statement.

The fair value of financial assets are determined as follows:
a) Debt securities (other than Government securities)
Debt securities are valued on the basis of rates determined by the Mutual Funds Association of Pakistan (MUFAP) inaccordance with the methodology prescribed by SECP for valuation of debt securities vide its Circular No. 33 of 2012 dated 24October 2012. In the determination of the rates, MUFAP takes into account the holding pattern of these securities andcategorises them as traded, thinly traded and non-traded securities. The circular also specifies the valuation process to befollowed for each category as well as the criteria for the provisioning of non-performing debt securities.
b) Government securities
The government securities are valued on the basis of rates announced by the Financial Markets Association of Pakistan.
3.2.5 Impairment of financial assets
In relation to the impairment of financial assets, IFRS 9 requires an expected credit loss model. The expected credit loss modelrequires an entity to account for expected credit losses and changes in those expected credit losses at each reporting date toreflect changes in credit risk since initial recognition. In other words, it is no longer necessary for a credit event to have occurredbefore credit losses are recognized. However, SECP through its SCD/AMCW/RS/MUFAP/2017-148 dated 21 November 2017 havedeferred the applicability of impairment requirements of IFRS 9 in relation to debt securities for mutual funds and have instructed tocontinue to follow the requirements of Circular No. 33 of 2012 dated 24 October 2012. However, the circular does not coverimpairment requirements for government debt securities. Based on the past performance management considers that there is no probability of default as in any adverse situation State Bank of Pakistan has the right to discharge government obligations by issuance of currency notes. The provisioning policy has been duly formulated and approved by the Board of Directors of theManagement Company.
3.2.6 Reclassifications
Financial assets are not reclassified subsequent to their initial recognition unless the Fund were to change its business model formanaging financial assets, in which case all affected financial assets would be reclassified on the first day of the first reportingperiod following the change in the business model.
3.3 Derecognition
Financial assets are derecognised when the rights to receive cash flows from the financial assets have expired or have beentransferred and where the Fund has transferred substantially all risks and rewards of ownership.
3.4 Offsetting of financial instruments
Financial assets and financial liabilities are offset and the net amount reported in the Statement of Assets and Liabilities when thereis a legally enforceable right to set off the recognised amounts and there is an intention to settle on a net basis, or to realize theassets and settle the liabilities simultaneously.
3.5 Financial liabilities
Financial liabilities are recognised at the time when the Fund becomes a party to the contractual provisions of the instruments.These are initially recognised at fair values and subsequently stated at amortised cost.
A financial liability is derecognised when the obligation under the liability is discharged, cancelled or expires.
3.6 Deferred formation cost
This represents expenses incurred on the formation of the Fund. As permitted in the Non-Banking Finance Companies and NotifiedEntities Regulations, 2008, these expenses are being amortised to the income statement over a period of three years (effectivefrom 09 November 2018).
3.7 Unitholders' fund
Unitholders' fund representing the units issued by the Fund, is carried at the redemption amount representing the investors’ right to
a residual interest in the Fund’s assets.
3.8 Revenue recognition
- Mark-up on deposits with banks and mark-up / return on investments in debt and government securities is recognised usingeffective yield method.
- Realised gains / (losses) arising on sale of investments are included in the Income Statement on the date at which thetransaction takes place.
3.9 Issuance and redemption of units
Units issued are recorded at the offer price, determined by the Management Company for the applications received, by thedistributors / Management Company during business hours, as of the close of the previous day on which the applications werereceived. The offer price represents the net assets value per unit as of the close of previous day plus the allowable sales load,provision for transaction costs and any provision for duties and charges, if applicable.
Units redeemed are recorded at the redemption price, applicable to units as of the close of the previous day. The redemption pricerepresents the net assets value per unit as of the close of the previous day on which the applications were received less anyback-end load, any duties, taxes, charges on redemption and any provision for transaction costs, if applicable.
3.10 Element of income
Element of Income represents the difference between net assets value on the issuance or redemption date, as the case may be, ofunits and the Net asset Value (NAV) at the beginning of the relevant accounting period.
Element of Income is a transaction of capital nature and the receipt and payment of element of income is taken to unit holders'fund; however, to maintain same ex-dividend net assets value of all units outstanding on accounting date, net element of incomecontributed on issue of units lying in unit holders fund is refunded on units (refund of capital) in the same proportion as dividendbears to accounting income available for distribution. As per guideline provided by MUFAP (MUFAP Guidelines consented upon bySECP) the refund of capital is made in the form of additional units at zero price.
MUFAP, in consultation with the SECP, has specified methodology for determination of income paid on units redeemed (incomealready paid) during the year under which such income is paid on gross element received and is calculated from the latest date atwhich the Fund achieved net profitability during the year. The income already paid (Element of Income) on redemption of unitsduring the year are taken separately in statement of movement in unitholders' fund.
3.11 Zakat Payable
Zakat payment is the responsibility of each unit holder. Nevertheless, the Fund follows the provisions of Zakat and Ushr Ordinance,1980. Units held by individual resident Pakistani unit holders are subject to Zakat at 2.5% of the par value of unit under the saidOrdinance, except those exempted from Zakat. Zakat is deducted at source from dividend or from redemption proceeds, if units areredeemed during the Zakat year before the payment of Zakat.
3.12 Provisions
Provisions are recognised when the Fund has a present legal or constructive obligation as a result of past events, it is probable thatan outflow of resources embodying economic benefits will be required to settle the obligation and a reliable estimate of the amountof obligation can be made. Provisions are reviewed at each balance sheet date and are adjusted to reflect the current best estimate.
3.13 Net assets value per unit
The net assets value per unit as disclosed on the Statement of Assets and Liabilities is calculated by dividing the net assets of theFund by the number of units outstanding at the year end.
3.14 Taxation
The Fund is exempt from income tax under clause 99 of Part I of the Second Schedule to the Income Tax Ordinance, 2001, subjectto the condition that not less than ninety percent of its accounting income for the year as reduced by capital gains, whether realisedor unrealised, is distributed among the unit holders. Provided that for the purpose of determining distribution of atleast ninety percentof its accounting income for the year, the income distributed through bonus units shall not be taken into account.
The Fund is also exempt from the provisions of section 113 (minimum tax) under clause 11A of Part IV of the Second Schedule tothe Income Tax Ordinance, 2001.
3.15 Expenses
All expenses including Management fee, Trustee fee and Securities and Exchange Commission of Pakistan fee are recognised inthe Income Statement on accrual basis.
3.16 Earnings per unit
Earnings per unit based on cumulative weighted average units for the period has not been disclosed as in the opinion of theManagement Company the determination of the same is not practicable.
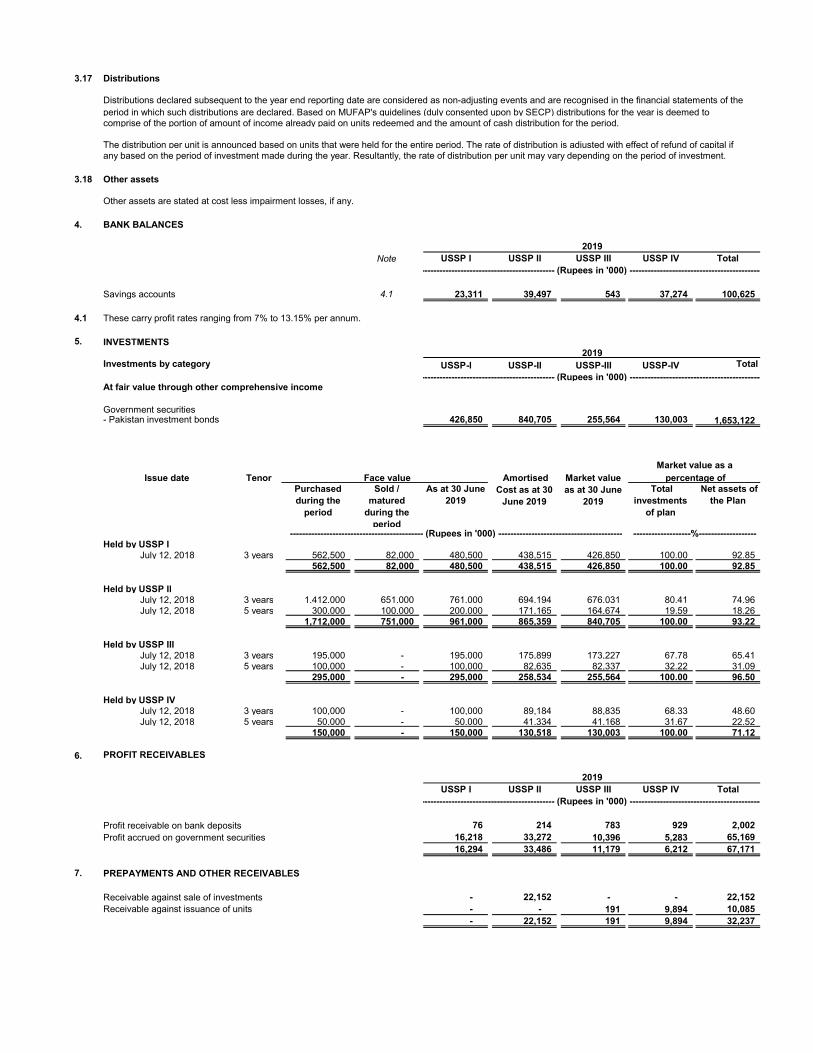
3.17 Distributions
Distributions declared subsequent to the year end reporting date are considered as non-adjusting events and are recognised in the financial statements of theperiod in which such distributions are declared. Based on MUFAP's guidelines (duly consented upon by SECP) distributions for the year is deemed tocomprise of the portion of amount of income already paid on units redeemed and the amount of cash distribution for the period.
The distribution per unit is announced based on units that were held for the entire period. The rate of distribution is adjusted with effect of refund of capital ifany based on the period of investment made during the year. Resultantly, the rate of distribution per unit may vary depending on the period of investment.
3.18 Other assets
Other assets are stated at cost less impairment losses, if any.
4. BANK BALANCES
Note USSP I USSP II USSP III USSP IV Total
Savings accounts 4.1 23,311 39,497 543 37,274 100,625
4.1 These carry profit rates ranging from 7% to 13.15% per annum.
5. INVESTMENTS
Investments by category USSP-I USSP-II USSP-III USSP-IV Total
At fair value through other comprehensive income
Government securities- Pakistan investment bonds 426,850 840,705 255,564 130,003 1,653,122
Held by USSP I3 years 562,500 82,000 480,500 438,515 426,850 100.00 92.85
562,500 82,000 480,500 438,515 426,850 100.00 92.85
Held by USSP II3 years 1,412,000 651,000 761,000 694,194 676,031 80.41 74.96 5 years 300,000 100,000 200,000 171,165 164,674 19.59 18.26
1,712,000 751,000 961,000 865,359 840,705 100.00 93.22
Held by USSP III3 years 195,000 - 195,000 175,899 173,227 67.78 65.41 5 years 100,000 - 100,000 82,635 82,337 32.22 31.09
295,000 - 295,000 258,534 255,564 100.00 96.50
Held by USSP IV3 years 100,000 - 100,000 89,184 88,835 68.33 48.60 5 years 50,000 - 50,000 41,334 41,168 31.67 22.52
150,000 - 150,000 130,518 130,003 100.00 71.12
6. PROFIT RECEIVABLES
USSP I USSP II USSP III USSP IV Total
Profit receivable on bank deposits 76 214 783 929 2,002 Profit accrued on government securities 16,218 33,272 10,396 5,283 65,169
16,294 33,486 11,179 6,212 67,171
7. PREPAYMENTS AND OTHER RECEIVABLES
Receivable against sale of investments - 22,152 - - 22,152 Receivable against issuance of units - - 191 9,894 10,085
- 22,152 191 9,894 32,237
July 12, 2018
July 12, 2018July 12, 2018
July 12, 2018
July 12, 2018July 12, 2018
July 12, 2018
Issue date Tenor Amortised Cost as at 30
June 2019 Purchased during the
period
Sold / matured
during the period
As at 30 June 2019
2019
------------------------------------------------------------------------------------------ (Rupees in '000) ------------------------------------------------------------------------------------------
Total investments
of plan
Net assets of the Plan
-------------------%-------------------
2019
------------------------------------------------------------------------------------------ (Rupees in '000) ------------------------------------------------------------------------------------------
2019
-------------------------------------------- (Rupees in '000) -----------------------------------------
------------------------------------------------------------------------------------- (Rupees in '000) -------------------------------------------------------------------------------------
Face valueMarket value as a
Market value as at 30 June
2019
percentage of

8. PRELIMINARY EXPENSES AND FLOATATION COST2019
USSP I(Rupees in '000)
Deferred fomation cost 1,131 Amortisation during the period (241) Unamortised formation cost at end of the period 890
8.1 As per the offering documents all preliminary and floatation expenses of the Fund including expenses incurred inconnection with the establishment and authorisation of the Fund, including execution and registration of the ConstitutiveDocuments, issue, legal costs, printing, circulation and publication of the Offering Document, and all expenses incurredfor announcing the Fund and other expenses during and up to the Initial Offering Period (IOP), shall be borne andreimbursed by the Fund to the Management Company subject to the audit of expenses. Deferred formation cost shallbe borne by the Fund and amortised within the maturity of plan which is 36 months.
9. ADVANCE TAX
The income of the Fund is exempt from tax under clause 99 of Part I of the Second Schedule to the Income TaxOrdinance, 2001 (ITO 2001). Further, the Fund is exempt under clause 47(B) of Part IV of Second Schedule to the ITO2001 from withholding of tax under section 150A, 151 and 233 of ITO 2001. The Federal Board of Revenue through acircular “C.No.1 (43) DG (WHT)/ 2008-Vol.II- 66417-R” dated 12 May 2015, made it mandatory to obtain exemptioncertificates under section 159 (1) of the ITO 2001 from Commissioner Inland Revenue (CIR). During the period, prior toreceiving tax exemption certificate(s) from CIR various withholding agents have deducted advance tax under section151 of ITO 2001. The management is confident that the same shall be refunded after filing of Income Tax Return forTax year 2019.
10. PAYABLE TO THE MANAGEMENT COMPANY
NoteUSSP I USSP II USSP III USSP IV Total
Management remuneration payable 10.1 451 855 244 155 1,705 Payable against formation cost 1,137 - - - 1,137 Sales load and other payables 363 128 1,713 64 2,268 Payable against selling and marketing expense 10.2 496 - - - 496
2,447 983 1,957 219 5,606
10.1 As per regulation 61 of amended Non-Banking Finance Companies and Notified Entities Regulations, 2008 (the NBFCRegulations), the Management Company of the Fund is entitled to remuneration equal to an amount not exceeding 1%of average annual net assets in case of Income Scheme. The Management Company has charged remuneration at therate of 1% per annum of the average daily net assets of the Fund. The remuneration is paid to the ManagementCompany on monthly basis in arrears.
10.2 Securities and Exchange Commission of Pakistan vide Circular No. 5 of 2018 dated 04 June 2018, has allowed AssetManagement Companies to charge Selling and Marketing expenses to its CIS's at a maximum cap of 0.4% per annumof net assets of the Fund or actual expenses whichever is lower. Accordingly, the Management Company has charged0.4% on daily net assets of the Fund, being the lower amount.
11. PAYABLE TO CENTRAL DEPOSITORY COMPANY OF PAKISTAN LIMITED - TRUSTEE
NoteUSSP I USSP II USSP III USSP IV Total
Trustee remuneration 11.1 35 68 19 12 134 Sindh Sales Tax on Trustee remuneration 11.2 5 9 3 2 19
40 77 22 14 153
2019
------------------------------------------------------------------------------------------ (Rupees in '000) ------------------------------------------------------------------------------------------
2019
------------------------------------------------------------------------------------------ (Rupees in '000) ------------------------------------------------------------------------------------------
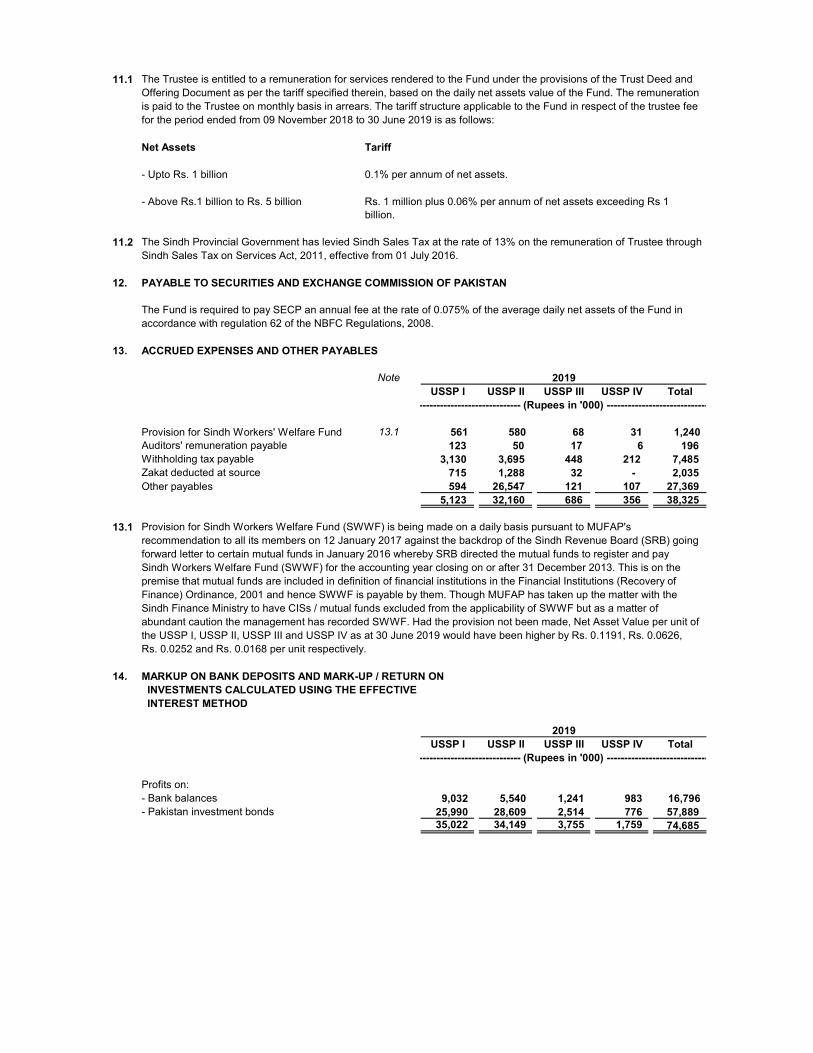
11.1 The Trustee is entitled to a remuneration for services rendered to the Fund under the provisions of the Trust Deed andOffering Document as per the tariff specified therein, based on the daily net assets value of the Fund. The remunerationis paid to the Trustee on monthly basis in arrears. The tariff structure applicable to the Fund in respect of the trustee feefor the period ended from 09 November 2018 to 30 June 2019 is as follows:
Net Assets Tariff
- Upto Rs. 1 billion 0.1% per annum of net assets.
- Above Rs.1 billion to Rs. 5 billion Rs. 1 million plus 0.06% per annum of net assets exceeding Rs 1billion.
11.2 The Sindh Provincial Government has levied Sindh Sales Tax at the rate of 13% on the remuneration of Trustee throughSindh Sales Tax on Services Act, 2011, effective from 01 July 2016.
12. PAYABLE TO SECURITIES AND EXCHANGE COMMISSION OF PAKISTAN
The Fund is required to pay SECP an annual fee at the rate of 0.075% of the average daily net assets of the Fund inaccordance with regulation 62 of the NBFC Regulations, 2008.
13. ACCRUED EXPENSES AND OTHER PAYABLES
NoteUSSP I USSP II USSP III USSP IV Total
Provision for Sindh Workers' Welfare Fund 13.1 561 580 68 31 1,240 Auditors' remuneration payable 123 50 17 6 196 Withholding tax payable 3,130 3,695 448 212 7,485 Zakat deducted at source 715 1,288 32 - 2,035 Other payables 594 26,547 121 107 27,369
5,123 32,160 686 356 38,325
13.1 Provision for Sindh Workers Welfare Fund (SWWF) is being made on a daily basis pursuant to MUFAP'srecommendation to all its members on 12 January 2017 against the backdrop of the Sindh Revenue Board (SRB) goingforward letter to certain mutual funds in January 2016 whereby SRB directed the mutual funds to register and paySindh Workers Welfare Fund (SWWF) for the accounting year closing on or after 31 December 2013. This is on thepremise that mutual funds are included in definition of financial institutions in the Financial Institutions (Recovery ofFinance) Ordinance, 2001 and hence SWWF is payable by them. Though MUFAP has taken up the matter with theSindh Finance Ministry to have CISs / mutual funds excluded from the applicability of SWWF but as a matter ofabundant caution the management has recorded SWWF. Had the provision not been made, Net Asset Value per unit ofthe USSP I, USSP II, USSP III and USSP IV as at 30 June 2019 would have been higher by Rs. 0.1191, Rs. 0.0626,Rs. 0.0252 and Rs. 0.0168 per unit respectively.
14. MARKUP ON BANK DEPOSITS AND MARK-UP / RETURN ON INVESTMENTS CALCULATED USING THE EFFECTIVE INTEREST METHOD
USSP I USSP II USSP III USSP IV Total
Profits on:- Bank balances 9,032 5,540 1,241 983 16,796 - Pakistan investment bonds 25,990 28,609 2,514 776 57,889
35,022 34,149 3,755 1,759 74,685
2019
2019
------------------------------------------------------------------------------------------ (Rupees in '000) ------------------------------------------------------------------------------------------
------------------------------------------------------------------------------------------ (Rupees in '000) ------------------------------------------------------------------------------------------

15. REALISED LOSS ON SALE OF INVESTMENTS
USSP I USSP II USSP III USSP IV Total
Investment at fair value through other comprehensive income
- Pakistan investment bonds (1,503) (1,071) - - (2,574) (1,503) (1,071) - - (2,574)
16. AUDITORS’ REMUNERATION
Annual audit fee 87 35 13 5 140 Half yearly review fee 76 - - - 76 Fee for certifications and other services 88 12 3 1 104 Out of pocket expenses 14 3 1 - 18
265 50 17 6 338
17. CONTINGENCIES AND COMMITMENTS
As at 30 June 2019, there are no contingencies and commitments.
18. RECONCILIATION OF LIABILITIES ARISING OUT OF Receivable Payable TotalFINANCING ACTIVITIES against against
sale of units redemptionof units
USSP I
Receivable against issuance of units 717,615 - 717,615 Payable against redemption of units - (247,499) (247,499)
717,615 (247,499) 470,116
Amount received on issuance of units 717,615 - 717,615 Amount paid on redemption of units - (247,499) (247,499)
717,615 (247,499) 470,116
Closing balance as at 30 June 2019 - - -
USSP II
Receivable against issuance of units 941,206 - 941,206 Payable against redemption of units - (15,976) (15,976)
941,206 (15,976) 925,230
Amount received on issuance of units 941,206 - 941,206 Amount paid on redemption of units - (15,976) (15,976)
941,206 (15,976) 925,230
Closing balance as at 30 June 2019 - - -
USSP III
Receivable against issuance of units 268,354 - 268,354 Payable against redemption of units - (502) (502)
268,354 (502) 267,852
Amount received on issuance of units 268,163 - 268,163 Amount paid on redemption of units - (502) (502)
268,163 (502) 267,661
Closing balance as at 30 June 2019 191 - 191
USSP IV
Receivable against issuance of units 187,745 - 187,745 Payable against redemption of units - (4,389) (4,389)
187,745 (4,389) 183,356
Amount received on issuance of units 177,851 - 177,851 Amount paid on redemption of units - (4,389) (4,389)
177,851 (4,389) 173,462
Closing balance as at 30 June 2019 9,894 - 9,894
------------------ (Rupees in '000) -----------------
2019
------------------------------------------------------------------------------------------ (Rupees in '000) ------------------------------------------------------------------------------------------

19. TOTAL EXPENSE RATIO (TER)
The Securities and Exchange Commission of Pakistan (SECP) vide directive no. SCD/PRDD/Direction/18/2016 dated 20 July 2016,requires that Collective Investment Scheme (CIS) shall disclose Total Expense Ratio (all the expenses, including government levies,incurred during the year divided by average net assets value for the year) in the periodic financial statements of CIS / the Fund.
USSP I USSP II USSP III USSP IV
Total expense ratio 1.22% 0.63% 0.34% 0.14%
Government levy, SWWF and SECP fee 0.26% 0.17% 0.09% 0.04%
20. TAXATION
The Fund's income is exempt from Income Tax as per clause (99) of part I of the Second Schedule to the Income Tax Ordinance, 2001subject to the condition that not less than 90% of the accounting income for the period as reduced by capital gains whether realised orunrealised is distributed amongst the unit holders. Provided that for the purpose of determining distribution of at least 90% of accountingincome, the income distributed through bonus shares, units or certificates as the case may be, shall not be taken into account.Furthermore, as per regulation 63 of the Non-Banking Finance Companies and Notified Entities Regulations, 2008, the Fund is required todistribute 90% of the net accounting income other than capital gains to the unit holders. The Fund has distributed more than ninetypercent of the Fund's accounting income for the period as reduced by capital gains, whether realised or unrealised, to its unit holdersduring the period. Accordingly, no provision has been made in the financial statements for the period ended 30 June 2019.
21. TRANSACTIONS WITH CONNECTED PERSONS / RELATED PARTIES
Connected persons / related parties comprise of United Bank Limited (Holding Company of Management Company), UBL FundManagers Limited (Management Company), Al - Ameen Islamic Financial Services (Private) Limited (Subsidiary of the ManagementCompany), entities under the common management or directorship, Central Depository Company of Pakistan Limited as trustee andcustodian of the Fund, the directors and officers of the Management Company and unit holders holding 10% or more of the Fund's netassets.
Remuneration payable to the Management Company and the Trustee is determined in accordance with the provisions of the NBFCRules, NBFC Regulations and the Trust Deed respectively.
All other transactions with related parties / connected persons are in the normal course of business, at contracted rates and termsdetermined in accordance with the market rates.
Details of transactions with related parties / connected persons and balances with them at the period end are as follows:
USSP I
Transactions during the period
Units issued 201,498 - - - - - Units redeemed 201,498 - - - - - Dividend paid 1,703 - - - - - Remuneration 3,061 - 294 - - - Sindh sales tax on remuneration 398 - 38 - - - Selling and marketing expense 636 - - - - -
Balances held
Remuneration payable* 451 - 40 - - - Sales load and other payables 363 - - - - - Formation cost payable 1,137 - - - - - Payable against selling and marketing 496 - - - - -
* These balances are inclusive of Sindh Sales Tax.
Funds under common
management
Directors and key
executives
2019
2019
------------------------------------------------------ (Rupees in '000) ------------------------------------------------------
Other connected persons /
related parties
Management Company
Associated companies
Trustee

USSP II
Transactions during the period
Remuneration 2,838 - 262 - - -
Sindh sales tax on remuneration 369 - 34 - - -
Balances held
Remuneration payable* 855 - 77 - - -
Sales load and other payables 128 - - - - -
* These balances are inclusive of Sindh Sales Tax.
USSP III
Transactions during the period
Units issued - - - - - 108,794
Dividend paid - - - - - 1,755
Remuneration 306 - 27 - - -
Sindh sales tax on remuneration 40 - 4 - - -
Balances held
Units held (units in '000) - - - - - 1,069
Units held (Rupees in '000) - - - - - 105,682
Remuneration payable* 244 - 22 - - -
Sales load and other payables 1,713 - - - - -
* These balances are inclusive of Sindh Sales Tax.
USSP IV
Transactions during the period
Units issued - - - - - 85,611
Dividend paid - - - - - 828
Remuneration 137 - 12 - - -
Sindh sales tax on remuneration 18 - 1 - - -
Balances held
Units held (units in '000) - - - - - 856
Units held (Rupees in '000) - - - - - 85,316
Remuneration payable* 155 - 14 - - -
Sales load and other payables 64 - - - - -
* These balances are inclusive of Sindh Sales Tax.
------------------------------------------------------ (Rupees in '000) ------------------------------------------------------
Management Company
Associated companies
Trustee Funds under common
management
Directors and key
executives
Other connected persons /
related parties
2019

22. FINANCIAL INSTRUMENTS BY CATEGORY
Financial AssetsBank balances - - 23,311 23,311 Investments - 426,850 - 426,850 Profit receivable - - 16,294 16,294 Prepayments and other receivables - - - -
- 426,850 39,605 466,455
Financial liabilitiesPayable to the Management Company 2,447 2,447 Payable to Central Depository Company of Pakistan Limited - Trustee 40 40 Accrued expenses and other payables 4,562 4,562
7,049 7,049
Financial AssetsBank balances - - 39,497 39,497 Investments - 840,705 - 840,705 Profit receivable - - 33,486 33,486 Prepayments and other receivables - - 22,152 22,152
- 840,705 95,135 935,840
Financial liabilitiesPayable to the Management Company 983 983 Payable to Central Depository Company of Pakistan Limited - Trustee 77 77 Dividend payable 627 627 Accrued expenses and other payables 31,580 31,580
33,267 33,267
Financial AssetsBank balances - - 543 543 Investments - 255,564 - 255,564 Profit receivable - - 11,179 11,179 Prepayments and other receivables - - 191 191
- 255,564 11,913 267,477
Financial liabilitiesPayable to the Management Company 1,957 1,957 Payable to Central Depository Company of Pakistan Limited - Trustee 22 22 Accrued expenses and other payables 618 618
2,597 2,597
-------------------------------- (Rupees in '000) ----------------------------------
-------------------------------- (Rupees in '000) ----------------------------------
USSP IIIAt fair value
through profit or loss
At fair value through other
comprehensive income
At amortised cost
Total
At amortised cost
At fair value through other
comprehensive income
2019USSP I
At fair value through other
comprehensive income
Total At amortised cost
-------------------------------- (Rupees in '000) ----------------------------------
At fair value through profit
or loss
At fair value through profit
or loss
USSP II Total

-
130,003
53,380
183,383
Financial liabilitiesPayable to the Management Company 219 219 Payable to Central Depository Company of Pakistan Limited - Trustee 14 14 Accrued expenses and other payables 325 325
558 558
Financial AssetsBank balances - - 37,274 37,274 Investments - 130,003 - 130,003 Profit receivable - - 6,212 6,212 Prepayments and other receivables - - 9,894 9,894
-------------------------------- (Rupees in '000) ----------------------------------
USSP IVAt fair value
through profit or loss
At fair value through other
comprehensive income
At amortised cost
Total
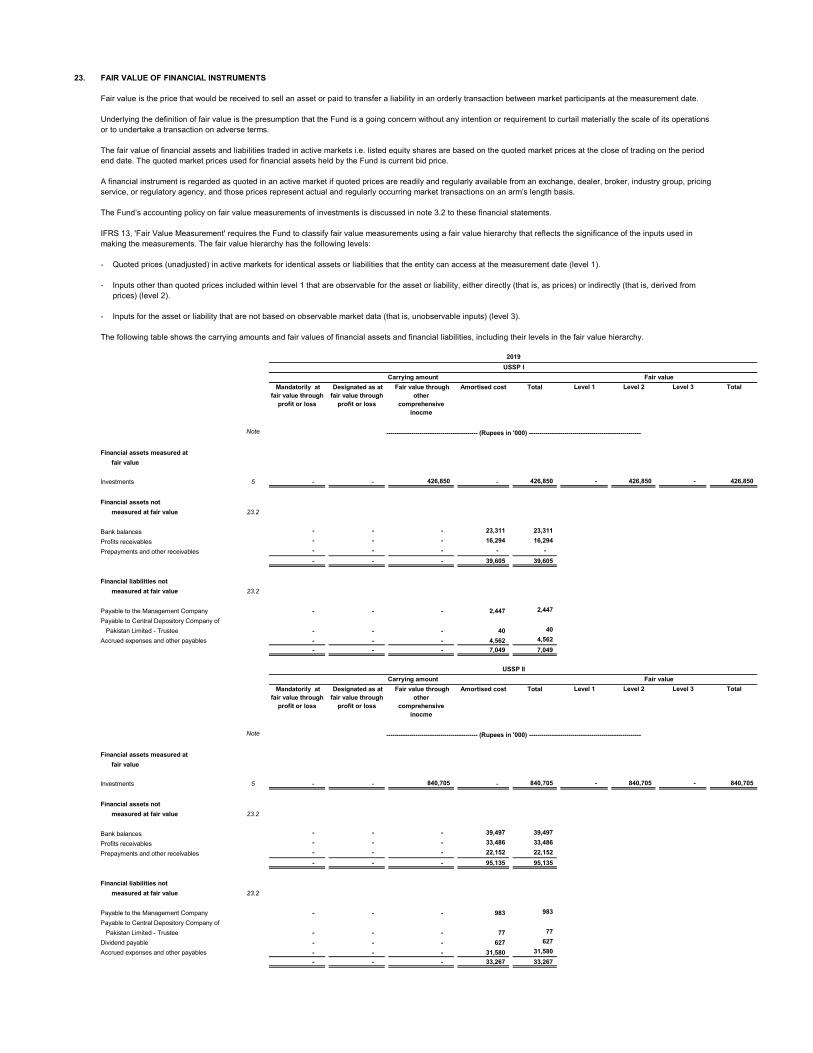
23. FAIR VALUE OF FINANCIAL INSTRUMENTS
Fair value is the price that would be received to sell an asset or paid to transfer a liability in an orderly transaction between market participants at the measurement date.
Underlying the definition of fair value is the presumption that the Fund is a going concern without any intention or requirement to curtail materially the scale of its operationsor to undertake a transaction on adverse terms.
The fair value of financial assets and liabilities traded in active markets i.e. listed equity shares are based on the quoted market prices at the close of trading on the periodend date. The quoted market prices used for financial assets held by the Fund is current bid price.
A financial instrument is regarded as quoted in an active market if quoted prices are readily and regularly available from an exchange, dealer, broker, industry group, pricingservice, or regulatory agency, and those prices represent actual and regularly occurring market transactions on an arm’s length basis.
The Fund’s accounting policy on fair value measurements of investments is discussed in note 3.2 to these financial statements.
IFRS 13, 'Fair Value Measurement' requires the Fund to classify fair value measurements using a fair value hierarchy that reflects the significance of the inputs used inmaking the measurements. The fair value hierarchy has the following levels:
- Quoted prices (unadjusted) in active markets for identical assets or liabilities that the entity can access at the measurement date (level 1).
- Inputs other than quoted prices included within level 1 that are observable for the asset or liability, either directly (that is, as prices) or indirectly (that is, derived fromprices) (level 2).
- Inputs for the asset or liability that are not based on observable market data (that is, unobservable inputs) (level 3).
The following table shows the carrying amounts and fair values of financial assets and financial liabilities, including their levels in the fair value hierarchy.
Level 1 Level 2 Level 3 Total
Note
Financial assets measured at
fair value
Investments 5 - - 426,850 - 426,850 - 426,850 - 426,850
Financial assets not
measured at fair value 23.2
Bank balances - - - 23,311 23,311
Profits receivables - - - 16,294 16,294
Prepayments and other receivables - - - - -
- - - 39,605 39,605
Financial liabilities not
measured at fair value 23.2
Payable to the Management Company - - - 2,447 2,447
Payable to Central Depository Company of
Pakistan Limited - Trustee - - - 40 40
Accrued expenses and other payables - - - 4,562 4,562
- - - 7,049 7,049
Level 1 Level 2 Level 3 Total
Note
Financial assets measured at
fair value
Investments 5 - - 840,705 - 840,705 - 840,705 - 840,705
Financial assets not
measured at fair value 23.2
Bank balances - - - 39,497 39,497
Profits receivables - - - 33,486 33,486
Prepayments and other receivables - - - 22,152 22,152
- - - 95,135 95,135
Financial liabilities not
measured at fair value 23.2
Payable to the Management Company - - - 983 983
Payable to Central Depository Company of
Pakistan Limited - Trustee - - - 77 77
Dividend payable - - - 627 627
Accrued expenses and other payables - - - 31,580 31,580
- - - 33,267 33,267
USSP I
-------------------------------------------- (Rupees in '000) ------------------------------------------------------
Mandatorily at fair value through
profit or loss
Fair value through other
comprehensive inocme
TotalAmortised cost
Carrying amount
-------------------------------------------- (Rupees in '000) ------------------------------------------------------
Fair value
USSP II
Carrying amount Fair value
Mandatorily at fair value through
profit or loss
Fair value through other
comprehensive inocme
Amortised cost
Designated as at fair value through
profit or loss
Designated as at fair value through
profit or loss
2019
Total

Level 1 Level 2 Level 3 Total
Note
Financial assets measured at
fair value
Investments 5 - - 255,564 - 255,564 - 255,564 - 255,564
Financial assets not
measured at fair value 23.2
Bank balances - - - 543 543
Profits receivables - - - 11,179 11,179
Prepayments and other receivables - - - 191 191
- - - 11,913 11,913
Financial liabilities not
measured at fair value 23.2
Payable to the Management Company - - - 1,957 1,957
Payable to Central Depository Company of
Pakistan Limited - Trustee - - - 22 22
Accrued expenses and other payables - - - 618 618
- - - 2,597 2,597
Level 1 Level 2 Level 3 Total
Note
Financial assets measured at
fair value
Investments 5 - - 130,003 - 130,003 - 130,003 130,003
Financial assets not
measured at fair value 23.2
Bank balances - - - 37,274 37,274
Profits receivables - - - 6,212 6,212
Prepayments and other receivables - - - 9,894 9,894
- - - 53,380 53,380
Financial liabilities not
measured at fair value 23.2
Payable to the Management Company - - - 219 219
Payable to Central Depository Company of
Pakistan Limited - Trustee - - - 14 14
Accrued expenses and other payables - - - 325 325
- - - 558 558
23.1 Valuation techniques used in determination of fair values within level 2:
Investments in Pakistan Investment Bonds, issued by a company or a body corporate for the purpose of raising funds in the form of redeemable capital, are valued on the basis of the PKRVs announced by the Mutual Funds Association of Pakistan (MUFAP) in accordance with the methodology prescribed by the Securities and Exchange Commission of Pakistan.
23.2
23.3 Net assets attributable to unitholders. The Fund routinely redeems and issues the units at the amount equal to the proportionate share of net assets of the Fund at the time ofredemption, calculated on a basis consistent with that used in these financial statements. Accordingly, the carrying amount of net assets attributable to unitholdersapproximates their fair value. The units are categorized into Level 2 of the fair value hierarchy.
24. FINANCIAL RISK MANAGEMENT
The Fund’s objective in managing risks is the creation and protection of Unit holders’ value. Risk is inherent in the Fund’s activities, but it is managed through monitoring andcontrolling activities which are primarily set up to be performed based on limits established by the Management Company, Fund's constitutive documents and theregulations and directives of the SECP. These limits reflect the business strategy and market environment of the Fund as well as the level of the risk that Fund is willing toaccept. The Board of Directors of the Management Company supervises the overall risk management approach within the Fund. The Fund is exposed to credit risk, liquidityrisk and market risk arising from the financial instruments it holds.
The Fund primarily invests in a portfolio of debt and money market investments such as investment - government securities and other money market instruments. Theseactivities are exposed to a variety of financial risks i.e. market risk (which includes currency risk and interest rate risk), credit risk and liquidity risk arising from thefinancial instruments it holds.
24.1 Credit Risk
Credit risk is the risk that the counterparty to a financial instrument will cause a financial loss to the Fund by failing to discharge its obligation. The Fund’s policy is to enterinto financial contracts with reputable counter parties in accordance with the internal guidelines, offering document and regulatory requirements.
Management of credit risk
The Fund's policy is to enter into financial contracts in accordance with the investment guidelines approved by the Investment Committee, its Trust Deed and therequirements of NBFC rules and regulations and guidelines given by SECP from time to time.
Credit risk is managed and controlled by the management company of the Fund in the following manner:
- The Fund limits its exposure to credit risk by only investing in instruments and bank deposits that have a minimum "AA-" from a credit rating agency duly approved by the
Amortised cost Fair value through other
comprehensive inocme
Total
Designated as at fair value through
profit or loss
Designated as at fair value through
profit or loss
-------------------------------------------- (Rupees in '000) ------------------------------------------------------
The Fund has not disclosed the fair values for these financial assets and financial liabilities, as these are either short term in nature or repriced periodically. Therefore, their carrying amounts are a reasonable approximation of fair value.
USSP III
Carrying amount Fair value
Mandatorily at fair value through
profit or loss
Fair value through other
comprehensive inocme
Amortised cost Total
-------------------------------------------- (Rupees in '000) ------------------------------------------------------
USSP IV
Carrying amount Fair value
Mandatorily at fair value through
profit or loss
SECP.
- Investment transactions are carried out with large number of brokers, whose credit rating is taken into account so as to minimize the risk of default and transactions aresettled or paid for only upon deliveries.
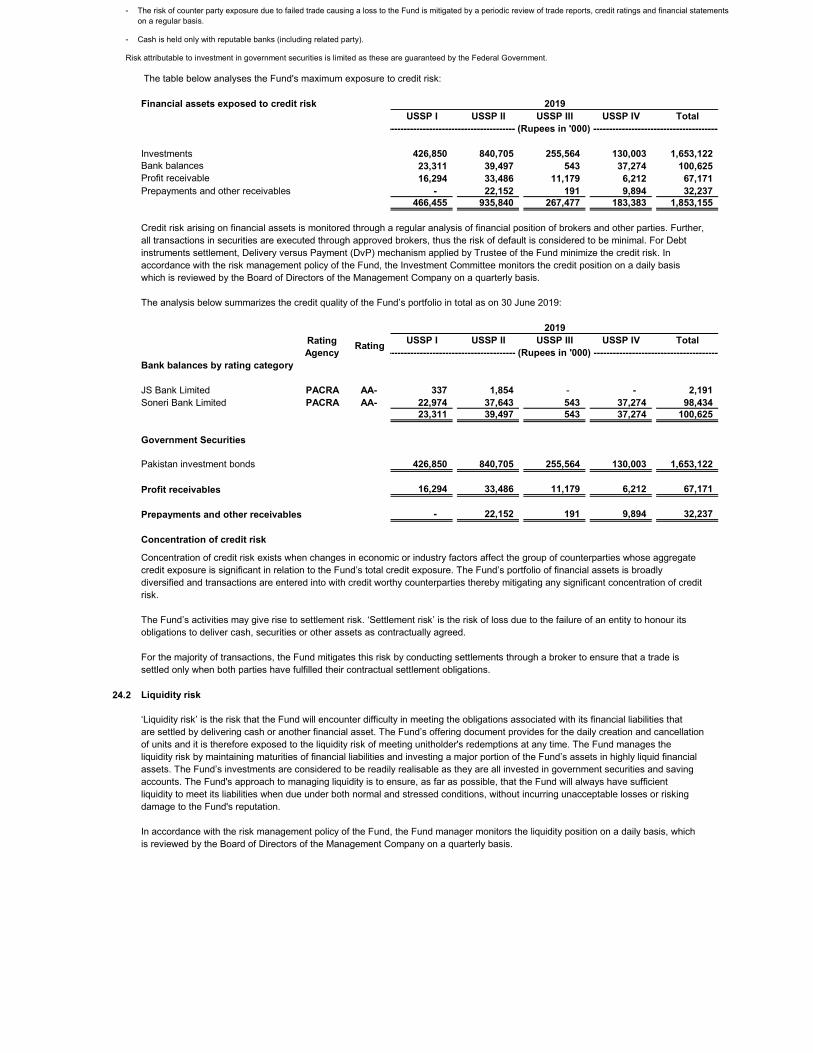
The table below analyses the Fund's maximum exposure to credit risk:
Financial assets exposed to credit riskUSSP I USSP II USSP III USSP IV Total
Investments 426,850 840,705 255,564 130,003 1,653,122 Bank balances 23,311 39,497 543 37,274 100,625 Profit receivable 16,294 33,486 11,179 6,212 67,171 Prepayments and other receivables - 22,152 191 9,894 32,237
466,455 935,840 267,477 183,383 1,853,155
Credit risk arising on financial assets is monitored through a regular analysis of financial position of brokers and other parties. Further,all transactions in securities are executed through approved brokers, thus the risk of default is considered to be minimal. For Debtinstruments settlement, Delivery versus Payment (DvP) mechanism applied by Trustee of the Fund minimize the credit risk. Inaccordance with the risk management policy of the Fund, the Investment Committee monitors the credit position on a daily basiswhich is reviewed by the Board of Directors of the Management Company on a quarterly basis.
The analysis below summarizes the credit quality of the Fund’s portfolio in total as on 30 June 2019:
USSP I USSP II USSP III USSP IV Total
Bank balances by rating category
JS Bank Limited PACRA AA- 337 1,854 - - 2,191 Soneri Bank Limited PACRA AA- 22,974 37,643 543 37,274 98,434
23,311 39,497 543 37,274 100,625
Government Securities
Pakistan investment bonds 426,850 840,705 255,564 130,003 1,653,122
Profit receivables 16,294 33,486 11,179 6,212 67,171
Prepayments and other receivables - 22,152 191 9,894 32,237
Concentration of credit risk
Concentration of credit risk exists when changes in economic or industry factors affect the group of counterparties whose aggregatecredit exposure is significant in relation to the Fund’s total credit exposure. The Fund’s portfolio of financial assets is broadlydiversified and transactions are entered into with credit worthy counterparties thereby mitigating any significant concentration of creditrisk.
The Fund’s activities may give rise to settlement risk. ‘Settlement risk’ is the risk of loss due to the failure of an entity to honour itsobligations to deliver cash, securities or other assets as contractually agreed.
For the majority of transactions, the Fund mitigates this risk by conducting settlements through a broker to ensure that a trade issettled only when both parties have fulfilled their contractual settlement obligations.
24.2 Liquidity risk
‘Liquidity risk’ is the risk that the Fund will encounter difficulty in meeting the obligations associated with its financial liabilities thatare settled by delivering cash or another financial asset. The Fund’s offering document provides for the daily creation and cancellationof units and it is therefore exposed to the liquidity risk of meeting unitholder's redemptions at any time. The Fund manages theliquidity risk by maintaining maturities of financial liabilities and investing a major portion of the Fund’s assets in highly liquid financialassets. The Fund’s investments are considered to be readily realisable as they are all invested in government securities and savingaccounts. The Fund's approach to managing liquidity is to ensure, as far as possible, that the Fund will always have sufficientliquidity to meet its liabilities when due under both normal and stressed conditions, without incurring unacceptable losses or riskingdamage to the Fund's reputation.
In accordance with the risk management policy of the Fund, the Fund manager monitors the liquidity position on a daily basis, whichis reviewed by the Board of Directors of the Management Company on a quarterly basis.
2019
------------------------------------------------------------------------------------------ (Rupees in '000) ------------------------------------------------------------------------------------------
Rating Agency------------------------------------------------------------------------------------------ (Rupees in '000) ------------------------------------------------------------------------------------------
2019
Rating
- The risk of counter party exposure due to failed trade causing a loss to the Fund is mitigated by a periodic review of trade reports, credit ratings and financial statementson a regular basis.
- Cash is held only with reputable banks (including related party).
Risk attributable to investment in government securities is limited as these are guaranteed by the Federal Government.

In accordance with regulation 58(1)(k) of the NBFC Regulations, 2008, the Fund has the ability to borrow funds for meeting theredemption requests, with the approval of the Trustee, for a period not exceeding three months to the extent of fifteen percent of thenet assets. However, no such borrowing has been obtained during the year.
Further, the Fund is also allowed in accordance with regulation 57 (10) of the NBFC Regulations, 2008, to defer redemption requeststo the next dealing day, had such requests exceed ten percent of the total number of units in issue.
In addition to unitholders' fund, the analysis below summarizes the Fund's financial liabilities into relevant maturity grouping as at 30June 2019:
USSP I Total Three Six One More than
months months Year one yearFinancial Liabilities
Payable to Management Company 2,447 - - - 2,447 Payable to Central Depository Company
of Pakistan Limited - Trustee 40 - - - 40 Accrued expenses and other payables 4,562 - - - 4,562
7,049 - - - 7,049
Unit holders' fund 459,720 - - - 459,720
USSP II
Financial Liabilities
Payable to Management Company 983 - - - 983 Payable to Central Depository Company
of Pakistan Limited - Trustee 77 - - - 77 Dividend payable 627 - - - 627 Accrued expenses and other payables 31,580 - - - 31,580
33,267 - - - 33,267
Unit holders' fund 901,819 - - - 901,819
USSP III
Financial Liabilities
Payable to Management Company 1,957 - - - 1,957 Payable to Central Depository Company
of Pakistan Limited - Trustee 22 - - - 22 Accrued expenses and other payables 618 - - - 618
2,597 - - - 2,597
Unit holders' fund 264,825 - - - 264,825
USSP IV
Financial Liabilities
Payable to Management Company 219 - - - 219 Payable to Central Depository Company
of Pakistan Limited - Trustee 14 - - - 14 Accrued expenses and other payables 325 - - - 325
558 - - - 558
Unit holders' fund 182,787 - - - 182,787
24.3 Market risk
Market risk is the risk that the fair value or future cash flows of financial instruments will fluctuate due to changes in market variablessuch as interest rates, foreign exchange rates and debt security prices.
The UBL Fund Managers manages market risk by monitoring exposure on marketable securities by following the internal riskmanagement policies and investment guidelines approved by the Investment Committee and regulations laid down by the Securitiesand Exchange Commission of Pakistan. The maximum risk resulting from financial instruments equals their fair values.
---------------------------------------------------------- (Rupees in '000) ------------------------------------------------------------
Maturity Upto2019

Market risk comprises of three types of risk: currency risk, interest rate risk and price risk.
i) Currency risk
Currency risk is the risk that the fair value or future cash flows of a financial instrument will fluctuate as aresult of changes in foreign exchange rates. The Fund, at present, is not exposed to currency risk as alltransactions are carried out in Pakistani Rupees.
ii) Interest rate risk
Interest rate risk is the risk that the fair value or future cash flows of financial instruments will fluctuate dueto changes in the market interest rates. The Fund's interest rate risk is monitored on a quarterly basis by theboard of directors.
a) Sensitivity analysis for fixed rate instruments
As at 30 June 2019, the Plan I, Plan II, Plan III and Plan IV hold Pakistan Investment Bonds which areclassified as 'fair value through other comprehensive income', exposing the Fund to fair value interest
rate risk. In case of 100 basis points increase / decrease in mark-up rates on 30 June 2019, with allother variables held constant, the impact on the net assets and total comprehensive income for the yearis as follows:
USSP I USSP II USSP III USSP IV Total
Pakistan Investment Bonds 426,850 840,705 255,564 130,003 1,653,122
USSP I USSP II USSP III USSP IV Total
Change in basis points
100 (7,581) (17,237) (5,692) (2,885) (33,395)
(100) 7,760 17,736 5,872 2,976 34,344
b) Sensitivity analysis for Variable rate instruments
USSP I USSP II USSP III USSP IV Total
Bank balances 23,311 39,497 543 37,274 100,625
Cash flow sensitivity analysis for variable rate instruments
A change of 100 basis points in interest rates at the year end would have increased / (decreased) the netassets and net income by Rs. 1.006 million, assuming all other variables held constant.
2019
Total Exposure2019
------------------------------------------------------------------------------------------ (Rupees in '000) ------------------------------------------------------------------------------------------
Total Exposure
------------------------------------------------------------------------------------------ (Rupees in '000) ------------------------------------------------------------------------------------------
Effect on total comprehensive income and net assets
------------------------------------------------------------------------------------------ (Rupees in '000) ------------------------------------------------------------------------------------------
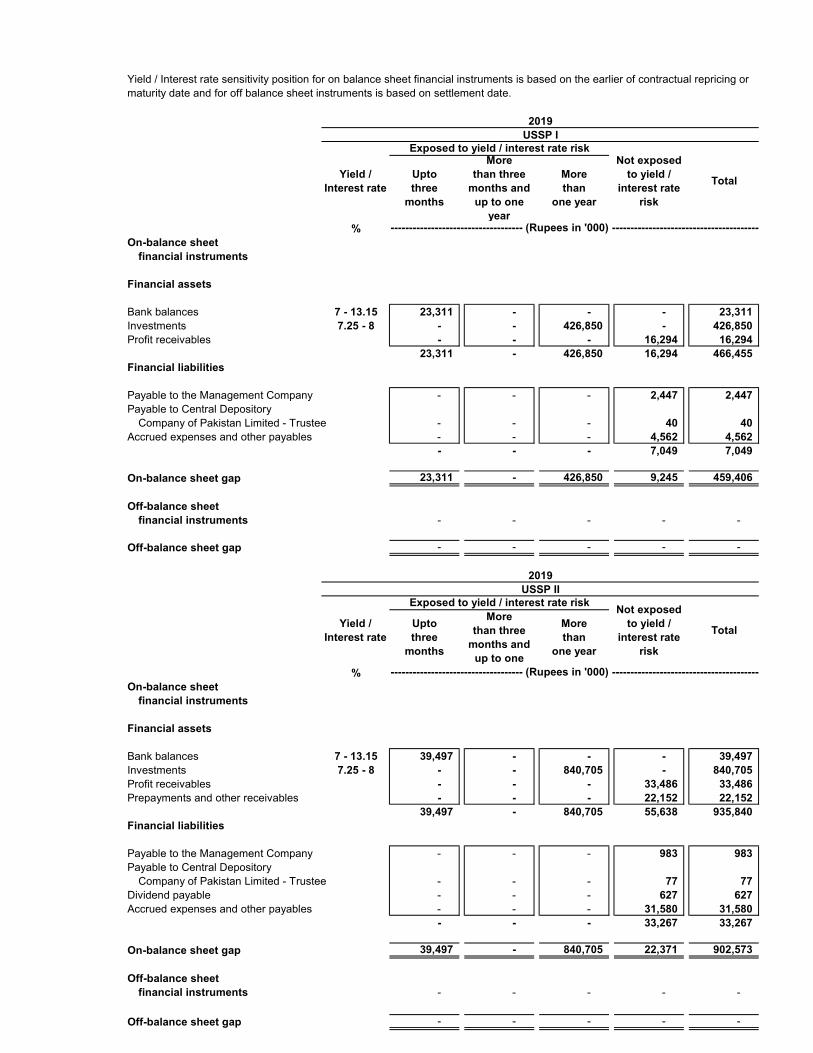
Yield / Interest rate sensitivity position for on balance sheet financial instruments is based on the earlier of contractual repricing ormaturity date and for off balance sheet instruments is based on settlement date.
%On-balance sheet
financial instruments
Financial assets
Bank balances 7 - 13.15 23,311 - - - 23,311 Investments 7.25 - 8 - - 426,850 - 426,850 Profit receivables - - - 16,294 16,294
23,311 - 426,850 16,294 466,455 Financial liabilities
Payable to the Management Company - - - 2,447 2,447 Payable to Central Depository
Company of Pakistan Limited - Trustee - - - 40 40 Accrued expenses and other payables - - - 4,562 4,562
- - - 7,049 7,049
On-balance sheet gap 23,311 - 426,850 9,245 459,406
Off-balance sheetfinancial instruments - - - - -
Off-balance sheet gap - - - - -
%On-balance sheet
financial instruments
Financial assets
Bank balances 7 - 13.15 39,497 - - - 39,497 Investments 7.25 - 8 - - 840,705 - 840,705 Profit receivables - - - 33,486 33,486 Prepayments and other receivables - - - 22,152 22,152
39,497 - 840,705 55,638 935,840 Financial liabilities
Payable to the Management Company - - - 983 983 Payable to Central Depository
Company of Pakistan Limited - Trustee - - - 77 77 Dividend payable - - - 627 627 Accrued expenses and other payables - - - 31,580 31,580
- - - 33,267 33,267
On-balance sheet gap 39,497 - 840,705 22,371 902,573
Off-balance sheetfinancial instruments - - - - -
2019USSP I
2019USSP II
Yield /Interest rate
Exposed to yield / interest rate riskNot exposed
to yield / interest rate
risk
TotalUptothree
months
Morethan three
months and up to one
Morethan
one year
------------------------------------ (Rupees in '000) ----------------------------------------
Not exposed to yield /
interest rate risk
Total
Exposed to yield / interest rate risk
Yield /Interest rate
Uptothree
months
Morethan three
months and up to one
year
Morethan
one year
------------------------------------ (Rupees in '000) ----------------------------------------
Off-balance sheet gap - - - - -

%On-balance sheet
financial instruments
Financial assets
Bank balances 7 - 13.15 543 - - - 543 Investments 7.25 - 8 - - 255,564 - 255,564 Profit receivables - - - 11,179 11,179 Prepayments and other receivables - - - 191 191
543 - 255,564 11,370 267,477 Financial liabilities
Payable to the Management Company - - - 1,957 1,957 Payable to Central Depository
Company of Pakistan Limited - Trustee - - - 22 22 Accrued expenses and other payables - - - 618 618
- - - 2,597 2,597
On-balance sheet gap 543 - 255,564 8,773 264,880
Off-balance sheetfinancial instruments - - - - -
Off-balance sheet gap - - - - -
%On-balance sheet
financial instruments
Financial assets
Bank balances 7 - 13.15 37,274 - - - 37,274 Investments 7.25 - 8 - - 130,003 - 130,003 Profit receivables - - - 6,212 6,212 Prepayments and other receivables - - - 9,894 9,894
37,274 - 130,003 16,106 183,383 Financial liabilities
Payable to the Management Company - - - 219 219 Payable to Central Depository
Company of Pakistan Limited - Trustee - - - 14 14 Accrued expenses and other payables - - - 325 325
- - - 558 558
On-balance sheet gap 37,274 - 130,003 15,548 182,825
Off-balance sheetfinancial instruments - - - - -
Off-balance sheet gap - - - - -
2019USSP III
Yield /Interest rate
Exposed to yield / interest rate riskNot exposed
to yield / interest rate
risk
TotalUptothree
months
Morethan three
months and up to one
Morethan
one year
------------------------------------ (Rupees in '000) ----------------------------------------
------------------------------------ (Rupees in '000) ----------------------------------------
2019USSP IV
Yield /Interest rate
Exposed to yield / interest rate riskNot exposed
to yield / interest rate
risk
TotalUptothree
months
Morethan three
months and up to one
Morethan
one year

Price risk is the risk of volatility in prices of financial instruments resulting from their dependence on market sentiments,speculative activities, supply and demand for financial instruments and liquidity in the market. The value of investments mayfluctuate due to change in business cycles affecting the business of the Fund in which the investment is made, change inbusiness circumstances of the Fund, industry environment and / or the economy in general. The Fund is not exposed to the riskas its constitutive documents prohibit it from investing in equity securities.
iii) Price risk
24.4 Unit holders' fund risk management (Capital risk management)
The Fund's objective when managing unit holders' funds is to safeguard the Fund's ability to continue as a going concernso that it can continue to provide optimum returns to its unit holders and to ensure reasonable safety of capital. The Fundmanages its investment portfolio and other assets by monitoring return on net assets and makes adjustments to it in thelight of changes in market conditions. Under the NBFC regulations 2008, the minimum size of an open end scheme shallbe one hundred million rupees at all the times during the life of the scheme. The Fund size depends on the issuance andredemption of units.
In order to maintain or adjust the unit holders' Fund structure, the Fund’s policy is to perform the following:
- Monitors the level of daily issuance and redemptions relative to the liquid assets and adjusts the amount ofdistributions the Fund pays to unit holders;
- Redeem and issue units in accordance with the constitutive documents of the Fund, which include the ability torestrict redemptions and require certain minimum holdings and issuance; and
- The Fund Manager / Investment Committee members and Chief Executive of the Management Company criticallytrack the movement of Assets under Management’. The Board of Directors is updated about the Fund yield andmovement of NAV and total fund size at the end of each quarter.
25. TOP TEN BROKERS / DEALERS BY PERCENTAGE OFCOMMISSION PAID BY THE FUND
Plan I Plan II Plan III Plan IV
Name of Broker
Invest One Markets Limited 8.00 7.28 - - Summit Capital (Private) Limited 92.00 3.53 - - Arif Habib Limited - 3.53 - - Pearl Securities Limited - 3.53 - - C & M Management (Private) Limited - 0.11 - - Js Global Capital Limited - 14.10 - - Bright Capital (Private) Limited - 13.27 - - Magenta Capital (Private) Limited - 7.05 16.95 - Continental Exchange (Private) Limited - 37.02 32.20 100.00 BIPL Securities Limited (Formerly Kasb Securities) - 10.58 33.90 - Currency Market Associates (Private) Limited - - 16.95 -
100.00 100.00 100.00 100.00
Commission
2019
%
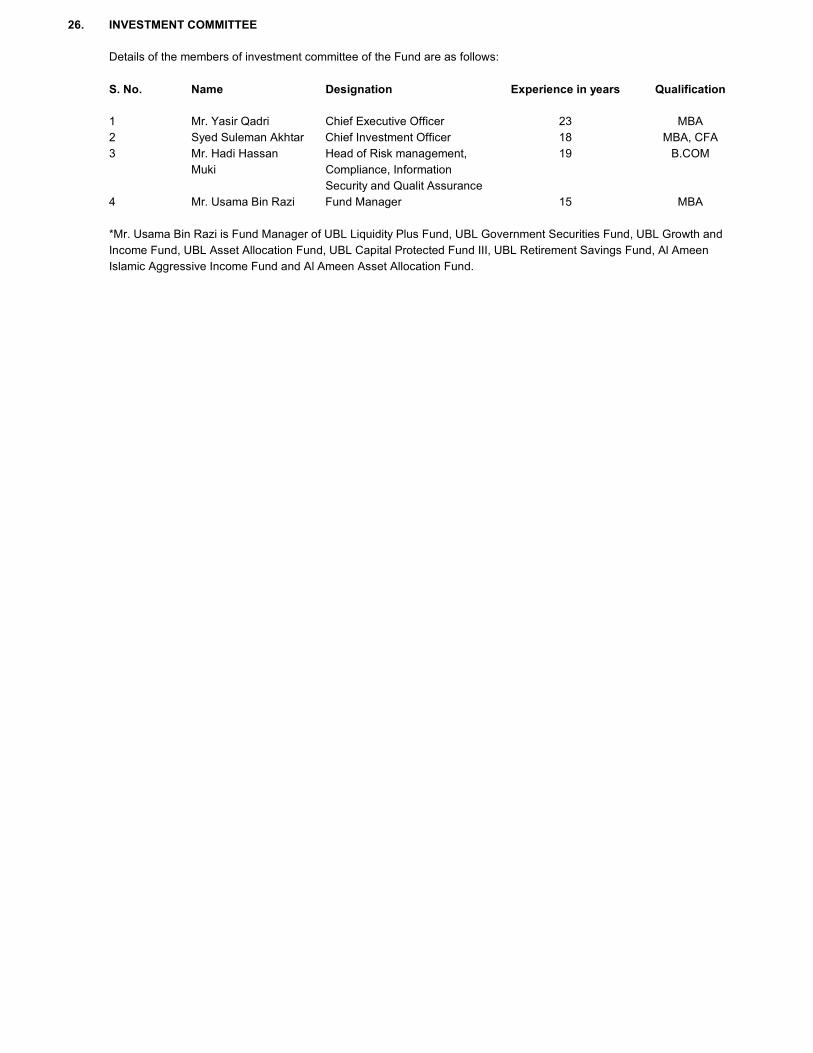
26. INVESTMENT COMMITTEE
Details of the members of investment committee of the Fund are as follows:
S. No. Name Designation
1 Mr. Yasir Qadri Chief Executive Officer2 Syed Suleman Akhtar Chief Investment Officer3 Mr. Hadi Hassan Head of Risk management,
Muki Compliance, Information Security and Qualit Assurance
4 Mr. Usama Bin Razi Fund Manager
*Mr. Usama Bin Razi is Fund Manager of UBL Liquidity Plus Fund, UBL Government Securities Fund, UBL Growth andIncome Fund, UBL Asset Allocation Fund, UBL Capital Protected Fund III, UBL Retirement Savings Fund, Al AmeenIslamic Aggressive Income Fund and Al Ameen Asset Allocation Fund.
19
15
Qualification
MBAMBA, CFA
B.COM
MBA
Experience in years
2318

27. DIRECTORS' MEETING ATTENDANCE
During the year, seven meetings of the Board of Directors of the Management Company were held. The details of the attendance are as under:
Dates 28 August 26 October 08 November 11 December 27 February 29 April 06 May2018 2018 2018 2018 2019 2018 2018
Name of Director Meetingsattended
Mr. Azhar Hamid 7 Yes Yes Yes Yes Yes Yes YesMr. Yasir Qadri 7 Yes Yes Yes Yes Yes Yes YesMs. Naz Khan 7 Yes Yes Yes Yes Yes Yes YesMr. Sharjeel Shahid * 1 Yes N/A N/A N/A N/A N/A N/AMr. Zia Ijaz * 0 No N/A N/A N/A N/A N/A N/ASyed Furrukh Zaeem 6 Yes Yes Yes No Yes Yes YesMr. Mirza Muhammad Sadeed Hassan Barlas * 1 Yes N/A N/A N/A N/A N/A N/AMr. Tauqeer Mazhar ** 3 N/A N/A Yes Yes No No YesMr. Imran Sarwar ** 4 N/A N/A Yes Yes No Yes YesMs. Sadia Saeed ** 5 N/A N/A Yes Yes Yes Yes Yes
Name of Key ExecutivesMr. S.M. Aly Osman 7 Yes Yes Yes Yes Yes Yes YesMr. Umair Ahmed 7 Yes Yes Yes Yes Yes Yes Yes
* Mr. Sharjeel Shahid, Mr. Zia Ijaz & Mr. Mirza Muhammad Sadeed Hassan Barlas resigned on 09 October 2018.** Mr. Tauqeer Mazhar, Mr. Imran Sarwar & Ms. Sadia Saeed appointed as of 02 November 2018.
28. PATTERN OF UNIT HOLDERS
CategoryPlan I Unit holders Units held
Individuals 262 4,699,957 99.79 Others 1 10,002 0.21
263 4,709,959 100.00
Plan II
Individuals 463 8,707,697 94.06 Retirement funds 1 217,407 2.35 Others 2 332,720 3.59
466 9,257,824 100.00
Plan III
Individuals 142 2,670,679 99.70 Retirement funds 1 8,088 0.30
143 2,678,767 100.00
Plan IV
Individuals 67 1,833,947 100.00 67 1,833,947 100.00
29. CREDIT RATING
VIS Credit Rating Company has re-affirmed quality rating of 'AM1' (stable outlook) to the Management Company as on 27 December 2018 (30 June2018: AM1).
30. GENERAL
30.1 This financial statement is presented in Pakistan Rupees which is also the Fund's functional currency and all financial information presented has beenrounded off to the nearest thousand rupees unless otherwise stated.
30.2 This financial statement was authorised for issue by the board of directors of the Management Company on ___________________.
____________________ ________________ ____________________Chief Executive Officer Director Chief Financial Officer
For UBL Fund Managers Limited(Management Company)
2019Number of Percentage
SD SD SD
30-Aug-2019


![Untitled - Jurnal - Univ. Bandar Lampung [UBL]](https://static.fdokumen.com/doc/165x107/63150beec72bc2f2dd04947c/untitled-jurnal-univ-bandar-lampung-ubl.jpg)


![Expert - Jurnal - Univ. Bandar Lampung [UBL]](https://static.fdokumen.com/doc/165x107/6312278fd43a2591a9054707/expert-jurnal-univ-bandar-lampung-ubl.jpg)