The Hundred Differences between Islamic and Conventional ...
Upload
khangminh22Category
view
2download
0
1
UNIT – I – Non Conventional Energy Systems – SMEA3013
SCHOOL OF MECHANICAL ENGINEERING
DEPARTMENT OF MECHANICAL ENGINEERING

2
I. Introduction
The people of energy dependant countries like India are much aware of the importance of
conversion, conservation and development of new energy sources. Today the Power
Engineer are concerned with three “E‟s” namely Energy, Economics and Ecology
(Environment). Thus the power engineer must try to develop systems that produce large
quantities of energy with minimal cost and with low impact on environment. The proper
balance of these 3 “E‟s” is a major technological challenge.
In any energy conversion process, the energy must be conserved as implied by First Law of
Thermodynamics. (For discussion: Einstein Equation) open system, closed system, isolated
system, energy transformation, energy transfer (involves shaft work) machines).
MAN AND ENERGY:
ENERGY is the ability to do work.
ENERGY is the primary and most universal measure of all kind o f work
byhumanbeings and nature.
Energy: It isthecapabilityto producemotion, force, work, change inshape, changeinform etc.
Energy exists in several forms such as:
Chemical energy
Nuclear energy
Mechanical energy
Electrical energy
Internal energy
Bio-energy in vegetables and animal bodies
Thermal energyetc.

3
Man has needed and used energy at an increasing rate for his sustenance and well-
being ever since he came on the earth a few million years ago.
Primitivemanrequired energyprimarilyinthe formoffood. He derived this
byeatingplantsor animals which he hunted. Subsequently he discovered fire and his energy
needs increased as he startedto make useofwood andotherbiomassto
supplytheenergyneeds forcookingaswell as for keeping himself warm.
With the passage of time man started to cultivate land for agriculture. He added a new
dimension to the use of energy by domesticating and training animals to work for him.
With further demand for energy, man began to harness the wind for sailing ships and for
driving windmills, and the force of falling water to turn waterwheels.
Till this time, it would not be wrong to say that the sun was supplying all the energy needs of
maneither directlyor indirectlyand thatmanwasusingonlyrenewable sourcesofenergy.
CLASSIFICATION OF ENERGY SOURCES:
1. BASED ON USABILITY
a) PRIMARY SOURCES
These sources are obtained from environment.
Example: fossil fuels, solar energy, hydro energy and tidal energy.
b) SECONDARY SOURCES
These resourcesdo notoccur innature but are derived fromprimaryenergyresources.
c) SUPPLIMENTRY SOURCES
It is define as those whose net energy yield is zero and those requiring highest
investment in terms of energy insulation (thermal) is an example of this source.
2. BASED ON TRADITIONAL
a) CONVECTION
The sources of energy which have been in use for a long time, e.g., coal, petroleum,
natural gas and waterpower.

4
b) NON CONVECTION
The resources which are yet in the process of development over the past few years. It
includes solar, wind, tidal, biogas, and biomass, geothermal.
3. BASED ON LONG TERM AVAILABILITY
a) RENEWABLE
These sources are being continuouslyproduced in nature and are inexhaustible.
Wood, wind energy, biomass, biogas, solar energyetc.
b) NON RENEWABLE
These are finite and exhaustible.
Coal, petroleum etc.
4. BASED ON COMMERCIALAPPLICATION
a) COMMERCIAL
The commercial energy has great economic value. This energy pollutes the environment
badly. These types of energy are limited in nature. High capital investment is
required in the purification. It is used in urban as well as rural areas. Coal, petroleum,
natural gas and nuclear energy.
b) NON COMMERCIAL
The non-commercial energy is cheaper. This is pure and keeps the environment
clean. Abundant in nature. It can be used in raw form. It is dominantlyused in rural
areas. Cow dung, charcoal, firewood and agricultural waste.
WORLD’S AND INDIA’S PRODUCTION AND RESERVES OF ENERGY
Today, every countrydraws its energy needs from a varietyof sources.
We can broadly categorize these sources as
a) Commercial/Conventional
b) Non-commercial/Non-conventional
The commercialsource include the fossil fuels, nuclear, Hydro-electricpower, while
the non- commercial source include wood ,animal waste and agriculturalwastes.

5
GLOBAL ENERGY CONSUMPTION
The global primaryenergyconsumption at present was equivalent to 9741 million
tons of oil equivalent (Mtoe)
Coal 32.5
Oil 38.3
Gas 19 92%
Uranium 0.13
Hydro 2
Wood 6.6
Dung 1.2 8%
Waste 0.3
CONVECTIONAL/NON RENEWABLE ENERGY SOURCES
Convectional sourcesare asfollow: FOSSIL FUEL:
Coal Oil Gas
Uranium/ Nuclear Hydro-electric
COAL
It has been estimated that there are over 847 billion tones of proven coal reserve
worldwide. This means that there is enough coal to last us around 118 years at
current rate of production (2011). In contrast, proven oil and gas reserves are
equivalent to around 46 and 59 years at current production levels respectively.
Coal reserves are available in almost every country worldwide, with recoverable
reserves in around 70 countries. Thebiggestreservesare in the USA, Russia, China, and
India.
Coal provides 30.3% of global primary energy needs and generates 42% of the
world's electricity. In 2011 coal was the fastest growing form of energyoutside
renewable. Its share in global primaryenergyconsumptionincreased to 30.3% - the
highest since 1969.
Totalworldcoalproductionreached a recordlevelof7,678 Mtinyear 2011,
increasingby6.6% over 2010. The average annual growth rate of coal since 1999 was
4.4%.
6
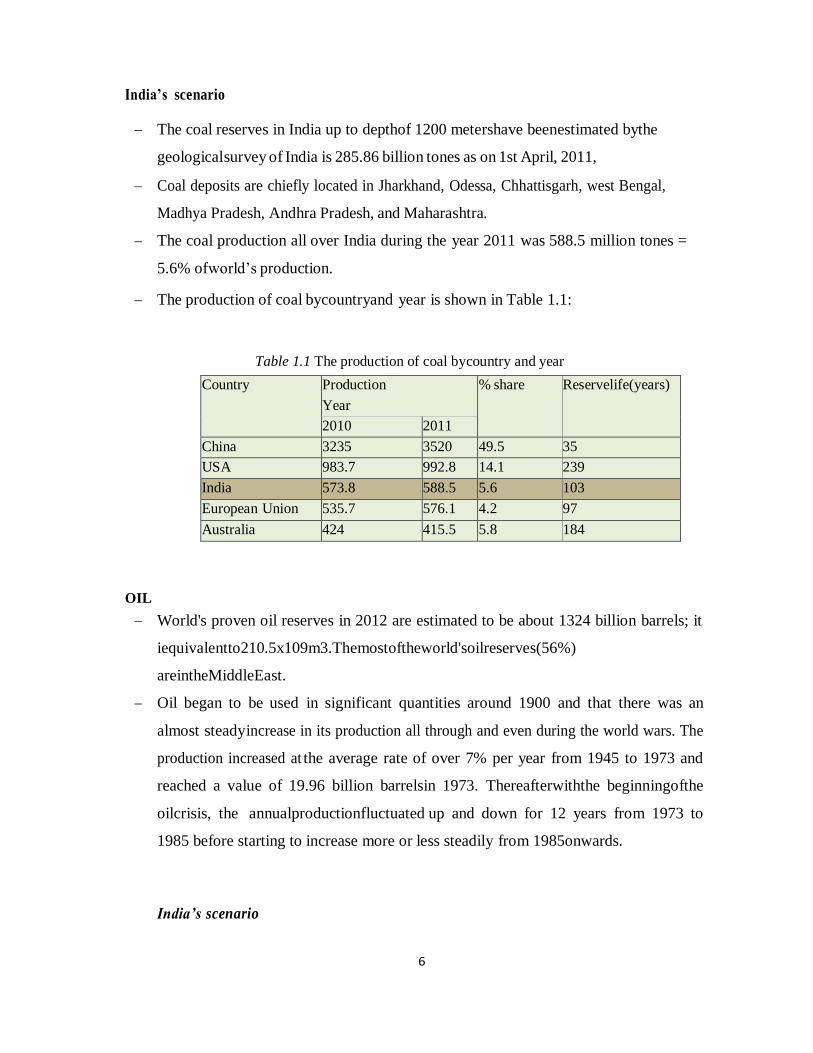
India’s scenario
The coal reserves in India up to depthof 1200 metershave beenestimated bythe
geological survey of India is 285.86 billion tones as on 1st April, 2011,
Coal deposits are chiefly located in Jharkhand, Odessa, Chhattisgarh, west Bengal,
Madhya Pradesh, Andhra Pradesh, and Maharashtra.
The coal production all over India during the year 2011 was 588.5 million tones =
5.6% of world’s production.
The production of coal bycountryand year is shown in Table 1.1:
Table 1.1 The production of coal by country and year
Country Production
Year
% share Reservelife(years)
2010 2011
China 3235 3520 49.5 35
USA 983.7 992.8 14.1 239
India 573.8 588.5 5.6 103
European Union 535.7 576.1 4.2 97
Australia 424 415.5 5.8 184
OIL
World's proven oil reserves in 2012 are estimated to be about 1324 billion barrels; it
iequivalentto210.5x109m3.Themostoftheworld'soilreserves(56%)
areintheMiddleEast.
Oil began to be used in significant quantities around 1900 and that there was an
almost steady increase in its production all through and even during the world wars. The
production increased at the average rate of over 7% per year from 1945 to 1973 and
reached a value of 19.96 billion barrelsin 1973. Thereafterwiththe beginningofthe
oilcrisis, the annualproductionfluctuated up and down for 12 years from 1973 to
1985 before starting to increase more or less steadily from 1985onwards.
India’s scenario

7
In 1951, the consumption of petroleum products was only 3.89 Mt, most of
which were imported; while in 2011 it was increase to 141.785 Mt.
Crudeoilproductionduring2010-11at37.71
Mt.Therefiningcapacityincountrywas187.686 Mt per annum as on 1st April 2011.
India has total reserves (proved and indicated) of 757 Mtofcrudeoil 1 ason 1st April 2011.
NATURAL GAS
Natural gas is a mixture of various compounds of hydrocarbons and small quantities
of non- hydrocarbons.
The world's proven natural gas reserves are estimated to be 196,163 billion m3 in the
year 2011. They were 192,549 billion m3 in the year 2010. Associated gas will last for
approximately the same time as crude oil. However, the presence of non- associated gas
should help. Thus, the peakintheproductionofnatural gasmayoccuraround 2025,
about10 yearsafter the peakin oil production.
The world'smarketed productionofnatural gas isabout 2,636,611 millionm3 inthe year
2011.it is seen that the production has been increasing more or less continuously at the
rate of about 5% per year.
India has total reserves (proved and indicated) of 1241 billion m3 ofnatural gas as on
1st April 2011.Grossproductionofnaturalgas in the countryat 52.22 billionm3 during
2010-11
HYDRO-ELECTRIC POWER
Hydro-electric power (water power) is developed by allowing water to fall under the
force of gravity. Hydroelectricity accounted for 16% of global electricity consumption and
3,644 terawatt hours of electricity production in 2011.
Hydroelectric power is produced in 150 countries with the Asia-Pacific region generated
32% of global hydropower in 2010. China is the largest hydroelectricity producer, with
721 terawatt- hoursof production in 2010, representing around 17% ofdomestic
electricityuse.
Brazil, Canada, New Zealand, Norway, Paraguay, Australia, Switzerland, and Venezuela
have a majority of the internal electric energy production from hydroelectric power.
Paraguay produces 100% of its electricityfrom hydroelectric dams, and exports 90% of

8
its productionto Brazil and to Argentina. Norway produces 98-99% of its electricity from
hydroelectric sources.
Out of the total power generation installed capacity in India of 1, 76,990 MW (June,
2011), hydro power contributes about 21.5%, i.e. 38,106 MW.
The public sector has a predominant share of 97% in this sector.
National Hydroelectric Power Corporation (NHPC), Northeast Electric Power company
(NEEPCO), Satluj Jal Vidyut Nigam ltd.(SJVNL), Tehri Hydro Development
Corporation, NTPC- Hydro are a few public sector companies engaged in development
of Hydro electric power in India.
NUCLEAR POWER
Nuclear power is developed byfission reactions of nuclear fuel in nuclear reactor.
Common nuclear fuel used is uranium. Nuclear power plants provided 12.3% of the
world's electricity production in 2011. In total, 13 countries relied on nuclear energy to
supplyat least one-quarter of their total electricity.
As of August 2012, 30 countries worldwide are operating 435 nuclear reactors for
electricity generation and 66 new nuclear plats are under construction in 14 countries.
The world's resources of uranium are estimated to be 8.8 Mt.
As of 2011, India had 4.8 GW of installed electricity generation capacity using nuclear
fuels. Nuclear power plants generated 32455 million units or 3.75% of total electricity
produced in India.
India’s nuclear power plant development began in 1964. India signed an agreement with
general electric of the United States for the construction and commissioning of two
boiling water reactors at Tarapur. In 1967, this effort was placed under India's
Department of atomic energy. In, 1971, India set up its first pressurized heavy water
reactors with Canadian collaboration in Rajasthan. In 1987, India created Nuclear Power
Corporation of India Limited (NPCIL) to commercialize nuclear power.

9
India’s Kakrapar-I reactor is the world's first reactor which uses thorium rather than
Depleted uranium to achieve power flattening acrossthe reactor core. India, which
hasabout 25% of the world’s thorium reserves; is developing a 300 MW prototype of a
thorium-based Advanced Heavy Water Reactor (AHWR). The prototype is expected to be
fully operational by 2013, after which five more reactors will be constructed. India
currently envisages meeting 30% of its electricity demand through thorium based
reactors by 2050.
India’s resources of uranium are not extensive. It is estimated that reserves available are
about 61,000 t. It is easyto show that the reserves would onlybe adequate forproviding
The requirements of an installed capacityof 10,000 MW for about 30 years.
Advantages of convectional/non renewable energy sources
The advantage of non renewable energy is it's easyand cheap to use.
There is no better way to store transfer and use energy than gasoline for powering motor
vehicles.
It's quick to pump fossil fuel into acar. It's stable in the tankand a gas tankhold quite abit,
and a gasoline powered car is cheap to manufacture.
Coal is a ready-made fuel. It is relatively cheap to mine and to convert into energy. Coal
supplies will last longer thanoil or gas Oil is a ready-made fuel. Relativelycheap to mine
and to convert into energy. It is a relatively cheap form ofenergy.
Natural Gasisaready-made fuel. It's aslightlycleaner fuelthancoaloroil,
emittinglesscarbon dioxide.
Nuclear has a small amount of radioactive material produces a lot of energy. And raw
materials arerelativelycheapandcanlastquitealongtime.
Itdoesn'tgiveoffatmosphericpollutants.
Disadvantages of convectional/non renewable energy sources
Non-renewable energy comes from fossil fuels (coal, oil, natural gas, uranium): they are
non- renewable and fastdepleting.
They leave behind harmful by-products upon combustion, thereby causing a lot of
10
pollution; mining of such fuels leads to irreversible damage to the adjoining
environment.
Fossil fuels pollute the environment. They will eventually run out. Prices for fossil
fuels are rising, especially if the real cost of their carbon is included. Burning fossil fuels
produces carbon dioxide, a major cause of global warming.
NON CONVENTIONAL/ RENEWABLE ENERGY SOURCE PRODUCTION & RESERVE
These sources include wind energy, solar energy, biomass and biofuel, small hydro
resources, geothermal energyetc.
The mankind’s have started the use of these sources recently, hence they are known as
non- conventional energy sources. The share of these sources in world’s electricity
generation is around 3% in2011.
The use of wind power is increasing at an annual rate of 20% with a worldwide
installed capacityof 238,000 MW at the end of 2011, and is widelyused in Europe, Asia,
and the United States. Since 2004, photovoltaic’s passed. Wind as the fastest growing energy
source, and since 2007 has more than doubled every two years.
At the end of 2011 the photovoltaic (PV) capacityworldwide was 67,000 MW, and PV
power stations are popular in Germany and Italy.
Solar thermal power stations operate in the USA and Spain, and the largest of these is the
354 MW SEGS power plant in the Mojave Desert.
The world's largest geothermal power installation is the Geysers in California; with
aerated capacity of 750 MW Brazil has one of the largest renewable energy programs in
the world, involving production of ethanol fuel from sugarcane, and ethanol now provide
18% of the country’s automotive fuel. Ethanol fuel is also widely available in the USA.
Top ten wind power generating countries are given in table 1.2

11
Table 1.2 wind power generating countries
COUNTRY TOTAL CAPACITY IN
2011(MW)
COUNTRY TOTAL CAPACITY IN
2011(MW)
China 62,733 France 6,800
USA 46,919 Italy 6,747
Germany 29,060 U.K. 6,540
Spain 21,674 Canada 5,265
India 16,084 Portugal 4,083
India’s non-conventional sources
1. Grid based: As of June 2011, the Government of India was successful in deploying a
total of 2051.05 MWcapacityof grid based renewable energy 14550.68 MWof which was
from wind power, 3105.63 MW from small hydro power, 1742.53 MW from bagasse
cogeneration, 1045.10 MWfrombiomasspower, 39.66 MWfromsolarpower(SPV),
andtherest fromwaste to power.
2. Off-grid: As of June 2011, the total deployment totaldeployment of off-grid based
renewable energy capacity was 601.23 MW Of these, biomass (non-bagasse) cogeneration
consisted of
316.76 MW, biomass gasifier was 133.63 MW; waste to energywas 73.72 MW. SPV
systems (less than 1 kW) capacitywas 69 MW, and the rest from micro-hydro and wind
power.
As was the case for the world, in India also, wind energy is the main contributor. India
has the fifth largest installed wind power capacityin the world. In 2011, wind power
accounted for 6% of India's total installed power capacity, and 1.6% of the country's
power output. Suzlon is the leading Indian company, in wind power, with an installed
generation capacity of 6.2 GW in India.

12
NON-CONVENTIONAL SOURCES/RENEWABLE ENERGY SOURCES
A plenty of energy is needed to sustain industrial growth and agricultural production. The
existing sources of energy such as coal, oil, uranium etc. may not be adequate to meet the
ever increasing energy demands. These conventional sources of energy are also depleting and
may be exhausted at the end of the centuryor beginning of the next century.
Consequently sincere and untiring efforts shall have to be made by the scientists and
engineers in exploring the possibilities of harnessing energy from several non-
conventional energy sources.
The various non-conventional energy sources are as follows:
1. Solar energy
2. Windenergy
3. Energy from biomass and biogas
4. Ocean thermal energyconversion
5. Tidal energy
6. Geothermal energy
7. Hydrogen energy
8. Fuel cells
9. Magneto-hydro-dynamic generator
10. Thermionic converter
11. Thermo-electric power.

13
Fig:1.1 Classification of Energy sources
1. Direct application of solar energy
1. Solar Space heating and cooling of residential buildings
2. Solar waterheating
3. Solar drying of agricultural and animal products
4. Solar distillation
5. Salt production byevaporation of seawater or inland brines
6. Solar cookers
7. Solar pumping
8. Food refrigeration
9. Solar greenhouses
10. Solar furnaces
11. Solar electric Powergeneration
12. Solar photovoltaic cells
2. Indirect application of solar energy
1. Wind energy
A small portionof solar radiation reaches on earth surface causes wind dueto:
a) Heating up of earth surface due to absorption of solar radiation and cooling at night.
b) Rotation of earth and its motion around sun.

14
UNIT –II – Non Conventional Energy Systems – SMEA3013

15
II. Solar Energy
Solar Radiation outside the Earth’s Surface:
Sun is a large sphere of very hot gases, the heat being generated by various kinds of
fusion reactions. Its diameter is 1.39X10⁶km, while that of the earth is 1.27X10⁴ km.
It subtends an angle of 32minutes at the earth’s surface. This is because it is also at
large distance. Thus the beam radiation received from the sun on the earth is almost
parallel. The brightness of the sun varies from its center to its edge. However for
engineering calculations. It is customaryto assume that the brightness all over the
solar disc uniform.
Solar Constant (Isc):
It is the rate at which energy is received from the sun on a unit area perpendicular to
the ray’s of the sun, at the mean distance of the earth from the sun. Based on the
measurements made up to 1970 a standard value of 1353 W/m2 was adopted in
1971. However based on subsequent measurements, a revised value of 1367 W/m2
has been recommended. The earth revolves around the sun in an elliptical orbit
having a very small eccentricity and the sun at the foci. Consequently, the distance
between earth and sun varies a little through the year. Because of this variation, the extra
terrestrial flux also varies. The value on any day can be calculated from the
equation.
Solar Radiation Received at the Earth’s surface:
Solar radiation received at the earth’s surface is in the attenuated form because it is
subjected to the mechanisms of absorption and scattering as it passes through the
earth’s atmosphere (Figure below). Absorption occurs primarily because of the presence
of ozone and water vapour in the atmosphere and lesser extent due to other gases( like
CO2, NO2, CO,O2 and CH4)and particulate matter. It results in an increase in the

16
internal energy of the atmosphere. On the other hand, scattering occurs due to all
gaseous molecules as well as particulate matter in the atmosphere. The scattered
radiation is redistributed in all directions, some going back to the space and some
reaching the earth’s surface.
Fig 2.1 Solar radiation
Solar radiation received at the earth’s surface without change of direction i.e, in line with the sun is
called direct radiation or beam radiation. The radiation received at the earth’s surface from all parts of
sky’s hemisphere (after being subjected to scattering in the atmosphere) is called diffuse radiation.
The sum of beam radiation and diffuse radiation is called as total or global radiation.
Instruments used for measuring solar radiation
Pyranometer:
A Pyranometer is an instrument which measure’s either global or diffuse radiation falling on a
horizontal surface over a hemispherical field of view. A sketch of one type of Pyranometer as
installed form easuring global radiationisshowninthefollowingfigure. Pyranometer consists of
a black surface which heats up when exposed to solar radiation. It’s temperature increases until
the rate of heat gain by solar radiation equals the rate of heat loss by convection, conduction and
radiation. The hot junctions of thermopile are attached to the black surface, while the cold
junctions are located under a guard plate so that they do not receive the radiationdirectly. Asa
result an emf is generated. Thisemf whichis usuallyinthe range of 0 t0 10mv can be read,
recorded or integrated over a period of time and is a measure of global radiation. The
17
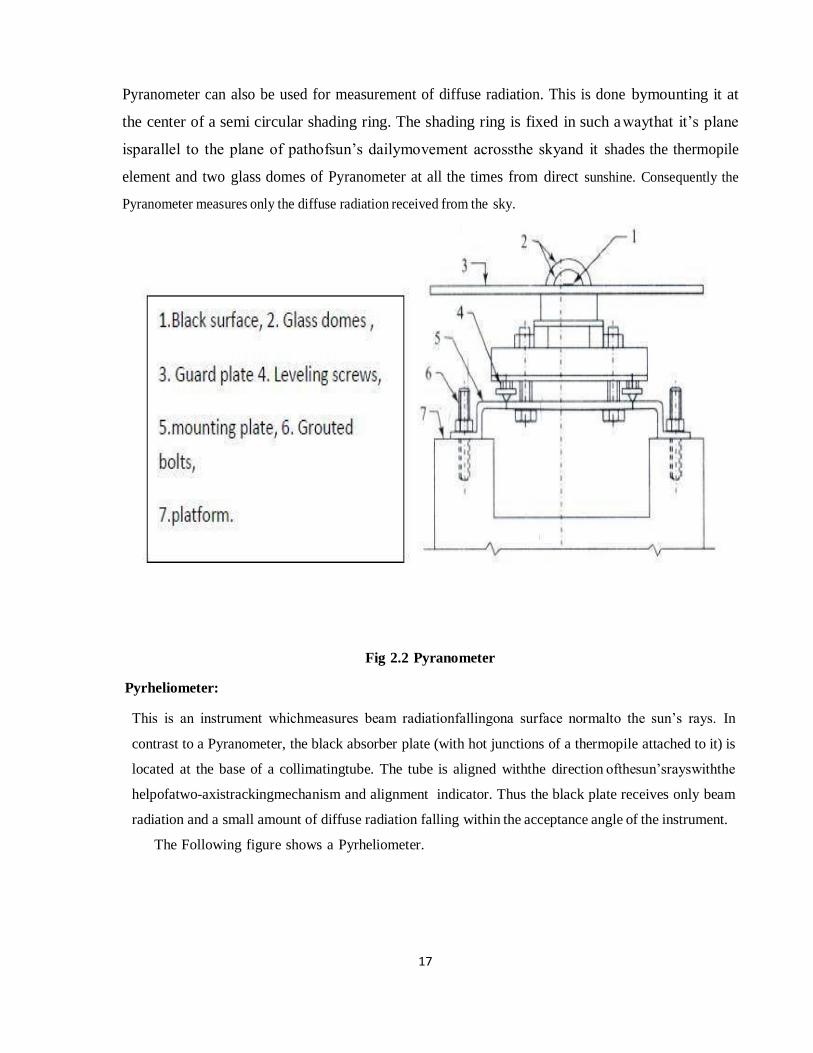
Pyranometer can also be used for measurement of diffuse radiation. This is done bymounting it at
the center of a semi circular shading ring. The shading ring is fixed in such a waythat it’s plane
isparallel to the plane of pathofsun’s dailymovement acrossthe skyand it shades the thermopile
element and two glass domes of Pyranometer at all the times from direct sunshine. Consequently the
Pyranometer measures only the diffuse radiation received from the sky.
Fig 2.2 Pyranometer
Pyrheliometer:
This is an instrument whichmeasures beam radiationfallingona surface normalto the sun’s rays. In
contrast to a Pyranometer, the black absorber plate (with hot junctions of a thermopile attached to it) is
located at the base of a collimatingtube. The tube is aligned withthe direction ofthesun’srayswiththe
helpofatwo-axistrackingmechanism and alignment indicator. Thus the black plate receives only beam
radiation and a small amount of diffuse radiation falling within the acceptance angle of the instrument.
The Following figure shows a Pyrheliometer.

18
Fig 2.3 Phrheliometer
Solar Radiation Geometry
Definitions:
(a) Solar altitude angle(α):
Altitude Angle is the angle between the Sun‘s rays and projection of the Sun’s
rays on thehorizontal plane
(b) Zenith angle (θz):
It is Complementary angle of Sun‘s Altitude angle It is a vertical angle between Sun‘s
rays and line perpendicular to the horizontal plane through the point i.e. angle between
the beam and the vertical Θz=M/2-α
(c) Solar Azimuth Angle (ys):
It is the solar angle in degrees along the horizon east or west of north or It is the
horizontal angle measured from north to the horizontal projection of sun‘s rays.
(d) Declination (6):
It is the angle between a line extending from the centre of the Sun and center of the earth
and projection of this on earth‘s equatorial plane. Declination is the direct consequence of
earth‘s tilt and It would vary between 23.5o on June 22 to – 23.5o on December 22. On
equinoxes of March21 & Sept22 declination is zero.
The declination is given by the formula

19
Where n is the day of the year
(e) Meridian:
Meridian is the imaginary line passing through a point or place on earth and north and south
poles of theearth‘.
(f) Hour angle(ω):
Hour angle is the angle through which the earth must turn to bring meridian of the point
directly in line with the sun‘s rays. Hour angle is equal to 15o per hour.
(g) Slope (β):
Angle between the collector surface with the horizontal plane is called slope(β).
(h) Surface azimuth angle(y):
Anglebetweenthe normaltothecollectorandsouthdirectioniscalledsurfaceazimuthangle(y)
(i) Solar Incident angle(θ):
It is the angle between an incident beam radiation falling on the collector and normal to
the plane surface

20
Fig 2.4 Solar Angles
Relation between θ and other angles is as follows
Cosθ=Sinфl(sin6cosβ+Cos6cosycosωsinβ)+Cosфl(Cos6cosωcosβ-sin6 cosysinβ)+Cos6 siny
sinωsinβ- Eqn (1)
фl=Latitude( north positive) 6=declination(north
positive)
ω=solar hour angle(Positive between midnight and solar noon)
Case1
Vertical
Surface:
β=90o Eqn (1) becomes
Cosθ=Sin фcos6 cosy cos ω- Cosфsin6 cosy+ Cos6 siny Sinω ------------------------------------------Eqn (2)
Case2 Horizontal
21
surfaces
β=0o Eqn(1) becomes
Cosθ=Sin фsin6+cos6 cosфcosω=sinα=cosθz ------------------------------------------------------------- Eqn (3)
Case3
Surface facing south y =0
cos θT=Sin ф (sin6cosβ+ Cos6 cosω sinβ)
=Cos ф (cos6 cosω cosβ-sin6 sinβ)
=Sin6 Sin(ф-β)+Cos6 cosω Cos(ф-β) Eqn (4)
Case4
Vertical surfaces facing south (β=90o, y=0)
cosθz=Sinфcos6cosω-CosфSin6 - Eqn (5)
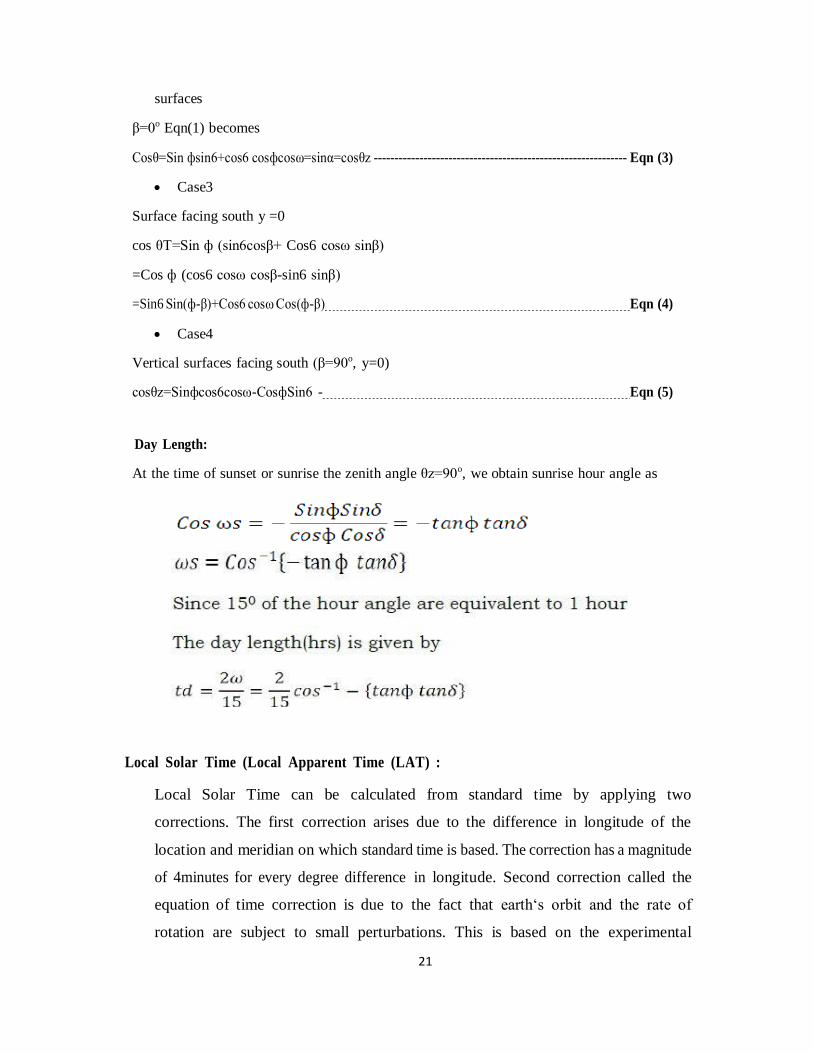
Day Length:
At the time of sunset or sunrise the zenith angle θz=90o, we obtain sunrise hour angle as
Local Solar Time (Local Apparent Time (LAT) :
Local Solar Time can be calculated from standard time by applying two
corrections. The first correction arises due to the difference in longitude of the
location and meridian on which standard time is based. The correction has a magnitude
of 4minutes for every degree difference in longitude. Second correction called the
equation of time correction is due to the fact that earth‘s orbit and the rate of
rotation are subject to small perturbations. This is based on the experimental

22
observations.
Thus, Local Solar Time=Standard time± 4(Standard time Longitude-Longitude of
the location)+(Equation of time correction)
Solar collectors:
Solarcollectorsarethedevicesusedtocollectsolarradiation. Generallytherearetwotypesof
solar collectors. They are 1) Non-conventional type or Flat plate collector and 2)
Concentrating or
Focusingcollector. Ina non-concentratingtypetheareaoftheabsorberisequalstheareaof the
collector and since the radiation is not focused, the maximum temp achieved in this type
is about 100° C. on the other hand in a concentrating type the area of the absorber is very
small (50-100 times) as compared to the collector area. This results in less loss of heat and
also since the radiation is focused to apoint or aline the maximum temp achieved is about
350°C.
Principle of solar energy conversion to heat:
The principle on which the solar energy is converted into heat is the greenhouse effect.
The name is derived from the first application of green houses in which it is possible to
grow vegetation in cold climate through the better utilization of the available sunlight.
The solar radiation incident on the earth‘s surface at a particular wavelength increases the
surface temp of the earth. As a result of difference in temp between the earth‘s surface
and the surroundings, the absorbed radiation is reradiated back to the atmosphere with its
wavelength increased. The Co2 gas in the atmosphere is transparent to the incoming
shorter wavelength solarradiation, whileit isopaque
tothelongwavelengthreradiatedradiation. Asaresultofthis the long wavelength radiation
gets reflected repeatedly between the earth‘s atmosphere and the earth‘s surface resulting
in the increase in temp of the earth‘s surface. This is known as the Green House Effect.
Thisis the principle bywhichsolarenergyisconverted to thermal energy using collector. In
a flat plate collector the absorber plate which is a black metal plate absorbs the radiation
incident throughthe glasscovers. The temp of the absorber plate increases and it begins to
emit radiationoflonger wavelength (IR). This long wavelengthradiation is blocked from

23
the glass covers which act like the Co2 layer in the atmosphere. This repeated reflection of
radiation between the covers and the absorber plate results in the rise of the temp of the
absorber plate.
Flat plate collector (FPC):
The schematic diagram of a FPC is as shown in fig. it consists of a casing either made up of
wood or plastic having an area of about 2m*1m*15cm. in the casing insulator is
provided at the bottom to check conductive heat transfer. Mineral wool, glass wool,
fiber glass, asbestos thermo cal etc. are used as insulator. Above the insulator the
absorber plate is fixed. The absorber plate is made of good conducting material like
aluminum or copper. It is coated black to increase its absorption property. Usually the
black coating is done by chemical treatment. Selective coatings which allow for
maximum absorption of radiation and minimum amount of emissionare applied onto the
absorberplate. Theundersideoftheplateconsistsofabsorber tubeswhichrunalongthe
lengthoftheplate. Theseplatesare alsomadeofthesamematerial asthat oftheabsorberplate.
Sometimestheplate itselfisbent into the formoftubes. Through these tubesthe heat
absorbingmedium(water) is circulated. Thismediumwill absorb the heat from the plates
and the tubes and its temp increases. This medium will absorb the heat from the plates
and the tubes and its temp increases. This way solar energy is collected as heat energy.
Above the absorber plate glass covers are provided. These glasses covers help to bring out
the greenhouse effect, thusincreasing the η of the collector. More thanone cover is used to
prevent the loss of radiation by refraction.
Energy balance equation and collector efficiency: The performance of solar collector is
described by an energy balance equation that indicates the distribution of incident solar
radiation into the useful energy gain and various losses.
Theenergybalanceequationis givenas Qu=Ac [HR (τ, α) – UL (tp-ta)]
Where Qu is the useful energy gained bythe collector in watts, Ac is the collector area in
m2, HR is the solar energy received on the upper surface of the inclined collector, τ is
the fraction of incoming radiation that is transmitted through the cover system and is known
as transmissivity, α is the fraction of solar energy reaching the surface that is absorbed

24
and is known as absorptivity. (τ,α) is the effective transmittance and absorptance
product of cover system for beam and diffuse radiation. UL is the overall heat transfer
coefficient. It is the rate of heat transfer to the surroundings per sq.meter of exposed
collector surface per deg C Difference between average collector surface temp and the
surrounding air temp in w/m2 C. tp is the absorber plate temp in °C, ta is the atmospheric
temp in °C.
Thusthe totalincidentradiationonthecollectoris QT= AcHR[(τ,α)]
Thetotallossesfromthecollectoris AcUL[(tp-ta)]
In order to increase the η of the collector Qu has to be increased. This
isdonebydecreasingthe losses as it is not possible to vary the incident radiation. The
losses that occur are
1) Conduction loss: This loss is prevented by introducing an insulating material between the
absorber plate and the casing where there is contact between the two and also by
usingalowconductingmateriallikewoodorplasticforthecasing. Thustheconduction loss
is reduced.
2) Convection loss: It takesplace bothfrom the top and the bottomofthe absorber plate.
Thebottomlossisreduced byprovidinginsulationbetweenthe absorber tubesand the base
of the casing. The top side loss is prevented by providing glass covers and
maintainingthe distance between the covers byabout 1.25 to 2.5 cm. Also convection
loss is prevented byevacuatingthe top and the bottom side ofthe absorberplate.
3) Radiation losses: It is prevented by applying a selective coating on to the top side of the
absorber plate. This coating allows 90% of the radiation to be incident on to the absorber
plate while transmissivity of the plate is reduced to only 10%. The usual material used for
the coating is ―black chrome. The radiation loss also prevented by treating the underside of
the glass covers by coating which are opaque to the reradiated infrared radiations but are
transparent to the incident visible radiation. The materials used for this coating are tin oxide
or indium oxide.
4) Reflection and refraction losses: These losses are prevented by providing more than
one glass covers so that the reflected and refracted radiation is incident back on the absorber
plate.

25
Thus the collector efficiency is given as,
Parameters affecting the performance of the FPC:
• Selective coating
• No. of covers
• Spacing between thecovers
• Tilt of thecollector
• Incident radiation
• Inlet fluid temperature
• Dust collection on the cover plate
Selective coating:
The η of the collector can be maximized by coating the absorber plate by materials which will
absorbmaximumamountofradiationbutemitminimumamountofradiation. Suchacoatingis known
as selective coating. By applying the selective coating on the absorber plate, input to the collector is
maximized while the loss is minimized by this the η of the collector will improve. The selective
coating Should have maximum absorptivity for a wavelength of less than 4µm, because the
incident radiation will be having a wavelength less than 4µm. Similarly the coating should have
minimum transmissivity for h greater than 4µm, because the radiation emitted from the
absorber plate will be having a h of greater than 4µm. Should have maximum absorptivityfor a
wavelength ofless than 4µm, because the incident radiation will be havinga wavelength less
than4µm.

26
Table 2.1 Property value of solar energy parameters
Similarly the coating should have minimum transmissivity for h greater than 4µm, because the
radiation emitted from the absorber plate will be having a h of greater than 4µm.
The effect of selective coating on the performance of the collector is studied with the help of
following data. From the above data it is seen that the η of the collector having a nonselective
absorber is minimum because of the maximum loss. As the loss increases, the useful heat gains
decreases resulting in decreased η. A collector having a selective absorber coating will have less
loss and more useful heat gain because of its improved absorptivity and reduced emissivity.
Asresult of this the useful heat gain will increase resulting in the increased η of the collector.
The commercially used selective coating are copper oxide on copper (α=0.89, s=0.17) nickel black
on galvanized iron (α=0.868,s=0.088).
Desirable properties of selective coatings: The selective coatings should withstand the
continuous exposed to high temperature without losing the absorbing and emitting
characteristics. These should be less expensive. These coatings should not get corroded or
eroded by theatmosphere.
Concentrating collectors:
These are the solar collectors where the radiation is focused either to a point (focal point of the
collector) or along a line (focal axis of the collector). Since the radiation is focused, the η of
concentrating collector is always greater than that of non-focusing or FPC.
This is because of the following reasons,
1) In case of focusing collector the area of the absorber is many times smaller than that of the area
of the collector. Where as in a non-concentrating type the area of the absorber equals area of the collector.
Hence here the loss of absorbed radiation is more compared to the concentrating type.

27
Inaconcentratingcollectorsincetheradiationisfocused,itsintensityisalwaysgreaterthan that
in the non-focusing type. Because of these reasons the concentrating collectors are always
used for high temp applications like power generation and industrial process heating

28
Fig 2.5 Solar Collectors

29
Compound Parabolic Concentrator (CPC):
Compound Parabolic Concentrator consists of two parabolic mirror segments, attached to a flat
receiver. The segments are oriented such that the focus of one is located at the bottom end point
of the other in contact with the receiver. It has a large acceptance angle and needs to be adjusted
intermittently. Rays in the central region of the aperture reach the absorber directly whereas, those
near the edges undergo one or more reflections before reaching the absorber. The concentration
ratio achieved from this collector is in the range of 3-7.
Cylindrical Parabolic Concentrator:
It consists of a cylindrical parabolic through reflector and a metal tube receiver at its focal line as
shown in figure above. The receiver tube is blackened at the outside surface to increase absorption.
It is rotated about one axis to track the sun. The heat transfer fluid flows through the receiver tube,
carrying the thermal energy to the next stage of the system. This type of collector maybe oriented
in anyone of the three directions: East-West, North-Southor polar. The polar configuration
intercepts more solar radiation per unit area as compared to other modes and thus gives best
performance. The concentration ratio in the range of 5-30 may be achieved from thesecollectors.
Fixed Mirror Solar Concentrator:
Due to practical difficulty in manufacturing a large mirror in a single piece in cylindrical parabolic
shape, long narrow mirror strips are used in this concentrator. The concentrator consists of fixed
mirror strips arranged on a circular reference cylinder with a tracking receiver tube as shown in
Figure above. The receiver tube is made to rotate about the center of curvature of reflector module
to track the sun. The image width at the absorber is ideally the same as the projected width of a
mirror element; the concentration ratio is approximately the same as the number of mirrorstrips.
Solar Energy Storage Systems
Concrete is a relatively good medium for heat storage in passively heated or cooled houses. It
is also considered for application in intermediate–temperature solar thermal plants.Consider the
thermal energy storage system shown schematically in the below Figure . The system consist of a
large liquid bath of mass m and specific heat C placed in an insulated vessel. The system also
includes a collector to give the collector fluid a heat gain and a room in which this heat gain is
discharged.

30
Fig2.6 Solar Energy Storage system
Operation of the system takes place in three steps; charging, storage and removal processes. At the
beginning of the storage process valves A, B, C are opened. Hot fluid from the collector at
temperature Tis enters the system through valve C. This hot collector fluid is cooled while flowing
through the heat exchanger 2 immersed in the bath and leaves at the bottom of the system at
temperature Tes. The heat carrying liquid is then pumped to the collector with the help of pump 2.
The fluid entering the collector takes QH from the sun and its temperature increases to Tis and the
storage cycle is completed. While the hot gas flowing through the heat exchanger 2, the bath
temperature Tb and fluid exit temperature of storage process Tes approach the hot fluid inlet
temperature of storage process Tis. The heating process is allowed to continue up to the desired
storage material (water) temperature. At that desired moment the valves A, B, C are closed. After the
storage period D, E, F are opened, so the removal process begins. Cold fluid with constant mass flow
rate flows through valve F and gets into the heat exchanger 1 and it receives energy from the liquid
bath then leaves the system through valve D. This heated fluid is then pumped to the radiator to give
heat to the medium (room) and the removal cycle is completed. other controlling unit is located at the
radiator outlet. If the radiator outlet temperature is higher than the tank temperature it stops the pump
1 automatically.
SENSIBLE HEAT STORAGE
In sensible heat storage systems, energy is stored or extracted by heating or cooling a liquid
or solid which does not change its phase during the process.
Liquids used: water, heat transfer oils, inorganic molten salts
Solids used: rocks, pebbles, refractories – material is invariably in porous form. Heat is
stored or extracted by the flow of a gas or liquid through the pores or voids.
Choice of the substance depends on the temperature level of the application.
For temperatures below 100 ̊C – water is used.
For temperatures around1000 ̊C – refractory bricks are used.
31
Advantage of sensible heat storage: simpler in design than latent heat or thermo- chemical
storage.
Disadvantage: 1. Bigger in size. 2. They cannot store or deliver energy at a constant temperature.
SENSIBLE HEAT STORAGE – LIQUIDS
Water is the most commonly used medium in a sensible heat storage systems.
Most solar water heating and space heating systems use hot water storage tanks
located either inside or outside the buildings or underground.
Size of the tanks - few 100 litres to a few 1000 cubic meters.
General thumb rule: 75 -100 litres of storage per square meter of collector area.
Storage tanks are made of steel, concrete and fibreglass.
Tanks should be suitably insulated with glass wool, mineral wool or polyurethane.
Thickness of insulation: 10 – 20 cm.
Because of the above, the cost of the insulation represents a significant part of the total cost of
the sensible heat storage.
It is possible to store water at temperatures a little above 100 ̊C by using pressurized tanks.
In order to reduce the cost of water storage systems, naturally occurring underground aquifers
which already contain water is used.
In such systems, the need for building a storage tank is eliminated.
For storing energy, hot water is pumped into the aquifer through an injection well.
At the same time, cold ground water is displaced through another well.
For withdrawing energy, the reverse procedure is followed.
Heat transfer oils: Used for intermediate temperatures ranging from 100 – 300 ̊C.
Eg: Servotherm is used in India.
Disadvantages: 1. The main problem associated with the use of heat transfer oils is that they tend to
degrade with time.The degradation is particularly serious if they are used above their recommended
temperature limit.
The use of oils also presents safety problems since there is a possibility of ignition above their flash point.
For this reason, it is recommended to use the systems with inert gas cover. Cost of the heat transfer oil,
which ranges from 60 – 120 per litre (of Indian brands). Hence these are used in small storage systems

32
Phase Change Energy Storage
In latent heat storage the principle is that when heat is applied to the material it changes its phase from solid
to liquid by storing the heat as latent heat of fusion or from liquid to vapor as latent heat of vaporization.
When the stored heat is extracted by the load, the material will again change its phase from liquid to solid or
from vapor to liquid. The latent heat of transformation from one solid phase into another is small. Solid-
vapor and liquid-vapor transitions have large amounts of heat of transformation, but large changes in
volume make the system complex and impractical. The solid-liquid transformations involve relatively small
changes in volume. Such materials are available in a range of transition temperatures. Heat storage through
phase change has the advantage of compactness, since the latent heat of fusion of most materials is very
much larger than their enthalpy change for 1 K or even 0 K.. For example, the ratio of latent heat
to specific heat of water is 80, which means that the energy required to melt one kilogram of ice is
80 times more than that required to raise the temperature of one kilogram of water one degree
Celsius. Any latent heat thermal energy storage system should have at least the following three
components:a suitable phase change material (PCM) in the desired temperature range, a
containment for the storage substance, and a suitable heat carrying fluid for transferring the heat
effectively from the heat source to the heat storage. Furthermore, the PCMs undergo solidification
and therefore cannot generally be used as heat transfer media in a solar collector or the load. Many
PCMs have poor thermal conductivity and therefore require large heat exchange area. Others are
corrosive and require special containers. Latent heat storage materials are more expensive than the
sensible heat storage media generally employed, like water and rocks. These increase the system
cost.
SOLAR COOKER An important domestic thermal application is that of cooking.
SOLAR COOKER Box type cooker Dish type cooker
(for domestic purpose) (for community purpose)
A slow cooking device suitable for domestic purposes.
It consists of a rectangular enclosure
Insulated at the bottom and sides with one or two glass covers on the top. Solar radiation enters through the
top and heats up the enclosure in which the food to be cooked is placed in shallow vessels.
Temperatures around 100 ˚C can be obtained in these cookers on sunny days and pulses, rice, vegetables
etc., can be readily cooked.
The time taken for cooking depends upon the solar radiation and varies from half an hour two and a half
hours.

33
A single class reflector (mirror) whose inclination can be varied is usually attached to the box type cooker.
The reflector helps in achieving enclosure temperatures which are higher by about 15 – 20 ˚C. As a result,
cooking time is reduced.
Fig2.7 solar cooker
SOLAR DRYING
One of the traditional uses of solar energy has been drying of agricultural products.The drying process
removes moisture and helps in the preservation of the product.A cabinet type solar dryer consists of an
enclosure with a transparent cover.The material to be dried is placed on perforated drying trays. Solar
radiation entering the enclosure is absorbed in the product itself and the surrounding internal surfaces of
the enclosure. As a result, moisture is removed from the product and the air inside is heated. Suitable
openings at the bottom and the top ensure a natural circulation. Temperatures ranging from 50 - 80 ̊C are
usually attained and drying time ranges from 2 – 4 days. Products dried are: dates, apricots, chillies and
grapes.
Fig.2.8 solar dryer

34
Fig.2.9 Solar dryer
When the temperature of the product needs to be controlled or when the solar radiation
falling on the product is not adequate, indirect gain forced circulation dryer is used.Here,
the air is heated separately in an array of solar air heaters and then ducted to the chamber in
which the product to be dried is stored. Suitable for food grains, tea, spices, leather and
ceramics.

35
SOLAR POND
A solar pond is a body of water that collects and stores solar energy. Solar energy will warm a body of
water (that is exposed to the sun), but the water loses its heat unless some method is used to trap it.
Water warmed by the sun expands and rises as it becomes less dense. Once it reaches the surface, the
water loses its heat to the airthrough convection, or evaporates, taking heat with it. The colder water,
which is heavier, moves down to replace the warm water, creating a natural convective circulation
that mixes the water and dissipates the heat. The design of solar ponds reduces either convection or
evaporation in order to store the heat collected by the pond. They can operate in almost any climate.
A solar pond can store solar heat much more efficiently than a body of water of the same size because
the salinity gradient prevents convection currents. Solar radiation entering the pond penetrates through
to the lower layer, which contains concentrated salt solution.
WORKING PRINCIPLE
The solar pond works on a very simple principle. It is well-known that water or air is heated they
become lighter and rise upward. Similarly, in an ordinary pond, the sun‟s rays heat the water and the
heated water from within the pond rises and reaches the top but loses the heat into the atmosphere.
The net result is that the pond water remains at the atmospheric temperature. The solar pond restricts
this tendency by dissolving salt in the bottom layer ofthe pond making it too heavy to rise .
A solar pond is an artificially constructed water pond in which significant temperature rises are caused
in the lower regions by preventing the occurrence of convection currents. The more specific terms
salt-gradient solar pond or non-convecting solar pond are also used. The solar pond, which is actually
a large area solar collector is a simple technology that uses water- a pond between one to four metres
deep as a working material for three main functions
• Collection of radiant energy and its conversion into heat (upto 95° C)
• Storage of heat and transport of thermal energy out of the system
The solar pond possesses a thermal storage capacity spanning the seasons. The surface area of
the pond affects the amount of solar energy it can collect. The bottom of the pond is generally lined
with a durable plastic liner made from material such as black polythene and hypalon reinforced with
nylon mesh. This dark surface at the bottom of the pond increases the absorption of solar radiation.
Salts like magnesium chloride, sodium chloride or sodium nitrate are dissolved in the water, the
concentration being densest at the bottom (20% to 30%) and gradually decreasing to almost zero at
the top. Typically, a salt gradient solar pond consists of three zones.
•
•

36
•
• An upper convective zone of clear fresh water that acts as solar collector/receiver and
which is relatively the most shallow in depth and is generally close to ambient temperature,
• A gradient which serves as the non-convective zone which is much thicker and occupies
more than half the depth of the pond. Salt concentration and temperature increase with
depth,
A lower convective zone with the densest salt concentration, serving as the heat storage zone.
Almost as thick as the middle non-convective zone, salt concentration and temperatures are nearly
constant in this zone,
When solar radiation strikes the pond, most of it is absorbed by the surface at the bottom of the
pond. The temperature of the dense salt layer therefore increases. If the pond contained no salt, the
bottom layer would be less dense than the top layer as the heated water expands. The less dense
layer would then rise up and the layers would mix. But the salt density difference keeps the
„layers‟ of the solar pond separate. The denser salt water at the bottom prevents the heat being
transferred to the top layer of fresh water by natural convection, due to which the temperature of
the lower layer may rise to as much as 95°C.
SOLAR DESALINATION
These are separation processes that rely on a technique or technology for transforming a
mixture of substances into two or more distinct components. The purpose of this type of process is to
purify the saline water of its impurities.
The principle of a separation process is to use a difference of properties between the interest
compound and the remaining mixture. When the difference property will be greater, the separation is
easy. So the choice of the separation process starts with a good knowledge of the mixture composition
and properties of different components. The desalination processes are divided into two main categories:
on the one hand, the distillation process (which requires a phase change, evaporation / condensation)
and on the other hand the membrane processes (filtration).
The most current techniques of desalination are thermal distillation - for the treatment of
great volumes of water (55 000 m3/jour) – and the membranes technology: electrodialysis and reverse
osmosis. The ability of treatment with membrane technology can be adapted according to the intended
use (the great plants have a capacity of more than 5000 m3/day, the averages plant between 500 and
5000 m3/day, while that small installations have a maximum capacity of 500 m3/day).
It is noticed that these processes use thermal energy and / or electrical energy and
consequently are consumer‟s energy and pollutants. The energy, conventional methods commonly used,
can be of solar origin either a partial or total depending on production capacity and in this way we

37
minimize significantly the consumption of energy while protecting the environment. Future
research in this area is oriented toward the maximum utilization of solar energy, which is free and clean,
or through technological innovation and/or improvements on conventional methods. For their operation,
the distillation processes require for much of the thermal energy for heating salt water. temperature,
between 60 and 120 ° C. Heat can be provided in the case of the use of solar energy by solar flat plate or
concentrator collector according to working conditions.The processes most commonly used and which are
likely to be coupled to a source of solar energy are: The direct solar greenhouse distillation is a properly
solar process.-The conventional distillation processes such as multi-stage flash, multi-effects, vapor
compression

38
Solar Heating and Cooling:
Solar thermal energy is appropriate for both heating and cooling. Key applications for solar
technologies are those that require low temperature heat such as domestic water heating, space
heating, pool heating, drying process and certain industrial processes. Solar applications can also
meet cooling needs, with the advantage that the supply (sunny summer days) and the demand
(desire for a cool indoor environment) are well matched. To generate synergy effects in climates
with heating and cooling demand combined systems should be used.
Solar Heating:
Over 70% of the household‟s energy use goes into space and water heating. Covering a big part
with a solar system leads to energy as well as financial savings. Solar heating is a well established
renewable energy source and applied in numerous projects worldwide. Solar thermal systems consist of
a solar collector, a heat exchanger, storage, a backup system and a load. This system may serve for both,
space heating and tap water heating, known as combi system.
Passive Solar heating
• A passive solar system uses no external energy, its key element is good design.
• House faces south.
• South facing side has maximum window area (double or triple glazed).
• Roof overhangs to reduce cooling costs.
• Thermal mass inside the house (brick, stones or dark tile).
• Deciduous trees on the south side to cool the house in summer, let light in the winter.
• Insulating drapes (closed at night and in the summer).
• Greenhouse addition.
• Indirect gain systems also such as large concrete walls to transfer heat inside.

39
Active Solar Heating
• Flat plate collectors are usually placed on the roof or ground in the sunlight.
• The sunny side has a glass or plastic cover.
• The inside space is a black absorbing material.
• Air or water is pumped (hence active) through the space to collect the heat.
• Fans or pumps deliver the heat to the house.
Solar Photovoltaic
PV systems are like any other electrical power generating systems, just the equipment used is
different than that used for conventional electromechanical generating systems. However, the
principles of operation and interfacing with other electrical systems remain the same, and are guided
by a well-established body of electrical codes and standards. Although a PV array produces power
when exposed to sunlight, a number of other components are required to properly conduct, control,
convert, distribute, and store the energy produced by the array.Depending on the functional and
operational requirements of the system, the specific components required may include major
components such as a DC-AC power inverter, battery bank, system and battery controller, auxiliary
energy sources and sometimes the specified electrical load(appliances). In addition, an assortment of
balance of system (BOS) hardware, including wiring,overcurrent, surge protection and disconnect
devices, and other power processing equipment. Figure show a basic diagram of a photovoltaic
system and the relationship of individual components.
Fig 2.7:Major photovoltaic system components.

40
Batteries are often used in PV systems for the purpose of storing energy produced by the PV array
during the day, and to supply it to electrical loads as needed (during the night and periods of cloudy
weather). Other reasons batteries are used in PV systems are to operate the PV array near its maximum
power point, to power electrical loads at stable voltages, and to supply surge currents to electrical
loads and inverters. In most cases, a battery charge controller is used in these systems to protect the
battery from overcharge and over discharge.
Off-grid PV systems have traditionally used rechargeable batteries to store excesselectricity. With
grid-tied systems, excess electricity can be sent to the transmission grid. Net metering programs give these
systems a credit for the electricity they deliver to the grid. This credit offsets electricity provided
from the grid when the system cannot meet demand, effectively using the grid as a storage mechanism.
Credits are normally rolled over month to month and any remaining surplus settled annually.Pumped-storage
hydroelectricity stores energy in the form of water pumped when surplus electricity is available, from a
lower elevation reservoir to a higher elevation one. The energy is recovered when demand is high by
releasing the water: the pump becomes a turbine, and the motor a hydroelectric power generator.

41
UNIT –III – Non Conventional Energy Systems – SMEA3013

42
I. WIND ENERGY INTRODUCTION
• Wind is essentially air in motion, which carries with it kinetic energy.
• The amount of energy contained in the wind at any given instant is proportional to
the wind speed at thatinstant.
• Wind results primarilyby unequal heating of the earth's surface bythe sun.
• About 2% of the total solar flux that reaches the earth's surface is transformed
into wind energy.
• Solarenergymeetsclouds, uneven surfaces, and mountainswhile reachingthe earth.
• This unequal heating causes temperature, density, and pressure differences on the
earth's surface that are responsible for local wind formation.
• Duringdaytime, the airoverthe land massheatsupfasterthanthe airovertheoceans.
Hotair expandsand riseswhilecoolairfromoceansrushestofillthespace,
creatinglocalwinds.
• Atnighttheprocessisreversed astheaircoolmorerapidlyoverlandthanwateroveroff-
shore land, causingbreeze.
• Onaglobalscale, the primaryforceforglobalwindsisdevelopedduetodifferentialheatingof
the earth at equatorial and Polar Regions.
POWER IN WIND
• Wind possesses energy by virtue of its motion. Any device capable of slowing down the
mass of moving air like a sail or propeller can extract part of the energy of the energy
and convert it into useful work.
• Three factor determine the output from a wind energyconverter:
□ The wind speed
□ The cross-section of wind sweptby rotor
□ Theoverallconversionefficiencyoftherotor, transmissionsystemandgeneratororpump.
• Wind mill/turbine converts the kinetic energyof the wind into mechanical energy.
• The total power of the wind stream is equal to the time rate of kinetic energy.
K.E=1/2mV 2
• The amount of air passing in unit time through an area A with velocity V
m=A.V m3/s
.˙. Mass flow rate of air m =p A • V Where, p is the density of air.
K.E=1/2(ρAV)V2

43
BASIC COMPONENTS OF A WIND ENERGY CONVERSION SYSTEM (WECS)
The main components of a wind energy conversion system (WECS) in the form of block
diagram. A wind energy conversion system converts wind energy into some form of
electrical energy. In particular, medium and large scale WECS are designed to operate
in parallel with a utility AC grid. This is known as a grid-connected system. A small
system, isolated from the id, feeding onlyto a local load is known as autonomous or
isolated power system.
Fig 3.1 Wind Energy Conversion System
(WECS)
Types of Wind Energy:
1. According to orientation of the axis of rotor
□ Horizontal axis: When the axis of rotation is parallel to the air stream (i.e.
horizontal), the turbine is said to be a Horizontal Axis Wind Turbine(HAWT).
□ Vertical axis: When the axis of rotation is perpendicular to the air stream (i.e.
vertical), the turbine is said to be a Vertical Axis Wind Turbine (VAWT)
2. According to useful electrical power output
□ Small output: up to 2 kW
□ Medium output: 2 to 100 kW output
□ Large output: More than 100 kW output

44
m
3. According to type of rotor
□ Propeller type: It is horizontal axis high speed rotor.
□ Multiple blade type: It is horizontal axis low speed rotor.
□ Savoniustype: It is vertical axisrotor.
□ Darrieus type: It is vertical axis rotor.
Horizontal Axis Wind Turbine (HAWT)
Horizontalaxis machines have emerged as the most successful type of turbines. These are being used
for commercial energy generation in many parts of theworld.Theyhave low cut-inwind speed,
easyfurlingand, ingeneral, showhighpowercoefficient.
However, their design is more complex and expensive as the generator and gear box are to be
placed at the top of the tower. Also, a tail or yaw drive is to be installed to orient them in the
wind direction.
Main components:
1. Turbine blades
2. Hub
3. Nacelle
4. Power transmissionsyste
5. Generator
6. Yaw control
7. Brakes
8. Tower
Fig 3.2 Photographic view of wind mills
1. Turbine blades
Wind turbine blades need to be light weight and possess adequate strength and hence
require to be fabricated with aircraft industrytechniques.
The blades are made of glass fibre reinforced plastic (F.R.P.). They have an aerofoil type
of cross section to create lift as the air flows over them.
The blades are slightlytwisted from the outer tip to the root to reduce the tendencyto stall.

45
In addition to centrifugal force and fatigue due to continuous vibration, there are many
extraneous forces arising from wind turbulence, gust, gravitational forces and
directional changes inthe wind. All these factors have to be considered at the designing
stage.
The diameter of a typical, MW range, modern rotor maybe of the order of 100m.
SITE SELECTION CONSIDERATIONS
1. Average annual windspeed
The power available in wind increases rapidly with wind speed. Therefore, the main
consideration for locating a wind-power generation plant is the availability of adequate
and uniform average wind velocity throughout the year.
The total wind power from free wind stream increases as the cube of the wind speed.
Therefore, wind velocities available should be in the range of 5 m/s to 25 m/s throughout the
year.
2. Area
As the building, forests offers the resistance to the air movement, the wind farms are
located away from cities and forests. Flat open area should be selected, as the wind
velocities are high in flat openarea.
3. Altitude of thesite
Altitude of the proposed site should be considered. Higher altitude ground experience
strong winds than lower altitude ground. Thus, altitude affects the electric power output
of wind energy conversion system.
Wind velocities must be measured by anemometer at several heights from the ground
The velocity of wind increases with height given bythe relation:
1/ 7
V H
This relation is applicable for the heights between 50 m to 250 m.

46
4. Wind structure
At the proposed site, wind should blow, smooth and steady all the time, i.e. the wind
velocity curve should be flat. Wind specially near the ground is turbulent and gusty, and
changes rapidly in direction and in velocity.
5. Local ecology
If small trees, grass or vegetations are present, all of which destructure the wind, then
the height of the tower will increase, which increases the cost of thesystem.
6. Nature of land and its cost
The site selected should have high load bearing capacity. It would reduce the cost of
foundation. The cost of the land should be low to reduce the initialcost.
7. Transport facilities
There should be transport facilities for transportation of heavy machinery, structures,
materials, blades, etc to chosen site for installation.
8. Nearness of site to load centre
The site should be located near the load to which the power is supplied. The location of
site near load centre reduces the cost of transmission linesand the lossesoccurring in it.
9. Away from localities
The selected site should be awayfrom localities so that the sound pollution caused
bywind turbine does notaffect.
Advantages
1. It is renewable and not depleted with the use like fossil fuels.
2. Wind energy generation is eco-friendly and does not pollute the atmosphere, unlike in
the case of generation from coal, oil, etc.
3. The cost of installation of wind power plant is competitive compared to conventional
power plant/Since, thereisno fuelcostand lowmaintenancecost,
thecostofenergyproducedinlong run is almostfree.

47
Fig 3.3 Wind mill sites
4. Wind energy system does not require fuel and its transportation.
5. In large portion of the world, wind blows for 320 days in a year and this gives them an
advantage over sunlight in direct conversion programmer.
Disadvantages
1. Wind energy is available in dilute and fluctuating in nature.
2. It is necessaryto store wind energyin some other forms during periods of high winds
for use later on duringcalm.
3. Favorable winds are available only in few geographical locations.

48
4. There is fluctuation in electric power depending on fluctuating wind speed.
5. The capital cost is high. At present it is about Rs. 3.5 crores/MW.
6. It causes negative impacts like noise, bird hits, land erosion, impact on wild life, etc.
WIND ENERGY DEVELOPMENT IN INDIA
• The wind powerprogrammer in India wasinitiated towardsthe endof the Sixth Plan, in
1983- 84.
• In India, the wind energyprogrammer is managed and implemented by the Ministry of
New and Renewable Energy sources, Government of India. The wind power potential in
India is 49,130 MW as per the official estimates in the Indian Wind Atlas (2010) bythe
Centre for Wind energy Technology.
• The potential is calculated with respect to 2% land availability at windy locations and pertains
to a 50 meter hub height level of the wind turbines.
• A total capacity of 17365.03 MW has been established up to March 31, 2012 in the
country. India is now the fifth largest wind power producer in the world, after USA,
Germany, Spain and China.
Table 3.1 Thebreak-upofprojectsimplementedinprominentwind potentialstates
49
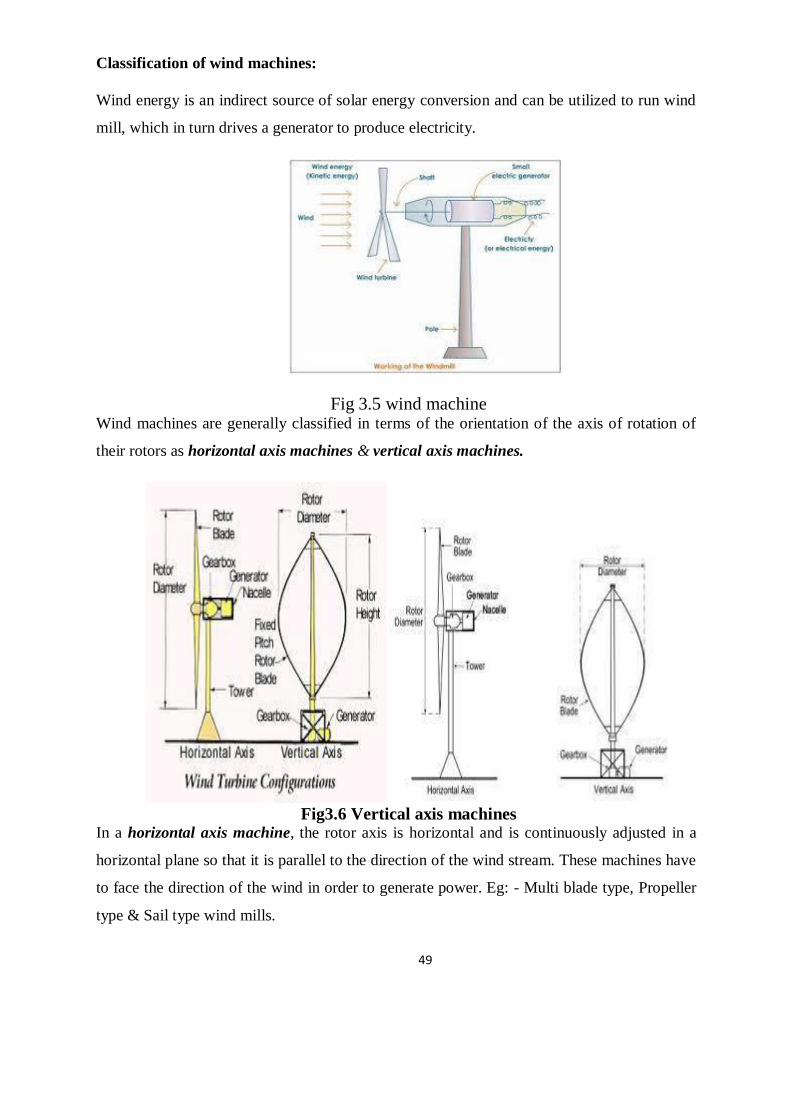
Classification of wind machines:
Wind energy is an indirect source of solar energy conversion and can be utilized to run wind
mill, which in turn drives a generator to produce electricity.
Fig 3.5 wind machine Wind machines are generally classified in terms of the orientation of the axis of rotation of
their rotors as horizontal axis machines & vertical axis machines.
Fig3.6 Vertical axis machines In a horizontal axis machine, the rotor axis is horizontal and is continuously adjusted in a
horizontal plane so that it is parallel to the direction of the wind stream. These machines have
to face the direction of the wind in order to generate power. Eg: - Multi blade type, Propeller
type & Sail type wind mills.
50
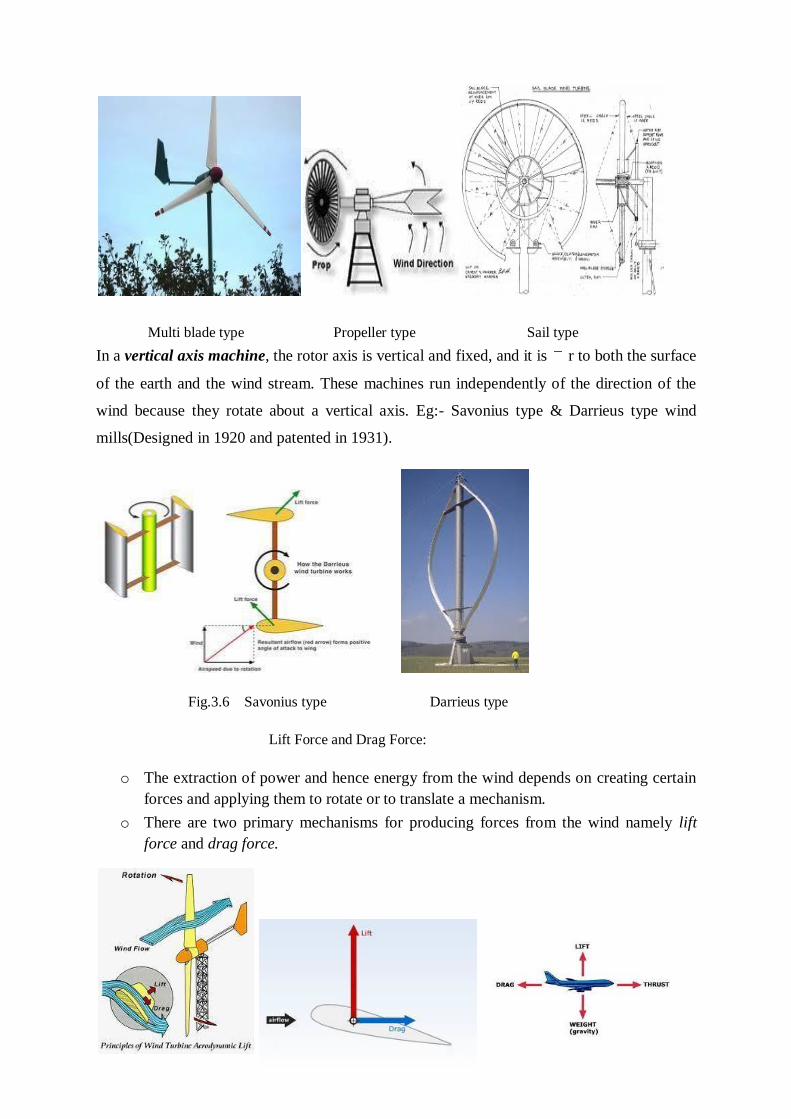
Multi blade type Propeller type Sail type
In a vertical axis machine, the rotor axis is vertical and fixed, and it is r to both the surface
of the earth and the wind stream. These machines run independently of the direction of the
wind because they rotate about a vertical axis. Eg:- Savonius type & Darrieus type wind
mills(Designed in 1920 and patented in 1931).
Fig.3.6 Savonius type Darrieus type
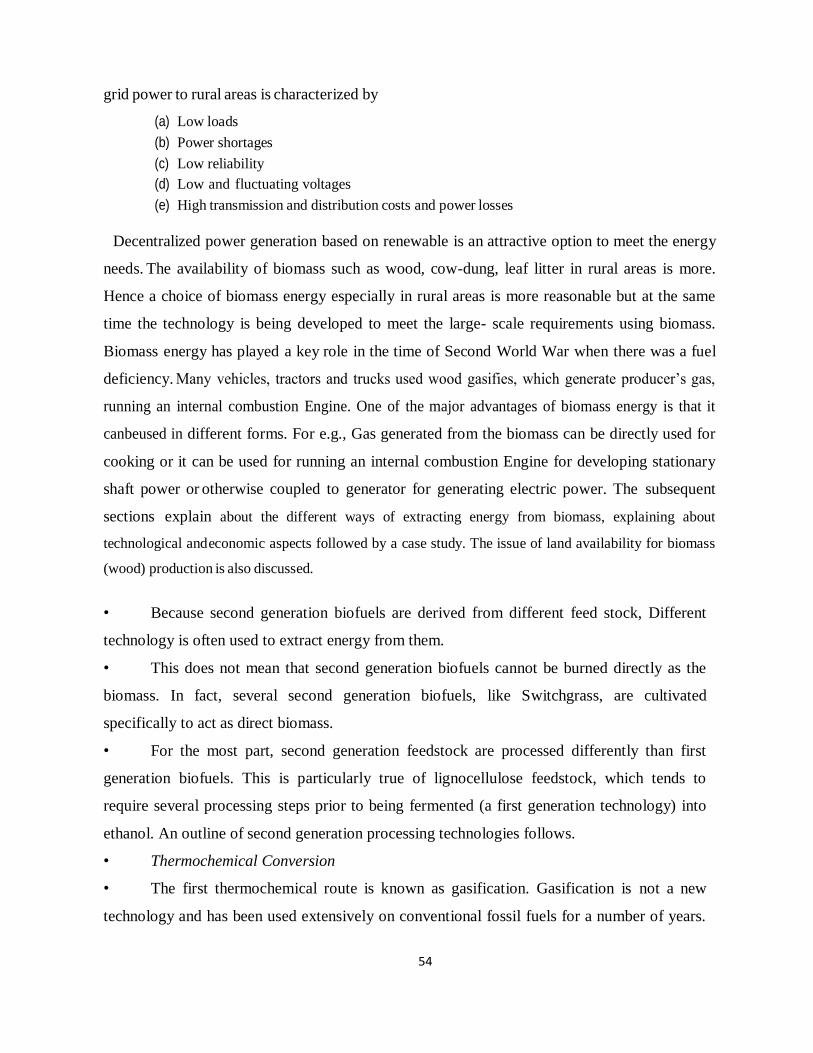
Lift Force and Drag Force:
o The extraction of power and hence energy from the wind depends on creating certain
forces and applying them to rotate or to translate a mechanism.
o There are two primary mechanisms for producing forces from the wind namely lift
force and drag force.

51
o Lift force act perpendicular to the air flow while drag force act parallel to the
direction of air flow.
o Lift force is produced by changing the velocity of the air stream flowing over either
side of the lifting surface (aerofoil): speeding up of the air flow causes the pressure to
drop while slowing the air flow down leads to increase in pressure.
o In other words, any change in velocity generates a pressure difference across the
lifting surface. This pressure difference produces a force that begins to act on a high
pressure side and moves towards the low pressure side of the aerofoil.
o A good aerofoil should have more lift/drag ratio. For efficient operation, a wind
turbine blade needs to function with as much lift and as little drag as possible because
the drag force dissipates the energy.

52
UNIT –IV – Non Conventional Energy Systems – SMEA3013

53
BIO ENERGY
INTRODUCTION
In the past few years, there have been significant improvements in renewable
energy technologies along with declines in cost. The growing concern for the environment and
sustainable development, have led to worldwide interest in renewable energies and bio-energy in
particular. Biomass canbe converted into modernenergyforms suchasliquid and gaseous fuels,
electricity, and process heat to provide energy services needed by rural and urban
populations and also by industry. This paper explains the different ways of extracting energy
from biomass and a comparison is made among them. This paper also explains about the
potentiality of biomass energy in India, analyses current situation compares bio-
energy and other options for promoting development, brings out the advantages over the other
renewable putting forth the drawbacks to be overcome to make it still more successful. This
paper analyses current situation compares bio-energy and other options for promoting
development, explore the potential forbio-energy.
• Today, the use of biofuels has expanded throughout the globe.
• Some of the major producers and users of biogases are Asia, Europe and
America.
• There are several factors that decide the balance between biofuel and fossil
fuel use around the world. Those factors are cost, availability, and food supply
• .There is only so much land fit for farming in the world and growing bio
fuels necessarily detracts from the process of growing food. As the population grows, our
demands for both energy and food grow. At this point, we do not have enough land to grow
both enough biofuel and enough food to meet both needs
Inpast 10 years or so, considerable practicalexperience has accumulated in Indiaaswell as in
other developing and industrialized countries, on biomass energy production and conversion.
India is pioneer among developing countries, with significant indigenous efforts in promoting
renewable energy technologies. The importance of bioenergy as a modern fuel has been
recognized. India has about 70,000 villages yet to be connected to the electricity grid. The supply of
54
grid power to rural areas is characterized by
(a) Low loads
(b) Power shortages
(c) Low reliability
(d) Low and fluctuating voltages
(e) High transmission and distribution costs and power losses
Decentralized power generation based on renewable is an attractive option to meet the energy
needs. The availability of biomass such as wood, cow-dung, leaf litter in rural areas is more.
Hence a choice of biomass energy especially in rural areas is more reasonable but at the same
time the technology is being developed to meet the large- scale requirements using biomass.
Biomass energy has played a key role in the time of Second World War when there was a fuel
deficiency. Many vehicles, tractors and trucks used wood gasifies, which generate producer’s gas,
running an internal combustion Engine. One of the major advantages of biomass energy is that it
canbeused in different forms. For e.g., Gas generated from the biomass can be directly used for
cooking or it can be used for running an internal combustion Engine for developing stationary
shaft power or otherwise coupled to generator for generating electric power. The subsequent
sections explain about the different ways of extracting energy from biomass, explaining about
technological and economic aspects followed by a case study. The issue of land availability for biomass
(wood) production is also discussed.
• Because second generation biofuels are derived from different feed stock, Different
technology is often used to extract energy from them.
• This does not mean that second generation biofuels cannot be burned directly as the
biomass. In fact, several second generation biofuels, like Switchgrass, are cultivated
specifically to act as direct biomass.
• For the most part, second generation feedstock are processed differently than first
generation biofuels. This is particularly true of lignocellulose feedstock, which tends to
require several processing steps prior to being fermented (a first generation technology) into
ethanol. An outline of second generation processing technologies follows.
• Thermochemical Conversion
• The first thermochemical route is known as gasification. Gasification is not a new
technology and has been used extensively on conventional fossil fuels for a number of years.
55
Second generation gasification technologies have been slightly altered to accommodate the
differences in biomass stock. Through gasification, carbon-based materials are converted to
carbon monoxide, hydrogen, and carbon dioxide. This process is different from combustion in
that oxygen is limited. The gas that result is referred to as synthesis gas or syngas. Syngas is
then used to produce energy or heat. Wood, black liquor, brown liquor, and other feedstock
are used in this process.
• The second thermochemical route is known as pyrolysis. Pyrolysis also has a long
history of use with fossil fuels. Pyrolysis is carried out in the absence of oxygen and often in
the presence of an inert gas like halogen. The fuel is generally converted into two products:
tars and char. Wood and a number of other energy crops can be used as feedstock to produce
bio-oil through pyrolysis.
• A third thermochemical reaction, called torrefaction, is very similar to pyrolysis, but is
carried out at lower temperatures. The process tends to yield better fuels for further use in
gasification or combustion. Torrefaction is often used to convert biomass feedstock into a
form that is more easily transported and stored.
• Biochemical Conversion
• A number of biological and chemical processes are being adapted for the production of
biofuel from second generation feedstock. Fermentation with unique or genetically modified
bacteria is particularly popular for second generation feedstock like landfill gas and municipal
waste.
• Unofficial category reserved for biofuels derived from algae
• Previously, algae were considered second generation biofuels. However, when it became
apparent that algae are capable of much higher yields with lower resource inputs than other
feedstock, many suggested that they be moved to their own category
• Algae-based biofuels require a unique production mechanism and potentially offer solutions
to mitigate most of the drawbacks of 1st and 2nd generation biofuels.
• No feedstock can match algae In terms of quantity or diversity.
• Algae produce an oil that can easily be refined into diesel or even certain components of
gasoline
• Algae can be genetically manipulated to produce everything from ethanol and butanol to
even gasoline and diesel fuel directly

56
• Butanol is of great interest because the alcohol is exceptionally similar to gasoline. In fact,
it has a nearly identical energy density to gasoline and an improved emissions profile.
• Until the advent of genetically modified algae, scientists had a great deal of difficulty
producing butanol
• Outstanding yields
• Algae have been used to produce up to 9000 gallons of biofuel per acre, which is 10-fold
what the best traditional feedstock have been able to generate
• People who work closely with algae have suggested that yields as high as 20,000 gallons
per acre are attainable
• According to the US Department of Energy, yields that are 10 times higher than second
generation biofuels mean that only 0.42% of the U.S. land area would be needed to
generate enough biofuel to meet all of the U.S. needs.
• Algae can adventitiously be cultivated in diverse ways:
• Open ponds
• Algae is grown in a pond in the open air
• Simple design and low capital costs
• Less efficient than other systems
• Other organisms can contaminate the pond and potentially damage or kill the algae
Closed-loop systems
• Similar to open ponds but not exposed to the atmosphere and use of a sterile source
of carbon dioxide
• Could potentially be directly connected to carbon dioxide sources (such as
smokestacks) and thus use the gas before it is every released into the atmosphere
• Photobioreactors
• Complex, expensive, closed systems
• Significantly higher yield and better control
Different Ways of extracting energy from biomass
The different methods of biomass extraction can be broadly be classified as:
1) Anaerobic Digestion
2) Gasification
3) Liquefaction

57
Solid fuel combustion
The simplest and most common way of extracting energy from biomass is by direct
combustion ofsolid matter. Majorityof the developing countries especiallyin rural areas
obtain the majority of their energy needs from the burning of wood, animal dung and
other biomass. But burning can be inefficient. An open fireplace may let large amounts
of heat escape, while a significant proportion of the fuel may not even get burnt.
Gasification
Gasification is a process that exposes a solid fuel to high temperatures and limited
oxygen, to produce a gaseous fuel. This is a mix of gases such as carbon monoxide,
carbon dioxide, nitrogen, hydrogen andmethane.
Gasification has several advantages over burning solid fuel. One is convenience - one
of the resultant gases, methane, can be treated in a similar way as natural gas, and used
for the same purposes.
Another advantage of gasification is that it produces a fuel that has had many impurities
removed and will therefore cause fewer pollution problems when burnt. And, under suitable
circumstances, it can produce synthesis gas, a mixture of carbon monoxide and hydrogen. This can
be used to make almost any hydrocarbon (e.g., methane and methanol), which can then be
substituted for fossil fuels. But hydrogen itself is a potential fuel of the future.
Paralysis
Paralysis is an old technologywith a new lease of life. In its simplest form it involves
heating the biomass to drive off the volatile matter, leaving behind the black residue we
know as charcoal. Thishasdoublethe energydensityoftheoriginalmaterial. Thismeansthat
charcoal, whichis half the weight of the original biomass, contains the same amount of
energy - making the fuel more transportable. The charcoal also burns at a much higher
temperature than the original biomass, making it more useful for manufacturing
processes. More sophisticated Paralysis techniques have been developed recently to
collect the volatiles that are otherwise lost to the system.

58
The collected volatiles produce a gas rich in hydrogen (a potential fuel) and carbon
monoxide. These compounds, if desired, can be synthesized into methane, methanol and
other hydrocarbons. 'Flash' Paralysiscanbeused toproducebio-crudeacombustiblefuel.
Digestion
Biomass digestion works by the action of anaerobic bacteria. These microorganisms usually
live at the bottom of swamps or in other places where there is no air, consuming dead
organic matter to produce, among other things, methane and hydrogen.
We can put these bacteria to work for us. By feeding organic matter such as animal
dung or human sewage into tanks - called digesters - and adding bacteria, we can
collect the emitted gas touseasanenergysource.
Thiscanbeaveryefficientmeansofextractingusableenergy from such biomass - up to two-
thirdsof the fuelenergyof the animaldungis recovered.
Another, related, technique is to collect gas from landfill sites. A large proportion of
household biomass waste, such as kitchen scraps, lawn clippings and pruning, ends up at
the local tip. Over a period of several decades, anaerobic bacteria are at work at the
bottom of such tips, steadily decomposing the organic matter and emitting methane.
The gas can be extracted and used by 'capping' a landfill site with an impervious layer
of clay and then inserting perforated pipes that collect the gas and bring it to the surface.
Fermentation
Like many of the other processes described here, fermentation isn't a new idea. For
centuries, people have used yeasts and other microorganisms to ferment the sugar of
various plants into ethanol. Producing fuel from biomass by fermentation is just an
extension of this old process, although a wider range of plant material can now be used,
from sugar cane to wood fiber. For instance, the waste from a wheat mill in New South
Wales has been used to produce ethanol through fermentation. This is then mixed with
diesel to produce 'dishelm', a product used by some trucks and buses in Sydney and
Canberra.
An elaborated discussion on Digestion and Gasification, which are the major ways
employed in India, are explained in subsequent sections.

59
Anaerobic Digestion
Anaerobic Digestion is a biochemical degradation process that converts complex
organic material, such as animal manure, into methane and other byproducts.
What is Anaerobic Digester?
Anaerobic digester (commonly referred to as an AD) is a device that promotes the
decomposition of manure or “digestion” of the organics in manure to simple organics
and gaseous biogas products. Biogas is formed by the activity of anaerobic bacteria.
Microbial growth and biogas production are very slow at ambient temperatures. These
bacteria occur naturally in organic environments where oxygen is limited. Biogas is
comprised of about 60% methane, 40% carbon dioxide, and 0.2 to 0.4% of hydrogen
sulfide. Manure is regularly put into the digester after which the microbes break down the
manure into biogas and a digested solid. The digested manure is then deposited into a
storage structure. The biogas can be used in an engine generator or burned in a hot
water heater. AD systems are simple biological systems and must be kept at an operating
temperature of 100 degrees F in order to function properly. The first methane digester
plant was built at a leper colony in Bombay, India. Biogas is very corrosive to
equipment and requires frequent oil changes in an engine generator set to prevent
mechanical failure. The heating value of biogas is about 60% of natural gas and about
1/4 of propane. Because of the low energy content and its corrosive nature of biogas,
storage of biogas is not practical.
There are two major types of biogas designs promoted in India
1) Floating Drum
2) Fixed Dome
The floating drum is an old design with a mild-steel, Ferro-cement or fiberglass drum, which
floats alongacentralguideframe and actsasastoragereservoirforthebiogasproduced. The fixed
dome design is of Chinese origin and has dome structure made of cement and bricks. It
is a low-cost alternative to the floating drum, but requires high masonry skills and is
prone to cracks and gas leakages. Family biogas plants come in different size
depending on the availability of dung and the quantity of biogas required for cooking.

60
The average size of the family is 5-6 persons, and thus biogas plant of capacity 2-4 m3
is adequate. The biomass requirement is estimated to be 1200 liters for afamily.
Fig 4.1Floating Gasholder drum design (a conventional Indian
design
Fig 4.2 Spherical shaped fixed - dome plant
Uses of Biogas
Biogas can be directly used for cooking by supplying the gas though pipes to households from
the plant. Biogas has been effectively used as a fuel in industrial high compression spark ignition
engines. To generate electricity an induction generator can be used and is the simplest to
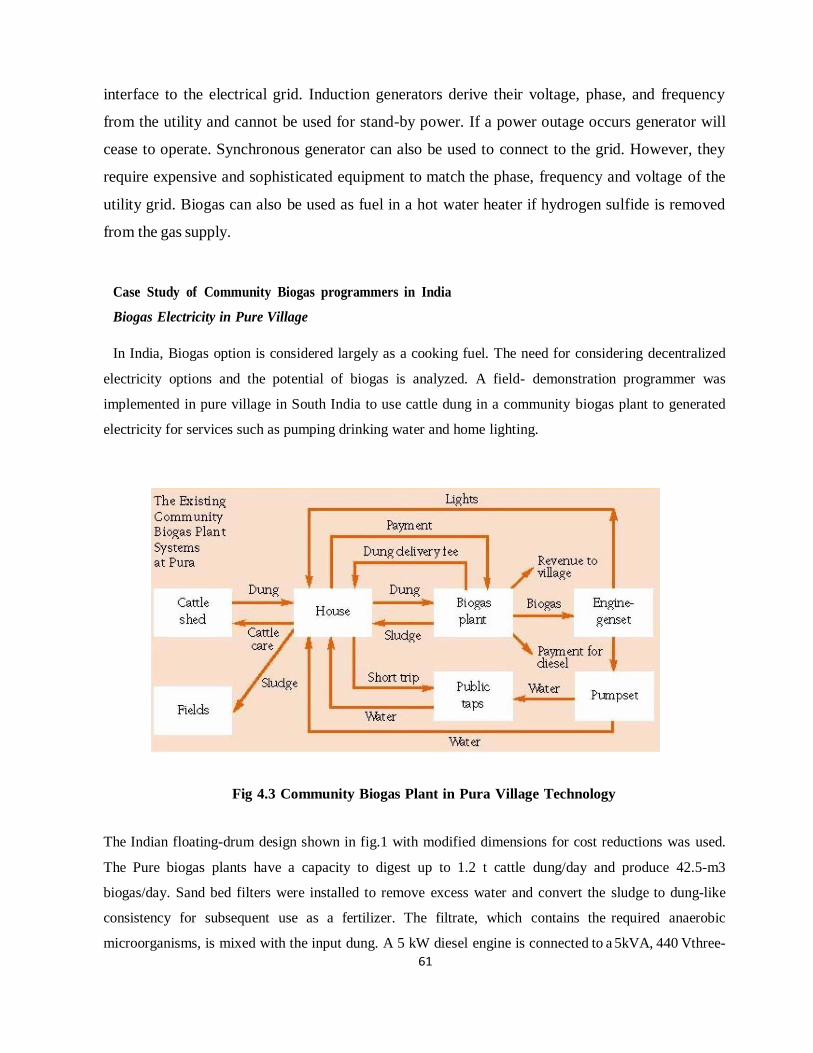
61
interface to the electrical grid. Induction generators derive their voltage, phase, and frequency
from the utility and cannot be used for stand-by power. If a power outage occurs generator will
cease to operate. Synchronous generator can also be used to connect to the grid. However, they
require expensive and sophisticated equipment to match the phase, frequency and voltage of the
utility grid. Biogas can also be used as fuel in a hot water heater if hydrogen sulfide is removed
from the gas supply.
Case Study of Community Biogas programmers in India
Biogas Electricity in Pure Village
In India, Biogas option is considered largely as a cooking fuel. The need for considering decentralized
electricity options and the potential of biogas is analyzed. A field- demonstration programmer was
implemented in pure village in South India to use cattle dung in a community biogas plant to generated
electricity for services such as pumping drinking water and home lighting.
Fig 4.3 Community Biogas Plant in Pura Village Technology
The Indian floating-drum design shown in fig.1 with modified dimensions for cost reductions was used.
The Pure biogas plants have a capacity to digest up to 1.2 t cattle dung/day and produce 42.5-m3
biogas/day. Sand bed filters were installed to remove excess water and convert the sludge to dung-like
consistency for subsequent use as a fertilizer. The filtrate, which contains the required anaerobic
microorganisms, is mixed with the input dung. A 5 kW diesel engine is connected to a 5kVA, 440 Vthree-

62
phase generatorofelectricitygeneration.
Lighting
Out of 87 households in the village 39 already had grid electricity, there are 103 fluorescent tube lights of
20 W capacity connected biogas generated electricity. Forty-seven houses opted for one tubelightand 25
houseshavetwo tubelights. Lightingisprovidedintheeveningfor 2.5 hours/day. Even homes connected to the
grid had lighting connections from the biogas system.
Water supply
A submersible pump is connected to a tube well and water is pumped to storage tanks for 1 hour
and 40 minutes/day. The majorityof the households have opted for private taps at their doorsteps.
Biomass Gasifies:
Biomass, or more particularly wood, can be converted to a high-energy combustible gas for use in
internal combustion engines for mechanical or electrical applications. This process is known as
gasification and the technology has been known for decades, but its application to power
generationisofrecentorigin. Abiomassgasifiedconsistsofareactorwhere, undercontrolled
temperature and air supply, solid biomass is combusted to obtain a combustible gas called
Producers gas (consisting of H2 and CH4). This gas passes through a cooling and cleaning system
before it is fed into a compression ignition engine for generation of mechanical or electricity (by
coupling to a generator). An assessment of its potential concluded that India presents a unique
opportunity for large-scale commercial exploitation of biomass gasification technology to meet a
variety of energy needs, particularly in the agricultural and rural sectors. The large potential of
biomass gasification for water pumping and power generation for rural electrification was
recognized.
Feed Stocks for producer-gas systems:
A range of crop residues and woody biomass from trees could be used as feed stocks for producer-
gas systems. Currently, wood-based systems are available, and designs using other low- density

63
biomass are under development and should soon be available in India. Crop residues with fuel
potential are limited, since nearly all cereal and most pulse residues are used as fodder or manure and
thus are not available as fuel. It is important to note that currently crop residues are used and
have an opportunity cost. Rice husks are used in the cement industry, in rice mills and in the
manufacture ofbricks. Coconut leaves are used asthatchand the husk as fiber and sugarcane biogases
is used in sugar mills. In Punjab, for rice-husk-based power generation systems, the price ofresidues
such as rice husk could increase once new uses and demands are developed. Crop residues may
continue to be used as fuel in domestic sector assuming that cooking-energy requirements are
going to be met from bio-energy options. Constant supply of crop residues as feedstock cannot
be assured over a long period on continuous basis and the transportation of low-density residues
is not feasible. Woody biomass wouldbethedominantsourceoffeedstockfor gasification. The
availability of woody biomass and production potentials are discussed in the following section.
Biomass availability issues:
Before assessing the country's bio-energy production potential, it is important to:
i. Estimate the land availability for biomass production.
ii. Identifyand evaluate the biomass productionoptions—yield/ha and financialviability,
iii. Estimate sustainable biomass production potential for energy,
iv. Estimate the energy potential of biomass production,
v. Assessthe investmentrequiredandbarrierstoproducingbiomasssustainablyforenergy.
Logging waste.
vi.
vii. Consideration of options 2 and 3 involves a range of related issues, such as land availability, land
quality, competitive uses of land, and sustainability of wood production. Some proportion of wood
currently burnt, as cooking fuel would become available for the producer-gas electricity option.
Tree plantations, farm trees, homestead gardens, and degraded lands are the various sources of
fuel wood used for cooking. Among these sources, only wood from tree plantations could be
considered as easily available as feedstock for power generation. Woody biomass would be the
dominant source of feedstock for gasification. The availability of woody biomass and production

64
potentials are discussed in the following section.
Different options for wood supply:
1. Conservation potential of wood used in cooking.
2. Producing wood on community, government, or degraded forest land.
3. Producing wood on degraded private or farm land.
4. Sustainable harvest from existing forest.

65
UNIT –V – Non Conventional Energy Systems – SMEA3013

66
Other Renewable Energy Sources
Geo thermal energy
Geo thermal energy itself on earth’s surface in the form of geyster, hot spring, furnar hole
& boing Mud
By drilling hole 3 km deep in the field the steam and water comes out from surface at
temperature Up to500°c It can be used for power generating.
Fig 5.1 Geothermal power plant
Geothermal electricity is electricity generated from geothermal energy. Technologies in use
include dry steam power plants, flash steam power plants and binary cycle power plants.
Geothermal electricity generation is currently used in 24 countries while geothermal heating is in
use in 70 countries.
Estimates of the electricity generating potential of geothermal energy vary from 35 to 2000 GW.
Current worldwide installed capacity is 10,715 megawatts (MW), with the largest capacity in the
United States (3,086 MW), Philippines, and Indonesia.
Geothermal Power (Hot Dry Rocks)
Geothermal heat of over 200 °C can be delivered from up to 5000 m deep holes to operate
organic Rankine cycles or Kalina cycle power machines. Unit sizes are about 1 MW today and

67
limited to about 100 MW maximum in the future. Geothermal energy is often used for the co-
generation of heat and power. Geothermal power plants are used all over the world where
surface near geothermal hot water or steam sources are available, like in USA, Italy and the
Philippines. In the MED-CSP study region those conventional geothermal potentials are
significant in Island, Italy, Turkey, Yemen and Iran. Those potentials are small in comparison to
the HDR potentials and are not quantified separately in the study. The Hot Dry Rock
technology aims to make geothermal potentials available everywhere, drilling deep holes into
the ground to inject cold water and receive hot water from cooling down the hot rocks in the
depth /IGA 2004/. However, this is a very new though promising approach and technical
feasibility must still be proven. Geothermal power plants provide power on demand using the
ideal storage of the earth’s hot interior as reservoir.They can provide peak load, intermediate load or
base load electricity. Therefore, the capacity factor of geothermal plants is defined by the load and their
operation mode. Assuming a plant availability of 90 %, their capacity credit would have that same value.
Ocean thermal energy conversion (OTEC):
Ocean serves a big store house of solar energy
At water surface 23°c-source ,while temperature at depth of 100m is 5°c-sink
Temperature differential can be used to run heat engine & power can be produce using
working fluids NH3, R-12, propane gas .
Fig 5.2 Photographic view of OTEC

68
Ocean thermal energy conversion (OTEC) uses the difference between cooler deep and warmer shallow
or surface oceanwaters to runa heat engine and produceuseful work, usuallyin the form of
electricity.
A heat engine gives greater efficiency and power when run with a large temperature difference. In
the oceans the temperature difference between surface and deep water is greatest in the tropics,
although still a modest 20oC to 25oC. It is therefore in the tropics that OTEC offers the greatest
possibilities. OTEC has the potential to offer global amounts of energy that are 10 to 100 times
greater than other ocean energy options such as wave power. OTEC plants can operate
continuously providing a base load supply for an electrical power generation system. The main
technical challenge of OTEC is to generate significant amounts of power efficiently from small
temperature differences. It is still considered an emerging technology. Early OTEC systems were of
1 to 3% thermal efficiency, well below the theoretical maximum for this temperature difference
of between 6 and 7%.[2] Current designs are expected to be closer to the maximum. The first
operational system was built in Cuba in 1930 and generated 22 kW. Modern designs allow
performance approaching the theoretical maximum Carnot efficiency and the largest built in 1999
by the USA generated 250 kW.
Themostcommonly usedheatcycle for OTECisthe Rankine cycle using a low- pressure turbine.
Systemsmay be either closed-cycle or open-cycle. Closed-cycle engines use working fluids that are
typically thought ofas refrigerants such as ammonia or R-134a. Open-cycle engines use vapour
from the seawater itself as the workingfluid. OTEC can also supply quantities of cold water as a
by-product. This can be used for air conditioning and refrigeration and the fertile deep ocean
water can feed biological technologies. Another by-product is fresh water distilled from the
sea. Cold seawater is an integral part of each of the three types of OTEC systems: closed- cycle,
open-cycle, and hybrid. To operate, the cold seawater must be brought to the surface. The primary
approaches are active pumping and desalination. Desalinating seawater near the sea floor lowers
its density, which causes it to rise to the surface.
The alternative to costly pipes to bring condensing cold water to the surface is to pump
vaporized low boiling point fluid into the depths to be condensed, thus reducing pumping
volumes and reducing technical and environmental problems and lowering costs.

69
Diagram of a closed cycle OTEC plant
Closed-cycle systems use fluid with a low boiling point, such as ammonia, to power a turbine to
generate electricity. Warm surface seawater is pumped through a heat exchanger to vaporize the
fluid. The expanding vapor turns the turbo-generator. Cold water, pumped through a second heat
exchanger, condensesthe vaporinto a liquid, which isthen recycled throughthe system. In 1979,
the Natural Energy Laboratory and several private-sector partners developed the "mini OTEC"
experiment, which achieved the first successful at-sea production of net electrical
powerfromclosed-cycle OTEC.[12] TheminiOTECvesselwasmoored1.5 miles(2 km) off the
Hawaiiancoast and produced enough net electricity to illuminatetheship'slight bulbsandrun its
computers andtelevision.
Fig 5.3 Diagram of an open cycle OTEC plant
Open-cycle OTEC uses warm surface water directly to make electricity. Placing warm seawater in a low-
pressure container causes it to boil. The expanding steam drives a low-pressure turbine
attachedtoanelectricalgenerator. Thesteam, whichhasleftitssaltandothercontaminants in thelow-
pressurecontainer, ispurefreshwater. Itiscondensedintoaliquidbyexposuretocold temperatures from deep-
ocean water. This method produces desalinized fresh water, suitable for drinking water or irrigation.
Tidal energy:

70
Tides are generated due to gravitational pull between the earth and the moon and sun.
The difference between high tide & low tide could be utilized to operate hydraulic turbine.
Fig 5.4 Tidal energy Generation
Tidal power, also called tidal energy, is a form of hydropower that converts the energy of tides into
electricity or other useful forms of power. The first large-scale tidal power plant (the Rance Tidal
Power Station) started operation in 1966.
Although not yet widely used, tidal power has potential for future electricity generation. Tides are
more predictable than wind energy and solar power. Among sources of renewable energy, tidal power
has traditionally suffered from relatively high cost and limited availability of sites with
sufficiently high tidal ranges or flow velocities, thus constricting its total availability. However,
many recent technological developments and improvements, both in design (e.g. dynamic tidal
power, tidal lagoons) and turbine technology (e.g. new axial turbines, crossflow turbines),
indicate that the totalavailabilityof tidalpower maybemuch higher than previously assumed, and
that economic and environmental costs may be brought down to competitive levels.

71
HYDROPOWER
Basic principles and features
The basic principles are explained in the lecture notes on Energy Sources and Generation of
Energy Carriers, see sections 4 and 6.3.2.
Sustainable potential
Also the sustainable potential is discussed in the lecture notes on Energy Sources and Generation
of Energy Carriers, see section 4. The emphasis there is on large scale hydropower generation. Small
scale use of hydropower can be quite important locally even though the contribution to the
overall national energybalance is marginal.
In Sweden, small hydropowerplantswithacapacitybelow 1500 kWiscontributingwithabout 2
TWh(el) annually. The potential for expansion of small hydropower in Sweden has been
estimated to about 2,5 TWh(el).
Technological state of the art
The technology for exploitation of hydropower in large and small scale is well developed and
fully commercial.
Economy
A hydropower plant does not normally cost much to operate. The driving energy is available at
zero cost. The economyis almost entirelydepending onthe initial investment for civil work, like
dams and water channels, machines, buildings and installation of the machines. Building of
a power line from the site of the power plant to the national grid or an isolated group of
consumers may also require a significant investment.
The necessary investment varies depending on the conditions on site. The range can be 1300 – 6000
SEK/annualkWh. Withaninterestrateof5%andaneconomiclifeof40 years, thecapital cost for
generation will be 86 – 396 SEK/MWh(el). Maintenance costs range between 10 and 40
SEK/MWh(el)

72
Environmental considerations
Exploitation of hydropower resources will always lead to landscape changes. The picture is
seldom as idyllic asthe illustrationof small scale hydropower generation infigure 4 implies. A
water-fall or rapids will disappear or at least show a reduced water flow. Large parts of the
original river may be left dry. If a man-made water reservoir is included in the project, the dam
as such means a change in the landscape. More important is the flooding of land caused bythe
dam and the appearance of the shores when the water level in the reservoir is low. The effects on
aquatic life can be significant. In particular migrating fish will be affected.
The MHD generation or, also known as magneto hydrodynamic power generation is a direct
energy conversion system which converts the heat energy directly into electrical energy, without
any intermediate mechanical energy conversion, as opposed to the case in all other power
generating plants. Therefore, in this process, substantial fuel economy can be achieved due to the
elimination of the link process of producing mechanical energy and then again converting it to
electrical energy.
The concept of MHD power generation was introduced for the very first time by Michael
Faraday in the year 1832 in his Bakerian lecture to the Royal Society. He in fact carried out an
experiment at the Waterloo Bridge in Great Britain for measuring the current, from the flow of
the river Thames in earth’s Magnetic field
This experiment in a way outlined the basic concept behind MHD generation over the years
then, several research work had been conducted on this topic, and later in August 13, 1940 this
concept of magneto hydro dynamic power generation, was imbibed as the most widely
accepted process for the conversion of heat energy directly into electrical energy without a
mechanical sub-link.

73
Principle of MHD Generation
Fig.5.1 MHD Generation
The principal of MHD power generation is very simple and is based on Faraday’s law of
electromagnetic induction, which states that when a conductor and a magnetic field moves
relative to each other, then voltage is induced in the conductor, which results in flow of current
acrosstheterminals.
As the name implies, the magneto hydro dynamics generator shown in the figure below, is
concerned with the flow of a conducting fluid in the presence of magnetic and electric fields. In
conventional generator or alternator, the conductor consists of copper windings or stripswhile in
an MHD generator the hot ionized gas or conducting fluid replaces the solid conductor.
A pressurized, electrically conducting fluid flows through a transverse magnetic field in a

74
channel or duct. Pair of electrodes are located on the channel walls at right angle to the magnetic
field and connected through an external circuit to deliver power to a load connected to it.
Electrodes in the MHD generator perform the same function as brushes in a conventional DC
generator. The MHD generator develops DC power and the conversion to AC is done using an
inverter.
The power generated per unit length by MHD generator is approximately given by,
Where, u is the fluid velocity, B is the magnetic flux density, σ is the electrical conductivity of
conducting fluid and P is the density of the fluid.
MHD Cycles and Working Fluids
The MHD cycles can be of two types, namely
1. Open Cycle MHD.
2. Closed Cycle MHD.
The detailed account of the types of MHD cycles and the working fluids used, are given below.
Open Cycle MHD System
In open cycle MHD system, atmospheric air at very high temperature and pressure is passed
through the strong magnetic field. Coal is first processed and burnet in the combustor at a high
temperature of about 2700oC and pressure about 12 ATP with pre-heated air from the plasma.
Then a seeding material such as potassium carbonate is injected to the plasma to increase the
electrical conductivity. The resulting mixture having an electrical conductivity of about 10
Siemens/m is expanded through a nozzle, so as to have a high velocity and then passed through
the magnetic field of MHD generator. During the expansion of the gas at high temperature, the
positive and negative ions move to the electrodes and thus constitute an electric current. The gas
is then made to exhaust through the generator. Since the same air cannot be reused again hence it
forms an open cycle and thus is named as open cycle MHD.
Closed Cycle MHD System

75
As the name suggests the working fluid in a closed cycle MHD is circulated in a closed loop.
Hence, in this case inert gas or liquid metal is used as the working fluid to transfer the heat. The
liquid metal has typically the advantage of high electrical conductivity, hence the heat provided
by the combustion material need not be too high. Contrary to the open loop system there is no
inlet and outlet for the atmospheric air. Hence, the process is simplified to a great extent, as the
same fluid is circulated time and again for effective heat transfer.
Advantages of MHD Generation
The advantages of MHD generation over the other conventional methods of generation are given
below. Here only working fluid is circulated, and there are no moving mechanical parts. This
reduces the mechanical losses to nil and makes the operation more dependable.
1. The temperature of working fluid is maintained by the walls of MHD.
2. It has the ability to reach full power level almost directly.
3. The price of MHD generators is much lower than conventional generators.
4. MHD has very high efficiency, which is higher than most of the other conventional or non-
conventional method of generation.
TEXT / REFERENCE BOOKS
1. 1.Rai G.D, Non Conventional Energy Sources, Khanna Publishers, New Delhi, 2011.
2. Twidell, J.W. & Weir, A., Renewable Energy Sources, EFN Spon Ltd., UK, 2006.
3. Sukhatme S.P, Solar Energy, Tata McGraw Hill Publishing Company Ltd., New Delhi,
1997.
4. Godfrey Boyle, Renewable Energy, Power for a Sustainable Future, Oxford University
Press,U.K., 1996.
5. Tiwari G.N, Solar Energy – Fundamentals Design, Modelling& Applications, Narosa
Publishing House, New Delhi,
6. 2002. Freris L.L, Wind Energy Conversion Systems, Prentice Hall, UK, 1990.
7. Johnson Gary, L. Wind Energy Systems, Prentice Hall, New York, 1985
8. David M. Mousdale – Introduction to Biofuels, CRC Press, Taylor & Francis Group,
USA2010
9. Chetan Singh Solanki, Solar Photovoltaic’s, Fundamentals, Technologies and
Applications, PHI Learning Private Limited,New Delhi 2009.
Copyright © 2022 FDOKUMEN