Unit Cost and Break-Even Point Analysis of Data Communication Company Case Study: Pt Xyz
19
Proceedings of World Business and Social Science Research Conference 24-25 October, 2013, Novotel Bangkok on Siam Square, Bangkok, Thailand, ISBN: 978-1-922069-33-7 1 Unit Cost and Break-Even Point Analysis of Data Communication Company Case Study: Pt Xyz Muhammad Arif Information and communication technology (ICT) has played an important role in the economic transformation of countries including Indonesia. For the year 2013, the International Data Corporation (IDC) predicts the technology will play an integral role in traditional sectors. Along with that, there will be significant impact in data communication network market industry, which eventually leads to market competition. One of major challenges of data communication network providers is maintaining the profitability of the company. There are two indicators to maintain the profitability of the company: unit cost and the break-even point. This research conducted cost analysis at PT XYZ to find the unit cost and break-even point. PT XYZ is one of major data communication network provider specialist for business enterprises since 1988. There are three kinds of products: terrestrial (leased line, metro ethernet, leased circuit, packet switched, frame relay, IPVPN), VSAT, and internet (dedicated internet and broadband internet). They are offered in same unit: bandwidth –transmission capacity of a computer network or other telecommunication system stated in MB/s. The methodology framework starts with cost classification, which divides the cost incurred into production cost and nonproduction cost. Second, cost allocation distributes the classified cost into each product to find total cost of each product. Third, the unit cost is calculated. Along with that, this research determined the cost behavior whether fixed cost or variable cost using account analysis. Finally, the break-even point is calculated using weighted-average contribution margin approach. Based on the framework, this research discovered the unit cost product. The highest unit cost was packet switched (IDR 337,419,354 / MB/s), followed by VSAT (IDR 43,812,106 / MB/s) and frame relay (IDR 19,921,313 / MB/s). The highest unit profit was also packet switched (IDR 135,377,765 / MB/s), followed by frame relay (IDR 12,003,682 / MB/s) and VSAT (IDR 11,551,289 / MB/s). In conclusion, all products were profitable at 4.0%-50.6%. Last, the PT XYZ break-even point is 143,267 MB/s and the break-even point of each product is also determined. Keywords: Unit Cost, Break-Even Point, Cost Analysis, Data Communication, Indonesia ICT Field of Research: Managerial Accounting 1. Introduction 1.1 Research Background Information and communication technology (ICT) has played an important role in the economic transformation of countries including Indonesia. _____________________________________________________ Mr. Muhammad Arif, School of Business and Management, Institut Teknologi Bandung, West Java, Indonesia. [email protected]
-
Upload
independent -
Category
Documents
-
view
1 -
download
0
Transcript of Unit Cost and Break-Even Point Analysis of Data Communication Company Case Study: Pt Xyz

Proceedings of World Business and Social Science Research Conference
24-25 October, 2013, Novotel Bangkok on Siam Square, Bangkok, Thailand, ISBN: 978-1-922069-33-7
1
Unit Cost and Break-Even Point Analysis of Data Communication Company Case Study: Pt Xyz
Muhammad Arif
Information and communication technology (ICT) has played an important role in the economic transformation of countries including Indonesia. For the year 2013, the International Data Corporation (IDC) predicts the technology will play an integral role in traditional sectors. Along with that, there will be significant impact in data communication network market industry, which eventually leads to market competition. One of major challenges of data communication network providers is maintaining the profitability of the company. There are two indicators to maintain the profitability of the company: unit cost and the break-even point. This research conducted cost analysis at PT XYZ to find the unit cost and break-even point. PT XYZ is one of major data communication network provider specialist for business enterprises since 1988. There are three kinds of products: terrestrial (leased line, metro ethernet, leased circuit, packet switched, frame relay, IPVPN), VSAT, and internet (dedicated internet and broadband internet). They are offered in same unit: bandwidth –transmission capacity of a computer network or other telecommunication system stated in MB/s. The methodology framework starts with cost classification, which divides the cost incurred into production cost and nonproduction cost. Second, cost allocation distributes the classified cost into each product to find total cost of each product. Third, the unit cost is calculated. Along with that, this research determined the cost behavior whether fixed cost or variable cost using account analysis. Finally, the break-even point is calculated using weighted-average contribution margin approach. Based on the framework, this research discovered the unit cost product. The highest unit cost was packet switched (IDR 337,419,354 / MB/s), followed by VSAT (IDR 43,812,106 / MB/s) and frame relay (IDR 19,921,313 / MB/s). The highest unit profit was also packet switched (IDR 135,377,765 / MB/s), followed by frame relay (IDR 12,003,682 / MB/s) and VSAT (IDR 11,551,289 / MB/s). In conclusion, all products were profitable at 4.0%-50.6%. Last, the PT XYZ break-even point is 143,267 MB/s and the break-even point of each product is also determined.
Keywords: Unit Cost, Break-Even Point, Cost Analysis, Data Communication, Indonesia ICT Field of Research: Managerial Accounting
1. Introduction 1.1 Research Background Information and communication technology (ICT) has played an important role in the economic transformation of countries including Indonesia. _____________________________________________________ Mr. Muhammad Arif, School of Business and Management, Institut Teknologi Bandung, West Java, Indonesia.
Proceedings of World Business and Social Science Research Conference
24-25 October, 2013, Novotel Bangkok on Siam Square, Bangkok, Thailand, ISBN: 978-1-922069-33-7
2
In November 2012, the rate of economic growth in Indonesia was very good predominantly because of the influx of foreign direct investment in ICT sector. For the year 2013, the International Data Corporation (IDC) predicts the technology will play an integral role in traditional sectors. ICT adoption among enterprises is expected to increase significantly in the coming years. (Ningrum, 2013) Along with that, there will be significant impact in data communication network providers market industry, which eventually leads to market competition. Recalled the price war happened in cellular telecommunication industry in early 2006 (Antaranews, 2007), it could also be happened in data communication network industry. One of major challenges of data communication network providers is maintaining the profitability of the company. There are two indicators to maintain the profitability of the company: unit cost and the break-even point. Unit cost is the cost incurred of every unit of product. It helps the company to set proper price and earn profit. The break-even point is the number of units that must be sold for a company to break even –to neither earn a profit nor incur a loss (Jiambalvo, 2007). In order to determine unit cost and break-even point, cost analysis should be conducted. This research conducted cost analysis at PT XYZ, Jakarta. XYZ is chosen because it has been one of major telecommunication network provider specialist for data communication (one of ICT segment) for business enterprises since 1988. It initially provided the banking sector with data communication services and bank reporting system, leading eventually to the development of ATM Bersama. It allowed customers of different banks to execute inter-bank transactions via automated teller machine (ATM). Now, XYZ focuses in secured data communication provider for business enterprises. For instance, a bank in Jakarta plans to open new branch in Depok (southern Jakarta). The new branch needs data from Jakarta such as inter-bank withdrawal. The new branch also has to transfer data to Jakarta such as reporting any transactions occurred. Therefore, connectivity between Jakarta-Depok has to be established. However, it takes huge effort if the bank builds its own infrastructure (cable, router, modem, utility, trunk, etc.) just to establish connectivity between two banks. Moreover, the bank has less competence about it and the costs will be very expensive. Here is where XYZ takes part. XYZ has network infrastructure that spreaded over cities in Indonesia. The solution is that the Jakarta bank just needs to get plugged into XYZ network in Jakarta, while the Depok bank into XYZ network in Depok. Through integrated XYZ network infrastructure, the connectivity between Jakarta-Depok bank could be established. This is much less expensive rather than the bank build its own network infrastructure. Based on the topology of the network, XYZ has three categorized products: terrestrial products, VSAT, and internet products. Terrestrial products provide connectivity between every point of customer’s business through terrestrial (on ground) infrastructure network. Terrestrial products are divided into six products: Leased Line, Metro Ethernet, Leased Circuit, Packet Switched, Frame Relay, and IPVPN, which typically divided based on the technology used. The strength of terrestrial products is the stability of network.

Proceedings of World Business and Social Science Research Conference
24-25 October, 2013, Novotel Bangkok on Siam Square, Bangkok, Thailand, ISBN: 978-1-922069-33-7
3
Figure 1: Terrestrial Network Topology
VSAT provides connectivity between every point of customer’s business through extraterrestrial infrastructure network. VSAT connects to transponder (part of satellite) that orbits outside the earth. The strength of VSAT is it could reach remote area not be reach by terrestrial lastmile (cable, fiber optic, or radio).
Figure 2: VSAT Network Topology
While data communication products and VSAT offer connectivity between customer points, internet products provide connectivity between customer and the worldwide internet. Therefore, customer only needs to get plugged into XYZ network infrastructure and customer can browse the internet. Internet products are divided into Dedicated Internet and Broadband Internet, which divided based on the offered bandwidth.

Proceedings of World Business and Social Science Research Conference
24-25 October, 2013, Novotel Bangkok on Siam Square, Bangkok, Thailand, ISBN: 978-1-922069-33-7
4
Figure 3: Internet Network Topology
There are two terms that related to data communication: network and bandwidth. Network is a complete single connection between customer and XYZ network. A customer may establish more than a network, based on the order. Bandwidth is the transmission capacity of a computer network or other telecommunication system. The unit of bandwidth is megabyte per second (MB/s) or kilobyte per second (KB/s). All products in XYZ are offered in bandwidth. For instance, Figure 1 shows three networks. However, the bandwidth of each network varies due to the customers’ needs. 1.2. Problem Identification XYZ faces problem in determining product profitability. Based on managerial accounting perspective, XYZ may conduct and apply cost analysis to get the desirable information. Cost analysis allows the company to identify and trace unit cost. Next, unit profit can also be calculated. The comparison between products unit profit will determine which product is more or less profitable. Moreover, cost analysis can also find break-even point (BEP), the activity level of production when no profit earned (revenue = cost). However, the cost analysis itself has major challenges that driven of several reasons. First, XYZ has numerous costs that incurred not directly to the product. For instance, the cost of participating in Indonesia ICT Fair (marketing costs) was incurred to promote all products. Moreover, the cost of office rent in Jakarta (general and administrative costs) was incurred to provide spaces for all staffs, managers, and directors –not each product exclusively. Second, though there are costs that incurred directly to the product, mostly they are joint costs. For instance, domestic backbone is required to transfer data for both terrestrial and internet products. Therefore, the domestic backbone rent cost should be allocated for each terrestrial and internet products. The question is: what method that most proper for allocating the costs to the product? What is the cost driver of each cost related to the product? Third, calculating Break-Even Point (BEP) per product requires cost behavior analysis. It divides costs into fixed cost, variable cost, or mixed cost. Therefore, comprehensive business process and in-depth interview with managers are surely important for accurate analysis. The first and second problems are related to calculate unit cost, while third problem is related to calculate BEP. In conclusion, the identified problems are:
1. How the costs are allocated to each XYZ’s product?

Proceedings of World Business and Social Science Research Conference
24-25 October, 2013, Novotel Bangkok on Siam Square, Bangkok, Thailand, ISBN: 978-1-922069-33-7
5
2. What is the unit cost of each XYZ’s product? 3. What is the cost behavior in XYZ? 4. What is the Break-Even Point (BEP) of each XYZ’s product?
1.3. Objectives The problems identification that mentioned above has a general purpose: information to gain more profit in the future. Specifically, the objectives of this research are:
1. To map and describe about the cost structure of the company. 2. To understand deeper product knowledge about unit cost. 3. To understand the cost behavior in XYZ. 4. To give information about BEP for each XYZ product that would be useful for XYZ
specially marketing division. 5. To recommend valuable input for future decision-making particularly related to the
product. 1.4. Research Scope This research is conducted on cost analysis regarding to unit cost and break-even point (BEP) analysis of PT XYZ for one-year period valid from January 2012 until December 2012. The products that will be included are: terrestrial products (Leased Line, Metro Ethernet, Leased Circuit, Packet Switched, Frame Relay, and IPVPN), VSAT, and internet products (Dedicated Internet and Broadband Internet). In order to simplify the analysis, this research ignores the factor of working area that covers entire Indonesia. Thus, it assumes that the cost was typically similar in every point in Indonesia.
2. Literature Review 2.1. Cost Classifications Based on Jiambalvo (2007), cost classifications in a firm are divided into manufacturing costs and non-manufacturing costs. Manufacturing costs consist of direct material cost, direct labor cost, and manufacturing overhead. Nonmanufacturing costs consist of selling cost and general-and-administrative cost. The hierarchy of cost classifications is shown at Figure 4.

Proceedings of World Business and Social Science Research Conference
24-25 October, 2013, Novotel Bangkok on Siam Square, Bangkok, Thailand, ISBN: 978-1-922069-33-7
6
Figure 4: Cost Classification in Manufacturing Firms
1. Manufacturing Costs Manufacturing costs (also known as product cost) are all the costs associated with the production of goods. They include three cost categories: direct material, direct labor, and manufacturing overhead (Jiambalvo, 2007: 39). a. Direct Material Cost (DMC)
Direct material cost (DMC) is the cost of all materials and parts that are directly traced to items produced (Jiambalvo, 2007: 39). Direct material cost often does not include the cost of minor materials, such as screws and glue. Although such minor material costs could be traced to a particular product or service, tracing the costs may not be worth the time it would take to do so. Materials that are not directly traced to a product are referred to as indirect materials, which are included in manufacturing overhead.
b. Direct Labor Cost (DLC) Direct labor cost (DLC) is the cost of labor that is directly traced to items produced (Jiambalvo, 2007: 40). However, the cost of production supervisors, such as the salary, is not included into direct labor cost. Labor costs that are not directly traced to a product are referred to as indirect labor costs, which are included in manufacturing overhead.
c. Manufacturing Overhead (MO) Manufacturing overhead (MO) is the cost of all manufacturing activities other than direct material and direct labor. It includes indirect material and indirect labor, which were explained earlier (Jiambalvo, 2007: 40).
2. Nonmanufacturing Costs Nonmanufacturing costs (also known as period cost) can be defined simply as all costs that are not associated with the production of goods. (Jiambalvo, 2007: 40). Typically, nonmanufacturing costs include selling cost and general-and-administrative cost.
Total Costs
Manufacturing Costs
Direct Material Cost
Direct Labor Cost
Manufacturing Overhead
Nonmanufacturing Costs
Selling Cost
General and Administrative
Cost

Proceedings of World Business and Social Science Research Conference
24-25 October, 2013, Novotel Bangkok on Siam Square, Bangkok, Thailand, ISBN: 978-1-922069-33-7
7
a. Selling Cost (SC) Selling cost (SC) includes all the cost associated with securing and filling customer orders (Jiambalvo, 2007: 40). Selling cost includes advertising cost, sales personnel salaries, depreciation of any equipment used by sales force, and also cost of storing and shipping finished goods.
b. General and Administrative Cost (GAC) General and administrative cost (GAC) is all the costs associated with the firm’s general management (Jiambalvo, 2007: 40). General and administrative cost includes salaries of the board of directors, depreciation of building and office equipment, and cost of supplies used by administrative employees.
2.2. Cost Behavior To implement cost-volume-profit analysis, the behavior of costs should be determined. There are some costs that change when business activities (e.g., sales volume and production volume) changes; while some other costs not change. There is generally three types cost behavior: variable costs, fixed costs, and mixed costs.
1. Variable Costs (VC) Variable costs (VC) are costs that change in proportion to changes in volume or activity (Jiambalvo, 2007: 126). Whenever activity increases by 20 percent, variable costs are supposed to increase by 20 percent.
2. Fixed Costs (FC) Fixed costs (FC) are costs that do not change in response to changes in activity levels (Jiambalvo, 2007: 126). Whenever activity increases by 20 percent, fixed costs are supposed to remain the same.
3. Mixed Costs (MC) Mixed costs (MC) are costs that contain both a variable cost element and a fixed cost element (Jiambalvo, 2007: 128). These costs are often referred to as semi variable costs. For instance, a salesperson paid by Rp3.000.000/month (fixed element) plus commission equal to 1 percent of sales (variable element) is categorized as mixed costs.
2.3. Weighted Average Contribution Margin (WACM) Contribution margin is the difference between the selling price (SP) and variable cost per unit (VC) (Jiambalvo, 2007: 140). The formula of CM is shown below:
(1) where = Contribution margin
= Selling price per unit
= Variable cost per unit For business that offers more than a product, weighted average contribution margin (WACM) is needed. It represents the average contribution margin of all business’ products. The formula of WACM is shown below:
∑
∑
where = Weighted average contribution margin
Proceedings of World Business and Social Science Research Conference
24-25 October, 2013, Novotel Bangkok on Siam Square, Bangkok, Thailand, ISBN: 978-1-922069-33-7
8
= Selling proportion of product
= Contribution margin of product 2.4. Break-Even Point (BEP) Break-even point (BEP) is the number of units that must be sold for a company to break even –to neither earn a profit nor incur a loss (Jiambalvo, 2007: 138). The formula to calculate BEP is shown below:
where = Break-even point = Total fixed cost
= Weighted average contribution margin
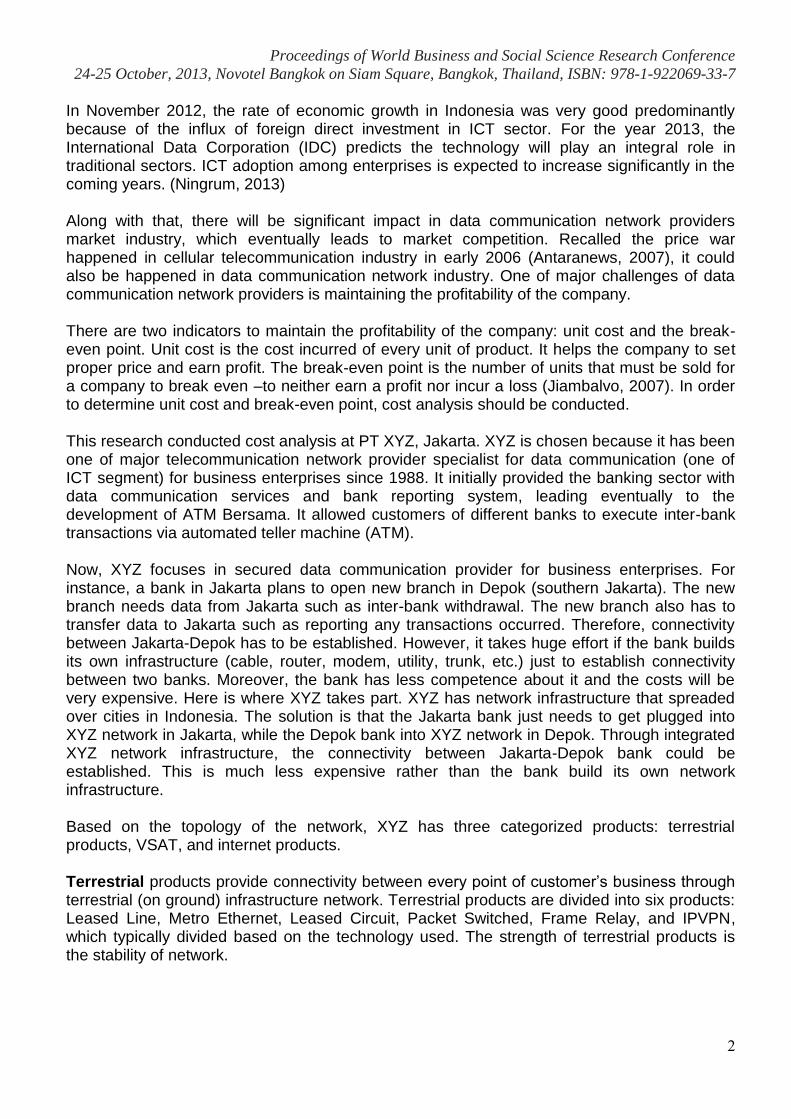
3. Methodology This research combines cost classification, cost allocation, cost behavior, and break-even analysis in order to find unit cost and break-even point. The framework is shown as follows:
Figure 5: Framework Methodology

Proceedings of World Business and Social Science Research Conference
24-25 October, 2013, Novotel Bangkok on Siam Square, Bangkok, Thailand, ISBN: 978-1-922069-33-7
9
1. Costs Incurred All costs incurred during 2012 take into account. The data is gathered primarily from PT XYZ accounting division, with a total IDR 1,241,871,272,455.
2. Cost Classification In this part, the costs incurred will be classified. Based on Jiambalvo (2007), manufacturing firm divides its cost into manufacturing costs and nonmanufacturing costs. Since XYZ is not a manufacturing company (but data communication service provider company), the term of “manufacturing” will be replaced into “production”. The term of “selling cost” will also be replaced into “marketing cost”.
Therefore, XYZ has two cost classification: (1) production costs which consist of direct material cost, direct labor cost, and overhead; and (2) nonproduction costs which consist of marketing cost and general and administrative cost.
3. Cost Allocation The third step is allocating the classified costs into each product. Several assumptions of cost drivers will be used to split joint costs incurred for certain product. The objective is to determine total cost incurred of each product.
4. Unit Cost Calculation The total cost incurred of each product divided by total units sold equals the unit cost of each product.
5. Cost Behavior Analysis It determines fixed cost and variable cost using account analysis method. This method requires that the manager use professional judgment to classify costs as either fixed or variable. In this research, four managers were asked and the mean of theirs will be used for calculation.
6. Break-Even Calculation The last step is calculating break-even point of each product using the result of cost behavior and cost allocation. The objective is to find the production level of each product when no profit earned.
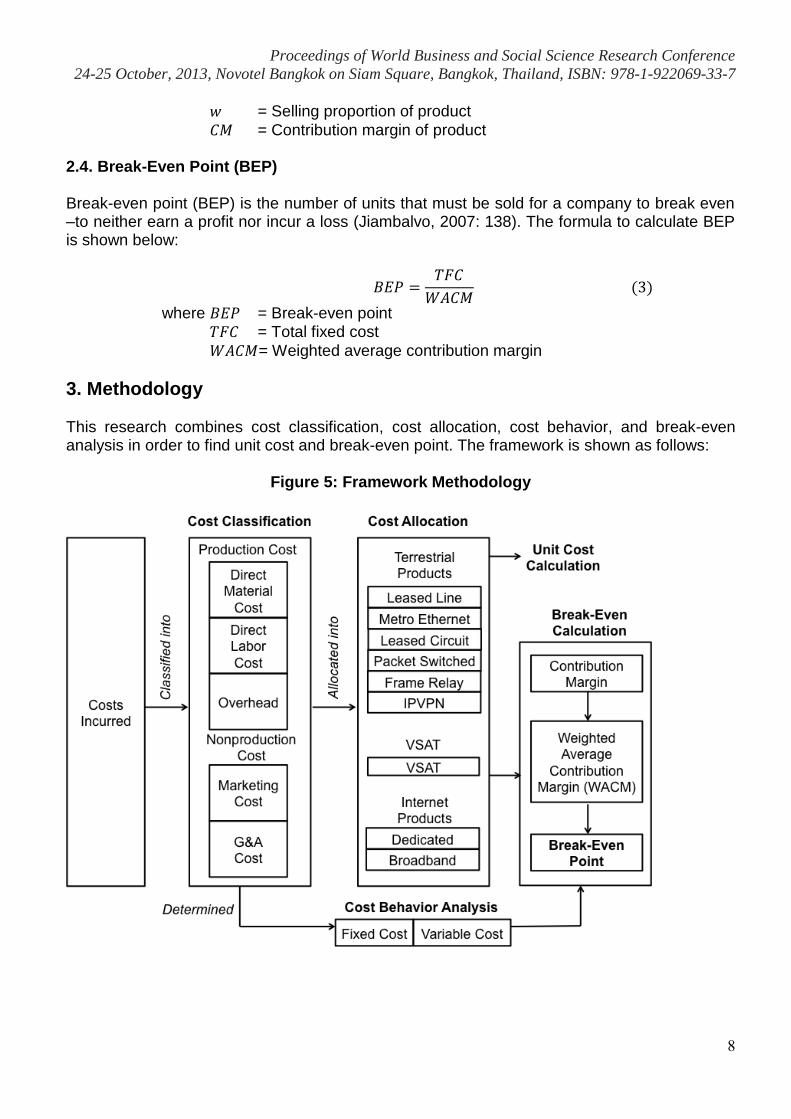
4. Findings 4.1. Cost Classification Based on the analysis, XYZ has no direct material cost since the entire network devices and infrastructure are depreciated and rented, which classified as overhead. Furthermore, certain assumption is used to split joint costs. For example, depreciation of office building is divided into overhead, marketing cost, and general & administrative cost by 70%, 15%, and 15%, respectively. The result of cost classification is cost structure of the company. Production cost, marketing cost, and general & administrative cost covered 85.9%, 6.1%, and 8.0% of total cost, respectively. The summary of cost structure is shown at Table 1.

Proceedings of World Business and Social Science Research Conference
24-25 October, 2013, Novotel Bangkok on Siam Square, Bangkok, Thailand, ISBN: 978-1-922069-33-7
10
Table 1: Cost Structure of PT XYZ
NO COST ITEMS AMOUNT (IDR) %
A. Production Cost
1. Direct Labor Cost
a) Production Operational Employee Salary 10,069,027,889 0.8%
Total Direct Labor Cost 10,069,027,889 0.8%
2. Overhead
a) Communication Network
1) Transponder Rent Cost 118,408,870,569 9.5%
2) Domestic Backbone Rent Cost 126,719,850,982 10.2%
3) International Backbone Rent Cost 59,112,533,522 4.8%
4) Lastmile Access Rent Cost 117,187,327,645 9.4%
5) Production Telephone Cost 3,375,508,594 0.3%
6) Other Communication Network Cost 7,620,132,879 0.6%
b) Production Facility Rent Cost
1) Device Rent Cost 1,895,519,635 0.2%
2) Device Room Rent Cost 70,761,886,617 5.7%
3) Office Building Rent Cost 2,814,630,636 0.2%
4) Transportation Rent Cost 9,233,931,736 0.7%
c) Concession Cost
1) Frequency Concession Cost 11,724,817,145 0.9%
2) Telecommunication Concession Cost 38,593,594,979 3.1%
d) Utility
1) Device Room Utility 8,925,586,854 0.7%
2) Office Building Utility 8,046,320,575 0.6%
e) Production Training Cost 68,309,120 0.0%
f) Device Installation Cost 59,085,252,260 4.8%
g) Depreciations
1) Depreciation of Specialized Devices 25,465,844,984 2.1%
2) Depreciation of Terrestrial Devices 173,946,791,946 14.0%
3) Depreciation of Supporting Devices 67,162,230,190 5.4%
4) Depreciation of Office Tools 2,174,916,380 0.2%
5) Depreciation of Building 4,027,867,394 0.3%
6) Depreciation of Production Director's Vehicle 200,339,856 0.0%
h) Production Maintenance
1) Maintenance of Specialized Devices 7,222,615,980 0.6%
2) Maintenance of Supporting Devices 2,926,389,540 0.2%
3) Maintenance of Other Devices 27,795,539,319 2.2%
4) Other Production Maintenance 6,481,167,590 0.5%
i) Maintenance of Production Director's Vehicle 88,120,481 0.0%
j) Production Non-Operational Employee Salary 90,621,250,998 7.3%
k) Production Director Salary 2,295,882,992 0.2%
l) Production Office Supplies 1,028,510,773 0.1%
m) Production Meeting and Transportation Cost 2,193,515,263 0.2%
Total Overhead 1,057,205,057,432 85.1%
Total Production Cost 1,067,274,085,320 85.9%
B. Nonproduction Cost
1. Marketing Cost
a) Exhibition Cost 1,818,424,758 0.1%
b) Promotion Cost 2,510,551,636 0.2%
c) Customer Benefit Cost 6,050,978,029 0.5%
d) Selling Forum Cost 471,414,648 0.0%
e) Other Selling Cost 13,332,655,785 1.1%
f) Other Marketing Cost 1,334,977,091 0.1%
Proceedings of World Business and Social Science Research Conference
24-25 October, 2013, Novotel Bangkok on Siam Square, Bangkok, Thailand, ISBN: 978-1-922069-33-7
11
NO COST ITEMS AMOUNT (IDR) %
g) Public Relation Cost 1,001,211,419 0.1%
h) Office Building Rent Cost 603,135,136 0.0%
i) Office Building Utility 1,724,211,552 0.1%
j) Depreciations
1) Depreciation of Office Tools 861,266,886 0.1%
2) Depreciation of Building 863,114,441 0.1%
3) Depreciation of Marketing Director's Vehicle 200,339,856 0.0%
k) Maintenance of Marketing Director's Vehicle 88,120,481 0.0%
l) Marketing Employee Salary 39,873,350,439 3.2%
m) Marketing Director Salary 2,295,882,992 0.2%
n) Marketing Office Supplies 407,290,266.30 0.0%
o) Marketing Telecommunication Cost 1,068,157,981 0.1%
p) Marketing Meeting and Transportation Cost 868,632,044.32 0.1%
Total Marketing Cost 75,373,715,439 6.1%
2. General and Administrative Cost
a) Third Party Service Cost 6,113,854,063 0.5%
b) Home Office Rent Cost 8,341,653,495 0.7%
c) G&A Meeting and Transportation Cost 824,761,739 0.1%
d) Tour of Duty Cost 5,951,514,186 0.5%
e) G&A Telecommunication Cost 1,014,210,608 0.1%
f) G&A Office Supplies 386,720,051 0.0%
g) Bad Debt Expense 4,187,525,042 0.3%
h) Other General and Administrative Cost 2,355,626,949 0.2%
i) Reimbursement Outsource SDM Cost 11,105,268,102 0.9%
j) Nonproduction Training Cost 2,686,094,191 0.2%
k) Office Building Rent Cost 603,135,136 0.0%
l) Office Building Utility 1,724,211,552 0.1%
m) Depreciations
1) Depreciation of Office Tools 817,768,559 0.1%
2) Depreciation of Building 863,114,441 0.1%
3) Depreciation of G&A Director's Vehicle 440,747,683 0.0%
n) Maintenance of Office Environment 437,734,626 0.0%
o) Maintenance of G&A Director's Vehicle 193,865,058 0.0%
p) G&A Employee Salary 37,859,544,861 3.0%
q) G&A Director Salary 13,316,121,354 1.1%
Total General and Administrative Cost 99,223,471,695 8.0%
Total Nonproduction Cost 174,597,187,135 14.1%
TOTAL COST 1,241,871,272,455 100.0%
4.2. Cost Allocation After all the costs classified, the costs will be allocated into each product. Every cost has its cost driver. For instance, domestic backbone rent is paid for every bandwidth rented, and only terrestrial and internet products that require domestic backbone. So, domestic backbone rent is driven and allocated by the number of bandwidth used of terrestrial and internet products. Different from domestic backbone, international backbone is essential to internet network topography and paid for every bandwidth rented. Therefore, international backbone rent is driven and allocated by the number of bandwidth used of internet products. On the other hand, several general costs such as board salary, marketing cost, and general & administrative cost are driven and allocated by the revenue. Detailed cost pool and cost driver is shown at Table 2.

Proceedings of World Business and Social Science Research Conference
24-25 October, 2013, Novotel Bangkok on Siam Square, Bangkok, Thailand, ISBN: 978-1-922069-33-7
12
Table 2: Cost Pool and Cost Driver
No. Cost Pool Cost Driver
1 Transponder Rent Transponders Usage (Table 3)
2 International Backbone Rent Bandwidth Usage of Internet (Table 4)
3 Domestic Backbone Rent Bandwidth Usage of Terrestrial and Internet (Table 5)
4 Direct Labor
Network Established (Table 6)
5 Production Telephone
6 Production Transportation Rent
7 Depreciation of Supporting Devices
8 Maintenance of Supporting Devices
9 Maintenance of Other Devices
10 Other Production Maintenance
11 Lastmile Access Rent
Network Established of Terrestrial and Internet (Table 7)
12 Other Communication Network
13 Device Rent
14 Device Room Rent
15 Office Building Rent
16 Device Room Utility
17 Office Building Utility
18 Depreciation of Terrestrial Devices
19 Depreciation of Building
20 Device Installation Setups (Table 8)
21 Depreciation of Specialized Devices Specialized Device (Table 9)
22 Maintenance of Specialized Device
23 Frequency Concession
Sales (Table 10)
24 Telecommunication Concession
25 Production Training
26 Depreciation of Office Tools
27 Depreciation of Vehicle
28 Nonoperational Employee Salary
29 BOD and BOC Salary
30 Marketing
31 General & Administrative
Table 3: Transponders Usage
Product Transponders %
VSAT 130,201.3 82.24%
Dedicated Internet 27,669.7 17.48%
Broadband Internet 442.3 0.28%
Total 158,313.3 100.00%

Proceedings of World Business and Social Science Research Conference
24-25 October, 2013, Novotel Bangkok on Siam Square, Bangkok, Thailand, ISBN: 978-1-922069-33-7
13
Table 4: Bandwidth Usage of Internet Products
Product Bandwidth (MB/s) %
Internet 119,319.98 100.00%
Dedicated Internet 117,442.47 98.43%
Broadband Internet 1,877.51 1.57%
Total 119,319.98 100.00%
Table 5: Bandwidth Usage of Terrestrial and Internet Products
Product Bandwidth (MB/s) %
Terrestrial 155,373.42 56.56%
Leased Line 104,843.13 38.17%
Metro Ethernet 9,163.80 3.34%
Leased Circuit 390.30 0.14%
Packet Switched 15.54 0.01%
Frame Relay 6,383.37 2.32%
IPVPN 34,577.27 12.59%
Internet 119,319.98 43.44%
Dedicated Internet 117,442.47 42.75%
Broadband Internet 1,877.51 0.68%
Total 274,693.40 100.00%
Table 6: Network Established
Product Network %
Terrestrial 222,112 80.36%
Leased Line 7,018 2.54%
Metro Ethernet 2,433 0.88%
Leased Circuit 134 0.05%
Packet Switched 1,819 0.66%
Frame Relay 39,055 14.13%
IPVPN 171,653 62.11%
VSAT 36,285 13.13%
VSAT 36,285 13.13%
Internet 17,988 6.51%
Dedicated Internet 13,768 4.98%
Broadband Internet 4,220 1.53%
Total 276,385 100.00%
Table 7: Network Established of Terrestrial and Internet Products
Product Network %
Terrestrial 222,112 92.51%
Leased Line 7,018 2.92%
Metro Ethernet 2,433 1.01%
Leased Circuit 134 0.06%
Packet Switched 1,819 0.76%
Frame Relay 39,055 16.27%
IPVPN 171,653 71.49%
Internet 17,988 7.49%
Dedicated Internet 13,768 5.73%
Broadband Internet 4,220 1.76%
Total 240,100 100.00%
Proceedings of World Business and Social Science Research Conference
24-25 October, 2013, Novotel Bangkok on Siam Square, Bangkok, Thailand, ISBN: 978-1-922069-33-7
14
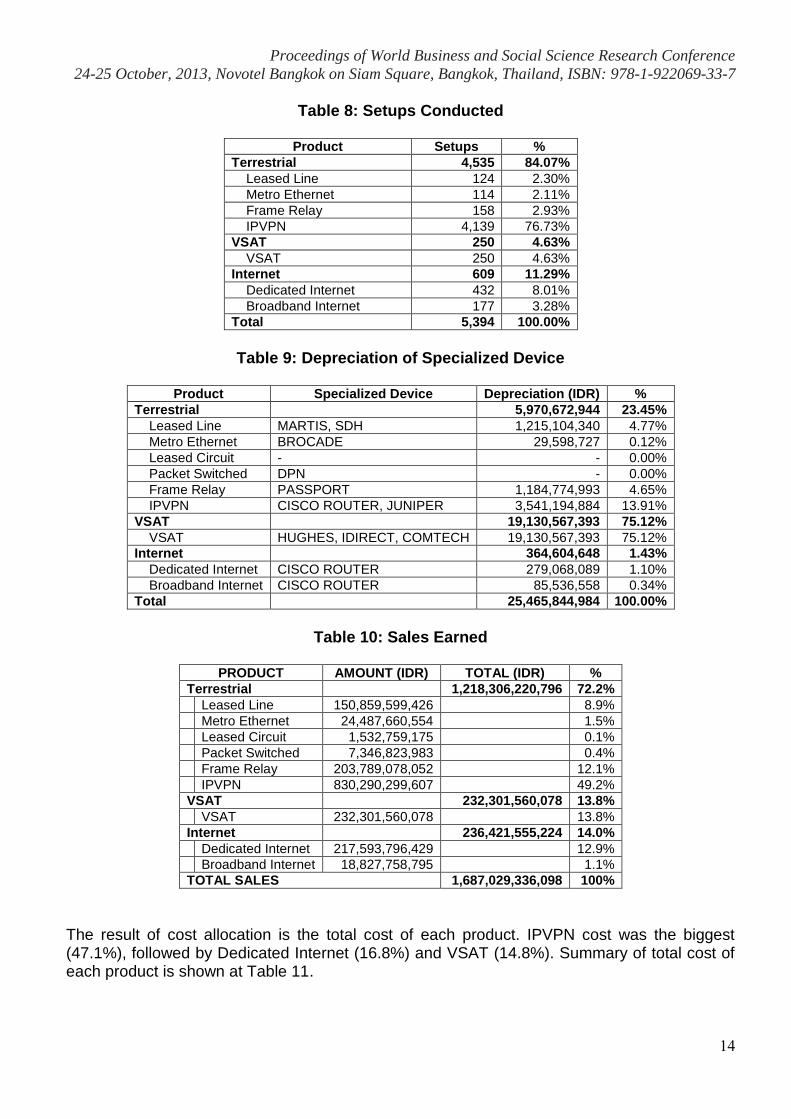
Table 8: Setups Conducted
Product Setups %
Terrestrial 4,535 84.07%
Leased Line 124 2.30%
Metro Ethernet 114 2.11%
Frame Relay 158 2.93%
IPVPN 4,139 76.73%
VSAT 250 4.63%
VSAT 250 4.63%
Internet 609 11.29%
Dedicated Internet 432 8.01%
Broadband Internet 177 3.28%
Total 5,394 100.00%
Table 9: Depreciation of Specialized Device
Product Specialized Device Depreciation (IDR) %
Terrestrial 5,970,672,944 23.45%
Leased Line MARTIS, SDH 1,215,104,340 4.77%
Metro Ethernet BROCADE 29,598,727 0.12%
Leased Circuit - - 0.00%
Packet Switched DPN - 0.00%
Frame Relay PASSPORT 1,184,774,993 4.65%
IPVPN CISCO ROUTER, JUNIPER 3,541,194,884 13.91%
VSAT 19,130,567,393 75.12%
VSAT HUGHES, IDIRECT, COMTECH 19,130,567,393 75.12%
Internet 364,604,648 1.43%
Dedicated Internet CISCO ROUTER 279,068,089 1.10%
Broadband Internet CISCO ROUTER 85,536,558 0.34%
Total 25,465,844,984 100.00%
Table 10: Sales Earned
PRODUCT AMOUNT (IDR) TOTAL (IDR) %
Terrestrial 1,218,306,220,796 72.2%
Leased Line 150,859,599,426
8.9%
Metro Ethernet 24,487,660,554
1.5%
Leased Circuit 1,532,759,175
0.1%
Packet Switched 7,346,823,983
0.4%
Frame Relay 203,789,078,052
12.1%
IPVPN 830,290,299,607
49.2%
VSAT 232,301,560,078 13.8%
VSAT 232,301,560,078
13.8%
Internet 236,421,555,224 14.0%
Dedicated Internet 217,593,796,429
12.9%
Broadband Internet 18,827,758,795
1.1%
TOTAL SALES 1,687,029,336,098 100%
The result of cost allocation is the total cost of each product. IPVPN cost was the biggest (47.1%), followed by Dedicated Internet (16.8%) and VSAT (14.8%). Summary of total cost of each product is shown at Table 11.

Proceedings of World Business and Social Science Research Conference
24-25 October, 2013, Novotel Bangkok on Siam Square, Bangkok, Thailand, ISBN: 978-1-922069-33-7
15
Table 11: Total Cost of Each Product (IDR)
No Product Production Cost Nonproduction Cost Total Cost
A. Terrestrial
1 Leased Line 79,165,374,715 15,613,043,086 94,778,417,801
2 Metro Ethernet 16,631,507,253 2,534,322,647 19,165,829,900
3 Leased Circuit 598,451,483 158,631,172 757,082,655
4 Packet Switched 4,482,829,221 760,351,213 5,243,180,433
5 Frame Relay 106,074,204,627 21,090,919,426 127,165,124,053
6 IPVPN 499,437,390,098 85,929,952,559 585,367,342,657
B. VSAT
1 VSAT 159,791,241,384 24,041,786,404 183,833,027,789
C. Internet
1 Dedicated Internet 186,401,392,981 22,519,623,092 208,921,016,073
2 Broadband Internet 14,691,693,558 1,948,557,536 16,640,251,094
TOTAL 1,067,274,085,320 174,597,187,135 1,241,871,272,455
4.3. Unit Cost Calculation After the total cost of each product is determined, the unit cost of each product can be calculated. The result is shown at Table 12.
Table 12: Unit Cost of Each Product
No Product Total Cost (IDR)
(A)
Total Units Sold (MB/s)
(B)
Unit Cost (IDR/MB/s)
(C=A/B)
A. Terrestrial
1 Leased Line 94,778,417,801 104,843.1 904,002
2 Metro Ethernet 19,165,829,900 9,163.8 2,091,472
3 Leased Circuit 757,082,655 390.3 1,939,722
4 Packet Switched 5,243,180,433 15.5 337,419,354
5 Frame Relay 127,165,124,053 6,383.4 19,921,313
6 IPVPN 585,367,342,657 34,577.3 16,929,251
B. VSAT
1 VSAT 183,833,027,789 4,195.9 43,812,106
C. Internet
1 Dedicated Internet 208,921,016,073 117,442.5 1,778,922
2 Broadband Internet 16,640,251,094 1,877.5 8,862,932
TOTAL 1,241,871,272,455
4.4. Cost Behavior Analysis In order to determine cost behavior, this research uses account analysis. This method requires that the manager use professional judgment to classify costs as either fixed or variable. So as to accurate the cost behavior, four managers had been asked for account analysis. The mean of theirs will be used to determine fixed costs and variable costs, as seen at Table 13.

Proceedings of World Business and Social Science Research Conference
24-25 October, 2013, Novotel Bangkok on Siam Square, Bangkok, Thailand, ISBN: 978-1-922069-33-7
16
Table 13: Account Analysis
Cost Items Mean (%)
Fixed Cost Variable Cost
Production Cost
Direct Labor Cost
a) Production Operational Employee Salary 95 5
Overhead
a) Communication Network
1) Transponder Rent Cost 0 100
2) Domestic Backbone Rent Cost 0 100
3) International Backbone Rent Cost 0 100
4) Lastmile Access Rent Cost 0 100
5) Telephone Cost 0 100
6) Other Communication Network Cost 0 100
b) Production Facility Rent Cost
1) Device Rent Cost 0 100
2) Device Room Rent Cost 60 40
3) Office Building Rent Cost 60 40
4) Transportation Rent Cost 50 50
c) Concession Cost
1) Frequency Concession Cost 0 100
2) Telecommunication Concession Cost 0 100
d) Utility
1) Device Room Utility 33 67
2) Office Building Utility 33 67
e) Production Training Cost 0 100
f) Device Installation Cost 100 0
g) Depreciations
1) Depreciation of Specialized Devices 0 100
2) Depreciation of Terrestrial Devices 60 40
3) Depreciation of Supporting Devices 60 40
4) Depreciation of Office Tools 95 5
5) Depreciation of Building 95 5
6)
Depreciation of Production Director's Vehicle 95 5
h) Production Maintenance
1) Maintenance of Specialized Devices 0 100
2) Maintenance of Supporting Devices 50 50
3) Maintenance of Other Devices 28 72
4) Other Production Maintenance 100 0
i) Maintenance of Production Director's Vehicle 5 95
j) Production Non-Operational Employee Salary 5 95
k) Production Director Salary 5 95
l) Production Office Supplies 5 95
m) Production Meeting and Transportation Cost 5 95
Nonproduction Cost
Marketing Cost
a) Exhibition Cost 75 25
b) Promotion Cost 75 25
c) Customer Benefit Cost 75 25
d) Selling Forum Cost 75 25
e) Other Selling Cost 15 85
f) Other Marketing Cost 75 25
g) Public Relation Cost 75 25
h) Office Building Rent Cost 95 5
i) Office Building Utility 95 5

Proceedings of World Business and Social Science Research Conference
24-25 October, 2013, Novotel Bangkok on Siam Square, Bangkok, Thailand, ISBN: 978-1-922069-33-7
17
Cost Items Mean (%)
Fixed Cost Variable Cost
j) Depreciations
1) Depreciation of Office Tools 95 5
2) Depreciation of Building 95 5
3) Depreciation of Marketing Director's Vehicle 95 5
k) Maintenance of Marketing Director's Vehicle 95 5
l) Marketing Employee Salary 95 5
m) Marketing Director Salary 95 5
n) Marketing Office Supplies 95 5
o) Marketing Telecommunication Cost 95 5
p) Marketing Meeting and Transportation Cost 95 5
General and Administrative Cost
a) Third Party Service Cost 95 5
b) Home Office Rent Cost 95 5
c) G&A Meeting and Transportation Cost 95 5
d) Tour of Duty Cost 95 5
e) G&A Telecommunication Cost 95 5
f) G&A Office Supplies 95 5
g) Bad Debt Expense 0 100
h) Other General and Administrative Cost 95 5
i) Reimbursement Outsource SDM Cost 95 5
j) Nonproduction Training Cost 95 5
k) Office Building Rent Cost 95 5
l) Office Building Utility 95 5
m) Depreciations
1) Depreciation of Office Tools 95 5
2) Depreciation of Building 95 5
3) Depreciation of G&A Director's Vehicle 95 5
n) Maintenance of Office Environment 95 95
o) Maintenance of G&A Director's Vehicle 95 95
p) G&A Employee Salary 95 95
q) G&A Director Salary 95 95
Combined and processed with the result of cost allocation, the cost behavior of each product can be calculated. The summary is shown at Table 14.
Table 14: Cost Behavior of Each Product (IDR)
No Product Fixed Cost Variable Cost Total Cost
A. Terrestrial
1 Leased Line 28,035,386,687 66,743,031,114 94,778,417,801
2 Metro Ethernet 5,724,319,796 13,441,510,104 19,165,829,900
3 Leased Circuit 341,713,659 415,368,996 757,082,655
4 Packet Switched 2,705,257,406 2,537,923,028 5,243,180,433
5 Frame Relay 64,697,903,876 62,467,220,177 127,165,124,053
6 IPVPN 274,964,228,368 310,403,114,289 585,367,342,657
B. VSAT
1 VSAT 43,505,704,663 140,327,323,126 183,833,027,789
C. Internet
1 Dedicated Internet 43,743,838,576 165,177,177,497 208,921,016,073
2 Broadband Internet 6,532,254,446 10,107,996,648 16,640,251,094
TOTAL 470,250,607,475 771,620,664,980 1,241,871,272,455

Proceedings of World Business and Social Science Research Conference
24-25 October, 2013, Novotel Bangkok on Siam Square, Bangkok, Thailand, ISBN: 978-1-922069-33-7
18
4.5. Break-Even Analysis Break-even point (BEP) is the number of units that must be sold for a company to break even –to neither earn a profit nor incur a loss. For multiple products like XYZ, unit contribution margin and weighted average contribution margin (WACM) must be determined formerly. Contribution margin of each product calculation is shown at Table 15.
Table 15: Contribution Margin of Each Product
No Product Units Sold
(MB/s)
Weight (% of Total Units)
Unit Variable
Cost (IDR) (A)
Unit Selling Price (IDR)
(B)
Contribution Margin
(IDR/MB/s) (C = B – A)
A. Terrestrial
1 Leased Line 104,843.1 37.59% 636,599 1,438,908 802,309
2 Metro Ethernet 9,163.8 3.29% 1,466,805 2,672,217 1,205,412
3 Leased Circuit 390.3 0.14% 1,064,217 3,927,084 2,862,866
4 Packet Switched 15.5 0.01% 163,325,363 472,797,119 309,471,756
5 Frame Relay 6,383.4 2.29% 9,785,930 31,924,995 22,139,065
6 IPVPN 34,577.3 12.40% 8,977,085 24,012,602 15,035,517
B. VSAT
1 VSAT 4,195.9 1.50% 33,443,585 55,363,395 21,919,810
C. Internet
1 Dedicated Internet 117,442.5 42.11% 1,406,452 1,852,769 446,317
2 Broadband Internet 1,877.5 0.67% 5,383,722 10,028,042 4,644,320
TOTAL 278,889.3 100.00%
After that, using equation (2), WACM can be calculated as follow:
∑
∑
Finally, using equation (3), the BEP can be calculated as follow:
So as to break-even, XYZ has to reach sales 143,267.0 MB/s in a year. The breakdown BEP of each product is shown at Table 16.

Proceedings of World Business and Social Science Research Conference
24-25 October, 2013, Novotel Bangkok on Siam Square, Bangkok, Thailand, ISBN: 978-1-922069-33-7
19
Table 16: Break-Even Point of Each Product
No Product Weight
(A)
BEP (MB/s)
(B)
BEP of Product (MB/s)
(C = A x B)
A. Terrestrial
143,267.0
1 Leased Line 37.59% 53,858.5
2 Metro Ethernet 3.29% 4,707.5
3 Leased Circuit 0.14% 200.5
4 Packet Switched 0.01% 8.0
5 Frame Relay 2.29% 3,279.2
6 IPVPN 12.40% 17,762.5
B. VSAT
1 VSAT 1.50% 2,155.5
C. Internet
1 Dedicated Internet 42.11% 60,330.9
2 Broadband Internet 0.67% 964.5
TOTAL
5. Conclusion With total cost of IDR 1,241,871,272,455, XYZ incurred cost mostly dominated by overhead (85,1%) since all of the network devices and infrastructure were depreciated and rented such as transponder rent (9.5%), domestic backbone rent (10.2%), lastmile access rent (9.4%), and depreciation of terrestrial devices (14.0%). The unit cost of each product has been determined. The highest unit cost was packet switched (IDR 337,419,354 / MB/s), followed by VSAT (IDR 43,812,106 / MB/s) and frame relay (IDR 19,921,313 / MB/s). The lowest unit cost was leased line (IDR 904,002 / MB/s), followed by dedicated internet (IDR 1,778,922 / MB/s) and broadband internet (IDR 8,862,932 / MB/s). The break-even point (BEP) of the company was 143,267.0 MB/s.
References Abidin, A.Z., 2011. Cost Analysis At UD Mentari Poultry Farm, Banyuwangi, Research.
Bandung: Undergraduate Program School of Business and Management Institut Teknologi Bandung
Antaranews, 2007. Terjadi Perang Harga Antar-Operator Telekomunikasi. Antaranews, [online] n.d. Available at: <http://www.antaranews.com/print/76161/> [Accessed 1 September, 2013].
Kamili, L., 2013. Cost Analysis of Small Medium Enterprise: Haur Bamboo Bike Research. Bandung: Undergraduate Program School of Business and Management Institut Teknologi Bandung
Jiambalvo, J., 2007. Managerial Accounting. 3rd ed. United States of America: John Wiley & Sons, Inc.
Ningrum, D.W., 2013. 10 Prediksi ICT di Indonesia Tahun 2013. Liputan 6, [online] 7 January. Available at: <http://tekno.liputan6.com/read/481904/10-prediksi-ict-di-indonesia-tahun-2013> [Accessed 1 September 2013]
XYZ, 2013. Marketing, Production, and Financial Reports Year 2012. [internal report]