Unincorporated Non-Agricultural Enterprises (Excluding ...
367
Unincorporated Non-Agricultural Enterprises (Excluding Construction) in Odisha Based on State Sample Data of NSS 73 rd Round July 2015 – June 2016 Directorate of Economics & Statistics, Government of Odisha
-
Upload
khangminh22 -
Category
Documents
-
view
0 -
download
0
Transcript of Unincorporated Non-Agricultural Enterprises (Excluding ...
Unincorporated Non-Agricultural
Enterprises (Excluding Construction)
in Odisha
Based on State Sample Data of NSS 73rd Round
July 2015 – June 2016
Directorate of Economics & Statistics, Government of Odisha
Unincorporated Non-Agricultural
Enterprises (Excluding Construction)
in Odisha
Based on State Sample Data of NSS 73rd Round
July 2015 – June 2016
Directorate of Economics & Statistics Government of Odisha
The survey on Unincorporated Non-Agricultural Enterprises (excluding Construction) of
NSS 73rd round was conducted during July 2015- June 2016. The survey was designed
to generate estimates of various operational and economic characteristics of the
unincorporated non-agricultural enterprises in manufacturing, trade and other
services (excluding construction) at more disaggregated activity category level. To
make use of the survey results in preparation of Supply-Use Table in National
Accounts Division (NAD), a specially designed three digit product classification
was introduced for the first time in the enterprise schedule of this round.
Additionally, provision for collecting information related to availability of skilled
manpower, access to toilet facilities, waste management system in the
unincorporated non-agricultural sector were included in the survey. At all Odisha
level a total of 8420 enterprises were surveyed (5014 enterprises in rural and 3406
enterprises in urban sector).
SURESH CHANDRA MAHAPATRA,IAS Tel : 0674-2536882 (O)
Development Commissioner-Cum- : 0674-2322617 Additional Chief Secretary & Secy. to Govt. Fax : 0674-2536792 P & C Department Email : [email protected]
MESSAGE
Directorate of Economics and Statistics, Odisha has brought out the report
“Unincorporated Non-Agricultural Enterprises (excluding Construction) in Odisha".
It is based on data collected through National Sample Survey (73rd round) during
July,2015 - June, 2016. This report attempts to provide State level estimates on gross
value added per enterprise, gross value added per worker, value of owned fixed assets,
utilization of fixed assets and annual rent payable on hired assets, emoluments of
hired workers, operating expenses, receipts, etc., of unincorporated non-agricultural
enterprises (excluding construction) of Odisha.
I hope this report will have significant contribution to the planning and policy
making process.
I wish all the success to this endeavour of the Directorate.
(Suresh Chandra Mahapatra)
Sri Gopabandhu Satpathy, IAS Phone : 0674-2392098
Special Secretary to Government Fax : 0674-2536792
Planning and Convergence Department
Government of Odisha
Foreword
1 am delighted that Directorate of Economics and Statistics, Odisha is going to
publish the report "Unincorporated Non-Agricultural Enterprises (excluding
Construction) in Odisha''.This is an attempt to use the data of National Sample Survey
(73rd round) to provide State level estimates on different characteristics of
unincorporated non-agricultural enterprises.
1 appreciate the efforts of officers and staff of Directorate of Economics &
Statistics in bringing out the Report, 1 hope this Report will be useful for further
statistical analysis for use in planning and policy making by Departments of
Government, academicians, researchers and scholars.
.
(G. Satpathy)
ସଙକରଷଣ ସାହ, ଭା.ପ.ସେ ଅରଥନୀତ ଓ ପରସଂଖୟାନ ଭବନ ନସଦେଶକ Arthaniti ‘O’ Parisankhyan Bhawan
ଅରେନୀତ ଓ ପରେଂଖୟାନ HOD Campus, Unit-V
Sankarsana Sahoo, ISS Bhubaneswar -751005, Odisha
Director Phone : 0674 -2391295 Economics & Statistics e-mail : [email protected]
Preface
The survey on Unincorporated Non-Agricultural Enterprises (excluding Construction) of
NSS 73rd round was conducted during July 2015- June 2016. The Present Report
“Unincorporated Non-Agricultural Enterprises (excluding Construction) in Odisha” presents
state level results derived from the state sample data of NSS 73rd round. The survey was
conducted, with a sample of 8420 enterprises (5014 enterprises from villages and 3406
enterprises from urban EBs/ UFS blocks).
It contains five chapters and three appendices. Chapter one contains the introductory
part. Chapter two gives the concepts and definitions followed in the survey. Summary of
findings of the survey related to the operational characteristics of unincorporated non-
agricultural enterprises like no of unincorporated non-agricultural enterprises, no of workers,
type of ownership, their location, nature of operation are presented in chapter three. Chapter
four contains findings of economic characteristics like gross value added per enterprise, gross
value added per worker, value of owned fixed assets, annual rent payable on hired assets,
emoluments of hired workers, operating expenses, receipts, outstanding loans, etc. Chapter
five contains the conclusion part.
Appendix A provides an outline of the sample design and estimation procedure for the
survey. The detailed tables are presented in Appendix B. A copy of the listing schedule (0.0)
and schedule of enquiry –“Schedule (2.34)” used in the survey are given in Appendix C.
Suggestions and comments, if any, from readers for further improvement is highly
solicited.
Bhubaneswar
August, 2019 (S. Sahoo)
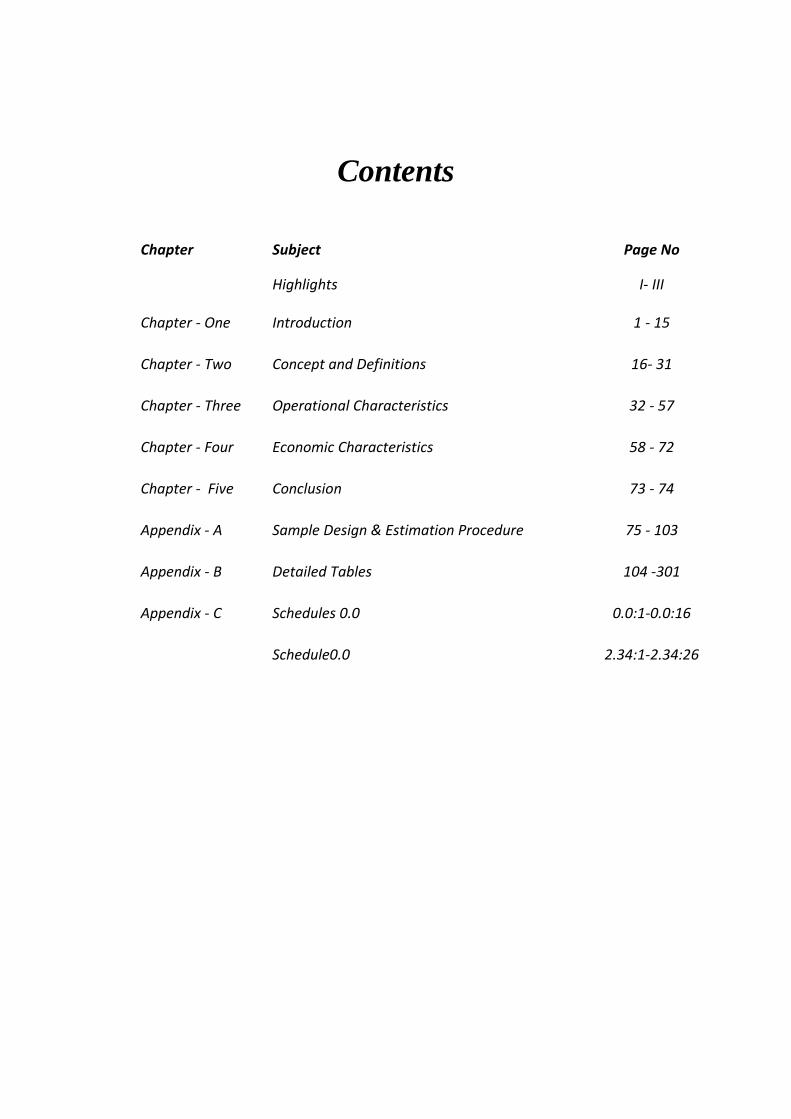
Contents
Chapter Subject Page No
Highlights I- III
Chapter - One Introduction 1 - 15
Chapter - Two Concept and Definitions 16- 31
Chapter - Three Operational Characteristics 32 - 57
Chapter - Four Economic Characteristics 58 - 72
Chapter - Five Conclusion 73 - 74
Appendix - A Sample Design & Estimation Procedure 75 - 103
Appendix - B Detailed Tables 104 -301
Appendix - C Schedules 0.0 0.0:1-0.0:16
Schedule0.0 2.34:1-2.34:26
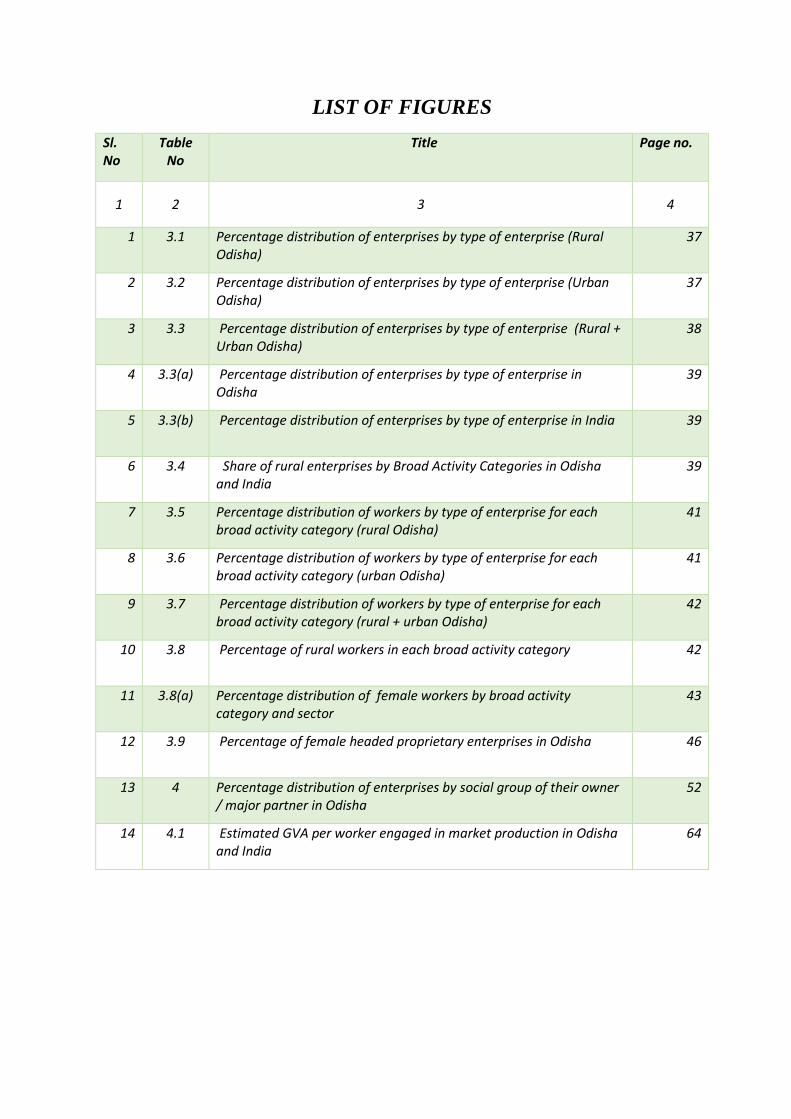
LIST OF FIGURES
Sl. No
Table No
Title Page no.
1 2 3 4
1 3.1 Percentage distribution of enterprises by type of enterprise (Rural Odisha)
37
2 3.2 Percentage distribution of enterprises by type of enterprise (Urban Odisha)
37
3 3.3 Percentage distribution of enterprises by type of enterprise (Rural + Urban Odisha)
38
4 3.3(a) Percentage distribution of enterprises by type of enterprise in Odisha
39
5 3.3(b) Percentage distribution of enterprises by type of enterprise in India 39
6 3.4 Share of rural enterprises by Broad Activity Categories in Odisha and India
39
7 3.5 Percentage distribution of workers by type of enterprise for each broad activity category (rural Odisha)
41
8 3.6 Percentage distribution of workers by type of enterprise for each broad activity category (urban Odisha)
41
9 3.7 Percentage distribution of workers by type of enterprise for each broad activity category (rural + urban Odisha)
42
10 3.8 Percentage of rural workers in each broad activity category 42
11 3.8(a) Percentage distribution of female workers by broad activity category and sector
43
12 3.9 Percentage of female headed proprietary enterprises in Odisha 46
13 4 Percentage distribution of enterprises by social group of their owner / major partner in Odisha
52
14 4.1 Estimated GVA per worker engaged in market production in Odisha and India
64
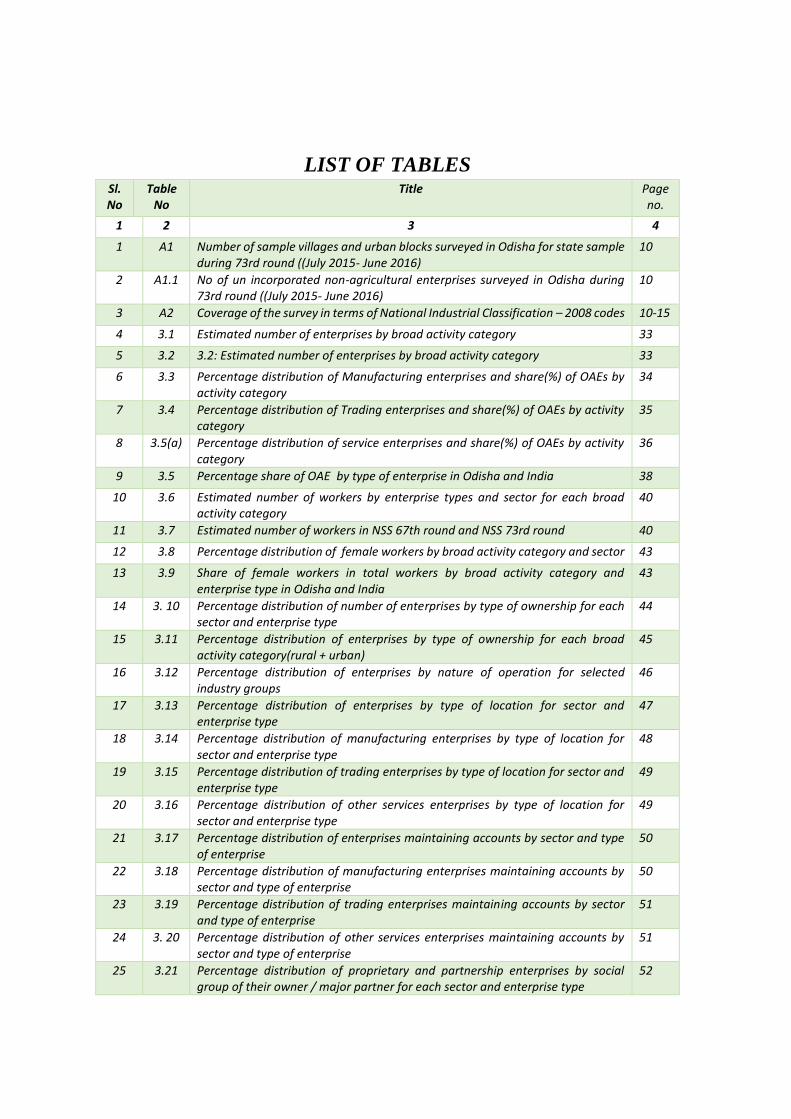
LIST OF TABLES Sl. No
Table No
Title Page no.
1 2 3 4
1 A1 Number of sample villages and urban blocks surveyed in Odisha for state sample during 73rd round ((July 2015- June 2016)
10
2 A1.1 No of un incorporated non-agricultural enterprises surveyed in Odisha during 73rd round ((July 2015- June 2016)
10
3 A2 Coverage of the survey in terms of National Industrial Classification – 2008 codes 10-15
4 3.1 Estimated number of enterprises by broad activity category 33
5 3.2 3.2: Estimated number of enterprises by broad activity category 33
6 3.3 Percentage distribution of Manufacturing enterprises and share(%) of OAEs by activity category
34
7 3.4 Percentage distribution of Trading enterprises and share(%) of OAEs by activity category
35
8 3.5(a) Percentage distribution of service enterprises and share(%) of OAEs by activity category
36
9 3.5 Percentage share of OAE by type of enterprise in Odisha and India 38
10 3.6 Estimated number of workers by enterprise types and sector for each broad activity category
40
11 3.7 Estimated number of workers in NSS 67th round and NSS 73rd round 40
12 3.8 Percentage distribution of female workers by broad activity category and sector 43
13 3.9 Share of female workers in total workers by broad activity category and enterprise type in Odisha and India
43
14 3. 10 Percentage distribution of number of enterprises by type of ownership for each sector and enterprise type
44
15 3.11 Percentage distribution of enterprises by type of ownership for each broad activity category(rural + urban)
45
16 3.12 Percentage distribution of enterprises by nature of operation for selected industry groups
46
17 3.13 Percentage distribution of enterprises by type of location for sector and enterprise type
47
18 3.14 Percentage distribution of manufacturing enterprises by type of location for sector and enterprise type
48
19 3.15 Percentage distribution of trading enterprises by type of location for sector and enterprise type
49
20 3.16 Percentage distribution of other services enterprises by type of location for sector and enterprise type
49
21 3.17 Percentage distribution of enterprises maintaining accounts by sector and type of enterprise
50
22 3.18 Percentage distribution of manufacturing enterprises maintaining accounts by sector and type of enterprise
50
23 3.19 Percentage distribution of trading enterprises maintaining accounts by sector and type of enterprise
51
24 3. 20 Percentage distribution of other services enterprises maintaining accounts by sector and type of enterprise
51
25 3.21 Percentage distribution of proprietary and partnership enterprises by social group of their owner / major partner for each sector and enterprise type
52
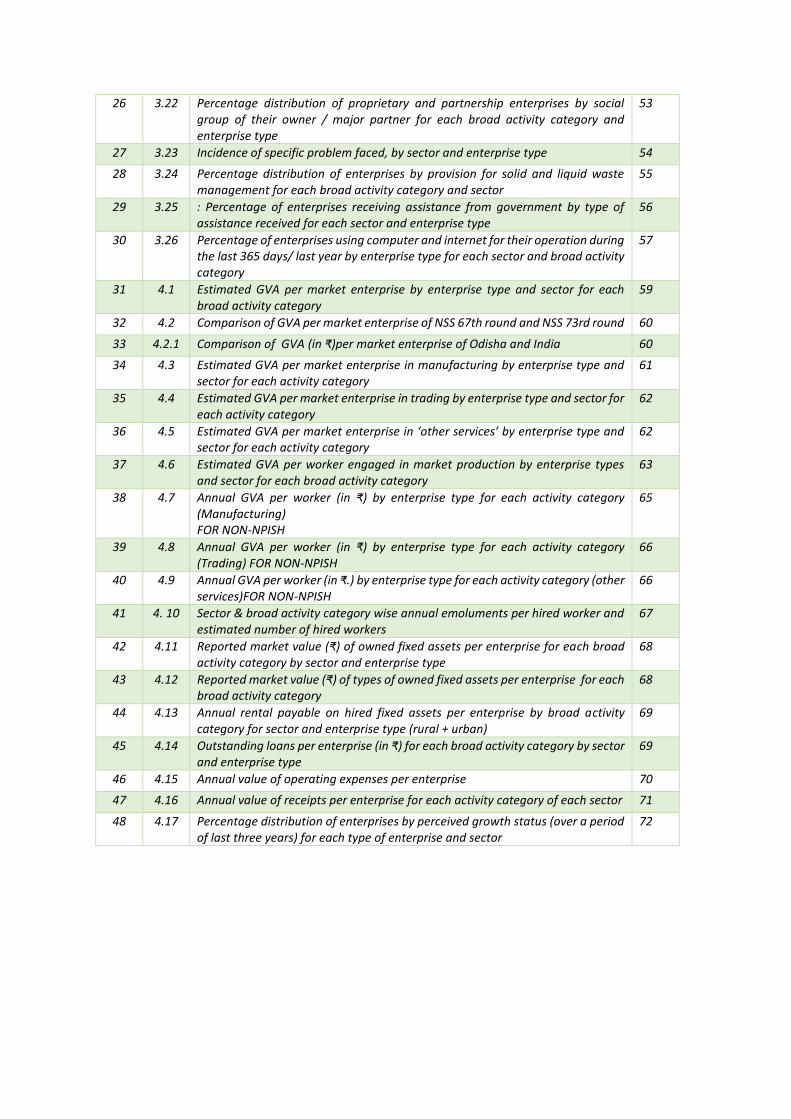
26 3.22 Percentage distribution of proprietary and partnership enterprises by social group of their owner / major partner for each broad activity category and enterprise type
53
27 3.23 Incidence of specific problem faced, by sector and enterprise type 54
28 3.24 Percentage distribution of enterprises by provision for solid and liquid waste management for each broad activity category and sector
55
29 3.25 : Percentage of enterprises receiving assistance from government by type of assistance received for each sector and enterprise type
56
30 3.26 Percentage of enterprises using computer and internet for their operation during the last 365 days/ last year by enterprise type for each sector and broad activity category
57
31 4.1 Estimated GVA per market enterprise by enterprise type and sector for each broad activity category
59
32 4.2 Comparison of GVA per market enterprise of NSS 67th round and NSS 73rd round 60
33 4.2.1 Comparison of GVA (in ₹)per market enterprise of Odisha and India 60
34 4.3 Estimated GVA per market enterprise in manufacturing by enterprise type and sector for each activity category
61
35 4.4 Estimated GVA per market enterprise in trading by enterprise type and sector for each activity category
62
36 4.5 Estimated GVA per market enterprise in ‘other services’ by enterprise type and sector for each activity category
62
37 4.6 Estimated GVA per worker engaged in market production by enterprise types and sector for each broad activity category
63
38 4.7 Annual GVA per worker (in ₹) by enterprise type for each activity category (Manufacturing) FOR NON-NPISH
65
39 4.8 Annual GVA per worker (in ₹) by enterprise type for each activity category (Trading) FOR NON-NPISH
66
40 4.9 Annual GVA per worker (in ₹.) by enterprise type for each activity category (other services)FOR NON-NPISH
66
41 4. 10 Sector & broad activity category wise annual emoluments per hired worker and estimated number of hired workers
67
42 4.11 Reported market value (₹) of owned fixed assets per enterprise for each broad activity category by sector and enterprise type
68
43 4.12 Reported market value (₹) of types of owned fixed assets per enterprise for each broad activity category
68
44 4.13 Annual rental payable on hired fixed assets per enterprise by broad activity category for sector and enterprise type (rural + urban)
69
45 4.14 Outstanding loans per enterprise (in ₹) for each broad activity category by sector and enterprise type
69
46 4.15 Annual value of operating expenses per enterprise 70
47 4.16 Annual value of receipts per enterprise for each activity category of each sector 71
48 4.17 Percentage distribution of enterprises by perceived growth status (over a period of last three years) for each type of enterprise and sector
72
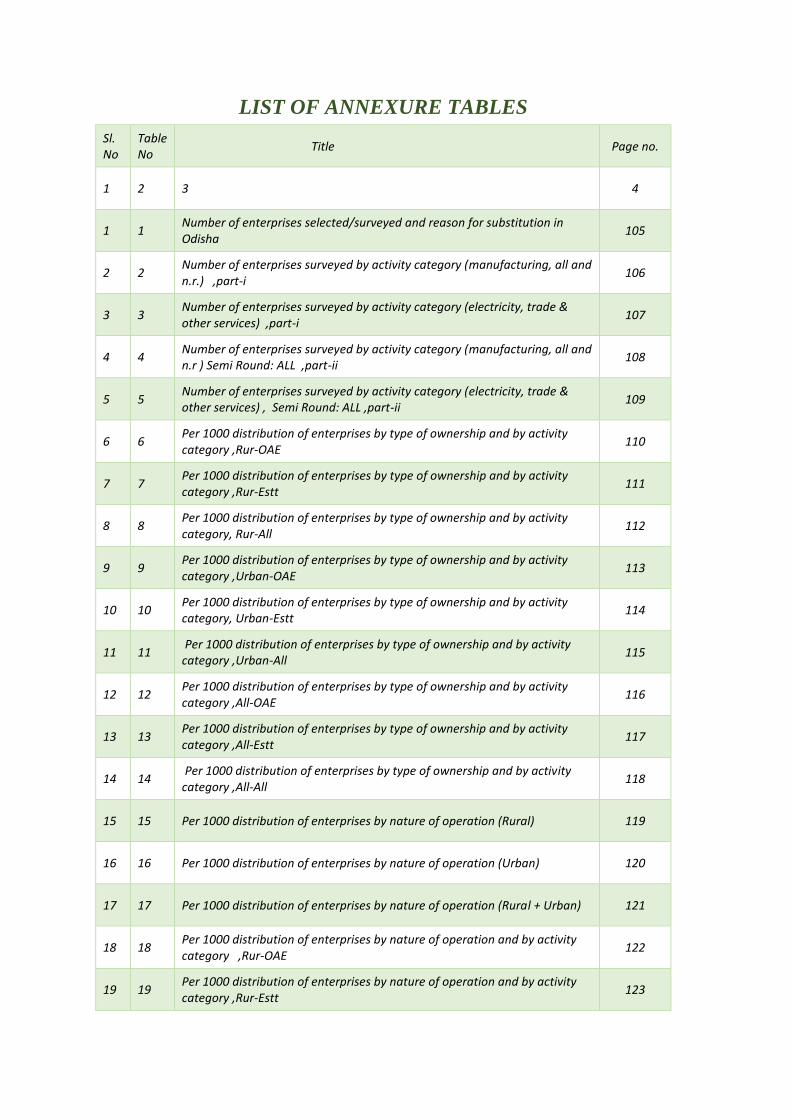
LIST OF ANNEXURE TABLES
Sl. No
Table No
Title Page no.
1 2 3 4
1 1 Number of enterprises selected/surveyed and reason for substitution in Odisha
105
2 2 Number of enterprises surveyed by activity category (manufacturing, all and n.r.) ,part-i
106
3 3 Number of enterprises surveyed by activity category (electricity, trade & other services) ,part-i
107
4 4 Number of enterprises surveyed by activity category (manufacturing, all and n.r ) Semi Round: ALL ,part-ii
108
5 5 Number of enterprises surveyed by activity category (electricity, trade & other services) , Semi Round: ALL ,part-ii
109
6 6 Per 1000 distribution of enterprises by type of ownership and by activity category ,Rur-OAE
110
7 7 Per 1000 distribution of enterprises by type of ownership and by activity category ,Rur-Estt
111
8 8 Per 1000 distribution of enterprises by type of ownership and by activity category, Rur-All
112
9 9 Per 1000 distribution of enterprises by type of ownership and by activity category ,Urban-OAE
113
10 10 Per 1000 distribution of enterprises by type of ownership and by activity category, Urban-Estt
114
11 11 Per 1000 distribution of enterprises by type of ownership and by activity category ,Urban-All
115
12 12 Per 1000 distribution of enterprises by type of ownership and by activity category ,All-OAE
116
13 13 Per 1000 distribution of enterprises by type of ownership and by activity category ,All-Estt
117
14 14 Per 1000 distribution of enterprises by type of ownership and by activity category ,All-All
118
15 15 Per 1000 distribution of enterprises by nature of operation (Rural) 119
16 16 Per 1000 distribution of enterprises by nature of operation (Urban) 120
17 17 Per 1000 distribution of enterprises by nature of operation (Rural + Urban) 121
18 18 Per 1000 distribution of enterprises by nature of operation and by activity category ,Rur-OAE
122
19 19 Per 1000 distribution of enterprises by nature of operation and by activity category ,Rur-Estt
123
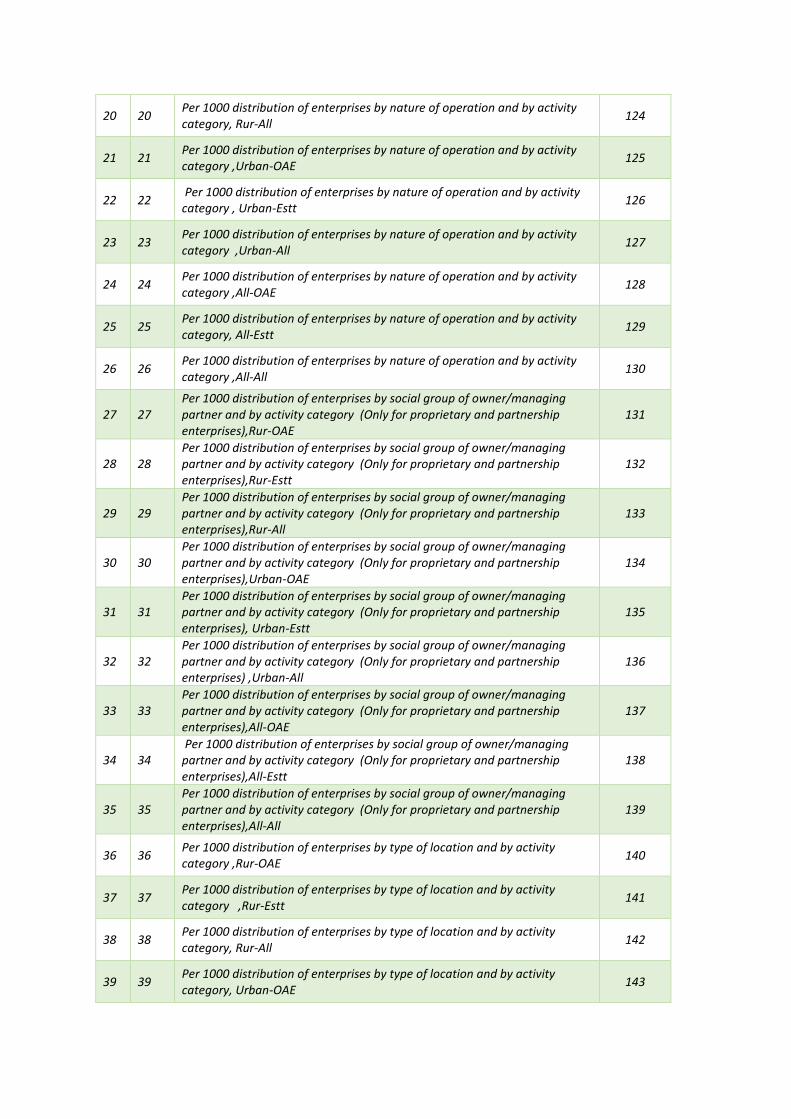
20 20 Per 1000 distribution of enterprises by nature of operation and by activity category, Rur-All
124
21 21 Per 1000 distribution of enterprises by nature of operation and by activity category ,Urban-OAE
125
22 22 Per 1000 distribution of enterprises by nature of operation and by activity category , Urban-Estt
126
23 23 Per 1000 distribution of enterprises by nature of operation and by activity category ,Urban-All
127
24 24 Per 1000 distribution of enterprises by nature of operation and by activity category ,All-OAE
128
25 25 Per 1000 distribution of enterprises by nature of operation and by activity category, All-Estt
129
26 26 Per 1000 distribution of enterprises by nature of operation and by activity category ,All-All
130
27 27 Per 1000 distribution of enterprises by social group of owner/managing partner and by activity category (Only for proprietary and partnership enterprises),Rur-OAE
131
28 28 Per 1000 distribution of enterprises by social group of owner/managing partner and by activity category (Only for proprietary and partnership enterprises),Rur-Estt
132
29 29 Per 1000 distribution of enterprises by social group of owner/managing partner and by activity category (Only for proprietary and partnership enterprises),Rur-All
133
30 30 Per 1000 distribution of enterprises by social group of owner/managing partner and by activity category (Only for proprietary and partnership enterprises),Urban-OAE
134
31 31 Per 1000 distribution of enterprises by social group of owner/managing partner and by activity category (Only for proprietary and partnership enterprises), Urban-Estt
135
32 32 Per 1000 distribution of enterprises by social group of owner/managing partner and by activity category (Only for proprietary and partnership enterprises) ,Urban-All
136
33 33 Per 1000 distribution of enterprises by social group of owner/managing partner and by activity category (Only for proprietary and partnership enterprises),All-OAE
137
34 34 Per 1000 distribution of enterprises by social group of owner/managing partner and by activity category (Only for proprietary and partnership enterprises),All-Estt
138
35 35 Per 1000 distribution of enterprises by social group of owner/managing partner and by activity category (Only for proprietary and partnership enterprises),All-All
139
36 36 Per 1000 distribution of enterprises by type of location and by activity category ,Rur-OAE
140
37 37 Per 1000 distribution of enterprises by type of location and by activity category ,Rur-Estt
141
38 38 Per 1000 distribution of enterprises by type of location and by activity category, Rur-All
142
39 39 Per 1000 distribution of enterprises by type of location and by activity category, Urban-OAE
143
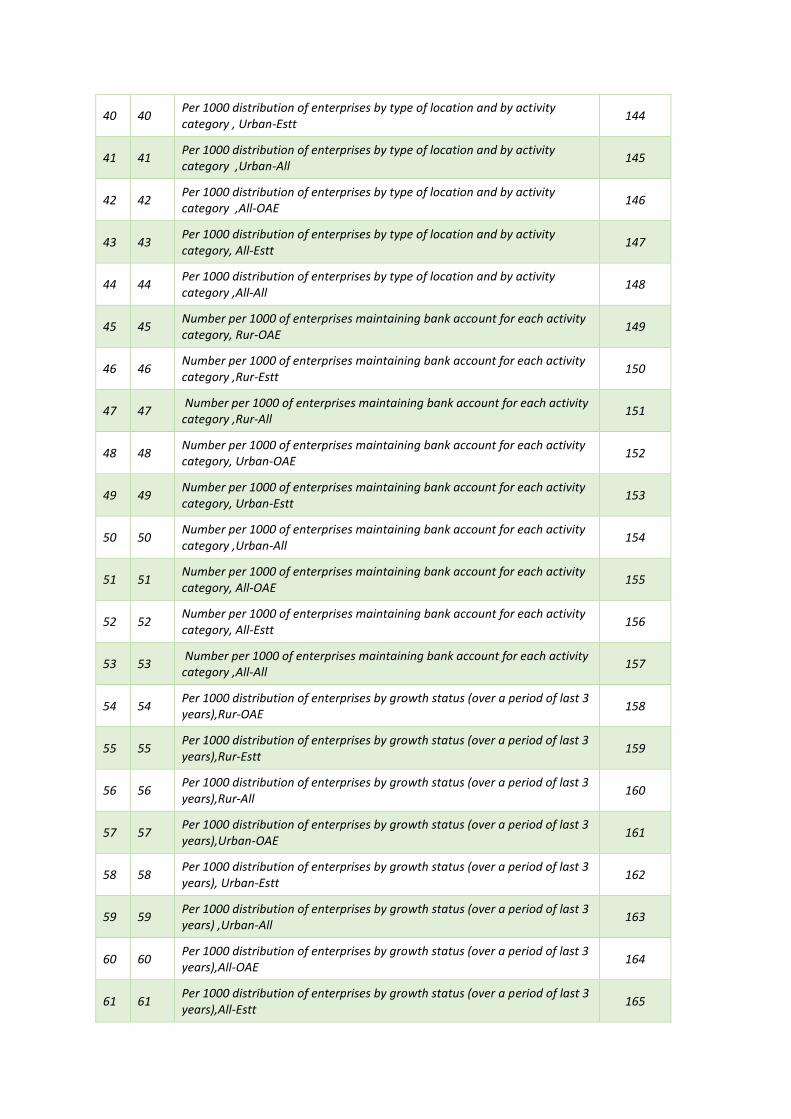
40 40 Per 1000 distribution of enterprises by type of location and by activity category , Urban-Estt
144
41 41 Per 1000 distribution of enterprises by type of location and by activity category ,Urban-All
145
42 42 Per 1000 distribution of enterprises by type of location and by activity category ,All-OAE
146
43 43 Per 1000 distribution of enterprises by type of location and by activity category, All-Estt
147
44 44 Per 1000 distribution of enterprises by type of location and by activity category ,All-All
148
45 45 Number per 1000 of enterprises maintaining bank account for each activity category, Rur-OAE
149
46 46 Number per 1000 of enterprises maintaining bank account for each activity category ,Rur-Estt
150
47 47 Number per 1000 of enterprises maintaining bank account for each activity category ,Rur-All
151
48 48 Number per 1000 of enterprises maintaining bank account for each activity category, Urban-OAE
152
49 49 Number per 1000 of enterprises maintaining bank account for each activity category, Urban-Estt
153
50 50 Number per 1000 of enterprises maintaining bank account for each activity category ,Urban-All
154
51 51 Number per 1000 of enterprises maintaining bank account for each activity category, All-OAE
155
52 52 Number per 1000 of enterprises maintaining bank account for each activity category, All-Estt
156
53 53 Number per 1000 of enterprises maintaining bank account for each activity category ,All-All
157
54 54 Per 1000 distribution of enterprises by growth status (over a period of last 3 years),Rur-OAE
158
55 55 Per 1000 distribution of enterprises by growth status (over a period of last 3 years),Rur-Estt
159
56 56 Per 1000 distribution of enterprises by growth status (over a period of last 3 years),Rur-All
160
57 57 Per 1000 distribution of enterprises by growth status (over a period of last 3 years),Urban-OAE
161
58 58 Per 1000 distribution of enterprises by growth status (over a period of last 3 years), Urban-Estt
162
59 59 Per 1000 distribution of enterprises by growth status (over a period of last 3 years) ,Urban-All
163
60 60 Per 1000 distribution of enterprises by growth status (over a period of last 3 years),All-OAE
164
61 61 Per 1000 distribution of enterprises by growth status (over a period of last 3 years),All-Estt
165
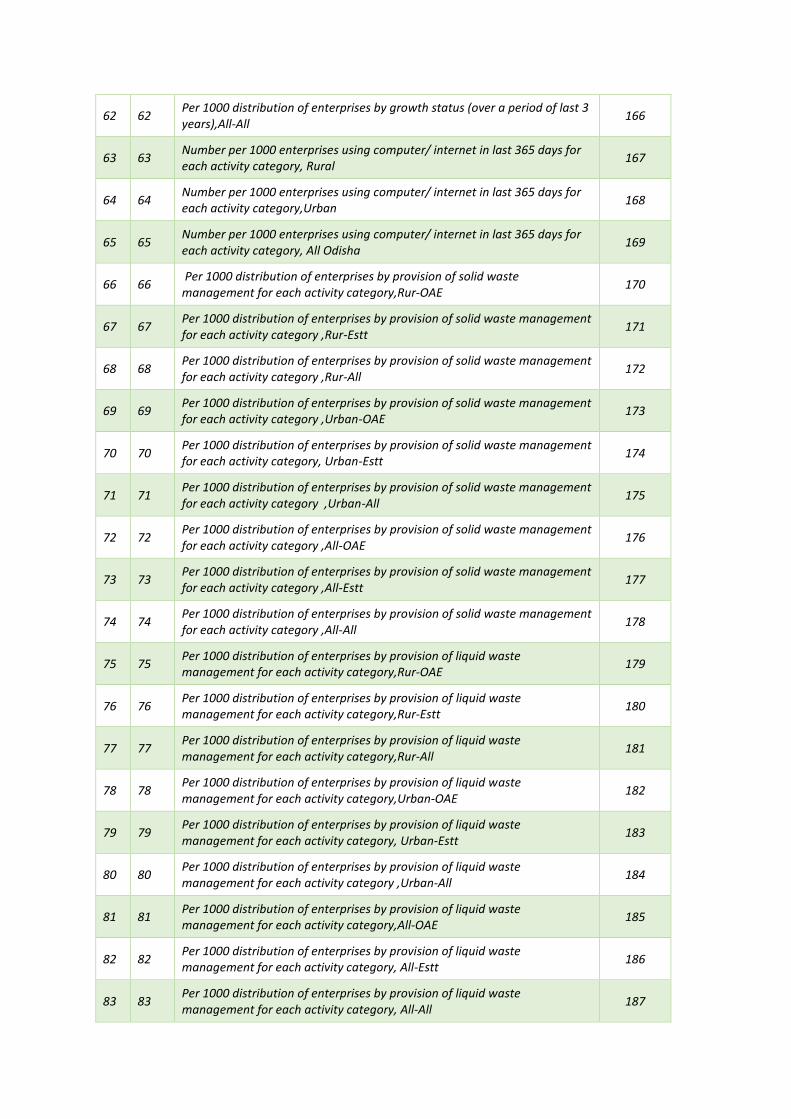
62 62 Per 1000 distribution of enterprises by growth status (over a period of last 3 years),All-All
166
63 63 Number per 1000 enterprises using computer/ internet in last 365 days for each activity category, Rural
167
64 64 Number per 1000 enterprises using computer/ internet in last 365 days for each activity category,Urban
168
65 65 Number per 1000 enterprises using computer/ internet in last 365 days for each activity category, All Odisha
169
66 66 Per 1000 distribution of enterprises by provision of solid waste management for each activity category,Rur-OAE
170
67 67 Per 1000 distribution of enterprises by provision of solid waste management for each activity category ,Rur-Estt
171
68 68 Per 1000 distribution of enterprises by provision of solid waste management for each activity category ,Rur-All
172
69 69 Per 1000 distribution of enterprises by provision of solid waste management for each activity category ,Urban-OAE
173
70 70 Per 1000 distribution of enterprises by provision of solid waste management for each activity category, Urban-Estt
174
71 71 Per 1000 distribution of enterprises by provision of solid waste management for each activity category ,Urban-All
175
72 72 Per 1000 distribution of enterprises by provision of solid waste management for each activity category ,All-OAE
176
73 73 Per 1000 distribution of enterprises by provision of solid waste management for each activity category ,All-Estt
177
74 74 Per 1000 distribution of enterprises by provision of solid waste management for each activity category ,All-All
178
75 75 Per 1000 distribution of enterprises by provision of liquid waste management for each activity category,Rur-OAE
179
76 76 Per 1000 distribution of enterprises by provision of liquid waste management for each activity category,Rur-Estt
180
77 77 Per 1000 distribution of enterprises by provision of liquid waste management for each activity category,Rur-All
181
78 78 Per 1000 distribution of enterprises by provision of liquid waste management for each activity category,Urban-OAE
182
79 79 Per 1000 distribution of enterprises by provision of liquid waste management for each activity category, Urban-Estt
183
80 80 Per 1000 distribution of enterprises by provision of liquid waste management for each activity category ,Urban-All
184
81 81 Per 1000 distribution of enterprises by provision of liquid waste management for each activity category,All-OAE
185
82 82 Per 1000 distribution of enterprises by provision of liquid waste management for each activity category, All-Estt
186
83 83 Per 1000 distribution of enterprises by provision of liquid waste management for each activity category, All-All
187
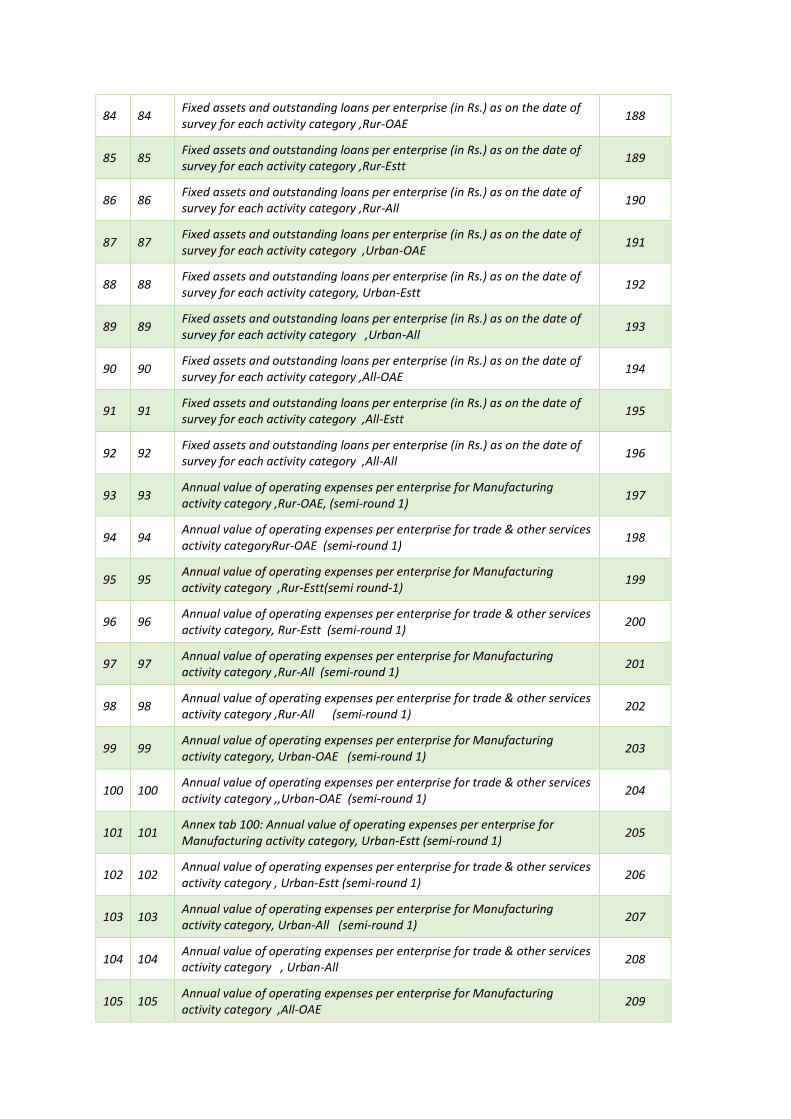
84 84 Fixed assets and outstanding loans per enterprise (in Rs.) as on the date of survey for each activity category ,Rur-OAE
188
85 85 Fixed assets and outstanding loans per enterprise (in Rs.) as on the date of survey for each activity category ,Rur-Estt
189
86 86 Fixed assets and outstanding loans per enterprise (in Rs.) as on the date of survey for each activity category ,Rur-All
190
87 87 Fixed assets and outstanding loans per enterprise (in Rs.) as on the date of survey for each activity category ,Urban-OAE
191
88 88 Fixed assets and outstanding loans per enterprise (in Rs.) as on the date of survey for each activity category, Urban-Estt
192
89 89 Fixed assets and outstanding loans per enterprise (in Rs.) as on the date of survey for each activity category ,Urban-All
193
90 90 Fixed assets and outstanding loans per enterprise (in Rs.) as on the date of survey for each activity category ,All-OAE
194
91 91 Fixed assets and outstanding loans per enterprise (in Rs.) as on the date of survey for each activity category ,All-Estt
195
92 92 Fixed assets and outstanding loans per enterprise (in Rs.) as on the date of survey for each activity category ,All-All
196
93 93 Annual value of operating expenses per enterprise for Manufacturing activity category ,Rur-OAE, (semi-round 1)
197
94 94 Annual value of operating expenses per enterprise for trade & other services activity categoryRur-OAE (semi-round 1)
198
95 95 Annual value of operating expenses per enterprise for Manufacturing activity category ,Rur-Estt(semi round-1)
199
96 96 Annual value of operating expenses per enterprise for trade & other services activity category, Rur-Estt (semi-round 1)
200
97 97 Annual value of operating expenses per enterprise for Manufacturing activity category ,Rur-All (semi-round 1)
201
98 98 Annual value of operating expenses per enterprise for trade & other services activity category ,Rur-All (semi-round 1)
202
99 99 Annual value of operating expenses per enterprise for Manufacturing activity category, Urban-OAE (semi-round 1)
203
100 100 Annual value of operating expenses per enterprise for trade & other services activity category ,,Urban-OAE (semi-round 1)
204
101 101 Annex tab 100: Annual value of operating expenses per enterprise for Manufacturing activity category, Urban-Estt (semi-round 1)
205
102 102 Annual value of operating expenses per enterprise for trade & other services activity category , Urban-Estt (semi-round 1)
206
103 103 Annual value of operating expenses per enterprise for Manufacturing activity category, Urban-All (semi-round 1)
207
104 104 Annual value of operating expenses per enterprise for trade & other services activity category , Urban-All
208
105 105 Annual value of operating expenses per enterprise for Manufacturing activity category ,All-OAE
209
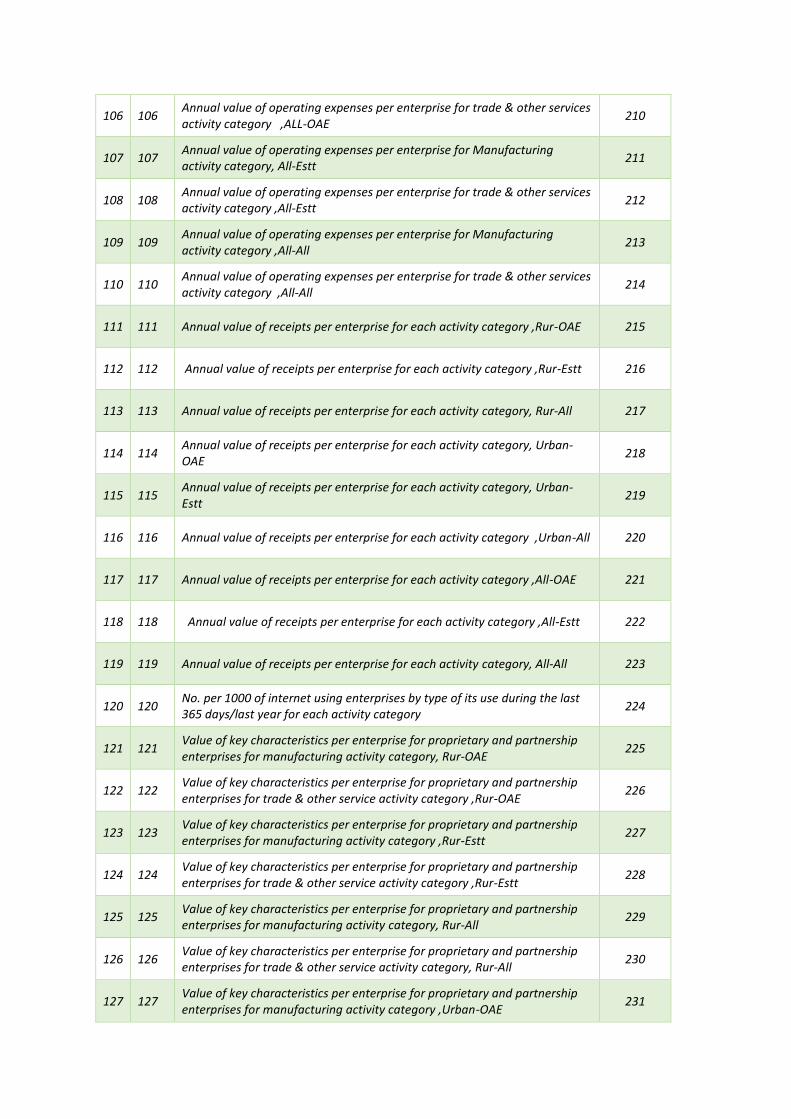
106 106 Annual value of operating expenses per enterprise for trade & other services activity category ,ALL-OAE
210
107 107 Annual value of operating expenses per enterprise for Manufacturing activity category, All-Estt
211
108 108 Annual value of operating expenses per enterprise for trade & other services activity category ,All-Estt
212
109 109 Annual value of operating expenses per enterprise for Manufacturing activity category ,All-All
213
110 110 Annual value of operating expenses per enterprise for trade & other services activity category ,All-All
214
111 111 Annual value of receipts per enterprise for each activity category ,Rur-OAE 215
112 112 Annual value of receipts per enterprise for each activity category ,Rur-Estt 216
113 113 Annual value of receipts per enterprise for each activity category, Rur-All 217
114 114 Annual value of receipts per enterprise for each activity category, Urban-OAE
218
115 115 Annual value of receipts per enterprise for each activity category, Urban-Estt
219
116 116 Annual value of receipts per enterprise for each activity category ,Urban-All 220
117 117 Annual value of receipts per enterprise for each activity category ,All-OAE 221
118 118 Annual value of receipts per enterprise for each activity category ,All-Estt 222
119 119 Annual value of receipts per enterprise for each activity category, All-All 223
120 120 No. per 1000 of internet using enterprises by type of its use during the last 365 days/last year for each activity category
224
121 121 Value of key characteristics per enterprise for proprietary and partnership enterprises for manufacturing activity category, Rur-OAE
225
122 122 Value of key characteristics per enterprise for proprietary and partnership enterprises for trade & other service activity category ,Rur-OAE
226
123 123 Value of key characteristics per enterprise for proprietary and partnership enterprises for manufacturing activity category ,Rur-Estt
227
124 124 Value of key characteristics per enterprise for proprietary and partnership enterprises for trade & other service activity category ,Rur-Estt
228
125 125 Value of key characteristics per enterprise for proprietary and partnership enterprises for manufacturing activity category, Rur-All
229
126 126 Value of key characteristics per enterprise for proprietary and partnership enterprises for trade & other service activity category, Rur-All
230
127 127 Value of key characteristics per enterprise for proprietary and partnership enterprises for manufacturing activity category ,Urban-OAE
231
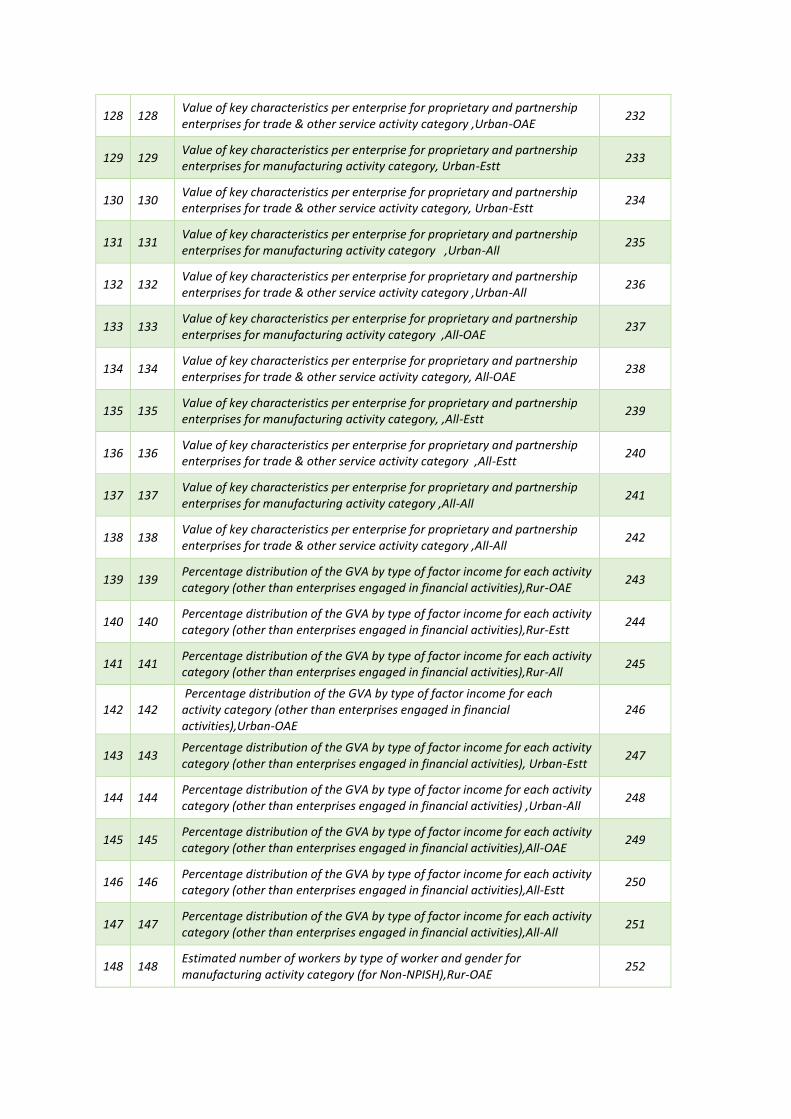
128 128 Value of key characteristics per enterprise for proprietary and partnership enterprises for trade & other service activity category ,Urban-OAE
232
129 129 Value of key characteristics per enterprise for proprietary and partnership enterprises for manufacturing activity category, Urban-Estt
233
130 130 Value of key characteristics per enterprise for proprietary and partnership enterprises for trade & other service activity category, Urban-Estt
234
131 131 Value of key characteristics per enterprise for proprietary and partnership enterprises for manufacturing activity category ,Urban-All
235
132 132 Value of key characteristics per enterprise for proprietary and partnership enterprises for trade & other service activity category ,Urban-All
236
133 133 Value of key characteristics per enterprise for proprietary and partnership enterprises for manufacturing activity category ,All-OAE
237
134 134 Value of key characteristics per enterprise for proprietary and partnership enterprises for trade & other service activity category, All-OAE
238
135 135 Value of key characteristics per enterprise for proprietary and partnership enterprises for manufacturing activity category, ,All-Estt
239
136 136 Value of key characteristics per enterprise for proprietary and partnership enterprises for trade & other service activity category ,All-Estt
240
137 137 Value of key characteristics per enterprise for proprietary and partnership enterprises for manufacturing activity category ,All-All
241
138 138 Value of key characteristics per enterprise for proprietary and partnership enterprises for trade & other service activity category ,All-All
242
139 139 Percentage distribution of the GVA by type of factor income for each activity category (other than enterprises engaged in financial activities),Rur-OAE
243
140 140 Percentage distribution of the GVA by type of factor income for each activity category (other than enterprises engaged in financial activities),Rur-Estt
244
141 141 Percentage distribution of the GVA by type of factor income for each activity category (other than enterprises engaged in financial activities),Rur-All
245
142 142 Percentage distribution of the GVA by type of factor income for each activity category (other than enterprises engaged in financial activities),Urban-OAE
246
143 143 Percentage distribution of the GVA by type of factor income for each activity category (other than enterprises engaged in financial activities), Urban-Estt
247
144 144 Percentage distribution of the GVA by type of factor income for each activity category (other than enterprises engaged in financial activities) ,Urban-All
248
145 145 Percentage distribution of the GVA by type of factor income for each activity category (other than enterprises engaged in financial activities),All-OAE
249
146 146 Percentage distribution of the GVA by type of factor income for each activity category (other than enterprises engaged in financial activities),All-Estt
250
147 147 Percentage distribution of the GVA by type of factor income for each activity category (other than enterprises engaged in financial activities),All-All
251
148 148 Estimated number of workers by type of worker and gender for manufacturing activity category (for Non-NPISH),Rur-OAE
252
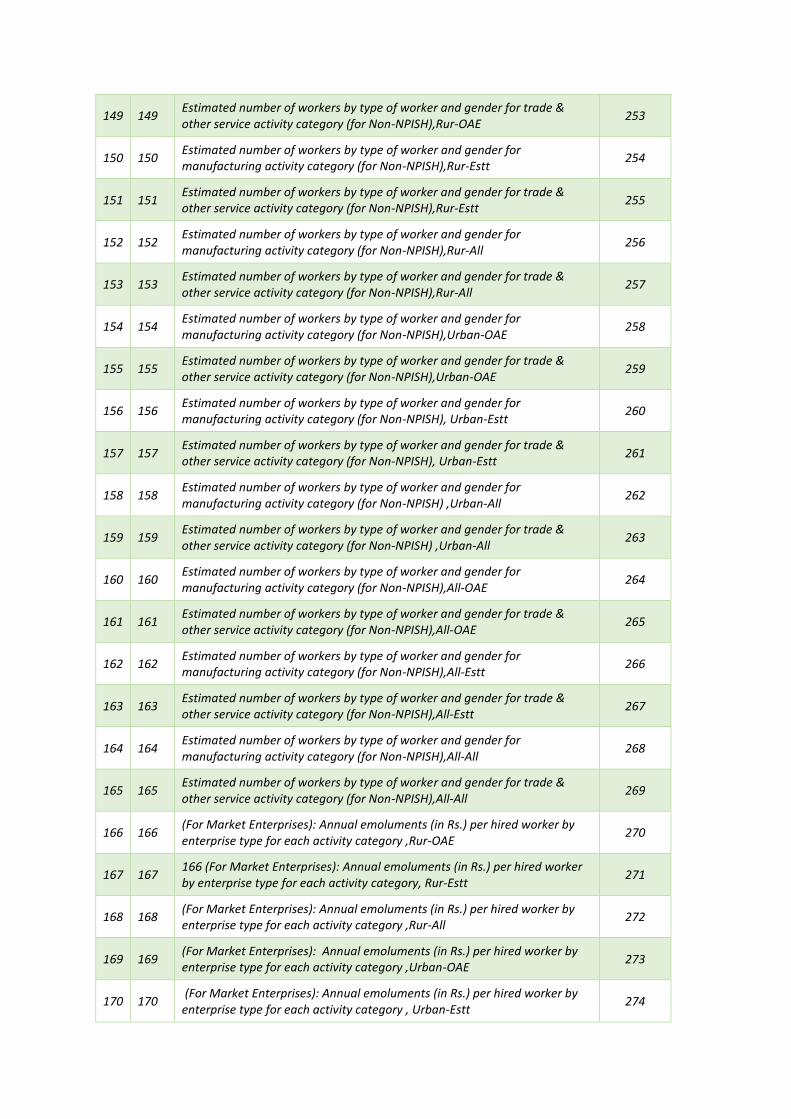
149 149 Estimated number of workers by type of worker and gender for trade & other service activity category (for Non-NPISH),Rur-OAE
253
150 150 Estimated number of workers by type of worker and gender for manufacturing activity category (for Non-NPISH),Rur-Estt
254
151 151 Estimated number of workers by type of worker and gender for trade & other service activity category (for Non-NPISH),Rur-Estt
255
152 152 Estimated number of workers by type of worker and gender for manufacturing activity category (for Non-NPISH),Rur-All
256
153 153 Estimated number of workers by type of worker and gender for trade & other service activity category (for Non-NPISH),Rur-All
257
154 154 Estimated number of workers by type of worker and gender for manufacturing activity category (for Non-NPISH),Urban-OAE
258
155 155 Estimated number of workers by type of worker and gender for trade & other service activity category (for Non-NPISH),Urban-OAE
259
156 156 Estimated number of workers by type of worker and gender for manufacturing activity category (for Non-NPISH), Urban-Estt
260
157 157 Estimated number of workers by type of worker and gender for trade & other service activity category (for Non-NPISH), Urban-Estt
261
158 158 Estimated number of workers by type of worker and gender for manufacturing activity category (for Non-NPISH) ,Urban-All
262
159 159 Estimated number of workers by type of worker and gender for trade & other service activity category (for Non-NPISH) ,Urban-All
263
160 160 Estimated number of workers by type of worker and gender for manufacturing activity category (for Non-NPISH),All-OAE
264
161 161 Estimated number of workers by type of worker and gender for trade & other service activity category (for Non-NPISH),All-OAE
265
162 162 Estimated number of workers by type of worker and gender for manufacturing activity category (for Non-NPISH),All-Estt
266
163 163 Estimated number of workers by type of worker and gender for trade & other service activity category (for Non-NPISH),All-Estt
267
164 164 Estimated number of workers by type of worker and gender for manufacturing activity category (for Non-NPISH),All-All
268
165 165 Estimated number of workers by type of worker and gender for trade & other service activity category (for Non-NPISH),All-All
269
166 166 (For Market Enterprises): Annual emoluments (in Rs.) per hired worker by enterprise type for each activity category ,Rur-OAE
270
167 167 166 (For Market Enterprises): Annual emoluments (in Rs.) per hired worker by enterprise type for each activity category, Rur-Estt
271
168 168 (For Market Enterprises): Annual emoluments (in Rs.) per hired worker by enterprise type for each activity category ,Rur-All
272
169 169 (For Market Enterprises): Annual emoluments (in Rs.) per hired worker by enterprise type for each activity category ,Urban-OAE
273
170 170 (For Market Enterprises): Annual emoluments (in Rs.) per hired worker by enterprise type for each activity category , Urban-Estt
274
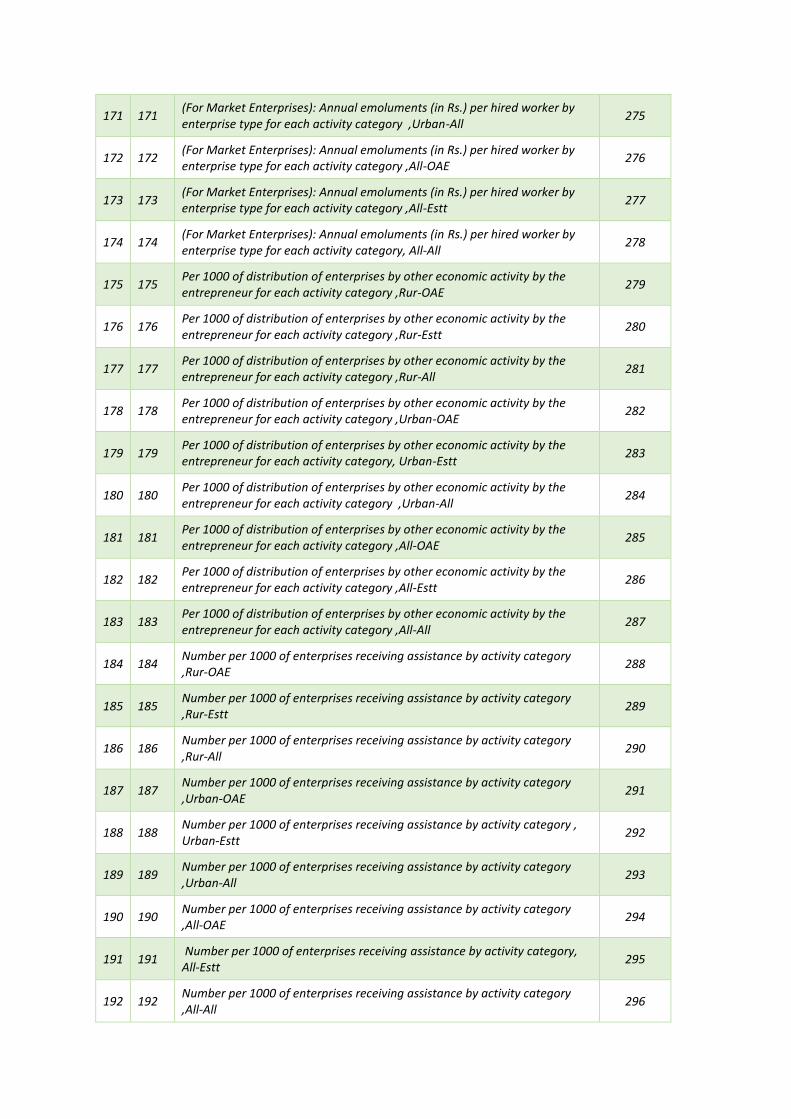
171 171 (For Market Enterprises): Annual emoluments (in Rs.) per hired worker by enterprise type for each activity category ,Urban-All
275
172 172 (For Market Enterprises): Annual emoluments (in Rs.) per hired worker by enterprise type for each activity category ,All-OAE
276
173 173 (For Market Enterprises): Annual emoluments (in Rs.) per hired worker by enterprise type for each activity category ,All-Estt
277
174 174 (For Market Enterprises): Annual emoluments (in Rs.) per hired worker by enterprise type for each activity category, All-All
278
175 175 Per 1000 of distribution of enterprises by other economic activity by the entrepreneur for each activity category ,Rur-OAE
279
176 176 Per 1000 of distribution of enterprises by other economic activity by the entrepreneur for each activity category ,Rur-Estt
280
177 177 Per 1000 of distribution of enterprises by other economic activity by the entrepreneur for each activity category ,Rur-All
281
178 178 Per 1000 of distribution of enterprises by other economic activity by the entrepreneur for each activity category ,Urban-OAE
282
179 179 Per 1000 of distribution of enterprises by other economic activity by the entrepreneur for each activity category, Urban-Estt
283
180 180 Per 1000 of distribution of enterprises by other economic activity by the entrepreneur for each activity category ,Urban-All
284
181 181 Per 1000 of distribution of enterprises by other economic activity by the entrepreneur for each activity category ,All-OAE
285
182 182 Per 1000 of distribution of enterprises by other economic activity by the entrepreneur for each activity category ,All-Estt
286
183 183 Per 1000 of distribution of enterprises by other economic activity by the entrepreneur for each activity category ,All-All
287
184 184 Number per 1000 of enterprises receiving assistance by activity category ,Rur-OAE
288
185 185 Number per 1000 of enterprises receiving assistance by activity category ,Rur-Estt
289
186 186 Number per 1000 of enterprises receiving assistance by activity category ,Rur-All
290
187 187 Number per 1000 of enterprises receiving assistance by activity category ,Urban-OAE
291
188 188 Number per 1000 of enterprises receiving assistance by activity category , Urban-Estt
292
189 189 Number per 1000 of enterprises receiving assistance by activity category ,Urban-All
293
190 190 Number per 1000 of enterprises receiving assistance by activity category ,All-OAE
294
191 191 Number per 1000 of enterprises receiving assistance by activity category, All-Estt
295
192 192 Number per 1000 of enterprises receiving assistance by activity category ,All-All
296
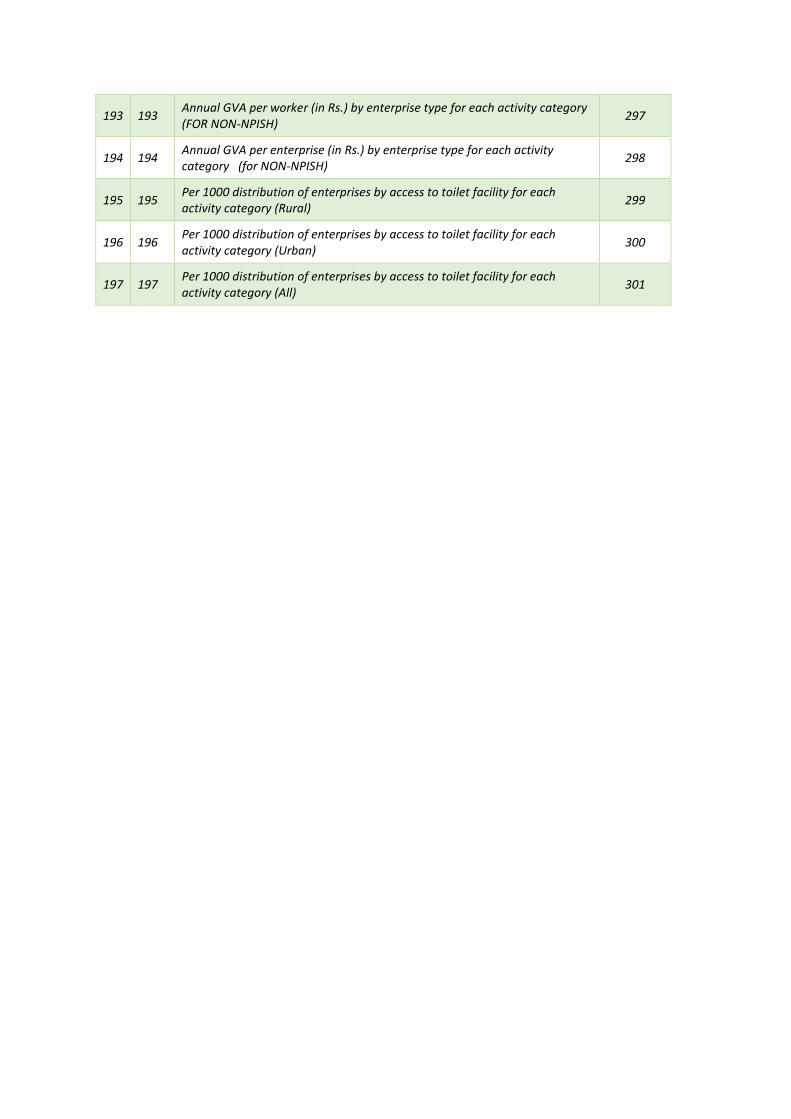
193 193 Annual GVA per worker (in Rs.) by enterprise type for each activity category (FOR NON-NPISH)
297
194 194 Annual GVA per enterprise (in Rs.) by enterprise type for each activity category (for NON-NPISH)
298
195 195 Per 1000 distribution of enterprises by access to toilet facility for each activity category (Rural)
299
196 196 Per 1000 distribution of enterprises by access to toilet facility for each activity category (Urban)
300
197 197 Per 1000 distribution of enterprises by access to toilet facility for each activity category (All)
301
i | P a g e Unincorporated Non-Agricultural Enterprises (Excluding Construction) in Odisha
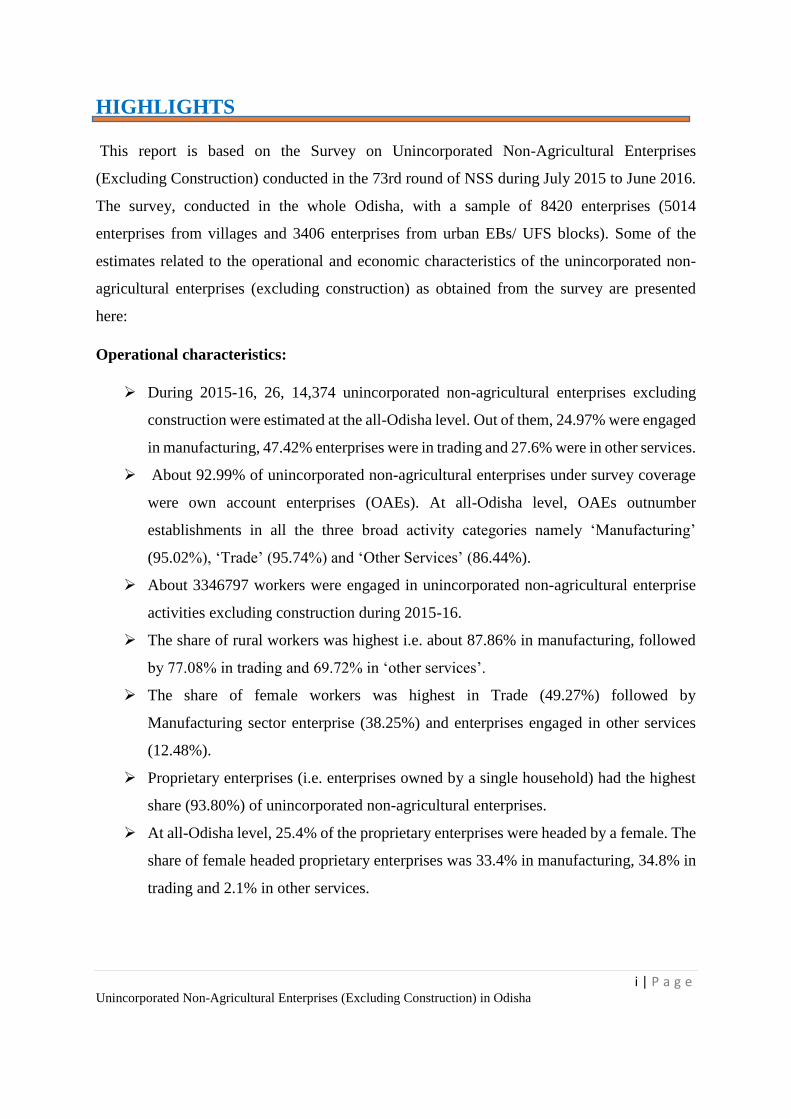
HIGHLIGHTS
This report is based on the Survey on Unincorporated Non-Agricultural Enterprises
(Excluding Construction) conducted in the 73rd round of NSS during July 2015 to June 2016.
The survey, conducted in the whole Odisha, with a sample of 8420 enterprises (5014
enterprises from villages and 3406 enterprises from urban EBs/ UFS blocks). Some of the
estimates related to the operational and economic characteristics of the unincorporated non-
agricultural enterprises (excluding construction) as obtained from the survey are presented
here:
Operational characteristics:
During 2015-16, 26, 14,374 unincorporated non-agricultural enterprises excluding
construction were estimated at the all-Odisha level. Out of them, 24.97% were engaged
in manufacturing, 47.42% enterprises were in trading and 27.6% were in other services.
About 92.99% of unincorporated non-agricultural enterprises under survey coverage
were own account enterprises (OAEs). At all-Odisha level, OAEs outnumber
establishments in all the three broad activity categories namely ‘Manufacturing’
(95.02%), ‘Trade’ (95.74%) and ‘Other Services’ (86.44%).
About 3346797 workers were engaged in unincorporated non-agricultural enterprise
activities excluding construction during 2015-16.
The share of rural workers was highest i.e. about 87.86% in manufacturing, followed
by 77.08% in trading and 69.72% in ‘other services’.
The share of female workers was highest in Trade (49.27%) followed by
Manufacturing sector enterprise (38.25%) and enterprises engaged in other services
(12.48%).
Proprietary enterprises (i.e. enterprises owned by a single household) had the highest
share (93.80%) of unincorporated non-agricultural enterprises.
At all-Odisha level, 25.4% of the proprietary enterprises were headed by a female. The
share of female headed proprietary enterprises was 33.4% in manufacturing, 34.8% in
trading and 2.1% in other services.
ii | P a g e Unincorporated Non-Agricultural Enterprises (Excluding Construction) in Odisha
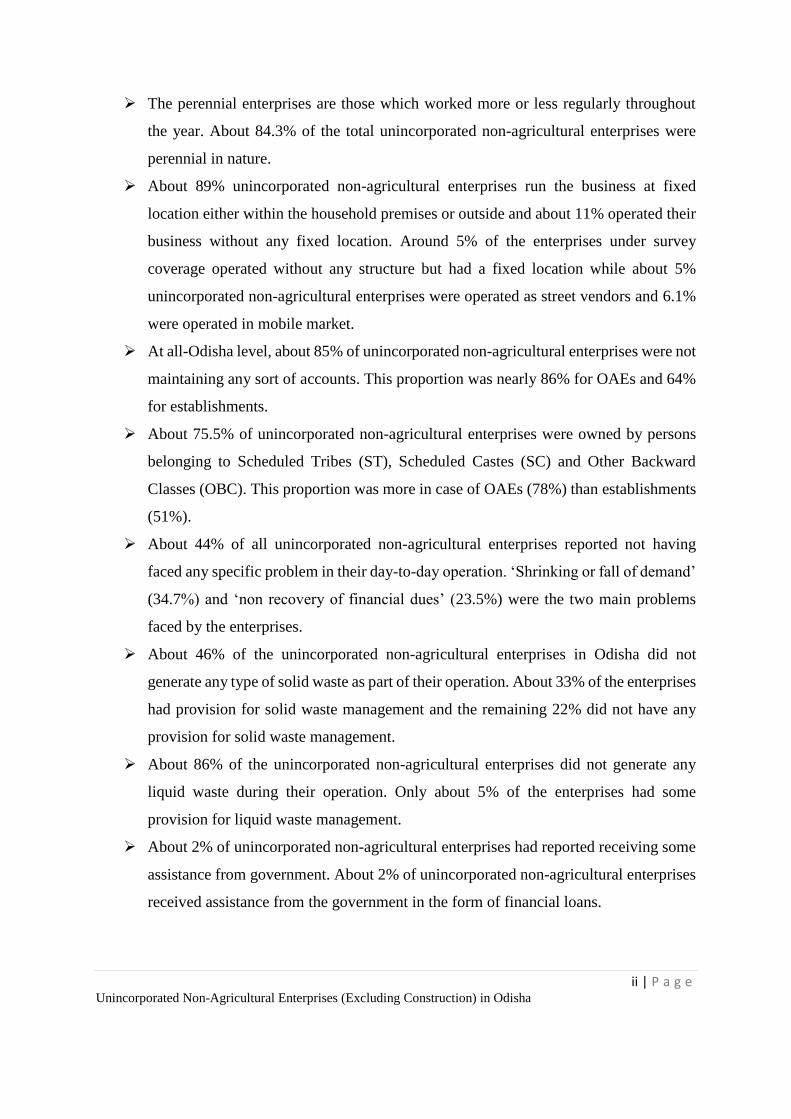
The perennial enterprises are those which worked more or less regularly throughout
the year. About 84.3% of the total unincorporated non-agricultural enterprises were
perennial in nature.
About 89% unincorporated non-agricultural enterprises run the business at fixed
location either within the household premises or outside and about 11% operated their
business without any fixed location. Around 5% of the enterprises under survey
coverage operated without any structure but had a fixed location while about 5%
unincorporated non-agricultural enterprises were operated as street vendors and 6.1%
were operated in mobile market.
At all-Odisha level, about 85% of unincorporated non-agricultural enterprises were not
maintaining any sort of accounts. This proportion was nearly 86% for OAEs and 64%
for establishments.
About 75.5% of unincorporated non-agricultural enterprises were owned by persons
belonging to Scheduled Tribes (ST), Scheduled Castes (SC) and Other Backward
Classes (OBC). This proportion was more in case of OAEs (78%) than establishments
(51%).
About 44% of all unincorporated non-agricultural enterprises reported not having
faced any specific problem in their day-to-day operation. ‘Shrinking or fall of demand’
(34.7%) and ‘non recovery of financial dues’ (23.5%) were the two main problems
faced by the enterprises.
About 46% of the unincorporated non-agricultural enterprises in Odisha did not
generate any type of solid waste as part of their operation. About 33% of the enterprises
had provision for solid waste management and the remaining 22% did not have any
provision for solid waste management.
About 86% of the unincorporated non-agricultural enterprises did not generate any
liquid waste during their operation. Only about 5% of the enterprises had some
provision for liquid waste management.
About 2% of unincorporated non-agricultural enterprises had reported receiving some
assistance from government. About 2% of unincorporated non-agricultural enterprises
received assistance from the government in the form of financial loans.
iii | P a g e Unincorporated Non-Agricultural Enterprises (Excluding Construction) in Odisha
Economic characteristics:
At all Odisha level, 2% of the enterprises reported having used computer and internet
for entrepreneurial activities during the previous 365 days/ year of their operation.
During 2015-16, the estimated GVAPE in the unincorporated non-agricultural sector
(excluding construction) for the state was estimated at ₹1, 09,477/-.
For rural Odisha, GVAPE for OAEs and establishments were estimated as ₹ 54,567 /-
and ₹ 4, 44,047/- respectively. The corresponding estimates for urban areas were ₹ 1,
75,181/- and 7, 80,235/- respectively. At all-Odisha level highest GVAPE was for
enterprise engaged in ‘other services ‘activities estimated as ₹ 1,41,352/- followed by
trading at ₹ 1,41,352/- and manufacturing at ₹ 78,096/-.
During 2015-16, the gross value added per worker in the unincorporated non-
agricultural sector (excluding construction) for the state was estimated at ₹ 85,538.
GVAPW for rural and urban Odisha were estimated as ₹ 60650 and ₹ 1, 74,679
respectively.
For rural Odisha, GVAPW for OAEs and establishments were estimated as ₹ 49,340
and ₹ 1, 34,752 respectively. The corresponding estimates for urban areas were ₹ 1,
56,496 and ₹ 1, 99,952 respectively. GVAPW for enterprises engaged in
manufacturing was lower compared to trading and ‘other services’. At all-Odisha level
highest GVAPW was for enterprise engaged in ‘other services’ activities estimated as
₹ 1, 10,759 followed by ‘trading’ at ₹ 91,457 and manufacturing at ₹. 52,644.
The average annual emolument per hired worker estimated from the survey was ₹
67,715. The highest emolument per hired worker was reported for Manufacturing (₹
72,199) followed by other services (₹67,638) and trade (₹63,743).
The reported market value of building as fixed assets per enterprise was found to be
highest for ‘other services’ with ₹ 99,450, followed by that of manufacturing (₹ 65,293)
and trading (₹ 50,471).
The survey reveals that during 2015-16 at all-Odisha level, about 56% enterprises were
stagnating over last three years whereas about 22% enterprises were expanding.
1 | P a g e
Unincorporated Non-Agricultural Enterprises (Excluding Construction) in Odisha
Chapter One
Introduction
1.1 Background
1.1.1 The unincorporated sector in the Indian economy has prime importance. Besides its
contribution to GDP, the sector is important on account of the number of enterprises in this
sector and the very large number of persons depended on it for their employment. The sector
comprises of a large number of enterprises of varying size and spread. The most growing
categories of Indian economy like manufacturing, trade and other services are dominated by
unincorporated units. This unincorporated segment of the Indian economy is characterized by
the proprietary and partnership enterprises.
1.1.2 The National Sample Survey Office (NSSO), Ministry of Statistics and Programme
Implementation (MOSPI), Government of India, since its inception in 1950 has been
conducting nationwide integrated large scale sample surveys, applying scientific sampling
methods, to generate data and statistical indicators on diverse socio-economic aspects. Along
with the household based socio-economic surveys, Enterprise surveys as follow up surveys of
Economic Census (EC) are also being conducted by NSSO, periodically, since the first
Economic Census in the year 1977. So far 15 such follow up surveys on non-agricultural
enterprises have been conducted by NSSO starting from the survey on Unorganised
Manufacturing - Non-Directory Establishments and Own-Account Enterprises during NSS
33rd round (July 1978 – June 1979) to the Survey on Unincorporated Non-Agricultural
Enterprises (Excluding Construction) of NSS 73rd round (July 2015- June 2016).
1.2 Objective of the Survey
1.2.1 The survey on Unincorporated Non-Agricultural Enterprises (excluding Construction) of
NSS 73rd round (July 2015- June 2016) was conducted as a repeat survey of NSS 67th round
(July 2010 –June 2011) survey on the same subject. NSS 67th round was the first NSS round
which covered the entire unincorporated non-agricultural sector (excluding construction) in a
focused way as a follow-up survey of 5th EC. In this round different industry sectors were
covered in an integrated approach instead of covering them in isolation as done in previous
2 | P a g e
Unincorporated Non-Agricultural Enterprises (Excluding Construction) in Odisha
NSS rounds. The survey was designed to generate estimates of various operational and
economic characteristics of the unincorporated non-agricultural enterprises in manufacturing,
trade and other services (excluding construction) at more disaggregated activity category level
as required by Central Statistics Office (CSO) which is also one of the prime users of the survey
results.
1.2.2 To make use of the survey results in preparation of Supply-Use Table in National
Accounts Division (NAD), a specially designed three digit product classification was
introduced for the first time in the enterprise schedule of this round. Additionally, provision for
collecting information related to availability of skilled manpower, access to toilet facilities,
waste management system in the unincorporated non-agricultural sector were included in the
survey to generate estimates related to some major focus of the government such as Skill
Development and Swachh Bharat Abhiyan. The Survey also collected information on original
investment in plant and machinery/ equipment based on which the unincorporated enterprises
could be classified as Micro, Small and Medium Enterprises (MSMEs) and others.
1.3 Comparability of results of NSS 73rd round with other sources of data on
unincorporated sector enterprises
1.3.1 Indicators related to the unincorporated sector enterprises are available from multiple
sources, enterprise surveys of NSSO and Economic Census conducted by CSO being the two
main official sources. However, the estimates obtained from these sources are not directly
comparable due to some differences in coverage and concepts and definitions adopted.
1.3.2 NSS 73rd round and NSS 67th round
1.3.2.1 NSS Surveys on unorganised/ unincorporated sector enterprises are designed to have
information on the operational and economic characteristics of this sector for effective policy
formulation. At the same time, they are also intended for generating periodic economic
indicators that could be used in National Accounts. Accordingly, coverage of NSS enterprise
surveys generally is restricted to the sectors for which no other official data source is available.
Similarly, certain concepts and definitions also undergo periodic changes in an attempt to make
them consistent with the latest System of National Accounts (SNA). As a result, estimates
obtained from NSS surveys on same topic conducted over different time points may not be
directly comparable with each other.
3 | P a g e
Unincorporated Non-Agricultural Enterprises (Excluding Construction) in Odisha
1.3.2.2 The survey of unincorporated non-agricultural enterprises (excluding construction) of
NSS 73rd round was planned as a repeat survey of the survey on same topic conducted during
NSS 67th round (July 2010- June 2011). However, the Working Group of NSS 73rd round,
while deciding the coverage of the survey suggested the following changes:
Activities related to Non captive electric power generation, transmission and
distribution by units not registered with the Central Electricity Authority (CEA) under
NIC 2008 codes 35103, 35105, 35106, 35107, 35109, which were not covered in NSS
67th round are included in the coverage of NSS 73rd round. It was observed by the
Working Group that this activity, which was not covered in previous NSS enterprise
surveys and no alternative data source was available, needs to be brought into the
coverage of NSS 73rd round.
Two additional special codes, namely, 64193: Chit funds and 64921: Investment club
are introduced under NIC 2008 Div.64: Financial service activities other than insurance
and pension funding. These special codes were introduced to capture detailed
information on some important financial activities which were understood to have a
sizable presence in the unincorporated sector.
NIC 2008 Div.65: Insurance, reinsurance and pension funding, except compulsory
social security and NIC 2008 code 6622: Activities of insurance agents is excluded from
the coverage of NSS 73rd round: Since Insurance companies in the country are only
present in the incorporated sector, the inclusion of this activity did not carry much
meaning, which was also clear from the analysis of data of NSS 67th round. Further,
data on activities of insurance agents is available from Insurance Regulatory and
Development Authority of India (IRDAI).
1.3.2.3 In addition to the difference in activity coverage, the following changes in the concepts
and definitions followed for collecting the information and presenting estimates were also
introduced in NSS 73rd round as a deviation from NSS 67th round:
The office bearers of Self Help Groups (SHGs) and the active members (i.e. those
members of SHG who regularly participates in the meetings) were treated as working
owners and were included in estimates of workers generated from the results of NSS
67th round. The active members of SHGs were not considered as working owners (and
therefore workers) in NSS 73rd round. However, information on active members of
4 | P a g e
Unincorporated Non-Agricultural Enterprises (Excluding Construction) in Odisha
SHGs was separately collected in this round to have a comparable study with 67th
round, if needed.
The purchase value of the goods sold in the same condition as purchased and the sale
value of goods sold in the same condition as purchased were included respectively in
the estimates of operating expenses and receipts in the results released from NSS 67th
round survey. Whereas in NSS 73rd round tabulation, adopting the SNA
recommendations for such activities, the purchase value of traded goods were excluded
from the operating expenses and the trade margin (instead of entire sale value) was
included in the receipt side wherever possible.
As a deviation from the approach followed in NSS 67th round, the procedure used for
calculation of receipts, expenditure and Gross Value Added (GVA) for financial
enterprises in NSS 73rd round were rectified by (a) excluding the interest payment from
the expenses part and (b) not directly taking the interest receipt in the output/receipt
calculation of the financial enterprise. Instead, the output / receipt of the financial
enterprise was worked out using the formula ‘FISIM3 + Actual Receipts’ using the
FISIM formula with a reference rate of 7.71 percent for the period 2015-16. The GVA
was also accordingly changed. (FISIM is computed, as per SNA 2008, on loans and
deposits using Reference Rates (RR) approach. Denoting LR/ DR as interest rates for
Lending/Deposit, FISIM = (LRRR) * Av. stock of Loans + (RR-DR) * Av. stock of
Deposits. RR which is taken as harmonic mean of lending and deposit rate for banking
sector was provided by NAD, CSO as 7.71 percent for the year 2015-16 and the same
was used in calculation. Also in unorganized/ informal banking activities, which are
mainly Money lenders, second factor in the FISIM formula would be absent.)
For Non Profit Institutions Serving Households (NPISH) and other enterprises engaged
in non-market production, output is calculated by cost approach using the formula:
Output of NPISH = Intermediate consumption (IC) + compensation of employees (CE)
+ consumption of fixed capital (CFC) + other taxes (less subsidies) on production
GVA for NPISH is calculated by the formula Net Value Added (NVA) + Consumption
of Fixed Capital (CFC) where NVA being Output – IC (which is equal to CE). Since
CFC and ‘other taxes on production’ for non-market producers are not available from
5 | P a g e
Unincorporated Non-Agricultural Enterprises (Excluding Construction) in Odisha
the survey, the GVA could not be calculated for NPISH and other enterprises engaged
in non-market production and instead, NVA is presented for such enterprises.
1.3.2.4 For presentation of estimates obtained from NSS 73rd round, the activity categories
similar to those used in NSS 67th round survey reports are adopted. However, while comparing
the estimates obtained from these two surveys, it is necessary to take into consideration the
above mentioned differences in coverage, concepts and definitions.
1.3.3 NSS 73rd round and 6th Economic Census
1.3.3.1 The Survey on unincorporated non-agricultural enterprises of NSS 73rd round covered
all (i) unorganised manufacturing units (ii) enterprises engaged in cotton ginning, cleaning and
baling which are not covered by the Annual Survey of Industries (ASI) and (iii) units engaged
in trading, non-captive electricity generation and transmission and other services activities. The
ownership categories of enterprises that were under coverage of NSS 73rd round were
proprietary and partnership enterprises, Trusts, Non Profit Institutions (NPIs), Self Help Groups
(SHG), etc. The ownership categories (a) incorporated enterprises (i.e. those registered under
Companies Act, 1956), (b) Government and public sector enterprises and (c) Cooperatives were
not considered for inclusion in the survey.
1.3.3.2 While the 6th Economic Census covered all the unincorporated enterprises as included
in the coverage of NSS 73rd round, it also covered all other units engaged in various agricultural
and non-agricultural activities excluding crop production, plantation, public administration,
defence and compulsory social security. While covering these activities, 6th Economic Census
considered the following ownership categories for inclusion:
Government/ PSU
Proprietary and Partnership establishments
Private Corporate Establishments (Companies)
Non-Profit Institutions (NPIs)
Trusts
Cooperatives
Self Help Groups(SHGs)
6 | P a g e
Unincorporated Non-Agricultural Enterprises (Excluding Construction) in Odisha
1.3.3.3 The SHGs, which were formed for engaging in financial intermediary services and later
changed into some group based non-financial activity, were also considered as SHGs in 6th
EC. In the NSS 73rd round, however, units formed as an SHG and engaged in nonfinancial
activities were considered as a partnership enterprise with members not all from the same
household. Further, all members of SHG who were regularly attending meetings or taking part
in decision making procedure like secretary, treasurer, active committee member etc. were
treated as working owners in 6th EC. In the NSS 73rd round, on the other hand, they were not
considered as working owners (or workers).
1.3.3.4 While comparing the estimates of number of enterprises and number of workers
obtained from NSS 73rd round with those of the 6th EC figures of number of enterprises and
workers, the adjustments for the above mentioned differences in coverage and concepts need
to be done.
1.3.4 Treatment of Active members of SHG in NSS 73rd round
1.3.4.1 With reference to the treatment of active members of SHG as working owners both in
Economic Census as well as NSS 67th round survey, the issue was considered in detail by the
Working Group of NSS 73rd round and made the following observations:
Self-help groups (SHGs) principally carry out the activity of financial intermediation.
The funds of the SHGs are created from individual members’ deposits and loans taken
from banks. The members of the SHGs undertake economic activities, either
individually or collectively, using micro-credit from the respective SHGs. Some of the
SHGs undertake collective economic activities (say stone-cutting, rice processing,
running a ration shop, cooking mid-day meal etc.) based on group credit from the SHG
and labour and management by members under the name of the SHG.
Active members (i.e., office bearers and other members who regularly attend meetings,
etc.) of SHGs that provide financial intermediation services only for its own members
are not to be treated as “worker” of the SHG.
However, a paid staff employed (full-time or part-time) by the SHG will be treated as a
worker. Needless to say, a member running his/her own enterprise – whether
individually or collectively – using micro-finance from the SHG will be treated as a
7 | P a g e
Unincorporated Non-Agricultural Enterprises (Excluding Construction) in Odisha
worker of the enterprise, but not of the SHG. An enterprise run collectively by the
members under the name of the SHG should be treated as a separate enterprise.
1.4 Features of the Survey
1.4.1 Schedule of Enquiry
1.4.1.1 The schedule of enquiry of survey on ‘Unincorporated Non-Agricultural Enterprises
(excluding Construction)’ (Schedule 2.34) was designed to collect information on the
operational characteristics of the unincorporated non-agricultural enterprises such as their
type of ownership, nature of operation, type of enterprise, their status of registration,
problem faced in operation, government assistance received, employment particulars, use
of Information and Communication Technology (ICT) etc. and their economic
characteristics measured in terms of operating expenses and receipts, Gross Value Added,
compensation to workers, owned and hired fixed assets, indebtedness status in terms of
outstanding loans, etc. Specific information was also collected to have some estimates
related to skill development, Swachh Bharat Abhiyan and also to classify the
unincorporated enterprises as MSMEs and others. Change in inventory during the
accounting year/ last 365 days in respect of enterprises where information was collected
from book of accounts and the loan amount advanced by enterprises engaged in financial
activities were also collected.
1.4.2 Scope and Coverage
1.4.2.1 Geographical Coverage: The survey covered the whole of the Odisha.
1.4.2.2 Subject Coverage: The coverage of NSS 73rd round (July 2015 – June 2016) was
unincorporated non-agricultural enterprises belonging to three sectors viz., Manufacturing,
Trade and Other Services (excluding construction).
The survey covered the following broad categories:
(a) Manufacturing enterprises excluding those registered under Sections 2m(i) and 2m(ii) of
the Factories Act, 1948
(b) Manufacturing enterprises registered under Section 85 of Factories Act, 1948
(c) Enterprises engaged in cotton ginning, cleaning and baling (code 01632 of NIC- 2008)
excluding those registered under Factories Act, 1948
8 | P a g e
Unincorporated Non-Agricultural Enterprises (Excluding Construction) in Odisha
(d) Enterprises manufacturing beedi and cigar excluding those registered under beedi and cigar
workers (conditions of employment) Act, 1966
(e) Non captive electric power generation, transmission and distribution by units not registered
with the Central Electricity Authority (CEA) (for example: small units operating generators on
diesel, kerosene to produce electricity)
(f) Trading enterprises
(g) Other Services sector enterprises excluding construction Categories of enterprises under
coverage in (a) to (g) above were:
(a) Proprietary and partnership enterprises [excluding Limited Liability Partnership (LLP)
enterprises]
(b) Trusts, Self-Help Groups (SHGs), Non-Profit Institutions (NPIs), etc.
Following enterprises were excluded from the coverage:
(a) Enterprises which are incorporated i.e. registered under Companies Act, 1956
(b) The electricity units registered with the Central Electricity Authority (CEA)
(c) Government and public sector enterprises
(d) Cooperatives
1.4.3 Survey Period: The survey was conducted during the period July 2015- June 2016.
1.4.4 Reference period
1.4.4.1 Last 30 days preceding the date of survey or last month was used as the reference period
to collect most of the data. Various items of receipts and expenses as well as data on
employment, emoluments, rent, interest, net surplus and value added for the enterprises were
collected for the above reference period only. However, for seasonal enterprises the reference
period referred to the last 30 days (preceding the date of survey), if they have worked
continuously for last 30 days or more (including scheduled holidays) in the season in which it
was surveyed (current season). For seasonal enterprises which have worked for less than 30
days in the current season, last month will referred to an average month in the last working
season.
9 | P a g e
Unincorporated Non-Agricultural Enterprises (Excluding Construction) in Odisha
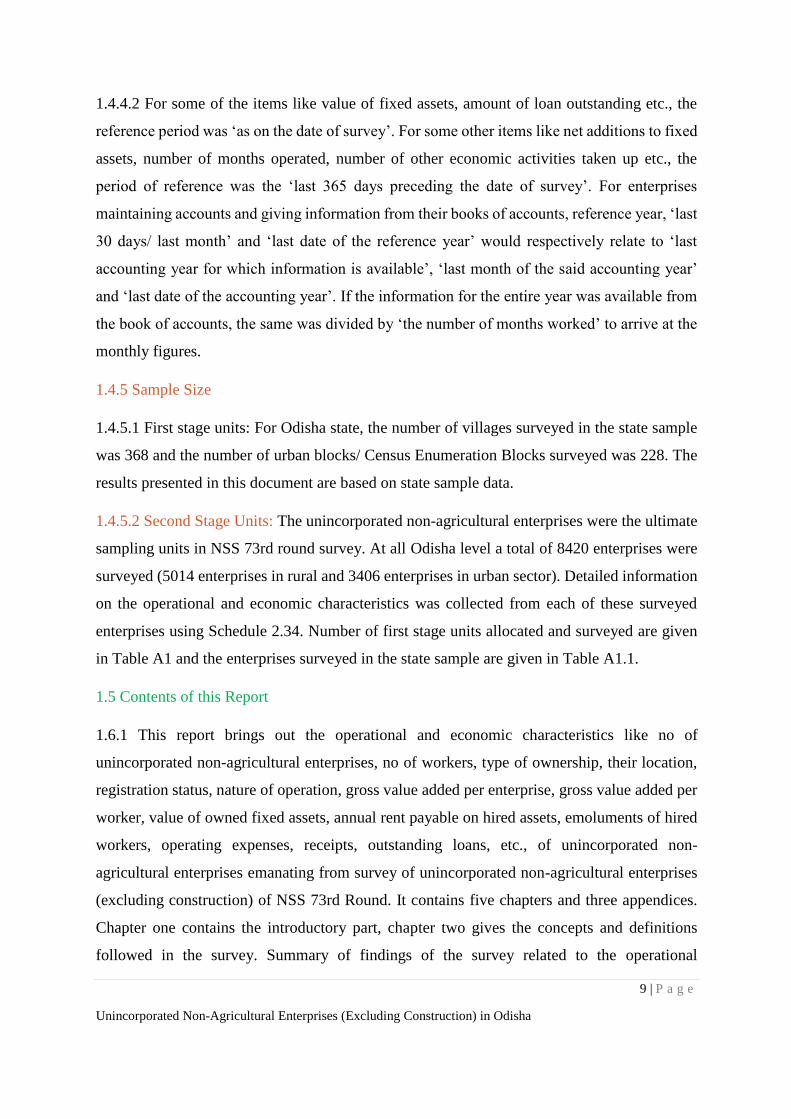
1.4.4.2 For some of the items like value of fixed assets, amount of loan outstanding etc., the
reference period was ‘as on the date of survey’. For some other items like net additions to fixed
assets, number of months operated, number of other economic activities taken up etc., the
period of reference was the ‘last 365 days preceding the date of survey’. For enterprises
maintaining accounts and giving information from their books of accounts, reference year, ‘last
30 days/ last month’ and ‘last date of the reference year’ would respectively relate to ‘last
accounting year for which information is available’, ‘last month of the said accounting year’
and ‘last date of the accounting year’. If the information for the entire year was available from
the book of accounts, the same was divided by ‘the number of months worked’ to arrive at the
monthly figures.
1.4.5 Sample Size
1.4.5.1 First stage units: For Odisha state, the number of villages surveyed in the state sample
was 368 and the number of urban blocks/ Census Enumeration Blocks surveyed was 228. The
results presented in this document are based on state sample data.
1.4.5.2 Second Stage Units: The unincorporated non-agricultural enterprises were the ultimate
sampling units in NSS 73rd round survey. At all Odisha level a total of 8420 enterprises were
surveyed (5014 enterprises in rural and 3406 enterprises in urban sector). Detailed information
on the operational and economic characteristics was collected from each of these surveyed
enterprises using Schedule 2.34. Number of first stage units allocated and surveyed are given
in Table A1 and the enterprises surveyed in the state sample are given in Table A1.1.
1.5 Contents of this Report
1.6.1 This report brings out the operational and economic characteristics like no of
unincorporated non-agricultural enterprises, no of workers, type of ownership, their location,
registration status, nature of operation, gross value added per enterprise, gross value added per
worker, value of owned fixed assets, annual rent payable on hired assets, emoluments of hired
workers, operating expenses, receipts, outstanding loans, etc., of unincorporated non-
agricultural enterprises emanating from survey of unincorporated non-agricultural enterprises
(excluding construction) of NSS 73rd Round. It contains five chapters and three appendices.
Chapter one contains the introductory part, chapter two gives the concepts and definitions
followed in the survey. Summary of findings of the survey related to the operational
10 | P a g e
Unincorporated Non-Agricultural Enterprises (Excluding Construction) in Odisha
characteristics of unincorporated non-agricultural enterprises are presented in chapter three,
chapter four contains findings of economic characteristics and chapter five contains the
conclusion part. Appendix A provides an outline of the sample design and estimation procedure
for the survey. The detailed tables are presented in Appendix B. A copy of the listing schedule
(0.0) and schedule of enquiry –“Schedule (2.34)” used in the survey are given in Appendix C.
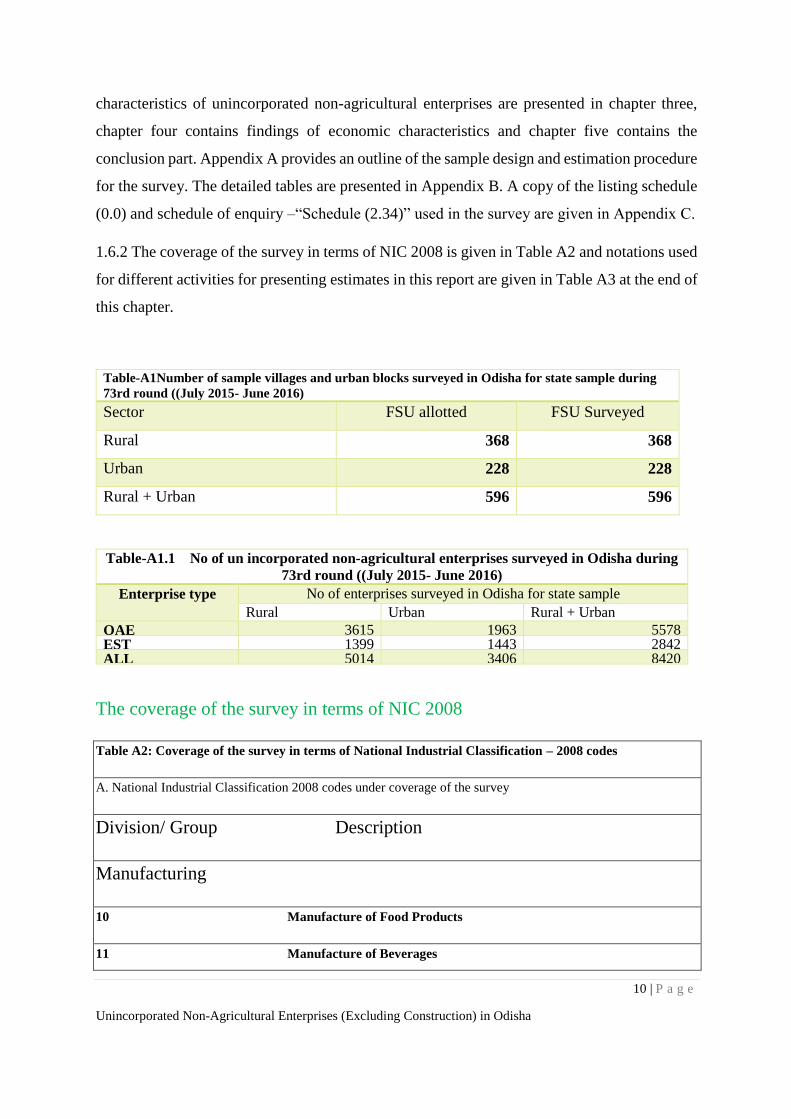
1.6.2 The coverage of the survey in terms of NIC 2008 is given in Table A2 and notations used
for different activities for presenting estimates in this report are given in Table A3 at the end of
this chapter.
Table-A1Number of sample villages and urban blocks surveyed in Odisha for state sample during
73rd round ((July 2015- June 2016)
Sector FSU allotted FSU Surveyed
Rural 368 368
Urban 228 228
Rural + Urban 596 596
Table-A1.1 No of un incorporated non-agricultural enterprises surveyed in Odisha during
73rd round ((July 2015- June 2016)
Enterprise type No of enterprises surveyed in Odisha for state sample
Rural Urban Rural + Urban
OAE 3615 1963 5578 EST 1399 1443 2842 ALL 5014 3406 8420
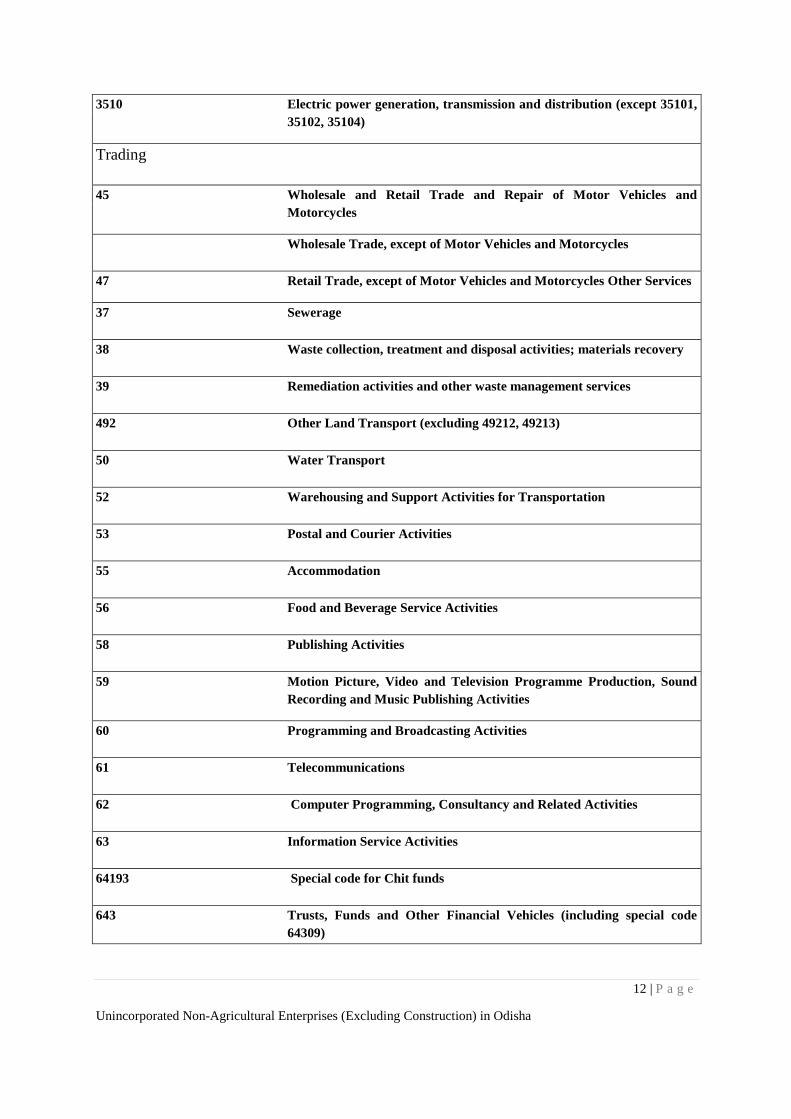
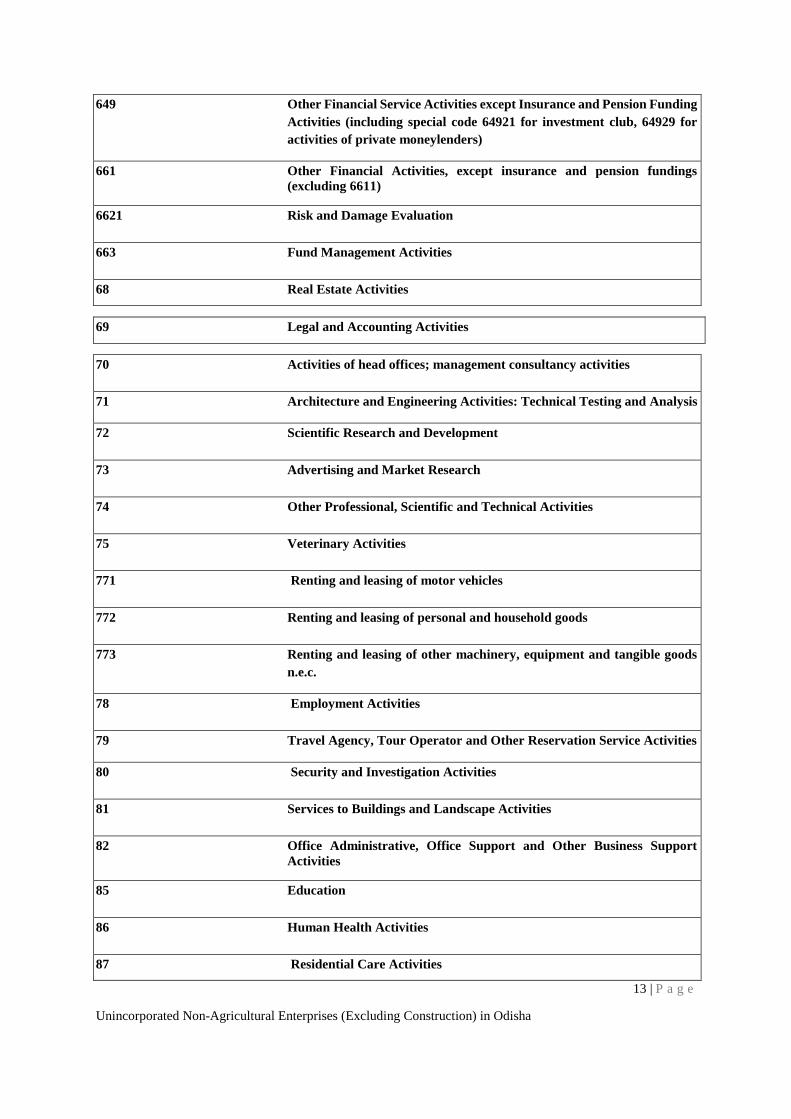
The coverage of the survey in terms of NIC 2008
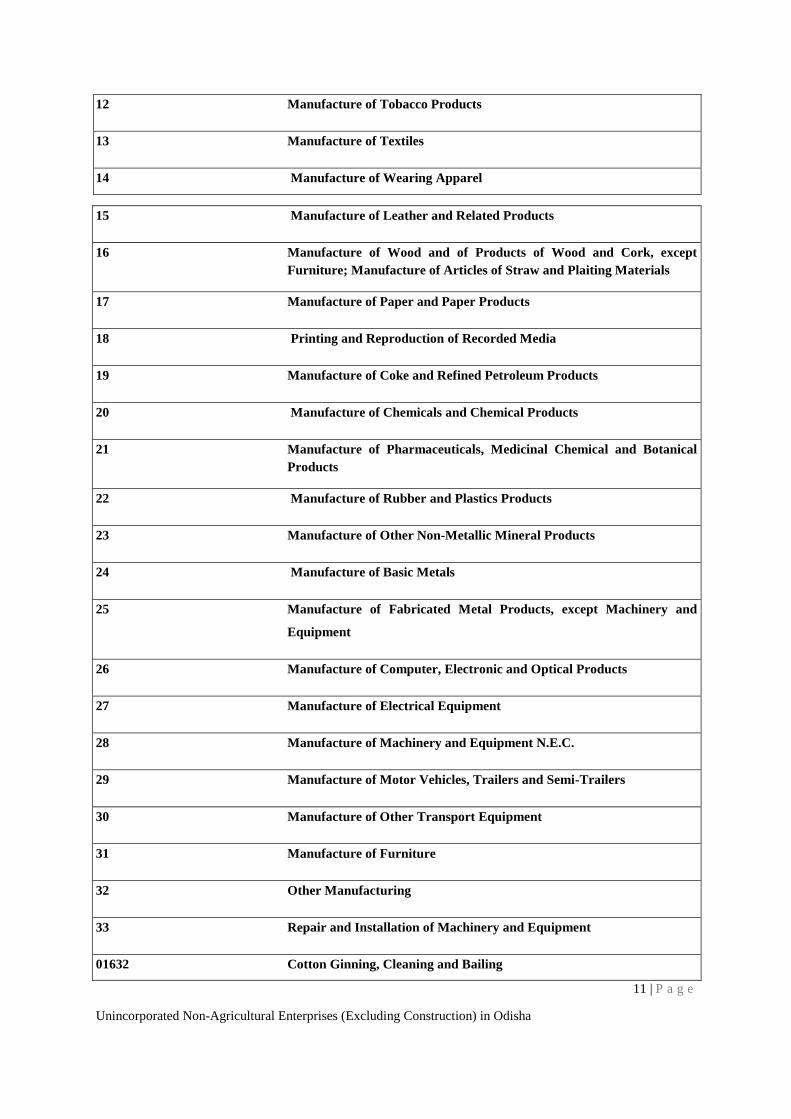
Table A2: Coverage of the survey in terms of National Industrial Classification – 2008 codes
A. National Industrial Classification 2008 codes under coverage of the survey
Division/ Group Description
Manufacturing
10 Manufacture of Food Products
11 Manufacture of Beverages
11 | P a g e
Unincorporated Non-Agricultural Enterprises (Excluding Construction) in Odisha
12 Manufacture of Tobacco Products
13 Manufacture of Textiles
14 Manufacture of Wearing Apparel
15 Manufacture of Leather and Related Products
16 Manufacture of Wood and of Products of Wood and Cork, except
Furniture; Manufacture of Articles of Straw and Plaiting Materials
17 Manufacture of Paper and Paper Products
18 Printing and Reproduction of Recorded Media
19 Manufacture of Coke and Refined Petroleum Products
20 Manufacture of Chemicals and Chemical Products
21 Manufacture of Pharmaceuticals, Medicinal Chemical and Botanical
Products
22 Manufacture of Rubber and Plastics Products
23 Manufacture of Other Non-Metallic Mineral Products
24 Manufacture of Basic Metals
25 Manufacture of Fabricated Metal Products, except Machinery and
Equipment
26 Manufacture of Computer, Electronic and Optical Products
27 Manufacture of Electrical Equipment
28 Manufacture of Machinery and Equipment N.E.C.
29 Manufacture of Motor Vehicles, Trailers and Semi-Trailers
30 Manufacture of Other Transport Equipment
31 Manufacture of Furniture
32 Other Manufacturing
33 Repair and Installation of Machinery and Equipment
01632 Cotton Ginning, Cleaning and Bailing
12 | P a g e
Unincorporated Non-Agricultural Enterprises (Excluding Construction) in Odisha
3510 Electric power generation, transmission and distribution (except 35101,
35102, 35104)
Trading
45 Wholesale and Retail Trade and Repair of Motor Vehicles and
Motorcycles
Wholesale Trade, except of Motor Vehicles and Motorcycles
47 Retail Trade, except of Motor Vehicles and Motorcycles Other Services
37 Sewerage
38 Waste collection, treatment and disposal activities; materials recovery
39 Remediation activities and other waste management services
492 Other Land Transport (excluding 49212, 49213)
50 Water Transport
52 Warehousing and Support Activities for Transportation
53 Postal and Courier Activities
55 Accommodation
56 Food and Beverage Service Activities
58 Publishing Activities
59 Motion Picture, Video and Television Programme Production, Sound
Recording and Music Publishing Activities
60 Programming and Broadcasting Activities
61 Telecommunications
62 Computer Programming, Consultancy and Related Activities
63 Information Service Activities
64193 Special code for Chit funds
643 Trusts, Funds and Other Financial Vehicles (including special code
64309)
13 | P a g e
Unincorporated Non-Agricultural Enterprises (Excluding Construction) in Odisha
649 Other Financial Service Activities except Insurance and Pension Funding
Activities (including special code 64921 for investment club, 64929 for
activities of private moneylenders)
661 Other Financial Activities, except insurance and pension fundings
(excluding 6611)
6621 Risk and Damage Evaluation
663 Fund Management Activities
68 Real Estate Activities
69 Legal and Accounting Activities
70 Activities of head offices; management consultancy activities
71 Architecture and Engineering Activities: Technical Testing and Analysis
72 Scientific Research and Development
73 Advertising and Market Research
74 Other Professional, Scientific and Technical Activities
75 Veterinary Activities
771 Renting and leasing of motor vehicles
772 Renting and leasing of personal and household goods
773 Renting and leasing of other machinery, equipment and tangible goods
n.e.c.
78 Employment Activities
79 Travel Agency, Tour Operator and Other Reservation Service Activities
80 Security and Investigation Activities
81 Services to Buildings and Landscape Activities
82 Office Administrative, Office Support and Other Business Support
Activities
85 Education
86 Human Health Activities
87 Residential Care Activities
14 | P a g e
Unincorporated Non-Agricultural Enterprises (Excluding Construction) in Odisha
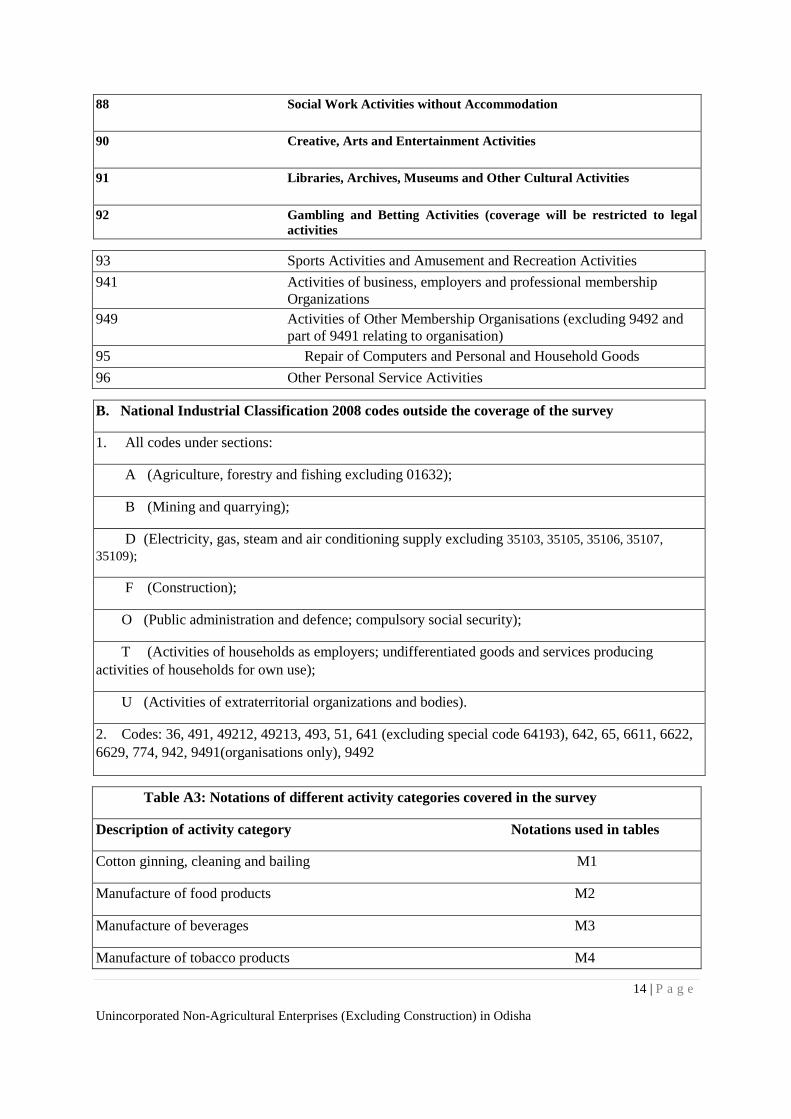
88 Social Work Activities without Accommodation
90 Creative, Arts and Entertainment Activities
91 Libraries, Archives, Museums and Other Cultural Activities
92 Gambling and Betting Activities (coverage will be restricted to legal
activities
93 Sports Activities and Amusement and Recreation Activities
941 Activities of business, employers and professional membership
Organizations
949 Activities of Other Membership Organisations (excluding 9492 and
part of 9491 relating to organisation)
95 Repair of Computers and Personal and Household Goods
96 Other Personal Service Activities
B. National Industrial Classification 2008 codes outside the coverage of the survey
1. All codes under sections:
A (Agriculture, forestry and fishing excluding 01632);
B (Mining and quarrying);
D (Electricity, gas, steam and air conditioning supply excluding 35103, 35105, 35106, 35107,
35109);
F (Construction);
O (Public administration and defence; compulsory social security);
T (Activities of households as employers; undifferentiated goods and services producing
activities of households for own use);
U (Activities of extraterritorial organizations and bodies).
2. Codes: 36, 491, 49212, 49213, 493, 51, 641 (excluding special code 64193), 642, 65, 6611, 6622,
6629, 774, 942, 9491(organisations only), 9492
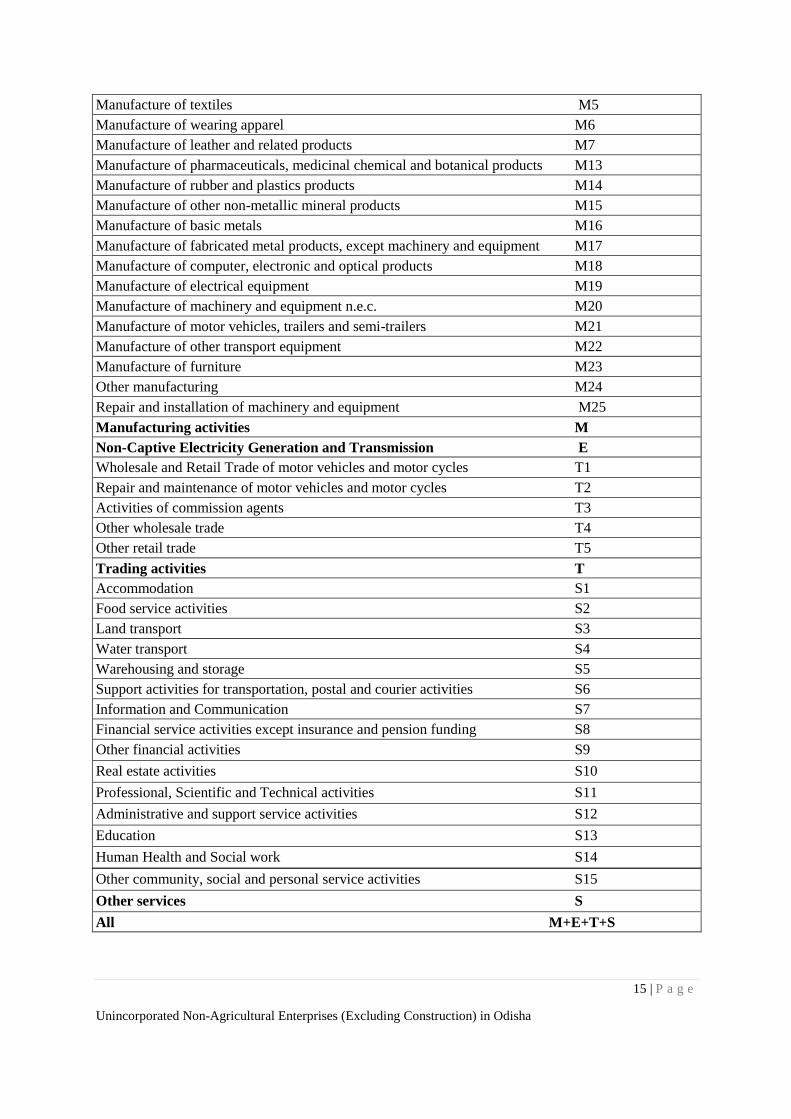
Table A3: Notations of different activity categories covered in the survey
Description of activity category Notations used in tables
Cotton ginning, cleaning and bailing M1
Manufacture of food products M2
Manufacture of beverages M3
Manufacture of tobacco products M4
15 | P a g e
Unincorporated Non-Agricultural Enterprises (Excluding Construction) in Odisha
Manufacture of textiles M5
Manufacture of wearing apparel M6
Manufacture of leather and related products M7
Manufacture of pharmaceuticals, medicinal chemical and botanical products M13
Manufacture of rubber and plastics products M14
Manufacture of other non-metallic mineral products M15
Manufacture of basic metals M16
Manufacture of fabricated metal products, except machinery and equipment M17
Manufacture of computer, electronic and optical products M18
Manufacture of electrical equipment M19
Manufacture of machinery and equipment n.e.c. M20
Manufacture of motor vehicles, trailers and semi-trailers M21
Manufacture of other transport equipment M22
Manufacture of furniture M23
Other manufacturing M24
Repair and installation of machinery and equipment M25
Manufacturing activities M
Non-Captive Electricity Generation and Transmission E
Wholesale and Retail Trade of motor vehicles and motor cycles T1
Repair and maintenance of motor vehicles and motor cycles T2
Activities of commission agents T3
Other wholesale trade T4
Other retail trade T5
Trading activities T
Accommodation S1
Food service activities S2
Land transport S3
Water transport S4
Warehousing and storage S5
Support activities for transportation, postal and courier activities S6
Information and Communication S7
Financial service activities except insurance and pension funding S8
Other financial activities S9
Real estate activities S10
Professional, Scientific and Technical activities S11
Administrative and support service activities S12
Education S13
Human Health and Social work S14
Other community, social and personal service activities S15
Other services S
All M+E+T+S
16 | P a g e
Unincorporated Non-Agricultural Enterprises (Excluding Construction) in Odisha
Chapter Two
Concepts and Definitions
2.1 Important concepts and definitions of some important terms used in the survey and relevant
to this report are explained in the following paragraphs.
2.2 Population coverage: The following rules regarding the population/households covered
were followed while visiting households for the purpose of listing of enterprises:
1. Under-trial prisoners in jails and indoor patients of hospitals, nursing homes etc.,
were excluded, but residential staff therein was included during listing. The persons of the first
category were considered as normal members of their parent households. Convicted prisoners
undergoing sentence were outside the coverage of the survey.
2. Floating population, i.e., persons without any normal residence were not considered.
But households residing in open space, roadside shelter, under a bridge, etc., more or less
regularly in the same place, were taken into account.
3. Foreign nationals were not considered, nor were their domestic servants, if by
definition the latter belong to the foreign national's household. If, however, an enterprise was
run by a member of such household located within the premises of the household or without
any fixed premises, it was listed as an enterprise.
4. Persons residing in barracks of military and paramilitary forces (like police, BSF,
etc.) was kept outside the survey coverage due to difficulty in conduct of survey therein.
However, civilian population residing in their neighbourhood, including the family quarters of
service personnel, were covered.
5. Orphanages, rescue homes, ashrams and vagrant houses were outside the survey
coverage but enterprises run by them and located within the premises of those institutions were
considered. However, persons staying in old age homes, students staying in ashrams/ hostels
and the residential staff (other than monks/ nuns) of these ashrams were treated as forming
households (as per the standing practice in NSS) for the purpose of identifying enterprises
through such households. For orphanages, although orphans were not covered, the persons
looking after them and staying there were considered as forming households.
17 | P a g e
Unincorporated Non-Agricultural Enterprises (Excluding Construction) in Odisha
2.3 House: Every structure, tent, shelter, etc. was considered as a house irrespective of its use.
It might have been used for residential or non-residential purpose or both or even it might have
been vacant.
2.4 Household: A group of persons who normally lived together and taking food from a
common kitchen constituted a household. It included temporary stay-away (those whose total
period of absence from the household was expected to be less than 6 months) but excluded
temporary visitors and guests (expected total period of stay less than 6 months).
Even though the determination of the actual composition of a household was left to the
judgment of the head of the household, the following procedures were adopted as guidelines.
(i) Each inmate (including residential staff) of a hostel, mess, hotel, boarding and lodging
house, etc., constituted a single-member household. If, however, a group of persons among
them normally pool their income for spending, they were together treated as forming a single
household. For example, a family living in a hotel was treated as a single household.
(ii) In deciding the composition of a household, more emphasis was given on 'normally living
together' than on 'ordinarily taking food from a common kitchen'. In case the place of residence
of a person was different from the place of boarding, he or she was treated as a member of the
household with whom he or she resided.
(iii) A resident employee, or domestic servant, or a paying guest (but not just a tenant in the
household) was considered as a member of the household with whom he or she resided even
though he or she was not a member of the same family.
(iv) When a person sleeps in one place (say, in a shop or in a room in another house because
of space shortage) but usually took food with his or her family, he or she was treated not as a
single member household but as a member of the household in which other members of his or
her family stayed.
(v) If a member of a family (say, a son or a daughter of the head of the family) stayed elsewhere
(say, in hostel for studies or for any other reason), he/ she was not considered as a member of
his/ her parent's household. However, he/ she were considered as a single member household
if the hostel is listed.
18 | P a g e
Unincorporated Non-Agricultural Enterprises (Excluding Construction) in Odisha
2.5 Enterprise: An enterprise is an undertaking which is engaged in the production and/ or
distribution of some goods and/ or services meant mainly for the purpose of sale, whether fully
or partly. An enterprise may be owned and operated by a single household or by several
households jointly, or by an institutional body.
2.6 Non-agricultural enterprise: All enterprises covered under Sections ‘C’ to ‘S’ of NIC-
2008 are "non-agricultural enterprises". All non-agricultural enterprises will be henceforth
referred to as NAE for this survey.
2.7 Unincorporated non-agricultural enterprises: Non-agricultural enterprises which are
‘not incorporated’ (i.e. not registered under Companies Act, 1956) were covered in the survey.
Further, the domain of ‘unincorporated enterprises’ excluded (a) enterprises registered under
Sections 2m(i) and 2m(ii) of the Factories Act, 1948 or bidi and cigar manufacturing enterprises
registered under bidi and cigar workers (condition of employment) Act, 1966, (b)
government/public sector enterprises and (c) cooperatives. Thus the coverage was restricted
primarily to all household proprietary and partnership enterprises. In addition, Self Help groups
(SHGs), Private Non-Profit Institutions (NPIs) including Non-Profit Institutions Serving
Households (NPISH) and Trusts were also covered.
2.8 Manufacturing Enterprise: A manufacturing enterprise is a unit engaged in the physical
or chemical transformation of materials, substances or components into new products. It covers
units working for other concerns on materials supplied by them. The units primarily engaged
in maintenance and repair of industrial, commercial and similar machinery and equipment,
which were, in general, classified in the same class of manufacturing as those specialising in
manufacturing the goods were also included. Thus all activities covered by NIC – 2008
divisions 10 to 33 of NIC- 2008 were considered as 'manufacturing' for the purpose of the
survey. In addition, the activity of cotton ginning, cleaning and baling (NIC -2008 code 01632)
was covered in the present survey. However the production of goods for the sole purpose of
domestic consumption was not covered in the survey. Non-captive electricity generation and
transmission under NIC 2008 code 3510 (except 35101, 35102, and 35104) was also considered
under manufacturing while collecting the data. However, the information collected under these
codes was tabulated separately under the broad activity category: ‘Non-captive electricity
generation and transmission’
19 | P a g e
Unincorporated Non-Agricultural Enterprises (Excluding Construction) in Odisha
2.9 Trading Enterprise: A trading enterprise is an undertaking engaged in trade. Trade is
defined to be an act of purchase of goods and their disposal by way of sale without any
intermediate physical transformation of the goods. Thus all the trading activities, both
wholesale and retail (perennial, casual or seasonal) listed under NIC-08 divisions 45 to 47 was
treated as trade in this survey. The activities of intermediaries who do not actually purchase or
sell goods but only arrange their purchase and sale and earn remuneration by way of brokerage
and commission were also treated as trade. The purchase and sale agents, brokers listed under
NIC-08 division and auctioneers listed under NIC group were also covered in the survey.
2.10 Servicing Enterprise: A servicing enterprise or service sector enterprise is engaged in
activities carried out for the benefit of a consuming unit and typically consists of changes in the
condition of consuming units realized by the activities of servicing unit at the demand of the
consuming unit. Some examples of changes that a producer of service brings about in the
condition of consumers of service are:
a) Changes in the condition of consumer’s goods: the producer works directly on goods owned
by the consumer by transporting, cleaning, repairing or otherwise transforming them;
b) Changes in the physical condition of persons: the producer transports the persons, provides
them with accommodation, provides them with medical or surgical treatments, improves their
appearance etc;
c) Changes in the mental condition of persons: the producer provides education, information,
advice, entertainment or similar services;
d) Changes in the general economic state of the institutional unit itself: the producer provides
insurance, financial intermediation, protection, guarantees, etc. All activities under NIC – 2008
Sections E – U except sections F (construction), G (trade) are considered as service activities
other than trade. However, Sections O (Public administration and defence; compulsory social
security), T (Activities of households as employer; undifferentiated goods and services
producing activities of households for own use) and U (Activities of extraterritorial
organisations and bodies) were excluded from coverage of this survey. Only unincorporated
enterprises in the service sector under coverage as described in Table A2 of Chapter 1 and Para
2.7 were surveyed. Among these also, activities under certain NIC - 2008 codes, viz. 36 (water
collection, treatment and supply), 491 (transport via railways), 49212 (urban or suburban
20 | P a g e
Unincorporated Non-Agricultural Enterprises (Excluding Construction) in Odisha
tramways), 49213 (urban or suburban underground or elevated railways), 493 (transport via
pipeline), 51 (air transport), 641 (monetary intermediation), 642 (activities of holding
companies), 65 (insurance, reinsurance and pension funding), 6611 (Administration of
financial markets), 6622 (activities of insurance agents and brokers), 6629 (other activities
auxiliary to insurance and pension funding), 774 (Leasing of nonfinancial intangible assets),
942 (activities of trade unions), 9491 (activities of religious organisations [although activities
of individuals are covered] ), 9492 (activities of political organisations) were kept out of survey
coverage.
2.11 Household Enterprise: A household enterprise is one which is run by one or more
members of a household or run jointly by two or more households on partnership basis
irrespective of whether the enterprise is located in the premises of the household(s) or not. In
other words, all proprietary and partnership enterprises are household enterprises.
2.12 Non-household Enterprise: Non-household enterprises are those which are institutional
i.e. owned and run by the public sector (Central or State Government, local self-governments,
local bodies, government undertakings, etc.), corporate sector, co-operative societies, other
type of societies, institutions, associations, trusts, etc.
2.13 Own-account Enterprise (OAE): An enterprise, which is run without any hired worker
employed on a fairly regular basis, is termed as an own account enterprise.
2.14 Establishment: An enterprise which is employing at least one hired worker on a fairly
regular basis is termed as establishment. Paid or unpaid apprentices, paid household
member/servant/resident worker in an enterprise are considered as hired workers.
2.15 Perennial enterprise: Enterprises that are run more or less regularly throughout the year
are called perennial enterprises.
2.16 Seasonal enterprise: Seasonal enterprises are those, which are usually run in a particular
season or fixed months of a year.
2.17 Casual enterprise: Enterprises that are run occasionally, for a total of at least 30 days in
the last 365 days, are called ‘casual enterprises’.
2.18 Classification of enterprises based on ownership:
(i) Proprietary: When an individual is the sole owner of an enterprise it is a proprietary
enterprise. Own account production of fixed assets for own use, when produced by a single
member, was classified as proprietary enterprise.
21 | P a g e
Unincorporated Non-Agricultural Enterprises (Excluding Construction) in Odisha
(ii) Partnership: Partnership is defined as the ‘relation between persons who have agreed to
share the profits of a business carried on by all or any one of them acting for all’. There may
be two or more owners, belonging to the same or different households, on a partnership basis,
with or without formal registration (where there is a tacit understanding about the distribution
of profit among the so-called partners). Own account production of fixed assets, when produced
by two or more members belonging to the same or different households will be classified as
partnership enterprises. Thus, own account production of fixed assets by a group of households
for community use was classified as partnership enterprise. The partnership enterprises
registered under Limited Liability Partnership (LLP) Act, 2008 were excluded from coverage
of the survey. Also, partnership enterprises registered under Factories Act, 1948 was outside
the survey coverage.
(iii) Government/public Sector Enterprise: An enterprise, which is wholly
owned/run/managed by Central or State governments, quasi-government institutions, local
bodies like Panchayat, Zilla Parisad, City Corporation, Municipal authorities, etc., autonomous
bodies like Universities, Education boards, and institutions like schools, libraries etc. set up by
the government, panchayat, etc., was considered as public sector enterprise. Enterprises owned/
managed by a single or a group of private persons with no participation of the Government,
local body etc. in it, both in terms of management and shares, was considered as private sector
enterprises. An enterprise was not considered as a public sector enterprise if it is run on a loan
granted by government, local body, etc.
(iv) Private Limited Company: For the purpose of the survey, Private Limited Company
meant a company which by its articles:
(a) restricts the right to transfer its shares, if any,
(b) limits the number of its members to fifty not including-
(i) persons who are in the employment of the company, and
(ii) persons who, having been formerly in the employment of the company, were members of
the company while in that employment and have continued to be members after the
employment ceased; and
22 | P a g e
Unincorporated Non-Agricultural Enterprises (Excluding Construction) in Odisha
(c) prohibits any initiation to the public to subscribe for any share in, or debentures of, the
company. Where two or more persons hold jointly one or more shares in a company, they were
considered as a single member in this survey.
(v) Public Limited Company: A public limited company is defined as a company that is not
a private company. As such public companies can have an unlimited number of members and
can invite the public to subscribe to its shares and debentures. The minimum number of
members required to form a public company is seven.
(vi) Co-operative Societies: Co-operative society is one that is formed through the cooperation
of a number of persons, recognised as members of the society to benefit themselves. In the
process, the funds are raised by members’ contributions/investments and the profits generated
out of the society’s activities are shared by the members. A government agency itself can also
be a member or shareholder of a registered co-operative society but this fact cannot render the
society into a public sector enterprise for the purpose of this survey.
(vii) Trust: An arrangement through which one set of people, the trustees, are the legal owners
of property which is administered in the interest of another set, the beneficiaries. Trusts may
be set up to provide support for individuals or families, to provide pensions, to run charities, to
liquidate the property of the bankrupts for the benefit of their creditors, or for the safe keeping
of securities bought by trusts with their investor’s money. The assets, which trusts hold are
regulated by law, must be administered in the interests of the beneficiaries, and not for the profit
of the trustees.
(viii) Non-Profit Institutions (NPI): Non-profit institutions are legal or social entities created
for the purpose of producing goods and services whose status does not permit them to be a
source of income, profit or other financial gain for the units that establish, control or finance
them.
2.19 Enterprises engaged in non-market production: Enterprises that provide most of their
output to others free or at prices which are not economically significant, i.e., at prices which do
not have a significant influence on the amounts the producers are willing to supply or on the
amounts purchasers wish to buy. Their major sources of finance will be coming from grants
and donations. Non-Profit Institutions Serving Households (NPISHs) are examples of
enterprises engaged in non-market production, which provide non-market goods and services
23 | P a g e
Unincorporated Non-Agricultural Enterprises (Excluding Construction) in Odisha
to households financed mainly by transfers from non-governmental sources - households,
corporations or non-residents.
2.19.1 The enterprises engaged mainly in market production are called ‘market enterprises’ in
this report and those engaged mainly in ‘non-market production’ are called ‘non-market
enterprises’ in this report.
2.20.1 Self-help Groups: A self-help group (SHG) is a financial intermediary usually
composed of between 10-20 local persons.
Members make small regular savings contributions over a few months until there is enough
capital in the group to begin lending. Funds are lent back to the members or at times to others.
In India, many SHGs are 'linked' to banks for the hand delivery of microcredit.
The characteristic features of self-help groups may be summarised as follows:
SHG is a small group generally comprising of people who are poor or economically
weak, who have voluntarily come forward to form a group for improvement of the social
and economic status of the members.
It can be formal (registered) or informal.
The concept underlines the principle of Thrift, Credit and Self Help.
Members of SHG agree to save regularly and contribute to a common fund.
The members agree to use this common fund and such other funds (like grants and loans
from banks), which they may receive as a group, to give small loans to needy members
as per the decision of the group.
The ideal size of an SHG is 10 to 20 members. Also, legally it is required that an
informal group should not be of more than 20 people. However, in difficult areas like
deserts, hills and areas with scattered and sparse populations and in case of disabled
persons, this number may be 5-20.
The group need not be registered.
From one family, only one person can become a member of an SHG. (More families
can join SHGs this way).
The group normally consists of either only men or only women.
Members should be between the age group of 21-60 years.
24 | P a g e
Unincorporated Non-Agricultural Enterprises (Excluding Construction) in Odisha
Members should be poor people [the term poor is in relation to the economic and living
conditions and this has no relation to poverty line. People living above poverty line
(APL) can also form SHG like people living below poverty line (BPL)].
2.20.2 Activity of self-help groups
Self-help groups are essentially engaged in the financial intermediation i.e. the activity of the
SHG is focussed to provide loans to the members and the members can utilise the loan for the
purposes - personal or entrepreneurial. However, an SHG may be formed initially and later all
or some members may be engaged in group-based non-financial activities. Examples of such
group-based activities are given below:
i. Collective organization of marketing for the produce of individual enterprises established
using micro-credit, particularly milk collection centres/ diary cooperatives at village level.
ii. Collective activities of SHGs using group credit to access larger natural assets for production
e.g. leasing lands and ponds for cultivation and pisciculture.
iii. Other collective economic activities based on group credit that combines labour and
management: stone-cutting, processing rice, managing a tent house etc.
iv. Management of government contracts such as running ration shops (as part of public
distribution systems), cooking mid-day meal for school children, managing a subsidised fodder
depot etc.
For self-help groups engaged in financial intermediation and also when all or some
members of the group run group based activities, the following guidelines may be followed:
While listing an SHG the following three cases may be found:-
(a) SHG is engaged in financial activities only. In that case, it will be listed under
financial intermediation.
(b) An SHG is formed and later all or some members of the group are engaged only in
some non-financial activity under survey coverage. In that case, the members will be
treated as running a partnership enterprise.
(c) An SHG is engaged in financial as well as non-financial activity. If accounts are
separable, the SHG will be listed under financial intermediation for its financial activity.
For the non-financial part, it will be treated as separate partnership enterprise. If
separate accounts are not identifiable, the major activity will be decided based on the
maximum turnover/employment.
25 | P a g e
Unincorporated Non-Agricultural Enterprises (Excluding Construction) in Odisha
2.20.3 Determination of eligibility of an SHG
An SHG will be considered as eligible enterprise for the purpose of survey if the total number
of days of operation of that SHG in last 365 days is at least 15. Working days will include-
a) Days of meeting
b) Days of interaction with the bank for purpose of deposit/withdrawal/loan/repayment
etc.
c) Days of performing other jobs related to SHG like maintenance of register
Generally, the SHG activities are coordinated by President/Secretary/Treasurer. In that case the
SHG may be listed in the house of the President/Secretary/Treasurer. In case any such member
is absent for an SHG it will be listed against the household of the member maintaining the
accounts/records. If more than one person maintains the accounts/records, the SHG will be
listed against the household of the senior-most member of the group.
2.20.4 Determination of number of hired workers of an SHG
In case of SHGs, if any member (including office bearers) performs the activities of the SHG
by drawing remuneration, they will be treated as hired workers. Members of SHG who attend
meetings regularly or participate in the activities of the SHG including decision making process
without taking any remuneration will not be treated as a worker for the purpose of this survey.
Instead they will be considered as ‘active members of SHG’.
2.21 Investment Club: Investment clubs are a group of people who pool their money to make
investments. Usually, investment clubs are organized as partnerships members usually meet on
periodic basis and study different investments, to make investment decisions as a group. The
decisions on buying and selling (investment) are made through voting process. Club meetings
may be educational and each member may actively participate in investment decisions. The
income and losses of the club are passed through to its partners and are reported on their
individual tax returns.
2.22 Chit fund: A chit fund company is the one which manages, conducts or supervises, as
foremen, agent or in any other capacity, chits as defined in Section 2 of the Chit Funds Act,
1982. Such schemes can be conducted by organised financial institutions or may be
unorganised schemes between friends and/or relatives. According to Section 2(b) of the Chit
26 | P a g e
Unincorporated Non-Agricultural Enterprises (Excluding Construction) in Odisha
Fund Act, 1982, "Chit means a transaction whether called chit, chit fund, chitty, kuri or by any
other name by or under which a person enters into an agreement with a specified number of
persons that every one of them shall subscribe a certain sum of money (or a certain quantity of
grain instead) by way of periodical instalments over a definite period and that each such
subscriber shall, in his turn, as determined by lot or by auction or by tender or in such other
manner as may be specified in the chit agreement, be entitled to the prize amount".
2.23 Mixed Activity: There are enterprises that carry out a number of activities simultaneously.
For example, a bakery may also sell cold drinks, a rice mill may sell sugar, a factory may run
a hospital in its premises, etc. Each such activity was treated as a separate enterprise if
information for them was separately available. If the accounts were not separable then the data
pertaining to the enterprise as a whole was collected and the enterprise was classified as having
mixed activities and the activities of such enterprises are generally a mixture of NIC’s. The
activities may be mixed at any level of NIC, but for the present survey an enterprise was
considered to have mixed activities if its activities are different at 2-digit level of NIC-2008.
The appropriate NIC in such cases was determined on the basis of major activity. Major activity
refers to the activity which yields maximum income/turnover/employment. The above criteria
are applied in the given order, i.e., income first, then turnover and then employment, to
determine the major activity.
2.24 Multiple Activities: Since many of the entrepreneurs belonging to the unorganised and
informal sector operate at small or marginal levels, the phenomenon of carrying out more than
one activity simultaneously or at different points of time is quite prevalent. If the activities were
carried out at one point of time at the same location and the information was not separately
available, then it was taken as “mixed activity”. Carrying out of more than one economic
activity by the entrepreneur during the reference year was called multiple activities. It differs
from mixed activities in the sense that former is with respect to the entrepreneur whereas the
latter is with respect to the enterprise. However, an entrepreneur of a manufacturing enterprise
manufacturing woollen garments before winter and cotton clothes before summer was not
considered as carrying out multiple activities.
27 | P a g e
Unincorporated Non-Agricultural Enterprises (Excluding Construction) in Odisha
2.25 Reference period
2.25.1 Last 30 days preceding the date of survey or last month was used as the reference period
to collect most of the data. Various items of receipts and expenses as well as data on
employment, emoluments, rent, interest, net surplus and value added for the enterprises were
collected for the above reference period only. However, for seasonal enterprises the reference
period referred to the last 30 days (preceding the date of survey), if they have worked
continuously for last 30 days or more (including scheduled holidays) in the season in which it
was surveyed (current season). For seasonal enterprises which have worked for less than 30
days in the current season, last month will referred to an average month in the last working
season.
2.25.2 For some of the items like value of fixed assets, amount of loan outstanding etc., the
reference period was ‘as on the date of survey’. For some other items like net additions to fixed
assets, number of months operated, number of other economic activities taken up etc. the period
of reference was the ‘last 365 days preceding the date of survey’. For enterprises maintaining
accounts and giving information from their books of accounts, reference year, ‘last 30 days/
last month’ and ‘last date of the reference year’ would respectively relate to ‘last accounting
year for which information is available’, ‘last month of the said accounting year’ and ‘last date
of the accounting year’. If the information for the entire year was available from the book of
accounts, the same was divided by ‘the number of months worked’ to arrive at the monthly
figures
2.26 Worker: For this survey, a worker was defined as all persons working within the
premises of the enterprise who were in the payroll of the enterprise as also the working owners
and unpaid family workers. The worker may serve the enterprise in any capacity -primary or
supervisory. He/she may or may not receive wages/salaries in return to his/her work incidental
to or connected with the entrepreneurial activity. Salespersons appointed by an enterprise for
selling its services and apprentices, paid or unpaid were also treated as workers.
2.26.1 Full time and part time workers: A worker need not mean that the same person will
be working continuously; it will only refer to a position. i.e., if one person is terminated and
another person is appointed in his place, it will be counted as 1 and not 2. A worker engaged
for more than half of the normal working hours of the enterprise will be treated as full time
28 | P a g e
Unincorporated Non-Agricultural Enterprises (Excluding Construction) in Odisha
worker. A part time worker is a person who works for less than or equal to half of the period of
normal working hours of the enterprise on a fairly regular basis.
2.26.2 Volunteers, who work without salary / honorarium, were not considered as workers.
Voluntary participation without remuneration in production of goods and services in
philanthropic organisation/ institutions or in any other organisation/ institution or even in the
individual capacity will not render one to be counted as worker/enterprise. Voluntary
participation will mean that the person has performed these activities without coercion or
obligation but has participated in his/ her own volition. Moreover, the voluntary participation
in the work should be without remuneration, which means that the person does not become
entitled to receive, in respect of the work performed by him/ her, any compensation including
honorarium from the institution/ organisation. For the purpose of the survey, minor
contingencies/ honorarium received from the institution/ organization against the voluntary
work done may not be considered as remuneration. To determine ‘minor’, average daily wage
received by the lowest paid full-time/part-time worker of that enterprise may be used as a
guiding tool.
2.26.3 Some enterprises do not hire individuals like porters, sweepers, accountants, etc., on a
fairly regular basis. These individuals can work in one or more enterprises in a locality, have
some autonomy to determine the charges receivable by him depending upon volume of job
performed and usually receive service charges as and when they render such services to the
enterprise. Such persons were not considered as workers of the enterprise using their services.
Instead, they were considered as independent OAEs.
2.26.4 If an enterprise has some contract with some other agency (e.g. security, cleaning,
nursing, midwife), or persons (like CA, lawyer, etc.), the employees of the agency (or persons)
who were working within the premises of the enterprise under survey (e.g. sweeper, guard,
nurse, etc.) were not counted as the employee of the enterprise. Rather they were considered as
the worker of the agency (or separate OAE, for persons).
2.26.5 Skilled Worker: If a worker of an enterprise possesses any special ability/ expertise
to perform a particular task is treated as a skilled worker for the purpose of the survey. The skill
will be in relation to the activities of the enterprise concerned. If a worker of an enterprise
possess some kind of skill which is not applicable/ required for the activities of the enterprise
29 | P a g e
Unincorporated Non-Agricultural Enterprises (Excluding Construction) in Odisha
he/ she is working, he/she will not be treated as a skilled worker for the enterprise. Both the
skills acquired by formal training and those acquired informally are considered for the survey.
Soft skills (which would include computer literacy, language and workplace interpersonal skills
relevant for the sector/trade) are also considered.
2.27 Working owner: In the case of proprietary enterprises, if the owner himself/ herself
works in the enterprise on a fairly regular basis, then he/she will be treated as working owner.
In fact, in most of the own-account enterprises the owner himself/ herself manages all activities
of the enterprise without help of anybody else (on fairly regular basis). In the case of partnership
enterprises, if only one partner or some of the partners or all the partners work in the enterprise
on a fairly regular basis then information for them shall be recorded.
2.28 Formal hired worker: A formal hired worker is one having continuity of job and eligible
for paid annual leave and also eligible for social security benefits like provident fund or
insurance provided by the employer.
2.29 Informal hired worker: An informal hired worker is not having continuity of job and/or
not eligible for paid annual leave and/or not eligible for social security benefits like provident
fund or insurance provided by the employer.
2.30 Other worker/ helper: This includes all persons belonging to the household of the
proprietor or households of the partners who are working in or for the enterprise without regular
salary or wages. Persons working as exchange labourer in the enterprise without salary or wages
will also be covered in this category. All unpaid household workers / helpers who are associated
with the activities of the enterprise during the reference month are considered in this category.
2.31 Working on Contract: The enterprises in the unorganised sector are mainly small units.
In many cases, the enterprises are seen to be working as per orders from a bigger unit. In such
cases, certain conditions are put on the servicing unit by the contractor or master unit.
Conditions may pertain to sale of products, supply of raw materials, mode of payment etc. In
many cases, the contractor specifies the design of the product to the servicing unit e.g. garment
manufacturing, shoe manufacturing etc. If the surveyed enterprise had undertaken any work on
contract during the reference year, it was considered as ‘enterprises working on contract’.
30 | P a g e
Unincorporated Non-Agricultural Enterprises (Excluding Construction) in Odisha
2.32 Broad Activity Categories: The activities under coverage of the survey have been
classified into four broad heads: Manufacturing, Non-captive electricity generation and
transmission, Trade and Other Services.
2.33 Subsidy: Subsidies are current unrequited payments that government units, including
non-resident government units, make to enterprises on the basis of the levels of their production
activities or the quantities or values of the goods and services which they produce, sell, import
or export. Subsidies can also be received by an enterprise for achieving a particular type of
efficiency in production (e.g., getting ISO certification, implementing pollution control
measures, repaying interests in time, etc.). Subsidies are equivalent to negative taxes on
production in so far as the impact on the operating surplus is in the opposite direction to that of
taxes on production. Subsidies can be on production or on interest. Various types of subsidies
are back-end subsidies on interest, export subsidies, duty drawback, etc. Subsidies do not
include grants that governments may make to enterprises in order to finance their capital
formation, or compensate them for damage to their capital assets, such grant being treated as
capital transfers.
2.34 Taxes on Products: Taxes are compulsory, unrequited payments, in cash or in kind,
made by institutional units to government units. A tax on a product is a tax that is payable per
unit of some good or service. Tax on product may be a specific amount of money per unit of
quantity of a good or service, the quantity being measured either in terms of discrete units or
continuous physical variables such as volume, weight, strength, distance, time, etc. or it may
be calculated ad valorem as a specified percentage of the price per unit or value of the goods
and services transacted. Some examples of taxes on products are VAT, excise duties, general
sales tax, service tax, export duties, turnover tax, taxes on financial and capital transactions
(mainly inheritances and gifts), etc.
2.35 Taxes on Production: Taxes on production consist of all taxes that the enterprise incurs
as a result of engaging in production. It is payable irrespective of the profitability of the
enterprise and consists of all taxes except those included under ‘Taxes on Products’. Some
examples of taxes on production are recurrent taxes on land, buildings or other structures,
business or professional licence fees, road tax and registration fee of vehicles, taxes on
pollution, taxes on international transactions such as travel abroad, foreign remittances, etc.
Stamp taxes on sale of specified products, which relate to per unit of product sold (e.g., per unit
31 | P a g e
Unincorporated Non-Agricultural Enterprises (Excluding Construction) in Odisha
of alcoholic beverages) will be considered as taxes on products, but other stamp taxes (e.g.,
stamps on legal documents or cheques) will be considered as taxes on production.
2.36 Fixed Assets: Assets held for the purpose of producing or providing goods or services
and not for resale in the normal course of entrepreneurial activities were classified as fixed
assets. These cover all goods, new or used, that have a normal economic life of more than one
year from the date of purchase.
2.37 Investments: An enterprise can purchase shares, debentures and other securities to earn
interest and dividend. These shares, debentures and other securities are called investments. If
securities are purchased and sold at regular intervals to make gains using market values of the
securities, then these investments are called investments for trade. Otherwise, it is called
investments (other than trade).
2.38 Financial liability: Financial liability is the total liability incurred by the enterprise as
on a particular date (generally the last date of the accounting year). It includes capital deployed
by the partners of an enterprise, share capital, reserve and surplus amount noted in the balance
sheet, long-term loans and also all short-term commitments for payments like unpaid wages
etc. With regard to loan, any borrowing in cash or kind to be repaid in cash or kind was treated
as loan. Loans taken for the purpose of utilising the same in the entrepreneurial activities of an
enterprise were considered even if such loans were used for other purposes. On the other hand,
loans taken for other purposes but ultimately used in the enterprise were excluded.
2.39 Compensation of employees: Compensation of employees is the total remuneration, in
cash or in kind, payable by an enterprise to an employee in return for work done by the
employee during the accounting period. It is recorded on accrual basis, i.e. measured by the
value of remuneration in cash or in kind which an employee becomes entitled to receive from
an employer in respect of work done during the relevant period, whether paid in advance,
simultaneously or in arrears. Self-employed persons (like working owners or unpaid family
workers) receive mixed income and not compensation of employees. However, the books of
accounts of some enterprises show salary payment to one or two working owners. In such cases,
these payments were recorded as compensation to employee. Compensation of employees has
two main components, i) wages and salaries payable in cash or in kind and ii) value of social
contributions payable by the employer. Wages and salaries also included
32 | P a g e
Unincorporated Non-Agricultural Enterprises (Excluding Construction) in Odisha
Chapter Three
Operational Characteristics
3.1 Introduction
3.1.1 The Survey of Unincorporated Non-Agricultural Enterprises (Excluding Construction)
conducted in NSS 73rd round (July 2015 – June 2016) was designed as a repeat survey of the
Enterprise survey of NSS 67th round (July 2010- June 2011) that exclusively covered all the
unincorporated non-agricultural enterprises in manufacturing, trade and other services sector
(excluding construction). The present survey also covered non-captive electricity generation
and transmission under NIC 2008 group 351. Enterprises registered under Companies Act,
1956, the electricity units registered with the Central Electricity Authority (CEA), Government
and public sector enterprises and Cooperatives were outside the coverage of the survey. From
the selected enterprises, detailed data was collected on both their operational and economic
characteristics.
3.1.2 This chapter presents distribution of unincorporated non-agricultural enterprises
(excluding construction) by various operational characteristics such as type of ownership, their
location, registration status, nature of operation etc. by activity category.
3.1.3 The term ‘enterprise’ is used in general to represent Own Account Enterprises (OAEs)
and also establishments as per the usual practice in NSS. In the tables, ‘all’ is used to denote
all the enterprises taken together. On the other hand, the figure “0” appears in some levels of
disaggregation when the estimated number or quantity is zero or very low and has become “0”
due to rounding off.
3.2 Sample number of enterprises: Information was collected from about 8420 enterprises
engaged in the manufacturing, trade and other services activities throughout the Odisha state.
About 5014 of these enterprises surveyed belonged to the rural sector and 3406 surveyed
enterprises belonged to the urban sector.
3.3 Estimated number of enterprises:
3.3.1 The estimated number of unincorporated non-agricultural enterprises in the state during
2015-16 was 26, 14,374. Out of the total number of enterprises 82.50% (21, 56,841) were in
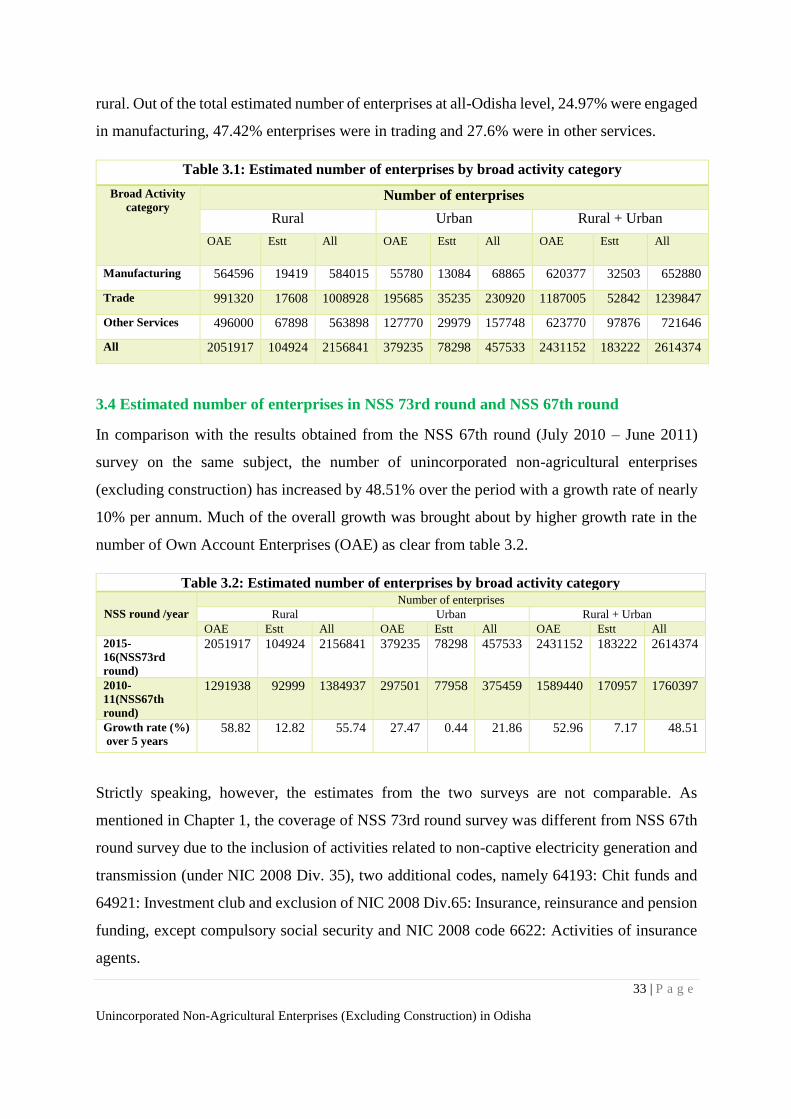
33 | P a g e
Unincorporated Non-Agricultural Enterprises (Excluding Construction) in Odisha
rural. Out of the total estimated number of enterprises at all-Odisha level, 24.97% were engaged
in manufacturing, 47.42% enterprises were in trading and 27.6% were in other services.
Table 3.1: Estimated number of enterprises by broad activity category
Broad Activity
category Number of enterprises
Rural Urban Rural + Urban
OAE Estt All OAE Estt All OAE Estt All
Manufacturing 564596 19419 584015 55780 13084 68865 620377 32503 652880
Trade 991320 17608 1008928 195685 35235 230920 1187005 52842 1239847
Other Services 496000 67898 563898 127770 29979 157748 623770 97876 721646
All 2051917 104924 2156841 379235 78298 457533 2431152 183222 2614374
3.4 Estimated number of enterprises in NSS 73rd round and NSS 67th round
In comparison with the results obtained from the NSS 67th round (July 2010 – June 2011)
survey on the same subject, the number of unincorporated non-agricultural enterprises
(excluding construction) has increased by 48.51% over the period with a growth rate of nearly
10% per annum. Much of the overall growth was brought about by higher growth rate in the
number of Own Account Enterprises (OAE) as clear from table 3.2.
Table 3.2: Estimated number of enterprises by broad activity category
NSS round /year
Number of enterprises
Rural Urban Rural + Urban
OAE Estt All OAE Estt All OAE Estt All
2015-
16(NSS73rd
round)
2051917 104924 2156841 379235 78298 457533 2431152 183222 2614374
2010-
11(NSS67th
round)
1291938 92999 1384937 297501 77958 375459 1589440 170957 1760397
Growth rate (%)
over 5 years 58.82 12.82 55.74 27.47 0.44 21.86 52.96 7.17 48.51
Strictly speaking, however, the estimates from the two surveys are not comparable. As
mentioned in Chapter 1, the coverage of NSS 73rd round survey was different from NSS 67th
round survey due to the inclusion of activities related to non-captive electricity generation and
transmission (under NIC 2008 Div. 35), two additional codes, namely 64193: Chit funds and
64921: Investment club and exclusion of NIC 2008 Div.65: Insurance, reinsurance and pension
funding, except compulsory social security and NIC 2008 code 6622: Activities of insurance
agents.
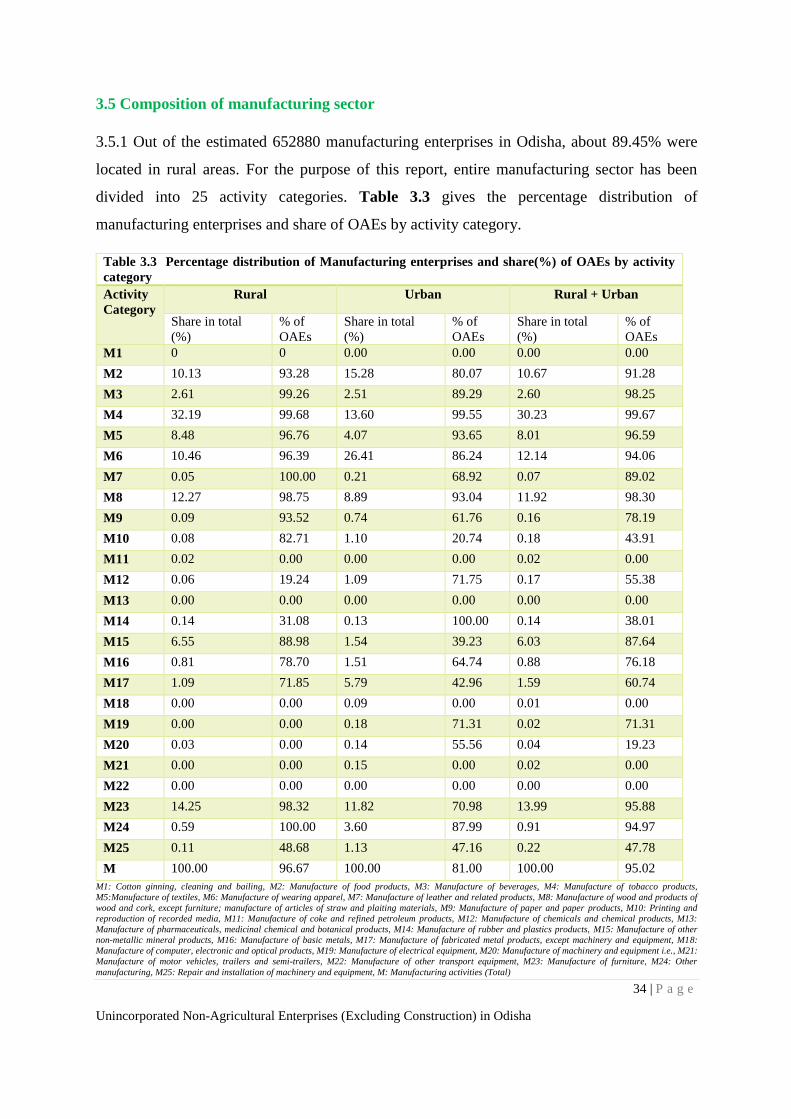
34 | P a g e
Unincorporated Non-Agricultural Enterprises (Excluding Construction) in Odisha
3.5 Composition of manufacturing sector
3.5.1 Out of the estimated 652880 manufacturing enterprises in Odisha, about 89.45% were
located in rural areas. For the purpose of this report, entire manufacturing sector has been
divided into 25 activity categories. Table 3.3 gives the percentage distribution of
manufacturing enterprises and share of OAEs by activity category.
Table 3.3 Percentage distribution of Manufacturing enterprises and share(%) of OAEs by activity
category
Activity
Category
Rural Urban Rural + Urban
Share in total
(%)
% of
OAEs
Share in total
(%)
% of
OAEs
Share in total
(%)
% of
OAEs
M1 0 0 0.00 0.00 0.00 0.00
M2 10.13 93.28 15.28 80.07 10.67 91.28
M3 2.61 99.26 2.51 89.29 2.60 98.25
M4 32.19 99.68 13.60 99.55 30.23 99.67
M5 8.48 96.76 4.07 93.65 8.01 96.59
M6 10.46 96.39 26.41 86.24 12.14 94.06
M7 0.05 100.00 0.21 68.92 0.07 89.02
M8 12.27 98.75 8.89 93.04 11.92 98.30
M9 0.09 93.52 0.74 61.76 0.16 78.19
M10 0.08 82.71 1.10 20.74 0.18 43.91
M11 0.02 0.00 0.00 0.00 0.02 0.00
M12 0.06 19.24 1.09 71.75 0.17 55.38
M13 0.00 0.00 0.00 0.00 0.00 0.00
M14 0.14 31.08 0.13 100.00 0.14 38.01
M15 6.55 88.98 1.54 39.23 6.03 87.64
M16 0.81 78.70 1.51 64.74 0.88 76.18
M17 1.09 71.85 5.79 42.96 1.59 60.74
M18 0.00 0.00 0.09 0.00 0.01 0.00
M19 0.00 0.00 0.18 71.31 0.02 71.31
M20 0.03 0.00 0.14 55.56 0.04 19.23
M21 0.00 0.00 0.15 0.00 0.02 0.00
M22 0.00 0.00 0.00 0.00 0.00 0.00
M23 14.25 98.32 11.82 70.98 13.99 95.88
M24 0.59 100.00 3.60 87.99 0.91 94.97
M25 0.11 48.68 1.13 47.16 0.22 47.78
M 100.00 96.67 100.00 81.00 100.00 95.02
M1: Cotton ginning, cleaning and bailing, M2: Manufacture of food products, M3: Manufacture of beverages, M4: Manufacture of tobacco products,
M5:Manufacture of textiles, M6: Manufacture of wearing apparel, M7: Manufacture of leather and related products, M8: Manufacture of wood and products of
wood and cork, except furniture; manufacture of articles of straw and plaiting materials, M9: Manufacture of paper and paper products, M10: Printing and
reproduction of recorded media, M11: Manufacture of coke and refined petroleum products, M12: Manufacture of chemicals and chemical products, M13:
Manufacture of pharmaceuticals, medicinal chemical and botanical products, M14: Manufacture of rubber and plastics products, M15: Manufacture of other
non-metallic mineral products, M16: Manufacture of basic metals, M17: Manufacture of fabricated metal products, except machinery and equipment, M18:
Manufacture of computer, electronic and optical products, M19: Manufacture of electrical equipment, M20: Manufacture of machinery and equipment i.e., M21:
Manufacture of motor vehicles, trailers and semi-trailers, M22: Manufacture of other transport equipment, M23: Manufacture of furniture, M24: Other
manufacturing, M25: Repair and installation of machinery and equipment, M: Manufacturing activities (Total)
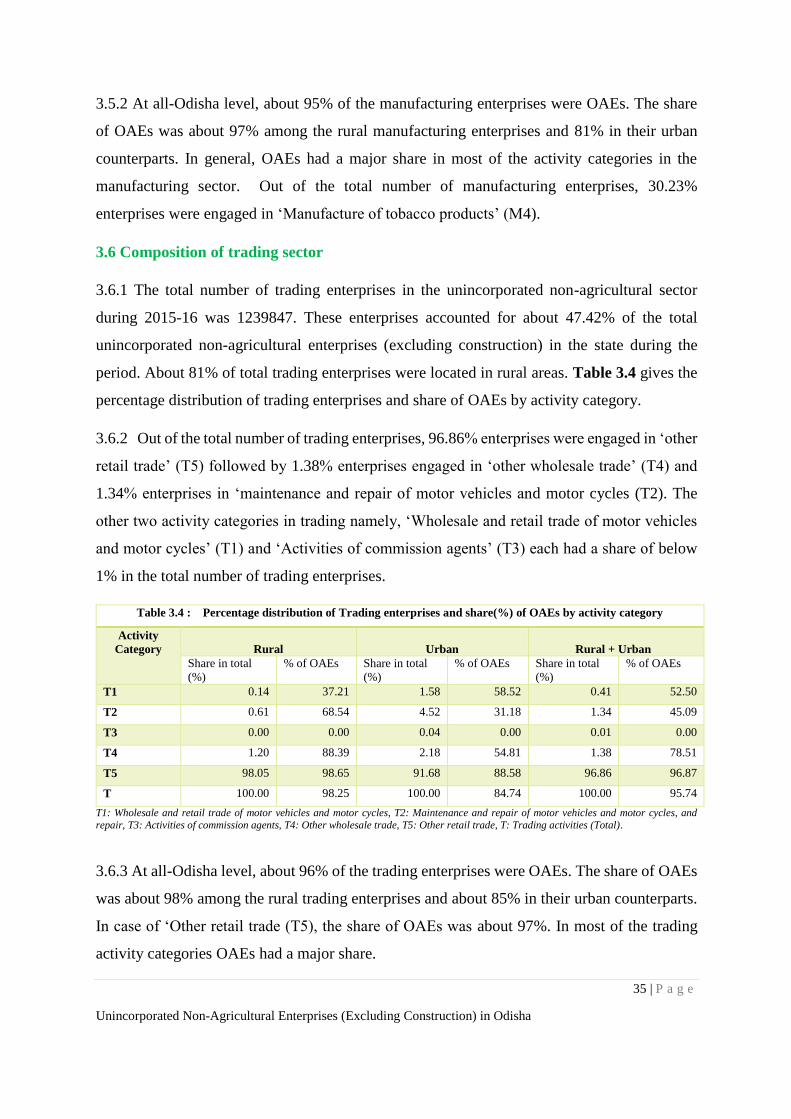
35 | P a g e
Unincorporated Non-Agricultural Enterprises (Excluding Construction) in Odisha
3.5.2 At all-Odisha level, about 95% of the manufacturing enterprises were OAEs. The share
of OAEs was about 97% among the rural manufacturing enterprises and 81% in their urban
counterparts. In general, OAEs had a major share in most of the activity categories in the
manufacturing sector. Out of the total number of manufacturing enterprises, 30.23%
enterprises were engaged in ‘Manufacture of tobacco products’ (M4).
3.6 Composition of trading sector
3.6.1 The total number of trading enterprises in the unincorporated non-agricultural sector
during 2015-16 was 1239847. These enterprises accounted for about 47.42% of the total
unincorporated non-agricultural enterprises (excluding construction) in the state during the
period. About 81% of total trading enterprises were located in rural areas. Table 3.4 gives the
percentage distribution of trading enterprises and share of OAEs by activity category.
3.6.2 Out of the total number of trading enterprises, 96.86% enterprises were engaged in ‘other
retail trade’ (T5) followed by 1.38% enterprises engaged in ‘other wholesale trade’ (T4) and
1.34% enterprises in ‘maintenance and repair of motor vehicles and motor cycles (T2). The
other two activity categories in trading namely, ‘Wholesale and retail trade of motor vehicles
and motor cycles’ (T1) and ‘Activities of commission agents’ (T3) each had a share of below
1% in the total number of trading enterprises.
Table 3.4 : Percentage distribution of Trading enterprises and share(%) of OAEs by activity category
Activity
Category
Rural
Urban
Rural + Urban
Share in total
(%)
% of OAEs Share in total
(%)
% of OAEs Share in total
(%)
% of OAEs
T1 0.14 37.21 1.58 58.52 0.41 52.50
T2 0.61 68.54 4.52 31.18 1.34 45.09
T3 0.00 0.00 0.04 0.00 0.01 0.00
T4 1.20 88.39 2.18 54.81 1.38 78.51
T5 98.05 98.65 91.68 88.58 96.86 96.87
T 100.00 98.25 100.00 84.74 100.00 95.74
T1: Wholesale and retail trade of motor vehicles and motor cycles, T2: Maintenance and repair of motor vehicles and motor cycles, and
repair, T3: Activities of commission agents, T4: Other wholesale trade, T5: Other retail trade, T: Trading activities (Total).
3.6.3 At all-Odisha level, about 96% of the trading enterprises were OAEs. The share of OAEs
was about 98% among the rural trading enterprises and about 85% in their urban counterparts.
In case of ‘Other retail trade (T5), the share of OAEs was about 97%. In most of the trading
activity categories OAEs had a major share.
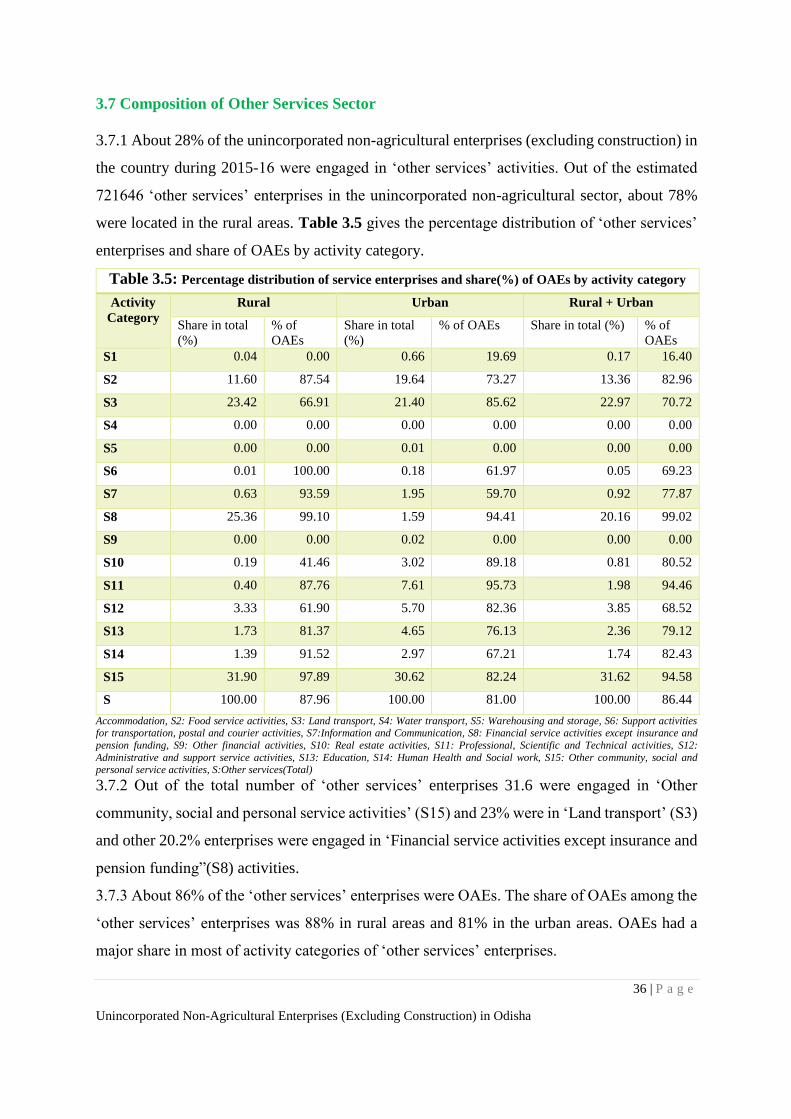
36 | P a g e
Unincorporated Non-Agricultural Enterprises (Excluding Construction) in Odisha
3.7 Composition of Other Services Sector
3.7.1 About 28% of the unincorporated non-agricultural enterprises (excluding construction) in
the country during 2015-16 were engaged in ‘other services’ activities. Out of the estimated
721646 ‘other services’ enterprises in the unincorporated non-agricultural sector, about 78%
were located in the rural areas. Table 3.5 gives the percentage distribution of ‘other services’
enterprises and share of OAEs by activity category.
Table 3.5: Percentage distribution of service enterprises and share(%) of OAEs by activity category
Activity
Category
Rural Urban Rural + Urban
Share in total
(%)
% of
OAEs
Share in total
(%)
% of OAEs Share in total (%) % of
OAEs
S1 0.04 0.00 0.66 19.69 0.17 16.40
S2 11.60 87.54 19.64 73.27 13.36 82.96
S3 23.42 66.91 21.40 85.62 22.97 70.72
S4 0.00 0.00 0.00 0.00 0.00 0.00
S5 0.00 0.00 0.01 0.00 0.00 0.00
S6 0.01 100.00 0.18 61.97 0.05 69.23
S7 0.63 93.59 1.95 59.70 0.92 77.87
S8 25.36 99.10 1.59 94.41 20.16 99.02
S9 0.00 0.00 0.02 0.00 0.00 0.00
S10 0.19 41.46 3.02 89.18 0.81 80.52
S11 0.40 87.76 7.61 95.73 1.98 94.46
S12 3.33 61.90 5.70 82.36 3.85 68.52
S13 1.73 81.37 4.65 76.13 2.36 79.12
S14 1.39 91.52 2.97 67.21 1.74 82.43
S15 31.90 97.89 30.62 82.24 31.62 94.58
S 100.00 87.96 100.00 81.00 100.00 86.44
Accommodation, S2: Food service activities, S3: Land transport, S4: Water transport, S5: Warehousing and storage, S6: Support activities for transportation, postal and courier activities, S7:Information and Communication, S8: Financial service activities except insurance and
pension funding, S9: Other financial activities, S10: Real estate activities, S11: Professional, Scientific and Technical activities, S12:
Administrative and support service activities, S13: Education, S14: Human Health and Social work, S15: Other community, social and personal service activities, S:Other services(Total)
3.7.2 Out of the total number of ‘other services’ enterprises 31.6 were engaged in ‘Other
community, social and personal service activities’ (S15) and 23% were in ‘Land transport’ (S3)
and other 20.2% enterprises were engaged in ‘Financial service activities except insurance and
pension funding”(S8) activities.
3.7.3 About 86% of the ‘other services’ enterprises were OAEs. The share of OAEs among the
‘other services’ enterprises was 88% in rural areas and 81% in the urban areas. OAEs had a
major share in most of activity categories of ‘other services’ enterprises.
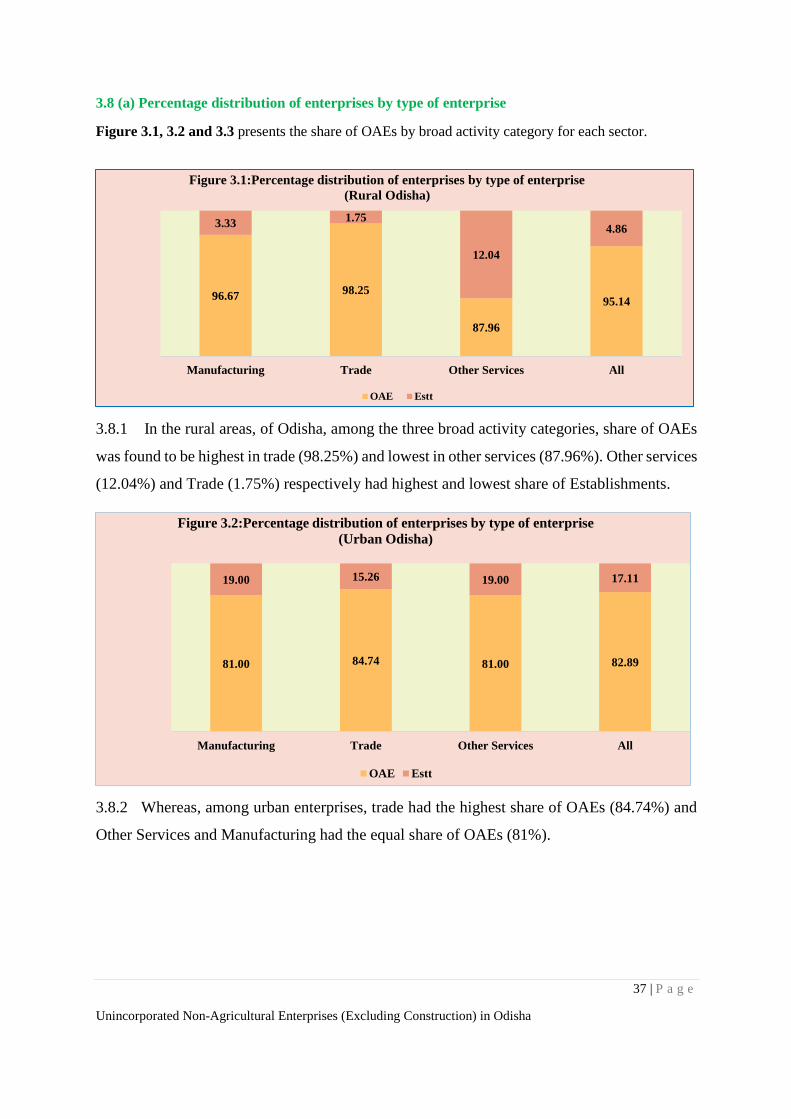
37 | P a g e
Unincorporated Non-Agricultural Enterprises (Excluding Construction) in Odisha
3.8 (a) Percentage distribution of enterprises by type of enterprise
Figure 3.1, 3.2 and 3.3 presents the share of OAEs by broad activity category for each sector.
3.8.1 In the rural areas, of Odisha, among the three broad activity categories, share of OAEs
was found to be highest in trade (98.25%) and lowest in other services (87.96%). Other services
(12.04%) and Trade (1.75%) respectively had highest and lowest share of Establishments.
3.8.2 Whereas, among urban enterprises, trade had the highest share of OAEs (84.74%) and
Other Services and Manufacturing had the equal share of OAEs (81%).
96.6798.25
87.96
95.14
3.331.75
12.04
4.86
Manufacturing Trade Other Services All
Figure 3.1:Percentage distribution of enterprises by type of enterprise
(Rural Odisha)
OAE Estt
81.00 84.74 81.00 82.89
19.00 15.26 19.00 17.11
Manufacturing Trade Other Services All
Figure 3.2:Percentage distribution of enterprises by type of enterprise
(Urban Odisha)
OAE Estt
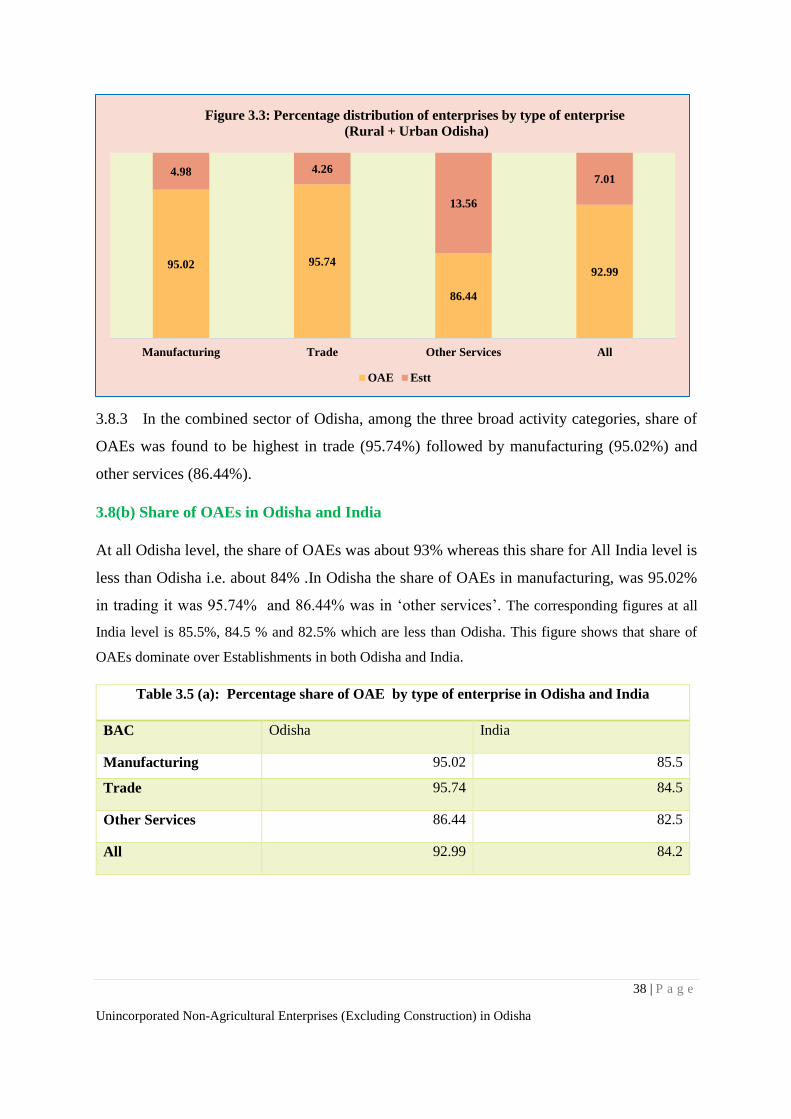
38 | P a g e
Unincorporated Non-Agricultural Enterprises (Excluding Construction) in Odisha
3.8.3 In the combined sector of Odisha, among the three broad activity categories, share of
OAEs was found to be highest in trade (95.74%) followed by manufacturing (95.02%) and
other services (86.44%).
3.8(b) Share of OAEs in Odisha and India
At all Odisha level, the share of OAEs was about 93% whereas this share for All India level is
less than Odisha i.e. about 84% .In Odisha the share of OAEs in manufacturing, was 95.02%
in trading it was 95.74% and 86.44% was in ‘other services’. The corresponding figures at all
India level is 85.5%, 84.5 % and 82.5% which are less than Odisha. This figure shows that share of
OAEs dominate over Establishments in both Odisha and India.
Table 3.5 (a): Percentage share of OAE by type of enterprise in Odisha and India
BAC Odisha India
Manufacturing 95.02 85.5
Trade 95.74 84.5
Other Services 86.44 82.5
All 92.99 84.2
95.02 95.74
86.44
92.99
4.98 4.26
13.56
7.01
Manufacturing Trade Other Services All
Figure 3.3: Percentage distribution of enterprises by type of enterprise
(Rural + Urban Odisha)
OAE Estt
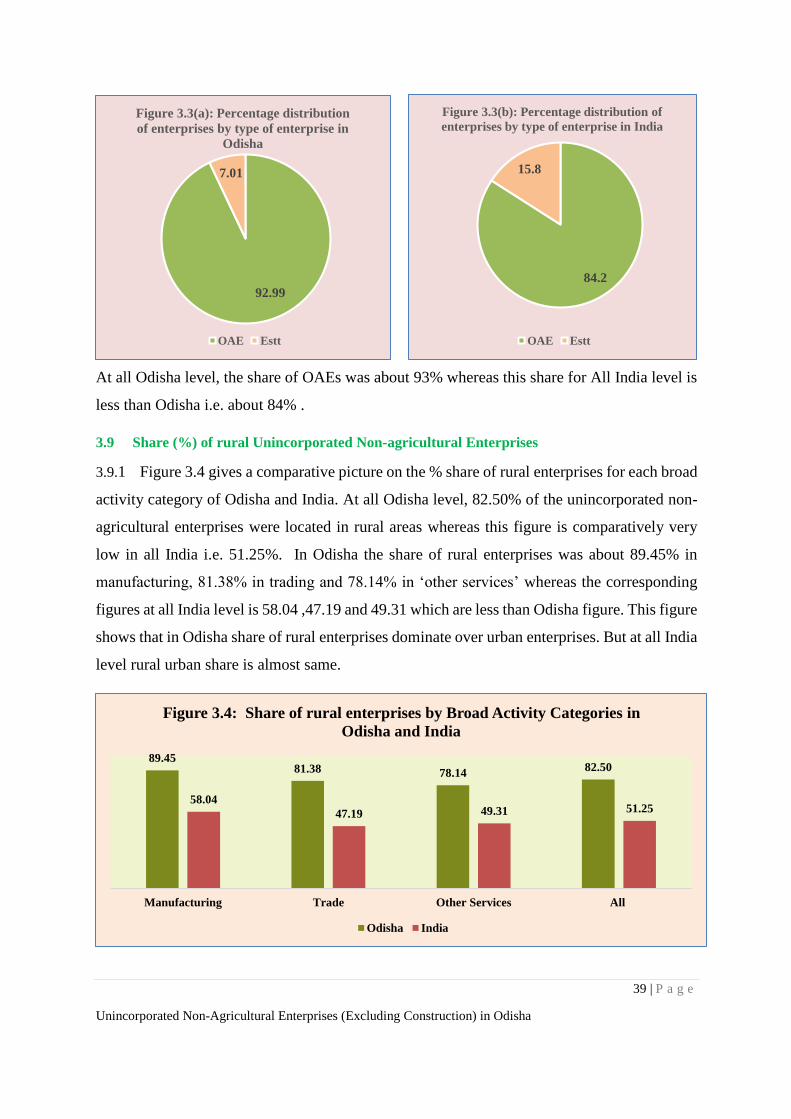
39 | P a g e
Unincorporated Non-Agricultural Enterprises (Excluding Construction) in Odisha
At all Odisha level, the share of OAEs was about 93% whereas this share for All India level is
less than Odisha i.e. about 84% .
3.9 Share (%) of rural Unincorporated Non-agricultural Enterprises
3.9.1 Figure 3.4 gives a comparative picture on the % share of rural enterprises for each broad
activity category of Odisha and India. At all Odisha level, 82.50% of the unincorporated non-
agricultural enterprises were located in rural areas whereas this figure is comparatively very
low in all India i.e. 51.25%. In Odisha the share of rural enterprises was about 89.45% in
manufacturing, 81.38% in trading and 78.14% in ‘other services’ whereas the corresponding
figures at all India level is 58.04 ,47.19 and 49.31 which are less than Odisha figure. This figure
shows that in Odisha share of rural enterprises dominate over urban enterprises. But at all India
level rural urban share is almost same.
84.2
15.8
Figure 3.3(b): Percentage distribution of
enterprises by type of enterprise in India
OAE Estt
89.4581.38 78.14
82.50
58.04
47.19 49.31 51.25
Manufacturing Trade Other Services All
Figure 3.4: Share of rural enterprises by Broad Activity Categories in
Odisha and India
Odisha India
92.99
7.01
Figure 3.3(a): Percentage distribution
of enterprises by type of enterprise in
Odisha
OAE Estt
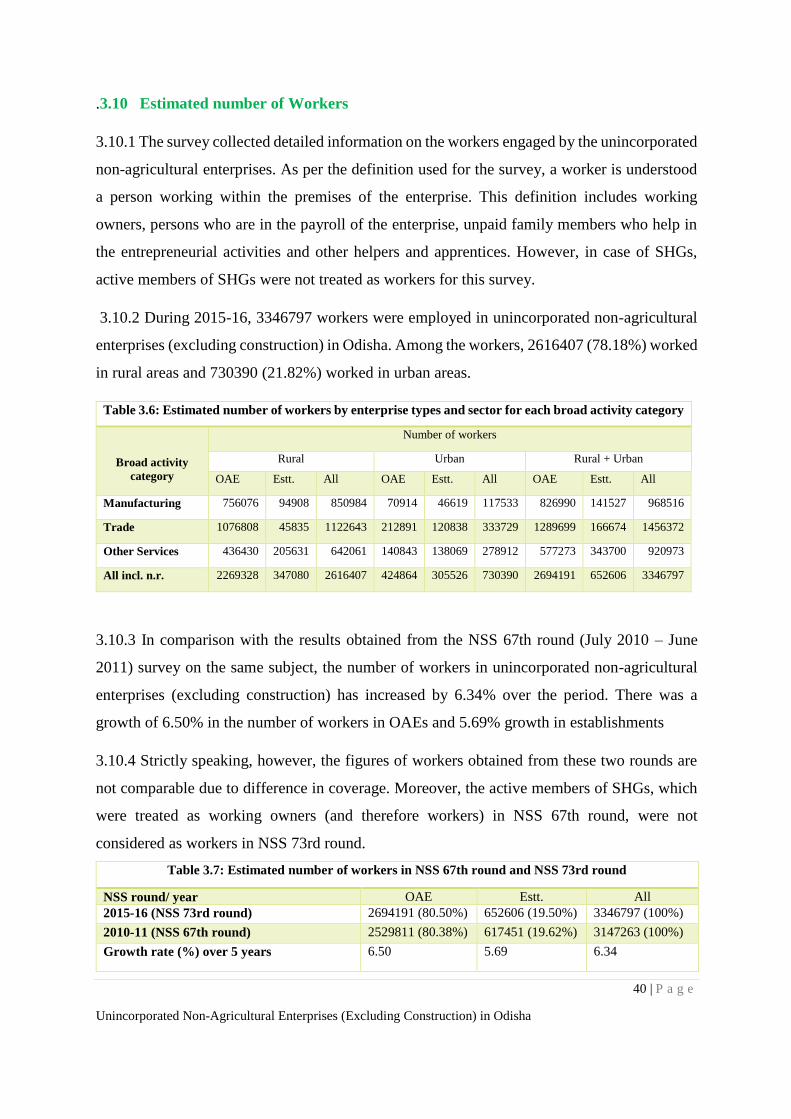
40 | P a g e
Unincorporated Non-Agricultural Enterprises (Excluding Construction) in Odisha
.3.10 Estimated number of Workers
3.10.1 The survey collected detailed information on the workers engaged by the unincorporated
non-agricultural enterprises. As per the definition used for the survey, a worker is understood
a person working within the premises of the enterprise. This definition includes working
owners, persons who are in the payroll of the enterprise, unpaid family members who help in
the entrepreneurial activities and other helpers and apprentices. However, in case of SHGs,
active members of SHGs were not treated as workers for this survey.
3.10.2 During 2015-16, 3346797 workers were employed in unincorporated non-agricultural
enterprises (excluding construction) in Odisha. Among the workers, 2616407 (78.18%) worked
in rural areas and 730390 (21.82%) worked in urban areas.
Table 3.6: Estimated number of workers by enterprise types and sector for each broad activity category
Broad activity
category
Number of workers
Rural Urban Rural + Urban
OAE Estt. All OAE Estt. All OAE Estt. All
Manufacturing 756076 94908 850984 70914 46619 117533 826990 141527 968516
Trade 1076808 45835 1122643 212891 120838 333729 1289699 166674 1456372
Other Services 436430 205631 642061 140843 138069 278912 577273 343700 920973
All incl. n.r. 2269328 347080 2616407 424864 305526 730390 2694191 652606 3346797
3.10.3 In comparison with the results obtained from the NSS 67th round (July 2010 – June
2011) survey on the same subject, the number of workers in unincorporated non-agricultural
enterprises (excluding construction) has increased by 6.34% over the period. There was a
growth of 6.50% in the number of workers in OAEs and 5.69% growth in establishments
3.10.4 Strictly speaking, however, the figures of workers obtained from these two rounds are
not comparable due to difference in coverage. Moreover, the active members of SHGs, which
were treated as working owners (and therefore workers) in NSS 67th round, were not
considered as workers in NSS 73rd round.
Table 3.7: Estimated number of workers in NSS 67th round and NSS 73rd round
NSS round/ year OAE Estt. All
2015-16 (NSS 73rd round) 2694191 (80.50%) 652606 (19.50%) 3346797 (100%)
2010-11 (NSS 67th round) 2529811 (80.38%) 617451 (19.62%) 3147263 (100%)
Growth rate (%) over 5 years 6.50 5.69 6.34
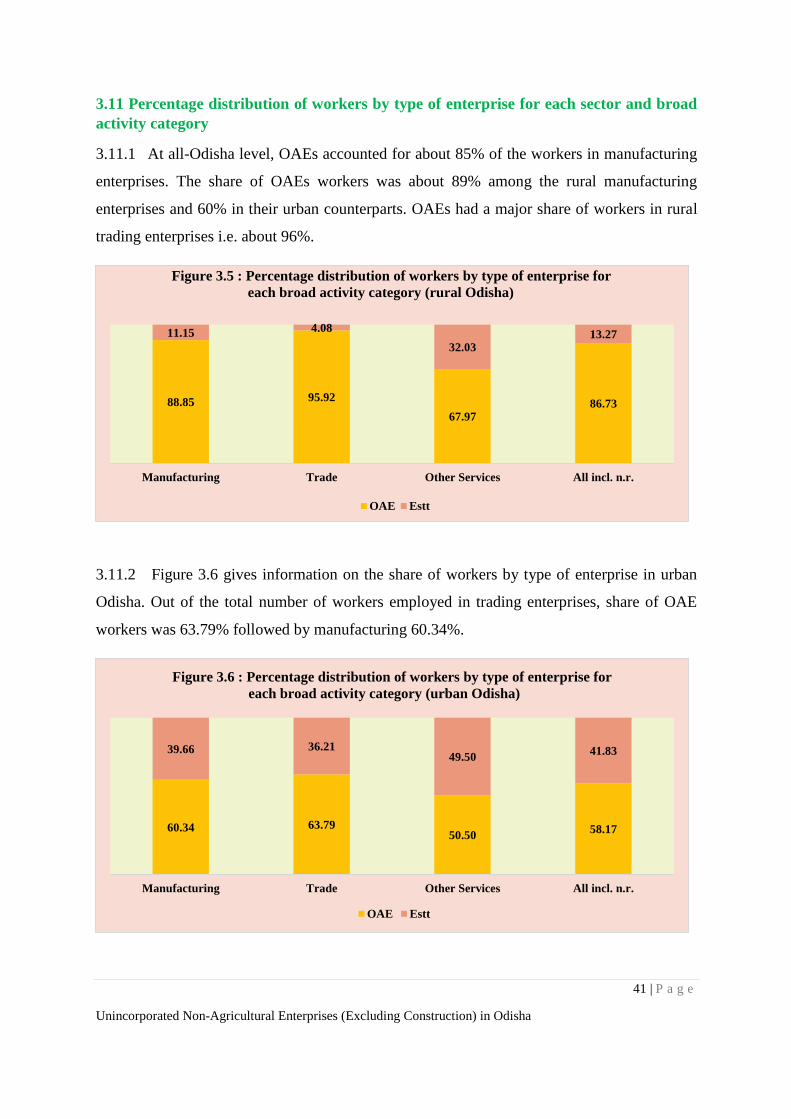
41 | P a g e
Unincorporated Non-Agricultural Enterprises (Excluding Construction) in Odisha
3.11 Percentage distribution of workers by type of enterprise for each sector and broad
activity category
3.11.1 At all-Odisha level, OAEs accounted for about 85% of the workers in manufacturing
enterprises. The share of OAEs workers was about 89% among the rural manufacturing
enterprises and 60% in their urban counterparts. OAEs had a major share of workers in rural
trading enterprises i.e. about 96%.
3.11.2 Figure 3.6 gives information on the share of workers by type of enterprise in urban
Odisha. Out of the total number of workers employed in trading enterprises, share of OAE
workers was 63.79% followed by manufacturing 60.34%.
88.85 95.92
67.9786.73
11.15 4.08
32.0313.27
Manufacturing Trade Other Services All incl. n.r.
Figure 3.5 : Percentage distribution of workers by type of enterprise for
each broad activity category (rural Odisha)
OAE Estt
60.34 63.7950.50
58.17
39.66 36.2149.50
41.83
Manufacturing Trade Other Services All incl. n.r.
Figure 3.6 : Percentage distribution of workers by type of enterprise for
each broad activity category (urban Odisha)
OAE Estt
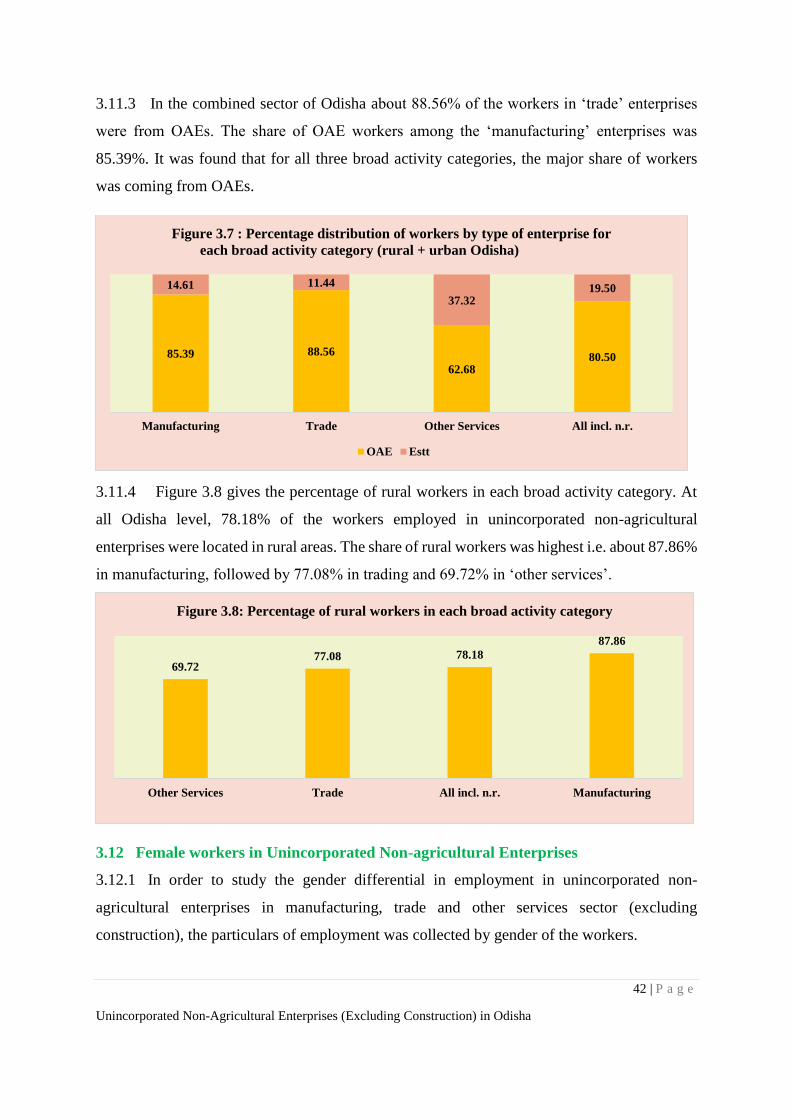
42 | P a g e
Unincorporated Non-Agricultural Enterprises (Excluding Construction) in Odisha
3.11.3 In the combined sector of Odisha about 88.56% of the workers in ‘trade’ enterprises
were from OAEs. The share of OAE workers among the ‘manufacturing’ enterprises was
85.39%. It was found that for all three broad activity categories, the major share of workers
was coming from OAEs.
3.11.4 Figure 3.8 gives the percentage of rural workers in each broad activity category. At
all Odisha level, 78.18% of the workers employed in unincorporated non-agricultural
enterprises were located in rural areas. The share of rural workers was highest i.e. about 87.86%
in manufacturing, followed by 77.08% in trading and 69.72% in ‘other services’.
3.12 Female workers in Unincorporated Non-agricultural Enterprises
3.12.1 In order to study the gender differential in employment in unincorporated non-
agricultural enterprises in manufacturing, trade and other services sector (excluding
construction), the particulars of employment was collected by gender of the workers.
85.39 88.56
62.6880.50
14.61 11.44
37.3219.50
Manufacturing Trade Other Services All incl. n.r.
Figure 3.7 : Percentage distribution of workers by type of enterprise for
each broad activity category (rural + urban Odisha)
OAE Estt
69.7277.08 78.18
87.86
Other Services Trade All incl. n.r. Manufacturing
Figure 3.8: Percentage of rural workers in each broad activity category
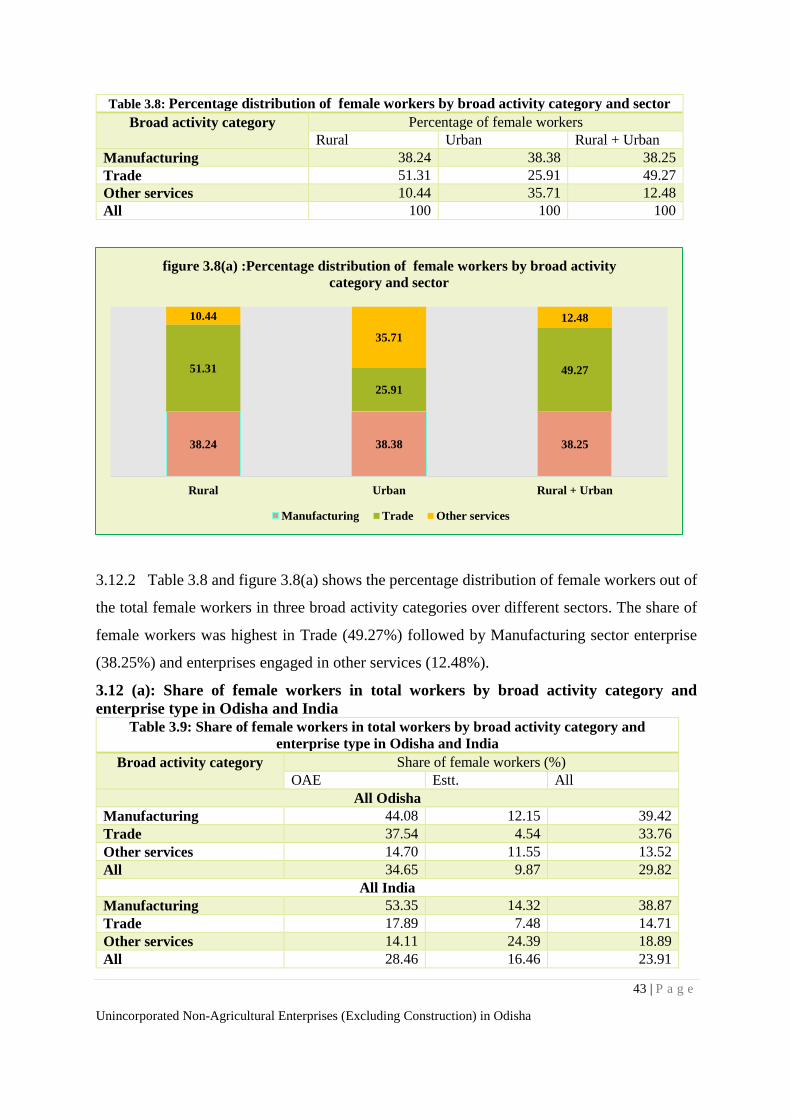
43 | P a g e
Unincorporated Non-Agricultural Enterprises (Excluding Construction) in Odisha
Table 3.8: Percentage distribution of female workers by broad activity category and sector
Broad activity category Percentage of female workers
Rural Urban Rural + Urban
Manufacturing 38.24 38.38 38.25
Trade 51.31 25.91 49.27
Other services 10.44 35.71 12.48
All 100 100 100
3.12.2 Table 3.8 and figure 3.8(a) shows the percentage distribution of female workers out of
the total female workers in three broad activity categories over different sectors. The share of
female workers was highest in Trade (49.27%) followed by Manufacturing sector enterprise
(38.25%) and enterprises engaged in other services (12.48%).
3.12 (a): Share of female workers in total workers by broad activity category and
enterprise type in Odisha and India Table 3.9: Share of female workers in total workers by broad activity category and
enterprise type in Odisha and India
Broad activity category Share of female workers (%)
OAE Estt. All
All Odisha
Manufacturing 44.08 12.15 39.42
Trade 37.54 4.54 33.76
Other services 14.70 11.55 13.52
All 34.65 9.87 29.82
All India
Manufacturing 53.35 14.32 38.87
Trade 17.89 7.48 14.71
Other services 14.11 24.39 18.89
All 28.46 16.46 23.91
38.24 38.38 38.25
51.31
25.91
49.27
10.44
35.71
12.48
Rural Urban Rural + Urban
figure 3.8(a) :Percentage distribution of female workers by broad activity
category and sector
Manufacturing Trade Other services
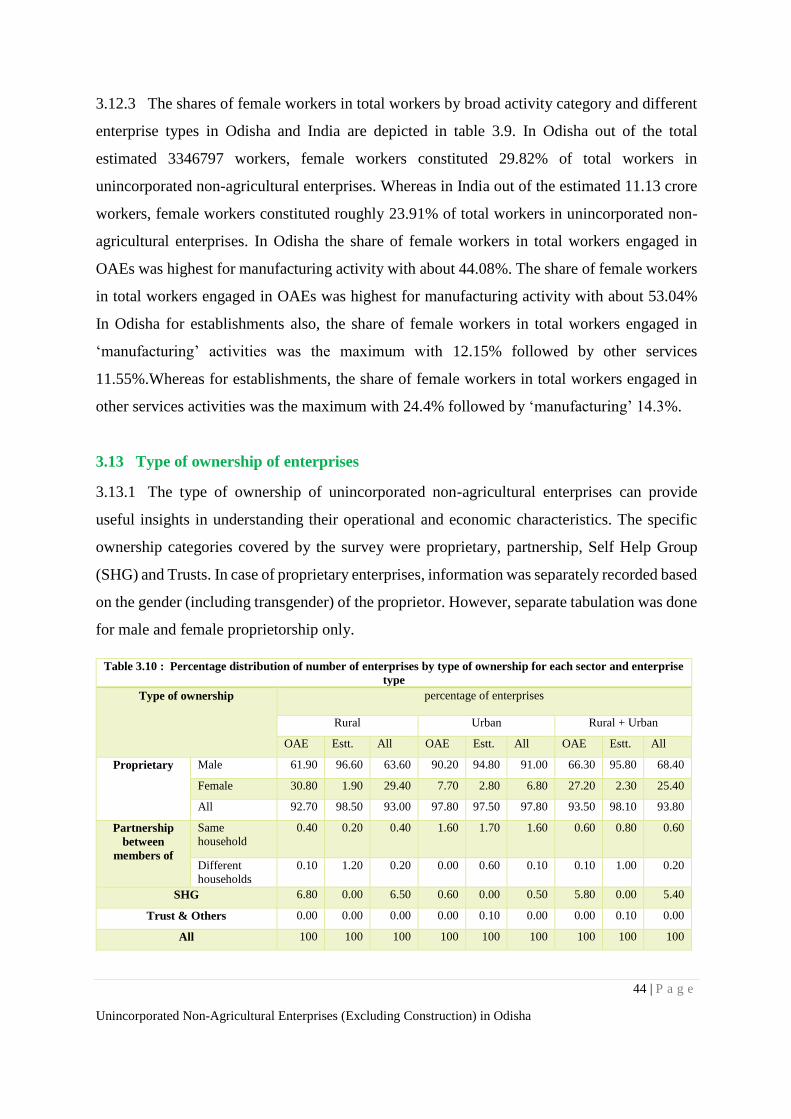
44 | P a g e
Unincorporated Non-Agricultural Enterprises (Excluding Construction) in Odisha
3.12.3 The shares of female workers in total workers by broad activity category and different
enterprise types in Odisha and India are depicted in table 3.9. In Odisha out of the total
estimated 3346797 workers, female workers constituted 29.82% of total workers in
unincorporated non-agricultural enterprises. Whereas in India out of the estimated 11.13 crore
workers, female workers constituted roughly 23.91% of total workers in unincorporated non-
agricultural enterprises. In Odisha the share of female workers in total workers engaged in
OAEs was highest for manufacturing activity with about 44.08%. The share of female workers
in total workers engaged in OAEs was highest for manufacturing activity with about 53.04%
In Odisha for establishments also, the share of female workers in total workers engaged in
‘manufacturing’ activities was the maximum with 12.15% followed by other services
11.55%.Whereas for establishments, the share of female workers in total workers engaged in
other services activities was the maximum with 24.4% followed by ‘manufacturing’ 14.3%.
3.13 Type of ownership of enterprises
3.13.1 The type of ownership of unincorporated non-agricultural enterprises can provide
useful insights in understanding their operational and economic characteristics. The specific
ownership categories covered by the survey were proprietary, partnership, Self Help Group
(SHG) and Trusts. In case of proprietary enterprises, information was separately recorded based
on the gender (including transgender) of the proprietor. However, separate tabulation was done
for male and female proprietorship only.
Table 3.10 : Percentage distribution of number of enterprises by type of ownership for each sector and enterprise
type
Type of ownership percentage of enterprises
Rural Urban Rural + Urban
OAE Estt. All OAE Estt. All OAE Estt. All
Proprietary Male 61.90 96.60 63.60 90.20 94.80 91.00 66.30 95.80 68.40
Female 30.80 1.90 29.40 7.70 2.80 6.80 27.20 2.30 25.40
All 92.70 98.50 93.00 97.80 97.50 97.80 93.50 98.10 93.80
Partnership
between
members of
Same
household
0.40 0.20 0.40 1.60 1.70 1.60 0.60 0.80 0.60
Different
households
0.10 1.20 0.20 0.00 0.60 0.10 0.10 1.00 0.20
SHG 6.80 0.00 6.50 0.60 0.00 0.50 5.80 0.00 5.40
Trust & Others 0.00 0.00 0.00 0.00 0.10 0.00 0.00 0.10 0.00
All 100 100 100 100 100 100 100 100 100
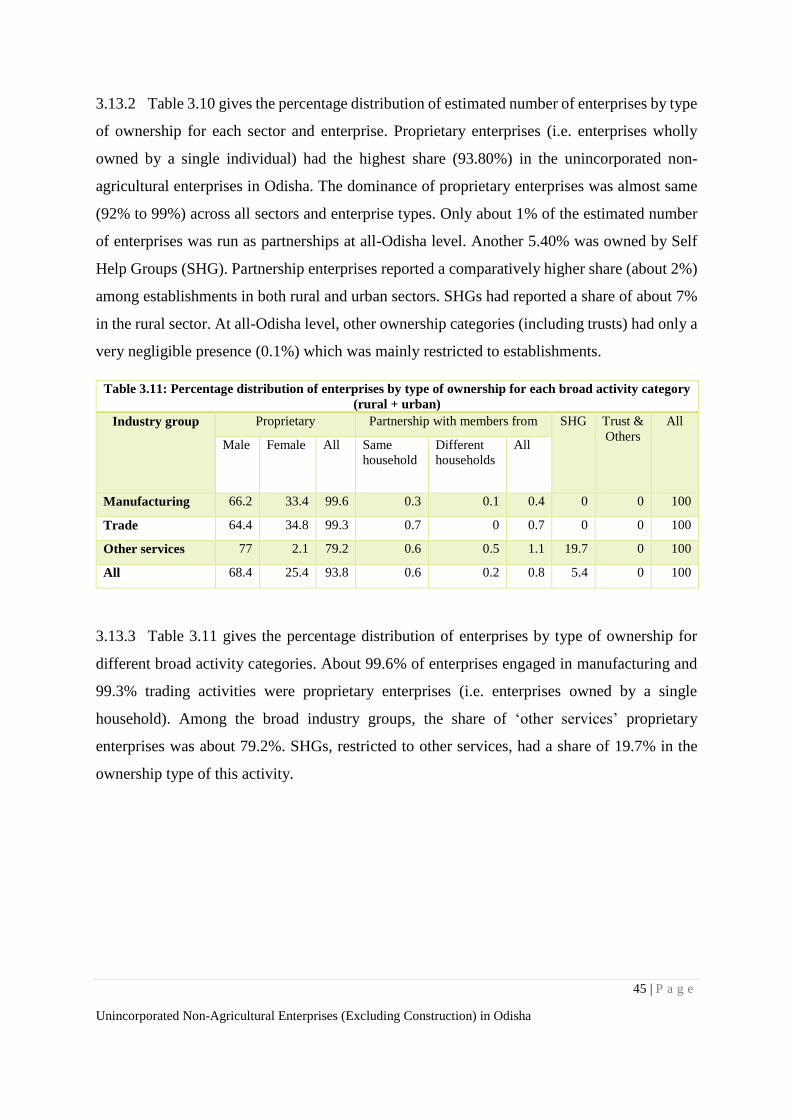
45 | P a g e
Unincorporated Non-Agricultural Enterprises (Excluding Construction) in Odisha
3.13.2 Table 3.10 gives the percentage distribution of estimated number of enterprises by type
of ownership for each sector and enterprise. Proprietary enterprises (i.e. enterprises wholly
owned by a single individual) had the highest share (93.80%) in the unincorporated non-
agricultural enterprises in Odisha. The dominance of proprietary enterprises was almost same
(92% to 99%) across all sectors and enterprise types. Only about 1% of the estimated number
of enterprises was run as partnerships at all-Odisha level. Another 5.40% was owned by Self
Help Groups (SHG). Partnership enterprises reported a comparatively higher share (about 2%)
among establishments in both rural and urban sectors. SHGs had reported a share of about 7%
in the rural sector. At all-Odisha level, other ownership categories (including trusts) had only a
very negligible presence (0.1%) which was mainly restricted to establishments.
Table 3.11: Percentage distribution of enterprises by type of ownership for each broad activity category
(rural + urban)
Industry group Proprietary Partnership with members from SHG Trust &
Others
All
Male Female All Same
household
Different
households
All
Manufacturing 66.2 33.4 99.6 0.3 0.1 0.4 0 0 100
Trade 64.4 34.8 99.3 0.7 0 0.7 0 0 100
Other services 77 2.1 79.2 0.6 0.5 1.1 19.7 0 100
All 68.4 25.4 93.8 0.6 0.2 0.8 5.4 0 100
3.13.3 Table 3.11 gives the percentage distribution of enterprises by type of ownership for
different broad activity categories. About 99.6% of enterprises engaged in manufacturing and
99.3% trading activities were proprietary enterprises (i.e. enterprises owned by a single
household). Among the broad industry groups, the share of ‘other services’ proprietary
enterprises was about 79.2%. SHGs, restricted to other services, had a share of 19.7% in the
ownership type of this activity.
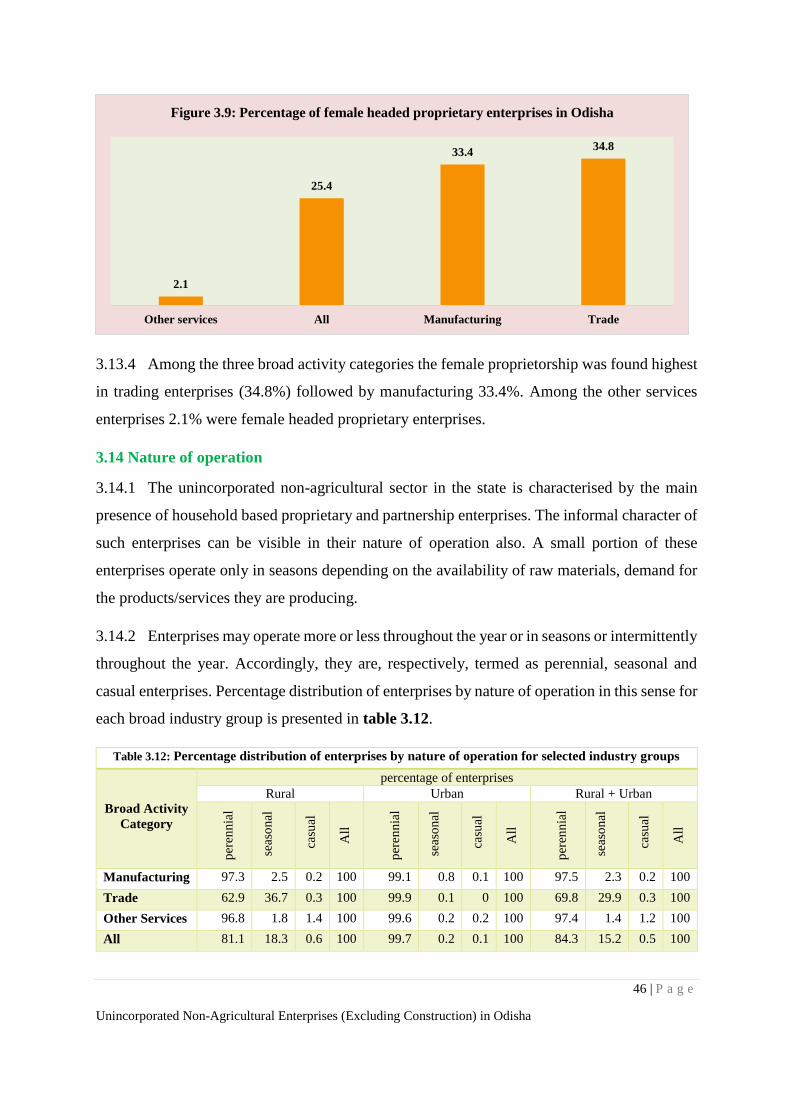
46 | P a g e
Unincorporated Non-Agricultural Enterprises (Excluding Construction) in Odisha
3.13.4 Among the three broad activity categories the female proprietorship was found highest
in trading enterprises (34.8%) followed by manufacturing 33.4%. Among the other services
enterprises 2.1% were female headed proprietary enterprises.
3.14 Nature of operation
3.14.1 The unincorporated non-agricultural sector in the state is characterised by the main
presence of household based proprietary and partnership enterprises. The informal character of
such enterprises can be visible in their nature of operation also. A small portion of these
enterprises operate only in seasons depending on the availability of raw materials, demand for
the products/services they are producing.
3.14.2 Enterprises may operate more or less throughout the year or in seasons or intermittently
throughout the year. Accordingly, they are, respectively, termed as perennial, seasonal and
casual enterprises. Percentage distribution of enterprises by nature of operation in this sense for
each broad industry group is presented in table 3.12.
Table 3.12: Percentage distribution of enterprises by nature of operation for selected industry groups
Broad Activity
Category
percentage of enterprises
Rural Urban Rural + Urban
per
enn
ial
sea
son
al
ca
sual
All
per
enn
ial
sea
son
al
ca
sual
All
per
enn
ial
sea
son
al
ca
sual
All
Manufacturing 97.3 2.5 0.2 100 99.1 0.8 0.1 100 97.5 2.3 0.2 100
Trade 62.9 36.7 0.3 100 99.9 0.1 0 100 69.8 29.9 0.3 100
Other Services 96.8 1.8 1.4 100 99.6 0.2 0.2 100 97.4 1.4 1.2 100
All 81.1 18.3 0.6 100 99.7 0.2 0.1 100 84.3 15.2 0.5 100
2.1
25.4
33.434.8
Other services All Manufacturing Trade
Figure 3.9: Percentage of female headed proprietary enterprises in Odisha
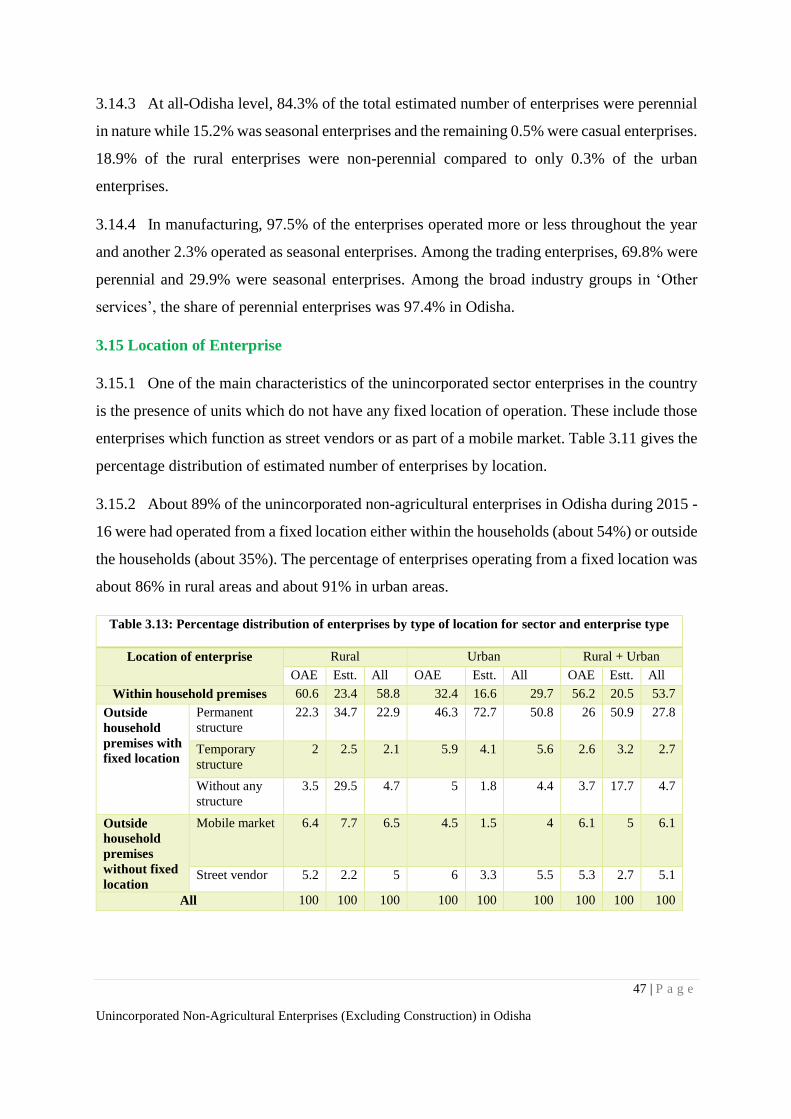
47 | P a g e
Unincorporated Non-Agricultural Enterprises (Excluding Construction) in Odisha
3.14.3 At all-Odisha level, 84.3% of the total estimated number of enterprises were perennial
in nature while 15.2% was seasonal enterprises and the remaining 0.5% were casual enterprises.
18.9% of the rural enterprises were non-perennial compared to only 0.3% of the urban
enterprises.
3.14.4 In manufacturing, 97.5% of the enterprises operated more or less throughout the year
and another 2.3% operated as seasonal enterprises. Among the trading enterprises, 69.8% were
perennial and 29.9% were seasonal enterprises. Among the broad industry groups in ‘Other
services’, the share of perennial enterprises was 97.4% in Odisha.
3.15 Location of Enterprise
3.15.1 One of the main characteristics of the unincorporated sector enterprises in the country
is the presence of units which do not have any fixed location of operation. These include those
enterprises which function as street vendors or as part of a mobile market. Table 3.11 gives the
percentage distribution of estimated number of enterprises by location.
3.15.2 About 89% of the unincorporated non-agricultural enterprises in Odisha during 2015 -
16 were had operated from a fixed location either within the households (about 54%) or outside
the households (about 35%). The percentage of enterprises operating from a fixed location was
about 86% in rural areas and about 91% in urban areas.
Table 3.13: Percentage distribution of enterprises by type of location for sector and enterprise type
Location of enterprise Rural Urban Rural + Urban
OAE Estt. All OAE Estt. All OAE Estt. All
Within household premises 60.6 23.4 58.8 32.4 16.6 29.7 56.2 20.5 53.7
Outside
household
premises with
fixed location
Permanent
structure
22.3 34.7 22.9 46.3 72.7 50.8 26 50.9 27.8
Temporary
structure
2 2.5 2.1 5.9 4.1 5.6 2.6 3.2 2.7
Without any
structure
3.5 29.5 4.7 5 1.8 4.4 3.7 17.7 4.7
Outside
household
premises
without fixed
location
Mobile market 6.4 7.7 6.5 4.5 1.5 4 6.1 5 6.1
Street vendor 5.2 2.2 5 6 3.3 5.5 5.3 2.7 5.1
All 100 100 100 100 100 100 100 100 100
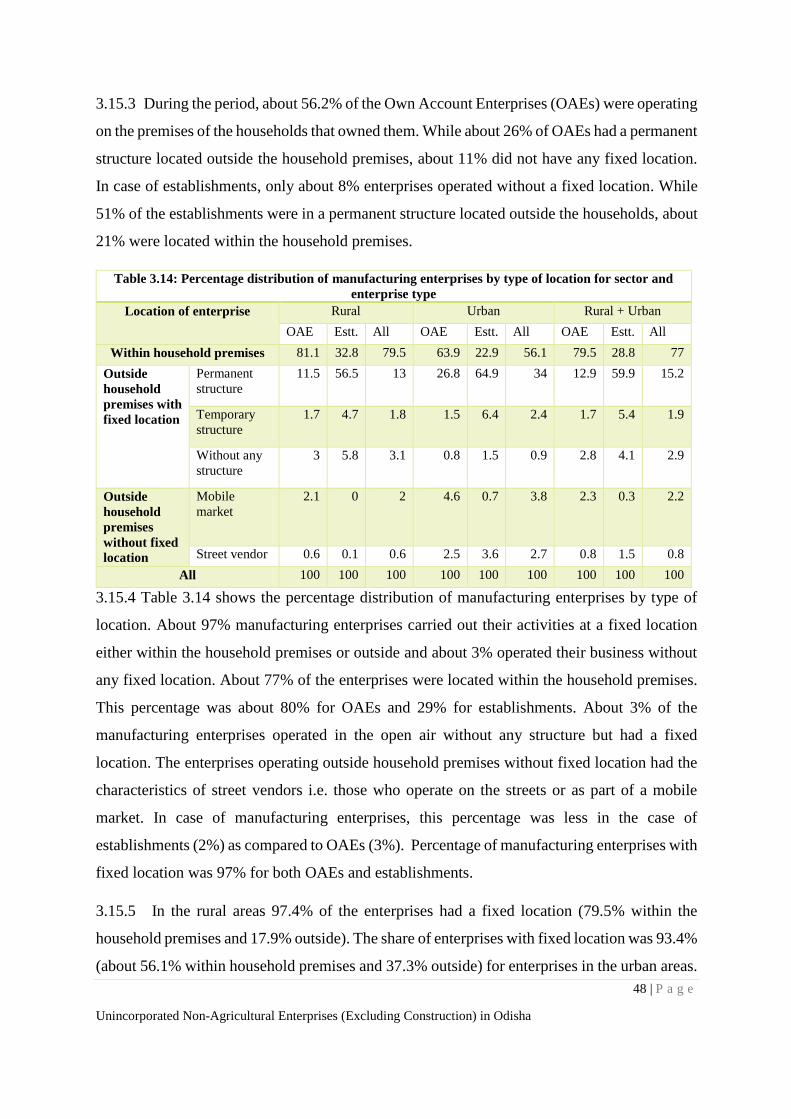
48 | P a g e
Unincorporated Non-Agricultural Enterprises (Excluding Construction) in Odisha
3.15.3 During the period, about 56.2% of the Own Account Enterprises (OAEs) were operating
on the premises of the households that owned them. While about 26% of OAEs had a permanent
structure located outside the household premises, about 11% did not have any fixed location.
In case of establishments, only about 8% enterprises operated without a fixed location. While
51% of the establishments were in a permanent structure located outside the households, about
21% were located within the household premises.
Table 3.14: Percentage distribution of manufacturing enterprises by type of location for sector and
enterprise type
Location of enterprise Rural Urban Rural + Urban
OAE Estt. All OAE Estt. All OAE Estt. All
Within household premises 81.1 32.8 79.5 63.9 22.9 56.1 79.5 28.8 77
Outside
household
premises with
fixed location
Permanent
structure
11.5 56.5 13 26.8 64.9 34 12.9 59.9 15.2
Temporary
structure
1.7 4.7 1.8 1.5 6.4 2.4 1.7 5.4 1.9
Without any
structure
3 5.8 3.1 0.8 1.5 0.9 2.8 4.1 2.9
Outside
household
premises
without fixed
location
Mobile
market
2.1 0 2 4.6 0.7 3.8 2.3 0.3 2.2
Street vendor 0.6 0.1 0.6 2.5 3.6 2.7 0.8 1.5 0.8
All 100 100 100 100 100 100 100 100 100
3.15.4 Table 3.14 shows the percentage distribution of manufacturing enterprises by type of
location. About 97% manufacturing enterprises carried out their activities at a fixed location
either within the household premises or outside and about 3% operated their business without
any fixed location. About 77% of the enterprises were located within the household premises.
This percentage was about 80% for OAEs and 29% for establishments. About 3% of the
manufacturing enterprises operated in the open air without any structure but had a fixed
location. The enterprises operating outside household premises without fixed location had the
characteristics of street vendors i.e. those who operate on the streets or as part of a mobile
market. In case of manufacturing enterprises, this percentage was less in the case of
establishments (2%) as compared to OAEs (3%). Percentage of manufacturing enterprises with
fixed location was 97% for both OAEs and establishments.
3.15.5 In the rural areas 97.4% of the enterprises had a fixed location (79.5% within the
household premises and 17.9% outside). The share of enterprises with fixed location was 93.4%
(about 56.1% within household premises and 37.3% outside) for enterprises in the urban areas.
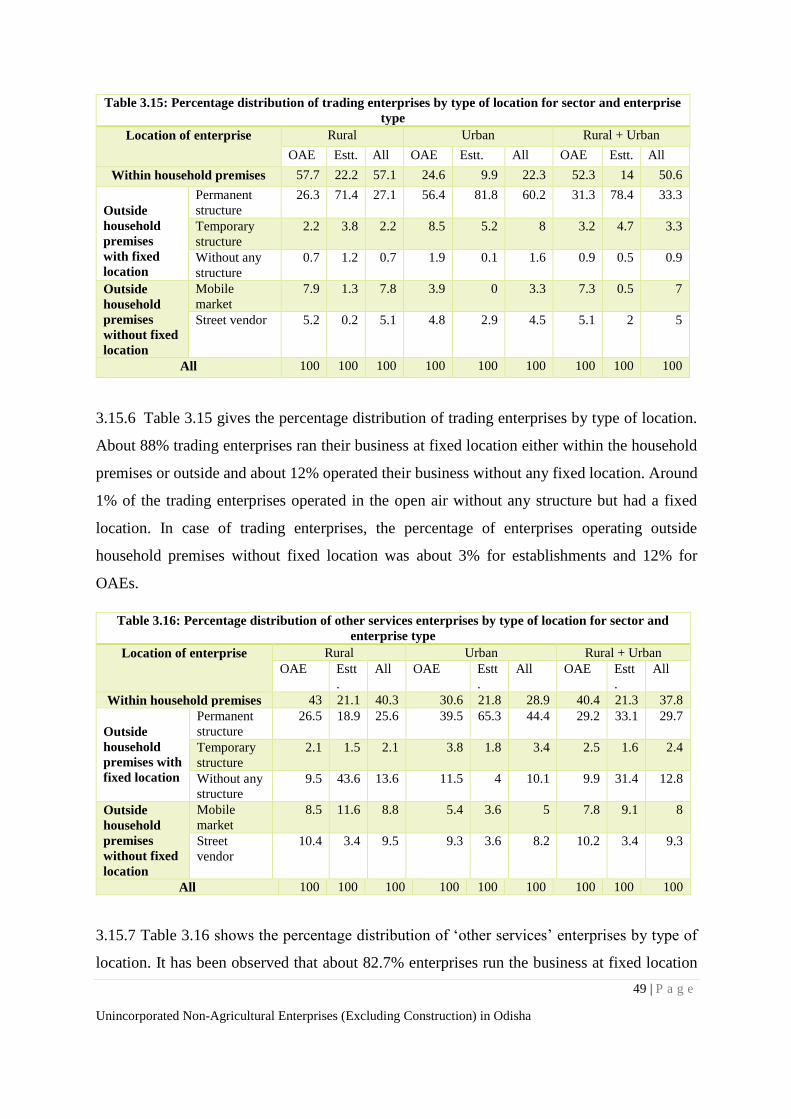
49 | P a g e
Unincorporated Non-Agricultural Enterprises (Excluding Construction) in Odisha
Table 3.15: Percentage distribution of trading enterprises by type of location for sector and enterprise
type
Location of enterprise Rural Urban Rural + Urban
OAE Estt. All OAE Estt. All OAE Estt. All
Within household premises 57.7 22.2 57.1 24.6 9.9 22.3 52.3 14 50.6
Outside
household
premises
with fixed
location
Permanent
structure
26.3 71.4 27.1 56.4 81.8 60.2 31.3 78.4 33.3
Temporary
structure
2.2 3.8 2.2 8.5 5.2 8 3.2 4.7 3.3
Without any
structure
0.7 1.2 0.7 1.9 0.1 1.6 0.9 0.5 0.9
Outside
household
premises
without fixed
location
Mobile
market
7.9 1.3 7.8 3.9 0 3.3 7.3 0.5 7
Street vendor 5.2 0.2 5.1 4.8 2.9 4.5 5.1 2 5
All 100 100 100 100 100 100 100 100 100
3.15.6 Table 3.15 gives the percentage distribution of trading enterprises by type of location.
About 88% trading enterprises ran their business at fixed location either within the household
premises or outside and about 12% operated their business without any fixed location. Around
1% of the trading enterprises operated in the open air without any structure but had a fixed
location. In case of trading enterprises, the percentage of enterprises operating outside
household premises without fixed location was about 3% for establishments and 12% for
OAEs.
Table 3.16: Percentage distribution of other services enterprises by type of location for sector and
enterprise type
Location of enterprise Rural Urban Rural + Urban
OAE Estt
.
All OAE Estt
.
All OAE Estt
.
All
Within household premises 43 21.1 40.3 30.6 21.8 28.9 40.4 21.3 37.8
Outside
household
premises with
fixed location
Permanent
structure
26.5 18.9 25.6 39.5 65.3 44.4 29.2 33.1 29.7
Temporary
structure
2.1 1.5 2.1 3.8 1.8 3.4 2.5 1.6 2.4
Without any
structure
9.5 43.6 13.6 11.5 4 10.1 9.9 31.4 12.8
Outside
household
premises
without fixed
location
Mobile
market
8.5 11.6 8.8 5.4 3.6 5 7.8 9.1 8
Street
vendor
10.4 3.4 9.5 9.3 3.6 8.2 10.2 3.4 9.3
All 100 100 100 100 100 100 100 100 100
3.15.7 Table 3.16 shows the percentage distribution of ‘other services’ enterprises by type of
location. It has been observed that about 82.7% enterprises run the business at fixed location
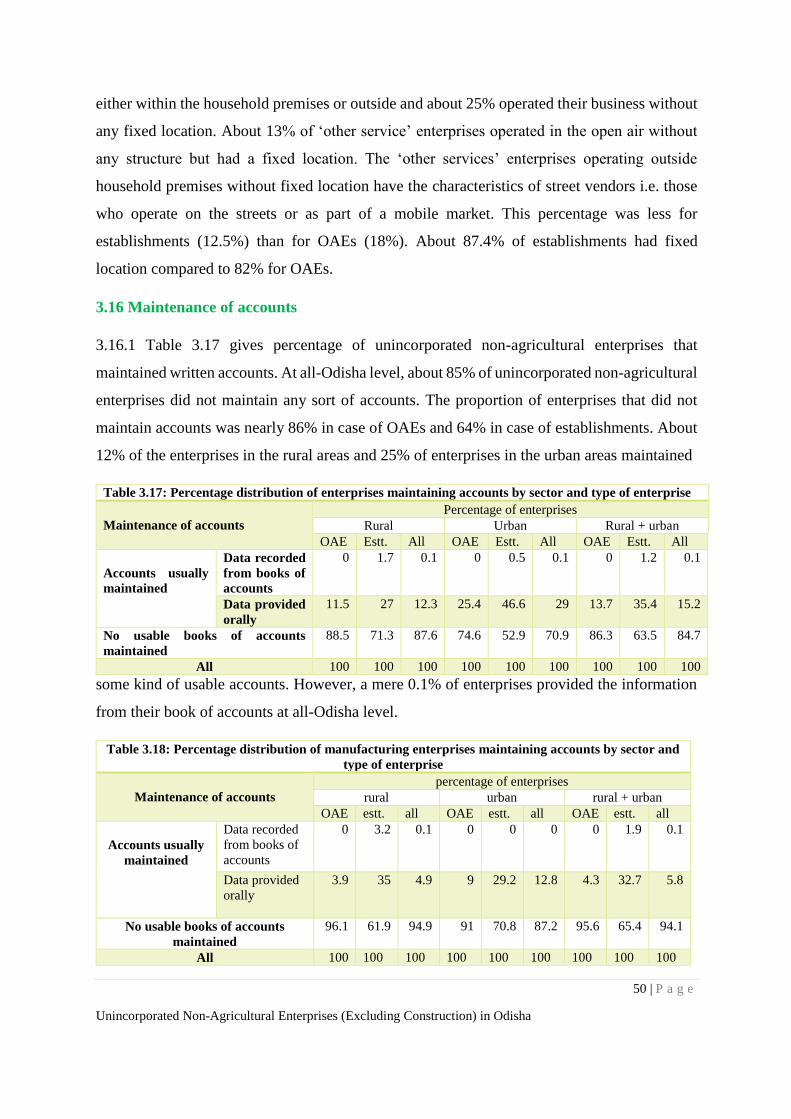
50 | P a g e
Unincorporated Non-Agricultural Enterprises (Excluding Construction) in Odisha
either within the household premises or outside and about 25% operated their business without
any fixed location. About 13% of ‘other service’ enterprises operated in the open air without
any structure but had a fixed location. The ‘other services’ enterprises operating outside
household premises without fixed location have the characteristics of street vendors i.e. those
who operate on the streets or as part of a mobile market. This percentage was less for
establishments (12.5%) than for OAEs (18%). About 87.4% of establishments had fixed
location compared to 82% for OAEs.
3.16 Maintenance of accounts
3.16.1 Table 3.17 gives percentage of unincorporated non-agricultural enterprises that
maintained written accounts. At all-Odisha level, about 85% of unincorporated non-agricultural
enterprises did not maintain any sort of accounts. The proportion of enterprises that did not
maintain accounts was nearly 86% in case of OAEs and 64% in case of establishments. About
12% of the enterprises in the rural areas and 25% of enterprises in the urban areas maintained
Table 3.17: Percentage distribution of enterprises maintaining accounts by sector and type of enterprise
Maintenance of accounts
Percentage of enterprises
Rural Urban Rural + urban
OAE Estt. All OAE Estt. All OAE Estt. All
Accounts usually
maintained
Data recorded
from books of
accounts
0 1.7 0.1 0 0.5 0.1 0 1.2 0.1
Data provided
orally
11.5 27 12.3 25.4 46.6 29 13.7 35.4 15.2
No usable books of accounts
maintained
88.5 71.3 87.6 74.6 52.9 70.9 86.3 63.5 84.7
All 100 100 100 100 100 100 100 100 100
some kind of usable accounts. However, a mere 0.1% of enterprises provided the information
from their book of accounts at all-Odisha level.
Table 3.18: Percentage distribution of manufacturing enterprises maintaining accounts by sector and
type of enterprise
Maintenance of accounts
percentage of enterprises
rural urban rural + urban
OAE estt. all OAE estt. all OAE estt. all
Accounts usually
maintained
Data recorded
from books of
accounts
0 3.2 0.1 0 0 0 0 1.9 0.1
Data provided
orally
3.9 35 4.9 9 29.2 12.8 4.3 32.7 5.8
No usable books of accounts
maintained
96.1 61.9 94.9 91 70.8 87.2 95.6 65.4 94.1
All 100 100 100 100 100 100 100 100 100
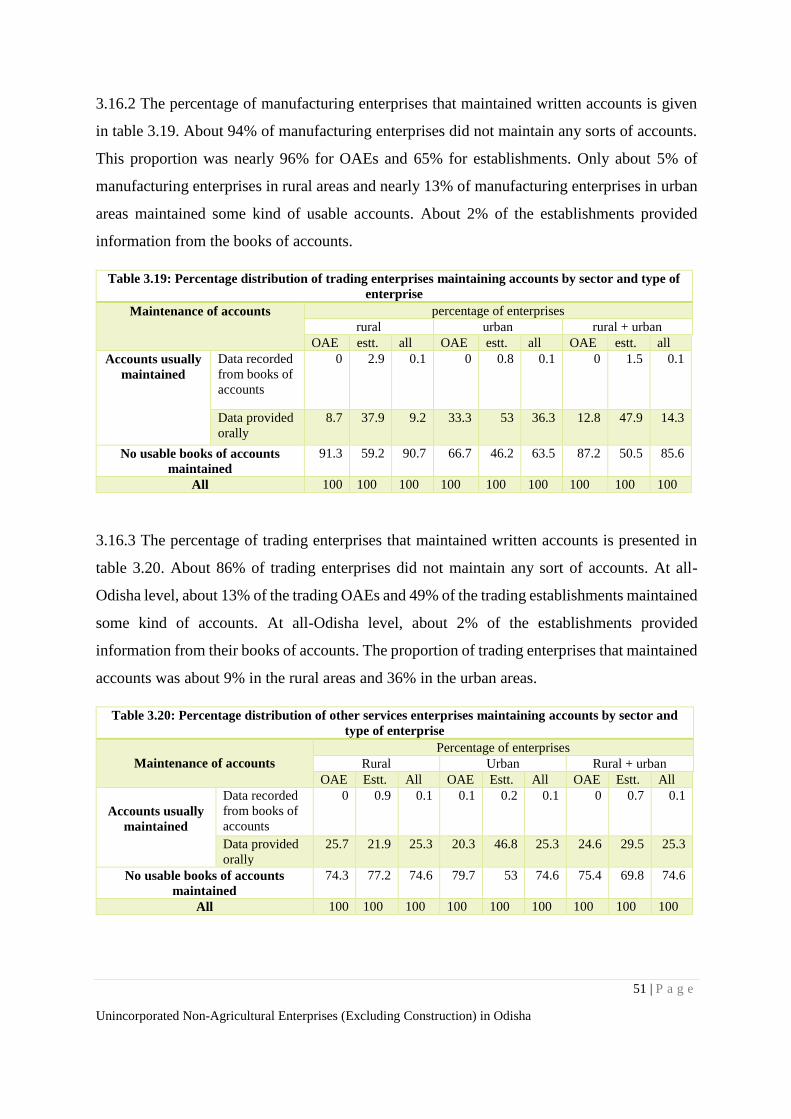
51 | P a g e
Unincorporated Non-Agricultural Enterprises (Excluding Construction) in Odisha
3.16.2 The percentage of manufacturing enterprises that maintained written accounts is given
in table 3.19. About 94% of manufacturing enterprises did not maintain any sorts of accounts.
This proportion was nearly 96% for OAEs and 65% for establishments. Only about 5% of
manufacturing enterprises in rural areas and nearly 13% of manufacturing enterprises in urban
areas maintained some kind of usable accounts. About 2% of the establishments provided
information from the books of accounts.
Table 3.19: Percentage distribution of trading enterprises maintaining accounts by sector and type of
enterprise
Maintenance of accounts percentage of enterprises
rural urban rural + urban
OAE estt. all OAE estt. all OAE estt. all
Accounts usually
maintained
Data recorded
from books of
accounts
0 2.9 0.1 0 0.8 0.1 0 1.5 0.1
Data provided
orally
8.7 37.9 9.2 33.3 53 36.3 12.8 47.9 14.3
No usable books of accounts
maintained
91.3 59.2 90.7 66.7 46.2 63.5 87.2 50.5 85.6
All 100 100 100 100 100 100 100 100 100
3.16.3 The percentage of trading enterprises that maintained written accounts is presented in
table 3.20. About 86% of trading enterprises did not maintain any sort of accounts. At all-
Odisha level, about 13% of the trading OAEs and 49% of the trading establishments maintained
some kind of accounts. At all-Odisha level, about 2% of the establishments provided
information from their books of accounts. The proportion of trading enterprises that maintained
accounts was about 9% in the rural areas and 36% in the urban areas.
Table 3.20: Percentage distribution of other services enterprises maintaining accounts by sector and
type of enterprise
Maintenance of accounts
Percentage of enterprises
Rural Urban Rural + urban
OAE Estt. All OAE Estt. All OAE Estt. All
Accounts usually
maintained
Data recorded
from books of
accounts
0 0.9 0.1 0.1 0.2 0.1 0 0.7 0.1
Data provided
orally
25.7 21.9 25.3 20.3 46.8 25.3 24.6 29.5 25.3
No usable books of accounts
maintained
74.3 77.2 74.6 79.7 53 74.6 75.4 69.8 74.6
All 100 100 100 100 100 100 100 100 100
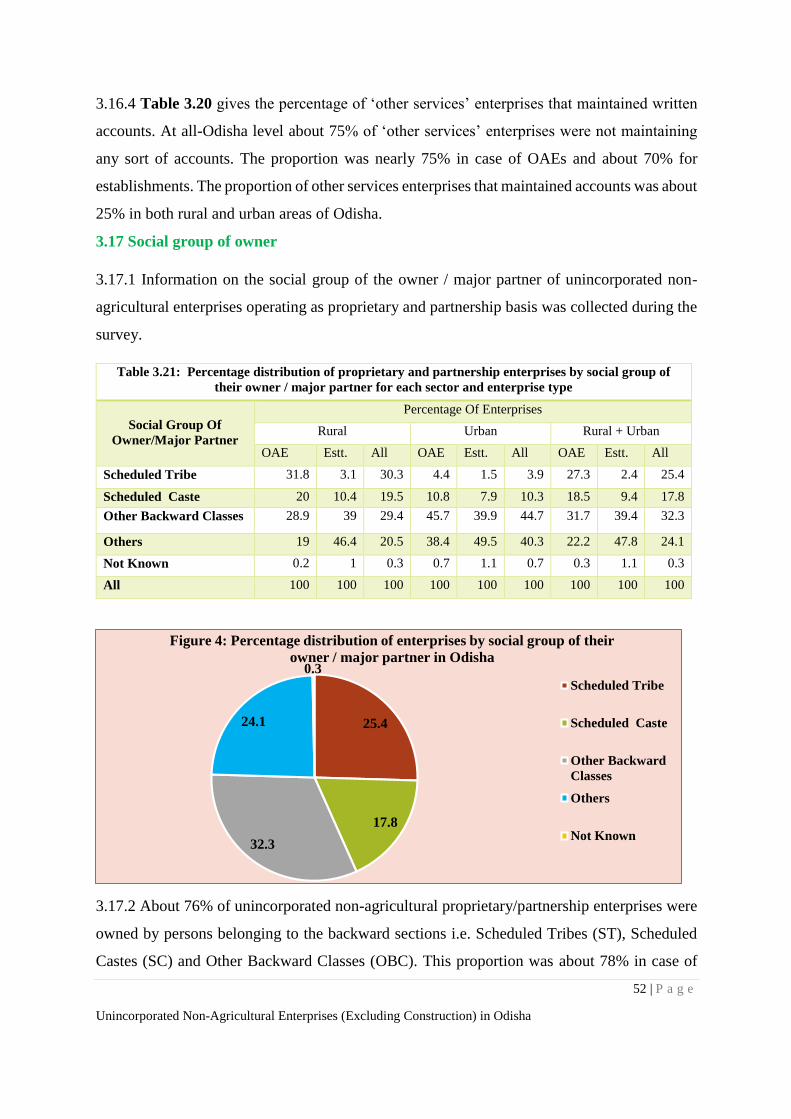
52 | P a g e
Unincorporated Non-Agricultural Enterprises (Excluding Construction) in Odisha
3.16.4 Table 3.20 gives the percentage of ‘other services’ enterprises that maintained written
accounts. At all-Odisha level about 75% of ‘other services’ enterprises were not maintaining
any sort of accounts. The proportion was nearly 75% in case of OAEs and about 70% for
establishments. The proportion of other services enterprises that maintained accounts was about
25% in both rural and urban areas of Odisha.
3.17 Social group of owner
3.17.1 Information on the social group of the owner / major partner of unincorporated non-
agricultural enterprises operating as proprietary and partnership basis was collected during the
survey.
Table 3.21: Percentage distribution of proprietary and partnership enterprises by social group of
their owner / major partner for each sector and enterprise type
Social Group Of
Owner/Major Partner
Percentage Of Enterprises
Rural Urban Rural + Urban
OAE Estt. All OAE Estt. All OAE Estt. All
Scheduled Tribe 31.8 3.1 30.3 4.4 1.5 3.9 27.3 2.4 25.4
Scheduled Caste 20 10.4 19.5 10.8 7.9 10.3 18.5 9.4 17.8
Other Backward Classes 28.9 39 29.4 45.7 39.9 44.7 31.7 39.4 32.3
Others 19 46.4 20.5 38.4 49.5 40.3 22.2 47.8 24.1
Not Known 0.2 1 0.3 0.7 1.1 0.7 0.3 1.1 0.3
All 100 100 100 100 100 100 100 100 100
3.17.2 About 76% of unincorporated non-agricultural proprietary/partnership enterprises were
owned by persons belonging to the backward sections i.e. Scheduled Tribes (ST), Scheduled
Castes (SC) and Other Backward Classes (OBC). This proportion was about 78% in case of
25.4
17.8
32.3
24.1
0.3
Figure 4: Percentage distribution of enterprises by social group of their
owner / major partner in Odisha
Scheduled Tribe
Scheduled Caste
Other Backward
Classes
Others
Not Known
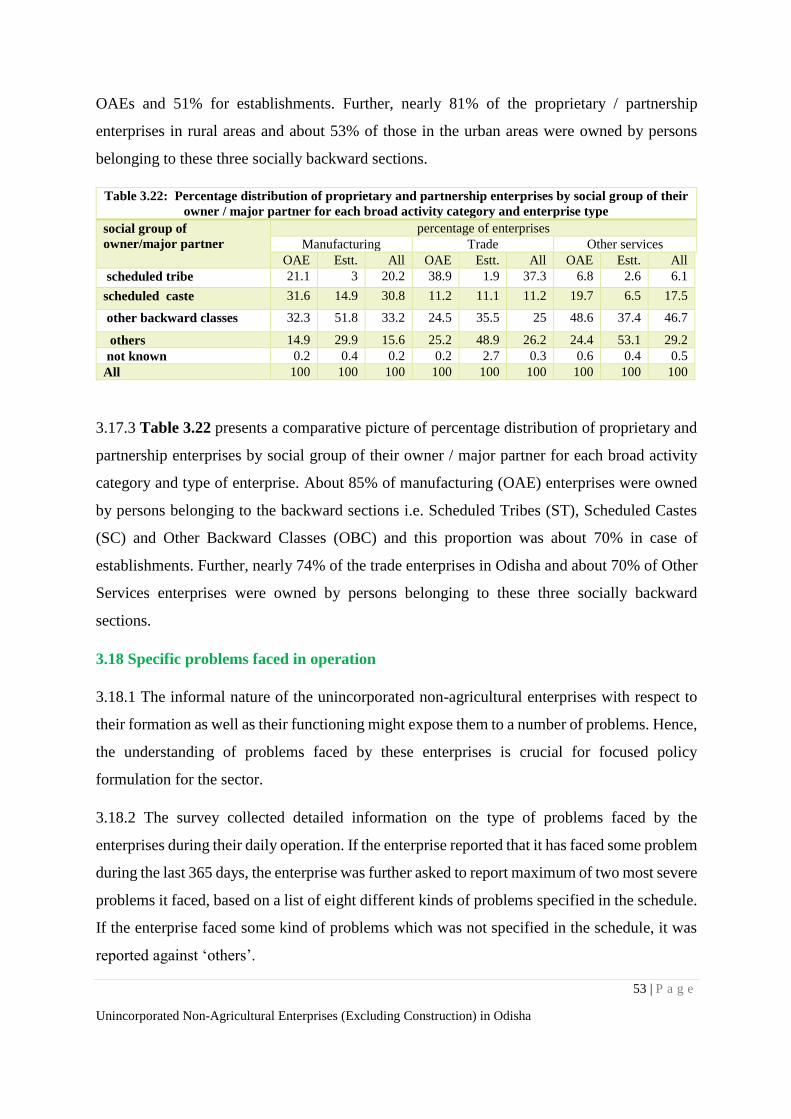
53 | P a g e
Unincorporated Non-Agricultural Enterprises (Excluding Construction) in Odisha
OAEs and 51% for establishments. Further, nearly 81% of the proprietary / partnership
enterprises in rural areas and about 53% of those in the urban areas were owned by persons
belonging to these three socially backward sections.
Table 3.22: Percentage distribution of proprietary and partnership enterprises by social group of their
owner / major partner for each broad activity category and enterprise type
social group of
owner/major partner
percentage of enterprises
Manufacturing Trade Other services
OAE Estt. All OAE Estt. All OAE Estt. All
scheduled tribe 21.1 3 20.2 38.9 1.9 37.3 6.8 2.6 6.1
scheduled caste 31.6 14.9 30.8 11.2 11.1 11.2 19.7 6.5 17.5
other backward classes 32.3 51.8 33.2 24.5 35.5 25 48.6 37.4 46.7
others 14.9 29.9 15.6 25.2 48.9 26.2 24.4 53.1 29.2
not known 0.2 0.4 0.2 0.2 2.7 0.3 0.6 0.4 0.5
All 100 100 100 100 100 100 100 100 100
3.17.3 Table 3.22 presents a comparative picture of percentage distribution of proprietary and
partnership enterprises by social group of their owner / major partner for each broad activity
category and type of enterprise. About 85% of manufacturing (OAE) enterprises were owned
by persons belonging to the backward sections i.e. Scheduled Tribes (ST), Scheduled Castes
(SC) and Other Backward Classes (OBC) and this proportion was about 70% in case of
establishments. Further, nearly 74% of the trade enterprises in Odisha and about 70% of Other
Services enterprises were owned by persons belonging to these three socially backward
sections.
3.18 Specific problems faced in operation
3.18.1 The informal nature of the unincorporated non-agricultural enterprises with respect to
their formation as well as their functioning might expose them to a number of problems. Hence,
the understanding of problems faced by these enterprises is crucial for focused policy
formulation for the sector.
3.18.2 The survey collected detailed information on the type of problems faced by the
enterprises during their daily operation. If the enterprise reported that it has faced some problem
during the last 365 days, the enterprise was further asked to report maximum of two most severe
problems it faced, based on a list of eight different kinds of problems specified in the schedule.
If the enterprise faced some kind of problems which was not specified in the schedule, it was
reported against ‘others’.
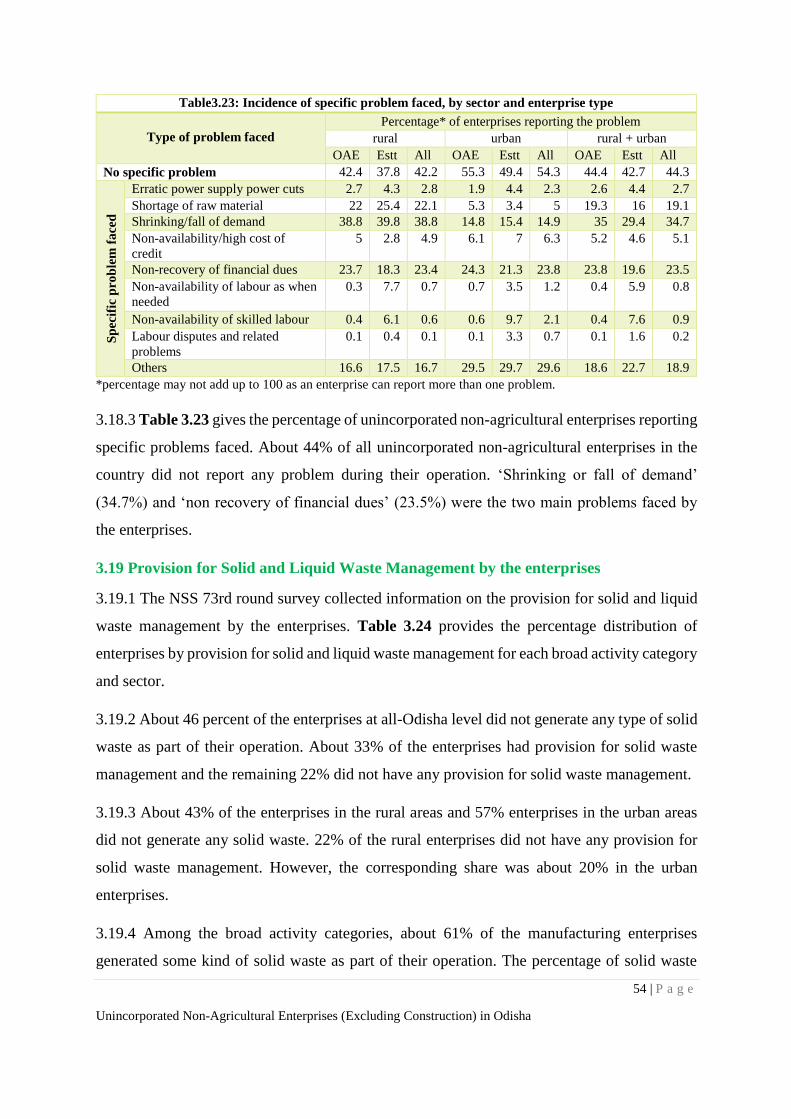
54 | P a g e
Unincorporated Non-Agricultural Enterprises (Excluding Construction) in Odisha
Table3.23: Incidence of specific problem faced, by sector and enterprise type
Type of problem faced
Percentage* of enterprises reporting the problem
rural urban rural + urban
OAE Estt All OAE Estt All OAE Estt All
No specific problem 42.4 37.8 42.2 55.3 49.4 54.3 44.4 42.7 44.3
Sp
ecif
ic p
rob
lem
fa
ced
Erratic power supply power cuts 2.7 4.3 2.8 1.9 4.4 2.3 2.6 4.4 2.7
Shortage of raw material 22 25.4 22.1 5.3 3.4 5 19.3 16 19.1
Shrinking/fall of demand 38.8 39.8 38.8 14.8 15.4 14.9 35 29.4 34.7
Non-availability/high cost of
credit
5 2.8 4.9 6.1 7 6.3 5.2 4.6 5.1
Non-recovery of financial dues 23.7 18.3 23.4 24.3 21.3 23.8 23.8 19.6 23.5
Non-availability of labour as when
needed
0.3 7.7 0.7 0.7 3.5 1.2 0.4 5.9 0.8
Non-availability of skilled labour 0.4 6.1 0.6 0.6 9.7 2.1 0.4 7.6 0.9
Labour disputes and related
problems
0.1 0.4 0.1 0.1 3.3 0.7 0.1 1.6 0.2
Others 16.6 17.5 16.7 29.5 29.7 29.6 18.6 22.7 18.9
*percentage may not add up to 100 as an enterprise can report more than one problem.
3.18.3 Table 3.23 gives the percentage of unincorporated non-agricultural enterprises reporting
specific problems faced. About 44% of all unincorporated non-agricultural enterprises in the
country did not report any problem during their operation. ‘Shrinking or fall of demand’
(34.7%) and ‘non recovery of financial dues’ (23.5%) were the two main problems faced by
the enterprises.
3.19 Provision for Solid and Liquid Waste Management by the enterprises
3.19.1 The NSS 73rd round survey collected information on the provision for solid and liquid
waste management by the enterprises. Table 3.24 provides the percentage distribution of
enterprises by provision for solid and liquid waste management for each broad activity category
and sector.
3.19.2 About 46 percent of the enterprises at all-Odisha level did not generate any type of solid
waste as part of their operation. About 33% of the enterprises had provision for solid waste
management and the remaining 22% did not have any provision for solid waste management.
3.19.3 About 43% of the enterprises in the rural areas and 57% enterprises in the urban areas
did not generate any solid waste. 22% of the rural enterprises did not have any provision for
solid waste management. However, the corresponding share was about 20% in the urban
enterprises.
3.19.4 Among the broad activity categories, about 61% of the manufacturing enterprises
generated some kind of solid waste as part of their operation. The percentage of solid waste
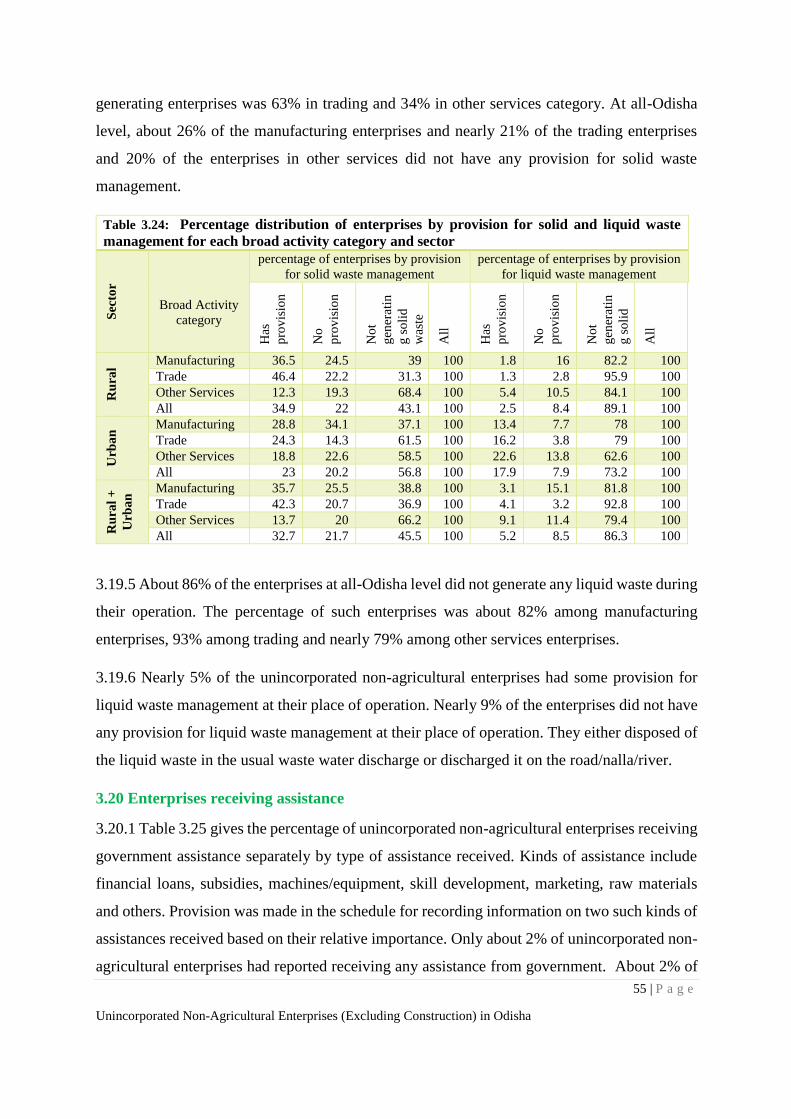
55 | P a g e
Unincorporated Non-Agricultural Enterprises (Excluding Construction) in Odisha
generating enterprises was 63% in trading and 34% in other services category. At all-Odisha
level, about 26% of the manufacturing enterprises and nearly 21% of the trading enterprises
and 20% of the enterprises in other services did not have any provision for solid waste
management.
Table 3.24: Percentage distribution of enterprises by provision for solid and liquid waste
management for each broad activity category and sector
Sec
tor
Broad Activity
category
percentage of enterprises by provision
for solid waste management
percentage of enterprises by provision
for liquid waste management H
as
pro
vis
ion
No
pro
vis
ion
No
t
gen
erat
in
g s
oli
d
was
te
All
Has
pro
vis
ion
No
pro
vis
ion
No
t
gen
erat
in
g s
oli
d
was
te
All
Ru
ral
Manufacturing 36.5 24.5 39 100 1.8 16 82.2 100
Trade 46.4 22.2 31.3 100 1.3 2.8 95.9 100
Other Services 12.3 19.3 68.4 100 5.4 10.5 84.1 100
All 34.9 22 43.1 100 2.5 8.4 89.1 100
Urb
an
Manufacturing 28.8 34.1 37.1 100 13.4 7.7 78 100
Trade 24.3 14.3 61.5 100 16.2 3.8 79 100
Other Services 18.8 22.6 58.5 100 22.6 13.8 62.6 100
All 23 20.2 56.8 100 17.9 7.9 73.2 100
Ru
ral
+
Urb
an
Manufacturing 35.7 25.5 38.8 100 3.1 15.1 81.8 100
Trade 42.3 20.7 36.9 100 4.1 3.2 92.8 100
Other Services 13.7 20 66.2 100 9.1 11.4 79.4 100
All 32.7 21.7 45.5 100 5.2 8.5 86.3 100
3.19.5 About 86% of the enterprises at all-Odisha level did not generate any liquid waste during
their operation. The percentage of such enterprises was about 82% among manufacturing
enterprises, 93% among trading and nearly 79% among other services enterprises.
3.19.6 Nearly 5% of the unincorporated non-agricultural enterprises had some provision for
liquid waste management at their place of operation. Nearly 9% of the enterprises did not have
any provision for liquid waste management at their place of operation. They either disposed of
the liquid waste in the usual waste water discharge or discharged it on the road/nalla/river.
3.20 Enterprises receiving assistance
3.20.1 Table 3.25 gives the percentage of unincorporated non-agricultural enterprises receiving
government assistance separately by type of assistance received. Kinds of assistance include
financial loans, subsidies, machines/equipment, skill development, marketing, raw materials
and others. Provision was made in the schedule for recording information on two such kinds of
assistances received based on their relative importance. Only about 2% of unincorporated non-
agricultural enterprises had reported receiving any assistance from government. About 2% of
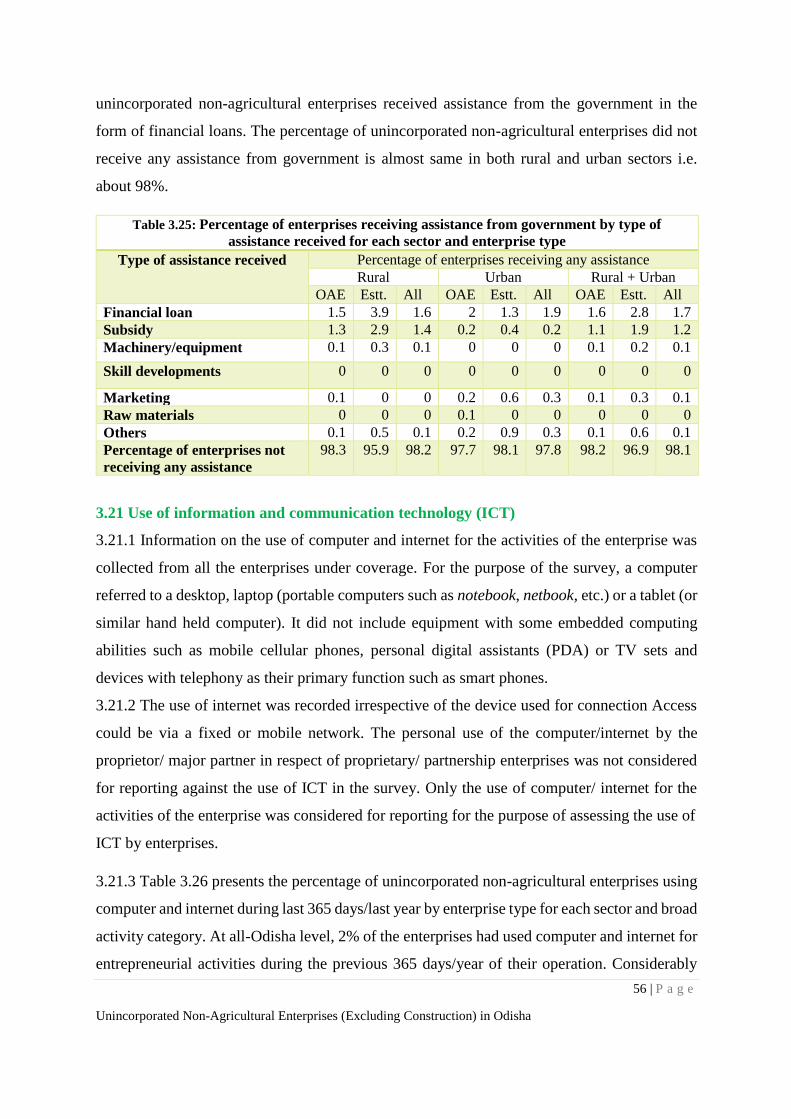
56 | P a g e
Unincorporated Non-Agricultural Enterprises (Excluding Construction) in Odisha
unincorporated non-agricultural enterprises received assistance from the government in the
form of financial loans. The percentage of unincorporated non-agricultural enterprises did not
receive any assistance from government is almost same in both rural and urban sectors i.e.
about 98%.
Table 3.25: Percentage of enterprises receiving assistance from government by type of
assistance received for each sector and enterprise type
Type of assistance received Percentage of enterprises receiving any assistance
Rural Urban Rural + Urban
OAE Estt. All OAE Estt. All OAE Estt. All
Financial loan 1.5 3.9 1.6 2 1.3 1.9 1.6 2.8 1.7
Subsidy 1.3 2.9 1.4 0.2 0.4 0.2 1.1 1.9 1.2
Machinery/equipment 0.1 0.3 0.1 0 0 0 0.1 0.2 0.1
Skill developments 0 0 0 0 0 0 0 0 0
Marketing 0.1 0 0 0.2 0.6 0.3 0.1 0.3 0.1
Raw materials 0 0 0 0.1 0 0 0 0 0
Others 0.1 0.5 0.1 0.2 0.9 0.3 0.1 0.6 0.1
Percentage of enterprises not
receiving any assistance
98.3 95.9 98.2 97.7 98.1 97.8 98.2 96.9 98.1
3.21 Use of information and communication technology (ICT)
3.21.1 Information on the use of computer and internet for the activities of the enterprise was
collected from all the enterprises under coverage. For the purpose of the survey, a computer
referred to a desktop, laptop (portable computers such as notebook, netbook, etc.) or a tablet (or
similar hand held computer). It did not include equipment with some embedded computing
abilities such as mobile cellular phones, personal digital assistants (PDA) or TV sets and
devices with telephony as their primary function such as smart phones.
3.21.2 The use of internet was recorded irrespective of the device used for connection Access
could be via a fixed or mobile network. The personal use of the computer/internet by the
proprietor/ major partner in respect of proprietary/ partnership enterprises was not considered
for reporting against the use of ICT in the survey. Only the use of computer/ internet for the
activities of the enterprise was considered for reporting for the purpose of assessing the use of
ICT by enterprises.
3.21.3 Table 3.26 presents the percentage of unincorporated non-agricultural enterprises using
computer and internet during last 365 days/last year by enterprise type for each sector and broad
activity category. At all-Odisha level, 2% of the enterprises had used computer and internet for
entrepreneurial activities during the previous 365 days/year of their operation. Considerably
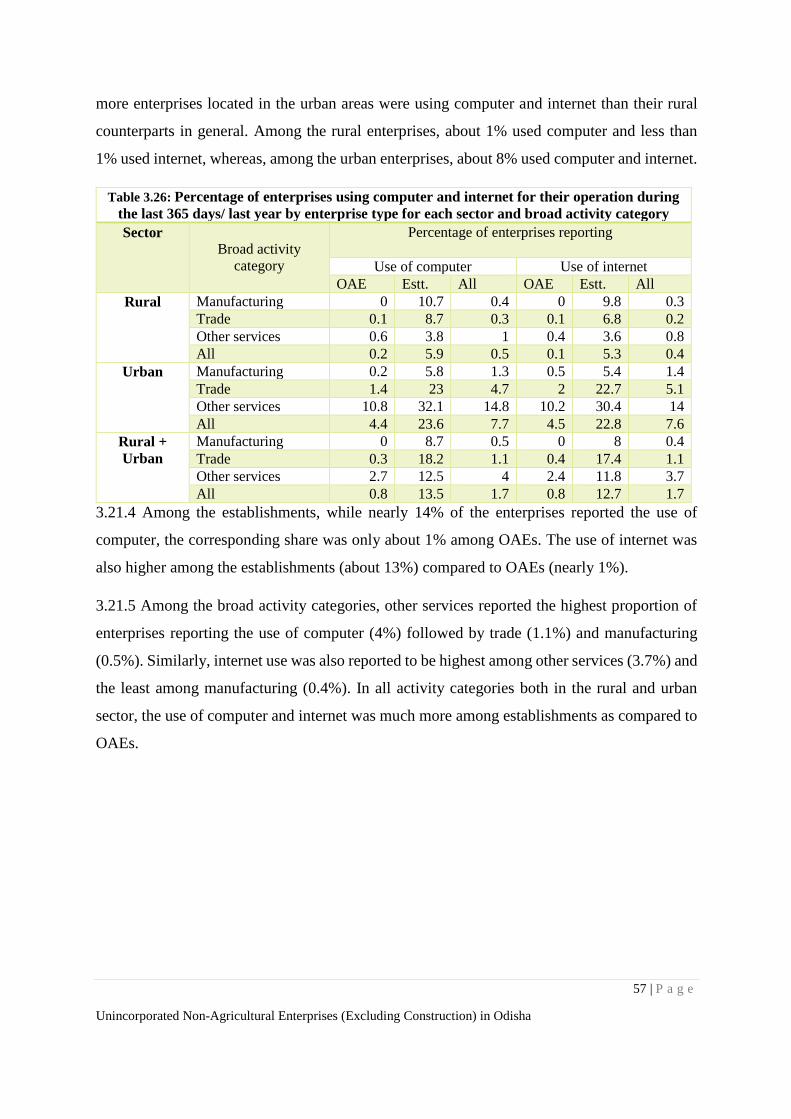
57 | P a g e
Unincorporated Non-Agricultural Enterprises (Excluding Construction) in Odisha
more enterprises located in the urban areas were using computer and internet than their rural
counterparts in general. Among the rural enterprises, about 1% used computer and less than
1% used internet, whereas, among the urban enterprises, about 8% used computer and internet.
Table 3.26: Percentage of enterprises using computer and internet for their operation during
the last 365 days/ last year by enterprise type for each sector and broad activity category
Sector
Broad activity
category
Percentage of enterprises reporting
Use of computer Use of internet
OAE Estt. All OAE Estt. All
Rural Manufacturing 0 10.7 0.4 0 9.8 0.3
Trade 0.1 8.7 0.3 0.1 6.8 0.2
Other services 0.6 3.8 1 0.4 3.6 0.8
All 0.2 5.9 0.5 0.1 5.3 0.4
Urban Manufacturing 0.2 5.8 1.3 0.5 5.4 1.4
Trade 1.4 23 4.7 2 22.7 5.1
Other services 10.8 32.1 14.8 10.2 30.4 14
All 4.4 23.6 7.7 4.5 22.8 7.6
Rural +
Urban
Manufacturing 0 8.7 0.5 0 8 0.4
Trade 0.3 18.2 1.1 0.4 17.4 1.1
Other services 2.7 12.5 4 2.4 11.8 3.7
All 0.8 13.5 1.7 0.8 12.7 1.7
3.21.4 Among the establishments, while nearly 14% of the enterprises reported the use of
computer, the corresponding share was only about 1% among OAEs. The use of internet was
also higher among the establishments (about 13%) compared to OAEs (nearly 1%).
3.21.5 Among the broad activity categories, other services reported the highest proportion of
enterprises reporting the use of computer (4%) followed by trade (1.1%) and manufacturing
(0.5%). Similarly, internet use was also reported to be highest among other services (3.7%) and
the least among manufacturing (0.4%). In all activity categories both in the rural and urban
sector, the use of computer and internet was much more among establishments as compared to
OAEs.
58 | P a g e
Unincorporated Non-Agricultural Enterprises (Excluding Construction) in Odisha
Chapter Four
Economic Characteristics
4.1 Introduction
4.1.1 This chapter presents the estimates of some economic characteristics of unincorporated
non-agricultural enterprises (excluding construction) viz., GVA per enterprise, GVA per
worker, outstanding loans and fixed assets per enterprise etc. by activity category. A summary
of some of these results is presented and discussed in this chapter. In addition, information
for‘Own Account Enterprises (OAEs) and‘establishments’ have been presented separately. The
marginal totals and the sum of the proportions presented in various tables may, in some cases,
differ slightly due to rounding off. Estimates of some are based on very small sample sizes.
4.1.2 The term ‘enterprise’ is used in general to represent OAEs and also establishments as
per the usual practice in NSS. In the tables, all is used to denote all the enterprises taken
together. A“-”has been used in the statements and tables if no enterprise of the relevant category
was surveyed. On the other hand, the figure“0”appears in some levels of disaggregation when
the estimated number or quantity is zero or very low and has become" 0” due to rounding off.
4.2 Gross Value Added (GVA)
4.2.1 Gross Value Added (GVA) is an important economic indicator that measures the
contribution of different segments to the economy. It gives the value of goods and services
produced less the cost of all intermediate consumption that are directly attributable to that
production. The survey being conducted on unincorporated enterprises, which do not usually
maintain a formal book of accounts, the data on the expenses, receipts and all other flow
variables were collected with a short reference period of a month. The GVA and NVA estimates
for one year presented in the report were derived as follows:
(Estimated GVA or NVA of the reference month) X (number of months the enterprise operated during last 365
days).
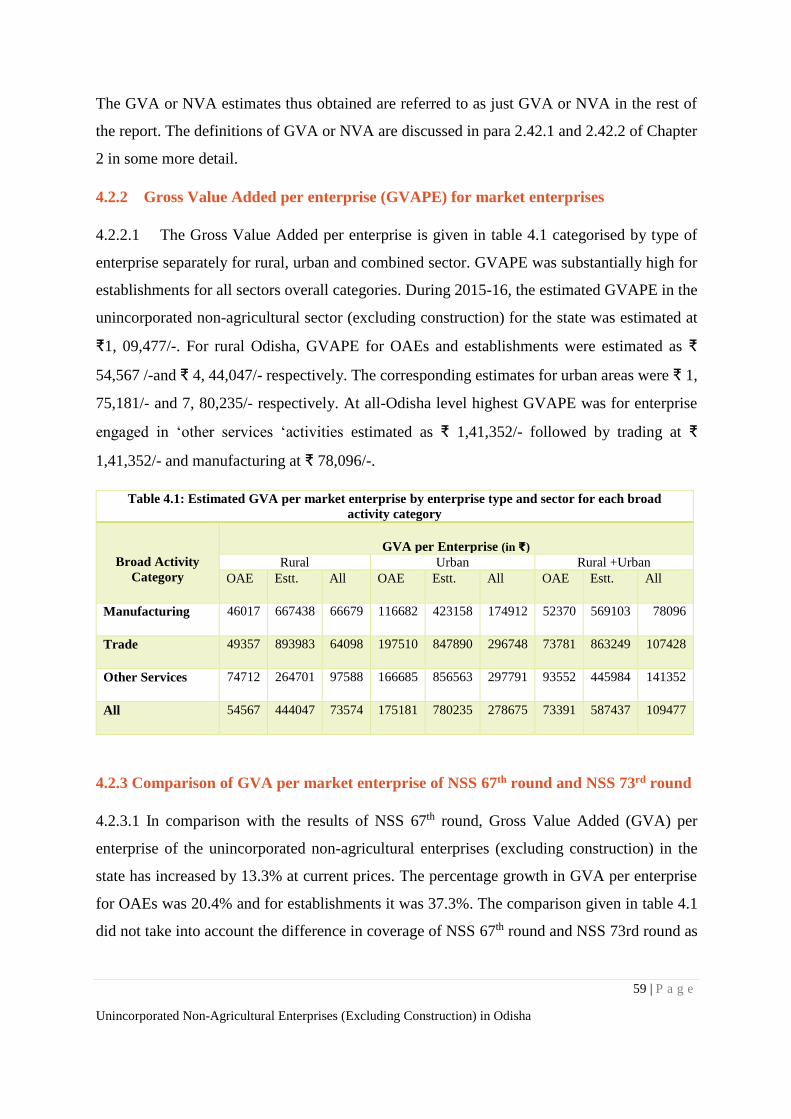
59 | P a g e
Unincorporated Non-Agricultural Enterprises (Excluding Construction) in Odisha
The GVA or NVA estimates thus obtained are referred to as just GVA or NVA in the rest of
the report. The definitions of GVA or NVA are discussed in para 2.42.1 and 2.42.2 of Chapter
2 in some more detail.
4.2.2 Gross Value Added per enterprise (GVAPE) for market enterprises
4.2.2.1 The Gross Value Added per enterprise is given in table 4.1 categorised by type of
enterprise separately for rural, urban and combined sector. GVAPE was substantially high for
establishments for all sectors overall categories. During 2015-16, the estimated GVAPE in the
unincorporated non-agricultural sector (excluding construction) for the state was estimated at
₹1, 09,477/-. For rural Odisha, GVAPE for OAEs and establishments were estimated as ₹
54,567 /-and ₹ 4, 44,047/- respectively. The corresponding estimates for urban areas were ₹ 1,
75,181/- and 7, 80,235/- respectively. At all-Odisha level highest GVAPE was for enterprise
engaged in ‘other services ‘activities estimated as ₹ 1,41,352/- followed by trading at ₹
1,41,352/- and manufacturing at ₹ 78,096/-.
Table 4.1: Estimated GVA per market enterprise by enterprise type and sector for each broad
activity category
Broad Activity
Category
GVA per Enterprise (in ₹)
Rural Urban Rural +Urban
OAE Estt. All OAE Estt. All OAE Estt. All
Manufacturing 46017 667438 66679 116682 423158 174912 52370 569103 78096
Trade 49357 893983 64098 197510 847890 296748 73781 863249 107428
Other Services 74712 264701 97588 166685 856563 297791 93552 445984 141352
All 54567 444047 73574 175181 780235 278675 73391 587437 109477
4.2.3 Comparison of GVA per market enterprise of NSS 67th round and NSS 73rd round
4.2.3.1 In comparison with the results of NSS 67th round, Gross Value Added (GVA) per
enterprise of the unincorporated non-agricultural enterprises (excluding construction) in the
state has increased by 13.3% at current prices. The percentage growth in GVA per enterprise
for OAEs was 20.4% and for establishments it was 37.3%. The comparison given in table 4.1
did not take into account the difference in coverage of NSS 67th round and NSS 73rd round as
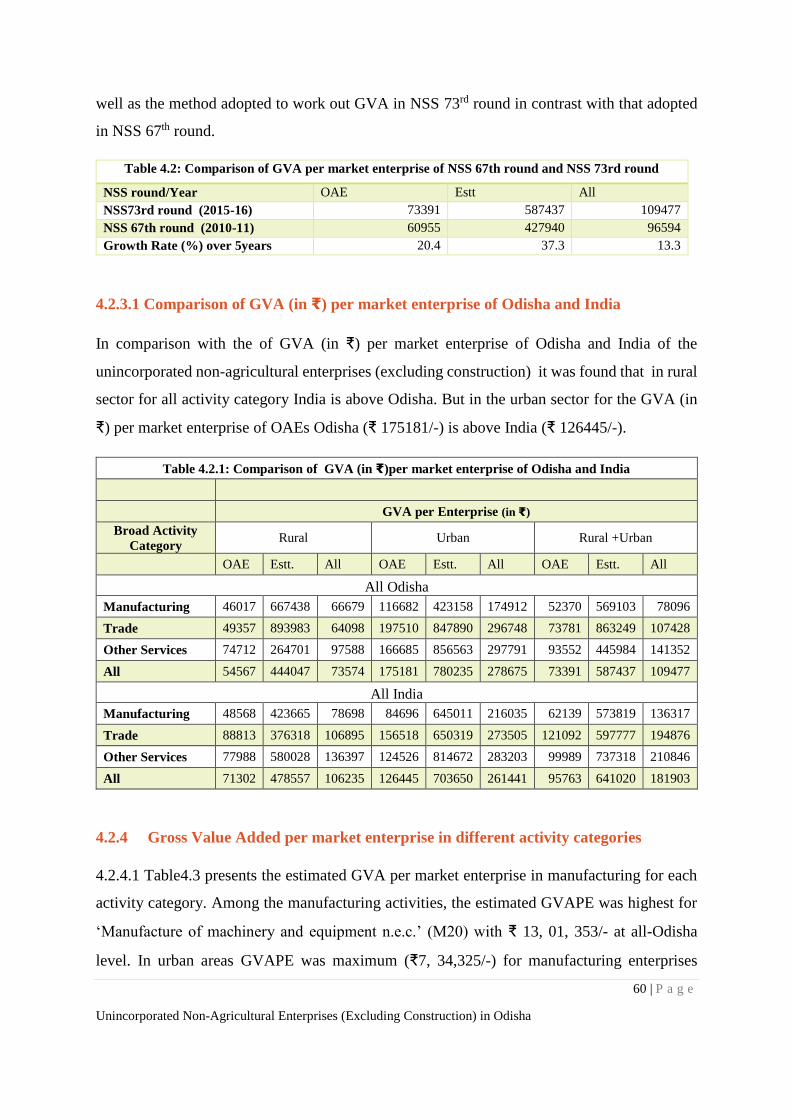
60 | P a g e
Unincorporated Non-Agricultural Enterprises (Excluding Construction) in Odisha
well as the method adopted to work out GVA in NSS 73rd round in contrast with that adopted
in NSS 67th round.
Table 4.2: Comparison of GVA per market enterprise of NSS 67th round and NSS 73rd round
NSS round/Year OAE Estt All
NSS73rd round (2015-16) 73391 587437 109477
NSS 67th round (2010-11) 60955 427940 96594
Growth Rate (%) over 5years 20.4 37.3 13.3
4.2.3.1 Comparison of GVA (in ₹) per market enterprise of Odisha and India
In comparison with the of GVA (in ₹) per market enterprise of Odisha and India of the
unincorporated non-agricultural enterprises (excluding construction) it was found that in rural
sector for all activity category India is above Odisha. But in the urban sector for the GVA (in
₹) per market enterprise of OAEs Odisha (₹ 175181/-) is above India (₹ 126445/-).
Table 4.2.1: Comparison of GVA (in ₹)per market enterprise of Odisha and India
GVA per Enterprise (in ₹)
Broad Activity
Category Rural Urban Rural +Urban
OAE Estt. All OAE Estt. All OAE Estt. All
All Odisha
Manufacturing 46017 667438 66679 116682 423158 174912 52370 569103 78096
Trade 49357 893983 64098 197510 847890 296748 73781 863249 107428
Other Services 74712 264701 97588 166685 856563 297791 93552 445984 141352
All 54567 444047 73574 175181 780235 278675 73391 587437 109477
All India
Manufacturing 48568 423665 78698 84696 645011 216035 62139 573819 136317
Trade 88813 376318 106895 156518 650319 273505 121092 597777 194876
Other Services 77988 580028 136397 124526 814672 283203 99989 737318 210846
All 71302 478557 106235 126445 703650 261441 95763 641020 181903
4.2.4 Gross Value Added per market enterprise in different activity categories
4.2.4.1 Table4.3 presents the estimated GVA per market enterprise in manufacturing for each
activity category. Among the manufacturing activities, the estimated GVAPE was highest for
‘Manufacture of machinery and equipment n.e.c.’ (M20) with ₹ 13, 01, 353/- at all-Odisha
level. In urban areas GVAPE was maximum (₹7, 34,325/-) for manufacturing enterprises
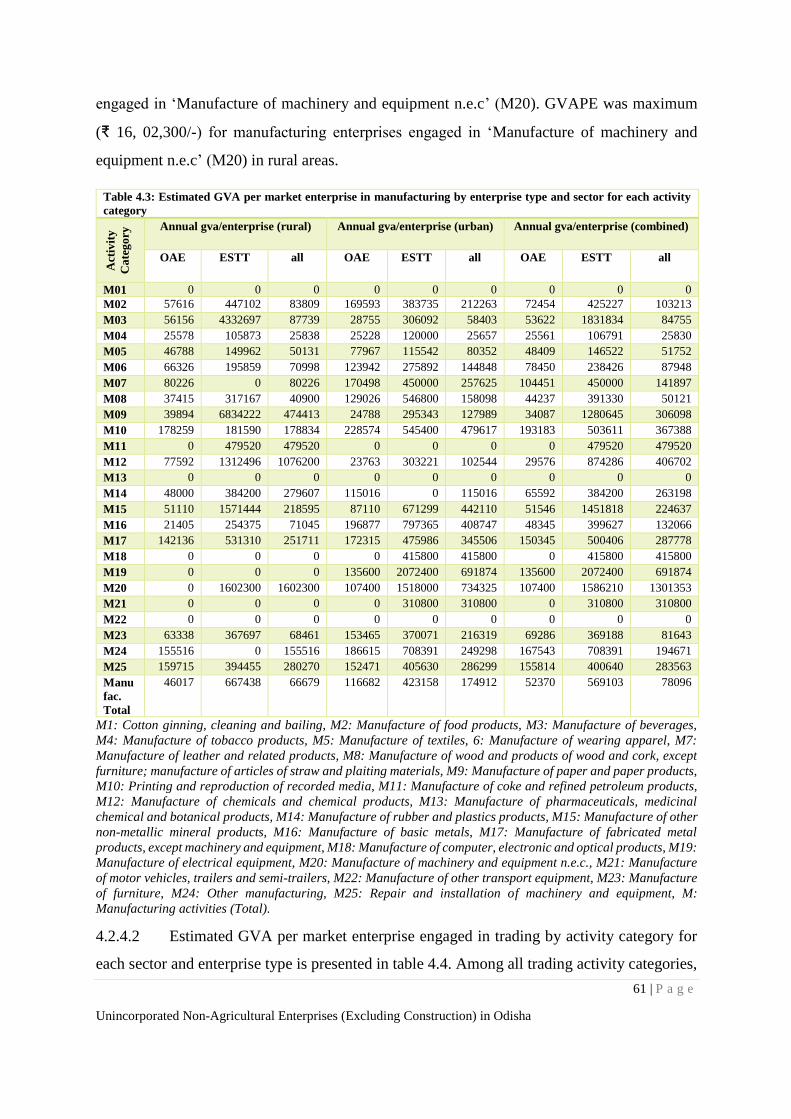
61 | P a g e
Unincorporated Non-Agricultural Enterprises (Excluding Construction) in Odisha
engaged in ‘Manufacture of machinery and equipment n.e.c’ (M20). GVAPE was maximum
(₹ 16, 02,300/-) for manufacturing enterprises engaged in ‘Manufacture of machinery and
equipment n.e.c’ (M20) in rural areas.
Table 4.3: Estimated GVA per market enterprise in manufacturing by enterprise type and sector for each activity
category
Act
ivit
y
Ca
teg
ory
Annual gva/enterprise (rural) Annual gva/enterprise (urban) Annual gva/enterprise (combined)
OAE ESTT all OAE ESTT all OAE ESTT all
M01 0 0 0 0 0 0 0 0 0
M02 57616 447102 83809 169593 383735 212263 72454 425227 103213
M03 56156 4332697 87739 28755 306092 58403 53622 1831834 84755
M04 25578 105873 25838 25228 120000 25657 25561 106791 25830
M05 46788 149962 50131 77967 115542 80352 48409 146522 51752
M06 66326 195859 70998 123942 275892 144848 78450 238426 87948
M07 80226 0 80226 170498 450000 257625 104451 450000 141897
M08 37415 317167 40900 129026 546800 158098 44237 391330 50121
M09 39894 6834222 474413 24788 295343 127989 34087 1280645 306098
M10 178259 181590 178834 228574 545400 479617 193183 503611 367388
M11 0 479520 479520 0 0 0 0 479520 479520
M12 77592 1312496 1076200 23763 303221 102544 29576 874286 406702
M13 0 0 0 0 0 0 0 0 0
M14 48000 384200 279607 115016 0 115016 65592 384200 263198
M15 51110 1571444 218595 87110 671299 442110 51546 1451818 224637
M16 21405 254375 71045 196877 797365 408747 48345 399627 132066
M17 142136 531310 251711 172315 475986 345506 150345 500406 287778
M18 0 0 0 0 415800 415800 0 415800 415800
M19 0 0 0 135600 2072400 691874 135600 2072400 691874
M20 0 1602300 1602300 107400 1518000 734325 107400 1586210 1301353
M21 0 0 0 0 310800 310800 0 310800 310800
M22 0 0 0 0 0 0 0 0 0
M23 63338 367697 68461 153465 370071 216319 69286 369188 81643
M24 155516 0 155516 186615 708391 249298 167543 708391 194671
M25 159715 394455 280270 152471 405630 286299 155814 400640 283563
Manu
fac.
Total
46017 667438 66679 116682 423158 174912 52370 569103 78096
M1: Cotton ginning, cleaning and bailing, M2: Manufacture of food products, M3: Manufacture of beverages,
M4: Manufacture of tobacco products, M5: Manufacture of textiles, 6: Manufacture of wearing apparel, M7:
Manufacture of leather and related products, M8: Manufacture of wood and products of wood and cork, except
furniture; manufacture of articles of straw and plaiting materials, M9: Manufacture of paper and paper products,
M10: Printing and reproduction of recorded media, M11: Manufacture of coke and refined petroleum products,
M12: Manufacture of chemicals and chemical products, M13: Manufacture of pharmaceuticals, medicinal
chemical and botanical products, M14: Manufacture of rubber and plastics products, M15: Manufacture of other
non-metallic mineral products, M16: Manufacture of basic metals, M17: Manufacture of fabricated metal
products, except machinery and equipment, M18: Manufacture of computer, electronic and optical products, M19:
Manufacture of electrical equipment, M20: Manufacture of machinery and equipment n.e.c., M21: Manufacture
of motor vehicles, trailers and semi-trailers, M22: Manufacture of other transport equipment, M23: Manufacture
of furniture, M24: Other manufacturing, M25: Repair and installation of machinery and equipment, M:
Manufacturing activities (Total).
4.2.4.2 Estimated GVA per market enterprise engaged in trading by activity category for
each sector and enterprise type is presented in table 4.4. Among all trading activity categories,
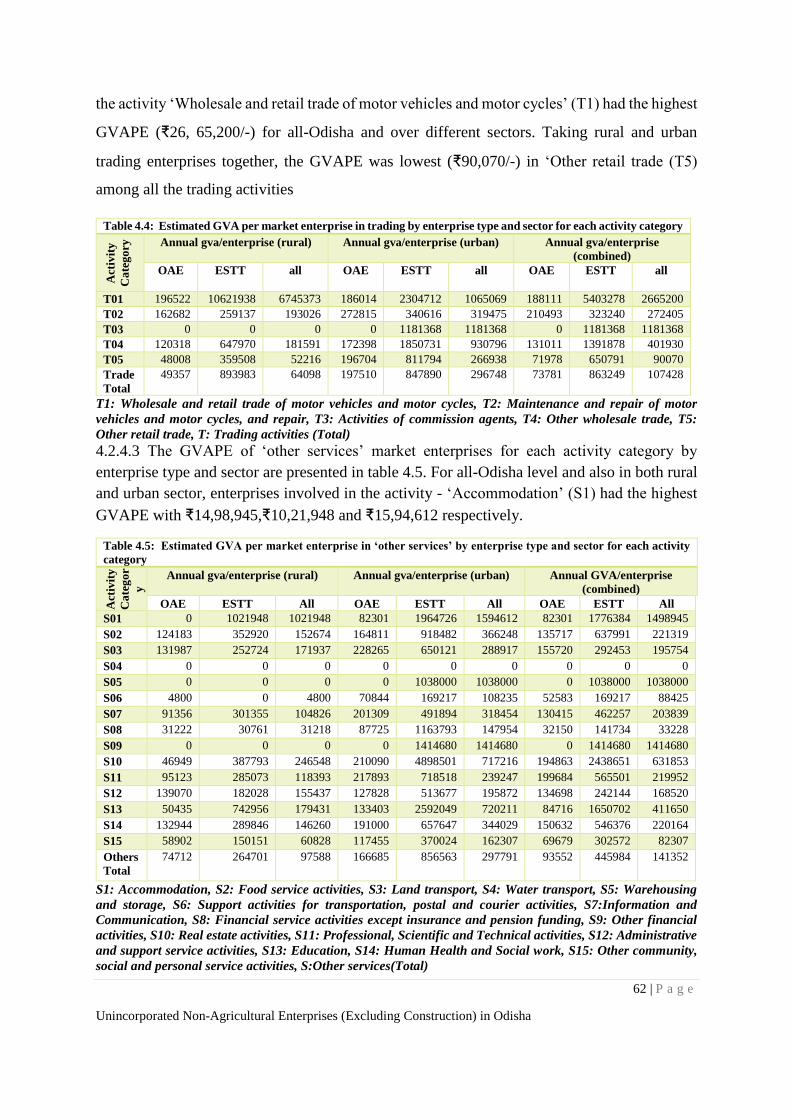
62 | P a g e
Unincorporated Non-Agricultural Enterprises (Excluding Construction) in Odisha
the activity ‘Wholesale and retail trade of motor vehicles and motor cycles’ (T1) had the highest
GVAPE (₹26, 65,200/-) for all-Odisha and over different sectors. Taking rural and urban
trading enterprises together, the GVAPE was lowest (₹90,070/-) in ‘Other retail trade (T5)
among all the trading activities
Table 4.4: Estimated GVA per market enterprise in trading by enterprise type and sector for each activity category
Act
ivit
y
Ca
teg
ory
Annual gva/enterprise (rural) Annual gva/enterprise (urban) Annual gva/enterprise
(combined)
OAE ESTT all OAE ESTT all OAE ESTT all
T01 196522 10621938 6745373 186014 2304712 1065069 188111 5403278 2665200
T02 162682 259137 193026 272815 340616 319475 210493 323240 272405
T03 0 0 0 0 1181368 1181368 0 1181368 1181368
T04 120318 647970 181591 172398 1850731 930796 131011 1391878 401930
T05 48008 359508 52216 196704 811794 266938 71978 650791 90070
Trade
Total
49357 893983 64098 197510 847890 296748 73781 863249 107428
T1: Wholesale and retail trade of motor vehicles and motor cycles, T2: Maintenance and repair of motor
vehicles and motor cycles, and repair, T3: Activities of commission agents, T4: Other wholesale trade, T5:
Other retail trade, T: Trading activities (Total)
4.2.4.3 The GVAPE of ‘other services’ market enterprises for each activity category by
enterprise type and sector are presented in table 4.5. For all-Odisha level and also in both rural
and urban sector, enterprises involved in the activity - ‘Accommodation’ (S1) had the highest
GVAPE with ₹14,98,945,₹10,21,948 and ₹15,94,612 respectively.
Table 4.5: Estimated GVA per market enterprise in ‘other services’ by enterprise type and sector for each activity
category
Act
ivit
y
Ca
teg
or
y
Annual gva/enterprise (rural) Annual gva/enterprise (urban) Annual GVA/enterprise
(combined)
OAE ESTT All OAE ESTT All OAE ESTT All
S01 0 1021948 1021948 82301 1964726 1594612 82301 1776384 1498945
S02 124183 352920 152674 164811 918482 366248 135717 637991 221319
S03 131987 252724 171937 228265 650121 288917 155720 292453 195754
S04 0 0 0 0 0 0 0 0 0
S05 0 0 0 0 1038000 1038000 0 1038000 1038000
S06 4800 0 4800 70844 169217 108235 52583 169217 88425
S07 91356 301355 104826 201309 491894 318454 130415 462257 203839
S08 31222 30761 31218 87725 1163793 147954 32150 141734 33228
S09 0 0 0 0 1414680 1414680 0 1414680 1414680
S10 46949 387793 246548 210090 4898501 717216 194863 2438651 631853
S11 95123 285073 118393 217893 718518 239247 199684 565501 219952
S12 139070 182028 155437 127828 513677 195872 134698 242144 168520
S13 50435 742956 179431 133403 2592049 720211 84716 1650702 411650
S14 132944 289846 146260 191000 657647 344029 150632 546376 220164
S15 58902 150151 60828 117455 370024 162307 69679 302572 82307
Others
Total
74712 264701 97588 166685 856563 297791 93552 445984 141352
S1: Accommodation, S2: Food service activities, S3: Land transport, S4: Water transport, S5: Warehousing
and storage, S6: Support activities for transportation, postal and courier activities, S7:Information and
Communication, S8: Financial service activities except insurance and pension funding, S9: Other financial
activities, S10: Real estate activities, S11: Professional, Scientific and Technical activities, S12: Administrative
and support service activities, S13: Education, S14: Human Health and Social work, S15: Other community,
social and personal service activities, S:Other services(Total)
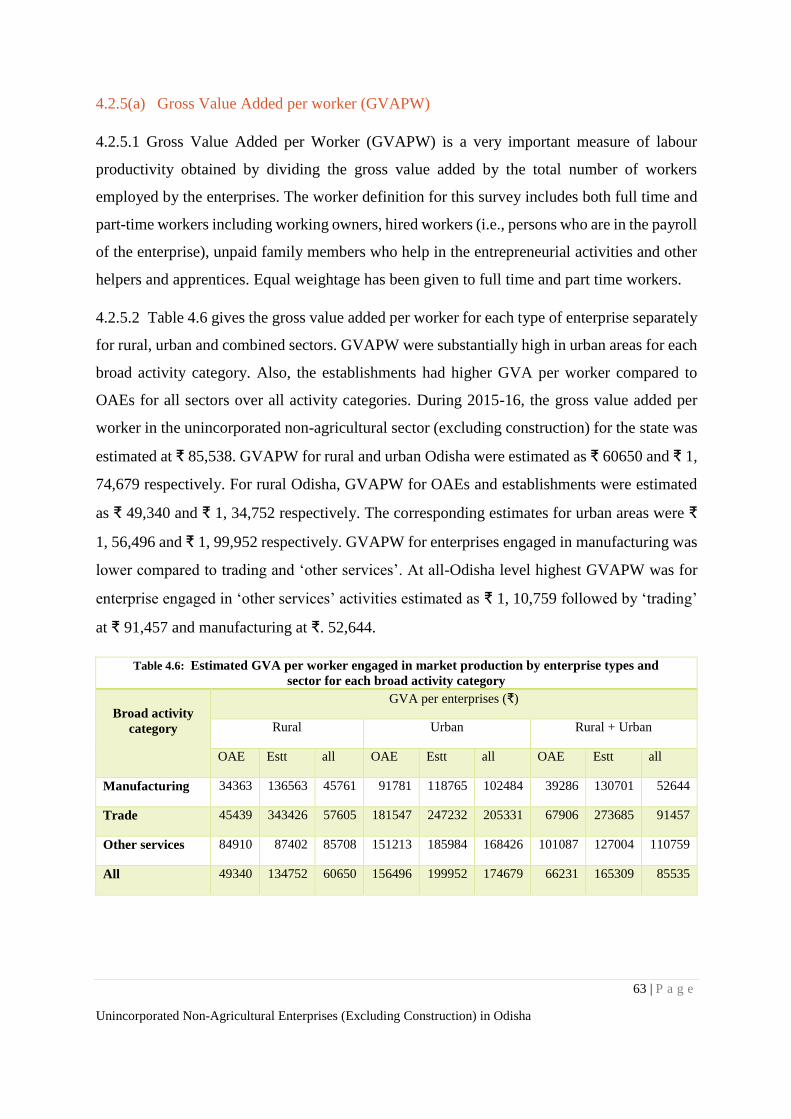
63 | P a g e
Unincorporated Non-Agricultural Enterprises (Excluding Construction) in Odisha
4.2.5(a) Gross Value Added per worker (GVAPW)
4.2.5.1 Gross Value Added per Worker (GVAPW) is a very important measure of labour
productivity obtained by dividing the gross value added by the total number of workers
employed by the enterprises. The worker definition for this survey includes both full time and
part-time workers including working owners, hired workers (i.e., persons who are in the payroll
of the enterprise), unpaid family members who help in the entrepreneurial activities and other
helpers and apprentices. Equal weightage has been given to full time and part time workers.
4.2.5.2 Table 4.6 gives the gross value added per worker for each type of enterprise separately
for rural, urban and combined sectors. GVAPW were substantially high in urban areas for each
broad activity category. Also, the establishments had higher GVA per worker compared to
OAEs for all sectors over all activity categories. During 2015-16, the gross value added per
worker in the unincorporated non-agricultural sector (excluding construction) for the state was
estimated at ₹ 85,538. GVAPW for rural and urban Odisha were estimated as ₹ 60650 and ₹ 1,
74,679 respectively. For rural Odisha, GVAPW for OAEs and establishments were estimated
as ₹ 49,340 and ₹ 1, 34,752 respectively. The corresponding estimates for urban areas were ₹
1, 56,496 and ₹ 1, 99,952 respectively. GVAPW for enterprises engaged in manufacturing was
lower compared to trading and ‘other services’. At all-Odisha level highest GVAPW was for
enterprise engaged in ‘other services’ activities estimated as ₹ 1, 10,759 followed by ‘trading’
at ₹ 91,457 and manufacturing at ₹. 52,644.
Table 4.6: Estimated GVA per worker engaged in market production by enterprise types and
sector for each broad activity category
Broad activity
category
GVA per enterprises (₹)
Rural Urban Rural + Urban
OAE Estt all OAE Estt all OAE Estt all
Manufacturing 34363 136563 45761 91781 118765 102484 39286 130701 52644
Trade 45439 343426 57605 181547 247232 205331 67906 273685 91457
Other services 84910 87402 85708 151213 185984 168426 101087 127004 110759
All 49340 134752 60650 156496 199952 174679 66231 165309 85535
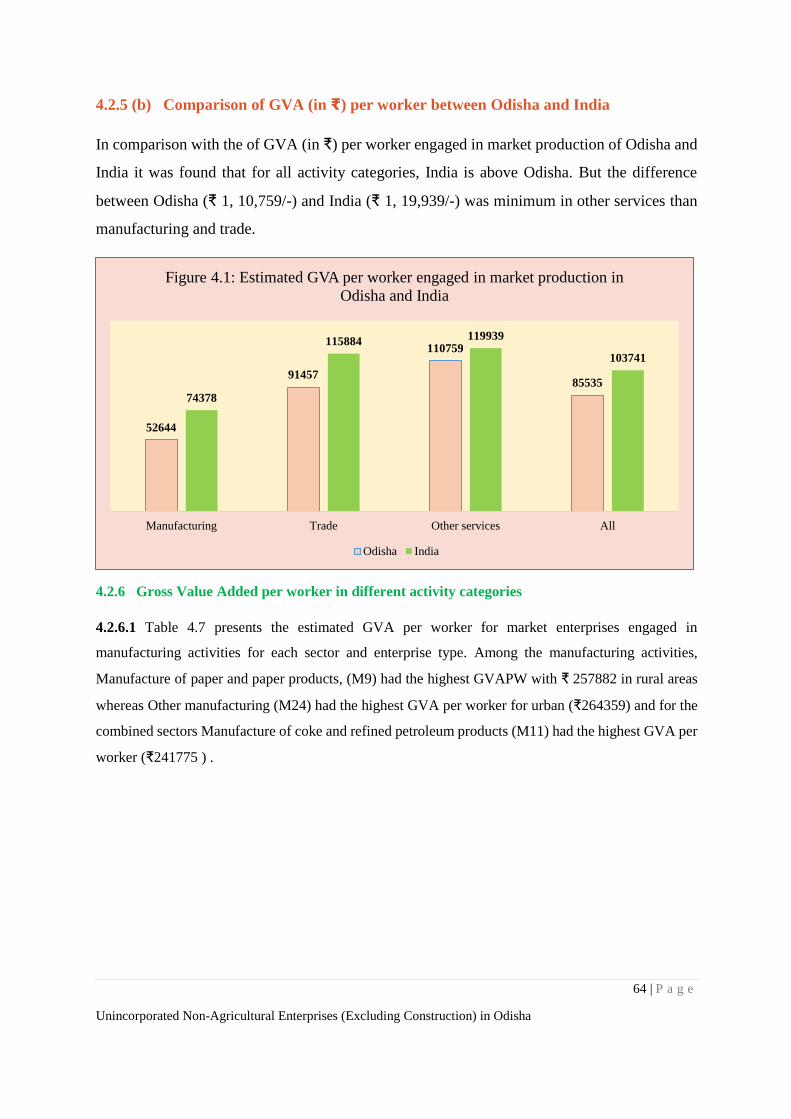
64 | P a g e
Unincorporated Non-Agricultural Enterprises (Excluding Construction) in Odisha
4.2.5 (b) Comparison of GVA (in ₹) per worker between Odisha and India
In comparison with the of GVA (in ₹) per worker engaged in market production of Odisha and
India it was found that for all activity categories, India is above Odisha. But the difference
between Odisha (₹ 1, 10,759/-) and India (₹ 1, 19,939/-) was minimum in other services than
manufacturing and trade.
4.2.6 Gross Value Added per worker in different activity categories
4.2.6.1 Table 4.7 presents the estimated GVA per worker for market enterprises engaged in
manufacturing activities for each sector and enterprise type. Among the manufacturing activities,
Manufacture of paper and paper products, (M9) had the highest GVAPW with ₹ 257882 in rural areas
whereas Other manufacturing (M24) had the highest GVA per worker for urban (₹264359) and for the
combined sectors Manufacture of coke and refined petroleum products (M11) had the highest GVA per
worker (₹241775 ) .
52644
91457
110759
85535
74378
115884119939
103741
Manufacturing Trade Other services All
Figure 4.1: Estimated GVA per worker engaged in market production in
Odisha and India
Odisha India
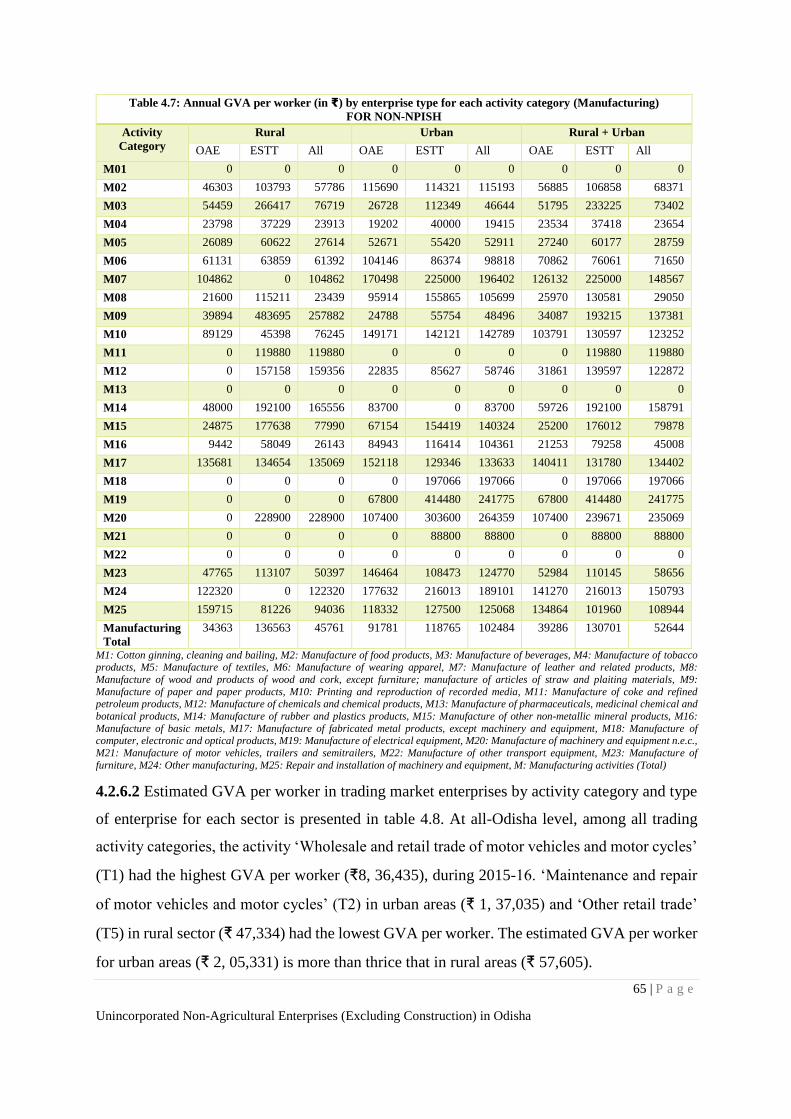
65 | P a g e
Unincorporated Non-Agricultural Enterprises (Excluding Construction) in Odisha
Table 4.7: Annual GVA per worker (in ₹) by enterprise type for each activity category (Manufacturing)
FOR NON-NPISH
Activity
Category
Rural Urban Rural + Urban
OAE ESTT All OAE ESTT All OAE ESTT All
M01 0 0 0 0 0 0 0 0 0
M02 46303 103793 57786 115690 114321 115193 56885 106858 68371
M03 54459 266417 76719 26728 112349 46644 51795 233225 73402
M04 23798 37229 23913 19202 40000 19415 23534 37418 23654
M05 26089 60622 27614 52671 55420 52911 27240 60177 28759
M06 61131 63859 61392 104146 86374 98818 70862 76061 71650
M07 104862 0 104862 170498 225000 196402 126132 225000 148567
M08 21600 115211 23439 95914 155865 105699 25970 130581 29050
M09 39894 483695 257882 24788 55754 48496 34087 193215 137381
M10 89129 45398 76245 149171 142121 142789 103791 130597 123252
M11 0 119880 119880 0 0 0 0 119880 119880
M12 0 157158 159356 22835 85627 58746 31861 139597 122872
M13 0 0 0 0 0 0 0 0 0
M14 48000 192100 165556 83700 0 83700 59726 192100 158791
M15 24875 177638 77990 67154 154419 140324 25200 176012 79878
M16 9442 58049 26143 84943 116414 104361 21253 79258 45008
M17 135681 134654 135069 152118 129346 133633 140411 131780 134402
M18 0 0 0 0 197066 197066 0 197066 197066
M19 0 0 0 67800 414480 241775 67800 414480 241775
M20 0 228900 228900 107400 303600 264359 107400 239671 235069
M21 0 0 0 0 88800 88800 0 88800 88800
M22 0 0 0 0 0 0 0 0 0
M23 47765 113107 50397 146464 108473 124770 52984 110145 58656
M24 122320 0 122320 177632 216013 189101 141270 216013 150793
M25 159715 81226 94036 118332 127500 125068 134864 101960 108944
Manufacturing
Total
34363 136563 45761 91781 118765 102484 39286 130701 52644
M1: Cotton ginning, cleaning and bailing, M2: Manufacture of food products, M3: Manufacture of beverages, M4: Manufacture of tobacco products, M5: Manufacture of textiles, M6: Manufacture of wearing apparel, M7: Manufacture of leather and related products, M8:
Manufacture of wood and products of wood and cork, except furniture; manufacture of articles of straw and plaiting materials, M9:
Manufacture of paper and paper products, M10: Printing and reproduction of recorded media, M11: Manufacture of coke and refined petroleum products, M12: Manufacture of chemicals and chemical products, M13: Manufacture of pharmaceuticals, medicinal chemical and
botanical products, M14: Manufacture of rubber and plastics products, M15: Manufacture of other non-metallic mineral products, M16:
Manufacture of basic metals, M17: Manufacture of fabricated metal products, except machinery and equipment, M18: Manufacture of computer, electronic and optical products, M19: Manufacture of electrical equipment, M20: Manufacture of machinery and equipment n.e.c.,
M21: Manufacture of motor vehicles, trailers and semitrailers, M22: Manufacture of other transport equipment, M23: Manufacture of
furniture, M24: Other manufacturing, M25: Repair and installation of machinery and equipment, M: Manufacturing activities (Total)
4.2.6.2 Estimated GVA per worker in trading market enterprises by activity category and type
of enterprise for each sector is presented in table 4.8. At all-Odisha level, among all trading
activity categories, the activity ‘Wholesale and retail trade of motor vehicles and motor cycles’
(T1) had the highest GVA per worker (₹8, 36,435), during 2015-16. ‘Maintenance and repair
of motor vehicles and motor cycles’ (T2) in urban areas (₹ 1, 37,035) and ‘Other retail trade’
(T5) in rural sector (₹ 47,334) had the lowest GVA per worker. The estimated GVA per worker
for urban areas (₹ 2, 05,331) is more than thrice that in rural areas (₹ 57,605).
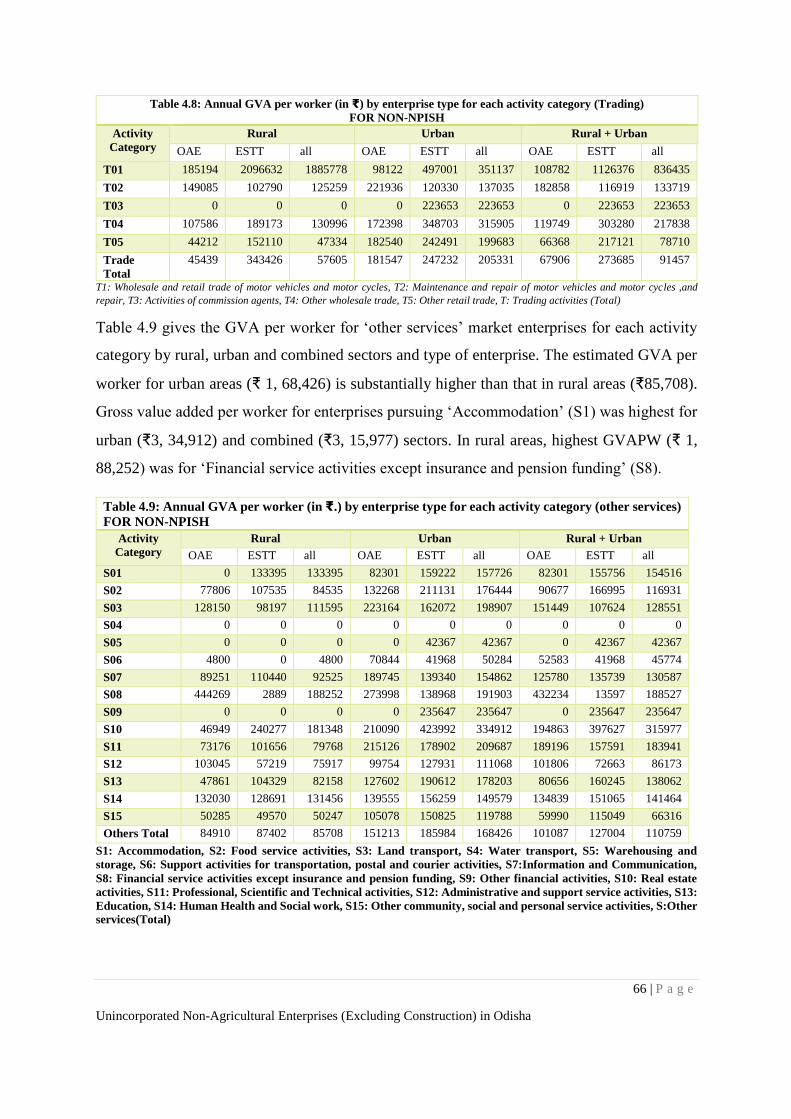
66 | P a g e
Unincorporated Non-Agricultural Enterprises (Excluding Construction) in Odisha
T1: Wholesale and retail trade of motor vehicles and motor cycles, T2: Maintenance and repair of motor vehicles and motor cycles ,and
repair, T3: Activities of commission agents, T4: Other wholesale trade, T5: Other retail trade, T: Trading activities (Total)
Table 4.9 gives the GVA per worker for ‘other services’ market enterprises for each activity
category by rural, urban and combined sectors and type of enterprise. The estimated GVA per
worker for urban areas (₹ 1, 68,426) is substantially higher than that in rural areas (₹85,708).
Gross value added per worker for enterprises pursuing ‘Accommodation’ (S1) was highest for
urban (₹3, 34,912) and combined (₹3, 15,977) sectors. In rural areas, highest GVAPW (₹ 1,
88,252) was for ‘Financial service activities except insurance and pension funding’ (S8).
Table 4.9: Annual GVA per worker (in ₹.) by enterprise type for each activity category (other services)
FOR NON-NPISH
Activity
Category
Rural Urban Rural + Urban
OAE ESTT all OAE ESTT all OAE ESTT all
S01 0 133395 133395 82301 159222 157726 82301 155756 154516
S02 77806 107535 84535 132268 211131 176444 90677 166995 116931
S03 128150 98197 111595 223164 162072 198907 151449 107624 128551
S04 0 0 0 0 0 0 0 0 0
S05 0 0 0 0 42367 42367 0 42367 42367
S06 4800 0 4800 70844 41968 50284 52583 41968 45774
S07 89251 110440 92525 189745 139340 154862 125780 135739 130587
S08 444269 2889 188252 273998 138968 191903 432234 13597 188527
S09 0 0 0 0 235647 235647 0 235647 235647
S10 46949 240277 181348 210090 423992 334912 194863 397627 315977
S11 73176 101656 79768 215126 178902 209687 189196 157591 183941
S12 103045 57219 75917 99754 127931 111068 101806 72663 86173
S13 47861 104329 82158 127602 190612 178203 80656 160245 138062
S14 132030 128691 131456 139555 156259 149579 134839 151065 141464
S15 50285 49570 50247 105078 150825 119788 59990 115049 66316
Others Total 84910 87402 85708 151213 185984 168426 101087 127004 110759
S1: Accommodation, S2: Food service activities, S3: Land transport, S4: Water transport, S5: Warehousing and
storage, S6: Support activities for transportation, postal and courier activities, S7:Information and Communication,
S8: Financial service activities except insurance and pension funding, S9: Other financial activities, S10: Real estate
activities, S11: Professional, Scientific and Technical activities, S12: Administrative and support service activities, S13:
Education, S14: Human Health and Social work, S15: Other community, social and personal service activities, S:Other
services(Total)
Table 4.8: Annual GVA per worker (in ₹) by enterprise type for each activity category (Trading)
FOR NON-NPISH
Activity
Category
Rural Urban Rural + Urban
OAE ESTT all OAE ESTT all OAE ESTT all
T01 185194 2096632 1885778 98122 497001 351137 108782 1126376 836435
T02 149085 102790 125259 221936 120330 137035 182858 116919 133719
T03 0 0 0 0 223653 223653 0 223653 223653
T04 107586 189173 130996 172398 348703 315905 119749 303280 217838
T05 44212 152110 47334 182540 242491 199683 66368 217121 78710
Trade
Total
45439 343426 57605 181547 247232 205331 67906 273685 91457
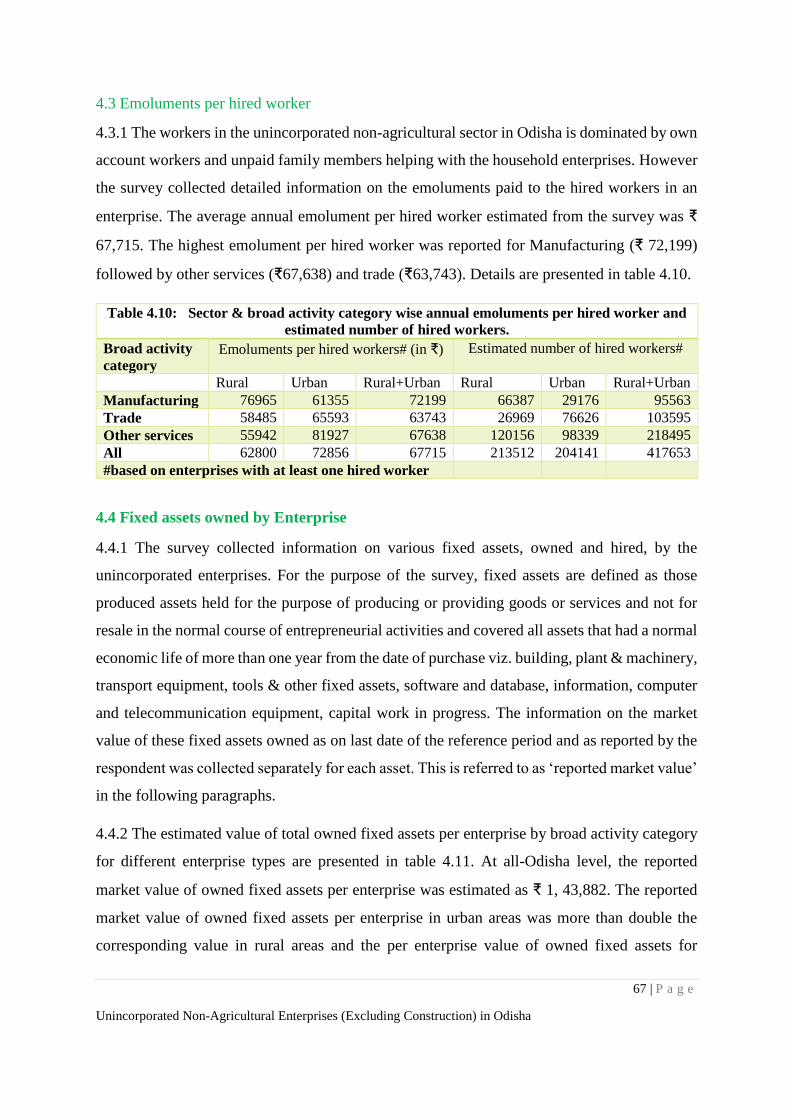
67 | P a g e
Unincorporated Non-Agricultural Enterprises (Excluding Construction) in Odisha
4.3 Emoluments per hired worker
4.3.1 The workers in the unincorporated non-agricultural sector in Odisha is dominated by own
account workers and unpaid family members helping with the household enterprises. However
the survey collected detailed information on the emoluments paid to the hired workers in an
enterprise. The average annual emolument per hired worker estimated from the survey was ₹
67,715. The highest emolument per hired worker was reported for Manufacturing (₹ 72,199)
followed by other services (₹67,638) and trade (₹63,743). Details are presented in table 4.10.
Table 4.10: Sector & broad activity category wise annual emoluments per hired worker and
estimated number of hired workers.
Broad activity
category Emoluments per hired workers# (in ₹) Estimated number of hired workers#
Rural Urban Rural+Urban Rural Urban Rural+Urban
Manufacturing 76965 61355 72199 66387 29176 95563
Trade 58485 65593 63743 26969 76626 103595
Other services 55942 81927 67638 120156 98339 218495
All 62800 72856 67715 213512 204141 417653
#based on enterprises with at least one hired worker
4.4 Fixed assets owned by Enterprise
4.4.1 The survey collected information on various fixed assets, owned and hired, by the
unincorporated enterprises. For the purpose of the survey, fixed assets are defined as those
produced assets held for the purpose of producing or providing goods or services and not for
resale in the normal course of entrepreneurial activities and covered all assets that had a normal
economic life of more than one year from the date of purchase viz. building, plant & machinery,
transport equipment, tools & other fixed assets, software and database, information, computer
and telecommunication equipment, capital work in progress. The information on the market
value of these fixed assets owned as on last date of the reference period and as reported by the
respondent was collected separately for each asset. This is referred to as ‘reported market value’
in the following paragraphs.
4.4.2 The estimated value of total owned fixed assets per enterprise by broad activity category
for different enterprise types are presented in table 4.11. At all-Odisha level, the reported
market value of owned fixed assets per enterprise was estimated as ₹ 1, 43,882. The reported
market value of owned fixed assets per enterprise in urban areas was more than double the
corresponding value in rural areas and the per enterprise value of owned fixed assets for
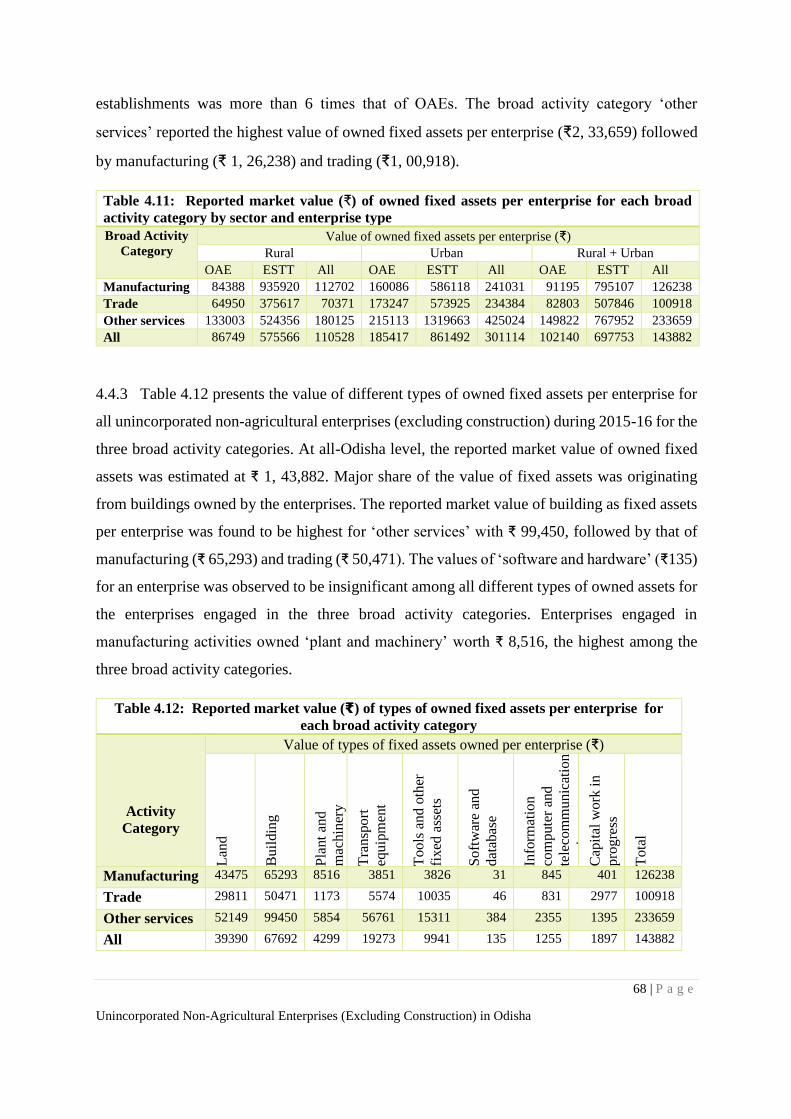
68 | P a g e
Unincorporated Non-Agricultural Enterprises (Excluding Construction) in Odisha
establishments was more than 6 times that of OAEs. The broad activity category ‘other
services’ reported the highest value of owned fixed assets per enterprise (₹2, 33,659) followed
by manufacturing (₹ 1, 26,238) and trading (₹1, 00,918).
Table 4.11: Reported market value (₹) of owned fixed assets per enterprise for each broad
activity category by sector and enterprise type
Broad Activity
Category Value of owned fixed assets per enterprise (₹)
Rural Urban Rural + Urban
OAE ESTT All OAE ESTT All OAE ESTT All
Manufacturing 84388 935920 112702 160086 586118 241031 91195 795107 126238
Trade 64950 375617 70371 173247 573925 234384 82803 507846 100918
Other services 133003 524356 180125 215113 1319663 425024 149822 767952 233659
All 86749 575566 110528 185417 861492 301114 102140 697753 143882
4.4.3 Table 4.12 presents the value of different types of owned fixed assets per enterprise for
all unincorporated non-agricultural enterprises (excluding construction) during 2015-16 for the
three broad activity categories. At all-Odisha level, the reported market value of owned fixed
assets was estimated at ₹ 1, 43,882. Major share of the value of fixed assets was originating
from buildings owned by the enterprises. The reported market value of building as fixed assets
per enterprise was found to be highest for ‘other services’ with ₹ 99,450, followed by that of
manufacturing (₹ 65,293) and trading (₹ 50,471). The values of ‘software and hardware’ (₹135)
for an enterprise was observed to be insignificant among all different types of owned assets for
the enterprises engaged in the three broad activity categories. Enterprises engaged in
manufacturing activities owned ‘plant and machinery’ worth ₹ 8,516, the highest among the
three broad activity categories.
Table 4.12: Reported market value (₹) of types of owned fixed assets per enterprise for
each broad activity category
Activity
Category
Value of types of fixed assets owned per enterprise (₹)
Lan
d
Bu
ildin
g
Pla
nt
and
mac
hin
ery
Tra
nsp
ort
equ
ipm
ent
To
ols
an
d o
ther
fix
ed a
sset
s
So
ftw
are
and
dat
abas
e
Info
rmat
ion
com
pute
r an
d
tele
com
mu
nic
atio
n
equ
ipm
ent
Cap
ital
work
in
pro
gre
ss
To
tal
Manufacturing 43475 65293 8516 3851 3826 31 845 401 126238
Trade 29811 50471 1173 5574 10035 46 831 2977 100918
Other services 52149 99450 5854 56761 15311 384 2355 1395 233659
All 39390 67692 4299 19273 9941 135 1255 1897 143882
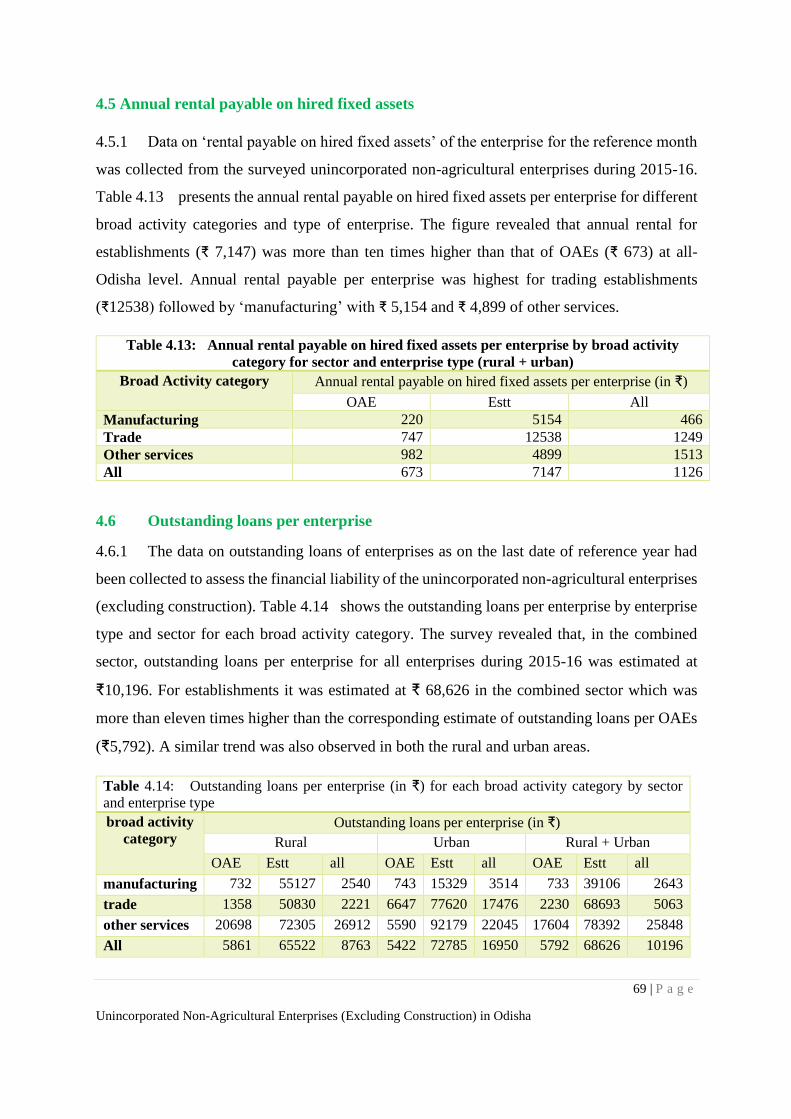
69 | P a g e
Unincorporated Non-Agricultural Enterprises (Excluding Construction) in Odisha
4.5 Annual rental payable on hired fixed assets
4.5.1 Data on ‘rental payable on hired fixed assets’ of the enterprise for the reference month
was collected from the surveyed unincorporated non-agricultural enterprises during 2015-16.
Table 4.13 presents the annual rental payable on hired fixed assets per enterprise for different
broad activity categories and type of enterprise. The figure revealed that annual rental for
establishments (₹ 7,147) was more than ten times higher than that of OAEs (₹ 673) at all-
Odisha level. Annual rental payable per enterprise was highest for trading establishments
(₹12538) followed by ‘manufacturing’ with ₹ 5,154 and ₹ 4,899 of other services.
Table 4.13: Annual rental payable on hired fixed assets per enterprise by broad activity
category for sector and enterprise type (rural + urban)
Broad Activity category Annual rental payable on hired fixed assets per enterprise (in ₹)
OAE Estt All
Manufacturing 220 5154 466
Trade 747 12538 1249
Other services 982 4899 1513
All 673 7147 1126
4.6 Outstanding loans per enterprise
4.6.1 The data on outstanding loans of enterprises as on the last date of reference year had
been collected to assess the financial liability of the unincorporated non-agricultural enterprises
(excluding construction). Table 4.14 shows the outstanding loans per enterprise by enterprise
type and sector for each broad activity category. The survey revealed that, in the combined
sector, outstanding loans per enterprise for all enterprises during 2015-16 was estimated at
₹10,196. For establishments it was estimated at ₹ 68,626 in the combined sector which was
more than eleven times higher than the corresponding estimate of outstanding loans per OAEs
(₹5,792). A similar trend was also observed in both the rural and urban areas.
Table 4.14: Outstanding loans per enterprise (in ₹) for each broad activity category by sector
and enterprise type
broad activity
category Outstanding loans per enterprise (in ₹)
Rural Urban Rural + Urban
OAE Estt all OAE Estt all OAE Estt all
manufacturing 732 55127 2540 743 15329 3514 733 39106 2643
trade 1358 50830 2221 6647 77620 17476 2230 68693 5063
other services 20698 72305 26912 5590 92179 22045 17604 78392 25848
All 5861 65522 8763 5422 72785 16950 5792 68626 10196
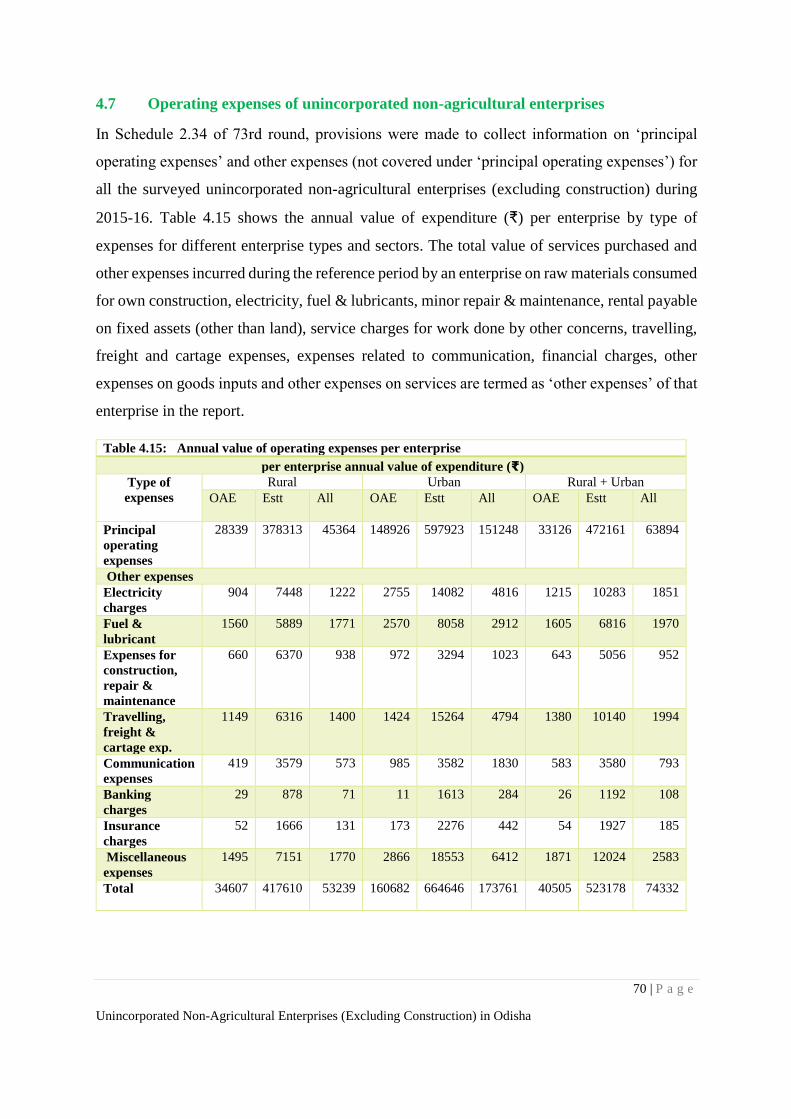
70 | P a g e
Unincorporated Non-Agricultural Enterprises (Excluding Construction) in Odisha
4.7 Operating expenses of unincorporated non-agricultural enterprises
In Schedule 2.34 of 73rd round, provisions were made to collect information on ‘principal
operating expenses’ and other expenses (not covered under ‘principal operating expenses’) for
all the surveyed unincorporated non-agricultural enterprises (excluding construction) during
2015-16. Table 4.15 shows the annual value of expenditure (₹) per enterprise by type of
expenses for different enterprise types and sectors. The total value of services purchased and
other expenses incurred during the reference period by an enterprise on raw materials consumed
for own construction, electricity, fuel & lubricants, minor repair & maintenance, rental payable
on fixed assets (other than land), service charges for work done by other concerns, travelling,
freight and cartage expenses, expenses related to communication, financial charges, other
expenses on goods inputs and other expenses on services are termed as ‘other expenses’ of that
enterprise in the report.
Table 4.15: Annual value of operating expenses per enterprise
per enterprise annual value of expenditure (₹)
Type of
expenses
Rural Urban Rural + Urban
OAE Estt All OAE Estt All OAE Estt All
Principal
operating
expenses
28339 378313 45364 148926 597923 151248 33126 472161 63894
Other expenses
Electricity
charges
904 7448 1222 2755 14082 4816 1215 10283 1851
Fuel &
lubricant
1560 5889 1771 2570 8058 2912 1605 6816 1970
Expenses for
construction,
repair &
maintenance
660 6370 938 972 3294 1023 643 5056 952
Travelling,
freight &
cartage exp.
1149 6316 1400 1424 15264 4794 1380 10140 1994
Communication
expenses
419 3579 573 985 3582 1830 583 3580 793
Banking
charges
29 878 71 11 1613 284 26 1192 108
Insurance
charges
52 1666 131 173 2276 442 54 1927 185
Miscellaneous
expenses
1495 7151 1770 2866 18553 6412 1871 12024 2583
Total 34607 417610 53239 160682 664646 173761 40505 523178 74332
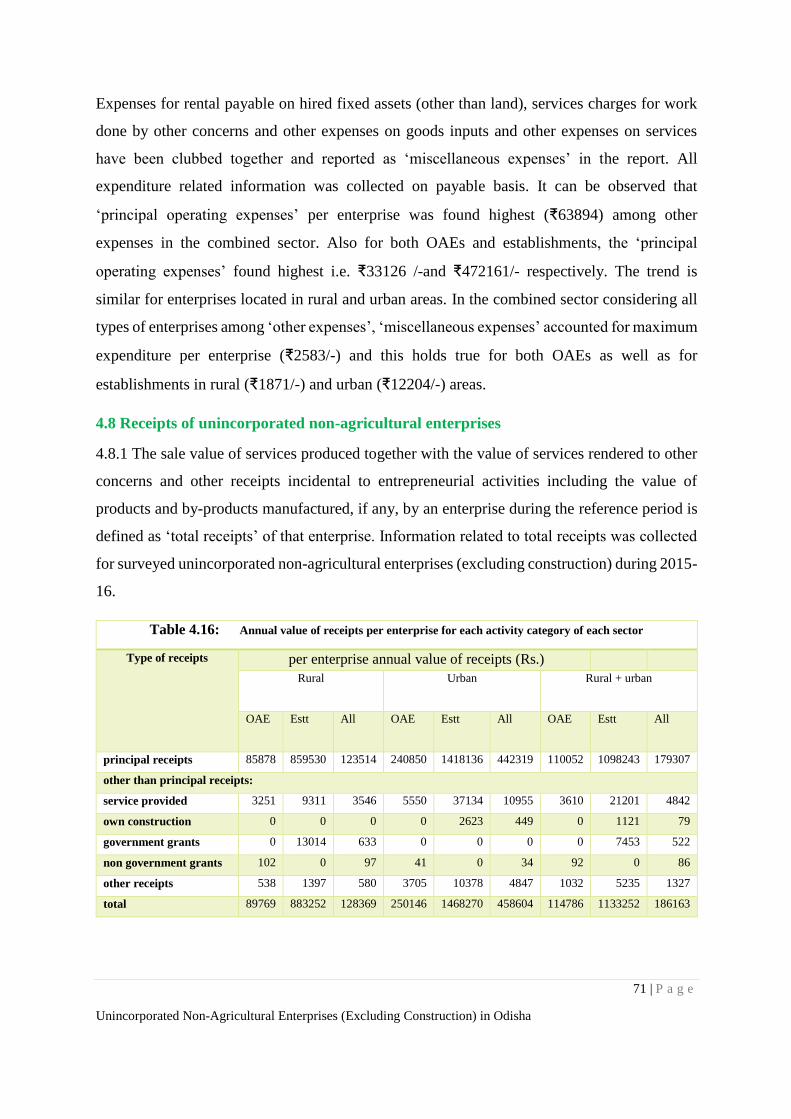
71 | P a g e
Unincorporated Non-Agricultural Enterprises (Excluding Construction) in Odisha
Expenses for rental payable on hired fixed assets (other than land), services charges for work
done by other concerns and other expenses on goods inputs and other expenses on services
have been clubbed together and reported as ‘miscellaneous expenses’ in the report. All
expenditure related information was collected on payable basis. It can be observed that
‘principal operating expenses’ per enterprise was found highest (₹63894) among other
expenses in the combined sector. Also for both OAEs and establishments, the ‘principal
operating expenses’ found highest i.e. ₹33126 /-and ₹472161/- respectively. The trend is
similar for enterprises located in rural and urban areas. In the combined sector considering all
types of enterprises among ‘other expenses’, ‘miscellaneous expenses’ accounted for maximum
expenditure per enterprise (₹2583/-) and this holds true for both OAEs as well as for
establishments in rural (₹1871/-) and urban (₹12204/-) areas.
4.8 Receipts of unincorporated non-agricultural enterprises
4.8.1 The sale value of services produced together with the value of services rendered to other
concerns and other receipts incidental to entrepreneurial activities including the value of
products and by-products manufactured, if any, by an enterprise during the reference period is
defined as ‘total receipts’ of that enterprise. Information related to total receipts was collected
for surveyed unincorporated non-agricultural enterprises (excluding construction) during 2015-
16.
Table 4.16: Annual value of receipts per enterprise for each activity category of each sector
Type of receipts per enterprise annual value of receipts (Rs.)
Rural Urban Rural + urban
OAE Estt All OAE Estt All OAE Estt All
principal receipts 85878 859530 123514 240850 1418136 442319 110052 1098243 179307
other than principal receipts:
service provided 3251 9311 3546 5550 37134 10955 3610 21201 4842
own construction 0 0 0 0 2623 449 0 1121 79
government grants 0 13014 633 0 0 0 0 7453 522
non government grants 102 0 97 41 0 34 92 0 86
other receipts 538 1397 580 3705 10378 4847 1032 5235 1327
total 89769 883252 128369 250146 1468270 458604 114786 1133252 186163
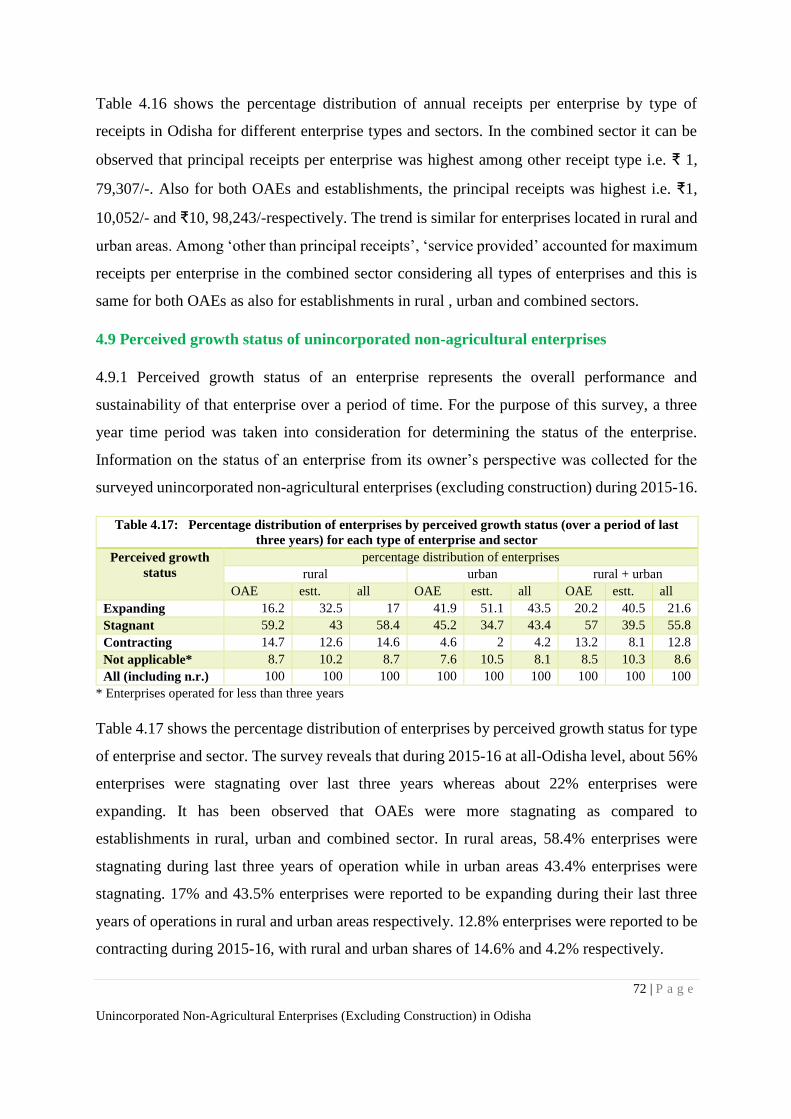
72 | P a g e
Unincorporated Non-Agricultural Enterprises (Excluding Construction) in Odisha
Table 4.16 shows the percentage distribution of annual receipts per enterprise by type of
receipts in Odisha for different enterprise types and sectors. In the combined sector it can be
observed that principal receipts per enterprise was highest among other receipt type i.e. ₹ 1,
79,307/-. Also for both OAEs and establishments, the principal receipts was highest i.e. ₹1,
10,052/- and ₹10, 98,243/-respectively. The trend is similar for enterprises located in rural and
urban areas. Among ‘other than principal receipts’, ‘service provided’ accounted for maximum
receipts per enterprise in the combined sector considering all types of enterprises and this is
same for both OAEs as also for establishments in rural , urban and combined sectors.
4.9 Perceived growth status of unincorporated non-agricultural enterprises
4.9.1 Perceived growth status of an enterprise represents the overall performance and
sustainability of that enterprise over a period of time. For the purpose of this survey, a three
year time period was taken into consideration for determining the status of the enterprise.
Information on the status of an enterprise from its owner’s perspective was collected for the
surveyed unincorporated non-agricultural enterprises (excluding construction) during 2015-16.
Table 4.17: Percentage distribution of enterprises by perceived growth status (over a period of last
three years) for each type of enterprise and sector
Perceived growth
status
percentage distribution of enterprises
rural urban rural + urban
OAE estt. all OAE estt. all OAE estt. all
Expanding 16.2 32.5 17 41.9 51.1 43.5 20.2 40.5 21.6
Stagnant 59.2 43 58.4 45.2 34.7 43.4 57 39.5 55.8
Contracting 14.7 12.6 14.6 4.6 2 4.2 13.2 8.1 12.8
Not applicable* 8.7 10.2 8.7 7.6 10.5 8.1 8.5 10.3 8.6
All (including n.r.) 100 100 100 100 100 100 100 100 100
* Enterprises operated for less than three years
Table 4.17 shows the percentage distribution of enterprises by perceived growth status for type
of enterprise and sector. The survey reveals that during 2015-16 at all-Odisha level, about 56%
enterprises were stagnating over last three years whereas about 22% enterprises were
expanding. It has been observed that OAEs were more stagnating as compared to
establishments in rural, urban and combined sector. In rural areas, 58.4% enterprises were
stagnating during last three years of operation while in urban areas 43.4% enterprises were
stagnating. 17% and 43.5% enterprises were reported to be expanding during their last three
years of operations in rural and urban areas respectively. 12.8% enterprises were reported to be
contracting during 2015-16, with rural and urban shares of 14.6% and 4.2% respectively.
73 | P a g e
Unincorporated Non-Agricultural Enterprises (Excluding Construction) in Odisha
Chapter Five
Conclusion
The economy of Odisha is one of the fastest growing economy of our country. Odisha’s
economy has seen a major growth in the last few decades. The credit for this boom largely goes
to the service sector. The manufacturing and trade sectors also do not lag behind.
It now seems that there has been a turning point in the last few years and the economy
of Odisha has witnessed an acceleration. In comparison with the results obtained from the NSS
67th round (July 2010 – June 2011) survey on the same subject, the number of unincorporated
non-agricultural enterprises (excluding construction) has increased by 48.51% over the period
with a growth rate of nearly 10% per annum. During 2015-16, 3346797 workers were employed
in unincorporated non-agricultural enterprises (excluding construction) in Odisha. Among the
workers, 2616407 (78.18%) worked in rural areas and 730390 (21.82%) worked in urban areas.
In comparison with the results obtained from the NSS 67th round survey the number of workers
in unincorporated non-agricultural enterprises (excluding construction) has increased by 6.34%
over the 5 years.
In terms of the Gross Value Added (GVA) the evidence presented here clearly shows
that the economy is poised for a take-off to a high growth phase. In comparison with the results
of NSS 67th round (July 2010 to June 2011), Gross Value Added per enterprise (GVAPE) of
the unincorporated non-agricultural enterprises (excluding construction) in the state has
increased by 13.3% at current prices over the 5 years. The percentage growth in GVA per
enterprise for OAEs was 20.4% and for establishments it was 37.3%. At all-Odisha level
highest GVAPE was for enterprise engaged in ‘other services ‘activities estimated as ₹
1,41,352/- followed by trading at ₹ 1,41,352/- and manufacturing at ₹ 78,096/-.
During 2015-16, the gross value added per worker in the unincorporated non-
agricultural sector (excluding construction) for the state was estimated at ₹ 85,538. GVAPW
for rural and urban Odisha were estimated as ₹ 60650 and ₹ 1, 74,679 respectively. At all-
Odisha level highest GVAPW was for enterprise engaged in ‘other services’ activities
estimated as ₹ 1, 10,759 followed by ‘trading’ at ₹ 91,457 and manufacturing at ₹. 52,644. In
74 | P a g e
Unincorporated Non-Agricultural Enterprises (Excluding Construction) in Odisha
comparison with the of GVA (in ₹) per worker engaged in market production of Odisha and
India it was found that for all activity categories, India is above Odisha. But the difference
between Odisha (₹ 1, 10,759/-) and India (₹ 1, 19,939/-) was minimum in other services than
manufacturing and trade.
Any state’s economic development depends on the growth and evolution of the three
sectors of the economy. However in recent years the service sector growing at a very faster rate
in Odisha’s economy and is contributing a major share in terms of GVA and employment. The
above result proves that the service sector is an important component of Odisha’s economy.
The process of development usually coincides with a growing role of services in the state’s
economy. Service sector activities generally require relatively less capital investment than
activities in other sectors. But a majority of these activities also require relatively less space for
operations service sector is a knowledge intensive sector and substantial HRD inputs are the
necessary for developing most of the services sector activities. So Government should give
more attention to service sector for rapid and high economic growth of the state.
75 | P a g e
Unincorporated Non-Agricultural Enterprises (Excluding Construction) in Odisha
Appendix-A
Note on Sample Design and Estimation Procedure
76 | P a g e
Unincorporated Non-Agricultural Enterprises (Excluding Construction) in Odisha
Note on Sample Design and Estimation Procedure of NSS 73rd Round
1. Introduction
1.1 The National Sample Survey (NSS), set up by the Government of India in 1950 to collect
socio-economic data employing scientific sampling methods, started its seventy third round
from 1st July 2015. The survey continued up to 30th June 2016.
2 Outline of Survey Programme
2.1 Subject Coverage: The coverage of NSS 73rd round (July 2015 – June 2016) was
unincorporated non-agricultural enterprises belonging to Manufacturing, Trade and Other
Services (excluding construction).
The survey covered the following broad categories:
(a) Manufacturing enterprises excluding those registered under Sections 2m(i) and
2m(ii) of the Factories Act, 1948
(b) Manufacturing enterprises registered under Section 85 of Factories Act, 1948
(c) Enterprises engaged in cotton ginning, cleaning and baling (code 01632 of NIC-
2008) excluding those registered under Factories Act, 1948
(d) Enterprises manufacturing beedi and cigar excluding those registered under beedi
and cigar workers (conditions of employment) Act, 1966
(e) Non-captive electric power generation, transmission and distribution by units not
registered with the Central Electricity Authority (CEA)
(f) Trading enterprises
(g) Other Service sector enterprises (excluding construction)
Categories of enterprises under coverage in (a) to (g) above were:
(a) Proprietary and partnership enterprises [excluding Limited Liability Partnership
(LLP) enterprises]
(b) Trusts, Self-Help Groups (SHGs), Non-Profit Institutions (NPIs), etc.
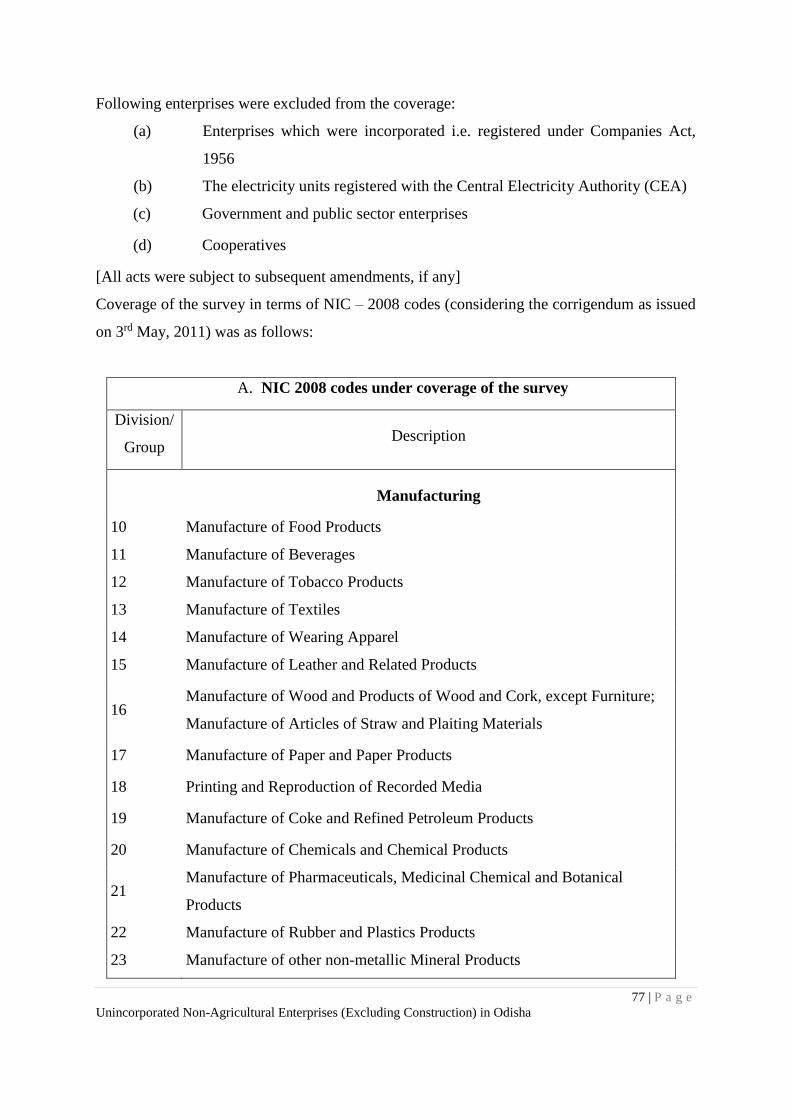
77 | P a g e
Unincorporated Non-Agricultural Enterprises (Excluding Construction) in Odisha
Following enterprises were excluded from the coverage:
(a) Enterprises which were incorporated i.e. registered under Companies Act,
1956
(b) The electricity units registered with the Central Electricity Authority (CEA)
(c) Government and public sector enterprises
(d) Cooperatives
[All acts were subject to subsequent amendments, if any]
Coverage of the survey in terms of NIC – 2008 codes (considering the corrigendum as issued
on 3rd May, 2011) was as follows:
A. NIC 2008 codes under coverage of the survey
Division/
Group Description
Manufacturing
10 Manufacture of Food Products
11 Manufacture of Beverages
12 Manufacture of Tobacco Products
13 Manufacture of Textiles
14 Manufacture of Wearing Apparel
15 Manufacture of Leather and Related Products
16 Manufacture of Wood and Products of Wood and Cork, except Furniture;
Manufacture of Articles of Straw and Plaiting Materials
17 Manufacture of Paper and Paper Products
18 Printing and Reproduction of Recorded Media
19 Manufacture of Coke and Refined Petroleum Products
20 Manufacture of Chemicals and Chemical Products
21 Manufacture of Pharmaceuticals, Medicinal Chemical and Botanical
Products
22 Manufacture of Rubber and Plastics Products
23 Manufacture of other non-metallic Mineral Products
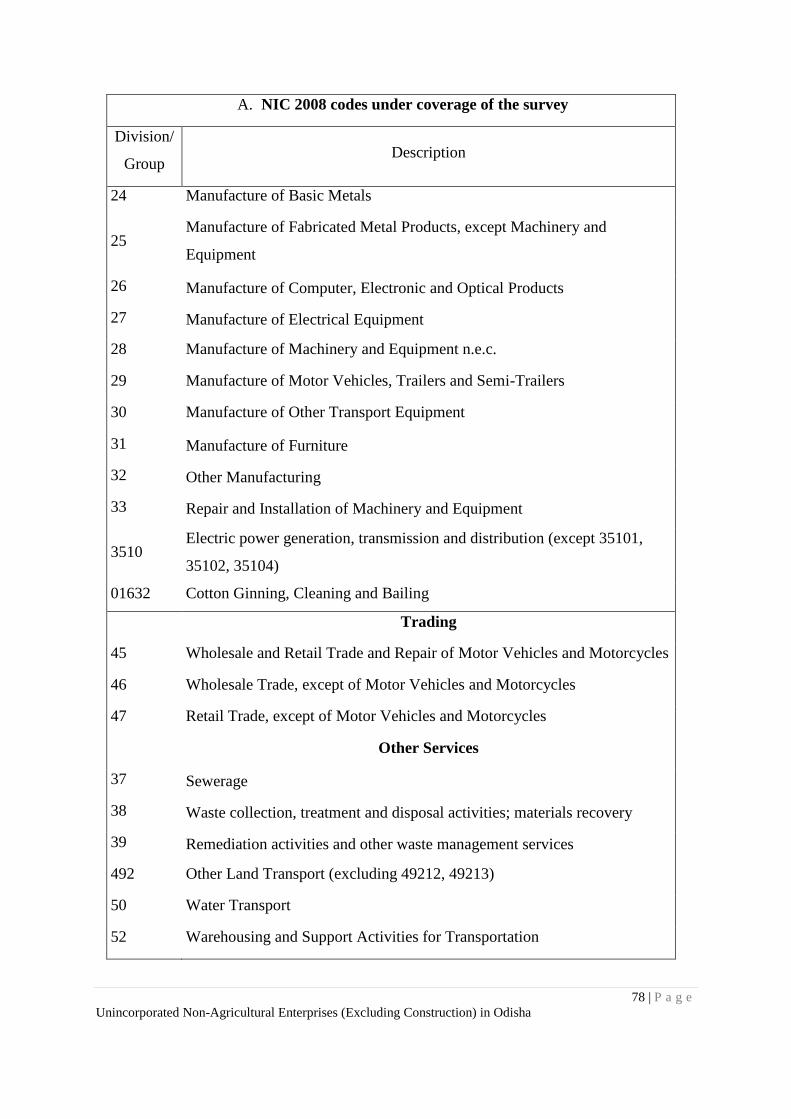
78 | P a g e
Unincorporated Non-Agricultural Enterprises (Excluding Construction) in Odisha
A. NIC 2008 codes under coverage of the survey
Division/
Group Description
24 Manufacture of Basic Metals
25 Manufacture of Fabricated Metal Products, except Machinery and
Equipment
26 Manufacture of Computer, Electronic and Optical Products
27 Manufacture of Electrical Equipment
28 Manufacture of Machinery and Equipment n.e.c.
29 Manufacture of Motor Vehicles, Trailers and Semi-Trailers
30 Manufacture of Other Transport Equipment
31 Manufacture of Furniture
32 Other Manufacturing
33 Repair and Installation of Machinery and Equipment
3510 Electric power generation, transmission and distribution (except 35101,
35102, 35104)
01632 Cotton Ginning, Cleaning and Bailing
Trading
45 Wholesale and Retail Trade and Repair of Motor Vehicles and Motorcycles
46 Wholesale Trade, except of Motor Vehicles and Motorcycles
47 Retail Trade, except of Motor Vehicles and Motorcycles
Other Services
37 Sewerage
38 Waste collection, treatment and disposal activities; materials recovery
39 Remediation activities and other waste management services
492 Other Land Transport (excluding 49212, 49213)
50 Water Transport
52 Warehousing and Support Activities for Transportation
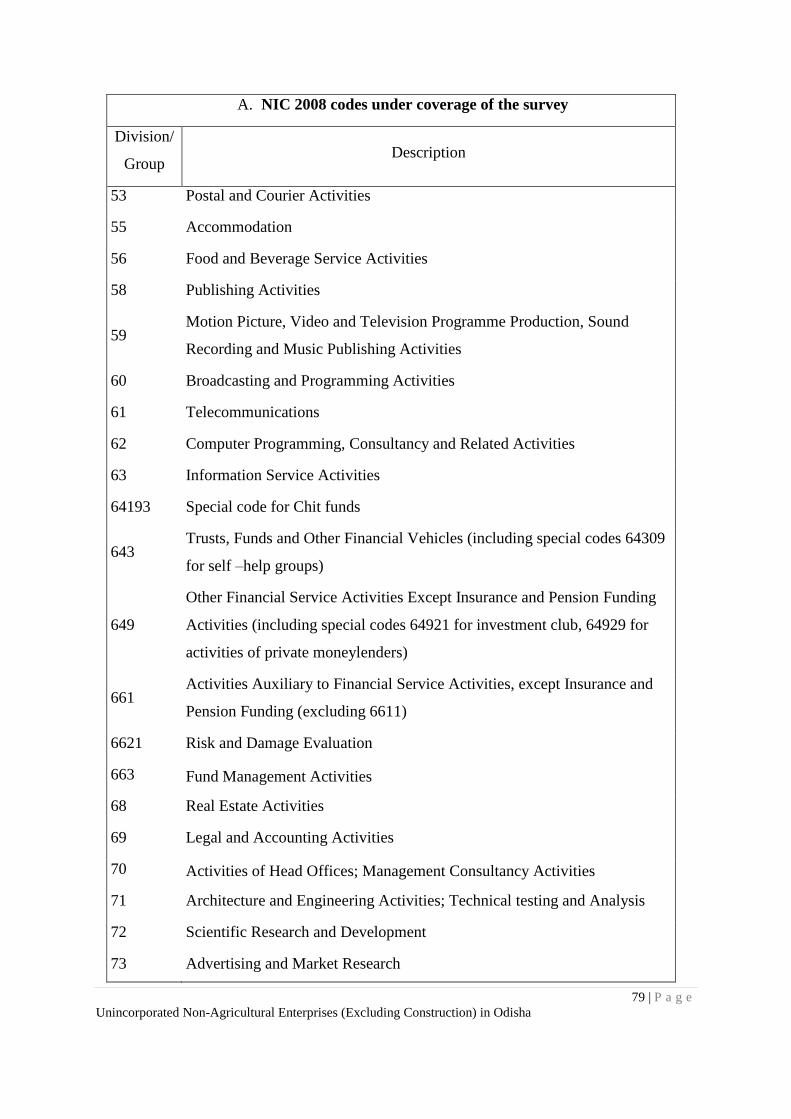
79 | P a g e
Unincorporated Non-Agricultural Enterprises (Excluding Construction) in Odisha
A. NIC 2008 codes under coverage of the survey
Division/
Group Description
53 Postal and Courier Activities
55 Accommodation
56 Food and Beverage Service Activities
58 Publishing Activities
59 Motion Picture, Video and Television Programme Production, Sound
Recording and Music Publishing Activities
60 Broadcasting and Programming Activities
61 Telecommunications
62 Computer Programming, Consultancy and Related Activities
63 Information Service Activities
64193 Special code for Chit funds
643 Trusts, Funds and Other Financial Vehicles (including special codes 64309
for self –help groups)
649
Other Financial Service Activities Except Insurance and Pension Funding
Activities (including special codes 64921 for investment club, 64929 for
activities of private moneylenders)
661 Activities Auxiliary to Financial Service Activities, except Insurance and
Pension Funding (excluding 6611)
6621 Risk and Damage Evaluation
663 Fund Management Activities
68 Real Estate Activities
69 Legal and Accounting Activities
70 Activities of Head Offices; Management Consultancy Activities
71 Architecture and Engineering Activities; Technical testing and Analysis
72 Scientific Research and Development
73 Advertising and Market Research
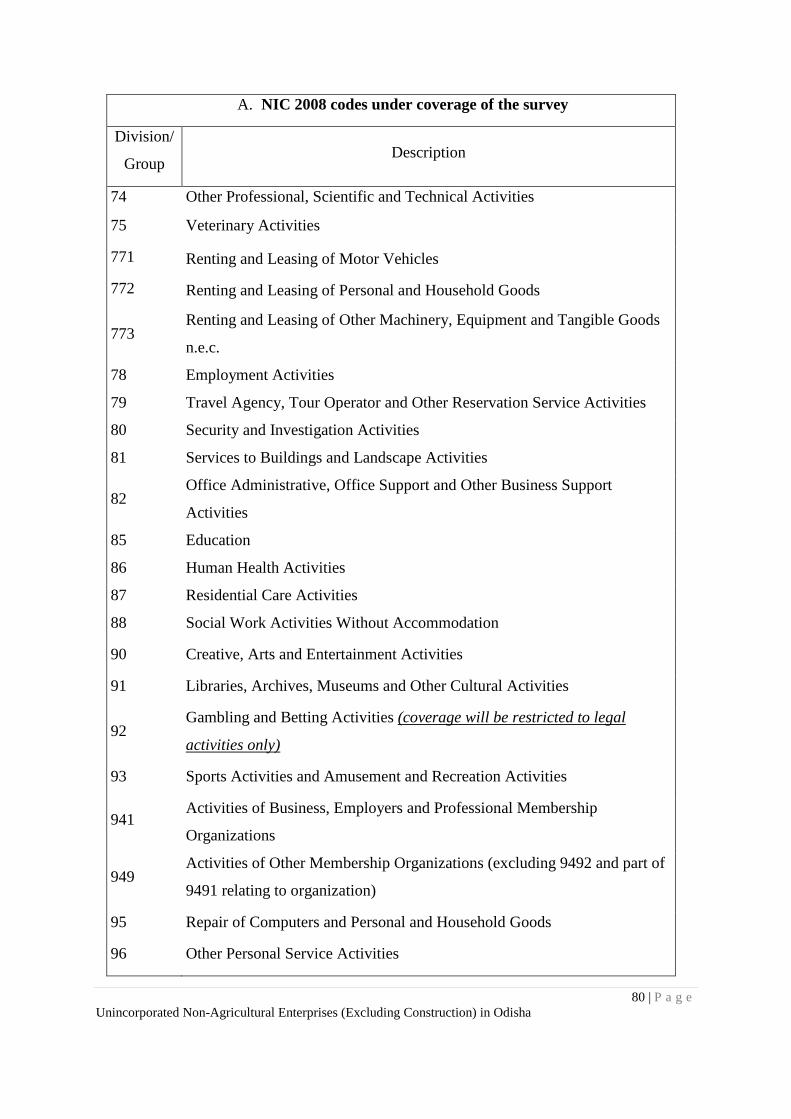
80 | P a g e
Unincorporated Non-Agricultural Enterprises (Excluding Construction) in Odisha
A. NIC 2008 codes under coverage of the survey
Division/
Group Description
74 Other Professional, Scientific and Technical Activities
75 Veterinary Activities
771 Renting and Leasing of Motor Vehicles
772 Renting and Leasing of Personal and Household Goods
773 Renting and Leasing of Other Machinery, Equipment and Tangible Goods
n.e.c.
78 Employment Activities
79 Travel Agency, Tour Operator and Other Reservation Service Activities
80 Security and Investigation Activities
81 Services to Buildings and Landscape Activities
82 Office Administrative, Office Support and Other Business Support
Activities
85 Education
86 Human Health Activities
87 Residential Care Activities
88 Social Work Activities Without Accommodation
90 Creative, Arts and Entertainment Activities
91 Libraries, Archives, Museums and Other Cultural Activities
92 Gambling and Betting Activities (coverage will be restricted to legal
activities only)
93 Sports Activities and Amusement and Recreation Activities
941 Activities of Business, Employers and Professional Membership
Organizations
949 Activities of Other Membership Organizations (excluding 9492 and part of
9491 relating to organization)
95 Repair of Computers and Personal and Household Goods
96 Other Personal Service Activities
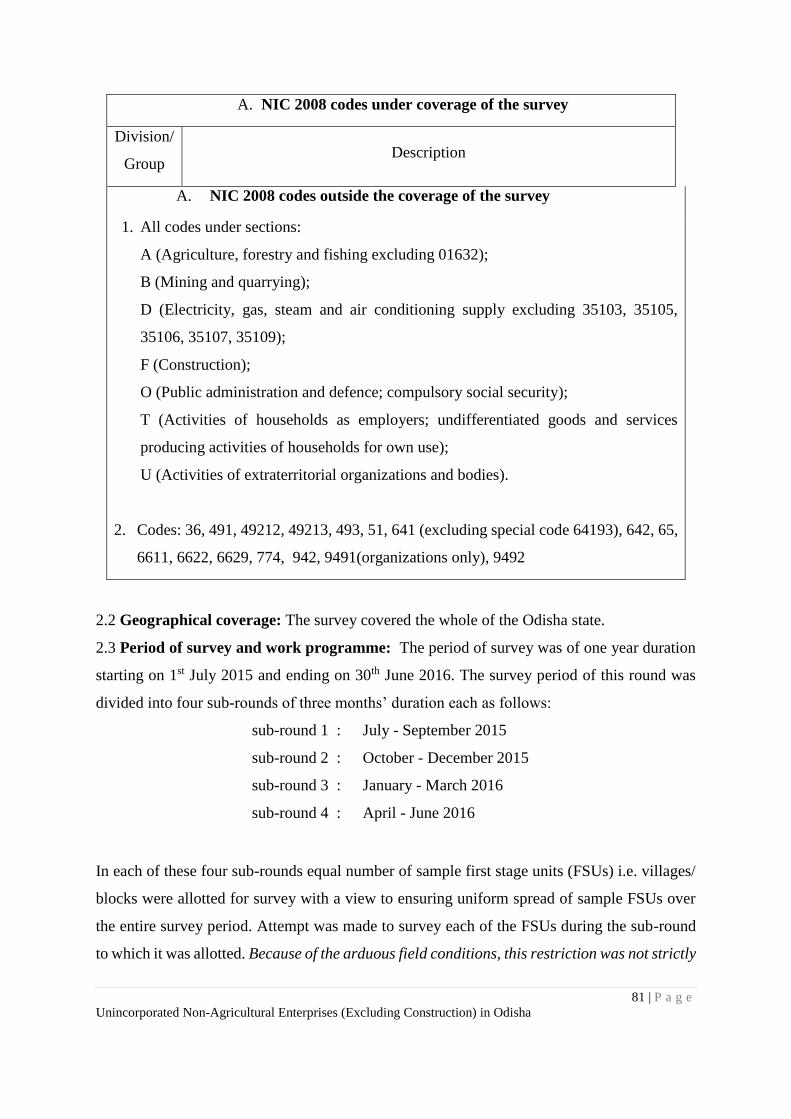
81 | P a g e
Unincorporated Non-Agricultural Enterprises (Excluding Construction) in Odisha
A. NIC 2008 codes under coverage of the survey
Division/
Group Description
A. NIC 2008 codes outside the coverage of the survey
1. All codes under sections:
A (Agriculture, forestry and fishing excluding 01632);
B (Mining and quarrying);
D (Electricity, gas, steam and air conditioning supply excluding 35103, 35105,
35106, 35107, 35109);
F (Construction);
O (Public administration and defence; compulsory social security);
T (Activities of households as employers; undifferentiated goods and services
producing activities of households for own use);
U (Activities of extraterritorial organizations and bodies).
2. Codes: 36, 491, 49212, 49213, 493, 51, 641 (excluding special code 64193), 642, 65,
6611, 6622, 6629, 774, 942, 9491(organizations only), 9492
2.2 Geographical coverage: The survey covered the whole of the Odisha state.
2.3 Period of survey and work programme: The period of survey was of one year duration
starting on 1st July 2015 and ending on 30th June 2016. The survey period of this round was
divided into four sub-rounds of three months’ duration each as follows:
sub-round 1 : July - September 2015
sub-round 2 : October - December 2015
sub-round 3 : January - March 2016
sub-round 4 : April - June 2016
In each of these four sub-rounds equal number of sample first stage units (FSUs) i.e. villages/
blocks were allotted for survey with a view to ensuring uniform spread of sample FSUs over
the entire survey period. Attempt was made to survey each of the FSUs during the sub-round
to which it was allotted. Because of the arduous field conditions, this restriction was not strictly
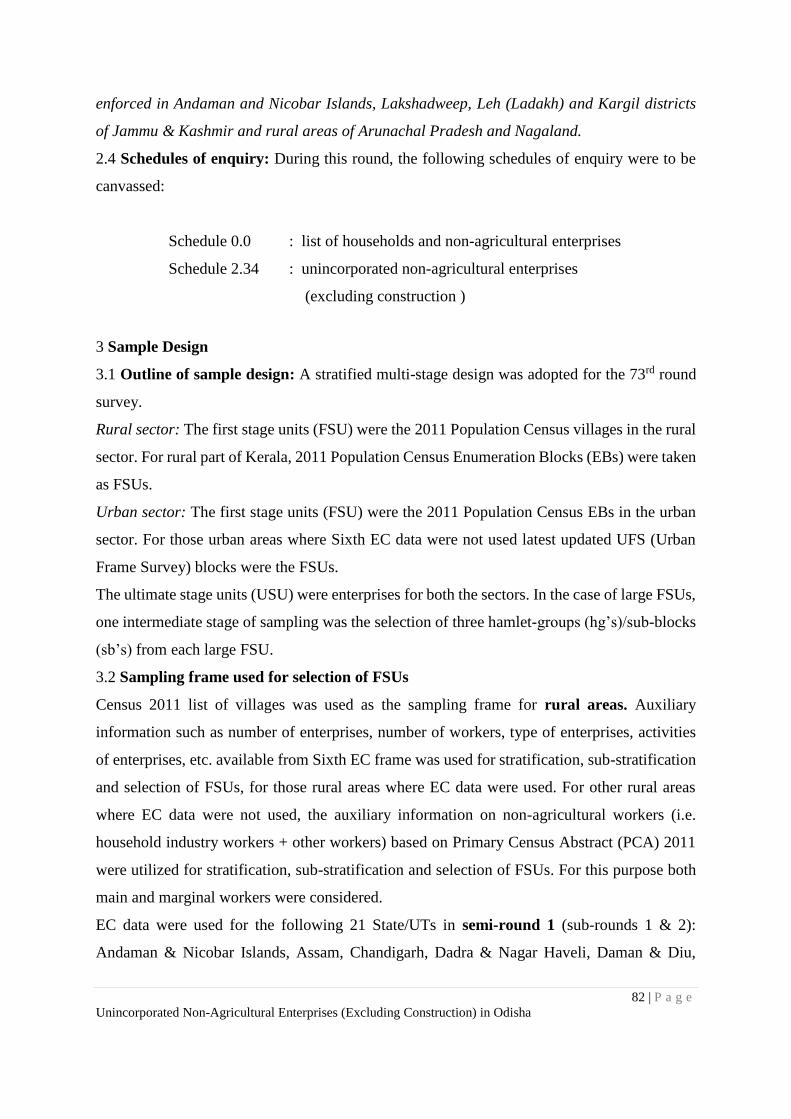
82 | P a g e
Unincorporated Non-Agricultural Enterprises (Excluding Construction) in Odisha
enforced in Andaman and Nicobar Islands, Lakshadweep, Leh (Ladakh) and Kargil districts
of Jammu & Kashmir and rural areas of Arunachal Pradesh and Nagaland.
2.4 Schedules of enquiry: During this round, the following schedules of enquiry were to be
canvassed:
Schedule 0.0 : list of households and non-agricultural enterprises
Schedule 2.34 : unincorporated non-agricultural enterprises
(excluding construction )
3 Sample Design
3.1 Outline of sample design: A stratified multi-stage design was adopted for the 73rd round
survey.
Rural sector: The first stage units (FSU) were the 2011 Population Census villages in the rural
sector. For rural part of Kerala, 2011 Population Census Enumeration Blocks (EBs) were taken
as FSUs.
Urban sector: The first stage units (FSU) were the 2011 Population Census EBs in the urban
sector. For those urban areas where Sixth EC data were not used latest updated UFS (Urban
Frame Survey) blocks were the FSUs.
The ultimate stage units (USU) were enterprises for both the sectors. In the case of large FSUs,
one intermediate stage of sampling was the selection of three hamlet-groups (hg’s)/sub-blocks
(sb’s) from each large FSU.
3.2 Sampling frame used for selection of FSUs
Census 2011 list of villages was used as the sampling frame for rural areas. Auxiliary
information such as number of enterprises, number of workers, type of enterprises, activities
of enterprises, etc. available from Sixth EC frame was used for stratification, sub-stratification
and selection of FSUs, for those rural areas where EC data were used. For other rural areas
where EC data were not used, the auxiliary information on non-agricultural workers (i.e.
household industry workers + other workers) based on Primary Census Abstract (PCA) 2011
were utilized for stratification, sub-stratification and selection of FSUs. For this purpose both
main and marginal workers were considered.
EC data were used for the following 21 State/UTs in semi-round 1 (sub-rounds 1 & 2):
Andaman & Nicobar Islands, Assam, Chandigarh, Dadra & Nagar Haveli, Daman & Diu,
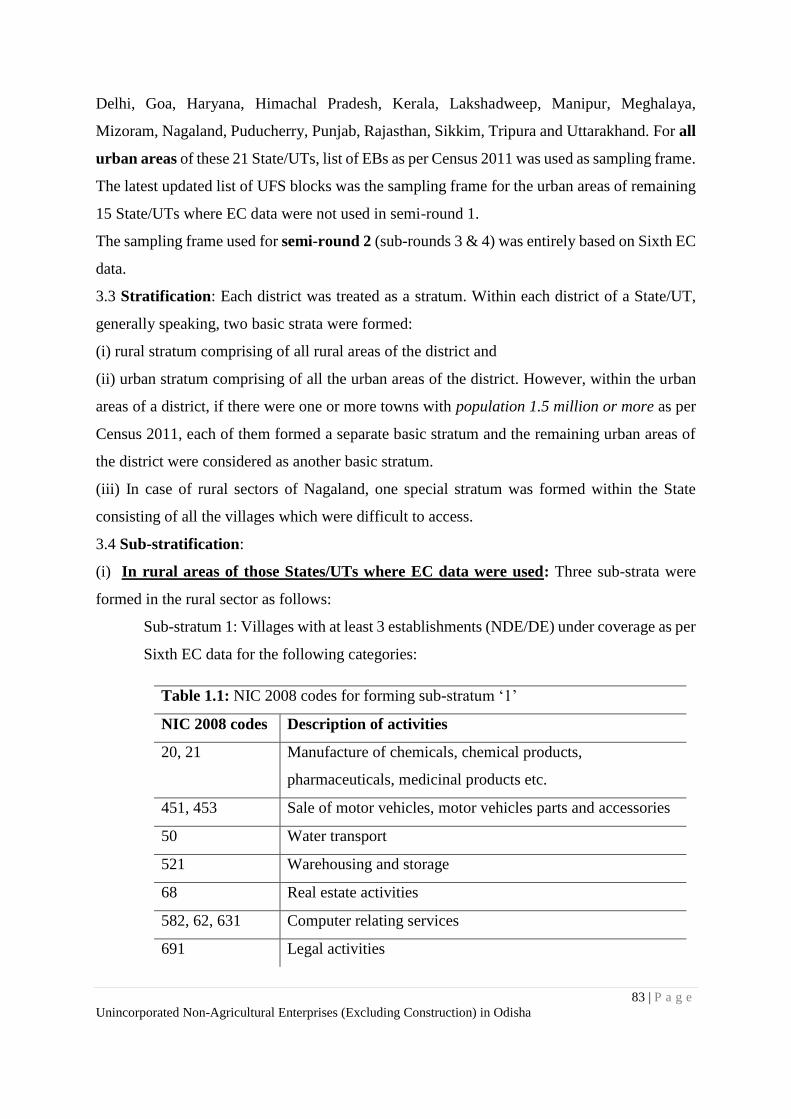
83 | P a g e
Unincorporated Non-Agricultural Enterprises (Excluding Construction) in Odisha
Delhi, Goa, Haryana, Himachal Pradesh, Kerala, Lakshadweep, Manipur, Meghalaya,
Mizoram, Nagaland, Puducherry, Punjab, Rajasthan, Sikkim, Tripura and Uttarakhand. For all
urban areas of these 21 State/UTs, list of EBs as per Census 2011 was used as sampling frame.
The latest updated list of UFS blocks was the sampling frame for the urban areas of remaining
15 State/UTs where EC data were not used in semi-round 1.
The sampling frame used for semi-round 2 (sub-rounds 3 & 4) was entirely based on Sixth EC
data.
3.3 Stratification: Each district was treated as a stratum. Within each district of a State/UT,
generally speaking, two basic strata were formed:
(i) rural stratum comprising of all rural areas of the district and
(ii) urban stratum comprising of all the urban areas of the district. However, within the urban
areas of a district, if there were one or more towns with population 1.5 million or more as per
Census 2011, each of them formed a separate basic stratum and the remaining urban areas of
the district were considered as another basic stratum.
(iii) In case of rural sectors of Nagaland, one special stratum was formed within the State
consisting of all the villages which were difficult to access.
3.4 Sub-stratification:
(i) In rural areas of those States/UTs where EC data were used: Three sub-strata were
formed in the rural sector as follows:
Sub-stratum 1: Villages with at least 3 establishments (NDE/DE) under coverage as per
Sixth EC data for the following categories:
Table 1.1: NIC 2008 codes for forming sub-stratum ‘1’
NIC 2008 codes Description of activities
20, 21 Manufacture of chemicals, chemical products,
pharmaceuticals, medicinal products etc.
451, 453 Sale of motor vehicles, motor vehicles parts and accessories
50 Water transport
521 Warehousing and storage
68 Real estate activities
582, 62, 631 Computer relating services
691 Legal activities
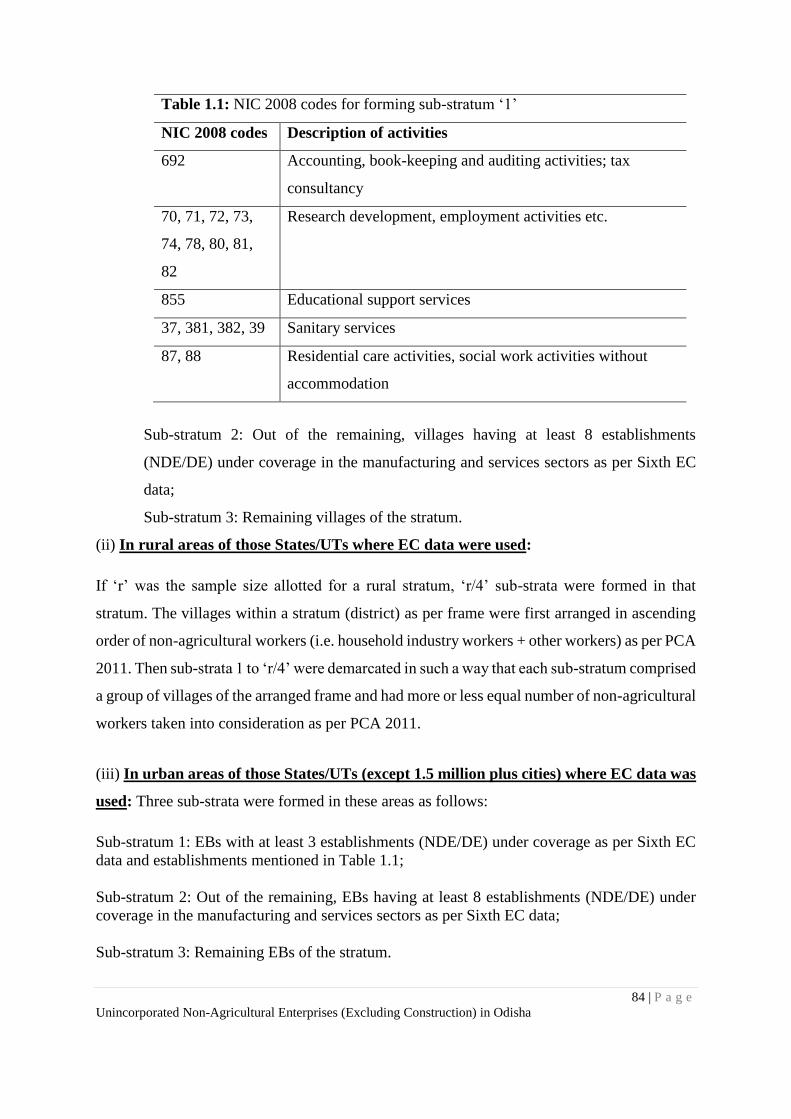
84 | P a g e
Unincorporated Non-Agricultural Enterprises (Excluding Construction) in Odisha
Table 1.1: NIC 2008 codes for forming sub-stratum ‘1’
NIC 2008 codes Description of activities
692 Accounting, book-keeping and auditing activities; tax
consultancy
70, 71, 72, 73,
74, 78, 80, 81,
82
Research development, employment activities etc.
855 Educational support services
37, 381, 382, 39 Sanitary services
87, 88 Residential care activities, social work activities without
accommodation
Sub-stratum 2: Out of the remaining, villages having at least 8 establishments
(NDE/DE) under coverage in the manufacturing and services sectors as per Sixth EC
data;
Sub-stratum 3: Remaining villages of the stratum.
(ii) In rural areas of those States/UTs where EC data were used:
If ‘r’ was the sample size allotted for a rural stratum, ‘r/4’ sub-strata were formed in that
stratum. The villages within a stratum (district) as per frame were first arranged in ascending
order of non-agricultural workers (i.e. household industry workers + other workers) as per PCA
2011. Then sub-strata 1 to ‘r/4’ were demarcated in such a way that each sub-stratum comprised
a group of villages of the arranged frame and had more or less equal number of non-agricultural
workers taken into consideration as per PCA 2011.
(iii) In urban areas of those States/UTs (except 1.5 million plus cities) where EC data was
used: Three sub-strata were formed in these areas as follows:
Sub-stratum 1: EBs with at least 3 establishments (NDE/DE) under coverage as per Sixth EC
data and establishments mentioned in Table 1.1;
Sub-stratum 2: Out of the remaining, EBs having at least 8 establishments (NDE/DE) under
coverage in the manufacturing and services sectors as per Sixth EC data;
Sub-stratum 3: Remaining EBs of the stratum.
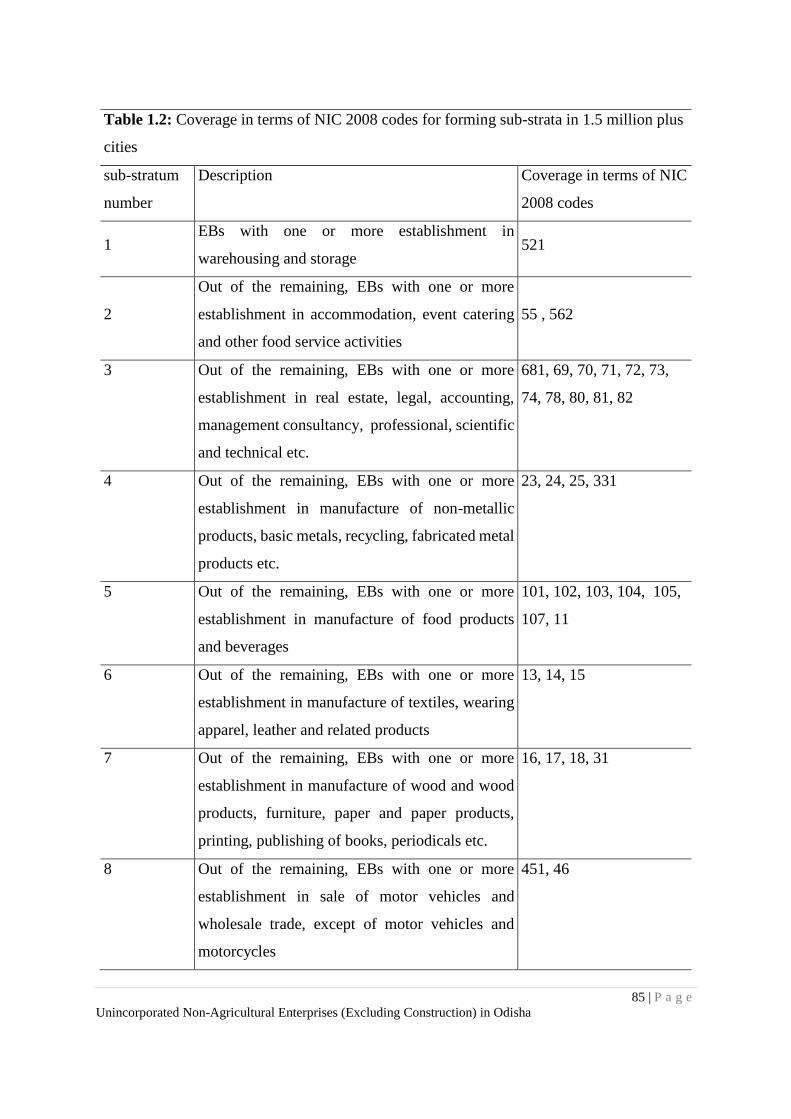
85 | P a g e
Unincorporated Non-Agricultural Enterprises (Excluding Construction) in Odisha
Table 1.2: Coverage in terms of NIC 2008 codes for forming sub-strata in 1.5 million plus
cities
sub-stratum
number
Description Coverage in terms of NIC
2008 codes
1 EBs with one or more establishment in
warehousing and storage 521
2
Out of the remaining, EBs with one or more
establishment in accommodation, event catering
and other food service activities
55 , 562
3 Out of the remaining, EBs with one or more
establishment in real estate, legal, accounting,
management consultancy, professional, scientific
and technical etc.
681, 69, 70, 71, 72, 73,
74, 78, 80, 81, 82
4 Out of the remaining, EBs with one or more
establishment in manufacture of non-metallic
products, basic metals, recycling, fabricated metal
products etc.
23, 24, 25, 331
5 Out of the remaining, EBs with one or more
establishment in manufacture of food products
and beverages
101, 102, 103, 104, 105,
107, 11
6 Out of the remaining, EBs with one or more
establishment in manufacture of textiles, wearing
apparel, leather and related products
13, 14, 15
7 Out of the remaining, EBs with one or more
establishment in manufacture of wood and wood
products, furniture, paper and paper products,
printing, publishing of books, periodicals etc.
16, 17, 18, 31
8 Out of the remaining, EBs with one or more
establishment in sale of motor vehicles and
wholesale trade, except of motor vehicles and
motorcycles
451, 46
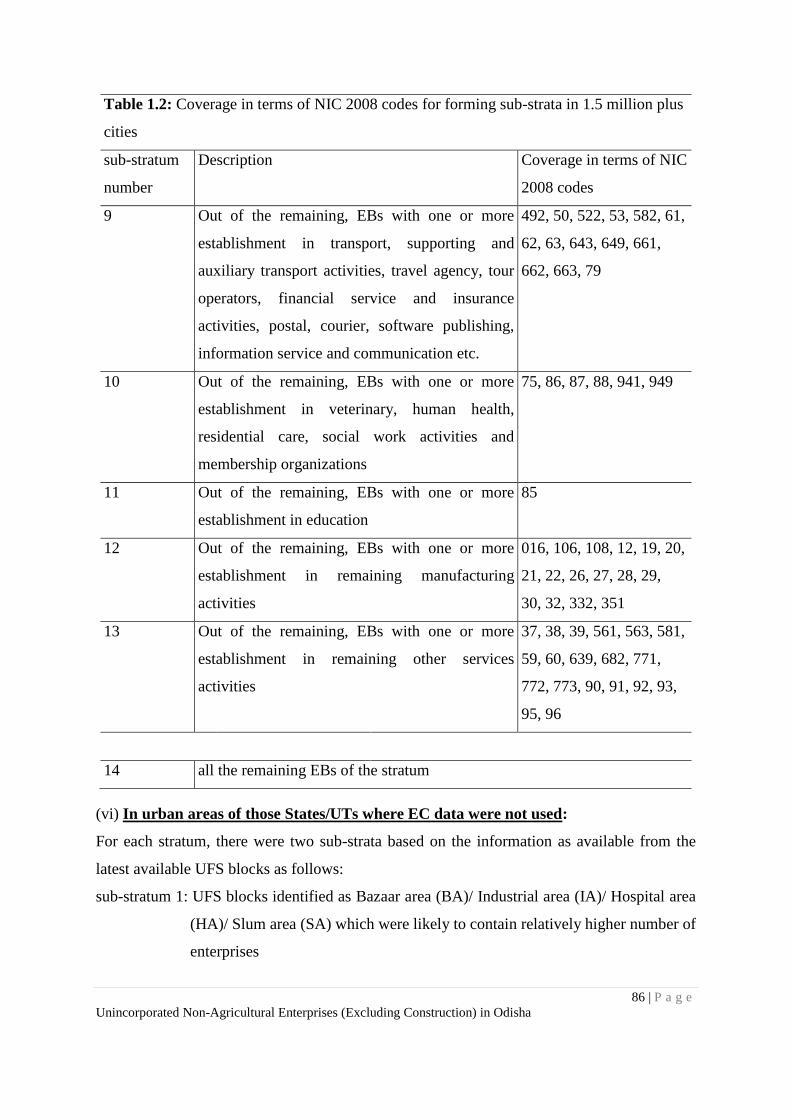
86 | P a g e
Unincorporated Non-Agricultural Enterprises (Excluding Construction) in Odisha
Table 1.2: Coverage in terms of NIC 2008 codes for forming sub-strata in 1.5 million plus
cities
sub-stratum
number
Description Coverage in terms of NIC
2008 codes
9 Out of the remaining, EBs with one or more
establishment in transport, supporting and
auxiliary transport activities, travel agency, tour
operators, financial service and insurance
activities, postal, courier, software publishing,
information service and communication etc.
492, 50, 522, 53, 582, 61,
62, 63, 643, 649, 661,
662, 663, 79
10 Out of the remaining, EBs with one or more
establishment in veterinary, human health,
residential care, social work activities and
membership organizations
75, 86, 87, 88, 941, 949
11 Out of the remaining, EBs with one or more
establishment in education
85
12 Out of the remaining, EBs with one or more
establishment in remaining manufacturing
activities
016, 106, 108, 12, 19, 20,
21, 22, 26, 27, 28, 29,
30, 32, 332, 351
13 Out of the remaining, EBs with one or more
establishment in remaining other services
activities
37, 38, 39, 561, 563, 581,
59, 60, 639, 682, 771,
772, 773, 90, 91, 92, 93,
95, 96
14 all the remaining EBs of the stratum
(vi) In urban areas of those States/UTs where EC data were not used:
For each stratum, there were two sub-strata based on the information as available from the
latest available UFS blocks as follows:
sub-stratum 1: UFS blocks identified as Bazaar area (BA)/ Industrial area (IA)/ Hospital area
(HA)/ Slum area (SA) which were likely to contain relatively higher number of
enterprises
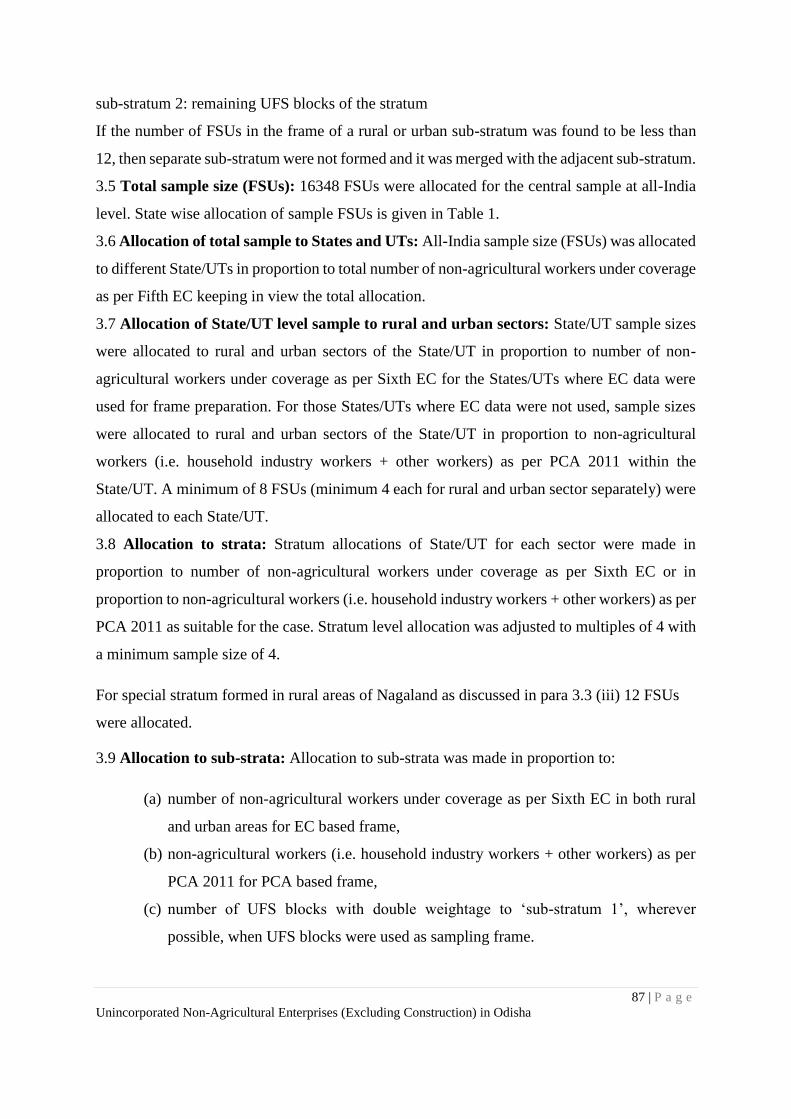
87 | P a g e
Unincorporated Non-Agricultural Enterprises (Excluding Construction) in Odisha
sub-stratum 2: remaining UFS blocks of the stratum
If the number of FSUs in the frame of a rural or urban sub-stratum was found to be less than
12, then separate sub-stratum were not formed and it was merged with the adjacent sub-stratum.
3.5 Total sample size (FSUs): 16348 FSUs were allocated for the central sample at all-India
level. State wise allocation of sample FSUs is given in Table 1.
3.6 Allocation of total sample to States and UTs: All-India sample size (FSUs) was allocated
to different State/UTs in proportion to total number of non-agricultural workers under coverage
as per Fifth EC keeping in view the total allocation.
3.7 Allocation of State/UT level sample to rural and urban sectors: State/UT sample sizes
were allocated to rural and urban sectors of the State/UT in proportion to number of non-
agricultural workers under coverage as per Sixth EC for the States/UTs where EC data were
used for frame preparation. For those States/UTs where EC data were not used, sample sizes
were allocated to rural and urban sectors of the State/UT in proportion to non-agricultural
workers (i.e. household industry workers + other workers) as per PCA 2011 within the
State/UT. A minimum of 8 FSUs (minimum 4 each for rural and urban sector separately) were
allocated to each State/UT.
3.8 Allocation to strata: Stratum allocations of State/UT for each sector were made in
proportion to number of non-agricultural workers under coverage as per Sixth EC or in
proportion to non-agricultural workers (i.e. household industry workers + other workers) as per
PCA 2011 as suitable for the case. Stratum level allocation was adjusted to multiples of 4 with
a minimum sample size of 4.
For special stratum formed in rural areas of Nagaland as discussed in para 3.3 (iii) 12 FSUs
were allocated.
3.9 Allocation to sub-strata: Allocation to sub-strata was made in proportion to:
(a) number of non-agricultural workers under coverage as per Sixth EC in both rural
and urban areas for EC based frame,
(b) non-agricultural workers (i.e. household industry workers + other workers) as per
PCA 2011 for PCA based frame,
(c) number of UFS blocks with double weightage to ‘sub-stratum 1’, wherever
possible, when UFS blocks were used as sampling frame.
88 | P a g e
Unincorporated Non-Agricultural Enterprises (Excluding Construction) in Odisha
Minimum allocation for a sub-stratum had, in principle, been decided as 4 to control seasonal
fluctuation.
3.10 Sampling of FSUs: Sampling of the First Stage Units was done separately in two phases
– for first six months (July – December, 2015, 1st and 2nd sub-rounds) and next six months
(January – June, 2016, 3rd & 4th sub-rounds). Samples were drawn in the form of two
independent sub-samples in each phase for each sector ensuring stratum/sub-stratum allocation
multiple of 2 (i.e. half of stratum/sub-stratum allocation which was multiple of 4). In the first
phase, EC data were used for preparation of sampling frame for those States, for which data
were available and for the remaining States, usual procedure of PCA based frame and UFS
based frame had been used. For drawing of samples for 3rd and 4th sub-rounds only EC based
sampling frame was used for all States/UTs.
3.11 Selection of FSUs:
For both rural and urban sectors for EC based frame: From each stratum/sub-stratum,
required number of sample FSUs was selected by Probability Proportional to Size With
Replacement (PPSWR), size being the total number of non-agricultural workers under
coverage in the village/EB as per Sixth EC.
For rural sectors using PCA based frame: In rural areas, from each stratum/sub-stratum,
FSUs were selected by PPSWR with size as non-agricultural workers (i.e. household industry
workers + other workers) as per PCA 2011. For this purpose both main and marginal workers
were considered.
For urban sectors using UFS frame: In urban areas, from each stratum/sub-stratum, FSUs
were selected by SRSWOR scheme.
Both rural and urban samples were drawn in the form of two independent sub-samples in
each phase of six months and equal number of samples were allocated among the two sub-
rounds of each phase.
3.12 Formation of segment 9 and selection of hamlet-groups/ sub-blocks
3.12.1 Formation of Segment 9: Having determined the boundaries of the sample FSU, all
non-agricultural enterprises having 20 or more workers in the entire FSU and having operated
at least one day during last 365 days preceding the day of survey (hereinafter to be called as
‘big enterprises’) were listed and all the eligible units under coverage were surveyed. All the
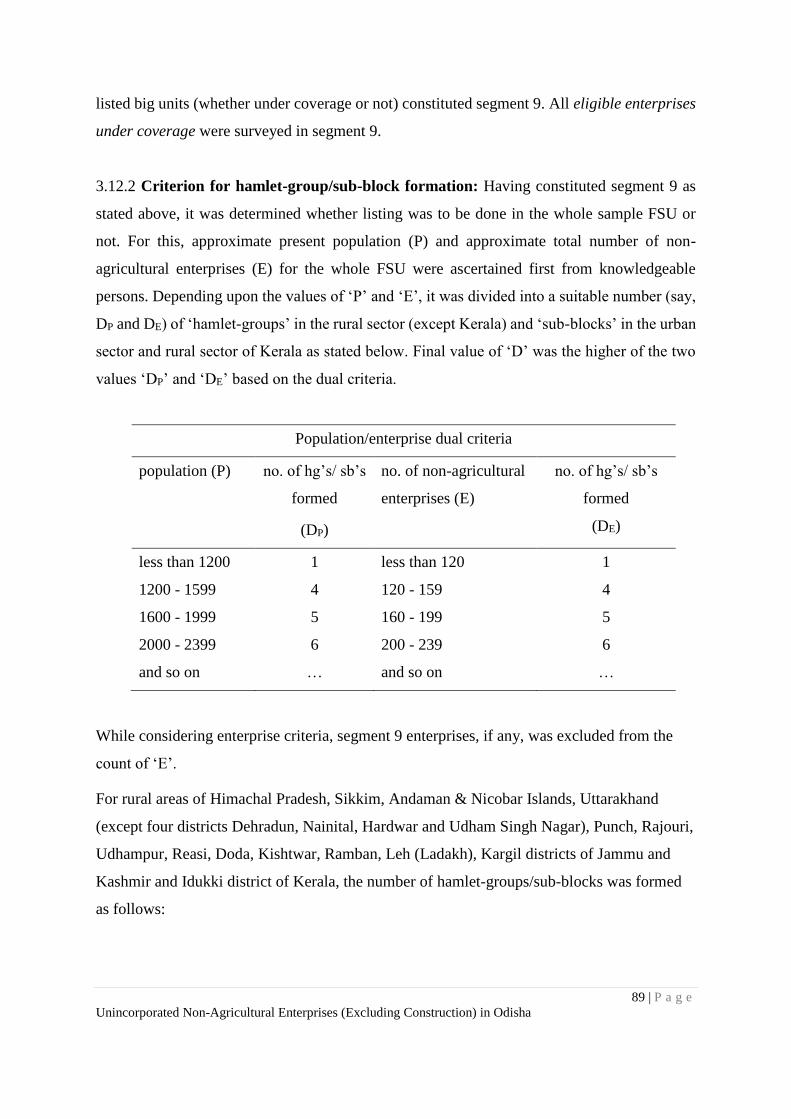
89 | P a g e
Unincorporated Non-Agricultural Enterprises (Excluding Construction) in Odisha
listed big units (whether under coverage or not) constituted segment 9. All eligible enterprises
under coverage were surveyed in segment 9.
3.12.2 Criterion for hamlet-group/sub-block formation: Having constituted segment 9 as
stated above, it was determined whether listing was to be done in the whole sample FSU or
not. For this, approximate present population (P) and approximate total number of non-
agricultural enterprises (E) for the whole FSU were ascertained first from knowledgeable
persons. Depending upon the values of ‘P’ and ‘E’, it was divided into a suitable number (say,
DP and DE) of ‘hamlet-groups’ in the rural sector (except Kerala) and ‘sub-blocks’ in the urban
sector and rural sector of Kerala as stated below. Final value of ‘D’ was the higher of the two
values ‘DP’ and ‘DE’ based on the dual criteria.
Population/enterprise dual criteria
population (P) no. of hg’s/ sb’s
formed
(DP)
no. of non-agricultural
enterprises (E)
no. of hg’s/ sb’s
formed
(DE)
less than 1200 1 less than 120 1
1200 - 1599 4 120 - 159 4
1600 - 1999 5 160 - 199 5
2000 - 2399 6 200 - 239 6
and so on … and so on …
While considering enterprise criteria, segment 9 enterprises, if any, was excluded from the
count of ‘E’.
For rural areas of Himachal Pradesh, Sikkim, Andaman & Nicobar Islands, Uttarakhand
(except four districts Dehradun, Nainital, Hardwar and Udham Singh Nagar), Punch, Rajouri,
Udhampur, Reasi, Doda, Kishtwar, Ramban, Leh (Ladakh), Kargil districts of Jammu and
Kashmir and Idukki district of Kerala, the number of hamlet-groups/sub-blocks was formed
as follows:
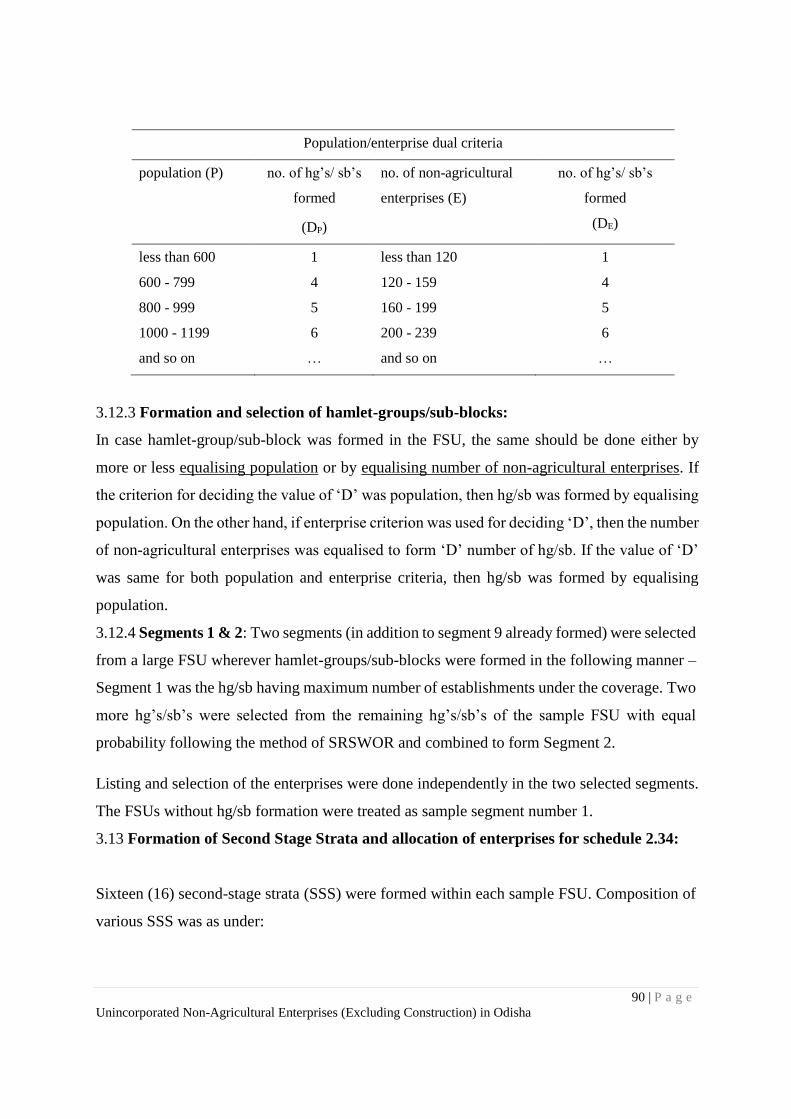
90 | P a g e
Unincorporated Non-Agricultural Enterprises (Excluding Construction) in Odisha
Population/enterprise dual criteria
population (P) no. of hg’s/ sb’s
formed
(DP)
no. of non-agricultural
enterprises (E)
no. of hg’s/ sb’s
formed
(DE)
less than 600 1 less than 120 1
600 - 799 4 120 - 159 4
800 - 999 5 160 - 199 5
1000 - 1199 6 200 - 239 6
and so on … and so on …
3.12.3 Formation and selection of hamlet-groups/sub-blocks:
In case hamlet-group/sub-block was formed in the FSU, the same should be done either by
more or less equalising population or by equalising number of non-agricultural enterprises. If
the criterion for deciding the value of ‘D’ was population, then hg/sb was formed by equalising
population. On the other hand, if enterprise criterion was used for deciding ‘D’, then the number
of non-agricultural enterprises was equalised to form ‘D’ number of hg/sb. If the value of ‘D’
was same for both population and enterprise criteria, then hg/sb was formed by equalising
population.
3.12.4 Segments 1 & 2: Two segments (in addition to segment 9 already formed) were selected
from a large FSU wherever hamlet-groups/sub-blocks were formed in the following manner –
Segment 1 was the hg/sb having maximum number of establishments under the coverage. Two
more hg’s/sb’s were selected from the remaining hg’s/sb’s of the sample FSU with equal
probability following the method of SRSWOR and combined to form Segment 2.
Listing and selection of the enterprises were done independently in the two selected segments.
The FSUs without hg/sb formation were treated as sample segment number 1.
3.13 Formation of Second Stage Strata and allocation of enterprises for schedule 2.34:
Sixteen (16) second-stage strata (SSS) were formed within each sample FSU. Composition of
various SSS was as under:
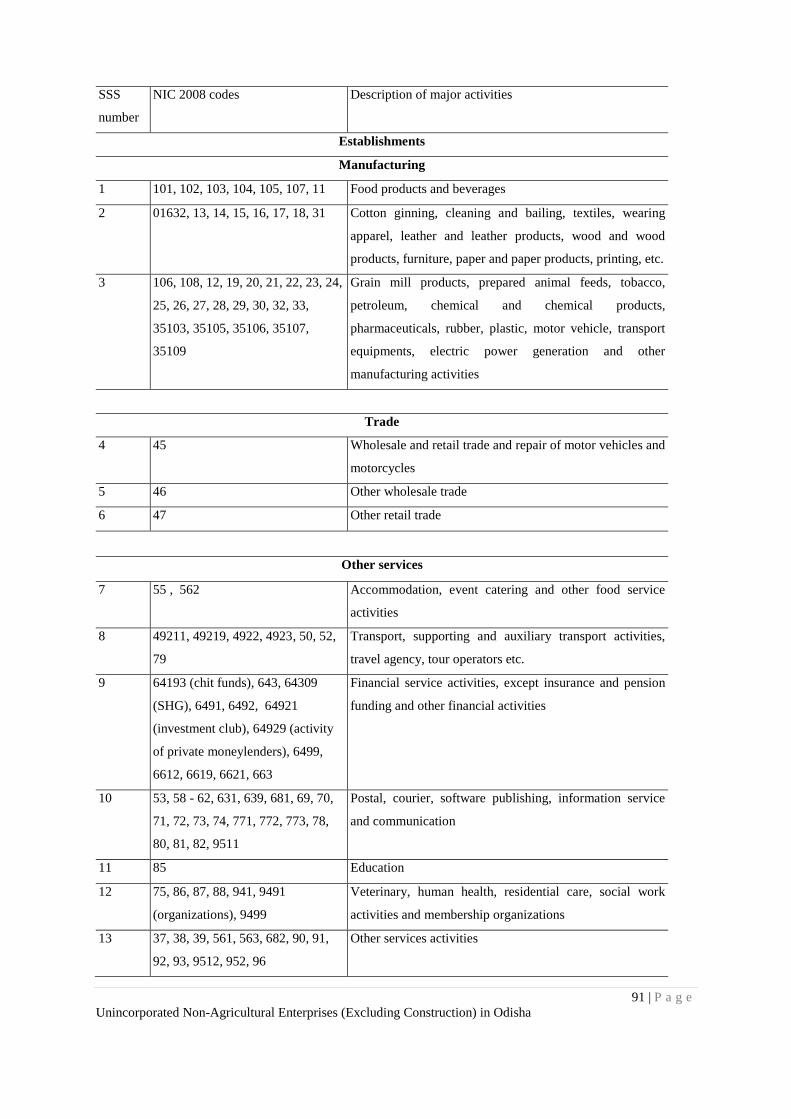
91 | P a g e
Unincorporated Non-Agricultural Enterprises (Excluding Construction) in Odisha
SSS
number
NIC 2008 codes Description of major activities
Establishments
Manufacturing
1 101, 102, 103, 104, 105, 107, 11 Food products and beverages
2 01632, 13, 14, 15, 16, 17, 18, 31 Cotton ginning, cleaning and bailing, textiles, wearing
apparel, leather and leather products, wood and wood
products, furniture, paper and paper products, printing, etc.
3 106, 108, 12, 19, 20, 21, 22, 23, 24,
25, 26, 27, 28, 29, 30, 32, 33,
35103, 35105, 35106, 35107,
35109
Grain mill products, prepared animal feeds, tobacco,
petroleum, chemical and chemical products,
pharmaceuticals, rubber, plastic, motor vehicle, transport
equipments, electric power generation and other
manufacturing activities
Trade
4 45 Wholesale and retail trade and repair of motor vehicles and
motorcycles
5 46 Other wholesale trade
6 47 Other retail trade
Other services
7 55 , 562 Accommodation, event catering and other food service
activities
8 49211, 49219, 4922, 4923, 50, 52,
79
Transport, supporting and auxiliary transport activities,
travel agency, tour operators etc.
9 64193 (chit funds), 643, 64309
(SHG), 6491, 6492, 64921
(investment club), 64929 (activity
of private moneylenders), 6499,
6612, 6619, 6621, 663
Financial service activities, except insurance and pension
funding and other financial activities
10 53, 58 - 62, 631, 639, 681, 69, 70,
71, 72, 73, 74, 771, 772, 773, 78,
80, 81, 82, 9511
Postal, courier, software publishing, information service
and communication
11 85 Education
12 75, 86, 87, 88, 941, 9491
(organizations), 9499
Veterinary, human health, residential care, social work
activities and membership organizations
13 37, 38, 39, 561, 563, 682, 90, 91,
92, 93, 9512, 952, 96
Other services activities
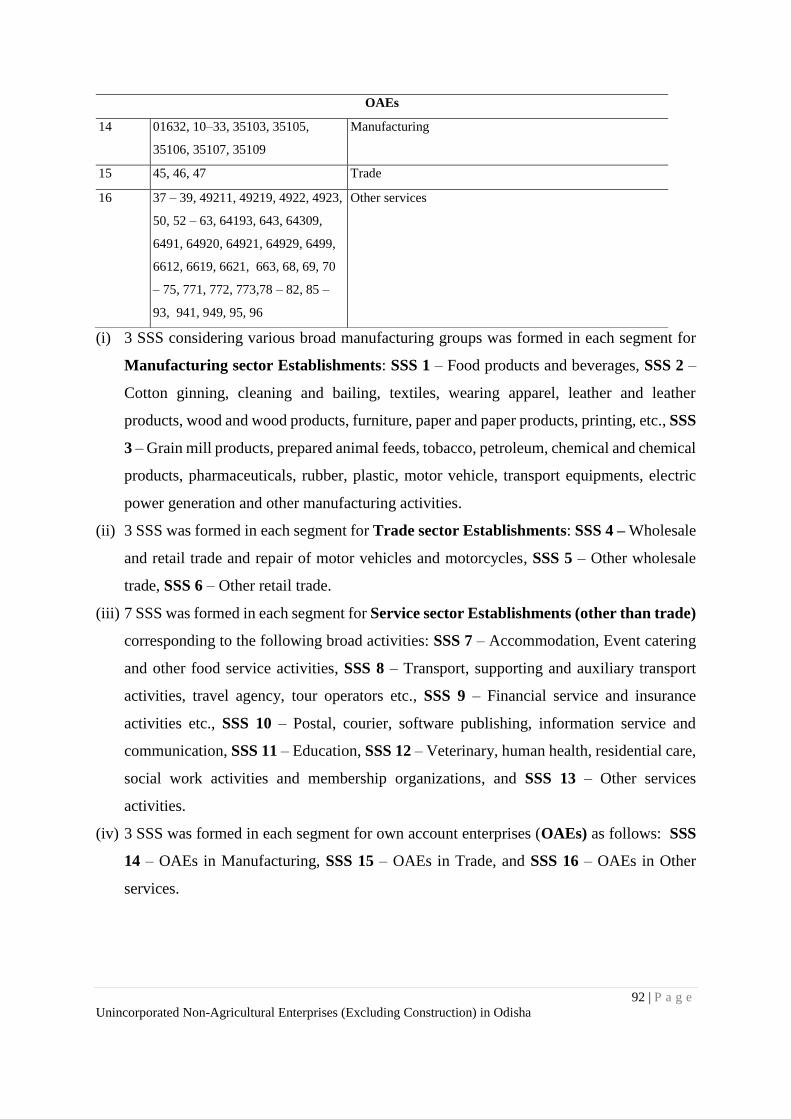
92 | P a g e
Unincorporated Non-Agricultural Enterprises (Excluding Construction) in Odisha
(i) 3 SSS considering various broad manufacturing groups was formed in each segment for
Manufacturing sector Establishments: SSS 1 – Food products and beverages, SSS 2 –
Cotton ginning, cleaning and bailing, textiles, wearing apparel, leather and leather
products, wood and wood products, furniture, paper and paper products, printing, etc., SSS
3 – Grain mill products, prepared animal feeds, tobacco, petroleum, chemical and chemical
products, pharmaceuticals, rubber, plastic, motor vehicle, transport equipments, electric
power generation and other manufacturing activities.
(ii) 3 SSS was formed in each segment for Trade sector Establishments: SSS 4 – Wholesale
and retail trade and repair of motor vehicles and motorcycles, SSS 5 – Other wholesale
trade, SSS 6 – Other retail trade.
(iii) 7 SSS was formed in each segment for Service sector Establishments (other than trade)
corresponding to the following broad activities: SSS 7 – Accommodation, Event catering
and other food service activities, SSS 8 – Transport, supporting and auxiliary transport
activities, travel agency, tour operators etc., SSS 9 – Financial service and insurance
activities etc., SSS 10 – Postal, courier, software publishing, information service and
communication, SSS 11 – Education, SSS 12 – Veterinary, human health, residential care,
social work activities and membership organizations, and SSS 13 – Other services
activities.
(iv) 3 SSS was formed in each segment for own account enterprises (OAEs) as follows: SSS
14 – OAEs in Manufacturing, SSS 15 – OAEs in Trade, and SSS 16 – OAEs in Other
services.
OAEs
14 01632, 10–33, 35103, 35105,
35106, 35107, 35109
Manufacturing
15 45, 46, 47 Trade
16 37 – 39, 49211, 49219, 4922, 4923,
50, 52 – 63, 64193, 643, 64309,
6491, 64920, 64921, 64929, 6499,
6612, 6619, 6621, 663, 68, 69, 70
– 75, 771, 772, 773,78 – 82, 85 –
93, 941, 949, 95, 96
Other services
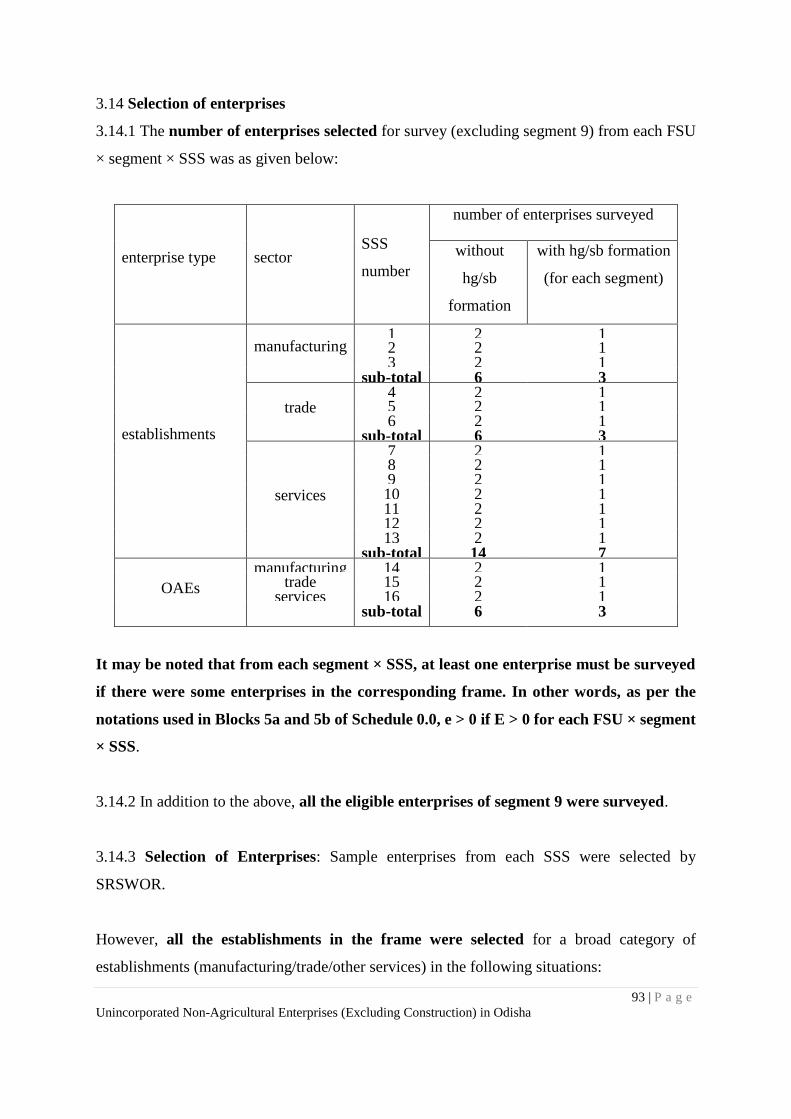
93 | P a g e
Unincorporated Non-Agricultural Enterprises (Excluding Construction) in Odisha
3.14 Selection of enterprises
3.14.1 The number of enterprises selected for survey (excluding segment 9) from each FSU
× segment × SSS was as given below:
It may be noted that from each segment × SSS, at least one enterprise must be surveyed
if there were some enterprises in the corresponding frame. In other words, as per the
notations used in Blocks 5a and 5b of Schedule 0.0, e > 0 if E > 0 for each FSU × segment
× SSS.
3.14.2 In addition to the above, all the eligible enterprises of segment 9 were surveyed.
3.14.3 Selection of Enterprises: Sample enterprises from each SSS were selected by
SRSWOR.
However, all the establishments in the frame were selected for a broad category of
establishments (manufacturing/trade/other services) in the following situations:
enterprise type sector SSS
number
number of enterprises surveyed
without
hg/sb
formation
with hg/sb formation
(for each segment)
establishments
manufacturing 1 2 1 2 2 1 3 2 1
sub-total 6 3
trade 4 2 1 5 2 1 6 2 1
sub-total 6 3
services
7 2 1 8 2 1 9 2 1 10 2 1 11 2 1 12 2 1 13 2 1
sub-total 14 7
OAEs
manufacturing 14 2 1 trade 15 2 1
services 16 2 1 sub-total 6 3
94 | P a g e
Unincorporated Non-Agricultural Enterprises (Excluding Construction) in Odisha
(i) All the manufacturing establishments if total number of establishments in
manufacturing SSSs was less than or equal to 6 considering both the segments 1 & 2
(ii) All the trading establishments if total number of establishments in trading SSSs was
less than or equal to 6 considering both the segments 1 & 2
(iii) All the ‘other service sector’ establishments if total number of establishments in other
services SSSs was less than or equal to 14 considering both the segments 1 & 2.
4. Estimation Procedure
4.1 Notations:
s = subscript for s-th stratum
t = subscript for t-th sub-stratum
m = subscript for sub-sample (m =1, 2)
r = subscript for semi-round (r = 1, 2)
i = subscript for i-th FSU [village/ block/ EB]
d = subscript for a segment (d = 1, 2, 9)
j = subscript for j-th second stage stratum in an FSU/ segment (j=1, 2, 3 ................, 16)
k = subscript for k-th sample enterprise under a particular second stage stratum within an
FSU/ segment
D = total number of hg’s/ sb’s formed in the sample FSU
D* = 0 if D = 1
= (D – 1)/2 for FSUs with D > 1
N = total number of FSUs in any urban sub-stratum (for States where UFS based frame was
used)
Z = total size of a rural/urban sub-stratum (= sum of sizes of all villages/EBs of a sub-stratum)
z = size of sample village/EB used for selection.
n = number of sample FSUs surveyed including ‘uninhabitated’ and ‘zero cases’ but excluding
casualty for a particular sub-sample and sub-stratum.
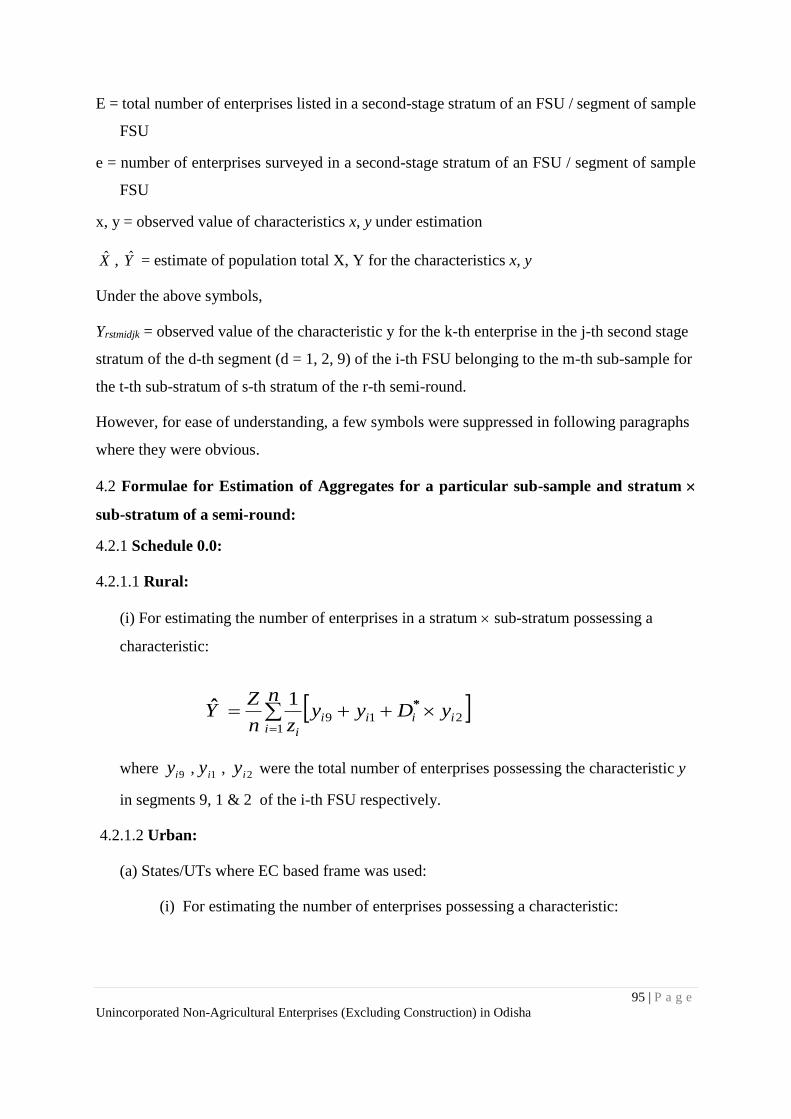
95 | P a g e
Unincorporated Non-Agricultural Enterprises (Excluding Construction) in Odisha
E = total number of enterprises listed in a second-stage stratum of an FSU / segment of sample
FSU
e = number of enterprises surveyed in a second-stage stratum of an FSU / segment of sample
FSU
x, y = observed value of characteristics x, y under estimation
X , Y = estimate of population total X, Y for the characteristics x, y
Under the above symbols,
Yrstmidjk = observed value of the characteristic y for the k-th enterprise in the j-th second stage
stratum of the d-th segment (d = 1, 2, 9) of the i-th FSU belonging to the m-th sub-sample for
the t-th sub-stratum of s-th stratum of the r-th semi-round.
However, for ease of understanding, a few symbols were suppressed in following paragraphs
where they were obvious.
4.2 Formulae for Estimation of Aggregates for a particular sub-sample and stratum
sub-stratum of a semi-round:
4.2.1 Schedule 0.0:
4.2.1.1 Rural:
(i) For estimating the number of enterprises in a stratum sub-stratum possessing a
characteristic:
n
yDyyzn
ZY
iiiii
i1219
1 *ˆ
where 9iy , 1iy , 2iy were the total number of enterprises possessing the characteristic y
in segments 9, 1 & 2 of the i-th FSU respectively.
4.2.1.2 Urban:
(a) States/UTs where EC based frame was used:
(i) For estimating the number of enterprises possessing a characteristic:
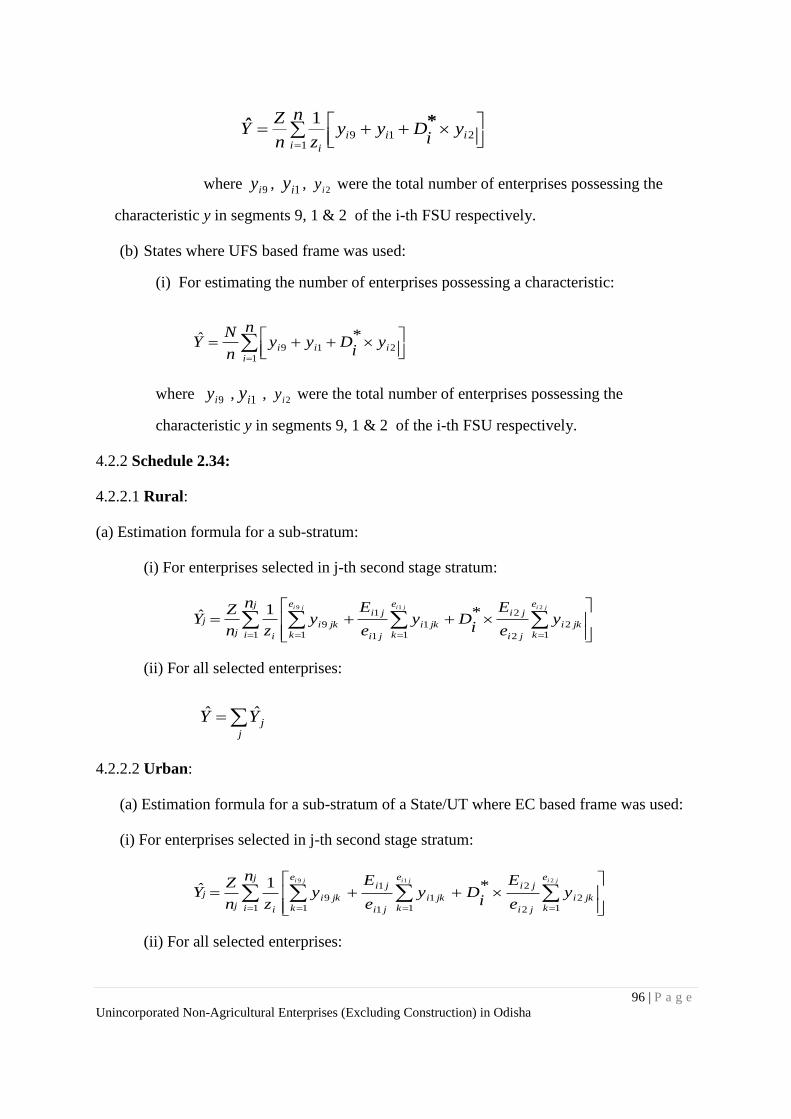
96 | P a g e
Unincorporated Non-Agricultural Enterprises (Excluding Construction) in Odisha
ny
iDyy
zn
ZY
iiii
i1219
1 *ˆ
where 9iy , 1iy , 2iy were the total number of enterprises possessing the
characteristic y in segments 9, 1 & 2 of the i-th FSU respectively.
(b) States where UFS based frame was used:
(i) For estimating the number of enterprises possessing a characteristic:
ny
iDyy
n
NY
iiii
1219
*ˆ
where 9iy , 1iy , 2iy were the total number of enterprises possessing the
characteristic y in segments 9, 1 & 2 of the i-th FSU respectively.
4.2.2 Schedule 2.34:
4.2.2.1 Rural:
(a) Estimation formula for a sub-stratum:
(i) For enterprises selected in j-th second stage stratum:
j
i
e
kjki
ji
jie
kjki
ji
jie
kjki
ij
j
ny
e
E
iDy
e
Ey
zn
ZY
jijiji
1 12
2
2
11
1
1
19
219
*1ˆ
(ii) For all selected enterprises:
j
jYY ˆˆ
4.2.2.2 Urban:
(a) Estimation formula for a sub-stratum of a State/UT where EC based frame was used:
(i) For enterprises selected in j-th second stage stratum:
j
i
e
kjki
ji
jie
kjki
ji
jie
kjki
ij
j
ny
e
E
iDy
e
Ey
zn
ZY
jijiji
1 12
2
2
11
1
1
19
219
*1ˆ
(ii) For all selected enterprises:
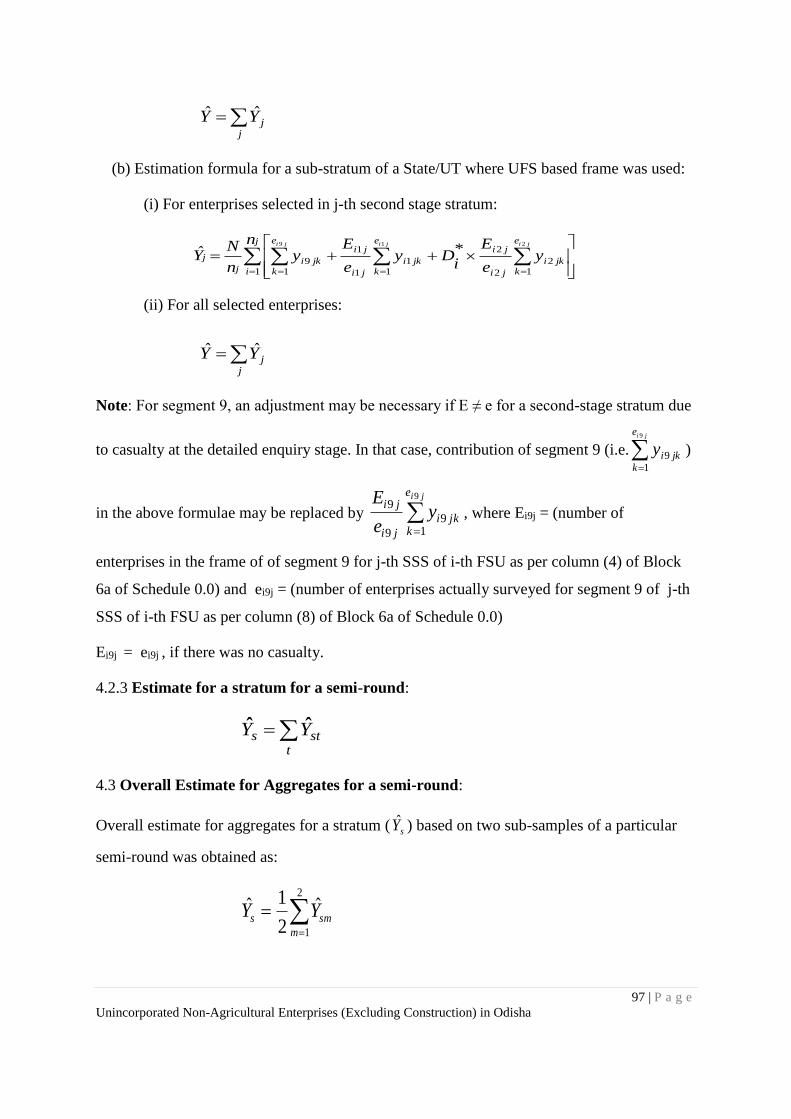
97 | P a g e
Unincorporated Non-Agricultural Enterprises (Excluding Construction) in Odisha
j
jYY ˆˆ
(b) Estimation formula for a sub-stratum of a State/UT where UFS based frame was used:
(i) For enterprises selected in j-th second stage stratum:
j
i
e
kjki
ji
jie
kjki
ji
jie
kjki
j
j
ny
e
E
iDy
e
Ey
n
NY
jijiji
1 12
2
2
11
1
1
19
219
*ˆ
(ii) For all selected enterprises:
j
jYY ˆˆ
Note: For segment 9, an adjustment may be necessary if E ≠ e for a second-stage stratum due
to casualty at the detailed enquiry stage. In that case, contribution of segment 9 (i.e.
jie
kjkiy
9
19 )
in the above formulae may be replaced by
jie
kjki
ji
jiy
e
E 9
19
9
9, where Ei9j = (number of
enterprises in the frame of of segment 9 for j-th SSS of i-th FSU as per column (4) of Block
6a of Schedule 0.0) and ei9j = (number of enterprises actually surveyed for segment 9 of j-th
SSS of i-th FSU as per column (8) of Block 6a of Schedule 0.0)
Ei9j = ei9j , if there was no casualty.
4.2.3 Estimate for a stratum for a semi-round:
t
sts YY ˆˆ
4.3 Overall Estimate for Aggregates for a semi-round:
Overall estimate for aggregates for a stratum ( sY ) based on two sub-samples of a particular
semi-round was obtained as:
2
1
ˆ2
1ˆ
m
sms YY
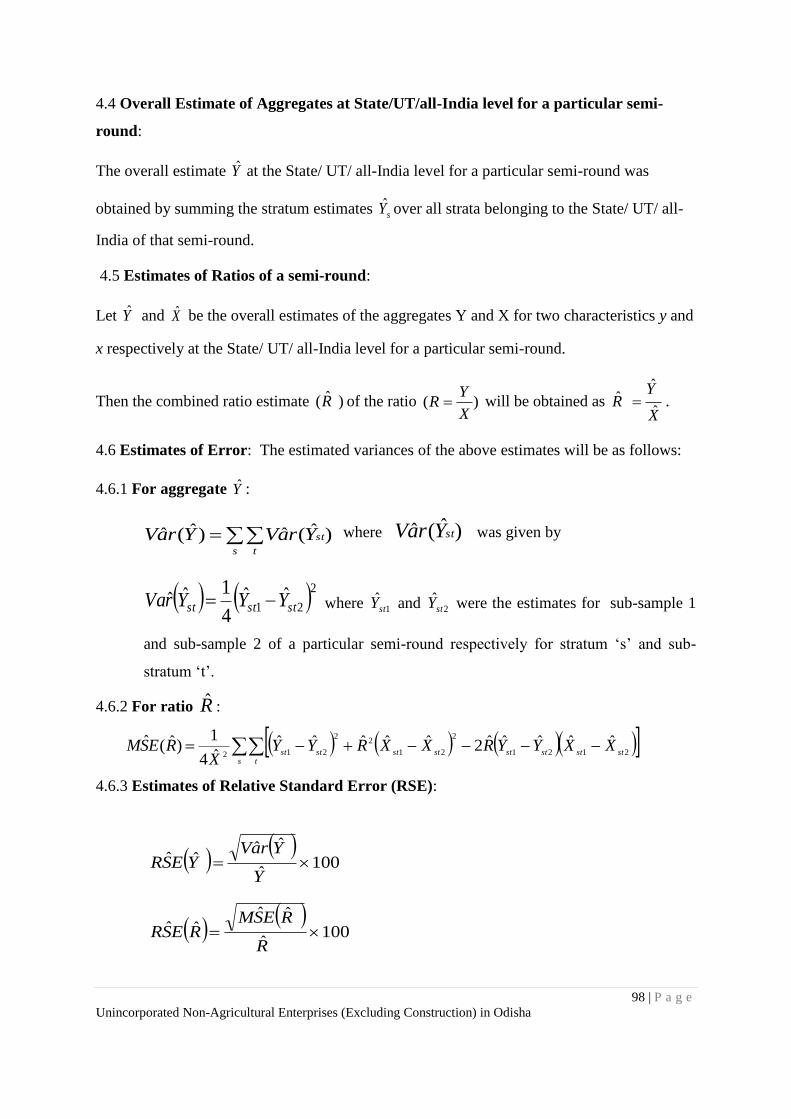
98 | P a g e
Unincorporated Non-Agricultural Enterprises (Excluding Construction) in Odisha
4.4 Overall Estimate of Aggregates at State/UT/all-India level for a particular semi-
round:
The overall estimate Y at the State/ UT/ all-India level for a particular semi-round was
obtained by summing the stratum estimates sY over all strata belonging to the State/ UT/ all-
India of that semi-round.
4.5 Estimates of Ratios of a semi-round:
Let Y and X be the overall estimates of the aggregates Y and X for two characteristics y and
x respectively at the State/ UT/ all-India level for a particular semi-round.
Then the combined ratio estimate )ˆ(R of the ratio )(X
YR will be obtained as
X
YR
ˆ
ˆˆ .
4.6 Estimates of Error: The estimated variances of the above estimates will be as follows:
4.6.1 For aggregate Y :
s t
stYraVYraV )ˆ(ˆ)ˆ(ˆ where )ˆ(ˆ stYraV was given by
221ˆˆ
4
1ˆˆ ststst YYYrVa where 1ˆstY and 2
ˆstY were the estimates for sub-sample 1
and sub-sample 2 of a particular semi-round respectively for stratum ‘s’ and sub-
stratum ‘t’.
4.6.2 For ratio R :
s t
ststststststststXXYYRXXRYY
XRESM
2121
2
21
22
212
ˆˆˆˆˆ2ˆˆˆˆˆˆ4
1)ˆ(ˆ
4.6.3 Estimates of Relative Standard Error (RSE):
100ˆ
ˆˆˆˆ
Y
YraVYESR
100ˆ
ˆˆˆˆ
R
RESMRESR
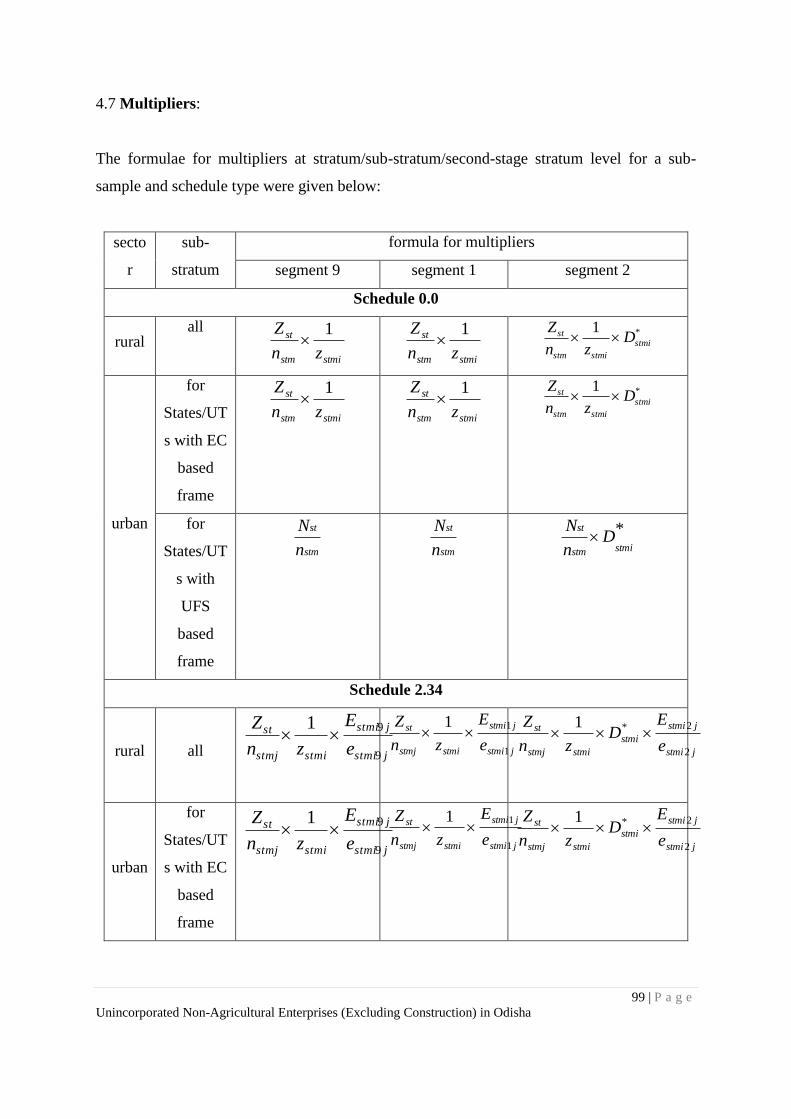
99 | P a g e
Unincorporated Non-Agricultural Enterprises (Excluding Construction) in Odisha
4.7 Multipliers:
The formulae for multipliers at stratum/sub-stratum/second-stage stratum level for a sub-
sample and schedule type were given below:
secto
r
sub-
stratum
formula for multipliers
segment 9 segment 1 segment 2
Schedule 0.0
rural all
stmistm
st
zn
Z 1
stmistm
st
zn
Z 1
*1stmi
stmistm
st Dzn
Z
urban
for
States/UT
s with EC
based
frame
stmistm
st
zn
Z 1
stmistm
st
zn
Z 1
*1stmi
stmistm
st Dzn
Z
for
States/UT
s with
UFS
based
frame
stm
st
n
N
stm
st
n
N
*stmistm
stD
n
N
Schedule 2.34
rural all jstmi
jstmi
stmistmj
st
e
E
zn
Z
9
91
jstmi
jstmi
stmistmj
st
e
E
zn
Z
1
11
jstmi
jstmi
stmi
stmistmj
st
e
ED
zn
Z
2
2*1
urban
for
States/UT
s with EC
based
frame
jstmi
jstmi
stmistmj
st
e
E
zn
Z
9
91
jstmi
jstmi
stmistmj
st
e
E
zn
Z
1
11
jstmi
jstmi
stmi
stmistmj
st
e
ED
zn
Z
2
2*1
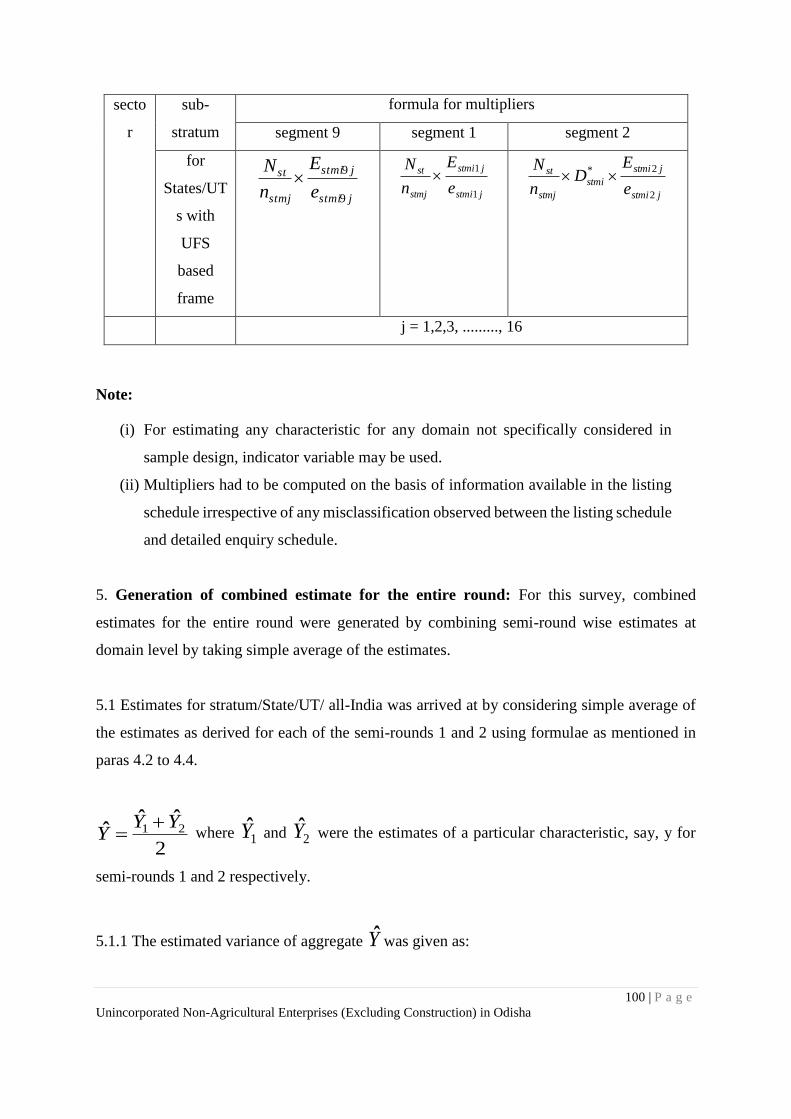
100 | P a g e
Unincorporated Non-Agricultural Enterprises (Excluding Construction) in Odisha
secto
r
sub-
stratum
formula for multipliers
segment 9 segment 1 segment 2
for
States/UT
s with
UFS
based
frame
jstmi
jstmi
stmj
st
e
E
n
N
9
9
jstmi
jstmi
stmj
st
e
E
n
N
1
1
jstmi
jstmi
stmi
stmj
st
e
ED
n
N
2
2*
j = 1,2,3, ........., 16
Note:
(i) For estimating any characteristic for any domain not specifically considered in
sample design, indicator variable may be used.
(ii) Multipliers had to be computed on the basis of information available in the listing
schedule irrespective of any misclassification observed between the listing schedule
and detailed enquiry schedule.
5. Generation of combined estimate for the entire round: For this survey, combined
estimates for the entire round were generated by combining semi-round wise estimates at
domain level by taking simple average of the estimates.
5.1 Estimates for stratum/State/UT/ all-India was arrived at by considering simple average of
the estimates as derived for each of the semi-rounds 1 and 2 using formulae as mentioned in
paras 4.2 to 4.4.
2
21 YYY
ˆˆˆ where 1Y and 2Y were the estimates of a particular characteristic, say, y for
semi-rounds 1 and 2 respectively.
5.1.1 The estimated variance of aggregate Y was given as:
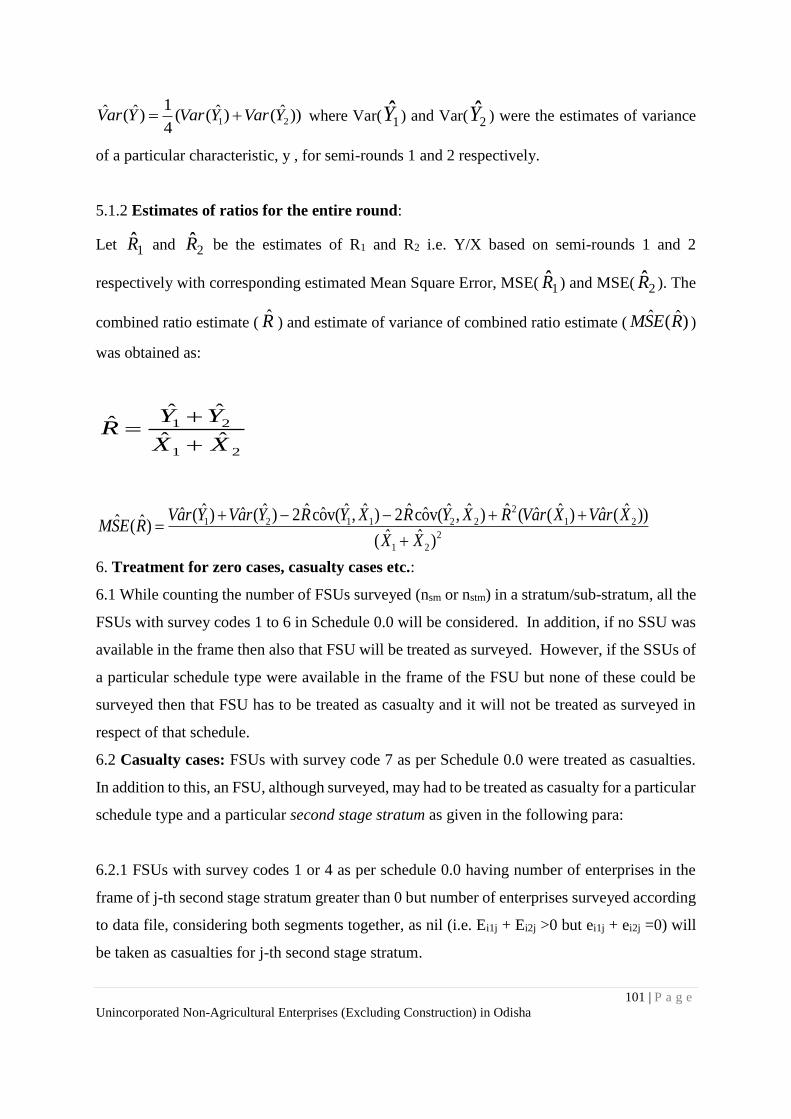
101 | P a g e
Unincorporated Non-Agricultural Enterprises (Excluding Construction) in Odisha
))ˆ()ˆ((4
1)ˆ(ˆ
21 YVarYVarYarV where Var( 1Y ) and Var( 2Y ) were the estimates of variance
of a particular characteristic, y , for semi-rounds 1 and 2 respectively.
5.1.2 Estimates of ratios for the entire round:
Let 1R and 2R be the estimates of R1 and R2 i.e. Y/X based on semi-rounds 1 and 2
respectively with corresponding estimated Mean Square Error, MSE( 1R ) and MSE( 2R ). The
combined ratio estimate ( R ) and estimate of variance of combined ratio estimate ( )ˆ(ˆ RESM )
was obtained as:
21
21
ˆˆ
ˆˆˆ
XX
YYR
2
21
21
2
221121
)ˆˆ(
))ˆ(ˆ)ˆ(ˆ(ˆ)ˆ,ˆv(ocˆ2)ˆ,ˆv(ocˆ2)ˆ(ˆ)ˆ(ˆ)ˆ(ˆ
XX
XraVXraVRXYRXYRYraVYraVRESM
6. Treatment for zero cases, casualty cases etc.:
6.1 While counting the number of FSUs surveyed (nsm or nstm) in a stratum/sub-stratum, all the
FSUs with survey codes 1 to 6 in Schedule 0.0 will be considered. In addition, if no SSU was
available in the frame then also that FSU will be treated as surveyed. However, if the SSUs of
a particular schedule type were available in the frame of the FSU but none of these could be
surveyed then that FSU has to be treated as casualty and it will not be treated as surveyed in
respect of that schedule.
6.2 Casualty cases: FSUs with survey code 7 as per Schedule 0.0 were treated as casualties.
In addition to this, an FSU, although surveyed, may had to be treated as casualty for a particular
schedule type and a particular second stage stratum as given in the following para:
6.2.1 FSUs with survey codes 1 or 4 as per schedule 0.0 having number of enterprises in the
frame of j-th second stage stratum greater than 0 but number of enterprises surveyed according
to data file, considering both segments together, as nil (i.e. Ei1j + Ei2j >0 but ei1j + ei2j =0) will
be taken as casualties for j-th second stage stratum.
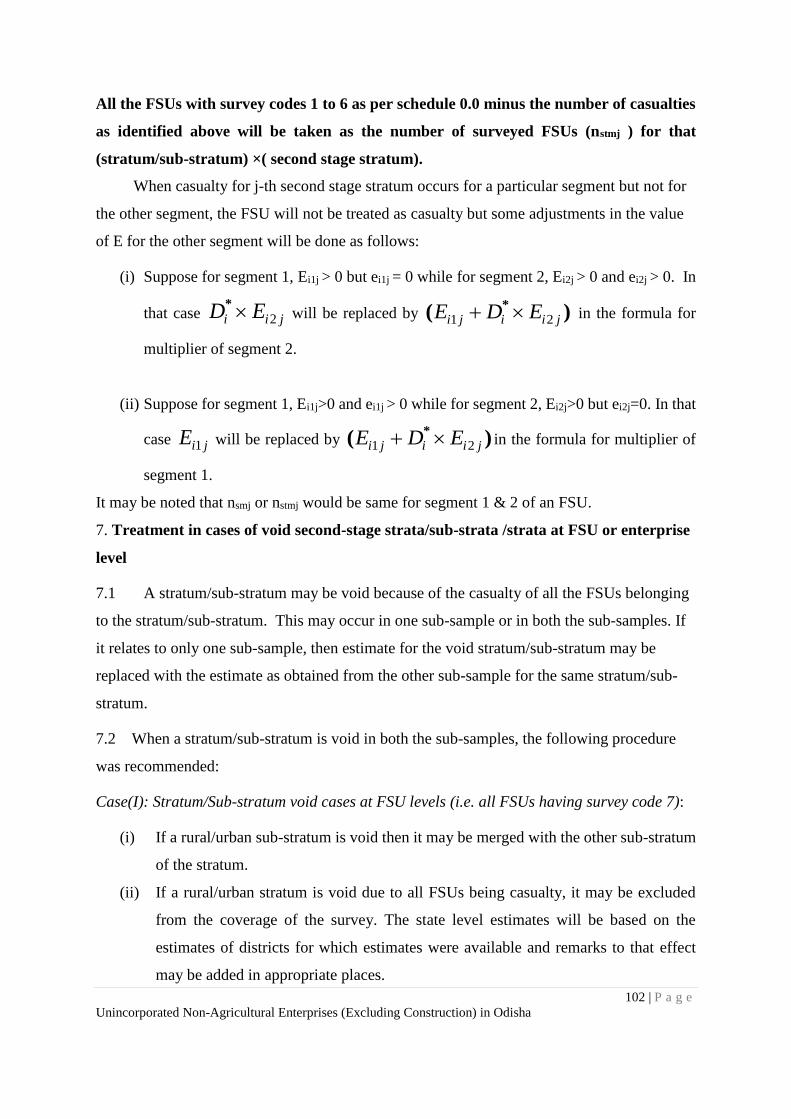
102 | P a g e
Unincorporated Non-Agricultural Enterprises (Excluding Construction) in Odisha
All the FSUs with survey codes 1 to 6 as per schedule 0.0 minus the number of casualties
as identified above will be taken as the number of surveyed FSUs (nstmj ) for that
(stratum/sub-stratum) ×( second stage stratum).
When casualty for j-th second stage stratum occurs for a particular segment but not for
the other segment, the FSU will not be treated as casualty but some adjustments in the value
of E for the other segment will be done as follows:
(i) Suppose for segment 1, Ei1j > 0 but ei1j = 0 while for segment 2, Ei2j > 0 and ei2j > 0. In
that case jii ED 2* will be replaced by )(
*
jiiji EDE 21 in the formula for
multiplier of segment 2.
(ii) Suppose for segment 1, Ei1j>0 and ei1j > 0 while for segment 2, Ei2j>0 but ei2j=0. In that
case jiE 1 will be replaced by )(*
jiiji EDE 21 in the formula for multiplier of
segment 1.
It may be noted that nsmj or nstmj would be same for segment 1 & 2 of an FSU.
7. Treatment in cases of void second-stage strata/sub-strata /strata at FSU or enterprise
level
7.1 A stratum/sub-stratum may be void because of the casualty of all the FSUs belonging
to the stratum/sub-stratum. This may occur in one sub-sample or in both the sub-samples. If
it relates to only one sub-sample, then estimate for the void stratum/sub-stratum may be
replaced with the estimate as obtained from the other sub-sample for the same stratum/sub-
stratum.
7.2 When a stratum/sub-stratum is void in both the sub-samples, the following procedure
was recommended:
Case(I): Stratum/Sub-stratum void cases at FSU levels (i.e. all FSUs having survey code 7):
(i) If a rural/urban sub-stratum is void then it may be merged with the other sub-stratum
of the stratum.
(ii) If a rural/urban stratum is void due to all FSUs being casualty, it may be excluded
from the coverage of the survey. The state level estimates will be based on the
estimates of districts for which estimates were available and remarks to that effect
may be added in appropriate places.
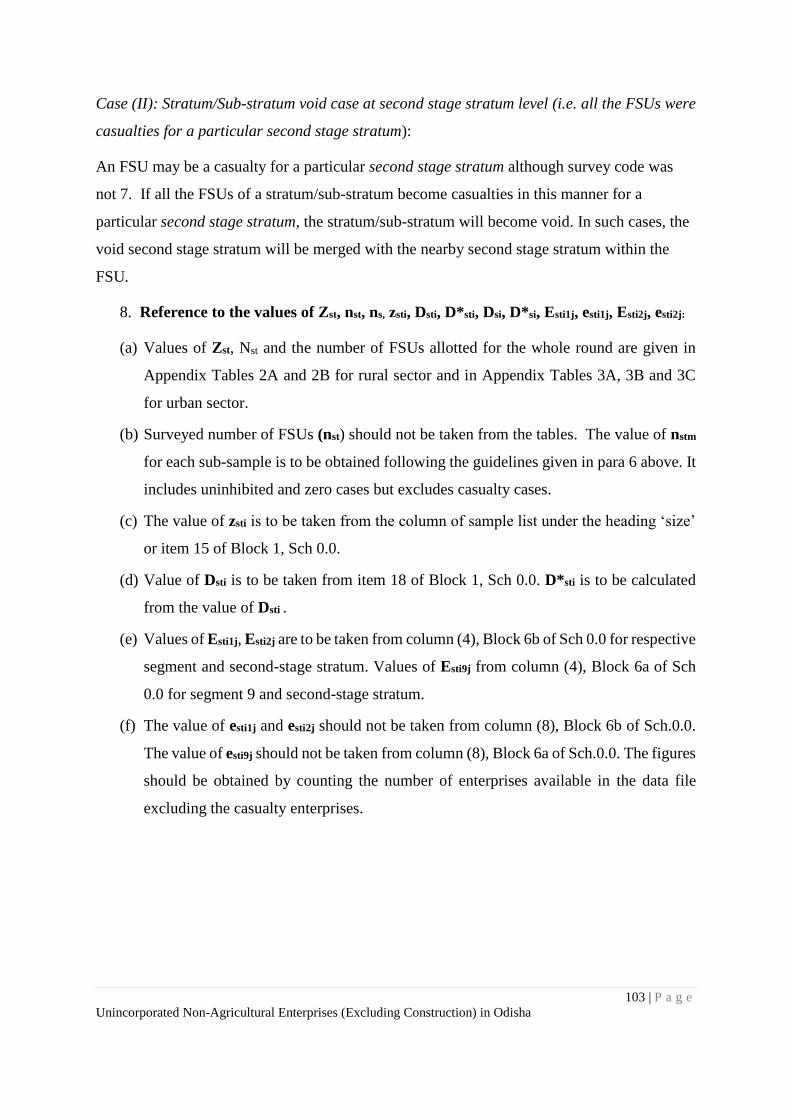
103 | P a g e
Unincorporated Non-Agricultural Enterprises (Excluding Construction) in Odisha
Case (II): Stratum/Sub-stratum void case at second stage stratum level (i.e. all the FSUs were
casualties for a particular second stage stratum):
An FSU may be a casualty for a particular second stage stratum although survey code was
not 7. If all the FSUs of a stratum/sub-stratum become casualties in this manner for a
particular second stage stratum, the stratum/sub-stratum will become void. In such cases, the
void second stage stratum will be merged with the nearby second stage stratum within the
FSU.
8. Reference to the values of Zst, nst, ns, zsti, Dsti, D*sti, Dsi, D*si, Esti1j, esti1j, Esti2j, esti2j:
(a) Values of Zst, Nst and the number of FSUs allotted for the whole round are given in
Appendix Tables 2A and 2B for rural sector and in Appendix Tables 3A, 3B and 3C
for urban sector.
(b) Surveyed number of FSUs (nst) should not be taken from the tables. The value of nstm
for each sub-sample is to be obtained following the guidelines given in para 6 above. It
includes uninhibited and zero cases but excludes casualty cases.
(c) The value of zsti is to be taken from the column of sample list under the heading ‘size’
or item 15 of Block 1, Sch 0.0.
(d) Value of Dsti is to be taken from item 18 of Block 1, Sch 0.0. D*sti is to be calculated
from the value of Dsti .
(e) Values of Esti1j, Esti2j are to be taken from column (4), Block 6b of Sch 0.0 for respective
segment and second-stage stratum. Values of Esti9j from column (4), Block 6a of Sch
0.0 for segment 9 and second-stage stratum.
(f) The value of esti1j and esti2j should not be taken from column (8), Block 6b of Sch.0.0.
The value of esti9j should not be taken from column (8), Block 6a of Sch.0.0. The figures
should be obtained by counting the number of enterprises available in the data file
excluding the casualty enterprises.
104 | P a g e
Unincorporated Non-Agricultural Enterprises (Excluding Construction) in Odisha
Appendix-B Detailed Tables
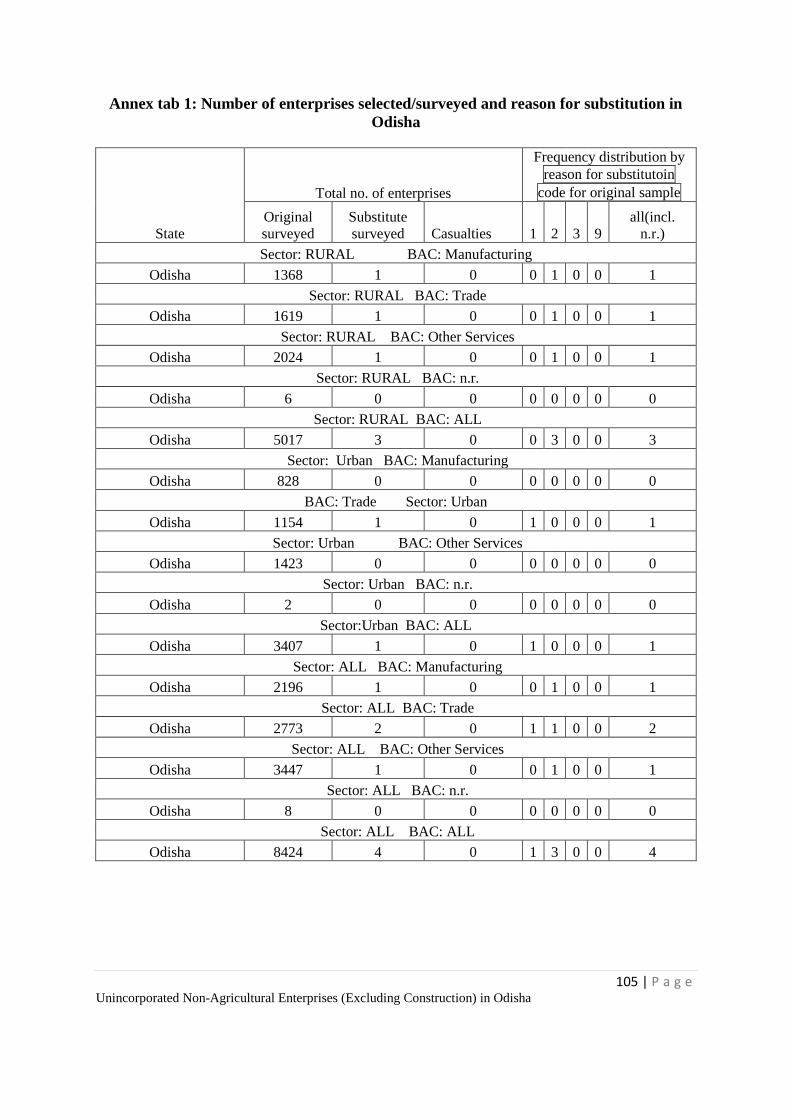
105 | P a g e Unincorporated Non-Agricultural Enterprises (Excluding Construction) in Odisha
Annex tab 1: Number of enterprises selected/surveyed and reason for substitution in
Odisha
State
Total no. of enterprises
Frequency distribution by
reason for substitutoin
code for original sample
Original
surveyed
Substitute
surveyed Casualties 1 2 3 9
all(incl.
n.r.)
Sector: RURAL BAC: Manufacturing
Odisha 1368 1 0 0 1 0 0 1
Sector: RURAL BAC: Trade
Odisha 1619 1 0 0 1 0 0 1
Sector: RURAL BAC: Other Services
Odisha 2024 1 0 0 1 0 0 1
Sector: RURAL BAC: n.r.
Odisha 6 0 0 0 0 0 0 0
Sector: RURAL BAC: ALL
Odisha 5017 3 0 0 3 0 0 3
Sector: Urban BAC: Manufacturing
Odisha 828 0 0 0 0 0 0 0
BAC: Trade Sector: Urban
Odisha 1154 1 0 1 0 0 0 1
Sector: Urban BAC: Other Services
Odisha 1423 0 0 0 0 0 0 0
Sector: Urban BAC: n.r.
Odisha 2 0 0 0 0 0 0 0
Sector:Urban BAC: ALL
Odisha 3407 1 0 1 0 0 0 1
Sector: ALL BAC: Manufacturing
Odisha 2196 1 0 0 1 0 0 1
Sector: ALL BAC: Trade
Odisha 2773 2 0 1 1 0 0 2
Sector: ALL BAC: Other Services
Odisha 3447 1 0 0 1 0 0 1
Sector: ALL BAC: n.r.
Odisha 8 0 0 0 0 0 0 0
Sector: ALL BAC: ALL
Odisha 8424 4 0 1 3 0 0 4
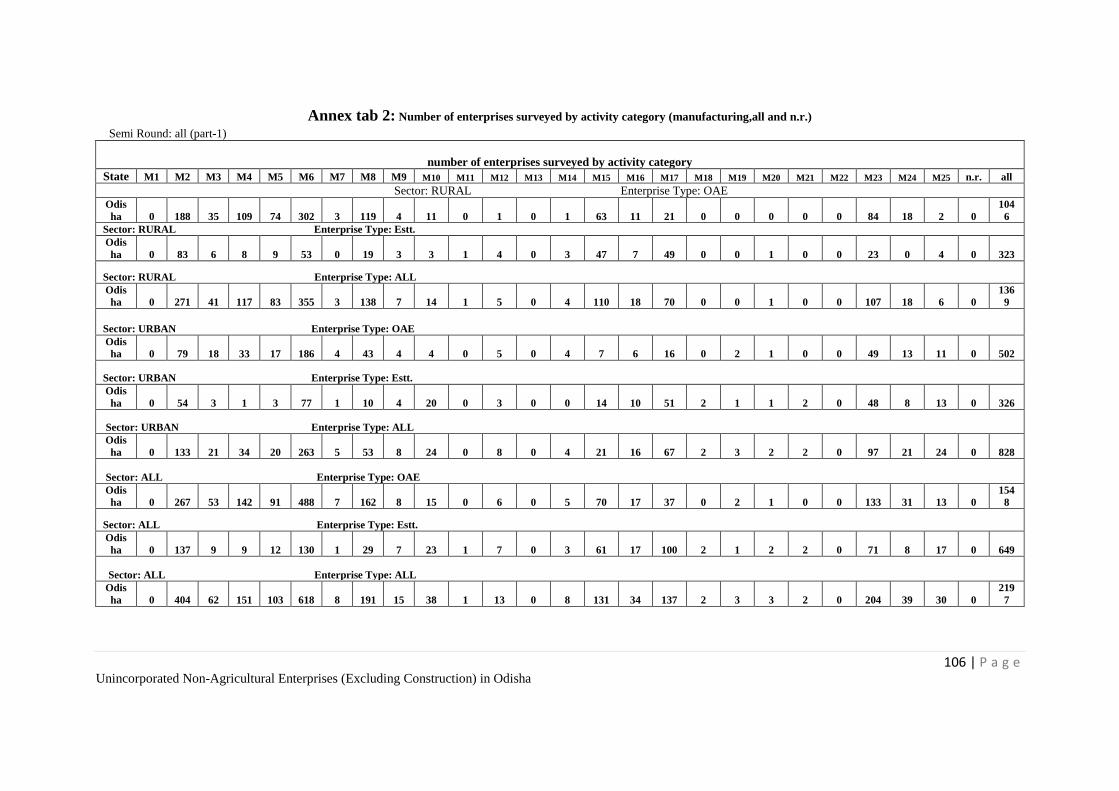
106 | P a g e Unincorporated Non-Agricultural Enterprises (Excluding Construction) in Odisha
Annex tab 2: Number of enterprises surveyed by activity category (manufacturing,all and n.r.)
Semi Round: all (part-1)
number of enterprises surveyed by activity category
State M1 M2 M3 M4 M5 M6 M7 M8 M9 M10 M11 M12 M13 M14 M15 M16 M17 M18 M19 M20 M21 M22 M23 M24 M25 n.r. all
Sector: RURAL Enterprise Type: OAE Odis
ha 0 188 35 109 74 302 3 119 4 11 0 1 0 1 63 11 21 0 0 0 0 0 84 18 2 0
104
6
Sector: RURAL Enterprise Type: Estt.
Odis
ha 0 83 6 8 9 53 0 19 3 3 1 4 0 3 47 7 49 0 0 1 0 0 23 0 4 0 323
Sector: RURAL Enterprise Type: ALL
Odis
ha 0 271 41 117 83 355 3 138 7 14 1 5 0 4 110 18 70 0 0 1 0 0 107 18 6 0
136
9
Sector: URBAN Enterprise Type: OAE
Odis
ha 0 79 18 33 17 186 4 43 4 4 0 5 0 4 7 6 16 0 2 1 0 0 49 13 11 0 502
Sector: URBAN Enterprise Type: Estt.
Odis
ha 0 54 3 1 3 77 1 10 4 20 0 3 0 0 14 10 51 2 1 1 2 0 48 8 13 0 326
Sector: URBAN Enterprise Type: ALL
Odis
ha 0 133 21 34 20 263 5 53 8 24 0 8 0 4 21 16 67 2 3 2 2 0 97 21 24 0 828
Sector: ALL Enterprise Type: OAE
Odis
ha 0 267 53 142 91 488 7 162 8 15 0 6 0 5 70 17 37 0 2 1 0 0 133 31 13 0
154
8
Sector: ALL Enterprise Type: Estt.
Odis
ha 0 137 9 9 12 130 1 29 7 23 1 7 0 3 61 17 100 2 1 2 2 0 71 8 17 0 649
Sector: ALL Enterprise Type: ALL
Odis
ha 0 404 62 151 103 618 8 191 15 38 1 13 0 8 131 34 137 2 3 3 2 0 204 39 30 0
219
7
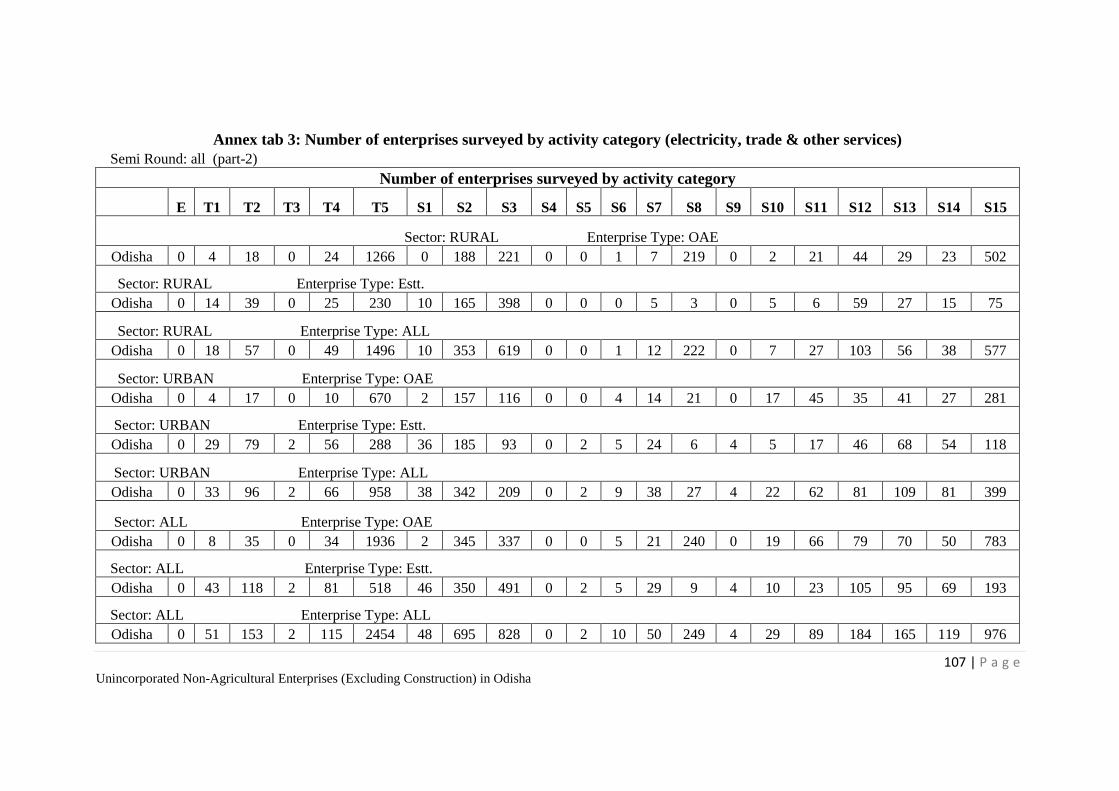
107 | P a g e Unincorporated Non-Agricultural Enterprises (Excluding Construction) in Odisha
Annex tab 3: Number of enterprises surveyed by activity category (electricity, trade & other services)
Semi Round: all (part-2)
Number of enterprises surveyed by activity category
E T1 T2 T3 T4 T5 S1 S2 S3 S4 S5 S6 S7 S8 S9 S10 S11 S12 S13 S14 S15
Sector: RURAL Enterprise Type: OAE
Odisha 0 4 18 0 24 1266 0 188 221 0 0 1 7 219 0 2 21 44 29 23 502
Sector: RURAL Enterprise Type: Estt.
Odisha 0 14 39 0 25 230 10 165 398 0 0 0 5 3 0 5 6 59 27 15 75
Sector: RURAL Enterprise Type: ALL
Odisha 0 18 57 0 49 1496 10 353 619 0 0 1 12 222 0 7 27 103 56 38 577
Sector: URBAN Enterprise Type: OAE
Odisha 0 4 17 0 10 670 2 157 116 0 0 4 14 21 0 17 45 35 41 27 281
Sector: URBAN Enterprise Type: Estt.
Odisha 0 29 79 2 56 288 36 185 93 0 2 5 24 6 4 5 17 46 68 54 118
Sector: URBAN Enterprise Type: ALL
Odisha 0 33 96 2 66 958 38 342 209 0 2 9 38 27 4 22 62 81 109 81 399
Sector: ALL Enterprise Type: OAE
Odisha 0 8 35 0 34 1936 2 345 337 0 0 5 21 240 0 19 66 79 70 50 783
Sector: ALL Enterprise Type: Estt.
Odisha 0 43 118 2 81 518 46 350 491 0 2 5 29 9 4 10 23 105 95 69 193
Sector: ALL Enterprise Type: ALL
Odisha 0 51 153 2 115 2454 48 695 828 0 2 10 50 249 4 29 89 184 165 119 976
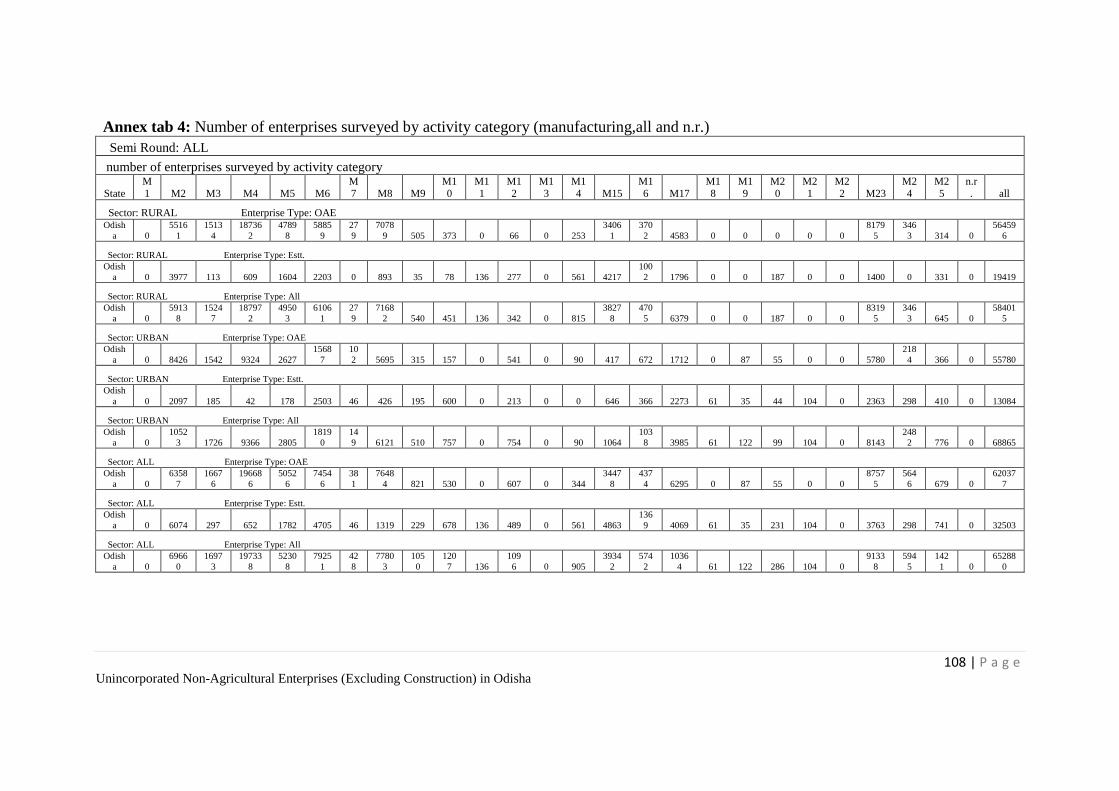
108 | P a g e Unincorporated Non-Agricultural Enterprises (Excluding Construction) in Odisha
Annex tab 4: Number of enterprises surveyed by activity category (manufacturing,all and n.r.)
Semi Round: ALL
number of enterprises surveyed by activity category
State M1 M2 M3 M4 M5 M6
M7 M8 M9
M10
M11
M12
M13
M14 M15
M16 M17
M18
M19
M20
M21
M22 M23
M24
M25
n.r. all
Sector: RURAL Enterprise Type: OAE Odish
a 0
5516
1
1513
4
18736
2
4789
8
5885
9
27
9
7078
9 505 373 0 66 0 253
3406
1
370
2 4583 0 0 0 0 0
8179
5
346
3 314 0
56459
6
Sector: RURAL Enterprise Type: Estt.
Odish
a 0 3977 113 609 1604 2203 0 893 35 78 136 277 0 561 4217
100
2 1796 0 0 187 0 0 1400 0 331 0 19419
Sector: RURAL Enterprise Type: All
Odish
a 0
5913
8
1524
7
18797
2
4950
3
6106
1
27
9
7168
2 540 451 136 342 0 815
3827
8
470
5 6379 0 0 187 0 0
8319
5
346
3 645 0
58401
5
Sector: URBAN Enterprise Type: OAE
Odish
a 0 8426 1542 9324 2627
1568
7
10
2 5695 315 157 0 541 0 90 417 672 1712 0 87 55 0 0 5780
218
4 366 0 55780
Sector: URBAN Enterprise Type: Estt.
Odish
a 0 2097 185 42 178 2503 46 426 195 600 0 213 0 0 646 366 2273 61 35 44 104 0 2363 298 410 0 13084
Sector: URBAN Enterprise Type: All
Odish
a 0
1052
3 1726 9366 2805
1819
0
14
9 6121 510 757 0 754 0 90 1064
103
8 3985 61 122 99 104 0 8143
248
2 776 0 68865
Sector: ALL Enterprise Type: OAE
Odish
a 0
6358
7
1667
6
19668
6
5052
6
7454
6
38
1
7648
4 821 530 0 607 0 344
3447
8
437
4 6295 0 87 55 0 0
8757
5
564
6 679 0
62037
7
Sector: ALL Enterprise Type: Estt.
Odish
a 0 6074 297 652 1782 4705 46 1319 229 678 136 489 0 561 4863
136
9 4069 61 35 231 104 0 3763 298 741 0 32503
Sector: ALL Enterprise Type: All
Odish
a 0
6966
0
1697
3
19733
8
5230
8
7925
1
42
8
7780
3
105
0
120
7 136
109
6 0 905
3934
2
574
2
1036
4 61 122 286 104 0
9133
8
594
5
142
1 0
65288
0
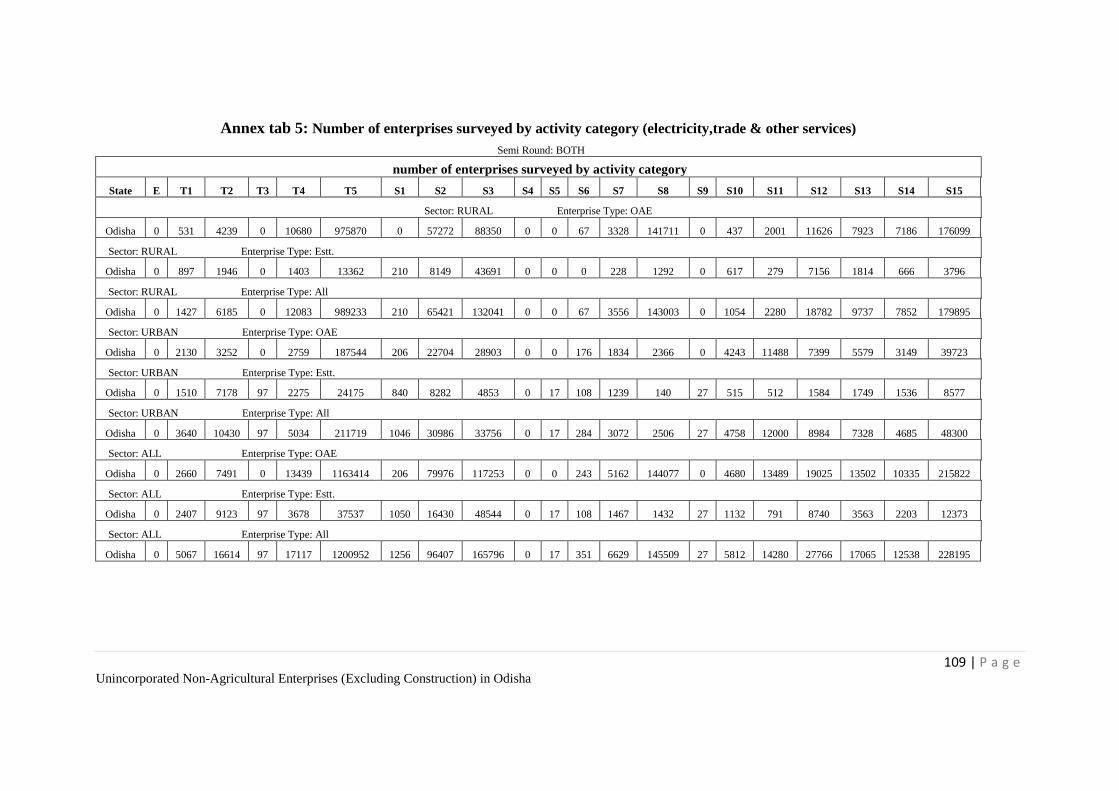
109 | P a g e Unincorporated Non-Agricultural Enterprises (Excluding Construction) in Odisha
Annex tab 5: Number of enterprises surveyed by activity category (electricity,trade & other services)
Semi Round: BOTH
number of enterprises surveyed by activity category
State E T1 T2 T3 T4 T5 S1 S2 S3 S4 S5 S6 S7 S8 S9 S10 S11 S12 S13 S14 S15
Sector: RURAL Enterprise Type: OAE
Odisha 0 531 4239 0 10680 975870 0 57272 88350 0 0 67 3328 141711 0 437 2001 11626 7923 7186 176099
Sector: RURAL Enterprise Type: Estt.
Odisha 0 897 1946 0 1403 13362 210 8149 43691 0 0 0 228 1292 0 617 279 7156 1814 666 3796
Sector: RURAL Enterprise Type: All
Odisha 0 1427 6185 0 12083 989233 210 65421 132041 0 0 67 3556 143003 0 1054 2280 18782 9737 7852 179895
Sector: URBAN Enterprise Type: OAE
Odisha 0 2130 3252 0 2759 187544 206 22704 28903 0 0 176 1834 2366 0 4243 11488 7399 5579 3149 39723
Sector: URBAN Enterprise Type: Estt.
Odisha 0 1510 7178 97 2275 24175 840 8282 4853 0 17 108 1239 140 27 515 512 1584 1749 1536 8577
Sector: URBAN Enterprise Type: All
Odisha 0 3640 10430 97 5034 211719 1046 30986 33756 0 17 284 3072 2506 27 4758 12000 8984 7328 4685 48300
Sector: ALL Enterprise Type: OAE
Odisha 0 2660 7491 0 13439 1163414 206 79976 117253 0 0 243 5162 144077 0 4680 13489 19025 13502 10335 215822
Sector: ALL Enterprise Type: Estt.
Odisha 0 2407 9123 97 3678 37537 1050 16430 48544 0 17 108 1467 1432 27 1132 791 8740 3563 2203 12373
Sector: ALL Enterprise Type: All
Odisha 0 5067 16614 97 17117 1200952 1256 96407 165796 0 17 351 6629 145509 27 5812 14280 27766 17065 12538 228195
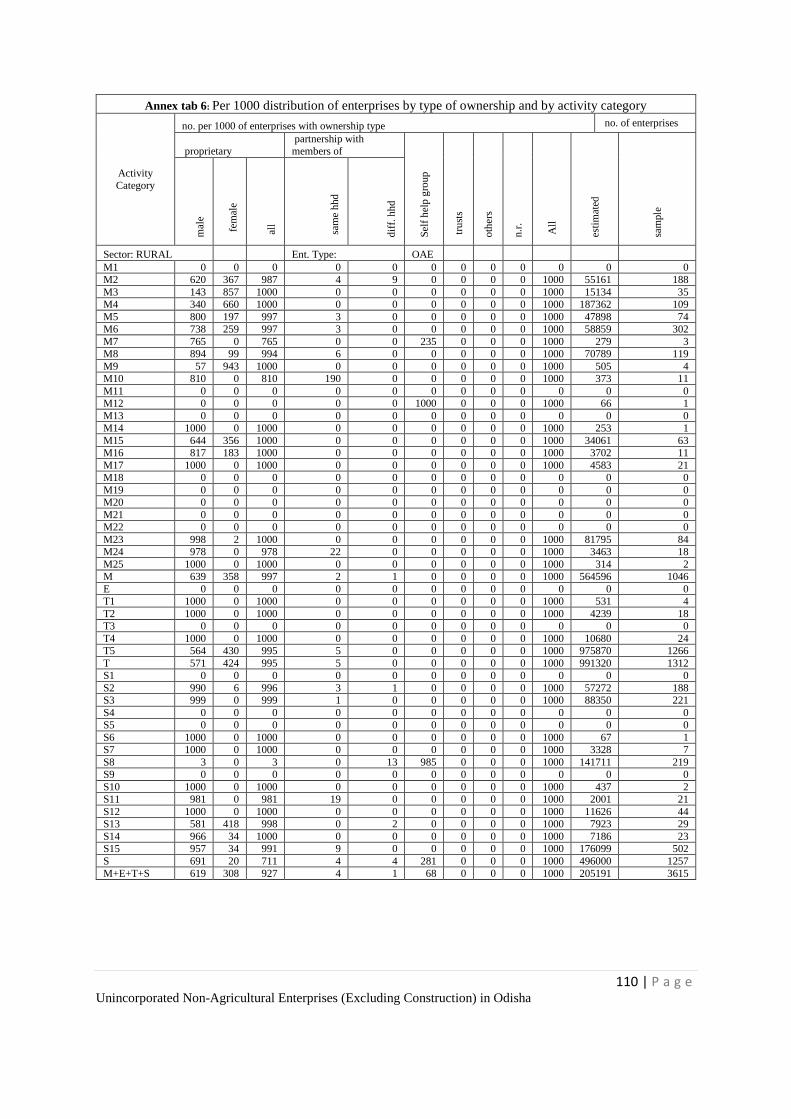
110 | P a g e Unincorporated Non-Agricultural Enterprises (Excluding Construction) in Odisha
Annex tab 6: Per 1000 distribution of enterprises by type of ownership and by activity category
Activity
Category
no. per 1000 of enterprises with ownership type no. of enterprises
proprietary
partnership with
members of
Sel
f h
elp
gro
up
tru
sts
oth
ers
n.r
.
All
esti
mat
ed
sam
ple
mal
e
fe
mal
e
all
sam
e hhd
dif
f. h
hd
Sector: RURAL Ent. Type: OAE M1 0 0 0 0 0 0 0 0 0 0 0 0
M2 620 367 987 4 9 0 0 0 0 1000 55161 188
M3 143 857 1000 0 0 0 0 0 0 1000 15134 35
M4 340 660 1000 0 0 0 0 0 0 1000 187362 109
M5 800 197 997 3 0 0 0 0 0 1000 47898 74
M6 738 259 997 3 0 0 0 0 0 1000 58859 302
M7 765 0 765 0 0 235 0 0 0 1000 279 3
M8 894 99 994 6 0 0 0 0 0 1000 70789 119
M9 57 943 1000 0 0 0 0 0 0 1000 505 4
M10 810 0 810 190 0 0 0 0 0 1000 373 11
M11 0 0 0 0 0 0 0 0 0 0 0 0
M12 0 0 0 0 0 1000 0 0 0 1000 66 1
M13 0 0 0 0 0 0 0 0 0 0 0 0
M14 1000 0 1000 0 0 0 0 0 0 1000 253 1
M15 644 356 1000 0 0 0 0 0 0 1000 34061 63
M16 817 183 1000 0 0 0 0 0 0 1000 3702 11
M17 1000 0 1000 0 0 0 0 0 0 1000 4583 21
M18 0 0 0 0 0 0 0 0 0 0 0 0
M19 0 0 0 0 0 0 0 0 0 0 0 0
M20 0 0 0 0 0 0 0 0 0 0 0 0
M21 0 0 0 0 0 0 0 0 0 0 0 0
M22 0 0 0 0 0 0 0 0 0 0 0 0
M23 998 2 1000 0 0 0 0 0 0 1000 81795 84
M24 978 0 978 22 0 0 0 0 0 1000 3463 18
M25 1000 0 1000 0 0 0 0 0 0 1000 314 2
M 639 358 997 2 1 0 0 0 0 1000 564596 1046
E 0 0 0 0 0 0 0 0 0 0 0 0
T1 1000 0 1000 0 0 0 0 0 0 1000 531 4
T2 1000 0 1000 0 0 0 0 0 0 1000 4239 18
T3 0 0 0 0 0 0 0 0 0 0 0 0
T4 1000 0 1000 0 0 0 0 0 0 1000 10680 24
T5 564 430 995 5 0 0 0 0 0 1000 975870 1266
T 571 424 995 5 0 0 0 0 0 1000 991320 1312
S1 0 0 0 0 0 0 0 0 0 0 0 0
S2 990 6 996 3 1 0 0 0 0 1000 57272 188
S3 999 0 999 1 0 0 0 0 0 1000 88350 221
S4 0 0 0 0 0 0 0 0 0 0 0 0
S5 0 0 0 0 0 0 0 0 0 0 0 0
S6 1000 0 1000 0 0 0 0 0 0 1000 67 1
S7 1000 0 1000 0 0 0 0 0 0 1000 3328 7
S8 3 0 3 0 13 985 0 0 0 1000 141711 219
S9 0 0 0 0 0 0 0 0 0 0 0 0
S10 1000 0 1000 0 0 0 0 0 0 1000 437 2
S11 981 0 981 19 0 0 0 0 0 1000 2001 21
S12 1000 0 1000 0 0 0 0 0 0 1000 11626 44
S13 581 418 998 0 2 0 0 0 0 1000 7923 29
S14 966 34 1000 0 0 0 0 0 0 1000 7186 23
S15 957 34 991 9 0 0 0 0 0 1000 176099 502
S 691 20 711 4 4 281 0 0 0 1000 496000 1257
M+E+T+S 619 308 927 4 1 68 0 0 0 1000 205191
7
3615
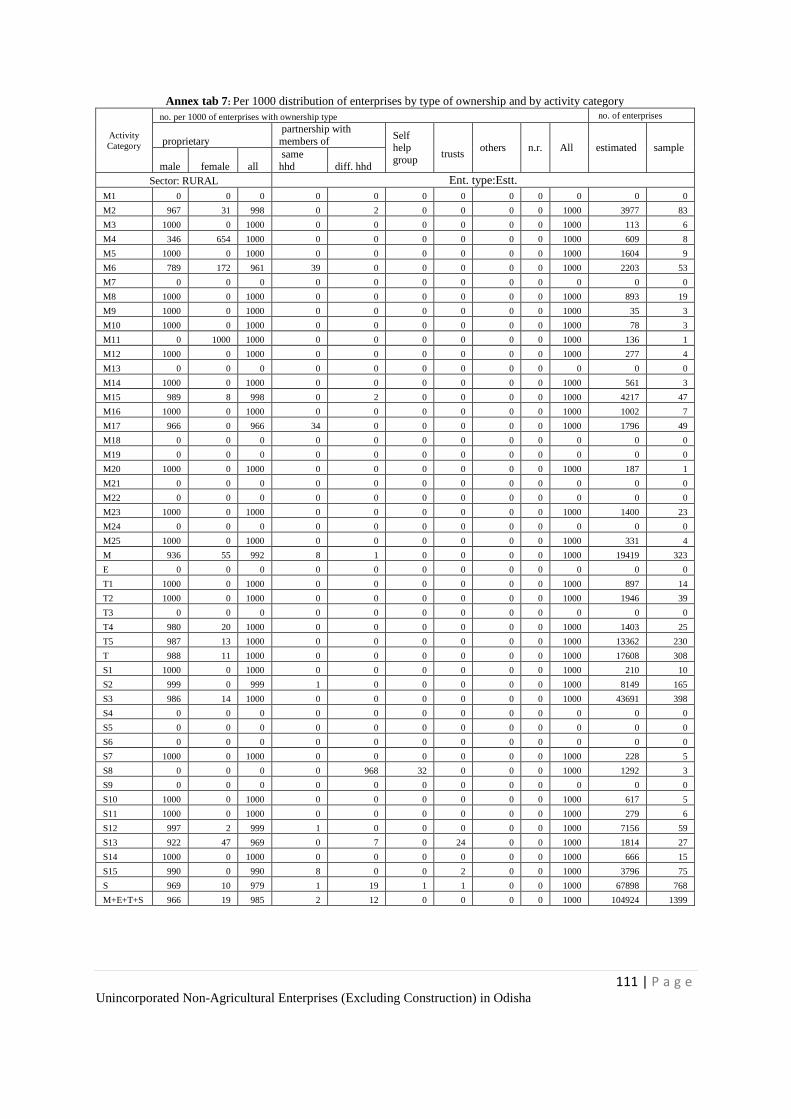
111 | P a g e Unincorporated Non-Agricultural Enterprises (Excluding Construction) in Odisha
Annex tab 7: Per 1000 distribution of enterprises by type of ownership and by activity category
Activity
Category
no. per 1000 of enterprises with ownership type no. of enterprises
proprietary
partnership with
members of Self help
group
trusts others n.r. All estimated sample
male female all
same
hhd diff. hhd
Sector: RURAL Ent. type:Estt.
M1 0 0 0 0 0 0 0 0 0 0 0 0
M2 967 31 998 0 2 0 0 0 0 1000 3977 83
M3 1000 0 1000 0 0 0 0 0 0 1000 113 6
M4 346 654 1000 0 0 0 0 0 0 1000 609 8
M5 1000 0 1000 0 0 0 0 0 0 1000 1604 9
M6 789 172 961 39 0 0 0 0 0 1000 2203 53
M7 0 0 0 0 0 0 0 0 0 0 0 0
M8 1000 0 1000 0 0 0 0 0 0 1000 893 19
M9 1000 0 1000 0 0 0 0 0 0 1000 35 3
M10 1000 0 1000 0 0 0 0 0 0 1000 78 3
M11 0 1000 1000 0 0 0 0 0 0 1000 136 1
M12 1000 0 1000 0 0 0 0 0 0 1000 277 4
M13 0 0 0 0 0 0 0 0 0 0 0 0
M14 1000 0 1000 0 0 0 0 0 0 1000 561 3
M15 989 8 998 0 2 0 0 0 0 1000 4217 47
M16 1000 0 1000 0 0 0 0 0 0 1000 1002 7
M17 966 0 966 34 0 0 0 0 0 1000 1796 49
M18 0 0 0 0 0 0 0 0 0 0 0 0
M19 0 0 0 0 0 0 0 0 0 0 0 0
M20 1000 0 1000 0 0 0 0 0 0 1000 187 1
M21 0 0 0 0 0 0 0 0 0 0 0 0
M22 0 0 0 0 0 0 0 0 0 0 0 0
M23 1000 0 1000 0 0 0 0 0 0 1000 1400 23
M24 0 0 0 0 0 0 0 0 0 0 0 0
M25 1000 0 1000 0 0 0 0 0 0 1000 331 4
M 936 55 992 8 1 0 0 0 0 1000 19419 323
E 0 0 0 0 0 0 0 0 0 0 0 0
T1 1000 0 1000 0 0 0 0 0 0 1000 897 14
T2 1000 0 1000 0 0 0 0 0 0 1000 1946 39
T3 0 0 0 0 0 0 0 0 0 0 0 0
T4 980 20 1000 0 0 0 0 0 0 1000 1403 25
T5 987 13 1000 0 0 0 0 0 0 1000 13362 230
T 988 11 1000 0 0 0 0 0 0 1000 17608 308
S1 1000 0 1000 0 0 0 0 0 0 1000 210 10
S2 999 0 999 1 0 0 0 0 0 1000 8149 165
S3 986 14 1000 0 0 0 0 0 0 1000 43691 398
S4 0 0 0 0 0 0 0 0 0 0 0 0
S5 0 0 0 0 0 0 0 0 0 0 0 0
S6 0 0 0 0 0 0 0 0 0 0 0 0
S7 1000 0 1000 0 0 0 0 0 0 1000 228 5
S8 0 0 0 0 968 32 0 0 0 1000 1292 3
S9 0 0 0 0 0 0 0 0 0 0 0 0
S10 1000 0 1000 0 0 0 0 0 0 1000 617 5
S11 1000 0 1000 0 0 0 0 0 0 1000 279 6
S12 997 2 999 1 0 0 0 0 0 1000 7156 59
S13 922 47 969 0 7 0 24 0 0 1000 1814 27
S14 1000 0 1000 0 0 0 0 0 0 1000 666 15
S15 990 0 990 8 0 0 2 0 0 1000 3796 75
S 969 10 979 1 19 1 1 0 0 1000 67898 768
M+E+T+S 966 19 985 2 12 0 0 0 0 1000 104924 1399
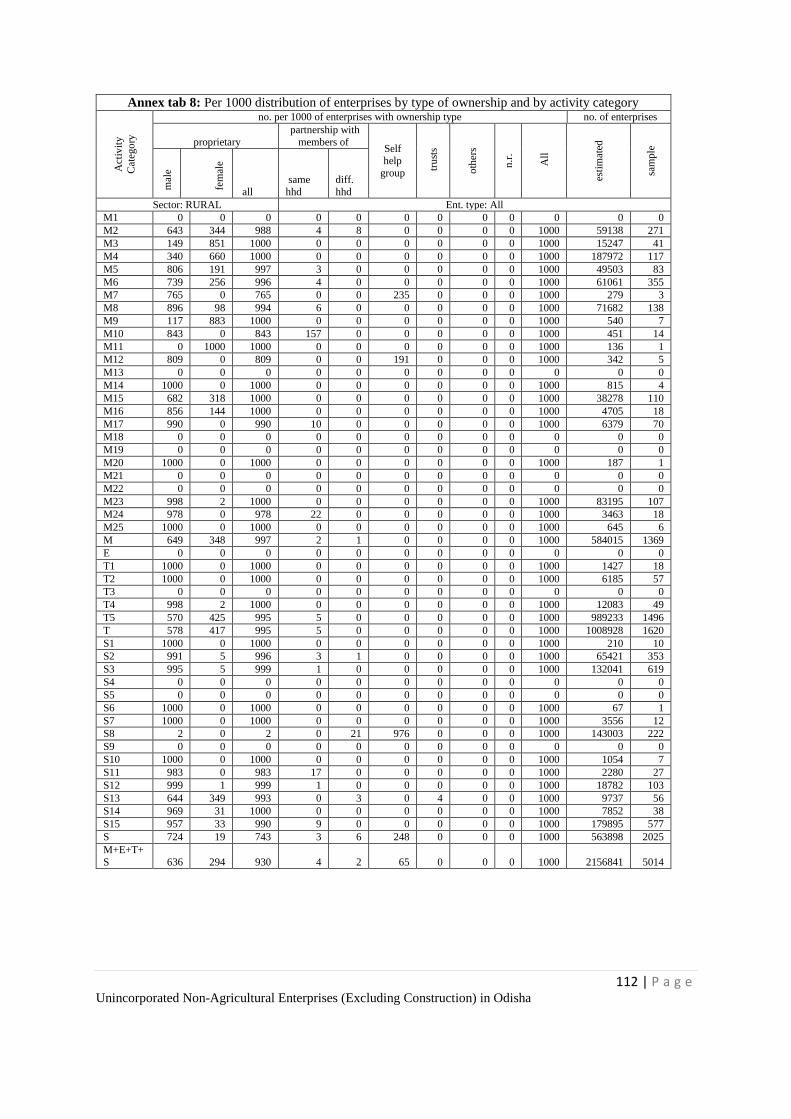
112 | P a g e Unincorporated Non-Agricultural Enterprises (Excluding Construction) in Odisha
Annex tab 8: Per 1000 distribution of enterprises by type of ownership and by activity category A
ctiv
ity
Cat
ego
ry
no. per 1000 of enterprises with ownership type no. of enterprises
proprietary
partnership with
members of Self help
group tru
sts
oth
ers
n.r
.
All
esti
mat
ed
sam
ple
mal
e
fem
ale
all
same
hhd
diff.
hhd
Sector: RURAL Ent. type: All
M1 0 0 0 0 0 0 0 0 0 0 0 0
M2 643 344 988 4 8 0 0 0 0 1000 59138 271
M3 149 851 1000 0 0 0 0 0 0 1000 15247 41
M4 340 660 1000 0 0 0 0 0 0 1000 187972 117
M5 806 191 997 3 0 0 0 0 0 1000 49503 83
M6 739 256 996 4 0 0 0 0 0 1000 61061 355
M7 765 0 765 0 0 235 0 0 0 1000 279 3
M8 896 98 994 6 0 0 0 0 0 1000 71682 138
M9 117 883 1000 0 0 0 0 0 0 1000 540 7
M10 843 0 843 157 0 0 0 0 0 1000 451 14
M11 0 1000 1000 0 0 0 0 0 0 1000 136 1
M12 809 0 809 0 0 191 0 0 0 1000 342 5
M13 0 0 0 0 0 0 0 0 0 0 0 0
M14 1000 0 1000 0 0 0 0 0 0 1000 815 4
M15 682 318 1000 0 0 0 0 0 0 1000 38278 110
M16 856 144 1000 0 0 0 0 0 0 1000 4705 18
M17 990 0 990 10 0 0 0 0 0 1000 6379 70
M18 0 0 0 0 0 0 0 0 0 0 0 0
M19 0 0 0 0 0 0 0 0 0 0 0 0
M20 1000 0 1000 0 0 0 0 0 0 1000 187 1
M21 0 0 0 0 0 0 0 0 0 0 0 0
M22 0 0 0 0 0 0 0 0 0 0 0 0
M23 998 2 1000 0 0 0 0 0 0 1000 83195 107
M24 978 0 978 22 0 0 0 0 0 1000 3463 18
M25 1000 0 1000 0 0 0 0 0 0 1000 645 6
M 649 348 997 2 1 0 0 0 0 1000 584015 1369
E 0 0 0 0 0 0 0 0 0 0 0 0
T1 1000 0 1000 0 0 0 0 0 0 1000 1427 18
T2 1000 0 1000 0 0 0 0 0 0 1000 6185 57
T3 0 0 0 0 0 0 0 0 0 0 0 0
T4 998 2 1000 0 0 0 0 0 0 1000 12083 49
T5 570 425 995 5 0 0 0 0 0 1000 989233 1496
T 578 417 995 5 0 0 0 0 0 1000 1008928 1620
S1 1000 0 1000 0 0 0 0 0 0 1000 210 10
S2 991 5 996 3 1 0 0 0 0 1000 65421 353
S3 995 5 999 1 0 0 0 0 0 1000 132041 619
S4 0 0 0 0 0 0 0 0 0 0 0 0
S5 0 0 0 0 0 0 0 0 0 0 0 0
S6 1000 0 1000 0 0 0 0 0 0 1000 67 1
S7 1000 0 1000 0 0 0 0 0 0 1000 3556 12
S8 2 0 2 0 21 976 0 0 0 1000 143003 222
S9 0 0 0 0 0 0 0 0 0 0 0 0
S10 1000 0 1000 0 0 0 0 0 0 1000 1054 7
S11 983 0 983 17 0 0 0 0 0 1000 2280 27
S12 999 1 999 1 0 0 0 0 0 1000 18782 103
S13 644 349 993 0 3 0 4 0 0 1000 9737 56
S14 969 31 1000 0 0 0 0 0 0 1000 7852 38
S15 957 33 990 9 0 0 0 0 0 1000 179895 577
S 724 19 743 3 6 248 0 0 0 1000 563898 2025
M+E+T+
S 636 294 930 4 2 65 0 0 0 1000 2156841 5014
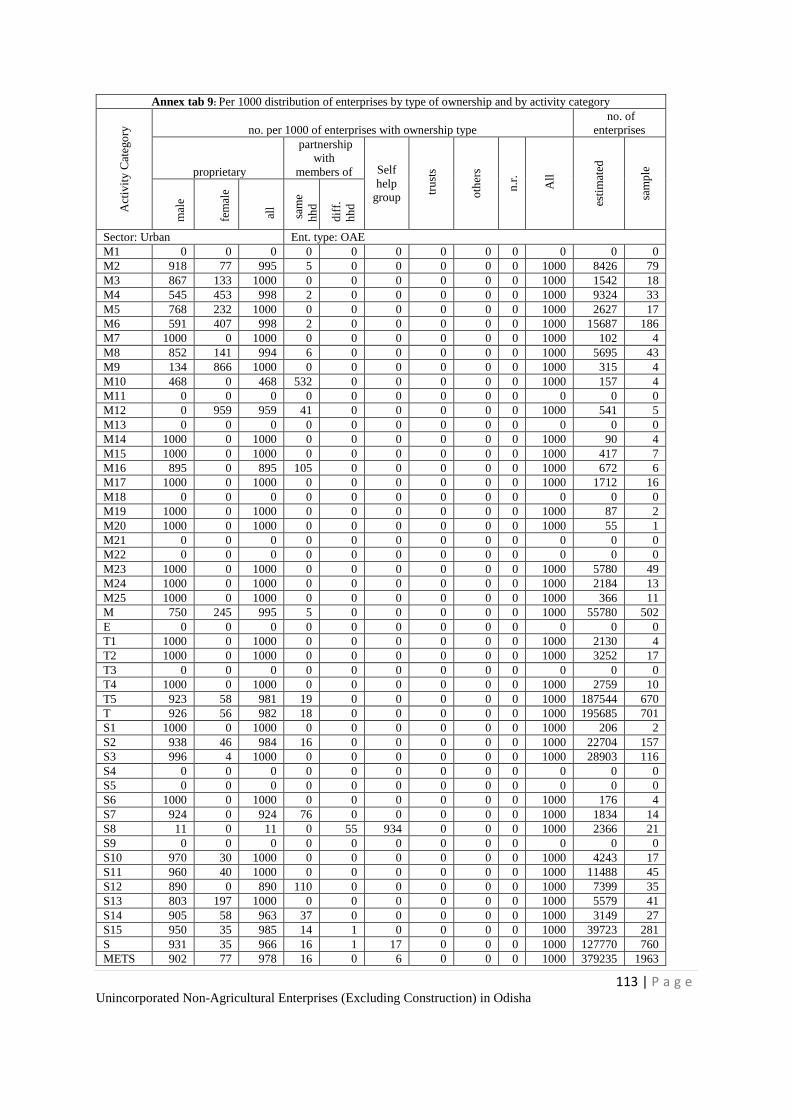
113 | P a g e Unincorporated Non-Agricultural Enterprises (Excluding Construction) in Odisha
Annex tab 9: Per 1000 distribution of enterprises by type of ownership and by activity category
Act
ivit
y C
ateg
ory
no. per 1000 of enterprises with ownership type
no. of
enterprises
proprietary
partnership
with
members of Self
help
group tru
sts
oth
ers
n.r
.
All
esti
mat
ed
sam
ple
mal
e
fem
ale
all
sam
e
hh
d
dif
f.
hh
d
Sector: Urban Ent. type: OAE
M1 0 0 0 0 0 0 0 0 0 0 0 0
M2 918 77 995 5 0 0 0 0 0 1000 8426 79
M3 867 133 1000 0 0 0 0 0 0 1000 1542 18
M4 545 453 998 2 0 0 0 0 0 1000 9324 33
M5 768 232 1000 0 0 0 0 0 0 1000 2627 17
M6 591 407 998 2 0 0 0 0 0 1000 15687 186
M7 1000 0 1000 0 0 0 0 0 0 1000 102 4
M8 852 141 994 6 0 0 0 0 0 1000 5695 43
M9 134 866 1000 0 0 0 0 0 0 1000 315 4
M10 468 0 468 532 0 0 0 0 0 1000 157 4
M11 0 0 0 0 0 0 0 0 0 0 0 0
M12 0 959 959 41 0 0 0 0 0 1000 541 5
M13 0 0 0 0 0 0 0 0 0 0 0 0
M14 1000 0 1000 0 0 0 0 0 0 1000 90 4
M15 1000 0 1000 0 0 0 0 0 0 1000 417 7
M16 895 0 895 105 0 0 0 0 0 1000 672 6
M17 1000 0 1000 0 0 0 0 0 0 1000 1712 16
M18 0 0 0 0 0 0 0 0 0 0 0 0
M19 1000 0 1000 0 0 0 0 0 0 1000 87 2
M20 1000 0 1000 0 0 0 0 0 0 1000 55 1
M21 0 0 0 0 0 0 0 0 0 0 0 0
M22 0 0 0 0 0 0 0 0 0 0 0 0
M23 1000 0 1000 0 0 0 0 0 0 1000 5780 49
M24 1000 0 1000 0 0 0 0 0 0 1000 2184 13
M25 1000 0 1000 0 0 0 0 0 0 1000 366 11
M 750 245 995 5 0 0 0 0 0 1000 55780 502
E 0 0 0 0 0 0 0 0 0 0 0 0
T1 1000 0 1000 0 0 0 0 0 0 1000 2130 4
T2 1000 0 1000 0 0 0 0 0 0 1000 3252 17
T3 0 0 0 0 0 0 0 0 0 0 0 0
T4 1000 0 1000 0 0 0 0 0 0 1000 2759 10
T5 923 58 981 19 0 0 0 0 0 1000 187544 670
T 926 56 982 18 0 0 0 0 0 1000 195685 701
S1 1000 0 1000 0 0 0 0 0 0 1000 206 2
S2 938 46 984 16 0 0 0 0 0 1000 22704 157
S3 996 4 1000 0 0 0 0 0 0 1000 28903 116
S4 0 0 0 0 0 0 0 0 0 0 0 0
S5 0 0 0 0 0 0 0 0 0 0 0 0
S6 1000 0 1000 0 0 0 0 0 0 1000 176 4
S7 924 0 924 76 0 0 0 0 0 1000 1834 14
S8 11 0 11 0 55 934 0 0 0 1000 2366 21
S9 0 0 0 0 0 0 0 0 0 0 0 0
S10 970 30 1000 0 0 0 0 0 0 1000 4243 17
S11 960 40 1000 0 0 0 0 0 0 1000 11488 45
S12 890 0 890 110 0 0 0 0 0 1000 7399 35
S13 803 197 1000 0 0 0 0 0 0 1000 5579 41
S14 905 58 963 37 0 0 0 0 0 1000 3149 27
S15 950 35 985 14 1 0 0 0 0 1000 39723 281
S 931 35 966 16 1 17 0 0 0 1000 127770 760
METS 902 77 978 16 0 6 0 0 0 1000 379235 1963
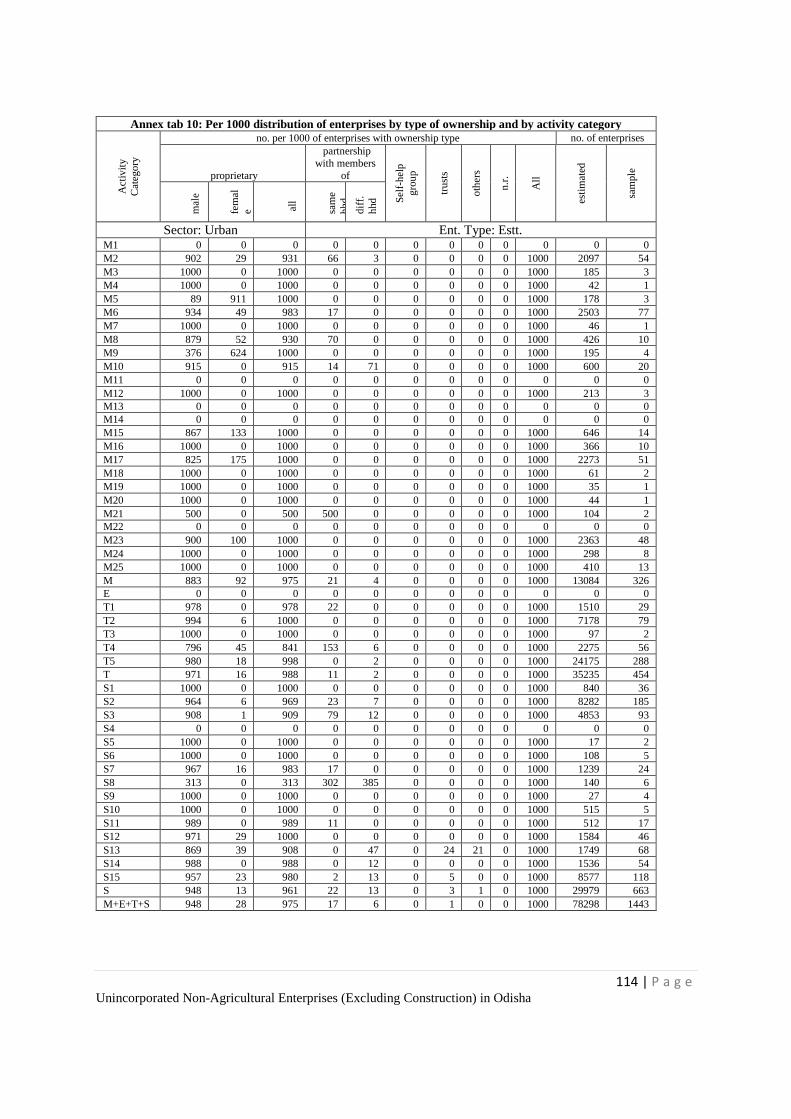
114 | P a g e Unincorporated Non-Agricultural Enterprises (Excluding Construction) in Odisha
Annex tab 10: Per 1000 distribution of enterprises by type of ownership and by activity category A
ctiv
ity
Cat
ego
ry
no. per 1000 of enterprises with ownership type no. of enterprises
proprietary
partnership
with members
of
Sel
f-h
elp
gro
up
tru
sts
oth
ers
n.r
.
All
esti
mat
ed
sam
ple
mal
e
fem
al
e
all
sam
e
hhd
dif
f.
hhd
Sector: Urban Ent. Type: Estt. M1 0 0 0 0 0 0 0 0 0 0 0 0
M2 902 29 931 66 3 0 0 0 0 1000 2097 54
M3 1000 0 1000 0 0 0 0 0 0 1000 185 3
M4 1000 0 1000 0 0 0 0 0 0 1000 42 1
M5 89 911 1000 0 0 0 0 0 0 1000 178 3
M6 934 49 983 17 0 0 0 0 0 1000 2503 77
M7 1000 0 1000 0 0 0 0 0 0 1000 46 1
M8 879 52 930 70 0 0 0 0 0 1000 426 10
M9 376 624 1000 0 0 0 0 0 0 1000 195 4
M10 915 0 915 14 71 0 0 0 0 1000 600 20
M11 0 0 0 0 0 0 0 0 0 0 0 0
M12 1000 0 1000 0 0 0 0 0 0 1000 213 3
M13 0 0 0 0 0 0 0 0 0 0 0 0
M14 0 0 0 0 0 0 0 0 0 0 0 0
M15 867 133 1000 0 0 0 0 0 0 1000 646 14
M16 1000 0 1000 0 0 0 0 0 0 1000 366 10
M17 825 175 1000 0 0 0 0 0 0 1000 2273 51
M18 1000 0 1000 0 0 0 0 0 0 1000 61 2
M19 1000 0 1000 0 0 0 0 0 0 1000 35 1
M20 1000 0 1000 0 0 0 0 0 0 1000 44 1
M21 500 0 500 500 0 0 0 0 0 1000 104 2
M22 0 0 0 0 0 0 0 0 0 0 0 0
M23 900 100 1000 0 0 0 0 0 0 1000 2363 48
M24 1000 0 1000 0 0 0 0 0 0 1000 298 8
M25 1000 0 1000 0 0 0 0 0 0 1000 410 13
M 883 92 975 21 4 0 0 0 0 1000 13084 326
E 0 0 0 0 0 0 0 0 0 0 0 0
T1 978 0 978 22 0 0 0 0 0 1000 1510 29
T2 994 6 1000 0 0 0 0 0 0 1000 7178 79
T3 1000 0 1000 0 0 0 0 0 0 1000 97 2
T4 796 45 841 153 6 0 0 0 0 1000 2275 56
T5 980 18 998 0 2 0 0 0 0 1000 24175 288
T 971 16 988 11 2 0 0 0 0 1000 35235 454
S1 1000 0 1000 0 0 0 0 0 0 1000 840 36
S2 964 6 969 23 7 0 0 0 0 1000 8282 185
S3 908 1 909 79 12 0 0 0 0 1000 4853 93
S4 0 0 0 0 0 0 0 0 0 0 0 0
S5 1000 0 1000 0 0 0 0 0 0 1000 17 2
S6 1000 0 1000 0 0 0 0 0 0 1000 108 5
S7 967 16 983 17 0 0 0 0 0 1000 1239 24
S8 313 0 313 302 385 0 0 0 0 1000 140 6
S9 1000 0 1000 0 0 0 0 0 0 1000 27 4
S10 1000 0 1000 0 0 0 0 0 0 1000 515 5
S11 989 0 989 11 0 0 0 0 0 1000 512 17
S12 971 29 1000 0 0 0 0 0 0 1000 1584 46
S13 869 39 908 0 47 0 24 21 0 1000 1749 68
S14 988 0 988 0 12 0 0 0 0 1000 1536 54
S15 957 23 980 2 13 0 5 0 0 1000 8577 118
S 948 13 961 22 13 0 3 1 0 1000 29979 663
M+E+T+S 948 28 975 17 6 0 1 0 0 1000 78298 1443
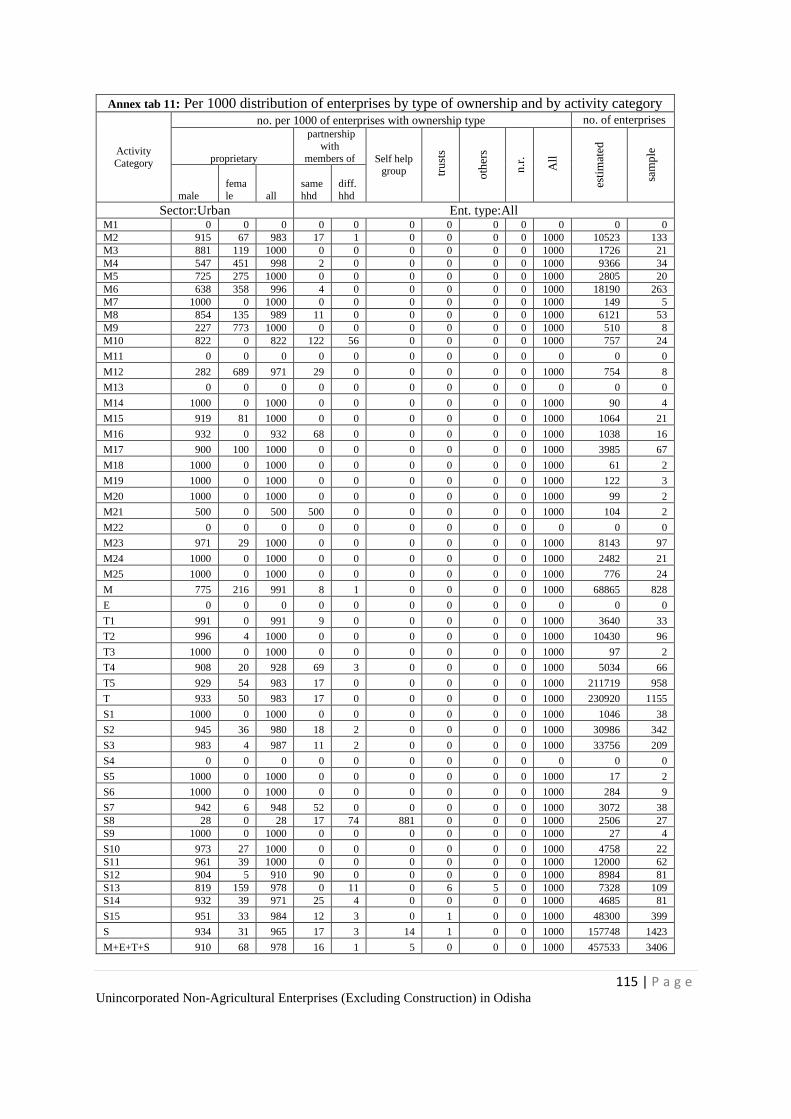
115 | P a g e Unincorporated Non-Agricultural Enterprises (Excluding Construction) in Odisha
Annex tab 11: Per 1000 distribution of enterprises by type of ownership and by activity category
Activity
Category
no. per 1000 of enterprises with ownership type no. of enterprises
proprietary
partnership
with
members of Self help group t
rust
s
oth
ers
n.r
.
All
esti
mat
ed
sam
ple
male
fema
le all
same
hhd
diff.
hhd
Sector:Urban Ent. type:All M1 0 0 0 0 0 0 0 0 0 0 0 0
M2 915 67 983 17 1 0 0 0 0 1000 10523 133
M3 881 119 1000 0 0 0 0 0 0 1000 1726 21
M4 547 451 998 2 0 0 0 0 0 1000 9366 34
M5 725 275 1000 0 0 0 0 0 0 1000 2805 20
M6 638 358 996 4 0 0 0 0 0 1000 18190 263
M7 1000 0 1000 0 0 0 0 0 0 1000 149 5
M8 854 135 989 11 0 0 0 0 0 1000 6121 53
M9 227 773 1000 0 0 0 0 0 0 1000 510 8
M10 822 0 822 122 56 0 0 0 0 1000 757 24
M11 0 0 0 0 0 0 0 0 0 0 0 0
M12 282 689 971 29 0 0 0 0 0 1000 754 8
M13 0 0 0 0 0 0 0 0 0 0 0 0
M14 1000 0 1000 0 0 0 0 0 0 1000 90 4
M15 919 81 1000 0 0 0 0 0 0 1000 1064 21
M16 932 0 932 68 0 0 0 0 0 1000 1038 16
M17 900 100 1000 0 0 0 0 0 0 1000 3985 67
M18 1000 0 1000 0 0 0 0 0 0 1000 61 2
M19 1000 0 1000 0 0 0 0 0 0 1000 122 3
M20 1000 0 1000 0 0 0 0 0 0 1000 99 2
M21 500 0 500 500 0 0 0 0 0 1000 104 2
M22 0 0 0 0 0 0 0 0 0 0 0 0
M23 971 29 1000 0 0 0 0 0 0 1000 8143 97
M24 1000 0 1000 0 0 0 0 0 0 1000 2482 21
M25 1000 0 1000 0 0 0 0 0 0 1000 776 24
M 775 216 991 8 1 0 0 0 0 1000 68865 828
E 0 0 0 0 0 0 0 0 0 0 0 0
T1 991 0 991 9 0 0 0 0 0 1000 3640 33
T2 996 4 1000 0 0 0 0 0 0 1000 10430 96
T3 1000 0 1000 0 0 0 0 0 0 1000 97 2
T4 908 20 928 69 3 0 0 0 0 1000 5034 66
T5 929 54 983 17 0 0 0 0 0 1000 211719 958
T 933 50 983 17 0 0 0 0 0 1000 230920 1155
S1 1000 0 1000 0 0 0 0 0 0 1000 1046 38
S2 945 36 980 18 2 0 0 0 0 1000 30986 342
S3 983 4 987 11 2 0 0 0 0 1000 33756 209
S4 0 0 0 0 0 0 0 0 0 0 0 0
S5 1000 0 1000 0 0 0 0 0 0 1000 17 2
S6 1000 0 1000 0 0 0 0 0 0 1000 284 9
S7 942 6 948 52 0 0 0 0 0 1000 3072 38
S8 28 0 28 17 74 881 0 0 0 1000 2506 27
S9 1000 0 1000 0 0 0 0 0 0 1000 27 4
S10 973 27 1000 0 0 0 0 0 0 1000 4758 22
S11 961 39 1000 0 0 0 0 0 0 1000 12000 62
S12 904 5 910 90 0 0 0 0 0 1000 8984 81
S13 819 159 978 0 11 0 6 5 0 1000 7328 109
S14 932 39 971 25 4 0 0 0 0 1000 4685 81
S15 951 33 984 12 3 0 1 0 0 1000 48300 399
S 934 31 965 17 3 14 1 0 0 1000 157748 1423
M+E+T+S 910 68 978 16 1 5 0 0 0 1000 457533 3406
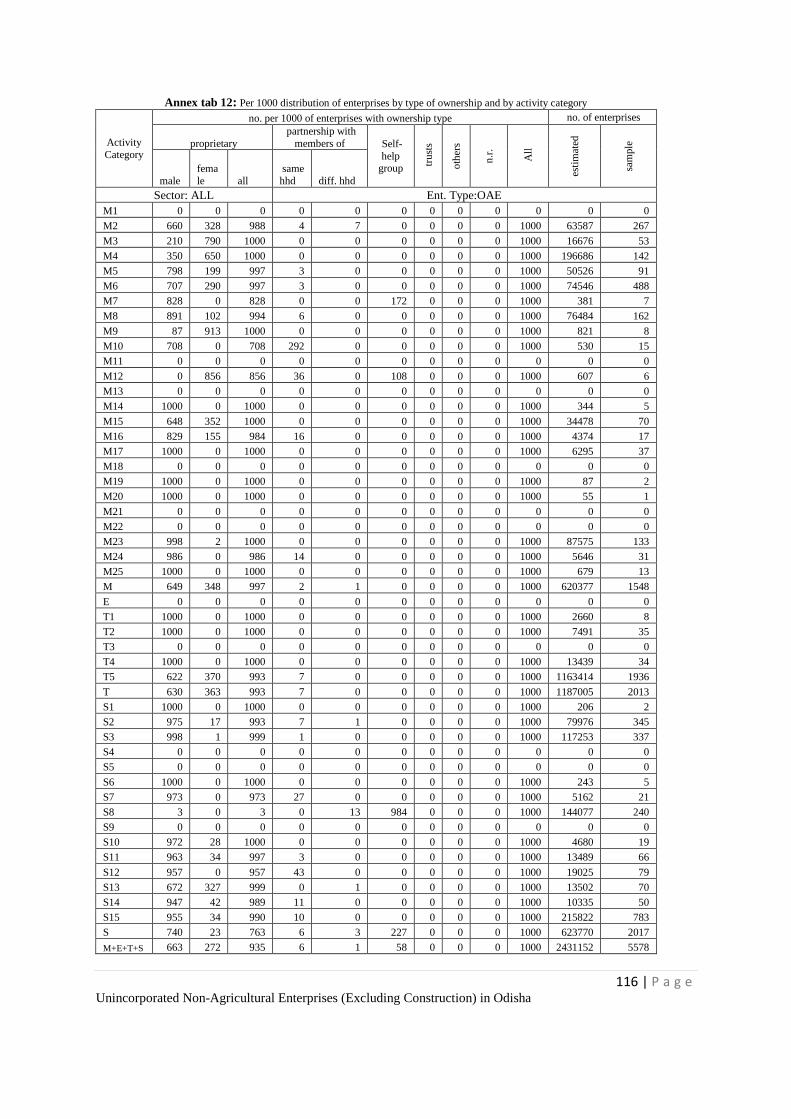
116 | P a g e Unincorporated Non-Agricultural Enterprises (Excluding Construction) in Odisha
Annex tab 12: Per 1000 distribution of enterprises by type of ownership and by activity category
Activity
Category
no. per 1000 of enterprises with ownership type no. of enterprises
proprietary
partnership with
members of Self-
help group t
rust
s
oth
ers
n.r
.
All
esti
mat
ed
sam
ple
male
fema
le all
same
hhd diff. hhd
Sector: ALL Ent. Type:OAE
M1 0 0 0 0 0 0 0 0 0 0 0 0
M2 660 328 988 4 7 0 0 0 0 1000 63587 267
M3 210 790 1000 0 0 0 0 0 0 1000 16676 53
M4 350 650 1000 0 0 0 0 0 0 1000 196686 142
M5 798 199 997 3 0 0 0 0 0 1000 50526 91
M6 707 290 997 3 0 0 0 0 0 1000 74546 488
M7 828 0 828 0 0 172 0 0 0 1000 381 7
M8 891 102 994 6 0 0 0 0 0 1000 76484 162
M9 87 913 1000 0 0 0 0 0 0 1000 821 8
M10 708 0 708 292 0 0 0 0 0 1000 530 15
M11 0 0 0 0 0 0 0 0 0 0 0 0
M12 0 856 856 36 0 108 0 0 0 1000 607 6
M13 0 0 0 0 0 0 0 0 0 0 0 0
M14 1000 0 1000 0 0 0 0 0 0 1000 344 5
M15 648 352 1000 0 0 0 0 0 0 1000 34478 70
M16 829 155 984 16 0 0 0 0 0 1000 4374 17
M17 1000 0 1000 0 0 0 0 0 0 1000 6295 37
M18 0 0 0 0 0 0 0 0 0 0 0 0
M19 1000 0 1000 0 0 0 0 0 0 1000 87 2
M20 1000 0 1000 0 0 0 0 0 0 1000 55 1
M21 0 0 0 0 0 0 0 0 0 0 0 0
M22 0 0 0 0 0 0 0 0 0 0 0 0
M23 998 2 1000 0 0 0 0 0 0 1000 87575 133
M24 986 0 986 14 0 0 0 0 0 1000 5646 31
M25 1000 0 1000 0 0 0 0 0 0 1000 679 13
M 649 348 997 2 1 0 0 0 0 1000 620377 1548
E 0 0 0 0 0 0 0 0 0 0 0 0
T1 1000 0 1000 0 0 0 0 0 0 1000 2660 8
T2 1000 0 1000 0 0 0 0 0 0 1000 7491 35
T3 0 0 0 0 0 0 0 0 0 0 0 0
T4 1000 0 1000 0 0 0 0 0 0 1000 13439 34
T5 622 370 993 7 0 0 0 0 0 1000 1163414 1936
T 630 363 993 7 0 0 0 0 0 1000 1187005 2013
S1 1000 0 1000 0 0 0 0 0 0 1000 206 2
S2 975 17 993 7 1 0 0 0 0 1000 79976 345
S3 998 1 999 1 0 0 0 0 0 1000 117253 337
S4 0 0 0 0 0 0 0 0 0 0 0 0
S5 0 0 0 0 0 0 0 0 0 0 0 0
S6 1000 0 1000 0 0 0 0 0 0 1000 243 5
S7 973 0 973 27 0 0 0 0 0 1000 5162 21
S8 3 0 3 0 13 984 0 0 0 1000 144077 240
S9 0 0 0 0 0 0 0 0 0 0 0 0
S10 972 28 1000 0 0 0 0 0 0 1000 4680 19
S11 963 34 997 3 0 0 0 0 0 1000 13489 66
S12 957 0 957 43 0 0 0 0 0 1000 19025 79
S13 672 327 999 0 1 0 0 0 0 1000 13502 70
S14 947 42 989 11 0 0 0 0 0 1000 10335 50
S15 955 34 990 10 0 0 0 0 0 1000 215822 783
S 740 23 763 6 3 227 0 0 0 1000 623770 2017
M+E+T+S 663 272 935 6 1 58 0 0 0 1000 2431152 5578
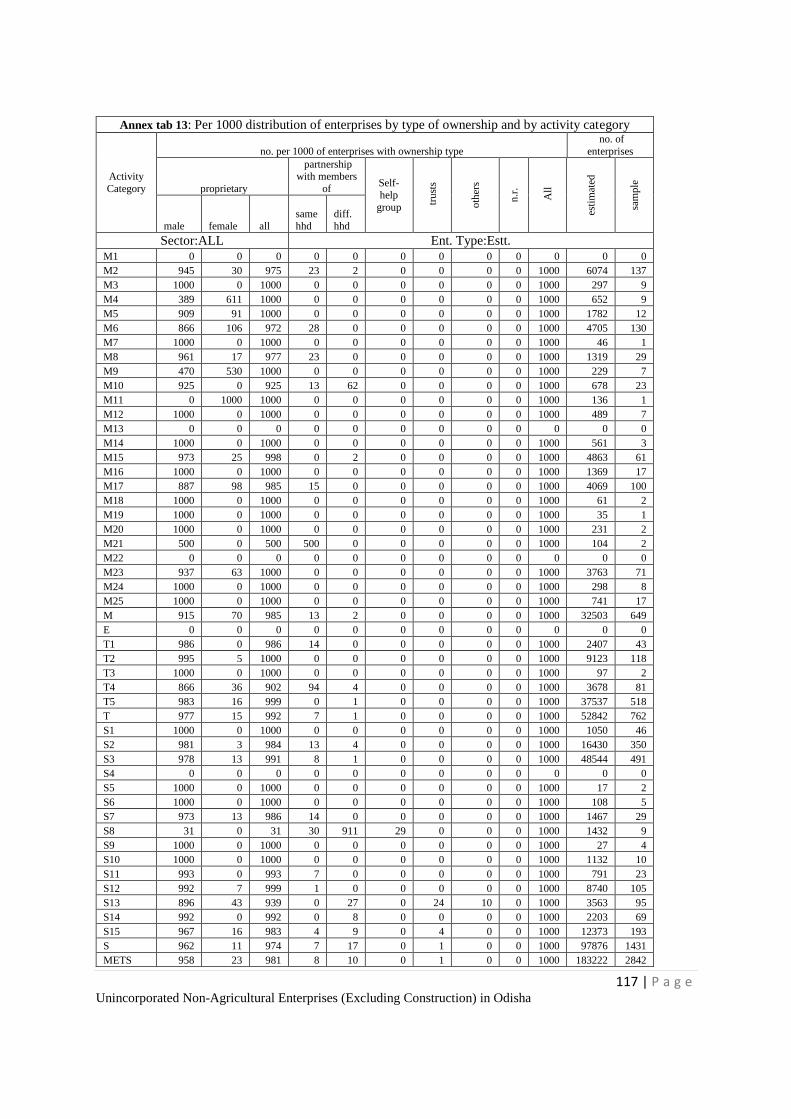
117 | P a g e Unincorporated Non-Agricultural Enterprises (Excluding Construction) in Odisha
Annex tab 13: Per 1000 distribution of enterprises by type of ownership and by activity category
Activity
Category
no. per 1000 of enterprises with ownership type
no. of
enterprises
proprietary
partnership with members
of Self-help
group tru
sts
oth
ers
n.r
.
All
esti
mat
ed
sam
ple
male female all
same hhd
diff. hhd
Sector:ALL Ent. Type:Estt. M1 0 0 0 0 0 0 0 0 0 0 0 0
M2 945 30 975 23 2 0 0 0 0 1000 6074 137
M3 1000 0 1000 0 0 0 0 0 0 1000 297 9
M4 389 611 1000 0 0 0 0 0 0 1000 652 9
M5 909 91 1000 0 0 0 0 0 0 1000 1782 12
M6 866 106 972 28 0 0 0 0 0 1000 4705 130
M7 1000 0 1000 0 0 0 0 0 0 1000 46 1
M8 961 17 977 23 0 0 0 0 0 1000 1319 29
M9 470 530 1000 0 0 0 0 0 0 1000 229 7
M10 925 0 925 13 62 0 0 0 0 1000 678 23
M11 0 1000 1000 0 0 0 0 0 0 1000 136 1
M12 1000 0 1000 0 0 0 0 0 0 1000 489 7
M13 0 0 0 0 0 0 0 0 0 0 0 0
M14 1000 0 1000 0 0 0 0 0 0 1000 561 3
M15 973 25 998 0 2 0 0 0 0 1000 4863 61
M16 1000 0 1000 0 0 0 0 0 0 1000 1369 17
M17 887 98 985 15 0 0 0 0 0 1000 4069 100
M18 1000 0 1000 0 0 0 0 0 0 1000 61 2
M19 1000 0 1000 0 0 0 0 0 0 1000 35 1
M20 1000 0 1000 0 0 0 0 0 0 1000 231 2
M21 500 0 500 500 0 0 0 0 0 1000 104 2
M22 0 0 0 0 0 0 0 0 0 0 0 0
M23 937 63 1000 0 0 0 0 0 0 1000 3763 71
M24 1000 0 1000 0 0 0 0 0 0 1000 298 8
M25 1000 0 1000 0 0 0 0 0 0 1000 741 17
M 915 70 985 13 2 0 0 0 0 1000 32503 649
E 0 0 0 0 0 0 0 0 0 0 0 0
T1 986 0 986 14 0 0 0 0 0 1000 2407 43
T2 995 5 1000 0 0 0 0 0 0 1000 9123 118
T3 1000 0 1000 0 0 0 0 0 0 1000 97 2
T4 866 36 902 94 4 0 0 0 0 1000 3678 81
T5 983 16 999 0 1 0 0 0 0 1000 37537 518
T 977 15 992 7 1 0 0 0 0 1000 52842 762
S1 1000 0 1000 0 0 0 0 0 0 1000 1050 46
S2 981 3 984 13 4 0 0 0 0 1000 16430 350
S3 978 13 991 8 1 0 0 0 0 1000 48544 491
S4 0 0 0 0 0 0 0 0 0 0 0 0
S5 1000 0 1000 0 0 0 0 0 0 1000 17 2
S6 1000 0 1000 0 0 0 0 0 0 1000 108 5
S7 973 13 986 14 0 0 0 0 0 1000 1467 29
S8 31 0 31 30 911 29 0 0 0 1000 1432 9
S9 1000 0 1000 0 0 0 0 0 0 1000 27 4
S10 1000 0 1000 0 0 0 0 0 0 1000 1132 10
S11 993 0 993 7 0 0 0 0 0 1000 791 23
S12 992 7 999 1 0 0 0 0 0 1000 8740 105
S13 896 43 939 0 27 0 24 10 0 1000 3563 95
S14 992 0 992 0 8 0 0 0 0 1000 2203 69
S15 967 16 983 4 9 0 4 0 0 1000 12373 193
S 962 11 974 7 17 0 1 0 0 1000 97876 1431
METS 958 23 981 8 10 0 1 0 0 1000 183222 2842
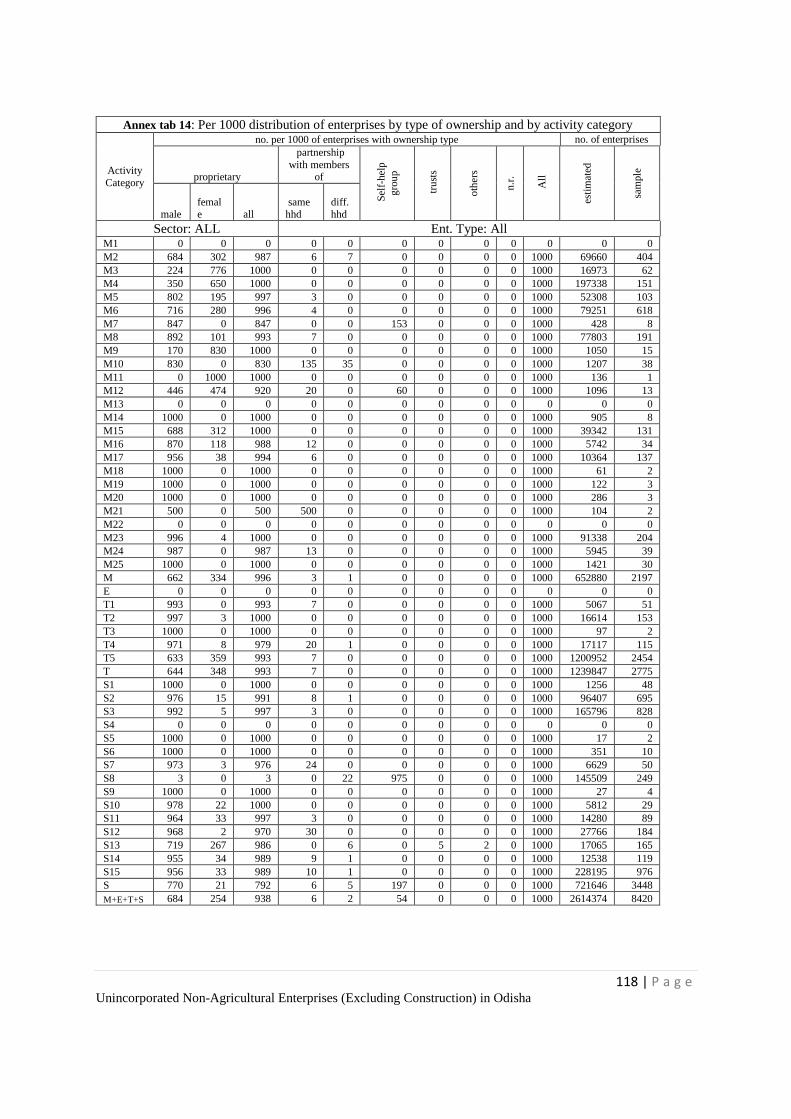
118 | P a g e Unincorporated Non-Agricultural Enterprises (Excluding Construction) in Odisha
Annex tab 14: Per 1000 distribution of enterprises by type of ownership and by activity category
Activity
Category
no. per 1000 of enterprises with ownership type no. of enterprises
proprietary
partnership
with members of
Sel
f-hel
p
gro
up
tru
sts
oth
ers
n.r
.
All
esti
mat
ed
sam
ple
male
female all
same hhd
diff. hhd
Sector: ALL Ent. Type: All M1 0 0 0 0 0 0 0 0 0 0 0 0
M2 684 302 987 6 7 0 0 0 0 1000 69660 404
M3 224 776 1000 0 0 0 0 0 0 1000 16973 62
M4 350 650 1000 0 0 0 0 0 0 1000 197338 151
M5 802 195 997 3 0 0 0 0 0 1000 52308 103
M6 716 280 996 4 0 0 0 0 0 1000 79251 618
M7 847 0 847 0 0 153 0 0 0 1000 428 8
M8 892 101 993 7 0 0 0 0 0 1000 77803 191
M9 170 830 1000 0 0 0 0 0 0 1000 1050 15
M10 830 0 830 135 35 0 0 0 0 1000 1207 38
M11 0 1000 1000 0 0 0 0 0 0 1000 136 1
M12 446 474 920 20 0 60 0 0 0 1000 1096 13
M13 0 0 0 0 0 0 0 0 0 0 0 0
M14 1000 0 1000 0 0 0 0 0 0 1000 905 8
M15 688 312 1000 0 0 0 0 0 0 1000 39342 131
M16 870 118 988 12 0 0 0 0 0 1000 5742 34
M17 956 38 994 6 0 0 0 0 0 1000 10364 137
M18 1000 0 1000 0 0 0 0 0 0 1000 61 2
M19 1000 0 1000 0 0 0 0 0 0 1000 122 3
M20 1000 0 1000 0 0 0 0 0 0 1000 286 3
M21 500 0 500 500 0 0 0 0 0 1000 104 2
M22 0 0 0 0 0 0 0 0 0 0 0 0
M23 996 4 1000 0 0 0 0 0 0 1000 91338 204
M24 987 0 987 13 0 0 0 0 0 1000 5945 39
M25 1000 0 1000 0 0 0 0 0 0 1000 1421 30
M 662 334 996 3 1 0 0 0 0 1000 652880 2197
E 0 0 0 0 0 0 0 0 0 0 0 0
T1 993 0 993 7 0 0 0 0 0 1000 5067 51
T2 997 3 1000 0 0 0 0 0 0 1000 16614 153
T3 1000 0 1000 0 0 0 0 0 0 1000 97 2
T4 971 8 979 20 1 0 0 0 0 1000 17117 115
T5 633 359 993 7 0 0 0 0 0 1000 1200952 2454
T 644 348 993 7 0 0 0 0 0 1000 1239847 2775
S1 1000 0 1000 0 0 0 0 0 0 1000 1256 48
S2 976 15 991 8 1 0 0 0 0 1000 96407 695
S3 992 5 997 3 0 0 0 0 0 1000 165796 828
S4 0 0 0 0 0 0 0 0 0 0 0 0
S5 1000 0 1000 0 0 0 0 0 0 1000 17 2
S6 1000 0 1000 0 0 0 0 0 0 1000 351 10
S7 973 3 976 24 0 0 0 0 0 1000 6629 50
S8 3 0 3 0 22 975 0 0 0 1000 145509 249
S9 1000 0 1000 0 0 0 0 0 0 1000 27 4
S10 978 22 1000 0 0 0 0 0 0 1000 5812 29
S11 964 33 997 3 0 0 0 0 0 1000 14280 89
S12 968 2 970 30 0 0 0 0 0 1000 27766 184
S13 719 267 986 0 6 0 5 2 0 1000 17065 165
S14 955 34 989 9 1 0 0 0 0 1000 12538 119
S15 956 33 989 10 1 0 0 0 0 1000 228195 976
S 770 21 792 6 5 197 0 0 0 1000 721646 3448
M+E+T+S 684 254 938 6 2 54 0 0 0 1000 2614374 8420
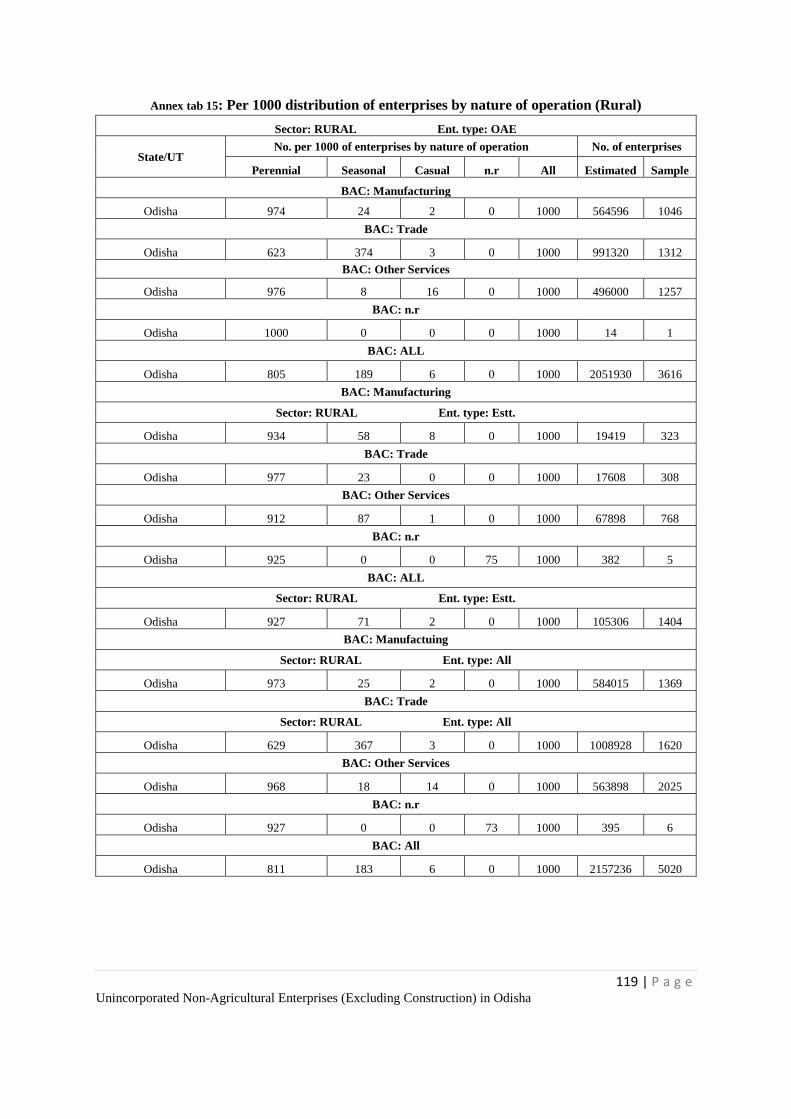
119 | P a g e Unincorporated Non-Agricultural Enterprises (Excluding Construction) in Odisha
Annex tab 15: Per 1000 distribution of enterprises by nature of operation (Rural)
Sector: RURAL Ent. type: OAE
State/UT No. per 1000 of enterprises by nature of operation No. of enterprises
Perennial Seasonal Casual n.r All Estimated Sample
BAC: Manufacturing
Odisha 974 24 2 0 1000 564596 1046
BAC: Trade
Odisha 623 374 3 0 1000 991320 1312
BAC: Other Services
Odisha 976 8 16 0 1000 496000 1257
BAC: n.r
Odisha 1000 0 0 0 1000 14 1
BAC: ALL
Odisha 805 189 6 0 1000 2051930 3616
BAC: Manufacturing
Sector: RURAL Ent. type: Estt.
Odisha 934 58 8 0 1000 19419 323
BAC: Trade
Odisha 977 23 0 0 1000 17608 308
BAC: Other Services
Odisha 912 87 1 0 1000 67898 768
BAC: n.r
Odisha 925 0 0 75 1000 382 5
BAC: ALL
Sector: RURAL Ent. type: Estt.
Odisha 927 71 2 0 1000 105306 1404
BAC: Manufactuing
Sector: RURAL Ent. type: All
Odisha 973 25 2 0 1000 584015 1369
BAC: Trade
Sector: RURAL Ent. type: All
Odisha 629 367 3 0 1000 1008928 1620
BAC: Other Services
Odisha 968 18 14 0 1000 563898 2025
BAC: n.r
Odisha 927 0 0 73 1000 395 6
BAC: All
Odisha 811 183 6 0 1000 2157236 5020
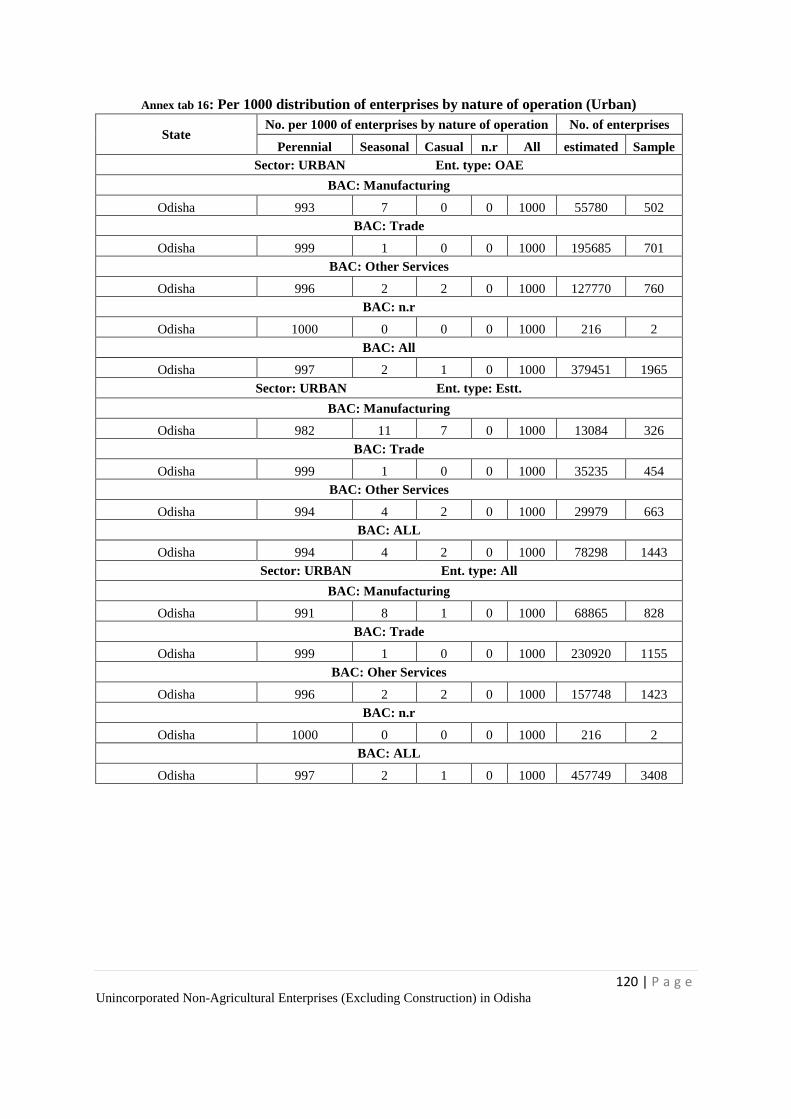
120 | P a g e Unincorporated Non-Agricultural Enterprises (Excluding Construction) in Odisha
Annex tab 16: Per 1000 distribution of enterprises by nature of operation (Urban)
State No. per 1000 of enterprises by nature of operation No. of enterprises
Perennial Seasonal Casual n.r All estimated Sample
Sector: URBAN Ent. type: OAE
BAC: Manufacturing
Odisha 993 7 0 0 1000 55780 502
BAC: Trade
Odisha 999 1 0 0 1000 195685 701
BAC: Other Services
Odisha 996 2 2 0 1000 127770 760
BAC: n.r
Odisha 1000 0 0 0 1000 216 2
BAC: All
Odisha 997 2 1 0 1000 379451 1965
Sector: URBAN Ent. type: Estt.
BAC: Manufacturing
Odisha 982 11 7 0 1000 13084 326
BAC: Trade
Odisha 999 1 0 0 1000 35235 454
BAC: Other Services
Odisha 994 4 2 0 1000 29979 663
BAC: ALL
Odisha 994 4 2 0 1000 78298 1443
Sector: URBAN Ent. type: All
BAC: Manufacturing
Odisha 991 8 1 0 1000 68865 828
BAC: Trade
Odisha 999 1 0 0 1000 230920 1155
BAC: Oher Services
Odisha 996 2 2 0 1000 157748 1423
BAC: n.r
Odisha 1000 0 0 0 1000 216 2
BAC: ALL
Odisha 997 2 1 0 1000 457749 3408
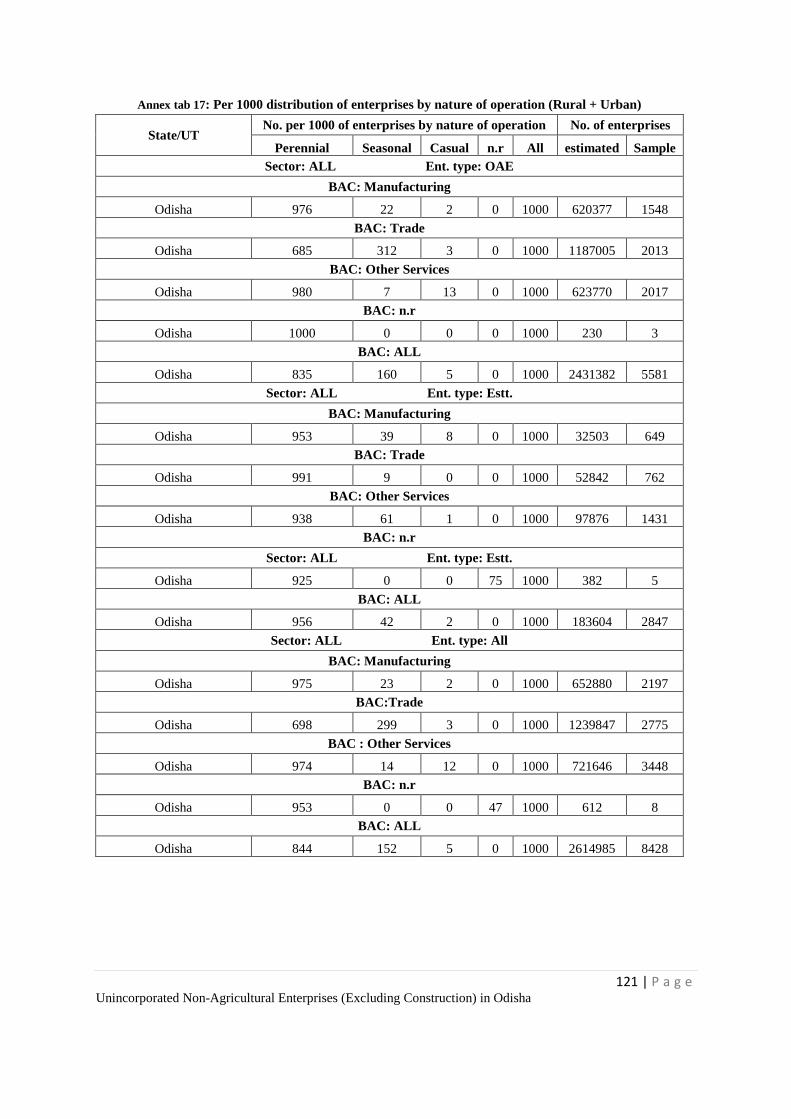
121 | P a g e Unincorporated Non-Agricultural Enterprises (Excluding Construction) in Odisha
Annex tab 17: Per 1000 distribution of enterprises by nature of operation (Rural + Urban)
State/UT No. per 1000 of enterprises by nature of operation No. of enterprises
Perennial Seasonal Casual n.r All estimated Sample
Sector: ALL Ent. type: OAE
BAC: Manufacturing
Odisha 976 22 2 0 1000 620377 1548
BAC: Trade
Odisha 685 312 3 0 1000 1187005 2013
BAC: Other Services
Odisha 980 7 13 0 1000 623770 2017
BAC: n.r
Odisha 1000 0 0 0 1000 230 3
BAC: ALL
Odisha 835 160 5 0 1000 2431382 5581
Sector: ALL Ent. type: Estt.
BAC: Manufacturing
Odisha 953 39 8 0 1000 32503 649
BAC: Trade
Odisha 991 9 0 0 1000 52842 762
BAC: Other Services
Odisha 938 61 1 0 1000 97876 1431
BAC: n.r
Sector: ALL Ent. type: Estt.
Odisha 925 0 0 75 1000 382 5
BAC: ALL
Odisha 956 42 2 0 1000 183604 2847
Sector: ALL Ent. type: All
BAC: Manufacturing
Odisha 975 23 2 0 1000 652880 2197
BAC:Trade
Odisha 698 299 3 0 1000 1239847 2775
BAC : Other Services
Odisha 974 14 12 0 1000 721646 3448
BAC: n.r
Odisha 953 0 0 47 1000 612 8
BAC: ALL
Odisha 844 152 5 0 1000 2614985 8428
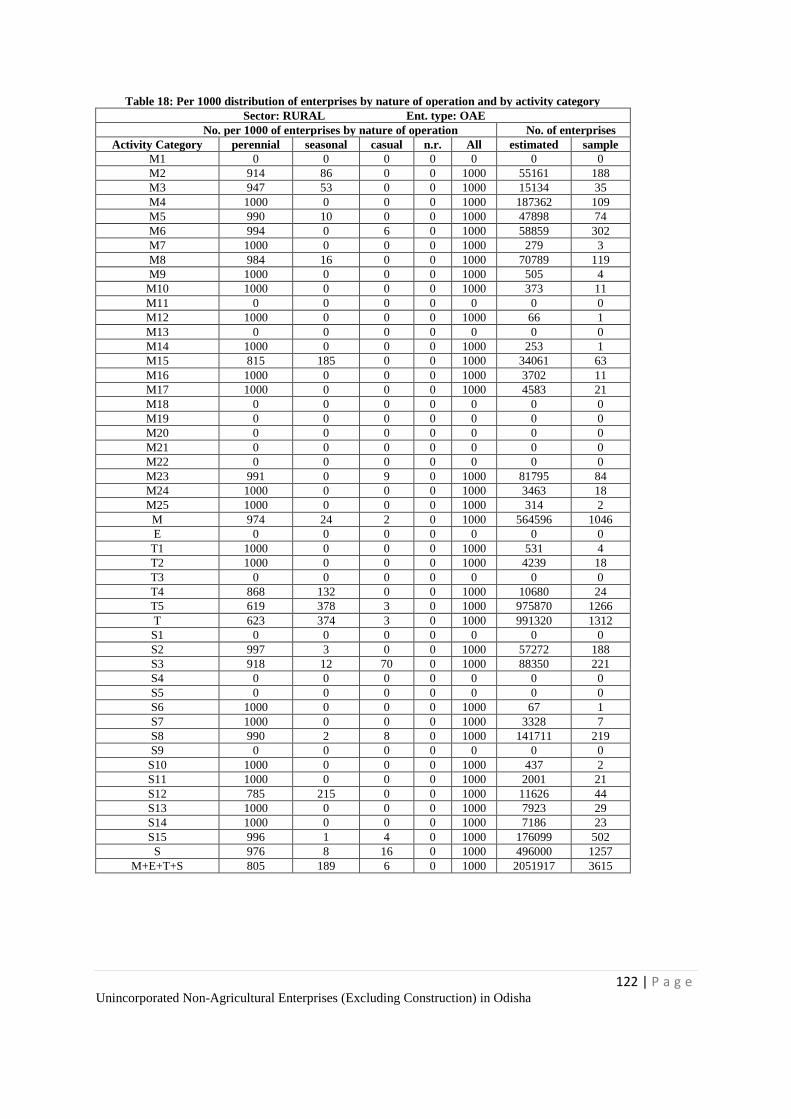
122 | P a g e Unincorporated Non-Agricultural Enterprises (Excluding Construction) in Odisha
Table 18: Per 1000 distribution of enterprises by nature of operation and by activity category
Sector: RURAL Ent. type: OAE
No. per 1000 of enterprises by nature of operation No. of enterprises
Activity Category perennial seasonal casual n.r. All estimated sample
M1 0 0 0 0 0 0 0
M2 914 86 0 0 1000 55161 188
M3 947 53 0 0 1000 15134 35
M4 1000 0 0 0 1000 187362 109
M5 990 10 0 0 1000 47898 74
M6 994 0 6 0 1000 58859 302
M7 1000 0 0 0 1000 279 3
M8 984 16 0 0 1000 70789 119
M9 1000 0 0 0 1000 505 4
M10 1000 0 0 0 1000 373 11
M11 0 0 0 0 0 0 0
M12 1000 0 0 0 1000 66 1
M13 0 0 0 0 0 0 0
M14 1000 0 0 0 1000 253 1
M15 815 185 0 0 1000 34061 63
M16 1000 0 0 0 1000 3702 11
M17 1000 0 0 0 1000 4583 21
M18 0 0 0 0 0 0 0
M19 0 0 0 0 0 0 0
M20 0 0 0 0 0 0 0
M21 0 0 0 0 0 0 0
M22 0 0 0 0 0 0 0
M23 991 0 9 0 1000 81795 84
M24 1000 0 0 0 1000 3463 18
M25 1000 0 0 0 1000 314 2
M 974 24 2 0 1000 564596 1046
E 0 0 0 0 0 0 0
T1 1000 0 0 0 1000 531 4
T2 1000 0 0 0 1000 4239 18
T3 0 0 0 0 0 0 0
T4 868 132 0 0 1000 10680 24
T5 619 378 3 0 1000 975870 1266
T 623 374 3 0 1000 991320 1312
S1 0 0 0 0 0 0 0
S2 997 3 0 0 1000 57272 188
S3 918 12 70 0 1000 88350 221
S4 0 0 0 0 0 0 0
S5 0 0 0 0 0 0 0
S6 1000 0 0 0 1000 67 1
S7 1000 0 0 0 1000 3328 7
S8 990 2 8 0 1000 141711 219
S9 0 0 0 0 0 0 0
S10 1000 0 0 0 1000 437 2
S11 1000 0 0 0 1000 2001 21
S12 785 215 0 0 1000 11626 44
S13 1000 0 0 0 1000 7923 29
S14 1000 0 0 0 1000 7186 23
S15 996 1 4 0 1000 176099 502
S 976 8 16 0 1000 496000 1257
M+E+T+S 805 189 6 0 1000 2051917 3615
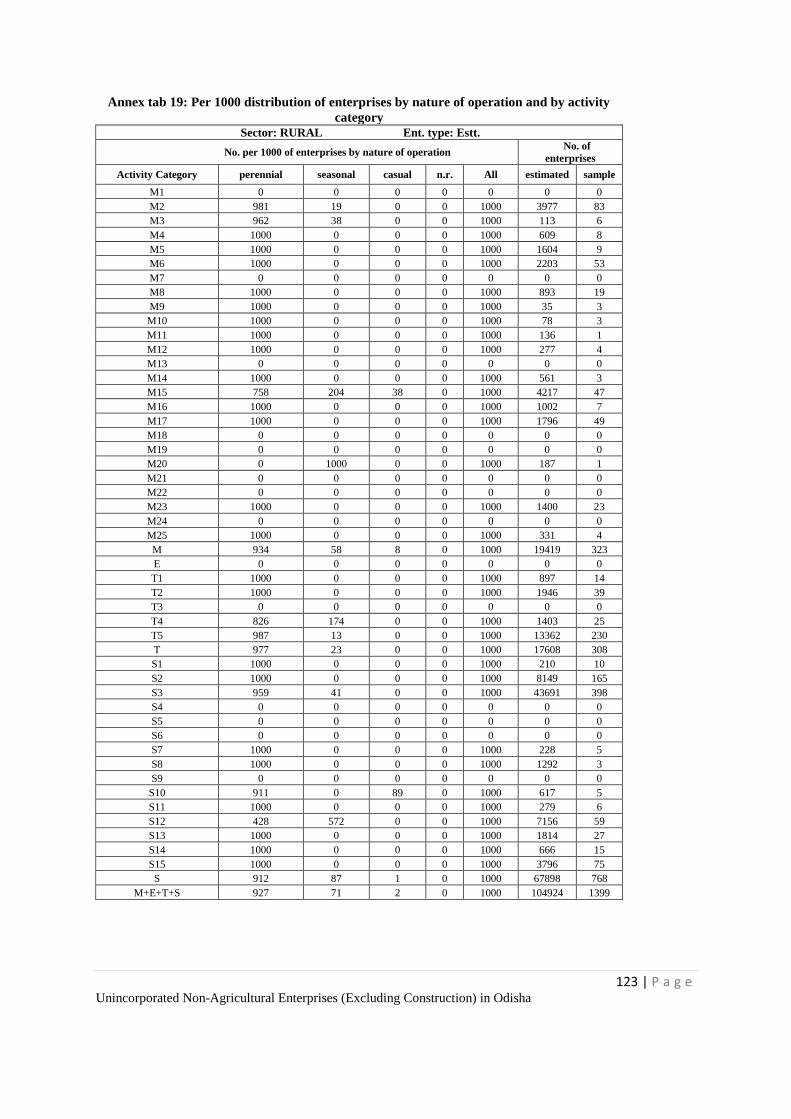
123 | P a g e Unincorporated Non-Agricultural Enterprises (Excluding Construction) in Odisha
Annex tab 19: Per 1000 distribution of enterprises by nature of operation and by activity
category
Sector: RURAL Ent. type: Estt.
No. per 1000 of enterprises by nature of operation No. of
enterprises
Activity Category perennial seasonal casual n.r. All estimated sample
M1 0 0 0 0 0 0 0
M2 981 19 0 0 1000 3977 83
M3 962 38 0 0 1000 113 6
M4 1000 0 0 0 1000 609 8
M5 1000 0 0 0 1000 1604 9
M6 1000 0 0 0 1000 2203 53
M7 0 0 0 0 0 0 0
M8 1000 0 0 0 1000 893 19
M9 1000 0 0 0 1000 35 3
M10 1000 0 0 0 1000 78 3
M11 1000 0 0 0 1000 136 1
M12 1000 0 0 0 1000 277 4
M13 0 0 0 0 0 0 0
M14 1000 0 0 0 1000 561 3
M15 758 204 38 0 1000 4217 47
M16 1000 0 0 0 1000 1002 7
M17 1000 0 0 0 1000 1796 49
M18 0 0 0 0 0 0 0
M19 0 0 0 0 0 0 0
M20 0 1000 0 0 1000 187 1
M21 0 0 0 0 0 0 0
M22 0 0 0 0 0 0 0
M23 1000 0 0 0 1000 1400 23
M24 0 0 0 0 0 0 0
M25 1000 0 0 0 1000 331 4
M 934 58 8 0 1000 19419 323
E 0 0 0 0 0 0 0
T1 1000 0 0 0 1000 897 14
T2 1000 0 0 0 1000 1946 39
T3 0 0 0 0 0 0 0
T4 826 174 0 0 1000 1403 25
T5 987 13 0 0 1000 13362 230
T 977 23 0 0 1000 17608 308
S1 1000 0 0 0 1000 210 10
S2 1000 0 0 0 1000 8149 165
S3 959 41 0 0 1000 43691 398
S4 0 0 0 0 0 0 0
S5 0 0 0 0 0 0 0
S6 0 0 0 0 0 0 0
S7 1000 0 0 0 1000 228 5
S8 1000 0 0 0 1000 1292 3
S9 0 0 0 0 0 0 0
S10 911 0 89 0 1000 617 5
S11 1000 0 0 0 1000 279 6
S12 428 572 0 0 1000 7156 59
S13 1000 0 0 0 1000 1814 27
S14 1000 0 0 0 1000 666 15
S15 1000 0 0 0 1000 3796 75
S 912 87 1 0 1000 67898 768
M+E+T+S 927 71 2 0 1000 104924 1399
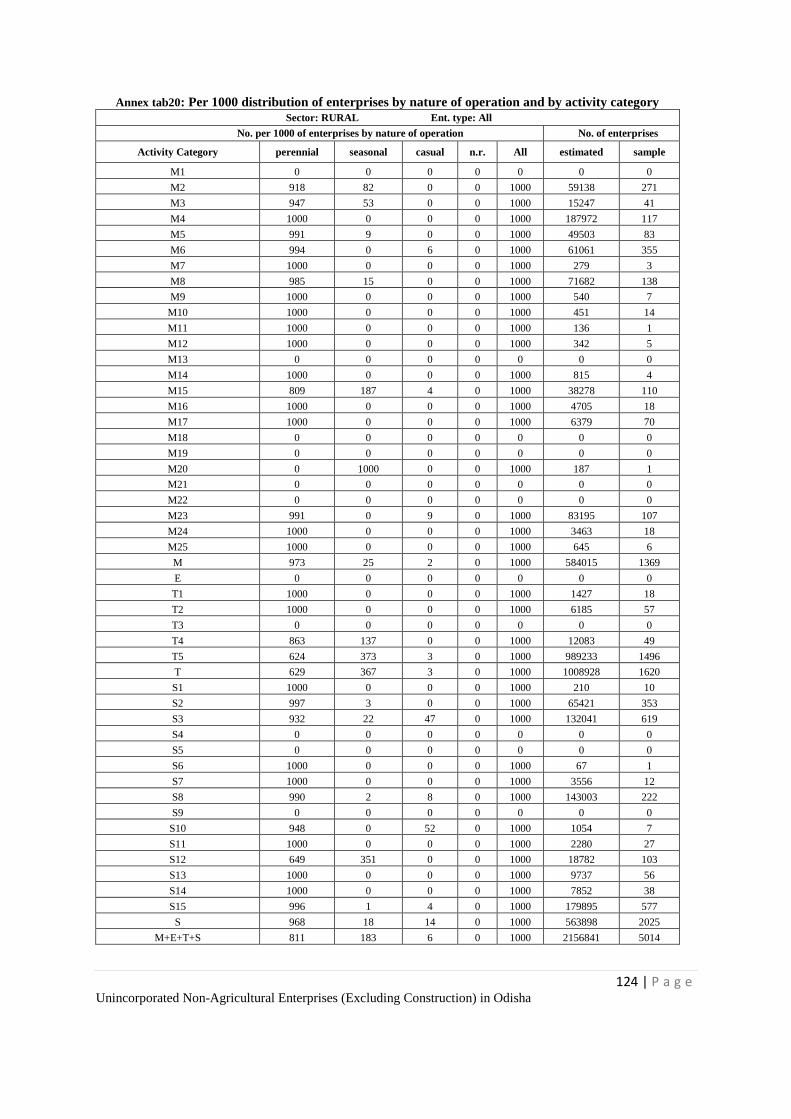
124 | P a g e Unincorporated Non-Agricultural Enterprises (Excluding Construction) in Odisha
Annex tab20: Per 1000 distribution of enterprises by nature of operation and by activity category
Sector: RURAL Ent. type: All
No. per 1000 of enterprises by nature of operation No. of enterprises
Activity Category perennial seasonal casual n.r. All estimated sample
M1 0 0 0 0 0 0 0
M2 918 82 0 0 1000 59138 271
M3 947 53 0 0 1000 15247 41
M4 1000 0 0 0 1000 187972 117
M5 991 9 0 0 1000 49503 83
M6 994 0 6 0 1000 61061 355
M7 1000 0 0 0 1000 279 3
M8 985 15 0 0 1000 71682 138
M9 1000 0 0 0 1000 540 7
M10 1000 0 0 0 1000 451 14
M11 1000 0 0 0 1000 136 1
M12 1000 0 0 0 1000 342 5
M13 0 0 0 0 0 0 0
M14 1000 0 0 0 1000 815 4
M15 809 187 4 0 1000 38278 110
M16 1000 0 0 0 1000 4705 18
M17 1000 0 0 0 1000 6379 70
M18 0 0 0 0 0 0 0
M19 0 0 0 0 0 0 0
M20 0 1000 0 0 1000 187 1
M21 0 0 0 0 0 0 0
M22 0 0 0 0 0 0 0
M23 991 0 9 0 1000 83195 107
M24 1000 0 0 0 1000 3463 18
M25 1000 0 0 0 1000 645 6
M 973 25 2 0 1000 584015 1369
E 0 0 0 0 0 0 0
T1 1000 0 0 0 1000 1427 18
T2 1000 0 0 0 1000 6185 57
T3 0 0 0 0 0 0 0
T4 863 137 0 0 1000 12083 49
T5 624 373 3 0 1000 989233 1496
T 629 367 3 0 1000 1008928 1620
S1 1000 0 0 0 1000 210 10
S2 997 3 0 0 1000 65421 353
S3 932 22 47 0 1000 132041 619
S4 0 0 0 0 0 0 0
S5 0 0 0 0 0 0 0
S6 1000 0 0 0 1000 67 1
S7 1000 0 0 0 1000 3556 12
S8 990 2 8 0 1000 143003 222
S9 0 0 0 0 0 0 0
S10 948 0 52 0 1000 1054 7
S11 1000 0 0 0 1000 2280 27
S12 649 351 0 0 1000 18782 103
S13 1000 0 0 0 1000 9737 56
S14 1000 0 0 0 1000 7852 38
S15 996 1 4 0 1000 179895 577
S 968 18 14 0 1000 563898 2025
M+E+T+S 811 183 6 0 1000 2156841 5014
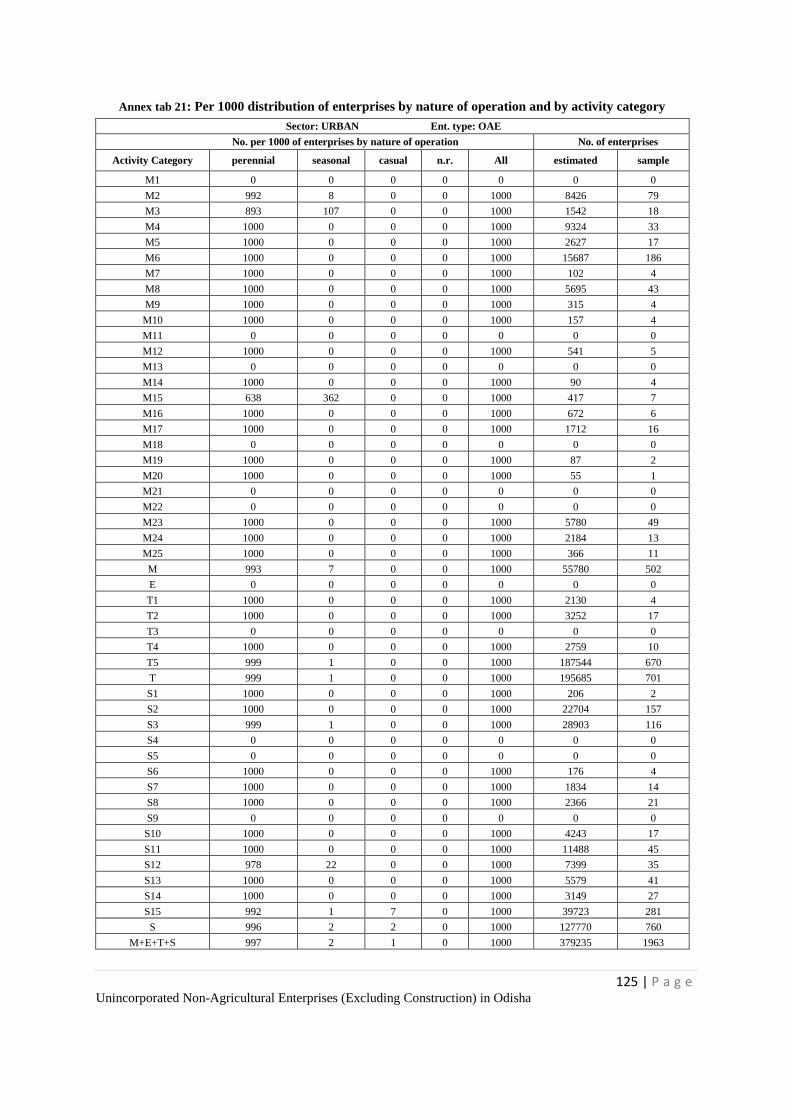
125 | P a g e Unincorporated Non-Agricultural Enterprises (Excluding Construction) in Odisha
Annex tab 21: Per 1000 distribution of enterprises by nature of operation and by activity category
Sector: URBAN Ent. type: OAE
No. per 1000 of enterprises by nature of operation No. of enterprises
Activity Category perennial seasonal casual n.r. All estimated sample
M1 0 0 0 0 0 0 0
M2 992 8 0 0 1000 8426 79
M3 893 107 0 0 1000 1542 18
M4 1000 0 0 0 1000 9324 33
M5 1000 0 0 0 1000 2627 17
M6 1000 0 0 0 1000 15687 186
M7 1000 0 0 0 1000 102 4
M8 1000 0 0 0 1000 5695 43
M9 1000 0 0 0 1000 315 4
M10 1000 0 0 0 1000 157 4
M11 0 0 0 0 0 0 0
M12 1000 0 0 0 1000 541 5
M13 0 0 0 0 0 0 0
M14 1000 0 0 0 1000 90 4
M15 638 362 0 0 1000 417 7
M16 1000 0 0 0 1000 672 6
M17 1000 0 0 0 1000 1712 16
M18 0 0 0 0 0 0 0
M19 1000 0 0 0 1000 87 2
M20 1000 0 0 0 1000 55 1
M21 0 0 0 0 0 0 0
M22 0 0 0 0 0 0 0
M23 1000 0 0 0 1000 5780 49
M24 1000 0 0 0 1000 2184 13
M25 1000 0 0 0 1000 366 11
M 993 7 0 0 1000 55780 502
E 0 0 0 0 0 0 0
T1 1000 0 0 0 1000 2130 4
T2 1000 0 0 0 1000 3252 17
T3 0 0 0 0 0 0 0
T4 1000 0 0 0 1000 2759 10
T5 999 1 0 0 1000 187544 670
T 999 1 0 0 1000 195685 701
S1 1000 0 0 0 1000 206 2
S2 1000 0 0 0 1000 22704 157
S3 999 1 0 0 1000 28903 116
S4 0 0 0 0 0 0 0
S5 0 0 0 0 0 0 0
S6 1000 0 0 0 1000 176 4
S7 1000 0 0 0 1000 1834 14
S8 1000 0 0 0 1000 2366 21
S9 0 0 0 0 0 0 0
S10 1000 0 0 0 1000 4243 17
S11 1000 0 0 0 1000 11488 45
S12 978 22 0 0 1000 7399 35
S13 1000 0 0 0 1000 5579 41
S14 1000 0 0 0 1000 3149 27
S15 992 1 7 0 1000 39723 281
S 996 2 2 0 1000 127770 760
M+E+T+S 997 2 1 0 1000 379235 1963
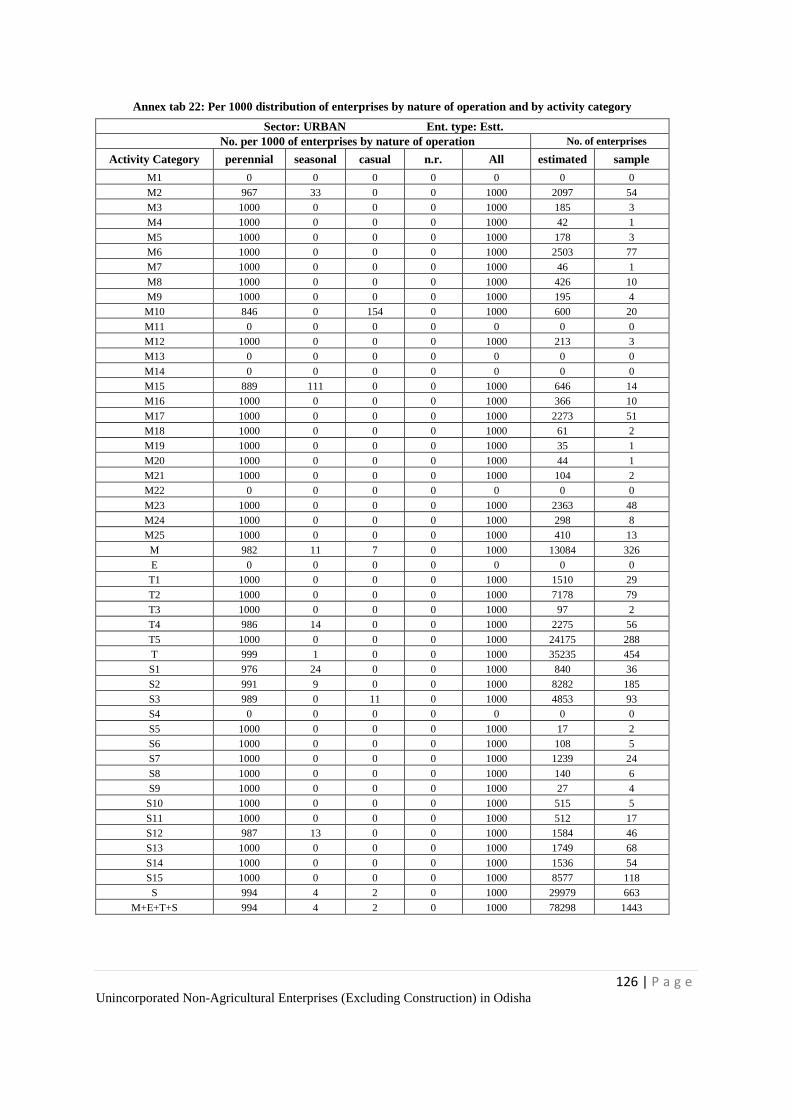
126 | P a g e Unincorporated Non-Agricultural Enterprises (Excluding Construction) in Odisha
Annex tab 22: Per 1000 distribution of enterprises by nature of operation and by activity category
Sector: URBAN Ent. type: Estt.
No. per 1000 of enterprises by nature of operation No. of enterprises
Activity Category perennial seasonal casual n.r. All estimated sample
M1 0 0 0 0 0 0 0
M2 967 33 0 0 1000 2097 54
M3 1000 0 0 0 1000 185 3
M4 1000 0 0 0 1000 42 1
M5 1000 0 0 0 1000 178 3
M6 1000 0 0 0 1000 2503 77
M7 1000 0 0 0 1000 46 1
M8 1000 0 0 0 1000 426 10
M9 1000 0 0 0 1000 195 4
M10 846 0 154 0 1000 600 20
M11 0 0 0 0 0 0 0
M12 1000 0 0 0 1000 213 3
M13 0 0 0 0 0 0 0
M14 0 0 0 0 0 0 0
M15 889 111 0 0 1000 646 14
M16 1000 0 0 0 1000 366 10
M17 1000 0 0 0 1000 2273 51
M18 1000 0 0 0 1000 61 2
M19 1000 0 0 0 1000 35 1
M20 1000 0 0 0 1000 44 1
M21 1000 0 0 0 1000 104 2
M22 0 0 0 0 0 0 0
M23 1000 0 0 0 1000 2363 48
M24 1000 0 0 0 1000 298 8
M25 1000 0 0 0 1000 410 13
M 982 11 7 0 1000 13084 326
E 0 0 0 0 0 0 0
T1 1000 0 0 0 1000 1510 29
T2 1000 0 0 0 1000 7178 79
T3 1000 0 0 0 1000 97 2
T4 986 14 0 0 1000 2275 56
T5 1000 0 0 0 1000 24175 288
T 999 1 0 0 1000 35235 454
S1 976 24 0 0 1000 840 36
S2 991 9 0 0 1000 8282 185
S3 989 0 11 0 1000 4853 93
S4 0 0 0 0 0 0 0
S5 1000 0 0 0 1000 17 2
S6 1000 0 0 0 1000 108 5
S7 1000 0 0 0 1000 1239 24
S8 1000 0 0 0 1000 140 6
S9 1000 0 0 0 1000 27 4
S10 1000 0 0 0 1000 515 5
S11 1000 0 0 0 1000 512 17
S12 987 13 0 0 1000 1584 46
S13 1000 0 0 0 1000 1749 68
S14 1000 0 0 0 1000 1536 54
S15 1000 0 0 0 1000 8577 118
S 994 4 2 0 1000 29979 663
M+E+T+S 994 4 2 0 1000 78298 1443
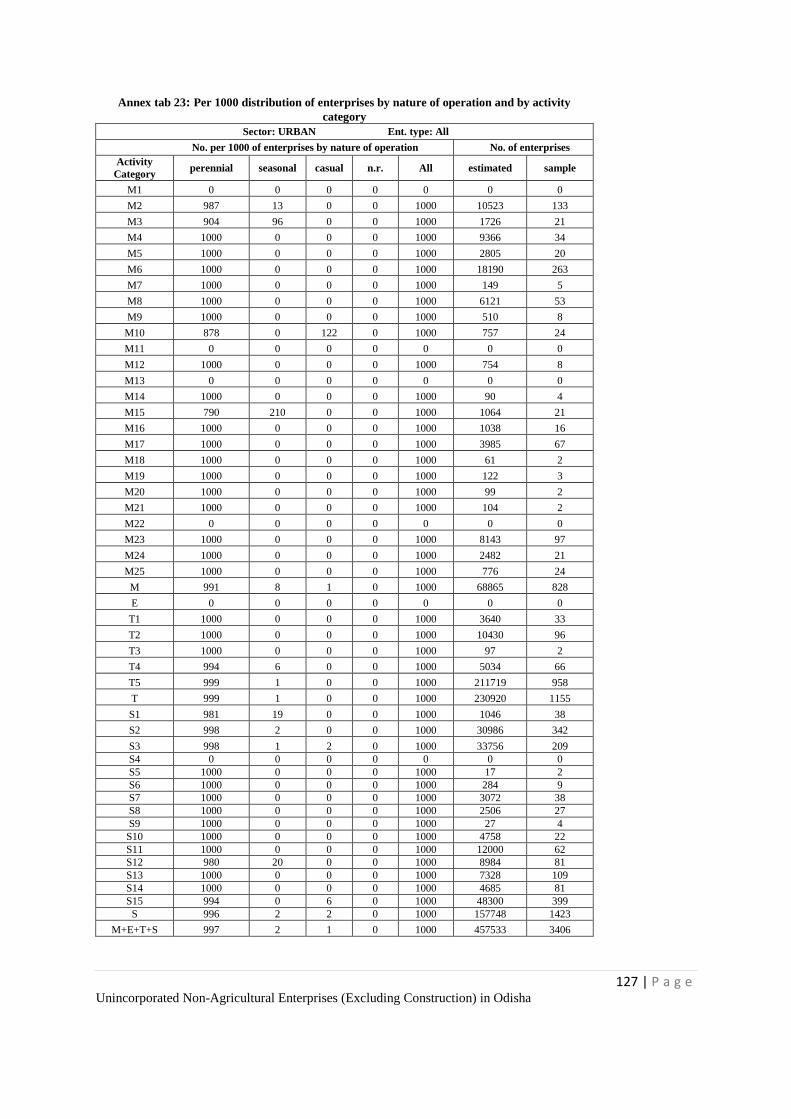
127 | P a g e Unincorporated Non-Agricultural Enterprises (Excluding Construction) in Odisha
Annex tab 23: Per 1000 distribution of enterprises by nature of operation and by activity
category
Sector: URBAN Ent. type: All
No. per 1000 of enterprises by nature of operation No. of enterprises
Activity
Category perennial seasonal casual n.r. All estimated sample
M1 0 0 0 0 0 0 0
M2 987 13 0 0 1000 10523 133
M3 904 96 0 0 1000 1726 21
M4 1000 0 0 0 1000 9366 34
M5 1000 0 0 0 1000 2805 20
M6 1000 0 0 0 1000 18190 263
M7 1000 0 0 0 1000 149 5
M8 1000 0 0 0 1000 6121 53
M9 1000 0 0 0 1000 510 8
M10 878 0 122 0 1000 757 24
M11 0 0 0 0 0 0 0
M12 1000 0 0 0 1000 754 8
M13 0 0 0 0 0 0 0
M14 1000 0 0 0 1000 90 4
M15 790 210 0 0 1000 1064 21
M16 1000 0 0 0 1000 1038 16
M17 1000 0 0 0 1000 3985 67
M18 1000 0 0 0 1000 61 2
M19 1000 0 0 0 1000 122 3
M20 1000 0 0 0 1000 99 2
M21 1000 0 0 0 1000 104 2
M22 0 0 0 0 0 0 0
M23 1000 0 0 0 1000 8143 97
M24 1000 0 0 0 1000 2482 21
M25 1000 0 0 0 1000 776 24
M 991 8 1 0 1000 68865 828
E 0 0 0 0 0 0 0
T1 1000 0 0 0 1000 3640 33
T2 1000 0 0 0 1000 10430 96
T3 1000 0 0 0 1000 97 2
T4 994 6 0 0 1000 5034 66
T5 999 1 0 0 1000 211719 958
T 999 1 0 0 1000 230920 1155
S1 981 19 0 0 1000 1046 38
S2 998 2 0 0 1000 30986 342
S3 998 1 2 0 1000 33756 209
S4 0 0 0 0 0 0 0
S5 1000 0 0 0 1000 17 2
S6 1000 0 0 0 1000 284 9
S7 1000 0 0 0 1000 3072 38
S8 1000 0 0 0 1000 2506 27
S9 1000 0 0 0 1000 27 4
S10 1000 0 0 0 1000 4758 22
S11 1000 0 0 0 1000 12000 62
S12 980 20 0 0 1000 8984 81
S13 1000 0 0 0 1000 7328 109
S14 1000 0 0 0 1000 4685 81
S15 994 0 6 0 1000 48300 399
S 996 2 2 0 1000 157748 1423
M+E+T+S 997 2 1 0 1000 457533 3406
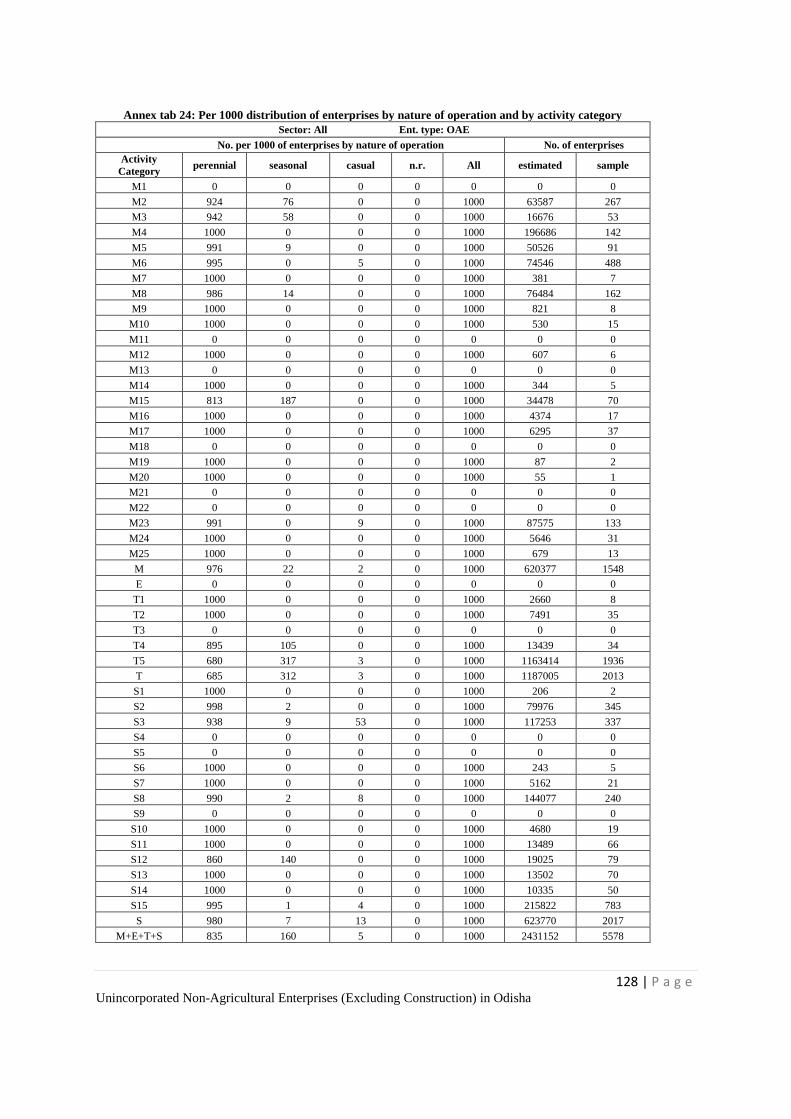
128 | P a g e Unincorporated Non-Agricultural Enterprises (Excluding Construction) in Odisha
Annex tab 24: Per 1000 distribution of enterprises by nature of operation and by activity category
Sector: All Ent. type: OAE
No. per 1000 of enterprises by nature of operation No. of enterprises
Activity
Category perennial seasonal casual n.r. All estimated sample
M1 0 0 0 0 0 0 0
M2 924 76 0 0 1000 63587 267
M3 942 58 0 0 1000 16676 53
M4 1000 0 0 0 1000 196686 142
M5 991 9 0 0 1000 50526 91
M6 995 0 5 0 1000 74546 488
M7 1000 0 0 0 1000 381 7
M8 986 14 0 0 1000 76484 162
M9 1000 0 0 0 1000 821 8
M10 1000 0 0 0 1000 530 15
M11 0 0 0 0 0 0 0
M12 1000 0 0 0 1000 607 6
M13 0 0 0 0 0 0 0
M14 1000 0 0 0 1000 344 5
M15 813 187 0 0 1000 34478 70
M16 1000 0 0 0 1000 4374 17
M17 1000 0 0 0 1000 6295 37
M18 0 0 0 0 0 0 0
M19 1000 0 0 0 1000 87 2
M20 1000 0 0 0 1000 55 1
M21 0 0 0 0 0 0 0
M22 0 0 0 0 0 0 0
M23 991 0 9 0 1000 87575 133
M24 1000 0 0 0 1000 5646 31
M25 1000 0 0 0 1000 679 13
M 976 22 2 0 1000 620377 1548
E 0 0 0 0 0 0 0
T1 1000 0 0 0 1000 2660 8
T2 1000 0 0 0 1000 7491 35
T3 0 0 0 0 0 0 0
T4 895 105 0 0 1000 13439 34
T5 680 317 3 0 1000 1163414 1936
T 685 312 3 0 1000 1187005 2013
S1 1000 0 0 0 1000 206 2
S2 998 2 0 0 1000 79976 345
S3 938 9 53 0 1000 117253 337
S4 0 0 0 0 0 0 0
S5 0 0 0 0 0 0 0
S6 1000 0 0 0 1000 243 5
S7 1000 0 0 0 1000 5162 21
S8 990 2 8 0 1000 144077 240
S9 0 0 0 0 0 0 0
S10 1000 0 0 0 1000 4680 19
S11 1000 0 0 0 1000 13489 66
S12 860 140 0 0 1000 19025 79
S13 1000 0 0 0 1000 13502 70
S14 1000 0 0 0 1000 10335 50
S15 995 1 4 0 1000 215822 783
S 980 7 13 0 1000 623770 2017
M+E+T+S 835 160 5 0 1000 2431152 5578
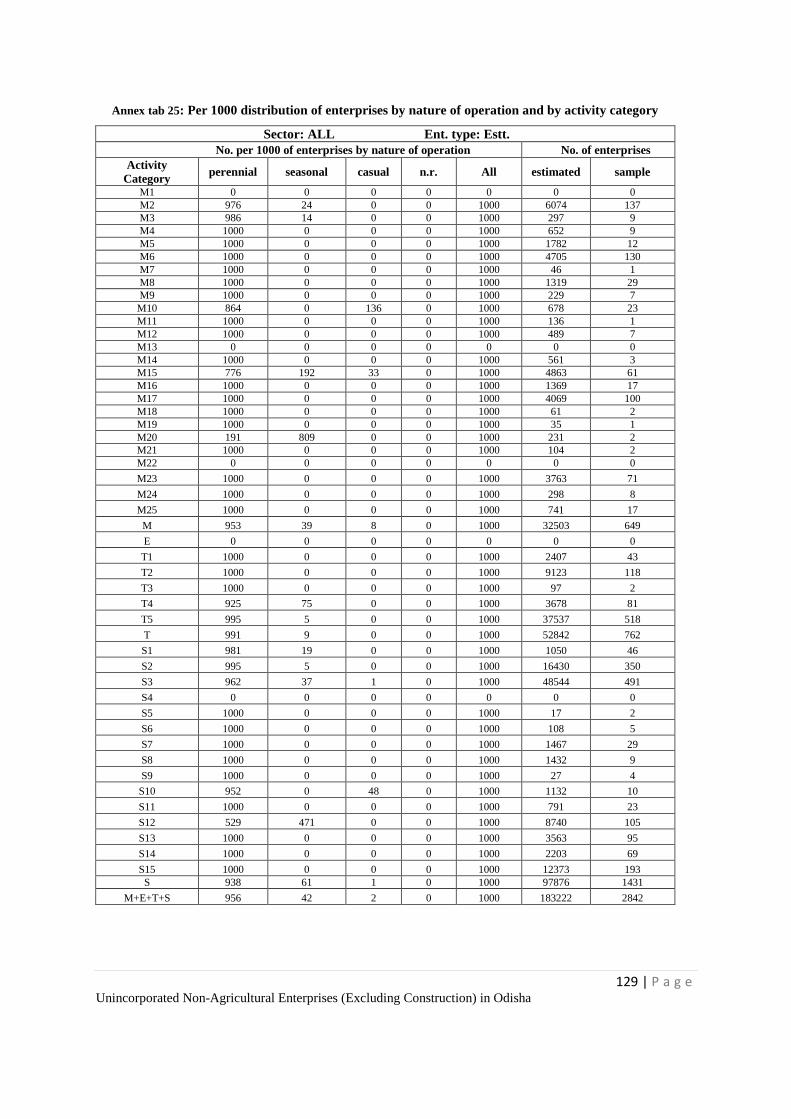
129 | P a g e Unincorporated Non-Agricultural Enterprises (Excluding Construction) in Odisha
Annex tab 25: Per 1000 distribution of enterprises by nature of operation and by activity category
Sector: ALL Ent. type: Estt.
No. per 1000 of enterprises by nature of operation No. of enterprises
Activity
Category perennial seasonal casual n.r. All estimated sample
M1 0 0 0 0 0 0 0
M2 976 24 0 0 1000 6074 137
M3 986 14 0 0 1000 297 9
M4 1000 0 0 0 1000 652 9
M5 1000 0 0 0 1000 1782 12
M6 1000 0 0 0 1000 4705 130
M7 1000 0 0 0 1000 46 1
M8 1000 0 0 0 1000 1319 29
M9 1000 0 0 0 1000 229 7
M10 864 0 136 0 1000 678 23
M11 1000 0 0 0 1000 136 1
M12 1000 0 0 0 1000 489 7
M13 0 0 0 0 0 0 0
M14 1000 0 0 0 1000 561 3
M15 776 192 33 0 1000 4863 61
M16 1000 0 0 0 1000 1369 17
M17 1000 0 0 0 1000 4069 100
M18 1000 0 0 0 1000 61 2
M19 1000 0 0 0 1000 35 1
M20 191 809 0 0 1000 231 2
M21 1000 0 0 0 1000 104 2
M22 0 0 0 0 0 0 0
M23 1000 0 0 0 1000 3763 71
M24 1000 0 0 0 1000 298 8
M25 1000 0 0 0 1000 741 17
M 953 39 8 0 1000 32503 649
E 0 0 0 0 0 0 0
T1 1000 0 0 0 1000 2407 43
T2 1000 0 0 0 1000 9123 118
T3 1000 0 0 0 1000 97 2
T4 925 75 0 0 1000 3678 81
T5 995 5 0 0 1000 37537 518
T 991 9 0 0 1000 52842 762
S1 981 19 0 0 1000 1050 46
S2 995 5 0 0 1000 16430 350
S3 962 37 1 0 1000 48544 491
S4 0 0 0 0 0 0 0
S5 1000 0 0 0 1000 17 2
S6 1000 0 0 0 1000 108 5
S7 1000 0 0 0 1000 1467 29
S8 1000 0 0 0 1000 1432 9
S9 1000 0 0 0 1000 27 4
S10 952 0 48 0 1000 1132 10
S11 1000 0 0 0 1000 791 23
S12 529 471 0 0 1000 8740 105
S13 1000 0 0 0 1000 3563 95
S14 1000 0 0 0 1000 2203 69
S15 1000 0 0 0 1000 12373 193
S 938 61 1 0 1000 97876 1431
M+E+T+S 956 42 2 0 1000 183222 2842
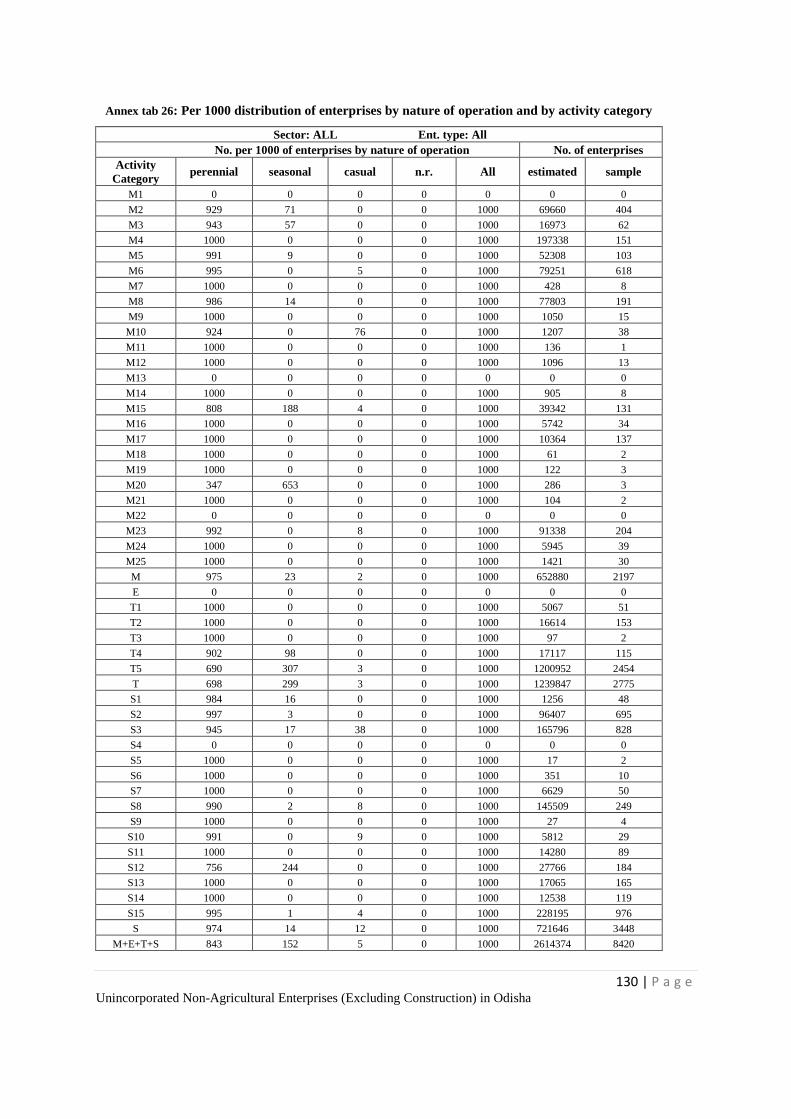
130 | P a g e Unincorporated Non-Agricultural Enterprises (Excluding Construction) in Odisha
Annex tab 26: Per 1000 distribution of enterprises by nature of operation and by activity category
Sector: ALL Ent. type: All
No. per 1000 of enterprises by nature of operation No. of enterprises
Activity
Category perennial seasonal casual n.r. All estimated sample
M1 0 0 0 0 0 0 0
M2 929 71 0 0 1000 69660 404
M3 943 57 0 0 1000 16973 62
M4 1000 0 0 0 1000 197338 151
M5 991 9 0 0 1000 52308 103
M6 995 0 5 0 1000 79251 618
M7 1000 0 0 0 1000 428 8
M8 986 14 0 0 1000 77803 191
M9 1000 0 0 0 1000 1050 15
M10 924 0 76 0 1000 1207 38
M11 1000 0 0 0 1000 136 1
M12 1000 0 0 0 1000 1096 13
M13 0 0 0 0 0 0 0
M14 1000 0 0 0 1000 905 8
M15 808 188 4 0 1000 39342 131
M16 1000 0 0 0 1000 5742 34
M17 1000 0 0 0 1000 10364 137
M18 1000 0 0 0 1000 61 2
M19 1000 0 0 0 1000 122 3
M20 347 653 0 0 1000 286 3
M21 1000 0 0 0 1000 104 2
M22 0 0 0 0 0 0 0
M23 992 0 8 0 1000 91338 204
M24 1000 0 0 0 1000 5945 39
M25 1000 0 0 0 1000 1421 30
M 975 23 2 0 1000 652880 2197
E 0 0 0 0 0 0 0
T1 1000 0 0 0 1000 5067 51
T2 1000 0 0 0 1000 16614 153
T3 1000 0 0 0 1000 97 2
T4 902 98 0 0 1000 17117 115
T5 690 307 3 0 1000 1200952 2454
T 698 299 3 0 1000 1239847 2775
S1 984 16 0 0 1000 1256 48
S2 997 3 0 0 1000 96407 695
S3 945 17 38 0 1000 165796 828
S4 0 0 0 0 0 0 0
S5 1000 0 0 0 1000 17 2
S6 1000 0 0 0 1000 351 10
S7 1000 0 0 0 1000 6629 50
S8 990 2 8 0 1000 145509 249
S9 1000 0 0 0 1000 27 4
S10 991 0 9 0 1000 5812 29
S11 1000 0 0 0 1000 14280 89
S12 756 244 0 0 1000 27766 184
S13 1000 0 0 0 1000 17065 165
S14 1000 0 0 0 1000 12538 119
S15 995 1 4 0 1000 228195 976
S 974 14 12 0 1000 721646 3448
M+E+T+S 843 152 5 0 1000 2614374 8420
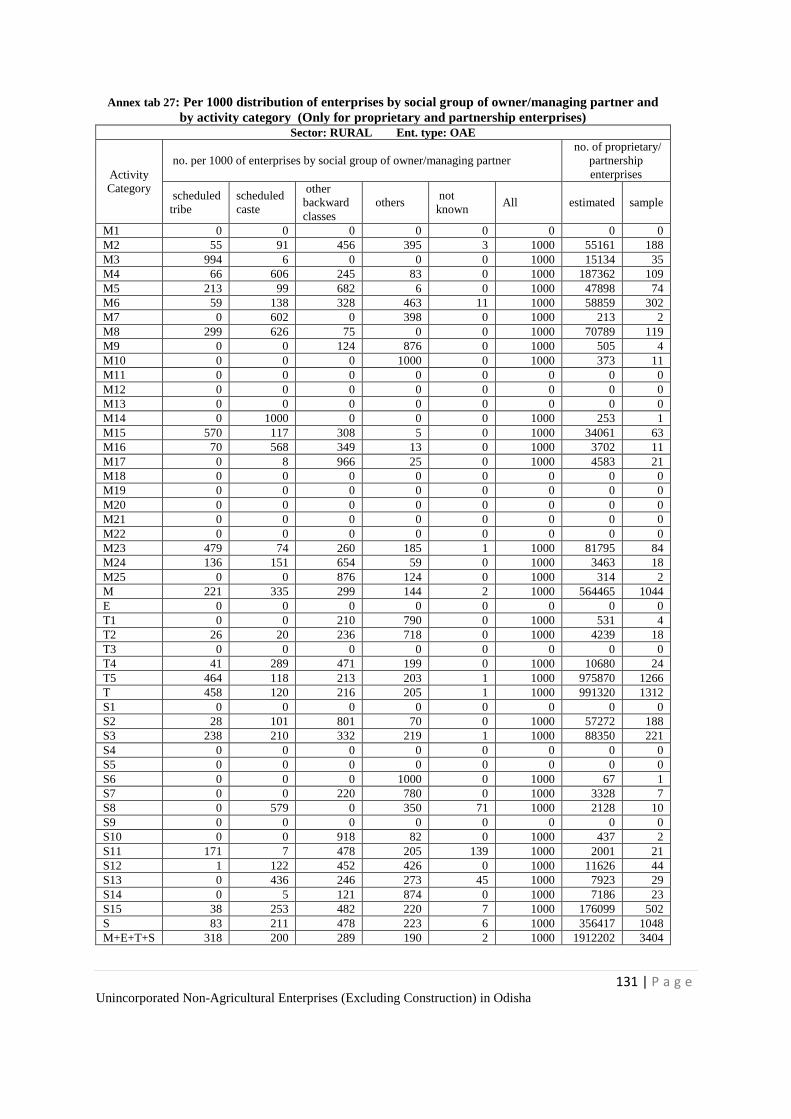
131 | P a g e Unincorporated Non-Agricultural Enterprises (Excluding Construction) in Odisha
Annex tab 27: Per 1000 distribution of enterprises by social group of owner/managing partner and
by activity category (Only for proprietary and partnership enterprises)
Sector: RURAL Ent. type: OAE
Activity
Category
no. per 1000 of enterprises by social group of owner/managing partner
no. of proprietary/
partnership
enterprises
scheduled
tribe
scheduled
caste
other
backward
classes
others not
known All estimated sample
M1 0 0 0 0 0 0 0 0
M2 55 91 456 395 3 1000 55161 188
M3 994 6 0 0 0 1000 15134 35
M4 66 606 245 83 0 1000 187362 109
M5 213 99 682 6 0 1000 47898 74
M6 59 138 328 463 11 1000 58859 302
M7 0 602 0 398 0 1000 213 2
M8 299 626 75 0 0 1000 70789 119
M9 0 0 124 876 0 1000 505 4
M10 0 0 0 1000 0 1000 373 11
M11 0 0 0 0 0 0 0 0
M12 0 0 0 0 0 0 0 0
M13 0 0 0 0 0 0 0 0
M14 0 1000 0 0 0 1000 253 1
M15 570 117 308 5 0 1000 34061 63
M16 70 568 349 13 0 1000 3702 11
M17 0 8 966 25 0 1000 4583 21
M18 0 0 0 0 0 0 0 0
M19 0 0 0 0 0 0 0 0
M20 0 0 0 0 0 0 0 0
M21 0 0 0 0 0 0 0 0
M22 0 0 0 0 0 0 0 0
M23 479 74 260 185 1 1000 81795 84
M24 136 151 654 59 0 1000 3463 18
M25 0 0 876 124 0 1000 314 2
M 221 335 299 144 2 1000 564465 1044
E 0 0 0 0 0 0 0 0
T1 0 0 210 790 0 1000 531 4
T2 26 20 236 718 0 1000 4239 18
T3 0 0 0 0 0 0 0 0
T4 41 289 471 199 0 1000 10680 24
T5 464 118 213 203 1 1000 975870 1266
T 458 120 216 205 1 1000 991320 1312
S1 0 0 0 0 0 0 0 0
S2 28 101 801 70 0 1000 57272 188
S3 238 210 332 219 1 1000 88350 221
S4 0 0 0 0 0 0 0 0
S5 0 0 0 0 0 0 0 0
S6 0 0 0 1000 0 1000 67 1
S7 0 0 220 780 0 1000 3328 7
S8 0 579 0 350 71 1000 2128 10
S9 0 0 0 0 0 0 0 0
S10 0 0 918 82 0 1000 437 2
S11 171 7 478 205 139 1000 2001 21
S12 1 122 452 426 0 1000 11626 44
S13 0 436 246 273 45 1000 7923 29
S14 0 5 121 874 0 1000 7186 23
S15 38 253 482 220 7 1000 176099 502
S 83 211 478 223 6 1000 356417 1048
M+E+T+S 318 200 289 190 2 1000 1912202 3404
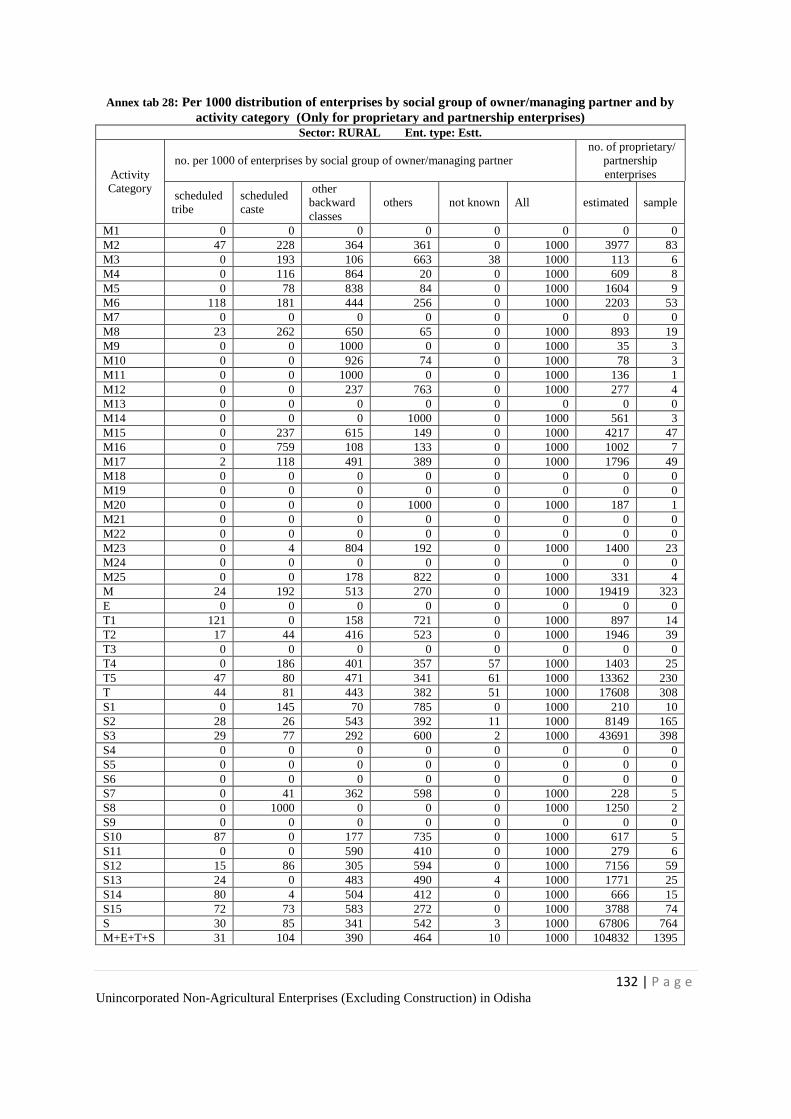
132 | P a g e Unincorporated Non-Agricultural Enterprises (Excluding Construction) in Odisha
Annex tab 28: Per 1000 distribution of enterprises by social group of owner/managing partner and by
activity category (Only for proprietary and partnership enterprises)
Sector: RURAL Ent. type: Estt.
Activity
Category
no. per 1000 of enterprises by social group of owner/managing partner
no. of proprietary/
partnership
enterprises
scheduled
tribe
scheduled
caste
other
backward
classes
others not known All estimated sample
M1 0 0 0 0 0 0 0 0
M2 47 228 364 361 0 1000 3977 83
M3 0 193 106 663 38 1000 113 6
M4 0 116 864 20 0 1000 609 8
M5 0 78 838 84 0 1000 1604 9
M6 118 181 444 256 0 1000 2203 53
M7 0 0 0 0 0 0 0 0
M8 23 262 650 65 0 1000 893 19
M9 0 0 1000 0 0 1000 35 3
M10 0 0 926 74 0 1000 78 3
M11 0 0 1000 0 0 1000 136 1
M12 0 0 237 763 0 1000 277 4
M13 0 0 0 0 0 0 0 0
M14 0 0 0 1000 0 1000 561 3
M15 0 237 615 149 0 1000 4217 47
M16 0 759 108 133 0 1000 1002 7
M17 2 118 491 389 0 1000 1796 49
M18 0 0 0 0 0 0 0 0
M19 0 0 0 0 0 0 0 0
M20 0 0 0 1000 0 1000 187 1
M21 0 0 0 0 0 0 0 0
M22 0 0 0 0 0 0 0 0
M23 0 4 804 192 0 1000 1400 23
M24 0 0 0 0 0 0 0 0
M25 0 0 178 822 0 1000 331 4
M 24 192 513 270 0 1000 19419 323
E 0 0 0 0 0 0 0 0
T1 121 0 158 721 0 1000 897 14
T2 17 44 416 523 0 1000 1946 39
T3 0 0 0 0 0 0 0 0
T4 0 186 401 357 57 1000 1403 25
T5 47 80 471 341 61 1000 13362 230
T 44 81 443 382 51 1000 17608 308
S1 0 145 70 785 0 1000 210 10
S2 28 26 543 392 11 1000 8149 165
S3 29 77 292 600 2 1000 43691 398
S4 0 0 0 0 0 0 0 0
S5 0 0 0 0 0 0 0 0
S6 0 0 0 0 0 0 0 0
S7 0 41 362 598 0 1000 228 5
S8 0 1000 0 0 0 1000 1250 2
S9 0 0 0 0 0 0 0 0
S10 87 0 177 735 0 1000 617 5
S11 0 0 590 410 0 1000 279 6
S12 15 86 305 594 0 1000 7156 59
S13 24 0 483 490 4 1000 1771 25
S14 80 4 504 412 0 1000 666 15
S15 72 73 583 272 0 1000 3788 74
S 30 85 341 542 3 1000 67806 764
M+E+T+S 31 104 390 464 10 1000 104832 1395
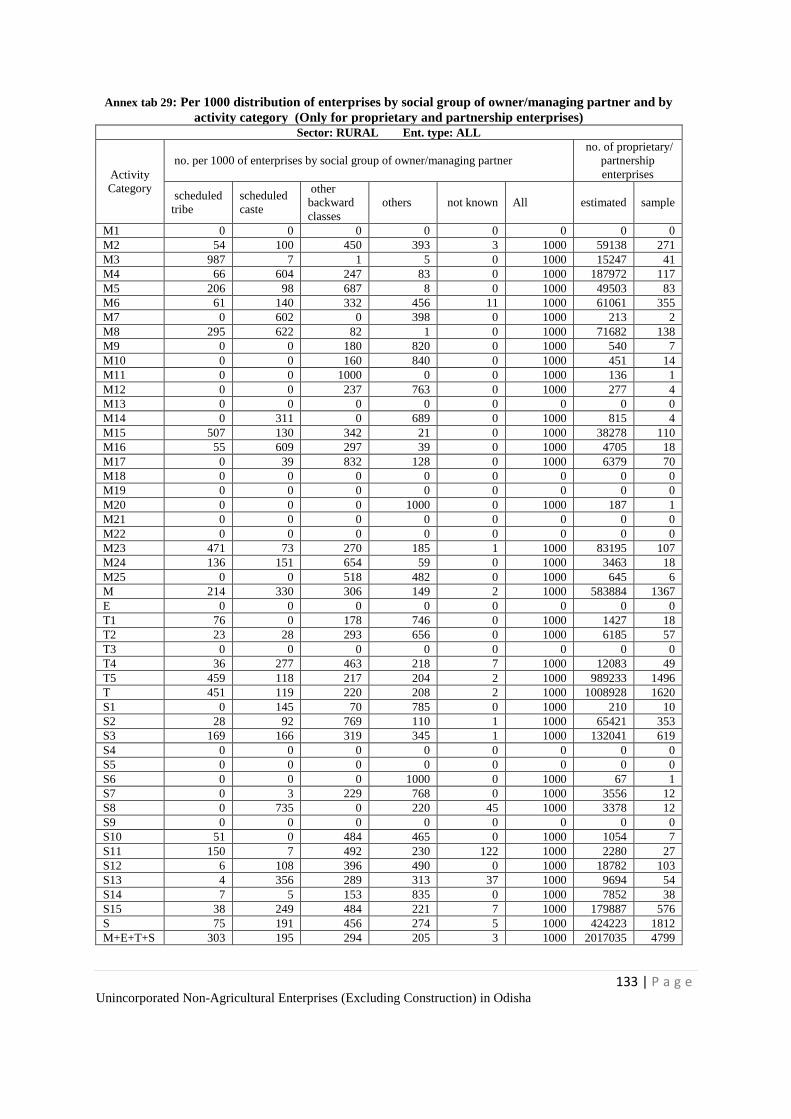
133 | P a g e Unincorporated Non-Agricultural Enterprises (Excluding Construction) in Odisha
Annex tab 29: Per 1000 distribution of enterprises by social group of owner/managing partner and by
activity category (Only for proprietary and partnership enterprises)
Sector: RURAL Ent. type: ALL
Activity
Category
no. per 1000 of enterprises by social group of owner/managing partner
no. of proprietary/
partnership
enterprises
scheduled
tribe
scheduled
caste
other
backward
classes
others not known All estimated sample
M1 0 0 0 0 0 0 0 0
M2 54 100 450 393 3 1000 59138 271
M3 987 7 1 5 0 1000 15247 41
M4 66 604 247 83 0 1000 187972 117
M5 206 98 687 8 0 1000 49503 83
M6 61 140 332 456 11 1000 61061 355
M7 0 602 0 398 0 1000 213 2
M8 295 622 82 1 0 1000 71682 138
M9 0 0 180 820 0 1000 540 7
M10 0 0 160 840 0 1000 451 14
M11 0 0 1000 0 0 1000 136 1
M12 0 0 237 763 0 1000 277 4
M13 0 0 0 0 0 0 0 0
M14 0 311 0 689 0 1000 815 4
M15 507 130 342 21 0 1000 38278 110
M16 55 609 297 39 0 1000 4705 18
M17 0 39 832 128 0 1000 6379 70
M18 0 0 0 0 0 0 0 0
M19 0 0 0 0 0 0 0 0
M20 0 0 0 1000 0 1000 187 1
M21 0 0 0 0 0 0 0 0
M22 0 0 0 0 0 0 0 0
M23 471 73 270 185 1 1000 83195 107
M24 136 151 654 59 0 1000 3463 18
M25 0 0 518 482 0 1000 645 6
M 214 330 306 149 2 1000 583884 1367
E 0 0 0 0 0 0 0 0
T1 76 0 178 746 0 1000 1427 18
T2 23 28 293 656 0 1000 6185 57
T3 0 0 0 0 0 0 0 0
T4 36 277 463 218 7 1000 12083 49
T5 459 118 217 204 2 1000 989233 1496
T 451 119 220 208 2 1000 1008928 1620
S1 0 145 70 785 0 1000 210 10
S2 28 92 769 110 1 1000 65421 353
S3 169 166 319 345 1 1000 132041 619
S4 0 0 0 0 0 0 0 0
S5 0 0 0 0 0 0 0 0
S6 0 0 0 1000 0 1000 67 1
S7 0 3 229 768 0 1000 3556 12
S8 0 735 0 220 45 1000 3378 12
S9 0 0 0 0 0 0 0 0
S10 51 0 484 465 0 1000 1054 7
S11 150 7 492 230 122 1000 2280 27
S12 6 108 396 490 0 1000 18782 103
S13 4 356 289 313 37 1000 9694 54
S14 7 5 153 835 0 1000 7852 38
S15 38 249 484 221 7 1000 179887 576
S 75 191 456 274 5 1000 424223 1812
M+E+T+S 303 195 294 205 3 1000 2017035 4799

134 | P a g e Unincorporated Non-Agricultural Enterprises (Excluding Construction) in Odisha
Annex tab 30: Per 1000 distribution of enterprises by social group of owner/managing partner and
by activity category (Only for proprietary and partnership enterprises)
Activity
Category
no. per 1000 of enterprises by social group of owner/managing partner
no. of proprietary/
partnership
enterprises
scheduled
tribe
scheduled
caste
other
backward
classes
others not
known All estimated sample
Sector: URBAN Ent. type: OAE
M1 0 0 0 0 0 0 0 0
M2 50 51 669 222 8 1000 8426 79
M3 792 37 107 64 0 1000 1542 18
M4 335 8 358 299 0 1000 9324 33
M5 44 110 614 232 0 1000 2627 17
M6 39 99 613 224 25 1000 15687 186
M7 0 0 74 926 0 1000 102 4
M8 19 576 377 28 0 1000 5695 43
M9 0 0 1000 0 0 1000 315 4
M10 0 0 404 596 0 1000 157 4
M11 0 0 0 0 0 0 0 0
M12 0 0 1000 0 0 1000 541 5
M13 0 0 0 0 0 0 0 0
M14 0 0 598 402 0 1000 90 4
M15 121 758 121 0 0 1000 417 7
M16 0 0 895 105 0 1000 672 6
M17 29 384 220 368 0 1000 1712 16
M18 0 0 0 0 0 0 0 0
M19 0 0 1000 0 0 1000 87 2
M20 0 0 0 0 1000 1000 55 1
M21 0 0 0 0 0 0 0 0
M22 0 0 0 0 0 0 0 0
M23 52 54 817 77 0 1000 5780 49
M24 0 0 1000 0 0 1000 2184 13
M25 0 134 285 580 0 1000 366 11
M 108 126 567 190 9 1000 55780 502
E 0 0 0 0 0 0 0 0
T1 0 18 15 967 0 1000 2130 4
T2 14 101 177 686 22 1000 3252 17
T3 0 0 0 0 0 0 0 0
T4 0 97 43 859 0 1000 2759 10
T5 39 71 406 476 7 1000 187544 670
T 38 72 393 490 7 1000 195685 701
S1 0 0 176 0 824 1000 206 2
S2 19 142 579 260 0 1000 22704 157
S3 31 155 707 101 6 1000 28903 116
S4 0 0 0 0 0 0 0 0
S5 0 0 0 0 0 0 0 0
S6 0 0 0 1000 0 1000 176 4
S7 275 2 489 234 0 1000 1834 14
S8 0 0 167 833 0 1000 157 2
S9 0 0 0 0 0 0 0 0
S10 0 88 621 291 0 1000 4243 17
S11 0 11 219 755 15 1000 11488 45
S12 7 644 94 255 0 1000 7399 35
S13 0 83 477 420 20 1000 5579 41
S14 0 8 401 591 0 1000 3149 27
S15 34 161 493 313 0 1000 39723 281
S 26 158 509 303 5 1000 125560 741
M+E+T+S 44 108 457 384 7 1000 377026 1944
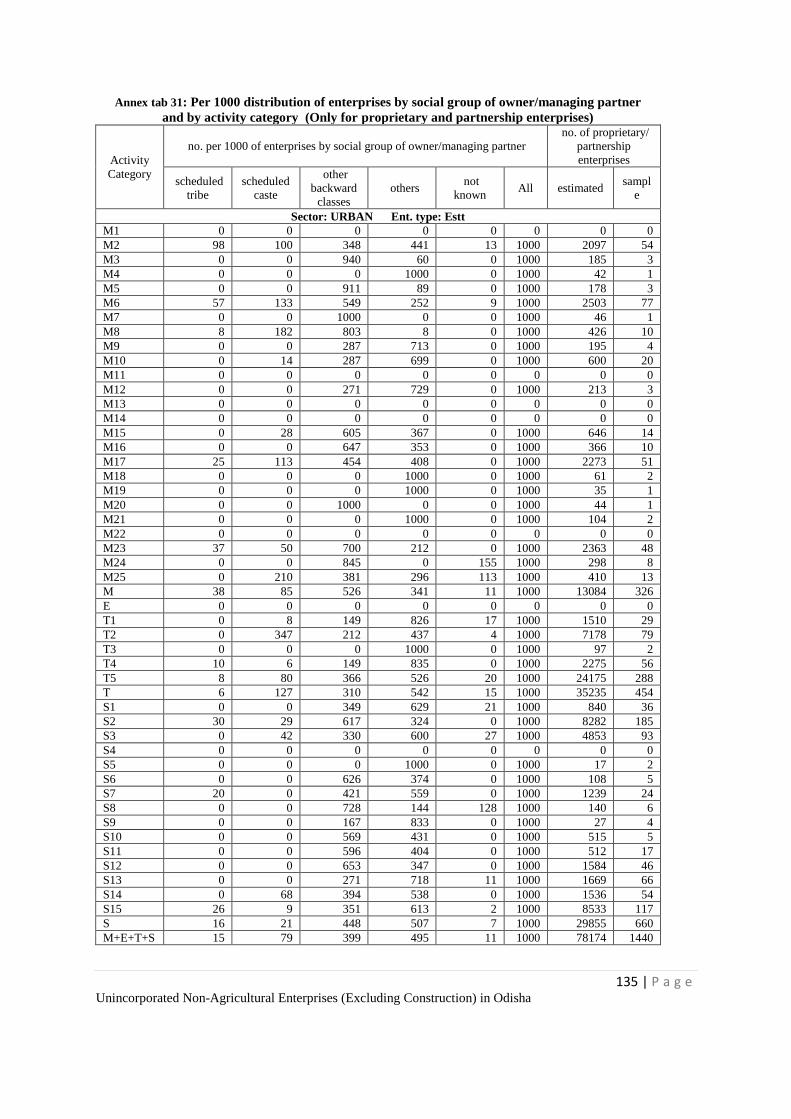
135 | P a g e Unincorporated Non-Agricultural Enterprises (Excluding Construction) in Odisha
Annex tab 31: Per 1000 distribution of enterprises by social group of owner/managing partner
and by activity category (Only for proprietary and partnership enterprises)
Activity
Category
no. per 1000 of enterprises by social group of owner/managing partner
no. of proprietary/
partnership
enterprises
scheduled
tribe
scheduled
caste
other
backward
classes
others not
known All estimated
sampl
e
Sector: URBAN Ent. type: Estt
M1 0 0 0 0 0 0 0 0
M2 98 100 348 441 13 1000 2097 54
M3 0 0 940 60 0 1000 185 3
M4 0 0 0 1000 0 1000 42 1
M5 0 0 911 89 0 1000 178 3
M6 57 133 549 252 9 1000 2503 77
M7 0 0 1000 0 0 1000 46 1
M8 8 182 803 8 0 1000 426 10
M9 0 0 287 713 0 1000 195 4
M10 0 14 287 699 0 1000 600 20
M11 0 0 0 0 0 0 0 0
M12 0 0 271 729 0 1000 213 3
M13 0 0 0 0 0 0 0 0
M14 0 0 0 0 0 0 0 0
M15 0 28 605 367 0 1000 646 14
M16 0 0 647 353 0 1000 366 10
M17 25 113 454 408 0 1000 2273 51
M18 0 0 0 1000 0 1000 61 2
M19 0 0 0 1000 0 1000 35 1
M20 0 0 1000 0 0 1000 44 1
M21 0 0 0 1000 0 1000 104 2
M22 0 0 0 0 0 0 0 0
M23 37 50 700 212 0 1000 2363 48
M24 0 0 845 0 155 1000 298 8
M25 0 210 381 296 113 1000 410 13
M 38 85 526 341 11 1000 13084 326
E 0 0 0 0 0 0 0 0
T1 0 8 149 826 17 1000 1510 29
T2 0 347 212 437 4 1000 7178 79
T3 0 0 0 1000 0 1000 97 2
T4 10 6 149 835 0 1000 2275 56
T5 8 80 366 526 20 1000 24175 288
T 6 127 310 542 15 1000 35235 454
S1 0 0 349 629 21 1000 840 36
S2 30 29 617 324 0 1000 8282 185
S3 0 42 330 600 27 1000 4853 93
S4 0 0 0 0 0 0 0 0
S5 0 0 0 1000 0 1000 17 2
S6 0 0 626 374 0 1000 108 5
S7 20 0 421 559 0 1000 1239 24
S8 0 0 728 144 128 1000 140 6
S9 0 0 167 833 0 1000 27 4
S10 0 0 569 431 0 1000 515 5
S11 0 0 596 404 0 1000 512 17
S12 0 0 653 347 0 1000 1584 46
S13 0 0 271 718 11 1000 1669 66
S14 0 68 394 538 0 1000 1536 54
S15 26 9 351 613 2 1000 8533 117
S 16 21 448 507 7 1000 29855 660
M+E+T+S 15 79 399 495 11 1000 78174 1440
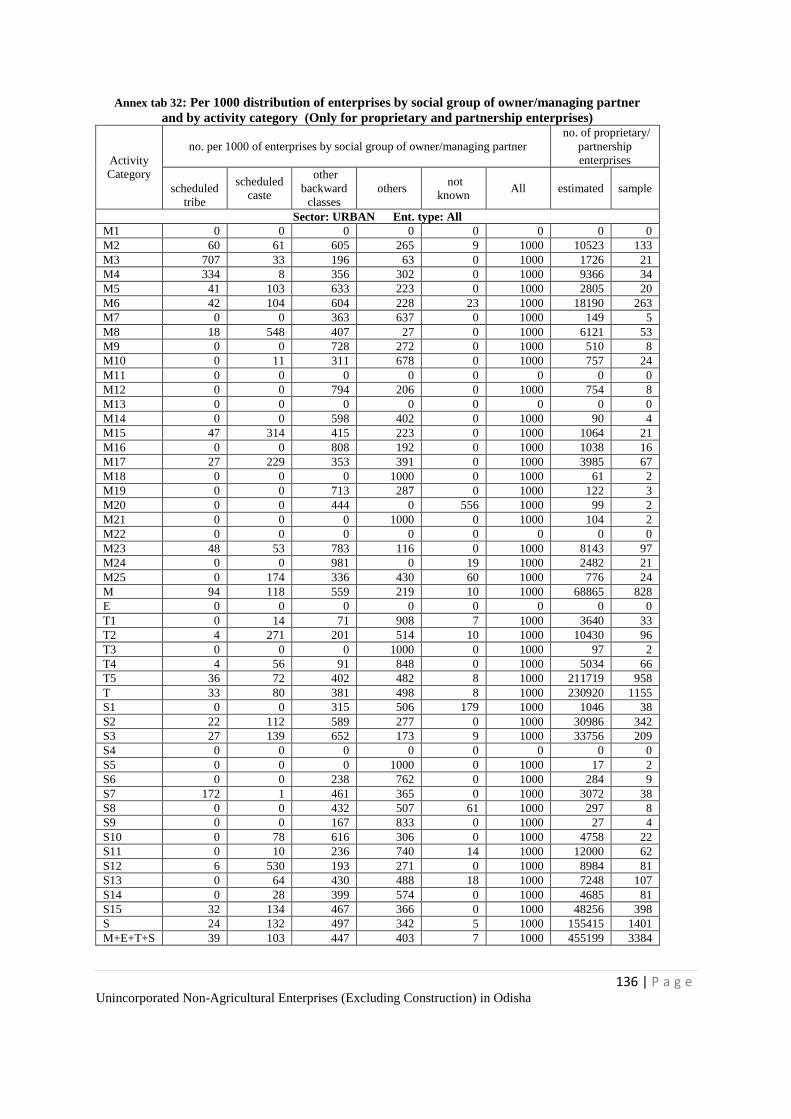
136 | P a g e Unincorporated Non-Agricultural Enterprises (Excluding Construction) in Odisha
Annex tab 32: Per 1000 distribution of enterprises by social group of owner/managing partner
and by activity category (Only for proprietary and partnership enterprises)
Activity
Category
no. per 1000 of enterprises by social group of owner/managing partner
no. of proprietary/
partnership
enterprises
scheduled
tribe
scheduled
caste
other
backward
classes
others not
known All estimated sample
Sector: URBAN Ent. type: All
M1 0 0 0 0 0 0 0 0
M2 60 61 605 265 9 1000 10523 133
M3 707 33 196 63 0 1000 1726 21
M4 334 8 356 302 0 1000 9366 34
M5 41 103 633 223 0 1000 2805 20
M6 42 104 604 228 23 1000 18190 263
M7 0 0 363 637 0 1000 149 5
M8 18 548 407 27 0 1000 6121 53
M9 0 0 728 272 0 1000 510 8
M10 0 11 311 678 0 1000 757 24
M11 0 0 0 0 0 0 0 0
M12 0 0 794 206 0 1000 754 8
M13 0 0 0 0 0 0 0 0
M14 0 0 598 402 0 1000 90 4
M15 47 314 415 223 0 1000 1064 21
M16 0 0 808 192 0 1000 1038 16
M17 27 229 353 391 0 1000 3985 67
M18 0 0 0 1000 0 1000 61 2
M19 0 0 713 287 0 1000 122 3
M20 0 0 444 0 556 1000 99 2
M21 0 0 0 1000 0 1000 104 2
M22 0 0 0 0 0 0 0 0
M23 48 53 783 116 0 1000 8143 97
M24 0 0 981 0 19 1000 2482 21
M25 0 174 336 430 60 1000 776 24
M 94 118 559 219 10 1000 68865 828
E 0 0 0 0 0 0 0 0
T1 0 14 71 908 7 1000 3640 33
T2 4 271 201 514 10 1000 10430 96
T3 0 0 0 1000 0 1000 97 2
T4 4 56 91 848 0 1000 5034 66
T5 36 72 402 482 8 1000 211719 958
T 33 80 381 498 8 1000 230920 1155
S1 0 0 315 506 179 1000 1046 38
S2 22 112 589 277 0 1000 30986 342
S3 27 139 652 173 9 1000 33756 209
S4 0 0 0 0 0 0 0 0
S5 0 0 0 1000 0 1000 17 2
S6 0 0 238 762 0 1000 284 9
S7 172 1 461 365 0 1000 3072 38
S8 0 0 432 507 61 1000 297 8
S9 0 0 167 833 0 1000 27 4
S10 0 78 616 306 0 1000 4758 22
S11 0 10 236 740 14 1000 12000 62
S12 6 530 193 271 0 1000 8984 81
S13 0 64 430 488 18 1000 7248 107
S14 0 28 399 574 0 1000 4685 81
S15 32 134 467 366 0 1000 48256 398
S 24 132 497 342 5 1000 155415 1401
M+E+T+S 39 103 447 403 7 1000 455199 3384
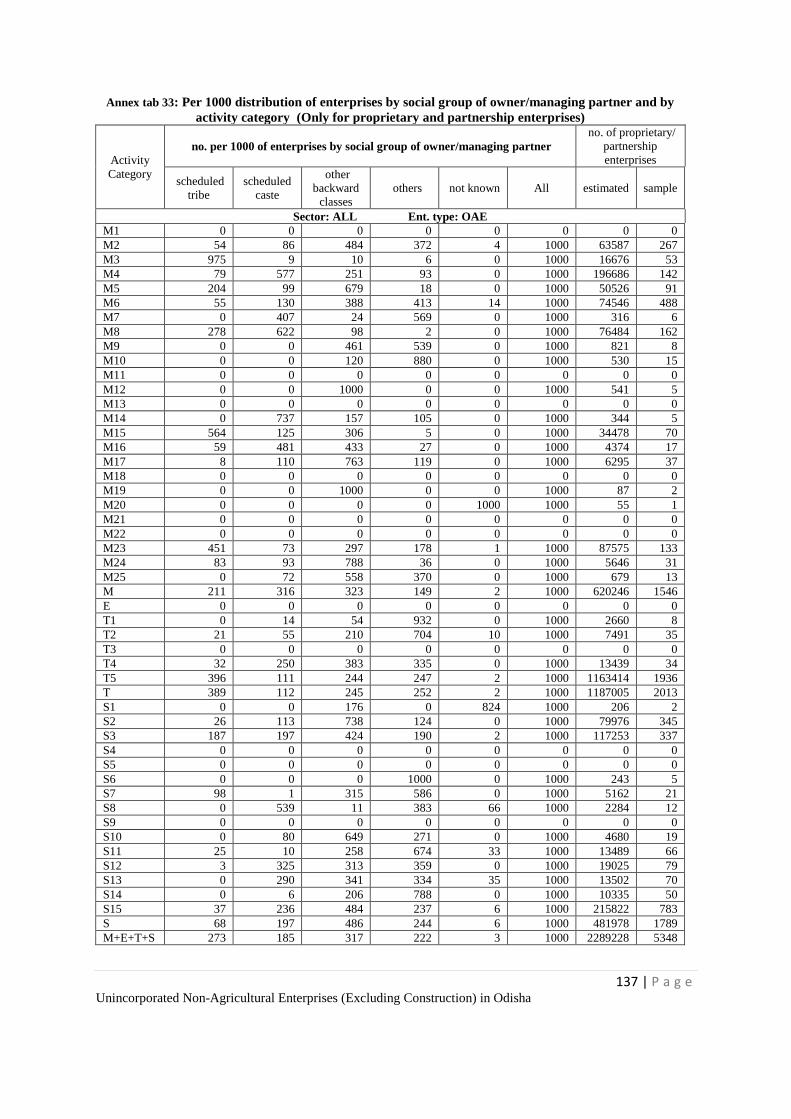
137 | P a g e Unincorporated Non-Agricultural Enterprises (Excluding Construction) in Odisha
Annex tab 33: Per 1000 distribution of enterprises by social group of owner/managing partner and by
activity category (Only for proprietary and partnership enterprises)
Activity
Category
no. per 1000 of enterprises by social group of owner/managing partner
no. of proprietary/
partnership
enterprises
scheduled
tribe
scheduled
caste
other
backward
classes
others not known All estimated sample
Sector: ALL Ent. type: OAE
M1 0 0 0 0 0 0 0 0
M2 54 86 484 372 4 1000 63587 267
M3 975 9 10 6 0 1000 16676 53
M4 79 577 251 93 0 1000 196686 142
M5 204 99 679 18 0 1000 50526 91
M6 55 130 388 413 14 1000 74546 488
M7 0 407 24 569 0 1000 316 6
M8 278 622 98 2 0 1000 76484 162
M9 0 0 461 539 0 1000 821 8
M10 0 0 120 880 0 1000 530 15
M11 0 0 0 0 0 0 0 0
M12 0 0 1000 0 0 1000 541 5
M13 0 0 0 0 0 0 0 0
M14 0 737 157 105 0 1000 344 5
M15 564 125 306 5 0 1000 34478 70
M16 59 481 433 27 0 1000 4374 17
M17 8 110 763 119 0 1000 6295 37
M18 0 0 0 0 0 0 0 0
M19 0 0 1000 0 0 1000 87 2
M20 0 0 0 0 1000 1000 55 1
M21 0 0 0 0 0 0 0 0
M22 0 0 0 0 0 0 0 0
M23 451 73 297 178 1 1000 87575 133
M24 83 93 788 36 0 1000 5646 31
M25 0 72 558 370 0 1000 679 13
M 211 316 323 149 2 1000 620246 1546
E 0 0 0 0 0 0 0 0
T1 0 14 54 932 0 1000 2660 8
T2 21 55 210 704 10 1000 7491 35
T3 0 0 0 0 0 0 0 0
T4 32 250 383 335 0 1000 13439 34
T5 396 111 244 247 2 1000 1163414 1936
T 389 112 245 252 2 1000 1187005 2013
S1 0 0 176 0 824 1000 206 2
S2 26 113 738 124 0 1000 79976 345
S3 187 197 424 190 2 1000 117253 337
S4 0 0 0 0 0 0 0 0
S5 0 0 0 0 0 0 0 0
S6 0 0 0 1000 0 1000 243 5
S7 98 1 315 586 0 1000 5162 21
S8 0 539 11 383 66 1000 2284 12
S9 0 0 0 0 0 0 0 0
S10 0 80 649 271 0 1000 4680 19
S11 25 10 258 674 33 1000 13489 66
S12 3 325 313 359 0 1000 19025 79
S13 0 290 341 334 35 1000 13502 70
S14 0 6 206 788 0 1000 10335 50
S15 37 236 484 237 6 1000 215822 783
S 68 197 486 244 6 1000 481978 1789
M+E+T+S 273 185 317 222 3 1000 2289228 5348
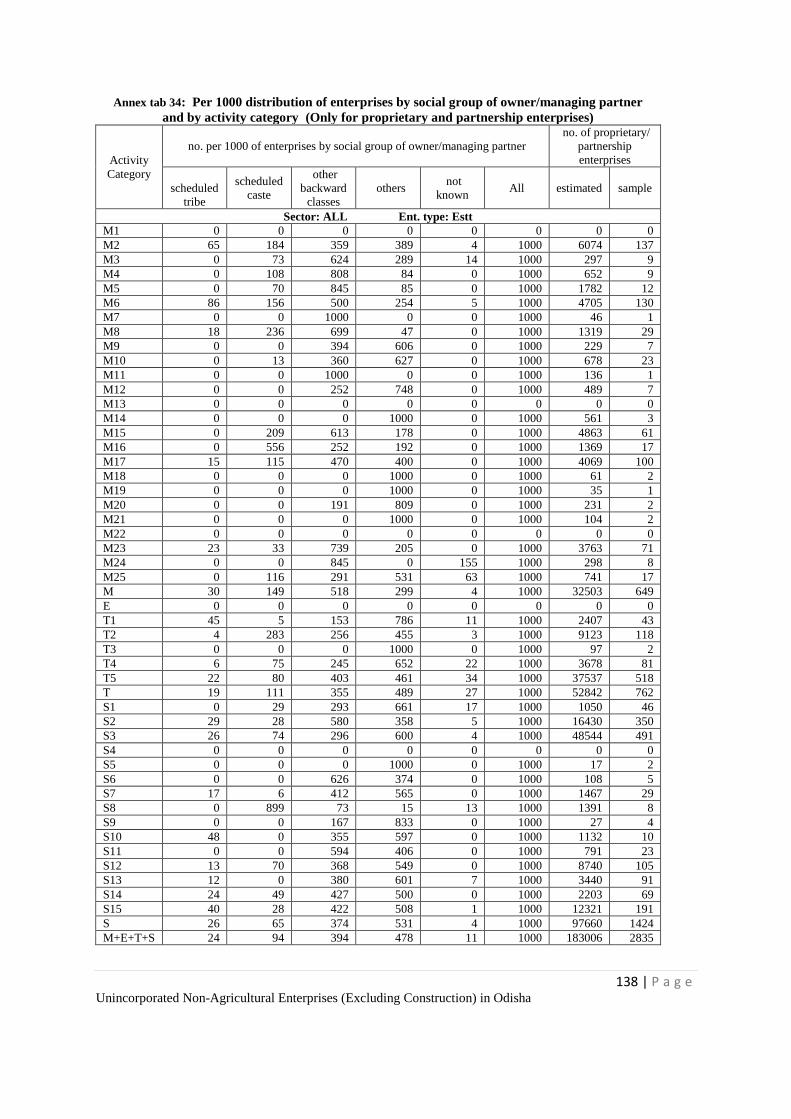
138 | P a g e Unincorporated Non-Agricultural Enterprises (Excluding Construction) in Odisha
Annex tab 34: Per 1000 distribution of enterprises by social group of owner/managing partner
and by activity category (Only for proprietary and partnership enterprises)
Activity
Category
no. per 1000 of enterprises by social group of owner/managing partner
no. of proprietary/
partnership
enterprises
scheduled
tribe
scheduled
caste
other
backward
classes
others not
known All estimated sample
Sector: ALL Ent. type: Estt
M1 0 0 0 0 0 0 0 0
M2 65 184 359 389 4 1000 6074 137
M3 0 73 624 289 14 1000 297 9
M4 0 108 808 84 0 1000 652 9
M5 0 70 845 85 0 1000 1782 12
M6 86 156 500 254 5 1000 4705 130
M7 0 0 1000 0 0 1000 46 1
M8 18 236 699 47 0 1000 1319 29
M9 0 0 394 606 0 1000 229 7
M10 0 13 360 627 0 1000 678 23
M11 0 0 1000 0 0 1000 136 1
M12 0 0 252 748 0 1000 489 7
M13 0 0 0 0 0 0 0 0
M14 0 0 0 1000 0 1000 561 3
M15 0 209 613 178 0 1000 4863 61
M16 0 556 252 192 0 1000 1369 17
M17 15 115 470 400 0 1000 4069 100
M18 0 0 0 1000 0 1000 61 2
M19 0 0 0 1000 0 1000 35 1
M20 0 0 191 809 0 1000 231 2
M21 0 0 0 1000 0 1000 104 2
M22 0 0 0 0 0 0 0 0
M23 23 33 739 205 0 1000 3763 71
M24 0 0 845 0 155 1000 298 8
M25 0 116 291 531 63 1000 741 17
M 30 149 518 299 4 1000 32503 649
E 0 0 0 0 0 0 0 0
T1 45 5 153 786 11 1000 2407 43
T2 4 283 256 455 3 1000 9123 118
T3 0 0 0 1000 0 1000 97 2
T4 6 75 245 652 22 1000 3678 81
T5 22 80 403 461 34 1000 37537 518
T 19 111 355 489 27 1000 52842 762
S1 0 29 293 661 17 1000 1050 46
S2 29 28 580 358 5 1000 16430 350
S3 26 74 296 600 4 1000 48544 491
S4 0 0 0 0 0 0 0 0
S5 0 0 0 1000 0 1000 17 2
S6 0 0 626 374 0 1000 108 5
S7 17 6 412 565 0 1000 1467 29
S8 0 899 73 15 13 1000 1391 8
S9 0 0 167 833 0 1000 27 4
S10 48 0 355 597 0 1000 1132 10
S11 0 0 594 406 0 1000 791 23
S12 13 70 368 549 0 1000 8740 105
S13 12 0 380 601 7 1000 3440 91
S14 24 49 427 500 0 1000 2203 69
S15 40 28 422 508 1 1000 12321 191
S 26 65 374 531 4 1000 97660 1424
M+E+T+S 24 94 394 478 11 1000 183006 2835

139 | P a g e Unincorporated Non-Agricultural Enterprises (Excluding Construction) in Odisha
Annex tab 35: Per 1000 distribution of enterprises by social group of owner/managing partner and
by activity category (Only for proprietary and partnership enterprises)
Activity
Category
no. per 1000 of enterprises by social group of owner/managing partner
no. of proprietary/
partnership
enterprises
scheduled
tribe
scheduled
caste
other
backward
classes
others not
known All estimated sample
Sector: ALL Ent. type: All
M1 0 0 0 0 0 0 0 0
M2 55 94 473 373 4 1000 69660 404
M3 958 10 21 11 0 1000 16973 62
M4 78 576 252 93 0 1000 197338 151
M5 197 98 684 20 0 1000 52308 103
M6 56 132 395 404 14 1000 79251 618
M7 0 355 149 496 0 1000 362 7
M8 273 616 108 3 0 1000 77803 191
M9 0 0 446 554 0 1000 1050 15
M10 0 7 255 738 0 1000 1207 38
M11 0 0 1000 0 0 1000 136 1
M12 0 0 645 355 0 1000 1031 12
M13 0 0 0 0 0 0 0 0
M14 0 280 60 660 0 1000 905 8
M15 495 135 344 26 0 1000 39342 131
M16 45 499 390 67 0 1000 5742 34
M17 10 112 648 229 0 1000 10364 137
M18 0 0 0 1000 0 1000 61 2
M19 0 0 713 287 0 1000 122 3
M20 0 0 154 653 193 1000 286 3
M21 0 0 0 1000 0 1000 104 2
M22 0 0 0 0 0 0 0 0
M23 433 71 315 179 1 1000 91338 204
M24 79 88 791 34 8 1000 5945 39
M25 0 95 418 454 33 1000 1421 30
M 202 308 332 156 2 1000 652749 2195
E 0 0 0 0 0 0 0 0
T1 21 10 101 863 5 1000 5067 51
T2 11 180 235 567 6 1000 16614 153
T3 0 0 0 1000 0 1000 97 2
T4 27 212 354 403 5 1000 17117 115
T5 384 110 249 253 3 1000 1200952 2454
T 373 112 250 262 3 1000 1239847 2775
S1 0 24 274 552 149 1000 1256 48
S2 26 98 711 164 1 1000 96407 695
S3 140 161 387 310 3 1000 165796 828
S4 0 0 0 0 0 0 0 0
S5 0 0 0 1000 0 1000 17 2
S6 0 0 192 808 0 1000 351 10
S7 80 2 337 582 0 1000 6629 50
S8 0 675 35 244 46 1000 3675 20
S9 0 0 167 833 0 1000 27 4
S10 9 64 592 335 0 1000 5812 29
S11 24 10 276 659 31 1000 14280 89
S12 6 245 330 419 0 1000 27766 184
S13 2 231 349 388 29 1000 16942 161
S14 4 14 245 737 0 1000 12538 119
S15 37 225 481 252 5 1000 228143 974
S 61 175 467 292 5 1000 579638 3213
M+E+T+S 254 178 323 241 3 1000 2472234 8183
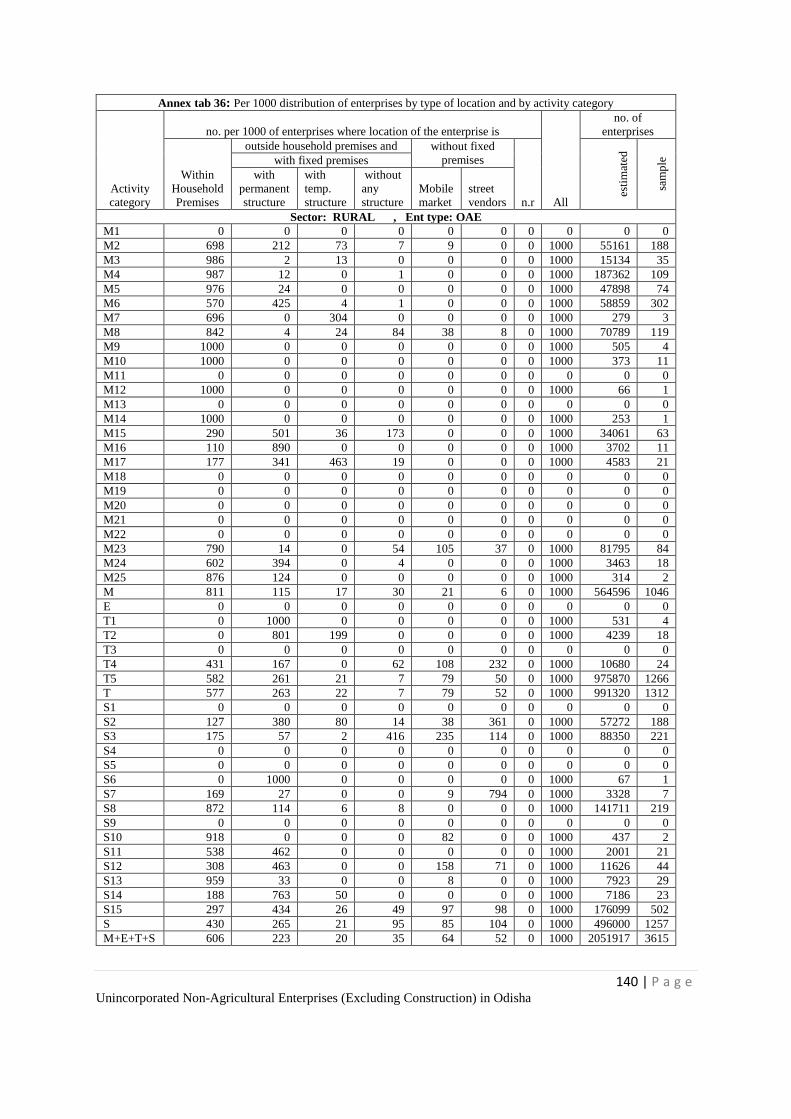
140 | P a g e Unincorporated Non-Agricultural Enterprises (Excluding Construction) in Odisha
Annex tab 36: Per 1000 distribution of enterprises by type of location and by activity category
Activity
category
no. per 1000 of enterprises where location of the enterprise is
All
no. of
enterprises
Within
Household
Premises
outside household premises and without fixed
premises
n.r
esti
mat
ed
sam
ple
with fixed premises
with
permanent
structure
with
temp.
structure
without
any
structure
Mobile
market
street
vendors
Sector: RURAL , Ent type: OAE
M1 0 0 0 0 0 0 0 0 0 0
M2 698 212 73 7 9 0 0 1000 55161 188
M3 986 2 13 0 0 0 0 1000 15134 35
M4 987 12 0 1 0 0 0 1000 187362 109
M5 976 24 0 0 0 0 0 1000 47898 74
M6 570 425 4 1 0 0 0 1000 58859 302
M7 696 0 304 0 0 0 0 1000 279 3
M8 842 4 24 84 38 8 0 1000 70789 119
M9 1000 0 0 0 0 0 0 1000 505 4
M10 1000 0 0 0 0 0 0 1000 373 11
M11 0 0 0 0 0 0 0 0 0 0
M12 1000 0 0 0 0 0 0 1000 66 1
M13 0 0 0 0 0 0 0 0 0 0
M14 1000 0 0 0 0 0 0 1000 253 1
M15 290 501 36 173 0 0 0 1000 34061 63
M16 110 890 0 0 0 0 0 1000 3702 11
M17 177 341 463 19 0 0 0 1000 4583 21
M18 0 0 0 0 0 0 0 0 0 0
M19 0 0 0 0 0 0 0 0 0 0
M20 0 0 0 0 0 0 0 0 0 0
M21 0 0 0 0 0 0 0 0 0 0
M22 0 0 0 0 0 0 0 0 0 0
M23 790 14 0 54 105 37 0 1000 81795 84
M24 602 394 0 4 0 0 0 1000 3463 18
M25 876 124 0 0 0 0 0 1000 314 2
M 811 115 17 30 21 6 0 1000 564596 1046
E 0 0 0 0 0 0 0 0 0 0
T1 0 1000 0 0 0 0 0 1000 531 4
T2 0 801 199 0 0 0 0 1000 4239 18
T3 0 0 0 0 0 0 0 0 0 0
T4 431 167 0 62 108 232 0 1000 10680 24
T5 582 261 21 7 79 50 0 1000 975870 1266
T 577 263 22 7 79 52 0 1000 991320 1312
S1 0 0 0 0 0 0 0 0 0 0
S2 127 380 80 14 38 361 0 1000 57272 188
S3 175 57 2 416 235 114 0 1000 88350 221
S4 0 0 0 0 0 0 0 0 0 0
S5 0 0 0 0 0 0 0 0 0 0
S6 0 1000 0 0 0 0 0 1000 67 1
S7 169 27 0 0 9 794 0 1000 3328 7
S8 872 114 6 8 0 0 0 1000 141711 219
S9 0 0 0 0 0 0 0 0 0 0
S10 918 0 0 0 82 0 0 1000 437 2
S11 538 462 0 0 0 0 0 1000 2001 21
S12 308 463 0 0 158 71 0 1000 11626 44
S13 959 33 0 0 8 0 0 1000 7923 29
S14 188 763 50 0 0 0 0 1000 7186 23
S15 297 434 26 49 97 98 0 1000 176099 502
S 430 265 21 95 85 104 0 1000 496000 1257
M+E+T+S 606 223 20 35 64 52 0 1000 2051917 3615
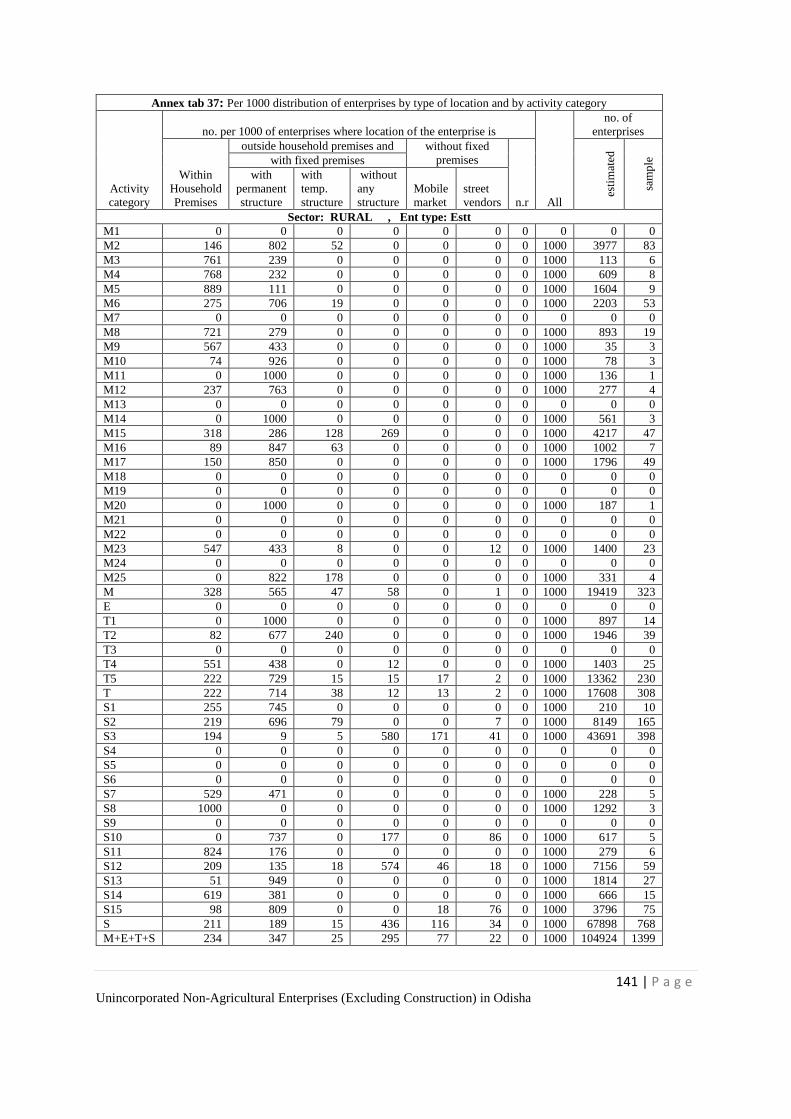
141 | P a g e Unincorporated Non-Agricultural Enterprises (Excluding Construction) in Odisha
Annex tab 37: Per 1000 distribution of enterprises by type of location and by activity category
Activity
category
no. per 1000 of enterprises where location of the enterprise is
All
no. of
enterprises
Within
Household
Premises
outside household premises and without fixed
premises
n.r
esti
mat
ed
sam
ple
with fixed premises
with
permanent
structure
with
temp.
structure
without
any
structure
Mobile
market
street
vendors
Sector: RURAL , Ent type: Estt
M1 0 0 0 0 0 0 0 0 0 0
M2 146 802 52 0 0 0 0 1000 3977 83
M3 761 239 0 0 0 0 0 1000 113 6
M4 768 232 0 0 0 0 0 1000 609 8
M5 889 111 0 0 0 0 0 1000 1604 9
M6 275 706 19 0 0 0 0 1000 2203 53
M7 0 0 0 0 0 0 0 0 0 0
M8 721 279 0 0 0 0 0 1000 893 19
M9 567 433 0 0 0 0 0 1000 35 3
M10 74 926 0 0 0 0 0 1000 78 3
M11 0 1000 0 0 0 0 0 1000 136 1
M12 237 763 0 0 0 0 0 1000 277 4
M13 0 0 0 0 0 0 0 0 0 0
M14 0 1000 0 0 0 0 0 1000 561 3
M15 318 286 128 269 0 0 0 1000 4217 47
M16 89 847 63 0 0 0 0 1000 1002 7
M17 150 850 0 0 0 0 0 1000 1796 49
M18 0 0 0 0 0 0 0 0 0 0
M19 0 0 0 0 0 0 0 0 0 0
M20 0 1000 0 0 0 0 0 1000 187 1
M21 0 0 0 0 0 0 0 0 0 0
M22 0 0 0 0 0 0 0 0 0 0
M23 547 433 8 0 0 12 0 1000 1400 23
M24 0 0 0 0 0 0 0 0 0 0
M25 0 822 178 0 0 0 0 1000 331 4
M 328 565 47 58 0 1 0 1000 19419 323
E 0 0 0 0 0 0 0 0 0 0
T1 0 1000 0 0 0 0 0 1000 897 14
T2 82 677 240 0 0 0 0 1000 1946 39
T3 0 0 0 0 0 0 0 0 0 0
T4 551 438 0 12 0 0 0 1000 1403 25
T5 222 729 15 15 17 2 0 1000 13362 230
T 222 714 38 12 13 2 0 1000 17608 308
S1 255 745 0 0 0 0 0 1000 210 10
S2 219 696 79 0 0 7 0 1000 8149 165
S3 194 9 5 580 171 41 0 1000 43691 398
S4 0 0 0 0 0 0 0 0 0 0
S5 0 0 0 0 0 0 0 0 0 0
S6 0 0 0 0 0 0 0 0 0 0
S7 529 471 0 0 0 0 0 1000 228 5
S8 1000 0 0 0 0 0 0 1000 1292 3
S9 0 0 0 0 0 0 0 0 0 0
S10 0 737 0 177 0 86 0 1000 617 5
S11 824 176 0 0 0 0 0 1000 279 6
S12 209 135 18 574 46 18 0 1000 7156 59
S13 51 949 0 0 0 0 0 1000 1814 27
S14 619 381 0 0 0 0 0 1000 666 15
S15 98 809 0 0 18 76 0 1000 3796 75
S 211 189 15 436 116 34 0 1000 67898 768
M+E+T+S 234 347 25 295 77 22 0 1000 104924 1399
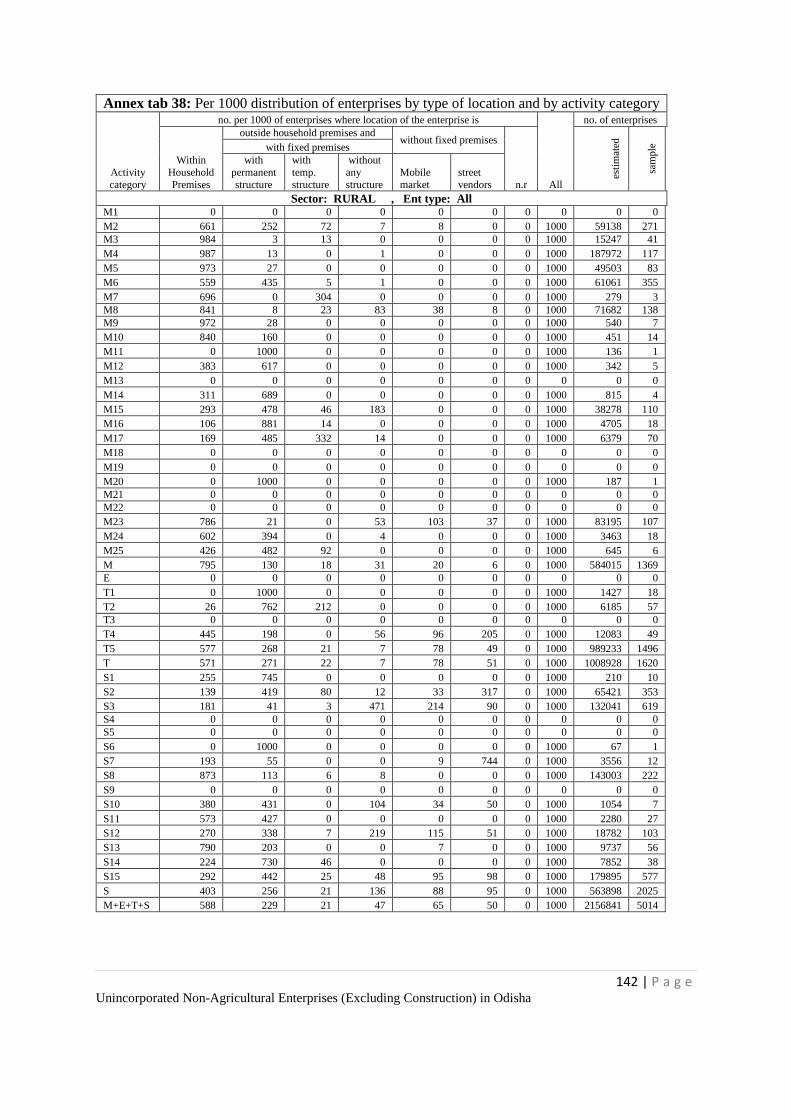
142 | P a g e Unincorporated Non-Agricultural Enterprises (Excluding Construction) in Odisha
Annex tab 38: Per 1000 distribution of enterprises by type of location and by activity category
Activity
category
no. per 1000 of enterprises where location of the enterprise is
All
no. of enterprises
Within
Household
Premises
outside household premises and without fixed premises
n.r
esti
mat
ed
sam
ple
with fixed premises
with
permanent
structure
with
temp.
structure
without
any
structure
Mobile
market
street
vendors
Sector: RURAL , Ent type: All M1 0 0 0 0 0 0 0 0 0 0
M2 661 252 72 7 8 0 0 1000 59138 271
M3 984 3 13 0 0 0 0 1000 15247 41
M4 987 13 0 1 0 0 0 1000 187972 117
M5 973 27 0 0 0 0 0 1000 49503 83
M6 559 435 5 1 0 0 0 1000 61061 355
M7 696 0 304 0 0 0 0 1000 279 3
M8 841 8 23 83 38 8 0 1000 71682 138
M9 972 28 0 0 0 0 0 1000 540 7
M10 840 160 0 0 0 0 0 1000 451 14
M11 0 1000 0 0 0 0 0 1000 136 1
M12 383 617 0 0 0 0 0 1000 342 5
M13 0 0 0 0 0 0 0 0 0 0
M14 311 689 0 0 0 0 0 1000 815 4
M15 293 478 46 183 0 0 0 1000 38278 110
M16 106 881 14 0 0 0 0 1000 4705 18
M17 169 485 332 14 0 0 0 1000 6379 70
M18 0 0 0 0 0 0 0 0 0 0
M19 0 0 0 0 0 0 0 0 0 0
M20 0 1000 0 0 0 0 0 1000 187 1
M21 0 0 0 0 0 0 0 0 0 0
M22 0 0 0 0 0 0 0 0 0 0
M23 786 21 0 53 103 37 0 1000 83195 107
M24 602 394 0 4 0 0 0 1000 3463 18
M25 426 482 92 0 0 0 0 1000 645 6
M 795 130 18 31 20 6 0 1000 584015 1369
E 0 0 0 0 0 0 0 0 0 0
T1 0 1000 0 0 0 0 0 1000 1427 18
T2 26 762 212 0 0 0 0 1000 6185 57
T3 0 0 0 0 0 0 0 0 0 0
T4 445 198 0 56 96 205 0 1000 12083 49
T5 577 268 21 7 78 49 0 1000 989233 1496
T 571 271 22 7 78 51 0 1000 1008928 1620
S1 255 745 0 0 0 0 0 1000 210 10
S2 139 419 80 12 33 317 0 1000 65421 353
S3 181 41 3 471 214 90 0 1000 132041 619
S4 0 0 0 0 0 0 0 0 0 0
S5 0 0 0 0 0 0 0 0 0 0
S6 0 1000 0 0 0 0 0 1000 67 1
S7 193 55 0 0 9 744 0 1000 3556 12
S8 873 113 6 8 0 0 0 1000 143003 222
S9 0 0 0 0 0 0 0 0 0 0
S10 380 431 0 104 34 50 0 1000 1054 7
S11 573 427 0 0 0 0 0 1000 2280 27
S12 270 338 7 219 115 51 0 1000 18782 103
S13 790 203 0 0 7 0 0 1000 9737 56
S14 224 730 46 0 0 0 0 1000 7852 38
S15 292 442 25 48 95 98 0 1000 179895 577
S 403 256 21 136 88 95 0 1000 563898 2025
M+E+T+S 588 229 21 47 65 50 0 1000 2156841 5014
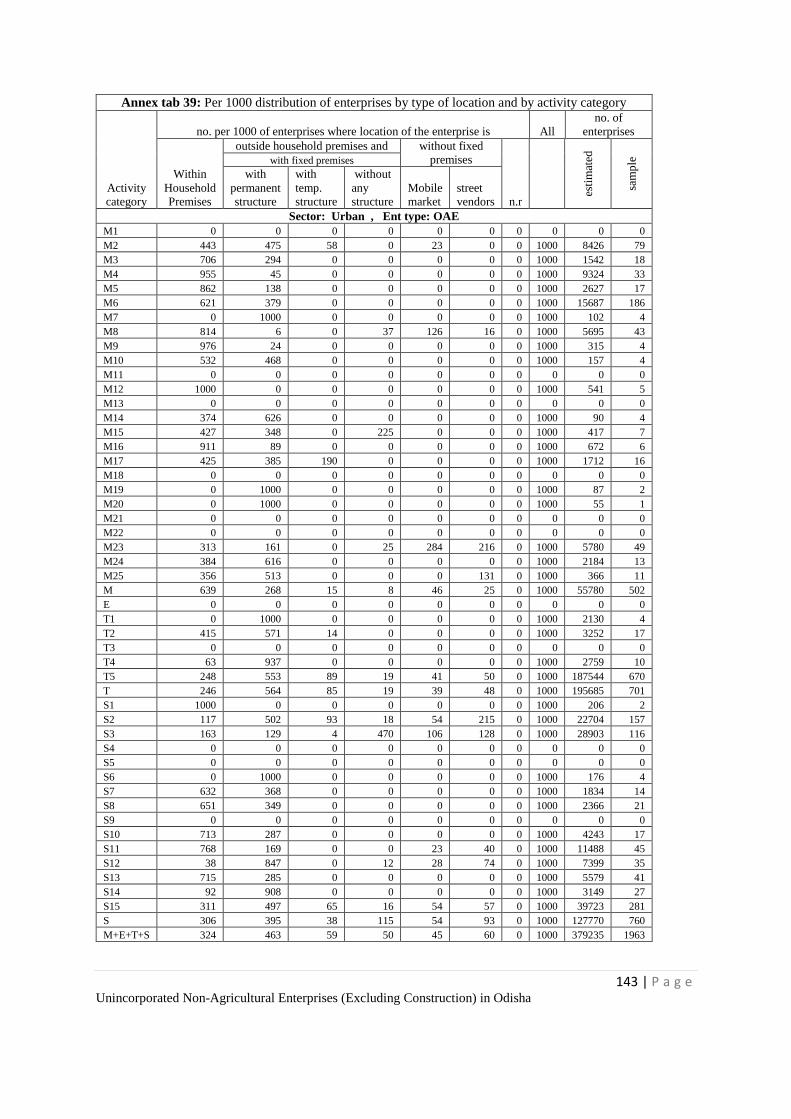
143 | P a g e Unincorporated Non-Agricultural Enterprises (Excluding Construction) in Odisha
Annex tab 39: Per 1000 distribution of enterprises by type of location and by activity category
Activity
category
no. per 1000 of enterprises where location of the enterprise is All
no. of
enterprises
Within
Household
Premises
outside household premises and without fixed
premises
n.r
esti
mat
ed
sam
ple
with fixed premises
with
permanent
structure
with
temp.
structure
without
any
structure
Mobile
market
street
vendors
Sector: Urban , Ent type: OAE
M1 0 0 0 0 0 0 0 0 0 0
M2 443 475 58 0 23 0 0 1000 8426 79
M3 706 294 0 0 0 0 0 1000 1542 18
M4 955 45 0 0 0 0 0 1000 9324 33
M5 862 138 0 0 0 0 0 1000 2627 17
M6 621 379 0 0 0 0 0 1000 15687 186
M7 0 1000 0 0 0 0 0 1000 102 4
M8 814 6 0 37 126 16 0 1000 5695 43
M9 976 24 0 0 0 0 0 1000 315 4
M10 532 468 0 0 0 0 0 1000 157 4
M11 0 0 0 0 0 0 0 0 0 0
M12 1000 0 0 0 0 0 0 1000 541 5
M13 0 0 0 0 0 0 0 0 0 0
M14 374 626 0 0 0 0 0 1000 90 4
M15 427 348 0 225 0 0 0 1000 417 7
M16 911 89 0 0 0 0 0 1000 672 6
M17 425 385 190 0 0 0 0 1000 1712 16
M18 0 0 0 0 0 0 0 0 0 0
M19 0 1000 0 0 0 0 0 1000 87 2
M20 0 1000 0 0 0 0 0 1000 55 1
M21 0 0 0 0 0 0 0 0 0 0
M22 0 0 0 0 0 0 0 0 0 0
M23 313 161 0 25 284 216 0 1000 5780 49
M24 384 616 0 0 0 0 0 1000 2184 13
M25 356 513 0 0 0 131 0 1000 366 11
M 639 268 15 8 46 25 0 1000 55780 502
E 0 0 0 0 0 0 0 0 0 0
T1 0 1000 0 0 0 0 0 1000 2130 4
T2 415 571 14 0 0 0 0 1000 3252 17
T3 0 0 0 0 0 0 0 0 0 0
T4 63 937 0 0 0 0 0 1000 2759 10
T5 248 553 89 19 41 50 0 1000 187544 670
T 246 564 85 19 39 48 0 1000 195685 701
S1 1000 0 0 0 0 0 0 1000 206 2
S2 117 502 93 18 54 215 0 1000 22704 157
S3 163 129 4 470 106 128 0 1000 28903 116
S4 0 0 0 0 0 0 0 0 0 0
S5 0 0 0 0 0 0 0 0 0 0
S6 0 1000 0 0 0 0 0 1000 176 4
S7 632 368 0 0 0 0 0 1000 1834 14
S8 651 349 0 0 0 0 0 1000 2366 21
S9 0 0 0 0 0 0 0 0 0 0
S10 713 287 0 0 0 0 0 1000 4243 17
S11 768 169 0 0 23 40 0 1000 11488 45
S12 38 847 0 12 28 74 0 1000 7399 35
S13 715 285 0 0 0 0 0 1000 5579 41
S14 92 908 0 0 0 0 0 1000 3149 27
S15 311 497 65 16 54 57 0 1000 39723 281
S 306 395 38 115 54 93 0 1000 127770 760
M+E+T+S 324 463 59 50 45 60 0 1000 379235 1963
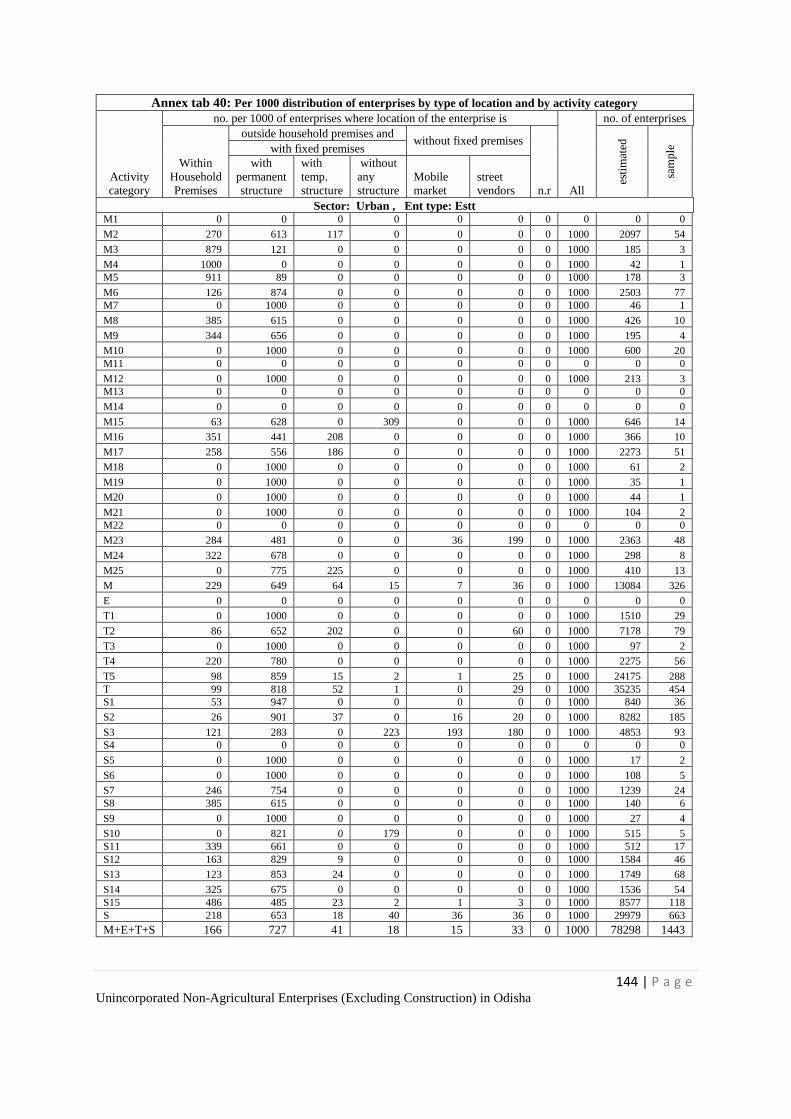
144 | P a g e Unincorporated Non-Agricultural Enterprises (Excluding Construction) in Odisha
Annex tab 40: Per 1000 distribution of enterprises by type of location and by activity category
Activity
category
no. per 1000 of enterprises where location of the enterprise is
All
no. of enterprises
Within
Household
Premises
outside household premises and without fixed premises
n.r
esti
mat
ed
sam
ple
with fixed premises
with
permanent
structure
with
temp.
structure
without
any
structure
Mobile
market
street
vendors
Sector: Urban , Ent type: Estt M1 0 0 0 0 0 0 0 0 0 0
M2 270 613 117 0 0 0 0 1000 2097 54
M3 879 121 0 0 0 0 0 1000 185 3
M4 1000 0 0 0 0 0 0 1000 42 1
M5 911 89 0 0 0 0 0 1000 178 3
M6 126 874 0 0 0 0 0 1000 2503 77
M7 0 1000 0 0 0 0 0 1000 46 1
M8 385 615 0 0 0 0 0 1000 426 10
M9 344 656 0 0 0 0 0 1000 195 4
M10 0 1000 0 0 0 0 0 1000 600 20
M11 0 0 0 0 0 0 0 0 0 0
M12 0 1000 0 0 0 0 0 1000 213 3
M13 0 0 0 0 0 0 0 0 0 0
M14 0 0 0 0 0 0 0 0 0 0
M15 63 628 0 309 0 0 0 1000 646 14
M16 351 441 208 0 0 0 0 1000 366 10
M17 258 556 186 0 0 0 0 1000 2273 51
M18 0 1000 0 0 0 0 0 1000 61 2
M19 0 1000 0 0 0 0 0 1000 35 1
M20 0 1000 0 0 0 0 0 1000 44 1
M21 0 1000 0 0 0 0 0 1000 104 2
M22 0 0 0 0 0 0 0 0 0 0
M23 284 481 0 0 36 199 0 1000 2363 48
M24 322 678 0 0 0 0 0 1000 298 8
M25 0 775 225 0 0 0 0 1000 410 13
M 229 649 64 15 7 36 0 1000 13084 326
E 0 0 0 0 0 0 0 0 0 0
T1 0 1000 0 0 0 0 0 1000 1510 29
T2 86 652 202 0 0 60 0 1000 7178 79
T3 0 1000 0 0 0 0 0 1000 97 2
T4 220 780 0 0 0 0 0 1000 2275 56
T5 98 859 15 2 1 25 0 1000 24175 288
T 99 818 52 1 0 29 0 1000 35235 454
S1 53 947 0 0 0 0 0 1000 840 36
S2 26 901 37 0 16 20 0 1000 8282 185
S3 121 283 0 223 193 180 0 1000 4853 93
S4 0 0 0 0 0 0 0 0 0 0
S5 0 1000 0 0 0 0 0 1000 17 2
S6 0 1000 0 0 0 0 0 1000 108 5
S7 246 754 0 0 0 0 0 1000 1239 24
S8 385 615 0 0 0 0 0 1000 140 6
S9 0 1000 0 0 0 0 0 1000 27 4
S10 0 821 0 179 0 0 0 1000 515 5
S11 339 661 0 0 0 0 0 1000 512 17
S12 163 829 9 0 0 0 0 1000 1584 46
S13 123 853 24 0 0 0 0 1000 1749 68
S14 325 675 0 0 0 0 0 1000 1536 54
S15 486 485 23 2 1 3 0 1000 8577 118
S 218 653 18 40 36 36 0 1000 29979 663
M+E+T+S 166 727 41 18 15 33 0 1000 78298 1443
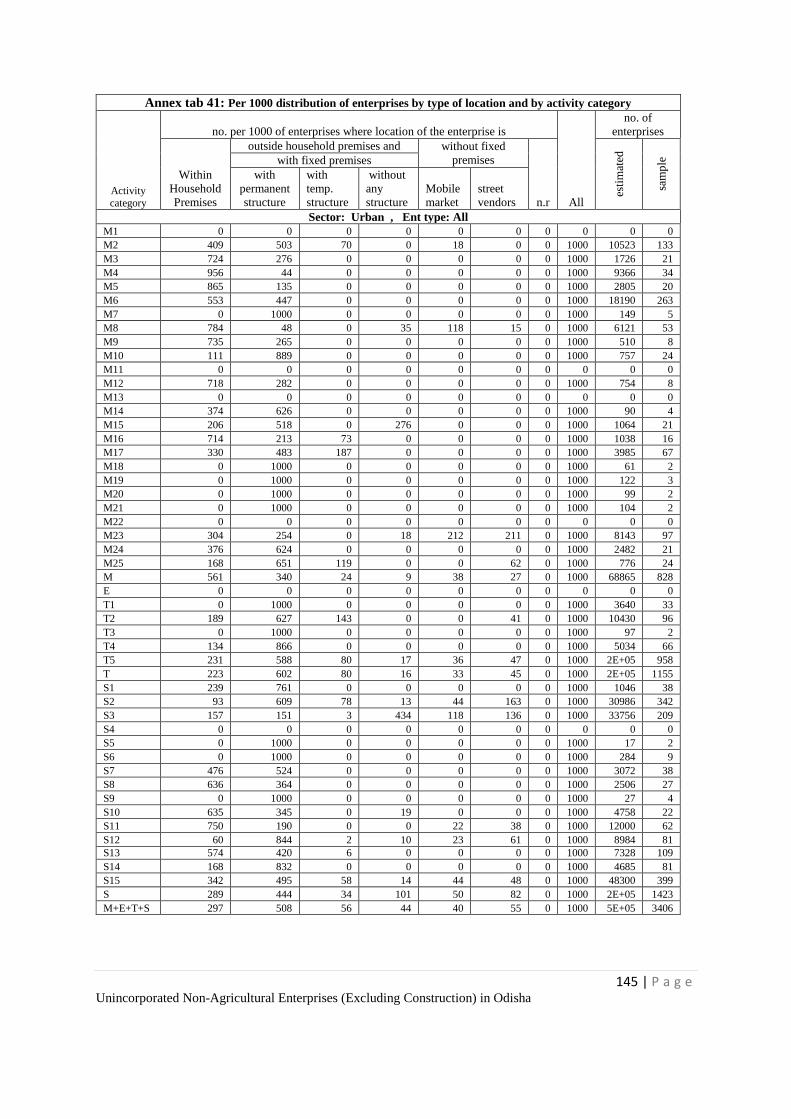
145 | P a g e Unincorporated Non-Agricultural Enterprises (Excluding Construction) in Odisha
Annex tab 41: Per 1000 distribution of enterprises by type of location and by activity category
Activity
category
no. per 1000 of enterprises where location of the enterprise is
All
no. of
enterprises
Within
Household
Premises
outside household premises and without fixed
premises
n.r
esti
mat
ed
sam
ple
with fixed premises
with
permanent
structure
with
temp.
structure
without
any
structure
Mobile
market
street
vendors
Sector: Urban , Ent type: All
M1 0 0 0 0 0 0 0 0 0 0
M2 409 503 70 0 18 0 0 1000 10523 133
M3 724 276 0 0 0 0 0 1000 1726 21
M4 956 44 0 0 0 0 0 1000 9366 34
M5 865 135 0 0 0 0 0 1000 2805 20
M6 553 447 0 0 0 0 0 1000 18190 263
M7 0 1000 0 0 0 0 0 1000 149 5
M8 784 48 0 35 118 15 0 1000 6121 53
M9 735 265 0 0 0 0 0 1000 510 8
M10 111 889 0 0 0 0 0 1000 757 24
M11 0 0 0 0 0 0 0 0 0 0
M12 718 282 0 0 0 0 0 1000 754 8
M13 0 0 0 0 0 0 0 0 0 0
M14 374 626 0 0 0 0 0 1000 90 4
M15 206 518 0 276 0 0 0 1000 1064 21
M16 714 213 73 0 0 0 0 1000 1038 16
M17 330 483 187 0 0 0 0 1000 3985 67
M18 0 1000 0 0 0 0 0 1000 61 2
M19 0 1000 0 0 0 0 0 1000 122 3
M20 0 1000 0 0 0 0 0 1000 99 2
M21 0 1000 0 0 0 0 0 1000 104 2
M22 0 0 0 0 0 0 0 0 0 0
M23 304 254 0 18 212 211 0 1000 8143 97
M24 376 624 0 0 0 0 0 1000 2482 21
M25 168 651 119 0 0 62 0 1000 776 24
M 561 340 24 9 38 27 0 1000 68865 828
E 0 0 0 0 0 0 0 0 0 0
T1 0 1000 0 0 0 0 0 1000 3640 33
T2 189 627 143 0 0 41 0 1000 10430 96
T3 0 1000 0 0 0 0 0 1000 97 2
T4 134 866 0 0 0 0 0 1000 5034 66
T5 231 588 80 17 36 47 0 1000 2E+05 958
T 223 602 80 16 33 45 0 1000 2E+05 1155
S1 239 761 0 0 0 0 0 1000 1046 38
S2 93 609 78 13 44 163 0 1000 30986 342
S3 157 151 3 434 118 136 0 1000 33756 209
S4 0 0 0 0 0 0 0 0 0 0
S5 0 1000 0 0 0 0 0 1000 17 2
S6 0 1000 0 0 0 0 0 1000 284 9
S7 476 524 0 0 0 0 0 1000 3072 38
S8 636 364 0 0 0 0 0 1000 2506 27
S9 0 1000 0 0 0 0 0 1000 27 4
S10 635 345 0 19 0 0 0 1000 4758 22
S11 750 190 0 0 22 38 0 1000 12000 62
S12 60 844 2 10 23 61 0 1000 8984 81
S13 574 420 6 0 0 0 0 1000 7328 109
S14 168 832 0 0 0 0 0 1000 4685 81
S15 342 495 58 14 44 48 0 1000 48300 399
S 289 444 34 101 50 82 0 1000 2E+05 1423
M+E+T+S 297 508 56 44 40 55 0 1000 5E+05 3406
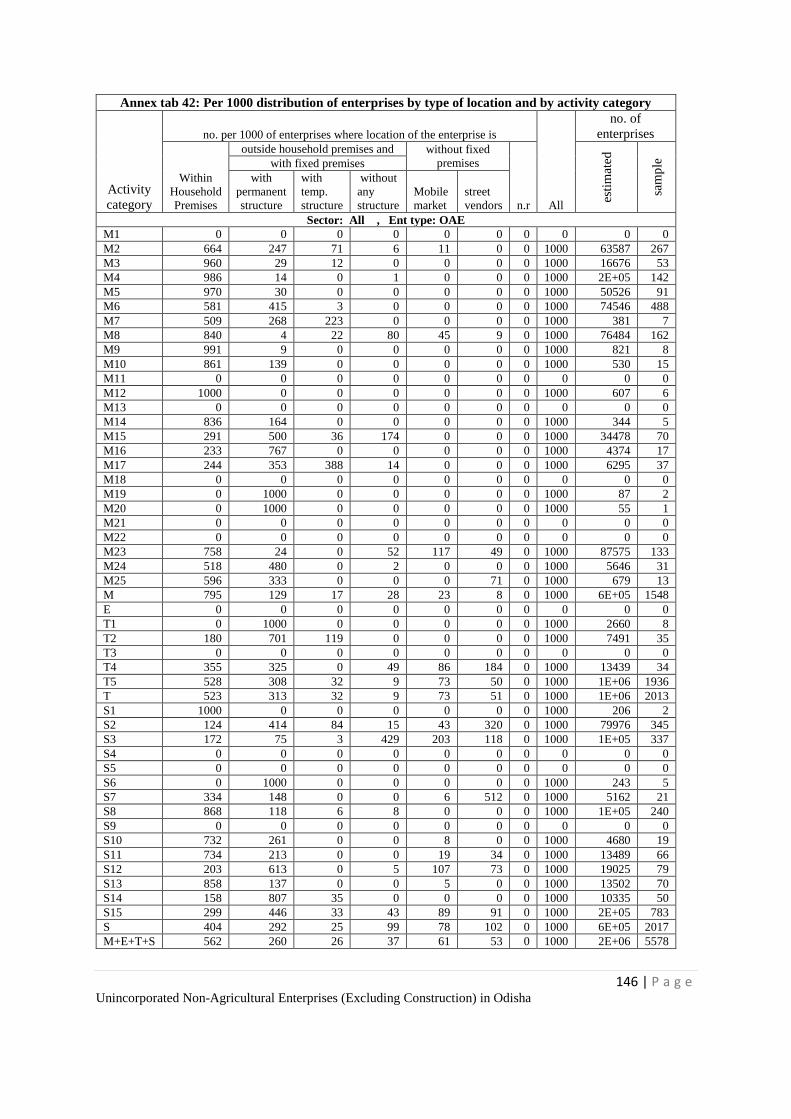
146 | P a g e Unincorporated Non-Agricultural Enterprises (Excluding Construction) in Odisha
Annex tab 42: Per 1000 distribution of enterprises by type of location and by activity category
Activity
category
no. per 1000 of enterprises where location of the enterprise is
All
no. of
enterprises
Within
Household
Premises
outside household premises and without fixed
premises
n.r
esti
mat
ed
sam
ple
with fixed premises
with
permanent
structure
with
temp.
structure
without
any
structure
Mobile
market
street
vendors
Sector: All , Ent type: OAE
M1 0 0 0 0 0 0 0 0 0 0
M2 664 247 71 6 11 0 0 1000 63587 267
M3 960 29 12 0 0 0 0 1000 16676 53
M4 986 14 0 1 0 0 0 1000 2E+05 142
M5 970 30 0 0 0 0 0 1000 50526 91
M6 581 415 3 0 0 0 0 1000 74546 488
M7 509 268 223 0 0 0 0 1000 381 7
M8 840 4 22 80 45 9 0 1000 76484 162
M9 991 9 0 0 0 0 0 1000 821 8
M10 861 139 0 0 0 0 0 1000 530 15
M11 0 0 0 0 0 0 0 0 0 0
M12 1000 0 0 0 0 0 0 1000 607 6
M13 0 0 0 0 0 0 0 0 0 0
M14 836 164 0 0 0 0 0 1000 344 5
M15 291 500 36 174 0 0 0 1000 34478 70
M16 233 767 0 0 0 0 0 1000 4374 17
M17 244 353 388 14 0 0 0 1000 6295 37
M18 0 0 0 0 0 0 0 0 0 0
M19 0 1000 0 0 0 0 0 1000 87 2
M20 0 1000 0 0 0 0 0 1000 55 1
M21 0 0 0 0 0 0 0 0 0 0
M22 0 0 0 0 0 0 0 0 0 0
M23 758 24 0 52 117 49 0 1000 87575 133
M24 518 480 0 2 0 0 0 1000 5646 31
M25 596 333 0 0 0 71 0 1000 679 13
M 795 129 17 28 23 8 0 1000 6E+05 1548
E 0 0 0 0 0 0 0 0 0 0
T1 0 1000 0 0 0 0 0 1000 2660 8
T2 180 701 119 0 0 0 0 1000 7491 35
T3 0 0 0 0 0 0 0 0 0 0
T4 355 325 0 49 86 184 0 1000 13439 34
T5 528 308 32 9 73 50 0 1000 1E+06 1936
T 523 313 32 9 73 51 0 1000 1E+06 2013
S1 1000 0 0 0 0 0 0 1000 206 2
S2 124 414 84 15 43 320 0 1000 79976 345
S3 172 75 3 429 203 118 0 1000 1E+05 337
S4 0 0 0 0 0 0 0 0 0 0
S5 0 0 0 0 0 0 0 0 0 0
S6 0 1000 0 0 0 0 0 1000 243 5
S7 334 148 0 0 6 512 0 1000 5162 21
S8 868 118 6 8 0 0 0 1000 1E+05 240
S9 0 0 0 0 0 0 0 0 0 0
S10 732 261 0 0 8 0 0 1000 4680 19
S11 734 213 0 0 19 34 0 1000 13489 66
S12 203 613 0 5 107 73 0 1000 19025 79
S13 858 137 0 0 5 0 0 1000 13502 70
S14 158 807 35 0 0 0 0 1000 10335 50
S15 299 446 33 43 89 91 0 1000 2E+05 783
S 404 292 25 99 78 102 0 1000 6E+05 2017
M+E+T+S 562 260 26 37 61 53 0 1000 2E+06 5578
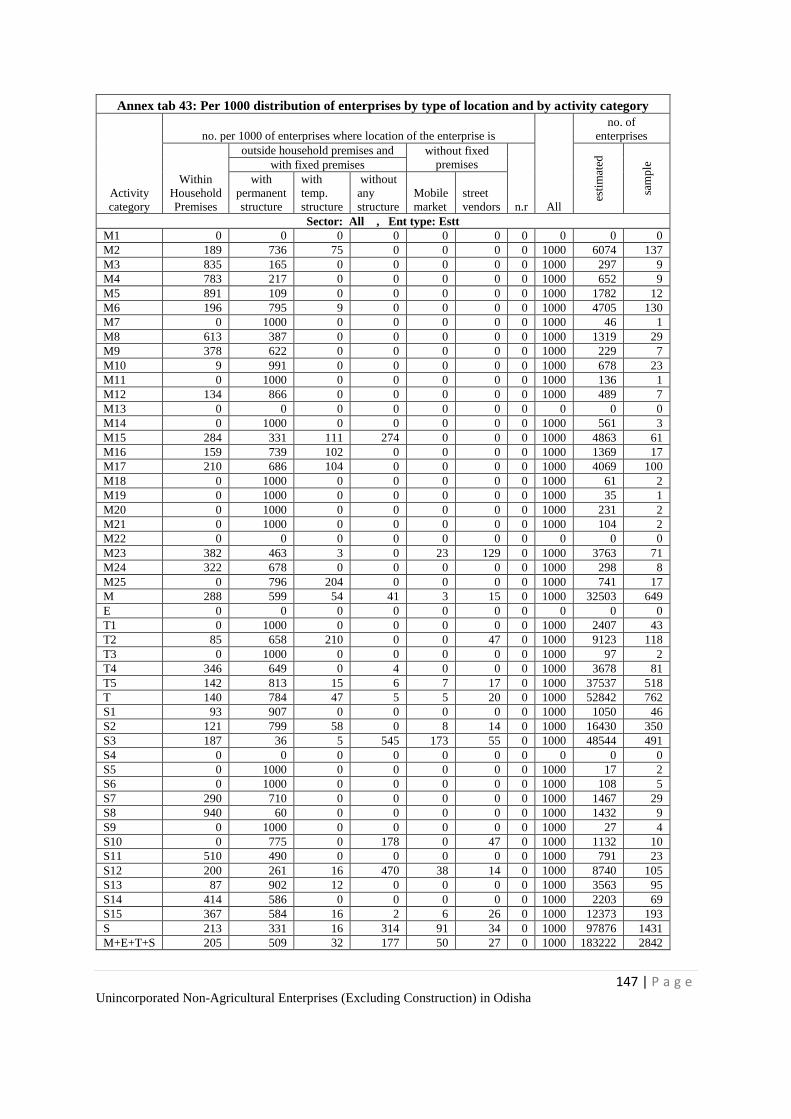
147 | P a g e Unincorporated Non-Agricultural Enterprises (Excluding Construction) in Odisha
Annex tab 43: Per 1000 distribution of enterprises by type of location and by activity category
Activity
category
no. per 1000 of enterprises where location of the enterprise is
All
no. of
enterprises
Within
Household
Premises
outside household premises and without fixed
premises
n.r
esti
mat
ed
sam
ple
with fixed premises
with
permanent
structure
with
temp.
structure
without
any
structure
Mobile
market
street
vendors
Sector: All , Ent type: Estt
M1 0 0 0 0 0 0 0 0 0 0
M2 189 736 75 0 0 0 0 1000 6074 137
M3 835 165 0 0 0 0 0 1000 297 9
M4 783 217 0 0 0 0 0 1000 652 9
M5 891 109 0 0 0 0 0 1000 1782 12
M6 196 795 9 0 0 0 0 1000 4705 130
M7 0 1000 0 0 0 0 0 1000 46 1
M8 613 387 0 0 0 0 0 1000 1319 29
M9 378 622 0 0 0 0 0 1000 229 7
M10 9 991 0 0 0 0 0 1000 678 23
M11 0 1000 0 0 0 0 0 1000 136 1
M12 134 866 0 0 0 0 0 1000 489 7
M13 0 0 0 0 0 0 0 0 0 0
M14 0 1000 0 0 0 0 0 1000 561 3
M15 284 331 111 274 0 0 0 1000 4863 61
M16 159 739 102 0 0 0 0 1000 1369 17
M17 210 686 104 0 0 0 0 1000 4069 100
M18 0 1000 0 0 0 0 0 1000 61 2
M19 0 1000 0 0 0 0 0 1000 35 1
M20 0 1000 0 0 0 0 0 1000 231 2
M21 0 1000 0 0 0 0 0 1000 104 2
M22 0 0 0 0 0 0 0 0 0 0
M23 382 463 3 0 23 129 0 1000 3763 71
M24 322 678 0 0 0 0 0 1000 298 8
M25 0 796 204 0 0 0 0 1000 741 17
M 288 599 54 41 3 15 0 1000 32503 649
E 0 0 0 0 0 0 0 0 0 0
T1 0 1000 0 0 0 0 0 1000 2407 43
T2 85 658 210 0 0 47 0 1000 9123 118
T3 0 1000 0 0 0 0 0 1000 97 2
T4 346 649 0 4 0 0 0 1000 3678 81
T5 142 813 15 6 7 17 0 1000 37537 518
T 140 784 47 5 5 20 0 1000 52842 762
S1 93 907 0 0 0 0 0 1000 1050 46
S2 121 799 58 0 8 14 0 1000 16430 350
S3 187 36 5 545 173 55 0 1000 48544 491
S4 0 0 0 0 0 0 0 0 0 0
S5 0 1000 0 0 0 0 0 1000 17 2
S6 0 1000 0 0 0 0 0 1000 108 5
S7 290 710 0 0 0 0 0 1000 1467 29
S8 940 60 0 0 0 0 0 1000 1432 9
S9 0 1000 0 0 0 0 0 1000 27 4
S10 0 775 0 178 0 47 0 1000 1132 10
S11 510 490 0 0 0 0 0 1000 791 23
S12 200 261 16 470 38 14 0 1000 8740 105
S13 87 902 12 0 0 0 0 1000 3563 95
S14 414 586 0 0 0 0 0 1000 2203 69
S15 367 584 16 2 6 26 0 1000 12373 193
S 213 331 16 314 91 34 0 1000 97876 1431
M+E+T+S 205 509 32 177 50 27 0 1000 183222 2842
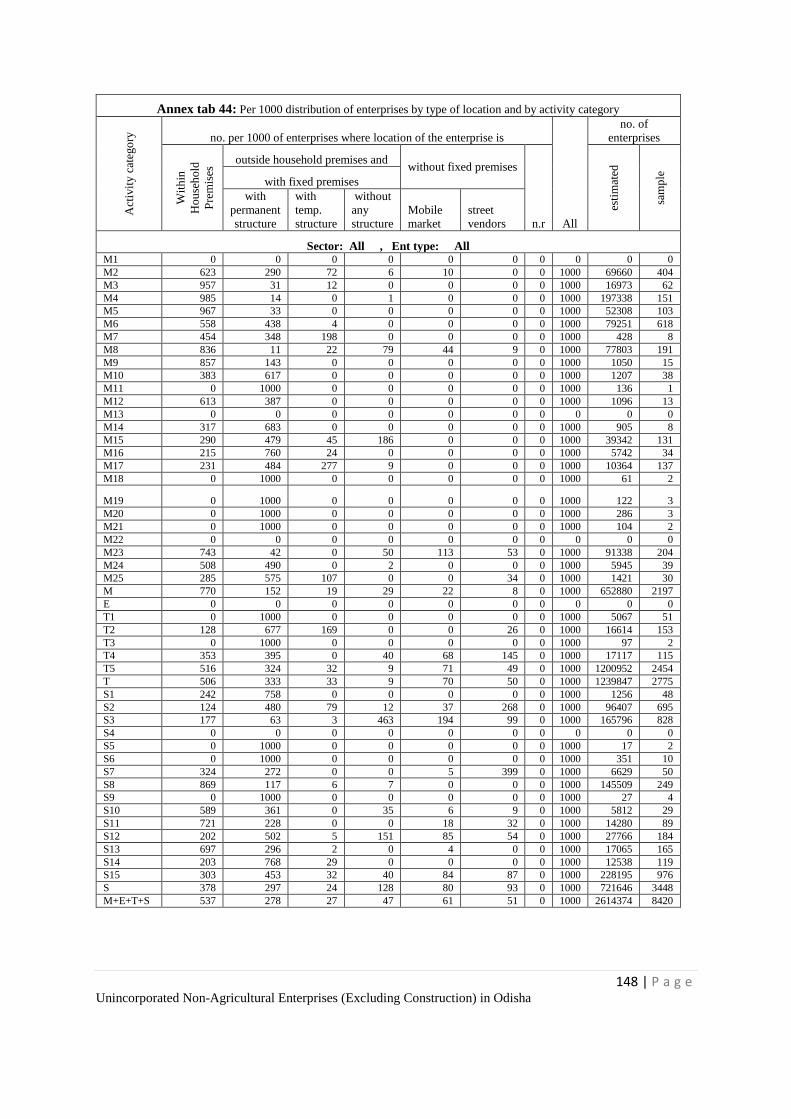
148 | P a g e Unincorporated Non-Agricultural Enterprises (Excluding Construction) in Odisha
Annex tab 44: Per 1000 distribution of enterprises by type of location and by activity category
Act
ivit
y c
ateg
ory
no. per 1000 of enterprises where location of the enterprise is
All
no. of
enterprises
Wit
hin
Ho
use
hold
Pre
mis
es outside household premises and
without fixed premises
n.r
esti
mat
ed
sam
ple
with fixed premises
with
permanent
structure
with
temp.
structure
without
any
structure
Mobile
market
street
vendors
Sector: All , Ent type: All M1 0 0 0 0 0 0 0 0 0 0
M2 623 290 72 6 10 0 0 1000 69660 404
M3 957 31 12 0 0 0 0 1000 16973 62
M4 985 14 0 1 0 0 0 1000 197338 151
M5 967 33 0 0 0 0 0 1000 52308 103
M6 558 438 4 0 0 0 0 1000 79251 618
M7 454 348 198 0 0 0 0 1000 428 8
M8 836 11 22 79 44 9 0 1000 77803 191
M9 857 143 0 0 0 0 0 1000 1050 15
M10 383 617 0 0 0 0 0 1000 1207 38
M11 0 1000 0 0 0 0 0 1000 136 1
M12 613 387 0 0 0 0 0 1000 1096 13
M13 0 0 0 0 0 0 0 0 0 0
M14 317 683 0 0 0 0 0 1000 905 8
M15 290 479 45 186 0 0 0 1000 39342 131
M16 215 760 24 0 0 0 0 1000 5742 34
M17 231 484 277 9 0 0 0 1000 10364 137
M18 0 1000 0 0 0 0 0 1000 61 2
M19 0 1000 0 0 0 0 0 1000 122 3
M20 0 1000 0 0 0 0 0 1000 286 3
M21 0 1000 0 0 0 0 0 1000 104 2
M22 0 0 0 0 0 0 0 0 0 0
M23 743 42 0 50 113 53 0 1000 91338 204
M24 508 490 0 2 0 0 0 1000 5945 39
M25 285 575 107 0 0 34 0 1000 1421 30
M 770 152 19 29 22 8 0 1000 652880 2197
E 0 0 0 0 0 0 0 0 0 0
T1 0 1000 0 0 0 0 0 1000 5067 51
T2 128 677 169 0 0 26 0 1000 16614 153
T3 0 1000 0 0 0 0 0 1000 97 2
T4 353 395 0 40 68 145 0 1000 17117 115
T5 516 324 32 9 71 49 0 1000 1200952 2454
T 506 333 33 9 70 50 0 1000 1239847 2775
S1 242 758 0 0 0 0 0 1000 1256 48
S2 124 480 79 12 37 268 0 1000 96407 695
S3 177 63 3 463 194 99 0 1000 165796 828
S4 0 0 0 0 0 0 0 0 0 0
S5 0 1000 0 0 0 0 0 1000 17 2
S6 0 1000 0 0 0 0 0 1000 351 10
S7 324 272 0 0 5 399 0 1000 6629 50
S8 869 117 6 7 0 0 0 1000 145509 249
S9 0 1000 0 0 0 0 0 1000 27 4
S10 589 361 0 35 6 9 0 1000 5812 29
S11 721 228 0 0 18 32 0 1000 14280 89
S12 202 502 5 151 85 54 0 1000 27766 184
S13 697 296 2 0 4 0 0 1000 17065 165
S14 203 768 29 0 0 0 0 1000 12538 119
S15 303 453 32 40 84 87 0 1000 228195 976
S 378 297 24 128 80 93 0 1000 721646 3448
M+E+T+S 537 278 27 47 61 51 0 1000 2614374 8420
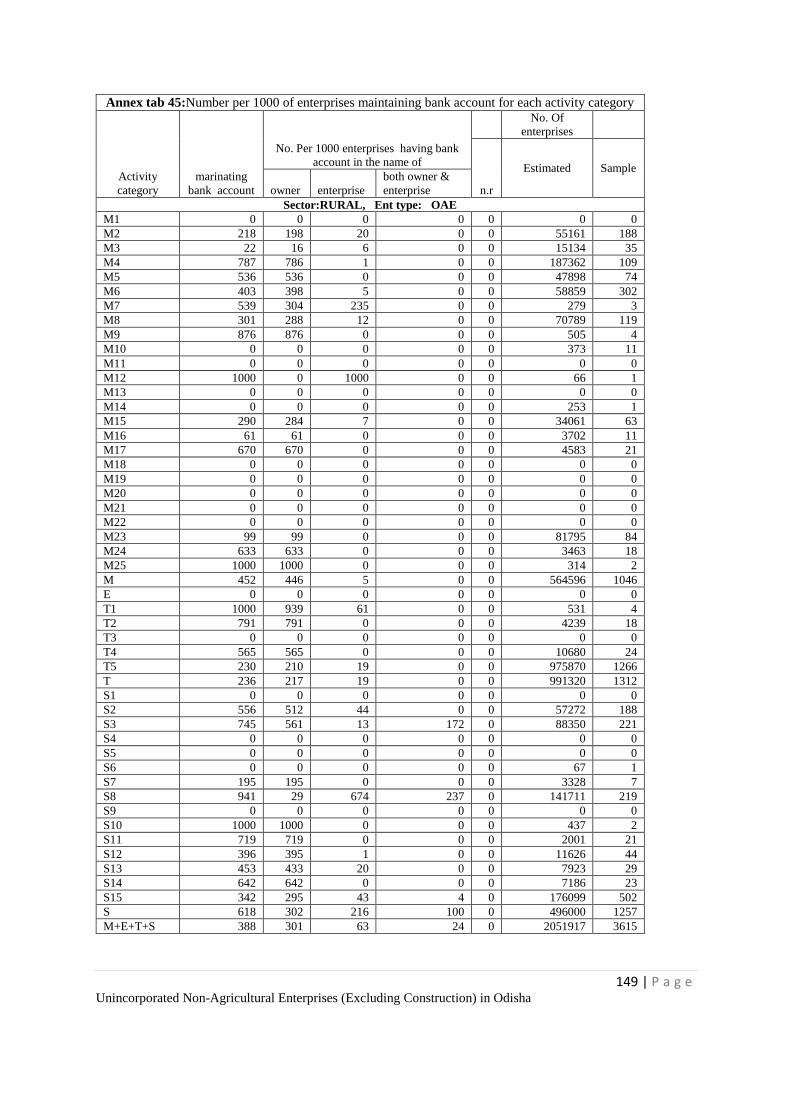
149 | P a g e Unincorporated Non-Agricultural Enterprises (Excluding Construction) in Odisha
Annex tab 45:Number per 1000 of enterprises maintaining bank account for each activity category
Activity
category
marinating
bank account
No. Per 1000 enterprises having bank
account in the name of
No. Of
enterprises
n.r
Estimated Sample
owner enterprise
both owner &
enterprise
Sector:RURAL, Ent type: OAE
M1 0 0 0 0 0 0 0
M2 218 198 20 0 0 55161 188
M3 22 16 6 0 0 15134 35
M4 787 786 1 0 0 187362 109
M5 536 536 0 0 0 47898 74
M6 403 398 5 0 0 58859 302
M7 539 304 235 0 0 279 3
M8 301 288 12 0 0 70789 119
M9 876 876 0 0 0 505 4
M10 0 0 0 0 0 373 11
M11 0 0 0 0 0 0 0
M12 1000 0 1000 0 0 66 1
M13 0 0 0 0 0 0 0
M14 0 0 0 0 0 253 1
M15 290 284 7 0 0 34061 63
M16 61 61 0 0 0 3702 11
M17 670 670 0 0 0 4583 21
M18 0 0 0 0 0 0 0
M19 0 0 0 0 0 0 0
M20 0 0 0 0 0 0 0
M21 0 0 0 0 0 0 0
M22 0 0 0 0 0 0 0
M23 99 99 0 0 0 81795 84
M24 633 633 0 0 0 3463 18
M25 1000 1000 0 0 0 314 2
M 452 446 5 0 0 564596 1046
E 0 0 0 0 0 0 0
T1 1000 939 61 0 0 531 4
T2 791 791 0 0 0 4239 18
T3 0 0 0 0 0 0 0
T4 565 565 0 0 0 10680 24
T5 230 210 19 0 0 975870 1266
T 236 217 19 0 0 991320 1312
S1 0 0 0 0 0 0 0
S2 556 512 44 0 0 57272 188
S3 745 561 13 172 0 88350 221
S4 0 0 0 0 0 0 0
S5 0 0 0 0 0 0 0
S6 0 0 0 0 0 67 1
S7 195 195 0 0 0 3328 7
S8 941 29 674 237 0 141711 219
S9 0 0 0 0 0 0 0
S10 1000 1000 0 0 0 437 2
S11 719 719 0 0 0 2001 21
S12 396 395 1 0 0 11626 44
S13 453 433 20 0 0 7923 29
S14 642 642 0 0 0 7186 23
S15 342 295 43 4 0 176099 502
S 618 302 216 100 0 496000 1257
M+E+T+S 388 301 63 24 0 2051917 3615
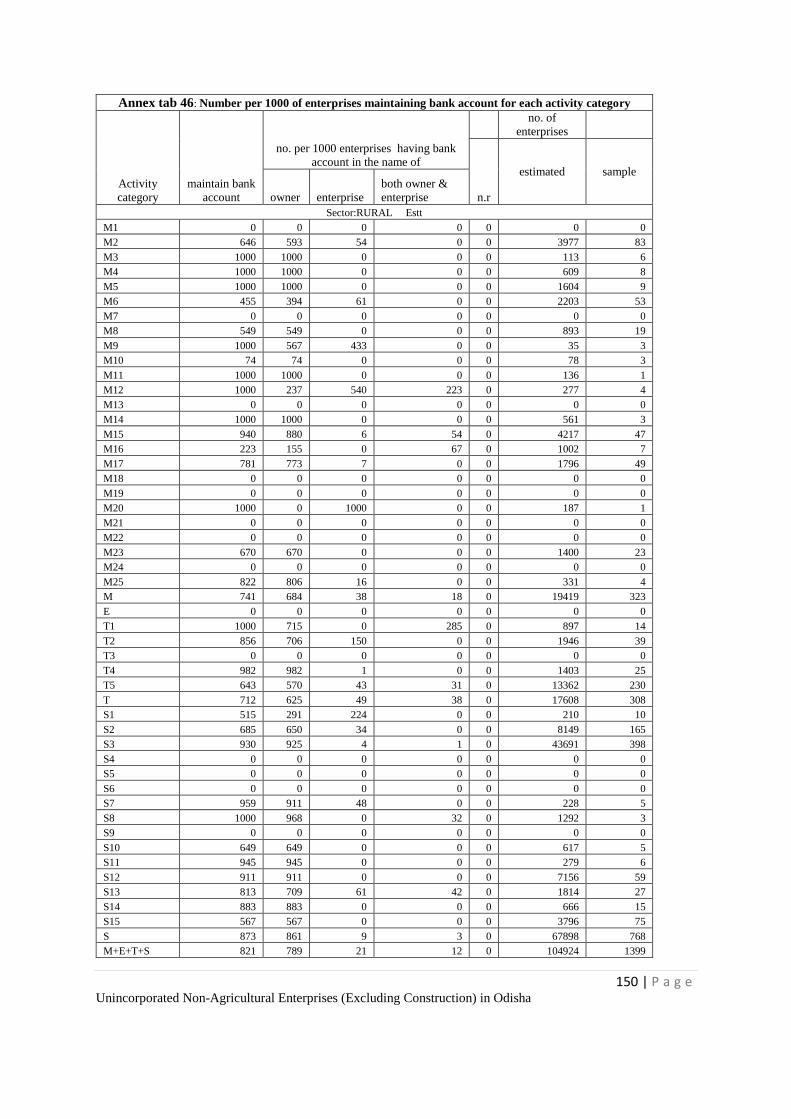
150 | P a g e Unincorporated Non-Agricultural Enterprises (Excluding Construction) in Odisha
Annex tab 46: Number per 1000 of enterprises maintaining bank account for each activity category
Activity
category
maintain bank
account
no. per 1000 enterprises having bank
account in the name of
no. of
enterprises
n.r
estimated sample
owner enterprise
both owner &
enterprise
Sector:RURAL Estt
M1 0 0 0 0 0 0 0
M2 646 593 54 0 0 3977 83
M3 1000 1000 0 0 0 113 6
M4 1000 1000 0 0 0 609 8
M5 1000 1000 0 0 0 1604 9
M6 455 394 61 0 0 2203 53
M7 0 0 0 0 0 0 0
M8 549 549 0 0 0 893 19
M9 1000 567 433 0 0 35 3
M10 74 74 0 0 0 78 3
M11 1000 1000 0 0 0 136 1
M12 1000 237 540 223 0 277 4
M13 0 0 0 0 0 0 0
M14 1000 1000 0 0 0 561 3
M15 940 880 6 54 0 4217 47
M16 223 155 0 67 0 1002 7
M17 781 773 7 0 0 1796 49
M18 0 0 0 0 0 0 0
M19 0 0 0 0 0 0 0
M20 1000 0 1000 0 0 187 1
M21 0 0 0 0 0 0 0
M22 0 0 0 0 0 0 0
M23 670 670 0 0 0 1400 23
M24 0 0 0 0 0 0 0
M25 822 806 16 0 0 331 4
M 741 684 38 18 0 19419 323
E 0 0 0 0 0 0 0
T1 1000 715 0 285 0 897 14
T2 856 706 150 0 0 1946 39
T3 0 0 0 0 0 0 0
T4 982 982 1 0 0 1403 25
T5 643 570 43 31 0 13362 230
T 712 625 49 38 0 17608 308
S1 515 291 224 0 0 210 10
S2 685 650 34 0 0 8149 165
S3 930 925 4 1 0 43691 398
S4 0 0 0 0 0 0 0
S5 0 0 0 0 0 0 0
S6 0 0 0 0 0 0 0
S7 959 911 48 0 0 228 5
S8 1000 968 0 32 0 1292 3
S9 0 0 0 0 0 0 0
S10 649 649 0 0 0 617 5
S11 945 945 0 0 0 279 6
S12 911 911 0 0 0 7156 59
S13 813 709 61 42 0 1814 27
S14 883 883 0 0 0 666 15
S15 567 567 0 0 0 3796 75
S 873 861 9 3 0 67898 768
M+E+T+S 821 789 21 12 0 104924 1399
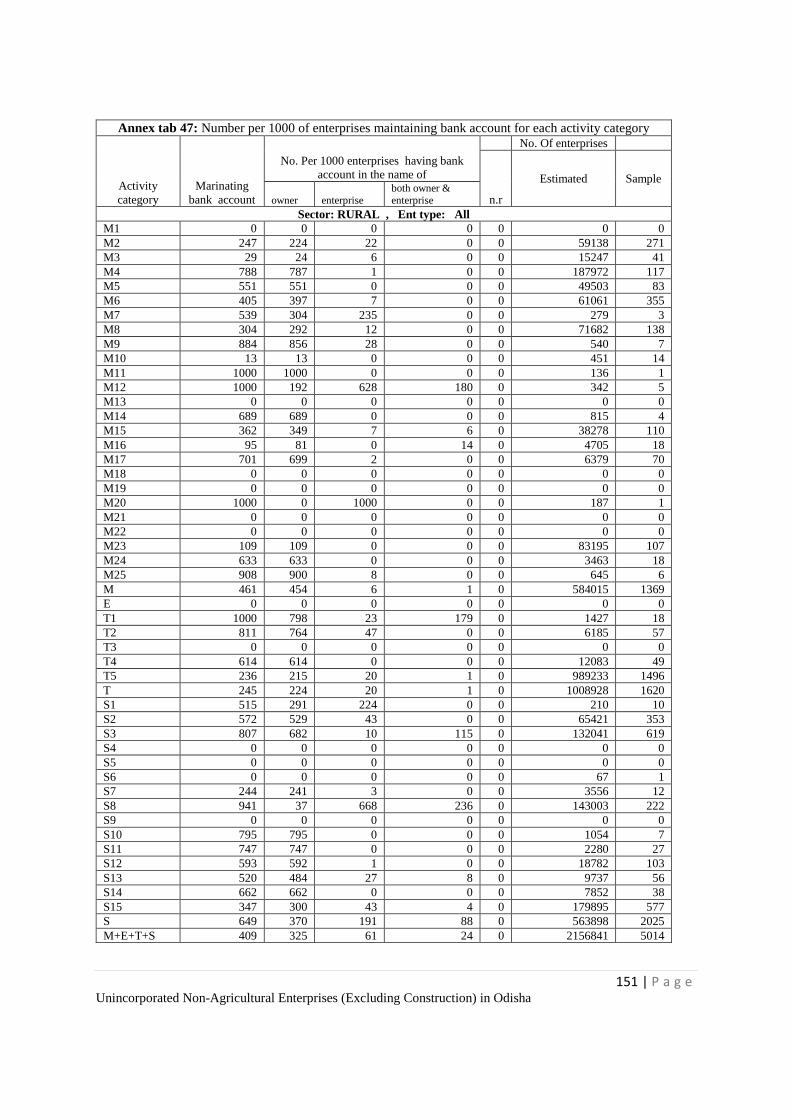
151 | P a g e Unincorporated Non-Agricultural Enterprises (Excluding Construction) in Odisha
Annex tab 47: Number per 1000 of enterprises maintaining bank account for each activity category
Activity
category
Marinating
bank account
No. Per 1000 enterprises having bank
account in the name of
No. Of enterprises
n.r
Estimated Sample
owner enterprise both owner & enterprise
Sector: RURAL , Ent type: All
M1 0 0 0 0 0 0 0
M2 247 224 22 0 0 59138 271
M3 29 24 6 0 0 15247 41
M4 788 787 1 0 0 187972 117
M5 551 551 0 0 0 49503 83
M6 405 397 7 0 0 61061 355
M7 539 304 235 0 0 279 3
M8 304 292 12 0 0 71682 138
M9 884 856 28 0 0 540 7
M10 13 13 0 0 0 451 14
M11 1000 1000 0 0 0 136 1
M12 1000 192 628 180 0 342 5
M13 0 0 0 0 0 0 0
M14 689 689 0 0 0 815 4
M15 362 349 7 6 0 38278 110
M16 95 81 0 14 0 4705 18
M17 701 699 2 0 0 6379 70
M18 0 0 0 0 0 0 0
M19 0 0 0 0 0 0 0
M20 1000 0 1000 0 0 187 1
M21 0 0 0 0 0 0 0
M22 0 0 0 0 0 0 0
M23 109 109 0 0 0 83195 107
M24 633 633 0 0 0 3463 18
M25 908 900 8 0 0 645 6
M 461 454 6 1 0 584015 1369
E 0 0 0 0 0 0 0
T1 1000 798 23 179 0 1427 18
T2 811 764 47 0 0 6185 57
T3 0 0 0 0 0 0 0
T4 614 614 0 0 0 12083 49
T5 236 215 20 1 0 989233 1496
T 245 224 20 1 0 1008928 1620
S1 515 291 224 0 0 210 10
S2 572 529 43 0 0 65421 353
S3 807 682 10 115 0 132041 619
S4 0 0 0 0 0 0 0
S5 0 0 0 0 0 0 0
S6 0 0 0 0 0 67 1
S7 244 241 3 0 0 3556 12
S8 941 37 668 236 0 143003 222
S9 0 0 0 0 0 0 0
S10 795 795 0 0 0 1054 7
S11 747 747 0 0 0 2280 27
S12 593 592 1 0 0 18782 103
S13 520 484 27 8 0 9737 56
S14 662 662 0 0 0 7852 38
S15 347 300 43 4 0 179895 577
S 649 370 191 88 0 563898 2025
M+E+T+S 409 325 61 24 0 2156841 5014
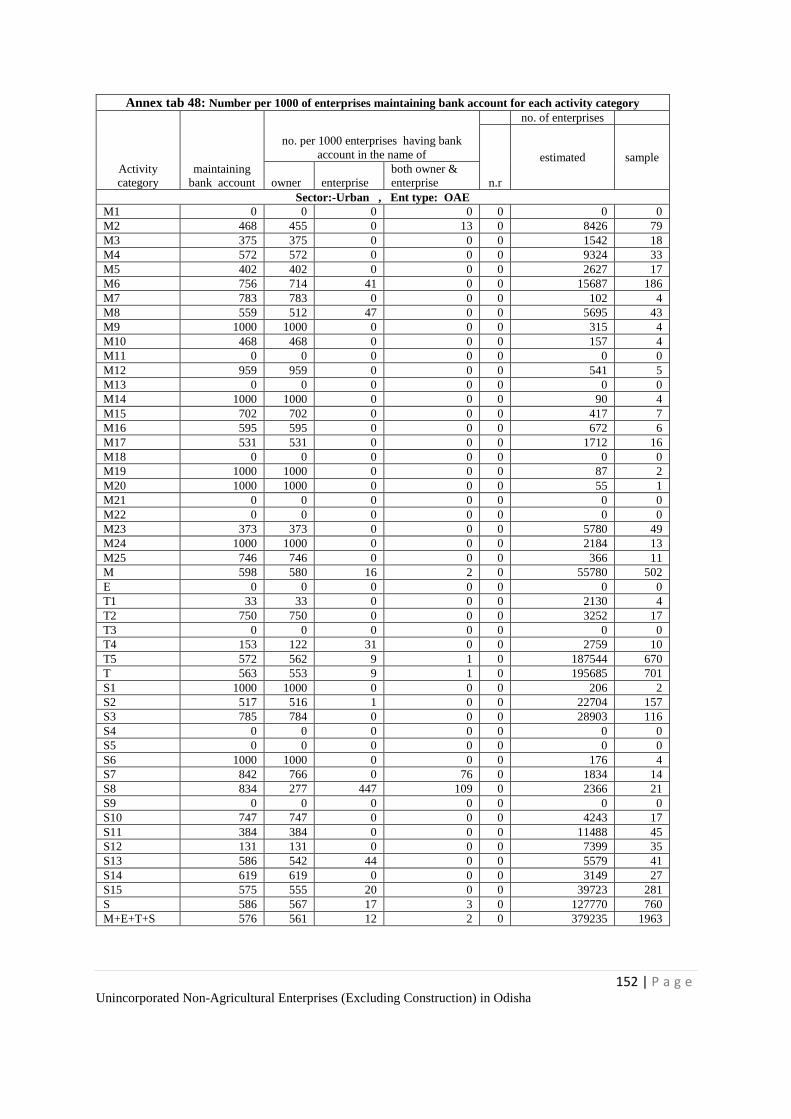
152 | P a g e Unincorporated Non-Agricultural Enterprises (Excluding Construction) in Odisha
Annex tab 48: Number per 1000 of enterprises maintaining bank account for each activity category
Activity
category
maintaining
bank account
no. per 1000 enterprises having bank
account in the name of
no. of enterprises
n.r
estimated sample
owner enterprise
both owner &
enterprise
Sector:-Urban , Ent type: OAE
M1 0 0 0 0 0 0 0
M2 468 455 0 13 0 8426 79
M3 375 375 0 0 0 1542 18
M4 572 572 0 0 0 9324 33
M5 402 402 0 0 0 2627 17
M6 756 714 41 0 0 15687 186
M7 783 783 0 0 0 102 4
M8 559 512 47 0 0 5695 43
M9 1000 1000 0 0 0 315 4
M10 468 468 0 0 0 157 4
M11 0 0 0 0 0 0 0
M12 959 959 0 0 0 541 5
M13 0 0 0 0 0 0 0
M14 1000 1000 0 0 0 90 4
M15 702 702 0 0 0 417 7
M16 595 595 0 0 0 672 6
M17 531 531 0 0 0 1712 16
M18 0 0 0 0 0 0 0
M19 1000 1000 0 0 0 87 2
M20 1000 1000 0 0 0 55 1
M21 0 0 0 0 0 0 0
M22 0 0 0 0 0 0 0
M23 373 373 0 0 0 5780 49
M24 1000 1000 0 0 0 2184 13
M25 746 746 0 0 0 366 11
M 598 580 16 2 0 55780 502
E 0 0 0 0 0 0 0
T1 33 33 0 0 0 2130 4
T2 750 750 0 0 0 3252 17
T3 0 0 0 0 0 0 0
T4 153 122 31 0 0 2759 10
T5 572 562 9 1 0 187544 670
T 563 553 9 1 0 195685 701
S1 1000 1000 0 0 0 206 2
S2 517 516 1 0 0 22704 157
S3 785 784 0 0 0 28903 116
S4 0 0 0 0 0 0 0
S5 0 0 0 0 0 0 0
S6 1000 1000 0 0 0 176 4
S7 842 766 0 76 0 1834 14
S8 834 277 447 109 0 2366 21
S9 0 0 0 0 0 0 0
S10 747 747 0 0 0 4243 17
S11 384 384 0 0 0 11488 45
S12 131 131 0 0 0 7399 35
S13 586 542 44 0 0 5579 41
S14 619 619 0 0 0 3149 27
S15 575 555 20 0 0 39723 281
S 586 567 17 3 0 127770 760
M+E+T+S 576 561 12 2 0 379235 1963
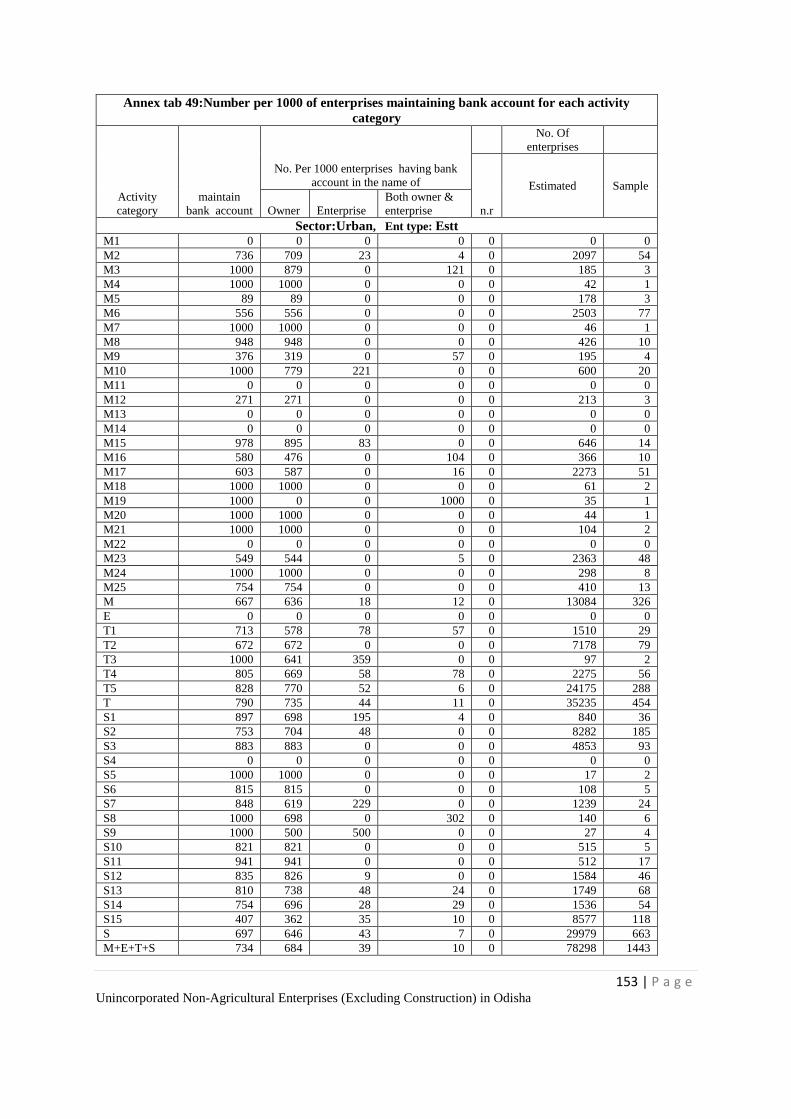
153 | P a g e Unincorporated Non-Agricultural Enterprises (Excluding Construction) in Odisha
Annex tab 49:Number per 1000 of enterprises maintaining bank account for each activity
category
Activity
category
maintain
bank account
No. Per 1000 enterprises having bank
account in the name of
No. Of
enterprises
n.r
Estimated Sample
Owner Enterprise
Both owner &
enterprise
Sector:Urban, Ent type: Estt M1 0 0 0 0 0 0 0
M2 736 709 23 4 0 2097 54
M3 1000 879 0 121 0 185 3
M4 1000 1000 0 0 0 42 1
M5 89 89 0 0 0 178 3
M6 556 556 0 0 0 2503 77
M7 1000 1000 0 0 0 46 1
M8 948 948 0 0 0 426 10
M9 376 319 0 57 0 195 4
M10 1000 779 221 0 0 600 20
M11 0 0 0 0 0 0 0
M12 271 271 0 0 0 213 3
M13 0 0 0 0 0 0 0
M14 0 0 0 0 0 0 0
M15 978 895 83 0 0 646 14
M16 580 476 0 104 0 366 10
M17 603 587 0 16 0 2273 51
M18 1000 1000 0 0 0 61 2
M19 1000 0 0 1000 0 35 1
M20 1000 1000 0 0 0 44 1
M21 1000 1000 0 0 0 104 2
M22 0 0 0 0 0 0 0
M23 549 544 0 5 0 2363 48
M24 1000 1000 0 0 0 298 8
M25 754 754 0 0 0 410 13
M 667 636 18 12 0 13084 326
E 0 0 0 0 0 0 0
T1 713 578 78 57 0 1510 29
T2 672 672 0 0 0 7178 79
T3 1000 641 359 0 0 97 2
T4 805 669 58 78 0 2275 56
T5 828 770 52 6 0 24175 288
T 790 735 44 11 0 35235 454
S1 897 698 195 4 0 840 36
S2 753 704 48 0 0 8282 185
S3 883 883 0 0 0 4853 93
S4 0 0 0 0 0 0 0
S5 1000 1000 0 0 0 17 2
S6 815 815 0 0 0 108 5
S7 848 619 229 0 0 1239 24
S8 1000 698 0 302 0 140 6
S9 1000 500 500 0 0 27 4
S10 821 821 0 0 0 515 5
S11 941 941 0 0 0 512 17
S12 835 826 9 0 0 1584 46
S13 810 738 48 24 0 1749 68
S14 754 696 28 29 0 1536 54
S15 407 362 35 10 0 8577 118
S 697 646 43 7 0 29979 663
M+E+T+S 734 684 39 10 0 78298 1443
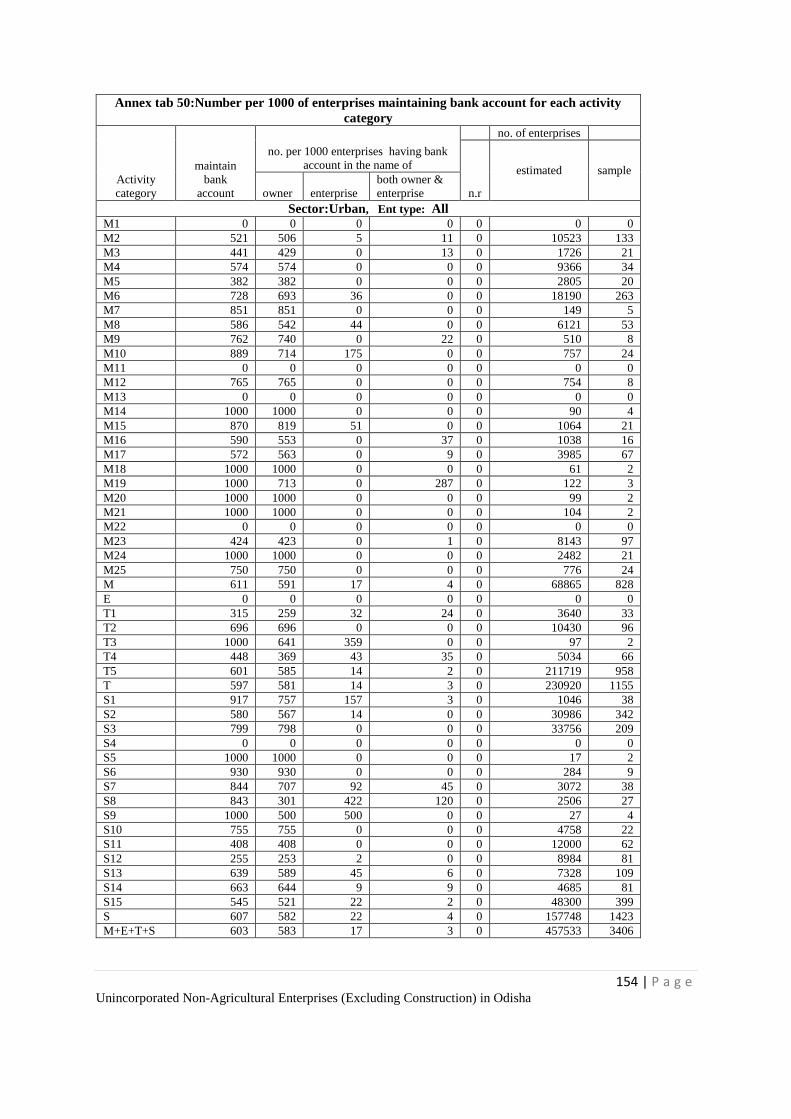
154 | P a g e Unincorporated Non-Agricultural Enterprises (Excluding Construction) in Odisha
Annex tab 50:Number per 1000 of enterprises maintaining bank account for each activity
category
Activity
category
maintain
bank
account
no. per 1000 enterprises having bank
account in the name of
no. of enterprises
n.r
estimated sample
owner enterprise
both owner &
enterprise
Sector:Urban, Ent type: All M1 0 0 0 0 0 0 0
M2 521 506 5 11 0 10523 133
M3 441 429 0 13 0 1726 21
M4 574 574 0 0 0 9366 34
M5 382 382 0 0 0 2805 20
M6 728 693 36 0 0 18190 263
M7 851 851 0 0 0 149 5
M8 586 542 44 0 0 6121 53
M9 762 740 0 22 0 510 8
M10 889 714 175 0 0 757 24
M11 0 0 0 0 0 0 0
M12 765 765 0 0 0 754 8
M13 0 0 0 0 0 0 0
M14 1000 1000 0 0 0 90 4
M15 870 819 51 0 0 1064 21
M16 590 553 0 37 0 1038 16
M17 572 563 0 9 0 3985 67
M18 1000 1000 0 0 0 61 2
M19 1000 713 0 287 0 122 3
M20 1000 1000 0 0 0 99 2
M21 1000 1000 0 0 0 104 2
M22 0 0 0 0 0 0 0
M23 424 423 0 1 0 8143 97
M24 1000 1000 0 0 0 2482 21
M25 750 750 0 0 0 776 24
M 611 591 17 4 0 68865 828
E 0 0 0 0 0 0 0
T1 315 259 32 24 0 3640 33
T2 696 696 0 0 0 10430 96
T3 1000 641 359 0 0 97 2
T4 448 369 43 35 0 5034 66
T5 601 585 14 2 0 211719 958
T 597 581 14 3 0 230920 1155
S1 917 757 157 3 0 1046 38
S2 580 567 14 0 0 30986 342
S3 799 798 0 0 0 33756 209
S4 0 0 0 0 0 0 0
S5 1000 1000 0 0 0 17 2
S6 930 930 0 0 0 284 9
S7 844 707 92 45 0 3072 38
S8 843 301 422 120 0 2506 27
S9 1000 500 500 0 0 27 4
S10 755 755 0 0 0 4758 22
S11 408 408 0 0 0 12000 62
S12 255 253 2 0 0 8984 81
S13 639 589 45 6 0 7328 109
S14 663 644 9 9 0 4685 81
S15 545 521 22 2 0 48300 399
S 607 582 22 4 0 157748 1423
M+E+T+S 603 583 17 3 0 457533 3406
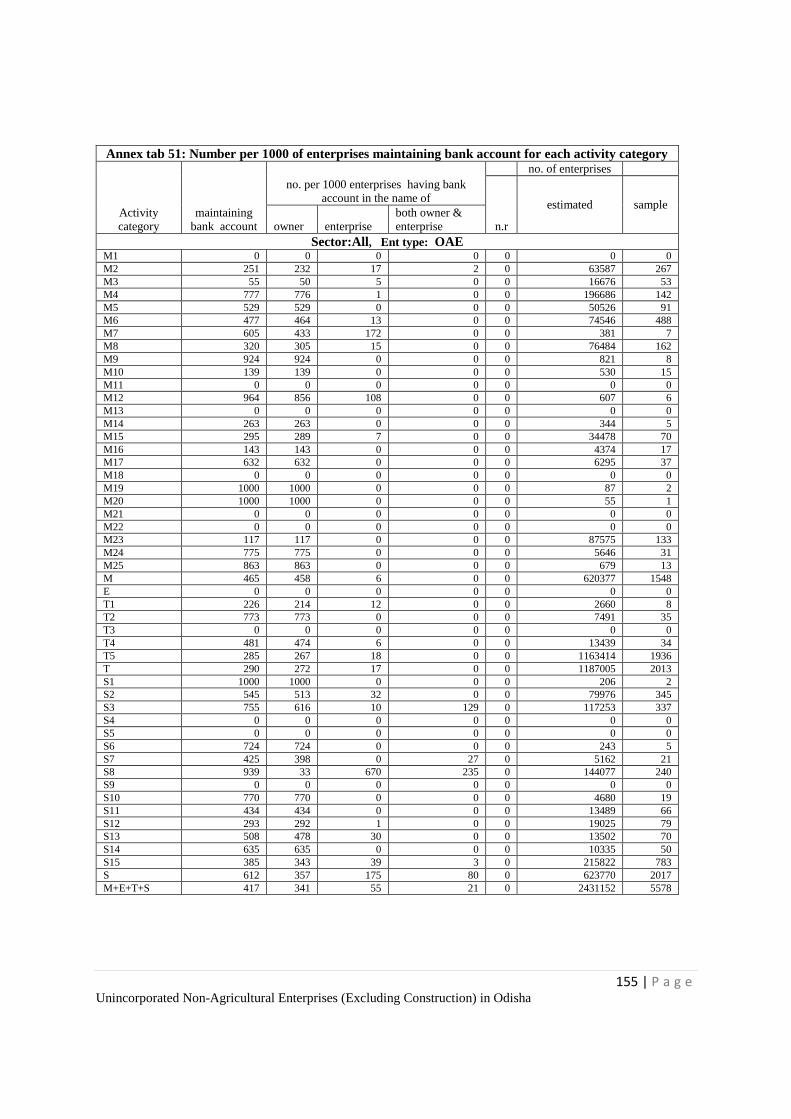
155 | P a g e Unincorporated Non-Agricultural Enterprises (Excluding Construction) in Odisha
Annex tab 51: Number per 1000 of enterprises maintaining bank account for each activity category
Activity
category
maintaining
bank account
no. per 1000 enterprises having bank
account in the name of
no. of enterprises
n.r
estimated sample
owner enterprise
both owner &
enterprise
Sector:All, Ent type: OAE M1 0 0 0 0 0 0 0
M2 251 232 17 2 0 63587 267
M3 55 50 5 0 0 16676 53
M4 777 776 1 0 0 196686 142
M5 529 529 0 0 0 50526 91
M6 477 464 13 0 0 74546 488
M7 605 433 172 0 0 381 7
M8 320 305 15 0 0 76484 162
M9 924 924 0 0 0 821 8
M10 139 139 0 0 0 530 15
M11 0 0 0 0 0 0 0
M12 964 856 108 0 0 607 6
M13 0 0 0 0 0 0 0
M14 263 263 0 0 0 344 5
M15 295 289 7 0 0 34478 70
M16 143 143 0 0 0 4374 17
M17 632 632 0 0 0 6295 37
M18 0 0 0 0 0 0 0
M19 1000 1000 0 0 0 87 2
M20 1000 1000 0 0 0 55 1
M21 0 0 0 0 0 0 0
M22 0 0 0 0 0 0 0
M23 117 117 0 0 0 87575 133
M24 775 775 0 0 0 5646 31
M25 863 863 0 0 0 679 13
M 465 458 6 0 0 620377 1548
E 0 0 0 0 0 0 0
T1 226 214 12 0 0 2660 8
T2 773 773 0 0 0 7491 35
T3 0 0 0 0 0 0 0
T4 481 474 6 0 0 13439 34
T5 285 267 18 0 0 1163414 1936
T 290 272 17 0 0 1187005 2013
S1 1000 1000 0 0 0 206 2
S2 545 513 32 0 0 79976 345
S3 755 616 10 129 0 117253 337
S4 0 0 0 0 0 0 0
S5 0 0 0 0 0 0 0
S6 724 724 0 0 0 243 5
S7 425 398 0 27 0 5162 21
S8 939 33 670 235 0 144077 240
S9 0 0 0 0 0 0 0
S10 770 770 0 0 0 4680 19
S11 434 434 0 0 0 13489 66
S12 293 292 1 0 0 19025 79
S13 508 478 30 0 0 13502 70
S14 635 635 0 0 0 10335 50
S15 385 343 39 3 0 215822 783
S 612 357 175 80 0 623770 2017
M+E+T+S 417 341 55 21 0 2431152 5578
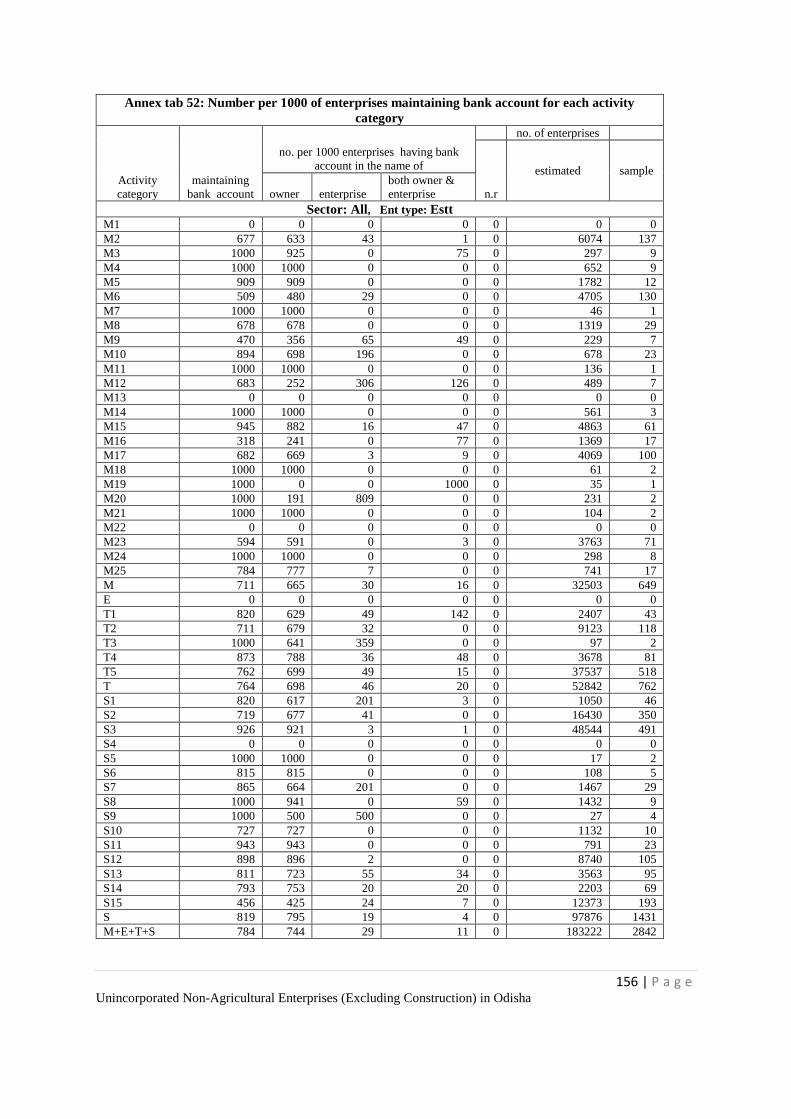
156 | P a g e Unincorporated Non-Agricultural Enterprises (Excluding Construction) in Odisha
Annex tab 52: Number per 1000 of enterprises maintaining bank account for each activity
category
Activity
category
maintaining
bank account
no. per 1000 enterprises having bank
account in the name of
no. of enterprises
n.r
estimated sample
owner enterprise
both owner &
enterprise
Sector: All, Ent type: Estt M1 0 0 0 0 0 0 0
M2 677 633 43 1 0 6074 137
M3 1000 925 0 75 0 297 9
M4 1000 1000 0 0 0 652 9
M5 909 909 0 0 0 1782 12
M6 509 480 29 0 0 4705 130
M7 1000 1000 0 0 0 46 1
M8 678 678 0 0 0 1319 29
M9 470 356 65 49 0 229 7
M10 894 698 196 0 0 678 23
M11 1000 1000 0 0 0 136 1
M12 683 252 306 126 0 489 7
M13 0 0 0 0 0 0 0
M14 1000 1000 0 0 0 561 3
M15 945 882 16 47 0 4863 61
M16 318 241 0 77 0 1369 17
M17 682 669 3 9 0 4069 100
M18 1000 1000 0 0 0 61 2
M19 1000 0 0 1000 0 35 1
M20 1000 191 809 0 0 231 2
M21 1000 1000 0 0 0 104 2
M22 0 0 0 0 0 0 0
M23 594 591 0 3 0 3763 71
M24 1000 1000 0 0 0 298 8
M25 784 777 7 0 0 741 17
M 711 665 30 16 0 32503 649
E 0 0 0 0 0 0 0
T1 820 629 49 142 0 2407 43
T2 711 679 32 0 0 9123 118
T3 1000 641 359 0 0 97 2
T4 873 788 36 48 0 3678 81
T5 762 699 49 15 0 37537 518
T 764 698 46 20 0 52842 762
S1 820 617 201 3 0 1050 46
S2 719 677 41 0 0 16430 350
S3 926 921 3 1 0 48544 491
S4 0 0 0 0 0 0 0
S5 1000 1000 0 0 0 17 2
S6 815 815 0 0 0 108 5
S7 865 664 201 0 0 1467 29
S8 1000 941 0 59 0 1432 9
S9 1000 500 500 0 0 27 4
S10 727 727 0 0 0 1132 10
S11 943 943 0 0 0 791 23
S12 898 896 2 0 0 8740 105
S13 811 723 55 34 0 3563 95
S14 793 753 20 20 0 2203 69
S15 456 425 24 7 0 12373 193
S 819 795 19 4 0 97876 1431
M+E+T+S 784 744 29 11 0 183222 2842
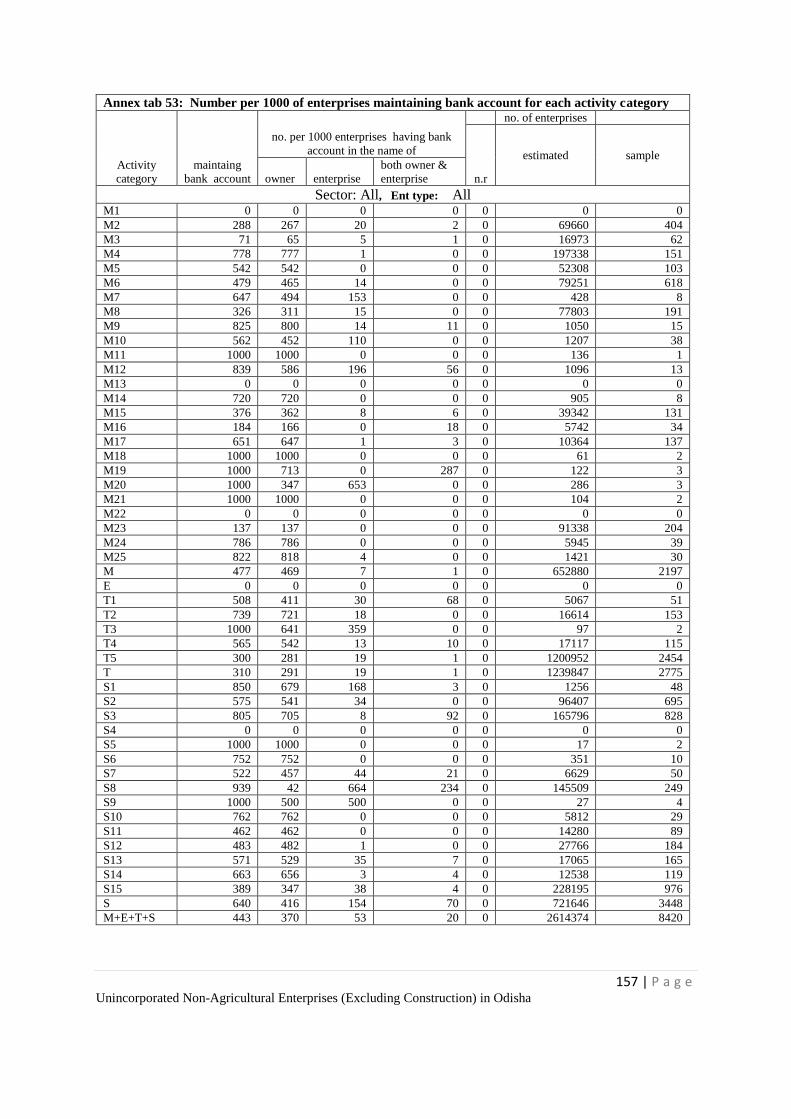
157 | P a g e Unincorporated Non-Agricultural Enterprises (Excluding Construction) in Odisha
Annex tab 53: Number per 1000 of enterprises maintaining bank account for each activity category
Activity
category
maintaing
bank account
no. per 1000 enterprises having bank
account in the name of
no. of enterprises
n.r
estimated sample
owner enterprise
both owner &
enterprise
Sector: All, Ent type: All M1 0 0 0 0 0 0 0
M2 288 267 20 2 0 69660 404
M3 71 65 5 1 0 16973 62
M4 778 777 1 0 0 197338 151
M5 542 542 0 0 0 52308 103
M6 479 465 14 0 0 79251 618
M7 647 494 153 0 0 428 8
M8 326 311 15 0 0 77803 191
M9 825 800 14 11 0 1050 15
M10 562 452 110 0 0 1207 38
M11 1000 1000 0 0 0 136 1
M12 839 586 196 56 0 1096 13
M13 0 0 0 0 0 0 0
M14 720 720 0 0 0 905 8
M15 376 362 8 6 0 39342 131
M16 184 166 0 18 0 5742 34
M17 651 647 1 3 0 10364 137
M18 1000 1000 0 0 0 61 2
M19 1000 713 0 287 0 122 3
M20 1000 347 653 0 0 286 3
M21 1000 1000 0 0 0 104 2
M22 0 0 0 0 0 0 0
M23 137 137 0 0 0 91338 204
M24 786 786 0 0 0 5945 39
M25 822 818 4 0 0 1421 30
M 477 469 7 1 0 652880 2197
E 0 0 0 0 0 0 0
T1 508 411 30 68 0 5067 51
T2 739 721 18 0 0 16614 153
T3 1000 641 359 0 0 97 2
T4 565 542 13 10 0 17117 115
T5 300 281 19 1 0 1200952 2454
T 310 291 19 1 0 1239847 2775
S1 850 679 168 3 0 1256 48
S2 575 541 34 0 0 96407 695
S3 805 705 8 92 0 165796 828
S4 0 0 0 0 0 0 0
S5 1000 1000 0 0 0 17 2
S6 752 752 0 0 0 351 10
S7 522 457 44 21 0 6629 50
S8 939 42 664 234 0 145509 249
S9 1000 500 500 0 0 27 4
S10 762 762 0 0 0 5812 29
S11 462 462 0 0 0 14280 89
S12 483 482 1 0 0 27766 184
S13 571 529 35 7 0 17065 165
S14 663 656 3 4 0 12538 119
S15 389 347 38 4 0 228195 976
S 640 416 154 70 0 721646 3448
M+E+T+S 443 370 53 20 0 2614374 8420
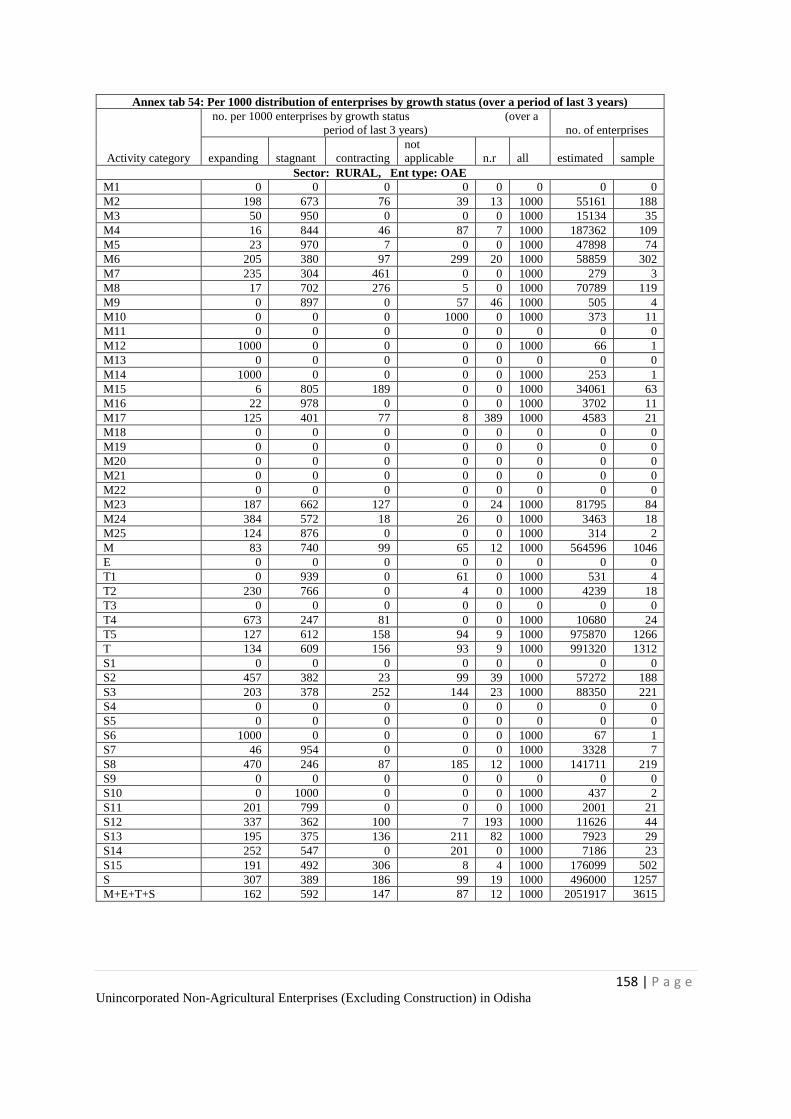
158 | P a g e Unincorporated Non-Agricultural Enterprises (Excluding Construction) in Odisha
Annex tab 54: Per 1000 distribution of enterprises by growth status (over a period of last 3 years)
Activity category
no. per 1000 enterprises by growth status (over a
period of last 3 years) no. of enterprises
expanding stagnant contracting
not
applicable n.r all estimated sample
Sector: RURAL, Ent type: OAE
M1 0 0 0 0 0 0 0 0
M2 198 673 76 39 13 1000 55161 188
M3 50 950 0 0 0 1000 15134 35
M4 16 844 46 87 7 1000 187362 109
M5 23 970 7 0 0 1000 47898 74
M6 205 380 97 299 20 1000 58859 302
M7 235 304 461 0 0 1000 279 3
M8 17 702 276 5 0 1000 70789 119
M9 0 897 0 57 46 1000 505 4
M10 0 0 0 1000 0 1000 373 11
M11 0 0 0 0 0 0 0 0
M12 1000 0 0 0 0 1000 66 1
M13 0 0 0 0 0 0 0 0
M14 1000 0 0 0 0 1000 253 1
M15 6 805 189 0 0 1000 34061 63
M16 22 978 0 0 0 1000 3702 11
M17 125 401 77 8 389 1000 4583 21
M18 0 0 0 0 0 0 0 0
M19 0 0 0 0 0 0 0 0
M20 0 0 0 0 0 0 0 0
M21 0 0 0 0 0 0 0 0
M22 0 0 0 0 0 0 0 0
M23 187 662 127 0 24 1000 81795 84
M24 384 572 18 26 0 1000 3463 18
M25 124 876 0 0 0 1000 314 2
M 83 740 99 65 12 1000 564596 1046
E 0 0 0 0 0 0 0 0
T1 0 939 0 61 0 1000 531 4
T2 230 766 0 4 0 1000 4239 18
T3 0 0 0 0 0 0 0 0
T4 673 247 81 0 0 1000 10680 24
T5 127 612 158 94 9 1000 975870 1266
T 134 609 156 93 9 1000 991320 1312
S1 0 0 0 0 0 0 0 0
S2 457 382 23 99 39 1000 57272 188
S3 203 378 252 144 23 1000 88350 221
S4 0 0 0 0 0 0 0 0
S5 0 0 0 0 0 0 0 0
S6 1000 0 0 0 0 1000 67 1
S7 46 954 0 0 0 1000 3328 7
S8 470 246 87 185 12 1000 141711 219
S9 0 0 0 0 0 0 0 0
S10 0 1000 0 0 0 1000 437 2
S11 201 799 0 0 0 1000 2001 21
S12 337 362 100 7 193 1000 11626 44
S13 195 375 136 211 82 1000 7923 29
S14 252 547 0 201 0 1000 7186 23
S15 191 492 306 8 4 1000 176099 502
S 307 389 186 99 19 1000 496000 1257
M+E+T+S 162 592 147 87 12 1000 2051917 3615
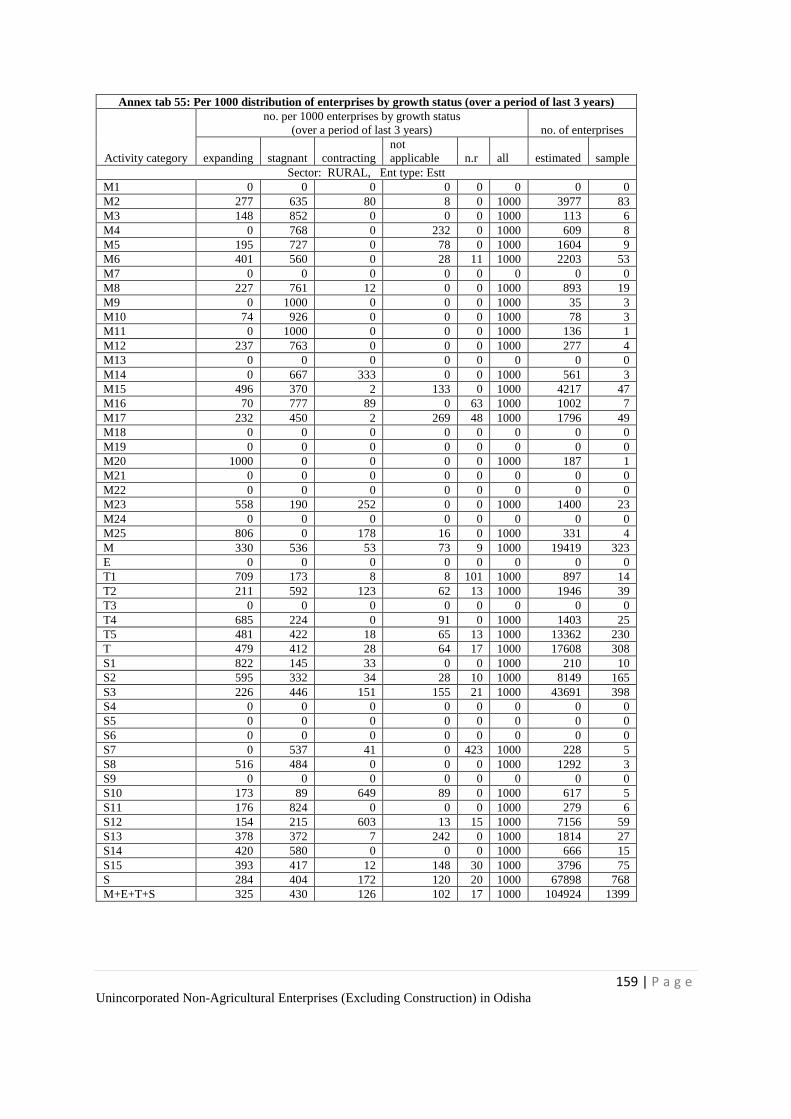
159 | P a g e Unincorporated Non-Agricultural Enterprises (Excluding Construction) in Odisha
Annex tab 55: Per 1000 distribution of enterprises by growth status (over a period of last 3 years)
Activity category
no. per 1000 enterprises by growth status
(over a period of last 3 years) no. of enterprises
expanding stagnant
contracting
not
applicable n.r all estimated sample
Sector: RURAL, Ent type: Estt
M1 0 0 0 0 0 0 0 0
M2 277 635 80 8 0 1000 3977 83
M3 148 852 0 0 0 1000 113 6
M4 0 768 0 232 0 1000 609 8
M5 195 727 0 78 0 1000 1604 9
M6 401 560 0 28 11 1000 2203 53
M7 0 0 0 0 0 0 0 0
M8 227 761 12 0 0 1000 893 19
M9 0 1000 0 0 0 1000 35 3
M10 74 926 0 0 0 1000 78 3
M11 0 1000 0 0 0 1000 136 1
M12 237 763 0 0 0 1000 277 4
M13 0 0 0 0 0 0 0 0
M14 0 667 333 0 0 1000 561 3
M15 496 370 2 133 0 1000 4217 47
M16 70 777 89 0 63 1000 1002 7
M17 232 450 2 269 48 1000 1796 49
M18 0 0 0 0 0 0 0 0
M19 0 0 0 0 0 0 0 0
M20 1000 0 0 0 0 1000 187 1
M21 0 0 0 0 0 0 0 0
M22 0 0 0 0 0 0 0 0
M23 558 190 252 0 0 1000 1400 23
M24 0 0 0 0 0 0 0 0
M25 806 0 178 16 0 1000 331 4
M 330 536 53 73 9 1000 19419 323
E 0 0 0 0 0 0 0 0
T1 709 173 8 8 101 1000 897 14
T2 211 592 123 62 13 1000 1946 39
T3 0 0 0 0 0 0 0 0
T4 685 224 0 91 0 1000 1403 25
T5 481 422 18 65 13 1000 13362 230
T 479 412 28 64 17 1000 17608 308
S1 822 145 33 0 0 1000 210 10
S2 595 332 34 28 10 1000 8149 165
S3 226 446 151 155 21 1000 43691 398
S4 0 0 0 0 0 0 0 0
S5 0 0 0 0 0 0 0 0
S6 0 0 0 0 0 0 0 0
S7 0 537 41 0 423 1000 228 5
S8 516 484 0 0 0 1000 1292 3
S9 0 0 0 0 0 0 0 0
S10 173 89 649 89 0 1000 617 5
S11 176 824 0 0 0 1000 279 6
S12 154 215 603 13 15 1000 7156 59
S13 378 372 7 242 0 1000 1814 27
S14 420 580 0 0 0 1000 666 15
S15 393 417 12 148 30 1000 3796 75
S 284 404 172 120 20 1000 67898 768
M+E+T+S 325 430 126 102 17 1000 104924 1399
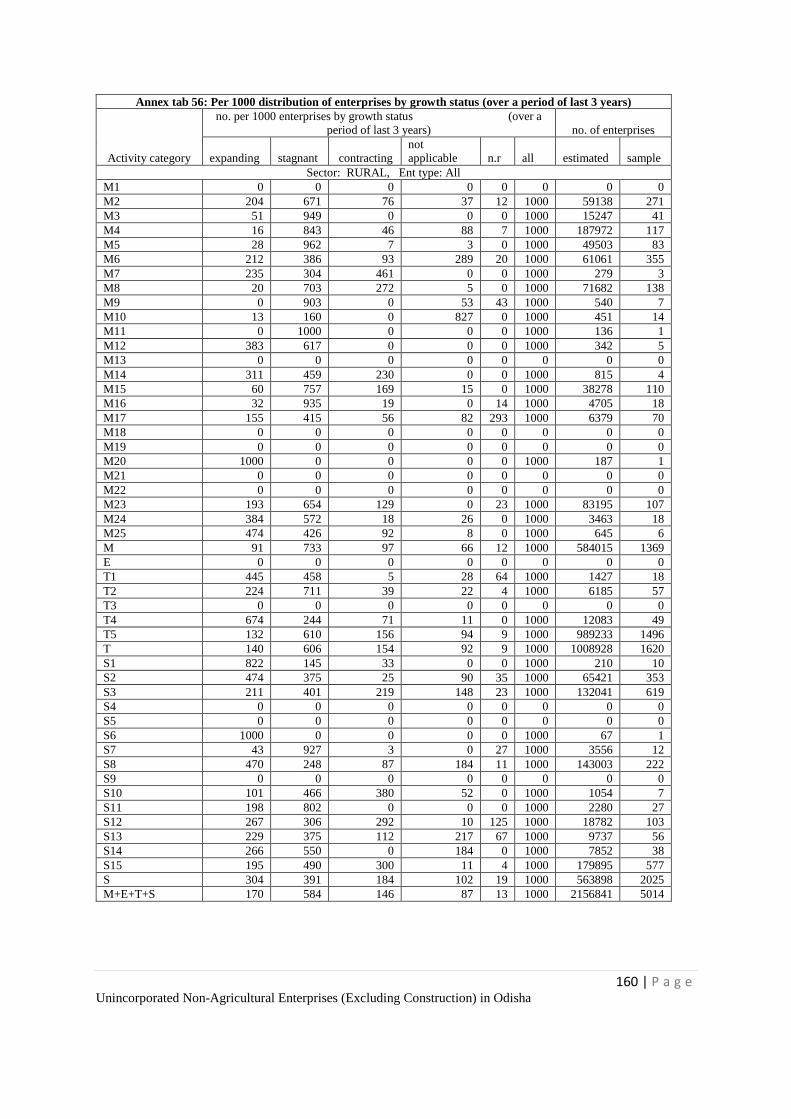
160 | P a g e Unincorporated Non-Agricultural Enterprises (Excluding Construction) in Odisha
Annex tab 56: Per 1000 distribution of enterprises by growth status (over a period of last 3 years)
Activity category
no. per 1000 enterprises by growth status (over a
period of last 3 years) no. of enterprises
expanding stagnant contracting
not
applicable n.r all estimated sample
Sector: RURAL, Ent type: All
M1 0 0 0 0 0 0 0 0
M2 204 671 76 37 12 1000 59138 271
M3 51 949 0 0 0 1000 15247 41
M4 16 843 46 88 7 1000 187972 117
M5 28 962 7 3 0 1000 49503 83
M6 212 386 93 289 20 1000 61061 355
M7 235 304 461 0 0 1000 279 3
M8 20 703 272 5 0 1000 71682 138
M9 0 903 0 53 43 1000 540 7
M10 13 160 0 827 0 1000 451 14
M11 0 1000 0 0 0 1000 136 1
M12 383 617 0 0 0 1000 342 5
M13 0 0 0 0 0 0 0 0
M14 311 459 230 0 0 1000 815 4
M15 60 757 169 15 0 1000 38278 110
M16 32 935 19 0 14 1000 4705 18
M17 155 415 56 82 293 1000 6379 70
M18 0 0 0 0 0 0 0 0
M19 0 0 0 0 0 0 0 0
M20 1000 0 0 0 0 1000 187 1
M21 0 0 0 0 0 0 0 0
M22 0 0 0 0 0 0 0 0
M23 193 654 129 0 23 1000 83195 107
M24 384 572 18 26 0 1000 3463 18
M25 474 426 92 8 0 1000 645 6
M 91 733 97 66 12 1000 584015 1369
E 0 0 0 0 0 0 0 0
T1 445 458 5 28 64 1000 1427 18
T2 224 711 39 22 4 1000 6185 57
T3 0 0 0 0 0 0 0 0
T4 674 244 71 11 0 1000 12083 49
T5 132 610 156 94 9 1000 989233 1496
T 140 606 154 92 9 1000 1008928 1620
S1 822 145 33 0 0 1000 210 10
S2 474 375 25 90 35 1000 65421 353
S3 211 401 219 148 23 1000 132041 619
S4 0 0 0 0 0 0 0 0
S5 0 0 0 0 0 0 0 0
S6 1000 0 0 0 0 1000 67 1
S7 43 927 3 0 27 1000 3556 12
S8 470 248 87 184 11 1000 143003 222
S9 0 0 0 0 0 0 0 0
S10 101 466 380 52 0 1000 1054 7
S11 198 802 0 0 0 1000 2280 27
S12 267 306 292 10 125 1000 18782 103
S13 229 375 112 217 67 1000 9737 56
S14 266 550 0 184 0 1000 7852 38
S15 195 490 300 11 4 1000 179895 577
S 304 391 184 102 19 1000 563898 2025
M+E+T+S 170 584 146 87 13 1000 2156841 5014
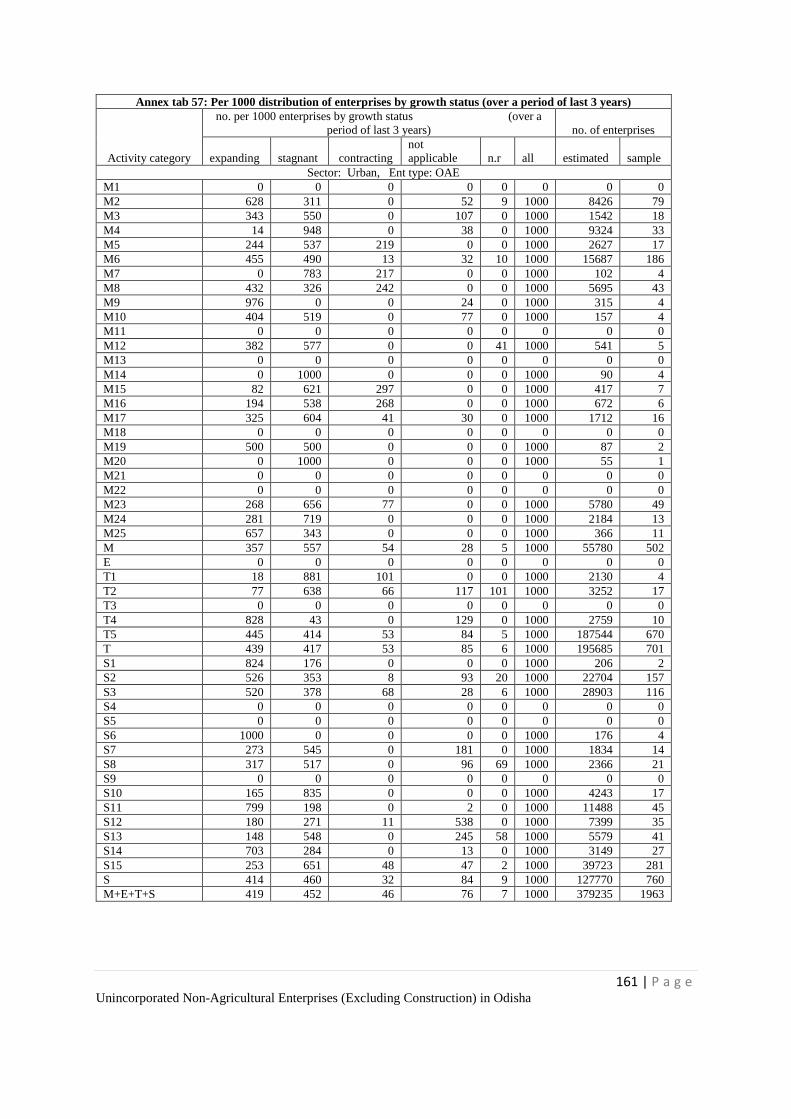
161 | P a g e Unincorporated Non-Agricultural Enterprises (Excluding Construction) in Odisha
Annex tab 57: Per 1000 distribution of enterprises by growth status (over a period of last 3 years)
Activity category
no. per 1000 enterprises by growth status (over a
period of last 3 years) no. of enterprises
expanding stagnant contracting
not
applicable n.r all estimated sample
Sector: Urban, Ent type: OAE
M1 0 0 0 0 0 0 0 0
M2 628 311 0 52 9 1000 8426 79
M3 343 550 0 107 0 1000 1542 18
M4 14 948 0 38 0 1000 9324 33
M5 244 537 219 0 0 1000 2627 17
M6 455 490 13 32 10 1000 15687 186
M7 0 783 217 0 0 1000 102 4
M8 432 326 242 0 0 1000 5695 43
M9 976 0 0 24 0 1000 315 4
M10 404 519 0 77 0 1000 157 4
M11 0 0 0 0 0 0 0 0
M12 382 577 0 0 41 1000 541 5
M13 0 0 0 0 0 0 0 0
M14 0 1000 0 0 0 1000 90 4
M15 82 621 297 0 0 1000 417 7
M16 194 538 268 0 0 1000 672 6
M17 325 604 41 30 0 1000 1712 16
M18 0 0 0 0 0 0 0 0
M19 500 500 0 0 0 1000 87 2
M20 0 1000 0 0 0 1000 55 1
M21 0 0 0 0 0 0 0 0
M22 0 0 0 0 0 0 0 0
M23 268 656 77 0 0 1000 5780 49
M24 281 719 0 0 0 1000 2184 13
M25 657 343 0 0 0 1000 366 11
M 357 557 54 28 5 1000 55780 502
E 0 0 0 0 0 0 0 0
T1 18 881 101 0 0 1000 2130 4
T2 77 638 66 117 101 1000 3252 17
T3 0 0 0 0 0 0 0 0
T4 828 43 0 129 0 1000 2759 10
T5 445 414 53 84 5 1000 187544 670
T 439 417 53 85 6 1000 195685 701
S1 824 176 0 0 0 1000 206 2
S2 526 353 8 93 20 1000 22704 157
S3 520 378 68 28 6 1000 28903 116
S4 0 0 0 0 0 0 0 0
S5 0 0 0 0 0 0 0 0
S6 1000 0 0 0 0 1000 176 4
S7 273 545 0 181 0 1000 1834 14
S8 317 517 0 96 69 1000 2366 21
S9 0 0 0 0 0 0 0 0
S10 165 835 0 0 0 1000 4243 17
S11 799 198 0 2 0 1000 11488 45
S12 180 271 11 538 0 1000 7399 35
S13 148 548 0 245 58 1000 5579 41
S14 703 284 0 13 0 1000 3149 27
S15 253 651 48 47 2 1000 39723 281
S 414 460 32 84 9 1000 127770 760
M+E+T+S 419 452 46 76 7 1000 379235 1963
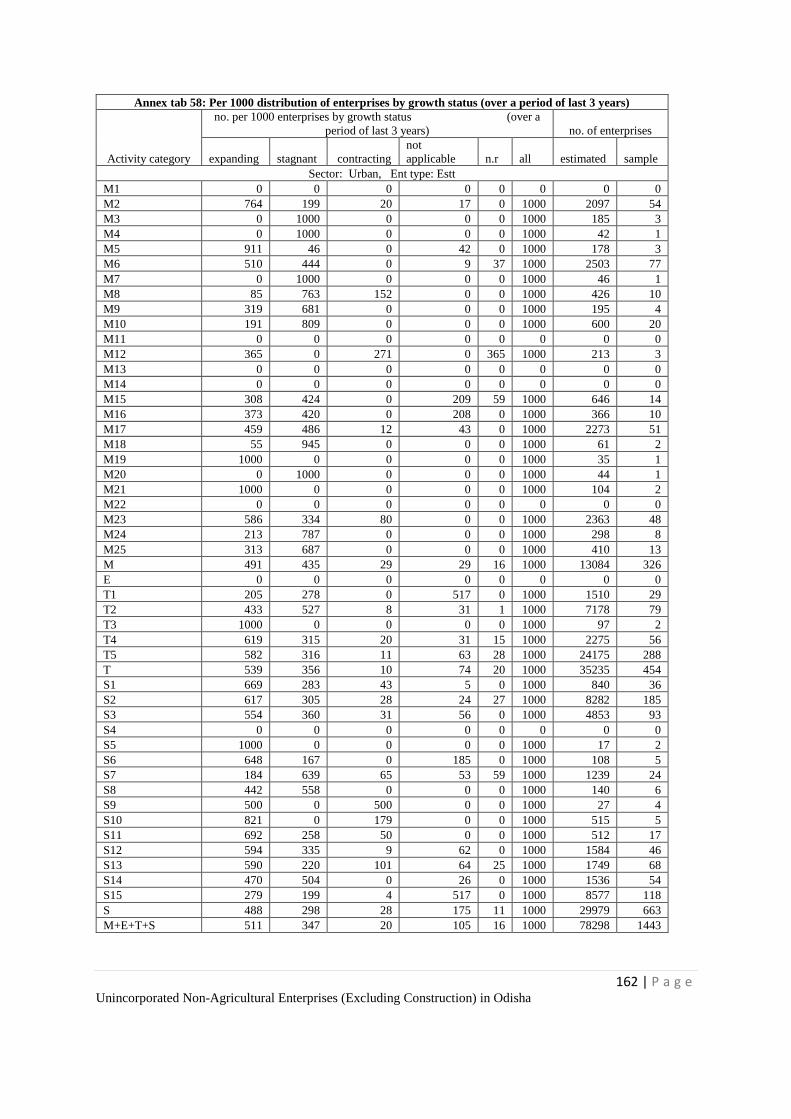
162 | P a g e Unincorporated Non-Agricultural Enterprises (Excluding Construction) in Odisha
Annex tab 58: Per 1000 distribution of enterprises by growth status (over a period of last 3 years)
Activity category
no. per 1000 enterprises by growth status (over a
period of last 3 years) no. of enterprises
expanding stagnant contracting
not
applicable n.r all estimated sample
Sector: Urban, Ent type: Estt
M1 0 0 0 0 0 0 0 0
M2 764 199 20 17 0 1000 2097 54
M3 0 1000 0 0 0 1000 185 3
M4 0 1000 0 0 0 1000 42 1
M5 911 46 0 42 0 1000 178 3
M6 510 444 0 9 37 1000 2503 77
M7 0 1000 0 0 0 1000 46 1
M8 85 763 152 0 0 1000 426 10
M9 319 681 0 0 0 1000 195 4
M10 191 809 0 0 0 1000 600 20
M11 0 0 0 0 0 0 0 0
M12 365 0 271 0 365 1000 213 3
M13 0 0 0 0 0 0 0 0
M14 0 0 0 0 0 0 0 0
M15 308 424 0 209 59 1000 646 14
M16 373 420 0 208 0 1000 366 10
M17 459 486 12 43 0 1000 2273 51
M18 55 945 0 0 0 1000 61 2
M19 1000 0 0 0 0 1000 35 1
M20 0 1000 0 0 0 1000 44 1
M21 1000 0 0 0 0 1000 104 2
M22 0 0 0 0 0 0 0 0
M23 586 334 80 0 0 1000 2363 48
M24 213 787 0 0 0 1000 298 8
M25 313 687 0 0 0 1000 410 13
M 491 435 29 29 16 1000 13084 326
E 0 0 0 0 0 0 0 0
T1 205 278 0 517 0 1000 1510 29
T2 433 527 8 31 1 1000 7178 79
T3 1000 0 0 0 0 1000 97 2
T4 619 315 20 31 15 1000 2275 56
T5 582 316 11 63 28 1000 24175 288
T 539 356 10 74 20 1000 35235 454
S1 669 283 43 5 0 1000 840 36
S2 617 305 28 24 27 1000 8282 185
S3 554 360 31 56 0 1000 4853 93
S4 0 0 0 0 0 0 0 0
S5 1000 0 0 0 0 1000 17 2
S6 648 167 0 185 0 1000 108 5
S7 184 639 65 53 59 1000 1239 24
S8 442 558 0 0 0 1000 140 6
S9 500 0 500 0 0 1000 27 4
S10 821 0 179 0 0 1000 515 5
S11 692 258 50 0 0 1000 512 17
S12 594 335 9 62 0 1000 1584 46
S13 590 220 101 64 25 1000 1749 68
S14 470 504 0 26 0 1000 1536 54
S15 279 199 4 517 0 1000 8577 118
S 488 298 28 175 11 1000 29979 663
M+E+T+S 511 347 20 105 16 1000 78298 1443
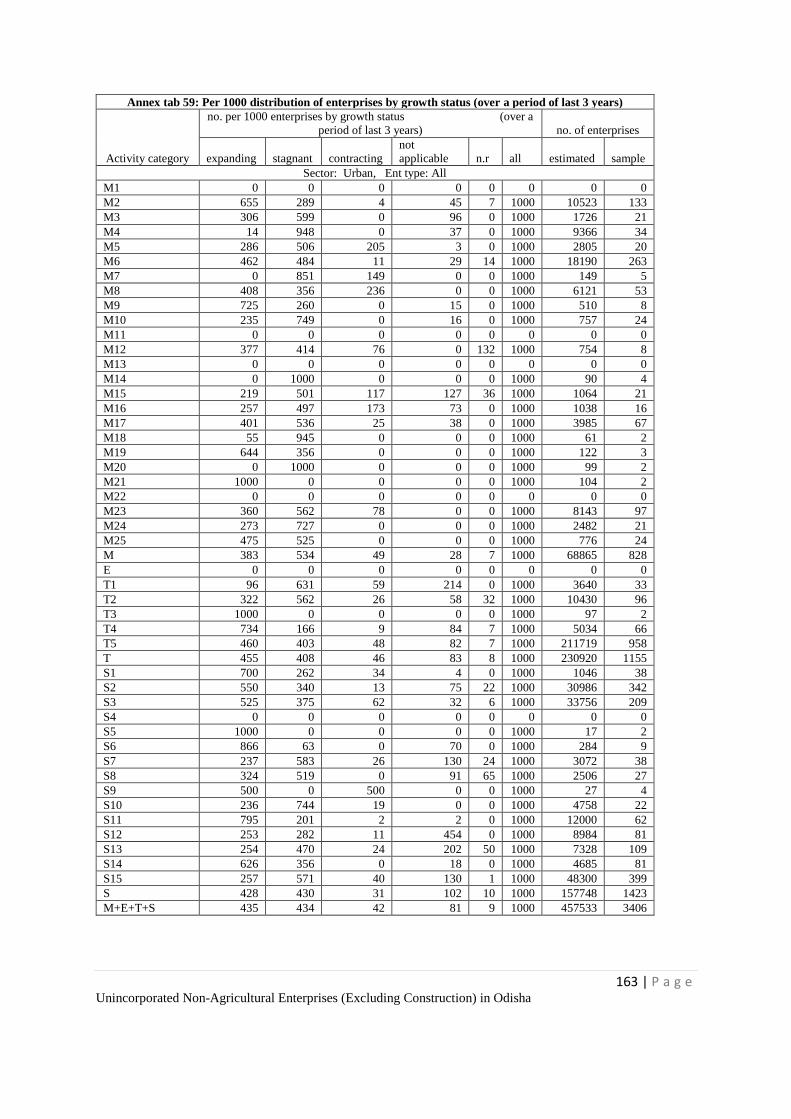
163 | P a g e Unincorporated Non-Agricultural Enterprises (Excluding Construction) in Odisha
Annex tab 59: Per 1000 distribution of enterprises by growth status (over a period of last 3 years)
Activity category
no. per 1000 enterprises by growth status (over a
period of last 3 years) no. of enterprises
expanding stagnant
contracting
not
applicable n.r all estimated sample
Sector: Urban, Ent type: All
M1 0 0 0 0 0 0 0 0
M2 655 289 4 45 7 1000 10523 133
M3 306 599 0 96 0 1000 1726 21
M4 14 948 0 37 0 1000 9366 34
M5 286 506 205 3 0 1000 2805 20
M6 462 484 11 29 14 1000 18190 263
M7 0 851 149 0 0 1000 149 5
M8 408 356 236 0 0 1000 6121 53
M9 725 260 0 15 0 1000 510 8
M10 235 749 0 16 0 1000 757 24
M11 0 0 0 0 0 0 0 0
M12 377 414 76 0 132 1000 754 8
M13 0 0 0 0 0 0 0 0
M14 0 1000 0 0 0 1000 90 4
M15 219 501 117 127 36 1000 1064 21
M16 257 497 173 73 0 1000 1038 16
M17 401 536 25 38 0 1000 3985 67
M18 55 945 0 0 0 1000 61 2
M19 644 356 0 0 0 1000 122 3
M20 0 1000 0 0 0 1000 99 2
M21 1000 0 0 0 0 1000 104 2
M22 0 0 0 0 0 0 0 0
M23 360 562 78 0 0 1000 8143 97
M24 273 727 0 0 0 1000 2482 21
M25 475 525 0 0 0 1000 776 24
M 383 534 49 28 7 1000 68865 828
E 0 0 0 0 0 0 0 0
T1 96 631 59 214 0 1000 3640 33
T2 322 562 26 58 32 1000 10430 96
T3 1000 0 0 0 0 1000 97 2
T4 734 166 9 84 7 1000 5034 66
T5 460 403 48 82 7 1000 211719 958
T 455 408 46 83 8 1000 230920 1155
S1 700 262 34 4 0 1000 1046 38
S2 550 340 13 75 22 1000 30986 342
S3 525 375 62 32 6 1000 33756 209
S4 0 0 0 0 0 0 0 0
S5 1000 0 0 0 0 1000 17 2
S6 866 63 0 70 0 1000 284 9
S7 237 583 26 130 24 1000 3072 38
S8 324 519 0 91 65 1000 2506 27
S9 500 0 500 0 0 1000 27 4
S10 236 744 19 0 0 1000 4758 22
S11 795 201 2 2 0 1000 12000 62
S12 253 282 11 454 0 1000 8984 81
S13 254 470 24 202 50 1000 7328 109
S14 626 356 0 18 0 1000 4685 81
S15 257 571 40 130 1 1000 48300 399
S 428 430 31 102 10 1000 157748 1423
M+E+T+S 435 434 42 81 9 1000 457533 3406
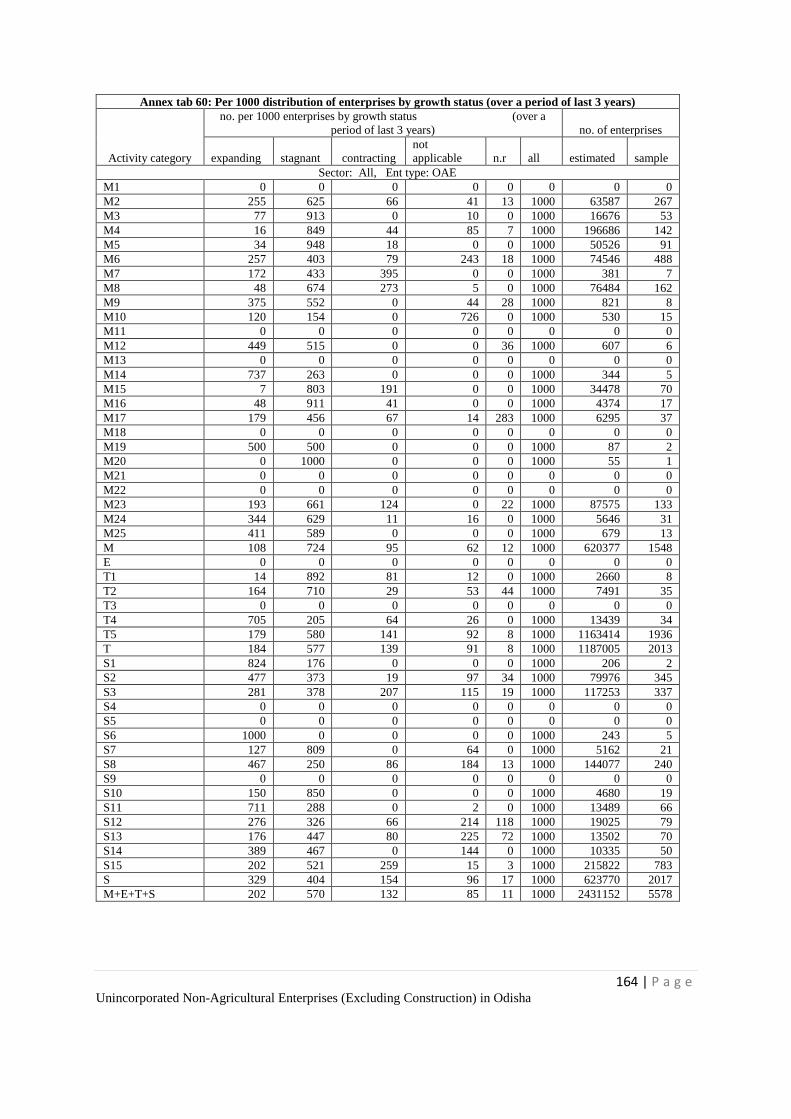
164 | P a g e Unincorporated Non-Agricultural Enterprises (Excluding Construction) in Odisha
Annex tab 60: Per 1000 distribution of enterprises by growth status (over a period of last 3 years)
Activity category
no. per 1000 enterprises by growth status (over a
period of last 3 years) no. of enterprises
expanding stagnant contracting
not
applicable n.r all estimated sample
Sector: All, Ent type: OAE
M1 0 0 0 0 0 0 0 0
M2 255 625 66 41 13 1000 63587 267
M3 77 913 0 10 0 1000 16676 53
M4 16 849 44 85 7 1000 196686 142
M5 34 948 18 0 0 1000 50526 91
M6 257 403 79 243 18 1000 74546 488
M7 172 433 395 0 0 1000 381 7
M8 48 674 273 5 0 1000 76484 162
M9 375 552 0 44 28 1000 821 8
M10 120 154 0 726 0 1000 530 15
M11 0 0 0 0 0 0 0 0
M12 449 515 0 0 36 1000 607 6
M13 0 0 0 0 0 0 0 0
M14 737 263 0 0 0 1000 344 5
M15 7 803 191 0 0 1000 34478 70
M16 48 911 41 0 0 1000 4374 17
M17 179 456 67 14 283 1000 6295 37
M18 0 0 0 0 0 0 0 0
M19 500 500 0 0 0 1000 87 2
M20 0 1000 0 0 0 1000 55 1
M21 0 0 0 0 0 0 0 0
M22 0 0 0 0 0 0 0 0
M23 193 661 124 0 22 1000 87575 133
M24 344 629 11 16 0 1000 5646 31
M25 411 589 0 0 0 1000 679 13
M 108 724 95 62 12 1000 620377 1548
E 0 0 0 0 0 0 0 0
T1 14 892 81 12 0 1000 2660 8
T2 164 710 29 53 44 1000 7491 35
T3 0 0 0 0 0 0 0 0
T4 705 205 64 26 0 1000 13439 34
T5 179 580 141 92 8 1000 1163414 1936
T 184 577 139 91 8 1000 1187005 2013
S1 824 176 0 0 0 1000 206 2
S2 477 373 19 97 34 1000 79976 345
S3 281 378 207 115 19 1000 117253 337
S4 0 0 0 0 0 0 0 0
S5 0 0 0 0 0 0 0 0
S6 1000 0 0 0 0 1000 243 5
S7 127 809 0 64 0 1000 5162 21
S8 467 250 86 184 13 1000 144077 240
S9 0 0 0 0 0 0 0 0
S10 150 850 0 0 0 1000 4680 19
S11 711 288 0 2 0 1000 13489 66
S12 276 326 66 214 118 1000 19025 79
S13 176 447 80 225 72 1000 13502 70
S14 389 467 0 144 0 1000 10335 50
S15 202 521 259 15 3 1000 215822 783
S 329 404 154 96 17 1000 623770 2017
M+E+T+S 202 570 132 85 11 1000 2431152 5578
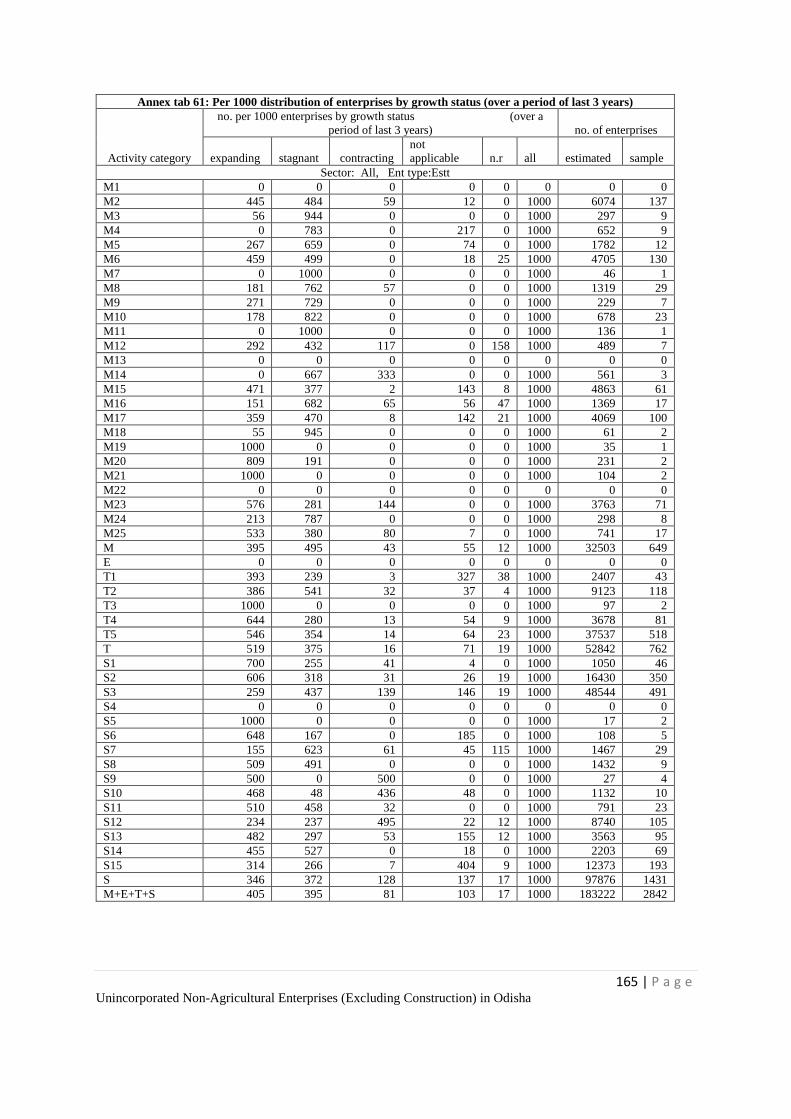
165 | P a g e Unincorporated Non-Agricultural Enterprises (Excluding Construction) in Odisha
Annex tab 61: Per 1000 distribution of enterprises by growth status (over a period of last 3 years)
Activity category
no. per 1000 enterprises by growth status (over a
period of last 3 years) no. of enterprises
expanding stagnant contracting
not
applicable n.r all estimated sample
Sector: All, Ent type:Estt
M1 0 0 0 0 0 0 0 0
M2 445 484 59 12 0 1000 6074 137
M3 56 944 0 0 0 1000 297 9
M4 0 783 0 217 0 1000 652 9
M5 267 659 0 74 0 1000 1782 12
M6 459 499 0 18 25 1000 4705 130
M7 0 1000 0 0 0 1000 46 1
M8 181 762 57 0 0 1000 1319 29
M9 271 729 0 0 0 1000 229 7
M10 178 822 0 0 0 1000 678 23
M11 0 1000 0 0 0 1000 136 1
M12 292 432 117 0 158 1000 489 7
M13 0 0 0 0 0 0 0 0
M14 0 667 333 0 0 1000 561 3
M15 471 377 2 143 8 1000 4863 61
M16 151 682 65 56 47 1000 1369 17
M17 359 470 8 142 21 1000 4069 100
M18 55 945 0 0 0 1000 61 2
M19 1000 0 0 0 0 1000 35 1
M20 809 191 0 0 0 1000 231 2
M21 1000 0 0 0 0 1000 104 2
M22 0 0 0 0 0 0 0 0
M23 576 281 144 0 0 1000 3763 71
M24 213 787 0 0 0 1000 298 8
M25 533 380 80 7 0 1000 741 17
M 395 495 43 55 12 1000 32503 649
E 0 0 0 0 0 0 0 0
T1 393 239 3 327 38 1000 2407 43
T2 386 541 32 37 4 1000 9123 118
T3 1000 0 0 0 0 1000 97 2
T4 644 280 13 54 9 1000 3678 81
T5 546 354 14 64 23 1000 37537 518
T 519 375 16 71 19 1000 52842 762
S1 700 255 41 4 0 1000 1050 46
S2 606 318 31 26 19 1000 16430 350
S3 259 437 139 146 19 1000 48544 491
S4 0 0 0 0 0 0 0 0
S5 1000 0 0 0 0 1000 17 2
S6 648 167 0 185 0 1000 108 5
S7 155 623 61 45 115 1000 1467 29
S8 509 491 0 0 0 1000 1432 9
S9 500 0 500 0 0 1000 27 4
S10 468 48 436 48 0 1000 1132 10
S11 510 458 32 0 0 1000 791 23
S12 234 237 495 22 12 1000 8740 105
S13 482 297 53 155 12 1000 3563 95
S14 455 527 0 18 0 1000 2203 69
S15 314 266 7 404 9 1000 12373 193
S 346 372 128 137 17 1000 97876 1431
M+E+T+S 405 395 81 103 17 1000 183222 2842

166 | P a g e Unincorporated Non-Agricultural Enterprises (Excluding Construction) in Odisha
Annex tab 62: Per 1000 distribution of enterprises by growth status (over a period of last 3 years)
Activity category
no. per 1000 enterprises by growth status (over a
period of last 3 years) no. of enterprises
expanding stagnant contracting
not
applicable n.r all estimated sample
Sector: All, Ent type:All
M1 0 0 0 0 0 0 0 0
M2 272 613 65 38 12 1000 69660 404
M3 77 913 0 10 0 1000 16973 62
M4 16 848 44 85 6 1000 197338 151
M5 42 938 18 3 0 1000 52308 103
M6 269 409 74 229 18 1000 79251 618
M7 153 494 353 0 0 1000 428 8
M8 50 675 270 5 0 1000 77803 191
M9 352 591 0 35 22 1000 1050 15
M10 152 529 0 319 0 1000 1207 38
M11 0 1000 0 0 0 1000 136 1
M12 379 478 52 0 91 1000 1096 13
M13 0 0 0 0 0 0 0 0
M14 280 513 207 0 0 1000 905 8
M15 64 750 167 18 1 1000 39342 131
M16 73 856 47 13 11 1000 5742 34
M17 250 461 44 65 180 1000 10364 137
M18 55 945 0 0 0 1000 61 2
M19 644 356 0 0 0 1000 122 3
M20 653 347 0 0 0 1000 286 3
M21 1000 0 0 0 0 1000 104 2
M22 0 0 0 0 0 0 0 0
M23 208 646 125 0 21 1000 91338 204
M24 337 637 11 15 0 1000 5945 39
M25 475 480 42 4 0 1000 1421 30
M 122 712 92 62 12 1000 652880 2197
E 0 0 0 0 0 0 0 0
T1 194 582 44 162 18 1000 5067 51
T2 286 617 31 44 22 1000 16614 153
T3 1000 0 0 0 0 1000 97 2
T4 692 221 53 32 2 1000 17117 115
T5 190 573 137 92 9 1000 1200952 2454
T 198 569 134 90 9 1000 1239847 2775
S1 720 242 34 4 0 1000 1256 48
S2 499 364 21 85 31 1000 96407 695
S3 275 395 187 124 19 1000 165796 828
S4 0 0 0 0 0 0 0 0
S5 1000 0 0 0 0 1000 17 2
S6 892 51 0 57 0 1000 351 10
S7 133 768 14 60 26 1000 6629 50
S8 468 252 85 182 12 1000 145509 249
S9 500 0 500 0 0 1000 27 4
S10 212 694 85 9 0 1000 5812 29
S11 699 297 2 2 0 1000 14280 89
S12 263 298 201 153 85 1000 27766 184
S13 240 416 74 211 60 1000 17065 165
S14 401 477 0 122 0 1000 12538 119
S15 208 507 245 36 4 1000 228195 976
S 331 399 151 102 17 1000 721646 3448
M+E+T+S 216 558 128 86 12 1000 2614374 8420
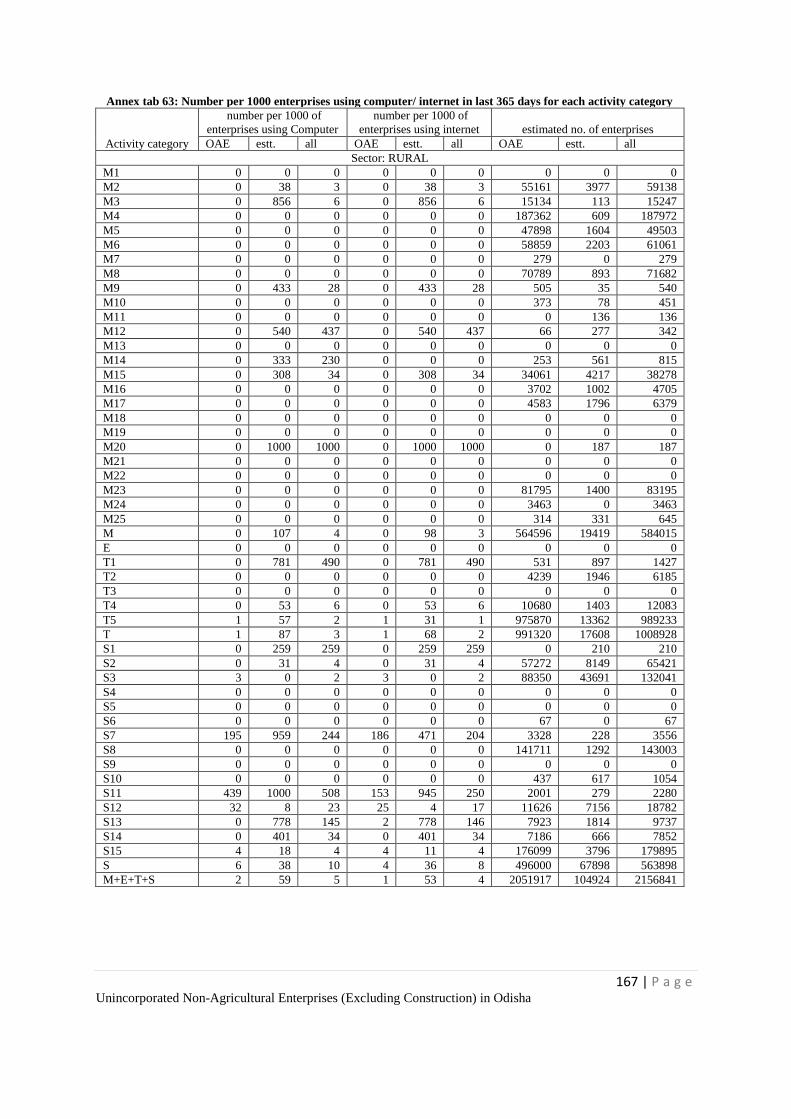
167 | P a g e Unincorporated Non-Agricultural Enterprises (Excluding Construction) in Odisha
Annex tab 63: Number per 1000 enterprises using computer/ internet in last 365 days for each activity category
Activity category
number per 1000 of
enterprises using Computer
number per 1000 of
enterprises using internet estimated no. of enterprises
OAE estt. all OAE estt. all OAE estt. all
Sector: RURAL
M1 0 0 0 0 0 0 0 0 0
M2 0 38 3 0 38 3 55161 3977 59138
M3 0 856 6 0 856 6 15134 113 15247
M4 0 0 0 0 0 0 187362 609 187972
M5 0 0 0 0 0 0 47898 1604 49503
M6 0 0 0 0 0 0 58859 2203 61061
M7 0 0 0 0 0 0 279 0 279
M8 0 0 0 0 0 0 70789 893 71682
M9 0 433 28 0 433 28 505 35 540
M10 0 0 0 0 0 0 373 78 451
M11 0 0 0 0 0 0 0 136 136
M12 0 540 437 0 540 437 66 277 342
M13 0 0 0 0 0 0 0 0 0
M14 0 333 230 0 0 0 253 561 815
M15 0 308 34 0 308 34 34061 4217 38278
M16 0 0 0 0 0 0 3702 1002 4705
M17 0 0 0 0 0 0 4583 1796 6379
M18 0 0 0 0 0 0 0 0 0
M19 0 0 0 0 0 0 0 0 0
M20 0 1000 1000 0 1000 1000 0 187 187
M21 0 0 0 0 0 0 0 0 0
M22 0 0 0 0 0 0 0 0 0
M23 0 0 0 0 0 0 81795 1400 83195
M24 0 0 0 0 0 0 3463 0 3463
M25 0 0 0 0 0 0 314 331 645
M 0 107 4 0 98 3 564596 19419 584015
E 0 0 0 0 0 0 0 0 0
T1 0 781 490 0 781 490 531 897 1427
T2 0 0 0 0 0 0 4239 1946 6185
T3 0 0 0 0 0 0 0 0 0
T4 0 53 6 0 53 6 10680 1403 12083
T5 1 57 2 1 31 1 975870 13362 989233
T 1 87 3 1 68 2 991320 17608 1008928
S1 0 259 259 0 259 259 0 210 210
S2 0 31 4 0 31 4 57272 8149 65421
S3 3 0 2 3 0 2 88350 43691 132041
S4 0 0 0 0 0 0 0 0 0
S5 0 0 0 0 0 0 0 0 0
S6 0 0 0 0 0 0 67 0 67
S7 195 959 244 186 471 204 3328 228 3556
S8 0 0 0 0 0 0 141711 1292 143003
S9 0 0 0 0 0 0 0 0 0
S10 0 0 0 0 0 0 437 617 1054
S11 439 1000 508 153 945 250 2001 279 2280
S12 32 8 23 25 4 17 11626 7156 18782
S13 0 778 145 2 778 146 7923 1814 9737
S14 0 401 34 0 401 34 7186 666 7852
S15 4 18 4 4 11 4 176099 3796 179895
S 6 38 10 4 36 8 496000 67898 563898
M+E+T+S 2 59 5 1 53 4 2051917 104924 2156841
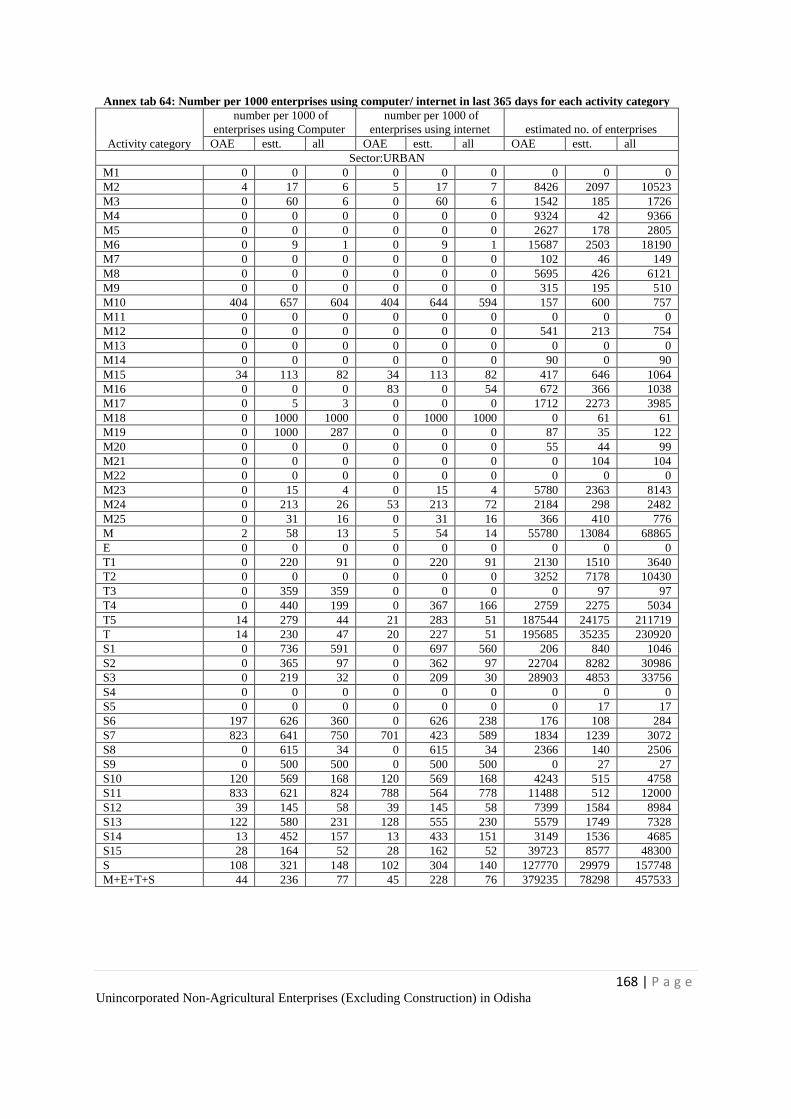
168 | P a g e Unincorporated Non-Agricultural Enterprises (Excluding Construction) in Odisha
Annex tab 64: Number per 1000 enterprises using computer/ internet in last 365 days for each activity category
Activity category
number per 1000 of
enterprises using Computer
number per 1000 of
enterprises using internet estimated no. of enterprises
OAE estt. all OAE estt. all OAE estt. all
Sector:URBAN
M1 0 0 0 0 0 0 0 0 0
M2 4 17 6 5 17 7 8426 2097 10523
M3 0 60 6 0 60 6 1542 185 1726
M4 0 0 0 0 0 0 9324 42 9366
M5 0 0 0 0 0 0 2627 178 2805
M6 0 9 1 0 9 1 15687 2503 18190
M7 0 0 0 0 0 0 102 46 149
M8 0 0 0 0 0 0 5695 426 6121
M9 0 0 0 0 0 0 315 195 510
M10 404 657 604 404 644 594 157 600 757
M11 0 0 0 0 0 0 0 0 0
M12 0 0 0 0 0 0 541 213 754
M13 0 0 0 0 0 0 0 0 0
M14 0 0 0 0 0 0 90 0 90
M15 34 113 82 34 113 82 417 646 1064
M16 0 0 0 83 0 54 672 366 1038
M17 0 5 3 0 0 0 1712 2273 3985
M18 0 1000 1000 0 1000 1000 0 61 61
M19 0 1000 287 0 0 0 87 35 122
M20 0 0 0 0 0 0 55 44 99
M21 0 0 0 0 0 0 0 104 104
M22 0 0 0 0 0 0 0 0 0
M23 0 15 4 0 15 4 5780 2363 8143
M24 0 213 26 53 213 72 2184 298 2482
M25 0 31 16 0 31 16 366 410 776
M 2 58 13 5 54 14 55780 13084 68865
E 0 0 0 0 0 0 0 0 0
T1 0 220 91 0 220 91 2130 1510 3640
T2 0 0 0 0 0 0 3252 7178 10430
T3 0 359 359 0 0 0 0 97 97
T4 0 440 199 0 367 166 2759 2275 5034
T5 14 279 44 21 283 51 187544 24175 211719
T 14 230 47 20 227 51 195685 35235 230920
S1 0 736 591 0 697 560 206 840 1046
S2 0 365 97 0 362 97 22704 8282 30986
S3 0 219 32 0 209 30 28903 4853 33756
S4 0 0 0 0 0 0 0 0 0
S5 0 0 0 0 0 0 0 17 17
S6 197 626 360 0 626 238 176 108 284
S7 823 641 750 701 423 589 1834 1239 3072
S8 0 615 34 0 615 34 2366 140 2506
S9 0 500 500 0 500 500 0 27 27
S10 120 569 168 120 569 168 4243 515 4758
S11 833 621 824 788 564 778 11488 512 12000
S12 39 145 58 39 145 58 7399 1584 8984
S13 122 580 231 128 555 230 5579 1749 7328
S14 13 452 157 13 433 151 3149 1536 4685
S15 28 164 52 28 162 52 39723 8577 48300
S 108 321 148 102 304 140 127770 29979 157748
M+E+T+S 44 236 77 45 228 76 379235 78298 457533
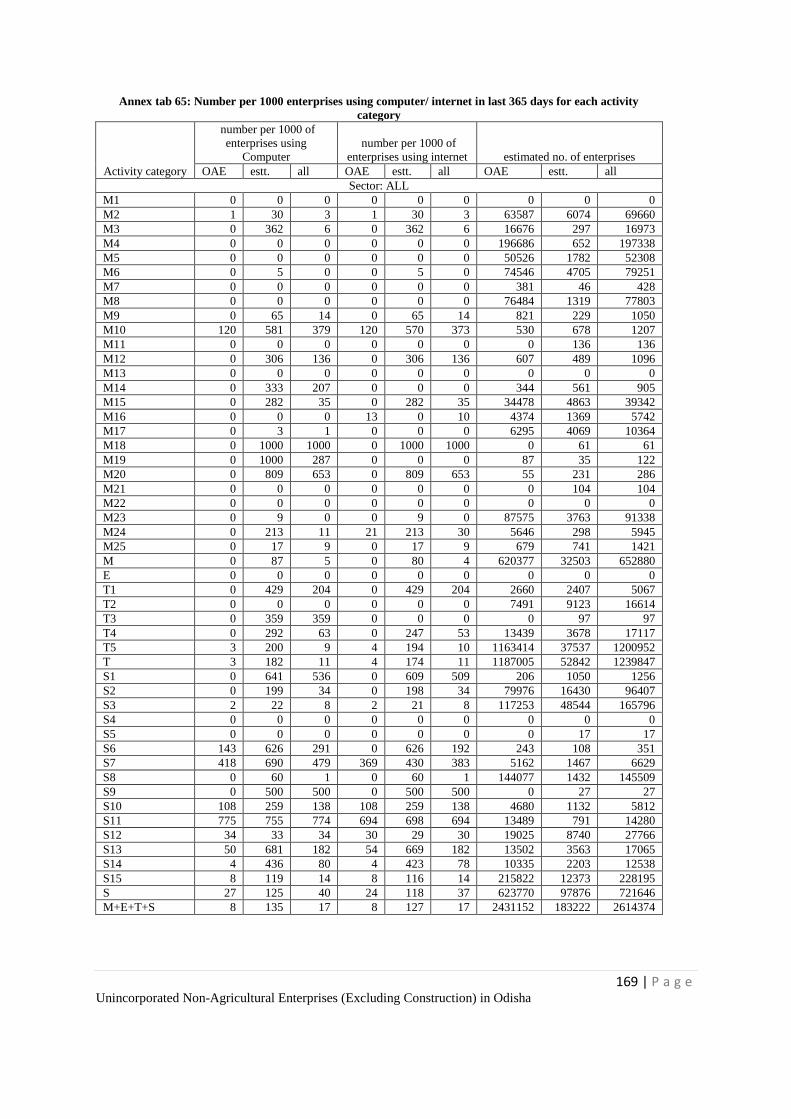
169 | P a g e Unincorporated Non-Agricultural Enterprises (Excluding Construction) in Odisha
Annex tab 65: Number per 1000 enterprises using computer/ internet in last 365 days for each activity
category
Activity category
number per 1000 of
enterprises using
Computer
number per 1000 of
enterprises using internet estimated no. of enterprises
OAE estt. all OAE estt. all OAE estt. all
Sector: ALL
M1 0 0 0 0 0 0 0 0 0
M2 1 30 3 1 30 3 63587 6074 69660
M3 0 362 6 0 362 6 16676 297 16973
M4 0 0 0 0 0 0 196686 652 197338
M5 0 0 0 0 0 0 50526 1782 52308
M6 0 5 0 0 5 0 74546 4705 79251
M7 0 0 0 0 0 0 381 46 428
M8 0 0 0 0 0 0 76484 1319 77803
M9 0 65 14 0 65 14 821 229 1050
M10 120 581 379 120 570 373 530 678 1207
M11 0 0 0 0 0 0 0 136 136
M12 0 306 136 0 306 136 607 489 1096
M13 0 0 0 0 0 0 0 0 0
M14 0 333 207 0 0 0 344 561 905
M15 0 282 35 0 282 35 34478 4863 39342
M16 0 0 0 13 0 10 4374 1369 5742
M17 0 3 1 0 0 0 6295 4069 10364
M18 0 1000 1000 0 1000 1000 0 61 61
M19 0 1000 287 0 0 0 87 35 122
M20 0 809 653 0 809 653 55 231 286
M21 0 0 0 0 0 0 0 104 104
M22 0 0 0 0 0 0 0 0 0
M23 0 9 0 0 9 0 87575 3763 91338
M24 0 213 11 21 213 30 5646 298 5945
M25 0 17 9 0 17 9 679 741 1421
M 0 87 5 0 80 4 620377 32503 652880
E 0 0 0 0 0 0 0 0 0
T1 0 429 204 0 429 204 2660 2407 5067
T2 0 0 0 0 0 0 7491 9123 16614
T3 0 359 359 0 0 0 0 97 97
T4 0 292 63 0 247 53 13439 3678 17117
T5 3 200 9 4 194 10 1163414 37537 1200952
T 3 182 11 4 174 11 1187005 52842 1239847
S1 0 641 536 0 609 509 206 1050 1256
S2 0 199 34 0 198 34 79976 16430 96407
S3 2 22 8 2 21 8 117253 48544 165796
S4 0 0 0 0 0 0 0 0 0
S5 0 0 0 0 0 0 0 17 17
S6 143 626 291 0 626 192 243 108 351
S7 418 690 479 369 430 383 5162 1467 6629
S8 0 60 1 0 60 1 144077 1432 145509
S9 0 500 500 0 500 500 0 27 27
S10 108 259 138 108 259 138 4680 1132 5812
S11 775 755 774 694 698 694 13489 791 14280
S12 34 33 34 30 29 30 19025 8740 27766
S13 50 681 182 54 669 182 13502 3563 17065
S14 4 436 80 4 423 78 10335 2203 12538
S15 8 119 14 8 116 14 215822 12373 228195
S 27 125 40 24 118 37 623770 97876 721646
M+E+T+S 8 135 17 8 127 17 2431152 183222 2614374
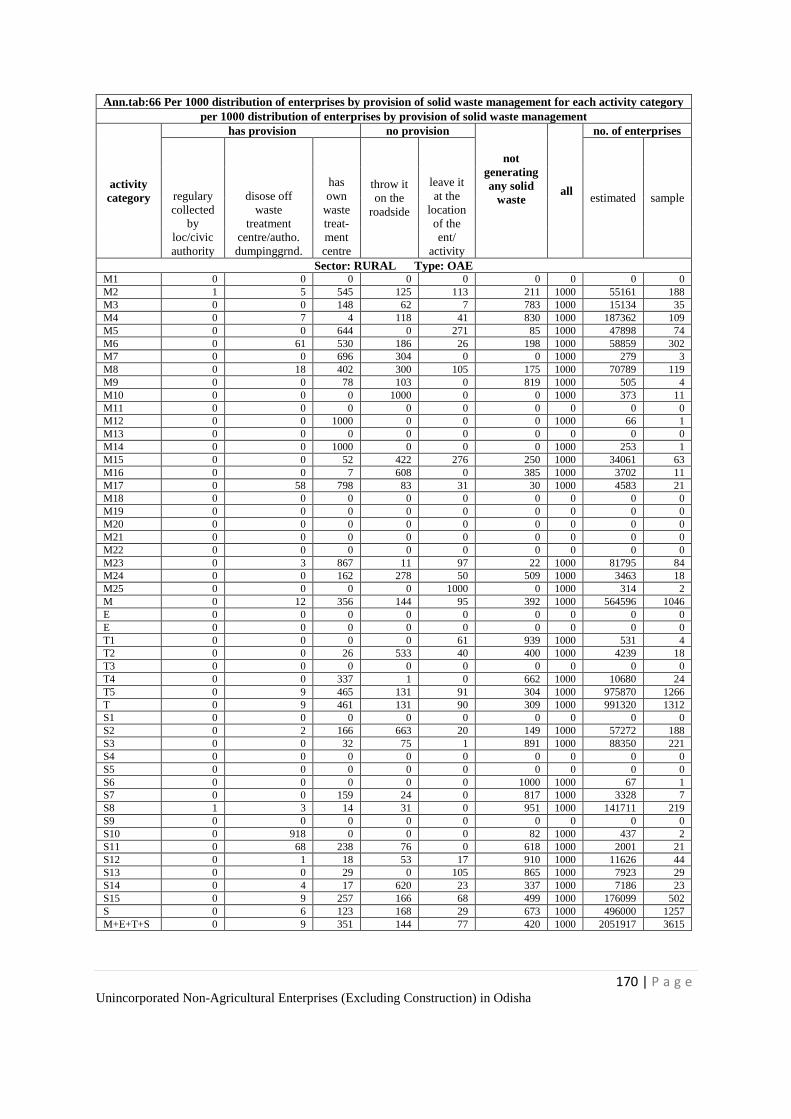
170 | P a g e Unincorporated Non-Agricultural Enterprises (Excluding Construction) in Odisha
Ann.tab:66 Per 1000 distribution of enterprises by provision of solid waste management for each activity category
per 1000 distribution of enterprises by provision of solid waste management
activity
category
has provision no provision
not
generating
any solid
waste all
no. of enterprises
regulary
collected
by
loc/civic
authority
disose off
waste
treatment
centre/autho.
dumpinggrnd.
has
own
waste
treat-
ment
centre
throw it
on the
roadside
leave it
at the
location
of the
ent/
activity
estimated sample
Sector: RURAL Type: OAE M1 0 0 0 0 0 0 0 0 0
M2 1 5 545 125 113 211 1000 55161 188
M3 0 0 148 62 7 783 1000 15134 35
M4 0 7 4 118 41 830 1000 187362 109
M5 0 0 644 0 271 85 1000 47898 74
M6 0 61 530 186 26 198 1000 58859 302
M7 0 0 696 304 0 0 1000 279 3
M8 0 18 402 300 105 175 1000 70789 119
M9 0 0 78 103 0 819 1000 505 4
M10 0 0 0 1000 0 0 1000 373 11
M11 0 0 0 0 0 0 0 0 0
M12 0 0 1000 0 0 0 1000 66 1
M13 0 0 0 0 0 0 0 0 0
M14 0 0 1000 0 0 0 1000 253 1
M15 0 0 52 422 276 250 1000 34061 63
M16 0 0 7 608 0 385 1000 3702 11
M17 0 58 798 83 31 30 1000 4583 21
M18 0 0 0 0 0 0 0 0 0
M19 0 0 0 0 0 0 0 0 0
M20 0 0 0 0 0 0 0 0 0
M21 0 0 0 0 0 0 0 0 0
M22 0 0 0 0 0 0 0 0 0
M23 0 3 867 11 97 22 1000 81795 84
M24 0 0 162 278 50 509 1000 3463 18
M25 0 0 0 0 1000 0 1000 314 2
M 0 12 356 144 95 392 1000 564596 1046
E 0 0 0 0 0 0 0 0 0
E 0 0 0 0 0 0 0 0 0
T1 0 0 0 0 61 939 1000 531 4
T2 0 0 26 533 40 400 1000 4239 18
T3 0 0 0 0 0 0 0 0 0
T4 0 0 337 1 0 662 1000 10680 24
T5 0 9 465 131 91 304 1000 975870 1266
T 0 9 461 131 90 309 1000 991320 1312
S1 0 0 0 0 0 0 0 0 0
S2 0 2 166 663 20 149 1000 57272 188
S3 0 0 32 75 1 891 1000 88350 221
S4 0 0 0 0 0 0 0 0 0
S5 0 0 0 0 0 0 0 0 0
S6 0 0 0 0 0 1000 1000 67 1
S7 0 0 159 24 0 817 1000 3328 7
S8 1 3 14 31 0 951 1000 141711 219
S9 0 0 0 0 0 0 0 0 0
S10 0 918 0 0 0 82 1000 437 2
S11 0 68 238 76 0 618 1000 2001 21
S12 0 1 18 53 17 910 1000 11626 44
S13 0 0 29 0 105 865 1000 7923 29
S14 0 4 17 620 23 337 1000 7186 23
S15 0 9 257 166 68 499 1000 176099 502
S 0 6 123 168 29 673 1000 496000 1257
M+E+T+S 0 9 351 144 77 420 1000 2051917 3615
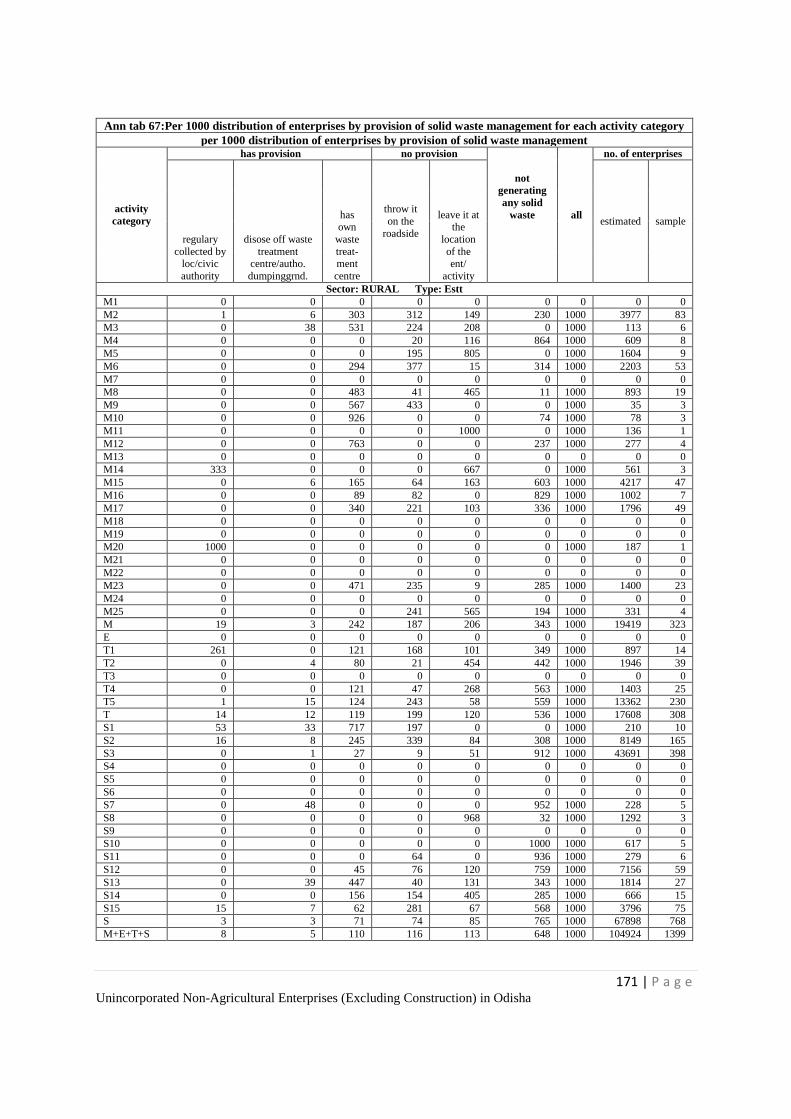
171 | P a g e Unincorporated Non-Agricultural Enterprises (Excluding Construction) in Odisha
Ann tab 67:Per 1000 distribution of enterprises by provision of solid waste management for each activity category
per 1000 distribution of enterprises by provision of solid waste management
activity
category
has provision no provision
not
generating
any solid
waste all
no. of enterprises
regulary
collected by loc/civic
authority
disose off waste
treatment centre/autho.
dumpinggrnd.
has own
waste
treat- ment
centre
throw it
on the
roadside
leave it at the
location
of the ent/
activity
estimated sample
Sector: RURAL Type: Estt
M1 0 0 0 0 0 0 0 0 0
M2 1 6 303 312 149 230 1000 3977 83
M3 0 38 531 224 208 0 1000 113 6
M4 0 0 0 20 116 864 1000 609 8
M5 0 0 0 195 805 0 1000 1604 9
M6 0 0 294 377 15 314 1000 2203 53
M7 0 0 0 0 0 0 0 0 0
M8 0 0 483 41 465 11 1000 893 19
M9 0 0 567 433 0 0 1000 35 3
M10 0 0 926 0 0 74 1000 78 3
M11 0 0 0 0 1000 0 1000 136 1
M12 0 0 763 0 0 237 1000 277 4
M13 0 0 0 0 0 0 0 0 0
M14 333 0 0 0 667 0 1000 561 3
M15 0 6 165 64 163 603 1000 4217 47
M16 0 0 89 82 0 829 1000 1002 7
M17 0 0 340 221 103 336 1000 1796 49
M18 0 0 0 0 0 0 0 0 0
M19 0 0 0 0 0 0 0 0 0
M20 1000 0 0 0 0 0 1000 187 1
M21 0 0 0 0 0 0 0 0 0
M22 0 0 0 0 0 0 0 0 0
M23 0 0 471 235 9 285 1000 1400 23
M24 0 0 0 0 0 0 0 0 0
M25 0 0 0 241 565 194 1000 331 4
M 19 3 242 187 206 343 1000 19419 323
E 0 0 0 0 0 0 0 0 0
T1 261 0 121 168 101 349 1000 897 14
T2 0 4 80 21 454 442 1000 1946 39
T3 0 0 0 0 0 0 0 0 0
T4 0 0 121 47 268 563 1000 1403 25
T5 1 15 124 243 58 559 1000 13362 230
T 14 12 119 199 120 536 1000 17608 308
S1 53 33 717 197 0 0 1000 210 10
S2 16 8 245 339 84 308 1000 8149 165
S3 0 1 27 9 51 912 1000 43691 398
S4 0 0 0 0 0 0 0 0 0
S5 0 0 0 0 0 0 0 0 0
S6 0 0 0 0 0 0 0 0 0
S7 0 48 0 0 0 952 1000 228 5
S8 0 0 0 0 968 32 1000 1292 3
S9 0 0 0 0 0 0 0 0 0
S10 0 0 0 0 0 1000 1000 617 5
S11 0 0 0 64 0 936 1000 279 6
S12 0 0 45 76 120 759 1000 7156 59
S13 0 39 447 40 131 343 1000 1814 27
S14 0 0 156 154 405 285 1000 666 15
S15 15 7 62 281 67 568 1000 3796 75
S 3 3 71 74 85 765 1000 67898 768
M+E+T+S 8 5 110 116 113 648 1000 104924 1399
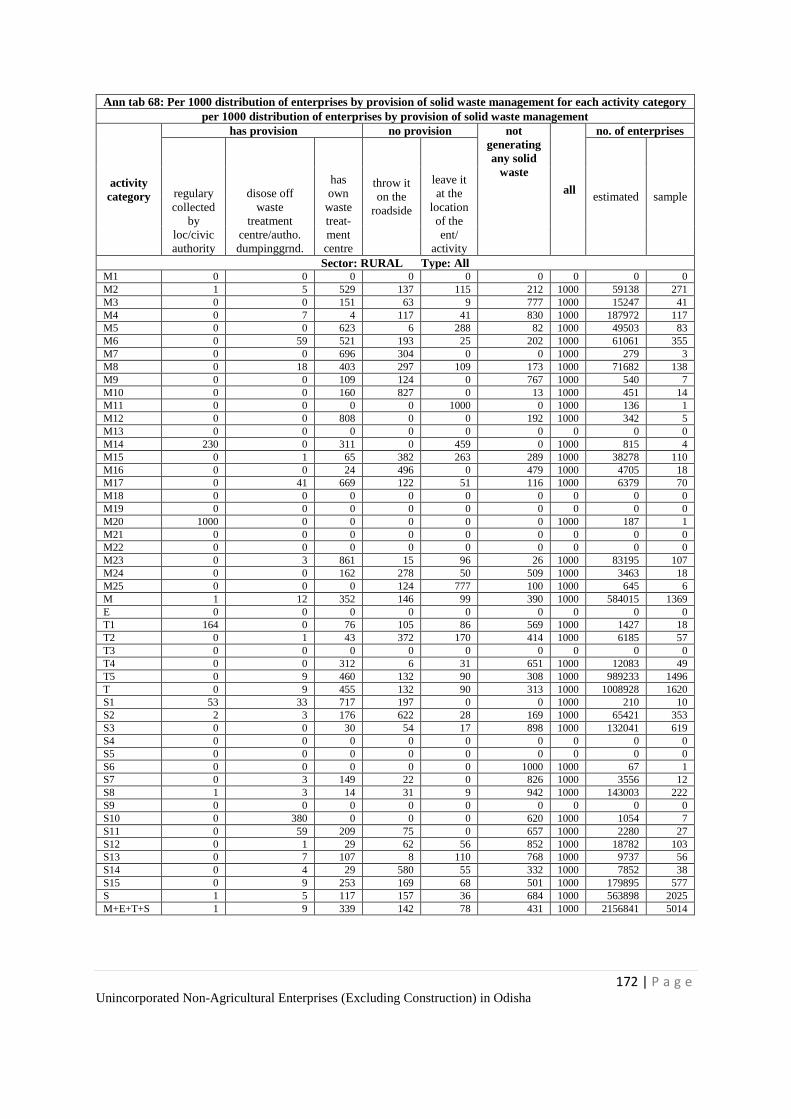
172 | P a g e Unincorporated Non-Agricultural Enterprises (Excluding Construction) in Odisha
Ann tab 68: Per 1000 distribution of enterprises by provision of solid waste management for each activity category
per 1000 distribution of enterprises by provision of solid waste management
activity
category
has provision no provision not
generating
any solid
waste
all
no. of enterprises
regulary
collected
by
loc/civic
authority
disose off
waste
treatment
centre/autho.
dumpinggrnd.
has
own
waste
treat-
ment
centre
throw it
on the
roadside
leave it
at the
location
of the
ent/
activity
estimated sample
Sector: RURAL Type: All M1 0 0 0 0 0 0 0 0 0
M2 1 5 529 137 115 212 1000 59138 271
M3 0 0 151 63 9 777 1000 15247 41
M4 0 7 4 117 41 830 1000 187972 117
M5 0 0 623 6 288 82 1000 49503 83
M6 0 59 521 193 25 202 1000 61061 355
M7 0 0 696 304 0 0 1000 279 3
M8 0 18 403 297 109 173 1000 71682 138
M9 0 0 109 124 0 767 1000 540 7
M10 0 0 160 827 0 13 1000 451 14
M11 0 0 0 0 1000 0 1000 136 1
M12 0 0 808 0 0 192 1000 342 5
M13 0 0 0 0 0 0 0 0 0
M14 230 0 311 0 459 0 1000 815 4
M15 0 1 65 382 263 289 1000 38278 110
M16 0 0 24 496 0 479 1000 4705 18
M17 0 41 669 122 51 116 1000 6379 70
M18 0 0 0 0 0 0 0 0 0
M19 0 0 0 0 0 0 0 0 0
M20 1000 0 0 0 0 0 1000 187 1
M21 0 0 0 0 0 0 0 0 0
M22 0 0 0 0 0 0 0 0 0
M23 0 3 861 15 96 26 1000 83195 107
M24 0 0 162 278 50 509 1000 3463 18
M25 0 0 0 124 777 100 1000 645 6
M 1 12 352 146 99 390 1000 584015 1369
E 0 0 0 0 0 0 0 0 0
T1 164 0 76 105 86 569 1000 1427 18
T2 0 1 43 372 170 414 1000 6185 57
T3 0 0 0 0 0 0 0 0 0
T4 0 0 312 6 31 651 1000 12083 49
T5 0 9 460 132 90 308 1000 989233 1496
T 0 9 455 132 90 313 1000 1008928 1620
S1 53 33 717 197 0 0 1000 210 10
S2 2 3 176 622 28 169 1000 65421 353
S3 0 0 30 54 17 898 1000 132041 619
S4 0 0 0 0 0 0 0 0 0
S5 0 0 0 0 0 0 0 0 0
S6 0 0 0 0 0 1000 1000 67 1
S7 0 3 149 22 0 826 1000 3556 12
S8 1 3 14 31 9 942 1000 143003 222
S9 0 0 0 0 0 0 0 0 0
S10 0 380 0 0 0 620 1000 1054 7
S11 0 59 209 75 0 657 1000 2280 27
S12 0 1 29 62 56 852 1000 18782 103
S13 0 7 107 8 110 768 1000 9737 56
S14 0 4 29 580 55 332 1000 7852 38
S15 0 9 253 169 68 501 1000 179895 577
S 1 5 117 157 36 684 1000 563898 2025
M+E+T+S 1 9 339 142 78 431 1000 2156841 5014
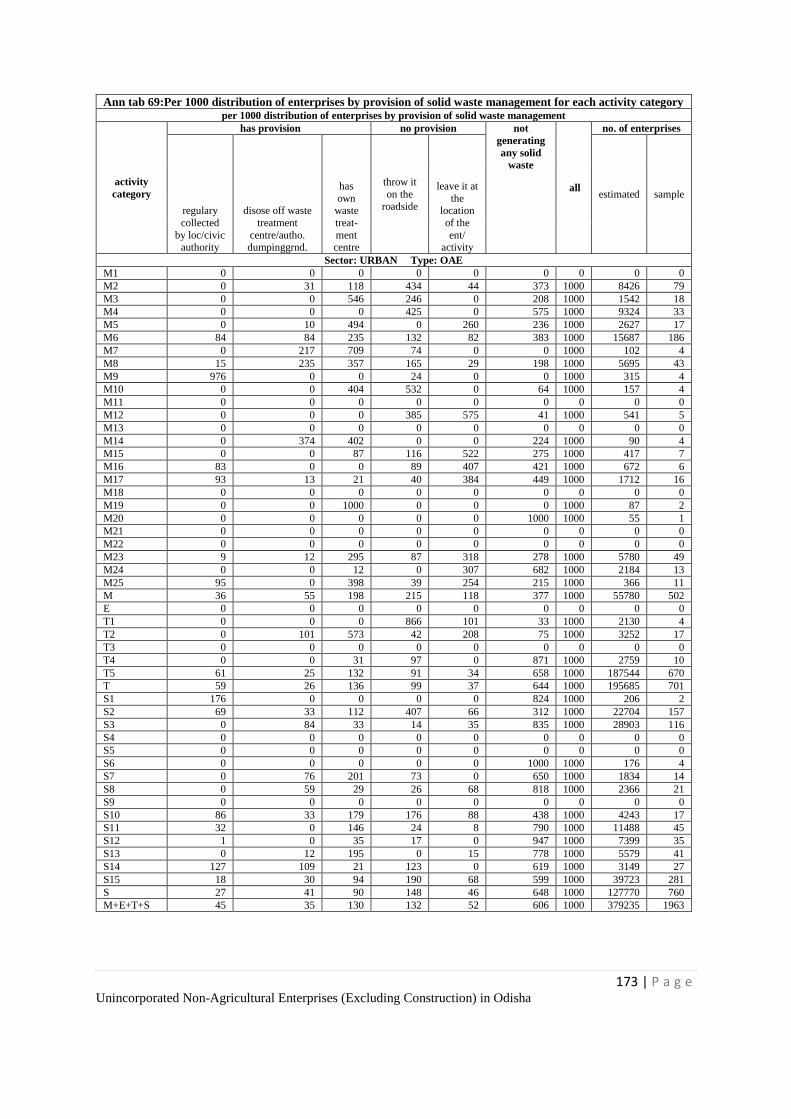
173 | P a g e Unincorporated Non-Agricultural Enterprises (Excluding Construction) in Odisha
Ann tab 69:Per 1000 distribution of enterprises by provision of solid waste management for each activity category per 1000 distribution of enterprises by provision of solid waste management
activity
category
has provision no provision not
generating
any solid
waste
all
no. of enterprises
regulary
collected
by loc/civic authority
disose off waste
treatment
centre/autho. dumpinggrnd.
has
own waste
treat-
ment centre
throw it
on the roadside
leave it at
the location
of the
ent/ activity
estimated sample
Sector: URBAN Type: OAE
M1 0 0 0 0 0 0 0 0 0
M2 0 31 118 434 44 373 1000 8426 79
M3 0 0 546 246 0 208 1000 1542 18
M4 0 0 0 425 0 575 1000 9324 33
M5 0 10 494 0 260 236 1000 2627 17
M6 84 84 235 132 82 383 1000 15687 186
M7 0 217 709 74 0 0 1000 102 4
M8 15 235 357 165 29 198 1000 5695 43
M9 976 0 0 24 0 0 1000 315 4
M10 0 0 404 532 0 64 1000 157 4
M11 0 0 0 0 0 0 0 0 0
M12 0 0 0 385 575 41 1000 541 5
M13 0 0 0 0 0 0 0 0 0
M14 0 374 402 0 0 224 1000 90 4
M15 0 0 87 116 522 275 1000 417 7
M16 83 0 0 89 407 421 1000 672 6
M17 93 13 21 40 384 449 1000 1712 16
M18 0 0 0 0 0 0 0 0 0
M19 0 0 1000 0 0 0 1000 87 2
M20 0 0 0 0 0 1000 1000 55 1
M21 0 0 0 0 0 0 0 0 0
M22 0 0 0 0 0 0 0 0 0
M23 9 12 295 87 318 278 1000 5780 49
M24 0 0 12 0 307 682 1000 2184 13
M25 95 0 398 39 254 215 1000 366 11
M 36 55 198 215 118 377 1000 55780 502
E 0 0 0 0 0 0 0 0 0
T1 0 0 0 866 101 33 1000 2130 4
T2 0 101 573 42 208 75 1000 3252 17
T3 0 0 0 0 0 0 0 0 0
T4 0 0 31 97 0 871 1000 2759 10
T5 61 25 132 91 34 658 1000 187544 670
T 59 26 136 99 37 644 1000 195685 701
S1 176 0 0 0 0 824 1000 206 2
S2 69 33 112 407 66 312 1000 22704 157
S3 0 84 33 14 35 835 1000 28903 116
S4 0 0 0 0 0 0 0 0 0
S5 0 0 0 0 0 0 0 0 0
S6 0 0 0 0 0 1000 1000 176 4
S7 0 76 201 73 0 650 1000 1834 14
S8 0 59 29 26 68 818 1000 2366 21
S9 0 0 0 0 0 0 0 0 0
S10 86 33 179 176 88 438 1000 4243 17
S11 32 0 146 24 8 790 1000 11488 45
S12 1 0 35 17 0 947 1000 7399 35
S13 0 12 195 0 15 778 1000 5579 41
S14 127 109 21 123 0 619 1000 3149 27
S15 18 30 94 190 68 599 1000 39723 281
S 27 41 90 148 46 648 1000 127770 760
M+E+T+S 45 35 130 132 52 606 1000 379235 1963
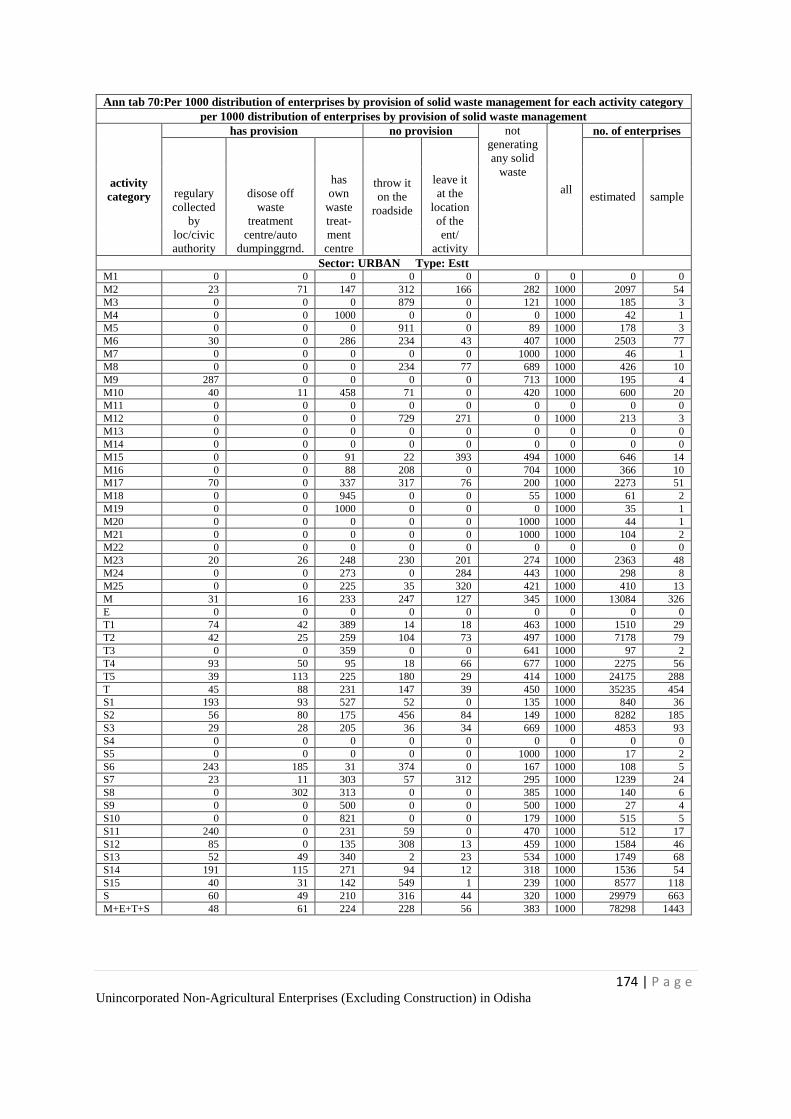
174 | P a g e Unincorporated Non-Agricultural Enterprises (Excluding Construction) in Odisha
Ann tab 70:Per 1000 distribution of enterprises by provision of solid waste management for each activity category
per 1000 distribution of enterprises by provision of solid waste management
activity
category
has provision no provision not
generating
any solid
waste
all
no. of enterprises
regulary
collected
by
loc/civic
authority
disose off
waste
treatment
centre/auto
dumpinggrnd.
has
own
waste
treat-
ment
centre
throw it
on the
roadside
leave it
at the
location
of the
ent/
activity
estimated sample
Sector: URBAN Type: Estt M1 0 0 0 0 0 0 0 0 0
M2 23 71 147 312 166 282 1000 2097 54
M3 0 0 0 879 0 121 1000 185 3
M4 0 0 1000 0 0 0 1000 42 1
M5 0 0 0 911 0 89 1000 178 3
M6 30 0 286 234 43 407 1000 2503 77
M7 0 0 0 0 0 1000 1000 46 1
M8 0 0 0 234 77 689 1000 426 10
M9 287 0 0 0 0 713 1000 195 4
M10 40 11 458 71 0 420 1000 600 20
M11 0 0 0 0 0 0 0 0 0
M12 0 0 0 729 271 0 1000 213 3
M13 0 0 0 0 0 0 0 0 0
M14 0 0 0 0 0 0 0 0 0
M15 0 0 91 22 393 494 1000 646 14
M16 0 0 88 208 0 704 1000 366 10
M17 70 0 337 317 76 200 1000 2273 51
M18 0 0 945 0 0 55 1000 61 2
M19 0 0 1000 0 0 0 1000 35 1
M20 0 0 0 0 0 1000 1000 44 1
M21 0 0 0 0 0 1000 1000 104 2
M22 0 0 0 0 0 0 0 0 0
M23 20 26 248 230 201 274 1000 2363 48
M24 0 0 273 0 284 443 1000 298 8
M25 0 0 225 35 320 421 1000 410 13
M 31 16 233 247 127 345 1000 13084 326
E 0 0 0 0 0 0 0 0 0
T1 74 42 389 14 18 463 1000 1510 29
T2 42 25 259 104 73 497 1000 7178 79
T3 0 0 359 0 0 641 1000 97 2
T4 93 50 95 18 66 677 1000 2275 56
T5 39 113 225 180 29 414 1000 24175 288
T 45 88 231 147 39 450 1000 35235 454
S1 193 93 527 52 0 135 1000 840 36
S2 56 80 175 456 84 149 1000 8282 185
S3 29 28 205 36 34 669 1000 4853 93
S4 0 0 0 0 0 0 0 0 0
S5 0 0 0 0 0 1000 1000 17 2
S6 243 185 31 374 0 167 1000 108 5
S7 23 11 303 57 312 295 1000 1239 24
S8 0 302 313 0 0 385 1000 140 6
S9 0 0 500 0 0 500 1000 27 4
S10 0 0 821 0 0 179 1000 515 5
S11 240 0 231 59 0 470 1000 512 17
S12 85 0 135 308 13 459 1000 1584 46
S13 52 49 340 2 23 534 1000 1749 68
S14 191 115 271 94 12 318 1000 1536 54
S15 40 31 142 549 1 239 1000 8577 118
S 60 49 210 316 44 320 1000 29979 663
M+E+T+S 48 61 224 228 56 383 1000 78298 1443
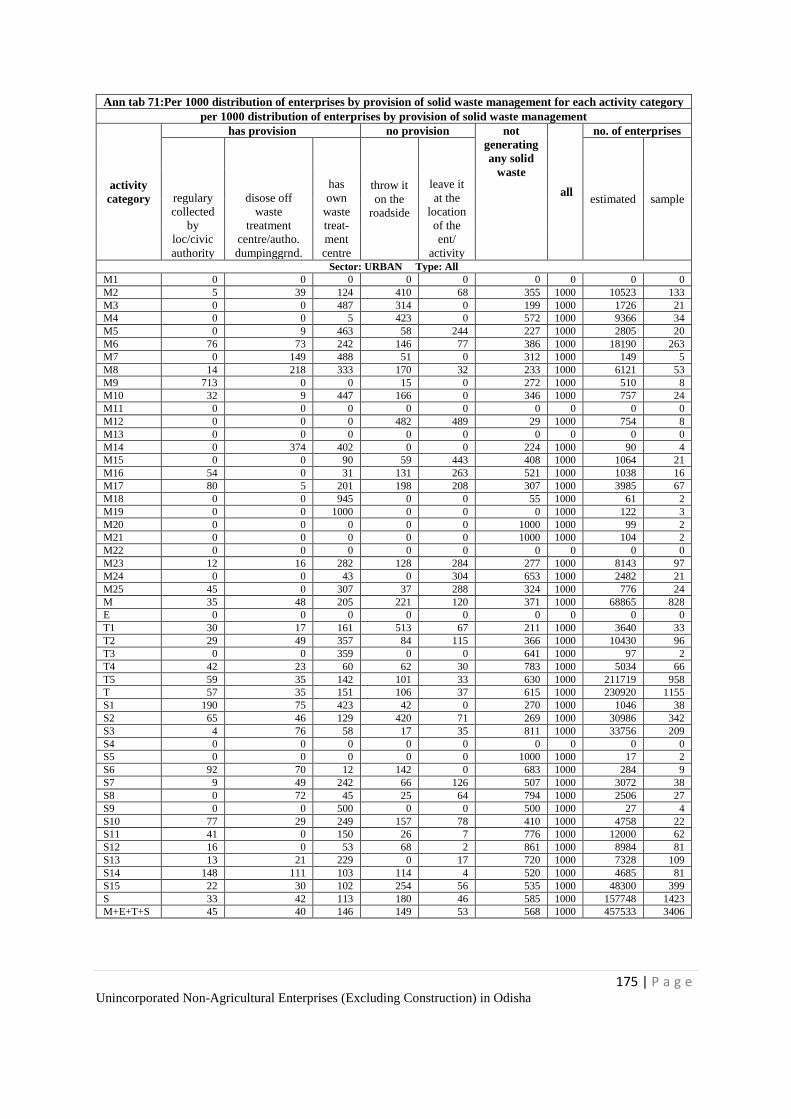
175 | P a g e Unincorporated Non-Agricultural Enterprises (Excluding Construction) in Odisha
Ann tab 71:Per 1000 distribution of enterprises by provision of solid waste management for each activity category
per 1000 distribution of enterprises by provision of solid waste management
activity
category
has provision no provision not
generating
any solid
waste
all
no. of enterprises
regulary
collected
by
loc/civic
authority
disose off
waste
treatment
centre/autho.
dumpinggrnd.
has
own
waste
treat-
ment
centre
throw it
on the
roadside
leave it
at the
location
of the
ent/
activity
estimated sample
Sector: URBAN Type: All
M1 0 0 0 0 0 0 0 0 0
M2 5 39 124 410 68 355 1000 10523 133
M3 0 0 487 314 0 199 1000 1726 21
M4 0 0 5 423 0 572 1000 9366 34
M5 0 9 463 58 244 227 1000 2805 20
M6 76 73 242 146 77 386 1000 18190 263
M7 0 149 488 51 0 312 1000 149 5
M8 14 218 333 170 32 233 1000 6121 53
M9 713 0 0 15 0 272 1000 510 8
M10 32 9 447 166 0 346 1000 757 24
M11 0 0 0 0 0 0 0 0 0
M12 0 0 0 482 489 29 1000 754 8
M13 0 0 0 0 0 0 0 0 0
M14 0 374 402 0 0 224 1000 90 4
M15 0 0 90 59 443 408 1000 1064 21
M16 54 0 31 131 263 521 1000 1038 16
M17 80 5 201 198 208 307 1000 3985 67
M18 0 0 945 0 0 55 1000 61 2
M19 0 0 1000 0 0 0 1000 122 3
M20 0 0 0 0 0 1000 1000 99 2
M21 0 0 0 0 0 1000 1000 104 2
M22 0 0 0 0 0 0 0 0 0
M23 12 16 282 128 284 277 1000 8143 97
M24 0 0 43 0 304 653 1000 2482 21
M25 45 0 307 37 288 324 1000 776 24
M 35 48 205 221 120 371 1000 68865 828
E 0 0 0 0 0 0 0 0 0
T1 30 17 161 513 67 211 1000 3640 33
T2 29 49 357 84 115 366 1000 10430 96
T3 0 0 359 0 0 641 1000 97 2
T4 42 23 60 62 30 783 1000 5034 66
T5 59 35 142 101 33 630 1000 211719 958
T 57 35 151 106 37 615 1000 230920 1155
S1 190 75 423 42 0 270 1000 1046 38
S2 65 46 129 420 71 269 1000 30986 342
S3 4 76 58 17 35 811 1000 33756 209
S4 0 0 0 0 0 0 0 0 0
S5 0 0 0 0 0 1000 1000 17 2
S6 92 70 12 142 0 683 1000 284 9
S7 9 49 242 66 126 507 1000 3072 38
S8 0 72 45 25 64 794 1000 2506 27
S9 0 0 500 0 0 500 1000 27 4
S10 77 29 249 157 78 410 1000 4758 22
S11 41 0 150 26 7 776 1000 12000 62
S12 16 0 53 68 2 861 1000 8984 81
S13 13 21 229 0 17 720 1000 7328 109
S14 148 111 103 114 4 520 1000 4685 81
S15 22 30 102 254 56 535 1000 48300 399
S 33 42 113 180 46 585 1000 157748 1423
M+E+T+S 45 40 146 149 53 568 1000 457533 3406

176 | P a g e Unincorporated Non-Agricultural Enterprises (Excluding Construction) in Odisha
Ann tab 72:Per 1000 distribution of enterprises by provision of solid waste management for each activity category
per 1000 distribution of enterprises by provision of solid waste management
activity
category
has provision no provision not
generating
any solid
waste
all
no. of enterprises
regulary
collected
by
loc/civic
authority
disose off
waste
treatment
centre/autho.
dumpinggrnd.
has
own
waste
treat-
ment
centre
throw it
on the
roadside
leave it
at the
location
of the
ent/
activity
estimated sample
Sector: ALL Type: OAE M1 0 0 0 0 0 0 0 0 0
M2 1 9 489 166 103 232 1000 63587 267
M3 0 0 185 79 6 730 1000 16676 53
M4 0 7 4 132 39 818 1000 196686 142
M5 0 0 636 0 270 93 1000 50526 91
M6 18 66 468 175 37 237 1000 74546 488
M7 0 58 699 243 0 0 1000 381 7
M8 1 34 399 290 99 176 1000 76484 162
M9 375 0 48 73 0 504 1000 821 8
M10 0 0 120 861 0 19 1000 530 15
M11 0 0 0 0 0 0 0 0 0
M12 0 0 108 343 513 36 1000 607 6
M13 0 0 0 0 0 0 0 0 0
M14 0 98 843 0 0 59 1000 344 5
M15 0 0 53 418 279 251 1000 34478 70
M16 13 0 6 529 62 390 1000 4374 17
M17 25 45 587 72 127 144 1000 6295 37
M18 0 0 0 0 0 0 0 0 0
M19 0 0 1000 0 0 0 1000 87 2
M20 0 0 0 0 0 1000 1000 55 1
M21 0 0 0 0 0 0 0 0 0
M22 0 0 0 0 0 0 0 0 0
M23 1 3 830 16 112 39 1000 87575 133
M24 0 0 104 171 149 576 1000 5646 31
M25 51 0 214 21 598 116 1000 679 13
M 3 16 342 151 97 390 1000 620377 1548
E 0 0 0 0 0 0 0 0 0
T1 0 0 0 693 93 214 1000 2660 8
T2 0 44 264 320 113 259 1000 7491 35
T3 0 0 0 0 0 0 0 0 0
T4 0 0 274 21 0 705 1000 13439 34
T5 10 12 411 124 82 361 1000 1163414 1936
T 10 12 408 126 81 364 1000 1187005 2013
S1 176 0 0 0 0 824 1000 206 2
S2 20 11 151 590 33 195 1000 79976 345
S3 0 21 32 60 9 877 1000 117253 337
S4 0 0 0 0 0 0 0 0 0
S5 0 0 0 0 0 0 0 0 0
S6 0 0 0 0 0 1000 1000 243 5
S7 0 27 174 41 0 758 1000 5162 21
S8 1 4 15 31 1 949 1000 144077 240
S9 0 0 0 0 0 0 0 0 0
S10 78 115 163 160 80 405 1000 4680 19
S11 27 10 160 32 7 764 1000 13489 66
S12 0 1 25 39 11 924 1000 19025 79
S13 0 5 98 0 68 829 1000 13502 70
S14 39 36 18 468 16 423 1000 10335 50
S15 3 13 227 171 68 518 1000 215822 783
S 6 13 117 164 33 668 1000 623770 2017
M+E+T+S 7 13 316 142 73 449 1000 2431152 5578
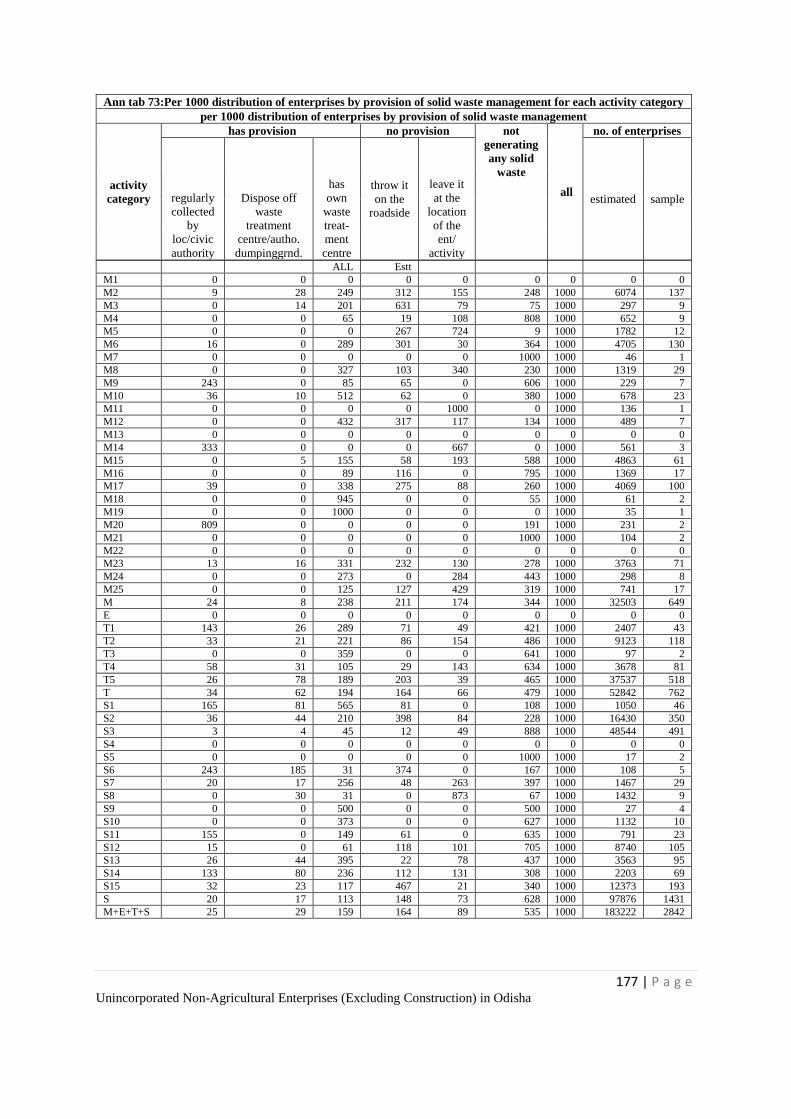
177 | P a g e Unincorporated Non-Agricultural Enterprises (Excluding Construction) in Odisha
Ann tab 73:Per 1000 distribution of enterprises by provision of solid waste management for each activity category
per 1000 distribution of enterprises by provision of solid waste management
activity
category
has provision no provision not
generating
any solid
waste
all
no. of enterprises
regularly
collected
by
loc/civic
authority
Dispose off
waste
treatment
centre/autho.
dumpinggrnd.
has
own
waste
treat-
ment
centre
throw it
on the
roadside
leave it
at the
location
of the
ent/
activity
estimated sample
ALL Estt
M1 0 0 0 0 0 0 0 0 0
M2 9 28 249 312 155 248 1000 6074 137
M3 0 14 201 631 79 75 1000 297 9
M4 0 0 65 19 108 808 1000 652 9
M5 0 0 0 267 724 9 1000 1782 12
M6 16 0 289 301 30 364 1000 4705 130
M7 0 0 0 0 0 1000 1000 46 1
M8 0 0 327 103 340 230 1000 1319 29
M9 243 0 85 65 0 606 1000 229 7
M10 36 10 512 62 0 380 1000 678 23
M11 0 0 0 0 1000 0 1000 136 1
M12 0 0 432 317 117 134 1000 489 7
M13 0 0 0 0 0 0 0 0 0
M14 333 0 0 0 667 0 1000 561 3
M15 0 5 155 58 193 588 1000 4863 61
M16 0 0 89 116 0 795 1000 1369 17
M17 39 0 338 275 88 260 1000 4069 100
M18 0 0 945 0 0 55 1000 61 2
M19 0 0 1000 0 0 0 1000 35 1
M20 809 0 0 0 0 191 1000 231 2
M21 0 0 0 0 0 1000 1000 104 2
M22 0 0 0 0 0 0 0 0 0
M23 13 16 331 232 130 278 1000 3763 71
M24 0 0 273 0 284 443 1000 298 8
M25 0 0 125 127 429 319 1000 741 17
M 24 8 238 211 174 344 1000 32503 649
E 0 0 0 0 0 0 0 0 0
T1 143 26 289 71 49 421 1000 2407 43
T2 33 21 221 86 154 486 1000 9123 118
T3 0 0 359 0 0 641 1000 97 2
T4 58 31 105 29 143 634 1000 3678 81
T5 26 78 189 203 39 465 1000 37537 518
T 34 62 194 164 66 479 1000 52842 762
S1 165 81 565 81 0 108 1000 1050 46
S2 36 44 210 398 84 228 1000 16430 350
S3 3 4 45 12 49 888 1000 48544 491
S4 0 0 0 0 0 0 0 0 0
S5 0 0 0 0 0 1000 1000 17 2
S6 243 185 31 374 0 167 1000 108 5
S7 20 17 256 48 263 397 1000 1467 29
S8 0 30 31 0 873 67 1000 1432 9
S9 0 0 500 0 0 500 1000 27 4
S10 0 0 373 0 0 627 1000 1132 10
S11 155 0 149 61 0 635 1000 791 23
S12 15 0 61 118 101 705 1000 8740 105
S13 26 44 395 22 78 437 1000 3563 95
S14 133 80 236 112 131 308 1000 2203 69
S15 32 23 117 467 21 340 1000 12373 193
S 20 17 113 148 73 628 1000 97876 1431
M+E+T+S 25 29 159 164 89 535 1000 183222 2842
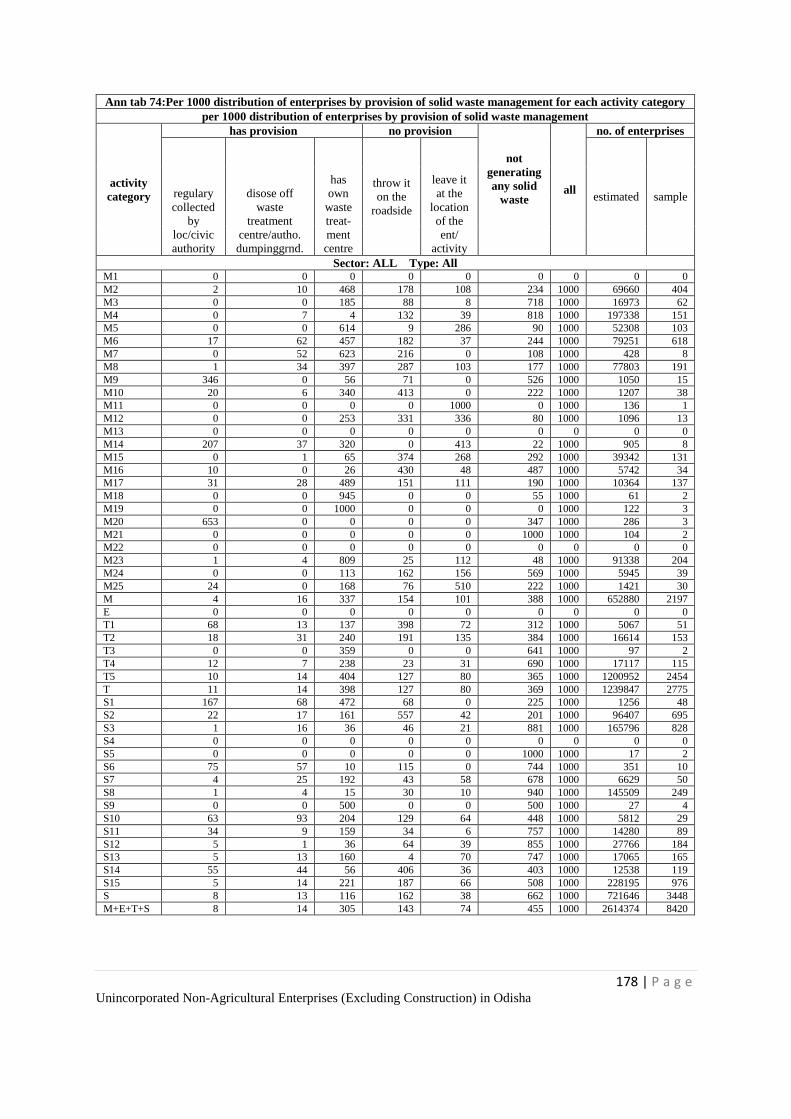
178 | P a g e Unincorporated Non-Agricultural Enterprises (Excluding Construction) in Odisha
Ann tab 74:Per 1000 distribution of enterprises by provision of solid waste management for each activity category
per 1000 distribution of enterprises by provision of solid waste management
activity
category
has provision no provision
not
generating
any solid
waste all
no. of enterprises
regulary
collected
by
loc/civic
authority
disose off
waste
treatment
centre/autho.
dumpinggrnd.
has
own
waste
treat-
ment
centre
throw it
on the
roadside
leave it
at the
location
of the
ent/
activity
estimated sample
Sector: ALL Type: All M1 0 0 0 0 0 0 0 0 0
M2 2 10 468 178 108 234 1000 69660 404
M3 0 0 185 88 8 718 1000 16973 62
M4 0 7 4 132 39 818 1000 197338 151
M5 0 0 614 9 286 90 1000 52308 103
M6 17 62 457 182 37 244 1000 79251 618
M7 0 52 623 216 0 108 1000 428 8
M8 1 34 397 287 103 177 1000 77803 191
M9 346 0 56 71 0 526 1000 1050 15
M10 20 6 340 413 0 222 1000 1207 38
M11 0 0 0 0 1000 0 1000 136 1
M12 0 0 253 331 336 80 1000 1096 13
M13 0 0 0 0 0 0 0 0 0
M14 207 37 320 0 413 22 1000 905 8
M15 0 1 65 374 268 292 1000 39342 131
M16 10 0 26 430 48 487 1000 5742 34
M17 31 28 489 151 111 190 1000 10364 137
M18 0 0 945 0 0 55 1000 61 2
M19 0 0 1000 0 0 0 1000 122 3
M20 653 0 0 0 0 347 1000 286 3
M21 0 0 0 0 0 1000 1000 104 2
M22 0 0 0 0 0 0 0 0 0
M23 1 4 809 25 112 48 1000 91338 204
M24 0 0 113 162 156 569 1000 5945 39
M25 24 0 168 76 510 222 1000 1421 30
M 4 16 337 154 101 388 1000 652880 2197
E 0 0 0 0 0 0 0 0 0
T1 68 13 137 398 72 312 1000 5067 51
T2 18 31 240 191 135 384 1000 16614 153
T3 0 0 359 0 0 641 1000 97 2
T4 12 7 238 23 31 690 1000 17117 115
T5 10 14 404 127 80 365 1000 1200952 2454
T 11 14 398 127 80 369 1000 1239847 2775
S1 167 68 472 68 0 225 1000 1256 48
S2 22 17 161 557 42 201 1000 96407 695
S3 1 16 36 46 21 881 1000 165796 828
S4 0 0 0 0 0 0 0 0 0
S5 0 0 0 0 0 1000 1000 17 2
S6 75 57 10 115 0 744 1000 351 10
S7 4 25 192 43 58 678 1000 6629 50
S8 1 4 15 30 10 940 1000 145509 249
S9 0 0 500 0 0 500 1000 27 4
S10 63 93 204 129 64 448 1000 5812 29
S11 34 9 159 34 6 757 1000 14280 89
S12 5 1 36 64 39 855 1000 27766 184
S13 5 13 160 4 70 747 1000 17065 165
S14 55 44 56 406 36 403 1000 12538 119
S15 5 14 221 187 66 508 1000 228195 976
S 8 13 116 162 38 662 1000 721646 3448
M+E+T+S 8 14 305 143 74 455 1000 2614374 8420
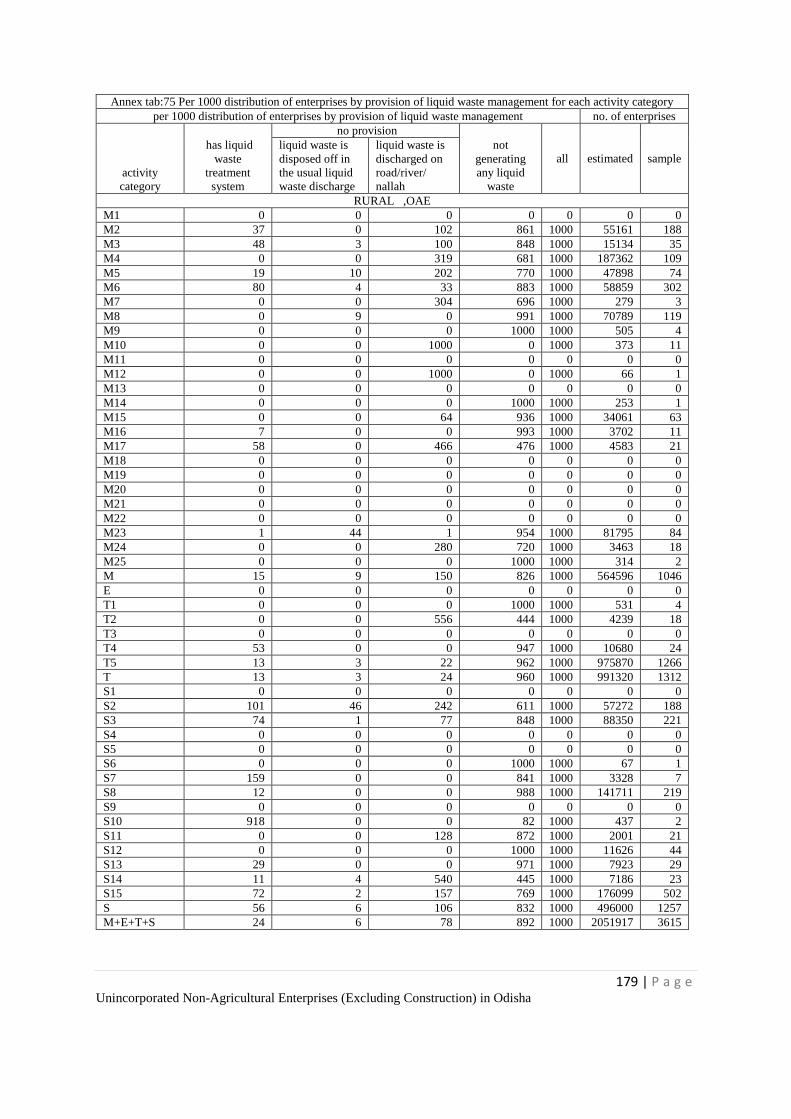
179 | P a g e Unincorporated Non-Agricultural Enterprises (Excluding Construction) in Odisha
Annex tab:75 Per 1000 distribution of enterprises by provision of liquid waste management for each activity category
per 1000 distribution of enterprises by provision of liquid waste management no. of enterprises
activity
category
has liquid
waste
treatment
system
no provision
not
generating
any liquid
waste
all estimated sample liquid waste is
disposed off in
the usual liquid
waste discharge
liquid waste is
discharged on
road/river/
nallah
RURAL ,OAE
M1 0 0 0 0 0 0 0
M2 37 0 102 861 1000 55161 188
M3 48 3 100 848 1000 15134 35
M4 0 0 319 681 1000 187362 109
M5 19 10 202 770 1000 47898 74
M6 80 4 33 883 1000 58859 302
M7 0 0 304 696 1000 279 3
M8 0 9 0 991 1000 70789 119
M9 0 0 0 1000 1000 505 4
M10 0 0 1000 0 1000 373 11
M11 0 0 0 0 0 0 0
M12 0 0 1000 0 1000 66 1
M13 0 0 0 0 0 0 0
M14 0 0 0 1000 1000 253 1
M15 0 0 64 936 1000 34061 63
M16 7 0 0 993 1000 3702 11
M17 58 0 466 476 1000 4583 21
M18 0 0 0 0 0 0 0
M19 0 0 0 0 0 0 0
M20 0 0 0 0 0 0 0
M21 0 0 0 0 0 0 0
M22 0 0 0 0 0 0 0
M23 1 44 1 954 1000 81795 84
M24 0 0 280 720 1000 3463 18
M25 0 0 0 1000 1000 314 2
M 15 9 150 826 1000 564596 1046
E 0 0 0 0 0 0 0
T1 0 0 0 1000 1000 531 4
T2 0 0 556 444 1000 4239 18
T3 0 0 0 0 0 0 0
T4 53 0 0 947 1000 10680 24
T5 13 3 22 962 1000 975870 1266
T 13 3 24 960 1000 991320 1312
S1 0 0 0 0 0 0 0
S2 101 46 242 611 1000 57272 188
S3 74 1 77 848 1000 88350 221
S4 0 0 0 0 0 0 0
S5 0 0 0 0 0 0 0
S6 0 0 0 1000 1000 67 1
S7 159 0 0 841 1000 3328 7
S8 12 0 0 988 1000 141711 219
S9 0 0 0 0 0 0 0
S10 918 0 0 82 1000 437 2
S11 0 0 128 872 1000 2001 21
S12 0 0 0 1000 1000 11626 44
S13 29 0 0 971 1000 7923 29
S14 11 4 540 445 1000 7186 23
S15 72 2 157 769 1000 176099 502
S 56 6 106 832 1000 496000 1257
M+E+T+S 24 6 78 892 1000 2051917 3615
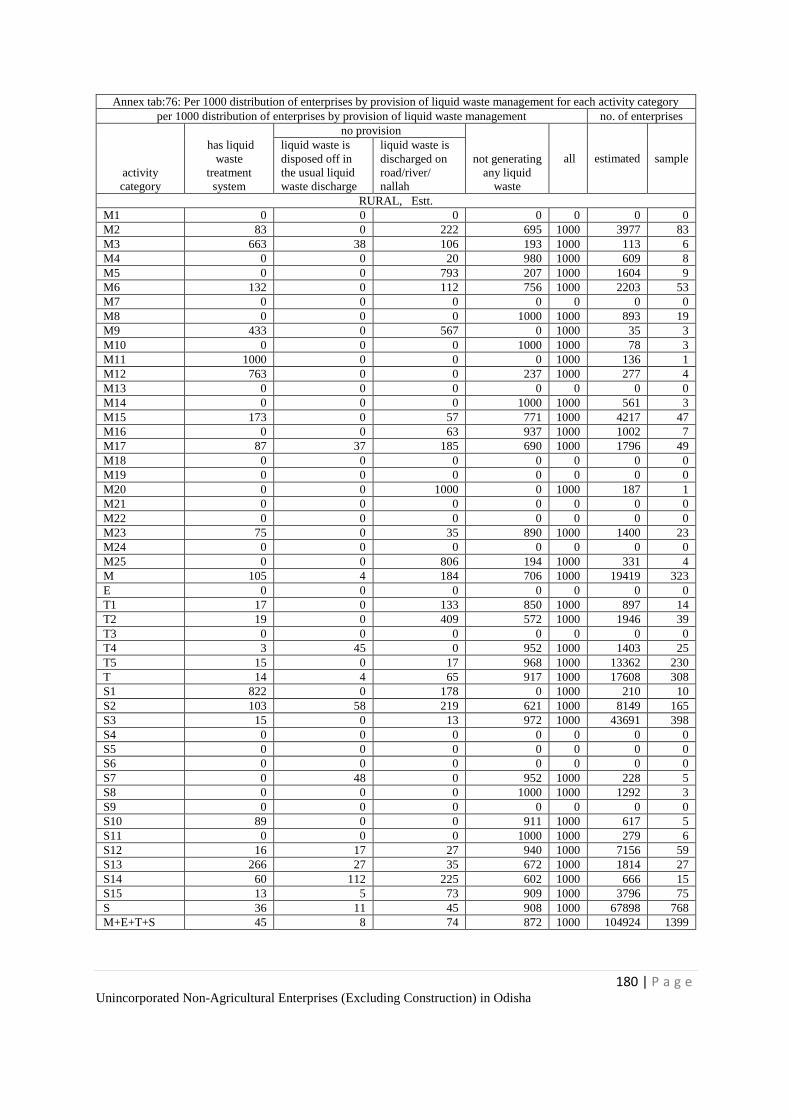
180 | P a g e Unincorporated Non-Agricultural Enterprises (Excluding Construction) in Odisha
Annex tab:76: Per 1000 distribution of enterprises by provision of liquid waste management for each activity category
per 1000 distribution of enterprises by provision of liquid waste management no. of enterprises
activity
category
has liquid
waste
treatment
system
no provision
not generating
any liquid
waste
all estimated sample liquid waste is
disposed off in
the usual liquid
waste discharge
liquid waste is
discharged on
road/river/
nallah
RURAL, Estt.
M1 0 0 0 0 0 0 0
M2 83 0 222 695 1000 3977 83
M3 663 38 106 193 1000 113 6
M4 0 0 20 980 1000 609 8
M5 0 0 793 207 1000 1604 9
M6 132 0 112 756 1000 2203 53
M7 0 0 0 0 0 0 0
M8 0 0 0 1000 1000 893 19
M9 433 0 567 0 1000 35 3
M10 0 0 0 1000 1000 78 3
M11 1000 0 0 0 1000 136 1
M12 763 0 0 237 1000 277 4
M13 0 0 0 0 0 0 0
M14 0 0 0 1000 1000 561 3
M15 173 0 57 771 1000 4217 47
M16 0 0 63 937 1000 1002 7
M17 87 37 185 690 1000 1796 49
M18 0 0 0 0 0 0 0
M19 0 0 0 0 0 0 0
M20 0 0 1000 0 1000 187 1
M21 0 0 0 0 0 0 0
M22 0 0 0 0 0 0 0
M23 75 0 35 890 1000 1400 23
M24 0 0 0 0 0 0 0
M25 0 0 806 194 1000 331 4
M 105 4 184 706 1000 19419 323
E 0 0 0 0 0 0 0
T1 17 0 133 850 1000 897 14
T2 19 0 409 572 1000 1946 39
T3 0 0 0 0 0 0 0
T4 3 45 0 952 1000 1403 25
T5 15 0 17 968 1000 13362 230
T 14 4 65 917 1000 17608 308
S1 822 0 178 0 1000 210 10
S2 103 58 219 621 1000 8149 165
S3 15 0 13 972 1000 43691 398
S4 0 0 0 0 0 0 0
S5 0 0 0 0 0 0 0
S6 0 0 0 0 0 0 0
S7 0 48 0 952 1000 228 5
S8 0 0 0 1000 1000 1292 3
S9 0 0 0 0 0 0 0
S10 89 0 0 911 1000 617 5
S11 0 0 0 1000 1000 279 6
S12 16 17 27 940 1000 7156 59
S13 266 27 35 672 1000 1814 27
S14 60 112 225 602 1000 666 15
S15 13 5 73 909 1000 3796 75
S 36 11 45 908 1000 67898 768
M+E+T+S 45 8 74 872 1000 104924 1399
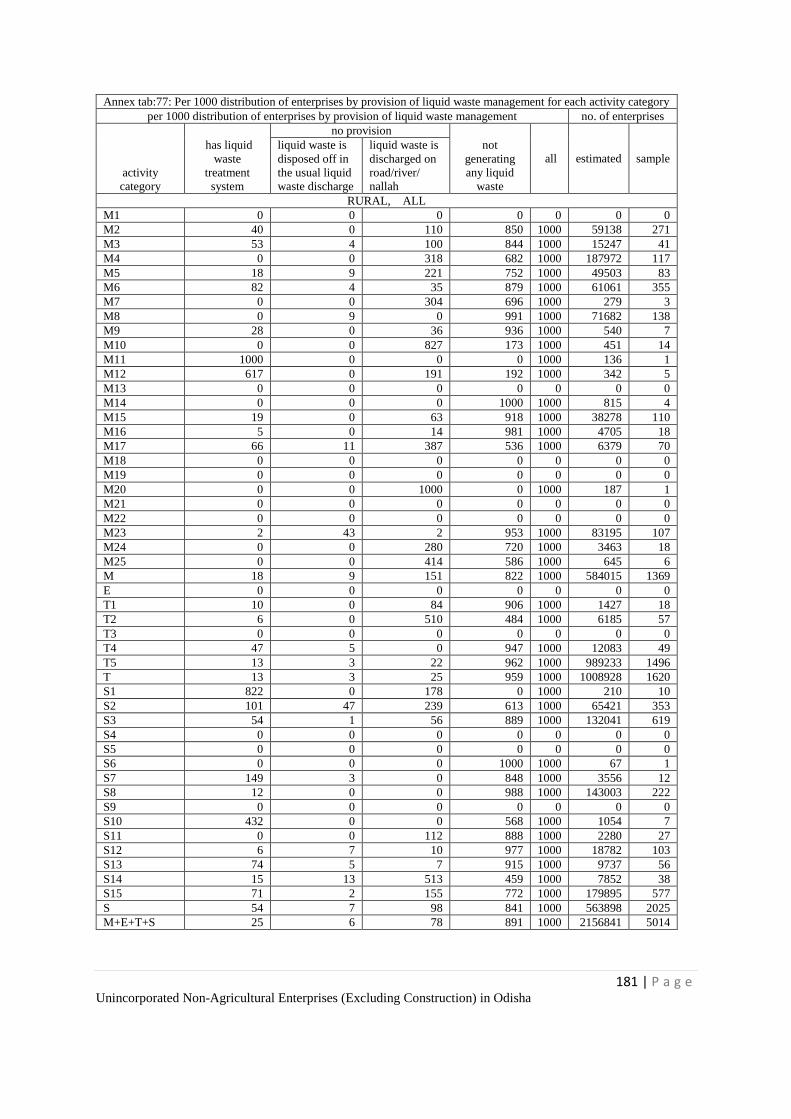
181 | P a g e Unincorporated Non-Agricultural Enterprises (Excluding Construction) in Odisha
Annex tab:77: Per 1000 distribution of enterprises by provision of liquid waste management for each activity category
per 1000 distribution of enterprises by provision of liquid waste management no. of enterprises
activity
category
has liquid
waste
treatment
system
no provision
not
generating
any liquid
waste
all estimated sample liquid waste is
disposed off in
the usual liquid
waste discharge
liquid waste is
discharged on
road/river/
nallah
RURAL, ALL
M1 0 0 0 0 0 0 0
M2 40 0 110 850 1000 59138 271
M3 53 4 100 844 1000 15247 41
M4 0 0 318 682 1000 187972 117
M5 18 9 221 752 1000 49503 83
M6 82 4 35 879 1000 61061 355
M7 0 0 304 696 1000 279 3
M8 0 9 0 991 1000 71682 138
M9 28 0 36 936 1000 540 7
M10 0 0 827 173 1000 451 14
M11 1000 0 0 0 1000 136 1
M12 617 0 191 192 1000 342 5
M13 0 0 0 0 0 0 0
M14 0 0 0 1000 1000 815 4
M15 19 0 63 918 1000 38278 110
M16 5 0 14 981 1000 4705 18
M17 66 11 387 536 1000 6379 70
M18 0 0 0 0 0 0 0
M19 0 0 0 0 0 0 0
M20 0 0 1000 0 1000 187 1
M21 0 0 0 0 0 0 0
M22 0 0 0 0 0 0 0
M23 2 43 2 953 1000 83195 107
M24 0 0 280 720 1000 3463 18
M25 0 0 414 586 1000 645 6
M 18 9 151 822 1000 584015 1369
E 0 0 0 0 0 0 0
T1 10 0 84 906 1000 1427 18
T2 6 0 510 484 1000 6185 57
T3 0 0 0 0 0 0 0
T4 47 5 0 947 1000 12083 49
T5 13 3 22 962 1000 989233 1496
T 13 3 25 959 1000 1008928 1620
S1 822 0 178 0 1000 210 10
S2 101 47 239 613 1000 65421 353
S3 54 1 56 889 1000 132041 619
S4 0 0 0 0 0 0 0
S5 0 0 0 0 0 0 0
S6 0 0 0 1000 1000 67 1
S7 149 3 0 848 1000 3556 12
S8 12 0 0 988 1000 143003 222
S9 0 0 0 0 0 0 0
S10 432 0 0 568 1000 1054 7
S11 0 0 112 888 1000 2280 27
S12 6 7 10 977 1000 18782 103
S13 74 5 7 915 1000 9737 56
S14 15 13 513 459 1000 7852 38
S15 71 2 155 772 1000 179895 577
S 54 7 98 841 1000 563898 2025
M+E+T+S 25 6 78 891 1000 2156841 5014
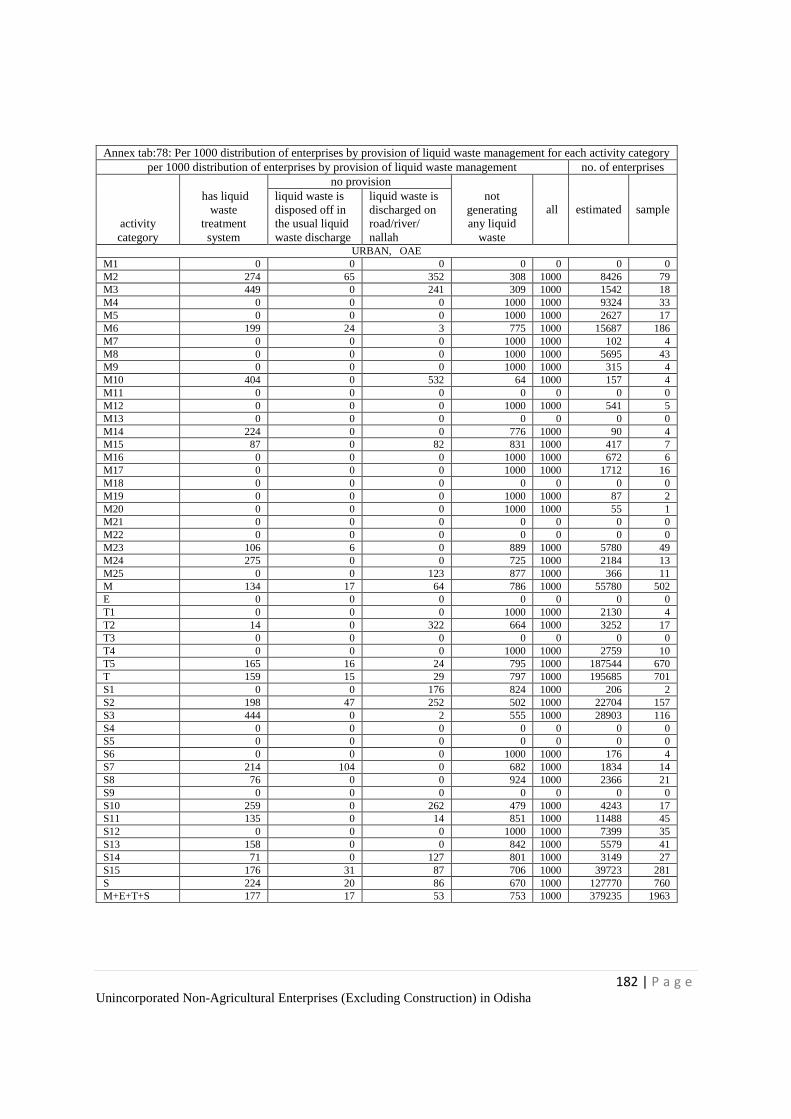
182 | P a g e Unincorporated Non-Agricultural Enterprises (Excluding Construction) in Odisha
Annex tab:78: Per 1000 distribution of enterprises by provision of liquid waste management for each activity category
per 1000 distribution of enterprises by provision of liquid waste management no. of enterprises
activity
category
has liquid
waste
treatment
system
no provision
not
generating
any liquid
waste
all estimated sample liquid waste is
disposed off in
the usual liquid
waste discharge
liquid waste is
discharged on
road/river/
nallah URBAN, OAE
M1 0 0 0 0 0 0 0
M2 274 65 352 308 1000 8426 79
M3 449 0 241 309 1000 1542 18
M4 0 0 0 1000 1000 9324 33
M5 0 0 0 1000 1000 2627 17
M6 199 24 3 775 1000 15687 186
M7 0 0 0 1000 1000 102 4
M8 0 0 0 1000 1000 5695 43
M9 0 0 0 1000 1000 315 4
M10 404 0 532 64 1000 157 4
M11 0 0 0 0 0 0 0
M12 0 0 0 1000 1000 541 5
M13 0 0 0 0 0 0 0
M14 224 0 0 776 1000 90 4
M15 87 0 82 831 1000 417 7
M16 0 0 0 1000 1000 672 6
M17 0 0 0 1000 1000 1712 16
M18 0 0 0 0 0 0 0
M19 0 0 0 1000 1000 87 2
M20 0 0 0 1000 1000 55 1
M21 0 0 0 0 0 0 0
M22 0 0 0 0 0 0 0
M23 106 6 0 889 1000 5780 49
M24 275 0 0 725 1000 2184 13
M25 0 0 123 877 1000 366 11
M 134 17 64 786 1000 55780 502
E 0 0 0 0 0 0 0
T1 0 0 0 1000 1000 2130 4
T2 14 0 322 664 1000 3252 17
T3 0 0 0 0 0 0 0
T4 0 0 0 1000 1000 2759 10
T5 165 16 24 795 1000 187544 670
T 159 15 29 797 1000 195685 701
S1 0 0 176 824 1000 206 2
S2 198 47 252 502 1000 22704 157
S3 444 0 2 555 1000 28903 116
S4 0 0 0 0 0 0 0
S5 0 0 0 0 0 0 0
S6 0 0 0 1000 1000 176 4
S7 214 104 0 682 1000 1834 14
S8 76 0 0 924 1000 2366 21
S9 0 0 0 0 0 0 0
S10 259 0 262 479 1000 4243 17
S11 135 0 14 851 1000 11488 45
S12 0 0 0 1000 1000 7399 35
S13 158 0 0 842 1000 5579 41
S14 71 0 127 801 1000 3149 27
S15 176 31 87 706 1000 39723 281
S 224 20 86 670 1000 127770 760
M+E+T+S 177 17 53 753 1000 379235 1963
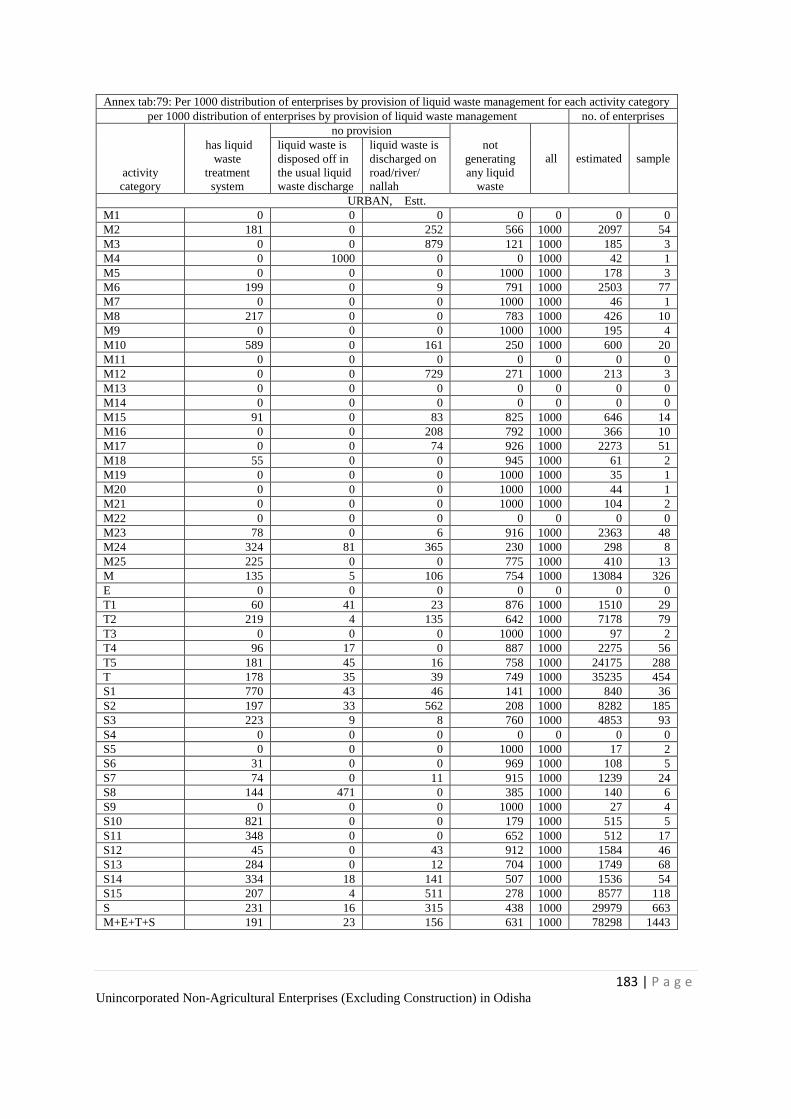
183 | P a g e Unincorporated Non-Agricultural Enterprises (Excluding Construction) in Odisha
Annex tab:79: Per 1000 distribution of enterprises by provision of liquid waste management for each activity category
per 1000 distribution of enterprises by provision of liquid waste management no. of enterprises
activity
category
has liquid
waste
treatment
system
no provision
not
generating
any liquid
waste
all estimated sample liquid waste is
disposed off in
the usual liquid
waste discharge
liquid waste is
discharged on
road/river/
nallah
URBAN, Estt.
M1 0 0 0 0 0 0 0
M2 181 0 252 566 1000 2097 54
M3 0 0 879 121 1000 185 3
M4 0 1000 0 0 1000 42 1
M5 0 0 0 1000 1000 178 3
M6 199 0 9 791 1000 2503 77
M7 0 0 0 1000 1000 46 1
M8 217 0 0 783 1000 426 10
M9 0 0 0 1000 1000 195 4
M10 589 0 161 250 1000 600 20
M11 0 0 0 0 0 0 0
M12 0 0 729 271 1000 213 3
M13 0 0 0 0 0 0 0
M14 0 0 0 0 0 0 0
M15 91 0 83 825 1000 646 14
M16 0 0 208 792 1000 366 10
M17 0 0 74 926 1000 2273 51
M18 55 0 0 945 1000 61 2
M19 0 0 0 1000 1000 35 1
M20 0 0 0 1000 1000 44 1
M21 0 0 0 1000 1000 104 2
M22 0 0 0 0 0 0 0
M23 78 0 6 916 1000 2363 48
M24 324 81 365 230 1000 298 8
M25 225 0 0 775 1000 410 13
M 135 5 106 754 1000 13084 326
E 0 0 0 0 0 0 0
T1 60 41 23 876 1000 1510 29
T2 219 4 135 642 1000 7178 79
T3 0 0 0 1000 1000 97 2
T4 96 17 0 887 1000 2275 56
T5 181 45 16 758 1000 24175 288
T 178 35 39 749 1000 35235 454
S1 770 43 46 141 1000 840 36
S2 197 33 562 208 1000 8282 185
S3 223 9 8 760 1000 4853 93
S4 0 0 0 0 0 0 0
S5 0 0 0 1000 1000 17 2
S6 31 0 0 969 1000 108 5
S7 74 0 11 915 1000 1239 24
S8 144 471 0 385 1000 140 6
S9 0 0 0 1000 1000 27 4
S10 821 0 0 179 1000 515 5
S11 348 0 0 652 1000 512 17
S12 45 0 43 912 1000 1584 46
S13 284 0 12 704 1000 1749 68
S14 334 18 141 507 1000 1536 54
S15 207 4 511 278 1000 8577 118
S 231 16 315 438 1000 29979 663
M+E+T+S 191 23 156 631 1000 78298 1443
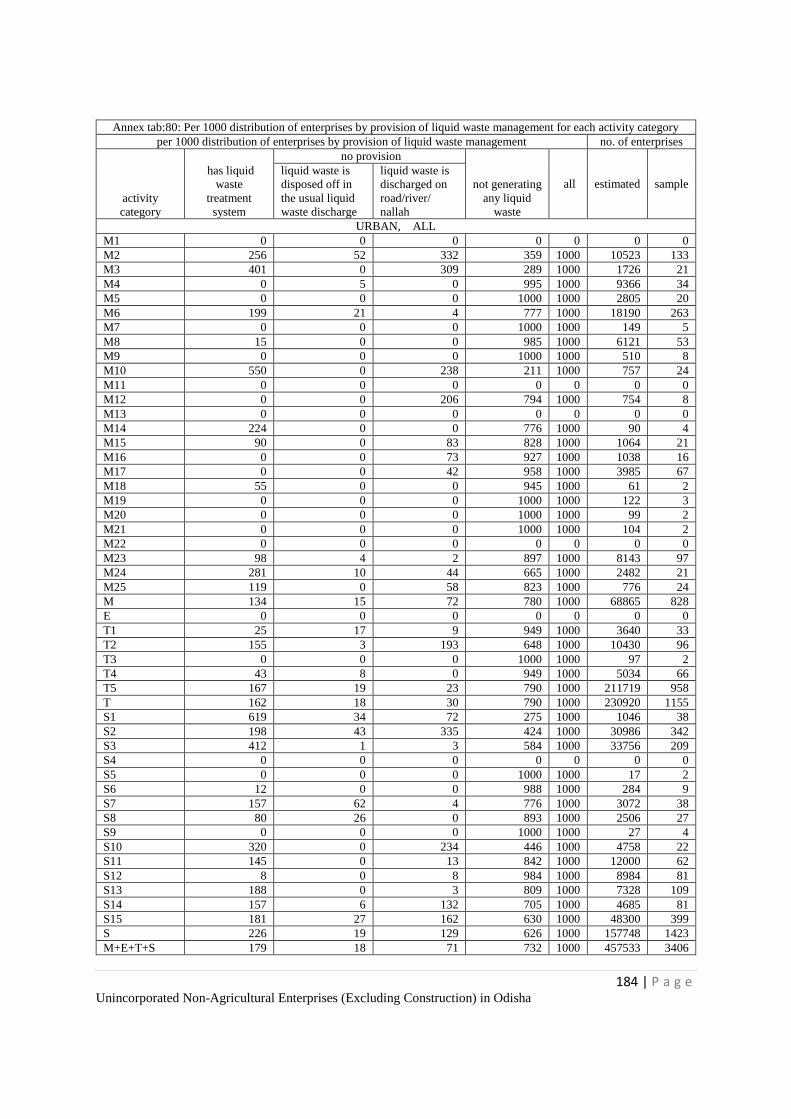
184 | P a g e Unincorporated Non-Agricultural Enterprises (Excluding Construction) in Odisha
Annex tab:80: Per 1000 distribution of enterprises by provision of liquid waste management for each activity category
per 1000 distribution of enterprises by provision of liquid waste management no. of enterprises
activity
category
has liquid
waste
treatment
system
no provision
not generating
any liquid
waste
all estimated sample liquid waste is
disposed off in
the usual liquid
waste discharge
liquid waste is
discharged on
road/river/
nallah
URBAN, ALL
M1 0 0 0 0 0 0 0
M2 256 52 332 359 1000 10523 133
M3 401 0 309 289 1000 1726 21
M4 0 5 0 995 1000 9366 34
M5 0 0 0 1000 1000 2805 20
M6 199 21 4 777 1000 18190 263
M7 0 0 0 1000 1000 149 5
M8 15 0 0 985 1000 6121 53
M9 0 0 0 1000 1000 510 8
M10 550 0 238 211 1000 757 24
M11 0 0 0 0 0 0 0
M12 0 0 206 794 1000 754 8
M13 0 0 0 0 0 0 0
M14 224 0 0 776 1000 90 4
M15 90 0 83 828 1000 1064 21
M16 0 0 73 927 1000 1038 16
M17 0 0 42 958 1000 3985 67
M18 55 0 0 945 1000 61 2
M19 0 0 0 1000 1000 122 3
M20 0 0 0 1000 1000 99 2
M21 0 0 0 1000 1000 104 2
M22 0 0 0 0 0 0 0
M23 98 4 2 897 1000 8143 97
M24 281 10 44 665 1000 2482 21
M25 119 0 58 823 1000 776 24
M 134 15 72 780 1000 68865 828
E 0 0 0 0 0 0 0
T1 25 17 9 949 1000 3640 33
T2 155 3 193 648 1000 10430 96
T3 0 0 0 1000 1000 97 2
T4 43 8 0 949 1000 5034 66
T5 167 19 23 790 1000 211719 958
T 162 18 30 790 1000 230920 1155
S1 619 34 72 275 1000 1046 38
S2 198 43 335 424 1000 30986 342
S3 412 1 3 584 1000 33756 209
S4 0 0 0 0 0 0 0
S5 0 0 0 1000 1000 17 2
S6 12 0 0 988 1000 284 9
S7 157 62 4 776 1000 3072 38
S8 80 26 0 893 1000 2506 27
S9 0 0 0 1000 1000 27 4
S10 320 0 234 446 1000 4758 22
S11 145 0 13 842 1000 12000 62
S12 8 0 8 984 1000 8984 81
S13 188 0 3 809 1000 7328 109
S14 157 6 132 705 1000 4685 81
S15 181 27 162 630 1000 48300 399
S 226 19 129 626 1000 157748 1423
M+E+T+S 179 18 71 732 1000 457533 3406
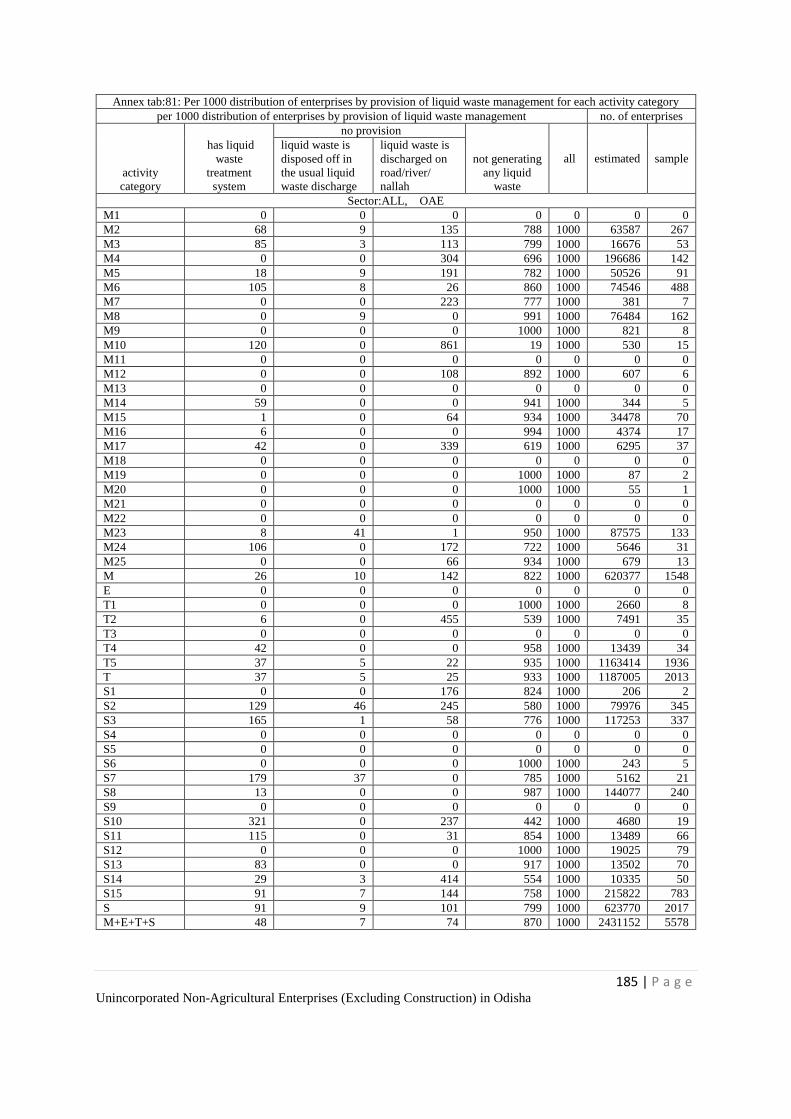
185 | P a g e Unincorporated Non-Agricultural Enterprises (Excluding Construction) in Odisha
Annex tab:81: Per 1000 distribution of enterprises by provision of liquid waste management for each activity category
per 1000 distribution of enterprises by provision of liquid waste management no. of enterprises
activity
category
has liquid
waste
treatment
system
no provision
not generating
any liquid
waste
all estimated sample liquid waste is
disposed off in
the usual liquid
waste discharge
liquid waste is
discharged on
road/river/
nallah
Sector:ALL, OAE
M1 0 0 0 0 0 0 0
M2 68 9 135 788 1000 63587 267
M3 85 3 113 799 1000 16676 53
M4 0 0 304 696 1000 196686 142
M5 18 9 191 782 1000 50526 91
M6 105 8 26 860 1000 74546 488
M7 0 0 223 777 1000 381 7
M8 0 9 0 991 1000 76484 162
M9 0 0 0 1000 1000 821 8
M10 120 0 861 19 1000 530 15
M11 0 0 0 0 0 0 0
M12 0 0 108 892 1000 607 6
M13 0 0 0 0 0 0 0
M14 59 0 0 941 1000 344 5
M15 1 0 64 934 1000 34478 70
M16 6 0 0 994 1000 4374 17
M17 42 0 339 619 1000 6295 37
M18 0 0 0 0 0 0 0
M19 0 0 0 1000 1000 87 2
M20 0 0 0 1000 1000 55 1
M21 0 0 0 0 0 0 0
M22 0 0 0 0 0 0 0
M23 8 41 1 950 1000 87575 133
M24 106 0 172 722 1000 5646 31
M25 0 0 66 934 1000 679 13
M 26 10 142 822 1000 620377 1548
E 0 0 0 0 0 0 0
T1 0 0 0 1000 1000 2660 8
T2 6 0 455 539 1000 7491 35
T3 0 0 0 0 0 0 0
T4 42 0 0 958 1000 13439 34
T5 37 5 22 935 1000 1163414 1936
T 37 5 25 933 1000 1187005 2013
S1 0 0 176 824 1000 206 2
S2 129 46 245 580 1000 79976 345
S3 165 1 58 776 1000 117253 337
S4 0 0 0 0 0 0 0
S5 0 0 0 0 0 0 0
S6 0 0 0 1000 1000 243 5
S7 179 37 0 785 1000 5162 21
S8 13 0 0 987 1000 144077 240
S9 0 0 0 0 0 0 0
S10 321 0 237 442 1000 4680 19
S11 115 0 31 854 1000 13489 66
S12 0 0 0 1000 1000 19025 79
S13 83 0 0 917 1000 13502 70
S14 29 3 414 554 1000 10335 50
S15 91 7 144 758 1000 215822 783
S 91 9 101 799 1000 623770 2017
M+E+T+S 48 7 74 870 1000 2431152 5578
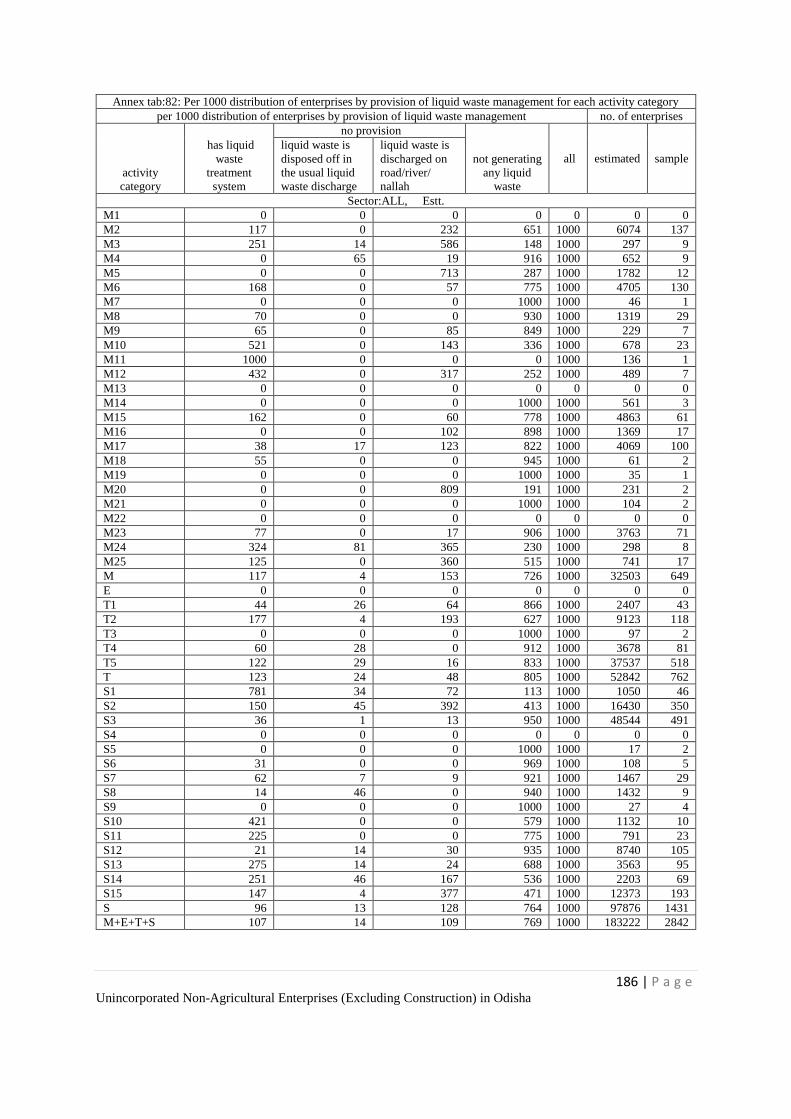
186 | P a g e Unincorporated Non-Agricultural Enterprises (Excluding Construction) in Odisha
Annex tab:82: Per 1000 distribution of enterprises by provision of liquid waste management for each activity category
per 1000 distribution of enterprises by provision of liquid waste management no. of enterprises
activity
category
has liquid
waste
treatment
system
no provision
not generating
any liquid
waste
all estimated sample liquid waste is
disposed off in
the usual liquid
waste discharge
liquid waste is
discharged on
road/river/
nallah
Sector:ALL, Estt.
M1 0 0 0 0 0 0 0
M2 117 0 232 651 1000 6074 137
M3 251 14 586 148 1000 297 9
M4 0 65 19 916 1000 652 9
M5 0 0 713 287 1000 1782 12
M6 168 0 57 775 1000 4705 130
M7 0 0 0 1000 1000 46 1
M8 70 0 0 930 1000 1319 29
M9 65 0 85 849 1000 229 7
M10 521 0 143 336 1000 678 23
M11 1000 0 0 0 1000 136 1
M12 432 0 317 252 1000 489 7
M13 0 0 0 0 0 0 0
M14 0 0 0 1000 1000 561 3
M15 162 0 60 778 1000 4863 61
M16 0 0 102 898 1000 1369 17
M17 38 17 123 822 1000 4069 100
M18 55 0 0 945 1000 61 2
M19 0 0 0 1000 1000 35 1
M20 0 0 809 191 1000 231 2
M21 0 0 0 1000 1000 104 2
M22 0 0 0 0 0 0 0
M23 77 0 17 906 1000 3763 71
M24 324 81 365 230 1000 298 8
M25 125 0 360 515 1000 741 17
M 117 4 153 726 1000 32503 649
E 0 0 0 0 0 0 0
T1 44 26 64 866 1000 2407 43
T2 177 4 193 627 1000 9123 118
T3 0 0 0 1000 1000 97 2
T4 60 28 0 912 1000 3678 81
T5 122 29 16 833 1000 37537 518
T 123 24 48 805 1000 52842 762
S1 781 34 72 113 1000 1050 46
S2 150 45 392 413 1000 16430 350
S3 36 1 13 950 1000 48544 491
S4 0 0 0 0 0 0 0
S5 0 0 0 1000 1000 17 2
S6 31 0 0 969 1000 108 5
S7 62 7 9 921 1000 1467 29
S8 14 46 0 940 1000 1432 9
S9 0 0 0 1000 1000 27 4
S10 421 0 0 579 1000 1132 10
S11 225 0 0 775 1000 791 23
S12 21 14 30 935 1000 8740 105
S13 275 14 24 688 1000 3563 95
S14 251 46 167 536 1000 2203 69
S15 147 4 377 471 1000 12373 193
S 96 13 128 764 1000 97876 1431
M+E+T+S 107 14 109 769 1000 183222 2842

187 | P a g e Unincorporated Non-Agricultural Enterprises (Excluding Construction) in Odisha
Annex tab:83: Per 1000 distribution of enterprises by provision of liquid waste management for each activity category
per 1000 distribution of enterprises by provision of liquid waste management no. of enterprises
activity
category
has liquid
waste
treatment
system
no provision
not generating
any liquid
waste
all estimated sample liquid waste is
disposed off in
the usual liquid
waste discharge
liquid waste is
discharged on
road/river/
nallah
Sector:ALL, ALL
M1 0 0 0 0 0 0 0
M2 73 8 144 776 1000 69660 404
M3 88 3 122 787 1000 16973 62
M4 0 0 303 696 1000 197338 151
M5 17 9 209 765 1000 52308 103
M6 109 8 28 855 1000 79251 618
M7 0 0 198 802 1000 428 8
M8 1 9 0 990 1000 77803 191
M9 14 0 19 967 1000 1050 15
M10 345 0 458 197 1000 1207 38
M11 1000 0 0 0 1000 136 1
M12 193 0 201 606 1000 1096 13
M13 0 0 0 0 0 0 0
M14 22 0 0 978 1000 905 8
M15 21 0 64 915 1000 39342 131
M16 4 0 24 971 1000 5742 34
M17 41 6 254 698 1000 10364 137
M18 55 0 0 945 1000 61 2
M19 0 0 0 1000 1000 122 3
M20 0 0 653 347 1000 286 3
M21 0 0 0 1000 1000 104 2
M22 0 0 0 0 0 0 0
M23 11 39 2 948 1000 91338 204
M24 117 4 181 697 1000 5945 39
M25 65 0 219 716 1000 1421 30
M 31 9 142 818 1000 652880 2197
E 0 0 0 0 0 0 0
T1 21 12 30 936 1000 5067 51
T2 100 2 311 587 1000 16614 153
T3 0 0 0 1000 1000 97 2
T4 46 6 0 948 1000 17117 115
T5 40 6 22 932 1000 1200952 2454
T 41 6 26 928 1000 1239847 2775
S1 653 29 89 229 1000 1256 48
S2 132 46 270 552 1000 96407 695
S3 127 1 45 827 1000 165796 828
S4 0 0 0 0 0 0 0
S5 0 0 0 1000 1000 17 2
S6 10 0 0 990 1000 351 10
S7 153 30 2 815 1000 6629 50
S8 13 0 0 986 1000 145509 249
S9 0 0 0 1000 1000 27 4
S10 340 0 191 468 1000 5812 29
S11 121 0 29 850 1000 14280 89
S12 7 5 9 980 1000 27766 184
S13 123 3 5 869 1000 17065 165
S14 68 10 371 551 1000 12538 119
S15 94 7 157 742 1000 228195 976
S 91 9 105 794 1000 721646 3448
M+E+T+S 52 8 77 863 1000 2614374 8420
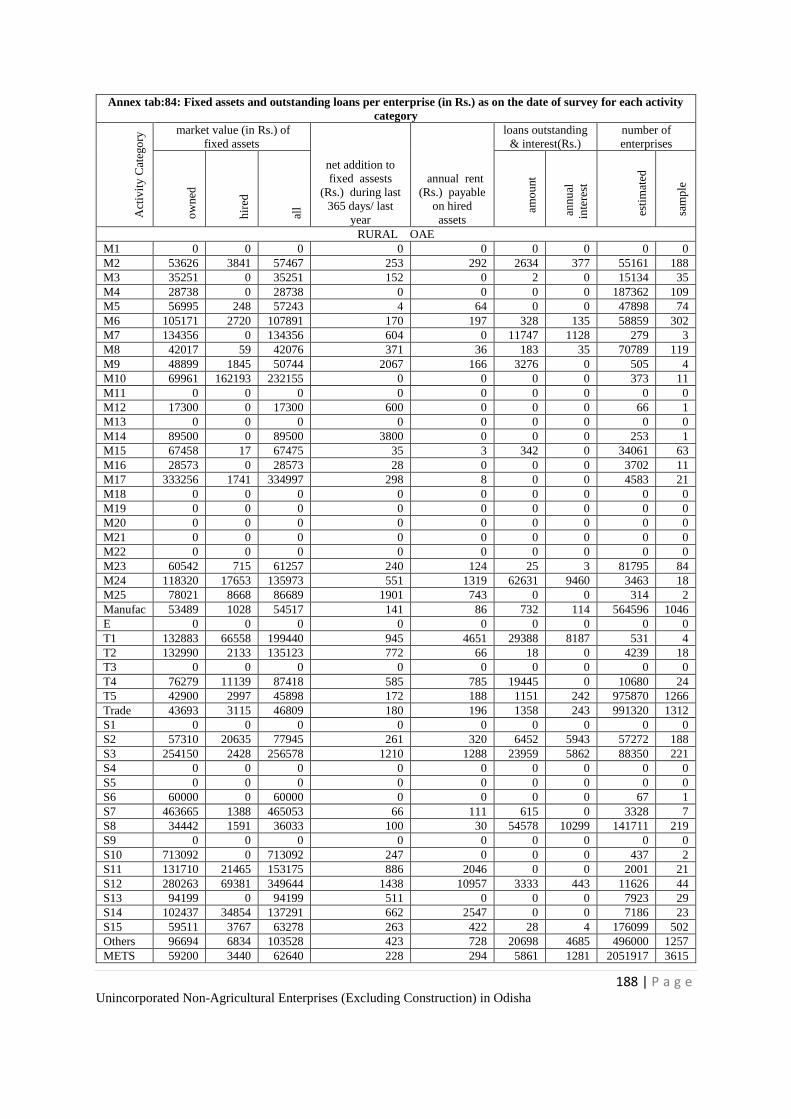
188 | P a g e Unincorporated Non-Agricultural Enterprises (Excluding Construction) in Odisha
Annex tab:84: Fixed assets and outstanding loans per enterprise (in Rs.) as on the date of survey for each activity
category
Act
ivit
y C
ateg
ory
market value (in Rs.) of
fixed assets
net addition to
fixed assests
(Rs.) during last
365 days/ last
year
annual rent
(Rs.) payable
on hired
assets
loans outstanding
& interest(Rs.)
number of
enterprises
ow
ned
hir
ed
all
am
ou
nt
an
nu
al
inte
rest
est
imat
ed
sam
ple
RURAL OAE
M1 0 0 0 0 0 0 0 0 0
M2 53626 3841 57467 253 292 2634 377 55161 188
M3 35251 0 35251 152 0 2 0 15134 35
M4 28738 0 28738 0 0 0 0 187362 109
M5 56995 248 57243 4 64 0 0 47898 74
M6 105171 2720 107891 170 197 328 135 58859 302
M7 134356 0 134356 604 0 11747 1128 279 3
M8 42017 59 42076 371 36 183 35 70789 119
M9 48899 1845 50744 2067 166 3276 0 505 4
M10 69961 162193 232155 0 0 0 0 373 11
M11 0 0 0 0 0 0 0 0 0
M12 17300 0 17300 600 0 0 0 66 1
M13 0 0 0 0 0 0 0 0 0
M14 89500 0 89500 3800 0 0 0 253 1
M15 67458 17 67475 35 3 342 0 34061 63
M16 28573 0 28573 28 0 0 0 3702 11
M17 333256 1741 334997 298 8 0 0 4583 21
M18 0 0 0 0 0 0 0 0 0
M19 0 0 0 0 0 0 0 0 0
M20 0 0 0 0 0 0 0 0 0
M21 0 0 0 0 0 0 0 0 0
M22 0 0 0 0 0 0 0 0 0
M23 60542 715 61257 240 124 25 3 81795 84
M24 118320 17653 135973 551 1319 62631 9460 3463 18
M25 78021 8668 86689 1901 743 0 0 314 2
Manufac 53489 1028 54517 141 86 732 114 564596 1046
E 0 0 0 0 0 0 0 0 0
T1 132883 66558 199440 945 4651 29388 8187 531 4
T2 132990 2133 135123 772 66 18 0 4239 18
T3 0 0 0 0 0 0 0 0 0
T4 76279 11139 87418 585 785 19445 0 10680 24
T5 42900 2997 45898 172 188 1151 242 975870 1266
Trade 43693 3115 46809 180 196 1358 243 991320 1312
S1 0 0 0 0 0 0 0 0 0
S2 57310 20635 77945 261 320 6452 5943 57272 188
S3 254150 2428 256578 1210 1288 23959 5862 88350 221
S4 0 0 0 0 0 0 0 0 0
S5 0 0 0 0 0 0 0 0 0
S6 60000 0 60000 0 0 0 0 67 1
S7 463665 1388 465053 66 111 615 0 3328 7
S8 34442 1591 36033 100 30 54578 10299 141711 219
S9 0 0 0 0 0 0 0 0 0
S10 713092 0 713092 247 0 0 0 437 2
S11 131710 21465 153175 886 2046 0 0 2001 21
S12 280263 69381 349644 1438 10957 3333 443 11626 44
S13 94199 0 94199 511 0 0 0 7923 29
S14 102437 34854 137291 662 2547 0 0 7186 23
S15 59511 3767 63278 263 422 28 4 176099 502
Others 96694 6834 103528 423 728 20698 4685 496000 1257
METS 59200 3440 62640 228 294 5861 1281 2051917 3615
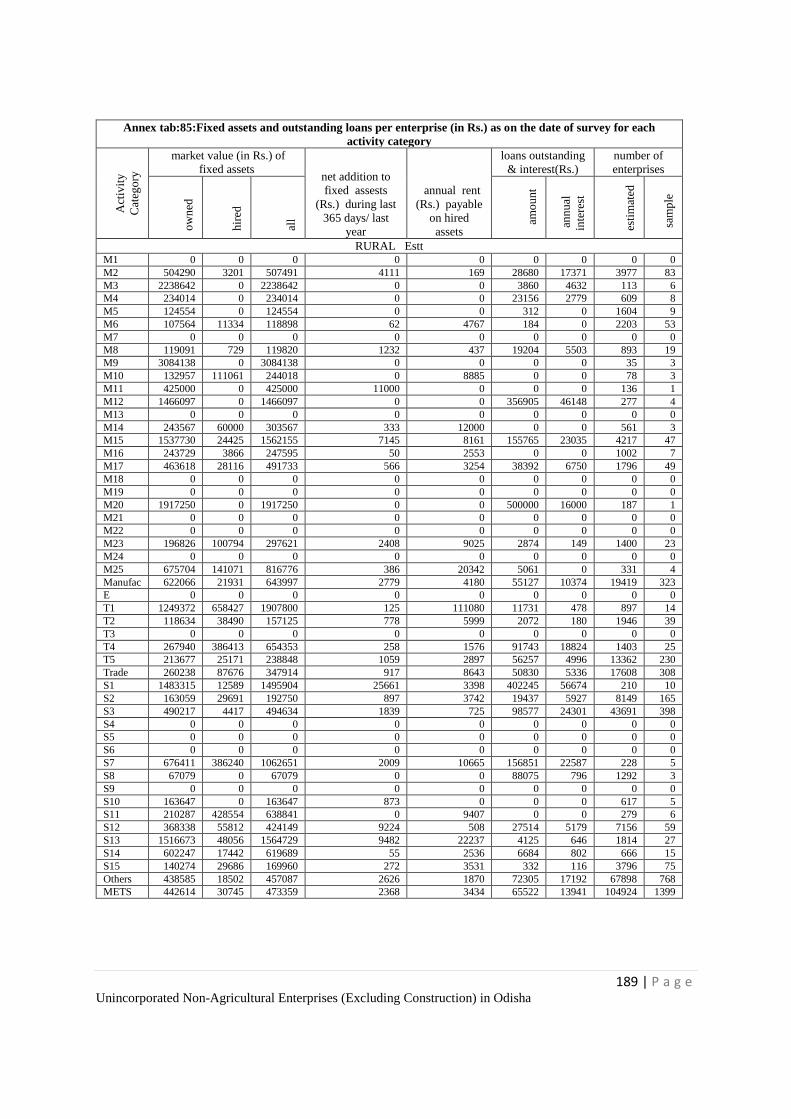
189 | P a g e Unincorporated Non-Agricultural Enterprises (Excluding Construction) in Odisha
Annex tab:85:Fixed assets and outstanding loans per enterprise (in Rs.) as on the date of survey for each
activity category
Act
ivit
y
Cat
ego
ry
market value (in Rs.) of
fixed assets net addition to
fixed assests
(Rs.) during last
365 days/ last
year
annual rent
(Rs.) payable
on hired
assets
loans outstanding
& interest(Rs.)
number of
enterprises
ow
ned
hir
ed
all
am
ou
nt
an
nu
al
inte
rest
esti
mat
ed
sam
ple
RURAL Estt M1 0 0 0 0 0 0 0 0 0
M2 504290 3201 507491 4111 169 28680 17371 3977 83
M3 2238642 0 2238642 0 0 3860 4632 113 6
M4 234014 0 234014 0 0 23156 2779 609 8
M5 124554 0 124554 0 0 312 0 1604 9
M6 107564 11334 118898 62 4767 184 0 2203 53
M7 0 0 0 0 0 0 0 0 0
M8 119091 729 119820 1232 437 19204 5503 893 19
M9 3084138 0 3084138 0 0 0 0 35 3
M10 132957 111061 244018 0 8885 0 0 78 3
M11 425000 0 425000 11000 0 0 0 136 1
M12 1466097 0 1466097 0 0 356905 46148 277 4
M13 0 0 0 0 0 0 0 0 0
M14 243567 60000 303567 333 12000 0 0 561 3
M15 1537730 24425 1562155 7145 8161 155765 23035 4217 47
M16 243729 3866 247595 50 2553 0 0 1002 7
M17 463618 28116 491733 566 3254 38392 6750 1796 49
M18 0 0 0 0 0 0 0 0 0
M19 0 0 0 0 0 0 0 0 0
M20 1917250 0 1917250 0 0 500000 16000 187 1
M21 0 0 0 0 0 0 0 0 0
M22 0 0 0 0 0 0 0 0 0
M23 196826 100794 297621 2408 9025 2874 149 1400 23
M24 0 0 0 0 0 0 0 0 0
M25 675704 141071 816776 386 20342 5061 0 331 4
Manufac 622066 21931 643997 2779 4180 55127 10374 19419 323
E 0 0 0 0 0 0 0 0 0
T1 1249372 658427 1907800 125 111080 11731 478 897 14
T2 118634 38490 157125 778 5999 2072 180 1946 39
T3 0 0 0 0 0 0 0 0 0
T4 267940 386413 654353 258 1576 91743 18824 1403 25
T5 213677 25171 238848 1059 2897 56257 4996 13362 230
Trade 260238 87676 347914 917 8643 50830 5336 17608 308
S1 1483315 12589 1495904 25661 3398 402245 56674 210 10
S2 163059 29691 192750 897 3742 19437 5927 8149 165
S3 490217 4417 494634 1839 725 98577 24301 43691 398
S4 0 0 0 0 0 0 0 0 0
S5 0 0 0 0 0 0 0 0 0
S6 0 0 0 0 0 0 0 0 0
S7 676411 386240 1062651 2009 10665 156851 22587 228 5
S8 67079 0 67079 0 0 88075 796 1292 3
S9 0 0 0 0 0 0 0 0 0
S10 163647 0 163647 873 0 0 0 617 5
S11 210287 428554 638841 0 9407 0 0 279 6
S12 368338 55812 424149 9224 508 27514 5179 7156 59
S13 1516673 48056 1564729 9482 22237 4125 646 1814 27
S14 602247 17442 619689 55 2536 6684 802 666 15
S15 140274 29686 169960 272 3531 332 116 3796 75
Others 438585 18502 457087 2626 1870 72305 17192 67898 768
METS 442614 30745 473359 2368 3434 65522 13941 104924 1399
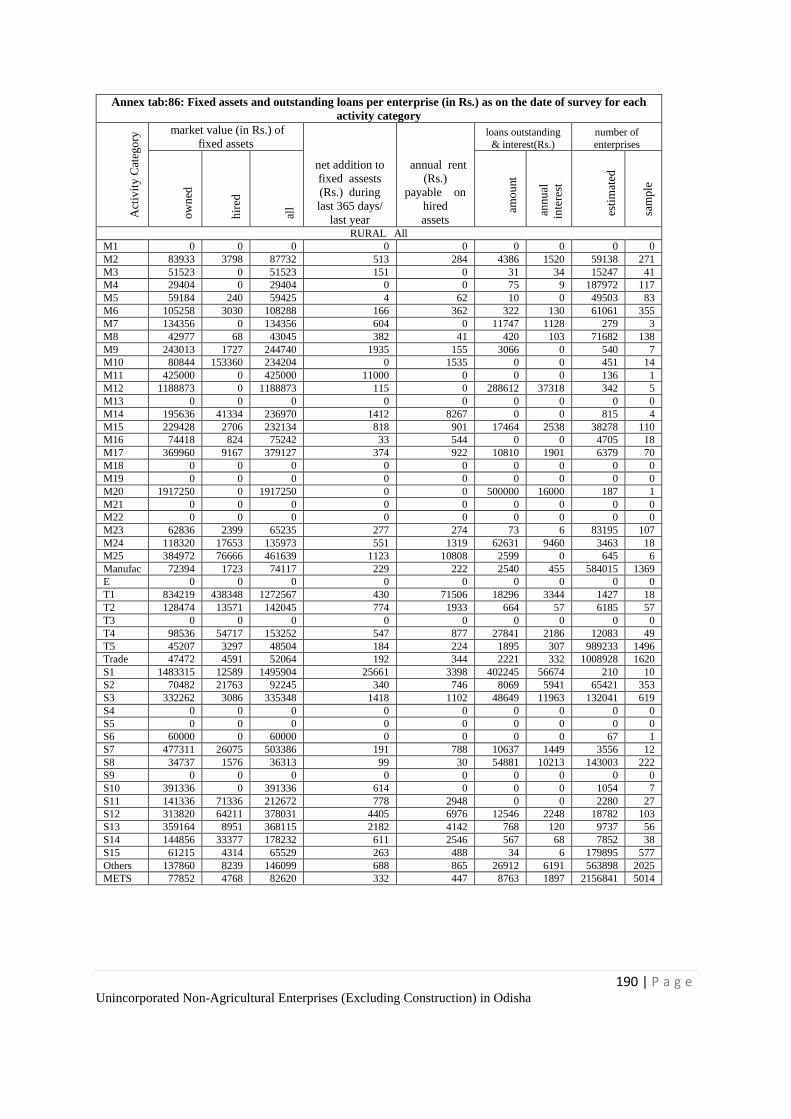
190 | P a g e Unincorporated Non-Agricultural Enterprises (Excluding Construction) in Odisha
Annex tab:86: Fixed assets and outstanding loans per enterprise (in Rs.) as on the date of survey for each
activity category
Act
ivit
y C
ateg
ory
market value (in Rs.) of
fixed assets
net addition to
fixed assests
(Rs.) during
last 365 days/
last year
annual rent
(Rs.)
payable on
hired
assets
loans outstanding
& interest(Rs.)
number of
enterprises
ow
ned
hir
ed
all
am
ou
nt
an
nu
al
inte
rest
est
imat
ed
sam
ple
RURAL All
M1 0 0 0 0 0 0 0 0 0
M2 83933 3798 87732 513 284 4386 1520 59138 271
M3 51523 0 51523 151 0 31 34 15247 41
M4 29404 0 29404 0 0 75 9 187972 117
M5 59184 240 59425 4 62 10 0 49503 83
M6 105258 3030 108288 166 362 322 130 61061 355
M7 134356 0 134356 604 0 11747 1128 279 3
M8 42977 68 43045 382 41 420 103 71682 138
M9 243013 1727 244740 1935 155 3066 0 540 7
M10 80844 153360 234204 0 1535 0 0 451 14
M11 425000 0 425000 11000 0 0 0 136 1
M12 1188873 0 1188873 115 0 288612 37318 342 5
M13 0 0 0 0 0 0 0 0 0
M14 195636 41334 236970 1412 8267 0 0 815 4
M15 229428 2706 232134 818 901 17464 2538 38278 110
M16 74418 824 75242 33 544 0 0 4705 18
M17 369960 9167 379127 374 922 10810 1901 6379 70
M18 0 0 0 0 0 0 0 0 0
M19 0 0 0 0 0 0 0 0 0
M20 1917250 0 1917250 0 0 500000 16000 187 1
M21 0 0 0 0 0 0 0 0 0
M22 0 0 0 0 0 0 0 0 0
M23 62836 2399 65235 277 274 73 6 83195 107
M24 118320 17653 135973 551 1319 62631 9460 3463 18
M25 384972 76666 461639 1123 10808 2599 0 645 6
Manufac 72394 1723 74117 229 222 2540 455 584015 1369
E 0 0 0 0 0 0 0 0 0
T1 834219 438348 1272567 430 71506 18296 3344 1427 18
T2 128474 13571 142045 774 1933 664 57 6185 57
T3 0 0 0 0 0 0 0 0 0
T4 98536 54717 153252 547 877 27841 2186 12083 49
T5 45207 3297 48504 184 224 1895 307 989233 1496
Trade 47472 4591 52064 192 344 2221 332 1008928 1620
S1 1483315 12589 1495904 25661 3398 402245 56674 210 10
S2 70482 21763 92245 340 746 8069 5941 65421 353
S3 332262 3086 335348 1418 1102 48649 11963 132041 619
S4 0 0 0 0 0 0 0 0 0
S5 0 0 0 0 0 0 0 0 0
S6 60000 0 60000 0 0 0 0 67 1
S7 477311 26075 503386 191 788 10637 1449 3556 12
S8 34737 1576 36313 99 30 54881 10213 143003 222
S9 0 0 0 0 0 0 0 0 0
S10 391336 0 391336 614 0 0 0 1054 7
S11 141336 71336 212672 778 2948 0 0 2280 27
S12 313820 64211 378031 4405 6976 12546 2248 18782 103
S13 359164 8951 368115 2182 4142 768 120 9737 56
S14 144856 33377 178232 611 2546 567 68 7852 38
S15 61215 4314 65529 263 488 34 6 179895 577
Others 137860 8239 146099 688 865 26912 6191 563898 2025
METS 77852 4768 82620 332 447 8763 1897 2156841 5014
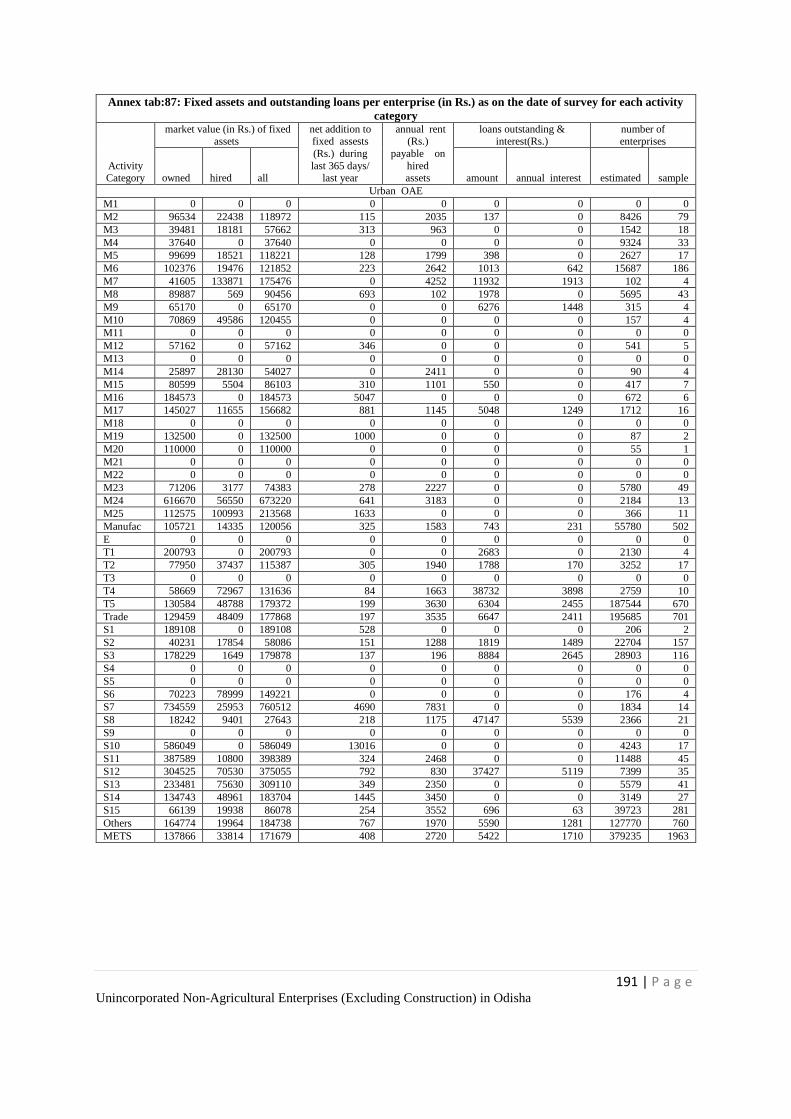
191 | P a g e Unincorporated Non-Agricultural Enterprises (Excluding Construction) in Odisha
Annex tab:87: Fixed assets and outstanding loans per enterprise (in Rs.) as on the date of survey for each activity
category
Activity Category
market value (in Rs.) of fixed assets
net addition to fixed assests
(Rs.) during
last 365 days/ last year
annual rent (Rs.)
payable on
hired assets
loans outstanding & interest(Rs.)
number of enterprises
owned hired all amount annual interest estimated sample
Urban OAE
M1 0 0 0 0 0 0 0 0 0
M2 96534 22438 118972 115 2035 137 0 8426 79
M3 39481 18181 57662 313 963 0 0 1542 18
M4 37640 0 37640 0 0 0 0 9324 33
M5 99699 18521 118221 128 1799 398 0 2627 17
M6 102376 19476 121852 223 2642 1013 642 15687 186
M7 41605 133871 175476 0 4252 11932 1913 102 4
M8 89887 569 90456 693 102 1978 0 5695 43
M9 65170 0 65170 0 0 6276 1448 315 4
M10 70869 49586 120455 0 0 0 0 157 4
M11 0 0 0 0 0 0 0 0 0
M12 57162 0 57162 346 0 0 0 541 5
M13 0 0 0 0 0 0 0 0 0
M14 25897 28130 54027 0 2411 0 0 90 4
M15 80599 5504 86103 310 1101 550 0 417 7
M16 184573 0 184573 5047 0 0 0 672 6
M17 145027 11655 156682 881 1145 5048 1249 1712 16
M18 0 0 0 0 0 0 0 0 0
M19 132500 0 132500 1000 0 0 0 87 2
M20 110000 0 110000 0 0 0 0 55 1
M21 0 0 0 0 0 0 0 0 0
M22 0 0 0 0 0 0 0 0 0
M23 71206 3177 74383 278 2227 0 0 5780 49
M24 616670 56550 673220 641 3183 0 0 2184 13
M25 112575 100993 213568 1633 0 0 0 366 11
Manufac 105721 14335 120056 325 1583 743 231 55780 502
E 0 0 0 0 0 0 0 0 0
T1 200793 0 200793 0 0 2683 0 2130 4
T2 77950 37437 115387 305 1940 1788 170 3252 17
T3 0 0 0 0 0 0 0 0 0
T4 58669 72967 131636 84 1663 38732 3898 2759 10
T5 130584 48788 179372 199 3630 6304 2455 187544 670
Trade 129459 48409 177868 197 3535 6647 2411 195685 701
S1 189108 0 189108 528 0 0 0 206 2
S2 40231 17854 58086 151 1288 1819 1489 22704 157
S3 178229 1649 179878 137 196 8884 2645 28903 116
S4 0 0 0 0 0 0 0 0 0
S5 0 0 0 0 0 0 0 0 0
S6 70223 78999 149221 0 0 0 0 176 4
S7 734559 25953 760512 4690 7831 0 0 1834 14
S8 18242 9401 27643 218 1175 47147 5539 2366 21
S9 0 0 0 0 0 0 0 0 0
S10 586049 0 586049 13016 0 0 0 4243 17
S11 387589 10800 398389 324 2468 0 0 11488 45
S12 304525 70530 375055 792 830 37427 5119 7399 35
S13 233481 75630 309110 349 2350 0 0 5579 41
S14 134743 48961 183704 1445 3450 0 0 3149 27
S15 66139 19938 86078 254 3552 696 63 39723 281
Others 164774 19964 184738 767 1970 5590 1281 127770 760
METS 137866 33814 171679 408 2720 5422 1710 379235 1963
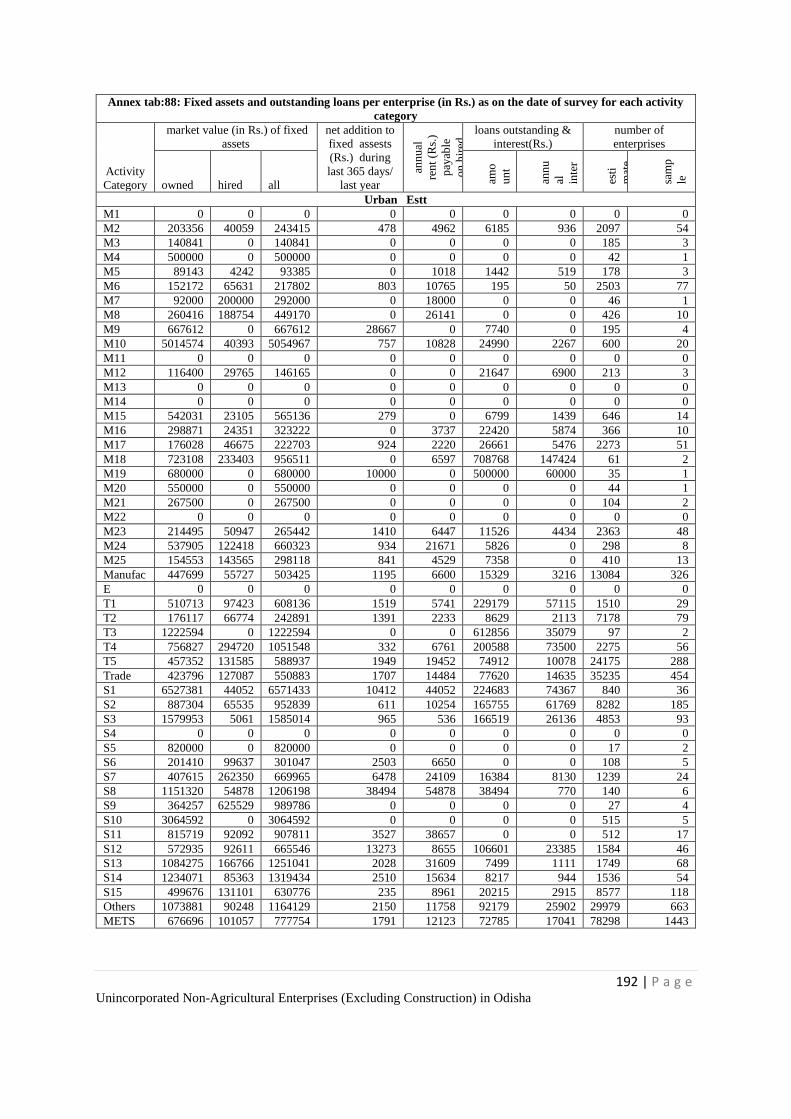
192 | P a g e Unincorporated Non-Agricultural Enterprises (Excluding Construction) in Odisha
Annex tab:88: Fixed assets and outstanding loans per enterprise (in Rs.) as on the date of survey for each activity
category
Activity
Category
market value (in Rs.) of fixed
assets
net addition to
fixed assests
(Rs.) during
last 365 days/
last year
ann
ual
ren
t (R
s.)
pay
able
on
hir
ed
asse
ts
loans outstanding &
interest(Rs.)
number of
enterprises
owned hired all amo
un
t
ann
u
al
inte
r
est
es
ti
mat
e
d
sam
p
le
Urban Estt
M1 0 0 0 0 0 0 0 0 0
M2 203356 40059 243415 478 4962 6185 936 2097 54
M3 140841 0 140841 0 0 0 0 185 3
M4 500000 0 500000 0 0 0 0 42 1
M5 89143 4242 93385 0 1018 1442 519 178 3
M6 152172 65631 217802 803 10765 195 50 2503 77
M7 92000 200000 292000 0 18000 0 0 46 1
M8 260416 188754 449170 0 26141 0 0 426 10
M9 667612 0 667612 28667 0 7740 0 195 4
M10 5014574 40393 5054967 757 10828 24990 2267 600 20
M11 0 0 0 0 0 0 0 0 0
M12 116400 29765 146165 0 0 21647 6900 213 3
M13 0 0 0 0 0 0 0 0 0
M14 0 0 0 0 0 0 0 0 0
M15 542031 23105 565136 279 0 6799 1439 646 14
M16 298871 24351 323222 0 3737 22420 5874 366 10
M17 176028 46675 222703 924 2220 26661 5476 2273 51
M18 723108 233403 956511 0 6597 708768 147424 61 2
M19 680000 0 680000 10000 0 500000 60000 35 1
M20 550000 0 550000 0 0 0 0 44 1
M21 267500 0 267500 0 0 0 0 104 2
M22 0 0 0 0 0 0 0 0 0
M23 214495 50947 265442 1410 6447 11526 4434 2363 48
M24 537905 122418 660323 934 21671 5826 0 298 8
M25 154553 143565 298118 841 4529 7358 0 410 13
Manufac 447699 55727 503425 1195 6600 15329 3216 13084 326
E 0 0 0 0 0 0 0 0 0
T1 510713 97423 608136 1519 5741 229179 57115 1510 29
T2 176117 66774 242891 1391 2233 8629 2113 7178 79
T3 1222594 0 1222594 0 0 612856 35079 97 2
T4 756827 294720 1051548 332 6761 200588 73500 2275 56
T5 457352 131585 588937 1949 19452 74912 10078 24175 288
Trade 423796 127087 550883 1707 14484 77620 14635 35235 454
S1 6527381 44052 6571433 10412 44052 224683 74367 840 36
S2 887304 65535 952839 611 10254 165755 61769 8282 185
S3 1579953 5061 1585014 965 536 166519 26136 4853 93
S4 0 0 0 0 0 0 0 0 0
S5 820000 0 820000 0 0 0 0 17 2
S6 201410 99637 301047 2503 6650 0 0 108 5
S7 407615 262350 669965 6478 24109 16384 8130 1239 24
S8 1151320 54878 1206198 38494 54878 38494 770 140 6
S9 364257 625529 989786 0 0 0 0 27 4
S10 3064592 0 3064592 0 0 0 0 515 5
S11 815719 92092 907811 3527 38657 0 0 512 17
S12 572935 92611 665546 13273 8655 106601 23385 1584 46
S13 1084275 166766 1251041 2028 31609 7499 1111 1749 68
S14 1234071 85363 1319434 2510 15634 8217 944 1536 54
S15 499676 131101 630776 235 8961 20215 2915 8577 118
Others 1073881 90248 1164129 2150 11758 92179 25902 29979 663
METS 676696 101057 777754 1791 12123 72785 17041 78298 1443
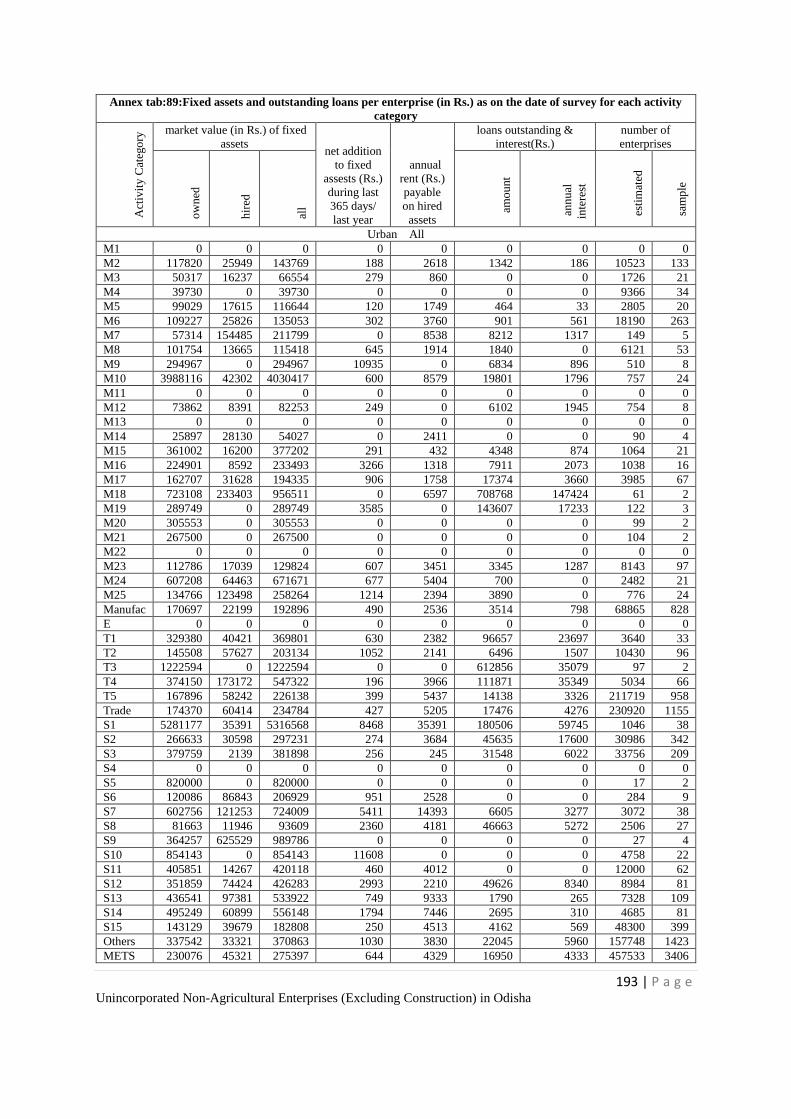
193 | P a g e Unincorporated Non-Agricultural Enterprises (Excluding Construction) in Odisha
Annex tab:89:Fixed assets and outstanding loans per enterprise (in Rs.) as on the date of survey for each activity
category
Act
ivit
y C
ateg
ory
market value (in Rs.) of fixed
assets net addition
to fixed
assests (Rs.)
during last
365 days/
last year
annual
rent (Rs.)
payable
on hired
assets
loans outstanding &
interest(Rs.)
number of
enterprises
ow
ned
hir
ed
all
am
ou
nt
an
nu
al
inte
rest
est
imat
ed
sam
ple
Urban All
M1 0 0 0 0 0 0 0 0 0
M2 117820 25949 143769 188 2618 1342 186 10523 133
M3 50317 16237 66554 279 860 0 0 1726 21
M4 39730 0 39730 0 0 0 0 9366 34
M5 99029 17615 116644 120 1749 464 33 2805 20
M6 109227 25826 135053 302 3760 901 561 18190 263
M7 57314 154485 211799 0 8538 8212 1317 149 5
M8 101754 13665 115418 645 1914 1840 0 6121 53
M9 294967 0 294967 10935 0 6834 896 510 8
M10 3988116 42302 4030417 600 8579 19801 1796 757 24
M11 0 0 0 0 0 0 0 0 0
M12 73862 8391 82253 249 0 6102 1945 754 8
M13 0 0 0 0 0 0 0 0 0
M14 25897 28130 54027 0 2411 0 0 90 4
M15 361002 16200 377202 291 432 4348 874 1064 21
M16 224901 8592 233493 3266 1318 7911 2073 1038 16
M17 162707 31628 194335 906 1758 17374 3660 3985 67
M18 723108 233403 956511 0 6597 708768 147424 61 2
M19 289749 0 289749 3585 0 143607 17233 122 3
M20 305553 0 305553 0 0 0 0 99 2
M21 267500 0 267500 0 0 0 0 104 2
M22 0 0 0 0 0 0 0 0 0
M23 112786 17039 129824 607 3451 3345 1287 8143 97
M24 607208 64463 671671 677 5404 700 0 2482 21
M25 134766 123498 258264 1214 2394 3890 0 776 24
Manufac 170697 22199 192896 490 2536 3514 798 68865 828
E 0 0 0 0 0 0 0 0 0
T1 329380 40421 369801 630 2382 96657 23697 3640 33
T2 145508 57627 203134 1052 2141 6496 1507 10430 96
T3 1222594 0 1222594 0 0 612856 35079 97 2
T4 374150 173172 547322 196 3966 111871 35349 5034 66
T5 167896 58242 226138 399 5437 14138 3326 211719 958
Trade 174370 60414 234784 427 5205 17476 4276 230920 1155
S1 5281177 35391 5316568 8468 35391 180506 59745 1046 38
S2 266633 30598 297231 274 3684 45635 17600 30986 342
S3 379759 2139 381898 256 245 31548 6022 33756 209
S4 0 0 0 0 0 0 0 0 0
S5 820000 0 820000 0 0 0 0 17 2
S6 120086 86843 206929 951 2528 0 0 284 9
S7 602756 121253 724009 5411 14393 6605 3277 3072 38
S8 81663 11946 93609 2360 4181 46663 5272 2506 27
S9 364257 625529 989786 0 0 0 0 27 4
S10 854143 0 854143 11608 0 0 0 4758 22
S11 405851 14267 420118 460 4012 0 0 12000 62
S12 351859 74424 426283 2993 2210 49626 8340 8984 81
S13 436541 97381 533922 749 9333 1790 265 7328 109
S14 495249 60899 556148 1794 7446 2695 310 4685 81
S15 143129 39679 182808 250 4513 4162 569 48300 399
Others 337542 33321 370863 1030 3830 22045 5960 157748 1423
METS 230076 45321 275397 644 4329 16950 4333 457533 3406
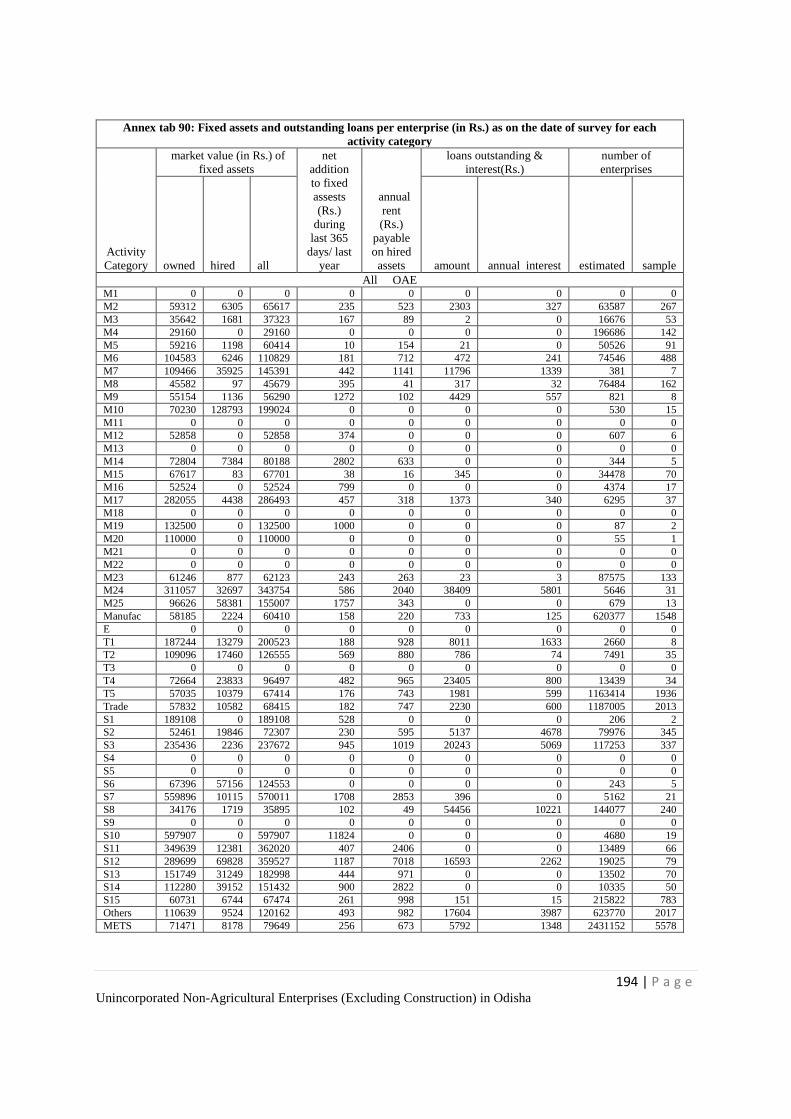
194 | P a g e Unincorporated Non-Agricultural Enterprises (Excluding Construction) in Odisha
Annex tab 90: Fixed assets and outstanding loans per enterprise (in Rs.) as on the date of survey for each
activity category
Activity
Category
market value (in Rs.) of
fixed assets
net
addition
to fixed
assests
(Rs.)
during
last 365
days/ last
year
annual
rent
(Rs.)
payable
on hired
assets
loans outstanding &
interest(Rs.)
number of
enterprises
owned hired all amount annual interest estimated sample
All OAE M1 0 0 0 0 0 0 0 0 0
M2 59312 6305 65617 235 523 2303 327 63587 267
M3 35642 1681 37323 167 89 2 0 16676 53
M4 29160 0 29160 0 0 0 0 196686 142
M5 59216 1198 60414 10 154 21 0 50526 91
M6 104583 6246 110829 181 712 472 241 74546 488
M7 109466 35925 145391 442 1141 11796 1339 381 7
M8 45582 97 45679 395 41 317 32 76484 162
M9 55154 1136 56290 1272 102 4429 557 821 8
M10 70230 128793 199024 0 0 0 0 530 15
M11 0 0 0 0 0 0 0 0 0
M12 52858 0 52858 374 0 0 0 607 6
M13 0 0 0 0 0 0 0 0 0
M14 72804 7384 80188 2802 633 0 0 344 5
M15 67617 83 67701 38 16 345 0 34478 70
M16 52524 0 52524 799 0 0 0 4374 17
M17 282055 4438 286493 457 318 1373 340 6295 37
M18 0 0 0 0 0 0 0 0 0
M19 132500 0 132500 1000 0 0 0 87 2
M20 110000 0 110000 0 0 0 0 55 1
M21 0 0 0 0 0 0 0 0 0
M22 0 0 0 0 0 0 0 0 0
M23 61246 877 62123 243 263 23 3 87575 133
M24 311057 32697 343754 586 2040 38409 5801 5646 31
M25 96626 58381 155007 1757 343 0 0 679 13
Manufac 58185 2224 60410 158 220 733 125 620377 1548
E 0 0 0 0 0 0 0 0 0
T1 187244 13279 200523 188 928 8011 1633 2660 8
T2 109096 17460 126555 569 880 786 74 7491 35
T3 0 0 0 0 0 0 0 0 0
T4 72664 23833 96497 482 965 23405 800 13439 34
T5 57035 10379 67414 176 743 1981 599 1163414 1936
Trade 57832 10582 68415 182 747 2230 600 1187005 2013
S1 189108 0 189108 528 0 0 0 206 2
S2 52461 19846 72307 230 595 5137 4678 79976 345
S3 235436 2236 237672 945 1019 20243 5069 117253 337
S4 0 0 0 0 0 0 0 0 0
S5 0 0 0 0 0 0 0 0 0
S6 67396 57156 124553 0 0 0 0 243 5
S7 559896 10115 570011 1708 2853 396 0 5162 21
S8 34176 1719 35895 102 49 54456 10221 144077 240
S9 0 0 0 0 0 0 0 0 0
S10 597907 0 597907 11824 0 0 0 4680 19
S11 349639 12381 362020 407 2406 0 0 13489 66
S12 289699 69828 359527 1187 7018 16593 2262 19025 79
S13 151749 31249 182998 444 971 0 0 13502 70
S14 112280 39152 151432 900 2822 0 0 10335 50
S15 60731 6744 67474 261 998 151 15 215822 783
Others 110639 9524 120162 493 982 17604 3987 623770 2017
METS 71471 8178 79649 256 673 5792 1348 2431152 5578
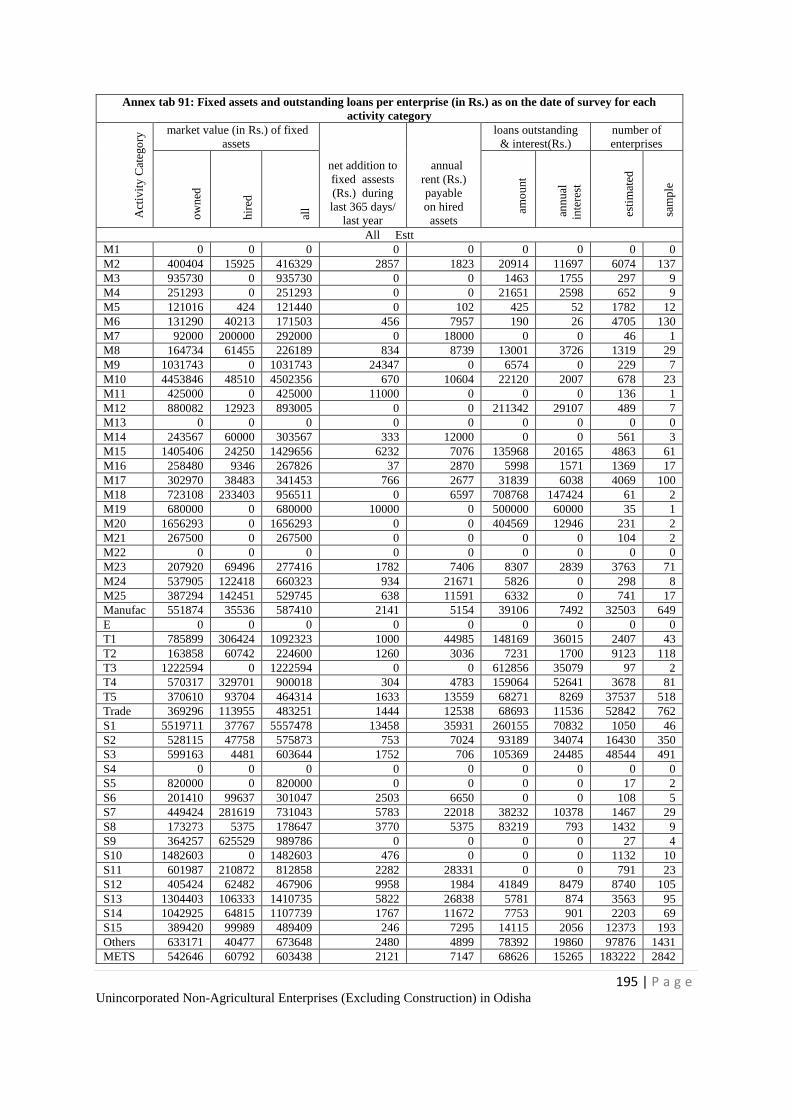
195 | P a g e Unincorporated Non-Agricultural Enterprises (Excluding Construction) in Odisha
Annex tab 91: Fixed assets and outstanding loans per enterprise (in Rs.) as on the date of survey for each
activity category
Act
ivit
y C
ateg
ory
market value (in Rs.) of fixed
assets
net addition to
fixed assests
(Rs.) during
last 365 days/
last year
annual
rent (Rs.)
payable
on hired
assets
loans outstanding
& interest(Rs.)
number of
enterprises
ow
ned
hir
ed
all
am
ou
nt
an
nu
al
inte
rest
est
imat
ed
sam
ple
All Estt
M1 0 0 0 0 0 0 0 0 0
M2 400404 15925 416329 2857 1823 20914 11697 6074 137
M3 935730 0 935730 0 0 1463 1755 297 9
M4 251293 0 251293 0 0 21651 2598 652 9
M5 121016 424 121440 0 102 425 52 1782 12
M6 131290 40213 171503 456 7957 190 26 4705 130
M7 92000 200000 292000 0 18000 0 0 46 1
M8 164734 61455 226189 834 8739 13001 3726 1319 29
M9 1031743 0 1031743 24347 0 6574 0 229 7
M10 4453846 48510 4502356 670 10604 22120 2007 678 23
M11 425000 0 425000 11000 0 0 0 136 1
M12 880082 12923 893005 0 0 211342 29107 489 7
M13 0 0 0 0 0 0 0 0 0
M14 243567 60000 303567 333 12000 0 0 561 3
M15 1405406 24250 1429656 6232 7076 135968 20165 4863 61
M16 258480 9346 267826 37 2870 5998 1571 1369 17
M17 302970 38483 341453 766 2677 31839 6038 4069 100
M18 723108 233403 956511 0 6597 708768 147424 61 2
M19 680000 0 680000 10000 0 500000 60000 35 1
M20 1656293 0 1656293 0 0 404569 12946 231 2
M21 267500 0 267500 0 0 0 0 104 2
M22 0 0 0 0 0 0 0 0 0
M23 207920 69496 277416 1782 7406 8307 2839 3763 71
M24 537905 122418 660323 934 21671 5826 0 298 8
M25 387294 142451 529745 638 11591 6332 0 741 17
Manufac 551874 35536 587410 2141 5154 39106 7492 32503 649
E 0 0 0 0 0 0 0 0 0
T1 785899 306424 1092323 1000 44985 148169 36015 2407 43
T2 163858 60742 224600 1260 3036 7231 1700 9123 118
T3 1222594 0 1222594 0 0 612856 35079 97 2
T4 570317 329701 900018 304 4783 159064 52641 3678 81
T5 370610 93704 464314 1633 13559 68271 8269 37537 518
Trade 369296 113955 483251 1444 12538 68693 11536 52842 762
S1 5519711 37767 5557478 13458 35931 260155 70832 1050 46
S2 528115 47758 575873 753 7024 93189 34074 16430 350
S3 599163 4481 603644 1752 706 105369 24485 48544 491
S4 0 0 0 0 0 0 0 0 0
S5 820000 0 820000 0 0 0 0 17 2
S6 201410 99637 301047 2503 6650 0 0 108 5
S7 449424 281619 731043 5783 22018 38232 10378 1467 29
S8 173273 5375 178647 3770 5375 83219 793 1432 9
S9 364257 625529 989786 0 0 0 0 27 4
S10 1482603 0 1482603 476 0 0 0 1132 10
S11 601987 210872 812858 2282 28331 0 0 791 23
S12 405424 62482 467906 9958 1984 41849 8479 8740 105
S13 1304403 106333 1410735 5822 26838 5781 874 3563 95
S14 1042925 64815 1107739 1767 11672 7753 901 2203 69
S15 389420 99989 489409 246 7295 14115 2056 12373 193
Others 633171 40477 673648 2480 4899 78392 19860 97876 1431
METS 542646 60792 603438 2121 7147 68626 15265 183222 2842
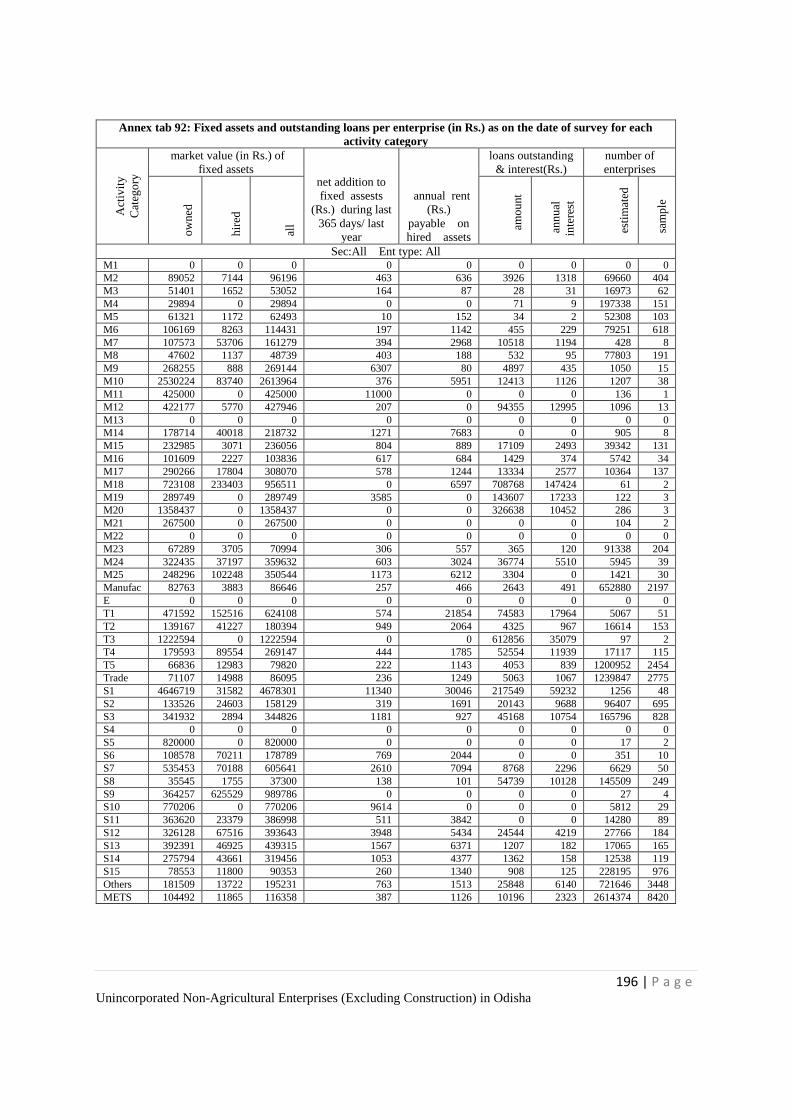
196 | P a g e Unincorporated Non-Agricultural Enterprises (Excluding Construction) in Odisha
Annex tab 92: Fixed assets and outstanding loans per enterprise (in Rs.) as on the date of survey for each
activity category
Act
ivit
y
Cat
ego
ry
market value (in Rs.) of
fixed assets net addition to
fixed assests
(Rs.) during last
365 days/ last
year
annual rent
(Rs.)
payable on
hired assets
loans outstanding
& interest(Rs.)
number of
enterprises
ow
ned
hir
ed
all
am
ou
nt
an
nu
al
inte
rest
est
imat
ed
sam
ple
Sec:All Ent type: All M1 0 0 0 0 0 0 0 0 0
M2 89052 7144 96196 463 636 3926 1318 69660 404
M3 51401 1652 53052 164 87 28 31 16973 62
M4 29894 0 29894 0 0 71 9 197338 151
M5 61321 1172 62493 10 152 34 2 52308 103
M6 106169 8263 114431 197 1142 455 229 79251 618
M7 107573 53706 161279 394 2968 10518 1194 428 8
M8 47602 1137 48739 403 188 532 95 77803 191
M9 268255 888 269144 6307 80 4897 435 1050 15
M10 2530224 83740 2613964 376 5951 12413 1126 1207 38
M11 425000 0 425000 11000 0 0 0 136 1
M12 422177 5770 427946 207 0 94355 12995 1096 13
M13 0 0 0 0 0 0 0 0 0
M14 178714 40018 218732 1271 7683 0 0 905 8
M15 232985 3071 236056 804 889 17109 2493 39342 131
M16 101609 2227 103836 617 684 1429 374 5742 34
M17 290266 17804 308070 578 1244 13334 2577 10364 137
M18 723108 233403 956511 0 6597 708768 147424 61 2
M19 289749 0 289749 3585 0 143607 17233 122 3
M20 1358437 0 1358437 0 0 326638 10452 286 3
M21 267500 0 267500 0 0 0 0 104 2
M22 0 0 0 0 0 0 0 0 0
M23 67289 3705 70994 306 557 365 120 91338 204
M24 322435 37197 359632 603 3024 36774 5510 5945 39
M25 248296 102248 350544 1173 6212 3304 0 1421 30
Manufac 82763 3883 86646 257 466 2643 491 652880 2197
E 0 0 0 0 0 0 0 0 0
T1 471592 152516 624108 574 21854 74583 17964 5067 51
T2 139167 41227 180394 949 2064 4325 967 16614 153
T3 1222594 0 1222594 0 0 612856 35079 97 2
T4 179593 89554 269147 444 1785 52554 11939 17117 115
T5 66836 12983 79820 222 1143 4053 839 1200952 2454
Trade 71107 14988 86095 236 1249 5063 1067 1239847 2775
S1 4646719 31582 4678301 11340 30046 217549 59232 1256 48
S2 133526 24603 158129 319 1691 20143 9688 96407 695
S3 341932 2894 344826 1181 927 45168 10754 165796 828
S4 0 0 0 0 0 0 0 0 0
S5 820000 0 820000 0 0 0 0 17 2
S6 108578 70211 178789 769 2044 0 0 351 10
S7 535453 70188 605641 2610 7094 8768 2296 6629 50
S8 35545 1755 37300 138 101 54739 10128 145509 249
S9 364257 625529 989786 0 0 0 0 27 4
S10 770206 0 770206 9614 0 0 0 5812 29
S11 363620 23379 386998 511 3842 0 0 14280 89
S12 326128 67516 393643 3948 5434 24544 4219 27766 184
S13 392391 46925 439315 1567 6371 1207 182 17065 165
S14 275794 43661 319456 1053 4377 1362 158 12538 119
S15 78553 11800 90353 260 1340 908 125 228195 976
Others 181509 13722 195231 763 1513 25848 6140 721646 3448
METS 104492 11865 116358 387 1126 10196 2323 2614374 8420
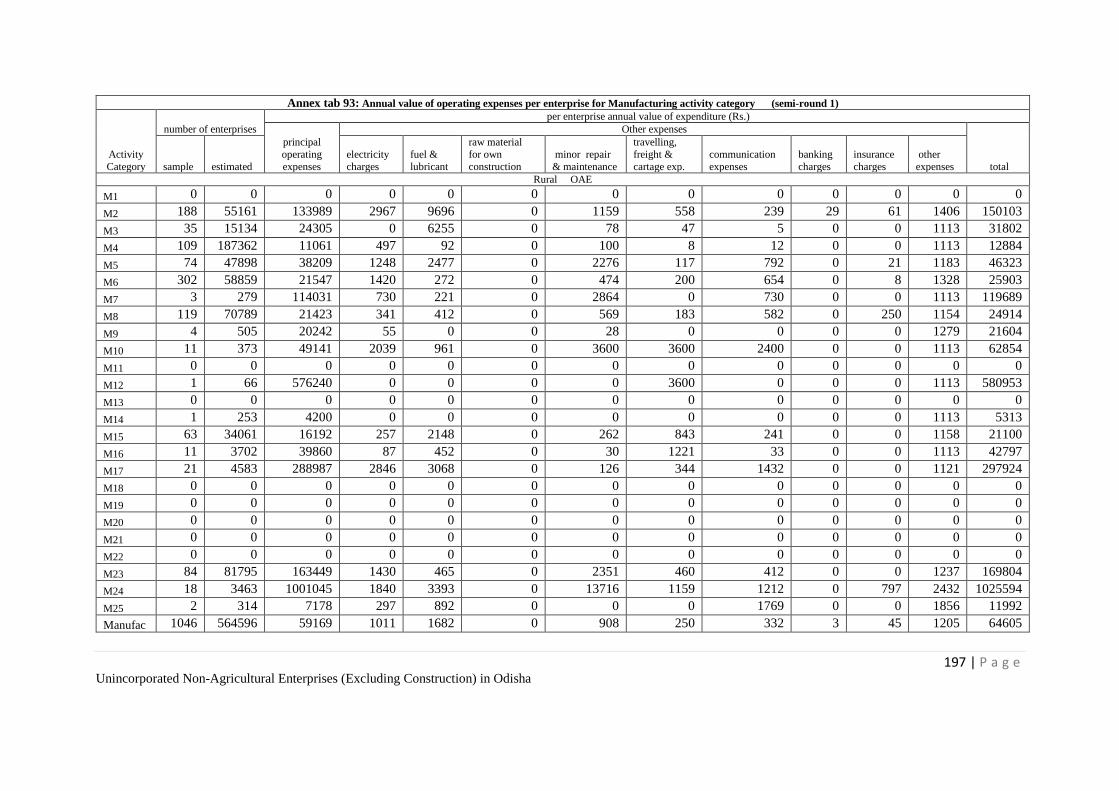
197 | P a g e Unincorporated Non-Agricultural Enterprises (Excluding Construction) in Odisha
Annex tab 93: Annual value of operating expenses per enterprise for Manufacturing activity category (semi-round 1)
Activity
Category
number of enterprises
per enterprise annual value of expenditure (Rs.)
principal
operating
expenses
Other expenses
total sample estimated
electricity
charges
fuel &
lubricant
raw material
for own
construction
minor repair
& maintenance
travelling,
freight &
cartage exp.
communication
expenses
banking
charges
insurance
charges
other
expenses
Rural OAE
M1 0 0 0 0 0 0 0 0 0 0 0 0 0
M2 188 55161 133989 2967 9696 0 1159 558 239 29 61 1406 150103
M3 35 15134 24305 0 6255 0 78 47 5 0 0 1113 31802
M4 109 187362 11061 497 92 0 100 8 12 0 0 1113 12884
M5 74 47898 38209 1248 2477 0 2276 117 792 0 21 1183 46323
M6 302 58859 21547 1420 272 0 474 200 654 0 8 1328 25903
M7 3 279 114031 730 221 0 2864 0 730 0 0 1113 119689
M8 119 70789 21423 341 412 0 569 183 582 0 250 1154 24914
M9 4 505 20242 55 0 0 28 0 0 0 0 1279 21604
M10 11 373 49141 2039 961 0 3600 3600 2400 0 0 1113 62854
M11 0 0 0 0 0 0 0 0 0 0 0 0 0
M12 1 66 576240 0 0 0 0 3600 0 0 0 1113 580953
M13 0 0 0 0 0 0 0 0 0 0 0 0 0
M14 1 253 4200 0 0 0 0 0 0 0 0 1113 5313
M15 63 34061 16192 257 2148 0 262 843 241 0 0 1158 21100
M16 11 3702 39860 87 452 0 30 1221 33 0 0 1113 42797
M17 21 4583 288987 2846 3068 0 126 344 1432 0 0 1121 297924
M18 0 0 0 0 0 0 0 0 0 0 0 0 0
M19 0 0 0 0 0 0 0 0 0 0 0 0 0
M20 0 0 0 0 0 0 0 0 0 0 0 0 0
M21 0 0 0 0 0 0 0 0 0 0 0 0 0
M22 0 0 0 0 0 0 0 0 0 0 0 0 0
M23 84 81795 163449 1430 465 0 2351 460 412 0 0 1237 169804
M24 18 3463 1001045 1840 3393 0 13716 1159 1212 0 797 2432 1025594
M25 2 314 7178 297 892 0 0 0 1769 0 0 1856 11992
Manufac 1046 564596 59169 1011 1682 0 908 250 332 3 45 1205 64605
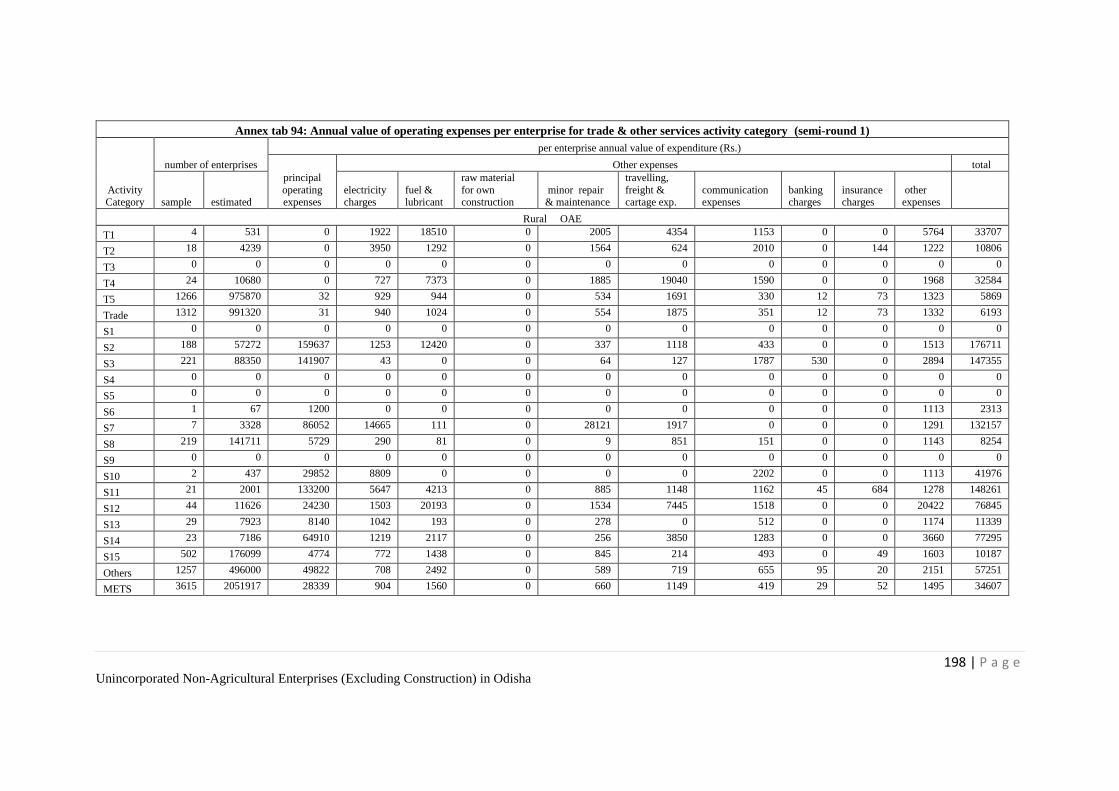
198 | P a g e Unincorporated Non-Agricultural Enterprises (Excluding Construction) in Odisha
Annex tab 94: Annual value of operating expenses per enterprise for trade & other services activity category (semi-round 1)
Activity Category
number of enterprises
per enterprise annual value of expenditure (Rs.)
principal
operating expenses
Other expenses total
sample estimated electricity charges
fuel & lubricant
raw material
for own construction
minor repair & maintenance
travelling,
freight & cartage exp.
communication expenses
banking charges
insurance charges
other expenses
Rural OAE
T1 4 531 0 1922 18510 0 2005 4354 1153 0 0 5764 33707
T2 18 4239 0 3950 1292 0 1564 624 2010 0 144 1222 10806
T3 0 0 0 0 0 0 0 0 0 0 0 0 0
T4 24 10680 0 727 7373 0 1885 19040 1590 0 0 1968 32584
T5 1266 975870 32 929 944 0 534 1691 330 12 73 1323 5869
Trade 1312 991320 31 940 1024 0 554 1875 351 12 73 1332 6193
S1 0 0 0 0 0 0 0 0 0 0 0 0 0
S2 188 57272 159637 1253 12420 0 337 1118 433 0 0 1513 176711
S3 221 88350 141907 43 0 0 64 127 1787 530 0 2894 147355
S4 0 0 0 0 0 0 0 0 0 0 0 0 0
S5 0 0 0 0 0 0 0 0 0 0 0 0 0
S6 1 67 1200 0 0 0 0 0 0 0 0 1113 2313
S7 7 3328 86052 14665 111 0 28121 1917 0 0 0 1291 132157
S8 219 141711 5729 290 81 0 9 851 151 0 0 1143 8254
S9 0 0 0 0 0 0 0 0 0 0 0 0 0
S10 2 437 29852 8809 0 0 0 0 2202 0 0 1113 41976
S11 21 2001 133200 5647 4213 0 885 1148 1162 45 684 1278 148261
S12 44 11626 24230 1503 20193 0 1534 7445 1518 0 0 20422 76845
S13 29 7923 8140 1042 193 0 278 0 512 0 0 1174 11339
S14 23 7186 64910 1219 2117 0 256 3850 1283 0 0 3660 77295
S15 502 176099 4774 772 1438 0 845 214 493 0 49 1603 10187
Others 1257 496000 49822 708 2492 0 589 719 655 95 20 2151 57251
METS 3615 2051917 28339 904 1560 0 660 1149 419 29 52 1495 34607
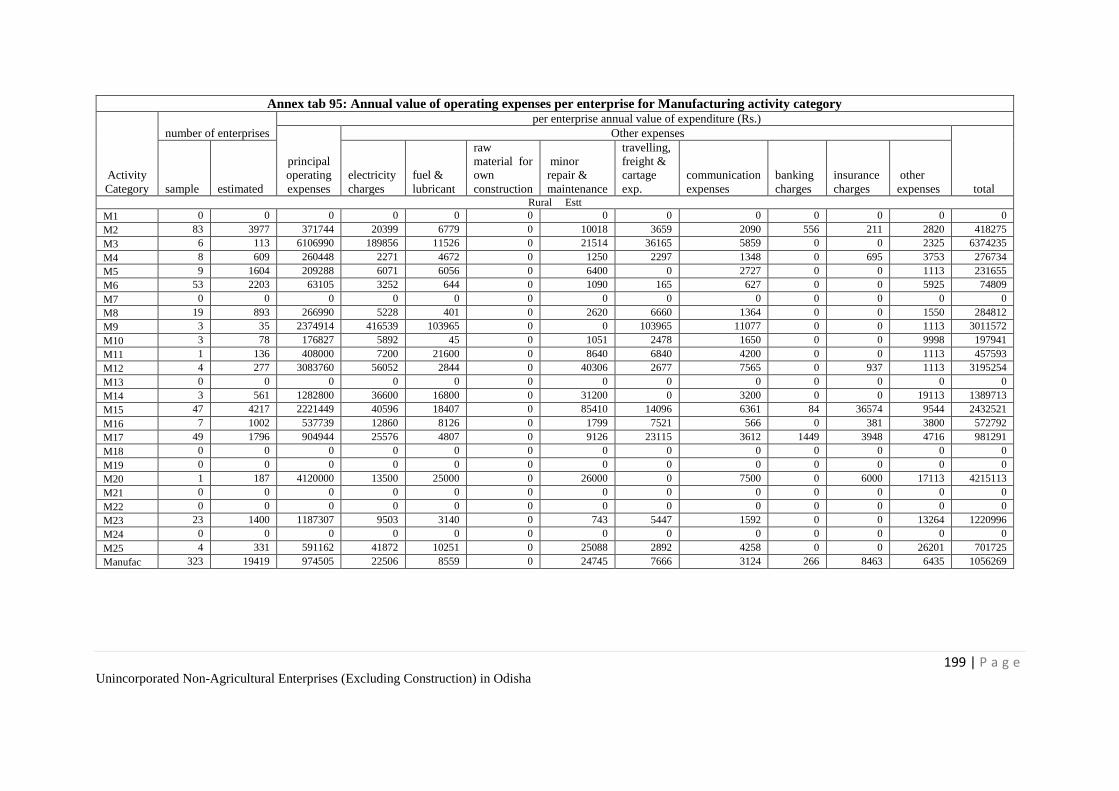
199 | P a g e Unincorporated Non-Agricultural Enterprises (Excluding Construction) in Odisha
Annex tab 95: Annual value of operating expenses per enterprise for Manufacturing activity category
Activity
Category
number of enterprises
per enterprise annual value of expenditure (Rs.)
principal
operating
expenses
Other expenses
total sample estimated
electricity
charges
fuel &
lubricant
raw
material for
own
construction
minor
repair &
maintenance
travelling,
freight &
cartage
exp.
communication
expenses
banking
charges
insurance
charges
other
expenses Rural Estt
M1 0 0 0 0 0 0 0 0 0 0 0 0 0
M2 83 3977 371744 20399 6779 0 10018 3659 2090 556 211 2820 418275
M3 6 113 6106990 189856 11526 0 21514 36165 5859 0 0 2325 6374235
M4 8 609 260448 2271 4672 0 1250 2297 1348 0 695 3753 276734
M5 9 1604 209288 6071 6056 0 6400 0 2727 0 0 1113 231655
M6 53 2203 63105 3252 644 0 1090 165 627 0 0 5925 74809
M7 0 0 0 0 0 0 0 0 0 0 0 0 0
M8 19 893 266990 5228 401 0 2620 6660 1364 0 0 1550 284812
M9 3 35 2374914 416539 103965 0 0 103965 11077 0 0 1113 3011572
M10 3 78 176827 5892 45 0 1051 2478 1650 0 0 9998 197941
M11 1 136 408000 7200 21600 0 8640 6840 4200 0 0 1113 457593
M12 4 277 3083760 56052 2844 0 40306 2677 7565 0 937 1113 3195254
M13 0 0 0 0 0 0 0 0 0 0 0 0 0
M14 3 561 1282800 36600 16800 0 31200 0 3200 0 0 19113 1389713
M15 47 4217 2221449 40596 18407 0 85410 14096 6361 84 36574 9544 2432521
M16 7 1002 537739 12860 8126 0 1799 7521 566 0 381 3800 572792
M17 49 1796 904944 25576 4807 0 9126 23115 3612 1449 3948 4716 981291
M18 0 0 0 0 0 0 0 0 0 0 0 0 0
M19 0 0 0 0 0 0 0 0 0 0 0 0 0
M20 1 187 4120000 13500 25000 0 26000 0 7500 0 6000 17113 4215113
M21 0 0 0 0 0 0 0 0 0 0 0 0 0
M22 0 0 0 0 0 0 0 0 0 0 0 0 0
M23 23 1400 1187307 9503 3140 0 743 5447 1592 0 0 13264 1220996
M24 0 0 0 0 0 0 0 0 0 0 0 0 0
M25 4 331 591162 41872 10251 0 25088 2892 4258 0 0 26201 701725
Manufac 323 19419 974505 22506 8559 0 24745 7666 3124 266 8463 6435 1056269
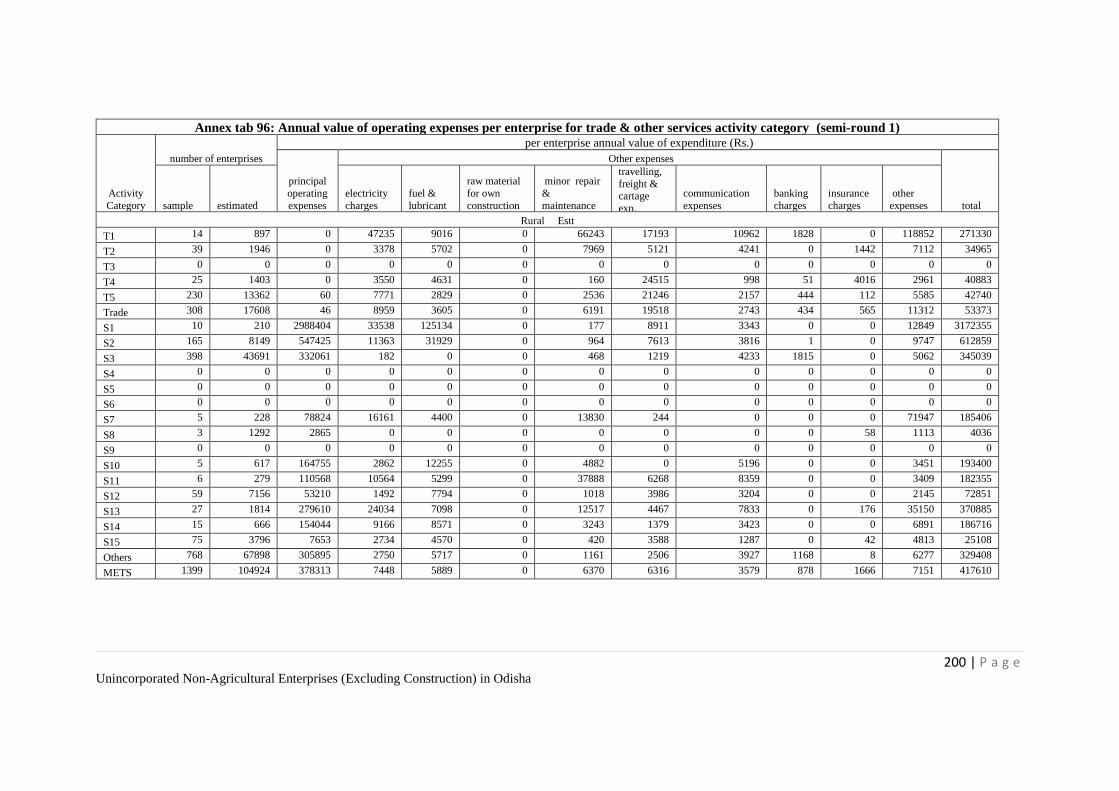
200 | P a g e Unincorporated Non-Agricultural Enterprises (Excluding Construction) in Odisha
Annex tab 96: Annual value of operating expenses per enterprise for trade & other services activity category (semi-round 1)
Activity
Category
number of enterprises
per enterprise annual value of expenditure (Rs.)
principal
operating
expenses
Other expenses
total sample estimated
electricity
charges
fuel &
lubricant
raw material
for own
construction
minor repair
&
maintenance
travelling,
freight & cartage
exp.
communication
expenses
banking
charges
insurance
charges
other
expenses
Rural Estt
T1 14 897 0 47235 9016 0 66243 17193 10962 1828 0 118852 271330
T2 39 1946 0 3378 5702 0 7969 5121 4241 0 1442 7112 34965
T3 0 0 0 0 0 0 0 0 0 0 0 0 0
T4 25 1403 0 3550 4631 0 160 24515 998 51 4016 2961 40883
T5 230 13362 60 7771 2829 0 2536 21246 2157 444 112 5585 42740
Trade 308 17608 46 8959 3605 0 6191 19518 2743 434 565 11312 53373
S1 10 210 2988404 33538 125134 0 177 8911 3343 0 0 12849 3172355
S2 165 8149 547425 11363 31929 0 964 7613 3816 1 0 9747 612859
S3 398 43691 332061 182 0 0 468 1219 4233 1815 0 5062 345039
S4 0 0 0 0 0 0 0 0 0 0 0 0 0
S5 0 0 0 0 0 0 0 0 0 0 0 0 0
S6 0 0 0 0 0 0 0 0 0 0 0 0 0
S7 5 228 78824 16161 4400 0 13830 244 0 0 0 71947 185406
S8 3 1292 2865 0 0 0 0 0 0 0 58 1113 4036
S9 0 0 0 0 0 0 0 0 0 0 0 0 0
S10 5 617 164755 2862 12255 0 4882 0 5196 0 0 3451 193400
S11 6 279 110568 10564 5299 0 37888 6268 8359 0 0 3409 182355
S12 59 7156 53210 1492 7794 0 1018 3986 3204 0 0 2145 72851
S13 27 1814 279610 24034 7098 0 12517 4467 7833 0 176 35150 370885
S14 15 666 154044 9166 8571 0 3243 1379 3423 0 0 6891 186716
S15 75 3796 7653 2734 4570 0 420 3588 1287 0 42 4813 25108
Others 768 67898 305895 2750 5717 0 1161 2506 3927 1168 8 6277 329408
METS 1399 104924 378313 7448 5889 0 6370 6316 3579 878 1666 7151 417610
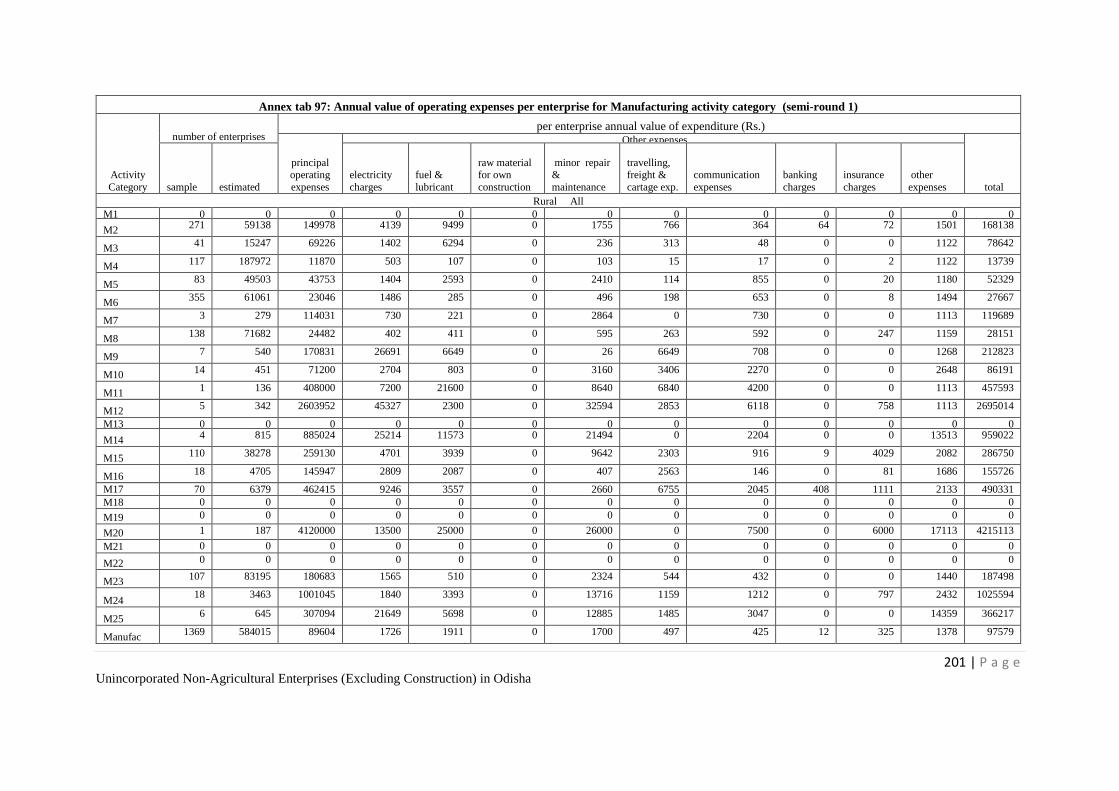
201 | P a g e Unincorporated Non-Agricultural Enterprises (Excluding Construction) in Odisha
Annex tab 97: Annual value of operating expenses per enterprise for Manufacturing activity category (semi-round 1)
Activity
Category
number of enterprises per enterprise annual value of expenditure (Rs.)
principal operating
expenses
Other expenses
total sample estimated
electricity
charges
fuel &
lubricant
raw material for own
construction
minor repair &
maintenance
travelling, freight &
cartage exp.
communication
expenses
banking
charges
insurance
charges
other
expenses
Rural All
M1 0 0 0 0 0 0 0 0 0 0 0 0 0
M2 271 59138 149978 4139 9499 0 1755 766 364 64 72 1501 168138
M3 41 15247 69226 1402 6294 0 236 313 48 0 0 1122 78642
M4 117 187972 11870 503 107 0 103 15 17 0 2 1122 13739
M5 83 49503 43753 1404 2593 0 2410 114 855 0 20 1180 52329
M6 355 61061 23046 1486 285 0 496 198 653 0 8 1494 27667
M7 3 279 114031 730 221 0 2864 0 730 0 0 1113 119689
M8 138 71682 24482 402 411 0 595 263 592 0 247 1159 28151
M9 7 540 170831 26691 6649 0 26 6649 708 0 0 1268 212823
M10 14 451 71200 2704 803 0 3160 3406 2270 0 0 2648 86191
M11 1 136 408000 7200 21600 0 8640 6840 4200 0 0 1113 457593
M12 5 342 2603952 45327 2300 0 32594 2853 6118 0 758 1113 2695014
M13 0 0 0 0 0 0 0 0 0 0 0 0 0
M14 4 815 885024 25214 11573 0 21494 0 2204 0 0 13513 959022
M15 110 38278 259130 4701 3939 0 9642 2303 916 9 4029 2082 286750
M16 18 4705 145947 2809 2087 0 407 2563 146 0 81 1686 155726
M17 70 6379 462415 9246 3557 0 2660 6755 2045 408 1111 2133 490331
M18 0 0 0 0 0 0 0 0 0 0 0 0 0
M19 0 0 0 0 0 0 0 0 0 0 0 0 0
M20 1 187 4120000 13500 25000 0 26000 0 7500 0 6000 17113 4215113
M21 0 0 0 0 0 0 0 0 0 0 0 0 0
M22 0 0 0 0 0 0 0 0 0 0 0 0 0
M23 107 83195 180683 1565 510 0 2324 544 432 0 0 1440 187498
M24 18 3463 1001045 1840 3393 0 13716 1159 1212 0 797 2432 1025594
M25 6 645 307094 21649 5698 0 12885 1485 3047 0 0 14359 366217
Manufac 1369 584015 89604 1726 1911 0 1700 497 425 12 325 1378 97579
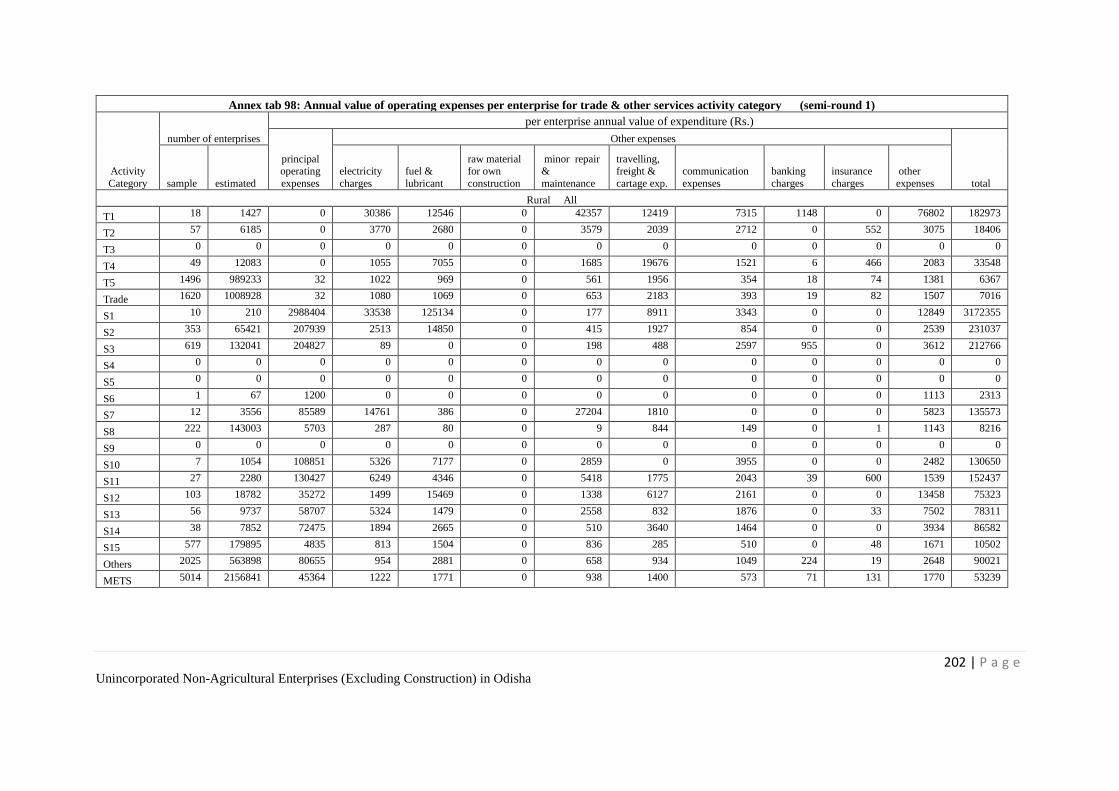
202 | P a g e Unincorporated Non-Agricultural Enterprises (Excluding Construction) in Odisha
Annex tab 98: Annual value of operating expenses per enterprise for trade & other services activity category (semi-round 1)
Activity
Category
number of enterprises
per enterprise annual value of expenditure (Rs.)
principal operating
expenses
Other expenses
total sample estimated
electricity
charges
fuel &
lubricant
raw material for own
construction
minor repair &
maintenance
travelling, freight &
cartage exp.
communication
expenses
banking
charges
insurance
charges
other
expenses
Rural All
T1 18 1427 0 30386 12546 0 42357 12419 7315 1148 0 76802 182973
T2 57 6185 0 3770 2680 0 3579 2039 2712 0 552 3075 18406
T3 0 0 0 0 0 0 0 0 0 0 0 0 0
T4 49 12083 0 1055 7055 0 1685 19676 1521 6 466 2083 33548
T5 1496 989233 32 1022 969 0 561 1956 354 18 74 1381 6367
Trade 1620 1008928 32 1080 1069 0 653 2183 393 19 82 1507 7016
S1 10 210 2988404 33538 125134 0 177 8911 3343 0 0 12849 3172355
S2 353 65421 207939 2513 14850 0 415 1927 854 0 0 2539 231037
S3 619 132041 204827 89 0 0 198 488 2597 955 0 3612 212766
S4 0 0 0 0 0 0 0 0 0 0 0 0 0
S5 0 0 0 0 0 0 0 0 0 0 0 0 0
S6 1 67 1200 0 0 0 0 0 0 0 0 1113 2313
S7 12 3556 85589 14761 386 0 27204 1810 0 0 0 5823 135573
S8 222 143003 5703 287 80 0 9 844 149 0 1 1143 8216
S9 0 0 0 0 0 0 0 0 0 0 0 0 0
S10 7 1054 108851 5326 7177 0 2859 0 3955 0 0 2482 130650
S11 27 2280 130427 6249 4346 0 5418 1775 2043 39 600 1539 152437
S12 103 18782 35272 1499 15469 0 1338 6127 2161 0 0 13458 75323
S13 56 9737 58707 5324 1479 0 2558 832 1876 0 33 7502 78311
S14 38 7852 72475 1894 2665 0 510 3640 1464 0 0 3934 86582
S15 577 179895 4835 813 1504 0 836 285 510 0 48 1671 10502
Others 2025 563898 80655 954 2881 0 658 934 1049 224 19 2648 90021
METS 5014 2156841 45364 1222 1771 0 938 1400 573 71 131 1770 53239
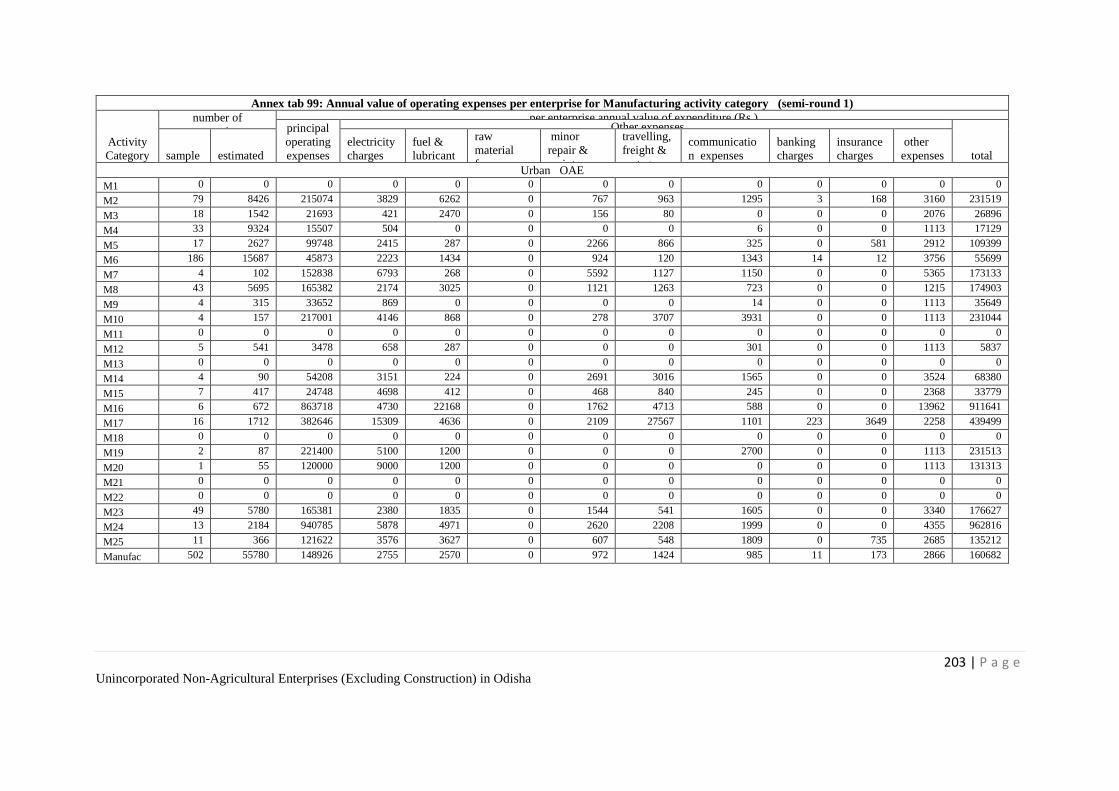
203 | P a g e Unincorporated Non-Agricultural Enterprises (Excluding Construction) in Odisha
Annex tab 99: Annual value of operating expenses per enterprise for Manufacturing activity category (semi-round 1)
Activity
Category
number of
enterprises
per enterprise annual value of expenditure (Rs.) principal
operating
expenses
Other expenses
total sample estimated
electricity
charges
fuel &
lubricant
raw
material
for own
constructio
n
minor
repair &
maintenanc
e
travelling,
freight &
cartage
exp.
communicatio
n expenses
banking
charges
insurance
charges
other
expenses
Urban OAE
M1 0 0 0 0 0 0 0 0 0 0 0 0 0
M2 79 8426 215074 3829 6262 0 767 963 1295 3 168 3160 231519
M3 18 1542 21693 421 2470 0 156 80 0 0 0 2076 26896
M4 33 9324 15507 504 0 0 0 0 6 0 0 1113 17129
M5 17 2627 99748 2415 287 0 2266 866 325 0 581 2912 109399
M6 186 15687 45873 2223 1434 0 924 120 1343 14 12 3756 55699
M7 4 102 152838 6793 268 0 5592 1127 1150 0 0 5365 173133
M8 43 5695 165382 2174 3025 0 1121 1263 723 0 0 1215 174903
M9 4 315 33652 869 0 0 0 0 14 0 0 1113 35649
M10 4 157 217001 4146 868 0 278 3707 3931 0 0 1113 231044
M11 0 0 0 0 0 0 0 0 0 0 0 0 0
M12 5 541 3478 658 287 0 0 0 301 0 0 1113 5837
M13 0 0 0 0 0 0 0 0 0 0 0 0 0
M14 4 90 54208 3151 224 0 2691 3016 1565 0 0 3524 68380
M15 7 417 24748 4698 412 0 468 840 245 0 0 2368 33779
M16 6 672 863718 4730 22168 0 1762 4713 588 0 0 13962 911641
M17 16 1712 382646 15309 4636 0 2109 27567 1101 223 3649 2258 439499
M18 0 0 0 0 0 0 0 0 0 0 0 0 0
M19 2 87 221400 5100 1200 0 0 0 2700 0 0 1113 231513
M20 1 55 120000 9000 1200 0 0 0 0 0 0 1113 131313
M21 0 0 0 0 0 0 0 0 0 0 0 0 0
M22 0 0 0 0 0 0 0 0 0 0 0 0 0
M23 49 5780 165381 2380 1835 0 1544 541 1605 0 0 3340 176627
M24 13 2184 940785 5878 4971 0 2620 2208 1999 0 0 4355 962816
M25 11 366 121622 3576 3627 0 607 548 1809 0 735 2685 135212
Manufac 502 55780 148926 2755 2570 0 972 1424 985 11 173 2866 160682
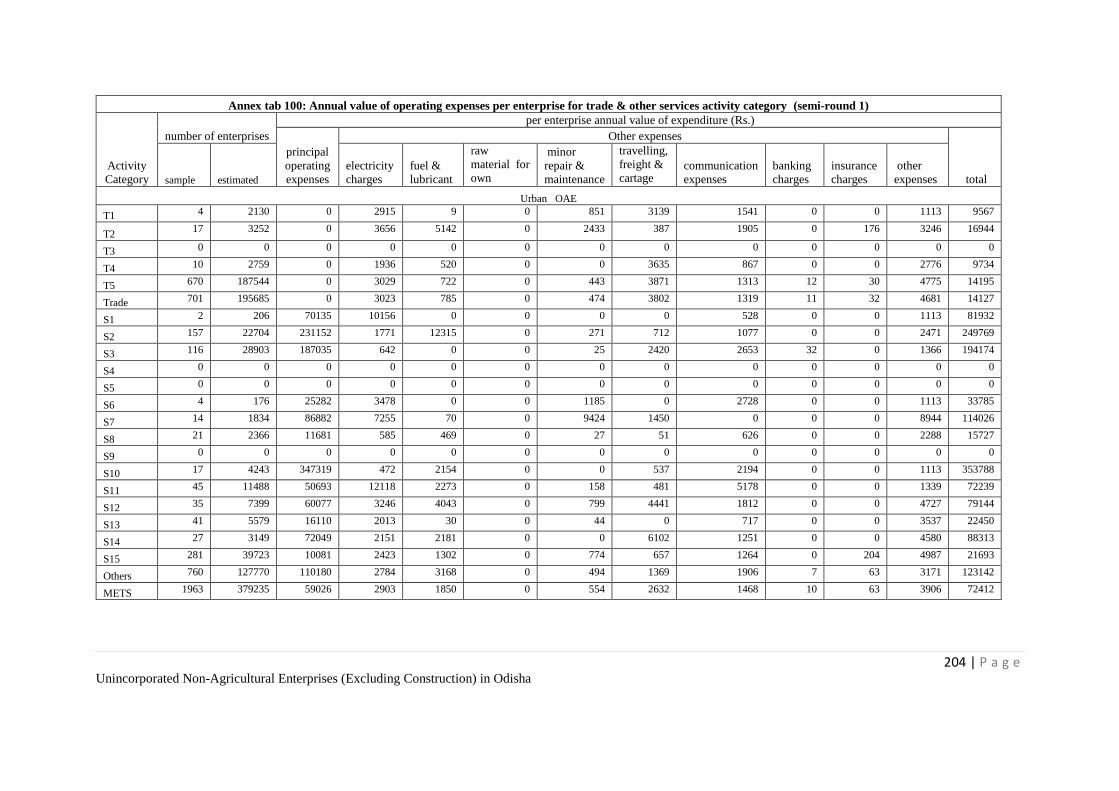
204 | P a g e Unincorporated Non-Agricultural Enterprises (Excluding Construction) in Odisha
Annex tab 100: Annual value of operating expenses per enterprise for trade & other services activity category (semi-round 1)
Activity
Category
number of enterprises
per enterprise annual value of expenditure (Rs.)
principal
operating
expenses
Other expenses
total sample estimated
electricity
charges
fuel &
lubricant
raw
material for
own
construction
minor
repair &
maintenance
travelling,
freight &
cartage
exp.
communication
expenses
banking
charges
insurance
charges
other
expenses
Urban OAE
T1 4 2130 0 2915 9 0 851 3139 1541 0 0 1113 9567
T2 17 3252 0 3656 5142 0 2433 387 1905 0 176 3246 16944
T3 0 0 0 0 0 0 0 0 0 0 0 0 0
T4 10 2759 0 1936 520 0 0 3635 867 0 0 2776 9734
T5 670 187544 0 3029 722 0 443 3871 1313 12 30 4775 14195
Trade 701 195685 0 3023 785 0 474 3802 1319 11 32 4681 14127
S1 2 206 70135 10156 0 0 0 0 528 0 0 1113 81932
S2 157 22704 231152 1771 12315 0 271 712 1077 0 0 2471 249769
S3 116 28903 187035 642 0 0 25 2420 2653 32 0 1366 194174
S4 0 0 0 0 0 0 0 0 0 0 0 0 0
S5 0 0 0 0 0 0 0 0 0 0 0 0 0
S6 4 176 25282 3478 0 0 1185 0 2728 0 0 1113 33785
S7 14 1834 86882 7255 70 0 9424 1450 0 0 0 8944 114026
S8 21 2366 11681 585 469 0 27 51 626 0 0 2288 15727
S9 0 0 0 0 0 0 0 0 0 0 0 0 0
S10 17 4243 347319 472 2154 0 0 537 2194 0 0 1113 353788
S11 45 11488 50693 12118 2273 0 158 481 5178 0 0 1339 72239
S12 35 7399 60077 3246 4043 0 799 4441 1812 0 0 4727 79144
S13 41 5579 16110 2013 30 0 44 0 717 0 0 3537 22450
S14 27 3149 72049 2151 2181 0 0 6102 1251 0 0 4580 88313
S15 281 39723 10081 2423 1302 0 774 657 1264 0 204 4987 21693
Others 760 127770 110180 2784 3168 0 494 1369 1906 7 63 3171 123142
METS 1963 379235 59026 2903 1850 0 554 2632 1468 10 63 3906 72412
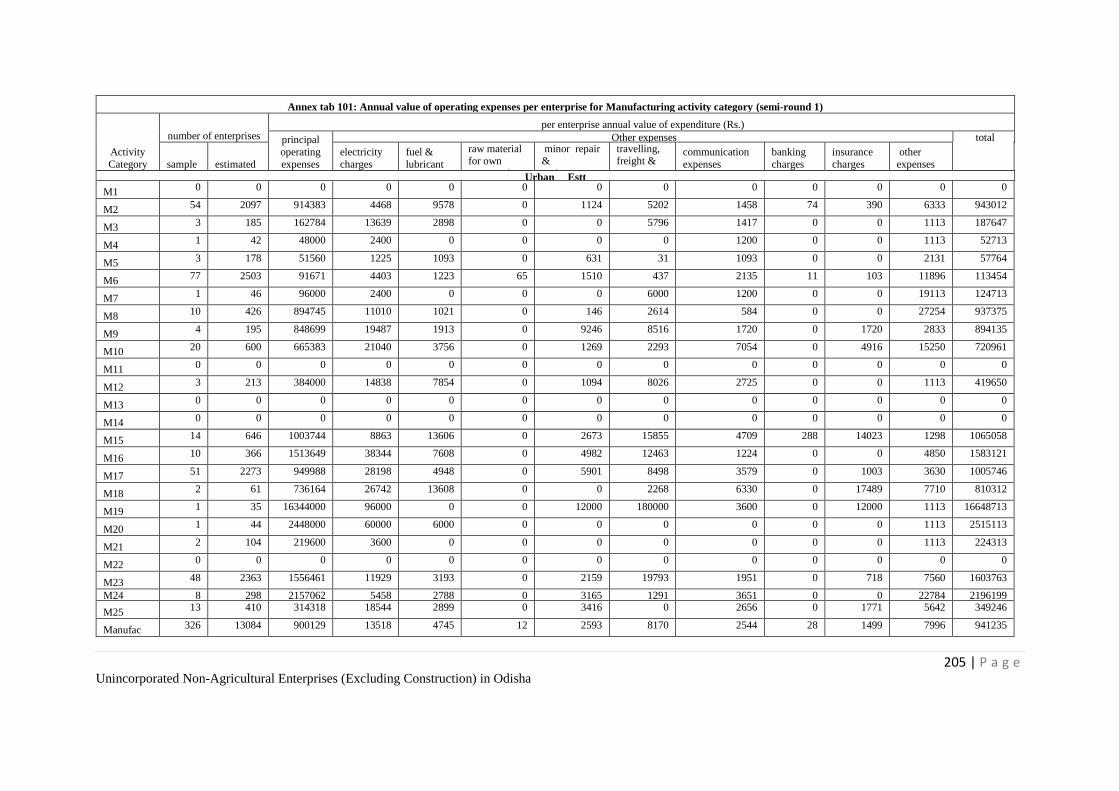
205 | P a g e Unincorporated Non-Agricultural Enterprises (Excluding Construction) in Odisha
Annex tab 101: Annual value of operating expenses per enterprise for Manufacturing activity category (semi-round 1)
Activity
Category
number of enterprises per enterprise annual value of expenditure (Rs.)
principal
operating
expenses
Other expenses total
sample estimated
electricity
charges
fuel &
lubricant
raw material for own
construction
minor repair &
maintenance
travelling, freight &
cartage exp.
communication
expenses
banking
charges
insurance
charges
other
expenses
Urban Estt
M1 0 0 0 0 0 0 0 0 0 0 0 0 0
M2 54 2097 914383 4468 9578 0 1124 5202 1458 74 390 6333 943012
M3 3 185 162784 13639 2898 0 0 5796 1417 0 0 1113 187647
M4 1 42 48000 2400 0 0 0 0 1200 0 0 1113 52713
M5 3 178 51560 1225 1093 0 631 31 1093 0 0 2131 57764
M6 77 2503 91671 4403 1223 65 1510 437 2135 11 103 11896 113454
M7 1 46 96000 2400 0 0 0 6000 1200 0 0 19113 124713
M8 10 426 894745 11010 1021 0 146 2614 584 0 0 27254 937375
M9 4 195 848699 19487 1913 0 9246 8516 1720 0 1720 2833 894135
M10 20 600 665383 21040 3756 0 1269 2293 7054 0 4916 15250 720961
M11 0 0 0 0 0 0 0 0 0 0 0 0 0
M12 3 213 384000 14838 7854 0 1094 8026 2725 0 0 1113 419650
M13 0 0 0 0 0 0 0 0 0 0 0 0 0
M14 0 0 0 0 0 0 0 0 0 0 0 0 0
M15 14 646 1003744 8863 13606 0 2673 15855 4709 288 14023 1298 1065058
M16 10 366 1513649 38344 7608 0 4982 12463 1224 0 0 4850 1583121
M17 51 2273 949988 28198 4948 0 5901 8498 3579 0 1003 3630 1005746
M18 2 61 736164 26742 13608 0 0 2268 6330 0 17489 7710 810312
M19 1 35 16344000 96000 0 0 12000 180000 3600 0 12000 1113 16648713
M20 1 44 2448000 60000 6000 0 0 0 0 0 0 1113 2515113
M21 2 104 219600 3600 0 0 0 0 0 0 0 1113 224313
M22 0 0 0 0 0 0 0 0 0 0 0 0 0
M23 48 2363 1556461 11929 3193 0 2159 19793 1951 0 718 7560 1603763
M24 8 298 2157062 5458 2788 0 3165 1291 3651 0 0 22784 2196199
M25 13 410 314318 18544 2899 0 3416 0 2656 0 1771 5642 349246
Manufac 326 13084 900129 13518 4745 12 2593 8170 2544 28 1499 7996 941235
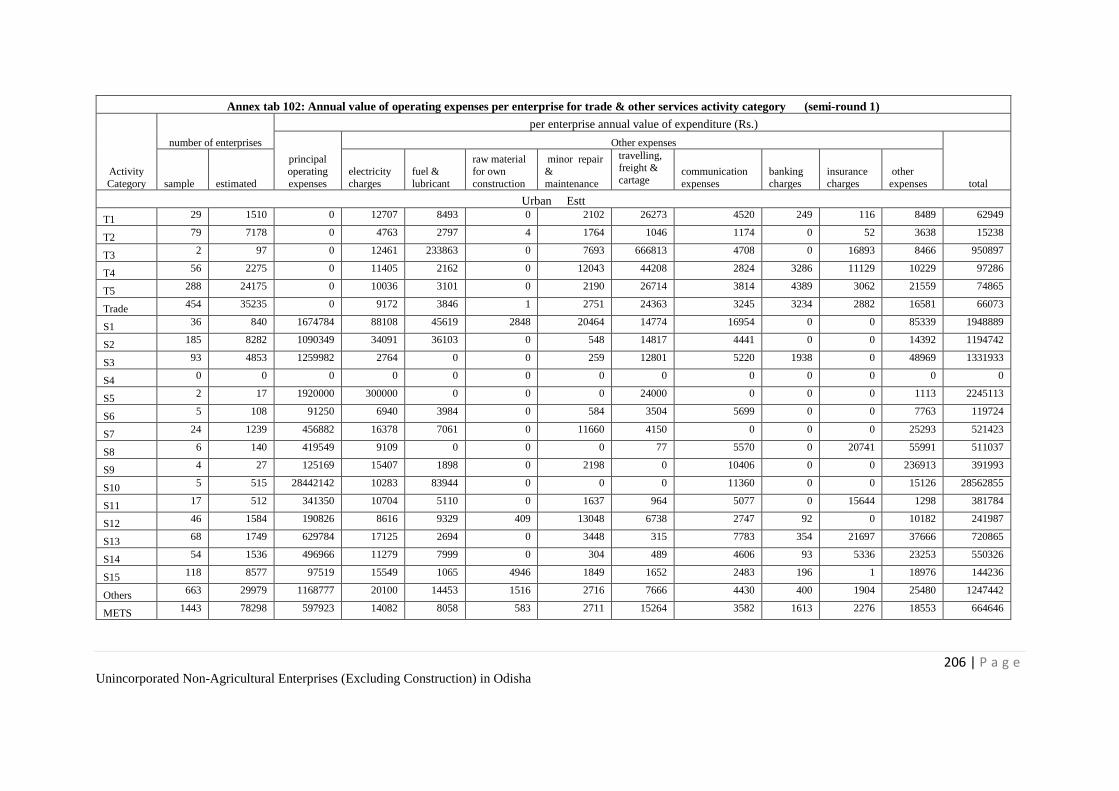
206 | P a g e Unincorporated Non-Agricultural Enterprises (Excluding Construction) in Odisha
Annex tab 102: Annual value of operating expenses per enterprise for trade & other services activity category (semi-round 1)
Activity
Category
number of enterprises
per enterprise annual value of expenditure (Rs.)
principal
operating
expenses
Other expenses
total sample estimated
electricity
charges
fuel &
lubricant
raw material
for own
construction
minor repair
&
maintenance
travelling,
freight &
cartage exp.
communication
expenses
banking
charges
insurance
charges
other
expenses
Urban Estt
T1 29 1510 0 12707 8493 0 2102 26273 4520 249 116 8489 62949
T2 79 7178 0 4763 2797 4 1764 1046 1174 0 52 3638 15238
T3 2 97 0 12461 233863 0 7693 666813 4708 0 16893 8466 950897
T4 56 2275 0 11405 2162 0 12043 44208 2824 3286 11129 10229 97286
T5 288 24175 0 10036 3101 0 2190 26714 3814 4389 3062 21559 74865
Trade 454 35235 0 9172 3846 1 2751 24363 3245 3234 2882 16581 66073
S1 36 840 1674784 88108 45619 2848 20464 14774 16954 0 0 85339 1948889
S2 185 8282 1090349 34091 36103 0 548 14817 4441 0 0 14392 1194742
S3 93 4853 1259982 2764 0 0 259 12801 5220 1938 0 48969 1331933
S4 0 0 0 0 0 0 0 0 0 0 0 0 0
S5 2 17 1920000 300000 0 0 0 24000 0 0 0 1113 2245113
S6 5 108 91250 6940 3984 0 584 3504 5699 0 0 7763 119724
S7 24 1239 456882 16378 7061 0 11660 4150 0 0 0 25293 521423
S8 6 140 419549 9109 0 0 0 77 5570 0 20741 55991 511037
S9 4 27 125169 15407 1898 0 2198 0 10406 0 0 236913 391993
S10 5 515 28442142 10283 83944 0 0 0 11360 0 0 15126 28562855
S11 17 512 341350 10704 5110 0 1637 964 5077 0 15644 1298 381784
S12 46 1584 190826 8616 9329 409 13048 6738 2747 92 0 10182 241987
S13 68 1749 629784 17125 2694 0 3448 315 7783 354 21697 37666 720865
S14 54 1536 496966 11279 7999 0 304 489 4606 93 5336 23253 550326
S15 118 8577 97519 15549 1065 4946 1849 1652 2483 196 1 18976 144236
Others 663 29979 1168777 20100 14453 1516 2716 7666 4430 400 1904 25480 1247442
METS 1443 78298 597923 14082 8058 583 2711 15264 3582 1613 2276 18553 664646
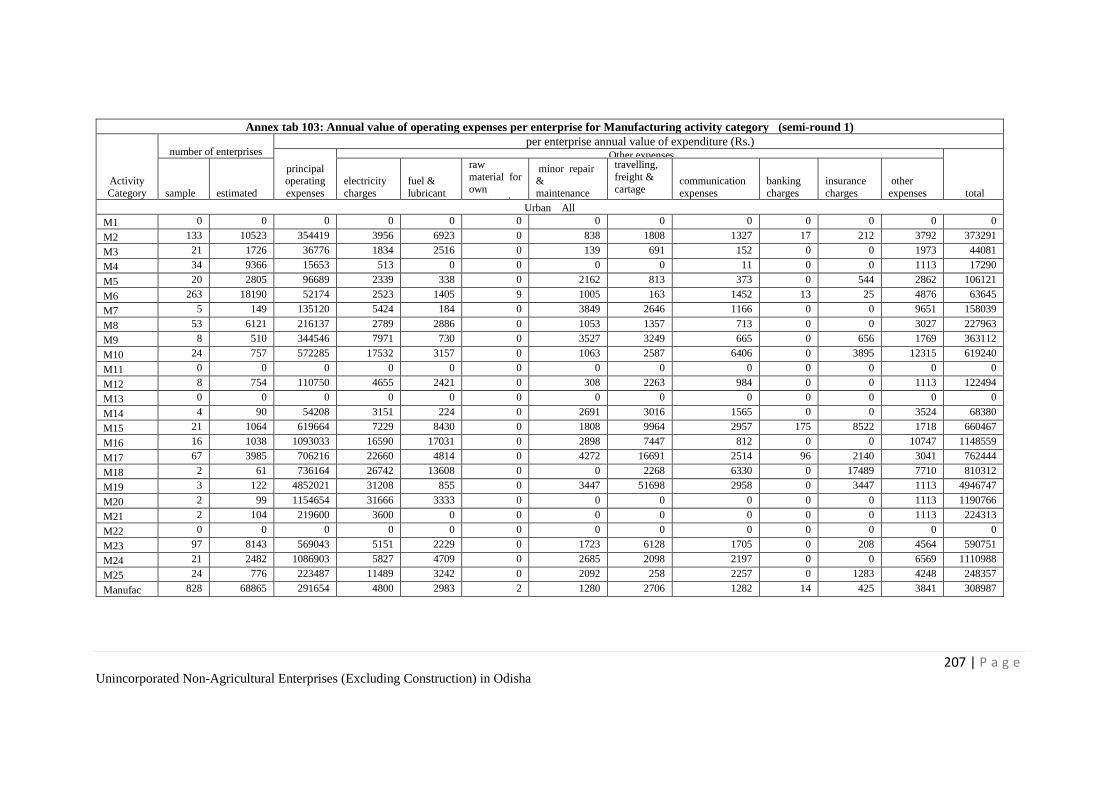
207 | P a g e Unincorporated Non-Agricultural Enterprises (Excluding Construction) in Odisha
Annex tab 103: Annual value of operating expenses per enterprise for Manufacturing activity category (semi-round 1)
Activity
Category
number of enterprises per enterprise annual value of expenditure (Rs.)
principal operating
expenses
Other expenses
total sample estimated
electricity
charges
fuel &
lubricant
raw
material for
own construction
minor repair &
maintenance
travelling,
freight &
cartage exp.
communication
expenses
banking
charges
insurance
charges
other
expenses
Urban All
M1 0 0 0 0 0 0 0 0 0 0 0 0 0
M2 133 10523 354419 3956 6923 0 838 1808 1327 17 212 3792 373291
M3 21 1726 36776 1834 2516 0 139 691 152 0 0 1973 44081
M4 34 9366 15653 513 0 0 0 0 11 0 0 1113 17290
M5 20 2805 96689 2339 338 0 2162 813 373 0 544 2862 106121
M6 263 18190 52174 2523 1405 9 1005 163 1452 13 25 4876 63645
M7 5 149 135120 5424 184 0 3849 2646 1166 0 0 9651 158039
M8 53 6121 216137 2789 2886 0 1053 1357 713 0 0 3027 227963
M9 8 510 344546 7971 730 0 3527 3249 665 0 656 1769 363112
M10 24 757 572285 17532 3157 0 1063 2587 6406 0 3895 12315 619240
M11 0 0 0 0 0 0 0 0 0 0 0 0 0
M12 8 754 110750 4655 2421 0 308 2263 984 0 0 1113 122494
M13 0 0 0 0 0 0 0 0 0 0 0 0 0
M14 4 90 54208 3151 224 0 2691 3016 1565 0 0 3524 68380
M15 21 1064 619664 7229 8430 0 1808 9964 2957 175 8522 1718 660467
M16 16 1038 1093033 16590 17031 0 2898 7447 812 0 0 10747 1148559
M17 67 3985 706216 22660 4814 0 4272 16691 2514 96 2140 3041 762444
M18 2 61 736164 26742 13608 0 0 2268 6330 0 17489 7710 810312
M19 3 122 4852021 31208 855 0 3447 51698 2958 0 3447 1113 4946747
M20 2 99 1154654 31666 3333 0 0 0 0 0 0 1113 1190766
M21 2 104 219600 3600 0 0 0 0 0 0 0 1113 224313
M22 0 0 0 0 0 0 0 0 0 0 0 0 0
M23 97 8143 569043 5151 2229 0 1723 6128 1705 0 208 4564 590751
M24 21 2482 1086903 5827 4709 0 2685 2098 2197 0 0 6569 1110988
M25 24 776 223487 11489 3242 0 2092 258 2257 0 1283 4248 248357
Manufac 828 68865 291654 4800 2983 2 1280 2706 1282 14 425 3841 308987
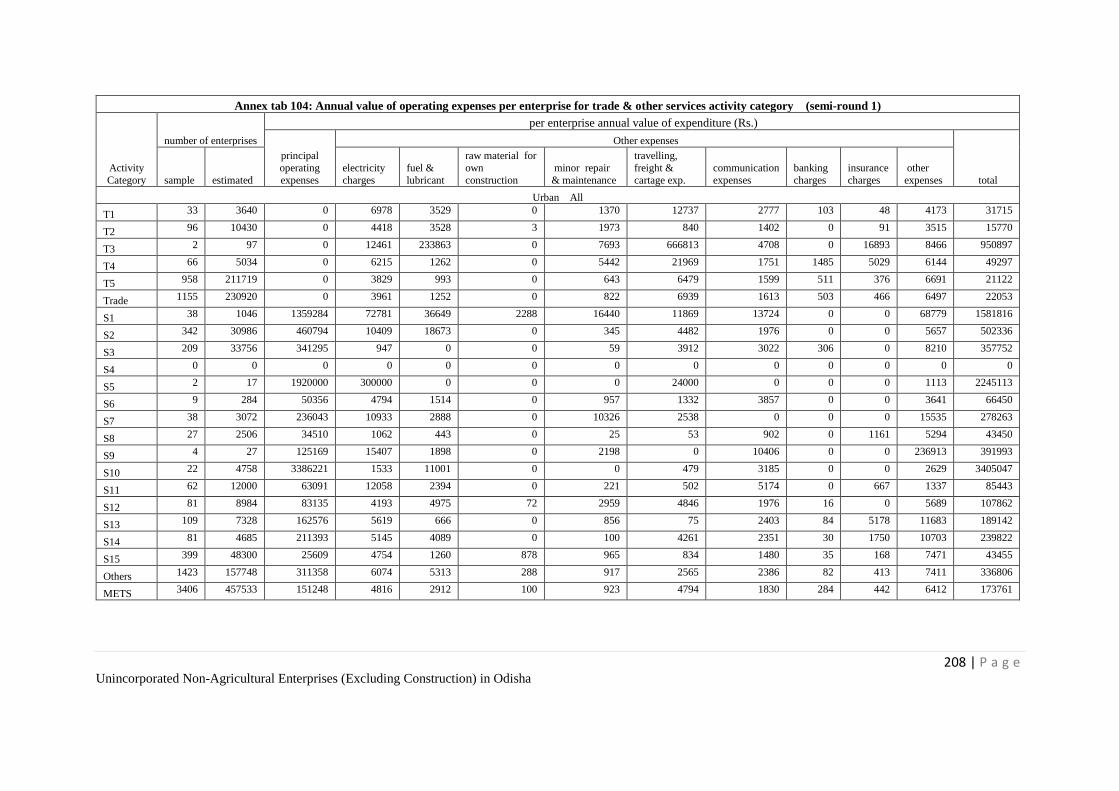
208 | P a g e Unincorporated Non-Agricultural Enterprises (Excluding Construction) in Odisha
Annex tab 104: Annual value of operating expenses per enterprise for trade & other services activity category (semi-round 1)
Activity
Category
number of enterprises
per enterprise annual value of expenditure (Rs.)
principal
operating
expenses
Other expenses
total sample estimated
electricity
charges
fuel &
lubricant
raw material for
own
construction
minor repair
& maintenance
travelling,
freight &
cartage exp.
communication
expenses
banking
charges
insurance
charges
other
expenses
Urban All
T1 33 3640 0 6978 3529 0 1370 12737 2777 103 48 4173 31715
T2 96 10430 0 4418 3528 3 1973 840 1402 0 91 3515 15770
T3 2 97 0 12461 233863 0 7693 666813 4708 0 16893 8466 950897
T4 66 5034 0 6215 1262 0 5442 21969 1751 1485 5029 6144 49297
T5 958 211719 0 3829 993 0 643 6479 1599 511 376 6691 21122
Trade 1155 230920 0 3961 1252 0 822 6939 1613 503 466 6497 22053
S1 38 1046 1359284 72781 36649 2288 16440 11869 13724 0 0 68779 1581816
S2 342 30986 460794 10409 18673 0 345 4482 1976 0 0 5657 502336
S3 209 33756 341295 947 0 0 59 3912 3022 306 0 8210 357752
S4 0 0 0 0 0 0 0 0 0 0 0 0 0
S5 2 17 1920000 300000 0 0 0 24000 0 0 0 1113 2245113
S6 9 284 50356 4794 1514 0 957 1332 3857 0 0 3641 66450
S7 38 3072 236043 10933 2888 0 10326 2538 0 0 0 15535 278263
S8 27 2506 34510 1062 443 0 25 53 902 0 1161 5294 43450
S9 4 27 125169 15407 1898 0 2198 0 10406 0 0 236913 391993
S10 22 4758 3386221 1533 11001 0 0 479 3185 0 0 2629 3405047
S11 62 12000 63091 12058 2394 0 221 502 5174 0 667 1337 85443
S12 81 8984 83135 4193 4975 72 2959 4846 1976 16 0 5689 107862
S13 109 7328 162576 5619 666 0 856 75 2403 84 5178 11683 189142
S14 81 4685 211393 5145 4089 0 100 4261 2351 30 1750 10703 239822
S15 399 48300 25609 4754 1260 878 965 834 1480 35 168 7471 43455
Others 1423 157748 311358 6074 5313 288 917 2565 2386 82 413 7411 336806
METS 3406 457533 151248 4816 2912 100 923 4794 1830 284 442 6412 173761
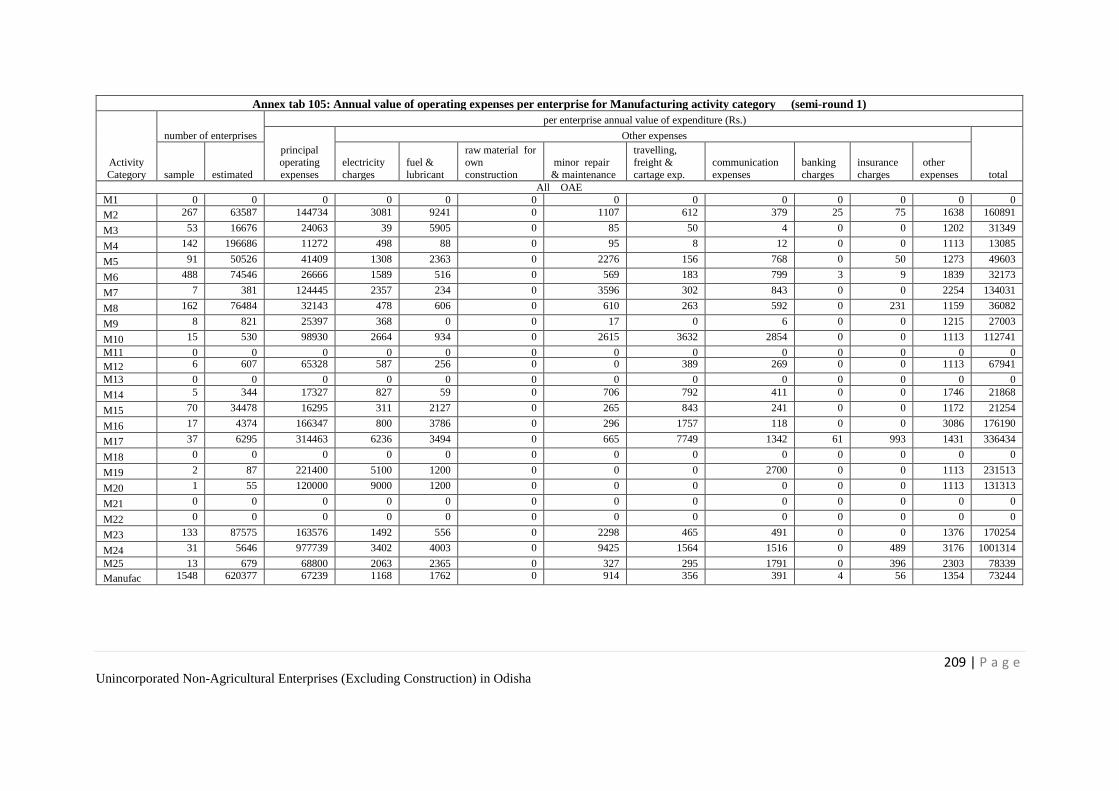
209 | P a g e Unincorporated Non-Agricultural Enterprises (Excluding Construction) in Odisha
Annex tab 105: Annual value of operating expenses per enterprise for Manufacturing activity category (semi-round 1)
Activity
Category
number of enterprises
per enterprise annual value of expenditure (Rs.)
principal
operating
expenses
Other expenses
total sample estimated
electricity
charges
fuel &
lubricant
raw material for
own
construction
minor repair
& maintenance
travelling,
freight &
cartage exp.
communication
expenses
banking
charges
insurance
charges
other
expenses
All OAE
M1 0 0 0 0 0 0 0 0 0 0 0 0 0
M2 267 63587 144734 3081 9241 0 1107 612 379 25 75 1638 160891
M3 53 16676 24063 39 5905 0 85 50 4 0 0 1202 31349
M4 142 196686 11272 498 88 0 95 8 12 0 0 1113 13085
M5 91 50526 41409 1308 2363 0 2276 156 768 0 50 1273 49603
M6 488 74546 26666 1589 516 0 569 183 799 3 9 1839 32173
M7 7 381 124445 2357 234 0 3596 302 843 0 0 2254 134031
M8 162 76484 32143 478 606 0 610 263 592 0 231 1159 36082
M9 8 821 25397 368 0 0 17 0 6 0 0 1215 27003
M10 15 530 98930 2664 934 0 2615 3632 2854 0 0 1113 112741
M11 0 0 0 0 0 0 0 0 0 0 0 0 0
M12 6 607 65328 587 256 0 0 389 269 0 0 1113 67941
M13 0 0 0 0 0 0 0 0 0 0 0 0 0
M14 5 344 17327 827 59 0 706 792 411 0 0 1746 21868
M15 70 34478 16295 311 2127 0 265 843 241 0 0 1172 21254
M16 17 4374 166347 800 3786 0 296 1757 118 0 0 3086 176190
M17 37 6295 314463 6236 3494 0 665 7749 1342 61 993 1431 336434
M18 0 0 0 0 0 0 0 0 0 0 0 0 0
M19 2 87 221400 5100 1200 0 0 0 2700 0 0 1113 231513
M20 1 55 120000 9000 1200 0 0 0 0 0 0 1113 131313
M21 0 0 0 0 0 0 0 0 0 0 0 0 0
M22 0 0 0 0 0 0 0 0 0 0 0 0 0
M23 133 87575 163576 1492 556 0 2298 465 491 0 0 1376 170254
M24 31 5646 977739 3402 4003 0 9425 1564 1516 0 489 3176 1001314
M25 13 679 68800 2063 2365 0 327 295 1791 0 396 2303 78339
Manufac 1548 620377 67239 1168 1762 0 914 356 391 4 56 1354 73244
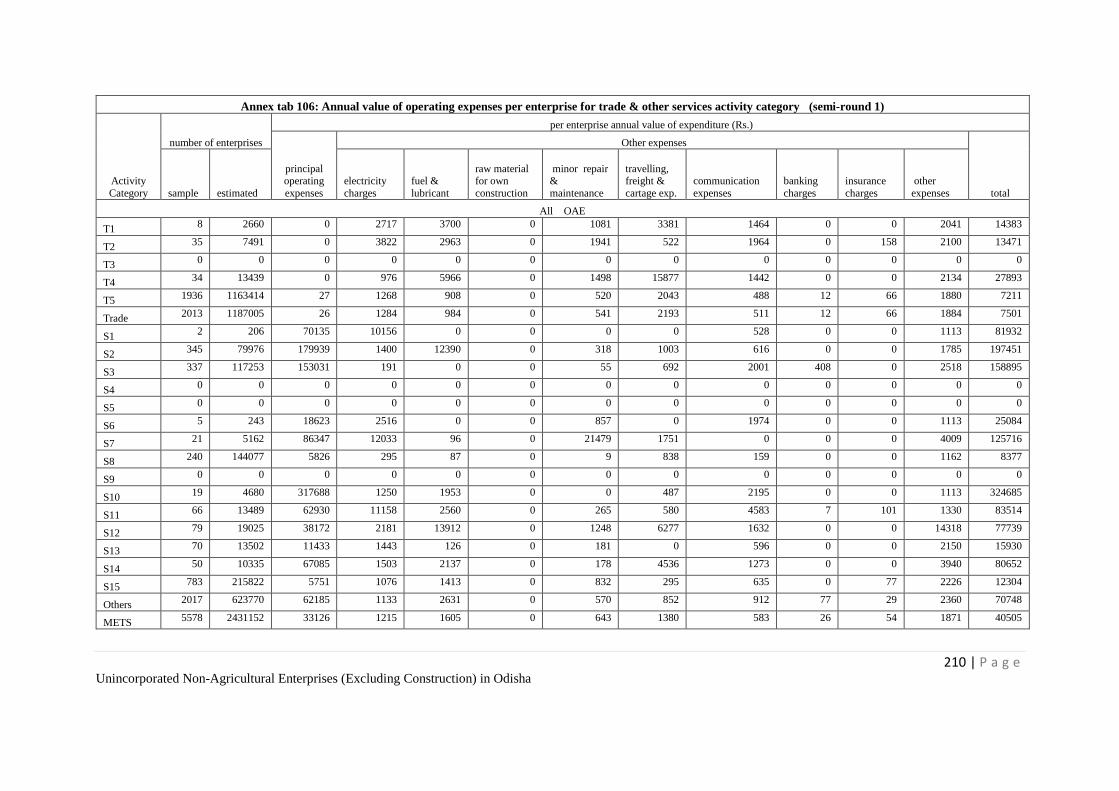
210 | P a g e Unincorporated Non-Agricultural Enterprises (Excluding Construction) in Odisha
Annex tab 106: Annual value of operating expenses per enterprise for trade & other services activity category (semi-round 1)
Activity
Category
number of enterprises
per enterprise annual value of expenditure (Rs.)
principal operating
expenses
Other expenses
total sample estimated
electricity
charges
fuel &
lubricant
raw material for own
construction
minor repair &
maintenance
travelling, freight &
cartage exp.
communication
expenses
banking
charges
insurance
charges
other
expenses
All OAE
T1 8 2660 0 2717 3700 0 1081 3381 1464 0 0 2041 14383
T2 35 7491 0 3822 2963 0 1941 522 1964 0 158 2100 13471
T3 0 0 0 0 0 0 0 0 0 0 0 0 0
T4 34 13439 0 976 5966 0 1498 15877 1442 0 0 2134 27893
T5 1936 1163414 27 1268 908 0 520 2043 488 12 66 1880 7211
Trade 2013 1187005 26 1284 984 0 541 2193 511 12 66 1884 7501
S1 2 206 70135 10156 0 0 0 0 528 0 0 1113 81932
S2 345 79976 179939 1400 12390 0 318 1003 616 0 0 1785 197451
S3 337 117253 153031 191 0 0 55 692 2001 408 0 2518 158895
S4 0 0 0 0 0 0 0 0 0 0 0 0 0
S5 0 0 0 0 0 0 0 0 0 0 0 0 0
S6 5 243 18623 2516 0 0 857 0 1974 0 0 1113 25084
S7 21 5162 86347 12033 96 0 21479 1751 0 0 0 4009 125716
S8 240 144077 5826 295 87 0 9 838 159 0 0 1162 8377
S9 0 0 0 0 0 0 0 0 0 0 0 0 0
S10 19 4680 317688 1250 1953 0 0 487 2195 0 0 1113 324685
S11 66 13489 62930 11158 2560 0 265 580 4583 7 101 1330 83514
S12 79 19025 38172 2181 13912 0 1248 6277 1632 0 0 14318 77739
S13 70 13502 11433 1443 126 0 181 0 596 0 0 2150 15930
S14 50 10335 67085 1503 2137 0 178 4536 1273 0 0 3940 80652
S15 783 215822 5751 1076 1413 0 832 295 635 0 77 2226 12304
Others 2017 623770 62185 1133 2631 0 570 852 912 77 29 2360 70748
METS 5578 2431152 33126 1215 1605 0 643 1380 583 26 54 1871 40505
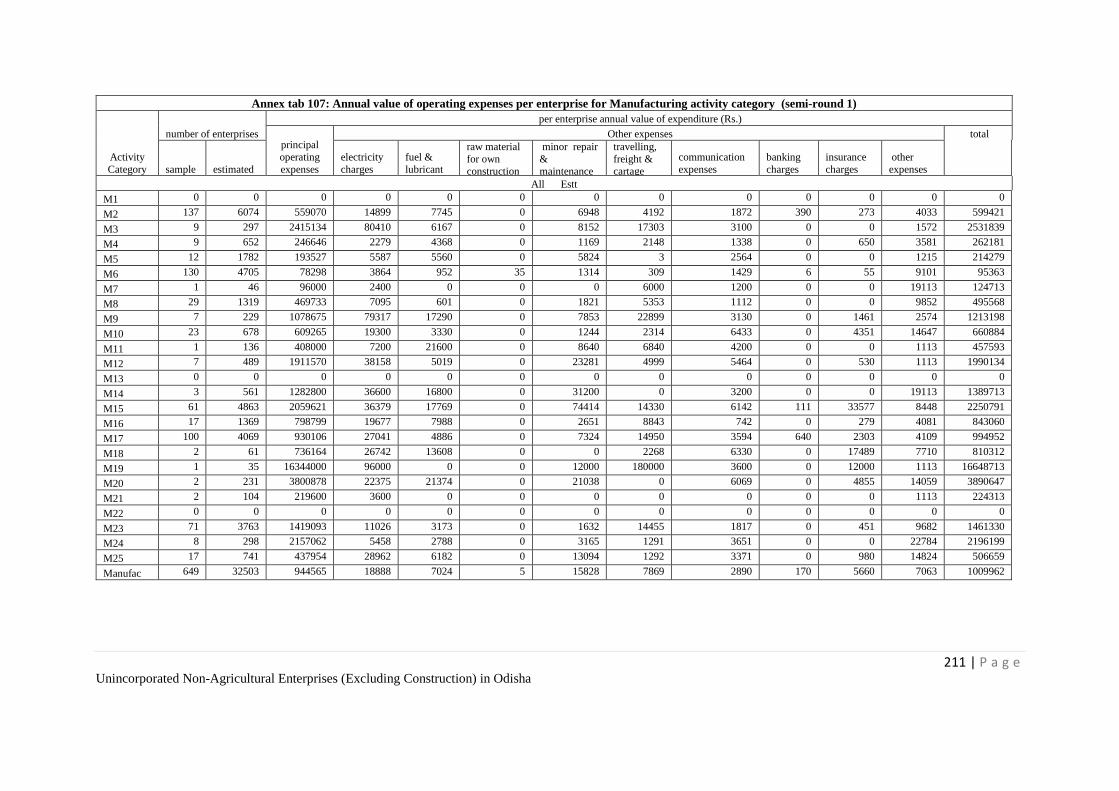
211 | P a g e Unincorporated Non-Agricultural Enterprises (Excluding Construction) in Odisha
Annex tab 107: Annual value of operating expenses per enterprise for Manufacturing activity category (semi-round 1)
Activity
Category
number of enterprises
per enterprise annual value of expenditure (Rs.)
principal
operating
expenses
Other expenses total
sample estimated
electricity
charges
fuel &
lubricant
raw material
for own
construction
minor repair
&
maintenance
travelling,
freight &
cartage exp.
communication
expenses
banking
charges
insurance
charges
other
expenses
All Estt
M1 0 0 0 0 0 0 0 0 0 0 0 0 0
M2 137 6074 559070 14899 7745 0 6948 4192 1872 390 273 4033 599421
M3 9 297 2415134 80410 6167 0 8152 17303 3100 0 0 1572 2531839
M4 9 652 246646 2279 4368 0 1169 2148 1338 0 650 3581 262181
M5 12 1782 193527 5587 5560 0 5824 3 2564 0 0 1215 214279
M6 130 4705 78298 3864 952 35 1314 309 1429 6 55 9101 95363
M7 1 46 96000 2400 0 0 0 6000 1200 0 0 19113 124713
M8 29 1319 469733 7095 601 0 1821 5353 1112 0 0 9852 495568
M9 7 229 1078675 79317 17290 0 7853 22899 3130 0 1461 2574 1213198
M10 23 678 609265 19300 3330 0 1244 2314 6433 0 4351 14647 660884
M11 1 136 408000 7200 21600 0 8640 6840 4200 0 0 1113 457593
M12 7 489 1911570 38158 5019 0 23281 4999 5464 0 530 1113 1990134
M13 0 0 0 0 0 0 0 0 0 0 0 0 0
M14 3 561 1282800 36600 16800 0 31200 0 3200 0 0 19113 1389713
M15 61 4863 2059621 36379 17769 0 74414 14330 6142 111 33577 8448 2250791
M16 17 1369 798799 19677 7988 0 2651 8843 742 0 279 4081 843060
M17 100 4069 930106 27041 4886 0 7324 14950 3594 640 2303 4109 994952
M18 2 61 736164 26742 13608 0 0 2268 6330 0 17489 7710 810312
M19 1 35 16344000 96000 0 0 12000 180000 3600 0 12000 1113 16648713
M20 2 231 3800878 22375 21374 0 21038 0 6069 0 4855 14059 3890647
M21 2 104 219600 3600 0 0 0 0 0 0 0 1113 224313
M22 0 0 0 0 0 0 0 0 0 0 0 0 0
M23 71 3763 1419093 11026 3173 0 1632 14455 1817 0 451 9682 1461330
M24 8 298 2157062 5458 2788 0 3165 1291 3651 0 0 22784 2196199
M25 17 741 437954 28962 6182 0 13094 1292 3371 0 980 14824 506659
Manufac 649 32503 944565 18888 7024 5 15828 7869 2890 170 5660 7063 1009962
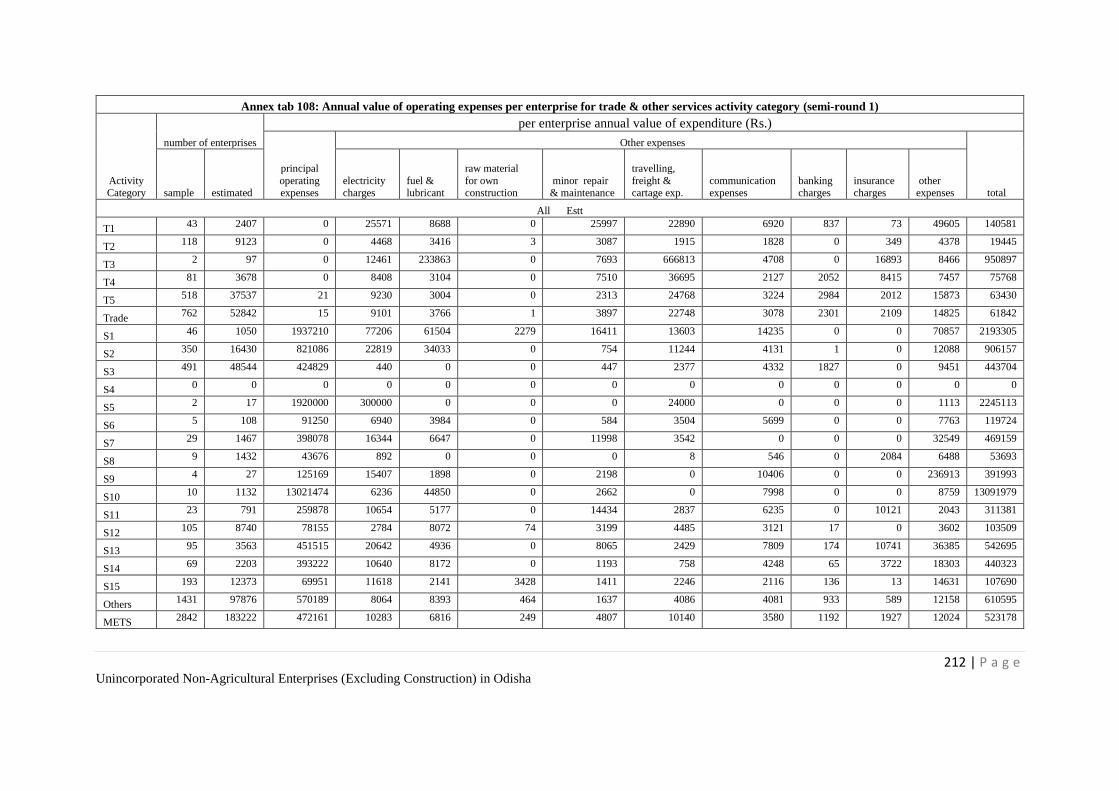
212 | P a g e Unincorporated Non-Agricultural Enterprises (Excluding Construction) in Odisha
Annex tab 108: Annual value of operating expenses per enterprise for trade & other services activity category (semi-round 1)
Activity Category
number of enterprises
per enterprise annual value of expenditure (Rs.)
principal
operating expenses
Other expenses
total sample estimated electricity charges
fuel & lubricant
raw material
for own construction
minor repair & maintenance
travelling,
freight & cartage exp.
communication expenses
banking charges
insurance charges
other expenses
All Estt
T1 43 2407 0 25571 8688 0 25997 22890 6920 837 73 49605 140581
T2 118 9123 0 4468 3416 3 3087 1915 1828 0 349 4378 19445
T3 2 97 0 12461 233863 0 7693 666813 4708 0 16893 8466 950897
T4 81 3678 0 8408 3104 0 7510 36695 2127 2052 8415 7457 75768
T5 518 37537 21 9230 3004 0 2313 24768 3224 2984 2012 15873 63430
Trade 762 52842 15 9101 3766 1 3897 22748 3078 2301 2109 14825 61842
S1 46 1050 1937210 77206 61504 2279 16411 13603 14235 0 0 70857 2193305
S2 350 16430 821086 22819 34033 0 754 11244 4131 1 0 12088 906157
S3 491 48544 424829 440 0 0 447 2377 4332 1827 0 9451 443704
S4 0 0 0 0 0 0 0 0 0 0 0 0 0
S5 2 17 1920000 300000 0 0 0 24000 0 0 0 1113 2245113
S6 5 108 91250 6940 3984 0 584 3504 5699 0 0 7763 119724
S7 29 1467 398078 16344 6647 0 11998 3542 0 0 0 32549 469159
S8 9 1432 43676 892 0 0 0 8 546 0 2084 6488 53693
S9 4 27 125169 15407 1898 0 2198 0 10406 0 0 236913 391993
S10 10 1132 13021474 6236 44850 0 2662 0 7998 0 0 8759 13091979
S11 23 791 259878 10654 5177 0 14434 2837 6235 0 10121 2043 311381
S12 105 8740 78155 2784 8072 74 3199 4485 3121 17 0 3602 103509
S13 95 3563 451515 20642 4936 0 8065 2429 7809 174 10741 36385 542695
S14 69 2203 393222 10640 8172 0 1193 758 4248 65 3722 18303 440323
S15 193 12373 69951 11618 2141 3428 1411 2246 2116 136 13 14631 107690
Others 1431 97876 570189 8064 8393 464 1637 4086 4081 933 589 12158 610595
METS 2842 183222 472161 10283 6816 249 4807 10140 3580 1192 1927 12024 523178
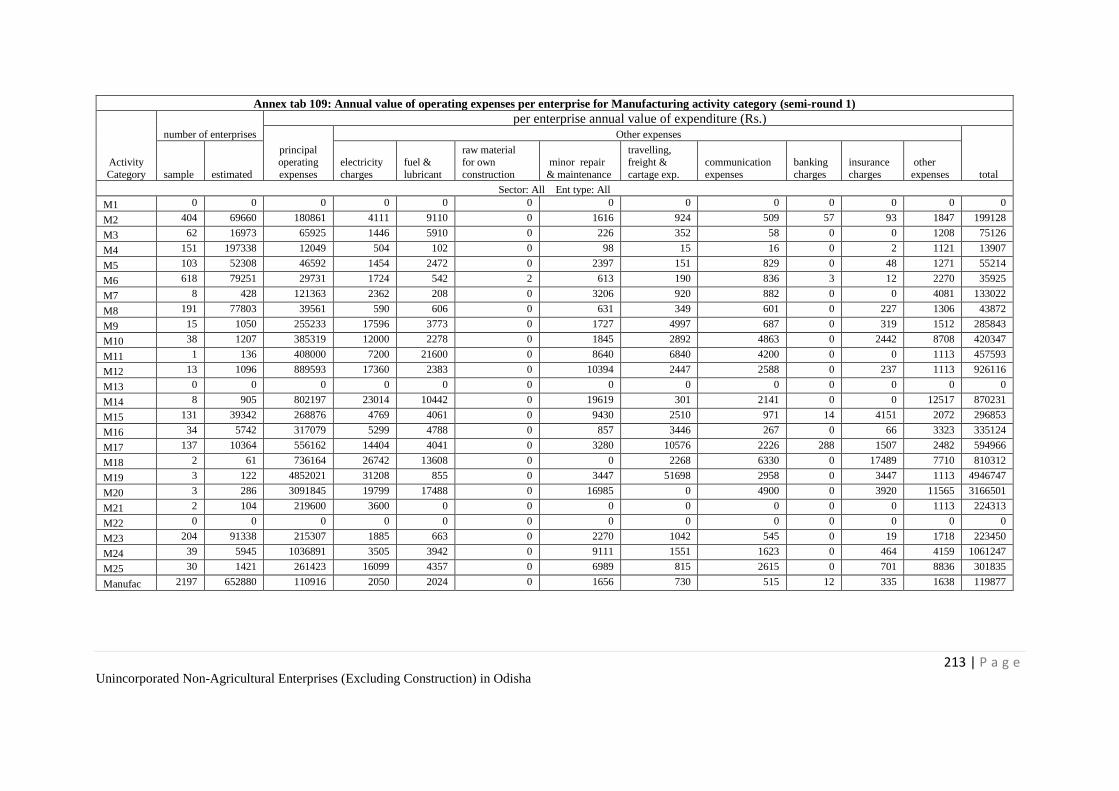
213 | P a g e Unincorporated Non-Agricultural Enterprises (Excluding Construction) in Odisha
Annex tab 109: Annual value of operating expenses per enterprise for Manufacturing activity category (semi-round 1)
Activity
Category
number of enterprises
per enterprise annual value of expenditure (Rs.)
principal
operating
expenses
Other expenses
total sample estimated
electricity
charges
fuel &
lubricant
raw material
for own
construction
minor repair
& maintenance
travelling,
freight &
cartage exp.
communication
expenses
banking
charges
insurance
charges
other
expenses
Sector: All Ent type: All
M1 0 0 0 0 0 0 0 0 0 0 0 0 0
M2 404 69660 180861 4111 9110 0 1616 924 509 57 93 1847 199128
M3 62 16973 65925 1446 5910 0 226 352 58 0 0 1208 75126
M4 151 197338 12049 504 102 0 98 15 16 0 2 1121 13907
M5 103 52308 46592 1454 2472 0 2397 151 829 0 48 1271 55214
M6 618 79251 29731 1724 542 2 613 190 836 3 12 2270 35925
M7 8 428 121363 2362 208 0 3206 920 882 0 0 4081 133022
M8 191 77803 39561 590 606 0 631 349 601 0 227 1306 43872
M9 15 1050 255233 17596 3773 0 1727 4997 687 0 319 1512 285843
M10 38 1207 385319 12000 2278 0 1845 2892 4863 0 2442 8708 420347
M11 1 136 408000 7200 21600 0 8640 6840 4200 0 0 1113 457593
M12 13 1096 889593 17360 2383 0 10394 2447 2588 0 237 1113 926116
M13 0 0 0 0 0 0 0 0 0 0 0 0 0
M14 8 905 802197 23014 10442 0 19619 301 2141 0 0 12517 870231
M15 131 39342 268876 4769 4061 0 9430 2510 971 14 4151 2072 296853
M16 34 5742 317079 5299 4788 0 857 3446 267 0 66 3323 335124
M17 137 10364 556162 14404 4041 0 3280 10576 2226 288 1507 2482 594966
M18 2 61 736164 26742 13608 0 0 2268 6330 0 17489 7710 810312
M19 3 122 4852021 31208 855 0 3447 51698 2958 0 3447 1113 4946747
M20 3 286 3091845 19799 17488 0 16985 0 4900 0 3920 11565 3166501
M21 2 104 219600 3600 0 0 0 0 0 0 0 1113 224313
M22 0 0 0 0 0 0 0 0 0 0 0 0 0
M23 204 91338 215307 1885 663 0 2270 1042 545 0 19 1718 223450
M24 39 5945 1036891 3505 3942 0 9111 1551 1623 0 464 4159 1061247
M25 30 1421 261423 16099 4357 0 6989 815 2615 0 701 8836 301835
Manufac 2197 652880 110916 2050 2024 0 1656 730 515 12 335 1638 119877
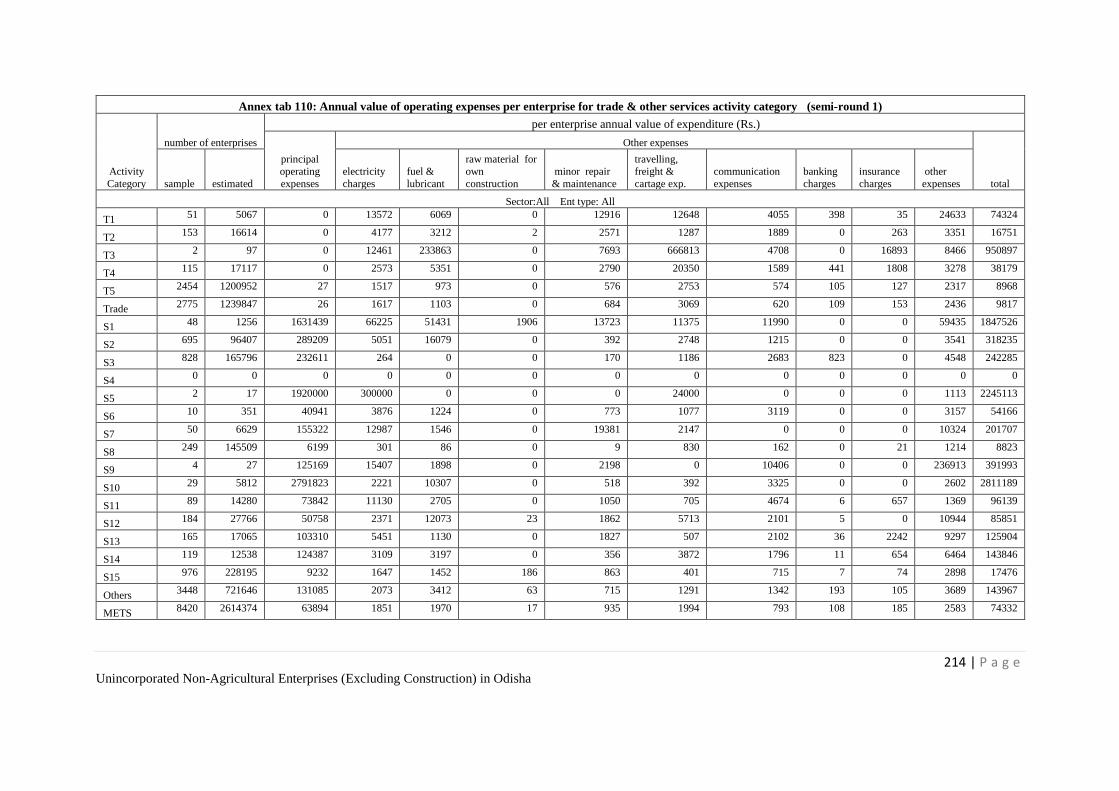
214 | P a g e Unincorporated Non-Agricultural Enterprises (Excluding Construction) in Odisha
Annex tab 110: Annual value of operating expenses per enterprise for trade & other services activity category (semi-round 1)
Activity
Category
number of enterprises
per enterprise annual value of expenditure (Rs.)
principal
operating
expenses
Other expenses
total sample estimated
electricity
charges
fuel &
lubricant
raw material for
own
construction
minor repair
& maintenance
travelling,
freight &
cartage exp.
communication
expenses
banking
charges
insurance
charges
other
expenses
Sector:All Ent type: All
T1 51 5067 0 13572 6069 0 12916 12648 4055 398 35 24633 74324
T2 153 16614 0 4177 3212 2 2571 1287 1889 0 263 3351 16751
T3 2 97 0 12461 233863 0 7693 666813 4708 0 16893 8466 950897
T4 115 17117 0 2573 5351 0 2790 20350 1589 441 1808 3278 38179
T5 2454 1200952 27 1517 973 0 576 2753 574 105 127 2317 8968
Trade 2775 1239847 26 1617 1103 0 684 3069 620 109 153 2436 9817
S1 48 1256 1631439 66225 51431 1906 13723 11375 11990 0 0 59435 1847526
S2 695 96407 289209 5051 16079 0 392 2748 1215 0 0 3541 318235
S3 828 165796 232611 264 0 0 170 1186 2683 823 0 4548 242285
S4 0 0 0 0 0 0 0 0 0 0 0 0 0
S5 2 17 1920000 300000 0 0 0 24000 0 0 0 1113 2245113
S6 10 351 40941 3876 1224 0 773 1077 3119 0 0 3157 54166
S7 50 6629 155322 12987 1546 0 19381 2147 0 0 0 10324 201707
S8 249 145509 6199 301 86 0 9 830 162 0 21 1214 8823
S9 4 27 125169 15407 1898 0 2198 0 10406 0 0 236913 391993
S10 29 5812 2791823 2221 10307 0 518 392 3325 0 0 2602 2811189
S11 89 14280 73842 11130 2705 0 1050 705 4674 6 657 1369 96139
S12 184 27766 50758 2371 12073 23 1862 5713 2101 5 0 10944 85851
S13 165 17065 103310 5451 1130 0 1827 507 2102 36 2242 9297 125904
S14 119 12538 124387 3109 3197 0 356 3872 1796 11 654 6464 143846
S15 976 228195 9232 1647 1452 186 863 401 715 7 74 2898 17476
Others 3448 721646 131085 2073 3412 63 715 1291 1342 193 105 3689 143967
METS 8420 2614374 63894 1851 1970 17 935 1994 793 108 185 2583 74332
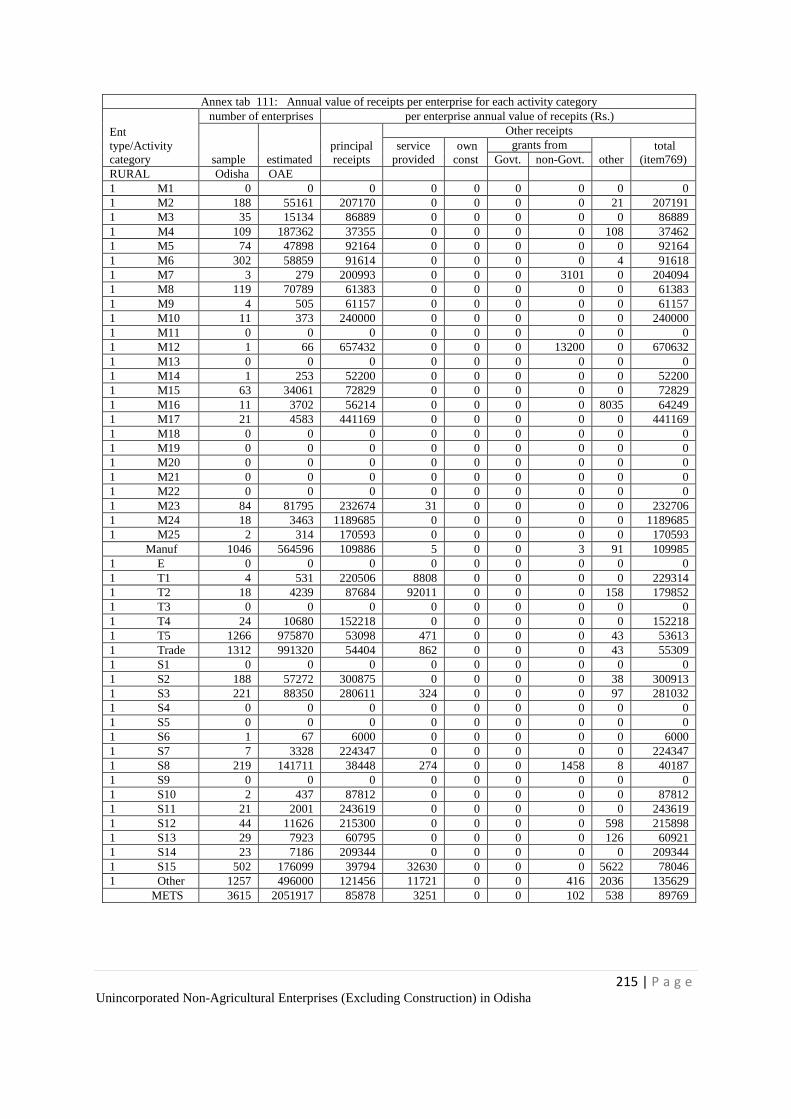
215 | P a g e Unincorporated Non-Agricultural Enterprises (Excluding Construction) in Odisha
Annex tab 111: Annual value of receipts per enterprise for each activity category
Ent
type/Activity
category
number of enterprises per enterprise annual value of recepits (Rs.)
sample estimated
principal
receipts
Other receipts
service
provided
own
const
grants from
other
total
(item769) Govt. non-Govt.
RURAL Odisha OAE
1 M1 0 0 0 0 0 0 0 0 0
1 M2 188 55161 207170 0 0 0 0 21 207191
1 M3 35 15134 86889 0 0 0 0 0 86889
1 M4 109 187362 37355 0 0 0 0 108 37462
1 M5 74 47898 92164 0 0 0 0 0 92164
1 M6 302 58859 91614 0 0 0 0 4 91618
1 M7 3 279 200993 0 0 0 3101 0 204094
1 M8 119 70789 61383 0 0 0 0 0 61383
1 M9 4 505 61157 0 0 0 0 0 61157
1 M10 11 373 240000 0 0 0 0 0 240000
1 M11 0 0 0 0 0 0 0 0 0
1 M12 1 66 657432 0 0 0 13200 0 670632
1 M13 0 0 0 0 0 0 0 0 0
1 M14 1 253 52200 0 0 0 0 0 52200
1 M15 63 34061 72829 0 0 0 0 0 72829
1 M16 11 3702 56214 0 0 0 0 8035 64249
1 M17 21 4583 441169 0 0 0 0 0 441169
1 M18 0 0 0 0 0 0 0 0 0
1 M19 0 0 0 0 0 0 0 0 0
1 M20 0 0 0 0 0 0 0 0 0
1 M21 0 0 0 0 0 0 0 0 0
1 M22 0 0 0 0 0 0 0 0 0
1 M23 84 81795 232674 31 0 0 0 0 232706
1 M24 18 3463 1189685 0 0 0 0 0 1189685
1 M25 2 314 170593 0 0 0 0 0 170593
Manuf 1046 564596 109886 5 0 0 3 91 109985
1 E 0 0 0 0 0 0 0 0 0
1 T1 4 531 220506 8808 0 0 0 0 229314
1 T2 18 4239 87684 92011 0 0 0 158 179852
1 T3 0 0 0 0 0 0 0 0 0
1 T4 24 10680 152218 0 0 0 0 0 152218
1 T5 1266 975870 53098 471 0 0 0 43 53613
1 Trade 1312 991320 54404 862 0 0 0 43 55309
1 S1 0 0 0 0 0 0 0 0 0
1 S2 188 57272 300875 0 0 0 0 38 300913
1 S3 221 88350 280611 324 0 0 0 97 281032
1 S4 0 0 0 0 0 0 0 0 0
1 S5 0 0 0 0 0 0 0 0 0
1 S6 1 67 6000 0 0 0 0 0 6000
1 S7 7 3328 224347 0 0 0 0 0 224347
1 S8 219 141711 38448 274 0 0 1458 8 40187
1 S9 0 0 0 0 0 0 0 0 0
1 S10 2 437 87812 0 0 0 0 0 87812
1 S11 21 2001 243619 0 0 0 0 0 243619
1 S12 44 11626 215300 0 0 0 0 598 215898
1 S13 29 7923 60795 0 0 0 0 126 60921
1 S14 23 7186 209344 0 0 0 0 0 209344
1 S15 502 176099 39794 32630 0 0 0 5622 78046
1 Other 1257 496000 121456 11721 0 0 416 2036 135629
METS 3615 2051917 85878 3251 0 0 102 538 89769
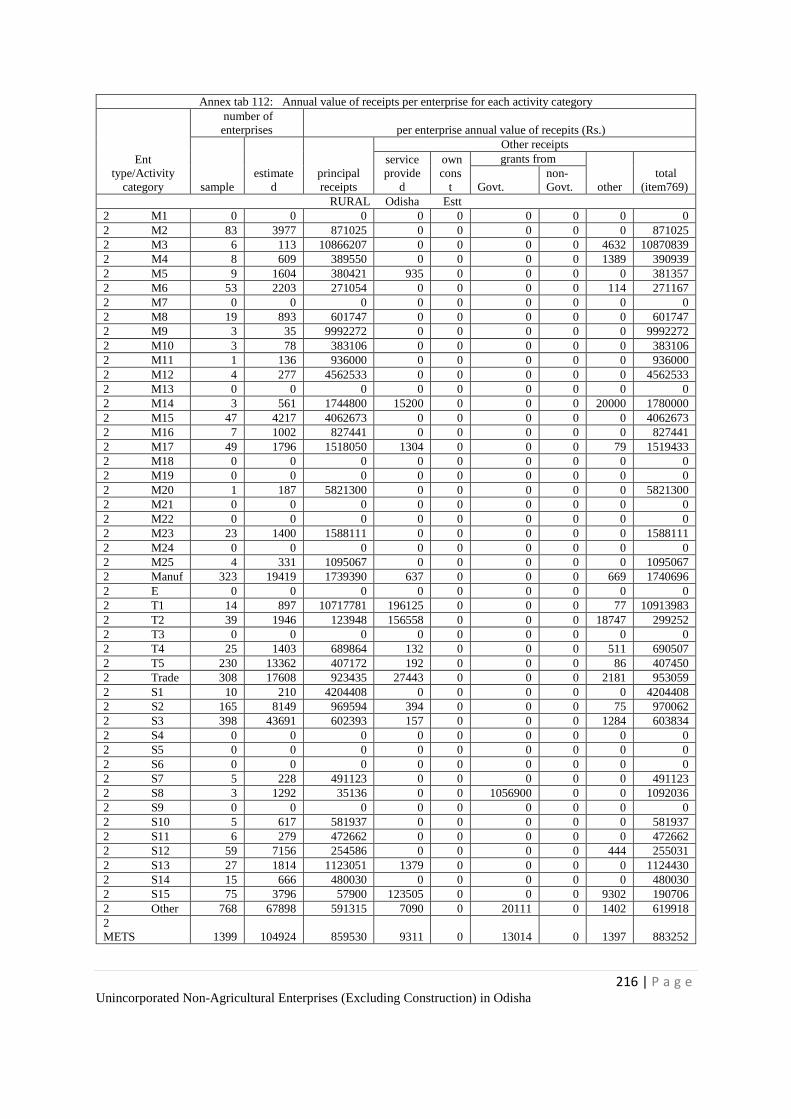
216 | P a g e Unincorporated Non-Agricultural Enterprises (Excluding Construction) in Odisha
Annex tab 112: Annual value of receipts per enterprise for each activity category
Ent
type/Activity
category
number of
enterprises per enterprise annual value of recepits (Rs.)
sample
estimate
d
principal
receipts
Other receipts
service
provide
d
own
cons
t
grants from
other
total
(item769) Govt.
non-
Govt.
RURAL Odisha Estt
2 M1 0 0 0 0 0 0 0 0 0
2 M2 83 3977 871025 0 0 0 0 0 871025
2 M3 6 113 10866207 0 0 0 0 4632 10870839
2 M4 8 609 389550 0 0 0 0 1389 390939
2 M5 9 1604 380421 935 0 0 0 0 381357
2 M6 53 2203 271054 0 0 0 0 114 271167
2 M7 0 0 0 0 0 0 0 0 0
2 M8 19 893 601747 0 0 0 0 0 601747
2 M9 3 35 9992272 0 0 0 0 0 9992272
2 M10 3 78 383106 0 0 0 0 0 383106
2 M11 1 136 936000 0 0 0 0 0 936000
2 M12 4 277 4562533 0 0 0 0 0 4562533
2 M13 0 0 0 0 0 0 0 0 0
2 M14 3 561 1744800 15200 0 0 0 20000 1780000
2 M15 47 4217 4062673 0 0 0 0 0 4062673
2 M16 7 1002 827441 0 0 0 0 0 827441
2 M17 49 1796 1518050 1304 0 0 0 79 1519433
2 M18 0 0 0 0 0 0 0 0 0
2 M19 0 0 0 0 0 0 0 0 0
2 M20 1 187 5821300 0 0 0 0 0 5821300
2 M21 0 0 0 0 0 0 0 0 0
2 M22 0 0 0 0 0 0 0 0 0
2 M23 23 1400 1588111 0 0 0 0 0 1588111
2 M24 0 0 0 0 0 0 0 0 0
2 M25 4 331 1095067 0 0 0 0 0 1095067
2 Manuf 323 19419 1739390 637 0 0 0 669 1740696
2 E 0 0 0 0 0 0 0 0 0
2 T1 14 897 10717781 196125 0 0 0 77 10913983
2 T2 39 1946 123948 156558 0 0 0 18747 299252
2 T3 0 0 0 0 0 0 0 0 0
2 T4 25 1403 689864 132 0 0 0 511 690507
2 T5 230 13362 407172 192 0 0 0 86 407450
2 Trade 308 17608 923435 27443 0 0 0 2181 953059
2 S1 10 210 4204408 0 0 0 0 0 4204408
2 S2 165 8149 969594 394 0 0 0 75 970062
2 S3 398 43691 602393 157 0 0 0 1284 603834
2 S4 0 0 0 0 0 0 0 0 0
2 S5 0 0 0 0 0 0 0 0 0
2 S6 0 0 0 0 0 0 0 0 0
2 S7 5 228 491123 0 0 0 0 0 491123
2 S8 3 1292 35136 0 0 1056900 0 0 1092036
2 S9 0 0 0 0 0 0 0 0 0
2 S10 5 617 581937 0 0 0 0 0 581937
2 S11 6 279 472662 0 0 0 0 0 472662
2 S12 59 7156 254586 0 0 0 0 444 255031
2 S13 27 1814 1123051 1379 0 0 0 0 1124430
2 S14 15 666 480030 0 0 0 0 0 480030
2 S15 75 3796 57900 123505 0 0 0 9302 190706
2 Other 768 67898 591315 7090 0 20111 0 1402 619918
2
METS 1399 104924 859530 9311 0 13014 0 1397 883252
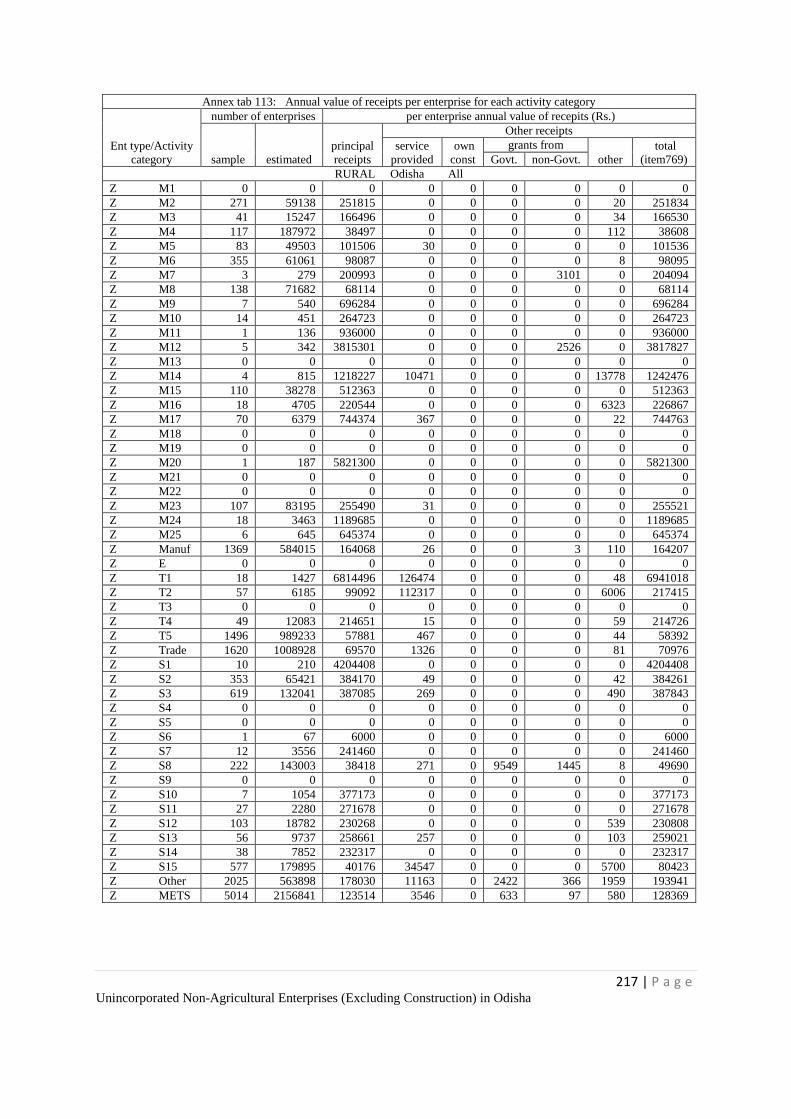
217 | P a g e Unincorporated Non-Agricultural Enterprises (Excluding Construction) in Odisha
Annex tab 113: Annual value of receipts per enterprise for each activity category
Ent type/Activity
category
number of enterprises per enterprise annual value of recepits (Rs.)
sample estimated
principal
receipts
Other receipts
service
provided
own
const
grants from
other
total
(item769) Govt. non-Govt.
RURAL Odisha All
Z M1 0 0 0 0 0 0 0 0 0
Z M2 271 59138 251815 0 0 0 0 20 251834
Z M3 41 15247 166496 0 0 0 0 34 166530
Z M4 117 187972 38497 0 0 0 0 112 38608
Z M5 83 49503 101506 30 0 0 0 0 101536
Z M6 355 61061 98087 0 0 0 0 8 98095
Z M7 3 279 200993 0 0 0 3101 0 204094
Z M8 138 71682 68114 0 0 0 0 0 68114
Z M9 7 540 696284 0 0 0 0 0 696284
Z M10 14 451 264723 0 0 0 0 0 264723
Z M11 1 136 936000 0 0 0 0 0 936000
Z M12 5 342 3815301 0 0 0 2526 0 3817827
Z M13 0 0 0 0 0 0 0 0 0
Z M14 4 815 1218227 10471 0 0 0 13778 1242476
Z M15 110 38278 512363 0 0 0 0 0 512363
Z M16 18 4705 220544 0 0 0 0 6323 226867
Z M17 70 6379 744374 367 0 0 0 22 744763
Z M18 0 0 0 0 0 0 0 0 0
Z M19 0 0 0 0 0 0 0 0 0
Z M20 1 187 5821300 0 0 0 0 0 5821300
Z M21 0 0 0 0 0 0 0 0 0
Z M22 0 0 0 0 0 0 0 0 0
Z M23 107 83195 255490 31 0 0 0 0 255521
Z M24 18 3463 1189685 0 0 0 0 0 1189685
Z M25 6 645 645374 0 0 0 0 0 645374
Z Manuf 1369 584015 164068 26 0 0 3 110 164207
Z E 0 0 0 0 0 0 0 0 0
Z T1 18 1427 6814496 126474 0 0 0 48 6941018
Z T2 57 6185 99092 112317 0 0 0 6006 217415
Z T3 0 0 0 0 0 0 0 0 0
Z T4 49 12083 214651 15 0 0 0 59 214726
Z T5 1496 989233 57881 467 0 0 0 44 58392
Z Trade 1620 1008928 69570 1326 0 0 0 81 70976
Z S1 10 210 4204408 0 0 0 0 0 4204408
Z S2 353 65421 384170 49 0 0 0 42 384261
Z S3 619 132041 387085 269 0 0 0 490 387843
Z S4 0 0 0 0 0 0 0 0 0
Z S5 0 0 0 0 0 0 0 0 0
Z S6 1 67 6000 0 0 0 0 0 6000
Z S7 12 3556 241460 0 0 0 0 0 241460
Z S8 222 143003 38418 271 0 9549 1445 8 49690
Z S9 0 0 0 0 0 0 0 0 0
Z S10 7 1054 377173 0 0 0 0 0 377173
Z S11 27 2280 271678 0 0 0 0 0 271678
Z S12 103 18782 230268 0 0 0 0 539 230808
Z S13 56 9737 258661 257 0 0 0 103 259021
Z S14 38 7852 232317 0 0 0 0 0 232317
Z S15 577 179895 40176 34547 0 0 0 5700 80423
Z Other 2025 563898 178030 11163 0 2422 366 1959 193941
Z METS 5014 2156841 123514 3546 0 633 97 580 128369
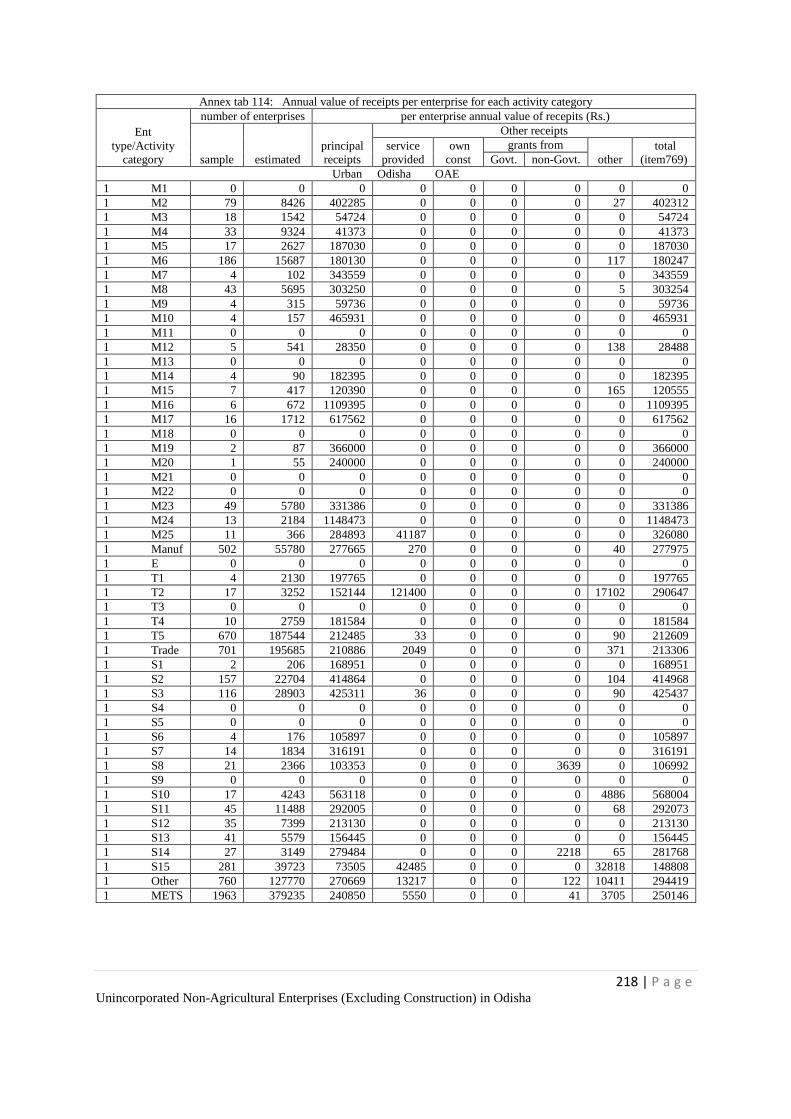
218 | P a g e Unincorporated Non-Agricultural Enterprises (Excluding Construction) in Odisha
Annex tab 114: Annual value of receipts per enterprise for each activity category
Ent
type/Activity
category
number of enterprises per enterprise annual value of recepits (Rs.)
sample estimated
principal
receipts
Other receipts
service
provided
own
const
grants from
other
total
(item769) Govt. non-Govt.
Urban Odisha OAE
1 M1 0 0 0 0 0 0 0 0 0
1 M2 79 8426 402285 0 0 0 0 27 402312
1 M3 18 1542 54724 0 0 0 0 0 54724
1 M4 33 9324 41373 0 0 0 0 0 41373
1 M5 17 2627 187030 0 0 0 0 0 187030
1 M6 186 15687 180130 0 0 0 0 117 180247
1 M7 4 102 343559 0 0 0 0 0 343559
1 M8 43 5695 303250 0 0 0 0 5 303254
1 M9 4 315 59736 0 0 0 0 0 59736
1 M10 4 157 465931 0 0 0 0 0 465931
1 M11 0 0 0 0 0 0 0 0 0
1 M12 5 541 28350 0 0 0 0 138 28488
1 M13 0 0 0 0 0 0 0 0 0
1 M14 4 90 182395 0 0 0 0 0 182395
1 M15 7 417 120390 0 0 0 0 165 120555
1 M16 6 672 1109395 0 0 0 0 0 1109395
1 M17 16 1712 617562 0 0 0 0 0 617562
1 M18 0 0 0 0 0 0 0 0 0
1 M19 2 87 366000 0 0 0 0 0 366000
1 M20 1 55 240000 0 0 0 0 0 240000
1 M21 0 0 0 0 0 0 0 0 0
1 M22 0 0 0 0 0 0 0 0 0
1 M23 49 5780 331386 0 0 0 0 0 331386
1 M24 13 2184 1148473 0 0 0 0 0 1148473
1 M25 11 366 284893 41187 0 0 0 0 326080
1 Manuf 502 55780 277665 270 0 0 0 40 277975
1 E 0 0 0 0 0 0 0 0 0
1 T1 4 2130 197765 0 0 0 0 0 197765
1 T2 17 3252 152144 121400 0 0 0 17102 290647
1 T3 0 0 0 0 0 0 0 0 0
1 T4 10 2759 181584 0 0 0 0 0 181584
1 T5 670 187544 212485 33 0 0 0 90 212609
1 Trade 701 195685 210886 2049 0 0 0 371 213306
1 S1 2 206 168951 0 0 0 0 0 168951
1 S2 157 22704 414864 0 0 0 0 104 414968
1 S3 116 28903 425311 36 0 0 0 90 425437
1 S4 0 0 0 0 0 0 0 0 0
1 S5 0 0 0 0 0 0 0 0 0
1 S6 4 176 105897 0 0 0 0 0 105897
1 S7 14 1834 316191 0 0 0 0 0 316191
1 S8 21 2366 103353 0 0 0 3639 0 106992
1 S9 0 0 0 0 0 0 0 0 0
1 S10 17 4243 563118 0 0 0 0 4886 568004
1 S11 45 11488 292005 0 0 0 0 68 292073
1 S12 35 7399 213130 0 0 0 0 0 213130
1 S13 41 5579 156445 0 0 0 0 0 156445
1 S14 27 3149 279484 0 0 0 2218 65 281768
1 S15 281 39723 73505 42485 0 0 0 32818 148808
1 Other 760 127770 270669 13217 0 0 122 10411 294419
1 METS 1963 379235 240850 5550 0 0 41 3705 250146
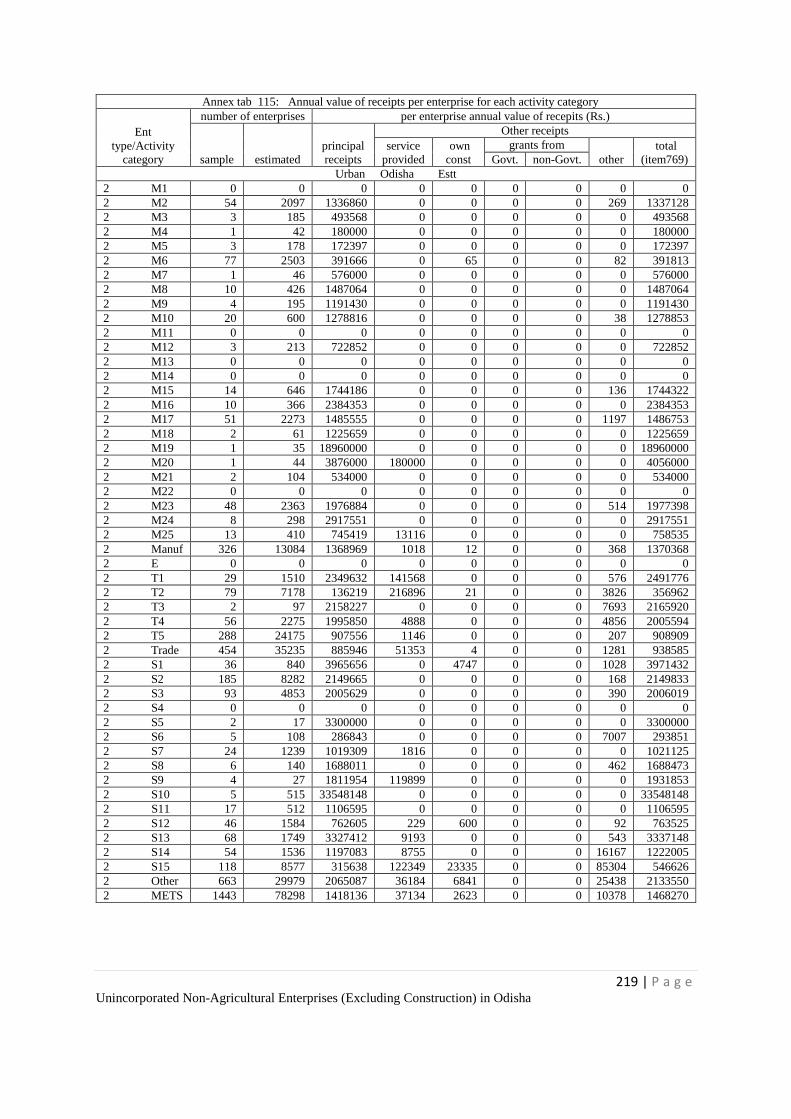
219 | P a g e Unincorporated Non-Agricultural Enterprises (Excluding Construction) in Odisha
Annex tab 115: Annual value of receipts per enterprise for each activity category
Ent
type/Activity
category
number of enterprises per enterprise annual value of recepits (Rs.)
sample estimated
principal
receipts
Other receipts
service
provided
own
const
grants from
other
total
(item769) Govt. non-Govt.
Urban Odisha Estt
2 M1 0 0 0 0 0 0 0 0 0
2 M2 54 2097 1336860 0 0 0 0 269 1337128
2 M3 3 185 493568 0 0 0 0 0 493568
2 M4 1 42 180000 0 0 0 0 0 180000
2 M5 3 178 172397 0 0 0 0 0 172397
2 M6 77 2503 391666 0 65 0 0 82 391813
2 M7 1 46 576000 0 0 0 0 0 576000
2 M8 10 426 1487064 0 0 0 0 0 1487064
2 M9 4 195 1191430 0 0 0 0 0 1191430
2 M10 20 600 1278816 0 0 0 0 38 1278853
2 M11 0 0 0 0 0 0 0 0 0
2 M12 3 213 722852 0 0 0 0 0 722852
2 M13 0 0 0 0 0 0 0 0 0
2 M14 0 0 0 0 0 0 0 0 0
2 M15 14 646 1744186 0 0 0 0 136 1744322
2 M16 10 366 2384353 0 0 0 0 0 2384353
2 M17 51 2273 1485555 0 0 0 0 1197 1486753
2 M18 2 61 1225659 0 0 0 0 0 1225659
2 M19 1 35 18960000 0 0 0 0 0 18960000
2 M20 1 44 3876000 180000 0 0 0 0 4056000
2 M21 2 104 534000 0 0 0 0 0 534000
2 M22 0 0 0 0 0 0 0 0 0
2 M23 48 2363 1976884 0 0 0 0 514 1977398
2 M24 8 298 2917551 0 0 0 0 0 2917551
2 M25 13 410 745419 13116 0 0 0 0 758535
2 Manuf 326 13084 1368969 1018 12 0 0 368 1370368
2 E 0 0 0 0 0 0 0 0 0
2 T1 29 1510 2349632 141568 0 0 0 576 2491776
2 T2 79 7178 136219 216896 21 0 0 3826 356962
2 T3 2 97 2158227 0 0 0 0 7693 2165920
2 T4 56 2275 1995850 4888 0 0 0 4856 2005594
2 T5 288 24175 907556 1146 0 0 0 207 908909
2 Trade 454 35235 885946 51353 4 0 0 1281 938585
2 S1 36 840 3965656 0 4747 0 0 1028 3971432
2 S2 185 8282 2149665 0 0 0 0 168 2149833
2 S3 93 4853 2005629 0 0 0 0 390 2006019
2 S4 0 0 0 0 0 0 0 0 0
2 S5 2 17 3300000 0 0 0 0 0 3300000
2 S6 5 108 286843 0 0 0 0 7007 293851
2 S7 24 1239 1019309 1816 0 0 0 0 1021125
2 S8 6 140 1688011 0 0 0 0 462 1688473
2 S9 4 27 1811954 119899 0 0 0 0 1931853
2 S10 5 515 33548148 0 0 0 0 0 33548148
2 S11 17 512 1106595 0 0 0 0 0 1106595
2 S12 46 1584 762605 229 600 0 0 92 763525
2 S13 68 1749 3327412 9193 0 0 0 543 3337148
2 S14 54 1536 1197083 8755 0 0 0 16167 1222005
2 S15 118 8577 315638 122349 23335 0 0 85304 546626
2 Other 663 29979 2065087 36184 6841 0 0 25438 2133550
2 METS 1443 78298 1418136 37134 2623 0 0 10378 1468270
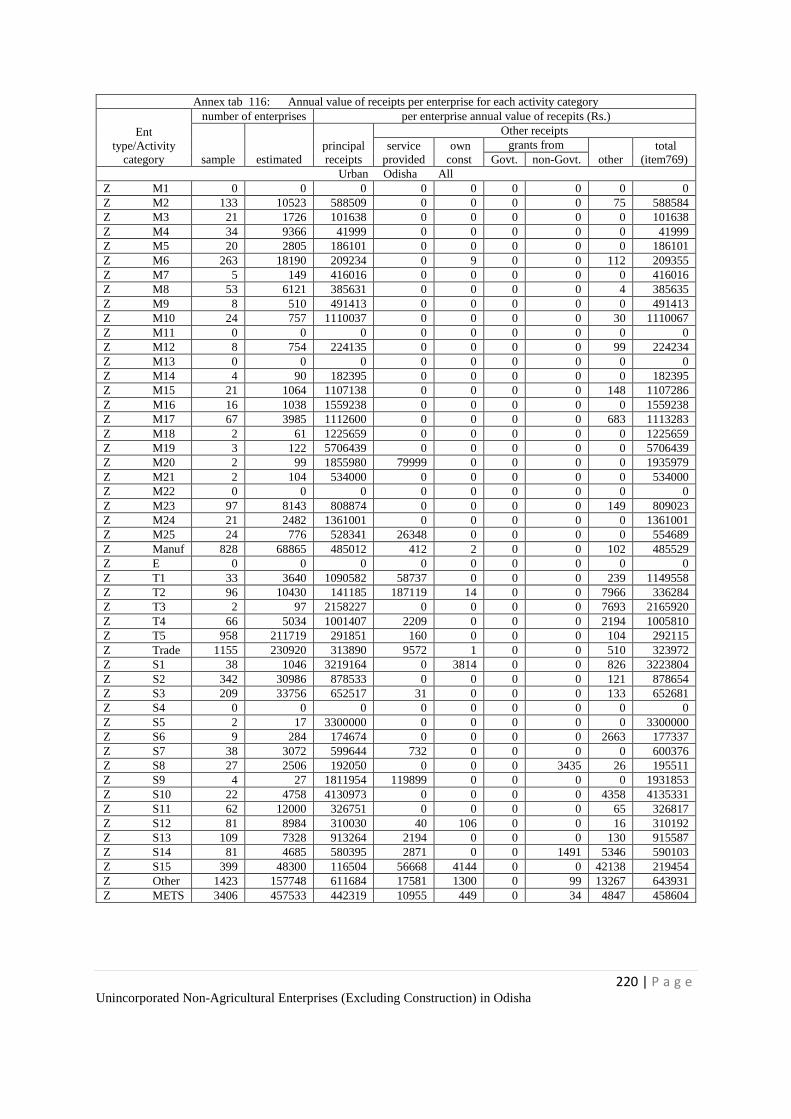
220 | P a g e Unincorporated Non-Agricultural Enterprises (Excluding Construction) in Odisha
Annex tab 116: Annual value of receipts per enterprise for each activity category
Ent
type/Activity
category
number of enterprises per enterprise annual value of recepits (Rs.)
sample estimated
principal
receipts
Other receipts
service
provided
own
const
grants from
other
total
(item769) Govt. non-Govt.
Urban Odisha All
Z M1 0 0 0 0 0 0 0 0 0
Z M2 133 10523 588509 0 0 0 0 75 588584
Z M3 21 1726 101638 0 0 0 0 0 101638
Z M4 34 9366 41999 0 0 0 0 0 41999
Z M5 20 2805 186101 0 0 0 0 0 186101
Z M6 263 18190 209234 0 9 0 0 112 209355
Z M7 5 149 416016 0 0 0 0 0 416016
Z M8 53 6121 385631 0 0 0 0 4 385635
Z M9 8 510 491413 0 0 0 0 0 491413
Z M10 24 757 1110037 0 0 0 0 30 1110067
Z M11 0 0 0 0 0 0 0 0 0
Z M12 8 754 224135 0 0 0 0 99 224234
Z M13 0 0 0 0 0 0 0 0 0
Z M14 4 90 182395 0 0 0 0 0 182395
Z M15 21 1064 1107138 0 0 0 0 148 1107286
Z M16 16 1038 1559238 0 0 0 0 0 1559238
Z M17 67 3985 1112600 0 0 0 0 683 1113283
Z M18 2 61 1225659 0 0 0 0 0 1225659
Z M19 3 122 5706439 0 0 0 0 0 5706439
Z M20 2 99 1855980 79999 0 0 0 0 1935979
Z M21 2 104 534000 0 0 0 0 0 534000
Z M22 0 0 0 0 0 0 0 0 0
Z M23 97 8143 808874 0 0 0 0 149 809023
Z M24 21 2482 1361001 0 0 0 0 0 1361001
Z M25 24 776 528341 26348 0 0 0 0 554689
Z Manuf 828 68865 485012 412 2 0 0 102 485529
Z E 0 0 0 0 0 0 0 0 0
Z T1 33 3640 1090582 58737 0 0 0 239 1149558
Z T2 96 10430 141185 187119 14 0 0 7966 336284
Z T3 2 97 2158227 0 0 0 0 7693 2165920
Z T4 66 5034 1001407 2209 0 0 0 2194 1005810
Z T5 958 211719 291851 160 0 0 0 104 292115
Z Trade 1155 230920 313890 9572 1 0 0 510 323972
Z S1 38 1046 3219164 0 3814 0 0 826 3223804
Z S2 342 30986 878533 0 0 0 0 121 878654
Z S3 209 33756 652517 31 0 0 0 133 652681
Z S4 0 0 0 0 0 0 0 0 0
Z S5 2 17 3300000 0 0 0 0 0 3300000
Z S6 9 284 174674 0 0 0 0 2663 177337
Z S7 38 3072 599644 732 0 0 0 0 600376
Z S8 27 2506 192050 0 0 0 3435 26 195511
Z S9 4 27 1811954 119899 0 0 0 0 1931853
Z S10 22 4758 4130973 0 0 0 0 4358 4135331
Z S11 62 12000 326751 0 0 0 0 65 326817
Z S12 81 8984 310030 40 106 0 0 16 310192
Z S13 109 7328 913264 2194 0 0 0 130 915587
Z S14 81 4685 580395 2871 0 0 1491 5346 590103
Z S15 399 48300 116504 56668 4144 0 0 42138 219454
Z Other 1423 157748 611684 17581 1300 0 99 13267 643931
Z METS 3406 457533 442319 10955 449 0 34 4847 458604
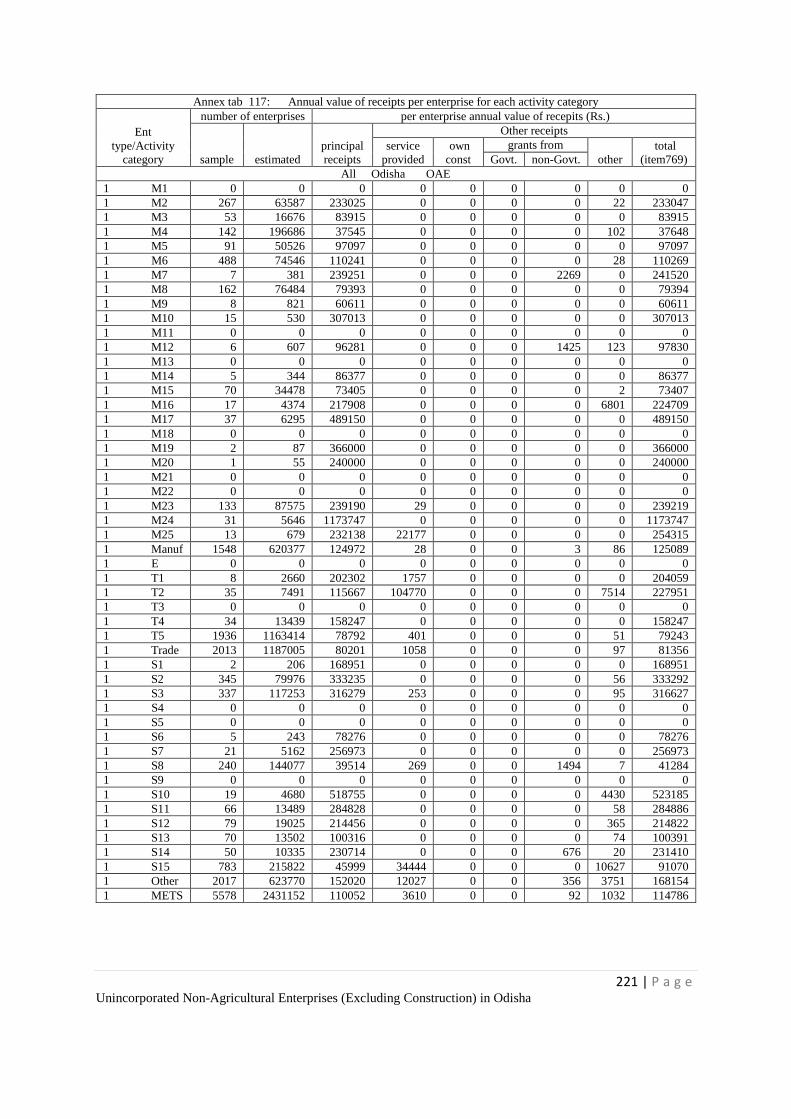
221 | P a g e Unincorporated Non-Agricultural Enterprises (Excluding Construction) in Odisha
Annex tab 117: Annual value of receipts per enterprise for each activity category
Ent
type/Activity
category
number of enterprises per enterprise annual value of recepits (Rs.)
sample estimated
principal
receipts
Other receipts
service
provided
own
const
grants from
other
total
(item769) Govt. non-Govt.
All Odisha OAE
1 M1 0 0 0 0 0 0 0 0 0
1 M2 267 63587 233025 0 0 0 0 22 233047
1 M3 53 16676 83915 0 0 0 0 0 83915
1 M4 142 196686 37545 0 0 0 0 102 37648
1 M5 91 50526 97097 0 0 0 0 0 97097
1 M6 488 74546 110241 0 0 0 0 28 110269
1 M7 7 381 239251 0 0 0 2269 0 241520
1 M8 162 76484 79393 0 0 0 0 0 79394
1 M9 8 821 60611 0 0 0 0 0 60611
1 M10 15 530 307013 0 0 0 0 0 307013
1 M11 0 0 0 0 0 0 0 0 0
1 M12 6 607 96281 0 0 0 1425 123 97830
1 M13 0 0 0 0 0 0 0 0 0
1 M14 5 344 86377 0 0 0 0 0 86377
1 M15 70 34478 73405 0 0 0 0 2 73407
1 M16 17 4374 217908 0 0 0 0 6801 224709
1 M17 37 6295 489150 0 0 0 0 0 489150
1 M18 0 0 0 0 0 0 0 0 0
1 M19 2 87 366000 0 0 0 0 0 366000
1 M20 1 55 240000 0 0 0 0 0 240000
1 M21 0 0 0 0 0 0 0 0 0
1 M22 0 0 0 0 0 0 0 0 0
1 M23 133 87575 239190 29 0 0 0 0 239219
1 M24 31 5646 1173747 0 0 0 0 0 1173747
1 M25 13 679 232138 22177 0 0 0 0 254315
1 Manuf 1548 620377 124972 28 0 0 3 86 125089
1 E 0 0 0 0 0 0 0 0 0
1 T1 8 2660 202302 1757 0 0 0 0 204059
1 T2 35 7491 115667 104770 0 0 0 7514 227951
1 T3 0 0 0 0 0 0 0 0 0
1 T4 34 13439 158247 0 0 0 0 0 158247
1 T5 1936 1163414 78792 401 0 0 0 51 79243
1 Trade 2013 1187005 80201 1058 0 0 0 97 81356
1 S1 2 206 168951 0 0 0 0 0 168951
1 S2 345 79976 333235 0 0 0 0 56 333292
1 S3 337 117253 316279 253 0 0 0 95 316627
1 S4 0 0 0 0 0 0 0 0 0
1 S5 0 0 0 0 0 0 0 0 0
1 S6 5 243 78276 0 0 0 0 0 78276
1 S7 21 5162 256973 0 0 0 0 0 256973
1 S8 240 144077 39514 269 0 0 1494 7 41284
1 S9 0 0 0 0 0 0 0 0 0
1 S10 19 4680 518755 0 0 0 0 4430 523185
1 S11 66 13489 284828 0 0 0 0 58 284886
1 S12 79 19025 214456 0 0 0 0 365 214822
1 S13 70 13502 100316 0 0 0 0 74 100391
1 S14 50 10335 230714 0 0 0 676 20 231410
1 S15 783 215822 45999 34444 0 0 0 10627 91070
1 Other 2017 623770 152020 12027 0 0 356 3751 168154
1 METS 5578 2431152 110052 3610 0 0 92 1032 114786
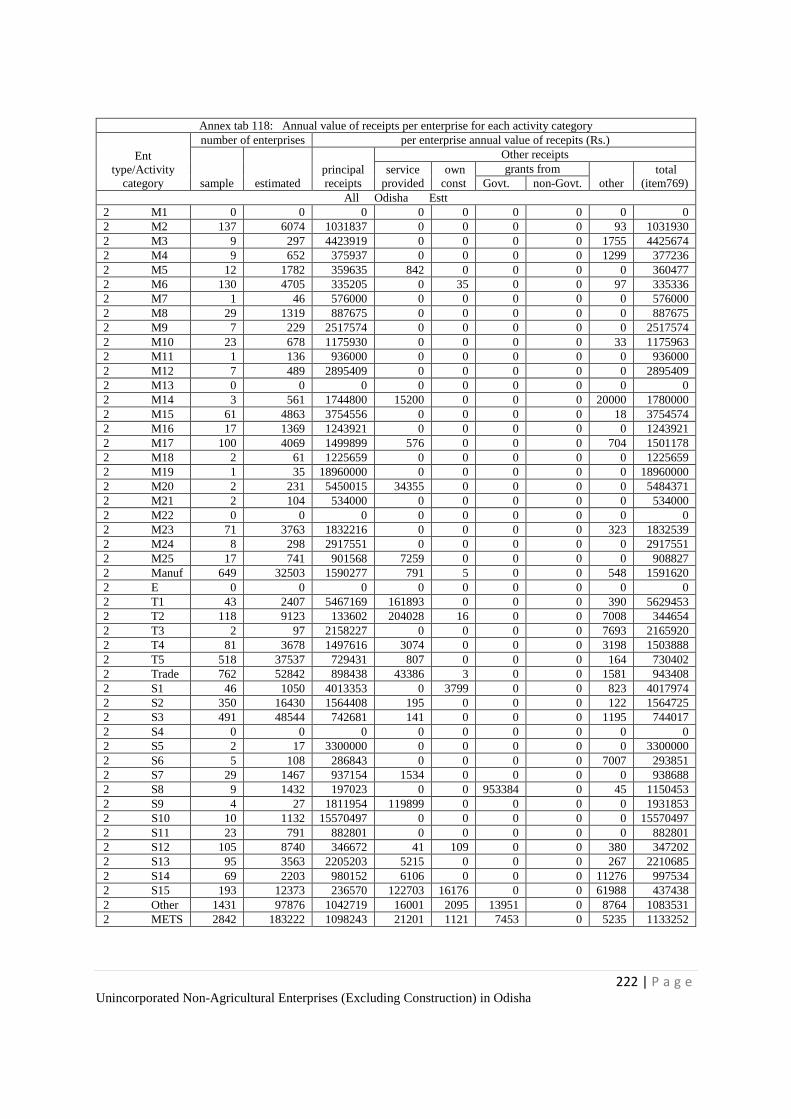
222 | P a g e Unincorporated Non-Agricultural Enterprises (Excluding Construction) in Odisha
Annex tab 118: Annual value of receipts per enterprise for each activity category
Ent
type/Activity
category
number of enterprises per enterprise annual value of recepits (Rs.)
sample estimated
principal
receipts
Other receipts
service
provided
own
const
grants from
other
total
(item769) Govt. non-Govt.
All Odisha Estt
2 M1 0 0 0 0 0 0 0 0 0
2 M2 137 6074 1031837 0 0 0 0 93 1031930
2 M3 9 297 4423919 0 0 0 0 1755 4425674
2 M4 9 652 375937 0 0 0 0 1299 377236
2 M5 12 1782 359635 842 0 0 0 0 360477
2 M6 130 4705 335205 0 35 0 0 97 335336
2 M7 1 46 576000 0 0 0 0 0 576000
2 M8 29 1319 887675 0 0 0 0 0 887675
2 M9 7 229 2517574 0 0 0 0 0 2517574
2 M10 23 678 1175930 0 0 0 0 33 1175963
2 M11 1 136 936000 0 0 0 0 0 936000
2 M12 7 489 2895409 0 0 0 0 0 2895409
2 M13 0 0 0 0 0 0 0 0 0
2 M14 3 561 1744800 15200 0 0 0 20000 1780000
2 M15 61 4863 3754556 0 0 0 0 18 3754574
2 M16 17 1369 1243921 0 0 0 0 0 1243921
2 M17 100 4069 1499899 576 0 0 0 704 1501178
2 M18 2 61 1225659 0 0 0 0 0 1225659
2 M19 1 35 18960000 0 0 0 0 0 18960000
2 M20 2 231 5450015 34355 0 0 0 0 5484371
2 M21 2 104 534000 0 0 0 0 0 534000
2 M22 0 0 0 0 0 0 0 0 0
2 M23 71 3763 1832216 0 0 0 0 323 1832539
2 M24 8 298 2917551 0 0 0 0 0 2917551
2 M25 17 741 901568 7259 0 0 0 0 908827
2 Manuf 649 32503 1590277 791 5 0 0 548 1591620
2 E 0 0 0 0 0 0 0 0 0
2 T1 43 2407 5467169 161893 0 0 0 390 5629453
2 T2 118 9123 133602 204028 16 0 0 7008 344654
2 T3 2 97 2158227 0 0 0 0 7693 2165920
2 T4 81 3678 1497616 3074 0 0 0 3198 1503888
2 T5 518 37537 729431 807 0 0 0 164 730402
2 Trade 762 52842 898438 43386 3 0 0 1581 943408
2 S1 46 1050 4013353 0 3799 0 0 823 4017974
2 S2 350 16430 1564408 195 0 0 0 122 1564725
2 S3 491 48544 742681 141 0 0 0 1195 744017
2 S4 0 0 0 0 0 0 0 0 0
2 S5 2 17 3300000 0 0 0 0 0 3300000
2 S6 5 108 286843 0 0 0 0 7007 293851
2 S7 29 1467 937154 1534 0 0 0 0 938688
2 S8 9 1432 197023 0 0 953384 0 45 1150453
2 S9 4 27 1811954 119899 0 0 0 0 1931853
2 S10 10 1132 15570497 0 0 0 0 0 15570497
2 S11 23 791 882801 0 0 0 0 0 882801
2 S12 105 8740 346672 41 109 0 0 380 347202
2 S13 95 3563 2205203 5215 0 0 0 267 2210685
2 S14 69 2203 980152 6106 0 0 0 11276 997534
2 S15 193 12373 236570 122703 16176 0 0 61988 437438
2 Other 1431 97876 1042719 16001 2095 13951 0 8764 1083531
2 METS 2842 183222 1098243 21201 1121 7453 0 5235 1133252
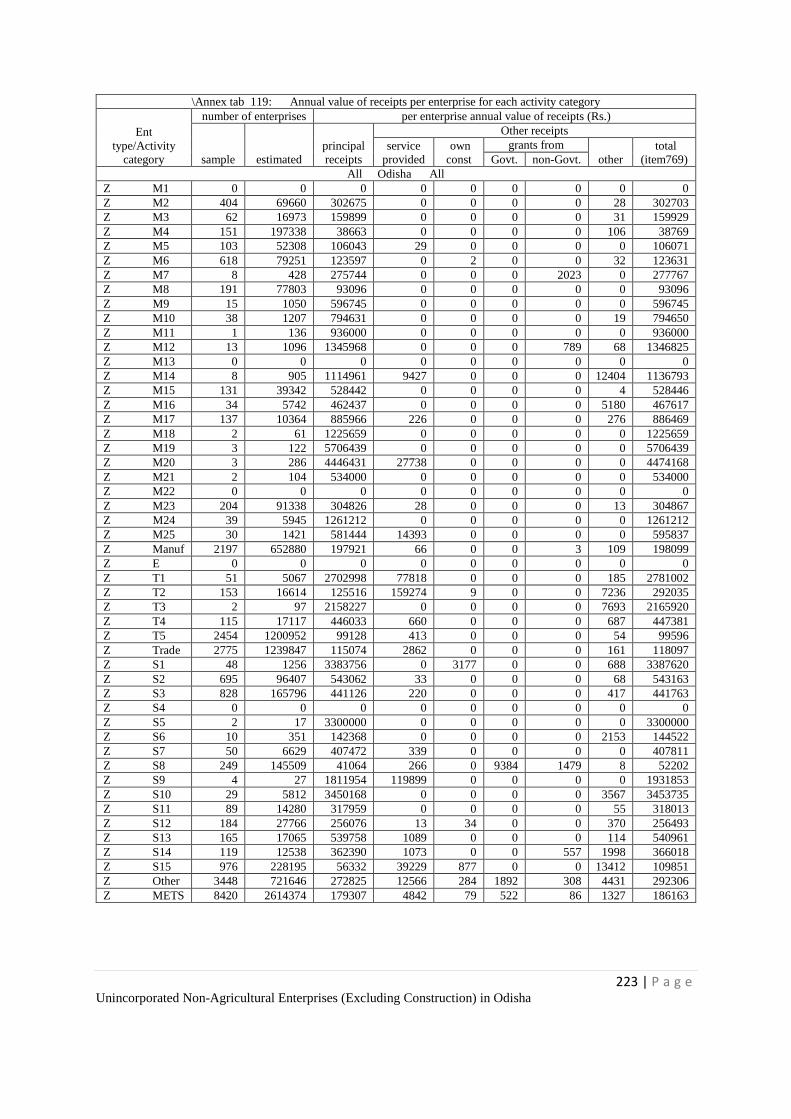
223 | P a g e Unincorporated Non-Agricultural Enterprises (Excluding Construction) in Odisha
\Annex tab 119: Annual value of receipts per enterprise for each activity category
Ent
type/Activity
category
number of enterprises per enterprise annual value of receipts (Rs.)
sample estimated
principal
receipts
Other receipts
service
provided
own
const
grants from
other
total
(item769) Govt. non-Govt.
All Odisha All
Z M1 0 0 0 0 0 0 0 0 0
Z M2 404 69660 302675 0 0 0 0 28 302703
Z M3 62 16973 159899 0 0 0 0 31 159929
Z M4 151 197338 38663 0 0 0 0 106 38769
Z M5 103 52308 106043 29 0 0 0 0 106071
Z M6 618 79251 123597 0 2 0 0 32 123631
Z M7 8 428 275744 0 0 0 2023 0 277767
Z M8 191 77803 93096 0 0 0 0 0 93096
Z M9 15 1050 596745 0 0 0 0 0 596745
Z M10 38 1207 794631 0 0 0 0 19 794650
Z M11 1 136 936000 0 0 0 0 0 936000
Z M12 13 1096 1345968 0 0 0 789 68 1346825
Z M13 0 0 0 0 0 0 0 0 0
Z M14 8 905 1114961 9427 0 0 0 12404 1136793
Z M15 131 39342 528442 0 0 0 0 4 528446
Z M16 34 5742 462437 0 0 0 0 5180 467617
Z M17 137 10364 885966 226 0 0 0 276 886469
Z M18 2 61 1225659 0 0 0 0 0 1225659
Z M19 3 122 5706439 0 0 0 0 0 5706439
Z M20 3 286 4446431 27738 0 0 0 0 4474168
Z M21 2 104 534000 0 0 0 0 0 534000
Z M22 0 0 0 0 0 0 0 0 0
Z M23 204 91338 304826 28 0 0 0 13 304867
Z M24 39 5945 1261212 0 0 0 0 0 1261212
Z M25 30 1421 581444 14393 0 0 0 0 595837
Z Manuf 2197 652880 197921 66 0 0 3 109 198099
Z E 0 0 0 0 0 0 0 0 0
Z T1 51 5067 2702998 77818 0 0 0 185 2781002
Z T2 153 16614 125516 159274 9 0 0 7236 292035
Z T3 2 97 2158227 0 0 0 0 7693 2165920
Z T4 115 17117 446033 660 0 0 0 687 447381
Z T5 2454 1200952 99128 413 0 0 0 54 99596
Z Trade 2775 1239847 115074 2862 0 0 0 161 118097
Z S1 48 1256 3383756 0 3177 0 0 688 3387620
Z S2 695 96407 543062 33 0 0 0 68 543163
Z S3 828 165796 441126 220 0 0 0 417 441763
Z S4 0 0 0 0 0 0 0 0 0
Z S5 2 17 3300000 0 0 0 0 0 3300000
Z S6 10 351 142368 0 0 0 0 2153 144522
Z S7 50 6629 407472 339 0 0 0 0 407811
Z S8 249 145509 41064 266 0 9384 1479 8 52202
Z S9 4 27 1811954 119899 0 0 0 0 1931853
Z S10 29 5812 3450168 0 0 0 0 3567 3453735
Z S11 89 14280 317959 0 0 0 0 55 318013
Z S12 184 27766 256076 13 34 0 0 370 256493
Z S13 165 17065 539758 1089 0 0 0 114 540961
Z S14 119 12538 362390 1073 0 0 557 1998 366018
Z S15 976 228195 56332 39229 877 0 0 13412 109851
Z Other 3448 721646 272825 12566 284 1892 308 4431 292306
Z METS 8420 2614374 179307 4842 79 522 86 1327 186163
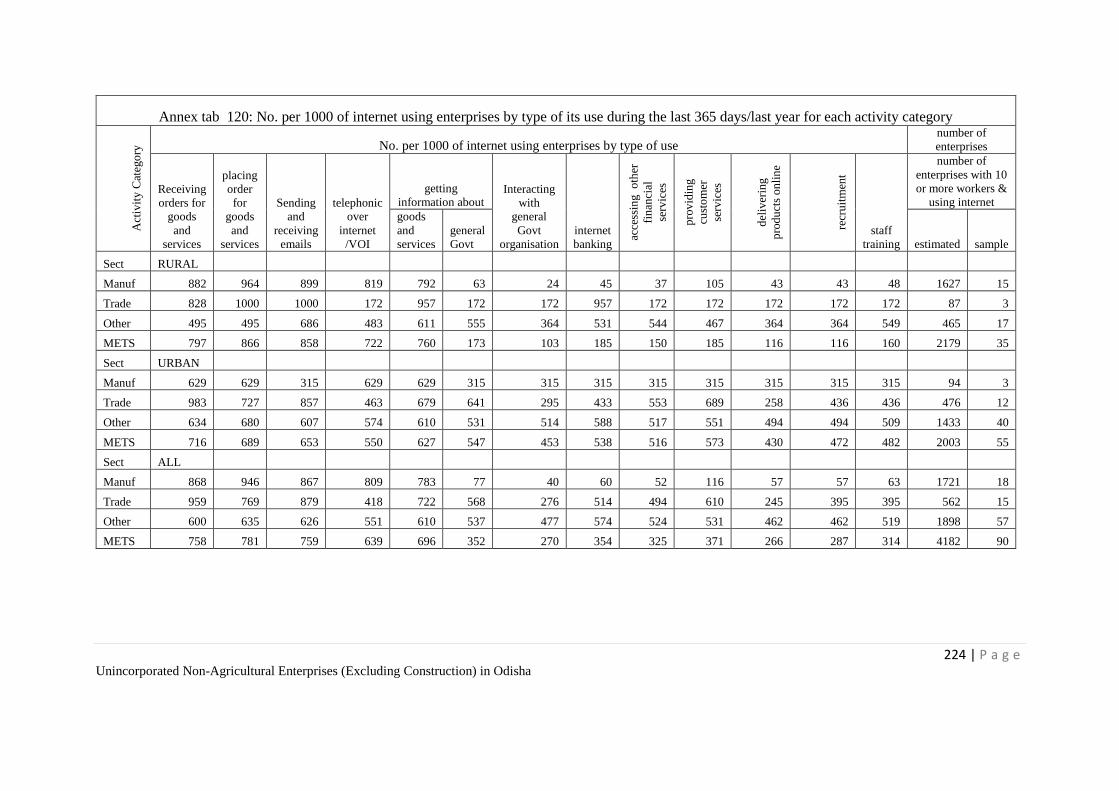
224 | P a g e Unincorporated Non-Agricultural Enterprises (Excluding Construction) in Odisha
Annex tab 120: No. per 1000 of internet using enterprises by type of its use during the last 365 days/last year for each activity category
Act
ivit
y C
ateg
ory
No. per 1000 of internet using enterprises by type of use number of
enterprises
Receiving
orders for
goods
and
services
placing
order
for
goods
and
services
Sending
and
receiving
emails
telephonic
over
internet
/VOI
getting
information about Interacting
with
general
Govt
organisation
internet
banking
acce
ssin
g o
ther
fin
anci
al
serv
ices
pro
vid
ing
cust
om
er
serv
ices
del
iver
ing
pro
du
cts
on
lin
e
recr
uit
men
t
staff
training
number of
enterprises with 10
or more workers &
using internet
goods
and
services
general
Govt estimated sample
Sect RURAL
Manuf 882 964 899 819 792 63 24 45 37 105 43 43 48 1627 15
Trade 828 1000 1000 172 957 172 172 957 172 172 172 172 172 87 3
Other 495 495 686 483 611 555 364 531 544 467 364 364 549 465 17
METS 797 866 858 722 760 173 103 185 150 185 116 116 160 2179 35
Sect URBAN
Manuf 629 629 315 629 629 315 315 315 315 315 315 315 315 94 3
Trade 983 727 857 463 679 641 295 433 553 689 258 436 436 476 12
Other 634 680 607 574 610 531 514 588 517 551 494 494 509 1433 40
METS 716 689 653 550 627 547 453 538 516 573 430 472 482 2003 55
Sect ALL
Manuf 868 946 867 809 783 77 40 60 52 116 57 57 63 1721 18
Trade 959 769 879 418 722 568 276 514 494 610 245 395 395 562 15
Other 600 635 626 551 610 537 477 574 524 531 462 462 519 1898 57
METS 758 781 759 639 696 352 270 354 325 371 266 287 314 4182 90
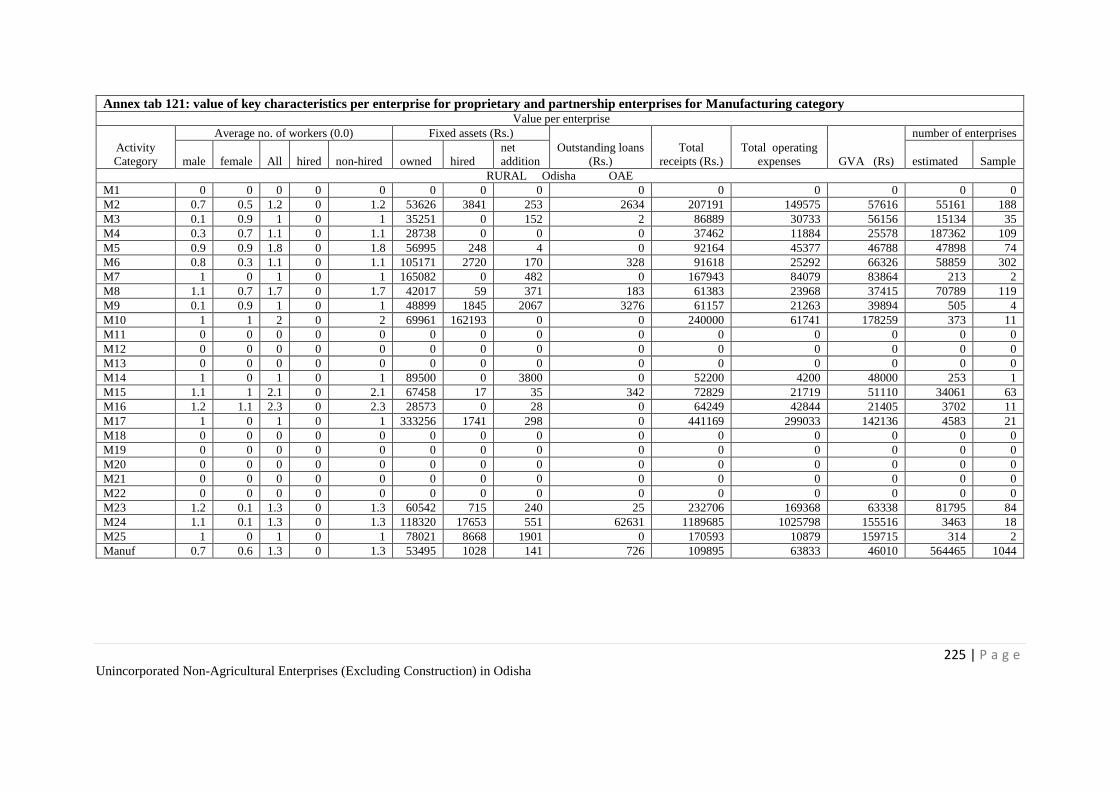
225 | P a g e Unincorporated Non-Agricultural Enterprises (Excluding Construction) in Odisha
Annex tab 121: value of key characteristics per enterprise for proprietary and partnership enterprises for Manufacturing category Value per enterprise
Activity
Category
Average no. of workers (0.0) Fixed assets (Rs.)
Outstanding loans
(Rs.)
Total
receipts (Rs.)
Total operating
expenses GVA (Rs)
number of enterprises
male female All hired non-hired owned hired
net
addition estimated Sample
RURAL Odisha OAE
M1 0 0 0 0 0 0 0 0 0 0 0 0 0 0
M2 0.7 0.5 1.2 0 1.2 53626 3841 253 2634 207191 149575 57616 55161 188
M3 0.1 0.9 1 0 1 35251 0 152 2 86889 30733 56156 15134 35
M4 0.3 0.7 1.1 0 1.1 28738 0 0 0 37462 11884 25578 187362 109
M5 0.9 0.9 1.8 0 1.8 56995 248 4 0 92164 45377 46788 47898 74
M6 0.8 0.3 1.1 0 1.1 105171 2720 170 328 91618 25292 66326 58859 302
M7 1 0 1 0 1 165082 0 482 0 167943 84079 83864 213 2
M8 1.1 0.7 1.7 0 1.7 42017 59 371 183 61383 23968 37415 70789 119
M9 0.1 0.9 1 0 1 48899 1845 2067 3276 61157 21263 39894 505 4
M10 1 1 2 0 2 69961 162193 0 0 240000 61741 178259 373 11
M11 0 0 0 0 0 0 0 0 0 0 0 0 0 0
M12 0 0 0 0 0 0 0 0 0 0 0 0 0 0
M13 0 0 0 0 0 0 0 0 0 0 0 0 0 0
M14 1 0 1 0 1 89500 0 3800 0 52200 4200 48000 253 1
M15 1.1 1 2.1 0 2.1 67458 17 35 342 72829 21719 51110 34061 63
M16 1.2 1.1 2.3 0 2.3 28573 0 28 0 64249 42844 21405 3702 11
M17 1 0 1 0 1 333256 1741 298 0 441169 299033 142136 4583 21
M18 0 0 0 0 0 0 0 0 0 0 0 0 0 0
M19 0 0 0 0 0 0 0 0 0 0 0 0 0 0
M20 0 0 0 0 0 0 0 0 0 0 0 0 0 0
M21 0 0 0 0 0 0 0 0 0 0 0 0 0 0
M22 0 0 0 0 0 0 0 0 0 0 0 0 0 0
M23 1.2 0.1 1.3 0 1.3 60542 715 240 25 232706 169368 63338 81795 84
M24 1.1 0.1 1.3 0 1.3 118320 17653 551 62631 1189685 1025798 155516 3463 18
M25 1 0 1 0 1 78021 8668 1901 0 170593 10879 159715 314 2
Manuf 0.7 0.6 1.3 0 1.3 53495 1028 141 726 109895 63833 46010 564465 1044
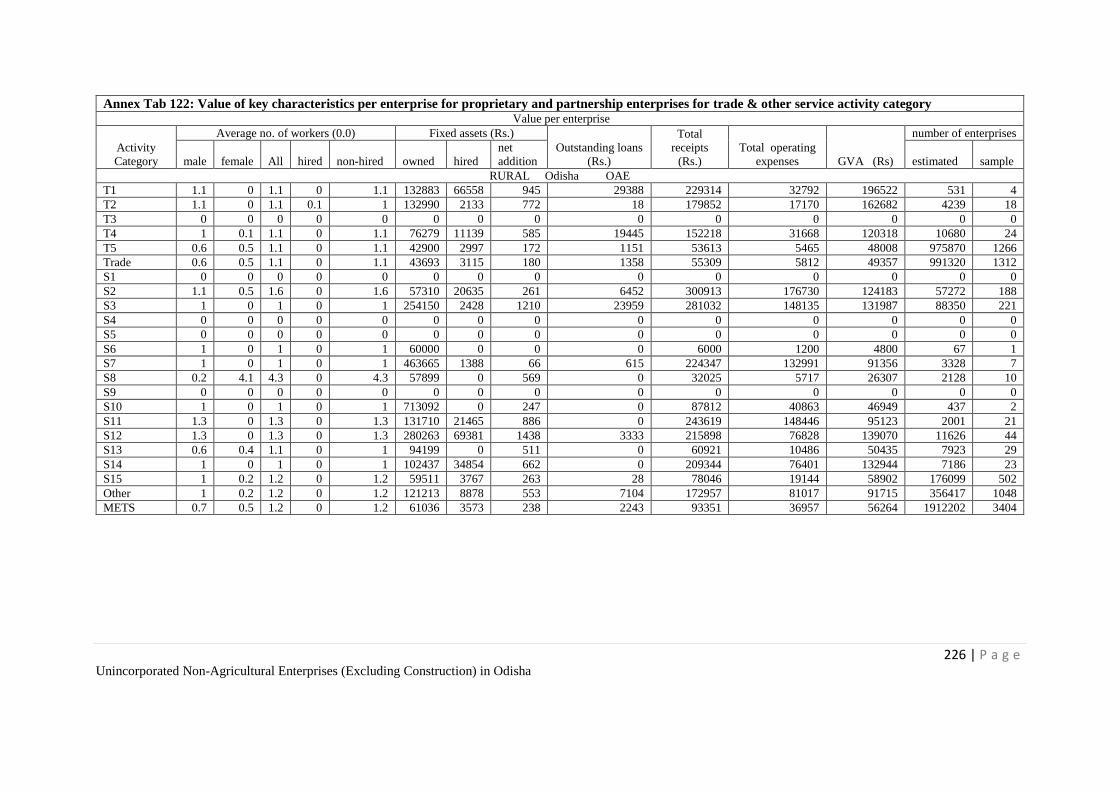
226 | P a g e Unincorporated Non-Agricultural Enterprises (Excluding Construction) in Odisha
Annex Tab 122: Value of key characteristics per enterprise for proprietary and partnership enterprises for trade & other service activity category Value per enterprise
Activity
Category
Average no. of workers (0.0) Fixed assets (Rs.)
Outstanding loans
(Rs.)
Total
receipts
(Rs.)
Total operating
expenses GVA (Rs)
number of enterprises
male female All hired non-hired owned hired
net
addition estimated sample
RURAL Odisha OAE
T1 1.1 0 1.1 0 1.1 132883 66558 945 29388 229314 32792 196522 531 4
T2 1.1 0 1.1 0.1 1 132990 2133 772 18 179852 17170 162682 4239 18
T3 0 0 0 0 0 0 0 0 0 0 0 0 0 0
T4 1 0.1 1.1 0 1.1 76279 11139 585 19445 152218 31668 120318 10680 24
T5 0.6 0.5 1.1 0 1.1 42900 2997 172 1151 53613 5465 48008 975870 1266
Trade 0.6 0.5 1.1 0 1.1 43693 3115 180 1358 55309 5812 49357 991320 1312
S1 0 0 0 0 0 0 0 0 0 0 0 0 0 0
S2 1.1 0.5 1.6 0 1.6 57310 20635 261 6452 300913 176730 124183 57272 188
S3 1 0 1 0 1 254150 2428 1210 23959 281032 148135 131987 88350 221
S4 0 0 0 0 0 0 0 0 0 0 0 0 0 0
S5 0 0 0 0 0 0 0 0 0 0 0 0 0 0
S6 1 0 1 0 1 60000 0 0 0 6000 1200 4800 67 1
S7 1 0 1 0 1 463665 1388 66 615 224347 132991 91356 3328 7
S8 0.2 4.1 4.3 0 4.3 57899 0 569 0 32025 5717 26307 2128 10
S9 0 0 0 0 0 0 0 0 0 0 0 0 0 0
S10 1 0 1 0 1 713092 0 247 0 87812 40863 46949 437 2
S11 1.3 0 1.3 0 1.3 131710 21465 886 0 243619 148446 95123 2001 21
S12 1.3 0 1.3 0 1.3 280263 69381 1438 3333 215898 76828 139070 11626 44
S13 0.6 0.4 1.1 0 1 94199 0 511 0 60921 10486 50435 7923 29
S14 1 0 1 0 1 102437 34854 662 0 209344 76401 132944 7186 23
S15 1 0.2 1.2 0 1.2 59511 3767 263 28 78046 19144 58902 176099 502
Other 1 0.2 1.2 0 1.2 121213 8878 553 7104 172957 81017 91715 356417 1048
METS 0.7 0.5 1.2 0 1.2 61036 3573 238 2243 93351 36957 56264 1912202 3404
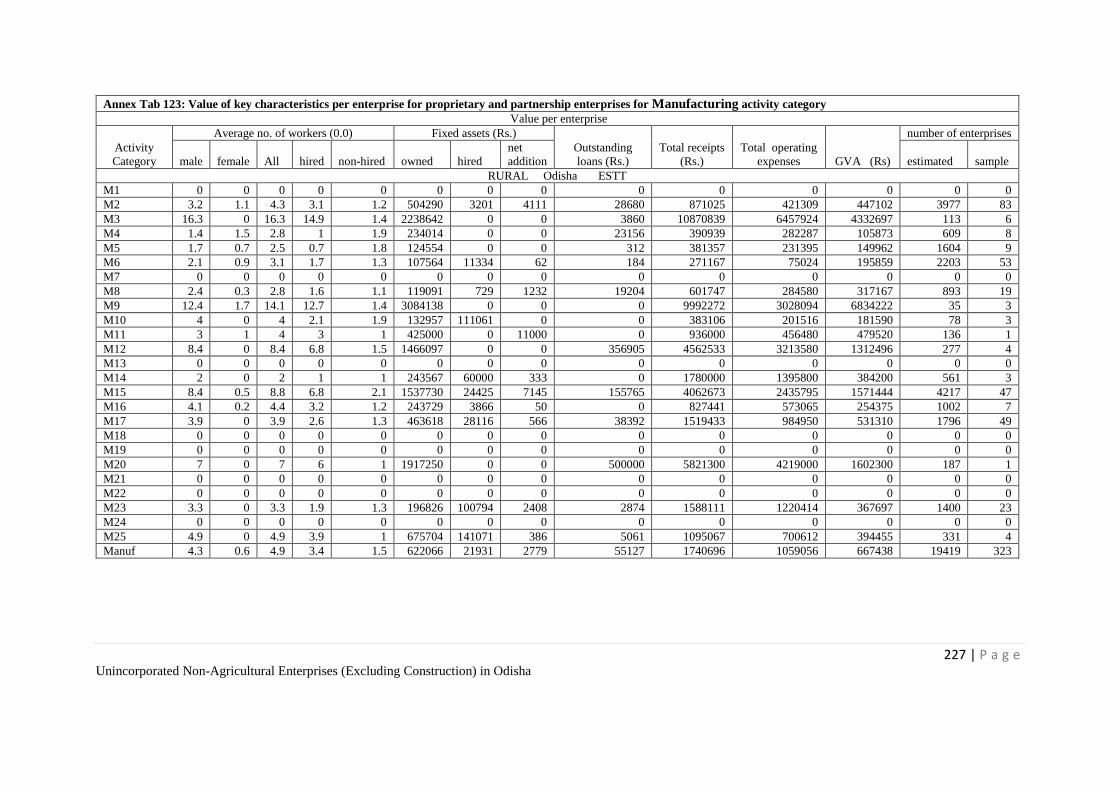
227 | P a g e Unincorporated Non-Agricultural Enterprises (Excluding Construction) in Odisha
Annex Tab 123: Value of key characteristics per enterprise for proprietary and partnership enterprises for Manufacturing activity category
Value per enterprise
Activity
Category
Average no. of workers (0.0) Fixed assets (Rs.)
Outstanding
loans (Rs.)
Total receipts
(Rs.)
Total operating
expenses GVA (Rs)
number of enterprises
male female All hired non-hired owned hired
net
addition estimated sample
RURAL Odisha ESTT
M1 0 0 0 0 0 0 0 0 0 0 0 0 0 0
M2 3.2 1.1 4.3 3.1 1.2 504290 3201 4111 28680 871025 421309 447102 3977 83
M3 16.3 0 16.3 14.9 1.4 2238642 0 0 3860 10870839 6457924 4332697 113 6
M4 1.4 1.5 2.8 1 1.9 234014 0 0 23156 390939 282287 105873 609 8
M5 1.7 0.7 2.5 0.7 1.8 124554 0 0 312 381357 231395 149962 1604 9
M6 2.1 0.9 3.1 1.7 1.3 107564 11334 62 184 271167 75024 195859 2203 53
M7 0 0 0 0 0 0 0 0 0 0 0 0 0 0
M8 2.4 0.3 2.8 1.6 1.1 119091 729 1232 19204 601747 284580 317167 893 19
M9 12.4 1.7 14.1 12.7 1.4 3084138 0 0 0 9992272 3028094 6834222 35 3
M10 4 0 4 2.1 1.9 132957 111061 0 0 383106 201516 181590 78 3
M11 3 1 4 3 1 425000 0 11000 0 936000 456480 479520 136 1
M12 8.4 0 8.4 6.8 1.5 1466097 0 0 356905 4562533 3213580 1312496 277 4
M13 0 0 0 0 0 0 0 0 0 0 0 0 0 0
M14 2 0 2 1 1 243567 60000 333 0 1780000 1395800 384200 561 3
M15 8.4 0.5 8.8 6.8 2.1 1537730 24425 7145 155765 4062673 2435795 1571444 4217 47
M16 4.1 0.2 4.4 3.2 1.2 243729 3866 50 0 827441 573065 254375 1002 7
M17 3.9 0 3.9 2.6 1.3 463618 28116 566 38392 1519433 984950 531310 1796 49
M18 0 0 0 0 0 0 0 0 0 0 0 0 0 0
M19 0 0 0 0 0 0 0 0 0 0 0 0 0 0
M20 7 0 7 6 1 1917250 0 0 500000 5821300 4219000 1602300 187 1
M21 0 0 0 0 0 0 0 0 0 0 0 0 0 0
M22 0 0 0 0 0 0 0 0 0 0 0 0 0 0
M23 3.3 0 3.3 1.9 1.3 196826 100794 2408 2874 1588111 1220414 367697 1400 23
M24 0 0 0 0 0 0 0 0 0 0 0 0 0 0
M25 4.9 0 4.9 3.9 1 675704 141071 386 5061 1095067 700612 394455 331 4
Manuf 4.3 0.6 4.9 3.4 1.5 622066 21931 2779 55127 1740696 1059056 667438 19419 323
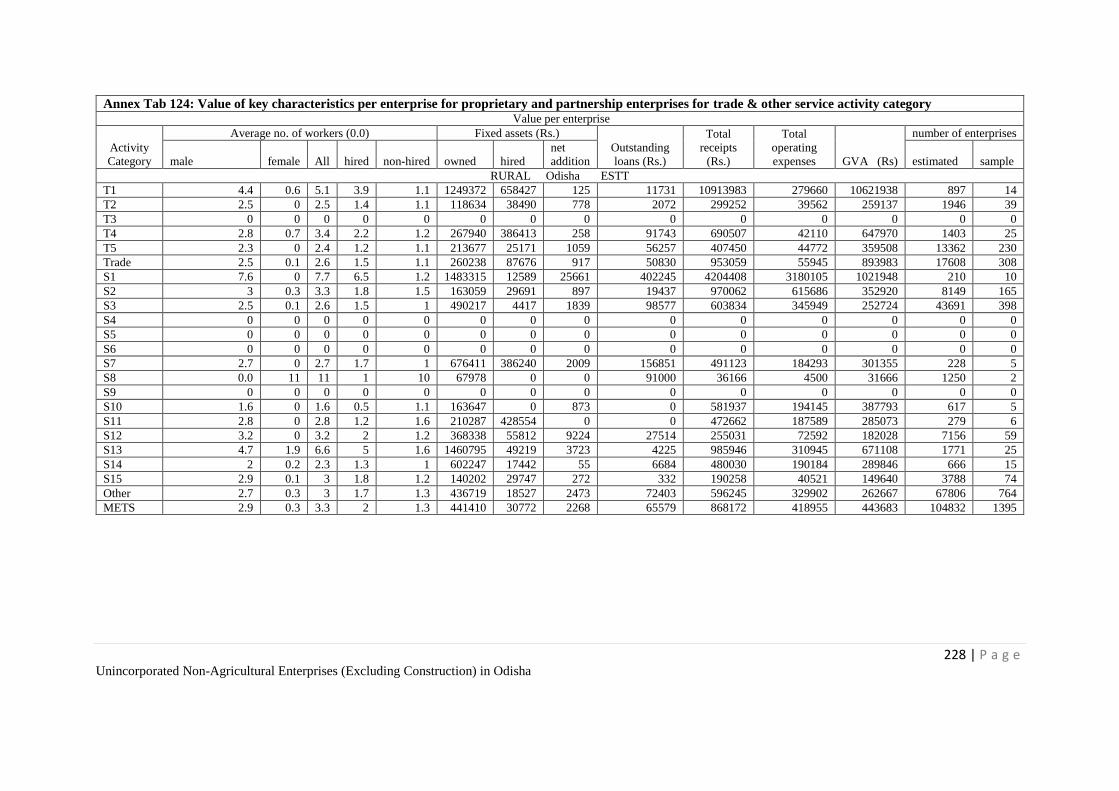
228 | P a g e Unincorporated Non-Agricultural Enterprises (Excluding Construction) in Odisha
Annex Tab 124: Value of key characteristics per enterprise for proprietary and partnership enterprises for trade & other service activity category Value per enterprise
Activity
Category
Average no. of workers (0.0) Fixed assets (Rs.)
Outstanding
loans (Rs.)
Total
receipts
(Rs.)
Total
operating
expenses GVA (Rs)
number of enterprises
male female All hired non-hired owned hired
net
addition estimated sample
RURAL Odisha ESTT
T1 4.4 0.6 5.1 3.9 1.1 1249372 658427 125 11731 10913983 279660 10621938 897 14
T2 2.5 0 2.5 1.4 1.1 118634 38490 778 2072 299252 39562 259137 1946 39
T3 0 0 0 0 0 0 0 0 0 0 0 0 0 0
T4 2.8 0.7 3.4 2.2 1.2 267940 386413 258 91743 690507 42110 647970 1403 25
T5 2.3 0 2.4 1.2 1.1 213677 25171 1059 56257 407450 44772 359508 13362 230
Trade 2.5 0.1 2.6 1.5 1.1 260238 87676 917 50830 953059 55945 893983 17608 308
S1 7.6 0 7.7 6.5 1.2 1483315 12589 25661 402245 4204408 3180105 1021948 210 10
S2 3 0.3 3.3 1.8 1.5 163059 29691 897 19437 970062 615686 352920 8149 165
S3 2.5 0.1 2.6 1.5 1 490217 4417 1839 98577 603834 345949 252724 43691 398
S4 0 0 0 0 0 0 0 0 0 0 0 0 0 0
S5 0 0 0 0 0 0 0 0 0 0 0 0 0 0
S6 0 0 0 0 0 0 0 0 0 0 0 0 0 0
S7 2.7 0 2.7 1.7 1 676411 386240 2009 156851 491123 184293 301355 228 5
S8 0.0 11 11 1 10 67978 0 0 91000 36166 4500 31666 1250 2
S9 0 0 0 0 0 0 0 0 0 0 0 0 0 0
S10 1.6 0 1.6 0.5 1.1 163647 0 873 0 581937 194145 387793 617 5
S11 2.8 0 2.8 1.2 1.6 210287 428554 0 0 472662 187589 285073 279 6
S12 3.2 0 3.2 2 1.2 368338 55812 9224 27514 255031 72592 182028 7156 59
S13 4.7 1.9 6.6 5 1.6 1460795 49219 3723 4225 985946 310945 671108 1771 25
S14 2 0.2 2.3 1.3 1 602247 17442 55 6684 480030 190184 289846 666 15
S15 2.9 0.1 3 1.8 1.2 140202 29747 272 332 190258 40521 149640 3788 74
Other 2.7 0.3 3 1.7 1.3 436719 18527 2473 72403 596245 329902 262667 67806 764
METS 2.9 0.3 3.3 2 1.3 441410 30772 2268 65579 868172 418955 443683 104832 1395
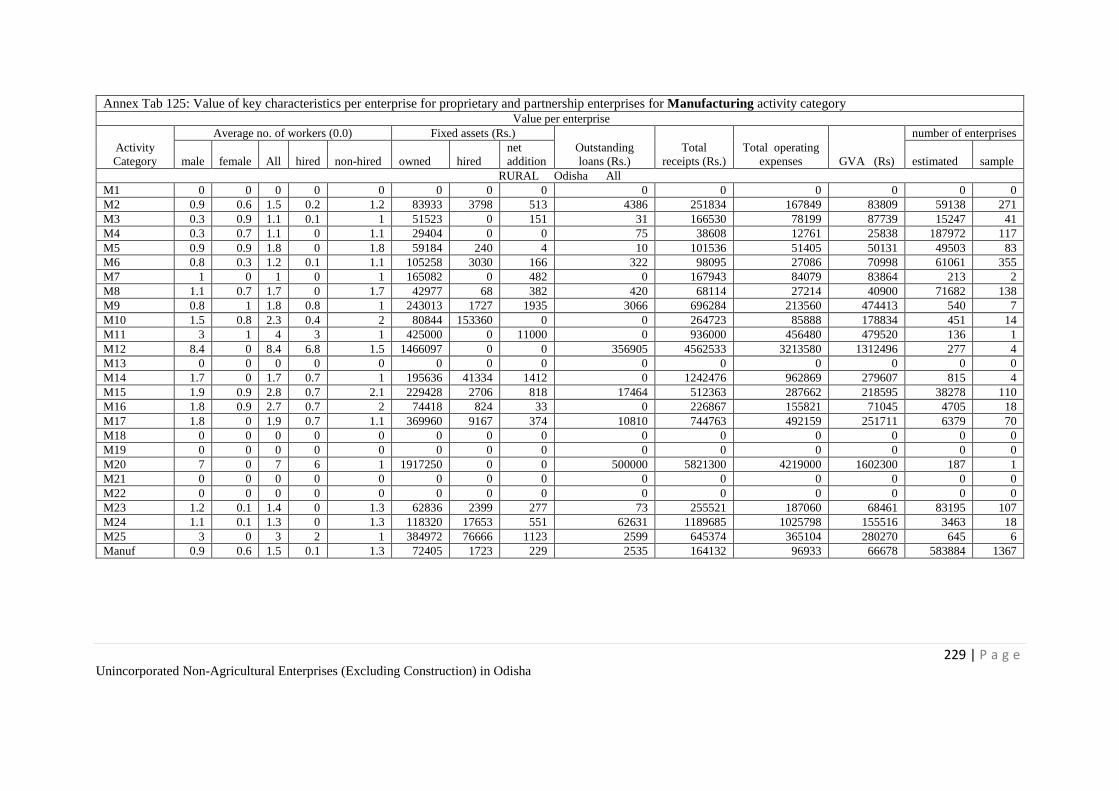
229 | P a g e Unincorporated Non-Agricultural Enterprises (Excluding Construction) in Odisha
Annex Tab 125: Value of key characteristics per enterprise for proprietary and partnership enterprises for Manufacturing activity category Value per enterprise
Activity
Category
Average no. of workers (0.0) Fixed assets (Rs.)
Outstanding
loans (Rs.)
Total
receipts (Rs.)
Total operating
expenses GVA (Rs)
number of enterprises
male female All hired non-hired owned hired
net
addition estimated sample
RURAL Odisha All
M1 0 0 0 0 0 0 0 0 0 0 0 0 0 0
M2 0.9 0.6 1.5 0.2 1.2 83933 3798 513 4386 251834 167849 83809 59138 271
M3 0.3 0.9 1.1 0.1 1 51523 0 151 31 166530 78199 87739 15247 41
M4 0.3 0.7 1.1 0 1.1 29404 0 0 75 38608 12761 25838 187972 117
M5 0.9 0.9 1.8 0 1.8 59184 240 4 10 101536 51405 50131 49503 83
M6 0.8 0.3 1.2 0.1 1.1 105258 3030 166 322 98095 27086 70998 61061 355
M7 1 0 1 0 1 165082 0 482 0 167943 84079 83864 213 2
M8 1.1 0.7 1.7 0 1.7 42977 68 382 420 68114 27214 40900 71682 138
M9 0.8 1 1.8 0.8 1 243013 1727 1935 3066 696284 213560 474413 540 7
M10 1.5 0.8 2.3 0.4 2 80844 153360 0 0 264723 85888 178834 451 14
M11 3 1 4 3 1 425000 0 11000 0 936000 456480 479520 136 1
M12 8.4 0 8.4 6.8 1.5 1466097 0 0 356905 4562533 3213580 1312496 277 4
M13 0 0 0 0 0 0 0 0 0 0 0 0 0 0
M14 1.7 0 1.7 0.7 1 195636 41334 1412 0 1242476 962869 279607 815 4
M15 1.9 0.9 2.8 0.7 2.1 229428 2706 818 17464 512363 287662 218595 38278 110
M16 1.8 0.9 2.7 0.7 2 74418 824 33 0 226867 155821 71045 4705 18
M17 1.8 0 1.9 0.7 1.1 369960 9167 374 10810 744763 492159 251711 6379 70
M18 0 0 0 0 0 0 0 0 0 0 0 0 0 0
M19 0 0 0 0 0 0 0 0 0 0 0 0 0 0
M20 7 0 7 6 1 1917250 0 0 500000 5821300 4219000 1602300 187 1
M21 0 0 0 0 0 0 0 0 0 0 0 0 0 0
M22 0 0 0 0 0 0 0 0 0 0 0 0 0 0
M23 1.2 0.1 1.4 0 1.3 62836 2399 277 73 255521 187060 68461 83195 107
M24 1.1 0.1 1.3 0 1.3 118320 17653 551 62631 1189685 1025798 155516 3463 18
M25 3 0 3 2 1 384972 76666 1123 2599 645374 365104 280270 645 6
Manuf 0.9 0.6 1.5 0.1 1.3 72405 1723 229 2535 164132 96933 66678 583884 1367

230 | P a g e Unincorporated Non-Agricultural Enterprises (Excluding Construction) in Odisha
Annex Tab 126: Value of key characteristics per enterprise for proprietary and partnership enterprises for trade & other service activity category Value per enterprise
Activity
Category
Average no. of workers (0.0) Fixed assets (Rs.)
Outstanding
loans (Rs.)
Total
receipts (Rs.)
Total operating
expenses GVA (Rs)
number of enterprises
male female All hired non-hired owned hired
net
addition estimated sample
RURAL Odisha All
T1 3.2 0.4 3.6 2.5 1.1 834219 438348 430 18296 6941018 187865 6745373 1427 18
T2 1.5 0 1.5 0.5 1 128474 13571 774 664 217415 24215 193026 6185 57
T3 0 0 0 0 0 0 0 0 0 0 0 0 0 0
T4 1.2 0.2 1.4 0.3 1.1 98536 54717 547 27841 214726 32881 181591 12083 49
T5 0.6 0.5 1.1 0 1.1 45207 3297 184 1895 58392 5996 52216 989233 1496
Trade 0.6 0.5 1.1 0 1.1 47472 4591 192 2221 70976 6687 64098 1008928 1620
S1 7.6 0 7.7 6.5 1.2 1483315 12589 25661 402245 4204408 3180105 1021948 210 10
S2 1.4 0.5 1.8 0.2 1.6 70482 21763 340 8069 384261 231405 152674 65421 353
S3 1.5 0 1.5 0.5 1 332262 3086 1418 48649 387843 213589 171937 132041 619
S4 0 0 0 0 0 0 0 0 0 0 0 0 0 0
S5 0 0 0 0 0 0 0 0 0 0 0 0 0 0
S6 1 0 1 0 1 60000 0 0 0 6000 1200 4800 67 1
S7 1.1 0 1.1 0.1 1 477311 26075 191 10637 241460 136282 104826 3556 12
S8 0.1 6.7 6.8 0.4 6.4 61630 0 358 33686 33558 5267 28291 3378 12
S9 0 0 0 0 0 0 0 0 0 0 0 0 0 0
S10 1.4 0 1.4 0.3 1.1 391336 0 614 0 377173 130625 246548 1054 7
S11 1.5 0 1.5 0.1 1.3 141336 71336 778 0 271678 153242 118393 2280 27
S12 2 0 2 0.8 1.3 313820 64211 4405 12546 230808 75214 155437 18782 103
S13 1.4 0.7 2.1 0.9 1.1 343839 8991 1098 772 229898 65372 163815 9694 54
S14 1.1 0.1 1.1 0.1 1 144856 33377 611 567 232317 86057 146260 7852 38
S15 1 0.2 1.2 0 1.2 61210 4314 263 34 80409 19594 60813 179887 576
Other 1.3 0.2 1.5 0.3 1.2 171642 10421 860 17541 240613 120797 119039 424223 1812
METS 0.8 0.5 1.3 0.1 1.2 80805 4987 343 5534 133621 56811 76400 2017035 4799
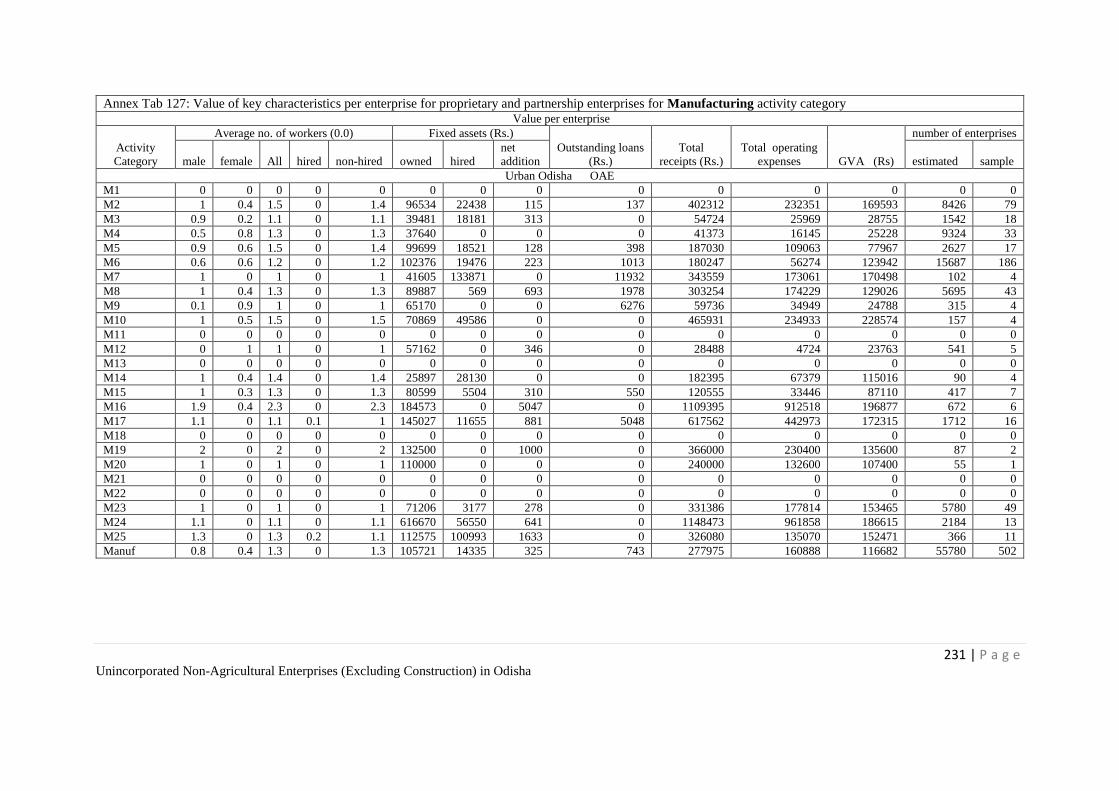
231 | P a g e Unincorporated Non-Agricultural Enterprises (Excluding Construction) in Odisha
Annex Tab 127: Value of key characteristics per enterprise for proprietary and partnership enterprises for Manufacturing activity category Value per enterprise
Activity
Category
Average no. of workers (0.0) Fixed assets (Rs.)
Outstanding loans
(Rs.)
Total
receipts (Rs.)
Total operating
expenses GVA (Rs)
number of enterprises
male female All hired non-hired owned hired
net
addition estimated sample
Urban Odisha OAE
M1 0 0 0 0 0 0 0 0 0 0 0 0 0 0
M2 1 0.4 1.5 0 1.4 96534 22438 115 137 402312 232351 169593 8426 79
M3 0.9 0.2 1.1 0 1.1 39481 18181 313 0 54724 25969 28755 1542 18
M4 0.5 0.8 1.3 0 1.3 37640 0 0 0 41373 16145 25228 9324 33
M5 0.9 0.6 1.5 0 1.4 99699 18521 128 398 187030 109063 77967 2627 17
M6 0.6 0.6 1.2 0 1.2 102376 19476 223 1013 180247 56274 123942 15687 186
M7 1 0 1 0 1 41605 133871 0 11932 343559 173061 170498 102 4
M8 1 0.4 1.3 0 1.3 89887 569 693 1978 303254 174229 129026 5695 43
M9 0.1 0.9 1 0 1 65170 0 0 6276 59736 34949 24788 315 4
M10 1 0.5 1.5 0 1.5 70869 49586 0 0 465931 234933 228574 157 4
M11 0 0 0 0 0 0 0 0 0 0 0 0 0 0
M12 0 1 1 0 1 57162 0 346 0 28488 4724 23763 541 5
M13 0 0 0 0 0 0 0 0 0 0 0 0 0 0
M14 1 0.4 1.4 0 1.4 25897 28130 0 0 182395 67379 115016 90 4
M15 1 0.3 1.3 0 1.3 80599 5504 310 550 120555 33446 87110 417 7
M16 1.9 0.4 2.3 0 2.3 184573 0 5047 0 1109395 912518 196877 672 6
M17 1.1 0 1.1 0.1 1 145027 11655 881 5048 617562 442973 172315 1712 16
M18 0 0 0 0 0 0 0 0 0 0 0 0 0 0
M19 2 0 2 0 2 132500 0 1000 0 366000 230400 135600 87 2
M20 1 0 1 0 1 110000 0 0 0 240000 132600 107400 55 1
M21 0 0 0 0 0 0 0 0 0 0 0 0 0 0
M22 0 0 0 0 0 0 0 0 0 0 0 0 0 0
M23 1 0 1 0 1 71206 3177 278 0 331386 177814 153465 5780 49
M24 1.1 0 1.1 0 1.1 616670 56550 641 0 1148473 961858 186615 2184 13
M25 1.3 0 1.3 0.2 1.1 112575 100993 1633 0 326080 135070 152471 366 11
Manuf 0.8 0.4 1.3 0 1.3 105721 14335 325 743 277975 160888 116682 55780 502

232 | P a g e Unincorporated Non-Agricultural Enterprises (Excluding Construction) in Odisha
Annex Tab 128: Value of key characteristics per enterprise for proprietary and partnership enterprises for trade & other service activity category Value per enterprise
Activity
Category
Average no. of workers (0.0) Fixed assets (Rs.)
Outstanding loans
(Rs.)
Total
receipts
(Rs.)
Total operating
expenses GVA (Rs)
number of enterprises
male female All hired non-hired owned hired
net
addition estimated sample
Urban Odisha OAE
T1 1.9 0 1.9 0 1.9 200793 0 0 2683 197765 11750 186014 2130 4
T2 1.2 0 1.2 0 1.2 77950 37437 305 1788 290647 17747 272815 3252 17
T3 0 0 0 0 0 0 0 0 0 0 0 0 0 0
T4 1 0 1 0 1 58669 72967 84 38732 181584 9186 172398 2759 10
T5 1 0.1 1.1 0 1.1 130584 48788 199 6304 212609 15223 196704 187544 670
Trade 1 0.1 1.1 0 1.1 129459 48409 197 6647 213306 15142 197510 195685 701
S1 1 0 1 0 1 189108 0 528 0 168951 85763 82301 206 2
S2 1 0.2 1.2 0 1.2 40231 17854 151 1819 414968 249728 164811 22704 157
S3 1 0 1 0 1 178229 1649 137 8884 425437 195311 228265 28903 116
S4 0 0 0 0 0 0 0 0 0 0 0 0 0 0
S5 0 0 0 0 0 0 0 0 0 0 0 0 0 0
S6 1 0 1 0 1 70223 78999 0 0 105897 35053 70844 176 4
S7 1.1 0 1.1 0 1 734559 25953 4690 0 316191 114882 201309 1834 14
S8 0.7 4.2 4.8 0.5 4.3 108575 0 0 83254 537764 3210 534554 157 2
S9 0 0 0 0 0 0 0 0 0 0 0 0 0 0
S10 1 0 1 0 1 586049 0 13016 0 568004 357914 210090 4243 17
S11 1 0 1 0 1 387589 10800 324 0 292073 74160 217893 11488 45
S12 1.3 0 1.3 0.1 1.2 304525 70530 792 37427 213130 78751 127828 7399 35
S13 0.8 0.2 1 0 1 233481 75630 349 0 156445 23043 133403 5579 41
S14 1.3 0.1 1.4 0 1.3 134743 48961 1445 0 279550 88469 191000 3149 27
S15 1 0.1 1.1 0 1.1 66139 19938 254 696 148808 31314 117455 39723 281
Other 1 0.1 1.1 0 1.1 167464 20138 776 4904 298199 128657 168632 125560 741
METS 1 0.1 1.1 0 1.1 138604 33953 409 5193 251146 74509 175935 377026 1944
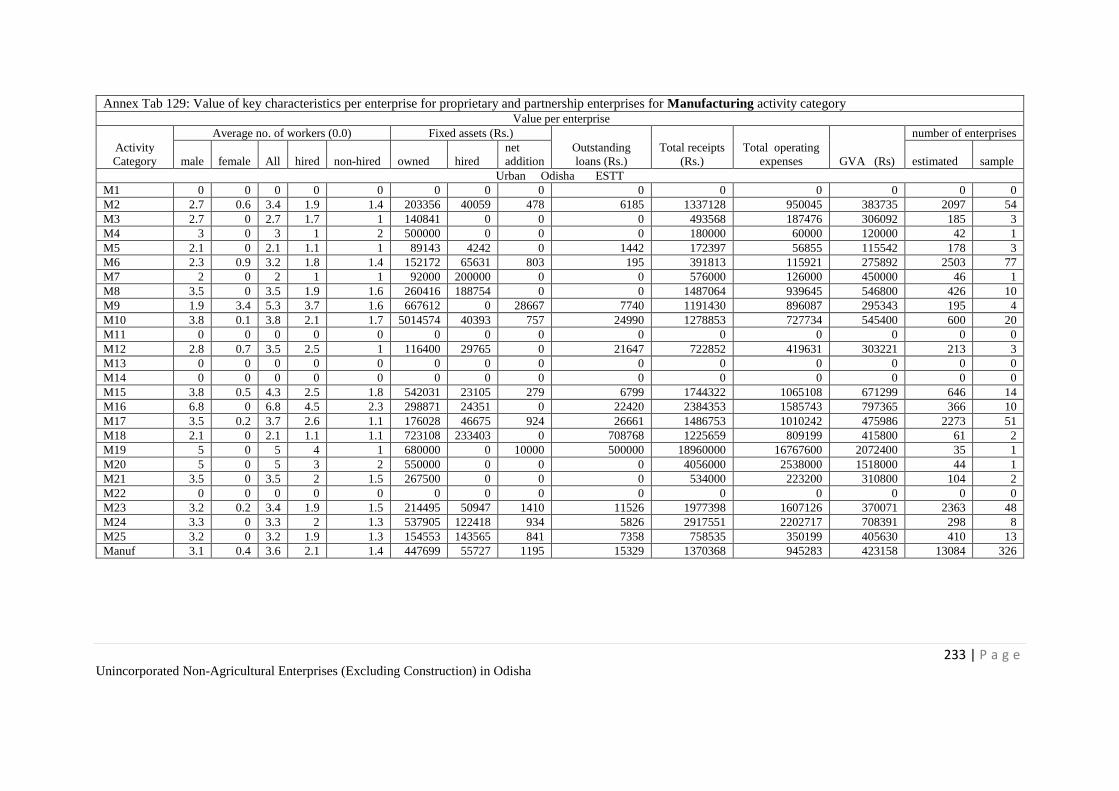
233 | P a g e Unincorporated Non-Agricultural Enterprises (Excluding Construction) in Odisha
Annex Tab 129: Value of key characteristics per enterprise for proprietary and partnership enterprises for Manufacturing activity category Value per enterprise
Activity
Category
Average no. of workers (0.0) Fixed assets (Rs.)
Outstanding
loans (Rs.)
Total receipts
(Rs.)
Total operating
expenses GVA (Rs)
number of enterprises
male female All hired non-hired owned hired
net
addition estimated sample
Urban Odisha ESTT
M1 0 0 0 0 0 0 0 0 0 0 0 0 0 0
M2 2.7 0.6 3.4 1.9 1.4 203356 40059 478 6185 1337128 950045 383735 2097 54
M3 2.7 0 2.7 1.7 1 140841 0 0 0 493568 187476 306092 185 3
M4 3 0 3 1 2 500000 0 0 0 180000 60000 120000 42 1
M5 2.1 0 2.1 1.1 1 89143 4242 0 1442 172397 56855 115542 178 3
M6 2.3 0.9 3.2 1.8 1.4 152172 65631 803 195 391813 115921 275892 2503 77
M7 2 0 2 1 1 92000 200000 0 0 576000 126000 450000 46 1
M8 3.5 0 3.5 1.9 1.6 260416 188754 0 0 1487064 939645 546800 426 10
M9 1.9 3.4 5.3 3.7 1.6 667612 0 28667 7740 1191430 896087 295343 195 4
M10 3.8 0.1 3.8 2.1 1.7 5014574 40393 757 24990 1278853 727734 545400 600 20
M11 0 0 0 0 0 0 0 0 0 0 0 0 0 0
M12 2.8 0.7 3.5 2.5 1 116400 29765 0 21647 722852 419631 303221 213 3
M13 0 0 0 0 0 0 0 0 0 0 0 0 0 0
M14 0 0 0 0 0 0 0 0 0 0 0 0 0 0
M15 3.8 0.5 4.3 2.5 1.8 542031 23105 279 6799 1744322 1065108 671299 646 14
M16 6.8 0 6.8 4.5 2.3 298871 24351 0 22420 2384353 1585743 797365 366 10
M17 3.5 0.2 3.7 2.6 1.1 176028 46675 924 26661 1486753 1010242 475986 2273 51
M18 2.1 0 2.1 1.1 1.1 723108 233403 0 708768 1225659 809199 415800 61 2
M19 5 0 5 4 1 680000 0 10000 500000 18960000 16767600 2072400 35 1
M20 5 0 5 3 2 550000 0 0 0 4056000 2538000 1518000 44 1
M21 3.5 0 3.5 2 1.5 267500 0 0 0 534000 223200 310800 104 2
M22 0 0 0 0 0 0 0 0 0 0 0 0 0 0
M23 3.2 0.2 3.4 1.9 1.5 214495 50947 1410 11526 1977398 1607126 370071 2363 48
M24 3.3 0 3.3 2 1.3 537905 122418 934 5826 2917551 2202717 708391 298 8
M25 3.2 0 3.2 1.9 1.3 154553 143565 841 7358 758535 350199 405630 410 13
Manuf 3.1 0.4 3.6 2.1 1.4 447699 55727 1195 15329 1370368 945283 423158 13084 326
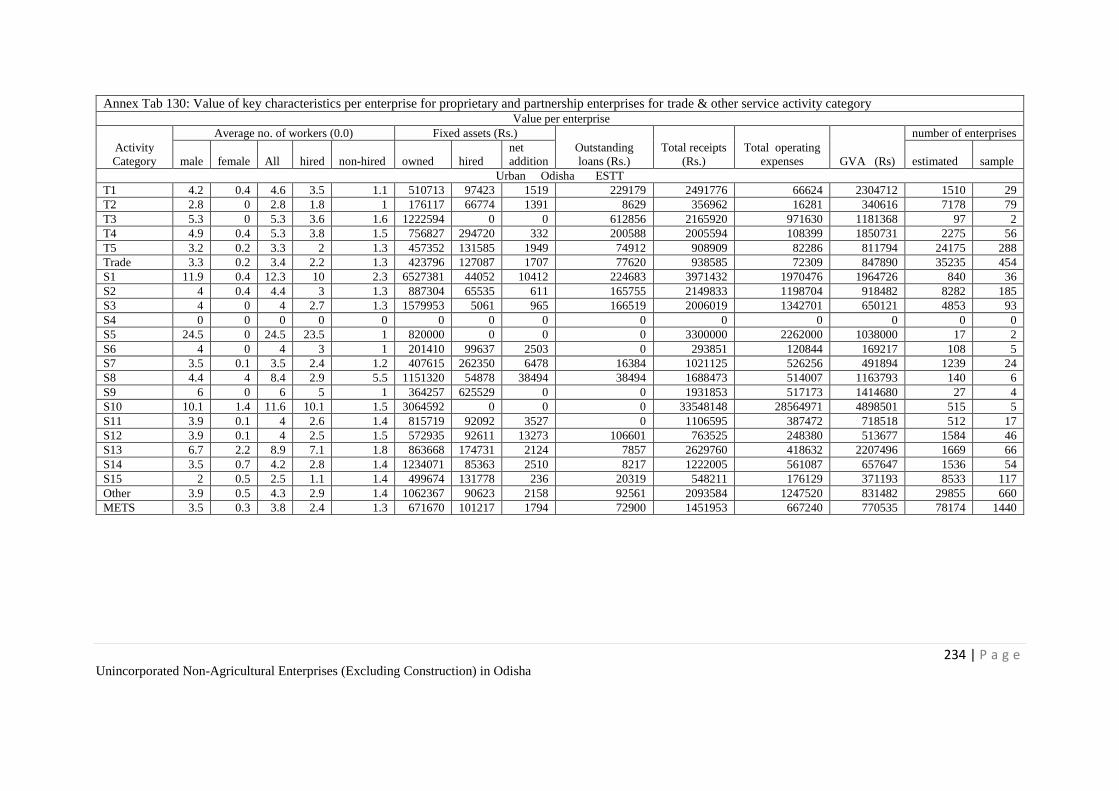
234 | P a g e Unincorporated Non-Agricultural Enterprises (Excluding Construction) in Odisha
Annex Tab 130: Value of key characteristics per enterprise for proprietary and partnership enterprises for trade & other service activity category Value per enterprise
Activity
Category
Average no. of workers (0.0) Fixed assets (Rs.)
Outstanding
loans (Rs.)
Total receipts
(Rs.)
Total operating
expenses GVA (Rs)
number of enterprises
male female All hired non-hired owned hired
net
addition estimated sample
Urban Odisha ESTT
T1 4.2 0.4 4.6 3.5 1.1 510713 97423 1519 229179 2491776 66624 2304712 1510 29
T2 2.8 0 2.8 1.8 1 176117 66774 1391 8629 356962 16281 340616 7178 79
T3 5.3 0 5.3 3.6 1.6 1222594 0 0 612856 2165920 971630 1181368 97 2
T4 4.9 0.4 5.3 3.8 1.5 756827 294720 332 200588 2005594 108399 1850731 2275 56
T5 3.2 0.2 3.3 2 1.3 457352 131585 1949 74912 908909 82286 811794 24175 288
Trade 3.3 0.2 3.4 2.2 1.3 423796 127087 1707 77620 938585 72309 847890 35235 454
S1 11.9 0.4 12.3 10 2.3 6527381 44052 10412 224683 3971432 1970476 1964726 840 36
S2 4 0.4 4.4 3 1.3 887304 65535 611 165755 2149833 1198704 918482 8282 185
S3 4 0 4 2.7 1.3 1579953 5061 965 166519 2006019 1342701 650121 4853 93
S4 0 0 0 0 0 0 0 0 0 0 0 0 0 0
S5 24.5 0 24.5 23.5 1 820000 0 0 0 3300000 2262000 1038000 17 2
S6 4 0 4 3 1 201410 99637 2503 0 293851 120844 169217 108 5
S7 3.5 0.1 3.5 2.4 1.2 407615 262350 6478 16384 1021125 526256 491894 1239 24
S8 4.4 4 8.4 2.9 5.5 1151320 54878 38494 38494 1688473 514007 1163793 140 6
S9 6 0 6 5 1 364257 625529 0 0 1931853 517173 1414680 27 4
S10 10.1 1.4 11.6 10.1 1.5 3064592 0 0 0 33548148 28564971 4898501 515 5
S11 3.9 0.1 4 2.6 1.4 815719 92092 3527 0 1106595 387472 718518 512 17
S12 3.9 0.1 4 2.5 1.5 572935 92611 13273 106601 763525 248380 513677 1584 46
S13 6.7 2.2 8.9 7.1 1.8 863668 174731 2124 7857 2629760 418632 2207496 1669 66
S14 3.5 0.7 4.2 2.8 1.4 1234071 85363 2510 8217 1222005 561087 657647 1536 54
S15 2 0.5 2.5 1.1 1.4 499674 131778 236 20319 548211 176129 371193 8533 117
Other 3.9 0.5 4.3 2.9 1.4 1062367 90623 2158 92561 2093584 1247520 831482 29855 660
METS 3.5 0.3 3.8 2.4 1.3 671670 101217 1794 72900 1451953 667240 770535 78174 1440
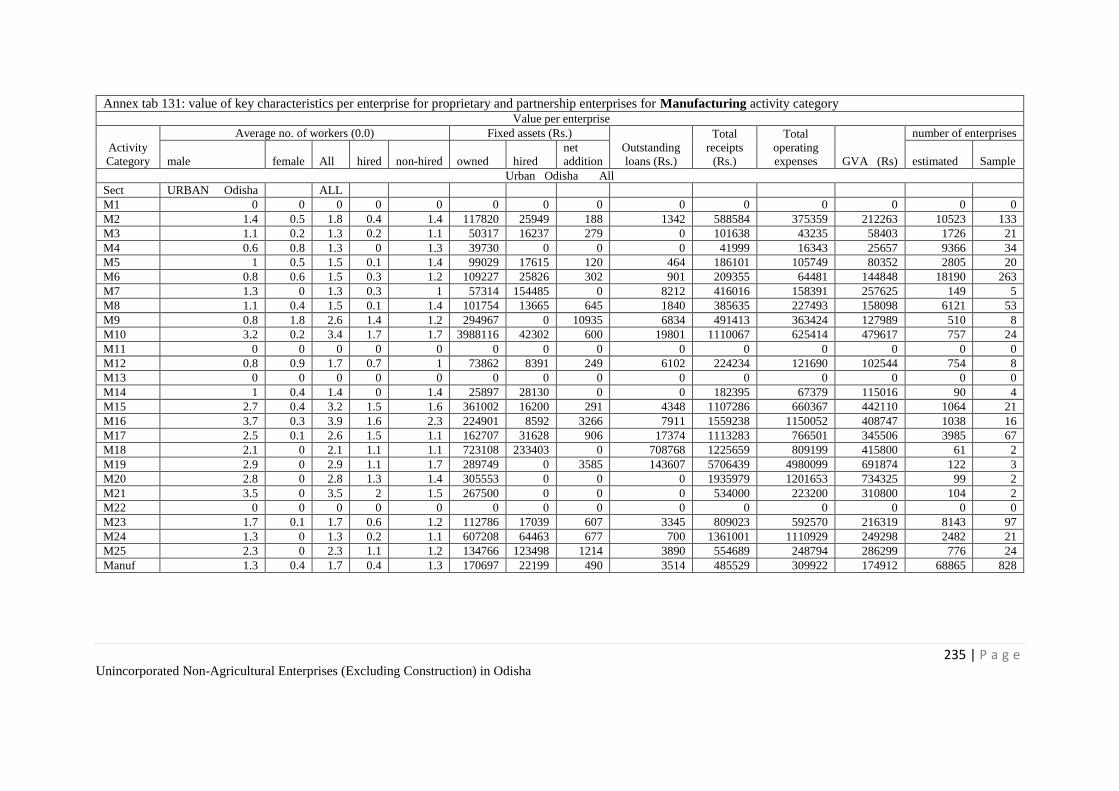
235 | P a g e Unincorporated Non-Agricultural Enterprises (Excluding Construction) in Odisha
Annex tab 131: value of key characteristics per enterprise for proprietary and partnership enterprises for Manufacturing activity category Value per enterprise
Activity
Category
Average no. of workers (0.0) Fixed assets (Rs.)
Outstanding
loans (Rs.)
Total
receipts
(Rs.)
Total
operating
expenses GVA (Rs)
number of enterprises
male female All hired non-hired owned hired
net
addition estimated Sample
Urban Odisha All
Sect URBAN Odisha ALL
M1 0 0 0 0 0 0 0 0 0 0 0 0 0 0
M2 1.4 0.5 1.8 0.4 1.4 117820 25949 188 1342 588584 375359 212263 10523 133
M3 1.1 0.2 1.3 0.2 1.1 50317 16237 279 0 101638 43235 58403 1726 21
M4 0.6 0.8 1.3 0 1.3 39730 0 0 0 41999 16343 25657 9366 34
M5 1 0.5 1.5 0.1 1.4 99029 17615 120 464 186101 105749 80352 2805 20
M6 0.8 0.6 1.5 0.3 1.2 109227 25826 302 901 209355 64481 144848 18190 263
M7 1.3 0 1.3 0.3 1 57314 154485 0 8212 416016 158391 257625 149 5
M8 1.1 0.4 1.5 0.1 1.4 101754 13665 645 1840 385635 227493 158098 6121 53
M9 0.8 1.8 2.6 1.4 1.2 294967 0 10935 6834 491413 363424 127989 510 8
M10 3.2 0.2 3.4 1.7 1.7 3988116 42302 600 19801 1110067 625414 479617 757 24
M11 0 0 0 0 0 0 0 0 0 0 0 0 0 0
M12 0.8 0.9 1.7 0.7 1 73862 8391 249 6102 224234 121690 102544 754 8
M13 0 0 0 0 0 0 0 0 0 0 0 0 0 0
M14 1 0.4 1.4 0 1.4 25897 28130 0 0 182395 67379 115016 90 4
M15 2.7 0.4 3.2 1.5 1.6 361002 16200 291 4348 1107286 660367 442110 1064 21
M16 3.7 0.3 3.9 1.6 2.3 224901 8592 3266 7911 1559238 1150052 408747 1038 16
M17 2.5 0.1 2.6 1.5 1.1 162707 31628 906 17374 1113283 766501 345506 3985 67
M18 2.1 0 2.1 1.1 1.1 723108 233403 0 708768 1225659 809199 415800 61 2
M19 2.9 0 2.9 1.1 1.7 289749 0 3585 143607 5706439 4980099 691874 122 3
M20 2.8 0 2.8 1.3 1.4 305553 0 0 0 1935979 1201653 734325 99 2
M21 3.5 0 3.5 2 1.5 267500 0 0 0 534000 223200 310800 104 2
M22 0 0 0 0 0 0 0 0 0 0 0 0 0 0
M23 1.7 0.1 1.7 0.6 1.2 112786 17039 607 3345 809023 592570 216319 8143 97
M24 1.3 0 1.3 0.2 1.1 607208 64463 677 700 1361001 1110929 249298 2482 21
M25 2.3 0 2.3 1.1 1.2 134766 123498 1214 3890 554689 248794 286299 776 24
Manuf 1.3 0.4 1.7 0.4 1.3 170697 22199 490 3514 485529 309922 174912 68865 828
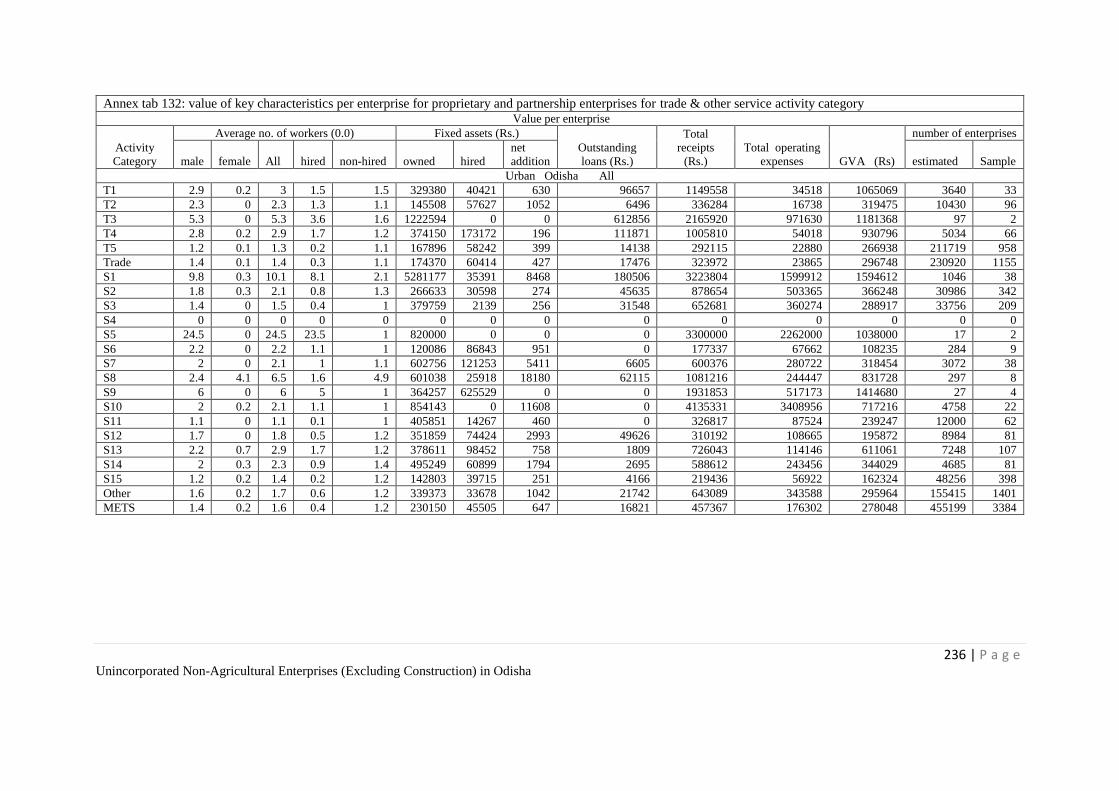
236 | P a g e Unincorporated Non-Agricultural Enterprises (Excluding Construction) in Odisha
Annex tab 132: value of key characteristics per enterprise for proprietary and partnership enterprises for trade & other service activity category Value per enterprise
Activity
Category
Average no. of workers (0.0) Fixed assets (Rs.)
Outstanding
loans (Rs.)
Total
receipts
(Rs.)
Total operating
expenses GVA (Rs)
number of enterprises
male female All hired non-hired owned hired
net
addition estimated Sample
Urban Odisha All
T1 2.9 0.2 3 1.5 1.5 329380 40421 630 96657 1149558 34518 1065069 3640 33
T2 2.3 0 2.3 1.3 1.1 145508 57627 1052 6496 336284 16738 319475 10430 96
T3 5.3 0 5.3 3.6 1.6 1222594 0 0 612856 2165920 971630 1181368 97 2
T4 2.8 0.2 2.9 1.7 1.2 374150 173172 196 111871 1005810 54018 930796 5034 66
T5 1.2 0.1 1.3 0.2 1.1 167896 58242 399 14138 292115 22880 266938 211719 958
Trade 1.4 0.1 1.4 0.3 1.1 174370 60414 427 17476 323972 23865 296748 230920 1155
S1 9.8 0.3 10.1 8.1 2.1 5281177 35391 8468 180506 3223804 1599912 1594612 1046 38
S2 1.8 0.3 2.1 0.8 1.3 266633 30598 274 45635 878654 503365 366248 30986 342
S3 1.4 0 1.5 0.4 1 379759 2139 256 31548 652681 360274 288917 33756 209
S4 0 0 0 0 0 0 0 0 0 0 0 0 0 0
S5 24.5 0 24.5 23.5 1 820000 0 0 0 3300000 2262000 1038000 17 2
S6 2.2 0 2.2 1.1 1 120086 86843 951 0 177337 67662 108235 284 9
S7 2 0 2.1 1 1.1 602756 121253 5411 6605 600376 280722 318454 3072 38
S8 2.4 4.1 6.5 1.6 4.9 601038 25918 18180 62115 1081216 244447 831728 297 8
S9 6 0 6 5 1 364257 625529 0 0 1931853 517173 1414680 27 4
S10 2 0.2 2.1 1.1 1 854143 0 11608 0 4135331 3408956 717216 4758 22
S11 1.1 0 1.1 0.1 1 405851 14267 460 0 326817 87524 239247 12000 62
S12 1.7 0 1.8 0.5 1.2 351859 74424 2993 49626 310192 108665 195872 8984 81
S13 2.2 0.7 2.9 1.7 1.2 378611 98452 758 1809 726043 114146 611061 7248 107
S14 2 0.3 2.3 0.9 1.4 495249 60899 1794 2695 588612 243456 344029 4685 81
S15 1.2 0.2 1.4 0.2 1.2 142803 39715 251 4166 219436 56922 162324 48256 398
Other 1.6 0.2 1.7 0.6 1.2 339373 33678 1042 21742 643089 343588 295964 155415 1401
METS 1.4 0.2 1.6 0.4 1.2 230150 45505 647 16821 457367 176302 278048 455199 3384
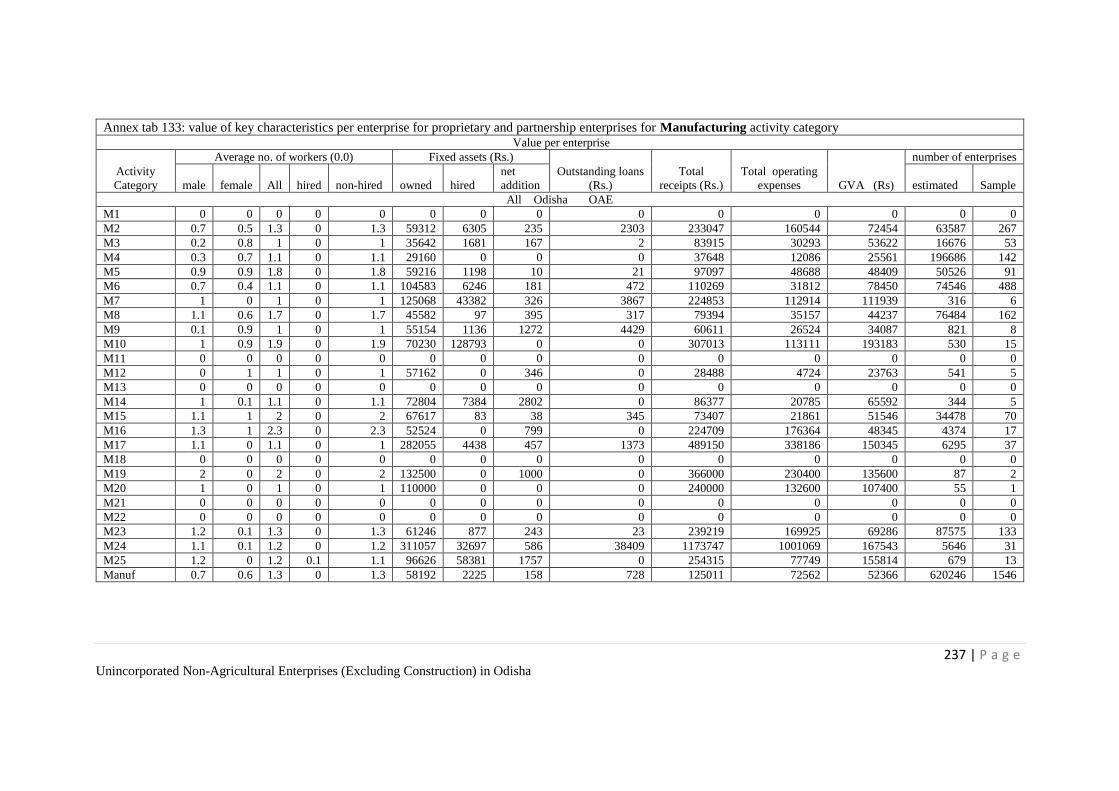
237 | P a g e Unincorporated Non-Agricultural Enterprises (Excluding Construction) in Odisha
Annex tab 133: value of key characteristics per enterprise for proprietary and partnership enterprises for Manufacturing activity category Value per enterprise
Activity
Category
Average no. of workers (0.0) Fixed assets (Rs.)
Outstanding loans
(Rs.)
Total
receipts (Rs.)
Total operating
expenses GVA (Rs)
number of enterprises
male female All hired non-hired owned hired
net
addition estimated Sample
All Odisha OAE
M1 0 0 0 0 0 0 0 0 0 0 0 0 0 0
M2 0.7 0.5 1.3 0 1.3 59312 6305 235 2303 233047 160544 72454 63587 267
M3 0.2 0.8 1 0 1 35642 1681 167 2 83915 30293 53622 16676 53
M4 0.3 0.7 1.1 0 1.1 29160 0 0 0 37648 12086 25561 196686 142
M5 0.9 0.9 1.8 0 1.8 59216 1198 10 21 97097 48688 48409 50526 91
M6 0.7 0.4 1.1 0 1.1 104583 6246 181 472 110269 31812 78450 74546 488
M7 1 0 1 0 1 125068 43382 326 3867 224853 112914 111939 316 6
M8 1.1 0.6 1.7 0 1.7 45582 97 395 317 79394 35157 44237 76484 162
M9 0.1 0.9 1 0 1 55154 1136 1272 4429 60611 26524 34087 821 8
M10 1 0.9 1.9 0 1.9 70230 128793 0 0 307013 113111 193183 530 15
M11 0 0 0 0 0 0 0 0 0 0 0 0 0 0
M12 0 1 1 0 1 57162 0 346 0 28488 4724 23763 541 5
M13 0 0 0 0 0 0 0 0 0 0 0 0 0 0
M14 1 0.1 1.1 0 1.1 72804 7384 2802 0 86377 20785 65592 344 5
M15 1.1 1 2 0 2 67617 83 38 345 73407 21861 51546 34478 70
M16 1.3 1 2.3 0 2.3 52524 0 799 0 224709 176364 48345 4374 17
M17 1.1 0 1.1 0 1 282055 4438 457 1373 489150 338186 150345 6295 37
M18 0 0 0 0 0 0 0 0 0 0 0 0 0 0
M19 2 0 2 0 2 132500 0 1000 0 366000 230400 135600 87 2
M20 1 0 1 0 1 110000 0 0 0 240000 132600 107400 55 1
M21 0 0 0 0 0 0 0 0 0 0 0 0 0 0
M22 0 0 0 0 0 0 0 0 0 0 0 0 0 0
M23 1.2 0.1 1.3 0 1.3 61246 877 243 23 239219 169925 69286 87575 133
M24 1.1 0.1 1.2 0 1.2 311057 32697 586 38409 1173747 1001069 167543 5646 31
M25 1.2 0 1.2 0.1 1.1 96626 58381 1757 0 254315 77749 155814 679 13
Manuf 0.7 0.6 1.3 0 1.3 58192 2225 158 728 125011 72562 52366 620246 1546
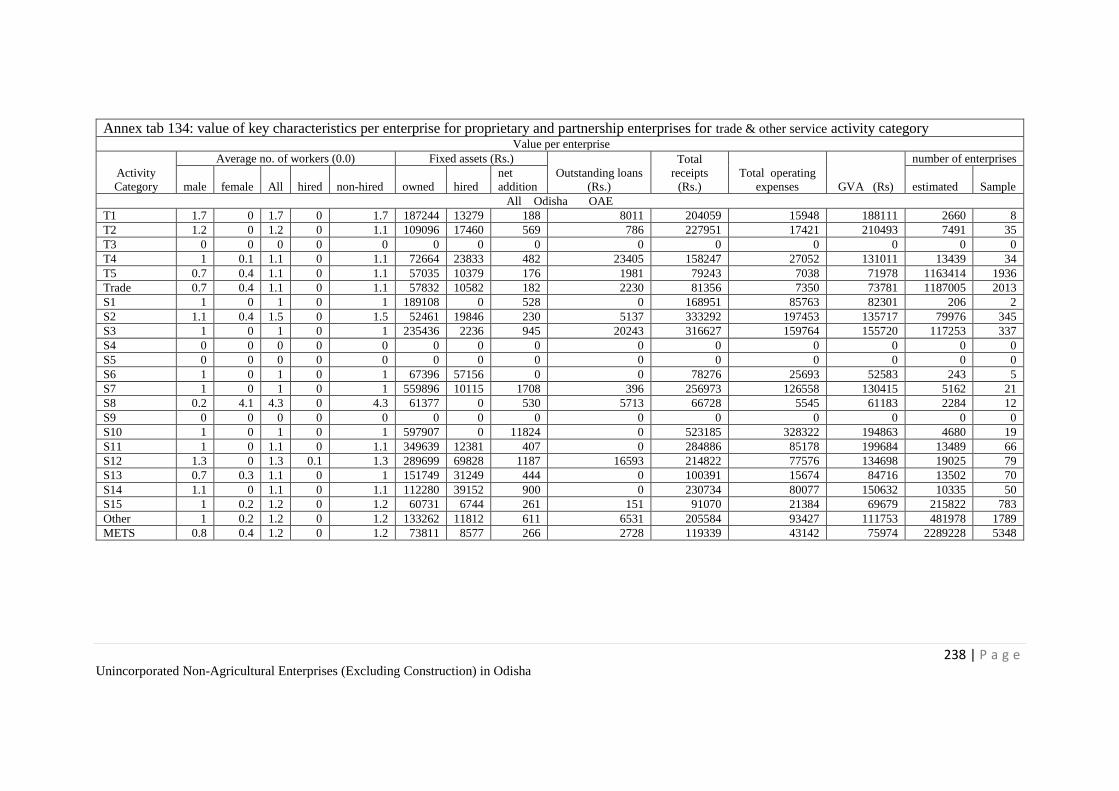
238 | P a g e Unincorporated Non-Agricultural Enterprises (Excluding Construction) in Odisha
Annex tab 134: value of key characteristics per enterprise for proprietary and partnership enterprises for trade & other service activity category Value per enterprise
Activity
Category
Average no. of workers (0.0) Fixed assets (Rs.)
Outstanding loans
(Rs.)
Total
receipts
(Rs.)
Total operating
expenses GVA (Rs)
number of enterprises
male female All hired non-hired owned hired
net
addition estimated Sample
All Odisha OAE
T1 1.7 0 1.7 0 1.7 187244 13279 188 8011 204059 15948 188111 2660 8
T2 1.2 0 1.2 0 1.1 109096 17460 569 786 227951 17421 210493 7491 35
T3 0 0 0 0 0 0 0 0 0 0 0 0 0 0
T4 1 0.1 1.1 0 1.1 72664 23833 482 23405 158247 27052 131011 13439 34
T5 0.7 0.4 1.1 0 1.1 57035 10379 176 1981 79243 7038 71978 1163414 1936
Trade 0.7 0.4 1.1 0 1.1 57832 10582 182 2230 81356 7350 73781 1187005 2013
S1 1 0 1 0 1 189108 0 528 0 168951 85763 82301 206 2
S2 1.1 0.4 1.5 0 1.5 52461 19846 230 5137 333292 197453 135717 79976 345
S3 1 0 1 0 1 235436 2236 945 20243 316627 159764 155720 117253 337
S4 0 0 0 0 0 0 0 0 0 0 0 0 0 0
S5 0 0 0 0 0 0 0 0 0 0 0 0 0 0
S6 1 0 1 0 1 67396 57156 0 0 78276 25693 52583 243 5
S7 1 0 1 0 1 559896 10115 1708 396 256973 126558 130415 5162 21
S8 0.2 4.1 4.3 0 4.3 61377 0 530 5713 66728 5545 61183 2284 12
S9 0 0 0 0 0 0 0 0 0 0 0 0 0 0
S10 1 0 1 0 1 597907 0 11824 0 523185 328322 194863 4680 19
S11 1 0 1.1 0 1.1 349639 12381 407 0 284886 85178 199684 13489 66
S12 1.3 0 1.3 0.1 1.3 289699 69828 1187 16593 214822 77576 134698 19025 79
S13 0.7 0.3 1.1 0 1 151749 31249 444 0 100391 15674 84716 13502 70
S14 1.1 0 1.1 0 1.1 112280 39152 900 0 230734 80077 150632 10335 50
S15 1 0.2 1.2 0 1.2 60731 6744 261 151 91070 21384 69679 215822 783
Other 1 0.2 1.2 0 1.2 133262 11812 611 6531 205584 93427 111753 481978 1789
METS 0.8 0.4 1.2 0 1.2 73811 8577 266 2728 119339 43142 75974 2289228 5348
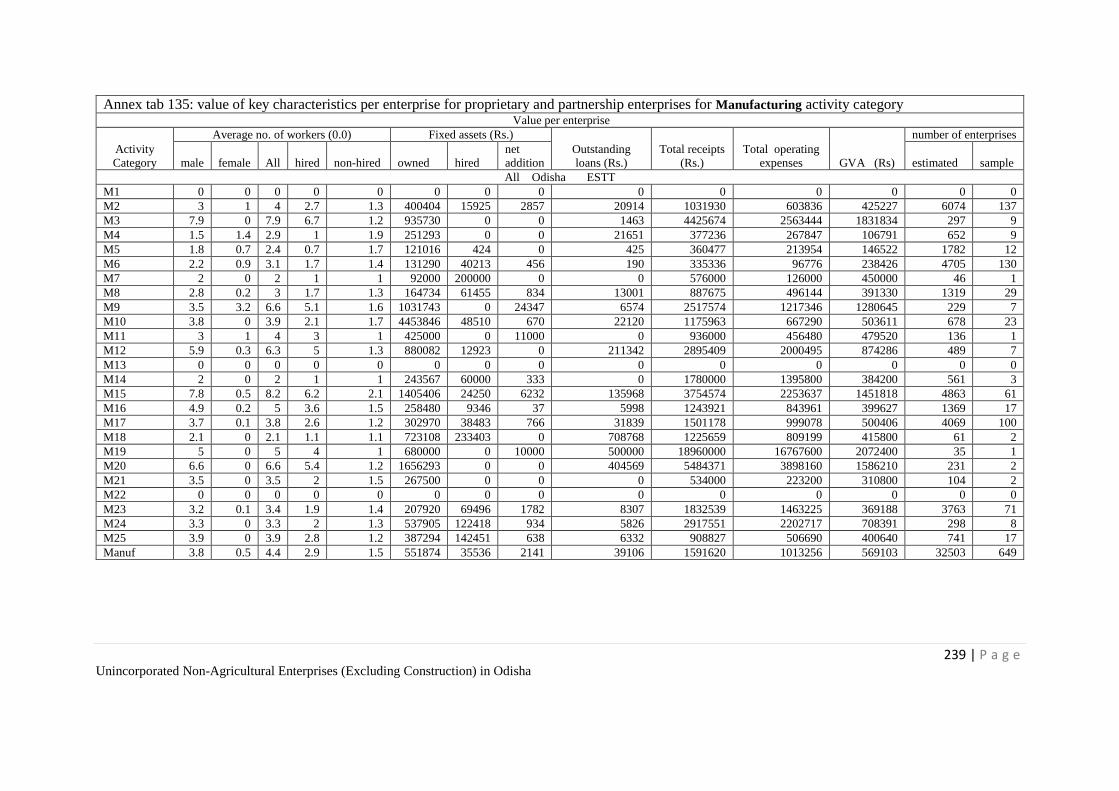
239 | P a g e Unincorporated Non-Agricultural Enterprises (Excluding Construction) in Odisha
Annex tab 135: value of key characteristics per enterprise for proprietary and partnership enterprises for Manufacturing activity category Value per enterprise
Activity
Category
Average no. of workers (0.0) Fixed assets (Rs.)
Outstanding
loans (Rs.)
Total receipts
(Rs.)
Total operating
expenses GVA (Rs)
number of enterprises
male female All hired non-hired owned hired
net
addition estimated sample
All Odisha ESTT
M1 0 0 0 0 0 0 0 0 0 0 0 0 0 0
M2 3 1 4 2.7 1.3 400404 15925 2857 20914 1031930 603836 425227 6074 137
M3 7.9 0 7.9 6.7 1.2 935730 0 0 1463 4425674 2563444 1831834 297 9
M4 1.5 1.4 2.9 1 1.9 251293 0 0 21651 377236 267847 106791 652 9
M5 1.8 0.7 2.4 0.7 1.7 121016 424 0 425 360477 213954 146522 1782 12
M6 2.2 0.9 3.1 1.7 1.4 131290 40213 456 190 335336 96776 238426 4705 130
M7 2 0 2 1 1 92000 200000 0 0 576000 126000 450000 46 1
M8 2.8 0.2 3 1.7 1.3 164734 61455 834 13001 887675 496144 391330 1319 29
M9 3.5 3.2 6.6 5.1 1.6 1031743 0 24347 6574 2517574 1217346 1280645 229 7
M10 3.8 0 3.9 2.1 1.7 4453846 48510 670 22120 1175963 667290 503611 678 23
M11 3 1 4 3 1 425000 0 11000 0 936000 456480 479520 136 1
M12 5.9 0.3 6.3 5 1.3 880082 12923 0 211342 2895409 2000495 874286 489 7
M13 0 0 0 0 0 0 0 0 0 0 0 0 0 0
M14 2 0 2 1 1 243567 60000 333 0 1780000 1395800 384200 561 3
M15 7.8 0.5 8.2 6.2 2.1 1405406 24250 6232 135968 3754574 2253637 1451818 4863 61
M16 4.9 0.2 5 3.6 1.5 258480 9346 37 5998 1243921 843961 399627 1369 17
M17 3.7 0.1 3.8 2.6 1.2 302970 38483 766 31839 1501178 999078 500406 4069 100
M18 2.1 0 2.1 1.1 1.1 723108 233403 0 708768 1225659 809199 415800 61 2
M19 5 0 5 4 1 680000 0 10000 500000 18960000 16767600 2072400 35 1
M20 6.6 0 6.6 5.4 1.2 1656293 0 0 404569 5484371 3898160 1586210 231 2
M21 3.5 0 3.5 2 1.5 267500 0 0 0 534000 223200 310800 104 2
M22 0 0 0 0 0 0 0 0 0 0 0 0 0 0
M23 3.2 0.1 3.4 1.9 1.4 207920 69496 1782 8307 1832539 1463225 369188 3763 71
M24 3.3 0 3.3 2 1.3 537905 122418 934 5826 2917551 2202717 708391 298 8
M25 3.9 0 3.9 2.8 1.2 387294 142451 638 6332 908827 506690 400640 741 17
Manuf 3.8 0.5 4.4 2.9 1.5 551874 35536 2141 39106 1591620 1013256 569103 32503 649
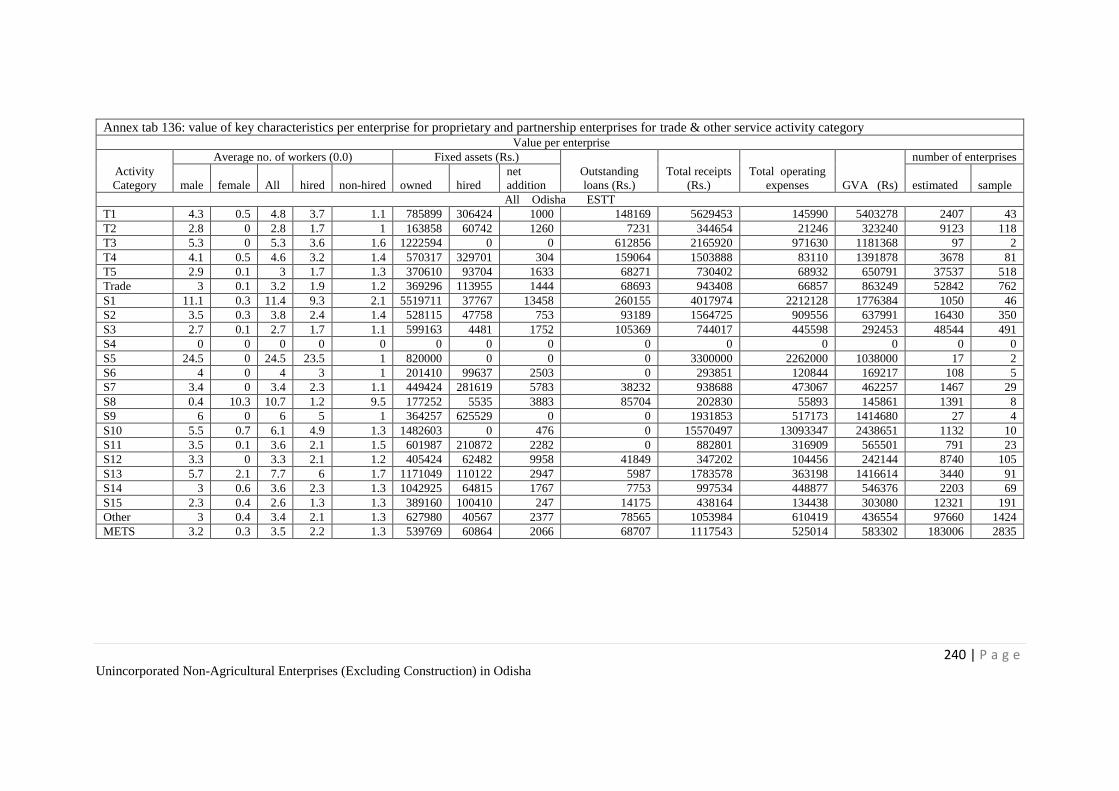
240 | P a g e Unincorporated Non-Agricultural Enterprises (Excluding Construction) in Odisha
Annex tab 136: value of key characteristics per enterprise for proprietary and partnership enterprises for trade & other service activity category Value per enterprise
Activity
Category
Average no. of workers (0.0) Fixed assets (Rs.)
Outstanding
loans (Rs.)
Total receipts
(Rs.)
Total operating
expenses GVA (Rs)
number of enterprises
male female All hired non-hired owned hired
net
addition estimated sample
All Odisha ESTT
T1 4.3 0.5 4.8 3.7 1.1 785899 306424 1000 148169 5629453 145990 5403278 2407 43
T2 2.8 0 2.8 1.7 1 163858 60742 1260 7231 344654 21246 323240 9123 118
T3 5.3 0 5.3 3.6 1.6 1222594 0 0 612856 2165920 971630 1181368 97 2
T4 4.1 0.5 4.6 3.2 1.4 570317 329701 304 159064 1503888 83110 1391878 3678 81
T5 2.9 0.1 3 1.7 1.3 370610 93704 1633 68271 730402 68932 650791 37537 518
Trade 3 0.1 3.2 1.9 1.2 369296 113955 1444 68693 943408 66857 863249 52842 762
S1 11.1 0.3 11.4 9.3 2.1 5519711 37767 13458 260155 4017974 2212128 1776384 1050 46
S2 3.5 0.3 3.8 2.4 1.4 528115 47758 753 93189 1564725 909556 637991 16430 350
S3 2.7 0.1 2.7 1.7 1.1 599163 4481 1752 105369 744017 445598 292453 48544 491
S4 0 0 0 0 0 0 0 0 0 0 0 0 0 0
S5 24.5 0 24.5 23.5 1 820000 0 0 0 3300000 2262000 1038000 17 2
S6 4 0 4 3 1 201410 99637 2503 0 293851 120844 169217 108 5
S7 3.4 0 3.4 2.3 1.1 449424 281619 5783 38232 938688 473067 462257 1467 29
S8 0.4 10.3 10.7 1.2 9.5 177252 5535 3883 85704 202830 55893 145861 1391 8
S9 6 0 6 5 1 364257 625529 0 0 1931853 517173 1414680 27 4
S10 5.5 0.7 6.1 4.9 1.3 1482603 0 476 0 15570497 13093347 2438651 1132 10
S11 3.5 0.1 3.6 2.1 1.5 601987 210872 2282 0 882801 316909 565501 791 23
S12 3.3 0 3.3 2.1 1.2 405424 62482 9958 41849 347202 104456 242144 8740 105
S13 5.7 2.1 7.7 6 1.7 1171049 110122 2947 5987 1783578 363198 1416614 3440 91
S14 3 0.6 3.6 2.3 1.3 1042925 64815 1767 7753 997534 448877 546376 2203 69
S15 2.3 0.4 2.6 1.3 1.3 389160 100410 247 14175 438164 134438 303080 12321 191
Other 3 0.4 3.4 2.1 1.3 627980 40567 2377 78565 1053984 610419 436554 97660 1424
METS 3.2 0.3 3.5 2.2 1.3 539769 60864 2066 68707 1117543 525014 583302 183006 2835
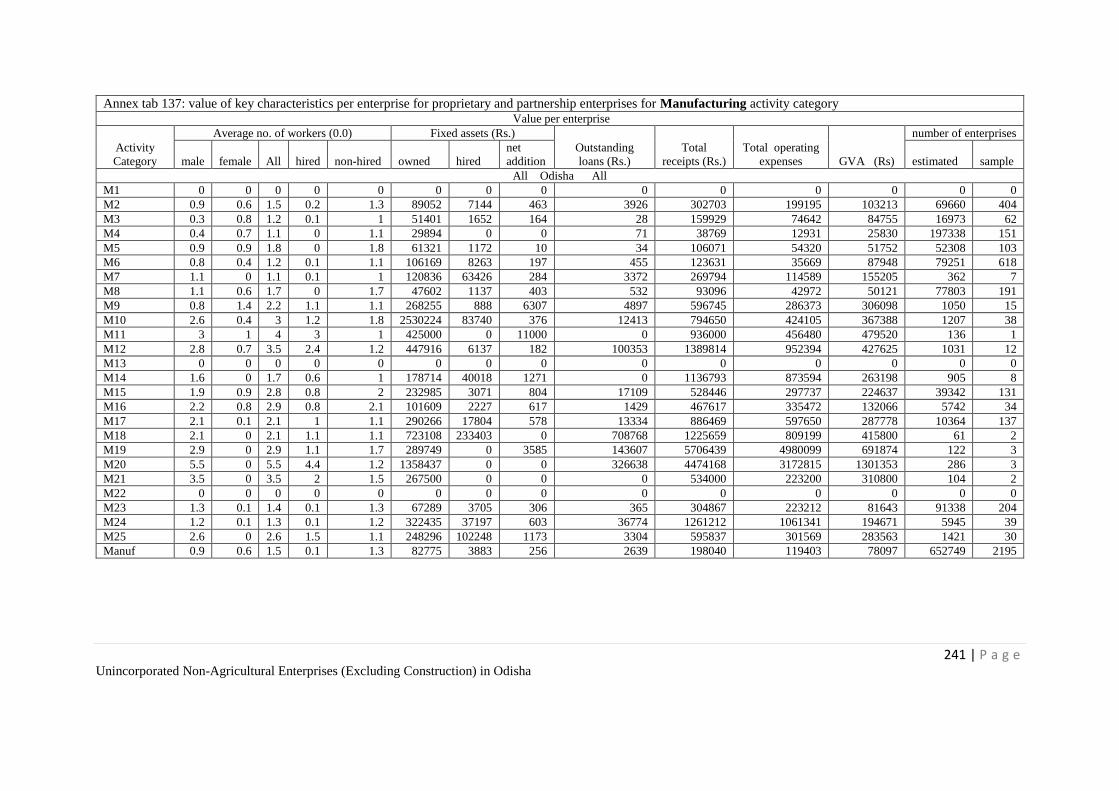
241 | P a g e Unincorporated Non-Agricultural Enterprises (Excluding Construction) in Odisha
Annex tab 137: value of key characteristics per enterprise for proprietary and partnership enterprises for Manufacturing activity category Value per enterprise
Activity
Category
Average no. of workers (0.0) Fixed assets (Rs.)
Outstanding
loans (Rs.)
Total
receipts (Rs.)
Total operating
expenses GVA (Rs)
number of enterprises
male female All hired non-hired owned hired
net
addition estimated sample
All Odisha All
M1 0 0 0 0 0 0 0 0 0 0 0 0 0 0
M2 0.9 0.6 1.5 0.2 1.3 89052 7144 463 3926 302703 199195 103213 69660 404
M3 0.3 0.8 1.2 0.1 1 51401 1652 164 28 159929 74642 84755 16973 62
M4 0.4 0.7 1.1 0 1.1 29894 0 0 71 38769 12931 25830 197338 151
M5 0.9 0.9 1.8 0 1.8 61321 1172 10 34 106071 54320 51752 52308 103
M6 0.8 0.4 1.2 0.1 1.1 106169 8263 197 455 123631 35669 87948 79251 618
M7 1.1 0 1.1 0.1 1 120836 63426 284 3372 269794 114589 155205 362 7
M8 1.1 0.6 1.7 0 1.7 47602 1137 403 532 93096 42972 50121 77803 191
M9 0.8 1.4 2.2 1.1 1.1 268255 888 6307 4897 596745 286373 306098 1050 15
M10 2.6 0.4 3 1.2 1.8 2530224 83740 376 12413 794650 424105 367388 1207 38
M11 3 1 4 3 1 425000 0 11000 0 936000 456480 479520 136 1
M12 2.8 0.7 3.5 2.4 1.2 447916 6137 182 100353 1389814 952394 427625 1031 12
M13 0 0 0 0 0 0 0 0 0 0 0 0 0 0
M14 1.6 0 1.7 0.6 1 178714 40018 1271 0 1136793 873594 263198 905 8
M15 1.9 0.9 2.8 0.8 2 232985 3071 804 17109 528446 297737 224637 39342 131
M16 2.2 0.8 2.9 0.8 2.1 101609 2227 617 1429 467617 335472 132066 5742 34
M17 2.1 0.1 2.1 1 1.1 290266 17804 578 13334 886469 597650 287778 10364 137
M18 2.1 0 2.1 1.1 1.1 723108 233403 0 708768 1225659 809199 415800 61 2
M19 2.9 0 2.9 1.1 1.7 289749 0 3585 143607 5706439 4980099 691874 122 3
M20 5.5 0 5.5 4.4 1.2 1358437 0 0 326638 4474168 3172815 1301353 286 3
M21 3.5 0 3.5 2 1.5 267500 0 0 0 534000 223200 310800 104 2
M22 0 0 0 0 0 0 0 0 0 0 0 0 0 0
M23 1.3 0.1 1.4 0.1 1.3 67289 3705 306 365 304867 223212 81643 91338 204
M24 1.2 0.1 1.3 0.1 1.2 322435 37197 603 36774 1261212 1061341 194671 5945 39
M25 2.6 0 2.6 1.5 1.1 248296 102248 1173 3304 595837 301569 283563 1421 30
Manuf 0.9 0.6 1.5 0.1 1.3 82775 3883 256 2639 198040 119403 78097 652749 2195
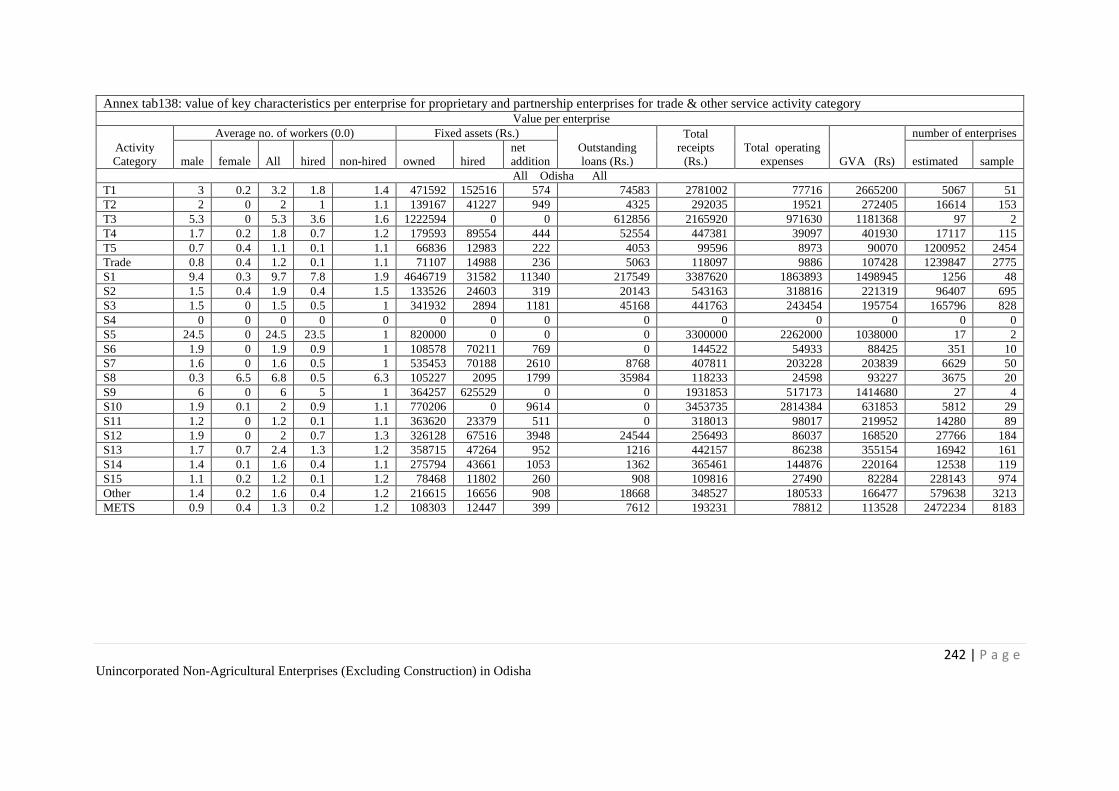
242 | P a g e Unincorporated Non-Agricultural Enterprises (Excluding Construction) in Odisha
Annex tab138: value of key characteristics per enterprise for proprietary and partnership enterprises for trade & other service activity category Value per enterprise
Activity
Category
Average no. of workers (0.0) Fixed assets (Rs.)
Outstanding
loans (Rs.)
Total
receipts
(Rs.)
Total operating
expenses GVA (Rs)
number of enterprises
male female All hired non-hired owned hired
net
addition estimated sample
All Odisha All
T1 3 0.2 3.2 1.8 1.4 471592 152516 574 74583 2781002 77716 2665200 5067 51
T2 2 0 2 1 1.1 139167 41227 949 4325 292035 19521 272405 16614 153
T3 5.3 0 5.3 3.6 1.6 1222594 0 0 612856 2165920 971630 1181368 97 2
T4 1.7 0.2 1.8 0.7 1.2 179593 89554 444 52554 447381 39097 401930 17117 115
T5 0.7 0.4 1.1 0.1 1.1 66836 12983 222 4053 99596 8973 90070 1200952 2454
Trade 0.8 0.4 1.2 0.1 1.1 71107 14988 236 5063 118097 9886 107428 1239847 2775
S1 9.4 0.3 9.7 7.8 1.9 4646719 31582 11340 217549 3387620 1863893 1498945 1256 48
S2 1.5 0.4 1.9 0.4 1.5 133526 24603 319 20143 543163 318816 221319 96407 695
S3 1.5 0 1.5 0.5 1 341932 2894 1181 45168 441763 243454 195754 165796 828
S4 0 0 0 0 0 0 0 0 0 0 0 0 0 0
S5 24.5 0 24.5 23.5 1 820000 0 0 0 3300000 2262000 1038000 17 2
S6 1.9 0 1.9 0.9 1 108578 70211 769 0 144522 54933 88425 351 10
S7 1.6 0 1.6 0.5 1 535453 70188 2610 8768 407811 203228 203839 6629 50
S8 0.3 6.5 6.8 0.5 6.3 105227 2095 1799 35984 118233 24598 93227 3675 20
S9 6 0 6 5 1 364257 625529 0 0 1931853 517173 1414680 27 4
S10 1.9 0.1 2 0.9 1.1 770206 0 9614 0 3453735 2814384 631853 5812 29
S11 1.2 0 1.2 0.1 1.1 363620 23379 511 0 318013 98017 219952 14280 89
S12 1.9 0 2 0.7 1.3 326128 67516 3948 24544 256493 86037 168520 27766 184
S13 1.7 0.7 2.4 1.3 1.2 358715 47264 952 1216 442157 86238 355154 16942 161
S14 1.4 0.1 1.6 0.4 1.1 275794 43661 1053 1362 365461 144876 220164 12538 119
S15 1.1 0.2 1.2 0.1 1.2 78468 11802 260 908 109816 27490 82284 228143 974
Other 1.4 0.2 1.6 0.4 1.2 216615 16656 908 18668 348527 180533 166477 579638 3213
METS 0.9 0.4 1.3 0.2 1.2 108303 12447 399 7612 193231 78812 113528 2472234 8183
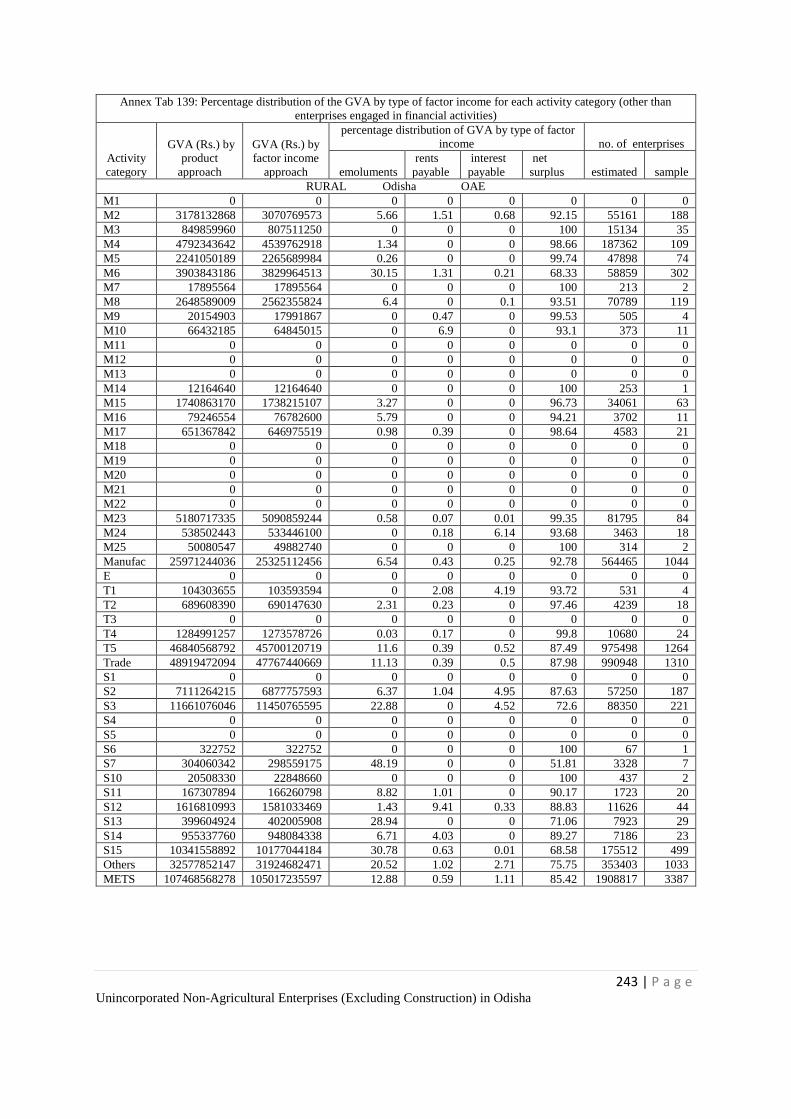
243 | P a g e Unincorporated Non-Agricultural Enterprises (Excluding Construction) in Odisha
Annex Tab 139: Percentage distribution of the GVA by type of factor income for each activity category (other than
enterprises engaged in financial activities)
Activity
category
GVA (Rs.) by
product
approach
GVA (Rs.) by
factor income
approach
percentage distribution of GVA by type of factor
income no. of enterprises
emoluments
rents
payable
interest
payable
net
surplus estimated sample
RURAL Odisha OAE
M1 0 0 0 0 0 0 0 0
M2 3178132868 3070769573 5.66 1.51 0.68 92.15 55161 188
M3 849859960 807511250 0 0 0 100 15134 35
M4 4792343642 4539762918 1.34 0 0 98.66 187362 109
M5 2241050189 2265689984 0.26 0 0 99.74 47898 74
M6 3903843186 3829964513 30.15 1.31 0.21 68.33 58859 302
M7 17895564 17895564 0 0 0 100 213 2
M8 2648589009 2562355824 6.4 0 0.1 93.51 70789 119
M9 20154903 17991867 0 0.47 0 99.53 505 4
M10 66432185 64845015 0 6.9 0 93.1 373 11
M11 0 0 0 0 0 0 0 0
M12 0 0 0 0 0 0 0 0
M13 0 0 0 0 0 0 0 0
M14 12164640 12164640 0 0 0 100 253 1
M15 1740863170 1738215107 3.27 0 0 96.73 34061 63
M16 79246554 76782600 5.79 0 0 94.21 3702 11
M17 651367842 646975519 0.98 0.39 0 98.64 4583 21
M18 0 0 0 0 0 0 0 0
M19 0 0 0 0 0 0 0 0
M20 0 0 0 0 0 0 0 0
M21 0 0 0 0 0 0 0 0
M22 0 0 0 0 0 0 0 0
M23 5180717335 5090859244 0.58 0.07 0.01 99.35 81795 84
M24 538502443 533446100 0 0.18 6.14 93.68 3463 18
M25 50080547 49882740 0 0 0 100 314 2
Manufac 25971244036 25325112456 6.54 0.43 0.25 92.78 564465 1044
E 0 0 0 0 0 0 0 0
T1 104303655 103593594 0 2.08 4.19 93.72 531 4
T2 689608390 690147630 2.31 0.23 0 97.46 4239 18
T3 0 0 0 0 0 0 0 0
T4 1284991257 1273578726 0.03 0.17 0 99.8 10680 24
T5 46840568792 45700120719 11.6 0.39 0.52 87.49 975498 1264
Trade 48919472094 47767440669 11.13 0.39 0.5 87.98 990948 1310
S1 0 0 0 0 0 0 0 0
S2 7111264215 6877757593 6.37 1.04 4.95 87.63 57250 187
S3 11661076046 11450765595 22.88 0 4.52 72.6 88350 221
S4 0 0 0 0 0 0 0 0
S5 0 0 0 0 0 0 0 0
S6 322752 322752 0 0 0 100 67 1
S7 304060342 298559175 48.19 0 0 51.81 3328 7
S10 20508330 22848660 0 0 0 100 437 2
S11 167307894 166260798 8.82 1.01 0 90.17 1723 20
S12 1616810993 1581033469 1.43 9.41 0.33 88.83 11626 44
S13 399604924 402005908 28.94 0 0 71.06 7923 29
S14 955337760 948084338 6.71 4.03 0 89.27 7186 23
S15 10341558892 10177044184 30.78 0.63 0.01 68.58 175512 499
Others 32577852147 31924682471 20.52 1.02 2.71 75.75 353403 1033
METS 107468568278 105017235597 12.88 0.59 1.11 85.42 1908817 3387
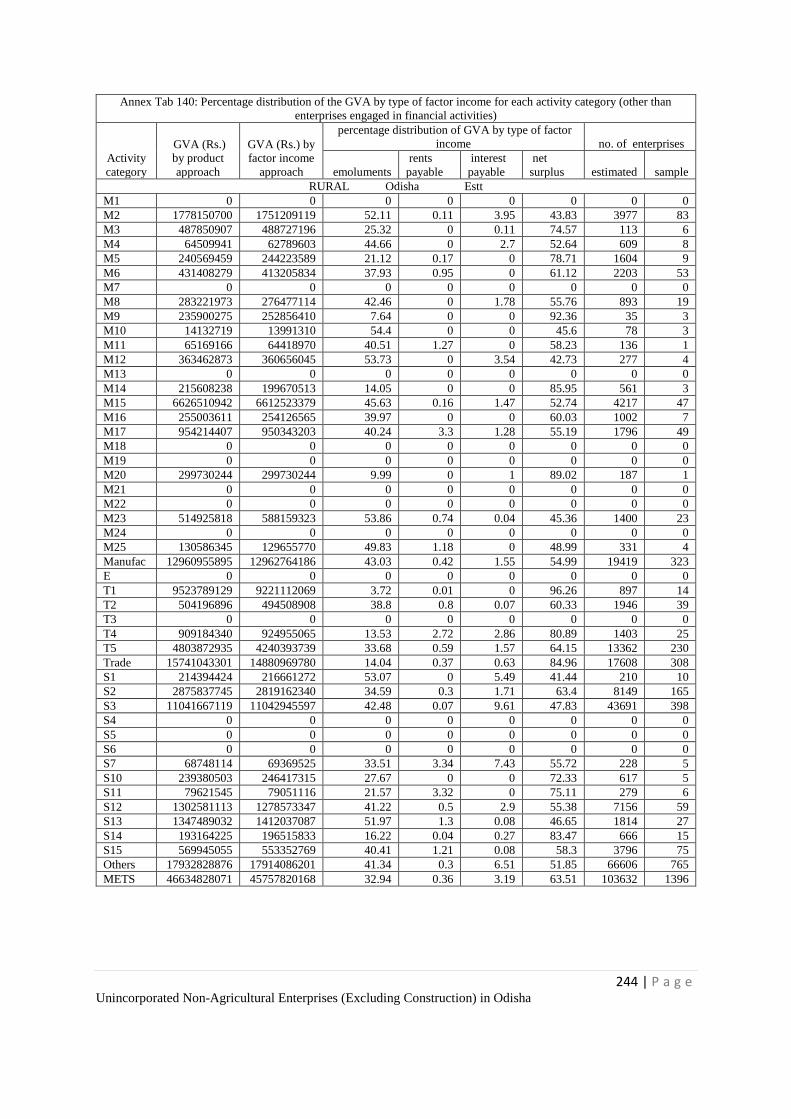
244 | P a g e Unincorporated Non-Agricultural Enterprises (Excluding Construction) in Odisha
Annex Tab 140: Percentage distribution of the GVA by type of factor income for each activity category (other than
enterprises engaged in financial activities)
Activity
category
GVA (Rs.)
by product
approach
GVA (Rs.) by
factor income
approach
percentage distribution of GVA by type of factor
income no. of enterprises
emoluments
rents
payable
interest
payable
net
surplus estimated sample
RURAL Odisha Estt
M1 0 0 0 0 0 0 0 0
M2 1778150700 1751209119 52.11 0.11 3.95 43.83 3977 83
M3 487850907 488727196 25.32 0 0.11 74.57 113 6
M4 64509941 62789603 44.66 0 2.7 52.64 609 8
M5 240569459 244223589 21.12 0.17 0 78.71 1604 9
M6 431408279 413205834 37.93 0.95 0 61.12 2203 53
M7 0 0 0 0 0 0 0 0
M8 283221973 276477114 42.46 0 1.78 55.76 893 19
M9 235900275 252856410 7.64 0 0 92.36 35 3
M10 14132719 13991310 54.4 0 0 45.6 78 3
M11 65169166 64418970 40.51 1.27 0 58.23 136 1
M12 363462873 360656045 53.73 0 3.54 42.73 277 4
M13 0 0 0 0 0 0 0 0
M14 215608238 199670513 14.05 0 0 85.95 561 3
M15 6626510942 6612523379 45.63 0.16 1.47 52.74 4217 47
M16 255003611 254126565 39.97 0 0 60.03 1002 7
M17 954214407 950343203 40.24 3.3 1.28 55.19 1796 49
M18 0 0 0 0 0 0 0 0
M19 0 0 0 0 0 0 0 0
M20 299730244 299730244 9.99 0 1 89.02 187 1
M21 0 0 0 0 0 0 0 0
M22 0 0 0 0 0 0 0 0
M23 514925818 588159323 53.86 0.74 0.04 45.36 1400 23
M24 0 0 0 0 0 0 0 0
M25 130586345 129655770 49.83 1.18 0 48.99 331 4
Manufac 12960955895 12962764186 43.03 0.42 1.55 54.99 19419 323
E 0 0 0 0 0 0 0 0
T1 9523789129 9221112069 3.72 0.01 0 96.26 897 14
T2 504196896 494508908 38.8 0.8 0.07 60.33 1946 39
T3 0 0 0 0 0 0 0 0
T4 909184340 924955065 13.53 2.72 2.86 80.89 1403 25
T5 4803872935 4240393739 33.68 0.59 1.57 64.15 13362 230
Trade 15741043301 14880969780 14.04 0.37 0.63 84.96 17608 308
S1 214394424 216661272 53.07 0 5.49 41.44 210 10
S2 2875837745 2819162340 34.59 0.3 1.71 63.4 8149 165
S3 11041667119 11042945597 42.48 0.07 9.61 47.83 43691 398
S4 0 0 0 0 0 0 0 0
S5 0 0 0 0 0 0 0 0
S6 0 0 0 0 0 0 0 0
S7 68748114 69369525 33.51 3.34 7.43 55.72 228 5
S10 239380503 246417315 27.67 0 0 72.33 617 5
S11 79621545 79051116 21.57 3.32 0 75.11 279 6
S12 1302581113 1278573347 41.22 0.5 2.9 55.38 7156 59
S13 1347489032 1412037087 51.97 1.3 0.08 46.65 1814 27
S14 193164225 196515833 16.22 0.04 0.27 83.47 666 15
S15 569945055 553352769 40.41 1.21 0.08 58.3 3796 75
Others 17932828876 17914086201 41.34 0.3 6.51 51.85 66606 765
METS 46634828071 45757820168 32.94 0.36 3.19 63.51 103632 1396
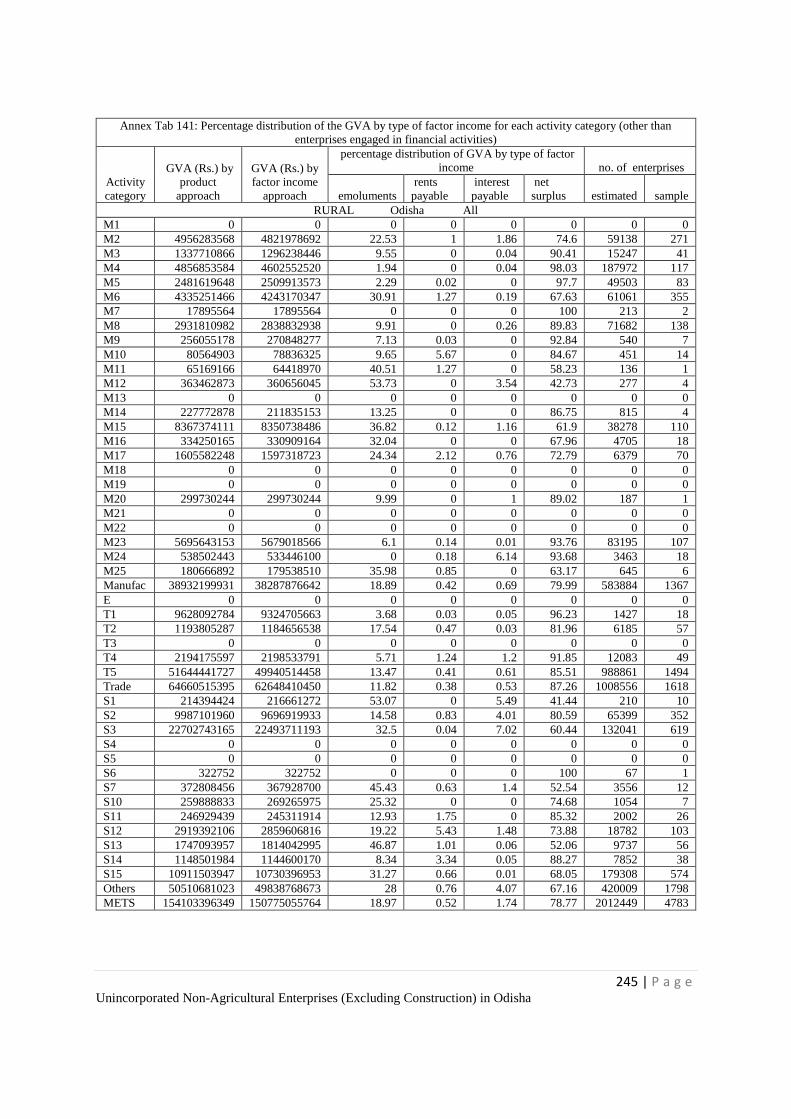
245 | P a g e Unincorporated Non-Agricultural Enterprises (Excluding Construction) in Odisha
Annex Tab 141: Percentage distribution of the GVA by type of factor income for each activity category (other than
enterprises engaged in financial activities)
Activity
category
GVA (Rs.) by
product
approach
GVA (Rs.) by
factor income
approach
percentage distribution of GVA by type of factor
income no. of enterprises
emoluments
rents
payable
interest
payable
net
surplus estimated sample
RURAL Odisha All
M1 0 0 0 0 0 0 0 0
M2 4956283568 4821978692 22.53 1 1.86 74.6 59138 271
M3 1337710866 1296238446 9.55 0 0.04 90.41 15247 41
M4 4856853584 4602552520 1.94 0 0.04 98.03 187972 117
M5 2481619648 2509913573 2.29 0.02 0 97.7 49503 83
M6 4335251466 4243170347 30.91 1.27 0.19 67.63 61061 355
M7 17895564 17895564 0 0 0 100 213 2
M8 2931810982 2838832938 9.91 0 0.26 89.83 71682 138
M9 256055178 270848277 7.13 0.03 0 92.84 540 7
M10 80564903 78836325 9.65 5.67 0 84.67 451 14
M11 65169166 64418970 40.51 1.27 0 58.23 136 1
M12 363462873 360656045 53.73 0 3.54 42.73 277 4
M13 0 0 0 0 0 0 0 0
M14 227772878 211835153 13.25 0 0 86.75 815 4
M15 8367374111 8350738486 36.82 0.12 1.16 61.9 38278 110
M16 334250165 330909164 32.04 0 0 67.96 4705 18
M17 1605582248 1597318723 24.34 2.12 0.76 72.79 6379 70
M18 0 0 0 0 0 0 0 0
M19 0 0 0 0 0 0 0 0
M20 299730244 299730244 9.99 0 1 89.02 187 1
M21 0 0 0 0 0 0 0 0
M22 0 0 0 0 0 0 0 0
M23 5695643153 5679018566 6.1 0.14 0.01 93.76 83195 107
M24 538502443 533446100 0 0.18 6.14 93.68 3463 18
M25 180666892 179538510 35.98 0.85 0 63.17 645 6
Manufac 38932199931 38287876642 18.89 0.42 0.69 79.99 583884 1367
E 0 0 0 0 0 0 0 0
T1 9628092784 9324705663 3.68 0.03 0.05 96.23 1427 18
T2 1193805287 1184656538 17.54 0.47 0.03 81.96 6185 57
T3 0 0 0 0 0 0 0 0
T4 2194175597 2198533791 5.71 1.24 1.2 91.85 12083 49
T5 51644441727 49940514458 13.47 0.41 0.61 85.51 988861 1494
Trade 64660515395 62648410450 11.82 0.38 0.53 87.26 1008556 1618
S1 214394424 216661272 53.07 0 5.49 41.44 210 10
S2 9987101960 9696919933 14.58 0.83 4.01 80.59 65399 352
S3 22702743165 22493711193 32.5 0.04 7.02 60.44 132041 619
S4 0 0 0 0 0 0 0 0
S5 0 0 0 0 0 0 0 0
S6 322752 322752 0 0 0 100 67 1
S7 372808456 367928700 45.43 0.63 1.4 52.54 3556 12
S10 259888833 269265975 25.32 0 0 74.68 1054 7
S11 246929439 245311914 12.93 1.75 0 85.32 2002 26
S12 2919392106 2859606816 19.22 5.43 1.48 73.88 18782 103
S13 1747093957 1814042995 46.87 1.01 0.06 52.06 9737 56
S14 1148501984 1144600170 8.34 3.34 0.05 88.27 7852 38
S15 10911503947 10730396953 31.27 0.66 0.01 68.05 179308 574
Others 50510681023 49838768673 28 0.76 4.07 67.16 420009 1798
METS 154103396349 150775055764 18.97 0.52 1.74 78.77 2012449 4783
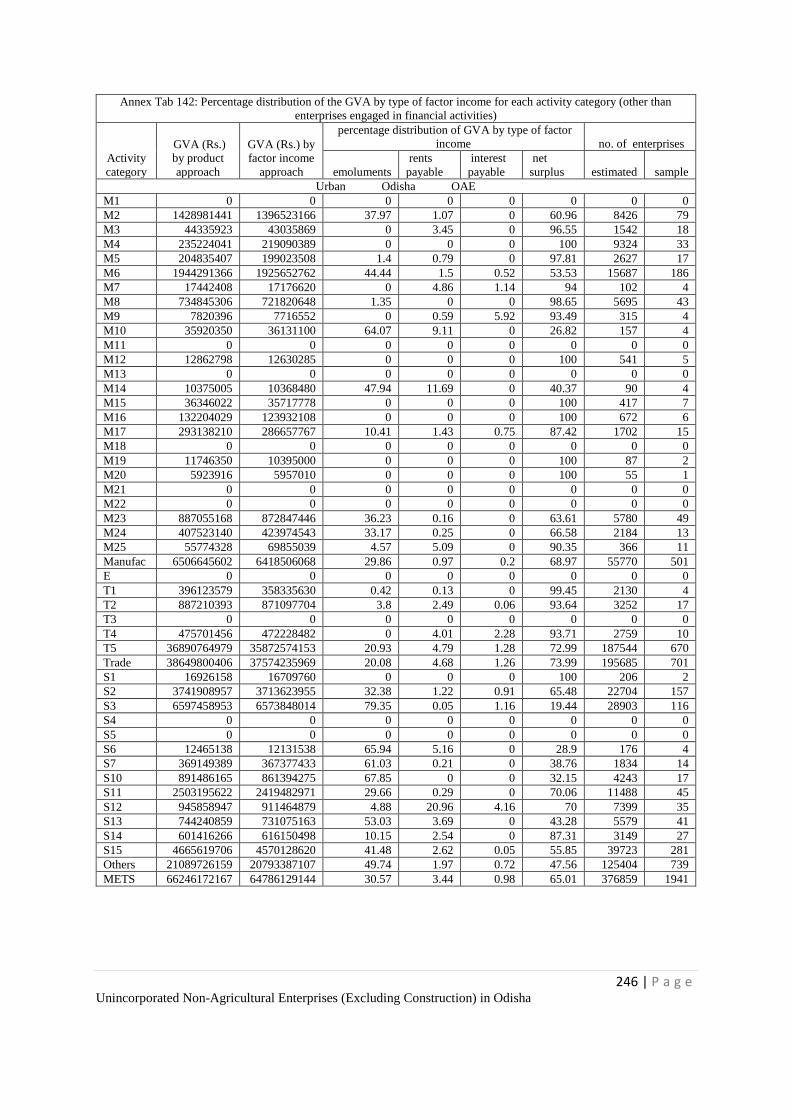
246 | P a g e Unincorporated Non-Agricultural Enterprises (Excluding Construction) in Odisha
Annex Tab 142: Percentage distribution of the GVA by type of factor income for each activity category (other than
enterprises engaged in financial activities)
Activity
category
GVA (Rs.)
by product
approach
GVA (Rs.) by
factor income
approach
percentage distribution of GVA by type of factor
income no. of enterprises
emoluments
rents
payable
interest
payable
net
surplus estimated sample
Urban Odisha OAE
M1 0 0 0 0 0 0 0 0
M2 1428981441 1396523166 37.97 1.07 0 60.96 8426 79
M3 44335923 43035869 0 3.45 0 96.55 1542 18
M4 235224041 219090389 0 0 0 100 9324 33
M5 204835407 199023508 1.4 0.79 0 97.81 2627 17
M6 1944291366 1925652762 44.44 1.5 0.52 53.53 15687 186
M7 17442408 17176620 0 4.86 1.14 94 102 4
M8 734845306 721820648 1.35 0 0 98.65 5695 43
M9 7820396 7716552 0 0.59 5.92 93.49 315 4
M10 35920350 36131100 64.07 9.11 0 26.82 157 4
M11 0 0 0 0 0 0 0 0
M12 12862798 12630285 0 0 0 100 541 5
M13 0 0 0 0 0 0 0 0
M14 10375005 10368480 47.94 11.69 0 40.37 90 4
M15 36346022 35717778 0 0 0 100 417 7
M16 132204029 123932108 0 0 0 100 672 6
M17 293138210 286657767 10.41 1.43 0.75 87.42 1702 15
M18 0 0 0 0 0 0 0 0
M19 11746350 10395000 0 0 0 100 87 2
M20 5923916 5957010 0 0 0 100 55 1
M21 0 0 0 0 0 0 0 0
M22 0 0 0 0 0 0 0 0
M23 887055168 872847446 36.23 0.16 0 63.61 5780 49
M24 407523140 423974543 33.17 0.25 0 66.58 2184 13
M25 55774328 69855039 4.57 5.09 0 90.35 366 11
Manufac 6506645602 6418506068 29.86 0.97 0.2 68.97 55770 501
E 0 0 0 0 0 0 0 0
T1 396123579 358335630 0.42 0.13 0 99.45 2130 4
T2 887210393 871097704 3.8 2.49 0.06 93.64 3252 17
T3 0 0 0 0 0 0 0 0
T4 475701456 472228482 0 4.01 2.28 93.71 2759 10
T5 36890764979 35872574153 20.93 4.79 1.28 72.99 187544 670
Trade 38649800406 37574235969 20.08 4.68 1.26 73.99 195685 701
S1 16926158 16709760 0 0 0 100 206 2
S2 3741908957 3713623955 32.38 1.22 0.91 65.48 22704 157
S3 6597458953 6573848014 79.35 0.05 1.16 19.44 28903 116
S4 0 0 0 0 0 0 0 0
S5 0 0 0 0 0 0 0 0
S6 12465138 12131538 65.94 5.16 0 28.9 176 4
S7 369149389 367377433 61.03 0.21 0 38.76 1834 14
S10 891486165 861394275 67.85 0 0 32.15 4243 17
S11 2503195622 2419482971 29.66 0.29 0 70.06 11488 45
S12 945858947 911464879 4.88 20.96 4.16 70 7399 35
S13 744240859 731075163 53.03 3.69 0 43.28 5579 41
S14 601416266 616150498 10.15 2.54 0 87.31 3149 27
S15 4665619706 4570128620 41.48 2.62 0.05 55.85 39723 281
Others 21089726159 20793387107 49.74 1.97 0.72 47.56 125404 739
METS 66246172167 64786129144 30.57 3.44 0.98 65.01 376859 1941
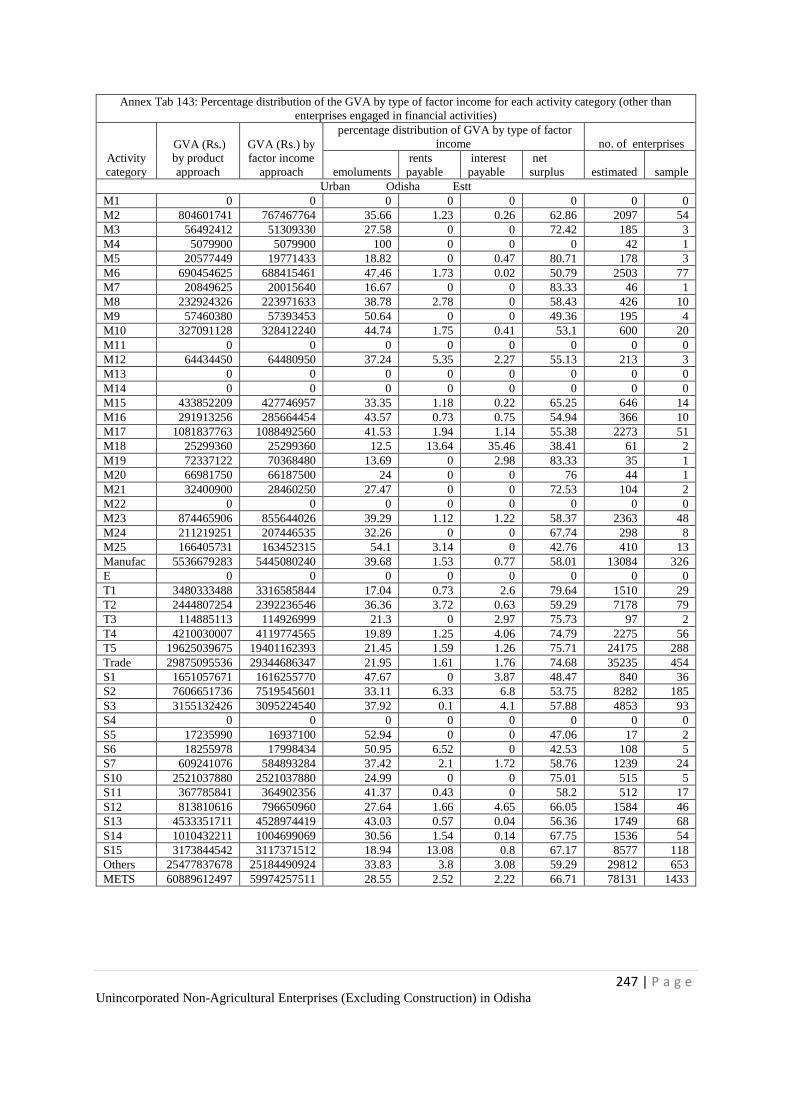
247 | P a g e Unincorporated Non-Agricultural Enterprises (Excluding Construction) in Odisha
Annex Tab 143: Percentage distribution of the GVA by type of factor income for each activity category (other than
enterprises engaged in financial activities)
Activity
category
GVA (Rs.)
by product
approach
GVA (Rs.) by
factor income
approach
percentage distribution of GVA by type of factor
income no. of enterprises
emoluments
rents
payable
interest
payable
net
surplus estimated sample
Urban Odisha Estt
M1 0 0 0 0 0 0 0 0
M2 804601741 767467764 35.66 1.23 0.26 62.86 2097 54
M3 56492412 51309330 27.58 0 0 72.42 185 3
M4 5079900 5079900 100 0 0 0 42 1
M5 20577449 19771433 18.82 0 0.47 80.71 178 3
M6 690454625 688415461 47.46 1.73 0.02 50.79 2503 77
M7 20849625 20015640 16.67 0 0 83.33 46 1
M8 232924326 223971633 38.78 2.78 0 58.43 426 10
M9 57460380 57393453 50.64 0 0 49.36 195 4
M10 327091128 328412240 44.74 1.75 0.41 53.1 600 20
M11 0 0 0 0 0 0 0 0
M12 64434450 64480950 37.24 5.35 2.27 55.13 213 3
M13 0 0 0 0 0 0 0 0
M14 0 0 0 0 0 0 0 0
M15 433852209 427746957 33.35 1.18 0.22 65.25 646 14
M16 291913256 285664454 43.57 0.73 0.75 54.94 366 10
M17 1081837763 1088492560 41.53 1.94 1.14 55.38 2273 51
M18 25299360 25299360 12.5 13.64 35.46 38.41 61 2
M19 72337122 70368480 13.69 0 2.98 83.33 35 1
M20 66981750 66187500 24 0 0 76 44 1
M21 32400900 28460250 27.47 0 0 72.53 104 2
M22 0 0 0 0 0 0 0 0
M23 874465906 855644026 39.29 1.12 1.22 58.37 2363 48
M24 211219251 207446535 32.26 0 0 67.74 298 8
M25 166405731 163452315 54.1 3.14 0 42.76 410 13
Manufac 5536679283 5445080240 39.68 1.53 0.77 58.01 13084 326
E 0 0 0 0 0 0 0 0
T1 3480333488 3316585844 17.04 0.73 2.6 79.64 1510 29
T2 2444807254 2392236546 36.36 3.72 0.63 59.29 7178 79
T3 114885113 114926999 21.3 0 2.97 75.73 97 2
T4 4210030007 4119774565 19.89 1.25 4.06 74.79 2275 56
T5 19625039675 19401162393 21.45 1.59 1.26 75.71 24175 288
Trade 29875095536 29344686347 21.95 1.61 1.76 74.68 35235 454
S1 1651057671 1616255770 47.67 0 3.87 48.47 840 36
S2 7606651736 7519545601 33.11 6.33 6.8 53.75 8282 185
S3 3155132426 3095224540 37.92 0.1 4.1 57.88 4853 93
S4 0 0 0 0 0 0 0 0
S5 17235990 16937100 52.94 0 0 47.06 17 2
S6 18255978 17998434 50.95 6.52 0 42.53 108 5
S7 609241076 584893284 37.42 2.1 1.72 58.76 1239 24
S10 2521037880 2521037880 24.99 0 0 75.01 515 5
S11 367785841 364902356 41.37 0.43 0 58.2 512 17
S12 813810616 796650960 27.64 1.66 4.65 66.05 1584 46
S13 4533351711 4528974419 43.03 0.57 0.04 56.36 1749 68
S14 1010432211 1004699069 30.56 1.54 0.14 67.75 1536 54
S15 3173844542 3117371512 18.94 13.08 0.8 67.17 8577 118
Others 25477837678 25184490924 33.83 3.8 3.08 59.29 29812 653
METS 60889612497 59974257511 28.55 2.52 2.22 66.71 78131 1433
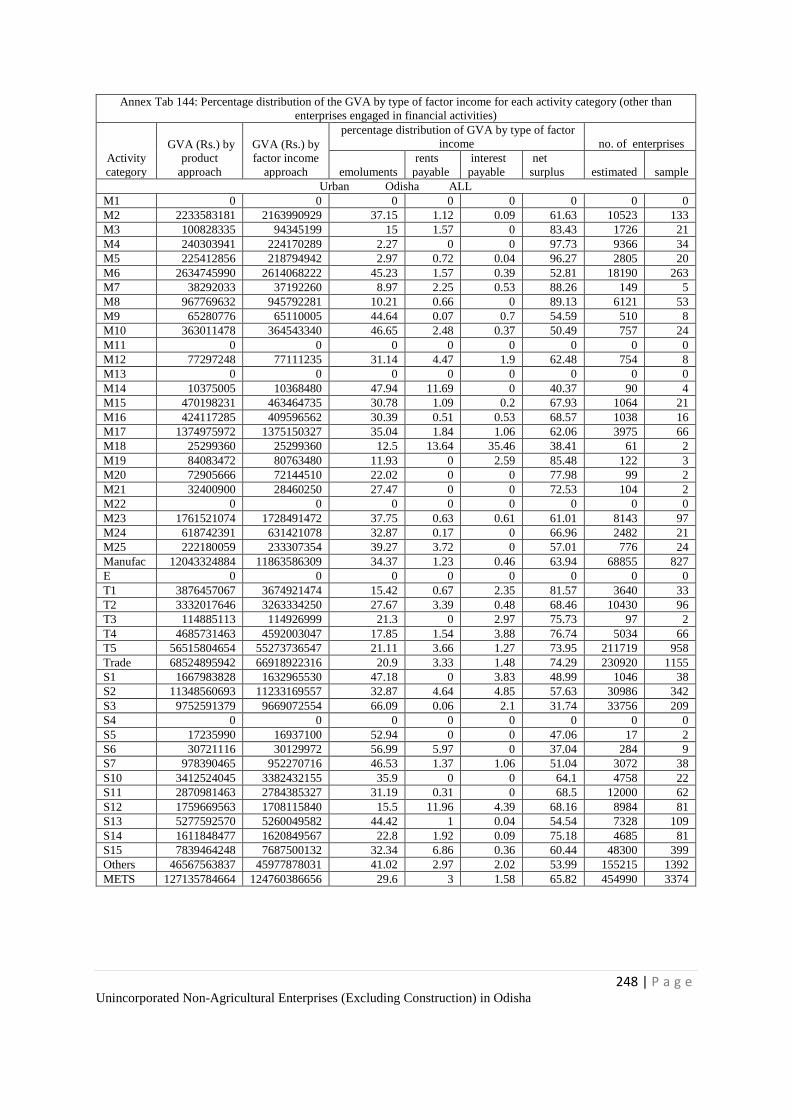
248 | P a g e Unincorporated Non-Agricultural Enterprises (Excluding Construction) in Odisha
Annex Tab 144: Percentage distribution of the GVA by type of factor income for each activity category (other than
enterprises engaged in financial activities)
Activity
category
GVA (Rs.) by
product
approach
GVA (Rs.) by
factor income
approach
percentage distribution of GVA by type of factor
income no. of enterprises
emoluments
rents
payable
interest
payable
net
surplus estimated sample
Urban Odisha ALL
M1 0 0 0 0 0 0 0 0
M2 2233583181 2163990929 37.15 1.12 0.09 61.63 10523 133
M3 100828335 94345199 15 1.57 0 83.43 1726 21
M4 240303941 224170289 2.27 0 0 97.73 9366 34
M5 225412856 218794942 2.97 0.72 0.04 96.27 2805 20
M6 2634745990 2614068222 45.23 1.57 0.39 52.81 18190 263
M7 38292033 37192260 8.97 2.25 0.53 88.26 149 5
M8 967769632 945792281 10.21 0.66 0 89.13 6121 53
M9 65280776 65110005 44.64 0.07 0.7 54.59 510 8
M10 363011478 364543340 46.65 2.48 0.37 50.49 757 24
M11 0 0 0 0 0 0 0 0
M12 77297248 77111235 31.14 4.47 1.9 62.48 754 8
M13 0 0 0 0 0 0 0 0
M14 10375005 10368480 47.94 11.69 0 40.37 90 4
M15 470198231 463464735 30.78 1.09 0.2 67.93 1064 21
M16 424117285 409596562 30.39 0.51 0.53 68.57 1038 16
M17 1374975972 1375150327 35.04 1.84 1.06 62.06 3975 66
M18 25299360 25299360 12.5 13.64 35.46 38.41 61 2
M19 84083472 80763480 11.93 0 2.59 85.48 122 3
M20 72905666 72144510 22.02 0 0 77.98 99 2
M21 32400900 28460250 27.47 0 0 72.53 104 2
M22 0 0 0 0 0 0 0 0
M23 1761521074 1728491472 37.75 0.63 0.61 61.01 8143 97
M24 618742391 631421078 32.87 0.17 0 66.96 2482 21
M25 222180059 233307354 39.27 3.72 0 57.01 776 24
Manufac 12043324884 11863586309 34.37 1.23 0.46 63.94 68855 827
E 0 0 0 0 0 0 0 0
T1 3876457067 3674921474 15.42 0.67 2.35 81.57 3640 33
T2 3332017646 3263334250 27.67 3.39 0.48 68.46 10430 96
T3 114885113 114926999 21.3 0 2.97 75.73 97 2
T4 4685731463 4592003047 17.85 1.54 3.88 76.74 5034 66
T5 56515804654 55273736547 21.11 3.66 1.27 73.95 211719 958
Trade 68524895942 66918922316 20.9 3.33 1.48 74.29 230920 1155
S1 1667983828 1632965530 47.18 0 3.83 48.99 1046 38
S2 11348560693 11233169557 32.87 4.64 4.85 57.63 30986 342
S3 9752591379 9669072554 66.09 0.06 2.1 31.74 33756 209
S4 0 0 0 0 0 0 0 0
S5 17235990 16937100 52.94 0 0 47.06 17 2
S6 30721116 30129972 56.99 5.97 0 37.04 284 9
S7 978390465 952270716 46.53 1.37 1.06 51.04 3072 38
S10 3412524045 3382432155 35.9 0 0 64.1 4758 22
S11 2870981463 2784385327 31.19 0.31 0 68.5 12000 62
S12 1759669563 1708115840 15.5 11.96 4.39 68.16 8984 81
S13 5277592570 5260049582 44.42 1 0.04 54.54 7328 109
S14 1611848477 1620849567 22.8 1.92 0.09 75.18 4685 81
S15 7839464248 7687500132 32.34 6.86 0.36 60.44 48300 399
Others 46567563837 45977878031 41.02 2.97 2.02 53.99 155215 1392
METS 127135784664 124760386656 29.6 3 1.58 65.82 454990 3374
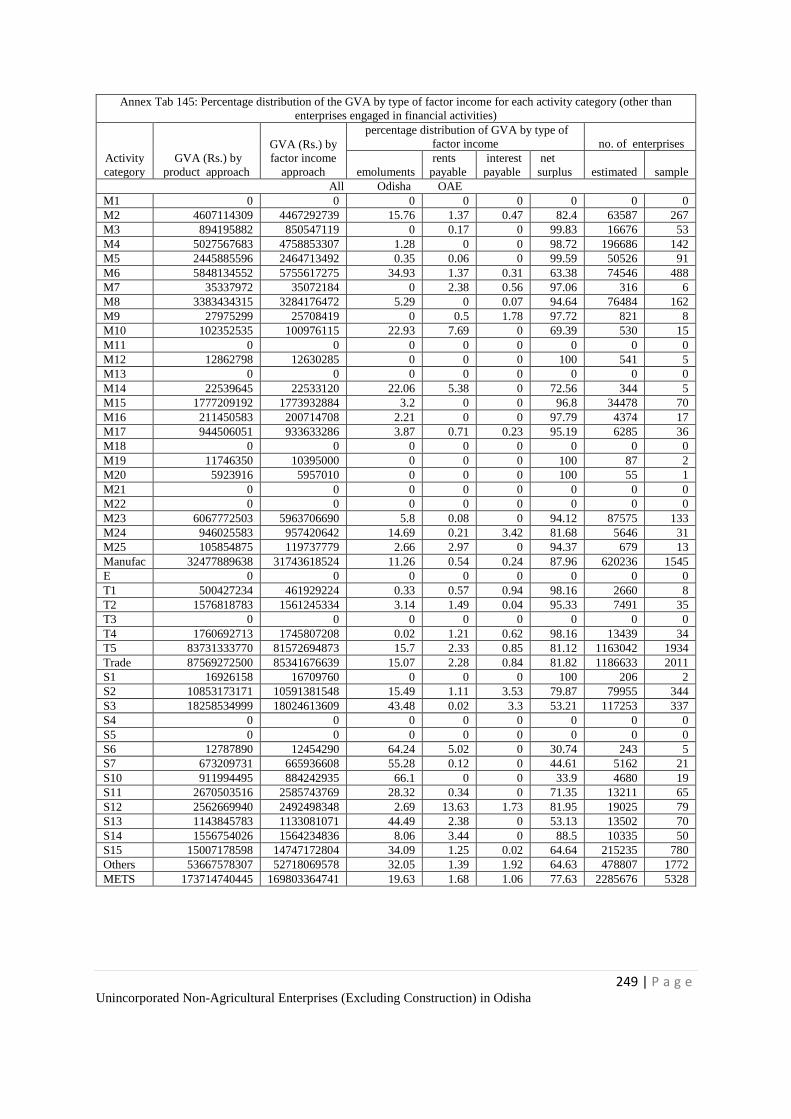
249 | P a g e Unincorporated Non-Agricultural Enterprises (Excluding Construction) in Odisha
Annex Tab 145: Percentage distribution of the GVA by type of factor income for each activity category (other than
enterprises engaged in financial activities)
Activity
category
GVA (Rs.) by
product approach
GVA (Rs.) by
factor income
approach
percentage distribution of GVA by type of
factor income no. of enterprises
emoluments
rents
payable
interest
payable
net
surplus estimated sample
All Odisha OAE
M1 0 0 0 0 0 0 0 0
M2 4607114309 4467292739 15.76 1.37 0.47 82.4 63587 267
M3 894195882 850547119 0 0.17 0 99.83 16676 53
M4 5027567683 4758853307 1.28 0 0 98.72 196686 142
M5 2445885596 2464713492 0.35 0.06 0 99.59 50526 91
M6 5848134552 5755617275 34.93 1.37 0.31 63.38 74546 488
M7 35337972 35072184 0 2.38 0.56 97.06 316 6
M8 3383434315 3284176472 5.29 0 0.07 94.64 76484 162
M9 27975299 25708419 0 0.5 1.78 97.72 821 8
M10 102352535 100976115 22.93 7.69 0 69.39 530 15
M11 0 0 0 0 0 0 0 0
M12 12862798 12630285 0 0 0 100 541 5
M13 0 0 0 0 0 0 0 0
M14 22539645 22533120 22.06 5.38 0 72.56 344 5
M15 1777209192 1773932884 3.2 0 0 96.8 34478 70
M16 211450583 200714708 2.21 0 0 97.79 4374 17
M17 944506051 933633286 3.87 0.71 0.23 95.19 6285 36
M18 0 0 0 0 0 0 0 0
M19 11746350 10395000 0 0 0 100 87 2
M20 5923916 5957010 0 0 0 100 55 1
M21 0 0 0 0 0 0 0 0
M22 0 0 0 0 0 0 0 0
M23 6067772503 5963706690 5.8 0.08 0 94.12 87575 133
M24 946025583 957420642 14.69 0.21 3.42 81.68 5646 31
M25 105854875 119737779 2.66 2.97 0 94.37 679 13
Manufac 32477889638 31743618524 11.26 0.54 0.24 87.96 620236 1545
E 0 0 0 0 0 0 0 0
T1 500427234 461929224 0.33 0.57 0.94 98.16 2660 8
T2 1576818783 1561245334 3.14 1.49 0.04 95.33 7491 35
T3 0 0 0 0 0 0 0 0
T4 1760692713 1745807208 0.02 1.21 0.62 98.16 13439 34
T5 83731333770 81572694873 15.7 2.33 0.85 81.12 1163042 1934
Trade 87569272500 85341676639 15.07 2.28 0.84 81.82 1186633 2011
S1 16926158 16709760 0 0 0 100 206 2
S2 10853173171 10591381548 15.49 1.11 3.53 79.87 79955 344
S3 18258534999 18024613609 43.48 0.02 3.3 53.21 117253 337
S4 0 0 0 0 0 0 0 0
S5 0 0 0 0 0 0 0 0
S6 12787890 12454290 64.24 5.02 0 30.74 243 5
S7 673209731 665936608 55.28 0.12 0 44.61 5162 21
S10 911994495 884242935 66.1 0 0 33.9 4680 19
S11 2670503516 2585743769 28.32 0.34 0 71.35 13211 65
S12 2562669940 2492498348 2.69 13.63 1.73 81.95 19025 79
S13 1143845783 1133081071 44.49 2.38 0 53.13 13502 70
S14 1556754026 1564234836 8.06 3.44 0 88.5 10335 50
S15 15007178598 14747172804 34.09 1.25 0.02 64.64 215235 780
Others 53667578307 52718069578 32.05 1.39 1.92 64.63 478807 1772
METS 173714740445 169803364741 19.63 1.68 1.06 77.63 2285676 5328
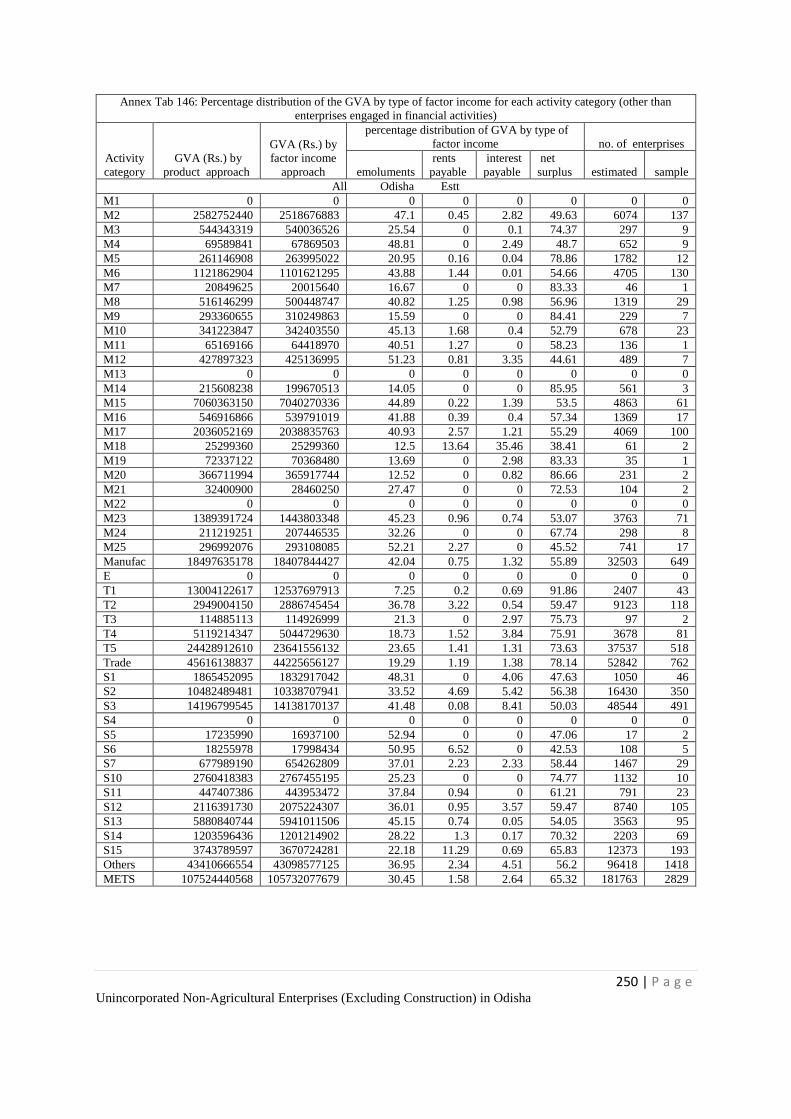
250 | P a g e Unincorporated Non-Agricultural Enterprises (Excluding Construction) in Odisha
Annex Tab 146: Percentage distribution of the GVA by type of factor income for each activity category (other than
enterprises engaged in financial activities)
Activity
category
GVA (Rs.) by
product approach
GVA (Rs.) by
factor income
approach
percentage distribution of GVA by type of
factor income no. of enterprises
emoluments
rents
payable
interest
payable
net
surplus estimated sample
All Odisha Estt
M1 0 0 0 0 0 0 0 0
M2 2582752440 2518676883 47.1 0.45 2.82 49.63 6074 137
M3 544343319 540036526 25.54 0 0.1 74.37 297 9
M4 69589841 67869503 48.81 0 2.49 48.7 652 9
M5 261146908 263995022 20.95 0.16 0.04 78.86 1782 12
M6 1121862904 1101621295 43.88 1.44 0.01 54.66 4705 130
M7 20849625 20015640 16.67 0 0 83.33 46 1
M8 516146299 500448747 40.82 1.25 0.98 56.96 1319 29
M9 293360655 310249863 15.59 0 0 84.41 229 7
M10 341223847 342403550 45.13 1.68 0.4 52.79 678 23
M11 65169166 64418970 40.51 1.27 0 58.23 136 1
M12 427897323 425136995 51.23 0.81 3.35 44.61 489 7
M13 0 0 0 0 0 0 0 0
M14 215608238 199670513 14.05 0 0 85.95 561 3
M15 7060363150 7040270336 44.89 0.22 1.39 53.5 4863 61
M16 546916866 539791019 41.88 0.39 0.4 57.34 1369 17
M17 2036052169 2038835763 40.93 2.57 1.21 55.29 4069 100
M18 25299360 25299360 12.5 13.64 35.46 38.41 61 2
M19 72337122 70368480 13.69 0 2.98 83.33 35 1
M20 366711994 365917744 12.52 0 0.82 86.66 231 2
M21 32400900 28460250 27.47 0 0 72.53 104 2
M22 0 0 0 0 0 0 0 0
M23 1389391724 1443803348 45.23 0.96 0.74 53.07 3763 71
M24 211219251 207446535 32.26 0 0 67.74 298 8
M25 296992076 293108085 52.21 2.27 0 45.52 741 17
Manufac 18497635178 18407844427 42.04 0.75 1.32 55.89 32503 649
E 0 0 0 0 0 0 0 0
T1 13004122617 12537697913 7.25 0.2 0.69 91.86 2407 43
T2 2949004150 2886745454 36.78 3.22 0.54 59.47 9123 118
T3 114885113 114926999 21.3 0 2.97 75.73 97 2
T4 5119214347 5044729630 18.73 1.52 3.84 75.91 3678 81
T5 24428912610 23641556132 23.65 1.41 1.31 73.63 37537 518
Trade 45616138837 44225656127 19.29 1.19 1.38 78.14 52842 762
S1 1865452095 1832917042 48.31 0 4.06 47.63 1050 46
S2 10482489481 10338707941 33.52 4.69 5.42 56.38 16430 350
S3 14196799545 14138170137 41.48 0.08 8.41 50.03 48544 491
S4 0 0 0 0 0 0 0 0
S5 17235990 16937100 52.94 0 0 47.06 17 2
S6 18255978 17998434 50.95 6.52 0 42.53 108 5
S7 677989190 654262809 37.01 2.23 2.33 58.44 1467 29
S10 2760418383 2767455195 25.23 0 0 74.77 1132 10
S11 447407386 443953472 37.84 0.94 0 61.21 791 23
S12 2116391730 2075224307 36.01 0.95 3.57 59.47 8740 105
S13 5880840744 5941011506 45.15 0.74 0.05 54.05 3563 95
S14 1203596436 1201214902 28.22 1.3 0.17 70.32 2203 69
S15 3743789597 3670724281 22.18 11.29 0.69 65.83 12373 193
Others 43410666554 43098577125 36.95 2.34 4.51 56.2 96418 1418
METS 107524440568 105732077679 30.45 1.58 2.64 65.32 181763 2829
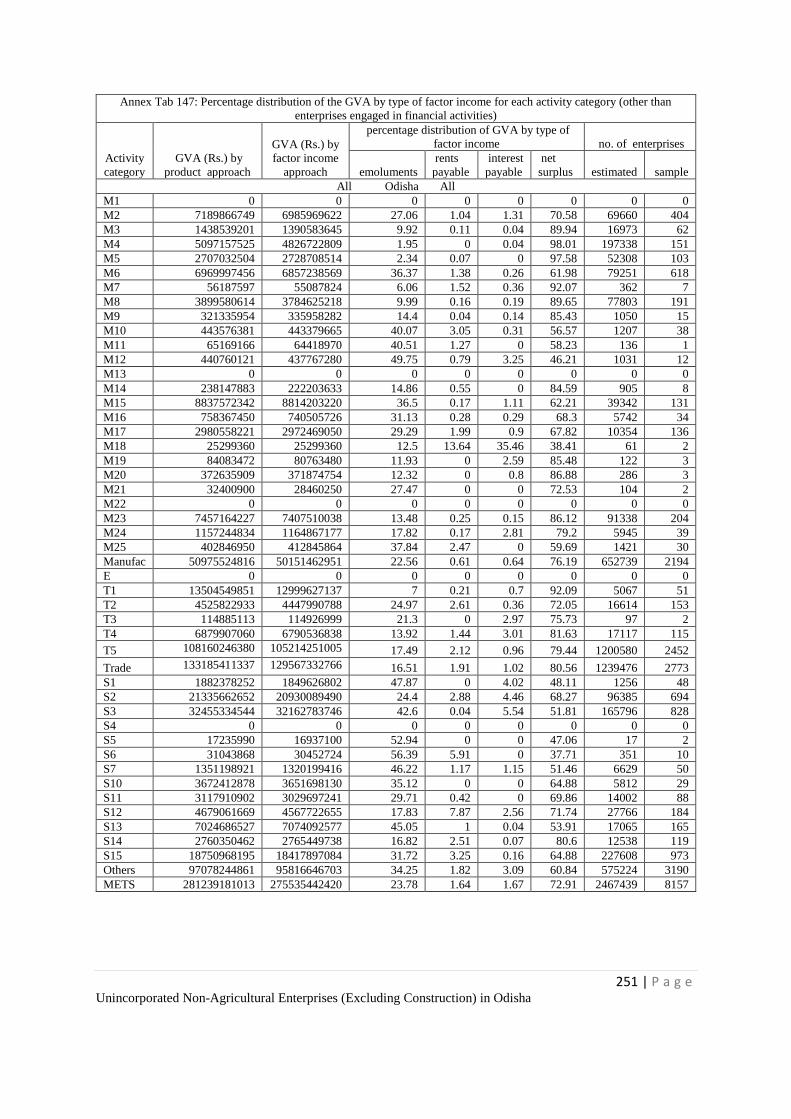
251 | P a g e Unincorporated Non-Agricultural Enterprises (Excluding Construction) in Odisha
Annex Tab 147: Percentage distribution of the GVA by type of factor income for each activity category (other than
enterprises engaged in financial activities)
Activity
category
GVA (Rs.) by
product approach
GVA (Rs.) by
factor income
approach
percentage distribution of GVA by type of
factor income no. of enterprises
emoluments
rents
payable
interest
payable
net
surplus estimated sample
All Odisha All
M1 0 0 0 0 0 0 0 0
M2 7189866749 6985969622 27.06 1.04 1.31 70.58 69660 404
M3 1438539201 1390583645 9.92 0.11 0.04 89.94 16973 62
M4 5097157525 4826722809 1.95 0 0.04 98.01 197338 151
M5 2707032504 2728708514 2.34 0.07 0 97.58 52308 103
M6 6969997456 6857238569 36.37 1.38 0.26 61.98 79251 618
M7 56187597 55087824 6.06 1.52 0.36 92.07 362 7
M8 3899580614 3784625218 9.99 0.16 0.19 89.65 77803 191
M9 321335954 335958282 14.4 0.04 0.14 85.43 1050 15
M10 443576381 443379665 40.07 3.05 0.31 56.57 1207 38
M11 65169166 64418970 40.51 1.27 0 58.23 136 1
M12 440760121 437767280 49.75 0.79 3.25 46.21 1031 12
M13 0 0 0 0 0 0 0 0
M14 238147883 222203633 14.86 0.55 0 84.59 905 8
M15 8837572342 8814203220 36.5 0.17 1.11 62.21 39342 131
M16 758367450 740505726 31.13 0.28 0.29 68.3 5742 34
M17 2980558221 2972469050 29.29 1.99 0.9 67.82 10354 136
M18 25299360 25299360 12.5 13.64 35.46 38.41 61 2
M19 84083472 80763480 11.93 0 2.59 85.48 122 3
M20 372635909 371874754 12.32 0 0.8 86.88 286 3
M21 32400900 28460250 27.47 0 0 72.53 104 2
M22 0 0 0 0 0 0 0 0
M23 7457164227 7407510038 13.48 0.25 0.15 86.12 91338 204
M24 1157244834 1164867177 17.82 0.17 2.81 79.2 5945 39
M25 402846950 412845864 37.84 2.47 0 59.69 1421 30
Manufac 50975524816 50151462951 22.56 0.61 0.64 76.19 652739 2194
E 0 0 0 0 0 0 0 0
T1 13504549851 12999627137 7 0.21 0.7 92.09 5067 51
T2 4525822933 4447990788 24.97 2.61 0.36 72.05 16614 153
T3 114885113 114926999 21.3 0 2.97 75.73 97 2
T4 6879907060 6790536838 13.92 1.44 3.01 81.63 17117 115
T5 108160246380 105214251005 17.49 2.12 0.96 79.44 1200580 2452
Trade 133185411337 129567332766 16.51 1.91 1.02 80.56 1239476 2773
S1 1882378252 1849626802 47.87 0 4.02 48.11 1256 48
S2 21335662652 20930089490 24.4 2.88 4.46 68.27 96385 694
S3 32455334544 32162783746 42.6 0.04 5.54 51.81 165796 828
S4 0 0 0 0 0 0 0 0
S5 17235990 16937100 52.94 0 0 47.06 17 2
S6 31043868 30452724 56.39 5.91 0 37.71 351 10
S7 1351198921 1320199416 46.22 1.17 1.15 51.46 6629 50
S10 3672412878 3651698130 35.12 0 0 64.88 5812 29
S11 3117910902 3029697241 29.71 0.42 0 69.86 14002 88
S12 4679061669 4567722655 17.83 7.87 2.56 71.74 27766 184
S13 7024686527 7074092577 45.05 1 0.04 53.91 17065 165
S14 2760350462 2765449738 16.82 2.51 0.07 80.6 12538 119
S15 18750968195 18417897084 31.72 3.25 0.16 64.88 227608 973
Others 97078244861 95816646703 34.25 1.82 3.09 60.84 575224 3190
METS 281239181013 275535442420 23.78 1.64 1.67 72.91 2467439 8157
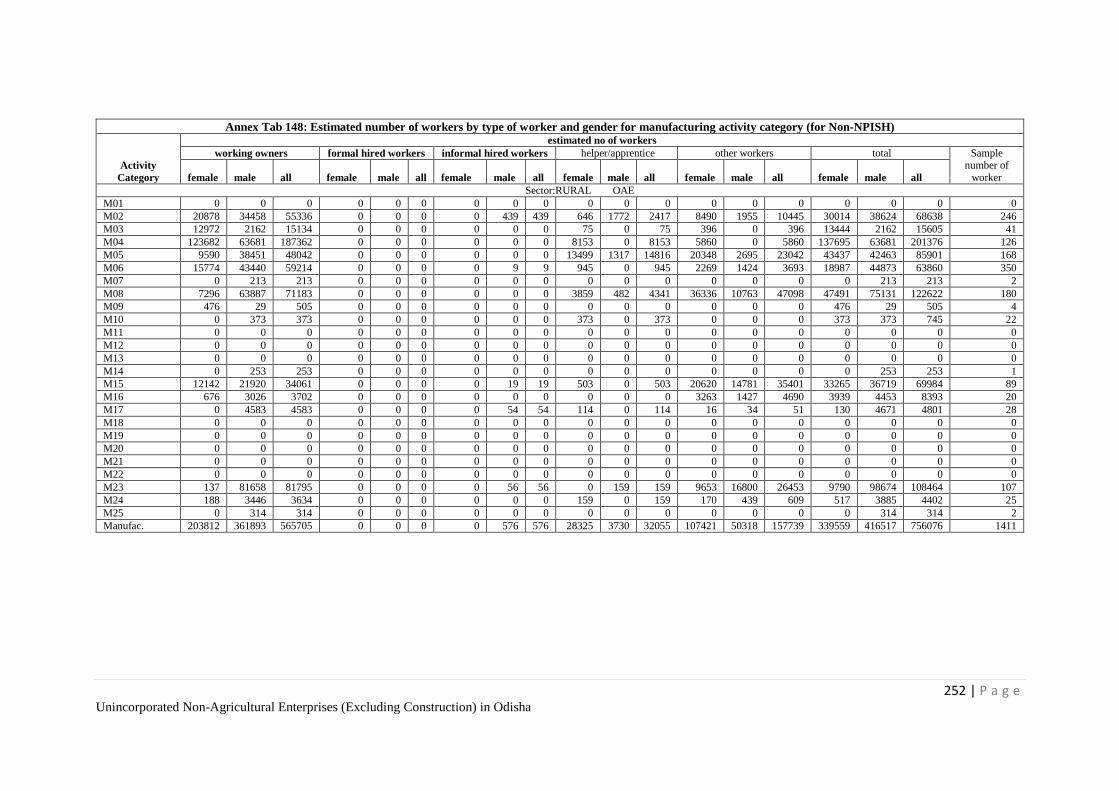
252 | P a g e Unincorporated Non-Agricultural Enterprises (Excluding Construction) in Odisha
Annex Tab 148: Estimated number of workers by type of worker and gender for manufacturing activity category (for Non-NPISH)
Activity
Category
estimated no of workers
working owners formal hired workers informal hired workers helper/apprentice other workers total Sample number of
worker female male all female male all female male all female male all female male all female male all
Sector:RURAL OAE
M01 0 0 0 0 0 0 0 0 0 0 0 0 0 0 0 0 0 0 0
M02 20878 34458 55336 0 0 0 0 439 439 646 1772 2417 8490 1955 10445 30014 38624 68638 246
M03 12972 2162 15134 0 0 0 0 0 0 75 0 75 396 0 396 13444 2162 15605 41
M04 123682 63681 187362 0 0 0 0 0 0 8153 0 8153 5860 0 5860 137695 63681 201376 126
M05 9590 38451 48042 0 0 0 0 0 0 13499 1317 14816 20348 2695 23042 43437 42463 85901 168
M06 15774 43440 59214 0 0 0 0 9 9 945 0 945 2269 1424 3693 18987 44873 63860 350
M07 0 213 213 0 0 0 0 0 0 0 0 0 0 0 0 0 213 213 2
M08 7296 63887 71183 0 0 0 0 0 0 3859 482 4341 36336 10763 47098 47491 75131 122622 180
M09 476 29 505 0 0 0 0 0 0 0 0 0 0 0 0 476 29 505 4
M10 0 373 373 0 0 0 0 0 0 373 0 373 0 0 0 373 373 745 22
M11 0 0 0 0 0 0 0 0 0 0 0 0 0 0 0 0 0 0 0
M12 0 0 0 0 0 0 0 0 0 0 0 0 0 0 0 0 0 0 0
M13 0 0 0 0 0 0 0 0 0 0 0 0 0 0 0 0 0 0 0
M14 0 253 253 0 0 0 0 0 0 0 0 0 0 0 0 0 253 253 1
M15 12142 21920 34061 0 0 0 0 19 19 503 0 503 20620 14781 35401 33265 36719 69984 89
M16 676 3026 3702 0 0 0 0 0 0 0 0 0 3263 1427 4690 3939 4453 8393 20
M17 0 4583 4583 0 0 0 0 54 54 114 0 114 16 34 51 130 4671 4801 28
M18 0 0 0 0 0 0 0 0 0 0 0 0 0 0 0 0 0 0 0
M19 0 0 0 0 0 0 0 0 0 0 0 0 0 0 0 0 0 0 0
M20 0 0 0 0 0 0 0 0 0 0 0 0 0 0 0 0 0 0 0
M21 0 0 0 0 0 0 0 0 0 0 0 0 0 0 0 0 0 0 0
M22 0 0 0 0 0 0 0 0 0 0 0 0 0 0 0 0 0 0 0
M23 137 81658 81795 0 0 0 0 56 56 0 159 159 9653 16800 26453 9790 98674 108464 107
M24 188 3446 3634 0 0 0 0 0 0 159 0 159 170 439 609 517 3885 4402 25
M25 0 314 314 0 0 0 0 0 0 0 0 0 0 0 0 0 314 314 2
Manufac. 203812 361893 565705 0 0 0 0 576 576 28325 3730 32055 107421 50318 157739 339559 416517 756076 1411
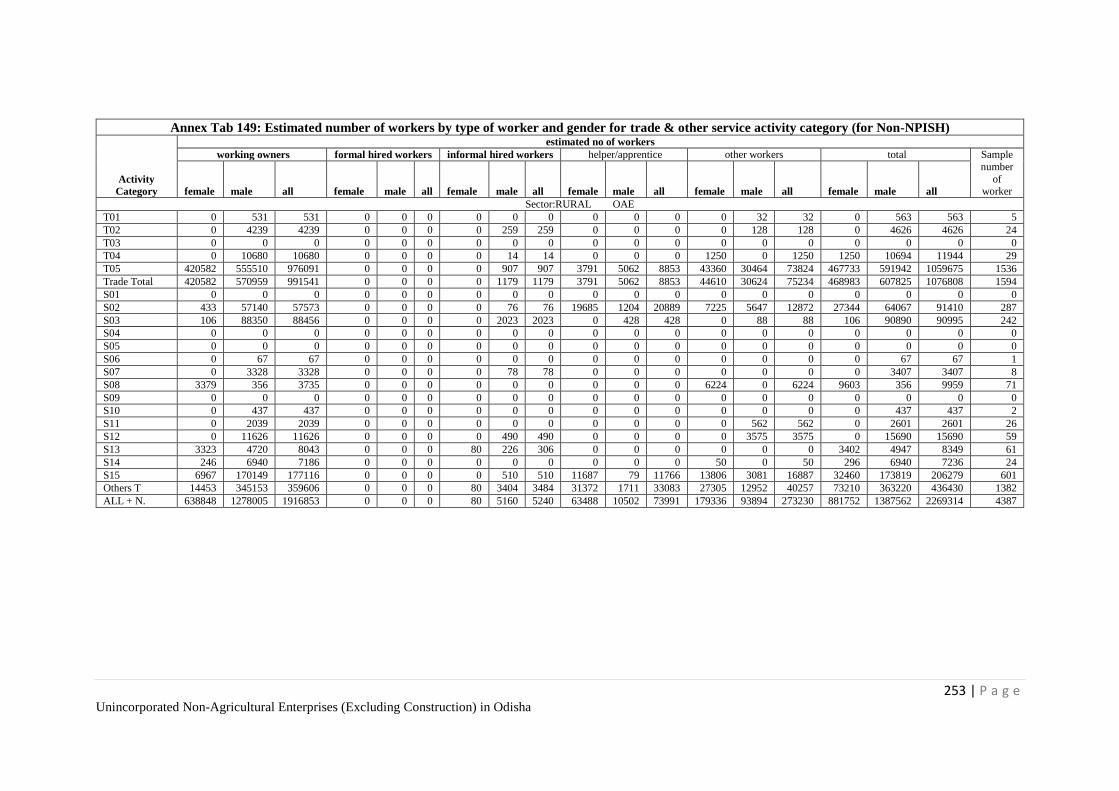
253 | P a g e Unincorporated Non-Agricultural Enterprises (Excluding Construction) in Odisha
Annex Tab 149: Estimated number of workers by type of worker and gender for trade & other service activity category (for Non-NPISH)
Activity
Category
estimated no of workers
working owners formal hired workers informal hired workers helper/apprentice other workers total Sample
number
of worker female male all female male all female male all female male all female male all female male all
Sector:RURAL OAE
T01 0 531 531 0 0 0 0 0 0 0 0 0 0 32 32 0 563 563 5
T02 0 4239 4239 0 0 0 0 259 259 0 0 0 0 128 128 0 4626 4626 24
T03 0 0 0 0 0 0 0 0 0 0 0 0 0 0 0 0 0 0 0
T04 0 10680 10680 0 0 0 0 14 14 0 0 0 1250 0 1250 1250 10694 11944 29
T05 420582 555510 976091 0 0 0 0 907 907 3791 5062 8853 43360 30464 73824 467733 591942 1059675 1536
Trade Total 420582 570959 991541 0 0 0 0 1179 1179 3791 5062 8853 44610 30624 75234 468983 607825 1076808 1594
S01 0 0 0 0 0 0 0 0 0 0 0 0 0 0 0 0 0 0 0
S02 433 57140 57573 0 0 0 0 76 76 19685 1204 20889 7225 5647 12872 27344 64067 91410 287
S03 106 88350 88456 0 0 0 0 2023 2023 0 428 428 0 88 88 106 90890 90995 242
S04 0 0 0 0 0 0 0 0 0 0 0 0 0 0 0 0 0 0 0
S05 0 0 0 0 0 0 0 0 0 0 0 0 0 0 0 0 0 0 0
S06 0 67 67 0 0 0 0 0 0 0 0 0 0 0 0 0 67 67 1
S07 0 3328 3328 0 0 0 0 78 78 0 0 0 0 0 0 0 3407 3407 8
S08 3379 356 3735 0 0 0 0 0 0 0 0 0 6224 0 6224 9603 356 9959 71
S09 0 0 0 0 0 0 0 0 0 0 0 0 0 0 0 0 0 0 0
S10 0 437 437 0 0 0 0 0 0 0 0 0 0 0 0 0 437 437 2
S11 0 2039 2039 0 0 0 0 0 0 0 0 0 0 562 562 0 2601 2601 26
S12 0 11626 11626 0 0 0 0 490 490 0 0 0 0 3575 3575 0 15690 15690 59
S13 3323 4720 8043 0 0 0 80 226 306 0 0 0 0 0 0 3402 4947 8349 61
S14 246 6940 7186 0 0 0 0 0 0 0 0 0 50 0 50 296 6940 7236 24
S15 6967 170149 177116 0 0 0 0 510 510 11687 79 11766 13806 3081 16887 32460 173819 206279 601
Others T 14453 345153 359606 0 0 0 80 3404 3484 31372 1711 33083 27305 12952 40257 73210 363220 436430 1382
ALL + N. 638848 1278005 1916853 0 0 0 80 5160 5240 63488 10502 73991 179336 93894 273230 881752 1387562 2269314 4387
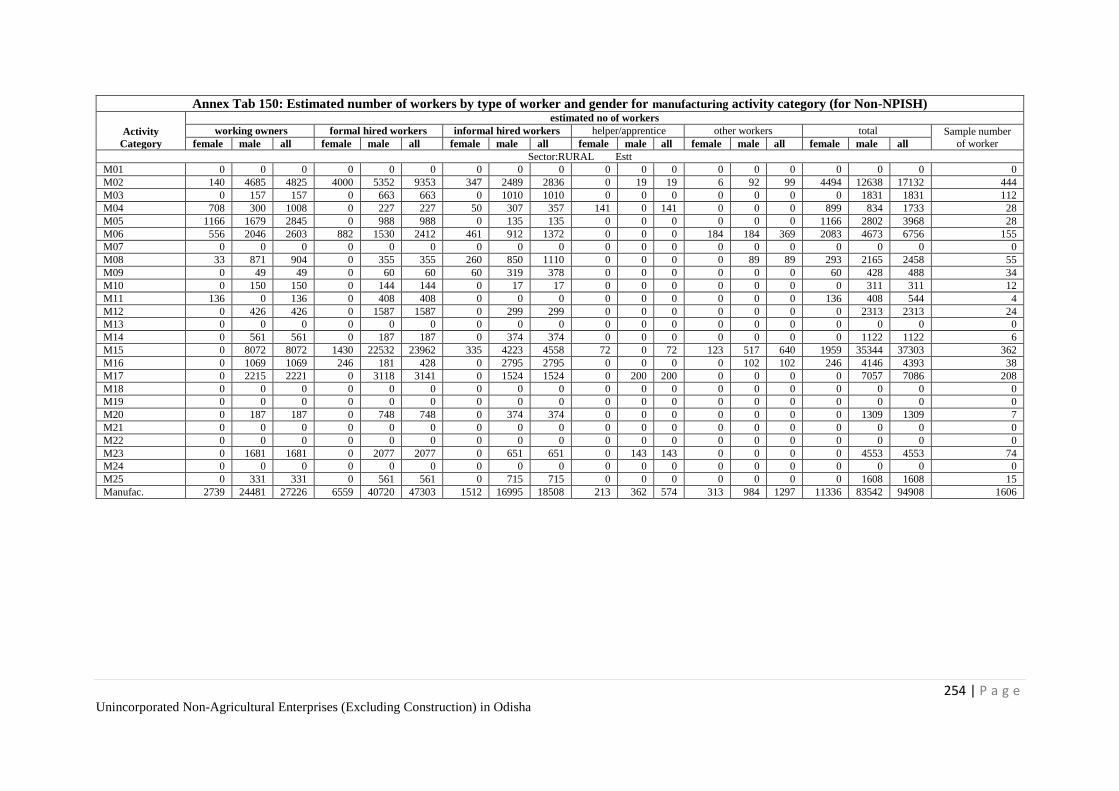
254 | P a g e Unincorporated Non-Agricultural Enterprises (Excluding Construction) in Odisha
Annex Tab 150: Estimated number of workers by type of worker and gender for manufacturing activity category (for Non-NPISH)
Activity
Category
estimated no of workers
working owners formal hired workers informal hired workers helper/apprentice other workers total Sample number
of worker female male all female male all female male all female male all female male all female male all
Sector:RURAL Estt
M01 0 0 0 0 0 0 0 0 0 0 0 0 0 0 0 0 0 0 0
M02 140 4685 4825 4000 5352 9353 347 2489 2836 0 19 19 6 92 99 4494 12638 17132 444
M03 0 157 157 0 663 663 0 1010 1010 0 0 0 0 0 0 0 1831 1831 112
M04 708 300 1008 0 227 227 50 307 357 141 0 141 0 0 0 899 834 1733 28
M05 1166 1679 2845 0 988 988 0 135 135 0 0 0 0 0 0 1166 2802 3968 28
M06 556 2046 2603 882 1530 2412 461 912 1372 0 0 0 184 184 369 2083 4673 6756 155
M07 0 0 0 0 0 0 0 0 0 0 0 0 0 0 0 0 0 0 0
M08 33 871 904 0 355 355 260 850 1110 0 0 0 0 89 89 293 2165 2458 55
M09 0 49 49 0 60 60 60 319 378 0 0 0 0 0 0 60 428 488 34
M10 0 150 150 0 144 144 0 17 17 0 0 0 0 0 0 0 311 311 12
M11 136 0 136 0 408 408 0 0 0 0 0 0 0 0 0 136 408 544 4
M12 0 426 426 0 1587 1587 0 299 299 0 0 0 0 0 0 0 2313 2313 24
M13 0 0 0 0 0 0 0 0 0 0 0 0 0 0 0 0 0 0 0
M14 0 561 561 0 187 187 0 374 374 0 0 0 0 0 0 0 1122 1122 6
M15 0 8072 8072 1430 22532 23962 335 4223 4558 72 0 72 123 517 640 1959 35344 37303 362
M16 0 1069 1069 246 181 428 0 2795 2795 0 0 0 0 102 102 246 4146 4393 38
M17 0 2215 2221 0 3118 3141 0 1524 1524 0 200 200 0 0 0 0 7057 7086 208
M18 0 0 0 0 0 0 0 0 0 0 0 0 0 0 0 0 0 0 0
M19 0 0 0 0 0 0 0 0 0 0 0 0 0 0 0 0 0 0 0
M20 0 187 187 0 748 748 0 374 374 0 0 0 0 0 0 0 1309 1309 7
M21 0 0 0 0 0 0 0 0 0 0 0 0 0 0 0 0 0 0 0
M22 0 0 0 0 0 0 0 0 0 0 0 0 0 0 0 0 0 0 0
M23 0 1681 1681 0 2077 2077 0 651 651 0 143 143 0 0 0 0 4553 4553 74
M24 0 0 0 0 0 0 0 0 0 0 0 0 0 0 0 0 0 0 0
M25 0 331 331 0 561 561 0 715 715 0 0 0 0 0 0 0 1608 1608 15
Manufac. 2739 24481 27226 6559 40720 47303 1512 16995 18508 213 362 574 313 984 1297 11336 83542 94908 1606
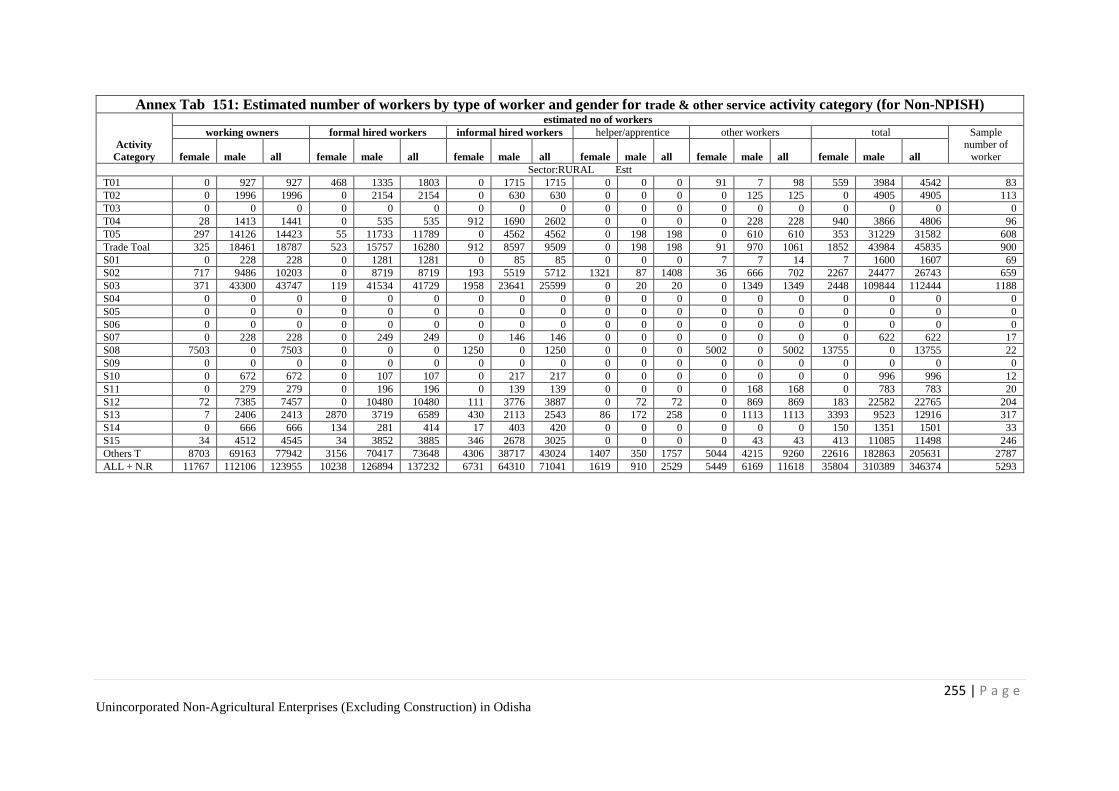
255 | P a g e Unincorporated Non-Agricultural Enterprises (Excluding Construction) in Odisha
Annex Tab 151: Estimated number of workers by type of worker and gender for trade & other service activity category (for Non-NPISH)
Activity
Category
estimated no of workers
working owners formal hired workers informal hired workers helper/apprentice other workers total Sample number of
worker female male all female male all female male all female male all female male all female male all
Sector:RURAL Estt
T01 0 927 927 468 1335 1803 0 1715 1715 0 0 0 91 7 98 559 3984 4542 83
T02 0 1996 1996 0 2154 2154 0 630 630 0 0 0 0 125 125 0 4905 4905 113
T03 0 0 0 0 0 0 0 0 0 0 0 0 0 0 0 0 0 0 0
T04 28 1413 1441 0 535 535 912 1690 2602 0 0 0 0 228 228 940 3866 4806 96
T05 297 14126 14423 55 11733 11789 0 4562 4562 0 198 198 0 610 610 353 31229 31582 608
Trade Toal 325 18461 18787 523 15757 16280 912 8597 9509 0 198 198 91 970 1061 1852 43984 45835 900
S01 0 228 228 0 1281 1281 0 85 85 0 0 0 7 7 14 7 1600 1607 69
S02 717 9486 10203 0 8719 8719 193 5519 5712 1321 87 1408 36 666 702 2267 24477 26743 659
S03 371 43300 43747 119 41534 41729 1958 23641 25599 0 20 20 0 1349 1349 2448 109844 112444 1188
S04 0 0 0 0 0 0 0 0 0 0 0 0 0 0 0 0 0 0 0
S05 0 0 0 0 0 0 0 0 0 0 0 0 0 0 0 0 0 0 0
S06 0 0 0 0 0 0 0 0 0 0 0 0 0 0 0 0 0 0 0
S07 0 228 228 0 249 249 0 146 146 0 0 0 0 0 0 0 622 622 17
S08 7503 0 7503 0 0 0 1250 0 1250 0 0 0 5002 0 5002 13755 0 13755 22
S09 0 0 0 0 0 0 0 0 0 0 0 0 0 0 0 0 0 0 0
S10 0 672 672 0 107 107 0 217 217 0 0 0 0 0 0 0 996 996 12
S11 0 279 279 0 196 196 0 139 139 0 0 0 0 168 168 0 783 783 20
S12 72 7385 7457 0 10480 10480 111 3776 3887 0 72 72 0 869 869 183 22582 22765 204
S13 7 2406 2413 2870 3719 6589 430 2113 2543 86 172 258 0 1113 1113 3393 9523 12916 317
S14 0 666 666 134 281 414 17 403 420 0 0 0 0 0 0 150 1351 1501 33
S15 34 4512 4545 34 3852 3885 346 2678 3025 0 0 0 0 43 43 413 11085 11498 246
Others T 8703 69163 77942 3156 70417 73648 4306 38717 43024 1407 350 1757 5044 4215 9260 22616 182863 205631 2787
ALL + N.R 11767 112106 123955 10238 126894 137232 6731 64310 71041 1619 910 2529 5449 6169 11618 35804 310389 346374 5293
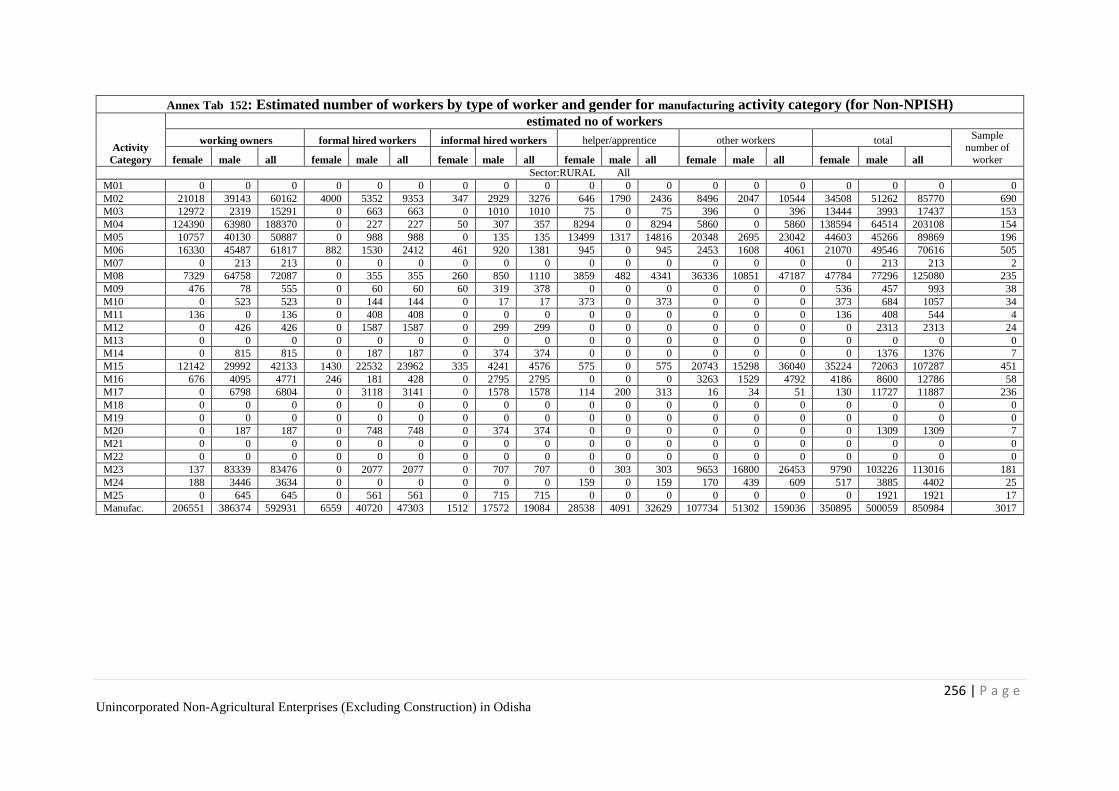
256 | P a g e Unincorporated Non-Agricultural Enterprises (Excluding Construction) in Odisha
Annex Tab 152: Estimated number of workers by type of worker and gender for manufacturing activity category (for Non-NPISH)
Activity
Category
estimated no of workers
working owners formal hired workers informal hired workers helper/apprentice other workers total Sample
number of
worker female male all female male all female male all female male all female male all female male all
Sector:RURAL All
M01 0 0 0 0 0 0 0 0 0 0 0 0 0 0 0 0 0 0 0
M02 21018 39143 60162 4000 5352 9353 347 2929 3276 646 1790 2436 8496 2047 10544 34508 51262 85770 690
M03 12972 2319 15291 0 663 663 0 1010 1010 75 0 75 396 0 396 13444 3993 17437 153
M04 124390 63980 188370 0 227 227 50 307 357 8294 0 8294 5860 0 5860 138594 64514 203108 154
M05 10757 40130 50887 0 988 988 0 135 135 13499 1317 14816 20348 2695 23042 44603 45266 89869 196
M06 16330 45487 61817 882 1530 2412 461 920 1381 945 0 945 2453 1608 4061 21070 49546 70616 505
M07 0 213 213 0 0 0 0 0 0 0 0 0 0 0 0 0 213 213 2
M08 7329 64758 72087 0 355 355 260 850 1110 3859 482 4341 36336 10851 47187 47784 77296 125080 235
M09 476 78 555 0 60 60 60 319 378 0 0 0 0 0 0 536 457 993 38
M10 0 523 523 0 144 144 0 17 17 373 0 373 0 0 0 373 684 1057 34
M11 136 0 136 0 408 408 0 0 0 0 0 0 0 0 0 136 408 544 4
M12 0 426 426 0 1587 1587 0 299 299 0 0 0 0 0 0 0 2313 2313 24
M13 0 0 0 0 0 0 0 0 0 0 0 0 0 0 0 0 0 0 0
M14 0 815 815 0 187 187 0 374 374 0 0 0 0 0 0 0 1376 1376 7
M15 12142 29992 42133 1430 22532 23962 335 4241 4576 575 0 575 20743 15298 36040 35224 72063 107287 451
M16 676 4095 4771 246 181 428 0 2795 2795 0 0 0 3263 1529 4792 4186 8600 12786 58
M17 0 6798 6804 0 3118 3141 0 1578 1578 114 200 313 16 34 51 130 11727 11887 236
M18 0 0 0 0 0 0 0 0 0 0 0 0 0 0 0 0 0 0 0
M19 0 0 0 0 0 0 0 0 0 0 0 0 0 0 0 0 0 0 0
M20 0 187 187 0 748 748 0 374 374 0 0 0 0 0 0 0 1309 1309 7
M21 0 0 0 0 0 0 0 0 0 0 0 0 0 0 0 0 0 0 0
M22 0 0 0 0 0 0 0 0 0 0 0 0 0 0 0 0 0 0 0
M23 137 83339 83476 0 2077 2077 0 707 707 0 303 303 9653 16800 26453 9790 103226 113016 181
M24 188 3446 3634 0 0 0 0 0 0 159 0 159 170 439 609 517 3885 4402 25
M25 0 645 645 0 561 561 0 715 715 0 0 0 0 0 0 0 1921 1921 17
Manufac. 206551 386374 592931 6559 40720 47303 1512 17572 19084 28538 4091 32629 107734 51302 159036 350895 500059 850984 3017
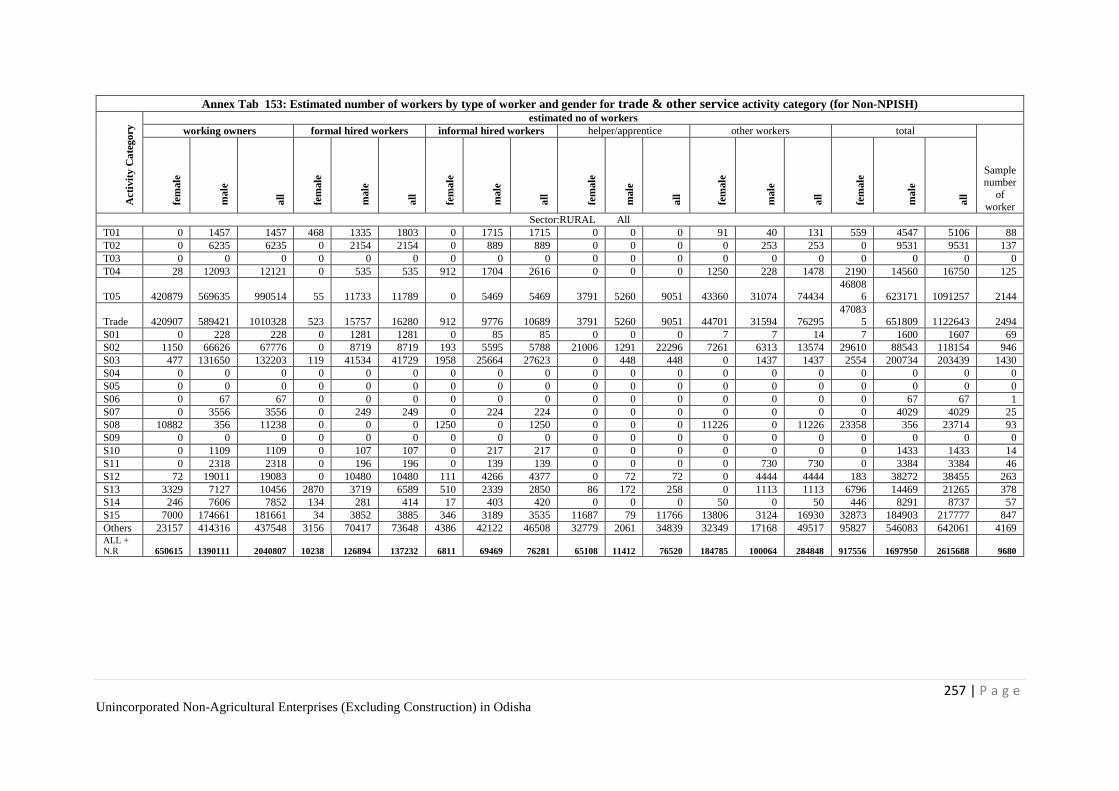
257 | P a g e Unincorporated Non-Agricultural Enterprises (Excluding Construction) in Odisha
Annex Tab 153: Estimated number of workers by type of worker and gender for trade & other service activity category (for Non-NPISH)
Acti
vit
y C
ate
go
ry estimated no of workers
working owners formal hired workers informal hired workers helper/apprentice other workers total
Sample number
of
worker
fem
ale
male
all
fem
ale
male
all
fem
ale
male
all
fem
ale
male
all
fem
ale
male
all
fem
ale
male
all
Sector:RURAL All
T01 0 1457 1457 468 1335 1803 0 1715 1715 0 0 0 91 40 131 559 4547 5106 88
T02 0 6235 6235 0 2154 2154 0 889 889 0 0 0 0 253 253 0 9531 9531 137
T03 0 0 0 0 0 0 0 0 0 0 0 0 0 0 0 0 0 0 0
T04 28 12093 12121 0 535 535 912 1704 2616 0 0 0 1250 228 1478 2190 14560 16750 125
T05 420879 569635 990514 55 11733 11789 0 5469 5469 3791 5260 9051 43360 31074 74434 46808
6 623171 1091257 2144
Trade 420907 589421 1010328 523 15757 16280 912 9776 10689 3791 5260 9051 44701 31594 76295
47083
5 651809 1122643 2494
S01 0 228 228 0 1281 1281 0 85 85 0 0 0 7 7 14 7 1600 1607 69
S02 1150 66626 67776 0 8719 8719 193 5595 5788 21006 1291 22296 7261 6313 13574 29610 88543 118154 946
S03 477 131650 132203 119 41534 41729 1958 25664 27623 0 448 448 0 1437 1437 2554 200734 203439 1430
S04 0 0 0 0 0 0 0 0 0 0 0 0 0 0 0 0 0 0 0
S05 0 0 0 0 0 0 0 0 0 0 0 0 0 0 0 0 0 0 0
S06 0 67 67 0 0 0 0 0 0 0 0 0 0 0 0 0 67 67 1
S07 0 3556 3556 0 249 249 0 224 224 0 0 0 0 0 0 0 4029 4029 25
S08 10882 356 11238 0 0 0 1250 0 1250 0 0 0 11226 0 11226 23358 356 23714 93
S09 0 0 0 0 0 0 0 0 0 0 0 0 0 0 0 0 0 0 0
S10 0 1109 1109 0 107 107 0 217 217 0 0 0 0 0 0 0 1433 1433 14
S11 0 2318 2318 0 196 196 0 139 139 0 0 0 0 730 730 0 3384 3384 46
S12 72 19011 19083 0 10480 10480 111 4266 4377 0 72 72 0 4444 4444 183 38272 38455 263
S13 3329 7127 10456 2870 3719 6589 510 2339 2850 86 172 258 0 1113 1113 6796 14469 21265 378
S14 246 7606 7852 134 281 414 17 403 420 0 0 0 50 0 50 446 8291 8737 57
S15 7000 174661 181661 34 3852 3885 346 3189 3535 11687 79 11766 13806 3124 16930 32873 184903 217777 847
Others 23157 414316 437548 3156 70417 73648 4386 42122 46508 32779 2061 34839 32349 17168 49517 95827 546083 642061 4169 ALL +
N.R 650615 1390111 2040807 10238 126894 137232 6811 69469 76281 65108 11412 76520 184785 100064 284848 917556 1697950 2615688 9680
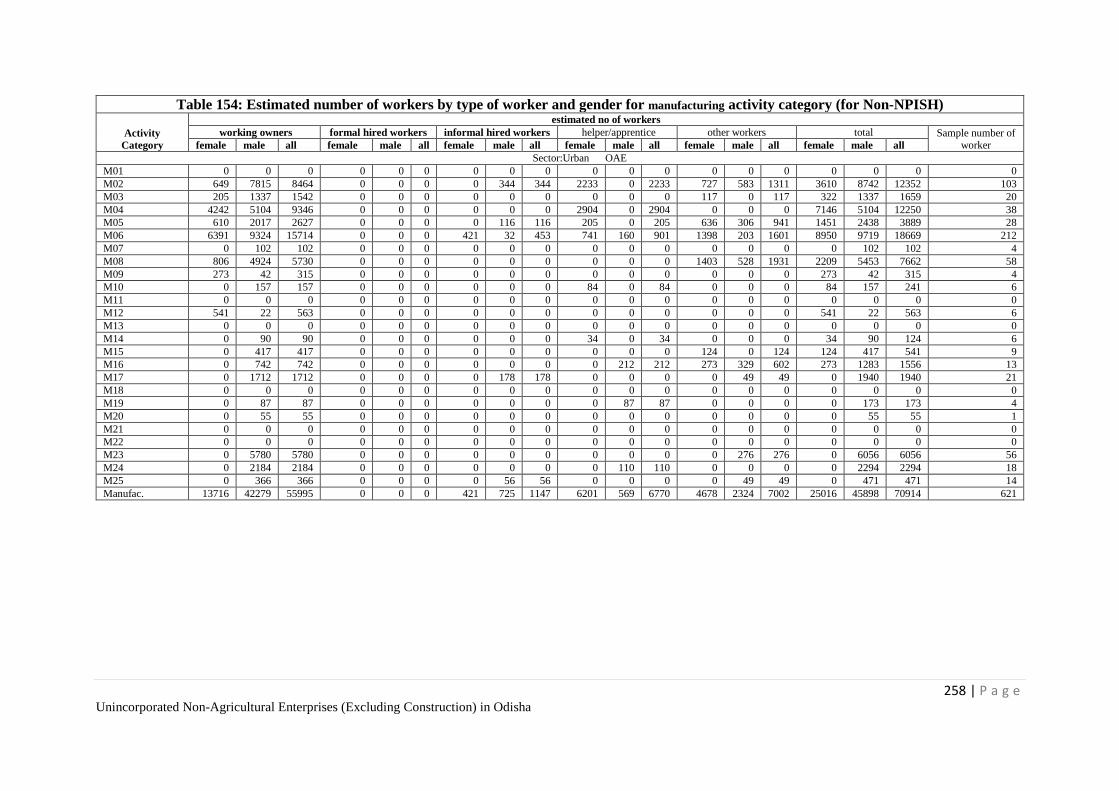
258 | P a g e Unincorporated Non-Agricultural Enterprises (Excluding Construction) in Odisha
Table 154: Estimated number of workers by type of worker and gender for manufacturing activity category (for Non-NPISH)
Activity
Category
estimated no of workers
working owners formal hired workers informal hired workers helper/apprentice other workers total Sample number of worker female male all female male all female male all female male all female male all female male all
Sector:Urban OAE
M01 0 0 0 0 0 0 0 0 0 0 0 0 0 0 0 0 0 0 0
M02 649 7815 8464 0 0 0 0 344 344 2233 0 2233 727 583 1311 3610 8742 12352 103
M03 205 1337 1542 0 0 0 0 0 0 0 0 0 117 0 117 322 1337 1659 20
M04 4242 5104 9346 0 0 0 0 0 0 2904 0 2904 0 0 0 7146 5104 12250 38
M05 610 2017 2627 0 0 0 0 116 116 205 0 205 636 306 941 1451 2438 3889 28
M06 6391 9324 15714 0 0 0 421 32 453 741 160 901 1398 203 1601 8950 9719 18669 212
M07 0 102 102 0 0 0 0 0 0 0 0 0 0 0 0 0 102 102 4
M08 806 4924 5730 0 0 0 0 0 0 0 0 0 1403 528 1931 2209 5453 7662 58
M09 273 42 315 0 0 0 0 0 0 0 0 0 0 0 0 273 42 315 4
M10 0 157 157 0 0 0 0 0 0 84 0 84 0 0 0 84 157 241 6
M11 0 0 0 0 0 0 0 0 0 0 0 0 0 0 0 0 0 0 0
M12 541 22 563 0 0 0 0 0 0 0 0 0 0 0 0 541 22 563 6
M13 0 0 0 0 0 0 0 0 0 0 0 0 0 0 0 0 0 0 0
M14 0 90 90 0 0 0 0 0 0 34 0 34 0 0 0 34 90 124 6
M15 0 417 417 0 0 0 0 0 0 0 0 0 124 0 124 124 417 541 9
M16 0 742 742 0 0 0 0 0 0 0 212 212 273 329 602 273 1283 1556 13
M17 0 1712 1712 0 0 0 0 178 178 0 0 0 0 49 49 0 1940 1940 21
M18 0 0 0 0 0 0 0 0 0 0 0 0 0 0 0 0 0 0 0
M19 0 87 87 0 0 0 0 0 0 0 87 87 0 0 0 0 173 173 4
M20 0 55 55 0 0 0 0 0 0 0 0 0 0 0 0 0 55 55 1
M21 0 0 0 0 0 0 0 0 0 0 0 0 0 0 0 0 0 0 0
M22 0 0 0 0 0 0 0 0 0 0 0 0 0 0 0 0 0 0 0
M23 0 5780 5780 0 0 0 0 0 0 0 0 0 0 276 276 0 6056 6056 56
M24 0 2184 2184 0 0 0 0 0 0 0 110 110 0 0 0 0 2294 2294 18
M25 0 366 366 0 0 0 0 56 56 0 0 0 0 49 49 0 471 471 14
Manufac. 13716 42279 55995 0 0 0 421 725 1147 6201 569 6770 4678 2324 7002 25016 45898 70914 621
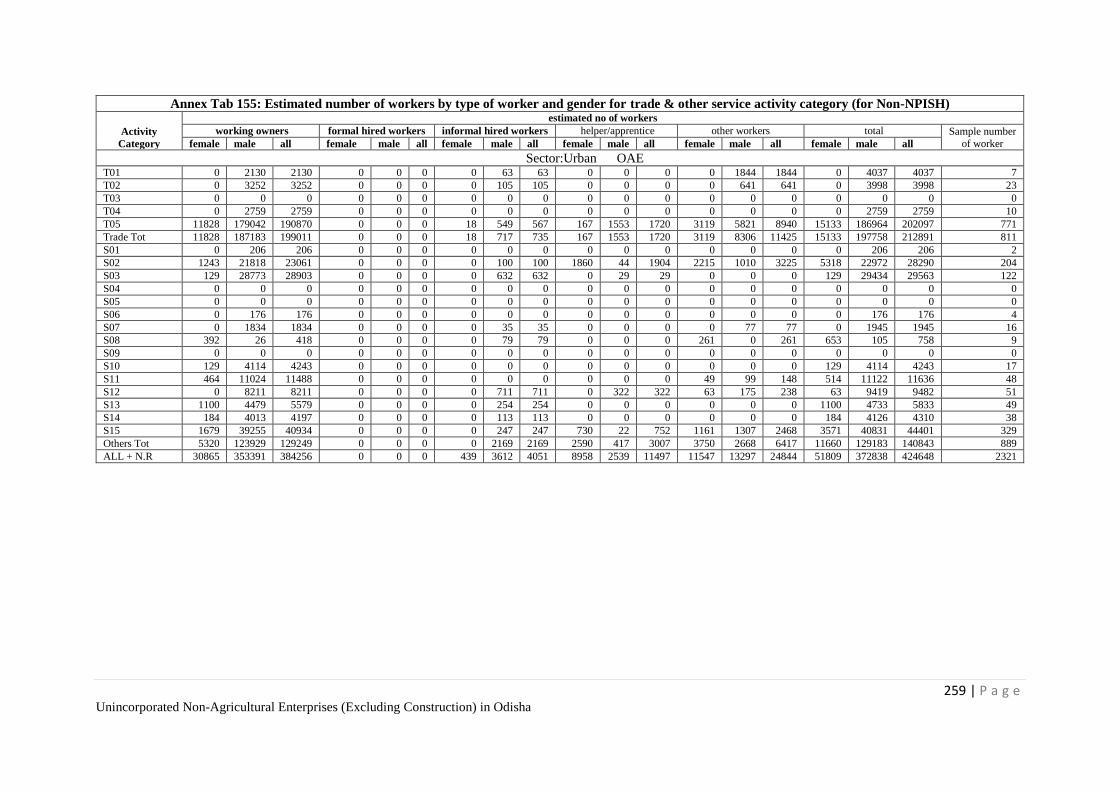
259 | P a g e Unincorporated Non-Agricultural Enterprises (Excluding Construction) in Odisha
Annex Tab 155: Estimated number of workers by type of worker and gender for trade & other service activity category (for Non-NPISH)
Activity
Category
estimated no of workers
working owners formal hired workers informal hired workers helper/apprentice other workers total Sample number
of worker female male all female male all female male all female male all female male all female male all
Sector:Urban OAE T01 0 2130 2130 0 0 0 0 63 63 0 0 0 0 1844 1844 0 4037 4037 7
T02 0 3252 3252 0 0 0 0 105 105 0 0 0 0 641 641 0 3998 3998 23
T03 0 0 0 0 0 0 0 0 0 0 0 0 0 0 0 0 0 0 0
T04 0 2759 2759 0 0 0 0 0 0 0 0 0 0 0 0 0 2759 2759 10
T05 11828 179042 190870 0 0 0 18 549 567 167 1553 1720 3119 5821 8940 15133 186964 202097 771
Trade Tot 11828 187183 199011 0 0 0 18 717 735 167 1553 1720 3119 8306 11425 15133 197758 212891 811
S01 0 206 206 0 0 0 0 0 0 0 0 0 0 0 0 0 206 206 2
S02 1243 21818 23061 0 0 0 0 100 100 1860 44 1904 2215 1010 3225 5318 22972 28290 204
S03 129 28773 28903 0 0 0 0 632 632 0 29 29 0 0 0 129 29434 29563 122
S04 0 0 0 0 0 0 0 0 0 0 0 0 0 0 0 0 0 0 0
S05 0 0 0 0 0 0 0 0 0 0 0 0 0 0 0 0 0 0 0
S06 0 176 176 0 0 0 0 0 0 0 0 0 0 0 0 0 176 176 4
S07 0 1834 1834 0 0 0 0 35 35 0 0 0 0 77 77 0 1945 1945 16
S08 392 26 418 0 0 0 0 79 79 0 0 0 261 0 261 653 105 758 9
S09 0 0 0 0 0 0 0 0 0 0 0 0 0 0 0 0 0 0 0
S10 129 4114 4243 0 0 0 0 0 0 0 0 0 0 0 0 129 4114 4243 17
S11 464 11024 11488 0 0 0 0 0 0 0 0 0 49 99 148 514 11122 11636 48
S12 0 8211 8211 0 0 0 0 711 711 0 322 322 63 175 238 63 9419 9482 51
S13 1100 4479 5579 0 0 0 0 254 254 0 0 0 0 0 0 1100 4733 5833 49
S14 184 4013 4197 0 0 0 0 113 113 0 0 0 0 0 0 184 4126 4310 38
S15 1679 39255 40934 0 0 0 0 247 247 730 22 752 1161 1307 2468 3571 40831 44401 329
Others Tot 5320 123929 129249 0 0 0 0 2169 2169 2590 417 3007 3750 2668 6417 11660 129183 140843 889
ALL + N.R 30865 353391 384256 0 0 0 439 3612 4051 8958 2539 11497 11547 13297 24844 51809 372838 424648 2321
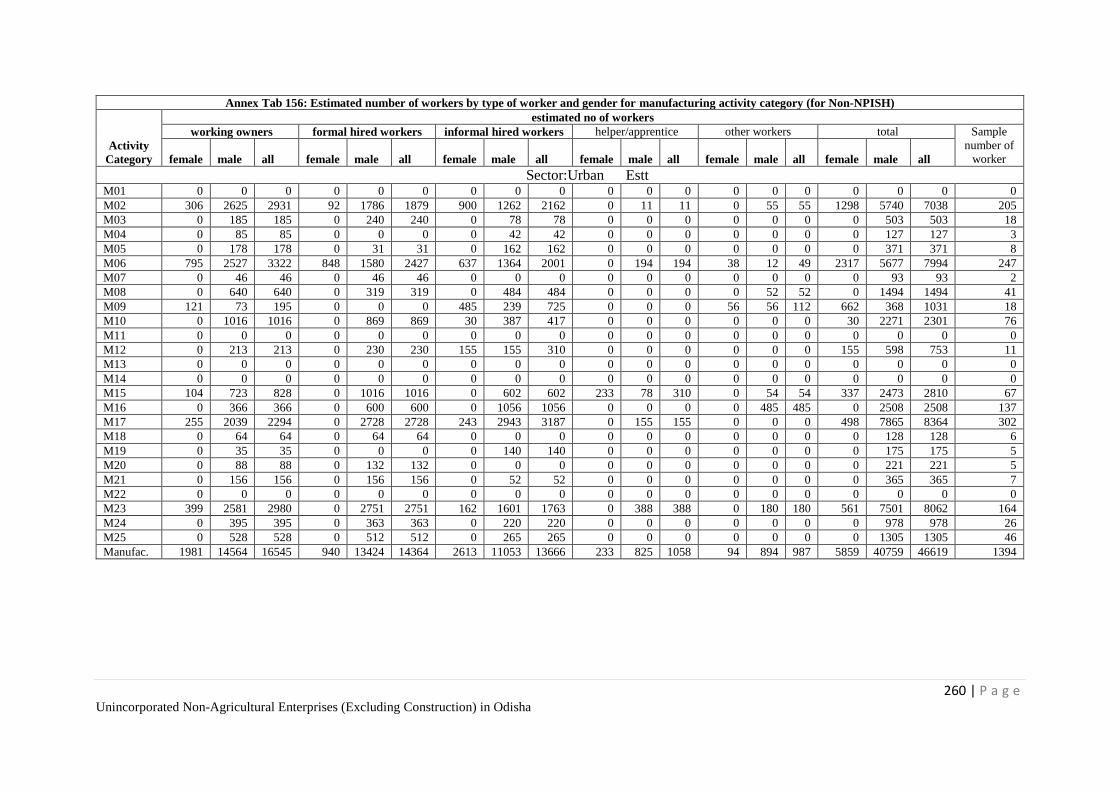
260 | P a g e Unincorporated Non-Agricultural Enterprises (Excluding Construction) in Odisha
Annex Tab 156: Estimated number of workers by type of worker and gender for manufacturing activity category (for Non-NPISH)
Activity
Category
estimated no of workers
working owners formal hired workers informal hired workers helper/apprentice other workers total Sample
number of
worker female male all female male all female male all female male all female male all female male all
Sector:Urban Estt M01 0 0 0 0 0 0 0 0 0 0 0 0 0 0 0 0 0 0 0
M02 306 2625 2931 92 1786 1879 900 1262 2162 0 11 11 0 55 55 1298 5740 7038 205
M03 0 185 185 0 240 240 0 78 78 0 0 0 0 0 0 0 503 503 18
M04 0 85 85 0 0 0 0 42 42 0 0 0 0 0 0 0 127 127 3
M05 0 178 178 0 31 31 0 162 162 0 0 0 0 0 0 0 371 371 8
M06 795 2527 3322 848 1580 2427 637 1364 2001 0 194 194 38 12 49 2317 5677 7994 247
M07 0 46 46 0 46 46 0 0 0 0 0 0 0 0 0 0 93 93 2
M08 0 640 640 0 319 319 0 484 484 0 0 0 0 52 52 0 1494 1494 41
M09 121 73 195 0 0 0 485 239 725 0 0 0 56 56 112 662 368 1031 18
M10 0 1016 1016 0 869 869 30 387 417 0 0 0 0 0 0 30 2271 2301 76
M11 0 0 0 0 0 0 0 0 0 0 0 0 0 0 0 0 0 0 0
M12 0 213 213 0 230 230 155 155 310 0 0 0 0 0 0 155 598 753 11
M13 0 0 0 0 0 0 0 0 0 0 0 0 0 0 0 0 0 0 0
M14 0 0 0 0 0 0 0 0 0 0 0 0 0 0 0 0 0 0 0
M15 104 723 828 0 1016 1016 0 602 602 233 78 310 0 54 54 337 2473 2810 67
M16 0 366 366 0 600 600 0 1056 1056 0 0 0 0 485 485 0 2508 2508 137
M17 255 2039 2294 0 2728 2728 243 2943 3187 0 155 155 0 0 0 498 7865 8364 302
M18 0 64 64 0 64 64 0 0 0 0 0 0 0 0 0 0 128 128 6
M19 0 35 35 0 0 0 0 140 140 0 0 0 0 0 0 0 175 175 5
M20 0 88 88 0 132 132 0 0 0 0 0 0 0 0 0 0 221 221 5
M21 0 156 156 0 156 156 0 52 52 0 0 0 0 0 0 0 365 365 7
M22 0 0 0 0 0 0 0 0 0 0 0 0 0 0 0 0 0 0 0
M23 399 2581 2980 0 2751 2751 162 1601 1763 0 388 388 0 180 180 561 7501 8062 164
M24 0 395 395 0 363 363 0 220 220 0 0 0 0 0 0 0 978 978 26
M25 0 528 528 0 512 512 0 265 265 0 0 0 0 0 0 0 1305 1305 46
Manufac. 1981 14564 16545 940 13424 14364 2613 11053 13666 233 825 1058 94 894 987 5859 40759 46619 1394
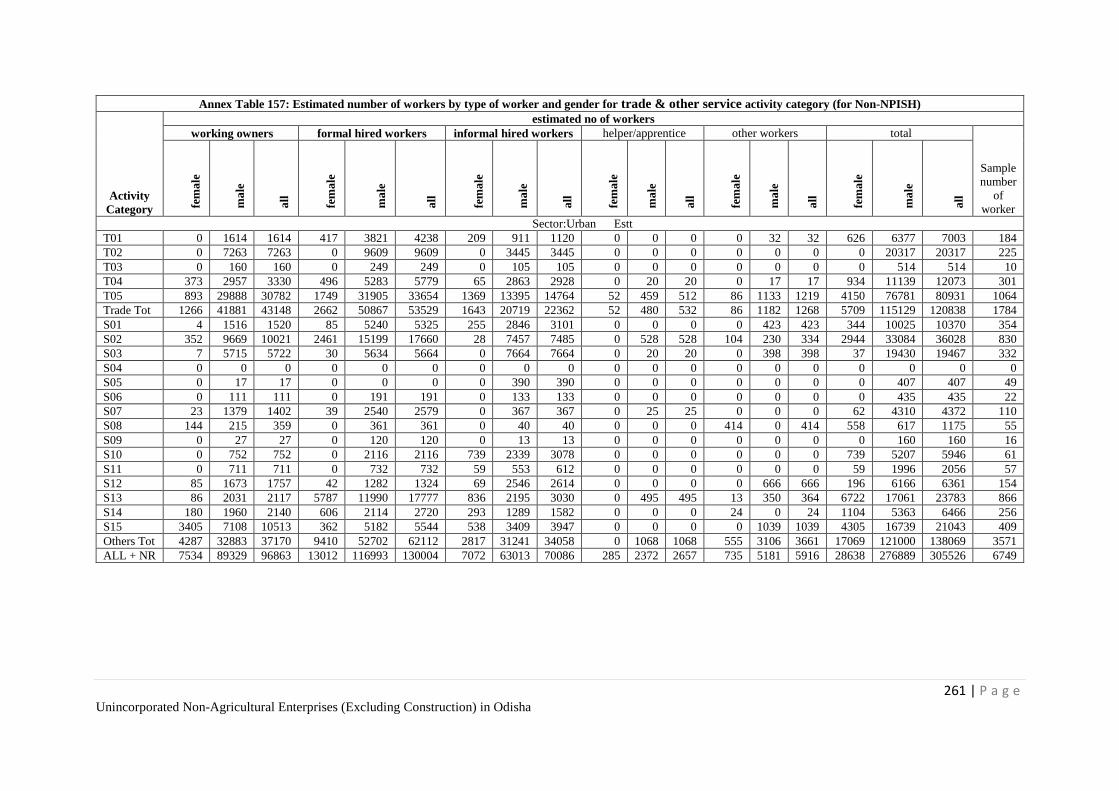
261 | P a g e Unincorporated Non-Agricultural Enterprises (Excluding Construction) in Odisha
Annex Table 157: Estimated number of workers by type of worker and gender for trade & other service activity category (for Non-NPISH)
Activity
Category
estimated no of workers
working owners formal hired workers informal hired workers helper/apprentice other workers total
Sample
number
of
worker fem
ale
ma
le
all
fem
ale
ma
le
all
fem
ale
ma
le
all
fem
ale
ma
le
all
fem
ale
ma
le
all
fem
ale
ma
le
all
Sector:Urban Estt
T01 0 1614 1614 417 3821 4238 209 911 1120 0 0 0 0 32 32 626 6377 7003 184
T02 0 7263 7263 0 9609 9609 0 3445 3445 0 0 0 0 0 0 0 20317 20317 225
T03 0 160 160 0 249 249 0 105 105 0 0 0 0 0 0 0 514 514 10
T04 373 2957 3330 496 5283 5779 65 2863 2928 0 20 20 0 17 17 934 11139 12073 301
T05 893 29888 30782 1749 31905 33654 1369 13395 14764 52 459 512 86 1133 1219 4150 76781 80931 1064
Trade Tot 1266 41881 43148 2662 50867 53529 1643 20719 22362 52 480 532 86 1182 1268 5709 115129 120838 1784
S01 4 1516 1520 85 5240 5325 255 2846 3101 0 0 0 0 423 423 344 10025 10370 354
S02 352 9669 10021 2461 15199 17660 28 7457 7485 0 528 528 104 230 334 2944 33084 36028 830
S03 7 5715 5722 30 5634 5664 0 7664 7664 0 20 20 0 398 398 37 19430 19467 332
S04 0 0 0 0 0 0 0 0 0 0 0 0 0 0 0 0 0 0 0
S05 0 17 17 0 0 0 0 390 390 0 0 0 0 0 0 0 407 407 49
S06 0 111 111 0 191 191 0 133 133 0 0 0 0 0 0 0 435 435 22
S07 23 1379 1402 39 2540 2579 0 367 367 0 25 25 0 0 0 62 4310 4372 110
S08 144 215 359 0 361 361 0 40 40 0 0 0 414 0 414 558 617 1175 55
S09 0 27 27 0 120 120 0 13 13 0 0 0 0 0 0 0 160 160 16
S10 0 752 752 0 2116 2116 739 2339 3078 0 0 0 0 0 0 739 5207 5946 61
S11 0 711 711 0 732 732 59 553 612 0 0 0 0 0 0 59 1996 2056 57
S12 85 1673 1757 42 1282 1324 69 2546 2614 0 0 0 0 666 666 196 6166 6361 154
S13 86 2031 2117 5787 11990 17777 836 2195 3030 0 495 495 13 350 364 6722 17061 23783 866
S14 180 1960 2140 606 2114 2720 293 1289 1582 0 0 0 24 0 24 1104 5363 6466 256
S15 3405 7108 10513 362 5182 5544 538 3409 3947 0 0 0 0 1039 1039 4305 16739 21043 409
Others Tot 4287 32883 37170 9410 52702 62112 2817 31241 34058 0 1068 1068 555 3106 3661 17069 121000 138069 3571
ALL + NR 7534 89329 96863 13012 116993 130004 7072 63013 70086 285 2372 2657 735 5181 5916 28638 276889 305526 6749
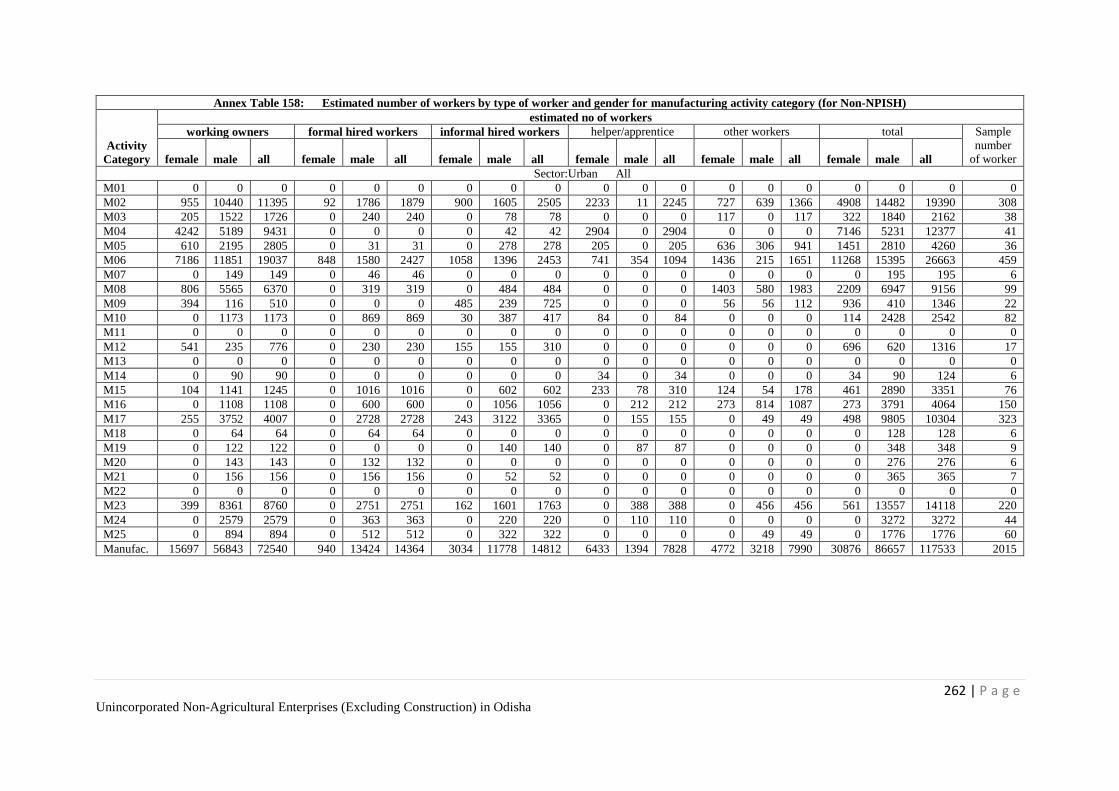
262 | P a g e Unincorporated Non-Agricultural Enterprises (Excluding Construction) in Odisha
Annex Table 158: Estimated number of workers by type of worker and gender for manufacturing activity category (for Non-NPISH)
Activity
Category
estimated no of workers
working owners formal hired workers informal hired workers helper/apprentice other workers total Sample
number
of worker female male all female male all female male all female male all female male all female male all
Sector:Urban All
M01 0 0 0 0 0 0 0 0 0 0 0 0 0 0 0 0 0 0 0
M02 955 10440 11395 92 1786 1879 900 1605 2505 2233 11 2245 727 639 1366 4908 14482 19390 308
M03 205 1522 1726 0 240 240 0 78 78 0 0 0 117 0 117 322 1840 2162 38
M04 4242 5189 9431 0 0 0 0 42 42 2904 0 2904 0 0 0 7146 5231 12377 41
M05 610 2195 2805 0 31 31 0 278 278 205 0 205 636 306 941 1451 2810 4260 36
M06 7186 11851 19037 848 1580 2427 1058 1396 2453 741 354 1094 1436 215 1651 11268 15395 26663 459
M07 0 149 149 0 46 46 0 0 0 0 0 0 0 0 0 0 195 195 6
M08 806 5565 6370 0 319 319 0 484 484 0 0 0 1403 580 1983 2209 6947 9156 99
M09 394 116 510 0 0 0 485 239 725 0 0 0 56 56 112 936 410 1346 22
M10 0 1173 1173 0 869 869 30 387 417 84 0 84 0 0 0 114 2428 2542 82
M11 0 0 0 0 0 0 0 0 0 0 0 0 0 0 0 0 0 0 0
M12 541 235 776 0 230 230 155 155 310 0 0 0 0 0 0 696 620 1316 17
M13 0 0 0 0 0 0 0 0 0 0 0 0 0 0 0 0 0 0 0
M14 0 90 90 0 0 0 0 0 0 34 0 34 0 0 0 34 90 124 6
M15 104 1141 1245 0 1016 1016 0 602 602 233 78 310 124 54 178 461 2890 3351 76
M16 0 1108 1108 0 600 600 0 1056 1056 0 212 212 273 814 1087 273 3791 4064 150
M17 255 3752 4007 0 2728 2728 243 3122 3365 0 155 155 0 49 49 498 9805 10304 323
M18 0 64 64 0 64 64 0 0 0 0 0 0 0 0 0 0 128 128 6
M19 0 122 122 0 0 0 0 140 140 0 87 87 0 0 0 0 348 348 9
M20 0 143 143 0 132 132 0 0 0 0 0 0 0 0 0 0 276 276 6
M21 0 156 156 0 156 156 0 52 52 0 0 0 0 0 0 0 365 365 7
M22 0 0 0 0 0 0 0 0 0 0 0 0 0 0 0 0 0 0 0
M23 399 8361 8760 0 2751 2751 162 1601 1763 0 388 388 0 456 456 561 13557 14118 220
M24 0 2579 2579 0 363 363 0 220 220 0 110 110 0 0 0 0 3272 3272 44
M25 0 894 894 0 512 512 0 322 322 0 0 0 0 49 49 0 1776 1776 60
Manufac. 15697 56843 72540 940 13424 14364 3034 11778 14812 6433 1394 7828 4772 3218 7990 30876 86657 117533 2015
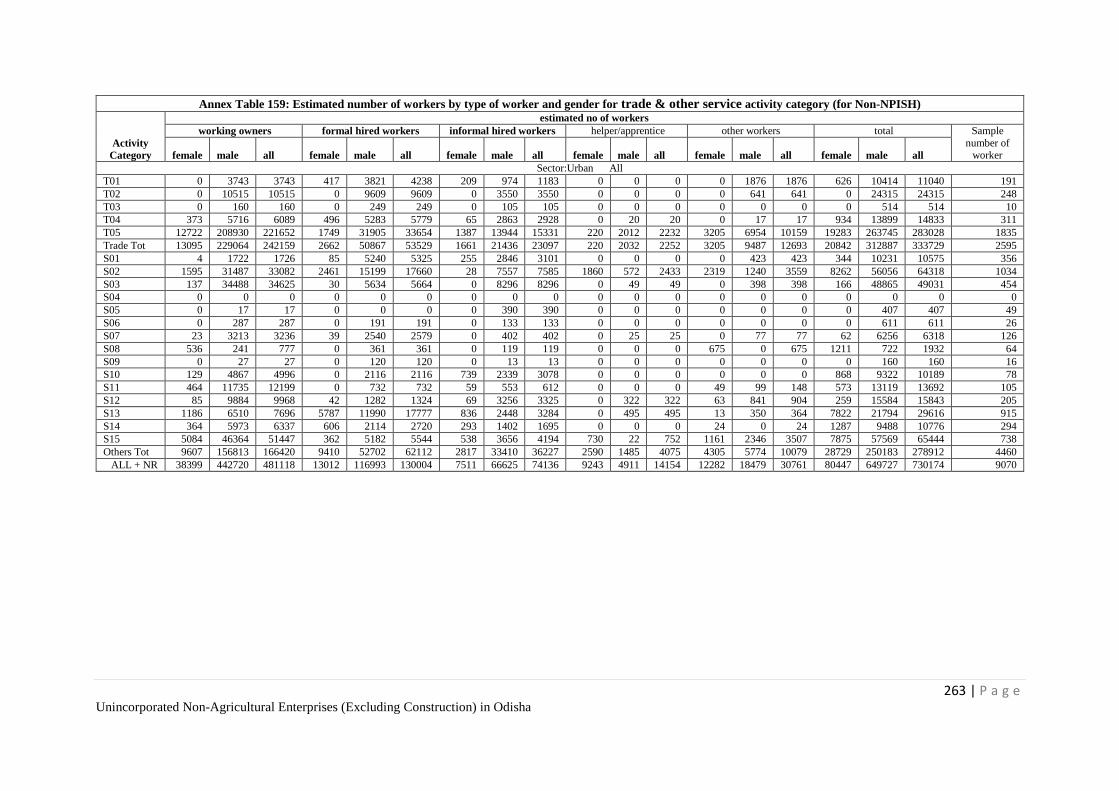
263 | P a g e Unincorporated Non-Agricultural Enterprises (Excluding Construction) in Odisha
Annex Table 159: Estimated number of workers by type of worker and gender for trade & other service activity category (for Non-NPISH)
Activity
Category
estimated no of workers
working owners formal hired workers informal hired workers helper/apprentice other workers total Sample
number of worker female male all female male all female male all female male all female male all female male all
Sector:Urban All
T01 0 3743 3743 417 3821 4238 209 974 1183 0 0 0 0 1876 1876 626 10414 11040 191
T02 0 10515 10515 0 9609 9609 0 3550 3550 0 0 0 0 641 641 0 24315 24315 248
T03 0 160 160 0 249 249 0 105 105 0 0 0 0 0 0 0 514 514 10
T04 373 5716 6089 496 5283 5779 65 2863 2928 0 20 20 0 17 17 934 13899 14833 311
T05 12722 208930 221652 1749 31905 33654 1387 13944 15331 220 2012 2232 3205 6954 10159 19283 263745 283028 1835
Trade Tot 13095 229064 242159 2662 50867 53529 1661 21436 23097 220 2032 2252 3205 9487 12693 20842 312887 333729 2595
S01 4 1722 1726 85 5240 5325 255 2846 3101 0 0 0 0 423 423 344 10231 10575 356
S02 1595 31487 33082 2461 15199 17660 28 7557 7585 1860 572 2433 2319 1240 3559 8262 56056 64318 1034
S03 137 34488 34625 30 5634 5664 0 8296 8296 0 49 49 0 398 398 166 48865 49031 454
S04 0 0 0 0 0 0 0 0 0 0 0 0 0 0 0 0 0 0 0
S05 0 17 17 0 0 0 0 390 390 0 0 0 0 0 0 0 407 407 49
S06 0 287 287 0 191 191 0 133 133 0 0 0 0 0 0 0 611 611 26
S07 23 3213 3236 39 2540 2579 0 402 402 0 25 25 0 77 77 62 6256 6318 126
S08 536 241 777 0 361 361 0 119 119 0 0 0 675 0 675 1211 722 1932 64
S09 0 27 27 0 120 120 0 13 13 0 0 0 0 0 0 0 160 160 16
S10 129 4867 4996 0 2116 2116 739 2339 3078 0 0 0 0 0 0 868 9322 10189 78
S11 464 11735 12199 0 732 732 59 553 612 0 0 0 49 99 148 573 13119 13692 105
S12 85 9884 9968 42 1282 1324 69 3256 3325 0 322 322 63 841 904 259 15584 15843 205
S13 1186 6510 7696 5787 11990 17777 836 2448 3284 0 495 495 13 350 364 7822 21794 29616 915
S14 364 5973 6337 606 2114 2720 293 1402 1695 0 0 0 24 0 24 1287 9488 10776 294
S15 5084 46364 51447 362 5182 5544 538 3656 4194 730 22 752 1161 2346 3507 7875 57569 65444 738
Others Tot 9607 156813 166420 9410 52702 62112 2817 33410 36227 2590 1485 4075 4305 5774 10079 28729 250183 278912 4460
ALL + NR 38399 442720 481118 13012 116993 130004 7511 66625 74136 9243 4911 14154 12282 18479 30761 80447 649727 730174 9070
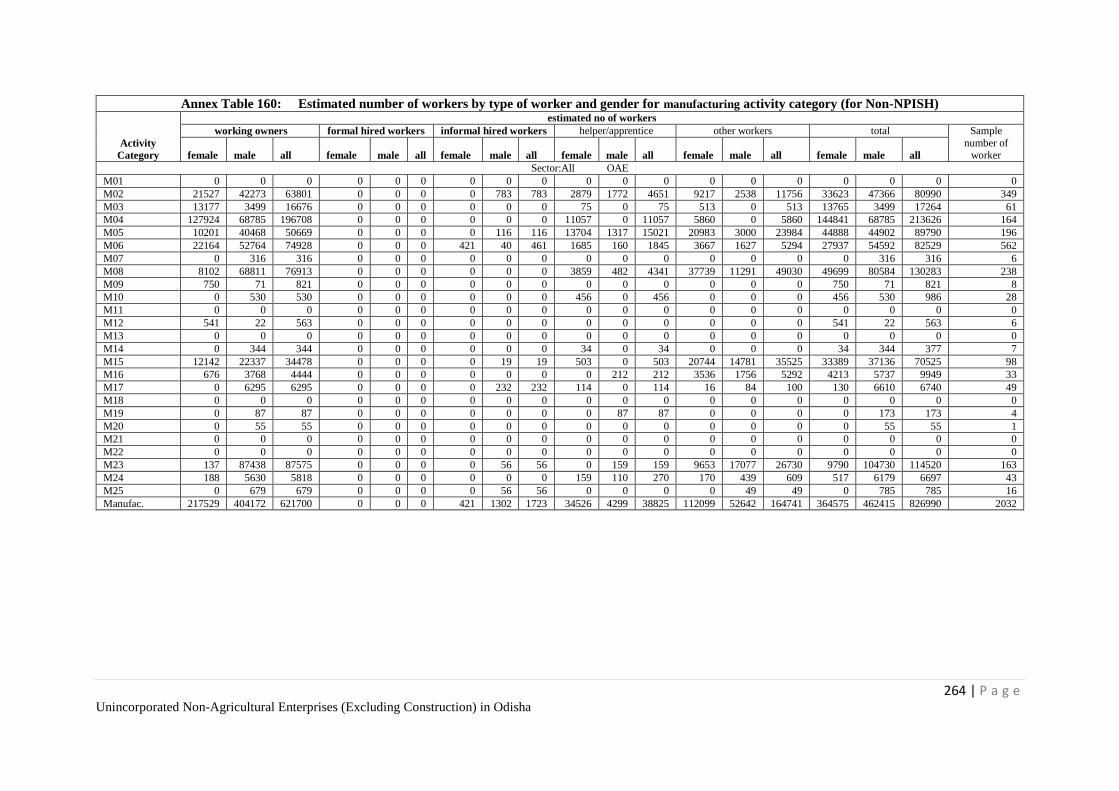
264 | P a g e Unincorporated Non-Agricultural Enterprises (Excluding Construction) in Odisha
Annex Table 160: Estimated number of workers by type of worker and gender for manufacturing activity category (for Non-NPISH)
Activity
Category
estimated no of workers
working owners formal hired workers informal hired workers helper/apprentice other workers total Sample
number of worker female male all female male all female male all female male all female male all female male all
Sector:All OAE
M01 0 0 0 0 0 0 0 0 0 0 0 0 0 0 0 0 0 0 0
M02 21527 42273 63801 0 0 0 0 783 783 2879 1772 4651 9217 2538 11756 33623 47366 80990 349
M03 13177 3499 16676 0 0 0 0 0 0 75 0 75 513 0 513 13765 3499 17264 61
M04 127924 68785 196708 0 0 0 0 0 0 11057 0 11057 5860 0 5860 144841 68785 213626 164
M05 10201 40468 50669 0 0 0 0 116 116 13704 1317 15021 20983 3000 23984 44888 44902 89790 196
M06 22164 52764 74928 0 0 0 421 40 461 1685 160 1845 3667 1627 5294 27937 54592 82529 562
M07 0 316 316 0 0 0 0 0 0 0 0 0 0 0 0 0 316 316 6
M08 8102 68811 76913 0 0 0 0 0 0 3859 482 4341 37739 11291 49030 49699 80584 130283 238
M09 750 71 821 0 0 0 0 0 0 0 0 0 0 0 0 750 71 821 8
M10 0 530 530 0 0 0 0 0 0 456 0 456 0 0 0 456 530 986 28
M11 0 0 0 0 0 0 0 0 0 0 0 0 0 0 0 0 0 0 0
M12 541 22 563 0 0 0 0 0 0 0 0 0 0 0 0 541 22 563 6
M13 0 0 0 0 0 0 0 0 0 0 0 0 0 0 0 0 0 0 0
M14 0 344 344 0 0 0 0 0 0 34 0 34 0 0 0 34 344 377 7
M15 12142 22337 34478 0 0 0 0 19 19 503 0 503 20744 14781 35525 33389 37136 70525 98
M16 676 3768 4444 0 0 0 0 0 0 0 212 212 3536 1756 5292 4213 5737 9949 33
M17 0 6295 6295 0 0 0 0 232 232 114 0 114 16 84 100 130 6610 6740 49
M18 0 0 0 0 0 0 0 0 0 0 0 0 0 0 0 0 0 0 0
M19 0 87 87 0 0 0 0 0 0 0 87 87 0 0 0 0 173 173 4
M20 0 55 55 0 0 0 0 0 0 0 0 0 0 0 0 0 55 55 1
M21 0 0 0 0 0 0 0 0 0 0 0 0 0 0 0 0 0 0 0
M22 0 0 0 0 0 0 0 0 0 0 0 0 0 0 0 0 0 0 0
M23 137 87438 87575 0 0 0 0 56 56 0 159 159 9653 17077 26730 9790 104730 114520 163
M24 188 5630 5818 0 0 0 0 0 0 159 110 270 170 439 609 517 6179 6697 43
M25 0 679 679 0 0 0 0 56 56 0 0 0 0 49 49 0 785 785 16
Manufac. 217529 404172 621700 0 0 0 421 1302 1723 34526 4299 38825 112099 52642 164741 364575 462415 826990 2032
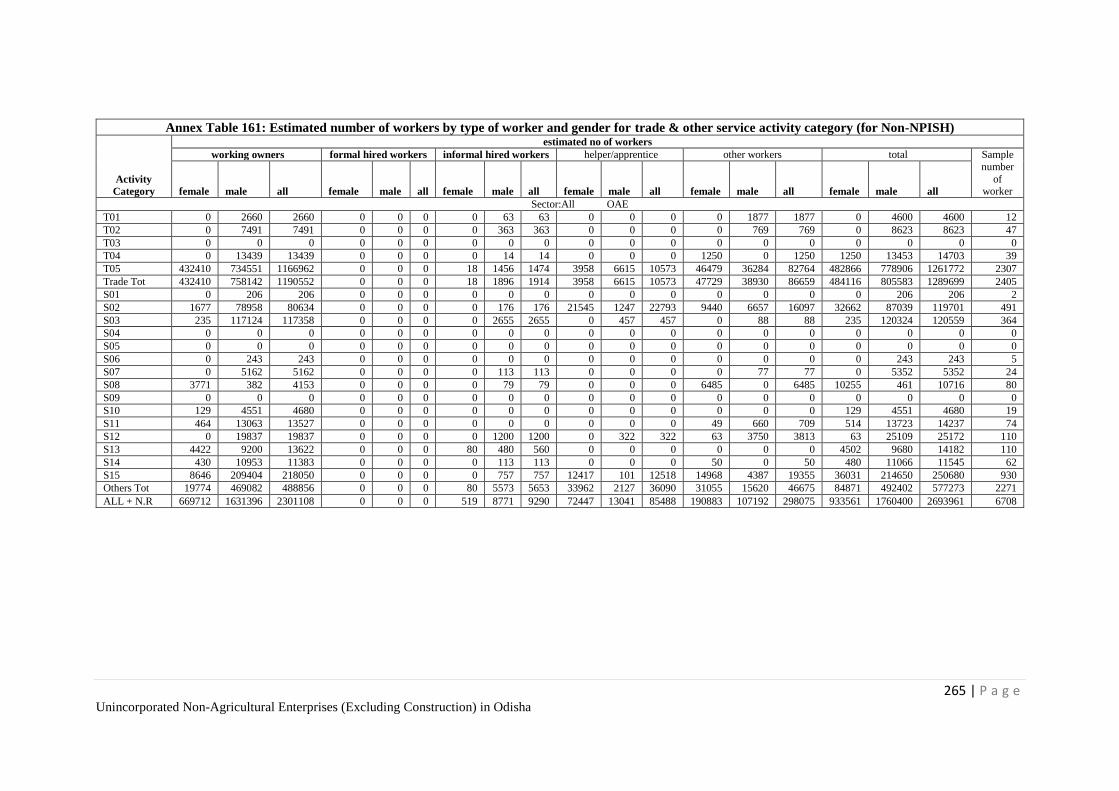
265 | P a g e Unincorporated Non-Agricultural Enterprises (Excluding Construction) in Odisha
Annex Table 161: Estimated number of workers by type of worker and gender for trade & other service activity category (for Non-NPISH)
Activity
Category
estimated no of workers
working owners formal hired workers informal hired workers helper/apprentice other workers total Sample
number
of worker female male all female male all female male all female male all female male all female male all
Sector:All OAE
T01 0 2660 2660 0 0 0 0 63 63 0 0 0 0 1877 1877 0 4600 4600 12
T02 0 7491 7491 0 0 0 0 363 363 0 0 0 0 769 769 0 8623 8623 47
T03 0 0 0 0 0 0 0 0 0 0 0 0 0 0 0 0 0 0 0
T04 0 13439 13439 0 0 0 0 14 14 0 0 0 1250 0 1250 1250 13453 14703 39
T05 432410 734551 1166962 0 0 0 18 1456 1474 3958 6615 10573 46479 36284 82764 482866 778906 1261772 2307
Trade Tot 432410 758142 1190552 0 0 0 18 1896 1914 3958 6615 10573 47729 38930 86659 484116 805583 1289699 2405
S01 0 206 206 0 0 0 0 0 0 0 0 0 0 0 0 0 206 206 2
S02 1677 78958 80634 0 0 0 0 176 176 21545 1247 22793 9440 6657 16097 32662 87039 119701 491
S03 235 117124 117358 0 0 0 0 2655 2655 0 457 457 0 88 88 235 120324 120559 364
S04 0 0 0 0 0 0 0 0 0 0 0 0 0 0 0 0 0 0 0
S05 0 0 0 0 0 0 0 0 0 0 0 0 0 0 0 0 0 0 0
S06 0 243 243 0 0 0 0 0 0 0 0 0 0 0 0 0 243 243 5
S07 0 5162 5162 0 0 0 0 113 113 0 0 0 0 77 77 0 5352 5352 24
S08 3771 382 4153 0 0 0 0 79 79 0 0 0 6485 0 6485 10255 461 10716 80
S09 0 0 0 0 0 0 0 0 0 0 0 0 0 0 0 0 0 0 0
S10 129 4551 4680 0 0 0 0 0 0 0 0 0 0 0 0 129 4551 4680 19
S11 464 13063 13527 0 0 0 0 0 0 0 0 0 49 660 709 514 13723 14237 74
S12 0 19837 19837 0 0 0 0 1200 1200 0 322 322 63 3750 3813 63 25109 25172 110
S13 4422 9200 13622 0 0 0 80 480 560 0 0 0 0 0 0 4502 9680 14182 110
S14 430 10953 11383 0 0 0 0 113 113 0 0 0 50 0 50 480 11066 11545 62
S15 8646 209404 218050 0 0 0 0 757 757 12417 101 12518 14968 4387 19355 36031 214650 250680 930
Others Tot 19774 469082 488856 0 0 0 80 5573 5653 33962 2127 36090 31055 15620 46675 84871 492402 577273 2271
ALL + N.R 669712 1631396 2301108 0 0 0 519 8771 9290 72447 13041 85488 190883 107192 298075 933561 1760400 2693961 6708
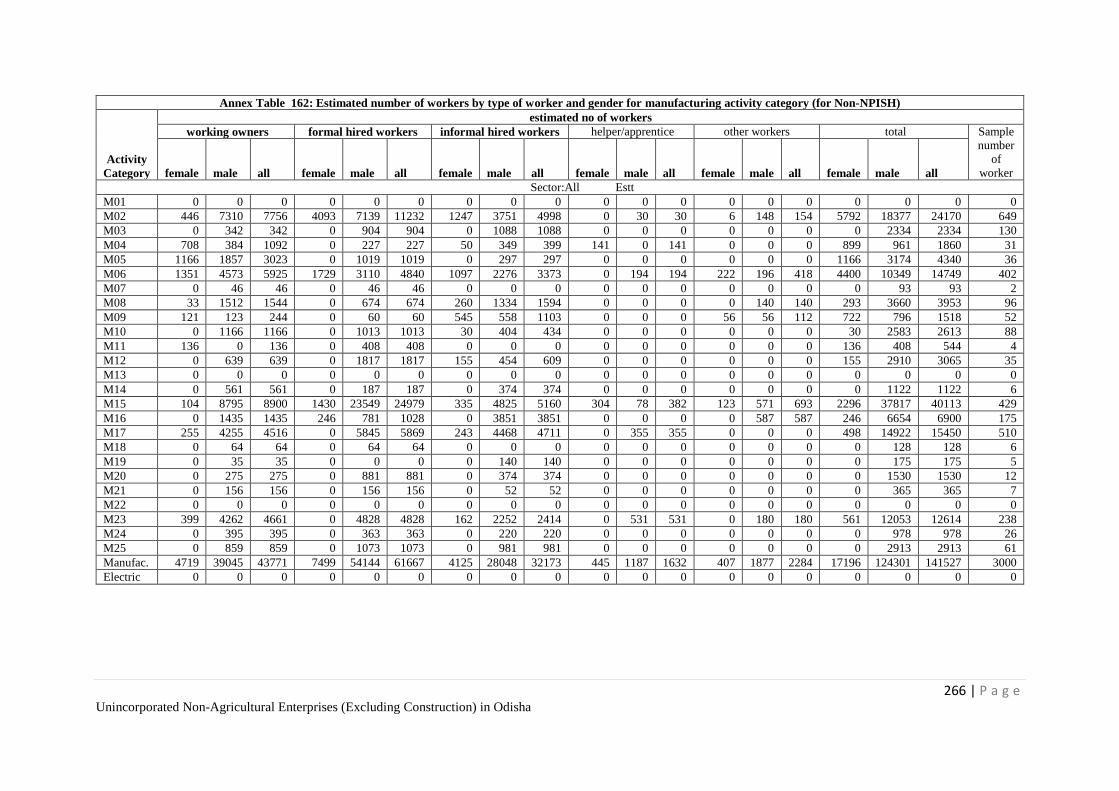
266 | P a g e Unincorporated Non-Agricultural Enterprises (Excluding Construction) in Odisha
Annex Table 162: Estimated number of workers by type of worker and gender for manufacturing activity category (for Non-NPISH)
Activity
Category
estimated no of workers
working owners formal hired workers informal hired workers helper/apprentice other workers total Sample
number
of
worker female male all female male all female male all female male all female male all female male all
Sector:All Estt
M01 0 0 0 0 0 0 0 0 0 0 0 0 0 0 0 0 0 0 0
M02 446 7310 7756 4093 7139 11232 1247 3751 4998 0 30 30 6 148 154 5792 18377 24170 649
M03 0 342 342 0 904 904 0 1088 1088 0 0 0 0 0 0 0 2334 2334 130
M04 708 384 1092 0 227 227 50 349 399 141 0 141 0 0 0 899 961 1860 31
M05 1166 1857 3023 0 1019 1019 0 297 297 0 0 0 0 0 0 1166 3174 4340 36
M06 1351 4573 5925 1729 3110 4840 1097 2276 3373 0 194 194 222 196 418 4400 10349 14749 402
M07 0 46 46 0 46 46 0 0 0 0 0 0 0 0 0 0 93 93 2
M08 33 1512 1544 0 674 674 260 1334 1594 0 0 0 0 140 140 293 3660 3953 96
M09 121 123 244 0 60 60 545 558 1103 0 0 0 56 56 112 722 796 1518 52
M10 0 1166 1166 0 1013 1013 30 404 434 0 0 0 0 0 0 30 2583 2613 88
M11 136 0 136 0 408 408 0 0 0 0 0 0 0 0 0 136 408 544 4
M12 0 639 639 0 1817 1817 155 454 609 0 0 0 0 0 0 155 2910 3065 35
M13 0 0 0 0 0 0 0 0 0 0 0 0 0 0 0 0 0 0 0
M14 0 561 561 0 187 187 0 374 374 0 0 0 0 0 0 0 1122 1122 6
M15 104 8795 8900 1430 23549 24979 335 4825 5160 304 78 382 123 571 693 2296 37817 40113 429
M16 0 1435 1435 246 781 1028 0 3851 3851 0 0 0 0 587 587 246 6654 6900 175
M17 255 4255 4516 0 5845 5869 243 4468 4711 0 355 355 0 0 0 498 14922 15450 510
M18 0 64 64 0 64 64 0 0 0 0 0 0 0 0 0 0 128 128 6
M19 0 35 35 0 0 0 0 140 140 0 0 0 0 0 0 0 175 175 5
M20 0 275 275 0 881 881 0 374 374 0 0 0 0 0 0 0 1530 1530 12
M21 0 156 156 0 156 156 0 52 52 0 0 0 0 0 0 0 365 365 7
M22 0 0 0 0 0 0 0 0 0 0 0 0 0 0 0 0 0 0 0
M23 399 4262 4661 0 4828 4828 162 2252 2414 0 531 531 0 180 180 561 12053 12614 238
M24 0 395 395 0 363 363 0 220 220 0 0 0 0 0 0 0 978 978 26
M25 0 859 859 0 1073 1073 0 981 981 0 0 0 0 0 0 0 2913 2913 61
Manufac. 4719 39045 43771 7499 54144 61667 4125 28048 32173 445 1187 1632 407 1877 2284 17196 124301 141527 3000
Electric 0 0 0 0 0 0 0 0 0 0 0 0 0 0 0 0 0 0 0
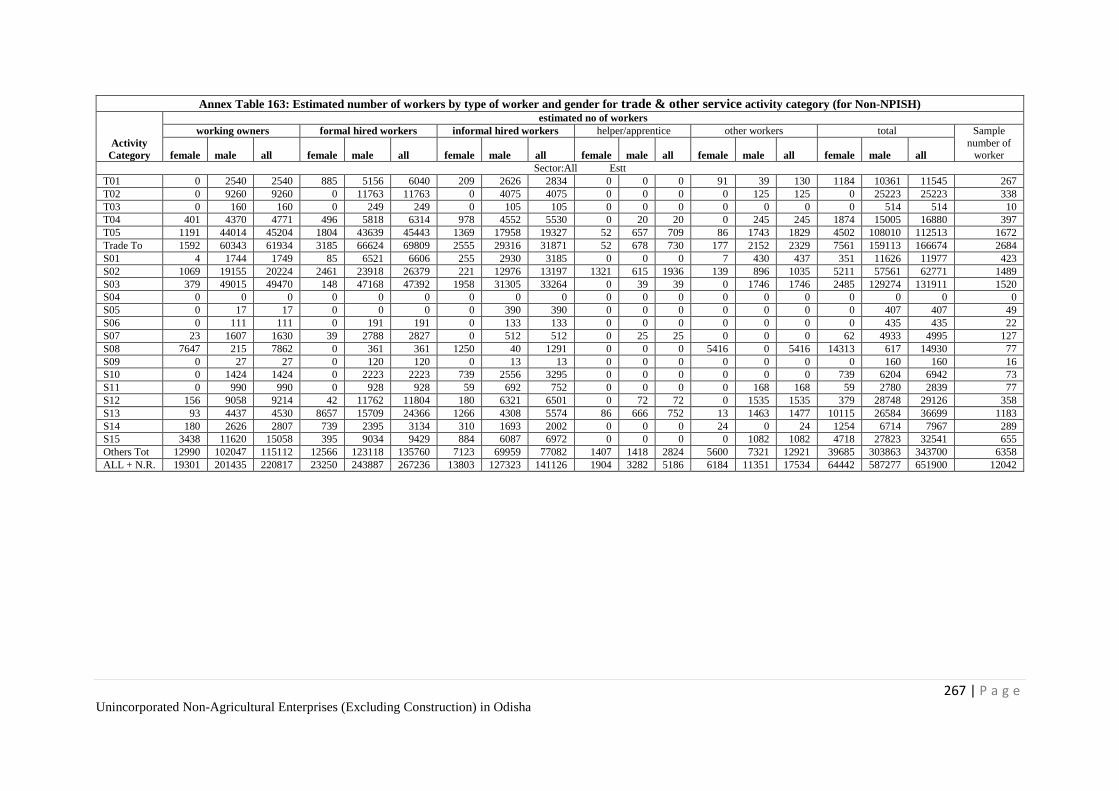
267 | P a g e Unincorporated Non-Agricultural Enterprises (Excluding Construction) in Odisha
Annex Table 163: Estimated number of workers by type of worker and gender for trade & other service activity category (for Non-NPISH)
Activity
Category
estimated no of workers
working owners formal hired workers informal hired workers helper/apprentice other workers total Sample
number of worker female male all female male all female male all female male all female male all female male all
Sector:All Estt
T01 0 2540 2540 885 5156 6040 209 2626 2834 0 0 0 91 39 130 1184 10361 11545 267
T02 0 9260 9260 0 11763 11763 0 4075 4075 0 0 0 0 125 125 0 25223 25223 338
T03 0 160 160 0 249 249 0 105 105 0 0 0 0 0 0 0 514 514 10
T04 401 4370 4771 496 5818 6314 978 4552 5530 0 20 20 0 245 245 1874 15005 16880 397
T05 1191 44014 45204 1804 43639 45443 1369 17958 19327 52 657 709 86 1743 1829 4502 108010 112513 1672
Trade To 1592 60343 61934 3185 66624 69809 2555 29316 31871 52 678 730 177 2152 2329 7561 159113 166674 2684
S01 4 1744 1749 85 6521 6606 255 2930 3185 0 0 0 7 430 437 351 11626 11977 423
S02 1069 19155 20224 2461 23918 26379 221 12976 13197 1321 615 1936 139 896 1035 5211 57561 62771 1489
S03 379 49015 49470 148 47168 47392 1958 31305 33264 0 39 39 0 1746 1746 2485 129274 131911 1520
S04 0 0 0 0 0 0 0 0 0 0 0 0 0 0 0 0 0 0 0
S05 0 17 17 0 0 0 0 390 390 0 0 0 0 0 0 0 407 407 49
S06 0 111 111 0 191 191 0 133 133 0 0 0 0 0 0 0 435 435 22
S07 23 1607 1630 39 2788 2827 0 512 512 0 25 25 0 0 0 62 4933 4995 127
S08 7647 215 7862 0 361 361 1250 40 1291 0 0 0 5416 0 5416 14313 617 14930 77
S09 0 27 27 0 120 120 0 13 13 0 0 0 0 0 0 0 160 160 16
S10 0 1424 1424 0 2223 2223 739 2556 3295 0 0 0 0 0 0 739 6204 6942 73
S11 0 990 990 0 928 928 59 692 752 0 0 0 0 168 168 59 2780 2839 77
S12 156 9058 9214 42 11762 11804 180 6321 6501 0 72 72 0 1535 1535 379 28748 29126 358
S13 93 4437 4530 8657 15709 24366 1266 4308 5574 86 666 752 13 1463 1477 10115 26584 36699 1183
S14 180 2626 2807 739 2395 3134 310 1693 2002 0 0 0 24 0 24 1254 6714 7967 289
S15 3438 11620 15058 395 9034 9429 884 6087 6972 0 0 0 0 1082 1082 4718 27823 32541 655
Others Tot 12990 102047 115112 12566 123118 135760 7123 69959 77082 1407 1418 2824 5600 7321 12921 39685 303863 343700 6358
ALL + N.R. 19301 201435 220817 23250 243887 267236 13803 127323 141126 1904 3282 5186 6184 11351 17534 64442 587277 651900 12042
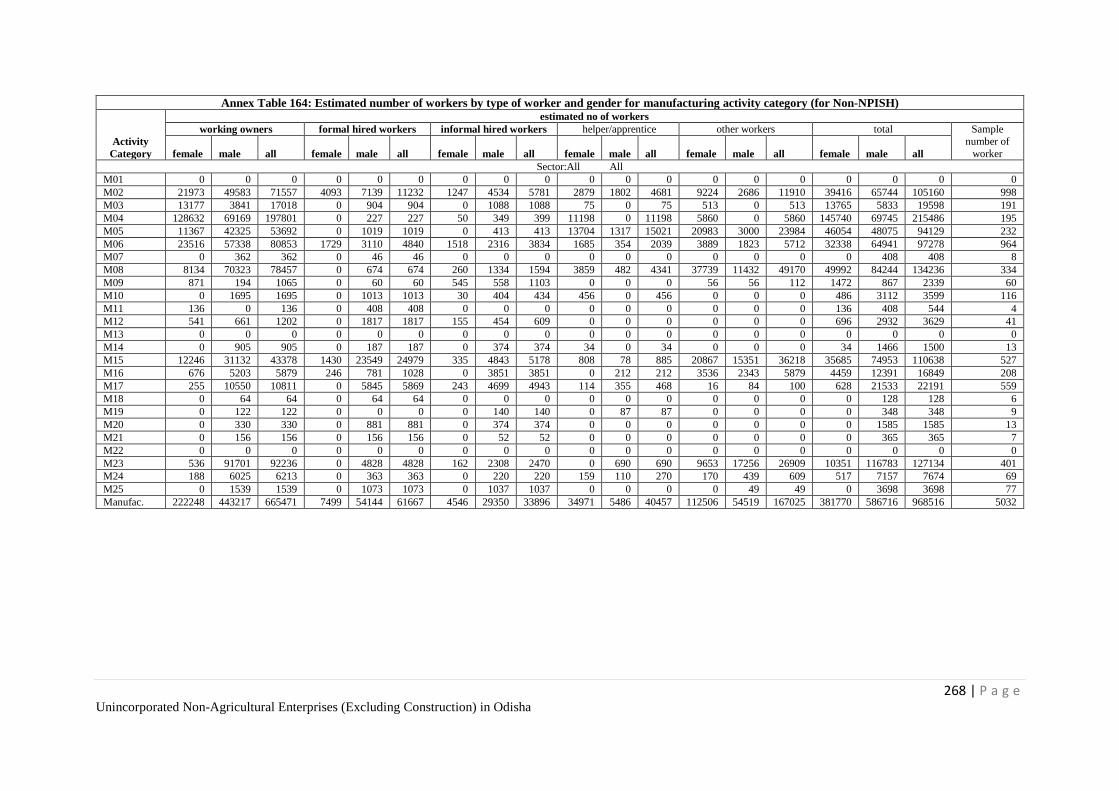
268 | P a g e Unincorporated Non-Agricultural Enterprises (Excluding Construction) in Odisha
Annex Table 164: Estimated number of workers by type of worker and gender for manufacturing activity category (for Non-NPISH)
Activity
Category
estimated no of workers
working owners formal hired workers informal hired workers helper/apprentice other workers total Sample
number of
worker female male all female male all female male all female male all female male all female male all
Sector:All All
M01 0 0 0 0 0 0 0 0 0 0 0 0 0 0 0 0 0 0 0
M02 21973 49583 71557 4093 7139 11232 1247 4534 5781 2879 1802 4681 9224 2686 11910 39416 65744 105160 998
M03 13177 3841 17018 0 904 904 0 1088 1088 75 0 75 513 0 513 13765 5833 19598 191
M04 128632 69169 197801 0 227 227 50 349 399 11198 0 11198 5860 0 5860 145740 69745 215486 195
M05 11367 42325 53692 0 1019 1019 0 413 413 13704 1317 15021 20983 3000 23984 46054 48075 94129 232
M06 23516 57338 80853 1729 3110 4840 1518 2316 3834 1685 354 2039 3889 1823 5712 32338 64941 97278 964
M07 0 362 362 0 46 46 0 0 0 0 0 0 0 0 0 0 408 408 8
M08 8134 70323 78457 0 674 674 260 1334 1594 3859 482 4341 37739 11432 49170 49992 84244 134236 334
M09 871 194 1065 0 60 60 545 558 1103 0 0 0 56 56 112 1472 867 2339 60
M10 0 1695 1695 0 1013 1013 30 404 434 456 0 456 0 0 0 486 3112 3599 116
M11 136 0 136 0 408 408 0 0 0 0 0 0 0 0 0 136 408 544 4
M12 541 661 1202 0 1817 1817 155 454 609 0 0 0 0 0 0 696 2932 3629 41
M13 0 0 0 0 0 0 0 0 0 0 0 0 0 0 0 0 0 0 0
M14 0 905 905 0 187 187 0 374 374 34 0 34 0 0 0 34 1466 1500 13
M15 12246 31132 43378 1430 23549 24979 335 4843 5178 808 78 885 20867 15351 36218 35685 74953 110638 527
M16 676 5203 5879 246 781 1028 0 3851 3851 0 212 212 3536 2343 5879 4459 12391 16849 208
M17 255 10550 10811 0 5845 5869 243 4699 4943 114 355 468 16 84 100 628 21533 22191 559
M18 0 64 64 0 64 64 0 0 0 0 0 0 0 0 0 0 128 128 6
M19 0 122 122 0 0 0 0 140 140 0 87 87 0 0 0 0 348 348 9
M20 0 330 330 0 881 881 0 374 374 0 0 0 0 0 0 0 1585 1585 13
M21 0 156 156 0 156 156 0 52 52 0 0 0 0 0 0 0 365 365 7
M22 0 0 0 0 0 0 0 0 0 0 0 0 0 0 0 0 0 0 0
M23 536 91701 92236 0 4828 4828 162 2308 2470 0 690 690 9653 17256 26909 10351 116783 127134 401
M24 188 6025 6213 0 363 363 0 220 220 159 110 270 170 439 609 517 7157 7674 69
M25 0 1539 1539 0 1073 1073 0 1037 1037 0 0 0 0 49 49 0 3698 3698 77
Manufac. 222248 443217 665471 7499 54144 61667 4546 29350 33896 34971 5486 40457 112506 54519 167025 381770 586716 968516 5032
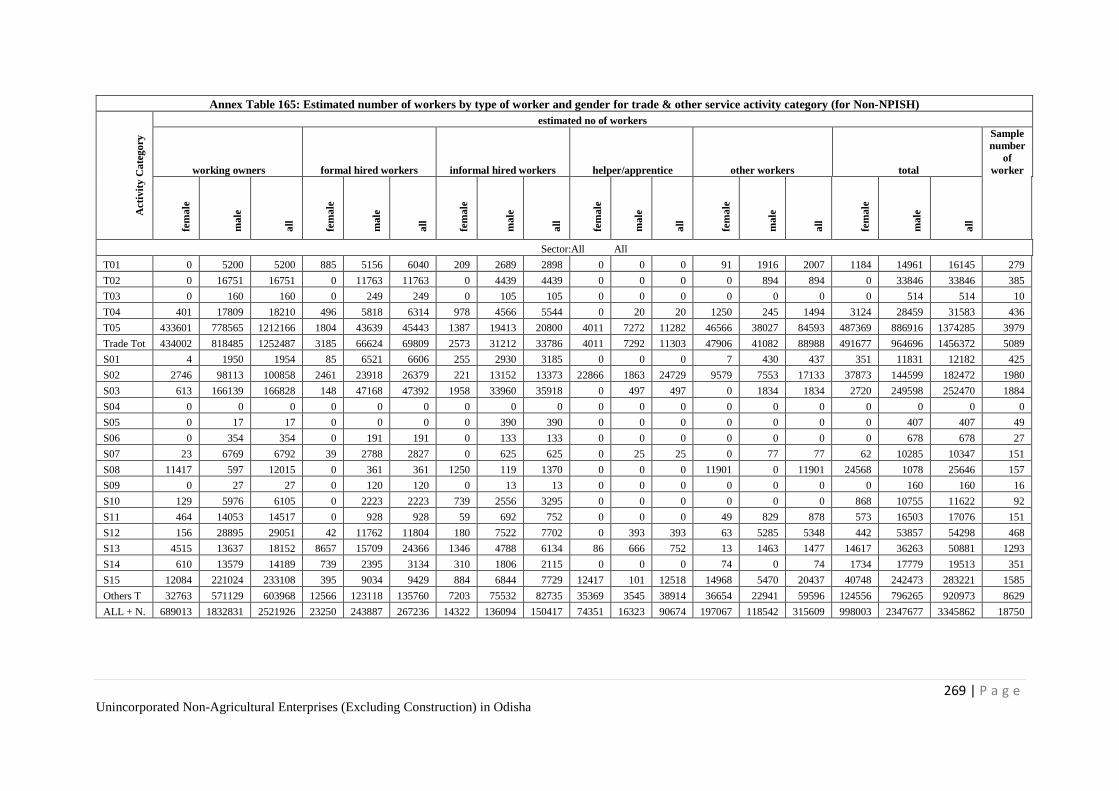
269 | P a g e Unincorporated Non-Agricultural Enterprises (Excluding Construction) in Odisha
Annex Table 165: Estimated number of workers by type of worker and gender for trade & other service activity category (for Non-NPISH)
Acti
vit
y C
ate
go
ry
estimated no of workers
working owners formal hired workers informal hired workers helper/apprentice other workers total
Sample
number
of
worker
fem
ale
male
all
fem
ale
male
all
fem
ale
male
all
fem
ale
male
all
fem
ale
male
all
fem
ale
male
all
Sector:All All
T01 0 5200 5200 885 5156 6040 209 2689 2898 0 0 0 91 1916 2007 1184 14961 16145 279
T02 0 16751 16751 0 11763 11763 0 4439 4439 0 0 0 0 894 894 0 33846 33846 385
T03 0 160 160 0 249 249 0 105 105 0 0 0 0 0 0 0 514 514 10
T04 401 17809 18210 496 5818 6314 978 4566 5544 0 20 20 1250 245 1494 3124 28459 31583 436
T05 433601 778565 1212166 1804 43639 45443 1387 19413 20800 4011 7272 11282 46566 38027 84593 487369 886916 1374285 3979
Trade Tot 434002 818485 1252487 3185 66624 69809 2573 31212 33786 4011 7292 11303 47906 41082 88988 491677 964696 1456372 5089
S01 4 1950 1954 85 6521 6606 255 2930 3185 0 0 0 7 430 437 351 11831 12182 425
S02 2746 98113 100858 2461 23918 26379 221 13152 13373 22866 1863 24729 9579 7553 17133 37873 144599 182472 1980
S03 613 166139 166828 148 47168 47392 1958 33960 35918 0 497 497 0 1834 1834 2720 249598 252470 1884
S04 0 0 0 0 0 0 0 0 0 0 0 0 0 0 0 0 0 0 0
S05 0 17 17 0 0 0 0 390 390 0 0 0 0 0 0 0 407 407 49
S06 0 354 354 0 191 191 0 133 133 0 0 0 0 0 0 0 678 678 27
S07 23 6769 6792 39 2788 2827 0 625 625 0 25 25 0 77 77 62 10285 10347 151
S08 11417 597 12015 0 361 361 1250 119 1370 0 0 0 11901 0 11901 24568 1078 25646 157
S09 0 27 27 0 120 120 0 13 13 0 0 0 0 0 0 0 160 160 16
S10 129 5976 6105 0 2223 2223 739 2556 3295 0 0 0 0 0 0 868 10755 11622 92
S11 464 14053 14517 0 928 928 59 692 752 0 0 0 49 829 878 573 16503 17076 151
S12 156 28895 29051 42 11762 11804 180 7522 7702 0 393 393 63 5285 5348 442 53857 54298 468
S13 4515 13637 18152 8657 15709 24366 1346 4788 6134 86 666 752 13 1463 1477 14617 36263 50881 1293
S14 610 13579 14189 739 2395 3134 310 1806 2115 0 0 0 74 0 74 1734 17779 19513 351
S15 12084 221024 233108 395 9034 9429 884 6844 7729 12417 101 12518 14968 5470 20437 40748 242473 283221 1585
Others T 32763 571129 603968 12566 123118 135760 7203 75532 82735 35369 3545 38914 36654 22941 59596 124556 796265 920973 8629
ALL + N. 689013 1832831 2521926 23250 243887 267236 14322 136094 150417 74351 16323 90674 197067 118542 315609 998003 2347677 3345862 18750
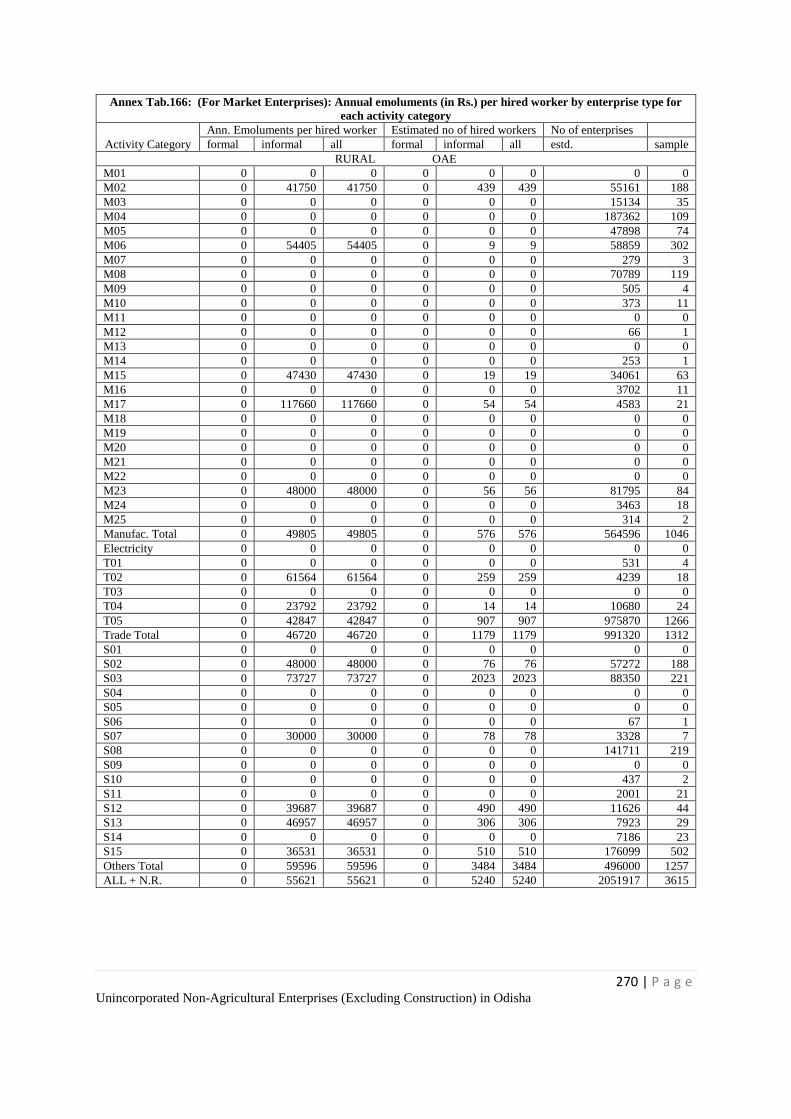
270 | P a g e Unincorporated Non-Agricultural Enterprises (Excluding Construction) in Odisha
Annex Tab.166: (For Market Enterprises): Annual emoluments (in Rs.) per hired worker by enterprise type for
each activity category
Activity Category
Ann. Emoluments per hired worker Estimated no of hired workers No of enterprises
formal informal all formal informal all estd. sample
RURAL OAE
M01 0 0 0 0 0 0 0 0
M02 0 41750 41750 0 439 439 55161 188
M03 0 0 0 0 0 0 15134 35
M04 0 0 0 0 0 0 187362 109
M05 0 0 0 0 0 0 47898 74
M06 0 54405 54405 0 9 9 58859 302
M07 0 0 0 0 0 0 279 3
M08 0 0 0 0 0 0 70789 119
M09 0 0 0 0 0 0 505 4
M10 0 0 0 0 0 0 373 11
M11 0 0 0 0 0 0 0 0
M12 0 0 0 0 0 0 66 1
M13 0 0 0 0 0 0 0 0
M14 0 0 0 0 0 0 253 1
M15 0 47430 47430 0 19 19 34061 63
M16 0 0 0 0 0 0 3702 11
M17 0 117660 117660 0 54 54 4583 21
M18 0 0 0 0 0 0 0 0
M19 0 0 0 0 0 0 0 0
M20 0 0 0 0 0 0 0 0
M21 0 0 0 0 0 0 0 0
M22 0 0 0 0 0 0 0 0
M23 0 48000 48000 0 56 56 81795 84
M24 0 0 0 0 0 0 3463 18
M25 0 0 0 0 0 0 314 2
Manufac. Total 0 49805 49805 0 576 576 564596 1046
Electricity 0 0 0 0 0 0 0 0
T01 0 0 0 0 0 0 531 4
T02 0 61564 61564 0 259 259 4239 18
T03 0 0 0 0 0 0 0 0
T04 0 23792 23792 0 14 14 10680 24
T05 0 42847 42847 0 907 907 975870 1266
Trade Total 0 46720 46720 0 1179 1179 991320 1312
S01 0 0 0 0 0 0 0 0
S02 0 48000 48000 0 76 76 57272 188
S03 0 73727 73727 0 2023 2023 88350 221
S04 0 0 0 0 0 0 0 0
S05 0 0 0 0 0 0 0 0
S06 0 0 0 0 0 0 67 1
S07 0 30000 30000 0 78 78 3328 7
S08 0 0 0 0 0 0 141711 219
S09 0 0 0 0 0 0 0 0
S10 0 0 0 0 0 0 437 2
S11 0 0 0 0 0 0 2001 21
S12 0 39687 39687 0 490 490 11626 44
S13 0 46957 46957 0 306 306 7923 29
S14 0 0 0 0 0 0 7186 23
S15 0 36531 36531 0 510 510 176099 502
Others Total 0 59596 59596 0 3484 3484 496000 1257
ALL + N.R. 0 55621 55621 0 5240 5240 2051917 3615
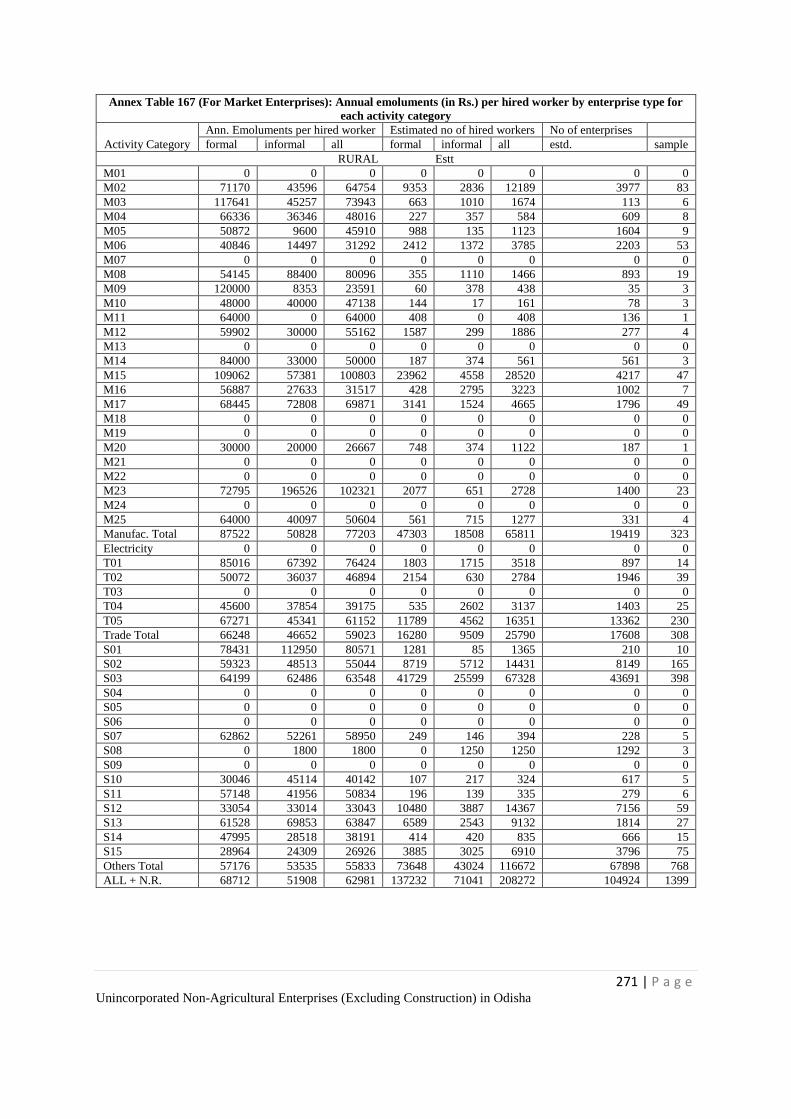
271 | P a g e Unincorporated Non-Agricultural Enterprises (Excluding Construction) in Odisha
Annex Table 167 (For Market Enterprises): Annual emoluments (in Rs.) per hired worker by enterprise type for
each activity category
Activity Category
Ann. Emoluments per hired worker Estimated no of hired workers No of enterprises
formal informal all formal informal all estd. sample
RURAL Estt
M01 0 0 0 0 0 0 0 0
M02 71170 43596 64754 9353 2836 12189 3977 83
M03 117641 45257 73943 663 1010 1674 113 6
M04 66336 36346 48016 227 357 584 609 8
M05 50872 9600 45910 988 135 1123 1604 9
M06 40846 14497 31292 2412 1372 3785 2203 53
M07 0 0 0 0 0 0 0 0
M08 54145 88400 80096 355 1110 1466 893 19
M09 120000 8353 23591 60 378 438 35 3
M10 48000 40000 47138 144 17 161 78 3
M11 64000 0 64000 408 0 408 136 1
M12 59902 30000 55162 1587 299 1886 277 4
M13 0 0 0 0 0 0 0 0
M14 84000 33000 50000 187 374 561 561 3
M15 109062 57381 100803 23962 4558 28520 4217 47
M16 56887 27633 31517 428 2795 3223 1002 7
M17 68445 72808 69871 3141 1524 4665 1796 49
M18 0 0 0 0 0 0 0 0
M19 0 0 0 0 0 0 0 0
M20 30000 20000 26667 748 374 1122 187 1
M21 0 0 0 0 0 0 0 0
M22 0 0 0 0 0 0 0 0
M23 72795 196526 102321 2077 651 2728 1400 23
M24 0 0 0 0 0 0 0 0
M25 64000 40097 50604 561 715 1277 331 4
Manufac. Total 87522 50828 77203 47303 18508 65811 19419 323
Electricity 0 0 0 0 0 0 0 0
T01 85016 67392 76424 1803 1715 3518 897 14
T02 50072 36037 46894 2154 630 2784 1946 39
T03 0 0 0 0 0 0 0 0
T04 45600 37854 39175 535 2602 3137 1403 25
T05 67271 45341 61152 11789 4562 16351 13362 230
Trade Total 66248 46652 59023 16280 9509 25790 17608 308
S01 78431 112950 80571 1281 85 1365 210 10
S02 59323 48513 55044 8719 5712 14431 8149 165
S03 64199 62486 63548 41729 25599 67328 43691 398
S04 0 0 0 0 0 0 0 0
S05 0 0 0 0 0 0 0 0
S06 0 0 0 0 0 0 0 0
S07 62862 52261 58950 249 146 394 228 5
S08 0 1800 1800 0 1250 1250 1292 3
S09 0 0 0 0 0 0 0 0
S10 30046 45114 40142 107 217 324 617 5
S11 57148 41956 50834 196 139 335 279 6
S12 33054 33014 33043 10480 3887 14367 7156 59
S13 61528 69853 63847 6589 2543 9132 1814 27
S14 47995 28518 38191 414 420 835 666 15
S15 28964 24309 26926 3885 3025 6910 3796 75
Others Total 57176 53535 55833 73648 43024 116672 67898 768
ALL + N.R. 68712 51908 62981 137232 71041 208272 104924 1399
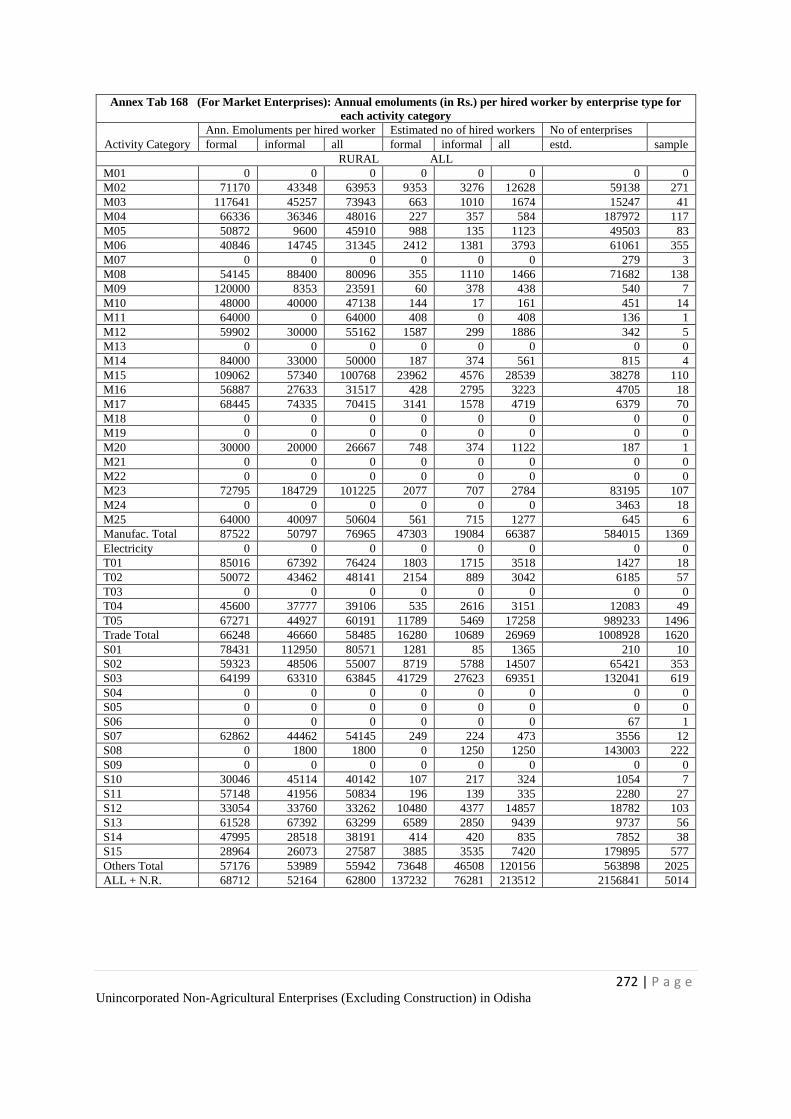
272 | P a g e Unincorporated Non-Agricultural Enterprises (Excluding Construction) in Odisha
Annex Tab 168 (For Market Enterprises): Annual emoluments (in Rs.) per hired worker by enterprise type for
each activity category
Activity Category
Ann. Emoluments per hired worker Estimated no of hired workers No of enterprises
formal informal all formal informal all estd. sample
RURAL ALL
M01 0 0 0 0 0 0 0 0
M02 71170 43348 63953 9353 3276 12628 59138 271
M03 117641 45257 73943 663 1010 1674 15247 41
M04 66336 36346 48016 227 357 584 187972 117
M05 50872 9600 45910 988 135 1123 49503 83
M06 40846 14745 31345 2412 1381 3793 61061 355
M07 0 0 0 0 0 0 279 3
M08 54145 88400 80096 355 1110 1466 71682 138
M09 120000 8353 23591 60 378 438 540 7
M10 48000 40000 47138 144 17 161 451 14
M11 64000 0 64000 408 0 408 136 1
M12 59902 30000 55162 1587 299 1886 342 5
M13 0 0 0 0 0 0 0 0
M14 84000 33000 50000 187 374 561 815 4
M15 109062 57340 100768 23962 4576 28539 38278 110
M16 56887 27633 31517 428 2795 3223 4705 18
M17 68445 74335 70415 3141 1578 4719 6379 70
M18 0 0 0 0 0 0 0 0
M19 0 0 0 0 0 0 0 0
M20 30000 20000 26667 748 374 1122 187 1
M21 0 0 0 0 0 0 0 0
M22 0 0 0 0 0 0 0 0
M23 72795 184729 101225 2077 707 2784 83195 107
M24 0 0 0 0 0 0 3463 18
M25 64000 40097 50604 561 715 1277 645 6
Manufac. Total 87522 50797 76965 47303 19084 66387 584015 1369
Electricity 0 0 0 0 0 0 0 0
T01 85016 67392 76424 1803 1715 3518 1427 18
T02 50072 43462 48141 2154 889 3042 6185 57
T03 0 0 0 0 0 0 0 0
T04 45600 37777 39106 535 2616 3151 12083 49
T05 67271 44927 60191 11789 5469 17258 989233 1496
Trade Total 66248 46660 58485 16280 10689 26969 1008928 1620
S01 78431 112950 80571 1281 85 1365 210 10
S02 59323 48506 55007 8719 5788 14507 65421 353
S03 64199 63310 63845 41729 27623 69351 132041 619
S04 0 0 0 0 0 0 0 0
S05 0 0 0 0 0 0 0 0
S06 0 0 0 0 0 0 67 1
S07 62862 44462 54145 249 224 473 3556 12
S08 0 1800 1800 0 1250 1250 143003 222
S09 0 0 0 0 0 0 0 0
S10 30046 45114 40142 107 217 324 1054 7
S11 57148 41956 50834 196 139 335 2280 27
S12 33054 33760 33262 10480 4377 14857 18782 103
S13 61528 67392 63299 6589 2850 9439 9737 56
S14 47995 28518 38191 414 420 835 7852 38
S15 28964 26073 27587 3885 3535 7420 179895 577
Others Total 57176 53989 55942 73648 46508 120156 563898 2025
ALL + N.R. 68712 52164 62800 137232 76281 213512 2156841 5014
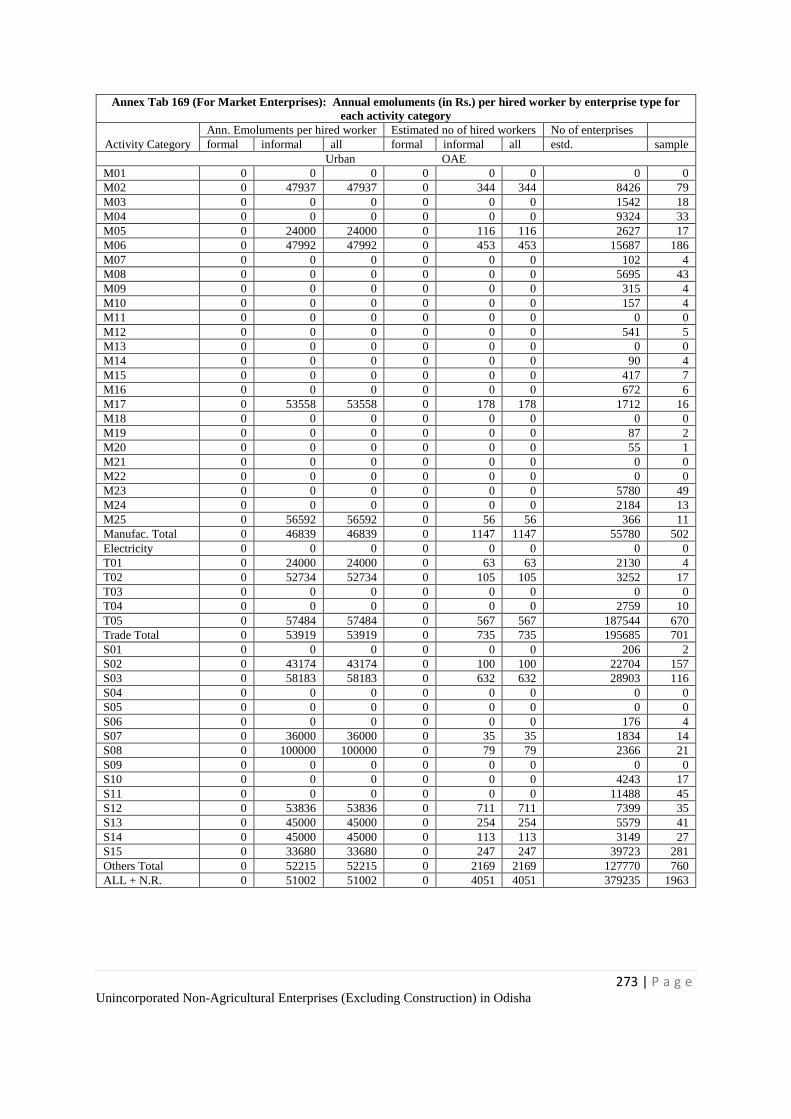
273 | P a g e Unincorporated Non-Agricultural Enterprises (Excluding Construction) in Odisha
Annex Tab 169 (For Market Enterprises): Annual emoluments (in Rs.) per hired worker by enterprise type for
each activity category
Activity Category
Ann. Emoluments per hired worker Estimated no of hired workers No of enterprises
formal informal all formal informal all estd. sample
Urban OAE
M01 0 0 0 0 0 0 0 0
M02 0 47937 47937 0 344 344 8426 79
M03 0 0 0 0 0 0 1542 18
M04 0 0 0 0 0 0 9324 33
M05 0 24000 24000 0 116 116 2627 17
M06 0 47992 47992 0 453 453 15687 186
M07 0 0 0 0 0 0 102 4
M08 0 0 0 0 0 0 5695 43
M09 0 0 0 0 0 0 315 4
M10 0 0 0 0 0 0 157 4
M11 0 0 0 0 0 0 0 0
M12 0 0 0 0 0 0 541 5
M13 0 0 0 0 0 0 0 0
M14 0 0 0 0 0 0 90 4
M15 0 0 0 0 0 0 417 7
M16 0 0 0 0 0 0 672 6
M17 0 53558 53558 0 178 178 1712 16
M18 0 0 0 0 0 0 0 0
M19 0 0 0 0 0 0 87 2
M20 0 0 0 0 0 0 55 1
M21 0 0 0 0 0 0 0 0
M22 0 0 0 0 0 0 0 0
M23 0 0 0 0 0 0 5780 49
M24 0 0 0 0 0 0 2184 13
M25 0 56592 56592 0 56 56 366 11
Manufac. Total 0 46839 46839 0 1147 1147 55780 502
Electricity 0 0 0 0 0 0 0 0
T01 0 24000 24000 0 63 63 2130 4
T02 0 52734 52734 0 105 105 3252 17
T03 0 0 0 0 0 0 0 0
T04 0 0 0 0 0 0 2759 10
T05 0 57484 57484 0 567 567 187544 670
Trade Total 0 53919 53919 0 735 735 195685 701
S01 0 0 0 0 0 0 206 2
S02 0 43174 43174 0 100 100 22704 157
S03 0 58183 58183 0 632 632 28903 116
S04 0 0 0 0 0 0 0 0
S05 0 0 0 0 0 0 0 0
S06 0 0 0 0 0 0 176 4
S07 0 36000 36000 0 35 35 1834 14
S08 0 100000 100000 0 79 79 2366 21
S09 0 0 0 0 0 0 0 0
S10 0 0 0 0 0 0 4243 17
S11 0 0 0 0 0 0 11488 45
S12 0 53836 53836 0 711 711 7399 35
S13 0 45000 45000 0 254 254 5579 41
S14 0 45000 45000 0 113 113 3149 27
S15 0 33680 33680 0 247 247 39723 281
Others Total 0 52215 52215 0 2169 2169 127770 760
ALL + N.R. 0 51002 51002 0 4051 4051 379235 1963
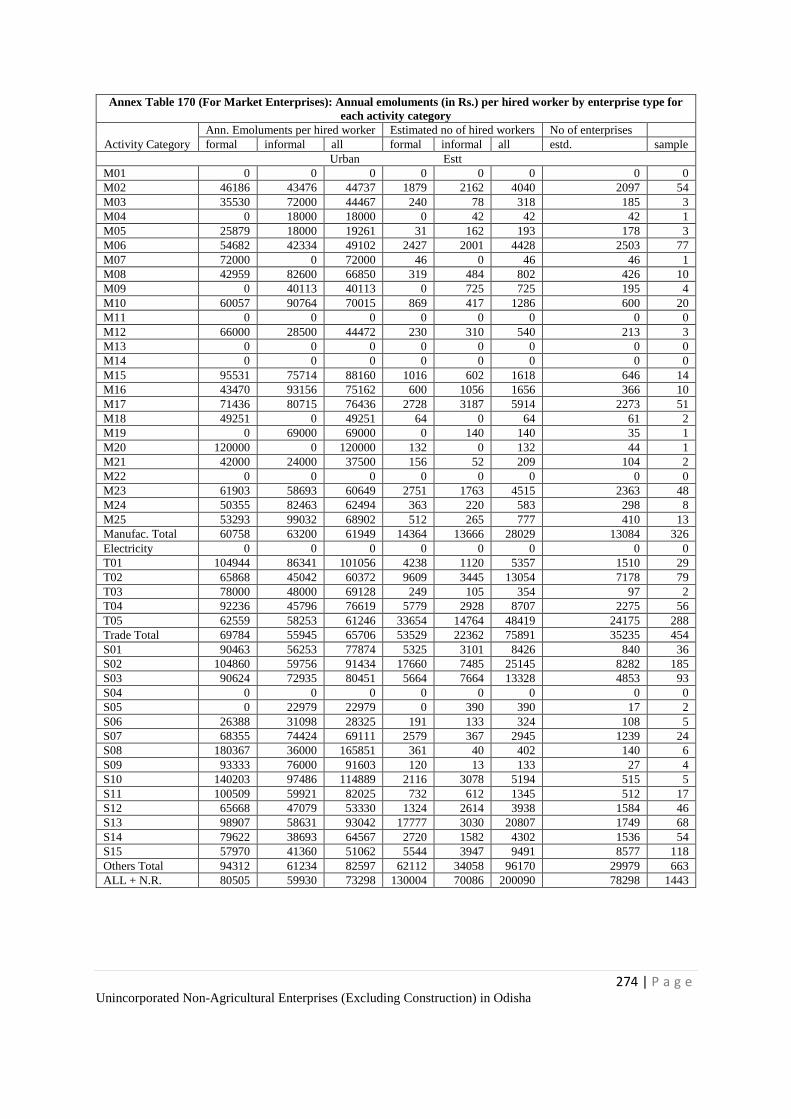
274 | P a g e Unincorporated Non-Agricultural Enterprises (Excluding Construction) in Odisha
Annex Table 170 (For Market Enterprises): Annual emoluments (in Rs.) per hired worker by enterprise type for
each activity category
Activity Category
Ann. Emoluments per hired worker Estimated no of hired workers No of enterprises
formal informal all formal informal all estd. sample
Urban Estt
M01 0 0 0 0 0 0 0 0
M02 46186 43476 44737 1879 2162 4040 2097 54
M03 35530 72000 44467 240 78 318 185 3
M04 0 18000 18000 0 42 42 42 1
M05 25879 18000 19261 31 162 193 178 3
M06 54682 42334 49102 2427 2001 4428 2503 77
M07 72000 0 72000 46 0 46 46 1
M08 42959 82600 66850 319 484 802 426 10
M09 0 40113 40113 0 725 725 195 4
M10 60057 90764 70015 869 417 1286 600 20
M11 0 0 0 0 0 0 0 0
M12 66000 28500 44472 230 310 540 213 3
M13 0 0 0 0 0 0 0 0
M14 0 0 0 0 0 0 0 0
M15 95531 75714 88160 1016 602 1618 646 14
M16 43470 93156 75162 600 1056 1656 366 10
M17 71436 80715 76436 2728 3187 5914 2273 51
M18 49251 0 49251 64 0 64 61 2
M19 0 69000 69000 0 140 140 35 1
M20 120000 0 120000 132 0 132 44 1
M21 42000 24000 37500 156 52 209 104 2
M22 0 0 0 0 0 0 0 0
M23 61903 58693 60649 2751 1763 4515 2363 48
M24 50355 82463 62494 363 220 583 298 8
M25 53293 99032 68902 512 265 777 410 13
Manufac. Total 60758 63200 61949 14364 13666 28029 13084 326
Electricity 0 0 0 0 0 0 0 0
T01 104944 86341 101056 4238 1120 5357 1510 29
T02 65868 45042 60372 9609 3445 13054 7178 79
T03 78000 48000 69128 249 105 354 97 2
T04 92236 45796 76619 5779 2928 8707 2275 56
T05 62559 58253 61246 33654 14764 48419 24175 288
Trade Total 69784 55945 65706 53529 22362 75891 35235 454
S01 90463 56253 77874 5325 3101 8426 840 36
S02 104860 59756 91434 17660 7485 25145 8282 185
S03 90624 72935 80451 5664 7664 13328 4853 93
S04 0 0 0 0 0 0 0 0
S05 0 22979 22979 0 390 390 17 2
S06 26388 31098 28325 191 133 324 108 5
S07 68355 74424 69111 2579 367 2945 1239 24
S08 180367 36000 165851 361 40 402 140 6
S09 93333 76000 91603 120 13 133 27 4
S10 140203 97486 114889 2116 3078 5194 515 5
S11 100509 59921 82025 732 612 1345 512 17
S12 65668 47079 53330 1324 2614 3938 1584 46
S13 98907 58631 93042 17777 3030 20807 1749 68
S14 79622 38693 64567 2720 1582 4302 1536 54
S15 57970 41360 51062 5544 3947 9491 8577 118
Others Total 94312 61234 82597 62112 34058 96170 29979 663
ALL + N.R. 80505 59930 73298 130004 70086 200090 78298 1443
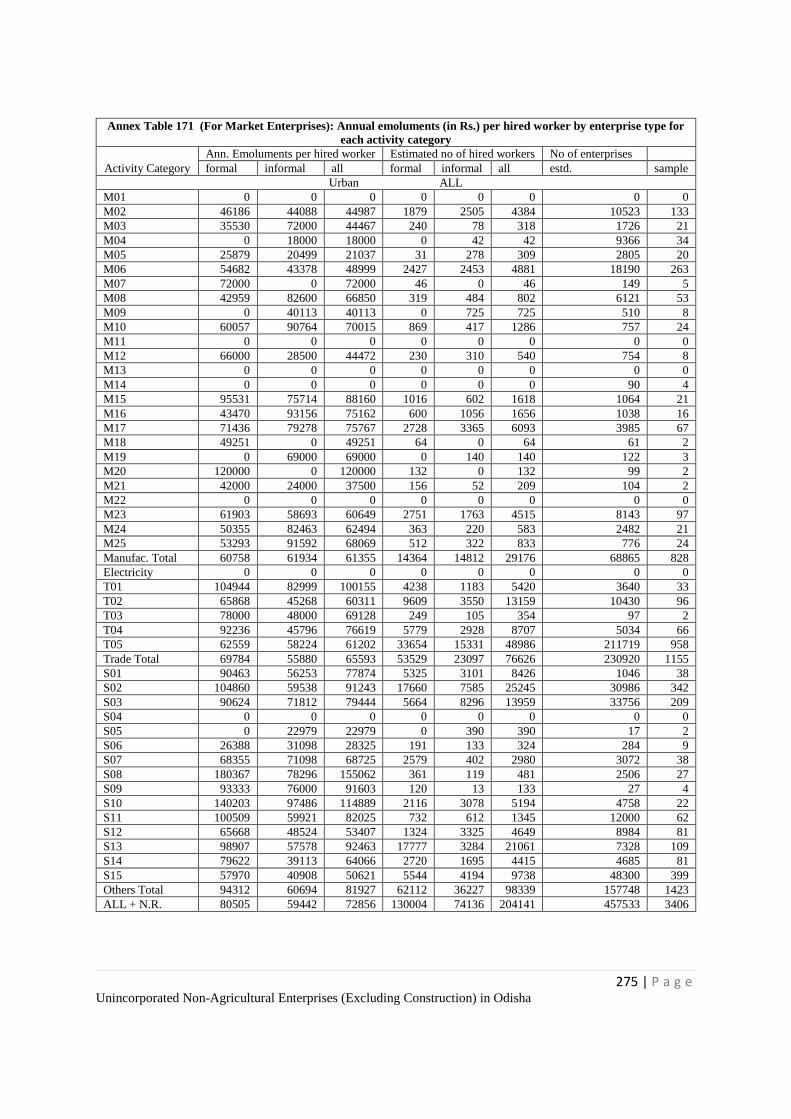
275 | P a g e Unincorporated Non-Agricultural Enterprises (Excluding Construction) in Odisha
Annex Table 171 (For Market Enterprises): Annual emoluments (in Rs.) per hired worker by enterprise type for
each activity category
Activity Category
Ann. Emoluments per hired worker Estimated no of hired workers No of enterprises
formal informal all formal informal all estd. sample
Urban ALL
M01 0 0 0 0 0 0 0 0
M02 46186 44088 44987 1879 2505 4384 10523 133
M03 35530 72000 44467 240 78 318 1726 21
M04 0 18000 18000 0 42 42 9366 34
M05 25879 20499 21037 31 278 309 2805 20
M06 54682 43378 48999 2427 2453 4881 18190 263
M07 72000 0 72000 46 0 46 149 5
M08 42959 82600 66850 319 484 802 6121 53
M09 0 40113 40113 0 725 725 510 8
M10 60057 90764 70015 869 417 1286 757 24
M11 0 0 0 0 0 0 0 0
M12 66000 28500 44472 230 310 540 754 8
M13 0 0 0 0 0 0 0 0
M14 0 0 0 0 0 0 90 4
M15 95531 75714 88160 1016 602 1618 1064 21
M16 43470 93156 75162 600 1056 1656 1038 16
M17 71436 79278 75767 2728 3365 6093 3985 67
M18 49251 0 49251 64 0 64 61 2
M19 0 69000 69000 0 140 140 122 3
M20 120000 0 120000 132 0 132 99 2
M21 42000 24000 37500 156 52 209 104 2
M22 0 0 0 0 0 0 0 0
M23 61903 58693 60649 2751 1763 4515 8143 97
M24 50355 82463 62494 363 220 583 2482 21
M25 53293 91592 68069 512 322 833 776 24
Manufac. Total 60758 61934 61355 14364 14812 29176 68865 828
Electricity 0 0 0 0 0 0 0 0
T01 104944 82999 100155 4238 1183 5420 3640 33
T02 65868 45268 60311 9609 3550 13159 10430 96
T03 78000 48000 69128 249 105 354 97 2
T04 92236 45796 76619 5779 2928 8707 5034 66
T05 62559 58224 61202 33654 15331 48986 211719 958
Trade Total 69784 55880 65593 53529 23097 76626 230920 1155
S01 90463 56253 77874 5325 3101 8426 1046 38
S02 104860 59538 91243 17660 7585 25245 30986 342
S03 90624 71812 79444 5664 8296 13959 33756 209
S04 0 0 0 0 0 0 0 0
S05 0 22979 22979 0 390 390 17 2
S06 26388 31098 28325 191 133 324 284 9
S07 68355 71098 68725 2579 402 2980 3072 38
S08 180367 78296 155062 361 119 481 2506 27
S09 93333 76000 91603 120 13 133 27 4
S10 140203 97486 114889 2116 3078 5194 4758 22
S11 100509 59921 82025 732 612 1345 12000 62
S12 65668 48524 53407 1324 3325 4649 8984 81
S13 98907 57578 92463 17777 3284 21061 7328 109
S14 79622 39113 64066 2720 1695 4415 4685 81
S15 57970 40908 50621 5544 4194 9738 48300 399
Others Total 94312 60694 81927 62112 36227 98339 157748 1423
ALL + N.R. 80505 59442 72856 130004 74136 204141 457533 3406
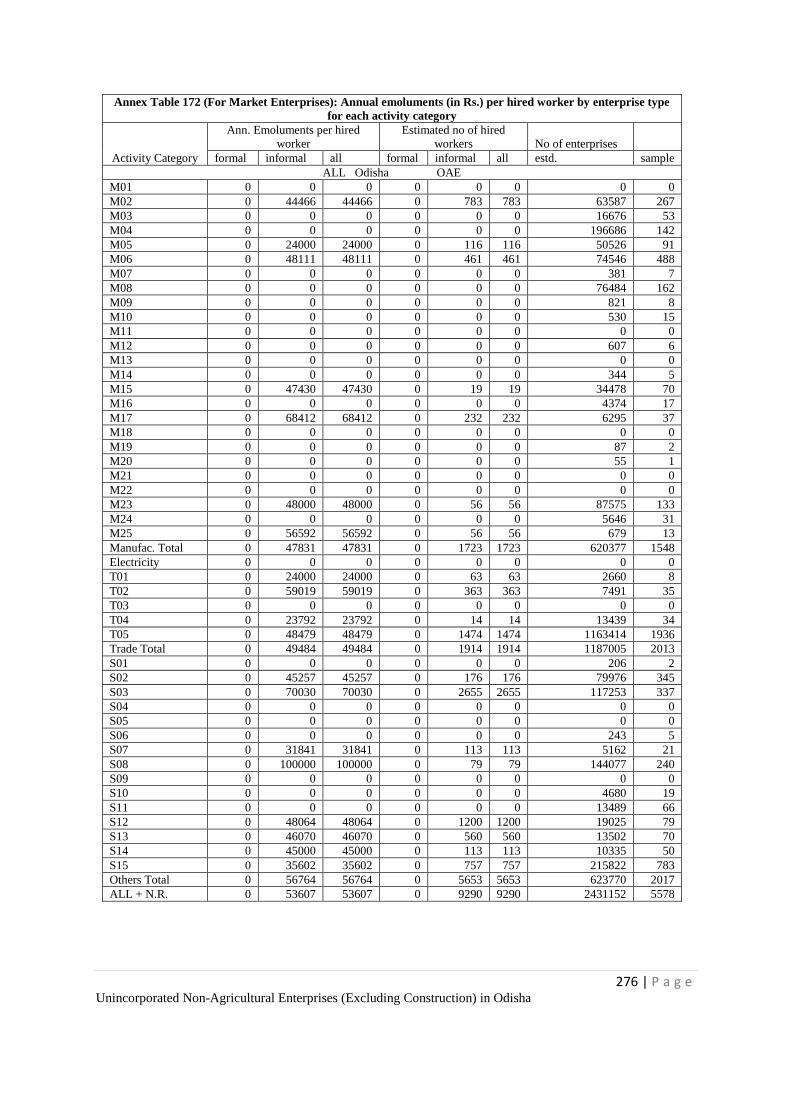
276 | P a g e Unincorporated Non-Agricultural Enterprises (Excluding Construction) in Odisha
Annex Table 172 (For Market Enterprises): Annual emoluments (in Rs.) per hired worker by enterprise type
for each activity category
Activity Category
Ann. Emoluments per hired
worker
Estimated no of hired
workers No of enterprises
formal informal all formal informal all estd. sample
ALL Odisha OAE
M01 0 0 0 0 0 0 0 0
M02 0 44466 44466 0 783 783 63587 267
M03 0 0 0 0 0 0 16676 53
M04 0 0 0 0 0 0 196686 142
M05 0 24000 24000 0 116 116 50526 91
M06 0 48111 48111 0 461 461 74546 488
M07 0 0 0 0 0 0 381 7
M08 0 0 0 0 0 0 76484 162
M09 0 0 0 0 0 0 821 8
M10 0 0 0 0 0 0 530 15
M11 0 0 0 0 0 0 0 0
M12 0 0 0 0 0 0 607 6
M13 0 0 0 0 0 0 0 0
M14 0 0 0 0 0 0 344 5
M15 0 47430 47430 0 19 19 34478 70
M16 0 0 0 0 0 0 4374 17
M17 0 68412 68412 0 232 232 6295 37
M18 0 0 0 0 0 0 0 0
M19 0 0 0 0 0 0 87 2
M20 0 0 0 0 0 0 55 1
M21 0 0 0 0 0 0 0 0
M22 0 0 0 0 0 0 0 0
M23 0 48000 48000 0 56 56 87575 133
M24 0 0 0 0 0 0 5646 31
M25 0 56592 56592 0 56 56 679 13
Manufac. Total 0 47831 47831 0 1723 1723 620377 1548
Electricity 0 0 0 0 0 0 0 0
T01 0 24000 24000 0 63 63 2660 8
T02 0 59019 59019 0 363 363 7491 35
T03 0 0 0 0 0 0 0 0
T04 0 23792 23792 0 14 14 13439 34
T05 0 48479 48479 0 1474 1474 1163414 1936
Trade Total 0 49484 49484 0 1914 1914 1187005 2013
S01 0 0 0 0 0 0 206 2
S02 0 45257 45257 0 176 176 79976 345
S03 0 70030 70030 0 2655 2655 117253 337
S04 0 0 0 0 0 0 0 0
S05 0 0 0 0 0 0 0 0
S06 0 0 0 0 0 0 243 5
S07 0 31841 31841 0 113 113 5162 21
S08 0 100000 100000 0 79 79 144077 240
S09 0 0 0 0 0 0 0 0
S10 0 0 0 0 0 0 4680 19
S11 0 0 0 0 0 0 13489 66
S12 0 48064 48064 0 1200 1200 19025 79
S13 0 46070 46070 0 560 560 13502 70
S14 0 45000 45000 0 113 113 10335 50
S15 0 35602 35602 0 757 757 215822 783
Others Total 0 56764 56764 0 5653 5653 623770 2017
ALL + N.R. 0 53607 53607 0 9290 9290 2431152 5578
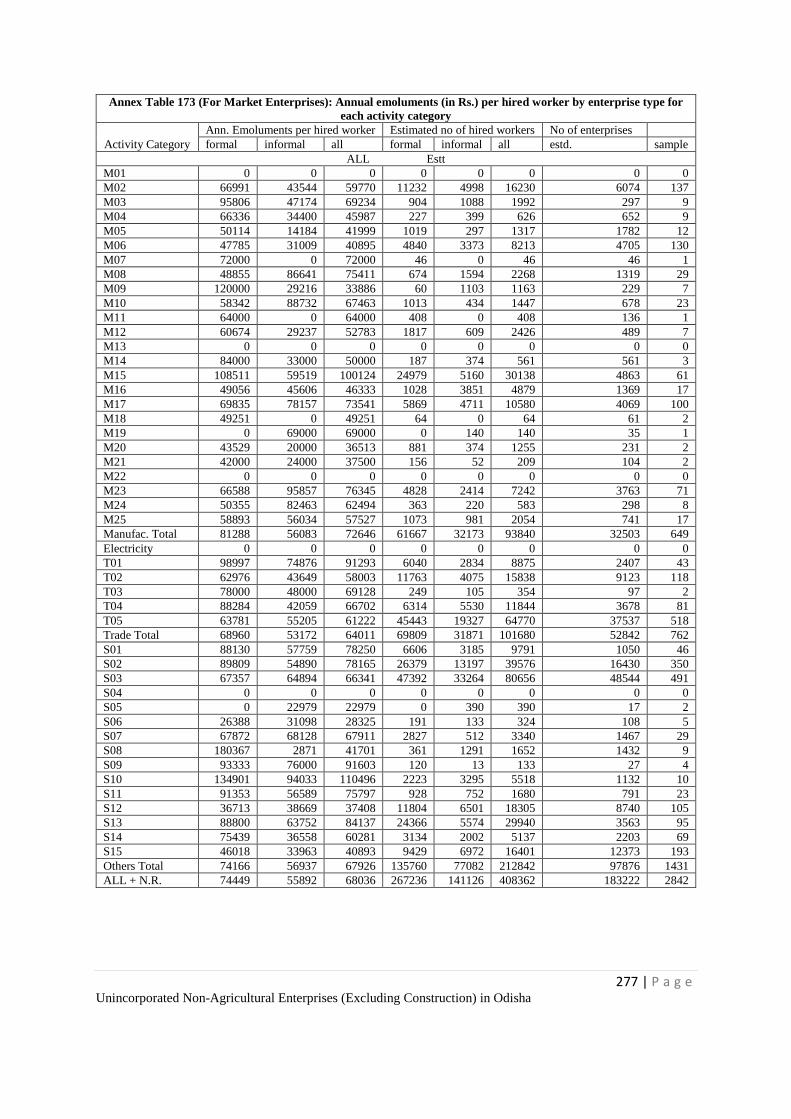
277 | P a g e Unincorporated Non-Agricultural Enterprises (Excluding Construction) in Odisha
Annex Table 173 (For Market Enterprises): Annual emoluments (in Rs.) per hired worker by enterprise type for
each activity category
Activity Category
Ann. Emoluments per hired worker Estimated no of hired workers No of enterprises
formal informal all formal informal all estd. sample
ALL Estt
M01 0 0 0 0 0 0 0 0
M02 66991 43544 59770 11232 4998 16230 6074 137
M03 95806 47174 69234 904 1088 1992 297 9
M04 66336 34400 45987 227 399 626 652 9
M05 50114 14184 41999 1019 297 1317 1782 12
M06 47785 31009 40895 4840 3373 8213 4705 130
M07 72000 0 72000 46 0 46 46 1
M08 48855 86641 75411 674 1594 2268 1319 29
M09 120000 29216 33886 60 1103 1163 229 7
M10 58342 88732 67463 1013 434 1447 678 23
M11 64000 0 64000 408 0 408 136 1
M12 60674 29237 52783 1817 609 2426 489 7
M13 0 0 0 0 0 0 0 0
M14 84000 33000 50000 187 374 561 561 3
M15 108511 59519 100124 24979 5160 30138 4863 61
M16 49056 45606 46333 1028 3851 4879 1369 17
M17 69835 78157 73541 5869 4711 10580 4069 100
M18 49251 0 49251 64 0 64 61 2
M19 0 69000 69000 0 140 140 35 1
M20 43529 20000 36513 881 374 1255 231 2
M21 42000 24000 37500 156 52 209 104 2
M22 0 0 0 0 0 0 0 0
M23 66588 95857 76345 4828 2414 7242 3763 71
M24 50355 82463 62494 363 220 583 298 8
M25 58893 56034 57527 1073 981 2054 741 17
Manufac. Total 81288 56083 72646 61667 32173 93840 32503 649
Electricity 0 0 0 0 0 0 0 0
T01 98997 74876 91293 6040 2834 8875 2407 43
T02 62976 43649 58003 11763 4075 15838 9123 118
T03 78000 48000 69128 249 105 354 97 2
T04 88284 42059 66702 6314 5530 11844 3678 81
T05 63781 55205 61222 45443 19327 64770 37537 518
Trade Total 68960 53172 64011 69809 31871 101680 52842 762
S01 88130 57759 78250 6606 3185 9791 1050 46
S02 89809 54890 78165 26379 13197 39576 16430 350
S03 67357 64894 66341 47392 33264 80656 48544 491
S04 0 0 0 0 0 0 0 0
S05 0 22979 22979 0 390 390 17 2
S06 26388 31098 28325 191 133 324 108 5
S07 67872 68128 67911 2827 512 3340 1467 29
S08 180367 2871 41701 361 1291 1652 1432 9
S09 93333 76000 91603 120 13 133 27 4
S10 134901 94033 110496 2223 3295 5518 1132 10
S11 91353 56589 75797 928 752 1680 791 23
S12 36713 38669 37408 11804 6501 18305 8740 105
S13 88800 63752 84137 24366 5574 29940 3563 95
S14 75439 36558 60281 3134 2002 5137 2203 69
S15 46018 33963 40893 9429 6972 16401 12373 193
Others Total 74166 56937 67926 135760 77082 212842 97876 1431
ALL + N.R. 74449 55892 68036 267236 141126 408362 183222 2842
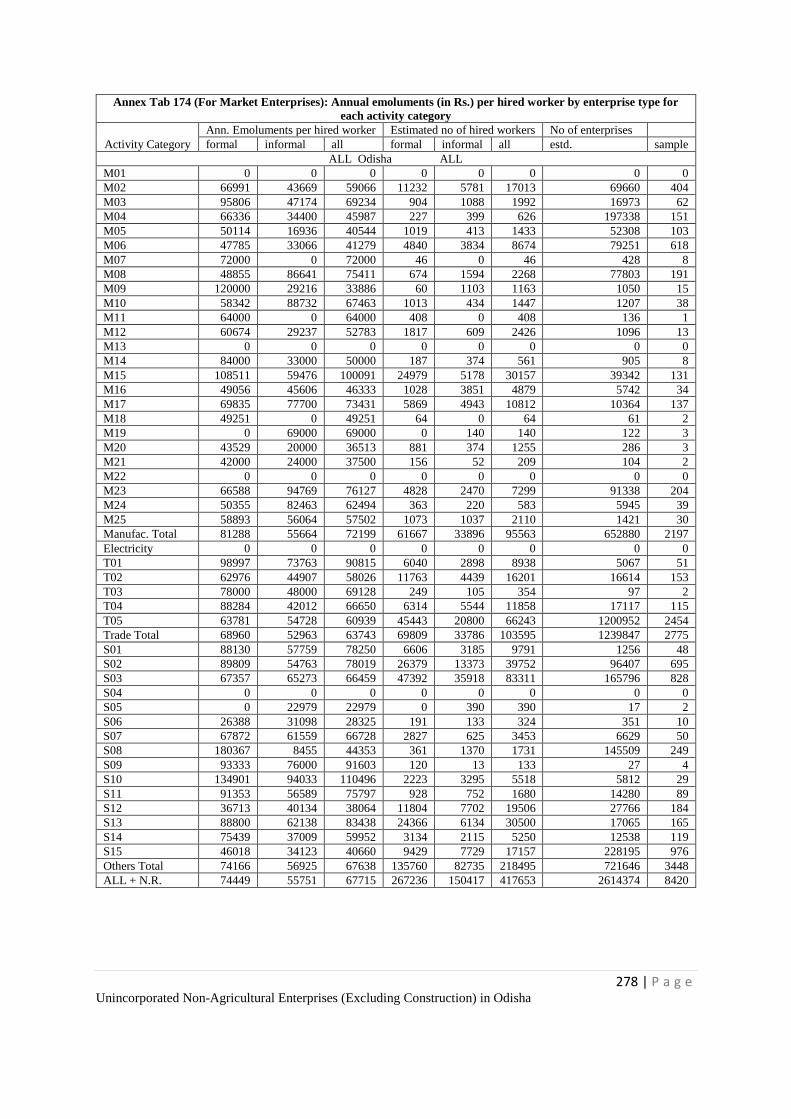
278 | P a g e Unincorporated Non-Agricultural Enterprises (Excluding Construction) in Odisha
Annex Tab 174 (For Market Enterprises): Annual emoluments (in Rs.) per hired worker by enterprise type for
each activity category
Activity Category
Ann. Emoluments per hired worker Estimated no of hired workers No of enterprises
formal informal all formal informal all estd. sample
ALL Odisha ALL
M01 0 0 0 0 0 0 0 0
M02 66991 43669 59066 11232 5781 17013 69660 404
M03 95806 47174 69234 904 1088 1992 16973 62
M04 66336 34400 45987 227 399 626 197338 151
M05 50114 16936 40544 1019 413 1433 52308 103
M06 47785 33066 41279 4840 3834 8674 79251 618
M07 72000 0 72000 46 0 46 428 8
M08 48855 86641 75411 674 1594 2268 77803 191
M09 120000 29216 33886 60 1103 1163 1050 15
M10 58342 88732 67463 1013 434 1447 1207 38
M11 64000 0 64000 408 0 408 136 1
M12 60674 29237 52783 1817 609 2426 1096 13
M13 0 0 0 0 0 0 0 0
M14 84000 33000 50000 187 374 561 905 8
M15 108511 59476 100091 24979 5178 30157 39342 131
M16 49056 45606 46333 1028 3851 4879 5742 34
M17 69835 77700 73431 5869 4943 10812 10364 137
M18 49251 0 49251 64 0 64 61 2
M19 0 69000 69000 0 140 140 122 3
M20 43529 20000 36513 881 374 1255 286 3
M21 42000 24000 37500 156 52 209 104 2
M22 0 0 0 0 0 0 0 0
M23 66588 94769 76127 4828 2470 7299 91338 204
M24 50355 82463 62494 363 220 583 5945 39
M25 58893 56064 57502 1073 1037 2110 1421 30
Manufac. Total 81288 55664 72199 61667 33896 95563 652880 2197
Electricity 0 0 0 0 0 0 0 0
T01 98997 73763 90815 6040 2898 8938 5067 51
T02 62976 44907 58026 11763 4439 16201 16614 153
T03 78000 48000 69128 249 105 354 97 2
T04 88284 42012 66650 6314 5544 11858 17117 115
T05 63781 54728 60939 45443 20800 66243 1200952 2454
Trade Total 68960 52963 63743 69809 33786 103595 1239847 2775
S01 88130 57759 78250 6606 3185 9791 1256 48
S02 89809 54763 78019 26379 13373 39752 96407 695
S03 67357 65273 66459 47392 35918 83311 165796 828
S04 0 0 0 0 0 0 0 0
S05 0 22979 22979 0 390 390 17 2
S06 26388 31098 28325 191 133 324 351 10
S07 67872 61559 66728 2827 625 3453 6629 50
S08 180367 8455 44353 361 1370 1731 145509 249
S09 93333 76000 91603 120 13 133 27 4
S10 134901 94033 110496 2223 3295 5518 5812 29
S11 91353 56589 75797 928 752 1680 14280 89
S12 36713 40134 38064 11804 7702 19506 27766 184
S13 88800 62138 83438 24366 6134 30500 17065 165
S14 75439 37009 59952 3134 2115 5250 12538 119
S15 46018 34123 40660 9429 7729 17157 228195 976
Others Total 74166 56925 67638 135760 82735 218495 721646 3448
ALL + N.R. 74449 55751 67715 267236 150417 417653 2614374 8420
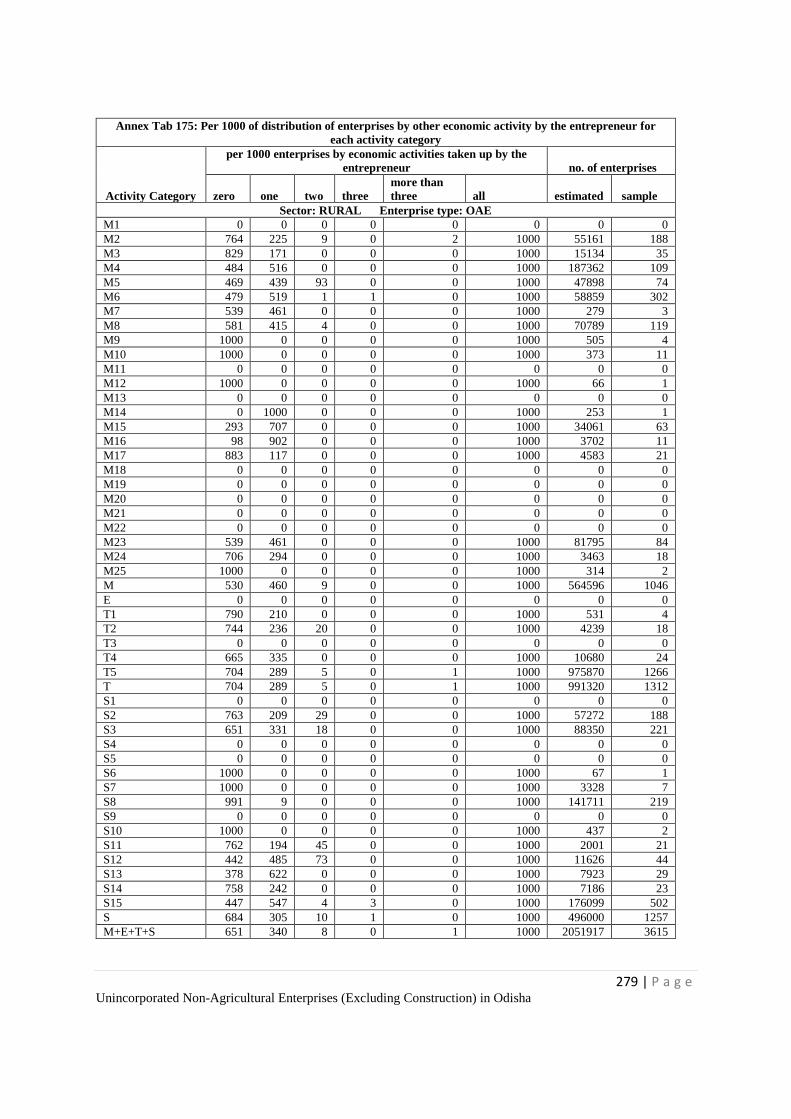
279 | P a g e Unincorporated Non-Agricultural Enterprises (Excluding Construction) in Odisha
Annex Tab 175: Per 1000 of distribution of enterprises by other economic activity by the entrepreneur for
each activity category
Activity Category
per 1000 enterprises by economic activities taken up by the
entrepreneur no. of enterprises
zero one two three
more than
three all estimated sample
Sector: RURAL Enterprise type: OAE
M1 0 0 0 0 0 0 0 0
M2 764 225 9 0 2 1000 55161 188
M3 829 171 0 0 0 1000 15134 35
M4 484 516 0 0 0 1000 187362 109
M5 469 439 93 0 0 1000 47898 74
M6 479 519 1 1 0 1000 58859 302
M7 539 461 0 0 0 1000 279 3
M8 581 415 4 0 0 1000 70789 119
M9 1000 0 0 0 0 1000 505 4
M10 1000 0 0 0 0 1000 373 11
M11 0 0 0 0 0 0 0 0
M12 1000 0 0 0 0 1000 66 1
M13 0 0 0 0 0 0 0 0
M14 0 1000 0 0 0 1000 253 1
M15 293 707 0 0 0 1000 34061 63
M16 98 902 0 0 0 1000 3702 11
M17 883 117 0 0 0 1000 4583 21
M18 0 0 0 0 0 0 0 0
M19 0 0 0 0 0 0 0 0
M20 0 0 0 0 0 0 0 0
M21 0 0 0 0 0 0 0 0
M22 0 0 0 0 0 0 0 0
M23 539 461 0 0 0 1000 81795 84
M24 706 294 0 0 0 1000 3463 18
M25 1000 0 0 0 0 1000 314 2
M 530 460 9 0 0 1000 564596 1046
E 0 0 0 0 0 0 0 0
T1 790 210 0 0 0 1000 531 4
T2 744 236 20 0 0 1000 4239 18
T3 0 0 0 0 0 0 0 0
T4 665 335 0 0 0 1000 10680 24
T5 704 289 5 0 1 1000 975870 1266
T 704 289 5 0 1 1000 991320 1312
S1 0 0 0 0 0 0 0 0
S2 763 209 29 0 0 1000 57272 188
S3 651 331 18 0 0 1000 88350 221
S4 0 0 0 0 0 0 0 0
S5 0 0 0 0 0 0 0 0
S6 1000 0 0 0 0 1000 67 1
S7 1000 0 0 0 0 1000 3328 7
S8 991 9 0 0 0 1000 141711 219
S9 0 0 0 0 0 0 0 0
S10 1000 0 0 0 0 1000 437 2
S11 762 194 45 0 0 1000 2001 21
S12 442 485 73 0 0 1000 11626 44
S13 378 622 0 0 0 1000 7923 29
S14 758 242 0 0 0 1000 7186 23
S15 447 547 4 3 0 1000 176099 502
S 684 305 10 1 0 1000 496000 1257
M+E+T+S 651 340 8 0 1 1000 2051917 3615
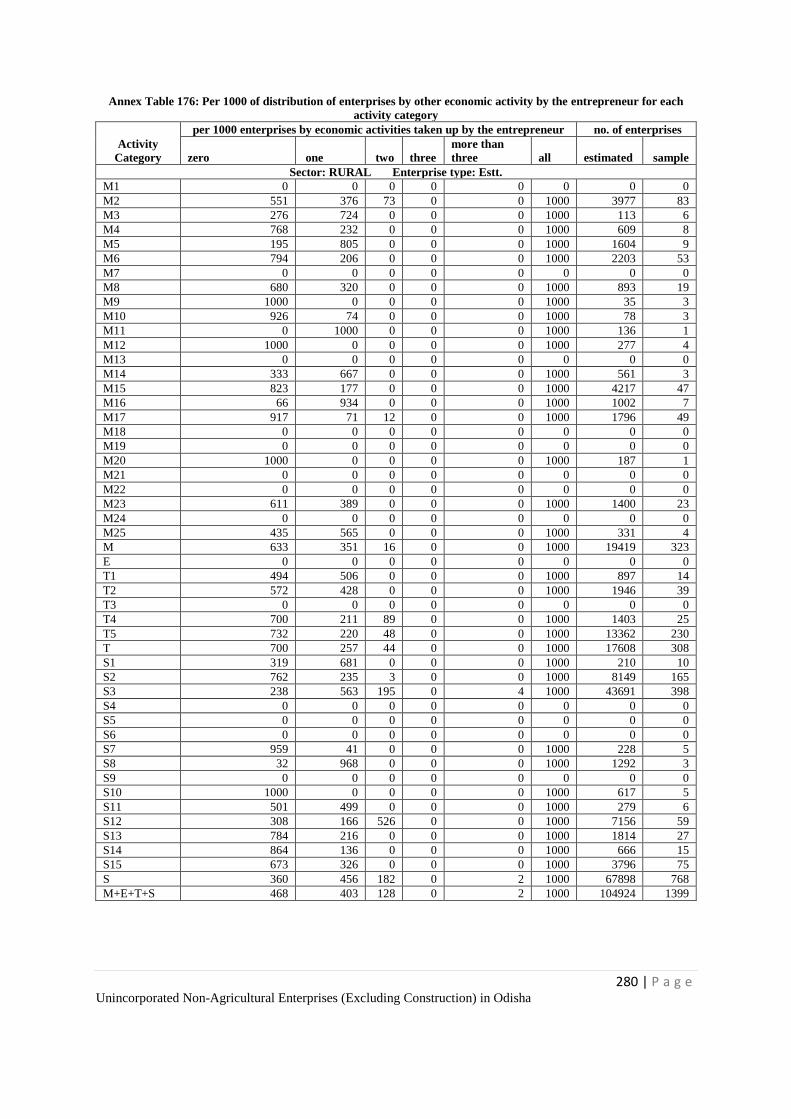
280 | P a g e Unincorporated Non-Agricultural Enterprises (Excluding Construction) in Odisha
Annex Table 176: Per 1000 of distribution of enterprises by other economic activity by the entrepreneur for each
activity category
Activity
Category
per 1000 enterprises by economic activities taken up by the entrepreneur no. of enterprises
zero one two three
more than
three all estimated sample
Sector: RURAL Enterprise type: Estt.
M1 0 0 0 0 0 0 0 0
M2 551 376 73 0 0 1000 3977 83
M3 276 724 0 0 0 1000 113 6
M4 768 232 0 0 0 1000 609 8
M5 195 805 0 0 0 1000 1604 9
M6 794 206 0 0 0 1000 2203 53
M7 0 0 0 0 0 0 0 0
M8 680 320 0 0 0 1000 893 19
M9 1000 0 0 0 0 1000 35 3
M10 926 74 0 0 0 1000 78 3
M11 0 1000 0 0 0 1000 136 1
M12 1000 0 0 0 0 1000 277 4
M13 0 0 0 0 0 0 0 0
M14 333 667 0 0 0 1000 561 3
M15 823 177 0 0 0 1000 4217 47
M16 66 934 0 0 0 1000 1002 7
M17 917 71 12 0 0 1000 1796 49
M18 0 0 0 0 0 0 0 0
M19 0 0 0 0 0 0 0 0
M20 1000 0 0 0 0 1000 187 1
M21 0 0 0 0 0 0 0 0
M22 0 0 0 0 0 0 0 0
M23 611 389 0 0 0 1000 1400 23
M24 0 0 0 0 0 0 0 0
M25 435 565 0 0 0 1000 331 4
M 633 351 16 0 0 1000 19419 323
E 0 0 0 0 0 0 0 0
T1 494 506 0 0 0 1000 897 14
T2 572 428 0 0 0 1000 1946 39
T3 0 0 0 0 0 0 0 0
T4 700 211 89 0 0 1000 1403 25
T5 732 220 48 0 0 1000 13362 230
T 700 257 44 0 0 1000 17608 308
S1 319 681 0 0 0 1000 210 10
S2 762 235 3 0 0 1000 8149 165
S3 238 563 195 0 4 1000 43691 398
S4 0 0 0 0 0 0 0 0
S5 0 0 0 0 0 0 0 0
S6 0 0 0 0 0 0 0 0
S7 959 41 0 0 0 1000 228 5
S8 32 968 0 0 0 1000 1292 3
S9 0 0 0 0 0 0 0 0
S10 1000 0 0 0 0 1000 617 5
S11 501 499 0 0 0 1000 279 6
S12 308 166 526 0 0 1000 7156 59
S13 784 216 0 0 0 1000 1814 27
S14 864 136 0 0 0 1000 666 15
S15 673 326 0 0 0 1000 3796 75
S 360 456 182 0 2 1000 67898 768
M+E+T+S 468 403 128 0 2 1000 104924 1399
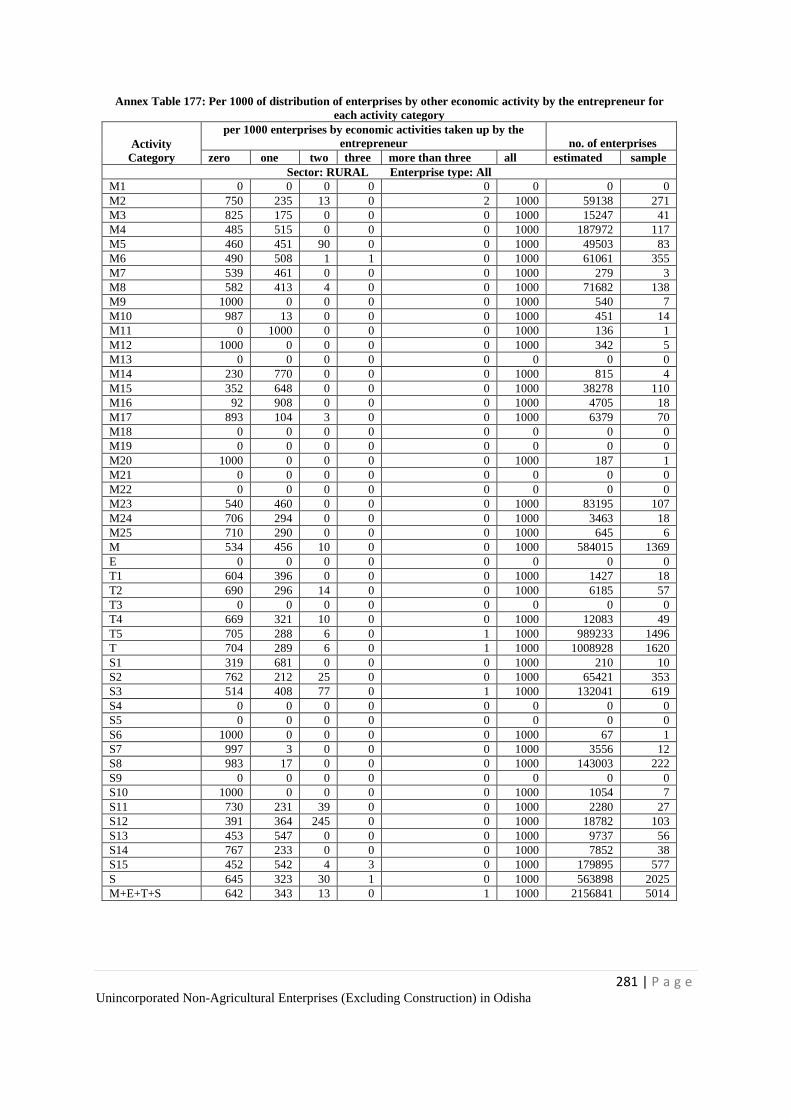
281 | P a g e Unincorporated Non-Agricultural Enterprises (Excluding Construction) in Odisha
Annex Table 177: Per 1000 of distribution of enterprises by other economic activity by the entrepreneur for
each activity category
Activity
Category
per 1000 enterprises by economic activities taken up by the
entrepreneur no. of enterprises
zero one two three more than three all estimated sample
Sector: RURAL Enterprise type: All
M1 0 0 0 0 0 0 0 0
M2 750 235 13 0 2 1000 59138 271
M3 825 175 0 0 0 1000 15247 41
M4 485 515 0 0 0 1000 187972 117
M5 460 451 90 0 0 1000 49503 83
M6 490 508 1 1 0 1000 61061 355
M7 539 461 0 0 0 1000 279 3
M8 582 413 4 0 0 1000 71682 138
M9 1000 0 0 0 0 1000 540 7
M10 987 13 0 0 0 1000 451 14
M11 0 1000 0 0 0 1000 136 1
M12 1000 0 0 0 0 1000 342 5
M13 0 0 0 0 0 0 0 0
M14 230 770 0 0 0 1000 815 4
M15 352 648 0 0 0 1000 38278 110
M16 92 908 0 0 0 1000 4705 18
M17 893 104 3 0 0 1000 6379 70
M18 0 0 0 0 0 0 0 0
M19 0 0 0 0 0 0 0 0
M20 1000 0 0 0 0 1000 187 1
M21 0 0 0 0 0 0 0 0
M22 0 0 0 0 0 0 0 0
M23 540 460 0 0 0 1000 83195 107
M24 706 294 0 0 0 1000 3463 18
M25 710 290 0 0 0 1000 645 6
M 534 456 10 0 0 1000 584015 1369
E 0 0 0 0 0 0 0 0
T1 604 396 0 0 0 1000 1427 18
T2 690 296 14 0 0 1000 6185 57
T3 0 0 0 0 0 0 0 0
T4 669 321 10 0 0 1000 12083 49
T5 705 288 6 0 1 1000 989233 1496
T 704 289 6 0 1 1000 1008928 1620
S1 319 681 0 0 0 1000 210 10
S2 762 212 25 0 0 1000 65421 353
S3 514 408 77 0 1 1000 132041 619
S4 0 0 0 0 0 0 0 0
S5 0 0 0 0 0 0 0 0
S6 1000 0 0 0 0 1000 67 1
S7 997 3 0 0 0 1000 3556 12
S8 983 17 0 0 0 1000 143003 222
S9 0 0 0 0 0 0 0 0
S10 1000 0 0 0 0 1000 1054 7
S11 730 231 39 0 0 1000 2280 27
S12 391 364 245 0 0 1000 18782 103
S13 453 547 0 0 0 1000 9737 56
S14 767 233 0 0 0 1000 7852 38
S15 452 542 4 3 0 1000 179895 577
S 645 323 30 1 0 1000 563898 2025
M+E+T+S 642 343 13 0 1 1000 2156841 5014
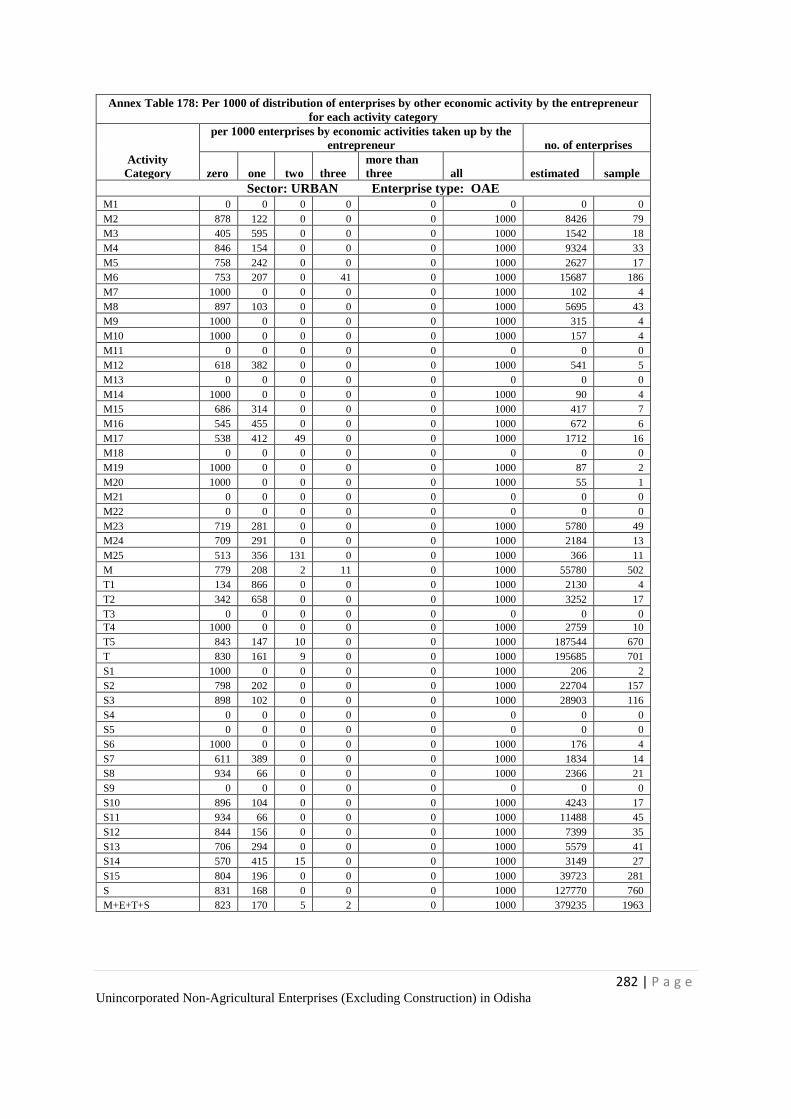
282 | P a g e Unincorporated Non-Agricultural Enterprises (Excluding Construction) in Odisha
Annex Table 178: Per 1000 of distribution of enterprises by other economic activity by the entrepreneur
for each activity category
Activity
Category
per 1000 enterprises by economic activities taken up by the
entrepreneur no. of enterprises
zero one two three
more than
three all estimated sample
Sector: URBAN Enterprise type: OAE
M1 0 0 0 0 0 0 0 0
M2 878 122 0 0 0 1000 8426 79
M3 405 595 0 0 0 1000 1542 18
M4 846 154 0 0 0 1000 9324 33
M5 758 242 0 0 0 1000 2627 17
M6 753 207 0 41 0 1000 15687 186
M7 1000 0 0 0 0 1000 102 4
M8 897 103 0 0 0 1000 5695 43
M9 1000 0 0 0 0 1000 315 4
M10 1000 0 0 0 0 1000 157 4
M11 0 0 0 0 0 0 0 0
M12 618 382 0 0 0 1000 541 5
M13 0 0 0 0 0 0 0 0
M14 1000 0 0 0 0 1000 90 4
M15 686 314 0 0 0 1000 417 7
M16 545 455 0 0 0 1000 672 6
M17 538 412 49 0 0 1000 1712 16
M18 0 0 0 0 0 0 0 0
M19 1000 0 0 0 0 1000 87 2
M20 1000 0 0 0 0 1000 55 1
M21 0 0 0 0 0 0 0 0
M22 0 0 0 0 0 0 0 0
M23 719 281 0 0 0 1000 5780 49
M24 709 291 0 0 0 1000 2184 13
M25 513 356 131 0 0 1000 366 11
M 779 208 2 11 0 1000 55780 502
T1 134 866 0 0 0 1000 2130 4
T2 342 658 0 0 0 1000 3252 17
T3 0 0 0 0 0 0 0 0
T4 1000 0 0 0 0 1000 2759 10
T5 843 147 10 0 0 1000 187544 670
T 830 161 9 0 0 1000 195685 701
S1 1000 0 0 0 0 1000 206 2
S2 798 202 0 0 0 1000 22704 157
S3 898 102 0 0 0 1000 28903 116
S4 0 0 0 0 0 0 0 0
S5 0 0 0 0 0 0 0 0
S6 1000 0 0 0 0 1000 176 4
S7 611 389 0 0 0 1000 1834 14
S8 934 66 0 0 0 1000 2366 21
S9 0 0 0 0 0 0 0 0
S10 896 104 0 0 0 1000 4243 17
S11 934 66 0 0 0 1000 11488 45
S12 844 156 0 0 0 1000 7399 35
S13 706 294 0 0 0 1000 5579 41
S14 570 415 15 0 0 1000 3149 27
S15 804 196 0 0 0 1000 39723 281
S 831 168 0 0 0 1000 127770 760
M+E+T+S 823 170 5 2 0 1000 379235 1963
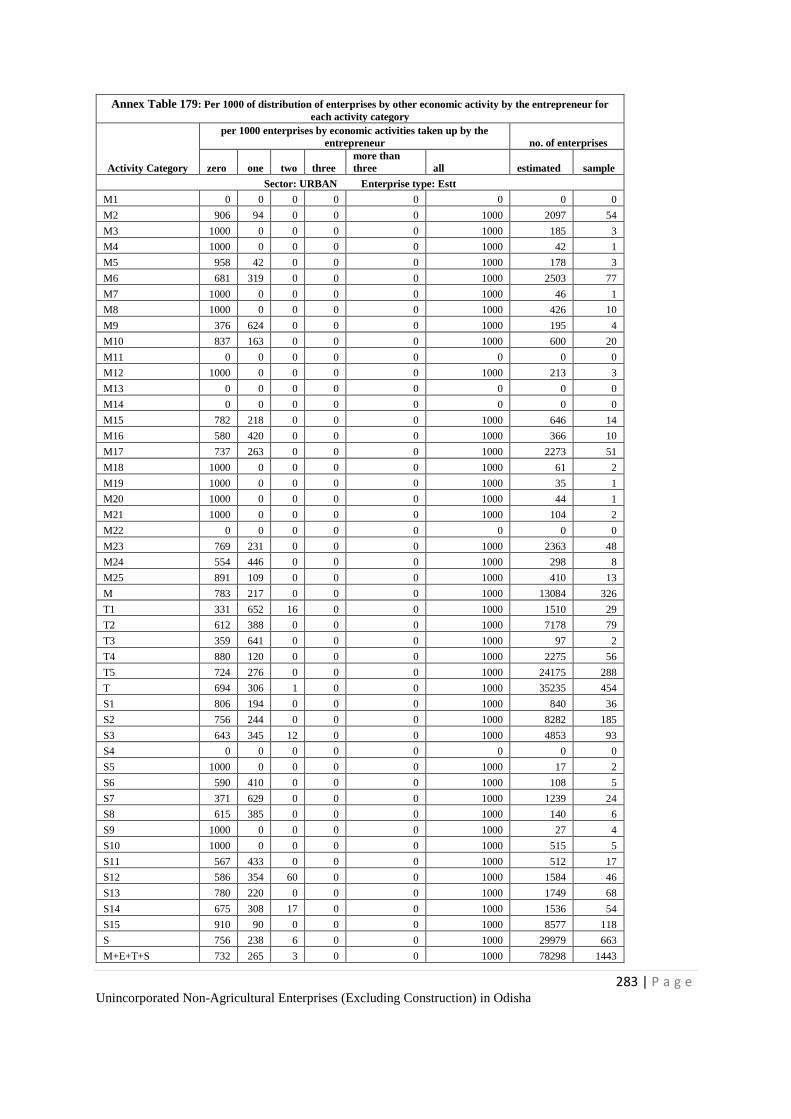
283 | P a g e Unincorporated Non-Agricultural Enterprises (Excluding Construction) in Odisha
Annex Table 179: Per 1000 of distribution of enterprises by other economic activity by the entrepreneur for
each activity category
Activity Category
per 1000 enterprises by economic activities taken up by the
entrepreneur no. of enterprises
zero one two three
more than
three all estimated sample
Sector: URBAN Enterprise type: Estt
M1 0 0 0 0 0 0 0 0
M2 906 94 0 0 0 1000 2097 54
M3 1000 0 0 0 0 1000 185 3
M4 1000 0 0 0 0 1000 42 1
M5 958 42 0 0 0 1000 178 3
M6 681 319 0 0 0 1000 2503 77
M7 1000 0 0 0 0 1000 46 1
M8 1000 0 0 0 0 1000 426 10
M9 376 624 0 0 0 1000 195 4
M10 837 163 0 0 0 1000 600 20
M11 0 0 0 0 0 0 0 0
M12 1000 0 0 0 0 1000 213 3
M13 0 0 0 0 0 0 0 0
M14 0 0 0 0 0 0 0 0
M15 782 218 0 0 0 1000 646 14
M16 580 420 0 0 0 1000 366 10
M17 737 263 0 0 0 1000 2273 51
M18 1000 0 0 0 0 1000 61 2
M19 1000 0 0 0 0 1000 35 1
M20 1000 0 0 0 0 1000 44 1
M21 1000 0 0 0 0 1000 104 2
M22 0 0 0 0 0 0 0 0
M23 769 231 0 0 0 1000 2363 48
M24 554 446 0 0 0 1000 298 8
M25 891 109 0 0 0 1000 410 13
M 783 217 0 0 0 1000 13084 326
T1 331 652 16 0 0 1000 1510 29
T2 612 388 0 0 0 1000 7178 79
T3 359 641 0 0 0 1000 97 2
T4 880 120 0 0 0 1000 2275 56
T5 724 276 0 0 0 1000 24175 288
T 694 306 1 0 0 1000 35235 454
S1 806 194 0 0 0 1000 840 36
S2 756 244 0 0 0 1000 8282 185
S3 643 345 12 0 0 1000 4853 93
S4 0 0 0 0 0 0 0 0
S5 1000 0 0 0 0 1000 17 2
S6 590 410 0 0 0 1000 108 5
S7 371 629 0 0 0 1000 1239 24
S8 615 385 0 0 0 1000 140 6
S9 1000 0 0 0 0 1000 27 4
S10 1000 0 0 0 0 1000 515 5
S11 567 433 0 0 0 1000 512 17
S12 586 354 60 0 0 1000 1584 46
S13 780 220 0 0 0 1000 1749 68
S14 675 308 17 0 0 1000 1536 54
S15 910 90 0 0 0 1000 8577 118
S 756 238 6 0 0 1000 29979 663
M+E+T+S 732 265 3 0 0 1000 78298 1443
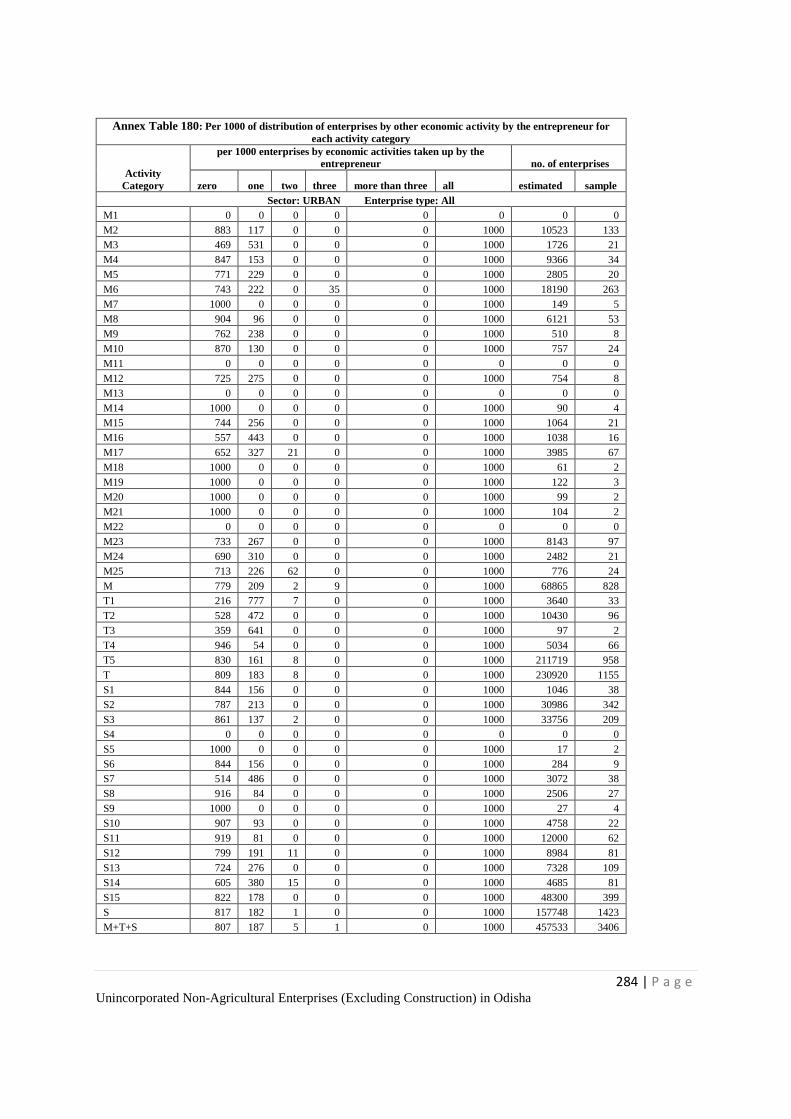
284 | P a g e Unincorporated Non-Agricultural Enterprises (Excluding Construction) in Odisha
Annex Table 180: Per 1000 of distribution of enterprises by other economic activity by the entrepreneur for
each activity category
Activity
Category
per 1000 enterprises by economic activities taken up by the
entrepreneur no. of enterprises
zero one two three more than three all estimated sample
Sector: URBAN Enterprise type: All
M1 0 0 0 0 0 0 0 0
M2 883 117 0 0 0 1000 10523 133
M3 469 531 0 0 0 1000 1726 21
M4 847 153 0 0 0 1000 9366 34
M5 771 229 0 0 0 1000 2805 20
M6 743 222 0 35 0 1000 18190 263
M7 1000 0 0 0 0 1000 149 5
M8 904 96 0 0 0 1000 6121 53
M9 762 238 0 0 0 1000 510 8
M10 870 130 0 0 0 1000 757 24
M11 0 0 0 0 0 0 0 0
M12 725 275 0 0 0 1000 754 8
M13 0 0 0 0 0 0 0 0
M14 1000 0 0 0 0 1000 90 4
M15 744 256 0 0 0 1000 1064 21
M16 557 443 0 0 0 1000 1038 16
M17 652 327 21 0 0 1000 3985 67
M18 1000 0 0 0 0 1000 61 2
M19 1000 0 0 0 0 1000 122 3
M20 1000 0 0 0 0 1000 99 2
M21 1000 0 0 0 0 1000 104 2
M22 0 0 0 0 0 0 0 0
M23 733 267 0 0 0 1000 8143 97
M24 690 310 0 0 0 1000 2482 21
M25 713 226 62 0 0 1000 776 24
M 779 209 2 9 0 1000 68865 828
T1 216 777 7 0 0 1000 3640 33
T2 528 472 0 0 0 1000 10430 96
T3 359 641 0 0 0 1000 97 2
T4 946 54 0 0 0 1000 5034 66
T5 830 161 8 0 0 1000 211719 958
T 809 183 8 0 0 1000 230920 1155
S1 844 156 0 0 0 1000 1046 38
S2 787 213 0 0 0 1000 30986 342
S3 861 137 2 0 0 1000 33756 209
S4 0 0 0 0 0 0 0 0
S5 1000 0 0 0 0 1000 17 2
S6 844 156 0 0 0 1000 284 9
S7 514 486 0 0 0 1000 3072 38
S8 916 84 0 0 0 1000 2506 27
S9 1000 0 0 0 0 1000 27 4
S10 907 93 0 0 0 1000 4758 22
S11 919 81 0 0 0 1000 12000 62
S12 799 191 11 0 0 1000 8984 81
S13 724 276 0 0 0 1000 7328 109
S14 605 380 15 0 0 1000 4685 81
S15 822 178 0 0 0 1000 48300 399
S 817 182 1 0 0 1000 157748 1423
M+T+S 807 187 5 1 0 1000 457533 3406
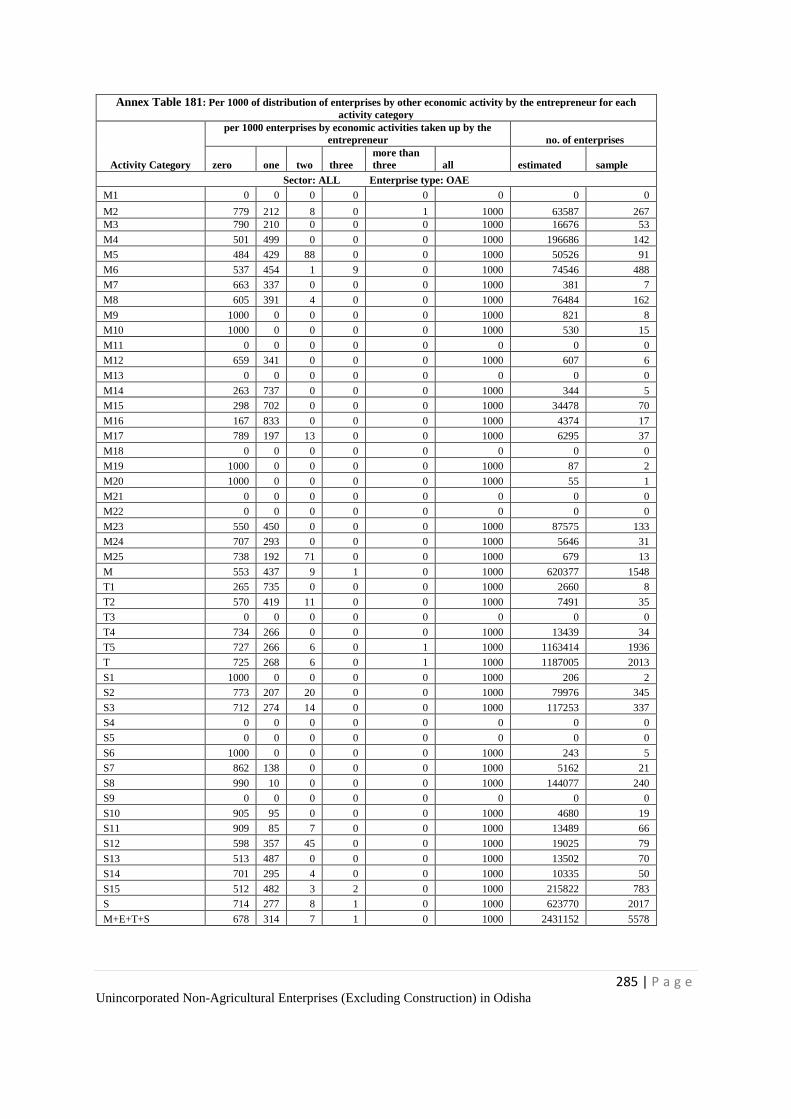
285 | P a g e Unincorporated Non-Agricultural Enterprises (Excluding Construction) in Odisha
Annex Table 181: Per 1000 of distribution of enterprises by other economic activity by the entrepreneur for each
activity category
Activity Category
per 1000 enterprises by economic activities taken up by the
entrepreneur no. of enterprises
zero
one two three
more than
three all estimated sample
Sector: ALL Enterprise type: OAE
M1 0 0 0 0 0 0 0 0
M2 779 212 8 0 1 1000 63587 267
M3 790 210 0 0 0 1000 16676 53
M4 501 499 0 0 0 1000 196686 142
M5 484 429 88 0 0 1000 50526 91
M6 537 454 1 9 0 1000 74546 488
M7 663 337 0 0 0 1000 381 7
M8 605 391 4 0 0 1000 76484 162
M9 1000 0 0 0 0 1000 821 8
M10 1000 0 0 0 0 1000 530 15
M11 0 0 0 0 0 0 0 0
M12 659 341 0 0 0 1000 607 6
M13 0 0 0 0 0 0 0 0
M14 263 737 0 0 0 1000 344 5
M15 298 702 0 0 0 1000 34478 70
M16 167 833 0 0 0 1000 4374 17
M17 789 197 13 0 0 1000 6295 37
M18 0 0 0 0 0 0 0 0
M19 1000 0 0 0 0 1000 87 2
M20 1000 0 0 0 0 1000 55 1
M21 0 0 0 0 0 0 0 0
M22 0 0 0 0 0 0 0 0
M23 550 450 0 0 0 1000 87575 133
M24 707 293 0 0 0 1000 5646 31
M25 738 192 71 0 0 1000 679 13
M 553 437 9 1 0 1000 620377 1548
T1 265 735 0 0 0 1000 2660 8
T2 570 419 11 0 0 1000 7491 35
T3 0 0 0 0 0 0 0 0
T4 734 266 0 0 0 1000 13439 34
T5 727 266 6 0 1 1000 1163414 1936
T 725 268 6 0 1 1000 1187005 2013
S1 1000 0 0 0 0 1000 206 2
S2 773 207 20 0 0 1000 79976 345
S3 712 274 14 0 0 1000 117253 337
S4 0 0 0 0 0 0 0 0
S5 0 0 0 0 0 0 0 0
S6 1000 0 0 0 0 1000 243 5
S7 862 138 0 0 0 1000 5162 21
S8 990 10 0 0 0 1000 144077 240
S9 0 0 0 0 0 0 0 0
S10 905 95 0 0 0 1000 4680 19
S11 909 85 7 0 0 1000 13489 66
S12 598 357 45 0 0 1000 19025 79
S13 513 487 0 0 0 1000 13502 70
S14 701 295 4 0 0 1000 10335 50
S15 512 482 3 2 0 1000 215822 783
S 714 277 8 1 0 1000 623770 2017
M+E+T+S 678 314 7 1 0 1000 2431152 5578
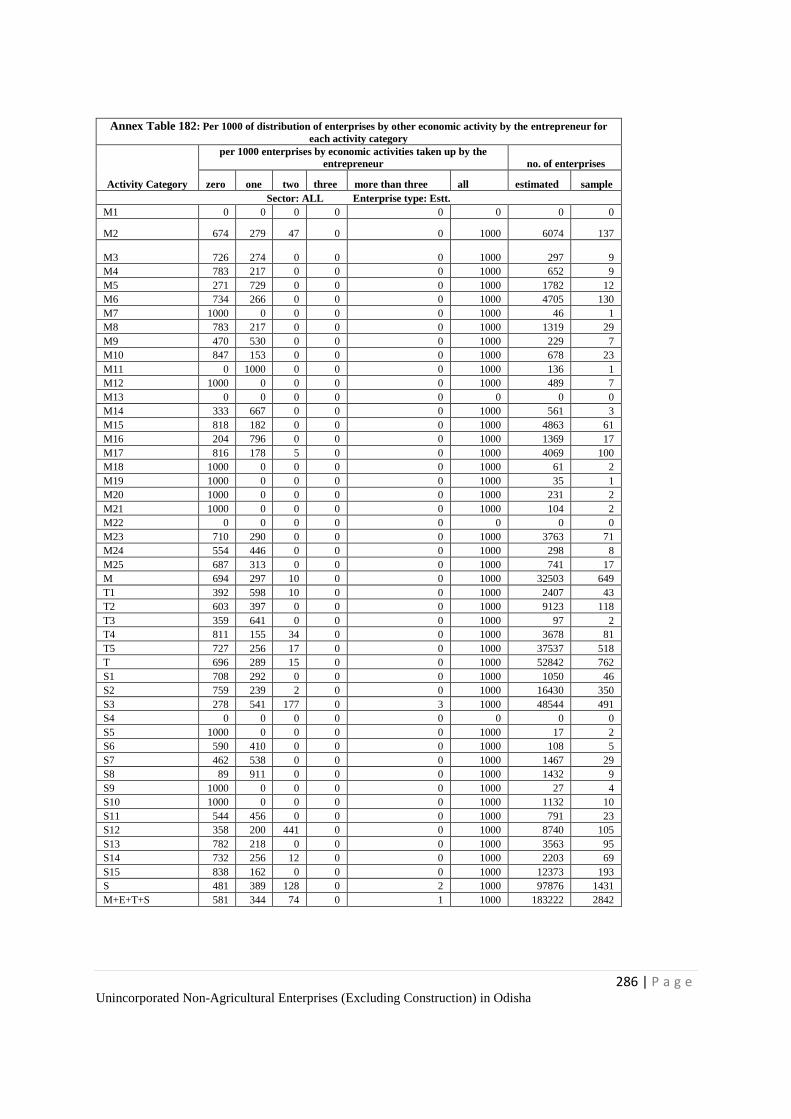
286 | P a g e Unincorporated Non-Agricultural Enterprises (Excluding Construction) in Odisha
Annex Table 182: Per 1000 of distribution of enterprises by other economic activity by the entrepreneur for
each activity category
Activity Category
per 1000 enterprises by economic activities taken up by the
entrepreneur no. of enterprises
zero one two three more than three all estimated sample
Sector: ALL Enterprise type: Estt.
M1 0 0 0 0 0 0 0 0
M2 674 279 47 0 0 1000 6074 137
M3 726 274 0 0 0 1000 297 9
M4 783 217 0 0 0 1000 652 9
M5 271 729 0 0 0 1000 1782 12
M6 734 266 0 0 0 1000 4705 130
M7 1000 0 0 0 0 1000 46 1
M8 783 217 0 0 0 1000 1319 29
M9 470 530 0 0 0 1000 229 7
M10 847 153 0 0 0 1000 678 23
M11 0 1000 0 0 0 1000 136 1
M12 1000 0 0 0 0 1000 489 7
M13 0 0 0 0 0 0 0 0
M14 333 667 0 0 0 1000 561 3
M15 818 182 0 0 0 1000 4863 61
M16 204 796 0 0 0 1000 1369 17
M17 816 178 5 0 0 1000 4069 100
M18 1000 0 0 0 0 1000 61 2
M19 1000 0 0 0 0 1000 35 1
M20 1000 0 0 0 0 1000 231 2
M21 1000 0 0 0 0 1000 104 2
M22 0 0 0 0 0 0 0 0
M23 710 290 0 0 0 1000 3763 71
M24 554 446 0 0 0 1000 298 8
M25 687 313 0 0 0 1000 741 17
M 694 297 10 0 0 1000 32503 649
T1 392 598 10 0 0 1000 2407 43
T2 603 397 0 0 0 1000 9123 118
T3 359 641 0 0 0 1000 97 2
T4 811 155 34 0 0 1000 3678 81
T5 727 256 17 0 0 1000 37537 518
T 696 289 15 0 0 1000 52842 762
S1 708 292 0 0 0 1000 1050 46
S2 759 239 2 0 0 1000 16430 350
S3 278 541 177 0 3 1000 48544 491
S4 0 0 0 0 0 0 0 0
S5 1000 0 0 0 0 1000 17 2
S6 590 410 0 0 0 1000 108 5
S7 462 538 0 0 0 1000 1467 29
S8 89 911 0 0 0 1000 1432 9
S9 1000 0 0 0 0 1000 27 4
S10 1000 0 0 0 0 1000 1132 10
S11 544 456 0 0 0 1000 791 23
S12 358 200 441 0 0 1000 8740 105
S13 782 218 0 0 0 1000 3563 95
S14 732 256 12 0 0 1000 2203 69
S15 838 162 0 0 0 1000 12373 193
S 481 389 128 0 2 1000 97876 1431
M+E+T+S 581 344 74 0 1 1000 183222 2842

287 | P a g e Unincorporated Non-Agricultural Enterprises (Excluding Construction) in Odisha
Annex Table 183: Per 1000 of distribution of enterprises by other economic activity by the entrepreneur for each
activity category
Activity Category
per 1000 enterprises by economic activities taken up by the
entrepreneur no. of enterprises
zero one two three more than three all estimated sample
Sector: ALL Enterprise type: ALL
M1 0 0 0 0 0 0 0 0
M2 770 217 11 0 1 1000 69660 404
M3 789 211 0 0 0 1000 16973 62
M4 502 498 0 0 0 1000 197338 151
M5 476 439 85 0 0 1000 52308 103
M6 548 442 1 9 0 1000 79251 618
M7 699 301 0 0 0 1000 428 8
M8 608 388 4 0 0 1000 77803 191
M9 884 116 0 0 0 1000 1050 15
M10 914 86 0 0 0 1000 1207 38
M11 0 1000 0 0 0 1000 136 1
M12 811 189 0 0 0 1000 1096 13
M13 0 0 0 0 0 0 0 0
M14 306 694 0 0 0 1000 905 8
M15 362 638 0 0 0 1000 39342 131
M16 176 824 0 0 0 1000 5742 34
M17 800 190 10 0 0 1000 10364 137
M18 1000 0 0 0 0 1000 61 2
M19 1000 0 0 0 0 1000 122 3
M20 1000 0 0 0 0 1000 286 3
M21 1000 0 0 0 0 1000 104 2
M22 0 0 0 0 0 0 0 0
M23 557 443 0 0 0 1000 91338 204
M24 700 300 0 0 0 1000 5945 39
M25 711 255 34 0 0 1000 1421 30
M 560 430 9 1 0 1000 652880 2197
T1 325 670 5 0 0 1000 5067 51
T2 588 407 5 0 0 1000 16614 153
T3 359 641 0 0 0 1000 97 2
T4 750 242 7 0 0 1000 17117 115
T5 727 266 6 0 1 1000 1200952 2454
T 723 269 6 0 1 1000 1239847 2775
S1 756 244 0 0 0 1000 1256 48
S2 770 212 17 0 0 1000 96407 695
S3 585 353 61 0 1 1000 165796 828
S4 0 0 0 0 0 0 0 0
S5 1000 0 0 0 0 1000 17 2
S6 874 126 0 0 0 1000 351 10
S7 773 227 0 0 0 1000 6629 50
S8 981 19 0 0 0 1000 145509 249
S9 1000 0 0 0 0 1000 27 4
S10 924 76 0 0 0 1000 5812 29
S11 888 105 6 0 0 1000 14280 89
S12 523 308 169 0 0 1000 27766 184
S13 570 430 0 0 0 1000 17065 165
S14 706 288 6 0 0 1000 12538 119
S15 530 465 3 2 0 1000 228195 976
S 683 292 24 1 0 1000 721646 3448
M+E+T+S 671 316 12 1 1 1000 2614374 8420
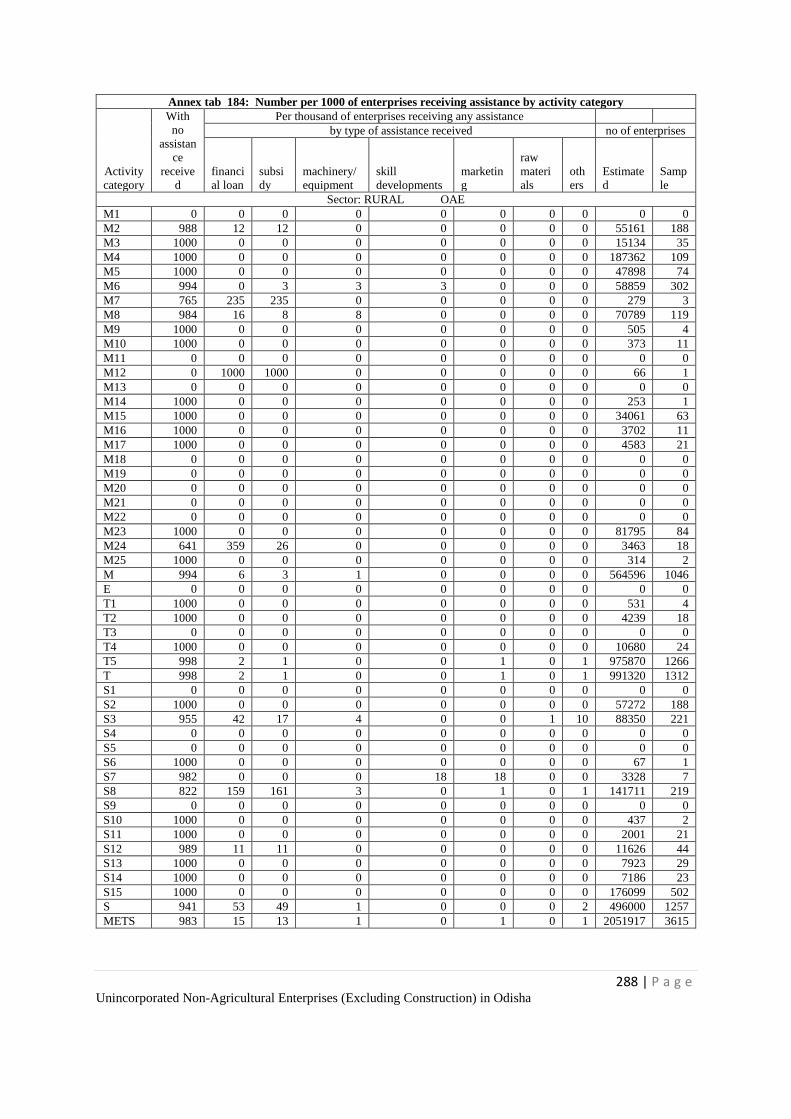
288 | P a g e Unincorporated Non-Agricultural Enterprises (Excluding Construction) in Odisha
Annex tab 184: Number per 1000 of enterprises receiving assistance by activity category
Activity
category
With
no
assistan
ce
receive
d
Per thousand of enterprises receiving any assistance
by type of assistance received no of enterprises
financi
al loan
subsi
dy
machinery/
equipment
skill
developments
marketin
g
raw
materi
als
oth
ers
Estimate
d
Samp
le
Sector: RURAL OAE
M1 0 0 0 0 0 0 0 0 0 0
M2 988 12 12 0 0 0 0 0 55161 188
M3 1000 0 0 0 0 0 0 0 15134 35
M4 1000 0 0 0 0 0 0 0 187362 109
M5 1000 0 0 0 0 0 0 0 47898 74
M6 994 0 3 3 3 0 0 0 58859 302
M7 765 235 235 0 0 0 0 0 279 3
M8 984 16 8 8 0 0 0 0 70789 119
M9 1000 0 0 0 0 0 0 0 505 4
M10 1000 0 0 0 0 0 0 0 373 11
M11 0 0 0 0 0 0 0 0 0 0
M12 0 1000 1000 0 0 0 0 0 66 1
M13 0 0 0 0 0 0 0 0 0 0
M14 1000 0 0 0 0 0 0 0 253 1
M15 1000 0 0 0 0 0 0 0 34061 63
M16 1000 0 0 0 0 0 0 0 3702 11
M17 1000 0 0 0 0 0 0 0 4583 21
M18 0 0 0 0 0 0 0 0 0 0
M19 0 0 0 0 0 0 0 0 0 0
M20 0 0 0 0 0 0 0 0 0 0
M21 0 0 0 0 0 0 0 0 0 0
M22 0 0 0 0 0 0 0 0 0 0
M23 1000 0 0 0 0 0 0 0 81795 84
M24 641 359 26 0 0 0 0 0 3463 18
M25 1000 0 0 0 0 0 0 0 314 2
M 994 6 3 1 0 0 0 0 564596 1046
E 0 0 0 0 0 0 0 0 0 0
T1 1000 0 0 0 0 0 0 0 531 4
T2 1000 0 0 0 0 0 0 0 4239 18
T3 0 0 0 0 0 0 0 0 0 0
T4 1000 0 0 0 0 0 0 0 10680 24
T5 998 2 1 0 0 1 0 1 975870 1266
T 998 2 1 0 0 1 0 1 991320 1312
S1 0 0 0 0 0 0 0 0 0 0
S2 1000 0 0 0 0 0 0 0 57272 188
S3 955 42 17 4 0 0 1 10 88350 221
S4 0 0 0 0 0 0 0 0 0 0
S5 0 0 0 0 0 0 0 0 0 0
S6 1000 0 0 0 0 0 0 0 67 1
S7 982 0 0 0 18 18 0 0 3328 7
S8 822 159 161 3 0 1 0 1 141711 219
S9 0 0 0 0 0 0 0 0 0 0
S10 1000 0 0 0 0 0 0 0 437 2
S11 1000 0 0 0 0 0 0 0 2001 21
S12 989 11 11 0 0 0 0 0 11626 44
S13 1000 0 0 0 0 0 0 0 7923 29
S14 1000 0 0 0 0 0 0 0 7186 23
S15 1000 0 0 0 0 0 0 0 176099 502
S 941 53 49 1 0 0 0 2 496000 1257
METS 983 15 13 1 0 1 0 1 2051917 3615
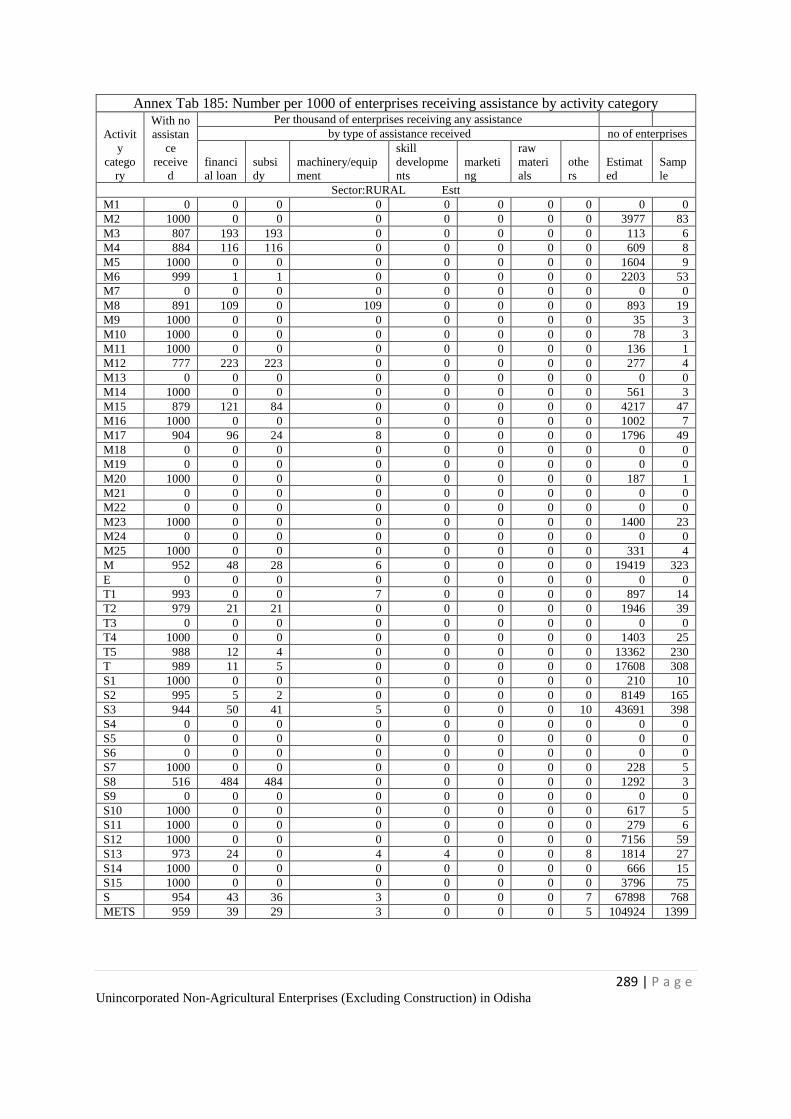
289 | P a g e Unincorporated Non-Agricultural Enterprises (Excluding Construction) in Odisha
Annex Tab 185: Number per 1000 of enterprises receiving assistance by activity category
Activit
y
catego
ry
With no
assistan
ce
receive
d
Per thousand of enterprises receiving any assistance
by type of assistance received no of enterprises
financi
al loan
subsi
dy
machinery/equip
ment
skill
developme
nts
marketi
ng
raw
materi
als
othe
rs
Estimat
ed
Samp
le
Sector:RURAL Estt
M1 0 0 0 0 0 0 0 0 0 0
M2 1000 0 0 0 0 0 0 0 3977 83
M3 807 193 193 0 0 0 0 0 113 6
M4 884 116 116 0 0 0 0 0 609 8
M5 1000 0 0 0 0 0 0 0 1604 9
M6 999 1 1 0 0 0 0 0 2203 53
M7 0 0 0 0 0 0 0 0 0 0
M8 891 109 0 109 0 0 0 0 893 19
M9 1000 0 0 0 0 0 0 0 35 3
M10 1000 0 0 0 0 0 0 0 78 3
M11 1000 0 0 0 0 0 0 0 136 1
M12 777 223 223 0 0 0 0 0 277 4
M13 0 0 0 0 0 0 0 0 0 0
M14 1000 0 0 0 0 0 0 0 561 3
M15 879 121 84 0 0 0 0 0 4217 47
M16 1000 0 0 0 0 0 0 0 1002 7
M17 904 96 24 8 0 0 0 0 1796 49
M18 0 0 0 0 0 0 0 0 0 0
M19 0 0 0 0 0 0 0 0 0 0
M20 1000 0 0 0 0 0 0 0 187 1
M21 0 0 0 0 0 0 0 0 0 0
M22 0 0 0 0 0 0 0 0 0 0
M23 1000 0 0 0 0 0 0 0 1400 23
M24 0 0 0 0 0 0 0 0 0 0
M25 1000 0 0 0 0 0 0 0 331 4
M 952 48 28 6 0 0 0 0 19419 323
E 0 0 0 0 0 0 0 0 0 0
T1 993 0 0 7 0 0 0 0 897 14
T2 979 21 21 0 0 0 0 0 1946 39
T3 0 0 0 0 0 0 0 0 0 0
T4 1000 0 0 0 0 0 0 0 1403 25
T5 988 12 4 0 0 0 0 0 13362 230
T 989 11 5 0 0 0 0 0 17608 308
S1 1000 0 0 0 0 0 0 0 210 10
S2 995 5 2 0 0 0 0 0 8149 165
S3 944 50 41 5 0 0 0 10 43691 398
S4 0 0 0 0 0 0 0 0 0 0
S5 0 0 0 0 0 0 0 0 0 0
S6 0 0 0 0 0 0 0 0 0 0
S7 1000 0 0 0 0 0 0 0 228 5
S8 516 484 484 0 0 0 0 0 1292 3
S9 0 0 0 0 0 0 0 0 0 0
S10 1000 0 0 0 0 0 0 0 617 5
S11 1000 0 0 0 0 0 0 0 279 6
S12 1000 0 0 0 0 0 0 0 7156 59
S13 973 24 0 4 4 0 0 8 1814 27
S14 1000 0 0 0 0 0 0 0 666 15
S15 1000 0 0 0 0 0 0 0 3796 75
S 954 43 36 3 0 0 0 7 67898 768
METS 959 39 29 3 0 0 0 5 104924 1399
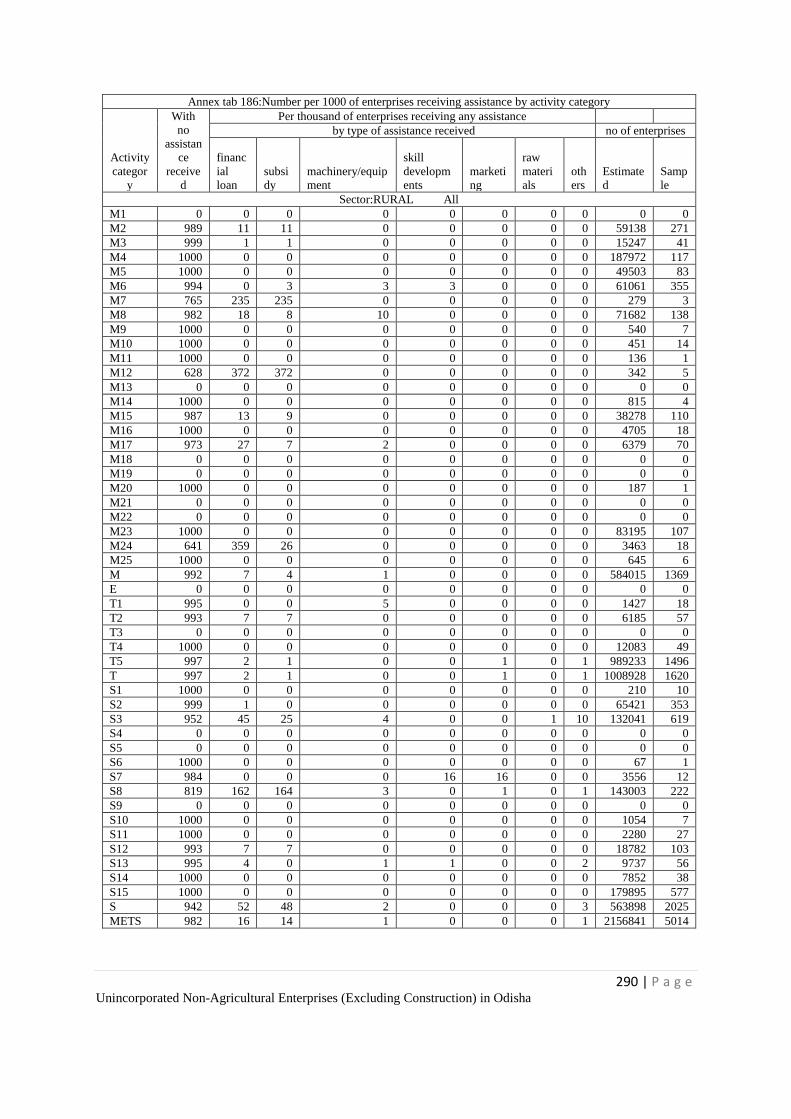
290 | P a g e Unincorporated Non-Agricultural Enterprises (Excluding Construction) in Odisha
Annex tab 186:Number per 1000 of enterprises receiving assistance by activity category
Activity
categor
y
With
no
assistan
ce
receive
d
Per thousand of enterprises receiving any assistance
by type of assistance received no of enterprises
financ
ial
loan
subsi
dy
machinery/equip
ment
skill
developm
ents
marketi
ng
raw
materi
als
oth
ers
Estimate
d
Samp
le
Sector:RURAL All
M1 0 0 0 0 0 0 0 0 0 0
M2 989 11 11 0 0 0 0 0 59138 271
M3 999 1 1 0 0 0 0 0 15247 41
M4 1000 0 0 0 0 0 0 0 187972 117
M5 1000 0 0 0 0 0 0 0 49503 83
M6 994 0 3 3 3 0 0 0 61061 355
M7 765 235 235 0 0 0 0 0 279 3
M8 982 18 8 10 0 0 0 0 71682 138
M9 1000 0 0 0 0 0 0 0 540 7
M10 1000 0 0 0 0 0 0 0 451 14
M11 1000 0 0 0 0 0 0 0 136 1
M12 628 372 372 0 0 0 0 0 342 5
M13 0 0 0 0 0 0 0 0 0 0
M14 1000 0 0 0 0 0 0 0 815 4
M15 987 13 9 0 0 0 0 0 38278 110
M16 1000 0 0 0 0 0 0 0 4705 18
M17 973 27 7 2 0 0 0 0 6379 70
M18 0 0 0 0 0 0 0 0 0 0
M19 0 0 0 0 0 0 0 0 0 0
M20 1000 0 0 0 0 0 0 0 187 1
M21 0 0 0 0 0 0 0 0 0 0
M22 0 0 0 0 0 0 0 0 0 0
M23 1000 0 0 0 0 0 0 0 83195 107
M24 641 359 26 0 0 0 0 0 3463 18
M25 1000 0 0 0 0 0 0 0 645 6
M 992 7 4 1 0 0 0 0 584015 1369
E 0 0 0 0 0 0 0 0 0 0
T1 995 0 0 5 0 0 0 0 1427 18
T2 993 7 7 0 0 0 0 0 6185 57
T3 0 0 0 0 0 0 0 0 0 0
T4 1000 0 0 0 0 0 0 0 12083 49
T5 997 2 1 0 0 1 0 1 989233 1496
T 997 2 1 0 0 1 0 1 1008928 1620
S1 1000 0 0 0 0 0 0 0 210 10
S2 999 1 0 0 0 0 0 0 65421 353
S3 952 45 25 4 0 0 1 10 132041 619
S4 0 0 0 0 0 0 0 0 0 0
S5 0 0 0 0 0 0 0 0 0 0
S6 1000 0 0 0 0 0 0 0 67 1
S7 984 0 0 0 16 16 0 0 3556 12
S8 819 162 164 3 0 1 0 1 143003 222
S9 0 0 0 0 0 0 0 0 0 0
S10 1000 0 0 0 0 0 0 0 1054 7
S11 1000 0 0 0 0 0 0 0 2280 27
S12 993 7 7 0 0 0 0 0 18782 103
S13 995 4 0 1 1 0 0 2 9737 56
S14 1000 0 0 0 0 0 0 0 7852 38
S15 1000 0 0 0 0 0 0 0 179895 577
S 942 52 48 2 0 0 0 3 563898 2025
METS 982 16 14 1 0 0 0 1 2156841 5014
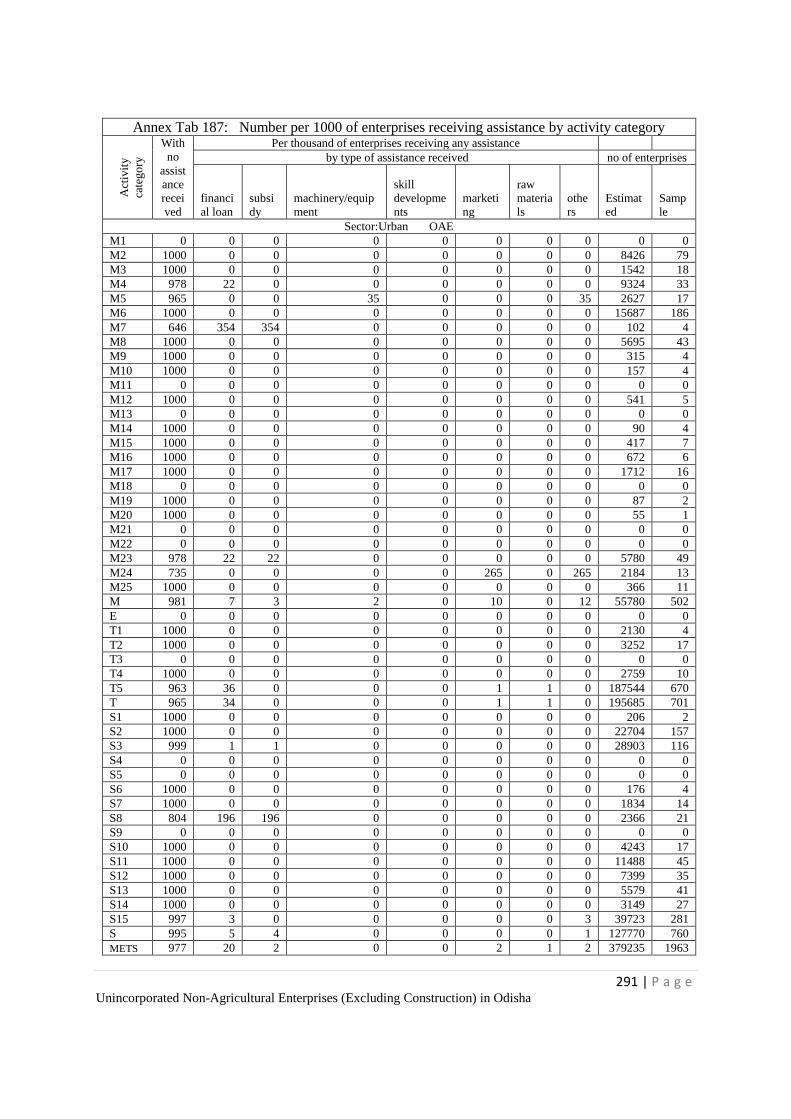
291 | P a g e Unincorporated Non-Agricultural Enterprises (Excluding Construction) in Odisha
Annex Tab 187: Number per 1000 of enterprises receiving assistance by activity category A
ctiv
ity
cate
go
ry
With
no
assist
ance
recei
ved
Per thousand of enterprises receiving any assistance
by type of assistance received no of enterprises
financi
al loan
subsi
dy
machinery/equip
ment
skill
developme
nts
marketi
ng
raw
materia
ls
othe
rs
Estimat
ed
Samp
le
Sector:Urban OAE
M1 0 0 0 0 0 0 0 0 0 0
M2 1000 0 0 0 0 0 0 0 8426 79
M3 1000 0 0 0 0 0 0 0 1542 18
M4 978 22 0 0 0 0 0 0 9324 33
M5 965 0 0 35 0 0 0 35 2627 17
M6 1000 0 0 0 0 0 0 0 15687 186
M7 646 354 354 0 0 0 0 0 102 4
M8 1000 0 0 0 0 0 0 0 5695 43
M9 1000 0 0 0 0 0 0 0 315 4
M10 1000 0 0 0 0 0 0 0 157 4
M11 0 0 0 0 0 0 0 0 0 0
M12 1000 0 0 0 0 0 0 0 541 5
M13 0 0 0 0 0 0 0 0 0 0
M14 1000 0 0 0 0 0 0 0 90 4
M15 1000 0 0 0 0 0 0 0 417 7
M16 1000 0 0 0 0 0 0 0 672 6
M17 1000 0 0 0 0 0 0 0 1712 16
M18 0 0 0 0 0 0 0 0 0 0
M19 1000 0 0 0 0 0 0 0 87 2
M20 1000 0 0 0 0 0 0 0 55 1
M21 0 0 0 0 0 0 0 0 0 0
M22 0 0 0 0 0 0 0 0 0 0
M23 978 22 22 0 0 0 0 0 5780 49
M24 735 0 0 0 0 265 0 265 2184 13
M25 1000 0 0 0 0 0 0 0 366 11
M 981 7 3 2 0 10 0 12 55780 502
E 0 0 0 0 0 0 0 0 0 0
T1 1000 0 0 0 0 0 0 0 2130 4
T2 1000 0 0 0 0 0 0 0 3252 17
T3 0 0 0 0 0 0 0 0 0 0
T4 1000 0 0 0 0 0 0 0 2759 10
T5 963 36 0 0 0 1 1 0 187544 670
T 965 34 0 0 0 1 1 0 195685 701
S1 1000 0 0 0 0 0 0 0 206 2
S2 1000 0 0 0 0 0 0 0 22704 157
S3 999 1 1 0 0 0 0 0 28903 116
S4 0 0 0 0 0 0 0 0 0 0
S5 0 0 0 0 0 0 0 0 0 0
S6 1000 0 0 0 0 0 0 0 176 4
S7 1000 0 0 0 0 0 0 0 1834 14
S8 804 196 196 0 0 0 0 0 2366 21
S9 0 0 0 0 0 0 0 0 0 0
S10 1000 0 0 0 0 0 0 0 4243 17
S11 1000 0 0 0 0 0 0 0 11488 45
S12 1000 0 0 0 0 0 0 0 7399 35
S13 1000 0 0 0 0 0 0 0 5579 41
S14 1000 0 0 0 0 0 0 0 3149 27
S15 997 3 0 0 0 0 0 3 39723 281
S 995 5 4 0 0 0 0 1 127770 760
METS 977 20 2 0 0 2 1 2 379235 1963
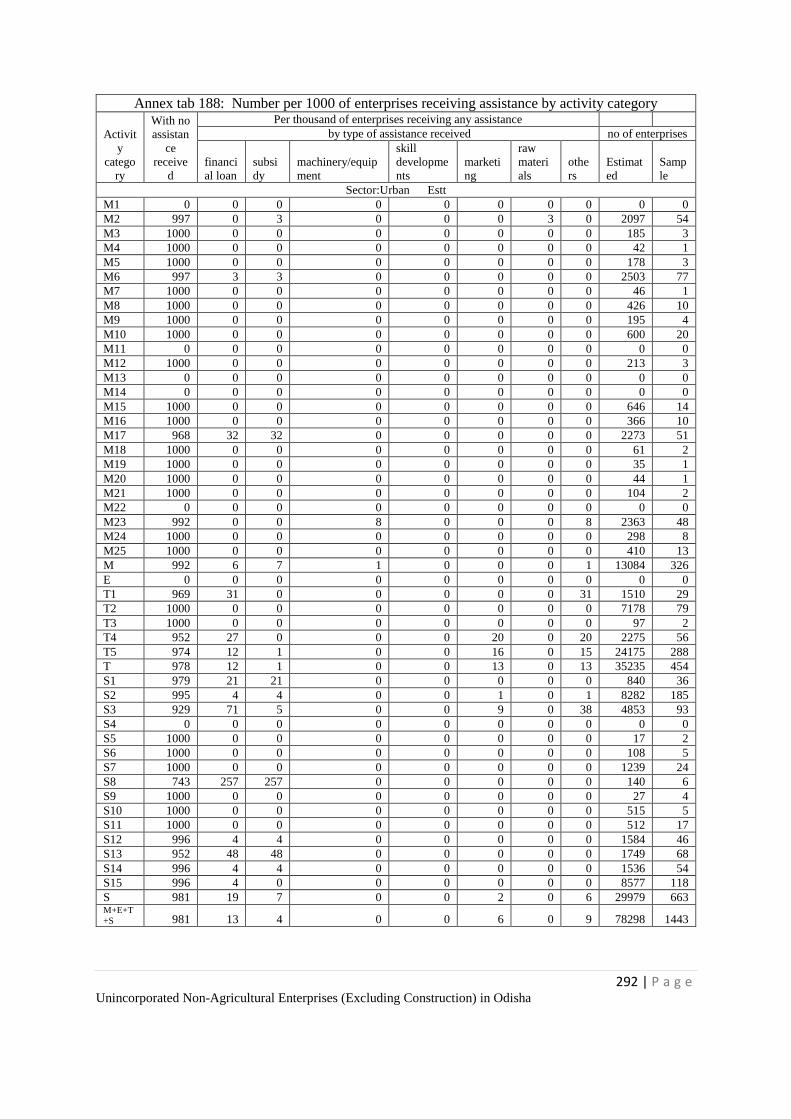
292 | P a g e Unincorporated Non-Agricultural Enterprises (Excluding Construction) in Odisha
Annex tab 188: Number per 1000 of enterprises receiving assistance by activity category
Activit
y
catego
ry
With no
assistan
ce
receive
d
Per thousand of enterprises receiving any assistance
by type of assistance received no of enterprises
financi
al loan
subsi
dy
machinery/equip
ment
skill
developme
nts
marketi
ng
raw
materi
als
othe
rs
Estimat
ed
Samp
le
Sector:Urban Estt
M1 0 0 0 0 0 0 0 0 0 0
M2 997 0 3 0 0 0 3 0 2097 54
M3 1000 0 0 0 0 0 0 0 185 3
M4 1000 0 0 0 0 0 0 0 42 1
M5 1000 0 0 0 0 0 0 0 178 3
M6 997 3 3 0 0 0 0 0 2503 77
M7 1000 0 0 0 0 0 0 0 46 1
M8 1000 0 0 0 0 0 0 0 426 10
M9 1000 0 0 0 0 0 0 0 195 4
M10 1000 0 0 0 0 0 0 0 600 20
M11 0 0 0 0 0 0 0 0 0 0
M12 1000 0 0 0 0 0 0 0 213 3
M13 0 0 0 0 0 0 0 0 0 0
M14 0 0 0 0 0 0 0 0 0 0
M15 1000 0 0 0 0 0 0 0 646 14
M16 1000 0 0 0 0 0 0 0 366 10
M17 968 32 32 0 0 0 0 0 2273 51
M18 1000 0 0 0 0 0 0 0 61 2
M19 1000 0 0 0 0 0 0 0 35 1
M20 1000 0 0 0 0 0 0 0 44 1
M21 1000 0 0 0 0 0 0 0 104 2
M22 0 0 0 0 0 0 0 0 0 0
M23 992 0 0 8 0 0 0 8 2363 48
M24 1000 0 0 0 0 0 0 0 298 8
M25 1000 0 0 0 0 0 0 0 410 13
M 992 6 7 1 0 0 0 1 13084 326
E 0 0 0 0 0 0 0 0 0 0
T1 969 31 0 0 0 0 0 31 1510 29
T2 1000 0 0 0 0 0 0 0 7178 79
T3 1000 0 0 0 0 0 0 0 97 2
T4 952 27 0 0 0 20 0 20 2275 56
T5 974 12 1 0 0 16 0 15 24175 288
T 978 12 1 0 0 13 0 13 35235 454
S1 979 21 21 0 0 0 0 0 840 36
S2 995 4 4 0 0 1 0 1 8282 185
S3 929 71 5 0 0 9 0 38 4853 93
S4 0 0 0 0 0 0 0 0 0 0
S5 1000 0 0 0 0 0 0 0 17 2
S6 1000 0 0 0 0 0 0 0 108 5
S7 1000 0 0 0 0 0 0 0 1239 24
S8 743 257 257 0 0 0 0 0 140 6
S9 1000 0 0 0 0 0 0 0 27 4
S10 1000 0 0 0 0 0 0 0 515 5
S11 1000 0 0 0 0 0 0 0 512 17
S12 996 4 4 0 0 0 0 0 1584 46
S13 952 48 48 0 0 0 0 0 1749 68
S14 996 4 4 0 0 0 0 0 1536 54
S15 996 4 0 0 0 0 0 0 8577 118
S 981 19 7 0 0 2 0 6 29979 663 M+E+T
+S 981 13 4 0 0 6 0 9 78298 1443
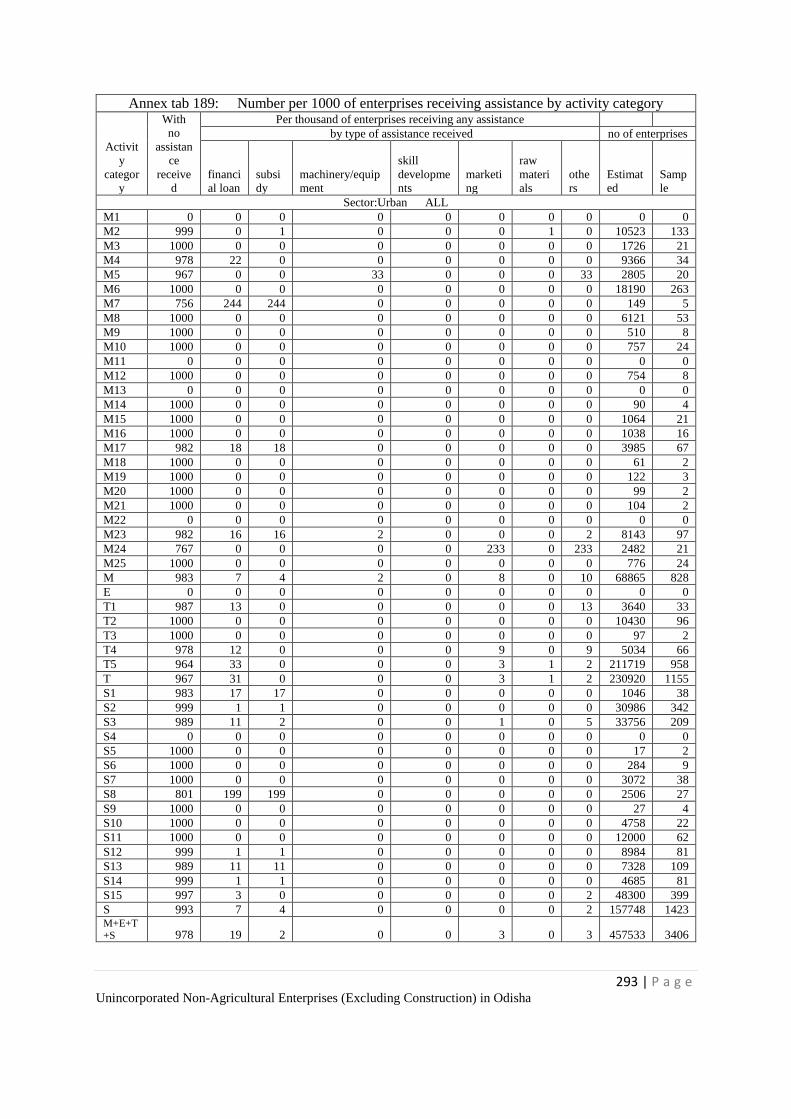
293 | P a g e Unincorporated Non-Agricultural Enterprises (Excluding Construction) in Odisha
Annex tab 189: Number per 1000 of enterprises receiving assistance by activity category
Activit
y
categor
y
With
no
assistan
ce
receive
d
Per thousand of enterprises receiving any assistance
by type of assistance received no of enterprises
financi
al loan
subsi
dy
machinery/equip
ment
skill
developme
nts
marketi
ng
raw
materi
als
othe
rs
Estimat
ed
Samp
le
Sector:Urban ALL
M1 0 0 0 0 0 0 0 0 0 0
M2 999 0 1 0 0 0 1 0 10523 133
M3 1000 0 0 0 0 0 0 0 1726 21
M4 978 22 0 0 0 0 0 0 9366 34
M5 967 0 0 33 0 0 0 33 2805 20
M6 1000 0 0 0 0 0 0 0 18190 263
M7 756 244 244 0 0 0 0 0 149 5
M8 1000 0 0 0 0 0 0 0 6121 53
M9 1000 0 0 0 0 0 0 0 510 8
M10 1000 0 0 0 0 0 0 0 757 24
M11 0 0 0 0 0 0 0 0 0 0
M12 1000 0 0 0 0 0 0 0 754 8
M13 0 0 0 0 0 0 0 0 0 0
M14 1000 0 0 0 0 0 0 0 90 4
M15 1000 0 0 0 0 0 0 0 1064 21
M16 1000 0 0 0 0 0 0 0 1038 16
M17 982 18 18 0 0 0 0 0 3985 67
M18 1000 0 0 0 0 0 0 0 61 2
M19 1000 0 0 0 0 0 0 0 122 3
M20 1000 0 0 0 0 0 0 0 99 2
M21 1000 0 0 0 0 0 0 0 104 2
M22 0 0 0 0 0 0 0 0 0 0
M23 982 16 16 2 0 0 0 2 8143 97
M24 767 0 0 0 0 233 0 233 2482 21
M25 1000 0 0 0 0 0 0 0 776 24
M 983 7 4 2 0 8 0 10 68865 828
E 0 0 0 0 0 0 0 0 0 0
T1 987 13 0 0 0 0 0 13 3640 33
T2 1000 0 0 0 0 0 0 0 10430 96
T3 1000 0 0 0 0 0 0 0 97 2
T4 978 12 0 0 0 9 0 9 5034 66
T5 964 33 0 0 0 3 1 2 211719 958
T 967 31 0 0 0 3 1 2 230920 1155
S1 983 17 17 0 0 0 0 0 1046 38
S2 999 1 1 0 0 0 0 0 30986 342
S3 989 11 2 0 0 1 0 5 33756 209
S4 0 0 0 0 0 0 0 0 0 0
S5 1000 0 0 0 0 0 0 0 17 2
S6 1000 0 0 0 0 0 0 0 284 9
S7 1000 0 0 0 0 0 0 0 3072 38
S8 801 199 199 0 0 0 0 0 2506 27
S9 1000 0 0 0 0 0 0 0 27 4
S10 1000 0 0 0 0 0 0 0 4758 22
S11 1000 0 0 0 0 0 0 0 12000 62
S12 999 1 1 0 0 0 0 0 8984 81
S13 989 11 11 0 0 0 0 0 7328 109
S14 999 1 1 0 0 0 0 0 4685 81
S15 997 3 0 0 0 0 0 2 48300 399
S 993 7 4 0 0 0 0 2 157748 1423 M+E+T+S 978 19 2 0 0 3 0 3 457533 3406
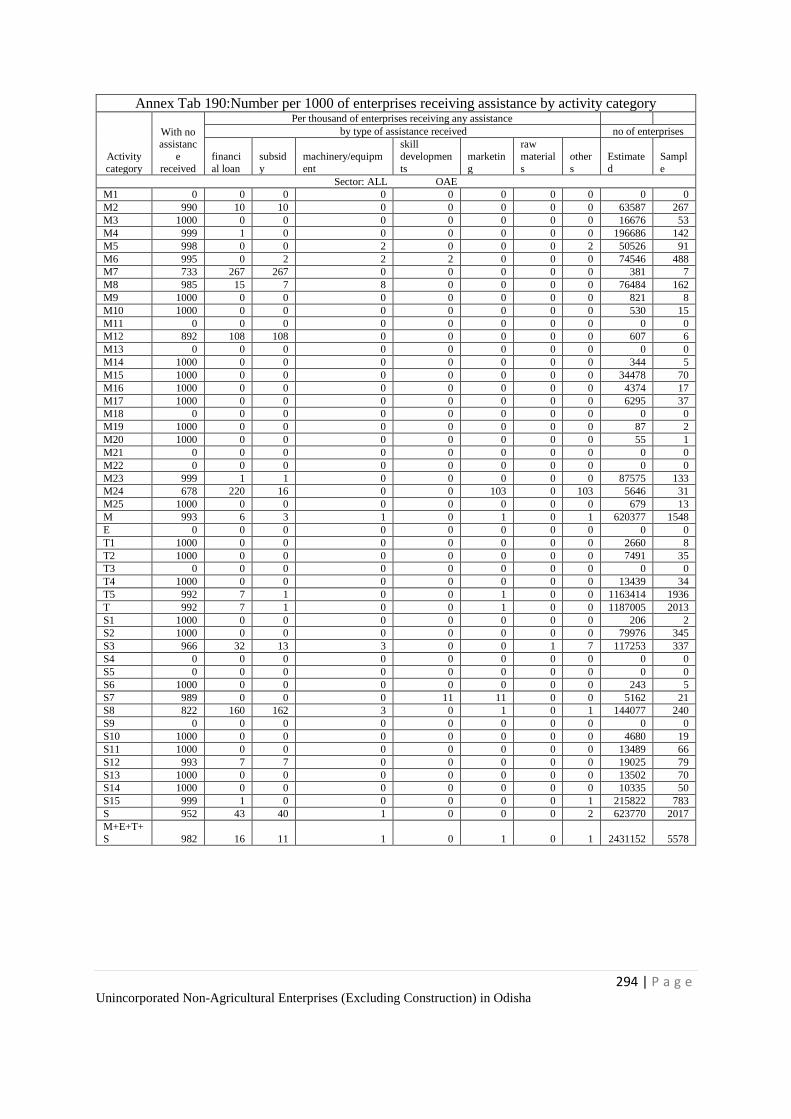
294 | P a g e Unincorporated Non-Agricultural Enterprises (Excluding Construction) in Odisha
Annex Tab 190:Number per 1000 of enterprises receiving assistance by activity category
Activity
category
With no assistanc
e
received
Per thousand of enterprises receiving any assistance
by type of assistance received no of enterprises
financi
al loan
subsid
y
machinery/equipm
ent
skill
developmen
ts
marketin
g
raw
material
s
other
s
Estimate
d
Sampl
e
Sector: ALL OAE
M1 0 0 0 0 0 0 0 0 0 0
M2 990 10 10 0 0 0 0 0 63587 267
M3 1000 0 0 0 0 0 0 0 16676 53
M4 999 1 0 0 0 0 0 0 196686 142
M5 998 0 0 2 0 0 0 2 50526 91
M6 995 0 2 2 2 0 0 0 74546 488
M7 733 267 267 0 0 0 0 0 381 7
M8 985 15 7 8 0 0 0 0 76484 162
M9 1000 0 0 0 0 0 0 0 821 8
M10 1000 0 0 0 0 0 0 0 530 15
M11 0 0 0 0 0 0 0 0 0 0
M12 892 108 108 0 0 0 0 0 607 6
M13 0 0 0 0 0 0 0 0 0 0
M14 1000 0 0 0 0 0 0 0 344 5
M15 1000 0 0 0 0 0 0 0 34478 70
M16 1000 0 0 0 0 0 0 0 4374 17
M17 1000 0 0 0 0 0 0 0 6295 37
M18 0 0 0 0 0 0 0 0 0 0
M19 1000 0 0 0 0 0 0 0 87 2
M20 1000 0 0 0 0 0 0 0 55 1
M21 0 0 0 0 0 0 0 0 0 0
M22 0 0 0 0 0 0 0 0 0 0
M23 999 1 1 0 0 0 0 0 87575 133
M24 678 220 16 0 0 103 0 103 5646 31
M25 1000 0 0 0 0 0 0 0 679 13
M 993 6 3 1 0 1 0 1 620377 1548
E 0 0 0 0 0 0 0 0 0 0
T1 1000 0 0 0 0 0 0 0 2660 8
T2 1000 0 0 0 0 0 0 0 7491 35
T3 0 0 0 0 0 0 0 0 0 0
T4 1000 0 0 0 0 0 0 0 13439 34
T5 992 7 1 0 0 1 0 0 1163414 1936
T 992 7 1 0 0 1 0 0 1187005 2013
S1 1000 0 0 0 0 0 0 0 206 2
S2 1000 0 0 0 0 0 0 0 79976 345
S3 966 32 13 3 0 0 1 7 117253 337
S4 0 0 0 0 0 0 0 0 0 0
S5 0 0 0 0 0 0 0 0 0 0
S6 1000 0 0 0 0 0 0 0 243 5
S7 989 0 0 0 11 11 0 0 5162 21
S8 822 160 162 3 0 1 0 1 144077 240
S9 0 0 0 0 0 0 0 0 0 0
S10 1000 0 0 0 0 0 0 0 4680 19
S11 1000 0 0 0 0 0 0 0 13489 66
S12 993 7 7 0 0 0 0 0 19025 79
S13 1000 0 0 0 0 0 0 0 13502 70
S14 1000 0 0 0 0 0 0 0 10335 50
S15 999 1 0 0 0 0 0 1 215822 783
S 952 43 40 1 0 0 0 2 623770 2017
M+E+T+
S 982 16 11 1 0 1 0 1 2431152 5578
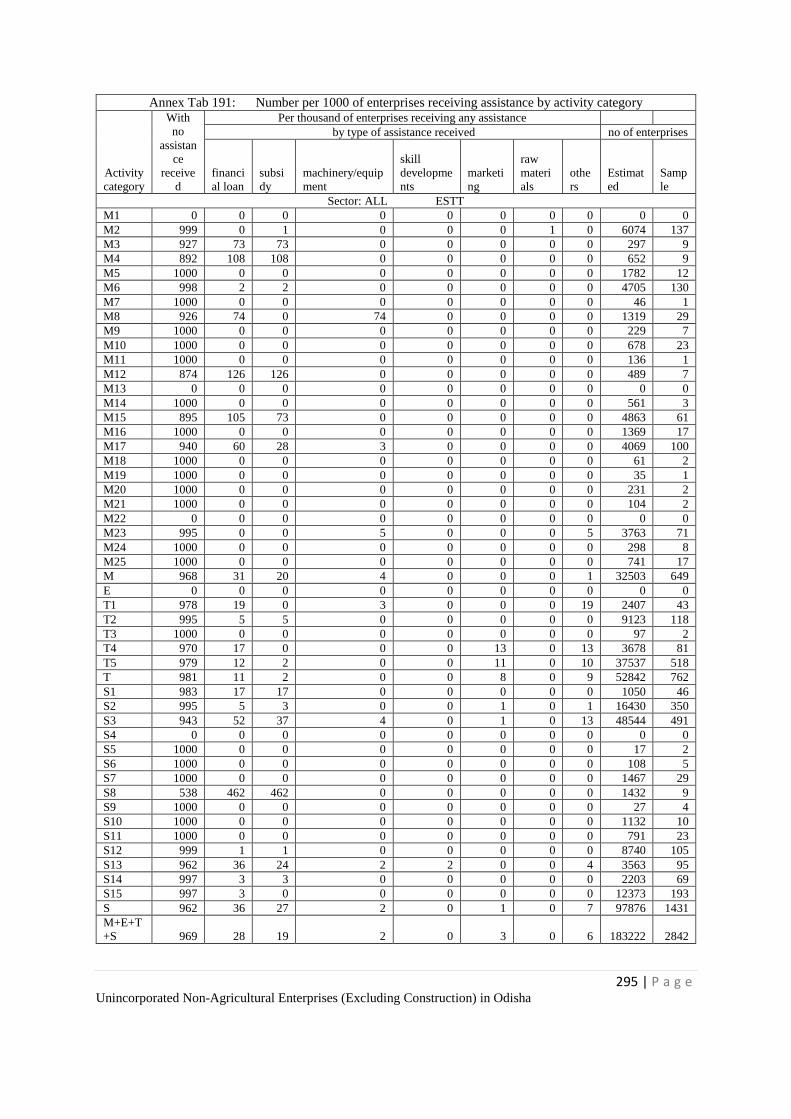
295 | P a g e Unincorporated Non-Agricultural Enterprises (Excluding Construction) in Odisha
Annex Tab 191: Number per 1000 of enterprises receiving assistance by activity category
Activity
category
With
no
assistan
ce
receive
d
Per thousand of enterprises receiving any assistance
by type of assistance received no of enterprises
financi
al loan
subsi
dy
machinery/equip
ment
skill
developme
nts
marketi
ng
raw
materi
als
othe
rs
Estimat
ed
Samp
le
Sector: ALL ESTT
M1 0 0 0 0 0 0 0 0 0 0
M2 999 0 1 0 0 0 1 0 6074 137
M3 927 73 73 0 0 0 0 0 297 9
M4 892 108 108 0 0 0 0 0 652 9
M5 1000 0 0 0 0 0 0 0 1782 12
M6 998 2 2 0 0 0 0 0 4705 130
M7 1000 0 0 0 0 0 0 0 46 1
M8 926 74 0 74 0 0 0 0 1319 29
M9 1000 0 0 0 0 0 0 0 229 7
M10 1000 0 0 0 0 0 0 0 678 23
M11 1000 0 0 0 0 0 0 0 136 1
M12 874 126 126 0 0 0 0 0 489 7
M13 0 0 0 0 0 0 0 0 0 0
M14 1000 0 0 0 0 0 0 0 561 3
M15 895 105 73 0 0 0 0 0 4863 61
M16 1000 0 0 0 0 0 0 0 1369 17
M17 940 60 28 3 0 0 0 0 4069 100
M18 1000 0 0 0 0 0 0 0 61 2
M19 1000 0 0 0 0 0 0 0 35 1
M20 1000 0 0 0 0 0 0 0 231 2
M21 1000 0 0 0 0 0 0 0 104 2
M22 0 0 0 0 0 0 0 0 0 0
M23 995 0 0 5 0 0 0 5 3763 71
M24 1000 0 0 0 0 0 0 0 298 8
M25 1000 0 0 0 0 0 0 0 741 17
M 968 31 20 4 0 0 0 1 32503 649
E 0 0 0 0 0 0 0 0 0 0
T1 978 19 0 3 0 0 0 19 2407 43
T2 995 5 5 0 0 0 0 0 9123 118
T3 1000 0 0 0 0 0 0 0 97 2
T4 970 17 0 0 0 13 0 13 3678 81
T5 979 12 2 0 0 11 0 10 37537 518
T 981 11 2 0 0 8 0 9 52842 762
S1 983 17 17 0 0 0 0 0 1050 46
S2 995 5 3 0 0 1 0 1 16430 350
S3 943 52 37 4 0 1 0 13 48544 491
S4 0 0 0 0 0 0 0 0 0 0
S5 1000 0 0 0 0 0 0 0 17 2
S6 1000 0 0 0 0 0 0 0 108 5
S7 1000 0 0 0 0 0 0 0 1467 29
S8 538 462 462 0 0 0 0 0 1432 9
S9 1000 0 0 0 0 0 0 0 27 4
S10 1000 0 0 0 0 0 0 0 1132 10
S11 1000 0 0 0 0 0 0 0 791 23
S12 999 1 1 0 0 0 0 0 8740 105
S13 962 36 24 2 2 0 0 4 3563 95
S14 997 3 3 0 0 0 0 0 2203 69
S15 997 3 0 0 0 0 0 0 12373 193
S 962 36 27 2 0 1 0 7 97876 1431
M+E+T
+S 969 28 19 2 0 3 0 6 183222 2842
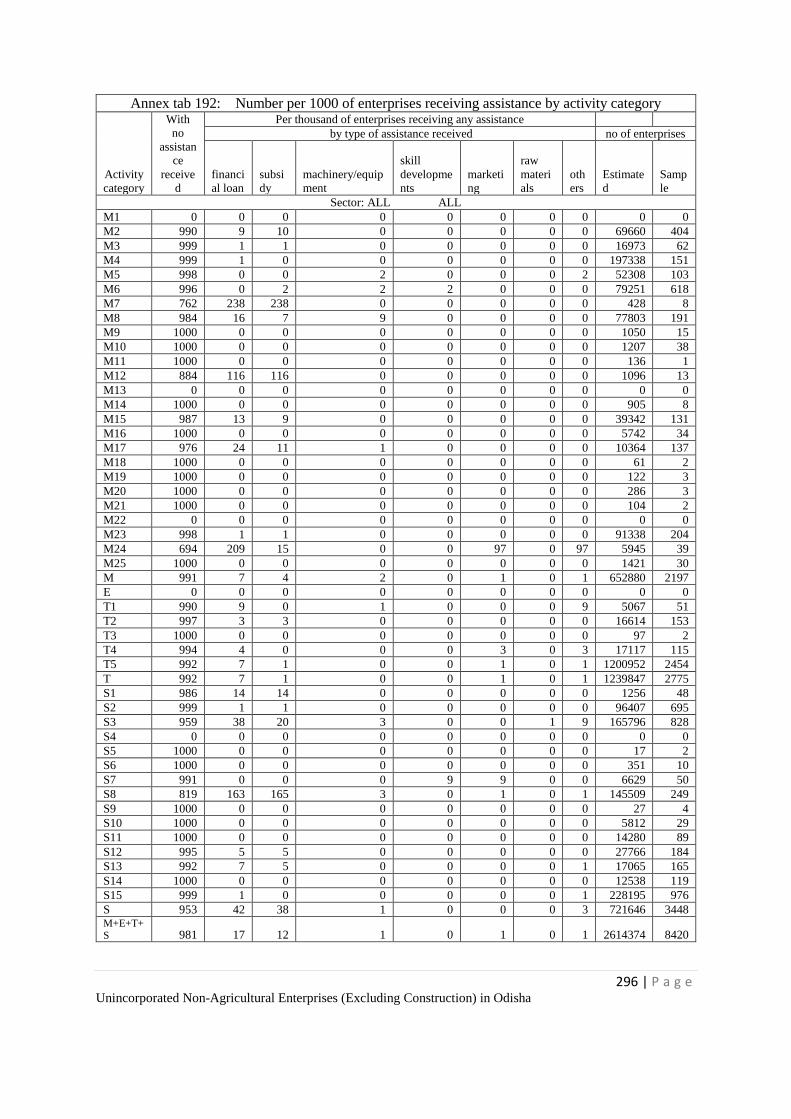
296 | P a g e Unincorporated Non-Agricultural Enterprises (Excluding Construction) in Odisha
Annex tab 192: Number per 1000 of enterprises receiving assistance by activity category
Activity
category
With
no
assistan
ce
receive
d
Per thousand of enterprises receiving any assistance
by type of assistance received no of enterprises
financi
al loan
subsi
dy
machinery/equip
ment
skill
developme
nts
marketi
ng
raw
materi
als
oth
ers
Estimate
d
Samp
le
Sector: ALL ALL
M1 0 0 0 0 0 0 0 0 0 0
M2 990 9 10 0 0 0 0 0 69660 404
M3 999 1 1 0 0 0 0 0 16973 62
M4 999 1 0 0 0 0 0 0 197338 151
M5 998 0 0 2 0 0 0 2 52308 103
M6 996 0 2 2 2 0 0 0 79251 618
M7 762 238 238 0 0 0 0 0 428 8
M8 984 16 7 9 0 0 0 0 77803 191
M9 1000 0 0 0 0 0 0 0 1050 15
M10 1000 0 0 0 0 0 0 0 1207 38
M11 1000 0 0 0 0 0 0 0 136 1
M12 884 116 116 0 0 0 0 0 1096 13
M13 0 0 0 0 0 0 0 0 0 0
M14 1000 0 0 0 0 0 0 0 905 8
M15 987 13 9 0 0 0 0 0 39342 131
M16 1000 0 0 0 0 0 0 0 5742 34
M17 976 24 11 1 0 0 0 0 10364 137
M18 1000 0 0 0 0 0 0 0 61 2
M19 1000 0 0 0 0 0 0 0 122 3
M20 1000 0 0 0 0 0 0 0 286 3
M21 1000 0 0 0 0 0 0 0 104 2
M22 0 0 0 0 0 0 0 0 0 0
M23 998 1 1 0 0 0 0 0 91338 204
M24 694 209 15 0 0 97 0 97 5945 39
M25 1000 0 0 0 0 0 0 0 1421 30
M 991 7 4 2 0 1 0 1 652880 2197
E 0 0 0 0 0 0 0 0 0 0
T1 990 9 0 1 0 0 0 9 5067 51
T2 997 3 3 0 0 0 0 0 16614 153
T3 1000 0 0 0 0 0 0 0 97 2
T4 994 4 0 0 0 3 0 3 17117 115
T5 992 7 1 0 0 1 0 1 1200952 2454
T 992 7 1 0 0 1 0 1 1239847 2775
S1 986 14 14 0 0 0 0 0 1256 48
S2 999 1 1 0 0 0 0 0 96407 695
S3 959 38 20 3 0 0 1 9 165796 828
S4 0 0 0 0 0 0 0 0 0 0
S5 1000 0 0 0 0 0 0 0 17 2
S6 1000 0 0 0 0 0 0 0 351 10
S7 991 0 0 0 9 9 0 0 6629 50
S8 819 163 165 3 0 1 0 1 145509 249
S9 1000 0 0 0 0 0 0 0 27 4
S10 1000 0 0 0 0 0 0 0 5812 29
S11 1000 0 0 0 0 0 0 0 14280 89
S12 995 5 5 0 0 0 0 0 27766 184
S13 992 7 5 0 0 0 0 1 17065 165
S14 1000 0 0 0 0 0 0 0 12538 119
S15 999 1 0 0 0 0 0 1 228195 976
S 953 42 38 1 0 0 0 3 721646 3448 M+E+T+S 981 17 12 1 0 1 0 1 2614374 8420
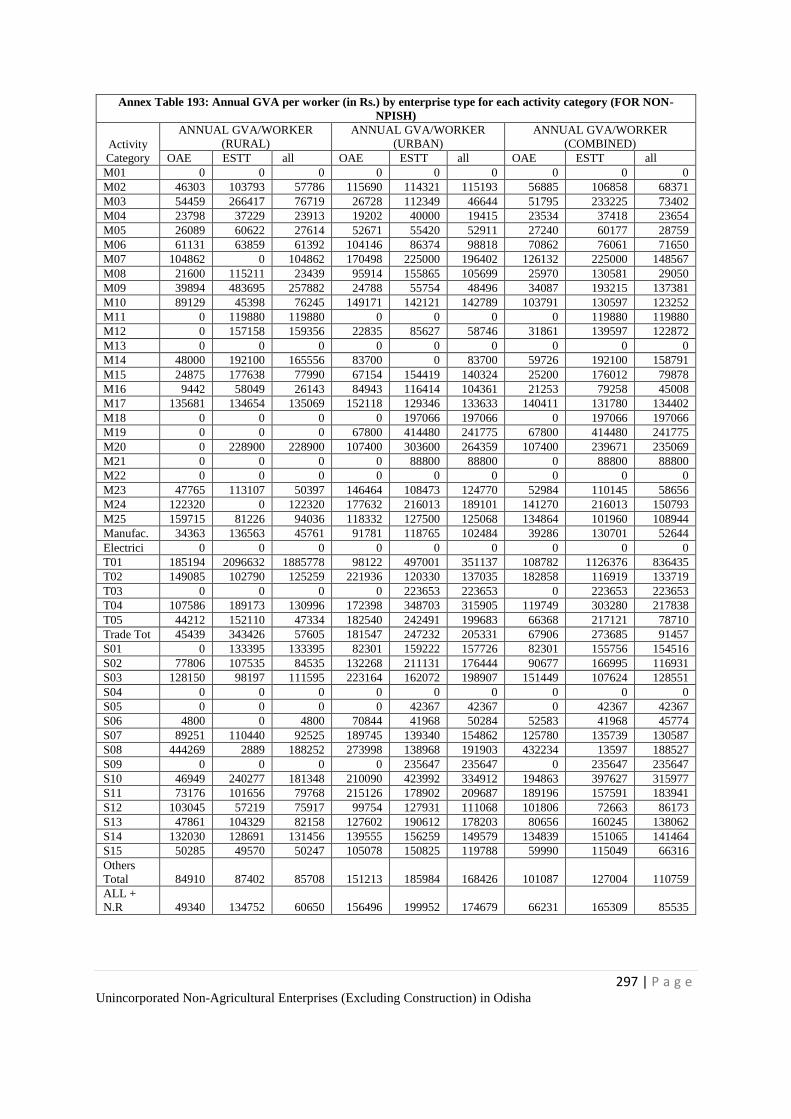
297 | P a g e Unincorporated Non-Agricultural Enterprises (Excluding Construction) in Odisha
Annex Table 193: Annual GVA per worker (in Rs.) by enterprise type for each activity category (FOR NON-
NPISH)
Activity
Category
ANNUAL GVA/WORKER
(RURAL)
ANNUAL GVA/WORKER
(URBAN)
ANNUAL GVA/WORKER
(COMBINED)
OAE ESTT all OAE ESTT all OAE ESTT all
M01 0 0 0 0 0 0 0 0 0
M02 46303 103793 57786 115690 114321 115193 56885 106858 68371
M03 54459 266417 76719 26728 112349 46644 51795 233225 73402
M04 23798 37229 23913 19202 40000 19415 23534 37418 23654
M05 26089 60622 27614 52671 55420 52911 27240 60177 28759
M06 61131 63859 61392 104146 86374 98818 70862 76061 71650
M07 104862 0 104862 170498 225000 196402 126132 225000 148567
M08 21600 115211 23439 95914 155865 105699 25970 130581 29050
M09 39894 483695 257882 24788 55754 48496 34087 193215 137381
M10 89129 45398 76245 149171 142121 142789 103791 130597 123252
M11 0 119880 119880 0 0 0 0 119880 119880
M12 0 157158 159356 22835 85627 58746 31861 139597 122872
M13 0 0 0 0 0 0 0 0 0
M14 48000 192100 165556 83700 0 83700 59726 192100 158791
M15 24875 177638 77990 67154 154419 140324 25200 176012 79878
M16 9442 58049 26143 84943 116414 104361 21253 79258 45008
M17 135681 134654 135069 152118 129346 133633 140411 131780 134402
M18 0 0 0 0 197066 197066 0 197066 197066
M19 0 0 0 67800 414480 241775 67800 414480 241775
M20 0 228900 228900 107400 303600 264359 107400 239671 235069
M21 0 0 0 0 88800 88800 0 88800 88800
M22 0 0 0 0 0 0 0 0 0
M23 47765 113107 50397 146464 108473 124770 52984 110145 58656
M24 122320 0 122320 177632 216013 189101 141270 216013 150793
M25 159715 81226 94036 118332 127500 125068 134864 101960 108944
Manufac. 34363 136563 45761 91781 118765 102484 39286 130701 52644
Electrici 0 0 0 0 0 0 0 0 0
T01 185194 2096632 1885778 98122 497001 351137 108782 1126376 836435
T02 149085 102790 125259 221936 120330 137035 182858 116919 133719
T03 0 0 0 0 223653 223653 0 223653 223653
T04 107586 189173 130996 172398 348703 315905 119749 303280 217838
T05 44212 152110 47334 182540 242491 199683 66368 217121 78710
Trade Tot 45439 343426 57605 181547 247232 205331 67906 273685 91457
S01 0 133395 133395 82301 159222 157726 82301 155756 154516
S02 77806 107535 84535 132268 211131 176444 90677 166995 116931
S03 128150 98197 111595 223164 162072 198907 151449 107624 128551
S04 0 0 0 0 0 0 0 0 0
S05 0 0 0 0 42367 42367 0 42367 42367
S06 4800 0 4800 70844 41968 50284 52583 41968 45774
S07 89251 110440 92525 189745 139340 154862 125780 135739 130587
S08 444269 2889 188252 273998 138968 191903 432234 13597 188527
S09 0 0 0 0 235647 235647 0 235647 235647
S10 46949 240277 181348 210090 423992 334912 194863 397627 315977
S11 73176 101656 79768 215126 178902 209687 189196 157591 183941
S12 103045 57219 75917 99754 127931 111068 101806 72663 86173
S13 47861 104329 82158 127602 190612 178203 80656 160245 138062
S14 132030 128691 131456 139555 156259 149579 134839 151065 141464
S15 50285 49570 50247 105078 150825 119788 59990 115049 66316
Others
Total 84910 87402 85708 151213 185984 168426 101087 127004 110759
ALL +
N.R 49340 134752 60650 156496 199952 174679 66231 165309 85535
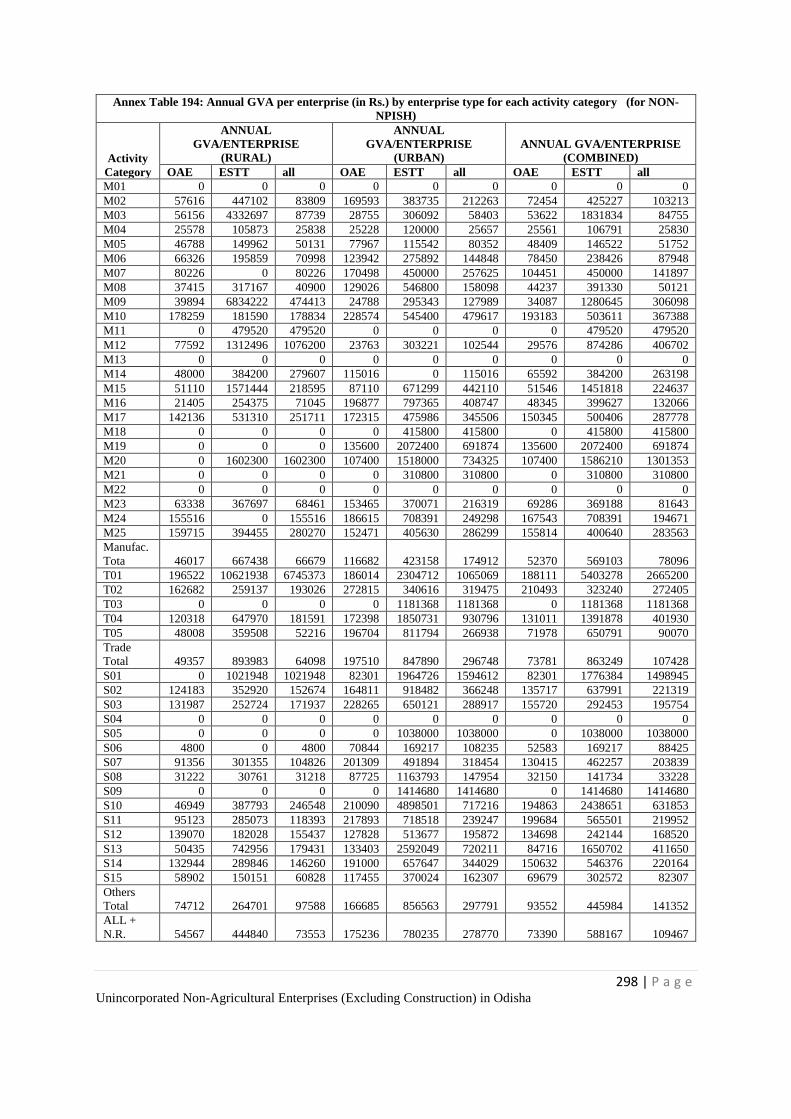
298 | P a g e Unincorporated Non-Agricultural Enterprises (Excluding Construction) in Odisha
Annex Table 194: Annual GVA per enterprise (in Rs.) by enterprise type for each activity category (for NON-
NPISH)
Activity
Category
ANNUAL
GVA/ENTERPRISE
(RURAL)
ANNUAL
GVA/ENTERPRISE
(URBAN)
ANNUAL GVA/ENTERPRISE
(COMBINED)
OAE ESTT all OAE ESTT all OAE ESTT all
M01 0 0 0 0 0 0 0 0 0
M02 57616 447102 83809 169593 383735 212263 72454 425227 103213
M03 56156 4332697 87739 28755 306092 58403 53622 1831834 84755
M04 25578 105873 25838 25228 120000 25657 25561 106791 25830
M05 46788 149962 50131 77967 115542 80352 48409 146522 51752
M06 66326 195859 70998 123942 275892 144848 78450 238426 87948
M07 80226 0 80226 170498 450000 257625 104451 450000 141897
M08 37415 317167 40900 129026 546800 158098 44237 391330 50121
M09 39894 6834222 474413 24788 295343 127989 34087 1280645 306098
M10 178259 181590 178834 228574 545400 479617 193183 503611 367388
M11 0 479520 479520 0 0 0 0 479520 479520
M12 77592 1312496 1076200 23763 303221 102544 29576 874286 406702
M13 0 0 0 0 0 0 0 0 0
M14 48000 384200 279607 115016 0 115016 65592 384200 263198
M15 51110 1571444 218595 87110 671299 442110 51546 1451818 224637
M16 21405 254375 71045 196877 797365 408747 48345 399627 132066
M17 142136 531310 251711 172315 475986 345506 150345 500406 287778
M18 0 0 0 0 415800 415800 0 415800 415800
M19 0 0 0 135600 2072400 691874 135600 2072400 691874
M20 0 1602300 1602300 107400 1518000 734325 107400 1586210 1301353
M21 0 0 0 0 310800 310800 0 310800 310800
M22 0 0 0 0 0 0 0 0 0
M23 63338 367697 68461 153465 370071 216319 69286 369188 81643
M24 155516 0 155516 186615 708391 249298 167543 708391 194671
M25 159715 394455 280270 152471 405630 286299 155814 400640 283563
Manufac.
Tota 46017 667438 66679 116682 423158 174912 52370 569103 78096
T01 196522 10621938 6745373 186014 2304712 1065069 188111 5403278 2665200
T02 162682 259137 193026 272815 340616 319475 210493 323240 272405
T03 0 0 0 0 1181368 1181368 0 1181368 1181368
T04 120318 647970 181591 172398 1850731 930796 131011 1391878 401930
T05 48008 359508 52216 196704 811794 266938 71978 650791 90070
Trade
Total 49357 893983 64098 197510 847890 296748 73781 863249 107428
S01 0 1021948 1021948 82301 1964726 1594612 82301 1776384 1498945
S02 124183 352920 152674 164811 918482 366248 135717 637991 221319
S03 131987 252724 171937 228265 650121 288917 155720 292453 195754
S04 0 0 0 0 0 0 0 0 0
S05 0 0 0 0 1038000 1038000 0 1038000 1038000
S06 4800 0 4800 70844 169217 108235 52583 169217 88425
S07 91356 301355 104826 201309 491894 318454 130415 462257 203839
S08 31222 30761 31218 87725 1163793 147954 32150 141734 33228
S09 0 0 0 0 1414680 1414680 0 1414680 1414680
S10 46949 387793 246548 210090 4898501 717216 194863 2438651 631853
S11 95123 285073 118393 217893 718518 239247 199684 565501 219952
S12 139070 182028 155437 127828 513677 195872 134698 242144 168520
S13 50435 742956 179431 133403 2592049 720211 84716 1650702 411650
S14 132944 289846 146260 191000 657647 344029 150632 546376 220164
S15 58902 150151 60828 117455 370024 162307 69679 302572 82307
Others
Total 74712 264701 97588 166685 856563 297791 93552 445984 141352
ALL +
N.R. 54567 444840 73553 175236 780235 278770 73390 588167 109467
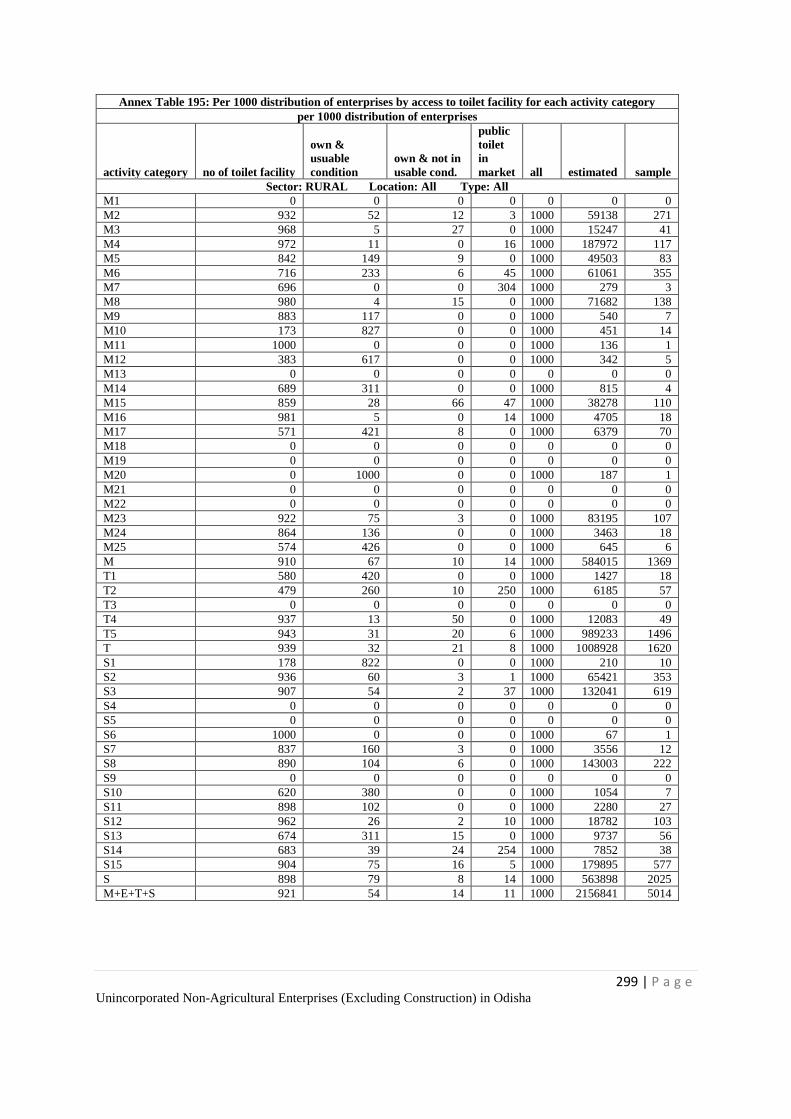
299 | P a g e Unincorporated Non-Agricultural Enterprises (Excluding Construction) in Odisha
Annex Table 195: Per 1000 distribution of enterprises by access to toilet facility for each activity category
per 1000 distribution of enterprises
activity category no of toilet facility
own &
usuable
condition
own & not in
usable cond.
public
toilet
in
market all estimated sample
Sector: RURAL Location: All Type: All
M1 0 0 0 0 0 0 0
M2 932 52 12 3 1000 59138 271
M3 968 5 27 0 1000 15247 41
M4 972 11 0 16 1000 187972 117
M5 842 149 9 0 1000 49503 83
M6 716 233 6 45 1000 61061 355
M7 696 0 0 304 1000 279 3
M8 980 4 15 0 1000 71682 138
M9 883 117 0 0 1000 540 7
M10 173 827 0 0 1000 451 14
M11 1000 0 0 0 1000 136 1
M12 383 617 0 0 1000 342 5
M13 0 0 0 0 0 0 0
M14 689 311 0 0 1000 815 4
M15 859 28 66 47 1000 38278 110
M16 981 5 0 14 1000 4705 18
M17 571 421 8 0 1000 6379 70
M18 0 0 0 0 0 0 0
M19 0 0 0 0 0 0 0
M20 0 1000 0 0 1000 187 1
M21 0 0 0 0 0 0 0
M22 0 0 0 0 0 0 0
M23 922 75 3 0 1000 83195 107
M24 864 136 0 0 1000 3463 18
M25 574 426 0 0 1000 645 6
M 910 67 10 14 1000 584015 1369
T1 580 420 0 0 1000 1427 18
T2 479 260 10 250 1000 6185 57
T3 0 0 0 0 0 0 0
T4 937 13 50 0 1000 12083 49
T5 943 31 20 6 1000 989233 1496
T 939 32 21 8 1000 1008928 1620
S1 178 822 0 0 1000 210 10
S2 936 60 3 1 1000 65421 353
S3 907 54 2 37 1000 132041 619
S4 0 0 0 0 0 0 0
S5 0 0 0 0 0 0 0
S6 1000 0 0 0 1000 67 1
S7 837 160 3 0 1000 3556 12
S8 890 104 6 0 1000 143003 222
S9 0 0 0 0 0 0 0
S10 620 380 0 0 1000 1054 7
S11 898 102 0 0 1000 2280 27
S12 962 26 2 10 1000 18782 103
S13 674 311 15 0 1000 9737 56
S14 683 39 24 254 1000 7852 38
S15 904 75 16 5 1000 179895 577
S 898 79 8 14 1000 563898 2025
M+E+T+S 921 54 14 11 1000 2156841 5014
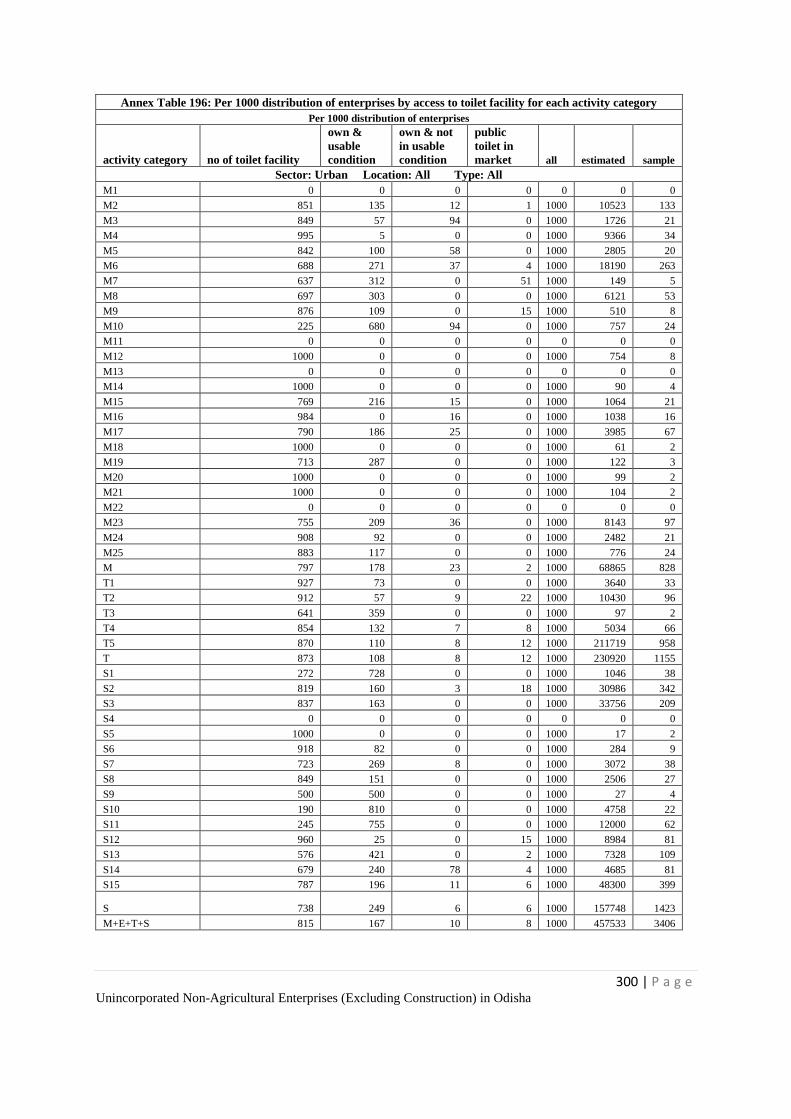
300 | P a g e Unincorporated Non-Agricultural Enterprises (Excluding Construction) in Odisha
Annex Table 196: Per 1000 distribution of enterprises by access to toilet facility for each activity category
Per 1000 distribution of enterprises
activity category no of toilet facility
own &
usable
condition
own & not
in usable
condition
public
toilet in
market all estimated sample
Sector: Urban Location: All Type: All
M1 0 0 0 0 0 0 0
M2 851 135 12 1 1000 10523 133
M3 849 57 94 0 1000 1726 21
M4 995 5 0 0 1000 9366 34
M5 842 100 58 0 1000 2805 20
M6 688 271 37 4 1000 18190 263
M7 637 312 0 51 1000 149 5
M8 697 303 0 0 1000 6121 53
M9 876 109 0 15 1000 510 8
M10 225 680 94 0 1000 757 24
M11 0 0 0 0 0 0 0
M12 1000 0 0 0 1000 754 8
M13 0 0 0 0 0 0 0
M14 1000 0 0 0 1000 90 4
M15 769 216 15 0 1000 1064 21
M16 984 0 16 0 1000 1038 16
M17 790 186 25 0 1000 3985 67
M18 1000 0 0 0 1000 61 2
M19 713 287 0 0 1000 122 3
M20 1000 0 0 0 1000 99 2
M21 1000 0 0 0 1000 104 2
M22 0 0 0 0 0 0 0
M23 755 209 36 0 1000 8143 97
M24 908 92 0 0 1000 2482 21
M25 883 117 0 0 1000 776 24
M 797 178 23 2 1000 68865 828
T1 927 73 0 0 1000 3640 33
T2 912 57 9 22 1000 10430 96
T3 641 359 0 0 1000 97 2
T4 854 132 7 8 1000 5034 66
T5 870 110 8 12 1000 211719 958
T 873 108 8 12 1000 230920 1155
S1 272 728 0 0 1000 1046 38
S2 819 160 3 18 1000 30986 342
S3 837 163 0 0 1000 33756 209
S4 0 0 0 0 0 0 0
S5 1000 0 0 0 1000 17 2
S6 918 82 0 0 1000 284 9
S7 723 269 8 0 1000 3072 38
S8 849 151 0 0 1000 2506 27
S9 500 500 0 0 1000 27 4
S10 190 810 0 0 1000 4758 22
S11 245 755 0 0 1000 12000 62
S12 960 25 0 15 1000 8984 81
S13 576 421 0 2 1000 7328 109
S14 679 240 78 4 1000 4685 81
S15 787 196 11 6 1000 48300 399
S 738 249 6 6 1000 157748 1423
M+E+T+S 815 167 10 8 1000 457533 3406
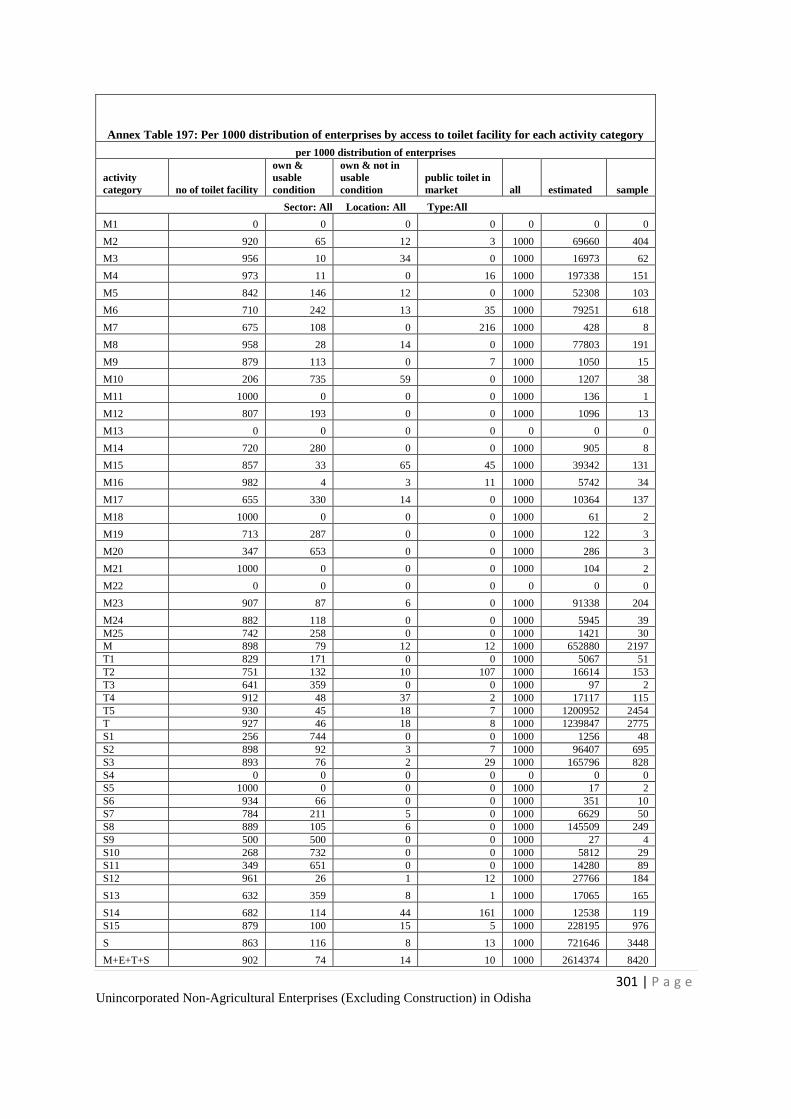
301 | P a g e Unincorporated Non-Agricultural Enterprises (Excluding Construction) in Odisha
Annex Table 197: Per 1000 distribution of enterprises by access to toilet facility for each activity category
per 1000 distribution of enterprises
activity
category no of toilet facility
own &
usable
condition
own & not in
usable
condition
public toilet in
market all estimated sample
Sector: All Location: All Type:All
M1 0 0 0 0 0 0 0
M2 920 65 12 3 1000 69660 404
M3 956 10 34 0 1000 16973 62
M4 973 11 0 16 1000 197338 151
M5 842 146 12 0 1000 52308 103
M6 710 242 13 35 1000 79251 618
M7 675 108 0 216 1000 428 8
M8 958 28 14 0 1000 77803 191
M9 879 113 0 7 1000 1050 15
M10 206 735 59 0 1000 1207 38
M11 1000 0 0 0 1000 136 1
M12 807 193 0 0 1000 1096 13
M13 0 0 0 0 0 0 0
M14 720 280 0 0 1000 905 8
M15 857 33 65 45 1000 39342 131
M16 982 4 3 11 1000 5742 34
M17 655 330 14 0 1000 10364 137
M18 1000 0 0 0 1000 61 2
M19 713 287 0 0 1000 122 3
M20 347 653 0 0 1000 286 3
M21 1000 0 0 0 1000 104 2
M22 0 0 0 0 0 0 0
M23 907 87 6 0 1000 91338 204
M24 882 118 0 0 1000 5945 39
M25 742 258 0 0 1000 1421 30
M 898 79 12 12 1000 652880 2197
T1 829 171 0 0 1000 5067 51
T2 751 132 10 107 1000 16614 153
T3 641 359 0 0 1000 97 2
T4 912 48 37 2 1000 17117 115
T5 930 45 18 7 1000 1200952 2454
T 927 46 18 8 1000 1239847 2775
S1 256 744 0 0 1000 1256 48
S2 898 92 3 7 1000 96407 695
S3 893 76 2 29 1000 165796 828
S4 0 0 0 0 0 0 0
S5 1000 0 0 0 1000 17 2
S6 934 66 0 0 1000 351 10
S7 784 211 5 0 1000 6629 50
S8 889 105 6 0 1000 145509 249
S9 500 500 0 0 1000 27 4
S10 268 732 0 0 1000 5812 29
S11 349 651 0 0 1000 14280 89
S12 961 26 1 12 1000 27766 184
S13 632 359 8 1 1000 17065 165
S14 682 114 44 161 1000 12538 119
S15 879 100 15 5 1000 228195 976
S 863 116 8 13 1000 721646 3448
M+E+T+S 902 74 14 10 1000 2614374 8420
302 | P a g e Unincorporated Non-Agricultural Enterprises (Excluding Construction) in Odisha
Appendix-C
Schedule 0.0 & 2.34
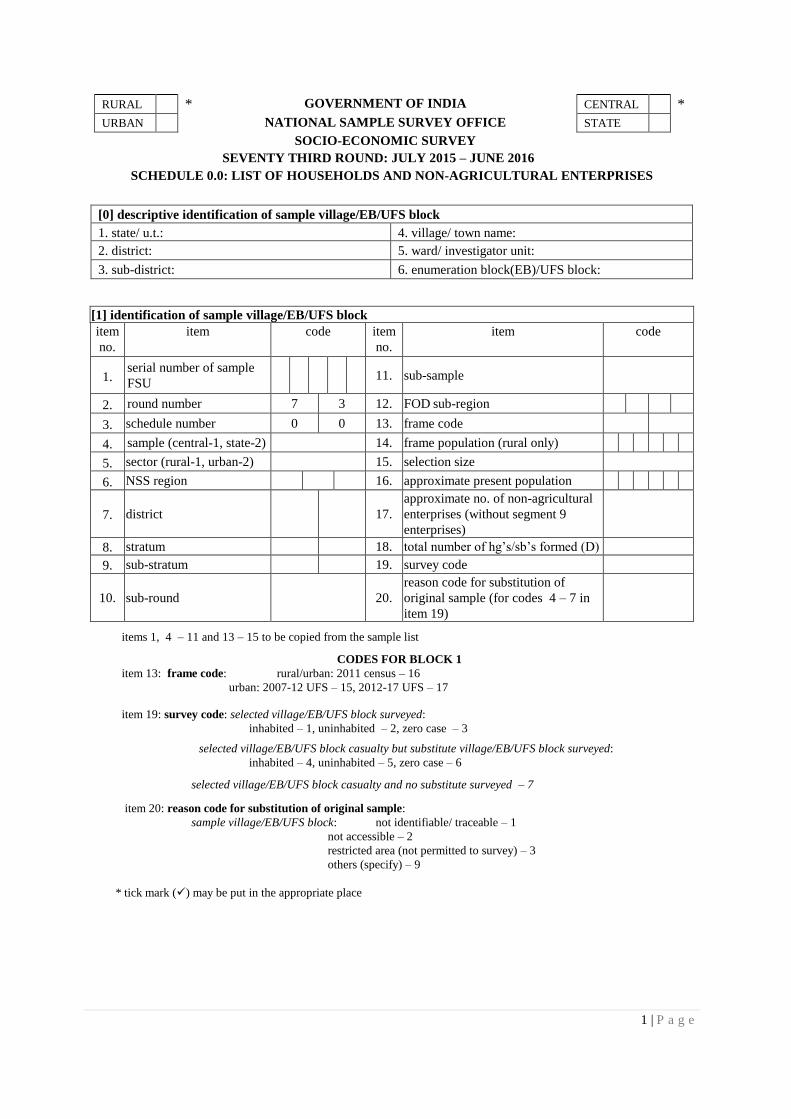
1 | P a g e
SCHEDULE 0.0: LIST OF HOUSEHOLDS AND NON-AGRICULTURAL ENTERPRISES
[0] descriptive identification of sample village/EB/UFS block
1. state/ u.t.: 4. village/ town name:
2. district: 5. ward/ investigator unit:
3. sub-district: 6. enumeration block(EB)/UFS block:
[1] identification of sample village/EB/UFS block
item
no.
item code item
no.
item code
1. serial number of sample
FSU
11. sub-sample
2. round number 7 3 12. FOD sub-region
3. schedule number 0 0 13. frame code
4. sample (central-1, state-2) 14. frame population (rural only)
5. sector (rural-1, urban-2) 15. selection size
6. NSS region 16. approximate present population
7. district
17.
approximate no. of non-agricultural
enterprises (without segment 9
enterprises)
8. stratum 18. total number of hg’s/sb’s formed (D)
9. sub-stratum 19. survey code
10. sub-round
20.
reason code for substitution of
original sample (for codes 4 – 7 in
item 19)
items 1, 4 – 11 and 13 – 15 to be copied from the sample list
CODES FOR BLOCK 1
item 13: frame code: rural/urban: 2011 census – 16
urban: 2007-12 UFS – 15, 2012-17 UFS – 17
item 19: survey code: selected village/EB/UFS block surveyed:
inhabited – 1, uninhabited – 2, zero case – 3
selected village/EB/UFS block casualty but substitute village/EB/UFS block surveyed:
inhabited – 4, uninhabited – 5, zero case – 6
selected village/EB/UFS block casualty and no substitute surveyed – 7
item 20: reason code for substitution of original sample:
sample village/EB/UFS block: not identifiable/ traceable – 1
not accessible – 2
restricted area (not permitted to survey) – 3
others (specify) – 9
* tick mark () may be put in the appropriate place
RURAL * GOVERNMENT OF INDIA CENTRAL *
URBAN NATIONAL SAMPLE SURVEY OFFICE STATE
SOCIO-ECONOMIC SURVEY
SEVENTY THIRD ROUND: JULY 2015 – JUNE 2016
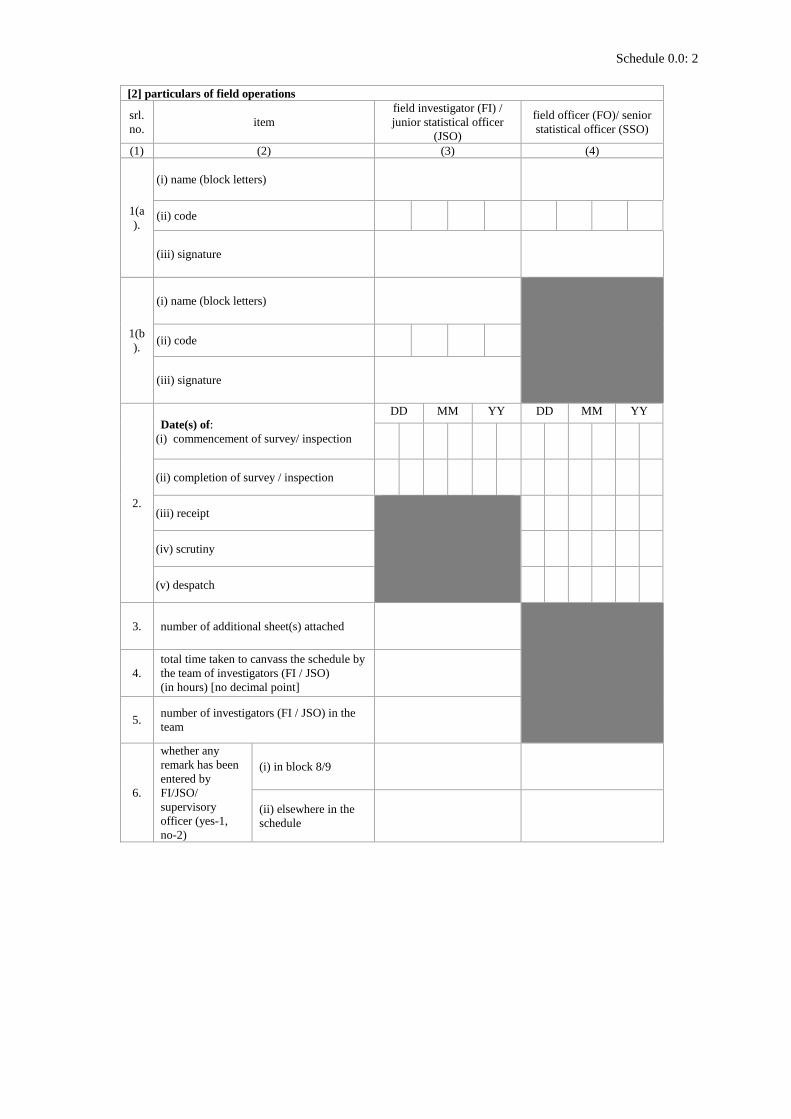
Schedule 0.0: 2
[2] particulars of field operations
srl.
no. item
field investigator (FI) /
junior statistical officer
(JSO)
field officer (FO)/ senior
statistical officer (SSO)
(1) (2) (3) (4)
1(a
).
(i) name (block letters)
(ii) code
(iii) signature
1(b
).
(i) name (block letters)
(ii) code
(iii) signature
2.
Date(s) of:
(i) commencement of survey/ inspection
DD MM YY DD MM YY
(ii) completion of survey / inspection
(iii) receipt
(iv) scrutiny
(v) despatch
3. number of additional sheet(s) attached
4.
total time taken to canvass the schedule by
the team of investigators (FI / JSO)
(in hours) [no decimal point]
5. number of investigators (FI / JSO) in the
team
6.
whether any
remark has been
entered by
FI/JSO/
supervisory
officer (yes-1,
no-2)
(i) in block 8/9
(ii) elsewhere in the
schedule
Schedule 0.0: 3
[8] remarks by investigators (FI/JSO)
[9] comments by supervisory officer(s)
Schedule 0.0: 4
[3] sketch map of hamlet-group (hg)/sub-block (sb) formation
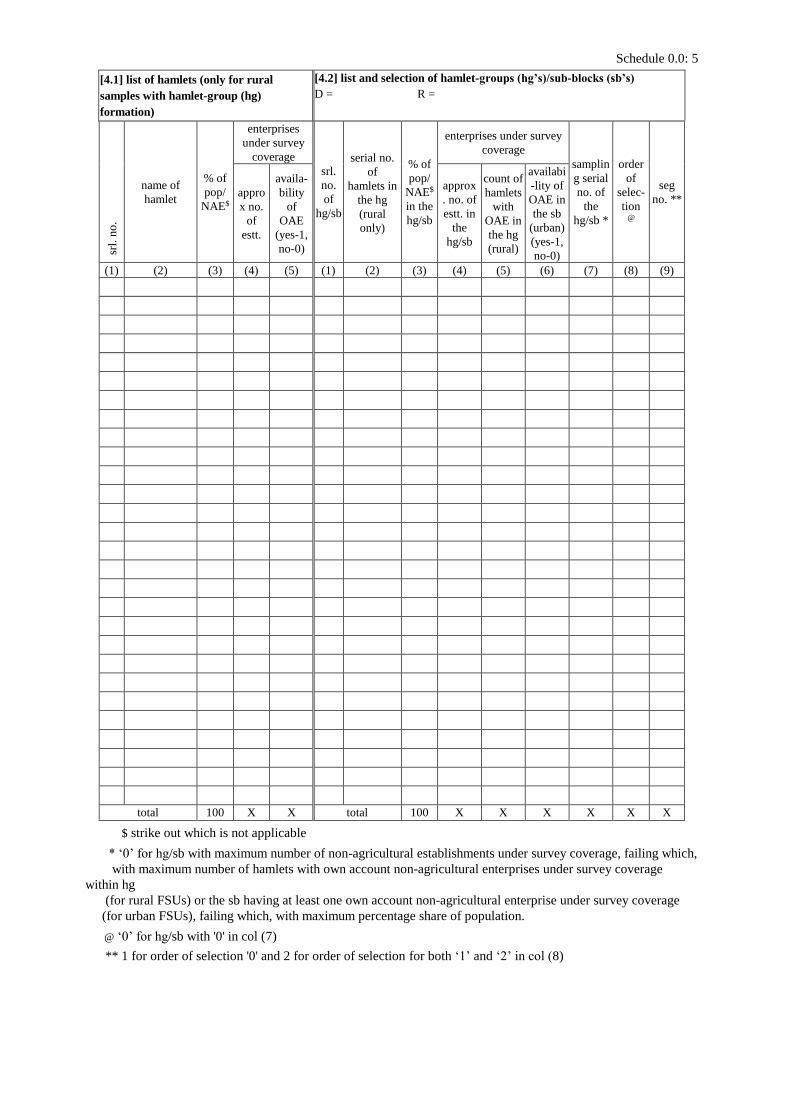
Schedule 0.0: 5
[4.1] list of hamlets (only for rural
samples with hamlet-group (hg)
formation)
[4.2] list and selection of hamlet-groups (hg’s)/sub-blocks (sb’s)
D = R =
srl.
no
.
name of
hamlet
% of
pop/
NAE$
enterprises
under survey
coverage
srl.
no.
of
hg/sb
serial no.
of
hamlets in
the hg
(rural
only)
% of
pop/
NAE$
in the
hg/sb
enterprises under survey
coverage
samplin
g serial
no. of
the
hg/sb *
order
of
selec-
tion @
seg
no. ** appro
x no.
of
estt.
availa-
bility
of
OAE
(yes-1,
no-0)
approx
. no. of
estt. in
the
hg/sb
count of
hamlets
with
OAE in
the hg
(rural)
availabi
-lity of
OAE in
the sb
(urban)
(yes-1,
no-0)
(1) (2) (3) (4) (5) (1) (2) (3) (4) (5) (6) (7) (8) (9)
total 100 X X total 100 X X X X X X
$ strike out which is not applicable
* ‘0’ for hg/sb with maximum number of non-agricultural establishments under survey coverage, failing which,
with maximum number of hamlets with own account non-agricultural enterprises under survey coverage
within hg
(for rural FSUs) or the sb having at least one own account non-agricultural enterprise under survey coverage
(for urban FSUs), failing which, with maximum percentage share of population.
@ ‘0’ for hg/sb with '0' in col (7)
** 1 for order of selection '0' and 2 for order of selection for both ‘1’ and ‘2’ in col (8)
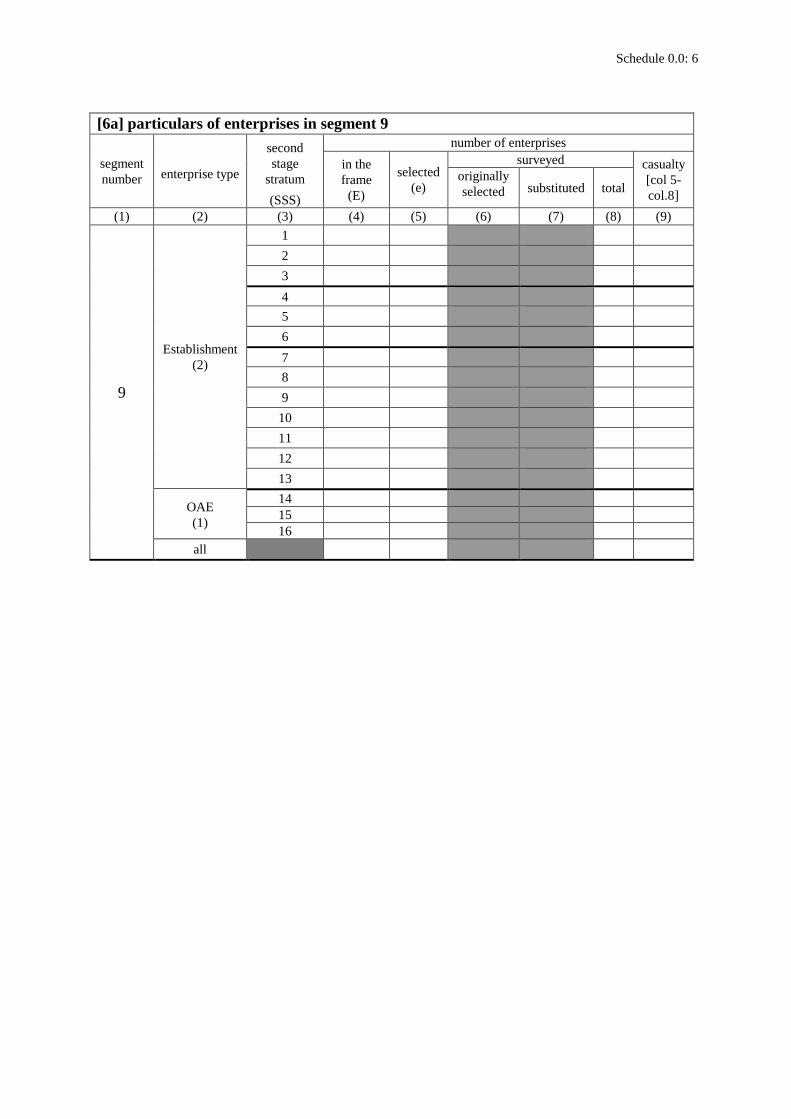
Schedule 0.0: 6
[6a] particulars of enterprises in segment 9
segment
number enterprise type
second
stage
stratum
(SSS)
number of enterprises
in the
frame
(E)
selected
(e)
surveyed casualty
[col 5-
col.8]
originally
selected substituted total
(1) (2) (3) (4) (5) (6) (7) (8) (9)
9
Establishment
(2)
1
2
3
4
5
6
7
8
9
10
11
12
13
OAE
(1)
14
15
16
all
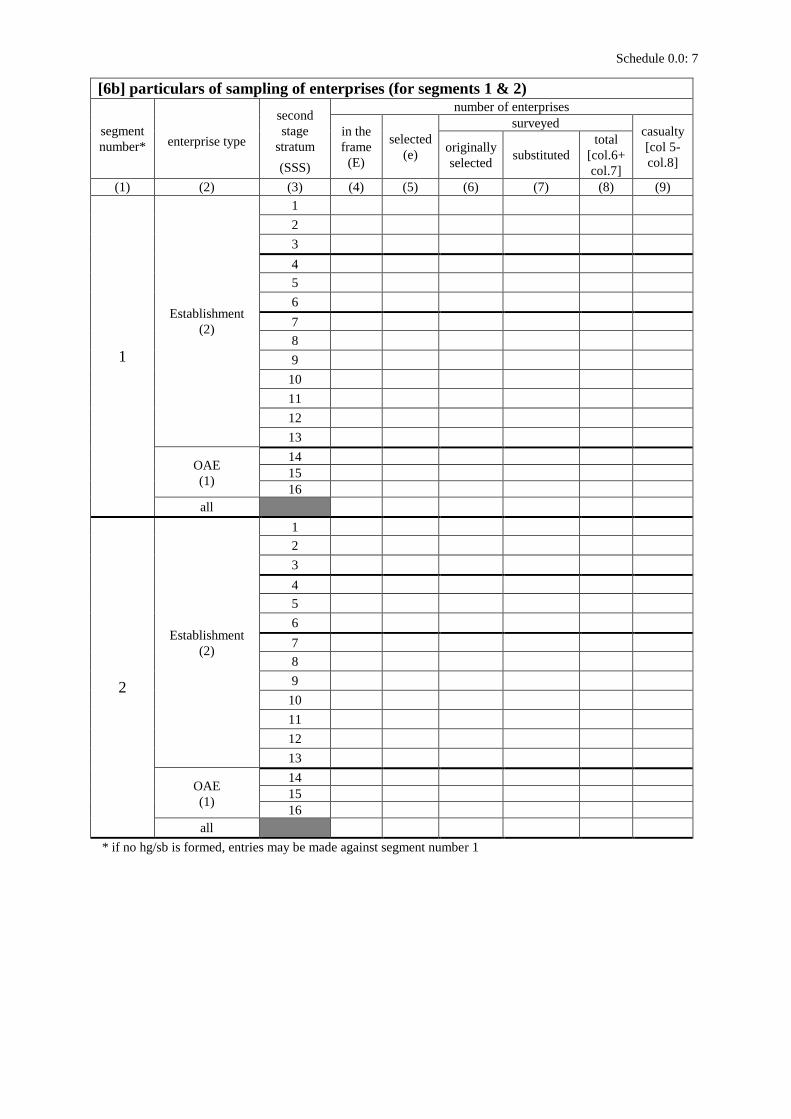
Schedule 0.0: 7
* if no hg/sb is formed, entries may be made against segment number 1
[6b] particulars of sampling of enterprises (for segments 1 & 2)
segment
number* enterprise type
second
stage
stratum
(SSS)
number of enterprises
in the
frame
(E)
selected
(e)
surveyed casualty
[col 5-
col.8]
originally
selected substituted
total
[col.6+
col.7]
(1) (2) (3) (4) (5) (6) (7) (8) (9)
1
Establishment
(2)
1
2
3
4
5
6
7
8
9
10
11
12
13
OAE
(1)
14
15
16
all
2
Establishment
(2)
1
2
3
4
5
6
7
8
9
10
11
12
13
OAE
(1)
14
15
16
all
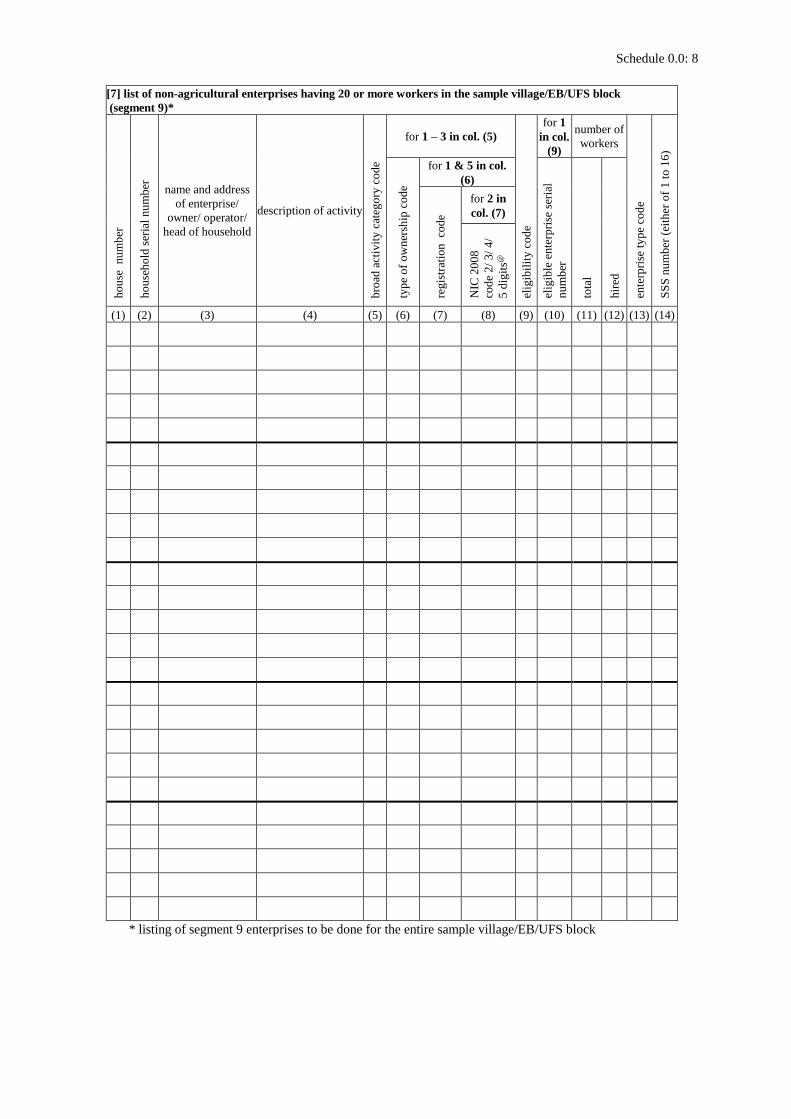
Schedule 0.0: 8
[7] list of non-agricultural enterprises having 20 or more workers in the sample village/EB/UFS block
(segment 9)* h
ou
se
nu
mb
er
ho
use
ho
ld s
eria
l n
um
ber
name and address
of enterprise/
owner/ operator/
head of household
description of activity
bro
ad a
ctiv
ity
cat
ego
ry c
od
e
for 1 – 3 in col. (5)
elig
ibil
ity
co
de
for 1
in col.
(9)
number of
workers
ente
rpri
se t
yp
e co
de
SS
S n
um
ber
(ei
ther
of
1 t
o 1
6)
typ
e o
f o
wn
ersh
ip c
od
e
for 1 & 5 in col.
(6)
elig
ible
en
terp
rise
ser
ial
nu
mb
er
tota
l
hir
ed
reg
istr
atio
n
cod
e
for 2 in
col. (7)
NIC
20
08
cod
e 2
/ 3
/ 4
/
5 d
igit
s@
(1) (2) (3) (4) (5) (6) (7) (8) (9) (10) (11) (12) (13) (14)
* listing of segment 9 enterprises to be done for the entire sample village/EB/UFS block
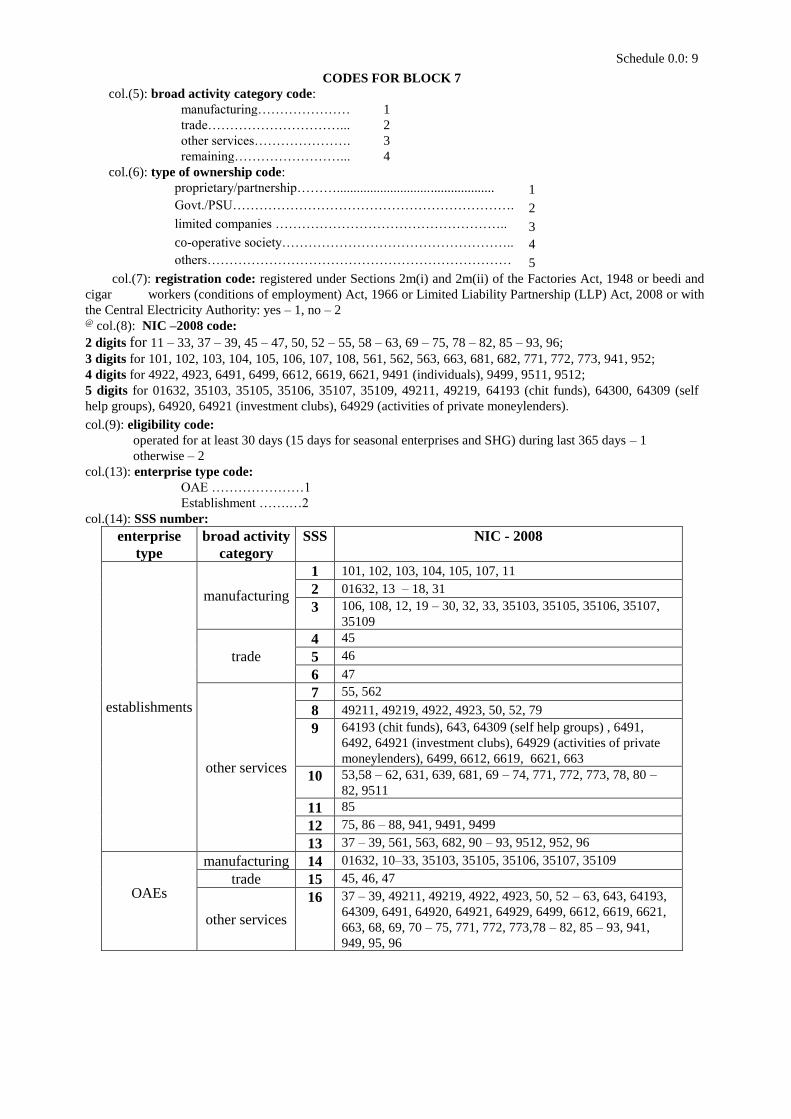
Schedule 0.0: 9
CODES FOR BLOCK 7
col.(5): broad activity category code:
manufacturing………………… 1
trade…………………………... 2
other services…………………. 3
remaining……………………... 4
col.(6): type of ownership code:
proprietary/partnership………............................................... 1
Govt./PSU………………………………………………………. 2
limited companies …………………………………………….. 3
co-operative society…………………………………………….. 4
others…………………………………………………………… 5
col.(7): registration code: registered under Sections 2m(i) and 2m(ii) of the Factories Act, 1948 or beedi and
cigar workers (conditions of employment) Act, 1966 or Limited Liability Partnership (LLP) Act, 2008 or with
the Central Electricity Authority: yes – 1, no – 2 @ col.(8): NIC –2008 code:
2 digits for 11 – 33, 37 – 39, 45 – 47, 50, 52 – 55, 58 – 63, 69 – 75, 78 – 82, 85 – 93, 96;
3 digits for 101, 102, 103, 104, 105, 106, 107, 108, 561, 562, 563, 663, 681, 682, 771, 772, 773, 941, 952;
4 digits for 4922, 4923, 6491, 6499, 6612, 6619, 6621, 9491 (individuals), 9499, 9511, 9512;
5 digits for 01632, 35103, 35105, 35106, 35107, 35109, 49211, 49219, 64193 (chit funds), 64300, 64309 (self
help groups), 64920, 64921 (investment clubs), 64929 (activities of private moneylenders).
col.(9): eligibility code:
operated for at least 30 days (15 days for seasonal enterprises and SHG) during last 365 days – 1
otherwise – 2
col.(13): enterprise type code:
OAE …………………1
Establishment …….…2
col.(14): SSS number:
enterprise
type
broad activity
category
SSS NIC - 2008
establishments
manufacturing
1 101, 102, 103, 104, 105, 107, 11
2 01632, 13 – 18, 31
3 106, 108, 12, 19 – 30, 32, 33, 35103, 35105, 35106, 35107,
35109
trade
4 45
5 46
6 47
other services
7 55, 562
8 49211, 49219, 4922, 4923, 50, 52, 79
9 64193 (chit funds), 643, 64309 (self help groups) , 6491,
6492, 64921 (investment clubs), 64929 (activities of private
moneylenders), 6499, 6612, 6619, 6621, 663
10 53,58 – 62, 631, 639, 681, 69 – 74, 771, 772, 773, 78, 80 –
82, 9511
11 85
12 75, 86 – 88, 941, 9491, 9499
13 37 – 39, 561, 563, 682, 90 – 93, 9512, 952, 96
OAEs
manufacturing 14 01632, 10–33, 35103, 35105, 35106, 35107, 35109
trade 15 45, 46, 47
other services
16 37 – 39, 49211, 49219, 4922, 4923, 50, 52 – 63, 643, 64193,
64309, 6491, 64920, 64921, 64929, 6499, 6612, 6619, 6621,
663, 68, 69, 70 – 75, 771, 772, 773,78 – 82, 85 – 93, 941,
949, 95, 96
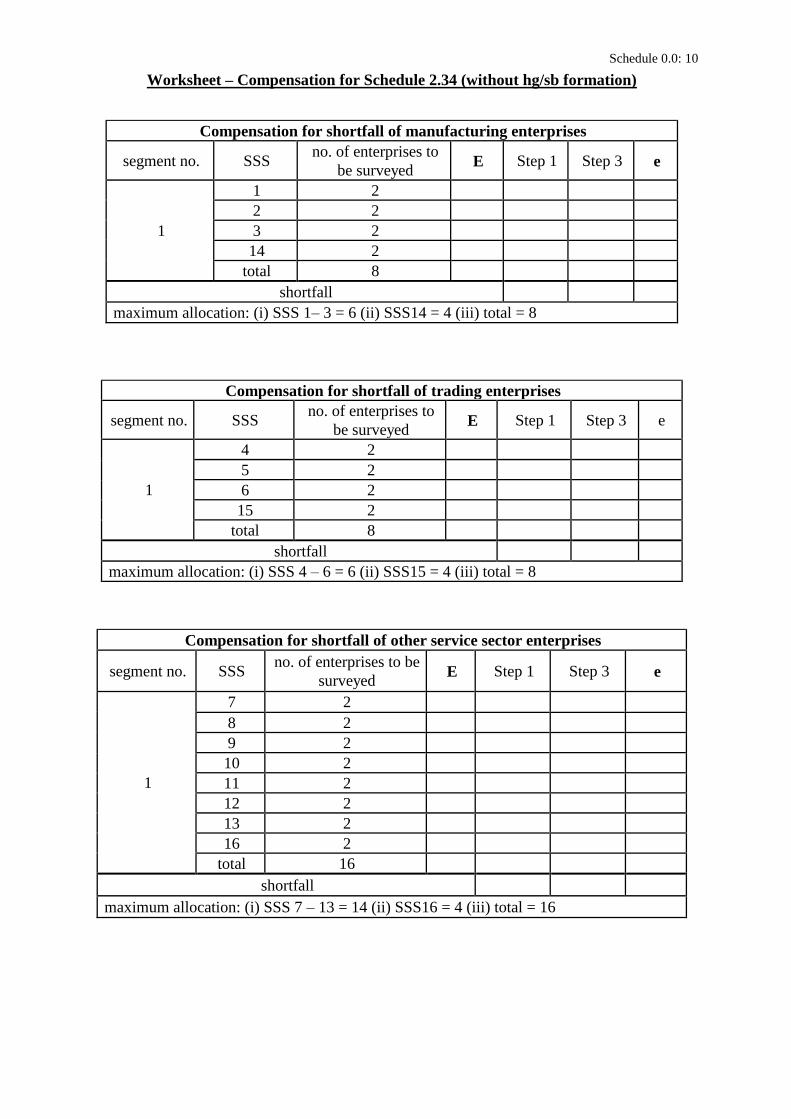
Schedule 0.0: 10
Worksheet – Compensation for Schedule 2.34 (without hg/sb formation)
Compensation for shortfall of manufacturing enterprises
segment no. SSS no. of enterprises to
be surveyed E Step 1 Step 3 e
1
1 2
2 2
3 2
14 2
total 8
shortfall
maximum allocation: (i) SSS 1– 3 = 6 (ii) SSS14 = 4 (iii) total = 8
Compensation for shortfall of trading enterprises
segment no. SSS no. of enterprises to
be surveyed E Step 1 Step 3 e
1
4 2
5 2
6 2
15 2
total 8
shortfall
maximum allocation: (i) SSS 4 – 6 = 6 (ii) SSS15 = 4 (iii) total = 8
Compensation for shortfall of other service sector enterprises
segment no. SSS no. of enterprises to be
surveyed E Step 1 Step 3 e
1
7 2
8 2
9 2
10 2
11 2
12 2
13 2
16 2
total 16
shortfall
maximum allocation: (i) SSS 7 – 13 = 14 (ii) SSS16 = 4 (iii) total = 16
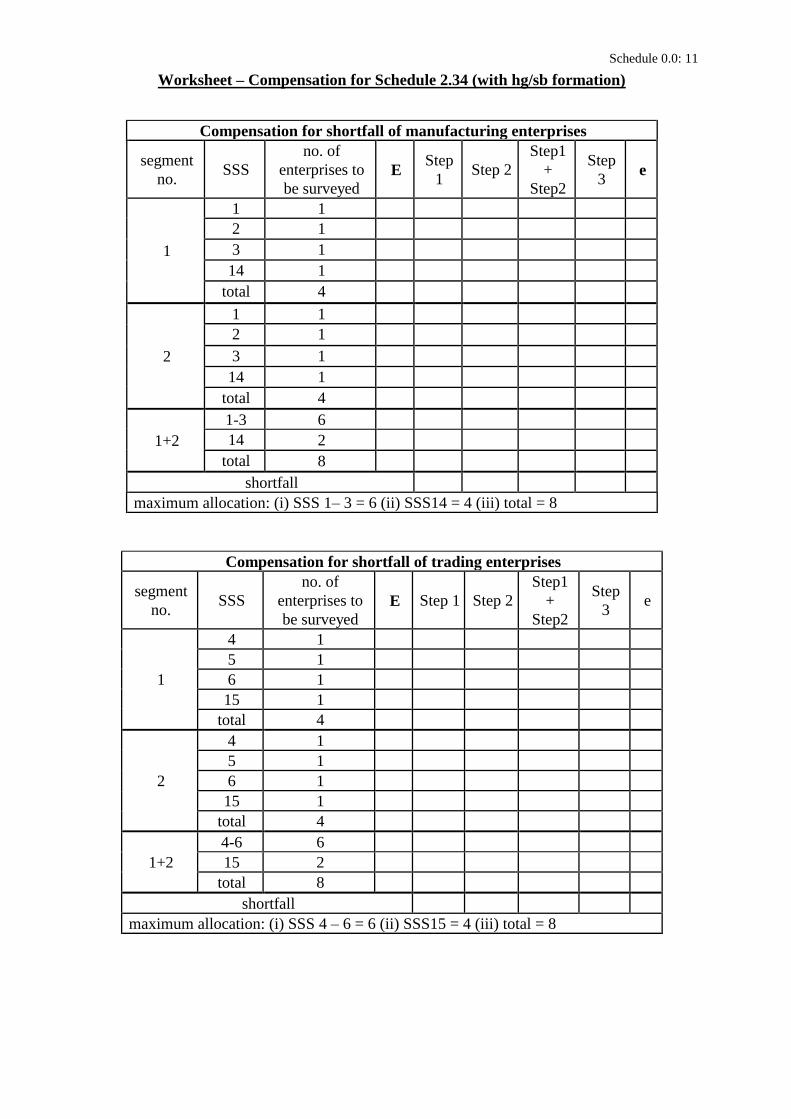
Schedule 0.0: 11
Worksheet – Compensation for Schedule 2.34 (with hg/sb formation)
Compensation for shortfall of manufacturing enterprises
segment
no. SSS
no. of
enterprises to
be surveyed
E Step
1 Step 2
Step1
+
Step2
Step
3 e
1
1 1
2 1
3 1
14 1
total 4
2
1 1
2 1
3 1
14 1
total 4
1+2
1-3 6
14 2
total 8
shortfall
maximum allocation: (i) SSS 1– 3 = 6 (ii) SSS14 = 4 (iii) total = 8
Compensation for shortfall of trading enterprises
segment
no. SSS
no. of
enterprises to
be surveyed
E Step 1 Step 2
Step1
+
Step2
Step
3 e
1
4 1
5 1
6 1
15 1
total 4
2
4 1
5 1
6 1
15 1
total 4
1+2
4-6 6
15 2
total 8
shortfall
maximum allocation: (i) SSS 4 – 6 = 6 (ii) SSS15 = 4 (iii) total = 8
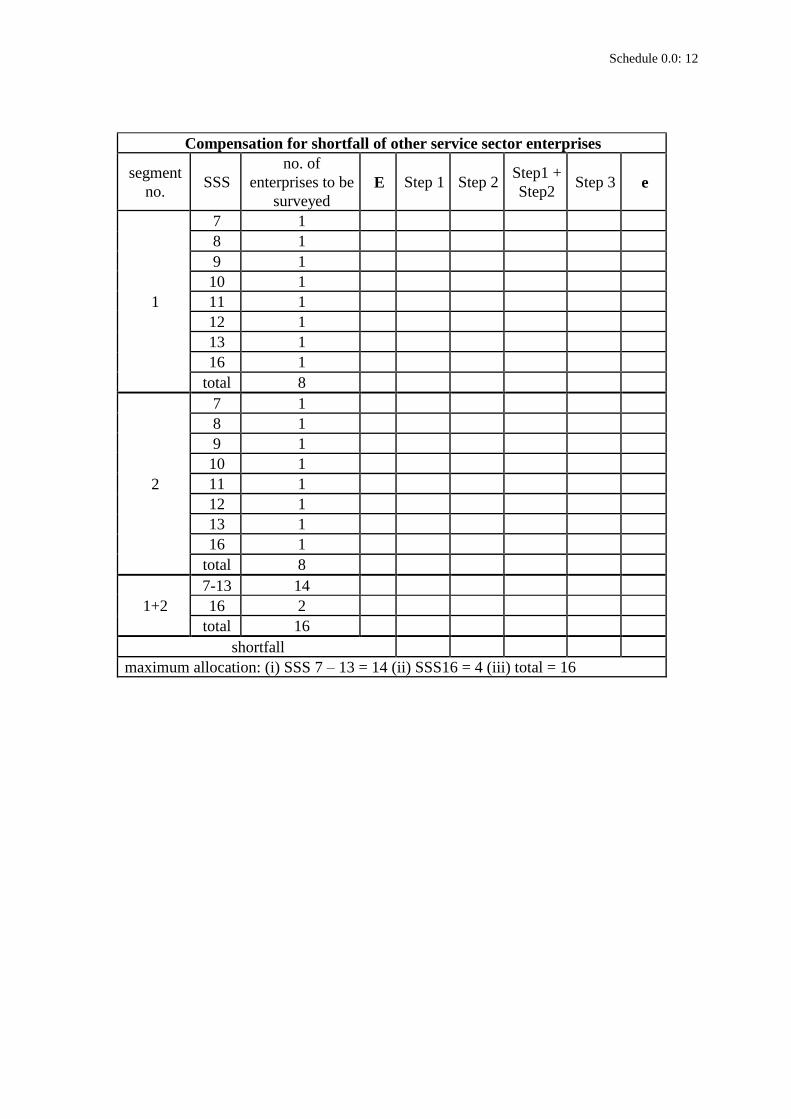
Schedule 0.0: 12
Compensation for shortfall of other service sector enterprises
segment
no. SSS
no. of
enterprises to be
surveyed
E Step 1 Step 2 Step1 +
Step2 Step 3 e
1
7 1
8 1
9 1
10 1
11 1
12 1
13 1
16 1
total 8
2
7 1
8 1
9 1
10 1
11 1
12 1
13 1
16 1
total 8
1+2
7-13 14
16 2
total 16
shortfall
maximum allocation: (i) SSS 7 – 13 = 14 (ii) SSS16 = 4 (iii) total = 16
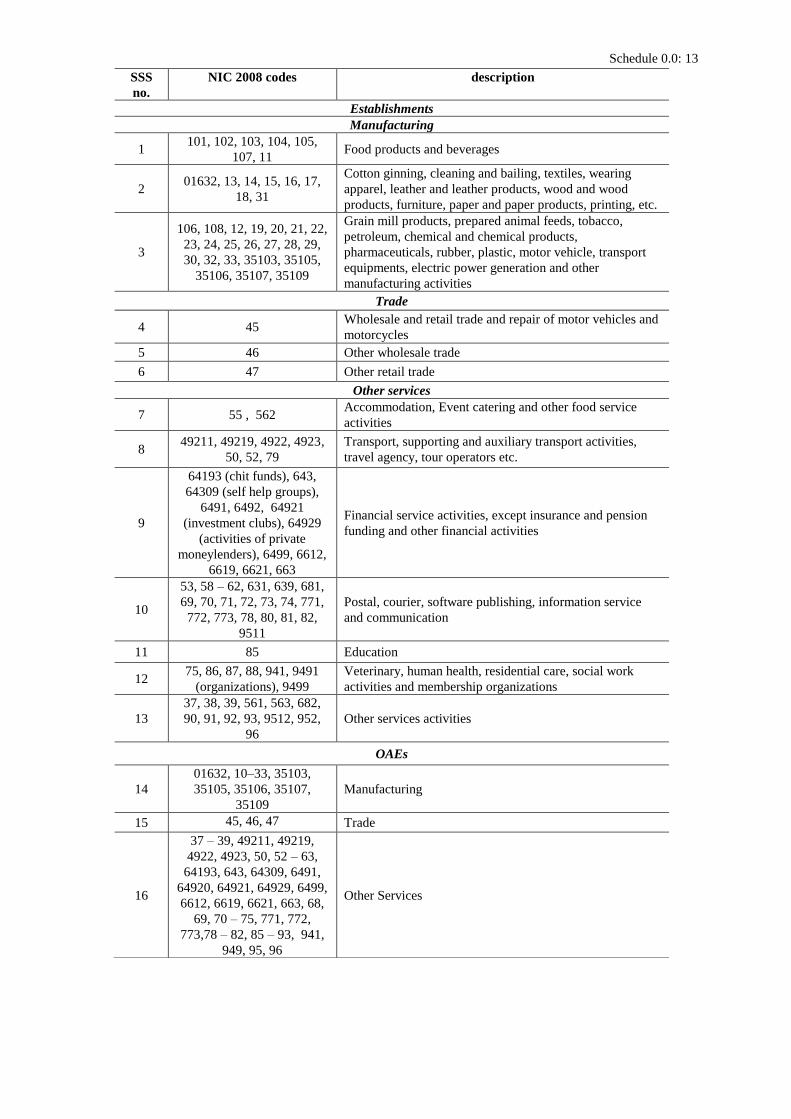
Schedule 0.0: 13
SSS
no.
NIC 2008 codes description
Establishments
Manufacturing
1 101, 102, 103, 104, 105,
107, 11 Food products and beverages
2 01632, 13, 14, 15, 16, 17,
18, 31
Cotton ginning, cleaning and bailing, textiles, wearing
apparel, leather and leather products, wood and wood
products, furniture, paper and paper products, printing, etc.
3
106, 108, 12, 19, 20, 21, 22,
23, 24, 25, 26, 27, 28, 29,
30, 32, 33, 35103, 35105,
35106, 35107, 35109
Grain mill products, prepared animal feeds, tobacco,
petroleum, chemical and chemical products,
pharmaceuticals, rubber, plastic, motor vehicle, transport
equipments, electric power generation and other
manufacturing activities
Trade
4 45 Wholesale and retail trade and repair of motor vehicles and
motorcycles
5 46 Other wholesale trade
6 47 Other retail trade
Other services
7 55 , 562 Accommodation, Event catering and other food service
activities
8 49211, 49219, 4922, 4923,
50, 52, 79
Transport, supporting and auxiliary transport activities,
travel agency, tour operators etc.
9
64193 (chit funds), 643,
64309 (self help groups),
6491, 6492, 64921
(investment clubs), 64929
(activities of private
moneylenders), 6499, 6612,
6619, 6621, 663
Financial service activities, except insurance and pension
funding and other financial activities
10
53, 58 – 62, 631, 639, 681,
69, 70, 71, 72, 73, 74, 771,
772, 773, 78, 80, 81, 82,
9511
Postal, courier, software publishing, information service
and communication
11 85 Education
12 75, 86, 87, 88, 941, 9491
(organizations), 9499
Veterinary, human health, residential care, social work
activities and membership organizations
13
37, 38, 39, 561, 563, 682,
90, 91, 92, 93, 9512, 952,
96
Other services activities
OAEs
14
01632, 10–33, 35103,
35105, 35106, 35107,
35109
Manufacturing
15 45, 46, 47 Trade
16
37 – 39, 49211, 49219,
4922, 4923, 50, 52 – 63,
64193, 643, 64309, 6491,
64920, 64921, 64929, 6499,
6612, 6619, 6621, 663, 68,
69, 70 – 75, 771, 772,
773,78 – 82, 85 – 93, 941,
949, 95, 96
Other Services
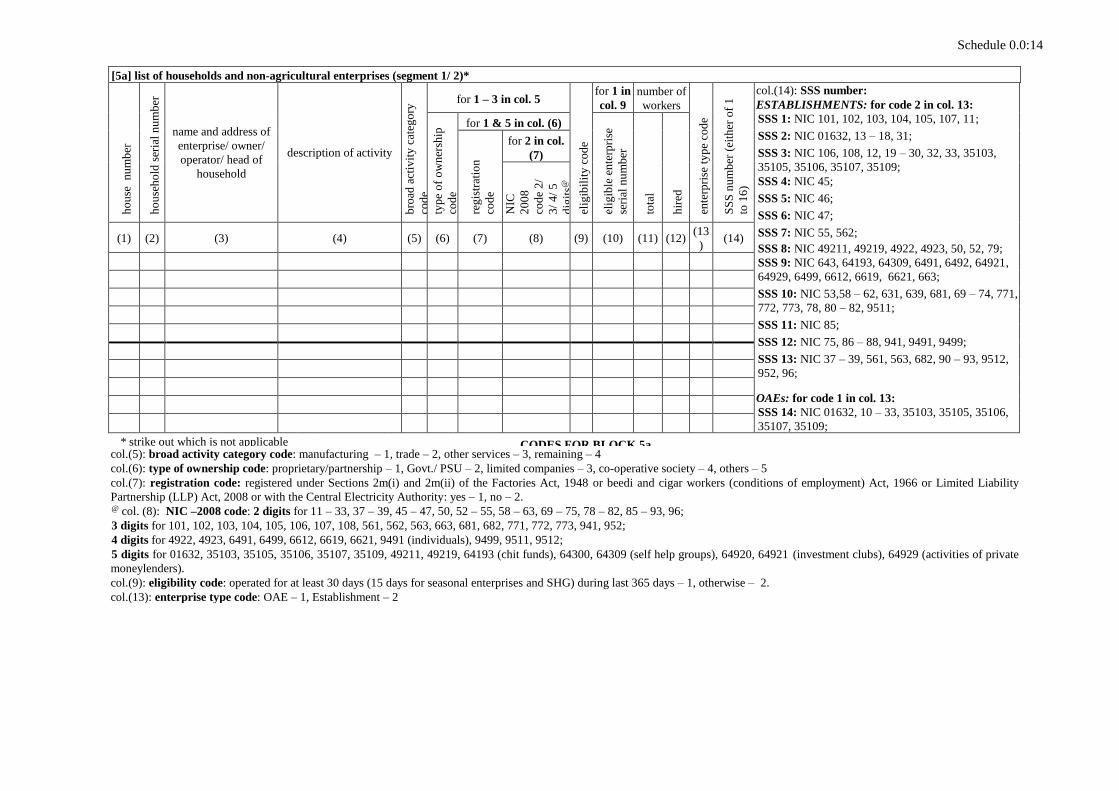
Schedule 0.0:14
[5a] list of households and non-agricultural enterprises (segment 1/ 2)*
ho
use
n
um
ber
ho
use
ho
ld s
eria
l n
um
ber
name and address of
enterprise/ owner/
operator/ head of
household
description of activity
bro
ad a
ctiv
ity
cat
ego
ry
cod
e
for 1 – 3 in col. 5
elig
ibil
ity
co
de
for 1 in
col. 9
number of
workers
ente
rpri
se t
yp
e co
de
SS
S n
um
ber
(ei
ther
of
1
to 1
6)
col.(14): SSS number:
ESTABLISHMENTS: for code 2 in col. 13:
SSS 1: NIC 101, 102, 103, 104, 105, 107, 11;
SSS 2: NIC 01632, 13 – 18, 31;
SSS 3: NIC 106, 108, 12, 19 – 30, 32, 33, 35103,
35105, 35106, 35107, 35109;
SSS 4: NIC 45;
SSS 5: NIC 46;
SSS 6: NIC 47;
SSS 7: NIC 55, 562;
SSS 8: NIC 49211, 49219, 4922, 4923, 50, 52, 79;
SSS 9: NIC 643, 64193, 64309, 6491, 6492, 64921,
64929, 6499, 6612, 6619, 6621, 663;
SSS 10: NIC 53,58 – 62, 631, 639, 681, 69 – 74, 771,
772, 773, 78, 80 – 82, 9511;
SSS 11: NIC 85;
SSS 12: NIC 75, 86 – 88, 941, 9491, 9499;
SSS 13: NIC 37 – 39, 561, 563, 682, 90 – 93, 9512,
952, 96;
OAEs: for code 1 in col. 13:
SSS 14: NIC 01632, 10 – 33, 35103, 35105, 35106,
35107, 35109;
SSS 15: NIC 45 – 47;
SSS 16: NIC 37 – 39, 49211, 49219, 4922, 4923, 50,
52 – 63, 643, 64193, 64309, 6491, 64920, 64921,
64929, 6499, 6612, 6619, 6621, 663, 68, 69, 70 – 75,
771, 772, 773,78 – 82, 85 – 93, 941, 949, 95, 96.
typ
e o
f o
wn
ersh
ip
cod
e
for 1 & 5 in col. (6)
elig
ible
en
terp
rise
seri
al n
um
ber
tota
l
hir
ed
reg
istr
atio
n
cod
e
for 2 in col.
(7)
NIC
20
08
cod
e 2
/
3/
4/
5
dig
its@
(1) (2) (3) (4) (5) (6) (7) (8) (9) (10) (11) (12) (13
) (14)
* strike out which is not applicable CODES FOR BLOCK 5a col.(5): broad activity category code: manufacturing – 1, trade – 2, other services – 3, remaining – 4
col.(6): type of ownership code: proprietary/partnership – 1, Govt./ PSU – 2, limited companies – 3, co-operative society – 4, others – 5
col.(7): registration code: registered under Sections 2m(i) and 2m(ii) of the Factories Act, 1948 or beedi and cigar workers (conditions of employment) Act, 1966 or Limited Liability
Partnership (LLP) Act, 2008 or with the Central Electricity Authority: yes – 1, no – 2. @ col. (8): NIC –2008 code: 2 digits for 11 – 33, 37 – 39, 45 – 47, 50, 52 – 55, 58 – 63, 69 – 75, 78 – 82, 85 – 93, 96;
3 digits for 101, 102, 103, 104, 105, 106, 107, 108, 561, 562, 563, 663, 681, 682, 771, 772, 773, 941, 952;
4 digits for 4922, 4923, 6491, 6499, 6612, 6619, 6621, 9491 (individuals), 9499, 9511, 9512;
5 digits for 01632, 35103, 35105, 35106, 35107, 35109, 49211, 49219, 64193 (chit funds), 64300, 64309 (self help groups), 64920, 64921 (investment clubs), 64929 (activities of private
moneylenders).
col.(9): eligibility code: operated for at least 30 days (15 days for seasonal enterprises and SHG) during last 365 days – 1, otherwise – 2.
col.(13): enterprise type code: OAE – 1, Establishment – 2
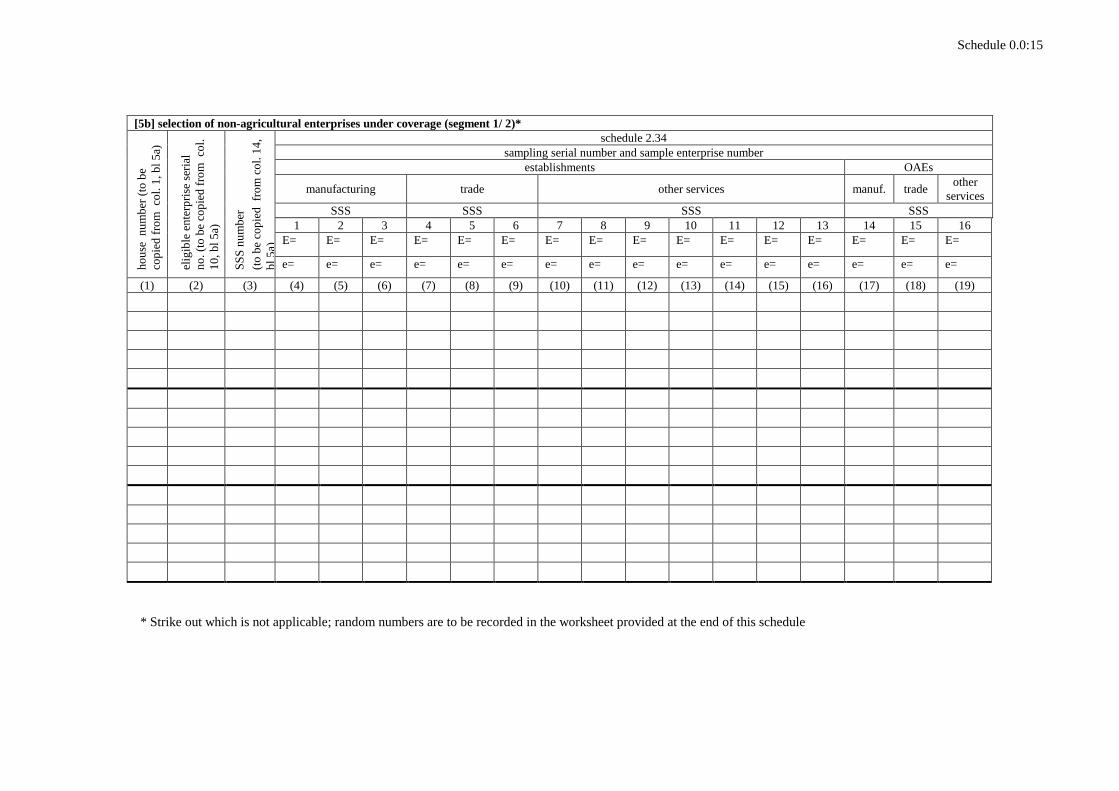
Schedule 0.0:15
* Strike out which is not applicable; random numbers are to be recorded in the worksheet provided at the end of this schedule
[5b] selection of non-agricultural enterprises under coverage (segment 1/ 2)*
ho
use
n
um
ber
(to
be
cop
ied
fro
m
col.
1,
bl
5a)
elig
ible
en
terp
rise
ser
ial
no
. (t
o b
e co
pie
d f
rom
co
l.
10
, b
l 5
a)
SS
S n
um
ber
(to
be
cop
ied
fr
om
co
l. 1
4,
bl
5a)
schedule 2.34
sampling serial number and sample enterprise number
establishments OAEs
manufacturing trade other services manuf. trade other
services
SSS SSS SSS SSS
1 2 3 4 5 6 7 8 9 10 11 12 13 14 15 16
E= E= E= E= E= E= E= E= E= E= E= E= E= E= E= E=
e= e= e= e= e= e= e= e= e= e= e= e= e= e= e= e=
(1) (2) (3) (4) (5) (6) (7) (8) (9) (10) (11) (12) (13) (14) (15) (16) (17) (18) (19)
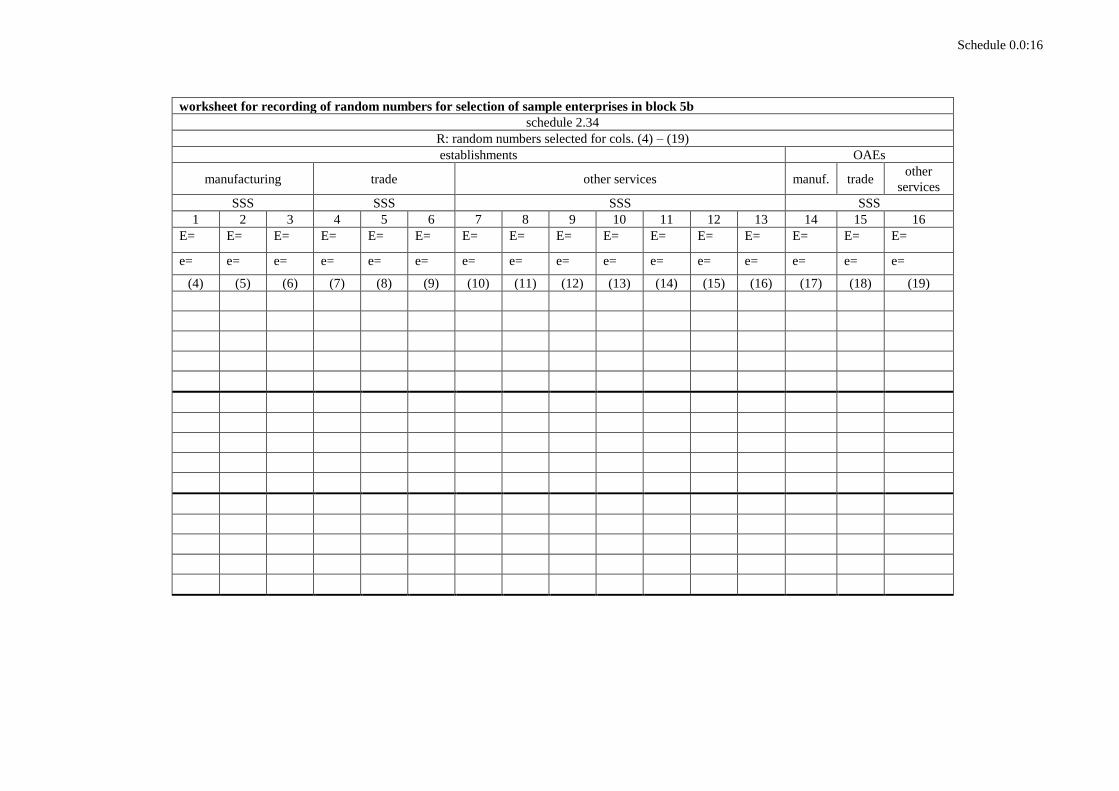
Schedule 0.0:16
worksheet for recording of random numbers for selection of sample enterprises in block 5b
schedule 2.34
R: random numbers selected for cols. (4) – (19)
establishments OAEs
manufacturing trade other services manuf. trade other
services
SSS SSS SSS SSS
1 2 3 4 5 6 7 8 9 10 11 12 13 14 15 16
E= E= E= E= E= E= E= E= E= E= E= E= E= E= E= E=
e= e= e= e= e= e= e= e= e= e= e= e= e= e= e= e=
(4) (5) (6) (7) (8) (9) (10) (11) (12) (13) (14) (15) (16) (17) (18) (19)
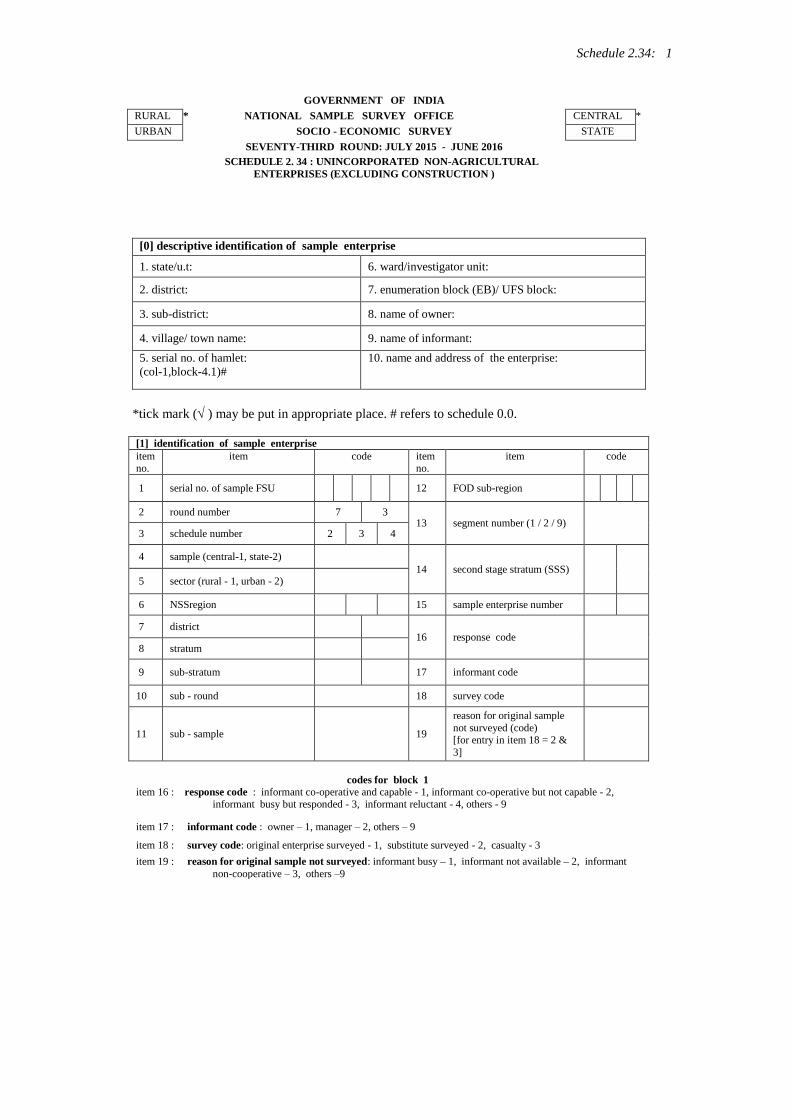
Schedule 2.34: 1
GOVERNMENT OF INDIA
RURAL *__________ NATIONAL SAMPLE SURVEY OFFICE CENTRAL *
URBAN SOCIO - ECONOMIC SURVEY STATE
SEVENTY-THIRD ROUND: JULY 2015 - JUNE 2016
SCHEDULE 2. 34 : UNINCORPORATED NON-AGRICULTURAL
ENTERPRISES (EXCLUDING CONSTRUCTION )
[0] descriptive identification of sample enterprise
1. state/u.t: 6. ward/investigator unit:
2. district: 7. enumeration block (EB)/ UFS block:
3. sub-district: 8. name of owner:
4. village/ town name: 9. name of informant:
5. serial no. of hamlet:
(col-1,block-4.1)#
10. name and address of the enterprise:
*tick mark ( ) may be put in appropriate place. # refers to schedule 0.0.
[1] identification of sample enterprise
item no.
item code item no.
item code
1 serial no. of sample FSU 12 FOD sub-region
2 round number 7 3 13 segment number (1 / 2 / 9)
3 schedule number 2 3 4
4 sample (central-1, state-2)
14 second stage stratum (SSS)
5 sector (rural - 1, urban - 2)
6 NSSregion 15 sample enterprise number
7 district 16 response code
8 stratum
9 sub-stratum 17 informant code
10 sub - round 18 survey code
11 sub - sample 19
reason for original sample
not surveyed (code) [for entry in item 18 = 2 &
3]
codes for block 1 item 16 : response code : informant co-operative and capable - 1, informant co-operative but not capable - 2,
informant busy but responded - 3, informant reluctant - 4, others - 9
item 17 : informant code : owner – 1, manager – 2, others – 9
item 18 : survey code: original enterprise surveyed - 1, substitute surveyed - 2, casualty - 3
item 19 : reason for original sample not surveyed: informant busy – 1, informant not available – 2, informant
non-cooperative – 3, others –9
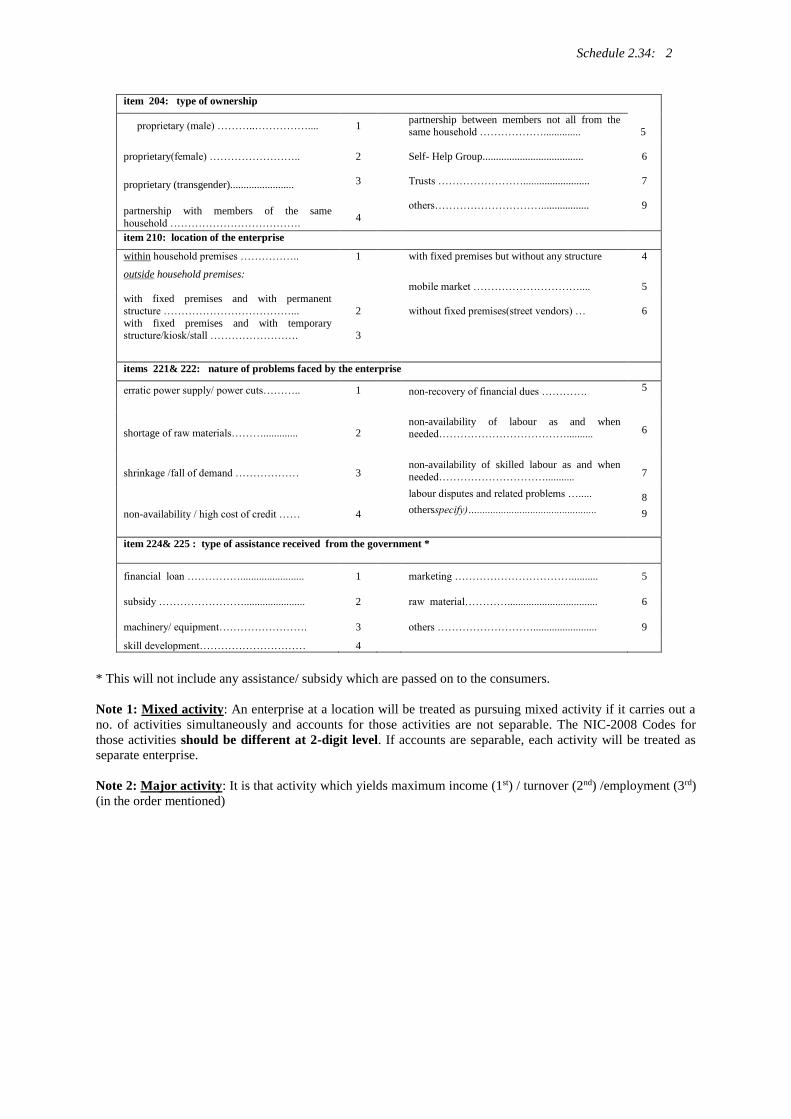
Schedule 2.34: 2
item 204: type of ownership
proprietary (male) ………..…………….... 1 partnership between members not all from the
same household ……………….............. 5
proprietary(female) ……………………..
proprietary (transgender)........................
partnership with members of the same
household ……………………………….
2
3
4
Self- Help Group......................................
Trusts …………………….........................
others…………………………..................
6
7
9
item 210: location of the enterprise
within household premises …………….. 1 with fixed premises but without any structure 4
outside household premises:
mobile market …………………………....
5 with fixed premises and with permanent
structure ………………………………...
2
without fixed premises(street vendors) …
6
with fixed premises and with temporary structure/kiosk/stall …………………….
3
items 221& 222: nature of problems faced by the enterprise
erratic power supply/ power cuts……….. 1 non-recovery of financial dues …………. 5
shortage of raw materials………............. 2
non-availability of labour as and when needed………………………………..........
6
shrinkage /fall of demand ……………… 3
non-availability of skilled labour as and when
needed…………………………...........
7
non-availability / high cost of credit …… 4
labour disputes and related problems ….....
othersspecify)…............................................. 8
9
item 224& 225 : type of assistance received from the government *
financial loan ……………........................ 1
marketing …………………………….......... 5
subsidy ……………………....................... 2
raw material………….................................. 6
machinery/ equipment……………………. 3
others ………………………........................ 9
skill development………………………… 4
* This will not include any assistance/ subsidy which are passed on to the consumers.
Note 1: Mixed activity: An enterprise at a location will be treated as pursuing mixed activity if it carries out a
no. of activities simultaneously and accounts for those activities are not separable. The NIC-2008 Codes for
those activities should be different at 2-digit level. If accounts are separable, each activity will be treated as
separate enterprise.
Note 2: Major activity: It is that activity which yields maximum income (1st) / turnover (2nd) /employment (3rd)
(in the order mentioned)
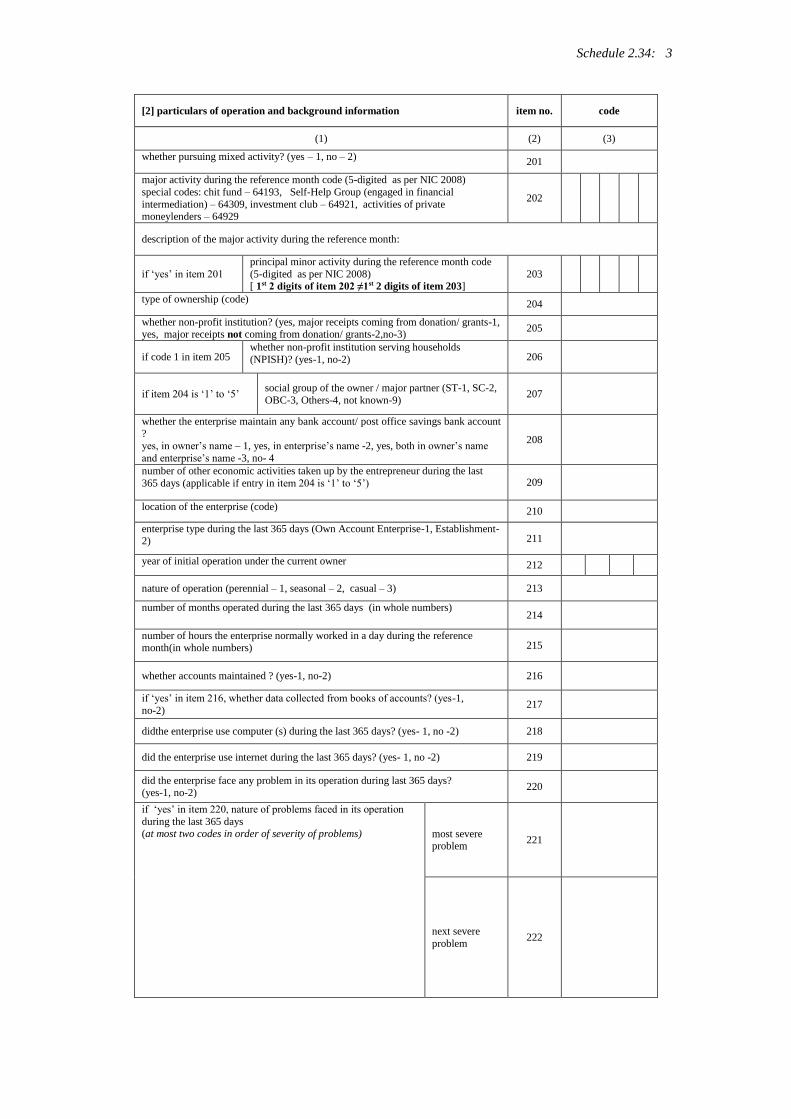
Schedule 2.34: 3
[2] particulars of operation and background information item no. code
(1) (2) (3)
whether pursuing mixed activity? (yes – 1, no – 2) 201
major activity during the reference month code (5-digited as per NIC 2008)
special codes: chit fund – 64193, Self-Help Group (engaged in financial
intermediation) – 64309, investment club – 64921, activities of private moneylenders – 64929
202
description of the major activity during the reference month:
if ‘yes’ in item 201
principal minor activity during the reference month code
(5-digited as per NIC 2008) [ 1st 2 digits of item 202 ≠1st 2 digits of item 203]
203
type of ownership (code) 204
whether non-profit institution? (yes, major receipts coming from donation/ grants-1, yes, major receipts not coming from donation/ grants-2,no-3)
205
if code 1 in item 205 whether non-profit institution serving households
(NPISH)? (yes-1, no-2) 206
if item 204 is ‘1’ to ‘5’ social group of the owner / major partner (ST-1, SC-2,
OBC-3, Others-4, not known-9) 207
whether the enterprise maintain any bank account/ post office savings bank account ?
yes, in owner’s name – 1, yes, in enterprise’s name -2, yes, both in owner’s name
and enterprise’s name -3, no- 4
208
number of other economic activities taken up by the entrepreneur during the last
365 days (applicable if entry in item 204 is ‘1’ to ‘5’) 209
location of the enterprise (code) 210
enterprise type during the last 365 days (Own Account Enterprise-1, Establishment-2) 211
year of initial operation under the current owner 212
nature of operation (perennial – 1, seasonal – 2, casual – 3) 213
number of months operated during the last 365 days (in whole numbers) 214
number of hours the enterprise normally worked in a day during the reference month(in whole numbers) 215
whether accounts maintained ? (yes-1, no-2) 216
if ‘yes’ in item 216, whether data collected from books of accounts? (yes-1,
no-2) 217
didthe enterprise use computer (s) during the last 365 days? (yes- 1, no -2) 218
did the enterprise use internet during the last 365 days? (yes- 1, no -2) 219
did the enterprise face any problem in its operation during last 365 days? (yes-1, no-2)
220
if ‘yes’ in item 220, nature of problems faced in its operation
during the last 365 days (at most two codes in order of severity of problems)
most severe problem
221
next severe
problem 222
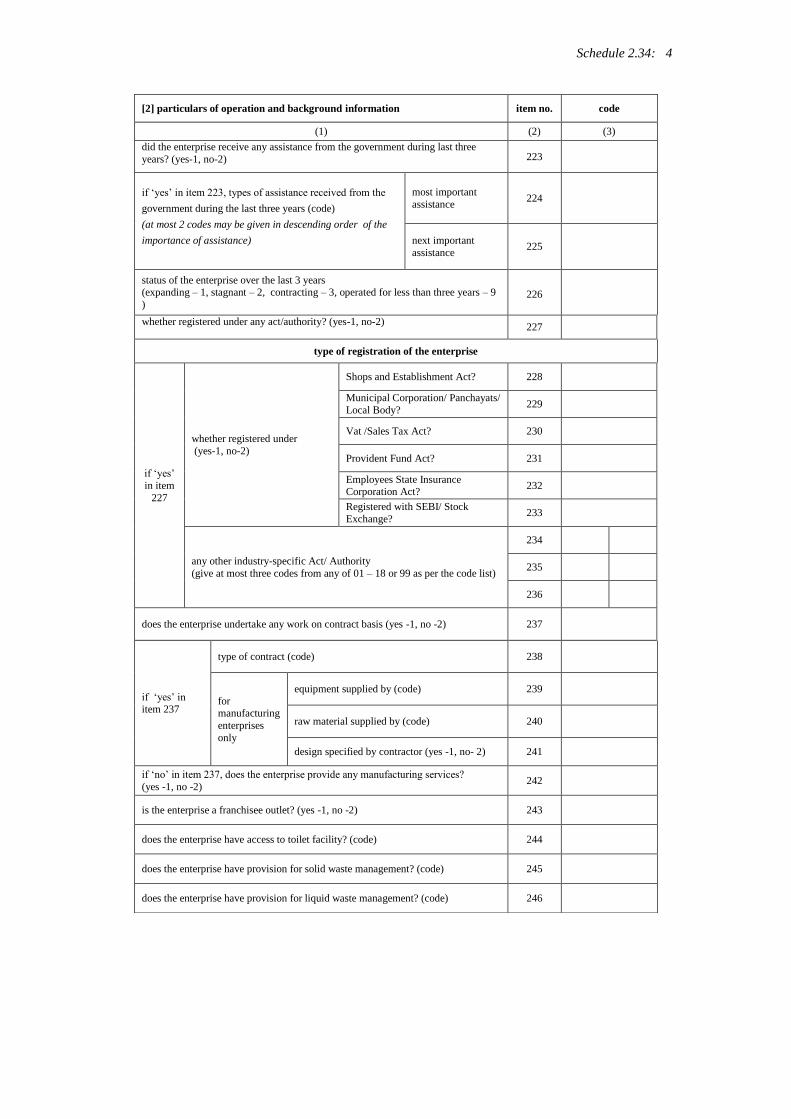
Schedule 2.34: 4
[2] particulars of operation and background information item no. code
(1) (2) (3)
did the enterprise receive any assistance from the government during last three
years? (yes-1, no-2) 223
if ‘yes’ in item 223, types of assistance received from the
government during the last three years (code)
(at most 2 codes may be given in descending order of the
importance of assistance)
most important
assistance 224
next important
assistance 225
status of the enterprise over the last 3 years (expanding – 1, stagnant – 2, contracting – 3, operated for less than three years – 9
) 226
whether registered under any act/authority? (yes-1, no-2) 227
type of registration of the enterprise
if ‘yes’
in item
227
whether registered under
(yes-1, no-2)
Shops and Establishment Act? 228
Municipal Corporation/ Panchayats/
Local Body? 229
Vat /Sales Tax Act? 230
Provident Fund Act? 231
Employees State Insurance Corporation Act?
232
Registered with SEBI/ Stock
Exchange? 233
any other industry-specific Act/ Authority
(give at most three codes from any of 01 – 18 or 99 as per the code list)
234
235
236
does the enterprise undertake any work on contract basis (yes -1, no -2) 237
if ‘yes’ in item 237
type of contract (code) 238
for manufacturing
enterprises
only
equipment supplied by (code) 239
raw material supplied by (code) 240
design specified by contractor (yes -1, no- 2) 241
if ‘no’ in item 237, does the enterprise provide any manufacturing services?
(yes -1, no -2) 242
is the enterprise a franchisee outlet? (yes -1, no -2) 243
does the enterprise have access to toilet facility? (code) 244
does the enterprise have provision for solid waste management? (code) 245
does the enterprise have provision for liquid waste management? (code) 246
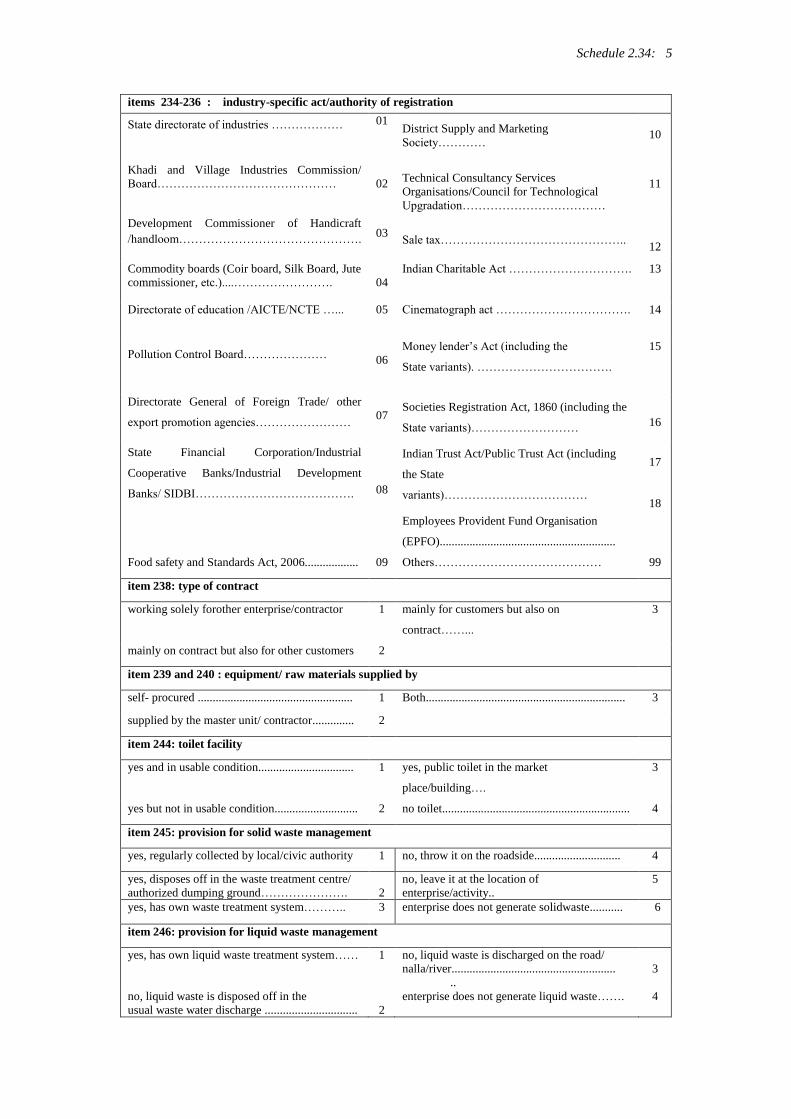
Schedule 2.34: 5
items 234-236 : industry-specific act/authority of registration
State directorate of industries ……………… 01 District Supply and Marketing
Society…………
10
Khadi and Village Industries Commission/
Board………………………………………
02 Technical Consultancy Services
Organisations/Council for Technological
Upgradation………………………………
11
Development Commissioner of Handicraft
/handloom……………………………………….
03
Sale tax………………………………………..
12
Commodity boards (Coir board, Silk Board, Jute
commissioner, etc.)....…………………….
04
Indian Charitable Act …………………………. 13
Directorate of education /AICTE/NCTE …... 05 Cinematograph act ……………………………. 14
Pollution Control Board…………………
06
Money lender’s Act (including the
State variants). …………………………….
15
Directorate General of Foreign Trade/ other
export promotion agencies……………………
07 Societies Registration Act, 1860 (including the
State variants)………………………
16
State Financial Corporation/Industrial
Cooperative Banks/Industrial Development
Banks/ SIDBI………………………………….
08
Indian Trust Act/Public Trust Act (including
the State
variants)………………………………
Employees Provident Fund Organisation
(EPFO)...........................................................
17
18
Food safety and Standards Act, 2006.................. 09 Others…………………………………… 99
item 238: type of contract
working solely forother enterprise/contractor 1 mainly for customers but also on
contract……...
3
mainly on contract but also for other customers 2
item 239 and 240 : equipment/ raw materials supplied by
self- procured .................................................... 1 Both................................................................... 3
supplied by the master unit/ contractor.............. 2
item 244: toilet facility
yes and in usable condition................................ 1 yes, public toilet in the market
place/building….
3
yes but not in usable condition............................ 2 no toilet............................................................... 4
item 245: provision for solid waste management
yes, regularly collected by local/civic authority 1 no, throw it on the roadside............................. 4
yes, disposes off in the waste treatment centre/
authorized dumping ground…………………. 2
no, leave it at the location of
enterprise/activity..
5
yes, has own waste treatment system……….. 3 enterprise does not generate solidwaste........... 6
item 246: provision for liquid waste management
yes, has own liquid waste treatment system…… 1 no, liquid waste is discharged on the road/
nalla/river.......................................................
..
3
no, liquid waste is disposed off in the
usual waste water discharge ...............................
2
enterprise does not generate liquid waste……. 4
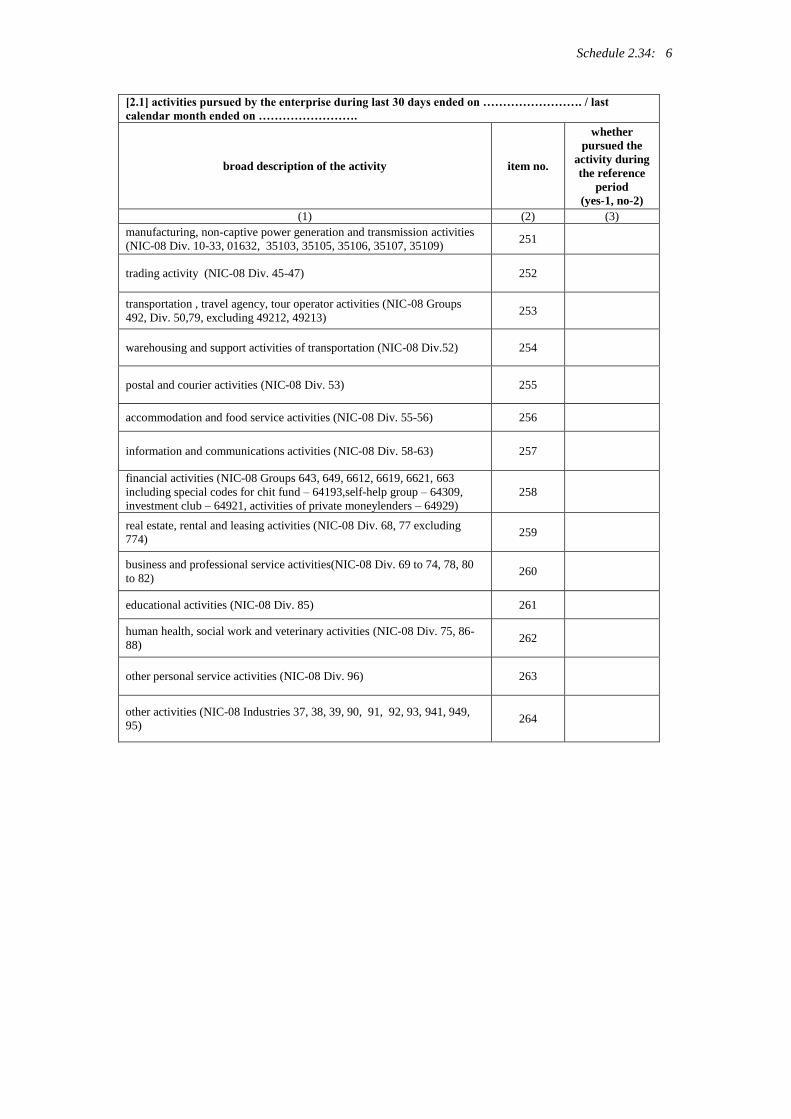
Schedule 2.34: 6
[2.1] activities pursued by the enterprise during last 30 days ended on ……………………. / last
calendar month ended on …………………….
broad description of the activity item no.
whether
pursued the
activity during
the reference
period
(yes-1, no-2)
(1) (2) (3)
manufacturing, non-captive power generation and transmission activities
(NIC-08 Div. 10-33, 01632, 35103, 35105, 35106, 35107, 35109) 251
trading activity (NIC-08 Div. 45-47) 252
transportation , travel agency, tour operator activities (NIC-08 Groups
492, Div. 50,79, excluding 49212, 49213) 253
warehousing and support activities of transportation (NIC-08 Div.52) 254
postal and courier activities (NIC-08 Div. 53) 255
accommodation and food service activities (NIC-08 Div. 55-56) 256
information and communications activities (NIC-08 Div. 58-63) 257
financial activities (NIC-08 Groups 643, 649, 6612, 6619, 6621, 663
including special codes for chit fund – 64193,self-help group – 64309,
investment club – 64921, activities of private moneylenders – 64929)
258
real estate, rental and leasing activities (NIC-08 Div. 68, 77 excluding
774) 259
business and professional service activities(NIC-08 Div. 69 to 74, 78, 80
to 82) 260
educational activities (NIC-08 Div. 85) 261
human health, social work and veterinary activities (NIC-08 Div. 75, 86-
88) 262
other personal service activities (NIC-08 Div. 96) 263
other activities (NIC-08 Industries 37, 38, 39, 90, 91, 92, 93, 941, 949,
95) 264
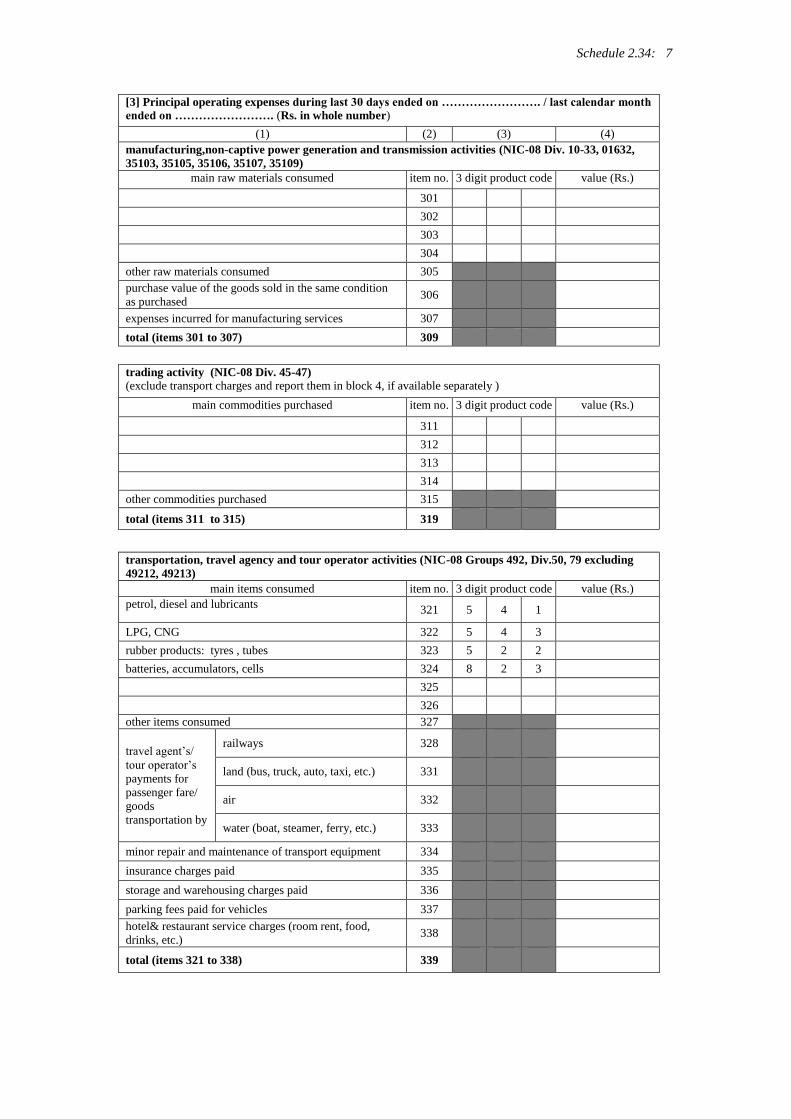
Schedule 2.34: 7
[3] Principal operating expenses during last 30 days ended on ……………………. / last calendar month
ended on ……………………. (Rs. in whole number)
(1) (2) (3) (4)
manufacturing,non-captive power generation and transmission activities (NIC-08 Div. 10-33, 01632,
35103, 35105, 35106, 35107, 35109)
main raw materials consumed item no. 3 digit product code value (Rs.)
301
302
303
304
other raw materials consumed 305
purchase value of the goods sold in the same condition
as purchased 306
expenses incurred for manufacturing services 307
total (items 301 to 307) 309
trading activity (NIC-08 Div. 45-47)
(exclude transport charges and report them in block 4, if available separately )
main commodities purchased item no. 3 digit product code value (Rs.)
311
312
313
314
other commodities purchased 315
total (items 311 to 315) 319
transportation, travel agency and tour operator activities (NIC-08 Groups 492, Div.50, 79 excluding
49212, 49213)
main items consumed item no. 3 digit product code value (Rs.)
petrol, diesel and lubricants
321 5 4 1
LPG, CNG 322 5 4 3
rubber products: tyres , tubes 323 5 2 2
batteries, accumulators, cells 324 8 2 3
325
326
other items consumed 327
travel agent’s/
tour operator’s
payments for
passenger fare/
goods
transportation by
railways 328
land (bus, truck, auto, taxi, etc.) 331
air 332
water (boat, steamer, ferry, etc.) 333
minor repair and maintenance of transport equipment 334
insurance charges paid 335
storage and warehousing charges paid 336
parking fees paid for vehicles 337
hotel& restaurant service charges (room rent, food,
drinks, etc.) 338
total (items 321 to 338) 339
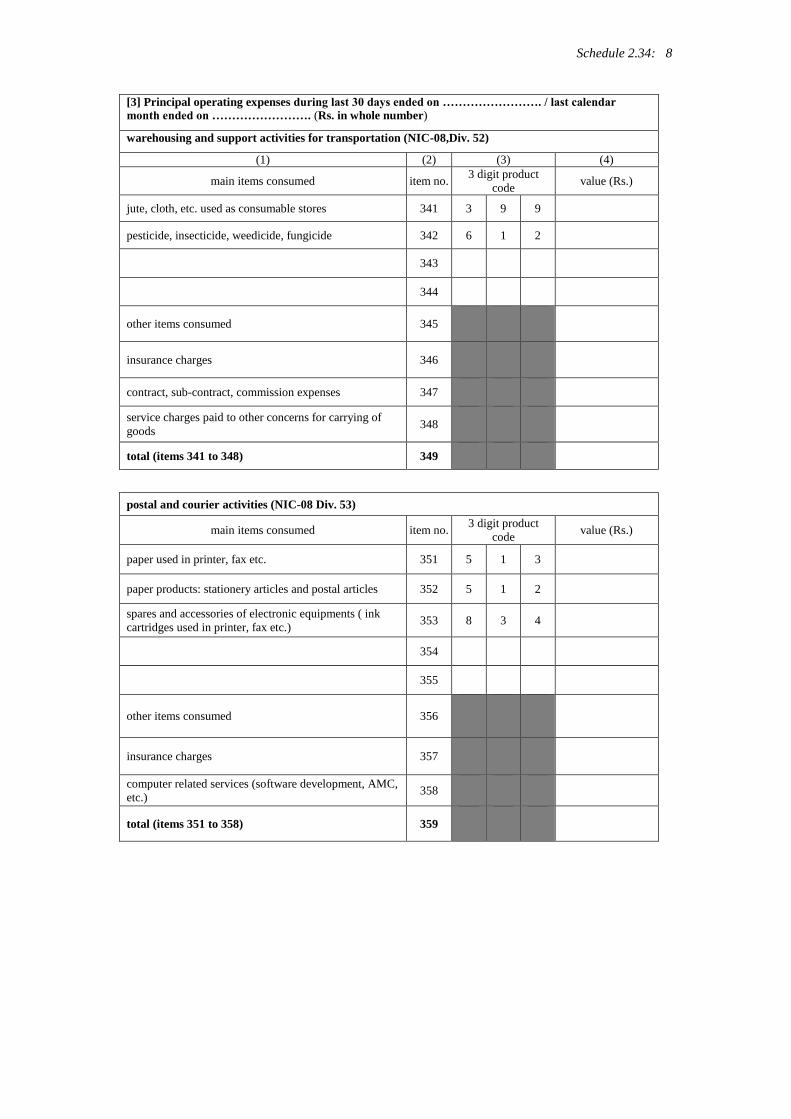
Schedule 2.34: 8
[3] Principal operating expenses during last 30 days ended on ……………………. / last calendar
month ended on ……………………. (Rs. in whole number)
warehousing and support activities for transportation (NIC-08,Div. 52)
(1) (2) (3) (4)
main items consumed item no. 3 digit product
code value (Rs.)
jute, cloth, etc. used as consumable stores 341 3 9 9
pesticide, insecticide, weedicide, fungicide 342 6 1 2
343
344
other items consumed 345
insurance charges 346
contract, sub-contract, commission expenses 347
service charges paid to other concerns for carrying of
goods 348
total (items 341 to 348) 349
postal and courier activities (NIC-08 Div. 53)
main items consumed item no. 3 digit product
code value (Rs.)
paper used in printer, fax etc. 351 5 1 3
paper products: stationery articles and postal articles 352 5 1 2
spares and accessories of electronic equipments ( ink
cartridges used in printer, fax etc.) 353 8 3 4
354
355
other items consumed 356
insurance charges 357
computer related services (software development, AMC,
etc.) 358
total (items 351 to 358) 359
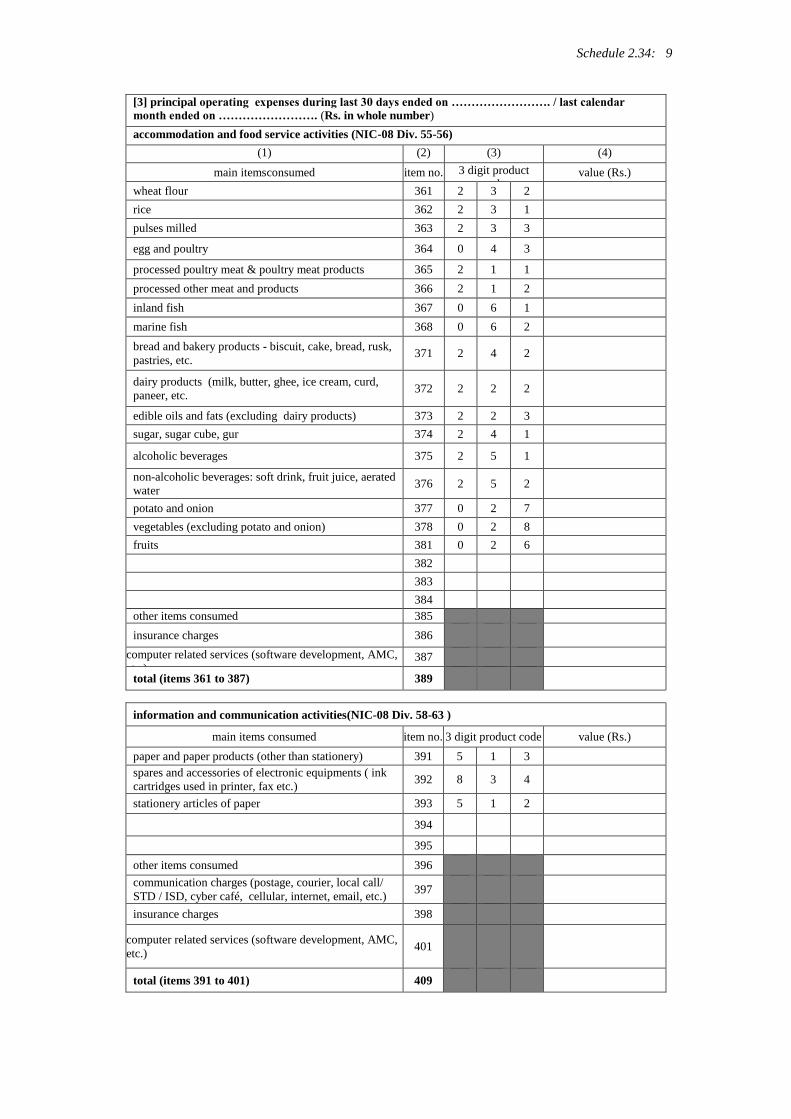
Schedule 2.34: 9
[3] principal operating expenses during last 30 days ended on ……………………. / last calendar
month ended on ……………………. (Rs. in whole number)
accommodation and food service activities (NIC-08 Div. 55-56)
(1) (2) (3) (4)
main itemsconsumed item no. 3 digit product
code value (Rs.)
wheat flour 361 2 3 2
rice 362 2 3 1
pulses milled 363 2 3 3
egg and poultry 364 0 4 3
processed poultry meat & poultry meat products 365 2 1 1
processed other meat and products 366 2 1 2
inland fish 367 0 6 1
marine fish 368 0 6 2
bread and bakery products - biscuit, cake, bread, rusk,
pastries, etc. 371 2 4 2
dairy products (milk, butter, ghee, ice cream, curd,
paneer, etc. 372 2 2 2
edible oils and fats (excluding dairy products) 373 2 2 3
sugar, sugar cube, gur 374 2 4 1
alcoholic beverages 375 2 5 1
non-alcoholic beverages: soft drink, fruit juice, aerated
water 376 2 5 2
potato and onion 377 0 2 7
vegetables (excluding potato and onion) 378 0 2 8
fruits 381 0 2 6
382
383
384
other items consumed 385
insurance charges 386
computer related services (software development, AMC,
etc.) 387
total (items 361 to 387) 389
information and communication activities(NIC-08 Div. 58-63 )
main items consumed item no. 3 digit product code value (Rs.)
paper and paper products (other than stationery) 391 5 1 3
spares and accessories of electronic equipments ( ink
cartridges used in printer, fax etc.) 392 8 3 4
stationery articles of paper 393 5 1 2
394
395
other items consumed 396
communication charges (postage, courier, local call/
STD / ISD, cyber café, cellular, internet, email, etc.) 397
insurance charges 398
computer related services (software development, AMC,
etc.) 401
total (items 391 to 401) 409
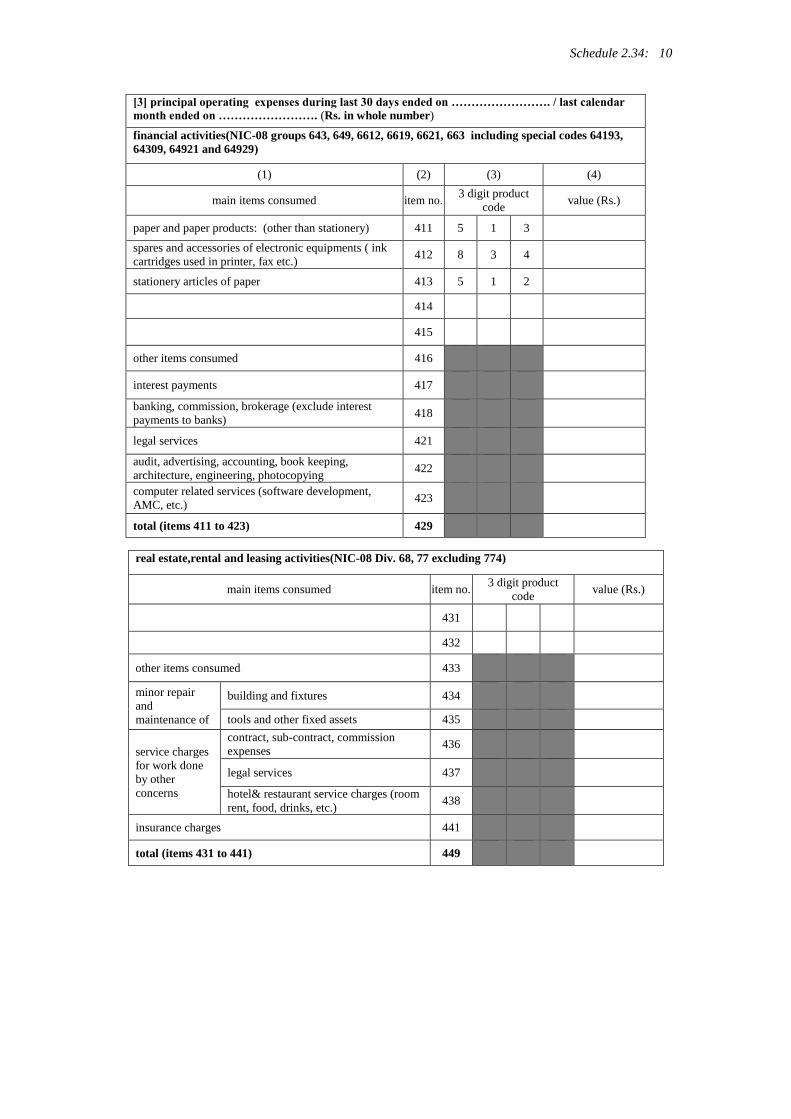
Schedule 2.34: 10
[3] principal operating expenses during last 30 days ended on ……………………. / last calendar
month ended on ……………………. (Rs. in whole number)
financial activities(NIC-08 groups 643, 649, 6612, 6619, 6621, 663 including special codes 64193,
64309, 64921 and 64929)
(1) (2) (3) (4)
main items consumed item no. 3 digit product
code value (Rs.)
paper and paper products: (other than stationery) 411 5 1 3
spares and accessories of electronic equipments ( ink
cartridges used in printer, fax etc.) 412 8 3 4
stationery articles of paper 413 5 1 2
414
415
other items consumed 416
interest payments 417
banking, commission, brokerage (exclude interest
payments to banks) 418
legal services 421
audit, advertising, accounting, book keeping,
architecture, engineering, photocopying 422
computer related services (software development,
AMC, etc.) 423
total (items 411 to 423) 429
real estate,rental and leasing activities(NIC-08 Div. 68, 77 excluding 774)
main items consumed item no. 3 digit product
code value (Rs.)
431
432
other items consumed 433
minor repair
and
maintenance of
building and fixtures 434
tools and other fixed assets 435
service charges
for work done
by other
concerns
contract, sub-contract, commission
expenses 436
legal services 437
hotel& restaurant service charges (room
rent, food, drinks, etc.) 438
insurance charges 441
total (items 431 to 441) 449
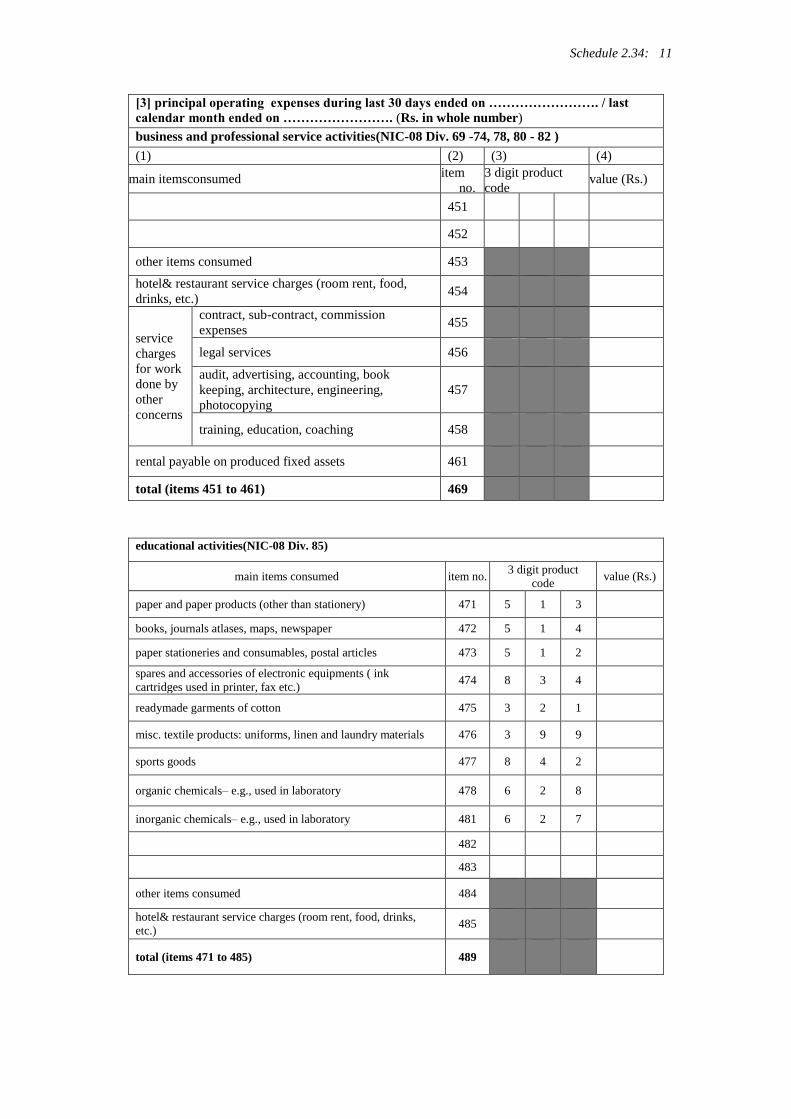
Schedule 2.34: 11
[3] principal operating expenses during last 30 days ended on ……………………. / last
calendar month ended on ……………………. (Rs. in whole number)
business and professional service activities(NIC-08 Div. 69 -74, 78, 80 - 82 )
(1) (2) (3) (4)
main itemsconsumed item
no.
3 digit product
code value (Rs.)
451
452
other items consumed 453
hotel& restaurant service charges (room rent, food,
drinks, etc.) 454
service
charges
for work
done by
other
concerns
contract, sub-contract, commission
expenses 455
legal services 456
audit, advertising, accounting, book
keeping, architecture, engineering,
photocopying
457
training, education, coaching 458
rental payable on produced fixed assets 461
total (items 451 to 461) 469
educational activities(NIC-08 Div. 85)
main items consumed item no. 3 digit product
code value (Rs.)
paper and paper products (other than stationery) 471 5 1 3
books, journals atlases, maps, newspaper 472 5 1 4
paper stationeries and consumables, postal articles 473 5 1 2
spares and accessories of electronic equipments ( ink
cartridges used in printer, fax etc.) 474 8 3 4
readymade garments of cotton 475 3 2 1
misc. textile products: uniforms, linen and laundry materials 476 3 9 9
sports goods 477 8 4 2
organic chemicals– e.g., used in laboratory 478 6 2 8
inorganic chemicals– e.g., used in laboratory 481 6 2 7
482
483
other items consumed 484
hotel& restaurant service charges (room rent, food, drinks,
etc.) 485
total (items 471 to 485) 489
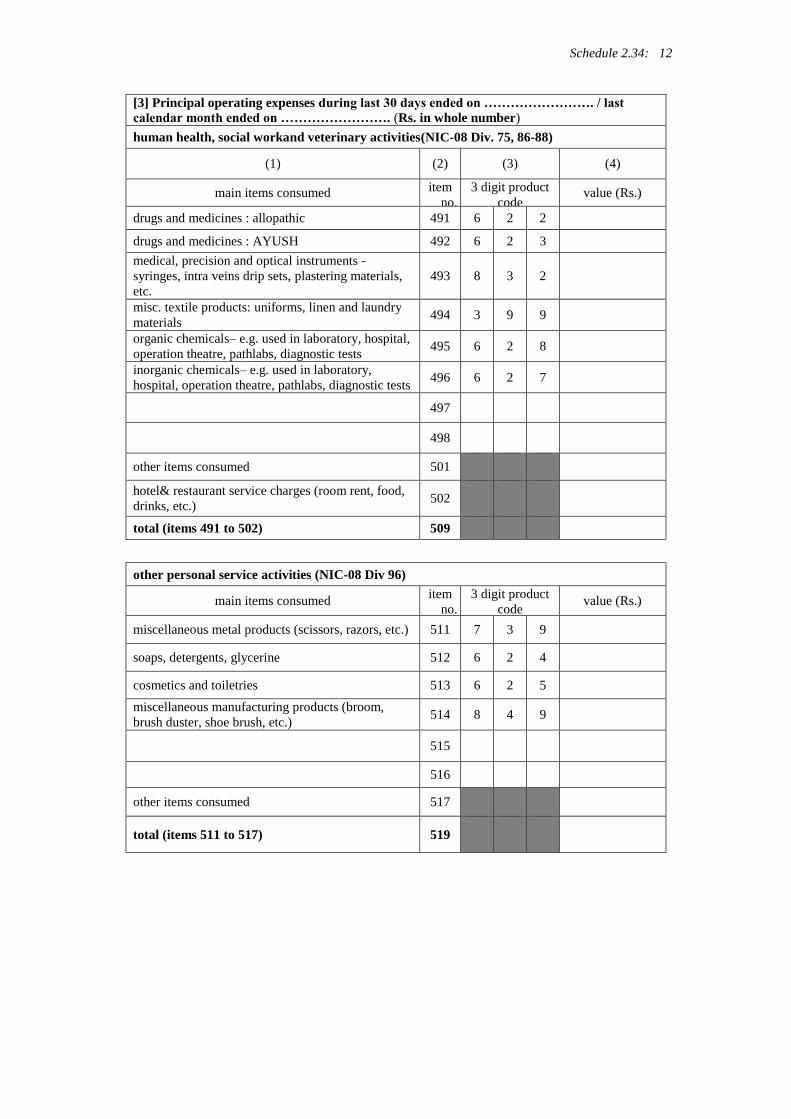
Schedule 2.34: 12
[3] Principal operating expenses during last 30 days ended on ……………………. / last
calendar month ended on ……………………. (Rs. in whole number)
human health, social workand veterinary activities(NIC-08 Div. 75, 86-88)
(1) (2) (3) (4)
main items consumed item
no.
3 digit product
code value (Rs.)
drugs and medicines : allopathic 491 6 2 2
drugs and medicines : AYUSH 492 6 2 3
medical, precision and optical instruments -
syringes, intra veins drip sets, plastering materials,
etc.
493 8 3 2
misc. textile products: uniforms, linen and laundry
materials 494 3 9 9
organic chemicals– e.g. used in laboratory, hospital,
operation theatre, pathlabs, diagnostic tests 495 6 2 8
inorganic chemicals– e.g. used in laboratory,
hospital, operation theatre, pathlabs, diagnostic tests 496 6 2 7
497
498
other items consumed 501
hotel& restaurant service charges (room rent, food,
drinks, etc.) 502
total (items 491 to 502) 509
other personal service activities (NIC-08 Div 96)
main items consumed item
no.
3 digit product
code value (Rs.)
miscellaneous metal products (scissors, razors, etc.) 511 7 3 9
soaps, detergents, glycerine 512 6 2 4
cosmetics and toiletries 513 6 2 5
miscellaneous manufacturing products (broom,
brush duster, shoe brush, etc.) 514 8 4 9
515
516
other items consumed 517
total (items 511 to 517) 519
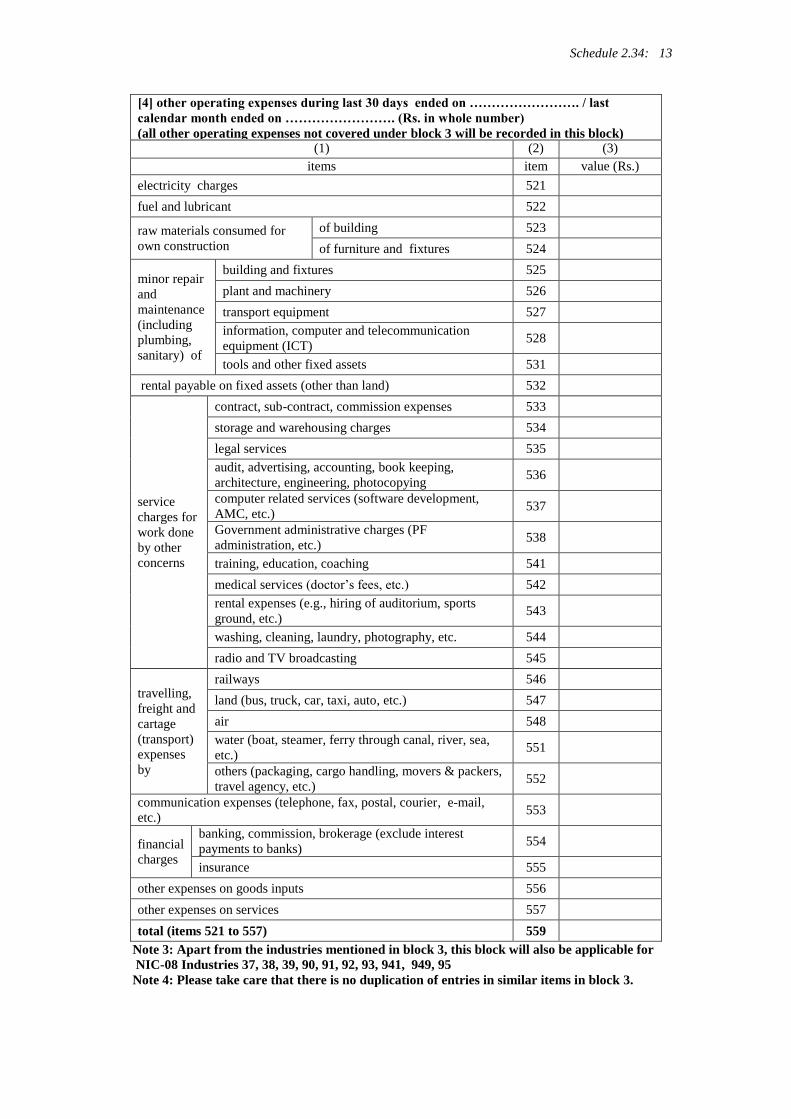
Schedule 2.34: 13
[4] other operating expenses during last 30 days ended on ……………………. / last
calendar month ended on ……………………. (Rs. in whole number)
(all other operating expenses not covered under block 3 will be recorded in this block)
(1) (2) (3)
items item
no.
value (Rs.)
electricity charges 521
fuel and lubricant 522
raw materials consumed for
own construction
of building 523
of furniture and fixtures 524
minor repair
and
maintenance
(including
plumbing,
sanitary) of
building and fixtures 525
plant and machinery 526
transport equipment 527
information, computer and telecommunication
equipment (ICT) 528
tools and other fixed assets 531
rental payable on fixed assets (other than land) 532
service
charges for
work done
by other
concerns
contract, sub-contract, commission expenses 533
storage and warehousing charges 534
legal services 535
audit, advertising, accounting, book keeping,
architecture, engineering, photocopying 536
computer related services (software development,
AMC, etc.) 537
Government administrative charges (PF
administration, etc.) 538
training, education, coaching 541
medical services (doctor’s fees, etc.) 542
rental expenses (e.g., hiring of auditorium, sports
ground, etc.) 543
washing, cleaning, laundry, photography, etc. 544
radio and TV broadcasting 545
travelling,
freight and
cartage
(transport)
expenses
by
railways 546
land (bus, truck, car, taxi, auto, etc.) 547
air 548
water (boat, steamer, ferry through canal, river, sea,
etc.) 551
others (packaging, cargo handling, movers & packers,
travel agency, etc.) 552
communication expenses (telephone, fax, postal, courier, e-mail,
etc.) 553
financial
charges
banking, commission, brokerage (exclude interest
payments to banks) 554
insurance 555
other expenses on goods inputs 556
other expenses on services 557
total (items 521 to 557) 559
Note 3: Apart from the industries mentioned in block 3, this block will also be applicable for
NIC-08 Industries 37, 38, 39, 90, 91, 92, 93, 941, 949, 95
Note 4: Please take care that there is no duplication of entries in similar items in block 3.
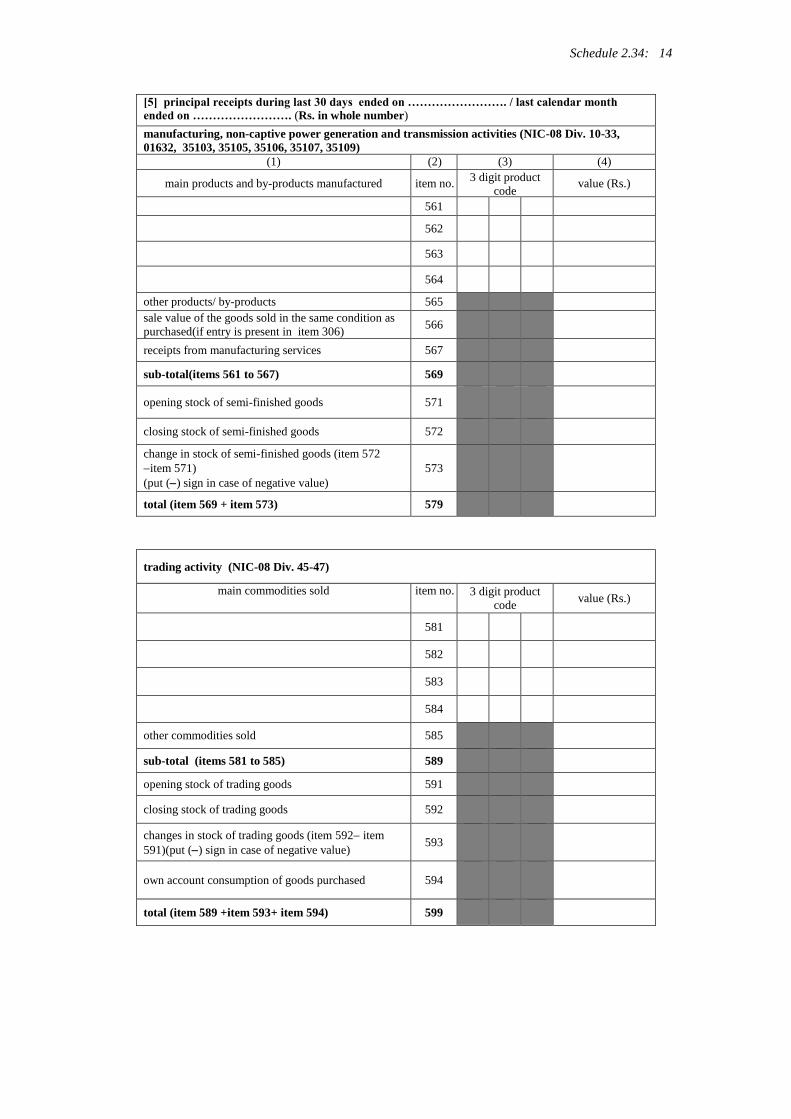
Schedule 2.34: 14
[5] principal receipts during last 30 days ended on ……………………. / last calendar month
ended on ……………………. (Rs. in whole number)
manufacturing, non-captive power generation and transmission activities (NIC-08 Div. 10-33,
01632, 35103, 35105, 35106, 35107, 35109)
(1) (2) (3) (4)
main products and by-products manufactured item no. 3 digit product
code value (Rs.)
561
562
563
564
other products/ by-products 565
sale value of the goods sold in the same condition as
purchased(if entry is present in item 306) 566
receipts from manufacturing services 567
sub-total(items 561 to 567) 569
opening stock of semi-finished goods 571
closing stock of semi-finished goods 572
change in stock of semi-finished goods (item 572
item 571)
(put () sign in case of negative value)
573
total (item 569 + item 573) 579
trading activity (NIC-08 Div. 45-47)
main commodities sold item no. 3 digit product
code value (Rs.)
581
582
583
584
other commodities sold 585
sub-total (items 581 to 585) 589
opening stock of trading goods 591
closing stock of trading goods 592
changes in stock of trading goods (item 592 item
591)(put () sign in case of negative value) 593
own account consumption of goods purchased 594
total (item 589 +item 593+ item 594) 599
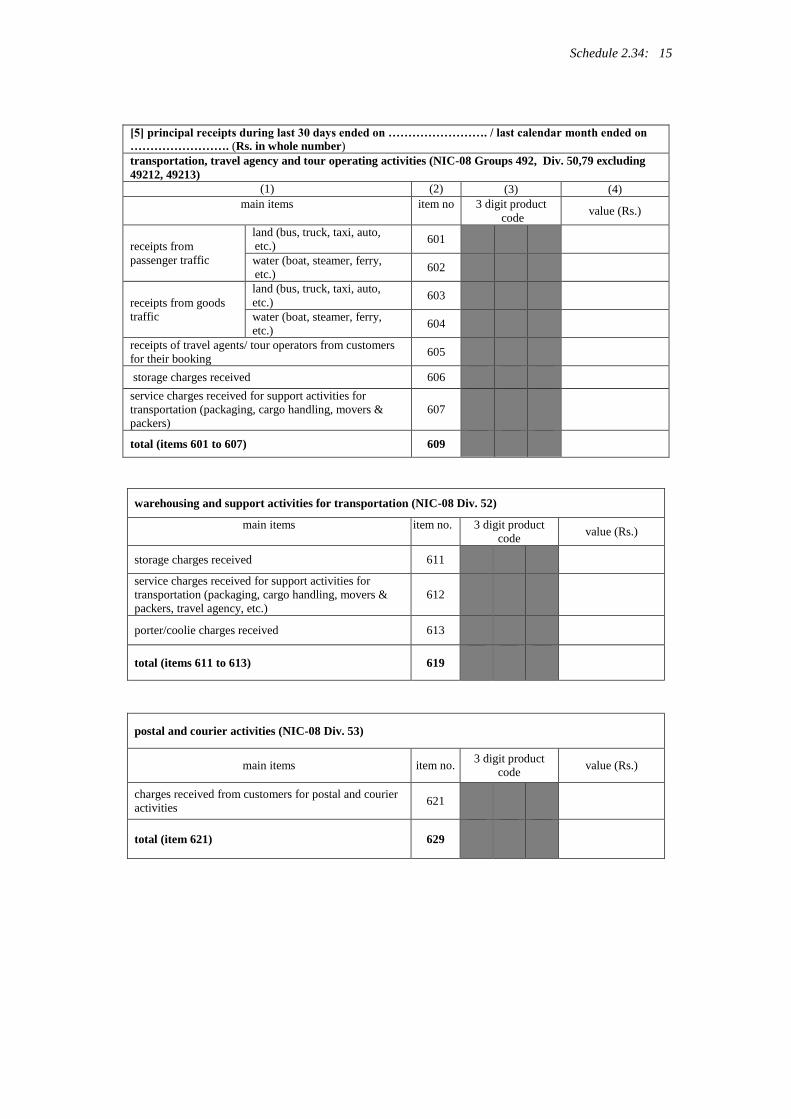
Schedule 2.34: 15
[5] principal receipts during last 30 days ended on ……………………. / last calendar month ended on
……………………. (Rs. in whole number)
transportation, travel agency and tour operating activities (NIC-08 Groups 492, Div. 50,79 excluding
49212, 49213)
(1) (2) (3) (4)
main items item no 3 digit product
code value (Rs.)
receipts from
passenger traffic
land (bus, truck, taxi, auto,
etc.) 601
water (boat, steamer, ferry,
etc.) 602
receipts from goods
traffic
land (bus, truck, taxi, auto,
etc.) 603
water (boat, steamer, ferry,
etc.) 604
receipts of travel agents/ tour operators from customers
for their booking 605
storage charges received 606
service charges received for support activities for
transportation (packaging, cargo handling, movers &
packers)
607
total (items 601 to 607) 609
warehousing and support activities for transportation (NIC-08 Div. 52)
main items item no. 3 digit product
code value (Rs.)
storage charges received 611
service charges received for support activities for
transportation (packaging, cargo handling, movers &
packers, travel agency, etc.)
612
porter/coolie charges received 613
total (items 611 to 613) 619
postal and courier activities (NIC-08 Div. 53)
main items item no. 3 digit product
code value (Rs.)
charges received from customers for postal and courier
activities 621
total (item 621) 629
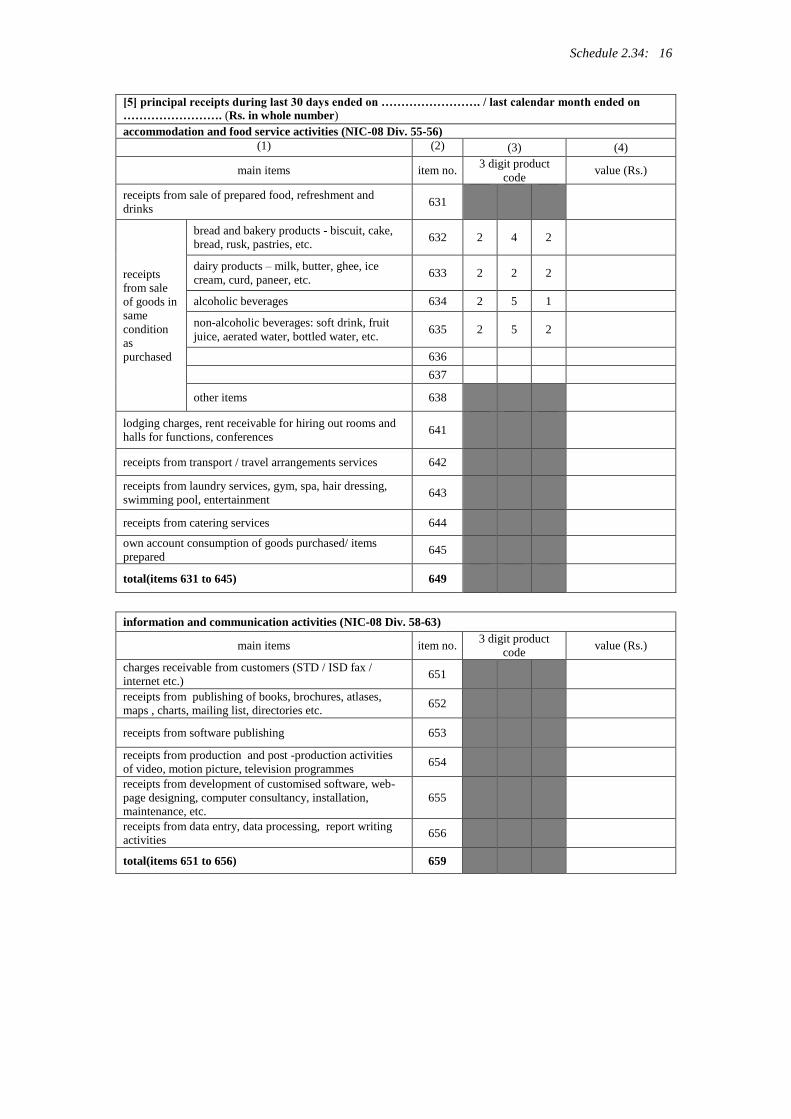
Schedule 2.34: 16
[5] principal receipts during last 30 days ended on ……………………. / last calendar month ended on
……………………. (Rs. in whole number)
accommodation and food service activities (NIC-08 Div. 55-56)
(1) (2) (3) (4)
main items item no. 3 digit product
code value (Rs.)
receipts from sale of prepared food, refreshment and
drinks 631
receipts
from sale
of goods in
same
condition
as
purchased
bread and bakery products - biscuit, cake,
bread, rusk, pastries, etc. 632 2 4 2
dairy products – milk, butter, ghee, ice
cream, curd, paneer, etc. 633 2 2 2
alcoholic beverages 634 2 5 1
non-alcoholic beverages: soft drink, fruit
juice, aerated water, bottled water, etc. 635 2 5 2
636
637
other items 638
lodging charges, rent receivable for hiring out rooms and
halls for functions, conferences 641
receipts from transport / travel arrangements services 642
receipts from laundry services, gym, spa, hair dressing,
swimming pool, entertainment 643
receipts from catering services 644
own account consumption of goods purchased/ items
prepared 645
total(items 631 to 645) 649
information and communication activities (NIC-08 Div. 58-63)
main items item no. 3 digit product
code value (Rs.)
charges receivable from customers (STD / ISD fax /
internet etc.) 651
receipts from publishing of books, brochures, atlases,
maps , charts, mailing list, directories etc. 652
receipts from software publishing 653
receipts from production and post -production activities
of video, motion picture, television programmes 654
receipts from development of customised software, web-
page designing, computer consultancy, installation,
maintenance, etc.
655
receipts from data entry, data processing, report writing
activities 656
total(items 651 to 656) 659
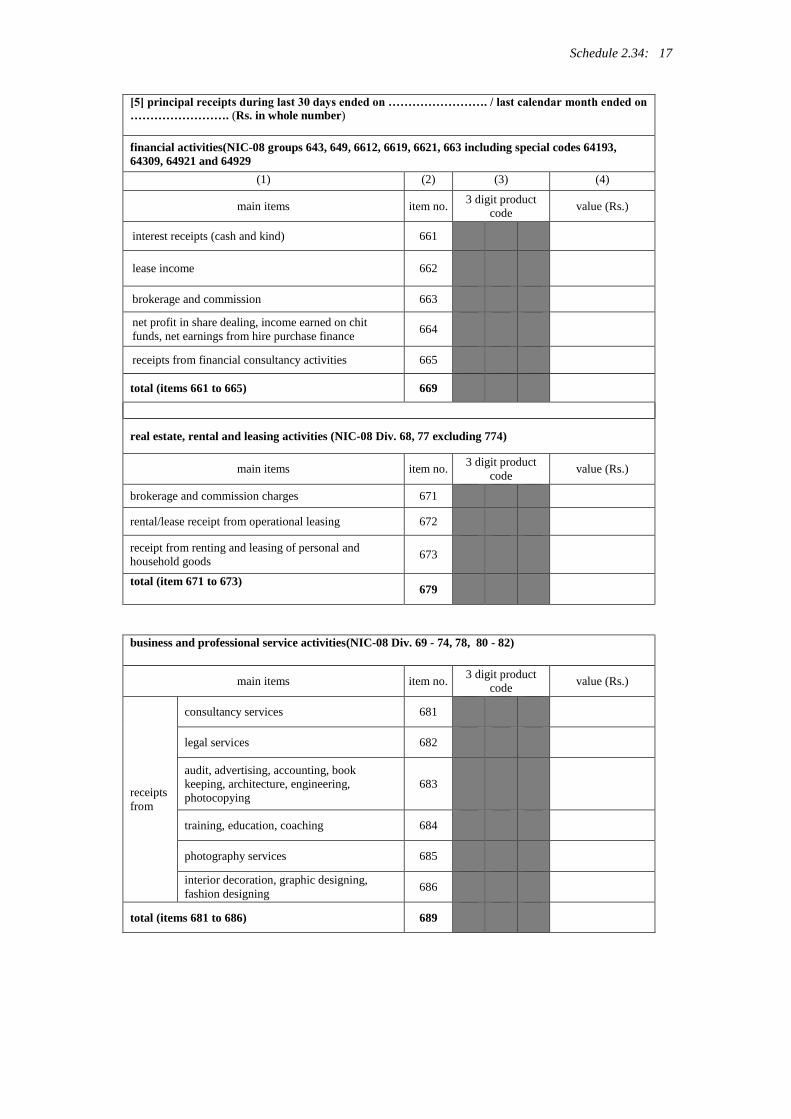
Schedule 2.34: 17
[5] principal receipts during last 30 days ended on ……………………. / last calendar month ended on
……………………. (Rs. in whole number)
financial activities(NIC-08 groups 643, 649, 6612, 6619, 6621, 663 including special codes 64193,
64309, 64921 and 64929
(1) (2) (3) (4)
main items item no. 3 digit product
code value (Rs.)
interest receipts (cash and kind) 661
lease income 662
brokerage and commission 663
net profit in share dealing, income earned on chit
funds, net earnings from hire purchase finance 664
receipts from financial consultancy activities 665
total (items 661 to 665) 669
real estate, rental and leasing activities (NIC-08 Div. 68, 77 excluding 774)
main items item no. 3 digit product
code value (Rs.)
brokerage and commission charges 671
rental/lease receipt from operational leasing 672
receipt from renting and leasing of personal and
household goods 673
total (item 671 to 673) 679
business and professional service activities(NIC-08 Div. 69 - 74, 78, 80 - 82)
main items item no. 3 digit product
code value (Rs.)
receipts
from
consultancy services 681
legal services 682
audit, advertising, accounting, book
keeping, architecture, engineering,
photocopying
683
training, education, coaching 684
photography services 685
interior decoration, graphic designing,
fashion designing 686
total (items 681 to 686) 689
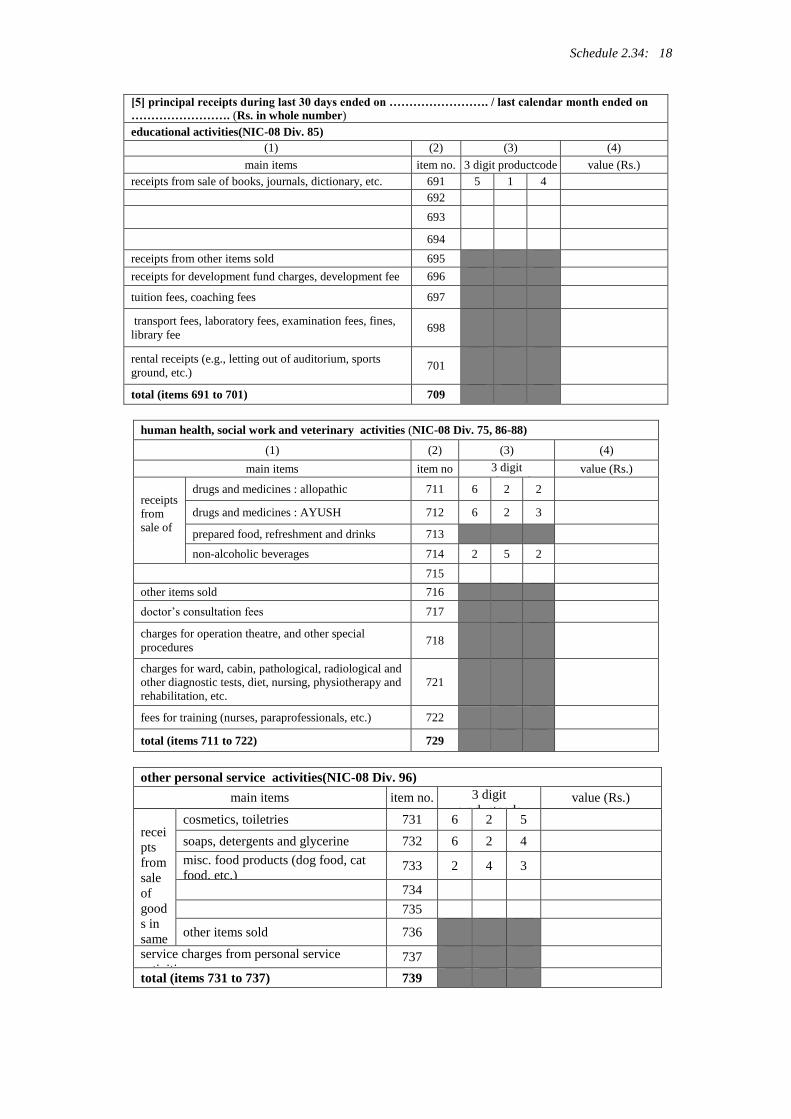
Schedule 2.34: 18
[5] principal receipts during last 30 days ended on ……………………. / last calendar month ended on
……………………. (Rs. in whole number)
educational activities(NIC-08 Div. 85)
(1) (2) (3) (4)
main items item no. 3 digit productcode value (Rs.)
receipts from sale of books, journals, dictionary, etc. 691 5 1 4
692
693
694
receipts from other items sold 695
receipts for development fund charges, development fee 696
tuition fees, coaching fees 697
transport fees, laboratory fees, examination fees, fines,
library fee 698
rental receipts (e.g., letting out of auditorium, sports
ground, etc.) 701
total (items 691 to 701) 709
human health, social work and veterinary activities (NIC-08 Div. 75, 86-88)
(1) (2) (3) (4)
main items item no 3 digit
productcode value (Rs.)
receipts
from
sale of
drugs and medicines : allopathic 711 6 2 2
drugs and medicines : AYUSH 712 6 2 3
prepared food, refreshment and drinks 713
non-alcoholic beverages 714 2 5 2
715
other items sold 716
doctor’s consultation fees 717
charges for operation theatre, and other special
procedures 718
charges for ward, cabin, pathological, radiological and
other diagnostic tests, diet, nursing, physiotherapy and
rehabilitation, etc.
721
fees for training (nurses, paraprofessionals, etc.) 722
total (items 711 to 722) 729
other personal service activities(NIC-08 Div. 96)
main items item no. 3 digit
productcode value (Rs.)
recei
pts
from
sale
of
good
s in
same
cond
ition
as
purc
hase
d
cosmetics, toiletries 731 6 2 5
soaps, detergents and glycerine 732 6 2 4
misc. food products (dog food, cat
food, etc.) 733 2 4 3
734
735
other items sold 736
service charges from personal service
activities 737
total (items 731 to 737) 739
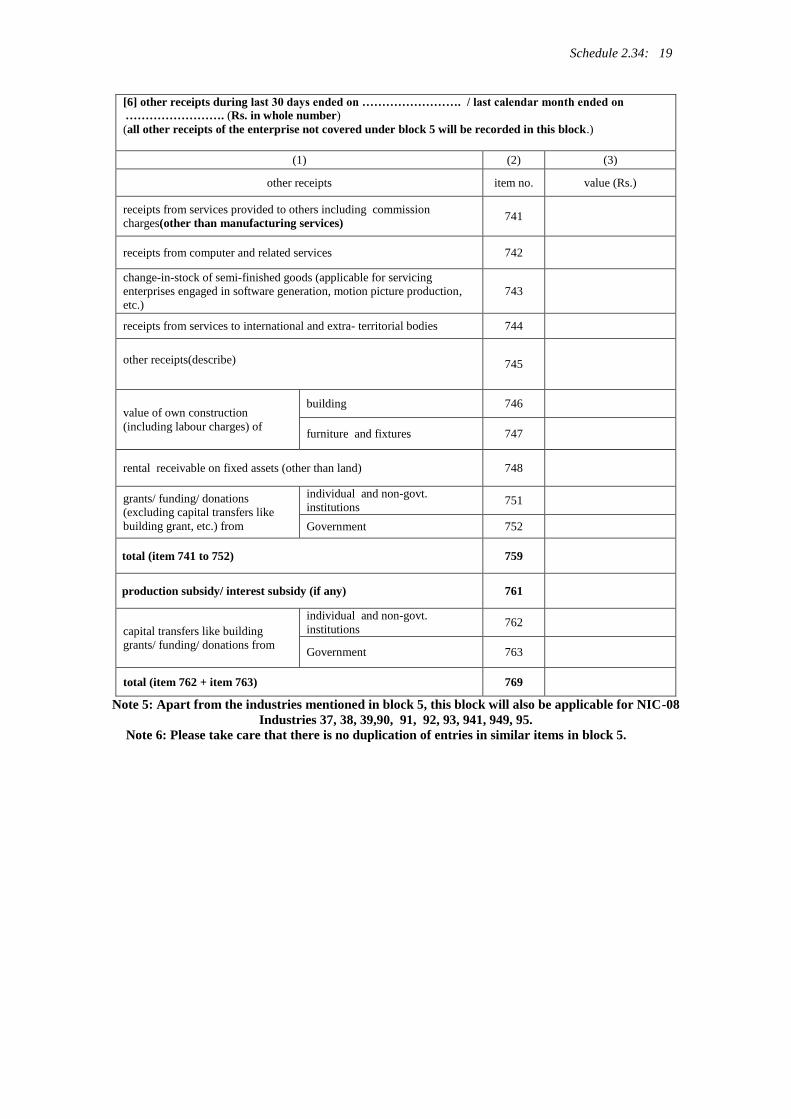
Schedule 2.34: 19
[6] other receipts during last 30 days ended on ……………………. / last calendar month ended on
……………………. (Rs. in whole number)
(all other receipts of the enterprise not covered under block 5 will be recorded in this block.)
(1) (2) (3)
other receipts item no. value (Rs.)
receipts from services provided to others including commission
charges(other than manufacturing services) 741
receipts from computer and related services 742
change-in-stock of semi-finished goods (applicable for servicing
enterprises engaged in software generation, motion picture production,
etc.)
743
receipts from services to international and extra- territorial bodies 744
other receipts(describe) 745
value of own construction
(including labour charges) of
building 746
furniture and fixtures 747
rental receivable on fixed assets (other than land) 748
grants/ funding/ donations
(excluding capital transfers like
building grant, etc.) from
individual and non-govt.
institutions 751
Government 752
total (item 741 to 752) 759
production subsidy/ interest subsidy (if any) 761
capital transfers like building
grants/ funding/ donations from
individual and non-govt.
institutions 762
Government 763
total (item 762 + item 763) 769
Note 5: Apart from the industries mentioned in block 5, this block will also be applicable for NIC-08
Industries 37, 38, 39,90, 91, 92, 93, 941, 949, 95.
Note 6: Please take care that there is no duplication of entries in similar items in block 5.
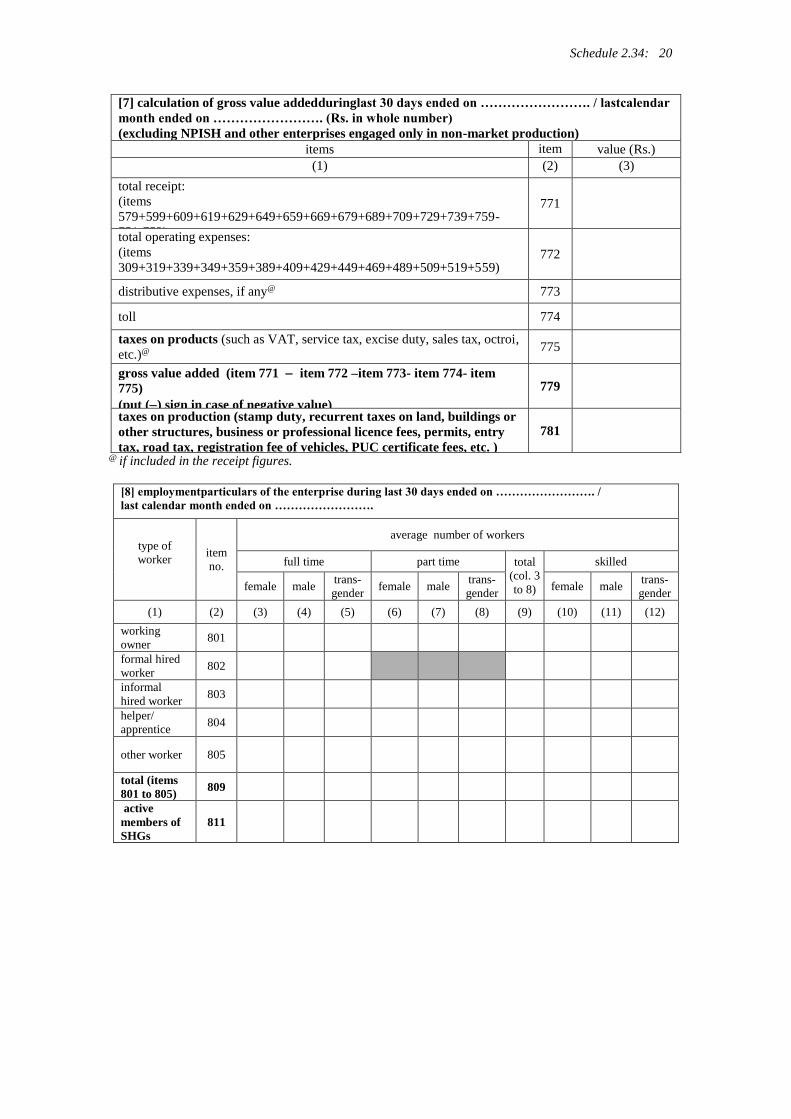
Schedule 2.34: 20
[7] calculation of gross value addedduringlast 30 days ended on ……………………. / lastcalendar
month ended on ……………………. (Rs. in whole number)
(excluding NPISH and other enterprises engaged only in non-market production)
items item
n
o.
value (Rs.)
(1) (2) (3)
total receipt:
(items
579+599+609+619+629+649+659+669+679+689+709+729+739+759-
751-752)
771
total operating expenses:
(items
309+319+339+349+359+389+409+429+449+469+489+509+519+559)
772
distributive expenses, if any@ 773
toll 774
taxes on products (such as VAT, service tax, excise duty, sales tax, octroi,
etc.)@ 775
gross value added (item 771 item 772 –item 773- item 774- item
775)
(put () sign in case of negative value)
779
taxes on production (stamp duty, recurrent taxes on land, buildings or
other structures, business or professional licence fees, permits, entry
tax, road tax, registration fee of vehicles, PUC certificate fees, etc. )
781
@ if included in the receipt figures.
[8] employmentparticulars of the enterprise during last 30 days ended on ……………………. /
last calendar month ended on …………………….
type of
worker
item
no.
average number of workers
full time part time total
(col. 3
to 8)
skilled
female male trans-
gender female male
trans-
gender female male
trans-
gender
(1) (2) (3) (4) (5) (6) (7) (8) (9) (10) (11) (12)
working
owner 801
formal hired
worker 802
informal
hired worker 803
helper/
apprentice 804
other worker 805
total (items
801 to 805) 809
active
members of
SHGs
811
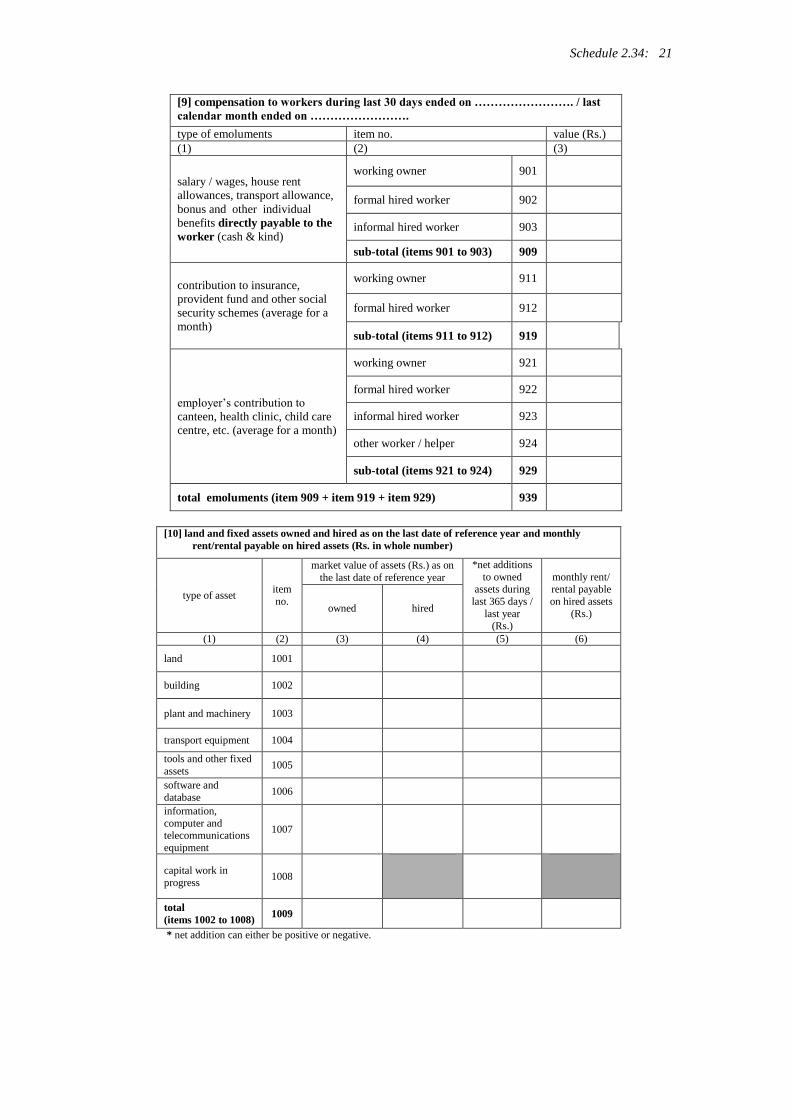
Schedule 2.34: 21
[9] compensation to workers during last 30 days ended on ……………………. / last
calendar month ended on …………………….
type of emoluments item no. value (Rs.)
(1) (2) (3)
salary / wages, house rent
allowances, transport allowance,
bonus and other individual
benefits directly payable to the
worker (cash & kind)
working owner 901
formal hired worker 902
informal hired worker 903
sub-total (items 901 to 903) 909
contribution to insurance,
provident fund and other social
security schemes (average for a
month)
working owner 911
formal hired worker 912
sub-total (items 911 to 912) 919
employer’s contribution to
canteen, health clinic, child care
centre, etc. (average for a month)
working owner 921
formal hired worker 922
informal hired worker 923
other worker / helper 924
sub-total (items 921 to 924) 929
total emoluments (item 909 + item 919 + item 929) 939
[10] land and fixed assets owned and hired as on the last date of reference year and monthly
rent/rental payable on hired assets (Rs. in whole number)
type of asset item
no.
market value of assets (Rs.) as on
the last date of reference year
*net additions
to owned assets during
last 365 days /
last year
(Rs.)
monthly rent/ rental payable
on hired assets
(Rs.) owned hired
(1) (2) (3) (4) (5) (6)
land 1001
building 1002
plant and machinery 1003
transport equipment 1004
tools and other fixed
assets 1005
software and
database 1006
information,
computer and telecommunications
equipment
1007
capital work in
progress 1008
total
(items 1002 to 1008) 1009
* net addition can either be positive or negative.
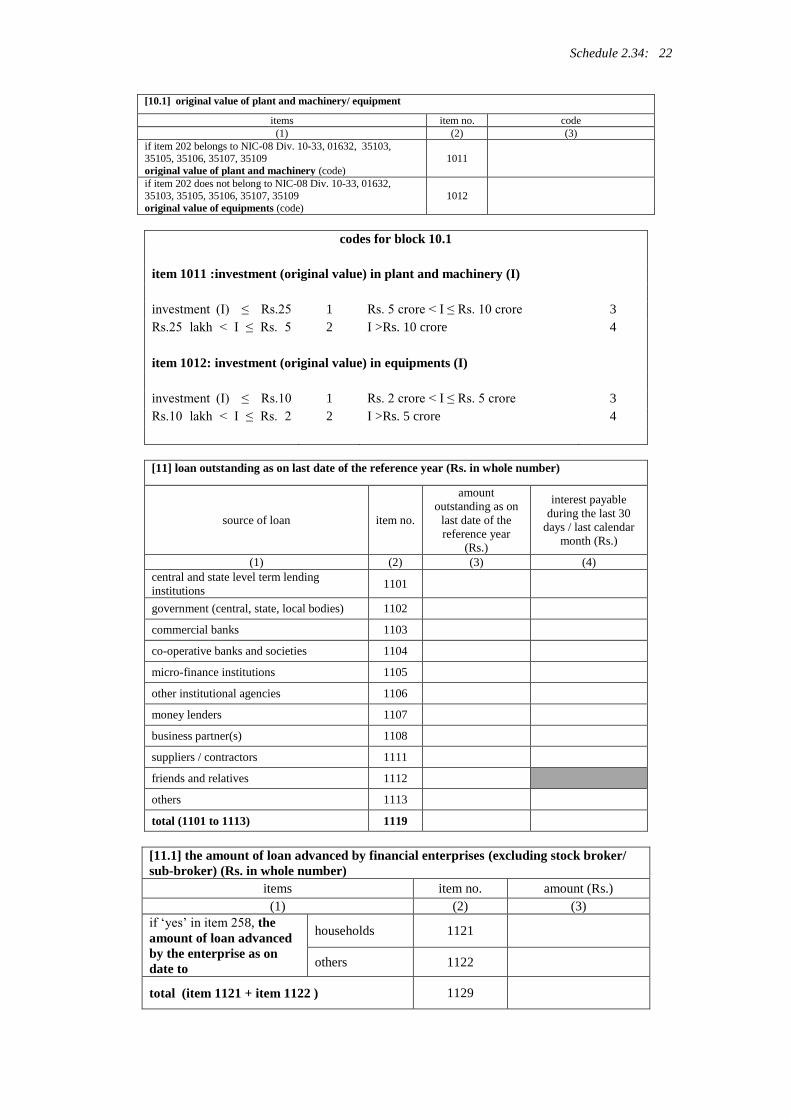
Schedule 2.34: 22
[10.1] original value of plant and machinery/ equipment
items item no. code
(1) (2) (3)
if item 202 belongs to NIC-08 Div. 10-33, 01632, 35103,
35105, 35106, 35107, 35109
original value of plant and machinery (code)
1011
if item 202 does not belong to NIC-08 Div. 10-33, 01632,
35103, 35105, 35106, 35107, 35109
original value of equipments (code)
1012
codes for block 10.1
item 1011 :investment (original value) in plant and machinery (I)
investment (I) ≤ Rs.25
lakh
1 Rs. 5 crore < I ≤ Rs. 10 crore 3
Rs.25 lakh < I ≤ Rs. 5
crore
2 I >Rs. 10 crore 4
item 1012: investment (original value) in equipments (I)
investment (I) ≤ Rs.10
lakh
1 Rs. 2 crore < I ≤ Rs. 5 crore 3
Rs.10 lakh < I ≤ Rs. 2
crore
2 I >Rs. 5 crore 4
[11] loan outstanding as on last date of the reference year (Rs. in whole number)
source of loan item no.
amount
outstanding as on
last date of the
reference year
(Rs.)
interest payable
during the last 30
days / last calendar
month (Rs.)
(1) (2) (3) (4)
central and state level term lending
institutions 1101
government (central, state, local bodies) 1102
commercial banks 1103
co-operative banks and societies 1104
micro-finance institutions 1105
other institutional agencies 1106
money lenders 1107
business partner(s) 1108
suppliers / contractors 1111
friends and relatives 1112
others 1113
total (1101 to 1113) 1119
[11.1] the amount of loan advanced by financial enterprises (excluding stock broker/
sub-broker) (Rs. in whole number)
items item no. amount (Rs.)
(1) (2) (3)
if ‘yes’ in item 258, the
amount of loan advanced
by the enterprise as on
date to
households 1121
others 1122
total (item 1121 + item 1122 ) 1129
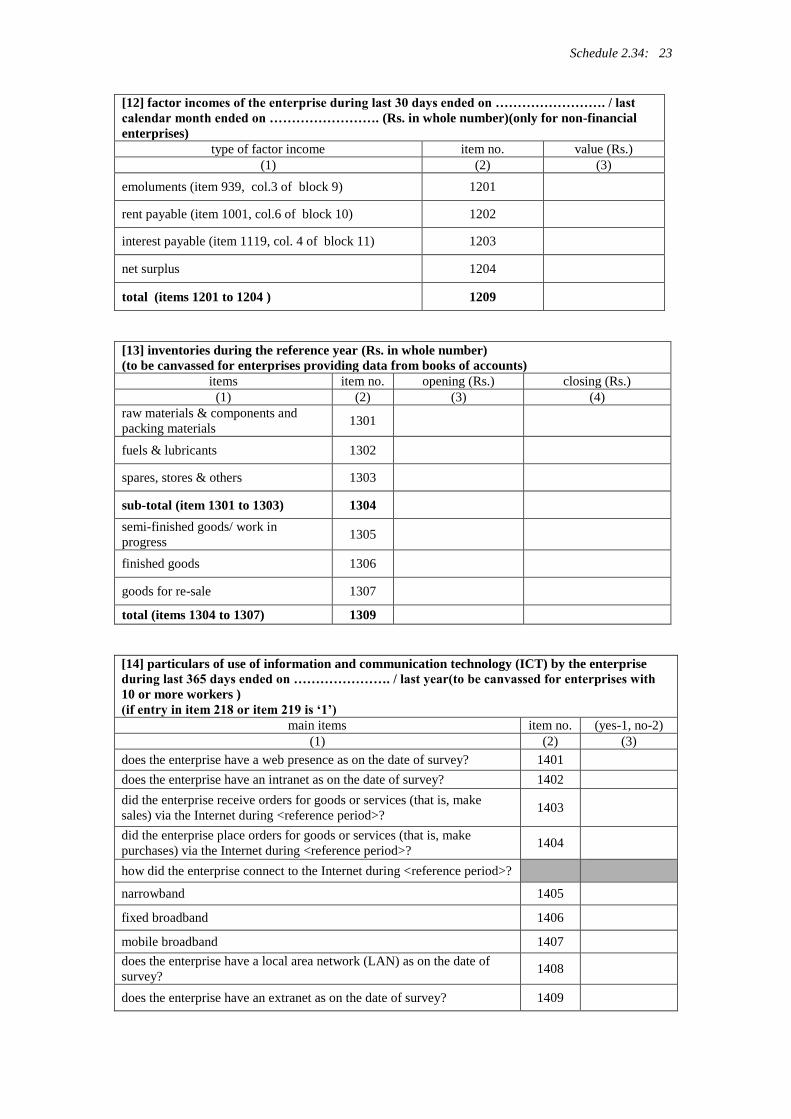
Schedule 2.34: 23
[12] factor incomes of the enterprise during last 30 days ended on ……………………. / last
calendar month ended on ……………………. (Rs. in whole number)(only for non-financial
enterprises)
type of factor income item no. value (Rs.)
(1) (2) (3)
emoluments (item 939, col.3 of block 9) 1201
rent payable (item 1001, col.6 of block 10) 1202
interest payable (item 1119, col. 4 of block 11) 1203
net surplus 1204
total (items 1201 to 1204 ) 1209
[13] inventories during the reference year (Rs. in whole number)
(to be canvassed for enterprises providing data from books of accounts)
items item no. opening (Rs.) closing (Rs.)
(1) (2) (3) (4)
raw materials & components and
packing materials 1301
fuels & lubricants 1302
spares, stores & others 1303
sub-total (item 1301 to 1303) 1304
semi-finished goods/ work in
progress 1305
finished goods 1306
goods for re-sale 1307
total (items 1304 to 1307) 1309
[14] particulars of use of information and communication technology (ICT) by the enterprise
during last 365 days ended on …………………. / last year(to be canvassed for enterprises with
10 or more workers )
(if entry in item 218 or item 219 is ‘1’)
main items item no. (yes-1, no-2)
(1) (2) (3)
does the enterprise have a web presence as on the date of survey? 1401
does the enterprise have an intranet as on the date of survey? 1402
did the enterprise receive orders for goods or services (that is, make
sales) via the Internet during <reference period>? 1403
did the enterprise place orders for goods or services (that is, make
purchases) via the Internet during <reference period>? 1404
how did the enterprise connect to the Internet during <reference period>?
narrowband 1405
fixed broadband 1406
mobile broadband 1407
does the enterprise have a local area network (LAN) as on the date of
survey? 1408
does the enterprise have an extranet as on the date of survey? 1409
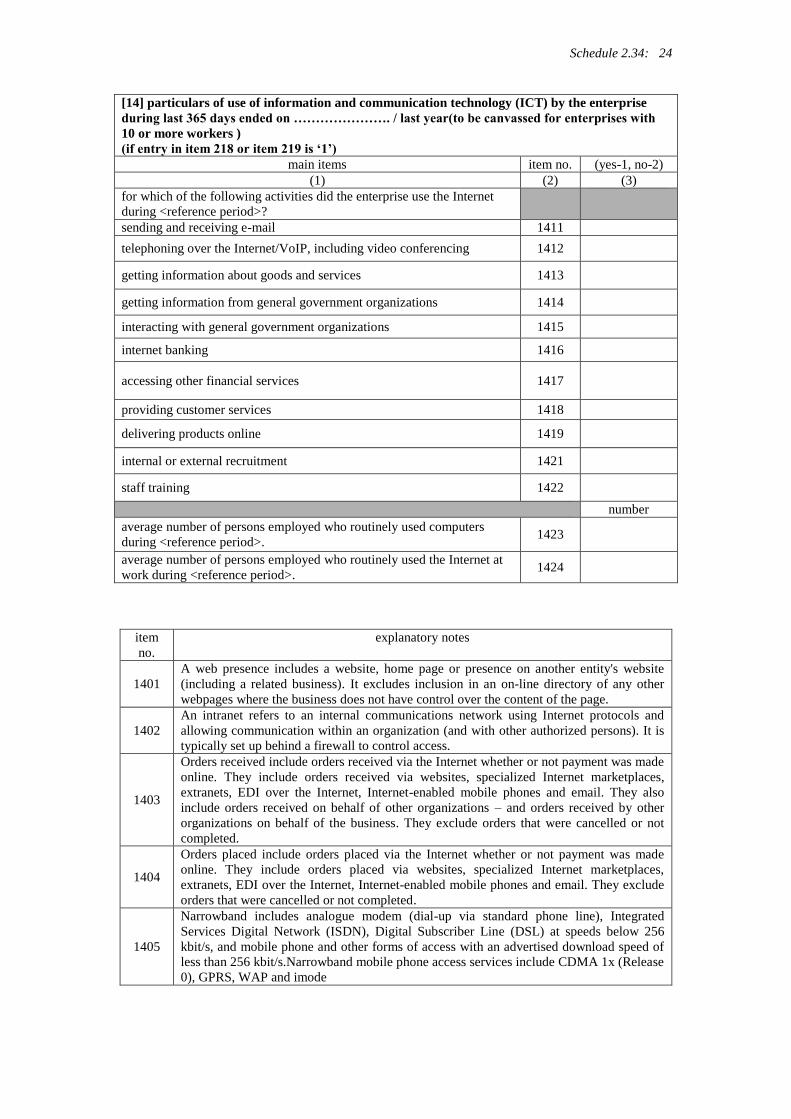
Schedule 2.34: 24
[14] particulars of use of information and communication technology (ICT) by the enterprise
during last 365 days ended on …………………. / last year(to be canvassed for enterprises with
10 or more workers )
(if entry in item 218 or item 219 is ‘1’)
main items item no. (yes-1, no-2)
(1) (2) (3)
for which of the following activities did the enterprise use the Internet
during <reference period>?
sending and receiving e-mail 1411
telephoning over the Internet/VoIP, including video conferencing 1412
getting information about goods and services 1413
getting information from general government organizations 1414
interacting with general government organizations 1415
internet banking 1416
accessing other financial services 1417
providing customer services 1418
delivering products online 1419
internal or external recruitment 1421
staff training 1422
number
average number of persons employed who routinely used computers
during <reference period>. 1423
average number of persons employed who routinely used the Internet at
work during <reference period>. 1424
item
no.
explanatory notes
1401
A web presence includes a website, home page or presence on another entity's website
(including a related business). It excludes inclusion in an on-line directory of any other
webpages where the business does not have control over the content of the page.
1402
An intranet refers to an internal communications network using Internet protocols and
allowing communication within an organization (and with other authorized persons). It is
typically set up behind a firewall to control access.
1403
Orders received include orders received via the Internet whether or not payment was made
online. They include orders received via websites, specialized Internet marketplaces,
extranets, EDI over the Internet, Internet-enabled mobile phones and email. They also
include orders received on behalf of other organizations – and orders received by other
organizations on behalf of the business. They exclude orders that were cancelled or not
completed.
1404
Orders placed include orders placed via the Internet whether or not payment was made
online. They include orders placed via websites, specialized Internet marketplaces,
extranets, EDI over the Internet, Internet-enabled mobile phones and email. They exclude
orders that were cancelled or not completed.
1405
Narrowband includes analogue modem (dial-up via standard phone line), Integrated
Services Digital Network (ISDN), Digital Subscriber Line (DSL) at speeds below 256
kbit/s, and mobile phone and other forms of access with an advertised download speed of
less than 256 kbit/s.Narrowband mobile phone access services include CDMA 1x (Release
0), GPRS, WAP and imode
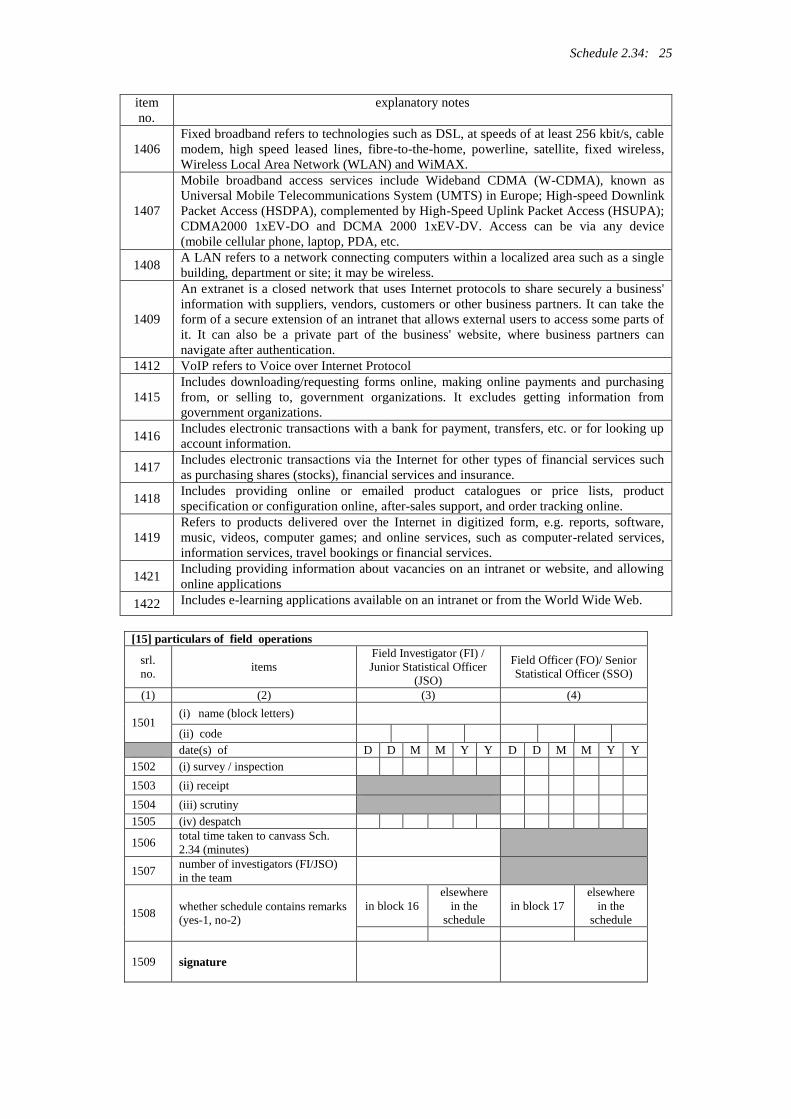
Schedule 2.34: 25
item
no.
explanatory notes
1406
Fixed broadband refers to technologies such as DSL, at speeds of at least 256 kbit/s, cable
modem, high speed leased lines, fibre-to-the-home, powerline, satellite, fixed wireless,
Wireless Local Area Network (WLAN) and WiMAX.
1407
Mobile broadband access services include Wideband CDMA (W-CDMA), known as
Universal Mobile Telecommunications System (UMTS) in Europe; High-speed Downlink
Packet Access (HSDPA), complemented by High-Speed Uplink Packet Access (HSUPA);
CDMA2000 1xEV-DO and DCMA 2000 1xEV-DV. Access can be via any device
(mobile cellular phone, laptop, PDA, etc.
1408 A LAN refers to a network connecting computers within a localized area such as a single
building, department or site; it may be wireless.
1409
An extranet is a closed network that uses Internet protocols to share securely a business'
information with suppliers, vendors, customers or other business partners. It can take the
form of a secure extension of an intranet that allows external users to access some parts of
it. It can also be a private part of the business' website, where business partners can
navigate after authentication.
1412 VoIP refers to Voice over Internet Protocol
1415
Includes downloading/requesting forms online, making online payments and purchasing
from, or selling to, government organizations. It excludes getting information from
government organizations.
1416 Includes electronic transactions with a bank for payment, transfers, etc. or for looking up
account information.
1417 Includes electronic transactions via the Internet for other types of financial services such
as purchasing shares (stocks), financial services and insurance.
1418 Includes providing online or emailed product catalogues or price lists, product
specification or configuration online, after-sales support, and order tracking online.
1419
Refers to products delivered over the Internet in digitized form, e.g. reports, software,
music, videos, computer games; and online services, such as computer-related services,
information services, travel bookings or financial services.
1421 Including providing information about vacancies on an intranet or website, and allowing
online applications
1422 Includes e-learning applications available on an intranet or from the World Wide Web.
[15] particulars of field operations
srl.
no. items
Field Investigator (FI) /
Junior Statistical Officer
(JSO)
Field Officer (FO)/ Senior
Statistical Officer (SSO)
(1) (2) (3) (4)
1501 (i) name (block letters)
(ii) code
date(s) of D D M M Y Y D D M M Y Y
1502 (i) survey / inspection
1503 (ii) receipt
1504 (iii) scrutiny
1505 (iv) despatch
1506 total time taken to canvass Sch.
2.34 (minutes)
1507 number of investigators (FI/JSO)
in the team
1508 whether schedule contains remarks
(yes-1, no-2)
in block 16
elsewhere
in the
schedule
in block 17
elsewhere
in the
schedule
1509 signature
Schedule 2.34: 26
[16] remarks by Field Investigator (FI) / Junior Statistical Officer (JSO)
[17] comments by supervisory officer(s)
Prepared By NSS Division, DE&S, Odisha