Understanding Skill in EVA Mass Handling. Volume 1: Theoretical & Operational Foundations
36
Technical Paper 3684 Understanding Skill in EVA Mass Handling Volume II: Empirical Investigation P. Vernon McDonald, Gary E. Riccio, Brian T. Peters, Charles S. Layne, and Jacob J. Bloomberg July 1997
-
Upload
independent -
Category
Documents
-
view
0 -
download
0
Transcript of Understanding Skill in EVA Mass Handling. Volume 1: Theoretical & Operational Foundations

Technical Paper 3684
Understanding Skill in EVA Mass Handling
Volume II: Empirical Investigation
P. Vernon McDonald, Gary E. Riccio, Brian T. Peters, Charles S. Layne, andJacob J. Bloomberg
July 1997

Technical Paper 3684
Understanding Skill in EVA Mass Handling
Volume II: Empirical Investigation
P. Vernon McDonald and Gary E. RiccioNascent Technologies
Brian T. Peters and Charles S. LayneKRUG Life Sciences
Jacob J. BloombergNASA JSC Life Sciences Research Laboratories
July 1997
National Aeronauticand Space Administration
Lyndon B. Johnson Space CenterHouston, Texas 77058-4406

ii
Acknowledgments
The investigation described in this report would not have been possible without the expertassistance of several groups and individuals from NASA's Johnson Space Center. We thank theAnthropometry & Biomechanics Facility for providing hardware and technical support for datacollection on the precision air bearing floor (PABF). We also wish to thank Tom Smith, FrankEades, Bill Lee, and John Harvey for their assistance in design and construction of the testhardware, and providing engineering and technical support in all phases of PABF operations.We thank Steve Anderson of ILC Dover for accommodating our investigation into the busy suitschedule, and providing the extravehicular mobility units (EMUs) and EMU technicians duringour data collection runs. Special thanks go to our volunteer test subjects who provided theirtime, expertise, and invaluable comments on our test protocol. We would also like to acknowl-edge all of those individuals from the extravehicular activity (EVA) operational communitywith whom we have discussed this project over the course of its progress. We are especiallygrateful to Jerry Ross, Leroy Chiao, and Jeff Hoffman for permitting an EVA-experienced crewmember to participate in our study. This project was support by NASA grant 199-16-11-48.
This publication is available from the Center for AeroSpace Information, 800 Elkridge Landing Road,Linthicum Heights, MD 21090-2934 (301) 621-0390.

iii
Contents
Page
1. Development of Empirical Design.................................................................................. 1
1.1 Defining an Operationally Relevant Protocol........................................................... 1
1.2 The Mass Handling Simulator .................................................................................. 2
1.3 Choice of Task.......................................................................................................... 2
1.4 Enhancement of the Mass Handling Simulator ........................................................ 2
2. Experimental Configuration ........................................................................................... 6
2.1 ORU design .............................................................................................................. 6
2.2 ORU docking structure ............................................................................................. 7
2.3 YAC-Sled Assembly................................................................................................. 8
2.4 PFR and Attachment Structure ................................................................................. 8
3. Experimental Manipulations........................................................................................... 10
3.1 PFR location ............................................................................................................. 10
3.2 ORU Trajectory ........................................................................................................ 10
3.3 Docking Accuracy .................................................................................................... 11
3.4 Postural Degrees of Freedom.................................................................................... 11
3.5 Subject Skill Level.................................................................................................... 12
4. Procedures and Data Collection...................................................................................... 12
4.1 EMU fitting............................................................................................................... 12
4.2 Kinematics ................................................................................................................ 13
4.2.1 Videography..................................................................................................... 13
4.2.2 Accelerometery ................................................................................................ 15

iv
Contents(continued)
Page
4.3 Kinetics..................................................................................................................... 15
4.3.1 PFR................................................................................................................... 15
4.3.2 ORU ................................................................................................................. 16
4.4 Data Synchronization................................................................................................ 16
4.5 Subjective Ratings .................................................................................................... 16
4.6 Trial Sequence .......................................................................................................... 17
5. Data Processing .............................................................................................................. 18
5.1 The Matrix of Variables in the Reduced Data Sets................................................... 18
5.2 Explanation and Justification for Reduced Variables............................................... 22
5.3 Explanation and Justification for Task-Relevant Cells in the Matrix....................... 23
6. Hypotheses...................................................................................................................... 26
6.1 Mass Handling Simulators and Manual Performance............................................... 26
6.2 Adaptive Postural Control and Manual Performance ............................................... 26
6.3 Restraint Systems and Manual Performance ............................................................ 27
6.4 Adaptive Postural Control During EVA Mass Handling.......................................... 27
6.5 Interactions Between Postural Control and Manual Control .................................... 27
6.6 Operational Relevance and External Validity .......................................................... 28
7. References....................................................................................................................... 28
v
Contents(completed)
Tables Page
Table 1. Operational Issues Evaluated By Way of Experimental Manipulations.............. 10
Table 2. Trials Performed in Each Condition by Each Subject ......................................... 17
Table 3. Example Condition-Trial Sequence..................................................................... 18
Table 4. Matrix of Dependent Variables for the Study of Mass Handling Skill................ 20
Figures Page
Figure 1. The Yaw axis cradle shown with the HUT element of the EMU inserted.......... 3
Figure 2. Yaw axis cradle shown in use on the PABF....................................................... 4
Figure 3. Schematic of YAC-EMU-sled assembly. ........................................................... 5
Figure 4. ORU mockup derived from the Rocketdyne battery box. .................................. 7
Figure 5. Schematic showing the layout for the PABF test of mass handling................... 9
Figure 6. Procedure for deriving update interval distribution moments. ........................... 21

vi
Acronyms
CCD charge-couple device
COP center of pressure
DOF degree of freedom
EMU extravehicular mobility unit
EVA extravehicular activity
HUT hard upper torso
JSC Johnson Space Center
ISS International Space Station
LTA lower torso assembly
ODR ORU docking receptacle
ODS ORU docking structure
ORU orbital replacement unit
PABF precision air bearing floor
PFR portable foot restraint
PLSS primary life support subsystem
WETF Weightless Environment Training Facility
YAC yaw axis cradle

vii
Preface
This series of four reports will describe the activities performed in the completion of workfunded under the NASA Research Announcement 93-OLMSA-07. The funded project, entitled"Environmental Constraints on Postural and Manual Control" was a 3-year project designed topromote a better understanding of the whole-body skill of extravehicular activity (EVA) masshandling. Summary details of task progress can be found in The Life Sciences Division of theNASA Office of Life and Microgravity Sciences "Life Sciences Program Tasks and Bibliogra-phy." The Task Book is available via the Internet at: http://peer1.idi.usra.edu.
The first report in the series, "Understanding Skill in EVA Mass Handling. Volume I: Theoreti-cal & Operational Foundations," describes the identification of state-of-the-art EVA operationalprocedures and the development of a systematic and uniquely appropriate scientific foundationfor the study of human adaptability and skill in extravehicular mass handling.
The second report in the series, "Understanding Skill in EVA Mass Handling. Volume II:Empirical Investigation" describes the implementation and design of an unique experimentalprotocol involving the use of NASA's principal mass handling simulator, the precision airbearing floor. A description of the independent variables, dependent variables, methods ofanalysis, and formal hypotheses is provided.
Volume III in the series presents the data and results of the empirical investigation described inVolume II. The final report in the series, Volume IV, provides a summary of the work per-formed with a particular emphasis on the operational implications of the phenomena observedin our empirical investigation.

Volume II1
Abstract
In this report we describe the details of our empirical protocol for investigating skill in extrave-
hicular mass handling using NASA's principal mass handling simulator, the precision air
bearing floor. Contents of this report include a description of the necessary modifications to
the mass handling simulator; choice of task, and the description of an operationally relevant
protocol. Our independent variables are presented in the context of the specific operational
issues they were designed to simulate. The explanation of our dependent variables focuses on
the specific data processing procedures used to transform data from common laboratory instru-
ments into measures that are relevant to a special class of nested control systems (discussed in
Volume I): manual interactions between an individual and the substantial environment. The
data reduction is explained in the context of the theoretical foundation described in Volume I.
Finally, as a preface to the presentation of the empirical data in Volume III of this report series,
a set of detailed hypotheses is presented.
1. Development of Empirical Design
1.1 Defining an Operationally Relevant Protocol
The primary criterion of the empirical effort pursued within the project Environmental
Constraints On Postural and Manual Control was to attain maximum operational relevance to
the skill of extravehicular activity (EVA) mass handling. To this end, the project investigators
engaged in interactions with representatives from the EVA operations community at NASA's
Johnson Space Center (JSC) and NASA Headquarters. These interactions were crucial in
providing this investigation with a thorough grounding in the lessons learned as a result of
NASA’s EVA operations to date. Comments from EVA crew members, engineers who design
and build EVA tools, EVA trainers, and support staff of the many training facilities at JSC were
supplemented with reviews of existing documentation of EVA operational procedures, and
EVA mission debriefs. Together, this information was pivotal in shaping the approach we
ultimately pursued in this investigation with respect to:
a) the relation between the experiments and operational considerations in EVA
b) the key scientific principles behind the relation between crew member (postural) restraintsand mass handling
c) methods that should be used to study the relation between postural restraints and masshandling
d) the design and use of ground-based simulators for the development of EVA skills such asmass handling

Volume II2
1.2 The Mass Handling Simulator
Since this project was a ground-based investigation, it was necessary to simulate the
characteristics of mass handling in weightlessness. NASA’s primary mass handling simulator
is JSC's precision air bearing floor (PABF), which comprises a high-precision stainless steel
surface 24 feet wide x 32 feet long made up of 32 steel plates (36x96x6 inches each) leveled to
±.01 inches over the extent of the floor. Masses are supported on sleds equipped with pads,
usually placed in a triangular array, through which is forced compressed air. The air forced
through the pads raises the sled, and the mass thereon, approximately .003 inches above the
floor so that it rides on a cushion of air. Consequently, the mass is moveable with minimal
friction in 3 degrees of freedom (DOFs). An additional air bearing, which can be placed onto a
sled, is able to add 2 further “frictionless” DOFs, giving a total of 5 DOFs. This air bearing is
usually used to support masses which are being handled so that one may better experience the
orbital dynamics of mass handling.
1.3 Choice of Task
A central requirement of our task was that it should capture some fundamental elements of
EVA mass handling. It was not necessary for the task to look like any actual on-orbit EVA,
rather the task should comprise generic components common to any, or most, EVA mass
handling. Of course, the task also had to be implemented on the PABF and thus was
constrained by the nature of the simulator. We defined a task which entailed the translation of
a mass from one body-relative location to another in order that the mass be docked into a
docking receptacle. The presence of both translation and docking components in this task
meant that it was compatible with many of the on-orbit mass handling activities likely to be
confronted. To explore the demands on postural control and manual control, a number of
experimental manipulations were necessary. The following sections describe these in detail.
1.4 Enhancement of the Mass Handling Simulator
A pivotal development of the investigation was a modification to NASA’s primary mass han-
dling simulatorthe PABF. Typically, the PABF has been used for mass handling activities
while the “handler” stood upright, or with the handler lying on their side on an air-bearing sled.
Each of these configurations pose different postural challenges; however, we considered neither
one to be sufficiently comparable to the on-orbit challenges to postural control. In particular,
we determined that a crucial aspect of on-orbit postural control entailed managing the postural
mobility/stability tradeoff concurrently in orthogonal rotational axes. Since we wished to
investigate the role of postural stability, it was crucial that we provide sufficient DOF for

Volume II3
postural movement. The “yaw-axis cradle (YAC)” was designed for use with the
extravehicular mobility unit (EMU) in the recumbent orientation on the PABF. This provided
the necessary additional DOF of postural movement such that subjects were forced to manage
the postural mobility/stability tradeoff concurrently in orthogonal rotational axes (i.e., pitch and
yaw).
Figure 1 shows a photograph of the YAC frame, and Figure 2 shows the YAC fully integrated
into the experimental setup. Figure 3 illustrates a schematic of how the EMU, YAC, and the
air-bearing sled were assembled on the PABF. Using body-relative definition of axes of
motion, pitch rotation was made available with the air bearing sled in the plane of the PABF,
and yaw rotation was available via the mechanical bearings on each end of the YAC. While in
the recumbent (left-hand-down) orientation in the YAC, the subject was restrained using a
portable foot restraint (PFR) similar to those used on orbit.
The YAC frame was designed such that the axis of rotation would pass through the center of
mass of the human-EMU-frame system, and be perpendicular to the axis of the EMU waist
bearing (rather than parallel to the longitudinal axis of the hard upper torso unit of the EMU).
Figure 1. The Yaw axis cradle shown with the HUT elementof the EMU inserted. The system is designed such that the axes for
yaw rotation run through the center of mass of the subject in the EMU.

Volume II4
Figure 2. Yaw axis cradle shown in use on the PABF.Subject in EMU in the YAC has just completed a docking trial
with the ORU, which is fully inserted into the docking structure.
The aim of this design was to minimize the mass of the counterweight required to attain neutral
stability in the yaw axis. One modification that was necessary concerned the tendency for
rotation of the lower torso assembly (LTA) toward the floor. This rotation was possible about
the EMU waist bearing, which we wished to permit. However, to eliminate the asymmetry, it
was necessary to counterweight the LTA. The best method was to support the LTA with a sling
connected to a counterbalancing weight cantilevered on the immobile components of the YAC.
As a safety measure, the bearings were limited to ±15 degree rotation by the use of physical
stops. However, this limit rarely impaired yaw rotation during subsequent testing to the extent
that yaw rotation was within this ±15 degree envelope. Subjects with little or no prior
experience in the EMU and in simulated EVA mass handling did not typically notice the yaw
motion that they produced during mass handling. However, one subject with prior experience

Volume II5
in these conditions did notice yaw mobility and commented favorably about this attribute of the
YAC.
Overall, the YAC appears to be a valuable addition to the complement of devices that are used
in the PABF. In particular, it appears to be a valuable enhancement to the simulation of mass
handling tasks. Its value is that it provides more of the mobility that is available in EVA. It
allows the multiaxis postural perturbations and, thus, the need to stabilize posture that we
believe is important to the whole-body skill of mass handling. It should be noted that the YAC
reduces the fidelity of EMU inertia in the sagittal plane because additional mass is required to
stabilize, against tipping moments, the air-bearing sled that supports the YAC.
sled
PLSS
PFR
EMU
cradle supportstanchion
sled
TopView
neutrallystable axisof cradlerotation
PLSSsupportframe
yaw axiscradle
set axis of cradle rotationperpendicular to plane ofwaist bearing and as closeas possible to EMU-PLSScenter of mass
PFR
PABF
midlinelongitudinalaxis
EMU
PF
R s
uppo
rt s
truc
ture
SidePosteriorView
yaw axiscradle
set mass distributionfor symmetry aboutaxis of cradle rotation
PLSS
sled
midlinesagittalaxis
sled
EMU
cradle supportstanchion
SideSuperiorView
cradle supportstanchion
PLSSsupport
yaw axiscradle
PLSS
PLSSsupportframe
no support under sideof torso that couldobstruct arm motion
set mass distributionfor symmetry aboutaxis of cradle rotation
PABF
Figure 3. Schematic of YAC-EMU-sled assembly.

Volume II6
2. Experimental Configuration
The components of our experimental configuration comprised a 5-DOF orbital replacement unit
(ORU), the YAC-EMU-sled assembly, the ORU docking structure (ODS), and the PFR and its
attachment structure. Each component is described below.
2.1 ORU design
The ORU for this test was based upon a generic International Space Station (ISS) component
the Rocketdyne “battery box”. This component was to be used in the STS-80 EVAs for evalua-
tion of mass handling tools. The mockup of this ORU was constructed using unistrut and
approximated the flight component volumetrically. The mass and inertial properties varied
from the flight component. The degree of dissimilarity depended upon the axis of motion. The
unistrut frame was supported at the geometric center by an air-bearing ball which permitted
limited rotation in pitch, yaw, and roll. The air-bearing ball was in turn supported by an air-
bearing sled so that the ORU-sled mass could be translated within the plane of the PABF. The
unistrut frame was neutrally balanced by the addition of lead plates within the frame. The
entire mass of the ORU was required to be greater than 180 Kg and less than 320 Kg.
A prototype D-handle microconical ORU handling tool was located on the (subject relative)
left-superior quadrant of the ORU. Consequently, the midpoint of the handle (i.e.,
microconical fitting) was not located on a principle plane of inertia, such that cross-coupled
moments would be encountered upon attempts to move the ORU. The handle was fitted to a 6-
DOF force-torque transducer which, in turn, was rigidly attached to the ORU structure. The
transducer allowed the measurement of the forces and torques applied to the handle and thus to
the ORU during the docking task.
Figure 4 shows the ORU and handle sitting at the opening to the docking structure. The air-
bearing ball is hidden by the plate at the center of the ORU. One notable difference of this
mockup is its transparency. Typically, crew members cannot see through the ORU they are
handling. This of course is a significant constraint on the ability to perform accurate docking
tasks. Often in such situations, a second crew member will be positioned for better visibility to
guide the crew member handling the ORU.
The ORU was approximately 93 cm square and 41.5 cm deep, and was adjustable to two differ-
ent heights above the plane of the PABF. One height placed the center of the D-handle such
that it was 109.2 cm above the floor and matched the height of the yaw rotation axis of the
YAC. Figure 5A illustrates this relationship. The other height placed the center of the D-
handle such that it was 99 cm above the floor and matched the height to the center of the PFR.

Volume II7
These two conditions were referred to as the midsagittal condition and the oblique condition
respectively. In the midsagittal condition the ORU handle was in a plane coincident with the
midsagittal plane of the body. In the oblique condition the ORU handle was in a plane 10 cm
closer to the floor (toward the subject’s left hand) and parallel to the floor. For comfort, the
PFR was offset from the midsagittal axis of the HUT. This is a common practice on the PABF.
2.2 ORU docking structure
A rigid and immobile ODS for the battery-box mockup was constructed from unistrut and
assembled such that yielding to the forces encountered during contact with the ORU was
minimized. The ODS included a rigid backstop at a depth that was equal to the depth of the
ORU. Corners and catch points on the ODR and ORU were eliminated so that docking was as
smooth and as operationally valid as possible. The docking structure is seen as the background
to the ORU in Figure 4.
Figure 4. ORU mockup derived from the Rocketdyne battery box.
The ODS was assembled so that the location and size of the ORU docking receptacle (ODR)
could be changed. The change in size of the ODR provides docking tasks with variable
Volume II8
amounts of tolerance or difficulty. The change in location of the ODR provided docking
trajectories that were either coincident with the midsagittal plane of the EMU, or 10 cm to the
left of this plane. The discrete locations of the ODR were set to have specific relationships to
the EMU in the YAC (e.g., midsagittal ORU trajectory). Two sizes of the ODR were used to
simulate “high” and “low” accuracy docking requirements. In the high-accuracy condition,
the ODR was 2.5 cm longer and 2.5 cm wider than the ORU. Thus there was a 1.25 cm gap
around the ORU when docked optimally in the ODR in the high-accuracy condition. In thelow-accuracy condition, the ODR was 10 cm longer and 10 cm wider than the ORU. Thus
there was a 5.0 cm gap around the ORU when docked optimally in the ODR in the low-
accuracy condition. In all conditions, the ODR was framed, for visual purposes, using foam-
core sheets. The ODR was structurally framed at the corners with aluminum angle running the
entire depth.
2.3 YAC-Sled Assembly
Details of the YAC are described in Section 1.4. The frame of the YAC attached to the primary
life support subsystem (PLSS) mockup which, in turn, rigidly attached to the hard upper torso
(HUT) unit of the EMU and, thus, essentially became an extension of the HUT. The frame was
suspended by the mechanical bearings on each end such that the yaw rotation axis was at a
height of 109 cm above the floor. A schematic illustrating the relation of these components is
presented in Figure 3. The YAC-EMU system sat upon an air-bearing sled such that the subject
in the EMU protruded slightly over the leading edge of the sled. This minimized the
interference of the YAC sled with the ORU sled during the docking task. The EMU, and thus
the subject, was always placed into the YAC in a left-hand-down orientation. Once in the
YAC, the subject's feet were locked into the PFR, and the LTA counterbalancing was
performed. Figure 5B shows this setup in relation to the ODS and the ORU. The YAC
assembly permitted 4 potential DOFs of postural movement. However, in some trials, we
eliminated DOFs by locking out the potential for yaw rotation and/or by turning off the air for
the sled. Consequently, without yaw rotation there were only 3 potential DOFs of postural
movement. With the additional absence of the air-bearing sled, there were essentially 0
potential DOFs of postural movement. This latter condition required the mass handling task to
be completed using hands and arms only.
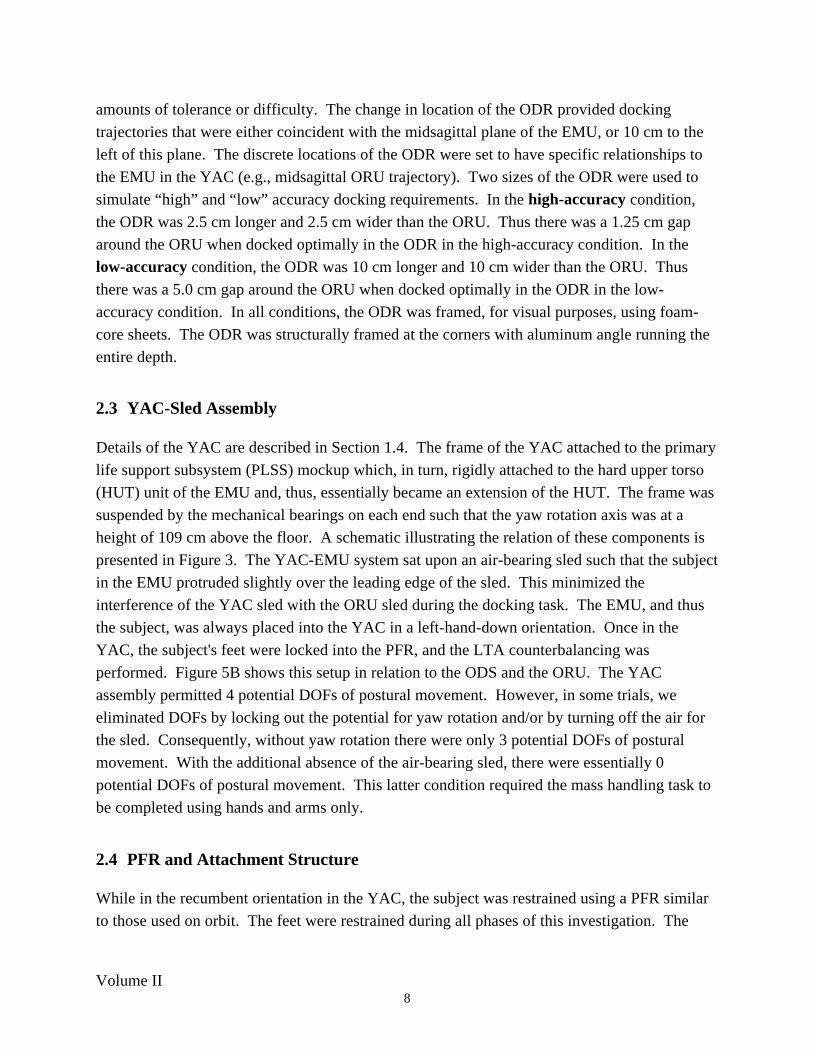
2.4 PFR and Attachment Structure
While in the recumbent orientation in the YAC, the subject was restrained using a PFR similar
to those used on orbit. The feet were restrained during all phases of this investigation. The
Volume II9
PFR was attached to a superstructure with a mass in excess of 1000 Kg. This superstructure
also possessed sufficient rigidity so that there was no noticeable yielding to forces and torques
applied through the PFR. The PFR attachment structure was set on an air-bearing sled to
permit relocation of the PFR to one of six positions which were used to vary the location of the
feet relative to the ODS. The PFR was instrumented with a 6-DOF force-torque transducer.
The transducer allowed the measurement of the forces and torques applied to the PFR during
the docking task. During testing, the PFR was positioned in one of six locations relative to the
ODS. These six locations were referenced to the height and reach of each subject so as to place
the performer in more or less optimal regions of a work envelope defined on the basis of their
reach geometry. Figure 5C illustrates the relative configurations of each of the components
described in the previous sections.
Docking Station
5 DoF ORU
Subject in EMUon air bearing sled PFR mounted on force
plate
YAC/PLSS Frame
109.2 cm99 cm
ORU92.71 x 92.71 cm
Yaw rotation axis
99 cm
MIDSAGITTAL
OBLIQUE
A
Docking Structure
2
4
6
1
3
5
PFR Locations
~30cm ~30cm
B C~130cm
Figure 5. Schematic showing the layout for the PABF test of mass handling.

Volume II10
3. Experimental Manipulations
The following section describes the independent variables of the PABF investigation of EVA
mass handling skill. Each independent variable was designed to simulate a specific operational
issue. The relation between the independent variables and the operational issues is summarized
in Table 1.
Table 1. Operational Issues Evaluated By Way of Experimental Manipulations
Operational Issue Experimental Manipulation
Limited worksite access 6 discrete PFR locations
Worksite layout & access 2 ORU trajectories
Task constraints Docking accuracy
Choice of restraint system 0, 4 postural DOF
Simulator fidelity 3, 4 postural DOF
Crew member skill Subject mix
3.1 PFR location
The PFR location was varied through 6 different locations. Figure 5C illustrates the relative
position of each location. The intent of this manipulation was to vary the location of the feet
relative to the ODS. This has the associated effect of varying the postural configuration
necessary for performing the docking task. This manipulation was designed to simulate the
operational constraint of restricted worksite access. For any orbital EVA there are finite PFR
locations available in the Shuttle payload bay (the same will be true for ISS). While a PFR
attached to the RMS permits substantially more flexibility, the RMS is not always available.
Consequently, crew members will commonly be forced to work from a PFR placement which
results in manual tasks being performed in a nonoptimal region of the manual workspace.
When the RMS is available, it would be useful to have guidelines for the accuracy of PFR
placement.
3.2 ORU Trajectory
The ORU trajectory was varied by changing the height of the ORU relative to the PABF
surface. In subject relative terms there were two trajectories, one coincident with the
midsagittal plane of the body (midsagittal condition), and the other shifted 10 cm toward the
left hand (toward the floor) so that the ORU would move the plane to the left of and, upon yaw

Volume II11
rotation, not necessarily parallel to the midsagittal plane. Again, worksite clutter and layout
may demand nonoptimal trajectories of ORUs which are being transported from one location to
another. This manipulation was designed to evaluate the consequences of such trajectories.
Figure 5A illustrates the planes of motion of the ORU relative to the PFR and the plane of the
PABF.
3.3 Docking Accuracy
Docking accuracy was set at two different tolerances. The high-accuracy condition entailed
docking the ORU with a 1.25 cm clearance on all sides. The low-accuracy condition entailed
docking the ORU with a 5.0 cm clearance on all sides. The operational counterpart of this
manipulation can be seen in the various tasks crew members have to complete under various
task constraints. For example, some of the Hubble Space Telescope repair activities demanded
highly accurate transport in light of the delicate instrumentation within the telescope and within
the ORU. Other mass handling scenarios may be less demanding on manual precision.
3.4 Postural Degrees of Freedom
Three conditions were possible: 4, 3, and 0 DOFs. The combination of the YAC and the air-
bearing sled permitted motion in 4 postural DOFs: body pitch and yaw, and anterior-posterior
and superior-inferior translation. No roll or medio-lateral translation was possible. With the
yaw rotation eliminated (using physical restraints), only 3 postural DOFs were available: body
pitch, and anterior-posterior and superior-inferior translation. By turning the air off, the air-
bearing sled became fixed in place, and 0 postural DOFs were available. In this case the
docking task had to be completed with arm motion only.
Operationally these postural DOF manipulations are equivalent to activities in which a crew
member has a number of restraint options available. NASA is currently developing a semirigid
tether that attaches to the miniworkstation on the HUT of the EMU. This device can be used
alone to provide a small degree of restraint, or it could be used in conjunction with the PFR to
essentially provided restraints at two locations: feet and torso. The latter scenario could elimi-
nate the majority of body motionsimilar to our 0-DOF manipulation. The use of the PFR
restraint on orbit is most closely resembled by our 4-DOF manipulation in which there is the
possibility of cross-coupled perturbations in orthogonal axes of motion. The 3-DOF manipula-
tion is an important comparison condition for the purpose of validating the fidelity and utility
of the YAC.

Volume II12
3.5 Subject Skill Level
Subjects were all volunteers, who had passed the Air Force Class III physical and had
undergone the NASA Physiological Training program. Subjects were primarily selected to
cover a broad range of EVA-related, suited, mass handling experience. Of the five subjects
selected, two were complete novices to the extent that their only experience of EVA mass
handling occurred within the context of this investigation, and was thus limited to activities on
the PABF. One subject had previously performed suited mass handling on the PABF. One
other subject had previously performed suited mass handling on the PABF, in the Weightless
Environment Training Facility (WETF), and on the KC-135 aircraft during parabolic flight.
Consequently these two subjects had some experience of EMU activities in all the available
simulators. The fifth subject had the most extensive range of experience, having performed on-
orbit EVAs. This subject had performed four Shuttle mission EVAs for a total of 25 hours of
on-orbit EVA.
4. Procedures and Data Collection
The following describes the procedures, transducers, and data sources used in the PABF
investigation of EVA mass handling skill. A matrix of the trial sequence is also provided.
4.1 EMU fitting
The EMU used for PABF testing was a CLASS III EMU, virtually identical to the CLASS I
system used on orbit. Differences between the two included the absence of operating
monitoring systems in the CLASS III and a PLSS mockup, since air and cooling were provided
by remote means. Prior to EMU operations, anthropometric measurements were made so that
an appropriately sized EMU could be constructed. The EMU comprises multiple components,
each of which can vary in size, according to the proportions of the wearer. Note that the gloves
are the one item which are personally sized and manufactured for each EVA crew member. For
our purposes, the non-crew member subjects were issued “off-the-shelf” gloves.
After the EMU was assembled, each subject proceeded through a “fit” check to validate the fit
and comfort of the EMU. While the EMU can be adjusted for different individuals, there are
still important differences with respect to mobility within the EMU. Fit and mobility of
particular body segments within the EMU also are influenced by postural configuration (and by
postural orientation in a terrestrial environment). Arm extension, for example, influences the
extent to which hands are “pushed into” the gloves and, thus, it influences prehensile
capabilities. For our purposes, this simply meant that arm extension was a stronger constraint

Volume II13
on postural configuration than without an EMU. In other words, subjects may adapt postural
configuration to a greater degree so that they can maintain or achieve an arm orientation that
optimizes prehensile ability. This emphasizes further the limited relevance of factors affecting
maximal strength for our investigation. The postural dependence of segmental fits in the EMU
probably will create an asymmetry when subjects are lying on their sides in the EMU. Our
prediction is that for equal fit of left and right hand-in-glove, the “lower” arm will have to be
extended more than the “upper” arm. To the extent that this is the case, the difference in
difficulty between the oblique docking trajectory (i.e., ORU lower than the subject above the
floor) and sagittal docking trajectory may be less than between the equivalent trajectories in
weightlessness.
A representative from ILC Doverthe contractor responsible for fitting the EMU to different
crew membersindicated there are significant individual differences in mobility inside the
EMU even though there are quite a few adjustments that can be made to fit the EMU to each
individual, and that it is not unusual for anthropometric dimensions to influence the selection of
crew members for particular EVA mass handling tasks. The implication of this is that the
postural constraints on mass handling performance will differ among crew members. At the
same time, the consequences of mass handling for postural stability will differ among crew
members because of individual differences in the fit of the EMU.
For the novice subjects, the fit check was their first experience of ingressing the EMU, and of
being pressurized inside the EMU. The pressure used was 4.3 psi, identical to the current on-
orbit EMU operating pressure. This made the suit “stiffness” comparable, although the history
of use can also affect this stiffness. The fit check provided an opportunity for the novice
subjects to “move” about under the constraints of the EMU joints. Notably these suit joints do
not map directly onto the joints of the human body. Consequently, one aspect of skilled
behavior in the EMU is learning how to work “with” the EMU so as to exploit the joint
geometry, rather than fight against it.
4.2 Kinematics
Kinematic data were collected using both videography and accelerometry. Details of both
procedures are described below.
4.2.1 Videography
Kinematic data were collected with a video-based motion analysis system. The technique for
three dimensional video motion analysis uses the two-dimensional images from multiple

Volume II14
cameras and the known orientations of those cameras relative to each other to reconstruct the
three-dimensional location of desired points. For our investigation, we used the HiRes system
manufactured by Motion Analysis Corporation, Santa Rosa, California. This system utilizes
the visible light spectrum to illuminate retro-reflective spheres. These spheres are attached to
those items whose motion one wishes to track. The HiRes system is highly automated and has
the ability to track the motion of multiple retroreflective spheres, or markers, placed within the
field.
Five NEC TI-23A black-and-white charge-couple device (CCD) cameras captured our video
images. The cameras were evenly spaced, radially along a 110O arc around the center of the
work space. The distance of the cameras from the arc’s center was dependent on the camera’s
lens. In an effort to place the cameras in areas where there would be minimal chance of them
being in the way or being accidentally moved, a combination of 4.8, 8, and 12 mm lenses were
used. Each camera/lens combination was precalibrated to map any nonlinearities and/or any
lens distortions. These were corrected algorithmically before calculating the movement
trajectories. The cameras were also equipped with electronic shutters that stopped the motion
to .001 seconds. To eliminate any temporal discrepancies in the video data collection, the
shutter opening for all of the cameras was synchronized at 30 Hz. The video data were
collected for 25 to 35 seconds per trial, according to the proficiency of the subject, and the
individual two-dimensional video images were processed in real time. This process resulted in
a digital file from each camera containing a two-dimensional location of each marker in the
CCD plane at a sample rate of 30Hz. Post-processing of these files is described below.
There are three main steps in the three-dimensional reconstruction process: calibration,
tracking, and editing. All of these steps are a part of the software of the HiRes system. The
calibration step, identified here, differs from the camera/lens calibration mentioned earlier.
This calibration is the process of identifying the position and orientation relationship between
the cameras. We accomplished this by collecting video data of a cube with eight markers,
whose locations were measured to within 0.0002 mm, before each data collection session. By
identifying a minimum of 6 of these markers from each camera view, the software calculates
the camera locations, in a coordinate system defined by the cube, and saves the information to
be used in the processing of subsequent files. The tracking step combines the individual
camera files of two-dimensional marker information and the camera calibration information so
as to determine the three-dimensional location of each marker in each frame of data. Spurious
reflections in the field of view and markers whose view is obstructed during portions of the trial
can produce inconsistencies in the data output of the tracking process. These issues are
addressed using the graphical interface of the editing process.

Volume II15
The completion of calibration, tracking, and editing results in a file containing the X, Y, and Z
trajectories (as defined by the calibration cube) of each of the reflective markers. The accuracy
of the HiRes system has been verified in our lab to be better than 1 in 2000 under ideal
conditions. For our experimental setup, with a field of view of approximately 4 meters, the
measurement accuracy is estimated in the order of 2 mm.
The requirements defined in our experimental design required the relative motions of four
objects be monitored: the ORU, PFR, ODS, and YAC. By tracking the motion of three non-
collinear markers per object, whose relationship to each other was fixed, we were able to
capture the motion in 6 DOFs: X, Y, and Z as well as roll, pitch, and yaw. Using fewer than
three markers reduces the number of DOF of the motion that can be determined. The markers
themselves were attached to each object with either double-sided tape or secured to rods which
were affixed to the object. Maximizing the distance between the markers served to improve the
system’s ability to resolve rotational movements.
4.2.2 Accelerometery
In order to monitor YAC rotation, two ±5 g Entran EGA3-5D triaxial accelerometers were
attached to the YAC. One accelerometer was placed on the lower (subjects’ left side) side of
the frame, the other on the upper side (subjects’ right side) of the frame. The accelerometers
were located equidistant from the yaw rotation axis. Each accelerometer was amplified by an
“in-line” amplifier located within 30 cm of the transducer. The immediate amplification was
necessary, given the long cable length to the A/D system. Analog data were sampled via a 12-
bit A/D system at a rate of 500 Hz. These data were stored to the hard drive of a portable
computer. Before each data collection session, transducer calibration determined the gain and
bias for each axis of the two accelerometers. Gains were approximately 1.9 v/g.
4.3 Kinetics
Two AMTI 6-DOF force-torque transducers were used to measure the kinetics at the PFR and
at the ORU handle. Interface fittings permitted rigid attachments between the transducers and
the other structures. All orientation definitions are body-relative. Data from both transducers
were sampled via a 12-bit A/D system at a rate of 500 Hz. These data were stored to the hard
drive of a portable computer and temporally synchronized with the accelerometer sampling.
4.3.1 PFR
The PFR transducer was oriented such that positive Fx corresponded to an anterior force;
positive Fy was a force to the right; and positive Fz was a force “down” (or inferior).

Volume II16
Amplification was set at maximum such that full-scale deflection in Fz corresponded to ±5800
Newtons, and full-scale deflection in Fx and Fy corresponded to ±2900 Newtons.
4.3.2 ORU
The ORU transducer was oriented such that positive Fx corresponded to a superior force;
positive Fy was a force to the right; and positive Fz was an anterior force. Amplification was
set at maximum such that full scale deflection in Fz corresponded to ±5800 Newtons, and full
scale deflection in Fx and Fy corresponded to ±2900 Newtons.
4.4 Data Synchronization
A critical aspect of the data collection was the synchronization of the kinetic and kinematic
data. This synchronization was accomplished by collecting a digital output signal from the
video system to an analog data channel. This normally high digital signal was changed to a
square-wave during the video data collection. The falling edge of each square wave cycle was
coincident with the shutter opening of the cameras, thus providing an analog time stamp for
each video sample. Because the analog and video data collection systems were triggered by
independent triggers, the analog data was collected for 40 seconds per trial. This longer data
collection period was used to provide a time buffer at the beginning and end of each analog
data trial to assure that the start and end of the video data collection would always be captured
on the analog channel.
4.5 Subjective Ratings
Subjective comparisons among simulator configurations and conditions was an important com-
ponent of the investigation. Participation of a crew member was important because it provided
for comparisons of the mass handling experiment with true weightlessness. Such comparisons
were intended to be somewhat open-ended and to be conducted at each subject’s convenience.
In addition, more constrained assessments were made immediately after particular trials.
Separate ratings of ORU and EMU handling qualities, for example, were made after each trial.
During PABF mass handling, subjects participated in conditions with 0, 3, and 4 postural
DOFs. There were consecutive trials in these configurations at each ORU position. This
permitted direct comparisons among the configurations after each set of trials. To facilitate this
formal rating and the acquisition of informal ad hoc comments, the communications link with
the subject in the EMU was recorded using the audio input of the videotape recorder which
simultaneously recorded a surveillance view of the experiment from a camera with an overhead
view of the PABF.

Volume II17
4.6 Trial Sequence
Table 2 illustrates the number and type of trial performed by each subject. The differences in
the number and type of trials performed by certain subjects was a function of contingencies
occurring at the time of data collection. In each of the experimental conditionstrajectory,
accuracy, and postural DOFsthere were six different positions of the PFR relative to ODS.
Zero postural DOFs indicates that the YAC was locked and air was off for the sled. Three
DOFs indicates that the YAC was locked and air was on for the sled (this provides a direct
evaluation of our PABF innovation). The postural DOFs were always manipulated within each
PFR location before changing to another PFR location. Each subject participated in at least two
90- to 120-minute experimental sessions to complete all trials. The two sessions were not
always on the same day.
Table 2. Trials Performed in Each Condition by Each Subject
2 NoviceNon-Crew
ExpertNon-Crew(PABF)
ExpertNon-Crew
(PABF,WETF &KC-135)
ExpertCrew
(On Orbit)
DockTrajectory
DockAccuracy
PosturalDOF
sagittal high 0 1 x 6 1 x 6 1 x 6 2 x 6
sagittal high 3 1 x 6 1 x 6 1 x 6 1 x 6
sagittal high 4 3 x 6 2 x 6 1 x 6 3 x 6
sagittal low 4 3 x 6 2 x 6
oblique high 0 1 x 6 1 x 6 1 x 6 2 x 6
oblique high 3 1 x 6 1 x 6 1 x 6 1 x 6
oblique high 4 3 x 6 3 x 6 2 x 6 4 x 6
oblique low 4 3 x 6 3 x 6
96 trialsper subject
78 trials 54 trials 78 trials

Volume II18
The trial sequence was randomized by trajectory, accuracy, and PFR location. The postural
DOF manipulation was consistent to permit comparisons with preceding trials. Thus a typical
trial/condition sequence is shown in Table 3.
Table 3. Example Condition-Trial Sequence
Trajectory(random)
Accuracy(random) PFR Location
Degrees of FreedomSequence for Each PFR
LocationTrial
Sagittal Low 1 - 6 randomlyselected
4 - 4 - 4 1-18
Sagittal High 1 - 6 randomlyselected
0 - 3 - 4 - 4 - 4 19-48
Oblique High 1 - 6 randomlyselected
0 - 3 - 4 - 4 - 4 49-78
Oblique Low 1 - 6 randomlyselected
4 - 4 - 4 78-96
5. Data Processing
This section describes the data analyses applied to the kinematic and kinetic data measures.The theoretical foundation for this analysis strategy is described in Volume I (Section 3.3)1.
5.1 The Matrix of Variables in the Reduced Data Sets
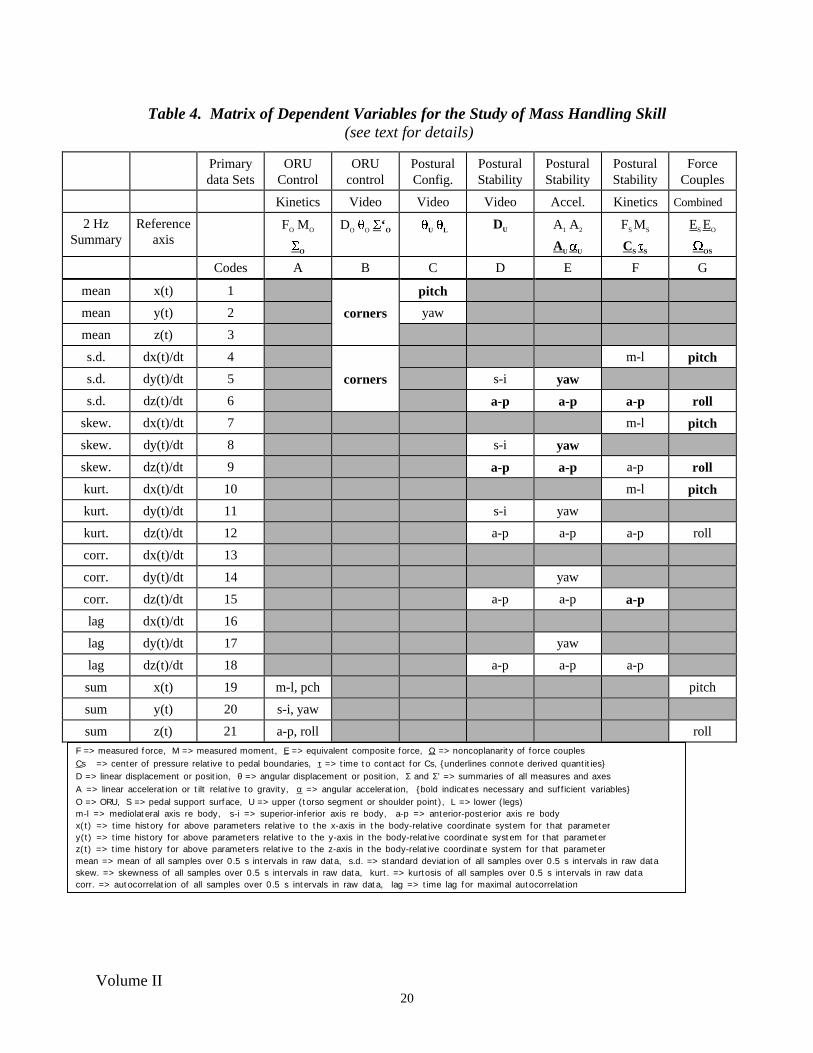
Table 4 describes the “primary” data sets that are derived from the raw time-histories for the
data collected in the mass handling experiments. The assignment of variables into rows and
columns is somewhat arbitrary. The row and column codes (A1:G21) are used to facilitate
communication about individual cells or groups of cells in the table. The columns in the table
can be conceptualized as bundles of variables that take into account the data-collection device
(i.e., force plate, accelerometer, video) and the hypothetically important observables (i.e., ORU
control, postural configuration, postural stability). Categories of dependent variables are listed
in the header of the table (abbreviations are explained in the footnote to the table). Each
symbol refers to a category of dependent variable because they summarize activity on more
than one axis of motion (e.g., body pitch, body yaw) and because there are a number of ways to
summarize such activity (e.g., mean, standard deviation).
1 Riccio, G.E., McDonald, P.V., Peters, B.T., Layne, C.S., & Bloomberg, J.J. (1997). Understanding Skill in EVAMass Handling. Volume I: Theoretical & Operational Foundations.

Volume II19
All variables in the reduced data sets are transformations or summaries of the data channels in
the raw time-history files. Underlined symbols in the table header indicate variables that are
derived through transformation of the data channels at every data point in the raw time-
histories. Rows correspond to particular summary statistics that are computed from intervals of
data in the raw time-histories. Each reduced variable is a time-history specified at a 2 Hz
update rate. Each data point in the reduced data sets is determined through computation of a
summary statistic over a 0.5-second interval from the corresponding raw time-histories. The
number of data points from which these summaries are calculated depend on the sampling rate
in the raw time-history (e.g., summaries are based on 250 data points when the sampling rate is
500 Hz). Figure 6 illustrates the steps in this process with an exemplar time series.
Specific dependent variables correspond to particular axes and particular summary statistics
which are described in successive rows of the table. Grayed-out cells in the table indicate that
there is not a variable for the corresponding combination of axis, summary statistic, and
category of variable that is both necessary and sufficient for testing a priori hypotheses. Entries
in the cell describe which of the six DOFs of motion are invoked by each particular
combination. Relevant DOFs are described in body-relative terms.
Volume II20
Table 4. Matrix of Dependent Variables for the Study of Mass Handling Skill (see text for details)
Primarydata Sets
ORUControl
ORUcontrol
PosturalConfig.
PosturalStability
PosturalStability
PosturalStability
ForceCouples
Kinetics Video Video Video Accel. Kinetics Combined
2 HzSummary
Referenceaxis
FO MO
O
DO O ‘ O U L DU A1 A2
AU U
FS MS
CS S
ES EO
OS
Codes A B C D E F G
mean x(t) 1 pitch
mean y(t) 2 corners yaw
mean z(t) 3
s.d. dx(t)/dt 4 m-l pitch
s.d. dy(t)/dt 5 corners s-i yaw
s.d. dz(t)/dt 6 a-p a-p a-p roll
skew. dx(t)/dt 7 m-l pitch
skew. dy(t)/dt 8 s-i yaw
skew. dz(t)/dt 9 a-p a-p a-p roll
kurt. dx(t)/dt 10 m-l pitch
kurt. dy(t)/dt 11 s-i yaw
kurt. dz(t)/dt 12 a-p a-p a-p roll
corr. dx(t)/dt 13
corr. dy(t)/dt 14 yaw
corr. dz(t)/dt 15 a-p a-p a-p
lag dx(t)/dt 16
lag dy(t)/dt 17 yaw
lag dz(t)/dt 18 a-p a-p a-p
sum x(t) 19 m-l, pch pitch
sum y(t) 20 s-i, yaw
sum z(t) 21 a-p, roll rollF => measured force, M => measured moment, E => equivalent compos ite force, Ω => noncoplanarity of force couplesCs => center of pressure relative to pedal boundaries, τ => time to contact for Cs, underlines connote derived quantit iesD => linear displacement or posit ion, θ => angular displacement or posit ion, Σ and Σ’ => summaries of all measures and axesA => linear acceleration or t ilt relative to gravity, α => angular acceleration, bold indicates necessary and sufficient variables O => ORU, S => pedal support surface, U => upper (torso segment or shoulder point), L => lower (legs)m-l => mediolateral axis re body, s -i => superior-inferior axis re body, a-p => anterior-posterior axis re bodyx(t) => time his tory for above parameters relative to the x-axis in the body-relative coordinate sys tem for that parametery(t) => time his tory for above parameters relative to the y-axis in the body-relative coordinate system for that parameterz(t) => time his tory for above parameters relative to the z -axis in the body-relative coordinate system for that parametermean => mean of all samples over 0.5 s intervals in raw data, s .d. => s tandard deviation of all samples over 0.5 s intervals in raw dataskew. => skewness of all samples over 0.5 s intervals in raw data, kurt. => kurtos is of all samples over 0.5 s intervals in raw datacorr. => autocorrelation of all samples over 0.5 s intervals in raw data, lag => time lag for maximal autocorrelation

Volume II21
-0.05
0
0.05
Time (ms)
-0.05 0 0.050
10
20
30
40
0 400 800 1200 1600 2000 2400 2800 3200 3600 4000-36
-34
-32
-30
-28
Time (ms)
PF
R P
itch
Mom
ent (
Nm
)
-0.04 -0.02 0 0.02 0.040
10
20
30
detrend: Xi = xi - xi-1
histogramof 250 samples
histogramof 250 samples
Detrended PFR Pitch Moment (Nm) Detrended PFR Pitch Moment (Nm)
Calculate moments of the distribution
PF
R P
itch
Mom
ent
(Nm
)
0 400 800 1200 1600 2000 2400 2800 3200 3600 4000
Num
ber
of s
ampl
es
Num
ber
of s
ampl
es
Figure 6. Procedure for deriving update interval distribution moments.Distributions are shown only for two update intervals for clarity. However,
distributions are calculated for contiguous update intervals throughout the trial.
Volume II22
5.2 Explanation and Justification for Reduced Variables
Column A (ORU control kinetics): O is a summary of the forces and moments measured at
the ORU force plate. This summary variable could be useful insofar as it is unnecessary to test
ORU-control hypotheses separately on forces and moments. O is monotonically related to the
energy in ORU translation and docking. Such an energy-related variable is relevant to the
softness of the docking and, thus, it is relevant to the task of the subject.
Column B (ORU control kinematics): ‘ O is a summary of the linear and angular
displacement between the ORU and a fully docked position. This variable is relevant to the
smoothness of docking and, thus, it is relevant to the task of the subject. ‘ O in cell ranges
B1:B3 and B4:B6 each collapse to a single observation per update interval in the reduced data
sets.
Column C (postural configuration kinematics): For the purpose of this analysis it was
sufficient to consider the human-EMU as a two-segment system (see Riccio & Stoffregen,
1988, and Riccio, 1993, for justification). The upper body was defined as the segment joining
the shoulder and hip; the lower body was defined as the segment joining the hip and the ankle.
Analyses focus on body configuration in the sagittal plane (i.e., pitch angles of the upper and
lower body, U and L). U was defined as that angle between the upper and lower segments. L
was defined as that angle between the lower segment and the plane of the PFR.
Columns D & E (postural stability kinematics): DU is a summary of the body displacement
defined as the motion at the EMU “shoulder.” It is important to evaluate stability at the
shoulder insofar as this region of the body provides the base of support for the head and arms.
The accelerations measured on the YAC, A1 and A2, were used to derive the degree of yaw
rotation occurring, U during a trial, in particular the degree of yaw stability.
Column F (postural stability kinetics): CS and S are measures derived from the center of
pressure on the pedal force plate. CS is the distance of the center of pressure from the nearest
pedal boundary. S is the instantaneous time-to-contact between the center of pressure (COP)
and the nearest pedal boundary. These variables are potentially valuable as measures of
postural stability (see Riccio, 1993, pp. 328-331). Variables from the raw force-plate time-
histories need not be retained in the reduced data sets when the boundary-relative measures
(e.g., time-to-contact) are used. Analysis of the boundary-relative measures currently is being
given a low priority in the mass handling experiments. Instead, we are relying on an expedient
measure from the raw data-channels retained in the reduced data sets: the location of the COP
relative to the origin of the force plate.
Volume II23
Column G (force couple dynamics): ES and EO are composite force vectors computed from
forces and moments at the two force platforms. All moments measured at one force plate are
transformed into equivalent forces at the other force plate using an expedient rigid-body
assumption. Clearly the human body is not rigid, and the link between the force plates at the
ORU and feet is not rigid. If it were, there would be no need to derive composite force vectors
because we know that the forces at the two locations would be equal and opposite. We invoke
the notion of a rigid body/linkage not as an assumption about our experimental situation but,
rather, as a baseline or standard against which nonrigidity, or its correlates, can be measured.
One cannot simply compare force-to-force and moment-to-moment between the two locations
to assess rigidity or equilibrium. All forces and moments must be reduced to commensurable
units to determine, from these data alone, whether the system is in equilibrium.
OS is a measure of the departure from equilibrium of the forces and moments at the hands and
feet. We are striving for a method of comparing forces and moments at two locations in (end-
points of) a distributed system (the human body) because we assume that the human perceptual
systems do this in controlling posture and in coordinating postural control and manual control
while interacting with the environment. We assume that a stable postural platform is necessary
for effective interactions with the environment (e.g., manual control) and, thus, that the action
(including the forces and moments) at the feet and hands must be controlled with respect to the
criteria of postural stability. Our strategy of measuring departure from equilibrium in terms of
forces and moments at the hands and feet can be viewed as an operational definition of theobservable and meaningful consequences of coupled actions at the hands and feet. We
hypothesize that alignment of the composite vectors in a couple ensures postural stability, as if
the body were rigid. Nonalignment or noncollinearity suggests instability, instability that is
restricted to a particular plane when the nonaligned vectors are coplanar. We further
hypothesize that noncoplanar vectors are especially destabilizing because of their tendency to
induce concurrent perturbations in orthogonal axes.
5.3 Explanation and Justification for Task-Relevant Cells in the Matrix
Cells B1:B6 and A19:A21. The purpose of cells A19:A21 was addressed above in the
paragraph on O and ‘ O. The purpose of cells B1:B6 is to summarize the smoothness of mass
handling. Smoothness of force and motion time-histories is revealed by the spread of data
within an interval. Smoothness can be summarized by computing the standard deviation on the
detrended data within an interval. These reduced time-histories are being used in assessing the
relationship between postural control and manual control. Time-histories for a particular
parameter can be reduced to a single parameter per trial by computing summaries (e.g., the
mean) of the within-interval standard deviation across all intervals within a trial.

Volume II24
Cells C1:C2. These cells describe changes in postural configuration on a reduced time scale
(i.e., 2 Hz). This allows for a point-by-point comparison between postural configuration and
various derived indices of postural stability, postural equilibrium, and manual control
(described below). The relationships between postural configuration and these indices indicate
the way in which these indices are used or can be used as criteria for control of postural
configuration (Riccio, 1993, pp. 332-349). Analyses focus on body configuration in the sagittal
plane (i.e., pitch angles of the upper and lower body, U and L).
Cells D5-E6. It has been argued that manual control, and even oculomotor control, ultimately
must be coordinated with postural control (Riccio, 1993, pp. 343-349; Riccio & Stoffregen,
1988). In particular, it is important to evaluate stability at the shoulder insofar as this region of
the body provides the base of support for the head and arms. Stability of posture in the sagittal
plane (anterior-posterior and superior-inferior axes) can be assessed in terms of the standard
deviation of the detrended position of the shoulder as indicated in the videographic data, DU.
Sagittal stability also can be assessed in terms of the standard deviation of translational
acceleration of the YAC as indicated in the accelerometer data, AU (Riccio et al., 1993). Yaw
stability can be evaluated in terms of the relationship between the anterior-posterior data from
the two accelerometers, U. These parameters are computed over the same intervals as other
derived measures and, thus, they are reduced to the same (2 Hz) time scale. This allows for a
point-by-point comparison between postural stability and various derived indices of manual
control and postural configuration. The relationships between postural stability and manual
control indicate the importance of a stable base of support for the arms during mass handling.
Analyses focus on postural stability in the anterior-posterior and yaw axes. Particular attention
will be given to interactions between these axes, that is, in terms of concurrent motion and
instability at these axes. In addition, time-histories for a particular parameter can be reduced to
a single parameter per trial by computing summaries (e.g., the mean) of the within-interval
standard deviation across all intervals within a trial.
Cells F4 and F6. Postural stability can be considered as the smoothness of relevant force and
motion time-histories and, as such, it can be revealed by the spread of data within an interval.
Smoothness can be summarized by computing the standard deviation on the detrended data
within an interval. Stability of the body as a whole can be assessed in terms of the standard
deviation of the detrended center of pressure, CS, or related measure, S, at the pedal force plate
(anterior-posterior and medio-lateral axes). These parameters are computed over the same
intervals as other derived measures and, thus, they are reduced to the same (2 Hz) time scale.
This allows for a point-by-point comparison between postural stability and various derived
indices of manual control and postural configuration. The relationships between postural
stability and manual control indicate the importance of stability of the whole body during mass

Volume II25
handling. Analyses focus on postural stability in the anterior-posterior axis. In addition, time-
histories for a particular parameter can be reduced to a single parameter per trial by computing
summaries (e.g., the mean) of the within-interval standard deviation across all intervals within a
trial.
Cells G4 and G6. Stability of the body as a whole can be assessed in terms of the standard
deviation of the nonalignment of the pedal-manual force couple, OS, in the roll and pitch axes.
These parameters are computed over the same intervals as other derived measures and, thus,
they are reduced to the same (2 Hz) time scale. This allows for a point-by-point comparison
between postural stability and various derived indices of manual control and postural
configuration. The relationships between postural stability and manual control indicate the
importance of stability of the whole body during mass handling. Particular attention is being
given to interactions between the two axes of noncoplanarity, that is, concurrent change and
instability at these axes. The noncoplanar interactions within the force couple are compared
with the multiaxis interactions in postural motion mentioned in the preceding paragraph. In
addition, time-histories for a particular parameter can be reduced to a single parameter per trial
by computing summaries (e.g., the mean) of the within-interval standard deviation across all
intervals within a trial.
Cells in block D7:G12. Higher-order statistical moments, skewness and kurtosis, are computed
for the same detrended data on which the standard deviation is computed (i.e., cells in block
D4:F7). Skewness can be used as a measure of departure from equilibrium, while kurtosis can
be used as a measure of intermittency of control (Riccio et al, 1993; Riccio & Stoffregen, 1991,
pp. 215-216). These statistics are computed over the same intervals as other derived measures
and, thus, they are reduced to the same (2 Hz) time scale. This allows for a point-by-point
comparison between the various indices of postural control. The relationships between postural
configuration and skewness of postural control, for example, indicate the way in which such
indices are used or can be used as criteria for control of postural configuration (Riccio, 1993,
pp. 332-342). In addition, time-histories for a particular parameter can be reduced to a single
parameter per trial by computing summaries (e.g., the mean) of the within-interval skewness or
kurtosis across all intervals within a trial.
Cells in block D14: F18. Enhanced or pathological tremor is assessed in terms of the auto-
correlation parameters for the detrended kinematic and kinetic data on postural control. These
statistics are computed over the same intervals as other dependent measures and, thus, they will
be reduced to the same (2 Hz) time scale. This allows for a point-by-point comparison between
tremor and the various indices of postural and manual control. Relationships between tremor
and postural configuration, for example, could indicate something about the relative difficulty

Volume II26
or effortfulness of various postural configurations. Analyses will focus on anterior-posterior
and yaw axes where available. Time-histories for a particular parameter can be reduced to a
single parameter per trial by computing summaries (e.g., the mean) of the within-interval
autocorrelation magnitude or lag across all intervals within a trial.
Cells G19 and G21. Noncoplanarity is assessed at the moment of contact between the ORU
and ODS. This interval of noncoplanarity is compared to the standard deviation of
noncoplanarity over the preceding intervals within trial. The comparison provides an
indication of the extent to which the relationship between pedal and manual forces is perceived
and the extent to which it is controlled and optimized during docking.
6. Hypotheses
This section formally presents the hypotheses addressed within the context of the empirical
investigation described in this report. These hypotheses are implicit within the empirical
description in Sections 1-5 and the material presented in Volume 1 of this report series1.
6.1 Mass Handling Simulators and Manual Performance
These hypotheses are primarily concerned with identification and measurement of manual
performance on the PABF. Comparisons of adaptive postural control in the support of manual
performance will be made during tasks performed on the PABF with the performer affixed to
the PFR:
There are differences between 3-DOF and 4-DOF simulators with respect to ORU controlduring the docking phase.
There are differences between 3-DOF and 4-DOF simulators with respect to postural controlduring the docking phase.
6.2 Adaptive Postural Control and Manual Performance
These hypotheses are primarily concerned with identification of adaptive postural behavior and
measurement of performance on the PABF. Evaluations of adaptive postural control in the
support of manual performance will be made during operations on the PABF during which the
performer has the opportunity to adaptively configure DOF in response to the task
requirements:
The chosen configuration in the 0-DOF condition is based on the relation betweenconfiguration and stability that is revealed in the 3-DOF condition.

Volume II27
ORU control in the 0-DOF condition is influenced by the relation between configurationand stability that is revealed in the 3-DOF condition.
6.3 Restraint Systems and Manual Performance
These hypotheses are primarily concerned with evaluation of manual performance while the
performer is restrained to 0 or 4 postural DOF:
There are differences between O-DOF and 4-DOF restraint conditions with respect to ORUcontrol during the docking phase.
There are interactions between restraint DOF and PFR locations with respect to ORUcontrol during the docking phase.
6.4 Adaptive Postural Control During EVA Mass Handling
These hypotheses primarily address the effectiveness and form of adaptive postural control in
relation to skill level, ORU handling constraints, and support surface reaction forces:
There are differences between novice and expert with respect to the interactions betweenyaw and pitch accelerations.
There are differences between novice and expert with respect to the kinetics of posturalcontrol.
There are differences between sagittal and oblique ORU trajectories with respect to ORUcontrol and postural control.
There are differences among PFR locations with respect to ORU control and posturalcontrol.
There are differences between high-accuracy and low-accuracy conditions with respect toORU control and postural control.
6.5 Interactions Between Postural Control and Manual Control
These hypotheses primarily address the form of adaptive control of the interacting posture and
manual systems during the co-variation of manual task criteria and support surface constraints:
There is a relationship between postural configuration and the kinetics of postural controlduring the transport phase across PFR locations.
There is a relationship between postural configuration and the kinematics of posturalcontrol during the transport phase across PFR locations.

Volume II28
There is a relationship between postural configuration and the ORU control during thetransport phase across PFR locations.
There is a multiplicative interaction between yaw and pitch accelerations with respect toORU control.
6.6 Operational Relevance and External Validity
These hypotheses primarily concern phenomenal/experiential assessments that reveal and
enhance the operational relevance and the external validity of this project:
The experimental task is experientially similar to a variety of tasks performed during EVA.
There are experiential differences between sagittal and oblique ORU trajectories.
There are experiential differences among PFR locations.
There are experiential difference between high-accuracy and low-accuracy conditions.
7. References
Riccio, G. (1993). Information in movement variability about the qualitative dynamics ofposture and orientation. In: K. Newell (Ed.), Variability and Motor Control (pp. 317-357),Champaign, IL: Human Kinetics.
Riccio, G., Lee, D., & Martin, E. (1993). Task constraints on postural control. In S.S. Valenti(Ed.), VIIth International Conference on Event Perception and Action (pp. 306-310).Vancouver Canada: Erlbaum.
Riccio, G. & Stoffregen, T. (1988). Affordances as constraints on the control of stance.Human Movement Science, 7, 265-300.
Riccio, G.E., & Stoffregen, T.A. (1991). An ecological theory of motion sickness and posturalinstability. Ecological Psychology, 3, 195-240.