Metabolomics in cancer and cancer-associated inflammatory ...
Upload
independentCategory
view
0download
0
Understanding Clostridium acetobutylicum ATCC 824 Metabolism Using Genome-Scale Thermodynamics and Metabolomics-based Modeling
Fahimeh Salimi*. Rupasri Mandal. ** David Wishart**,
Radhakrishnan Mahadevan***
*Department of Chemical Engineering and Applied Chemistry, University of Toronto, Toronto, ON, Canada (Tel: 416-978-4222; e-mail: [email protected])
** Department of Biological Sciences, University of Alberta, Edmonton, AB, Canada ([email protected]) ***Department of Chemical Engineering and Applied Chemistry, University of Toronto, Toronto, ON, Canada (Tel: 416-946-
0996; e-mail: [email protected])
Abstract: Biobutanol has a potential application as a biofuel and can replace gasoline as an alternative fuel. However, the productivity of the biobutanol process has to be increased significantly, before it can be commercialized. Clostridium acetobutylicum has been the primary microbial host used for biobutanol production. Consequently, systems biology based genome-scale metabolic model of C. acetobutylicum metabolism is essential to optimize the biobutanol production rate via genetic and process optimization and metabolic engineering. An updated genome-scale metabolic model of C. acetobutylicum ATCC824 consists of 700 genes, 709 reactions, 29 exchange reactions, and 679 metabolites, which covers 16.3% of ORFs and is more comprehensive compared to two other existing models. This metabolic network was used as a platform for simulating phenotypes using the constraint-based modeling approach. Flux variability analysis shows the presence of alternate carbon and electron sinks that allows for different carbon assimilation patterns and ranges of product formation rates. Incorporation of metabolomics and thermodynamics data into this model results in thermodynamically feasible flux distributions. We apply an NMR based approach to quantify 31 intracellular metabolites in both metabolic phases. The total molar concentration of metabolites was approximately 245mM, where asparagine was the most dominant metabolite. Keywords: Clostridium acetobutylicum, genome-scale metabolic model, butanol, FBA, FVA, TMFA.
1. INTRODUCTION
Clostridium acetobutylicum is a Gram-positive, solvent producing, anaerobic bacterium which is able to convert a variety of sugars to organic acids and solvents. In a typical fermentation of this bacterium two distinct phases are observed; in the acidogenic phase, the bacterium grows rapidly and produces acetate, butyrate, and hydrogen, whereas in the stationary growth phase the metabolic shift to solventogenesis takes place (Jones et al., 1986). Several studies have been conducted to increase the solvent yield; The ClosTron, a gene knockout system for the genus clostridia has been developed that facilitates further functional genomics studies (Heap et al., 2007), and genome wide transcriptome studies on this species have been performed (Alsaker et al., 2005). Therefore, systems biology approach that allows the integration of these genome-scale data and the improvement of C. acetobutylicum metabolic activity provides a promising method for optimizing the biobutanol production process. System-level quantitative analysis of cellular metabolism using in silico modeling approaches facilitates the generation of new knowledge, via iterative modification of in silico models and experimental designs. This knowledge can be applied for designing strains with improved metabolic activities for industrial applications (Lee et al., 2005).
Flux balance analysis (FBA) has been applied for analysis and quantitative prediction of phenotypic behaviours of various microorganisms across different biological domains. More recently the FBA has been extended to include genome-scale thermodynamics and metabolomics data (Wang et al., 2005, Henry et al., 2007, Zamboni et al., 2008) in order to refine the metabolic models and shed light on various aspects of the metabolism. Lee et al., has reconstructed a genome-scale metabolic model of C. acetobutylicum with 11.2% ORF coverage, and applied this model to predict the metabolic behaviours in acidogenic and solventogenic phases using FBA (Lee et al., 2008). Senger et al., has also presented another genome-scale metabolic model of C. acetobutylicum with 12.6% ORF coverage, and applied genetic algorithm to derive a constraint based on the specific proton flux state to further restrict the solution space in FBA, and predict the pH of the batch culture during the acidogenic phase (Senger et al., 2008 a,b). However, these models do not incorporate thermodynamics and metabolomics data analyses. These additional constraints can be applied to further limit the solution space. In this study, an expanded genome-scale metabolic model of C. acetobutylicum is presented. We applied thermodynamics-based metabolic flux analysis (Henry et al., 2007), to obtain thermodynamically feasible flux distributions, along with
Proceedings of the 11th International Symposium onComputer Applications in Biotechnology (CAB 2010),Leuven, Belgium, July 7-9, 2010Julio R. Banga, Philippe Bogaerts, Jan Van Impe,Denis Dochain, Ilse Smets (Eds.)
WeET3.3
Copyright held by the International Federation of Automatic Control 126
metabolomics data analysis to study the metabolism of C. acetobutylicum.
2. METHODS
2.1 C. acetobutylicum Metabolic Network Reconstruction
The MetaFluxNet® ,version 1.82 was the platform used for the model reconstruction (http://mbel.kaist.ac.kr/lab/mfn/), and the reconstructed network model was then exported to a Systems Biology Markup Language model (SBML; http://sbml.org), for further analyses using COBRA toolbox (Becker et al., 2007) in MATLAB environment (The MathWorks™). The automated annotated genome sequence of C. acetobutylicum ATCC824 was downloaded from TIGR-CMR database (http://www.tigr.org/) and was used as a framework for GPR assignments. The 4.13Mb-length genome sequence of ATCC824 (Nolling et al., 2001) comprises 4273 ORFs, and the GPR assignments were mostly based on this genome annotation; in addition the automated metabolic network of ATCC824, reconstructed using Pathway Tools software version 11.5 and MetaCyc version 11.1 (http://biocyc.org/biocyc-pgdb-list.shtml), were used for confirmation of GPR assignments or re-annotations after manual inspection. The model was reconstructed manually on the metabolic roles in the existing annotation, and biochemical databases such as KEGG (http://www.genome.jp/kegg/) and the enzyme nomenclature database were consulted for more information on pathways, metabolites, and enzymes (http://ca.expasy.org/enzyme/). The elementally and charge balanced reaction equations were mostly obtained from BIGG database (http://bigg.ucsd.edu/) and SimPheny™ database (Genomatica Inc. San Diego. CA); furthermore, the chemical composition and charge of some particular metabolites, which did not exist in the aforementioned databases, were determined using ACD/LogD Sol Suite version 11.0 (http://www.acdlabs.com/) at the physiological pH of 6.7, which is consistent with the intracellular pH of C. acetobutylicum (Jones et al., 1986). Transport reactions were included in the network according to the transport protein information in KEGG and TransportDB (http://www.membranetransport.org/) databases as well as the available physiological data. Pathway completion and gap filling were done manually so that the network produces ATP along with all biomass building blocks, including amino acids, solute pool, nucleotides, cofactors, lipids and polysaccharides, from available substrates in a defined growth medium (Monot et al., 1982). The BLAST search using UniProt Blast tool (http://www.uniprot.org/) was applied to assign predicted functions to some missing ORFs in the original annotation as well as some ORF re-annotations. The GPR assignments also were done using available literature data. Further network evaluation and pathway completion were done using computational analyses (FBA) of the network using COBRA toolbox; however, network gaps in some poorly characterized pathways can exist even after performing the network evaluation step. Non-gene associated reactions were added in order to fill the gaps or to meet the physiological requirements according to the available literature data. The biomass macromolecular composition was assumed to be identical to the Bacillus
subtilis (Lee et al., 2008, Oh et al., 2007), where the composition of nucleotides, protein, lipids and trace elements as well as the required polymerization energy were adapted from the model developed by Lee et al. The biomass synthesis equation, which includes 40 mmol ATP per gram DCW per hour as the growth associated maintenance energy (GAM) (Lee et al., 2008, Senger et al., 2008a), was included in the network as a demand reaction.
2.2 Flux Balance Analysis (FBA) and Flux Variability Analysis (FVA)
Metabolic phenotypes can be characterized as the metabolic flux distributions through the metabolic network derived using mathematical modelling approaches (Edwards et al., 2002). The flux balance analysis (FBA) is based on the mass conservation law for each metabolite in the network. Vallino et al. (1993) have shown that the steady-state approximation of the metabolite concentrations is a valid approximation, where due to the intracellular metabolite concentrations and rapid metabolic fluxes, the metabolic transients are very fast in comparison to the time constants of the cell growth.
In FBA, the constraints are defined by the stoichiometry of metabolic reactions, and flux distributions that satisfy these constraints, in this underdetermined system, are derived by optimizing a particular objective function such as growth rate or ATP production (Schilling et al., 1999). Thus, solving the linear programming (LP) problem subject to all constraints will result in a specific set of steady-state fluxes, which meet the objective function as well. In the C. acetobutylicum network, an additional constraint is required due to the presence of cyclic acid uptake pathways (Desai et al., 1999). This constraint relates the acetate and butyrate uptake rates based on the enzyme kinetic and selectivity data and metabolite concentrations. The butyrate and acetate concentrations were obtained from chemostat data (Meyer et al., 1989).
Ratebutyrate uptake / Rateacetate uptake=0.315[butyrate]/ [acetate]. (1)
However, alternate flux distributions can be achieved, using linear programming technique, under the same optimal condition and objective value (Mahadevan et al., 2003). These alternate flux distributions give an idea about the existence of alternate pathways in the metabolic network. In flux variability analysis (FVA), the optimal objective value is calculated by FBA, and then each flux is maximized and minimized under the same FBA constraints as well as the fixed optimal objective value. The obtained ranges of flux variability demonstrate the feasible fluxes due to alternate optimal solutions in the metabolic network (Mahadevan et al., 2003).
2.3 Thermodynamics-based Metabolic Flux analysis (TMFA)
In addition to the stoichiometric constraints, thermodynamics constraints have been imposed to further limit the solution space (Henry et al., 2007). Thermodynamics-based metabolic flux analysis (TMFA) integrates thermodynamics constraints
Copyright held by the International Federation of Automatic Control 127

into a constraint-based metabolic model to generate thermodynamically feasible fluxes through the metabolic network and to provide data on feasible metabolite activity ranges and ∆ rG´ (Henry et al., 2007). The ∆ rG´0 of the metabolic reactions, required for thermodynamics constraints, were estimated using an improved group contribution method (Jankowski et al., 2008).
2. 4 Batch Cultivation and Metabolomics samples
Batch cultivations of C. acetobutylicum ATCC 824 were conducted anaerobically at 37̊C in 1.5 litres fermenters on Clostridial Growth Medium (CGM), which contains per litre of distilled water: KH2PO4: 0.75g; K2HPO4: 0.75g; MgSO4: 0.348 g; MnSO4.1H2O: 0.01g; FeSO4.7H20: 0.01g; yeast extract: 5.0 g; glucose: 50g; NaC1: 1.0 g; para amino benzoic acid: 0.004g; asparagine: 2.0 g and (NH4)2SO4: 2g (Desai, R.P, 1999). The pH of the medium was adjusted to 5.5 before inoculation. Biomass concentration was monitored by measuring OD at 600nm, while the samples were diluted to keep the optical density below 1.0. Product concentrations were measured using HPLC system (Biorad Aminex HPX87H column) at 20˚C and 0.5ml min -1 of 5mM H2SO4 as eluent. The C. acetobutylicum metabolomics samples were taken in two growth phases and quenched using liquid nitrogen (Wang et al., 2006); Intracellular metabolite extraction from cell cultures was done according to the method described by Maharajan et al., (2003) using hot methanol; the extracted metabolites were then analyzed and quantified by NMR Spectroscopy.
3. RESULTS AND DISCUSSION
3.1 Genome-scale Network Reconstruction and Flux Balance Analysis
The comparison of the genome-scale model (i FS700) along with two other previously available genome-scale metabolic models of C. acetobutylicum ATCC 824 is illustrated in Table 1. The i FS700 includes 709 reactions, 679 metabolites and 700 genes, and has a higher ORF coverage comparing to the other existing models. Furthermore, a number of genes on ATCC824 annotation file were identified to be mis-annotated in the TIGR-CMR database, and were highlighted by the discrepancies among various database annotations, so these genes have been re-annotated with a defined confidence level in this model. The comparison of the existing model reactions is depicted in Fig. 1. The major differences in these network reactions are related to fatty acid and phospholipid metabolism, purines and pyrimidines metabolism, and transport reactions. Integration of these three available models will be useful to obtain a comprehensive model of C. acetobutylicum metabolism and to develop a universal model (Lee et al., 2008). Both i JL432 (Lee et al., 2008) and i RS474 (Senger et al., 2008) have been reconstructed mostly based on the KEGG database, and are similar in size; while i FS700 is mainly based on TIGR-CMR database. Also Senger et al. has applied a semi-automated reverse engineering approach for metabolic network
reconstruction and gap filling, but i JL432 and i FS700 are mainly manually curated networks.
Fig. 1.Venn diagram comparison of the existing model reactions. Table 1. Specifications of C. acetobutylicum metabolic networks
Another major difference of this model is the representation of the TCA cycle. The TCA cycle of C. acetobutylicum is incomplete and lacks several key enzymes. The degenerate TCA cycle has been found in many prokaryotes, but in those cases, the pathways of 2-oxoglutarate, succinyl-CoA and fumarate syntheses proceed in both reductive and oxidative directions (Nolling et al., 2001). It was previously suggested that 2-oxoglutarate, which is a key precursor in amino acid biosynthesis pathways, is being produced through either reductive counter clockwise direction of TCA cycle (Nolling et al., 2001, Lee et al., 2008) or from ornithine through the reverse direction of arginine biosynthesis pathway and urea cycle (Senger et al., 2008). However, a recent flux profiling experiment by Amador-Noguez et al. (2009) demonstrates that the TCA cycle in C. acetobutylicum is bifurcated. This suggested that 2-oxoglutarate is being produced through the oxidative side of the TCA cycle from oxaloacetate, despite the putative lack of citrate synthase, and succinate production from oxaloacetate is through the reductive direction of TCA cycle via malate and fumarate. Therefore, citrate synthase was included as a non-gene associated pathway in this model. In C. acetobutylicum the succinate dehydrogenase, which reduces fumarate to succinate, is missing and it is assumed in this model that
Model Features i FS700 i RS474 i JL432 Genes 700 474 432 Reactions 711 552 502 None-gene associated reactions 69 NA 71 Metabolites 679 422 479 ORF coverage % 16.3 12.6 11.2 Re-annotated ORFs 180
Copyright held by the International Federation of Automatic Control 128

another unknown dehydrogenase catalyzes this reaction (Nolling et al., 2001). Furthermore, the enzyme involved in succinyl-CoA formation is missing. This genome encodes a CoA transferase which catalyzes the acetyl-CoA and butyryl-CoA formations in solventogenic phase, and it is plausible that this enzyme also catalyzes the succinyl-CoA formation from succinate (Nolling et al., 2001). To analyse the reconstructed metabolic network, and to simulate the growth and metabolism in a continuous culture (Meyer et al., 1989), FBA was conducted using maximization of biomass as the objective function. The results showed that the predicted growth rate is in good agreement with the reported growth rate (µ=0.44 compared to the experimental value of µ=0.43); however the cell produced only acetate, hydrogen and CO2 in silico. Therefore, in order to investigate the possibility of the alternate flux distributions, flux variability analysis was performed (Mahadevan et al., 2003).
3.2 Flux Variability Analysis
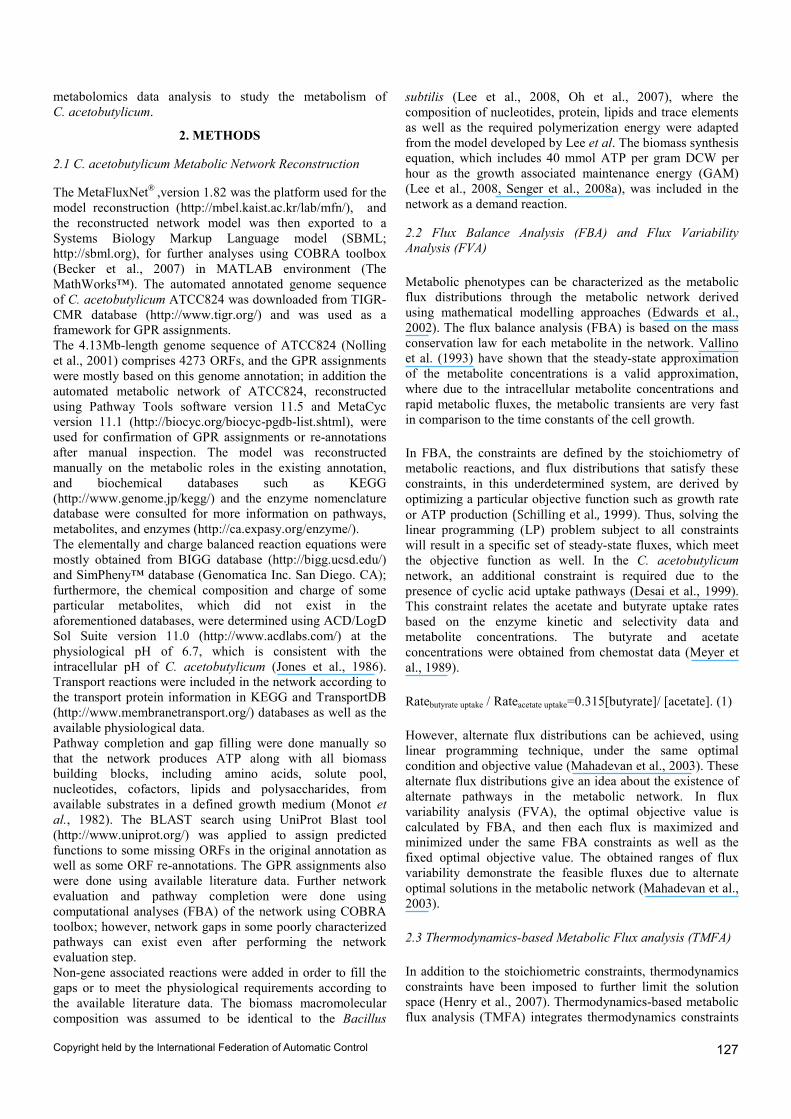
The results of FVA under various sets of stoichiometric, thermodynamics and metabolomics constraints are demonstrated in Fig 2a. In these analyses, the growth rate has been fixed to its predicted value by FBA (µ=0.44). The FVA determines the maximum and minimum values for each flux that can satisfy the model constraints as well as the exact growth rate. In all cases, there are significant flux variation ranges for the product formation rates, and all of the experimental chemostat flux data fall in these model-predicted ranges.
The alternate optimal solutions are due to the presence of equivalent pathways in the metabolic network (Price et al., 2002, Mahadevan et al., 2003). There were 191 reactions with significant variation ranges (above 0.1 mMol.gDCW-1. h-1), which can be examined for identification of the alternate pathways using extreme pathway analysis (Schilling et al., 2000). However, alternate pathways are equivalent routes for the production of metabolites, under the same objective value, and cannot describe the various fluxes through these
alternative product pathways. These results suggest that these various products act as alternative carbon and electron sinks in C. acetobutylicum metabolism. All of these pathways are thermodynamically feasible, and consequently, the fluxes through them are perhaps determined by the regulatory network resulting in different product patterns. The iFS700 model was able to predict the growth rate and flux variability in a chemostat and incorporate metabolomics data. Furthermore, it is metabolically feasible to have both acids and solvents produced simultaneously in the exponential growth phase (Harris et al., 2000); we applied FVA under predicted maximum growth and butanol formation rates, and these results are depicted in Fig. 2b and suggest that hydrogen and acetate formation pathways are essential under maximum butanol formation rate and butyrate, ethanol, lactate, acetone and acetoin pathways can be eliminated. A previous study has also shown that higher amount of butanol is produced in iron limited cultures (Peguin et al., 1995). Lactate formation pathway is a less efficient alternative for NAD regeneration and energy production, when the activity of hydrogenase enzyme has been blocked or in iron deficient cultures where the levels of ferredoxin and the iron containing hydrogenase are low (Jones et al., 1986). Also, in CO-sparged culture of C. acetobutylicum, where the activity of hydrogenase enzyme has been blocked using carbon monoxide, a drastic increase in lactic acid formation has been reported (Datta et al., 1985). Lee et al. (2008) has also applied FBA to analyze this metabolic system, and maximization of biomass has been the objective function for modelling the acidogenic phase, and minimization of metabolic adjustment (MOMA) (Segre et al., 2002) has been applied to simulate the solventogenic phase. It has been shown that the QP-based approach results are significantly dependant on the reference flux distribution which is obtained from FBA (Mahadevan et al., 2003). So the predicted solventogenic fluxes will be dependent on the predicted fluxes in the acidogenic phase, where there are significant differences in the alternative optimal solutions as illustrated in Fig 2.
Fig. 2. The range of product flux variations for C. acetobutylicum metabolic products.
(B)
(A)
Copyright held by the International Federation of Automatic Control 129

3.3 Thermodynamics-based Metabolic Flux Analysis
In order to further constrain the model solution space and improve the model predictability, thermodynamics along with metabolomics information were integrated into the model using TMFA. Thermodynamics data of the model reactions were estimated by group contribution method (Jankowski et al., 2008). The upper and lower bound for metabolite concentrations were set at 250mM and 10-9 mM; for measured intracellular metabolites the concentrations were restricted to the observed ranges, and extracellular metabolites were fixed at the measured concentrations. TMFA along with metabolomics constraints predicted the same growth rate and flux ranges obtained using the FBA and FVA. So, all of the reactions involved in the in silico growth, which are not part of internal loops, are thermodynamically feasible. Furthermore, by analyzing the model-predicted ranges for the reaction Gibbs free energies (∆ rG´) putative regulatory sites (Kummel et al., 2006) in C. acetobutylicum metabolic network can be identified.
3.4 Metabolomics Data Analysis
Knowledge of the intracellular metabolite concentrations can be valuable for further characterizing the metabolic shift and shift inducing conditions in C. acetobutylicum metabolism. 31 intracellular metabolites were quantified, and the list of some of these metabolites with the error estimates and some of the extracellular concentrations are presented in Table 2. The total molar concentration of metabolites was approximately 245mM which is comparable with the E. coli metabolite pool of 300mM (Bennet et al., 2009). Measured metabolites are mainly amino acids, which are present at the same level in
both phases. The most dominant metabolite after glucose was asparagine, followed by alanine and glutamate. This is in contrast to the E. coli metabolome, where glutamate was the most abundant compound (Bennet et al., 2009). Nucleotides and redox coenzymes could be identified but were present in very low amounts, so could not be quantified. In terms of the significance of the changes in metabolite concentrations, butyrate and acetate concentrations show a significant increase in solventogenic phase, while phenylalanine, 2-oxoglutarate and fumarate show significant decrease during solventogenesis consistent with their role as precursors for biomass synthesis.
4. CONCLUSIONS
Flux balance analysis cannot predict the complex metabolism of C. acetobutylicum properly, and additional constraints are required to narrow down the solution space; previously, specific proton flux state (Senger et al., 2008 b) was developed for this purpose; here we incorporated thermodynamics and metabolomics data. Although it did not improve the predictability of the model, it allows for thermodynamically feasible flux distributions. On the other hand, incorporating the regulatory network in the genome-scale model is necessary for describing the metabolic shift from acidogenic to solventogenic phase (Covert et al., 2001). The intracellular metabolome of C. acetobutylicum was quantified in two phases, but a dynamic metabolome profiling experiment is necessary to trace the intracellular metabolite concentration changes over time and during the metabolic shift. Acknowledgments: We wish to thank Ming Po Wong for his collaboration, and Ramanarayan Krishna Murthy and Nikolaos Psychogios for their help in the metabolomics analyses. We also would like to appreciate the supports of this work by National Science and Engineering Research Council of Canada and Canada’s Agricultural Bioproducts Innovation Program (ABIP) grants.
Metabolites
Acidogenic phase Solventogenic phase Significant variation at 95% confidence
level Intracellular (µM) Extracellular (mM) Intracellular (µM) Extracellular (mM) Glucose 221191.4 (47574.5) 270.0 (2.2) 159967.1 (53935.6) 215.5 (2.5) Acetate 987.9 (362.2) 6.3 (5.9) 2618.4 (344.7) 19.7 (5.5) ● Acetone 68.7 (37.4) 0.15 (0.16) 47.9 (21.1) 12.7 (3.0) Butyrate 810.0 (379.7) 10.2 (9.9) 5116.6 (1438.4) 21.9 (9.8) ● Ethanol 115.6 (12.2) 2.07 (2.07) 338.4 (112.3) 4.6 (1.9) Formate 208.1 (54.2) 0.12 (0.15) 109.4 (25.8) 0.05 (0.05) Lactate 386.0 (110.5) 4.9 (7.2) 287.0 (55.2) 6.1 (3.6) Pyruvate 92.5 (23.3) 111.8 (22.9) Alanine 1730.8 (459.1) 2245.5 (415.2) Glutamate 1249.5 (248.6) 1267 (176.7) Asparagine 14089.5 (3749.7) 10022.2 (1232.6) Methionine 171.4 (52.9) 92.5 (10.3) Phenylalanine 529.8 (92.7) 210.8 (153.3) ● 2-Oxoglutarate 72.3 (21.1) 0 ● Citrate 15.3 (9.9) 0 Fumarate 7.3 (0.71) 0 ● Succinate 289.2 (22.9) 209.5 (110.2) Isocitrate 185.1 (60.9) 602.9 (413.7)
Table 2. Intracelluar and extracellular metabolite concentrations in acidogenic and solventogenic phases
Copyright held by the International Federation of Automatic Control 130

REFERENCES
Alsaker, K.V., Papoutsakis, E.T. (2005). Transcriptional Program of Early Sporulation and Stationary-Phase Events in C. acetobutylicum. Journal of Bacteriology, 187: 7103–7118. Amador-Noguez, D., Fan, L. et al., (2009). Systems-level kinetic flux profiling elucidates a bifurcated TCA cycle in C. acetobutylicum. In: Genomics:GTL Awardee Workshop VII and USDA-DOE Plant Feedstock Genomics for Bioenergy Awardee Workshop2009 , February 8-11, 2009, Bethesda, Maryland. Becker, S.A., Feist, A.M. et al., (2007). Quantitative prediction of cellular metabolism with constraint-based models: the COBRA Toolbox. Nature Protocols, 2: 727-737. Bennett, B.D., Kimball, E.H. et al., (2009). Absolute metabolite concentrations and implied enzyme active site occupancy in Escherichia coli. Nature, 5 (8):593-599. Covert, M.W., Schilling, C.H. , Palsson, B.Ø. (2001). Regulation of gene expression in flux balance models of metabolism. Journal of Theoretical Biology, 213(1):73–88. Datta, R., Zeikus, J.G. (1985). Modulation of Acetone-Butanol-Ethanol Fermentation by Carbon Monoxide and Organic Acids. Applied and Environmental Microbiology, 49: 522-529. Desai, R.P. (1999). Development of metabolic flux analysis and antisense RNA technologies as tools for metabolic engineering of Clostridium acetobutylicum ATCC824. PhD thesis. pp136–138. Desai, R.P., Nielsen, L.K., Papoutsakis, E.T. (1999). Stoichiometric modeling of Clostridium acetobutylicum fermentations with non-linear constraints. Journal of Biotechnology, 71: 191–205. Edwards, J.S., Covert, M., Palsson, B.Ø. (2002). Metabolic modeling of microbes: the flux-balance approach. Environmental Microbiology, 4:133-140. Harris, L.M., Desai, R.P. et al., (2000). Characterization of recombinant strains of the Clostridium acetobutylicum butyrate kinase inactivation mutant: Need for new phenomenological models for solventogenesis and butanol inhibition?. Biotechnology and Bioengineering, 67:1-11. Heap, J.T., Pennington et al., (2007). The ClosTron: A universal gene knock-out system for the genus Clostridium. Journal of Microbiological Methods, 70 :452–464. Henry, C.S., Broadbelt, L. J., Hatzimanikatis, V. (2007). Thermodynamics-Based Metabolic Flux Analysis. Biophysical Journal, 92:1792–1805. Jankowski, M.D., Henry, C.S., Broadbelt, L.J., Hatzimanikatis, V. (2008). Group contribution methods for Thermodynamic analysis of complex metabolic networks. Biophysical Journal, 95: 1487–1499. Jones, D.T., Woods, D.R. (1986). Acetone-Butanol Fermentation Revisited. Microbiological Reviews, 50: 484-524. Kummel, A., Panke, S., Heinemann, M. (2006). Putative regulatory sites unraveled by network-embedded thermodynamic analysis of metabolome data. Molecular Systems Biology,1-10. Lee, J., Yun, H., Feist, A.M., Palsson, B.Ø., Lee, S.Y. (2008). Genome-scale reconstruction and in silico analysis of the Clostridium acetobutylicum ATCC 824 metabolic network. Appl Microbiol Biotechnol, 80:849–862.
Lee, S.L., Lee, D.Y., Kim, T.Y. (2005). Systems biotechnology for strain Improvement. Trends in Biotechnology, 23:349-359. Mahadevan, R., Schilling, C.H. (2003).The effects of alternate optimal solutions in constraint-based genome-scale metabolic models. Metabolic Engineering, 5:264–276 Maharjan, R.P., Ferenci, T. (2003). Global metabolite analysis: the influence of extraction methodology on metabolome profiles of Escherichia coli. Anal Biochem, 313:145-154. Meyer, C.L., Papoutsakis, E.T. (1989). Continuous and biomass recycle fermentations of Clostridium acetobutylicum. Bioprocess Engineering, 4:1-10. Monot, F., Martin, J.R., Petitdemange, H., Gay, R. (1982). Acetone and Butanol Production by Clostridium acetobutylicum in a Synthetic Medium. Applied and Environmental Microbiology, 44: 1318-1324. Nolling, J., Breton, G., Omelchenko, M.V., Makarova, K.S. (2001). Genome sequence and comparative analysis of the solvent-producing bacterium Clostridium acetobutylicum. Journal of Bacteriology,183:4823–4838. Peguin, S., Soucaille, P. (1995). Modulation of Carbon and Electron Flow in Clostridium acetobutylicum by Iron Limitation and Methyl Viologen Addition. Applied and Environmental Microbiology, 61: 403–405. Price, N.D., Papin, J.A., Palsson, B. Ø. (2002). Determination of redundancy and systems properties of the metabolic network of Helicobacter pylori using genome-scale extreme pathway analysis.Genome Research, 12, 760–769. Schilling, C., Edwards, J.S., Palsson, B.Ø. (1999).Toward metabolic phenomics: analysis of genomic data using flux balances. Biotechnology Progress, 15:288–295. Schilling, C., Letscher, D., Palsson, B. Ø. (2000). Theory for the systemic definition of metabolic pathways and their use in interpreting metabolic function from a pathway-oriented perspective. Journal of Theoretical Biology, 203, 229–248. Segrè D., Vitkup D., Church G.M. (2002) Analysis of optimality in natural and perturbed metabolic networks. Proc Natl Acad Sci USA 99: 15112–15117. Senger, R.S., Papoutsakis, E.T. (2008a). Genome-Scale Model for Clostridium acetobutylicum: Part I. Metabolic Network Resolution and Analysis. Biotechnology and Bioengineering, 101:1036-1052. Senger, R.S., Papoutsakis, E.T. (2008b). Genome-Scale Model for Clostridium acetobutylicum: Part II. Development of Specific Proton Flux States and Numerically Determined Sub-Systems. Biotechnology and Bioengineering, 101:1053-1071. Vallino, J.J., Stephanopoulos, G. (1993). Metabolic Flux Distributions in Corynebacterium glutamicum During Growth and Lysine Overproduction. Biotechnology and Bioengineering, 41: 633-646. Wang, Q.Z., Wu, C.Y., Chen, T., Zhao, X.M. (2006). Integrating metabolomics into systems biology framework to exploit metabolic complexity: strategies and applications in microorganisms. Appl Microbiol Biotechnol, 70: 151–161. Zamboni, N., Kümmel, A., Heinemann, A. (2008). anNET: a tool for network-embedded thermodynamic analysis of quantitative metabolome data.BMC Bioinformatics, 9:199.
Copyright held by the International Federation of Automatic Control 131
Copyright © 2022 FDOKUMEN