
Anti-Allergic Properties of the Natural PAF Antagonist Yangambin

Metabolomics Analysis and Modeling Suggest aLysophosphocholines-PAF Receptor Interaction inFibromyalgiaPierluigi Caboni1, Barbara Liori1, Amit Kumar2,3, Maria Laura Santoru2, Shailendra Asthana2,
Enrico Pieroni3, Antonella Fais1, Benedetta Era1, Enrico Cacace4, Valeria Ruggiero4, Luigi Atzori2*
1 Department of Life and Environmental Sciences, University of Cagliari, Cagliari, Italy, 2 Department of Biomedical Sciences, University of Cagliari, Cagliari, Italy,
3 Biomedicine Department, CRS4, Cagliari, Italy, 4 Department of Medical Sciences ‘‘Mario Aresu’’, University of Cagliari, Cagliari, Italy
Abstract
Fibromyalgia Syndrome (FMS) is a chronic disease characterized by widespread pain, and difficult to diagnose and treat. Weanalyzed the plasma metabolic profile of patients with FMS by using a metabolomics approach combining LiquidChromatography-Quadrupole-Time Of Flight/Mass Spectrometry (LC-Q-TOF/MS) with multivariate statistical analysis, aimingto discriminate patients and controls. LC-Q-TOF/MS analysis of plasma (FMS patients: n = 22 and controls: n = 21) identifiedmany lipid compounds, mainly lysophosphocholines (lysoPCs), phosphocholines and ceramides. Multivariate statisticalanalysis was performed to identify the discriminating metabolites. A protein docking and molecular dynamic (MD) studywas then performed, using the most discriminating lysoPCs, to validate the binding to Platelet Activating Factor (1-alkyl-2-acetyl-sn-glycero-3-phosphocholine, PAF) Receptor (PAFr). Discriminating metabolites between FMS patients and controlswere identified as 1-tetradecanoyl-sn-glycero-3-phosphocholine [PC(14:0/0:0)] and 1-hexadecanoyl-sn-glycero-3-phospho-choline [PC(16:0/0:0)]. MD and docking indicate that the ligands investigated have similar potentialities to activate the PAFrreceptor. The application of a metabolomic approach discriminated FMS patients from controls, with an over-representationof PC(14:0/0:0) and PC(16:0/0:0) compounds in the metabolic profiles. These results and the modeling of metabolite-PAFrinteraction, allowed us to hypothesize that lipids oxidative fragmentation might generate lysoPCs in abundance, that in turnwill act as PAF-like bioactivators. Overall results suggest disease biomarkers and potential therapeutical targets for FMS.
Citation: Caboni P, Liori B, Kumar A, Santoru ML, Asthana S, et al. (2014) Metabolomics Analysis and Modeling Suggest a Lysophosphocholines-PAF ReceptorInteraction in Fibromyalgia. PLoS ONE 9(9): e107626. doi:10.1371/journal.pone.0107626
Editor: Richard H Barton, Imperial College London, United Kingdom
Received April 22, 2014; Accepted August 13, 2014; Published September 19, 2014
Copyright: � 2014 Caboni et al. This is an open-access article distributed under the terms of the Creative Commons Attribution License, which permitsunrestricted use, distribution, and reproduction in any medium, provided the original author and source are credited.
Data Availability: The authors confirm that all data underlying the findings are fully available without restriction. All relevant data are within the paper and itsSupporting Information files.
Funding: This study was partially supported by the RAS–LR7/2007 [grant number CRP-24879] and University of Cagliari. The funders had no role in study design,data collection and analysis, decision to publish, or preparation of the manuscript.
Competing Interests: The authors have declared that no competing interests exist.
* Email: [email protected]
Introduction
FMS is a complex illness to diagnose and treat, with several
related syndromes. Collectively FMS is characterized by wide-
spread pain associated with a variety of other signs and symptoms,
such as restless sleep, tiredness, fatigue, anxiety, depression and
disturbances in bowel function. In the past, the most widely
adopted diagnostic criteria were those of the American College of
Rheumatology (ACR) [1] that defined FMS as a condition
characterized by widespread pain and by the presence of at least
11 out of 18 specific tender points on physical examination. In
2010, the ACR published diagnostic criteria for FMS that
encompass the chronic widespread pain, fatigue, unrefreshing
sleep, cognitive symptoms, such as confusion, forgetfulness,
inability to concentrate, and somatic symptoms, such as myalgia,
paresthesia, dizziness, constipation, chest pain, fever, etc, previ-
ously considered the hallmarks of this condition [2]. Due to lack of
knowledge about the pathogenesis, researchers studying fibromy-
algia strive to identify objective, measurable biomarkers that may
help to discover susceptible individuals, thus facilitating disease
diagnosis and management. Despite this effort, nowadays no
laboratory test has been validated for the diagnosis, which remains
basically clinical. This is one of the most important reasons for the
long diagnostic delay in FMS. Recently, oxidative stress with lipid
peroxidation induced by reactive oxygen species has been
proposed both as a relevant event in the pathogenesis of FMS
and as a factor related to clinical symptoms [3–5]. When
phospholipids are oxidized by radicals, several different types of
oxidative products are formed. These include phospholipids
containing fatty acid oxidation products, lysophospholipids and
fragmentation products of fatty acid oxidation. Oestvang et al [6]
suggest that lysophosphocoline might act through the PAFr
leading to a wide range of cell events, including: arachidonic acid
release, phospholipase D activity and cytosolic phospholipase A2
stimulation.
In this context, metabolomics analysis could be a valuable help.
Metabolomics is an effective post-genomic research tool, that has
been applied to many disciplines, including the study of human
diseases, food control and plant physiology. In clinical context,
metabolomics has recently been used to study relevant rheumatic
PLOS ONE | www.plosone.org 1 September 2014 | Volume 9 | Issue 9 | e107626

diseases [7,8]. The metabolomics approach includes various
separation and detection techniques, such as gas and liquid
chromatography coupled to mass spectrometry (GC-MS, LC-MS),
nuclear magnetic resonance (NMR) and capillary electrophoresis/
mass spectrometry (CE-MS). LC-Q-TOF/MS provides high
resolution and reproducibility and is frequently used to identify
compounds through the analysis of fragmentation patterns [9].
The application of metabolomics represents a major advance
towards understanding human metabolic components and it
allows application in the diagnosis of several diseases [10]. In
order to gain knowledge in the pathogenesis of fibromyalgia
syndrome, in this study we investigated the metabolic profile of
patients with the fibromyalgic syndrome. We focused mainly on
plasma lipidomic analysis by LC-Q-TOF/MS and patient-
discriminating metabolites such as PC(14:0/0:0) and PC(16:0/
0:0). These metabolites, having a PAF-like structure, were also
evaluated by docking them to PAFr and modeling the complex
dynamics.
Materials and Methods
PatientsA group of 22 females affected by FMS and 21 controls was
enrolled for this study. The study was approved by the ethical
committee of the University Hospital of Cagliari and written
informed consent was obtained from each woman before
inclusion. Diagnosis was based on a history of widespread pain,
defined as bilateral, upper and lower body, as well as in the spine,
and the presence of excessive tenderness on applying pressure to
11 out of 18 specific muscle–tendon sites (Tender Points),
according to the ACR classification criteria [1]. All the patients
also fulfilled the new ACR diagnostic criteria [2]. The presence of
a major clinical condition other than fibromyalgia was excluded by
physical examination and routine blood and urine screening. All
FMS patients were examined by a qualified rheumatologist and
were interviewed by the examining physician using the Fibromy-
algia Impact Questionnaire (FIQ) [11]. Clinical monitoring
included the 100 mm non anchored horizontal Visual Analogue
Scale (VAS) for pain (patient and medical VAS pain). Blood
samples were simultaneously collected. After centrifugation,
plasma samples were stored at -80uC until use.
Metabolomic analysisReagents. All chemicals used in this study were of analytical
grade. Methanol and chloroform were used as extraction solvents.
1-nonadecanoyl-sn-glycero-3-phosphocholine was used as internal
standard and acetonitrile was used as a solvent Sigma (St. Louis,
MO, USA).
Plasma sample preparation. 100 mL plasma samples were
extracted by slight modification of the Folch procedure [12]. The
first step consisted in the addition of 250 mL of methanol and
125 mL of chloroform containing nonadecanoyl-sn-glycero-3-
phosphocholine at 10 mg/L. Samples were then kept for 1 h at
room temperature. 380 mL of chloroform and 90 mL KCl 0.2 M
were subsequently added and samples were centrifuged for
10 minutes at 13,200 rpm. The aqueous phase was separated
from the organic layer and both phases were dried overnight
under a gentle nitrogen stream. The organic layer was
resuspended with 250 mL of ACN and samples were filtered with
Acrodisc Syringe Filters with 0.45 mm PTFE Membrane (SIGMA,
St. Louis, MO, USA).
LC-Q-TOF/MS analysis. The organic layers were analyzed
by reverse-phase LC on an Agilent 1200 series LC system fitted
with a microchip technology using an Agilent Zorbax 300 SB-C18
5 mm, 43 mm675 mm (Agilent, Santa Clara, CA). The LC
conditions were as follows: flow rate: 0.4 mL/min; solvent A:
0.1% formic acid in water; solvent B: acetonitrile; and gradient
was from 5% to 100% B over 10 min. The samples (1 mL) were
then analyzed by ESI in positive mode using an Agilent 6520
Time of Flight (TOF) MS. Mass spectral data were acquired in the
range m/z of 100–1,500 with an acquisition rate of 1.35 spectra/s,
averaging 10,000 transients. The source parameters were adjusted
as follows: drying gas temperature 250uC, drying gas flow rate 5
L/min, nebulizer pressure 45 psi, and fragmentor voltage 150 V.
On the basis of the original acquisition files, we performed a pre-
processing step with MetAlign software used for automated
baseline correction and alignment of all extracted mass peaks
across all samples. Results were stored as CSV file. ESI/QTOF
MS data were then analyzed using the molecular feature
extraction algorithm of the MassHunter Workstation software
(version B 03.01 Qualitative Analysis, Agilent Technologies, Santa
Clara, CA, USA). The molecular feature extraction algorithm took
all ions into account exceeding 1000 counts with a charge state
equal to one. Blank runs showed a maximum of 10 features with
the intensity threshold at 1000 counts. Isotope grouping was based
on the common organic molecules model (See Table S1 for LC-
MS raw data)
Statistical analysis. Principal components analysis (PCA) of
LC-MS Q-TOF analysis data was performed using SIMCA
software package (version 13.0, Umetrics, Umea, Sweden). PCA is
a data clustering and visualization method that is useful to extract
groupings within multivariate data. Data is represented in ndimensional space, where n, the number of variables, is reduced
into a few principal components (PC’s), which describe the
maximum variation within the data. The PC’s can be displayed in
a graphical fashion as a ‘‘scores’’ plot. This plot is useful for
observing any groupings in the data set and, in addition, for
highlighting outliers, that may be due to errors in sample
preparation or instrumentation parameters. Coefficients by which
the original variables must be multiplied to obtain the PC’s are
called ‘‘loadings’’. The numerical value of a loading of a given
variable on a PC shows how much the variable has in common
with that component, that is how much the variable contributes to
the selected PC. The PCA showing a degree of intrinsic clustering
(unsupervised) suggests that a PLS-DA of the same data should
produce robust classification models. Partial least squares (PLS)
regression is a well-known method to find the relationship between
predictor variables X and dependent variables y. In a PLS model,
not only the variance of X, but also the covariance between X and
y is taken into account. Therefore, the central point of PLS is to
find latent variables in the feature space that have a maximum
covariance with y. PLS-DA is a variant of PLS to improve the
separation between classes using a categorical response variable y.
Model performance was evaluated using the squared correlation
coefficient R2 (goodness of fit) and the cross-validated correlation
coefficient Q2 (goodness of prediction), both of which vary
between 0 and 1. In details, R2 provides an indication of how
much of the variation within a data set can be explained by the
various components of the model, while Q2 indicates how
accurately the data can be predicted. A good prediction model
is achieved when Q2.0.5, and an excellent prediction for Q2.
0.9. The contribution plot showing the influence of each process
variable to the statistic was calculated (SIMCA 13.0, Umetrics,
Umea, Sweden). A high contribution of a process variable usually
indicates a role of this specific variable. The misclassification table,
showing the proportion of correct classification, and summarizes
how well the selected model classifies the observations into the
known classes.
Metabolomics, PAF Receptor and Fibromyalgia
PLOS ONE | www.plosone.org 2 September 2014 | Volume 9 | Issue 9 | e107626

Modeling of PAFr and ligandsThe starting three dimensional structure of the PAFr was
obtained from the homology model realized by previous authors
[13]. The structures of the two lysoPC ligands – PC(14:0/0:0) and
PC(16:0/0:0) – and PAF compound were modeled using the web-
server CORINA [14]. All the three ligands have a polar head and
a long lipid chain, with PC(14:0/0:0) being the smallest ligand
among them. The structures of the ligands were subjected to
geometry optimization using the Hartree-Fock basis set HF-6-
31G* and the Gaussian03 package [15]. The charges and the force
field parameters for the ligand were evaluated following the
standard AMBER protocol [16]. The optimized structures of the
ligands were then subjected to docking analysis using standard
protocol in Autodock [17] software package. Before MD
simulations, each ligand-PAFr complex was embedded in a POPC
lipid bilayer, mimicking the cell membrane environment, and
subsequently inserted in a water box [18]. After an initial
relaxation and equilibration run of 3 ns, a production run for a
simulation length of 50 ns for the three systems was performed.
MD simulations were performed using NAMD software with
AMBER 99 force field parameters [19]. MD analysis concerned in
particular the evaluation of: 1) Root Mean Square Deviation
(RMSD) of ligand heavy atoms, allowing to measure the stability
and identify the configurations of the ligand inside the PAFr; 2)
durable H-bond interaction (at least 10% of the simulation time),
providing relevant contribution to the binding energy; 3) binding
free energies for the complexes, calculated by using SIETRAJ
software [20], allowing us to quantitatively estimate binding
affinity.
Results
LC-Q-TOF/MS analysisDemographic characteristics and clinical parameters of FMS
and Control subjects are reported in Table 1.LC-Q-TOF/MS
analysis of the organic layer of plasma identified lipid compounds,
mainly lysoPCs, phosphocholines and ceramides. The unsuper-
vised PCA analysis of the metabolites identified by LC-Q-TOF/
MS didn’t show any outlier or intrinsic distribution, therefore all
subjects were used for the following supervised PLS-DA analysis
(Fig. 1). Quality assessment parameters of the resulting model are
R2X = 0.345, R2Y = 0.901, Q2 = 0.806 and p-value = 1.1610212.
PLS-DA analysis of the identified lipids showed a relevant and
significant difference between the two groups, fibromyalgia vscontrols (Fig.1). In order to describe the individual contribution of
the identified metabolites a Contribution Plot has been created by
using the different loadings (Fig.2). By loadings plot analysis the
most relevant molecules discriminating the two classes were:
PC(14:0/0:0), PC(16:0/0:0), 1-(9E-hexadecenoyl)-sn-glycero-3-
phosphocholine, 1-heptadecanoyl-sn-glycero-3-phosphocholine,
1-(9Z-octadecenoyl)-sn-glycero-3-phosphocholine, 1-(2E,4E-octa-
decadienoyl)-sn-glycero-3-phosphocholine and 1-(4Z,7Z,10Z,13Z,
16Z,19Z-docosahexaenoyl)-sn-glycero-3-phosphocholine. When
the plasma non polar compounds were analyzed by GC/MS we
were not able to discriminate FMS from controls (data not shown).
The ability of the model to correctly classify the individual subjects
was evaluated by the misclassification table tool available in
SIMCA. Misclassification analysis was able to correctly classify all
the subjects under investigation (Table 2). Among the most
discriminant metabolites, PC(14:0/0:0) and PC(16:0/0:0) have a
PAF-like structure, so the ability of these lysoPCs to interact with
PAFr was further investigated by MD.
Docking and Molecular Dynamics AnalysisThe initial docking analysis suggested the most relevant binding
sites for all the lysoPC ligands to be located inside the PAFr.
Furthermore, docking results indicated that PAFr displays a
preferential binding towards PC(14:0/0:0) with respect to the
other ligands (Table 3). Free energies obtained by docking also
show that the ligand PC(14:0/0:0) displays for PAFr a binding
energy very similar to the physiological PAF ligand PC(O-16:0,2:0)
(Table 3). The complex structures obtained from docking analysis
were then subjected to MD simulations. We analyzed in detail the
physicochemical properties of the ligand-PAFr binding dynamics,
as reported in the next paragraphs. The final docking pose of the
ligands inside PAFR is shown in Fig. 3 (Molecular movies of
ligand PC docked inside PAF receptor during MD simulations are
shown in Movie S1 and S2). Ligand RMSD inside the PAFr was
evaluated (Table 3). Analyzing in details the RMSD distribution
histograms, a moderate difference was observed between the
PC(14:0/0:0) and PC(16:0/0:0) ligands, both showing essentially a
single configuration peak, corresponding to a unique and well
defined chemical binding configuration. Regarding the PAF
ligand, the RMSD peak value is shifted to the left by ,2 A, with
respect to the other two lysoPC ligands. In summary, PC(16:0/0:0)
and PC(14:0/0:0) ligands appear to be slightly more flexible than
PAF, but overall the three ligands display similar binding
configurations inside the receptor. We evaluated H-bond interac-
tions between the ligands and the PAFr. Notably, a conserved and
durable H-bond interaction involving single residue R172 in Loop
E2 and the two lysoPC ligands was observed. PC(14:0/0:0) ligand
is also involved in H-bond interactions with residues from Helix 2,
Helix 6 and Loop E2, while PC(16:0/0:0) is involved with residues
from Helix 3, Helix 5, Helix 6 and Loop E2. Finally, the free
energies were estimated. These values are coherent with the
previous H-bond analysis and importantly confirm that PAF,
PC(14:0/0:0) and PC(16:0/0:0) ligands display a similar binding
affinity for PAFr (Table 3).
Discussion
To the best of our knowledge, no metabolomic study has been
reported on plasma of FMS patients, although a metabolomic
approach might be useful to better understand the pathogenesis of
this disorder and identify potential biomarkers. This is the first
study showing a distinct metabolomic profiles of FMS patients and
controls. In particular LC-Q-TOF/MS analyses revealed an
higher level of lysoPCs in FMS patients with respect to controls.
We focused on the LCMS determination of lyso PC because
human serum levels of lyso PC is about several hundred
nanomoles per milliliter, while PAF is generally present at very
low concentrations in many biological specimens. Lipid oxidative
fragmentation generates lysoPCs, implicating that they could be a
source of PAF-like bioactivators in FMS. LysoPCs are formed in
human plasma: the palmitic acid- and stearic acid-containing
species are formed by the lecithin-cholesterol acyltransferase
reaction, the oleic acid- and linoleic acid-containing species by
the action of PLA2 [21]. LysoPCs containing myristic and palmitic
acid may also derive from the action of PAF-acetylhydrolase on
oxidation products of phosphocholine [22] consequent to LDL
oxidation and/or oxidative stress. The latter process could explain
our data showing an increase of plasma PC(14:0/0:0) and
PC(16:0/0:0) in FMS.
Assessment of thiobarbituric acid reactive substances for the
measurement of lipid peroxidation revealed values over two-fold of
the normal range in FMS patients (data not shown), indicating a
condition of oxidative stress. These data might be consistent with a
Metabolomics, PAF Receptor and Fibromyalgia
PLOS ONE | www.plosone.org 3 September 2014 | Volume 9 | Issue 9 | e107626

previous study [23] that showed unexpected normal levels of uric
acid despite high levels of inosine, hypoxanthine, xanthine in FMS
patients. Uric acid is a powerful free radical scavenger in humans
that might not be increased in FMS patients due to its
consumption as a reactive oxygen species scavenger. Therefore,
it is reasonable to speculate that lysoPCs might act through the
PAFr mediation to activate a wide range of cell events [6]. The
higher affinity of the lysoPC here investigated toward PAFr
supports the hypothesis that these ligands are able to induce the
PAF receptor open state, activate it and then initiate the signal
transduction cascade through G-protein-PAFr coupling. In our
case, through modeling and MD analysis, we observed a binding
energy and configuration of PC(14:0/0:0) and PC(16:0/0:0)
similar to that obtained for PAF, the PAFr physiological ligand
(Table 3). The difference in binding free energies obtained with
docking and with MD simulations can be due to the fact that
conformational changes of the receptor are not considered in the
docking protocol. Moreover, docking was performed without a
priori information mainly to identify the relevant binding sites.
Considering the simulation error in evaluating the binding free
energies by MD, our results indicate that all the ligands here
investigated have similar potentialities to activate the PAFr
(Table 3). Previous experimental [24] and simulation studies
[13] have suggested histidine residues located in helix 5 (His 188)
Figure 1. PCA (A) and PLS-DA (B) of plasma analysis from patients with FMS vs controls. PLSA-DA values were: R2X = 0,345 R2Y = 0.901Q2 = 0,806 p-value = 1.1610212.doi:10.1371/journal.pone.0107626.g001
Metabolomics, PAF Receptor and Fibromyalgia
PLOS ONE | www.plosone.org 4 September 2014 | Volume 9 | Issue 9 | e107626

Figure 2. Contribution plot of plasma analysis from patients with FMS vs controls.doi:10.1371/journal.pone.0107626.g002
Table 1. Demographic characteristics and clinical parameters of FMS and Controls.
FMS (n = 22) CONTROLS (n = 21)
Age [years, mean (SE), range] 52 (3) (27–72) 50 (2) (27–67)
Menopause n = 15 n = 9
Body Mass Index (m2/kg)(mean 6 SE) 26 (1) 23 (0.6)
Pain score patient (VAS mm) (mean 6 SE) 57 (7) -
Pain score physician (VAS mm) (mean 6 SE) 40 (4) -
FIQ total score (2–100) (mean 6 SE) 61621 -
Associated clinical distresses
Tension type headache n = 16 -
Irritable colon n = 16 -
Oto vestibule syndrome n = 13 -
Paraesthesia n = 14 -
Sleep disturbance n = 14 -
Dysmenorrhea n = 4 -
Hemicrania n = 8 -
Urethral syndrome n = 8 -
Medication
No therapy n = 7 n = 21
Tricyclic* n = 8 -
SSRI** n = 2 -
SSNRIs n = 5 -
* Amitriptyline ,15 mg/die).** Selective Serotonin Reuptake Inhibitors (Citalopram 20 mg/die).***Selective Serotonin Noradrenaline Reuptake Inhibitors (Duloxetin 30 mg/die).doi:10.1371/journal.pone.0107626.t001
Metabolomics, PAF Receptor and Fibromyalgia
PLOS ONE | www.plosone.org 5 September 2014 | Volume 9 | Issue 9 | e107626

and helix 6 (His 248, His 249) to be important for ligand binding.
Our results confirm this observation, with His 188 involved in H-
bond interactions with both PAF and PC(16:0/0:0), His 248 with
PC(14:0/0:0) alone, and His 249 with PAF alone. The RMSD
variation observed for helix 6 for all the three ligands is smaller
with respect to what reported in MD simulations by previous
authors for another PAFr antagonist [13]. Nevertheless, we
noticed an identical peak for PAF and PC(16:0/0:0) RMSD
distribution in helix 6. The other ligand, PC(14:0/0:0), tends to
show in helix 3 higher RMSD values in the second half of the
simulation time, that can be interpreted as an evidence of a
conformational change upon binding, which again could be linked
to receptor activation. In detail, PAF is a lipid mediator derived
from cell membrane and it is implicated in a variety of
physiological and pathological conditions [25–28]. Because of
such a wide and relevant biological activity, the levels of PAF in
cells and in blood are strictly regulated at very low levels. The
intercellular actions of PAF are mediated through a G-protein–
linked receptor, PAFr, that is expressed on the surface of a variety
of cell types [29–31] and can be inhibited by a great variety of
chemical compounds [32]. Thus, it seems evident that PAFr can
Table 2. Misclassification table showing the proportion of correctly classified observations in FMS patients and control.
Class Members Correct (%) FMS CONTROLS No class
FMS 22 100 22 0 0
Control 21 100 0 21 0
No class 0 0 0 0 0
Total 43 100 22 21 0
Fishers probability: 9,50E-13.doi:10.1371/journal.pone.0107626.t002
Figure 3. Best binding pose obtained for the ligands (i) PC(14:0/0:0) in green and (ii) PC(16:0/0:0) in red inside PAF receptor. Thereceptor is shown using cartoon representation with helix 3 in pink and helix 6 in orange. The ligands are shown using ball and stick representation.doi:10.1371/journal.pone.0107626.g003
Metabolomics, PAF Receptor and Fibromyalgia
PLOS ONE | www.plosone.org 6 September 2014 | Volume 9 | Issue 9 | e107626
induce a variety of intracellular signaling pathways evoking a wide
range of biological functions [27].
Accumulating evidence indicates that the PAF/PAFr system
plays a role in modulating pain signaling. For instance, some
studies show that local injection of PAF into peripheral tissues,
such as skin, enhances pain sensitivity in animals and humans [33],
thus suggesting that PAF is an important substrate in the complex
biological pathways leading to the pain. In the central nervous
system, it has been reported that PAF is implicated in the
induction of pain behaviors. Morita et al. [34] demonstrated that
intrathecal injection of PAF produced potent tactile allodynia in
mice, suggesting that PAF in the spinal cord may be a mediator of
neuropathic pain following peripheral nerve injury [35]. Some
authors [36] indicate that neuropathic pain may also be a
component of FMS. In fact, a hallmark of neuropathic pain
syndrome is tactile allodynia; for instance other Authors [37]
reported that the activation of the PAFr may be a key event in the
development and maintenance of tactile allodynia and production
of pro-inflammatory cytokines such as TNFa and IL-1b in the
rodent dorsal root ganglion.
Conclusions
In conclusion, our results indicate, in a relatively small number
of patients needing to be further validated, the capability of a
metabolomics approach to identify distinct metabolic profiles for
FMS patients and controls, suggesting a possible role for lysoPCs
as biomarkers or a contribute to the disease phenotype by having a
role in the pathogenesis of this condition. Our metabolomics
results indicate a lysoPCs increase in FMS patients. Through
modeling, we focused the molecular dynamics analysis of the
binding capability of an endogenous ligand PAF and two
exogenous-derived lysophosphocolines having a structure similar
to PAF. In particular PC(14:0/0:0) and PC(16:0/0:0), may have a
PAF-like function, activating PAFr and supposedly playing a role
in the clinical manifestation of FMS. So, these results suggest
potential new disease biomarkers and new approaches for
treatment in FMS.
Supporting Information
Table S1 LC-Q-TOF/MS raw data from Control (n = 21)and FMS patients (n = 22).(XLS)
Movie S1 Molecular movie of Ligand PC(14:0/0:0)docked inside PAF receptor during 50 ns of MDsimulations. The receptor is shown using cartoon in grey and
the ligand using licorice representation and in red.
(MPG)
Movie S2 Molecular movie of Ligand PC(16:0/0:0)docked inside PAF receptor during 50 ns of MDsimulations. The receptor is shown using cartoon in grey and
the ligand using licorice representation and in green.
(MPG)
Author Contributions
Conceived and designed the experiments: PLC AK EP AF EC VR LA.
Performed the experiments: PLC BL MLS AK BE. Analyzed the data:
PLC BL AK MLS SA EP LA. Contributed reagents/materials/analysis
tools: PLC EP LA. Wrote the paper: PLC BL AK MLS SA EP AF BE VR
LA.
References
1. Wolfe F, Smythe HA, Yunus MB, Bennett RM, Bombardier C, et al (1990) The
American College of Rheumatology 1990 criteria for the classification of
fibromyalgia. Report of the Multicenter Criteria Committee. Arthritis Rheum
33: 160–172.
2. Wolfe F, Clauw DJ, Fitzcharles MA, Goldenberg DL, Katz RS, et al (2010) The
American College of Rheumatology Preliminary Diagnostic Criteria for
Fibromyalgia and Measurement of Symptom Severity. Arthritis Care Research
62: 600–610.
3. Altindag O, Celik H (2006) Total antioxidant capacity and the severity of the
pain in patients with fibromyalgia. Redox Rep 11: 131–135.
4. Ozgocmen S, Ozyurt H, Sogut S, Akyol O, Ardicoglu O, et al (2006)
Antioxidant status, lipid peroxidation and nitric oxide in fibromyalgia: etiologic
and therapeutic concerns. Rheumatol Int 26: 598–603.
5. Cordero MD, Alcocer-Gomez E, Cano-Garcia FJ, De Miguel M, Carrion AM,
et al (2011) Clinical symptoms in fibromyalgia are better associated to lipid
peroxidation levels in blood mononuclear cells rather than in plasma. PLoS One
6: e26915.
6. Oestvang J, Anthonsen MW, Johansen B (2011) LysoPC and PAF trigger
arachidonic acid release by divergent signaling mechanisms in monocytes.
J Lipids Article ID 532145, 11 pages; doi:10.1155/2011/532145
7. Weljie AM, Dowlatabadi R, Miller BJ, Vogel HJ, Jirik FR (2007) An
inflammatory arthritis-associated metabolite biomarker pattern revealed by 1H
NMR spectroscopy. J Proteome Res 6: 3456–3464.
8. Young SP, Kapoor SR, Viant MR, Byrne JJ, Filer A, et al. (2013) The impact ofinflammation on metabolomic profiles in patients with arthritis. Arthritis &
Rheumatism 5: 2015–2023.
9. Griffin JL, Atherton H, Shockcor J, Atzori L (2011) Metabolomics as a tool for
cardiac research. Nat Rev Cardiol 8: 630–643.
10. Nicholson JK, Holmes E, Kinross JM, Darzi AW, Takats Z, et al (2012)Metabolic phenotyping in clinical and surgical environments. Nature 491: 384–
392.
11. Bennett R (2005) The Fibromyalgia Impact Questionnaire (FIQ): a review of its
development, current version, operating characteristics and uses. Clin ExpRheumatol 23: S154–162.
12. Folch J, Lees M, Sloan Stanley GH (1957) A simple method for the isolation and
purification of total lipides from animal tissues. J. Biol. Chem 226: 497–509.
13. Gui C, Zhu W, Chen G, Luo X, Oi W. et al (2007) Understanding the
Regulation Mechanisms of PAF Receptor by Agonists and Antagonists:Molecular Modeling and Molecular Dynamics Simulation Studies. PROTEINS:
Structure, Function, and Bioinformatics 67: 41–52.
14. http://www.molecular-networks.com/online_demos/corina_demo.
15. Frisch MJ, Trucks GW; Schlegel HB; Scuseria GE; Robb MA, et al (2004)
Gaussian 03, Revision C.02. Wallingford CT..
16. Wang J, Wolf RM, Caldwell JW, Kollman PA, Case DA (2004) Developmentand testing of a general amber force field. J Comput Chem 25: 1157–1174.
17. Morris GM, Huey R, Lindstrom W, Sanner MF, Belew RK, et al (2009)
AutoDock4 and AutoDockTools4: Automated docking with selective receptor
flexibility. J Comput Chem 30: 2785–2791.
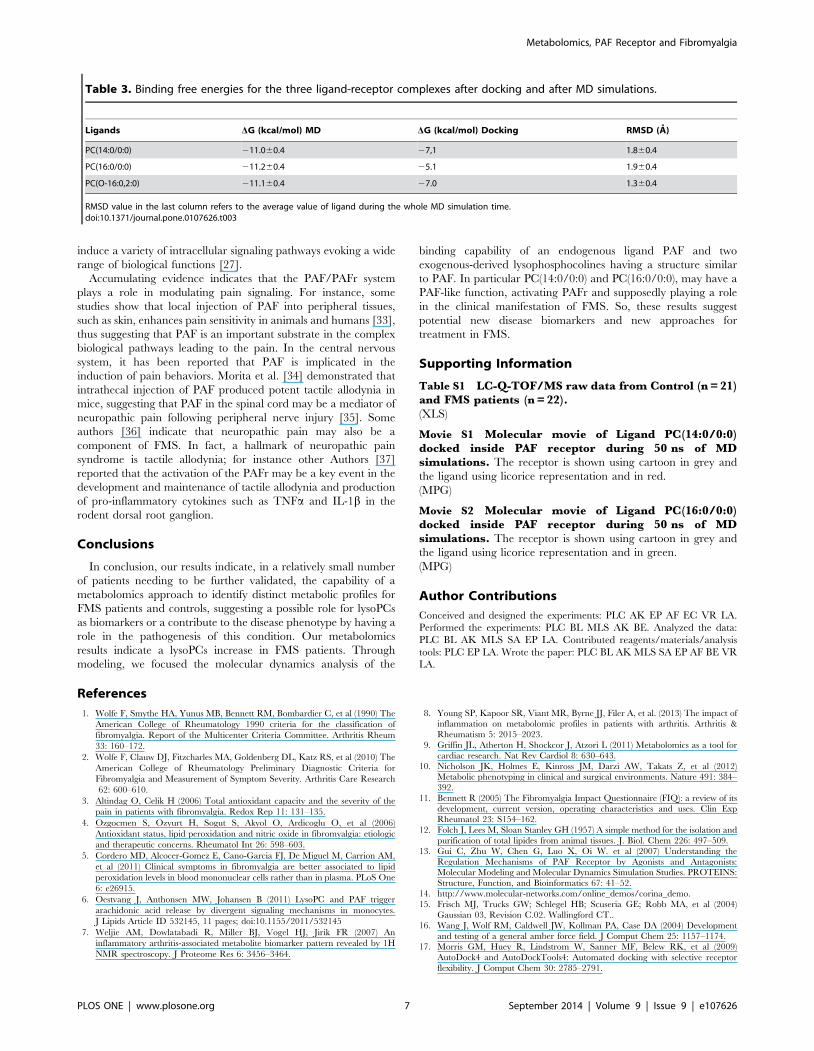
Table 3. Binding free energies for the three ligand-receptor complexes after docking and after MD simulations.
Ligands DG (kcal/mol) MD DG (kcal/mol) Docking RMSD (A)
PC(14:0/0:0) 211.060.4 27,1 1.860.4
PC(16:0/0:0) 211.260.4 25.1 1.960.4
PC(O-16:0,2:0) 211.160.4 27.0 1.360.4
RMSD value in the last column refers to the average value of ligand during the whole MD simulation time.doi:10.1371/journal.pone.0107626.t003
Metabolomics, PAF Receptor and Fibromyalgia
PLOS ONE | www.plosone.org 7 September 2014 | Volume 9 | Issue 9 | e107626

18. Kumar A, Hajjar E, Ruggerone P, Ceccarelli M (2010) Structural and
dynamical properties of the porins OmpF and OmpC: insights from molecular
simulations. J Phys Condens Matter 22: 454125.
19. Phillips JC, Braun R, Wang W, Gumbart J, Tajkhorshid E, et al (2005) Scalable
molecular dynamics with NAMD. J Comput Chem 26: 1781–1802.
20. Naım M, Bhat S, Rankin KN, Dennis S, Chowdhury SF, et al (2007) Solvated
interaction energy (SIE) for scoring protein-ligand binding affinities. 1. Exploring
the parameter space. J Chem Inf Model 47: 122–133.
21. Subbaiah PV, Chen SCH, Bagdade JD, Albers JJ (1985) Substrate Specificity of
Plasma Lysolecithin Acyltransferase and the Molecular Species of Lecithin
Formed by the Reaction. J Biol Chem 260: 5308–5314.
22. Karabina SA, Ninio E (2006) Plasma PAF-acetylhydrolase: An unfulfilled
promise? Biochim Biophys Acta 1761: 1351–1358.
23. Fais A, Cacace E, Corda M, Era B, Peri M, et al (2013) Purine metabolites in
fibromyalgia syndrome. Clin Biochem 46: 37–39.
24. Ishii I, Izumi T, Tsukamoto H, Umeyama H, Ui M, et al. (1997) Alanine
exchanges of polar amino acids in the transmembrane domains of a platelet-
activating factor receptor generate both constitutively active and inactive
mutants. J Biol Chem 272: 7846–7854.
25. Gelbard HA, Nottet HS, Swindells S, Jett M, Dzenko KA, et al (1994) Platelet-
activating factor: a candidate human immunodeficiency virus type 1-induced
neurotoxin. J Virol 68: 4628–4635.
26. Prescott SM, Zimmerman GA, Stafforini DM, McIntyre TM (2000) Platelet-
activating factor and related lipid mediators. Annu Rev Biochem 69: 419–445.
27. Ishii S, Shimizu T (2000) Platelet-activating factor (PAF) receptor and genetically
engineered PAF receptor mutant mice Prog Lipid Res 39: 41–82.
28. Demopoulos CA, Pinckard RN, Hanahan DJ (1979) Platelet-activating factor.
Evidence for 1-O-alkyl-2-acetyl-sn-glyceryl-3-phosphorylcholine as the active
component (a new class of lipid chemical mediators) J. Biol. Chem 254: 9355–
9358.29. Nakamura M, Honda ZI, Izumi T, Sakanaka C, Mutoh H, et al (1991)
Molecular cloning and expression of platelet- activating factor receptor from
human leukocytes. J Biol Chem 266: 20400–20405.30. Ye RD, Prossnitz ER, Zou A, Cochrane CG (1991) Characterization of a human
cDNA that encodes a functional receptor for platelet activating factor. BiochemBiophys Res Commun 180: 105–111.
31. Kunz D, Gerard NP, Gerard C (1992) The human leukocyte platelet-activating
factor receptor. cDNA cloning, cell surface expression, and construction of anovel epitope-bearing analog. J Biol Chem 267: 9101–9106.
32. Tsoupras AB, Papakyriakou A, Constantinos A, Demopoulos CA, Philippopou-los AI (2013) Synthesis, biochemical evaluation and molecular modeling studies
of novel rhodium complexes with nanomolar activity against Platelet ActivatingFactor. J Inorg Biochem 120: 63–73.
33. Tsuda M, Tozaki-saitoh H, Inoue K (2011) Platelet-Activating Factor and pain.
Biol. Pharm. Bull 34: 1159–1162.34. Morita K, Morioka N, Abdin J, Kitayama S, Nakata Y, et al (2004)
Development of tactile allodynia and thermal hyperalgesia by intrathecallyadministered platelet-activating factor in mice. Pain 111: 351–359.
35. Morita K, Kitayama T, Morioka N, Dohi T (2008) Glycinergic mediation of
tactile allodynia induced by platelet-activating factor (PAF) through glutamate-NO-cyclic GMP signalling in spinal cord in mice. Pain 138: 525–536.
36. Dworkin RH, Fields HL (2005) Fibromyalgia from the perspective of neuropaticpain. J. Rheumatol 75(s): 1–5.
37. Hasegawa S, Kohro Y, Shiratori M, Ishii S, Shimizu T, et al (2010) Role of PAFReceptor in Proinflammatory Cytokine Expression in the Dorsal Root Ganglion
and Tactile Allodynia in a Rodent Model of Neuropathic Pain. PLoS ONE 5:
e10467.
Metabolomics, PAF Receptor and Fibromyalgia
PLOS ONE | www.plosone.org 8 September 2014 | Volume 9 | Issue 9 | e107626
Copyright © 2022 FDOKUMEN