Unbinding forces of single pertussis toxin–antibody complexes measured by atomic force...
10
Unbinding forces of single pertussis toxin– antibody complexes measured by atomic force spectroscopy correlate with their dissociation rates determined by surface plasmon resonance Nadège Moreno a,b , Michel Chevalier a *, Frédéric Ronzon a , Catherine Manin a , Monique Dupuy a , Tino Krell c and Jean-Paul Rieu b ** An inactivated form of pertussis toxin (PTX) is the primary component of currently available acellular vaccines against Bordetella pertussis, the causative agent of whooping cough. The PTX analyzed here is purified at industrial scale and is subsequently inactivated using glutaraldehyde. The influence of this treatment on antibody recognition is of crucial importance and is analyzed in this study. Surface plasmon resonance (SPR) experiments using PTX and its inactivated form (toxoid) with 10 different monoclonal antibodies were conducted. PTX was found to recognize the antibodies with an average affinity of 1.34 0.50 nM, and chemical inactivation caused only a modest decrease in affinity by a factor of approximately 4.5. However, glutaraldehyde treatment had contrary effects on the kinetic association constant k a and the dissociation constant k d . A significant reduction in k a was observed, whereas the dis- sociation of the toxoid from the bound antibody occurred slower than PTX. These data indicate that the chemical inactivation of PTX not only reduces the velocity of antibody recognition but also stabilizes the interaction with anti- bodies as shown by a reduction in k d . The same interactions were also studied by dynamic force spectroscopy (DFS). Data reveal a correlation between the k d values determined by SPR and the mean unbinding force as measured by DFS. The unbinding forces of one complex were determined as a function of the loading rate to directly estimate the k d value. Several interactions were impossible to be analyzed using SPR because of ultratight binding. Using DFS, the unbinding forces of these interactions were determined, which in turn could be used to estimate k d values. The use of DFS as a technique to study ultratight binding is discussed. Copyright © 2011 John Wiley & Sons, Ltd. Keywords: AFM, force spectroscopy; PTX, pertussis toxin; SPR, surface plasmon resonance; DFS, dynamic force spectroscopy INTRODUCTION Bordetella pertussis is the main etiologic agent of whooping cough, a severe childhood disease (Locht, 1999; Locht et al., 2001). Nearly 50 million cases of whooping cough occur every year worldwide, and an estimated 300 000 persons die each year from this disease (He and Mertsola, 2008). It is further estimated that in 2003, global vaccination against pertussis averted approx- imately 38.3 million cases and 607 000 deaths (Tan et al., 2005). Although mostly prevalent in developing countries, the disease is also re-emerging in the developed world (Das, 2002; Tan et al., 2005). Pertussis toxin (PTX), the major virulence factor of B. pertussis, is an oligomeric protein composed of five noncovalently linked subunits, termed S1 to S5 according to their decreasing molec- ular weight (Locht and Keith, 1986; Nicosia et al., 1986). The structure of the toxin conforms to the A-B model for bacterial toxins (Tamura et al., 1982). The A protomer is composed of the subunit S1, which possesses ADP ribosyltransferase and NAD glycohydrolase activities (Locht and Antoine, 1995). The B oligomer is formed of two different dimers, D1 (subunits S2 and S4) and D2 (subunits S3 and S4), held together by the S5 * Correspondence to: Jean-Paul Rieu, Laboratoire de Physique de la Matière Condensée et Nanostructures, Université de Lyon, Université de Lyon I, CNRS, UMR 5586, 43 Boulevard du 11 Nov. 1918, Villeurbanne Cedex, France. E-mail [email protected] **Correspondence to: Michel Chevalier, Sanofi Pasteur, Bâtiment X3, 1541 avenue Marcel Mérieux, 69280 Marcy l’Etoile, France. E-mail Michel.Chevalier@sanofi- pasteur.com a N. Moreno, M. Chevalier, F. Ronzon, C. Manin, M. Dupuy Sanofi Pasteur, Bâtiment X3, 1541 avenue Marcel Mérieux, 69280 Marcy l’Etoile, France b N. Moreno, J.-P. Rieu Laboratoire de Physique de la Matière Condensée et Nanostructures, Université de Lyon, Université Claude Bernard Lyon I, CNRS, UMR 5586, 43 Boulevard du 11 Nov. 1918, Villeurbanne Cedex, France c T. Krell Department of Environmental Protection, Estación Experimental del Zaidín, CSIC, Granada 18008, Spain Abbreviations: PTX, pertussis toxin; SPR, surface plasmon resonance; DFS, dynamic force spectroscopy; ADP, adenosin diphosphate; NAD, nicotinamide adenine dinucleotide; ITC, Isothermal titration calorimetry; HBS-EP, HEPES buffer saline-EDTA surfactant P20. J. Mol. Recognit. 2011; 24: 1105–1114 Copyright © 2011 John Wiley & Sons, Ltd. Research Article Received: 8 February 2011, Revised: 29 July 2011, Accepted: 29 July 2011, Published online in Wiley Online Library: 2011 (wileyonlinelibrary.com) DOI: 10.1002/jmr.1159 1105
Transcript of Unbinding forces of single pertussis toxin–antibody complexes measured by atomic force...

Unbinding forces of single pertussis toxin–antibody complexes measured by atomicforce spectroscopy correlate with theirdissociation rates determined by surfaceplasmon resonanceNadège Morenoa,b, Michel Chevaliera*, Frédéric Ronzona,Catherine Manina, Monique Dupuya, Tino Krellc and Jean-Paul Rieub**
An inactivated form of pertussis toxin (PTX) is the primary component of currently available acellular vaccinesagainst Bordetella pertussis, the causative agent of whooping cough. The PTX analyzed here is purified at industrialscale and is subsequently inactivated using glutaraldehyde. The influence of this treatment on antibody recognitionis of crucial importance and is analyzed in this study. Surface plasmon resonance (SPR) experiments using PTX andits inactivated form (toxoid) with 10 different monoclonal antibodies were conducted. PTX was found to recognizethe antibodies with an average affinity of 1.34� 0.50nM, and chemical inactivation caused only a modest decreasein affinity by a factor of approximately 4.5. However, glutaraldehyde treatment had contrary effects on the kineticassociation constant ka and the dissociation constant kd. A significant reduction in ka was observed, whereas the dis-sociation of the toxoid from the bound antibody occurred slower than PTX. These data indicate that the chemicalinactivation of PTX not only reduces the velocity of antibody recognition but also stabilizes the interaction with anti-bodies as shown by a reduction in kd. The same interactions were also studied by dynamic force spectroscopy (DFS).Data reveal a correlation between the kd values determined by SPR and the mean unbinding force as measured byDFS. The unbinding forces of one complex were determined as a function of the loading rate to directly estimate thekd value. Several interactions were impossible to be analyzed using SPR because of ultratight binding. Using DFS, theunbinding forces of these interactions were determined, which in turn could be used to estimate kd values. The useof DFS as a technique to study ultratight binding is discussed. Copyright © 2011 John Wiley & Sons, Ltd.
Keywords: AFM, force spectroscopy; PTX, pertussis toxin; SPR, surface plasmon resonance; DFS, dynamic force spectroscopy
INTRODUCTIONBordetella pertussis is the main etiologic agent of whoopingcough, a severe childhood disease (Locht, 1999; Locht et al.,2001). Nearly 50 million cases of whooping cough occur everyyear worldwide, and an estimated 300 000 persons die each yearfrom this disease (He and Mertsola, 2008). It is further estimatedthat in 2003, global vaccination against pertussis averted approx-imately 38.3million cases and 607 000 deaths (Tan et al., 2005).Although mostly prevalent in developing countries, the diseaseis also re-emerging in the developed world (Das, 2002; Tanet al., 2005).Pertussis toxin (PTX), the major virulence factor of B. pertussis,
is an oligomeric protein composed of five noncovalently linkedsubunits, termed S1 to S5 according to their decreasing molec-ular weight (Locht and Keith, 1986; Nicosia et al., 1986). Thestructure of the toxin conforms to the A-B model for bacterialtoxins (Tamura et al., 1982). The A protomer is composed ofthe subunit S1, which possesses ADP ribosyltransferase andNAD glycohydrolase activities (Locht and Antoine, 1995). The Boligomer is formed of two different dimers, D1 (subunits S2and S4) and D2 (subunits S3 and S4), held together by the S5
* Correspondence to: Jean-Paul Rieu, Laboratoire de Physique de la MatièreCondensée et Nanostructures, Université de Lyon, Université de Lyon I, CNRS,UMR 5586, 43 Boulevard du 11 Nov. 1918, Villeurbanne Cedex, France.E-mail [email protected]
**Correspondence to: Michel Chevalier, Sanofi Pasteur, Bâtiment X3, 1541 avenueMarcel Mérieux, 69280 Marcy l’Etoile, France. E-mail [email protected]
a N. Moreno, M. Chevalier, F. Ronzon, C. Manin, M. DupuySanofi Pasteur, Bâtiment X3, 1541 avenue Marcel Mérieux, 69280 Marcyl’Etoile, France
b N. Moreno, J.-P. RieuLaboratoire de Physique de la Matière Condensée et Nanostructures, Universitéde Lyon, Université Claude Bernard Lyon I, CNRS, UMR 5586, 43 Boulevard du11 Nov. 1918, Villeurbanne Cedex, France
c T. KrellDepartment of Environmental Protection, Estación Experimental del Zaidín,CSIC, Granada 18008, Spain
Abbreviations: PTX, pertussis toxin; SPR, surface plasmon resonance; DFS,dynamic force spectroscopy; ADP, adenosin diphosphate; NAD, nicotinamideadenine dinucleotide; ITC, Isothermal titration calorimetry; HBS-EP, HEPESbuffer saline-EDTA surfactant P20.
J. Mol. Recognit. 2011; 24: 1105–1114 Copyright © 2011 John Wiley & Sons, Ltd.
Research Article
Received: 8 February 2011, Revised: 29 July 2011, Accepted: 29 July 2011, Published online in Wiley Online Library: 2011
(wileyonlinelibrary.com) DOI: 10.1002/jmr.1159
1105

subunit (Stein et al., 1994). The B oligomer contains the target-cell receptor binding sites (Tamura et al., 1982). After bindingof PTX to the target cell, the S1 subunit is internalized into thecell. The toxicity of PTX is based on the S1-mediated ADP ribosy-lation of host cell G proteins, leading to their inactivation andconsequently disruption of the corresponding signal transduc-tion cascades (Locht and Antoine, 1995; Carbonetti, 2010).
Several vaccines have been developed to fight this disease.Initially, whole-cell vaccines were produced, which are nowreplaced in more and more countries by the acellular pertussisvaccines (Sato et al., 1984). More than 10 different acellular vac-cines are now available (Storsaeter et al., 2007). As an essentialcomponent, vaccines contain an inactivated form of PTX and inaddition one or several other bacterial components such as fila-mentous hemagglutinin, pertactin, and fimbriae. Detoxified PTX(pertussis toxoid) can be regarded as the major protective anti-gen in all acellular vaccines available today.
The detoxification of vaccine antigens using chemical cross-linking agents was pioneered by Ramon in 1924 when he discov-ered that the addition of formaldehyde to supernatants ofCorynebacterium diphtheriae not only stabilized the vaccine fromdegradation but also rendered it nontoxic (Ramon, 1924). Thisdiscovery has found widespread application in the productionof human vaccines in subsequent decades (Relyveld, 1973), in-cluding pertussis vaccines. Several other reports document an in-crease in the long-term stability of the antigen after chemicalinactivation (Barteling, 1985; Rappuoli, 1990). This increase inlong-term stability may be due to a thermodynamic stabilizationof the antigen after detoxification, as evidenced by differentialscanning calorimetry (Krell et al., 2003).
Other work reported toxin inactivation by genetic methodssuch as the site-directed mutagenesis of active site residues(Sinha et al., 2000; Nencioni et al., 1991). However, to stabilizethe antigen and to obtain the required long-term stability ofthe antigen, it was in some cases necessary to treat geneticallymodified vaccine antigen with cross-linking agents (Nencioniet al., 1991; Nencioni et al. 1990). Partly because of the stabilizingeffect of cross-linking agents, the chemical inactivation of vac-cine antigens remains today the dominating way in industrialvaccine production. Therefore, research aimed at a better controlof the antigen inactivation process and a precise evaluation ofthe effect of chemical modification on the antigen remains bothof fundamental interest and of large biotechnological relevance.
The characterization of binding processes between biomole-cules is of increasing importance in life science. Traditionally,binding interactions have been characterized by measuringequilibrium constants using various techniques such as enzyme-linked immunosorbent assay (Friguet et al., 1985) or fluorescencetitration (Schwesinger et al., 2000). Furthermore, several othertechniques are now routinely used to obtain the additional para-meters of a binding interaction such as the determination of theenthalpic and entropic contribution to binding using isothermaltitration calorimetry (Krell, 2008) or the use of surface plasmonresonance (SPR) (Nieba et al., 1996) to obtain information onthe kinetic constants ka and kd.
However, both techniques are limited in their potential tocharacterize ultratight binding, which is characterized by KDvalues in the sub-nanomolar range. Using ITC, binding eventswith a KD less than 1 nM cannot be analyzed, and the precise de-termination of the kd for ultratight binding by SPR is often im-possible or prone to a significant error caused by the rebindingof ligand during the dissociation phase (Schier et al., 1996).
To circumvent these difficulties, we have explored here theuse of dynamic force spectroscopy (DFS), which is an alternativemethod to obtain information about the unbinding process ofreceptor–ligand interactions. This method has been used fora broad range of different biological systems, includingantibody–antigen interactions (Schwesinger, et al., 2000, Neuertet al., 2006, Morfill et al., 2007, Rankl et al., 2008). Force spectros-copy makes use of the fact that kd is increased if an externalforce is applied. Measuring the rupture forces of a receptor–ligand interaction for different loading rates allows the extrapo-lation of the dissociation rate at zero force, which representsthe natural kd.In this article, we present a study of the molecular interaction
of PTX and glutaraldehyde inactivated PTX (the toxoid) with aselection of different monoclonal antibodies (mAbs). We havedeveloped a simplified DFS protocol that guarantees a fastrecording of reliable data that complement analogous SPRstudies. The obtained data are relevant in understanding theconsequences of the chemical modification of vaccine antigens.In addition, data are of technological relevance because we wereable to demonstrate that kd values determined by SPR correlatewith the unbinding forces determined by DFS.
MATERIALS AND METHODS
Antigens and antibodies
PTX was purified from cultures of B. pertussis using industrial-scale procedures. Purified PTX was then inactivated by treatmentwith glutaraldehyde. mAbs were derived from an intraperitonealvaccination of BALB/c mice (National Cancer Institute, Frederick,USA) with purified PTX.
Antibody purification
All antibodies (IgG1) were affinity purified using NabTM Protein Gspin chromatography kit (Pierce, Rockford, IL, USA) according tothe manufacturer’s instructions. The protein concentration wasmeasured by Bradford Protein Assay using bovine serum albu-min (Thermo Scientific, Rockford, IL, USA) as standard.
Surface plasmon resonance
All SPR measurements were performed on a BIAcore 3000Upgrade system (BIAcore, Uppsala, Sweden). Rabbit antimouseimmunoglobulin (a-mouse immunoglobulins; BIAcore) was cova-lently coupled to a CM5 sensor chip (research grade) via aminecoupling (BIAcore AB amine coupling kit). To this end, the car-boxymethylated dextran surface of the chip was activated by ex-posure to a mixture of 0.2M of N-ethyl-N′-(diethylamino-propyl)carbodiimide and 0.05M of N-hydroxysuccinimide (NHS). Subse-quently, a-mouse immunoglobulins in 10mM of acetate buffer,pH 5.0, were then injected. To achieve an immobilization levelof approximately 12 000 resonance units (RU), we adjusted acti-vation time, a-mouse immunoglobulin concentration, and con-tact time. The remaining protein-free NHS esters of the chipwere blocked by the injection of 1M of ethanolamine hydrochlo-ride, pH 8.5. All immobilization steps were performed at a flowrate of 10 ml�min�1. Control flow cells were prepared by carryingout the same conditions.Once the chip was covalently coated with a-mouse immuno-
globulins, anti-pertussis antibodies were then diluted in 10mMof HEPES buffer, pH 7.4, containing 0.15M of NaCl and
N. MORENO ET AL.
wileyonlinelibrary.com/journal/jmr Copyright © 2011 John Wiley & Sons, Ltd. J. Mol. Recognit. 2011; 24: 1105–1114
1106

0.005% (v/v) of P20 surfactant (HBS-EP buffer; BIAcore AB) andcaptured on three individual flow cells. On the remaining flowcell, a nonspecific antibody was immobilized as a control. An-tibody capture levels were optimized to target maximumantigen binding responses of approximately 100–200 RU(162� 22 RU). Binding assays were performed at 25 �C inHBS-EP. Antigen samples at a concentration between 0.2 and10 nM (PTX) and between 1 and 100 nM (toxoid) were injectedat a flow rate of 70ml�min�1. Buffer injections identical to theantigen injections were interspersed for the purpose of doublereferencing. Association and dissociation phases were monitoredfor 170 and 1000 sec, respectively. The surface was regeneratedwith a pulse of 10mM of glycine–HCl, pH 1.5, which were usedto obtain control sensorgrams showing nonspecific binding tothe surface as well as changes of refractive index resulting fromchanges in the bulk properties of the solution. Control sensor-grams were then subtracted from sensorgrams obtained withimmobilized ligand to yield true binding responses.Control sensorgrams (flow cell with nonspecific antibody)
were automatically subtracted from the sensorgrams obtainedwith anti-pertussis antibodies to yield true binding responses.To determine the kinetic parameters of the interactions (ka andkd), each sensorgram was double referenced and fitted to a 1:1interaction model using the BIAevaluation 4.1 software (BIAcore).Rmax, the maximal capacity of the surface, was left floating duringthe fitting procedure. The closeness of the fit is described by thestatistical value w2, which represents the mean square of the sig-nal noise and should be lower than 10.
Functionalization of atomic force microscopy tips andglass surfaces
PTX and antibodies were tethered to a Si3N4 cantilever (seenext section) using carboxymethyl amylose (CMA; Sigma-AldrichSt Quentin-Fallavier, France) tethers following the proto-col developed by Desmeules et al. (2002). First, the Si-OH layerof the cantilever was silanized by immersion in 2% (v/v) of3-aminopropyltriethoxysilane (Sigma-Aldrich) toluene solutionfor 1 hr. After silanization, the cantilever was rinsed threetimes in toluene, ethanol, and water, respectively, and finallycured for 1 hr at 90 �C. A HEPES-buffered saline (HBS-EP) so-lution of 10mg�ml�1 of CMA was prepared and activated with50mg�ml�1 of N-ethyl-N′-(diethylamino- propyl)carbodiimide(Sigma-Aldrich) and 10mg�ml�1 of NHS (Sigma-Aldrich) to intro-duce succinimidyl groups along the amylose chain. The amino-functionalized tip was incubated with this NHS-activated CMAfor 2min and rinsed in HBS-EP. The tip was then coated with pro-teins by immersing it in a solution containing 1mg�ml�1 of per-tussis antigens in protein buffer HBS-EP for 1 hr and rinsing withthe same buffer to remove unbound antigens. This concentra-tion resulted in approximately 25% probability for the detectionof specific interactions, which falls within the common range ofbond probability for atomic force microscopy (AFM) experimentson antigen–antibody complexes (Sulchek et al., 2005, Rankl et al.,2008, Taranta et al., 2008). However, with such a value, it is nec-essary to discriminate between single and multiple simultaneousunbinding events (Williams, 2003) as explained in the next sec-tion. During the incubation with protein, an amide bond linkageis formed between the free amino groups of pertussis antigensand the NHS ester groups of amylose. Functionalized tips werekept hydrated in HBS-EP buffer and immediately used for forcemeasurements.
Antibodies were tethered to borosilicate glass surfaces(Pignat, France) using the protocol described earlier, except thatglass surfaces were treated as follows: they were sonicated twicefor 20min at 60 �C in aqueous detergent Micro90 (Fisher-Bioblock, France) and once for 20min at 60 �C in ultrapure waterand finally rinsed copiously with ultrapure water immediatelybefore functionalization.
Force spectroscopy measurements and unbinding detection
Measurements were carried out at 25 �C on a commercial AFM(Topometrix Explorer, Santa Clara, USA) equipped with a liquidscanner and a homemade liquid open cell. Force plots were ac-quired using V-shaped Si3N4 cantilevers (Veeco, MLCT-EXMT-A)with a nominal spring constant of kC = 0.05N�m�1, functionalizedas described earlier. Individual spring constants were calibratedusing the thermal noise method of the AFM. Hundreds ofapproach-retraction (AR) cycles were performed at several loca-tions of the glass surface. Force was measured using cantilever de-flection and was recorded versus the Z-piezo position of the AFM.
For all force measurement experiments, the antigen-coatedtip is brought in contact with an approaching speed V and isthen retracted until detachment occurs at the same probespeed. To compare various antigen–antibody complexes(Figures 3 and 4), we used a constant probe speed, V= 50 nm�sec�1.To investigate the effect of various loading rates on a givenantigen–antibody complex (dynamical force spectroscopy; Figure 5),we used the following speeds: 5, 10, 50, 100, 500, and1000nm�sec�1. Unbinding events (i.e. adhesion peaks forces;see Figure 2B) were automatically measured using our ownC++ code. Briefly, we first calculated the variance of the retrac-tion force as a function of Z-piezo position by using a movingwindow of 5 successive data points (2.66 nm) as well as the base-line variance (BV), which is measured in with a larger window farfrom the contact region (typically BV ~252 pN2). Unbindingevents are characterized by a sudden release of the force. Theyare detected from variance peaks that exceed a threshold thatis set as twice BV. Once unbinding was detected, unbindingforce F is determined as the maximal force variation (minoredby twice the baseline standard deviation value) in a region of15 points (i.e. 8 nm) centered on the position of the variancepeak. Typically, the force returns to the baseline level immedi-ately after unbinding. However, in case of multiple unbindingevents on the same curve (e.g. red curve of Figure B), this isnot always the case as a subsequent tether might be stretchedwith a none-zero force just after the unbinding of the first bond.All unbinding events are used for the statistics.
We determined the experimental loading rate, re, on the basis ofa multiple parallel bond system as reported in Odorico et al. (2007):
re ¼ kΡV1þ kΡ=kC
(1)
where kP represents the spring constant of tether attached onthe substrate and was obtained by the following relationship:
kΡ ¼ keqkCkC � keq
(2)
where keq is the observed loading slope of the force distancecurve before the rupture event.
ANTIGEN-ANTIBODY COMPLEX AFFINITY BY AFM AND SPR
J. Mol. Recognit. 2011; 24: 1105–1114 Copyright © 2011 John Wiley & Sons, Ltd. wileyonlinelibrary.com/journal/jmr
1107

Force spectroscopy analysis
All mathematical analyses (ANOVA test for statistics, correlationcoefficients, and curve fitting) were performed using Kaleida-Graph (Synergy Software). Correlation coefficients R betweenvarious experimental quantities were calculated with the curvefit option by weighting the data with standard deviation. The dis-tribution of rupture forces {F} (for each antibody–antigen com-plex at a given retracting speed or for different loading rates)was clustered into 25-pN bins. Because bond probability is high,the simultaneous unbinding of multiple bonds is possible. In thatcase, {F} presents multiple peaks and is fitted as a sum of threeGaussians centered at forces fn = nf proportional to the numberof bonds n and to an elementary force per single bond f:
Ff g ¼X3
n¼1an exp �� F � nfð Þ2
2sn2
!(3)
where f represents the most probable individual bond unbindingforce. The standard deviation s1 is used to calculate the standarderror on f as s1/N1
1/2, where N1 is the number of rupture events inthe first peak.
For dynamical force spectroscopy, the natural logarithms ofthe loading rates were clustered into Δln(re) = 1 bins. The mostprobable rupture force f was calculated for each bin, plotted asa function of ln(re), and fitted using the Bell–Evans single barriermodel (Evans and Ritchie, 1997):
f ¼ kBTxB
lnxBrekdkBT
(4)
where kBT is the thermal energy, kd is the dissociation rate atzero force, and xB is the minimum-to-barrier distance or potentialwidth.
RESULTS
After the vaccination of BALB/c mice with purified PTX, 10 differ-ent mAbs were generated and purified. Subsequently, the inter-action of these antibodies with purified PTX and toxoid werestudied by SPR and DFS.
Antibody–antigen interaction analyzed by SPR
BIAcore experiments were conducted to determine the bindingcharacteristics of these antibodies to PTX and to determinehow these binding parameters vary after the glutaraldehyde in-activation of the antigen. To this end, mAbs were immobilized
in situ on the NHS-activated carboxyl groups of the sensor chipand brought into contact with six different concentrations ofPTX (0.2–10 nM) and toxoid (1–100 nM). Raw data were correctedusing antigen binding to a nonspecific antibody, and some ofthe resulting sensorgrams are shown in Figure 1.The initial part of the sensorgram corresponds to the injection
of antigen over bound antibody. The increase in the responsecorresponds to the amount of bound antigen, and data shownreveal that the antigen binds in a concentration-dependantmanner. In the second part of the sensorgram, the chip is ex-posed to a constant flow of buffer, and the decrease in signalrepresents the dissociation of bound antigen. The resulting sen-sorgrams were fitted by a global fitting using a 1:1 Langmuirbinding model (w2< 10) of the BIAevaluation software v4.1. todetermine for each antibody the kinetic constants ka (thesecond-order rate constant for the association) and kd (the first-order rate constant for the dissociation). Subsequently, the equi-librium dissociation constant (KD = kd/ka) was calculated. Derivedconstants are found in Table 1.PTX bound to all 10 antibodies with a similarly high affinity
with equilibrium constants in the range of 0.50–1.95nM (Table 1),indicating that these antibodies are characterized by tight anti-gen recognition. The ka values observed for these 10 antibodieswere similar as indicated by an average of 1.2� 0.2� 106M�1 s�1.In contrast, kd values differed to a larger degree and were foundto be in the range between 5 and 23 � 10�4 sec�1 (Table 1). In-terestingly, no PTX dissociation could be measured from anti-body LP12c. Figure 1 shows the sensorgram of antibody PS18c,which permitted the determination of kd, and that of LP12c,clearly showing that no measurable dissociation of bound PTXoccurs. Failing to determine kd for antibody LP12c did not conse-quently allow the calculation of the equilibrium constant.Subsequently, the interaction of the set of antibodies with
the toxoid was analyzed. As expected, the equilibrium con-stant was reduced and an average KD of 5.9� 3.9 nM wasdetermined (Table 1). This corresponds to only a modest reduc-tion by a factor of approximately 4.5 as compared with thecorresponding value of PTX. Most interestingly, PTX detoxifica-tion had a differential effect on ka and kd. The association con-stant was reduced by an average factor of approximately 13 forthe antibodies tested, whereas the dissociation constant wasalso reduced by a factor of 2.3 (Table 1). This implies that thechemical inactivation of PTX significantly reduces not only thekinetics of antibody association but also the rate of dissociation,although to a lesser extent. The latter observation indicatesthat the antibody–antigen complex is more stable afterdetoxification.
Figure 1. Kinetic analysis of the interaction between PTX with mAbs. Overlay of SPR sensorgrams resulting from the injection of different concentra-tions (10, 5, 3, 1, 0.5, and 0.2 nM from top to bottom) of PTX over (A) captured antibody LP12c and (B) captured antibody LP18c (flow rate, 70ml/min;injected volume, 200ml). Nonspecific binding to the sensor chip evaluated on flow cell 1 was subtracted from the raw data. RU, resonance units.
N. MORENO ET AL.
wileyonlinelibrary.com/journal/jmr Copyright © 2011 John Wiley & Sons, Ltd. J. Mol. Recognit. 2011; 24: 1105–1114
1108

The complexity of this situation is illustrated in Figure 2, whichis a plot of ka versus kd. The diagonals link the points character-ized by the same equilibrium constant. The values for the mea-surements of PTX group well around the 1-nM diagonal,whereas the toxoid values group together between the 1 andthe 10-nM diagonals, reflecting the abovementioned reductionin KD by a factor of approximately 4.5. However, the cloud of tox-oid values is clearly shifted downward (reduction in ka) and tothe left with respect to the PTX data, reflecting the unexpecteddecrease in kd. ANOVAs (ka and kd responses) were performedto compare the mean values of the binding constants for thefour antibodies and the toxin or toxoid sample. The results showa significant difference between the mean responses observedwith the toxin and the toxoid (p-value ≤ 0.0001). The toxin or
toxoid samples showed mean values of 1.59 � 10�3 and 7.26� 10�4 sec�1, respectively, for kd and mean values of 1.14 �106 and 1.20 � 105M�1�sec�1, respectively, for ka.
In analogy to the PTX binding to antibody LP12c, no antigendissociation was observed for the experiments using the anti-body PS21c and the toxoid as ligands. This failure to quantifyultratight interaction like in the case of antibodies LP12c andPS21c is not a problem restricted to the SPR technology. Simi-larly, experimental approaches on the basis of the titration ofany two ligands such as fluorescence titration or microcalorimet-ric titrations are not able to analyze ultratight binding eventsbecause the quantitative binding of all titrated ligand does notpermit to generate data that define equilibrium. To address thisissue, we have explored the use of DFS.
Antibody–antigen interaction at a single-molecule level
The rupture force between antigen and antibody receptorwas investigated by DFS. We have designed our experimentalsystem to minimize the effect of nonspecific interactions andto maximize the probability of detecting specific antigen–antibody interactions by attaching covalently the interactingmolecules to flexible polymer tethers (Haselgrübler et al., 1995;Hinterdorfer, 2003). The tethers, in our case CMA, spatially isolatenonspecific probe–sample interactions from the specific interac-tions of the tethered molecules. The AFM tip coated withantigens is approached to the surface, which contains the cova-lently attached antibodies (Figure 3A). When antibody–antigenbinding has occurred, an attractive force is measured, whichraises by increasing the tip–surface separation. The physical con-nection between the tip and the surface sustains the increasingforce until the antigen–antibody complex dissociates at a certaincritical force (unbinding or rupture force) and the cantilever jumpsfinally back to the resting position (Figure 3B). The shape of theAR curves is determined by the elastic properties of the flexibletether (Kienberger et al., 2000) and shows nonlinear, parabolic-like characteristics as a function of tip–surface distance.
Table 1. Kinetic and equilibrium constants determined from the analysis of the interaction between different mAbs with purifiedPTX and its detoxified form (toxoid)
mAb PTX Toxoid Comparison PTX–Toxoid
ka (M�1 s�1)
(�106)kd (sec�1)(�10�4)
KD (nM) ka (M�1 s�1)
(� 104)kd (sec�1)(� 10�4)
KD (nM) kaPTX/kaTox
kdPTX/kdTox
KDPTX/KDTox
LP3 1.40� 0.20 23.60� 2.10 1.65� 0.10 Not determinedLP4c 1.10� 0.10 21.50� 1.40 1.95� 0.10 9.50� 1.40 10.60� 1.80 11.30� 0.40 11.50 2.00 0.17LP5c 1.40� 0.20 8.90� 2.20 0.65� 0.10 Not determinedLP6 1.05� 0.10 17.50� 1.30 1.85� 0.10 Not determinedLP8c 0.95� 0.10 17.70� 1.40 1.85� 0.10 12.20� 1.90 11.20� 5.10 9.00� 2.80 7.80 1.58 0.20LP12c 1.40� 0.20 No dissociation
measurable14.70� 4.50 5.10� 1.50 3.90� 2.20 9.50
LP14c 1.20� 0.30 16.80� 3.60 1.40� 0.01 11.80� 0.30 5.00� 0.20 4.20� 0.30 10.10 3.40 0.33LP18c 1.40� 0.10 10.10� 0.50 0.80� 0.01 15.50� 3.70 5.00� 0.80 3.50� 1.50 4.10 2.00 0.23PS11c 1.30� 0.30 17.90� 3.60 1.40� 0.02 Not determinedPS21c 0.95� 0.10 5.00� 0.20 0.50� 0.01 23.40� 6.30 No dissociation measurable
Average 1.22� 0.19 15.44� 6.13 1.34� 0.56 14.52� 4.85 7.38� 3.22 6.38� 3.54 8.60 2.25 0.23
Right-hand side indicates the factor by which these parameters differ for PTX and toxoid.
Figure 2. SPR analysis of the interaction of 10 different antibodies withPTX and its glutaraldehyde inactivated form (toxoid). Shown is a plot ofka versus kd values obtained for each interaction. The equilibrium con-stant KD corresponds to ka/kd. The diagonals link points of the same KD,which are indicated. The data are taken from Table 1. Red, PTX;blue, toxoid.
ANTIGEN-ANTIBODY COMPLEX AFFINITY BY AFM AND SPR
J. Mol. Recognit. 2011; 24: 1105–1114 Copyright © 2011 John Wiley & Sons, Ltd. wileyonlinelibrary.com/journal/jmr
1109
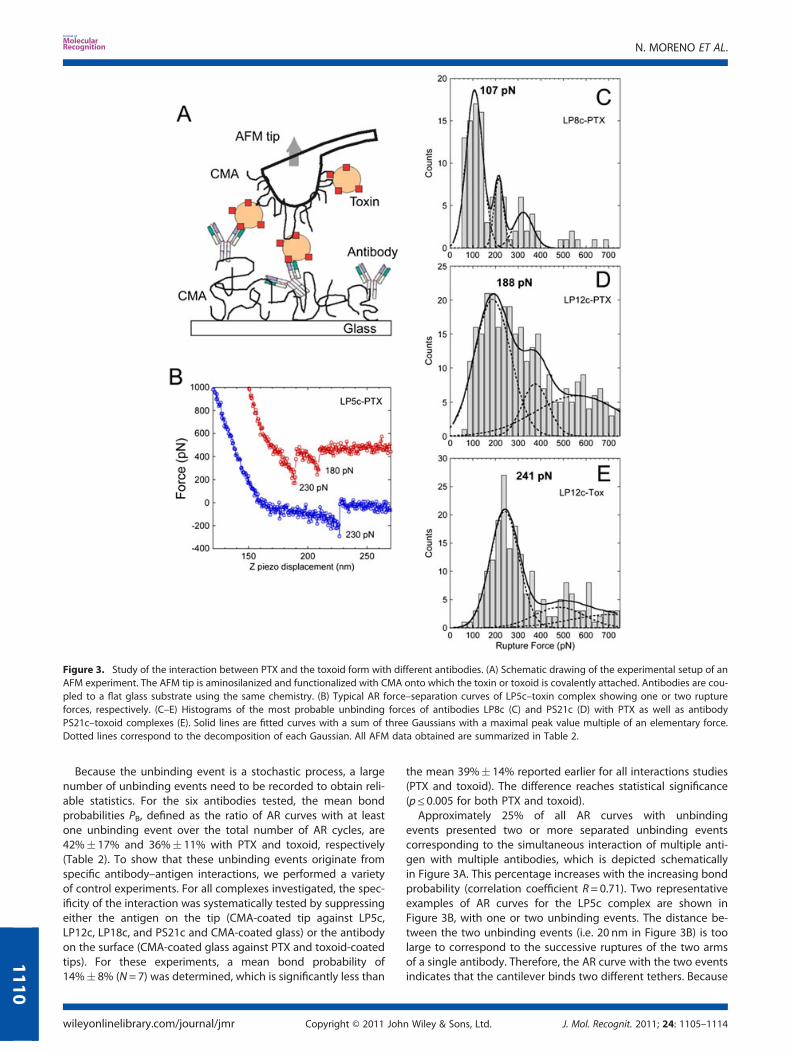
Because the unbinding event is a stochastic process, a largenumber of unbinding events need to be recorded to obtain reli-able statistics. For the six antibodies tested, the mean bondprobabilities PB, defined as the ratio of AR curves with at leastone unbinding event over the total number of AR cycles, are42%� 17% and 36%� 11% with PTX and toxoid, respectively(Table 2). To show that these unbinding events originate fromspecific antibody–antigen interactions, we performed a varietyof control experiments. For all complexes investigated, the spec-ificity of the interaction was systematically tested by suppressingeither the antigen on the tip (CMA-coated tip against LP5c,LP12c, LP18c, and PS21c and CMA-coated glass) or the antibodyon the surface (CMA-coated glass against PTX and toxoid-coatedtips). For these experiments, a mean bond probability of14%� 8% (N=7) was determined, which is significantly less than
the mean 39%� 14% reported earlier for all interactions studies(PTX and toxoid). The difference reaches statistical significance(p≤ 0.005 for both PTX and toxoid).Approximately 25% of all AR curves with unbinding
events presented two or more separated unbinding eventscorresponding to the simultaneous interaction of multiple anti-gen with multiple antibodies, which is depicted schematicallyin Figure 3A. This percentage increases with the increasing bondprobability (correlation coefficient R= 0.71). Two representativeexamples of AR curves for the LP5c complex are shown inFigure 3B, with one or two unbinding events. The distance be-tween the two unbinding events (i.e. 20 nm in Figure 3B) is toolarge to correspond to the successive ruptures of the two armsof a single antibody. Therefore, the AR curve with the two eventsindicates that the cantilever binds two different tethers. Because
Figure 3. Study of the interaction between PTX and the toxoid form with different antibodies. (A) Schematic drawing of the experimental setup of anAFM experiment. The AFM tip is aminosilanized and functionalized with CMA onto which the toxin or toxoid is covalently attached. Antibodies are cou-pled to a flat glass substrate using the same chemistry. (B) Typical AR force–separation curves of LP5c–toxin complex showing one or two ruptureforces, respectively. (C–E) Histograms of the most probable unbinding forces of antibodies LP8c (C) and PS21c (D) with PTX as well as antibodyPS21c–toxoid complexes (E). Solid lines are fitted curves with a sum of three Gaussians with a maximal peak value multiple of an elementary force.Dotted lines correspond to the decomposition of each Gaussian. All AFM data obtained are summarized in Table 2.
N. MORENO ET AL.
wileyonlinelibrary.com/journal/jmr Copyright © 2011 John Wiley & Sons, Ltd. J. Mol. Recognit. 2011; 24: 1105–1114
1110

bond probability is high, the nearly simultaneous rupture of morethan one molecular bond is possible (Williams, 2003; Guo et al.,2008). In that case, the unbinding force depends on the numberof bonds, and the measured force distribution {F} presents notonly a single but several peaks of decreasing population withincreasing force (see for instance Figure 3C). By fitting {F} toGaussian functions, we found that the seconds and thirds peaksare centered at around twofold and threefold the value of thefirst ones, suggesting a quantization phenomenon as alreadysuggested (Florin et al., 1994; Wong et al., 1999; Taranta et al.,2008). Accordingly, to minimize the fitting parameters, we haveused throughout this work a sum of three Gaussians centeredat forces fn = nf, proportional to the number of bonds n andto an elementary force per single bond f (see Materials andMethods section). Each separate Gaussian is displayed as a dottedline and the sum of the three by a solid line in Figures 3C–3E.Fitting parameters (the most probable unbinding force of a sin-gle bond f and the standard deviation of the first Gaussian) aresummarized in Table 2 and shown in Figure 4 as a function ofthe dissociation rate measured by SPR.Several conclusions can be drawn analyzing data presented in
Table 2. First, there seems to be a slight correlation between thebond probability and the mean unbinding force (R=0.64). Thehighest bond probability and highest rupture forces are mea-sured for the LP12c–PTX, LP5c–PTX, and PS21c–PTX interactions,respectively. Second, the detoxification of PTX results in a veryslight reduction of both, the bond probability and the unbindingforce. The difference does not reach statistical significance, butthe trend is consistent with the reduction in affinity after detox-ification, as measured by SPR. Third, it was possible to quantifythe unbinding of the LP12c–PTX and PS21c–toxoid by DFS. Theunbinding forces observed for both interactions are superior tothe corresponding values of the other interactions indicative ofvery tight association, which made it impossible to be quantifiedby SPR. Finally, there was a correlation between dissociation ratedetermined by SPR and the unbinding forces as measured byDFS (Figure 4). The unbinding force is nearly linearly decreasingwith kd (R= 0.91 for both PTX and toxoid). This correlation is seen
over a range covering a fourfold variation of both quantities(kd = 5–25 � 10�4 sec�1, F= 50–200 pN).
The Bell–Evans model (Bell, 1978; Evans and Ritchie, 1997) pre-dicts a linear dependence of unbinding force (most probableforce) on the natural logarithm of the dissociation rate at zeroforce kd but also on two other quantities, namely, the experimen-tal loading rate re and the potential width xB (Equation (4)). Atconstant probe speed, the mean experimental loading rate(measured as explained in the Materials and Methods section,Equations (2) and (3)) presents a strong correlation with the mostprobable force (see inset of Figure 4). This correlation is due tothe nonlinear elasticity of the molecular tethers and of the
Table 2. Analysis of the interaction between different mAbs with purified PTX and its detoxified form (toxoid) using single mol-ecule force spectroscopy
mAb
PTX Toxoid Comparison
No. curves Bond probability (%) Force (pN) No. curves Bond probability (%) Force (pN) ForcePTX/ForceTox
LP3LP4c 380 25 54� 18 408 22 123� 38 0.44LP5c 392 58 236� 69 552 49 120� 43 1.97LP6LP8c 408 22 107� 36 408 25 110� 27 0.97LP12c 324 52 256� 87 764 40 182� 65 1.41LP14cLP18c 416 33 133� 12 408 34 152� 40 0.88PS11cPS21c 564 61 188� 80 340 45 241� 63 0.78
Average 42� 17 162� 78 36� 11 155� 50 1.05
The force is the most probable single bond force f obtained from the fit with the sum of three Gaussians, and the error on force isthe standard deviation s1 of this fit. The right-hand side shows the change in force after the chemical inactivation of PTX treatmentwith glutaraldehyde (which gives rise to the toxoid).
Figure 4. Plot of the most probable unbinding force obtained from AFMexperiments as a function of dissociation rate kd obtained by SPR experi-ments. Data are extracted from Tables 1 and 2. The solid line is a linear fitweighted by error bars (standard errors, correlation coefficient R=0.74).(Inset) Plot of the most probable force as a function of loading rate re.,correlation coefficient R=0.87.
ANTIGEN-ANTIBODY COMPLEX AFFINITY BY AFM AND SPR
J. Mol. Recognit. 2011; 24: 1105–1114 Copyright © 2011 John Wiley & Sons, Ltd. wileyonlinelibrary.com/journal/jmr
1111

immobilized proteins: the higher the rupture force, the higherthe loading rate (fivefolds variation in re). Even by introducing thevalue of re in Equation 4, it is difficult to conclude whetherthe Bell–Evans model fits correctly the data obtained becausethe potential width xB must not necessarily be constant for allinvestigated complexes. We therefore performed a detailedstudy of the influence of loading rate on the rupture force forone complex (namely, PS21c–PTX) by varying probe speedbetween 5 and 1000 nm�sec�1. We obtained experimental load-ing rates in the range 30–22 000 pN�sec�1. We clustered dataevery Δln(re) = 1, calculated the most probable rupture forcef in each set, and plotted it against ln(re) (Figure 5). Thisplot presents a uniform slope, indicating that the Bell–Evansmodel satisfactorily fits our data. From this model, we obtainkd = 0.0016� 0.0019 sec�1 and xB to be 0.28� 0.02 nm (errorswere estimated by bootstrapping). The dissociation rate at zeroforce estimated from DFS is therefore about three times higherthan the one obtained from SPR (Table 1).
By using both the direct loading rates measurements (inset ofFigure 4) and the SPR measurements (Table 1), the rupture forcesof the different complexes may be plotted in a lin-log graphagainst the reduced variable re/kd (Figure 6). The experimentalpoints are much better aligned than the ones in Figure 4, indicat-ing that the scatter of Figure 4 was greatly affected by the load-ing rate variations. However, the Bell–Evans model with a singlepotential width xB cannot fit the full range of forces (see the bestfit with xB = 0.28 nm as a solid line). The widths necessary toaccount for low and large rupture forces are 0.72 and 0.19 nm,respectively (dotted lines).
DISCUSSION
During infection, B. pertussis releases highly toxic PTX, which actsas the main virulence factor of this pathogen. The vaccine anti-gen against this organism is prepared by glutaraldehyde treat-ment, which modifies primarily e-amino groups of lysine
residues and to a lesser extent tyrosine, histidine, and sulfhydrylresidues (Habeeb and Hiramoto, 1968). It is essential that theresulting toxoid is free of catalytic activity but at the same timemust be capable of inducing an immune response toward theunmodified, active toxin. It is therefore of uttermost importanceto evaluate the effect of chemical inactivation on the propertiesof the antigen. This is even more relevant because the PTX andtoxoid samples analyzed in this work have been produced at in-dustrial scale and the toxoid analyzed here forms part of manymillion vaccine doses annually.The effect of aldehyde detoxification on PTX has been already
evaluated in the past. Bolgiano et al. (1999) demonstrated thatthe detoxification process induces large changes in the physico-chemical properties of the antigen as witnessed by an importantchange in its intrinsic fluorescence maximum (8–10 nm red-shift)and a large increase in its apparent size. Ibsen (1996) has studiedthe effect of the formaldehyde detoxification of PTX on the rec-ognition by 38 different antibodies. The obtained results werevery disperse and ranged from a reduction in the binding con-stant by a factor of 1000 to increase in binding by a factor of10 after chemical inactivation. The data here show that thedetoxification protocol that is used to generate the vaccine anti-gen, which is present in the commercial vaccine, causes only amodest decrease in affinity of around 4.5 as compared with theunmodified protein. This is evidenced by the fact that antibodiesrecognize PTX with an average affinity of 1.34� 0.5 nM, whereasthe corresponding value for the toxoid was determined to be5.9� 3.9 nM (Table 1). This modest reduction in the equilibriumconstant seemed to be a general phenomenon because themagnitude of reduction was similar for all the antibodiesanalyzed.SPR analysis permits the determination of the individual ki-
netic constants ka and kd. A surprising finding of this work con-sists in the fact that glutaraldehyde inactivation had a contraryeffect on both kinetic parameters. Detoxification reduces the
Figure 6. Plot of the most probable unbinding force obtained as a func-tion of the ratio between the loading rate re and the dissociation rate kdobtained by SPR experiments. The solid line is the best fit using theBell–Evans relation (Equation (4)) weighted by error bars (standard errors)with a single free parameter (i.e. the barrier width xB). Dotted lines aretwo the predicted unbinding forces with the Bell–Evans relation andtwo extreme values of xB given in the plot.
Figure 5. Plot of the most probable unbinding force obtained as a func-tion of the natural logarithm of the loading rate re. Data are obtained byvarying the probe speed between 5 and 1000 nm�sec�1. The solid line isa linear fit using Bell–Evans relation (Equation (4)) weighted by error bars(standard errors), correlation coefficient R=0.94.
N. MORENO ET AL.
wileyonlinelibrary.com/journal/jmr Copyright © 2011 John Wiley & Sons, Ltd. J. Mol. Recognit. 2011; 24: 1105–1114
1112

kinetics of initial antigen recognition but in turn seems to stabi-lize the formed complex as evidenced by a reduction in the dis-sociation constants for the toxoid (Table 1). The treatment ofproteins with glutaraldehyde causes primarily a modification ofthe e-amino groups of lysine residues (Habeeb and Hiramoto,1968). Glutaraldehyde is a bifunctional reagent and introduceseither intramolecular or intermolecular bonds. The sodium dode-cyl sulfate–polyacrylamide gel electrophoresis analysis of toxoid(data not shown) shows that glutaraldehyde induces primarilyintramolecular bridges, which is consistent with DeSantis andJones (1999). At neutral pH, the e-amino group of lysines is pro-tonated, which confers a positive charge to the side chain.Chemical modification results therefore in a reduction in thenet surface charge and in an increase in the hydrophobicity ofthe antigen. An analysis of protein–protein interfaces (Galletet al., 2000) reveals that lysine is one of the most frequent aminoacids in these interfaces, and its charge contributes to guaran-teeing the specificity of interaction. The increase in hydrophobic-ity after glutaraldehyde treatment is likely to stabilize thecomplex as shown by the reduction in the dissociation constant.It remains to be established whether or to what degree chemicalmodification affects the specificity of antibody recognition.In life science, the study and quantification of ultratight bind-
ing interaction remains a difficult issue. In titration-based techni-ques such as fluorescence spectroscopy or titration calorimetry,equilibrium constants are determined from a plot of the bindingsignal over the corresponding ligand concentration. To use theseapproaches, it is essential that there are at least two points at thesteep rising part of the curve that defines the equilibrium. In thecase of ITC, this sets the lower limit for measuring binding inter-actions to a KD of 1 to 10 nM (Wiseman et al., 1989). However,many relevant interactions are ultratight and characterized bysub-nanomolar affinities. To circumvent these problems, severalapproaches have been proposed, such as the use of differentialscanning calorimetry (Brandts and Lin, 1999), or in the case thatseveral ligands with different affinities bind to the same bindingsite, competition assays can be conducted (Sigurskjold, 2000).Using the SPR technology, the equilibrium constant is calculatedfrom the measured ka and kd. According to the manufacturer’sspecifications, ka values in the range of 103 to 107M�1 s�1 andkd values from 5 � 10�6 to 10�1 sec�1 can be determined usinga BIAcore 3000 instrument. In two cases of the present studies,the interaction between LP12c with PTX and PS21c with toxoid(Table 1), the kd values were not in the measurable range, whichconsequently made the calculation of KD impossible. However, inboth cases, it was possible to follow the rupture of this ultratightinteraction by DFS. For the interaction between PS21c withPTX, we were able to demonstrate using a large range of load-ing rates (by changing probe velocity) that kd could bemeasured using the Bell–Evans model (Bell, 1978; Evans andRitchie, 1997).
Although the value estimated from DFS is about three timeshigher than the one obtained from SPR, the discrepancy is notsurprising for several reasons. First, the estimated error bar onkd by DFS is large (~100%). By measuring thousands of forcesand by taking into account accurately instrumental noise, hydro-dynamic effects, finite sampling rates, and other factors, thiserror may be reduced (Guo et al., 2008; Williams 2008). Second,we plot here the most probable rupture force against the naturallogarithm of the most probable loading rate. This is the mostcommonly used type of analysis for DFS, but it may introduce adeviation for xB of approximately 15% and of about a factor of2 for kd, which is because tethers are not linear springs (Friedsamet al., 2003). Rather monodisperse tethers such as bifunctionalPEG linkers (Sulchek et al., 2005) are probably more suited thanthe CMA used throughout this study. Third, a much larger (6.5-fold) dissociation rate was already measured by DFS as com-pared with the bulk SPR measurement by Sulchek et al. (2005).The authors attribute this difference either to the presence ofdimers in SPR experiments or to the existence of an additionalenergy barrier, which is not accessible to DFS because of the lim-ited range of the loading rates. The lower detection limit of theAFM instrument used here was of 25 pN, which implies that itis little suited to study low-affinity interactions. The latest genera-tions of AFM instruments and cantilevers offer a much lower de-tection limit (i.e. close to 1 pN), enabling to extend the range ofaffinities investigated. Other techniques, such as BiomembraneForce Probe (Merkel et al., 1999), which could achieve the veryslow loading rates necessary for probing such barriers, are alsobetter suited to answer this question.
DFS seems therefore to be another alternative to quantify thedissociation rate of ultratight binding events. In addition, itbrings new information on the potential width of the energeticlandscape. Although it was not concluding here, it seems possi-ble to obtain an estimate of the kinetic on-rate constant byDFS by analyzing the bond probability (Rankl et al., 2008). Onthe experimental level, it takes only approximately 1 hr to recordthe several hundred AR cycles necessary to obtain an averageunbinding force. In addition, the same tip coated with a ligandcan be used to study the interaction with many different ligands,and the change of the sample surface is straightforward using anopen liquid cell, which facilitates the use of DFS to analyze manydifferent ligands. Future studies will show whether the observedcorrelation DFS and SPR can be extended to other antibodiesand pertussis antigens as well as other types of molecularinteractions.
Acknowledgements
The authors thank Catherine Hessler for her help with the statis-tical analyses of data.
REFERENCES
BartelingSJ. 1985. Conditions for proper formaldehyde inactivation of footand mouse disease alhydrogel vaccines. Dev. Biol. Stand. 60: 323–329.
Bell GI. 1978. Models for the specific adhesion of cells to cells. Science200: 618–627.
Bolgiano B, Crane DT, Xing D, Williams L, Jones C, Corbel MJ. 1999. Phy-sico-chemical analysis of Bordetella pertussis antigens. Biologicals27: 155–162.
Carbonetti NH. 2010. Pertussis toxin and adenylate cyclase toxin: keyvirulence factors of Bordetella pertussis and cell biology tools. FutureMicrobiol. 5: 455–469.
Das P. 2002. Whooping cough makes global comeback. Lancet Infect. Dis.2: 322.
DeSantis G, Jones JB. 1999. Chemical modification of enzymes forenhanced functionality. Curr. Opin. Biotechnol. 10: 324–330.
ANTIGEN-ANTIBODY COMPLEX AFFINITY BY AFM AND SPR
J. Mol. Recognit. 2011; 24: 1105–1114 Copyright © 2011 John Wiley & Sons, Ltd. wileyonlinelibrary.com/journal/jmr
1113

Desmeules P, Grandbois M, Bondarenko VA, Yamazaki A, Salesse C. 2002.Measurement of membrane binding between recoverin, a calcium-myristoyl switch protein, and lipid bilayers by AFM-based force spec-troscopy. Biophys. J. 82: 3343–3350.
Evans E, Ritchie K.1997. Dynamic strength of molecular adhesion bonds.Biophys J. 72: 1541–1555.
Florin EL, Moy VT, Gaub HE. 1994. Adhesion forces between individualligand-receptor pairs. Science 264: 415–417.
Friedsam C, Wehle AK, Kühner F, Gaub H. 2003. Dynamic single-moleculeforce spectroscopy: bond rupture analysis with variable spacerlength. J. Phys. Condens. Matter 15: 1709–1723.
Friguet B, Chaffotte AF, Djavadi-Ohaniance L, Goldberg ME. 1985. Mea-surements of the true affinity constant in solution of antigen–antibody complexes by enzyme-linked immunosorbent assay. J.Immunol. Methods. 77: 305–319.
Gallet X, Charloteaux B, Thomas A, Brasseur R. 2000. A fast method to pre-dict protein interaction sites from sequences. J. Mol. Biol. 302: 917–926.
Guo S, Ray C, Kirkpatrick A, Lad N, Akhremitchev B. 2008. Effects of mul-tiple-bond ruptures on kinetic parameters extracted from force spec-troscopy measurements: revisiting biotin-streptavidin interactions.Biophys. J. 95: 3964–3976.
Habeeb AJ, Hiramoto R. 1968. Reaction of proteins with glutaraldehyde.Arch. Biochem. Biophys. 126: 16–26.
Haselgrübler T, Amerstorfer A, Schindler H, Gruber HJ. 1995. Synthesisand applications of a new poly(ethylene glycol) derivative for thecrosslinking of amines with thiols. Bioconjug. Chem. 6(3): 242–8.
He Q, Mertsola J. 2008. Factors contributing to pertussis resurgence.Future Microbiol. 3: 329–339.
Hinterdorfer P. 2003. Molecular recognition studies using the atomicforce microscope. Methods Cell Biol. 68: 115–39
Ibsen PH. 1996. The effect of formaldehyde, hydrogen peroxide andgenetic detoxification of pertussis toxin on epitope recognition bymurine monoclonal antibodies. Vaccine 14: 359–368.
Kienberger F, Pastushenko V Ph, Kada G, Gruber HJ, Riener C, Schindler H,Hinterdorfer P. 2000. Static and dynamical properties of single poly(ethylene glycol) molecules investigated by force spectroscopy. Sin-gle Mol. 1: 123–128
Krell T, Greco F, Nicolaï MC, Dubayle J, Renauld-Mongénie G, Poisson N,Bernard I. 2003. The use of microcalorimetry to characterize tetanusneurotoxin, pertussis toxin and filamentous haemagglutinin. Biotech-nol. Appl. Biochem. 38: 241–251.
Krell T. 2008. Microcalorimetry: a response to challenges in modern bio-technology. Microb. Biotechnol. 1: 126–136.
Locht C, Antoine R, Jacob-Dubuisson F. 2001. Bordetella pertussis, molec-ular pathogenesis under multiple aspects. Curr. Opin. Microbiol. 4:82–89.
Locht C, Antoine R. 1995. A proposed mechanism of ADP-ribosylationcatalyzed by the pertussis toxin S1 subunit. Biochimie 77: 333–340.
Locht C, Keith JM. 1986. Pertussis toxin gene: nucleotide sequence andgenetic organization. Science 232: 1258–1264.
Locht C. 1999. Molecular aspects of Bordetella pertussis pathogenesis. Int.Microbiol. 2: 137–144.
Merkel R, Nassoy P, Leung A, Ritchie K, Evans E. 1999. Energy landscapesof receptor–ligand bonds explored with dynamic force spectros-copy. Nature 397: 50–53.
Morfill J, Blank K, Zahnd C, Luginbühl B, Kühner F, Gottschalk KE,Plückthun A, Gaub HE. 2007. Affinity-matured recombinant antibodyfragments analyzed by single-molecule force spectroscopy. BiophysJ. 93: 3583–90.
Nencioni L, Pizza M, Bugnoli M, De Magistris T, Di Tommaso A,Giovannoni F, Manetti R, Marsili I, Matteucci G, Nucci D, et al. 1990.Characterization of genetically inactivated pertussis toxin mutants:candidates for a new vaccine against whooping cough. Infect.Immun. 58: 1308–1315.
Nencioni L, Volpini G, Peppoloni S, Bugnoli M, De Magistris T, Marsili I,Rappuoli R. 1991. Properties of pertussis toxin mutant PT-9K/129Gafter formaldehyde treatment. Infect. Immun. 59: 625–630.
Neuert G, Albrecht C, Pamir E, Gaub HE. 2006. Dynamic force spectros-copy of the digoxigenin-antibody complex. FEBS Lett. 580: 505–509.
Nicosia A, Perugini M, Franzini C, Casagli MC, Borri MG, Antoni G,Almoni M, Neri P, Ratti G, Rappuoli R. 1986. Cloning and sequencingof the pertussis toxin genes: operon structure and gene duplication.Proc. Natl. Acad. Sci. USA. 83: 4631–4635.
Nieba L, Krebber A, Plückthun A. 1996. Competition BIAcore for measur-ing true affinities: large differences from values determined frombinding kinetics. Anal. Biochem. 234: 155–165.
Odorico M, Teulon JM, Bessou T, Vidaud C, Bellanger L, Chen SW,Quéméneur E, Parot P, Pellequer JL. 2007. Energy landscape of che-lated uranyl: antibody interactions by dynamic force spectroscopy.Biophys. J. 93: 645–654.
Ramon G. 1924. Sur la toxine et sur l’toxoide diphtherique. Ann. Inst.Pasteur 38: 1–18.
Rankl C, Kienberger F, Wildling L, Wruss J, Gruber HJ, Blaas D, HinterdorferP. 2008. Multiple receptors involved in human rhinovirus attachmentto live cells. Proc Natl Acad Sci U S A. 105:17778–83.
Rappuoli R. 1990. New and improved vaccines against Diphtheria andTetanus. In Woodrow G., Levine MM (eds). New generation vaccines.New York: Marcel Dekker Inc. pp. 251–268.
Relyveld EH. 1973. Preparation of antitoxic and antimicrobial vaccinesusing glutaraldehyde. C. R. Acad. Sci. Hebd. Seances. Acad. Sci. D277:613–616
Sato Y, Kimura M, Fukumi H. 1984. Development of a pertussis compo-nent vaccine in Japan, Lancet 1:122–126.
Schier R, McCall A, Adams GP, Marshall KW, Merritt H, Yim M, Crawford RS,Weiner LM, Marks C, Marks JD. 1996. Isolation of picomolar affinityanti-c-erbB-2 single-chain Fv by molecular evolution of the comple-mentarity determining regions in the center of the antibody bindingsite. J. Mol. Biol. 263:551–567.
Schwesinger F, Ros R, Strunz T, Anselmetti D, Güntherodt HJ, Honegger A,Jermutus L, Tiefenauer L, Pluckthun A. 2000. Unbinding forces ofsingle antibody–antigen complexes correlate with their thermal dis-sociation rates. Proc. Natl. Acad. Sci. USA. 97:9972–9977.
Sigurskjold BW. 2000 Exact analysis of competition ligand binding bydisplacement isothermal titration calorimetry. Anal Biochem.277:260–266.
Sinha K, Box M, Lalli G, Schiavo G, Schneider H, Groves M, Siligardi G,Fairweather N. 2000. Analysis of mutants of tetanus toxin Hc frag-ment: ganglioside binding, cell binding and retrograde axonal trans-port properties. Mol. Microbiol. 37:1041–1051.
Stein PE, Boodhoo A, Armstrong GD, Cockle SA, Klein MH, Read RJ. 1994.The crystal structure of pertussis toxin. Structure 2:45–57.
Storsaeter J, Wolter J, Locht C. 2007. Pertussis vaccines, in: C. Locht (Ed.),Bordetella Molecular Microbiology, Horizon Bioscience, Norfolk, U.K.,pp. 245–288.
Sulchek TA, Friddle RW, Langry K, Lau EY, Albrecht H, Ratto TV, DeNardoSJ, Colvin ME, Noy A. 2005. Dynamic force spectroscopy of parallelindividual Mucin1-antibody bonds. Proc. Natl. Acad. Sci. USA.102:16638–16643.
Tamura M, Nogimori K, Murai S, Yajima M, Ito K, Katada T, Ui M,Ishii S. 1982. Subunit structure of islet-activating protein, pertus-sis toxin, in conformity with the A-B model. Biochemistry 21:5516–5522.
Tan T. 2205. Summary: epidemiology of pertussis. Pediatr. Infect. Dis. J. 24:S35-8.
Taranta M, Bizzarria AR, Cannistraro S. 2008. Probing the interaction be-tween p53 and the bacterial protein azurin by single molecule forcespectroscopy. J. Mol. Recognit. 21: 63–70.
Williams PM. 2003. Analytical descriptions of dynamic force spectros-copy behaviour of multiple connections. Anal. Chim. Acta 479:107–115.
Williams PM. 2008. Dynamic force spectroscopy with the atomic force mi-croscope. In: Noy A (ed) Handbook of molecular force spectroscopy.Springer, New York, pp 142–160.
Wiseman T, Williston S, Brandts JF, Lin LN. 1989. Rapid measurement ofbinding constants and heats of binding using a new titration calo-rimeter. Anal. Biochem. 179:131–137.
Wong J, Chilkoti A, Moy VT. 1999. Direct force measurements of thestreptavidin-biotin interaction. Biomol. Eng. 16: 45–55.
N. MORENO ET AL.
wileyonlinelibrary.com/journal/jmr Copyright © 2011 John Wiley & Sons, Ltd. J. Mol. Recognit. 2011; 24: 1105–1114
1114