Unaffected Arm Muscle Hypercatabolism in Dysphagic Subacute Stroke Patients: The Effects of...
18
Clinical Study Unaffected Arm Muscle Hypercatabolism in Dysphagic Subacute Stroke Patients: The Effects of Essential Amino Acid Supplementation Roberto Aquilani, 1 Mirella Boselli, 2 Giuseppe D’Antona, 3,4 Paola Baiardi, 5 Federica Boschi, 6 Simona Viglio, 4 Paolo Iadarola, 7 Evasio Pasini, 8 Annalisa Barbieri, 6 Maurizia Dossena, 7 Andria Innocenza Bongiorno, 7 and Manuela Verri 7 1 Servizio di Fisiopatologia Metabolico-Nutrizionale e Nutrizione Clinica, Centro Medico di Montescano, IRCCS, Via per Montescano 31, 27040 Montescano, Italy 2 Unit` a di Riabilitazione Neuromotoria, Unit` a Gravi Cerebrolesioni Acquisite, Centro Medico di Montescano, IRCCS, Via per Montescano 31, 27040 Montescano, Italy 3 Laboratorio Universitario per lo Studio delle Attivit` a Motorie nelle Malattie Rare (LUSAMMR), Via Ugo Foscolo 13, 27058 Voghera, Italy 4 Dipartimento di Medicina Molecolare, Universit` a degli Studi di Pavia, Viale Taramelli 3/B, 27100 Pavia, Italy 5 Direzione Scientifica Centrale, Fondazione S. Maugeri, IRCCS, Via Salvatore Maugeri 10, 27100 Pavia, Italy 6 Dipartimento di Scienze del Farmaco, Universit` a degli Studi di Pavia, Viale Taramelli 14, 27100 Pavia, Italy 7 Dipartimento di Biologia e Biotecnologie “Lazzaro Spallanzani,” Universit` a degli Studi di Pavia, Via Ferrata 9, 27100 Pavia, Italy 8 Istituto Scientifico di Lumezzane (Brescia) Fondazione S. Maugeri, IRCCS, Via Mazzini 9 Lumezzane, 25065 Brescia, Italy Correspondence should be addressed to Manuela Verri; [email protected] Received 8 April 2014; Revised 4 September 2014; Accepted 7 September 2014; Published 9 November 2014 Academic Editor: Laura Guidetti Copyright © 2014 Roberto Aquilani et al. is is an open access article distributed under the Creative Commons Attribution License, which permits unrestricted use, distribution, and reproduction in any medium, provided the original work is properly cited. Alterations in muscle protein turnover of the unaffected side of stroke patients could contribute to physical disability. We investigated whether hypercatabolic activity occurred in unaffected arm muscle and whether supplemented essential amino acids (EAAs) could limit muscle hypercatabolism (MH). irty-eight dysphagic subacute stroke subjects (<3 months aſter acute event) (29 males + 9 females; 69.7 ± 11.4 yrs) were enrolled and randomized to receive 8 g/day EAAs (n = 19; EAA group) or isocaloric placebo (maltodextrin; n = 19, Plac group). Before randomization, all patients had their arterial (A) and venous (V) amino acids measured and muscle (A − V) differences calculated in the unaffected arm. Eight matched and healthy subjects served as controls. When compared to healthy controls, the entire stroke population showed significant muscle release (= negative value A − V) of the amino acid phenylalanine (phenyl-) indicating a prevalence of MH. Moreover, randomized EAA and Plac groups had similar rates of MH. Aſter 38 days from the start of the protocol, the EAA group but not the Plac group had MH converted to balanced protein turnover or anabolic activity. We concluded that muscle protein metabolism of the unaffected arm of dysphagic subacute stroke individuals could be characterized by MH which can be corrected by supplemented EAAs. 1. Introduction Strokes are the world’s leading cause of disability. About one- third of stroke survivors are permanently disabled one year aſter the acute event [1, 2]. About two-thirds of patients do not completely recover aſter strokes [3], while one-third cannot walk without assistance [4]. Furthermore, in hemiparetic subjects who can still walk, gait efficiency is reduced and the energy cost of the gait is increased compared with efficient symmetric gait [5, 6]. Hindawi Publishing Corporation BioMed Research International Volume 2014, Article ID 964365, 17 pages http://dx.doi.org/10.1155/2014/964365
Transcript of Unaffected Arm Muscle Hypercatabolism in Dysphagic Subacute Stroke Patients: The Effects of...
Clinical StudyUnaffected Arm Muscle Hypercatabolism in DysphagicSubacute Stroke Patients: The Effects of Essential AminoAcid Supplementation
Roberto Aquilani,1 Mirella Boselli,2 Giuseppe D’Antona,3,4 Paola Baiardi,5
Federica Boschi,6 Simona Viglio,4 Paolo Iadarola,7 Evasio Pasini,8 Annalisa Barbieri,6
Maurizia Dossena,7 Andria Innocenza Bongiorno,7 and Manuela Verri7
1 Servizio di Fisiopatologia Metabolico-Nutrizionale e Nutrizione Clinica, Centro Medico di Montescano, IRCCS,Via per Montescano 31, 27040 Montescano, Italy
2 Unita di Riabilitazione Neuromotoria, Unita Gravi Cerebrolesioni Acquisite, Centro Medico di Montescano, IRCCS,Via per Montescano 31, 27040 Montescano, Italy
3 Laboratorio Universitario per lo Studio delle Attivita Motorie nelle Malattie Rare (LUSAMMR), Via Ugo Foscolo 13,27058 Voghera, Italy
4Dipartimento di Medicina Molecolare, Universita degli Studi di Pavia, Viale Taramelli 3/B, 27100 Pavia, Italy5 Direzione Scientifica Centrale, Fondazione S. Maugeri, IRCCS, Via Salvatore Maugeri 10, 27100 Pavia, Italy6Dipartimento di Scienze del Farmaco, Universita degli Studi di Pavia, Viale Taramelli 14, 27100 Pavia, Italy7 Dipartimento di Biologia e Biotecnologie “Lazzaro Spallanzani,” Universita degli Studi di Pavia, Via Ferrata 9,27100 Pavia, Italy
8 Istituto Scientifico di Lumezzane (Brescia) Fondazione S. Maugeri, IRCCS, Via Mazzini 9 Lumezzane, 25065 Brescia, Italy
Correspondence should be addressed to Manuela Verri; [email protected]
Received 8 April 2014; Revised 4 September 2014; Accepted 7 September 2014; Published 9 November 2014
Academic Editor: Laura Guidetti
Copyright © 2014 Roberto Aquilani et al. This is an open access article distributed under the Creative Commons AttributionLicense, which permits unrestricted use, distribution, and reproduction in any medium, provided the original work is properlycited.
Alterations in muscle protein turnover of the unaffected side of stroke patients could contribute to physical disability. Weinvestigated whether hypercatabolic activity occurred in unaffected arm muscle and whether supplemented essential amino acids(EAAs) could limit muscle hypercatabolism (MH). Thirty-eight dysphagic subacute stroke subjects (<3 months after acute event)(29 males + 9 females; 69.7 ± 11.4 yrs) were enrolled and randomized to receive 8 g/day EAAs (n = 19; EAA group) or isocaloricplacebo (maltodextrin; n = 19, Plac group). Before randomization, all patients had their arterial (A) and venous (V) amino acidsmeasured and muscle (A − V) differences calculated in the unaffected arm. Eight matched and healthy subjects served as controls.When compared to healthy controls, the entire stroke population showed significant muscle release (= negative value A −V) of theamino acid phenylalanine (phenyl-) indicating a prevalence of MH. Moreover, randomized EAA and Plac groups had similar ratesof MH. After 38 days from the start of the protocol, the EAA group but not the Plac group had MH converted to balanced proteinturnover or anabolic activity. We concluded that muscle protein metabolism of the unaffected arm of dysphagic subacute strokeindividuals could be characterized by MH which can be corrected by supplemented EAAs.
1. Introduction
Strokes are the world’s leading cause of disability. About one-third of stroke survivors are permanently disabled one yearafter the acute event [1, 2]. About two-thirds of patients do not
completely recover after strokes [3], while one-third cannotwalk without assistance [4]. Furthermore, in hemipareticsubjects who can still walk, gait efficiency is reduced and theenergy cost of the gait is increased compared with efficientsymmetric gait [5, 6].
Hindawi Publishing CorporationBioMed Research InternationalVolume 2014, Article ID 964365, 17 pageshttp://dx.doi.org/10.1155/2014/964365
2 BioMed Research International
In addition to the loss of central trophic effects [7, 8]and transsynaptic degeneration of lower motor neurons [9–11], poststroke skeletal muscle changes can also potentiallycontribute to disability. These changes include fibre-typeshift in the paretic (= controlateral) side [12, 13], increasedintramuscular fat (myosteatosis) substituting muscle tissue[14], spasticity [15], disuse [16, 17], malnutrition [18], andmuscle unloading [19].
Subjects with subacute stroke (<3 months after acuteevent) [20, 21] were studied to find whether stroke disabilitycould be due to altered protein turnover in unaffectedmuscles. Our hypothesis is based on a previous study whichshowed that skeletalmuscles of subacute stroke patients couldbe hypercatabolic (i.e., protein degradation is higher thanprotein synthesis) due to a persistent systemic inflammatorystate [22]. Muscle hypercatabolism (MH) of the unaffectedside could contribute to patient disability by inducing a lossof bothmusclemass and strength, that is, a state of sarcopenia[23]. Highlighting MH as early as possible could be clinicallyimportant in order to limit patient disability.
We also formulated another hypothesis in that MH couldbe attenuated or even converted to muscle anabolism byproviding patients with essential amino acids supplements(EAAs) as these nutrients are potent promoters of proteinsynthesis. This fact has been amply documented in animal[24–27] and human studies, both in healthy subjects [28, 29]and in those suffering from chronic diseases associated withmuscle depletion and different from stroke [30–33].
This study was therefore carried out on subacute strokepatients with the aim of highlighting protein turnover (i.e.,anabolic and catabolic rate) of the unaffected arm to docu-ment whether EAA supplements could reduce MH.
2. Subjects and Methods
2.1. Population. Sixty-seven dysphagic subacute strokepatients (<3 months after acute cerebrovascular event)[20, 21] admitted to our rehabilitation centre were eligiblefor the study. Following our criteria, 11 were excludedfor associated chronic heart failure, 1 for acute coronarysyndrome, 4 for acute or chronic renal failure (creatinineclearance < 30mg/100mL), 1 for cancer surgery, 2 forpressure ulcer, 7 for diabetes (on oral hypoglycemic orinsulin treatment), 2 for dysthyroidism, and finally 1 forbeing on steroid therapy. The reason for excluding thesediseases was strictly related to their strong impact on muscleprotein metabolism.
The remaining thirty-eight patients (29males + 9 females;69.7 ± 11.4 yrs) were enrolled in this randomized, doubleblind, placebo-controlled study.The reason for patient admis-sion was due to rehabilitation for dysphagia and hemiplegia.All patients were bedridden and had been admitted fromneurosurgery (34.2%), neurological or stroke units (52.6%),or other rehabilitation settings (13.2%). Cerebrovascular acci-dent documented by computerized tomography was char-acterized by ischemia in 57.9% of patients or haemorrhagicinjury in the remaining 42.1%. We pooled ischemic andhaemorrhagic individuals because, in the rehabilitative phase
Table 1: Classification of stroke location, functional effects of stroke,and swallowing abnormalities of stroke population at admission tothe rehabilitation centre.
Patients (%)Stroke location
Cortical stroke:Dominant (left) Number 9 (23.7%)Nondominant (right) Number 8 (21%)
Subcortical stroke:Dominant (left) Number 7 (18.4%)Nondominant (right) Number 5 (13.2%)
Brainstem stroke Number 6 (15.8%)Cerebellar stroke Number 3 (7.9%)
Stroke severityFIM impairments (score)
Motor 21 ± 15∗
Cognitive 8 ± 6.5∗
Dysphagia (clinical/video fluoroscopic evaluation)Delayed oral transit Number 18 (47.4%)Incomplete oral clearance Number 10 (26.3%)Wet voice Number 3 (7.9%)Absent cough Number 7 (18.4%)FIM: functional independence measure. ∗Total FIM scores range from 18(totally dependent) to 126 (totally independent); motor scores range from 13(total dependence) to 91 (total independence); cognitive scores range from 5(total dependence) to 35 (total independence).
of stroke, these two groups have similar metabolic, nutri-tional, functional profiles [22].
On the basis of computerized tomography or magneticresonance imaging, the damaged stroke areas were classifiedin relation to the location of the ischaemic destruction asPACI (partial anterior circulation infarction; 23.7%), TACI(total anterior circulation infarction; 50%), or POCI (pos-terior anterior circulation infarction; 26.3%). These data arecontained in Table 1 which also shows stroke severity andassessed mechanisms underlying swallowing abnormalities.
At admission, all patients were fed via percutaneousendoscopy gastrostomy (PEG; 𝑛 = 30) or by oral modifieddiet (𝑛 = 8).
2.2. Procedures. Within two days of admission, after over-night fasting at 8 am, blood samples were taken from eachpatient to determine the following.
2.2.1. PlasmaAminoAcids. These substrateswere determinedboth in arterial (radial artery) and in venous blood of theunaffected arm. Concentrations of free amino acids in theplasma were measured using an AminoQuant II aminoacid analyser, based on the HP 1090 HPLC system, withfully automated precolumn derivatization, using both ortho-phthalaldehyde and 9-fluorenyl-methyl-chloroformate reac-tion chemistries according to the manufacturer’s protocol.The results were obtained by injecting 1 𝜇L of the derivatizedmixture andmeasuring absorbance simultaneously at 338 and262 nm. Plasma concentrations were expressed as 𝜇mol/L.
BioMed Research International 3
Amino acid measurements were carried out as a comparisonin eight healthy subjects matched for age (71 ± 4.5 years),sex distribution (6M/2 F), and body mass index (22.3 ±3.5 kg/m2).
Calculations
(a) Muscle protein metabolism. As described elsewhere[34], muscle protein overdegradation was estimatedby the muscle release of the essential amino acidphenylalanine (phenyl-), whereas muscle proteinsynthesis was determined by muscle phenyl- uptake.Given that phenyl- is neither synthesized nordegraded in muscle tissue, any changes in the muscleuptake/release would reflect the total protein balance[35]. A negative phenyl- A − V (= release) signifiedan imbalanced protein metabolism with an excess ofprotein degradation over protein synthesis, whereasa positive phenyl- A − V (= uptake) indicated apredominance of protein synthesis. A phenyl- A − Vof zero (no uptake/no release) indicated a balancedmuscle protein metabolism.
(b) A − V differences of the other amino acids, totalamino acids (TAAs), total essential amino acids(EAAs: valine, isoleucine, leucine, threonine, phenyl-,tryptophan, methionine, lysine), and branched-chainamino acids (BCAAs: valine, isoleucine, leucine) werecalculated.
2.2.2. Biomarkers of Body Inflammatory Status
(i) Serum levels of interleukin-6 (IL-6; normal value <7 pg/mL) were determined in duplicate, using a high-sensitivity commercial sandwich enzyme-linkedimmunosorbent assay (ELISA) kit from Mabtech(Agilent Technologies GmbH, Boblingen, Germany);
(ii) C-reactive protein (CRP; normal value < 0.3mg/dL)was determined with an immune-turbidimetricmethod;
(iii) acute-phase reactant proteins (haptoglobin, normalvalues 30–200mg/dL; 𝛼-1 globulin system, nor-mal value 0.21–0.35 g/dL) and non-reactant proteins(albumin, normal values 4.02–4.76 g/dL; prealbumin,normal values 18–30mg/dL and transferrin, normalvalues 202–364mg/dL) were evaluated.
2.2.3. Plasma Lactate Concentrations. These were measuredwith enzymatic tests following procedures recommendedby the manufacturer (Siemens Diagnostic, Germany). Thenormal value is 0.6–2.2mmol/L.
2.2.4. As Part of Routine Assessment, Patients Had the Follow-ing Variables Measured
(i) Anthropometric characteristics: body weight (BW,kg), found using amechanical weight lifter, and height(m), calculated from knee height [36]. Body mass
index (BMI) was calculated as kg/m2. Patients (ortheir caregivers) were asked for their preacute BW.Loss of actual BW in relation to habitual (preacute)BW > 5%, that is, actual/habitual BW < 95%, wasconsidered an index of significant undernutrition;
(ii) biohumoral measurements: routine variables, includ-ing serum protein electrophoresis.
2.2.5. Functional Status. This was evaluated using functionalindependence measure (FIM) [37].This test is routinely usedby the centre’s neurorehabilitative physician. The FIM is an18-item scale that measures patient independence in feeding,grooming, dressing, toileting, mobility, and cognition. Ascore of 126 indicates complete functional independence.
2.2.6. Dysphagia. Identification of dysphagia was carriedout clinically for the entire population. In case of positiveor uncertain diagnosis, the patients underwent a videofluoroscopy examination. The severity of the dysphagia wasevaluated using the Dysphagia Outcome and Severity Scale(DOSS), a 7-point scale developed to systematically rate thefunctional severity of dysphagia [38]. The score range was 1–7, where level 1 denotes severe dysphagia, level 2 moderately-severe dysphagia, level 3 moderate-dysphagia, level 4 mild-to-moderate dysphagia, level 5mild-dysphagia, level 6 withinfunctional limit/modified independence, and level 7 normalunder all situations.
2.2.7. Nutritional Intake. For self-feeding patients (𝑛 = 8)on a modified diet, a 3-day alimentary diary was kept bythe rehabilitation nurses, who had been previously trainedad hoc. The nurses recorded the type and weight of cookedor uncooked food selected by patients from the hospital’scatering menu on a diet sheet for 3 days both before andafter the patients’meals.The amount of food actually ingestedwas converted (by Roberto Aquilani of the paper) to itsraw equivalent when necessary, using appropriate tables [39].Nutritional analysis, carried out using a computer programdesigned by this group [40], was used to calculate actualingested calories andmacro-/micronutrients.The nutritionalintake from pharmaceutical formula of the patients withPEG (𝑛 = 30) was calculated from nutritional compositionreported in the formula label.
2.2.8. Rehabilitation Therapy. All patients received rehabili-tative treatment adapted to each individual patient. Briefly,rehabilitation consisted of therapeutic exercise with a per-sonal physiotherapist for 60 minutes, five days a week. Theexercise included passive, active, and active-assistive range-of-motion exercise coordination, facilitation techniques ofthe controlateral limbs, trunk exercise, active exercises of theunaffected limbs, and ambulation with assistive devices orsupport. The number or repetition in exercise and walkingdistance was increased as the physical performance of thepatients progressed. Speech therapy, occupational therapy(activities of daily living, vocational, perceptual, and func-tional activity training), and recreational activity were alsoperformed depending on individual needs.
4 BioMed Research International
Assessed for eligibility (n = 67)
Placebo (n = 19)
Allocation
Intervention (n = 19)
Randomized (n = 38)
Lost to follow-up n = 0Discontinued intervention n = 0
Follow-up
Lost to follow-up n = 0Discontinued intervention n = 0
Analysis
Analysed n = 19Excluded from analysis n = 0
Analysed n = 19Excluded from analysis n = 0
Essential AA 8g/d
Excluded n = 29
∙ Chronic heart failure n = 11
∙ Acute coronary syndrome n = 1
∙ Acute/chronic renal failure n = 4
∙ Surgery for cancer n = 1
∙ Pressure ulcer n = 2
∙ Dysthyroidism n = 2∙ Diabetes n = 7
∙ Steroid therapy n = 1
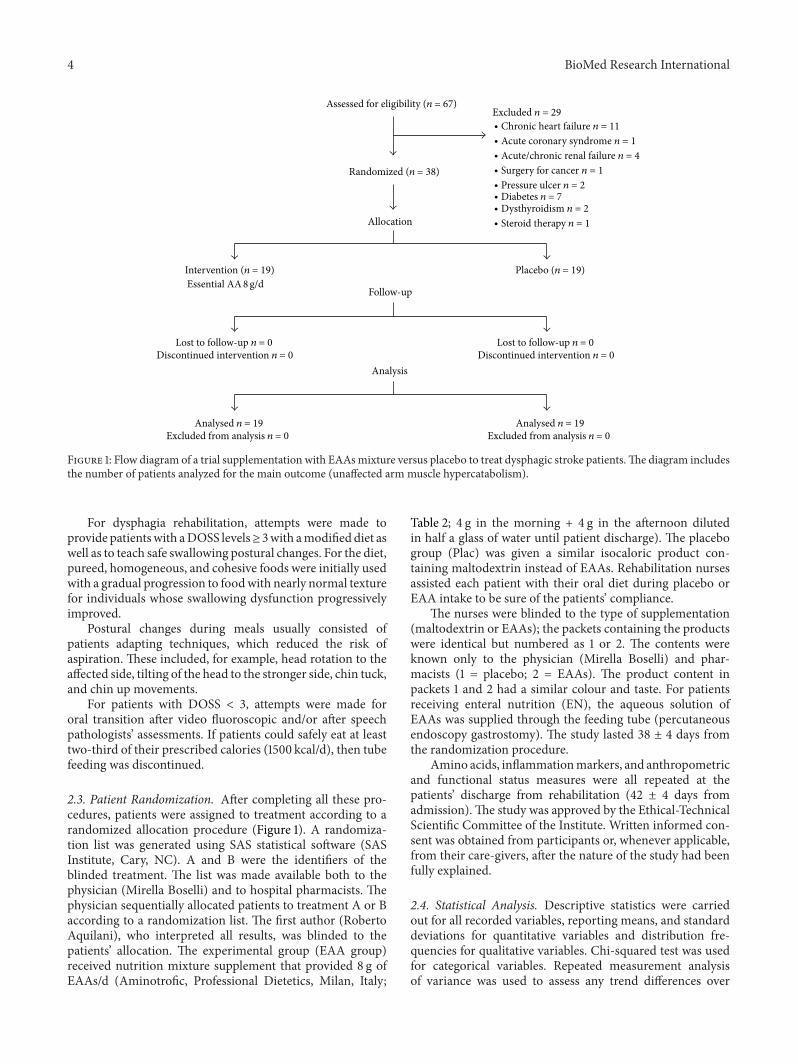
Figure 1: Flow diagram of a trial supplementation with EAAsmixture versus placebo to treat dysphagic stroke patients.The diagram includesthe number of patients analyzed for the main outcome (unaffected arm muscle hypercatabolism).
For dysphagia rehabilitation, attempts were made toprovide patientswith aDOSS levels≥ 3with amodifieddiet aswell as to teach safe swallowing postural changes. For the diet,pureed, homogeneous, and cohesive foods were initially usedwith a gradual progression to foodwith nearly normal texturefor individuals whose swallowing dysfunction progressivelyimproved.
Postural changes during meals usually consisted ofpatients adapting techniques, which reduced the risk ofaspiration. These included, for example, head rotation to theaffected side, tilting of the head to the stronger side, chin tuck,and chin up movements.
For patients with DOSS < 3, attempts were made fororal transition after video fluoroscopic and/or after speechpathologists’ assessments. If patients could safely eat at leasttwo-third of their prescribed calories (1500 kcal/d), then tubefeeding was discontinued.
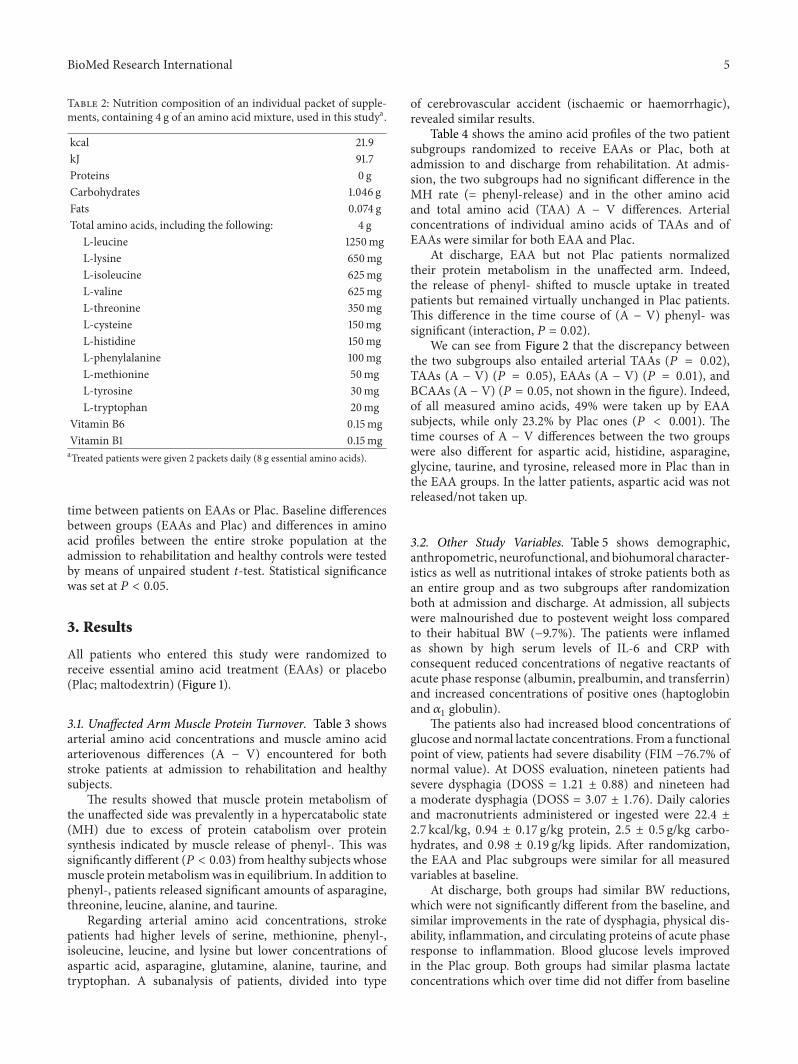
2.3. Patient Randomization. After completing all these pro-cedures, patients were assigned to treatment according to arandomized allocation procedure (Figure 1). A randomiza-tion list was generated using SAS statistical software (SASInstitute, Cary, NC). A and B were the identifiers of theblinded treatment. The list was made available both to thephysician (Mirella Boselli) and to hospital pharmacists. Thephysician sequentially allocated patients to treatment A or Baccording to a randomization list. The first author (RobertoAquilani), who interpreted all results, was blinded to thepatients’ allocation. The experimental group (EAA group)received nutrition mixture supplement that provided 8 g ofEAAs/d (Aminotrofic, Professional Dietetics, Milan, Italy;
Table 2; 4 g in the morning + 4 g in the afternoon dilutedin half a glass of water until patient discharge). The placebogroup (Plac) was given a similar isocaloric product con-taining maltodextrin instead of EAAs. Rehabilitation nursesassisted each patient with their oral diet during placebo orEAA intake to be sure of the patients’ compliance.
The nurses were blinded to the type of supplementation(maltodextrin or EAAs); the packets containing the productswere identical but numbered as 1 or 2. The contents wereknown only to the physician (Mirella Boselli) and phar-macists (1 = placebo; 2 = EAAs). The product content inpackets 1 and 2 had a similar colour and taste. For patientsreceiving enteral nutrition (EN), the aqueous solution ofEAAs was supplied through the feeding tube (percutaneousendoscopy gastrostomy). The study lasted 38 ± 4 days fromthe randomization procedure.
Amino acids, inflammationmarkers, and anthropometricand functional status measures were all repeated at thepatients’ discharge from rehabilitation (42 ± 4 days fromadmission).The study was approved by the Ethical-TechnicalScientific Committee of the Institute. Written informed con-sent was obtained from participants or, whenever applicable,from their care-givers, after the nature of the study had beenfully explained.
2.4. Statistical Analysis. Descriptive statistics were carriedout for all recorded variables, reporting means, and standarddeviations for quantitative variables and distribution fre-quencies for qualitative variables. Chi-squared test was usedfor categorical variables. Repeated measurement analysisof variance was used to assess any trend differences over
BioMed Research International 5
Table 2: Nutrition composition of an individual packet of supple-ments, containing 4 g of an amino acid mixture, used in this studya.
kcal 21.9kJ 91.7Proteins 0 gCarbohydrates 1.046 gFats 0.074 gTotal amino acids, including the following: 4 g
L-leucine 1250mgL-lysine 650mgL-isoleucine 625mgL-valine 625mgL-threonine 350mgL-cysteine 150mgL-histidine 150mgL-phenylalanine 100mgL-methionine 50mgL-tyrosine 30mgL-tryptophan 20mg
Vitamin B6 0.15mgVitamin B1 0.15mgaTreated patients were given 2 packets daily (8 g essential amino acids).
time between patients on EAAs or Plac. Baseline differencesbetween groups (EAAs and Plac) and differences in aminoacid profiles between the entire stroke population at theadmission to rehabilitation and healthy controls were testedby means of unpaired student t-test. Statistical significancewas set at 𝑃 < 0.05.
3. Results
All patients who entered this study were randomized toreceive essential amino acid treatment (EAAs) or placebo(Plac; maltodextrin) (Figure 1).
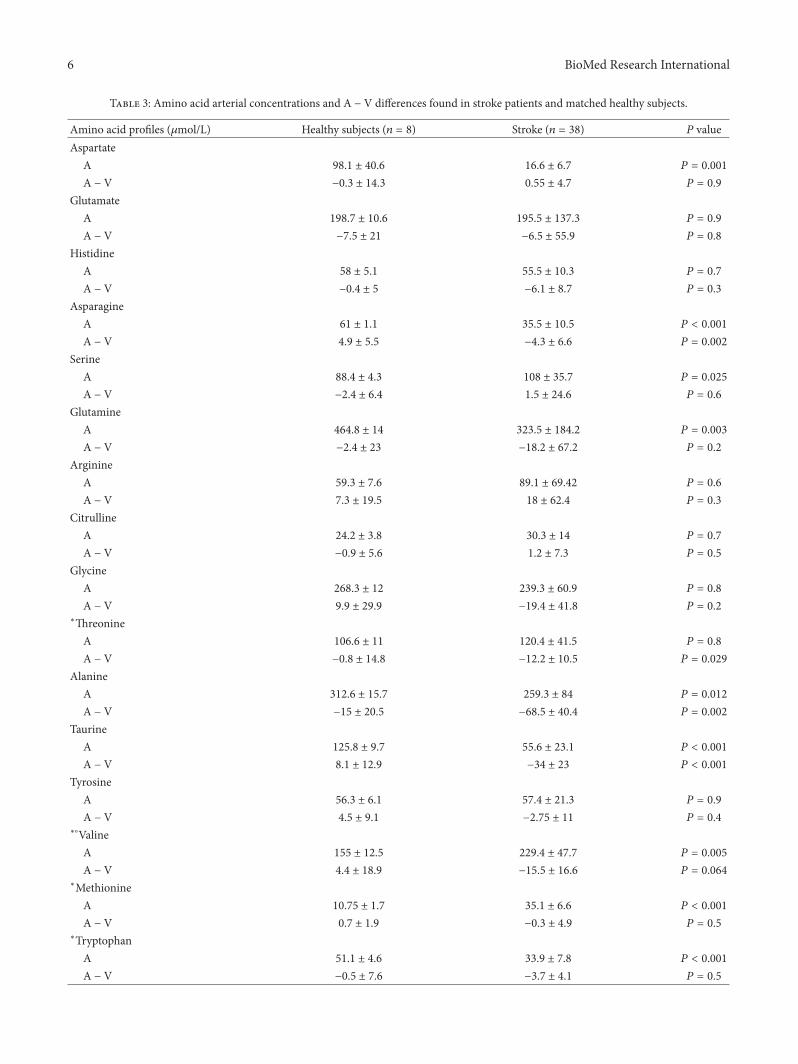
3.1. Unaffected Arm Muscle Protein Turnover. Table 3 showsarterial amino acid concentrations and muscle amino acidarteriovenous differences (A − V) encountered for bothstroke patients at admission to rehabilitation and healthysubjects.
The results showed that muscle protein metabolism ofthe unaffected side was prevalently in a hypercatabolic state(MH) due to excess of protein catabolism over proteinsynthesis indicated by muscle release of phenyl-. This wassignificantly different (𝑃 < 0.03) from healthy subjects whosemuscle proteinmetabolismwas in equilibrium. In addition tophenyl-, patients released significant amounts of asparagine,threonine, leucine, alanine, and taurine.
Regarding arterial amino acid concentrations, strokepatients had higher levels of serine, methionine, phenyl-,isoleucine, leucine, and lysine but lower concentrations ofaspartic acid, asparagine, glutamine, alanine, taurine, andtryptophan. A subanalysis of patients, divided into type
of cerebrovascular accident (ischaemic or haemorrhagic),revealed similar results.
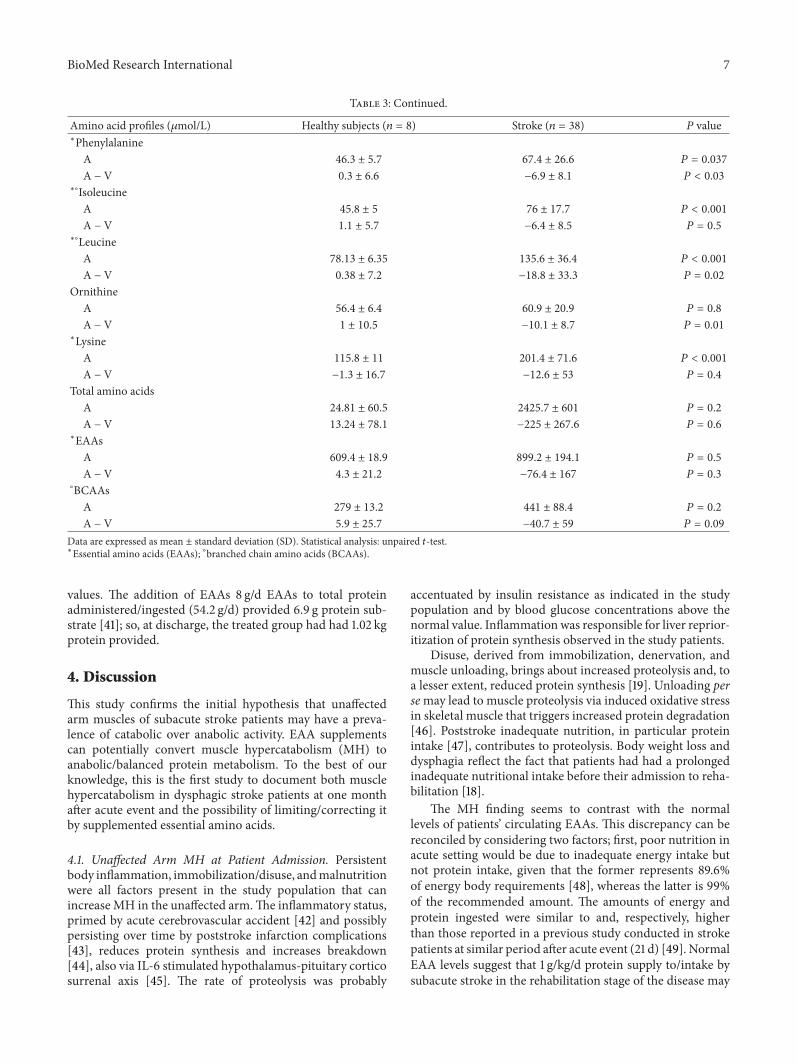
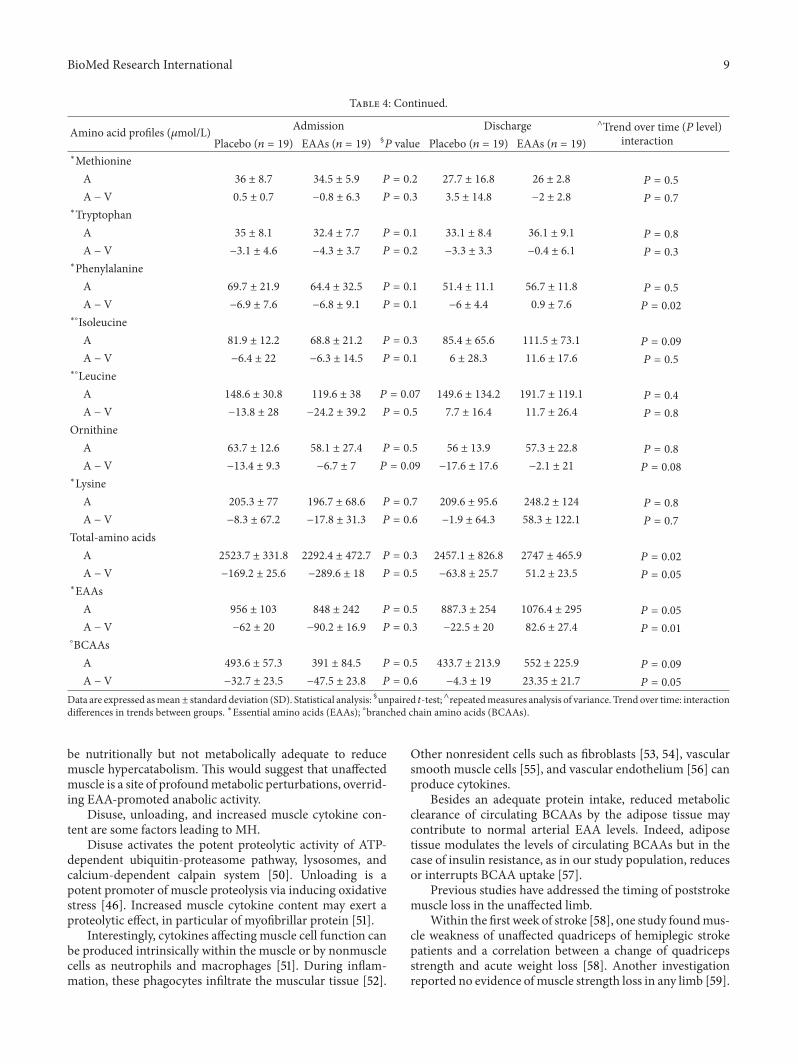
Table 4 shows the amino acid profiles of the two patientsubgroups randomized to receive EAAs or Plac, both atadmission to and discharge from rehabilitation. At admis-sion, the two subgroups had no significant difference in theMH rate (= phenyl-release) and in the other amino acidand total amino acid (TAA) A − V differences. Arterialconcentrations of individual amino acids of TAAs and ofEAAs were similar for both EAA and Plac.
At discharge, EAA but not Plac patients normalizedtheir protein metabolism in the unaffected arm. Indeed,the release of phenyl- shifted to muscle uptake in treatedpatients but remained virtually unchanged in Plac patients.This difference in the time course of (A − V) phenyl- wassignificant (interaction, 𝑃 = 0.02).
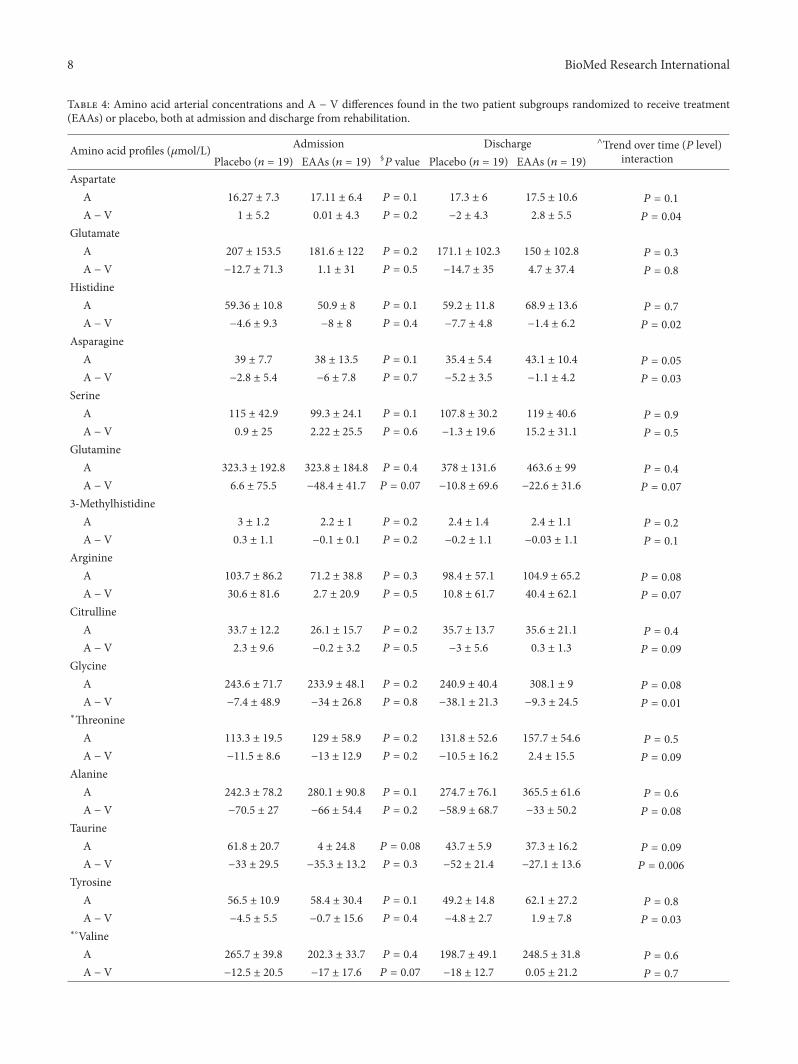
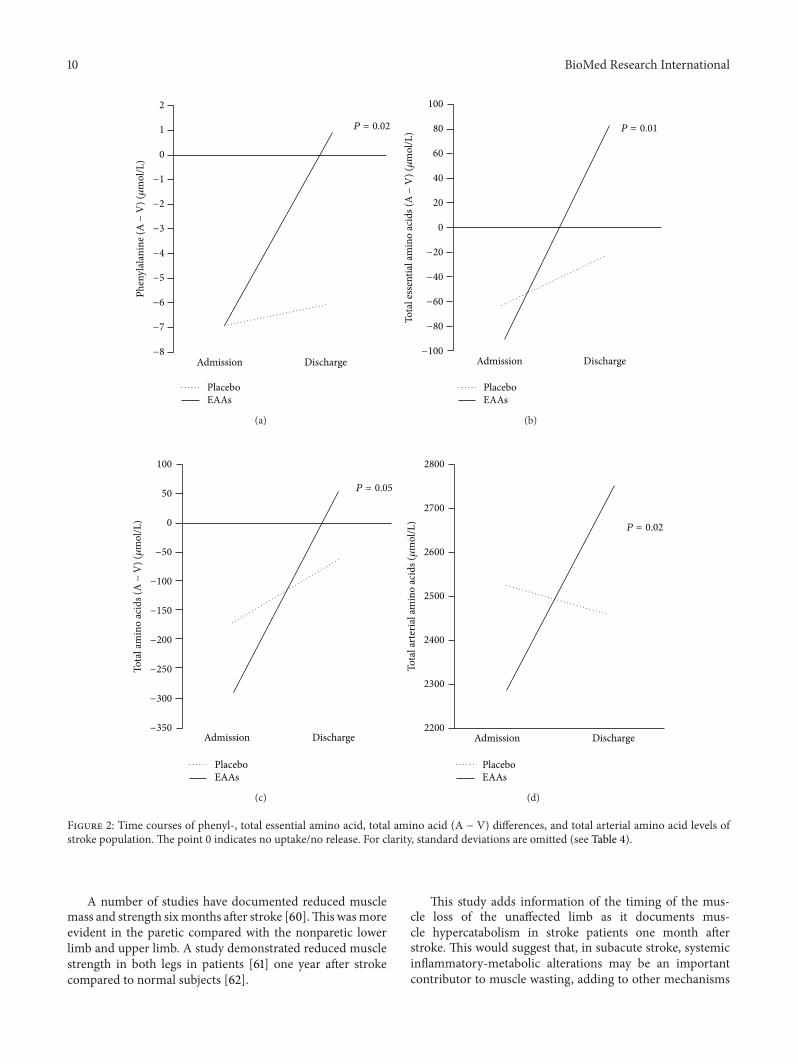
We can see from Figure 2 that the discrepancy betweenthe two subgroups also entailed arterial TAAs (𝑃 = 0.02),TAAs (A − V) (𝑃 = 0.05), EAAs (A − V) (𝑃 = 0.01), andBCAAs (A − V) (𝑃 = 0.05, not shown in the figure). Indeed,of all measured amino acids, 49% were taken up by EAAsubjects, while only 23.2% by Plac ones (𝑃 < 0.001). Thetime courses of A − V differences between the two groupswere also different for aspartic acid, histidine, asparagine,glycine, taurine, and tyrosine, released more in Plac than inthe EAA groups. In the latter patients, aspartic acid was notreleased/not taken up.
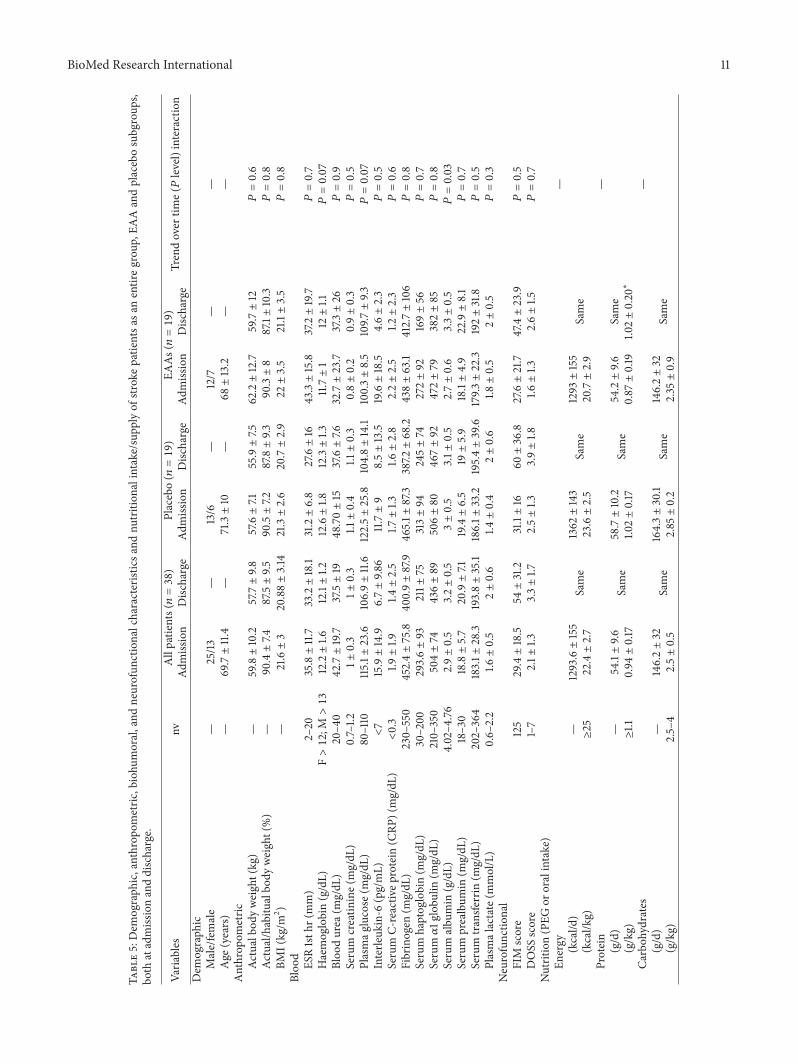
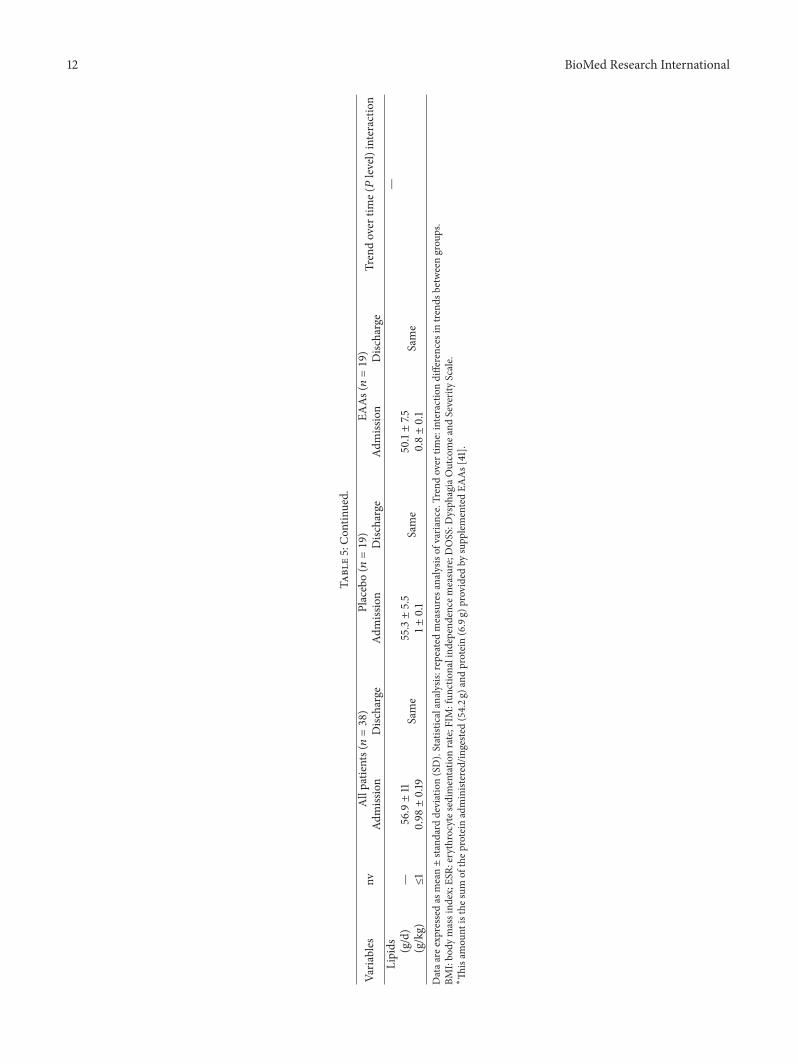
3.2. Other Study Variables. Table 5 shows demographic,anthropometric, neurofunctional, and biohumoral character-istics as well as nutritional intakes of stroke patients both asan entire group and as two subgroups after randomizationboth at admission and discharge. At admission, all subjectswere malnourished due to postevent weight loss comparedto their habitual BW (−9.7%). The patients were inflamedas shown by high serum levels of IL-6 and CRP withconsequent reduced concentrations of negative reactants ofacute phase response (albumin, prealbumin, and transferrin)and increased concentrations of positive ones (haptoglobinand 𝛼
1globulin).
The patients also had increased blood concentrations ofglucose and normal lactate concentrations. From a functionalpoint of view, patients had severe disability (FIM −76.7% ofnormal value). At DOSS evaluation, nineteen patients hadsevere dysphagia (DOSS = 1.21 ± 0.88) and nineteen hada moderate dysphagia (DOSS = 3.07 ± 1.76). Daily caloriesand macronutrients administered or ingested were 22.4 ±2.7 kcal/kg, 0.94 ± 0.17 g/kg protein, 2.5 ± 0.5 g/kg carbo-hydrates, and 0.98 ± 0.19 g/kg lipids. After randomization,the EAA and Plac subgroups were similar for all measuredvariables at baseline.
At discharge, both groups had similar BW reductions,which were not significantly different from the baseline, andsimilar improvements in the rate of dysphagia, physical dis-ability, inflammation, and circulating proteins of acute phaseresponse to inflammation. Blood glucose levels improvedin the Plac group. Both groups had similar plasma lactateconcentrations which over time did not differ from baseline
6 BioMed Research International
Table 3: Amino acid arterial concentrations and A − V differences found in stroke patients and matched healthy subjects.
Amino acid profiles (𝜇mol/L) Healthy subjects (𝑛 = 8) Stroke (𝑛 = 38) 𝑃 valueAspartate
A 98.1 ± 40.6 16.6 ± 6.7 𝑃 = 0.001
A − V −0.3 ± 14.3 0.55 ± 4.7 𝑃 = 0.9
GlutamateA 198.7 ± 10.6 195.5 ± 137.3 𝑃 = 0.9
A − V −7.5 ± 21 −6.5 ± 55.9 𝑃 = 0.8
HistidineA 58 ± 5.1 55.5 ± 10.3 𝑃 = 0.7
A − V −0.4 ± 5 −6.1 ± 8.7 𝑃 = 0.3
AsparagineA 61 ± 1.1 35.5 ± 10.5 𝑃 < 0.001
A − V 4.9 ± 5.5 −4.3 ± 6.6 𝑃 = 0.002
SerineA 88.4 ± 4.3 108 ± 35.7 𝑃 = 0.025
A − V −2.4 ± 6.4 1.5 ± 24.6 𝑃 = 0.6
GlutamineA 464.8 ± 14 323.5 ± 184.2 𝑃 = 0.003
A − V −2.4 ± 23 −18.2 ± 67.2 𝑃 = 0.2
ArginineA 59.3 ± 7.6 89.1 ± 69.42 𝑃 = 0.6
A − V 7.3 ± 19.5 18 ± 62.4 𝑃 = 0.3
CitrullineA 24.2 ± 3.8 30.3 ± 14 𝑃 = 0.7
A − V −0.9 ± 5.6 1.2 ± 7.3 𝑃 = 0.5
GlycineA 268.3 ± 12 239.3 ± 60.9 𝑃 = 0.8
A − V 9.9 ± 29.9 −19.4 ± 41.8 𝑃 = 0.2
∗ThreonineA 106.6 ± 11 120.4 ± 41.5 𝑃 = 0.8
A − V −0.8 ± 14.8 −12.2 ± 10.5 𝑃 = 0.029
AlanineA 312.6 ± 15.7 259.3 ± 84 𝑃 = 0.012
A − V −15 ± 20.5 −68.5 ± 40.4 𝑃 = 0.002
TaurineA 125.8 ± 9.7 55.6 ± 23.1 𝑃 < 0.001
A − V 8.1 ± 12.9 −34 ± 23 𝑃 < 0.001
TyrosineA 56.3 ± 6.1 57.4 ± 21.3 𝑃 = 0.9
A − V 4.5 ± 9.1 −2.75 ± 11 𝑃 = 0.4
∗∘ValineA 155 ± 12.5 229.4 ± 47.7 𝑃 = 0.005
A − V 4.4 ± 18.9 −15.5 ± 16.6 𝑃 = 0.064
∗MethionineA 10.75 ± 1.7 35.1 ± 6.6 𝑃 < 0.001
A − V 0.7 ± 1.9 −0.3 ± 4.9 𝑃 = 0.5
∗TryptophanA 51.1 ± 4.6 33.9 ± 7.8 𝑃 < 0.001
A − V −0.5 ± 7.6 −3.7 ± 4.1 𝑃 = 0.5
BioMed Research International 7
Table 3: Continued.
Amino acid profiles (𝜇mol/L) Healthy subjects (𝑛 = 8) Stroke (𝑛 = 38) 𝑃 value∗Phenylalanine
A 46.3 ± 5.7 67.4 ± 26.6 𝑃 = 0.037
A − V 0.3 ± 6.6 −6.9 ± 8.1 𝑃 < 0.03
∗∘IsoleucineA 45.8 ± 5 76 ± 17.7 𝑃 < 0.001
A − V 1.1 ± 5.7 −6.4 ± 8.5 𝑃 = 0.5
∗∘LeucineA 78.13 ± 6.35 135.6 ± 36.4 𝑃 < 0.001
A − V 0.38 ± 7.2 −18.8 ± 33.3 𝑃 = 0.02
OrnithineA 56.4 ± 6.4 60.9 ± 20.9 𝑃 = 0.8
A − V 1 ± 10.5 −10.1 ± 8.7 𝑃 = 0.01
∗LysineA 115.8 ± 11 201.4 ± 71.6 𝑃 < 0.001
A − V −1.3 ± 16.7 −12.6 ± 53 𝑃 = 0.4
Total amino acidsA 24.81 ± 60.5 2425.7 ± 601 𝑃 = 0.2
A − V 13.24 ± 78.1 −225 ± 267.6 𝑃 = 0.6
∗EAAsA 609.4 ± 18.9 899.2 ± 194.1 𝑃 = 0.5
A − V 4.3 ± 21.2 −76.4 ± 167 𝑃 = 0.3
∘BCAAsA 279 ± 13.2 441 ± 88.4 𝑃 = 0.2
A − V 5.9 ± 25.7 −40.7 ± 59 𝑃 = 0.09
Data are expressed as mean ± standard deviation (SD). Statistical analysis: unpaired 𝑡-test.∗Essential amino acids (EAAs); ∘branched chain amino acids (BCAAs).
values. The addition of EAAs 8 g/d EAAs to total proteinadministered/ingested (54.2 g/d) provided 6.9 g protein sub-strate [41]; so, at discharge, the treated group had had 1.02 kgprotein provided.
4. Discussion
This study confirms the initial hypothesis that unaffectedarm muscles of subacute stroke patients may have a preva-lence of catabolic over anabolic activity. EAA supplementscan potentially convert muscle hypercatabolism (MH) toanabolic/balanced protein metabolism. To the best of ourknowledge, this is the first study to document both musclehypercatabolism in dysphagic stroke patients at one monthafter acute event and the possibility of limiting/correcting itby supplemented essential amino acids.
4.1. Unaffected Arm MH at Patient Admission. Persistentbody inflammation, immobilization/disuse, andmalnutritionwere all factors present in the study population that canincrease MH in the unaffected arm.The inflammatory status,primed by acute cerebrovascular accident [42] and possiblypersisting over time by poststroke infarction complications[43], reduces protein synthesis and increases breakdown[44], also via IL-6 stimulated hypothalamus-pituitary corticosurrenal axis [45]. The rate of proteolysis was probably
accentuated by insulin resistance as indicated in the studypopulation and by blood glucose concentrations above thenormal value. Inflammation was responsible for liver reprior-itization of protein synthesis observed in the study patients.
Disuse, derived from immobilization, denervation, andmuscle unloading, brings about increased proteolysis and, toa lesser extent, reduced protein synthesis [19]. Unloading persemay lead to muscle proteolysis via induced oxidative stressin skeletal muscle that triggers increased protein degradation[46]. Poststroke inadequate nutrition, in particular proteinintake [47], contributes to proteolysis. Body weight loss anddysphagia reflect the fact that patients had had a prolongedinadequate nutritional intake before their admission to reha-bilitation [18].
The MH finding seems to contrast with the normallevels of patients’ circulating EAAs. This discrepancy can bereconciled by considering two factors; first, poor nutrition inacute setting would be due to inadequate energy intake butnot protein intake, given that the former represents 89.6%of energy body requirements [48], whereas the latter is 99%of the recommended amount. The amounts of energy andprotein ingested were similar to and, respectively, higherthan those reported in a previous study conducted in strokepatients at similar period after acute event (21 d) [49]. NormalEAA levels suggest that 1 g/kg/d protein supply to/intake bysubacute stroke in the rehabilitation stage of the disease may
8 BioMed Research International
Table 4: Amino acid arterial concentrations and A − V differences found in the two patient subgroups randomized to receive treatment(EAAs) or placebo, both at admission and discharge from rehabilitation.
Amino acid profiles (𝜇mol/L) Admission Discharge ∧Trend over time (𝑃 level)interactionPlacebo (𝑛 = 19) EAAs (𝑛 = 19) §
𝑃 value Placebo (𝑛 = 19) EAAs (𝑛 = 19)Aspartate
A 16.27 ± 7.3 17.11 ± 6.4 𝑃 = 0.1 17.3 ± 6 17.5 ± 10.6 𝑃 = 0.1
A − V 1 ± 5.2 0.01 ± 4.3 𝑃 = 0.2 −2 ± 4.3 2.8 ± 5.5 𝑃 = 0.04
GlutamateA 207 ± 153.5 181.6 ± 122 𝑃 = 0.2 171.1 ± 102.3 150 ± 102.8 𝑃 = 0.3
A − V −12.7 ± 71.3 1.1 ± 31 𝑃 = 0.5 −14.7 ± 35 4.7 ± 37.4 𝑃 = 0.8
HistidineA 59.36 ± 10.8 50.9 ± 8 𝑃 = 0.1 59.2 ± 11.8 68.9 ± 13.6 𝑃 = 0.7
A − V −4.6 ± 9.3 −8 ± 8 𝑃 = 0.4 −7.7 ± 4.8 −1.4 ± 6.2 𝑃 = 0.02
AsparagineA 39 ± 7.7 38 ± 13.5 𝑃 = 0.1 35.4 ± 5.4 43.1 ± 10.4 𝑃 = 0.05
A − V −2.8 ± 5.4 −6 ± 7.8 𝑃 = 0.7 −5.2 ± 3.5 −1.1 ± 4.2 𝑃 = 0.03
SerineA 115 ± 42.9 99.3 ± 24.1 𝑃 = 0.1 107.8 ± 30.2 119 ± 40.6 𝑃 = 0.9
A − V 0.9 ± 25 2.22 ± 25.5 𝑃 = 0.6 −1.3 ± 19.6 15.2 ± 31.1 𝑃 = 0.5
GlutamineA 323.3 ± 192.8 323.8 ± 184.8 𝑃 = 0.4 378 ± 131.6 463.6 ± 99 𝑃 = 0.4
A − V 6.6 ± 75.5 −48.4 ± 41.7 𝑃 = 0.07 −10.8 ± 69.6 −22.6 ± 31.6 𝑃 = 0.07
3-MethylhistidineA 3 ± 1.2 2.2 ± 1 𝑃 = 0.2 2.4 ± 1.4 2.4 ± 1.1 𝑃 = 0.2
A − V 0.3 ± 1.1 −0.1 ± 0.1 𝑃 = 0.2 −0.2 ± 1.1 −0.03 ± 1.1 𝑃 = 0.1
ArginineA 103.7 ± 86.2 71.2 ± 38.8 𝑃 = 0.3 98.4 ± 57.1 104.9 ± 65.2 𝑃 = 0.08
A − V 30.6 ± 81.6 2.7 ± 20.9 𝑃 = 0.5 10.8 ± 61.7 40.4 ± 62.1 𝑃 = 0.07
CitrullineA 33.7 ± 12.2 26.1 ± 15.7 𝑃 = 0.2 35.7 ± 13.7 35.6 ± 21.1 𝑃 = 0.4
A − V 2.3 ± 9.6 −0.2 ± 3.2 𝑃 = 0.5 −3 ± 5.6 0.3 ± 1.3 𝑃 = 0.09
GlycineA 243.6 ± 71.7 233.9 ± 48.1 𝑃 = 0.2 240.9 ± 40.4 308.1 ± 9 𝑃 = 0.08
A − V −7.4 ± 48.9 −34 ± 26.8 𝑃 = 0.8 −38.1 ± 21.3 −9.3 ± 24.5 𝑃 = 0.01
∗ThreonineA 113.3 ± 19.5 129 ± 58.9 𝑃 = 0.2 131.8 ± 52.6 157.7 ± 54.6 𝑃 = 0.5
A − V −11.5 ± 8.6 −13 ± 12.9 𝑃 = 0.2 −10.5 ± 16.2 2.4 ± 15.5 𝑃 = 0.09
AlanineA 242.3 ± 78.2 280.1 ± 90.8 𝑃 = 0.1 274.7 ± 76.1 365.5 ± 61.6 𝑃 = 0.6
A − V −70.5 ± 27 −66 ± 54.4 𝑃 = 0.2 −58.9 ± 68.7 −33 ± 50.2 𝑃 = 0.08
TaurineA 61.8 ± 20.7 4 ± 24.8 𝑃 = 0.08 43.7 ± 5.9 37.3 ± 16.2 𝑃 = 0.09
A − V −33 ± 29.5 −35.3 ± 13.2 𝑃 = 0.3 −52 ± 21.4 −27.1 ± 13.6 𝑃 = 0.006
TyrosineA 56.5 ± 10.9 58.4 ± 30.4 𝑃 = 0.1 49.2 ± 14.8 62.1 ± 27.2 𝑃 = 0.8
A − V −4.5 ± 5.5 −0.7 ± 15.6 𝑃 = 0.4 −4.8 ± 2.7 1.9 ± 7.8 𝑃 = 0.03
∗∘ValineA 265.7 ± 39.8 202.3 ± 33.7 𝑃 = 0.4 198.7 ± 49.1 248.5 ± 31.8 𝑃 = 0.6
A − V −12.5 ± 20.5 −17 ± 17.6 𝑃 = 0.07 −18 ± 12.7 0.05 ± 21.2 𝑃 = 0.7
BioMed Research International 9
Table 4: Continued.
Amino acid profiles (𝜇mol/L) Admission Discharge ∧Trend over time (𝑃 level)interactionPlacebo (𝑛 = 19) EAAs (𝑛 = 19) §
𝑃 value Placebo (𝑛 = 19) EAAs (𝑛 = 19)∗Methionine
A 36 ± 8.7 34.5 ± 5.9 𝑃 = 0.2 27.7 ± 16.8 26 ± 2.8 𝑃 = 0.5
A − V 0.5 ± 0.7 −0.8 ± 6.3 𝑃 = 0.3 3.5 ± 14.8 −2 ± 2.8 𝑃 = 0.7
∗TryptophanA 35 ± 8.1 32.4 ± 7.7 𝑃 = 0.1 33.1 ± 8.4 36.1 ± 9.1 𝑃 = 0.8
A − V −3.1 ± 4.6 −4.3 ± 3.7 𝑃 = 0.2 −3.3 ± 3.3 −0.4 ± 6.1 𝑃 = 0.3
∗PhenylalanineA 69.7 ± 21.9 64.4 ± 32.5 𝑃 = 0.1 51.4 ± 11.1 56.7 ± 11.8 𝑃 = 0.5
A − V −6.9 ± 7.6 −6.8 ± 9.1 𝑃 = 0.1 −6 ± 4.4 0.9 ± 7.6 𝑃 = 0.02
∗∘IsoleucineA 81.9 ± 12.2 68.8 ± 21.2 𝑃 = 0.3 85.4 ± 65.6 111.5 ± 73.1 𝑃 = 0.09
A − V −6.4 ± 22 −6.3 ± 14.5 𝑃 = 0.1 6 ± 28.3 11.6 ± 17.6 𝑃 = 0.5
∗∘LeucineA 148.6 ± 30.8 119.6 ± 38 𝑃 = 0.07 149.6 ± 134.2 191.7 ± 119.1 𝑃 = 0.4
A − V −13.8 ± 28 −24.2 ± 39.2 𝑃 = 0.5 7.7 ± 16.4 11.7 ± 26.4 𝑃 = 0.8
OrnithineA 63.7 ± 12.6 58.1 ± 27.4 𝑃 = 0.5 56 ± 13.9 57.3 ± 22.8 𝑃 = 0.8
A − V −13.4 ± 9.3 −6.7 ± 7 𝑃 = 0.09 −17.6 ± 17.6 −2.1 ± 21 𝑃 = 0.08
∗LysineA 205.3 ± 77 196.7 ± 68.6 𝑃 = 0.7 209.6 ± 95.6 248.2 ± 124 𝑃 = 0.8
A − V −8.3 ± 67.2 −17.8 ± 31.3 𝑃 = 0.6 −1.9 ± 64.3 58.3 ± 122.1 𝑃 = 0.7
Total-amino acidsA 2523.7 ± 331.8 2292.4 ± 472.7 𝑃 = 0.3 2457.1 ± 826.8 2747 ± 465.9 𝑃 = 0.02
A − V −169.2 ± 25.6 −289.6 ± 18 𝑃 = 0.5 −63.8 ± 25.7 51.2 ± 23.5 𝑃 = 0.05
∗EAAsA 956 ± 103 848 ± 242 𝑃 = 0.5 887.3 ± 254 1076.4 ± 295 𝑃 = 0.05
A − V −62 ± 20 −90.2 ± 16.9 𝑃 = 0.3 −22.5 ± 20 82.6 ± 27.4 𝑃 = 0.01
∘BCAAsA 493.6 ± 57.3 391 ± 84.5 𝑃 = 0.5 433.7 ± 213.9 552 ± 225.9 𝑃 = 0.09
A − V −32.7 ± 23.5 −47.5 ± 23.8 𝑃 = 0.6 −4.3 ± 19 23.35 ± 21.7 𝑃 = 0.05
Data are expressed asmean± standard deviation (SD). Statistical analysis: §unpaired 𝑡-test; ∧repeatedmeasures analysis of variance. Trend over time: interactiondifferences in trends between groups. ∗Essential amino acids (EAAs); ∘branched chain amino acids (BCAAs).
be nutritionally but not metabolically adequate to reducemuscle hypercatabolism. This would suggest that unaffectedmuscle is a site of profoundmetabolic perturbations, overrid-ing EAA-promoted anabolic activity.
Disuse, unloading, and increased muscle cytokine con-tent are some factors leading to MH.
Disuse activates the potent proteolytic activity of ATP-dependent ubiquitin-proteasome pathway, lysosomes, andcalcium-dependent calpain system [50]. Unloading is apotent promoter of muscle proteolysis via inducing oxidativestress [46]. Increased muscle cytokine content may exert aproteolytic effect, in particular of myofibrillar protein [51].
Interestingly, cytokines affecting muscle cell function canbe produced intrinsically within the muscle or by nonmusclecells as neutrophils and macrophages [51]. During inflam-mation, these phagocytes infiltrate the muscular tissue [52].
Other nonresident cells such as fibroblasts [53, 54], vascularsmooth muscle cells [55], and vascular endothelium [56] canproduce cytokines.
Besides an adequate protein intake, reduced metabolicclearance of circulating BCAAs by the adipose tissue maycontribute to normal arterial EAA levels. Indeed, adiposetissue modulates the levels of circulating BCAAs but in thecase of insulin resistance, as in our study population, reducesor interrupts BCAA uptake [57].
Previous studies have addressed the timing of poststrokemuscle loss in the unaffected limb.
Within the first week of stroke [58], one study foundmus-cle weakness of unaffected quadriceps of hemiplegic strokepatients and a correlation between a change of quadricepsstrength and acute weight loss [58]. Another investigationreported no evidence ofmuscle strength loss in any limb [59].
10 BioMed Research International
Phen
ylal
anin
e (A
− V
) (𝜇
mol
/L)
2
1
0
−1
−2
−3
−4
−5
−6
−7
−8Admission Discharge
P = 0.02
PlaceboEAAs
(a)
Admission Discharge
Tota
l ess
entia
l am
ino
acid
s (A
− V
) (𝜇
mol
/L)
100
80
60
40
20
0
−20
−40
−60
−80
−100
P = 0.01
PlaceboEAAs
(b)
Admission Discharge
P = 0.05
Tota
l am
ino
acid
s (A
− V
) (𝜇
mol
/L)
100
50
0
−50
−100
−150
−200
−250
−300
−350
PlaceboEAAs
(c)
Admission Discharge
PlaceboEAAs
P = 0.02
Tota
l art
eria
l am
ino
acid
s (𝜇
mol
/L)
2800
2700
2600
2500
2400
2300
2200
(d)
Figure 2: Time courses of phenyl-, total essential amino acid, total amino acid (A − V) differences, and total arterial amino acid levels ofstroke population. The point 0 indicates no uptake/no release. For clarity, standard deviations are omitted (see Table 4).
A number of studies have documented reduced musclemass and strength sixmonths after stroke [60].This wasmoreevident in the paretic compared with the nonparetic lowerlimb and upper limb. A study demonstrated reduced musclestrength in both legs in patients [61] one year after strokecompared to normal subjects [62].
This study adds information of the timing of the mus-cle loss of the unaffected limb as it documents mus-cle hypercatabolism in stroke patients one month afterstroke. This would suggest that, in subacute stroke, systemicinflammatory-metabolic alterations may be an importantcontributor to muscle wasting, adding to other mechanisms
BioMed Research International 11
Table5:Dem
ograph
ic,anthrop
ometric
,biohu
moral,and
neurofun
ctionalcharacteristicsa
ndnu
trition
alintake/sup
plyof
stroke
patie
ntsa
sanentiregrou
p,EA
Aandplacebosubgroup
s,bo
thatadmissionanddischarge.
Varia
bles
nvAllpatie
nts(𝑛=38)
Placebo(𝑛=19)
EAAs(𝑛=19)
Trendover
time(𝑃level)interaction
Admission
Disc
harge
Admission
Disc
harge
Admission
Disc
harge
Dem
ograph
icMale/female
—25/13
—13/6
—12/7
——
Age
(years)
—69.7±11.4
—71.3±10
—68±13.2
——
Anthrop
ometric
Actualbo
dyweight(kg)
—59.8±10.2
57.7±9.8
57.6±7.1
55.9±7.5
62.2±12.7
59.7±12
𝑃=0.6
Actual/habitu
albo
dyweight(%)
—90.4±7.4
87.5±9.5
90.5±7.2
87.8±9.3
90.3±8
87.1±10.3
𝑃=0.8
BMI(kg/m
2 )—
21.6±3
20.88±3.14
21.3±2.6
20.7±2.9
22±3.5
21.1±3.5
𝑃=0.8
Bloo
dES
R1sth
r(mm)
2–20
35.8±11.7
33.2±18.1
31.2±6.8
27.6±16
43.3±15.8
37.2±19.7
𝑃=0.7
Haemoglobin(g/dL)
F>12;M>13
12.2±1.6
12.1±1.2
12.6±1.8
12.3±1.3
11.7±1
12±1.1
𝑃=0.07
Bloo
durea
(mg/dL
)20–4
042.7±19.7
37.5±19
48.70±15
37.6±7.6
32.7±23.7
37.3±26
𝑃=0.9
Serum
creatin
ine(mg/dL
)0.7–1.2
1±0.3
1±0.3
1.1±0.4
1.1±0.3
0.8±0.2
0.9±0.3
𝑃=0.5
Plasmag
lucose
(mg/dL
)80–110
115.1±
23.6
106.9±11.6
122.5±25.8
104.8±14.1
100.3±8.5
109.7±9.3
𝑃=0.07
Interle
ukin-6
(pg/mL)
<7
15.9±14.9
6.7±9.8
611.7±9
8.5±13.5
19.6±18.5
4.6±2.3
𝑃=0.5
Serum
C-reactiv
eprotein
(CRP
)(mg/dL
)<0.3
1.9±1.9
1.4±2.5
1.7±1.3
1.6±2.8
2.2±2.5
1.2±2.3
𝑃=0.6
Fibrinogen
(mg/dL
)230–
550
452.4±75.8
400.9±87.9
465.1±
87.3
387.2±68.2
438±63.1
412.7±106
𝑃=0.8
Serum
haptoglobin(m
g/dL
)30–200
293.6±93
211±
75313±94
245±74
272±92
169±56
𝑃=0.7
Serum𝛼1g
lobu
lin(m
g/dL
)210–
350
504±74
436±89
506±80
467±92
472±79
382±85
𝑃=0.8
Serum
albu
min
(g/dL)
4.02–4
.762.9±0.5
3.2±0.5
3±0.5
3.1±
0.5
2.7±0.6
3.3±0.5
𝑃=0.03
Serum
prealbum
in(m
g/dL
)18–30
18.8±5.7
20.9±7.1
19.4±6.5
19±5.9
18.1±4.9
22.9±8.1
𝑃=0.7
Serum
transfe
rrin
(mg/dL
)202–364
183.1±
28.3
193.8±35.1
186.1±
33.2
195.4±39.6
179.3±22.3
192±31.8
𝑃=0.5
Plasmalactate(m
mol/L)
0.6–
2.2
1.6±0.5
2±0.6
1.4±0.4
2±0.6
1.8±0.5
2±0.5
𝑃=0.3
Neurofunctio
nal
FIM
score
125
29.4±18.5
54±31.2
31.1±16
60±36.8
27.6±21.7
47.4±23.9
𝑃=0.5
DOSS
score
1–7
2.1±
1.33.3±1.7
2.5±1.3
3.9±1.8
1.6±1.3
2.6±1.5
𝑃=0.7
Nutrition(PEG
ororalintake)
Energy
—(kcal/d
)—
1293.6±155
Same
1362±143
Same
1293±155
Same
(kcal/k
g)≥25
22.4±2.7
23.6±2.5
20.7±2.9
Protein
—(g/d)
—54.1±9.6
Same
58.7±10.2
Same
54.2±9.6
Same
(g/kg)
≥1.1
0.94±0.17
1.02±0.17
0.87±0.19
1.02±0.20∗
Carboh
ydrates
—(g/d)
—146.2±32
Same
164.3±30.1
Same
146.2±32
Same
(g/kg)
2.5–4
2.5±0.5
2.85±0.2
2.35±0.9
12 BioMed Research International
Table5:Con
tinued.
Varia
bles
nvAllpatie
nts(𝑛=38)
Placebo(𝑛=19)
EAAs(𝑛=19)
Trendover
time(𝑃level)interaction
Admission
Disc
harge
Admission
Disc
harge
Admission
Disc
harge
Lipids
—(g/d)
—56.9±11
Same
55.3±5.5
Same
50.1±7.5
Same
(g/kg)
≤1
0.98±0.19
1±0.1
0.8±0.1
Dataa
reexpressedas
mean±standard
deviation(SD).Statisticalanalysis:
repeated
measuresa
nalysis
ofvaria
nce.Trendover
time:interactiondifferences
intre
ndsb
etweengrou
ps.
BMI:bo
dymassind
ex;E
SR:erythrocytesedimentatio
nrate;FIM
:fun
ctionalind
ependencem
easure;D
OSS:D
ysph
agiaOutcomea
ndSeverityScale.
∗
Thisam
ount
isthes
umof
thep
rotein
administered/in
geste
d(54.2g
)and
protein(6.9g)
provided
bysupp
lementedEA
As[41].
BioMed Research International 13
of unaffected side weakness. These mechanisms includemuscle damage from stroke lesion due to bilateral projectionsof each cerebral hemisphere [63], physical inactivity [14,64], undernutrition, and possible motor weakness fromcomorbidities in preevent period. It is reasonable to believethat systemic factors also negatively impact the damagedcontrolateral muscles. Compared to healthy subjects, ourpatients also released significant amounts of the amino acidsasparagine, threonine, and BCAAs. This would suggest pro-gressive impoverishment of amino acid content of unaffectedmuscle.
Another finding differentiating stroke and healthy sub-jects is the concentration of certain amino acids in arterialblood. Strokes have decreased levels of aspartate, asparagine,glutamine, alanine, taurine, and tryptophan but increasedlevels of BCAAs, methionine, phenyl-, and lysine. In inflam-mation and muscle proteolysis, these reductions would sug-gest increased metabolic clearance of amino acids by visceralorgans including liver, gut, and kidney, which would be ina hypermetabolic state. For instance, the liver has a highconsumption of gluconeogenic aspartate, asparagine, alanine,and glutamine, the gut and the kidney of glutamine, theimmune cells of glutamine, and the brain of all amino acidsin particular of the serotonin precursor tryptophan.
The increases in arterial amino acid concentrations aremainly of muscular origin given that, in addition to phenyl-release, BCAAs andmethionine, also lysine undergoes exces-sive release. The normal lactate levels suggest that, in unaf-fected arm muscles, there is a balanced aerobic-anaerobicpathway energy-forming. Interestingly, both protein degra-dation and synthesis require large amounts of energy in orderto occur.
To sum up, this investigation shows that the unaffectedarm muscles of hemiplegic, dysphagic stroke patients aresites of hypercatabolic activity which, if not corrected, leadsto muscle wasting. Furthermore, dysphagic strokes havealterations of arterial amino acid profile. The loss of musclemass and strength has a significant impact on stroke patients’functionality and life prognosis. Muscle depleted subjectshave impaired glucose metabolic control [65, 66], increasedrisk of osteoporosis [64, 67], which may be responsible forhip-fracture and falls, cardiovascular deconditioning [64, 65,67], and more accentuated disability, in particular walking[68]. Therefore, recognizing and treating muscle wastingas early as possible may be of paramount importance forrehabilitation outcome for stroke patients, especially if weconsider that 80%of total neuromotor recovery occurswithinthe first month of acute stroke [69].
4.2. The Effects of EAA Supplementation on Unaffected ArmMH. This study clearly indicates that supplemented EAAscan correct unaffected muscle protein overdegradation insubacute dysphagic stroke patients. On the contrary, withoutEAA supplementation, patients continued to lose musclemass seventy days after the acute stroke. After rehabilita-tion, the prevalently anabolic activity in the EAA groupwas accompanied by unaffected muscle uptake of 49% ofarterial amino acids and of plasma total arterial amino acids
suggesting the anabolic muscle protein turnover. This wasreinforced by the lower releases of histidine, glycine, andtaurine compared to those of the Plac group, as well as byincreased arterial TAA availability. Anabolic activity associ-ated with EAA supplementation has been documented bothin experimental and in human studies.Themainmechanismsinvolved are induced protein synthesis and reduced proteinbreakdown.
Regarding protein synthesis, essential BCAAs act asfuel and anabolic signals in human muscle [70]. Chronicsupplementation of leucine, as mentioned here, stimulatespostprandial protein synthesis in responsive tissues includingskeletal muscle, liver, and adipose tissue [71]. Oral intake of2.5 g leucine stimulatesmuscle protein synthesis after exerciseor an overnight fast [72]. EAA ingestion stimulates muscleprotein synthesis even in bedridden subjects [73] or duringhypercortisolemia [73]. Amino acid infusion elevates plasmaamino acids above base values leading to 30% increase inmuscle protein synthesis of myofibrillar, sarcoplasmic, andmitochondrial proteins [74].
Regarding proteolysis, it is well documented that EAAsexert a potent antiproteolytic effect. The BCAA leucineis a regulating factor of myofibrillar protein degradation[75] as it suppresses myofibrillar protein degradation soonafter oral administration. Infusion of BCAAs in humansmarkedly diminishes skeletal muscle protein degradation butstimulates protein synthesis in the heart [76, 77]. It has beenshown that efficient protein use is determined by sensitivityvariation of proteolysis to amino acids rather than proteinsynthesis [78]. Small amounts of amino acids are enough toreduce proteolysis unlike protein synthesis [78].
Severalmechanisms underlie protein synthesis and, at thesame time, reduce proteolysis by EAAs. One mechanism isthe adequate availability of EAAs per se. Indeed, EAAs canstimulate protein synthesis independent of hormones [79].Other mechanisms include the regulation of gene expression,modulation of anabolic hormone activities, improved aero-bic metabolism energy-forming, and a reduced circulatingTNF𝛼/IGF-1 ratio. Finally, amino acids influence target genesat transcription,mRNA stability, and translation [80]. Aminoacids and in particular EAAs promote protein synthesis bystimulating insulin-growth factor 1 (IGF-1) [81] and mod-ulating insulin signalling [79]. Indeed, they play a role inregulating insulin signalling via themTORnutrient signallingpathway [79]. Insulin (and IGF-1) cannot stimulate proteinsynthesis if amino acid concentrations are not maintained[79].
Moreover, EAAs can also reduce insulin resistance [82].EAAs induce anabolic activity indirectly by boosting cell aer-obic metabolism to produce energy, the availability of whichis indispensable for protein synthesis [24–27]. Particularlyimportant in a state of systemic inflammation, EAAs canpromote muscle protein synthesis by reducing circulatingcytokine TNF𝛼, so reducing the TNF𝛼/IGF-1 index [31].
The discrepancy observed here between normal plasmaEAA levels andmuscle hypercatabolism suggests that chronicsupplementation of free EAAs may be superior to proteinEAAs in promoting muscle anabolism. Indeed, for muscleprotein synthesis to occur, rapid increases of plasma EAA
14 BioMed Research International
levels following EAA ingestion are more important thanintramuscular amino acid availability [74].This is because theprotein synthetic machinery in muscle is unresponsive after2.5 hrs [74]. The speed by which blood peak concentrationsare achieved is higher after free EAA ingestion than afterEAA from protein because the absorption rate of the latteris slowed by the copresence in the diet of complex carbo-hydrates and fats [83]. We showed that, in normal subjects,blood EAA concentrations after ingestion of 8 g free EAAwere achieved within 40 minutes in young individuals and90 minutes in elderly ones [84]. The modulation of muscleprotein synthesis by blood elevations in EAAs may explainwhy, here, two stroke-patient groups had similar plasma EAAlevels but different muscle protein metabolism responses.
A final reason why free EAAs are superior to EAA-protein in promoting anabolism is that free EAAs cause lessefficient uptake of the splanchnic organs [85]. This has beenindirectly confirmed here as we demonstrated that muscleanabolism following similar nutritional nitrogen availabilityoccurred only in patients in which there was higher nitrogenavailability from EAAs.
Limitations of This Study. Several study limitations requirefurther investigations to overcome. One limit is the relativelysmall sample size of only dysphagic patients. A larger trialis also needed to document whether similar results arefound in nondysphagic patients. We therefore consider thisinvestigation as a pilot study. A comparative analysis betweenaffected and unaffected arms would have strengthen thediscussion and would have documented both the impact ofsystemic inflammation on metabolic alterations of denervedarmmuscle and the rate of metabolic recovery, if any, exertedby supplemented EAAs.
The two subgroups of patients tended to reduce bodyweight during rehabilitation.This suggests a need to monitorenergy intake/administeredmainly in patients with increasedenergy expenditure after walking training protocols and/orrecovery of walking capacity. Attention should also be paidto a possible synergistic effect between EAA supplemen-tation and physical training of unaffected limbs. Patientbody composition analysis would also have strengthened thediscussion. Indeed, the evaluation of body tissue compositionby dual X-ray absorptiometry (DEXA) or by bioelectricalimpedance analysis (BIA) methods would have allowed usto measure the loss of fat-free mass (FFM) at rehabilitationadmission and its time course during the hospital stay bothfor treated and placebo patients. In addition, measured FFMwould have allowed us to provide patients with the sameamount of EAAs per kg FFM.
We chose isoenergetic maltodextrin instead of nitrogensubstance because it is well known that EAAs are superior tonitrogen from nonindispensable amino acids or from proteinin promoting protein synthesis [86]. In addition, maltodex-trin and EAAs share common immunological activity [87–89]. On the other hand, infection complications frequentlyfollow acute strokes [90].
Potential Clinical Implications. Notwithstanding these limita-tions, this investigation provides some useful information for
clinical practice. The physician should be aware of possibleMH of the unaffected body side and of its reversibility.Indeed, recognizing and correcting MH as early as possiblecould allow patients better recovery in physical autonomy.This is a key point in reducing the risk of recurrent strokes,cardiovascular disease, metabolic syndrome, muscle atrophy,osteoporosis, and type II diabetes [91]. It is imperative thatdysphagic stroke subjects are administered adequate amountsof high quality protein. It is useful to remember that weeat proteins but use their EAAs. Reduced protein intakeleading to low blood EAA levels can contribute to a dramaticincrease ofMH.The amount of supplemented EAAs (8 g/d) isinsufficient to enhance brain function recovery, given that theneurofunctional recovery was similar between both groupsconfirming the finding of a previous study [90].
5. Conclusions
This study shows the prevalence of muscle hypercatabolismof unaffected arm of dysphagic subacute stroke subjects. Thehypercatabolism may be converted to anabolism by supple-menting patients with free essential amino acid mixture.
Conflict of Interests
The authors state that there is no conflict of interests.
Acknowledgment
The authors would like to thank Dr. Robert Coates (CentroLinguistico, Bocconi University, Via Sarfatti, Milano, Italy),medical writer, for his linguistic revision.
References
[1] SPREAD, Stroke Prevention and Educational Awareness. Dif-fusion. Ictus Cerebrale: Linee Guida Italiane di Prevenzione eTrattamento, Pubblicazioni Catel-Hyperphar Group, Milano,Italy, 2005.
[2] V. L. Roger, A. S. Go, D. M. Lloyd-Jones et al., “Heart diseaseand stroke statistics—2011 update: a report from the AmericanHeart Association,” Circulation, vol. 123, no. 4, pp. e18–e209,2011.
[3] W. Hacke, G. Donnan, and C. Fieschi, “ATLANTIS TrialsInvestigators; ECASS Trials Investigators; NINDS rt-PA StudyGroup Investigators. Association of outcome with early stroketreatment: pooled analysis of ATLANTIS, ECASS, and NINDSrt -PA stroke trials,”The Lancet, vol. 363, no. 9411, pp. 768–774,2004.
[4] M. Kelly-Hayes, A. Beiser, C. S. Kase, A. Scaramucci, R. B.D’Agostino, and P. A. Wolf, “The influence of gender and ageon disability following ischemic stroke: the Framingham study,”Journal of Stroke and Cerebrovascular Diseases, vol. 12, no. 3, pp.119–126, 2003.
[5] P. Zamparo, M. P. Francescato, G. De Luca, L. Lovati, and P.E. di Prampero, “The energy cost of level walking in patientswith hemiplegia,” Scandinavian Journal of Medicine & Sciencein Sports, vol. 5, no. 6, pp. 348–352, 1995.
[6] C. Detrembleur, F. Dierick, G. Stoquart, F. Chantraine, andT. Lejeune, “Energy cost, mechanical work, and efficiency of
BioMed Research International 15
hemiparetic walking,” Gait & Posture, vol. 18, no. 2, pp. 47–55,2003.
[7] A. Silverstein, “Diagnostic localizing value of muscle atrophy inparietal lobe lesions,” Neurology, vol. 5, no. 1, pp. 30–55, 1950.
[8] G. M. Fenichel, R. B. Daroff, and G. H. Glaser, “Hemiplegicatrophy: histological and etiologic considerations,” Neurology,vol. 14, pp. 883–890, 1964.
[9] O. Goldkamp, “Electromyography and nerve conduction stud-ies in 116 patientswith hemiplegia,”Archives of PhysicalMedicineand Rehabilitation, vol. 48, no. 2, pp. 59–63, 1967.
[10] A. Cruz Martinez, F. del Campo, P. Mingo, and M. C.Perez Conde, “Altered motor unit architecture in hemipareticpatients: a single fibre EMG study,” Journal of Neurology Neuro-surgery and Psychiatry, vol. 45, no. 8, pp. 756–757, 1982.
[11] K. Hachisuka, Y. Umezu, and H. Ogata, “Disuse muscle atrophyof lower limbs in hemiplegic patients,” Archives of PhysicalMedicine and Rehabilitation, vol. 78, no. 1, pp. 13–18, 1997.
[12] A. Raffaello, P. Laveder, C. Romualdi et al., “Denervation inmurine fast-twitch muscle: short-term physiological changesand temporal expression profiling,” Physiological Genomics, vol.25, no. 1, pp. 60–74, 2006.
[13] P. G. de Deyne, C. E. Hafer-Macko, F. M. Ivey, A. S. Ryan,and R. F. Macko, “Muscle molecular phenotype after stroke isassociated with gait speed,”Muscle and Nerve, vol. 30, no. 2, pp.209–215, 2004.
[14] A. S. Ryan, C. L. Dobrovolny, G. V. Smith, K. H. Silver, and R. F.Macko, “Hemiparetic muscle atrophy and increased intramus-cular fat in stroke patients,” Archives of Physical Medicine andRehabilitation, vol. 83, no. 12, pp. 1703–1707, 2002.
[15] J.-M. Gracies, “Pathophysiology of spastic paresis. I: paresis andsoft tissue changes,”Muscle andNerve, vol. 31, no. 5, pp. 535–551,2005.
[16] M. D. de Boer, A. Selby, P. Atherton et al., “The temporalresponses of protein synthesis, gene expression and cell sig-nalling in human quadriceps muscle and patellar tendon todisuse,” Journal of Physiology, vol. 585, no. 1, pp. 241–251, 2007.
[17] M.D. de Boer, C. N.Maganaris, O. R. Seynnes,M. J. Rennie, andM. V. Narici, “Time course of muscular, neural and tendinousadaptations to 23 day unilateral lower-limb suspension in youngmen,” Journal of Physiology, vol. 583, no. 3, pp. 1079–1091, 2007.
[18] N. C. Foley, R. E. Martin, K. L. Salter, and R. W. Teasell, “Areview of the relationship between dysphagia and malnutritionfollowing stroke,” Journal of Rehabilitation Medicine, vol. 41, no.9, pp. 707–713, 2009.
[19] R. W. Jackman and S. C. Kandarian, “The molecular basis ofskeletal muscle atrophy,” American Journal of Physiology—CellPhysiology, vol. 287, no. 4, pp. C834–C843, 2004.
[20] R. Aquilani, M. Scocchi, P. Iadarola et al., “Protein supplemen-tation may enhance the spontaneous recovery of neurologicalalterations in patients with ischaemic stroke,” Clinical Rehabili-tation, vol. 22, no. 12, pp. 1042–1050, 2008.
[21] Linee Guida del Ministero della Sanita per le Attivita diRiabilitazione. Piano Sanitario Nazionale 1998–2000.
[22] R. Aquilani, M. Boselli, B. Paola et al., “Is stroke rehabilitationa metabolic problem?” Brain Injury, vol. 28, no. 2, pp. 161–173,2014.
[23] N. Scherbakov, S. von Haehling, S. D. Anker, U. Dirnagl, andW. Doehner, “Stroke induced Sarcopenia: muscle wasting anddisability after stroke,” International Journal of Cardiology, vol.170, no. 2, pp. 89–94, 2013.
[24] M. A. Pellegrino, C. Patrini, E. Pasini et al., “Amino acidsupplementation counteracts metabolic and functional damagein the diabetic rat heart,” The American Journal of Cardiology,vol. 101, no. 11, pp. 49E–56E, 2008.
[25] G. D’Antona, M. Ragni, A. Cardile et al., “Branched-chainamino acid supplementation promotes survival and sup-ports cardiac and skeletal muscle mitochondrial biogenesis inmiddle-aged mice,” Cell Metabolism, vol. 12, no. 4, pp. 362–372,2010.
[26] O. Pansarasa, V. Flati, G. Corsetti, L. Brocca, E. Pasini, andG. D’Antona, “Oral amino acid supplementation counteractsage-induced sarcopenia in elderly rats,” American Journal ofCardiology, vol. 101, no. 11, pp. S35–S41, 2008.
[27] G. Corsetti, E. Pasini, G. D’Antona et al., “Morphometricchanges induced by amino acid supplementation in skeletaland cardiac muscles of old mice,” The American Journal ofCardiology, vol. 101, no. 11, pp. S26–S34, 2008.
[28] A. A. Ferrando, D. Paddon-Jones, N. P. Hays et al., “EAAsupplementation to increase nitrogen intake improves musclefunction during bed rest in the elderly,” Clinical Nutrition, vol.29, no. 1, pp. 18–23, 2010.
[29] D. Paddon-Jones, M. Sheffield-Moore, X.-J. Zhang et al.,“Amino acid ingestion improves muscle protein synthesis inthe young and elderly,” The American Journal of Physiology:Endocrinology and Metabolism, vol. 286, no. 3, pp. E321–E328,2004.
[30] R. Aquilani, C. Opasich, A. Gualco et al., “Adequate energy-protein intake is not enough to improve nutritional andmetabolic status in muscle-depleted patients with chronic heartfailure,” European Journal of Heart Failure, vol. 10, no. 11, pp.1127–1135, 2008.
[31] S. B. Solerte, C. Gazzaruso, R. Bonacasa et al., “Nutritionalsupplements with oral amino acid mixtures increases whole-body lean mass and insulin sensitivity in elderly subjects withsarcopenia,”TheAmerican Journal of Cardiology, vol. 101, no. 11,pp. 69E–77E, 2008.
[32] S. Baldi, R. Aquilani, G. D. Pinna, P. Poggi, A. deMartini, and C.Bruschi, “Fat-free mass change after nutritional rehabilitationin weight losing COPD: role of insulin, C-reactive proteinand tissue hypoxia,” Journal of Chronic Obstructive PulmonaryDisease, vol. 5, no. 1, pp. 29–39, 2010.
[33] R. W. Dal Negro, A. Testa, R. Aquilani et al., “Essentialamino acid supplementation in patients with severe COPD: astep towards home rehabilitation,” Monaldi Archives for ChestDisease—Pulmonary Series, vol. 77, no. 2, pp. 67–75, 2012.
[34] R. Aquilani, M. T. La Rovere, O. Febo et al., “Preserved muscleproteinmetabolism in obese patientswith chronic heart failure,”International Journal of Cardiology, vol. 160, no. 2, pp. 102–108,2012.
[35] Z. Liu and E. J. Barrett, “Human protein metabolism: itsmeasurement and regulation,”American Journal of Physiology—Endocrinology and Metabolism, vol. 283, no. 6, pp. E1105–E1112,2002.
[36] W. C. Chumlea, A. F. Roche, andM. L. Steinbaugh, “Estimatingstature from knee height for persons 60 to 90 years of age,”Journal of the American Geriatrics Society, vol. 33, no. 2, pp. 116–120, 1985.
[37] R. A. Keith, C. V. Granger, B. B. Hamilton, and F. S. Sherwin,“The functional independence measure: a new tool for rehabil-itation,” in Advances in Clinical Rehabilitation, M. G. Eisenbergand R. C. Grzesiak, Eds., vol. 1, pp. 6–18, Springer, New York,NY, USA, 1987.
16 BioMed Research International
[38] K. H. O’Neil, M. Purdy, J. Falk, and L. Gallo, “The dysphagiaoutcome and severity scale,” Dysphagia, vol. 14, no. 3, pp. 139–145, 1999.
[39] E. Carnevale, L. Marletta, and Istituto Nazionale di Ricercaper gli Alimenti e la Nutrizione, Tabelle di Composizione DegliAlimenti, Istituto Superiore Nazionale della Nutrizione, Rome,Italy, 1989.
[40] R. Aquilani, R. Tramarin, R. F. E. Pedretti et al., “Despitegood compliance, very low fat diet alone does not achieverecommended cholesterol goals in outpatients with coronaryheart disease,” European Heart Journal, vol. 20, no. 14, pp. 1020–1029, 1999.
[41] L. J. Hoffer, “How much protein do parenteral amino acidmixtures provide?” The American Journal of Clinical Nutrition,vol. 94, no. 6, pp. 1396–1398, 2011.
[42] Y. Yoshimoto, Y. Tanaka, and K. Hoya, “Acute systemic inflam-matory response syndrome in subarachnoid hemorrhage,”Stroke, vol. 32, no. 9, pp. 1989–1993, 2001.
[43] J. Klehmet, H. Harms, M. Richter et al., “Stroke-inducedimmunodepression and post-stroke infections: lessons from thepreventive antibacterial therapy in stroke trial,” Neuroscience,vol. 158, no. 3, pp. 1184–1193, 2009.
[44] R. F. Vesali, N. Cibicek, T. Jakobsson, M. Klaude, J. Werner-man, and O. Rooyackers, “Protein metabolism in leg musclefollowing an endotoxin injection in healthy volunteers,”ClinicalScience, vol. 118, no. 6, pp. 421–427, 2010.
[45] G. Mastorakos, G. P. Chrousos, and J. S. Weber, “Recombinantinterleukin-6 activates the hypothalamic-pituitary-adrenal axisin humans,” Journal of Clinical Endocrinology and Metabolism,vol. 77, no. 6, pp. 1690–1694, 1993.
[46] J. M. Lawler,W. Song, and S. R. Demaree, “Hindlimb unloadingincreases oxidative stress and disrupts antioxidant capacity inskeletal muscle,” Free Radical Biology and Medicine, vol. 35, no.1, pp. 9–16, 2003.
[47] H. C. Dreyer and E. Volpi, “Role of protein and amino acids inthe pathophysiology and treatment of sarcopenia,” The Journalof theAmericanCollege ofNutrition, vol. 24, no. 2, pp. 140S–145S,2005.
[48] R. Aquilani, M. Galli, C. Guarnaschelli et al., “Prevalenceof malnutrition and inadequate food intake in self-feedingrehabilitation patients with stroke,” Europa Medicophysica, vol.35, no. 2, pp. 75–81, 1999.
[49] N. Foley, H. Finestone, M. G. Woodbury, R. Teasell, and L.Greene-Finestone, “Energy and protein intakes of acute strokepatients,” Journal of Nutrition, Health and Aging, vol. 10, no. 3,pp. 171–175, 2006.
[50] S. Carda, C. Cisari, and M. Invernizzi, “Sarcopenia or musclemodifications in neurologic diseases: a lexical or patophysiolog-ical difference?” European Journal of Physical and RehabilitationMedicine, vol. 49, no. 1, pp. 119–130, 2013.
[51] E. Zoico and R. Roubenoff, “The role of cytokines in regulatingprotein metabolism and muscle function,” Nutrition Reviews,vol. 60, no. 2, pp. 39–51, 2002.
[52] J. G. Cannon, “Cytokines in aging andmuscle homeostasis,”TheJournals of Gerontology Series A: Biological Sciences andMedicalSciences, vol. 50, pp. 120–123, 1995.
[53] N. G. Morrow, W. E. Kraus, J. W. Moore, R. S. Williams, and J.L. Swain, “Increased expression of fibroblast growth factors in arabbit skeletal muscle model of exercise conditioning,” Journalof Clinical Investigation, vol. 85, no. 6, pp. 1816–1820, 1990.
[54] M. de Rossi, P. Bernasconi, F. Baggi, R. de Waal Malefyt, and R.Mantegazza, “Cytokines and chemokines are both expressed byhumanmyoblasts: possible relevance for the immune pathogen-esis of muscle inflammation,” International Immunology, vol. 12,no. 9, pp. 1329–1335, 2000.
[55] H. Loppnow and P. Libby, “Proliferating or interleukin 1-activated human vascular smooth muscle cells secrete copiousinterleukin 6,” Journal of Clinical Investigation, vol. 85, no. 3, pp.731–738, 1990.
[56] A. V. Sterpetti, A. Cucina, A. R. Morena et al., “Shear stressincreases the release of interleukin-1 and interleukin-6 by aorticendothelial cells,” Surgery, vol. 114, no. 5, pp. 911–914, 1993.
[57] M. A. Herman, P. She, O. D. Peroni, C. J. Lynch, and B. B.Kahn, “Adipose tissue Branched Chain Amino Acid (BCAA)metabolism modulates circulating BCAA levels,” Journal ofBiological Chemistry, vol. 285, no. 15, pp. 11348–11356, 2010.
[58] M. L. Harris, M. I. Polkey, P. M. W. Bath, and J. Mox-ham, “Quadriceps muscle weakness following acute hemiplegicstroke,” Clinical Rehabilitation, vol. 15, no. 3, pp. 274–281, 2001.
[59] G. Carin-Levy, C. Greig, A. Young, S. Lewis, J. Hannan, and G.Mead, “Longitudinal changes in muscle strength andmass afteracute stroke,” Cerebrovascular Diseases, vol. 21, no. 3, pp. 201–207, 2006.
[60] C. English, H. McLennan, K. Thoirs, A. Coates, and J. Bern-hardt, “Loss of skeletal muscle mass after stroke: a systematicreview,” International Journal of Stroke, vol. 5, no. 5, pp. 395–402,2010.
[61] C. A. Greig, T. Savaridas, D. Saunders, S. Joseph, A. Young, andG. E. Mead, “Lower limb muscle strength and power outputfollowing stroke,” Age Ageing, vol. 32, supplement 1, p. 34, 2003.
[62] D.A. Skelton, C.A.Greig, J.M.Davies, andA. Young, “Strength,power and related functional ability of healthy people aged 65–89 years,” Age and Ageing, vol. 23, no. 5, pp. 371–377, 1994.
[63] J. G. Colebatch and S. C. Gandevia, “The distribution ofmuscular weakness in upper motor neuron lesions affecting thearm,” Brain, vol. 112, part 3, pp. 749–763, 1989.
[64] L. Jorgensen and B. K. Jacobsen, “Changes in muscle mass, fatmass, and bone mineral content in the legs after stroke: a 1 yearprospective study,” Bone, vol. 28, no. 6, pp. 655–659, 2001.
[65] F. M. Ivey, C. E. Hafer-Macko, and R. F. Macko, “Exercisetraining for cardiometabolic adaptation after stroke,” Journal ofCardiopulmonary Rehabilitation and Prevention, vol. 28, no. 1,pp. 2–11, 2008.
[66] A. S. Ryan, C. L. Dobrovolny, K. H. Silver, G. V. Smith, and R. F.Macko, “Cardiovascular fitness after stroke: role of muscle massand gait deficit severity,” Journal of Stroke and CerebrovascularDiseases, vol. 9, no. 4, pp. 185–191, 2000.
[67] M. Y. C. Pang, J. J. Eng, H. A. McKay, and A. S. Dawson,“Reduced hip bone mineral density is related to physical fitnessand leg lean mass in ambulatory individuals with chronicstroke,”Osteoporosis International, vol. 16, no. 12, pp. 1769–1779,2005.
[68] S. L. Patterson, L. W. Forrester, M. M. Rodgers et al., “Deter-minants of walking function after stroke: differences by deficitseverity,” Archives of Physical Medicine and Rehabilitation, vol.88, no. 1, pp. 115–119, 2007.
[69] P. W. Duncan, L. B. Goldstein, D. Matchar, G. W. Divine,and J. Feussner, “Measurement of motor recovery after stroke:outcome assessment and sample size requirements,” Stroke, vol.23, no. 8, pp. 1084–1089, 1992.
BioMed Research International 17
[70] M. J. Rennie, J. Bohe, K. Smith, H. Wackerhage, and P. Green-haff, “Branched-chain amino acids as fuels and anabolic signalsin human muscle,” Journal of Nutrition, vol. 136, supplement 1,pp. 264S–268S, 2006.
[71] C. J. Lynch, S. M. Hutson, B. J. Patson, A. Vaval, and T. C.Vary, “Tissue-specific effects of chronic dietary leucine and nor-leucine supplementation on protein synthesis in rats,”AmericanJournal of Physiology—Endocrinology and Metabolism, vol. 283,no. 4, pp. E824–E835, 2002.
[72] D. K. Layman and D. A. Walker, “Potential importance ofleucine in treatment of obesity and the metabolic syndrome,”Journal of Nutrition, vol. 136, supplement 1, pp. 319S–323S, 2006.
[73] D. Paddon-Jones, R. R. Wolfe, and A. A. Ferrando, “Amino acidsupplementation for reversing bed rest and steroidmyopathies,”Journal of Nutrition, vol. 135, no. 7, pp. 1809S–1812S, 2005.
[74] J. Bohe, A. Low, R. R. Wolfe, and M. J. Rennie, “Humanmuscle protein synthesis is modulated by extracellular, notintramuscular amino acid availability: a dose-response study,”Journal of Physiology, vol. 552, part 1, pp. 315–324, 2003.
[75] T. Nagasawa, T. Kido, F. Yoshizawa, Y. Ito, and N. Nishizawa,“Rapid suppression of protein degradation in skeletal muscleafter oral feeding of leucine in rats,” Journal of NutritionalBiochemistry, vol. 13, no. 2, pp. 121–127, 2002.
[76] R. J. Louard, E. J. Barrett, and R. A. Gelfand, “Effect of infusedbranched-chain amino acids on muscle and whole-body aminoacidmetabolism inman,”Clinical Science, vol. 79, no. 5, pp. 457–466, 1990.
[77] R. J. Louard, E. J. Barrett, and R. A. Gelfand, “Overnightbranched-chain amino acid infusion causes sustained suppres-sion of muscle proteolysis,”Metabolism, vol. 44, no. 4, pp. 424–429, 1995.
[78] M. Kadowaki and T. Kanazawa, “Amino acids as regulators ofproteolysis,” Journal of Nutrition, vol. 133, no. 6, pp. 2052S–2056S, 2003.
[79] M. J. Drummond, J. A. Bell, S. Fujita et al., “Amino acids arenecessary for the insulin-induced activation of mTOR/S6K1signaling and protein synthesis in healthy and insulin resistanthuman skeletal muscle,” Clinical Nutrition, vol. 27, no. 3, pp.447–456, 2008.
[80] J. Averous, A. Bruhat, S. Mordier, and P. Fafournoux, “Recentadvances in the understanding of amino acid regulation of geneexpression,” Journal of Nutrition, vol. 133, supplement 1, no. 6,pp. 2040S–2045S, 2003.
[81] E. L.Dillon,M. Sheffield-Moore,D. Paddon-Jones et al., “Aminoacid supplementation increases lean body mass, basal muscleprotein synthesis, and insulin-like growth factor-I expres-sion in older women,” Journal of Clinical Endocrinology andMetabolism, vol. 94, no. 5, pp. 1630–1637, 2009.
[82] S. B. Solerte, M. Fioravanti, E. Locatelli et al., “Improvementof blood glucose control and insulin sensitivity during a long-term (60 weeks) randomized study with amino acid dietarysupplements in elderly subjects with type 2 diabetes mellitus,”TheAmerican Journal of Cardiology, vol. 101, no. 11, pp. 82E–88E,2008.
[83] J. D. Gupta, A. M. Dakroury, and A. E. Harper, “Observationson protein digestion in vivo. I. Rate of disappearance of ingestedprotein from the gastrointestinal tract,”The Journal of Nutrition,vol. 64, no. 3, pp. 447–456, 1958.
[84] A. M. Condino, R. Aquilani, E. Pasini et al., “Plasma kinetic ofingested essential amino acids in healthy elderly people,” AgingClinical and Experimental Research, vol. 25, no. 6, pp. 711–714,2013.
[85] A. H. Manninen, “Protein hydrolysates in sports nutrition,”Nutrition & Metabolism, vol. 28, no. 6, p. 38, 2009.
[86] E. Volpi, H. Kobayashi, M. Sheffield-Moore, B. Mittendorfer,and R. R. Wolfe, “Essential amino acids are primarily responsi-ble for the amino acid stimulation of muscle protein anabolismin healthy elderly adults,” The American Journal of ClinicalNutrition, vol. 78, no. 2, pp. 250–258, 2003.
[87] M. T. Liong and N. P. Shah, “Effects of a Lactobacillus casei syn-biotic on serum lipoprotein, intestinal microflora, and organicacids in rats,” Journal of Dairy Science, vol. 89, no. 5, pp. 1390–1399, 2006.
[88] E. Olano-Martin, K. C. Mountzouris, G. R. Gibson, and R.A. Rastall, “In vitro fermentability of dextran, oligodextranand maltodextrin by human gut bacteria,” British Journal ofNutrition, vol. 83, no. 3, pp. 247–255, 2000.
[89] S.Wichienchot, P. Prasertsan, T.Hongpattarakere,G. R.Gibson,and R. A. Rastall, “In vitro fermentation ofmixed linkage gluco-oligosaccharides produced by gluconobacter oxydans NCIMB4943 by the human colonic microflora,” Current Issues inIntestinal Microbiology, vol. 7, no. 1, pp. 7–12, 2006.
[90] M. Boselli, R. Aquilani, P. Baiardi et al., “Supplementation ofessential amino acids may reduce the occurrence of infectionsin rehabilitation patients with brain injury,”Nutrition in ClinicalPractice, vol. 27, no. 1, pp. 99–113, 2012.
[91] T. Jung, Y. Ozaki, B. Lai, and K. Vrongistinos, “Comparison ofenergy expenditure between aquatic and overground treadmillwalking in people post-stroke,” Physiotherapy Research Interna-tional, vol. 19, no. 1, pp. 55–64, 2014.

Submit your manuscripts athttp://www.hindawi.com
Hindawi Publishing Corporationhttp://www.hindawi.com Volume 2014
Anatomy Research International
PeptidesInternational Journal of
Hindawi Publishing Corporationhttp://www.hindawi.com Volume 2014
Hindawi Publishing Corporation http://www.hindawi.com
International Journal of
Volume 2014
Zoology
Hindawi Publishing Corporationhttp://www.hindawi.com Volume 2014
Molecular Biology International
GenomicsInternational Journal of
Hindawi Publishing Corporationhttp://www.hindawi.com Volume 2014
The Scientific World JournalHindawi Publishing Corporation http://www.hindawi.com Volume 2014
Hindawi Publishing Corporationhttp://www.hindawi.com Volume 2014
BioinformaticsAdvances in
Marine BiologyJournal of
Hindawi Publishing Corporationhttp://www.hindawi.com Volume 2014
Hindawi Publishing Corporationhttp://www.hindawi.com Volume 2014
Signal TransductionJournal of
Hindawi Publishing Corporationhttp://www.hindawi.com Volume 2014
BioMed Research International
Evolutionary BiologyInternational Journal of
Hindawi Publishing Corporationhttp://www.hindawi.com Volume 2014
Hindawi Publishing Corporationhttp://www.hindawi.com Volume 2014
Biochemistry Research International
ArchaeaHindawi Publishing Corporationhttp://www.hindawi.com Volume 2014
Hindawi Publishing Corporationhttp://www.hindawi.com Volume 2014
Genetics Research International
Hindawi Publishing Corporationhttp://www.hindawi.com Volume 2014
Advances in
Virolog y
Hindawi Publishing Corporationhttp://www.hindawi.com
Nucleic AcidsJournal of
Volume 2014
Stem CellsInternational
Hindawi Publishing Corporationhttp://www.hindawi.com Volume 2014
Hindawi Publishing Corporationhttp://www.hindawi.com Volume 2014
Enzyme Research
Hindawi Publishing Corporationhttp://www.hindawi.com Volume 2014
International Journal of
Microbiology