Ultra sensitive sensor with enhanced dynamic range for high speed detection of multi-color...
7
Available online at www.sciencedirect.com Biosensors and Bioelectronics 23 (2008) 1512–1518 Ultra sensitive sensor with enhanced dynamic range for high speed detection of multi-color fluorescence radiation A. Tsupryk a,∗ , I. Tovkach a , D. Gavrilov a , O. Kosobokova a , G. Gudkov a , G. Tyshko a , B. Gorbovitski b , V. Gorfinkel a a Department of Electrical and Computer Engineering, Stony Brook University, Stony Brook, NY 11794-2350, USA b BioPhotonics Corp, Stony Brook, NY, USA Received 29 October 2007; received in revised form 16 December 2007; accepted 3 January 2008 Available online 19 January 2008 Abstract This paper describes design of the new ultra sensitive sensor system for fluorescence detection applications. System comprises two units: optical spectra separation unit and detection unit. Optical unit of the sensor performs spatial spectra separation of signal from the laser excited fluorescence, and resulting spectra is collected in the detection part of the system. Optical part is built using diffraction grating as spectra separation element. Detection part comprises 32-channel photomultiplier tube working in single photon counting mode with our 32-channel amplifier. Using single photon detection technique and specific signal processing algorithms for collected data, the proposed system allows to achieve unique combination of characteristics—high sensitivity, high detection speed and wide linearity dynamic range comparing to existing commercial instruments. DNA sequencing experiments with new sensor as detection device, and using two types of lasers (Ar-ion and Nd-YAG) were carried out, yielding sequencing traces which have quality factor of 20 for read lengths as long as 650 base pairs. © 2008 Elsevier B.V. All rights reserved. Keywords: Spectrometer; DNA sequencing; Fluorescence detection 1. Introduction A number of extremely sensitive fluorescence detection techniques are available based on registering single pho- tons (Papageorgas et al., 1999; Tiberg and Paulauskas, 1981; Evtyushenkov et al., 1982; Shelevoi, 1985) commonly referred to as the single photon detection (SPD) techniques. Because of their complexity and cost, in biomedical applications single photon detection techniques are mostly used for time resolved fluorescence spectroscopy or detection of single fluorescent molecules (Dovichi et al., 1984; Chen and Dovichi, 1996; Soper et al., 1992, 1993). A very important factor impeding the use of single photon detection is a relatively narrow linearity dynamic range of the available photon counting devices (typically order of 10 6 photocounts/s). During last several years our research group has developed a number of single photon sensors with increased dynamic range and has demonstrated first DNA sequencing instruments pos- ∗ Corresponding author. Tel.: +1 631 974 8891; fax: +1 631 632 1819. E-mail address: [email protected] (A. Tsupryk). sessing an ultra high sensitivity and a large detection dynamic range (Alaverdian et al., 2002; Gavrilov et al., 2003, 2006; Dhulla et al., 2005, 2007). In this paper for the first time, we describe a novel sin- gle photon spectrometer, which is able to detect and identify compositions of multi-color fluorescent species with very high accuracy. The key component of the spectrometer—32-channel single photon detector developed by our group is a unique device with detection dynamic range of more than 20 bit and frame rate of 3300 frames/s. We shall also present a method which enables an accurate separation of fluorescent signals emitted by individ- ual dyes. The dynamic range of the detector’s channels reaches 10 7 photocounts/s and can be enhanced by a factor of 10 with the proposed signal processing algorithms. 2. Materials and methods 2.1. General description of the sensor The sensor is developed to measure with single photon sen- sitivity radiation emitted by mixtures of minute amounts of 0956-5663/$ – see front matter © 2008 Elsevier B.V. All rights reserved. doi:10.1016/j.bios.2008.01.015
-
Upload
independent -
Category
Documents
-
view
4 -
download
0
Transcript of Ultra sensitive sensor with enhanced dynamic range for high speed detection of multi-color...
A
saDposs©
K
1
ttEtopflmesro
na
0d
Available online at www.sciencedirect.com
Biosensors and Bioelectronics 23 (2008) 1512–1518
Ultra sensitive sensor with enhanced dynamic range for highspeed detection of multi-color fluorescence radiation
A. Tsupryk a,∗, I. Tovkach a, D. Gavrilov a, O. Kosobokova a, G. Gudkov a,G. Tyshko a, B. Gorbovitski b, V. Gorfinkel a
a Department of Electrical and Computer Engineering, Stony Brook University, Stony Brook, NY 11794-2350, USAb BioPhotonics Corp, Stony Brook, NY, USA
Received 29 October 2007; received in revised form 16 December 2007; accepted 3 January 2008Available online 19 January 2008
bstract
This paper describes design of the new ultra sensitive sensor system for fluorescence detection applications. System comprises two units: opticalpectra separation unit and detection unit. Optical unit of the sensor performs spatial spectra separation of signal from the laser excited fluorescence,nd resulting spectra is collected in the detection part of the system. Optical part is built using diffraction grating as spectra separation element.etection part comprises 32-channel photomultiplier tube working in single photon counting mode with our 32-channel amplifier. Using single
hoton detection technique and specific signal processing algorithms for collected data, the proposed system allows to achieve unique combinationf characteristics—high sensitivity, high detection speed and wide linearity dynamic range comparing to existing commercial instruments. DNAequencing experiments with new sensor as detection device, and using two types of lasers (Ar-ion and Nd-YAG) were carried out, yieldingequencing traces which have quality factor of 20 for read lengths as long as 650 base pairs.2008 Elsevier B.V. All rights reserved.
srD
gcaswoau1t
eywords: Spectrometer; DNA sequencing; Fluorescence detection
. Introduction
A number of extremely sensitive fluorescence detectionechniques are available based on registering single pho-ons (Papageorgas et al., 1999; Tiberg and Paulauskas, 1981;vtyushenkov et al., 1982; Shelevoi, 1985) commonly referred
o as the single photon detection (SPD) techniques. Becausef their complexity and cost, in biomedical applications singlehoton detection techniques are mostly used for time resolveduorescence spectroscopy or detection of single fluorescentolecules (Dovichi et al., 1984; Chen and Dovichi, 1996; Soper
t al., 1992, 1993). A very important factor impeding the use ofingle photon detection is a relatively narrow linearity dynamicange of the available photon counting devices (typically orderf 106 photocounts/s).
During last several years our research group has developed aumber of single photon sensors with increased dynamic rangend has demonstrated first DNA sequencing instruments pos-
∗ Corresponding author. Tel.: +1 631 974 8891; fax: +1 631 632 1819.E-mail address: [email protected] (A. Tsupryk).
2
2
s
956-5663/$ – see front matter © 2008 Elsevier B.V. All rights reserved.oi:10.1016/j.bios.2008.01.015
essing an ultra high sensitivity and a large detection dynamicange (Alaverdian et al., 2002; Gavrilov et al., 2003, 2006;hulla et al., 2005, 2007).In this paper for the first time, we describe a novel sin-
le photon spectrometer, which is able to detect and identifyompositions of multi-color fluorescent species with very highccuracy. The key component of the spectrometer—32-channelingle photon detector developed by our group is a unique deviceith detection dynamic range of more than 20 bit and frame ratef 3300 frames/s. We shall also present a method which enablesn accurate separation of fluorescent signals emitted by individ-al dyes. The dynamic range of the detector’s channels reaches07 photocounts/s and can be enhanced by a factor of 10 withhe proposed signal processing algorithms.
. Materials and methods
.1. General description of the sensor
The sensor is developed to measure with single photon sen-itivity radiation emitted by mixtures of minute amounts of
A. Tsupryk et al. / Biosensors and Bioelectronics 23 (2008) 1512–1518 1513
ation
mabatp3mpod
2
oTfiN∼tgwaH((
2
pHcptvd
baapa24ficccsc
sfcch2stlftodtrt
2d
Fig. 1. Block diagrams of the sensor (A), spectral separ
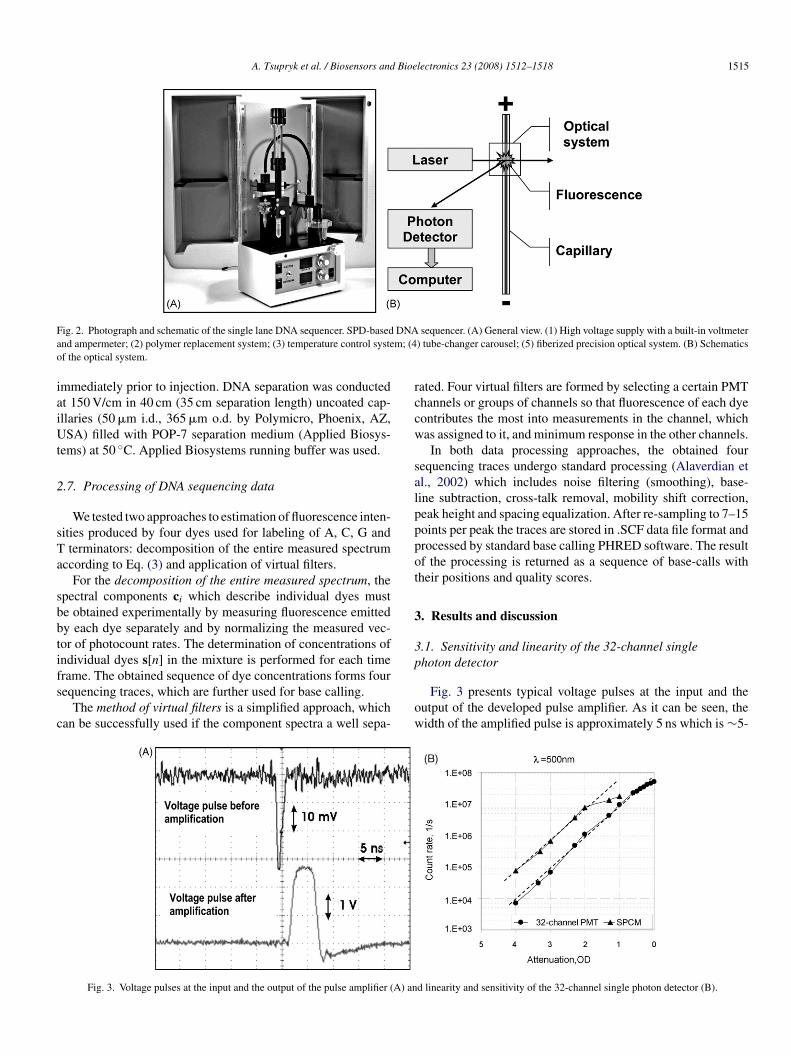
ultiple fluorescence dyes, and to determine very accuratelycontent of individual dyes in the dye mixture. Fig. 1A presentslock diagrams of the sensor and its main modules. In the sensor,polychromatic fluorescence collected by the input fiber passes
hrough the spectral separation module (Fig. 1B) and the decom-osed fluorescent signal illuminates photosensitive pixels of the2-channel photosensor (32-channel PMT H7260-20, Hama-atsu, Japan). The received photons produce very short current
ulses which undergo amplification and photon counting. Thebtained photocount is transferred to computer for recording andata processing (see Section 2.3 for details).
.2. Spectral separation module
This module performs separation and measurement of flu-rescence in the range of wavelengths from 480 to 630 nm.he fluorescence comes to the spectrometer through the inputber coupled to the collimator (F810SMA-543, Thorlabs Inc.,J, USA) which produces a parallel polychromatic beam of10 mm diameter. The parallel beam passes through laser rejec-
ion filters and then undergoes separation on the diffractionrating (GR13-1850, Thorlabs Inc., NJ, USA) into constituentavelength components. The separated monochromatic beams
re focused onto channels of the 32-channel PMT (H7260-20,amamatsu, Japan) by the system comprising spherical mirror
CM254-075-G01, Thorlabs Inc., NJ, USA) and cylindrical lensLJ1095L2, Thorlabs Inc., NJ, USA).
.3. 32-Channel single photon detector and data format
Fluorescence detection in our 32-channel spectrometer iserformed using 32-channel linear PMT array (H7260-20,amamatsu, Japan) in a single photon counting mode. Each
hannel of the PMT produces a stream of short (∼1 ns) current
ulses in response to an incident photon flux. The pulse ampli-ude ranges between 0.4 and 0.6 mA with corresponding peakoltage between 8 and 12 mV. In order to realize photon countingetection mode, we have developed a 32-channel pulse amplifiermin
module (B) and 32-channel single photon detector (C).
ased on the surface mounted devices (SMD) technology and32-channel photon counter based on field programmed gate
rray (FPGA) technology. The amplifier comprises 32 identicalulse amplifying channels (35–40 dB gain, 1 GHz bandwidth)nd 32 fast comparators having rise and a fall time of aboutns, which limits the minimum pulse width to approximately.5 ns. After amplification, a digitization (counting) of the ampli-ed signal is performed by a home-designed 32-channel photonounter. The counting of the input photon pulses in each of 32hannels is performed by summation of pulses arriving to thehannel input during the integration time intervals provided by aynchro-generator (minimum integration time is 0.3 ms, whichorresponds to detection frame rate of ∼3300 frames/s).
Data collected by the counter is transferred to a PC usingtandard IEEE 1284 Parallel Port Interface. The data is trans-erred in 105-byte frames using a binary format. Data framesonsist of count values obtained for each of the 32 detectionhannels (3 bytes per channel). Each frame starts with a 6-byteeader which includes the following fields: 1-byte counter type,-byte frame number and a 2-byte counting period length mea-ured in milliseconds. The frame number contains the number ofhe current frame. The number is incremented by 1 for each fol-owing frame thus forming a rising sequence with overflow. Therame numbers serve as synchronization marks and are used byhe data processing software to find data frames in the continu-us data stream. Frame numbers are also used for verification ofata integrity and for finding errors introduced by interference inhe transmission line. A special software package performs theecording and the on-line visualization of the data transferred byhe counter.
.4. Channel cross-talk in multi-channel single photonetection system
First of all, we would like to note, that in the analyzed dyesixtures proportion of different dye components may differs
n orders of magnitude. Therefore, even a very small chan-el cross-talk in the sensor may cause an ambiguity in the
1 Bioe
dmtotcHcctttnb
2
octbNsc
nt(flHsdtoflt
r
aScc(
s
Ppomt
r
tnd
s
wi
C
wut
r
tmbbvomr
posTb
2
beu(p(afl((lTc
514 A. Tsupryk et al. / Biosensors and
ata analysis. In the developed 32-channel photosensor, twoajor types of the lane cross-talk may occurs: electronic cross-
alks inside of the 32-channel PMT and electronic cross-talkf the amplification channels in the 32-channel amplifier andhe counter. Our tests showed no electronic cross-talk betweenhannels of the amplifier and the 32-channel photon counter.owever, we observed a channel cross-talk (∼3%) in the 32-
hannel PMT, which appeared when we illuminated individualhannels through optical fiber. According to the data sheet ofhe H7260-20, this cross-talk is caused by certain features ofhe electronic optics inside of the photo-multiplying tube and,herefore, is unavoidable. However, as it will be shown in theext section, the electronic cross-talk can be fully compensatedy applying a special device calibration and data processing.
.5. Processing of fluorescence spectra
The main task of the signal processing is the determinationf concentrations of individual fluorescent dyes in dye mixturesomposed of n dyes having distinct and known fluorescent spec-ra. The concentrations of individual dyes in the mixture cane found by a decomposition of the fluorescence measured inindependent channels of the spectrometer, provided that the
pectrometer produces linear response to the detected fluores-ence.
We assume that the number of the analyzed fluorescent dyes≤ N (e.g. n = 4 for DNA sequencing). Let us introduce the sys-
em matrix H(N × n) = (h1, h2, . . ., h3), where hi = (h1i, . . ., hNi)T
1 ≤ i ≤ n) are N-component vectors representing spectra of theuorescent dyes in the analyzed dye mixture. A system matrixis obtained after performing the system calibration and mea-
uring in advance spectral responses of individual fluorescentyes hi. If r = (r1, . . ., rN)T is the measured fluorescent spec-rum of the dye mixture, and s = (s1, s2, . . ., sn)T is a vectorf component weights representing concentrations of individualuorescent dyes, than in the presence of noise ω = (ω1, . . ., ωN)T
he measured spectrum
= Hs + � (1)
The optimal solution s of Eq. (1) depends on the assumptionbout the distribution properties of the noise components ωi.implified assumption about ωi being independent and identi-ally distributed normal random values yields well known andomputationally efficient minimum variance unbiased solutionKay, 1993) for estimate s:
ˆ = (HTH)−1
HTr (2)
In photon counting, individual rate observations ri haveoisson distribution with equal mean and variance. For higherhotocount rates (over 50 counts per observation period), thebserved rates are well approximated by superposition of ‘true’
ean rate ri and Gaussian noise ωi with variance depending onhe mean rate:
i = ri + ωi, ωi ∼ N(0, f (ri))
StB
lectronics 23 (2008) 1512–1518
Thus, more precise solution can be obtained by assuminghe components ωi are independent non-identically distributedormal random variables. The general solution for Eq. (1) waserived in (Kay, 1993):
ˆ∗ = (HTC−1H)−1
HTC−1r (3)
here C is the covariance matrix of components ωi. Due tondependence of ωi the matrix C is diagonal:
=
⎛⎜⎜⎜⎜⎝
σ21 0
σ22
. . .
0 σ2N
⎞⎟⎟⎟⎟⎠
(4)
here σ2i is the variance of ωi. In practice, mean rate ri is
nknown and observed rate ri is used for the computation ofhe variance:
¯i ∼= ri
Variances σ2i are estimated for each measurement. The func-
ion that relates σ2i and ri is specific for each preprocessing
ethod used to obtain ri. For example, if ri are obtained directlyy counting of photons during a sampling period, then σ2
i = ri. Ifackground bi is subtracted from the result of the counting obser-ation, then σ2
i = ri + bi. If ri is obtained by averaging countingbservation over k sampling periods, then σ2
i = ri/k. The esti-ator (3) is more accurate, but requires more of computational
esources than the estimator (2).The approach described above allows construction of the
rocedure, which performs background subtraction at the stagef cross-talk removal. This is achieved by creating additionalpectrum (column in matrix H) that represents the background.he estimators (2) and (3) with new matrix H will separate theackground from the other spectral components.
.6. DNA sequencing experiments
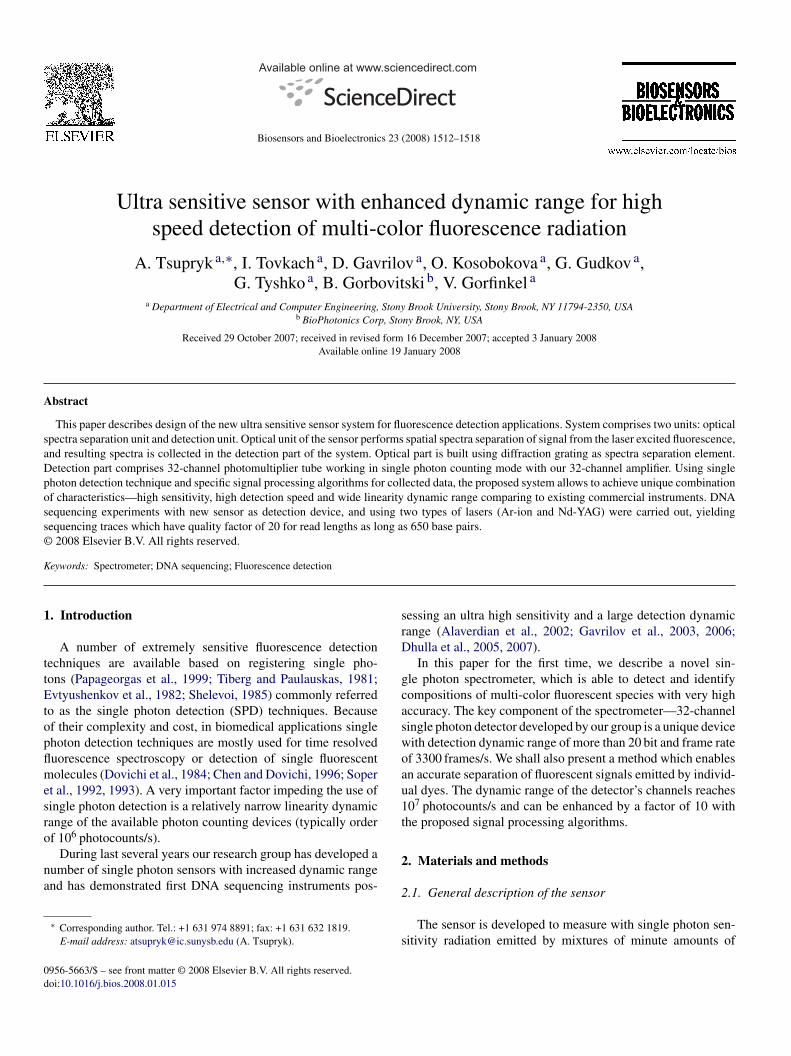
We use a single lane DNA sequencer (Fig. 2) developedy our group (Alaverdian et al., 2002). DNA samples undergolectrophoretic separation in a single-capillary separation mod-le (A) which comprises of a miniature high voltage supplyup to 15 kV) with a built-in voltmeter and amperemeter, aolymer replacement system, a temperature control system25–70 ± 0.01 ◦C), a tube-changer carousel for DNA samplesnd running buffer, and a precision optical system. When theuorescently labeled DNA fragments pass the optical systemB), they are illuminated by a fiberized laser (either Ar-ion laser488 and 514 nm, 20 mW, Uniphase, CA, USA) or Nd:YAGaser (532 nm, 25 mW, GCL-025-S, CrystaLaser, NV, USA)).he laser-induced fluorescence is collected by the fiber (200 �more diameter) and delivered to the spectral separation module.
DNA samples labeled with BigDye (BigDye Terminator v1.1equencing Standard) obtained from Applied Biosystems (Fos-
er City, CA, USA) were denatured in 25 �l Formamide (Appliediosystems) followed by dilution 1–5 in HPLC grade water
A. Tsupryk et al. / Biosensors and Bioelectronics 23 (2008) 1512–1518 1515
F DNAa m; (4o
iaiUt
2
sTa
sbbtifs
c
rccw
salpppot
3
3p
ig. 2. Photograph and schematic of the single lane DNA sequencer. SPD-basednd ampermeter; (2) polymer replacement system; (3) temperature control systef the optical system.
mmediately prior to injection. DNA separation was conductedt 150 V/cm in 40 cm (35 cm separation length) uncoated cap-llaries (50 �m i.d., 365 �m o.d. by Polymicro, Phoenix, AZ,SA) filled with POP-7 separation medium (Applied Biosys-
ems) at 50 ◦C. Applied Biosystems running buffer was used.
.7. Processing of DNA sequencing data
We tested two approaches to estimation of fluorescence inten-ities produced by four dyes used for labeling of A, C, G and
terminators: decomposition of the entire measured spectrumccording to Eq. (3) and application of virtual filters.
For the decomposition of the entire measured spectrum, thepectral components ci which describe individual dyes muste obtained experimentally by measuring fluorescence emittedy each dye separately and by normalizing the measured vec-or of photocount rates. The determination of concentrations ofndividual dyes s[n] in the mixture is performed for each time
rame. The obtained sequence of dye concentrations forms fourequencing traces, which are further used for base calling.The method of virtual filters is a simplified approach, whichan be successfully used if the component spectra a well sepa-
ow
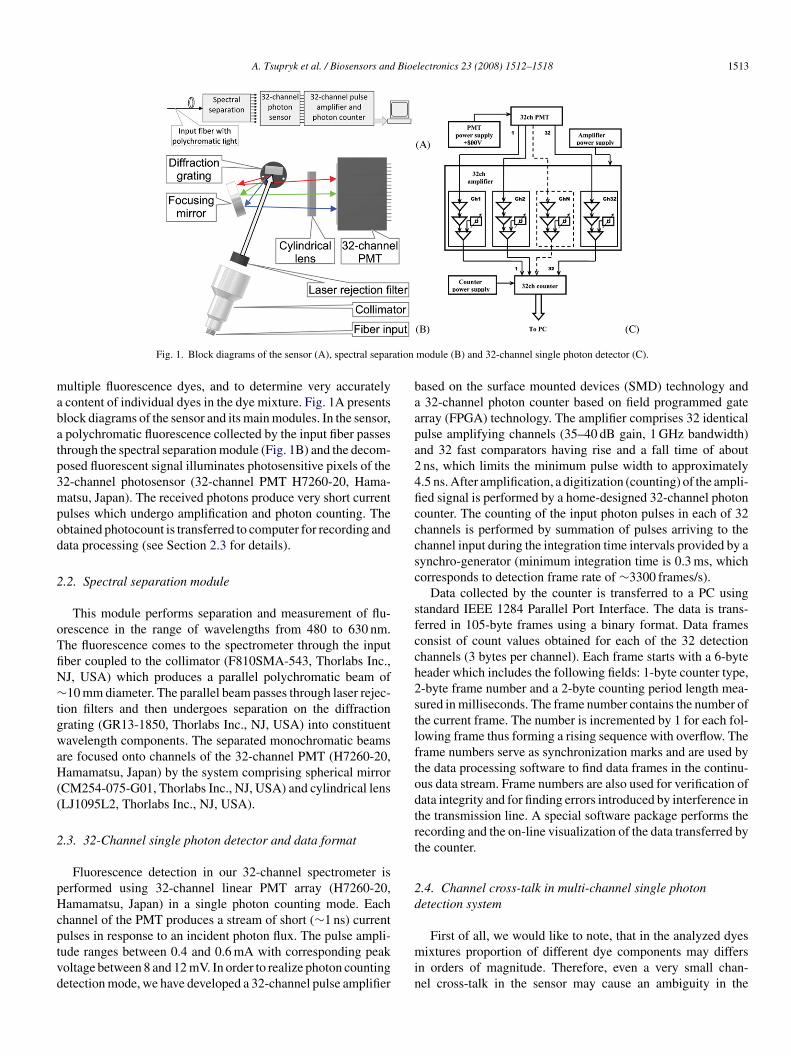
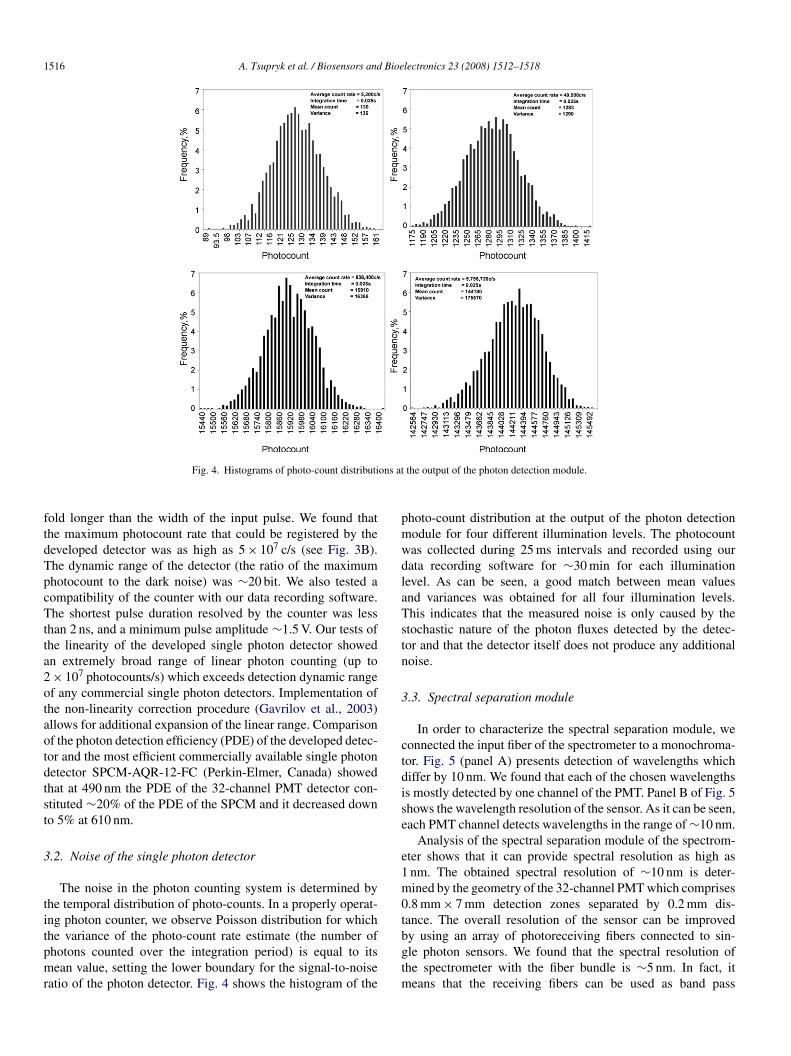
Fig. 3. Voltage pulses at the input and the output of the pulse amplifier (A) an
sequencer. (A) General view. (1) High voltage supply with a built-in voltmeter) tube-changer carousel; (5) fiberized precision optical system. (B) Schematics
ated. Four virtual filters are formed by selecting a certain PMThannels or groups of channels so that fluorescence of each dyeontributes the most into measurements in the channel, whichas assigned to it, and minimum response in the other channels.In both data processing approaches, the obtained four
equencing traces undergo standard processing (Alaverdian etl., 2002) which includes noise filtering (smoothing), base-ine subtraction, cross-talk removal, mobility shift correction,eak height and spacing equalization. After re-sampling to 7–15oints per peak the traces are stored in .SCF data file format androcessed by standard base calling PHRED software. The resultf the processing is returned as a sequence of base-calls withheir positions and quality scores.
. Results and discussion
.1. Sensitivity and linearity of the 32-channel singlehoton detector
Fig. 3 presents typical voltage pulses at the input and theutput of the developed pulse amplifier. As it can be seen, theidth of the amplified pulse is approximately 5 ns which is ∼5-
d linearity and sensitivity of the 32-channel single photon detector (B).
1516 A. Tsupryk et al. / Biosensors and Bioelectronics 23 (2008) 1512–1518
ons at
ftdTpcTtta2otaotdtst
3
titpmr
pmwdlaTstn
3
ctdise
e1m0t
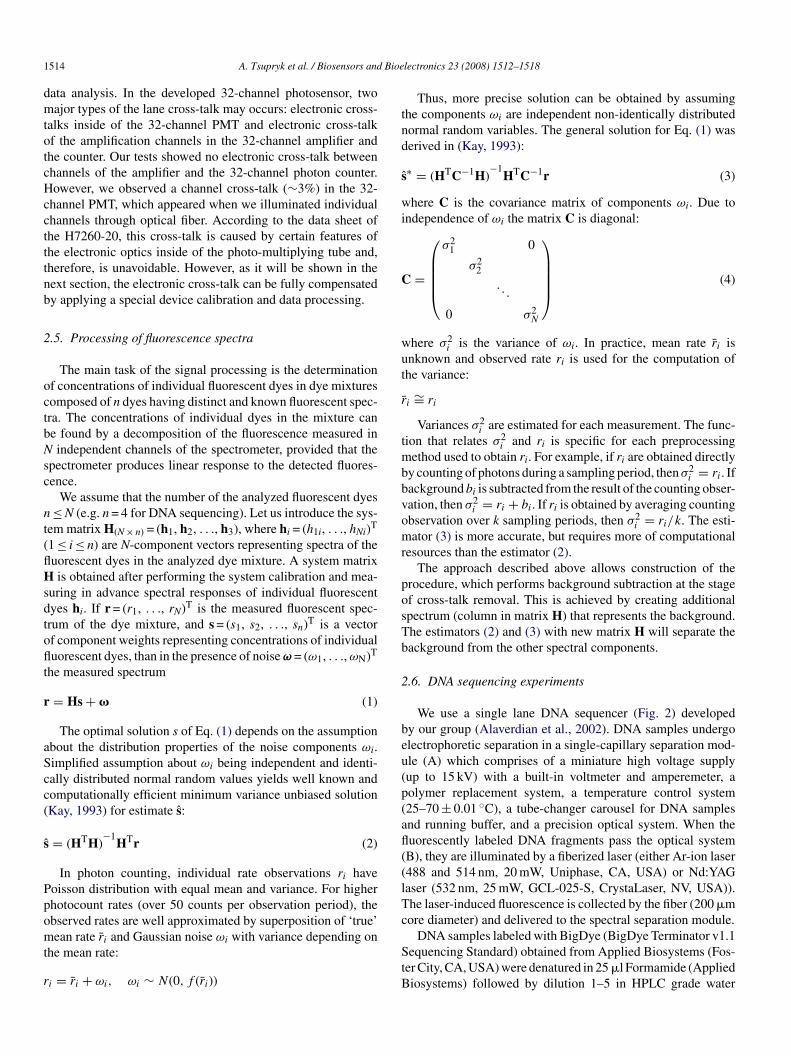
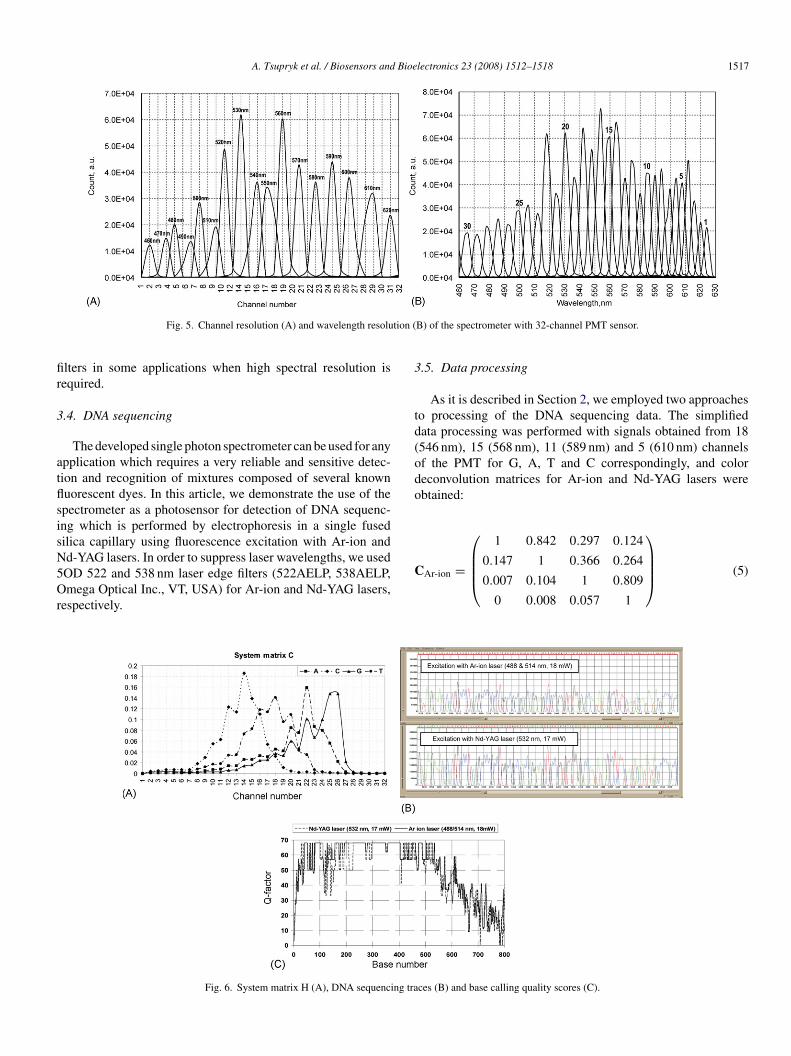
Fig. 4. Histograms of photo-count distributi
old longer than the width of the input pulse. We found thathe maximum photocount rate that could be registered by theeveloped detector was as high as 5 × 10⁷ c/s (see Fig. 3B).he dynamic range of the detector (the ratio of the maximumhotocount to the dark noise) was ∼20 bit. We also tested aompatibility of the counter with our data recording software.he shortest pulse duration resolved by the counter was less
han 2 ns, and a minimum pulse amplitude ∼1.5 V. Our tests ofhe linearity of the developed single photon detector showedn extremely broad range of linear photon counting (up to× 107 photocounts/s) which exceeds detection dynamic rangef any commercial single photon detectors. Implementation ofhe non-linearity correction procedure (Gavrilov et al., 2003)llows for additional expansion of the linear range. Comparisonf the photon detection efficiency (PDE) of the developed detec-or and the most efficient commercially available single photonetector SPCM-AQR-12-FC (Perkin-Elmer, Canada) showedhat at 490 nm the PDE of the 32-channel PMT detector con-tituted ∼20% of the PDE of the SPCM and it decreased downo 5% at 610 nm.
.2. Noise of the single photon detector
The noise in the photon counting system is determined byhe temporal distribution of photo-counts. In a properly operat-ng photon counter, we observe Poisson distribution for which
he variance of the photo-count rate estimate (the number ofhotons counted over the integration period) is equal to itsean value, setting the lower boundary for the signal-to-noiseatio of the photon detector. Fig. 4 shows the histogram of the
bgtm
the output of the photon detection module.
hoto-count distribution at the output of the photon detectionodule for four different illumination levels. The photocountas collected during 25 ms intervals and recorded using ourata recording software for ∼30 min for each illuminationevel. As can be seen, a good match between mean valuesnd variances was obtained for all four illumination levels.his indicates that the measured noise is only caused by thetochastic nature of the photon fluxes detected by the detec-or and that the detector itself does not produce any additionaloise.
.3. Spectral separation module
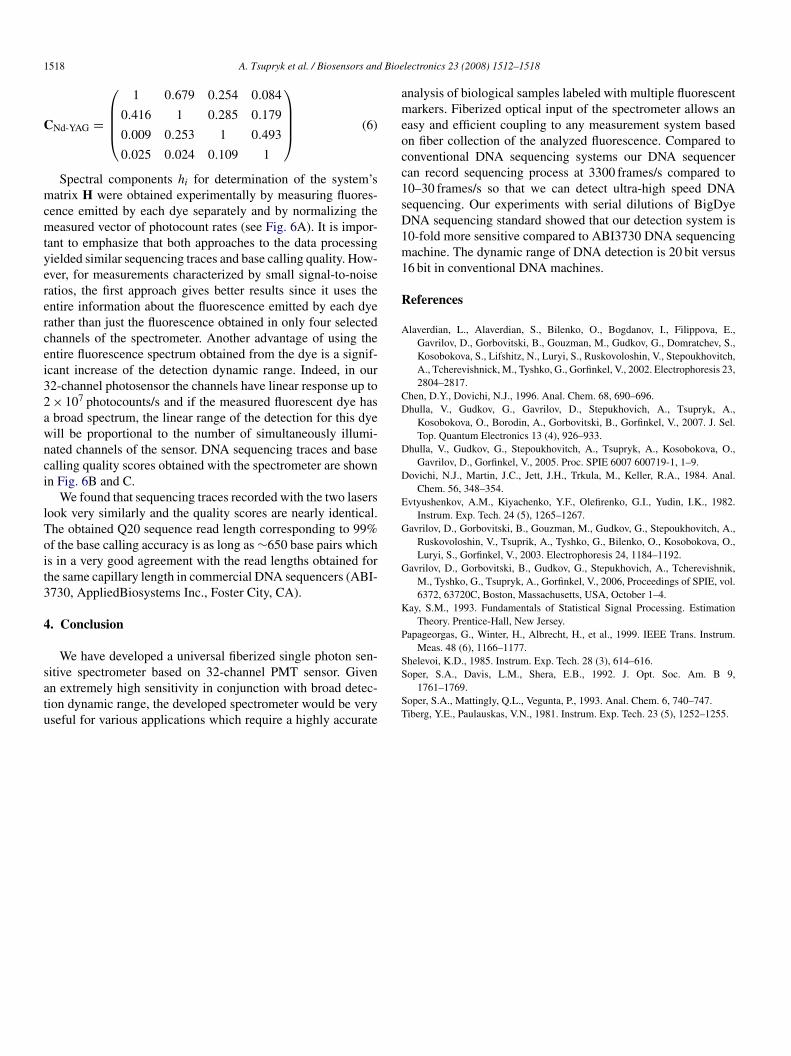
In order to characterize the spectral separation module, weonnected the input fiber of the spectrometer to a monochroma-or. Fig. 5 (panel A) presents detection of wavelengths whichiffer by 10 nm. We found that each of the chosen wavelengthss mostly detected by one channel of the PMT. Panel B of Fig. 5hows the wavelength resolution of the sensor. As it can be seen,ach PMT channel detects wavelengths in the range of ∼10 nm.
Analysis of the spectral separation module of the spectrom-ter shows that it can provide spectral resolution as high asnm. The obtained spectral resolution of ∼10 nm is deter-ined by the geometry of the 32-channel PMT which comprises
.8 mm × 7 mm detection zones separated by 0.2 mm dis-ance. The overall resolution of the sensor can be improved
y using an array of photoreceiving fibers connected to sin-le photon sensors. We found that the spectral resolution ofhe spectrometer with the fiber bundle is ∼5 nm. In fact, iteans that the receiving fibers can be used as band pass
A. Tsupryk et al. / Biosensors and Bioelectronics 23 (2008) 1512–1518 1517
tion (
fir
3
atflsisN5Or
3
td(odo
Fig. 5. Channel resolution (A) and wavelength resolu
lters in some applications when high spectral resolution isequired.
.4. DNA sequencing
The developed single photon spectrometer can be used for anypplication which requires a very reliable and sensitive detec-ion and recognition of mixtures composed of several knownuorescent dyes. In this article, we demonstrate the use of thepectrometer as a photosensor for detection of DNA sequenc-ng which is performed by electrophoresis in a single fusedilica capillary using fluorescence excitation with Ar-ion and
d-YAG lasers. In order to suppress laser wavelengths, we usedOD 522 and 538 nm laser edge filters (522AELP, 538AELP,mega Optical Inc., VT, USA) for Ar-ion and Nd-YAG lasers,espectively.
C
Fig. 6. System matrix H (A), DNA sequencing tra
B) of the spectrometer with 32-channel PMT sensor.
.5. Data processing
As it is described in Section 2, we employed two approacheso processing of the DNA sequencing data. The simplifiedata processing was performed with signals obtained from 18546 nm), 15 (568 nm), 11 (589 nm) and 5 (610 nm) channelsf the PMT for G, A, T and C correspondingly, and coloreconvolution matrices for Ar-ion and Nd-YAG lasers werebtained:
⎛1 0.842 0.297 0.124
⎞
Ar-ion =⎜⎜⎜⎝
0.147 1 0.366 0.264
0.007 0.104 1 0.809
0 0.008 0.057 1
⎟⎟⎟⎠ (5)
ces (B) and base calling quality scores (C).
1 Bioe
C
mcmtyerercei32awnci
lToit3
4
satu
ameocc1sD1m1
R
A
CD
D
D
E
G
G
K
P
Shelevoi, K.D., 1985. Instrum. Exp. Tech. 28 (3), 614–616.
518 A. Tsupryk et al. / Biosensors and
Nd-YAG =
⎛⎜⎜⎜⎝
1 0.679 0.254 0.084
0.416 1 0.285 0.179
0.009 0.253 1 0.493
0.025 0.024 0.109 1
⎞⎟⎟⎟⎠ (6)
Spectral components hi for determination of the system’satrix H were obtained experimentally by measuring fluores-
ence emitted by each dye separately and by normalizing theeasured vector of photocount rates (see Fig. 6A). It is impor-
ant to emphasize that both approaches to the data processingielded similar sequencing traces and base calling quality. How-ver, for measurements characterized by small signal-to-noiseatios, the first approach gives better results since it uses thentire information about the fluorescence emitted by each dyeather than just the fluorescence obtained in only four selectedhannels of the spectrometer. Another advantage of using thentire fluorescence spectrum obtained from the dye is a signif-cant increase of the detection dynamic range. Indeed, in our2-channel photosensor the channels have linear response up to× 107 photocounts/s and if the measured fluorescent dye hasbroad spectrum, the linear range of the detection for this dyeill be proportional to the number of simultaneously illumi-ated channels of the sensor. DNA sequencing traces and basealling quality scores obtained with the spectrometer are shownn Fig. 6B and C.
We found that sequencing traces recorded with the two lasersook very similarly and the quality scores are nearly identical.he obtained Q20 sequence read length corresponding to 99%f the base calling accuracy is as long as ∼650 base pairs whichs in a very good agreement with the read lengths obtained forhe same capillary length in commercial DNA sequencers (ABI-730, AppliedBiosystems Inc., Foster City, CA).
. Conclusion
We have developed a universal fiberized single photon sen-
itive spectrometer based on 32-channel PMT sensor. Givenn extremely high sensitivity in conjunction with broad detec-ion dynamic range, the developed spectrometer would be veryseful for various applications which require a highly accurateS
ST
lectronics 23 (2008) 1512–1518
nalysis of biological samples labeled with multiple fluorescentarkers. Fiberized optical input of the spectrometer allows an
asy and efficient coupling to any measurement system basedn fiber collection of the analyzed fluorescence. Compared toonventional DNA sequencing systems our DNA sequenceran record sequencing process at 3300 frames/s compared to0–30 frames/s so that we can detect ultra-high speed DNAequencing. Our experiments with serial dilutions of BigDyeNA sequencing standard showed that our detection system is0-fold more sensitive compared to ABI3730 DNA sequencingachine. The dynamic range of DNA detection is 20 bit versus
6 bit in conventional DNA machines.
eferences
laverdian, L., Alaverdian, S., Bilenko, O., Bogdanov, I., Filippova, E.,Gavrilov, D., Gorbovitski, B., Gouzman, M., Gudkov, G., Domratchev, S.,Kosobokova, S., Lifshitz, N., Luryi, S., Ruskovoloshin, V., Stepoukhovitch,A., Tcherevishnick, M., Tyshko, G., Gorfinkel, V., 2002. Electrophoresis 23,2804–2817.
hen, D.Y., Dovichi, N.J., 1996. Anal. Chem. 68, 690–696.hulla, V., Gudkov, G., Gavrilov, D., Stepukhovich, A., Tsupryk, A.,
Kosobokova, O., Borodin, A., Gorbovitski, B., Gorfinkel, V., 2007. J. Sel.Top. Quantum Electronics 13 (4), 926–933.
hulla, V., Gudkov, G., Stepoukhovitch, A., Tsupryk, A., Kosobokova, O.,Gavrilov, D., Gorfinkel, V., 2005. Proc. SPIE 6007 600719-1, 1–9.
ovichi, N.J., Martin, J.C., Jett, J.H., Trkula, M., Keller, R.A., 1984. Anal.Chem. 56, 348–354.
vtyushenkov, A.M., Kiyachenko, Y.F., Olefirenko, G.I., Yudin, I.K., 1982.Instrum. Exp. Tech. 24 (5), 1265–1267.
avrilov, D., Gorbovitski, B., Gouzman, M., Gudkov, G., Stepoukhovitch, A.,Ruskovoloshin, V., Tsuprik, A., Tyshko, G., Bilenko, O., Kosobokova, O.,Luryi, S., Gorfinkel, V., 2003. Electrophoresis 24, 1184–1192.
avrilov, D., Gorbovitski, B., Gudkov, G., Stepukhovich, A., Tcherevishnik,M., Tyshko, G., Tsupryk, A., Gorfinkel, V., 2006, Proceedings of SPIE, vol.6372, 63720C, Boston, Massachusetts, USA, October 1–4.
ay, S.M., 1993. Fundamentals of Statistical Signal Processing. EstimationTheory. Prentice-Hall, New Jersey.
apageorgas, G., Winter, H., Albrecht, H., et al., 1999. IEEE Trans. Instrum.Meas. 48 (6), 1166–1177.
oper, S.A., Davis, L.M., Shera, E.B., 1992. J. Opt. Soc. Am. B 9,1761–1769.
oper, S.A., Mattingly, Q.L., Vegunta, P., 1993. Anal. Chem. 6, 740–747.iberg, Y.E., Paulauskas, V.N., 1981. Instrum. Exp. Tech. 23 (5), 1252–1255.