Ultimate load analysis of plate reinforced concrete beams
12
Engineering Structures 23 (2001) 1068–1079 www.elsevier.com/locate/engstruct Ultimate load analysis of plate reinforced concrete beams Nutan Kumar Subedi * , Paul Stuart Baglin Department of Civil Engineering, University of Dundee, Dundee DD1 4HN, UK Received 11 August 2000; received in revised form 7 February 2001; accepted 8 February 2001 Abstract In a previous paper, the experimental work carried out on concrete–steel composite beams utilising the ‘encased plate construction’ was presented. The provision of steel plates as shear reinforcement allows very high shear stresses to be safely developed. This is a new concept in the design of reinforced concrete beams. This paper describes the structural behaviour and ultimate limit state analysis of plate reinforced beams with short shear spans. The proposed analytical method is based on the equilibrium of forces and strain-compatibility. This method predicts both the mode of failure and the ultimate limit state capacity. The proposed analysis shows good agreement with the experimental results presented in the previous paper. 2001 Elsevier Science Ltd. All rights reserved. Keywords: Shear; Concrete; Composite beam; Plate reinforcement; Shear analysis; Short span beams 1. Introduction The use of steel plates as shear reinforcement is a new concept in the design of reinforced concrete beams. The plates are given a ridged surface to improve the bond between the concrete and plates. The ‘bond-enhanced’ plates are produced by welding ‘Expamet’ expanded metal mesh to both sides of a plain mild steel plate. The steel plates are arranged vertically within the cross-sec- tion and are continuous over the full length of the beam, as shown in Fig. 1. The construction method is described as ‘encased-plate construction’ (EPC). EPC can provide a very high shear capacity with average shear stresses in excess of 20 N/mm 2 . The high percentage of shear steel employed and unique geometry can also lead to the shear failure being ductile, similar to that normally associated with flexural failure. EPC is applicable wherever concrete beams are sub- jected to high shear forces. The utilisation of EPC can lead to substantial reductions in beam sections, allowing greater flexibility of design and direct cost savings. The replacement of conventional links in regions of high con- * Corresponding author. Tel.: +44-1382-344355; fax: +44-1382- 344816. E-mail address: [email protected] (N.K. Subedi). 0141-0296/01/$ - see front matter 2001 Elsevier Science Ltd. All rights reserved. PII:S0141-0296(01)00013-X gestion simplifies construction, saving assembly time and cost. Studies carried out at the University of Dundee since 1985 have established the feasibility of EPC. The failure mechanisms, and specifically the behaviour of plate reinforced beams at ultimate capacity, are examined, further details of which can be found in Refs. [1–3]. In the previous paper [3] the experimental work carried out on EPC was presented. The beam reference numbers and the experimental results presented in this paper have been discussed fully in Ref. [3]. The structural behaviour of EPC beams is character- ised by the overall mode of failure in diagonal splitting between the support and the load. The variations of the diagonal splitting mode are identified as the compression zone crushing mechanism, compression zone shear mechanism (shear compression) and flexural shear. In this paper, a method of analysis, based on the equilib- rium of forces and compatibility of deformation, has been developed. The method is proposed for the predic- tion of the mode of failure and the ultimate strength of plate-encased beams. The method covers the behaviour and calculations at ultimate load. It does not cover the behaviour at service load nor any other intermediate stages of loading. The ‘encased-plate’ referred to in this paper is a plain steel plate provided with ‘Expamet’ expanded metal mesh welded onto both sides of the plate.
-
Upload
independent -
Category
Documents
-
view
1 -
download
0
Transcript of Ultimate load analysis of plate reinforced concrete beams

Engineering Structures 23 (2001) 1068–1079www.elsevier.com/locate/engstruct
Ultimate load analysis of plate reinforced concrete beams
Nutan Kumar Subedi *, Paul Stuart BaglinDepartment of Civil Engineering, University of Dundee, Dundee DD1 4HN, UK
Received 11 August 2000; received in revised form 7 February 2001; accepted 8 February 2001
Abstract
In a previous paper, the experimental work carried out on concrete–steel composite beams utilising the ‘encased plate construction’was presented. The provision of steel plates as shear reinforcement allows very high shear stresses to be safely developed. This isa new concept in the design of reinforced concrete beams. This paper describes the structural behaviour and ultimate limit stateanalysis of plate reinforced beams with short shear spans. The proposed analytical method is based on the equilibrium of forcesand strain-compatibility. This method predicts both the mode of failure and the ultimate limit state capacity. The proposed analysisshows good agreement with the experimental results presented in the previous paper. 2001 Elsevier Science Ltd. All rightsreserved.
Keywords: Shear; Concrete; Composite beam; Plate reinforcement; Shear analysis; Short span beams
1. Introduction
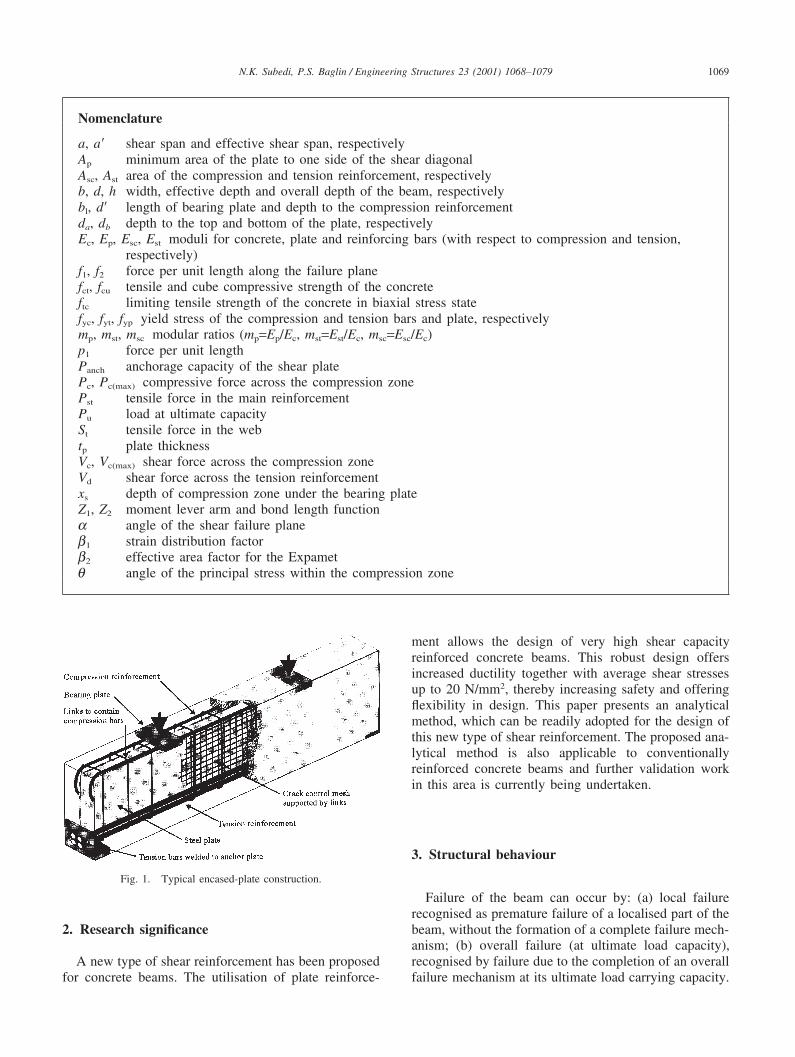
The use of steel plates as shear reinforcement is a newconcept in the design of reinforced concrete beams. Theplates are given a ridged surface to improve the bondbetween the concrete and plates. The ‘bond-enhanced’plates are produced by welding ‘Expamet’ expandedmetal mesh to both sides of a plain mild steel plate. Thesteel plates are arranged vertically within the cross-sec-tion and are continuous over the full length of the beam,as shown in Fig. 1. The construction method is describedas ‘encased-plate construction’ (EPC). EPC can providea very high shear capacity with average shear stressesin excess of 20 N/mm2. The high percentage of shearsteel employed and unique geometry can also lead tothe shear failure being ductile, similar to that normallyassociated with flexural failure.
EPC is applicable wherever concrete beams are sub-jected to high shear forces. The utilisation of EPC canlead to substantial reductions in beam sections, allowinggreater flexibility of design and direct cost savings. Thereplacement of conventional links in regions of high con-
* Corresponding author. Tel.: +44-1382-344355; fax: +44-1382-344816.
E-mail address: [email protected] (N.K. Subedi).
0141-0296/01/$ - see front matter 2001 Elsevier Science Ltd. All rights reserved.PII: S0141- 02 96 (01)00 01 3- X
gestion simplifies construction, saving assembly timeand cost.
Studies carried out at the University of Dundee since1985 have established the feasibility of EPC. The failuremechanisms, and specifically the behaviour of platereinforced beams at ultimate capacity, are examined,further details of which can be found in Refs. [1–3]. Inthe previous paper [3] the experimental work carried outon EPC was presented. The beam reference numbers andthe experimental results presented in this paper havebeen discussed fully in Ref. [3].
The structural behaviour of EPC beams is character-ised by the overall mode of failure in diagonal splittingbetween the support and the load. The variations of thediagonal splitting mode are identified as the compressionzone crushing mechanism, compression zone shearmechanism (shear compression) and flexural shear. Inthis paper, a method of analysis, based on the equilib-rium of forces and compatibility of deformation, hasbeen developed. The method is proposed for the predic-tion of the mode of failure and the ultimate strength ofplate-encased beams. The method covers the behaviourand calculations at ultimate load. It does not cover thebehaviour at service load nor any other intermediatestages of loading. The ‘encased-plate’ referred to in thispaper is a plain steel plate provided with ‘Expamet’expanded metal mesh welded onto both sides of theplate.
1069N.K. Subedi, P.S. Baglin / Engineering Structures 23 (2001) 1068–1079
Nomenclature
a, a� shear span and effective shear span, respectivelyAp minimum area of the plate to one side of the shear diagonalAsc, Ast area of the compression and tension reinforcement, respectivelyb, d, h width, effective depth and overall depth of the beam, respectivelybl, d� length of bearing plate and depth to the compression reinforcementda, db depth to the top and bottom of the plate, respectivelyEc, Ep, Esc, Est moduli for concrete, plate and reinforcing bars (with respect to compression and tension,
respectively)f1, f2 force per unit length along the failure planefct, fcu tensile and cube compressive strength of the concreteftc limiting tensile strength of the concrete in biaxial stress statefyc, fyt, fyp yield stress of the compression and tension bars and plate, respectivelymp, mst, msc modular ratios (mp=Ep/Ec, mst=Est/Ec, msc=Esc/Ec)p1 force per unit lengthPanch anchorage capacity of the shear platePc, Pc(max) compressive force across the compression zonePst tensile force in the main reinforcementPu load at ultimate capacitySt tensile force in the webtp plate thicknessVc, Vc(max) shear force across the compression zoneVd shear force across the tension reinforcementxs depth of compression zone under the bearing plateZ1, Z2 moment lever arm and bond length functiona angle of the shear failure planeb1 strain distribution factorb2 effective area factor for the Expametq angle of the principal stress within the compression zone
Fig. 1. Typical encased-plate construction.
2. Research significance
A new type of shear reinforcement has been proposedfor concrete beams. The utilisation of plate reinforce-
ment allows the design of very high shear capacityreinforced concrete beams. This robust design offersincreased ductility together with average shear stressesup to 20 N/mm2, thereby increasing safety and offeringflexibility in design. This paper presents an analyticalmethod, which can be readily adopted for the design ofthis new type of shear reinforcement. The proposed ana-lytical method is also applicable to conventionallyreinforced concrete beams and further validation workin this area is currently being undertaken.
3. Structural behaviour
Failure of the beam can occur by: (a) local failurerecognised as premature failure of a localised part of thebeam, without the formation of a complete failure mech-anism; (b) overall failure (at ultimate load capacity),recognised by failure due to the completion of an overallfailure mechanism at its ultimate load carrying capacity.

1070 N.K. Subedi, P.S. Baglin / Engineering Structures 23 (2001) 1068–1079
3.1. Local failures
Local failures prevent full utilisation of the beam’soverall capacity. Any failure that preempts the formationof a failure mechanism is considered a premature failure.One of the aims of this study was to ‘design out’ allpremature failures. The following types of failure areconsidered local failures: bearing, plate anchorage andplate buckling.
3.1.1. Bearing failureIn short shear span and deep beams, where patch loads
are applied, high bearing stresses are inevitable. Bearingfailure is caused by localised crushing of concrete andcan occur both under the load and above the support.Allowable limits depend on both the biaxial stress con-dition and the adopted detailing.
3.1.2. Plate anchorage failurePlate anchorage failure is caused by the breakdown
of composite interaction between the plate and concrete,caused by tensile splitting failure of the concretebetween the ‘ridges’ of the plate. This leads to suddenand brittle failure of the beam. Ideally the anchoragecapacity should be sufficient to allow tensile yielding ofthe plate along the full length of the failure plane.
3.1.3. Plate bucklingBuckling of the slender plate causes sudden failure,
without any previous warning signs. A sufficient covermust be provided by the concrete in order to control anyinstability inherent in the plate. The maximum deviationfrom vertical alignment, and possible small torsionaleffects induced by the loading arrangement, must beaccommodated by the design.
3.2. Overall failure — flexural
The flexural failure mechanism is similar to that ofconventionally reinforced concrete beams. The full depthof the plate can be assumed to be effective when calcu-lating the flexural capacity of the section.
3.3. Overall failure: shear — diagonal splitting
With all symmetrically reinforced rectangular sectionsthe shear failure mechanism is characterised by the for-mation of a tensile splitting shear crack within the shearpanel. This is initiated close to the mid-height of thebeam, when the concrete reaches the limiting tensilestress under the biaxial tension–compression stressespresent. The deformation of the shear panel is thencharacterised by the strength capacity across this tensioncrack. Depending on the capacity across the tensioncrack the behaviour could be either concrete controlledor plate controlled. In any beam, diagonal splitting alone
does not complete the failure. For failure to be com-pleted, following the diagonal splitting, a mechanism hasto be formed. The complete failure mechanisms areidentified here as compression zone crushing, com-pression zone shear (shear compression) and flexuralshear. Examples of these mechanisms of failureobserved in actual beams are given in Ref. [3].
(a) Concrete controlled behaviour in diagonal split-ting. The effect of the diagonal splitting in an unre-inforced web of a beam would be that the tension crackwill extend rapidly and it will effectively ‘rip through’the section. Then the beam will not be able to carry anyadditional load. However, a relatively small amount ofsteel across the failure plane in the web could preventrapid extension of the tension crack and allow a redistri-bution of the load to stiffer parts of the panel. Failure isthen delayed until either the tension bars yield or thecompression zone fails at a further stage of the behav-iour. This is described as ‘concrete controlled behaviour’because the tensile limit of the web is reflected by thetensile capacity of the concrete. The presence of a smallamount of steel will enhance the carrying capacity ofthe web, but only nominally. The behaviour of concretebecomes the dominating effect.
(b) Plate controlled behaviour in diagonal splitting.When there is a large amount of steel across the tensioncrack then the formation of the splitting crack causes atransfer of tensile stress from the concrete to the platebut without a significant change in panel stiffness. Effec-tively this means that the strength capacity of the steelplate is greater than that of the concrete. There is alsoa significantly less redistribution of the load. Themaximum crack width remains at mid-height for mostpart of the loading; the tensile crack extends slowlytowards the load and support as the plate reaches yieldstrain at mid-height. A ‘notional hinge’ is formed at theneutral axis (point of zero strain). The failure mechanismcompletes when the tension bars yield or slip (flexuralshear), the concrete within the compression zone crushes(compression zone crushing), or the concrete within thecompression zone fails in shear (compression zoneshear). This is described as ‘plate controlled behaviour’because the tensile limit of the web is controlled by thetensile capacity of the plate.
Within the diagonal splitting behaviour (Figs. 2 and3), the compression zone crushing occurs when the com-pression force, Pc, reaches its limiting capacity. Com-pression zone shear (shear compression) failure occurswhen the shear force, Vc, reaches its limiting capacity.These two mechanisms are further illustrated in the fol-lowing paragraphs.
3.3.1. Compression zone crushing mechanismThe characteristics of this mode of failure may be
described as follows. At first, the shear crack formationis initiated as a diagonal splitting tension crack in the
1071N.K. Subedi, P.S. Baglin / Engineering Structures 23 (2001) 1068–1079
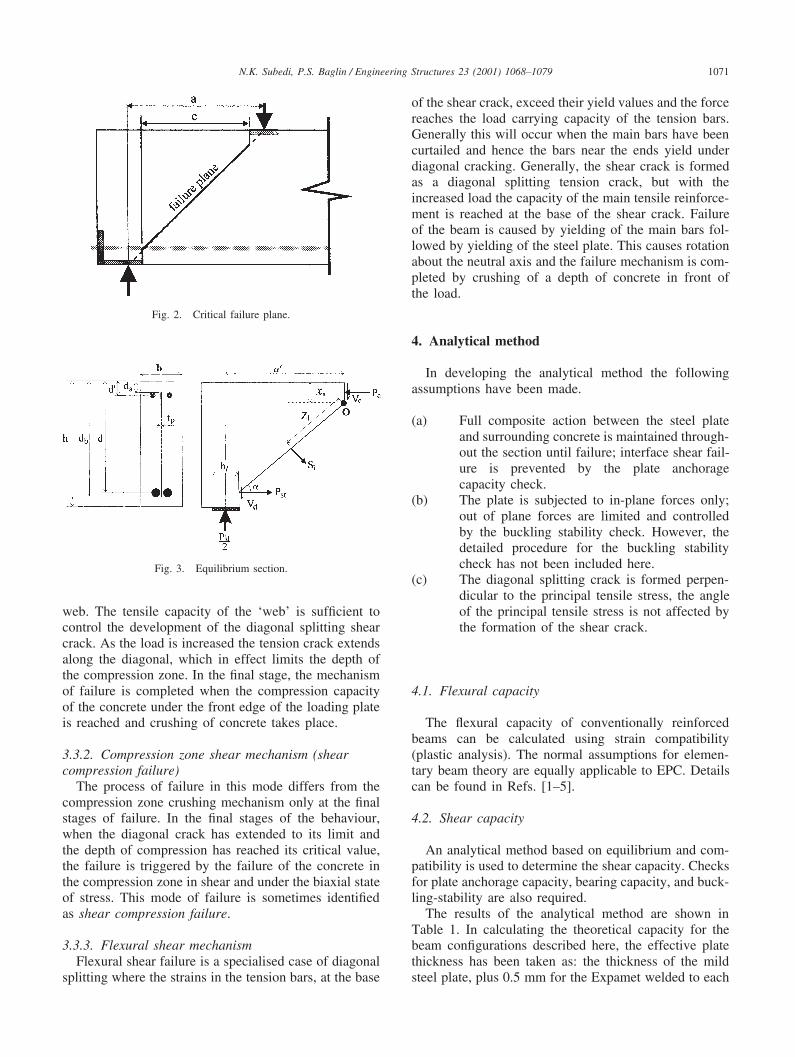
Fig. 2. Critical failure plane.
Fig. 3. Equilibrium section.
web. The tensile capacity of the ‘web’ is sufficient tocontrol the development of the diagonal splitting shearcrack. As the load is increased the tension crack extendsalong the diagonal, which in effect limits the depth ofthe compression zone. In the final stage, the mechanismof failure is completed when the compression capacityof the concrete under the front edge of the loading plateis reached and crushing of concrete takes place.
3.3.2. Compression zone shear mechanism (shearcompression failure)
The process of failure in this mode differs from thecompression zone crushing mechanism only at the finalstages of failure. In the final stages of the behaviour,when the diagonal crack has extended to its limit andthe depth of compression has reached its critical value,the failure is triggered by the failure of the concrete inthe compression zone in shear and under the biaxial stateof stress. This mode of failure is sometimes identifiedas shear compression failure.
3.3.3. Flexural shear mechanismFlexural shear failure is a specialised case of diagonal
splitting where the strains in the tension bars, at the base
of the shear crack, exceed their yield values and the forcereaches the load carrying capacity of the tension bars.Generally this will occur when the main bars have beencurtailed and hence the bars near the ends yield underdiagonal cracking. Generally, the shear crack is formedas a diagonal splitting tension crack, but with theincreased load the capacity of the main tensile reinforce-ment is reached at the base of the shear crack. Failureof the beam is caused by yielding of the main bars fol-lowed by yielding of the steel plate. This causes rotationabout the neutral axis and the failure mechanism is com-pleted by crushing of a depth of concrete in front ofthe load.
4. Analytical method
In developing the analytical method the followingassumptions have been made.
(a) Full composite action between the steel plateand surrounding concrete is maintained through-out the section until failure; interface shear fail-ure is prevented by the plate anchoragecapacity check.
(b) The plate is subjected to in-plane forces only;out of plane forces are limited and controlledby the buckling stability check. However, thedetailed procedure for the buckling stabilitycheck has not been included here.
(c) The diagonal splitting crack is formed perpen-dicular to the principal tensile stress, the angleof the principal tensile stress is not affected bythe formation of the shear crack.
4.1. Flexural capacity
The flexural capacity of conventionally reinforcedbeams can be calculated using strain compatibility(plastic analysis). The normal assumptions for elemen-tary beam theory are equally applicable to EPC. Detailscan be found in Refs. [1–5].
4.2. Shear capacity
An analytical method based on equilibrium and com-patibility is used to determine the shear capacity. Checksfor plate anchorage capacity, bearing capacity, and buck-ling-stability are also required.
The results of the analytical method are shown inTable 1. In calculating the theoretical capacity for thebeam configurations described here, the effective platethickness has been taken as: the thickness of the mildsteel plate, plus 0.5 mm for the Expamet welded to each

1072 N.K. Subedi, P.S. Baglin / Engineering Structures 23 (2001) 1068–1079
Table 1Shear capacity: analysisa
Beam ref. no. Web control Diagonal splitting shear failure Shear capacitymechanisms
a/d ftc m Compression zone Flexural Xs Ultimate Failuremode
Crushing Shear (case Shear (case(case 1) 2) 3)
(N/mm2) (kN) (kN) (kN) (mm) (kN)1 2 3 4 5 6 7 8 9 10 11
7S2 1.25 3.5 6.14 Plate 991 1015 1531 71 991 CC7S2/2 1.75 785 � 1025 75 785 CC7S2/c3 0.75 1323 1195 2352 129 1195 CS7S4 1.25 3.5 6.14 Plate 1021 1124 1580 75 1021 CC7S4/2 0.75 1413 1285 2695 111 1285 CS7S4/c3 1.0 1167 1182 1975 73 1167 CC/CS7S6 1.0 4.2 6.06 Plate 1519 1606 2333 81 1519 CC7S6/2 1.25 1314 1530 1867 82 1314 CC7S6/c3 0.75 1871 1743 3185 105 1743 CS8S2 2.25 4.7 5.74 Plate 797 – 990 66 797 CC8S2/c2 1.25 1248 1256 1825 62 1248 CC/CS8S2/c3 0.75 1624 1516 3084 117 1516 CS8S4 1.75 4.7 5.74 Plate 1084 – 1332 71 1084 CC8S4/2 1.0 1485 1480 2366 66 1480 CS/CC8S6 1.75 4.7 5.80 Plate 1140 – 1371 78 1140 CC8S6/c2 1.0 1622 1697 2452 75 1622 CC8D4 1.25 4.7 5.74 Plate 2040 2295 2675 89 2040 CC8D4/2 1.25 89 2040 CC10S2A 1.25 3.9 5.89 Plate 682 660 1052 51 660 CS/CC10S2B 1.75 565 601 741 46 565 CC10S4A 1.0 5.89 Plate 817 738 1450 62 738 CS10S4B 1.25 682 701 1110 43 682 CC/CS11S4 1.0 4.0 5.81 Plate 2838 3157 – 319 2838 CC
a CC: compression zone crushing, CS: compression zone shear, FS: flexural shear. Beam notation: 7S2 — series 7, single plate, 2 mm platebefore addition of Expamet; 8D4/2 — series 8, double plates, 4 mm, secondary test on undamaged section of previously tested beam (c: cut sectionfrom previously tested beam).
plate, and 0.5 mm for the two layers of crack controlweld mesh.
The critical section considered is shown in Fig. 2 andthe forces which keep the section in equilibrium areshown in Fig. 3, where Pc is the compressive forceacross the compression zone, Vc is the shear force acrossthe compression zone, St is the principal tensile forceperpendicular to the failure plane, Vd is the shear forceacross the main reinforcement, Pst is the tensile force inthe main reinforcement, Pu is the ultimate capacity ofthe beam, a� is the effective shear span, xs is the depthof the compression zone and a is the angle of shear fail-ure plane. Other quantities shown in the figure are thegeometric parameters for the beam.
Applying equilibrium to the critical section shown inFig. 3, we can write the following equations.
Vertical equilibrium:
Pu
2�St cos a�Vc�Vd (1)
Horizontal equilibrium:
Pc�St sin a�Pst (2)
Moment equilibrium, taking moments about thenotional hinge ‘O’:
Pua�
2�Pc0.5xs�Pst(d�xs)�Stz1�Vd� d−xs
tan a� (3)
Eqs. (1)–(3) define the overall equilibrium of the sectionand contain eight unknowns, Pc, Pst, Pu, St, Vc, Vd, xs
and a. In order to determine all of the unknown para-meters other relationships between the parameters mustbe defined.
4.2.1. Displacement compatibility of the shear panelIt is assumed that the overall deformation of the shear
span may be represented by the shear deformation of the

1073N.K. Subedi, P.S. Baglin / Engineering Structures 23 (2001) 1068–1079
panel and the extension of the tension bars. Compati-bility is based on the stiffness of the web immediatelyprior to completion of the shear failure mechanism.Therefore, the tensile strains in the panel can be rep-resented by the tensile strains in the steel plate.
The relationship between the diagonal tensile strain inthe plate and the tensile strain in the tension bars canthen be established. Referring to Fig. 4, dt represents thedeformation of the tensile diagonal of the plate and dhmay be assigned as the deformation of the main tensionbars. The relationship between dt and dh can beexpressed by:
dh�dt cos a (4)
Assuming that the strains are approximately proportionalto the extensions,
est/ept�dh/dt
Therefore,
est�ept cos a (5)
where est is the tensile strain in the main tension bars,corresponding to deformation dh and ept is the tensilestrain in the plate, corresponding to plate deformationdt. Therefore, the corresponding forces are given by:
Pst�St cos aAstEs
b1tp�db−xs
sin a�Ep
(6)
Fig. 4. Compatibility of panel deformation. (a) Panel deformation;(b) enlargened view of extension.
where b1 is a factor allowing for the strain distributionin the web along the shear crack. From experimentalmeasurements the strain profile for the plate along thefailure plane was approximately parabolic. Therefore,for b1 a value of 0.67 is considered appropriate.
Eq. (6) gives the relationship between the forces Pst,St, and the inclination of the failure plane, a. It shouldbe noted that the value of the web tension force, St,depends on whether the web is concrete controlled (Eq.(15)) or plate controlled (Eq. (17)).
4.2.2. Contributing forcesIt was stated earlier that the final stages of failure in
diagonal splitting are characterised by failure of the com-pression zone. This occurs with crushing of the concreteeither at the limiting compression force or splitting ofthe concrete at the limiting shear value. The limitingvalues for the compression zone forces are Pc(max) andVc(max).
(a) Stress state under the load. The biaxial stress stateunder the load must be considered when calculating theultimate limit state for the compression zone. Thestresses acting on an element along the failure plane areshown in Fig. 5, these stresses are assumed to be aver-aged over the depth of the compression zone. The mini-mum stress has been found to be close to zero, themaximum permissible stress (s1) is therefore limited tofcu. Assuming that s1=fcu and s2=0, then from Mohr’scircle the stress state at 0.5xs can be calculated, Fig. 5.
sv�Pu−Vc
2(b+tp(mp−1))(b1+xs)(7)
sh�fcu�sv (8)
2q�cos−1sh−sv
fcu(9)
t�fcu
2sin 2q (10)
Fig. 5. Stress state under the load.

1074 N.K. Subedi, P.S. Baglin / Engineering Structures 23 (2001) 1068–1079
(b) Compression zone limit, Pc(max). In calculatingPc(max) contributions from both the plate and the com-pression bars are included. The stress distribution underthe load is assumed to be rectangular over the full depthand the reinforcing bars are assumed to be fully effectiveif xs�d�. Therefore, Pc(max)=contributions from concrete,plate and rebar
Pc(max)�sh(xsb)�tp(fyp�sh)(xs�da)�Asc(fyc�sh) (11)
(c) Compression zone shear limit, Vc(max). In calculat-ing Vc(max) it is assumed that the concrete is critical.Therefore, using a transformed ‘all concrete section’with a rectangular stress distribution over the full depth,Vc(max)=contributions from concrete, plate and rebar
Vc(max)�t(bxs�tp(xs�da)(mp�1)�Asc(msc�1)) (12)
(d) Shear across tension reinforcement, Vd. It isassumed that the cover is insufficient to allow full dowelaction to develop. Therefore, a nominal value equivalentto the transformed concrete area is used.
Vs�fctmstAst (13)
(e) Failure angle, a.
a�tan−1�h−xs
a� � but not less than 30° (14)
(f) Web tension force, St. The control of the webbehaviour depends on the relative tensile capacity, of theconcrete–plate composite section and the plate, at thetensile splitting limit of the concrete. A biaxial stresssystem exists in the web within the shear span of a beam.The limiting tensile strength of concrete under a state ofbiaxial stress is ftc. Within the range of beams tested herethe value of ftc was found to be very close to the valueof fct given by CEB-FIP [6], where:
fct�1.4(0.008fcu)2/3
(i) Concrete controlled: web tension force, St: tpfyp�ftc(b+tp(mp�1)). If the tensile capacity of the plate is lessthan the capacity of the composite section at the limitingtensile strength of the concrete, then the web is said tobe concrete controlled. In this situation, formation of thediagonal splitting crack will cause a reduction in the ten-sile capacity of the web. The change in panel stiffnesscauses a redistribution of the forces within the web, withadditional load being transferred to the main bars andcompression zone. The tensile stress profile for the ‘con-crete controlled’ case is shown in Fig. 6. In Fig. 6 thetheoretical stress distribution, for the composite section,along the inclined failure plane is assumed to be para-
Fig. 6. Concrete controlled section.
bolic as suggested by the experimental strain profile inthe plate. Therefore, the average tensile stress, whichoccurs over the shear diagonal will be b1ftc.
For the concrete controlled mechanism St is given by:
St�ftcb1(b�tp(mp�1))�d−xs
sin a� (15)
where ftc is the tensile limit of the concrete under thebiaxial stress state of the web, and b1 is the strain distri-bution factor 0.67. The term ftcb1(b+tp(mp�1)) representsthe average force per unit length, p1 in Fig. 6, along thefailure plane for a ‘concrete controlled’ case.
The moment lever arm is given by:
Z1�d−xs
2 sin a(16)
(ii) Plate controlled: web tension force, St: tpfyp�ftc(b+tp(mp�1)). If the tensile capacity of the plate isgreater than the capacity of the composite section at thelimiting tensile strength of the concrete, then the web issaid to be plate controlled. In this situation formation ofthe diagonal splitting crack in the concrete causes atransfer of the tensile forces from the concrete to theplate. The plate is then assumed to carry all of the tensilestresses developed by the shear action. The tensile stressprofile for the ‘plate controlled’ case is shown in Fig. 7.In Fig, 7 the theoretical stress distribution in the steelplate along the failure plane consists of two parts: f1 isthe force per unit length along the diagonal, due to thenormal (axial) load (composite state), and f2 is theadditional force per unit length along the diagonal, trans-ferred from the concrete section after the formation ofthe shear crack (plate carrying the total force).
For the plate controlled mechanism, St is given by:
St�fyptp�db−xs
sin a�
Z2
2 � (17)

1075N.K. Subedi, P.S. Baglin / Engineering Structures 23 (2001) 1068–1079
Fig. 7. Plate controlled section: stress profile and forces along fail-ure plane.
The term fyptp represents the force per unit length, p1 inFig. 7, along the failure plane for a ‘plate controlled’case.
It is assumed that in the ‘plate controlled’ case, fullyield strength can only develop if the plate has sufficientanchorage perpendicular to the failure plane. Therefore,full yield strength develops only in the plate above theanchorage development length. The full anchoragedevelopment length, Z2, is determined by applying straincompatibility. Prior to tensile crack formation the con-crete carries a proportion of the tensile force, f2 (per unitlength). After cracking, this force must also be carriedby the plate and must be transferred via plate anchorage.
At the ultimate capacity of the plate,
f2�fyptp
b−tp
b+tp(mp−1)
The force over the length Z2 is given by (Fig. 8(a)):
fyptpb−tp
b+tp(mp−1)Z2
2
The plate anchorage capacity is ftcb2 times the areaswiped by the minimum length of the plate for each face.Therefore, at position Z2, the anchorage force is givenby (Fig. 8(b)):
2�12Z2Z2 tan afctb2�
where b2 is the effective area of the plate anchorage(void area/total area).
The two expressions for the force are:
Z2�b−tp
b+tp(mp−1)tpfyp
b22fct tan a(18)
The moment lever arm is given by:
Fig. 8. Derivation of parameter Z2. (a) Variation of f2; (b) Plateanchorage area.
Z1�d−xs
2 sin a�
Z2
4(19)
4.2.3. Summary of equationsEight independent equations representing the relation-
ships between the eight unknown parameters identifiedearlier are (1), (2), (3), (6), [(11) and (12)], (13), (14)and [(15) and (17)]. These equations can be used toidentify the mode of failure and to calculate the ultimateload for any configuration of an encased-plate beam.
5. Limit state capacity
An iterative solution procedure for calculating the ulti-mate load capacity is shown in Fig. 9. In order to deter-mine the ultimate capacity the web control mechanismmust be known. In this study all of the specimens werefound to be ‘plate controlled’ satisfying the criteriontpfyp�ftc(b+tp(mp�1)) for step 1. Once the web control

1076 N.K. Subedi, P.S. Baglin / Engineering Structures 23 (2001) 1068–1079
mechanism is determined the iteration is started byassuming the first parameter, a neutral axis depth, x. Theremaining steps are then followed, as detailed for thefailure mechanisms, until the decision box is reached.The most important question here is whether the failureis due to the crushing of concrete in the compressionzone (reaching the limit, Pc(max)) or by the shear mech-anism (reaching the limit Vc(max)). The results are givenin Table 1.
(a) Compression zone crushing (case 1). The com-pression zone crushing mechanism is completedwhen the compression force Pc reaches the con-crete compressive stress limit under the biaxialstress state Pc(max) calculated using Eq. (11).
(b) Compression zone shear (case 2). The com-pression zone shear mechanism is completedwhen the shear force Vc reaches the shear limitof the concrete under the biaxial stress stateVc(max) calculated using Eq. (12).
In Fig. 10, for beam 7S6, the variations of Pc(max) andVc(max) for various values of x are shown. For this beam,the failure is completed by the crushing of concrete inthe compression zone, reaching the limit Pc(max) at avalue of x=81 mm. The iterated value of x is compatiblewith the equations. The value of Pu is 1519 kN (Fig. 10).
(c) Flexural shear (case 3). The flexural shearmechanism is initiated with the yielding oranchorage failure of the main steel at the baseof the shear crack near one of the supports. Thecapacity is calculated by setting Pst equal to therebar limit (step 6) and following the solutionprocedure shown in Fig. 9 for case 1.
Fig. 9. Equilibrium limits for plate controlled failure of beam 7S6.
Fig. 10. Flow chart for analysis.
6. Capacity checks
Local capacity checks are required to prevent prema-ture and undesirable failure of the section. The require-ments of these checks are outlined here. Full details canbe found in Ref. [1].
6.1. Plate anchorage capacity
The ability of the plate to maintain composite actionunder loading, is an important consideration for the safedesign of encased-plate beams. Anchorage failure causesan explosive collapse of the section, with no visiblewarning of the imminent failure. The plate anchoragecapacity check must contain a sufficient factor of safetyto ensure that this type of failure cannot, under normalcircumstances, occur. Heavy plates increase the anchor-age requirement and are therefore more likely to sufferplate anchorage failure.

1077N.K. Subedi, P.S. Baglin / Engineering Structures 23 (2001) 1068–1079
The anchorage capacity is limited by the mechanicalanchorage of the Expamet grid and should be greaterthan the tensile force developed along the shear planeSt. The mechanical anchorage is derived from the ridgesof the Expamet trying to pull off the surrounding con-crete. This interface bond is limited by the tensilestrength of the concrete, fct, acting on the ridges of theExpamet. The anchorage capacity of the plate isassessed by:
Panch�2Apb2fct (20)
where Ap is the minimum area of the plate to one sideof the shear diagonal, fct is the tensile strength of con-crete, and b2 is a factor defined as the percentage ofconcrete area required to split in tension to allow failureof the interface (the area of concrete in the Expametgaps). (Apb2) defines the area of concrete providinganchorage to the plate.
6.2. Bearing capacity
Deep beams with patch loads are subjected to largebearing forces at the loads and supports; these must belimited to prevent local crushing. Values of 0.6fcu at endsupports without anchor plates and 0.8fcu for internalsupports and end supports with anchor plates are sug-gested as being suitable for encased-plate design.
6.3. Buckling-stability check
Buckling of the slender plate causes peeling of theconcrete cover, loss of composite action, and prematurefailure of the section. Failure due to plate instability isexplosive with little warning of imminent collapse.
Transverse moments can be induced by eccentricityin the applied load, caused by misalignment of the platewithin the beam, or misalignment between the load andthe support. Additional lateral deflections are alsoinduced by the compressive component of the load.
In calculating the plate stability limits, constructiontolerances must be fully appreciated.
For conciseness, detailed results from the plateanchorage, bearing and buckling stability checks are notpresented here. This is a separate subject for later publi-cation.
7. Results
7.1. Local failure mechanisms
Although none of the experimental specimens showedsigns of plate anchorage failure and all of the theoreticalcapacities showed a factor of safety in excess of 1.00,six of the specimens had a factor of safety against plateanchorage failure of less than 1.25. For design, the factor
of safety should ensure that plate anchorage failure doesnot occur even in an overload situation.
On four occasions, the design bearing capacity wasexceeded by 22–69%. None of the tests showed anysigns of bearing failure and the bearing limit is thereforeconsidered safe. Further tests will be needed if a lessconservative approach is required.
Examining beam 11S4 during the test, it was observedthat the error in vertical alignment increased during load-ing to 10 mm, double the specified construction toler-ance. Calculating the plate stability limit, using theobserved construction tolerance, yields a theoreticalbuckling load of 2300 kN [1]. This is 95% of the experi-mental failure load (2433 kN) and confirms the behav-iour observed in the test. The conclusion is that the poorshuttering of beam 11S4 initiated plate buckling, whichin turn led to failure of the section.
7.2. Analytical method
The results from the proposed analysis are shown inTable 1. Limits are given for each of the failure mech-anisms. It can be seen that all of the sections were platecontrolled, with the 2 mm plates being at the lowerbound of plate control behaviour. In plate controlled sec-tions, when local failures are prevented, the majority offailures will be caused by compression zone crushing.
A comparison of the results from the analyticalmethod and experimental test specimens are shown inTable 2. There is a good correlation between the analyti-cal and experimental results.
The values from Table 2 have been plotted againstshear span depth ratios and are shown in Fig. 11. Thetrend indicates that the effect of the shear span depthratio on the capacity of the section is not fully accountedfor in the analysis. However, examination of the resultsin Table 2 show that variations, within a beam arrange-ment, are typically less than 5%.
The results have also been plotted against the averageshear stress in Fig. 12. The analytical method shows nosigns of divergence at the high shear stresses producedby EPC, the values of which are far in excess of theupper limits imposed by all current reinforced concretedesign codes.
The analytical method clearly shows a high degree ofaccuracy over the range of tests examined. This analyti-cally derived method is considered to account for all ofthe main parameters affecting the shear capacity of thesection. The distribution of the experimental results, ana-lysed in this work, shows only the nominal variationexpected from the material behaviour. However, in orderto determine fully the confidence limits of the analysis,the method needs to be verified against a much largerdata sample.

1078 N.K. Subedi, P.S. Baglin / Engineering Structures 23 (2001) 1068–1079
Table 2Comparison of resultsa
Beam ref. no. Experimental results Analytical method
a/d Ultimate Failure mode Flexural capacity Shear capacity Theoretical ComparisonUltimate Col 7/col 3
(kN) (kN) (kN) (kN)1 2 3 4 5 6 7 8
7S2 1.25 1118 D/S 1197 991 991 0.887S2/2 1.75 902 F/S 860 785 785 0.877S2/c3 0.75 1373 S/C 2002 1195 1195 0.907S4 1.25 1196 D/S 1262 1021 1021 0.857S4/2 0.75 1609 S/C 2120 1285 1285 0.827S4/c3 1.0 1413 D/S 1587 1167 1167 0.837S6 1.0 1668 S/C 1907 1519 1519 0.917S6/2 1.25 1491 D/S 1517 1314 1314 0.887S6/c3 0.75 1952 S/C 2548 1743 1743 0.898S2 2.25 844 Flex 791 797 791 0.948S2/c2 1.25 1138 D/S 1395 1248 1248 1.108S2/c3 0.75 1550 S/C 2343 1516 1516 0.988S4 1.75 1167 F/S 1071 1084 1071 0.928S4/2 1.0 1609 S/C 1845 1480 1480 0.928S6 1.75 1256 F/S 1146 1140 0.918S6/c2 1.0 1756 S/C 1974 1622 1622 0.928D4 1.25 2119 F/S 2032 2040 2032 0.968D4/2 1.25 2237 F/S 2032 2040 2032 0.9110S2A 1.25 640 D/S 799 660 660 1.0310S2B 1.75 530 F/S 573 565 565 1.0710S4A 1.0 893 S/C 1048 738 738 0.8310S4B 1.25 775 D/S 836 682 682 0.8811S4 1.0 2433 P/B 3245 2838 2838 0.95b
Average 0.922SD 0.071
a Bold type represents predicted flexural failures.b Plate buckling limit.
Fig. 11. Ultimate capacity predictions — shear span depth ratio.
8. Summary and conclusions
This paper describes an analytical tool for the designof plate reinforced short span beams. A series of experi-mental tests were conducted over a range of configur-
Fig. 12. Ulitmate capacity predictions — average shear stress.
ations. The data recorded from these tests was used tovalidate the proposed analytical method.
The following conclusions may be drawn:
1. The failure modes of plate reinforced concrete beams
1079N.K. Subedi, P.S. Baglin / Engineering Structures 23 (2001) 1068–1079
are characterised by the formation of tension splittingshear cracks (diagonal splitting shear failure). The fol-lowing failure mechanisms have been identified:flexural shear, compression zone crushing, com-pression zone shear.
2. An analytical method, based on the equilibrium offorces along the critical failure plane and on compati-bility, has been proposed. This method includes:
(a) identification of the web control mechanism;(b) identification of the failure mechanism;(c) a prediction of the effect of all geometrical andmaterial properties controlling the shear capacity ofthe section.
3. The analysis yields results that closely reflect thebehaviour observed in the experimental beams overthe full range of variables so far tested. The meanvalue of the predicted/measured ultimate load is 0.93with a standard deviation of 7.1%.
4. For safe design, control limits must be imposed toprevent premature and undesirable failure of the sec-tion. Limits are imposed to control bearing stress,plate stability, and plate anchorage.
Acknowledgements
The work described in this paper was supported by agrant from the Engineering and Physical SciencesResearch Council (EPSRC), UK. This is gratefullyacknowledged.
References
[1] Baglin PS. Plate reinforcement for shear — the analysis, design,and detailing of reinforced concrete beams. PhD Thesis, Universityof Dundee, 1998.
[2] Subedi NK. Reinforced concrete beams with plate reinforcementfor shear. In: Proceedings of ICE, Part 2, Sept, 1989:377–99.
[3] Subedi NK, Baglin PS. Plate reinforced concrete beams — experi-mental work. Engng Struct 1999;21(3):232–54.
[4] Subedi NK. Reinforced concrete deep beams: a method of analy-sis. In: Proceedings of ICE, Part 2, March, 1988:1–29.
[5] BSI. British Standards, BS 8110. Structural use of concrete, part1: code of practice for design and construction, and part 2: codeof practice for special circumstances, 1985.
[6] CEB. CEB-FIP model code 1990. Thomas Telford, London, 1993.