Uinta County: A Case Study in Wyoming Land Use Planning
152
Community-Based Social Marketing: Involvement in Health Programs ........... 1 Frank L Farmer, Leslie L. Clarke, Joan D. Flocks , Carol A. Bryant, Camilla S. Romund, and Stan L. Albrecht Building Capacity for Community Efficacy for Economic Development in Mississippi ................................................................................................. 19 Domenico Parisi, Steven M. Grice, Michael Taquino, and Duane A. Gill Ecosystem Restoration as Community Economic Development? An Assessment of the Possibilities ............................................................... 39 Michael Hibbard and Kristen Karle Sponsorship of Community Leadership Development Programs: What Constitutes an Ideal Partnership? ........................................................ 61 Mitchell R. Williams and Vickey M. Wade Community Development and Environmental Quality: Benefits and Challenges Using a Service Learning Model for University Engagement ..... 72 Wendy A. Kellogg Uinta County: A Case Study in Wyoming Land Use Planning ...................... 91 Katherine Inman, Donald M. McLeod, and Roger H. Coupal Collaboration, New Generation Cooperatives and Local Development ...... 112 Norman Walzer and Christopher D. Merrett TABLE OF CONTENTS Vol. 33 No. 2 2002 Research on Community Development Practice
Transcript of Uinta County: A Case Study in Wyoming Land Use Planning
Community-Based Social Marketing: Involvement in Health Programs ........... 1
Frank L Farmer, Leslie L. Clarke, Joan D. Flocks , Carol A. Bryant,Camilla S. Romund, and Stan L. Albrecht
Building Capacity for Community Efficacy for Economic Developmentin Mississippi ................................................................................................. 19
Domenico Parisi, Steven M. Grice, Michael Taquino, andDuane A. Gill
Ecosystem Restoration as Community Economic Development?An Assessment of the Possibilities ............................................................... 39
Michael Hibbard and Kristen Karle
Sponsorship of Community Leadership Development Programs:What Constitutes an Ideal Partnership? ........................................................ 61
Mitchell R. Williams and Vickey M. Wade
Community Development and Environmental Quality: Benefits andChallenges Using a Service Learning Model for University Engagement ..... 72
Wendy A. Kellogg
Uinta County: A Case Study in Wyoming Land Use Planning ...................... 91
Katherine Inman, Donald M. McLeod, and Roger H. Coupal
Collaboration, New Generation Cooperatives and Local Development ......112
Norman Walzer and Christopher D. Merrett
TABLE OF CONTENTSVol. 33 No. 2 2002
Research on Community Development Practice

Book Reviews
Cradle to Cradle: Remaking the Way We Make Thingsby William McDonough and Michael Braungart ...................................136
Reviewed by Karri Winn, Institute for EnvironmentalEntrepreneurship-New College, San Francisco, CA
Microenterprise Development for Better Health Outcomesby Rosalia Rodriguez-Garcia, James A. Macinko, and William F. Waters ... 137
Reviewed by Christine Daugherty, Charleston, West Virginia
Greenbelt, Maryland: A Living Legacy of the New Dealby Cathy D. Knepper .............................................................................139
Reviewed by Roberta W. Walsh, Florida Gulf Coast University
Water Follies: Groundwater Pumping and the Fate of America’s Fresh Waterby Robert Glennon .................................................................................141
Reviewed by Stephen P. Gasteyer, Rural CommunityAssistance Program, Washington, DC
Collaboration: What Makes It Work by Paul W. Mattessich, Marta Murray-Close, and Barbara R. Monsey ...144
Reviewed by Frank Antonucci, Illinois Institute for RuralAffairs, Western Illinois University, Macomb, Il.

© 2002, The Community Development Society
EDITOR’S COMMENTS
Special Theme: Research on Community Development Practice
This issue includes a set of papers that share the theme of research oncommunity development practice. It is fitting that this second issue of theJournal of the Community Development Society under my editorship has thisfocus, following the first Special Issue on Community Development Theory thatwas nurtured under the special editorship of Ron Hustedde. My vision is thatthe purpose of the Journal is to contribute to both building the theoreticalframework of community development and to researching and evaluating thepractice of community development. Over the next few years, I intend to continueto encourage papers on both the theory and practice of community development,especially around key themes that define our field.
The papers in this issue were not specially solicited for their contributionto the theme of research on community development practice, but they happenedto all be ready to publish at the same time and they all had this common focus.All the articles were strong research articles looking at community developmentpractices in communities. However, I asked some of the authors to draw out andexpand on the community development implications and actions at the core oftheir article, and I appreciate the willingness of the authors to do so.
Each of the excellent articles in this issue of the Journal report on researchthat demonstrates the contribution of different community development practices.The seven articles use very different research methodologies, and their statisticalsophistication covers a wide range as well. However, the practices studied inthis issue are at the core of the set of tools used by community developers tohelp make communities better places.
Farmer and his colleagues looked at social marketing as a strategy forcommunity change in health organizations in Arkansas. Parisi and his colleaguesconstructed an innovative research program looking at the role of the impact ofbuilding community capacity and community efficacy for economic development.Hibbard and Karle examine community problem-solving capacity as a role ineffective ecosystem restoration projects. Williams and Wade studied leadershipdevelopment programs through university partnerships. Kellogg also showshow universities can contribute through a service-learning model. Inman,McCloud and Coupal examine growth management strategies and their role inmanaging urbanization in rural areas. Finally, Walzer and Merrett looks at NewGeneration Cooperatives, which are business ventures in which producers investin a local commodity processing businesses. These articles evaluate and assessa multitude of different strategies and organizational methods that are used insome communities, and each article contributes to the research on what worksand what does not work when community developers help communities reachtheir goals.
Journal of the Community Development Society
The practices of community development that are represented in thesearticles do not constitute a full vision of the toolbox of practical skills thatcommunity developers have and are honing. Over the next few years, I lookforward to more articles that will push forward our knowledge of the effectivenessand potential of community development practice in rural and urban communities.
In closing, I would like to thank all those who have contributed to makingthe Journal possible by preparing, submitting, reviewing, and re-reviewing themany manuscripts submitted to us. As we go to press with this volume, we havereceived over 86 manuscripts, far more than we ever anticipated. Our gratitudegoes to the following reviewers:
Steve AignerDon AlbrechtBill AshtonJanet Ayres*Frank Barry*Howell Baum*Roger BeckTerry Besser*Jnan BhattacharyyaRobert BlairEdward Blakely*Audie BlevinsTimothy BorichLisa BourkeRachel Bratt*Ralph Brown*James Calvin*Dave CampbellLee CaryDan ChekkiCarol ColferKenneth DahlbergJohn Daley*Willard DelavanMary DomahidyMike DoughertyDel DyerMary EmeryJerry Endres
Gail FeenstraDon FieldEmmet FiskeJan FloraCornelia FloraCharlie FrenchThomas GauntStephen GoetzWillis Goudy*Jim GrieshopJohn GruidlWilliam HaasJim HacklerDebra HarleyWilliam HarrisStacy HarwoodPeggy HickmanFrank Higdon*Lilian HillDaryl HobbsBeth Honadle*Allen MooreBrian MullerLee MunnichDavid NeuendorfStuart Huntington*Ron HusteddePatresse IngramSteve Jeanetta
Bernie Jones*Jim KellyJuliet KingJim KingDonald KleinDavid LamieSteve LarrickLarry LeistritzRaymond Lenzi*Theresa LinsDoris LittrellMilton LopesScott LoveridgeAl LuloffPatricia MaloneDeb MaroisDiane McLaughlinArt Mehrhoff*Daniel MillerDavid MillsJanet MoenMark NordRobert OgilvieDuane OlsenDomenico ParisiMark Peterson*Kenneth Pigg*Ron PowersBrian Raison
Dixie RayLaura ReeseNorman ReidMargaret ReidVickie RightmyreJerry Robinson*Boyd RossingVern RyanMark SettleRon ShafferJeff SharpMary Simon-Leuci*Charles St. ClairJudith StallmanDaniela StehlikJason TescherJames ThompsonMarilyn TrailJerry WadeRoberta Walsh*Norman Walzer*Mildred Warner*Rob WeinerKelvin WilloughbyKarri WinnMike Woods*Joan Wright*
* Reviewed two or more manuscripts

COMMUNITY-BASED SOCIALMARKETING:
INVOLVEMENT IN HEALTHPROGRAMS
By Frank L Farmer, Leslie L. Clarke,Joan D. Flocks, Carol A. Bryant,
Camilla S. Romund, and Stan L. Albrecht
Journal of the Community Development Society Vol. 33 No. 2 2002
© 2002, The Community Development Society
Frank L Farmer, Ph.D., is a Professor of Rural Sociology at the University of Arkansas. Leslie L. Clarke, Ph.D.,is an Associate Professor at the University of Florida. Joan D. Flocks, J.D., is a Research Assistant Professor atthe University of Florida. Carol A. Bryant, Ph.D. is a Professor at the University of South Florida. Camilla S.Romund, M.A. is a Technical Editor at the University of Arkansas. Stan L. Albrecht, Ph.D. is Vice President andProvost at the Utah State University.
Correspondence should be directed to Frank L Farmer, 118 HOEC Bldg., University of Arkansas, Fayetteville,AR 72701. Tel: (479) 575-2358. Email: [email protected].
ABSTRACT
Social marketing is a strategy that uses marketing approaches developed within the businessarena to design, implement, and evaluate socially beneficial programs. This approach can bean effective social change strategy for groups working in the profession of communitydevelopment. This paper describes two community-based projects that employed socialmarketing to design and implement interventions to promote health in Arkansas andFlorida. We describe the stages of the research, as well as the limitations and strengths of thisapproach.
Keywords: community-based social marketing, community services, health
INTRODUCTION
Within the world of domestic and international commerce, the principlesand practices of business marketing have proven to be powerful in maximizingprofit by creating or increasing consumer demand for goods and services andreducing the real or perceived costs of these goods and services. While productmarketing is integral to the world of business, social marketing, the applicationof marketing approaches to non-business enterprises, such as communitydevelopment efforts, is not so widespread.1 Social marketing is now in a rapidgrowth phase, with several textbooks, a peer review journal, two conferences,and numerous social marketing institutions now available to assist programplanners in using this powerful approach to social change (Andreasen, 2002).
Social marketing is a “…process that promotes the voluntary behaviorof target audiences by offering benefits they want, reducing barriers they areconcerned about, and using persuasion to motivate their participation in program
2 Journal of the Community Development Society
activity” (Kotler & Roberto, 1989, p. 24). While the majority of efforts in socialmarketing has emerged from origins, impetus, and application at policy andprogrammatic points outside the local community (Middlestadt et al., 1997), aheightening awareness of the importance of including locality in a process of“community-based social marketing” is gaining currency among researchersand practitioners alike (cf. Israel et al., 1994; Middlestadt et al.,1997; Tyson &Colter 1999).
A community-based approach to social marketing can be seen as theintegration of the basic ideas of community development within a marketingframework. It is founded on the premise that local citizens can be activeparticipants in the process. Practitioners and academic researchers work withcommunity members to adapt marketing tools to design effective strategies forchange. Through this collaborative participation and the resulting increasedunderstanding, community members and groups may gain the capacity to addressother issues germane to community well being (Brown & Vega, 1996; Bryant etal., 2000; Andreasen, 1995). Thus, community-based social marketing is anadaptation and integration of the concepts that drive marketing, as well as thosethat drive community development processes. As defined by Wilkinson (1989,p. 247), community development is a “process by which local people, actingtogether for their own common good, develop the capacity to direct andcoordinate the use that is made of their labor and other resources.” Community-based projects can facilitate community development not only by assuring thecentral roles of community members, but also by implementing a process thatextends community capacity and/or community resources.
This article provides a description of two very different community-based projects that, to varying degrees, have applied social marketing andinvolved citizens in the development and implementation of community healthinterventions. Each project is described within a social marketing context. Thesetwo case studies are intended to contribute to the idea that communityinvolvement enhances the social marketing process. Specifically, the manuscriptextends the traditional application of social marketing techniques to include theinvolvement of local communities to promote the process of improving the wellbeing of citizens.
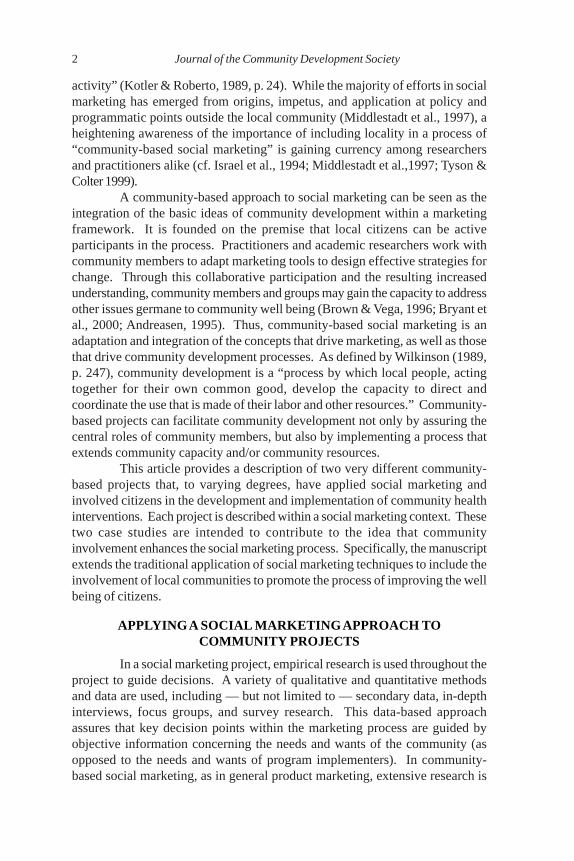
APPLYING A SOCIAL MARKETING APPROACH TOCOMMUNITY PROJECTS
In a social marketing project, empirical research is used throughout theproject to guide decisions. A variety of qualitative and quantitative methodsand data are used, including — but not limited to — secondary data, in-depthinterviews, focus groups, and survey research. This data-based approachassures that key decision points within the marketing process are guided byobjective information concerning the needs and wants of the community (asopposed to the needs and wants of program implementers). In community-based social marketing, as in general product marketing, extensive research is

Farmer, Clarke, Flocks, Bryant, Romund, and Albrecht 3
completed to understand needs and wants of the target population and tounderstand the barriers preventing this population from satisfying these needsor wants.2 The results of this research are then used to build the foundation forthe project: the marketing plan. This plan is based on marketing’s “four Ps,” or“4P’s,” approach: product, price, placement, and promotion.
The four P’s are simple alliterative devices that allow a systematicapproach to the planning and implementation of social marketing. Productrepresents behavior, beliefs, information, or services that the target group isasked to accept. Price refers to the cost (e.g. financial, social, material, physical,and/or psychological) imposed in exchange for product acceptance or adoption.Placement is concerned with the channels of distribution employed in makingthe product accessible for use by the target group. Promotion refers to thestrategies and efforts used to convey the desired message to the target population.These four elements of the marketing mix are used to describe and promotecommunity-based projects. As summarized in Table 1, the 4P’s serve as a guideto the basic process of social marketing and require the careful consideration ofthe various internal elements of each of these dimensions.
Table 1: The 4P’s in Community-Based Social Marketing
s'P4 noitpircseD snoitseuQtnatropmIemoS
tcudorP roroivaheb,ecivres,sdoogehTdetomorpgniebmargorp
rosdeens'noitalupoptegratehtfohcihW?llifluftcudorpehtseodstnaw
cificepsehtteemotderoliattcudorpehtsI?noitalupoptegrat/ytinummocehtfosdeen
ecirPtegratehtot)s(tsocehT
ehtgniniatboninoitalupopstifenebs'tcudorp
?devlovnistsocyratenomtceriderA
nidevlovnistsocyratenom-nonerehterA?)cte,levart,emit(noitapicitrap
)cteslebal,samgits(stsoclaicoserehterA?devlovni
otdecnalabebstsocsuoiravesehtnacwoH?ssenevitceffemargorperussa
tnemecalP
ehtfonoitubirtsidfolennahcehT)s(msinahcemehT.tcudorp
elbignat,secivresgnirussanoitamrofnidetalerdnastcudorp
tegratehtybdeviecerera.noitalupop
noitubirtsidevitceffetsomehtsitahW?msinahcem
lacisyhpevitceffetsomehteraerehWfoesacehtni(noitubirtsidrofsnoitacol
?)sdooglairetam
noitomorPnidevlovniseitivitcafoximehTnoisausrepdnanoitacinummoc.ecneiduategratehtnodesucof
noitacinummocfomuidemtsebehtsitahW?)yticilbup,gnisitrevda,tcatnoclanosrep(
etairporppa/evitceffetsomehtsitahW?noitacinummocehtfotnetnoc
-esuotaidemevitceffetsomehteratahW?tenretnI,slairetamtnirp,aidemssam

4 Journal of the Community Development Society
In Table 1, there are number of questions that are quickly suggested bythe 4P’s framework. Furthermore, each of the components of the frameworkholds the potential for involving community members. The role of the communityis that of collaborator in the development, implementation, and evaluation of theproject. This collaborative arrangement between the outside group (university,governmental agencies, nonprofit organizations, etc.) and community membersis increasingly recognized as beneficial in a wide range of settings and problemareas (c.f. Nichols et al., 2000; Arcury et al., 2000; Padilla et al., 1999). At eachstage of the social marketing process, community members are engaged, andthey contribute to the overall design and implementation. The ability of thecommunity members to contribute is likely to vary dramatically, and the processholds the potential for training citizens and thus increasing the capacity of thecommunity as a whole.
The two projects presented here as case studies in this paper wereselected because they focus on different types of health problems addressed bycommunity groups working in collaboration with “outside” agents. One projectaddresses a region-wide issue affecting all low-income children and their accessto health care, and the other addresses a more narrowly defined population ofagricultural workers who are exposed to pesticides at the worksite. In the firstproject, the community-based marketing approach is used extensively to determinethe cost and placement of an insurance product; and community members helpto shape these factors. In the second project, community members select theintervention and collect data for the project. They work with academic andsocial marketing partners to shape the marketing plan and to assure that theintervention will have a significant impact on worker behavior and safety. Thesediscussions, by investigators involved with these projects, focus more on theprocess of applying the social marketing principles and the stages in solvingcommunity health problems, and less on the details of the individual projects.
TWO PROJECTS: ARKANSAS AND FLORIDA
I. THE ARKANSAS PROJECT: DEVELOPMENT, IMPLEMENTATION, AND
ANALYSIS OF A COMMUNITY-BASED PREVENTIVE CARE HEALTH
INSURANCE AND DELIVERY PROGRAM
The Lower Mississippi Delta Region of the United States is marked bychronic, excessive poverty, and lack of opportunity for many residents. Becauseof the conditions within the Delta, there is considerable evidence that the healthof the rural Delta population is poorer than much of the population of the UnitedStates. Indeed, the mortality profile of the region indicates substantially highermortality rates at all points in the life-range compared to those of the nation(Farmer, 1990). One reason for the levels of ill health in the rural Delta is the lackof access to basic health care. While there are numerous barriers to appropriatehealth care in this region (cf. Farmer, 1992), most important has been the lack of

Farmer, Clarke, Flocks, Bryant, Romund, and Albrecht 5
health insurance coverage for a substantial segment of the population. The lackof coverage is the result of (a) public insurance (Medicaid) income cutoffs; and(b) prevalence of agriculture and light manufacturing, two industrial sectors thatgenerally do not provide health insurance as an employment benefit. Thus,there is a substantial population, sometimes referred to as the working poor,within the region with incomes sufficient to preclude eligibility for public healthinsurance, but insufficient to afford private coverage.
Between 1992 and 1998, a Housing and Urban Development fundedproject titled, The Development, Implementation and Analysis of a Community-Based Preventive Care Health Insurance and Delivery Program, delivered apreventive health program and publicly subsidized a health insurance productto eligible residents in two rural communities in the Lower Mississippi DeltaRegion of Arkansas. The project was directed by the Rural Sociology programat the University of Arkansas in collaboration with the Department of Pediatrics,University of Arkansas,Medical Sciences, and the two local Delta communities.
Typical of community development projects, social marketing effortsbegin by gaining insight into the clients and understanding their needs. Theselection of specific sites for the insurance project was based onrepresentativeness (in terms of the potential for future expansion of the programto the broader region), needs, rural location, willingness of community leadershipand members to participate, availability of care, income levels, and studentpopulation. A team composed of health care professionals, social and behavioralscientists, social workers, physicians, and community leaders was charged withguiding the needs assessment and formulating an appropriate health-care benefitpackage that would conform to the project’s goals. During the needs assessment(and subsequent health surveys), numerous child health problems and areas ofconcern were identified by community leaders, participants and their families,health-care providers, and school personnel in the project locales. The result ofthe needs assessment and problem identification process demonstrated theidentification of the need for preventive health care and a program of healtheducation.
Methods
The formative and evaluative research integral to the project includedacademic researchers, actuarial and community partners, and an array ofapproaches. These are outlined below.
Key Informant Interviews. In the earliest phase of the project, localcommunity members were engaged in needs assessment. Through a series ofcommunity site visits and the use of “snowball” sampling, key informants wereidentified who were willing to provide opinions and insights into communityneeds. In a series of semi-structured interviews, and eventually group meetings,local parents, mayors, teachers, school nurses, and religious leaders aided indeveloping the product by designing educational outreach, formulating
6 Journal of the Community Development Society
community-based health screenings, and designing methods to monitor andidentify eligible children who lacked health-care benefits. Additionally, throughthis process, the need for a community health education program was identifiedand integrated into the project.
Actuarial Analysis. As part of the formative research, the projectconducted a formal actuarial analysis. The schools were used uniquely as “riskpools” to develop an insurance plan because they were located in communitiescharacterized by low income, low education, and high minority populations.Generally available actuarial data were deemed inadequate for even the crudestestimates of the cost of a tailored insurance product. Thus, the project engagedan actuarial firm to develop these preliminary estimates from secondary data.
Surveys. As a component of both the process and outcome evaluationof the project, survey instruments were designed to address the health careneeds and perceptions of the parents of the school children. Local citizens weretrained in survey administration, and local teachers were engaged in the datacollection process. Given the rural nature of the population and the high degreeof illiteracy within the sample, the local community members played a crucial rolein the successful administration of the survey. Additionally, student surveyswere developed and administered at the school sites with the cooperation oflocal teachers and school administrators.
Participant Observation. As a part of the process evaluation of theproject, a team member spent extended periods in each community observingthe development of the project. Using a full disclosure approach and a series ofstructured and unstructured interviews with community members involved inthe project, the researcher gathered information to refine the operation of theproject.
Using the data derived from this array of sources, the project developedand implemented a unique school-based health insurance effort in the twocommunities. Additionally, the project team developed and implementedcommunity-based health education and outreach programs. The communitieswere engaged as full participants. They actively integrated the project intoongoing efforts to address problems of ill health in the communities. Thefollowing information describes the project in terms of the Product, Price, Place,and Promotion efforts.
Product. There are two interrelated project products: child healthinsurance and community health awareness. Regarding health insurance, thisproject is unique because the insurance risk pool was established through theschools. Children exhibit a unique set of health care needs and, thereby, representa unique risk pool in that many health risks prevalent in the general populationare not so common in the child pool. Thus, an insurance product was developedthat encouraged use of regular and preventive type services. It coveredimmunizations, well-child check-ups, sick visits, diagnostic services, emergencyaccident care, emergency medical care, hospitalization, and prescription services.3

Farmer, Clarke, Flocks, Bryant, Romund, and Albrecht 7
After offering the initial product, parent and adolescent health surveys,community health screenings, and community task force interaction (see below)yielded information on oral health conditions and vision deficits in the clientpopulation. Thus, the health insurance product was developed. Data wasgathered with respect to the degree that the product met the consumer’s needs,and, based on this data, the product was modified. Specifically, the product wasrestructured to include coverage for optical and dental care.
Significantly, collaborating with community partners demonstrated theneed to identify health awareness programs and to supplement the healthinsurance coverage. Among other things, the communities identified the needfor nutrition education, AIDS awareness, and drug abuse. Additionally, bothcommunities identified the need for greater awareness of the use of preventivehealth measures (not only the availability of health care, but also suchpreventative measures as anti-smoking/tobacco campaigns, four-wheeler safety,etc.)
Price. Based on information from key informant surveys and othersecondary data, it was concluded that because the target segment was extremelyprice sensitive,4 the project would provide preventive care insurance to as largea group as possible at no monetary cost to the parent or guardian of the children.This pricing policy was also extended to prescription drugs. Other costs identifiedby community partners were the social costs, e.g., stigma attached to “being onwelfare,” the costs of certain types of care unavailable in rural areas andtransportation. While it is beyond the scope of the current article to detail eacheffort made to minimize each of these barriers, it is important to note that in all thecases the local community and the project collaborated in creating solutions tominimize the identified cost barrier impact on the program participants. Similarly,the cost(s) of participation in the community health awareness programs wasminimized by using central locations, convenient times, and, in general, providingcost-free services.
Placement. As noted at the outset, this community-based projectused public schools as the grouping mechanism and site for creating the riskpool. However, the project teams quickly decided that the schools were also thelogical location for student and family recruitment, program enrollment,promotion, and health education. The schools thus served as not only as theconceptual base (risk pool development) for the program but also as theoperational base for promotion and implementation of the effort within thecommunity. While the vast majority of the activities took place in the schoolsetting, the project also engaged the local clergy and the community church asa location for increasing program awareness. Health awareness programs wereconducted in the schools and at the town centers as well.
Promotion. This component of marketing faced three fundamentalchallenges: (1) to identify and enroll eligible children; (2) to encourage use ofbenefits; and (3) to increase community awareness of the benefits of preventive

8 Journal of the Community Development Society
care. The recruitment/enrollment promotional effort engaged public healthclinicians, school personnel, and local clergy. Community partners made surethat the enrollment drives were coordinated with the local academic scheduleand that difficult-to-reach segments were contacted and made aware of theexistence of the program. Given the rural nature of the communities, the highlevel of illiteracy, and a general distrust of “outsiders,” the involvement of schooladministrators, teachers, nurses, and local church leaders was central to theplanning and implementation of the enrollment drives. The second effort wasneeded because many enrollees had no previous insurance coverage; they werenot “in the habit” of seeking preventive health services. School nurses, schoolstaff, teachers, administrators, and the clergy began the promotional campaignendorsing health services. They produced a stream of printed and verbalreminders, flyers, announcements, various forms of electronic media, andcommunity-wide events advertising health education. The general lack of locallyavailable health services required the team to direct efforts toward facilitatingaccess to health care. Physicians came from other areas to conduct school-wide“Early Periodic Screening, Diagnosis, and Testing” that screened the childrenand assessed the health care needs that might be addressed in a restructuredinsurance product (see above). The project provided transportation of thestudents to health care facilities outside of the community. This entailedproviding the vehicle, subcontracting the driver, coordinating with school officialsfor school absences, and scheduling with the physicians and dentists outsidethe communities.
To address the health awareness needs, community-based task forceswere formed. These task forces were composed of local leaders, mayors, schoolsuperintendents, business owners and operators, school nurses, social serviceagency and medical leaders, parents, and project members. Each task forceplanned and conducted community-based health fairs, education programs, andexhibitions. These community-specific programs brought health care providers,as well as health educators and educational programs, to the communities. Giventhat they originated at the local level, the fairs and programs were tailored to thespecific needs of each community.5 Furthermore, services such as flu shots,glucose monitoring, eye examinations, and blood pressure checks were offeredto community members (beyond school-aged children). Community healthexhibitions were promoted through local media, flyers, announcements in schoolsand churches, and the city council.
Summary
The Arkansas project used fundamental marketing ideas and activecommunity participation to develop and implement a campaign that provided aunique health insurance package to upwards of 625 children over a period of sixyears. Community members were actively engaged in the development andimplementation stages. Additionally, community members were actively involved
Farmer, Clarke, Flocks, Bryant, Romund, and Albrecht 9
in collecting and compiling data used in the evaluation phase of the project. Theinvolvement of the community served to enhance understanding of thecommunity (by community members and university partners alike), as well as toincrease understanding of the complexities of developing and implementingprograms.
II. THE FLORIDA PROJECT: TOGETHER FOR AGRICULTURAL SAFETY – ACOMMUNITY-BASED APPROACH TO PROTECTING AGRICULTURAL
WORKERS FROM PESTICIDES
Agricultural workers suffer from poorer health than the generalpopulation (Moses, 1989) and many adverse health problems linked to theiroccupational and socioeconomic status. Poverty forces many agriculturalworkers to live in substandard, unsanitary, and overcrowded housing (Wilk,1986) that can lead to the spread of bacterial and viral diseases. Agriculturalworkers have no access to adequate health care because they lack insurance,the ability to take time off from work, adequate financial resources, and for manythe skills to communicate in English (Lantz et al., 1994). Workplace conditionscan also contribute to poor health. For example, agricultural workers routinelyexperience dermal, oral, and respiratory contact with pesticides that can be harmfulto human health.
The safety guidelines for agricultural workers recommend that theytake precautions to remove pesticides from skin and clothing. It is recommendedthat workers wash their hands before they eat, drink, smoke, or use the bathroomduring the workday. However, it is not always possible for workers to followthese precautions. In central Florida ferneries, workers face extreme timeconstraints because they are often paid a piece rate (a fixed amount per unitproduced), and if they take time to wash before every incidence of hand-to-mouth contact, they may lose wages. Furthermore, many agricultural workersreport a lack accessible hand-washing facilities at their worksites (Ciesielski etal., 1994).
To address these problems, a community and university collaborationformed the Together for Agricultural Safety/Unidos para la Seguridad Agricola/Tet Ansanm pou Sekirite Agrikilti (TAS) project. The project drew in staffmembers from the Farmworker Association of Florida (FWAF); health scienceresearchers from the University of Florida (UF); and social marketing consultantsfrom Best Start, Inc., a nonprofit, social marketing firm.
The TAS project is a community-based prevention/interventionresearch project funded by the National Institute of Environmental HealthSciences (NIEHS). The goals of the project are to establish three interventions:(1) to develop and implement a health intervention program based on communityparticipation; (2) to reduce the potential health risks associated with pesticideexposure; and (3) to create monitoring and evaluation of the major process,outcomes, and cost components.
10 Journal of the Community Development Society
The project targeted fernery and nursery workers in five central Floridacounties. Similar to all agricultural workers, these workers are regularly exposedto pesticides at the worksite. However, nursery and fernery workers migrate lessoften than workers in other agricultural industries, and the FWAF has a historyof involvement with these communities, factors that provided for better accessand follow-up for the project.
Methods
The project team began with a problem. Community meetings andfocus groups were held to gather information, focusing on the routes of pesticideexposure and the reasons why workers did not avoid pesticide exposure at theworkplace more frequently. Findings described multiple barriers preventing theimplementation of basic safety practices, such as hand-washing, at the worksite.Barriers preventing workers from this washing their hands more frequentlyincluded beliefs about the efficiency of washing, access to washing facilities,and potential loss of wages.
Once the team members identified hand-washing as the target behavior,additional formative research was undertaken with employers, supervisors, andworkers to determine product, pricing, placement, and promotion strategies mosteffective in promoting this safety practice.
Focus Groups. Focus groups were conducted in Spanish or HaitianCreole, with workers to help the team understand the worker knowledge, beliefs,and attitudes about hand-washing and other safety practices. The data summarywas examined to develop planning models that identified health behaviors thatcould be targeted for intervention. Based on the results of the focus groups, theteam conducted three sets of interviews in order to assess further the frequencyof, and correlations between, various beliefs, norms, and safety behaviors.
Health Care Provider Interviews. First, the team conducted interviewswith health care providers to understand the type and prevalence of pesticide-related illnesses among workers, as well as to understand the extent of providers’knowledge and experience in recognizing, managing, and reporting pesticide-related illnesses.
Worker Surveys. Next, the team surveyed a random sample ofagricultural workers to assess further the knowledge, perceived benefits andcosts, and other factors effecting hand-washing and other safety practices. Thesurvey included questions that addressed the costs, benefits, and results ofimplementing health practices; the factors that would make it easy for workers toimplement a health practice; and other questions that the team needed in orderto segment workers, based on characteristics related to their current beliefs orpractices. Community members were involved in developing the surveyinstrument, conducting interviews, and summarizing and analyzing findings.
Employer/Supervisor Interviews. The analysis and results of the workersurveys suggested the need to implement the third set of interviews with

Farmer, Clarke, Flocks, Bryant, Romund, and Albrecht 11
employers and supervisors to collect comparable information on safety practicecosts, benefits, perceptions, and outcomes among those who control access tosuch safety practices. The team developed a structured interview, drawing onresults from focus groups conducted with workers, and conducted interviewswith fernery and nursery employers and supervisors.
Research results were used to segment the population based on acombination of historical, social, demographic, and attitudinal factors thatinfluence responsiveness to marketing interventions. There were three segmentsof workers: Hispanic fernery workers, Hispanic nursery workers, and Haitiannursery workers. The intervention campaign was geared toward workers whoare aware of the importance of hand-washing at the worksite, but do not orcannot wash at the important workday intervals.
Secondary audiences were identified through the focus groups andinterviews and were found to have a major impact on worker behavior. Forexample, data showed that workers who believed that co-workers were washingtheir hands frequently or that supervisors thought hand-washing was importantwere more likely to wash their hands at certain intervals during the workday.
Product. Qualitative research identified numerous behaviors that couldbe promoted to minimize pesticide exposure. Of these, hand-washing behaviorwas selected as the primary “product” to be promoted for several reasons. First,it is a key protective behavior that is malleable and generally accepted asimportant by owners and workers. The responsibility for practicing good hand-washing at the worksite does not fall solely on one group, but it is distributedamong owners, supervisors, workers, and even health care providers. Thus, theproduct should be important to all audiences.
Because lack of access to hand-washing facilities was found to be akey barrier, the team developed a mobile hand-washing station that is inexpensiveand easy-to-use. The design of the station was based on worker and supervisorrecommendations gathered during focus groups and field-testing of prototypestations. An educational and information campaign, tailored for each group, isalso part of the product.
Price. A significant cost of the hand-washing intervention for theworkers is the potential for lost time and wages. However, the team believed thatif hand-washing stations are located next to the site where workers are cutting,this potential cost to the worker could be lowered. Benefits of using the stationwill be promoted through an education and informational campaign.
Placement. In addition to the placement of the hand-washing tank, itwas also important to identify places where workers would notice messagesabout pesticides. Through worker interviews and focus groups, the team learnedthat nursery workers read the signs posted by time clocks and on break roombulletin boards. They also determined that community locations such as ethnicgrocery stores, credit unions, and other retail outlets that workers frequentwould be effective avenues for educational messages. Finally, they chose day

12 Journal of the Community Development Society
care centers and health clinics as placement sites because these locations havecontextual importance for certain messages about decontamination and workerhealth. Workers should be particularly careful to wash after work before touchingtheir children; and they should also discuss their occupation and potentialexposure-related symptoms with their health care providers.
Promotion. For the intervention to be successful, employers,supervisors, regulators, health care providers, day care providers, and workersmust work together to promote hand-washing. Employers and supervisors mustbe convinced to use, and possibly purchase, the hand-washing station.Supervisors must be convinced to take time from their busy schedules to fill thetank, replace soap and paper towels, and take the tank into the fields whennecessary. Workers must be motivated to use the equipment. Health careproviders need to recommend hand-washing and other safety practices as wellas to identify and treat pesticide-related problems. Because they play a mutuallyreinforcing role in the overall success of the project, careful coordination isrequired to reach and maintain the motivation of each group. Regulators, daycare workers, and health care providers can also reinforce the messages toemployers, supervisors, and workers that the endeavor is worthwhile.Promotional techniques must be multilateral, carefully organized, and timed.
Examples of strategic recommendations for promoting hand-washingthrough these spokespersons include four courses of action: (1) developing atraining program for supervisors that teaches the benefits of hand-washing; (2)disseminating research findings to employers, supervisors, workers, and theirfamily members through the popular media; (3) forging partnerships with manyorganizations and health care providers; and (4) developing a Health CareProvider’s information kit to assist providers with the diagnosis, management,and treatment of pesticide-related illness and to help them teach their patientsways to minimize their exposure risk.
Program Implementation and Evaluation
As a community-based project, it is important that the community hasearly knowledge of, and access to, the data. Therefore, an important first step inthe intervention was the presentation of the research findings and the socialmarketing plan to the project advisory boards. Project advisory boards, forexample, were informed early so they could help guide the process. Stateregulatory agencies and institutions, as well as professional associations werealso informed. Educational materials will be distributed through health careproviders, supervisors, media outlets, and other information channels.
The intervention was in the communities during the spring of 2003 toobtain final input on the social marketing campaign. Implementation of the fullintervention will follow. Evaluation data will be collected throughout the projectintervention period to measure changes in worker beliefs and behaviors regarding

Farmer, Clarke, Flocks, Bryant, Romund, and Albrecht 13
hand-washing. The project is using a quasi-experimental design to assess theimpact of the intervention. Specifically, it will compare post-intervention attitudeand behavior changes in the outcomes of interest to pre-intervention measures.The outcomes of interest include farm owner and supervisor attitudes and beliefsabout hand-washing and the hand-washing intervention; the incidence of skinrashes; lost work time due to skin rashes and other pesticide-related illnesses;and worker knowledge of the importance of hand-washing.
Summary
Although the project team members initially had little empiricalinformation on how social marketing would work with non-native, agriculturalworker populations, they believed that a community-based social marketingapproach would effectively integrate both community and academic researcherneeds in the design of an effective intervention for workers. The particularprocess used was time- and labor-intensive because it involved all partners in allphases of data collection and interpretation, behavior selection, and interventiondevelopment. However, the extra effort has paid off in several ways.
Community members are now trained in implementing virtually all stagesof the social marketing campaign and have been involved in all stages of theproject (Flocks et al., 2001). This collaborative process, therefore, has helped toexpand community capacity for research and problem solving. Throughcollaborative participation, community members and groups gain more powerover social and tangible resources. Together, the TAS partners have becomemore active and effective in promoting healthy behaviors and obtaining improvedconditions for agricultural workers.
CONCLUSIONS
The two projects described in this paper implemented community-basedsocial marketing approaches to address two different health issues — healthinsurance for low-income families and occupational exposure to harmful pesticides.While the actual implementation at the community level differed for each, bothprojects used social marketing ideas to guide development, implementation, andanalysis of the respective products. The projects worked closely with communitymembers to define the problem, understand the needs of the population, anddevelop solutions tailored to the local circumstance.
Several lessons can be extracted from the two cases described above:
! Social marketing concepts can be applied readily to communitydevelopment projects.
! Community involvement increases the probability of success.
! Community involvement represents an opportunity forsubstantive growth in community capacity.

14 Journal of the Community Development Society
! Community involvement in all stages of the social marketingprocess (c.f. 4P’s) results in a program/project that is morefinely tailored to the individual community.
! Community involvement in smaller communities is moredifficult largely because of “cost of sparsity.”
Community-based social marketing adds a dimension to social marketingthat takes complete control of activities from the hands of “outside” agents andrequires collaboration between community members and outside participants.With community-based research, local partners contribute “unique strengthsand shared responsibilities to enhance understanding of a given phenomenonand the social and cultural dynamics of the community” (Israel et al., 1998, p.177). Further, knowledge gained is acted upon to improve the health and wellbeing of community members. Community-based research holds the promise ofleading to improved community development and empowerment throughengaging community members in the process of change, from analyzing theproblem to developing grass-roots solutions.
Community development is facilitated when a project includescommunity involvement, as the Arkansas project did with the task groups anddata collection, and as the Florida project did with the FWAF staff and communitymembers. Training in techniques of data collection, for example, extends theknowledge and skills of community members to gather information on their owncommunity. This gives community members control of the skill and of theinformation, once obtained. This activity also improves community capacity asthese skills are retained after funding may cease, and these data-collection skillscan be used for a variety of community purposes.
Participants in community-based work also extend their social capacitiesin the community through increased knowledge of research and communityneeds. The more community members are trained and provided opportunities tolearn new skills, the greater the gains to community capacity. The skills learnedthrough social marketing projects may help community members use data towrite grants and to facilitate inter-agency solutions to social problems (Flockset al., 2001).
Although social marketing remains in its formative stages as a sub-discipline and approach, it represents a promising avenue for addressing anarray of community challenges. The idea of community engagement is a goal ofthe community-based social marketing approach and serves as a mechanism toachieve success in efforts to develop responses to challenges faced by localcommunities. Morse (1998) has identified five key elements in creating asuccessful community: increasing civic dialogue, finding new ways to organizecommunity work, making community life accessible to all, creating new avenuesfor leadership, and focusing on the future. Community-based social marketingcan be seen as an approach for building the capacity of local communities toachieve these ideals.
Farmer, Clarke, Flocks, Bryant, Romund, and Albrecht 15
Several points are crucial to understanding the involvement ofcommunity members in social marketing efforts. First, it is necessary to recognizethat each community is unique and represents a unique social and demographicorganization that serves to structure social interaction in the given locale. Thismeans that when engaging a community in social marketing efforts, a wide arrayof non-project issues will likely arise. For example, power structures within acommunity will often dictate the extent and nature of the involvement ofindividuals and groups of individuals. While there often is a stated ideal ofcommunity empowerment, this idea often does not take into account the extantpower structures that exist within a given community. Community empowermentis often, in fact, empowerment of a small group of community members who donot represent the community and do not distribute the knowledge of resourcesequitably to the community.
A second and related point is the nature of rural communities, in general,and impoverished rural communities, specifically. In many rural communities,there is a social cost of population sparsity (cf. Kraenzel, 1980) and this sparsitylimits the amount of involvement in social programming within the community.For example, participation on community health task forces entails meeting fororganizational and planning purposes, coordination of internal and externalresources, actual implementation of tasks, and evaluation of the results of efforts.The simple fact is that many communities lack the critical mass of individuals toengage in extensive community development efforts. Often in rural communities,those who are involved are the people who have the time to be involved, whilethe majority of community members do not have time to attend planning meetingsor participate directly in program activities. These are challenges that face ruralcommunity development in general and rural community-based health promotionspecifically.
Regardless of the approaches used, a key strategy of these efforts is tocollaborate with community members and to provide knowledge that will enhancecommunity capacity. A number of national and international health organizationshave recognized the importance of empowering people so they may improvetheir health condition. In response, government agencies and private foundationshave directed significant resources to projects that delegate the control ofresources to the community. That having been said, more research anddevelopment is needed to determine which aspects of community-based socialmarketing are most effective and most sustainable in the long term. Unfortunately,the science of measuring community capacity is quite young and the measurementimprecise. Often such measurement requires longitudinal funding, which agenciesoften are not interested in providing after the intervention is completed. However,to advance the value and impact of this work, the science should continue to bedeveloped, and community-based projects should be rigorous in collecting thetype of information that will help other communities document the value ofcommunity-based work. Campaigns to institute social marketing help to assurethe collection of data by providing a framework for it.

16 Journal of the Community Development Society
NOTES
1. Despite being discussed and variously applied for more than forty years, socialmarketing has been recently described as “remain(ing) in its infancy” (Goldberg, Fishbein,and Middlestat 1997:ix). For an example of some early thinking on the issue of socialmarketing, see Lazerfeld and Merton (1949).
2. In community based social marketing projects, community members work withacademic and other professional researchers to identify data needs, availability, andappropriate collection and analytic strategies. Research results at virtually all stages of themarketing process, from the planning to the outcomes assessment, are used to develop,evaluate, and modify the project strategy.
3. This package of services was then submitted to the State Health insurance board forapproval. Upon approval, a bid was solicited from the major insurance carriers nationally.Because of this process, a final insurance product was developed which provided the aboveservices but with maximum caps being imposed. These caps were a result of concerns withinthe insurance industry about exposure. This uncertainty was a result of having a unique riskpool located in a “high risk” region. This capping of exposure allowed the offering of theinsurance product to the entirety of the target segment and mollified concerns of the healthinsurance carrier. As part of late negotiations for this third-party coverage, a “no profit”clause was inserted.
4. As one anonymous reviewer points out, a central thrust in the early phases ofmarket research is the determination of market demand and price for any product or service.As the reviewer points out, public services may be seen as a market failure (service is notprovided) because of inability to pay by individuals and the inability of firms to capture areasonable profit. This is certainly evident in the health insurance case where interventionwas required to meet the demand (need) for care.
5. For example, one community identified hunting safety as a need and thereforebrought in Department of Wildlife personnel to do hunting and gun safety programs. Thiswas offered along with health education program services such as flu shots, glucosemonitoring, eye examinations and blood pressure checks to community members (beyondthe school-aged children).
REFERENCES
Andreasen, A. 2002. Foreword. Pp. xi-xii in Kotler, Roberto, & Lee. Social Marketing:Strategies for Changing Public Behavior. Thousand Oaks: Sage Publications, Inc.
Andreasen, A. 1995. Marketing Social Change. San Francisco, CA: Jossey-Bass Publishers.
Acrury, T., S. Quandt, & L. McCauley. 2000. Farmworkers and pesticides: Community-based research. Environmental Health Perspectives 20(8):787-792.
Bracht, N., L. Kingsbury, & C. Rissel. 1999. A five-stage community organization model forhealth promotion: Empowerment and partnership strategies. Pp. 83-104 in N.Bracht (ed.), Health Promotion at the Community Level 2. Thousand Oaks, CA:Sage Publications.
Brown, L. & W. Vega. 1996. A protocol for community-based research. American Journalof Preventive Medicine 12(4):4-5.
Bryant, C.A., M.S. Forthofer, K.R. McCormack Brown, D.C. Landis, & R.J. McDermott.2000. Community-based prevention marketing: The next steps in disseminatingbehavior change. American Journal of Health Behavior 24(1):61-68.
Ciesielski, S., L.P. Loomis, S.R. Mims, & A. Auer. 1994. Pesticide exposures,cholinestersase depression and symptoms among North Carolina migrantfarmworkers. American Journal of Public Health 84(3):446-451.
Farmer, Clarke, Flocks, Bryant, Romund, and Albrecht 17
Farmer, F. 1992. Improved Health Insurance Coverage: Necessary But Not SufficientCondition for Meeting the Health Care Needs of the Rural Population. Testimonyand prepared statement presented before the United States Senate Hearings onHealth Care Reform. Committee on Small Business.
Farmer, F. 1990. A Mortality Profile for the Lower Mississippi Delta Region. Final Reportsubmitted to the Lower Mississippi Delta Commission.
Flocks, J., L. Clarke, S. Albrecht, C. Bryant, P. Monaghan, & H. Baker. 2001.Implementing a community-based social marketing project to improveagricultural worker health. Environmental Health Perspective 109(supplement3):461-468.
Goldberg, M., M. Fishbein, & S.E. Middlestadt (eds). 1997. Social Marketing: Theoretical andPractical Perspectives. Mahwah, New Jersey: Lawrence Erlbaum Associates, Inc.
Israel, B., A. Schulz, E. Parker, & A. Becker. 1998. Review of community-based research:Assessing partnership approaches to improve public health. Annual Revue ofPublic Health 19: 173-202.
Israel, B., B. Checkoway, A. Schulz, & M. Zimmerman. 1994. Health education andcommunity empowerment: Conceptualizing and measure perceptions ofindividual, organizational, and community control. Health Education Quarterly21(2): 149-170.
Kotler, P., & E. Roberto. 1989. Social Marketing: Strategies for Changing PublicBehavior. New York: The Free Press.
Kraenzel, C. 1980. The Social Cost of Space in Yonland. Bozeman, MT: Big Sky Press.
Lantz, P.M., L. Dupuis, D. Reding, M. Krauska, & K. Lappe. 1994. Peer discussions ofcancer among Hispanic migrant farm workers. Public Health Reports109(4):512-520.
Lazarfeld, P., & R. Merton. 1949. Mass communication, popular taste and organized socialaction. Pp. 459-480 in W. Schramm (ed.), Mass Communication. Urbana:University of Illinois Press.
Middlestadt, S., C. Schechter, J. Peyton, & B. Tjugum. 1997. Community involvement inhealth planning: Lessons learned from practicing social marketing in a context ofcommunity control, participation, and ownership. In M.E. Goldberg, M. Fishbein,and S.E. Middlestadt (eds.), Social Marketing: Theoretical and PracticalPerspectives. Mahwah, New Jersey: Lawrence Erlbaum Associates, Inc.
Morse, S. 1998. Five building blocks for successful communities. Pp. 229-36 in F.Haesslebein, M. Goldsdsmith, R. Beckhard, and R. Schubert (eds.), The Communityof the Future. Drucker Foundation Future Series. San Fransico: Jossey-Bass.
Moses, M. 1989. Pesticide-related health problems and farmworkers. AmericanAssociation of Occupational Health Nursing 37(3):115-136.
Nichols, W., K. Bird, & S. Garcia. 2000. Community-based research and its application tosea turtle conservation in Bahia Magdalena, BSC, Mexico. Marine TurtleNewsletter 89: 4-7.
Padilla, Y., L. Lien, & M. Cruz. 1999. Community-based research in policy planning: A casestudy addressing poverty in the Texas-Mexico border region. CommunityPractice 6(3): 1-22.
Tyson, B., & R. Coulter. 1999. Marketing enlightened self-interest: A model of individualand community-oriented motivations. Social Marketing Quarterly 5(1): 34-49.

18 Journal of the Community Development Society
Wilk, V.A. 1986. The Occupational Health of Migrant and Seasonal Farmworkers in theUnited States. The Farmworker Justice Fund, Inc.: Washington, D.C.
Wilkinson, K. 1989. Community development and industrial policy. Research in RuralSociology and Development 4: 241-254.

BUILDING CAPACITY FORCOMMUNITY EFFICACY
FOR ECONOMIC DEVELOPMENTIN MISSISSIPPI
By Domenico Parisi, Steven Michael Grice,Michael Taquino, and Duane A. Gill
Journal of the Community Development Society Vol. 33 No. 2 2002
© 2002, The Community Development Society
Department of Sociology, Anthropology, and Social Work and Social Science Research Center, Mississippi StateUniversity, Starkville, Mississippi 39762.
Communication should be directed to Domenico Parisi, Social Science Research Center, PO Box 5287, MississippiState University, MS 39762. Phone: 662-325-8065; email: [email protected].
The core support for this research came from the Research Office of Mississippi State University. The project wasalso supported by the Mississippi Agricultural and Forestry Experiment Station (Project No. MIS-605080), andthe Mississippi State University Social Science Research Center.
ABSTRACT
In the present political environment, there is an interest in developing policies aimed atbuilding capacity for community efficacy: the ability of a local population to come togetherand act collectively in pursuit of a generalized interest. In this study, we examine the extentto which variation in local conditions might account for variation in community efficacy foreconomic development in Mississippi. Drawing on multiple sources of data, the resultsclearly indicated that capacity for community efficacy rested on four major characteristics:(1) community social capital; (2) local civic physical infrastructure; (3) human andeconomic characteristics; and (4) community spatial characteristics.
Keywords: civic physical infrastructure, community efficacy, humanand economic characteristics, key informants, social capital, spatialscale
INTRODUCTION
In the present political environment there is an interest in developingpolicies aimed at building capacity for community efficacy: the ability of a localpopulation to come together and act collectively in pursuit of a generalizedinterest. The philosophical justification for this new orientation is simple: if acommunity is able to act on its own, it is better able to promote its interests innegotiations with the outside world (Shuman, 2000; Wilkinson, 2000). Put simply,under macro social, economic, and political forces, community efficacy is centralto maintaining and enhancing individual and collective well-being in a localpopulation (Green & Haines, 2002; Littrell & Hobbs, 1989; Luloff & Swanson,1995; Putnam, 1993; Young, 1999). In this view, community efficacy is a qualitynecessary for a community to engage in viable and sustainable economic

20 Journal of the Community Development Society
development over time (Flora & Flora, 1993; Shuman, 2000; Swanson, 2001;Wilkinson, 2000).
Although building capacity for community efficacy has become a widelyaccepted strategy in community development initiatives, there are two questionsopen for consideration. First, how can it be determined if a community has thecapacity to act on its own? Second, how can it be determined if a community isactively involved in its own development? An answer to these questions requiresan analysis that links local conditions to the ability of a community to engage inlocally-oriented actions. This is both a theoretical and methodological issuethat has received limited attention.
Conceptually, Wilkinson (2000) provides a comprehensive theory forunderstanding how members of a local population, along with local economic,social, and political institutions, can come together to act collectively toward ageneralized interest. According to his theory, collective efforts rest primarily onsocial resources, commonly known as social capital (Putnam, 2000). The literaturealso indicates that the capacity to come together and act collectively rests notonly on social capital, but also on other local features. For example, somecommunity scholars have indicated that locally-owned businesses and localmeeting places are necessary structural conditions for the promotion of processesof civic engagement (Green & Haines, 2002; Oldenburg, 1999; Putnam, 2000;Tolbert, Lyson, & Irwin, 1998; Tolbert et al., 2001; Tolbert et al., 2002), and othershave stressed the importance of local human, economic, and spatial conditions(Duncan, 1999; Luloff & Swanson, 1995; Wilkinson, 2000). Although the literaturehas acknowledged the importance of each of these local factors in determiningcapacity for community efficacy, it has failed to incorporate these factors into asingle conceptual and empirical model for cross-comparative analysis. This is amajor limitation in the field of community development research because there isno well-defined methodology for measuring and comparing differences incommunity efficacy.
In the sections that follow, we first provide a theoretical basis for definingcommunity efficacy. Second, we provide a general description of four localfeatures that can help define local capacity for community efficacy. Third, wepresent a key-informant methodology for measuring community efficacy for thepurpose of conducting a cross-comparative analysis. Fourth, the results of amultivariate analysis are presented. Our analysis is based on sub-county unitsin Mississippi and focuses on determining capacity for community efficacytoward local economic development. Finally, a discussion on how to encouragecommunity efficacy for community development is presented.
Defining Community Efficacy
We argue that a community possesses the quality of community efficacywhen its members can engage in locally-oriented collective actions throughopen and inclusive processes of interaction within and between social groups.

Parisi, Grice, Taquino, and Gill 21
Within processes of interaction can be referred to as social fields (Wilkinson,2000). These social processes take place within community groups, such asfaith-based organizations, civic interest groups, and economic and politicalorganizations. Processes of interaction within social groups enable participantsto develop similar interests about local issues. When different interests expressedthrough social fields converge, overlap, and are coordinated, actors engage inlocally-oriented processes of interaction that lead to the emergence of communityfield (Wilkinson, 2000). Within this framework, community efficacy embodiesthree general qualities: (1) the principal actors and beneficiaries are local residents;(2) the goals represent local interests; and (3) the action is public, as opposed toprivate, in the sense that beneficiaries include others besides the actors(Wilkinson, 1970, pp. 56-57).
In this study, we aim to explore the extent that capacity for communityefficacy is based on four major features of a local population: (1) social capital,(2) community civic infrastructure, (3) human and economic characteristics, and(4) spatial scale.
Social Capital
Social capital is a social resource that fosters processes of interactionwithin and between social groups (Lin, 2001), and it is understood to meannorms, trust, and reciprocity that facilitate coordination and cooperation formutual benefit (Putnam, 1993). This social resource is embedded in the socialrelations between and among “actors,” such as individuals, organizations, andinstitutions (Bourdieu, 1986; Coleman, 1988; Flora, 1998; Flora & Flora, 1993;Putnam, 2000; Portes & Sensenbrenner, 1993). Because social capital can beaccessed only through social connections, the extent to which actors can engagein collective efforts is contingent upon the quantity and the quality of socialconnections. Quantity refers to the number of actors involved in social relations(Bourdieu, 1986), and quality refers to the intensity of reciprocal exchangesbetween and among actors (Coleman, 1988; Coleman, 1990).
The mechanism by which social capital leads to the emergence ofcollective efforts rests on two general conditions (Coleman, 1988). First, actorsin a local population must be self-motivated to engage in collective efforts.Second, actors must engage in reciprocal exchange with others with respect toachieving a common goal. Coleman (1990) indicates that social capital leads tocollective efforts only when both of these conditions can be met. Within thisframework, self-motivation and reciprocal exchange among actors in a localpopulation can be viewed as key social factors relevant for determining capacityfor community efficacy.
Community Civic Infrastructure
For community efficacy to emerge, community members need placeswhere they can meet and discuss local issues. Such places constitute what we
22 Journal of the Community Development Society
refer to as the community civic physical infrastructure. Because suchinfrastructure can facilitate the emergence of open and inclusive processes ofinteraction toward the development of a generalized interest, it can be viewed asan important local feature for determining capacity for community efficacy.
Locally-owned businesses can facilitate the emergence of collectiveefforts in three important ways. The first is that owners, managers, and workersinteract in a more informal and friendly manner. The second is that the hiringprocess often occurs through word of mouth. The third is that the businessesare called upon to actively participate in community decision processes (Tolbertet al., 2002, pp. 93). These three qualities lead to the development of socialrelations that help channel processes of interaction toward a generalized interest.
Another important feature that can facilitate processes of interaction ina local population is the presence of meeting places (Tolbert et al., 2002). Theseare places where people can come together to discuss local issues, and they canbe planned and unplanned (Gieryn, 2000). Examples of planned places are malls,squares, and city parks. On the other hand, barbershops, coffee shops,convenience stores, and the like are examples of unplanned places, commonlyknown as “third places” (Oldenburg, 1999).
In addition to these places, community-based organizations, such ascivic and religious organizations, are important for bringing people together (Green& Haines, 2002; Putnam, 2000). In this respect, Wilkinson (2000) argues that localchurches are important places where people can meet and discuss local issues.
Human and Economic Characteristics
A local population with limited human resources (e.g., education) andeconomic resources (e.g., employment and income) is less likely to engage inlocally-oriented social processes toward a generalized interest. This can be bestunderstood within the context of the hierarchy of human needs. Individuals thatlive on the social and economic margins place greater emphasis on meetingbasic material needs, and thus higher levels of needs, such as investment insocial relations outside immediate groups, are less likely to be satisfied. Failureto be integrated into the social life of a community leads to fragmentation, anomie,and alienation (Luloff & Swanson, 1995). In such conditions, individuals of alocal population are unable to realize the importance of their common valueswith respect to the well being of the community as a whole (Duncan, 1999;Sampson, 2001). In this respect, poor human and economic resources in a localpopulation can translate into a diminished capacity for community efficacy.
Spacial Scale
The spatial scale of a community refers to its population size and itsgeographic location (Parisi et al., 2002). In this respect, a community can beclassified as either rural or urban, or as metropolitan or non-metropolitan. TheU.S. Census Bureau defines a community as rural if its population is less than

Parisi, Grice, Taquino, and Gill 23
2,500, and urban if it is greater than 2,500. The Census Bureau also defines acommunity as metropolitan if its population is greater than 50,000, or it is locatedin a geographic area with a total population of at least 100,000.
The spatial scale of a community is important because, as Wilkinson(2000) indicates, small rural communities often have limited capacity to engagein collective efforts. These communities are characterized by a predominance ofstrong primary ties and insufficient weak secondary ties necessary to bridgevarious primary groups in a community. Weak ties are important because theyprovide channels of communication and connections between social groups,and they determine the extent to which individuals project themselves outsideof primary groups (Freudenburg, 1986) and the extent to which community fieldcan emerge (Wilkinson, 2000). In addition, small rural communities lack theability to develop economies of scale. As a result, these communities are likelyto become dependent on external resources, weakening their ability to controltheir own resources and leading to a loss of interest in participating in communityaffairs (Sharp & Flora, 1999; Wilkinson, 2000).
Communities falling within metropolitan also face structural impedimentsto the emergence of collective efforts. Although there are substantial economicand social resources in these communities, they are generally characterized by ahigh level of social disorganization. In such conditions, people fail to recognizetheir common values and, consequently, they fail to come together to addresstheir common issues (Sampson, 2001).
In contrast, medium-sized communities are said to provide the backboneof American civic society (Tolbert et al., 2002; Young, 1999). In such communities,a balance between strong and weak ties characterizes the social relations of theirlocal populations, and they are less dependent on external resources (Wilkinson,2000). In addition, Young (1999) indicates that medium-sized communities arebetter equipped with social and economic institutions embedded in the sociallife of a community, enhancing their collective problem-solving capacity.
Summary
The foregoing discussion provides the basis for our conceptualframework. There are two dimensions of social capital that can be linked tocommunity efficacy. First, actors of a community must be self-motivated, andsecond, they must engage in reciprocal exchange. Consequently, we expect thathigher levels of self-motivation and reciprocal exchange will increase capacityfor community efficacy. Similarly, we hypothesize that communities endowedwith higher levels of human and economic resources, as well as with higherpresence of locally-owned businesses and meeting places, will have higherlevels of community efficacy. We also expect a positive relationship betweencommunity size and community efficacy. That is, small rural communities areexpected to have lower levels of community efficacy than medium-sizedcommunities. Similarly, we expect communities in metropolitan areas to have lower

24 Journal of the Community Development Society
levels of community efficacy, when compared to their non-metropolitancounterparts.
METHODOLOGY
In this section, we first describe a procedure for identifying, comparing,and measuring community attributes. Next, we present the data used to measurecommunity efficacy and factors related to capacity for community efficacy.Specifically, a key informant methodology was developed to gather informationabout community efficacy and community social capital. Information on localhuman, economic, and spatial characteristics was generated using 1990 censusdata. Information on civic physical infrastructure was generated using 1998American Business Directory data and 1997 Department of Commerce data.
Community Areas
Community is generally delineated by administrative boundaries, suchas census tracts and counties. However, these boundaries fail to capture thegeographic space within which community happens (Green & Haines, 2002;Kemmis, 1990; Morrill, Cromartie, & Hart, 1999; Wilkinson, 2000). According toTolbert et al. (2002), towns, villages, and small cities should be the focus ofcommunity because they provide the economic and social institutions necessaryfor the emergence of civic society. In addition, people can identify with thesecentral areas because they have names and sets of economic, social, and politicalorganizations, which are important for maintaining the identity of a communityover time (Gieryn, 2000). Because people can identify with towns, villages, andcities, these places provide the backbone for the emergence of open and inclusivelocally-oriented processes of interaction toward a generalized local interest.
Wilkinson (2000), however, indicates that processes of interaction mightinclude not only people residing within town, village, and city boundaries butalso people living in their surrounding areas. To overcome this limitation, somescholars have delineated community boundaries within a five to ten mile radiusfrom the geographic center of a densely populated settlement (Bohon &Humphrey, 2000; Luloff, Smith, & Humphrey, 1996; Theodori, 2001), while othershave used ten minutes travel time (Parisi et al., 2003; Taquino, Parisi, & Gill,2002). In this study, we used geographic information system technology toidentify community boundaries based on ten minutes travel time from thegeographic center of towns, villages, and cities in Mississippi. Through thisprocedure, we were able to identify 296 communities.
Community Key Informant Data
Typically, only a limited number of residents are able to provide reliableand valid information about locally-oriented collective actions in a community.Such people are known as community key informants (Young, 1999). A key

Parisi, Grice, Taquino, and Gill 25
informant is an individual knowledgeable about local activities through his orher experience, who is asked to act in an “informant’s role” (Merton, 1947). Inthis role, informants are said to provide useful information about the communityin which they live, about others in the community, and about themselves (Parisiet al., 2000; Seidler, 1974). This information can then be compared and pooled tocreate reliable and valid indicators about locally-oriented collective actionsundertaken in a community (Krannich & Humphrey, 1986; Parisi et al., 2003;Poggie, 1972; Schwartz, Bridger, & Hyman, 2001). In this study, we developedand implemented a two-step key-informant methodology to gather informationon locally-oriented collective actions toward community sustainable developmentin Mississippi since 1990. The first step consisted of selecting key informants,and the second of conducting a key informant survey.
Key Informant Selection. The most knowledgeable and reliable keyinformants are likely to be those individuals who are repeatedly recognized bymembers of a community as being knowledgeable about community happenings(Paul, 1953). Although information from multiple key informants can help reducepotential response bias (Beckley & Krogman, 2002), one key informant stillprovides reliable and valid information (Mead & Metraux, 1953; Parisi et al.,2000; Poggie, 1972; Schwartz et al., 2001). The quality of key informant data restsnot so much on the number as on the selection of representative key informants.That is, people that are likely to respond truthfully about community events,regardless the power structure of a community.
To assure the selection of representative key informants, we used atelephone “snowball” procedure. The procedure started with a call to the chiefmunicipal officer (and/or secretary or clerk) in each community. The individualcontacted was first briefed about the objective of the study. This is important toestablish a common frame of reference with members of a community, so that themost knowledgeable persons about particular types of information being soughtcan be identified (Parisi et al., 2000). Second, the person contacted was asked toprovide the name, the phone number, and physical address of other individualsin their community generally perceived as having considerable knowledge aboutlocally-oriented collective actions toward community sustainable development.The third step of the procedure was to contact the individuals identified in thefirst call. When these individuals were contacted, they were briefed about theinformation being sought and asked to provide the name, phone number, andphysical address of knowledgeable people. The process continued until a list ofseveral people, named at least twice by other members of the community, wascompiled. These individuals were recontacted to determine if they were willingto participate in the study. If they refused or indicated a lack of knowledge, theywere asked to name other individuals who might be able to provide the informationbeing sought. The identification process ended with an initial sample of 1,428key informants. Of the 296 communities contacted, only 255 were able to providekey informants.
26 Journal of the Community Development Society
Key Informant Survey. In October 1999, a mail survey was sent tocommunity key informants to determine if, since 1990, any organized groups,agencies, or citizens in the community had engaged in any locally-orientedcollective actions toward three general areas of community sustainabledevelopment: (1) economic development, (2) workforce development, and (3)environmental protection. The survey consisted of sets of questions comprisedof close-ended items, providing only “yes” or “no” responses, where “yes”indicated that locally-oriented collective actions had been undertaken, and “no”otherwise. At the end of the first wave, 284 of the 1,428 key informants returnedusable questionnaires, and 163 of the 255 communities returned at least onequestionnaire, accounting for a response rate of 19.8 percent and 63.9 percent,respectively. The subsequent waves were organized in such a way thatindividuals could be reminded by telephone within one week of the mailing.1
Five waves were conducted, resulting in the return of 586 usable surveys. Thisaccounted for a 41 percent key informant response rate. However, usable surveyswere received from 238 of the communities under investigation, accounting for a93.3 percent community response rate. On average, three usable surveys werereturned from each of the 238 communities.
Of the 586 key informants that returned a usable survey, approximately63 percent were male and 34 percent were female (See Table 1). They were, onaverage, 53 years old. Approximately 50 percent of the respondents had acollege degree or greater, and approximately 46 percent were employed full time.The majority of the respondents identified themselves as general public leaders(approximately 54 percent), and the remaining as either elected or appointedofficials (approximately 22 and 24 percent, respectively). On average, they heldtheir positions for approximately 10 years, and lived in their community forapproximately 34 years. Finally, the respondents indicated that they were activelyinvolved in their community’s affairs, and that they were very satisfied withliving in their community.
Community Census Data
Generally, the Census Bureau does not provide data at the communitylevel. As a result, community data were generated through a three-step GIS-based procedure that summed 1990 Decennial Census block group data to thecommunity level. The first step was to create a database of census data at theblock group level. The second step was to merge the census block groupdatabase created in the first step with the block groups that make up communityareas, using the block group identification code as the common field to link thedata. Finally, block group-level data were summed to the community level by aunique identifier developed for each community.

Parisi, Grice, Taquino, and Gill 27
Data on Locally-Owned Businesses and Local Meeting Places
The 1998 American Business Directory data provided single recordson the spatial locations of locally-owned businesses and meeting places, andthe 1997 Department of Commerce data provided single records on churchlocations. A three-step procedure was used to develop community level indicators.
Table 1. Key Informant Descriptive Statistics
First, each record was geo-coded by ZIP Code. Next, the records weremapped and overlaid on community boundaries. This step assigned a geographicidentification code (community-ID) to records falling within the communityboundaries. Finally, individual records were summed by community IDs.
Measurement
Community Efficacy. Community efficacy was defined as locally-oriented collective actions in pursuit of a generalized interest. For the purposeof this study, we limited our focus to locally-oriented collective actions towardlocal economic development. In this respect, key informants were asked if, since1990, any organized groups, agencies, or citizens in their communities had
selbairaV naeM/% DS .niM .xaM
xeSelaM 90.36 - - -
elameF 19.63 - - -egA 77.25 78.21 00.0 00.58
noitacudEfoleveLloohcShgiHemoS 66.2 - - -eergeDloohcShgiH 70.51 - - -
egelloCemoS 86.33 - - -eergeDegelloC 33.91 - - -
kroWetaudarGemoS 88.11 - - -eergeDetaudarG 83.71 - - -
tnemyolpmEemiTtraP 50.45 - - -
emiTlluF 59.54 - - -noitisoP
laiciffOdetcelE 79.12 - - -laiciffOdetnioppA 82.42 - - -
redaeLcilbuPlareneG 57.35 - - -noitisoPnisraeYforebmuN 90.01 00.9 00.0 00.05
ytinummoCnisraeYforebmuN 15.43 83.81 00.1 00.58ecivreSytinummoCfosruoHylkeeW 77.8 73.9 00.0 00.57
seitivitcAytinummoCnitnemevlovnIfoleveL 50.3 29.0 00.1 00.4noitcafsitaSytinummoCfoleveL 68.3 24.0 00.1 00.4
28 Journal of the Community Development Society
undertaken collective actions to (1) develop one or more programs to expandbusiness and industry; (2) develop one or more programs to keep business andindustry; and (3) develop one or more programs to provide information aboutthe community to business and industry investors. These items provided a“yes” or “no” response, where “yes” indicated that the community hadundertaken the action and “no” otherwise.
In order to utilize key informant responses from each community, thekey informant responses were transformed into a corresponding communityscore. To this end, the following coding rule procedure was developed: if thenumber of key informants responding “yes” was greater than or equal to thenumber responding “no,” then the aggregate community response was treatedas “yes.” Here, all ties were treated as “yes.” In this study, a community wasdefined as having community efficacy toward economic development if it hadundertaken all three actions. Consequently, community efficacy wasoperationalized as a dummy variable, where a score of 1 indicated that a communityhad community efficacy, and 0 otherwise.
Community Social Capital. Two conditions were used to operationalizesocial capital in a community: (1) actors’ self-motivation to engage in locally-oriented collective actions; and (2) reciprocal exchange between and amongactors. For the first condition, key informants were asked to report levels ofcommitment for civic interest groups, local government agencies, and faith-based organizations in engaging in locally-oriented collective actions towardeconomic development. For each group of actors, the scale of commitmentranged from 1 to 4, where 1 was not committed and 4 very committed. For thesecond condition, key informants were asked if collective actions were undertakenby (1) one person, (2) a few community groups, or (3) the entire community. Thescale ranged from 1 to 3, where 1 indicated no reciprocal exchange, 2 mediumreciprocal exchange, and 3 high reciprocal exchange. For both conditions, thecommunity score was computed by averaging the key informant responses.
Human and Economic Characteristics. Sampson et al., (1999) indicatethat human and economic characteristics can be gauged using five majorindicators: (1) percent African American; (2) percent in poverty; (3) percentunemployed; (4) percent with less than a high school education; and (5) percentof households headed by females. Because these indicators are highlyintercorrelated, a composite score was developed using factor analysis, whichreveal that the indicators were one-dimensional. The Eigen value was 3.5,explaining 70 percent of the total variance. The Cronbach’s alpha for thiscomposite score was 0.81. The higher the score, the lower the level of humanand economic resources in a community.
Civic Physical Infrastructure. Following Tolbert et al. (1998), locally-owned businesses were defined as the percent of manufacturing businesseswith less than 20 employees. Meeting places were defined as (1) the percent ofcoffee shops, barbershops, restaurants, convenience stores, and other small

Parisi, Grice, Taquino, and Gill 29
service establishments; and (2) the numbers of churches per 1000 population.Our data did not provide information to measure the presence of parks, squares,and other planned meeting places.
Spatial Scale. To determine the spatial scale of a community, wedeveloped a scale of population size ranging from 1 to 4, where 1 includedcommunities with less than 2,500 persons; 2 from 2,500 to 5,000 persons; 3 from5,000 to 10,000 persons; and 4 greater than 10,000 persons. Communities fallingwithin the first group were defined as rural, and those falling in the remaininggroups were classified as urban. A set of dummy variables was developed togauge the differences in community efficacy across types of communities;communities with less than 2,500 persons were used as the reference group.Communities were also classified as falling within metropolitan or non-metropolitan areas. A dummy variable was developed, where non-metropolitanwas used as the reference group.
ANALYTICAL STRATEGY
The analytical strategy was to estimate logistic regression models ofcommunity efficacy that included social capital, civic physical infrastructure,human and economic characteristics, and spatial scale features that determinecapacity for community efficacy:
logP
PX
i
ii i
10
−
= +β β
Pi = Estimated expected probability of experiencing community
efficacy toward local economic development;
1 - Pi = Estimated expected probability of not experiencing community
efficacy;
0β = Estimated vector of log odds of the probability ofexperiencing community efficacy when the vector iβ equals 0;
iβ = Estimated vector of the log-odds of the probability ofexperiencing community efficacy for each unit change in thecorresponding vector of independent variables;
Here, the log-odds [ln(Pi/1-Pi)] of the probability of experiencingcommunity efficacy is a linear additive function of the vectors of the independentvariables. However, because log-odds (logit) make little intuitive sense, thismodel can be transformed into the following multiplicative probability model:
P
Pe
i
i
Xi i
1−
= 0+β β
This exponential relationship implies that, for every unit increase in theindependent variable, there is a multiplicative effect on the odds of experiencingcommunity efficacy.
30 Journal of the Community Development Society
RESULTS
Descriptive Statistics
Of the 238 communities, 119 were found to have community efficacy forlocal economic development (See Table 2). On a scale of 1 to 4, on average, faith-based groups were rated by key informants as the most self-motivated in engagingin locally-oriented action toward economic development (2.69). The second-highest motivated actor was local government (2.42), followed by civic interestgroups (2.13). Action toward economic development, on average, involvedmore than one actor, suggesting the importance of reciprocal exchange inpursuing locally-oriented efforts.
The civic physical infrastructure in Mississippi communities waspredominantly characterized by small services (27.26 percent of businesses). Incontrast, approximately two percent of businesses were small manufacturing.Finally, communities were found to have an average of four churches per 1000population.
For human and economic characteristics, on average, approximately 40percent of a community’s population was African American and with less than ahigh school education. In addition, these communities had approximately 30percent of their population in poverty, approximately nine percent wereunemployed, and females headed approximately 17 percent of households.
Of the 238 communities, 54 percent had a population less than 2,500, 22percent between 2,500 and 5,000, 11 percent between 5,000 and 10,000, and 13percent greater than 10,000. Of all the communities under investigation, 13percent were located in metropolitan areas.
Bivariate Analysis
When the zero-order correlations were examined, the coefficientsindicated statistical significance for all but two of the independent variables (seethe fifth column in Table 2). Specifically, the positive coefficients of self-motivation and reciprocal exchange indicate that the higher the social capital ina local population, the higher the likelihood of a community to have communityefficacy. Similarly, the higher the percent of small services, the higher thelikelihood of community efficacy. In contrast, the negative coefficient for churchesper 1000 population indicates that greater numbers of churches in a communitytranslates into a lower likelihood of community efficacy. One plausible explanationis that a greater number of churches in a community results in smallercongregations. The implication is that small congregations might be morehomogenous and more likely to develop a strong identity with a specific socialgroup. This may restrict interaction across social groups because strong identitywith religious or social groups may lead to self-imposed social isolation. On theother hand, larger congregations might be more inclusive because they can

Parisi, Grice, Taquino, and Gill 31
Table 2. Community Descriptive Statistics
V selbaira naeM DS .niM .xaM AR
ycaciffEytinummoC 05.0 05.0 00.0 00.1 -latipaClaicoS
noitavitoM-fleSrotcAspuorGdesaB-htiaF 96.2 86.0 00.1 00.4 ***442.0spuorGtseretnIciviC 31.2 27.0 00.1 00.4 ***763.0
tnemnrevoGlacoL 24.2 47.0 00.1 00.4 ***424.0egnahcxElacorpiceR 17.1 85.0 00.1 00.3 ***383.0
erutcurtsarfnIlacisyhPciviCsessenisuBecivreSllamStnecreP 62.72 15.51 00.0 00.001 ***403.0
gnirutcafunaMllamStnecreP 27.1 11.2 00.0 67.11 760.00001repsehcruhC 20.4 16.3 00.0 35.12 ***533.0-
scitsiretcarahCcimonocEdnanamuHnaciremAnacirfAtnecreP 25.04 33.32 00.0 18.39 ***002.0-
ytrevoPnitnecreP 10.03 77.21 49.3 19.76 ***391.0-deyolpmenUtnecreP 92.9 40.5 63.1 87.14 *501.0-
loohcShgiHnahtsseLtnecreP 21.24 75.01 00.7 00.76 ***792.0-sdlohesuoHdedaeHelameFtnecreP 52.71 05.7 14.1 87.64 520.0-
elacSlaitapSlaruR
)puorGecnerefeR(005,2nahtsseL 45.0 05.0 00.0 00.1 -nabrU
000,5-005,2 22.0 14.0 00.0 00.1 ***471.0000,01-000,5 11.0 13.0 00.0 00.1 ***002.0
retaerGro000,01 31.0 43.0 00.0 00.1 ***833.0)puorGecnerefeR=ortemnon(1=orteM 31.0 33.0 00.0 00.1 **641.0
.selbairavtnednepedniehthtiwycaciffeytinummocfostneiciffeocnoitalerrocredro-oreZ:a01.<p*;50.<p**;10.<p***
bring together different social groups in a community. Finally, although thepercentage of small manufacturing is in the expected direction, it is not statisticallysignificant.
The negative coefficients of each feature of human and economiccharacteristics in a community indicate that higher percentages of the populationthat is African American, poor, unemployed, and with less than a high schooleducation decrease the likelihood of community efficacy. Similarly, communitieswith less than 2,500 persons are less likely than their larger counterparts toexperience community efficacy. In addition, communities falling within non-metropolitan areas are less likely than their metropolitan counterparts toexperience community efficacy, suggesting that the metropolitan context mightprovide an ideal environment for promoting economic development.
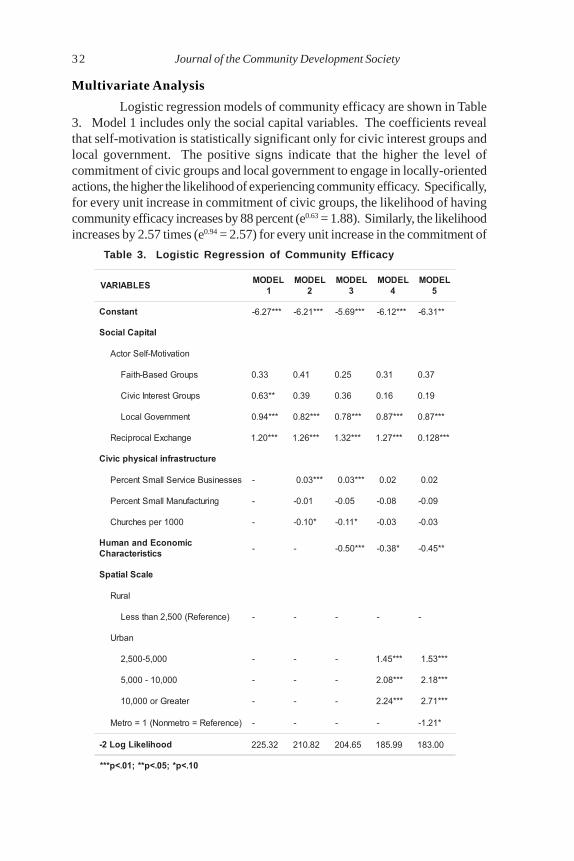
32 Journal of the Community Development Society
Multivariate Analysis
Logistic regression models of community efficacy are shown in Table3. Model 1 includes only the social capital variables. The coefficients revealthat self-motivation is statistically significant only for civic interest groups andlocal government. The positive signs indicate that the higher the level ofcommitment of civic groups and local government to engage in locally-orientedactions, the higher the likelihood of experiencing community efficacy. Specifically,for every unit increase in commitment of civic groups, the likelihood of havingcommunity efficacy increases by 88 percent (e0.63 = 1.88). Similarly, the likelihoodincreases by 2.57 times (e0.94 = 2.57) for every unit increase in the commitment of
Table 3. Logistic Regression of Community Efficacy
VARIABLESMODEL
1
MODEL
2
MODEL
3
MODEL
4
MODEL
5
Constant -6.27*** -6.21*** -5.69*** -6.12*** -6.31**
Social Capital
Actor Self-Motivation
Faith-Based Groups 0.33 0.41 0.25 0.31 0.37
Civic Interest Groups 0.63** 0.39 0.36 0.16 0.19
Local Government 0.94*** 0.82*** 0.78*** 0.87*** 0.87***
Reciprocal Exchange 1.20*** 1.26*** 1.32*** 1.27*** 0.128***
Civic physical infrastructure
Percent Small Service Businesses - 0.03*** 0.03*** 0.02 0.02
Percent Small Manufacturing - -0.01 -0.05 -0.08 -0.09
Churches per 1000 - -0.10* -0.11* -0.03 -0.03
Human and Economic
Characteristics- - -0.50*** -0.38* -0.45**
Spatial Scale
Rural
Less than 2,500 (Reference) - - - - -
Urban
2,500-5,000 - - - 1.45*** 1.53***
5,000 - 10,000 - - - 2.08*** 2.18***
10,000 or Greater - - - 2.24*** 2.71***
Metro = 1 (Nonmetro = Reference) - - - - -1.21*
-2 Log Likelihood 225.32 210.82 204.65 185.99 183.00
***p<.01; **p<.05; *p<.10
Parisi, Grice, Taquino, and Gill 33
local government. Reciprocal exchange among actors is also statisticallysignificant and in the expected direction. Its positive coefficient indicates thatfor every unit increase in reciprocal exchange, the likelihood of having communityefficacy increases by 3.33 times (e1.20 = 3.33). The larger coefficient of reciprocalexchange, as compared to those of commitment to engage in locally-orientedactions, suggests that reciprocal exchange might play a larger role in determiningthe capacity for community efficacy. The results reported in Model 1 also indicatethat commitment of local government in promoting collective efforts is moreimportant than the commitment of other groups in the community.
Model 2 adds the civic physical infrastructure variables. Thecoefficients reveal that percent small service businesses is statistically significantand in the expected direction. Its positive sign indicates that, for every percentincrease in small service businesses, the likelihood of a community to experiencecommunity efficacy increases by three percent. In contrast, the negative sign ofchurch indicates that, for each unit increase in number of churches per 1000, thelikelihood of a community to have community efficacy decreases by 10 percent.As mentioned in the previous section (zero-order correlations), a large numberof churches per 1000 may translate into a stronger division of a local populationacross racial and economic lines. The important issue here is that this relationshipremains positive and significant even after controlling for other local factors.After controlling for civic physical infrastructure variables, the effect of thecommitment of civic interest groups becomes insignificant. In addition, theeffect of the commitment of local government commitment is reduced, but remainssignificant. In contrast, the coefficient for reciprocal exchange increases. Thissuggests that the impact of social capital in promoting locally-oriented actionsis linked to civic physical infrastructure.
Model 3 adds the human and economic characteristics. As expected,these characteristics are statistically significantly related to community efficacy.The negative sign indicates that poorer human and economic conditions reducethe likelihood of a community to engage in locally-oriented collective actions.That is, for each unit increase in disadvantaged conditions, the likelihood of acommunity to experience community efficacy decreases by 40 percent.
Models 4 and 5 examine the implications of the spatial scale when otherfactors are controlled. The results indicate that communities that havepopulations greater than 2,500 are more likely to experience community efficacythan those that do not (See Model 4). Specifically, communities with a populationsize ranging from 2,500 to 5,000 are 4.25 times more likely to engage in locally-oriented collective actions toward economic development than those with lessthan 2,500. These communities, however, are less likely than communities withpopulations greater than 5,000. In fact, the coefficients reveal that communitieswith populations ranging from 5,000 to 10,000 and greater than 10,000 are 8.02and 9.42 times more likely to engage in locally-oriented collective actions towardeconomic development than those with less than 2,500.

34 Journal of the Community Development Society
The results also indicate that, when communities are situated inmetropolitan areas, they are approximately 70 percent less likely to havecommunity efficacy than those in non-metropolitan areas (See Model 5). Thedirection of this relationship shifted from positive (see zero-order correlations inTable 2) to negative. In addition, controlling for the spatial location of a communityincreases the effect of other local conditions. This indicates that the extent andthe direction of the impact of spatial location rest on other local conditions.Specifically, the results indicate that communities with the least capacity topromote community efficacy toward economic development are those with limitedaccess to human and economic resources and communities with populationsless than 2,500. This means that, in general, communities in metropolitan areashave greater capacity than those in non-metropolitan areas. However,communities with poor conditions are worse off in metropolitan than non-metropolitan areas.
SUMMARY AND CONCLUSION
The main objective of this study was to address two questions. First,how can it be determined if a community has the capacity to act on its own?Second, how can it be determined if a community is actively involved in its owndevelopment? Answering these questions can help to understand how toencourage community efficacy as a means to preserve and promote individualand collective well-being across local populations.
We developed a key informant methodology to gather information onlocally-oriented collective action toward economic development across localcommunities in Mississippi. Key informant data indicated that, of the 238communities, only 119 had community efficacy for economic development. Resultsfrom a multivariate analysis indicated that the extent to which a community canengage in locally-oriented collective action rests on local social capital, civicphysical infrastructure, and human, economic, and spatial characteristics.
The findings indicated that commitment of local government to engagein locally-oriented actions toward local economic development was moreimportant than commitment of other groups. The findings also supported thecentral role of interactions between and among actors in a community inpromoting community efficacy. Clearly, social capital is an important factor topromote community efficacy. In addition, human, economic, and spatialcharacteristics played an important role in the capacity of communities to cometogether and act collectively.
The implication of these findings is that successful policy aimed atencouraging community efficacy rests on the ability of community practitionersto examine and address three important factors. First, community practitionersshould establish if a community has the political will to improve local conditions.This is not to say that the engagement of other parties in the community is
Parisi, Grice, Taquino, and Gill 35
irrelevant, but that the local government should be the focal point to coordinatelocally-oriented efforts with other community groups. From a communitydevelopment perspective, this means that investment in community social capitalshould be aimed at increasing the conditions that facilitate a civic/democraticdialogue between local governments and other community organizations.
Second, community development practitioners should determine if acommunity has sufficient human and economic resources and civic physicalinfrastructure. Their importance rests on two facts. First, investing in humanand economic resources increases the knowledge and the means to mobilizesocial resources into collective efforts. Second, locally-owned businesses canprovide places to meet and discuss local issues. In addition, they can helpdevelop a line of defense against macro economic and political forces impingingupon a community, because owners of such businesses have vested interest inthe local community. For those owners, community is not just a production site,but also the place they call “home.”
Finally, community practitioners should establish the extent to whichspatial conditions can be structural impediments for people to come together.For example, our findings indicate that, in small rural communities, communityefficacy can be seriously compromised. One way to overcome such spatialdisadvantage is that community practitioners should encourage the developmentof inter-jurisdictional relations with surrounding communities. In other words,rural communities should embrace regional development that cuts across politicalboundaries as a strategy to encourage community efficacy. In doing so, smallcommunities can overcome the problem of achieving economies of scale andother local barriers imposed by spatial disadvantage.
In conclusion, we believe that the approach outlined in this paperprovides a conceptual and empirical platform to address the issue of communityefficacy. The contribution of this approach is that it can provide a useful tool toexamine community efficacy from a cross-comparative perspective, and assistcommunity researchers, practitioners, and policy-makers in establishingvariations in capacity for community efficacy within a given state. In doing so,communities with low capacity for community efficacy can be targeted for “site-specific” community development.
NOTES
1. Recontacting individuals by telephone instead of by a reminder card is moreeffective in increasing the response rate. In addition, this procedure can help to determineif people are still willing to participate in the study. If they are not, new key informants canbe identified in a timely fashion (Parisi et al., 2000).
REFERENCES
Beckley, T.M., & N.T. Krogman. 2002. Social consequences of employee/managementbuyouts: Two Canadian examples from the forest sector. Rural Sociology 67(2):183-207.
36 Journal of the Community Development Society
Bohon, S.A., & C.R. Humphrey. 2000. Courting LULUs: Characteristics of suitor andobjector communities. Rural Sociology 5(3): 376-395.
Bourdieu, P. 1986. The forms of capital. Pp. 241-258 in J. Richardson (ed.), Handbook ofTheory and Research for the Sociology of Education. New York: GreenwoodPress.
Coleman, J.S. 1988. Social capital in the creation of human capital. American Journal ofSociology 94 (Supplement): 95-120.
Coleman, J.S. 1990. Foundations of Social Theory. Cambridge: Harvard University Press.
Duncan, C.M. 1999. Why Poverty Persists in Rural America. New Haven: Yale UniversityPress.
Flora, C.B., & J.L. Flora. 1993. Entrepreneurial social infrastructure: A necessaryingredient. The Annals of the American Academy of Political and Social Science529: 48-58.
Flora, J.L. 1998. Social capital and communities of place. Rural Sociology 63(4): 481-506.
Freudenburg, W.R. 1986. The density of acquaintanceship: An overlooked variable incommunity research. American Journal of Sociology 92(1): 27-63.
Gieryn, T.F. 2000. A space for place in sociology. Annual Review of Sociology 26: 463-496.
Green, G.P. and A. Haines. 2002. Asset Building and Community Development. ThousandOaks: Sage Publications.
Kemmis, D. 1990. Community and the Politics of Place. Normon: University of OklahomaPress.
Krannich, R.S., & C.R. Humphrey. 1986. Using key informant data in comparativecommunity research. Sociological Methods and Research 14(4): 473-493.
Lin, N. 2001. Social Capital: A Theory of Social Structure and Action. New York:Cambridge University Press.
Littrell, D.W., & D. Hobbs. 1989. The community self-help approach. Pp. 181-202 in A.E.Luloff and L.E. Swanson (eds.), American Rural Communities. Boulder:Westview Press.
Luloff, A. E., S. Smith, & C.R. Humphrey. 1996. Economic Restructuring and RuralCommunity Transformation. Washington, DC: U.S. Department of Agriculture.
Luloff, A.E., & L.E. Swanson. 1995. Community agency and disaffection:
Enhancing collective resources. Pp. 351-372 in L.J. Beaulieu and D. Mulkey (eds.),Investing in People: The Human Capital Needs of Rural America. Boulder:Westview Press.
Mead, M., & R. Metraux. 1953. Anthropological models for the study of culture at adistance. Pp. 41-53 in The Study of Culture at a Distance. Chicago: University ofChicago Press.
Merton, R.K. 1947. Field work in a planned community. American Sociological Review12(3): 304-312.
Morrill, R.L., J. Cromartie, & G. Hart. 1999. Metropolitan, urban, and rural commutingareas: Toward a better depiction of the United States settlement system. UrbanGeography 20(8): 727-748.
Oldenburg, R. 1999. The Great Good Place. New York: Marlow and Company.
Parisi, Grice, Taquino, and Gill 37
Parisi, D., D.A. Gill, & M. Taquino. 2000. Identifying and Measuring Rural Community:A Necessary Step in Promoting Rural Development in Mississippi and the Nationat Large. Mississippi State University: Social Science Research Center.
Parisi, D., D.K. McLaughlin, M. Taquino, S.M. Grice, & N.R. White. 2002. TANF/welfaredecline and community context in the rural south, 1997-2000. Southern RuralSociology 18(1): 154-185.
Parisi, D., M. Taquino, S.M. Grice, & D.A. Gill. 2003. Promoting environmentaldemocracy using GIS as a means to integrate community into the EPA BASINSapproach. Society and Natural Resources 16(3): 205-219.
Paul, B.D. 1953. Interview techniques and field relationships. In A.L. Kroeber (ed.),Anthropology Today. Chicago: University of Chicago Press
Poggie, J.R. 1972. Toward quality control key informant data. Human Organization 31:23-30.
Portes, A., & J. Sensenbrenner. 1993. Embeddedness and immigration: Notes on the socialdeterminants of economic action. American Journal of Sociology 98(6): 1320-1350.
Putnam, R.D. 1993. Making Democracy Work: Civic Traditions in Modern Italy. Princeton:Princeton University Press.
Putnam, R.D. 2000. Bowling Alone. New York: Simon and Schuster.
Sampson, R.J. 2001. How do communities undergird or undermine human development?Relevant contexts and social mechanisms. Pp. 3-30 in A. Booth & A.C. Crouter(eds.), Does it Take a Village? Community Effects on Children, Adolescents, andFamilies. Mahwah: Lawrence Erlbaum Associates.
Sampson, R.J., J.D. Morenoff, & F. Earls. 1999. Beyond social capital: Spatial dynamics ofcollective efficacy for children. American Sociological Review 64(5): 633-660.
Schwartz, M.R., J.C. Bridger, & D. Hyman. 2001. A validity assessment of aggregationmethods for multiple key informant survey data. Journal of the CommunityDevelopment Society 32(2): 226-237.
Seidler, John. 1974. On using informants: A technique for collecting quantitative data andcontrolling measurement error in organization analysis. American SociologicalReview 39(6): 816-831.
Sharp, J.S., & J.L. Flora. 1999. Entrepreneurial social infrastructure and growth machinecharacteristics associated with industrial-recruitment and self-developmentstrategies in non-metropolitan communities. Journal of the CommunityDevelopment Society 30(2): 131-153.
Shuman, M.H. 2000. Going Local: Creating Self-Reliant Communities in a Global Age.New York: Routledge.
Swanson, L.F. 2001. Rural policy and direct local participation: Democracy, inclusiveness,collective agency, and locality-based policy. Rural Sociology 66(1): 1-21.
Taquino, M., D. Parisi, & D.A. Gill. 2002. Units of analysis and the environmental justicehypothesis: The case of industrial hog farms. Social Science Quarterly 83(1):298-316.
Theodori, G. 2001. Examining the effects of community satisfaction and attachment onindividual well-being. Rural Sociology 66(4): 618-628.

38 Journal of the Community Development Society
Tolbert, C.M., T.C. Blanchard, M.D. Irwin, T.A. Lyson, & A.R. Nucci. 2001. Civicengagement and locally oriented firms. Southern Perspective 5(2): 1-4.
Tolbert, C.M., M.D. Irwin, T.A. Lyson, & A.R. Nucci. 2002. Civic community in small-town America: How civic welfare is influenced by local capitalism and civicengagement. Rural Sociology 67(1): 90-113.
Tolbert, C.M., T.A. Lyson, & M.D. Irwin. 1998. Local capitalism, civic engagement, andsocioeconomic well-being. Social Forces 77(2): 401-427.
Wilkinson, K.P. 1970. Phases and roles in community action. Rural Sociology 35(1): 54–68.
Wilkinson, K.P. 2000. The Community in Rural America. Middleton: Social EcologyPress.
Young, F. 1999. Small Towns in Multilevel Society. Lanham: University Press of America.
ECOSYSTEM RESTORATION ASCOMMUNITY ECONOMIC
DEVELOPMENT?AN ASSESSMENT OFTHE POSSIBILITIES
By Michael Hibbard and Kristen Karle
Journal of the Community Development Society Vol. 33 No. 2 2002
© 2002, The Community Development Society
Michael Hibbard, Professor and Head, Department of Planning, Public Policy & Management, and Director,Ecosystem Workforce Program, Institute for a Sustainable Environment; Kristen Karle, Research Associate,Institute for a Sustainable Environment, University of Oregon, Eugene.
Communication should be directed to Prof. Michael Hibbard, Department of Planning, Public Policy &Management, 1209 University of Oregon, Eugene, OR 97403. Phone: 541-346-3897, Fax: 541-346-2040, email:[email protected].
The research on which this article is based was funded by a grant from the Ford Foundation Asset Building andCommunity Development Program. An earlier version was presented at the forty-third Annual Conference of theAssociation of Collegiate Schools of Planning, Cleveland, November 8-11, 2001.
ABSTRACT
The decline of the primary economy over the past two decades has had devastating socio-economic effects on rural communities and people across the American West. However, ithas also opened up an opportunity to restore ecosystem health while rebuilding localcommunities – by organizing resource management efforts so that their objectives includenot only environmental health but also the creation of jobs and wealth and promotion ofstrong local social institutions. It is an approach that has implications for agricultural andresource-based communities throughout the industrialized world.
This paper describes an assessment of a three-year demonstration project to test thepossibilities of ecosystem restoration as a tool for community development. The assessmentuses a quasi-experimental design to compare the socio-economic climate and communityproblem-solving capacity among four demonstration (“experimental”) communities andtwo control communities. Baseline socio-economic data were collected on all sixcommunities in 1998 and follow-up data in summer, 2001. Data sources include existingdemographic, social, and economic statistics; household surveys; and in-depth interviews.
Keywords: civil society, community capacity-building, communityeconomic development, ecosystem management
INTRODUCTION
The decline of the primary economy over the past two decades has haddevastating socio-economic effects on rural communities and people across theAmerican West. However, it has also opened up an opportunity to restoreecosystem health while rebuilding local communities, through the shift toward

40 Journal of the Community Development Society
“collaborative stewardship” between land managers and local communities. Inthe Pacific Northwest, this shift has emerged from the environmental, economic,and political crises over the management of federal timberlands that dominatedthe early 1990s. Similar cooperative, community-level approaches are emergingwith respect to resource management on private lands, such as the Oregon Plan forSalmon and Watersheds (the “salmon recovery plan”) and the watershed councilsthat have been instituted by several states including Oregon and Washington.
These community-based approaches are local, place-based projects,programs and policies that aim to “meld ecology with economics and the needsof community in pursuit of symbiotic sustainability” (Weber, 2000, p. 238). Theiremergence has led to a new appreciation of the possibility of resource managementas a community socio-economic development strategy. This is done by organizingresource management efforts so that their objectives include not onlyenvironmental health but also the creation of jobs and wealth and promotion ofstrong local social institutions. It is an approach that has implications foragricultural and resource-based communities throughout the industrialized world.
This paper reports on an assessment of a three-year demonstrationproject to test the possibilities of ecosystem management as a tool for communitydevelopment.1 The demonstration actively promotes community-based ecosystemmanagement in four rural Oregon communities. The research question is:
To what extent does the community-based approach to environmentalmanagement contribute to enhancing community problem-solvingcapacity?
The assessment uses a quasi-experimental design, comparing the fourdemonstration (“experimental”) communities with two control communities.Baseline socio-economic data were collected on all six communities in 1998 andfollow-up data in summer 2001. Data sources include existing demographic,social, and economic statistics; household surveys; and in-depth interviews.
We begin by describing the situation of our study communities and, byextension, that of agricultural and resource-based communities in general. Wethen briefly discuss some of the theoretical underpinnings of collaborativestewardship for ecosystem management in the context of communitydevelopment. Next, we present the results of the demonstration project. Finally,we draw conclusions.
RESOURCE COMMUNITIES IN TRANSITION
The American West was tied to the primary economy – agriculture andnatural resource production – for most of the 19th and 20th centuries. Since the1980s, however, there has been a widespread “rural restructuring,” a demographicand economic transformation. Those areas of the West able to link to the “neweconomy” are experiencing unprecedented growth (Nelson, 2001). However,the same forces that have produced the new economy have also uncoupled theprimary economy from the larger economy. For example, at the turn of the 20th
Hibbard and Karle 41
century, farmers made up almost one-third of the American population; theirincome was one-fourth of the GNP; and their output was primarily for the domesticmarket. Additionally, a major part of U.S. industrial output was in the manufactureof agricultural equipment for the domestic market. In stark contrast, today farmersconstitute less than five percent of the population; their output is less than fivepercent of GNP, and they are a minor market for American manufacturers. Allthis, despite the fact that agricultural output is at record levels and a majorportion of that output is for world markets (Hibbard & Römer, 1999).
On top of this uncoupling, primary producers have also been facedwith a fundamental shift in public expectations. Until the late 20th century,American farmers and natural resource managers were encouraged to maximizeproduction for the market, in the interest of providing affordable goods forconsumers and turning the United States into a global economic powerhouse(Hibbard, 1999). In the past twenty-five years or so, however, competingexpectations have arisen. In addition to maintaining market production, primaryproducers are also being asked to steward rural lands and resources for futuregenerations and to protect a variety of non-market values and cultural amenitiesin their land and resource management practices (Hibbard & Madsen, 2003).
The upshot of these twin phenomena is that many rural westerncommunities have been left in social and economic decline. Fisher (2001) reportsthat contrary to established expectations, resource extraction is now associatedwith poverty. A prime example is found in the forests and forest communities ofthe Pacific Northwest. They have been buffeted for the past fifteen to twentyyears by changes in markets and technology, changes in environmental values,and changes in public policy related to the management of both private andgovernment lands (Hibbard, 1989).
There has been a two-pronged response to these pressures. On theground, it entails a shift from the former emphasis on production for markets toa new “ecosystem management” approach that tries to link ecological, economic,and social objectives. Administratively, it entails a shift from a bureaucraticapproach that separates objectives and responsibilities among variousorganizations to a management approach that combines responsibilities so thatmultiple objectives can be considered simultaneously (Brick, Snow, & Van deWetering, 2001). These shifts are embodied in the Northwest Forest Plan andNorthwest Economic Adjustment Initiative, the Oregon Plan for Salmon andWatersheds, the Oregon Sustainability Act, and similar policy initiatives.
A central aim of many of these initiatives is to find ways to achievesimultaneously the environmental goal of healthy and sustainable ecosystems,as well as the socio-economic goal of healthy communities. Translating that aiminto on-the-ground change has been a major challenge. Initially, it was hopedthat the experience, skills, and availability of displaced timber workers living inforest communities could be utilized in restoration work. The intent was thatincome from that work would supplement or replace income lost from reduced

42 Journal of the Community Development Society
timber harvests, benefiting workers, their families, and communities (see Carroll,Daniels, & Kusel, 2000 for a thoughtful summary and analysis of the workforceaspects of these initiatives).
Historically, however, most thinning, tree planting, and other restorationwork has been carried out by a low-skill, low-wage workforce under least-cost,short duration contracts. A continuation of these contracting practices wouldturn highly skilled, well-paid loggers and mill workers into low-skill, poorly-paidday laborers or force them to abandon the woods, leaving the work to the mostdesperate and marginalized workers. In either case, local communities would befurther impoverished.
The alternative is what has been termed the “quality jobs approach”(America’s Choice, 1990). It involves creating a new industry, the “ecosystemmanagement industry,” and a new profession, the “ecosystem managementworker” or “applied ecologist.” Ecosystem restoration and management wouldbe reorganized, giving local workers and their firms responsibility for assessmentand monitoring tasks and equipment operation as well as basic labor. Thesehigher-skilled workers would expect higher wages, of course. However, thesavings from reduced administrative costs and higher quality work should morethan make up for the higher wages. Additionally, there should be positiveimpacts on the environment in the form of higher quality work and on localcommunities because of increased incomes (Brodsky & Hallock, 1998).
There is little hard data about the current size and scope of theecosystem management industry. However, an analysis commissioned by theOregon Economic and Community Development Department (Beltram et al., 2001)found more than 16,000 workers in the industry in that state, with an annualpayroll of $560 million and average weekly wages ranging from $340 to $1600.These numbers suggest that the industry is becoming an important part of therural economy.
COMMUNITY-BASED ECOSYSTEM MANAGEMENT ANDCOMMUNITY CAPACITY
The quality jobs approach has received a good deal of support fromthe U.S. Forest Service and Bureau of Land Management, state agencies, andvarious other organizations. A three-year demonstration project coordinated bythe Ecosystem Workforce Program (EWP)2 has been testing whether thisadministrative support can be translated into “on-the-ground” change. Liaisonand technical assistance have been provided to promote these goals:
1) to encourage work design and procurement strategies thatdraw on the emerging ecosystem management industry andapplied ecologists to carry out the contracts;
2) to encourage the creation of community-based ecosystemmanagement firms to take up the contracts and employ localapplied ecologists; and

Hibbard and Karle 43
3) to create networks among land managers and their partners,both at the local level and across the region, to promotecooperation and collaboration in implementing the “qualityjobs” approach.
Behind these immediate goals is a broader community developmentgoal. The relationships and skills developed in network-building andcollaboration activities are assumed to carry over into other aspects of communityproblem-solving (Warner et al., 1999). Stable family wage jobs with community-based employers benefit the local community both economically and socially.Taken as a whole, then, it is presumed that the quality jobs approach should leadto healthier communities with increased problem-solving capacity. Thesepresumed connections are diagrammed in Figure 1.
Figure 1. Hypothesized Relationship between EWPActivities and Community Problem-Solving Capacity
EWP Partnership Building Activities
Contracting Firms
Stable family wage jobs
Increase in Household incomes
Stimulation of local economy
Decrease in social
pathologies
More opportunities for
community engagement
Increase in revenue to local government and
NPOs
Enhanced community problem solving capacity
44 Journal of the Community Development Society
The presumed relationships begin with the notion of the small, rural,agricultural community as “the model against which agriculture and other resourcedependent communities are evaluated” (Kusel & Fortmann, 1991, p. 3). Theoriginator of this line of community studies was Walter Goldschmidt (1946), whofound that when small scale family farming forms the economic base of anagricultural community, it has a much higher standard of living and quality of lifethan when the economic base is corporate agriculture. Specifically, the formerhave more numerous and better schools, better infrastructure, more (and morevaried) social and civic organizations, higher levels of church attendance, astronger non-farm business sector, and higher levels of engagement in communitydecision-making.
Linda Lobao (1990) provides an excellent review of the many replicationsand other studies done in the Goldschmidt tradition. She reports that the majorityconfirms the original findings. Most significantly for the present study, shepoints out that if the structure of the local economy is central to the creation oflocal inequality, the capacity of producers and their households to modify theconditions of production are key to reducing inequality (Lobao, 1990). And, ofcourse, modifying the conditions of production is exactly the aim of the qualityjobs agenda.
Recent studies support the Goldschmidt hypothesis. Tolbert and Lyson(1998) found that in rural manufacturing communities, an economy comprised ofa number of small- to medium-sized firms leads to greater socio-economic well-being than one made up of a few large corporate firms. They also report a strongrelationship between economic structure, socio-economic outcomes, and thestrength of local civic organizations and involvements – what is sometimescalled civil society. Similarly, Besser and Ryan (2000) report higher levels ofcommunity participation among people employed full-time in the communitywhere they live.3
There has been renewed interest in recent years in the concept of civilsociety. In broad terms, civil society consists of the social sectors of societyincluding families, neighborhoods, voluntary associations, and civil enterprises(Eberly, 2000). With respect to community well being, civil society enables thecreation of local relationships and networks wherein individuals transcend self-interest and act toward common goals or the collective good.
The associations and institutions of civil society have been termedmediating structures (Berger & Neuhaus, 1977). Beyond their explicit purpose,mediating structures accomplish three other things, according to Eberly (2000).They mediate between the individual and the large mega-structures of the marketand the state; they impart important democratic values and habits; and theycreate social capital.
Tying these concepts together, the ability of a community to act towardcommon goals or the collective good – its capacity to address community problems– depends on a strong civil society with healthy mediating structures. In addition,
Hibbard and Karle 45
the research in the Goldschmidt tradition shows how the structure of the localeconomic base shapes local civil society. Thus, while the immediate aim of thequality jobs approach is to reshape the local economy, it is hoped that an indirectoutcome will be to strengthen civil society.
In this regard, between 1993 and 1996, the Aspen Institute coordinateda “capacity-building learning cluster” consisting of community developmentprofessionals from across the United States. According to their work, an essentialcomponent of a healthy, viable community is the existence of a high level ofcommunity capacity. They define community capacity as “the combinedinfluence of a community’s commitment, resources and skills that can bedeployed to build on community strengths and address community problemsand opportunities” (Aspen Institute, 1996).
Based upon our research, we have modified the Aspen Institute’scomponents of community capacity to include: resources, human factors, andcommitment. Our experience and research reveal that human factors of individualsengaged in community capacity-building activities are essential components ofcommunity capacity and should be assessed as separate components. Thesefactors can be described as follows:4
· Resources are the financial, natural, and human assets, and themeans to deploy them intelligently and fairly. Resources alsoinclude having the information and guidelines that will insurethe best use of these resources.
· Human factors are the human capacities of the people involvedin community development activities. They include severalcomponents:
Leadership – the presence of people in the community whoact as catalysts in addressing community issues, whoencourage others to join the process, and who can coordinateactivities.
Skills – includes all the talents and expertise of individualsand organizations that can be used to address problems, seizeopportunities, and to add strength to existing and emerginginstitutions.
Depth – the presence of a broad base of professionals andvolunteers who are actively engaged in the community andcommitted to the common goal/purpose. In other words, ifkey people leave the community, are there others who are ableand willing to step in?
· Community commitment is the community-wide will to act,based on a shared awareness of problems, opportunities, and
46 Journal of the Community Development Society
workable solutions. It refers also to heightened support inkey sectors of the community to address opportunities, solveproblems, and strengthen community responses.
These components of community capacity are not mutually exclusive.They are interrelated, and they may overlap. However, a high level of communitycapacity requires that each of them be present at a high level. Thus, it is importantto assess each of them.
FINDINGS FROM DEMONSTRATION PROJECT
The above factors provide the framework we used for assessingcommunity capacity. This section summarizes the findings from our six casestudy communities.5
We used existing statistics to track changes in the socio-economicwell-being of five of the six communities from 1980 to the present along severaldimensions – population change, income, unemployment, teen pregnancy rate,and low birth weight rate. We conducted household surveys in 1999 and 2001 inboth of the control communities and in two of the four demonstrationcommunities. Questions addressed respondents’ perceptions of the social andeconomic health and political attitudes in their communities. We also collectedethnographic data during the period 1999-2001, through extensive observationand in-depth interviews with key informants in each community.
To assess the capacity of each community we observed meetings,conducted open-ended interviews, and collected written documents pertainingto strategic planning efforts, visioning exercises, economic development planning,civic activities, natural resource plans, and similar activities. In the demonstrationcommunities, we gave particular attention to such efforts when they involvedEWP. We were especially interested in what types of groups were primarilyinvolved in the activity. In our study communities, we found the primary groupsinvolved in capacity-building activities are local governments, communityeconomic development organizations, and the ecosystem management industry.
To arrive at community capacity ratings below, data from the abovesources were synthesized, organized, and presented to an expert panel, in aDelbecq-like process.
The first two places discussed are the control communities in whichEWP has not been involved. EWP has been involved in promoting the qualityjobs agenda in the remaining four communities.
Jefferson County
Community Description
Jefferson County is in central Oregon, east of the Cascades. Itseconomic base is centered in agriculture and forestry. It contains one of themost vigorous secondary wood-products economies in the Pacific Northwest –

Hibbard and Karle 47
centered on manufactured homes and doors/windows/sashes. Much of theWarm Springs Indian Reservation is in Jefferson County. The County also hasa large Latino population, initially attracted by the agricultural industry.
The secondary data indicate an overall low level of socio-economicwell being in Jefferson County. This information supports the qualitativeinformation obtained through interviews and a review of local current events.
The survey responses in Jefferson County help us to understand betterthe community conditions. In general, Jefferson County respondents have arelatively positive outlook on the economic situation of their community; amixed perception of the social atmosphere of the community; a somewhat negativeperception of the political atmosphere of the community; and a low level ofparticipation in social and civic organizations.
Discussion
There is no ecosystem management activity in Jefferson County. EWPhas not worked in Jefferson County on any activities. In addition, there do notseem to be any other capacity-building activities in Jefferson County. Communityand economic development activities occur as a reaction to external factorsrather than as community planning efforts.
Our assessment of Jefferson County’s capacity to address communityissues and opportunities follows:
· Resources—Low—There is no locally-based organizationfocused on improving the community well being througheconomic and community development in Jefferson County.The people working on local community development issuesare limited to local officials and the executive director of theChamber of Commerce. They lack information and guidance(no plans of any kind exist) to make informed decisions thatwill enhance community well being.
· Human factors—Low—Controversy in the local governmentreveals a lack of strong leadership in the community. It isdifficult to assess the level of skills of those engaged inactivities. Most of the local officials have been recently electedand a planner was recently hired. There does not seem to bedepth of leadership within the community.
· Community commitment—Low—Our survey results reveal thatthere are some indications of a positive social atmosphere,yet there are also indications that there are many problems inthe community. Racial and cultural tensions are apparent andthe community is divided regarding the impacts of growth. In

48 Journal of the Community Development Society
addition, secondary data and information from interviewsreveal that the community suffers from many socialpathologies, including high teen pregnancy rates; highpercentage of low birthweight babies born; and high crimerates. In addition, existing social services are at capacity.
The lack of community capacity-building activities and low ratings ineach of the community capacity factors has led to a weak organizational structurefor community development in Jefferson County. There is some integrationbetween local government and community economic development entities, butit is important to remember that these groups consist of relatively few people.The lack of capacity-building activities leads to this weak structure and low levelof participation in community economic development activities. This low levelof capacity leaves Jefferson County extremely vulnerable in addressingcommunity issues and opportunities. Those involved are unable to address thevast array of issues related to community well being. If any of these leadersleave the community or decide not continue in their work, it will be even moredifficult for Jefferson County to initiate community development activities.
Upper Willamette Valley
Community Description
The Upper Willamette Valley, located on the west side of the CascadeRange in southeastern Lane County, contains the headwaters of the WillametteRiver as well as several important tributaries. It contains the small communitiesof Oakridge and Westfir, which were pioneering Oregon timber towns. The areahas been the subject of a vigorous community development effort in recentyears, but ecosystem restoration work has not been part of the activities.
Secondary data were not available for the Upper Willamette. Surveyresults, however, provide a good indication of conditions in the community ofOakridge. (Westfir, population 260, was not included in the survey sample). Byfar, of the communities surveyed, Oakridge respondents have the most negativeperception of their economy. Respondents in Oakridge are very negativeregarding the social conditions of their community. Oakridge respondents havea negative perception of the local political atmosphere. Despite their negativeresponses, however, respondents to the survey are very involved in communityorganizations.
Discussion
Oakridge has undergone many community development-planningefforts over the past 20 years. These have focused mainly on business recruitmentand tourism but have not included any strategies regarding ecosystemmanagement. While these planning efforts have created a common vision forthe future of Oakridge, the volunteers who carry out these efforts do not havethe skills to enable them to move toward reaching their goals.

Hibbard and Karle 49
Our results provide an assessment of Oakridge’s community capacity:
· Resources—Medium—Three community organizations areworking on local community economic development efforts.Their efforts are somewhat coordinated, yet they could beimproved.
· Human factors—Low—For the most part, these organizationsare run by volunteers. They do not have the level of skillsneeded to initiate and implement successful CED efforts.While there are a few people with adequate skills, they need abroader base and greater depth of community leadership forprojects to be successfully implemented.
· Community commitment—Low—Survey responses show verylow levels of community cohesiveness and community pride.While those who responded indicated they were very involvedin community activities and groups, they also seemed quitefrustrated with community response to problems, localgovernment, and lack of contribution in community affairsfrom fellow residents.
Oakridge’s community capacity, overall, is judged to be Low. Capacity-building activities have resulted in the creation of local organizations anddevelopment plans for the community. In order to take action, however, theyneed leadership that is more effective from local government and other communitymembers. They need to enhance the skills of current community leaders, andthey need to increase community commitment to engage in community activitiesand projects in order to improve community capacity and to see success inproject implementation.
Coos County
Community Description
Coos County, located on the south coast of Oregon, was one of thecounties most affected by the decline of the timber industry. Secondary dataindicate that Coos County is struggling economically and with social pathologies.The data for Coos County may suggest that while a segment of the populationis doing relatively well, there is still a significant proportion of the populationthat lives in poverty. Household surveys were not administered in Coos County.
Discussion
To address the effects of the decline of traditional economic activity,entities within Coos County developed a series of economic development plansand strategies throughout the 1980s and 1990s to revitalize the area. Most of theformal plans emphasize industrial recruitment and/or business expansion/retention as a means for economic stability. They also emphasize the region’s

50 Journal of the Community Development Society
natural beauty as an asset for tourism as a means to attract both visitors andentrepreneurs to the area. In addition to city plans, local governments andcitizen groups have collaborated to form regional economic development plans.These plans are rooted in the industrial recruitment strategies, but some havethe added components of environmental protection and human capitaldevelopment.
The assessment of the capacity of Coos County reveals the following factors:
· Resources—Medium—There are a several organizationsworking in different aspects of community economicdevelopment and ecosystem management, but these effortsare not coordinated. There are no guidelines in place to ensurethat community/organizational assets are being used in thebest ways possible. The lack of a local community economicdevelopment organization has inhibited development of thecommunity’s ability to coordinate projects and achieve results.In addition, watershed associations working in ecosystemrestoration activities are completely disconnected from localeconomic development activities and players.
· Human factors—Medium—There are many talented and skilledpeople working in various areas of community economicdevelopment and ecosystem restoration. However, no oneseems to have the vision or skills to integrate efforts andassets. Again, the depth of leadership in the community isquestionable.
· Community commitment—Low—Although we do not havesurvey results for Coos County, we know from our interviewsthat there is not a high level of community commitment toaddress issues and problems. Many of the higher skillresidents have left the community because of a lack ofemployment opportunities.
The relatively low ratings in the factors of community capacity haveresulted in a disjointed organizational structure of community development andecosystem restoration activities. There is a disconnection between EWPactivities and other capacity-building activities in Coos County. EWP effortshave focused mainly on working with watershed associations that are engagedin ecosystem management activities. EWP is trying to encourage the watershedassociations to connect their restoration efforts with community economicdevelopment objectives and connect with community economic developmententities. Other community development efforts in Coos County have beeninitiated by local government community economic development entities, andthey are aimed at promoting “traditional economic development” and industrialrecruitment. These efforts have largely been uncoordinated even within the

Hibbard and Karle 51
economic development entities. The recently-formed economic developmentorganization may have the potential to take a lead role in coordinating communitywide capacity-building activities and community development efforts, but atthis time, it is still working out its mission and goals.
South Santiam Watershed
Community Description
The South Santiam River flows from the western slope of the CascadeMountains into the Willamette River, approximately in the middle of the WillametteValley. The South Santiam watershed encompasses approximately 1,300 squaremiles. It consists of six rural, timber-and-agriculture communities. Secondarydata and survey results are not available.
Discussion
Because the focus of this study is the impact of the quality jobs agendaupon community capacity, we will turn our attention to Sweet Home, the communitywithin the South Santiam watershed with the highest potential for ecosystemmanagement activity. Sweet Home’s Ames Creek project is the primary capacity-building project. It involves local government and parties engaged in ecosystemrestoration activities, yet it does not address any potential socio-economicbenefits. Other capacity-building activities include a strategic planning process,and some attempts at economic development activities have been lead largely bylocal government and to some extent the Sweet Home Economic Development Group.
Based on the case study, community capacity in Sweet Home wasjudged as follows:
· Resources—Medium—There is a variety of organizationsworking on different aspects of community economicdevelopment and ecosystem management activities. Absentis an organization with the capability to coordinate effortsamong agencies and move projects forward.
· Human factors—Low—City staff does not have enoughresources to dedicate enough time to community economicdevelopment efforts, and the Sweet Home EconomicDevelopment Group has had funding only recently to hire afull-time staff person. We do not know the staff person’sskills and abilities at this point. The South Santiam WatershedCouncil has recently mentioned that they do not have thestaff capacity to meet their mission.
· Community commitment—Medium—Participants in the 2001strategic planning process noted the community’s “volunteerspirit” as one of the most defining characteristics of SweetHome (second only to its natural beauty). A variety of civicgroups exist. They are responsible for many of the identified

52 Journal of the Community Development Society
goals in the plan. The Ames Creek project, initially viewed bysome as contentious because of tensions regardingenvironmental attitudes, is now widely accepted and issupported by a variety of volunteers.
Local government is involved with both the ecosystem managementwork, primarily in the Ames Creek project, and other with community economicdevelopment efforts. Ecosystem management work in the Willamette NationalForest, Ames Creek Project, and other projects headed by the South SantiamWatershed Council (SSWC) are not connected to community economicdevelopment goals and objectives or entities involved in community economicdevelopment (except for local government staff). There is a weak connectionbetween EWP efforts and other capacity building activities.
Tillamook County
Community Description
Tillamook County is located on Oregon’s north coast. The TillamookCounty economy is dominated by tourism, dairy farming, and timber. Cattleoutnumber people. Watershed restoration is a key issue for elected countyofficials and other residents.
Analysis of secondary data suggests a relatively high level ofcommunity well being in Tillamook County. Survey results provide moreinformation regarding the economic, social, and political conditions in TillamookCounty. Respondents in Tillamook County have a negative outlook on theircommunity’s economy, describing it as “depressed.” Responses indicate apositive social atmosphere and negative perception of local government.
Discussion
Numerous planning exercises involving community economicdevelopment and restoration have occurred in Tillamook County over the pastseveral years. These efforts have resulted in the development of several projectsaimed at maintaining and protecting the natural environment as well as the rural,small town flavor; protecting agricultural land; and creating more family wagejobs. A constellation of local development groups aims to address these issues:the Economic Development Council of Tillamook County (EDCTC) and theTillamook Bay National Estuary Project (NEP), the Futures Council, and thePerformance Partnership. While these organizations have worked extensivelywith each other, there has been inconsistent support from local government.This inconsistency has been the major challenge in reaching the vision describedin community plans.
EWP has worked primarily with EDCTC and key public agency partners(BLM Tillamook Area, Oregon Department of Forestry, and Hebo Ranger District,Siuslaw National Forest) to advance the quality jobs agenda.
Based on the information collected, the capacity of Tillamook Countyis assessed as follows:

Hibbard and Karle 53
· Resources—Medium—The Tillamook Performance Partnership,the EDCTC, and Futures Council are all working on a varietyof projects in Tillamook County. The strategic planningprocess has established a common vision and goals. Theobstacle to a higher level of resource capacity is the localgovernment’s lack of commitment to these projects.
· Human factors—Medium—Again, the reason for this ratingis the unstable leadership in local government. The EDCTCand Performance Partnership have a high level of skills andleadership capability. The depth of leadership and skills in allentities involved in community development activities isquestionable.
• Community commitment—Medium—Results from our surveyshow mixed results for the strength of community commitment.There seems to be a definite rift between those who do notwant things to change and newcomers who would like to seemore diversity, acceptance, and positive change within thecommunity. Respondents indicate there are high levels ofcommunity pride and a good deal of social connections withinthe community
There is a disconnection between EWP activities and other capacity-building efforts in Tillamook County. As previously mentioned, EWP hasinterfaced primarily with the Economic Development Council of Tillamook County(EDCTC). The EDCTC has worked extensively with EWP to promote qualityjobs in ecosystem management in Tillamook County, but these efforts and thisrelationship has not extended to other entities in Tillamook County. While thegoals related to restoration of Tillamook Bay and other estuary restoration haveinvolved ecosystem management considerations, the ecosystem managementas an economic development strategy has not been a central theme in the overallcommunity planning process.
Lake County
Community Description
Lake County is one of a handful of very large counties (7,600 sq. miles)situated in the less noticed, less affluent part of Oregon, east of the CascadeMountains. The county has roughly 7,500 residents, around 4,500 in the countyseat of Lakeview, and the rest scattered in small rural agricultural communities. Itis the third largest county in Oregon. Over 78 percent of the land in Lake Countyis owned and managed by government agencies, mostly the Bureau of LandManagement and the U.S. Forest Service.
Secondary data show that Lake County is struggling economically, yetindicators of social pathologies are still quite low. Survey data provide more

54 Journal of the Community Development Society
information regarding the social and economic conditions in Lake County.Overall, Lake County respondents have a bleak outlook on the current andfuture economic situation of the community. In contrast, respondents indicate avery positive social atmosphere in the community. In general, like the othercommunities, Lake County respondents seem skeptical of local politics. Comparedto the other communities examined, Lake County has a high level of communityparticipation in community organizations. The percent of respondents whoengage in leadership activities is among the highest of all communities.
Discussion
A number of efforts are underway to address the economic downturnin Lake County. Activities have focused on developing a general capacity topursue business recruitment and retention, providing infrastructure that willsupport growth, and supporting community development that will make LakeCounty an enticing place for businesses to locate and for people to live. Theprimary community development effort in Lake County over the past severalyears has been the reauthorization of the Lake Federal Sustained Yield Unit(LFSYU). Sustainable Northwest (SNW), an organization based in Portland, hasbeen the catalyst in this effort.
The Sustained Yield Unit Committee – the local group of elected officials,business people, timber industry representatives, and citizen representatives –that provided local input into the operation of the Unit, has worked for severalyears to develop a future for the unit. Ultimately, it endorsed fundamentallychanging the Unit’s function, proposing that an ecosystem-based approach betaken toward the LFSYU’s management. That proposal was adopted when theForest Service reauthorized the SYU in early 2001.
Based on the analysis of secondary data, survey results, and informationfrom interviews, documents, and site visits, we can provide an assessment ofthe community capacity in Lake County:
· Resources—High—Throughout the reauthorization process,staff from Sustainable Northwest were based in Lake Countyand engaged in helping to ensure the process moved forward.The staff person was able to access outside resources (suchas assistance from EWP) to contribute to the process. A greatdeal of technical information was gathered and analyzed tohelp understand the issues, challenges, and opportunitiesfacing Lake County, especially regarding workforce issues.Now, a locally based non-profit, with a full time staff member,has been created that will continue work begun by SustainableNorthwest and the Sustained Yield Unit Committee.
· Human Factors—Medium—People involved in developmentwork in Lake County have the skills to address issues in thecommunity. Local government and other leaders were activelyinvolved in the reauthorization process as well as addressing

Hibbard and Karle 55
other issues in the community. The depth of human factors isquestionable.
· Community Commitment—High—Results from our surveygive us insight into the commitment of the general communityto Lake County. Responses reveal a great deal of socialconnection within the community, dedication to staying intheir community despite difficult economic times, and a greatdeal of community pride. In addition, respondents participatein a variety of community organizations and groups.
All the entities involved in community development activities areworking in a coordinated, integrated manner. The LFSYU reauthorization processhas provided a foundation for community collaboration among local government,community economic development, and ecosystem management groups. Inaddition, the process resulted in helping the community to understand how tolink socio-economic goals and ecosystem health.
In regard to the impacts of EWP efforts, EWP activities and interactionhave been highly coordinated with the other capacity building activities andwith all entities involved in community development activities. The strongrelationship between EWP and other capacity-building activities has lead tosuccess in ensuring that ecosystem management goals and the quality jobsagenda have a key role in Lake County’s planning efforts.
CONCLUSIONS
Table 1 summarizes our assessment of community capacity for each of thesix communities, based upon the factors of community capacity described earlier.
This assessment leads us to two key findings. The first is that economicdevelopment activities, such as the EWP quality jobs agenda, must becoordinated with other community capacity-building activities to be effective inincreasing overall community capacity. To put it another way, for communityeconomic development efforts to contribute to increased socio-economic well
secruoseRnamuHsrotcaF
ytinummoCtnemtimmoC
llarevOyticapaC
ytnuoCekaL hgiH muideM hgiH hgiH
ytnuoCkoomalliT muideM muideM muideM muideM
ytnuoCsooC muideM muideM woL muideM
maitnaShtuoS muideM woL muideM muideM
ytnuoCnosreffeJ woL woL woL woL
ettemalliWreppU muideM woL woL woL
Table 1. Summary of Community Capacity
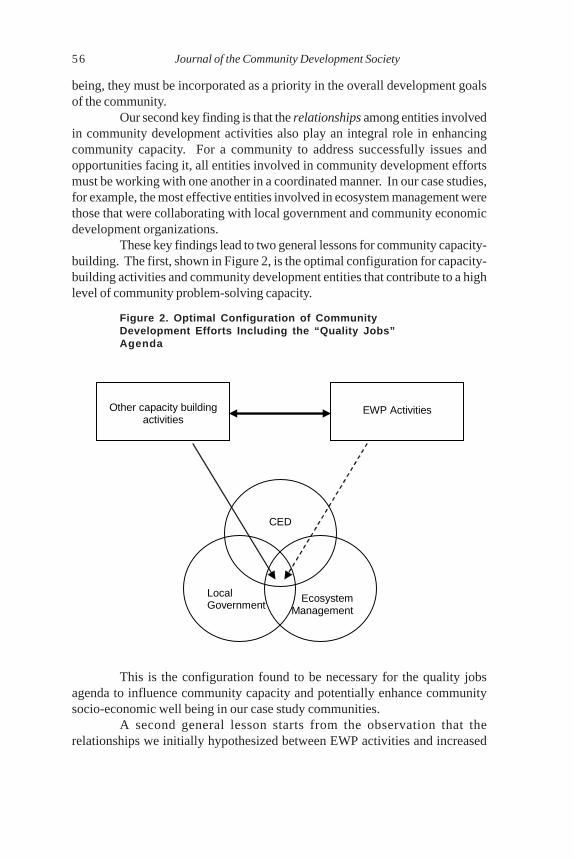
56 Journal of the Community Development Society
being, they must be incorporated as a priority in the overall development goalsof the community.
Our second key finding is that the relationships among entities involvedin community development activities also play an integral role in enhancingcommunity capacity. For a community to address successfully issues andopportunities facing it, all entities involved in community development effortsmust be working with one another in a coordinated manner. In our case studies,for example, the most effective entities involved in ecosystem management werethose that were collaborating with local government and community economicdevelopment organizations.
These key findings lead to two general lessons for community capacity-building. The first, shown in Figure 2, is the optimal configuration for capacity-building activities and community development entities that contribute to a highlevel of community problem-solving capacity.
Figure 2. Optimal Configuration of CommunityDevelopment Efforts Including the “Quality Jobs”Agenda
This is the configuration found to be necessary for the quality jobsagenda to influence community capacity and potentially enhance communitysocio-economic well being in our case study communities.
A second general lesson starts from the observation that therelationships we initially hypothesized between EWP activities and increased
Other capacity building
activities EWP Activities
CED
Ecosystem Management
Local Government
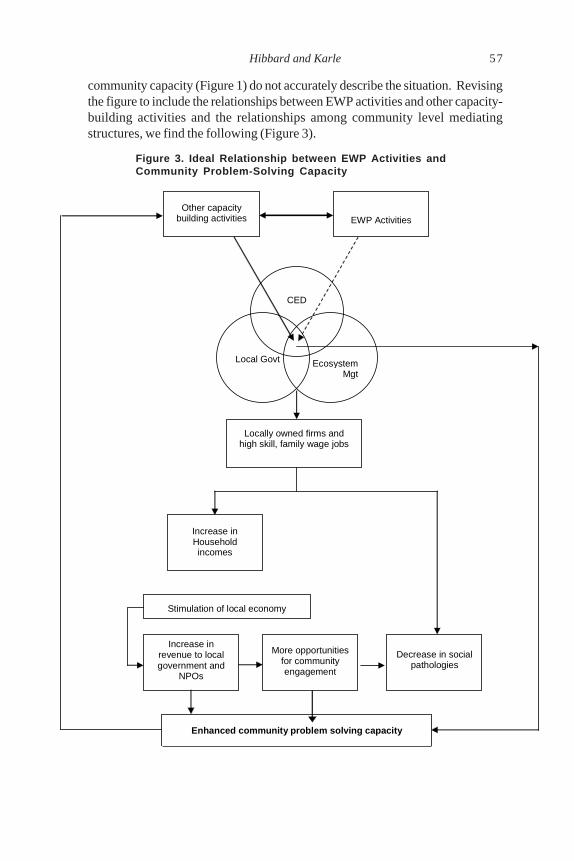
Hibbard and Karle 57
community capacity (Figure 1) do not accurately describe the situation. Revisingthe figure to include the relationships between EWP activities and other capacity-building activities and the relationships among community level mediatingstructures, we find the following (Figure 3).
Figure 3. Ideal Relationship between EWP Activities andCommunity Problem-Solving Capacity
Locally owned firms and high skill, family wage jobs
Increase in Household incomes
Stimulation of local economy
Decrease in social pathologies
More opportunities for community engagement
Increase in revenue to local government and
NPOs
Enhanced community problem solving capacity
Other capacity building activities EWP Activities
CED
Ecosystem Mgt
Local Govt

58 Journal of the Community Development Society
Figure 3 reflects our findings and helps to answer our original researchquestion:
To what extent does the community-based approach to environmentalmanagement contribute to enhancing community problem-solvingcapacity?
For the community-based approach to successfully improve communityproblem-solving capacity, community-based environmental management mustbe coordinated with other capacity-building activities in the community. Inaddition, the organizations engaged in community-building activities mustintegrate their efforts and work in a collaborative manner.
Generalizing to other communities with their economic base in theprimary sectors, this study suggests that their agenda cannot be limited to job orindustry development efforts; they must pay attention to other communityactivities as well. Groups focusing on advancing community forestry, watershedrestoration, sustainable agriculture, family farms, community-supportedagriculture, and so on, must broaden their agenda to ensure that their goals areintegrated into the overall community development effort. These groups mustbuild partnerships with the various groups engaged in efforts within thecommunity. Without connecting their goals to overall community developmentgoals, it is unlikely that they will successfully contribute to enhancing communityproblem-solving capacity and thus, to improving socio-economic well being.
NOTES
1. The demonstration project was conducted by the Ecosystem Workforce Programof the University of Oregon’s Institute for a Sustainable Environment, with funding fromthe U.S. Forest Service and Oregon Department of Economic and CommunityDevelopment. This assessment was funded by a grant from the Ford Foundation AssetBuilding and Community Development Program.
2. The Ecosystem Workforce Program provides technical assistance, research, andfacilitation for watershed councils, public land management agencies, local economicdevelopment staff, contractors and workers in promoting stable business and workforcecapacity for the emerging ecosystem management industry.
3. These studies have important implications for the quality jobs agenda. From acommunity development perspective, the aim should be to promote numerous small, localcontracting firms.
4. With the exception of Human Factors, definitions of factors of communitycapacity are taken directly from the Aspen Institute. Please see References for a fullcitation.
5. See Hibbard & Karle (2001) for a complete description of the methodology andfindings.
REFERENCES
America’s Choice: High Skills or Low Wages: Report of the Commission on the Skills of theAmerican Workforce. 1990. Rochester, N.Y.: National Center on Educationand the Economy.
Hibbard and Karle 59
Aspen Institute. 1996. Measuring Community Capacity Building: A Workbook-in-Progress for Rural Communities, version 3/96. Washington, D.C.: AspenInstitute.
Beltram, J., R. Evans, M. Hibbard, & J. Luzzi. 2001. Scope and Future Prospects –Oregon’s Ecosystem Management Industry. Eugene, OR: University of OregonInstitute for a Sustainable Environment.
Berger, P, & R. J. Neuhaus. 1977. To Empower People: The Role of Mediating Structuresin Public Policy. Washington, D.C.: American Enterprise Institute.
Besser, T. L. & V. D. Ryan. 2000. The impact of labor market involvement onparticipation in community. Journal of the Community Development Society31(1): 72-88.
Brick, P., D. Snow, & S. Van de Wetering. 2001. Across the Great Divide: Explorations inCollaborative Conservation and the American West. Washington, D.C.: IslandPress.
Brodsky, G. & M. Hallock. 1998. The High-Skill Approach to Ecosystem Management:Combining Economic, Ecological, and Social Objectives. Eugene, OR:University of Oregon Labor Education and Research Center.
Carroll, M. S., S. E. Daniels, & J. Kusel. 2000. Employment and displacement amongnorthwestern forest products workers. Society and Natural Resources 13(2):151-156.
Eberly, D. (ed.). 2000. The Meaning, Origins, and Applications of Civil Society. TheEssential Civil Society Reader. Lanham, MD: Rowman & Littlefield.
Fisher, D. R. 2001. Resource dependency and rural poverty: Rural areas in the United Statesand Japan. Rural Sociology 66(2): 181-202.
Goldschmidt, W. 1946. As You Sow. New York, NY: Harcourt, Brace and Company.
Hibbard, M. 1999. Organic regionalism, corporate liberalism, and federal land management:Creating Pacific Northwest timber towns. Journal of Planning Education &Research 19(2): 144-150.
Hibbard, M. 1989. Issues and options for the other Oregon. Community DevelopmentJournal 24(2): 145-153.
Hibbard, M.& K. M. Karle. 2001. Socio-Economic Implications of the Quality JobsApproach. Final Report to the Ford Foundation. Eugene, OR: University ofOregon Institute for a Sustainable Environment, Ecosystem Workforce Program.
Hibbard, M. & J.Madsen. 2003. Environmental resistance to community forestry in theU.S. Pacific Northwest. Society and Natural Resources (forthcoming).
Hibbard, M.& C. Römer. 1999. Planning the global countryside: Comparing approaches toteaching rural planning. Journal of Planning Education and Research 19(1): 86-92.
Kusel, J.& L. Fortmann. 1991. Well Being in Forest-Dependent Communities. Vols. 1 & 2.Berkeley, CA: Dept. of Forestry and Resource Management, University ofCalifornia.
Lobao, L. 1990. Locality and Inequality. Albany, NY: The State University of New YorkPress.
Nelson, P. B. 2001. Rural restructuring in the American West. Journal of Rural Studies17(4): 395-407.

60 Journal of the Community Development Society
Tobert, C. & T. Lyson. 1998. Local capitalism, civic engagement, and socioeconomic well-being. Social Forces 77(2): 401-429.
Warner, M. E., C. C. Hinrichs, J. Schneyer, & L. Joyce. 1999. Organizing communities tosustain rural landscapes: Lessons from New York. Journal of the CommunityDevelopment Society 30(2): 178-195.
Weber, E. P. 2000. A new vanguard for the environment: Grass-roots ecosystemmanagement as a new environmental movement. Society and Natural Resources13: 237-259.

SPONSORSHIP OF COMMUNITYLEADERSHIP DEVELOPMENT
PROGRAMS:WHAT CONSTITUTES AN IDEAL
PARTNERSHIP?
By Mitchell R. Williams and Vickey M. Wade
Journal of the Community Development Society Vol. 33 No. 2 2002
© 2002, The Community Development Society
Mitchell R. Williams, Ed.D., is Director of Academic Programs for the University of Virginia at the SouthwestVirginia Higher Education Center in Abingdon, Virginia.
Vickey M. Wade, M.A., is the Director of the Local Government Training Program at Western Carolina Universityin Cullowhee, North Carolina.
Correspondence can be directed to: Mitchell Williams, University of Virginia, Southwest Virginia HigherEducation Center, P.O. Box 1987, Abingdon, Virginia 24212; telephone 276-619-4312; [email protected].
ABSTRACT
Leadership development programs help communities to address today’scomplex challenges. Such programs frequently emphasize the importance ofcollaborating with others to effect long-term, positive change. The costs anddemands of operating effective programs make partnerships essential. This raisesa question: What groups should be actively engaged in sponsoring leadershipprograms? A survey of those who design and implement leadership programsacross the United States asked respondents to identify their current partnersand those they consider ideal partners. The responses support the need formodifications in program sponsorship. That is, institutions of higher educationshould work more closely with community-based organizations to plan andadminister these valuable community development programs.
Keywords: partnerships in community leadership development,community leadership development, higher education and communitydevelopment
INTRODUCTION
Communities face challenges that may seem overwhelming, and ascommunities grow and become more diverse, the issues affecting them willbecome more complex and daunting. The challenges facing contemporarysociety require leaders who are adept at community-building. Recent discoursein the area of community development links successful responses to suchchallenges with strong leadership (Peirce & Johnson, 1998; Pigg, 1999).

62 Journal of the Community Development Society
In communities across the country, leadership programs train citizensto work together to effect positive change. With a myriad of objectives, priorities,and formats, these programs are based on the premise that communities thatcultivate leaders are better able to address the problems that threaten theirsuccess and sustainability. Developing leaders who can meet the demands ofthe 21st century will require new strategies from the programs designed toeducate and train community leaders (Pigg, 1999; Rossing, 1998). Rost (1993)commented on this new approach to community leadership development asfollows:
Instead of leader development, we need to think about leadershipdevelopment . . . to develop people who want to engage in leadershipas collaborators or leaders or both (since leaders and collaboratorswill change places for the new paradigm); people who want to workcollaboratively with other people to change organizations,committees, and or society, who want to work in teams to institutechange that reflects the majority of the team members (pp. 101-102).
Rost challenged community developers to re-think the concept ofleadership. Arguing that group relationships and interaction are essential tocommunity leadership, he urged leadership program developers to identify andprovide collaborative opportunities for those who aspire to lead. Others havefollowed suit in recognizing the need to focus less upon individual skills andmore upon strengthening group interaction (Pigg, 1999) and on cultivating leaderswho can initiate collaborative processes (Gray, 1989). Heifetz (1994) discussedthe fact that leaders must have partners. He proposed that, “leadership cannot beexercised alone. The lone-warrior model of leadership is heroic suicide” (p. 268).
It is clear that collaboration and partnerships should play a significantrole in the curriculum of a community leadership development program. Thequestion addressed by this study is whether this same collaborative ethic is apart of the sponsorship and planning process for leadership developmentprograms. If relationship-building and cooperative interaction are importantgoals for program participants, do organizations sponsoring leadershipdevelopment programs give equal importance to engaging partners who cancontribute to the success of their programs?
Little research has been done on the sponsorship of communityleadership development programs. Questions exist about the organizations thatsponsor such programs and the partnerships they form to plan and conduct theprograms: (a) what types of organizations sponsor community leadershipdevelopment programs; (b) what types of partnerships currently exist in programsponsorship; (c) what are the perceptions of these current program sponsorsregarding ideal partnerships in the sponsorship of these programs; and (d)where are the largest disparities found between the current partnerships and theperceived ideal partnerships?
Williams and Wade 63
LEADERSHIP AND COMMUNITY DEVELOPMENT
Community development is the process whereby those in a communityarrive at decisions and take actions to improve their well being (Warner, 1980).Implicit in this definition is the need for leadership to ensure the success ofefforts to develop a community. Leadership defies easy definition. It is oftenthought of as a process in which one person enlists the aid and support ofothers in the accomplishment of a common task. Further, in the so-called“Information Age,” leadership is associated with helping individuals to becapable of living in a world of increasing change, complexity, and ambiguity.Leadership is, however, increasingly associated with the shared relationshipsthat develop between leaders and followers (Rost, 1993). Community leadershipdevelopment is based on the idea that citizens can work together to resolvecomplex community problems and to effect positive change. The connectionbetween community development and community leadership development isinstantly recognizable (Peirce & Johnson, 1998; Pigg, 1999).
A variety of organizations sponsor community leadership developmentprograms: chambers of commerce, private non-profit agencies, local governments,and institutions of higher education. For the purposes of this study, the termsponsorship means planning, designing, and conducting a program of communityleadership development (as opposed to simply providing speakers, facilities, orother resources). Often the sponsorship of these programs represents acollaborative effort among several partnering organizations that supportcommunity development. According to Gray (1989),
Collaboration is a process through which parties who see differentaspects of a problem can constructively explore their differencesand search for solutions that go beyond their limited vision of whatis possible. Collaboration is based on the simple adages that twoheads are better than one and that one by itself is simply not goodenough (p. 5).
Different organizations bring different strengths to communityleadership programs. Finding the right combination of sponsoring organizationscan mean the difference between a successful experience for program participantsand a disappointing one. Strong partnerships encourage several outcomes: (1)broader and more comprehensive analysis of issues addressed by the program;(2) greater and more diversified response capacity; (3) more innovative programs;and (4) more thorough examination of stakeholders and their interests (Gray, 1989).
Some leadership programs are based at institutions of higher education,but most exist outside the established educational system (Hamilton, 1992).Community development and related programs to develop community leadershiphave, says Hamilton, “become a stepchild of the educational establishment” (p.xiv), a relationship which in many cases curtails opportunities for collaborationbetween institutions of higher education and community-based organizations.

64 Journal of the Community Development Society
RESEARCH QUESTIONS AND METHODOLOGIES
This study was designed to assist community leaders and othersinterested in the sponsorship of leadership development programs in determininganswers to the following questions.
· What types of organizations sponsor and co-sponsor currentprograms to develop community leadership?
· What perceptions do current program sponsors have of idealpartners in sponsoring programs to develop communityleadership?
· Where are the largest disparities found between currentsponsorship of programs to develop community leadershipand the perceived ideal program sponsors?
To examine these questions, the authors designed and constructed asurvey instrument that was reviewed for validity by experienced professionalsin the field of community leadership development. The instrument asked eachrespondent to categorize his/her organization within the following eight typesof organizations:
1. chamber of commerce2. public university or college3. private college of university4. community college5. major employer in the community6. private non-profit agency7. local government, and8. other.
Respondents were then asked if their organization joins with otherorganizations in sponsoring a leadership development program. Thoseresponding affirmatively were asked to identify (again using the eightorganizational types) the organizations they collaborate with in programsponsorship. Finally, respondents were asked to identify the organizations theyperceived to be ideal partners in sponsoring programs to develop communityleadership.
The survey instrument was mailed to 106 randomly selected programsfrom the membership list of the Community Leadership Association, a non-profitorganization dedicated to enhancing the capacity of community leadershipprograms to strengthen and serve communities across the United States. Afterthe initial mailing, attempts were made to encourage non-respondents toparticipate in the survey. Sixty-seven responses were received from programs in29 states plus the District of Columbia. This represents a response rate of 63.2percent.
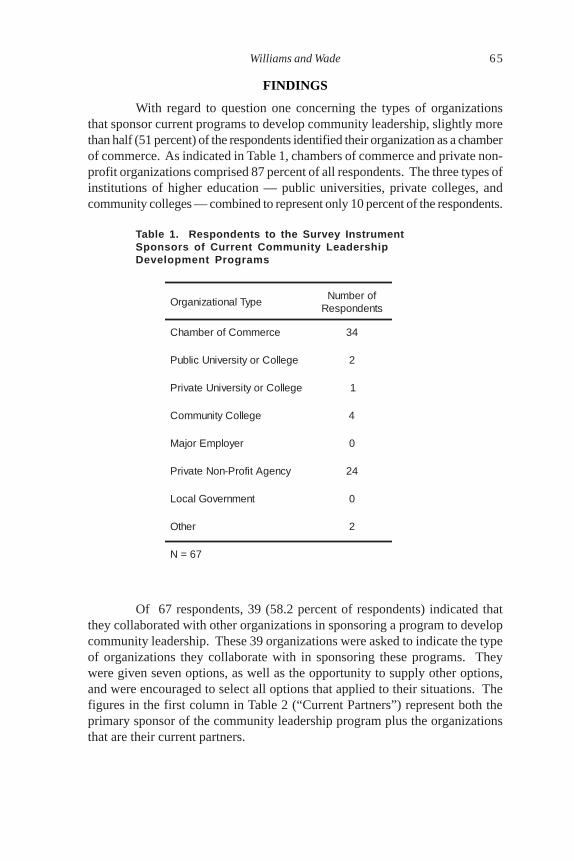
Williams and Wade 65
FINDINGS
With regard to question one concerning the types of organizationsthat sponsor current programs to develop community leadership, slightly morethan half (51 percent) of the respondents identified their organization as a chamberof commerce. As indicated in Table 1, chambers of commerce and private non-profit organizations comprised 87 percent of all respondents. The three types ofinstitutions of higher education — public universities, private colleges, andcommunity colleges — combined to represent only 10 percent of the respondents.
Table 1. Respondents to the Survey InstrumentSponsors of Current Community LeadershipDevelopment Programs
Of 67 respondents, 39 (58.2 percent of respondents) indicated thatthey collaborated with other organizations in sponsoring a program to developcommunity leadership. These 39 organizations were asked to indicate the typeof organizations they collaborate with in sponsoring these programs. Theywere given seven options, as well as the opportunity to supply other options,and were encouraged to select all options that applied to their situations. Thefigures in the first column in Table 2 (“Current Partners”) represent both theprimary sponsor of the community leadership program plus the organizationsthat are their current partners.
epyTlanoitazinagrOforebmuNstnednopseR
ecremmoCforebmahC 43
egelloCroytisrevinUcilbuP 2
egelloCroytisrevinUetavirP 1
egelloCytinummoC 4
reyolpmErojaM 0
ycnegAtiforP-noNetavirP 42
tnemnrevoGlacoL 0
rehtO 2
76=N
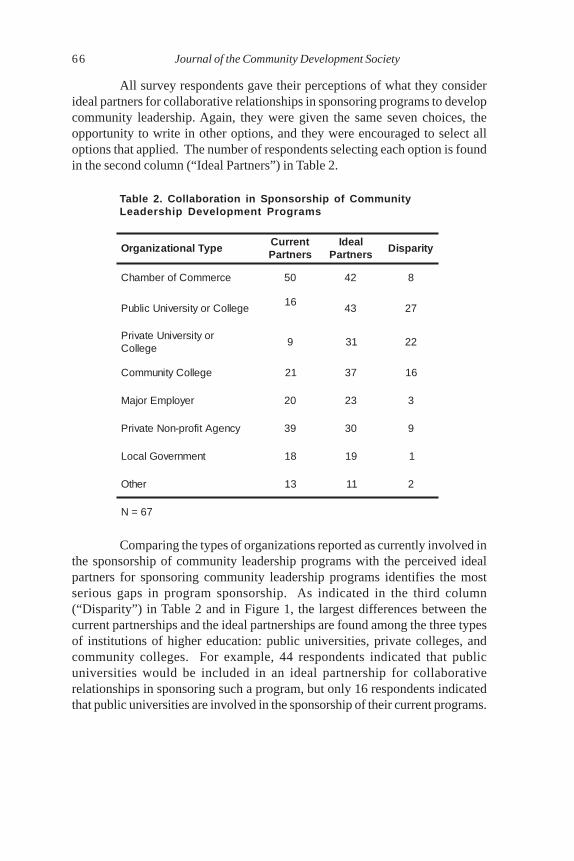
66 Journal of the Community Development Society
All survey respondents gave their perceptions of what they considerideal partners for collaborative relationships in sponsoring programs to developcommunity leadership. Again, they were given the same seven choices, theopportunity to write in other options, and they were encouraged to select alloptions that applied. The number of respondents selecting each option is foundin the second column (“Ideal Partners”) in Table 2.
Table 2. Collaboration in Sponsorship of CommunityLeadership Development Programs
Comparing the types of organizations reported as currently involved inthe sponsorship of community leadership programs with the perceived idealpartners for sponsoring community leadership programs identifies the mostserious gaps in program sponsorship. As indicated in the third column(“Disparity”) in Table 2 and in Figure 1, the largest differences between thecurrent partnerships and the ideal partnerships are found among the three typesof institutions of higher education: public universities, private colleges, andcommunity colleges. For example, 44 respondents indicated that publicuniversities would be included in an ideal partnership for collaborativerelationships in sponsoring such a program, but only 16 respondents indicatedthat public universities are involved in the sponsorship of their current programs.
epyTlanoitazinagrOtnerruCsrentraP
laedIsrentraP
ytirapsiD
ecremmoCforebmahC 05 24 8
egelloCroytisrevinUcilbuP61
34 72
roytisrevinUetavirPegelloC
9 13 22
egelloCytinummoC 12 73 61
reyolpmErojaM 02 32 3
ycnegAtiforp-noNetavirP 93 03 9
tnemnrevoGlacoL 81 91 1
rehtO 31 11 2
76=N

Williams and Wade 67
Figure 1. The Disparity Between Current and IdealPartners in the Sponsorship of Community LeadershipDevelopment Programs: Three Types of Institutions ofHigher Education
IMPLICATIONS FOR COMMUNITY DEVELOPMENT
The findings of this study support a further review of how communityleadership education and training should be approached by the organizationsthat sponsor these programs. Many who design and conduct leadershipdevelopment programs recognize the importance of collaborating in programsponsorship. There is, however, a marked disparity between the currentpartnerships and the organizations that would be included in perceived idealpartnerships. The involvement of institutions of higher education in currentprogram sponsorship is far below the level most program planners andpractitioners desire.
Colleges and universities can significantly enhance the value andusefulness of programs to develop community leadership. Drawing on theresources of two- and four-year colleges and universities can lead to more diverseand inclusive programs. Interinstitutional relationships among colleges and
0
5
10
15
2 0
2 5
3 0
3 5
4 0
4 5
C urrent Part ners 16 9 2 1
Ideal Part ners 4 3 3 1 3 7
Pub lic Pr ivat e C ommunit y

68 Journal of the Community Development Society
universities with different missions, curricula, resources, and community serviceinterests will create community leadership programs that are more efficacious,more highly valued, more innovative, and more cost effective (Williams, 2002).
No two institutions of higher education have exactly the same mission,philosophy, or resources. Each institution offers different resources andperspectives. Public and private four-year institutions may serve as sources ofknowledge about leadership, provide data on trends and issues related toleadership, and conduct applied research to benefit leadership programs. Landgrant institutions, for example, are often involved in leadership developmentand other community development initiatives through Cooperative Extensionprograms (Langone, 1992). At the same time, community colleges have developedprocesses to position themselves to play major roles in resolving communityissues (Boone, 1997), and they can contribute to community leadershipdevelopment through an emphasis on excellent teaching and their ability tocustomize programs.
Clearly, institutions of higher education can make unique contributionsto community development initiatives and community leadership programs(Williams, 2002). The results of the survey used in this study, however, indicatedthat the disparity between current program sponsors and partners and theperceived ideal sponsorship partners is significantly greater for public and privatefour-year institutions (49) than for community colleges (16). Many communitycolleges serve as catalysts in the development of their communities. They are ina unique position to bring together organizations, individuals, and stakeholdersinterested in community leadership development to form functioning and viablecoalitions (Boone, 1997). This may explain why the disparity between the currentlevel of involvement in sponsoring programs to develop community leadershipand the ideal level of involvement is smaller for community colleges than forfour-year institutions. Since many community colleges have institutionalizedcommunity-based programming, they may be more likely to meet communityneeds related to leadership development. This view was anecdotally supportedby the comments received on the survey instrument:
“The community college is a major source of speakers for ourprogram because their instructors are more familiar with theexperiential learning processes we prefer. It is also a resource forinformation on community needs; they know what is going on inthe community.
“Local colleges and universities are resources for our program,but not collaborators. The community college is actually a programpartner. They are able and willing to adapt to our program.”
Survey respondents often indicated that four-year institutions of highereducation would be included in their ideal partnerships. The study suggests,however, that colleges and universities have not always been responsive to
Williams and Wade 69
opportunities to assist in program sponsorship or there has been a lack ofcommunication between current program sponsors and officials at four-yearinstitutions regarding these opportunities. Once again, the anecdotal evidencefrom comments on survey instruments supports this conclusion:
“We would like to partner with the local university. This wouldallow us to have more special events and a greater variety ofspeakers.”
“In our area, the public university does not participate incommunity life as much as we would like. While they have resources,they are too academic, and our program is very issue-based.”
The findings of this study should not be seen as a criticism of highereducation generally or four-year institutions in particular. Previous research hasindicated that leaders of all types of institutions of higher education — two-yearand four-year, public and private — perceive that community service andresponding to external requests for assistance are important factors in the successof agreements and consortia involving their schools (Williams & Pettitt, in press).The results of the current study should be seen as a challenge to include programsthat develop community leadership in outreach services. The Kellogg Commission(1999) referred to “engaged institutions” or colleges or universities that gobeyond customary outreach and service to become productively involved withcommunities in partnerships that are “two-way streets defined by mutual respectamong the partners for what each brings to the table” (p. 9).
In order to facilitate the engagement of institutions of higher educationin community development, the Commission also sets forth guidingcharacteristics of engaged institutions of higher education. Two of theseprinciples support the idea of involving colleges and universities in programs todevelop community leadership.
· Accessibility. Institutions of higher education are sometimesconfusing and intimidating to outsiders. It is recommendedthat colleges and universities take steps to ensure that theirresources and services are more readily accessible throughefforts to institute community awareness.
· Respect for partners. The purpose of partnerships forcommunity development is not to allow the university to offerits superior expertise but, “to encourage joint academic-community definitions of problems, solutions, and definitionsof success” (p. 12). Additionally, institutions of highereducation need to be certain they are listening respectfully tothe communities they serve and the organizations available tocollaborate in finding solutions to community challenges.

70 Journal of the Community Development Society
Increased involvement in programs that develop community leadershipwill also give colleges and universities an opportunity to address some of thechallenges facing higher education. Specifically, these challenges includeproviding opportunities for citizens to have lifelong relationships with the post-secondary schools in their communities and altering the public perception thatcolleges and universities are at times indifferent to community needs (KelloggCommission, 1999).
CONCLUSIONS
Colleges and universities — public, private, four-year, and two-year —can contribute to the value and usefulness of community leadership programsand to the related efficacy of broader community development initiatives. Tomake comprehensive community leadership programs as effective as possible,institutions of higher education should work with other community-basedorganizations to design and implement leadership programs. This collaborationis particularly compelling for land grant universities established by Congress aspublic universities and charged with disseminating their findings to the public ina form that non-scientists could understand and put to use. The synergy createdby bringing together multiple organizations, especially colleges and universitiesfrom different sectors within the higher education community, can create leadershipdevelopment opportunities that no single organization could hope to provide.
Innovative forms of collaboration are at the center of many communitydevelopment and revitalization programs of what Peirce and Johnson (1998)called the “partnership era” (p. 46). John W. Gardner is co-chair of the CitizenParticipation and Political Leadership Focus Group of the Kellogg LeadershipStudies Project. In the foreword to the book, Boundary Crossers: CommunityLeadership for a Global Age, he writes, “Today, in one community after another,the diverse segments and sectors of the community are working together in newpatterns of collaboration and partnership” (p. i), leading to emerging “networksof responsibility drawn from all segments and coming together to create awholeness that incorporates diversity” (p. iii). The authors believe universitiesand colleges should contribute to this way of thinking by expanding participationin the sponsorship of programs that enhance community leadership.
This study examined the discrepancy between sponsors of currentleadership development programs and those perceived to be ideal. The studywas limited in that the survey instrument was sent only to 106 randomly selectedprograms that were members of the Community Leadership Association. Nowthat the survey instrument has been developed and employed in practice, furtherresearch is needed to determine if the findings of this study are consistent withsimilar studies. At the same time, future studies should continually update andrevise the list of organizations suggested as potential program partners.
It is left to future researchers to determine why certain partners mightbe considered ideal or what perceptions define an ideal partner. Further study is
Williams and Wade 71
also needed to determine why the perceived disparity of engagement ofinstitutions of higher education exists and why institutions of higher educationdo not participate as program sponsors. It is equally important to know ifleaders of higher education institutions are aware of the desire to have collegesand universities involved in planning and conducting leadership developmentprograms. Finally, further research, including case studies, should be conductedto investigate the critical factors required for successful partnerships insponsoring community leadership development programs.
It is hoped that practitioners in the field of community developmentand leadership development will benefit from the findings of this study.Recognition of the disparity between current partnerships in program sponsorshipand ideal partnerships will allow program sponsors and planners to pursuealliances that will make their efforts more effective and valuable.
REFERENCES
Boone, E.J. 1997. Community Leadership Through Community-Based Programming: TheRole of the Community College. Washington, DC: Community College Press.
Gray, B. 1989. Collaborating: Finding Common Ground for Multiparty Problems. SanFrancisco: Jossey-Bass.
Hamilton, E. 1992. Adult education for Community Development. New York: Greenwood.
Heifetz, R.A. 1994. Leadership Without Easy Answers. Cambridge, MA: The Belknap Pressof Harvard University Press.
Kellogg Commission on the Future of State and Land-Grant Universities. 1999, February.Returning to Our Roots: The Engaged Institution (Third Report). Washington,DC: National Association of State Universities and Land-Grant Colleges.
Langone, C.A. 1992. Building community leadership. Journal of Extension 30(4).Available on-line at: http://www.joe.org/joe/1992winter/a7.html
Peirce, N., & C. Johnson. 1998. Boundary Crossers: Community Leadership for a GlobalAge. College Park, MD: The Burns Academy of Leadership Press.
Pigg, K.E. 1999. Community leadership and community theory: A practical synthesis.Journal of the Community Development Society 30(2): 196-212.
Rossing, B.E. 1998. Learning laboratories for renewed community leadership: Rationale,programs, and challenges. Journal of Leadership Studies 5(4): 68-81.
Rost, J. 1993. Leadership development in the new millennium. Journal of LeadershipStudies 1(1), 91-110.
Warner, P.D. 1980. Professional roles: An overview. Pp. 96-103 in J.A. Christenson &J.W. Robinson, Jr., (eds.), Community Development in America. Ames, IA: TheIowa State University Press.
Williams, M.R. 2002. Consortia and institutional partnerships for communitydevelopment. Pp. 29-36 in L.G. Dotolo & J.B. Noftsinger, Jr. (eds.), LeveragingResources Through Partnerships. San Francisco: Jossey-Bass.
Williams, M.R., & J.M. Pettitt. In press. Partnerships among institutions from differentsectors of higher education: Expanding views of collaboration for outreach andcommunity service. Journal of Higher Education Outreach and Engagement.

COMMUNITY DEVELOPMENTAND ENVIRONMENTAL QUALITY:
BENEFITS AND CHALLENGESUSING A SERVICE LEARNING
MODEL FOR UNIVERSITYENGAGEMENT
By Wendy A. Kellogg
Journal of the Community Development Society Vol. 33 No. 2 2002
© 2002, The Community Development Society
Dr. Wendy A. Kellogg, Associate Professor of Urban Planning and Environmental Studies, Maxine GoodmanLevin College of Urban Affairs, Cleveland State University, Cleveland, OH 44115. Email:[email protected].
ABSTRACT
Urban neighborhood-based organizations have long played an important role in mobilizingresources and resident participation to revitalize communities. Today, these organizationsseek information about environmental hazards and assets that affect the health and qualityof life of residents as part of the revitalization efforts. University students and faculty cancontribute to these community development activities if they become cognizant of theneighborhood’s needs and challenges. This paper describes the use of a service learningframework to guide faculty and students who engage in community development activitiesand capacity-building in the community. The paper presents a case study that describesseveral projects focused on access to and use of environmental information forenvironmental problem-solving in a Cleveland neighborhood. Guiding principles, design,implementation challenges, and lessons learned from the projects are described.
Keywords: service learning, community capacity-building,environmental information, Internet
INTRODUCTION
Community- and neighborhood-based planning for redevelopment hasa long tradition in the United States (Silver, 1985), in addressing neighborhoodproblems such as infrastructure, housing, and the economic, social, and politicalaspects of neighborhood vitality. Community- and neighborhood-basedorganizations have played an important role in accessing resources and mobilizingcitizen participation for neighborhood revitalization (Keating et al., 1996). Suchorganizations have intimate knowledge of a community and its needs and thebest methods for organizing community members. For the work described in thispaper, “community development” is envisioned as enhanced social capacity, orthe creation and strengthening of a set of community resources and relationships
Kellogg 73
that allow members of the community to address increasingly more difficultproblems through joint effort.
University participation in community development offers considerablepotential because universities can mobilize resources that could be of greatbenefit to the community and the society, particularly information and problem-solving expertise (Harkavy & Puckett, 1992; Harkavy, 1993). U.S. universitiesbegan and flourished from their engagement in the community (Boyer, 1990;Boyer, 1996), with most universities recognizing their responsibility to benefitthe community around them through their applied research and education ofcitizens. However, by the turn of the twentieth century, an emphasis on basicresearch overshadowed the role of the university as a teaching institution, andin some cases, even its role in providing service to society through appliedresearch. This trend accelerated following World War II (Boyer, 1990; Boyer,1996). In the last two decades, many institutions of higher education examinedtheir roles in the community, returning to their mission to use knowledge toimprove society’s condition and to instill citizenship and a sense of communityresponsibility in students (Boyer, 1990; Harkavy & Puckett, 1992; Boyer, 1996).Part of this reorientation was accomplished using service learning (describedbelow), with universities across the country joining organizations such as CampusCompact, the Council for Adult Experiential Learning, the National Society forExperiential Education, the National Youth Leadership Council, and Partnershipfor Service learning (Bringle & Hatcher, 1996).
This paper presents a case study of an on-going relationship betweena local university and a community development organization that developed inresponse to a neighborhood’s environmental quality concerns. In my experienceas an instructor, the university role in community development was well-servedby involving faculty and students using a service learning model that seeks toenhance the capacity for community problem-solving. I first describe servicelearning as an educational model and discuss how service learning offers potentialfor achieving goals of community capacity-building. A case study describeshow service learning was implemented in several classes. I then discussconclusions about the effectiveness of service learning as a model for buildingcommunity capacity and the challenges that students, faculty, communitymembers, organizations, and I faced in implementing the model.
A SERVICE LEARNING EDUCATIONAL MODEL
Service learning is an educational model that integrates communityservice with academic study (See Figure 1). In a service learning class, studentscomplete a service project in the community, such as mentoring younger studentsin a public school, teaching reading, helping a community-based organizationdeliver meals to seniors, or cleaning up a stream. Service learning is not merelyan opportunity to volunteer in the community (which is, of course, a worthwhileendeavor), but rather an opportunity to undertake a more holistic experience as
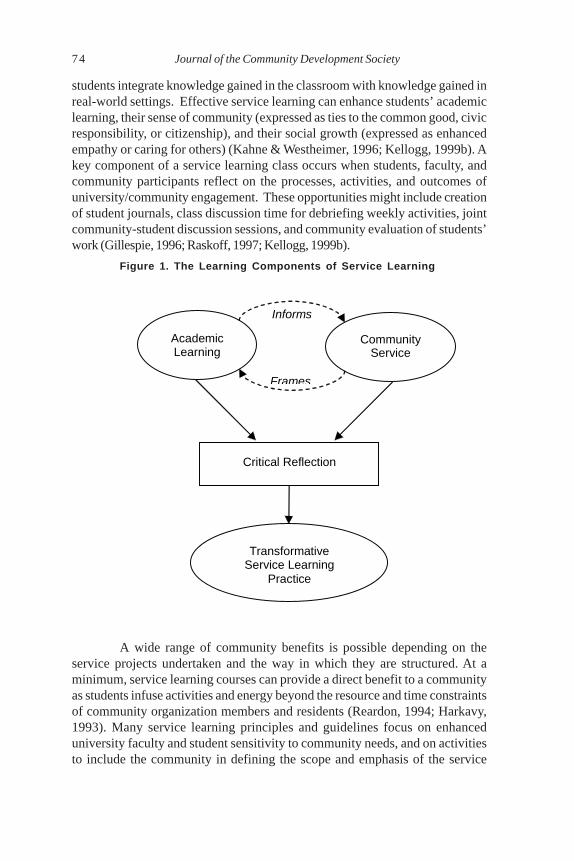
74 Journal of the Community Development Society
students integrate knowledge gained in the classroom with knowledge gained inreal-world settings. Effective service learning can enhance students’ academiclearning, their sense of community (expressed as ties to the common good, civicresponsibility, or citizenship), and their social growth (expressed as enhancedempathy or caring for others) (Kahne & Westheimer, 1996; Kellogg, 1999b). Akey component of a service learning class occurs when students, faculty, andcommunity participants reflect on the processes, activities, and outcomes ofuniversity/community engagement. These opportunities might include creationof student journals, class discussion time for debriefing weekly activities, jointcommunity-student discussion sessions, and community evaluation of students’work (Gillespie, 1996; Raskoff, 1997; Kellogg, 1999b).
Figure 1. The Learning Components of Service Learning
A wide range of community benefits is possible depending on theservice projects undertaken and the way in which they are structured. At aminimum, service learning courses can provide a direct benefit to a communityas students infuse activities and energy beyond the resource and time constraintsof community organization members and residents (Reardon, 1994; Harkavy,1993). Many service learning principles and guidelines focus on enhanceduniversity faculty and student sensitivity to community needs, and on activitiesto include the community in defining the scope and emphasis of the service
Frames
Informs
Academic Learning
Community Service
Critical Reflection
Transformative Service Learning
Practice
Kellogg 75
(COOL, 1993; Honnet & Poulsen, 1989; Kraft, 1996). Service learning classeshave been shown to facilitate collaboration and exchange that are more effectivebetween community and university (Harkavy, 1993; Reardon, 1994; Rubin, 1998).Service learning classes can allow for more effective use of university resources.As areas of focus are defined by community organizations, university activitiesmay go farther to address existing or ongoing problems. The university, as aninstitution, can do much to facilitate and support efforts to promote servicelearning by faculty and students (Rubin, 1998; Education Commission of theStates, 1994), but ultimately, the faculty and students who practice in thecommunity will have the greatest direct influence.
More transformative benefits are possible for the community if servicelearning efforts are designed to enhance the capacity of the community to addressproblems on its own. How might a service learning course be structured toenhance community capacity? What goals should guide faculty and student,and therefore university, engagement? These questions shaped our effortsover several years as students, faculty, community members, communityadvocates, and I worked in and with an urban neighborhood to addressenvironmental quality issues. The “framework,” which is still evolving, isdescribed here.
A SERVICE LEARNING FRAMEWORK FOR ENHANCINGCOMMUNITY CAPACITY
A set of interrelated principles has framed the design of our classroomactivities and work with community members, based on the following directives:
1. Provide a tangible, genuine, and timely benefit that meetscommunity needs as a minimum expectation for each project.Community-defined needs must be at the heart of student activities.Engagement in a community not only requires preparation and effortby faculty and students, but also requires impetus and motivationby the community organization. Such organizations tend to havelimited resources and time, which are grounds to welcome universityinvolvement. The faculty and students should provide a tangiblebenefit to the organization and the neighborhood that outweighsthe organization’s opportunity costs for its involvement.
2. Sensitize students to the challenges faced by neighborhoodparticipants in their efforts to develop their community. The servicelearning class must satisfy academic learning goals, and in ourmodel, the class must strive to sensitize students to the needs ofthe community as partners in development, not as clients in need ofcharity (Kahne & Westheimer, 1996; Maybach, 1996). Thetransformative education of the student as he or she integratesacademic knowledge with practical knowledge can be facilitatedthrough reflection that places the act of service in its social, political,

76 Journal of the Community Development Society
and economic contexts (Kupiec, 1993). For our work, the goals ofreflection include an examination of the intellectual, civic, ethical,or cross-cultural dynamics of the service experience in theneighborhood, and the goals include time spent reflecting on theexperience with other students and community partners (Kellogg, 1999b).
3. Engage students and neighborhood organization staff and/orresidents together in a variety of capacity-building activitieswhenever possible. The greatest benefits to the community accruedfrom activities in which the community participants worked withstudents. Community members had prior experience in working onneighborhood problems, but they were not familiar with manyaspects of the environmental problems they wanted to address. Ihoped that working with students would facilitate absorption of agreater amount of information and would sensitize students andcommunity members to each other’s needs in the time availableduring an academic quarter (semester). Initially, service learningclasses were held during the quarter and later during the semester,as the university restructured its 10-week quarter system to a 16-week semester system. These joint activities would help create alearning community comprised of community members who couldaddress community needs in the future (Honnet & Poulsen, 1989;Kraft, 1996).
4. Teach and share a process for solving problems. A problem-solving structure for learning has been used across academicdisciplines. It proved to be an effective, if sometimes challenging,mechanism for learning (Yamane, 1996; Yelsma, 1994). A problem-solving framework offers two benefits: development of an intellectualprocess that can be applied to successive learning situations, andexperience working out intellectual, political, and personaldifferences during the process (Raskoff, 1997). Over the course ofcarrying out the projects described below, our student-faculty teamused all or some of a classic multi-step problem-solving process toaddress the community’s environmental concerns: problemidentification, data need assessment and retrieval, data analysis,generation and evaluation of action alternatives, and actionimplementation. Such processes as a framework for learning havebeen used successfully with adult learners (Iraksen & Teffinger,1985). Our objective was to develop enhanced social capital forsolving problems. Focus on problem-solving as a process couldassist here because it can be adapted for use by community membersafter the service learning class was concluded.
Kellogg 77
CASE STUDY: ENHANCED ACCESS TO AND USE OFINFORMATION FOR ENVIRONMENTAL PROBLEM-SOLVING IN
AN URBAN NEIGHBORHOOD
Urban Environmental Quality
Deteriorating environmental quality and the resulting consequenceson human health have emerged as high priority issues in many urbanneighborhoods. Aging industrial cities in the United States suffer from a varietyof problems caused by pollution that stress the health of urban residents. Someof the sources of pollution include emissions of acutely hazardous chemicalsinto the air, concentrated automobile-generated ozone, the presence of hazardouswaste (generators and waste treatment, storage and disposal facilities), anduncontrolled closed hazardous waste sites. While one-to-one correspondenceof exposure to particular pollutants to particular disease outcomes has onlybeen established for a small number of pollutants, a growing body of scientificknowledge suggests a connection between the mix of urban pollutants anddecreased health and quality of life for many urban residents. Residents ofurban areas exhibit higher-than-national averages in deaths from cardio-pulmonary disease attributable to particulate air pollution (NRDC, 1996), andhigher-than-national averages in deaths from lung cancer, breast cancer, andpediatric cancer (Goldman, 1991).
Neighborhood-based organizations tended not to focus on“environmental” problems per se in the past, but many of the issues they haveaddressed, including unhealthy housing conditions, children’s health, andcontaminated vacant lots, represent important components of environmentalquality. Despite their relative lack of experience, members of community-basedorganizations are playing an increasingly important role in accessing resourcesand mobilizing citizens to address environmental quality concerns (Kellogg,1999a; Heiman, 1997).
Enhanced Information Use for Neighborhood-based EnvironmentalPlanning and Action
At the foundation of efforts to address environmental concerns are theavailability and use of information by citizens and their community-basedorganizations. A community development corporation (CDC) working in aCleveland neighborhood came to us in search of information on the location ofhistoric, small industrial facilities that may have contaminated properties and onthe air pollutants that were being discharged from several industrial facilities inthe neighborhood. As our student-faculty team continued discussions withCDC staff members, we formulated a set of information types that would beneeded to answer their questions: environmental conditions (levels of soilcontaminants, presence of chemicals in the air, etc.); possible exposure pathwaysto judge relative health risks these contaminants impose; and agency programs

78 Journal of the Community Development Society
and practices (availability of agency resources, agency mandates and authority)to understand which government agencies had regulatory responsibility andwhat a given agency could do about a specific problem.
Two types of obstacles can impede efforts by community-basedorganizations and citizens to access environmental information and use iteffectively: those resulting from citizen capacity and those resulting from agencypractices. Obstacles of citizen capacity include uncertainty about whatinformation is available or where to obtain it, less-than-needed education andexperience to understand scientific and technical information, and the absenceof skills needed to process data into knowledge that is useful and relevant to theneighborhood. Citizens and their organizations can, however, improve theircapacity to access and use highly technical information by engaging in theprocess of knowledge production (identifying information needs, collecting data,and building capacity to understand and use data) (Kellogg, 1998; Kweit &Kweit, 1987; Susskind & Elliot, 1983).
Government agencies can also present a challenge by framinginformation-gathering in a particular regulatory context. An agency may emphasizethe processing of data predominantly from regulated facilities to ensure permitcompliance, a process that has structured the information that is collected. Asthe regulated facilities were asked to provide increasing amounts of data, theyasked the agencies in turn to assemble data at a higher and higher technical levelfor use by the facilities. While regulatory agencies make some informationavailable to the public, the President’s Council on Sustainable Development(PCSD), an agency that existed from 1993 to 2000, noted the often difficultconditions under which information is available: “The government already hascollected an abundance of information, but often it is not available to policymakers or the public in a form they can use” (PCSD, 1994). Informationtechnologies such as the Internet are used more often by government agencies,sometimes replacing more traditional access methods (Coder, 1997), but lack ofaccess to these technologies in many urban neighborhoods is likely to aggravatedifficulties in obtaining information (Kellogg, 2002b). Agencies have beenuncertain about issuing directives, given the resource constraints typical ofpublic information offices, to best suit the needs of community organizationsand citizens (Coder, 1997; Skowronski, 1997).
Universities and their students have a special capacity to work withurban neighborhoods to facilitate more effective access to, and use of,information. As repositories of information, universities typically employcomputer labs and retain a group of individuals highly trained in informationaccess and use. University faculty and students can help communityorganizations modify data to create information that is more meaningful anduseful to neighborhood organizations and residents.
Our goals to produce knowledge for the service learning classes werefour: (1) to help provide information that was meaningful for addressing
Kellogg 79
neighborhood concerns; (2) to develop information resources and tools that theorganization could use to be more effective knowledge “consumers” anddisseminators; (3) to help the organization become involved in generatinginformation relevant to its needs; and finally, (4) to work with the community sothat it gained the problem-solving capacity needed to effect change (Gaventa,1993). The ultimate goal was to facilitate among neighborhood leaders theknowledge base that would support their participation in the public decision-making processes that determine environmental quality in their neighborhood.
The Neighborhood and Its Organization
St. Clair-Superior is a low-income neighborhood (1999 medianhousehold income, $19,000) in the northeast section of the City of Cleveland,near the downtown area and on the shore of Lake Erie. The neighborhood’sapproximately 11,410 residents are culturally and ethnically diverse.1 Land use inthe neighborhood is a mix of residential, industrial, and commercial. Industrialfacilities and small residential streets are often contiguous, typical of urbanneighborhoods settled in the last decades of the nineteenth and early twentiethcenturies. Discharges of toxic vapors and smoke from several dozen industrialfacilities are ubiquitous.2 The neighborhood shares characteristics with manyolder urban neighborhoods, with problems of disinvestment, crime, abandonedhousing, vacant parcels, high unemployment, poverty, and environmentaldegradation.
The St. Clair-Superior Neighborhood Development Corporation(SCSNDC), the community partner for our student-faculty projects, is acommunity development organization working with a well-established networkof block and street clubs, business associations, social clubs, and churches toaddress these problems. SCSNDC is recognized by the City of Cleveland as theCDC for the area and is funded by the city, private foundations, federal and stategrants, and corporate donations. The organization has five full-time staff memberswho organize neighborhood block clubs, coordinate rehabilitation of multi-familyand single family housing, provide marketing assistance to merchants, promotesmall business development in the area, administer a job search assistanceprogram, and administer a city-sponsored pediatric lead-poisoning awarenesseducation and abatement program.
The Service Learning Projects
The service learning framework described above was used in severalservice learning projects and classes in the St. Clair-Superior neighborhoodduring four semesters over a three-year period. For each project, I discuss ourobjectives, the activities related to problem-solving and information use, thecapacity-building activities undertaken during the project, and the capacity-building outcomes. Figure 2 presents a schematic representation of the projects.
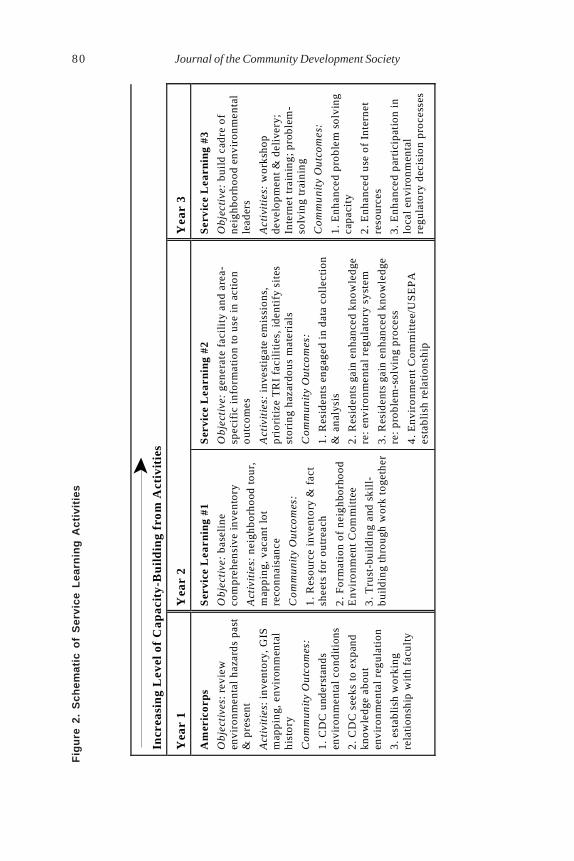
80 Journal of the Community Development SocietyF
igu
re 2
. S
chem
atic
of
Ser
vice
Lea
rnin
g A
ctiv
itie
s
In
crea
sin
g L
evel
of
Cap
acit
y-B
uil
din
g fr
om
Act
ivit
ies
Yea
r 1
Yea
r 2
Y
ear
3
Am
eric
orp
s
Ob
ject
ives
: re
view
en
viro
nmen
tal
haza
rds
past
&
pre
sent
Act
ivit
ies:
inv
ento
ry, G
IS
map
ping
, env
iron
men
tal
hist
ory
Co
mm
un
ity
Ou
tco
mes
:
1. C
DC
und
erst
ands
en
viro
nmen
tal
cond
itio
ns
2. C
DC
see
ks t
o ex
pand
kn
owle
dge
abou
t en
viro
nmen
tal
regu
lati
on
3. e
stab
lish
wor
king
re
lati
onsh
ip w
ith
facu
lty
Ser
vice
Lea
rnin
g #
1
Ob
ject
ive:
bas
elin
e co
mpr
ehen
sive
inv
ento
ry
Act
ivit
ies:
nei
ghbo
rhoo
d to
ur,
map
ping
, vac
ant
lot
reco
nnai
sanc
e
Co
mm
un
ity
Ou
tco
mes
:
1. R
esou
rce
inve
ntor
y &
fac
t sh
eets
for
out
reac
h
2. F
orm
atio
n of
nei
ghbo
rhoo
d E
nvir
onm
ent
Com
mit
tee
3. T
rust
-bui
ldin
g an
d sk
ill-
bui
ldin
g th
roug
h w
ork
toge
ther
Ser
vice
Lea
rnin
g #
2
Ob
ject
ive:
gen
erat
e fa
cili
ty a
nd a
rea-
spec
ific
inf
orm
atio
n to
use
in
acti
on
out
com
es
Act
ivit
ies:
inv
esti
gate
em
issi
ons,
p
rior
itiz
e T
RI
faci
liti
es, i
dent
ify
site
s st
orin
g ha
zard
ous
mat
eria
ls
Co
mm
un
ity
Ou
tco
mes
:
1. R
esid
ents
eng
aged
in
data
col
lect
ion
& a
naly
sis
2. R
esid
ents
gai
n en
hanc
ed k
now
ledg
e re
: en
viro
nmen
tal
regu
lato
ry s
yste
m
3. R
esid
ents
gai
n en
hanc
ed k
now
ledg
e re
: pr
oble
m-s
olvi
ng p
roce
ss
4. E
nvir
onm
ent
Com
mit
tee/
US
EP
A
esta
blis
h re
lati
onsh
ip
Ser
vice
Lea
rnin
g #3
Ob
ject
ive:
bui
ld c
adre
of
neig
hbor
hood
env
iron
men
tal
lead
ers
Act
ivit
ies:
wor
ksho
p de
velo
pm
ent
& d
eliv
ery;
In
tern
et t
rain
ing;
pro
blem
-so
lvin
g tr
aini
ng
Co
mm
un
ity
Ou
tco
mes
:
1. E
nhan
ced
prob
lem
sol
ving
ca
paci
ty
2. E
nhan
ced
use
of I
nter
net
reso
urce
s
3. E
nhan
ced
part
icip
atio
n in
lo
cal
envi
ronm
enta
l re
gula
tory
dec
isio
n pr
oces
ses
Kellogg 81
Year 1: Americorps Research
In 1994, the SCSNDC hired the Data/Geographic Information Systems(GIS) center at the Maxine Goodman Levin College of Urban Affairs to create aGIS map of the service area of the neighborhood. In 1995-1996, a Cleveland StateUniversity Americorps3 graduate student collected information aboutenvironmental hazards in the neighborhood, including the incidence of elevatedpediatric blood lead-poisoning levels, the location of hazardous materials storagesites, and the location of leaking underground storage tanks (LUSTs) whichwere mapped using GIS. Two students and I then developed a history of landuses that might indicate the presence of soil contamination. The SCSNDC thenasked if the students, faculty, and I would complete an environmental history ofthe neighborhood that documented changes in land use, surface water,development of public infrastructure, and development of railroads and industryas these created environmental problems in the neighborhood. This projectgave the SCSNDC staff an understanding of the environmental quality issuesthe neighborhood faced from current and historic sources (Kellogg, 2002a).
During the course of these projects, SCSNDC staff recognized theneed to have a more comprehensive assessment of environmental conditionsand assets, indicating a more integrative view of the knowledge they desired.The staff began to question which agencies held authority to address problems(the city’s public health department, the state or federal EPA, etc.), to express aninterest in using GIS for organizing their neighborhood data, and to make mapsfor its outreach and organizing efforts. The SCSNDC accepted my proposal tobring a service learning class to continue work in the neighborhood.
Year 2: Service Learning Class #1
The service learning class developed a comprehensive inventory ofenvironmental conditions in the neighborhood and a resource guide to assistthe staff in their outreach on environmental quality issues to the neighborhood’sblock and street clubs. The resource guide described not only conditions in theneighborhood (the inventory) but also the regulatory context for decision-making(local, state, and federal) and contact information for the appropriate agencies.Students and staff generated a set of fact sheets that could be used by theSCSNDC staff to inform residents who had questions about a particularenvironmental concern.
Early in the quarter, students toured the neighborhood with severalresidents who pointed out specific facilities with environmental problems.Students organized a tour of the sewage treatment plant that serves theneighborhood, including a demonstration of soil contaminant testing techniquesat the district USEPA laboratory, attended by several SCSNDC staff and residents.Students worked in four teams of three or four, each responsible for a differentsection of the inventory and resource guide. Data for the inventory was retrievedfrom a variety of local, regional, state and federal agencies using a wide range oftechniques, including telephone calls, diskette copies retrieved at agency offices,

82 Journal of the Community Development Society
and the Internet. Periodic meetings between students and SCSNDC staff reviewedprogress and reported on the data collection activities. Much of the data wasmapped using GIS.
Students organized a site reconnaissance in the neighborhood onseveral vacant lots that SCSNDC had identified as high priorities, located onstreets in need of reinvestment and stabilization. These lots were in the city’sland-bank program and were available for purchase by neighborhood residents,developers, and community development organizations. Students generated amap of the lot boundary and designed a site reconnaissance protocol. Each sitereconnaissance team of students, residents, and staff recorded site characteristics(such as presence of trash, foundation remnants or depressions, vegetation,etc.) on a walk-through of the site. This activity was one of the highlights of theclass, for students and residents spent extended time together with opportunitiesto talk about the neighborhood, its struggle to revitalize, and how the residentsviewed that effort in relationship to environmental concerns.
The project benefited the SCSNDC in several ways. It now had a usefulresource tool (resource guide and fact sheets) for its community improvementefforts.4 The project also enhanced the social capital of the neighborhoodregarding environmental problem-solving, as residents participated in data-gathering activities such as the site reconnaissance. Because of the class project,the SCSNDC organized an Environment Committee of residents and block clubleaders to begin addressing air quality issues in the neighborhood.
Year 2: Service Learning Class #2
Together the SCSNDC staff and students determined that theneighborhood’s needs would best be served by delving deeper into severalenvironmental problems that had been identified during the first service learningclass. The nine environmental and urban studies students and neighborhoodparticipants were divided into three teams. Neighborhood residents and CDCstaff together defined the problem, developed a work plan for development,collected data, and identified actions to improve the status of the problem. Eachteam assembled a resource portfolio that was left with SCSNDC and the blockclub at the end of the quarter. Team #1 worked with a block club concerned aboutemissions from a small motor “refurbishing” plant that emitted fumes andparticulates when it incinerated the plastic from old motors. Neighbors receivedlittle data regarding the facility because it was regulated by the local city healthdepartment, not the state EPA. The team concluded that the neighborhood neededto document emissions and their possible effects. The team investigated similarindustrial operations and incinerators to gain an understanding of the emissionsthat might be emitted. Subsequently, the team drafted a survey instrument forthe SCSNDC staff and block members to use in a house-to-house survey of residentssurrounding the facility and devised a plan to videotape facility emissions.
Team #2 worked with the Environment Committee to identify and ranka set of facilities in the neighborhood that report to the Toxic Release Inventory,

Kellogg 83
based on the amount and potential hazard of chemicals they emitted. Thisinformation and analysis process bolstered the neighborhood’s capacity andconfidence. Over the next two years, SCSNDC staff and the EnvironmentalCommittee met with the city health department’s Air Pollution Control Division,the Ohio Environmental Protection Agency, and the manager of the facility withwhich the SCSNDC was most concerned. The neighborhood now has anestablished relationship with both the regulators and the regulated entity, andmore recently, the neighborhood was invited to be involved in the process toreview the facility’s state air emission permit.
Team #3 updated information on leaking underground storage tanks(LUSTs), hazardous materials in facilities, and the county’s neighborhoodemergency evacuation plans in the event of a release of hazardous materials.They compiled a complete table of facilities that store hazardous materials in theneighborhood and identified personnel in charge of emergency responsemanagement at the facilities. The location of LUSTs and hazardous materialsstorage facilities were mapped using GIS, and copies were given to SCSNDC.
Because of our service learning class, the SCSNDC and block clubsdeveloped portfolios presenting information and tools that could be used tocontinue environmental problem-solving and action in the neighborhood. Theyengaged facility managers and regulatory agency staff in part because of theirincreased understanding of environmental regulations and their growingconfidence and capacity to organize around environmental health concerns, atestament to the benefits gained from the structure and activities of the servicelearning course.
Year 3: Service learning Class #3
In this third year, a second partner from the community, the SustainableCleveland Partnership (SCP), joined the project. SCP was formed to increasecitizen access to environmental information and to increase the capacity to useinformation effectively. To that end, the partners5 sought to develop and implementa series of environmental information training workshops to create a cadre ofneighborhood environmental leaders who could train other organizations andresidents in addressing environmental health concerns in several Clevelandneighborhoods. An SCSNDC staff member became one of the partners on theSCP, a sign indicating that the neighborhood had secured input into the structureand content of the training materials that an important local environmentalorganization was developing. Students assisted the SCP project director and mein designing and delivering the workshops, which again focused on access toand use of environmental information (problem-solving, federal regulations thatshape environmental data collection and availability to citizens, strategies forinformation management, and use of the Internet to retrieve environmental data).Each workshop lasted about two hours. All workshops used interactive exercisesthat involved the leadership trainees in problem solving exercises using a casestudy or concerns they raised about their own neighborhoods, and the exercises

84 Journal of the Community Development Society
involved them in searching for environmental information on the Internet. Severalneighborhood members (the SCSNDC staff member, an SCSNDC board memberwho is also a resident, and an SCSNDC resident Environmental Committeemember) participated in the training sessions.
Because of their participation in previous service learning classes, thestaff and residents from St. Clair-Superior have continued to expand theirparticipation in environmental decision-making processes. In the last two years,they have given testimony at a Title V air permit process concerning a facility inthe neighborhood, completing their own research and writing their own testimony.They continue to meet with regional Ohio EPA staff concerning air emissionsfrom several other facilities. The regional director of the Ohio EPA, who is anSCP partner, has welcomed them to a place “at the decision-making table.” Theyare now participating in a USEPA air toxic pilot program in Cleveland, in whichtheir knowledge of environmental regulations and air quality issues far surpassesanother neighborhood involved in the pilot. One of the most interestingoutcomes that illustrates the change in capacity among the neighborhood staffand residents is their ongoing collaboration with the SCP project director withoutthe university faculty and staff acting as intermediaries.
OBSERVATIONS: SUCCESSES, CHALLENGES, AND LESSONS
Our student-faculty team goals for involvement in communitydevelopment in these projects were to address “real-world” problems as prioritizedby community leaders, to work with the community to bring resources to beareffectively, and to build community capacity for environmental problem-solving.Developing materials and a process involving both students and communityresidents helped to resolve problems identified by the community and to enhancethe capacity of community residents and the staff of SCSNDC. The SCSNDCnow acts independently. It has formed partnerships with non-universityorganizations to address several environmental quality problems.
I sought to assess the extent to which our model of service learningwas effective for student learning, and overall I believe it succeeded because itsensitized university participants to the needs of the community. The structureof the service learning class in a problem-solving format integrated studentacademic and experiential learning in the community. Problem-solving thatincluded collaboration among the students, the neighborhood residents, andthe CDC staff engendered sensitivity in the students to the neighborhood.Students were inspired by the dedication of community members, and wereenthusiastic about the level of knowledge among the community participants.The students were grateful to do a project that they felt would make a positivedifference.
The projects generated a learning community consisting of students,residents and the community development organization, and created new skillsamong the community members. I believe that the designation of the class as a
Kellogg 85
“service learning class” resonated with neighbors and CDC staff. For thesecommunity leaders, giving service to their community and learning more aboutcommunity problems were already activities of high value. That students wantedto join with them in a partnership opened the community members, I believe, tonew learning methods such as a structured problem-solving model. They learnedalong with students. Our experience in this regard emphasizes the need forservice learning to be designed and implemented as a partnership with thecommunity, one that is recognized as such by both the students and thecommunity participants.
A sustained presence by any faculty member engaged in service learningcontributes to the longevity and constancy to build “institutional memory” thatis often needed to advance the types of activities undertaken to reach the nextlevel of capacity-building. The first two activities in the neighborhood weredominated by activities to collect data and produce documents. Gradually ourobjectives shifted to creating resource tools that the neighborhood could use,and then our focus shifted toward activities that would directly build the skills ofneighborhood residents and the CDC staff members to initiate and work onproblems. These higher-order activities included the site reconnaissance,searching for data on the Internet and working through the analysis of pollutants,and the environmental leadership training sessions.
The challenges associated with building a partnership between auniversity faculty member, students, and community development organizationsare substantial, however. Developing a partnership takes time and a willingnessto make mistakes and learn from each other. Residents always wanted to talkwith students at length at the beginning of the quarter to tell them their storiesabout the problems the neighborhood faced and how long they had been tryingto resolve them. Students often confessed later that their initial response tothese sessions was impatience. However, through our class discussions, studentsrealized that these sessions built the foundation of a relationship with theresidents and let the students begin to appreciate the broad social and politicalcontext within which they were working.
Providing this time for students and residents to begin to know eachother proved important for building trust as well. One of the greatest challengesregarding environmental health problems is for students to attain awareness ofthe degree to which citizens generally mistrust the regulatory institutions toprovide accurate data. As residents discussed their neighborhood’s problemswith the students, the residents repeatedly questioned whether the informationthey had received from the agencies, and the information the university mightbring to them, was accurate or “true.” The questions residents raised played agreat role in shaping the focus of our activities in the neighborhood. The student-faculty team and I let residents know that we had no access to any special dataother than what was provided by the federal, state, and local governments.What we could do, however, was to share our understanding of how the
86 Journal of the Community Development Society
information was generated (through monitoring, reporting, etc.), the ways inwhich it was used to make policies and set regulations, and the broad forces thataffected information management in the agencies. Ultimately, the degree to whicha community trusts the information provided by its government must be decidedby a community, based on its knowledge and experience, but not based onreassurances from the university. The interaction facilitated betweenneighborhood participants and agency staff through the projects has begun tobreak down long-standing frustration with and distrust of the agency as well.
One of the greatest challenges arises from the different culturalcircumstances from which the students and residents come. Students and thefaculty members operated initially on a 10-week quarter clock (and later, a 16-week semester clock), and because quarter time is relatively short, they areinclined to want to jump into the project as soon as possible. The organization,on the other hand, has been working in the neighborhood for years. Establishinga relationship was necessary to demonstrate a commitment to the neighborhoodby the university participants. The time spent to be acquainted with theneighborhood through tours and block club meetings to identify what we coulddo to meet their needs helped in this regard as well.
Another challenge encountered can be ameliorated somewhat by amore long-term relationship, but it was inherent when working with small,understaffed organizations. Sometimes it was apparent that the organizationhad difficulty in mobilizing time and resources to use student time and energymost efficiently when it was available. One implication for faculty and studentsconsidering service learning practice is to start small – to focus on parts ofproblems and the least complex tasks to build capacity in students and in theorganization with which one is working over time. Staff changes at non-profit,community-based organizations are difficult for the organization in terms ofefficiency and effectiveness, and the students, faculty, and I found the situationdifficult as well. The SCSNDC staff person with whom we had worked in yearone, and who had administered the city’s lead-poisoning awareness programbefore we began our work, left the organization just before the beginning of oursecond class. The staff person assigned to us had been with the organization forsome time, but had not worked on environmental issues before. He participatedin lead-poisoning awareness program training halfway through our class, whichcurtailed progress on two of the projects during that week as well. This staffperson participated in subsequent training and organized the EnvironmentCommittee with good results. Changes in staffing can be overcome if there is alonger-term, consistent relationship between the faculty and the organization.
The faculty and student team considered the possibility that difficultiesmight exist when working in low income and ethnically diverse neighborhoods,and two issues proved challenging. One issue was the representativeness of theparticipants in our projects when compared with the neighborhood characteristicsof age, ethnicity, religion, education, occupation, gender, and income. The older,
Kellogg 87
long-time Slavic residents, who have invested in the neighborhood for thelongest time, have been those most interested and active in working onneighborhood problems. The population of the neighborhood has changedsignificantly over the years the students, faculty, and I have worked there,however, primarily through loss of the white Slavic residents. Younger, newerAfrican American and Hispanic residents were poorer, and were preoccupiedwith raising children and with economic issues. It has been difficult for theSCSNDC to get these residents involved, although the organization has begunto see results. The participants in our classes, however, have been representativeacross the community’s institutions, including street and block clubs, CDC boardmembers, church leaders, and small business owners.
In addition to representativeness, a second issue was access tocomputers. Our work focused on information about environmental problems inthe neighborhood, and much of the information that has been assembled by theregulatory agencies is increasingly being made available through the Internet.The faculty-student team incorporated training in computer skills into ouractivities. However, the team found that very few residents with whom weworked had computers at home or had worked with computers. Their primaryaccess point for using the Internet was at the local library that did not haveenough computers or available reserved time for the training sessions. This lackof technology meant that for several computer-oriented classes, the team neededto transport participants to the university’s computer lab. Many residents lackedaccess to automobiles and faced increased travel time and cost to participate.The student-faculty team eventually either arranged for a small transit authoritybus or incorporated a travel stipend into the training sessions to offset theirincreased costs to address this challenge.
A final caveat stems from student-faculty experience that the challengeswe faced were overcome because of the relationship of trust that we developedbetween the faculty, organizational staff, and residents. We have been wary ofuniversity efforts to develop a “bank” of organizations needing student workthrough which faculty could find interesting service learning projects. Whilethis method might prove to bring added value to the community to some extent,we believe that more transformative benefits will accrue to the community througha process in which student projects build on previous activities and communityparticipants’ work through these various additive stages of knowledge andlearning. Faculty who commit to a longer-term focus in one place or with oneorganization that is willing to build a relationship, a partnership, will provide notonly a better experience for their students, but also will contribute to a greaterdegree to building community capacity.
These challenges can be addressed, and the effort is well worth it in ourexperience. In the end, students and faculty appreciated the experiencesencountered in urban neighborhoods. Students testified that because of theirservice experience, they felt an enhanced sense of community and a more positive
88 Journal of the Community Development Society
perception of the city. The university, through its support of our service learningefforts, has fulfilled its responsibility to the surrounding community to a greaterdegree. Moreover, most importantly, the community continues to gain capacityto direct its own environmental problem-solving activities.
ACKNOWLEDGMENTS
Faculty participation in the projects described in this paper wassupported by the Urban Center and the Urban Child Research Center, both at theLevin College of Urban Affairs, Cleveland State University; by a fellowship fromOhio Campus Compact, funded by the Corporation for National Service; and bya fellowship from the Program on Risk Analysis, Center for Environmental Science,Technology and Policy (CESTP) at Cleveland State University, funded throughUSEPA. Special thanks to Mary Shannon and Amy Wainio. Opinions or pointsof view expressed in this document are those of the author and do not necessarilyreflect the official position of the Corporation for National Service, the Learn andServe American Higher Education Program, the Urban Center or Urban ChildResearch Center, CESTP at Cleveland State, or USEPA.
NOTES
1. According to the 1990 census, the population was 12,000, with 56% AfricanAmerican, 36% white, and 7% Hispanic. Current figures from the 2000 Census categories are78% African American, 18% white, and 6% Hispanic (for respondents who indicatedthemselves as one race only). Data source: the Census CD and Maps, by Geolytics, Inc.
2. Present-day industrial activities include paint manufacturing, electroplating, tooland dye manufacturing, motor refurbishing, metal forging, plastic production, and printing.The neighborhood, which is less than four square miles, is host to nearly 20 facilities thatreport to the Toxic Release Inventory. The Toxic Release Inventory is data reportedannually by facilities emitting over 600 chemicals of a certain classification (toxins) andexceeding a threshold amount of 25,000 pounds. The United States EnvironmentalProtection Agency assembles this data and makes it available to the regulated communityand to the general public.
3. The Americorps program was one of the initiatives launched by the 1993 Nationaland Community Service Trust Act. It is modeled on the Peace Corps program. Under theprogram, students receive a modest stipend toward their tuition in exchange for their serviceon community projects.
4. The resource guide and environmental history (sans appendices) is available on-line at the following URL: http://urban.csuohio.edu/~wendy/StClr/Title.htm.
5. The SCP partnership is comprised of two local environmental advocacyorganizations, two national environmental organizations, city and county governments,several local non-profit social service-oriented organizations, the author’s college, twoneighborhood-based organizations, and state and federal environmental regulatory agencies.The work of the partnership is coordinated and staffed by the Cleveland’s Earth DayCoalition.
REFERENCES
Boyer, E. 1990. Scholarship Reconsidered: Priorities of the Professoriate. Princeton, NJ:The Carnegie Foundation for the Advancement of Teaching.

Kellogg 89
Boyer, E. 1996. The scholarship of engagement. Journal of Public Service & Outreach1(1): 11-20.
Bringle, R., & Hatcher, J. 1996. Implementing service learning in higher education. Journalof Higher Education 67(2): 221-239.
Coder, G. 1997. Personal Communication. USEPA Information Officer, Region V.
COOL. 1993. Into the Streets Manual. Available at: URL http://www.cool2serve.org/
Education Commission of the States. 1994. Service Matters. Providence, RI: CampusCompact.
Gaventa, J. 1993. The powerful, the powerless, and the experts: Knowledge struggles in aninformation age. Pp 21-40 in P. Park, M. Brydon-Miller, B. Hall & T. Jackson(eds.), Voices of Change: Participatory Research in the United States andCanada. Westport, CT: Begin & Garvey.
Gillespie, D. 1996. Service learning course evaluation form. Bennion Community ServiceCenter. Salt Lake City, UT: University of Utah.
Goldman, B. 1991. The Truth About Where You Live. New York: Times Books.
Harkavy, I. 1993. University-community partnerships: The University of Pennsylvaniaand West Philadelphia as a case study. In T. Kupiec, (ed.), Rethinking Tradition:Integrating Service with Academic Study on College Campuses. Denver:Education Commission of the States.
Harkavy, I., & Puckett, J. 1992. Universities and the inner cities. Planning for HigherEducation 20: 27-33.
Heiman, M. 1997. Science by the people: Grassroots environmental monitoring and thedebate over scientific expertise. Journal of Planning Education and Research16(4): 291-299.
Honnet, E. P., & Poulsen, S. (eds.). 1989. principles of good practice for combining serviceand learning, A wingspread special report. Racine, WI: The Johnson Foundation,Inc. Reprinted in T. Kupiec, (ed.), Rethinking Tradition: Integrating Service withAcademic Study on College Campuses. Denver: Education Commission of theStates.
Iraksen, S., & Treffinger, D. 1985. Creative Problem Solving: The Basic Course. NewYork: Bearly Limited.
Kahne, J., & Westheimer, J. 1996. In the service of what? The politics of service learning.Phi Beta Kappan (May): 593-599.
Keating, W. D., Krumholz, N., & Star, P. (eds). 1996. Revitalizing Urban NeighborhoodsLawrence: University Press of Kansas.
Kellogg, W. 1998. Adopting an ecosystem approach: Local variability in remedial actionplanning. Society and Natural Resources 11(5): 1-19.
Kellogg, W. 1999a. From the field: Observations on using GIS for community basedorganizations. Journal of Urban and Regional Analysis Systems 11(1):15-32.).
Kellogg, W. 1999b. Toward more transformative service learning: Experiences from anurban environmental problem-solving class. Michigan Journal of CommunityService Learning 6: 63-73.
Kellogg, W. 2002a. Nature’s neighborhood: The use of environmental history inneighborhood planning. Journal of the American Planning Association 68(4):1-16.
90 Journal of the Community Development Society
Kellogg, W. 2002b. Environmental justice and information technologies: Overcoming theinformation access paradox in urban communities. Public Administration Review63(5): 573-585 (in press).
Kraft, R. 1996. Service learning: An introduction to its theory, practice and effects.Education and Urban Society 28(2):131-159.
Kupiec, T. 1993. Introduction. In T. Kupiec, (ed.), Rethinking Tradition: IntegratingService with Academic Study on College Campuses. Denver: EducationCommission of the States.
Kweit, M., & Kweit, R. 1987. The politics of policy analysis: The role of citizenparticipation in analytic decision making. Pp.19-37 in J. Desario & S. Langton(eds.), Citizen Participation in Public Decision Making. Westport, CT.:Greenwood Press.
Maybach, C. 1996. Investigating urban community needs: Service learning from a socialjustice perspective. Education and Urban Society 28(2): 224-236.
NRDC. 1996. Breathtaking: Premature Mortality Due to Particulate Air Pollution in 219American Cities. Washington, D.C.: Natural Resources Defense Council.
PCSD. 1994. Sustainable America —A New Consensus. Available at: URL http://www.whitehouse.gov/WH/EOP/pcsd/info/executive-order.html. Washington, D.C.:President’s Council on Sustainable Development.
Raskoff, S. 1997. Group dynamics in service learning: Guiding student relations. MichiganJournal of Community Service Learning 4:109-115.
Reardon, K. 1994. Undergraduate research in distressed urban communities: An undervaluedform of service learning. Michigan Journal of Community Service Learning 1(2):44-54.
Rubin, V. 1998. The role of universities in community-building initiatives. Journal ofPlanning Education and Research 17(4): 302-311.
Silver, C. 1985. Neighborhood planning in historical perspective. Journal of the AmericanPlanning Association 51(2):161-174.
Skowronski, W. 1997. Ohio EPA, Northeast District, Personal Communication, May1997.
Susskind, L. & Elliot, M. 1983. Paternalism, conflict and co-production: Learning fromcitizen action and citizen participation. In L. Susskind & M. Elliot (eds.),Paternalism, Conflict and Co-production in Western Europe. New York: PlenumPress.
Yamane, D. 1996. Collaboration and its discontents: Steps toward overcoming barriers tosuccessful group projects. Teaching Sociology 24: 378-383.
Yelsma, P. 1994. Combining small group problem solving with service learning. MichiganJournal of Community Service Learning 1: 62-69.
UINTA COUNTY:A CASE STUDY IN WYOMING
LAND USE PLANNING
By Katherine Inman, Donald M. McLeod,and Roger H. Coupal
Journal of the Community Development Society Vol. 33 No. 2 2002
© 2002, The Community Development Society
Katherine Inman, Research Associate, Department of Psychology; Donald M. McLeod and Roger H. Coupal,Associate Professors in the Department of Agricultural and Applied Economics, University of Wyoming. Pleasedirect correspondence to Donald M. McLeod, Department of Agricultural and Applied Economics, College ofAgriculture, P.O. Box 3354, University of Wyoming, Laramie, WY 82071-3415. (307) 766-3116. Email:[email protected]
The authors acknowledge support from USDA-NRI Rural Development (Grant 99-35401-7742) for researchfunding.
ABSTRACT
Many Rocky Mountain States are experiencing unprecedented conversion of agriculturalland to residential use. An early 1980s oil boom in Uinta County, Wyoming, set a precedentfor rapid, unmanaged growth. Recent population growth and recreation pressures inneighboring Utah have again brought growth to rural Uinta County, though at a slower ratethan during the oil boom. This paper examines issues relevant to rural land use and planningin Uinta County. Data are from county focus groups and responses to a 1999 mail survey.Most respondents see growth as a problem and support preservation of environmentalquality and working ranch landscapes. Rural landowners may clash with respondents,concerned with growth management, over property rights issues. Findings in Uinta County,though unique in some ways, are useful for understanding Rocky Mountain residents’preferences for rural land use and policy.
Keywords: Agricultural land, development, land use policy, residentpreferences, rural communities.
INTRODUCTION
Land use in the Rocky Mountain West is changing from a “workinglandscape” based on mining, timber, and agriculture to one of leisure (Plotkin,1987, pp. 32-33). Western mountain states had higher population growth ratesbetween 1990 and 2000 than the rest of the country (U.S. Census Bureau, 2001b).Economic prosperity, early retirement in an aging population, and innovations intransportation, communications, and technology make rural relocationincreasingly possible (Brown et al., 1997; Champion, 1992; Frey & Johnson,1998). Rural counties near large metropolitan areas and those with environmentalamenities, especially mild climates, varied topography, and water access(McGranahan, 1999), are growing fastest (Beale & Johnson, 1998; Nelson, 1986;Power, 1996; Rudzitis & Johansen, 1989; Rudzitis, 1993).
92 Journal of the Community Development Society
People moving to the West for its scenic beauty and rural lifestylefrequently change the landscape with development (Power, 1996, p. 53).Residential development changes natural and scenic amenities, views, and wildlifemigration and habitat (Collinge, 1996; Theobald et al., 1997). Subdivisionsdeveloped next to public land holdings in the West cause fragmentation from anincrease in buildings, roads, and fences (Knight et al., 1995). Light, noise, andhuman presence disturbances affect wildlife habitat. Exotic species spreadunwanted weeds into agricultural crops. Roads and fences impede migrationand change the mix of species from those requiring larger unfragmented tracts ofland, to species that are adaptable to edge habitat (Theobald et al., 1997). Waterquality may be at risk with the proliferation of new septic systems, and increasednumbers of pets may prey on smaller wildlife.
Residential development has social impacts as well. New residentsunfamiliar with ranch practices may come into conflict with established ranchersover fencing, pets, water, access, weeds, dust, and odors. Fragmentation andconflicts with newcomers reduce operational viability for remaining ranchers,making sale of agricultural land more likely (Theobald et al., 1996; Zollinger &Krannich, 2001). While agricultural land usually pays more than its share ofcounty property taxes, new residential developments rarely pay for themselves(Daniels, 1999). Costs for community services and infrastructure increasedisproportionately with rural residential development, resulting in higher costsfor everyone (Coupal et al., 2001; Propst & Schmid, 1993). The cultural andhistorical heritage embodied by ranch life is diminished as land conversionincreases. When private land is developed, management of neighboring publiclands can become more complicated and costly, raising issues of recreationalaccess, water rights, liability, and public relations (Knight et al., 1995).
Awareness of the impacts of rural development is growing, as is supportfor land use planning and growth management. Both long-term and newerresidents value the open space associated with the ranching lifestyle (Smith &Krannich, 2000), and solutions are increasingly sought to manage growth in away that minimizes negative impacts. This paper examines circumstancessurrounding development of agricultural land in Uinta County, Wyoming.Evidence suggests that population growth is putting pressure on ranchers tosell or develop their land for residential housing. Uinta County experiencedrapid growth from an oil boom in the late 1970s and early 1980s, and growth islikely to continue. This paper provides information on preferences for land useand planning in Uinta County and lessons for other growing, amenity-richWestern counties.
THE PROBLEM
Daniels (1999, p. 45) identifies eight obstacles to effective growthmanagement in rural fringe areas. These are as follows: (1) “fragmented andoverlapping governments, authorities, and special districts; (2) the large size of

Inman, McLeod, and Coupal 93
fringe areas; (3) lack of a community, county, or regional vision; (4) lack of asense of place and identity; (5) newcomers, social conflicts, and rapid populationgrowth; (6) the spread of scattered new development; (7) too few planningresources; and (8) outdated planning and zoning techniques.”
These are general growth issues facing many communities, includingUinta County. County planners and commissioners invited researchers toconduct a survey in Uinta County to help update their master plan (#8) and geta sense of community vision (#3). These officials felt this was necessary due tothe potential for unmanaged rural growth in the area (#5 and #6). They felt betterable to apply current planning tools and resources, and pursue new strategiesthat reflected community visions and values for rural landscapes, if they hadinformation on residents’ and landowners’ visions for their county. Researchersthus explored the following research questions (RQ):
1) Do residents and landowners see growth in the county as aproblem?
2) How likely is future land development in the county?3) What do residents and landowners want their county to look
like? If development continues, what kind of development dothey want and where do they want it?
4) How much support is there for conservation efforts? Specifically,a.What kinds and characteristics of agricultural land dorespondents want to preserve?b.What kinds of preservation programs would they support?
5) How do current regulations support or limit potential planningefforts?Data and findings presented below are exploratory. A logistic regression
of respondent support for a conservation easement (CE) program on relevantindependent variables tests factors affecting support for CEs in the county.Literature on these factors is reviewed and hypotheses presented below.
Literature Review and Hypotheses
Respondents with different views on growth, planning, and the impactsof growth are likely to differ in their views on growth management. Rurallandowners would be most affected by a conservation easement (CE) program.They have expressed little support for CE programs without financial incentives(Gobster & Dickhut, 1988). They support private land management strategies(Inman & McLeod, 2002) and would keep agricultural land in agricultural andrecreation/wildlife uses (Inman et al., 2002). Community attachment, as measuredby length of residence (Sampson, 1988), has been significant in predictingsupport for rural land preservation (Cockerham & Blevins, 1977; Fortmann &Huntsinger, 1989), as have full- and part-time residence (Green et al., 1996).Long-term and full-time residents tend to support growth and economicdevelopment while new and seasonal residents support land managementstrategies.

94 Journal of the Community Development Society
Higher levels of education have been associated with support forenvironmental protection (Black & Reeve, 1993; Gobster & Dickhut, 1988; VanLiere & Dunlap, 1980; Wilson, 1992), and might therefore indicate support forland preservation. Age has been a significant predictor of environmentalprotection and land use. Older rural residents are likely to value agricultural landaesthetically (Kline & Wichelns, 1996), but may also use it productively (Wilson,1992) or sell it for added income (Gobster & Dickhut, 1988). Effects of income areuncertain (Buttel & Flinn, 1974; Gobster & Dickhut, 1988; Van Liere & Dunlap,1980) and may vary over time (Kline & Wichelns, 1996). Older, wealthierrespondents might support residential development of more remote rurallandscapes (Inman et al., 2002). Early evidence has been inconclusive (Van Liere& Dunlap, 1980), but later studies suggest that women are more environmentallyconcerned than men (Blocker & Eckberg, 1997) and participate in grass rootsenvironmental activism more than men (Dunlap & Mertig, 1992; Shabecoff, 1993).They might, therefore, support local land preservation efforts.
Logistic Regression Hypotheses. Those with greater concern for growthand planning, county appearance, and environmental amenities are expected tosupport a CE program. Those concerned with social entitlements (includingservices, infrastructure, and private property rights) are not likely to support aCE program. Rural landowners and long-term, full-time residents are not likely tosupport a CE program. Women and those with more education are likely tosupport a CE program. The influences of age and residence location are uncertain(see expected signs in Table 3).
THE UINTA COUNTY LAND USE PLANNING PROJECT
Uinta County is located in the southwest corner of Wyoming. Evanston,the county seat, is in the western part of the county and is the county’s majorpopulation center. Eastern Uinta County is largely agricultural with two small,incorporated towns (Lyman and Mountain View) and a handful of unincorporatedhamlets. BLM land and Union Pacific railroad checkerboard holdings covermost of the northern half and the eastern border of the county. Most productiveagricultural land and incorporated areas lie along river valleys in the southernhalf of the county. The high Uinta Mountains rise in a striking backdrop justover the southern border in Utah. These peaks hold a wilderness area andprovide a variety of year-round recreation opportunities. A small part of theWasatch National Forest arches into the southern part of the county.
Interstate 80 is a major truck route connecting Uinta County to Cheyenneand Denver to the east and Salt Lake City to the southwest. The railroad looselyparallels I-80, delivering goods and raw materials to and from the county. TheSalt Lake City airport and distribution center lies within 70 miles, providing bigcity culture, employment, and relatively easy travel access. This combination ofready access to a metropolitan area, coupled with scenic beauty to the south, is
Inman, McLeod, and Coupal 95
drawing new residents. Uinta is one of the most mineral dependent counties inthe state but has also developed some industries other than gas and oilproduction that provide stable opportunities for local employment.
Context and Forces for Change
Circumstances occurring over the past 20 years in Uinta County havetriggered changes in population, infrastructure, and housing needs that continueto have impacts on land use. These largely external forces have createdconditions conducive to further community growth. First, an oil boom in the late1970s and early 1980s brought a rapid influx of workers to the county. UintaCounty population increased nearly 44 percent between 1980 and 1990 (U.S.Census Bureau, 1990a). Growth slowed to just over 5 percent during the 1990s(U.S. Census Bureau, 2002). The need for housing and expanded schools followedpopulation growth. Property taxes increased dramatically. Sixty-three percentof ad valorem tax assessed valuation came from minerals (Wyoming Departmentof Revenue, 2001), a revenue source not directly linked to population. Long-term debt was incurred to build or expand schools, a library, county buildings,and a recreation center. County officials had difficulty collecting payments fromthe oil companies when the “bust” came, but the improved schools and otherfacilities were in place by then to serve future population growth1.
Demand for Housing. The oil boom brought a flood of workers whoneeded immediate and affordable housing. Mobile trailer homes supplied thatneed. These dwellings were unregulated in rural areas and park owners oftenprovided little infrastructure. More recent pressures, while less than in the oilboom years, continue to create demand for low-income housing. Summit County,Utah, southwest of Uinta County, grew by over 91 percent between 1990 and2000. Summit County is home to Park City, a ski town that is attracting recreationalvisitors and new homebuyers to nearby mountains. Service workers from ParkCity have moved to Uinta County seeking affordable housing. Mobile homeshave frequently met this demand. Second, recent standards passed in Utahregulating singlewide mobile homes resulted in export of over 800 units intoWyoming in the late 1990s. Several hundred of these were located in UintaCounty. Mobile homes have become a contentious subject among countyresidents. At issue is affordable home ownership versus appearance, safety,and surrounding land values.
Demand for mid-range housing and higher-end second homes has alsogrown. Professionals in the oil, gas, and trona industries have bought mid-priced homes in town and in outlying subdivisions. Recreational visitors fromUtah drive through the county to reach Utah’s Uinta Mountains to the south.Some have purchased land and built houses near the national forest. Local realestate agents report increasing inquiries for homes. Visitors to the 2002 WinterOlympics in Salt Lake City may have found Uinta County an attractive place tobuy land for a retirement or second home.
96 Journal of the Community Development Society
Land Availability and Conditions for Conversion. Land is still availablewithin the Evanston city limits, but pressure is being put on agricultural land forconversion to residential development. Ranchers report receiving million-dollaroffers for their land, according to a focus group participant. Beef prices continueto fluctuate. Yield and price risk relative to production costs make ranching lessviable for producers (Wyoming Agricultural Statistics Service, 1996). The averageage of Wyoming ranchers is increasing (Foulke et al., 2000), suggesting thatmore ranches will change hands. Ranchers may sell their lands to provide forretirement if they have no willing inheritors and need the cash. Inheritors maysell if they cannot afford to pay estate taxes or buy out non-ranching siblings(Zollinger & Krannich, 2001). Future land price increases could lead to speculationand land sale. The amount of land converted will depend on the amount soldand the density of development. The Union Pacific Railroad also began sellingrural checkerboard parcels in 1996 and 1997. The company decided it couldmake more money from land sales than from grazing leases and mineraldevelopment. This has made rural land available to both agriculture andresidential developers. Ranchers may not be able to compete with residentialprices for former grazing parcels.
Conversion of agricultural land is not occurring as fast in Uinta Countyas in Colorado’s Front Range, but change is apparent. Small “ranchettes” andhobby farms, of ten acres or more, increased at the expense of mid-sized ranches(500 to 1,000 acres), while larger ranches consolidated between 1987 and 1997(Wyoming Agricultural Census, 1997). Uinta County is just over 46 percentpublic land (State of Wyoming, 1999a). The remaining 54 percent, largelyagricultural land, is a target for future development. Data are examined below tounderstand what county residents and landowners want for Uinta County’srural landscape.
METHODOLOGY AND FINDINGS
The Uinta County survey was developed from focus groups conductedin September 1998. Three groups, consisting of east side residents, west sideresidents, and public officials, were chosen by the county commissioners.Participants were selected for their knowledge of county land use and planningissues. They represented a wide spectrum of land use interests. This knowledgeand local terminology were used to create the mail survey. The survey wasadministered to a random sample of households, described below, to elicitrepresentative views from all potentially interested and affected parties.
The Focus Groups
East side focus group participants included ranchers, mobile homedwellers, retirees, a construction contractor, and a developer. West side focusgroup participants included rural landowners, ranchers, a realtor, retirees, businesspeople, and mobile home dwellers. Public officials included state, county, and
Inman, McLeod, and Coupal 97
city officials (exact positions are withheld to protect individual identities), aswell as representatives of the Bureau of Land Management and U. S. ForestService. The resident focus groups met separately because of potential politicaldifferences. A preliminary meeting with county Farm Bureau members in MountainView confirmed a lack of trust on the part of east side ranchers for establishedcounty leaders based in Evanston to the west. They perceived a lack ofrepresentation for their differing views compared to west side residents. Surveyresponses, however, showed fewer differences than researchers were led toexpect (see McLeod et al., 2002).
Each focus group met for two and one half hours on two separate daysor evenings. Videos of Western population growth and land conversion issueswere shown to each group. A trained facilitator monitored discussion on topicsthat included shared resources; private property and public interests; land usepreferences for different types of landscapes; preferences regarding landscapechanges and dwelling types; subdivisions; impacts and conflicts resulting fromgrowth; and growth management strategies.
The Survey
The mail survey was conducted in spring of 1999 using Dillman’s (1978)Total Design Method. A random sample was taken from a list of all countyhouseholds and out-of-county landowners. The list was developed from propertytax rolls and the August 1998/99 US West telephone “white pages” for UintaCounty. Landowners (including those living outside the county) and non-landowner households were targeted because, either as residents, voters, and/or property tax payers, they were likely to be involved in or affected by land usedecisions. Randomly, 2,100 addresses were chosen from the list. Sampling wasbased on three resident groups: east side residents, west side residents, andabsentee landowners. The proportion sampled for each group was based on theactual percentage of households in each group within the total population. Thereturn rate was 43 percent after undeliverable surveys were subtracted from thetotal sent.
Sample Validity. Validity of the responses depends on howrepresentative respondent views are of the target population (see McLeod et al.,2002). Respondent characteristics were compared with U. S. Census statistics todetermine how representative the sample was of county residents in general.Out-of-county landowners were not included because U.S. Census figures werefor county residents only. A similar proportion of residents (55.4, 11.7, and 6.4percent) responded as actually live in Evanston (57.9 percent), Lyman (10.2percent), and Mountain View (6.5 percent), according to 1998 Census estimates(U.S. Census Bureau, 2000b). The respondents’ median age (46 years) was olderthan the Census 2000 median age (31.4 years) for Uinta County (U.S. CensusBureau, 2001a). A good part of survey respondents’ higher median age can beattributed to the exclusion of those under age 18.

98 Journal of the Community Development Society
The U.S. Census estimate of 1997 median household income for UintaCounty was $43,939 (U.S. Census 2002). Survey respondents’ 1998 medianhousehold income (measured in income ranges) was about $50,000. Thisdiscrepancy could be due in part to increased income levels between 1997 and1999. Survey respondent incomes may also be slightly higher than countymedian income.
Education levels of full-time resident respondents (in 1999) were veryclose to Wyoming Census figures for 2000. In 1999, 94 percent of surveyrespondents had at least a high school diploma; 26 percent had a four-yearcollege degree or more. The 2000 Wyoming average education levels were 87.8percent with at least a high school diploma and 24 percent with college degreesare more (U.S. Census, 2000a). The fact that survey respondents include thoseaged 18 and above may account for the somewhat higher reported rate of highschool diplomas. U.S. Census figures only include those aged 25 and above.Uinta County education levels for 1990 were also slightly higher than theWyoming average (U.S. Census 1990b), suggesting that Uinta County mightaverage higher education levels in general.
Data and Results
Measurement descriptions and results are reported below. Summarydescriptive data are reported in McLeod et al. (2002) as noted. Data address thefirst four research questions (RQ1-4) in the “problem” section above. A logisticregression was calculated on preferences for conservation easement programsto estimate significant factors contributing to support for preservation efforts(RQ4b). Land use planners can use these findings to focus on issues ofimportance to their constituents.
Perception of the Problem (RQ1). Table 1 reports how respondentsfelt on issues related to growth and conversion of agricultural land in UintaCounty. The issues were grouped into conceptually consistent categories,based on responses, using cluster analysis. Variables were grouped with factorrotation. Non-overlapping clusters were then determined using the SASVARCLUS procedure (SAS Institute, Inc., 1999, p. 99). This produced fourgroups of issues: (1) growth and planning; (2) landscape appearance; (3) socialentitlements potentially affected by growth; and (4) environmental amenitiespotentially affected by growth.
Over 75 percent of respondents thought it important to extremelyimportant for the county land use plan to address all issues except singlewidemobile homes. Two-thirds thought the issue of mobile homes was important toextremely important. Increased population was seen as less important, whileover half of the respondents thought unplanned residential growth and lack ofland protection were very to extremely important. Nearly two-thirds felt loss ofagricultural land and lack of planning coordination were very to extremely
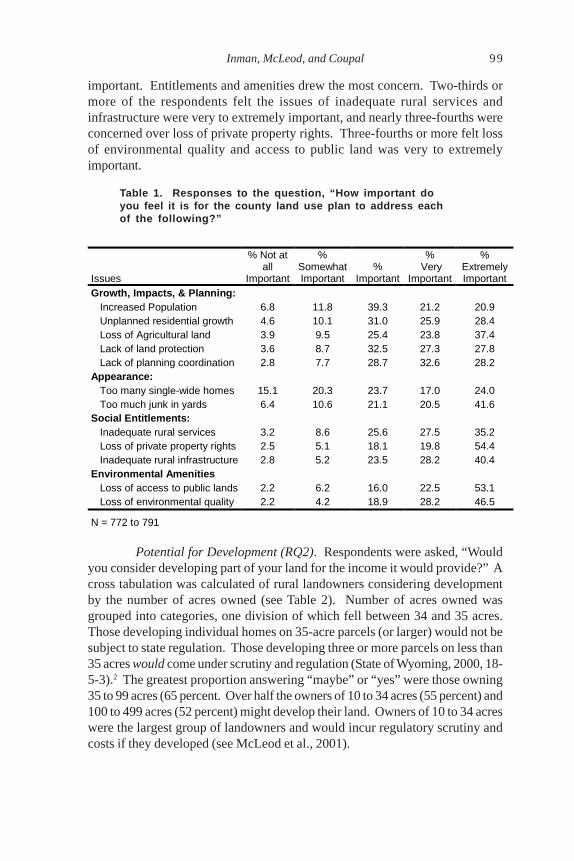
Inman, McLeod, and Coupal 99
important. Entitlements and amenities drew the most concern. Two-thirds ormore of the respondents felt the issues of inadequate rural services andinfrastructure were very to extremely important, and nearly three-fourths wereconcerned over loss of private property rights. Three-fourths or more felt lossof environmental quality and access to public land was very to extremelyimportant.
Table 1. Responses to the question, “How important doyou feel it is for the county land use plan to address eachof the following?”
Potential for Development (RQ2). Respondents were asked, “Wouldyou consider developing part of your land for the income it would provide?” Across tabulation was calculated of rural landowners considering developmentby the number of acres owned (see Table 2). Number of acres owned wasgrouped into categories, one division of which fell between 34 and 35 acres.Those developing individual homes on 35-acre parcels (or larger) would not besubject to state regulation. Those developing three or more parcels on less than35 acres would come under scrutiny and regulation (State of Wyoming, 2000, 18-5-3).2 The greatest proportion answering “maybe” or “yes” were those owning35 to 99 acres (65 percent. Over half the owners of 10 to 34 acres (55 percent) and100 to 499 acres (52 percent) might develop their land. Owners of 10 to 34 acreswere the largest group of landowners and would incur regulatory scrutiny andcosts if they developed (see McLeod et al., 2001).
Issues
% Not at all
Important
% Somewhat Important
% Important
% Very
Important
% Extremely Important
Growth, Impacts, & Planning: Increased Population 6.8 11.8 39.3 21.2 20.9 Unplanned residential growth 4.6 10.1 31.0 25.9 28.4 Loss of Agricultural land 3.9 9.5 25.4 23.8 37.4 Lack of land protection 3.6 8.7 32.5 27.3 27.8 Lack of planning coordination 2.8 7.7 28.7 32.6 28.2 Appearance: Too many single-wide homes 15.1 20.3 23.7 17.0 24.0 Too much junk in yards 6.4 10.6 21.1 20.5 41.6 Social Entitlements: Inadequate rural services 3.2 8.6 25.6 27.5 35.2 Loss of private property rights 2.5 5.1 18.1 19.8 54.4 Inadequate rural infrastructure 2.8 5.2 23.5 28.2 40.4 Environmental Amenities Loss of access to public lands 2.2 6.2 16.0 22.5 53.1 Loss of environmental quality 2.2 4.2 18.9 28.2 46.5
N = 772 to 791
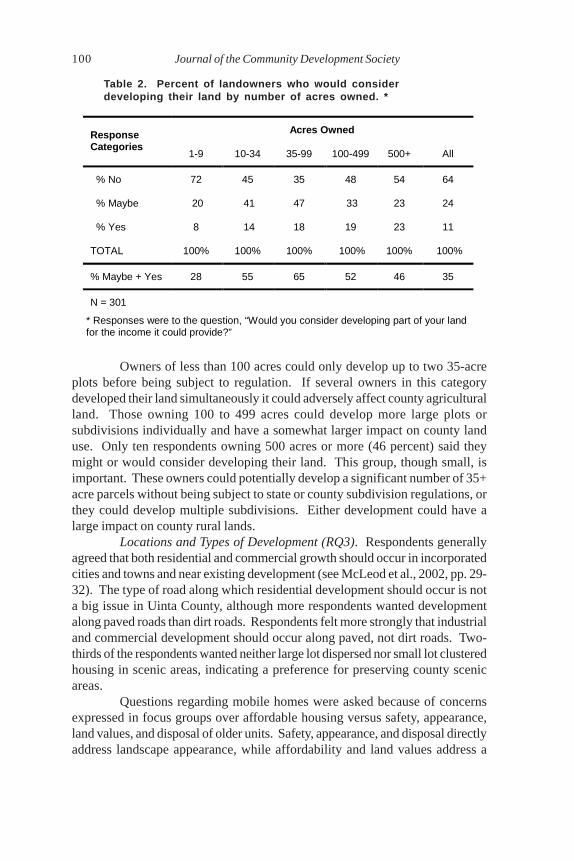
100 Journal of the Community Development Society
Table 2. Percent of landowners who would considerdeveloping their land by number of acres owned. *
Owners of less than 100 acres could only develop up to two 35-acreplots before being subject to regulation. If several owners in this categorydeveloped their land simultaneously it could adversely affect county agriculturalland. Those owning 100 to 499 acres could develop more large plots orsubdivisions individually and have a somewhat larger impact on county landuse. Only ten respondents owning 500 acres or more (46 percent) said theymight or would consider developing their land. This group, though small, isimportant. These owners could potentially develop a significant number of 35+acre parcels without being subject to state or county subdivision regulations, orthey could develop multiple subdivisions. Either development could have alarge impact on county rural lands.
Locations and Types of Development (RQ3). Respondents generallyagreed that both residential and commercial growth should occur in incorporatedcities and towns and near existing development (see McLeod et al., 2002, pp. 29-32). The type of road along which residential development should occur is nota big issue in Uinta County, although more respondents wanted developmentalong paved roads than dirt roads. Respondents felt more strongly that industrialand commercial development should occur along paved, not dirt roads. Two-thirds of the respondents wanted neither large lot dispersed nor small lot clusteredhousing in scenic areas, indicating a preference for preserving county scenicareas.
Questions regarding mobile homes were asked because of concernsexpressed in focus groups over affordable housing versus safety, appearance,land values, and disposal of older units. Safety, appearance, and disposal directlyaddress landscape appearance, while affordability and land values address a
Acres Owned Response Categories
1-9 10-34 35-99 100-499 500+ All
% No 72 45 35 48 54 64
% Maybe 20 41 47 33 23 24
% Yes 8 14 18 19 23 11
TOTAL 100% 100% 100% 100% 100% 100%
% Maybe + Yes 28 55 65 52 46 35
N = 301
* Responses were to the question, “Would you consider developing part of your land for the income it could provide?”
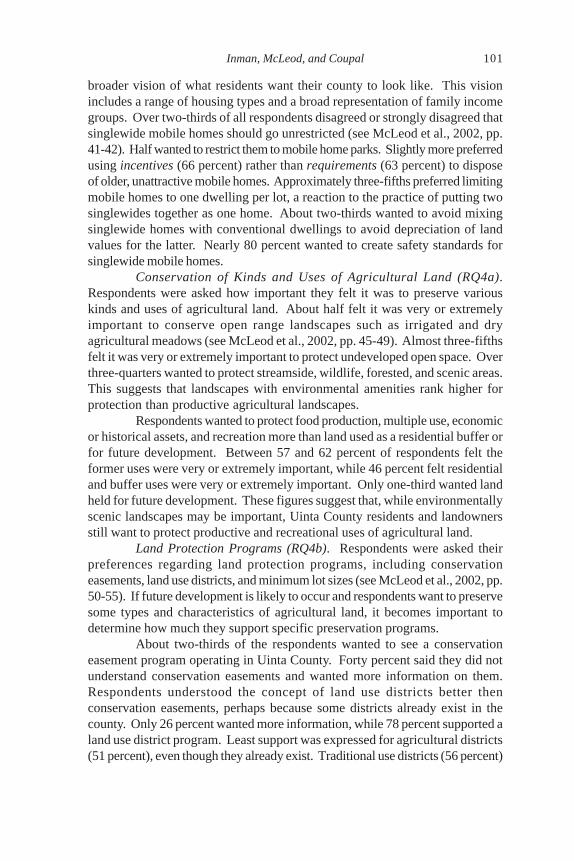
Inman, McLeod, and Coupal 101
broader vision of what residents want their county to look like. This visionincludes a range of housing types and a broad representation of family incomegroups. Over two-thirds of all respondents disagreed or strongly disagreed thatsinglewide mobile homes should go unrestricted (see McLeod et al., 2002, pp.41-42). Half wanted to restrict them to mobile home parks. Slightly more preferredusing incentives (66 percent) rather than requirements (63 percent) to disposeof older, unattractive mobile homes. Approximately three-fifths preferred limitingmobile homes to one dwelling per lot, a reaction to the practice of putting twosinglewides together as one home. About two-thirds wanted to avoid mixingsinglewide homes with conventional dwellings to avoid depreciation of landvalues for the latter. Nearly 80 percent wanted to create safety standards forsinglewide mobile homes.
Conservation of Kinds and Uses of Agricultural Land (RQ4a).Respondents were asked how important they felt it was to preserve variouskinds and uses of agricultural land. About half felt it was very or extremelyimportant to conserve open range landscapes such as irrigated and dryagricultural meadows (see McLeod et al., 2002, pp. 45-49). Almost three-fifthsfelt it was very or extremely important to protect undeveloped open space. Overthree-quarters wanted to protect streamside, wildlife, forested, and scenic areas.This suggests that landscapes with environmental amenities rank higher forprotection than productive agricultural landscapes.
Respondents wanted to protect food production, multiple use, economicor historical assets, and recreation more than land used as a residential buffer orfor future development. Between 57 and 62 percent of respondents felt theformer uses were very or extremely important, while 46 percent felt residentialand buffer uses were very or extremely important. Only one-third wanted landheld for future development. These figures suggest that, while environmentallyscenic landscapes may be important, Uinta County residents and landownersstill want to protect productive and recreational uses of agricultural land.
Land Protection Programs (RQ4b). Respondents were asked theirpreferences regarding land protection programs, including conservationeasements, land use districts, and minimum lot sizes (see McLeod et al., 2002, pp.50-55). If future development is likely to occur and respondents want to preservesome types and characteristics of agricultural land, it becomes important todetermine how much they support specific preservation programs.
About two-thirds of the respondents wanted to see a conservationeasement program operating in Uinta County. Forty percent said they did notunderstand conservation easements and wanted more information on them.Respondents understood the concept of land use districts better thenconservation easements, perhaps because some districts already exist in thecounty. Only 26 percent wanted more information, while 78 percent supported aland use district program. Least support was expressed for agricultural districts(51 percent), even though they already exist. Traditional use districts (56 percent)
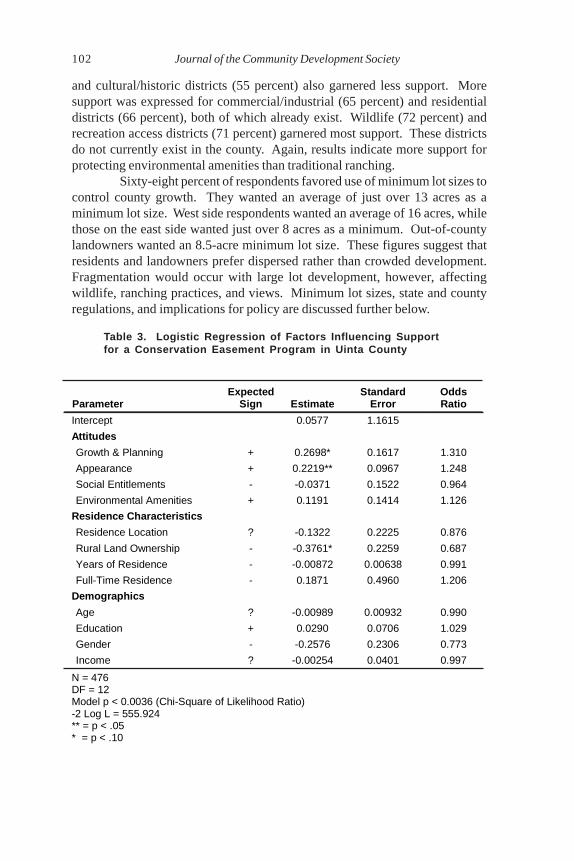
102 Journal of the Community Development Society
and cultural/historic districts (55 percent) also garnered less support. Moresupport was expressed for commercial/industrial (65 percent) and residentialdistricts (66 percent), both of which already exist. Wildlife (72 percent) andrecreation access districts (71 percent) garnered most support. These districtsdo not currently exist in the county. Again, results indicate more support forprotecting environmental amenities than traditional ranching.
Sixty-eight percent of respondents favored use of minimum lot sizes tocontrol county growth. They wanted an average of just over 13 acres as aminimum lot size. West side respondents wanted an average of 16 acres, whilethose on the east side wanted just over 8 acres as a minimum. Out-of-countylandowners wanted an 8.5-acre minimum lot size. These figures suggest thatresidents and landowners prefer dispersed rather than crowded development.Fragmentation would occur with large lot development, however, affectingwildlife, ranching practices, and views. Minimum lot sizes, state and countyregulations, and implications for policy are discussed further below.
Table 3. Logistic Regression of Factors Influencing Supportfor a Conservation Easement Program in Uinta County
Parameter Expected
Sign Estimate Standard
Error Odds Ratio
Intercept 0.0577 1.1615
Attitudes
Growth & Planning + 0.2698* 0.1617 1.310
Appearance + 0.2219** 0.0967 1.248
Social Entitlements - -0.0371 0.1522 0.964
Environmental Amenities + 0.1191 0.1414 1.126
Residence Characteristics
Residence Location ? -0.1322 0.2225 0.876
Rural Land Ownership - -0.3761* 0.2259 0.687
Years of Residence - -0.00872 0.00638 0.991
Full-Time Residence - 0.1871 0.4960 1.206
Demographics
Age ? -0.00989 0.00932 0.990
Education + 0.0290 0.0706 1.029
Gender - -0.2576 0.2306 0.773
Income ? -0.00254 0.0401 0.997
N = 476 DF = 12 Model p < 0.0036 (Chi-Square of Likelihood Ratio) -2 Log L = 555.924 ** = p < .05 * = p < .10
Inman, McLeod, and Coupal 103
Logistic Regression Model (RQ4b). Table 3 reports a logistic regressionanalysis of factors contributing to support for a conservation easement programin Uinta County, the dependent variable. Independent variables were groupedinto general categories including attitudes toward land use planning issues,community and residence characteristics, and demographic characteristics. Thesame attitude measures were used as were identified as issues of importance inTable 1. Pearson correlation coefficients were calculated on variables used inthe logistic regression. No variables were correlated above 0.47.
Regression results indicate attitudes about growth and planning aswell as about landscape appearance were positively correlated with support forconservation easements at the .10 and .05 levels respectively. Rural landownership was negatively correlated with support for conservation easements.Those most directly affected have the least support for an easement program,while those with most concern for county appearance and larger issues of growthmanagement were most supportive. No other variables were significant.Residence location (east, west, or out-of-county) made no difference in support,despite fears to the contrary by east side residents. Length of residence madeno difference, nor did any demographic variables. Concern for entitlements andamenities made no difference, even though loss of public access, loss ofenvironmental quality, and property rights ranked highest as issues of importancein Table 1. This may be due in part to the fact that there is so much agreement onthese subjects. Respondents may also be clear in their opinions about issues,but less clear on how they feel about actions related to those issues. Growthmanagement issues garnered less respondent support (see Table 1), indicating agreater difference in opinion about them. Creation of a conservation easementprogram is clearly a controversial issue between those who support growthmanagement and rural landowners.
CURRENT REGULATIONS AND GROWTHMANAGEMENT POLICY
Information presented here provides an opportunity for Uinta Countyto consider what it wants to do with regard to land use planning. Currentregulations influence how change can occur. Respondent preferences can beused to evaluate likely development scenarios and help guide county officials indecisions regarding enforcement of existing regulations and creation of newregulations and incentives. The following discussion addresses the fifth researchquestion by examining relevant state, county, and federal policies in relation tothe survey results and growth management and planning in Uinta County.
Residents and landowners do see growth as a problem, particularly itseffects on social entitlements and the environment. Private property rights,access to public lands, and environmental quality are of utmost importance.Ranchers’ property rights are protected to an extent by the “Wyoming Right toFarm and Ranch Act,” passed in 1991 (State of Wyoming, 2000, pp. 11-44). This

104 Journal of the Community Development Society
act protects farm and ranch operations from nuisance complaints if they conformto accepted agricultural practices and were operating before adjacent land wasconverted to other uses. It does not address owners’ rights to sell or developtheir land.
Access to public lands could be better protected than it is now undercounty land use district standards. Current districts only include agriculturaland natural resource, commercial/industrial, and residential districts (Uinta County,1999). Survey respondents supported recreational access districts as well aswildlife migration and winter range districts. The addition of these types ofdistricts to the current county Land Use Resolution (Uinta County, 1999) wouldhelp preserve public access as well as environmental amenities associated withwildlife and wildlife habitat.
Respondents’ concerns for impacts of growth on rural social servicesand infrastructure might be justified, given current policies in the Uinta CountyComprehensive Plan (Uinta County, 1984). Standards are set for higher-densityurban growth areas, while services are limited to the same amount provided toexisting rural homes and ranches for low-density rural development areas. Thismeans that new residential growth in dispersed areas might lack adequate servicesand infrastructure if private developers do not provide them.
More rural land is likely to be developed in the future. Impacts willdepend on the amount and density of development. Scenic and environmentalimpacts can be minimized and working landscapes protected if building permitsare granted based on guidelines for current and proposed land use districts, andon goals and policies of the Uinta County Comprehensive Plan. Residents andlandowners want to preserve landscapes with amenities and protect workingranches. Residential and commercial development would be largely segregatedfrom agricultural and other rural pursuits if current guidelines were followed.Survey respondents also want development to occur near cities, towns, andexisting development. The county’s comprehensive plan supports this.Encouraging development in these areas would reduce environmental impactsand costs of providing adequate services and infrastructure to newdevelopments.
Respondents want regulations on mobile homes to address safety,disposal, and surrounding land values, but they also want affordable homeownership options. Existing regulations on mobile homes at the state levelpertain to mobile home parks, manufacturing standards, and warranties (WyomingSecretary of State, 2001). County standards also focus on parks or courts (UintaCounty, 2000). Mobile homes on individual lots are considered single-familydwellings in Uinta County and are treated as such (Uinta County, 1999, V-3/4).Standards exist for “abandoned or burnt-out” individual mobile homes inresidential land use districts (Uinta County, 1999, V-3-h), but these standards donot apply to agricultural and commercial/industrial districts. Improvedcountywide regulations could address safety and disposal with minimal impact

Inman, McLeod, and Coupal 105
on property rights, especially if free disposal sites or financial aid for disposalfees were provided. Regulations to limit mixing mobile homes with conventionalhousing would affect individual rights but might be supported by wealthierlandowners.
Respondents supported a conservation easement program for thecounty. Conservation easements would provide ranchers with income to keepranching, thus preserving working landscapes. Some ranchers might be reluctantto participate, and conflicts could occur over county appearance and growthmanagement. Educational materials on conservation easement programs couldprovide information to make decisions about the type of program, sources offunding, and program administration that would be appropriate for the county.Emphasizing the voluntary nature of conservation easement programs wouldsupport private property rights.
Survey respondents supported minimum lot sizes in between thecounty’s current limit (1 acre with a well and septic system) (Uinta County, 1984)and the state’s 34-acre subdivision limit. Both state and county regulationswould have to be changed to accommodate this preference. Current stateregulations apply to parcels of less than 35 acres with three or more houses(State of Wyoming, 2000, 18-5-3). This effectively sets a 35-acre minimum lotsize. Ranchers who want to develop more than two parcels on their land arelikely to develop individual homes on 35 acres or more to avoid regulation.
Use of minimum lot sizes as a tool for preservation is deceptive.Preserving large acreages around each dwelling gives the appearance of openspace, but scenic qualities can be diminished, depending on the type, color, andplacement of houses. Agricultural production and watershed management arealso made more difficult, and wildlife habitat is altered or lost when landscapesare residentially fragmented this way (Collinge, 1996; Knight & Cole, 1995;Theobald et al., 1996; Theobald et al., 1997; Zollinger & Krannich, 2001). Sale ofrailroad land has this effect as well. The alternating checkerboard ownershippattern structures land fragmentation as a result of sale unless the parcel is soldfor continued agricultural use. Provision of services and infrastructure to newcheckerboard homes is difficult and continued ranching between convertedsquares would be less viable.
Smaller minimum lot sizes often lead to rapid conversion of agriculturalland when price per acre rises for smaller parcels (Daniels & Bowers, 1997).Development impacts could be minimized by clustering houses, requiring openspace, and enforcing “use by right” in current and proposed agricultural,recreational, and wildlife districts. County and state regulations are confusingwith regard to clustered housing, however. County residential district standardscurrently allow clustered development of up to seven houses per acre whereterrain, lower costs for services and infrastructure, and economical use of spacemake clustered housing more advisable (Uinta County, 1999, V-3-b-3). Provisionof open space is already required in compensation for greater housing density.
106 Journal of the Community Development Society
Cluster development regulations and minimum lot size regulations would haveto be reconciled. State subdivision regulations would not apply to clusterslocated at the intersecting corners of separate lots of 35 acres or more, each withonly one or two houses on it. The county minimum lot size regulation for singleunits would also not apply in this case.
Minimum lot size and clustered housing might be more appropriatelyaddressed by introducing maximum lot size regulations for residentialdevelopment, possibly with a maximum number of parcels per township, topromote housing density. Regulations on minimum farm size would encourageworking farms to continue. Minimum farm size could be set at or near the smallestaverage size of current working ranches so that all ranches, including the smallest,would comply with the new regulations (see Daniels & Bowers, 1997). A maximumallowable number of residential buildings could be set for each ranch to limitfurther development. This would allow ranchers to build a limited number ofhomes for family members. These solutions might impinge on individual ranchers’rights to develop parcels, but if applied to all landowners, may be perceived as afair compromise to achieve county-supported preservation goals.
CONCLUSION: PLANNING STRATEGIES FORTHE MOUNTAIN WEST
Open space is still abundant in Wyoming, suggesting little need forland preservation. Property taxes are low, making differential assessment anineffective preservation tool. Rural development in Uinta County is likely tooccur. The questions are where, when, and how much. If even one-quarter of alllandowners with 35 acres or more decides to develop part of their land, a significantrural conversion would take place. Add the development of railroad checkerboardand the results could be dramatic. Uinta County will continue to see developmentpressure on agricultural lands. New and expanded services and schools, arejuvenated urban center, and an experienced outlook on newcomers pave theway for additional growth.
Many strategies for land preservation in counties facing rapid growthhave been suggested in land use and planning literature (see Daniels, 1999, pp.167-74). Strategies suggested here fall into three categories: (1) planningresources, (2) regulatory techniques, and (3) incentives. All counties couldbenefit from keeping comprehensive plans and zoning ordinances up-to-date(Daniels, 1999, p. 137). Sound zoning and development guidelines and standardsexist in Uinta County. Local efforts to inform and guide development mustinclude improvements in monitoring and enforcement. Additional regulationsconcerning county appearance and location of development, as well asdesignation of more land use districts could help preservation efforts.
Counties that do not have a planner should hire one who is trained as aplanner, who is committed to staying in the community, and who will listen andbuild relationships of trust with landowners as well as residents. County planners
Inman, McLeod, and Coupal 107
should examine county and state regulations to see how they do or do notcoordinate with each other. County governments make most land use decisions,and states rarely coordinate with local comprehensive plans (Daniels, 1999, p. 136).
Wyoming provides a good example of a state that effectively sets aminimum lot size through subdivision regulations. Landowners, given feelingsagainst government regulation and for private property rights, are likely tocontinue developing large parcels if the state’s 35-acre subdivision limit is notreduced. County efforts could be made to change state regulations where theyconflict with positive planning on the county level. Fewer acres might bedeveloped and ranchers could gain needed income to keep ranching if theycould develop a few smaller parcels without being subject to regulation. Conflictsbetween ranchers and new residents could be minimized. The state right-to-farmlaw would assure ranchers continued support for production activities. Locationof dwellings in either clustered or small lot individual developments wouldmaintain scenic and environmental amenities and promote production onremaining land. Counties in other Western states should examine their state’sland use regulations to determine if conflicts arise with county guidelines.
Use of incentives respects the nature of voluntary participation andtherefore supports private property rights. Positive incentives include suchprograms as density bonuses for clustered housing development (Arendt et al.,1994, p. 229; Daniels, 1999, p. 172). “Conservation by design” (Arendt, 1996)lowers costs, appreciates land values, and contributes to a sense of place andcommunity by designing public areas for neighbors to meet. Land conversiontaxes (Daniels, 1999, p. 173), a negative incentive, encourage farmers and ranchersto retain land in agricultural uses.
Another incentive for southern Wyoming counties might be a grant orlow-interest loan program to help ranchers buy railroad checkerboard forcontinued agricultural uses. This would allow neighboring ranches to retainnearby grazing lands. A larger benefit would be the preservation of largeundeveloped tracts in agricultural use. One difficulty with such a programwould be funding. Political controversy might ensue if a public agency subsidizedprivate ranch businesses. Private organizations such as the American FarmlandTrust or the Nature Conservancy might support a loan program, although theytend to focus on areas such as Colorado with greater pressure for development.They, or the Wyoming Stock Grower’s Association, might support a program ifan endowment were established and buyers agreed to place a conservationeasement on the property at the time of purchase.
Combining planning resources, regulations, incentive programs, andgrowth management techniques could balance trade-offs between property rightsand preservation of agricultural land. A skillful mix of strategies could supportland preservation efforts while reassuring landowners of their ownership rightsand providing adequate, cost-effective services and infrastructure. Issues raisedin this study are important to residents and landowners across the Mountain
108 Journal of the Community Development Society
West. Conflicts between rural landowners and constituents concerned withcounty appearance, growth, and planning issues are likely to be contentious.Reconciling preferences to preserve open space and environmental amenitieswhile protecting private property rights will be a requirement for any countyseeking to address preservation of agricultural landscapes.
NOTES
1. Personal communication with Allen Fawcett, former Uinta County planner.2. Any development on less than 35 acres was regulated in 1999 (State of Wyoming,
1999b, 18-5-301 to 306).
REFERENCES
Arendt, R. G. 1996. Conservation Design for Subdivisions: A Practical Guide to CreatingOpen Space Networks. Washington, DC and Covelo, CA: Island Press.
Arendt, R. G., E. A. Brabec, H. L. Dodson, C. Reid, & R. D. Yaro. 1994. Rural By Design.Chicago and Washington DC: Planners Press, American Planning Association.
Beale, C. L. & K. M. Johnson. 1998. The identification of recreational counties in non-metropolitan areas of the United States. Population Research and Policy Review17: 37-53.
Black, A.W. & I. Reeve. 1993. Participation in landcare groups: The relative importanceof attitudinal and situational factors. Journal of Environmental Management 39:51-71.
Blocker, T. J. & D. L. Eckberg. 1997. Gender and environmentalism: results from the 1993General Social Survey. Social Science Quarterly 78(4): 841-858.
Brown, D. L., G. V. Fuguitt, T. B. Heaton, & S. Waseem. 1997. Continuities in size of placepreferences in the United States, 1972-1992. Rural Sociology 62: 408-28.
Buttel, F. H. & W. L. Flinn. 1974. The structure of support for the environmentalmovement, 1968-1970. Rural Sociology 39: 56-69.
Champion, A. G. 1992. Urban and regional demographic trends in the developed world.Urban Studies 29: 461-82.
Cockerham, W. C. & A. L. Blevins, Jr. 1977. Attitudes toward land-use planning andcontrolled population growth in Jackson Hole. Journal of CommunityDevelopment Society 8(1): 62-73.
Collinge, S. K. 1996. Ecological consequences of habitat fragmentation implications forlandscape architecture and planning. Landscape and Urban Planning 36: 59-77.
Coupal, R., D. T. Taylor, & D. M. McLeod. 2001. The Cost of County Rural ResidentialDevelopment: A Statewide Summary of Results. Laramie, WY: Department ofAgricultural & Applied Economics, University of Wyoming. Available at: http://agecon.uwyo.edu/EconDev/pubs.htm.
Daniels, T. L. 1999. When City and Country Collide: Managing Growth in the MetropolitanFringe. Washington, DC: Island Press.
Daniels, T. L. & D. Bowers. 1997. Holding Our Ground: Protecting America’s Farms andFarmlands. Washington, DC: Island Press.
Dillman, D. 1978. Mail and Telephone Surveys: The Total Design Method. New York:Wiley.

Inman, McLeod, and Coupal 109
Dunlap, R. E., & A. G. Mertig. 1992. American Environmentalism: The U. S.Environmental Movement, 1970-1990. Washington, DC: Taylor and Francis.
Fortmann, L., & L. Huntsinger. 1989. The effects of non-metropolitan population growthon resource management. Society and Natural Resources 2: 9-22.
Foulke, T., R. Coupal, & D. Taylor. 2000. Trends in Wyoming Agriculture: The ChangingDemographics of Wyoming Agricultural Operators (1959-1997). CooperativeExtension Service, Report No. MP-103. Laramie: College of Agriculture,University of Wyoming.
Frey, W. H., & K. M. Johnson. 1998. Concentrated inmigration, restructuring and the“Selective Deconcentration” of the United States population. In P. Boyle & K.Halfacree (eds.). Migration into Rural Areas. London: Wiley.
Gobster, P. H., & K. E. Dickhut. 1988. Factors influencing landowner acceptance of openspace preservation methods. Society and Natural Resources 1: 351-64.
Green, G. P., D. Marcouiller, S. Deller, D. Erkkila, & N. R. Sumathi. 1996. Localdependency, land use attitudes, and economic development: Comparisonsbetween seasonal and permanent residents. Rural Sociology 61(3): 427-45.
Inman, K., & D. M. McLeod. 2002. Property rights and public interests: a Wyomingagricultural lands study. Growth and Change 33(1): 91-114.
Inman, K., D. M. McLeod, & D. J. Menkhaus. 2002. Rural land use and sale preferences ina Wyoming County. Land Economics 78(1): 72-87.
Kline, J., & D. Wichelns. 1996. Public preferences regarding the goals of farmlandpreservation programs. Land Economics 72(4): 538-49.
Knight, R. L., & D. N. Cole. 1995. Wildlife responses to recreationists. In R. L. Knight &K. J. Gutzwiller (eds.). Wildlife and Recreationists: Coexistence throughManagement and Research. Washington DC: Island Press:
Knight, R. L., G. N. Wallace, & W. E. Riebsame. 1995. Ranching the view: Subdivisionsversus agriculture. Conservation Biology 9(2): 459-461.
McGranahan, D. A. 1999. Natural Amenities Drive Rural Population Change. AgriculturalEconomics Report No. 781. Washington, DC: U.S. Department of Agriculture,Economic Research Service.
McLeod, D. M., J. Woirhaye, & D. J. Menkhaus. 2001. Factors influencing support for ruralland use control: A reply. Agricultural and Resource Economics Review 30(2):212-14.
McLeod, D., K. Inman, R. Coupal, & J. Gates. 2002. Uinta County Land Use and PlanningSurvey Results. Wyoming Agricultural Experiment Station Report #B-1106.Laramie: University of Wyoming.
Nelson, A. C. 1986. Towards a theory of the American rural residential land market.Journal of Rural Studies 2(4): 309-19.
Plotkin, S. 1987. Keep Out: The Struggle for Land Use Control. Berkeley: University ofCalifornia Press.
Power, T. M. 1996. Lost Landscapes and Failed Economies: The Search for a Value ofPlace. Washington DC: Island Press.
Propst, L., & M. Schmid. 1993. The Fiscal and Economic Impacts of Local Conservationand Community Development Measures: A Review of the Literature. Bozeman,MT: The Sonoran Institute.

110 Journal of the Community Development Society
Rudzitis, G. 1993. Non-metropolitan geography: Migration, sense of place, and theAmerican West. Urban Geography 14(6): 574-85.
Rudzitis, G., & H. Johansen. 1989. Migration into western wilderness counties: Causes andconsequences. Western Wildlands (Spring): 19-23.
Sampson, R. J. 1988. Local friendship ties and community attachment in mass society: Amultilevel systemic model. American Sociological Review 53: 766-79.
Shabecoff, P. 1993. A Fierce Green Fire: The American Environmental Movement. NewYork: Hill and Wang.
Smith, M. D., & R. S. Krannich. 2000. ‘Culture Clash’ revisited: Newcomer and longer-termresidents’ attitudes toward land use, development, and environmental issues inrural communities in the Rocky Mountain West. Rural Sociology 65(3): 396-421.
SAS Institute, Inc. 1999. SAS/STAT User’s Guide, Version 8. Cary, NC: SAS Institute, Inc.
State of Wyoming. 1999a. Equality State Almanac. Cheyenne, WY: Division of EconomicAnalysis, Department of Administration and Information.
State of Wyoming. 1999b. Wyoming Statutes. Charlottesville, VA: LEXIS Law Publishing.
State of Wyoming. 2000. 2000 Wyoming Statutes. Available at: http://legisweb.state.wy.us/titles/statutes.htm.
Theobald D. M., H. Gosnell, & W. E. Riebsame. 1996. Land use and landscape change in theColorado Mountains II: A case study of the East River Valley. Mountain Researchand Development 16(4): 407-18.
Theobald, D. M., J. R. Miller, & N. T. Hobbs. 1997. Estimating the cumulative effects ofdevelopment on wildlife habitat. Landscape and Urban Planning 39:25-36.
Uinta County, Wyoming. 1984. Uinta County Comprehensive Plan. Evanston, WY: UintaCounty Planning and Zoning Commission.
Uinta County, Wyoming. 1999. Land Use Resolution, Land Use Districts (Zones).Evanston, WY: Uinta County Planning and Zoning Commission.
Uinta County, Wyoming. 2000. Uinta County Subdivision Resolution. Evanston, WY:Uinta County Planning and Zoning Commission.
U. S. Census Bureau. 1990a. Census of population and housing, Table 30, page 113.Available at: http://www.census.gov/prod/cen1990;cph2/cph-2-1-1.pdf.
U. S. Census Bureau. 1990b. Social Characteristics: 1990, STF 3. Available at: http://factfinder.census.gov/servlet/BasicFactsServlet.
U. S. Census Bureau. 2000a. Census 2000 Supplementary Survey. Available at: http://www.factfinder.census.gov/home/en/c2ss.html.
U. S. Census Bureau. 2000b. Place and County Subdivision Population Estimates. U.S.Census Bureau, Population Division: Available at: http://www.census.gov/population/www/estimates/citypop.html.
U.S. Census Bureau. 2001a. Profile of General Demographic Characteristics: 2000. U.S.Census Bureau, Census 2000. Available at: http://www2.census.gov/census_2000/datasets/demographic_profile/Wyoming/2kh56.pdf.
U.S. Census Bureau. 2001b. Rankings, Comparisons, and Summaries. U.S. Census Bureau,Population Division: Available at: http://www.census.gov/main/www/cen2000.html.
Inman, McLeod, and Coupal 111
U. S. Census Bureau. 2002. State and county quick facts. Available at: http://quickfacts.census.gov/ qfd/states/56/56041.html.
Van Liere, K. D., & R. E. Dunlap. 1980. The social bases of environmental concern: Areview of hypotheses, explanations and empirical evidence. Public OpinionQuarterly 44: 181-97.
Wilson, G. A. 1992. A survey of attitudes of landholders to native forest on farmland.Journal of Environmental Management 34: 117-36.
Wyoming Agricultural Census. 1997. Table 6, Farms, land in farms, value of land.Government Information Sharing Project, Oregon State University. Available at:http://govinfo.library.orst.edu/cgi-bin/ag-list?06-state.wys.
Wyoming Agricultural Statistics Service. 1996. Wyoming Agricultural Statistics.Cheyenne, WY: Wyoming Department of Agriculture, University of Wyoming/College of Agriculture, and U.S. Department of Agriculture/National AgriculturalStatistics Service.
Wyoming Department of Revenue. 2001. Annual Report 2000. State of Wyoming.Available at: http://revenue.state.wy.us/revframe.htm.
Wyoming Secretary of State. 2001. Rules. Available at: http://soswy.state.wy.us/rules/index/mobile.htm.
Zollinger, B., & R. S. Krannich. 2001. Utah agricultural operators’ attitudes towardcommon agricultural land preservation initiatives. Journal of the CommunityDevelopment Society 32(1): 35-64.

COLLABORATION,NEW GENERATION COOPERATIVES
AND LOCAL DEVELOPMENT
By Norman Walzer and Christopher D. Merrett
Journal of the Community Development Society Vol. 33 No. 2 2002
© 2002, The Community Development Society
ABSTRACT
Local public officials and development practitioners are struggling to find ways to revitalizetheir communities. This article examines an expanded role for agricultural businesses in thedevelopment process. Three main issues are addressed. Findings from a national survey of117 New Generation Cooperative managers show the reasons for starting these venturesincluding an interest in creating local jobs, the roles played by development organizations,and how successful they have been. The relative importance of social capital in starting theNGCs is also statistically tested. A survey of 43 development agencies in Illinois is thenexamined to determine the interest in working with agribusiness ventures, the types ofincentives available, and whether the presence of agricultural interests on the board of directorsaffected the industries contacted. The article concludes with a discussion of the experiences inRenville, Minnesota, which has worked with five NGCs in a local revitalization program.
Keywords: value-added, New Generation Cooperatives, social
capital, local economic development, collaboration
INTRODUCTION
Local public officials and leaders in many rural communities arestruggling to find ways to stimulate employment, sales, and incomes. While thenational economic expansion during the 1990s brought prosperity to areas withretirement or tourism attractions, it largely bypassed many areas that depend onagriculture or natural resources (Johnson & Beale, 1998).
Even worse, agricultural areas have experienced low commodity andlivestock prices, adversely affecting small family farms and local businesses thatrely on these farmers as customers (Fellows & Lasley, 1995). Farmers, in response,have supplemented their incomes from off-farm sources, namely employment innearby communities (Greider, 2000). The fact that small towns have lost jobs, atthe same time that farm families need additional income from local employment,creates a situation in which community leaders and agricultural producers mustwork together to revitalize local economies (Egerstrom, 1994; Leistritz & Sell, 2001).
Norman Walzer, Professor of Economics and Director of the Illinois Institute for Rural Affairs. Christopher D.Merrett, Associate Professor of Geography, Illinois Institute for Rural Affairs. The authors thank Lori Sutton,Mary Holmes, and Karen Poncin, IIRA, for their assistance in data collection and tabulation. Support for datacollection and tabulation came from the Illinois Council on Food and Agricultural Research (C-FAR) through theI-FARMM and VALUE projects.
Correspondence can be directed to Norman Walzer, Illinois Institute for Rural Affairs, Western Illinois University,518 Stipes Hall, Macomb, IL 61455. Email: [email protected].
Walzer and Merrett 113
While some commentators have proclaimed “a crisis in rural America”(Roland, 2000), there are examples where even relatively small communities havetaken steps to successfully revitalize their economies. These efforts range fromattracting call centers to small towns, such as Bottineau or Fessenden in NorthDakota, or pursuing a development strategy based on value-added agricultureas exemplified by Renville, Minnesota (Call Solutions, 2001; City of Renville, n.d.).
Typically, agriculture is not seen as a growth industry and thus doesnot rate high as a local development strategy. Instead, rural communities prioritizetourism or recruiting branch plants (Malecki, 1995, p. 328). While these strategiescreate jobs and thereby raise local incomes, incorporating agriculture into thedevelopment strategy has the advantage of creating income for local producerswho provide the inputs to the processing plants, as well as providing opportunitiesfor them to share in the value-added generated in the production process.
Equally important is the fact that because of low commodity prices,state departments of agriculture have worked aggressively with producers andlocal farm groups to expand markets for agricultural products in an attempt toraise the incomes of farm families. Because the funds are marketed to producersrather than development agencies, economic developers may not be as directlyinvolved in these efforts, but they can work with producers and create businessventures using these funds.
This paper explores opportunities for incorporating agriculture moreeffectively into local economic development initiatives. Specifically, weinvestigate the willingness and opportunities for local development practitionersto work with producer groups. We also report on the efforts by leaders of NewGeneration Cooperatives (NGCs) to start value-adding agricultural processingbusiness ventures, and how they have received local support.
The paper concludes with examples of collaboration between farmersand developers, including the efforts of a small rural city (Renville, MN) that hasworked with several NGCs to revitalize its local economy. This city, the self-proclaimed “Cooperative Capital of the U.S.,” is certainly not the norm, but byworking with local producers, it has stimulated employment in a variety ofindustries, some with high paying jobs (City of Renville, n.d.).
Understanding NGCs
NGCs are cooperative business ventures in which producers invest ina local commodity processing business with the hopes of receiving a higherprice for their products and a dividend from the additional value generated in theprocessing stages (Merrett & Walzer, 2001b). As with other business startups,not all of these ventures succeed, and this approach is not a panacea for allareas. However, when they do succeed, local employment is increased whileproducers earn higher incomes.
Traditional purchasing cooperatives were designed to reduceproduction costs by helping farmers purchase farm inputs at lower prices. Bymaking agriculture more profitable, these co-ops promoted rural community
114 Journal of the Community Development Society
development (Flora, 1990; Fulton, 2001). NGCs, however, typically focus onadding value to a commodity and distributing a dividend to co-op members inthe process. The NGC approach requires a commitment to sell a specific amountof produce as an input into the production process. Plus, it demands a significantinitial cash investment—as much as $20,000 to $30,000—to build a localcommodity processing plant and start operations. Participation is usually limitedto the initial investors although shares can be sold to other producers if theventure has been profitable.
NGCs have been most popular in the Midwest and Plains regions—afunction of the disproportionate decline of family farms in this region (Cook &Iliopoulos, 1999; Egerstrom 1994; Nadeau & Thompson, 1996; Merrett, Holmes,& Waner, 1999). The NGC is an attractive business model because it is a localbusiness owned by producers, which generates salaries and employment fornon-farm workers as well (Egerstrom, 1994). Depending on state regulations,non-producers can invest in these types of ventures, and sometimes a limitedliability company (LLC) is used (Brown & Merrett, 2000).
From a local economic development perspective, an NGC or LLC offersseveral attractions. First, they use local inputs that otherwise might leave theregion unprocessed and at a relatively low price. Second, the NGC/LLC approachcan attract local capital for a business venture since producers must invest inthe process to capture the value-added commodity. Third, the NGC approachcan involve a broad range of products as is shown in Renville, MN, with fiveNGCs including corn, hogs, chickens, fish, sugar, and soybeans. Fourth, NGCscan create jobs and generate taxes for the region—a key aspect for localdevelopers (Trechter & King, 2000).
An NGC faces many challenges, including raising capital, identifyingmarkets, developing an efficient production process, and marketing the output(s)(Hanson, 1999). In this regard, an NGC poses the same risks associated withvirtually any business startup. Some NGCs have failed because of insufficientcapital, inadequate management, and/or lack of a market. Examples includeSouthwest Iowa Soybean Cooperative, which closed because it could not identifya sufficiently large market (Walzer & Holmes, 2000). AgGrow Oils, a flaxseedcooperative, failed because managers did not completely understand theprocessing procedures (Wiesenborn, 2001). Ranchers’ Choice, a specialty meat-processing cooperative in Colorado, failed because of management difficultiesand undercapitalization (Carter, 2001).
Other NGCs that did not quite reach the production stage include Tri-State Corn Processors, in Rosholt, South Dakota. This farmer-owned enterpriseraised only $3 million from members, which was insufficient to build the $18million ethanol plant (Pates, 2000). Private lenders would not extend credit untilthe farmers had raised at least $7.2 million or 40 percent of the startup equity.
Others, however, have done well and have paid dividends to theproducer-owners along with creating local employment (Buschette, 2000). Solidbusiness planning is as important to a successful NGC as to other businesses.
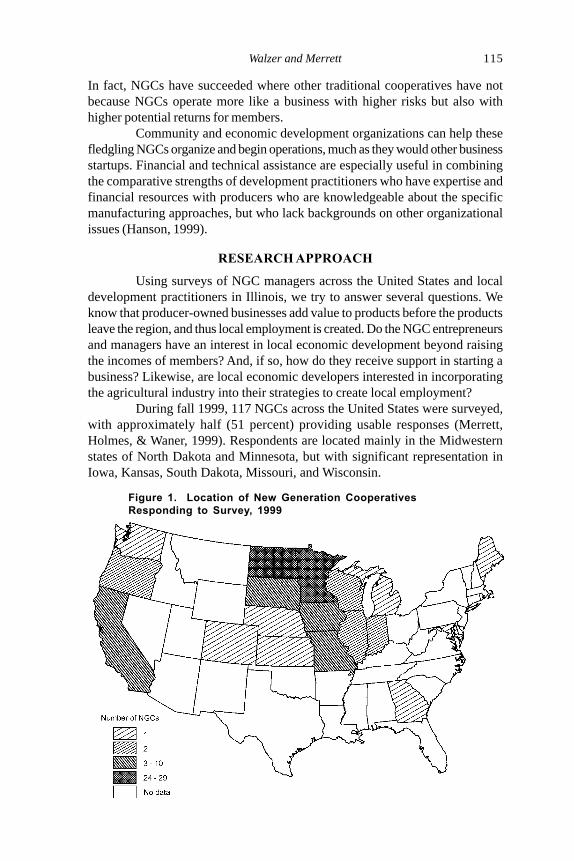
Walzer and Merrett 115
In fact, NGCs have succeeded where other traditional cooperatives have notbecause NGCs operate more like a business with higher risks but also withhigher potential returns for members.
Community and economic development organizations can help thesefledgling NGCs organize and begin operations, much as they would other businessstartups. Financial and technical assistance are especially useful in combiningthe comparative strengths of development practitioners who have expertise andfinancial resources with producers who are knowledgeable about the specificmanufacturing approaches, but who lack backgrounds on other organizationalissues (Hanson, 1999).
RESEARCH APPROACH
Using surveys of NGC managers across the United States and localdevelopment practitioners in Illinois, we try to answer several questions. Weknow that producer-owned businesses add value to products before the productsleave the region, and thus local employment is created. Do the NGC entrepreneursand managers have an interest in local economic development beyond raisingthe incomes of members? And, if so, how do they receive support in starting abusiness? Likewise, are local economic developers interested in incorporatingthe agricultural industry into their strategies to create local employment?
During fall 1999, 117 NGCs across the United States were surveyed,with approximately half (51 percent) providing usable responses (Merrett,Holmes, & Waner, 1999). Respondents are located mainly in the Midwesternstates of North Dakota and Minnesota, but with significant representation inIowa, Kansas, South Dakota, Missouri, and Wisconsin.
Figure 1. Location of New Generation Cooperatives
Responding to Survey, 1999
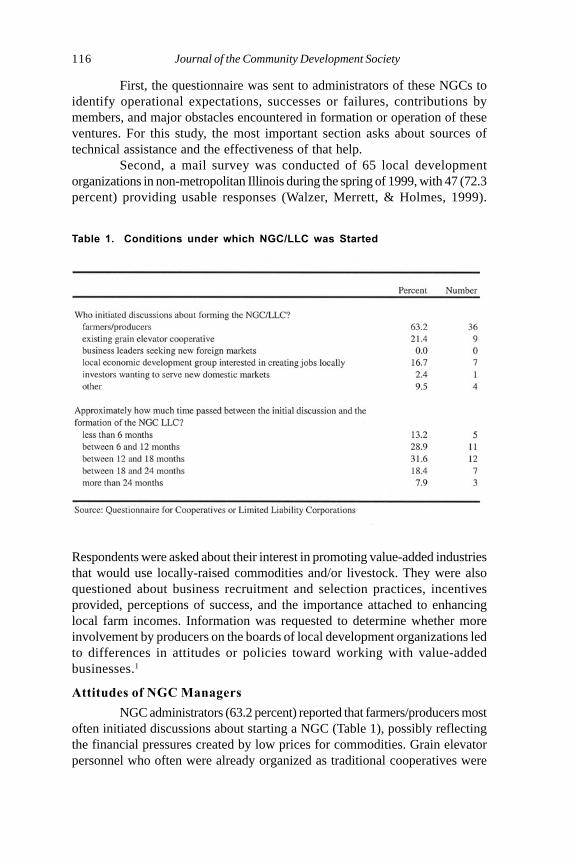
116 Journal of the Community Development Society
First, the questionnaire was sent to administrators of these NGCs toidentify operational expectations, successes or failures, contributions bymembers, and major obstacles encountered in formation or operation of theseventures. For this study, the most important section asks about sources oftechnical assistance and the effectiveness of that help.
Second, a mail survey was conducted of 65 local developmentorganizations in non-metropolitan Illinois during the spring of 1999, with 47 (72.3percent) providing usable responses (Walzer, Merrett, & Holmes, 1999).
Table 1. Conditions under which NGC/LLC was Started
Respondents were asked about their interest in promoting value-added industriesthat would use locally-raised commodities and/or livestock. They were alsoquestioned about business recruitment and selection practices, incentivesprovided, perceptions of success, and the importance attached to enhancinglocal farm incomes. Information was requested to determine whether moreinvolvement by producers on the boards of local development organizations ledto differences in attitudes or policies toward working with value-addedbusinesses.1
Attitudes of NGC Managers
NGC administrators (63.2 percent) reported that farmers/producers mostoften initiated discussions about starting a NGC (Table 1), possibly reflectingthe financial pressures created by low prices for commodities. Grain elevatorpersonnel who often were already organized as traditional cooperatives were
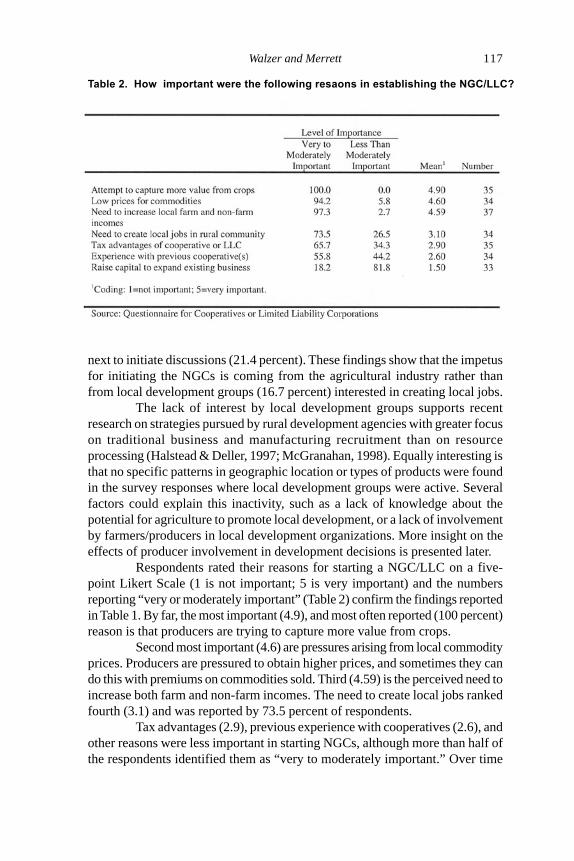
Walzer and Merrett 117
next to initiate discussions (21.4 percent). These findings show that the impetusfor initiating the NGCs is coming from the agricultural industry rather thanfrom local development groups (16.7 percent) interested in creating local jobs.
The lack of interest by local development groups supports recentresearch on strategies pursued by rural development agencies with greater focuson traditional business and manufacturing recruitment than on resourceprocessing (Halstead & Deller, 1997; McGranahan, 1998). Equally interesting isthat no specific patterns in geographic location or types of products were foundin the survey responses where local development groups were active. Severalfactors could explain this inactivity, such as a lack of knowledge about thepotential for agriculture to promote local development, or a lack of involvementby farmers/producers in local development organizations. More insight on theeffects of producer involvement in development decisions is presented later.
Respondents rated their reasons for starting a NGC/LLC on a five-point Likert Scale (1 is not important; 5 is very important) and the numbersreporting “very or moderately important” (Table 2) confirm the findings reportedin Table 1. By far, the most important (4.9), and most often reported (100 percent)reason is that producers are trying to capture more value from crops.
Second most important (4.6) are pressures arising from local commodityprices. Producers are pressured to obtain higher prices, and sometimes they cando this with premiums on commodities sold. Third (4.59) is the perceived need toincrease both farm and non-farm incomes. The need to create local jobs rankedfourth (3.1) and was reported by 73.5 percent of respondents.
Tax advantages (2.9), previous experience with cooperatives (2.6), andother reasons were less important in starting NGCs, although more than half ofthe respondents identified them as “very to moderately important.” Over time
Table 2. How important were the following resaons in establishing the NGC/LLC?

118 Journal of the Community Development Society
with the growth of NGCs, one might expect that positive previous experiencesmay become relatively more important although certainly failures of NGCswill have the opposite effect.
The reasons given show that while farmers prioritize their own financialsecurity, as business owners must prioritize financial security, most farmers arealso interested in promoting local economic expansion. More than half of theincome earned by farm families, especially those with small- to medium-sizefarms, are from off-farm sources (Leistritz & Barnard, 1995, p. 56). NGCs orsimilar ventures that pay competitive wages provide more opportunities to farmoperators and their families.
Amount of time needed to start a business is important for developersin deciding whether to support a specific business activity. NGC administratorswere asked how much time had passed between the initial discussions and theactual formation of the business venture. The largest numbers reported from sixmonths to a year (28.9 percent) or from 12 to 18 months (31.6 percent). Thus,nearly three-quarters (73.7 percent) had reached the formation stage within 18months.
Table 3. Test of Independant Means for Succesful and Unsuccessful NGCs
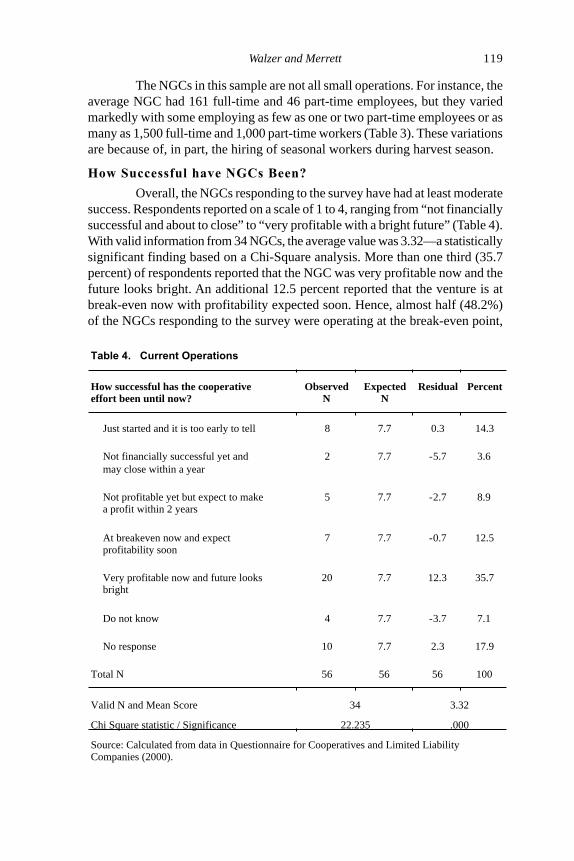
Walzer and Merrett 119
The NGCs in this sample are not all small operations. For instance, theaverage NGC had 161 full-time and 46 part-time employees, but they variedmarkedly with some employing as few as one or two part-time employees or asmany as 1,500 full-time and 1,000 part-time workers (Table 3). These variationsare because of, in part, the hiring of seasonal workers during harvest season.
How Successful have NGCs Been?
Overall, the NGCs responding to the survey have had at least moderatesuccess. Respondents reported on a scale of 1 to 4, ranging from “not financiallysuccessful and about to close” to “very profitable with a bright future” (Table 4).With valid information from 34 NGCs, the average value was 3.32—a statisticallysignificant finding based on a Chi-Square analysis. More than one third (35.7percent) of respondents reported that the NGC was very profitable now and thefuture looks bright. An additional 12.5 percent reported that the venture is atbreak-even now with profitability expected soon. Hence, almost half (48.2%)of the NGCs responding to the survey were operating at the break-even point,
Table 4. Current Operations
How successful has the cooperative effort been until now?
Observed N
Expected N
Residual Percent
Just started and it is too early to tell 8 7.7 0.3 14.3
Not financially successful yet and may close within a year
2 7.7 -5.7 3.6
Not profitable yet but expect to make a profit within 2 years
5 7.7 -2.7 8.9
At breakeven now and expect profitability soon
7 7.7 -0.7 12.5
Very profitable now and future looks bright
20 7.7 12.3 35.7
Do not know 4 7.7 -3.7 7.1
No response 10 7.7 2.3 17.9
Total N 56 56 56 100
Valid N and Mean Score 34 3.32
Chi Square statistic / Significance 22.235 .000
Source: Calculated from data in Questionnaire for Cooperatives and Limited Liability Companies (2000).
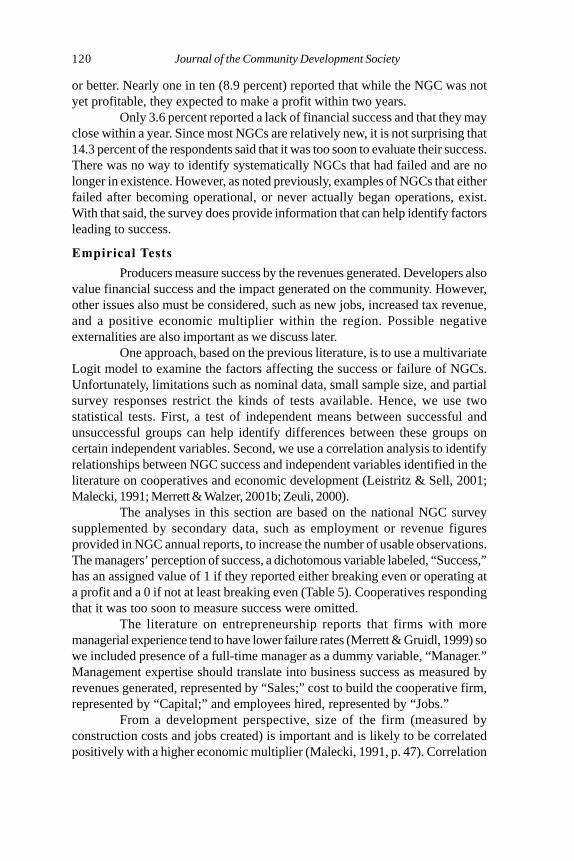
120 Journal of the Community Development Society
or better. Nearly one in ten (8.9 percent) reported that while the NGC was notyet profitable, they expected to make a profit within two years.
Only 3.6 percent reported a lack of financial success and that they mayclose within a year. Since most NGCs are relatively new, it is not surprising that14.3 percent of the respondents said that it was too soon to evaluate their success.There was no way to identify systematically NGCs that had failed and are nolonger in existence. However, as noted previously, examples of NGCs that eitherfailed after becoming operational, or never actually began operations, exist.With that said, the survey does provide information that can help identify factorsleading to success.
Empirical Tests
Producers measure success by the revenues generated. Developers alsovalue financial success and the impact generated on the community. However,other issues also must be considered, such as new jobs, increased tax revenue,and a positive economic multiplier within the region. Possible negativeexternalities are also important as we discuss later.
One approach, based on the previous literature, is to use a multivariateLogit model to examine the factors affecting the success or failure of NGCs.Unfortunately, limitations such as nominal data, small sample size, and partialsurvey responses restrict the kinds of tests available. Hence, we use twostatistical tests. First, a test of independent means between successful andunsuccessful groups can help identify differences between these groups oncertain independent variables. Second, we use a correlation analysis to identifyrelationships between NGC success and independent variables identified in theliterature on cooperatives and economic development (Leistritz & Sell, 2001;Malecki, 1991; Merrett & Walzer, 2001b; Zeuli, 2000).
The analyses in this section are based on the national NGC surveysupplemented by secondary data, such as employment or revenue figuresprovided in NGC annual reports, to increase the number of usable observations.The managers’ perception of success, a dichotomous variable labeled, “Success,”has an assigned value of 1 if they reported either breaking even or operating ata profit and a 0 if not at least breaking even (Table 5). Cooperatives respondingthat it was too soon to measure success were omitted.
The literature on entrepreneurship reports that firms with moremanagerial experience tend to have lower failure rates (Merrett & Gruidl, 1999) sowe included presence of a full-time manager as a dummy variable, “Manager.”Management expertise should translate into business success as measured byrevenues generated, represented by “Sales;” cost to build the cooperative firm,represented by “Capital;” and employees hired, represented by “Jobs.”
From a development perspective, size of the firm (measured byconstruction costs and jobs created) is important and is likely to be correlatedpositively with a higher economic multiplier (Malecki, 1991, p. 47). Correlation
Walzer and Merrett 121
analysis requires linear, normally distributed data (Taylor, 1977). Because therevenue, job creation, and capital investment data were not normally distributedin the sample, we transformed these variables using a logarithmic function toimpose linearity.
In addition to the impact of investment capital, we are also interested inthe issue of social capital generated. Social capital is the extent to which thereare extensive networks of social ties and correspondingly high levels of trust inthe community (Putnam 2000, p. 19). The premise is that farmers and non-farmersworking together, facilitated by community developers, will increase overallprosperity (Flora, 1990). NGCs need financial capital to succeed, but are other,non-monetary considerations, such as social capital, also important?
Several writers and co-op managers have argued that institutions suchas cooperatives can foster social capital within a community by providing acontext for people to interact around a common interest (Rocky Mountain FarmersUnion, n.d.; Putnam, 1993; Putnam, 2000). In addition, while the issue of increasedfriendship must not be discounted, there may be an indirect, economic elementto social capital, too. Putnam (2000) claims that investments “…[in] socialnetworks have value. Just as a screwdriver (physical capital) or a college education(human capital) can increase productivity…so too social contacts affect theproductivity of individuals and groups” (p.19). Social capital reduces costsbecause with an increased level of trust, there is less need to verify that businesspartners or customers should be extended credit or other resources (de Janvry &Sadoulet, 1996; Putnam, 1993).
The challenge, then, is to find proxy variables for an admittedly difficultconcept to measure. Given that social capital is based on the quality of socialnetworks, we speculate that social capital is higher when cooperatives andcommunities are more geographically concentrated, rather than spread acrossseveral states. The logic here is that when members live closer together, they willhave more opportunity to have face-to-face meetings. Using the “GeographicScale” variable, co-op managers were asked to identify if their membership wasdrawn from one of five increasingly expansive scales (members from only onecommunity = 1; one county = 2; several countries = 3; one state = 4; or severalstates = 5).
We also measure social capital by the extent to which managers rated achange in their relationship with the non-farm community since the co-op wasestablished. The rating used a Likert scale, with 1 = no improvement, and 5 =much improvement. The resulting responses are folded into the “Relations withCommunity” variable.
A test of independent means was used to determine how successfulversus unsuccessful NGCs differed on these variables (Table 3). Results showthat for all variables except one, successful NGCs had higher values thanunsuccessful NGCs. However, of the 10 variables tested, only five had meansthat differed statistically between the successful group and those who had not

122 Journal of the Community Development Society
succeeded. Successful NGCs required more startup capital, created more jobs,and generated more income, and they were more likely to have a full-timemanager. Of special interest is the fact that successful NGCs, on average, tendto draw members from a more geographically concentrated area. To helpunderstand this issue, a correlation analysis was conducted of the success variableand the five significant variables identified in the test of independent means.
A series of significant relationships emerged from a bivariate Pearsoncorrelation procedure (Table 5). First, an obvious positive relationship existsbetween sales generated by a NGC and success. A more noteworthy relationshipis identified between success of the NGC and hiring an experienced manager. Aprofessional manager may be needed to minimize the inherent financial risks.
Note also the correlation between a full-time manager and ability toraise startup capital that shows potential for generating more local jobs andrevenue. The significant relationships between total startup capital required andnumber of jobs created, sales generated, and NGC membership reveal asynergistic relationship between these variables. Developers interested in helpingfarmers start an NGC for the job creation potential should note that larger NGCs,
Table 5. Pearson Correlation Coefficients Comparing NGC Characteristics
Variables Success Capital (Log)
Jobs (Log)
Sales (Log)
Co-op Members Manager
Geographic Scale
Relations with
Community
Success 1.000
Capital (Log)
.339* 1.000
Jobs (Log) .310* .623*** 1.000
Sales (Log) .478** .779*** .879*** 1.000
Co-op Members
.067 .462*** .570*** .606*** 1.000
Manager .345** .448*** .554*** .498*** .334** 1.000
Geographic Scale
-.423** -.112 .000 .049 .309* -.011 1.000
Relations with Community
.288 -.050 -.437** -.462* -.329 -.175 -.212 1.000
Source: Calculated from data in Questionnaire for Cooperatives and Limited Liability Companies (2000). N = 39. Coefficients significant, where * = p < 0.10, ** = p < 0.05, and *** = p < 0.01.

Walzer and Merrett 123
as measured by gross sales, are likely to generate more jobs. Greater initialinvestment in the processing facility produces greater numbers of jobs createdin the community.
An important caveat emerges, however, from the relationship betweenthe NGC and the host community. The significantly negative correlation betweencommunity relations versus sales, capital, and jobs suggests an upper limit onthe size of a processing cooperative before the local community begins tocomplain (Table 5). Potential problems include a range of negative externalitiessuch as pollution, noise, odor, increased traffic, and migration of new workersinto the community. Developers must identify this upper size limit and find outhow to manage potential conflict.
Factors Contributing to Success
When a cooperative venture agrees to build a large processing facility,many farmers must be recruited to help raise the necessary equity. A key role forcommunity development practitioners might be to use their skills to help recruitparticipants and otherwise raise the capital needed for a viable venture. Thiscould be especially helpful for LLCs where non-producers participate.
In addition, development practitioners can anticipate other questionsfrom NGC organizers including availability of TIF (tax increment financing)support to help defray startup costs. A producer group may seek grants or loansto pay for feasibility studies or to hire a manager. Questions about land-usezoning, business financing, grant writing, environmental issues, legal affairs, ormarketing may also arise with NGCs as with other business ventures.
The survey asked NGC managers to evaluate the usefulness of technicalassistance provided by various groups on a scale of 1 to 5, where 1 = not helpful,and 5 = very helpful. For each agency, an average is computed and a Chi-Squarestatistic was used to determine if the average score obtained occurred randomly,or if it was in fact a significant measure of the perceived quality of technicalassistance (Table 6).
Of the nine groups of technical assistance agencies, only three eliciteda significant evaluation from the survey respondents. Respondents ratedinformation from other NGCs as most valuable, followed by assistance providedby local development agencies, which was significantly favorable. This findingsuggests that while development agencies have not taken the lead in startingNGCs, the assistance that they provide has been important.
The Farm Bureau was the only other significant variable, but it eliciteda slightly negative response. One interpretation might be that when this surveywas conducted, the Farm Bureau’s Producer Alliance initiative was just starting,and NGC board members may not have heard about it. A second interpretation isthat the Farm Bureau (2002) has supported issues favoring agribusiness andlarge producers, such as biotechnology and free trade—at the perceived expenseof smaller farm operations. This interpretation is consistent with the finding that

124 Journal of the Community Development Society
NGCs comprised of smaller farm operations that are less than 500 acres onaverage, tended to judge the Farm Bureau more negatively than NGCs comprisedof large farm operations—exceeding 500 acres on average per co-op member.Note, however, that several NGCs did approach the Farm Bureau for assistanceand did rate that help favorably.
While there are ways in which developers can help NGCs succeed,equally important is the question of whether or not rural local developers arewilling to play this role instead of, or at the same time as, the more traditionalapproach, focusing on business recruitment and other business startups. Thenext section examines the attitudes of local developers, especially regardingagriculture as a strategy to expand development.
Interests and Approaches of Development Agencies
The capacity of local development groups to promote businesses,especially in rural areas, is often limited by a lack of experience and trained staff(Walzer & Kapper, 1989). Consequently, boards of directors in these agencies
Table 6. Evaluation of Technical Assistance from Local, State and Federal Agencies
Agency Evaluation
Scorea Significanceb
Other NGCs 3.82*** .002
State Department of Agriculture 3.64 .564
State Economic Development Agencies 3.50 .150
Private Consultants 3.50 .234
Local Economic Development Agencies 3.46** .036
USDA 3.35 .113
Lending Institutions 3.33 .105
Cooperative Extension Service 3.19 .652
Farm Bureau 2.55* .063
Source: Calculated from data in Questionnaire for Cooperatives and Limited Liability Companies (2000) a Respondents were asked “How helpful were each of the following agencies that were approached for financial, technical or managerial assistance” using a Likert Scale where 1 = not helpful and 5 = very helpful. b The test of significance is based on a Chi-Square test of the respondents’ ratings of the varies agencies, where * = p < 0.10, ** = p < 0.05, and *** = p < 0.01.
Table 3. Test of Independant Means for Succesful and Unsuccessful NGCs

Walzer and Merrett 125
exert much influence over the approaches taken and strategies pursued. Recallthat respondents to the national NGC survey (73.5 percent) reported thatstimulating local economic development is a moderate or important reason forstarting a NGC, but local development agencies were ranked relatively low asinitiators for the NGC (Table 1).
One question is whether or not more involvement by producers on thegoverning boards of development organizations would make them more likely toincorporate agricultural products into local development strategies. This questionis especially important because previous research shows that agriculturalprocessing facilities can have a significant impact on the economic base of acommunity (Leistritz, 1997; Gale, 1999).
The 1999 survey of 60 economic development practitioners in Illinoisdescribed previously shows that most respondents (80 percent) had at leastsome involvement by agricultural interests on the board of directors, but thequestion did not clearly define the agricultural interest (Table 7). The“representation” may not involve someone directly engaged in farming operations.
Table 7. Agricultural Representation on Boards
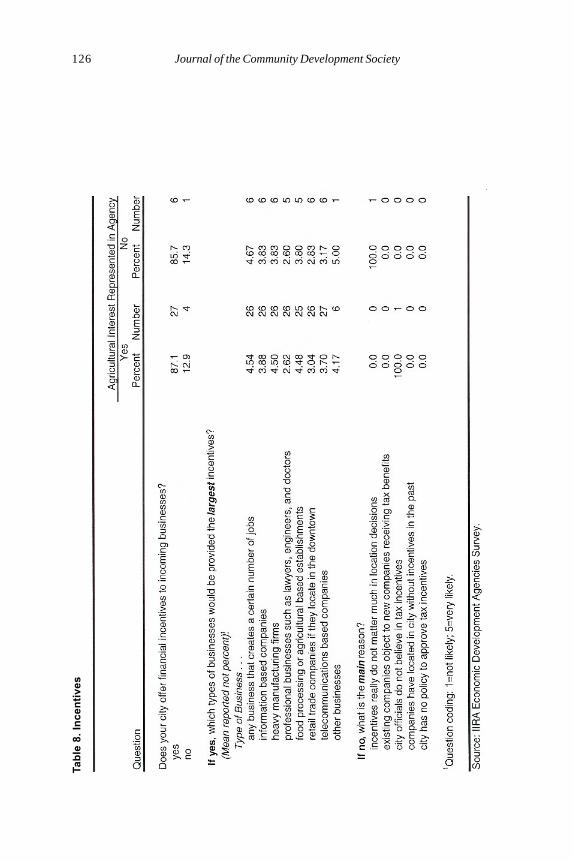
126 Journal of the Community Development Society
Ta
ble
8.
Inc
en
tiv
es
Walzer and Merrett 127
When asked why agricultural interests are not represented on the board(Likert scale with 5 as most important), respondents reported that, “they had notasked for representation (3.4),” or “it is an economic development action plan forthe city (2.25),” or “agricultural groups in this area are not organized (2.0).” Otherrespondents reported, “We don’t see agriculture as an industry,” or “We are notfamiliar with the food-processing or agricultural industry.”
Comparing agencies with or without agricultural involvement showssubstantial differences in the approaches taken (Table 8). Specifically,respondents were asked, “Which types of businesses would be provided thelargest incentives” and several findings are worth noting.2
First, while the sample sizes are small, the goals or interests advancedby development agencies with or without agricultural representatives are similarand both will provide incentives to “any business that creates a specific numberof jobs.” Also, both groups will provide incentives to “professional businessessuch as lawyers, engineers, and doctors.” (Table 8).
Second, economic development groups with agricultural interests onthe board placed higher priority on heavy manufacturing firms, food-processingor agricultural based industries, and retail businesses that strengthen thedowntown than those agencies without agricultural representation. The greaterinterest in providing incentives to “food processing or agricultural basedindustries” shown by agencies with agricultural representation should encourageproducers to become more actively involved. On the Likert scale, (Table 8)agencies with agricultural representation reported a 4.48 for providing incentivesto food-processing and agricultural-based establishments compared, with a 3.80for those agencies without agricultural representation. However, virtually nodifference exists between the two groups in terms of willingness to provide overallincentives for businesses in general (87.1 percent for agricultural representation;85.7 percent for those without). Thus, agricultural representation seems to representa different focus, more willingly than it represents overall policies.
Development agencies, with or without agricultural representation, alsodiffer regarding types of businesses with which they work (Table 7). Respondentswere asked if they give more serious consideration to agricultural based industriesas businesses to contact about locating in the city. A much higher proportion ofagencies with agricultural representation (87.1 percent) responded affirmativelycompared to the proportion of agencies without agricultural representation (37.5percent). Likewise, 58.8 percent of agencies with agricultural representation hadbeen contacted by an agricultural or biomass company, compared to only 12.5percent of agencies without this representation. At the same time, all respondentsreported that they would consider a biomass or agricultural based industry fortheir community.
Renville and Golden Oval
Clearly, opportunities exist for communities to foster businesses bylinking producers and local economic development agencies and by using locally-

128 Journal of the Community Development Society
raised products in a processing or manufacturing process. Many ruralcommunities have robust economies because they host an NGC. Carrington,ND, hosts Dakota Growers—a wheat cooperative that produces pasta. Volga,South Dakota, hosts South Dakota Soybean Processors. West Liberty, Iowa,hosts West Liberty Foods—a turkey-processing cooperative.
Renville, Minnesota, is the exemplary cooperative community thatprocesses locally grown commodities. Following is a short case study of itsexperiences. Minnesota has a long history of working with producer groups,including NGCs, for several reasons. First, the relatively remote locationcompared with most markets makes Minnesota a strategical location from whichto process products rather than to incur the high expense of shipping unprocessedgrain to distant markets.
Second, Scandinavian immigrants brought a strong cooperative legacyto Minnesota, which promoted collaborative developments (Egerstrom, 1994).Third, cooperatives were developed because of the closure of existing processingplants, such as the American Crystal Sugar Company. Producers who formerlysold sugar beets to American Crystal had to find new outlets, and they formedthe Southern Minnesota Beet Sugar Cooperative. In the early 1980s, theMinnesota Corn Processors Cooperative began operation followed by severalother NGCs, including Golden Oval Eggs—a cooperative owned by corn growersin the region.
In 1989 and 1990, discussions turned to new ventures, specifically anNGC that would accommodate the needs of local corn producers while creatinga new profit center for Co-op Country (Buschette, 2000). Egg production wasselected as the next business venture with the fast food and the baking industriesas intended markets. The outcome is a NGC owned by corn producers whosupport an egg laying operation that strains and sells eggs in liquid form to fastfood operations and bakeries.
After a three-year study of the market, an umbrella organization (MidwestInvestors of Renville, Inc.) was formed in 1994. Shares in the initial offer raised $4million through an aggressive marketing effort. A total of 411 co-op membersdeliver corn that is ground for feed for an egg-laying operation. In formingGolden Oval, a feed-milling facility was constructed in an alliance with two othercooperatives.
The City of Renville recognized the potential economic developmentvalue of Golden Oval and made available 40 acres of city property in an industrialpark for the venture. In addition, the city arranged a TIF program to help financethe project. Note that Renville also helped other cooperatives secure financing.The town helped MinAqua Fisheries Cooperative write a successful U.S.Economic Development Administration grant to help defray construction costs(Institute for Local Self-Reliance, 1999).
Golden Oval has been a profitable venture and the effects on Renvilleand the surrounding area have been substantial. The share price started at $3.50and has sold as high as $5.42 per share. Golden Oval spends approximately $14
Walzer and Merrett 129
million in annual payrolls, shareholder payments, feed, supplies, and otheroperating expenses (Buschette, 2000). A multiplier of even 1.25, for example,would mean an infusion of as much as $17.5 million dollars to the area.
Golden Oval pays more than $1 million in local, state, and federal taxesand has approximately 80 employees. These jobs involve quality control scientistsas well as unskilled workers and, for this reason, provide opportunities forsecondary school graduates to return to Renville after college graduation. Thecommercial impact is substantial, as a walk through Renville’s bustling commercialdistrict will confirm (City of Renville, n.d.). County level business data confirmthe economic health, as the number of commercial establishments increasedfrom 604 to 632 firms between 1998 and 1999 (U.S. Census, 2000b). The numberof private non-farm jobs increased 51 percent between 1990 and 1999 (U.S.Census, 2000a).
While Golden Oval provides an excellent example of a successful NGC,the positive impacts on Renville cannot all be attributed to Golden Oval, becauseseveral other NGCs have started in the area and a traditional cooperative alsohas done well. While successful, Golden Oval has had difficulties. Environmentalissues arise with any animal confinement or processing operation. The financialsuccess enjoyed by Golden Oval prompted its managers to propose an expansionfrom 2 million to 2.76 million birds (Norstrud, 1999c, p. 2).
Golden Oval submitted a plan to the Minnesota Pollution ControlAgency (MPCA) to determine if a full environmental impact statement (EIS) wasneeded. By state law, Golden Oval also had to announce its plans and provide aperiod to allow public comment, so that local residents had an opportunity toexpress support or opposition to the expansion plans. The outcome of the MPCAanalysis was that a full EIS was needed, a process that would delay GoldenOval’s expansion by a year and would cost as much as $250,000 to complete(Persson, 1999c, p. 3).
To avoid these added costs, Golden Oval built an additional processingfacility in Thompson, Iowa. Thompson residents were divided about the meritsof having this plant as a neighbor. The community debates can be read online inthe local newspaper, the Thompson Courier-Rake Register (Hegland, 1999, p. 3;Persson, 1999b, p. 3). The editor was a strong supporter of Golden Oval—evenmaking a trip to Renville to report personally on the benefits Golden Oval couldbring. He tried to assuage the worries of residents by reporting that there was nosmell, and he witnessed only one fly—an allusion to a problem Golden Oval hadin attracting flies, but one that has been remediated (Nostrud 1999b, p. 1; Nostrud,1999c, p. 2).
However, a group called CKGOO (Committee to Keep Golden Oval Out)gathered more than 400 signatures on a petition opposing Golden Oval.Opponents argued that jobs associated with the NGC would likely pay lowwages, and that increased pollution and commercial traffic would disruptThompson. Opponents to Golden Oval were also concerned that the economicmultiplier generated by Golden Oval would not offset the loss of local taxes
130 Journal of the Community Development Society
caused by the TIF district that was created specifically for Golden Oval (Hegland,1999, p. 3).
The CKGOO brought a lawsuit against Golden Oval to stop constructionof the facility, but it was dismissed by the court. The actions taken by CKGOO inThompson may seem extreme, since Renville residents largely support GoldenOval. However, their actions may appear more reasonable if it is known thatGolden Oval’s Renville operation puts up about 2.0 million chickens. TheThompson facility will eventually become the largest animal confinementoperation in Iowa when it reaches its planned capacity of 7.0 million chickens(U.S. Department of Agriculture, 2000). The different reactions in Renville versusThompson may reflect the differences in size of NGCs. As the correlations reportedearlier in this paper suggest, there is a significantly negative relationship betweenthe size of the NGC, measured by jobs and sales, and the relationship betweenthe NGC and the community. Thompson residents may be less receptive thanRenville residents because the Golden Oval facility in Iowa will house more thanthree times as many chickens, with the potential for a commensurate increase innumber of environmental and social problems.
The job quality issue also deserves comment. Does Golden Oval, orother NGCs for that matter, pay workers an adequate wage? According to theCEO of Golden Oval, (Persson, 1999c, p. 3), workers at the new Thompsonfacility will receive “full-time positions with a competitive wage and benefitpackage.” A brief examination of two other NGCs may help illustrate wage issues.
In general, farm and food workers endure difficult work and low wages.However, when the West Liberty Foods Turkey Cooperative in West Liberty,Iowa, began operations, it applied for a loan of $875,000 through the IowaDepartment of Economic Development (IDED). The IDED granted the loan onthe condition that the 475 workers hired must be paid an average wage of $9.66per hour—considerably higher than the 1999 minimum wage of $5.15 per hour(Swalla Holmes and Curry, 2000, p. 170). This IDED-mandated wage isapproximately $21,000 per year. However, in 1999, the average non-metro wagesin Iowa, according to the Economic Research Service (2001), were $22,807. So,on the one hand, state economic developers tried to create jobs with decentwages, but the average wages paid remain below the state average for non-metro wages.
Other NGCs, such as American Crystal Sugar (2001), have a unionizedworkforce that receives health and retirement benefits. The ambiguity over thewage values represents an opening for community developers who may be ableto identify ways to ensure that farmers, workers, and the overall communitybenefit from a NGC.
SUMMARY AND CONCLUSIONS
Small communities, especially those in remote and rural areas, mustfind a suitable economic stimulus that builds on local characteristics. This article
Walzer and Merrett 131
suggests reasons why they should consider agricultural industries that may offeralternatives not fully-utilized in the past. Several findings from the surveys ofNGC administrators and local economic development agencies are importantto consider.
First, producers, especially during periods of low commodity prices,are often interested in supplementing on-farm incomes. Investing in a businessor process that adds value to the crops or livestock raised offers this possibility,and producers in some states have used NGCs in this way. The extra revenuesearned can stimulate the local economy.
Second, while a survey of NGC managers in Midwestern states showsthat local economic development agencies have not aggressively promotedNGCs, the technical assistance that they provided is considered useful. It wouldseem that development groups can help these ventures in a variety of ways.
Third, participation by agricultural interests on local economicdevelopment agency boards is associated with more interest paid to agriculturalrelated industries. Having agricultural interests on the board is also associatedwith more contacts between the agency and agricultural businesses. Thus, theinteraction can benefit both groups.
Fourth, agricultural enterprises, especially those that confine animals,run a risk of environmental concerns and issues that invite public opposition.Development agencies interested in introducing these enterprises must recognizethese issues early in the negotiation process.
Fifth, the economic impacts of NGCs on the regional economy varywith type of business, wages paid, and other aspects in starting businessventures. Processing plants often pay relatively low wages. On the other hand,science-related positions could be attractive in wages and working conditions.These issues must be considered carefully and factored into the types of tax-expenditure concessions provided.
Towns, especially in remote areas where agriculture is a dominantindustry, have faced a stagnating economy and, in many instances, declines inpopulation. The analyses in this paper suggest that greater attention paid tostarting or attracting businesses that use agricultural products may offer yetanother alternative for local economic development in rural areas. If producersneed to raise incomes, they may be willing to invest in value-added businesses.Rural states have financial programs to stimulate markets for commodities andlivestock, and community leaders can use these programs as part of their strategyto improve economic development.
NGCs, LLCs, and similar ventures are not fail-safe, and they may incurall of the associated risks associated with other businesses. Thus, localdevelopment personnel must evaluate the feasibility of these ventures and buildin as many safeguards as possible before embarking on these efforts. All theusual due diligence associated with customary business prospects should beundertaken with agricultural related proposals as well.
132 Journal of the Community Development Society
Nevertheless, value-added enterprises have succeeded in some areas,and they can stimulate employment and incomes with the potential for increasesin the local economy. When value-added enterprises also pay a premium toproducers in the area, the economic impact can be even greater. Rural communityleaders interested in revitalization efforts must recognize all of their assets andtry to build on them. Agriculture is a major industry in many remote rural areasand, in the past, producers have overlooked the economies created by value-added enterprises when they ship unprocessed commodities out of the region.Integrating agriculture into efforts to develop local economies warrants moreconsideration.
NOTES
1. We readily admit that the analysis would be stronger if all of the observations hadbeen drawn from the same state, but since these data are drawn from two separate projects,that was not possible.
2. These comparisons are based on a small sample—32 agencies with agriculturalrepresentation and 8 without. The findings should be considered tentative and will requireadditional research with more agencies represented.
REFERENCES
Brown, R. & C.D. Merrett. 2000. The Limited Liability Company versus the NewGeneration Cooperative: Alternative business forms for rural economicdevelopment. Rural Research Report 11 (7): 1-8. Macomb, IL: Illinois Institutefor Rural Affairs. Available online: http://www.iira.org.
Buschette, P. 2000. Golden Oval. Pp. 33-42 in Holmes, Walzer, & Merrett (eds.), NewGeneration Cooperatives: Case Studies. Macomb, IL: Illinois Institute for RuralAffairs. Available online: http://www.iira.org.
Call Solutions. 2001. Website for Call_Solutions.com, Inc. Available online: http://www.callsolutions.com/htm/news.cfm?ID=4.
Carter, D. 2001. Hard Choices: The birth and death of Ranchers Choice Cooperative. Pp121-131 in Holmes, Walzer, & Merrett (eds.), New Generation Cooperatives:Case Studies Expanded 2001. Macomb, IL: Illinois Institute for Rural Affairs.
City of Renville. n.d. Co-op Capital of the United States. Available online: http://www.ci.renville.mn.us/coopcap/page1.htm.
Cook, M. & C. Iliopoulis. 1999. Beginning to inform the theory of the cooperative firm:Emergence of the New Generation Cooperative. Finnish Journal of BusinessEconomics. 4: 525-35.
De Janvry, A., & E. Sadoulet. 1996. Seven Theses in Support of Successful RuralDevelopment. SD Dimensions. Land Reform Bulletin 1996. Rome: Food andAgriculture Organization of the United Nations (FAO). Available online: http://www.fao.org/sd/LTdirect/LR96/dejan.htm.
Gruidl, J. & C. Merrett. 1995. A profile of female-owned business start-ups in downstateIllinois. Rural Research Report (7) 2.
Walzer and Merrett 133
Economic Research Service. 2001. State Fact Sheets: Iowa Fact Sheet. Washington, DC: UnitedStates Department of Agriculture. Available online: http://www.ers.usda.gov/StateFacts/IA.htm.
Egerstrom, L. 1994. Make No Small Plans: A Cooperative Revival for Rural America. Rochester,MN: Lone Oak Press.
Farm Bureau. 2002. Backgrounders for the 107th Congress: Issues of concern to Farm Bureau andits members. Available online: http://www.fb.org/issues/backgrd/.
Fellows, J. & P. Lasley. 1995. The changing division of labor on family farms. Pp. 109-126 inLasley, Leistritz, Labao, & Meyer (eds.), Beyond the Amber Waves of Grain: AnExamination of Social and Economic Restructuring in the Heartland. Boulder, CO:Westview Press.
Flora, C. 1990. Potentials and limits of cooperatives for community development: A comparativeanalysis. Paper presented at the annual meeting of the Rural Sociological Society.
Flora, C., & J. Flora. 1990. Developing Entrepreneurial Rural Communities. Sociological Practice8: 197-207.
Fulton, M. 2001. Traditional versus new generation cooperatives. Pp. 11-24 in Merrett & Walzer(eds.), Cooperative Approaches to Local Economic Development. Westport, CT:Greenwood Publishing.
Gale, F. 1999. Value-added manufacturing has strong local linkages. Rural Conditions and Trends8 (3): 23-26.
Greider, W. 2000. The last farm crisis. The Nation. November 20: 11-18.
Halstead, J., & S. Deller. 1997. Public infrastructure in economic development and growth:Evidence from rural manufacturers. Journal of the Community DevelopmentSociety. 28 (2): 149-69.
Hanson, M. J. 1999. Starting a Value-Added Agribusiness: The Legal Perspective.Macomb, IL: Illinois Institute for Rural Affairs. Available online: http://www.iira.org.
Hegland, S. 1999. Letter to the editor. Thompson Courier-Rake Register, May 13: 3.Available online: http://trnews.com/cr/pdf/051399.pdf.
Institute for Local Self-Reliance. 1999. Renville: The Cooperative Capital. TheCarbohydrate Economy 2(2). Available online: http://www.carbohydrateeconomy.org/library/admin/uploadedfiles/Renville_The_Cooperative_Capital.htm
Johnson, K., & C. Beale. 1998. The rural rebound. The Wilson Quarterly (Spring). Availableonline: http://wwics.si.edu/OUTREACH/WQ/WQSELECT/RURAL.HTM.
Leistritz, F. L. 1997. Assessing local socioeconomic impacts of rural manufacturingfacilities: The case of a proposed agricultural processing plant. Journal of theCommunity Development Society. 28(1): 43-64.
Leistritz, F. L., & F. L. Barnard. 1995. Financial characteristics of farm operators. Pp. 53-70 in Lasley, Leistritz, Labao, & Meyer (eds.), Beyond the Amber Waves of Grain:An Examination of Social and Economic Restructuring in the Heartland..Boulder, CO: Westview Press.
Leistritz, F. L., & R. S. Sell. 2001. Socioeconomic impacts of agricultural processing plants.Journal of the Community Development Society. 32(1): 130-59.
Malecki, E. 1991. Technology and Economic Development: The Dynamics of Local, Regional and

134 Journal of the Community Development Society
National Change. New York: Longman.
Mather, W., & H. Preston. 1990. Cooperative Benefits and Limitations: Farmer Cooperatives in theUnited States. Cooperative Information Report 1, Section 3 (revised).
McGranahan, D. 1998. Local Problems Facing Manufacturers: Results of the ERS RuralManufacturing Survey. Agriculture Information Bulletin, Number 736-03.Washington, DC: United State Department of Agriculture, Economic ResearchService.
Merrett, C.D., & N. Walzer (eds.). 2001a. A Cooperative Approach to Local EconomicDevelopment. Westport CT: Quorum Books.
Merrett, C.D., & N. Walzer. 2001b. A survey of new generation cooperatives: Exploringalternative forms of rural economic development. Pp. 91-116 in Merrett &Walzer (eds.), Cooperative Approaches to Local Economic Development.Westport, CT: Greenwood Publishing.
Merrett, C. D., M. Holmes, & J. Waner. 1999. Directory of New Generation Cooperatives.Macomb, IL: Illinois Institute for Rural Affairs. Available online: http://www.iira.org.
Nadeau, E.G. & D. Thompson. 1996. Cooperation Works! Rochester, MN: Lone Oak Press.
Norstrud, K. 1999a. Editor tours Golden Oval Eggs in Renville. Thompson Courier-RakeRegister, May 13, p. 1. Available online: http://trnews.com/cr/pdf/051399.pdf.
Norstrud, K. 1999b. No smell, one fly, tight ship operation. Thompson Courier-RakeRegister. May 13, p. 2. Available online: http://trnews.com/cr/pdf/051399.pdf.
Norstrud, K. 1999c. MCPA responds to editor. Thompson Courier-Rake Register, May 20,p. 2. Available online: http://trnews.com/cr/pdf/052099.pdf.
Pates, M. 2000. Out of fuel? Lack of progress prompts investors to pull out of S.D. ethanolco-op. AgLink: Agweek Online. June 12. Available online: http://www.gfherald.com/news/docs00/0610/35629.htm.
Persson, D. 1999a. Earth Day Editorial. Golden Oval Eggs Website. Available online:http://www.goldenovaleggs.com/earthday04,22,99.htm.
Persson, D. 1999b. Letter to the Editor. Thompson Courier-Rake Register, May 13, p. 3.Available online: http://trnews.com/cr/pdf/051399.pdf.
Persson, D. 1999c. Letter to the Editor. Thompson Courier-Rake Register, May 20, p. 3.Available online: http://trnews.com/cr/pdf/052099.pdf.
Putnam, R. 1993. The prosperous community: Social capital and public life. The AmericanProspect 4(13). Available online: http://www.prospect.org/print/V4/13/putnam-r.html.
Putnam, R. 2000. Bowling Alone: The Collapse and Revival of American Community. NewYork: Simon and Schuster.
Questionnaire for Cooperatives and Limited Liability Companies. 2000. Illinois Institutefor Rural Affairs, Western Illinois University, Macomb, IL.
Rocky Mountain Farmers Union. n.d. Perspective: It is all about Value. Available online:http://www.co-ops.org/perspective.
Roland, E. 2000. There is a crisis in rural America. AgLINK: Agweek Online. May 8.Available online: http://www.agweek.com/docs/0508/2784CD5.htm.
Rundle, L. 2000. Challenge and Opportunities in the Grain and Food Sectors: A Producer’s

Walzer and Merrett 135
Perspective. Conference Presentation at the Northern Great Plains Initiative for RuralDevelopment. Available online: http://www.ngplains.org/Trade_Transportation/I29/Conference_Transcript/Lynn_Rundle/lynn_rundle.htm.
Swalla Holmes, M., & D. Curry. 2001. Iowa Turkey Growers Cooperative and West Liberty Foods.Pp.167-178 in Holmes, Merrett, & Walzer (eds.), New Generation Cooperatives CaseStudies Expanded 2001. Macomb, IL: Illinois Institute for Rural Affairs.
Taylor, P. 1977. Quantitative Methods in Geography: An Introduction to Spatial Analysis. Boston,MA: Houghton Mifflin Company.
Trechter, D., & D. King (eds.). 2000. The Impact of New Generation Cooperatives on TheirCommunities. Rural Business—Cooperative Service, RBS Research Report 177.Washington, DC: United States Department of Agriculture.
U.S. Census. 2000a. State and Country QuickFacts. Washington, DC: United States Bureauof the Census. Available online: http://quickfacts.census.gov/qfd/.
U.S. Census. 2000b. County Business Patterns (NAICS—North American IndustryClassification System). Washington, DC: United States Bureau of the Census.Available online: http://tier2.census.gov/cbp_naics/index.html.
U.S. Department of Agriculture. 2000. Judge says permit properly granted to Golden Oval.Newsline (June). Available online: http://www.rurdev.usda.gov/rbs/pub/june00/newsline.htm.
Walzer, N., & M.Holmes. 2001. Case Study of Southwest Iowa Soy Cooperative. Pp. 55-68in Holmes, Merrett, & Walzer (eds.), New Generation Cooperatives: Case StudiesExpanded 2001. Macomb, IL: Illinois Institute for Rural Affairs.
Walzer, N., & S. Kapper. 1989. Issues and Concerns of Small City Mayors. Macomb, IL:Illinois Institute for Rural Affairs.
Walzer, N., C. Merrett., & M. Holmes. 1999. Agriculture and Local EconomicDevelopment. Macomb, IL: Illinois Institute for Rural Affairs.
Wiesenborn, D. 2001. Research in value-added processing—improved mechanicalextraction of oil from niche oilseeds. Newsletter—Agricultural and BiosystemsEngineering Department, North Dakota State University (May). Availableonline: http://www.ageng.ndsu.nodak.edu/News/newsletter01.pdf.
Zeuli, K. 2000. Cooperatives and communities: Findings, previous research, ideas forfurther study. Pp. 5-14 in Trechter & King (eds.), The Impact of New GenerationCooperatives on Their Communities. Rural Business—Cooperative Service, RBSResearch Report 177 Washington, DC: United States Department of Agriculture.
Journal of the Community Development Society Vol. 33 No. 2 2002
© 2002, The Community Development Society
BOOK REVIEWSMcDONOUGH, WILLIAM and MICHAEL BRAUNGART. Cradle to Cradle:Remaking the Way We Make Things. (New York: North Point Press, 2002, 186pp.).
Reviewed by Karri Winn, Institute for EnvironmentalEntrepreneurship-New College, San Francisco, CA
While the subjects of industrial design, chemistry and productdevelopment are generally not the focal points of community development, theyplay a decisive role in shaping our quality of life. In an age of unprecedentedconsumerism, most of us are unaware of the ecological or social ramifications ofthe products we use on a daily basis. In Cradle to Cradle by William McDonoughand Michael Braungart, readers will get an excellent introduction into the newand burgeoning field of industrial ecology. In the process they will be usheredinto a new paradigm for product design and production that is effectiveecologically and productive financially and culturally.
The topic of industrial ecology may at first seem daunting especiallyfor those of us who are not technically inclined, but the authors’ presentation ofthe concepts here is bound to stimulate new ideas in any reader. The first twochapters skillfully illustrate the unintended consequences of industrial growthand how it impacts the quality of life in our communities. Chapters three throughsix present three design criteria (eco-effectiveness, waste equals food, and respectdiversity) alongside a vision of industry that is absolutely revolutionary andwithin our reach.
Underlying their design criteria is a poignant but pragmatic set of ideas.The authors contend that to simply make less waste or to reduce emissions is anindicator of bad design. Indeed, regulations are an indicator of bad design.Rather, by improving the industrial system and increasing the efficacy of design– or eco-effectiveness (see chapter three), the authors show how manyregulations can be eliminated while still producing cost effective products andgenerating revenues. McDonough and Braungart inspire the reader to considerwhat the marketplace would look like if regulations were unnecessary.
McDonough and Braungart make a convincing argument regardingthe debate between growth and no growth. They claim the problem is not growth,but rather, what we grow. Currently we grow an industry that spews poisonsinto the environment and values money at the expense of human health orecosystem integrity (see chapters one & two). The opportunity is to grow health,art, culture and the pursuit of knowledge.
The authors contend that positive growth is possible by consciousdesign choices and thinking about products from cradle to cradle. This meansnot only how we put the product together in the factory, but thinking where we

Book Reviews 137
source the materials, how the materials are absorbed into the product and thencarefully constructing a design intention for each product. Thus, at the end ofits usefulness, it has a place to go – either recycled into industry as a technicalnutrient, or recycled into the biosphere as a biological nutrient.
The book is bubbling with fascinating case studies and vignettes fromtheir design challenges. To demonstrate waste equals food (chapter four), theydiscussed a project involving the US-based firm Designtex, a Swiss textilemanufacturer and Ciba Geigy – a multinational chemical company. The project’sgoal was to develop a benign industrial strength textile. The end product wasdesigned as a biological nutrient such that worn fabric can be used as mulch inthe garden where it will provide nutrients for the soil. In addition to a totally non-toxic product that meets industrial and comparable product use standards, thefactory even cleans and distills the water used in the process. It’s the kind of“win-win” story that leaves the reader feeling uplifted and hopeful.
What moved me while reading this book was the authors’ ontologicalquestion: How can we love all the children of all species for all time? To bringthis kind of basic question into an industrial design environment makes for anexceptional exploration into the way we make things. This is a well-written,insightful book that chronicles some of today’s most well known corporationswith a depth of spirit and passion for quality of life. And if for no other reasonthan novelty itself, this book was designed as a technical nutrient – it’s waterproofand you can enjoy reading it in the shower!
RODRIGUEZ-GARCIA, ROSALIA, JAMES A. MACINKO, and WILLIAM F.WATERS (eds.) Microenterprise Development for Better Health Outcomes.(Westport, CT: Greenwood Press, 2001, 139 pp.). Hardback.
Reviewed by Christine Daugherty, Charleston, West Virginia
The authors of this book are from the George Washington Center forInternational Health (GWCIH). In the data surveyed, they report on their ownfield studies from Bolivia and the Dominican Republic, as well as evaluation datafrom other international non-governmental organizations. The book grew out ofa conference held in Bellagio, Italy in 1996 on “Microenterprise Development forBetter Health Outcomes” with 20 international participants. There are twoquestions that this book asks and attempts to answer. One is, “Do programs formicroenterprise development increase the overall health of the people and familieswho run the businesses?” The other question asks, “Is there a way to answerthis question?” The answer to both questions in this book is “maybe yes,maybe no.”
Herein lies the difficulty. Neither one of the questions is really answered.In addition, you would never know by reading this book that microenterprise

138 Journal of the Community Development Society
programs exist in any region of the world other than Latin America, Africa, andparts of Asia. In fact, there are programs all over the globe, including in theauthor’s own back yard in the United States. There are many programs in Europe,in western, central and eastern Europe. Afghanistan has a couple of verysuccessful programs. So does California. But the authors seem to be writingexclusively to the funders of overseas development, operating almost entirely inthe southern hemisphere.
The book does a good job of defining the microenterprise field andanalyzing the various programs that may or may not answer the first question.But the question regarding health is defined too narrowly. A broader questionmight be – “Since the goal of most microenterprise programs is to alleviatepoverty, do these programs offer people choices that will improve the quality oftheir lives as well as their economic status?” According to an evaluation of someof the top ten U.S. programs funded by the Ms. Foundation for WomenCollaborative Fund, all the programs were committed to helping women “addressa range of personal issues, from building self-esteem, to dealing with health,social and family matters, to targeting educational and vocational deficits.”
The book’s authors agree with this finding. According to their reviewof the evidence from Bolivia and the Dominican Republic where they worked,there are implicit linkages in programs that may not have a specific mechanismfor improving health, but support conditions that might impact on health.However, they also assert:
It is important to retain a healthy skepticism. Although many linkagesmay occur, there is little evidence to support the assertion that any ofthe system-level linkages do in fact occur, or that they are importantto either the success of microenterprise development activities, orthe health system, as a whole (my emphasis).
So why, then, a whole book on the topic? Here and there are snatchesof data indicating that an argument can be made for the linkage between healthand microenterprise. Programs in Ghana, Honduras, and Mali report that two-thirds of program participants reported increased incomes over the previousyear. This increase was spent on food, clothing, health, and school expenses.Based on this evidence, the authors identify three factors to optimize the impactof increased income on health. One is the percentage of income managed bywomen, another is the provision of health promotion to guide women in investingin their family’s health, and finally, the practice of group lending to buildempowerment. On the other hand, there is also evidence that women who mustmanage households as well as businesses suffer from increased stress, as wellas neglect of their own health. One of the goals of microenterprise programs inthe U.S. is to bring in enough income from the business to afford the owner anopportunity to purchase health insurance. This is obviously different in parts ofthe world where there is universal health insurance provided by government.Since there are so many families in the U.S. without this precious commodity,

Book Reviews 139
this is a laudable goal. However, according to a practitioner from Maine, veryfew people were able to cover the costs of health insurance through businessincome. She commented that the scale of women’s businesses usually aren’t bigor profitable enough to be able to purchase insurance. In addition, families willoften “patch” together a number of various sources, including microenterprise,just to make a living. Clearly the link between health and microenterprisedevelopment would be strengthened if entrepreneurs could afford health insurance.
I was interested in reviewing this book because of my own long history(over fifteen years) in the microenterprise field. I am particularly interested in theways that people in many countries might create microenterprises that actuallywork in the health field, either in promotion or service. Herbs, alternative medicine,care of the sick and elderly – are all businesses that women, especially, create.Therefore, I was looking particularly for even anecdotal evidence thatmicroenterprises can serve low-income people with their health needs by sellingservices or products that promote healthy outcomes. I didn’t find it.
Instead, there was a whole chapter, “Challenges in Evaluating the Link,”which assumed that consultants (maybe those from GWCIH?) would set upelaborate evaluation systems of qualitative and quantitative methods, includingcommunity surveys. My own impression of this book is that it might have madean interesting article in a professional journal, but because their evidence of thelinkage between health and microenterprise is so thin, a book-length treatise isnot useful.
KNEPPER, CATHY D. Greenbelt, Maryland: A Living Legacy of the New Deal.(Baltimore, MD: The Johns Hopkins University Press, 2001, 304 pp.) Cloth.
Reviewed by Roberta W. Walsh, Florida Gulf Coast University
Never having visited the city of Greenbelt, Maryland, I wondered if thisbook would hold my interest for very long. After reading this rich and well-documented account of its unique history, however, I now believe it will bedifficult to travel along Interstate 95 and resist the urge to take a tour of thiscommunity.
Knepper combines her background as an English major and advanceddegrees in social work and American studies to create a fascinating account ofGreenbelt as an experiment of the federal government in creating a plannedcommunity. Based on the idealistic tenets of one Rexford Tugwell, an economistand member of Franklin Roosevelt’s inner circle, Greenbelt was conceived aspart of the New Deal as indeed a “living legacy” to a social policy approach toeconomic recovery in the 1930’s. Other influences derived from architects andsociologists of the period who forged the concept of Greenbelt’s design andsocial plan founded on the principle of cooperation within and amongneighborhood units. Physical characteristics such as connecting paths,
140 Journal of the Community Development Society
courtyards and residential blocks were key to the planning elements of Greenbelt.Green spaces (hence its name) as well as recreational and educational facilitieswere all carefully thought through to promote a strong sense of interdependenceamong dwellers of a “utopia” outside of the nation’s capital. The idea of acooperative economy took hold early in the planning and extended to includeservices such as a community newspaper and health care that remain today.
As the title suggests, the book is a documentary on Greenbelt. Onecan almost visualize a Ken Burns production quality to the material. Historicphotographs depict everyday life and milestone events in Greenbelt over sixtyyears of its existence. Maps and plans dating from as early as 1936 and aerialshots of the beltway-parkway periphery give the reader a bird’s eye perspectiveof the greater Greenbelt area through stages of its development. Extensivequotations from residents and distinguished visitors from the U.S. and abroadattest to the strongly held convictions of Greenbelt as a model community. Theauthor includes a bibliographic essay describing the wide range of resourcesconsulted in writing a book to reflect “the complexity of real life and real peoplein a community planned to be as perfect as possible” (p. 264).
In rich, anecdotal form the author relates how the many dimensions ofa community emerged and played out in Greenbelt—education, religion, politics,the press, and racial/ethnic integration, for example. Readers who are enlightenedcitizens in their own communities can identify with what it would have been liketo live there and experience the city’s growth and development through peaksand valleys. For example, when in conflict, the community resolved issues in astyle reminiscent of early New Englanders in town meetings: Letters to theeditor of the community newspaper proliferate on the issues, “…testimony flowsin city council meetings…flyers appear on doorsteps…and a vote is held todetermine the outcome” (p. 238). Community spirit triumphs during difficultperiods when Greenbelt is the target of the private sector and most notablyduring the McCarthy era when it is branded as “communist,” complete with oneof its citizens singled out as a victim of the “witch hunt” mentality of the day.
More specifically, though, the book appeals to specialists as diverse ashistorians, planners, community development professionals, publicadministrators, and civic leaders. Readers falling into these and other categoriescan trace their own area of interest using Greenbelt as a case study, albeit aunique case as an American urban phenomenon. Although few municipalitiestrace their origin to the experimental nature that is Greenbelt, readers with specialinterests can draw conclusions about certain qualities of this city that contributedto its staying power over the dramatic changes in economic, political and socialconditions that have occurred since its founding. Examples include a higherthan normal voter turnout record, an emphasis on recreational activities and aseemingly unrelenting passion for improvement in all aspects of community life.
The book is not, however, a critical analysis of the rationale underlyingthe development of Greenbelt as a social experiment. Although it adequately

Book Reviews 141
covers failures that Greenbelt endured and points of view of its detractors overthe years, one senses a cause celebre theme throughout. This theme is mostpronounced in the section titled “Developers versus Greenbelt” which chroniclesvictories over well organized and politically connected developers. Elsewhere,the author notes long-standing and emerging traditions of the community thatcreate an enduring bond among its members. Among these are an annual fishfry, commemorative observances of the city’s founding and Labor Daycelebrations, citizenship awards and the formation of chapters of former Greenbeltresidents in Florida. In a final section focusing on “Greenbelt Today andTomorrow,” Knepper attributes the city’s success to adherence to the “Greenbelt[P]rinciples” embracing effective organization, active public participation and astrong sense of social responsibility.
Overall, the book succeeds in memorializing Greenbelt in the reader’smind. It describes its founding and evolution into contemporary times so vividlythat I found myself sharing the book’s insights of Greenbelt with friends,colleagues and students in conversations in both social and work settings. Iwas even prompted to explore Greenbelt web sites for current information on itsinstitutions—its designation as a National Historic Landmark, for example, andits community newspaper, the News Review that had a major role throughoutGreenbelt’s history.
Finally, it is noteworthy that the book is one of thirteen in a series titled,Creating the North American Landscape. Other subjects in the series areplaces as diverse as Boston, Los Angeles, Toronto, Detroit and Park Forest,Illinois, with subtitles addressing topics ranging from urban and suburbanplanning to studies of village living. Reading Greenbelt whets the appetite tolearn more about the origins and unique qualities of our cities and towns. Eachlocale has a story to tell about what makes it a special place—a refreshing thoughtthat counters the image of prevailing homogeneity in the American way of life.
GLENNON, ROBERT. Water Follies: Groundwater Pumping and the Fate ofAmerica’s Fresh Water. (Washington, DC: Island Press, 2002, 314 pp.).
Reviewed by Stephen P. Gasteyer, Rural Community AssistanceProgram, Washington, DC
The use and misuse of water in the United States is hardly an original orunresearched topic. Conspicuous consumption in the West was well documentedin Marc Reisner’s (1986) Cadillac Desert. Sandra Postel (1997) and Peter Gleick(2002) have documented water excesses in numerous books. Even the subjectof overuse and misuse of groundwater has been covered in numerous scientificand policy publications, such as John Opie’s (2000) Ogallala, or Payal Sampat’s(2000) Worldwatch policy brief Deep Trouble: The Hidden Threat of GroundwaterPollution.

142 Journal of the Community Development Society
Given that fresh water is critical to human life, however, one more bookon the subject is hardly saturating the subject, especially when, as Robert Glennonstates:
…most Americans take water for granted. Turn on the tap, and waterflows for cooking and drinking. Jump in the shower and wash off the dirt, andfeel refreshed. Turn on the hose to wash the car or water the lawn and garden.Most Americans’ involvement with their water supply occurs once a monthwhen they write a small check to the local water utility. Some cities do not evenhave a separate charge for water. In these cities, people are literally free to use asmuch water as they desire (Glennon, 2002, p. 14).
As a society, we need literature that connects the hydro/eco/sociocultural and economic dots for Americans. Far too often, case studies ofwater resources management are presented through disciplinary lenses. Studiesof water management often focus uniquely on the regulatory or funding tools,hydrologic aspects, economic aspects, or social processes. For those concernedwith water and community development, these are all pieces of the puzzle thatwe need to understand to improve groundwater management and distribution inmultiple contexts.
What Robert Glennon’s Water Follies does beautifully is talk aboutgroundwater issues through a series of vignettes. The stories demonstrate howin each case, key questions of social structures and relationships, economicforces, political pressures, and scientific understanding of ecological processeshave created and then led to a water problem related to groundwater pumpingand allocation.
These stories serve the additional purpose of giving the reader a senseof the range of issues that can arise from groundwater misuse, and the failure ofexisting U.S. laws to effectively regulate water use. The stories describe theinability of either Federal or State law to adequately address the groundwater,surface water interaction, as described in the depiction of the battle againstNestle/Perrier’s plan to pump groundwater for bottled ‘spring’ water—thusdestroying the ‘spring’ tributary near the Mecan River in Wisconsin. Glennon’sdepiction weaves in both the value of the water to the ecosystem, but also thecompeting use values for residents—economic development versus fishing andquality of life.
The book later takes aim at other corporate misuses of water. Forexample, aquifers are being “dewatered” to allow gold mining companies to digever deeper for gold particles in Nevada. The Peabody coal company is drainingthe Hopi aquifer to create coal slurry that can be shipped to power plantsthroughout the Southwest.
Case studies also address the agricultural industry. Producingstandardized potatoes for McDonalds’ Corporation has led to groundwaterpumping that imperils the Straight River in Minnesota. Irrigation to improve

Book Reviews 143
production of wild blueberries in Maine has threatened the Atlantic Salmon,though, in this case, judicious use of groundwater might provide a potentialsolution.
In three different cases, the book also addresses pressures on theecosystem caused by urban sprawl, population pressure and excessive waterconsumption. The Santa Cruz River in Tuscon, Arizona, has all but disappeareddue to over-pumping of groundwater to support population growth and a lifestyleof green lawns in the desert. Attempts to encourage population growth in theFort Huachuca and the town of Sierra Vista nearly dried up the San Pedro Riverin Arizona. Groundwater pumping to feed the water system of the sprawlingtown of Tampa Bay, Florida, destroyed lakes, marshes, and eventually housesaround the city. A chapter on San Antonio, Texas, illuminates the laughable (ortragic!) folly of water use in that part of Texas—from the San Antonio River thatis fed by pumped groundwater, to the proposal of T. Bone Pickens to supplywater from more than 250 miles away.
In all cases, Glennon combines explanation of the hydrology andecosystem interactions with descriptions of the political processes, laws, andsocial action. He highlights the efforts of local activists to document and fightagainst the excesses of egregious water use and the absurd attempts to solvewater problems through even higher-tech engineering.
It would be a mistake, however, to tag Glennon as a knee-jerk leftist.While he documents the excesses of free-market approaches to water, he isequally skeptical that water can be a purely public resource in the U.S. context.He argues:
Proposals that conceive of water either as exclusively a publicresource or as entirely private property are merely simplistic appealsfrom opposite ends of the rhetorical spectrum. Their proponentsfail to appreciate the historic development of our laws and institutions,the localized context of water conflicts, and the inescapable realitythat our current system recognizes that water is both a public resourceand a private property right (Glennon, 2002, p. 213).
By far the weakest section is the last part of the last chapter, whereGlennon attempts to lay out his recommendations for how to change laws toaddress water issues. A number of the recommendations have considerablemerit, but the section reads like a like a policy brief and some of his proposedcompromises, such as a dedicated Federal fund for water management, open apolitical can of worms. Another fault is that the book excludes mention of thework of a myriad of non-governmental organizations (NGOs) that protectsgroundwater through stakeholder processes, often facilitating communityplanning before overpumping has started. Having said that, this book is botheducational and an enjoyable read, especially for those interested in communitydevelopment.
144 Journal of the Community Development Society
References:
Gleick, Peter. 2002. The World’s Water 2002-2003. Washington, DC: Island Press.
Opie, John. 2000. Ogallala: Water for a Dry Land. Lincoln, NE: University of NebraskaPress.
Postel, Sandra. 1997. Last Oasis: Facing Water Scarcity. New York: W.W. Norton Press.
Reisner, Marc. 1986. Cadillac Desert: The American Desert and its Disappearing Water.New York: Viking Press.
Sampat, Payal. 2000. Deep Trouble: The Hidden Threat of Groundwater Pollution.Washington, DC: Worldwatch Institute.
MATTESSICH, PAUL W., MARTA MURRAY-CLOSE, and BARBARA R.MONSEY. Collaboration: What Makes It Work, 2nd Edition. (St. Paul, MN:Amherst H. Wilder Foundation, 2001. 82 pp.). Paper.
Reviewed by Frank Antonucci, Illinois Institute for Rural Affairs,Western Illinois University, Macomb, IL.
One of the key values among the Community Development Society’sPrinciples of Good Practice is to promote the active and representativeparticipation of community members in meaningfully influencing decisions thataffect their lives. In the current environment of limited public budgets and services,local people and agencies must be willing to collaborate to pursue self-helpstrategies for community development. Mattessich’s second edition book,Collaboration: What Makes It Work?, provides a clear and practical guide forunderstanding and developing community collaboration.
After an extensive literature review, the authors identify twenty factorsthat have a strong influence on community collaboration. All relevant casestudies are identified, screened and accepted based on a process of meta-analysis. A list of factors is developed by researcher consensus on the casestudies. Factors based on the case studies are grouped into six categories thatinclude environment, membership characteristics, process and structure,communication, purpose and resources. The authors only identify factors thathave some influence on collaboration but are unable to gauge the extent of theinfluence. The following twenty factors are grouped into six categories andserve as a checklist of issues to consider during the collaboration process.
The Wilder Collaboration Factors Inventory is a survey instrumentthat has been developed as a readiness guide or a way to check group progressin the midst of a collaboration effort. The survey is based on the twentycollaboration factors and can serve as a facilitation tool to discuss the strengthsand weaknesses of any collaborative venture. The survey has been used byseveral different organizations including the Red Cross with reported success.Factors that receive low scores from the collective group need to be discussedand considered before further collaboration.
Book Reviews 145
The authors acknowledge the difficult nature of administering andtallying the survey scores on paper for a large group of participants in a meeting.The Wilder survey is also on line for use by individuals. The use of a keypadelectronic polling system like the unit available at the Institute for Rural Affairs,Western Illinois University could be a useful tool for the collaboration surveysince it provides the opportunity to tally and display survey results for largegroup discussion.
Collaboration: What Makes It Work? is an important work because itprovides some guidance on how to identify important issues that affect thesuccess of a collaborative effort. Survey results highlight some of the potentialpitfalls that have been identified by collaboration researchers. The Wilder surveyinstrument can be used before collaboration as a readiness guide or during acollaboration to check the progress of the collective effort. Groups can thenanalyze their strengths and weaknesses for future development. Although thefactors survey cannot be used to provide specific guidance in particular situationsor identify the proper mix of the various factors, it does provide valuableinformation about group progress.
Collaboration: What Makes It Work? is an important contribution tothe study and practice of collaboration and should be reviewed and consideredfor use by community development professionals.

Please direct inquiries and submissions to the Guest Editors listed below.
1. Special issue on Telecommunications Technology and Community Development.This topic has received a lot of interest within CDS interest groups and Global Networkingconferences. We look to papers that examine the impact of community informatics on thestrategies and practice of community development.
Guest Editor: Kenneth E. Pigg, Department of Rural Sociology,University of Missouri- Columbia, Columbia, MO 65211. Email:[email protected]
2. Special issue on Urban Community Development. Community development hasboth urban and rural roots, and this special issue will identify the challenges and potentialsof urban community development. Papers are desired that give special attention tocutting edge policies, practices, and analysis that have implications for communitydevelopment in suburban, exurban, regional, or rural areas as well.
Guest Editor: Edward J. Blakely, Dean, Robert J. Milano GraduateSchool of Management and Urban Policy, New School University,72 5th Avenue - 4th Floor, New York, NY 10011. Email:[email protected]
3. Special Issue on Leadership. No topic has received as much attention over a longperiod as the need for and implications of building strong local leadership in communitydevelopment. It is time to examine theoretical developments in leadership from severalrelated fields, collect empirical case studies of leadership development and training, andspeculate on the role of leadership in the 21st century.
Guest Editor: James R. Calvin, Director Leadership DevelopmentProgram, School of Professional Studies in Business and Education,Johns Hopkins University, 1625 Mass Ave NW, Washington DC20036. Email: [email protected]
4. Special Issue on Social Capital. The topic of social capital has become pervasivein scholarly and popular community analysis, but its implications and linkage is perhapsstrongest in community development. In this issue, we look for research and theory onthe way social capital is linked to community development practices, programs, and strategiesin order to explore both the contribution and limitations of this very popular concept.
Guest Editor: Jan L. Flora, Department of Sociology, 317D EastHall, Iowa State University, Ames, IA 50011-1070. Email:[email protected]
5. Special Issue on Entrepreneurship in Community Development. The topic ofentrepreneurship is essential for growing communities, and a growing body of researchhas been exploring how community development and economic development programsin rural and urban areas can stimulate entrepreneurship.
Guest Editor: Norman Walzer, Director, Illinois Institute for RuralAffairs, Western Illinois University, 518 Stipes Hall, Macomb, IL61455. Email: [email protected]
CALL FOR PAPERSJOURNAL OF THE COMMUNITY DEVELOPMENT SOCIETY
INSTRUCTIONS TO AUTHORSAddress submissions to Ted Bradshaw, Editor, Journal of the Community Development Society,
Human and Community Development Department, University of California, Davis, CA95616. Email: [email protected].
Submission RequirementsSubmit four printed copies of the manuscript on 8 1/2" by 11" bond in near-letter quality
type. Double space all material, including indented passages, footnotes, and references,with ragged right margins and no hyphenation. At least three copies without authoridentification will be submitted to referees for peer review.
An electronic copy must also be submitted in Word on PC compatible 3 1/2" diskette or CDor by email. If you do not have access to Word, please contact the Editor to determinethat your file can be read. Submissions should be in US English. The content of theelectronic files should match exactly the content of the printed manuscript.
Printed ManuscriptCover Page. Show article title, institutional affiliation(s), and professional position(s) of
author(s). Omit author name(s) and affiliation(s) from the manuscript itself.Abstract. Include on a separate page the article title and a summary of 100 to 150 words.Keywords. Authors must supply from three (3) to five (5) alphabetized keywords or phrases
that identify the most important subjects covered by the paper. Place keywords on thebottom of the Abstract page.
Endnotes. Use notes in the text sparingly for substantive comments only, not for bibliographicreferences. Notes should be numbered consecutively on a separate page following thetext. Include location notes at appropriate places in the text.
Tables and Figures. Append tables and figures on separate pages at the end of themanuscript. Include location notes, e.g., “Table 1 about here,” “Fig. 1 near here,” atappropriate places in the text. Tables and figures must be included in the electronicfile, sized to fit within the Journal’s 4 1/2" by 7" page format. Figures may be also besubmitted in Harvard Graphics, Powerpoint, EPS, or TIFF files. Include location notesat the appropriate places in the main text file.
References in the Text. References in the body of the text should include the name of theauthor(s) cited and date of reference in parentheses within the manuscript, e.g., (Carrey,1972). Do not use ibid., op. cit., loc. cit., etc. If reference is a direct quote, include pagenumber also, e.g., (Carrey, 1972, p. 241). For repeat citations, continue to use name ofauthor(s) and date. In case of multiple works with the same author(s) and publicationyear, use “1991a,” “1991b,” etc.
References at End of Text. Complete data on all references should be listed alphabeticallyat the end of the article. Include page numbers, volume and issue numbers of journals,and all authors’ names. Double space the listing of references. Forms for articles, books,and articles in books are as follows:Willits, F. K., & D. M. Crider. 1993. Pennsylvanians view economic development:
A ten year perspective. Journal of the Community Development Society24(1): 30-45.
Babbie, E. 1993. The Practice of Social Research. Belmont: WadsworthPublishing.
Fear, F., L. Gamm, & F. Fisher. 1989. The technical assistance approach. In J.A. Christenson & J. W. Robinson, Jr. (eds.), Community Development inPerspective. Ames, IA: Iowa State University Press.
Omit Self-Identifying References. Authors should be careful to eliminate any text orcitations that identify the author of the paper or the author’s institution to our reviewers,although authors may cite their own work if it is not identified explicitly with the currentpaper. These identifications can be added after the reviews have been completed.
The Journal of the Community Development Society regards submission of a manuscriptas a commitment by the author(s) that is not to be breached by submission to anotherjournal while the manuscript is under review. There is an institutional charge of $35 perprinted page, which is payable by the granting agency or employer who supports thework. If no support exists, an exemption may be granted.

The Journal of the Community Development Society (ISSN0010-3829) is devoted to improving knowledge and practicein the field of purposive community change. The purpose ofthe Journal is to disseminate information on theory, research,and practice. The Editors welcome manuscripts that reportresearch; evaluate theory, techniques, and methods;examine community problems; or analyze, critically, theprofession itself. The Journal is published twice each year.
The Society’s membership fee (membership year July-June) is$85.00 for an individual, which includes two issues of theJournal and quarterly issues of the Vanguard. Members whohave paid their dues by March 1 will receive the Spring and Fallissue of the Journal when they are published. Members whopay their dues after March 1 and before September 15 willreceive both issues with the Fall mailing of the Journal. Duespaid after September 15 will be credited to the following calendaryear for membership in the Society.
Mail payment to: Community Development Society, 17 SouthHigh Street, Suite 200, Columbus, OH 43215 (phone: 614-221-1900, fax: 614-221-1989, e-mail: [email protected]).
Authorization to photocopy articles in this journal can beobtained by contacting the Copyright Clearance Center(CCC), Academic Permission Service, 222 Rosewood Drive,Danvers, Massachusetts 01923. Community DevelopmentSociety members can obtain permission from the editor tophotocopy articles without any fee. Requests for permissionto reprint articles should be directed to the editor.
Articles in the Journal of the Community Development Societyare abstracted in Current Index to Journals and Education(C.I.J.E.), Educational Resource Information Center (ERIC),Journal of Planning Literature, PAIS Bulletin, PAISInternational, Social Planning/Policy and DevelopmentAbstracts, Social Work Research and Abstracts, Sociofile,Sociological Abstracts, Ulrich’s International PeriodicalsDirectory and the International Regional Science Review.