Typologies of crop-drought vulnerability: an empirical analysis of the socio-economic factors that...
15
Typologies of crop-drought vulnerability: an empirical analysis of the socio-economic factors that influence the sensitivity and resilience to drought of three major food crops in China (1961–2001) Elisabeth Simelton a, *, Evan D.G. Fraser a , Mette Termansen a , Piers M. Forster b , Andrew J. Dougill a a Sustainability Research Institute, School of Earth and Environment, University of Leeds, Leeds, United Kingdom b Institute for Climate and Atmospheric Science, School of Earth and Environment, University of Leeds, Leeds, United Kingdom 1. Introduction Climate change policy is based on evidence that is under- pinned by mathematical and physical models that project the consequences of increasing concentrations of greenhouse gases. Today, climate models include large numbers of variables and feedbacks, all of which can be calculated to a relatively fine spatial and temporal resolution, covering the entire globe (Intergovernmental Panel on Climate Change, 2007). Despite this extraordinary accomplishment, these models are not yet designed to fully capture one of the most important aspects of the climate system: humanity’s ability to respond to changes in regional and local weather patterns. The chapter on agriculture by Working Group II of the Intergovernmental Panel on Climate Change’s fourth assess- ment report is illustrative. It provides a lengthy survey of how crops respond to moisture stress, carbon dioxide fertilization and elevated temperatures. The chapter concludes that if environmental science & policy xxx (2009) xxx–xxx article info Keywords: Climate change impacts Adaptability Resilience Food security Crop model abstract Why is it that sometimes small droughts trigger serious crop losses while in other cases even large droughts do not have such a major effect? In this paper, we identify socio-economic indicators associated with sensitivity and resilience to drought for each of China’s main grain crops (rice, wheat and corn). Provincial harvest and rainfall data (1961–2001) are used to calculate an annual ‘‘crop-drought vulnerability index’’. We separate ‘‘sensitive cases’’ (where significant harvest losses occurred in years with only minor droughts) and ‘‘resilient cases’’ (where harvest losses were minimal despite there being a major drought) and explore the socio-economic characteristics of these different situations. Results show that sensitive cases were particularly common in economically poor landlocked provinces and in wealthy coastal areas that have a limited land base. In such ‘‘sensitive cases’’, the size of the rural population and the quantity of agricultural inputs were negatively correlated with drought vulnerability, while for resilient cases, vulnerability was negatively correlated with the abundance of land. This leads us to propose a series of drought-vulnerability typologies based on the extent to which land, labour, capital, agricultural technology, and infrastruc- ture buffer or exacerbate the effect of a drought event. # 2008 Elsevier Ltd. All rights reserved. * Corresponding author. E-mail address: [email protected] (E. Simelton). ENVSCI-679; No of Pages 15 Please cite this article in press as: Simelton, E., et al., Typologies of crop-drought vulnerability: an empirical analysis of the socio- economic factors that influence the sensitivity and resilience to drought of three major food crops in China (1961–2001). Environ. Sci. Policy (2009), doi:10.1016/j.envsci.2008.11.005 available at www.sciencedirect.com journal homepage: www.elsevier.com/locate/envsci 1462-9011/$ – see front matter # 2008 Elsevier Ltd. All rights reserved. doi:10.1016/j.envsci.2008.11.005
-
Upload
independent -
Category
Documents
-
view
0 -
download
0
Transcript of Typologies of crop-drought vulnerability: an empirical analysis of the socio-economic factors that...
ENVSCI-679; No of Pages 15
Typologies of crop-drought vulnerability: an empiricalanalysis of the socio-economic factors that influence thesensitivity and resilience to drought of three major food cropsin China (1961–2001)
Elisabeth Simelton a,*, Evan D.G. Fraser a, Mette Termansen a,Piers M. Forster b, Andrew J. Dougill a
a Sustainability Research Institute, School of Earth and Environment, University of Leeds, Leeds, United Kingdomb Institute for Climate and Atmospheric Science, School of Earth and Environment, University of Leeds, Leeds, United Kingdom
e n v i r o n m e n t a l s c i e n c e & p o l i c y x x x ( 2 0 0 9 ) x x x – x x x
a r t i c l e i n f o
Keywords:
Climate change impacts
Adaptability
Resilience
Food security
Crop model
a b s t r a c t
Why is it that sometimes small droughts trigger serious crop losses while in other cases even
large droughts do not have such a major effect? In this paper, we identify socio-economic
indicators associated with sensitivity and resilience to drought for each of China’s main
grain crops (rice, wheat and corn). Provincial harvest and rainfall data (1961–2001) are used
to calculate an annual ‘‘crop-drought vulnerability index’’. We separate ‘‘sensitive cases’’
(where significant harvest losses occurred in years with only minor droughts) and ‘‘resilient
cases’’ (where harvest losses were minimal despite there being a major drought) and explore
the socio-economic characteristics of these different situations. Results show that sensitive
cases were particularly common in economically poor landlocked provinces and in wealthy
coastal areas that have a limited land base. In such ‘‘sensitive cases’’, the size of the rural
population and the quantity of agricultural inputs were negatively correlated with drought
vulnerability, while for resilient cases, vulnerability was negatively correlated with the
abundance of land. This leads us to propose a series of drought-vulnerability typologies
based on the extent to which land, labour, capital, agricultural technology, and infrastruc-
ture buffer or exacerbate the effect of a drought event.
# 2008 Elsevier Ltd. All rights reserved.
avai lab le at www.sc iencedi rec t .com
journal homepage: www.elsevier.com/locate/envsci
1. Introduction
Climate change policy is based on evidence that is under-
pinned by mathematical and physical models that project the
consequences of increasing concentrations of greenhouse
gases. Today, climate models include large numbers of
variables and feedbacks, all of which can be calculated to a
relatively fine spatial and temporal resolution, covering the
entire globe (Intergovernmental Panel on Climate Change,
* Corresponding author.E-mail address: [email protected] (E. Simelton).
Please cite this article in press as: Simelton, E., et al., Typologies o
economic factors that influence the sensitivity and resilience to droug
Policy (2009), doi:10.1016/j.envsci.2008.11.005
1462-9011/$ – see front matter # 2008 Elsevier Ltd. All rights reserveddoi:10.1016/j.envsci.2008.11.005
2007). Despite this extraordinary accomplishment, these
models are not yet designed to fully capture one of the most
important aspects of the climate system: humanity’s ability to
respond to changes in regional and local weather patterns.
The chapter on agriculture by Working Group II of the
Intergovernmental Panel on Climate Change’s fourth assess-
ment report is illustrative. It provides a lengthy survey of how
crops respond to moisture stress, carbon dioxide fertilization
and elevated temperatures. The chapter concludes that if
f crop-drought vulnerability: an empirical analysis of the socio-
ht of three major food crops in China (1961–2001). Environ. Sci.
.
e n v i r o n m e n t a l s c i e n c e & p o l i c y x x x ( 2 0 0 9 ) x x x – x x x2
ENVSCI-679; No of Pages 15
global mean temperature rises more than 2 8C, yield declines
are likely throughout the globe (Easterling et al., 2007). When it
comes to exploring how socio-economic factors may buffer (or
exacerbate) the effect of climate change on crop productivity,
however, there is a far less robust literature to draw upon. As a
result, the IPCC’s chapter covers this matter in a few short
paragraphs by reviewing how the impact of climate change on
food production will also depend on local socio-economic
conditions. For example, the chapter looks at how the same
meteorological shock had very different effects in adjacent
areas of the southern United States and Northern Mexico. The
importance of socio-economic context is further backed up by
literature that shows what conditions enable farmers to create
more or less robust agricultural systems (Fraser, 2003, 2006,
2007; Mendelsohn, 2007; Mendelsohn et al., 2007; Reidsma
et al., 2007; Sullivan and Meigh, 2005). Such geographic and
economic insights have not yet been integrated into the
current generation of coupled global circulation and land use
models where human activities are encapsulated by broad
‘land use’ categories that are themselves defined by only a few
parameters such as albedo and soil moisture (see: Heister-
mann et al., 2006 for a review of land-use models). Similarly, in
assessments of climate impacts on agriculture, two types of
models are common but rarely joined together: biophysical
crop models and econometric/trade models. In the crop
models, farmers’ decisions are typically represented by simple
parameters (such as the assumption that soil moisture
determines planting date) and inputs like fertilisers are
assumed in models to be used consistently over the growing
season (Osborne et al., 2006). In econometric models, farmers
are typically treated as an aggregated group of profit
maximisers acting in a free market, possibly with parameters
representing environmental limitations (Wang and Davis,
2000). In these examples, factors that might influence on-farm
activities are unaccounted for (Patt and Siebenhuner, 2005),
e.g. risk-reduction strategies. Consequently, we have thus far
only a poor understanding of how socio-economic changes
may affect land use decisions, and how these may then
translate into more or less vulnerable cropping systems.
There are many difficulties associated with incorporating
human dimensions into climate change impact models. These
are confounded by the need to find a suitable scale and a
flexible set of environmental, social, and economic indicators.
Regardless of these challenges, it is imperative that integrated
climate change impact models capture more socio-economic
factors. Take vulnerability to drought as an example. In some
historic situations, such as the Ethiopian Famine during the
1980s, the underlying socio-economic and political conditions
were such that a minor climatic perturbation had a massive
impact (Comenetz and Caviedes, 2002). In other cases, even
severe droughts were adapted to without significant problems;
for example, a major drought in southern Africa in the early
1990s did not result in significant hunger and famine-related
deaths due to a combination of local adaptability, pro-active
governmental response and long-range forecasting (Green,
1993). The role of society and economics, therefore, may either
counteract or amplify the climate signal, and this has led some
development experts to suggest that food shortages almost
never emerge due to environmental triggers but are inevitably
caused by social phenomena (Sen, 1981).
Please cite this article in press as: Simelton, E., et al., Typologies o
economic factors that influence the sensitivity and resilience to droug
Policy (2009), doi:10.1016/j.envsci.2008.11.005
This is particularly important in terms of drought, which
is a slow onset problem (as compared with floods or storms)
that we have a reasonable capacity to anticipate based on
medium range weather forecasting and our understanding
of El Nino/La Nina cycles (Rook, 1997). Since droughts are
anticipated to become more pronounced in some of the
world’s already dry regions as a consequence of global
warming (Awosika et al., 1998; IPCC, 2007), and since these
areas are among the world’s poorest, understanding the
underlying socio-economic characteristics of ‘‘drought-
resilient’’ regions is critical. Research is needed, therefore,
to build more synergies between the crop–climate modelling
community and those who focus on food security, poverty
and how environmental problems in the past have affected
household and community-level coping strategies (Corbett,
1988; Hitchcock, 2002).
To contribute to this debate, we identify cases where
relatively small droughts were associated with large harvest
losses (we call these ‘‘sensitive cases’’) and contrast these
with cases where large droughts were associated with only a
small impact on harvests (‘‘resilient cases’’). The goal of our
research is then to identify spatial and temporal trends and
explain the underlying socio-economic factors that charac-
terise resilient and sensitive cases. We do this using
provincial scale crop production, rainfall, and socio-eco-
nomic data for China between 1961 and 2001. In this paper,
‘‘vulnerability’’ refers to the extent to which a drought of a
given size (measured meteorologically) has an impact on
agricultural production (measured in terms of harvest). In
particular, we are interested in those high-vulnerability cases
where crop production was ‘‘sensitive’’ (i.e. when a small
drought triggered a large harvest loss) to drought and contrast
these with low-vulnerability or ‘‘resilient’’ cases (defined as
occurring when a large drought seems to have had little or no
effect on harvest) with a view to identify factors that
contribute to adaptive capacity. This paper is organised
around the following four objectives.
� The first objective is to review the literature that: (i)
integrates socio-economic and climate factors to assess
food production; (ii) discusses the policy and climate change
context of Chinese agriculture.
� The second objective is to present a research framework
that shows how to identify sensitive and resilient cases by
constructing a ‘‘crop-drought vulnerability index’’ and
describe the methodological steps and data we used to
assess vulnerability for Chinese provincial rice, wheat and
corn harvests between 1961 and 2001.
� The third objective is to statistically determine (i) those
regions in China where grain harvests were most vulnerable
to rainfall anomaly; (ii) trends in vulnerability at the
provincial scale over time; and (iii) socio-economic char-
acteristics of provinces and years that have different levels
of vulnerability.
� The fourth objective is to use the results to show how
indicators of vulnerability vary depending on socio-eco-
nomic contexts and propose a ‘‘vulnerability typology’’ that
could provide the basis for including socio-economic
variables in crop–climate models as well as informing
interested in promoting climate change adaptability.
f crop-drought vulnerability: an empirical analysis of the socio-
ht of three major food crops in China (1961–2001). Environ. Sci.
e n v i r o n m e n t a l s c i e n c e & p o l i c y x x x ( 2 0 0 9 ) x x x – x x x 3
ENVSCI-679; No of Pages 15
2. Background literature
2.1. Integrating socio-economic and climate factors toassess food production
The literature that links socio-economic factors with climate
change impacts and agriculture falls along a qualitative–
quantitative spectrum of research. In terms of the more
qualitative work, scholars often use a ‘‘livelihoods approach’’
to understand local adaptation to past environmental shocks.
These studies are generally aimed at understanding how
households or communities deployed different types of assets
or ‘‘capital’’ (e.g. human, social, environmental, political and
financial capital) to overcome problems. These methods have
been applied in a large range of bio-physical and socio-
economic settings including coastal communities (Adger,
1999), small islands (Tompkins, 2005), the Mediterranean
(Nicholls and Hoozemans, 1996), flood-prone river basins
(Mustafa, 1998), the Arctic (Ford et al., 2006), as well as African
farming systems (e.g. Thomas et al., 2007). This literature has
exposed the complexity of trying to identify social factors that
are linked to climate vulnerability (e.g. see: Reed et al., 2006;
Sullivan and Meigh, 2005; Thomas and Twyman, 2005;
Thornton et al., 2006). For example, one study has shown
that when farmers in Zimbabwe were given the opportunity to
interact personally with weather forecasters they were better
able to make use of the long-range drought predictions, and
obtained statistically higher agricultural yields, than farmers
those who had no access to forecasts or those who received
forecasts via radio (Patt and Gwata, 2004).
Given the complexity of individual case study based
research, a number of other papers attempt to discern
common trends from this field research and develop ‘‘vulner-
ability frameworks’’ that situate food production within a
global environmental context (Alcamo et al., 2001; Ericksen,
2008; Kasperson et al., 1995; Turner et al., 2003). This literature
is summarized by Adger (2006), who concludes that vulner-
ability analyses need to be placed within a specific spatial scale
that is linked to other scales. Many of these papers also build
on Watts and Bohle’s (1993) food security framework that links
local-level exposure to a risk with the capacity of members of a
community to adapt to that risk, and the potential of the
problem to have severe consequences at a range of scales.
With the possible exception of Alcamo et al.’s ‘‘security
diagrams’’, however, all these frameworks are conceptual and
not predictive tools. For example, Turner et al. stress that their
framework, ‘‘. . . is not explanatory but provides the broad
classes of components and linkages that comprise a coupled
system’s vulnerability to hazards.’’ (Turner et al., 2003, p.
8076). Others take a less conceptual and more pragmatic
approach and construct ‘‘water poverty’’ and ‘‘climate
vulnerability’’ indices based on weighted factors grouped into
key components, e.g. resources, access, capacity, use and
environment (Sullivan and Meigh, 2005). The way these
indices are weighted, however, is not based on replicable
quantitative empirical evidence.
In terms of more quantitative approaches, economic
modellers have made a significant contribution to the field,
showing that agricultural productivity not only depends on
climate and biophysical variables but relies on the availability
Please cite this article in press as: Simelton, E., et al., Typologies o
economic factors that influence the sensitivity and resilience to droug
Policy (2009), doi:10.1016/j.envsci.2008.11.005
of capital and labour. Economic modellers explore the
dependence of net cropland revenues on climate with cross
sectional and panel data (Mendelsohn and Reinsborough,
2007; Schlenker et al., 2007) using a ‘‘Ricardian analysis’’ that
assumes land rents reflect net productivity that itself is a
function of soil and climate. Based on data from US counties,
researchers show that 39% of crop failure is explained by
variations in climate and soil. This economic modelling
approach provides evidence that variations in rainfall are
correlated to variations in production, and while the studies
provide excellent empirical data sets for this type of study, this
is not an unexpected result. More importantly, however, some
counties/regions are better able to absorb climatic anomalies
than others and this suggests that the relationship between
climatic and production anomalies is confounded by other
factors. Brooks et al. (2005) make a preliminary attempt to
define these ‘‘other factors’’ and use statistical methods to link
national-level socio-economic data with data on mortality due
to natural disasters and identify key factors that correlate with
the impacts of extreme weather events in the past. Their
study, however, uses only country level mortality statistics as
its dependent variable and does not control for the size of the
environmental shock. As such, Brooks et al.’s study should be
seen as an important step towards identifying and quantifying
the socio-economic factors that pre-dispose a country to being
sensitive to climate but insufficient to base policy on.
2.2. Policy and climate dimensions of Chinese agriculture
Given its size (geographic, economic and population) and its
ever-increasing global integration, any changes to Chinese
agricultural production will have both national and global
implications. Although the increase in China’s grain yields over
the past 20–50 years has varied somewhat between region,
generally speaking, gains have been achieved through state
policies that have transferred a certain degree of decision
making to the farm level (Wang and Davis, 2000). This has led to
new agricultural management practices, land use changes, an
increaseduseof technical inputsnotably fertiliserandirrigation
and a concentration of agriculture to the plains in the north
(Simelton, 2007; Ma et al., 2006; Wang and Davis, 2000; Yang,
1998). These changes make China an interesting place to
explore how different underlying socio-economic contexts may
influence farm management and allows us to ask the question:
what are the key socio-economic variables that allow farmers to
take advantage of these new opportunities? Fanfani and Brasili
(2003) use the 1997 census to explore this question and they
found that two variables (the ‘concentration of people engaged
in agricultural or non-agricultural activities’ and the ‘level of
mechanization’) explained over 60% of the total regional
variance in harvest. They also found that GDP was inversely
correlated with the ratio of persons involved in agriculture and
that geographic factors also play an important role. Although
government policies differ little between regions (Wang and
Davis, 2000), the census in 1997 revealed a very diverse
agricultural geography in China (Fanfani and Brasili, 2003).
More detailed overviews of agricultural policies, including
trade-related and food economy models have been provided in
a number of recent reviews (Huang, 2002; Wang and Davis, 2000;
Zhang, 2003).
f crop-drought vulnerability: an empirical analysis of the socio-
ht of three major food crops in China (1961–2001). Environ. Sci.
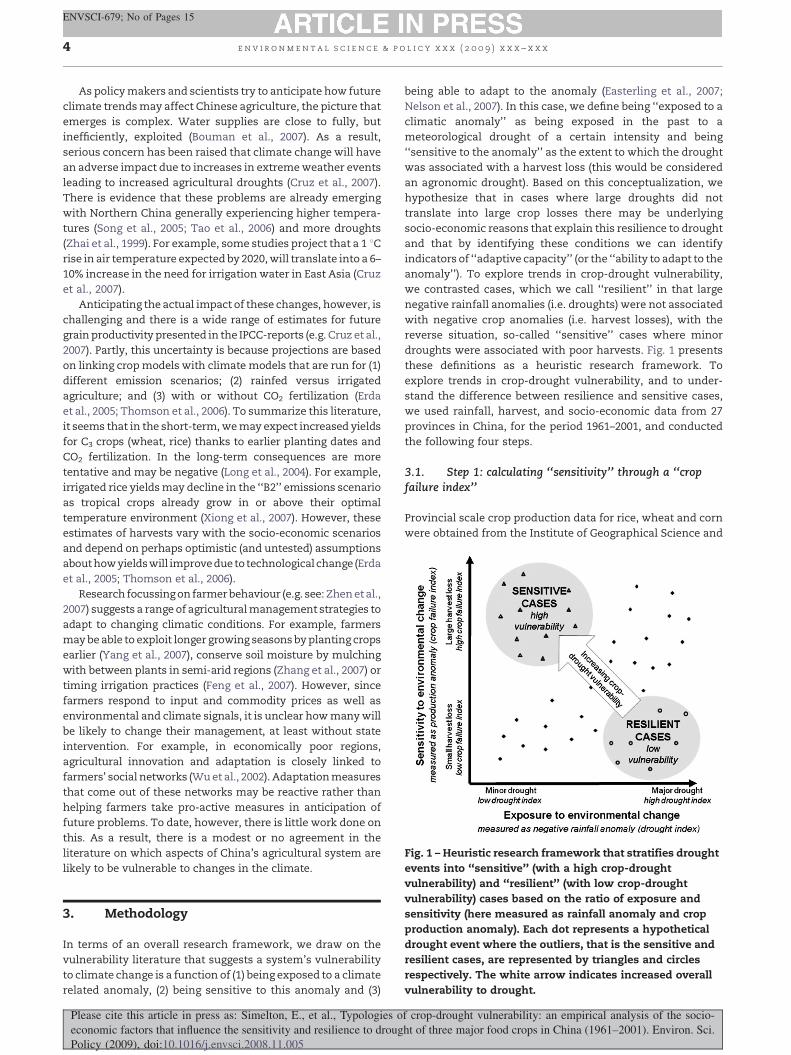
Fig. 1 – Heuristic research framework that stratifies drought
events into ‘‘sensitive’’ (with a high crop-drought
vulnerability) and ‘‘resilient’’ (with low crop-drought
vulnerability) cases based on the ratio of exposure and
sensitivity (here measured as rainfall anomaly and crop
production anomaly). Each dot represents a hypothetical
drought event where the outliers, that is the sensitive and
resilient cases, are represented by triangles and circles
respectively. The white arrow indicates increased overall
vulnerability to drought.
e n v i r o n m e n t a l s c i e n c e & p o l i c y x x x ( 2 0 0 9 ) x x x – x x x4
ENVSCI-679; No of Pages 15
As policy makers and scientists try to anticipate how future
climate trends may affect Chinese agriculture, the picture that
emerges is complex. Water supplies are close to fully, but
inefficiently, exploited (Bouman et al., 2007). As a result,
serious concern has been raised that climate change will have
an adverse impact due to increases in extreme weather events
leading to increased agricultural droughts (Cruz et al., 2007).
There is evidence that these problems are already emerging
with Northern China generally experiencing higher tempera-
tures (Song et al., 2005; Tao et al., 2006) and more droughts
(Zhai et al., 1999). For example, some studies project that a 1 8C
rise in air temperature expected by 2020, will translate into a 6–
10% increase in the need for irrigation water in East Asia (Cruz
et al., 2007).
Anticipating the actual impact of these changes, however, is
challenging and there is a wide range of estimates for future
grain productivity presented in the IPCC-reports (e.g. Cruz et al.,
2007). Partly, this uncertainty is because projections are based
on linking crop models with climate models that are run for (1)
different emission scenarios; (2) rainfed versus irrigated
agriculture; and (3) with or without CO2 fertilization (Erda
et al., 2005; Thomson et al., 2006). To summarize this literature,
it seems that in the short-term, we may expect increased yields
for C3 crops (wheat, rice) thanks to earlier planting dates and
CO2 fertilization. In the long-term consequences are more
tentative and may be negative (Long et al., 2004). For example,
irrigated rice yields may decline in the ‘‘B2’’ emissions scenario
as tropical crops already grow in or above their optimal
temperature environment (Xiong et al., 2007). However, these
estimates of harvests vary with the socio-economic scenarios
and depend on perhaps optimistic (and untested) assumptions
about how yieldswill improvedue to technological change (Erda
et al., 2005; Thomson et al., 2006).
Research focussing on farmer behaviour (e.g. see: Zhen et al.,
2007) suggests a range of agricultural management strategies to
adapt to changing climatic conditions. For example, farmers
may be able to exploit longer growing seasons by planting crops
earlier (Yang et al., 2007), conserve soil moisture by mulching
with between plants in semi-arid regions (Zhang et al., 2007) or
timing irrigation practices (Feng et al., 2007). However, since
farmers respond to input and commodity prices as well as
environmental and climate signals, it is unclear how many will
be likely to change their management, at least without state
intervention. For example, in economically poor regions,
agricultural innovation and adaptation is closely linked to
farmers’ social networks (Wu et al., 2002). Adaptation measures
that come out of these networks may be reactive rather than
helping farmers take pro-active measures in anticipation of
future problems. To date, however, there is little work done on
this. As a result, there is a modest or no agreement in the
literature on which aspects of China’s agricultural system are
likely to be vulnerable to changes in the climate.
3. Methodology
In terms of an overall research framework, we draw on the
vulnerability literature that suggests a system’s vulnerability
to climate change is a function of (1) being exposed to a climate
related anomaly, (2) being sensitive to this anomaly and (3)
Please cite this article in press as: Simelton, E., et al., Typologies o
economic factors that influence the sensitivity and resilience to droug
Policy (2009), doi:10.1016/j.envsci.2008.11.005
being able to adapt to the anomaly (Easterling et al., 2007;
Nelson et al., 2007). In this case, we define being ‘‘exposed to a
climatic anomaly’’ as being exposed in the past to a
meteorological drought of a certain intensity and being
‘‘sensitive to the anomaly’’ as the extent to which the drought
was associated with a harvest loss (this would be considered
an agronomic drought). Based on this conceptualization, we
hypothesize that in cases where large droughts did not
translate into large crop losses there may be underlying
socio-economic reasons that explain this resilience to drought
and that by identifying these conditions we can identify
indicators of ‘‘adaptive capacity’’ (or the ‘‘ability to adapt to the
anomaly’’). To explore trends in crop-drought vulnerability,
we contrasted cases, which we call ‘‘resilient’’ in that large
negative rainfall anomalies (i.e. droughts) were not associated
with negative crop anomalies (i.e. harvest losses), with the
reverse situation, so-called ‘‘sensitive’’ cases where minor
droughts were associated with poor harvests. Fig. 1 presents
these definitions as a heuristic research framework. To
explore trends in crop-drought vulnerability, and to under-
stand the difference between resilience and sensitive cases,
we used rainfall, harvest, and socio-economic data from 27
provinces in China, for the period 1961–2001, and conducted
the following four steps.
3.1. Step 1: calculating ‘‘sensitivity’’ through a ‘‘cropfailure index’’
Provincial scale crop production data for rice, wheat and corn
were obtained from the Institute of Geographical Science and
f crop-drought vulnerability: an empirical analysis of the socio-
ht of three major food crops in China (1961–2001). Environ. Sci.
e n v i r o n m e n t a l s c i e n c e & p o l i c y x x x ( 2 0 0 9 ) x x x – x x x 5
ENVSCI-679; No of Pages 15
Natural Resources at the Chinese Academy of Sciences for the
period 1961–2001 (IGSNRR, 2007). To calculate the harvest
anomaly, we detrended the yearly harvest data between 1961
and 2001 using an auto-regression function (Schneider and
Neumaier, 2001) with 3-year lags in Matlab (version 2007a)
software. In effect, this means we studied the period 1964–
2001 as the first 3 years are lost in the auto-regression process.
The auto-regression removes the effect of increased
technology or consistent mis-reporting, and allowed us to
calculate an ‘‘expected’’ or ‘‘normal’’ harvest, Hi, for each year,
in province i (see Eq. (1)). The anomaly was then divided by the
actual observed harvest, Hi, to result in an index with a score of
one if the actual harvest and the expected harvest were the
same, and a score of above one in those years when the
harvest was below the expected value. In this paper, we refer
to this value as our ‘‘crop failure index’’.
3.2. Step 2: calculating ‘‘exposure’’ through the ‘‘droughtindex’’
Rainfall data for 1960–2001 was obtained from the Climate
Research Unit at the University of East Anglia’s TS2.1 dataset
which is based on observed weather station data that are
averaged over 0.58 � 0.58 grid cells (Mitchell and Jones, 2005).
Each grid cell over mainland China was coded by province and
analyzed for trends using non-parametric Mann–Kendall test
(Gao et al., 2007). The monthly rainfall was detrended per grid
then averaged for each province. Given that some months’
rainfall are more important than others for crop production,
we conducted a paired t-test between six different rainfall
periods that Cheng (1993) suggests are critical for rice, corn,
and wheat production to determine what monthly intervals
were most significant. This analysis suggested that a long-
term period ending with July of the harvest year and starting
from July the previous year (called ‘‘J2J’’) explained most of the
variance for rice while a spring-drought ‘‘March to May’’
explained most of the variance for wheat and corn. This may
be because up to three rice harvests are lost if the July to July
rainfall is below normal, while two crops of corn or wheat
rarely are cultivated in the same year. Both of these rainfall
periods have significant linear and quadratic correlations with
harvests for all three crops (p < 0.001, Spearman correlation
coefficient for linear 0.793 with n = 1056 for rice, �0.356 with
n = 1101 for wheat, and �0.375 with n = 1013 for corn), where
extremely low and high rainfall sums correspond with lower
harvests.1 For clarity reasons, we present only the results
relating to the July to July period (J2J) for all three crops in this
paper. Then, using the accumulated rainfall for J2J for all three
grain crops, we identified those years in which the rainfall was
significantly higher or lower than normal by modifying a
rainfall anomaly index (van Rooy, 1965) where the average
amount of rainfall, Ri, for the J2J period in province i was
divided by the ‘‘actual’’ amount of rainfall, Ri, that fell during
1 Four other rainfall periods had similar to or poorer correlationresults than J2J and March to May: (1) July to November in harvestyear, (2) December to January, (3) June to August, and (4) April ofthe harvest year and September of the previous year (these are thetwo single months that provided the strongest overall correlationwith crop harvests).
Please cite this article in press as: Simelton, E., et al., Typologies o
economic factors that influence the sensitivity and resilience to droug
Policy (2009), doi:10.1016/j.envsci.2008.11.005
J2J in that year (see Eq. (1)). This returns a score of one for a year
in which the actual rainfall and the average rainfall equalled
each other, and a score of above one for dry years.
3.3. Step 3: identifying adaptive capacity by calculating a‘‘crop-drought vulnerability index’’
For each province and each year, the crop failure index for
each crop (rice, wheat and corn) was divided by the drought
index. This resulted in a ‘‘crop-drought vulnerability index’’
(referred to as the vulnerability index) where a high number
indicates that crop failure is high relative to the rainfall
anomaly. This is shown in Eq. (1).
crop-drought vulnerability index ¼ crop failure indexdrought index
¼ ðHi=HiÞðRi=RiÞ
(1)
3.4. Step 4: identifying the socio-economic characteristicsof vulnerability
There were three analytical aspects to this step. The first was
to identify what provinces had statistically higher/lower
vulnerability index scores. The second was to determine what
provinces, if any, had a statistically significant trend in
vulnerability over time. The third was to determine the
characteristics of the resilient and sensitive cases, thereby
identifying what socio-economic factors were significant in
explaining the vulnerability index.
To identify provinces with statistically different vulner-
ability indices, we used a one-way analysis of variance
(ANOVA) that determined statistically significant differences
between provinces in each of the three grain crops’ vulner-
ability index and a subsequent post hoc Duncan pair-wise
comparison that divided rice, wheat, and corn vulnerability
indexes into a number of overlapping groups. Time trend tests
for the vulnerability index were estimated by linear regression
on provincial scale and as a national mean for each crop.
To separate sensitive from resilient cases we extracted two
sets of data points, one representing evidence of resilient
cases and the other representing sensitive cases. We defined
‘‘resilient’’ cases as years and provinces where the harvest
index was below the first quartile and where rainfall was
above the third quartile, i.e. those provinces and years when
relatively severe droughts occurred with relatively good
harvests. ‘‘Sensitive’’ cases were defined as a crop failure
index above the third quartile and a drought index between
the first and third quartiles, i.e. occurring when harvests were
poor while rainfall was relatively normal. The ranking of
harvests and rainfall into quartiles was performed on a
provincial scale, thus giving each province the same chance
for the combination of sensitive, resilient, or disregarded
cases. Having identified years and provinces that were
statistically more ‘‘vulnerable’’ we used secondary statistical
data sets available from the Institute of Geographical Sciences
and Natural Resources Research (IGSNRR, 2007) to explore
what socio-economic variables were significantly correlated
with the vulnerability scores in resilient versus sensitive
cases. Socio-economic indicators were grouped into five major
f crop-drought vulnerability: an empirical analysis of the socio-
ht of three major food crops in China (1961–2001). Environ. Sci.
e n v i r o n m e n t a l s c i e n c e & p o l i c y x x x ( 2 0 0 9 ) x x x – x x x6
ENVSCI-679; No of Pages 15
categories related to land, population, technical inputs,
economic inputs and infrastructure. The socio-economic
statistical data were analyzed in two ways: (1) as absolute
values to characterise factors that have changed significantly
over time, and (2) as standardised anomalies (Fanfani and
Brasili, 2003), whereby yearly values were subtracted from the
mean values for all years and the resulting difference was
divided by the standard deviation of all years to enable cross
country comparisons. These types of data were used as
independent variables to explain variance in the vulnerability
index for each crop and for those provinces/regions and years
where harvests were resilient/sensitive to drought. Non-
parametric Spearman two-tailed bivariate correlation (Ligon
and Schechter, 2004) analyses were used to test the statistical
significance between the vulnerability index and the socio-
economic indicators as this method does not make assump-
tions about the distribution of data. The significance level is
set to 0.05 for all statistical analyses and only statistically
significant results are highlighted and discussed.
3.5. Data quality issues
This study excludes analyses of occurrences of pests and
diseases, improved crop varieties, environmental degrada-
tion, and influences of rainfall intensity and other meteor-
ological changes on harvests. Furthermore, we were unable to
derive reliable provincial scale proxy data indicating access to
agricultural inputs or health/education status that possibly
could help explaining intra/inter-provincial variations. Una-
voidably, the coverage of the variables is also inconsistent.
The information for technical inputs (such as fertiliser,
irrigation or machinery) and economic investments are not
specified for a certain crop or farm size. It is also vital to note
that we are aware that the results of this analysis can never be
better than quality of the data and Chinese official statistics
need to be considered with great caution. For example,
reconstructions of national total cropland areas suggest State
Statistical Bureau data for 1990–1995 is systematically under-
estimated by 45% and data from Ministry of Land and
Resources for 1996–2000 by 10% (Liu et al., 2005). Earlier
estimates are more uncertain, and the degree of under-
reporting likely to be higher in poorer provinces (Smil, 1995).
This means that crop yields are almost certainly over-
estimated. To minimize these problems we have focused
on grain harvests (production) rather than yields (productiv-
ity) that crop modelling studies have tended to focus upon
(Erda et al., 2005; Tao et al., 2006). This is because yield
statistics add potential errors from both crop area and
harvests. Also, while harvests show the actual outcome,
which is relevant for food security, ‘yield’ may hide areas that
have been taken out of cultivation or may be misinterpreted if
farmers are producing more than one crop per year (i.e.
‘‘double cropping’’) (Kumar et al., 2004). Furthermore,
Chinese agriculture is characterised by small plots and
perhaps as much as 60–80% of grain production between
1955 and 1995 was for subsistence consumption (Wang and
Davis, 2000). These data are not included in official statistics.
As a result, we are conscious that vulnerability patterns may
look different had home-consumed harvests been included
and are planning as the next phase of this research to look in
Please cite this article in press as: Simelton, E., et al., Typologies o
economic factors that influence the sensitivity and resilience to droug
Policy (2009), doi:10.1016/j.envsci.2008.11.005
much greater detail at the county level for key provinces.
Rural population, and data on the rural labour force in
particular, is also assumed to be overestimated as migrating
workers frequently remain ‘‘officially’’ resident in their home
village (Xu et al., 2006). Furthermore the definitions for
‘agricultural’ and ‘rural’ have been inconsistent over time
(Fanfani and Brasili, 2003) adding other possible problems to
the data.
To reduce the impact of chronic over- and under-reporting
we de-trended harvest data using a 3-year lag auto-correlation
function. To explore the potential influence of economic
transition, we cross-checked the standardised relations for all
years with those for 1995–2001, during which the statistics is
believed to have a higher accuracy, and this demonstrated
very similar results for the sensitive cases, while there were
too few resilient cases to enable a comparison (not shown).
Given these issues, however, we are aware that our results are
preliminary and they form part of an on-going research project
in which we are working to triangulate the analysis through
on-the-ground field work involving collaborations with Chi-
nese research centres with regional expertise. We also plan to
expand this analysis to other exposed parts of the world
(notably Sub-Saharan Africa) to see if the trends observed here
are confirmed elsewhere.
4. Results
The results are divided into three sections. The patterns of
crop vulnerability are first examined spatially across China,
then as a trend over time. Finally, we identify the socio-
economic characteristics of sensitive and resilient cases.
4.1. Spatial patterns in crop-drought vulnerability
Across all three crops, provinces with a high mean vulner-
ability index and high frequency of vulnerable cases, were
predominantly located in southern and/or coastal regions.
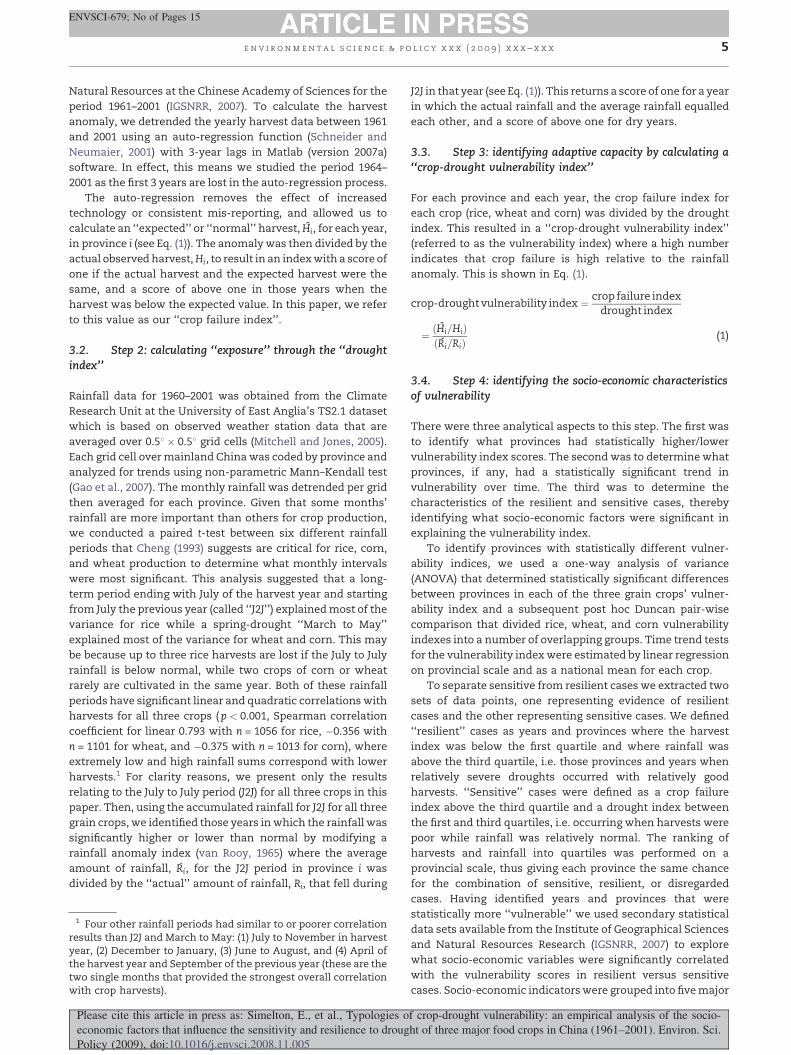
More specifically, when the vulnerability scores were analyzed
using a Duncan Pair-wise test, rice vulnerability was divided
into five partly overlapping groups of provinces, and corn and
wheat into six partly overlapping categories (results for corn
are given in Fig. 2). For rice, Heilongjiang in the northeast and
Gansu in the west had the lowest mean vulnerability while
provinces in the north had the highest. This contrasted with
wheat crops, where provinces on the North China Plain had a
low mean vulnerability while some northeastern and south-
western provinces had the highest vulnerability. In terms of
corn, Ningxia in the west together with Hubei, Guizhou and
Hunan the south central had a low vulnerability while a
number of provinces along the coast had a higher mean
vulnerability score.
4.2. Temporal trends in crop-drought vulnerability
Between the 1960s and 2000, a period of time marked by rapid
urbanization and a large scale shift from agriculture to urban
industry, the overall mean crop-drought vulnerability index
decreased significantly suggesting that Chinese crops are better
buffered against low rainfall today than they were in the 1960s
f crop-drought vulnerability: an empirical analysis of the socio-
ht of three major food crops in China (1961–2001). Environ. Sci.
Fig. 2 – Mean provincial crop-drought vulnerability index (1961–2001) for corn harvests. High numbers suggest that corn
harvests were more sensitive to rainfall anomalies (drier years) than low numbers. Overall, an analysis of variance
indicates that vulnerability varied significantly between provinces ( p < 0.05). A Duncan pair-wise comparison test placed
provinces into six (a–f) statistically significant groups.
e n v i r o n m e n t a l s c i e n c e & p o l i c y x x x ( 2 0 0 9 ) x x x – x x x 7
ENVSCI-679; No of Pages 15
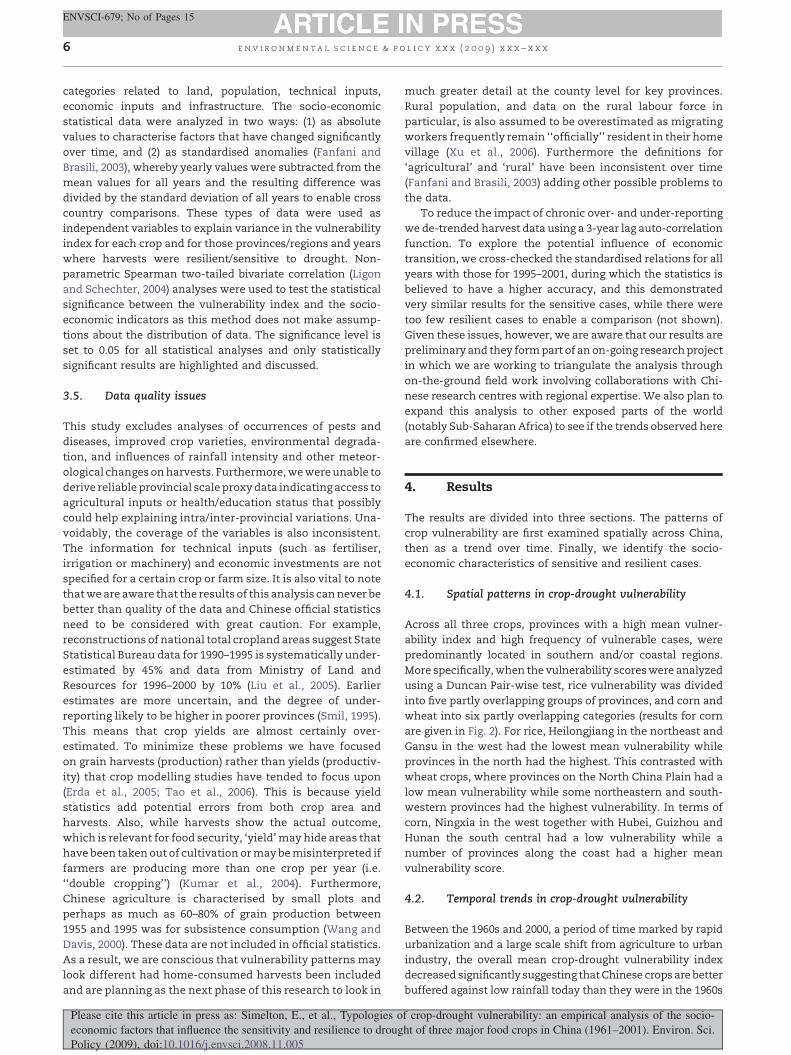
(p < 0.05). At the regional scale, the vulnerability of harvests
decreased in growing seasons with below normal rainfall in the
north (where the area planted to wheat has declined) for all
three crops, and in the west for wheat and corn, in the northeast
for rice and on the North China Plain for wheat (p < 0.05). On the
provincial scale, however, increases in the crop-drought
vulnerability for all three grain crops occurred in parts of the
rapidly urbanising central coastal zone (in particular Shanghai
for rice and Jiangxi for wheat, p < 0.05). In addition, the
vulnerability index increased for rice in the western provinces,
for wheat in parts of the northwest and the south coast (where
the amount of land used to produce two crops/year has
increased), and for corn in parts of the north and the western
regions. Fig. 3 provides a breakdown of these changes in
vulnerability by province for each of the three grain crops.
4.3. Characteristics of resilient and sensitive cases
The socio-economic factors that are significantly correlated
with the drought-vulnerability index for resilient and sensitive
cases are listed in Table 1 together with their correlation
coefficients. For rice harvests, resilient cases are found where
the available agricultural land area is large and the ‘‘double
cropping index’’ is high, i.e. more than one harvest per year.
Resilient rice cases are also related to a high per capita GDP in
agriculture. A number of variables were negatively correlated
with vulnerability for sensitive rice cases, but broadly speak-
ing population indicators, which measure the size of the rural
population, and economic indicators, which show the degree
to which capital has been invested in agriculture, were most
important. This contrasts with wheat, where resilient cases
were negatively correlated with the double cropping index and
supplies of electricity. The vulnerability scores for sensitive
wheat cases were explained by a similar range of indicators as
for sensitive rice though indicators related to the size of the
rural population had a larger (negative) correlation than for
Please cite this article in press as: Simelton, E., et al., Typologies o
economic factors that influence the sensitivity and resilience to droug
Policy (2009), doi:10.1016/j.envsci.2008.11.005
rice. For resilient corn, the vulnerability score was positively
correlated with the land devoted to agriculture, the amount of
machinery used, and two economic indicators, the fixed
capital per farmer and percent GDP in agriculture (like for rice,
these indicators relate to the capital invested in agriculture).
Sensitive corn was negatively correlated with the land devoted
to agriculture, the urbanization rate, and indicators dealing
with the amount of capital invested in agriculture.
Overall, the categories that influence the vulnerability of
sensitive cases are related to land, population and economy,
while there are fewer categories influencing the vulnerability
for resilient cases (see Supplementary Material).
5. Discussion
5.1. Implications of results
Overall, this analysis shows that different provinces display a
range of abilities to cope with low rainfall, and while it needs to
be stressed that this analysis excludes a number of possible
reasons for harvest losses (such as pests or storm damages), a
number of trends can be observed. For example, the analyses
of spatial trends (Section 4.1) suggest that continental semi-
arid and temperate areas are better buffered against the
impacts of drought events than coastal and sub-tropical/
tropical regions. This may be because farmers in these regions
are used to poor or fluctuating rainfall and have already
adapted to this sort of problem (see: Liu et al., 2005). Similarly,
provinces that display low mean vulnerability, such as Gansu
in the west and provinces on the North China Plain, make use
of extensive irrigation, so it is likely that these irrigation
systems buffer crops against the effects of drought. Some
sensitive cases had very small areas allocated to the crop in
question. For example, Ningxia, which had high vulnerability
in corn planted less than 5% of cultivated land to this crop.
f crop-drought vulnerability: an empirical analysis of the socio-
ht of three major food crops in China (1961–2001). Environ. Sci.
Fig. 3 – Temporal trends in (a) rice, (b) wheat and (c) corn vulnerability index for each province between 1961 and 2001 when
the June-to-July rainfall was below normal. The size of the triangles indicate the slope of the overall trend (large = 0.014,
medium = 0.007 and small = 0.0014). Black triangles indicate that the overall vulnerability of crop harvests to rainfall
anomalies is increasing. Clear triangles indicate that overall vulnerability is decreasing. The trends are significant ( p < 0.05)
in Inner Mongolia, Liaoning and Tianjin for rice, in Guangdong, Inner Mongolia, Jiangsu, Liaoning, Shanghai and Tianjin for
wheat, and in Heilongjiang, Hunan, Jilin, Liaoning and Sichuan for corn.
e n v i r o n m e n t a l s c i e n c e & p o l i c y x x x ( 2 0 0 9 ) x x x – x x x8
ENVSCI-679; No of Pages 15
Please cite this article in press as: Simelton, E., et al., Typologies of crop-drought vulnerability: an empirical analysis of the socio-
economic factors that influence the sensitivity and resilience to drought of three major food crops in China (1961–2001). Environ. Sci.
Policy (2009), doi:10.1016/j.envsci.2008.11.005
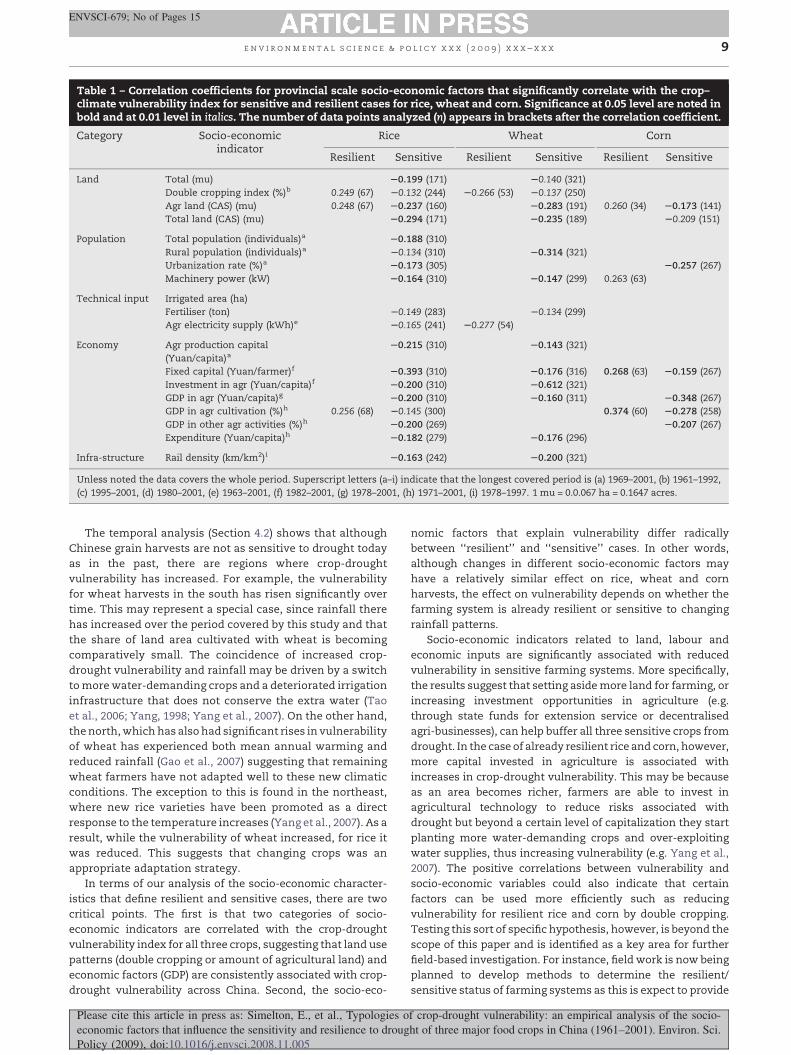
Table 1 – Correlation coefficients for provincial scale socio-economic factors that significantly correlate with the crop–climate vulnerability index for sensitive and resilient cases for rice, wheat and corn. Significance at 0.05 level are noted inbold and at 0.01 level in italics. The number of data points analyzed (n) appears in brackets after the correlation coefficient.
Category Socio-economicindicator
Rice Wheat Corn
Resilient Sensitive Resilient Sensitive Resilient Sensitive
Land Total (mu) S0.199 (171) S0.140 (321)
Double cropping index (%)b 0.249 (67) S0.132 (244) S0.266 (53) S0.137 (250)
Agr land (CAS) (mu) 0.248 (67) S0.237 (160) S0.283 (191) 0.260 (34) S0.173 (141)
Total land (CAS) (mu) S0.294 (171) S0.235 (189) S0.209 (151)
Population Total population (individuals)a S0.188 (310)
Rural population (individuals)a S0.134 (310) S0.314 (321)
Urbanization rate (%)a S0.173 (305) S0.257 (267)
Machinery power (kW) S0.164 (310) S0.147 (299) 0.263 (63)
Technical input Irrigated area (ha)
Fertiliser (ton) S0.149 (283) S0.134 (299)
Agr electricity supply (kWh)e S0.165 (241) S0.277 (54)
Economy Agr production capital
(Yuan/capita)a
S0.215 (310) S0.143 (321)
Fixed capital (Yuan/farmer)f S0.393 (310) S0.176 (316) 0.268 (63) S0.159 (267)
Investment in agr (Yuan/capita)f S0.200 (310) S0.612 (321)
GDP in agr (Yuan/capita)g S0.200 (310) S0.160 (311) S0.348 (267)
GDP in agr cultivation (%)h 0.256 (68) S0.145 (300) 0.374 (60) S0.278 (258)
GDP in other agr activities (%)h S0.200 (269) S0.207 (267)
Expenditure (Yuan/capita)h S0.182 (279) S0.176 (296)
Infra-structure Rail density (km/km2)i S0.163 (242) S0.200 (321)
Unless noted the data covers the whole period. Superscript letters (a–i) indicate that the longest covered period is (a) 1969–2001, (b) 1961–1992,
(c) 1995–2001, (d) 1980–2001, (e) 1963–2001, (f) 1982–2001, (g) 1978–2001, (h) 1971–2001, (i) 1978–1997. 1 mu = 0.0.067 ha = 0.1647 acres.
e n v i r o n m e n t a l s c i e n c e & p o l i c y x x x ( 2 0 0 9 ) x x x – x x x 9
ENVSCI-679; No of Pages 15
The temporal analysis (Section 4.2) shows that although
Chinese grain harvests are not as sensitive to drought today
as in the past, there are regions where crop-drought
vulnerability has increased. For example, the vulnerability
for wheat harvests in the south has risen significantly over
time. This may represent a special case, since rainfall there
has increased over the period covered by this study and that
the share of land area cultivated with wheat is becoming
comparatively small. The coincidence of increased crop-
drought vulnerability and rainfall may be driven by a switch
to more water-demanding crops and a deteriorated irrigation
infrastructure that does not conserve the extra water (Tao
et al., 2006; Yang, 1998; Yang et al., 2007). On the other hand,
the north, which has also had significant rises in vulnerability
of wheat has experienced both mean annual warming and
reduced rainfall (Gao et al., 2007) suggesting that remaining
wheat farmers have not adapted well to these new climatic
conditions. The exception to this is found in the northeast,
where new rice varieties have been promoted as a direct
response to the temperature increases (Yang et al., 2007). As a
result, while the vulnerability of wheat increased, for rice it
was reduced. This suggests that changing crops was an
appropriate adaptation strategy.
In terms of our analysis of the socio-economic character-
istics that define resilient and sensitive cases, there are two
critical points. The first is that two categories of socio-
economic indicators are correlated with the crop-drought
vulnerability index for all three crops, suggesting that land use
patterns (double cropping or amount of agricultural land) and
economic factors (GDP) are consistently associated with crop-
drought vulnerability across China. Second, the socio-eco-
Please cite this article in press as: Simelton, E., et al., Typologies o
economic factors that influence the sensitivity and resilience to droug
Policy (2009), doi:10.1016/j.envsci.2008.11.005
nomic factors that explain vulnerability differ radically
between ‘‘resilient’’ and ‘‘sensitive’’ cases. In other words,
although changes in different socio-economic factors may
have a relatively similar effect on rice, wheat and corn
harvests, the effect on vulnerability depends on whether the
farming system is already resilient or sensitive to changing
rainfall patterns.
Socio-economic indicators related to land, labour and
economic inputs are significantly associated with reduced
vulnerability in sensitive farming systems. More specifically,
the results suggest that setting aside more land for farming, or
increasing investment opportunities in agriculture (e.g.
through state funds for extension service or decentralised
agri-businesses), can help buffer all three sensitive crops from
drought. In the case of already resilient rice and corn, however,
more capital invested in agriculture is associated with
increases in crop-drought vulnerability. This may be because
as an area becomes richer, farmers are able to invest in
agricultural technology to reduce risks associated with
drought but beyond a certain level of capitalization they start
planting more water-demanding crops and over-exploiting
water supplies, thus increasing vulnerability (e.g. Yang et al.,
2007). The positive correlations between vulnerability and
socio-economic variables could also indicate that certain
factors can be used more efficiently such as reducing
vulnerability for resilient rice and corn by double cropping.
Testing this sort of specific hypothesis, however, is beyond the
scope of this paper and is identified as a key area for further
field-based investigation. For instance, field work is now being
planned to develop methods to determine the resilient/
sensitive status of farming systems as this is expect to provide
f crop-drought vulnerability: an empirical analysis of the socio-
ht of three major food crops in China (1961–2001). Environ. Sci.
e n v i r o n m e n t a l s c i e n c e & p o l i c y x x x ( 2 0 0 9 ) x x x – x x x10
ENVSCI-679; No of Pages 15
valuable information for modelling the actual likely impact of
climate change on crop yields (Challinor, this issue).
5.2. Proposed typology of crop-drought vulnerability
We believe that our findings, and their links to field-based
studies, allow us to propose a broad-strokes synthesis of crop-
drought vulnerability. Specifically, our results suggest that
that regions in China are likely to be sensitive to drought if
they: (1) are economically poor and with considerable
climatic hardship and topographic constraints (e.g. west
and southwest) or (2) if they have a limited amount of
agricultural land near industrialised/near-urban regions and
an oversupply of rural labour (e.g. coastal region). By contrast,
‘‘resilient’’ cases have (1) higher levels of capital investments
in agriculture (e.g. northeast), (2) modest urbanization rates
and (3) rising rates of land intensification (e.g. northeast,
west). These overall patterns resemble the insights that
Fanfani and Brasili (2003) derived from their analysis of how
the area sown, agricultural labour and education levels all
affect agricultural productivity. These broad types of vulner-
ability also resonates with early work by Bray (1986) that
characterises different economic systems based on whether
land is scarce and labour intensive (‘‘rice economies’’), land is
abundant (like the agricultural frontier in North America) or
where both land and labour are expensive (e.g. intensive
agriculture in Europe).
Building on this, we suggest there are generic socio-
economic strategies that should reduce vulnerability across a
range of cases. Firstly, these strategies need, however, be
different in regions that are already sensitive versus areas
that are already resilient. For example, in most sensitive
areas, policies that promote capital investments into basic
agricultural inputs (fertiliser and machinery), extension
services and agri-business development should reduce
crop-drought vulnerability. For resilient areas, however,
policies to reduce crop-drought vulnerability include limiting
urban expansion on high-quality agricultural land and
improving access to more sophisticated technical inputs
(machinery and electricity).
Secondly, policies to reduce vulnerability need to be
dynamic in order to respond to changes in the regional
economy. This is especially important for a country in
economic transition, like China, where measures that will
help reduce vulnerability today will be very different in the
future as agricultural technological standards develop. As a
result, we agree with Fanfani and Brasili (2003) that the
traditional regionalisation of Chinese provinces into north,
south and west or into regions that produce wheat, grain and
corn is insufficient. This is vital because drought vulnerability
is fundamentally driven by different factors in already
‘‘sensitive’’ and ‘‘resilient’’ regions. Hence, the same policy
may either increase or decrease vulnerability depending on
the nature of the local economy, demography and climatic
conditions and trends.
To help guide the policy process, we cautiously draw from
our results and present a preliminary typology that we suggest
explains crop-drought vulnerability in China based on socio-
economic factors that seem to limit adaptation (Table 2).
Different types of vulnerability seem to occur when:
Please cite this article in press as: Simelton, E., et al., Typologies o
economic factors that influence the sensitivity and resilience to droug
Policy (2009), doi:10.1016/j.envsci.2008.11.005
� Labour limits adaptation to drought. This would be typical of the
northeast of China (Yang et al., 2007; Zhang et al., 2008) and
in this sort of region, a key strategy to reduce vulnerability is
through capital investments that would upgrade agricul-
tural technology and possibly increase double cropping with
more drought-tolerant crop varieties. This would make
more effective use of available labour and help buffer
harvests against drought.
� Land limits adaptability. This type of vulnerability is repre-
sented in the resilient wheat cases in the northeast and
sensitive rice growing areas of the North China Plain where
technical inputs such as increasing access to irrigation and
fertilisers as well as an increasing rural populations reduce
vulnerability to drought, but may have serious negative
environmental impacts (Zhai et al., 1999). This type of
vulnerability seems to overlap with urbanising areas, hence
when land becomes too limited, improved water harvesting
methods may be required to reduce the vulnerability to
drought.
� Land and labour are limited but there is financial capital available.
In these cases, which include rice production in the south,
increases in population and double cropping buffer harvests
against low rainfall and strategies to reduce vulnerability
further would be to use technological inputs such as
fertiliser or fast growing varieties to make production more
intensive. Although rice productivity is constrained by small
plots and low levels of technology in the south (Yang, 1998),
we assume that when the household economy increases,
farmers may invest in other crops. Hiring seasonal tempor-
ary labour may also offer a more flexible solution to drought.
� Land and capital are limiting. In regions belonging to this type
of vulnerability (e.g. sensitive wheat cases in all but the
southern region) deploying labour more effectively may be a
key strategy to reduce vulnerability. This could involve using
labour to produce annual crops on flatlands more inten-
sively, while extending conservation agriculture on sloping
land and targeting investments so that research reaches
farmers through agricultural extension services and short
training courses on subject such as water-harvesting
methods (Zhang et al., 2007) and integrated pest and
fertiliser management.
� Land, labour and capital are all limited. This is more typical for
certain parts of southern China, particularly for sensitive
wheat cases and in north for sensitive rice cases. The
location of these crops on their southern and northern
limits, suggest that climate (in particular temperature) may
be one limiting factor (Song et al., 2005; Tao et al., 2006).
Here, preventing out-migration, continuing programmes of
land intensification and making capital available for
investment may all reduce vulnerability. Investing in
extension services that aid climate, environmentally and
market adaptable farming systems is a key adaptation
strategy in such areas.
� Capital is limiting. This type was found for a number of
resilient rice and corn regions. Many provinces in north fall
into this type because land areas are less constrained, the
area devoted to these crops is small, or there is a high degree
of state farms that have a better capacity to adopt new
technology (Huang, 2002; Wang and Davis, 2000). However,
this is not to say that these cases provide a template for a
f crop-drought vulnerability: an empirical analysis of the socio-
ht of three major food crops in China (1961–2001). Environ. Sci.
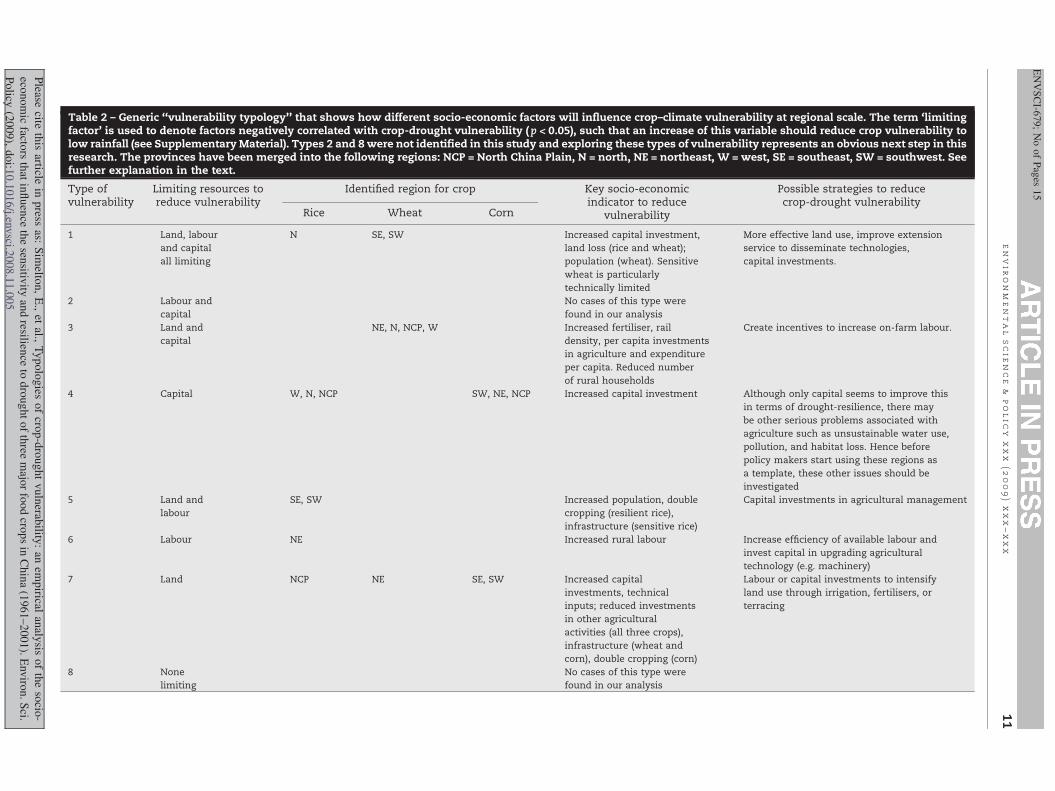
Table 2 – Generic ‘‘vulnerability typology’’ that shows how different socio-economic factors will influence crop–climate vulnerability at regional scale. The term ‘limitingfactor’ is used to denote factors negatively correlated with crop-drought vulnerability (p < 0.05), such that an increase of this variable should reduce crop vulnerability tolow rainfall (see Supplementary Material). Types 2 and 8 were not identified in this study and exploring these types of vulnerability represents an obvious next step in thisresearch. The provinces have been merged into the following regions: NCP = North China Plain, N = north, NE = northeast, W = west, SE = southeast, SW = southwest. Seefurther explanation in the text.
Type ofvulnerability
Limiting resources toreduce vulnerability
Identified region for crop Key socio-economicindicator to reduce
vulnerability
Possible strategies to reducecrop-drought vulnerability
Rice Wheat Corn
1 Land, labour
and capital
all limiting
N SE, SW Increased capital investment,
land loss (rice and wheat);
population (wheat). Sensitive
wheat is particularly
technically limited
More effective land use, improve extension
service to disseminate technologies,
capital investments.
2 Labour and
capital
No cases of this type were
found in our analysis
3 Land and
capital
NE, N, NCP, W Increased fertiliser, rail
density, per capita investments
in agriculture and expenditure
per capita. Reduced number
of rural households
Create incentives to increase on-farm labour.
4 Capital W, N, NCP SW, NE, NCP Increased capital investment Although only capital seems to improve this
in terms of drought-resilience, there may
be other serious problems associated with
agriculture such as unsustainable water use,
pollution, and habitat loss. Hence before
policy makers start using these regions as
a template, these other issues should be
investigated
5 Land and
labour
SE, SW Increased population, double
cropping (resilient rice),
infrastructure (sensitive rice)
Capital investments in agricultural management
6 Labour NE Increased rural labour Increase efficiency of available labour and
invest capital in upgrading agricultural
technology (e.g. machinery)
7 Land NCP NE SE, SW Increased capital
investments, technical
inputs; reduced investments
in other agricultural
activities (all three crops),
infrastructure (wheat and
corn), double cropping (corn)
Labour or capital investments to intensify
land use through irrigation, fertilisers, or
terracing
8 None
limiting
No cases of this type were
found in our analysis
en
vir
on
me
nt
al
sc
ie
nc
e&
po
lic
yx
xx
(2
00
9)
xx
x–
xx
x1
1
EN
VS
CI-6
79
;N
oo
fP
ages
15
Please
citeth
isarticle
inp
ressas:
Sim
elton
,E
.,et
al.,T
yp
olo
gies
of
crop
-dro
ug
ht
vu
lnerab
ility:
anem
pirical
analy
siso
fth
eso
cio-
econ
om
icfacto
rsth
atin
flu
ence
the
sensitiv
ityan
dresilien
ceto
dro
ug
ht
of
three
majo
rfo
od
crop
sin
Ch
ina
(19
61
–2
00
1).
Env
iron
.S
ci.
Po
licy(2
00
9),
do
i:10
.10
16
/j.envsci.2
00
8.1
1.0
05
e n v i r o n m e n t a l s c i e n c e & p o l i c y x x x ( 2 0 0 9 ) x x x – x x x12
ENVSCI-679; No of Pages 15
resilient farming system since there are indications (e.g. Ma
et al., 2006) that some practises are unsustainable in the
long-term.
By combining land, labour and capital limited areas we can
conceptualize eight generic types of vulnerability to drought
(Table 2). As a region’s economy, demography or land base
changes, however, it is further possible to imagine a pathway
from one type of vulnerability to another. More work is needed
to further refine the analysis and interpret the results into a
more robust typology. This will be done in the next phase of
this research by triangulating results obtained at different
scales and by exploring more climate change related problems
than just droughts. For example, vulnerability to drought
coexists with vulnerability to other environmental stresses,
and preparing for one type of environmental stress may
require trade-offs between resilience and adaptedness to
other stresses (Nelson et al., 2007). Such an understanding is
crucial for a range of applications. First, this type of analysis
provides a tool that can help inform stakeholder discussions
on ways to plan, and later monitor, their actions to deal with
environmental change. Implementing such policies requires
close collaboration across administrative borders to more
specifically identify the characteristics of the vulnerability to
drought, and prioritise its importance among exposures to
other types of environmental changes. Second, crop scientists
who model the impacts of climate change (e.g. Osborne et al.,
2006; Xiong et al., 2007) need quantifiable parameters as a
measure of vulnerability dynamics in order to simulate
potential and more realistic yields and to determine different
levels of likelihood that farmers will have access to (and
actually use) new management practices. As such, this
typology presents one way of showing how human dimen-
sions can be better incorporated into crop–climate models.
Since farmers have a tremendous capacity to adapt to societal
as well as environmental challenges, improving our aware-
ness on how underlying socio-economic processes affect the
extent to which agriculture and food production are vulner-
able to these changes is crucial.
6. Conclusions
In this paper, agricultural and meteorological records for
Chinese provinces were used to identify the socio-economic
characteristics of rice, wheat, and corn producing provinces
that make their harvests ‘‘sensitive’’ or ‘‘resilient’’ to rainfall
anomalies. The vulnerability to drought was quantified by a
crop-drought vulnerability index and correlated with socio-
economic factors representing land, labour, technical and
economic inputs. Most clearly, we found that economic
investments in rural areas generally correlate with reduced
vulnerability where harvests were sensitive to droughts. For
resilient harvests however, these same factors had no, or the
opposite, correlation. Vulnerability to drought seems, there-
fore, related to underlying population economic, and land-use
factors.
Based on these results, we argued that land, labour and
capital/technical inputs can be used to define eight different
‘‘types’’ of vulnerability and that in each type of vulnerability
Please cite this article in press as: Simelton, E., et al., Typologies o
economic factors that influence the sensitivity and resilience to droug
Policy (2009), doi:10.1016/j.envsci.2008.11.005
there will be different strategies to reduce the vulnerability of
crops to drought. It is vital to realize, however, that as a region
changes in terms of its economy, land use and population, it
may move from one ‘‘type’’ of vulnerability to another, and
different factors will become more or less important in terms
of determining vulnerability. This led us to propose the
concept of ‘‘crop-drought vulnerability typology’’, as a concept
that can be of use to both policy makers trying to determine
appropriate strategies to reduce climate vulnerability, as well
as to crop–climate modellers who need ways of including
socio-economic factors in crop models to reduce the uncer-
tainty in yield projections.
Acknowledgments
This research was funded by the Natural Environment
Research Council (UK) through the ‘‘Quantifying and Under-
standing the Earth System: Global Scale Impacts Project’’ and
the Rural Economy and Land Use Programme, which is a
collaboration between the Economic and Social Research
Council (ESRC), the Biotechnology and Biological Sciences
Research Council (BBSRC) and the Natural Environment
Research Council (NERC). This is QUEST Publication number
T3.GSI.02. The authors are grateful to Kuishuang Feng and
Yang Yu for data acquisition, the Climate Research Unit
(University of East Anglia) and the Institute of Geographical
Sciences and Natural Resources Research (Chinese Academy
of Sciences) for data, and to Alexander Walther for some
useful Matlab scripts. We are also grateful to three anonymous
referees, Jouni Paavola and Andrew Challinor for comments
on this paper and to Tianyi Zhang for an expert opinion on rice
production.
Appendix A. Supplementary data
Supplementary data associated with this article can be
found, in the online version, at doi:10.1016/j.envsci.2008.11.005.
r e f e r e n c e s
Adger, W.N., 1999. Social vulnerability to climate change andextremes in coastal Vietnam. World Development 27 (2),249–269.
Adger, W.N., 2006. Vulnerability. Global Environmental Change16 (3), 268.
Alcamo, J., Endejan, M., Kaspar, F., Rosch, T., 2001. The GLASSmodel: a strategy for quantifying global environmentalsecurity. Environmental Science and Policy 4, 1–12.
Awosika, L., Diop, E.S., Downing, T.E., El-Raey, M., Le Sueur, D.,Magadza, C.H.D., Tour, S., Vogel, C., 1998. Chapter 2: Africa.In: Watson, R., Zinyowera, M., Moss, R., Dokken, D. (Eds.),IPCC Special Report on the Regional Impacts of ClimateChange An Assessment of Vulnerability. UNEP, WMO(http://www.ipcc.ch/ipccreports/sres/regional/006.htmaccessed: 19th July, 2008).
Bouman, B.A.M., Feng, L., Tuong, T.P., Lu, G., Wang, H., Feng, Y.,2007. Exploring options to grow rice using less water innorthern China using a modelling approach II. Quantifying
f crop-drought vulnerability: an empirical analysis of the socio-
ht of three major food crops in China (1961–2001). Environ. Sci.
e n v i r o n m e n t a l s c i e n c e & p o l i c y x x x ( 2 0 0 9 ) x x x – x x x 13
ENVSCI-679; No of Pages 15
yield, water balance components, and water productivity.Agricultural Water Management 88, 23–33.
Bray, F., 1986. The Rice Economies. Basil Blackwell, Oxford.Brooks, N., Adger, W.N., Kelly, P.M., 2005. The determinants of
vulnerability and adaptive capacity at the national level andthe implications for adaptation. Global EnvironmentalChange Part A 15 (2), 151.
Challinor, A. Towards the development of adaptation optionsusing climate and crop yield forecasting at seasonal tomulti-decadal timescales. Environmental Science andPolicy, doi:10.1016/j.envsci.2008.09.008, this issue.
Cheng, C., 1993. Climate and agriculture in China. ForeignLanguage Book No. 108. China Meteorological Press, Beijing,519 pp.
Comenetz, J., Caviedes, C., 2002. Climate variability, politicalcrises, and historical population displacements in Ethiopia.Global Environmental Change Part B: EnvironmentalHazards 4 (4), 113–127.
Corbett, J., 1988. Famine and household coping strategies. WorldDevelopment 16 (9), 1099–1112.
Cruz, R.V., Harasawa, H., Lal, M., Wu, S., Anokhin, Y.,Punsalmaa, B., Honda, Y., Jafari, M., Li, C., Huu Ninh, N.,2007. Asia. In: Canziani, O.F., Parry, M.L., Palutikof, J.P., vander Linden, P.J., Hanson, C.E. (Eds.), Climate Change 2007:Impacts, Adaptation and Vulnerability. Contribution ofWorking Group II to the Fourth Assessment Report of theIntergovernmental Panel on Climate Change. CambridgeUniversity Press, Cambridge, pp. 469–506.
Easterling, W.E., Aggarwal, P.K., Batima, P., Brander, K.M., Erda, L.,Howden, S.M., Kirilenko, A., Morton, J., Soussan, J.-F,Schmidhuber, J., Tubiello, F.N., 2007. Food, fibre and forestproducts. In: Parry, M.L., Canziani, O.F., Palutikof, J.P., Linden,P.J.v.d., Hanson, C.E. (Eds.), Climate Change 2007: Impacts,Adaptation and Vulnerability. Contribution of WorkingGroup II to the Fourth Assessment Report of theIntergovernmental Panel on Climate Change. CambridgeUniversity Press, Cambridge, UK, pp. 273–313.
Erda, L., Wei, X., Hui, J., Xu, Y., Li, Y., Bai, L., Xie, L., 2005. Climatechange impacts on crop yield and quality with CO2
fertilization in China. Philosophical Transactions of theRoyal Society B 360, 2149–2154.
Ericksen, P., 2008. Conceptualizing food systems for globalenvironmental change research. Global EnvironmentalChange 18 (1), 234–245.
Fanfani, R., Brasili, C., 2003. Regional differences in Chineseagriculture: results from the 1997 first national agriculturalcensus. Journal of Peasant Studies 30 (3), 18–44.
Feng, L., Bouman, B.A.M., Tuong, T.P., Cabangon, R.J., Li, Y., Lu,G., Feng, Y., 2007. Exploring options to grow rice using lesswater in northern China using a modelling approach I. Fieldexperiments and model evaluation. Agricultural WaterManagement 88, 1–13.
Ford, J.D., Smit, B., Wandel, J., 2006. Vulnerability to climatechange in the Arctic: a case study from Arctic Bay, Canada.Global Environmental Change 16 (2), 145.
Fraser, E., 2003. Social vulnerability and ecological fragility:building bridges between social and natural sciences usingthe Irish Potato Famine as a case study. ConservationEcology 7 (1), 9.
Fraser, E., 2006. Agro-ecosystem vulnerability. Using pastfamines to help understand adaptation to future problemsin today’s global agri-food system. Journal of EcologicalComplexity 3 (4), 328–335.
Fraser, E., 2007. Travelling in antique lands: studying pastfamines to understand present vulnerabilities to climatechange. Climate Change 83 (4), 495–514.
Gao, G., Chen, D., Xu, C.-Y., Simelton, E., 2007. Trend ofestimated actual evapotranspiration over China. Journal ofGeophysical Research 112 , doi:10.1029/2006JD008010.
Please cite this article in press as: Simelton, E., et al., Typologies o
economic factors that influence the sensitivity and resilience to droug
Policy (2009), doi:10.1016/j.envsci.2008.11.005
Green, R., 1993. The political economy of drought in SouthernAfrica 1991–1993. Health Policy and Planning 8 (3), 256–266.
Heistermann, M., Muller, C., Ronneberger, K., 2006. Land insight? Achievements, deficits and potentials of continentalto global scale land-use modeling. Agriculture Ecosystemsand Environment 114, 141–158.
Hitchcock, R.K., 2002. Coping with uncertainty: adaptiveresponses to drought and livestock disease in the NorthernKalahari. In: Sporton, D., Thomas, D.S.G. (Eds.), SustainableLivelihoods in Kalahari Environments. Oxford UniversityPress, Oxford, UK, pp. 221–236.
Huang, Y., 2002. State Grain Marketing Policy and FarmerBehaviour. Asia Pacific Press (http://ncdsnet.anu.edu.au).
IGSNRR, 2007. Chinese Natural Resources Database. Institute ofGeographical Sciences and Natural Resources Research,Chinese Academy of Sciences (http://www.naturalresources.csdb.cn/index.asp).
Intergovernmental Panel on Climate Change (IPCC), 2007. In:Solomon, S., Qin, D., Manning, M., Chen, Z., Marquis, M.,Averyt, K.B., Tignor, M., Miller, H.L. (Eds.), Climate Change2007: The Physical Science Basis. Contribution of WorkingGroup I to the Fourth Assessment Report of theIntergovernmental Panel on Climate Change. CambridgeUniversity Press, Cambridge, United Kingdom and NewYork, NY, USA, 996 pp.
Kasperson, J., Kasperson, R., Turner, B., 1995. Regions at Risk.United Nations University Press, Tokyo.
Kumar, K.K., Kumar, R.K., Ashrit, R.G., Deshpande, N.R.,Hansen, J.W., 2004. Climate impacts on Indian agriculture.International Journal of Climatology 24, 1375–1393.
Ligon, E., Schechter, L., 2004. Evaluating Different Approaches toEstimating Vulnerability, Social Protection Unit, HumanDevelopment Network. The World Bank.
Liu, J., Liu, M., Tian, H., Zhuang, D., Zhang, Z., Zhang, W., Tang,X., Deng, X., 2005. Spatial and temporal patterns of China’scropland during 1990–2000: an analysis based on LandsatTM data. Remote Sensing of Environment 98, 442–456.
Long, S.P., Ainsworth, E.A., Rogers, A., Ort, D.R., 2004. Risingatmospheric carbon dioxide: plants FACE the future. AnnualReview of Plant Biology 55, 591–628.
Ma, J., Hoeckstra, A.J., Wang, H., Chapagain, A.K., Wang, D.,2006. Virtual versus real water transfers in China.Philosophical Transactions of the Royal Society B 361, 835–842.
Mendelsohn, R., 2007. Measuring climate impacts with cross-sectional analysis. Climatic Change 81 (1), 1–7.
Mendelsohn, R., Basist, A., Kurukulasuriya, P., Dinar, A., 2007.Climate and rural income. Climatic Change 81 (1), 101.
Mendelsohn, R., Reinsborough, M., 2007. A Ricardian analysis ofUS and Canadian farmland. Climatic Change 81 (1), 9–16.
Mitchell, T.D., Jones, P.D., 2005. An improved method ofconstructing a database of monthly climate observationsand associated high-resolution grids. International Journalof Climatology 25, 693–712.
Mustafa, D., 1998. Structural causes of vulnerability to floodhazard in Pakistan. Economic Geography 74 (3), 289–305.
Nelson, D.R., Adger, N., Brown, K., 2007. Adaptation toenvironmental change: contributions of a resilienceframework. The Annual Review of Environment andResources 32, 395–419.
Nicholls, R.J., Hoozemans, F.M.J., 1996. The Mediterranean:vulnerability to coastal implications of climate change.Ocean & Coastal Management 31 (2–3), 105–132.
Osborne, T.M., Lawrence, D.M., Challinor, A.J., Slingo, J.M.,Wheeler, T.R., 2006. Development and assessment of acoupled crop–climate model. Global Change Biology 12,1–15.
Patt, A., Gwata, C., 2004. Effects of seasonal climate forecastsand participatory workshops among subsistence farmers in
f crop-drought vulnerability: an empirical analysis of the socio-
ht of three major food crops in China (1961–2001). Environ. Sci.
e n v i r o n m e n t a l s c i e n c e & p o l i c y x x x ( 2 0 0 9 ) x x x – x x x14
ENVSCI-679; No of Pages 15
Zimbabwe. Proceeding of the National Academy of Science102 (35), 12623–12628.
Patt, A., Siebenhuner, B., 2005. Agent based modeling andadaptation to climate change. Vierteljahrshefte zurWirtschaftsforschung 74 (2), 310–320.
Reed, M., Fraser, E., Dougill, A.J., 2006. An adaptive learningprocess for developing and applying sustainabilityindicators with local communities. Ecological Economics 59(4), 406–418.
Reidsma, P., Ewert, F., Lansink, A.O., 2007. Analysis of farmperformance in Europe under different climatic andmanagement conditions to improve understanding ofadaptive capacity. Climate Change 84, 403–422.
Rook, J., 1997. The SADC regional early warning system:experience gained and lessons learnt from the 1991–1992Southern Africa drought. Internet Journal for AfricanStudies 2 (available online at: http://www.ccb.ucar.edu/ijas/ijasno2/rook.html).
Schlenker, W., Hanemann, W., Fisher, A., 2007. Wateravailability, degree days, and the potential impact ofclimate change on irrigated agriculture in California.Climatic Change 81 (1), 19–26.
Schneider, T., Neumaier, A., 2001. Algorithm 808: ARfit—aMatlab package for the estimation of parameters andeigenmodes of multivariate autoregressive models. ACMTransactions on Mathematical Software 27 (1), 58–65.
Sen, A., 1981. Poverty and Famines. Claredon Press, Oxford.Simelton, E., 2007. Climate and human impacts on wheat
production and land use in the Loess Plateau region, China.Earth Sciences Centre A115. Ph.D. thesis. GoteborgUniversity, Goteborg.
Smil, V., 1995. Who will feed China? The China Quarterly801–813.
Song, Y., Simelton, E., Chen, D., Dong, W., 2005. Influence ofclimate change on winter wheat growth in North Chinaduring 1950–2000. ACTA Meteorologica Sinica 19 (4), 501–510.
Sullivan, C., Meigh, J., 2005. Targeting attention on localvulnerabilities using an integrated index approach: theexample of the climate vulnerability index. Water Scienceand Technology 51 (5), 69–78.
Tao, F., Yokozawa, M., Xu, Y., Hayashi, Y., Zhang, Z., 2006.Climate changes and trends in phenology and yields of fieldcrops in China 1981–2000. Agricultural and ForestMeteorology 138, 82–92.
Thomas, D.S.G., Twyman, C., 2005. Equity and justice in climatechange adaptation amongst natural-resource-dependentsocieties. Global Environmental Change Part A 15 (2), 115.
Thomas, D.S.G., Twyman, C., Osbahr, H., Hewitson, B., 2007.Adaptation to climate change and variability: farmerresponses to intra-seasonal precipitation trends in SouthAfrica. Climatic Change 83, 310–322.
Thomson, A.M., Izaurralde, R.C., Rosenberg, N.J., He, X., 2006.Climate change impacts on agriculture and carbonsequestration potential in the Huang-Hai Plain of China.Agriculture Ecosystems and Environment 114 (2–4), 195–209.
Thornton, P.K., Jones, P.G., Owiyo, T., Kruska, R.L., Herrero, M.,Kristjanson, P., Notenbaert, A., Bekele, N., Omolo, A., withcontributions from Orindi, V., Ochieng, A., Otiende, B.,Bhadwal, S., Anantram, K., Nair, S., Kumar, V., Kelkar, U.,2006. Mapping climate vulnerability and poverty in Africa.Report to the Department for International Development,ILRI, Nairobi, Kenya, May 2006, 200 pp. (online at http://www.dfid.gov.uk/research/mapping-climate.pdf).
Tompkins, E., 2005. Planning for climate change in smallislands: insights from national hurricane preparednessin the Cayman Islands. Global Environmental Change 15,139–149.
Turner, B.L., Kasperson, R.E., Matson, P.A., McCarthy, J.J., Corell,R.W., Christensen, L., Eckley, N., Kasperson, J.X., Luers, A.,
Please cite this article in press as: Simelton, E., et al., Typologies o
economic factors that influence the sensitivity and resilience to droug
Policy (2009), doi:10.1016/j.envsci.2008.11.005
Martello, M.L., Polsky, C., Pulsipher, A., Schiller, A., 2003. Aframework for vulnerability analysis in sustainabilityscience. Proceedings of the National Academy of Sciences ofthe United States of America 100 (14), 8074–8079.
van Rooy, M.P., 1965. A rainfall anomaly index independent oftime and space. NOTOS. Weather Bureau of South Africa 14,43–48.
Wang, L., Davis, J., 2000. China’s grain economy. In: TheChallenge of Feeding More than a Billion, AshgatePublishing Ltd., Aldershot, 256 pp.
Watts, M., Bohle, H., 1993. The space of vulnerability: the causalstructure of hunger and famine. Progress in HumanGeography 17 (1), 43–67.
Wu, S.Y., Yarnal, B., Fisher, A., 2002. Vulnerability of coastalcommunities to sea-level rise: a case study of Cape MayCounty, New Jersey, USA. Climate Research 22 (3), 255–270.
Xiong, W., Lin, E., Ju, H., Xu, Y., 2007. Climate change and criticalthresholds in China’s food security. Climatic Change 81,205–221.
Xu, Z., Xu, J., Deng, X., Huang, J., Uchida, E., Rozelle, S., 2006.Grain for green versus grain: conflict between food securityand conservation set-aside in China. World Development 34(1), 130–148.
Yang, H., 1998. Trends in China’s regional grain production andtheir implications. Agricultural Economics 19, 309–325.
Yang, X., Lin, E., Ma, S., Ju, H., Guo, L., Xiong, W., Xu, Y., 2007.Adaptation of agriculture to warming in Northeast China.Climatic Change 84 (1), 45.
Zhai, P., Sun, A., Ren, F., Liu, X., Gao, B., Zhang, Q., 1999.Changes of climate extremes in China. Climatic Change 42(1), 203.
Zhang, S., Simelton, E., Lovdahl, L., Grip, H., Chen, D., 2007.Simulated long-term effects of different soil managementregimes on the water balance in the Loess Plateau, China.Field Crops Research 100, 311–319.
Zhang, T., Zhu, J., Yang, X., Zhang, X., 2008. Correlation changesbetween rice yields in North and Northwest China andENSO from 1960 to 2004. Agricultural and ForestMeteorology, doi:10.1016/J.AGRFORMET.2008/01.018.
Zhang, X., 2003. A comparative study of projection models onChina’s food economy. Journal of Peasant Studies 30 (3),192–223.
Zhen, L., Xie, G., Yang, L., Cheng, S., 2007. Land use dynamics,farmers’ preferences and policy implications in the Jinghewatershed of remote north-western China. Outlook onAgriculture 36 (2), 127–135.
Elisabeth Simelton is research assistant in the Quantifying andUnderstanding the Earth System-Global Scale Impacts (QUEST-GSI) project. She is BA in education, and MSc and PhD in geogra-phy. She has work and research experience in rural development,soil science, agricultural extension and participatory researchfrom several countries in Asia. Her research interests are envir-onmental/climate change and rural land use dynamics.
Evan D.G. Fraser is senior lecturer and Rural Economy and LandUse Research Fellow. He was awarded BA in anthropology (1996),MSc in forestry (1997) and PhD from University of British Columbiain 2002. His key research interests include understanding howfood systems become vulnerable and the characteristics of foodsystems vulnerable to collapse.
Mette Termansen is senior lecturer in ecological/environmentaleconomics at the Sustainability Research Institute, School of Earthand Environment, University of Leeds. Her research interests arein the area of ecological economic modelling, particularly relatedto modelling environmental and economic impacts of land useand climate change. Her specific expertise is in the area of discrete
f crop-drought vulnerability: an empirical analysis of the socio-
ht of three major food crops in China (1961–2001). Environ. Sci.
e n v i r o n m e n t a l s c i e n c e & p o l i c y x x x ( 2 0 0 9 ) x x x – x x x 15
ENVSCI-679; No of Pages 15
choice modelling and the application of GIS to integrated eco-nomic and environmental modelling.
Piers M. Forster is professor of physical climate change at theUniversity of Leeds. He has a nine-person research group studyingseveral aspects of climate change, particularly related to causes of20th century change and predicting the Earth’s response. He isauthor of several international assessments including a Coordi-nating Lead author of the IPCC WG1 Fourth Assessment Report(2007).
Please cite this article in press as: Simelton, E., et al., Typologies o
economic factors that influence the sensitivity and resilience to droug
Policy (2009), doi:10.1016/j.envsci.2008.11.005
Andy Dougill is a senior lecturer in environment and developmentand has over 15 years experience developing integrated landdegradation assessment methodologies in a range of globalagro-ecosystems, notably in dryland regions of Southern Africa.His research has spanned a wide range of disciplines from soilscience, ecology, development studies and policy analysis toenable the development of holistic understandings of complexenvironmental problems on scales ranging from local commu-nities to national overviews. He is Head of the School of Earth andEnvironment, University of Leeds.
f crop-drought vulnerability: an empirical analysis of the socio-
ht of three major food crops in China (1961–2001). Environ. Sci.