Types of Forecast and Weather-Related Information Used among Tourism Businesses in Coastal North...
139
Types of Forecast and Weather-Related Information Used among Tourism Businesses in Coastal North Carolina by Emily P. Ayscue May, 2014 Director: Scott Curtis Center for Sustainability: Tourism, Natural Resources and the Built Environment This study profiles the coastal tourism sector, a large and diverse consumer of climate and weather information. It is crucial to provide reliable, accurate and relevant resources for the climate and weather-sensitive portions of this stakeholder group in order to guide them in capitalizing on current climate and weather conditions and to prepare them for potential changes. An online survey of tourism business owners, managers and support specialists was conducted within the eight North Carolina oceanfront counties asking respondents about forecasts they use and for what purposes as well as why certain forecasts are not used. Respondents were also asked about their perceived dependency of their business on climate and weather as well as how valuable different forecasts are to their decision-making. Business types represented include: Agriculture, Outdoor Recreation, Accommodations, Food Services, Parks and Heritage, and Other. Weekly forecasts were the most popular forecasts with Monthly and Seasonal being the least used. MANOVA and ANOVA analyses revealed outdoor-oriented businesses (Agriculture and Outdoor Recreation) as perceiving themselves significantly more dependent on climate and weather than indoor-oriented ones (Food Services and Accommodations). Outdoor businesses also valued short-range forecasts significantly more than indoor businesses. This suggests a positive relationship between perceived climate and weather dependency and forecast value. The low perceived dependency and value of short-range forecasts of indoor businesses presents an
Transcript of Types of Forecast and Weather-Related Information Used among Tourism Businesses in Coastal North...
Types of Forecast and Weather-Related Information Used among Tourism Businesses in
Coastal North Carolina
by
Emily P. Ayscue
May, 2014
Director: Scott Curtis
Center for Sustainability: Tourism, Natural Resources and the Built Environment
This study profiles the coastal tourism sector, a large and diverse consumer of climate
and weather information. It is crucial to provide reliable, accurate and relevant resources for the
climate and weather-sensitive portions of this stakeholder group in order to guide them in
capitalizing on current climate and weather conditions and to prepare them for potential changes.
An online survey of tourism business owners, managers and support specialists was conducted
within the eight North Carolina oceanfront counties asking respondents about forecasts they use
and for what purposes as well as why certain forecasts are not used. Respondents were also
asked about their perceived dependency of their business on climate and weather as well as how
valuable different forecasts are to their decision-making. Business types represented include:
Agriculture, Outdoor Recreation, Accommodations, Food Services, Parks and Heritage, and
Other. Weekly forecasts were the most popular forecasts with Monthly and Seasonal being the
least used. MANOVA and ANOVA analyses revealed outdoor-oriented businesses (Agriculture
and Outdoor Recreation) as perceiving themselves significantly more dependent on climate and
weather than indoor-oriented ones (Food Services and Accommodations). Outdoor businesses
also valued short-range forecasts significantly more than indoor businesses. This suggests a
positive relationship between perceived climate and weather dependency and forecast value. The
low perceived dependency and value of short-range forecasts of indoor businesses presents an

opportunity to create climate and weather information resources directed at how they can
capitalize on positive climate and weather forecasts and how to counter negative effects with
forecasted adverse conditions. The low use of long-range forecasts among all business types can
be related to the low value placed on these forecasts. However, these forecasts are still important
in that they are used to make more financially risky decisions such as investment decisions.

Types of Forecast and Weather-Related Information Used among Tourism Businesses in
Coastal North Carolina
A Thesis
Presented to
The Faculty of the Center for Sustainability: Tourism, Natural Resources and the Built
Environment
East Carolina University
In Partial Fulfillment
Of the Requirements for the Degree
Master of Science
by
Emily P. Ayscue
May. 2014
Committee:
Dr. Scott Curtis, Committee Chair, Department of Geography, Planning and Environment
Dr. Burell Montz, Member, Department of Geography, Planning and Environment Chair
Dr. Huili Hao, Member, Center for Sustainability: Tourism, Natural Resource and the Built Environment

©Copyright 2014
Types of Forecast and Weather-Related Information Used among Tourism Businesses in
Coastal North Carolina
Types of Forecast and Weather-Related Information Used among Tourism Businesses in
Coastal North Carolina
by
Emily P. Ayscue
APPROVED BY:
DIRECTOR OF
DISSERTATION/THESIS: ______________________________________________________
(Scott Curtis, PhD)
COMMITTEE MEMBER: _______________________________________________________
(Huili Hao, PhD)
COMMITTEE MEMBER: ______________________________________________________
(Burrell Montz, PhD)
DIRECTOR OF THE MASTERS
IN SUSTAINABLE TOURISM: ___________________________________________________
(Jason Oliver, PhD)
DEAN OF THE
GRADUATE SCHOOL: ________________________________________________________
Paul J. Gemperline, PhD

ii
ACKNOWLEDGEMENTS
Thank you to my parents and my grandma for supporting me and helping me see my true
potential. Thank you my friends at the Center with whom I now share life-long memories. I
could not have been as successful without your support. To my closest friends, you helped me
maintain my clear perspective through this process and have kept me grounded.
To my advisor, Dr. Curtis, thank you for all of your support and hard work. I have enjoyed
growing as a researcher through your guidance and all the laughs along the way. To my friend
Dr. Huili Hao, I will never drink hot tea again without thinking fondly of our long afternoon
conversations about everything besides school work. To my committee member Dr. Montz, I
admire your hard work and honesty and appreciate the refinement you helped bring to my
research and writing skills. To Dr. Pat Long, you are an incredible friend and colleague which I
will always cherish. My guitar will always be ready to play a few tunes with you. Dr. Paige
Schneider, granting me the opportunity to teach with you confirmed my decision to move toward
the path in front of me. Your energy and kindness are contagious and I will always cherish our
friendship.
Through this journey of graduate school I have learned hard life lessons but have also discovered
amazing opportunities. Thank you to everyone who has made it a special experience.
May God bless you and keep you
May his face shine upon you and be gracious to you
May he lift his face to you and grant you peace
~Numbers 6:24-26
iii
TABLE OF CONTENTS
LIST OF FIGURES ................................................................................................................... vii
1. Introduction ..................................................................................................................... 3
2. Literature Review ............................................................................................................. 3
2.1 Definitions ................................................................................................................................3
2.3 Impacts of weather and climate on tourism businesses .............................................................4
2.4 Climate and Weather-sensitive tourism businesses....................................................................5
2.5 Weather and climate information needs of tourism businesses..................................................5
2.6 The state of weather and seasonal forecast use among tourism businesses ................................6
2.7 Alternate sources of climate and weather information ..............................................................9
3. Methods ........................................................................................................................... 9
3.1 Area of study ............................................................................................................................9
3.2 Sample ................................................................................................................................... 10
3.3 Sampling Procedure ................................................................................................................ 12
3.4 Survey Design ......................................................................................................................... 13
3.5 Survey Administration ............................................................................................................ 13
3.6 Measurements ....................................................................................................................... 13
4. Results............................................................................................................................. 18
4.1 Recruitment ........................................................................................................................... 18
4.2 Analysis .................................................................................................................................. 18
4.2.1 Descriptives ................................................................................................................................ 19
4.2.2 Correlation and Principle Component Factor Analysis for Value .............................................. 75
4.2.3 Correlation and Principle Component Factor Analysis for Forecast Usefulness ....................... 78
4.3 Comparison Analysis ............................................................................................................... 81
5. Discussion ....................................................................................................................... 91
5.1 Short range forecasts .............................................................................................................. 92
5.2 Long-range forecasts ............................................................................................................... 96
5.3 Other forecasts ....................................................................................................................... 98
5.4 Null results ............................................................................................................................. 98
5.5 Sustainability Implications .................................................................................................... 100
6. Limitations .................................................................................................................... 100
7. Future Research ............................................................................................................. 101
8. Conclusions ................................................................................................................... 102

iv
REFERENCES ...................................................................................................................... 106
APPENDIX B ....................................................................................................................... 116
APPENDIX C ....................................................................................................................... 117
v
LIST OF TABLES
Table 1: Open-ended responses for Other sources of climate and weather information ............................ 27
Table 2: Open-ended responses for Other types of forecasts ...................................................................... 30
Table 3: Open-ended responses for other Hourly forecast uses .................................................................. 33
Table 4: Specific uses of Hourly forecasts by Business Type .................................................................... 34
Table 5: Open-ended responses for other Daily forecast uses .................................................................... 37
Table 6: Specific uses of Daily forecasts by Business Type ....................................................................... 38
Table 7: Open-ended responses for other Weekly forecast uses ................................................................. 40
Table 8: Specific uses of Weekly forecasts by Business Type ................................................................... 41
Table 9: Open-ended responses for other Monthly forecast uses ............................................................... 43
Table 10: Specific uses of Monthly forecasts by Business Type ................................................................ 44
Table 11: Open-ended responses for other Seasonal forecast uses ............................................................. 46
Table 12: Specific Uses of Seasonal forecasts by Business type ................................................................ 47
Table 13: Open-ended responses for remaining Other forecast uses .......................................................... 49
Table 14: Specific uses of Other forecasts by Business Type .................................................................... 50
Table 15: Open-ended responses for why Hourly forecasts are not used ................................................... 52
Table 16: Specific reasons for not using Hourly forecasts by Business Type ............................................ 53
Table 17: Open-ended responses for other reasons why Daily forecasts were not used............................. 54
Table 18: Specific reasons for not using Daily forecasts by Business Type ............................................... 55
Table 19: Open-ended responses why Weekly forecasts were not used ..................................................... 56
Table 20: Specific reasons for not using Weekly forecasts by Business Type ........................................... 57
Table 21: Open ended responses for why Monthly forecasts were not used .............................................. 58
Table 22: Specific reasons for not using Monthly forecasts by Business Type .......................................... 59
Table 23: Open-ended responses for why Seasonal forecasts were not used ............................................. 61
vi
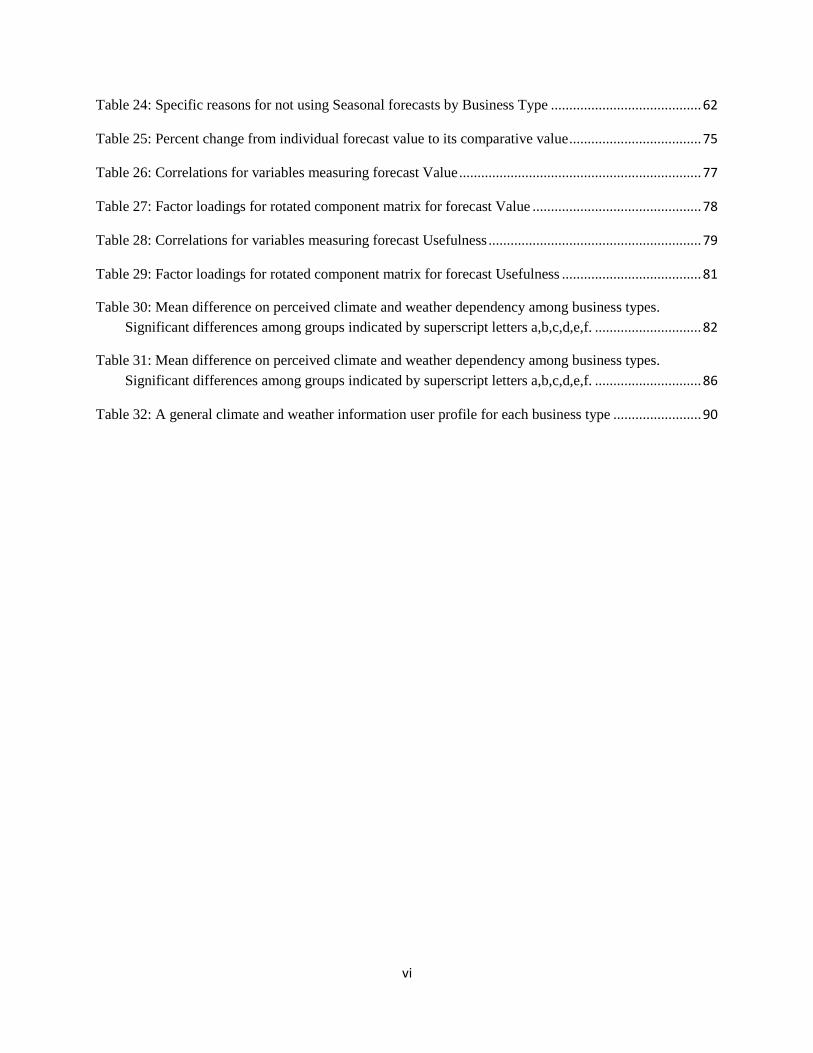
Table 24: Specific reasons for not using Seasonal forecasts by Business Type ......................................... 62
Table 25: Percent change from individual forecast value to its comparative value .................................... 75
Table 26: Correlations for variables measuring forecast Value .................................................................. 77
Table 27: Factor loadings for rotated component matrix for forecast Value .............................................. 78
Table 28: Correlations for variables measuring forecast Usefulness .......................................................... 79
Table 29: Factor loadings for rotated component matrix for forecast Usefulness ...................................... 81
Table 30: Mean difference on perceived climate and weather dependency among business types.
Significant differences among groups indicated by superscript letters a,b,c,d,e,f. ............................. 82
Table 31: Mean difference on perceived climate and weather dependency among business types.
Significant differences among groups indicated by superscript letters a,b,c,d,e,f. ............................. 86
Table 32: A general climate and weather information user profile for each business type ........................ 90
vii
LIST OF FIGURES
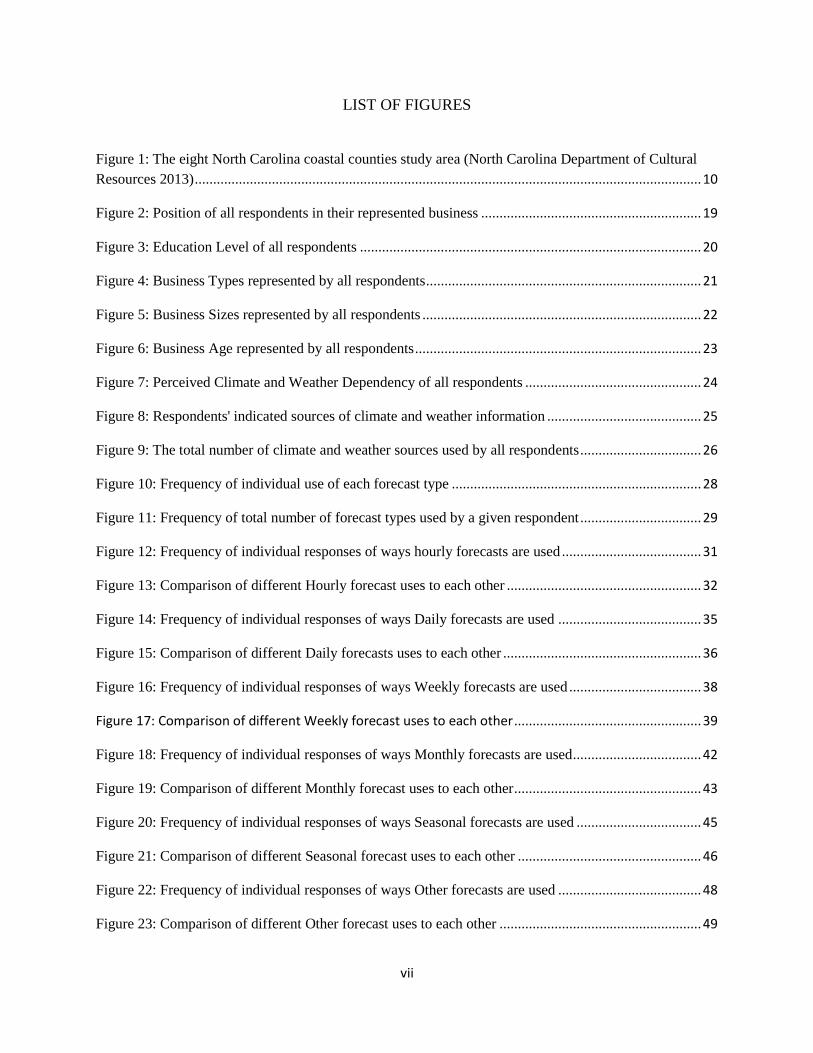
Figure 1: The eight North Carolina coastal counties study area (North Carolina Department of Cultural
Resources 2013) .......................................................................................................................................... 10
Figure 2: Position of all respondents in their represented business ............................................................ 19
Figure 3: Education Level of all respondents ............................................................................................. 20
Figure 4: Business Types represented by all respondents ........................................................................... 21
Figure 5: Business Sizes represented by all respondents ............................................................................ 22
Figure 6: Business Age represented by all respondents .............................................................................. 23
Figure 7: Perceived Climate and Weather Dependency of all respondents ................................................ 24
Figure 8: Respondents' indicated sources of climate and weather information .......................................... 25
Figure 9: The total number of climate and weather sources used by all respondents ................................. 26
Figure 10: Frequency of individual use of each forecast type .................................................................... 28
Figure 11: Frequency of total number of forecast types used by a given respondent ................................. 29
Figure 12: Frequency of individual responses of ways hourly forecasts are used ...................................... 31
Figure 13: Comparison of different Hourly forecast uses to each other ..................................................... 32
Figure 14: Frequency of individual responses of ways Daily forecasts are used ....................................... 35
Figure 15: Comparison of different Daily forecasts uses to each other ...................................................... 36
Figure 16: Frequency of individual responses of ways Weekly forecasts are used .................................... 38
Figure 17: Comparison of different Weekly forecast uses to each other ................................................... 39
Figure 18: Frequency of individual responses of ways Monthly forecasts are used ................................... 42
Figure 19: Comparison of different Monthly forecast uses to each other ................................................... 43
Figure 20: Frequency of individual responses of ways Seasonal forecasts are used .................................. 45
Figure 21: Comparison of different Seasonal forecast uses to each other .................................................. 46
Figure 22: Frequency of individual responses of ways Other forecasts are used ....................................... 48
Figure 23: Comparison of different Other forecast uses to each other ....................................................... 49
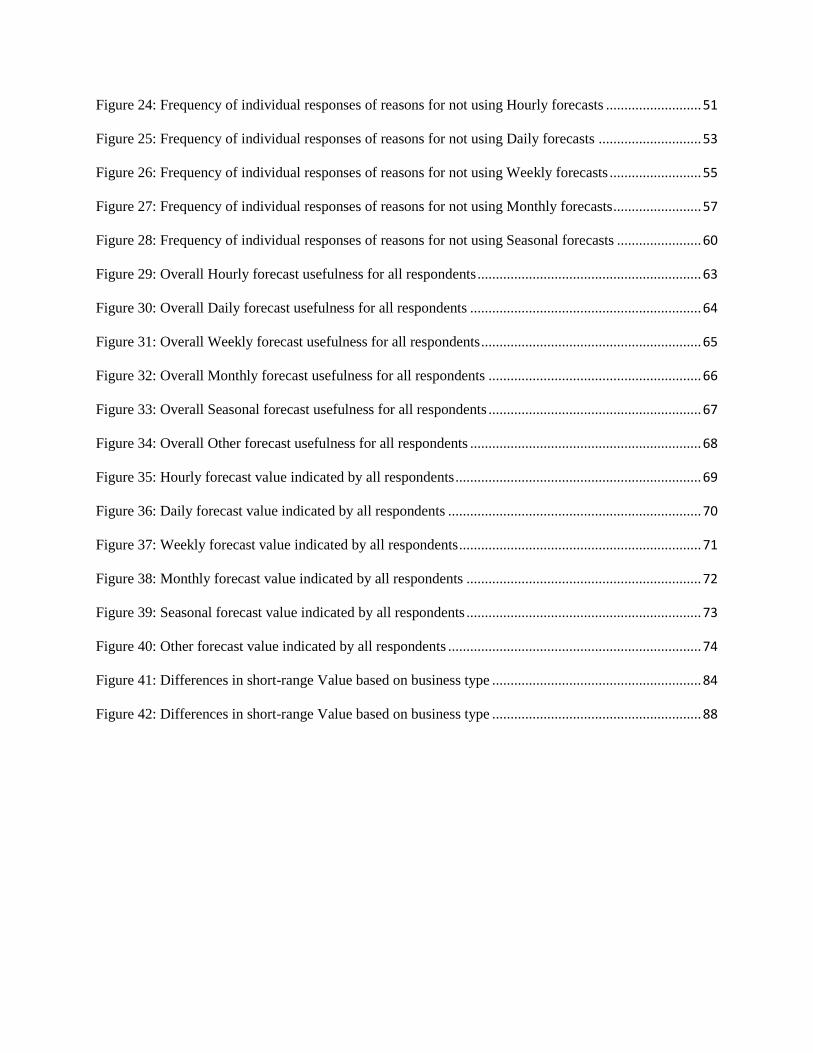
Figure 24: Frequency of individual responses of reasons for not using Hourly forecasts .......................... 51
Figure 25: Frequency of individual responses of reasons for not using Daily forecasts ............................ 53
Figure 26: Frequency of individual responses of reasons for not using Weekly forecasts ......................... 55
Figure 27: Frequency of individual responses of reasons for not using Monthly forecasts ........................ 57
Figure 28: Frequency of individual responses of reasons for not using Seasonal forecasts ....................... 60
Figure 29: Overall Hourly forecast usefulness for all respondents ............................................................. 63
Figure 30: Overall Daily forecast usefulness for all respondents ............................................................... 64
Figure 31: Overall Weekly forecast usefulness for all respondents ............................................................ 65
Figure 32: Overall Monthly forecast usefulness for all respondents .......................................................... 66
Figure 33: Overall Seasonal forecast usefulness for all respondents .......................................................... 67
Figure 34: Overall Other forecast usefulness for all respondents ............................................................... 68
Figure 35: Hourly forecast value indicated by all respondents ................................................................... 69
Figure 36: Daily forecast value indicated by all respondents ..................................................................... 70
Figure 37: Weekly forecast value indicated by all respondents .................................................................. 71
Figure 38: Monthly forecast value indicated by all respondents ................................................................ 72
Figure 39: Seasonal forecast value indicated by all respondents ................................................................ 73
Figure 40: Other forecast value indicated by all respondents ..................................................................... 74
Figure 41: Differences in short-range Value based on business type ......................................................... 84
Figure 42: Differences in short-range Value based on business type ......................................................... 88
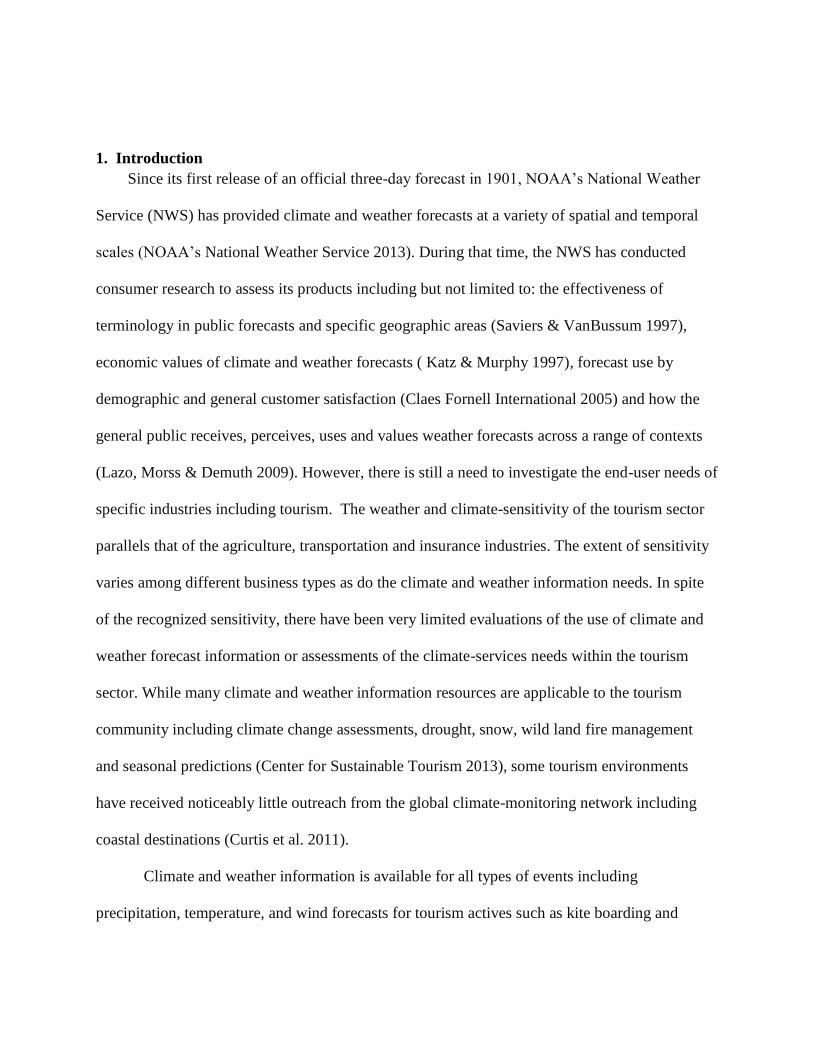
1. Introduction
Since its first release of an official three-day forecast in 1901, NOAA’s National Weather
Service (NWS) has provided climate and weather forecasts at a variety of spatial and temporal
scales (NOAA’s National Weather Service 2013). During that time, the NWS has conducted
consumer research to assess its products including but not limited to: the effectiveness of
terminology in public forecasts and specific geographic areas (Saviers & VanBussum 1997),
economic values of climate and weather forecasts ( Katz & Murphy 1997), forecast use by
demographic and general customer satisfaction (Claes Fornell International 2005) and how the
general public receives, perceives, uses and values weather forecasts across a range of contexts
(Lazo, Morss & Demuth 2009). However, there is still a need to investigate the end-user needs of
specific industries including tourism. The weather and climate-sensitivity of the tourism sector
parallels that of the agriculture, transportation and insurance industries. The extent of sensitivity
varies among different business types as do the climate and weather information needs. In spite
of the recognized sensitivity, there have been very limited evaluations of the use of climate and
weather forecast information or assessments of the climate-services needs within the tourism
sector. While many climate and weather information resources are applicable to the tourism
community including climate change assessments, drought, snow, wild land fire management
and seasonal predictions (Center for Sustainable Tourism 2013), some tourism environments
have received noticeably little outreach from the global climate-monitoring network including
coastal destinations (Curtis et al. 2011).
Climate and weather information is available for all types of events including
precipitation, temperature, and wind forecasts for tourism actives such as kite boarding and
2
sailing; sea surface temperatures for fishing; and surf reports (Weather Flow Inc. 2014; Fish
Weather 2014; Magic Seaweed Ltd. 2014;NWS 2013). This study focuses on the precipitation
and temperature forecasts produced by NOAA with a focus on the use of different temporal
forecasts. A variety of forecast types with differing lead times exist within NOAA’s National
Weather Service (NWS 2013) and Climate Prediction Center (CPC 2013). Short-range forecasts
include, but are not limited to, hourly and daily forecast lead times, medium range forecasts
include weekly forecast lead times (NWS 2013), and long-range forecasts include monthly and
seasonal forecast lead times (CPC 2013). This study proposes to investigate the use of different
forecast types and furthermore, addresses the decision-making processes among tourism business
owners in the eight NC CAMA oceanfront counties through a statistical analysis of an online
survey.
Based on our current understanding of uses of weather and climate forecasts in the
tourism sector, it is hypothesized that short and medium range forecasts would be consulted
more than long-range forecasts. Independent variables measured in this study include: business
type (Curtis et al. 2009), business size (SBA 2013) and age of business. Dependent variables
measured in this study include: forecast value (Murphy 1993), the number of ways forecasts
(Klopper et al. 2006) and other weather-related tools (Roncolli et al. 2009; Weather Flow Inc.
2014; Fish Weather 2014; Magic Seaweed Ltd. 2014) are used, and business owners/managers’
perceived dependency on climate and weather. Additional information attained included: the
respondent’s position in the company, their sources of climate and weather information, and
education (Orlove et al. 2004). This study’s research questions are as follows:
RQ1: What types of forecasts do tourism business owners use the most and for what purposes?
RQ2: What types of forecasts do tourism business owners use the least and why?
3
RQ3: What factors influence their decisions to use or not use a forecast?
RQ3a: What impact does business age have on the business owner/manager’s perceived
dependency on climate and weather, forecast use and perceived forecast value for each type of
forecast?
RQ3b: Does the size of a business impact its perceived dependency on climate and weather,
forecast use and perceived forecast value for each type of forecast?
RQ3c: Do certain types of businesses exhibit similar patterns in perceived dependency on
climate and weather, forecast use and perceived forecast value for each type of forecast?
RQ4: What other tools do coastal tourism business owners use as alternatives to weather and
climate forecasts?
2. Literature Review
2.1 Definitions
Weather is a summary of the atmospheric conditions at a particular time and place, while
climate is a statistical description of daily weather events over a long period of time. Tourism
has been defined as the experience of traveling for recreation where recreation is the voluntary
engagement in activities for satisfaction and pleasure. Tourism climate research, often called
tourism climatology, is broadly defined as the interactions and relationships of tourism and
recreation with climate and weather. These connections have highlighted the economic value of
climate to tourism destinations and have led to the suggestion of climate being a resource
exploited by tourism, thus justifying the need to explore its opportunities and value to the
tourism industry (Matzarakis & Freitas 2001). Therefore, it is suggested that climate and weather
forecasts can be a valuable tool in creating positive relationships with a destination and in
planning for the best ways to take advantage of environmental resources.
A weather forecast for the purposes of this study is defined as a description in 12-hour
increments of the behavior of various weather elements including: probability and type of
4
precipitation, sky condition, temperature and wind (National Weather Service/NOAA,
Department of Commerce 2013). A seasonal forecast for this study is defined as a “probabilistic
prediction of the climate for the season” as adapted from Ziervogel and Downing (2004 p.73).
The Climate Prediction Center produces forecasts with three-month lead-time known as
“seasonal outlooks” (CPC 2013).
2.3 Impacts of weather and climate on tourism businesses
Weather and climate-induced factors can create long-lasting impacts on tourism
dependent businesses (World Tourism Organization 2008), including the approximately 27,300
North Carolina tourism related businesses (Curtis et al. 2009). Businesses respond to weather
and climate in many ways including: shortening traditional profit-making seasons, raising prices
to help cover economic losses, and responding to the challenge of maintaining stable business
activity (Alvord et al. 2008). Positive relationships can also be formed between weather-sensitive
outdoor recreational activities and indoor activities. Seasonal climatic information can help with
the planning, scheduling and promotion of alternative indoor activities when weather conditions
are not conducive to outdoor activities and vice-versa (Perry 1972).
Since 1991, all eight oceanfront counties in North Carolina have experienced a general
trend in increased economic impact from travel in North Carolina. Moreover, latest reports
indicate all eight counties saw the greatest impact yet in 2012. Assessing the types and specific
uses of tools by businesses among coastal regions such as this study area (i.e. climate and
weather forecasts) is one way to identify barriers and opportunities for its continued economic
success (US Travel Association 2014).
5
2.4 Climate and Weather-sensitive tourism businesses
Tourism end users of climate and weather information vary greatly and include
Accommodation, Hotel managers, Franchises, ‘Chain’ operators, Restaurants, Cruise lines,
Resort managers, Support and subsidiary organizations, Destination Marketing Organizations,
Insurers, Retailers, Services (e.g. laundry), Business Consultants, Trainers, Research
Organizations’ Industry Organizations, Trade Associations, and Non-Governmental
Organizations (Hale and Altalo, 2002). Other recognized potential end users include: federal,
state, regional, and local governmental planning, commerce, and marketing agencies, cultural
event planners, and the sporting event industry that includes events such as football, baseball,
and the Olympics. Tourism businesses recognized as weather-dependent such as ski resorts and
diving companies are also potential beneficiaries of climate and weather forecast information
(National Climatic Data Center 2010). Coastal regions also contain distinctive end users of
climate and weather information including charter fishing & boat rentals (Gamble & Leonard
2005).
2.5 Weather and climate information needs of tourism businesses
Many uses of climate and weather information have been proposed, but implementation
is limited within tourism businesses. One explanation for this lack of use is that many tourism
businesses are not even sure of their exact climate and weather information needs (Curtis et al.
2009). It has also been suggested that product adoption, referring to seasonal forecasts, is driven
by perceived utility. Two different models can explain the adoption of a product-appropriability
and contextual adaptation models. The appropriability model proposes “the utility of the product
should sell itself”. However, in the case of seasonal forecasting, the scientific community has
6
seen a shift to a contextual model approach, which proposes that a product’s utility and
subsequent success, is created through its relevance to end-users (Ziervogel & Downing 2004).
Tourism businesses are looking for realistic forecast information as well as strategies to
effectively use this information. Centers such as The National Climatic Data Center (NCDC),
North Carolina Climate Office (NCCO), Southeast Regional Climate Center (SERCC), and
North Carolina Sea Grant are responding to this need by considering tourism businesses as a
stakeholder in their product and thus, looking for ways to communicate weather and climate
information to this stakeholder sector effectively (Robinson, 2008).
Tourism business end users’ perceived utility and value of a forecast can be directly
related to its accuracy (Hartmann et al. 2002).
2.6 The state of weather and seasonal forecast use among tourism businesses
Climate and weather can impact the overall experience and satisfaction of a tourist,
positively and negatively. In this service-oriented industry, financial success is dependent on
facilitating good experiences resulting in satisfied customers who then have a reason to patronize
a business’ services again. Weather and climate forecasts are tools that can be used to prevent
negative experiences or market potentially good ones. A windy day might make cycling or
golfing difficult. Storms halt almost all outdoor activities or in the least make them very
dangerous. Adverse weather conditions can drive tourists inside looking for activities of a social
or cultural nature perhaps. Knowledge of the upcoming seasonal forecast can provide planning
insight in order to respond to some of the typical weather patterns. Having a strategy to deal with
the many weather scenarios possible in a season could result in a better ability to keep tourists
satisfied with an overall good experience in the event of bad weather. Tourism business owners
7
are not the only users of climate and weather information. Tourists can find value in this
information as well. For instance, most resorts have tourist information centers that provide
weather forecasts with lead times up to 72 hours (Martín, Gómez 2005). The use of seasonal
forecasts in general has remained mostly in an agricultural risk management and decision-
making context (Everingham et. al 2002). This literature would most relate to agritourism and
wine tourism, which are also affected by seasonal climate variability. The changing of leaves or
wine quality both depend on complex climate and weather activity ranging from a year to a day
out (Curtis et. al 2009). Investigation into the perception and use of weather and seasonal
forecasts into a wider range of tourism sectors has yet to be seen.
Some of the indoor tourism operations such as hotels, vacation rentals and restaurants do
find value in pertinent climate and weather information (National Climatic Data Center 2010).
However, it is recognized that a majority of recreational and tourism activities in coastal
destinations are outdoor-oriented making climate and weather information invaluable to planning
outdoor activities, their duration and the success or enjoyment of that activity (Gamble &
Leonard 2005). The National Weather Service offers forecasts ranging from hourly to weekly
lead times. The Climate Prediction Center- a branch of the National Weather Service- offers
many types of climate information such as climate variability predictions, real-time monitoring
of climate and assessments of the origins of major climate anomalies. Predictions span a time
scale of a week to seasons and extend as far as technically feasible into the future. Three-month
outlooks also known as Seasonal Outlooks, predict variability in regards to seasonal averages for
precipitation and temperature (National Weather Service 2008). Climate and weather dependent
businesses could make advantageous operational decisions using seasonal outlooks such as resort
renovations or commencement of snowmaking at ski resorts. Forecasting probabilities for
8
weather phenomena such as precipitation and temperature can help with interpretation of
hazardous conditions and be used for operational decisions.
Weather and climate can be viewed as a resource to be exploited and used for a
competitive edge. Preferable weather and climate conditions can provide tourism-marketing
materials. Costs related to heat and air-conditioning are considered in development and
renovation investment decisions. Knowledge of an upcoming summer season with above normal
temperatures for example, could compel tourism businesses to invest in destination renovations
that include more energy efficient air conditioning units. Resort design and landscaping could
respond to weather and climate data. Rain gardens could be constructed to help absorb excess
water from an unusual rainy season as well as providing aesthetically pleasing aspects to a
destination. Predicting profit returns or cash flow is pertinent for forecasting the degree of
financial stability a business will face in the future. Seasonal and weekly weather information
can aid in these predictions. A beach-side restaurant knowing that there will be above normal
summer precipitation can prepare for a possible sales decrease, consequently reducing staff to
mirror this sales decrease (Matzarakis & Freitas 2001).
Although there are many suggested uses of climate and weather information among
tourism businesses, a disconnect still exists between the information and end-users. An
adaptation of the explanations offered by Ziervogel and Downing (2004) for hindrances of
seasonal forecast awareness and uptake could prove applicable to tourism business owners as
well. Ziervogel and Downing suggest that forecast interpretation, relevance to the destination and
knowledge of seasonal forecasts could attribute to a lack of seasonal forecast use. A poor
understanding of forecasts could be due to the use of technical language by the scientific
community that is expected to be understood by the general public. The broad geographical
9
context in which seasonal forecasts are delivered could prove inappropriate for tourism business
owners planning for a specific location. Lastly, potential users may not even know about
seasonal forecasts, where to get them or how they may be used (Ziervogel & Downing 2004).
2.7 Alternate sources of climate and weather information
The cultural contexts from which end-users’ perceptions and knowledge frameworks
come from can greatly shape the way they ascribe meaning and value to what they see and know.
In communities particularly sensitive to changes in nature, specifically climate and weather, the
sole dependence on climate and weather forecasts is seen as a fallacy (Roncolli et al. 2009).
These communities often rely on wind, flora and fauna as forecast indicators. However, in areas
where these indicators' reliability is eroding due to climate change, the need for scientific
forecast information is increasing. The perceived objectivity of scientific information has been
described as a basic societal value and influences the acceptance and implementation of
scientific information (Strauss 2003). Other factors not related to climate variation such as price
fluctuations, violent attacks, legal prosecution and social marginalization can influence a tourism
business owner’s decision making. All of these human dimensions should be considered in
understanding the use or lack thereof in climate and weather information among tourism
businesses located in particularly weather-sensitive communities such as coastal destinations
(Roncolli et al. 2009).
3. Methods
3.1 Area of study
10
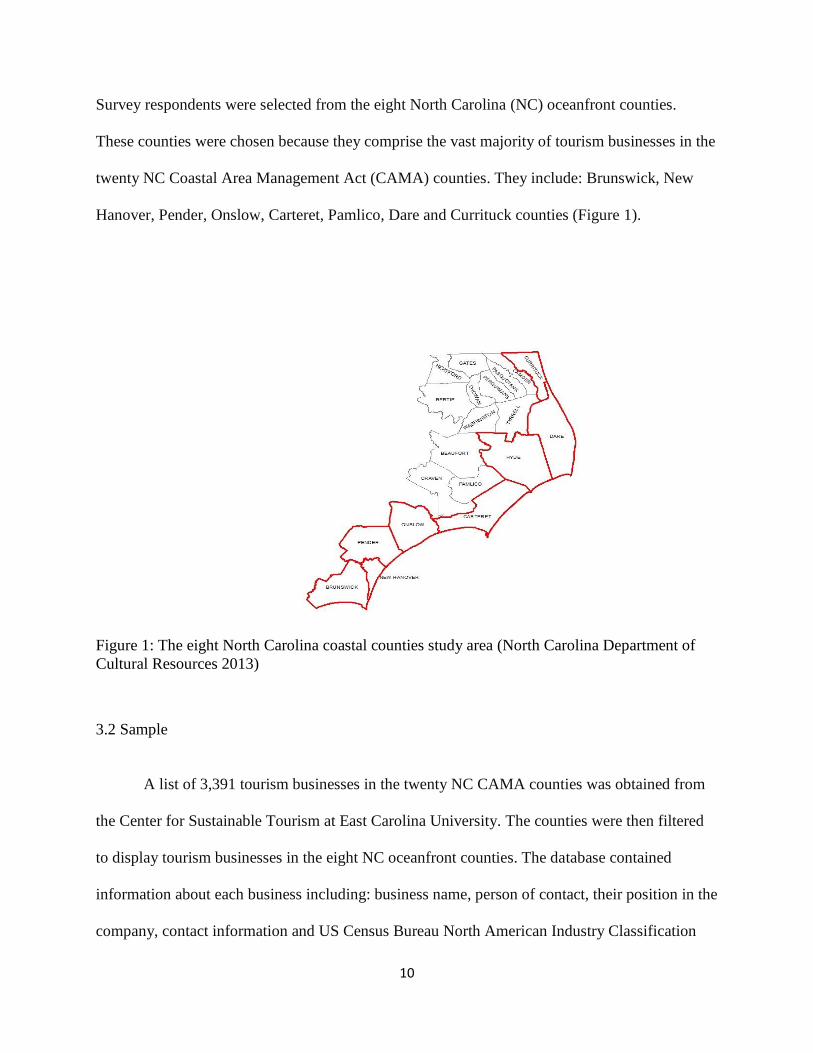
Survey respondents were selected from the eight North Carolina (NC) oceanfront counties.
These counties were chosen because they comprise the vast majority of tourism businesses in the
twenty NC Coastal Area Management Act (CAMA) counties. They include: Brunswick, New
Hanover, Pender, Onslow, Carteret, Pamlico, Dare and Currituck counties (Figure 1).
Figure 1: The eight North Carolina coastal counties study area (North Carolina Department of
Cultural Resources 2013)
3.2 Sample
A list of 3,391 tourism businesses in the twenty NC CAMA counties was obtained from
the Center for Sustainable Tourism at East Carolina University. The counties were then filtered
to display tourism businesses in the eight NC oceanfront counties. The database contained
information about each business including: business name, person of contact, their position in the
company, contact information and US Census Bureau North American Industry Classification
11
System (NAICS) code. The following coastal tourism businesses sectors were identified as
climate and weather dependent: accommodations, restaurants and bars, transportation, retail,
outdoor activities, state parks, charter fishing, boat rentals and ecotourism (Curtis et al. 2009,
Gamble & Leonard 2005) all of which have corresponding NAICS codes. Because of the wide
variety of businesses discovered in the area though, more general categories were needed to
accommodate businesses that would experience climate and weather dependency but may not fit
these categories. These general categories were adapted from a study by Roehl (1998, p.63) and
grouped into the following categories:
Performing Arts, Spectator Sports and Related Industries
Museums, Historical Sites, and Similar Institutions
Amusement, Gambling, and Recreation Industries
Accommodation
Food Services and Drinking Places
The counties were filtered again to only display climate and weather dependent businesses.
Initial descriptive statistics deemed some sizes of these categories too small for analysis,
therefore existing categories were restructured and new ones created. According to NAICS
codes, Agriculture, Forestry, Fishing and Hunting are underneath one category. Therefore,
original responses for Fishing, Hunting and Trapping were grouped with crop production into an
Agriculture category. Establishments in this sector can include: farms, ranches, nurseries,
orchards or hatcheries (Bureau of Labor Statistics 2014). While charter boat fishermen are seen
as tour operators in a tourism context, in an agricultural context, they could be seen as hunters
and trappers or even farmers of a product should they participate in cultivation in nurseries and
hatcheries for livestock such as oyster beds. Outdoor Recreation was created by combining
12
original categories of recreational activities that are primarily outdoor-oriented: Amusement and
Recreation; RV Parks and Recreational Camps; Spectator Sports; Diving; Scenic and
Sightseeing; Transportation. Accommodations only saw an addition of travel arrangements and
reservations to its category. Park and Heritage was a newly created category that included state
park facilities and governmental funded organizations. The Other business sector included
mainly store retailers and event planning. Food services remained the same. The following
business types emerged:
Agriculture (i.e. charter boats, a pier)
Outdoor Recreation (i.e. golf clubs, campgrounds)
Accommodations (i.e. cottages, inns)
Food Services (i.e. chain and local restaurants, grills)
Parks and Heritage (i.e. historical gardens, state parks)
Other (i.e. bookstore, event planning)
3.3 Sampling Procedure
North Carolina Chamber of Commerce (COC) websites were visited to verify their
business directories with the database. Each business not found in a COC business directory was
Google searched to verify its existence. Each business website was visited to verify their contact
information in the database. Businesses were sent a message (Appendix B) containing
information about the study and the survey link though email, contact forms on websites and
Facebook. A total of 1,089 businesses were contacted with 186 businesses taking the survey.
Completed surveys amounted to 177 yielding a response rate of 16.3%.
13
3.4 Survey Design
The survey (Appendix C) possessed a variety of question types including: multiple
choice, single choice, graphics and open-ended questions. A flow-logic was installed to direct
respondents to certain lines of questions based on their indicated types and frequency of forecasts
used.
A pilot test list was created through an existing recipient list of a climate and weather
related product created out of the Center for Sustainable Tourism at East Carolina University.
Pilot test participants were NC tourism business owners/managers located outside of the study
area. Upon completion, respondents were asked about the quality of survey questions, question
answer choices, length of the survey and general comments they may have. Pilot survey
suggestions were considered and subsequent survey changes were made.
3.5 Survey Administration
The survey was administered online through Qualtrics and took an average of 8 minutes
to complete. Survey respondents were not allowed to answer questions twice and were forced to
respond to every question in order to move forward in the survey. Respondents were able to
close out the survey and return to complete it as many times as needed. At the end of the survey,
respondents were thanked for their time and given contact information for follow-up
opportunities.
3.6 Measurements
Independent variables measured in this study include: business type (Curtis et al. 2009),
business size (SBA 2013) and age of business. Dependent variables measured in this study
14
include: forecast value (Murphy 1993), the different ways forecasts (Klopper et al. 2006) and
other weather-related tools (Roncolli et al. 2009) are used, and business owners/managers’
perceived dependency on climate and weather. Frequencies were also examined for the
respondent’s position in the company, their sources of climate and weather information, and
education. Business type options within the survey are determined according to the North
American Industry Classification System (NAICS) and a study conducted by Roehl (1998, p.63).
The NAICS is a business classification system used by federal statistical agencies to collect,
analyze, and publish statistical data related to the U.S. business economy (U.S. Census Bureau
2013). Business type options include: crop production; breweries and wineries; fishing, hunting
and trapping; amusement and recreation; RV parks and recreational camps; spectator sports;
scenic and sightseeing transportation; store retailer; travel arrangements and reservations;
accommodations; food services and bars and “Other” with an option to write in their other
choice. Descriptive statistics revealed some of the original categories were not represented such
as wineries and breweries while other categories only had two or three businesses representing
them. Also, examination of forty-five text responses resulted in eighteen responses that did not
easily fit underneath existing business type categories. Therefore, the following new categories
were created or existing categories restructured: Agriculture (n = 23); Outdoor Recreation (n =
33); Accommodations (n = 41); Food Services (n = 53); Parks and Heritage (n = 14); Other (n =
13).
Respondents were asked in an open-ended question how many employees the company
has. Responses were converted to numerical values using a variety of methods. If the number of
employees was given as a range such as “8-10”, then the average value of that range was entered.
Some respondents differentiated between staff sizes in the on-season and the off-season. On-
15
season staff sizes were used because they contribute the most to the total yearly revenue of the
business. Some respondents specified the number of part-time and full-time employees. The sum
of both values was entered. If a number with a plus sign (“+”) or an approximate value such as
“50+” or “approximately 15 years” was given, the number plus one was entered (51 or 16).
Volunteers were not counted as employees. One respondent entered “none” because they are
family owned. However, even if the owner/s do not count themselves as an employee, their
family-owned distinction led to an assumption that at least two people from the family run the
business. The average U.S. family size of 2.58 according to the U.S. Census Bureau (2010) was
rounded up to 3 and entered. Rounding up accounted for the likelihood of a child of the owner/s
working in the family business and eventually taking it over. The numerical responses were
grouped in accordance with the business size standards of the United States Small Business
Administration. In the US a micro business has 1-6 employees, a small business has less than
250 employees, a medium sized business has less than 500 employees, a large business has less
than 1000 and an enterprise has greater than 1000 employees. However, only two respondents
were identified as a medium business and three as an enterprise. Thus, they were added to the
category of “small business” (7-1600 employees) to ensure the sample size for each level was
robust. The SBA prefers to use receipts to measure business size for industries with a high-
proportion of part-time or seasonal employment (such as tourism) because it “measures the value
of output of a business and can be easily verified by business tax returns and financial records”
(SBA 2013). However, these records would have been nearly impossible to collect in the given
time frame for data collection for the 1089 potential respondents contacted. Therefore, number of
employees seemed a justifiable measure for business size.
16
In an open-ended question, respondents were asked to enter the age of their business. If a
specific year was given, then the value was subtracted from 2014 and entered. Months were
converted to a percentage of a year. If a respondent differentiated between their number of years
in that business and their total years in that profession, the number of years in the profession was
used because their experiences in that profession will most likely impact the policies and
planning within the company. If a number with a plus sign (“+”) or an approximate value such as
“50+” or “approximately 15 years” was given, the number plus one was entered (51 or 16).
Qualtrics did not force five respondents to answer this question. Because these missing values
were random, the mean of non-missing scores was substituted for missing data (Thompson 2006,
p.50). The following four business age categories were subsequently created: Infant (0-2 years),
Adolescent (3-4 years), Middle-Aged (5-24 years), and Old (25 + years) (Robb 2002, p. 47)
While Robb (2002) identified infant as 1-2 years old, we included zero since some businesses
were less than a year old. However, only five respondents were identified as infant and eleven as
adolescent. In response, a larger category of “Young” (0-4 years) was created.
Value is measured by the ability of a tool, in this case climate and weather forecasts, to
help a business make financially beneficial decisions for their company. Value was measured
two different ways. First, respondents were asked to rate the forecast types that they indicated
they use individually in likert-scale from one to five with one being the least valuable, thus
giving the respondents a scored value for each type of temporal scale forecast used. The value
for each type of forecast was used within the MANOVA analysis. Second, respondents were
asked to rank the five forecast types against each other based on each forecast type’s realized or
potential value in a likert-scale from one to five with one being the least valuable. Frequencies
were reported for this measure of value. Besides asking the reason for non-use of a forecast, the
17
flow logic of the survey only directed respondents to questions relating to forecasts they used
resulting in missing value scores of unused forecasts. Therefore, the lowest value of 1 was
assigned to missing value scores since this is the most likely value the respondent would have
given to the unused forecasts if asked.
Respondents were asked what temporal forecast scale they used. An image for each type
of forecast was provided including: an Hourly forecast on a smartphone, a Daily forecast from
weatherchannel.com, a Weekly forecast from a local TV news station weather report, a Monthly
forecast from NOAA’s monthly outlooks, and a Seasonal forecast from an independent source
(Appendix C). For each forecast a respondent indicated that they used in the beginning of the
survey, they were asked to check all the following ways they used that type of forecast:
Operational Decision-Making, Risk Assessment, Marketing, Investment Decisions,
Sustainability Practices, Landscaping and Finance and Budgeting (Klopper et al. 2006). The
following examples were given to respondents as how these uses are implemented: Operational
Decision-Making, such as staffing; Risk Assessment, such as staff and customer safety;
Marketing, such as promoting attractive or appealing climate; Investment Decisions, such as
buying new property or equipment; Sustainability Practices, such as energy conservation;
Landscaping, such as deciding what types of vegetation to plant around your business; Finance
and Budgeting, such as predicting profit returns or cash flow (Appendix C). A respondent could
select up to seven uses of a forecast with the total number of uses resulting in a ”usefulness”
score for each forecast, which was used in the comparison analyses. Frequencies were reported
for each way a forecast was used.
Respondents were asked to indicate their perceived dependency of their business on
climate and weather on a likert-scale from one to five with the following values: one being not
18
dependent, two being somewhat dependent, three being not sure, four being dependent, and five
being very dependent.
Education level of end-user was measured with the following options: less than high
school, high school or GED, 2-year college/ technical school, some college but not degree, 4-
year college and post graduate.
In an open-ended question, respondents were asked their position in the company. Three
main category types were extracted from the text including “Owner”, “Manager” and “Support
Specialist”. Responses comprising the Owner category included: owner, captain, CEO, CFO, co-
owner partner, president and V.P. Responses comprising the Manager category included:
manager coordinator, director, dock master, and superintendent. Responses comprising the
Support Specialist category included: accounting assistant, support specialist, innkeeper,
reservationist, and sales person.
4. Results
4.1 Recruitment
Potential respondents were contacted a total of five times to take the survey the second week of
each month if they had not taken or finished the survey. Contact dates include: September 2013,
October 2013, November 2013, January 2014, and a couple of days before the survey closed at
the end of January. Due to the vacation patterns of business owners and managers in the area as
well as the winter holidays, respondents were not contacted in December.
4.2 Analysis
19
4.2.1 Descriptives
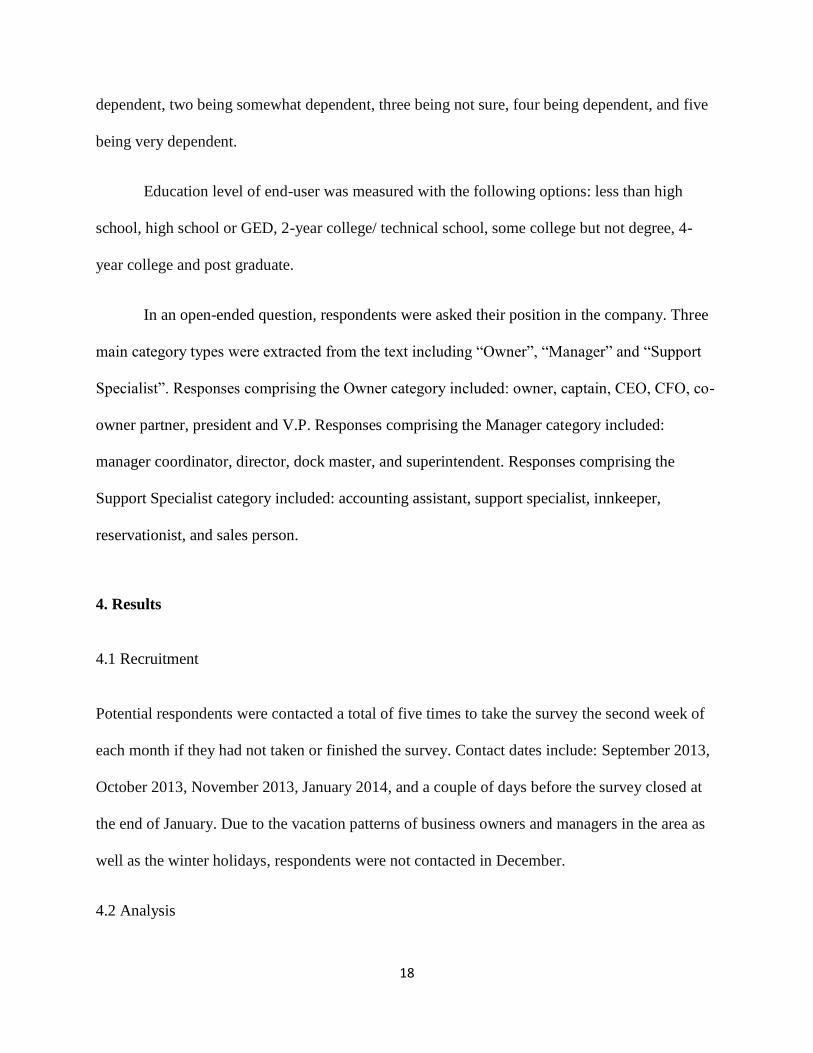
Respondent Position
Respondents were represented by the following three categories: 55% Owners, 40% Managers
and 5% Support Specialists (M = 1.5). Business owners were the most common type of
respondent (Figure 2).
Figure 2: Position of all respondents in their represented business
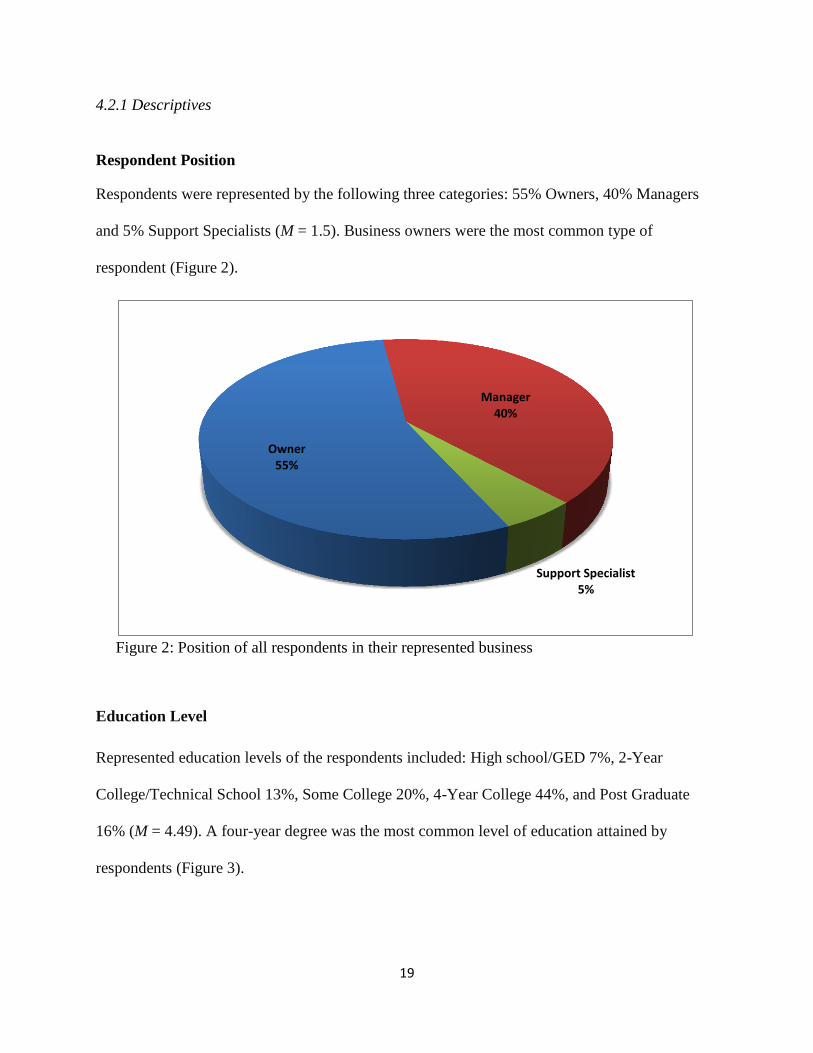
Education Level
Represented education levels of the respondents included: High school/GED 7%, 2-Year
College/Technical School 13%, Some College 20%, 4-Year College 44%, and Post Graduate
16% (M = 4.49). A four-year degree was the most common level of education attained by
respondents (Figure 3).
Owner 55%
Manager 40%
Support Specialist 5%
20
Figure 3: Education Level of all respondents
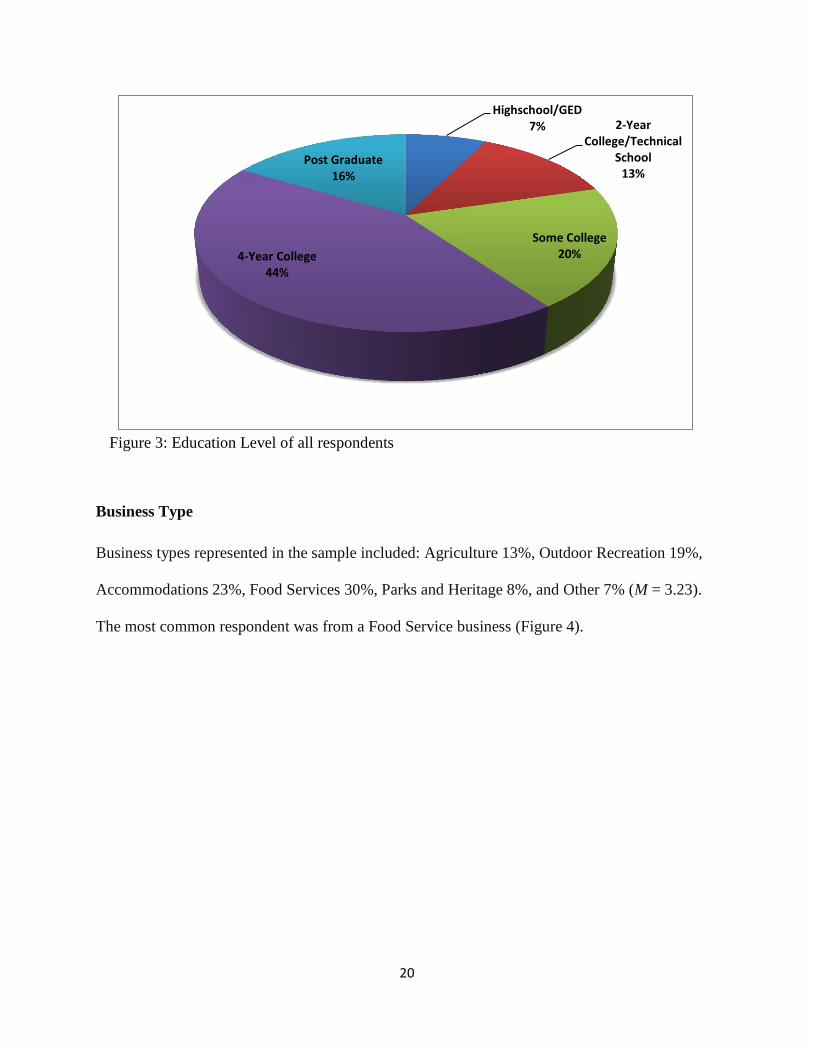
Business Type
Business types represented in the sample included: Agriculture 13%, Outdoor Recreation 19%,
Accommodations 23%, Food Services 30%, Parks and Heritage 8%, and Other 7% (M = 3.23).
The most common respondent was from a Food Service business (Figure 4).
Highschool/GED 7% 2-Year
College/Technical School
13%
Some College 20% 4-Year College
44%
Post Graduate 16%
21
Figure 4: Business Types represented by all respondents
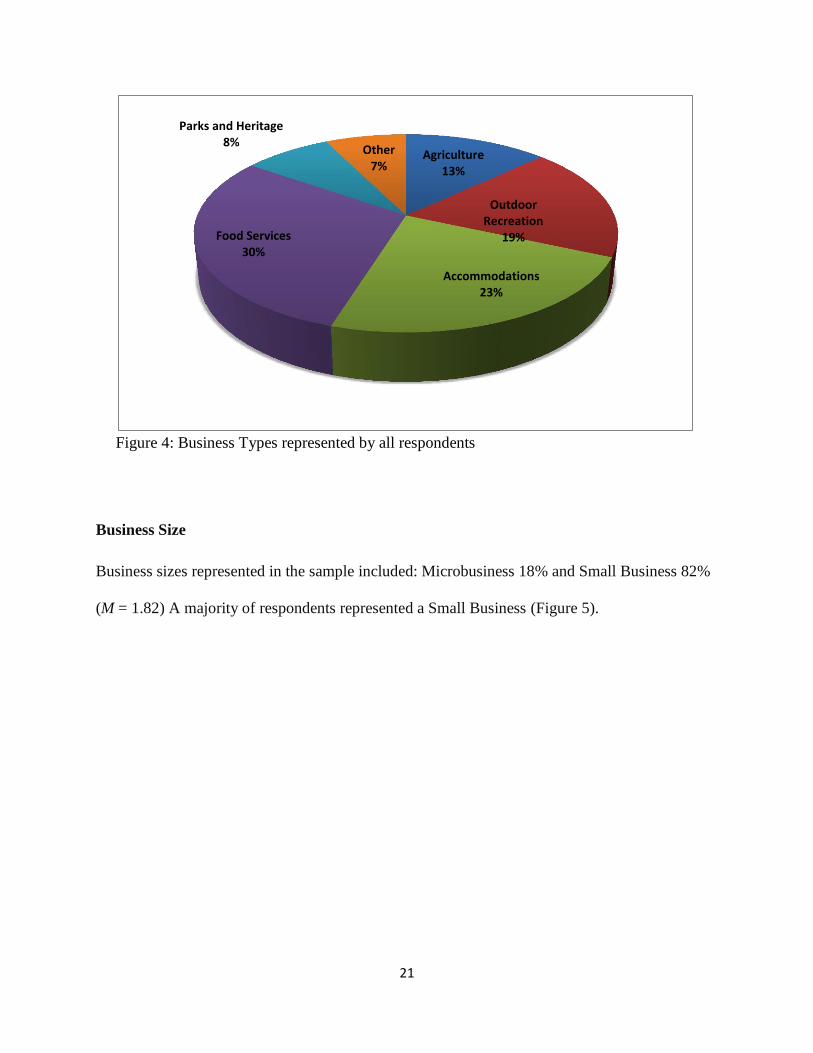
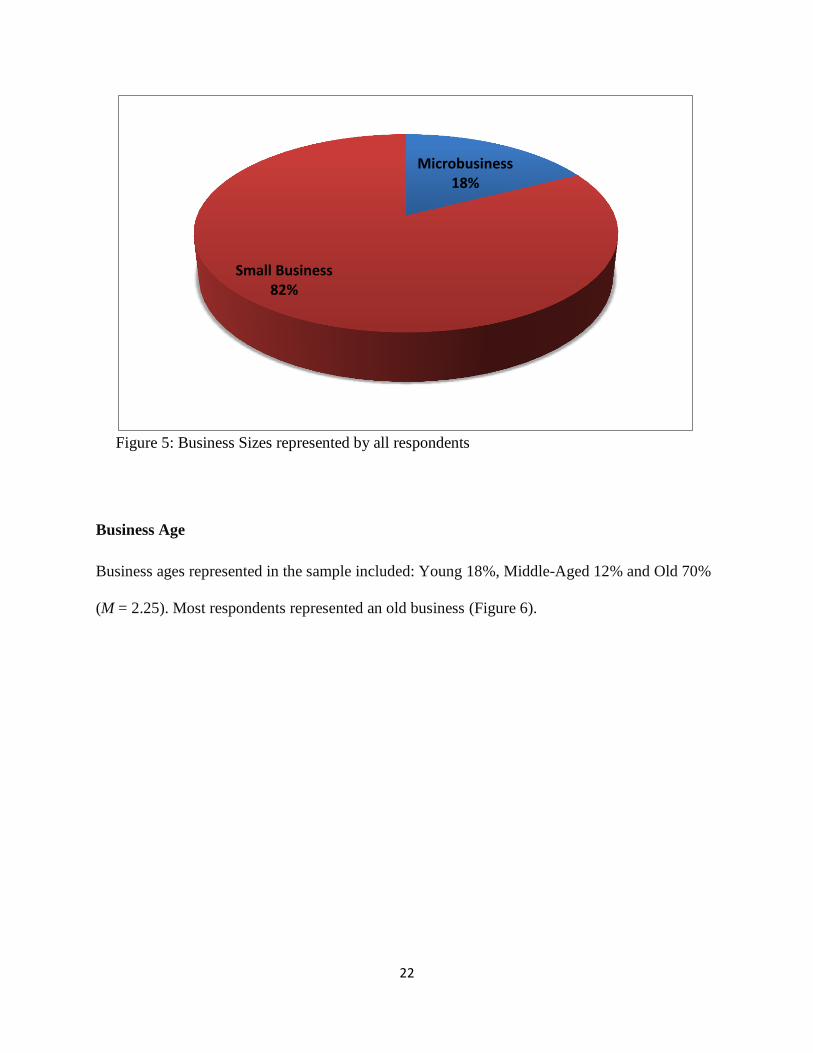
Business Size
Business sizes represented in the sample included: Microbusiness 18% and Small Business 82%
(M = 1.82) A majority of respondents represented a Small Business (Figure 5).
Agriculture 13%
Outdoor Recreation
19%
Accommodations 23%
Food Services 30%
Parks and Heritage 8%
Other 7%
22
Figure 5: Business Sizes represented by all respondents
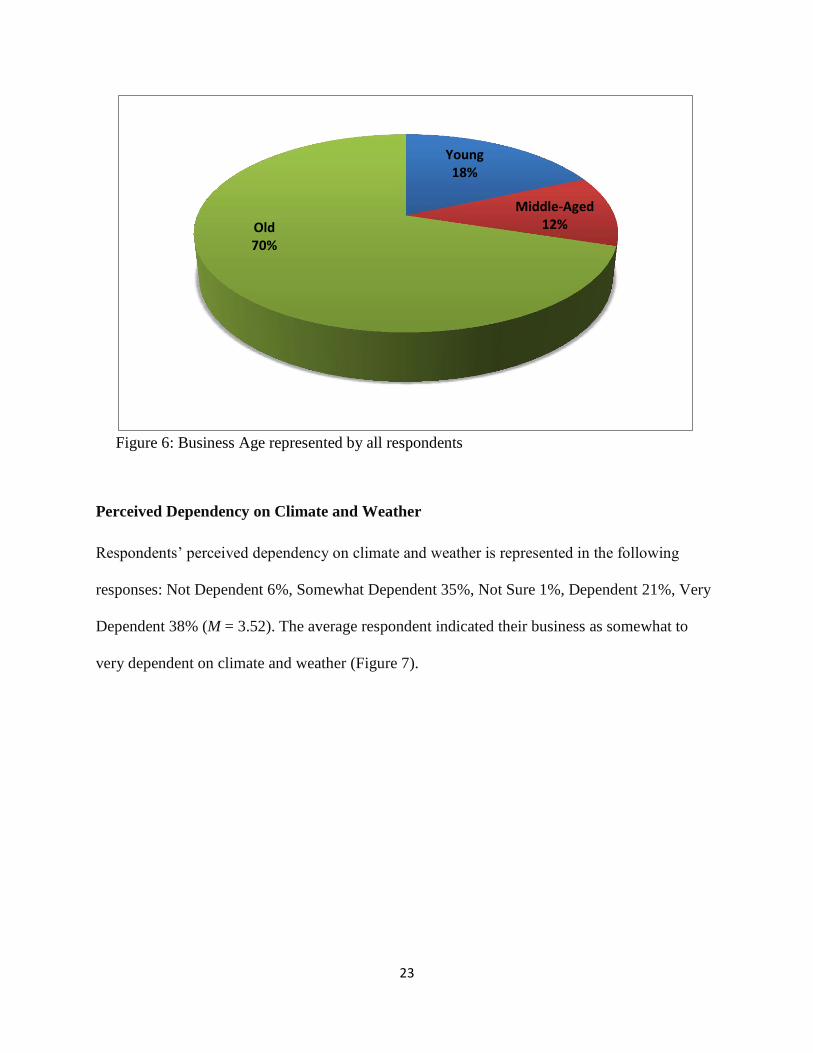
Business Age
Business ages represented in the sample included: Young 18%, Middle-Aged 12% and Old 70%
(M = 2.25). Most respondents represented an old business (Figure 6).
Microbusiness 18%
Small Business 82%
23
Figure 6: Business Age represented by all respondents
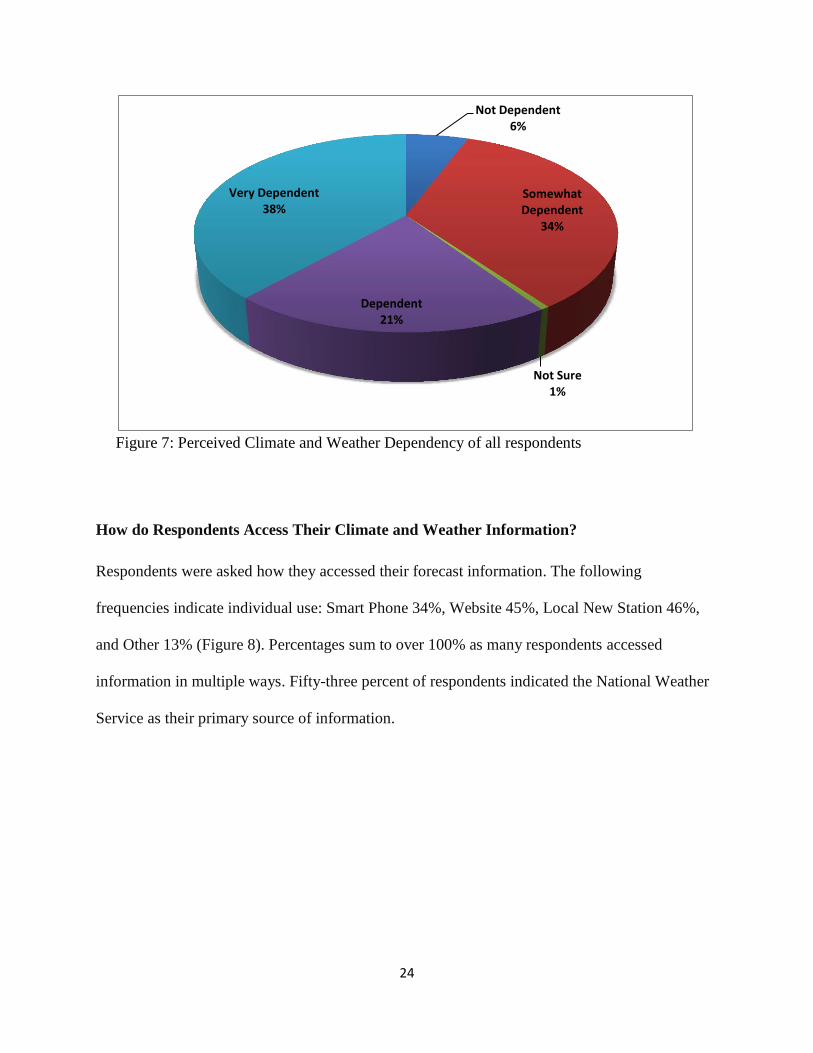
Perceived Dependency on Climate and Weather
Respondents’ perceived dependency on climate and weather is represented in the following
responses: Not Dependent 6%, Somewhat Dependent 35%, Not Sure 1%, Dependent 21%, Very
Dependent 38% (M = 3.52). The average respondent indicated their business as somewhat to
very dependent on climate and weather (Figure 7).
Young 18%
Middle-Aged 12% Old
70%
24
Figure 7: Perceived Climate and Weather Dependency of all respondents
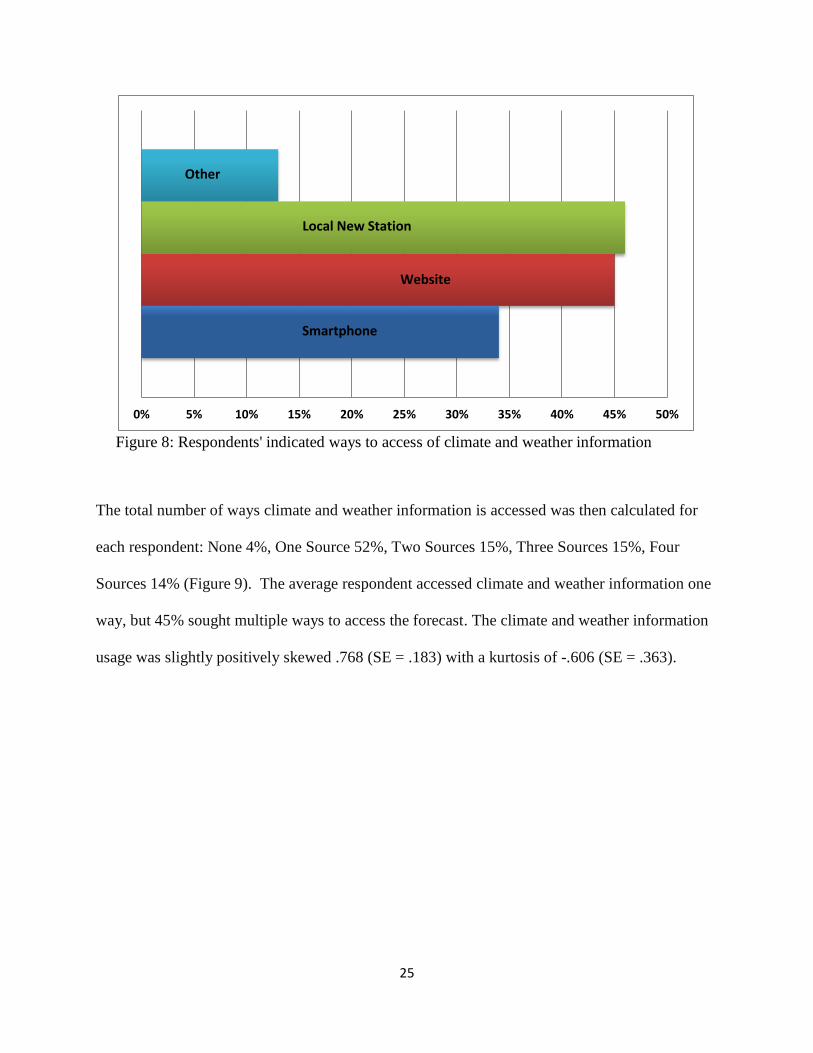
How do Respondents Access Their Climate and Weather Information?
Respondents were asked how they accessed their forecast information. The following
frequencies indicate individual use: Smart Phone 34%, Website 45%, Local New Station 46%,
and Other 13% (Figure 8). Percentages sum to over 100% as many respondents accessed
information in multiple ways. Fifty-three percent of respondents indicated the National Weather
Service as their primary source of information.
Not Dependent 6%
Somewhat Dependent
34%
Not Sure 1%
Dependent 21%
Very Dependent 38%
25
Figure 8: Respondents' indicated ways to access of climate and weather information
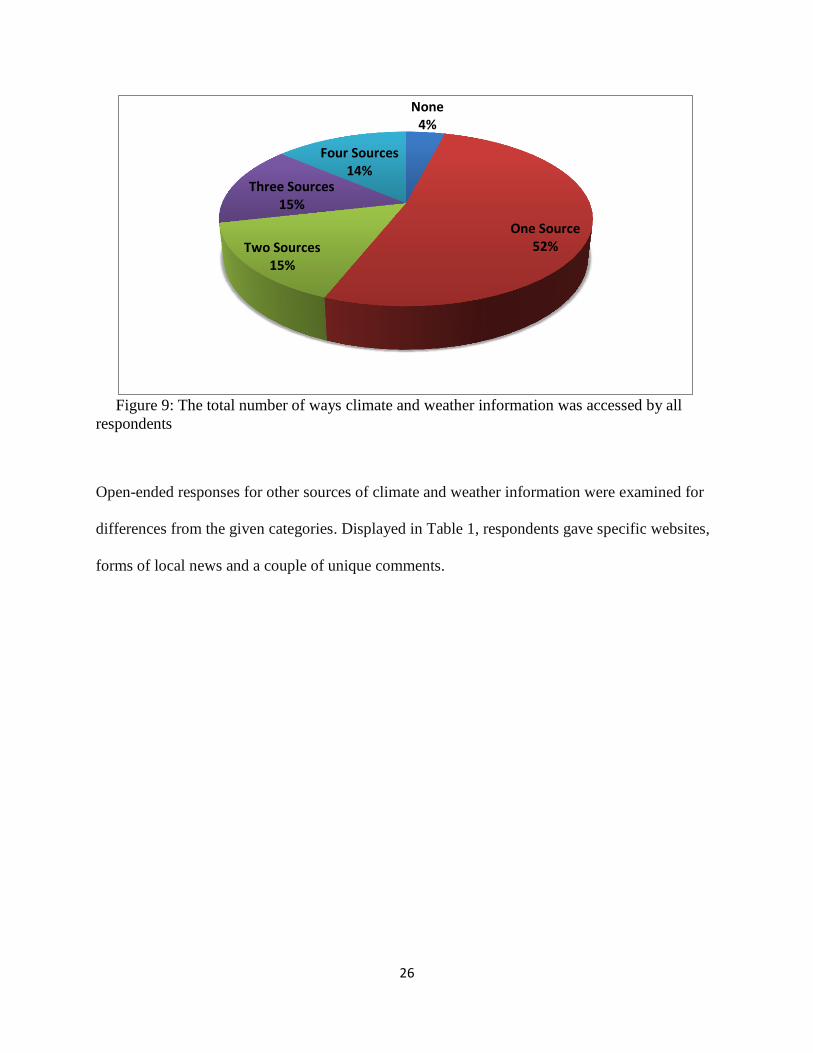
The total number of ways climate and weather information is accessed was then calculated for
each respondent: None 4%, One Source 52%, Two Sources 15%, Three Sources 15%, Four
Sources 14% (Figure 9). The average respondent accessed climate and weather information one
way, but 45% sought multiple ways to access the forecast. The climate and weather information
usage was slightly positively skewed .768 (SE = .183) with a kurtosis of -.606 (SE = .363).
Smartphone
Website
Other
0% 5% 10% 15% 20% 25% 30% 35% 40% 45% 50%
Local New Station
26
Figure 9: The total number of ways climate and weather information was accessed by all
respondents
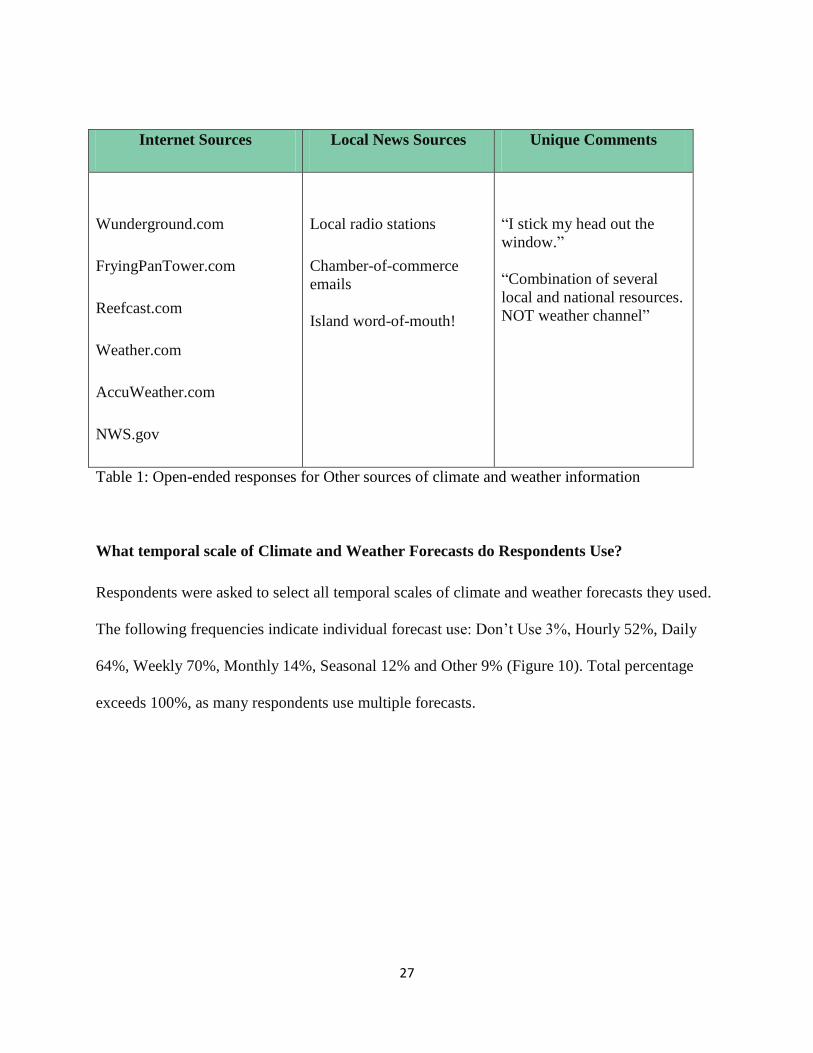
Open-ended responses for other sources of climate and weather information were examined for
differences from the given categories. Displayed in Table 1, respondents gave specific websites,
forms of local news and a couple of unique comments.
None 4%
One Source 52% Two Sources
15%
Three Sources 15%
Four Sources 14%
27
Internet Sources Local News Sources Unique Comments
Wunderground.com
FryingPanTower.com
Reefcast.com
Weather.com
AccuWeather.com
NWS.gov
Local radio stations
Chamber-of-commerce
emails
Island word-of-mouth!
“I stick my head out the
window.”
“Combination of several
local and national resources.
NOT weather channel”
Table 1: Open-ended responses for Other sources of climate and weather information
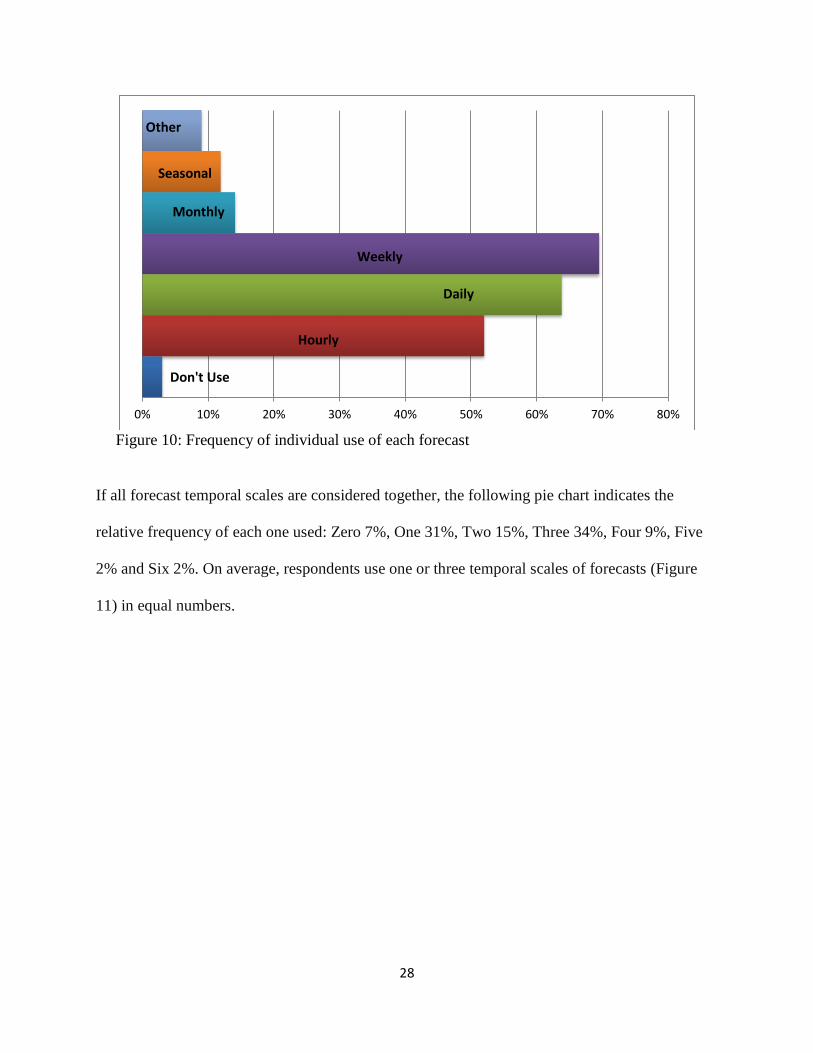
What temporal scale of Climate and Weather Forecasts do Respondents Use?
Respondents were asked to select all temporal scales of climate and weather forecasts they used.
The following frequencies indicate individual forecast use: Don’t Use 3%, Hourly 52%, Daily
64%, Weekly 70%, Monthly 14%, Seasonal 12% and Other 9% (Figure 10). Total percentage
exceeds 100%, as many respondents use multiple forecasts.
28
Figure 10: Frequency of individual use of each forecast
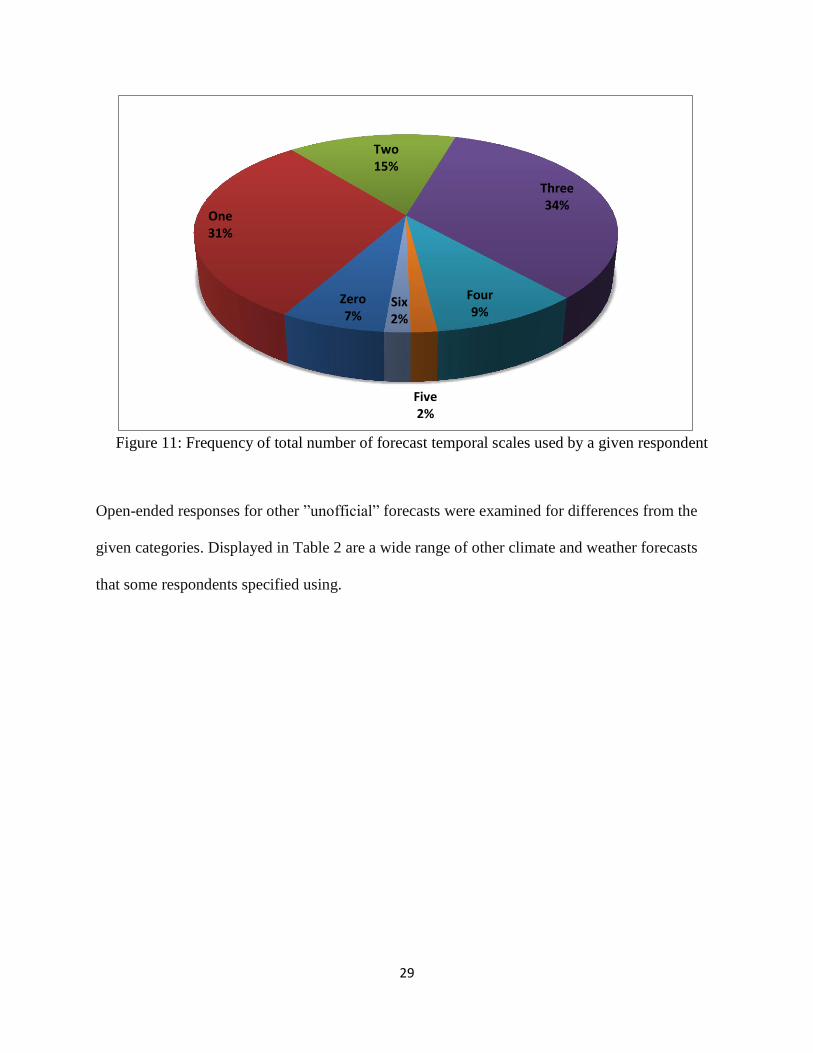
If all forecast temporal scales are considered together, the following pie chart indicates the
relative frequency of each one used: Zero 7%, One 31%, Two 15%, Three 34%, Four 9%, Five
2% and Six 2%. On average, respondents use one or three temporal scales of forecasts (Figure
11) in equal numbers.
Don't Use
Hourly
Daily
Weekly
Monthly
Seasonal
Other
0% 10% 20% 30% 40% 50% 60% 70% 80%
29
Figure 11: Frequency of total number of forecast temporal scales used by a given respondent
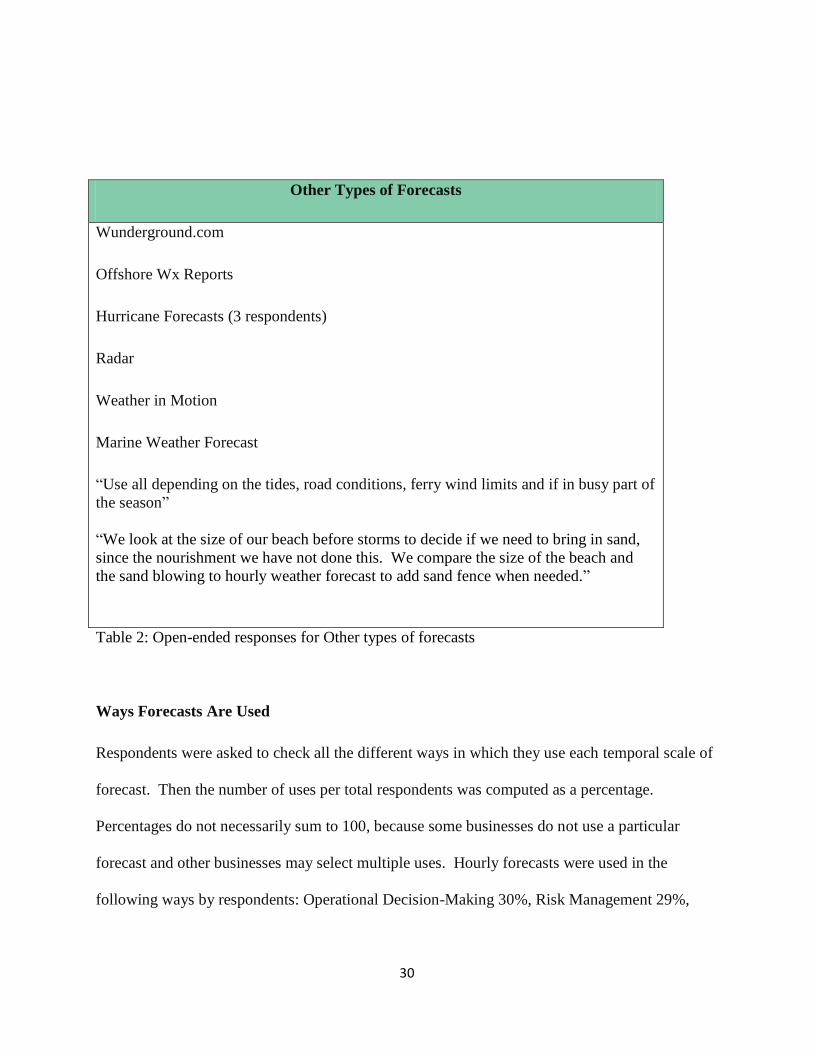
Open-ended responses for other ”unofficial” forecasts were examined for differences from the
given categories. Displayed in Table 2 are a wide range of other climate and weather forecasts
that some respondents specified using.
Zero 7%
One 31%
Two 15%
Three 34%
Four 9%
Five 2%
Six 2%
30
Other Types of Forecasts
Wunderground.com
Offshore Wx Reports
Hurricane Forecasts (3 respondents)
Radar
Weather in Motion
Marine Weather Forecast
“Use all depending on the tides, road conditions, ferry wind limits and if in busy part of
the season”
“We look at the size of our beach before storms to decide if we need to bring in sand,
since the nourishment we have not done this. We compare the size of the beach and
the sand blowing to hourly weather forecast to add sand fence when needed.”
Table 2: Open-ended responses for Other types of forecasts
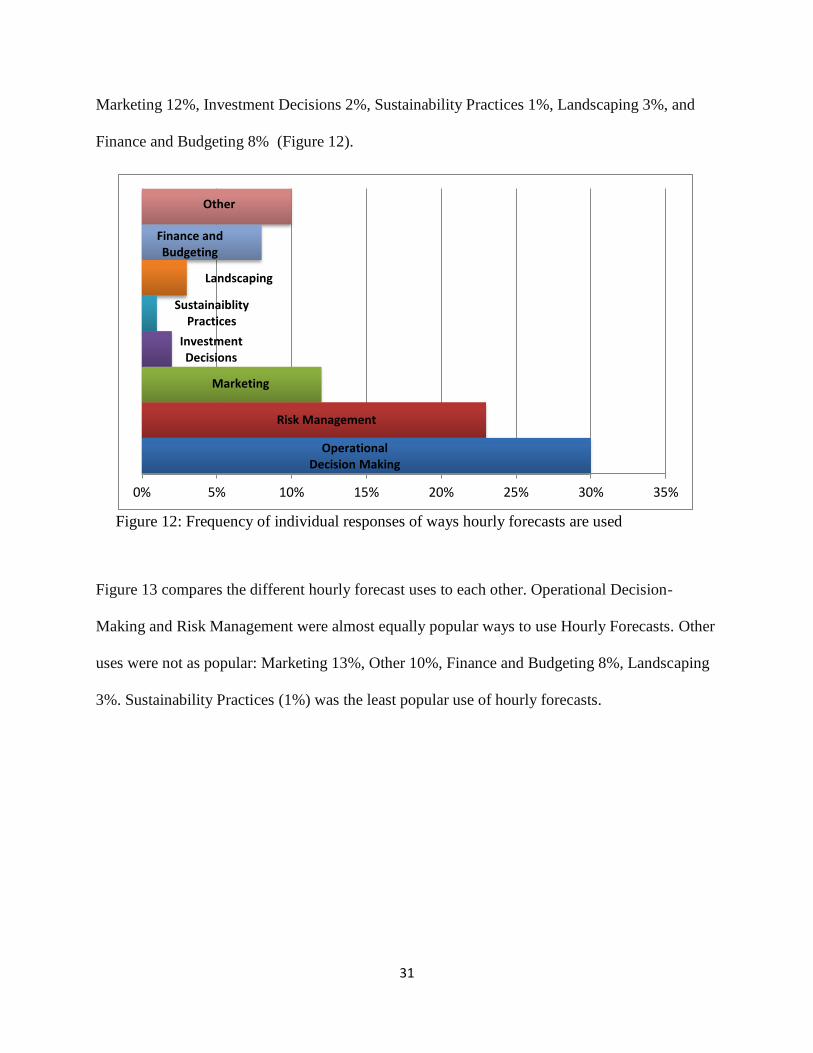
Ways Forecasts Are Used
Respondents were asked to check all the different ways in which they use each temporal scale of
forecast. Then the number of uses per total respondents was computed as a percentage.
Percentages do not necessarily sum to 100, because some businesses do not use a particular
forecast and other businesses may select multiple uses. Hourly forecasts were used in the
following ways by respondents: Operational Decision-Making 30%, Risk Management 29%,
31
Marketing 12%, Investment Decisions 2%, Sustainability Practices 1%, Landscaping 3%, and
Finance and Budgeting 8% (Figure 12).
Figure 12: Frequency of individual responses of ways hourly forecasts are used
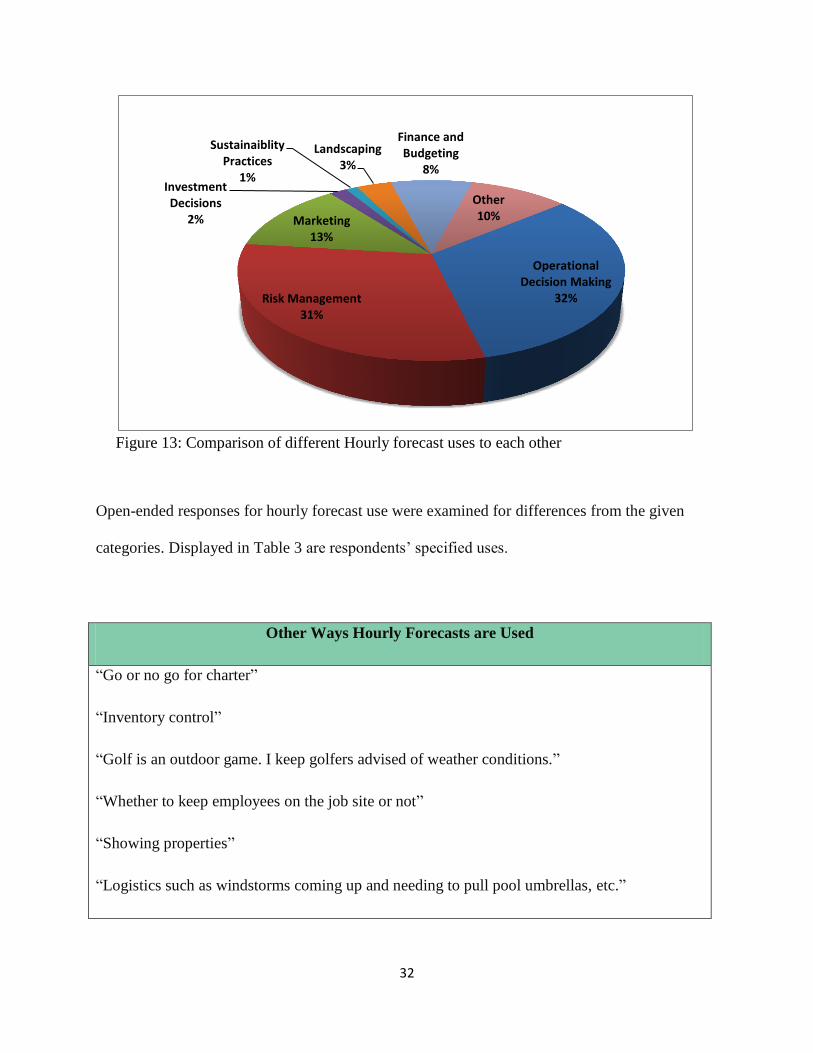
Figure 13 compares the different hourly forecast uses to each other. Operational Decision-
Making and Risk Management were almost equally popular ways to use Hourly Forecasts. Other
uses were not as popular: Marketing 13%, Other 10%, Finance and Budgeting 8%, Landscaping
3%. Sustainability Practices (1%) was the least popular use of hourly forecasts.
Operational Decision Making
Risk Management
Marketing
Investment Decisions
Sustainaiblity Practices
Landscaping
Finance and Budgeting
Other
0% 5% 10% 15% 20% 25% 30% 35%
32
Figure 13: Comparison of different Hourly forecast uses to each other
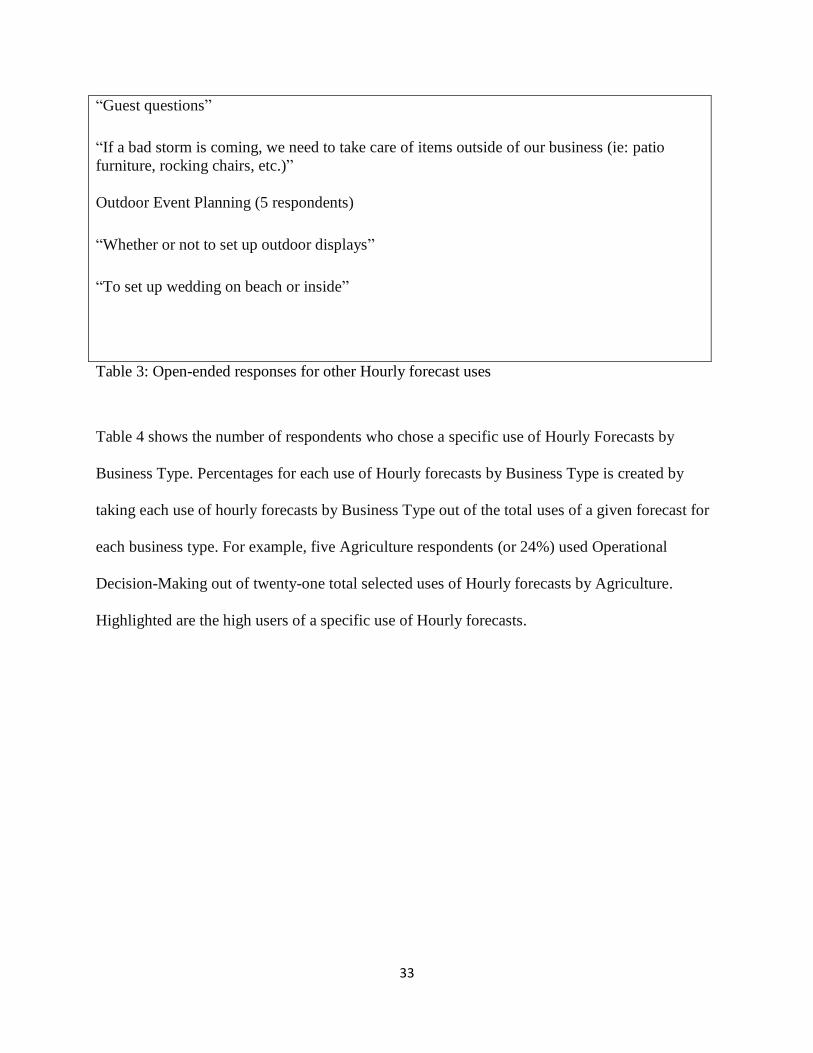
Open-ended responses for hourly forecast use were examined for differences from the given
categories. Displayed in Table 3 are respondents’ specified uses.
Other Ways Hourly Forecasts are Used
“Go or no go for charter”
“Inventory control”
“Golf is an outdoor game. I keep golfers advised of weather conditions.”
“Whether to keep employees on the job site or not”
“Showing properties”
“Logistics such as windstorms coming up and needing to pull pool umbrellas, etc.”
Operational Decision Making
32% Risk Management 31%
Marketing 13%
Investment Decisions
2%
Sustainaiblity Practices
1%
Landscaping 3%
Finance and Budgeting
8%
Other 10%
33
“Guest questions”
“If a bad storm is coming, we need to take care of items outside of our business (ie: patio
furniture, rocking chairs, etc.)”
Outdoor Event Planning (5 respondents)
“Whether or not to set up outdoor displays”
“To set up wedding on beach or inside”
Table 3: Open-ended responses for other Hourly forecast uses
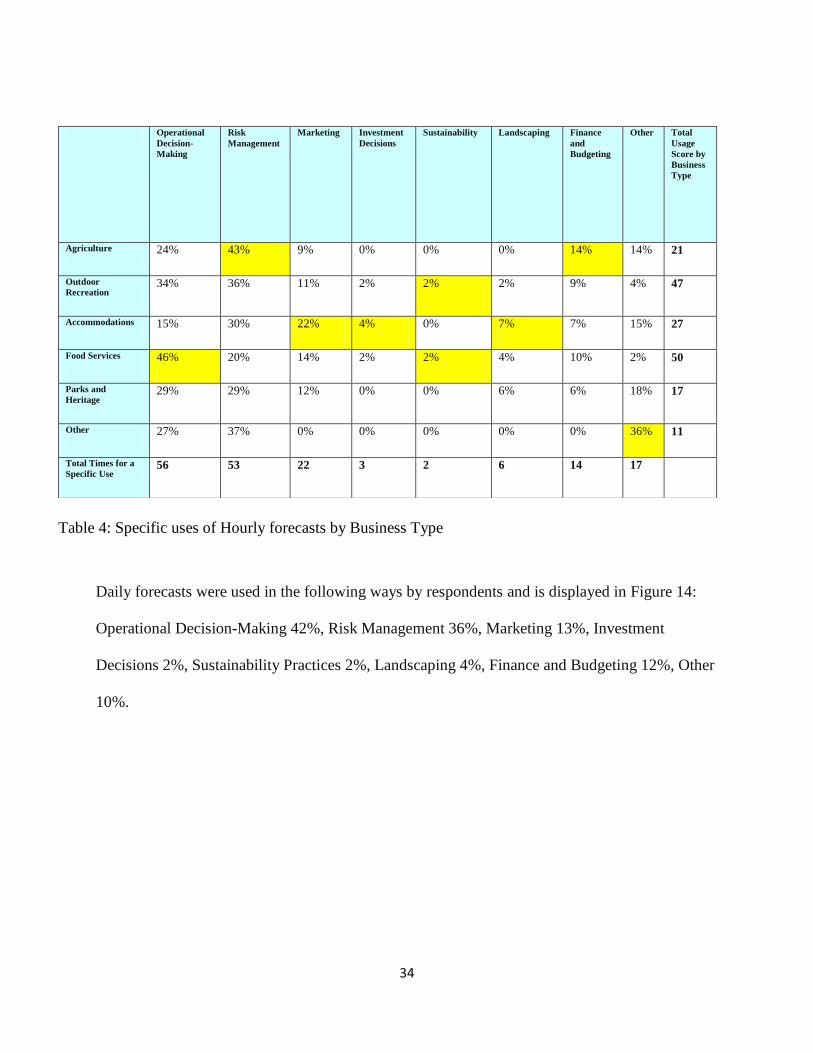
Table 4 shows the number of respondents who chose a specific use of Hourly Forecasts by
Business Type. Percentages for each use of Hourly forecasts by Business Type is created by
taking each use of hourly forecasts by Business Type out of the total uses of a given forecast for
each business type. For example, five Agriculture respondents (or 24%) used Operational
Decision-Making out of twenty-one total selected uses of Hourly forecasts by Agriculture.
Highlighted are the high users of a specific use of Hourly forecasts.
34
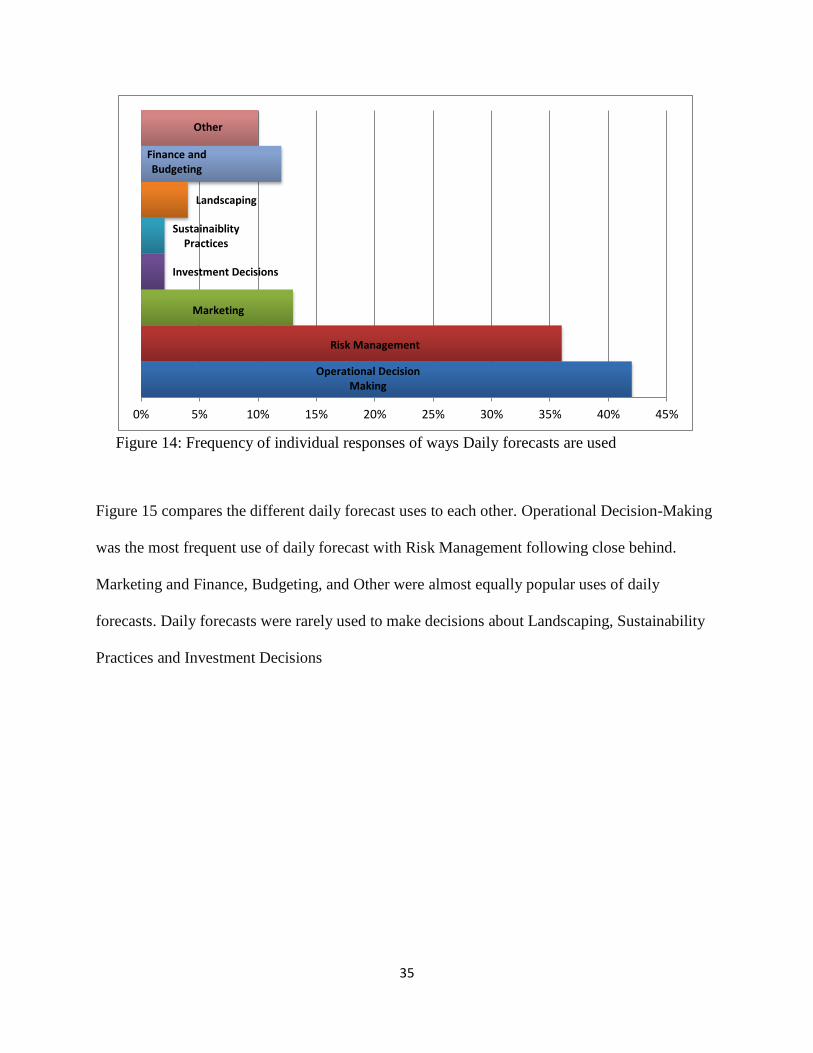
Daily forecasts were used in the following ways by respondents and is displayed in Figure 14:
Operational Decision-Making 42%, Risk Management 36%, Marketing 13%, Investment
Decisions 2%, Sustainability Practices 2%, Landscaping 4%, Finance and Budgeting 12%, Other
10%.
Operational
Decision-
Making
Risk
Management
Marketing Investment
Decisions
Sustainability Landscaping Finance
and
Budgeting
Other Total
Usage
Score by
Business
Type
Agriculture 24% 43% 9% 0% 0% 0% 14% 14% 21
Outdoor
Recreation 34% 36% 11% 2% 2% 2% 9% 4% 47
Accommodations 15% 30% 22% 4% 0% 7% 7% 15% 27
Food Services 46% 20% 14% 2% 2% 4% 10% 2% 50
Parks and
Heritage 29% 29% 12% 0% 0% 6% 6% 18% 17
Other 27% 37% 0% 0% 0% 0% 0% 36% 11
Total Times for a
Specific Use 56 53 22 3 2 6 14 17
Table 4: Specific uses of Hourly forecasts by Business Type
35
Figure 14: Frequency of individual responses of ways Daily forecasts are used
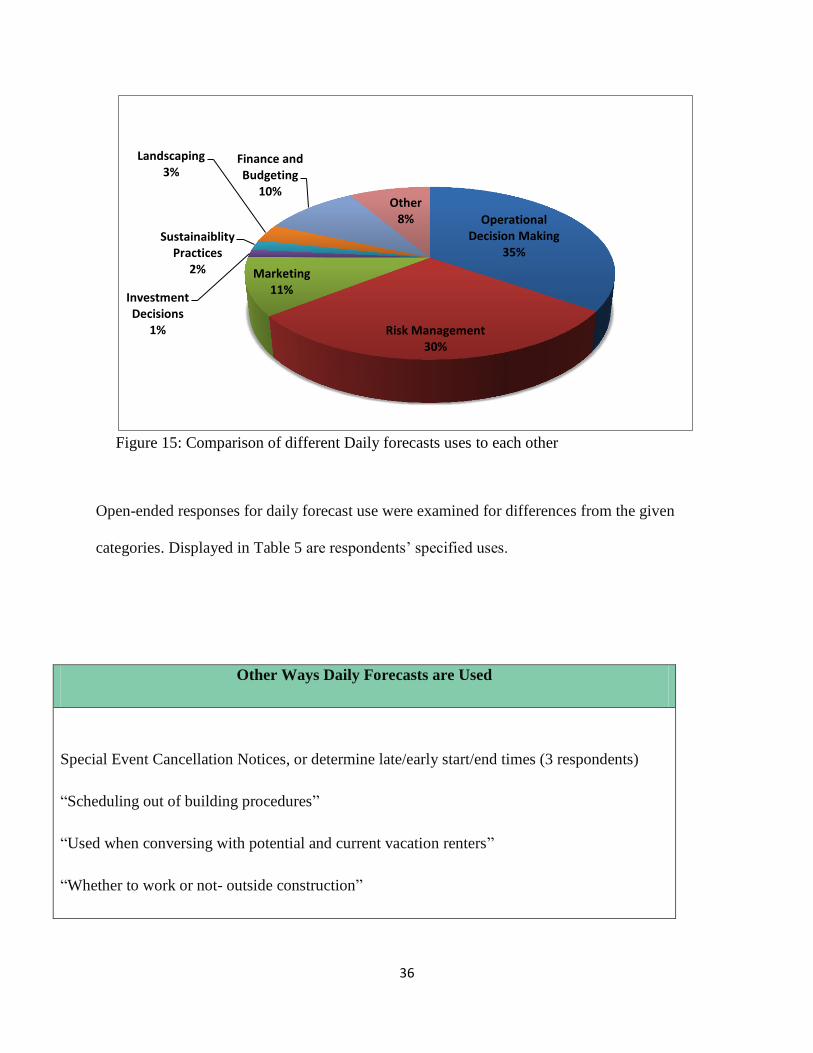
Figure 15 compares the different daily forecast uses to each other. Operational Decision-Making
was the most frequent use of daily forecast with Risk Management following close behind.
Marketing and Finance, Budgeting, and Other were almost equally popular uses of daily
forecasts. Daily forecasts were rarely used to make decisions about Landscaping, Sustainability
Practices and Investment Decisions
Operational Decision Making
Risk Management
Marketing
Investment Decisions
Sustainaiblity Practices
Landscaping
Finance and Budgeting
Other
0% 5% 10% 15% 20% 25% 30% 35% 40% 45%
36
Figure 15: Comparison of different Daily forecasts uses to each other
Open-ended responses for daily forecast use were examined for differences from the given
categories. Displayed in Table 5 are respondents’ specified uses.
Other Ways Daily Forecasts are Used
Special Event Cancellation Notices, or determine late/early start/end times (3 respondents)
“Scheduling out of building procedures”
“Used when conversing with potential and current vacation renters”
“Whether to work or not- outside construction”
Operational Decision Making
35%
Risk Management 30%
Marketing 11%
Investment Decisions
1%
Sustainaiblity Practices
2%
Landscaping 3%
Finance and Budgeting
10% Other
8%
37
“Number of walk-ins”
“people eat rain or shine”
“Menu choices, quantity of prep”
“Outside dining”
“Outdoor entertainment”
“State Park”
“Educational programs / field trips”
“Whether or not to set up outdoor displays”
Table 5: Open-ended responses for other Daily forecast uses
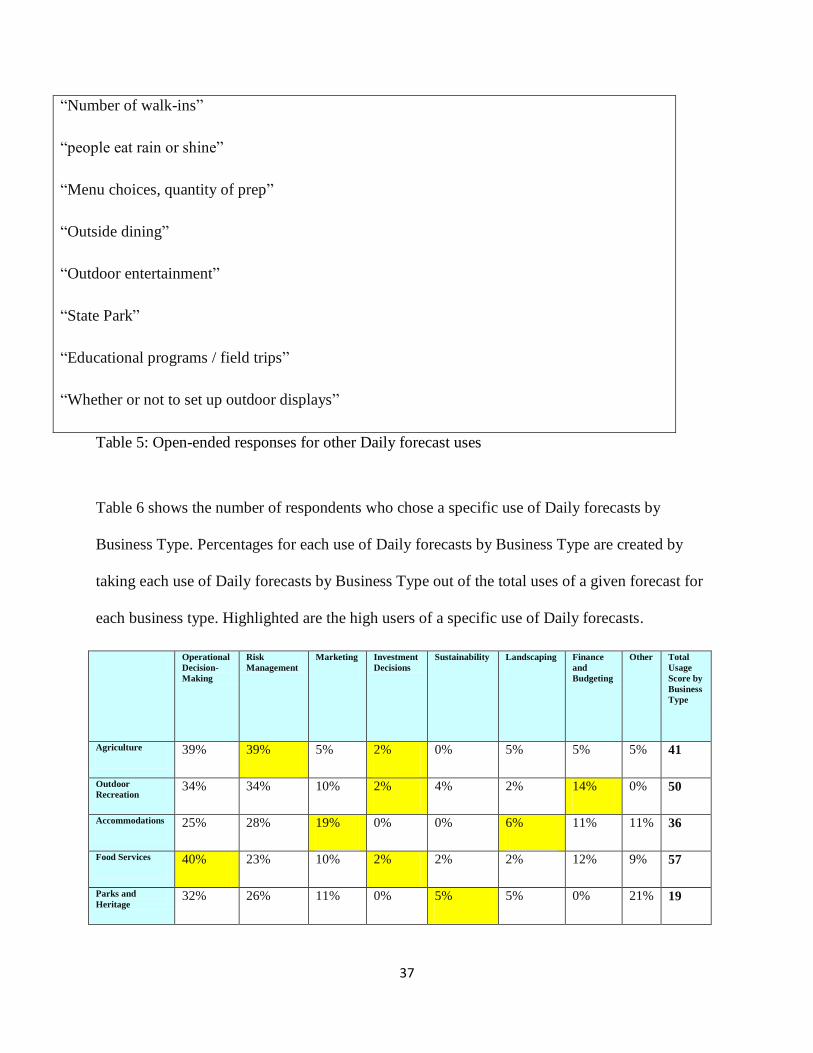
Table 6 shows the number of respondents who chose a specific use of Daily forecasts by
Business Type. Percentages for each use of Daily forecasts by Business Type are created by
taking each use of Daily forecasts by Business Type out of the total uses of a given forecast for
each business type. Highlighted are the high users of a specific use of Daily forecasts.
Operational
Decision-
Making
Risk
Management
Marketing Investment
Decisions
Sustainability Landscaping Finance
and
Budgeting
Other Total
Usage
Score by
Business
Type
Agriculture 39% 39% 5% 2% 0% 5% 5% 5% 41
Outdoor
Recreation 34% 34% 10% 2% 4% 2% 14% 0% 50
Accommodations 25% 28% 19% 0% 0% 6% 11% 11% 36
Food Services 40% 23% 10% 2% 2% 2% 12% 9% 57
Parks and
Heritage 32% 26% 11% 0% 5% 5% 0% 21% 19
38
Other 30% 20% 10% 0% 0% 0% 10% 30% 10
Total Times for a
Specific Uses 74 63 23 3 4 7 21 18
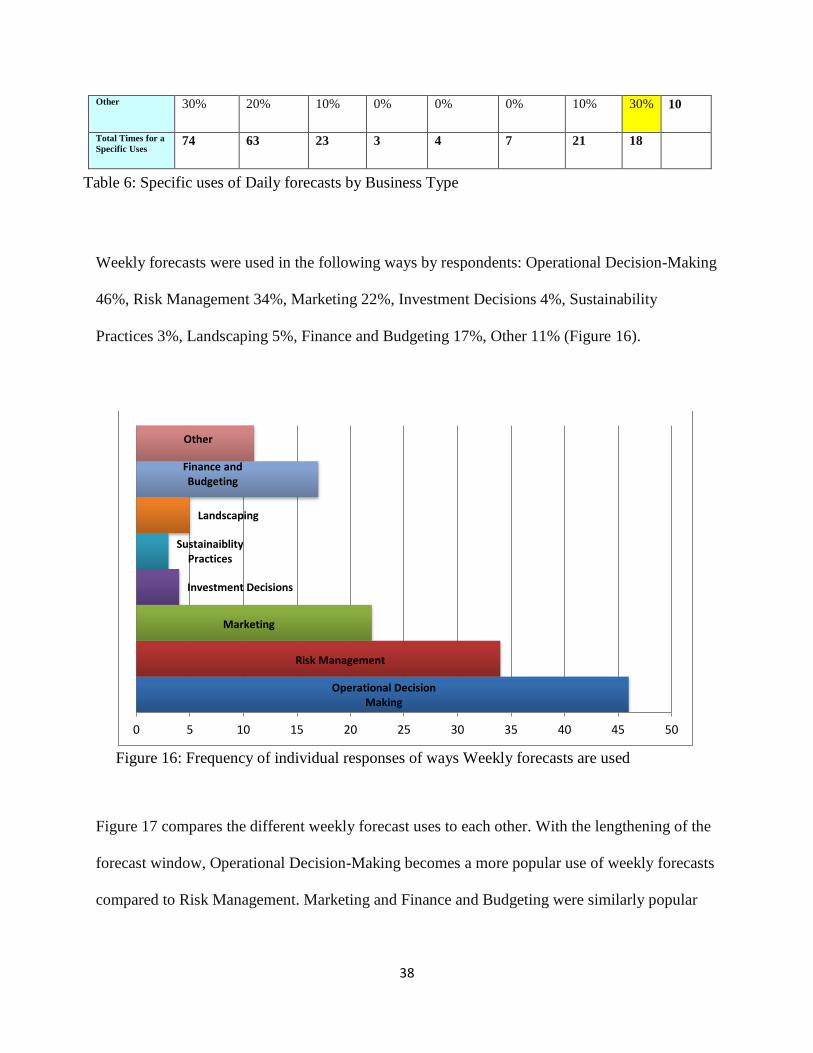
Weekly forecasts were used in the following ways by respondents: Operational Decision-Making
46%, Risk Management 34%, Marketing 22%, Investment Decisions 4%, Sustainability
Practices 3%, Landscaping 5%, Finance and Budgeting 17%, Other 11% (Figure 16).
Figure 16: Frequency of individual responses of ways Weekly forecasts are used
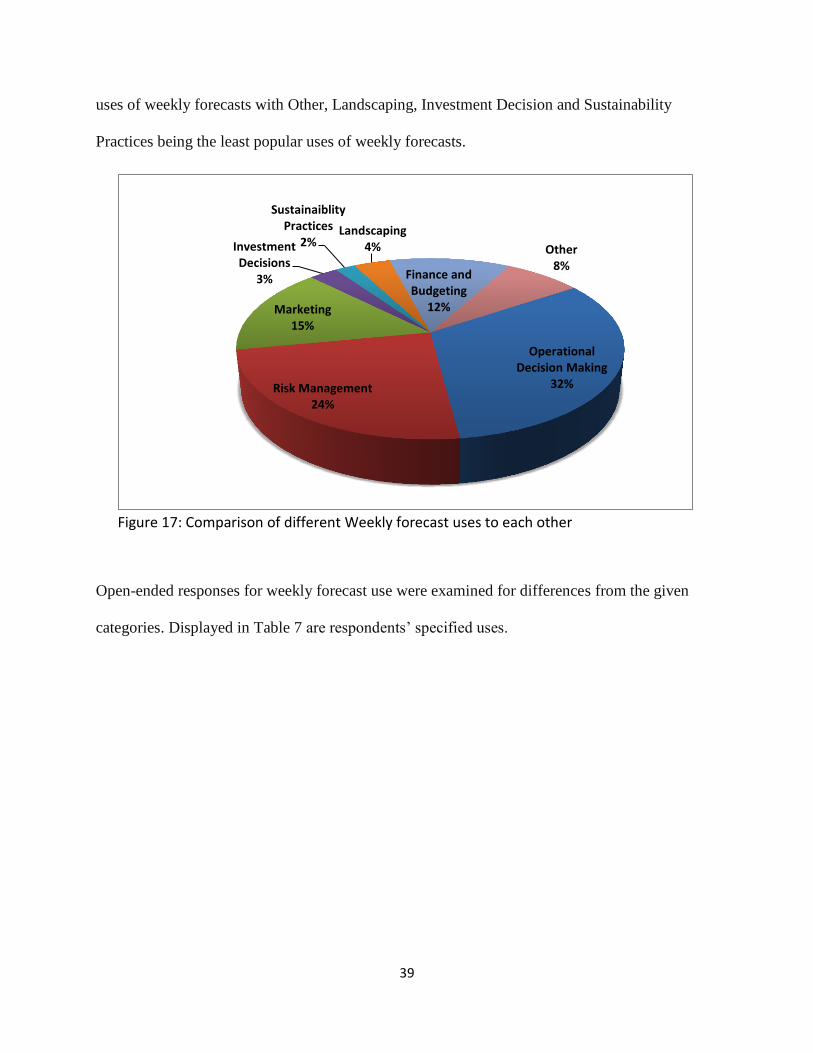
Figure 17 compares the different weekly forecast uses to each other. With the lengthening of the
forecast window, Operational Decision-Making becomes a more popular use of weekly forecasts
compared to Risk Management. Marketing and Finance and Budgeting were similarly popular
Operational Decision Making
Risk Management
Marketing
Investment Decisions
Sustainaiblity Practices
Landscaping
Finance and Budgeting
Other
0 5 10 15 20 25 30 35 40 45 50
Table 6: Specific uses of Daily forecasts by Business Type
39
uses of weekly forecasts with Other, Landscaping, Investment Decision and Sustainability
Practices being the least popular uses of weekly forecasts.
Figure 17: Comparison of different Weekly forecast uses to each other
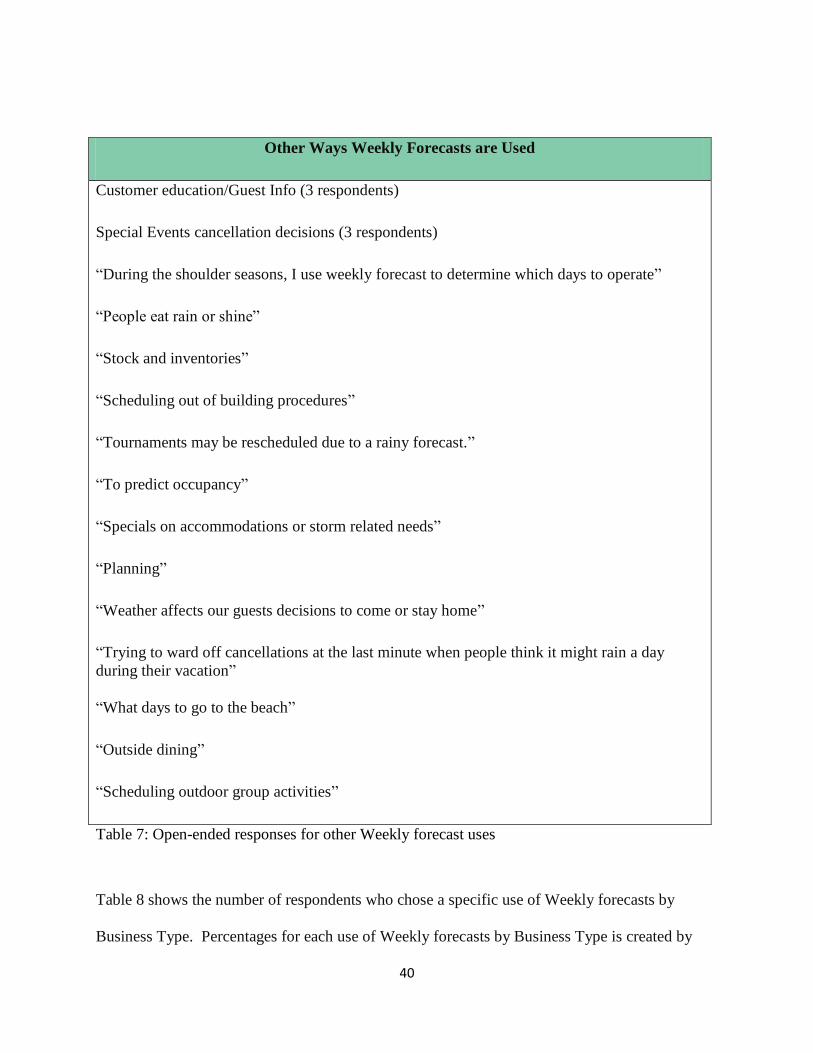
Open-ended responses for weekly forecast use were examined for differences from the given
categories. Displayed in Table 7 are respondents’ specified uses.
Operational Decision Making
32% Risk Management 24%
Marketing 15%
Investment Decisions
3%
Sustainaiblity Practices
2% Landscaping
4%
Finance and Budgeting
12%
Other 8%
40
Other Ways Weekly Forecasts are Used
Customer education/Guest Info (3 respondents)
Special Events cancellation decisions (3 respondents)
“During the shoulder seasons, I use weekly forecast to determine which days to operate”
“People eat rain or shine”
“Stock and inventories”
“Scheduling out of building procedures”
“Tournaments may be rescheduled due to a rainy forecast.”
“To predict occupancy”
“Specials on accommodations or storm related needs”
“Planning”
“Weather affects our guests decisions to come or stay home”
“Trying to ward off cancellations at the last minute when people think it might rain a day
during their vacation”
“What days to go to the beach”
“Outside dining”
“Scheduling outdoor group activities”
Table 7: Open-ended responses for other Weekly forecast uses
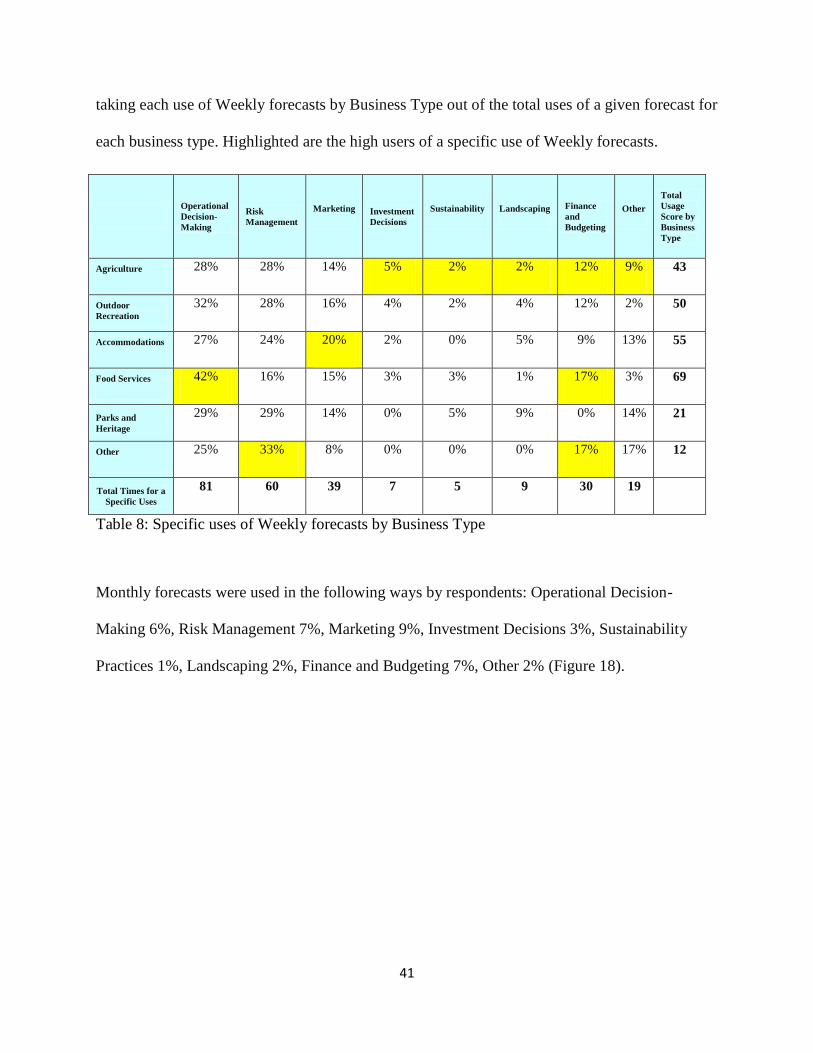
Table 8 shows the number of respondents who chose a specific use of Weekly forecasts by
Business Type. Percentages for each use of Weekly forecasts by Business Type is created by
41
taking each use of Weekly forecasts by Business Type out of the total uses of a given forecast for
each business type. Highlighted are the high users of a specific use of Weekly forecasts.
Operational
Decision-
Making
Risk
Management
Marketing Investment
Decisions
Sustainability Landscaping Finance
and
Budgeting
Other
Total
Usage
Score by
Business
Type
Agriculture 28% 28% 14% 5% 2% 2% 12% 9% 43
Outdoor
Recreation
32% 28% 16% 4% 2% 4% 12% 2% 50
Accommodations 27% 24% 20% 2% 0% 5% 9% 13% 55
Food Services 42% 16% 15% 3% 3% 1% 17% 3% 69
Parks and
Heritage
29% 29% 14% 0% 5% 9% 0% 14% 21
Other 25% 33% 8% 0% 0% 0% 17% 17% 12
Total Times for a
Specific Uses
81 60 39 7 5 9 30 19
Table 8: Specific uses of Weekly forecasts by Business Type
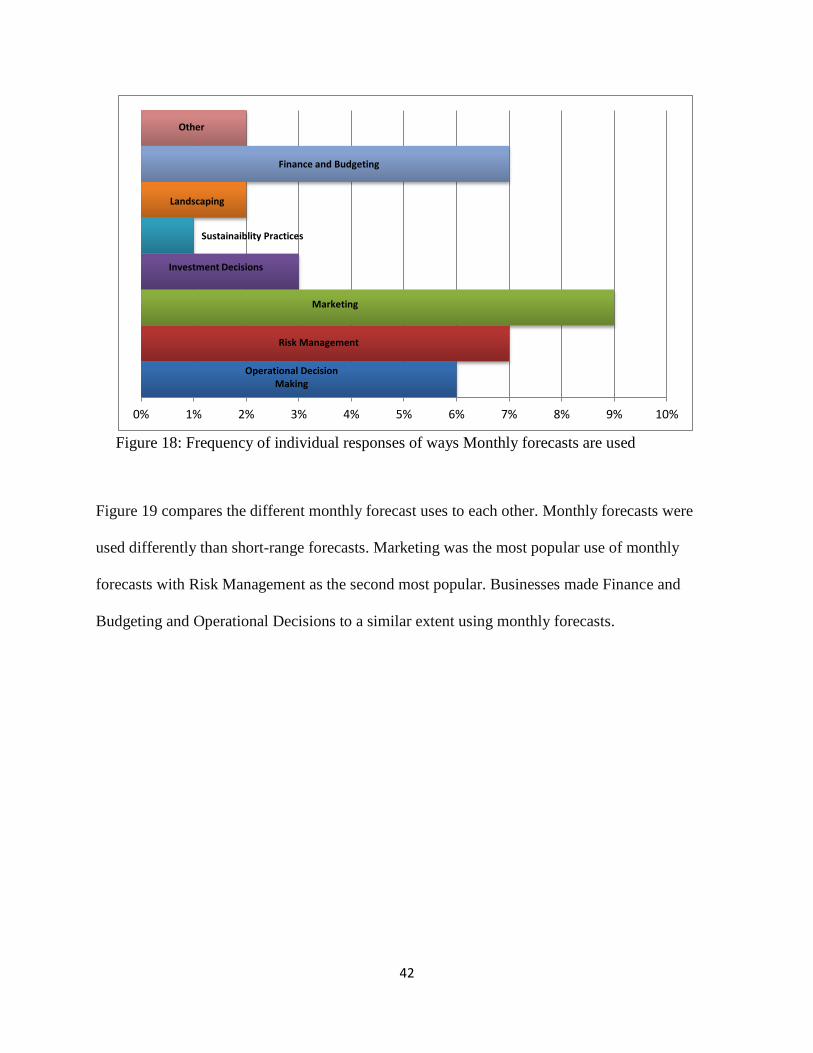
Monthly forecasts were used in the following ways by respondents: Operational Decision-
Making 6%, Risk Management 7%, Marketing 9%, Investment Decisions 3%, Sustainability
Practices 1%, Landscaping 2%, Finance and Budgeting 7%, Other 2% (Figure 18).
42
Figure 18: Frequency of individual responses of ways Monthly forecasts are used
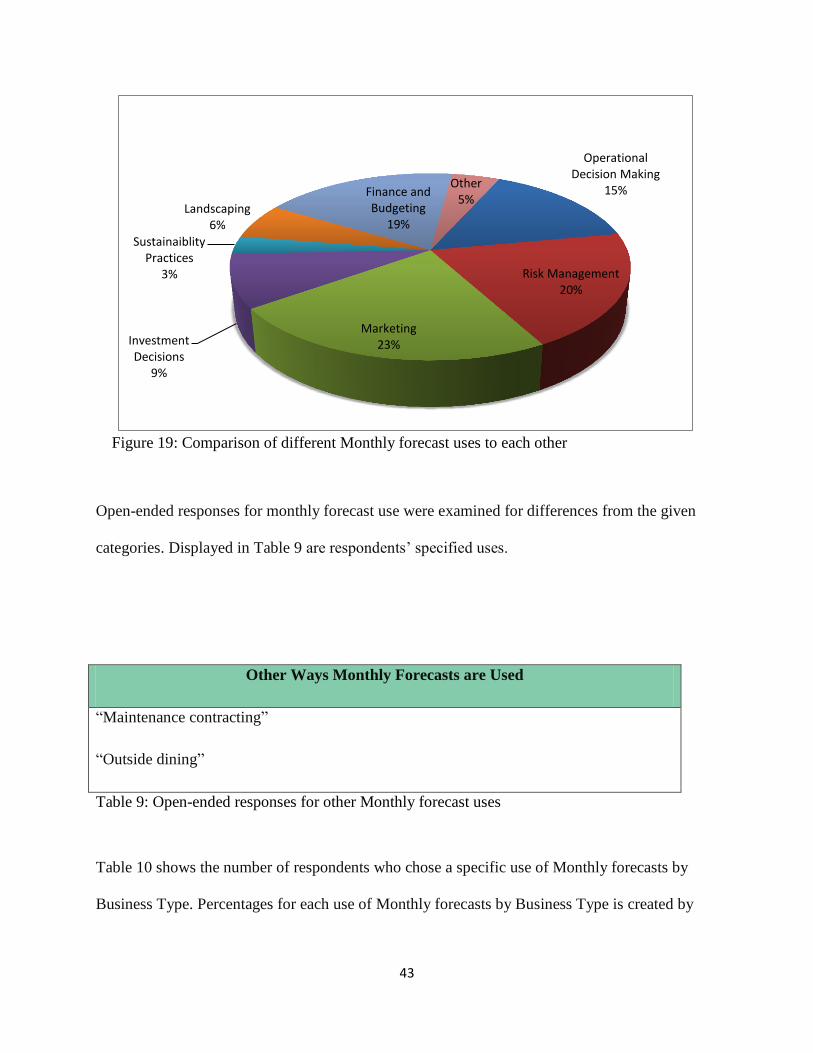
Figure 19 compares the different monthly forecast uses to each other. Monthly forecasts were
used differently than short-range forecasts. Marketing was the most popular use of monthly
forecasts with Risk Management as the second most popular. Businesses made Finance and
Budgeting and Operational Decisions to a similar extent using monthly forecasts.
Operational Decision Making
Risk Management
Marketing
Investment Decisions
Sustainaiblity Practices
Landscaping
Finance and Budgeting
Other
0% 1% 2% 3% 4% 5% 6% 7% 8% 9% 10%
43
Figure 19: Comparison of different Monthly forecast uses to each other
Open-ended responses for monthly forecast use were examined for differences from the given
categories. Displayed in Table 9 are respondents’ specified uses.
Other Ways Monthly Forecasts are Used
“Maintenance contracting”
“Outside dining”
Table 9: Open-ended responses for other Monthly forecast uses
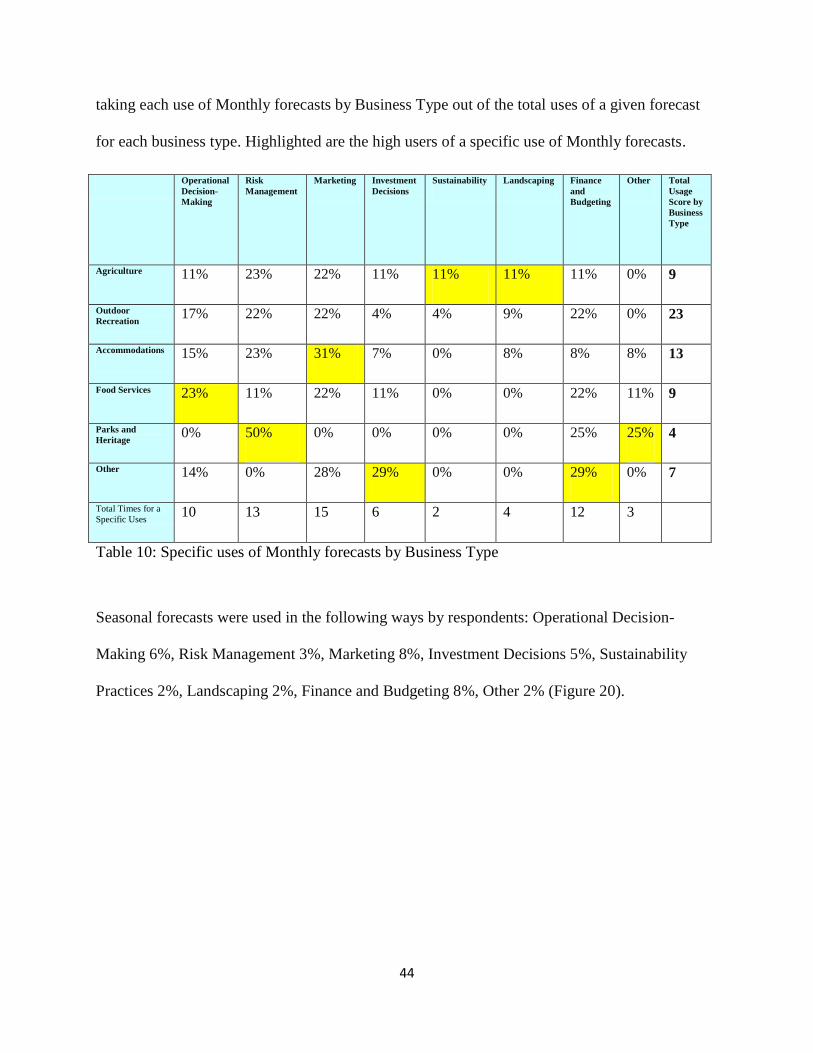
Table 10 shows the number of respondents who chose a specific use of Monthly forecasts by
Business Type. Percentages for each use of Monthly forecasts by Business Type is created by
Operational Decision Making
15%
Risk Management 20%
Marketing 23% Investment
Decisions 9%
Sustainaiblity Practices
3%
Landscaping 6%
Finance and Budgeting
19%
Other 5%
44
taking each use of Monthly forecasts by Business Type out of the total uses of a given forecast
for each business type. Highlighted are the high users of a specific use of Monthly forecasts.
Operational
Decision-
Making
Risk
Management
Marketing Investment
Decisions
Sustainability Landscaping Finance
and
Budgeting
Other Total
Usage
Score by
Business
Type
Agriculture 11% 23% 22% 11% 11% 11% 11% 0% 9
Outdoor
Recreation 17% 22% 22% 4% 4% 9% 22% 0% 23
Accommodations 15% 23% 31% 7% 0% 8% 8% 8% 13
Food Services 23% 11% 22% 11% 0% 0% 22% 11% 9
Parks and
Heritage 0% 50% 0% 0% 0% 0% 25% 25% 4
Other 14% 0% 28% 29% 0% 0% 29% 0% 7
Total Times for a
Specific Uses 10 13 15 6 2 4 12 3
Table 10: Specific uses of Monthly forecasts by Business Type
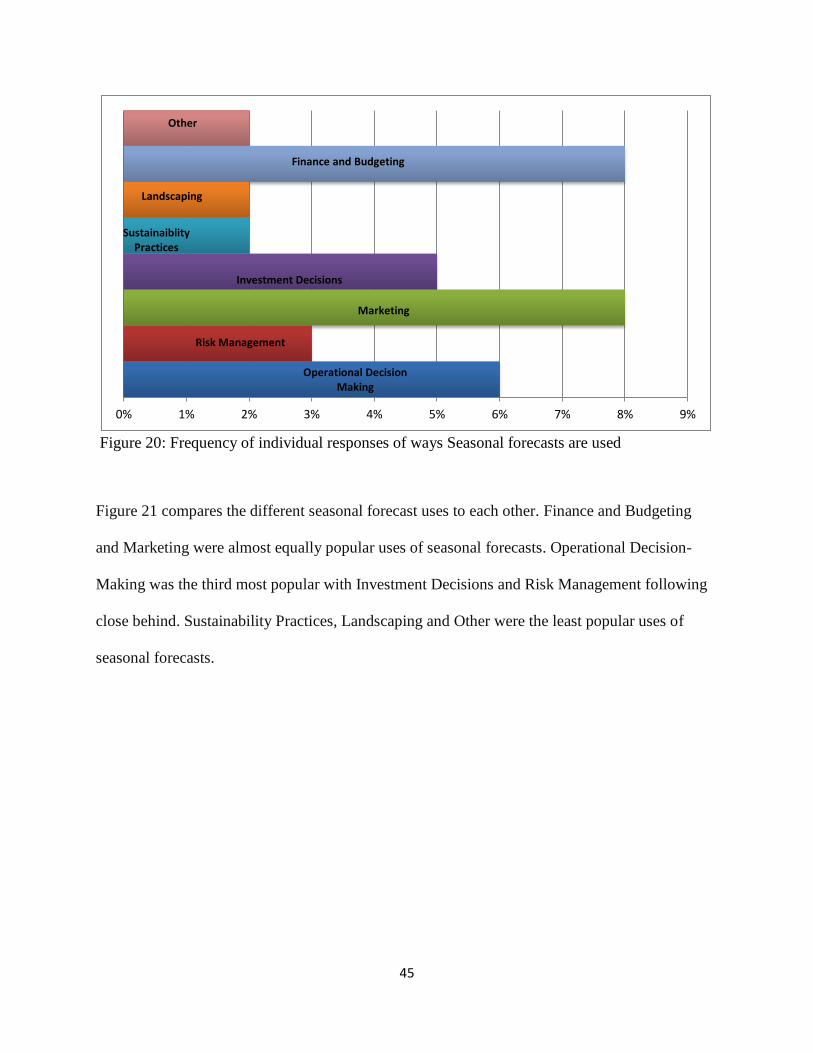
Seasonal forecasts were used in the following ways by respondents: Operational Decision-
Making 6%, Risk Management 3%, Marketing 8%, Investment Decisions 5%, Sustainability
Practices 2%, Landscaping 2%, Finance and Budgeting 8%, Other 2% (Figure 20).
45
Figure 20: Frequency of individual responses of ways Seasonal forecasts are used
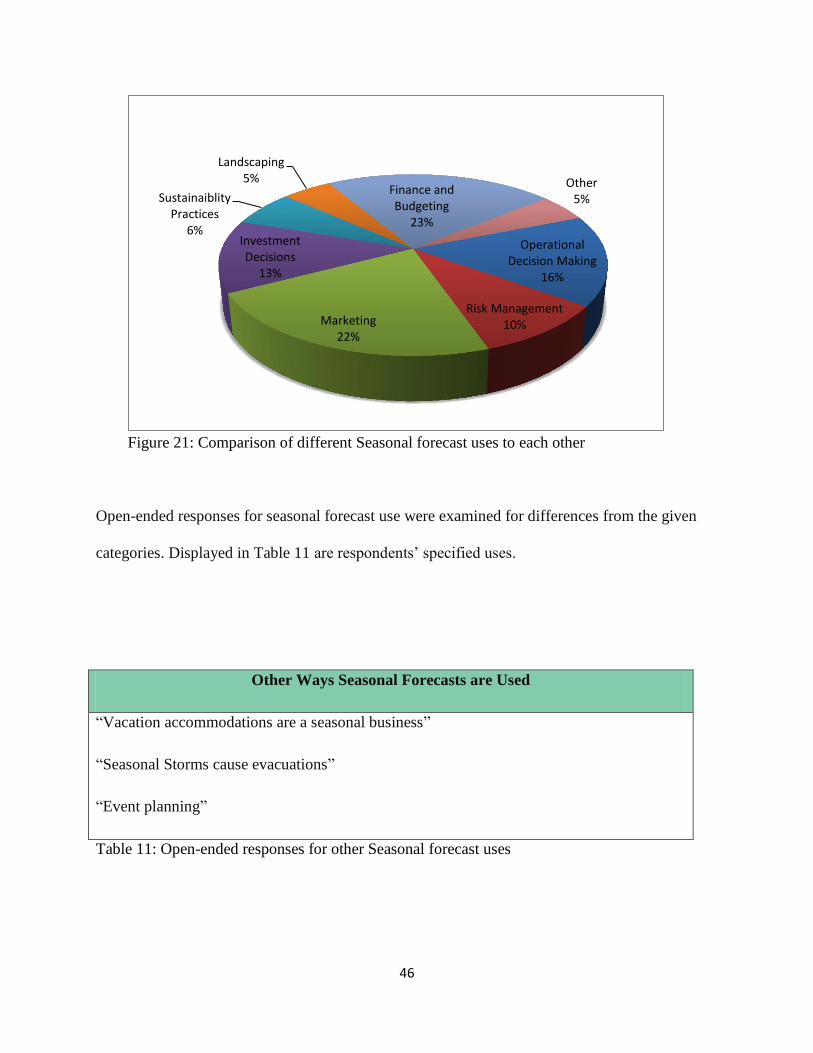
Figure 21 compares the different seasonal forecast uses to each other. Finance and Budgeting
and Marketing were almost equally popular uses of seasonal forecasts. Operational Decision-
Making was the third most popular with Investment Decisions and Risk Management following
close behind. Sustainability Practices, Landscaping and Other were the least popular uses of
seasonal forecasts.
Operational Decision Making
Risk Management
Marketing
Investment Decisions
Sustainaiblity Practices
Landscaping
Finance and Budgeting
Other
0% 1% 2% 3% 4% 5% 6% 7% 8% 9%
46
Figure 21: Comparison of different Seasonal forecast uses to each other
Open-ended responses for seasonal forecast use were examined for differences from the given
categories. Displayed in Table 11 are respondents’ specified uses.
Other Ways Seasonal Forecasts are Used
“Vacation accommodations are a seasonal business”
“Seasonal Storms cause evacuations”
“Event planning”
Table 11: Open-ended responses for other Seasonal forecast uses
Operational Decision Making
16%
Risk Management 10% Marketing
22%
Investment Decisions
13%
Sustainaiblity Practices
6%
Landscaping 5%
Finance and Budgeting
23%
Other 5%
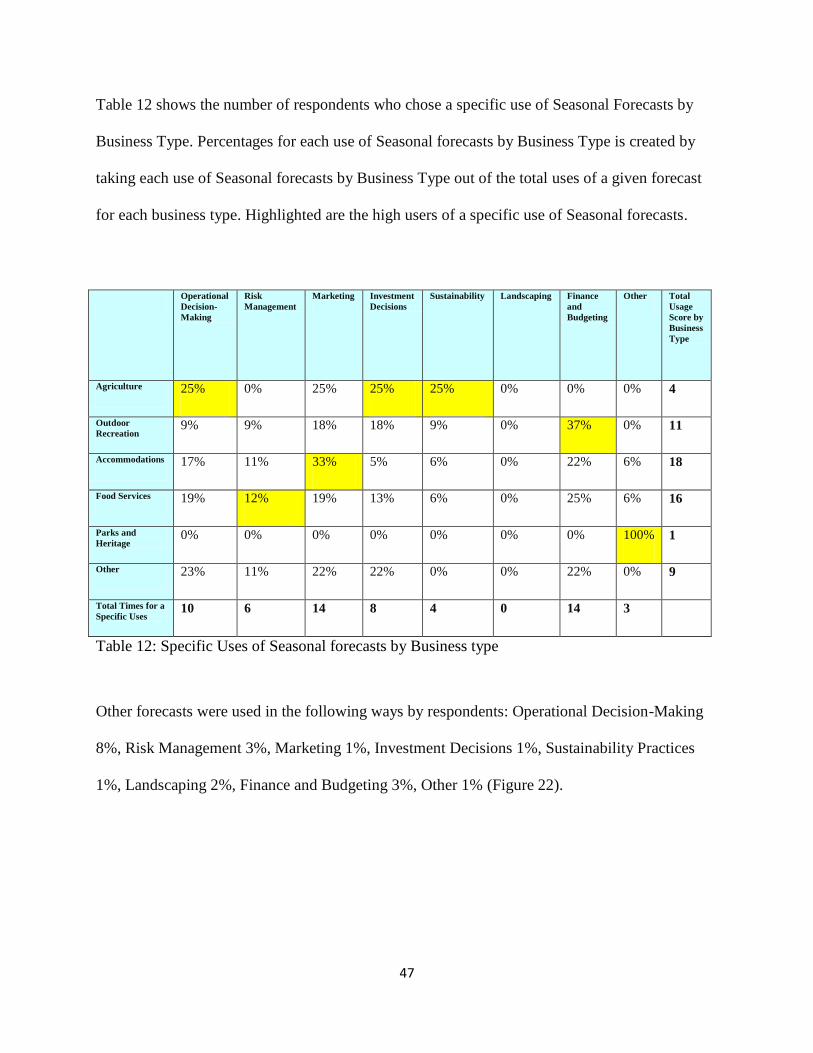
47
Table 12 shows the number of respondents who chose a specific use of Seasonal Forecasts by
Business Type. Percentages for each use of Seasonal forecasts by Business Type is created by
taking each use of Seasonal forecasts by Business Type out of the total uses of a given forecast
for each business type. Highlighted are the high users of a specific use of Seasonal forecasts.
Operational
Decision-
Making
Risk
Management
Marketing Investment
Decisions
Sustainability Landscaping Finance
and
Budgeting
Other Total
Usage
Score by
Business
Type
Agriculture 25% 0% 25% 25% 25% 0% 0% 0% 4
Outdoor
Recreation 9% 9% 18% 18% 9% 0% 37% 0% 11
Accommodations 17% 11% 33% 5% 6% 0% 22% 6% 18
Food Services 19% 12% 19% 13% 6% 0% 25% 6% 16
Parks and
Heritage 0% 0% 0% 0% 0% 0% 0% 100% 1
Other 23% 11% 22% 22% 0% 0% 22% 0% 9
Total Times for a
Specific Uses 10 6 14 8 4 0 14 3
Table 12: Specific Uses of Seasonal forecasts by Business type
Other forecasts were used in the following ways by respondents: Operational Decision-Making
8%, Risk Management 3%, Marketing 1%, Investment Decisions 1%, Sustainability Practices
1%, Landscaping 2%, Finance and Budgeting 3%, Other 1% (Figure 22).
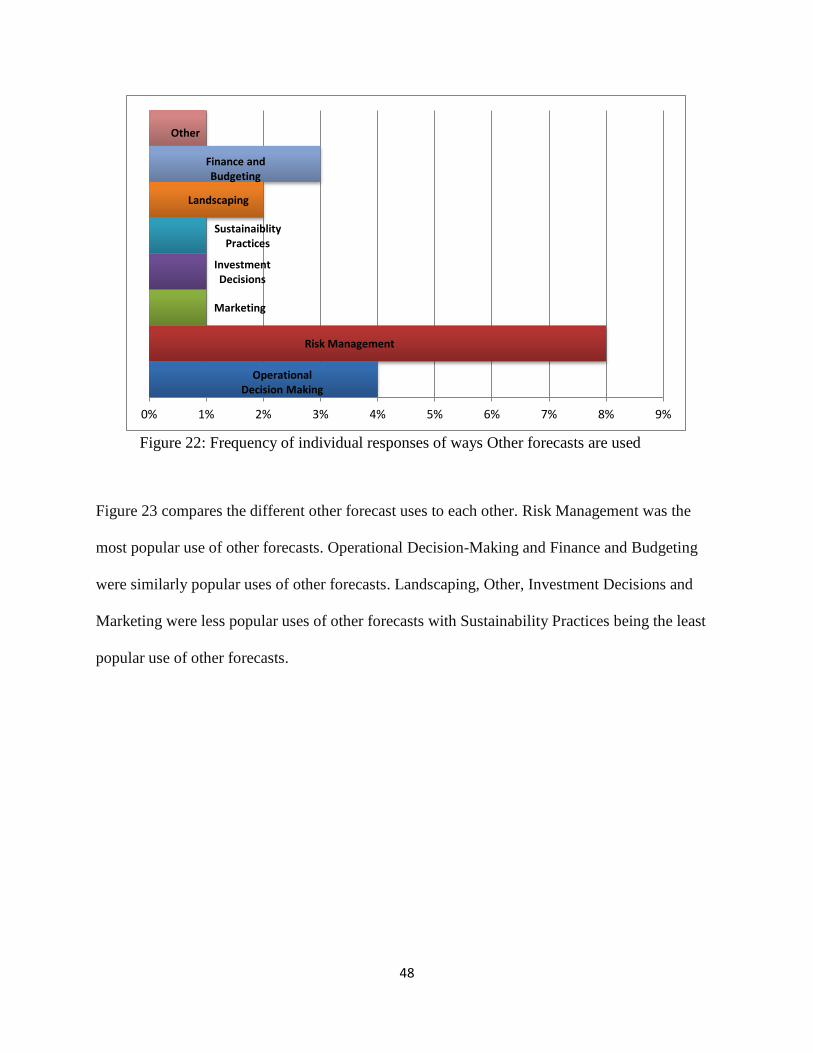
48
Figure 22: Frequency of individual responses of ways Other forecasts are used
Figure 23 compares the different other forecast uses to each other. Risk Management was the
most popular use of other forecasts. Operational Decision-Making and Finance and Budgeting
were similarly popular uses of other forecasts. Landscaping, Other, Investment Decisions and
Marketing were less popular uses of other forecasts with Sustainability Practices being the least
popular use of other forecasts.
Operational Decision Making
Risk Management
Marketing
Investment Decisions
Sustainaiblity Practices
Landscaping
Finance and Budgeting
Other
0% 1% 2% 3% 4% 5% 6% 7% 8% 9%
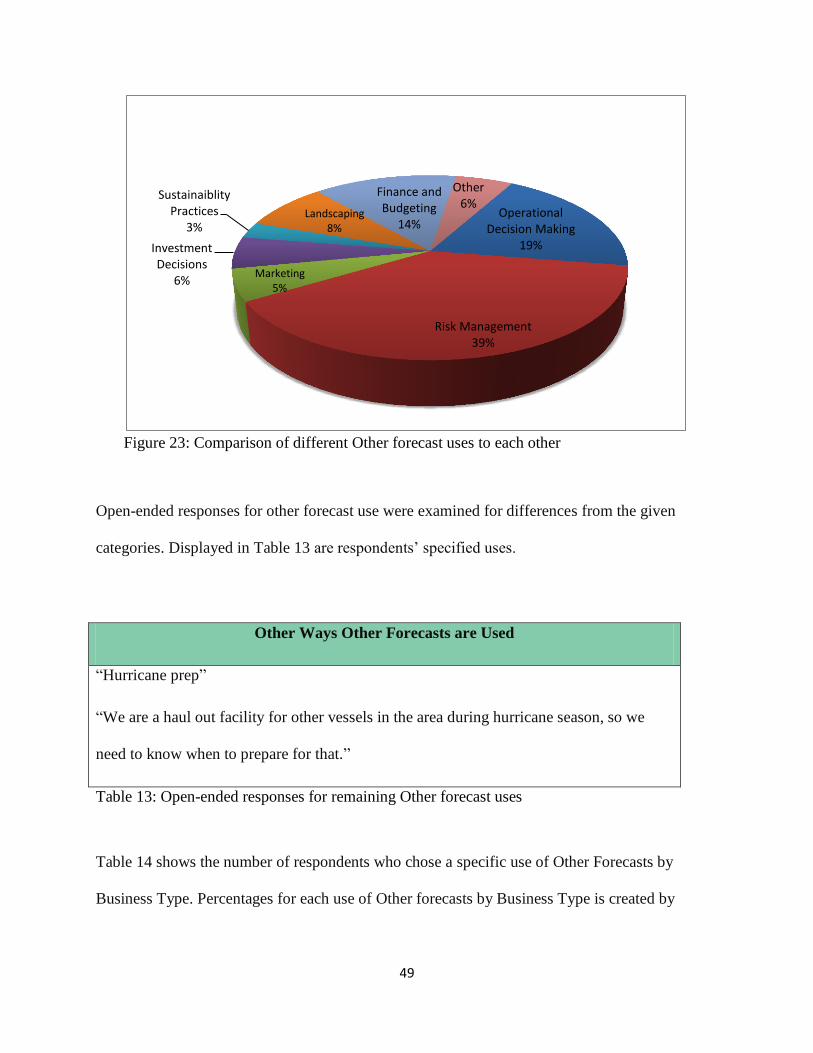
49
Figure 23: Comparison of different Other forecast uses to each other
Open-ended responses for other forecast use were examined for differences from the given
categories. Displayed in Table 13 are respondents’ specified uses.
Other Ways Other Forecasts are Used
“Hurricane prep”
“We are a haul out facility for other vessels in the area during hurricane season, so we
need to know when to prepare for that.”
Table 13: Open-ended responses for remaining Other forecast uses
Table 14 shows the number of respondents who chose a specific use of Other Forecasts by
Business Type. Percentages for each use of Other forecasts by Business Type is created by
Operational Decision Making
19%
Risk Management 39%
Marketing 5%
Investment Decisions
6%
Sustainaiblity Practices
3% Landscaping
8%
Finance and Budgeting
14%
Other 6%
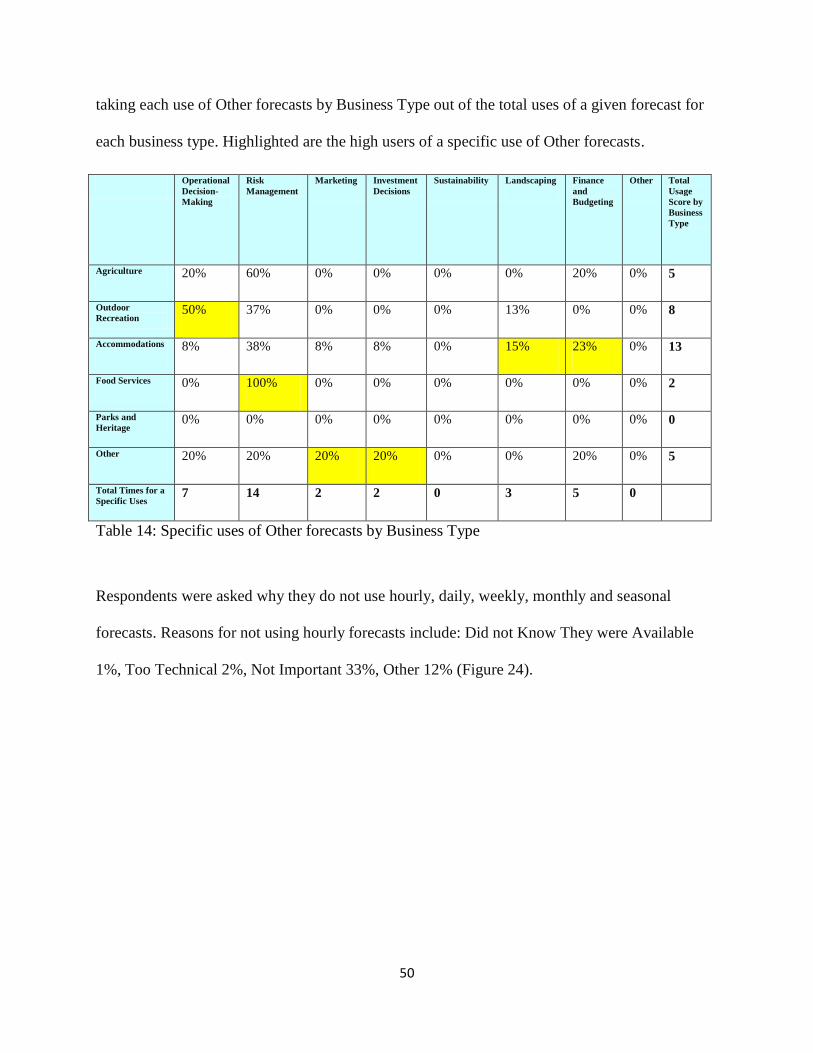
50
taking each use of Other forecasts by Business Type out of the total uses of a given forecast for
each business type. Highlighted are the high users of a specific use of Other forecasts.
Operational
Decision-
Making
Risk
Management
Marketing Investment
Decisions
Sustainability Landscaping Finance
and
Budgeting
Other Total
Usage
Score by
Business
Type
Agriculture 20% 60% 0% 0% 0% 0% 20% 0% 5
Outdoor
Recreation 50% 37% 0% 0% 0% 13% 0% 0% 8
Accommodations 8% 38% 8% 8% 0% 15% 23% 0% 13
Food Services 0% 100% 0% 0% 0% 0% 0% 0% 2
Parks and
Heritage 0% 0% 0% 0% 0% 0% 0% 0% 0
Other 20% 20% 20% 20% 0% 0% 20% 0% 5
Total Times for a
Specific Uses 7 14 2 2 0 3 5 0
Table 14: Specific uses of Other forecasts by Business Type
Respondents were asked why they do not use hourly, daily, weekly, monthly and seasonal
forecasts. Reasons for not using hourly forecasts include: Did not Know They were Available
1%, Too Technical 2%, Not Important 33%, Other 12% (Figure 24).
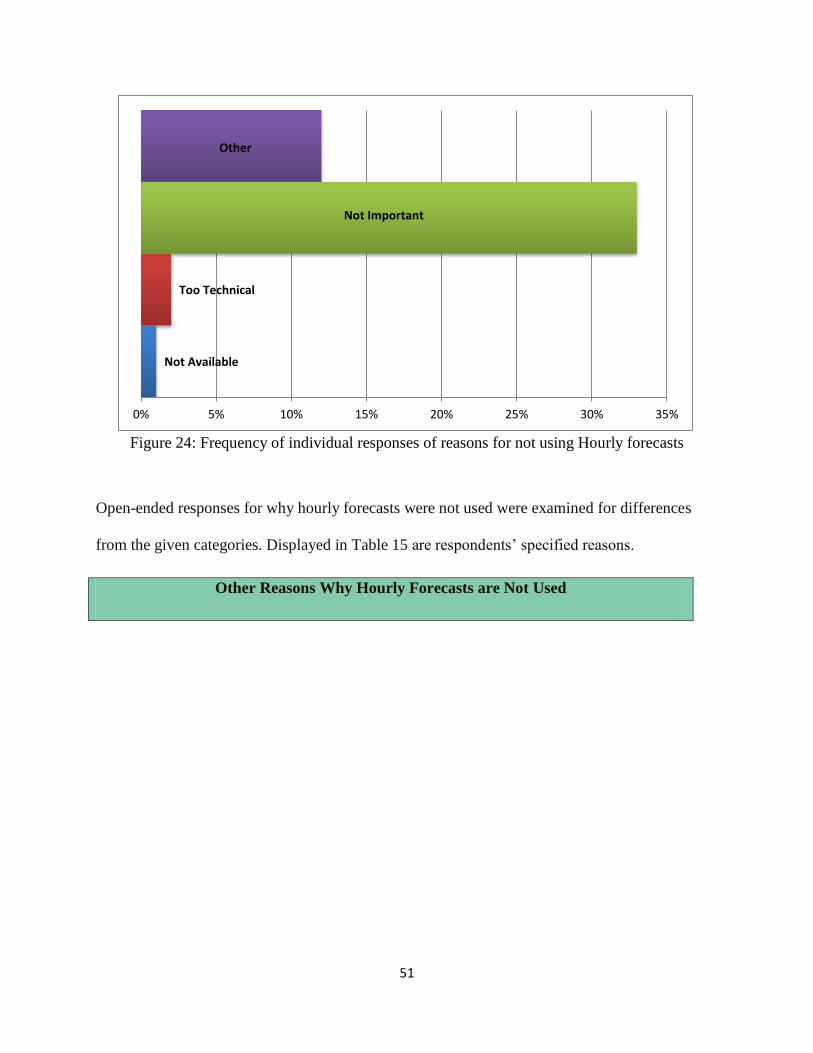
51
Figure 24: Frequency of individual responses of reasons for not using Hourly forecasts
Open-ended responses for why hourly forecasts were not used were examined for differences
from the given categories. Displayed in Table 15 are respondents’ specified reasons.
Other Reasons Why Hourly Forecasts are Not Used
Not Available
Too Technical
Not Important
Other
0% 5% 10% 15% 20% 25% 30% 35%
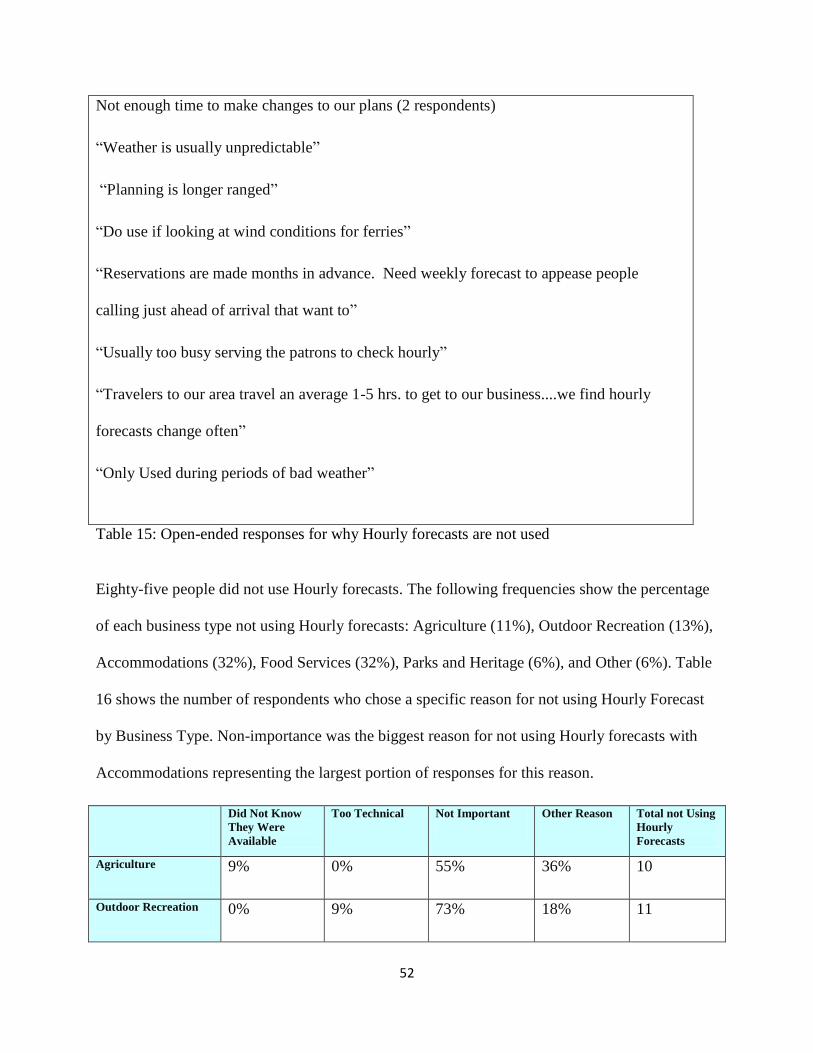
52
Not enough time to make changes to our plans (2 respondents)
“Weather is usually unpredictable”
“Planning is longer ranged”
“Do use if looking at wind conditions for ferries”
“Reservations are made months in advance. Need weekly forecast to appease people
calling just ahead of arrival that want to”
“Usually too busy serving the patrons to check hourly”
“Travelers to our area travel an average 1-5 hrs. to get to our business....we find hourly
forecasts change often”
“Only Used during periods of bad weather”
Table 15: Open-ended responses for why Hourly forecasts are not used
Eighty-five people did not use Hourly forecasts. The following frequencies show the percentage
of each business type not using Hourly forecasts: Agriculture (11%), Outdoor Recreation (13%),
Accommodations (32%), Food Services (32%), Parks and Heritage (6%), and Other (6%). Table
16 shows the number of respondents who chose a specific reason for not using Hourly Forecast
by Business Type. Non-importance was the biggest reason for not using Hourly forecasts with
Accommodations representing the largest portion of responses for this reason.
Did Not Know
They Were
Available
Too Technical Not Important Other Reason Total not Using
Hourly
Forecasts
Agriculture 9% 0% 55% 36% 10
Outdoor Recreation 0% 9% 73% 18% 11
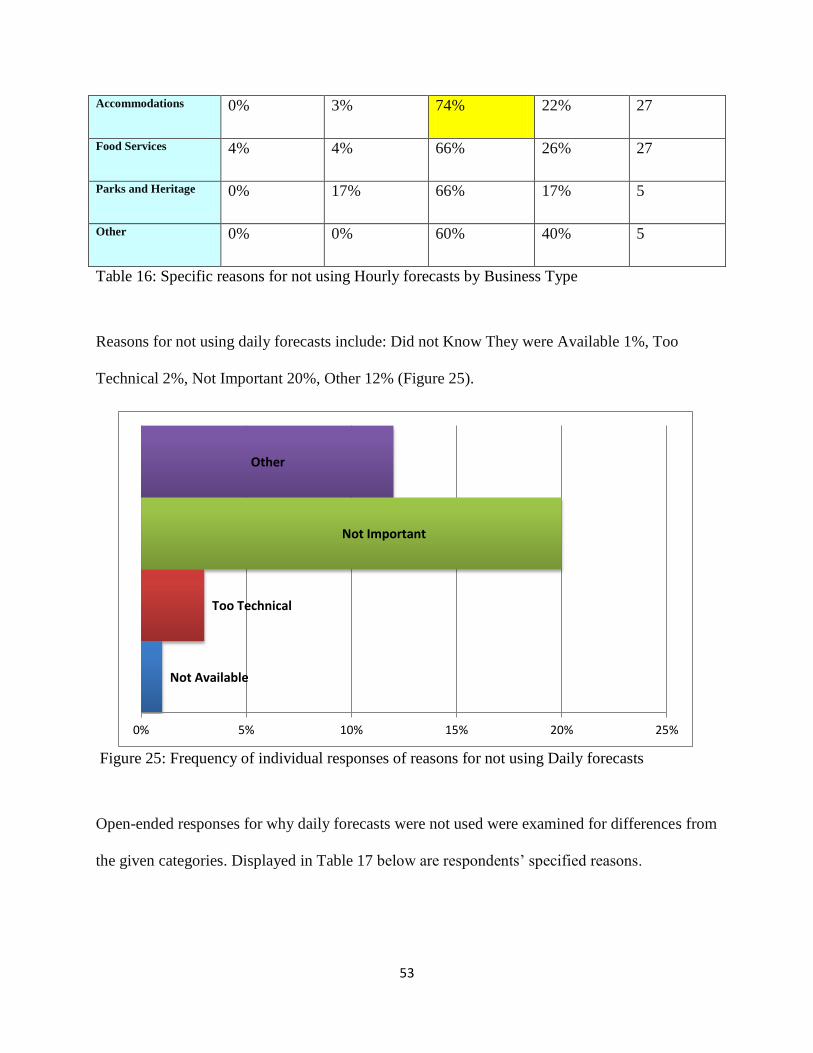
53
Accommodations 0% 3% 74% 22% 27
Food Services 4% 4% 66% 26% 27
Parks and Heritage 0% 17% 66% 17% 5
Other 0% 0% 60% 40% 5
Table 16: Specific reasons for not using Hourly forecasts by Business Type
Reasons for not using daily forecasts include: Did not Know They were Available 1%, Too
Technical 2%, Not Important 20%, Other 12% (Figure 25).
Figure 25: Frequency of individual responses of reasons for not using Daily forecasts
Open-ended responses for why daily forecasts were not used were examined for differences from
the given categories. Displayed in Table 17 below are respondents’ specified reasons.
Not Available
Too Technical
Not Important
Other
0% 5% 10% 15% 20% 25%
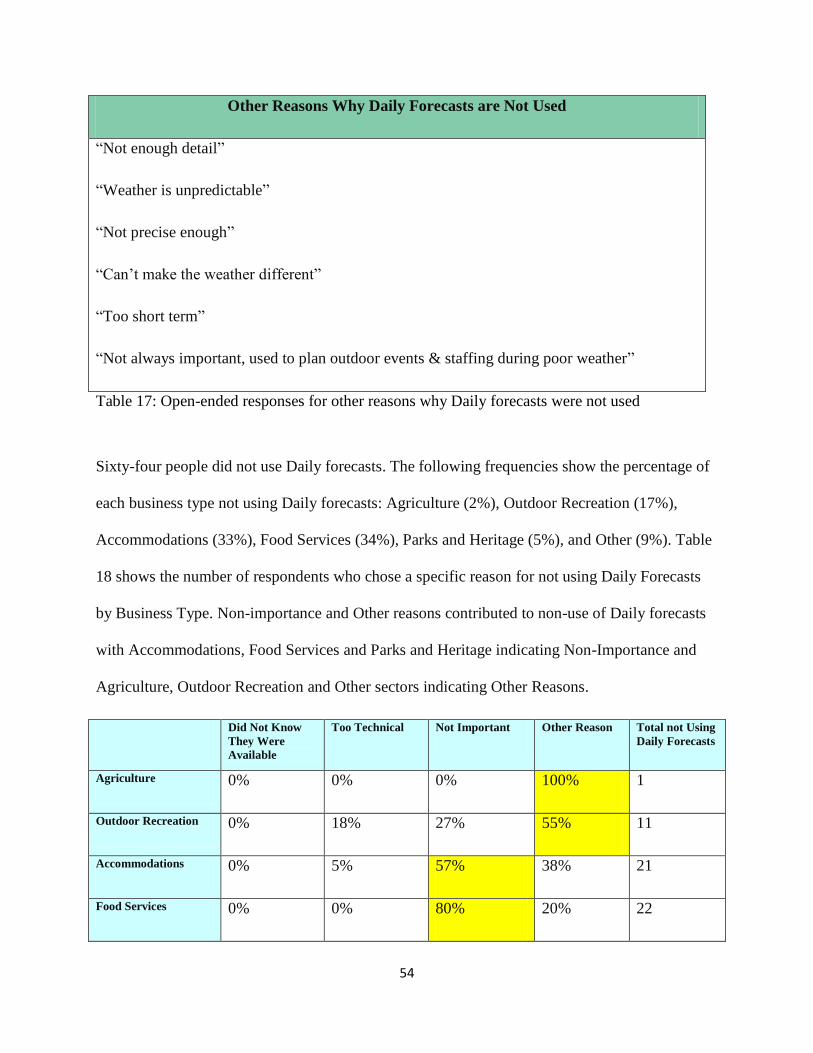
54
Other Reasons Why Daily Forecasts are Not Used
“Not enough detail”
“Weather is unpredictable”
“Not precise enough”
“Can’t make the weather different”
“Too short term”
“Not always important, used to plan outdoor events & staffing during poor weather”
Table 17: Open-ended responses for other reasons why Daily forecasts were not used
Sixty-four people did not use Daily forecasts. The following frequencies show the percentage of
each business type not using Daily forecasts: Agriculture (2%), Outdoor Recreation (17%),
Accommodations (33%), Food Services (34%), Parks and Heritage (5%), and Other (9%). Table
18 shows the number of respondents who chose a specific reason for not using Daily Forecasts
by Business Type. Non-importance and Other reasons contributed to non-use of Daily forecasts
with Accommodations, Food Services and Parks and Heritage indicating Non-Importance and
Agriculture, Outdoor Recreation and Other sectors indicating Other Reasons.
Did Not Know
They Were
Available
Too Technical Not Important Other Reason Total not Using
Daily Forecasts
Agriculture 0% 0% 0% 100% 1
Outdoor Recreation 0% 18% 27% 55% 11
Accommodations 0% 5% 57% 38% 21
Food Services 0% 0% 80% 20% 22
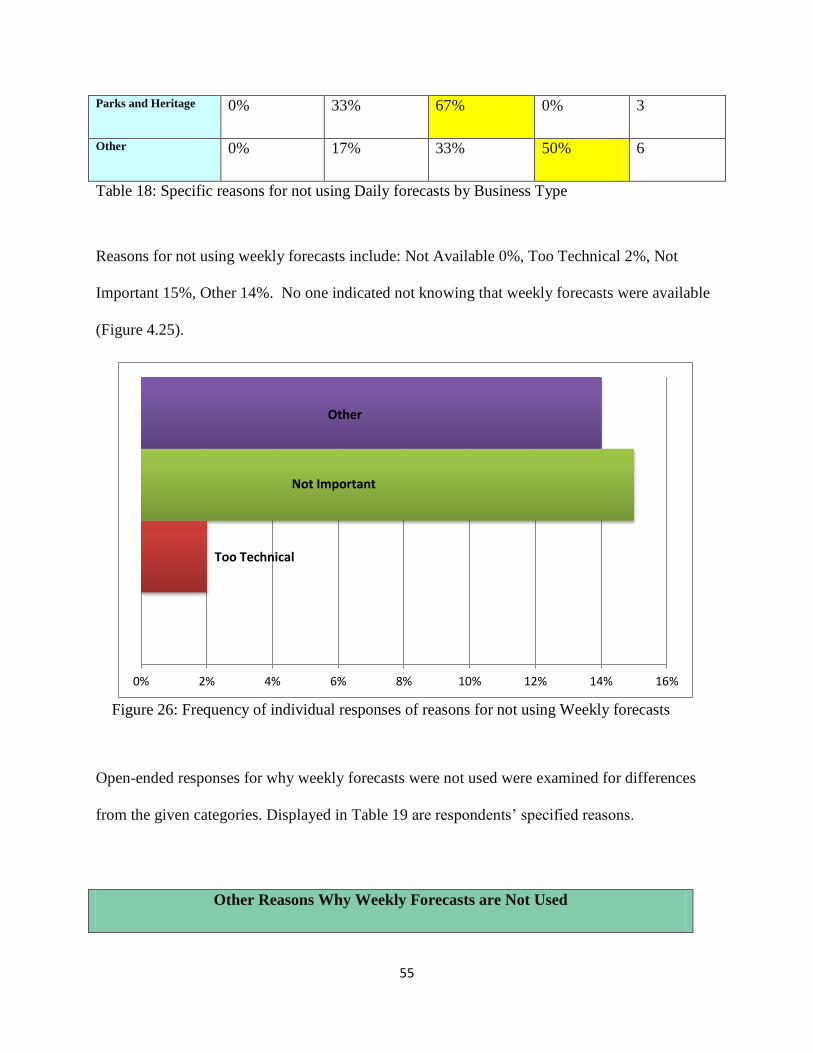
55
Parks and Heritage 0% 33% 67% 0% 3
Other 0% 17% 33% 50% 6
Table 18: Specific reasons for not using Daily forecasts by Business Type
Reasons for not using weekly forecasts include: Not Available 0%, Too Technical 2%, Not
Important 15%, Other 14%. No one indicated not knowing that weekly forecasts were available
(Figure 4.25).
Figure 26: Frequency of individual responses of reasons for not using Weekly forecasts
Open-ended responses for why weekly forecasts were not used were examined for differences
from the given categories. Displayed in Table 19 are respondents’ specified reasons.
Other Reasons Why Weekly Forecasts are Not Used
Too Technical
Not Important
Other
0% 2% 4% 6% 8% 10% 12% 14% 16%
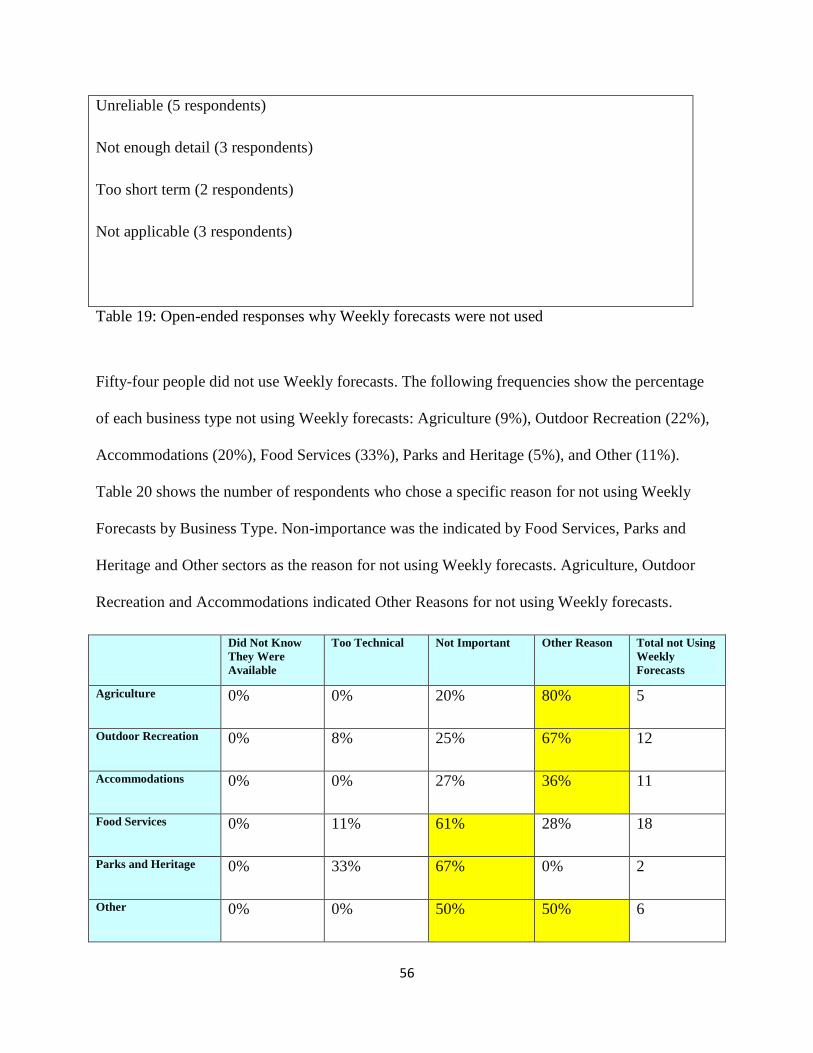
56
Unreliable (5 respondents)
Not enough detail (3 respondents)
Too short term (2 respondents)
Not applicable (3 respondents)
Table 19: Open-ended responses why Weekly forecasts were not used
Fifty-four people did not use Weekly forecasts. The following frequencies show the percentage
of each business type not using Weekly forecasts: Agriculture (9%), Outdoor Recreation (22%),
Accommodations (20%), Food Services (33%), Parks and Heritage (5%), and Other (11%).
Table 20 shows the number of respondents who chose a specific reason for not using Weekly
Forecasts by Business Type. Non-importance was the indicated by Food Services, Parks and
Heritage and Other sectors as the reason for not using Weekly forecasts. Agriculture, Outdoor
Recreation and Accommodations indicated Other Reasons for not using Weekly forecasts.
Did Not Know
They Were
Available
Too Technical Not Important Other Reason Total not Using
Weekly
Forecasts
Agriculture 0% 0% 20% 80% 5
Outdoor Recreation 0% 8% 25% 67% 12
Accommodations 0% 0% 27% 36% 11
Food Services 0% 11% 61% 28% 18
Parks and Heritage 0% 33% 67% 0% 2
Other 0% 0% 50% 50% 6
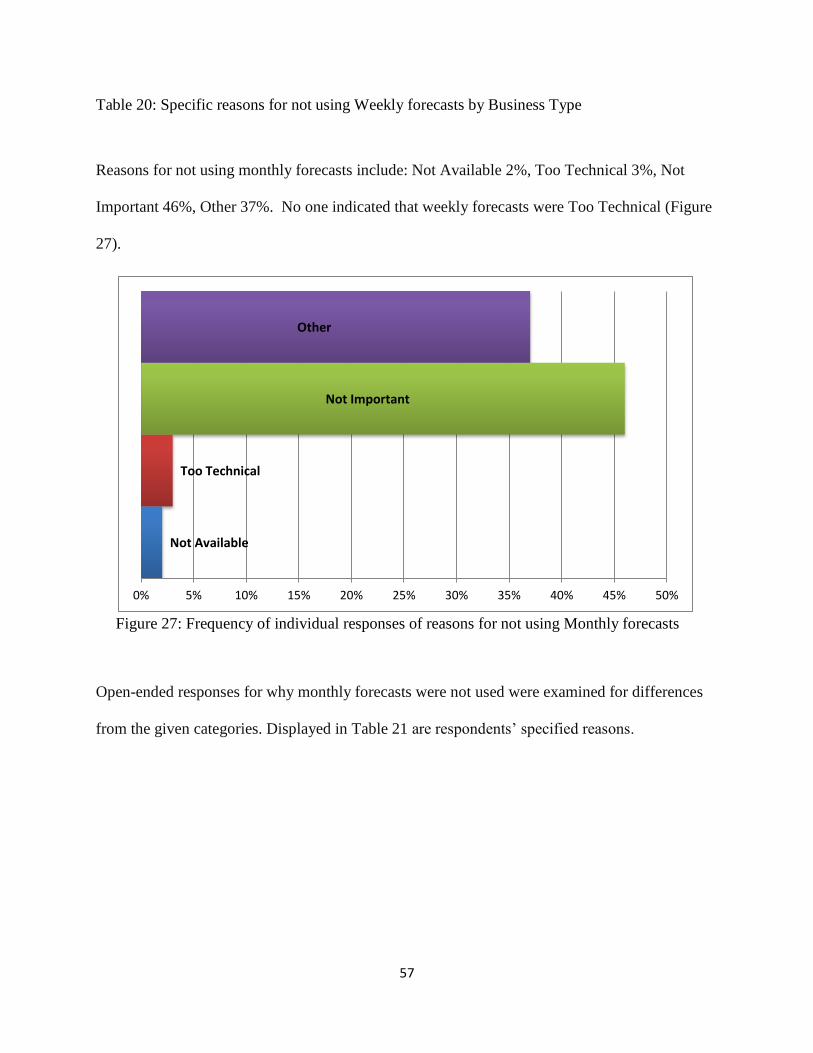
57
Table 20: Specific reasons for not using Weekly forecasts by Business Type
Reasons for not using monthly forecasts include: Not Available 2%, Too Technical 3%, Not
Important 46%, Other 37%. No one indicated that weekly forecasts were Too Technical (Figure
27).
Figure 27: Frequency of individual responses of reasons for not using Monthly forecasts
Open-ended responses for why monthly forecasts were not used were examined for differences
from the given categories. Displayed in Table 21 are respondents’ specified reasons.
Not Available
Too Technical
Not Important
Other
0% 5% 10% 15% 20% 25% 30% 35% 40% 45% 50%
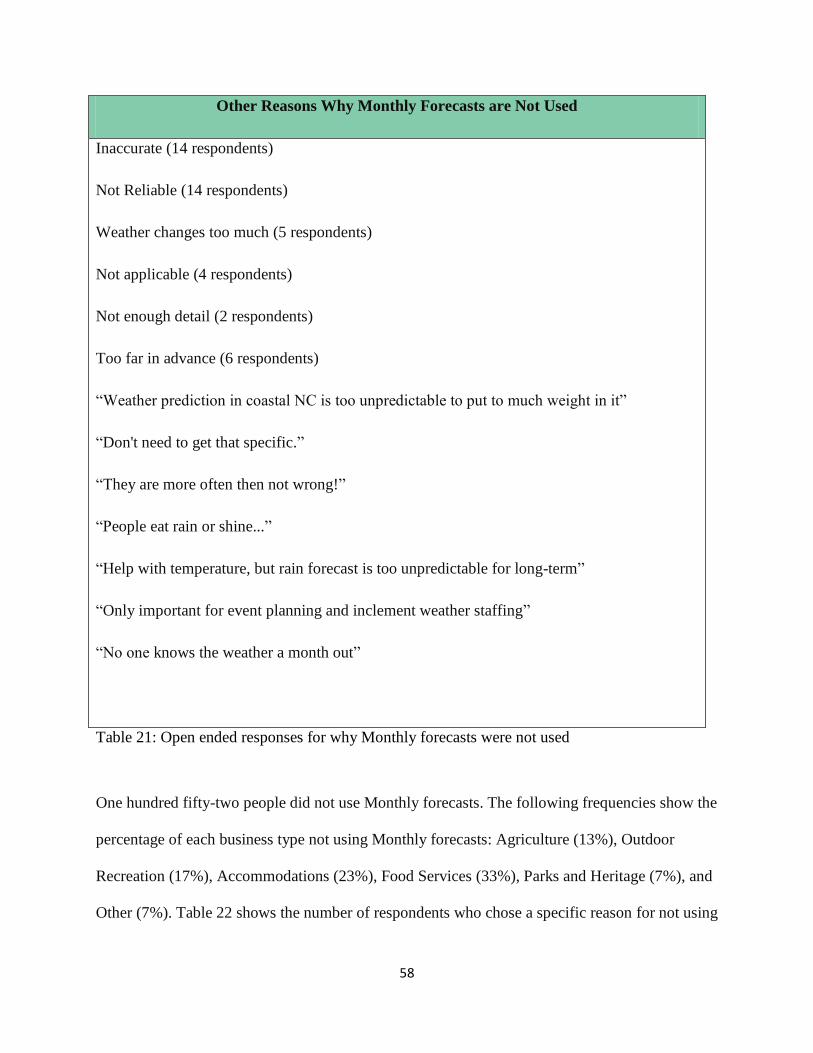
58
Other Reasons Why Monthly Forecasts are Not Used
Inaccurate (14 respondents)
Not Reliable (14 respondents)
Weather changes too much (5 respondents)
Not applicable (4 respondents)
Not enough detail (2 respondents)
Too far in advance (6 respondents)
“Weather prediction in coastal NC is too unpredictable to put to much weight in it”
“Don't need to get that specific.”
“They are more often then not wrong!”
“People eat rain or shine...”
“Help with temperature, but rain forecast is too unpredictable for long-term”
“Only important for event planning and inclement weather staffing”
“No one knows the weather a month out”
Table 21: Open ended responses for why Monthly forecasts were not used
One hundred fifty-two people did not use Monthly forecasts. The following frequencies show the
percentage of each business type not using Monthly forecasts: Agriculture (13%), Outdoor
Recreation (17%), Accommodations (23%), Food Services (33%), Parks and Heritage (7%), and
Other (7%). Table 22 shows the number of respondents who chose a specific reason for not using
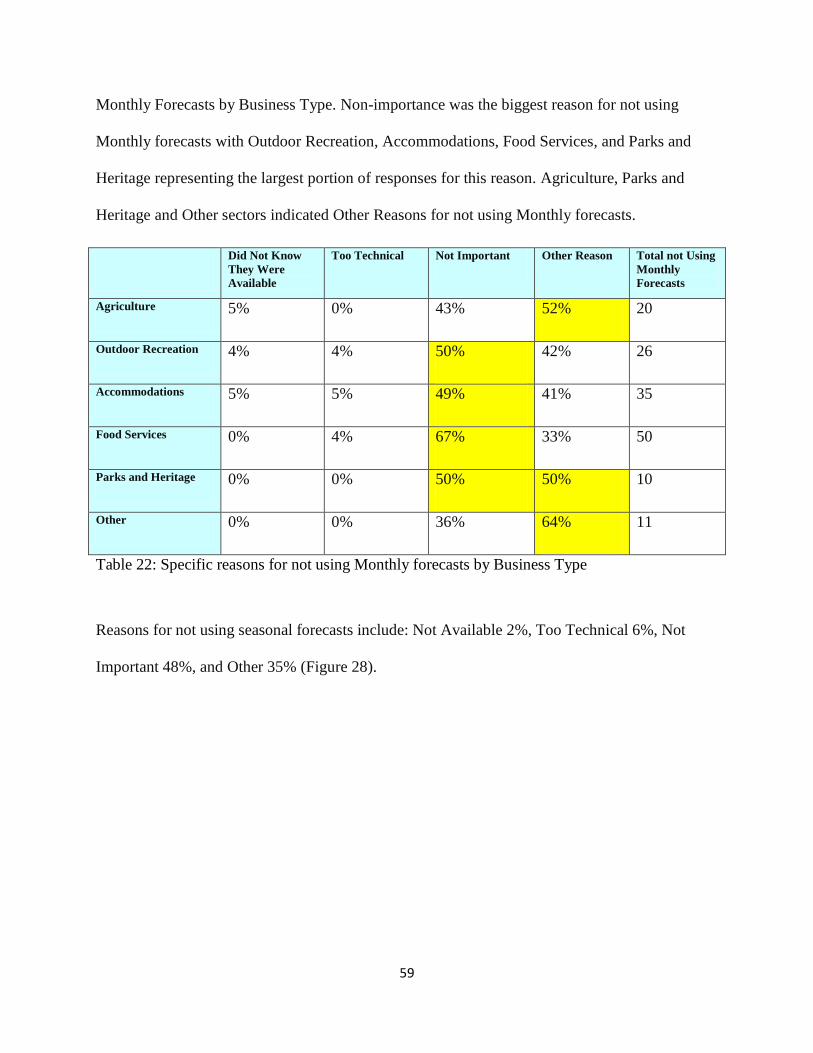
59
Monthly Forecasts by Business Type. Non-importance was the biggest reason for not using
Monthly forecasts with Outdoor Recreation, Accommodations, Food Services, and Parks and
Heritage representing the largest portion of responses for this reason. Agriculture, Parks and
Heritage and Other sectors indicated Other Reasons for not using Monthly forecasts.
Did Not Know
They Were
Available
Too Technical Not Important Other Reason Total not Using
Monthly
Forecasts
Agriculture 5% 0% 43% 52% 20
Outdoor Recreation 4% 4% 50% 42% 26
Accommodations 5% 5% 49% 41% 35
Food Services 0% 4% 67% 33% 50
Parks and Heritage 0% 0% 50% 50% 10
Other 0% 0% 36% 64% 11
Table 22: Specific reasons for not using Monthly forecasts by Business Type
Reasons for not using seasonal forecasts include: Not Available 2%, Too Technical 6%, Not
Important 48%, and Other 35% (Figure 28).
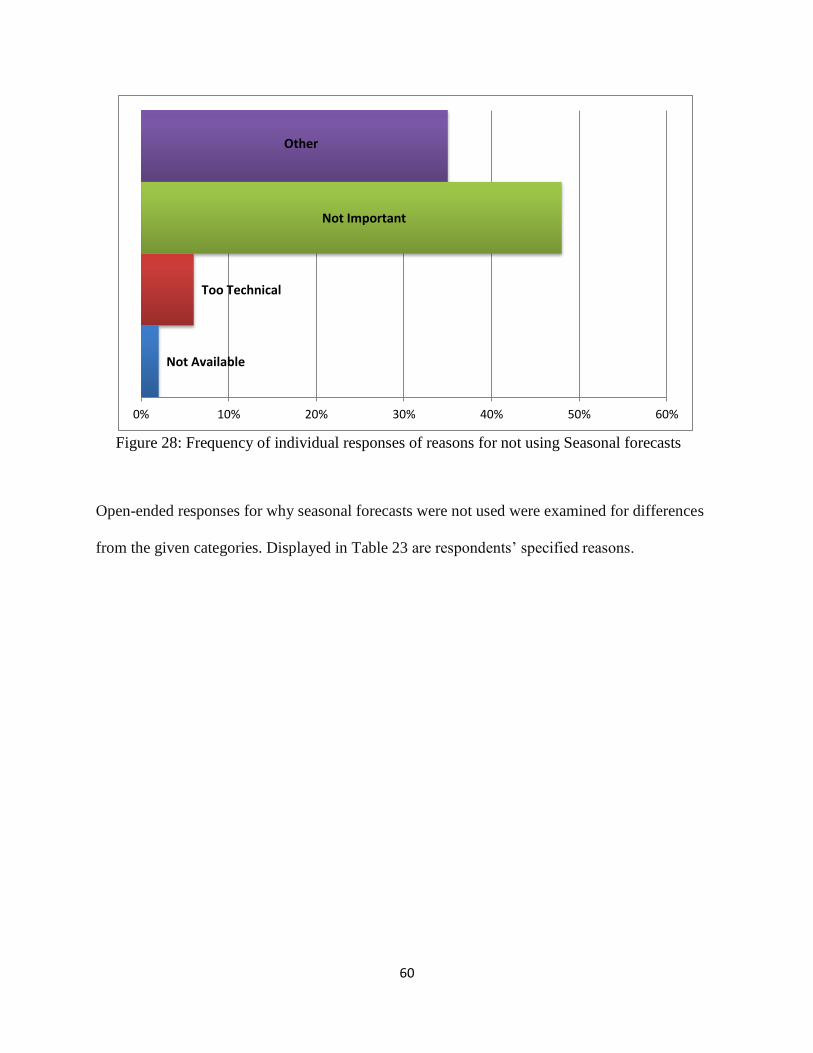
60
Figure 28: Frequency of individual responses of reasons for not using Seasonal forecasts
Open-ended responses for why seasonal forecasts were not used were examined for differences
from the given categories. Displayed in Table 23 are respondents’ specified reasons.
Not Available
Too Technical
Not Important
Other
0% 10% 20% 30% 40% 50% 60%
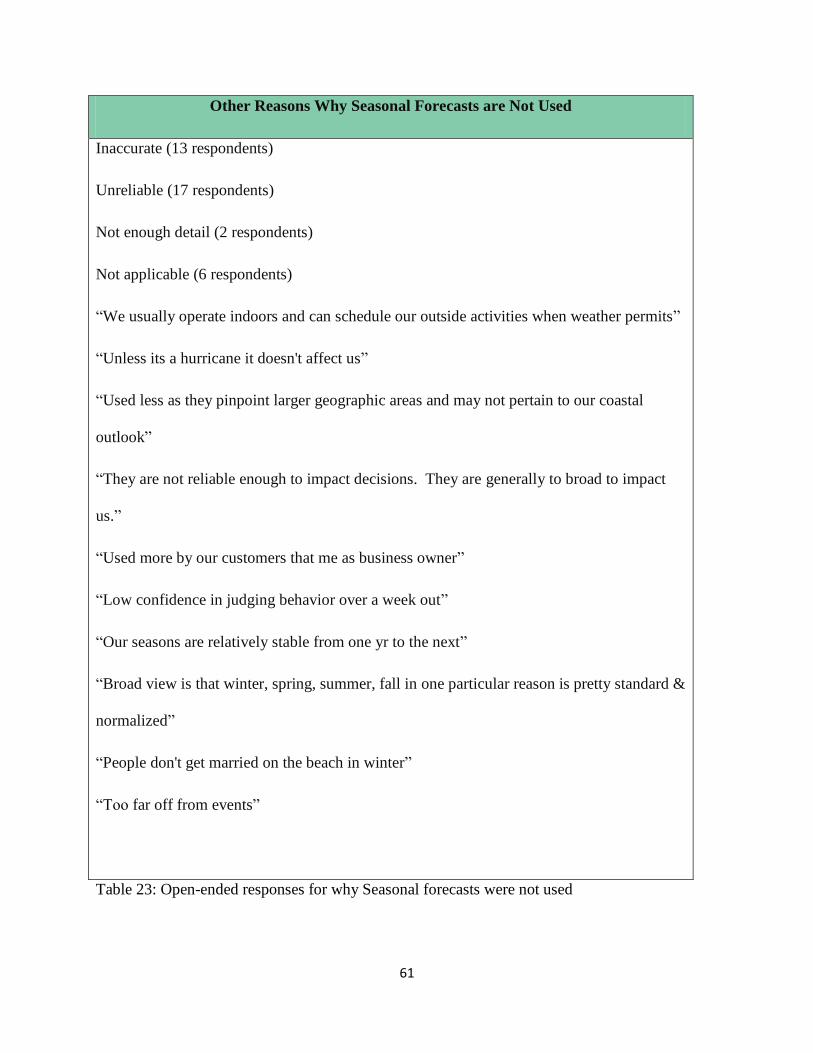
61
Other Reasons Why Seasonal Forecasts are Not Used
Inaccurate (13 respondents)
Unreliable (17 respondents)
Not enough detail (2 respondents)
Not applicable (6 respondents)
“We usually operate indoors and can schedule our outside activities when weather permits”
“Unless its a hurricane it doesn't affect us”
“Used less as they pinpoint larger geographic areas and may not pertain to our coastal
outlook”
“They are not reliable enough to impact decisions. They are generally to broad to impact
us.”
“Used more by our customers that me as business owner”
“Low confidence in judging behavior over a week out”
“Our seasons are relatively stable from one yr to the next”
“Broad view is that winter, spring, summer, fall in one particular reason is pretty standard &
normalized”
“People don't get married on the beach in winter”
“Too far off from events”
Table 23: Open-ended responses for why Seasonal forecasts were not used
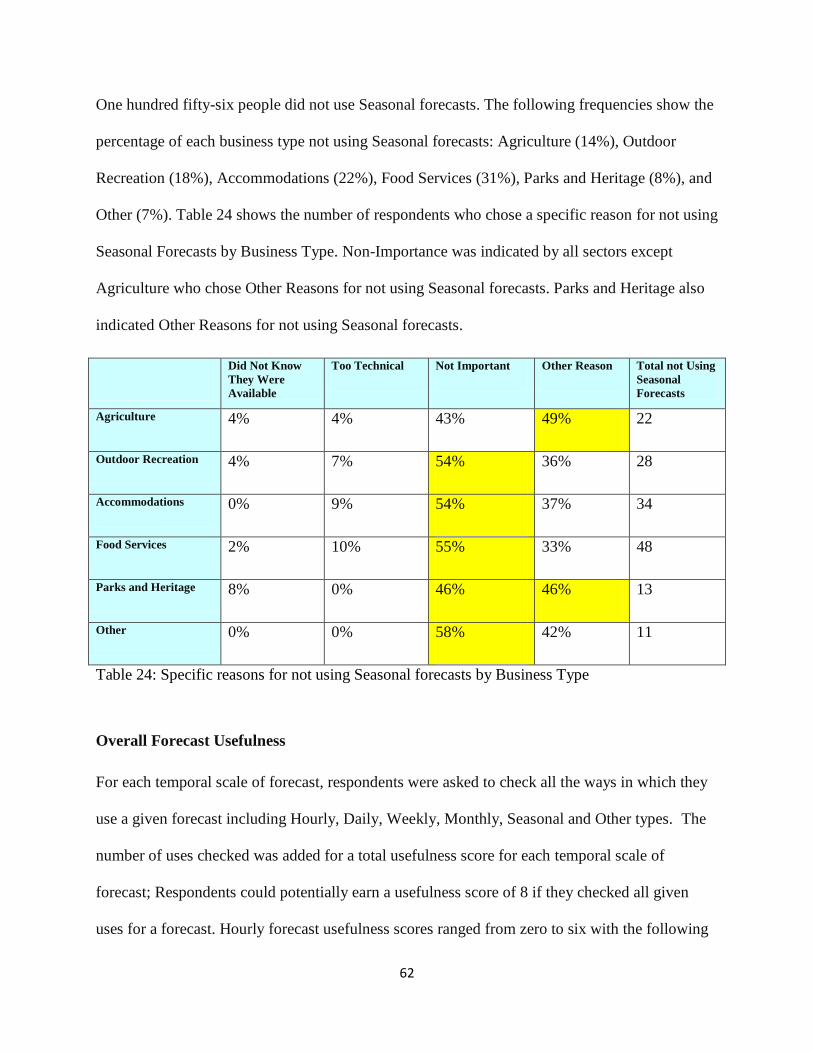
62
One hundred fifty-six people did not use Seasonal forecasts. The following frequencies show the
percentage of each business type not using Seasonal forecasts: Agriculture (14%), Outdoor
Recreation (18%), Accommodations (22%), Food Services (31%), Parks and Heritage (8%), and
Other (7%). Table 24 shows the number of respondents who chose a specific reason for not using
Seasonal Forecasts by Business Type. Non-Importance was indicated by all sectors except
Agriculture who chose Other Reasons for not using Seasonal forecasts. Parks and Heritage also
indicated Other Reasons for not using Seasonal forecasts.
Did Not Know
They Were
Available
Too Technical Not Important Other Reason Total not Using
Seasonal
Forecasts
Agriculture 4% 4% 43% 49% 22
Outdoor Recreation 4% 7% 54% 36% 28
Accommodations 0% 9% 54% 37% 34
Food Services 2% 10% 55% 33% 48
Parks and Heritage 8% 0% 46% 46% 13
Other 0% 0% 58% 42% 11
Table 24: Specific reasons for not using Seasonal forecasts by Business Type
Overall Forecast Usefulness
For each temporal scale of forecast, respondents were asked to check all the ways in which they
use a given forecast including Hourly, Daily, Weekly, Monthly, Seasonal and Other types. The
number of uses checked was added for a total usefulness score for each temporal scale of
forecast; Respondents could potentially earn a usefulness score of 8 if they checked all given
uses for a forecast. Hourly forecast usefulness scores ranged from zero to six with the following
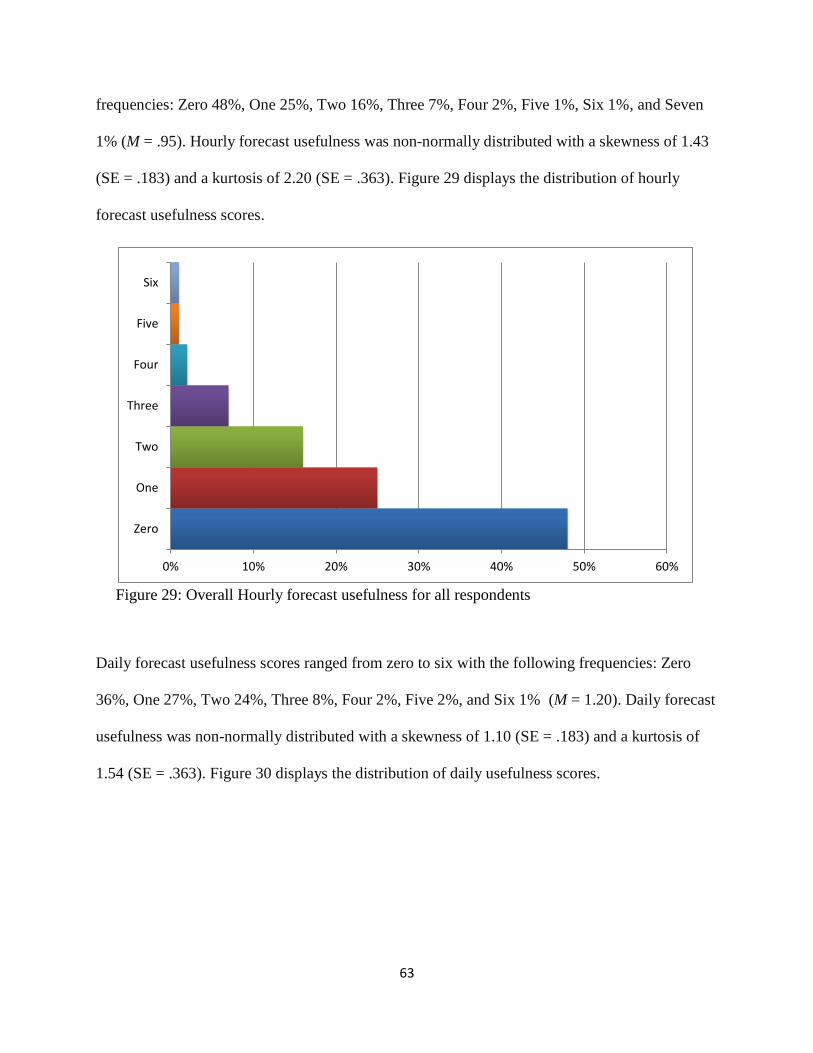
63
frequencies: Zero 48%, One 25%, Two 16%, Three 7%, Four 2%, Five 1%, Six 1%, and Seven
1% (M = .95). Hourly forecast usefulness was non-normally distributed with a skewness of 1.43
(SE = .183) and a kurtosis of 2.20 (SE = .363). Figure 29 displays the distribution of hourly
forecast usefulness scores.
Figure 29: Overall Hourly forecast usefulness for all respondents
Daily forecast usefulness scores ranged from zero to six with the following frequencies: Zero
36%, One 27%, Two 24%, Three 8%, Four 2%, Five 2%, and Six 1% (M = 1.20). Daily forecast
usefulness was non-normally distributed with a skewness of 1.10 (SE = .183) and a kurtosis of
1.54 (SE = .363). Figure 30 displays the distribution of daily usefulness scores.
0% 10% 20% 30% 40% 50% 60%
Zero
One
Two
Three
Four
Five
Six
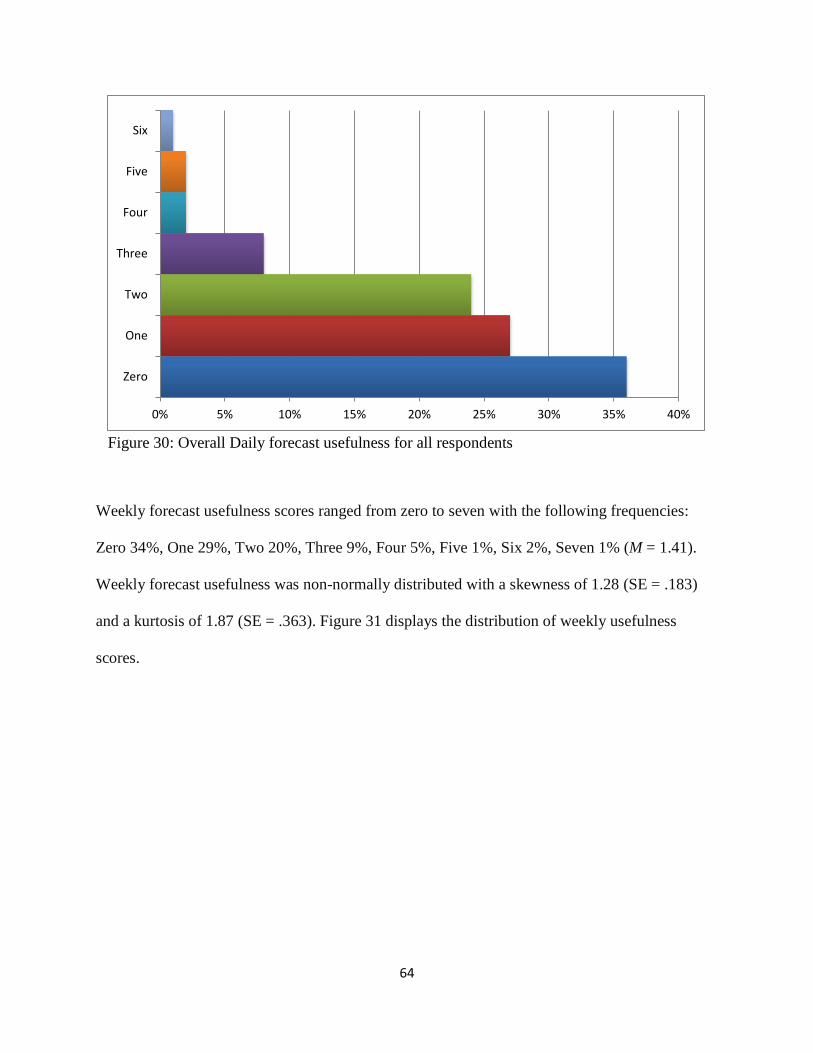
64
Figure 30: Overall Daily forecast usefulness for all respondents
Weekly forecast usefulness scores ranged from zero to seven with the following frequencies:
Zero 34%, One 29%, Two 20%, Three 9%, Four 5%, Five 1%, Six 2%, Seven 1% (M = 1.41).
Weekly forecast usefulness was non-normally distributed with a skewness of 1.28 (SE = .183)
and a kurtosis of 1.87 (SE = .363). Figure 31 displays the distribution of weekly usefulness
scores.
0% 5% 10% 15% 20% 25% 30% 35% 40%
Zero
One
Two
Three
Four
Five
Six
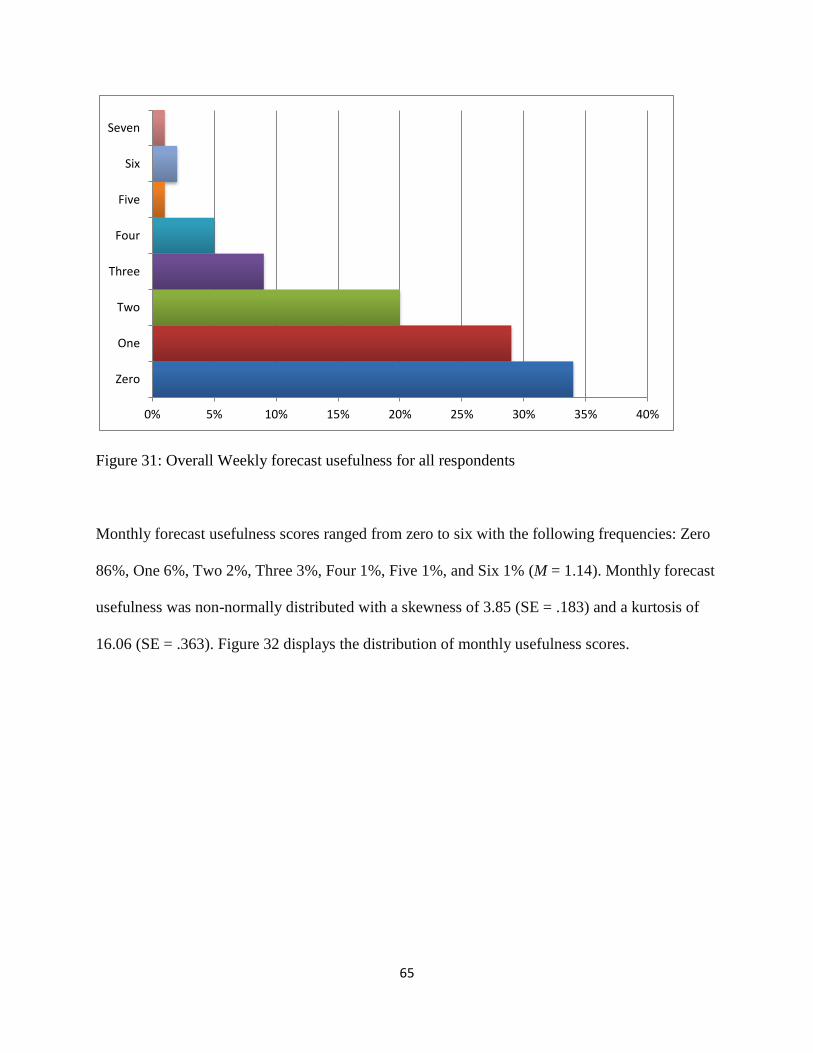
65
Figure 31: Overall Weekly forecast usefulness for all respondents
Monthly forecast usefulness scores ranged from zero to six with the following frequencies: Zero
86%, One 6%, Two 2%, Three 3%, Four 1%, Five 1%, and Six 1% (M = 1.14). Monthly forecast
usefulness was non-normally distributed with a skewness of 3.85 (SE = .183) and a kurtosis of
16.06 (SE = .363). Figure 32 displays the distribution of monthly usefulness scores.
0% 5% 10% 15% 20% 25% 30% 35% 40%
Zero
One
Two
Three
Four
Five
Six
Seven
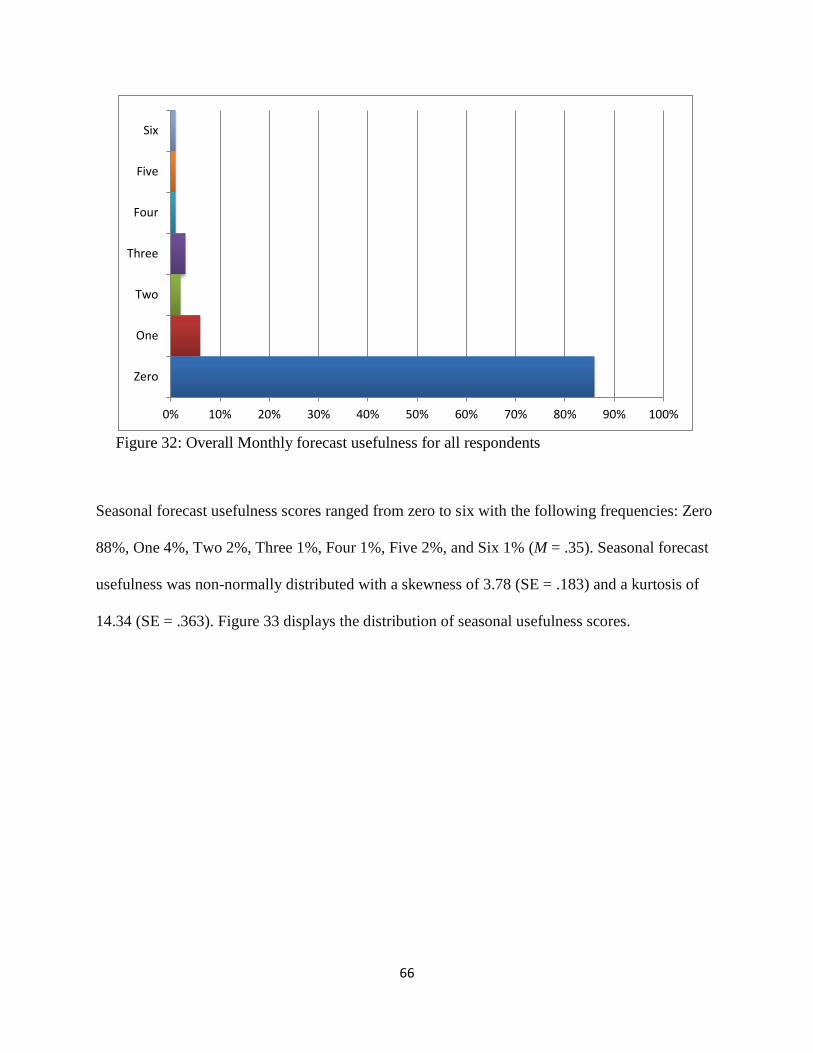
66
Figure 32: Overall Monthly forecast usefulness for all respondents
Seasonal forecast usefulness scores ranged from zero to six with the following frequencies: Zero
88%, One 4%, Two 2%, Three 1%, Four 1%, Five 2%, and Six 1% (M = .35). Seasonal forecast
usefulness was non-normally distributed with a skewness of 3.78 (SE = .183) and a kurtosis of
14.34 (SE = .363). Figure 33 displays the distribution of seasonal usefulness scores.
0% 10% 20% 30% 40% 50% 60% 70% 80% 90% 100%
Zero
One
Two
Three
Four
Five
Six
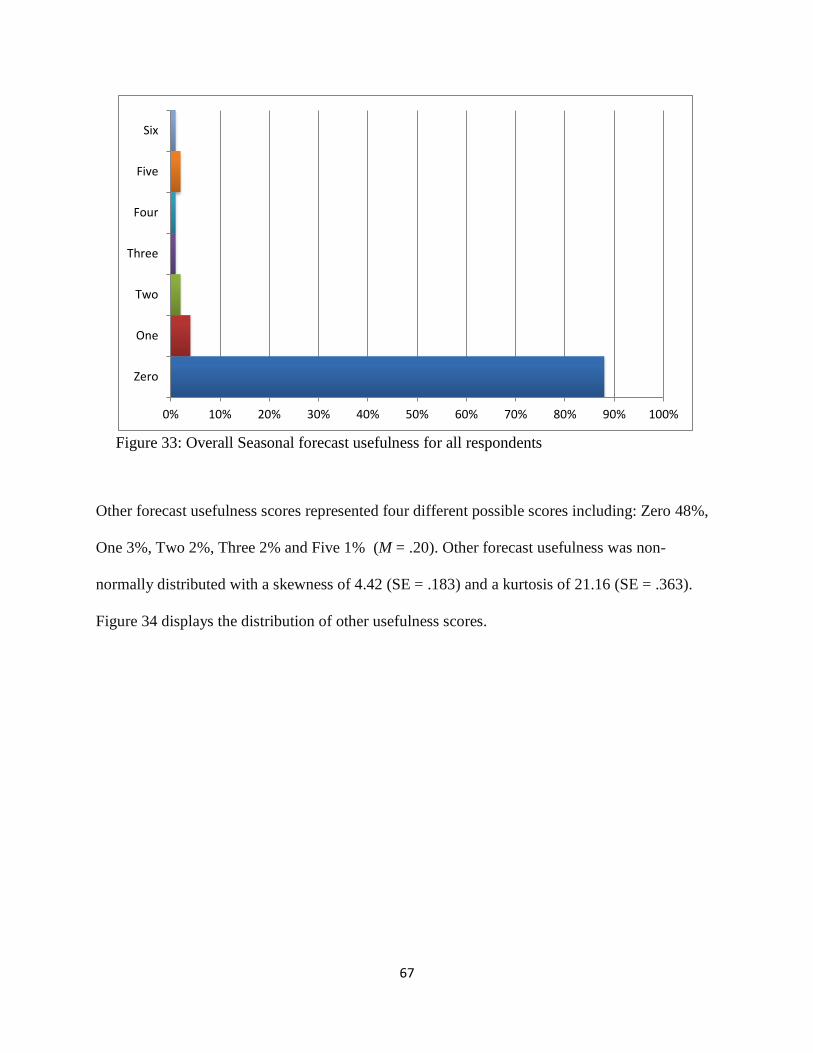
67
Figure 33: Overall Seasonal forecast usefulness for all respondents
Other forecast usefulness scores represented four different possible scores including: Zero 48%,
One 3%, Two 2%, Three 2% and Five 1% (M = .20). Other forecast usefulness was non-
normally distributed with a skewness of 4.42 (SE = .183) and a kurtosis of 21.16 (SE = .363).
Figure 34 displays the distribution of other usefulness scores.
0% 10% 20% 30% 40% 50% 60% 70% 80% 90% 100%
Zero
One
Two
Three
Four
Five
Six
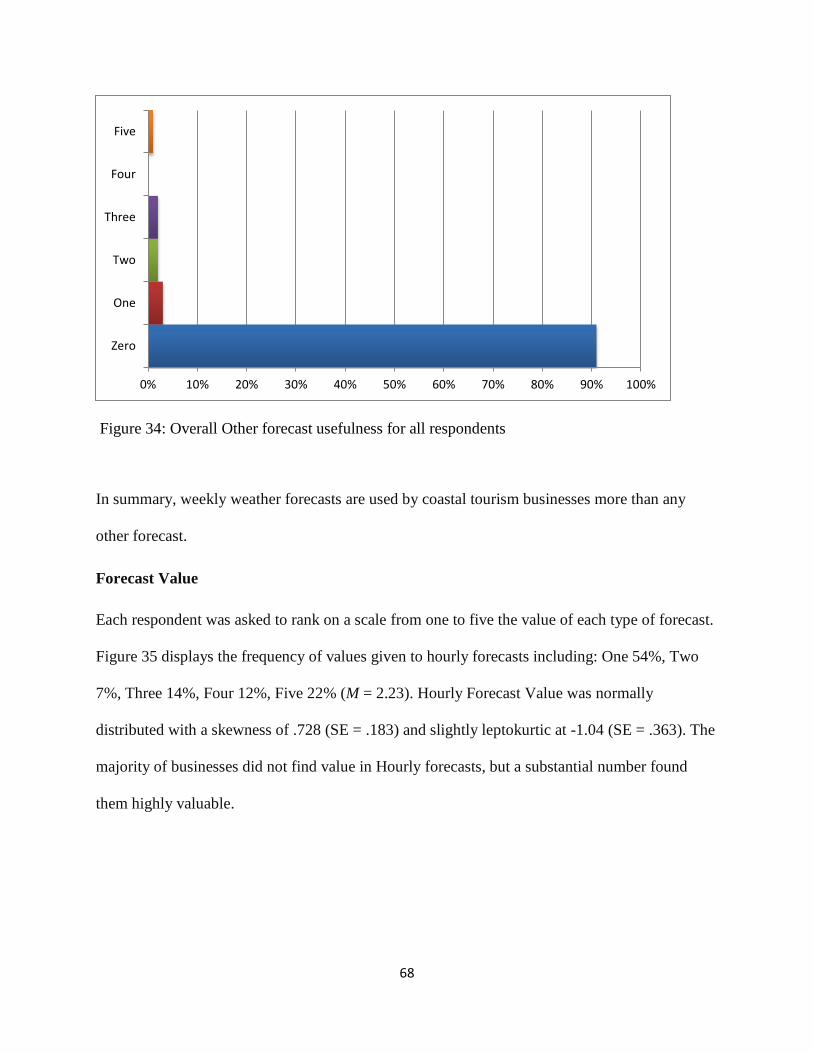
68
Figure 34: Overall Other forecast usefulness for all respondents
In summary, weekly weather forecasts are used by coastal tourism businesses more than any
other forecast.
Forecast Value
Each respondent was asked to rank on a scale from one to five the value of each type of forecast.
Figure 35 displays the frequency of values given to hourly forecasts including: One 54%, Two
7%, Three 14%, Four 12%, Five 22% (M = 2.23). Hourly Forecast Value was normally
distributed with a skewness of .728 (SE = .183) and slightly leptokurtic at -1.04 (SE = .363). The
majority of businesses did not find value in Hourly forecasts, but a substantial number found
them highly valuable.
0% 10% 20% 30% 40% 50% 60% 70% 80% 90% 100%
Zero
One
Two
Three
Four
Five
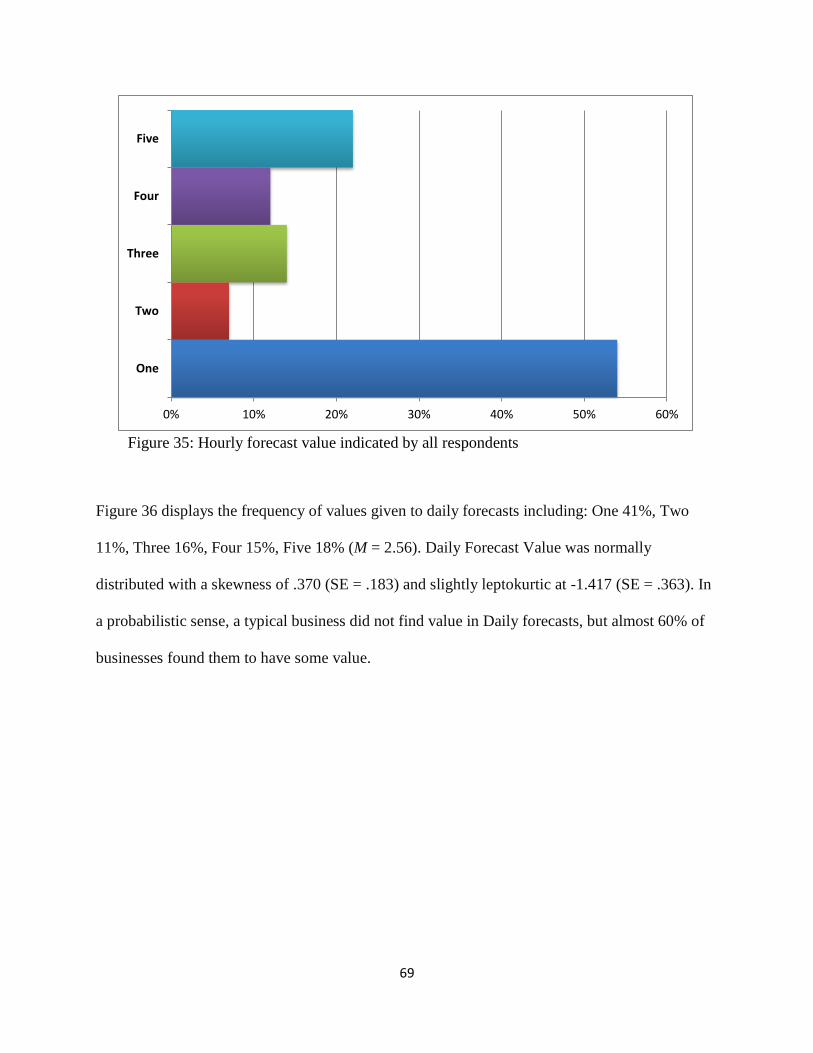
69
Figure 35: Hourly forecast value indicated by all respondents
Figure 36 displays the frequency of values given to daily forecasts including: One 41%, Two
11%, Three 16%, Four 15%, Five 18% (M = 2.56). Daily Forecast Value was normally
distributed with a skewness of .370 (SE = .183) and slightly leptokurtic at -1.417 (SE = .363). In
a probabilistic sense, a typical business did not find value in Daily forecasts, but almost 60% of
businesses found them to have some value.
0% 10% 20% 30% 40% 50% 60%
One
Two
Three
Four
Five
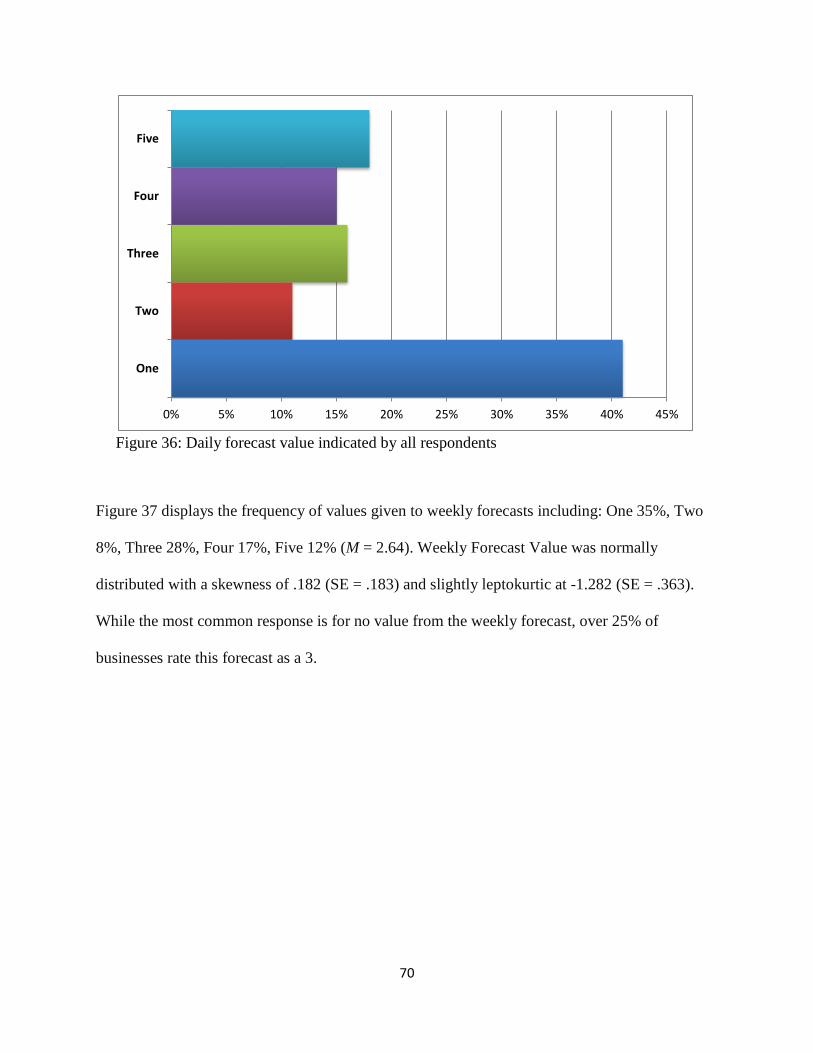
70
Figure 36: Daily forecast value indicated by all respondents
Figure 37 displays the frequency of values given to weekly forecasts including: One 35%, Two
8%, Three 28%, Four 17%, Five 12% (M = 2.64). Weekly Forecast Value was normally
distributed with a skewness of .182 (SE = .183) and slightly leptokurtic at -1.282 (SE = .363).
While the most common response is for no value from the weekly forecast, over 25% of
businesses rate this forecast as a 3.
0% 5% 10% 15% 20% 25% 30% 35% 40% 45%
One
Two
Three
Four
Five
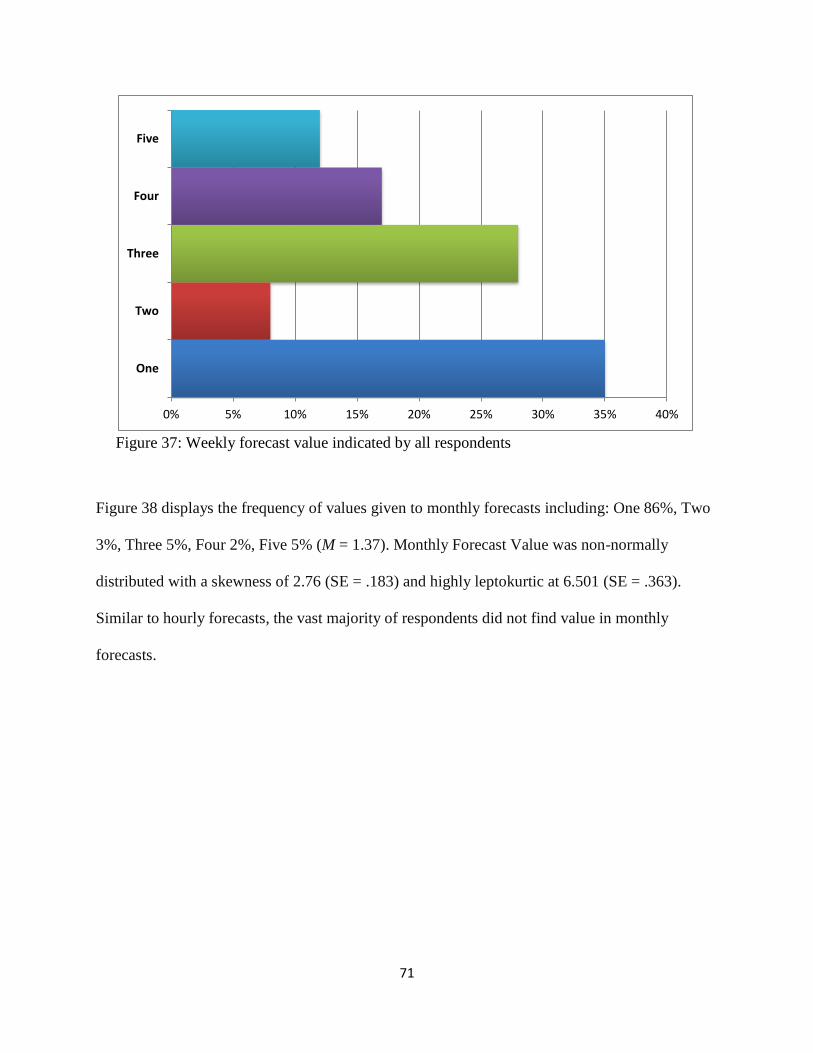
71
Figure 37: Weekly forecast value indicated by all respondents
Figure 38 displays the frequency of values given to monthly forecasts including: One 86%, Two
3%, Three 5%, Four 2%, Five 5% (M = 1.37). Monthly Forecast Value was non-normally
distributed with a skewness of 2.76 (SE = .183) and highly leptokurtic at 6.501 (SE = .363).
Similar to hourly forecasts, the vast majority of respondents did not find value in monthly
forecasts.
0% 5% 10% 15% 20% 25% 30% 35% 40%
One
Two
Three
Four
Five
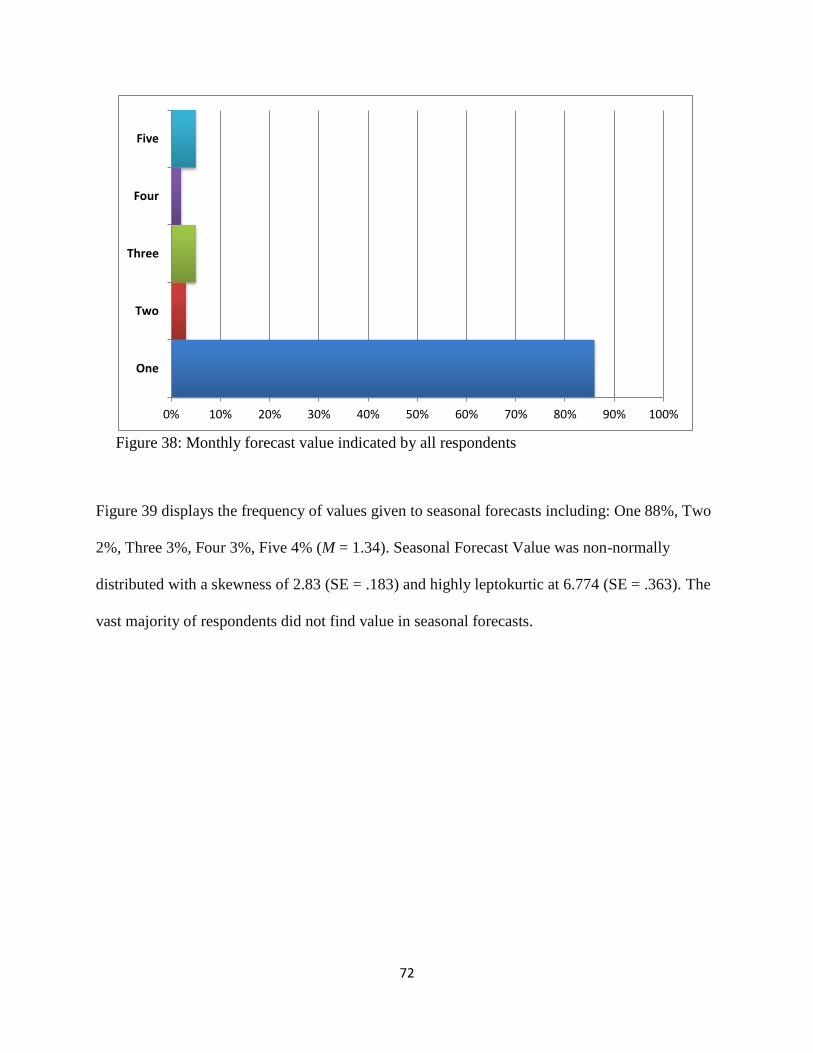
72
Figure 38: Monthly forecast value indicated by all respondents
Figure 39 displays the frequency of values given to seasonal forecasts including: One 88%, Two
2%, Three 3%, Four 3%, Five 4% (M = 1.34). Seasonal Forecast Value was non-normally
distributed with a skewness of 2.83 (SE = .183) and highly leptokurtic at 6.774 (SE = .363). The
vast majority of respondents did not find value in seasonal forecasts.
0% 10% 20% 30% 40% 50% 60% 70% 80% 90% 100%
One
Two
Three
Four
Five
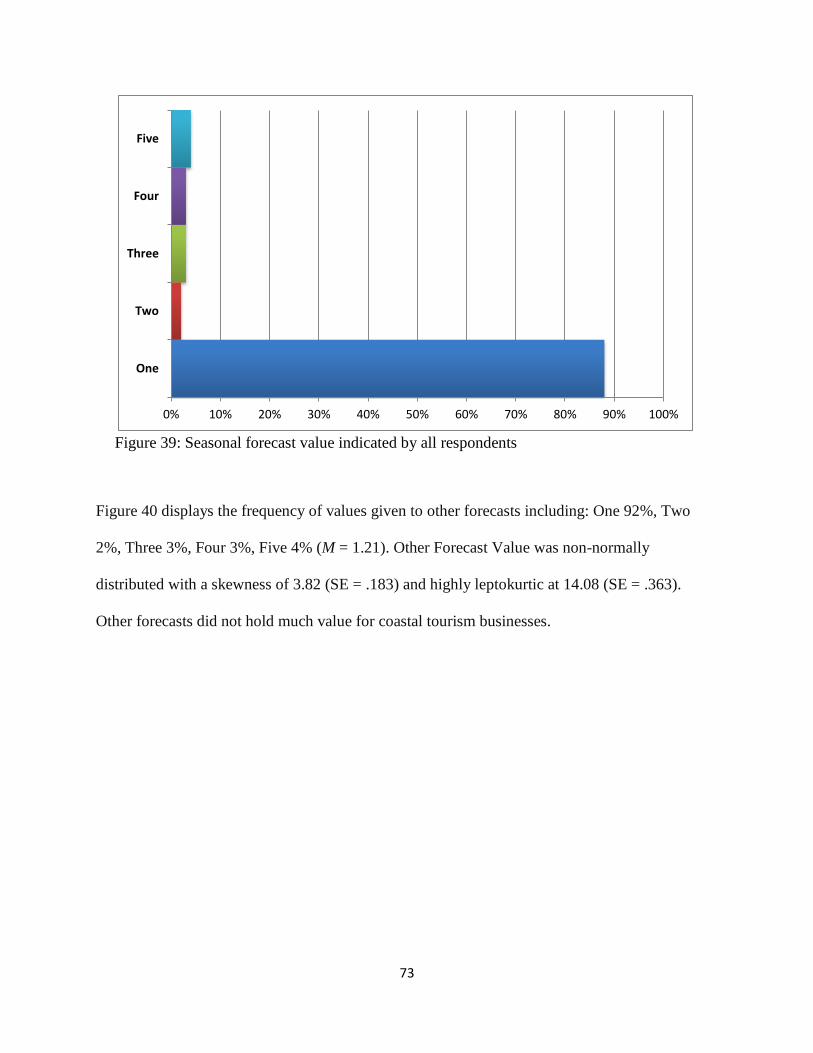
73
Figure 39: Seasonal forecast value indicated by all respondents
Figure 40 displays the frequency of values given to other forecasts including: One 92%, Two
2%, Three 3%, Four 3%, Five 4% (M = 1.21). Other Forecast Value was non-normally
distributed with a skewness of 3.82 (SE = .183) and highly leptokurtic at 14.08 (SE = .363).
Other forecasts did not hold much value for coastal tourism businesses.
0% 10% 20% 30% 40% 50% 60% 70% 80% 90% 100%
One
Two
Three
Four
Five
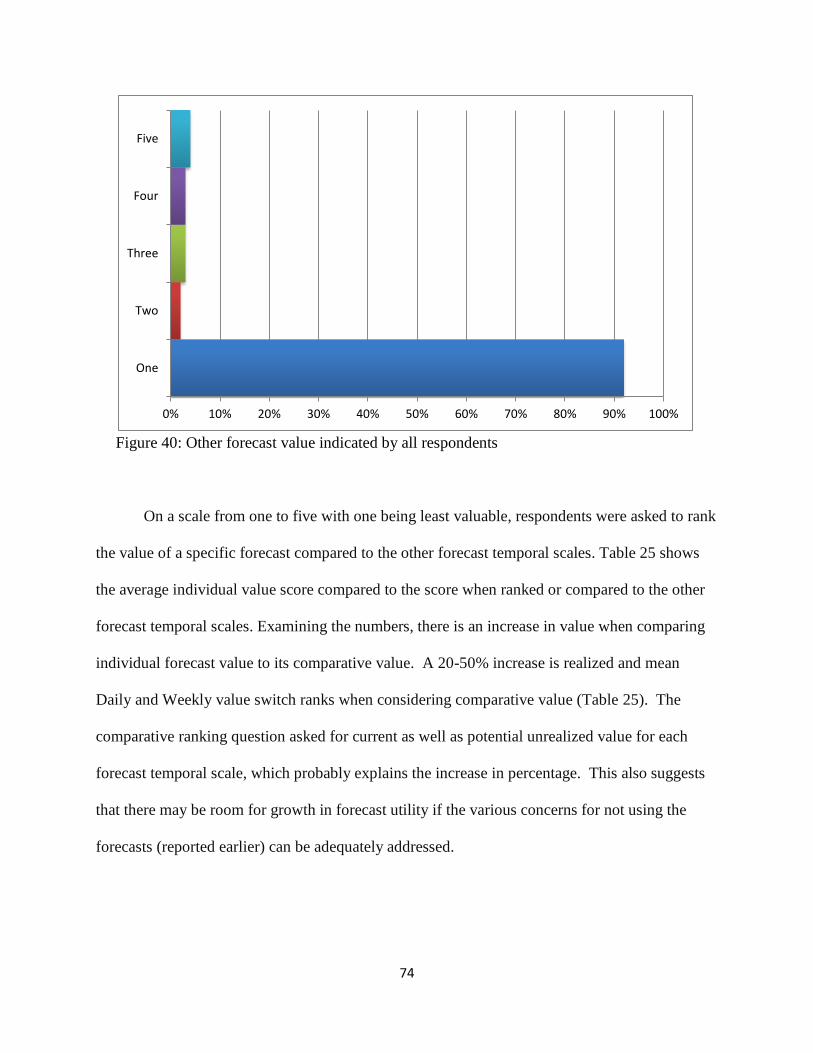
74
Figure 40: Other forecast value indicated by all respondents
On a scale from one to five with one being least valuable, respondents were asked to rank
the value of a specific forecast compared to the other forecast temporal scales. Table 25 shows
the average individual value score compared to the score when ranked or compared to the other
forecast temporal scales. Examining the numbers, there is an increase in value when comparing
individual forecast value to its comparative value. A 20-50% increase is realized and mean
Daily and Weekly value switch ranks when considering comparative value (Table 25). The
comparative ranking question asked for current as well as potential unrealized value for each
forecast temporal scale, which probably explains the increase in percentage. This also suggests
that there may be room for growth in forecast utility if the various concerns for not using the
forecasts (reported earlier) can be adequately addressed.
0% 10% 20% 30% 40% 50% 60% 70% 80% 90% 100%
One
Two
Three
Four
Five
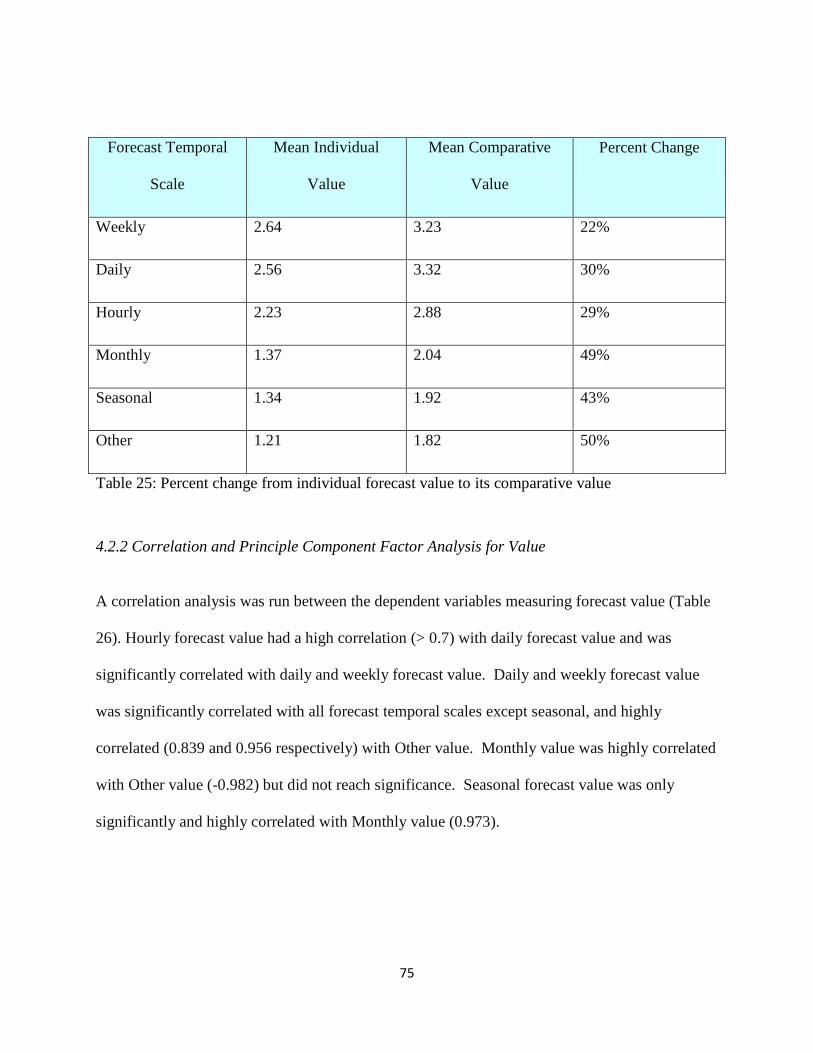
75
Forecast Temporal
Scale
Mean Individual
Value
Mean Comparative
Value
Percent Change
Weekly 2.64 3.23 22%
Daily 2.56 3.32 30%
Hourly 2.23 2.88 29%
Monthly 1.37 2.04 49%
Seasonal 1.34 1.92 43%
Other 1.21 1.82 50%
Table 25: Percent change from individual forecast value to its comparative value
4.2.2 Correlation and Principle Component Factor Analysis for Value
A correlation analysis was run between the dependent variables measuring forecast value (Table
26). Hourly forecast value had a high correlation (> 0.7) with daily forecast value and was
significantly correlated with daily and weekly forecast value. Daily and weekly forecast value
was significantly correlated with all forecast temporal scales except seasonal, and highly
correlated (0.839 and 0.956 respectively) with Other value. Monthly value was highly correlated
with Other value (-0.982) but did not reach significance. Seasonal forecast value was only
significantly and highly correlated with Monthly value (0.973).
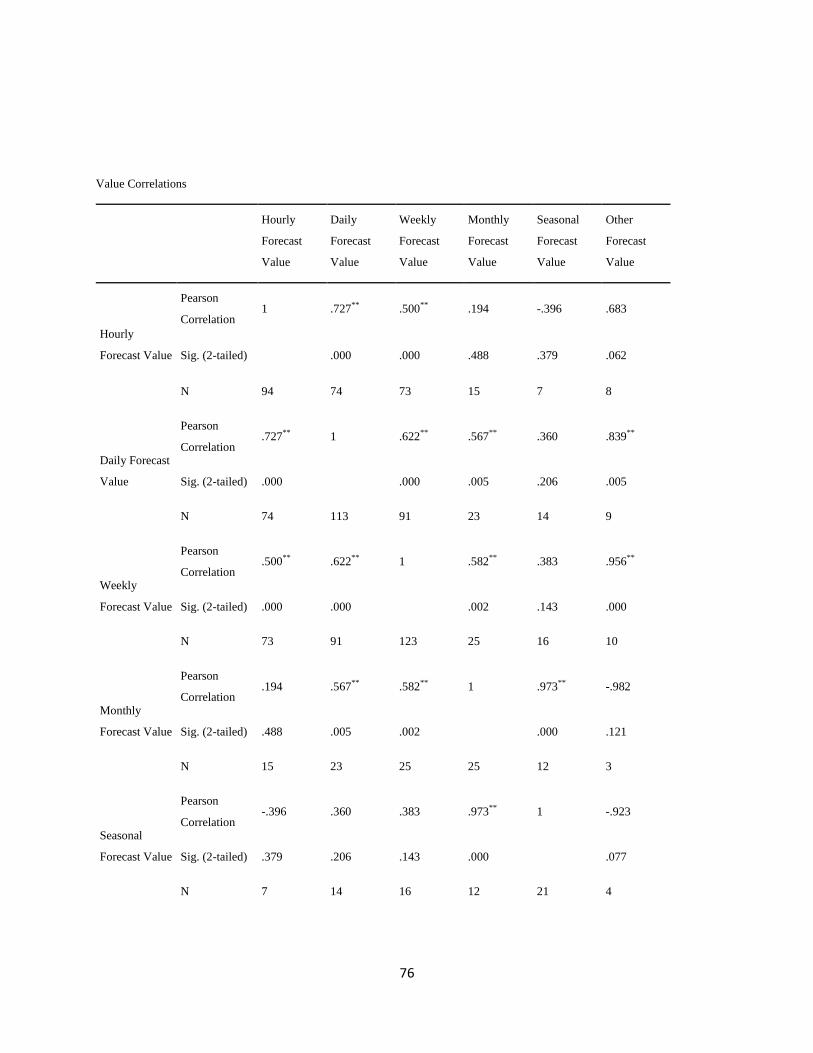
76
Value Correlations
Hourly
Forecast
Value
Daily
Forecast
Value
Weekly
Forecast
Value
Monthly
Forecast
Value
Seasonal
Forecast
Value
Other
Forecast
Value
Hourly
Forecast Value
Pearson
Correlation 1 .727** .500** .194 -.396 .683
Sig. (2-tailed)
.000 .000 .488 .379 .062
N 94 74 73 15 7 8
Daily Forecast
Value
Pearson
Correlation .727** 1 .622** .567** .360 .839**
Sig. (2-tailed) .000
.000 .005 .206 .005
N 74 113 91 23 14 9
Weekly
Forecast Value
Pearson
Correlation .500** .622** 1 .582** .383 .956**
Sig. (2-tailed) .000 .000
.002 .143 .000
N 73 91 123 25 16 10
Monthly
Forecast Value
Pearson
Correlation .194 .567** .582** 1 .973** -.982
Sig. (2-tailed) .488 .005 .002
.000 .121
N 15 23 25 25 12 3
Seasonal
Forecast Value
Pearson
Correlation -.396 .360 .383 .973** 1 -.923
Sig. (2-tailed) .379 .206 .143 .000
.077
N 7 14 16 12 21 4
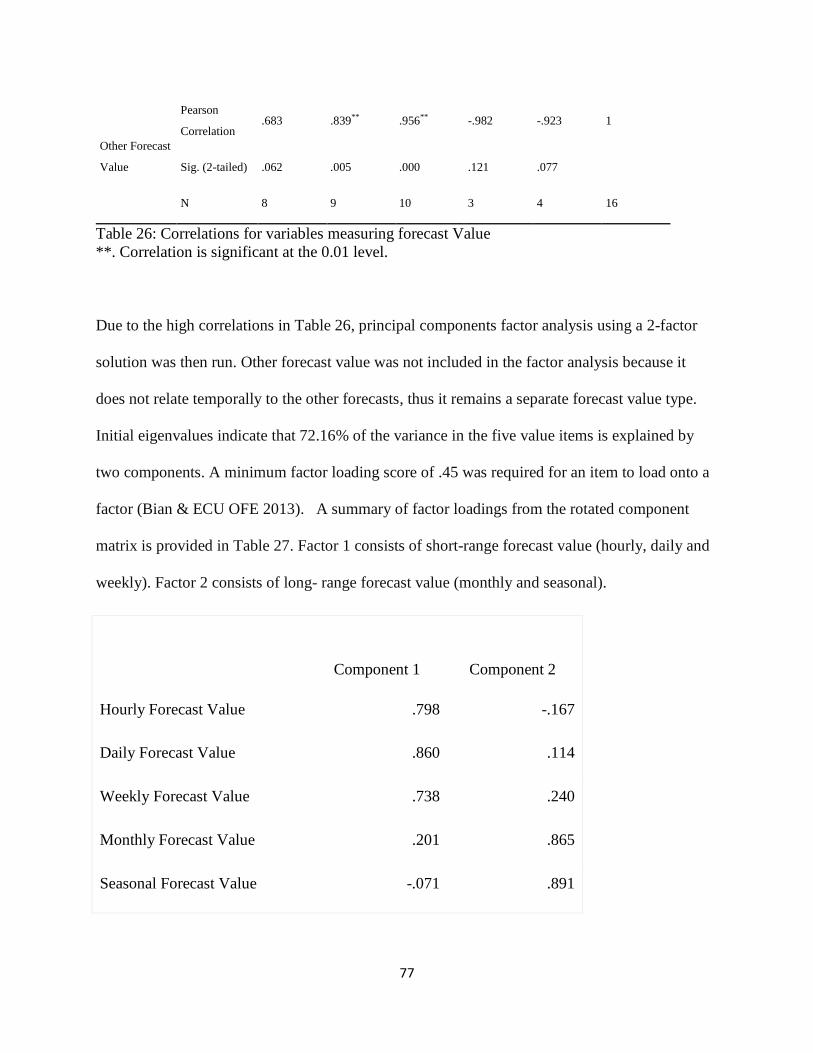
77
Other Forecast
Value
Pearson
Correlation .683 .839** .956** -.982 -.923 1
Sig. (2-tailed) .062 .005 .000 .121 .077
N 8 9 10 3 4 16
Table 26: Correlations for variables measuring forecast Value
**. Correlation is significant at the 0.01 level.
Due to the high correlations in Table 26, principal components factor analysis using a 2-factor
solution was then run. Other forecast value was not included in the factor analysis because it
does not relate temporally to the other forecasts, thus it remains a separate forecast value type.
Initial eigenvalues indicate that 72.16% of the variance in the five value items is explained by
two components. A minimum factor loading score of .45 was required for an item to load onto a
factor (Bian & ECU OFE 2013). A summary of factor loadings from the rotated component
matrix is provided in Table 27. Factor 1 consists of short-range forecast value (hourly, daily and
weekly). Factor 2 consists of long- range forecast value (monthly and seasonal).
Component 1 Component 2
Hourly Forecast Value .798 -.167
Daily Forecast Value .860 .114
Weekly Forecast Value .738 .240
Monthly Forecast Value .201 .865
Seasonal Forecast Value -.071 .891
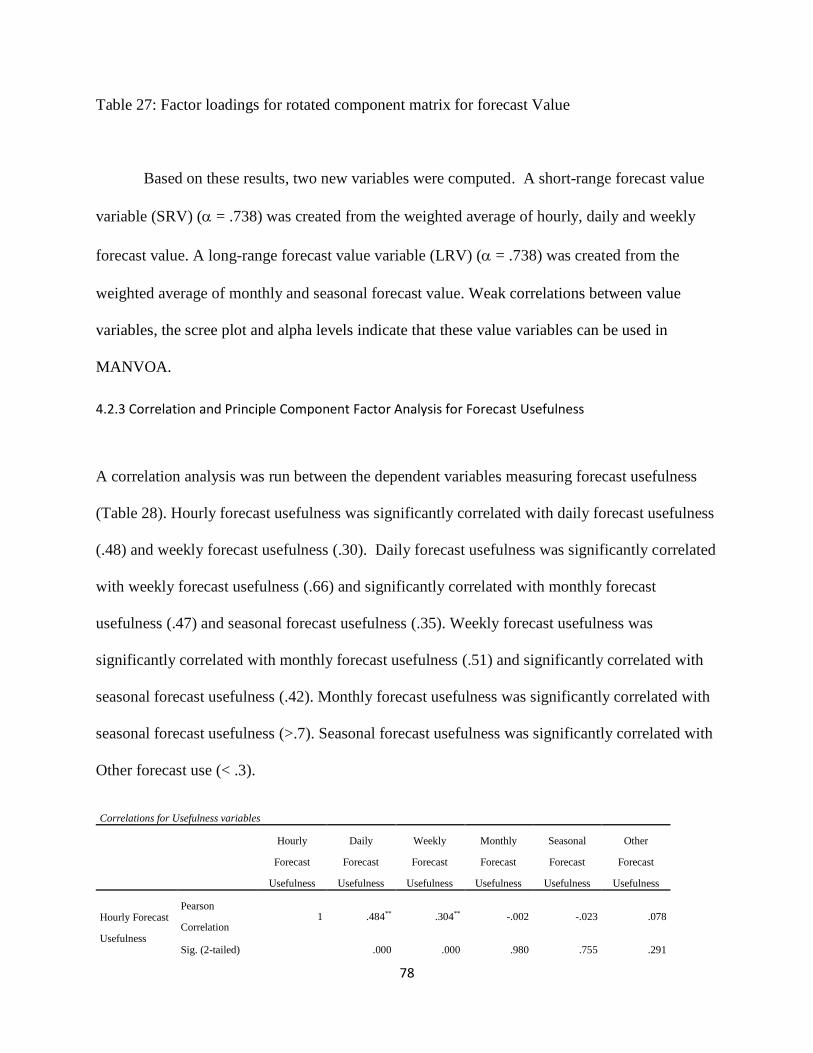
78
Table 27: Factor loadings for rotated component matrix for forecast Value
Based on these results, two new variables were computed. A short-range forecast value
variable (SRV) ( = .738) was created from the weighted average of hourly, daily and weekly
forecast value. A long-range forecast value variable (LRV) ( = .738) was created from the
weighted average of monthly and seasonal forecast value. Weak correlations between value
variables, the scree plot and alpha levels indicate that these value variables can be used in
MANVOA.
4.2.3 Correlation and Principle Component Factor Analysis for Forecast Usefulness
A correlation analysis was run between the dependent variables measuring forecast usefulness
(Table 28). Hourly forecast usefulness was significantly correlated with daily forecast usefulness
(.48) and weekly forecast usefulness (.30). Daily forecast usefulness was significantly correlated
with weekly forecast usefulness (.66) and significantly correlated with monthly forecast
usefulness (.47) and seasonal forecast usefulness (.35). Weekly forecast usefulness was
significantly correlated with monthly forecast usefulness (.51) and significantly correlated with
seasonal forecast usefulness (.42). Monthly forecast usefulness was significantly correlated with
seasonal forecast usefulness (>.7). Seasonal forecast usefulness was significantly correlated with
Other forecast use (< .3).
Correlations for Usefulness variables
Hourly
Forecast
Usefulness
Daily
Forecast
Usefulness
Weekly
Forecast
Usefulness
Monthly
Forecast
Usefulness
Seasonal
Forecast
Usefulness
Other
Forecast
Usefulness
Hourly Forecast
Usefulness
Pearson
Correlation 1 .484** .304** -.002 -.023 .078
Sig. (2-tailed)
.000 .000 .980 .755 .291
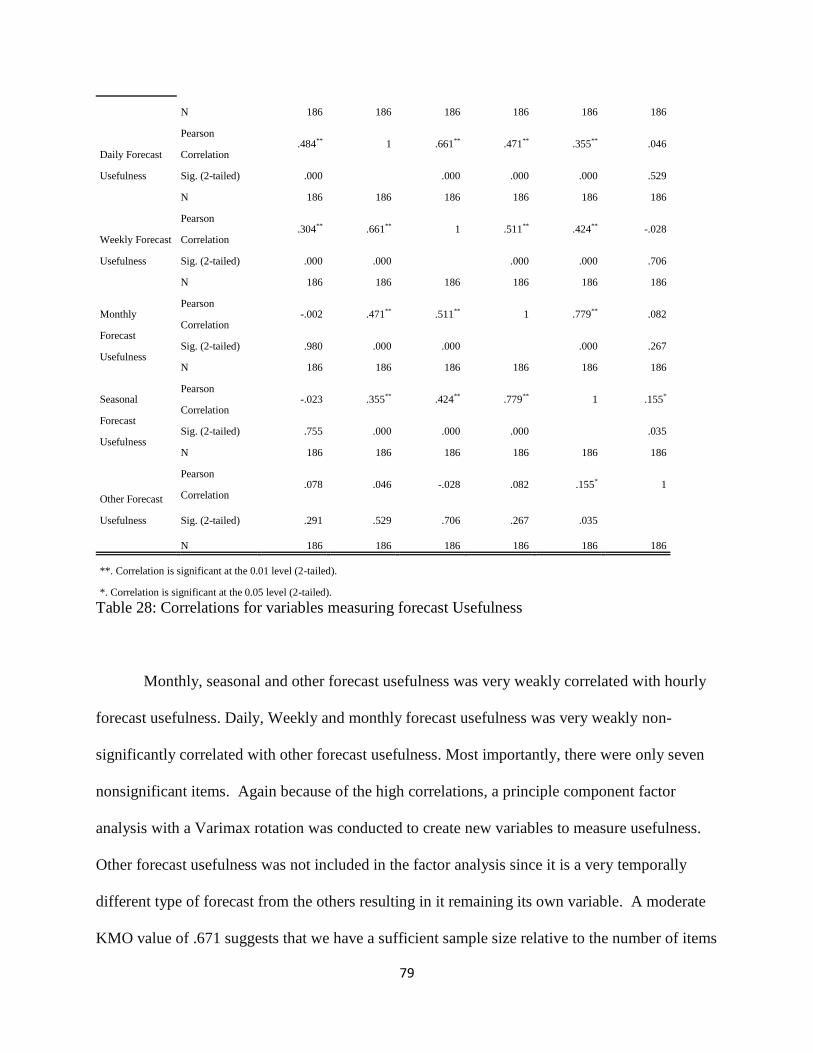
79
N 186 186 186 186 186 186
Daily Forecast
Usefulness
Pearson
Correlation .484** 1 .661** .471** .355** .046
Sig. (2-tailed) .000
.000 .000 .000 .529
N 186 186 186 186 186 186
Weekly Forecast
Usefulness
Pearson
Correlation .304** .661** 1 .511** .424** -.028
Sig. (2-tailed) .000 .000
.000 .000 .706
N 186 186 186 186 186 186
Monthly
Forecast
Usefulness
Pearson
Correlation -.002 .471** .511** 1 .779** .082
Sig. (2-tailed) .980 .000 .000
.000 .267
N 186 186 186 186 186 186
Seasonal
Forecast
Usefulness
Pearson
Correlation -.023 .355** .424** .779** 1 .155*
Sig. (2-tailed) .755 .000 .000 .000
.035
N 186 186 186 186 186 186
Other Forecast
Usefulness
Pearson
Correlation .078 .046 -.028 .082 .155* 1
Sig. (2-tailed) .291 .529 .706 .267 .035
N 186 186 186 186 186 186
**. Correlation is significant at the 0.01 level (2-tailed).
*. Correlation is significant at the 0.05 level (2-tailed).
Table 28: Correlations for variables measuring forecast Usefulness
Monthly, seasonal and other forecast usefulness was very weakly correlated with hourly
forecast usefulness. Daily, Weekly and monthly forecast usefulness was very weakly non-
significantly correlated with other forecast usefulness. Most importantly, there were only seven
nonsignificant items. Again because of the high correlations, a principle component factor
analysis with a Varimax rotation was conducted to create new variables to measure usefulness.
Other forecast usefulness was not included in the factor analysis since it is a very temporally
different type of forecast from the others resulting in it remaining its own variable. A moderate
KMO value of .671 suggests that we have a sufficient sample size relative to the number of items
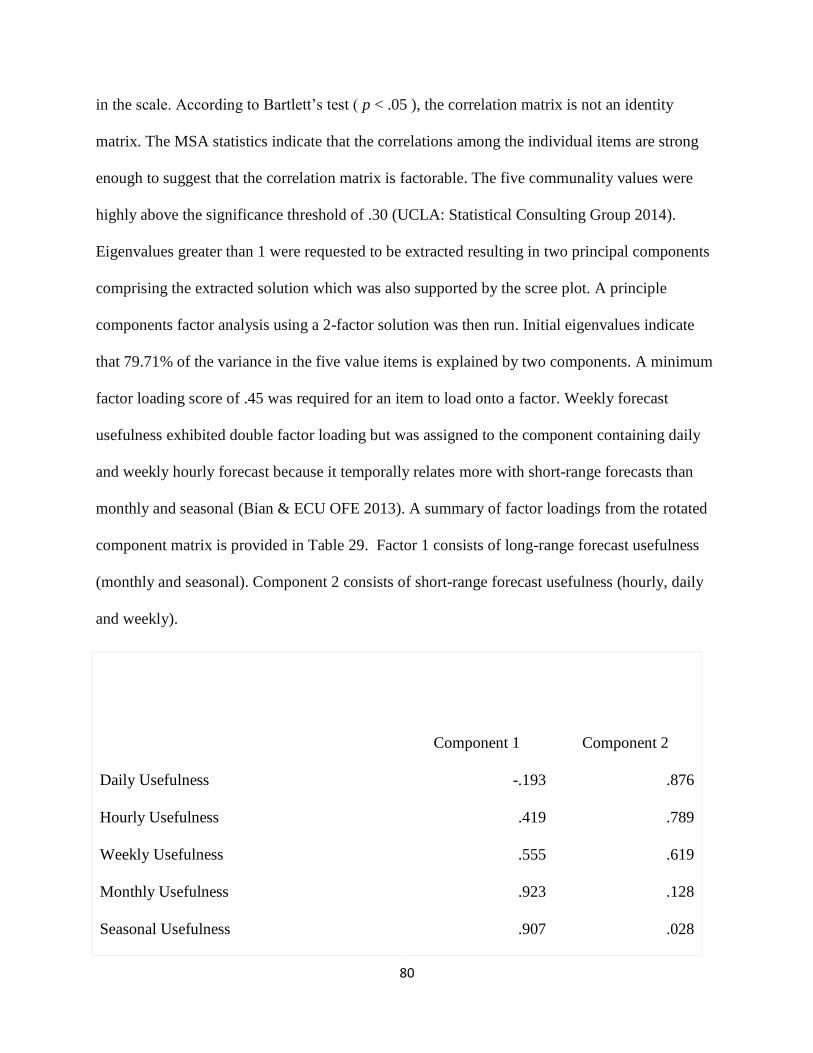
80
in the scale. According to Bartlett’s test ( p < .05 ), the correlation matrix is not an identity
matrix. The MSA statistics indicate that the correlations among the individual items are strong
enough to suggest that the correlation matrix is factorable. The five communality values were
highly above the significance threshold of .30 (UCLA: Statistical Consulting Group 2014).
Eigenvalues greater than 1 were requested to be extracted resulting in two principal components
comprising the extracted solution which was also supported by the scree plot. A principle
components factor analysis using a 2-factor solution was then run. Initial eigenvalues indicate
that 79.71% of the variance in the five value items is explained by two components. A minimum
factor loading score of .45 was required for an item to load onto a factor. Weekly forecast
usefulness exhibited double factor loading but was assigned to the component containing daily
and weekly hourly forecast because it temporally relates more with short-range forecasts than
monthly and seasonal (Bian & ECU OFE 2013). A summary of factor loadings from the rotated
component matrix is provided in Table 29. Factor 1 consists of long-range forecast usefulness
(monthly and seasonal). Component 2 consists of short-range forecast usefulness (hourly, daily
and weekly).
Component 1 Component 2
Daily Usefulness -.193 .876
Hourly Usefulness .419 .789
Weekly Usefulness .555 .619
Monthly Usefulness .923 .128
Seasonal Usefulness .907 .028
81
Table 29: Factor loadings for rotated component matrix for forecast Usefulness
Based on these results, two new variables were computed.Monthly and seasonal forecast
usefulness were averaged for a long-range forecast usefulness variable (LRU) ( = .876).
Hourly, daily and weekly forecast usefulness were averaged for a short-range forecast usefulness
variable (SRU) ( = .735). In general, usefulness variables are weakly correlated. However, SRU
and LRU are correlated at 0.394 (p < 0.05). These conditions combined with the scree plot and
the alpha levels indicate that these usefulness variables can be used in MANVOA.
4.3 Comparison Analysis
ANOVA is run three times to test whether the mean of perceived weather and climate
dependency is different among i) the six categories of business types ii) the three categories of
business age and iii) the two categories of business size. MANOVA is run three times to test
whether the means of three variables: short-range forecast value, long-range forecast value, and
other forecast value are different among i) business types ii) business age and iii) business size.
This statistical test was repeated (run three more times) with forecast value variables being
replaced by forecast usefulness variables. The significant results are presented first, followed by
the null results. Business Type and Perceived Dependency
There is a statistically significant difference in levels of perceived climate and weather
dependency based on business type determined by a one-way ANOVA F (5, 171) = 10.785; p <
.05. A Tukey post-hoc test revealed that perceived climate and weather dependency was
statistically significantly lower for Accommodations (M = 3.15 + 1.5, p = .001), Food Services
(M = 2.91 + 1.3, p = .000) and Other (M = 3.08 + 1.5, p = .016) compared to Agriculture (M =
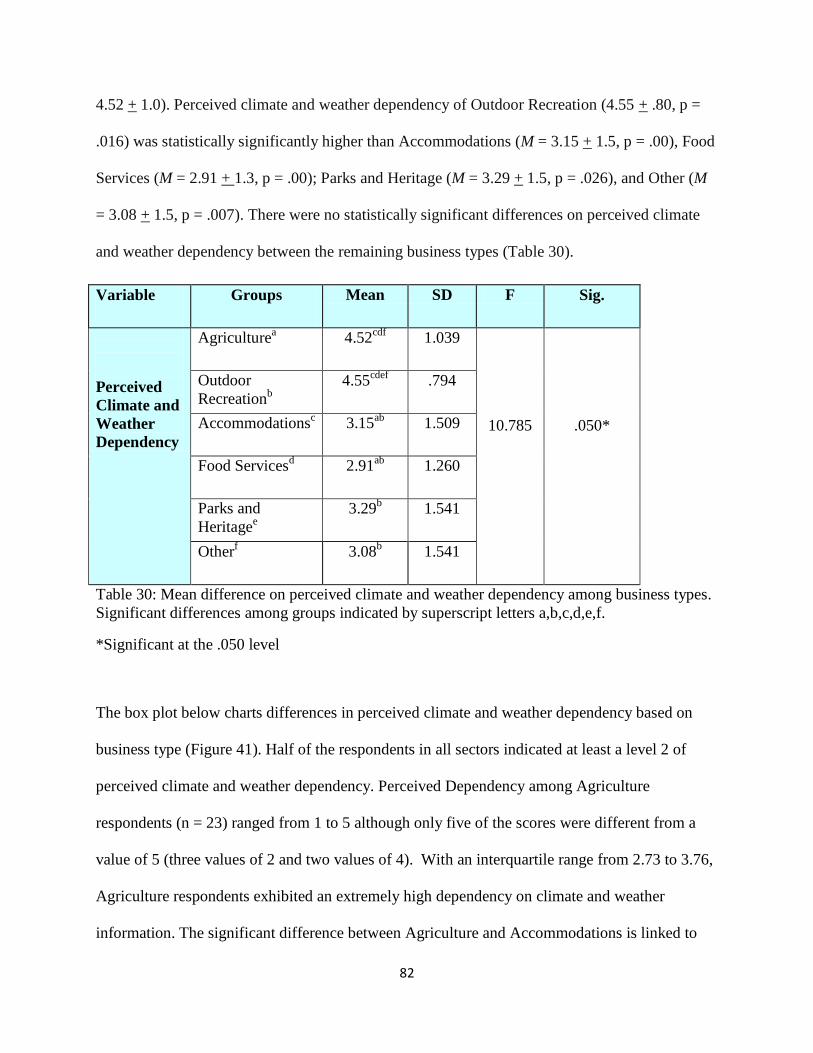
82
4.52 + 1.0). Perceived climate and weather dependency of Outdoor Recreation (4.55 + .80, p =
.016) was statistically significantly higher than Accommodations (M = 3.15 + 1.5, p = .00), Food
Services (M = 2.91 + 1.3, p = .00); Parks and Heritage (M = 3.29 + 1.5, p = .026), and Other (M
= 3.08 + 1.5, p = .007). There were no statistically significant differences on perceived climate
and weather dependency between the remaining business types (Table 30).
Variable Groups Mean SD F Sig.
Perceived
Climate and
Weather
Dependency
Agriculturea 4.52
cdf 1.039
10.785
.050*
Outdoor
Recreationb
4.55cdef
.794
Accommodationsc 3.15
ab 1.509
Food Servicesd 2.91
ab 1.260
Parks and
Heritagee
3.29b 1.541
Otherf 3.08
b 1.541
Table 30: Mean difference on perceived climate and weather dependency among business types.
Significant differences among groups indicated by superscript letters a,b,c,d,e,f.
*Significant at the .050 level
The box plot below charts differences in perceived climate and weather dependency based on
business type (Figure 41). Half of the respondents in all sectors indicated at least a level 2 of
perceived climate and weather dependency. Perceived Dependency among Agriculture
respondents (n = 23) ranged from 1 to 5 although only five of the scores were different from a
value of 5 (three values of 2 and two values of 4). With an interquartile range from 2.73 to 3.76,
Agriculture respondents exhibited an extremely high dependency on climate and weather
information. The significant difference between Agriculture and Accommodations is linked to
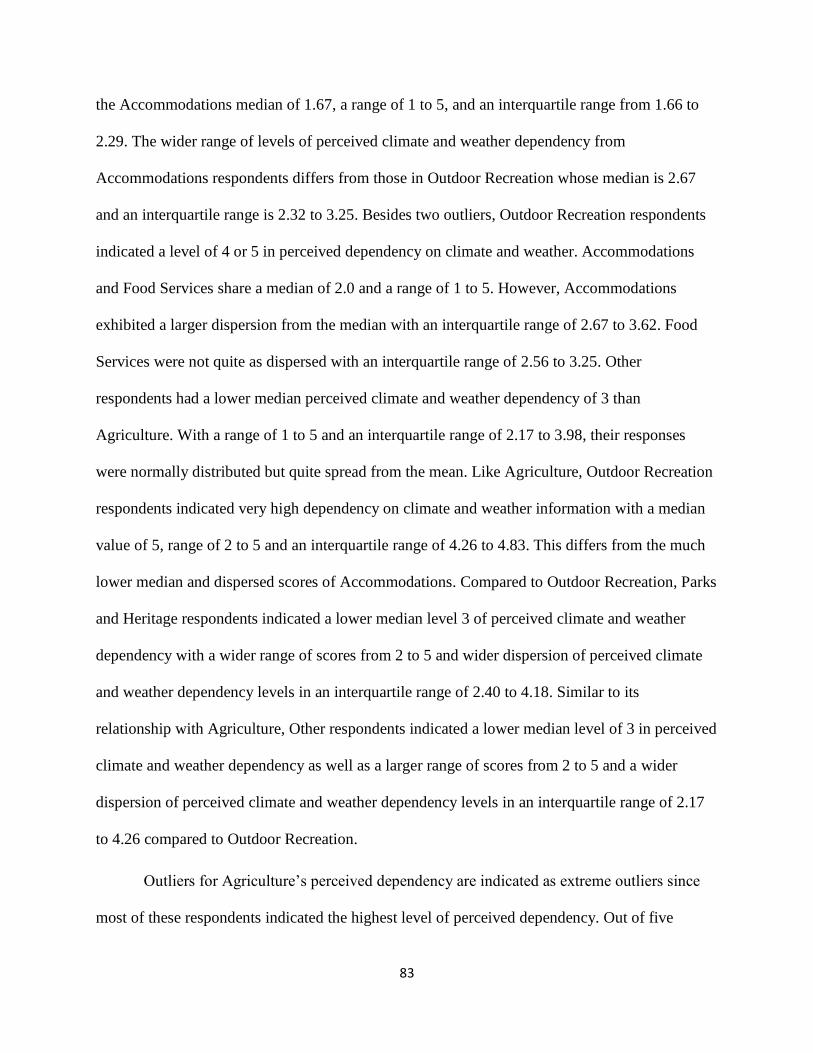
83
the Accommodations median of 1.67, a range of 1 to 5, and an interquartile range from 1.66 to
2.29. The wider range of levels of perceived climate and weather dependency from
Accommodations respondents differs from those in Outdoor Recreation whose median is 2.67
and an interquartile range is 2.32 to 3.25. Besides two outliers, Outdoor Recreation respondents
indicated a level of 4 or 5 in perceived dependency on climate and weather. Accommodations
and Food Services share a median of 2.0 and a range of 1 to 5. However, Accommodations
exhibited a larger dispersion from the median with an interquartile range of 2.67 to 3.62. Food
Services were not quite as dispersed with an interquartile range of 2.56 to 3.25. Other
respondents had a lower median perceived climate and weather dependency of 3 than
Agriculture. With a range of 1 to 5 and an interquartile range of 2.17 to 3.98, their responses
were normally distributed but quite spread from the mean. Like Agriculture, Outdoor Recreation
respondents indicated very high dependency on climate and weather information with a median
value of 5, range of 2 to 5 and an interquartile range of 4.26 to 4.83. This differs from the much
lower median and dispersed scores of Accommodations. Compared to Outdoor Recreation, Parks
and Heritage respondents indicated a lower median level 3 of perceived climate and weather
dependency with a wider range of scores from 2 to 5 and wider dispersion of perceived climate
and weather dependency levels in an interquartile range of 2.40 to 4.18. Similar to its
relationship with Agriculture, Other respondents indicated a lower median level of 3 in perceived
climate and weather dependency as well as a larger range of scores from 2 to 5 and a wider
dispersion of perceived climate and weather dependency levels in an interquartile range of 2.17
to 4.26 compared to Outdoor Recreation.
Outliers for Agriculture’s perceived dependency are indicated as extreme outliers since
most of these respondents indicated the highest level of perceived dependency. Out of five
84
Agriculture outliers, three indicated a level two of perceived dependency and included two
marinas and a yacht retailer. The other two Agriculture outliers indicated a level four of
perceived dependency and included a marina/boating community and a charter boat business.
The diversity of revenue streams within the marina/boating community could provide a larger
safety net from climate and weather impacts explaining their low perceived dependency on
climate and weather. Outdoor Recreation had two extreme outliers indicating a level two of
perceived dependency and included a youth summer camp and a laser tag facility. Since there
were only three indoor recreation businesses within our sample, they were included into the
general category of Outdoor Recreation. Their low perceived dependency is similar to other
indoor businesses within Accommodations and Food Services.
Figure 41: Differences in short-range Value based on business type
Outlier
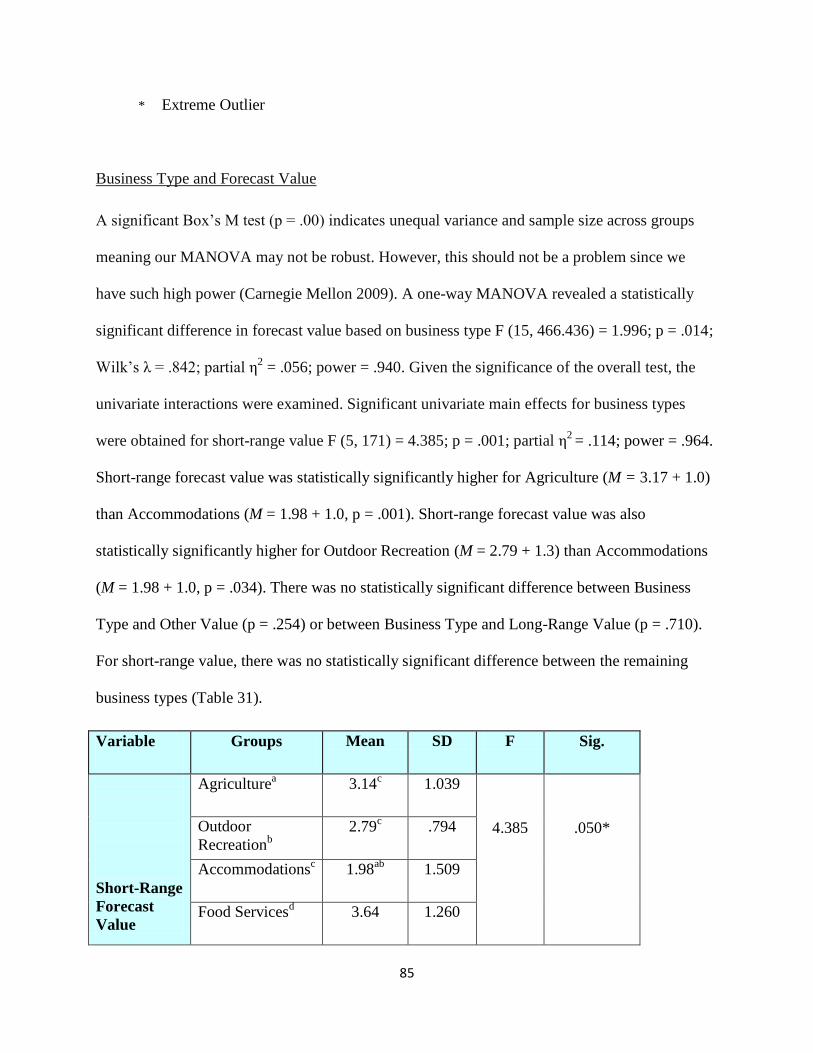
85
* Extreme Outlier
Business Type and Forecast Value
A significant Box’s M test (p = .00) indicates unequal variance and sample size across groups
meaning our MANOVA may not be robust. However, this should not be a problem since we
have such high power (Carnegie Mellon 2009). A one-way MANOVA revealed a statistically
significant difference in forecast value based on business type F (15, 466.436) = 1.996; p = .014;
Wilk’s λ = .842; partial η2 = .056; power = .940. Given the significance of the overall test, the
univariate interactions were examined. Significant univariate main effects for business types
were obtained for short-range value F (5, 171) = 4.385; p = .001; partial η2 = .114; power = .964.
Short-range forecast value was statistically significantly higher for Agriculture (M = 3.17 + 1.0)
than Accommodations (M = 1.98 + 1.0, p = .001). Short-range forecast value was also
statistically significantly higher for Outdoor Recreation (M = 2.79 + 1.3) than Accommodations
(M = 1.98 + 1.0, p = .034). There was no statistically significant difference between Business
Type and Other Value (p = .254) or between Business Type and Long-Range Value (p = .710).
For short-range value, there was no statistically significant difference between the remaining
business types (Table 31).
Variable Groups Mean SD F Sig.
Short-Range
Forecast
Value
Agriculturea 3.14
c 1.039
4.385
.050*
Outdoor
Recreationb
2.79c
.794
Accommodationsc 1.98
ab 1.509
Food Servicesd 3.64 1.260
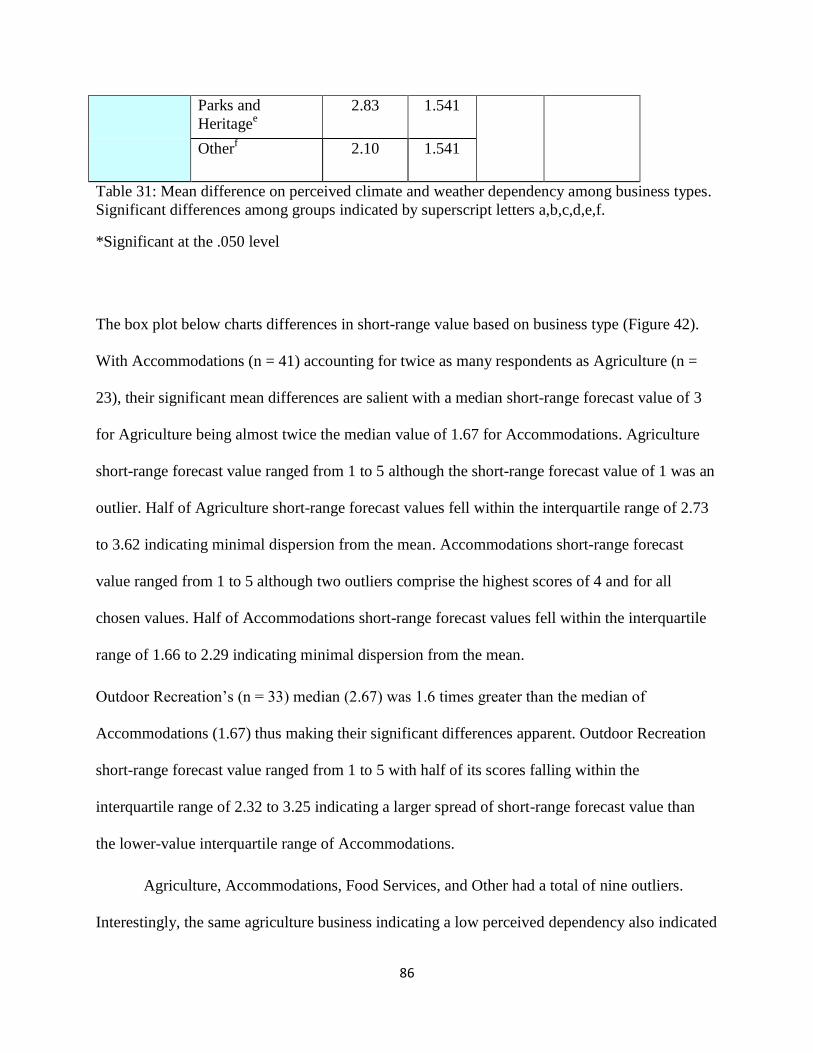
86
Parks and
Heritagee
2.83 1.541
Otherf 2.10 1.541
Table 31: Mean difference on perceived climate and weather dependency among business types.
Significant differences among groups indicated by superscript letters a,b,c,d,e,f.
*Significant at the .050 level
The box plot below charts differences in short-range value based on business type (Figure 42).
With Accommodations (n = 41) accounting for twice as many respondents as Agriculture (n =
23), their significant mean differences are salient with a median short-range forecast value of 3
for Agriculture being almost twice the median value of 1.67 for Accommodations. Agriculture
short-range forecast value ranged from 1 to 5 although the short-range forecast value of 1 was an
outlier. Half of Agriculture short-range forecast values fell within the interquartile range of 2.73
to 3.62 indicating minimal dispersion from the mean. Accommodations short-range forecast
value ranged from 1 to 5 although two outliers comprise the highest scores of 4 and for all
chosen values. Half of Accommodations short-range forecast values fell within the interquartile
range of 1.66 to 2.29 indicating minimal dispersion from the mean.
Outdoor Recreation’s (n = 33) median (2.67) was 1.6 times greater than the median of
Accommodations (1.67) thus making their significant differences apparent. Outdoor Recreation
short-range forecast value ranged from 1 to 5 with half of its scores falling within the
interquartile range of 2.32 to 3.25 indicating a larger spread of short-range forecast value than
the lower-value interquartile range of Accommodations.
Agriculture, Accommodations, Food Services, and Other had a total of nine outliers.
Interestingly, the same agriculture business indicating a low perceived dependency also indicated

87
a very low value on short-range forecasts. The two outliers for Accommodations included a
waterfront property contractor and a realty company indicating high value on short-range
forecasts. The five outliers for Food Services included two waterfront restaurants, two grills and
one general restaurant that indicated high value of short-range forecasts. Perhaps the proximity
of a restaurant to the water means increase risk from flooding and waves from adverse weather
conditions that could be minimized by using short-range forecasts. An outdoor recreation guide
and outfitter business indicated the highest value of short-range forecasts in the Other category,
which is consistent with businesses in the Outdoor Recreation sector.
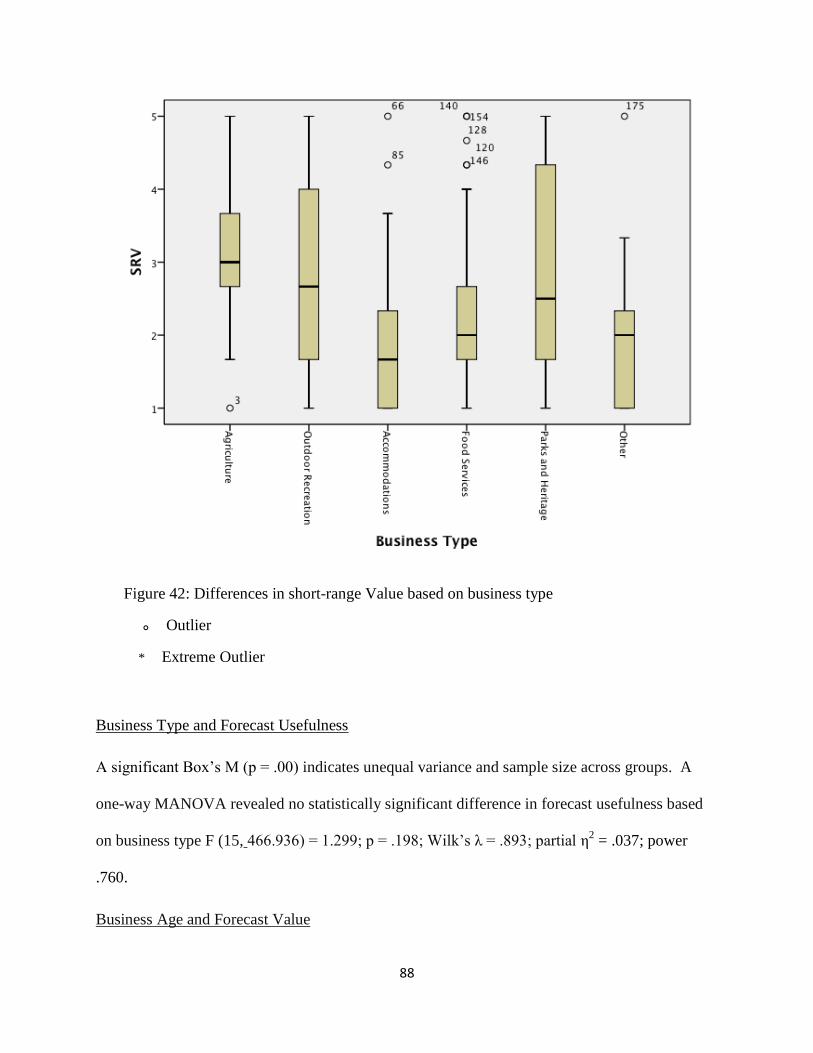
88
Figure 42: Differences in short-range Value based on business type
Outlier
* Extreme Outlier
Business Type and Forecast Usefulness
A significant Box’s M (p = .00) indicates unequal variance and sample size across groups. A
one-way MANOVA revealed no statistically significant difference in forecast usefulness based
on business type F (15, 466.936) = 1.299; p = .198; Wilk’s λ = .893; partial η2 = .037; power
.760.
Business Age and Forecast Value
89
A significant Box’s M test (p = .025) indicates unequal variance and sample size across groups.
A one-way MANOVA revealed no statistically significant difference in forecast value based on
business age F (6, 344) = .413; p = .870; Wilk’s λ = .986, partial η2
= .01; power = .760.
Business Age and Usefulness
A significant Box’s M (p = .00) indicates unequal variance and sample size across groups. A
one-way MANOVA revealed no statistically significant difference in forecast usefulness based
on business age F (6, 344) = .344; p = .919; Wilk’s λ = .988; partial η2 = .01; power = .144.
Business Age and Perceived Dependency
There is a non-significant difference between business age and perceived dependency as
determined by a one-way ANOVA F (2, 174) = 2.492; p = .086.
Business Size and Value
A non-significant Box’ M test (p = .083) indicates equal variance and sample size across groups.
A one-way MANOVA revealed no statistically significant difference in forecast value based on
business size F ( 3, 173); p = .368; Wilk’s λ = .982; partial η2 = .018; power = .284.
Business Size and Usefulness
A significant Box’s M (p = .00) indicates unequal variance and sample size across groups. A
one-way MANOVA revealed no statistically significant difference in forecast usefulness based
on business size F (3, 173) = .641; p = .589; Wilk’s λ = .989; partial η2 = .011; power = .183.
Business Size and Perceived Dependency
There is a non-significant difference between groups as determined by one-way ANOVA F (2,
174) = 1.150; p = .319.
Table 32 is a general user profile for each business type created from the above analysis.
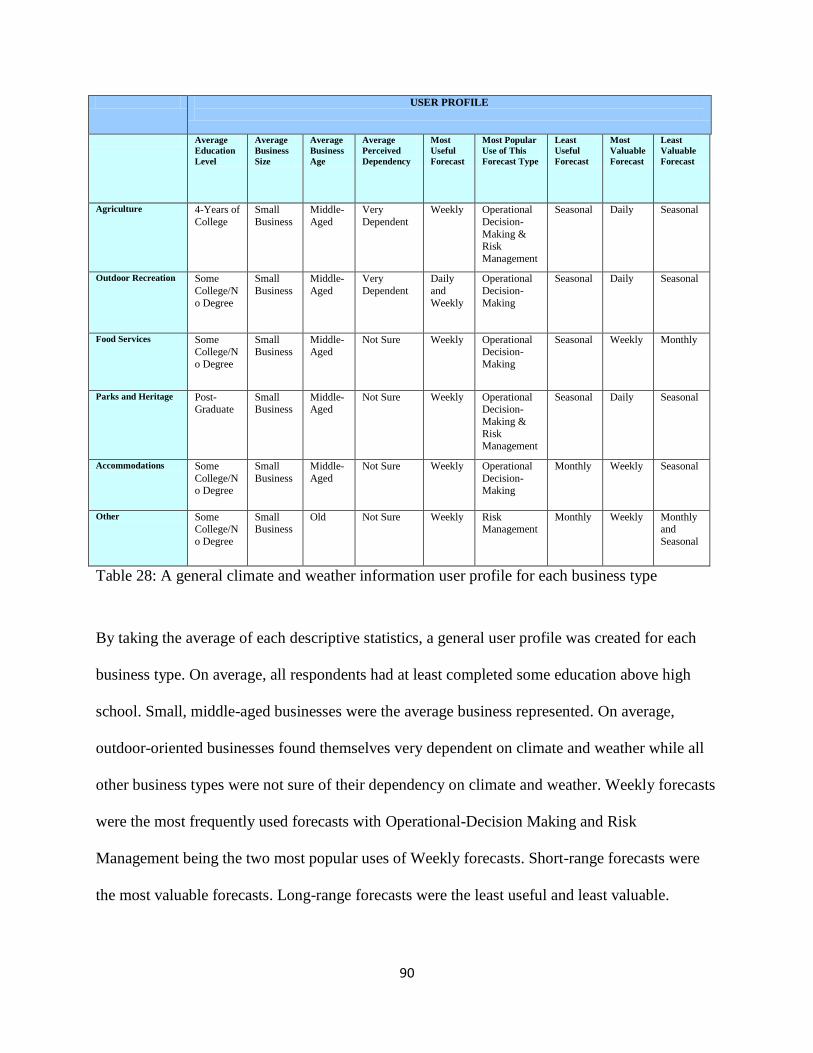
90
USER PROFILE
Average
Education
Level
Average
Business
Size
Average
Business
Age
Average
Perceived
Dependency
Most
Useful
Forecast
Most Popular
Use of This
Forecast Type
Least
Useful
Forecast
Most
Valuable
Forecast
Least
Valuable
Forecast
Agriculture 4-Years of
College
Small
Business
Middle-
Aged
Very
Dependent
Weekly Operational
Decision-
Making & Risk
Management
Seasonal Daily Seasonal
Outdoor Recreation Some
College/N
o Degree
Small
Business
Middle-
Aged
Very
Dependent
Daily
and
Weekly
Operational
Decision-
Making
Seasonal Daily Seasonal
Food Services Some College/N
o Degree
Small Business
Middle-Aged
Not Sure Weekly Operational Decision-
Making
Seasonal Weekly Monthly
Parks and Heritage Post-Graduate
Small Business
Middle-Aged
Not Sure Weekly Operational Decision-
Making &
Risk Management
Seasonal Daily Seasonal
Accommodations Some
College/No Degree
Small
Business
Middle-
Aged
Not Sure Weekly Operational
Decision-Making
Monthly Weekly Seasonal
Other Some College/N
o Degree
Small Business
Old Not Sure Weekly Risk Management
Monthly Weekly Monthly and
Seasonal
Table 28: A general climate and weather information user profile for each business type
By taking the average of each descriptive statistics, a general user profile was created for each
business type. On average, all respondents had at least completed some education above high
school. Small, middle-aged businesses were the average business represented. On average,
outdoor-oriented businesses found themselves very dependent on climate and weather while all
other business types were not sure of their dependency on climate and weather. Weekly forecasts
were the most frequently used forecasts with Operational-Decision Making and Risk
Management being the two most popular uses of Weekly forecasts. Short-range forecasts were
the most valuable forecasts. Long-range forecasts were the least useful and least valuable.
91
5. Discussion
The purpose of this project was to determine the weather and climate sensitivity of
coastal tourism businesses and learn how they use climate and weather forecasts for decision
making. Interestingly, there was a difference among business type to their perceived
dependence. From an ANOVA analysis, Food Services behaved similarly to Accommodations
in that the Perceived Climate and Weather Dependency is much lower than Agriculture and
Outdoor Recreation. This could indicate a divide between indoor and outdoor tourism
businesses. Accommodations and Food Services could be classified as indoor-oriented
businesses because of their similarities. Out of twenty-five Agriculture businesses, one business
had originally identified their operations as a bed and breakfast and farm as Crop Production.
The other twenty-two businesses were comprised of charter boats, marinas, yacht clubs and a
pier. Outdoor Recreation contained a wide range of businesses including country clubs; festivals;
outdoor drama theatre; golf courses; campgrounds; riverboat, dolphin and wild horse tours.
Three out of thirty-six businesses from the original category of Amusement and Recreation were
actually indoor businesses that included: a bowling alley, an arcade, and a laser tag facility.
These three businesses might have marginally exaggerated the total percentage of Outdoor
Recreation businesses. Despite being the only three indoor businesses outside of Food Services
and Accommodations in our sample, they represent other sectors within indoor businesses with
which outdoor businesses could partner.
The reason for Parks and Heritage businesses having significantly lower Perceived
Dependency on climate and weather information could be because respondents in this category
represent a state/federal funded operation that operates for the most part, rain or shine year-
round. This thinking could be reversed as outside forces such as government shutdowns or
92
unprecedented extreme weather events such as Hurricane Sandy shut down park and cultural
sites to a critical point of decreased visitor spending. For instance, during the 2013 government
shutdown, some states signed agreements to fund the opening of certain national parks, as was
the case of Utah that funded the opening of all eight of its national parks at the daily cost of
$166,572 for a six-day period. The importance of visitor spending was seen with the estimated
25,000 people per day visiting one of Utah’s national parks generating about $1.67 million in
NPS-related visitor spending during that six-day period (National Park Service 2013). With a
likely increased frequency of these complex situations, this stakeholder might realize a greater
dependency on climate and weather, and thus a greater use of climate and weather information.
5.1 Short range forecasts
Hourly forecasts were the third most used forecasts and were primarily used for
Operational Decision-Making and Risk Management. Operational Decision-Making was
represented by seven out of eleven open-ended response. Risk Management was represented by
three out of eleven open-ended responses thus supporting their position as the two primary uses
of hourly forecasts. Hourly forecasts provide real-time relatively accurate data with which
businesses feel they can safely make low-risk immediate decisions explaining the popularity of
Operational Decision-Making and Risk Management. Agriculture used Hourly forecasts for both
long-range (Finance and Budgeting) and short-range (Operational Decision-Making and Risk
Management) decisions. This wide range of uses could reflect their high perceived dependency
on climate and weather. Interestingly, Accommodations used this short-range forecast for long-
range decisions (Marketing, Investment Decisions, Landscaping). Perhaps this was selected as a
forecast used during a landscaping project as opposed to planning for one at a new resort. The
marketing strategies may be short-term such as a hotel partnering with the aquarium to send their
93
patrons at a discounted price during adverse weather. The unimportance to the business was the
most frequently indicated reason for not using hourly forecasts, particularly by Accommodations
by 74% of its respondents not using Hourly forecasts. This is not surprising however with their
heavier use on long-range forecasts due to the nature of reservations in some NC coastal areas
occurring many months out. Accommodations indicated an uncertainty about its dependency on
climate and weather that could affect the importance it places on climate and weather
information. Themes emerging from the open-ended responses for non-use of Hourly forecasts
include: useful in adverse weather conditions, the lead-time not being long enough to alter plans
and not enough detail in these forecasts. The need for more detail was seen across all forecast
open-ended non-use responses. An example of low detail could be a daily forecast on a local
news station with a rain cloud and a 30% probability of rain from 10am-2pm. The confusion may
lie in whether that means 30% of the viewing area will receive rain or that it will rain for twenty
minutes per hour. Also the need for detail may relate to the need for overall interpretation of how
the forecast will affect their specific tourism operation. Open-ended responses revealed hourly
and daily forecasts being used for guest information, which is supported by Gomez (2005) who
identifies tourists as another important consumer of climate and weather information. While our
forecasts included temperature and precipitation forecasts, open-ended responses might have
revealed a user-slant towards precipitation forecasts in general with the mention of responding to
stormy weather.
Daily forecasts were the second most used forecasts and were primarily used for
Operational Decision-Making and Risk Management. Ten of out eleven open-ended responses
fell underneath Operational Decision-Making supporting its role as a primary use of Daily
forecasts. As with Hourly forecasts, Daily forecasts provide detailed relatively accurate data with
94
which businesses feel they can safely make low-risk immediate decisions explaining the
popularity of Operational Decision-Making and Risk Management. Food Services used Daily
forecasts for the primary purpose of Operational Decision-Making. This could include cutting or
increasing staff for the day, hosting outside events or even whether to breakdown outside eating
areas in the case of an adverse weather event. Agriculture used Daily forecasts for the primary
purpose of Risk Management. Charter boats are one business of this sector that might use Daily
forecasts to help determine if the weather conditions are safe enough to take fishers out on the
boat. Outdoor Recreation used Daily forecasts primarily for Finance and Budgeting. Perhaps
keeping track of sales using historical daily forecast data could help predict future sales for a
given daily forecast. Themes emerging from open-ended responses for non-use of a daily
forecast include: low accuracy, lead-time not being long enough to alter plans and not enough
detail. The fact that inaccuracy was a problem for Daily forecasts and not for Hourly and Weekly
might relate to problem with detail. A general daily forecast of partly sunny could leave
respondents wondering how much of the day the sun will be out. Since chances of sunshine are
not given in percentages, rather relative descriptions, users will have differing expectations based
on their subjective interpretation of what a sunny day looks like. A better use of cloud cover
predictions could help develop a likelihood scale for sunshine or cloud cover. The importance of
sun to coastal destinations lies within the overall perceived image of a coastal destination
particularly in the summer and also relates to many outdoor activities in the area from tanning on
the beach to visiting historical sites. Overall, Accommodations, Food Services, and Parks and
Heritage placed little value on short-range forecasts. This indicated unimportance could relate to
the uncertainty of these three business sectors about their dependency on climate and weather.
Perhaps these three business types use climate and weather out of habit and do not realize the
95
extent of their use thus distorting the actual integration of climate and weather in various aspects
of the business.
Weekly forecasts were used the most and primarily for Operational Decision-Making
followed by Risk Management. The Weekly forecast use profile shifts a little towards long-term
decision making with Finance and Budgeting and Marketing comprising a larger share of uses
than with Hourly and Daily forecasts. A large proportion of agriculture businesses use weekly
forecasts for Investment Decisions and Sustainability. In fact, the portfolio of uses is quite
diverse, which relates to the strong perceived dependence agriculture has on weather and
climate. Fourteen open-ended responses revealed tourists using this temporal scale of forecast
the most in their planning (five respondents) revealing the most difficult planning obstacle for
business owners and managers. Nine responses fell underneath Operational Decision-Making
supporting its role as a lead use of Weekly forecasts. Two responses refer to Finance and
Budgeting supporting the idea that Weekly Forecast represents a set of users who make a mix of
short and long-term decisions. This could mean that they do not need as much help in figuring
out how to use climate and weather information for their planning purposes. The unimportance
to the business and other reasons were the most frequently indicated reasons for not using
Weekly forecasts. Weekly and Daily forecasts share a similar non-use profile meaning that
respondents may see similar problems with these forecasts. Therefore, open-ended responses for
non-use of Weekly forecasts were examined and emerging themes included: unreliability and not
enough detail.
Responses to hourly, daily, and weekly forecasts were highly related and so were
combined into a short-range forecast index to measure usefulness and value. This index was
input into a MANOVA analysis to determine factors that may predict whether a business would
96
use and/or value short range forecasts. Similar to perceived dependence, Agriculture and
Outdoor Recreation both place a statistically significant greater value on short range forecasts
than Accommodations. Gamble and Leonard (2005) suggest that outdoor-oriented tourism
activities find climate and weather information vitally important. As mentioned earlier, forecast
Usefulness and Value are thought to relate. Usefulness was measured by how many times or
ways a forecast is used, thus predisposing short-range forecasts to be ranked as more useful than
long-range or other forecasts.
5.2 Long-range forecasts
An obvious shift towards long-range planning is seen in Monthly Forecasts with
Marketing and Finance and Budgeting as the two most popular uses. Like Monthly forecasts,
Marketing and Finance and Budgeting are the two most popular uses of Seasonal forecasts.
However, these high-risk uses may be augmented by other forecasts such as average profit
margin. Also, the raw historical data used in creating these forecasts can be obtained for
businesses to make their own projections about monthly and seasonal climate and weather
conditions. Forecasts regardless of weather or financial, assume the same risk of error or
decreased accuracy. Tourism business owners using this information are likely to understand this
relationship and can interpret the meaning of a long-range weather forecast with the same
caution as a financial one. Other business types used Monthly forecasts for Investment Decisions
and Finance and Budgeting. This sector included event-planning businesses for which Monthly
forecasts could aid in adjusting budgets according to predicted event cancellations or extra-
incurred costs due to adverse weather conditions. Long-range forecast users may also use these
forecasts to guide their short-range forecast use. For instance, a projected abnormally wet
summer might direct coastal tourism business owners to focus more on weekly forecasts in that
97
summer. Unimportance to the business was the most frequently indicated reason for not using
Monthly forecasts by all business sectors except Agriculture and Other sectors who chose Other
Reasons for not using Seasonal forecasts. Accommodations indicated unimportance of Monthly
forecasts although it was the number one user of long-range Seasonal forecasts primarily for
Marketing. This would make sense to market at least a season out since most reservations will
occur at least that far in advance. In this case, perceived dependency could relate to the actual
frequency with which climate and weather information is used. Seasonal forecasts are the only
forecasts that might be used for Investment Decisions, which supports the idea that high-risk
decisions require more uncertain and long-range data including climate and weather. According
to our data, seasonal forecasts are not very useful or valuable to our respondents with
Unimportance being the number one reason by all sectors except for Agriculture and Other
sectors that chose Other Reasons for not using Seasonal forecasts. However, this should be
placed in the context of the decisions that are being made with these forecasts. Usefulness and
value seem to directly correlate meaning the less Seasonal forecasts are used, the less valuable
they will appear to be in the data. Uncertainty in forecast usefulness increases with forecast
temporal scale. This seems to directly relate to the level of confidence in a forecast, which could
translate into use. To increase confidence in and subsequent use of long-range forecasts, climate
and weather information producers must simultaneously increase accuracy to decrease
uncertainty and educate end-users on how to actually use this information for their specific
needs. Themes emerging for non-use of Monthly forecasts include inaccuracy, unreliability and
not enough detail. Themes emerging for non-use of Seasonal forecasts include: inaccuracy,
unreliability, not enough detail and the thought of seasons being relatively stable in the area. In
the face of climate change, the last theme may become less and less viable in the coming years.
98
5.3 Other forecasts
These non-traditional forecasts were rarely used, with Risk Management being the
primary use. This application of Other forecasts could refer to hurricane forecasts for hurricane
preparedness as mentioned in open-ended responses. Although it may seem counter-intuitive to
make high-risk decision using less uncertain data, their temporal similarities validate their
relationship.
5.4 Null results
Business age and size of business did not have an impact on forecast value, usefulness
and perceived climate and weather dependency. The reason that age might not have been a
factor could be because it does not take long to get an idea of a location’s climate and weather
when relocating to coastal North Carolina. Furthermore, business owners are most likely well-
versed on the geography of the area including climate and weather beforehand meaning
usefulness, value and perceived dependency are probably established early in a businesses’
existence. With only two business sizes, it is no surprise that business size had no impact on a
forecast’s usefulness, value and perceived dependency in our study area. While no statistically
significant mean differences exist on usefulness between business types, raw usefulness scores
for each business type further highlights the alliance of short-range forecasts being valued and
used more by outdoor-oriented businesses. Although Accommodations and Food Services
indicated short-range forecasts as less important, they are still generally used, mostly for
Operational Decision-Making and Marketing purposes. These contradictions, a comment that
“people eat rain or shine”, and a statistically significantly lower perceived climate and weather
dependency for these indoor-oriented businesses than outdoor-oriented businesses suggests that
99
they may be unaware of the extent that climate and weather relates to their business, at least
indirectly. As mentioned in the introduction, positive relationships can be formed between
weather-sensitive outdoor recreational activities and indoor activities. Seasonal climatic
information can help with the planning, scheduling and promotion of alternative indoor activities
when weather conditions are not conducive to outdoor activities and vice-versa (Perry 1972).
Sustainability was one of the least popular uses of all forecasts, and the reason could be due to
the confusion of the definition. Although Matzarakis and Freitas (2001) propose landscaping as
a possible use of climate and weather data, it was not a popular use of any of our forecasts.
Interestingly, Sustainability and Landscaping decisions were informed by the weekly forecasts in
less than 5% of respondents across all sectors, with the exception of agriculture, where
percentages reached 20%. Overall, agriculture had a more diverse set of uses for climate and
weather information.
It was thought that alternate sources of climate and weather data would entail wind, flora
and fauna as forecast indicators (Roncolli 2009). Not finding this in open-ended answers could
be due to the quantitative nature of our study. Qualitative research methods such as interviews
might uncover this type of information.
Technical language is a suggested barrier to forecast use (Ziervogel and Downing 2004).
However, our sample did not support this finding, and most respondents were aware of all the
forecasts available to them. Our sample seems to be climate and weather savvy in some form or
another. While a business type may only use two types of forecasts, they seem to be familiar
with their forecast options. The key is reaching the business types who are unsure of their
climate and weather dependency. This uninformed stakeholder holds much potential for outreach
from government and private sector producers of climate and weather information.
100
5.5 Sustainability Implications
A majority of our respondents represented small locally owned businesses meaning that
the multiplier effect is huge and beneficial to the local economy. However, these businesses
thrive by being provided tools in which to operate effectively and efficiently to cut down on
costs and minimize risk whether it be physical or financial. Although climate and weather are
woven into the fabric of these counties’ environments, its residents, in this case the tourism
business owners still need accurate and reliable information about this aspect of their life so that
they can capitalize on its financial opportunities and combat the negative effects it may bring.
Achieving this will contribute to the financial sustainability of these businesses and the local
economy in our study area.
Our sample used a variety of forecasts outside of just precipitation and temperature.
Almost all of the forecasts respondents indicated using could be used for individual business
sustainability purposes. The possibility of wind energy farms off of the North Carolina coast
presents the possibility of change in business owners’ energy consumption patterns depending on
how much of their energy would be provided by these farms. While sunshine forecast use was
not specifically mentioned, providing end-users with an accurate cloud-cover forecast (i.e. 30%
cloud cover today) could encourage business owners to invest in solar panels since energy and
financial savings can be forecasted with a little more accuracy.
6. Limitations
The small proportion of Microbusinesses may not be very representative of the actual number in
our study area since chamber of commerce business directories may not be updated as quickly as
101
Microbusinesses come and go. Furthermore, Microbusinesses may not report themselves as a
business if they’re family-owned or more informal such as a from-home operation.
Although websites and local news are the two greatest ways to communicate climate and
weather information, it is important to consider smartphones as valid means of information
whose quality should be maintained. Respondents who selected the source of National Weather
Service (NWS) might have been referring to accessing the NWS website meaning there is
probably a greater percentage of website users than our data shows. While examining open-
ended responses, some respondents may not have known the difference between NOAA and its
branch of the NWS.
7. Future Research
This study did not specifically study the use of temperature vs. precipitation forecasts but
rather generally examined them. More in-depth studies could be made on the usefulness and
value between these weather conditions.
Marketing is a very broad category that contains ambiguity of which marketing
strategies businesses develop with each temporal scale of forecast. With its popularity among
monthly and seasonal forecast users, it is worth investigating what these strategies might be.
It might be important to think of the magnitude of decisions being made with these forecasts.
Investment decisions have long-term implications and could affect all other facets of a business
i.e. Operational Decision-Making or Finance and Budgeting. Therefore, it may be worth
investigating the use of seasonal forecast for investment decisions of tourism businesses.
Awareness of climate change will increase as its impacts are more frequently felt, thus making
traditional seasonal climates uncertain and could increase interest in seasonal forecasts.
102
Because of the confusion of the definition of sustainability, a specific study into the
sustainable initiative being taken by NC coastal tourism businesses and their relationship with
climate and weather could be conducted.
Studying the impact of climate and weather on state and federal parks and cultural
heritage sites might be helpful in tracking their use of climate and weather information. Further
research could go into the relationship between forecast Accuracy, Value and Usefulness.
Choosing a study area with equal representation of different business types could be used
to better study the relationship between business size and climate and weather.
A study by Lazo et al. (2009) surveyed US residents’ perceived monetary value of the
weather forecasts produced by private and public meteorology groups. The same method could
be applied to our sample or the greater tourism industry.
Qualitative research methods such as interviews would complement the quantitative piece
in this study to uncover alternative environmental indicators that may be used for forecasting by
communities that are very aware of climate and weather in their area.
Forecast usefulness could have been skewed by the seasonal nature of tourism
businesses. We did not ask respondents about the times of year in which they use different
forecasts. Administering the survey at different times of the year or replicating this survey with a
seasonality measure might affect respondents’ answers.
8. Conclusions
The first research question of this study investigated what types of forecasts do tourism
business owners use the most and for what purposes. Weekly forecasts were used the most for
103
Operational Decision-Making primarily by Food Services, contain the most diverse set of uses,
and are the strongest threat to business owners of customers canceling plans. A better pairing of
hourly and daily forecasts with weekly forecasts would provide a better picture of conditions for
tourists’ planning purposes and an opportunity for business owners and managers to create a
positive relationship between outdoor and indoor actives to offer a better product to their
customers (Perry 1972). If businesses contextualize themselves into broader categories of indoor
and outdoor businesses, they could form strategic partnerships with other businesses to
counteract potential negative climate and weather impacts by sharing customers.
It makes sense for short-range forecasts to see the most usage since everyday business
operations will find the most relevance in them. However, the low value and usage of long-range
forecasts should be contextualized by the frequency and magnitude of the types of decisions
being made with these forecasts. Decision such as Investment and Marketing contain financial
risk that must be addressed with more planning time and a wider range of resources, hourly to
seasonal forecasts, in order to make informed and sound decisions for the business. The
relationship between Usefulness and Value becomes more distorted as forecast lead times
increase. Therefore, other indicators should be included to measure the true Usefulness and
Value of long-range forecasts.
The use of Other forecasts such as wind and wave reports reflects the wide range of types
of climate and weather information being used by this sector thus supporting the investigation
into developing resources targeted for the needs of this stakeholder.
The second research question of this study investigated what types of forecasts do
tourism business owners use the least and why. Seasonal forecasts were the least used forecasts
104
with non-importance/irrelevance being the primary reason for not using seasonal forecasts. Food
Services were the lowest users of Seasonal forecasts.
The third research question of this study investigated what factors influence tourism
business owners’ decisions to use or not use a forecast. Many factors that have been reported to
influence the use and value of weather and climate forecasts were not observed in this study.
Business type did not have a statistically significant impact on forecast usefulness. Business age
did not have a statistically significant impact on forecast value, usefulness and perceived
dependency on climate and weather. Business Size did not have a statistically significant impact
on forecast value, usefulness and perceived dependency on climate and weather.
The use of a forecast seems to be partly predicted by usefulness, value and
relevance/importance to the business. Other factors that seem to impact forecast use include:
perceived dependency on climate and weather, forecast accuracy, forecast reliability, and a lack
of detail in forecasts.
The third research question also investigated specifically the impacts of business age,
business size, and business type have on forecast use, forecast value and perceived dependency
on climate and weather. Business Type impacted perceived dependency on climate and weather
and revealed Agriculture being statistically significantly more dependent on climate and weather
than Accommodations, Food Services and Other. Outdoor Recreation was statistically
significantly more dependent on climate and weather than Accommodations, Food Services and
Parks and Heritage. Business Type also impacted forecast Value particularly for short-range
forecasts. Short-range forecast value was statistically significantly higher for Agriculture than
Accommodations. Short-range forecast value was statistically significantly higher for Outdoor
Recreation than Accommodations. In this study the Agriculture type was primarily businesses
105
that rely on the water (fishing). Weather cannot only decrease profits for these businesses, but
can potentially harm life and property.
The fourth research question asked about other tools coastal tourism business owners use
as alternatives to weather and climate forecasts. While respondents indicated that they use other
types of forecasts such as wind and wave forecasts, the quantitative approach to this study did
not provide much of an opportunity to discover uses of alternative environmental indicators
outside of traditional weather and climate forecasts that might have been obtained through a
qualitative component.
This study provides a novel profile of this large, diverse and sophisticated stakeholder,
which is the tourism industry. According to the World Travel and Tourism Council’s 2014
Travel and Tourism World Economic report, 2013 ended with the global tourism industry
supporting 8.7% (265,855,000 jobs) of world employment including jobs indirectly supported by
this industry. It is projected to rise to 10.2% by 2024. Additionally, the direct contribution of
travel and tourism to the global GDP in 2013 was 2.9% and is projected to rise to 3.1% over the
next decade (WTTC 2014). Many parts of the world’s economy, including the US, depend upon
or are impacted by the tourism industry’s financial success. The coastal tourism sector of this
industry is large and faces a triple threat of climate change, over development and in many cases,
low sustainability standards. Therefore, it is crucial to provide reliable, accurate and relevant
resources for the climate and weather-sensitive portions of this stakeholder in order to guide
them in capitalizing on current climate and weather conditions and to prepare them for their
potential changes.
106
REFERENCES
Altalo, M., & Hale, M. (2002). Requirements of the U.S. recreation and tourism industry for
climate, weather, and ocean information. (Weather, Climate, and Ocean Information Needs
Assessment of Major Economic Sectors of the U.S. Economy).Energy Solutions Group
Science Applications International Corporation.
Alvord, C., Long, P., Pulwarty, R., & Udall, B. (2007). Climate and tourism on the Colorado
plateau. Boulder, Colorado.
Bian, H., & East Carolina University Office of Faculty Excellence. (2013). Exploratory factor
analysis. Retrieved 2/15, 2014, from
http://core.ecu.edu/ofe/StatisticsResearch/SPSS%20Series%206%20Factor%20analysis.pdf
Bureau of Labor Statistics. (2014). Industries at a glance. Retrieved 3/19, 2014, from
http://www.bls.gov/iag/tgs/iag11.htm
Carnegie Mellon University. (2009). Statistical power. Retrieved 03/07, 2014, from
http://www.stat.cmu.edu/~hseltman/309/Book/chapter12.pdf
Center for Sustainable Tourism. (2013). Community resources. Retrieved 5/8, 2013, from
http://www.ecu.edu/cs-acad/sustainabletourism/Community-Resources.cfm
Claes Fornell International. (2005). National weather service customer satisfaction survey
general public: Final report 2005. ().National Oceanic and Atmospheric Administration.
Climate Prediction Center: NOAA. (2013). Climate prediction center. Retrieved 5/7, 2013, from
http://www.cpc.ncep.noaa.gov/
107
Curtis, S., Long, P., & Arrigo, J. (2011). Climate, weather, and tourism: Issues and opportunities.
Bulletin of the American Meteorological Society, 92(3), p.361.
doi:10.1175/2010BAMS2983.1
Curtis, S., Arrigo, J., Long, P., & Covington, R. (2009). Climate, weather and tourism: Bridging
science and practice. (). Center for Sustainable Tourism, East Carolina University:
Everingham, Y. L., Muchow, R. C., Stone, R. C., Inman-Bamber, N. G., Singels, A., &
Bezuidenhout, C. N. (2002). Enhanced risk management and decision-making capability
across the sugarcane industry value chain based on seasonal climate forecasts. Agricultural
Systems, 74(3), 459-477. doi:10.1016/S0308-521X(02)00050-1
Fish Weather. (2014). Sea surface temperatures. Retrieved 2/3, 2014, from
http://fishweather.com/map#35.873,-75.074,12,7
Gamble, D. W., & Leonard, L. (2005). Coastal climatology products for recreation and tourism
end users in southeastern north carolina. ().Department of Earh Sciences,University of
North Carolina at Wilmington.
Grundy, S. E. (1993). The confidence scale: Development and psychometric characteristics.
Nurse Educator, 18(1), 6-9.
Hartmann, H., Pagano, T., Sorooshian, S., & Bales, R. (2002). Confidence builders: Evaluating
seasonal climate forecasts from user perspectives. Bulletin of the American Meteorological
Society, (May), 683--698.

108
Katz, R. W., & Murphy, A. H. (1997). Economic value of weather and climate forecasts
Cambridge University Press.
Klopper, E., Vogel, C. H., & Landman, W. A. (2006). Seasonal climate forecasts–potential
agricultural-risk management tools? Climatic Change, 76(1-2), 73-90.
Krakauer, N., Grossber, M., Gladkova, I., & Aizenman, H. (2012). Information content of
seasonal forecasts in a changing climate. Advances in Meteorology,
Lazo, J. K., Morss, R. E., & Demuth, J. L. (2009). 300 billion served: Sources, perceptions, uses,
and values of weather forecasts. Bulletin of the American Meteorological Society, 90(6),
785-798.
Magic Seaweed Ltd. (2014). Mid Atlantic charts. Retrieved 2/3, 2014, from
http://magicseaweed.com/Mid-Atlantic-Surf-Chart/22/
Martín, G., & Belén, M. (2005). Weather, climate and tourism a geographical perspective.
Annals of Tourism Research, 32(3), 571-591.
Matzarakis, A., & Freitas, C. R. d. (2001). Proceedings of the first international workshop on
climate, tourism and recreation. (Workshop Proceedings). Halkidiki, Greece: International
Society of Biometeorology.
Morss, R. E., Demuth, J. L., & Lazo, J. K. (2008). Communicating uncertainty in weather
forecasts: A survey of the US public. Weather and Forecasting, 23(5), 974-991.
109
Murphy, A. (1993). What is a good forecast? An essay on the nature of goodness in weather
forecasting. (Unpublished College of Oceanic and Atmospheric Sciences, Oregon State
University, Corvallis, Oregon.
Mylne, K. R. (2006). Decision-making from probability forecasts based on forecast value.
Meteorological Applications, 9(3), 307--315.
National Climatic Data Center. (2010). NOAA's national climatic data center sectoral
engagement fact sheet:Tourism. ().NOAA.
National Park Service. (2014). Effects of the October 2013 government shutdown on national
park service visitor spending in gateway communities
. ( No. NPS/EQD/NRSS/NRR—2014/761).National Park Service.
National Weather Service. (2008). Climate prediction center- who we are. Retrieved 4/22, 2013,
from http://www.cpc.ncep.noaa.gov/information/who_we_are/index.shtml
National Weather Service/NOAA, Department of Commerce.NWS forecasts-what do they
mean? Retrieved 8/6/13, 2013, from
http://www.utexas.edu/depts/grg/kimmel/nwsforecasts.html
National Weather Service: NOAA.National weather service. Retrieved 5/7, 2013, from
http://www.weather.gov/forecastmaps
NOAA/Space Weather Prediction Center. (October 1,2007). Forecast verification glossary.
Retrieved 4/29, 2013, from http://www.swpc.noaa.gov/forecast_verification/Glossary.html
110
NOAA's National Weather Service. (2013). Evolution of the national weather service. Retrieved
1/31, 2014, from http://www.nws.noaa.gov/pa/history/timeline.php
North Carolina Department of Cultural Resources.North Carolina maps. Retrieved 08/13, 2013,
from http://www2.lib.unc.edu/dc/ncmaps/index.html
Orlove, B., Broad, K., & Petty, A. (2004). Factors that influence the use of climate forecasts:
Evidence from the 1997/98 el Niño even in Peru. Bulletin of the American Meteorological
Society, , 1735--1743.
Paolissp, M. (2003). Chesapeake bay watermen, weather and blue crabs: Cultural models and
fishery policies. In S. Strauss, & B. Orlove (Eds.), Weather, climate, culture (pp. 67--83).
New York, NY: Berg.
Perry, A. H. (1972). Weather, climate and tourism. Weather, 27(5), 199--203.
Robb, A. M. (2002). Small business financing: Differences between young and old firms.
Journal of Entrepreneurial Finance, JEF, 7(2), 45-65.
Robinson, P. (2008). Climate, weather and tourism workshop.
Roehl, W. (1998). The logic of industrial classification. The Economic Geography of the Tourist
Industry: A Supply-Side Analysis, , 53.
Roncolli, C., Crane, T., & Orlove, B. (2009). Fielding climate change in cultural anthropology.
In S. Crate, & M. Nuttall (Eds.), Anthropology and climate change from encounters to
actions (pp. 87--116). Walnut Creek, California: Left Coast Press, Inc.
111
Saviers, A., & Van Bussum, L. (1997). Juneau public questionnaire: Results, analyses, and
conclusions US Department of Commerce, National Oceanic and Atmospheric
Administration, National Weather Service Alaska Region, Environmental and Scientific
Services Division.
Scott, D. J., Lemieux, C. J., & Malone, L. (2011). Climate service to support sustainable tourism
and adaptation to climate change. Climate Research Interactions of Climate with
Organisms, Ecosystems, and Human Societies, 47, 111-122. doi:10.3354/cr00952
Stern, P., & Easterling, W. (1999). Making climate forecast information more useful. Making
climate forecasts matter (pp. 64). Washington D.C.: The National Acadamies Press.
Strauss, S. (2003). Weather wise: Speaking folklore to science in leukerbad. In S. O. Strauss B.
(Ed.), Climate, weather, culture (pp. 39--60). New York, NY: Berg.
Strauss, S., & Orlove, B. S. (2003). Weather, climate, culture Berg Publishers.
The Center for Australian Weather and Climate Research. (2013). Forecast verification: Issues,
methods and FAQ. Retrieved 5/25, 2013, from
http://www.cawcr.gov.au/projects/verification/#Forecast_quality_vs._value
Thompson, B. (2006). Foundations of behavioral statistics: An insight-based approach Guilford
Press.
U.S. Census Bureau. (2012). Households and families. ( No. C2010BR-14).
112
U.S. Census Bureau. (2013). North American industry classification system. Retrieved 8/6, 2013,
from http://www.census.gov/eos/www/naics/
U.S. Small Business Administration.Small business size standards. Retrieved 5/25, 2013, from
http://www.sba.gov/category/navigation-structure/contracting/contracting-
officials/eligibility-size-standards
UCLA: Statistical Consulting Group. (2014). Factor analysis using SAS PROC FACTOR.
Retrieved 2/20, 2014, from http://www.ats.ucla.edu/stat/sas/library/factor_ut.htm
US Travel Association. (2014). The economic impact of travel on North Carolina counties.
Retrieved 4/2, 2014, from http://www.nccommerce.com/tourism/research/economic-
impact/teim
Weather Flow Inc. (2014). Wind & forecasts. Retrieved 2/3, 2014, from
http://www.ikitesurf.com/windandwhere.iws?regionID=110&geographicalAreaID=999
World Tourism Organization. (2008). The importance of weather forecasts and climate
prediction for the tourism sector. Climate change and tourism : Responding to global
challenges (pp. 58--59) Madrid : World Tourism Organization ; Paris : United Nations
Environment Programme.
World Travel and Tourism Council. (2014). Travel & tourism economic impact 2014: World.
(Economic Impact).World Travel and Tourism Council.
Ziervogel, G., & Downing, T. (2004). Stakeholder network: Improving seasonal climate
forecasts. Climatic Change, 65(1-2), 73--101.

113
114
APPENDIX A
EAST CAROLINA UNIVERSITY
University & Medical Center Institutional Review Board Office
4N-70 Brody Medical Sciences Building· Mail Stop 682
600 Moye Boulevard · Greenville, NC 27834
Office 252-744-2914 · Fax 252-744-2284 · www.ecu.edu/irb
Notification of Exempt Certification
From: Social/Behavioral IRB
To: Emily Ayscue
CC:
Scott Curtis
Date: 9/3/2013
Re: UMCIRB 13-001493
Climate and Weather Forecast Use among NC Coastal Tourism Businesses
I am pleased to inform you that your research submission has been certified as exempt on 9/3/2013. This study is eligible for Exempt Certification under category #2.
It is your responsibility to ensure that this research is conducted in the manner reported in your application and/or protocol, as well as being consistent with the ethical principles of the Belmont Report and your profession.
This research study does not require any additional interaction with the UMCIRB unless there are proposed changes to this study. Any change, prior to implementing that change, must be submitted to the UMCIRB for review and approval. The UMCIRB will determine if the change impacts the eligibility
of the research for exempt status. If more substantive review is required, you will be notified within five business days.
The UMCIRB office will hold your exemption application for a period of five years from the date of this letter. If you wish to continue this protocol beyond this period, you will need to submit an Exemption

115
Certification request at least 30 days before the end of the five year period.
The Chairperson (or designee) does not have a potential for conflict of interest on this study.
IRB00000705 East Carolina U IRB #1 (Biomedical) IORG0000418
IRB00003781 East Carolina U IRB #2 (Behavioral/SS) IORG0000418

116
APPENDIX B
RECRUITMENT TEXT
Dear (name inserted here),
My name is Emily Ayscue and I am a graduate student from the Center for
Sustainable Tourism at ECU. Coastal tourism businesses are an important
stakeholder in the production and dissemination of climate and weather
information. In an effort to understand your businesses’ climate and weather
information uses and needs, I have created a short survey whose results will be
offered to various climate and weather forecast producers such as The National
Weather Service and the State Climate Office of North Carolina. Responses are
confidential and participation voluntary. The survey should take no longer than 10
minutes. I have inserted the survey link below. We greatly value your opinion and
appreciate your time. If you have any questions or know of anyone else who
would be interested in taking the survey, please email me at
Thank You,
(survey link here)
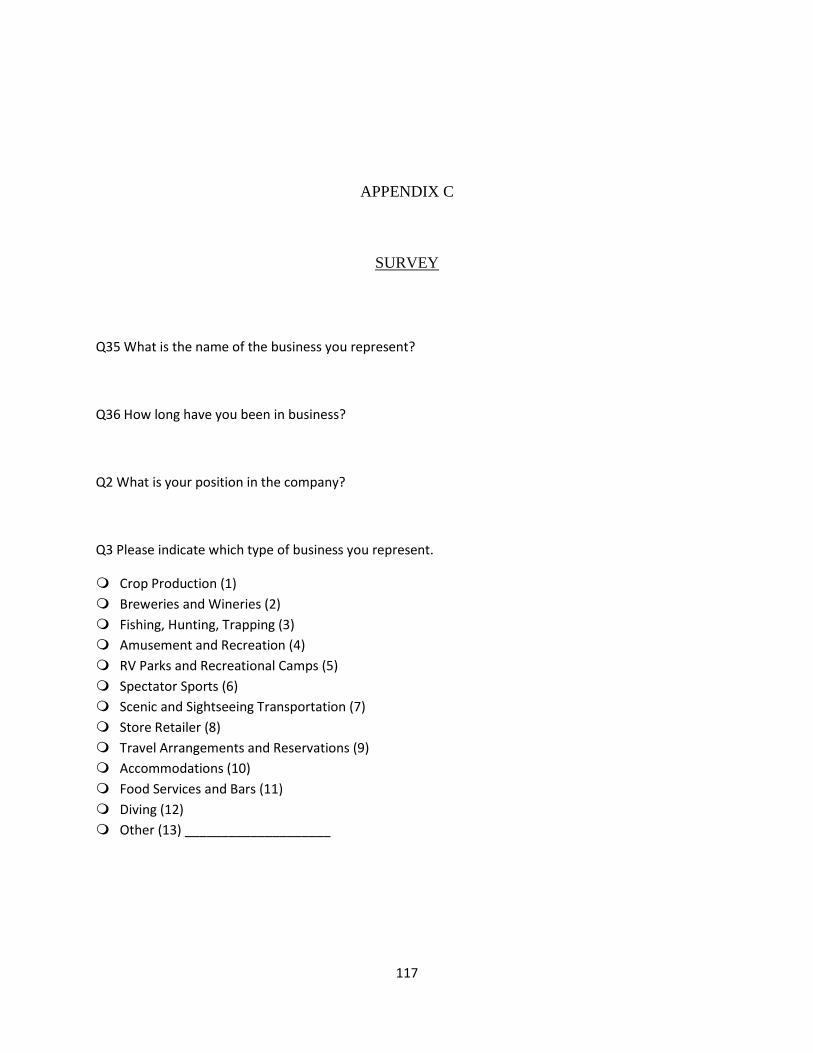
117
APPENDIX C
SURVEY
Q35 What is the name of the business you represent?
Q36 How long have you been in business?
Q2 What is your position in the company?
Q3 Please indicate which type of business you represent.
Crop Production (1)
Breweries and Wineries (2)
Fishing, Hunting, Trapping (3)
Amusement and Recreation (4)
RV Parks and Recreational Camps (5)
Spectator Sports (6)
Scenic and Sightseeing Transportation (7)
Store Retailer (8)
Travel Arrangements and Reservations (9)
Accommodations (10)
Food Services and Bars (11)
Diving (12)
Other (13) ____________________
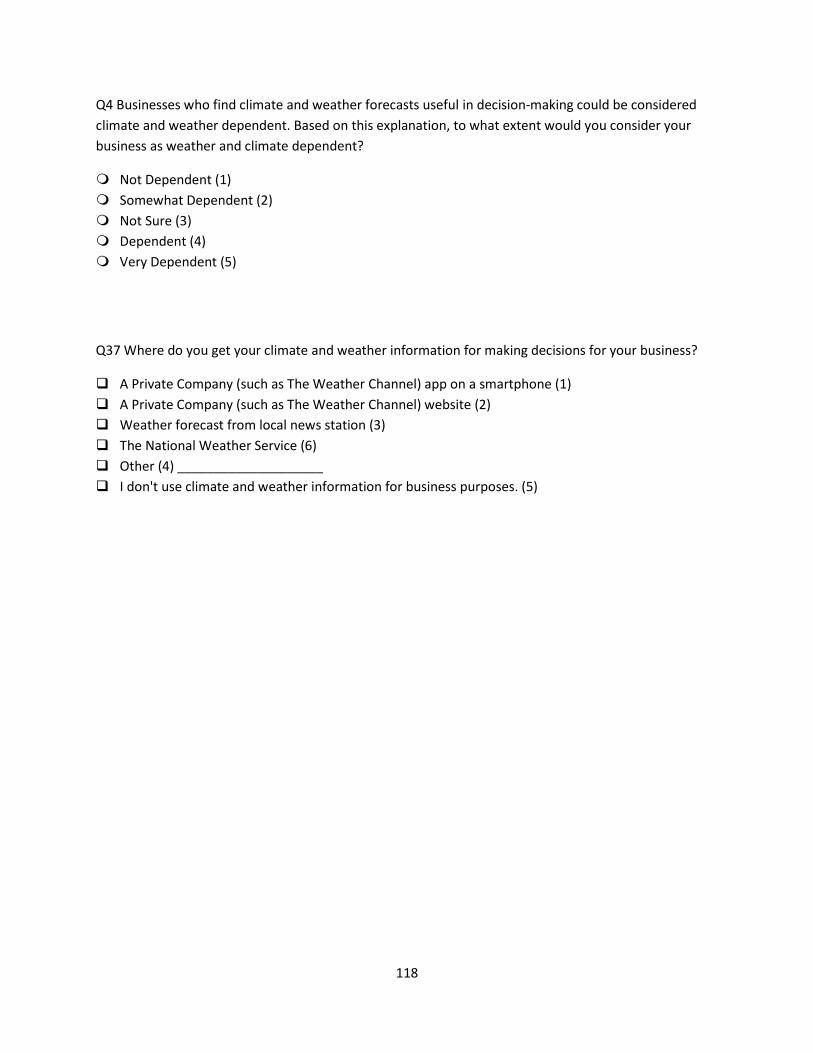
118
Q4 Businesses who find climate and weather forecasts useful in decision-making could be considered
climate and weather dependent. Based on this explanation, to what extent would you consider your
business as weather and climate dependent?
Not Dependent (1)
Somewhat Dependent (2)
Not Sure (3)
Dependent (4)
Very Dependent (5)
Q37 Where do you get your climate and weather information for making decisions for your business?
A Private Company (such as The Weather Channel) app on a smartphone (1)
A Private Company (such as The Weather Channel) website (2)
Weather forecast from local news station (3)
The National Weather Service (6)
Other (4) ____________________
I don't use climate and weather information for business purposes. (5)
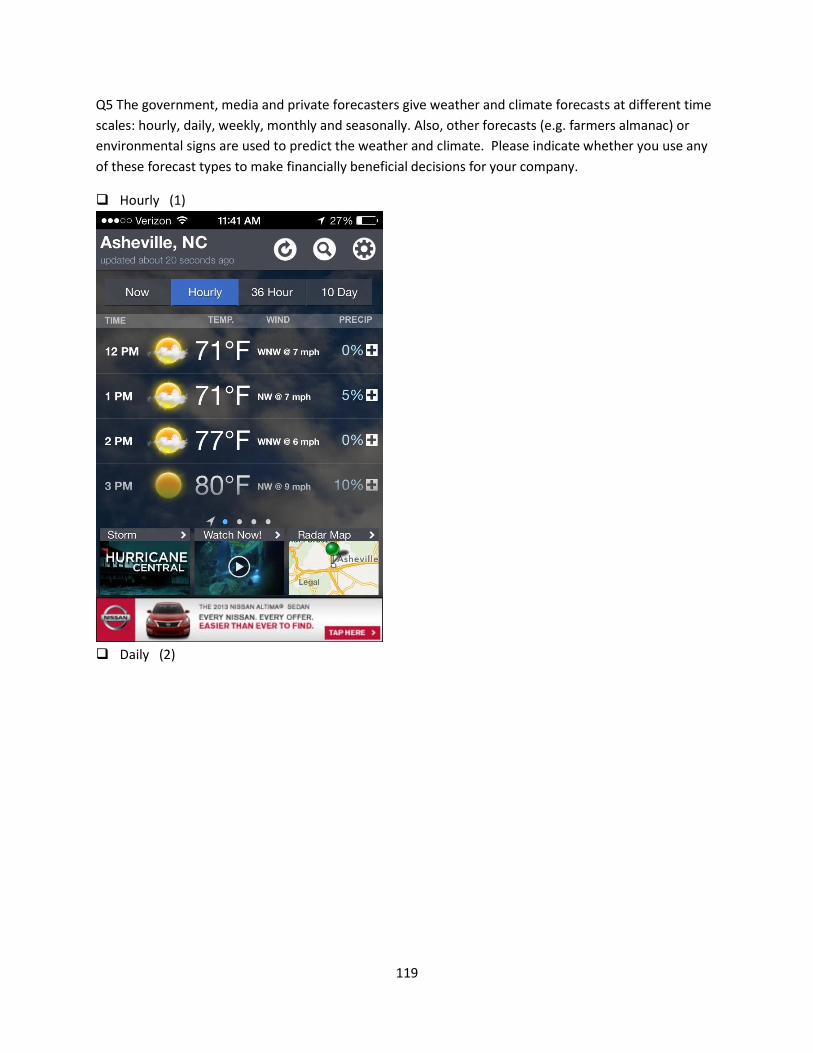
119
Q5 The government, media and private forecasters give weather and climate forecasts at different time
scales: hourly, daily, weekly, monthly and seasonally. Also, other forecasts (e.g. farmers almanac) or
environmental signs are used to predict the weather and climate. Please indicate whether you use any
of these forecast types to make financially beneficial decisions for your company.
Hourly (1)
Daily (2)
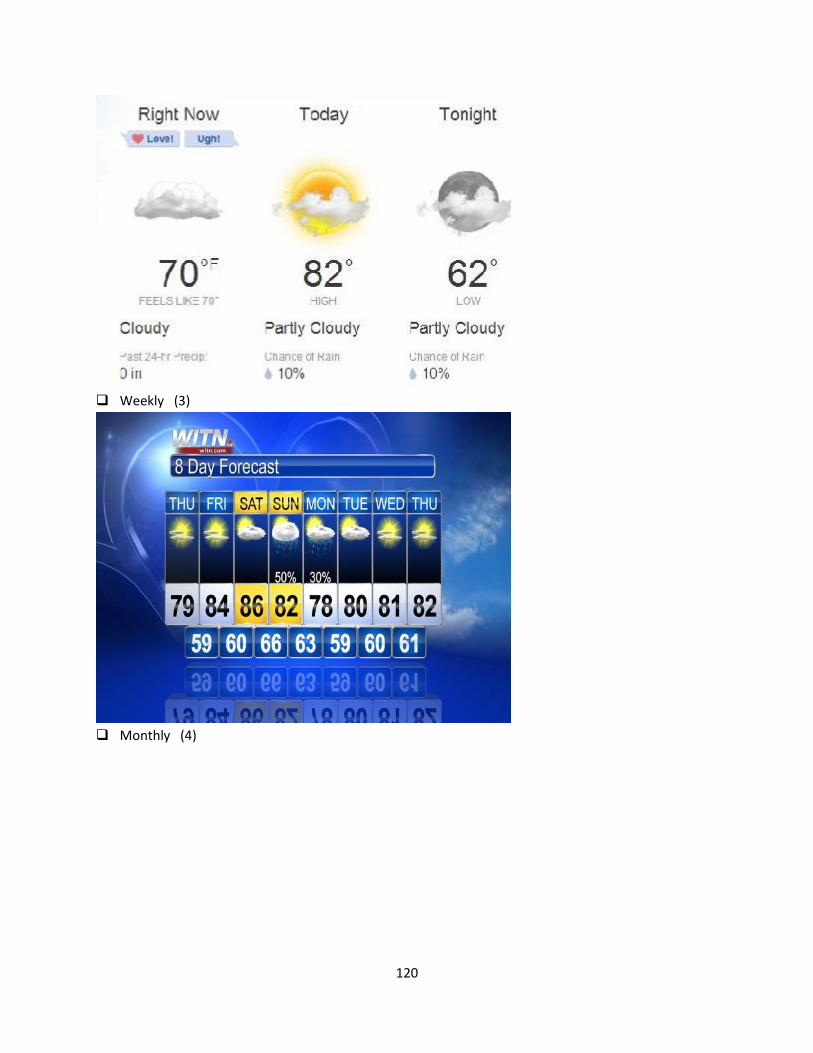
120
Weekly (3)
Monthly (4)
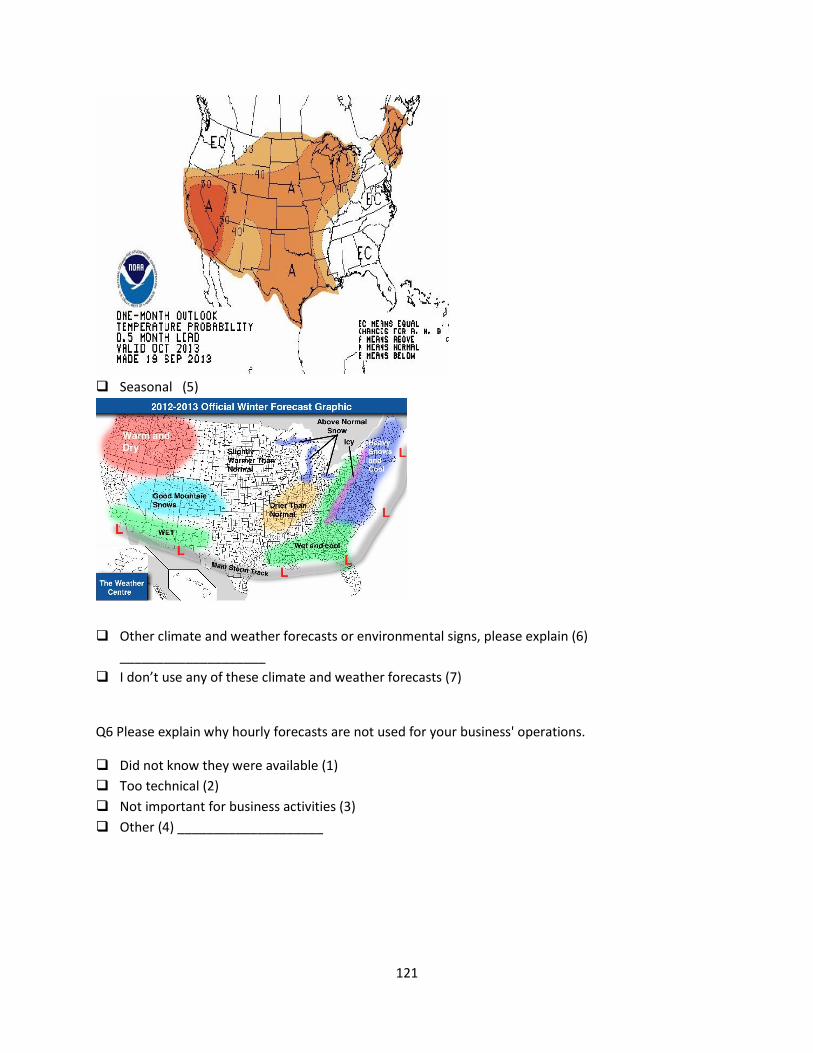
121
Seasonal (5)
Other climate and weather forecasts or environmental signs, please explain (6)
____________________
I don’t use any of these climate and weather forecasts (7)
Q6 Please explain why hourly forecasts are not used for your business' operations.
Did not know they were available (1)
Too technical (2)
Not important for business activities (3)
Other (4) ____________________
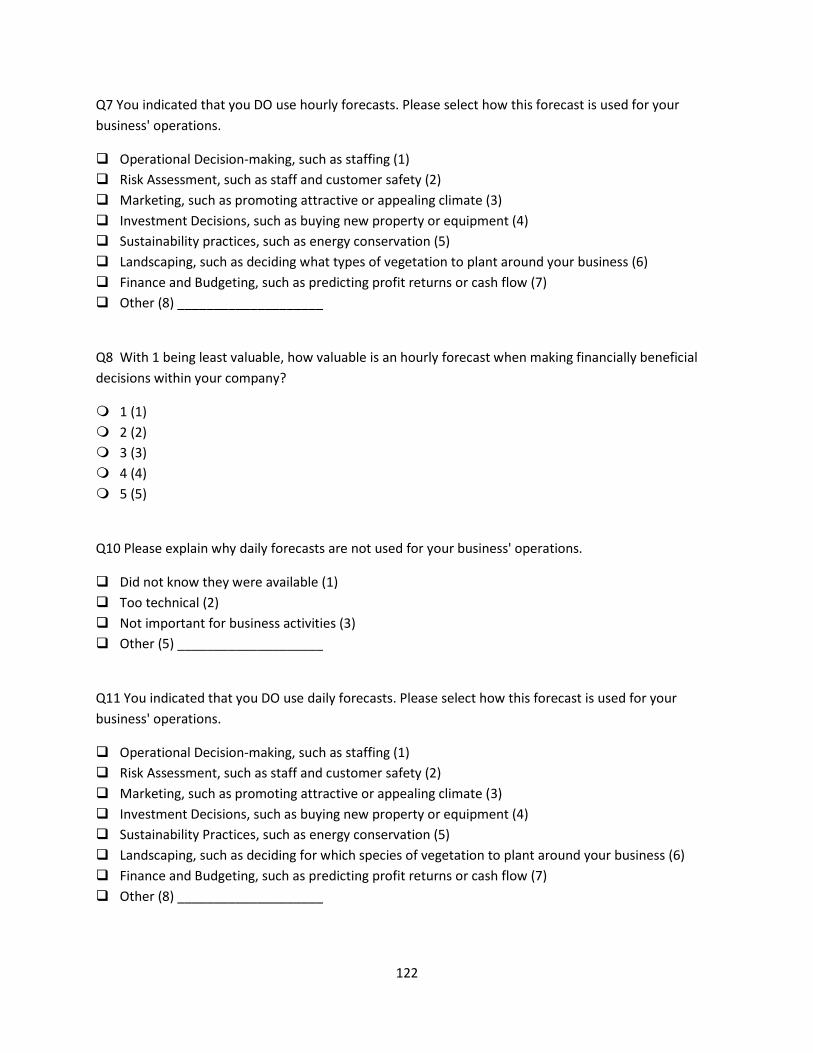
122
Q7 You indicated that you DO use hourly forecasts. Please select how this forecast is used for your
business' operations.
Operational Decision-making, such as staffing (1)
Risk Assessment, such as staff and customer safety (2)
Marketing, such as promoting attractive or appealing climate (3)
Investment Decisions, such as buying new property or equipment (4)
Sustainability practices, such as energy conservation (5)
Landscaping, such as deciding what types of vegetation to plant around your business (6)
Finance and Budgeting, such as predicting profit returns or cash flow (7)
Other (8) ____________________
Q8 With 1 being least valuable, how valuable is an hourly forecast when making financially beneficial
decisions within your company?
1 (1)
2 (2)
3 (3)
4 (4)
5 (5)
Q10 Please explain why daily forecasts are not used for your business' operations.
Did not know they were available (1)
Too technical (2)
Not important for business activities (3)
Other (5) ____________________
Q11 You indicated that you DO use daily forecasts. Please select how this forecast is used for your
business' operations.
Operational Decision-making, such as staffing (1)
Risk Assessment, such as staff and customer safety (2)
Marketing, such as promoting attractive or appealing climate (3)
Investment Decisions, such as buying new property or equipment (4)
Sustainability Practices, such as energy conservation (5)
Landscaping, such as deciding for which species of vegetation to plant around your business (6)
Finance and Budgeting, such as predicting profit returns or cash flow (7)
Other (8) ____________________
123
Q12 With 1 being least valuable, how valuable is a daily forecast when making financially beneficial
decisions within your company?
1 (1)
2 (2)
3 (3)
4 (4)
5 (5)
Q14 Please explain why weekly forecasts are not used for your business' operations.
Did not know they were available (1)
Too technical (2)
Not important for business activities (3)
Other (4) ____________________
Q15 You indicated that you DO use weekly forecasts. Please select how this forecast is used for your
business' operations.
Operational Decision-making, such as staffing (1)
Risk Assessment, such as staff and customer safety (2)
Marketing, such as promoting attractive or appealing climate (3)
Investment Decisions, such as buying new property or equipment (4)
Sustainability Practices, such as energy conservation (5)
Landscaping, such as deciding for which species of vegetation to plant around your business (6)
Finance and Budgeting, such as predicting profit returns or cash flow (7)
Other (8) ____________________
Q16 With 1 being least valuable, how valuable is a weekly forecast when making financially beneficial
decisions.
1 (1)
2 (2)
3 (3)
4 (4)
5 (5)
124
Q18 Please explain why monthly forecasts are not used for your business' operations.
Did not know they were available (1)
Too technical (2)
Not important for business activities (3)
Other (4) ____________________
Q19 You indicated that you DO use monthly forecasts. Please select how this forecast is used for your
business' operations.
Operational Decision-making, such as staffing (1)
Risk Assessment, such as staff and customer safety (2)
Marketing, such as promoting attractive or appealing climate (3)
Investment Decisions, such as buying new property or equipment (4)
Sustainability Practices, such as energy conservation (5)
Landscaping, such as deciding for which species of vegetation to plant around your business (6)
Finance and Budgeting, such as predicting profit returns or cash flow (7)
Other (8) ____________________
Q20 With 1 being least valuable, how valuable is a monthly forecast when making financially beneficial
decisions?
1 (1)
2 (2)
3 (3)
4 (4)
5 (5)
Q22 Please explain why seasonal forecasts are not used for your business' operations.
Did not know they were available (1)
Too technical (2)
Not important for business activities (3)
Other (4) ____________________
125
Q23 You indicated that you DO use seasonal forecasts. Please select how this forecast is used for your
business' operations.
Operational Decision-making, such as staffing (1)
Risk Assessment, such as staff and customer safety (2)
Marketing, such as promoting attractive or appealing climate (3)
Investment Decisions, such as buying new property or equipment (4)
Sustainability Practices, such as energy conservation (5)
Landscaping, such as deciding for which species of vegetation to plant around your business (6)
Finance and Budgeting, such as predicting profit returns or cash flow (7)
Other (8) ____________________
Q24 With 1 being least valuable, how valuable is a seasonal forecast when making financially beneficial
decisions within your company?
1 (1)
2 (2)
3 (3)
4 (4)
5 (5)
Q30 You indicated that you DO use other forecasts or environmental signs. Please select how this
forecast is used for your business' operations.
Operational Decision-making, such as staffing (1)
Risk Assessment, such as staff and customer safety (2)
Marketing, such as promoting attractive or appealing climate (3)
Investment Decisions, such as buying new property or equipment (4)
Sustainability Practices, such as energy conservation (5)
Landscaping, such as deciding for which species of vegetation to plant around your business (6)
Finance and Budgeting, such as predicting profit returns or cash flow (7)
Other (9) ____________________
126
Q31 With 1 being least valuable, how valuable other forecasts or environmental signs are when making
financially beneficial decisions within your company?
1 (1)
2 (2)
3 (3)
4 (4)
5 (5)
Q33 Thinking about how each forecast can help you make financially beneficial decisions for your
company, please compare the value of each forecast type with 1 being the least valuable.
1 (1) 2 (2) 3 (3) 4 (4) 5 (5)
Hourly (1)
Daily (2)
Weekly (3)
Monthly (4)
Seasonal (5)
Other Forecasts (6)
Q27 Please indicate your highest level of completed education.
Less than high school (1)
High School or General Equivalency Diploma (GED) (2)
2-year college/ Technical school (3)
Some College but no degree (4)
4-year college (5)
Post graduate (6)
Q28 How many people are employed in your company?
Q19 Is there anything else you would like to say about forecast use in your business or about certain
types of forecasts in particular?
Yes (1) ____________________
No (2)