Type of the Paper (Article - MDPI
27
Citation: Kim, S.; Jung, B.; Han, D.; Lee, C. Technology Prediction for Acquiring a Must-Have Mobile Device for Military Communication Infrastructure. Appl. Sci. 2022, 12, 3207. https://doi.org/10.3390/ app12063207 Academic Editor: Sungkon Kim Received: 11 February 2022 Accepted: 10 March 2022 Published: 21 March 2022 Publisher’s Note: MDPI stays neutral with regard to jurisdictional claims in published maps and institutional affil- iations. Copyright: © 2022 by the authors. Licensee MDPI, Basel, Switzerland. This article is an open access article distributed under the terms and conditions of the Creative Commons Attribution (CC BY) license (https:// creativecommons.org/licenses/by/ 4.0/). applied sciences Article Technology Prediction for Acquiring a Must-Have Mobile Device for Military Communication Infrastructure Sungil Kim 1 , Byungki Jung 2 , Dongyun Han 3 and Choonjoo Lee 3, * 1 Defense Institute of SeoulTech, Seoul National University of Science and Technology, Seoul 01811, Korea; [email protected] 2 Navy Headquarters, Sindoan-myeon, Gyeryong-si 32800, Korea; [email protected] 3 Defense Science Department, Korea National Defense University, Nonsan-si 33021, Korea; [email protected] * Correspondence: [email protected] Abstract: The smartphone is a must-have mobile device for the military forces to accomplish critical missions and protect critical infrastructures. This paper explores the applicability of a technology prediction methodology to manage technological obsolescence while pursuing the acquisition of advanced commercial technology for military use. It reviews the Technology Forecasting using Data Envelopment Analysis (TFDEA) methodology and applies an author-written Stata program for smartphone technology forecasting using TFDEA. We analyzed smartphone launch data from 2005 to 2020 to predict the adoption of smartphone technology and discuss the pace of technological change. The study identifies that the market is undergoing reorganization as new smartphone models expand the market and increase their technical performance. The average rate of technological change, the efficiency change, and the technology change were 1.079, 1.004, and 1.011 each, respectively, which means that the technology progressed over the period. When dividing before and after 2017, technological change and efficiency change generally regressed except for Huawei, Xiaomi, and Oppo. This means that Chinese smartphones are expanding the global market in all directions and the technology is reaching maturity and market competition is accelerating. Keywords: Technology Forecasting using Data Envelopment Analysis (TFDEA); Malmquist Produc- tivity Index (MPI); smartphone; state-of-the-art technology; dual-use technology; Stata 1. Introduction Smartphones have been widely distributed around the world since 2010 and are being applied not only in the private sector but also in military applications. As Samsung Electronics unveiled in 2020, the tactical mobile solution ‘Galaxy S20 Tactical Edition (TE)’ was jointly developed with the US federal government and the Ministry of Defense [1]. The Republic of Korea (ROK) military also saw its applicability as a military tactical operation, and as a first step, introduced commercial smartphones to the military for general administrative work. In the military, the difference between the life cycle of weapon systems hardware and the life cycle of software is significant and the rate of obsolescence of software with rapid technological progress is relatively fast, so component obsolescence management is essential [2–4]. Efforts such as technology prediction for component obsolescence management are required to procure commercial smartphones for military tactical application. In Korea, in 1999, the dual-use technology development project was legislated and promoted, with the main tasks being defense technology transfer, civil- military standard unification, and technology information exchange [3,4]. Additionally, there were various studies and policy considerations that the concept of open technological innovation should be applied for defense science and technology innovation [5–7]. In 2014, the Institute of Civil-Military Technology Cooperation was established for civil- military technology development and cooperation [8]. As smartphones become widely used militarily, it becomes important to acquire devices that can counter potential threats. Appl. Sci. 2022, 12, 3207. https://doi.org/10.3390/app12063207 https://www.mdpi.com/journal/applsci
-
Upload
khangminh22 -
Category
Documents
-
view
0 -
download
0
Transcript of Type of the Paper (Article - MDPI
�����������������
Citation: Kim, S.; Jung, B.; Han, D.;
Lee, C. Technology Prediction for
Acquiring a Must-Have Mobile
Device for Military Communication
Infrastructure. Appl. Sci. 2022, 12,
3207. https://doi.org/10.3390/
app12063207
Academic Editor: Sungkon Kim
Received: 11 February 2022
Accepted: 10 March 2022
Published: 21 March 2022
Publisher’s Note: MDPI stays neutral
with regard to jurisdictional claims in
published maps and institutional affil-
iations.
Copyright: © 2022 by the authors.
Licensee MDPI, Basel, Switzerland.
This article is an open access article
distributed under the terms and
conditions of the Creative Commons
Attribution (CC BY) license (https://
creativecommons.org/licenses/by/
4.0/).
applied sciences
Article
Technology Prediction for Acquiring a Must-Have MobileDevice for Military Communication InfrastructureSungil Kim 1, Byungki Jung 2, Dongyun Han 3 and Choonjoo Lee 3,*
1 Defense Institute of SeoulTech, Seoul National University of Science and Technology, Seoul 01811, Korea;[email protected]
2 Navy Headquarters, Sindoan-myeon, Gyeryong-si 32800, Korea; [email protected] Defense Science Department, Korea National Defense University, Nonsan-si 33021, Korea; [email protected]* Correspondence: [email protected]
Abstract: The smartphone is a must-have mobile device for the military forces to accomplish criticalmissions and protect critical infrastructures. This paper explores the applicability of a technologyprediction methodology to manage technological obsolescence while pursuing the acquisition ofadvanced commercial technology for military use. It reviews the Technology Forecasting usingData Envelopment Analysis (TFDEA) methodology and applies an author-written Stata program forsmartphone technology forecasting using TFDEA. We analyzed smartphone launch data from 2005 to2020 to predict the adoption of smartphone technology and discuss the pace of technological change.The study identifies that the market is undergoing reorganization as new smartphone models expandthe market and increase their technical performance. The average rate of technological change,the efficiency change, and the technology change were 1.079, 1.004, and 1.011 each, respectively,which means that the technology progressed over the period. When dividing before and after 2017,technological change and efficiency change generally regressed except for Huawei, Xiaomi, andOppo. This means that Chinese smartphones are expanding the global market in all directions andthe technology is reaching maturity and market competition is accelerating.
Keywords: Technology Forecasting using Data Envelopment Analysis (TFDEA); Malmquist Produc-tivity Index (MPI); smartphone; state-of-the-art technology; dual-use technology; Stata
1. Introduction
Smartphones have been widely distributed around the world since 2010 and arebeing applied not only in the private sector but also in military applications. As SamsungElectronics unveiled in 2020, the tactical mobile solution ‘Galaxy S20 Tactical Edition (TE)’was jointly developed with the US federal government and the Ministry of Defense [1].The Republic of Korea (ROK) military also saw its applicability as a military tacticaloperation, and as a first step, introduced commercial smartphones to the military forgeneral administrative work. In the military, the difference between the life cycle ofweapon systems hardware and the life cycle of software is significant and the rate ofobsolescence of software with rapid technological progress is relatively fast, so componentobsolescence management is essential [2–4]. Efforts such as technology prediction forcomponent obsolescence management are required to procure commercial smartphones formilitary tactical application. In Korea, in 1999, the dual-use technology development projectwas legislated and promoted, with the main tasks being defense technology transfer, civil-military standard unification, and technology information exchange [3,4]. Additionally,there were various studies and policy considerations that the concept of open technologicalinnovation should be applied for defense science and technology innovation [5–7]. In2014, the Institute of Civil-Military Technology Cooperation was established for civil-military technology development and cooperation [8]. As smartphones become widelyused militarily, it becomes important to acquire devices that can counter potential threats.
Appl. Sci. 2022, 12, 3207. https://doi.org/10.3390/app12063207 https://www.mdpi.com/journal/applsci

Appl. Sci. 2022, 12, 3207 2 of 27
In order to use a smartphone with commercial technology for military purposes, it isnecessary to select an alternative that can meet the military needs and target level.
In terms of national security, new technologies are both a challenging threat to theprotection of national key infrastructure and an important asset. The US Patriot Act of2001 and Cybersecurity and Infrastructure Security Agency (CISA) states that “Criticalinfrastructure includes the assets, systems, facilities, networks, and other elements thatsociety relies upon to maintain national security, economic vitality, and public health andsafety. Additionally, there are four designated lifeline functions—transportation, water,energy, and communications, which means that their reliable operations are so criticalthat a disruption or loss of one of these functions will directly affect the security andresilience of critical infrastructure within and across numerous sectors. For example, energystakeholders provide essential power and fuels to stakeholders in the communication,transportation, and water sectors, and, in return, the energy sector relies on them for fueldelivery (transportation), electricity generation (water for production and cooling), aswell as control and operation of infrastructure (communication)” [9]. ROK also managesnational critical infrastructures that are closely related to national operation and people’slives by ministries, and the communication infrastructure is considered as the criticalinfrastructure [10].
The development of smartphone technology has continued over the past 30 years, andabout half of the world’s population uses a smartphone in June 2021 [11]. Smartphoneshave rapidly spread since they were introduced to the world in the early 1990s and havebecome an essential tool in daily life, and there have been epochal changes in shape andperformance. In addition, the foldable smartphone and 5G communication expected in thepast have become a reality.
Technological advances are good news for consumers, but companies that makeproducts need a competitive strategy to survive. Technology-based companies need astrategy to develop core technology through technology prediction to respond to rapidtechnological change. Technology forecasting is a structured discipline which started bythe United States Department of Defense and the RAND Corporation in the 1950s andwas closely associated with military affairs [12]. Technological prediction began in the1950s as a military competition between the United States and the Soviet Union. AfterWorld War II, while promoting national development through scientific and technologicalinnovation, technology prediction played an important role in establishing R & D prioritiesand development strategies for the development of new weapons in the military field aswell. However, over the last 70 years, many technology forecasting methods have beendeveloped and used by governments, companies, and other organizations to ease theuncertainty of the future.
Countries around the world, including the Korean military, are paying attention tonew technologies that will lead to the fourth industrial revolution in military capabilitybuilding. The Korean Agency for Defense Development (ADD) chose 57 technologiesthat correspond to the core fields of the fourth industrial revolution, such as robots, newmaterials, internet of things, artificial intelligence, synthetic biology, and smart medical care,in a booklet titled “Patented Defense Technology to Lead the Fourth Industrial Revolution”.In 2021, the Ministry of National Defense and the Ministry of Science and ICT decided toestablish a defense Information and Communications Technology (ICT) support group andprepared a Digital New Deal/Smart Defense Innovation Workshop to explore a role forsmart defense innovation at the academic level. From July 2020, South Korean soldierswere allowed to use smartphones during after-work hours. With the development of ITtechnology, smartphones are now becoming the unparalleled comrades of soldiers in themilitary base.
Defense Acquisition Program Administrations (DAPA), which is responsible for ac-quiring Korea’s weapon systems, has signed a contract with Samsung Electronics for therapid trial acquisition of a commercial smartphone-based small unit combat commandsystem in 2020 in order to quickly apply innovative technologies in the civil sector that will
Appl. Sci. 2022, 12, 3207 3 of 27
change the future battlefield to the defense sector [13]. The ‘Commercial Smartphone-basedSmall Unit Combat Command System’ is a personal combat device that integrates SamsungElectronics’ Galaxy S20 military tactical version and radio. It communicates with real-timeencrypted data and voice through the module. It also features a night vision mode toensure operational security and combatant survivability (night displayed adjustment),stealth mode (communication interruption), and intelligence capture mode (night videocapture and sharing) functions.
Considering the trend of rapid technological development in the era of the fourthindustrial revolution, it is necessary to quickly apply and utilize advanced technologiesin the civilian field to the military for efficient defense acquisition. Through the RapidDemonstration Acquisition Project (RDAP), the DAPA purchases privately developedproducts to which the fourth industrial revolution-based technology is applied; the militaryconducts a pilot operation to confirm military utility, and the results are fed back to theprivate sector. In addition, products whose military utility has been confirmed are promotedthrough an official acquisition program such as additional mass production according tomilitary requirements. The RDAP is a new system for rapidly acquiring weapon systemsin line with the speed of technological development of the fourth industrial revolutionand was first introduced in the defense sector in 2020 led by the DAPA. Smartphones are arepresentative product that integrates the core technologies of this era and can be used forboth dual-use purposes, civilian and national defense. This study is about a technologyprediction methodology that can be used for technology prediction, which is the mainactivity of defense technology planning. Considering that technological superiority is animportant factor that can determine victory or defeat due to the competitive nature of themilitary, the technology prediction methodology was selected, and its applicability wasexamined for smartphones, which are representative products of dual use.
Despite the merits of the acquisition program that applies the superior technology ofthe private sector to the military, it is necessary to solve the problems of the obsolescenceof products and parts by private companies and technological obsolescence [2–4]. TheKorean Ministry of National Defense (MND) must follow the reinforced parts obsolescencemanagement task for newly promoted projects in accordance with “the Parts ObsolescenceManagement Work Order” implemented in 2019. In Article 5 of the Order, the basic princi-ple of component obsolescence management manages component obsolescence throughoutthe entire life cycle of a weapon system, and emphasizing the need to focus on management,it is specified to minimize the impact on the acquisition, operation, and logistics support ofweapon systems by predicting parts obsolescence problems in advance and establishingalternatives [14]. Against this background, it is necessary to analyze technology obso-lescence and component discontinuation through application of technology predictionmethodology before applying civilian advanced technology to the military. The purposeof this study is to confirm the significance of the application of technology predictionmethodology to high-tech private sector and to draw implications from the analysis oftechnological development and obsolescence. The case of smartphones withdrawn from themarket offers implications for what to consider when predicting disruptive technologies.The R-based TFDEA program is provided by Shott and Lim [15], and in this paper, theauthor-written Stata programs dea.ado and malmq.ado are additionally provided [16,17](Supplementary materials). Additionally, it tries to give some implications on defensetechnology obsolescence management when we procure the advanced technology from thecivilian side.
In Section 2, we briefly explain the concept and procedure of the TFDEA and MalmquistProductivity Index using DEA. Section 3 shows empirical examples using smartphone data,and Section 4 suggests a conclusion.
Appl. Sci. 2022, 12, 3207 4 of 27
2. Technology Forecasting Methodology2.1. Concepts of Technology Forecast
Technological forecasting is premised on a certain orderliness of the innovation pro-cess [18]. Technological forecasting is the study of new trends, technologies, or new forcesthat arise due to policies, social changes, or scientific inventions. Martino [19] defines it as:“A prediction of the future characteristics of useful machines, procedures or techniques”.The classification of technology forecasting methods varies according to experts. Accordingto Cho and Daim [20], technology forecasting methods could be traditionally categorizedinto three groups: exploratory, normative, and combined (normative/experimental) meth-ods. Exploratory methods try to predict future technological state of the art (SOA) fromthe present by extrapolating past technological trends. Trend extrapolation, Growth Curve,Bibliometrics, and Cross impact analysis are kinds of experimental methods. Normativemethods set up a possible future that ought to be or needs to be, then suggest a strategyto achieve this future. Morphological analysis, Relevance tree, Analytic Hierarchy Pro-cess (AHP), and Backcasting are normative methods. Combined (normative/exploratory)methods use two different methods, normative and experimental, in forecasting. Delphi,Scenario Planning, Trend impact analysis, and Technology roadmapping could be cate-gorized as these methods. Anderson et al. [21] introduced a new exploratory forecastingmethodology, Technology Forecasting using Data Envelopment Analysis (TFDEA), at thePICMET 01 Conference for assessing the change of database market.
TFDEA extends the traditional Data Envelopment Analysis (DEA) for technologyforecasting, so it has inherited DEA’s nonparametric and non-statistic characteristics. Tech-nological SOA frontiers are estimated using DEA and measuring the rate of change (ROC)by observing the evolution of SOA frontiers. After being introduced in 2001, TFDEA hasbeen used in a variety of sectors including jet fighter aircraft, wireless communications,microprocessors, hybrid electric vehicles (HEV), Research and Development (R & D) target-setting, etc. [21–29]. The TFDEA methodology can be said to be a technology predictioncentered on SOA technology in that it predicts future technology by considering the degreeof change in the technology frontier. TFDEA provides better forecasting results than regres-sion when forecasting technological SOA because it chooses SOA based observation andpredicts future SOA according to ROC [21–29]. Because TFDEA is modeled based on DEA,it retains the strengths and limitations of DEA’s methodology. There is another reason toconsider TFDEA as a research methodology because it has the advantage of being ableto make technology predictions for multiple inputs and multiple outputs that regressionmodels cannot handle. Smartphone technology, the subject of this study, had characteris-tics such as enlarged screen size, increased battery capacity, applied next-generation datacommunication, sensors, applied advanced camera technology, and expanded applications.On the other hand, discussions about the prospect of sixth generation communicationtechnology applicable to smartphones, expansion of IoT technology, and application ofartificial intelligence technology are revealing the limitations of predicting future smart-phone technology due to technological changes in the past. In addition, the equipmentrequired to achieve a strategic advantage militarily in the new battlefield environment inthe future requires a new technology that is different from the past. Therefore, despite theadvantages of TFDEA as a technology prediction methodology, an approach to supplementthe limitations of TFDEA classified as an exploratory methodology is needed.
It was first developed for military use, such as the Internet, GPS, computers for de-cryption, microwave ovens, and drones that we use in our daily life, but it is a case thathas spread to the public. On the other hand, considering that civil-military compatibilityis great at the stage of low technological maturity, there is an investment efficiency ofapplying technologies led by the private sector, such as commercial satellite communica-tion technology, for military use. Therefore, predicting technologies with great militaryapplicability starts with identifying promising technologies that can grow into necessarytechnologies. However, if the dependence on the general market grows, it is necessary tobe able to receive the military-necessary products continuously and stably, and this needs

Appl. Sci. 2022, 12, 3207 5 of 27
to be considered. In addition, the competition for technological hegemony between theUnited States and China is accelerating in fields such as semiconductors, 5G, quantumcomputing, and artificial intelligence. Therefore, to adopt commercial technology that canbe used for military purposes, it is necessary to understand the growth of companies thatdevelop products.
The technology prediction approach proposed in this study to develop military prod-ucts based on commercial technology is as follows. First, as an exploratory study, TFDEA isused to measure the rate of technological change. Then, a candidate product that can satisfythe performance of the product to be launched at the time of the military target is selected.Finally, it is to prepare basic data for product selection decision-making by analyzing thegrowth trend of companies that produce products.
The TFDEA technique applied to measure the rate of technological change is intro-duced in Sections 2.2 and 2.3. Figure 1 shows the approach in this study to select futurecommercial equipment that can meet the performance level of smartphones required formilitary purposes through technology prediction. It can be used for basic analysis to selectan alternative that can satisfy military needs among products from A to E. The Malmquistindex was used for the analysis of productivity, which is the core of the growth potential ofa company that develops products, and the introduction of the methodology is describedin Section 2.4.
Appl. Sci. 2022, 12, x FOR PEER REVIEW 5 of 27
technologies. However, if the dependence on the general market grows, it is necessary to
be able to receive the military-necessary products continuously and stably, and this needs
to be considered. In addition, the competition for technological hegemony between the
United States and China is accelerating in fields such as semiconductors, 5G, quantum
computing, and artificial intelligence. Therefore, to adopt commercial technology that can
be used for military purposes, it is necessary to understand the growth of companies that
develop products.
The technology prediction approach proposed in this study to develop military prod-
ucts based on commercial technology is as follows. First, as an exploratory study, TFDEA
is used to measure the rate of technological change. Then, a candidate product that can
satisfy the performance of the product to be launched at the time of the military target is
selected. Finally, it is to prepare basic data for product selection decision-making by ana-
lyzing the growth trend of companies that produce products.
The TFDEA technique applied to measure the rate of technological change is intro-
duced in Sections 2.2 and 2.3. Figure 1 shows the approach in this study to select future
commercial equipment that can meet the performance level of smartphones required for
military purposes through technology prediction. It can be used for basic analysis to select
an alternative that can satisfy military needs among products from A to E. The Malmquist
index was used for the analysis of productivity, which is the core of the growth potential
of a company that develops products, and the introduction of the methodology is de-
scribed in Section 2.4.
Figure 1. Desired defense production frontier.
2.2. Measuring Technological SOA Frontiers Using DEA
Farrell [30] suggests measuring efficiency using linear programming. He estimates
the efficient point of each observed enterprise based on the production function. Addi-
tionally, he suggests measuring the relative efficiency of each enterprise according to the
isoquants of efficient points using fraction programming. In 1978, Charnes, Cooper, and
Rhodes (CCR) [31] introduced Data Envelopment Analysis (DEA), which could measure
the relative efficiency of Decision-Making Units (DMUs) based on given observation with-
out assuming any production functions. They composed a Production Possibility Set
(PPS) using observations, i.e., input and output combination of DMUs, and then inference
of the production frontiers, which is the boundaries of PPS. Then, DEA estimates the rel-
ative efficiency of each DMUs according to production frontiers. In 1984, Banker, Charnes,
and Cooper (BCC) [32] suggested Variable Returns to Scale (VRS) models, which comple-
mented the assumption of Constant Returns to Scale (CRS) with the economy of scales.
Figure 1. Desired defense production frontier.
2.2. Measuring Technological SOA Frontiers Using DEA
Farrell [30] suggests measuring efficiency using linear programming. He estimates theefficient point of each observed enterprise based on the production function. Additionally,he suggests measuring the relative efficiency of each enterprise according to the isoquantsof efficient points using fraction programming. In 1978, Charnes, Cooper, and Rhodes(CCR) [31] introduced Data Envelopment Analysis (DEA), which could measure the rel-ative efficiency of Decision-Making Units (DMUs) based on given observation withoutassuming any production functions. They composed a Production Possibility Set (PPS)using observations, i.e., input and output combination of DMUs, and then inference ofthe production frontiers, which is the boundaries of PPS. Then, DEA estimates the relativeefficiency of each DMUs according to production frontiers. In 1984, Banker, Charnes, andCooper (BCC) [32] suggested Variable Returns to Scale (VRS) models, which complementedthe assumption of Constant Returns to Scale (CRS) with the economy of scales.
Basic DEA models, such as CCR and BCC, use Farrell’s measurement method [30]or Shephard’s directional distance functions [33] to estimate the efficiency of each DMU.
Appl. Sci. 2022, 12, 3207 6 of 27
Because Farrell’s efficiency [30] and Shephard’s distance functions [33] have a reciprocalrelationship, Shephard’s method [30] is usually used for convenience. Directional distancefunctions measure the Euclidean distances from DMUs’ current position to its projectionpoint to the frontier. If there is a production possibility set that has (1 × p) input variables,(1 × q) output variables, and n observations, then an output-oriented efficiency of arbitraryDMU K (xk, yk) is calculated using the following Equation (1),
θ̂CRSk = max{θ | θyk ≤ Yλ, xk ≥ Xλ, λ ≥ 0} (1)
where θ is an efficiency estimate, X is a (n × p) matrix of input variables, Y is a (n × q)matrix of output variables, and λ is a (1 × n) vector of reference weights [17,34].
In DEA, efficient DMU means the best-performed products, companies, or organi-zations in each input and output variable. The definition of efficient is “performing orfunctioning in the best possible manner with the least waste of time and effort, havingand using requisite knowledge, skill, and industry” [34,35]. This definition of efficient isvery similar to that of SOA. Dodson [36] defined SOA as the “state of best-implementedtechnology as reflected by the physical and performance characteristics achieved duringthe period in question”. SOA is usually represented as a boundary or planar surface inwhich one or more characteristics have a trade-off relationship with other characteristics. Ifa DMU was efficient, then it could produce the best performance; it can produce an outputlevel with a minimum input level or maximum output level within a fixed input level. SOAtechnology is a technology belonging to the frontier, which consists of a set of DMU’s thatare efficient at a certain time.
2.3. Technology Forecasting Using TFDEA
A fundamental concept of TFDEA is estimating technological frontier using DEAand measuring a change of frontiers as new DMUs appear even though there is a slightvariation according to an objective of forecasting. Rate of Change (ROC) is measured byobserving a DMU that existed in the frontier when it appeared but moved inside as newDMUs are presented and forecasting a future technology or product using ROC. In TFDEA,the frontier is state-of-the-art (SOA) which means the most efficient status that can beachieved at that time, and DMUs that exist on a frontier are regarded as SOA. Thus, ROC ismeasured with a change of efficiency estimates of DMUs which were SOA when they firstappeared but became non-SOA as time goes by. This method has excellence in measuringtechnological ROC because it uses only SOA, which means widespread and cutting-edgetechnology compared with all other observations. The process of TFDEA is composed oftwo phases. In phase 1, it estimates the technological frontier using DEA and measures anROC of the frontier. Additionally, it then forecasts a technology or product in the futureusing ROC in phase 2.
2.3.1. Phase 1. Measuring Technological Rate of Change
A technological ROC is measured by an algorithm of Inman et al. [22] and Inman [37].An Algorithm for measuring technological ROC in TFDEA.
1. For the input and output specified in Equation (1), compose production possibility setas accumulating DMUs from first appearance date (tk= t0) to current date (tf);
2. Select an SOA DMU which is efficient at the date it first appeared (θtki = 1), using an
output-oriented DEA model;3. Select a non-SOA DMU which was selected in the previous step 2 but not any more
efficient (θtfi > 1) according to current (tf) frontier. Additionally, project these non-SOA
DMUs to the current frontier to calculate an effective date (ti,eff) by Equation (2).
ti,eff = ∑nj=1 λjtj/ ∑n
j=1 λj∀j = 1, . . . , n; λj reference weight (2)
Appl. Sci. 2022, 12, 3207 7 of 27
4. Compute rate of change each DMU which selected in the previous step 3 using thefollowing Equation (3).
γtfi =
(θ
tfi
)( 1ti,eff−tk
)∀j = 1, . . . , n (3)
5. Compute technological ROC (−γ) by averaging the rate of change each DMU.
−γ = ∑n
j=1 λj,kγk/ ∑nj=1 λj,k (4)
A calculation of technological ROC is performed by iterating through 1–3 from thedate of first DMU released (t0) to the current date (tf). We can select DMUs that were SOAwhen released but become non-SOA as new DMUs appeared during this process. Weexcept DMUs which remain on the frontier when measuring a technological ROC becausethat is still an SOA. The ROC of each DMU is calculated in 1–5 with selected DMUs usingEquation (3). Additionally, the elapsed time of each DMU is from its released date (tk) tothe effective date (ti,eff), which was calculated using Equation (2). An effective date (ti,eff) isa projected point on the current frontier, a weighted average of DMU’s reference set and its
released dates. The annual average ROC (−γ) is a weighted average of each DMU’s ROC by
Equation (4).
2.3.2. Phase 2. Forecasting Future Technological SOA
Before the forecasting, we need to measure the super-efficiency of target DMUs.Anderson and Petersen [38] and Rousseau and Semple [39] suggested the super-efficiencyDEA models identify relative rank among the efficient DMUs. First, it composes PPSwithout the specified DMU. Then, it measures the efficiency score of the specified DMUusing distance functions. Suppose the efficiency score of DMU K is less than unity (θSE
k < 1),it is considered that DMU K is located inside the production frontier. Additionally, if theefficiency score is greater than the unity (θSE
k > 1), it is considered that DMU K is locatedoutside of the production frontier.
In TFDEA, if the super-efficiency score of the target DMU is greater than the unity,it means that the technology is more advanced than the current technological SOA fron-tiers. Inman et al. [22] and Inman [37] forecast the releasing date of target DMU K usingEquation (5)
tk,expected = teff +ln(
1/θSE,tfk
)ln(−γ) (5)
where tK,expected is releasing date of target DMU K and teff is the effective date of DMU K.The effective date of DMU K is calculated using Equation (2), and then super-efficiency score(θSE,tf
k ) is measured according to the current (tf) technological frontiers. The technologyforecasting estimates the releasing date of target DMU by calculating the required time thatcurrent technological frontiers are moving to that of futures by the rate of annual averageROC.
2.4. Efficiency and Technology Change Analysis Using Malmquist Index
The Malmquist Productivity Index (MPI) measures the productivity changes alongwith time variations and can be decomposed into changes in efficiency and technologywith DEA, such as a nonparametric approach. Productivity decomposition into technicalchange and efficiency catch-up necessitates the use of a contemporaneous version of thedata and the time variants of technology in the study period. The MPI can be expressed in
Appl. Sci. 2022, 12, 3207 8 of 27
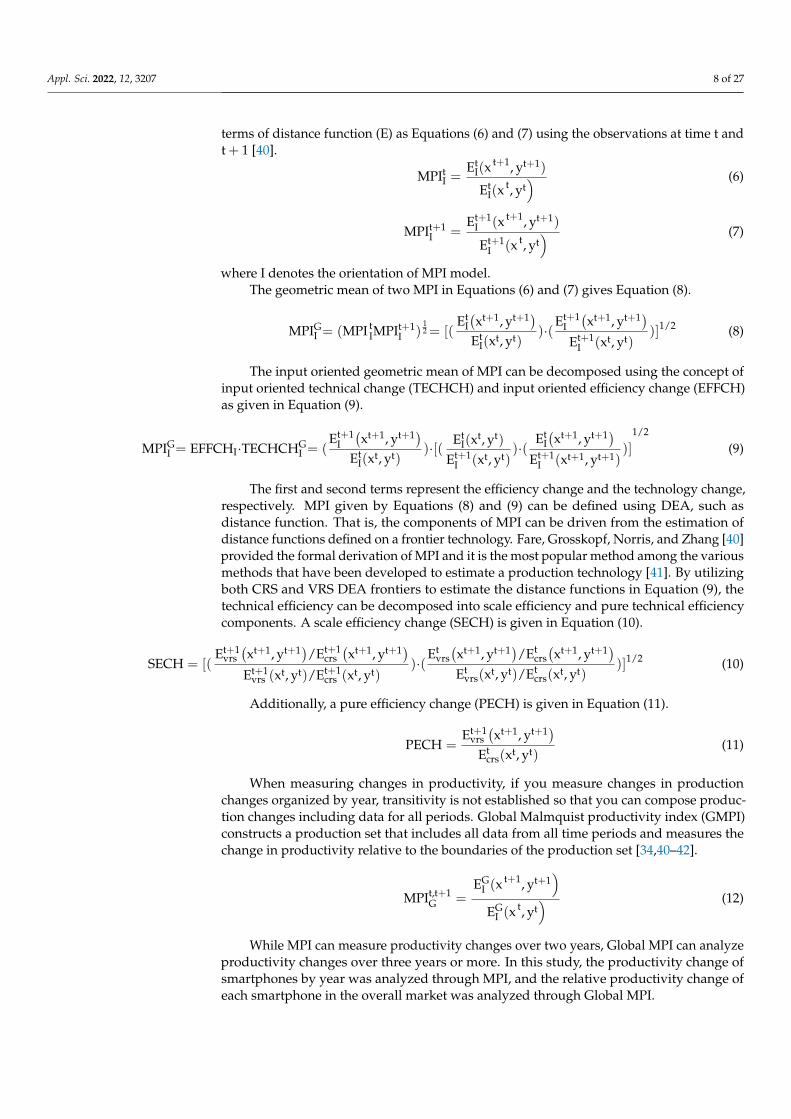
terms of distance function (E) as Equations (6) and (7) using the observations at time t andt + 1 [40].
MPItI =
EtI(x
t+1, yt+1)
EtI(x
t, yt) (6)
MPIt+1I =
Et+1I (x t+1, yt+1)
Et+1I (x t, yt
) (7)
where I denotes the orientation of MPI model.The geometric mean of two MPI in Equations (6) and (7) gives Equation (8).
MPIGI = (MPI t
IMPIt+1I )
12 = [(
EtI(xt+1, yt+1)
EtI(xt, yt)
)·(Et+1
I(xt+1, yt+1)
Et+1I (xt, yt)
)]1/2 (8)
The input oriented geometric mean of MPI can be decomposed using the concept ofinput oriented technical change (TECHCH) and input oriented efficiency change (EFFCH)as given in Equation (9).
MPIGI = EFFCHI·TECHCHG
I = (Et+1
I(xt+1, yt+1)
EtI(xt, yt)
)·[( EtI(x
t, yt)
Et+1I (xt, yt)
)·(Et
I(xt+1, yt+1)
Et+1I (xt+1, yt+1)
)]
1/2
(9)
The first and second terms represent the efficiency change and the technology change,respectively. MPI given by Equations (8) and (9) can be defined using DEA, such asdistance function. That is, the components of MPI can be driven from the estimation ofdistance functions defined on a frontier technology. Fare, Grosskopf, Norris, and Zhang [40]provided the formal derivation of MPI and it is the most popular method among the variousmethods that have been developed to estimate a production technology [41]. By utilizingboth CRS and VRS DEA frontiers to estimate the distance functions in Equation (9), thetechnical efficiency can be decomposed into scale efficiency and pure technical efficiencycomponents. A scale efficiency change (SECH) is given in Equation (10).
SECH = [(Et+1
vrs(xt+1, yt+1)/Et+1
crs(xt+1, yt+1)
Et+1vrs (xt, yt)/Et+1
crs (xt, yt))·(
Etvrs
(xt+1, yt+1)/Et
crs(xt+1, yt+1)
Etvrs(xt, yt)/Et
crs(xt, yt))]1/2 (10)
Additionally, a pure efficiency change (PECH) is given in Equation (11).
PECH =Et+1
vrs(xt+1, yt+1)
Etcrs(xt, yt)
(11)
When measuring changes in productivity, if you measure changes in productionchanges organized by year, transitivity is not established so that you can compose produc-tion changes including data for all periods. Global Malmquist productivity index (GMPI)constructs a production set that includes all data from all time periods and measures thechange in productivity relative to the boundaries of the production set [34,40–42].
MPIt,t+1G =
EGI (x
t+1, yt+1)
EGI (x
t, yt) (12)
While MPI can measure productivity changes over two years, Global MPI can analyzeproductivity changes over three years or more. In this study, the productivity change ofsmartphones by year was analyzed through MPI, and the relative productivity change ofeach smartphone in the overall market was analyzed through Global MPI.

Appl. Sci. 2022, 12, 3207 9 of 27
3. Data and Results3.1. Date and Models
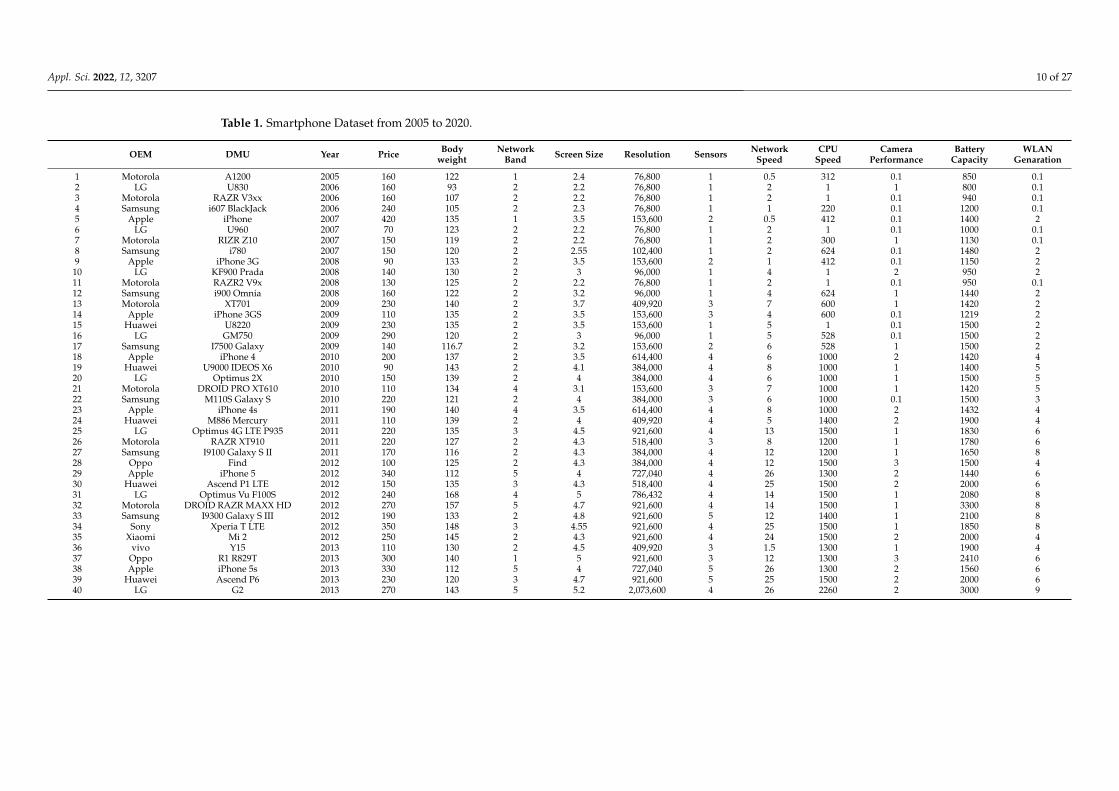
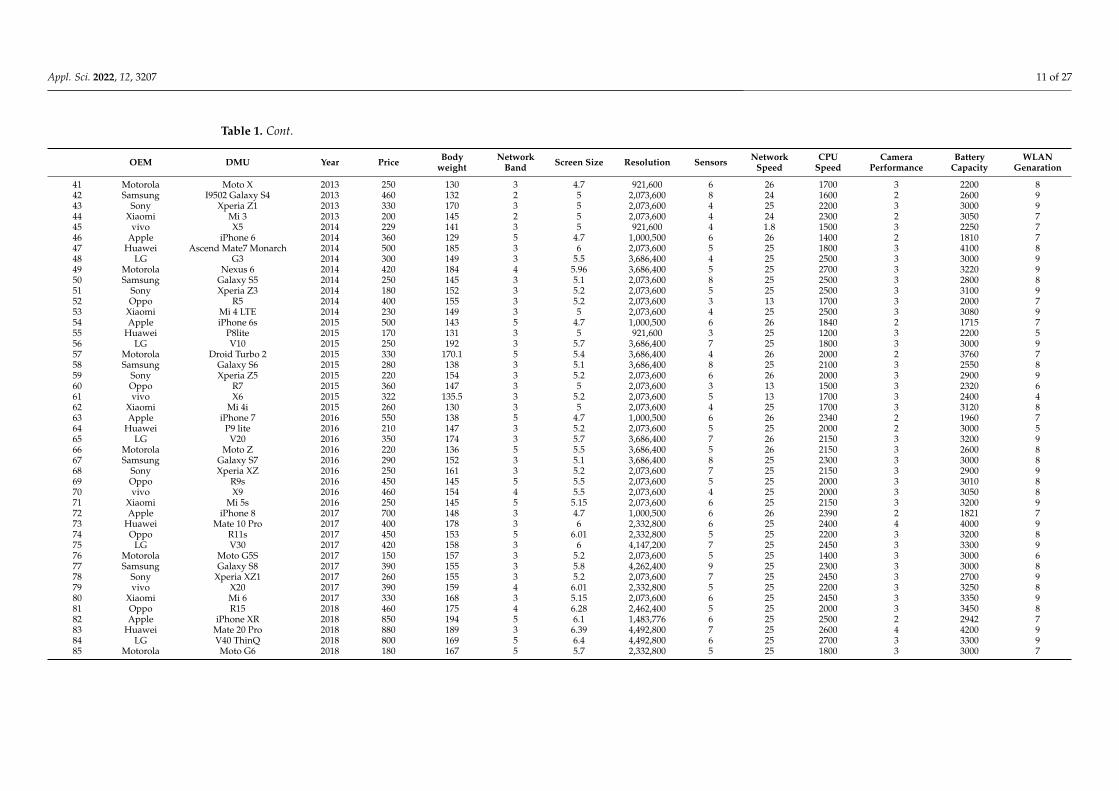
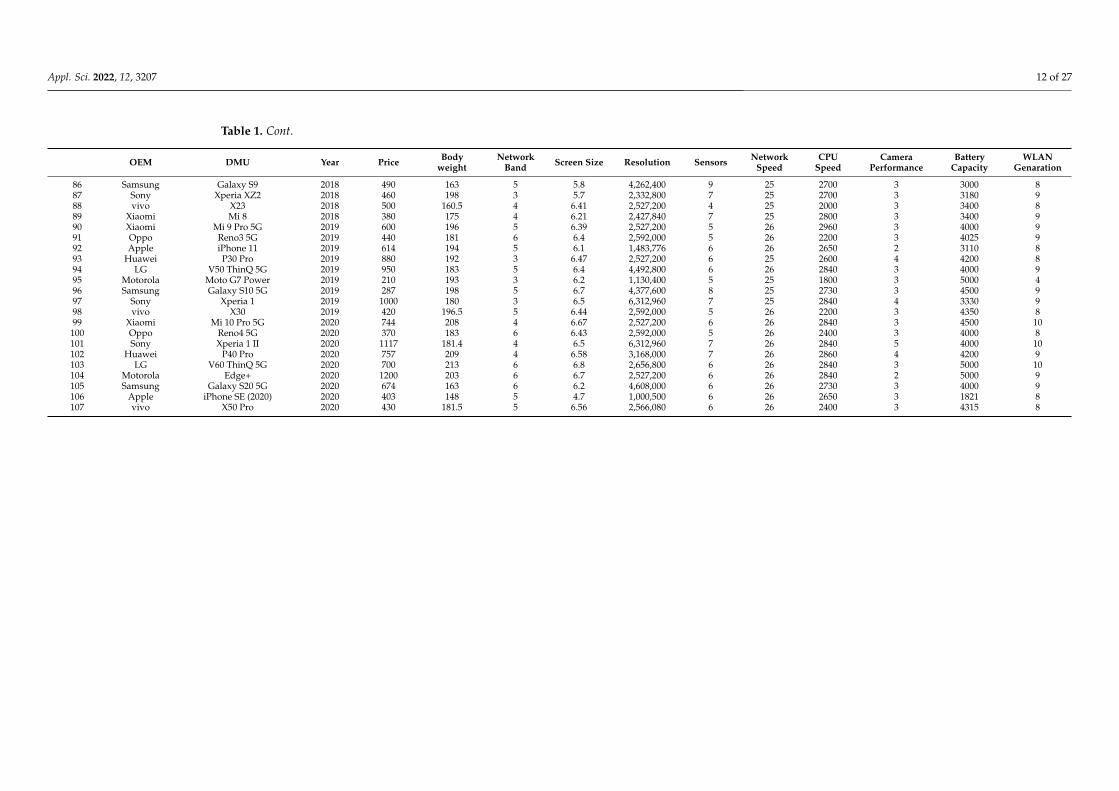
In this study, the rate of technological change was calculated using the technical dataof smartphones, which are evaluated to have a high rate of technological development.Smartphone manufacturers for this study are selected considering dual-use technology,global market share, and growth rate [15,43–46]. The main data sources are from thewebsites https://www.kaggle.com/msainani/gsmarena-mobile-devices (accessed on 13February 2022) and www.gsmarena.com (accessed on 3 March 2022).
The dataset, initially introduced by Sainani [45], has 10,105 observations that includeperformance and characteristics parameters of smartphone data that were firstly flown from1994 to 2020. Missing values are supplemented if there is data provided by the GSMARENAsite [46], and smartphone models with insufficient data necessary for analysis are deleted,and data are constructed focusing on representative models of each manufacturer. Table 1shows the final smartphone dataset used for the analysis. The analysis of this study coveredtechnical data of 107 smartphones released between 2005 and 2020.
In the case of TFDEA application, an output-oriented VRS model was used in con-sideration of previous studies and the characteristics of the model [24,25,28]. The inputvariables are price and body weight, and output variables are network speed (ntwk), dis-play resolution (resolution), battery capacity (btrycpcty), sensors (sensors), CPU speed(cpus), and primary camera performance (pcamp).
As analysis software, TFDEA R program of Shott and Lim [15] and Stata programs,dea.ado, tfdea.ado, malmq.ado, supereff.ado, of Lee [16,17,42] were used in parallel.
Smartphone specification data were selected in terms of performance required for themilitary use of commercial products of interest in this study, and input/output variableswere determined as follows. Although it is the leading technology for commercial smart-phones, the military requirement may be low, and conversely, it may not be consideredimportant in commercial smartphones but may have high military requirements. In thisstudy, performance variables in the military field were selected in consideration of theperformance parameters of military radios presented in Jane’s Defense Data Service (JDDS).The performance indicators of military radios included frequency range, operable channels,display performance, battery duration, sensitivity, weight, operable temperature, size, andaudio output in common. Table 2 shows the input and output variables used in the analysis.Srivastava [47] was referred to quantify qualitative variable values.
• DMU: name of the smartphone• year: year of smartphone introduction• price: retail price announced in EUD• bdywgt: body weight in kg• ntwk: network bands in generation• scrnsize: display size in square inches• resolution: display resolution in ppi• sensors: sensors in generation• ntwk.1: network speed in Mbps• cpus: cpu speed in MHz• pcamp: main camera performance in MP• btycpcty: battery capacity in mAh• comlev: WLAN in generation
Appl. Sci. 2022, 12, 3207 10 of 27
Table 1. Smartphone Dataset from 2005 to 2020.
OEM DMU Year Price Bodyweight
NetworkBand Screen Size Resolution Sensors Network
SpeedCPU
SpeedCamera
PerformanceBattery
CapacityWLAN
Genaration
1 Motorola A1200 2005 160 122 1 2.4 76,800 1 0.5 312 0.1 850 0.12 LG U830 2006 160 93 2 2.2 76,800 1 2 1 1 800 0.13 Motorola RAZR V3xx 2006 160 107 2 2.2 76,800 1 2 1 0.1 940 0.14 Samsung i607 BlackJack 2006 240 105 2 2.3 76,800 1 1 220 0.1 1200 0.15 Apple iPhone 2007 420 135 1 3.5 153,600 2 0.5 412 0.1 1400 26 LG U960 2007 70 123 2 2.2 76,800 1 2 1 0.1 1000 0.17 Motorola RIZR Z10 2007 150 119 2 2.2 76,800 1 2 300 1 1130 0.18 Samsung i780 2007 150 120 2 2.55 102,400 1 2 624 0.1 1480 29 Apple iPhone 3G 2008 90 133 2 3.5 153,600 2 1 412 0.1 1150 210 LG KF900 Prada 2008 140 130 2 3 96,000 1 4 1 2 950 211 Motorola RAZR2 V9x 2008 130 125 2 2.2 76,800 1 2 1 0.1 950 0.112 Samsung i900 Omnia 2008 160 122 2 3.2 96,000 1 4 624 1 1440 213 Motorola XT701 2009 230 140 2 3.7 409,920 3 7 600 1 1420 214 Apple iPhone 3GS 2009 110 135 2 3.5 153,600 3 4 600 0.1 1219 215 Huawei U8220 2009 230 135 2 3.5 153,600 1 5 1 0.1 1500 216 LG GM750 2009 290 120 2 3 96,000 1 5 528 0.1 1500 217 Samsung I7500 Galaxy 2009 140 116.7 2 3.2 153,600 2 6 528 1 1500 218 Apple iPhone 4 2010 200 137 2 3.5 614,400 4 6 1000 2 1420 419 Huawei U9000 IDEOS X6 2010 90 143 2 4.1 384,000 4 8 1000 1 1400 520 LG Optimus 2X 2010 150 139 2 4 384,000 4 6 1000 1 1500 521 Motorola DROID PRO XT610 2010 110 134 4 3.1 153,600 3 7 1000 1 1420 522 Samsung M110S Galaxy S 2010 220 121 2 4 384,000 3 6 1000 0.1 1500 323 Apple iPhone 4s 2011 190 140 4 3.5 614,400 4 8 1000 2 1432 424 Huawei M886 Mercury 2011 110 139 2 4 409,920 4 5 1400 2 1900 425 LG Optimus 4G LTE P935 2011 220 135 3 4.5 921,600 4 13 1500 1 1830 626 Motorola RAZR XT910 2011 220 127 2 4.3 518,400 3 8 1200 1 1780 627 Samsung I9100 Galaxy S II 2011 170 116 2 4.3 384,000 4 12 1200 1 1650 828 Oppo Find 2012 100 125 2 4.3 384,000 4 12 1500 3 1500 429 Apple iPhone 5 2012 340 112 5 4 727,040 4 26 1300 2 1440 630 Huawei Ascend P1 LTE 2012 150 135 3 4.3 518,400 4 25 1500 2 2000 631 LG Optimus Vu F100S 2012 240 168 4 5 786,432 4 14 1500 1 2080 832 Motorola DROID RAZR MAXX HD 2012 270 157 5 4.7 921,600 4 14 1500 1 3300 833 Samsung I9300 Galaxy S III 2012 190 133 2 4.8 921,600 5 12 1400 1 2100 834 Sony Xperia T LTE 2012 350 148 3 4.55 921,600 4 25 1500 1 1850 835 Xiaomi Mi 2 2012 250 145 2 4.3 921,600 4 24 1500 2 2000 436 vivo Y15 2013 110 130 2 4.5 409,920 3 1.5 1300 1 1900 437 Oppo R1 R829T 2013 300 140 1 5 921,600 3 12 1300 3 2410 638 Apple iPhone 5s 2013 330 112 5 4 727,040 5 26 1300 2 1560 639 Huawei Ascend P6 2013 230 120 3 4.7 921,600 5 25 1500 2 2000 640 LG G2 2013 270 143 5 5.2 2,073,600 4 26 2260 2 3000 9
Appl. Sci. 2022, 12, 3207 11 of 27
Table 1. Cont.
OEM DMU Year Price Bodyweight
NetworkBand Screen Size Resolution Sensors Network
SpeedCPU
SpeedCamera
PerformanceBattery
CapacityWLAN
Genaration
41 Motorola Moto X 2013 250 130 3 4.7 921,600 6 26 1700 3 2200 842 Samsung I9502 Galaxy S4 2013 460 132 2 5 2,073,600 8 24 1600 2 2600 943 Sony Xperia Z1 2013 330 170 3 5 2,073,600 4 25 2200 3 3000 944 Xiaomi Mi 3 2013 200 145 2 5 2,073,600 4 24 2300 2 3050 745 vivo X5 2014 229 141 3 5 921,600 4 1.8 1500 3 2250 746 Apple iPhone 6 2014 360 129 5 4.7 1,000,500 6 26 1400 2 1810 747 Huawei Ascend Mate7 Monarch 2014 500 185 3 6 2,073,600 5 25 1800 3 4100 848 LG G3 2014 300 149 3 5.5 3,686,400 4 25 2500 3 3000 949 Motorola Nexus 6 2014 420 184 4 5.96 3,686,400 5 25 2700 3 3220 950 Samsung Galaxy S5 2014 250 145 3 5.1 2,073,600 8 25 2500 3 2800 851 Sony Xperia Z3 2014 180 152 3 5.2 2,073,600 5 25 2500 3 3100 952 Oppo R5 2014 400 155 3 5.2 2,073,600 3 13 1700 3 2000 753 Xiaomi Mi 4 LTE 2014 230 149 3 5 2,073,600 4 25 2500 3 3080 954 Apple iPhone 6s 2015 500 143 5 4.7 1,000,500 6 26 1840 2 1715 755 Huawei P8lite 2015 170 131 3 5 921,600 3 25 1200 3 2200 556 LG V10 2015 250 192 3 5.7 3,686,400 7 25 1800 3 3000 957 Motorola Droid Turbo 2 2015 330 170.1 5 5.4 3,686,400 4 26 2000 2 3760 758 Samsung Galaxy S6 2015 280 138 3 5.1 3,686,400 8 25 2100 3 2550 859 Sony Xperia Z5 2015 220 154 3 5.2 2,073,600 6 26 2000 3 2900 960 Oppo R7 2015 360 147 3 5 2,073,600 3 13 1500 3 2320 661 vivo X6 2015 322 135.5 3 5.2 2,073,600 5 13 1700 3 2400 462 Xiaomi Mi 4i 2015 260 130 3 5 2,073,600 4 25 1700 3 3120 863 Apple iPhone 7 2016 550 138 5 4.7 1,000,500 6 26 2340 2 1960 764 Huawei P9 lite 2016 210 147 3 5.2 2,073,600 5 25 2000 2 3000 565 LG V20 2016 350 174 3 5.7 3,686,400 7 26 2150 3 3200 966 Motorola Moto Z 2016 220 136 5 5.5 3,686,400 5 26 2150 3 2600 867 Samsung Galaxy S7 2016 290 152 3 5.1 3,686,400 8 25 2300 3 3000 868 Sony Xperia XZ 2016 250 161 3 5.2 2,073,600 7 25 2150 3 2900 969 Oppo R9s 2016 450 145 5 5.5 2,073,600 5 25 2000 3 3010 870 vivo X9 2016 460 154 4 5.5 2,073,600 4 25 2000 3 3050 871 Xiaomi Mi 5s 2016 250 145 5 5.15 2,073,600 6 25 2150 3 3200 972 Apple iPhone 8 2017 700 148 3 4.7 1,000,500 6 26 2390 2 1821 773 Huawei Mate 10 Pro 2017 400 178 3 6 2,332,800 6 25 2400 4 4000 974 Oppo R11s 2017 450 153 5 6.01 2,332,800 5 25 2200 3 3200 875 LG V30 2017 420 158 3 6 4,147,200 7 25 2450 3 3300 976 Motorola Moto G5S 2017 150 157 3 5.2 2,073,600 5 25 1400 3 3000 677 Samsung Galaxy S8 2017 390 155 3 5.8 4,262,400 9 25 2300 3 3000 878 Sony Xperia XZ1 2017 260 155 3 5.2 2,073,600 7 25 2450 3 2700 979 vivo X20 2017 390 159 4 6.01 2,332,800 5 25 2200 3 3250 880 Xiaomi Mi 6 2017 330 168 3 5.15 2,073,600 6 25 2450 3 3350 981 Oppo R15 2018 460 175 4 6.28 2,462,400 5 25 2000 3 3450 882 Apple iPhone XR 2018 850 194 5 6.1 1,483,776 6 25 2500 2 2942 783 Huawei Mate 20 Pro 2018 880 189 3 6.39 4,492,800 7 25 2600 4 4200 984 LG V40 ThinQ 2018 800 169 5 6.4 4,492,800 6 25 2700 3 3300 985 Motorola Moto G6 2018 180 167 5 5.7 2,332,800 5 25 1800 3 3000 7
Appl. Sci. 2022, 12, 3207 12 of 27
Table 1. Cont.
OEM DMU Year Price Bodyweight
NetworkBand Screen Size Resolution Sensors Network
SpeedCPU
SpeedCamera
PerformanceBattery
CapacityWLAN
Genaration
86 Samsung Galaxy S9 2018 490 163 5 5.8 4,262,400 9 25 2700 3 3000 887 Sony Xperia XZ2 2018 460 198 3 5.7 2,332,800 7 25 2700 3 3180 988 vivo X23 2018 500 160.5 4 6.41 2,527,200 4 25 2000 3 3400 889 Xiaomi Mi 8 2018 380 175 4 6.21 2,427,840 7 25 2800 3 3400 990 Xiaomi Mi 9 Pro 5G 2019 600 196 5 6.39 2,527,200 5 26 2960 3 4000 991 Oppo Reno3 5G 2019 440 181 6 6.4 2,592,000 5 26 2200 3 4025 992 Apple iPhone 11 2019 614 194 5 6.1 1,483,776 6 26 2650 2 3110 893 Huawei P30 Pro 2019 880 192 3 6.47 2,527,200 6 25 2600 4 4200 894 LG V50 ThinQ 5G 2019 950 183 5 6.4 4,492,800 6 26 2840 3 4000 995 Motorola Moto G7 Power 2019 210 193 3 6.2 1,130,400 5 25 1800 3 5000 496 Samsung Galaxy S10 5G 2019 287 198 5 6.7 4,377,600 8 25 2730 3 4500 997 Sony Xperia 1 2019 1000 180 3 6.5 6,312,960 7 25 2840 4 3330 998 vivo X30 2019 420 196.5 5 6.44 2,592,000 5 26 2200 3 4350 899 Xiaomi Mi 10 Pro 5G 2020 744 208 4 6.67 2,527,200 6 26 2840 3 4500 10100 Oppo Reno4 5G 2020 370 183 6 6.43 2,592,000 5 26 2400 3 4000 8101 Sony Xperia 1 II 2020 1117 181.4 4 6.5 6,312,960 7 26 2840 5 4000 10102 Huawei P40 Pro 2020 757 209 4 6.58 3,168,000 7 26 2860 4 4200 9103 LG V60 ThinQ 5G 2020 700 213 6 6.8 2,656,800 6 26 2840 3 5000 10104 Motorola Edge+ 2020 1200 203 6 6.7 2,527,200 6 26 2840 2 5000 9105 Samsung Galaxy S20 5G 2020 674 163 6 6.2 4,608,000 6 26 2730 3 4000 9106 Apple iPhone SE (2020) 2020 403 148 5 4.7 1,000,500 6 26 2650 3 1821 8107 vivo X50 Pro 2020 430 181.5 5 6.56 2,566,080 6 26 2400 3 4315 8
Appl. Sci. 2022, 12, 3207 13 of 27
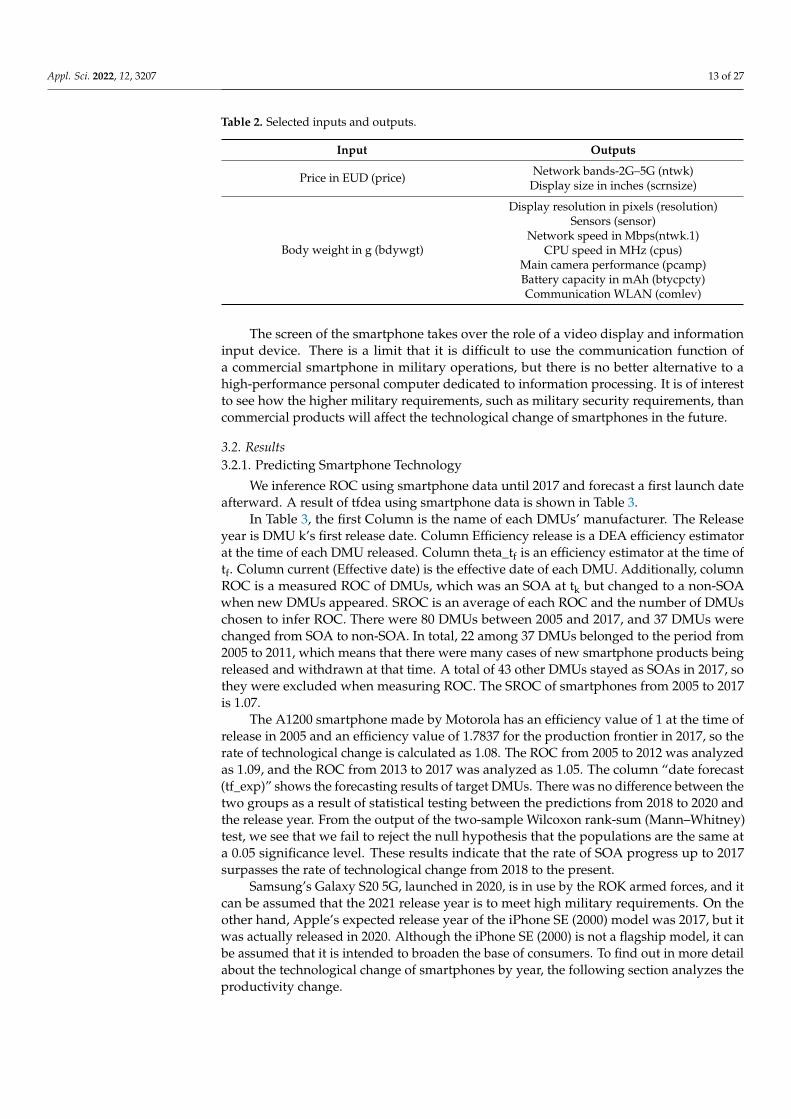
Table 2. Selected inputs and outputs.
Input Outputs
Price in EUD (price) Network bands-2G–5G (ntwk)Display size in inches (scrnsize)
Body weight in g (bdywgt)
Display resolution in pixels (resolution)Sensors (sensor)
Network speed in Mbps(ntwk.1)CPU speed in MHz (cpus)
Main camera performance (pcamp)Battery capacity in mAh (btycpcty)Communication WLAN (comlev)
The screen of the smartphone takes over the role of a video display and informationinput device. There is a limit that it is difficult to use the communication function ofa commercial smartphone in military operations, but there is no better alternative to ahigh-performance personal computer dedicated to information processing. It is of interestto see how the higher military requirements, such as military security requirements, thancommercial products will affect the technological change of smartphones in the future.
3.2. Results3.2.1. Predicting Smartphone Technology
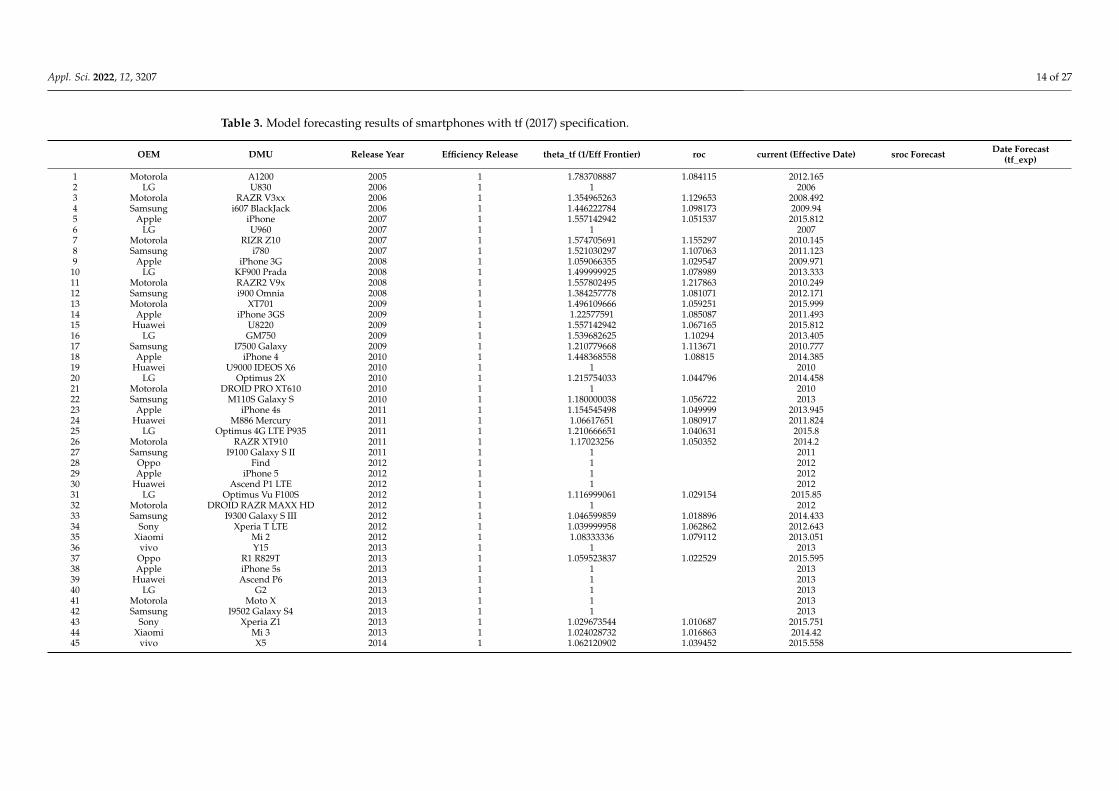
We inference ROC using smartphone data until 2017 and forecast a first launch dateafterward. A result of tfdea using smartphone data is shown in Table 3.
In Table 3, the first Column is the name of each DMUs’ manufacturer. The Releaseyear is DMU k’s first release date. Column Efficiency release is a DEA efficiency estimatorat the time of each DMU released. Column theta_tf is an efficiency estimator at the time oftf. Column current (Effective date) is the effective date of each DMU. Additionally, columnROC is a measured ROC of DMUs, which was an SOA at tk but changed to a non-SOAwhen new DMUs appeared. SROC is an average of each ROC and the number of DMUschosen to infer ROC. There were 80 DMUs between 2005 and 2017, and 37 DMUs werechanged from SOA to non-SOA. In total, 22 among 37 DMUs belonged to the period from2005 to 2011, which means that there were many cases of new smartphone products beingreleased and withdrawn at that time. A total of 43 other DMUs stayed as SOAs in 2017, sothey were excluded when measuring ROC. The SROC of smartphones from 2005 to 2017is 1.07.
The A1200 smartphone made by Motorola has an efficiency value of 1 at the time ofrelease in 2005 and an efficiency value of 1.7837 for the production frontier in 2017, so therate of technological change is calculated as 1.08. The ROC from 2005 to 2012 was analyzedas 1.09, and the ROC from 2013 to 2017 was analyzed as 1.05. The column “date forecast(tf_exp)” shows the forecasting results of target DMUs. There was no difference between thetwo groups as a result of statistical testing between the predictions from 2018 to 2020 andthe release year. From the output of the two-sample Wilcoxon rank-sum (Mann–Whitney)test, we see that we fail to reject the null hypothesis that the populations are the same ata 0.05 significance level. These results indicate that the rate of SOA progress up to 2017surpasses the rate of technological change from 2018 to the present.
Samsung’s Galaxy S20 5G, launched in 2020, is in use by the ROK armed forces, and itcan be assumed that the 2021 release year is to meet high military requirements. On theother hand, Apple’s expected release year of the iPhone SE (2000) model was 2017, but itwas actually released in 2020. Although the iPhone SE (2000) is not a flagship model, it canbe assumed that it is intended to broaden the base of consumers. To find out in more detailabout the technological change of smartphones by year, the following section analyzes theproductivity change.
Appl. Sci. 2022, 12, 3207 14 of 27
Table 3. Model forecasting results of smartphones with tf (2017) specification.
OEM DMU Release Year Efficiency Release theta_tf (1/Eff Frontier) roc current (Effective Date) sroc Forecast Date Forecast(tf_exp)
1 Motorola A1200 2005 1 1.783708887 1.084115 2012.1652 LG U830 2006 1 1 20063 Motorola RAZR V3xx 2006 1 1.354965263 1.129653 2008.4924 Samsung i607 BlackJack 2006 1 1.446222784 1.098173 2009.945 Apple iPhone 2007 1 1.557142942 1.051537 2015.8126 LG U960 2007 1 1 20077 Motorola RIZR Z10 2007 1 1.574705691 1.155297 2010.1458 Samsung i780 2007 1 1.521030297 1.107063 2011.1239 Apple iPhone 3G 2008 1 1.059066355 1.029547 2009.97110 LG KF900 Prada 2008 1 1.499999925 1.078989 2013.33311 Motorola RAZR2 V9x 2008 1 1.557802495 1.217863 2010.24912 Samsung i900 Omnia 2008 1 1.384257778 1.081071 2012.17113 Motorola XT701 2009 1 1.496109666 1.059251 2015.99914 Apple iPhone 3GS 2009 1 1.22577591 1.085087 2011.49315 Huawei U8220 2009 1 1.557142942 1.067165 2015.81216 LG GM750 2009 1 1.539682625 1.10294 2013.40517 Samsung I7500 Galaxy 2009 1 1.210779668 1.113671 2010.77718 Apple iPhone 4 2010 1 1.448368558 1.08815 2014.38519 Huawei U9000 IDEOS X6 2010 1 1 201020 LG Optimus 2X 2010 1 1.215754033 1.044796 2014.45821 Motorola DROID PRO XT610 2010 1 1 201022 Samsung M110S Galaxy S 2010 1 1.180000038 1.056722 201323 Apple iPhone 4s 2011 1 1.154545498 1.049999 2013.94524 Huawei M886 Mercury 2011 1 1.06617651 1.080917 2011.82425 LG Optimus 4G LTE P935 2011 1 1.210666651 1.040631 2015.826 Motorola RAZR XT910 2011 1 1.17023256 1.050352 2014.227 Samsung I9100 Galaxy S II 2011 1 1 201128 Oppo Find 2012 1 1 201229 Apple iPhone 5 2012 1 1 201230 Huawei Ascend P1 LTE 2012 1 1 201231 LG Optimus Vu F100S 2012 1 1.116999061 1.029154 2015.8532 Motorola DROID RAZR MAXX HD 2012 1 1 201233 Samsung I9300 Galaxy S III 2012 1 1.046599859 1.018896 2014.43334 Sony Xperia T LTE 2012 1 1.039999958 1.062862 2012.64335 Xiaomi Mi 2 2012 1 1.08333336 1.079112 2013.05136 vivo Y15 2013 1 1 201337 Oppo R1 R829T 2013 1 1.059523837 1.022529 2015.59538 Apple iPhone 5s 2013 1 1 201339 Huawei Ascend P6 2013 1 1 201340 LG G2 2013 1 1 201341 Motorola Moto X 2013 1 1 201342 Samsung I9502 Galaxy S4 2013 1 1 201343 Sony Xperia Z1 2013 1 1.029673544 1.010687 2015.75144 Xiaomi Mi 3 2013 1 1.024028732 1.016863 2014.4245 vivo X5 2014 1 1.062120902 1.039452 2015.558
Appl. Sci. 2022, 12, 3207 15 of 27
Table 3. Cont.
OEM DMU Release Year Efficiency Release theta_tf (1/Eff Frontier) roc current (Effective Date) sroc Forecast Date Forecast(tf_exp)
46 Apple iPhone 6 2014 1 1 201447 Huawei Ascend Mate7 Monarch 2014 1 1.000725726 1.000243 2016.98248 LG G3 2014 1 1 201449 Motorola Nexus 6 2014 1 1 201450 Samsung Galaxy S5 2014 1 1 201451 Sony Xperia Z3 2014 1 1 201452 Oppo R5 2014 1 1.11631014 1.04315 2016.60553 Xiaomi Mi 4 LTE 2014 1 1.000649822 1.017088 2014.03854 Apple iPhone 6s 2015 1 1 201555 Huawei P8lite 2015 1 1 201556 LG V10 2015 1 1 201557 Motorola Droid Turbo 2 2015 1 1 201558 Samsung Galaxy S6 2015 1 1 201559 Sony Xperia Z5 2015 1 1 201560 Oppo R7 2015 1 1.101190486 1.099942 2016.01261 vivo X6 2015 1 1.013928231 1.054154 2015.26262 Xiaomi Mi 4i 2015 1 1 201563 Apple iPhone 7 2016 1 1 201664 Huawei P9 lite 2016 0.970297 201765 LG V20 2016 1 1 201666 Motorola Moto Z 2016 1 1 201667 Samsung Galaxy S7 2016 1 1 201668 Sony Xperia XZ 2016 1 1.013820297 2014.71869 Oppo R9s 2016 1 1 201670 vivo X9 2016 1 1.031346009 1.15334 2016.21671 Xiaomi Mi 5s 2016 1 1 201672 Apple iPhone 8 2017 1 1 201773 Huawei Mate 10 Pro 2017 1 1 201774 Oppo R11s 2017 1 1 201775 LG V30 2017 1 1 201776 Motorola Moto G5S 2017 1 1 201777 Samsung Galaxy S8 2017 1 1 201778 Sony Xperia XZ1 2017 1 1 201779 vivo X20 2017 1 1 201780 Xiaomi Mi 6 2017 0.9898305 201781 Oppo R15 2018 2017 1.070013 2017.6582 Apple iPhone XR 2018 2015.538 1.070013 2017.27883 Huawei Mate 20 Pro 2018 2017 1.070013 2019.87784 LG V40 ThinQ 2018 2015.36 1.070013 2018.65885 Motorola Moto G6 2018 2014.878 1.070013 2017.07286 Samsung Galaxy S9 2018 2016.276 1.070013 2019.57387 Sony Xperia XZ2 2018 2014.364 1.070013 2015.53288 vivo X23 2018 2017 1.070013 2017.95389 Xiaomi Mi 8 2018 2014.594 1.070013 2015.92490 Xiaomi Mi 9 Pro 5G 2019 2014.801 1.070013 2017.314
Appl. Sci. 2022, 12, 3207 16 of 27
Table 3. Cont.
OEM DMU Release Year Efficiency Release theta_tf (1/Eff Frontier) roc current (Effective Date) sroc Forecast Date Forecast(tf_exp)
91 Oppo Reno3 5G 2019 2015.2 1.070013 2018.49792 Apple iPhone 11 2019 2015.298 1.070013 2017.34793 Huawei P30 Pro 2019 2014.882 1.070013 2017.75194 LG V50 ThinQ 5G 2019 2015.949 1.070013 2019.2995 Motorola Moto G7 Power 2019 2015.954 1.070013 2017.77696 Samsung Galaxy S10 5G 2019 2015.382 1.070013 2018.6897 Sony Xperia 1 2019 2017 1.070013 2022.80498 vivo X30 2019 2016.911 1.070013 2017.98599 Xiaomi Mi 10 Pro 5G 2020 2015.57 1.070013 2017.71
100 Oppo Reno4 5G 2020 2015.2 1.070013 2018.497101 Sony Xperia 1 II 2020 2017 1.070013 2023.834102 Huawei P40 Pro 2020 2014.536 1.070013 2018.346103 LG V60 ThinQ 5G 2020 2014.5 1.070013 2020.492104 Motorola Edge+ 2020 2015.715 1.070013 2019.181105 Samsung Galaxy S20 5G 2020 2014.473 1.070013 2021.647106 Apple iPhone SE (2020) 2020 2014.5 1.070013 2017.797107 vivo X50 Pro 2020 2016.974 1.070013 2018.421
Appl. Sci. 2022, 12, 3207 17 of 27
The discrepancy between the predicted value and the actual value in Table 3 meansthat the market launch of a product is not determined solely by technological superioritybut is a product of various business environments. Despite these limitations, in the longrun, technological forecasting can recognize opportunities and challenges through scientificmethods and predict technological limitations by performing technological forecasting.Separately from this study, multiple regression analysis was performed by selecting thedependent variable as the product release year and the independent variable as the vari-able used in TFDEA. Because the analysis conditions are different, the results of the twomethodologies cannot be compared, but the results of the TFDEA for the year of release arenot rejected.
3.2.2. Efficiency and Technology Change Analysis
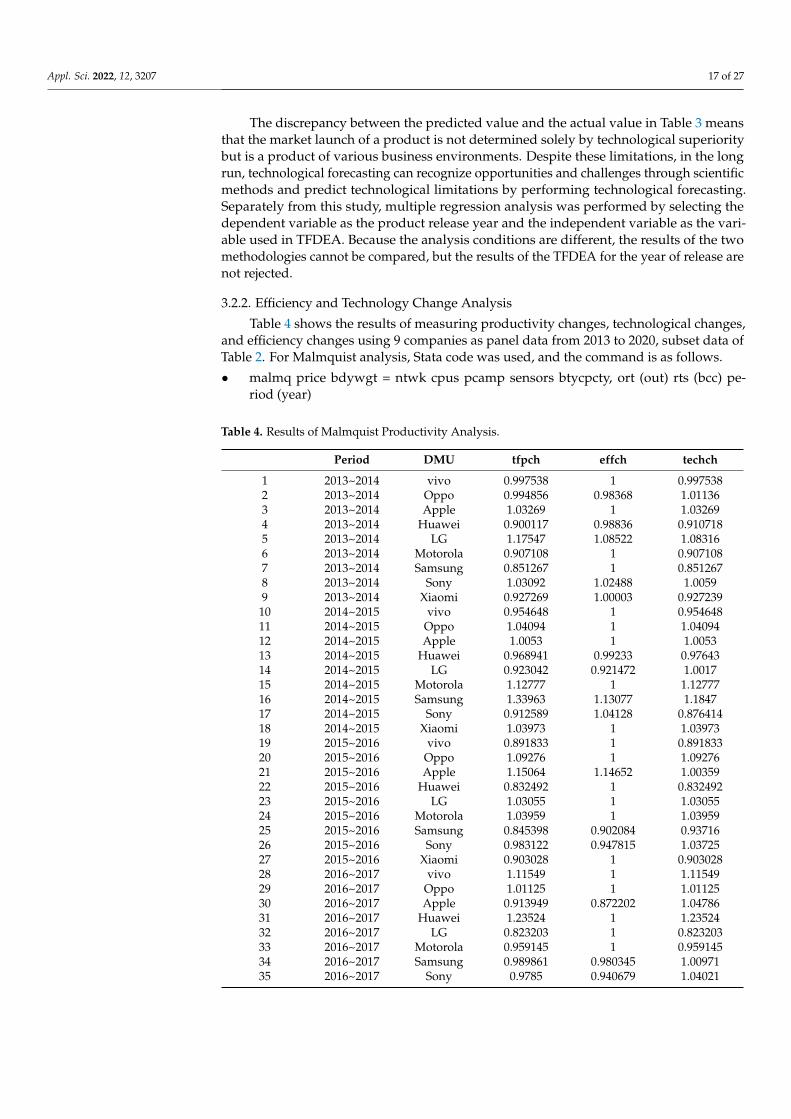
Table 4 shows the results of measuring productivity changes, technological changes,and efficiency changes using 9 companies as panel data from 2013 to 2020, subset data ofTable 2. For Malmquist analysis, Stata code was used, and the command is as follows.
• malmq price bdywgt = ntwk cpus pcamp sensors btycpcty, ort (out) rts (bcc) pe-riod (year)
Table 4. Results of Malmquist Productivity Analysis.
Period DMU tfpch effch techch
1 2013~2014 vivo 0.997538 1 0.9975382 2013~2014 Oppo 0.994856 0.98368 1.011363 2013~2014 Apple 1.03269 1 1.032694 2013~2014 Huawei 0.900117 0.98836 0.9107185 2013~2014 LG 1.17547 1.08522 1.083166 2013~2014 Motorola 0.907108 1 0.9071087 2013~2014 Samsung 0.851267 1 0.8512678 2013~2014 Sony 1.03092 1.02488 1.00599 2013~2014 Xiaomi 0.927269 1.00003 0.92723910 2014~2015 vivo 0.954648 1 0.95464811 2014~2015 Oppo 1.04094 1 1.0409412 2014~2015 Apple 1.0053 1 1.005313 2014~2015 Huawei 0.968941 0.99233 0.9764314 2014~2015 LG 0.923042 0.921472 1.001715 2014~2015 Motorola 1.12777 1 1.1277716 2014~2015 Samsung 1.33963 1.13077 1.184717 2014~2015 Sony 0.912589 1.04128 0.87641418 2014~2015 Xiaomi 1.03973 1 1.0397319 2015~2016 vivo 0.891833 1 0.89183320 2015~2016 Oppo 1.09276 1 1.0927621 2015~2016 Apple 1.15064 1.14652 1.0035922 2015~2016 Huawei 0.832492 1 0.83249223 2015~2016 LG 1.03055 1 1.0305524 2015~2016 Motorola 1.03959 1 1.0395925 2015~2016 Samsung 0.845398 0.902084 0.9371626 2015~2016 Sony 0.983122 0.947815 1.0372527 2015~2016 Xiaomi 0.903028 1 0.90302828 2016~2017 vivo 1.11549 1 1.1154929 2016~2017 Oppo 1.01125 1 1.0112530 2016~2017 Apple 0.913949 0.872202 1.0478631 2016~2017 Huawei 1.23524 1 1.2352432 2016~2017 LG 0.823203 1 0.82320333 2016~2017 Motorola 0.959145 1 0.95914534 2016~2017 Samsung 0.989861 0.980345 1.0097135 2016~2017 Sony 0.9785 0.940679 1.04021
Appl. Sci. 2022, 12, 3207 18 of 27
Table 4. Cont.
Period DMU tfpch effch techch
36 2016~2017 Xiaomi 1.21739 1.00209 1.2148537 2017~2018 vivo 1.05136 1.032 1.0187638 2017~2018 Oppo 1.26962 1.19018 1.0667439 2017~2018 Apple 1.04813 1 1.0481340 2017~2018 Huawei 0.998205 1 0.99820541 2017~2018 LG 0.89409 1 0.8940942 2017~2018 Motorola 0.997031 1 0.99703143 2017~2018 Samsung 1.27636 1.15796 1.1022544 2017~2018 Sony 1.01832 0.985403 1.0334145 2017~2018 Xiaomi 1.00028 0.997918 1.0023646 2018~2019 vivo 0.967091 0.968994 0.99803647 2018~2019 Oppo 0.813669 0.840206 0.96841648 2018~2019 Apple 1.13868 1.05402 1.0803249 2018~2019 Huawei 1.04281 1 1.0428150 2018~2019 LG 1.22317 1 1.2231751 2018~2019 Motorola 0.973883 1 0.97388352 2018~2019 Samsung 0.817516 0.863575 0.94666553 2018~2019 Sony 0.973725 1 0.97372554 2018~2019 Xiaomi 1.02228 1.05297 0.97086155 2019~2020 vivo 1.06505 1.1231 0.94831656 2019~2020 Oppo 0.950499 1 0.95049957 2019~2020 Apple 0.791447 0.948744 0.83420458 2019~2020 Huawei 1.00505 1.07279 0.93685459 2019~2020 LG 0.960468 1.02972 0.93274560 2019~2020 Motorola 1.42793 1 1.4279361 2019~2020 Samsung 1.26642 1.00002 1.266462 2019~2020 Sony 0.884251 1 0.88425163 2019~2020 Xiaomi 0.949742 0.949698 1.00005
The period is a variable indicating the year for measuring the change in productivityfrom period t to t + 1. tfpch, effch, and techch are variables corresponding to productivitychange, efficiency change, and technological change presented in Equations (6)–(9). Theaverage tfpch for the entire period was 1.0154, the efficiency change was 1.0036, and thetechnology change was 1.0107. It means that progress has been made in all aspects of totalfactor productivity, technological change, and efficiency change.
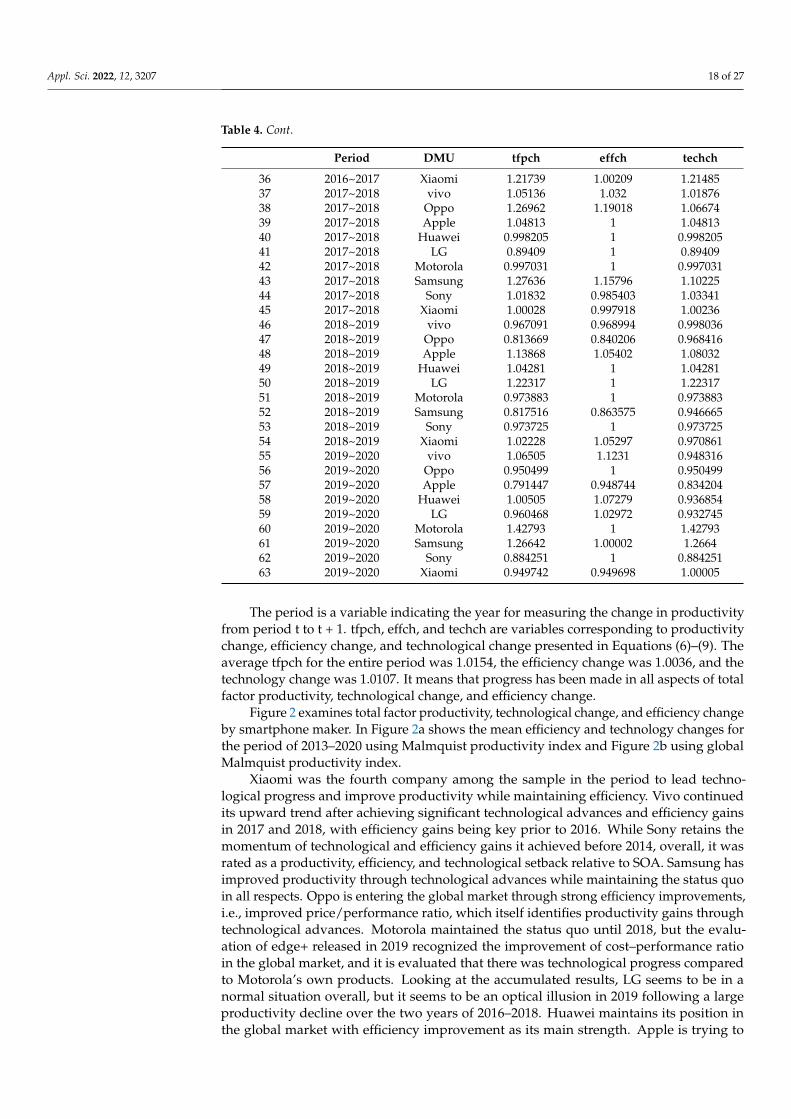
Figure 2 examines total factor productivity, technological change, and efficiency changeby smartphone maker. In Figure 2a shows the mean efficiency and technology changes forthe period of 2013–2020 using Malmquist productivity index and Figure 2b using globalMalmquist productivity index.
Xiaomi was the fourth company among the sample in the period to lead techno-logical progress and improve productivity while maintaining efficiency. Vivo continuedits upward trend after achieving significant technological advances and efficiency gainsin 2017 and 2018, with efficiency gains being key prior to 2016. While Sony retains themomentum of technological and efficiency gains it achieved before 2014, overall, it wasrated as a productivity, efficiency, and technological setback relative to SOA. Samsung hasimproved productivity through technological advances while maintaining the status quoin all respects. Oppo is entering the global market through strong efficiency improvements,i.e., improved price/performance ratio, which itself identifies productivity gains throughtechnological advances. Motorola maintained the status quo until 2018, but the evalu-ation of edge+ released in 2019 recognized the improvement of cost–performance ratioin the global market, and it is evaluated that there was technological progress comparedto Motorola’s own products. Looking at the accumulated results, LG seems to be in anormal situation overall, but it seems to be an optical illusion in 2019 following a largeproductivity decline over the two years of 2016–2018. Huawei maintains its position inthe global market with efficiency improvement as its main strength. Apple is trying to
Appl. Sci. 2022, 12, 3207 19 of 27
improve productivity through technological advances, but in the global market, efficiencywas assessed as temporarily regressing in 2020.
Appl. Sci. 2022, 12, x FOR PEER REVIEW 18 of 27
and 2018, with efficiency gains being key prior to 2016. While Sony retains the momentum
of technological and efficiency gains it achieved before 2014, overall, it was rated as a
productivity, efficiency, and technological setback relative to SOA. Samsung has im-
proved productivity through technological advances while maintaining the status quo in
all respects. Oppo is entering the global market through strong efficiency improvements,
i.e., improved price/performance ratio, which itself identifies productivity gains through
technological advances. Motorola maintained the status quo until 2018, but the evaluation
of edge+ released in 2019 recognized the improvement of cost–performance ratio in the
global market, and it is evaluated that there was technological progress compared to
Motorola’s own products. Looking at the accumulated results, LG seems to be in a normal
situation overall, but it seems to be an optical illusion in 2019 following a large productiv-
ity decline over the two years of 2016–2018. Huawei maintains its position in the global
market with efficiency improvement as its main strength. Apple is trying to improve
productivity through technological advances, but in the global market, efficiency was as-
sessed as temporarily regressing in 2020.
(a)
Appl. Sci. 2022, 12, x FOR PEER REVIEW 19 of 27
(b)
Figure 2. Mean efficiency and technology changes for the period of 2013–2020: (a) MPI; (b) Global
MPI.
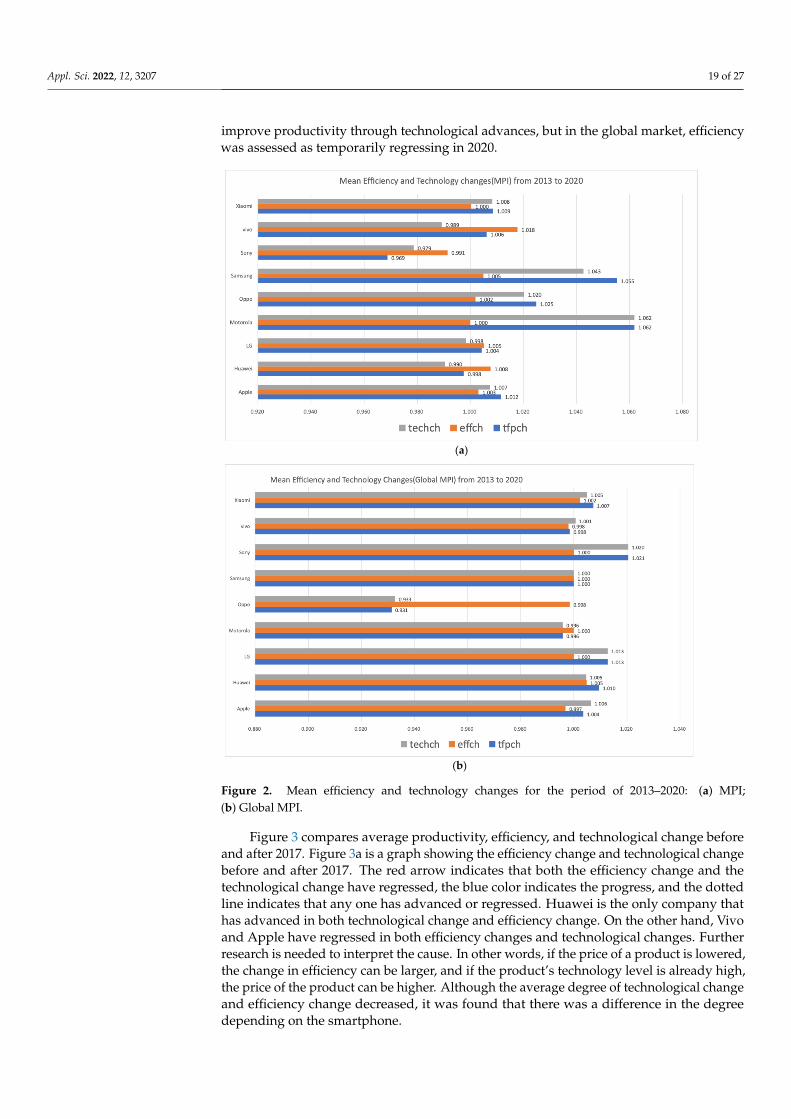
Figure 3 compares average productivity, efficiency, and technological change before
and after 2017. Figure 3a is a graph showing the efficiency change and technological
change before and after 2017. The red arrow indicates that both the efficiency change and
the technological change have regressed, the blue color indicates the progress, and the
dotted line indicates that any one has advanced or regressed. Huawei is the only company
that has advanced in both technological change and efficiency change. On the other hand,
Vivo and Apple have regressed in both efficiency changes and technological changes. Fur-
ther research is needed to interpret the cause. In other words, if the price of a product is
lowered, the change in efficiency can be larger, and if the product’s technology level is
already high, the price of the product can be higher. Although the average degree of tech-
nological change and efficiency change decreased, it was found that there was a difference
in the degree depending on the smartphone.
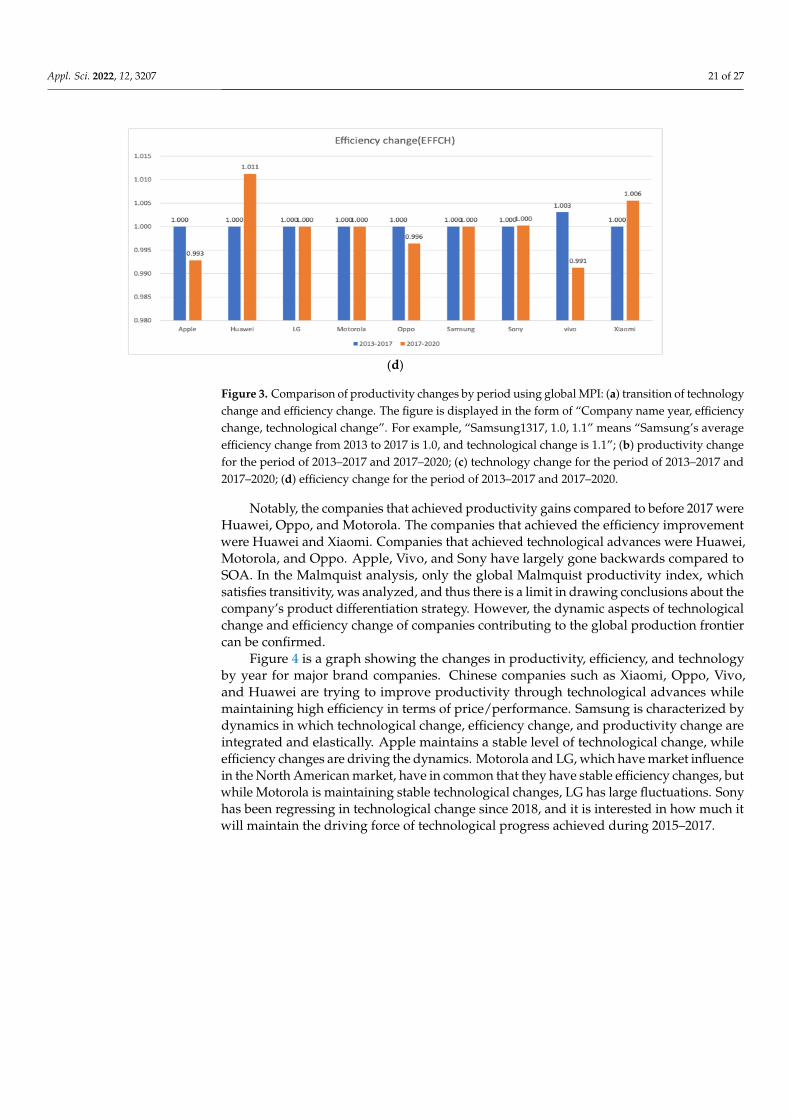
Notably, the companies that achieved productivity gains compared to before 2017
were Huawei, Oppo, and Motorola. The companies that achieved the efficiency improve-
ment were Huawei and Xiaomi. Companies that achieved technological advances were
Huawei, Motorola, and Oppo. Apple, Vivo, and Sony have largely gone backwards com-
pared to SOA. In the Malmquist analysis, only the global Malmquist productivity index,
which satisfies transitivity, was analyzed, and thus there is a limit in drawing conclusions
about the company’s product differentiation strategy. However, the dynamic aspects of
technological change and efficiency change of companies contributing to the global pro-
duction frontier can be confirmed.
Figure 2. Mean efficiency and technology changes for the period of 2013–2020: (a) MPI;(b) Global MPI.
Figure 3 compares average productivity, efficiency, and technological change beforeand after 2017. Figure 3a is a graph showing the efficiency change and technological changebefore and after 2017. The red arrow indicates that both the efficiency change and thetechnological change have regressed, the blue color indicates the progress, and the dottedline indicates that any one has advanced or regressed. Huawei is the only company thathas advanced in both technological change and efficiency change. On the other hand, Vivoand Apple have regressed in both efficiency changes and technological changes. Furtherresearch is needed to interpret the cause. In other words, if the price of a product is lowered,the change in efficiency can be larger, and if the product’s technology level is already high,the price of the product can be higher. Although the average degree of technological changeand efficiency change decreased, it was found that there was a difference in the degreedepending on the smartphone.
Appl. Sci. 2022, 12, 3207 20 of 27Appl. Sci. 2022, 12, x FOR PEER REVIEW 20 of 27
(a)
(b)
(c)
Apple1720, 0.993 , 0.965
Huawei1720, 1.011 , 1.033
LG1720, 1.000 , 1.001
Motorola1720, 1.000 , 1.002
Oppo1720, 0.996 , 0.947
Samsung1720, 1.000 , 1.000
Sony1720, 1.000 , 0.990
vivo1720, 0.991 , 0.971
Xiaomi1720, 1.006 , 0.989
Apple1317, 1.000 , 1.038
Huawei1317, 1.000 , 0.983
LG1317, 1.000 , 1.021
Motorola1317, 1.000 , 0.992
Oppo1317, 1.000 , 0.922
Samsung1317, 1.000 , 1.009
Sony1317, 1.000 , 1.043
vivo1317, 1.003 , 1.023
Xiaomi1317, 1.000 , 1.017
0.900
0.920
0.940
0.960
0.980
1.000
1.020
1.040
1.060
0.990 0.995 1.000 1.005 1.010 1.015
Tech
nolo
gy c
hang
e
Efficiency change
Figure 3. Cont.
Appl. Sci. 2022, 12, 3207 21 of 27Appl. Sci. 2022, 12, x FOR PEER REVIEW 21 of 27
(d)
Figure 3. Comparison of productivity changes by period using global MPI: (a) transition of technol-
ogy change and efficiency change. The figure is displayed in the form of “Company name year,
efficiency change, technological change”. For example, “Samsung1317, 1.0, 1.1” means “Samsung’s
average efficiency change from 2013 to 2017 is 1.0, and technological change is 1.1”; (b) productivity
change for the period of 2013–2017 and 2017–2020; (c) technology change for the period of 2013–
2017 and 2017–2020; (d) efficiency change for the period of 2013–2017 and 2017–2020.
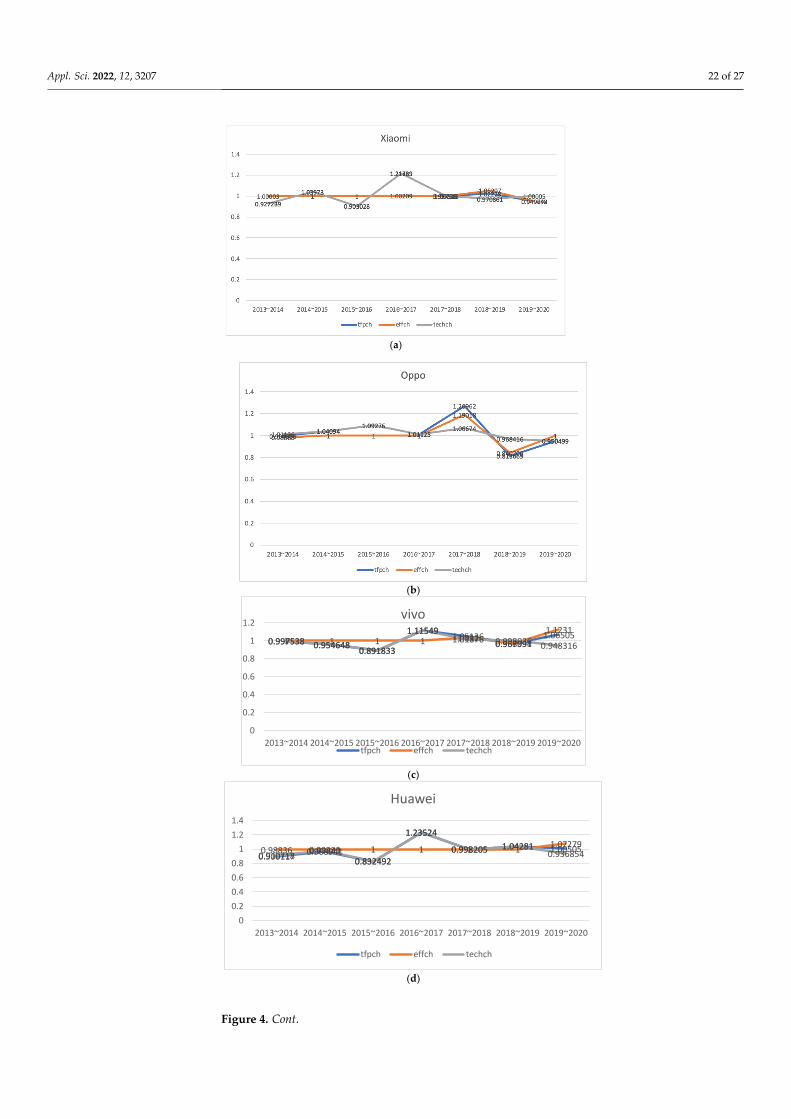
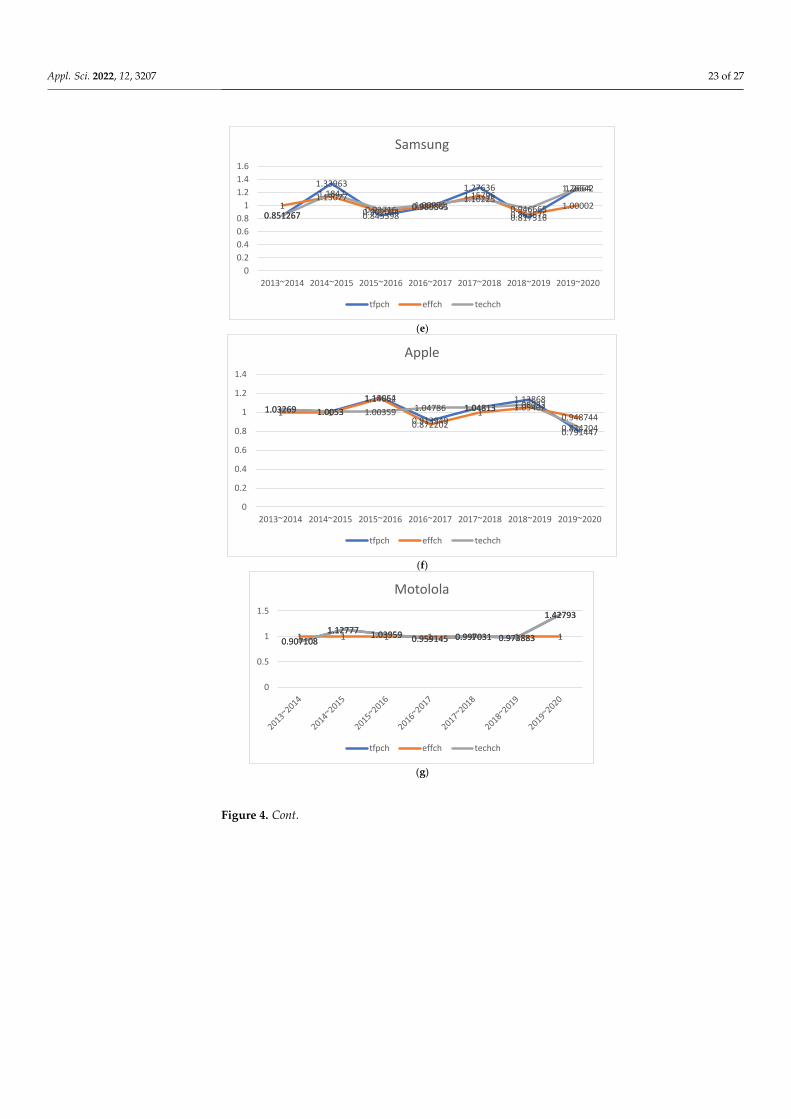
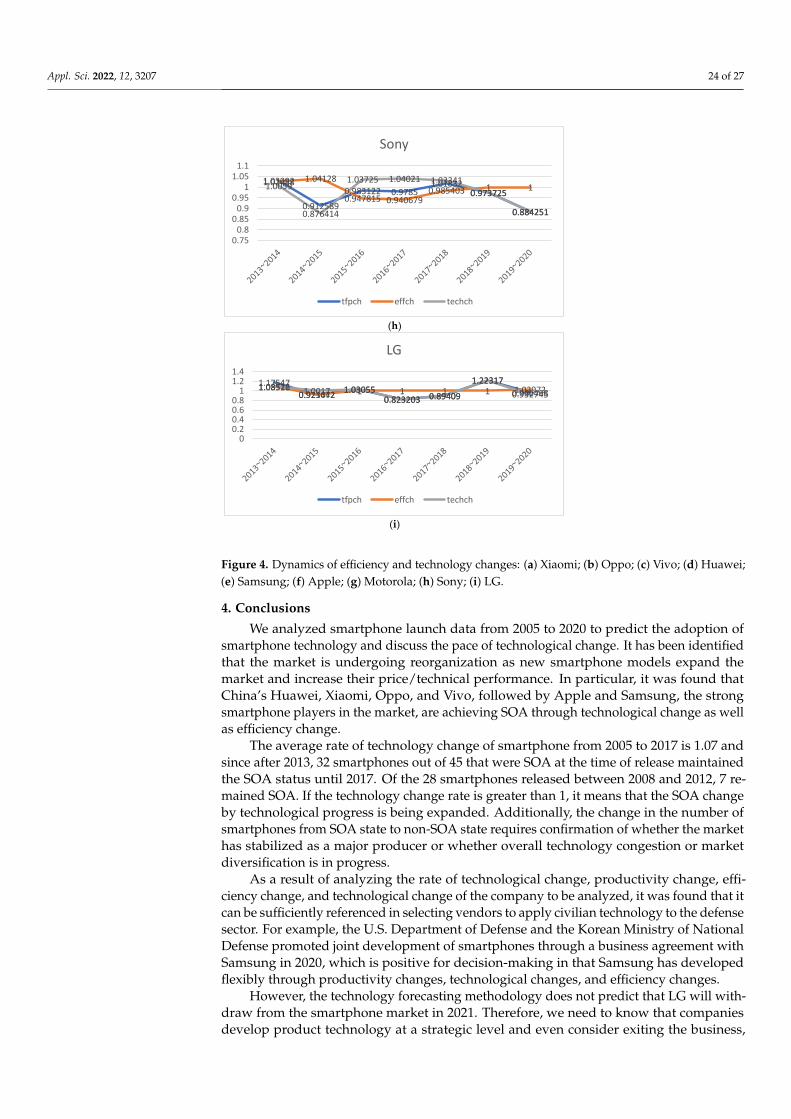
Figure 4 is a graph showing the changes in productivity, efficiency, and technology
by year for major brand companies. Chinese companies such as Xiaomi, Oppo, Vivo, and
Huawei are trying to improve productivity through technological advances while main-
taining high efficiency in terms of price/performance. Samsung is characterized by dy-
namics in which technological change, efficiency change, and productivity change are in-
tegrated and elastically. Apple maintains a stable level of technological change, while ef-
ficiency changes are driving the dynamics. Motorola and LG, which have market influ-
ence in the North American market, have in common that they have stable efficiency
changes, but while Motorola is maintaining stable technological changes, LG has large
fluctuations. Sony has been regressing in technological change since 2018, and it is inter-
ested in how much it will maintain the driving force of technological progress achieved
during 2015–2017.
(a)
Figure 3. Comparison of productivity changes by period using global MPI: (a) transition of technologychange and efficiency change. The figure is displayed in the form of “Company name year, efficiencychange, technological change”. For example, “Samsung1317, 1.0, 1.1” means “Samsung’s averageefficiency change from 2013 to 2017 is 1.0, and technological change is 1.1”; (b) productivity changefor the period of 2013–2017 and 2017–2020; (c) technology change for the period of 2013–2017 and2017–2020; (d) efficiency change for the period of 2013–2017 and 2017–2020.
Notably, the companies that achieved productivity gains compared to before 2017 wereHuawei, Oppo, and Motorola. The companies that achieved the efficiency improvementwere Huawei and Xiaomi. Companies that achieved technological advances were Huawei,Motorola, and Oppo. Apple, Vivo, and Sony have largely gone backwards compared toSOA. In the Malmquist analysis, only the global Malmquist productivity index, whichsatisfies transitivity, was analyzed, and thus there is a limit in drawing conclusions about thecompany’s product differentiation strategy. However, the dynamic aspects of technologicalchange and efficiency change of companies contributing to the global production frontiercan be confirmed.
Figure 4 is a graph showing the changes in productivity, efficiency, and technologyby year for major brand companies. Chinese companies such as Xiaomi, Oppo, Vivo,and Huawei are trying to improve productivity through technological advances whilemaintaining high efficiency in terms of price/performance. Samsung is characterized bydynamics in which technological change, efficiency change, and productivity change areintegrated and elastically. Apple maintains a stable level of technological change, whileefficiency changes are driving the dynamics. Motorola and LG, which have market influencein the North American market, have in common that they have stable efficiency changes, butwhile Motorola is maintaining stable technological changes, LG has large fluctuations. Sonyhas been regressing in technological change since 2018, and it is interested in how much itwill maintain the driving force of technological progress achieved during 2015–2017.
Appl. Sci. 2022, 12, 3207 22 of 27
Appl. Sci. 2022, 12, x FOR PEER REVIEW 21 of 27
(d)
Figure 3. Comparison of productivity changes by period using global MPI: (a) transition of technol-
ogy change and efficiency change. The figure is displayed in the form of “Company name year,
efficiency change, technological change”. For example, “Samsung1317, 1.0, 1.1” means “Samsung’s
average efficiency change from 2013 to 2017 is 1.0, and technological change is 1.1”; (b) productivity
change for the period of 2013–2017 and 2017–2020; (c) technology change for the period of 2013–
2017 and 2017–2020; (d) efficiency change for the period of 2013–2017 and 2017–2020.
Figure 4 is a graph showing the changes in productivity, efficiency, and technology
by year for major brand companies. Chinese companies such as Xiaomi, Oppo, Vivo, and
Huawei are trying to improve productivity through technological advances while main-
taining high efficiency in terms of price/performance. Samsung is characterized by dy-
namics in which technological change, efficiency change, and productivity change are in-
tegrated and elastically. Apple maintains a stable level of technological change, while ef-
ficiency changes are driving the dynamics. Motorola and LG, which have market influ-
ence in the North American market, have in common that they have stable efficiency
changes, but while Motorola is maintaining stable technological changes, LG has large
fluctuations. Sony has been regressing in technological change since 2018, and it is inter-
ested in how much it will maintain the driving force of technological progress achieved
during 2015–2017.
(a)
Appl. Sci. 2022, 12, x FOR PEER REVIEW 22 of 27
(b)
(c)
(d)
0.997538 0.9546480.891833
1.115491.05136
0.9670911.06505
1 1 1 1 1.0320.968994
1.12310.997538 0.954648
0.891833
1.115491.01876 0.998036 0.948316
0
0.2
0.4
0.6
0.8
1
1.2
2013~2014 2014~2015 2015~2016 2016~2017 2017~2018 2018~2019 2019~2020
vivo
tfpch effch techch
0.9001170.968941
0.832492
1.23524
0.998205 1.04281 1.005050.98836 0.99233 1 1 1 11.07279
0.910718 0.976430.832492
1.23524
0.998205 1.042810.936854
0
0.2
0.4
0.6
0.8
1
1.2
1.4
2013~2014 2014~2015 2015~2016 2016~2017 2017~2018 2018~2019 2019~2020
Huawei
tfpch effch techch
Figure 4. Cont.
Appl. Sci. 2022, 12, 3207 23 of 27Appl. Sci. 2022, 12, x FOR PEER REVIEW 23 of 27
(e)
(f)
(g)
0.851267
1.33963
0.8453980.989861
1.27636
0.817516
1.26642
11.13077
0.9020840.980345
1.15796
0.8635751.00002
0.851267
1.1847
0.93716 1.009711.10225
0.946665
1.2664
0
0.2
0.4
0.6
0.8
1
1.2
1.4
1.6
2013~2014 2014~2015 2015~2016 2016~2017 2017~2018 2018~2019 2019~2020
Samsung
tfpch effch techch
1.03269 1.0053
1.15064
0.913949
1.048131.13868
0.791447
1 1
1.14652
0.872202
11.05402
0.9487441.03269 1.0053 1.00359 1.04786 1.04813 1.08032
0.834204
0
0.2
0.4
0.6
0.8
1
1.2
1.4
2013~2014 2014~2015 2015~2016 2016~2017 2017~2018 2018~2019 2019~2020
Apple
tfpch effch techch
0.9071081.12777 1.03959 0.959145 0.997031 0.973883
1.42793
1 1 1 1 1 1 10.9071081.12777 1.03959 0.959145 0.997031 0.973883
1.42793
0
0.5
1
1.5
Motolola
tfpch effch techch
Figure 4. Cont.
Appl. Sci. 2022, 12, 3207 24 of 27Appl. Sci. 2022, 12, x FOR PEER REVIEW 24 of 27
(h)
(i)
Figure 4. Dynamics of efficiency and technology changes: (a) Xiaomi; (b) Oppo; (c) Vivo; (d)
Huawei; (e) Samsung; (f) Apple; (g) Motorola; (h) Sony; (i) LG.
4. Conclusions
We analyzed smartphone launch data from 2005 to 2020 to predict the adoption of
smartphone technology and discuss the pace of technological change. It has been identi-
fied that the market is undergoing reorganization as new smartphone models expand the
market and increase their price/technical performance. In particular, it was found that
China’s Huawei, Xiaomi, Oppo, and Vivo, followed by Apple and Samsung, the strong
smartphone players in the market, are achieving SOA through technological change as
well as efficiency change.
The average rate of technology change of smartphone from 2005 to 2017 is 1.07 and
since after 2013, 32 smartphones out of 45 that were SOA at the time of release maintained
the SOA status until 2017. Of the 28 smartphones released between 2008 and 2012, 7 re-
mained SOA. If the technology change rate is greater than 1, it means that the SOA change
by technological progress is being expanded. Additionally, the change in the number of
smartphones from SOA state to non-SOA state requires confirmation of whether the mar-
ket has stabilized as a major producer or whether overall technology congestion or market
diversification is in progress.
As a result of analyzing the rate of technological change, productivity change, effi-
ciency change, and technological change of the company to be analyzed, it was found that
it can be sufficiently referenced in selecting vendors to apply civilian technology to the
defense sector. For example, the U.S. Department of Defense and the Korean Ministry of
1.03092
0.912589
0.983122 0.97851.01832
0.973725
0.884251
1.02488 1.04128
0.947815 0.9406790.985403 1 11.0059
0.876414
1.03725 1.04021 1.03341
0.973725
0.884251
0.750.80.850.90.95
11.051.1
Sony
tfpch effch techch
1.17547
0.9230421.03055
0.823203 0.89409
1.22317
0.9604681.08522
0.921472 1 1 1 1 1.029721.08316 1.0017 1.030550.823203 0.89409
1.22317
0.932745
00.20.40.60.81
1.21.4
LG
tfpch effch techch
Figure 4. Dynamics of efficiency and technology changes: (a) Xiaomi; (b) Oppo; (c) Vivo; (d) Huawei;(e) Samsung; (f) Apple; (g) Motorola; (h) Sony; (i) LG.
4. Conclusions
We analyzed smartphone launch data from 2005 to 2020 to predict the adoption ofsmartphone technology and discuss the pace of technological change. It has been identifiedthat the market is undergoing reorganization as new smartphone models expand themarket and increase their price/technical performance. In particular, it was found thatChina’s Huawei, Xiaomi, Oppo, and Vivo, followed by Apple and Samsung, the strongsmartphone players in the market, are achieving SOA through technological change as wellas efficiency change.
The average rate of technology change of smartphone from 2005 to 2017 is 1.07 andsince after 2013, 32 smartphones out of 45 that were SOA at the time of release maintainedthe SOA status until 2017. Of the 28 smartphones released between 2008 and 2012, 7 re-mained SOA. If the technology change rate is greater than 1, it means that the SOA changeby technological progress is being expanded. Additionally, the change in the number ofsmartphones from SOA state to non-SOA state requires confirmation of whether the markethas stabilized as a major producer or whether overall technology congestion or marketdiversification is in progress.
As a result of analyzing the rate of technological change, productivity change, effi-ciency change, and technological change of the company to be analyzed, it was found that itcan be sufficiently referenced in selecting vendors to apply civilian technology to the defensesector. For example, the U.S. Department of Defense and the Korean Ministry of NationalDefense promoted joint development of smartphones through a business agreement withSamsung in 2020, which is positive for decision-making in that Samsung has developedflexibly through productivity changes, technological changes, and efficiency changes.
However, the technology forecasting methodology does not predict that LG will with-draw from the smartphone market in 2021. Therefore, we need to know that companiesdevelop product technology at a strategic level and even consider exiting the business,
Appl. Sci. 2022, 12, 3207 25 of 27
and it is necessary to try to identify factors that can influence strategic decision-makingthrough technology forecasting. Additionally, further discussion is needed on the develop-ment of the technology prediction methodology for disruptive technology and technologyprediction based on the purpose for military application. In this respect, these will be thelimitations of the technical prediction methodology and an opportunity for new research.For example, it is of interest to see how the higher military requirements such as militarysecurity requirements than commercial products will affect the technological change dual-use technology in the future. Research on the military’s ability to absorb superior civiliantechnology and measures of open innovation for the spin-on technology development willalso be important.
The nature of the practical and professional application of the technology understudy implies the existence of additional functions and extensions, which significantlylimit the price competitiveness of such products in the commercial market. Discussion onthe desirable direction of technological innovation or distortion of the market by defenseR & D investment is beyond the scope of this study, but a separate discussion will benecessary, like the recent ethical and legal discussion on autonomous weapons systems. Bypointing out the limitations of exploratory research methodologies and grafting normativetechniques to predict technologies that satisfy military requirements, we tried to satisfythe author’s need for the visibility of the TFDEA approach. If a technical point of viewnot considered in this study is added, the result of technical prediction itself may becomemeaningless. Therefore, to find meaning in the results of this study, it is necessary tolimit the search for technological products in the market that can meet the clearly requiredmilitary performance goals.
In addition, we provided an author-written Stata program of TFDEA and verified ourprogram and found that it is acceptable to compare with the existing one. Because TFDEAis one of the younger forecasting methodologies in Technometrics, only a few programs areavailable. We extend the accessibility of TFDEA by suggesting the Stata TFDEA module.
Supplementary Materials: The following are available online at [16,17]: http://sourceforge.net/p/deas/code/HEAD/tree/trunk/ (accessed on 10 March 2022) dea.ado, malmq.ado, dea_supereff.ado module.
Author Contributions: Conceptualization, C.L. and S.K.; methodology, C.L. and B.J.; software, C.L.and B.J.; validation, C.L. and S.K.; formal analysis, S.K., D.H. and C.L.; investigation, D.H. and C.L.;resources, S.K. and C.L.; data curation, D.H., C.L. and S.K.; writing—original draft preparation, S.K.,C.L. and B.J.; writing—review and editing, S.K., D.H. and C.L. All authors have read and agreed tothe published version of the manuscript.
Funding: This research received no external funding.
Institutional Review Board Statement: Not applicable.
Informed Consent Statement: Not applicable.
Data Availability Statement: Data available in a publicly accessible repository.
Acknowledgments: The authors would like to thank Daniel J. Lee for introducing and helping withdata collection techniques.
Conflicts of Interest: The authors declare no conflict of interest.
References1. Samsung. The Military Smartphone Tested and Proven by Operators. Available online: https://www.samsung.com/us/
business/solutions/industries/government/tactical-edition/ (accessed on 16 August 2021).2. Lee, K.R. A study on The Management over Embedded Software in Weapon Systems. Mil. Oper. Res. Soc. Korea 2015, 41, 15–28.3. Lee, K.R.; Lee, C.J. A Study on Performance Evaluation of Parts Localization in Weapon Systems. J. Korea Assoc. Def. Ind. Stud.
2014, 21, 211–231.4. Lee, K.R.; Lim, K.J.; Lee, C.J. The Performance Analysis of the Military and Commercial Specification Unification Project. J. Korea
Assoc. Def. Ind. Stud. 2012, 19, 54–73.5. Jang, W.J.; Lee, C.J. A study on the Application of Open Innovation Concept for the Defense Science and Technology Innovation.
J. Korea Technol. Innov. Soc. 2009, 12, 312–334.
Appl. Sci. 2022, 12, 3207 26 of 27
6. Ministry of Defense (MOD). Defense S&T Promotion Policy 2014~2028; Defense Publication Support Group: Seoul, Korea, 2014.7. Ministry of Defense (MOD). Defense S&T Promotion Policy 2019~2033; Defense Publication Support Group: Seoul, Korea, 2019.8. ICMTC. Available online: https://www.icmtc.re.kr/mps (accessed on 9 September 2021).9. CISA. A Guide to Critical Infrastructure Security and Resilience. Available online: https://www.cisa.gov/sites/default/files/
publications/Guide-Critical-Infrastructure-Security-Resilience-110819-508v2.pdf (accessed on 7 March 2022).10. Defense Disaster Management Directive. Available online: https://www.law.go.kr/LSW/admRulLsInfoP.do?admRulSeq=2100
000199050 (accessed on 6 March 2022).11. Strategy Analytics. Half the World Owns a Smartphone. Available online: https://www.strategyanalytics.com/access-services/
devices/mobile-phones/smartphone/smartphones/reports/report-detail/half-the-world-now-owns-a-smartphone (accessedon 9 September 2021).
12. National Research Council. Persistent Forecasting of Disruptive Technologies; The National Academies Press: Washington, DC, USA,2010. [CrossRef]
13. The Korea Herald. Military to use Samsung smartphone-based combat information device. Available online: http://www.koreaherald.com/view.php?ud=20201204000212 (accessed on 12 February 2022).
14. Ministry of National Defense (MOD). Parts Obsolescence Management Work Order. Available online: https://www.law.go.kr/LSW/admRulLsInfoP.do?admRulSeq=2100000178980 (accessed on 5 September 2021).
15. Shott, T.; Lim, D.-J. TFDEA: Technology Forecasting Using DEA. Available online: https://rdrr.io/cran/TFDEA/ (accessed on 7September 2021).
16. Lee, C. Data Envelopment Analysis Using Stata. Available online: https://sourceforge.net/p/deas/code/HEAD/tree/trunk/(accessed on 9 September 2021).
17. Ji, Y.-b.; Lee, C. Data envelopment analysis. Stata J. 2010, 10, 267–280. [CrossRef]18. Watts, R.-J.; Porter, A.-L. Innovation forecasting. Technol. Forecast. Soc. Chang. 1997, 56, 25–47. [CrossRef]19. Martino, J.-P. Technological Forecasting for Decision Making; McGraw-Hill, Inc.: New York, NY, USA, 1993.20. Cho, Y.; Daim, T. Technology Forecasting Methods. In Research and Technology Management in the Electricity Industry; Green Energy
and Technology; Daim, T., Oliver, T., Kim, J., Eds.; Springer: London, UK, 2013; pp. 67–112.21. Anderson, T.; Hollingsworth, K.; Inman, L. Assessing the rate of change in the enterprise database system market over time using
DEA. In Proceedings of the PICMET ‘01. Portland International Conference on Management of Engineering and Technology,Portland, OR, USA, 29 July–2 August 2001; Volume 2, pp. 384–390.
22. Inman, O.L.; Anderson, T.R.; Harmon, R.R. Predicting U.S. jet fighter aircraft introductions from 1944 to 1982: A dogfight betweenregression and TFDEA. Technol. Forecast. Soc. Chang. 2006, 73, 1178–1187. [CrossRef]
23. Anderson, T.R.; Daim, T.U.; Kim, J. Technology forecasting for wireless communication. Technovation 2008, 28, 602–614. [CrossRef]24. Lim, D.-J.; Anderson, T.R.; Inman, O.L. Choosing effective dates from multiple optima in Technology Forecasting using Data
Envelopment Analysis (TFDEA). Technol. Forecast. Soc. Chang. 2014, 88, 91–97. [CrossRef]25. Lim, D.-J.; Anderson, T.R. Improving forecast accuracy by a segmented rate of change in technology forecasting using data
envelopment analysis (TFDEA). In Proceedings of the PICMET ‘14 Conference: Portland International Center for Management ofEngineering and Technology; Infrastructure and Service Integration, Kanazawa, Japan, 27–31 July 2014; pp. 2903–2907.
26. Lim, D.-J.; Jahromi, S.R.; Anderson, T.R.; Tudorie, A.-A. Comparing technological advancement of hybrid electric vehicles (HEV)in different market segments. Technol. Forecast. Soc. Chang. 2014, 97, 140–153. [CrossRef]
27. Lim, D.-J.; Anderson, T.R.; Shott, T. Technological forecasting of supercomputer development: The March to Exascale computing.Omega 2015, 51, 128–135. [CrossRef]
28. Lamb, A.-M.; Anderson, T.; Daim, T. Difficulties in R & D target-setting addressed through technology forecasting using data en-velopment analysis. In Proceedings of the PICMET 2010 Technology Management for Global Economic Growth, Phuket, Thailand,18–22 July 2010; pp. 1–9.
29. Jung, B.K.; Kim, H.C.; Lee, C. A Study on Technology Forecasting of Unmanned Aerial Vehicles (UAVs) Using TFDEA. J. KoreaTechnol. Innov. Soc. 2016, 19, 799–821.
30. Farrell, M.J. The measurement of productive efficiency. J. R. Stat. Soc. Ser. A 1957, 120, 253–290. [CrossRef]31. Charnes, A.; Cooper, W.W.; Rhodes, E. Measuring the efficiency of decision making units. Eur. J. Oper. Res. 1978, 2, 429–444.
[CrossRef]32. Banker, R.D.; Charnes, A.; Cooper, W.W. Some Models for Estimating Technical and Scale Inefficiencies in Data Envelopment
Analysis. Manag. Sci. 1984, 30, 1078–1092. [CrossRef]33. Shephard, R.W. Theory of Cost and Production Functions; Princeton University: Princeton, NY, USA, 1970.34. Lee, J.-D.; Oh, D.-H. Theory of Efficiency Analysis: Data Envelopment Analysis, 2nd ed.; JiPhil Publishing: Paju-si, Korea, 2012.35. Available online: https://www.dictionary.com/browse/efficient (accessed on 6 September 2021).36. Dodson, E.N. A general approach to measurement of the state of the art and technological advance. Technol. Forecast. 1970, 1,
391–408. [CrossRef]37. Inman, O.L. Technology Forecasting Using Data Envelopment Analysis. Ph.D. Thesis, Portland State University, Portland,
OR, USA, 2004.38. Andersen, P.; Petersen, N.C. A procedure for ranking efficient units in data envelopment analysis. Manag. Sci. 1993, 39, 1261–1264.
[CrossRef]
Appl. Sci. 2022, 12, 3207 27 of 27
39. Rousseau, J.J.; Semple, J.H. Radii of classification preservation in data envelopment analysis: A case study of ‘Program Follow-Through’. J. Oper. Res. Soc. 1995, 46, 943–957. [CrossRef]
40. Fare, R.; Grosskopf, S.; Norris, M.; Zhang, Z. Productivity Growth, Technical Progress, and Efficiency Change in IndustrializedCountries. Am. Econ. Rev. 1994, 84, 66–83.
41. Coelli, T.J.; Rao, D.S.P.; O’Donnell, C.J.; Battese, G.E. An Introduction to Efficiency and Productivity Analysis, 2nd ed.; SpringerScience & Business Media: Berlin, Germany, 2005; pp. 109–113.
42. Lee, C.J. Malmquist Productivity Analysis using DEA frontier in Stata. In Proceedings of the 2011 Stata Conference Chicago,Chicago, IL, USA, 14–15 July 2011; Available online: https://www.stata.com/meeting/chicago11/ (accessed on 9 March 2022).
43. Statista. Global Smartphone Market Share from 4th Quarter 2009 to 2nd Quarter 2021. Available online: https://www.statista.com/statistics/271496/global-market-share-held-by-smartphone-vendors-since-4th-quarter-2009/ (accessed on 12August 2021).
44. IDC. Smartphone Market Share. Available online: https://www.idc.com/promo/smartphone-market-share (accessed on 3May 2021).
45. Sainani, M. GSMarena Mobile Phone Devices: 10,000+ Mobile Device Specifications Scraped from the GSMARENA Website.Available online: https://www.kaggle.com/msainani/gsmarena-mobile-devices (accessed on 3 August 2021).
46. GSMARENA. Available online: https://www.gsmarena.com/ (accessed on 12 December 2021).47. Srivastava, S.; Misra, M. Assessing and forecasting technology dynamics in smartphones: A TFDEA approach. Technol. Anal.
Strateg. Manag. 2016, 28, 783–797. [CrossRef]