Pulp and Paper Industry: Decarbonisation Technology ... - MDPI
30
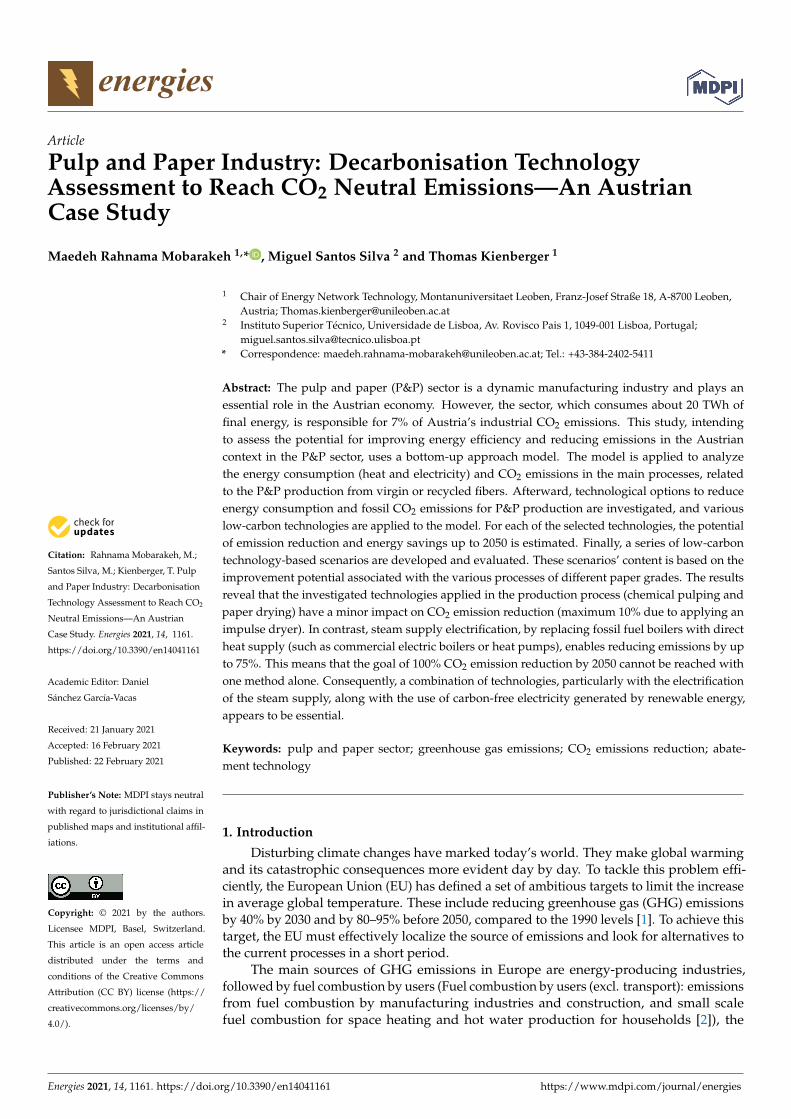
energies Article Pulp and Paper Industry: Decarbonisation Technology Assessment to Reach CO 2 Neutral Emissions—An Austrian Case Study Maedeh Rahnama Mobarakeh 1, * , Miguel Santos Silva 2 and Thomas Kienberger 1 Citation: Rahnama Mobarakeh, M.; Santos Silva, M.; Kienberger, T. Pulp and Paper Industry: Decarbonisation Technology Assessment to Reach CO 2 Neutral Emissions—An Austrian Case Study. Energies 2021, 14, 1161. https://doi.org/10.3390/en14041161 Academic Editor: Daniel Sánchez García-Vacas Received: 21 January 2021 Accepted: 16 February 2021 Published: 22 February 2021 Publisher’s Note: MDPI stays neutral with regard to jurisdictional claims in published maps and institutional affil- iations. Copyright: © 2021 by the authors. Licensee MDPI, Basel, Switzerland. This article is an open access article distributed under the terms and conditions of the Creative Commons Attribution (CC BY) license (https:// creativecommons.org/licenses/by/ 4.0/). 1 Chair of Energy Network Technology, Montanuniversitaet Leoben, Franz-Josef Straße 18, A-8700 Leoben, Austria; [email protected] 2 Instituto Superior Técnico, Universidade de Lisboa, Av. Rovisco Pais 1, 1049-001 Lisboa, Portugal; [email protected] * Correspondence: [email protected]; Tel.: +43-384-2402-5411 Abstract: The pulp and paper (P&P) sector is a dynamic manufacturing industry and plays an essential role in the Austrian economy. However, the sector, which consumes about 20 TWh of final energy, is responsible for 7% of Austria’s industrial CO 2 emissions. This study, intending to assess the potential for improving energy efficiency and reducing emissions in the Austrian context in the P&P sector, uses a bottom-up approach model. The model is applied to analyze the energy consumption (heat and electricity) and CO 2 emissions in the main processes, related to the P&P production from virgin or recycled fibers. Afterward, technological options to reduce energy consumption and fossil CO 2 emissions for P&P production are investigated, and various low-carbon technologies are applied to the model. For each of the selected technologies, the potential of emission reduction and energy savings up to 2050 is estimated. Finally, a series of low-carbon technology-based scenarios are developed and evaluated. These scenarios’ content is based on the improvement potential associated with the various processes of different paper grades. The results reveal that the investigated technologies applied in the production process (chemical pulping and paper drying) have a minor impact on CO 2 emission reduction (maximum 10% due to applying an impulse dryer). In contrast, steam supply electrification, by replacing fossil fuel boilers with direct heat supply (such as commercial electric boilers or heat pumps), enables reducing emissions by up to 75%. This means that the goal of 100% CO 2 emission reduction by 2050 cannot be reached with one method alone. Consequently, a combination of technologies, particularly with the electrification of the steam supply, along with the use of carbon-free electricity generated by renewable energy, appears to be essential. Keywords: pulp and paper sector; greenhouse gas emissions; CO 2 emissions reduction; abate- ment technology 1. Introduction Disturbing climate changes have marked today’s world. They make global warming and its catastrophic consequences more evident day by day. To tackle this problem effi- ciently, the European Union (EU) has defined a set of ambitious targets to limit the increase in average global temperature. These include reducing greenhouse gas (GHG) emissions by 40% by 2030 and by 80–95% before 2050, compared to the 1990 levels [1]. To achieve this target, the EU must effectively localize the source of emissions and look for alternatives to the current processes in a short period. The main sources of GHG emissions in Europe are energy-producing industries, followed by fuel combustion by users (Fuel combustion by users (excl. transport): emissions from fuel combustion by manufacturing industries and construction, and small scale fuel combustion for space heating and hot water production for households [2]), the Energies 2021, 14, 1161. https://doi.org/10.3390/en14041161 https://www.mdpi.com/journal/energies
-
Upload
khangminh22 -
Category
Documents
-
view
0 -
download
0
Transcript of Pulp and Paper Industry: Decarbonisation Technology ... - MDPI
energies
Article
Pulp and Paper Industry: Decarbonisation TechnologyAssessment to Reach CO2 Neutral Emissions—An AustrianCase Study
Maedeh Rahnama Mobarakeh 1,* , Miguel Santos Silva 2 and Thomas Kienberger 1
�����������������
Citation: Rahnama Mobarakeh, M.;
Santos Silva, M.; Kienberger, T. Pulp
and Paper Industry: Decarbonisation
Technology Assessment to Reach CO2
Neutral Emissions—An Austrian
Case Study. Energies 2021, 14, 1161.
https://doi.org/10.3390/en14041161
Academic Editor: Daniel
Sánchez García-Vacas
Received: 21 January 2021
Accepted: 16 February 2021
Published: 22 February 2021
Publisher’s Note: MDPI stays neutral
with regard to jurisdictional claims in
published maps and institutional affil-
iations.
Copyright: © 2021 by the authors.
Licensee MDPI, Basel, Switzerland.
This article is an open access article
distributed under the terms and
conditions of the Creative Commons
Attribution (CC BY) license (https://
creativecommons.org/licenses/by/
4.0/).
1 Chair of Energy Network Technology, Montanuniversitaet Leoben, Franz-Josef Straße 18, A-8700 Leoben,Austria; [email protected]
2 Instituto Superior Técnico, Universidade de Lisboa, Av. Rovisco Pais 1, 1049-001 Lisboa, Portugal;[email protected]
* Correspondence: [email protected]; Tel.: +43-384-2402-5411
Abstract: The pulp and paper (P&P) sector is a dynamic manufacturing industry and plays anessential role in the Austrian economy. However, the sector, which consumes about 20 TWh offinal energy, is responsible for 7% of Austria’s industrial CO2 emissions. This study, intendingto assess the potential for improving energy efficiency and reducing emissions in the Austriancontext in the P&P sector, uses a bottom-up approach model. The model is applied to analyzethe energy consumption (heat and electricity) and CO2 emissions in the main processes, relatedto the P&P production from virgin or recycled fibers. Afterward, technological options to reduceenergy consumption and fossil CO2 emissions for P&P production are investigated, and variouslow-carbon technologies are applied to the model. For each of the selected technologies, the potentialof emission reduction and energy savings up to 2050 is estimated. Finally, a series of low-carbontechnology-based scenarios are developed and evaluated. These scenarios’ content is based on theimprovement potential associated with the various processes of different paper grades. The resultsreveal that the investigated technologies applied in the production process (chemical pulping andpaper drying) have a minor impact on CO2 emission reduction (maximum 10% due to applying animpulse dryer). In contrast, steam supply electrification, by replacing fossil fuel boilers with directheat supply (such as commercial electric boilers or heat pumps), enables reducing emissions by upto 75%. This means that the goal of 100% CO2 emission reduction by 2050 cannot be reached withone method alone. Consequently, a combination of technologies, particularly with the electrificationof the steam supply, along with the use of carbon-free electricity generated by renewable energy,appears to be essential.
Keywords: pulp and paper sector; greenhouse gas emissions; CO2 emissions reduction; abate-ment technology
1. Introduction
Disturbing climate changes have marked today’s world. They make global warmingand its catastrophic consequences more evident day by day. To tackle this problem effi-ciently, the European Union (EU) has defined a set of ambitious targets to limit the increasein average global temperature. These include reducing greenhouse gas (GHG) emissionsby 40% by 2030 and by 80–95% before 2050, compared to the 1990 levels [1]. To achieve thistarget, the EU must effectively localize the source of emissions and look for alternatives tothe current processes in a short period.
The main sources of GHG emissions in Europe are energy-producing industries,followed by fuel combustion by users (Fuel combustion by users (excl. transport): emissionsfrom fuel combustion by manufacturing industries and construction, and small scalefuel combustion for space heating and hot water production for households [2]), the
Energies 2021, 14, 1161. https://doi.org/10.3390/en14041161 https://www.mdpi.com/journal/energies
Energies 2021, 14, 1161 2 of 30
transport sector, industrial process and product use (Industrial Process emissions occurringfrom chemical reactions during the production [2]), and agriculture [2]. In 2017, the CO2emission reduction of industrial processes was one of the top priorities in Europe’s emissionreduction strategy. The contribution of this sector for the EU-28 was reported as 9% of totalemissions in 2017 [3].
However, for Austria the industrial sector accounted for 21% of GHG emissions causedby production processing [4] and 28% of the total final energy consumption, respectively [5]in 2017. This was one of the motivations for the creation of NEFI (www.nefi.at, accessed on21 January 2021) (New Energy for Industry), a consortium of Austrian companies, researchinstitutes, and public institutions. One of the objectives of NEFI is to provide an integratedapproach to profound decarbonization pathways for the energy system in Austria, drivenby a transformation of the industrial sector towards being sustainable, efficient, and alow-carbon economy. The present work seeks fulfillment of this objective for the pulp andpaper industrial sub-sector.
The pulp and paper sector (P&P) is one of the oldest and most significant industrialsectors in Austria, and accounted for 0.89% of the Austrian gross domestic product (GDP)in 2017 [6,7]. The process of paper production consists of three stages, each of which hasseveral sub-processes and can take different routes. This makes the sector very complexand energy-intensive, ranking it the highest final energy consumer in industry, by approxi-mately 20 TWh in 2017 (corresponding to 23% of total final industrial energy use). [5] TheP&P sector is also responsible for 7% of industrial emissions, and can play an essential rolein the decarbonization of the Austrian industrial energy system. Although the sector hasstarted to reduce CO2 emissions, by 20% in the last decades [8], due to improvements inenergy efficiency (e.g., waste heat recovery) and the reduction of fossil fuel consumption(from 58% in 2000 to 40% in 2017 [9]) by replacement with biofuels (mostly black liquid), asignificant emission reduction potential still exists.
1.1. State of Research
In recent years, many studies have started to consider the potential for reducingenergy consumption and the options for cutting CO2 emissions in the pulp and paperindustry. The Joint Research Centre (JRC) prepared a report by Moya and Pavel in 2018 [10].They predicted a 1.1% increase in the European P&P sector’s energy consumption and CO2emissions of 4.8% in 2050 compared to 2015 without technological updates. Their analysis,using a bottom-up model, showed that the application of the best available technologies inpapermaking could lead to a 14.4% reduction in energy consumption in Europe, resulting ina 62.2% reduction in CO2 emissions due to the contribution of technological improvement.Most of the energy improvement came from the integration of state-of-the-art technologiesinto new equipment, such as heat recovery, black liquor gasification, and highly efficientappliances. However, most CO2 savings were due to the conversion from fossil fuels tobiofuels and the use of new technologies.
In 2012, Fleiter et al. [11] investigated the diffusion of 17 process technologies forimproving energy efficiency and resulting CO2 reduction for the German pulp and papersector up to 2035 using a techno-economic approach. Based on their results, electricity andfuel consumption in 2035 would be reduced by 16% and 21%, respectively, in the techno-diffusion scenario compared to the frozen efficiency scenario. This energy-saving couldreduce CO2 emissions by 19%. They stated that the most impressive technologies are wasteheat recovery in paper mills and new paper drying technologies. Several other energy-saving technologies were not included in the study. They concluded that a significantpotential for saving still exists, especially if the system boundaries extend across theenterprise level.
P. Griffen et al. [12] conducted a study on the decarbonization of the P&P sector inthe UK in 2018. They believe that the P&P sector is a heterogeneous sector with a widerange of product outputs, and lies roughly on the borderline between energy-intensive andnonenergy-intensive industrial sectors. They developed a series of low carbon technology

Energies 2021, 14, 1161 3 of 30
roadmaps based on various alternative scenarios for the UK paper sector. The resultsof their study indicate that achieving a significant reduction in GHG emissions in thelong term will depend on the adoption of some key technologies such as heat recoverytechniques, energy efficiency improvements, use of bioenergy, and electrification (besidesthe decarbonization of grid electricity). Based on their assumptions, under a reasonableaction scenario, the sector’s total greenhouse gas emissions would decrease by about 80%over the period 1990–2050 through the installation of all efficiency technologies by 2025and the replacement of retired equipment with the best practice by 2030.
The Confederation of European Paper Industries (CEPI) [13] has been working todevelop a roadmap for the transition to a competitive low-carbon economy in 2050. CEPIaims to reduce CO2 emissions by 80% compared to 1990, and cut CO2 emissions to 12 mil-lion tons (10 million tons direct), compared to 49 million tons (32 million tons direct) in2015. CEPI also has a goal to reduce energy demand in the wood fiber industry by 20%and to increase product value by 50% by 2050, compared to the 2010 benchmark, usingimproved energy efficiency, fuel switching, and demand-side flexibility. They introduced agroup of breakthrough technologies that can reduce CO2 emissions in various areas from20% (e.g., deep eutectic solvents technology) to 100% (100% electricity technology). Thesewere presented in the report “Two Team Project”.
1.2. Open Research Questions and Structure of This Paper
The previous section provided the current state of research that considered energyconsumption and carbon emission reduction potential in the P&P sector. However, thereare still some less addressed topics in the literature, which are discussed in this paper:
• An energy flow Sankey diagram and allocation of the total, final and useful energyconsumption
• A bottom-up model for energy efficiency and CO2 reduction potential for various P&Pproducts and the sector as a whole
• A comprehensive technology overview by considering the best available technology(BAT) and innovative technology (IT)
• A bottom-up technology model and analysis of high-impact technologies toward theclimate goal.
To tackle the mentioned issues, this work considers the Austrian pulp and papersector as a case study, and the possibility of decarbonization by 2050 is evaluated based onthe following steps.
In Section 2, an extensive literature review was made on the main processes andthe state of the art in the industry, emphasizing the energy consumption of each step. Inthis section, the current situation of the Austrian P&P sector is also examined in termsof CO2 emissions and energy consumption. Section 3 describes the methodology formodel development to calculate CO2 emissions and energy consumption at the processlevel for the different types of pulp and paper production. The model is based on atechnology-based linear bottom-up approach, and will also be used in the next sectionto analyze decarbonization paths. Section 4 evaluates the opportunities and challengesof reducing carbon dioxide (CO2) and industrial energy demand in the Austrian P&Psector. In this section, based on the literature review, a technology database is presentedin two groups: BAT and IT. Six promising technologies are selected from the databaseand explained with further details for the Austrian case. Subsequently, in Section 5, thetechnology-specific information is integrated into the bottom-up model to evaluate thedecarbonization pathways and scenarios. The impact of energy efficiency and the emissionreduction potential of each technology on the sector is investigated through six individualscenarios. Finally, Section 6 presents the conclusions of the most important results. Thesefindings help to identify the steps that need to be taken by experts and policymakers toensure the decarbonization of the Austrian paper sector.
Energies 2021, 14, 1161 4 of 30
2. The Pulp and Paper Industry2.1. Structure of Pulp and Paper Sector
The paper industry is one of the most expressive industries globally, producing over400 million tons of paper per year [14]. Pulp and paper mills are highly complex, andinvolve various process steps, including wood preparation, pulp production, chemicalrecovery, bleaching, and papermaking, to transform the wood into the final product [15].Paper mills can be fully integrated or non-integrated mills. Integrated mills include apulp mill and a paper mill on the same site. These types of mills receive logs or chips andproduce paper.
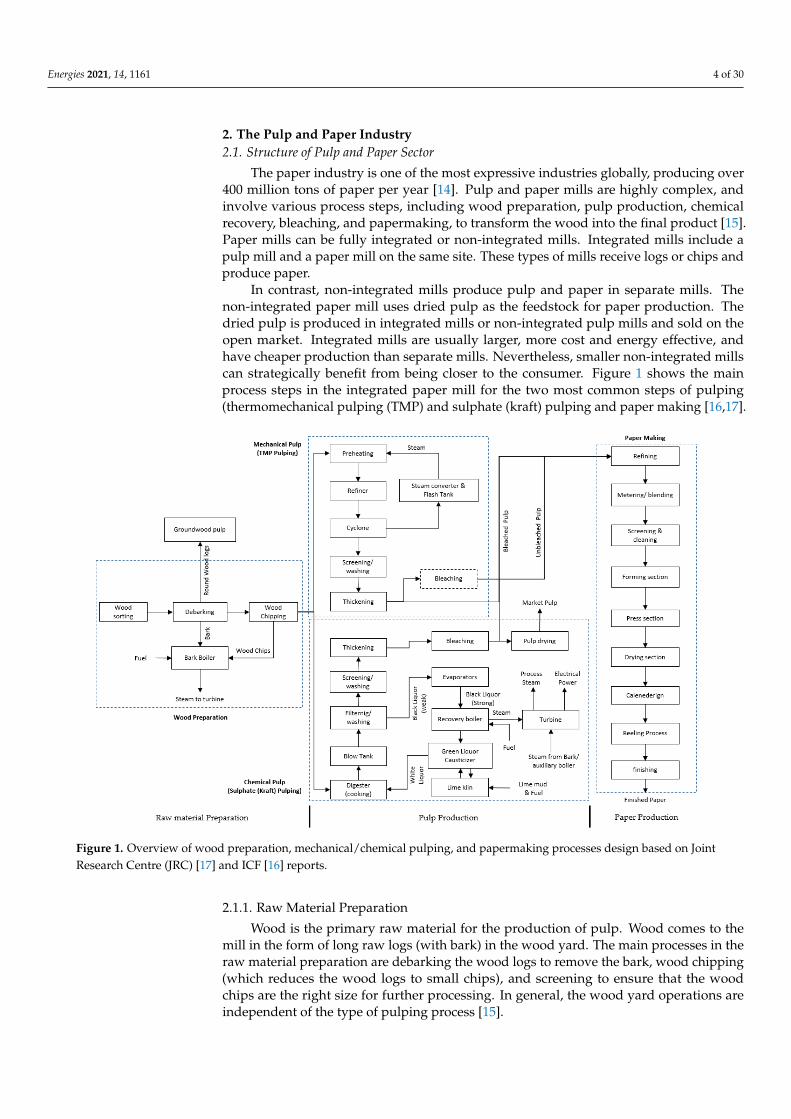
In contrast, non-integrated mills produce pulp and paper in separate mills. Thenon-integrated paper mill uses dried pulp as the feedstock for paper production. Thedried pulp is produced in integrated mills or non-integrated pulp mills and sold on theopen market. Integrated mills are usually larger, more cost and energy effective, andhave cheaper production than separate mills. Nevertheless, smaller non-integrated millscan strategically benefit from being closer to the consumer. Figure 1 shows the mainprocess steps in the integrated paper mill for the two most common steps of pulping(thermomechanical pulping (TMP) and sulphate (kraft) pulping and paper making [16,17].
Energies 2021, 14, x FOR PEER REVIEW 4 of 29
2.1. Structure of Pulp and Paper Sector The paper industry is one of the most expressive industries globally, producing over
400 million tons of paper per year [14]. Pulp and paper mills are highly complex, and involve various process steps, including wood preparation, pulp production, chemical re-covery, bleaching, and papermaking, to transform the wood into the final product [15]. Paper mills can be fully integrated or non-integrated mills. Integrated mills include a pulp mill and a paper mill on the same site. These types of mills receive logs or chips and pro-duce paper.
In contrast, non-integrated mills produce pulp and paper in separate mills. The non-integrated paper mill uses dried pulp as the feedstock for paper production. The dried pulp is produced in integrated mills or non-integrated pulp mills and sold on the open market. Integrated mills are usually larger, more cost and energy effective, and have cheaper production than separate mills. Nevertheless, smaller non-integrated mills can strategically benefit from being closer to the consumer. Figure 1 shows the main process steps in the integrated paper mill for the two most common steps of pulping (thermome-chanical pulping (TMP) and sulphate (kraft) pulping and paper making [16,17].
Figure 1. Overview of wood preparation, mechanical/chemical pulping, and papermaking processes design based on Joint Research Centre (JRC) [17] and ICF [16] reports.
2.1.1. Raw Material Preparation Wood is the primary raw material for the production of pulp. Wood comes to the
mill in the form of long raw logs (with bark) in the wood yard. The main processes in the raw material preparation are debarking the wood logs to remove the bark, wood chipping (which reduces the wood logs to small chips), and screening to ensure that the wood chips are the right size for further processing. In general, the wood yard operations are inde-pendent of the type of pulping process [15].
The two major products resulting from the raw material preparation process are chips and bark. The chips are the main product. Their quality is of high importance, as the
Figure 1. Overview of wood preparation, mechanical/chemical pulping, and papermaking processes design based on JointResearch Centre (JRC) [17] and ICF [16] reports.
2.1.1. Raw Material Preparation
Wood is the primary raw material for the production of pulp. Wood comes to themill in the form of long raw logs (with bark) in the wood yard. The main processes in theraw material preparation are debarking the wood logs to remove the bark, wood chipping(which reduces the wood logs to small chips), and screening to ensure that the woodchips are the right size for further processing. In general, the wood yard operations areindependent of the type of pulping process [15].
Energies 2021, 14, 1161 5 of 30
The two major products resulting from the raw material preparation process arechips and bark. The chips are the main product. Their quality is of high importance, asthe consumption of raw material increases if the chips produced are not homogeneous.Furthermore, a homogenized chip distribution improves the energy efficiency of thesystem. Another main product is the bark, which is the by-product and is typically usedas fuel in the burner for energy production, or can be sold for other purposes off-site [15].Raw material processing consumes roughly 10% of electricity use [15]. The main energyconsumers are conveyor motors, debarking operational motors, and wood chipping motors(see Table 1). Thermal energy is only needed in some mills in cold climates, where the logshave to be de-iced with hot water before debarking [16].
Table 1. Specific electricity and heat consumption of the wood processes in pulp and paper production.
Process Specific Electricity Consumption(kWh/twood)
Specific Heat Consumption(GJ/twood) Reference
Debarking 8.5 (7–10 KWh/m3 wood) 0.0 [15,17,18]Chipping and conveying 30.3 0.0 [15,18]
2.1.2. Pulp Production
The second step in paper processing is the production of pulp from raw materials(virgin wood or recycled fibers). Wood is usually composed of about 60–65% cellulose andhemicelluloses, the paper’s main fibrous components [15,19]. The remaining material massconsists mostly of lignin, with small amounts of extractives and ash. The fundamental aimof the pulping process is to release the fibers from the lignin that holds the fibers togetherin the wood. Typically, wood is composed of about 50% fiber, 20 to 30% non-fibroussugars, and 20 to 30% lignin [15,17]. In the pulping process, wood chips are separated intoindividual cellulose fibers by removing the wood lignin [15,17]. The pulp is produced bythree main methods: mechanical, chemical, and recycled fiber (RCF) pulping (There areanother types of pulp production, semi-chemical, dissolving, and non-wood pulp, whichare not considered in this paper).
• Mechanical pulp: the primary form of pulping is mechanical pulping, which has beenextensively replaced by chemical pulping. Mechanical pulping processes separatethe fibers from each other by mechanical means, retaining part of the lignin in thepaper and increasing the yield (mass of pulp/mass of original fiber source) to around85–90%.
The main kinds of mechanical pulping are the production of groundwood pulping(GW), refiner mechanical pulping (RMP), thermomechanical pulping (TMP), and chemither-momechanical pulping (CTMP). Two main techniques are used to produce mechanicalpulping: pressing logs against a rotating grindstone for GW pulping, and feeding thewood chips between metal finishing discs and defibrating them for RMP, TMP, and CTMP.Typically, mechanical pulp is used for low-grade paper such as newsprint and magazines,the fibers with this pulp type are short and weak, and sometimes need to be combined withstrong chemical fibers (especially for GW). The main energy source for mechanical pulp iselectricity, which is usually converted into heat that can be partially recovered and used inother processes. However, some types of pulp (TMP, CTMP) use steam on the wood chipsbefore they are used in the equipment (see Table 2) [15,17].
• Chemical pulp: The most common pulping process is chemical pulping, dividedinto two types: kraft (sulphate) pulp and sulphite pulp. In both types, the digesterprocesses the raw material with watery chemical solutions at high temperatures andhigh pressure to extract pulp fibers.
Kraft pulp is the most common kind of chemical pulp, accounting for about 80% ofthe world’s pulp production. As illustrated in Figure 1, for kraft pulp, the wood chips aremixed with a strongly alkaline solution known as white liquor, which includes sodium

Energies 2021, 14, 1161 6 of 30
hydroxide and sodium sulfide, in the batch or continuous digester for several hours underhigh pressure and high-temperature (155–175 ◦C) conditions [17]. After the cooking step inthe digester, the hot pulp is transferred under pressure to the blow tank, where softenedwood chips decompose into fibers or pulp. Then, in the next stage, in the filtering andwashing step, the pulp and the cooking liquor, which is called black liquor, are separated.During the cooking process in the digester, almost half of the wood is not solved, and as aresult, black liquor includes organic and inorganic substances. In the next step, black liquoris sent into the chemical recovery system to recover the cooking chemicals and energy.
Chemical recovery is an essential part of the chemical pulping process. The chemicalrecovery system by evaporating the water content of the black liquor in the recovery boiler,on the one hand, recovers the white liquor (by causticizing the green liquor with lime(Figure 1)) and, on the other hand, generates high-pressure steam. The white liquor isreturned to the digester, and the steam is used in the heat and power plant (CHP) togenerate the process steam (medium-low pressure steam) and electricity. In most cases, therecoverable black liquor’s fuel value is sufficient to make the kraft pulp mills largely self-sufficient in heat and electrical energy. Chemical recovery also offers the mill regenerationof chemical digestion at a rate up to 98%, which leads to a significant reduction in the costsof purchasing process chemicals and energy [15,17].
The production of sulphite pulp is not so common compared to the production of kraftpulp. Pulp produced by sulphite pulp usually has weaker strength properties compared tokraft pulp, although sulphite pulp offers other advantageous properties for some specialtypulp applications (such as textile production). In the sulphite pulping process, the woodchips are digested with the cooking liquor, an acidic mixture of sulphurous acid andbisulphite ion. The acidic solution in the cooking liquor leads to a decomposition of thelignin bonds between the wood fibers. Like the kraft pulp, energy can be recovered inthe sulphite process, and the solvent can be regenerate. Due to sulfite pulp’s lower colorcontent, it can be bleached more easily than kraft pulp, but it is not as strong [15,17].
In total, chemical pulping has a low fiber yield, in the range of 40–55%, compared tomechanical pulping, but the pulp produced is of very high quality and is mainly used toproduce higher-grade paper, such as office paper. Nowadays, chemical pulp consumptionhas grown because the demand for printing and writing paper is increasing. In contrast,due to the rising use of social media, newsprint consumption has decreased, causing areduction of mechanical pulp demand [15].
• Recycled fibers pulp (RCF): this type of pulp production requires a more straightfor-ward process than the pulping of virgin wood, and consumes less energy than theother types. The main step in RCF pulping is to dissolve the shredded paper in hotwater by mechanical means to separate the fibers without damaging and destroyingthem. For paper grades requiring white pulp, an additional step of de-inking takesplace. Recycled fiber pulp is also subjected to mechanical removal of impurities. Insome pulp mills, recycled fiber and virgin fibers are used together, and recycle fiber isadded to the virgin (wood) pulp [15].
After the pulp has been produced by mechanical, chemical, or RCF processes, thepulp is washed and screened to remove impurities such as remaining pieces of wood anduncooked chips that have not been properly pulped. In the final step, depending on theproduct’s end-use, bleaching is applied to give the pulp a white color by adding chemicalcomponents. This is not an essential process and is only applied to paper types that requiregood optical properties: graphic paper, whiteboard, etc. An additional drying step isrequired when the pulp and paper mills are not in the same location (non-integrated mills).The pulp drying process is energy-intensive and not significant for the paper manufacturingprocess. Therefore, cost and energy savings can be achieved by integrating the pulp andpaper mills.
Energies 2021, 14, 1161 7 of 30
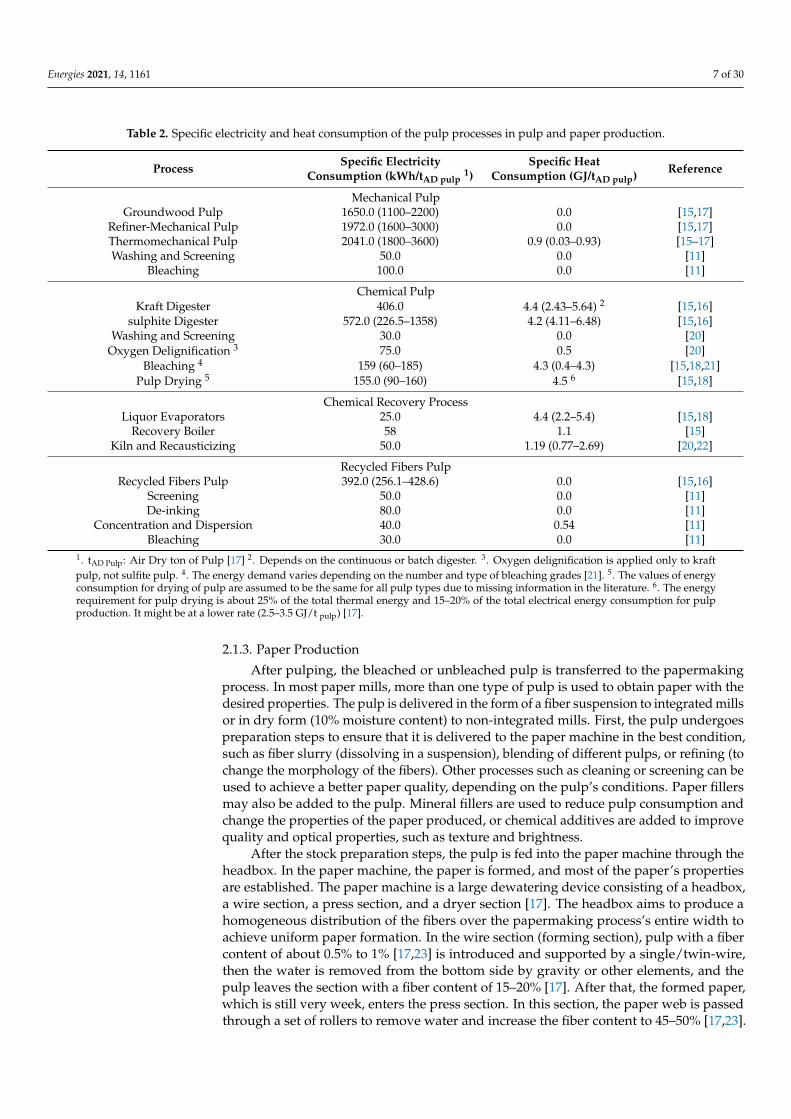
Table 2. Specific electricity and heat consumption of the pulp processes in pulp and paper production.
Process Specific ElectricityConsumption (kWh/tAD pulp
1)Specific Heat
Consumption (GJ/tAD pulp) Reference
Mechanical PulpGroundwood Pulp 1650.0 (1100–2200) 0.0 [15,17]
Refiner-Mechanical Pulp 1972.0 (1600–3000) 0.0 [15,17]Thermomechanical Pulp 2041.0 (1800–3600) 0.9 (0.03–0.93) [15–17]Washing and Screening 50.0 0.0 [11]
Bleaching 100.0 0.0 [11]
Chemical PulpKraft Digester 406.0 4.4 (2.43–5.64) 2 [15,16]
sulphite Digester 572.0 (226.5–1358) 4.2 (4.11–6.48) [15,16]Washing and Screening 30.0 0.0 [20]
Oxygen Delignification 3 75.0 0.5 [20]Bleaching 4 159 (60–185) 4.3 (0.4–4.3) [15,18,21]
Pulp Drying 5 155.0 (90–160) 4.5 6 [15,18]
Chemical Recovery ProcessLiquor Evaporators 25.0 4.4 (2.2–5.4) [15,18]
Recovery Boiler 58 1.1 [15]Kiln and Recausticizing 50.0 1.19 (0.77–2.69) [20,22]
Recycled Fibers PulpRecycled Fibers Pulp 392.0 (256.1–428.6) 0.0 [15,16]
Screening 50.0 0.0 [11]De-inking 80.0 0.0 [11]
Concentration and Dispersion 40.0 0.54 [11]Bleaching 30.0 0.0 [11]
1. tAD Pulp: Air Dry ton of Pulp [17] 2. Depends on the continuous or batch digester. 3. Oxygen delignification is applied only to kraftpulp, not sulfite pulp. 4. The energy demand varies depending on the number and type of bleaching grades [21]. 5. The values of energyconsumption for drying of pulp are assumed to be the same for all pulp types due to missing information in the literature. 6. The energyrequirement for pulp drying is about 25% of the total thermal energy and 15–20% of the total electrical energy consumption for pulpproduction. It might be at a lower rate (2.5–3.5 GJ/t pulp) [17].
2.1.3. Paper Production
After pulping, the bleached or unbleached pulp is transferred to the papermakingprocess. In most paper mills, more than one type of pulp is used to obtain paper with thedesired properties. The pulp is delivered in the form of a fiber suspension to integrated millsor in dry form (10% moisture content) to non-integrated mills. First, the pulp undergoespreparation steps to ensure that it is delivered to the paper machine in the best condition,such as fiber slurry (dissolving in a suspension), blending of different pulps, or refining (tochange the morphology of the fibers). Other processes such as cleaning or screening can beused to achieve a better paper quality, depending on the pulp’s conditions. Paper fillersmay also be added to the pulp. Mineral fillers are used to reduce pulp consumption andchange the properties of the paper produced, or chemical additives are added to improvequality and optical properties, such as texture and brightness.
After the stock preparation steps, the pulp is fed into the paper machine through theheadbox. In the paper machine, the paper is formed, and most of the paper’s propertiesare established. The paper machine is a large dewatering device consisting of a headbox,a wire section, a press section, and a dryer section [17]. The headbox aims to produce ahomogeneous distribution of the fibers over the papermaking process’s entire width toachieve uniform paper formation. In the wire section (forming section), pulp with a fibercontent of about 0.5% to 1% [17,23] is introduced and supported by a single/twin-wire,then the water is removed from the bottom side by gravity or other elements, and thepulp leaves the section with a fiber content of 15–20% [17]. After that, the formed paper,which is still very week, enters the press section. In this section, the paper web is passedthrough a set of rollers to remove water and increase the fiber content to 45–50% [17,23].
Energies 2021, 14, 1161 8 of 30
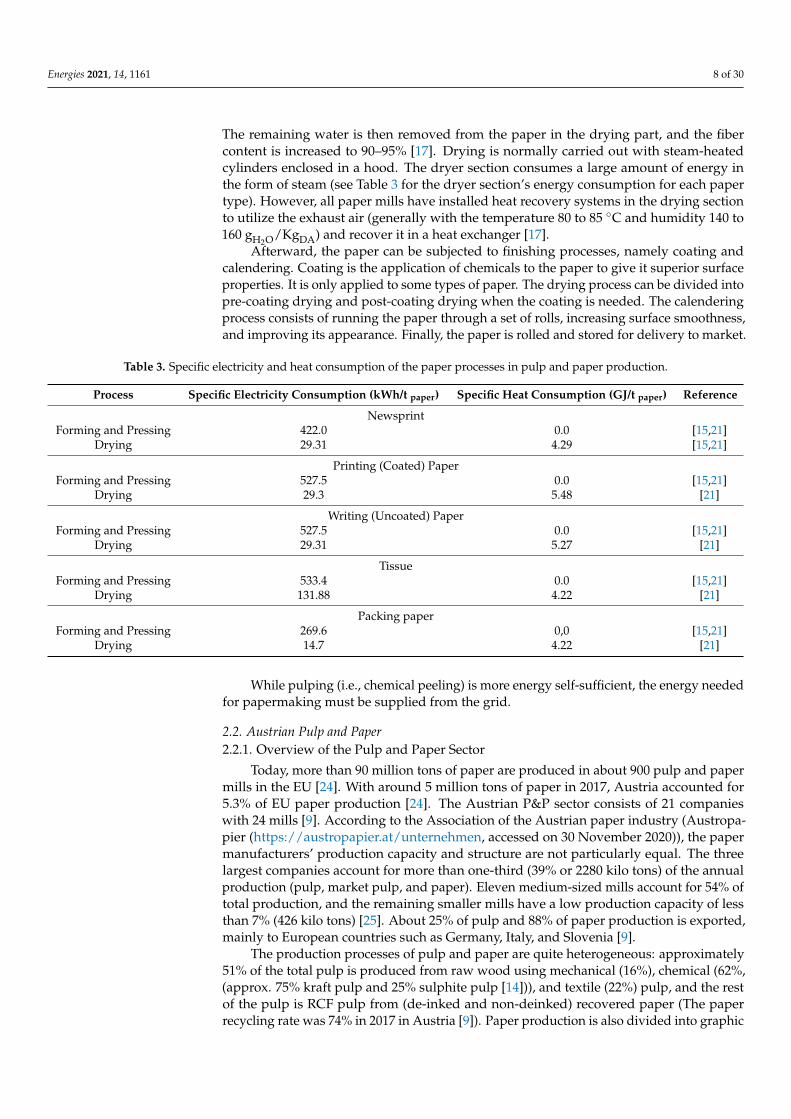
The remaining water is then removed from the paper in the drying part, and the fibercontent is increased to 90–95% [17]. Drying is normally carried out with steam-heatedcylinders enclosed in a hood. The dryer section consumes a large amount of energy inthe form of steam (see Table 3 for the dryer section’s energy consumption for each papertype). However, all paper mills have installed heat recovery systems in the drying sectionto utilize the exhaust air (generally with the temperature 80 to 85 ◦C and humidity 140 to160 gH2O/KgDA) and recover it in a heat exchanger [17].
Afterward, the paper can be subjected to finishing processes, namely coating andcalendering. Coating is the application of chemicals to the paper to give it superior surfaceproperties. It is only applied to some types of paper. The drying process can be divided intopre-coating drying and post-coating drying when the coating is needed. The calenderingprocess consists of running the paper through a set of rolls, increasing surface smoothness,and improving its appearance. Finally, the paper is rolled and stored for delivery to market.
Table 3. Specific electricity and heat consumption of the paper processes in pulp and paper production.
Process Specific Electricity Consumption (kWh/t paper) Specific Heat Consumption (GJ/t paper) Reference
NewsprintForming and Pressing 422.0 0.0 [15,21]
Drying 29.31 4.29 [15,21]
Printing (Coated) PaperForming and Pressing 527.5 0.0 [15,21]
Drying 29.3 5.48 [21]
Writing (Uncoated) PaperForming and Pressing 527.5 0.0 [15,21]
Drying 29.31 5.27 [21]
TissueForming and Pressing 533.4 0.0 [15,21]
Drying 131.88 4.22 [21]
Packing paperForming and Pressing 269.6 0,0 [15,21]
Drying 14.7 4.22 [21]
While pulping (i.e., chemical peeling) is more energy self-sufficient, the energy neededfor papermaking must be supplied from the grid.
2.2. Austrian Pulp and Paper2.2.1. Overview of the Pulp and Paper Sector
Today, more than 90 million tons of paper are produced in about 900 pulp and papermills in the EU [24]. With around 5 million tons of paper in 2017, Austria accounted for5.3% of EU paper production [24]. The Austrian P&P sector consists of 21 companieswith 24 mills [9]. According to the Association of the Austrian paper industry (Austropa-pier (https://austropapier.at/unternehmen, accessed on 30 November 2020)), the papermanufacturers’ production capacity and structure are not particularly equal. The threelargest companies account for more than one-third (39% or 2280 kilo tons) of the annualproduction (pulp, market pulp, and paper). Eleven medium-sized mills account for 54% oftotal production, and the remaining smaller mills have a low production capacity of lessthan 7% (426 kilo tons) [25]. About 25% of pulp and 88% of paper production is exported,mainly to European countries such as Germany, Italy, and Slovenia [9].
The production processes of pulp and paper are quite heterogeneous: approximately51% of the total pulp is produced from raw wood using mechanical (16%), chemical (62%,(approx. 75% kraft pulp and 25% sulphite pulp [14])), and textile (22%) pulp, and the restof the pulp is RCF pulp from (de-inked and non-deinked) recovered paper (The paperrecycling rate was 74% in 2017 in Austria [9]). Paper production is also divided into graphic
Energies 2021, 14, 1161 9 of 30
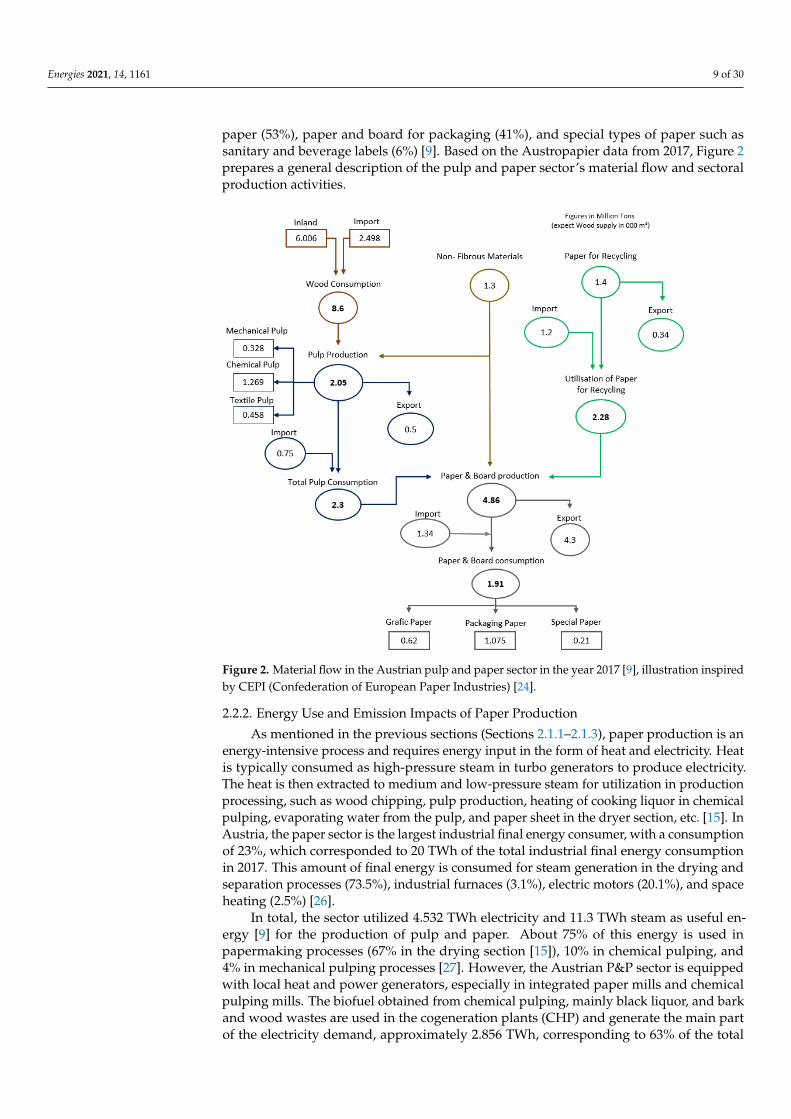
paper (53%), paper and board for packaging (41%), and special types of paper such assanitary and beverage labels (6%) [9]. Based on the Austropapier data from 2017, Figure 2prepares a general description of the pulp and paper sector’s material flow and sectoralproduction activities.
Energies 2021, 14, x FOR PEER REVIEW 9 of 29
Figure 2 prepares a general description of the pulp and paper sector’s material flow and sectoral production activities.
Figure 2. Material flow in the Austrian pulp and paper sector in the year 2017 [9], illustration in-spired by CEPI (Confederation of European Paper Industries) [23].
2.2.2. Energy Use and Emission Impacts of Paper Production As mentioned in the previous sections (Sections 2.1.1–2.1.3), paper production is an
energy-intensive process and requires energy input in the form of heat and electricity. Heat is typically consumed as high-pressure steam in turbo generators to produce elec-tricity. The heat is then extracted to medium and low-pressure steam for utilization in production processing, such as wood chipping, pulp production, heating of cooking liq-uor in chemical pulping, evaporating water from the pulp, and paper sheet in the dryer section, etc. [15]. In Austria, the paper sector is the largest industrial final energy con-sumer, with a consumption of 23%, which corresponded to 20 TWh of the total industrial final energy consumption in 2017. This amount of final energy is consumed for steam generation in the drying and separation processes (73.5%), industrial furnaces (3.1%), elec-tric motors (20.1%), and space heating (2.5%) [25].
In total, the sector utilized 4.532 TWh electricity and 11.3 TWh steam as useful energy [9] for the production of pulp and paper. About 75% of this energy is used in papermaking processes (67% in the drying section [15]), 10% in chemical pulping, and 4% in mechanical pulping processes [26]. However, the Austrian P&P sector is equipped with local heat and power generators, especially in integrated paper mills and chemical pulping mills. The biofuel obtained from chemical pulping, mainly black liquor, and bark and wood wastes are used in the cogeneration plants (CHP) and generate the main part of the electricity demand, approximately 2.856 TWh, corresponding to 63% of the total electricity demand in 2017, through the use of high-pressure steam in turbines (about 5% of this electricity is produced by on-site hydropower plants) [9]. Subsequently, the steam output at me-dium/low-pressure is applied to production processing, making the sector completely
Figure 2. Material flow in the Austrian pulp and paper sector in the year 2017 [9], illustration inspiredby CEPI (Confederation of European Paper Industries) [24].
2.2.2. Energy Use and Emission Impacts of Paper Production
As mentioned in the previous sections (Sections 2.1.1–2.1.3), paper production is anenergy-intensive process and requires energy input in the form of heat and electricity. Heatis typically consumed as high-pressure steam in turbo generators to produce electricity.The heat is then extracted to medium and low-pressure steam for utilization in productionprocessing, such as wood chipping, pulp production, heating of cooking liquor in chemicalpulping, evaporating water from the pulp, and paper sheet in the dryer section, etc. [15]. InAustria, the paper sector is the largest industrial final energy consumer, with a consumptionof 23%, which corresponded to 20 TWh of the total industrial final energy consumptionin 2017. This amount of final energy is consumed for steam generation in the drying andseparation processes (73.5%), industrial furnaces (3.1%), electric motors (20.1%), and spaceheating (2.5%) [26].
In total, the sector utilized 4.532 TWh electricity and 11.3 TWh steam as useful en-ergy [9] for the production of pulp and paper. About 75% of this energy is used inpapermaking processes (67% in the drying section [15]), 10% in chemical pulping, and4% in mechanical pulping processes [27]. However, the Austrian P&P sector is equippedwith local heat and power generators, especially in integrated paper mills and chemicalpulping mills. The biofuel obtained from chemical pulping, mainly black liquor, and barkand wood wastes are used in the cogeneration plants (CHP) and generate the main partof the electricity demand, approximately 2.856 TWh, corresponding to 63% of the total
Energies 2021, 14, 1161 10 of 30
electricity demand in 2017, through the use of high-pressure steam in turbines (about 5%of this electricity is produced by on-site hydropower plants) [9]. Subsequently, the steamoutput at medium/low-pressure is applied to production processing, making the sectorcompletely self-sufficient in terms of steam generation. The excess heat and electricity arealso fed into the grid [9]. Based on Austropapier [9] and Statistics Austria data [5,28,29],Table 4 presents a clear distribution of energy consumption (total, final, and useful), energyself-production, and system self-sufficiency in the year 2017.
Table 4. Energy consumption and production in the Austrian Pulp and Paper sector in the year 2017 [5,9,28,29]
∑ Sum Fuel Consumption Thermal Energy Electrical Energy
Total energy consumption (TWh) 22.5 18 - 4.532Final energy consumption (TWh) 20.8 16.22 - 4.532
Useful energy consumption (TWh) 15.84 - 11.312 4.532Self-energy production (TWh) 15.45 - 12.595 2.856
Self-sufficiency (%) 68 - 111.34 63
As shown in Table 4, a large amount of fuel is required to generate energy (heatand electricity). In 2017, the total fuel consumption was 18 TWh, of which about 40%was fossil fuels (e.g., coal, oil, natural gas) and 60% was biofuels (e.g., bark, sludge, andblack liquor) [28,29]. The use of more renewable energy and biofuel instead of fossil fuelenergy to reduce the fossil fuel CO2 emission is a priority of Austrian climate and energypolicy. The Austrian P&P industry has also followed this policy [9,30]. The pulp and paperindustry, on one hand, is a significant energy consumer, but on the other hand, it is asource of energy production, by producing black liquor and waste wood as biofuel duringthe production processing. Hence the industry has decided to use more inside-producedbiofuels instead of fossil fuels.
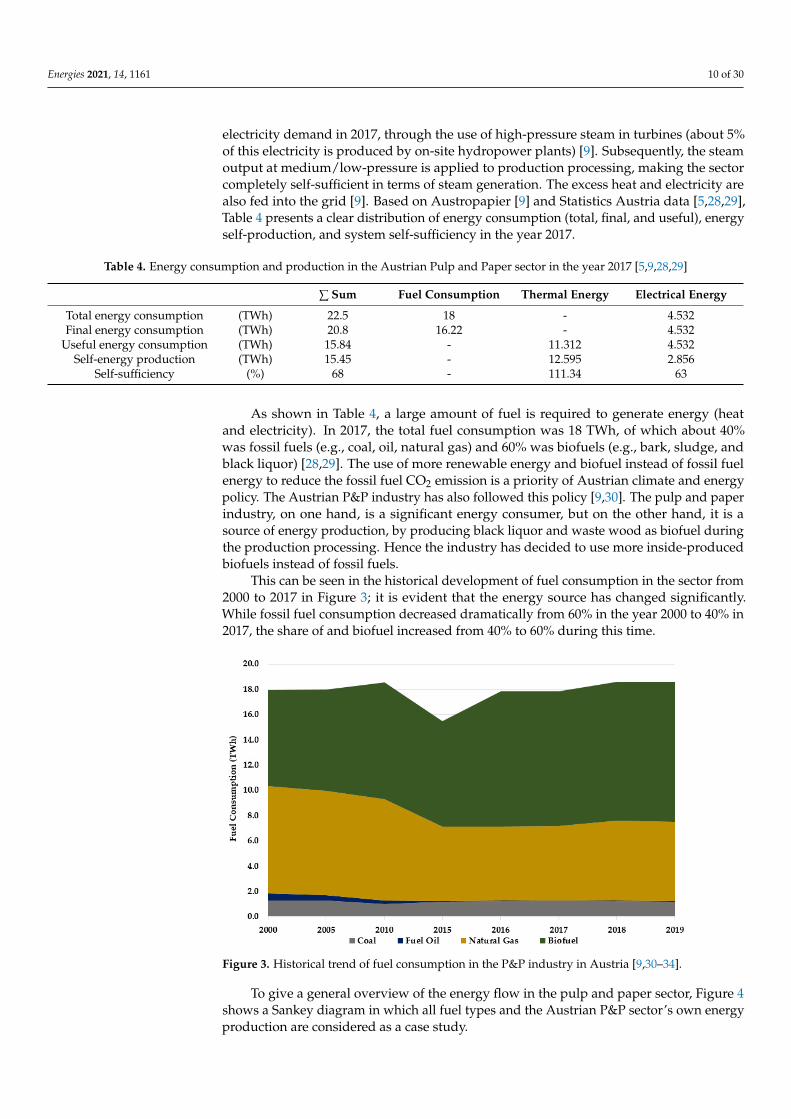
This can be seen in the historical development of fuel consumption in the sector from2000 to 2017 in Figure 3; it is evident that the energy source has changed significantly.While fossil fuel consumption decreased dramatically from 60% in the year 2000 to 40% in2017, the share of and biofuel increased from 40% to 60% during this time.
Energies 2021, 14, x FOR PEER REVIEW 10 of 29
self-sufficient in terms of steam generation. The excess heat and electricity are also fed into the grid [9]. Based on Austropapier [9] and Statistics Austria data [5,27,28], Table 4 pre-sents a clear distribution of energy consumption (total, final, and useful), energy self-pro-duction, and system self-sufficiency in the year 2017.
Table 4. Energy consumption and production in the Austrian Pulp and Paper sector in the year 2017 [5,9,27,28]
∑ Sum Fuel Consumption Thermal Energy Electrical Energy Total energy consumption (TWh) 22.5 18 - 4.532 Final energy consumption (TWh) 20.8 16.22 - 4.532
Useful energy consumption (TWh) 15.84 - 11.312 4.532 Self-energy production (TWh) 15.45 - 12.595 2.856
Self-sufficiency (%) 68 - 111.34 63
As shown in Table 4, a large amount of fuel is required to generate energy (heat and electricity). In 2017, the total fuel consumption was 18 TWh, of which about 40% was fossil fuels (e.g., coal, oil, natural gas) and 60% was biofuels (e.g., bark, sludge, and black liquor) [27,28]. The use of more renewable energy and biofuel instead of fossil fuel energy to re-duce the fossil fuel CO2 emission is a priority of Austrian climate and energy policy. The Austrian P&P industry has also followed this policy [9,30]. The pulp and paper industry, on one hand, is a significant energy consumer, but on the other hand, it is a source of energy production, by producing black liquor and waste wood as biofuel during the pro-duction processing. Hence the industry has decided to use more inside-produced biofuels instead of fossil fuels.
This can be seen in the historical development of fuel consumption in the sector from
2000 to 2017 in Figure 3; it is evident that the energy source has changed significantly. While fossil fuel consumption decreased dramatically from 60% in the year 2000 to 40% in 2017, the share of and biofuel increased from 40% to 60% during this time.
Figure 3. Historical trend of fuel consumption in the P&P industry in Austria [9,29–33].
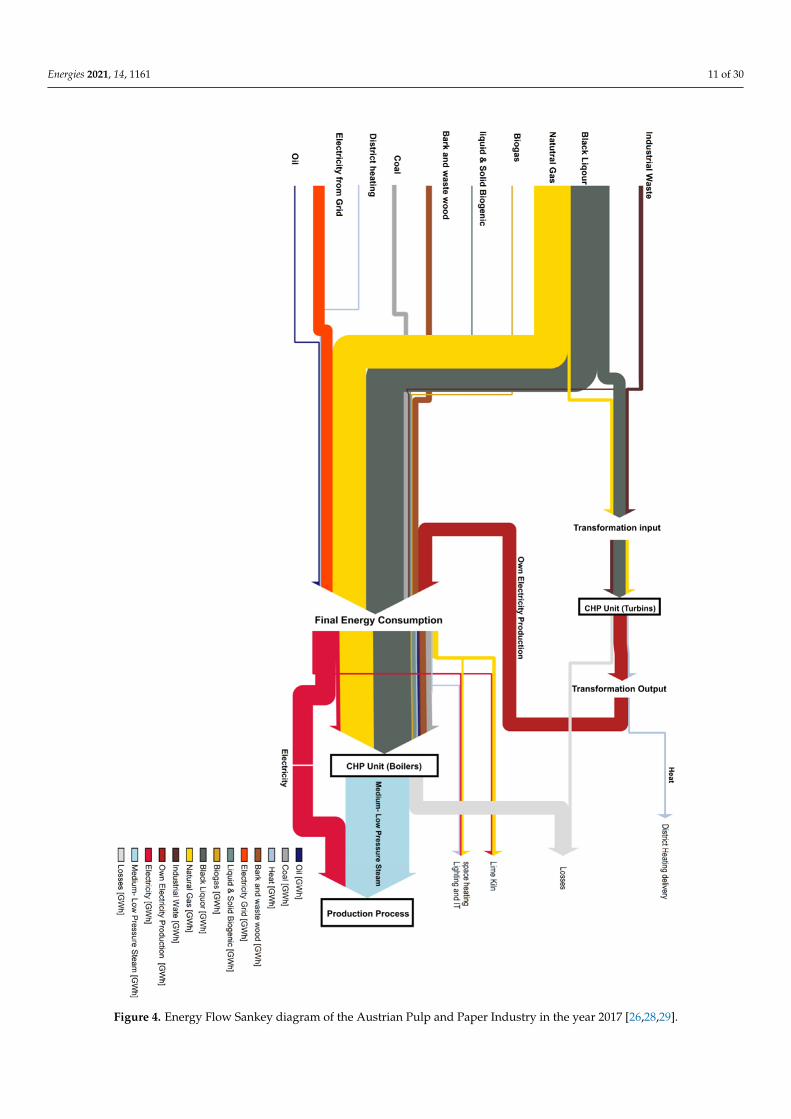
To give a general overview of the energy flow in the pulp and paper sector, Figure 4 shows a Sankey diagram in which all fuel types and the Austrian P&P sector’s own energy production are considered as a case study.
Figure 3. Historical trend of fuel consumption in the P&P industry in Austria [9,30–34].
To give a general overview of the energy flow in the pulp and paper sector, Figure 4shows a Sankey diagram in which all fuel types and the Austrian P&P sector’s own energyproduction are considered as a case study.
Energies 2021, 14, 1161 11 of 30Energies 2021, 14, x FOR PEER REVIEW 11 of 29
Figure 4. Energy Flow Sankey diagram of the Austrian Pulp and Paper Industry in the year 2017 [25,27,28]. Figure 4. Energy Flow Sankey diagram of the Austrian Pulp and Paper Industry in the year 2017 [26,28,29].

Energies 2021, 14, 1161 12 of 30
While pulp and paper is an energy-intensive sector and consumes a lot of energy inAustria, it is one of the least CO2-intensive industrial sectors. Greenhouse gas emissionsin P&P can be attributed to direct and indirect emissions. Direct emissions are emissionsfrom the burning of fuels on-site (fossil fuels and biofuels) and non-energy related sourcessuch as carbon dioxide emissions as a by-product of the chemical reaction in the lime kiln.The in-direct emission comes from the external power supply that has been purchased forthe plant [15,17].
For calculating the total CO2 emissions from the P&P sector, only fossil fuel emissionsare taken into account. The biofuel emissions are classified as carbon-neutral, accordingto the GHG Protocol of the Intergovernmental Panel on Climate Change (IPCC) [35].The carbon neutrality of bioenergy does not mean that emissions from bioenergy are notconsidered. Instead, they are assigned to the forest and land-use sector [36]. Hence, themain reason for the difference in carbon dioxide intensity between paper manufacturingand other industrial sectors is the extensive use of biofuel as an energy source [15].
In 2017 the total emission of the Austrian P&P sector was 1811 kilotons (kt) [8],which was 90% direct and 10% indirect emissions, corresponding to 7% of total industrialemissions. As illustrated in Figure 5, P&P showed a general decreasing trend in directfossil CO2 emissions from 2157 kt (0.54 kt CO2 per kt paper) in 2000, to 1639 kt (0.37 kt CO2per kt paper) in 2017 [8,9]. This was mainly due to the increased use of biofuel instead offossil fuels as an energy source. (Figure 4).
Energies 2021, 14, x FOR PEER REVIEW 12 of 29
While pulp and paper is an energy-intensive sector and consumes a lot of energy in Austria, it is one of the least CO2-intensive industrial sectors. Greenhouse gas emissions in P&P can be attributed to direct and indirect emissions. Direct emissions are emissions from the burning of fuels on-site (fossil fuels and biofuels) and non-energy related sources such as carbon dioxide emissions as a by-product of the chemical reaction in the lime kiln. The in-direct emission comes from the external power supply that has been purchased for the plant [15,17].
For calculating the total CO2 emissions from the P&P sector, only fossil fuel emissions are taken into account. The biofuel emissions are classified as carbon-neutral, according to the GHG Protocol of the Intergovernmental Panel on Climate Change (IPCC) [34]. The carbon neutrality of bioenergy does not mean that emissions from bioenergy are not con-sidered. Instead, they are assigned to the forest and land-use sector [35]. Hence, the main reason for the difference in carbon dioxide intensity between paper manufacturing and other industrial sectors is the extensive use of biofuel as an energy source [15].
In 2017 the total emission of the Austrian P&P sector was 1811 kilotons (kt) [8], which was 90% direct and 10% indirect emissions, corresponding to 7% of total industrial emis-sions. As illustrated in Figure 5, P&P showed a general decreasing trend in direct fossil CO2 emissions from 2157 kt (0.54 kt CO2 per kt paper) in 2000, to 1639 kt (0.37 kt CO2 per kt paper) in 2017 [8,9]. This was mainly due to the increased use of biofuel instead of fossil fuels as an energy source. (Figure 4).
Figure 5. Historical trend of CO2 emission in the P&P industry in Austria 2000–2017 [9,29,31–33].
3. Modeling Approach To assess the potential of technology-based energy efficiency improvement and CO2
mitigation measures on the P&P processes, we developed an analytical model based on a linear bottom-up approach. By calculating the energy consumption of each step of the production process, the fuel consumption and CO2 emissions can be estimated. This ap-proach makes it possible to calculate the impact that selected measures in a specific pro-cess would have on the energy consumption and CO2 emissions of the entire production process.
The first application of the model is the calculation of annual emissions and energy consumption of each paper product individually (printing and writing paper, tissue, newsprint, and packing paper), considering different production conditions such as inte-grated (int) or non-integrated (n.int) production, type of pulp used, and RCF content, to obtain the specific energy consumption and CO2 emission of each of those products and to understand the sources of CO2 throughout the process.
Figure 5. Historical trend of CO2 emission in the P&P industry in Austria 2000–2017 [9,30,32–34].
3. Modeling Approach
To assess the potential of technology-based energy efficiency improvement and CO2mitigation measures on the P&P processes, we developed an analytical model based ona linear bottom-up approach. By calculating the energy consumption of each step of theproduction process, the fuel consumption and CO2 emissions can be estimated. Thisapproach makes it possible to calculate the impact that selected measures in a specificprocess would have on the energy consumption and CO2 emissions of the entire productionprocess.
The first application of the model is the calculation of annual emissions and energy con-sumption of each paper product individually (printing and writing paper, tissue, newsprint,and packing paper), considering different production conditions such as integrated (int) ornon-integrated (n.int) production, type of pulp used, and RCF content, to obtain the specific
Energies 2021, 14, 1161 13 of 30
energy consumption and CO2 emission of each of those products and to understand thesources of CO2 throughout the process.
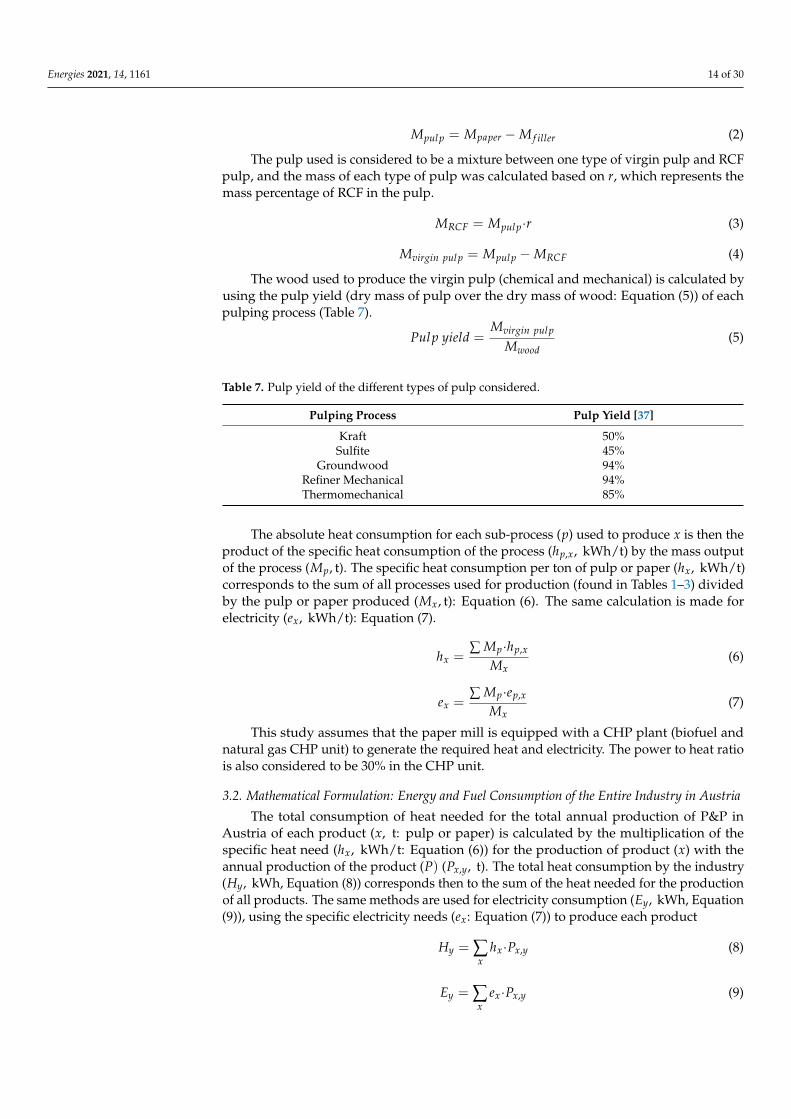
In the second application, the model is used to calculate the energy consumptionand CO2 emissions of the entire sector in Austria, using as input the pulp and paper’sannual production. Since the pulp is sold separately as market pulp, the total productionof pulp is not directly related to paper production, so the calculation methodology for theentire industry considered the production of pulp and paper separately (instead of pulpproduced to sustain the production of paper). The two variants of the model diverge onthe method used to calculate fuel consumption. Table 5 compares the two variants of theapplied model.
Table 5. Comparison of the two variants of the model used.
Individual Paper Grades Austrian P&P Production
Pulp and paper producedConsiders the production of 1 ton of thespecific paper grade, and the productionof pulp necessary, according to pulp yield
Considers the total annual productionof pulp and paper in Austria,
unrelated to one another.
Energy consumption calculation method Similar
Fuel consumption calculation method Assumes the typical energy productiontechnology used in P&P mills
Calculated from the industry reportedvalues of heat and fuel consumption
(according to Section 2.2)
CO2 emission calculation method Similar
Results Specific (Per ton of paper produced) Absolute
With both approaches, the impact of selected new technology on energy and emissionsavings, by considering the time required for the diffusion of the technology, can beanalyzed.
3.1. Mathematical Formulation: Energy and Fuel Consumption for Specific Paper Grades
The energy consumption to produce each paper grade depends on the characteristicsof the paper produced, which are defined in the model by the following variables:
• Paper grade produced (printing and writing paper, tissue, newsprint, or packingpaper);
• Mineral filler mass content in the paper (mf );• Integrated or non-integrated production;• Type of virgin pulp used: chemical (kraft, sulphite), mechanical (GW, TMP);• Recycled fibers (RCF) content in pulp (r);
Seven different cases were studied (filler content is always considered 10%), shown inTable 6.
Table 6. Production specifications of the cases studied.
Grade Writing (int.) Writing (n.int.)
Printing(int.) News (int.) Packing
(int.)Tissue
(kraft) (int.)Tissue (RCF)
(int.)
Virgin Pulp Kraft Kraft GW TMP Kraft Kraft -m f 10% 10% 10% 10% 10% 10% 10%r 0% 0% 0% 50% 50% 0% 100%
For each case, the impacts of producing one ton of paper are calculated (Mpaper = 1 ton).The dry mass of fillers and pulp necessary for the production are calculated according toEquations (1) and (2), respectively. m f represents the mass percentage of paper fillers inthe paper.
M f iller = Mpaper·m f (1)
Energies 2021, 14, 1161 14 of 30
Mpulp = Mpaper − M f iller (2)
The pulp used is considered to be a mixture between one type of virgin pulp and RCFpulp, and the mass of each type of pulp was calculated based on r, which represents themass percentage of RCF in the pulp.
MRCF = Mpulp·r (3)
Mvirgin pulp = Mpulp − MRCF (4)
The wood used to produce the virgin pulp (chemical and mechanical) is calculated byusing the pulp yield (dry mass of pulp over the dry mass of wood: Equation (5)) of eachpulping process (Table 7).
Pulp yield =Mvirgin pulp
Mwood(5)
Table 7. Pulp yield of the different types of pulp considered.
Pulping Process Pulp Yield [37]
Kraft 50%Sulfite 45%
Groundwood 94%Refiner Mechanical 94%Thermomechanical 85%
The absolute heat consumption for each sub-process (p) used to produce x is then theproduct of the specific heat consumption of the process (hp,x, kWh/t) by the mass outputof the process (Mp, t). The specific heat consumption per ton of pulp or paper (hx, kWh/t)corresponds to the sum of all processes used for production (found in Tables 1–3) dividedby the pulp or paper produced (Mx, t): Equation (6). The same calculation is made forelectricity (ex, kWh/t): Equation (7).
hx =∑ Mp·hp,x
Mx(6)
ex =∑ Mp·ep,x
Mx(7)
This study assumes that the paper mill is equipped with a CHP plant (biofuel andnatural gas CHP unit) to generate the required heat and electricity. The power to heat ratiois also considered to be 30% in the CHP unit.
3.2. Mathematical Formulation: Energy and Fuel Consumption of the Entire Industry in Austria
The total consumption of heat needed for the total annual production of P&P inAustria of each product (x, t: pulp or paper) is calculated by the multiplication of thespecific heat need (hx, kWh/t: Equation (6)) for the production of product (x) with theannual production of the product (P) (Px,y, t). The total heat consumption by the industry(Hy, kWh, Equation (8)) corresponds then to the sum of the heat needed for the productionof all products. The same methods are used for electricity consumption (Ey, kWh, Equation(9)), using the specific electricity needs (ex: Equation (7)) to produce each product
Hy = ∑x
hx·Px,y (8)
Ey = ∑x
ex·Px,y (9)
Energies 2021, 14, 1161 15 of 30
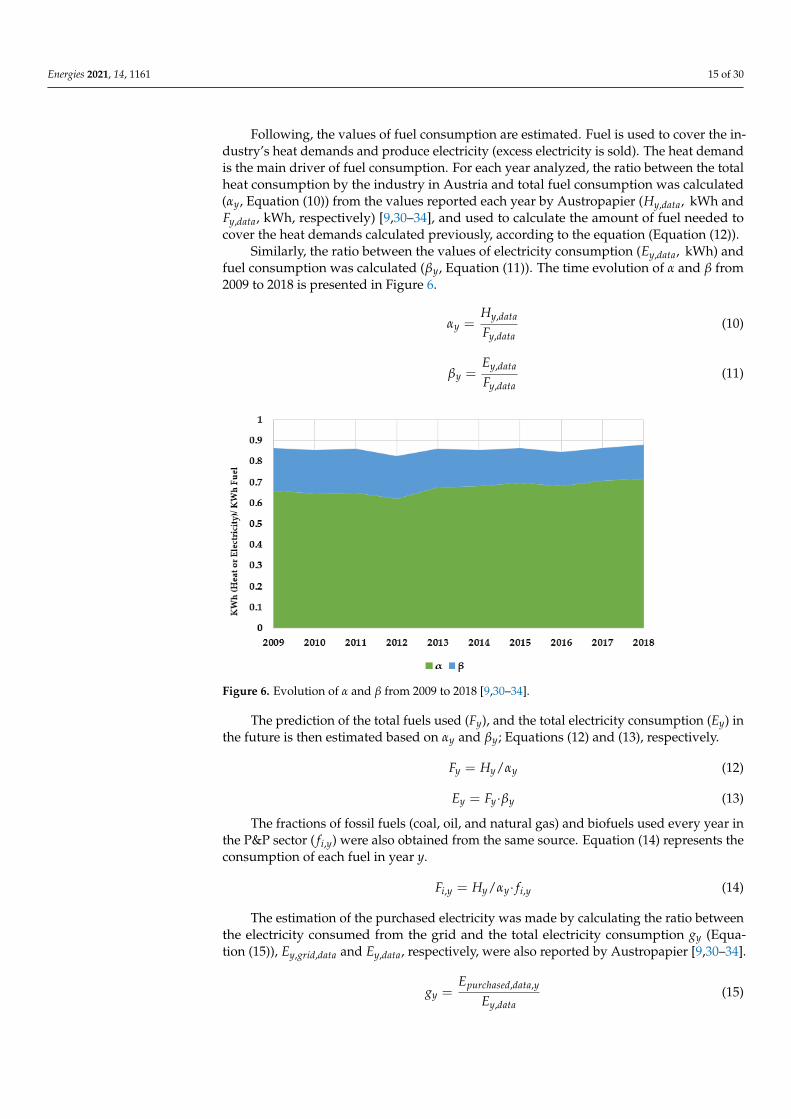
Following, the values of fuel consumption are estimated. Fuel is used to cover the in-dustry’s heat demands and produce electricity (excess electricity is sold). The heat demandis the main driver of fuel consumption. For each year analyzed, the ratio between the totalheat consumption by the industry in Austria and total fuel consumption was calculated(αy, Equation (10)) from the values reported each year by Austropapier (Hy,data, kWh andFy,data, kWh, respectively) [9,30–34], and used to calculate the amount of fuel needed tocover the heat demands calculated previously, according to the equation (Equation (12)).
Similarly, the ratio between the values of electricity consumption (Ey,data, kWh) andfuel consumption was calculated (βy, Equation (11)). The time evolution of α and β from2009 to 2018 is presented in Figure 6.
αy =Hy,data
Fy,data(10)
βy =Ey,data
Fy,data(11)
Energies 2021, 14, x FOR PEER REVIEW 15 of 29
the total heat consumption by the industry in Austria and total fuel consumption was calculated ( , Equation (10)) from the values reported each year by Austropapier ( , ,kWh and , , kWh, respectively) [9,29–33], and used to calculate the amount of fuel needed to cover the heat demands calculated previously, according to the equation (Equa-tion (12)).
Similarly, the ratio between the values of electricity consumption ( , , kWh) and fuel consumption was calculated ( , Equation (11)). The time evolution of α and β from 2009 to 2018 is presented in Figure 6. = , , (10)
= , , (11)
Figure 6. Evolution of α and β from 2009 to 2018 [9,29–33].
The prediction of the total fuels used ( ), and the total electricity consumption (E ) in the future is then estimated based on and ; Equations (12) and (13), respectively. = ⁄ (12) = . (13)
The fractions of fossil fuels (coal, oil, and natural gas) and biofuels used every year in the P&P sector ( , ) were also obtained from the same source. Equation (14) represents the consumption of each fuel in year y.
, = ⁄ ∙ , (14)
The estimation of the purchased electricity was made by calculating the ratio between the electricity consumed from the grid and the total electricity consumption (Equation (15)), , , and , , respectively, were also reported by Austropapier [9,29–33]. = , , , (15)
For future prospection, the total electricity purchased from the grid each year ( , ) was then estimated based on (Equation (16)).
, = ∙ (16)
3.3. Mathematical Formulation: CO2 Emission
Figure 6. Evolution of α and β from 2009 to 2018 [9,30–34].
The prediction of the total fuels used (Fy), and the total electricity consumption (Ey) inthe future is then estimated based on αy and βy; Equations (12) and (13), respectively.
Fy = Hy/αy (12)
Ey = Fy·βy (13)
The fractions of fossil fuels (coal, oil, and natural gas) and biofuels used every year inthe P&P sector ( fi,y) were also obtained from the same source. Equation (14) represents theconsumption of each fuel in year y.
Fi,y = Hy/αy· fi,y (14)
The estimation of the purchased electricity was made by calculating the ratio betweenthe electricity consumed from the grid and the total electricity consumption gy (Equa-tion (15)), Ey,grid,data and Ey,data, respectively, were also reported by Austropapier [9,30–34].
gy =Epurchased,data,y
Ey,data(15)

Energies 2021, 14, 1161 16 of 30
For future prospection, the total electricity purchased from the grid each year (Egrid,y)was then estimated based on gy (Equation (16)).
Epurchased,y = gy·Ey (16)
3.3. Mathematical Formulation: CO2 Emission
The CO2 emissions due to the consumption of fossil fuels (CO2 direct, t) is calculated asthe summation of the amount of fossil fuels consumed (Fi, t) multiplied by the emission fac-tor of each fossil fuel (e fi, tCO2 /tfuel), reported to Austria’s National Inventory Report [38](Equation (17)).
CO2 direct = ∑i
Fi·e fi (17)
The CO2 emitted due to the consumption of grid electricity (CO2 indirect, t) is cal-culated as the product of the grid electricity consumed (Epurchased, kWh) multiplied bythe respective emission factor for the paper industry (e fgrid, tCO2 /kWh). To calculatee f grid (Equation (19)), the total emissions from energy production of the electricity grid(CO2 grid,y, t) is estimated as the summation of the product of the consumption of each fuelused to power the grid (Fgrid,i,y, t) [39] and the respective emission factors (Equation (18)).The grid emission factor is then calculated as the division between CO2 grid,y and the totalgrid electricity in year y (Egrid,y). The value used in this section corresponds to the mostrecent data available.
CO2 grid,y = ∑i
Fgrid,i·e fgrid (18)
e fgrid =CO2 grid
Egrid(19)
The CO2 emission due to the purchase of grid electricity is then calculated (Equation (20)).
CO2 indirect = Epurchased·e fgrid (20)
The mentioned equations in Sections 3.1–3.3 are also used for each selected technology,and will analyze the decarbonization scenario.
4. Decarbonization Technology Selection
Based on the literature, there are already a number of opportunities for reducingenergy consumption and greenhouse gas emissions in the pulp and paper industry, andothers will be available in the future. In general, upgrading existing mills with energy-efficient technologies, such as switching fuel from fossil fuels to on-site produced biofuels(bark and black liquor) in combination with CHP, improving the energy managementsystem, increasing the use of waste paper and paper recycling, and implementation ofinnovative technologies are the key options identified to reduce CO2 emissions and energyconsumption in the P&P sector [10,16,40].
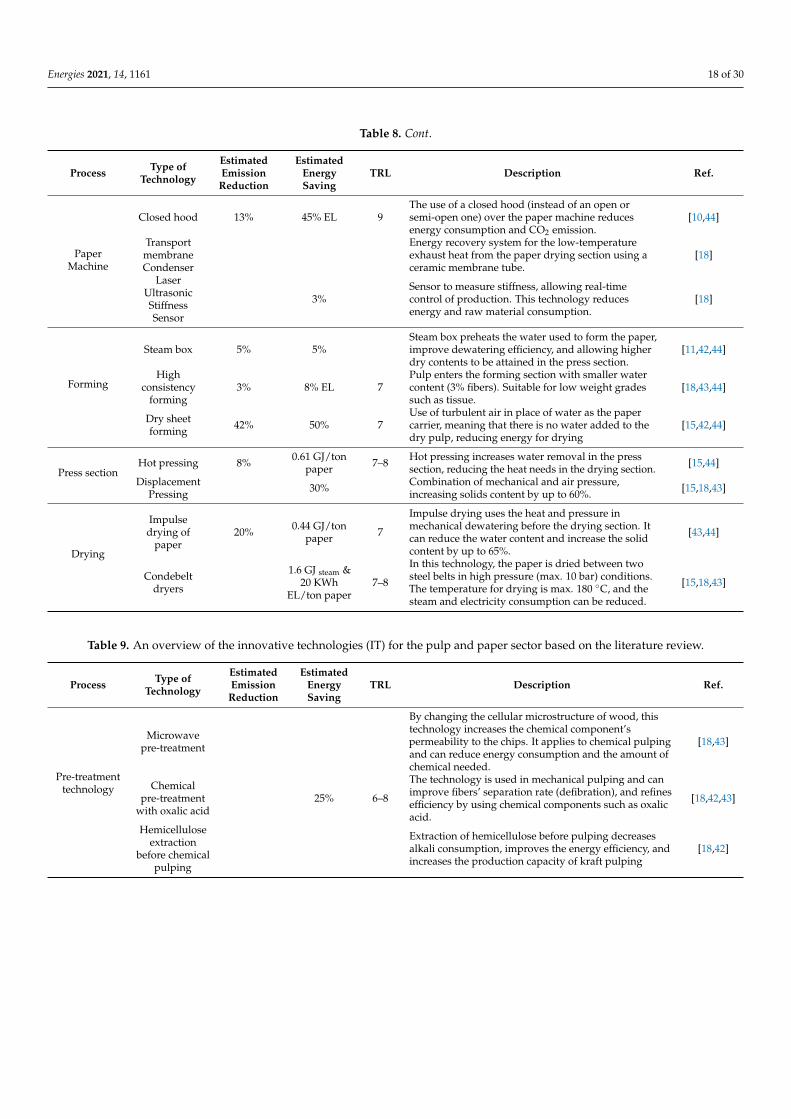
In this work, a list of best available technologies (BAT) and emerging innovative tech-nologies (IT) has been compiled based on a comprehensive literature review in Tables 8 and 9.These technologies are applicable at different stages of the pulping and papermaking pro-cess. For each technology, the energy-savings (heat or electricity) and the CO2 reductionpotential in the associated process are considered, and to find out how mature the technol-ogy is, the technology readiness level (TRL) is monitored.
Energies 2021, 14, 1161 17 of 30
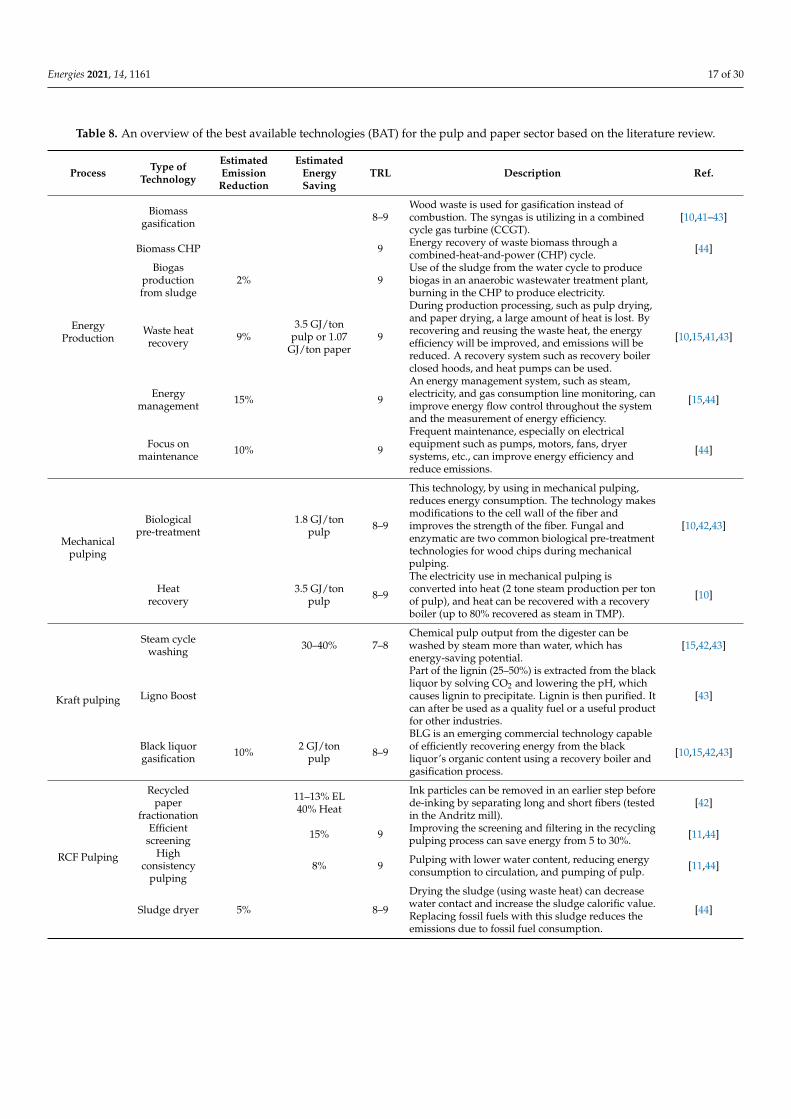
Table 8. An overview of the best available technologies (BAT) for the pulp and paper sector based on the literature review.
Process Type ofTechnology
EstimatedEmission
Reduction
EstimatedEnergySaving
TRL Description Ref.
EnergyProduction
Biomassgasification 8–9
Wood waste is used for gasification instead ofcombustion. The syngas is utilizing in a combinedcycle gas turbine (CCGT).
[10,41–43]
Biomass CHP 9 Energy recovery of waste biomass through acombined-heat-and-power (CHP) cycle. [44]
Biogasproductionfrom sludge
2% 9Use of the sludge from the water cycle to producebiogas in an anaerobic wastewater treatment plant,burning in the CHP to produce electricity.
Waste heatrecovery 9%
3.5 GJ/tonpulp or 1.07
GJ/ton paper9
During production processing, such as pulp drying,and paper drying, a large amount of heat is lost. Byrecovering and reusing the waste heat, the energyefficiency will be improved, and emissions will bereduced. A recovery system such as recovery boilerclosed hoods, and heat pumps can be used.
[10,15,41,43]
Energymanagement 15% 9
An energy management system, such as steam,electricity, and gas consumption line monitoring, canimprove energy flow control throughout the systemand the measurement of energy efficiency.
[15,44]
Focus onmaintenance 10% 9
Frequent maintenance, especially on electricalequipment such as pumps, motors, fans, dryersystems, etc., can improve energy efficiency andreduce emissions.
[44]
Mechanicalpulping
Biologicalpre-treatment
1.8 GJ/tonpulp 8–9
This technology, by using in mechanical pulping,reduces energy consumption. The technology makesmodifications to the cell wall of the fiber andimproves the strength of the fiber. Fungal andenzymatic are two common biological pre-treatmenttechnologies for wood chips during mechanicalpulping.
[10,42,43]
Heatrecovery
3.5 GJ/tonpulp 8–9
The electricity use in mechanical pulping isconverted into heat (2 tone steam production per tonof pulp), and heat can be recovered with a recoveryboiler (up to 80% recovered as steam in TMP).
[10]
Kraft pulping
Steam cyclewashing 30–40% 7–8
Chemical pulp output from the digester can bewashed by steam more than water, which hasenergy-saving potential.
[15,42,43]
Ligno Boost
Part of the lignin (25–50%) is extracted from the blackliquor by solving CO2 and lowering the pH, whichcauses lignin to precipitate. Lignin is then purified. Itcan after be used as a quality fuel or a useful productfor other industries.
[43]
Black liquorgasification 10% 2 GJ/ton
pulp 8–9
BLG is an emerging commercial technology capableof efficiently recovering energy from the blackliquor’s organic content using a recovery boiler andgasification process.
[10,15,42,43]
RCF Pulping
Recycledpaper
fractionation
11–13% EL40% Heat
Ink particles can be removed in an earlier step beforede-inking by separating long and short fibers (testedin the Andritz mill).
[42]
Efficientscreening 15% 9 Improving the screening and filtering in the recycling
pulping process can save energy from 5 to 30%. [11,44]
Highconsistency
pulping8% 9 Pulping with lower water content, reducing energy
consumption to circulation, and pumping of pulp. [11,44]
Sludge dryer 5% 8–9
Drying the sludge (using waste heat) can decreasewater contact and increase the sludge calorific value.Replacing fossil fuels with this sludge reduces theemissions due to fossil fuel consumption.
[44]
Energies 2021, 14, 1161 18 of 30
Table 8. Cont.
Process Type ofTechnology
EstimatedEmission
Reduction
EstimatedEnergySaving
TRL Description Ref.
PaperMachine
Closed hood 13% 45% EL 9The use of a closed hood (instead of an open orsemi-open one) over the paper machine reducesenergy consumption and CO2 emission.
[10,44]
TransportmembraneCondenser
Energy recovery system for the low-temperatureexhaust heat from the paper drying section using aceramic membrane tube.
[18]
LaserUltrasonicStiffnessSensor
3%Sensor to measure stiffness, allowing real-timecontrol of production. This technology reducesenergy and raw material consumption.
[18]
Forming
Steam box 5% 5%Steam box preheats the water used to form the paper,improve dewatering efficiency, and allowing higherdry contents to be attained in the press section.
[11,42,44]
Highconsistency
forming3% 8% EL 7
Pulp enters the forming section with smaller watercontent (3% fibers). Suitable for low weight gradessuch as tissue.
[18,43,44]
Dry sheetforming 42% 50% 7
Use of turbulent air in place of water as the papercarrier, meaning that there is no water added to thedry pulp, reducing energy for drying
[15,42,44]
Press sectionHot pressing 8% 0.61 GJ/ton
paper 7–8 Hot pressing increases water removal in the presssection, reducing the heat needs in the drying section. [15,44]
DisplacementPressing 30% Combination of mechanical and air pressure,
increasing solids content by up to 60%. [15,18,43]
Drying
Impulsedrying of
paper20% 0.44 GJ/ton
paper 7
Impulse drying uses the heat and pressure inmechanical dewatering before the drying section. Itcan reduce the water content and increase the solidcontent by up to 65%.
[43,44]
Condebeltdryers
1.6 GJ steam &20 KWh
EL/ton paper7–8
In this technology, the paper is dried between twosteel belts in high pressure (max. 10 bar) conditions.The temperature for drying is max. 180 ◦C, and thesteam and electricity consumption can be reduced.
[15,18,43]
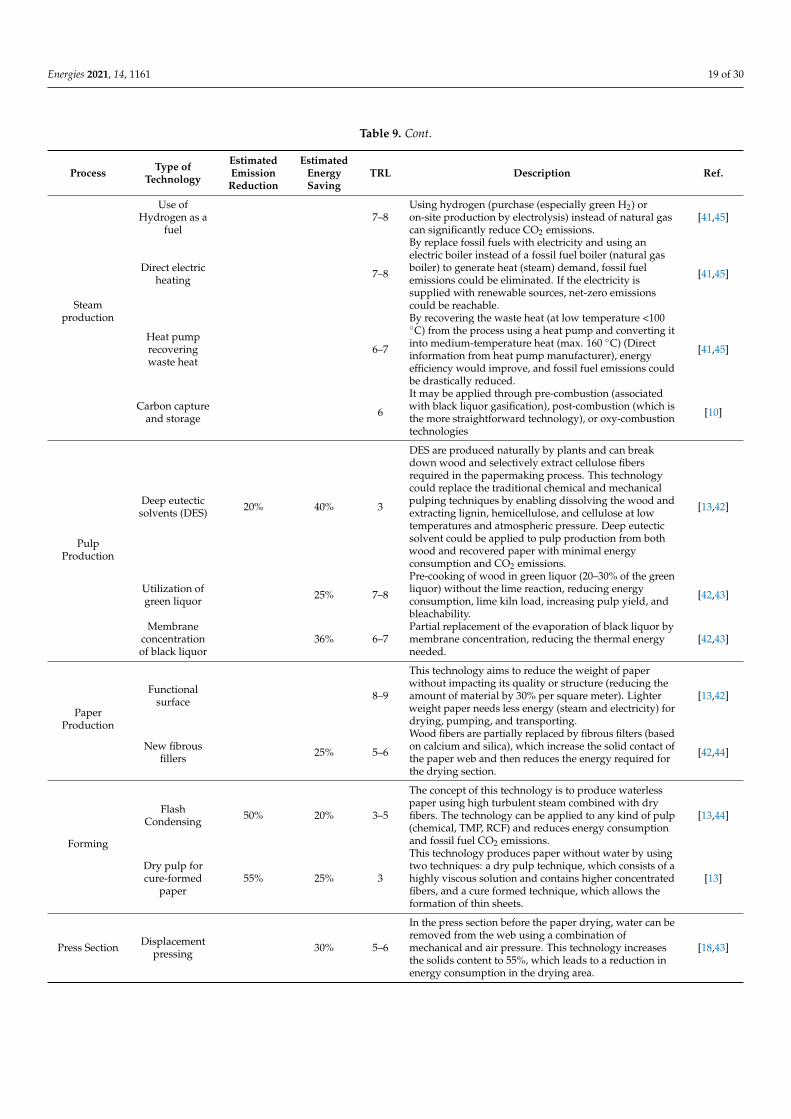
Table 9. An overview of the innovative technologies (IT) for the pulp and paper sector based on the literature review.
Process Type ofTechnology
EstimatedEmission
Reduction
EstimatedEnergySaving
TRL Description Ref.
Pre-treatmenttechnology
Microwavepre-treatment
By changing the cellular microstructure of wood, thistechnology increases the chemical component’spermeability to the chips. It applies to chemical pulpingand can reduce energy consumption and the amount ofchemical needed.
[18,43]
Chemicalpre-treatment
with oxalic acid25% 6–8
The technology is used in mechanical pulping and canimprove fibers’ separation rate (defibration), and refinesefficiency by using chemical components such as oxalicacid.
[18,42,43]
Hemicelluloseextraction
before chemicalpulping
Extraction of hemicellulose before pulping decreasesalkali consumption, improves the energy efficiency, andincreases the production capacity of kraft pulping
[18,42]
Energies 2021, 14, 1161 19 of 30
Table 9. Cont.
Process Type ofTechnology
EstimatedEmission
Reduction
EstimatedEnergySaving
TRL Description Ref.
Steamproduction
Use ofHydrogen as a
fuel7–8
Using hydrogen (purchase (especially green H2) oron-site production by electrolysis) instead of natural gascan significantly reduce CO2 emissions.
[41,45]
Direct electricheating 7–8
By replace fossil fuels with electricity and using anelectric boiler instead of a fossil fuel boiler (natural gasboiler) to generate heat (steam) demand, fossil fuelemissions could be eliminated. If the electricity issupplied with renewable sources, net-zero emissionscould be reachable.
[41,45]
Heat pumprecoveringwaste heat
6–7
By recovering the waste heat (at low temperature <100◦C) from the process using a heat pump and converting itinto medium-temperature heat (max. 160 ◦C) (Directinformation from heat pump manufacturer), energyefficiency would improve, and fossil fuel emissions couldbe drastically reduced.
[41,45]
Carbon captureand storage 6
It may be applied through pre-combustion (associatedwith black liquor gasification), post-combustion (which isthe more straightforward technology), or oxy-combustiontechnologies
[10]
PulpProduction
Deep eutecticsolvents (DES) 20% 40% 3
DES are produced naturally by plants and can breakdown wood and selectively extract cellulose fibersrequired in the papermaking process. This technologycould replace the traditional chemical and mechanicalpulping techniques by enabling dissolving the wood andextracting lignin, hemicellulose, and cellulose at lowtemperatures and atmospheric pressure. Deep eutecticsolvent could be applied to pulp production from bothwood and recovered paper with minimal energyconsumption and CO2 emissions.
[13,42]
Utilization ofgreen liquor 25% 7–8
Pre-cooking of wood in green liquor (20–30% of the greenliquor) without the lime reaction, reducing energyconsumption, lime kiln load, increasing pulp yield, andbleachability.
[42,43]
Membraneconcentrationof black liquor
36% 6–7Partial replacement of the evaporation of black liquor bymembrane concentration, reducing the thermal energyneeded.
[42,43]
PaperProduction
Functionalsurface 8–9
This technology aims to reduce the weight of paperwithout impacting its quality or structure (reducing theamount of material by 30% per square meter). Lighterweight paper needs less energy (steam and electricity) fordrying, pumping, and transporting.
[13,42]
New fibrousfillers 25% 5–6
Wood fibers are partially replaced by fibrous filters (basedon calcium and silica), which increase the solid contact ofthe paper web and then reduces the energy required forthe drying section.
[42,44]
Forming
FlashCondensing 50% 20% 3–5
The concept of this technology is to produce waterlesspaper using high turbulent steam combined with dryfibers. The technology can be applied to any kind of pulp(chemical, TMP, RCF) and reduces energy consumptionand fossil fuel CO2 emissions.
[13,44]
Dry pulp forcure-formed
paper55% 25% 3
This technology produces paper without water by usingtwo techniques: a dry pulp technique, which consists of ahighly viscous solution and contains higher concentratedfibers, and a cure formed technique, which allows theformation of thin sheets.
[13]
Press Section Displacementpressing 30% 5–6
In the press section before the paper drying, water can beremoved from the web using a combination ofmechanical and air pressure. This technology increasesthe solids content to 55%, which leads to a reduction inenergy consumption in the drying area.
[18,43]
Energies 2021, 14, 1161 20 of 30
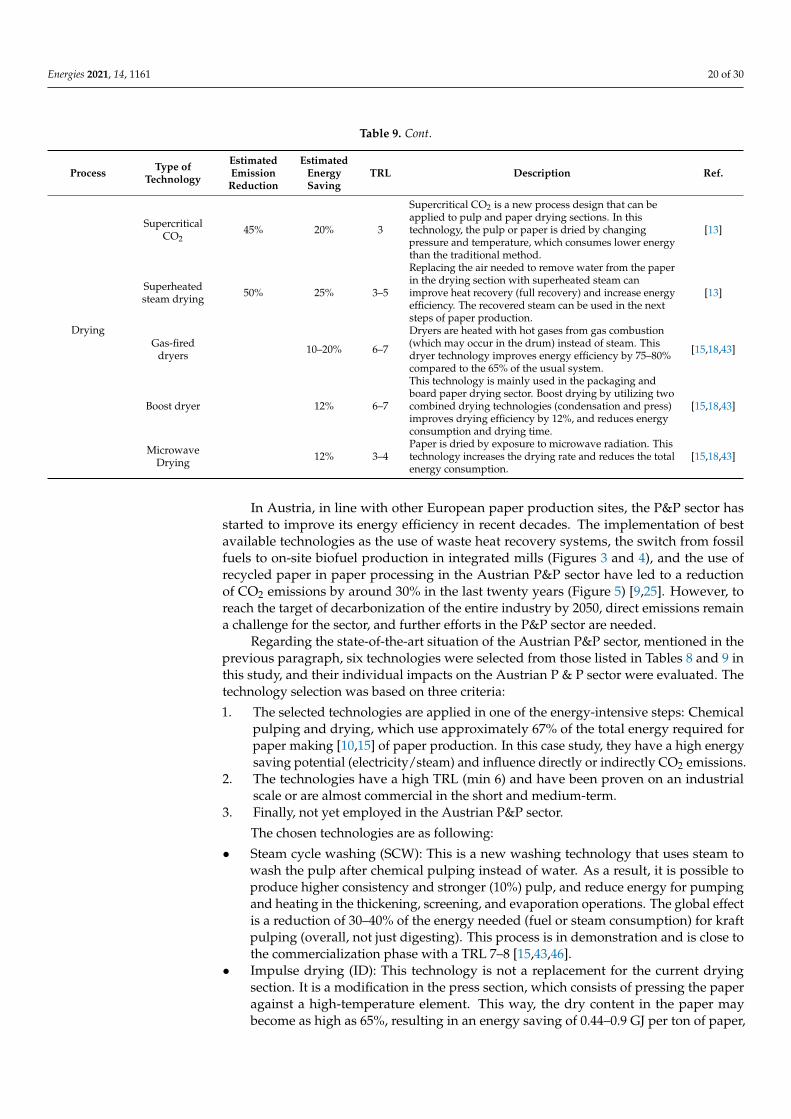
Table 9. Cont.
Process Type ofTechnology
EstimatedEmission
Reduction
EstimatedEnergySaving
TRL Description Ref.
Drying
SupercriticalCO2
45% 20% 3
Supercritical CO2 is a new process design that can beapplied to pulp and paper drying sections. In thistechnology, the pulp or paper is dried by changingpressure and temperature, which consumes lower energythan the traditional method.
[13]
Superheatedsteam drying 50% 25% 3–5
Replacing the air needed to remove water from the paperin the drying section with superheated steam canimprove heat recovery (full recovery) and increase energyefficiency. The recovered steam can be used in the nextsteps of paper production.
[13]
Gas-fireddryers 10–20% 6–7
Dryers are heated with hot gases from gas combustion(which may occur in the drum) instead of steam. Thisdryer technology improves energy efficiency by 75–80%compared to the 65% of the usual system.
[15,18,43]
Boost dryer 12% 6–7
This technology is mainly used in the packaging andboard paper drying sector. Boost drying by utilizing twocombined drying technologies (condensation and press)improves drying efficiency by 12%, and reduces energyconsumption and drying time.
[15,18,43]
MicrowaveDrying 12% 3–4
Paper is dried by exposure to microwave radiation. Thistechnology increases the drying rate and reduces the totalenergy consumption.
[15,18,43]
In Austria, in line with other European paper production sites, the P&P sector hasstarted to improve its energy efficiency in recent decades. The implementation of bestavailable technologies as the use of waste heat recovery systems, the switch from fossilfuels to on-site biofuel production in integrated mills (Figures 3 and 4), and the use ofrecycled paper in paper processing in the Austrian P&P sector have led to a reductionof CO2 emissions by around 30% in the last twenty years (Figure 5) [9,25]. However, toreach the target of decarbonization of the entire industry by 2050, direct emissions remaina challenge for the sector, and further efforts in the P&P sector are needed.
Regarding the state-of-the-art situation of the Austrian P&P sector, mentioned in theprevious paragraph, six technologies were selected from those listed in Tables 8 and 9 inthis study, and their individual impacts on the Austrian P & P sector were evaluated. Thetechnology selection was based on three criteria:
1. The selected technologies are applied in one of the energy-intensive steps: Chemicalpulping and drying, which use approximately 67% of the total energy required forpaper making [10,15] of paper production. In this case study, they have a high energysaving potential (electricity/steam) and influence directly or indirectly CO2 emissions.
2. The technologies have a high TRL (min 6) and have been proven on an industrialscale or are almost commercial in the short and medium-term.
3. Finally, not yet employed in the Austrian P&P sector.
The chosen technologies are as following:
• Steam cycle washing (SCW): This is a new washing technology that uses steam towash the pulp after chemical pulping instead of water. As a result, it is possible toproduce higher consistency and stronger (10%) pulp, and reduce energy for pumpingand heating in the thickening, screening, and evaporation operations. The global effectis a reduction of 30–40% of the energy needed (fuel or steam consumption) for kraftpulping (overall, not just digesting). This process is in demonstration and is close tothe commercialization phase with a TRL 7–8 [15,43,46].
• Impulse drying (ID): This technology is not a replacement for the current dryingsection. It is a modification in the press section, which consists of pressing the paperagainst a high-temperature element. This way, the dry content in the paper maybecome as high as 65%, resulting in an energy saving of 0.44–0.9 GJ per ton of paper,
Energies 2021, 14, 1161 21 of 30
corresponding to 10–25% energy (steam) consumption reduction in papermaking.This technology is in the demonstration phase with TRL 7 [15,43,47].
• Condebelt drying (CD): This is a replacement of the current drying section, in whichthe paper web is dried in a drying chamber between two steel belts instead of ontraditional steam-heated cylinders, achieving higher dryer rates and efficiency. Thisdryer improves fiber properties such as strength (20–60% increasing), smooth surface,dimensional stability, and moisture resistance. With Condebelt drying, the samestrength values can be achieved with recycled fibers as with fresh fibers in conventionaldrying. The CD reduces energy consumption by 15% (1.6 GJ steam per ton of paperand 20 kWh electricity per ton of paper). This technology is in the demonstrationphase with TRL 7–8 [15,43,47].
• Gas-fired dryers (GFD): Gas-fired dryers are an alternative to the current dryingdrums heating by steam, in which the same method is applied but the drums areheated by combustion inside the drum. This process has a much higher efficiency(energy efficiency increase from 60–65% in steam-operated, compared to 75–80% ingas-operated), and higher temperatures are achieved, resulting in higher drying ratesand a faster process. This method reduces the drying energy consumption by 10–20%and increases the production rate by up to 20%. The technology is still in the pilotstage with TRL 6–7, and has low CAPEX since it is an adaptation of the technologyused today [15,43,48].
• Dry sheet forming (DSF): A new method of forming which results in large reductionsof drying energy. In this method, the paper is formed without the addition of waterto the pulp. The sheet is supported by an air jet and a solution of resigns is sprayedon the surface to help to form the paper sheet. This forming method is only suitablefor tissue or hygienic paper since the surface smoothness decreases and the thicknesshas higher variations, but the resulting paper is soft. It is estimated that by usingthis technology, 50% of the drying energy requirement (fuel used for heat production)can be saved, but the electricity consumption may increase 150 to 250 kWh per tonof paper in an air-layered system to maintain the airflow and motor drive for theequipment. This technology is semi-commercial for the production of special productsand will be further developed in the near future for the production of standard papergrades. The TRL of this technology is near 7 [15,43,47].
• Direct electric heating (DEH): DEH can contribute to the electrification of the steamsupply of the P&P industry by replacing fossil fuels (especially natural gas) withelectric boilers with an efficiency of 90%. Since electric boilers exist and are com-mercially available, this technology can be easily installed in P&P mills. Since theenergy demand for paper production by applying this technology is the same withcurrent production processing (and only fossil fuels are replaced by electricity), thefeasibility of this option strongly depends on the power grid capacity to achieve sucha high load increase without increasing the use of fossil fuels. The generation of aCO2-free electricity grid would lead to complete decarbonization of the P&P sector byelectrification options [41,45,49].
The abovementioned technologies are applied as single technologies (no technologycombination) in the relevant paper grades shown in Table 6. Steam cycle washing, impulsedrying, Condebelt drying, and direct electric heating are used in integrated writing papermills and gas-fired dryer, and dry sheet forming in the non-integrated writing paper andintegrated tissue paper mills. The effects of every single technology on the individual papergrade were analyzed using the developed model. The specific energy (heat and electricity)consumption and specific CO2 emissions of paper grade utilizing the technology werecompared with the current situation of the selected paper grade, shown in Figure 7.
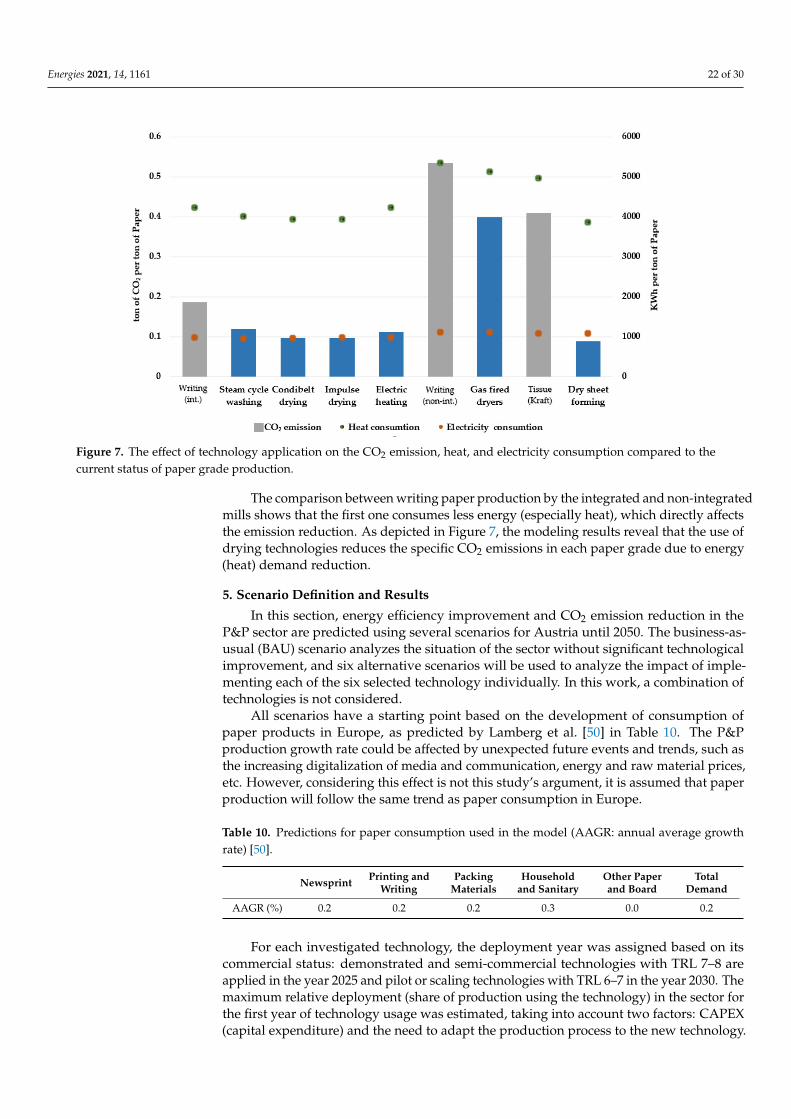
Energies 2021, 14, 1161 22 of 30
Energies 2021, 14, x FOR PEER REVIEW 21 of 29
available, this technology can be easily installed in P&P mills. Since the energy de-mand for paper production by applying this technology is the same with current pro-duction processing (and only fossil fuels are replaced by electricity), the feasibility of this option strongly depends on the power grid capacity to achieve such a high load increase without increasing the use of fossil fuels. The generation of a CO2-free elec-tricity grid would lead to complete decarbonization of the P&P sector by electrifica-tion options [40,44,48]. The abovementioned technologies are applied as single technologies (no technology
combination) in the relevant paper grades shown in Table 6. Steam cycle washing, impulse drying, Condebelt drying, and direct electric heating are used in integrated writing paper mills and gas-fired dryer, and dry sheet forming in the non-integrated writing paper and integrated tissue paper mills. The effects of every single technology on the individual pa-per grade were analyzed using the developed model. The specific energy (heat and elec-tricity) consumption and specific CO2 emissions of paper grade utilizing the technology were compared with the current situation of the selected paper grade, shown in Figure 7.
Figure 7. The effect of technology application on the CO2 emission, heat, and electricity consumption compared to the current status of paper grade production.
The comparison between writing paper production by the integrated and non-inte-grated mills shows that the first one consumes less energy (especially heat), which directly affects the emission reduction. As depicted in Figure 7, the modeling results reveal that the use of drying technologies reduces the specific CO2 emissions in each paper grade due to energy (heat) demand reduction.
5. Scenario Definition and Results In this section, energy efficiency improvement and CO2 emission reduction in the
P&P sector are predicted using several scenarios for Austria until 2050. The business-as-usual (BAU) scenario analyzes the situation of the sector without significant technological improvement, and six alternative scenarios will be used to analyze the impact of imple-menting each of the six selected technology individually. In this work, a combination of technologies is not considered.
All scenarios have a starting point based on the development of consumption of pa-per products in Europe, as predicted by Lamberg et al. [49] in Table 10. The P&P produc-tion growth rate could be affected by unexpected future events and trends, such as the increasing digitalization of media and communication, energy and raw material prices,
Figure 7. The effect of technology application on the CO2 emission, heat, and electricity consumption compared to thecurrent status of paper grade production.
The comparison between writing paper production by the integrated and non-integratedmills shows that the first one consumes less energy (especially heat), which directly affectsthe emission reduction. As depicted in Figure 7, the modeling results reveal that the use ofdrying technologies reduces the specific CO2 emissions in each paper grade due to energy(heat) demand reduction.
5. Scenario Definition and Results
In this section, energy efficiency improvement and CO2 emission reduction in theP&P sector are predicted using several scenarios for Austria until 2050. The business-as-usual (BAU) scenario analyzes the situation of the sector without significant technologicalimprovement, and six alternative scenarios will be used to analyze the impact of imple-menting each of the six selected technology individually. In this work, a combination oftechnologies is not considered.
All scenarios have a starting point based on the development of consumption ofpaper products in Europe, as predicted by Lamberg et al. [50] in Table 10. The P&Pproduction growth rate could be affected by unexpected future events and trends, such asthe increasing digitalization of media and communication, energy and raw material prices,etc. However, considering this effect is not this study’s argument, it is assumed that paperproduction will follow the same trend as paper consumption in Europe.
Table 10. Predictions for paper consumption used in the model (AAGR: annual average growthrate) [50].
Newsprint Printing andWriting
PackingMaterials
Householdand Sanitary
Other Paperand Board
TotalDemand
AAGR (%) 0.2 0.2 0.2 0.3 0.0 0.2
For each investigated technology, the deployment year was assigned based on itscommercial status: demonstrated and semi-commercial technologies with TRL 7–8 areapplied in the year 2025 and pilot or scaling technologies with TRL 6–7 in the year 2030. Themaximum relative deployment (share of production using the technology) in the sector forthe first year of technology usage was estimated, taking into account two factors: CAPEX(capital expenditure) and the need to adapt the production process to the new technology.
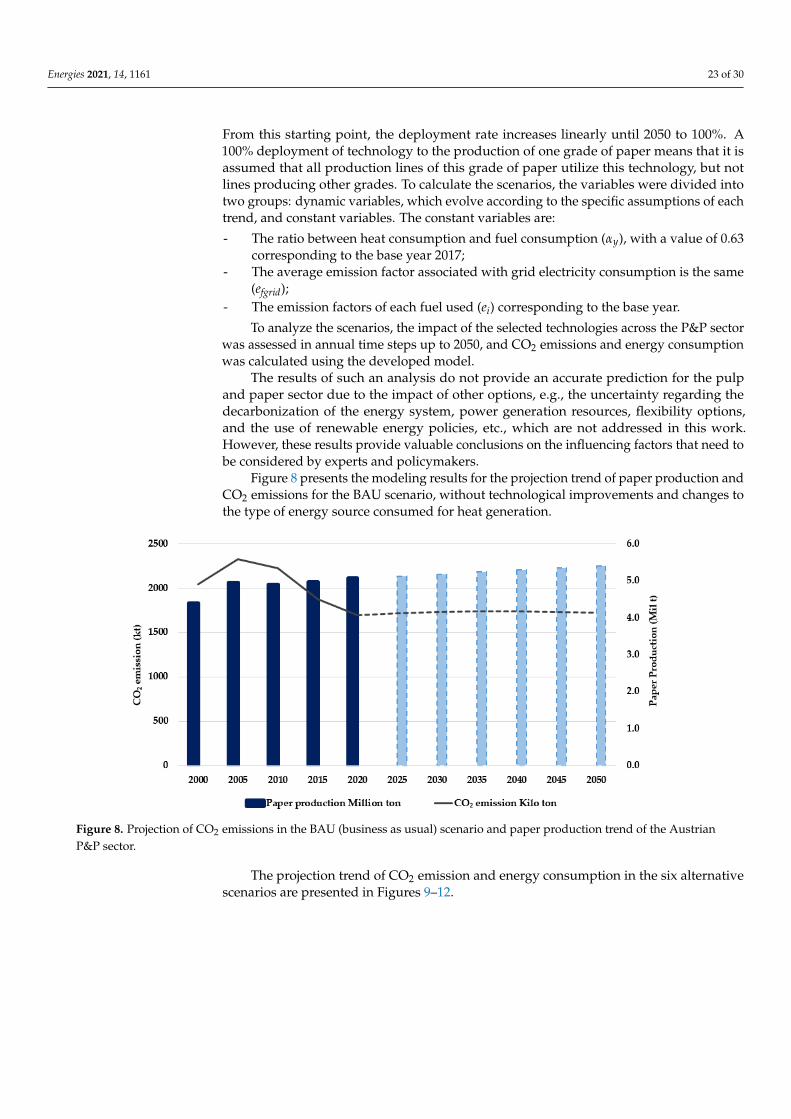
Energies 2021, 14, 1161 23 of 30
From this starting point, the deployment rate increases linearly until 2050 to 100%. A100% deployment of technology to the production of one grade of paper means that it isassumed that all production lines of this grade of paper utilize this technology, but notlines producing other grades. To calculate the scenarios, the variables were divided intotwo groups: dynamic variables, which evolve according to the specific assumptions of eachtrend, and constant variables. The constant variables are:
- The ratio between heat consumption and fuel consumption (αy), with a value of 0.63corresponding to the base year 2017;
- The average emission factor associated with grid electricity consumption is the same(efgrid);
- The emission factors of each fuel used (ei) corresponding to the base year.
To analyze the scenarios, the impact of the selected technologies across the P&P sectorwas assessed in annual time steps up to 2050, and CO2 emissions and energy consumptionwas calculated using the developed model.
The results of such an analysis do not provide an accurate prediction for the pulpand paper sector due to the impact of other options, e.g., the uncertainty regarding thedecarbonization of the energy system, power generation resources, flexibility options,and the use of renewable energy policies, etc., which are not addressed in this work.However, these results provide valuable conclusions on the influencing factors that need tobe considered by experts and policymakers.
Figure 8 presents the modeling results for the projection trend of paper production andCO2 emissions for the BAU scenario, without technological improvements and changes tothe type of energy source consumed for heat generation.Energies 2021, 14, x FOR PEER REVIEW 23 of 29
Figure 8. Projection of CO2 emissions in the BAU (business as usual) scenario and paper produc-tion trend of the Austrian P&P sector.
The projection trend of CO2 emission and energy consumption in the six alternative scenarios are presented in Figures 9–11.
Figure 9. Projection of energy consumption in alternative scenarios compared to the BAU scenario.
Figure 8. Projection of CO2 emissions in the BAU (business as usual) scenario and paper production trend of the AustrianP&P sector.
The projection trend of CO2 emission and energy consumption in the six alternativescenarios are presented in Figures 9–12.
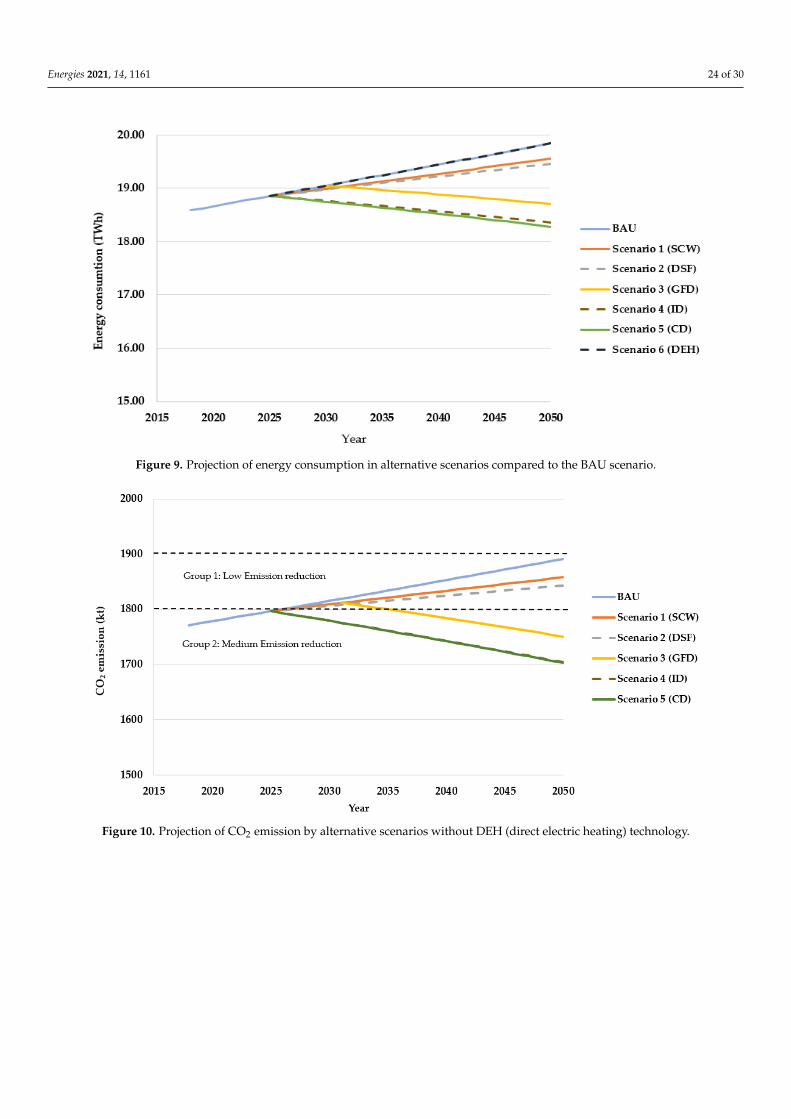
Energies 2021, 14, 1161 24 of 30
Energies 2021, 14, x FOR PEER REVIEW 23 of 29
Figure 8. Projection of CO2 emissions in the BAU (business as usual) scenario and paper produc-tion trend of the Austrian P&P sector.
The projection trend of CO2 emission and energy consumption in the six alternative scenarios are presented in Figures 9–11.
Figure 9. Projection of energy consumption in alternative scenarios compared to the BAU scenario.
Figure 9. Projection of energy consumption in alternative scenarios compared to the BAU scenario.Energies 2021, 14, x FOR PEER REVIEW 24 of 29
Figure 10. Projection of CO2 emission by alternative scenarios without DEH (direct electric heating) technology.
Figure 11. Projection of CO2 emission by alternative scenarios with DEH technology.
Figure 10. Projection of CO2 emission by alternative scenarios without DEH (direct electric heating) technology.
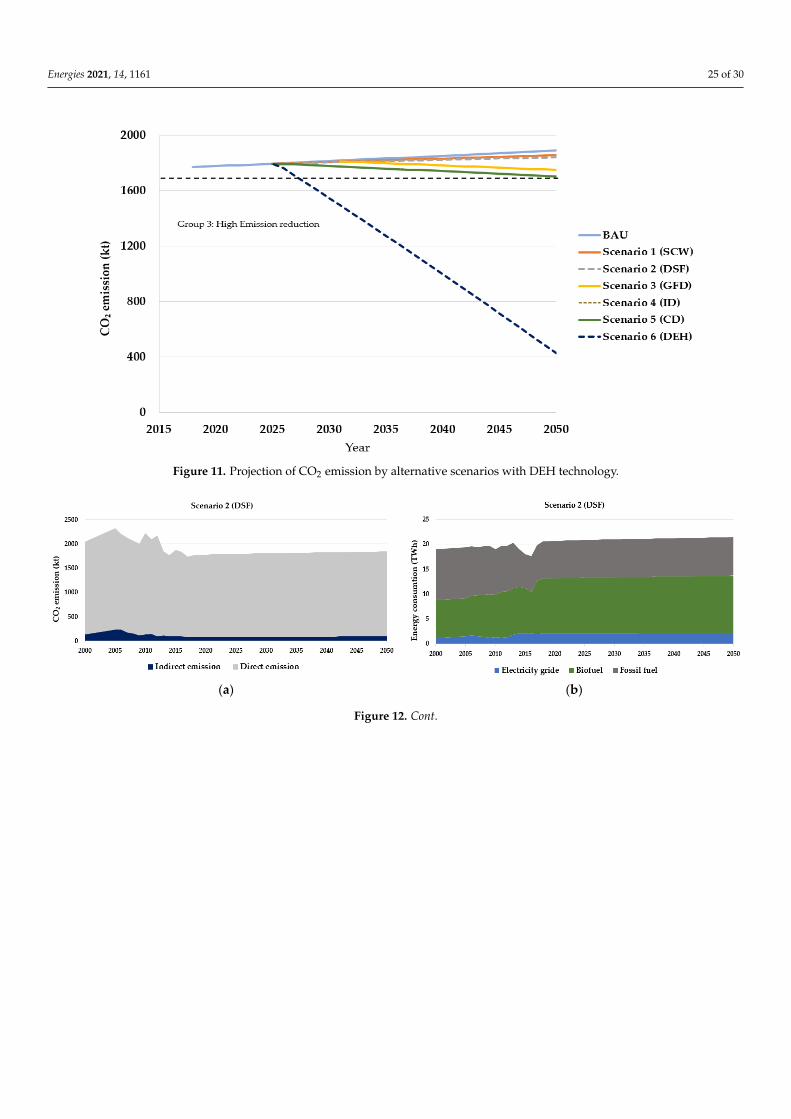
Energies 2021, 14, 1161 25 of 30
Energies 2021, 14, x FOR PEER REVIEW 24 of 29
Figure 10. Projection of CO2 emission by alternative scenarios without DEH (direct electric heating) technology.
Figure 11. Projection of CO2 emission by alternative scenarios with DEH technology.
Figure 11. Projection of CO2 emission by alternative scenarios with DEH technology.
Energies 2021, 14, x FOR PEER REVIEW 24 of 29
Figure 10. Projection of CO2 emission by alternative scenarios without DEH (direct electric heating) technology.
Figure 11. Projection of CO2 emission by alternative scenarios with DEH technology.
(a) (b)
Figure 12. Cont.
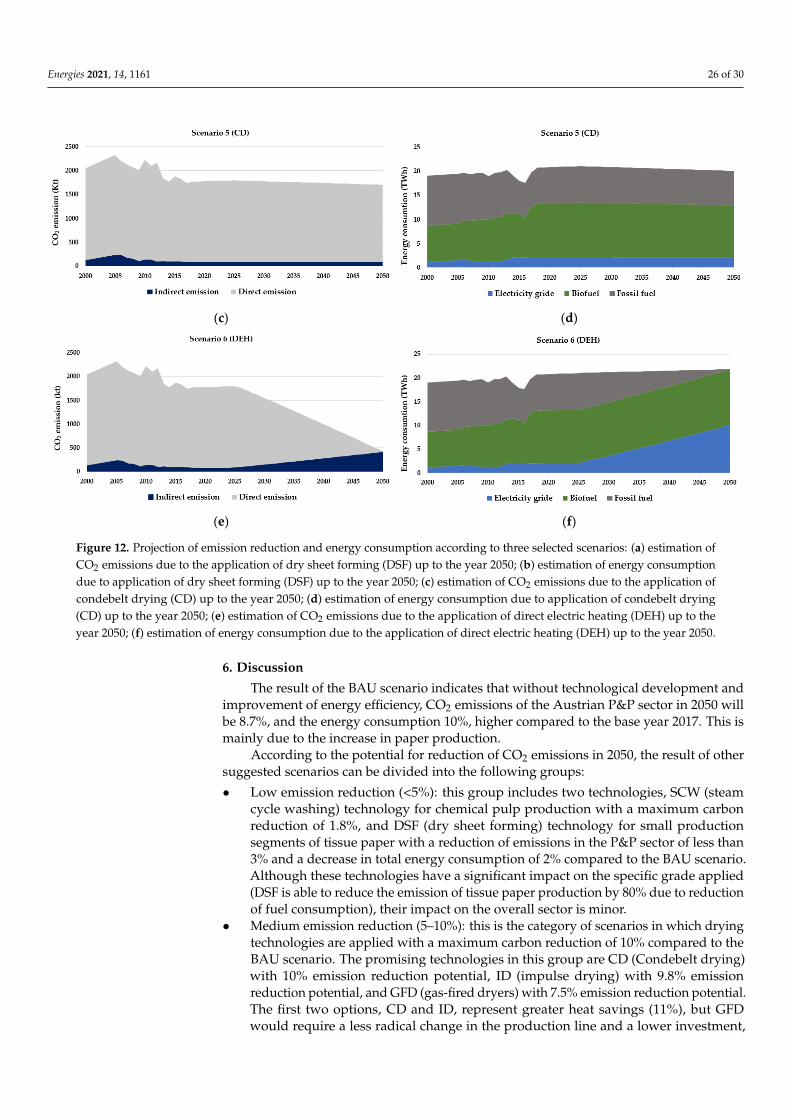
Energies 2021, 14, 1161 26 of 30Energies 2021, 14, x FOR PEER REVIEW 25 of 29
(a) (b)
(c) (d)
(e) (f)
Figure 12. Projection of emission reduction and energy consumption according to three selected scenarios: (a) estimation of CO2 emissions due to the application of dry sheet forming (DSF) up to the year 2050; (b) estimation of energy consump-tion due to application of dry sheet forming (DSF) up to the year 2050; (c) estimation of CO2 emissions due to the applica-tion of condebelt drying (CD) up to the year 2050; (d) estimation of energy consumption due to application of condebelt drying (CD) up to the year 2050; (e) estimation of CO2 emissions due to the application of direct electric heating (DEH) up to the year 2050; (f) estimation of energy consumption due to the application of direct electric heating (DEH) up to the year 2050.
6. Discussion The result of the BAU scenario indicates that without technological development and
improvement of energy efficiency, CO2 emissions of the Austrian P&P sector in 2050 will be 8.7%, and the energy consumption 10%, higher compared to the base year 2017. This is mainly due to the increase in paper production.
According to the potential for reduction of CO2 emissions in 2050, the result of other suggested scenarios can be divided into the following groups: • Low emission reduction (<5%): this group includes two technologies, SCW (steam
cycle washing) technology for chemical pulp production with a maximum carbon reduction of 1.8%, and DSF (dry sheet forming) technology for small production seg-ments of tissue paper with a reduction of emissions in the P&P sector of less than 3% and a decrease in total energy consumption of 2% compared to the BAU scenario. Although these technologies have a significant impact on the specific grade applied (DSF is able to reduce the emission of tissue paper production by 80% due to reduc-tion of fuel consumption), their impact on the overall sector is minor.
• Medium emission reduction (5–10%): this is the category of scenarios in which drying technologies are applied with a maximum carbon reduction of 10% compared to the BAU scenario. The promising technologies in this group are CD (Condebelt drying) with 10% emission reduction potential, ID (impulse drying) with 9.8% emission re-duction potential, and GFD (gas-fired dryers) with 7.5% emission reduction poten-tial. The first two options, CD and ID, represent greater heat savings (11%), but GFD would require a less radical change in the production line and a lower investment,
Figure 12. Projection of emission reduction and energy consumption according to three selected scenarios: (a) estimation ofCO2 emissions due to the application of dry sheet forming (DSF) up to the year 2050; (b) estimation of energy consumptiondue to application of dry sheet forming (DSF) up to the year 2050; (c) estimation of CO2 emissions due to the application ofcondebelt drying (CD) up to the year 2050; (d) estimation of energy consumption due to application of condebelt drying(CD) up to the year 2050; (e) estimation of CO2 emissions due to the application of direct electric heating (DEH) up to theyear 2050; (f) estimation of energy consumption due to the application of direct electric heating (DEH) up to the year 2050.
6. Discussion
The result of the BAU scenario indicates that without technological development andimprovement of energy efficiency, CO2 emissions of the Austrian P&P sector in 2050 willbe 8.7%, and the energy consumption 10%, higher compared to the base year 2017. This ismainly due to the increase in paper production.
According to the potential for reduction of CO2 emissions in 2050, the result of othersuggested scenarios can be divided into the following groups:
• Low emission reduction (<5%): this group includes two technologies, SCW (steamcycle washing) technology for chemical pulp production with a maximum carbonreduction of 1.8%, and DSF (dry sheet forming) technology for small productionsegments of tissue paper with a reduction of emissions in the P&P sector of less than3% and a decrease in total energy consumption of 2% compared to the BAU scenario.Although these technologies have a significant impact on the specific grade applied(DSF is able to reduce the emission of tissue paper production by 80% due to reductionof fuel consumption), their impact on the overall sector is minor.
• Medium emission reduction (5–10%): this is the category of scenarios in which dryingtechnologies are applied with a maximum carbon reduction of 10% compared to theBAU scenario. The promising technologies in this group are CD (Condebelt drying)with 10% emission reduction potential, ID (impulse drying) with 9.8% emissionreduction potential, and GFD (gas-fired dryers) with 7.5% emission reduction potential.The first two options, CD and ID, represent greater heat savings (11%), but GFDwould require a less radical change in the production line and a lower investment,
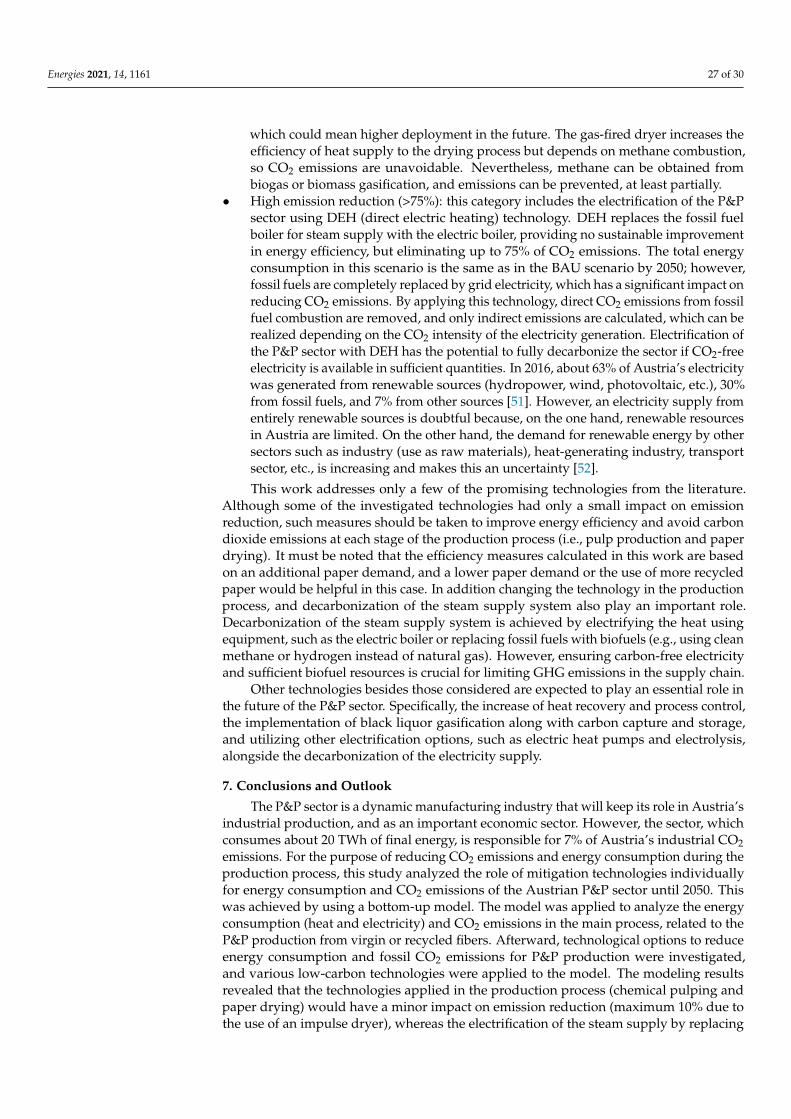
Energies 2021, 14, 1161 27 of 30
which could mean higher deployment in the future. The gas-fired dryer increases theefficiency of heat supply to the drying process but depends on methane combustion,so CO2 emissions are unavoidable. Nevertheless, methane can be obtained frombiogas or biomass gasification, and emissions can be prevented, at least partially.
• High emission reduction (>75%): this category includes the electrification of the P&Psector using DEH (direct electric heating) technology. DEH replaces the fossil fuelboiler for steam supply with the electric boiler, providing no sustainable improvementin energy efficiency, but eliminating up to 75% of CO2 emissions. The total energyconsumption in this scenario is the same as in the BAU scenario by 2050; however,fossil fuels are completely replaced by grid electricity, which has a significant impact onreducing CO2 emissions. By applying this technology, direct CO2 emissions from fossilfuel combustion are removed, and only indirect emissions are calculated, which can berealized depending on the CO2 intensity of the electricity generation. Electrification ofthe P&P sector with DEH has the potential to fully decarbonize the sector if CO2-freeelectricity is available in sufficient quantities. In 2016, about 63% of Austria’s electricitywas generated from renewable sources (hydropower, wind, photovoltaic, etc.), 30%from fossil fuels, and 7% from other sources [51]. However, an electricity supply fromentirely renewable sources is doubtful because, on the one hand, renewable resourcesin Austria are limited. On the other hand, the demand for renewable energy by othersectors such as industry (use as raw materials), heat-generating industry, transportsector, etc., is increasing and makes this an uncertainty [52].
This work addresses only a few of the promising technologies from the literature.Although some of the investigated technologies had only a small impact on emissionreduction, such measures should be taken to improve energy efficiency and avoid carbondioxide emissions at each stage of the production process (i.e., pulp production and paperdrying). It must be noted that the efficiency measures calculated in this work are basedon an additional paper demand, and a lower paper demand or the use of more recycledpaper would be helpful in this case. In addition changing the technology in the productionprocess, and decarbonization of the steam supply system also play an important role.Decarbonization of the steam supply system is achieved by electrifying the heat usingequipment, such as the electric boiler or replacing fossil fuels with biofuels (e.g., using cleanmethane or hydrogen instead of natural gas). However, ensuring carbon-free electricityand sufficient biofuel resources is crucial for limiting GHG emissions in the supply chain.
Other technologies besides those considered are expected to play an essential role inthe future of the P&P sector. Specifically, the increase of heat recovery and process control,the implementation of black liquor gasification along with carbon capture and storage,and utilizing other electrification options, such as electric heat pumps and electrolysis,alongside the decarbonization of the electricity supply.
7. Conclusions and Outlook
The P&P sector is a dynamic manufacturing industry that will keep its role in Austria’sindustrial production, and as an important economic sector. However, the sector, whichconsumes about 20 TWh of final energy, is responsible for 7% of Austria’s industrial CO2emissions. For the purpose of reducing CO2 emissions and energy consumption during theproduction process, this study analyzed the role of mitigation technologies individuallyfor energy consumption and CO2 emissions of the Austrian P&P sector until 2050. Thiswas achieved by using a bottom-up model. The model was applied to analyze the energyconsumption (heat and electricity) and CO2 emissions in the main process, related to theP&P production from virgin or recycled fibers. Afterward, technological options to reduceenergy consumption and fossil CO2 emissions for P&P production were investigated,and various low-carbon technologies were applied to the model. The modeling resultsrevealed that the technologies applied in the production process (chemical pulping andpaper drying) would have a minor impact on emission reduction (maximum 10% due tothe use of an impulse dryer), whereas the electrification of the steam supply by replacing

Energies 2021, 14, 1161 28 of 30
fossil fuel boilers with a direct heat supply (such as commercial electric boiler) wouldenable reducing emissions by up to 75%. This means that the goal of 100% CO2 emissionreduction by 2050 cannot be reached with a single method alone. Therefore, the followingpoints appear to be essential, and should be taken into account in the future:
• Selecting a combination of technologies, particularly with the electrification of thesteam supply, along with the use of carbon-free electricity generated by renewableenergy.
• Close cooperation with stakeholders to select the most promising decarbonizationoptions.
• Consideration of industry sectors coupling to explore the possibility of using wasteheat and biofuel generated in nearby industries.
Author Contributions: Conceptualization, designed the research, and developed the method M.R.M.and M.S.S.; methodology, M.R.M.; software, M.S.S. and M.R.M.; writing—original draft preparation,M.R.M.; review and editing, T.K. All authors have read and agreed to the published version of themanuscript.
Funding: This work was carried out as part of the NEFI_Lab project. The NEFI_Lab project issupported with the funds from the Climate and Energy Fund and implemented in the framework ofthe RTI-initiative “Flagship region Energy”.
Acknowledgments: We are grateful to Tânia Alexandra Dos Santos Costa e Sousa for her helpfulcomments and suggestions.
Conflicts of Interest: The authors declare no conflict of interest.
References1. European Commission. EU Climate Action. Available online: https://ec.europa.eu/clima/citizens/eu_en (accessed on 30
August 2018).2. Eurostat. How Are Emissions of Greenhouse Gases by the EU Evolving? Available online: https://ec.europa.eu/eurostat/cache/
infographs/energy/bloc-4a.html (accessed on 15 December 2020).3. Annual European Union Greenhouse Gas Inventory 1990–2017 and Inventory Report 2019; Submission under the United Nations
Framework Convention on Climate Change and the Kyoto Protocol; European Environment Agency: Copenhagen, Denmark,2019.
4. Austria’s National Inventory Report 2019; Submission under the United Nations Framework Convention on Climate Change andunder the Kyoto Protocol. REP-0677; Umweltbundesamt GmbH: Vienna, Austria, 2019; ISBN 978-3-99004-496-4.
5. Statistik Austria. Nutzenergieanalyse (NEA) 2018. Available online: https://www.statistik.at/web_de/statistiken/energie_umwelt-innovation_mobilitaet/energie_und_umwelt//energie/nutzenergieanalyse/index.html (accessed on 20 October 2020).
6. Statista. Umsatz der Österreichischen Papierindustrie von 1990 bis 2018 (in Millionen Euro). Available online: https://de.statista.com/statistik/daten/studie/899174/umfrage/umsatz-der-oesterreichischen-papierindustrie/ (accessed on 9 December 2019).
7. Statista. Bruttoinlandsprodukt (BIP) von Österreich von 2008 bis 2018 (in Milliarden Euro). Available online: https://de.statista.com/statistik/daten/studie/14390/umfrage/bruttoinlandsprodukt-in-oesterreich/ (accessed on 9 December 2019).
8. European Environment Agency. EEA Greenhouse Gas—Data Viewer. Available online: https://www.eea.europa.eu/data-and-maps/data/data-viewers/greenhouse-gases-viewer (accessed on 20 November 2020).
9. Austropapier. Papier aus Österreich 2017/18: Annual Report. 2018. Available online: https://austropapier.at/en/service-presse-publikationen (accessed on 15 August 2020).
10. Moya, J.A.; Pavel, C.C. Energy Efficiency and GHG Emissions: Prospective Scenarios for the Pulp and Paper Industry; 29280 EN;Publications Office of the European Union: Luxembourg, 2018. [CrossRef]
11. Fleiter, T.; Fehrenbach, D.; Worrell, E.; Eichhammer, W. Energy efficiency in the German pulp and paper industry—A model-basedassessment of saving potentials. Energy 2012, 40, 84–99. [CrossRef]
12. Griffin, P.W.; Hammond, G.P.; Norman, J.B. Inductrial decarbonisation of the Pulp and Paper sector: A UK perspective. Appl.Therm. Eng. 2018, 134, 152–162. [CrossRef]
13. Cepi. The Two Team Project; Confederation of European Paper Industries: Brussels, Belgium, 2013.14. FAO Statistics. Forest Products 2018; Food and Agriculture Organization of the United Nations: Rome, Italy, 2018; ISBN
978-92-5-133127-9.15. Bajpai, P. Pulp and Paper Industry: Energy Conservation; Elsevier: Amsterdam, The Netherlands, 2016; ISBN 978-0-12-803411-8.16. Chan, Y.; Kantamaneni, R. Study on Energy Efficiency and Energy Saving Potential in Industry from possible Policy Mechanisms; Contract
No. ENER/C3/2012-439/S12.666002; ICF Consulting Limited: London, UK, 2015.

Energies 2021, 14, 1161 29 of 30
17. Suhr, M.; Klein, G.; Kourti, I.; Gonzalo, M.R.; Santonja, G.G.; Roudier, S.; Sancho, L.D. Best Available Techniques (BAT) ReferenceDocument for the Production of Pulp, Paper and Board. Industrial Emissions Directive 2010/75/EU Integrated Pollution Prevention andControl; Publications Office of the European Union: Luxembourg, 2015; ISBN 978-92-79-48167-3.
18. Kong, L.; Hasanbeigi, A.; Price, L. Emerging Energy-Efficiency and Greenhouse Gas Mitigation Technologies for the Pulp and PaperIndustry; Lawrence Berkeley National Laboratory: Berkeley, CA, USA, 2012.
19. Kramer, K.J.; Masanet, E.; Xu, T.; Worrell, E. Energy Efficiency Improvement and Cost Saving Opportunities for the Pulp and PaperIndustry. An ENERGY STAR®Guide for Energy and Plant Managers; Energy Star: Berkeley, CA, USA, 2009.
20. Francis, D.W.; Towers, M.T.; Browne, T.C. Energy Cost Reduction in the Pulp and Paper Industry—An Energy Bench-Marking Perspective;Natural Resources Canada: Ottawa, ON, Canada, 2002; ISBN 0-662-66163-X.
21. U.S. Department of Energy. Energy and Environmental Profile of the U.S. Pulp and Paper Industry; DOE: Washington, DC, USA, 2005.22. Ecofys; Fraunhofer Institut; Öko-Institut. Methodology for the Free Allocation of Emission Allowances in the EU ETS Post 2012. Sector
Report for the Pulp and Paper Industry; European Commission: Berlin, Germany, 2009.23. Bajpai, P. Basic Overview of Pulp and Paper Manufacturing Process. In Green Chemistry and Sustainability in Pulp and Paper
Industry; Springer International Publishing: Cham, Switzerland, 2015; pp. 11–39.24. Cepi. Key Statistics 2017: European Pulp & Paper Industry 2017. Available online: https://www.cepi.org/key-statistics-report-
2017/ (accessed on 25 August 2020).25. Austropapier. Papier aus Österreich 2018/19. Annual Report, 2019. Available online: www.austropapier.at/mediacenter/
downloads/ (accessed on 20 November 2020).26. Statistik Austria. End Energy Verbraucht: Nutzenergieanalyse (NEA). Available online: https://www.statistik.at/web_de/
statistiken/energie_umwelt_innovation_mobilitaet/energie_und_umwelt/energie/nutzenergieanalyse/index.html (accessed on30 November 2020).
27. Posch, A.; Brudermann, T.; Braschel, N.; Gabriel, M. Strategic energy management in energy-intensive enter-prises: A quantitativeanalysis of relevant factors in the Austrian paper and pulp industry. J. Clean. Prod. 2015, 291–299. [CrossRef]
28. Statistik Austria. Produktion und Bauwesen: Gütereinsatzstatistik 2017—Verbrauch an Energie nach Ener-gieträger. Availableonline: https://www.statistik.at/web_de/statistiken/wirtschaft/produktion_und_bauwesen/guetereinsatzdaten/index.html(accessed on 30 November 2020).
29. Statistik Austria. Energiebilanzen für Österreich: Gesamtenergiebilanz Österreich 1970 bis; Statistik Austria: Vienna, Austria, 2018.30. Austropapier. Papier aus Österreich 2007: Annual Report. Available online: https://en.austropapier.at/fileadmin/austropapier.
at/dateiliste/Dokumente/Downloads/Jahresberichte/Jahresbericht_2007.pdf (accessed on 20 June 2020).31. Austropapier. Papier aus Österreich 2009: Annual Report. Available online: https://en.austropapier.at/fileadmin/austropapier.
at/dateiliste/Dokumente/Downloads/Jahresberichte/Jahresbericht_2009.pdf (accessed on 20 June 2020).32. Austropapier. Papier aus Österreich 2010: Annual Report. Available online: https://en.austropapier.at/fileadmin/austropapier.
at/dateiliste/Dokumente/Downloads/Jahresberichte/Jahresbericht_2010.pdf (accessed on 20 June 2020).33. Austropapier. Papier aus Österreich 2012: Annual Report. Available online: https://en.austropapier.at/fileadmin/austropapier.
at/dateiliste/Dokumente/Downloads/Jahresberichte/Jahresbericht_2012.pdf (accessed on 20 June 2020).34. Austropapier. Papier aus Österreich 2015/16: Annual Report. Available online: https://en.austropapier.at/media-centre/
downloads/ (accessed on 20 June 2020).35. The Intergovernmental Panel on Climate Change. 2006 IPCC Guidelines for National Greenhouse Gas Inventories. Available
online: https://www.ipcc.ch/report/2006-ipcc-guidelines-for-national-greenhouse-gas-inventories/ (accessed on 25 September2020).
36. Berndes, G.; Abt, B.; Asikainen, A.; Cowie, A.; Dale, V.; Egnell, G.; Lindner, M.; Marelli, L.; Paré, D.; Pingoud, K.; et al. Forestbiomass, carbon neutrality and climate change mitigation. Sci. Policy 2016, 1, 28.
37. Briggs, D.G. Forest Products Measurements and Conversion Factors. With Special Emphasis on the U.S. Pacific Northwest; College ofForest Resources, University of Washington: Seattle, WA, USA, 1994.
38. Anderl, M.; Gangl, M.; Haider, S.; Kampel, E.; Köther, T.; Lampert, C.; Matthews, B.; Pfaff, G.; Pinterits, M.; Poupa, S.; et al.Austria’s National Inventory Report 2018; Umweltbundesamt: Dessau-Roßlau, Germany, 2018.
39. IEA. Energy Balances of the World. Available online: https://www.iea.org/reports/world-energy-balances-overview (accessedon 22 August 2020).
40. European Commission. In-Depth Analysis in Support of the Commission Communication COM(2018). A Clean Planet for All—AEuropean Long-Term Strategic Vision for a Prosperous, Modern, Competitive and Climate Neutral Economy; European Commission:Brussels, Belgium, 2018.
41. Marsidi, M.; Rademaker, K.; Wetzels, W. Options for Decarbonising the Steam Supply of the Dutch Paper and Board Industry; TNO:Amsterdam, The Netherlands, 2018.
42. Rogers, J.G. Paper making in a low carbon economy. AIMS Energy 2018, 6, 187–202. [CrossRef]43. Kong, L.; Hasanbeigi, A.; Price, L. Assessment of emerging energy-efficiency technologies for the pulp and paper industry: A
technical review. J. Clean. Prod. 2016, 122, 5–28. [CrossRef]44. WSP Parsons Brinckerhoff. Industrial Decarbonisation & Energy Efficiency Roadmaps to 2050: Pulp and Paper; WSP Parsons
Brinckerhoff: New York, NY, USA, 2015.
Energies 2021, 14, 1161 30 of 30
45. Van Berkel, A. Raising Steam for Industry without Emitting CO2: Taking the C out of Steam; Lux Research Inc.: Boston, MA, USA,2018.
46. Muehlethaler, E.; Starkey, Y.; Salminen, R.; Harding, D. Steam Cycle Washer for Unbleached Pulp: (Final Report DE-FC36-04GO14304);DOE: Washington, DC, USA, 2008.
47. Martin, N.G.; Worrell, E.; Ruth, M.; E Price, L.; Elliott, R.; Shipley, A.; Thorne, J.H. Emerging Energy-Efficient Industrial Technologies;Lawrence Berkeley National Laboratory: Berkeley, CA, USA, 2000.
48. EPA. Available and Emerging Technologies for Reducing Greenhouse Gas Emissions from the Pulp and Paper Manufacturing Industry; U.S.Environmental Protection Agency: Washington, DC, USA, 2010.
49. Möllersten, K.; Gao, L.; Yan, J. CO2 Capture in Pulp and Paper Mills: CO2 Balances and Preliminary Cost Assessment. Mitig.Adapt. Strat. Glob. Chang. 2006, 11, 1129–1150. [CrossRef]
50. Lamberg, J.-A.; Ojala, J.; Peltoniemi, M.; Särkkä, T. The Evolution of Global Paper Industry 1800–2050. A Comparative Analysis;Springer: Dordrecht, The Netherlands, 2012; ISBN 978-94-007-5430-0.
51. Treibhausgasemissionen Von Strom. Empfehlungen zur Öko-Bilanzierung; Umweltbundesamt GmbH: Vienna, Austria, 2018; ISBN978-3-99004-472-8.
52. Sejkora, C.; Kianberger, T.; Moser, S.; Hofmann, R.; Haider, M.; Brunner, C. Renewables4Industry Abstimmung des Energiebedarfsvon Industriellen Anlagen und der Energieversorgung aus Fluktuierenden Erneuerbaren; Diskussionspapier (Endberichtsteil 2 von 3);Energieinstitut an der JKU Linz: Linz, Austria, 2018.