Two-Step Method Useful For Support of Technical Benchmarking Practice in the Automotive Market
13
-320- Inzinerine Ekonomika-Engineering Economics, 2014, 25(3), 320–332 Two-Step Method Useful For Support of Technical Benchmarking Practice in the Automotive Market Corrado lo Storto Department of Industrial Engineering, University of Naples Federico II Piazzale V. Tecchio, 80 - 80125 Napoli, Italy E-mail: [email protected] http://dx.doi.org/10.5755/j01.ee.25.3.2659 The aim of this paper is to present a two-step method useful for support of product benchmarking practice in the automotive industry by measuring a technical value of car model. This method assumes that a car is a bundle of objectively and subjectively measurable attributes (i.e. functional features) provided to users. The car’s technical value is thus a measure of the overall benefit it delivers to users, while the car’s technical efficiency measures a relative benefit the users gain when they utilize a particular car model charged by certain ownership and usage costs. Technical efficiency is calculated by implementing Data Envelopment Analysis (DEA). As an example, the method is implemented to conduct a retrospective benchmarking study in the Italian domestic passenger car market in the years 1970s-1990s. Results show that cars differed remarkably due to their technical efficiency, but only 35 car models in the sample have been classified by DEA as 100 % efficient. Car models sold in the 1980s resulted not so competitive in terms of technical efficiency as models sold in the 1970s and 1990s. The results also revealed that the technical value increases with the purchasing cost, but it diminishes with the usage cost. As additional value to literature and practice, the method suggests insights about how: a) to compare cars in a multi- dimension features space; b) to analyze technological trends in the car industry; c) to study the car market structure and identify the emergence of market niches still unexploited by automotive manufacturers. Keywords: data envelopment analysis, car, benchmarking, efficiency, product value, purchasing price, cost of usage. Introduction Since the mid of the last century, in all developed countries, automotive industry has played a leading role and become a core industry for the creation of wealth and growth of the economical systems. Automotive industry went through an intense transformation to meet the challenge that is coming from the market in terms of customers’ preferences, competition, need for manufacturing and development cost and time compression, environmental concerns, more pressing safety regulations, and opportunities offered by technology advancement (Calabrese, 2009). As a consequence, innovation in the automotive industry has acquired major significance, with an intensive effort of OEMs to develop new more performing car models, increase comfort and passengers safety, reduce manufacturing costs and fuel consumption, meet challenging environment needs, and a differentiated consumer demand (Goldberg, 1995; Klepper, 2002). In the last decades, due to this continuous pressure to innovate, increasing product complexity and rapid technology progress, the amount of R&D expenses that OEMs have to budget every year has achieved about 4.5% of total costs in their profit and loss statement, while about 5 % of the final market price of a car model accounts for R&D costs. Statistics also show that about 40% of total R&D expenses are absorbed by car models which are unable to achieve the targeted business revenue (Oliver Wyman Automotive, 2012). For these reasons, a sound technical or product benchmarking practice can be a valuable means that might assist car manufacturing companies to improve their innovative performance identifying trajectories for improving products and make them more competitive and appealing in the market (Griffin, 1997; Neely, 1999; Shetty, 1993). Product benchmarking is carried out in companies to compare the characteristics and performance of products they sell in the market with those of excellent competing companies with the aim to evaluate the state-of-the-art of the embodied technology, improve their design, manufacturing process, and marketing strategy and, finally, achieving competitive advantage (Lema & Price, 1995; Schumann, 1996). A major issue in the benchmarking analysis is identification of benchmark measurements, e.g. the standards of excellence against which to measure and compare product characteristics performance and carry on performance gap analysis (Bowman & Faulkner, 1994). Within the product development and manufacturing environment engineers and technical managers implement different approaches and adopt several tools that help collecting data and process information for product benchmarking purposes, i.e. Reverse Engineering, patent analysis and mapping, QFD, Taguchi DOEs, FMEA, DFMA, AHP (Bergquist & Abeysekera, 1996; Bradley & Guerrero, 2011; Hauser & Clausing, 1988; lo Storto, 2006; Nair, 1992; Tsui, 1992; Otto & Antonsson, 1993; Partovi, 1994; Samuelson & Scotchmer, 2002). However, many times collecting of data and implementing of benchmarking analysis may be a very costly and time consuming activity.
Transcript of Two-Step Method Useful For Support of Technical Benchmarking Practice in the Automotive Market

-320-
Inzinerine Ekonomika-Engineering Economics, 2014, 25(3), 320–332
Two-Step Method Useful For Support of Technical Benchmarking Practice in the
Automotive Market
Corrado lo Storto
Department of Industrial Engineering, University of Naples Federico II
Piazzale V. Tecchio, 80 - 80125 Napoli, Italy
E-mail: [email protected]
http://dx.doi.org/10.5755/j01.ee.25.3.2659
The aim of this paper is to present a two-step method useful for support of product benchmarking practice in the
automotive industry by measuring a technical value of car model. This method assumes that a car is a bundle of
objectively and subjectively measurable attributes (i.e. functional features) provided to users. The car’s technical value is
thus a measure of the overall benefit it delivers to users, while the car’s technical efficiency measures a relative benefit the
users gain when they utilize a particular car model charged by certain ownership and usage costs. Technical efficiency is
calculated by implementing Data Envelopment Analysis (DEA). As an example, the method is implemented to conduct a
retrospective benchmarking study in the Italian domestic passenger car market in the years 1970s-1990s. Results show
that cars differed remarkably due to their technical efficiency, but only 35 car models in the sample have been classified
by DEA as 100 % efficient. Car models sold in the 1980s resulted not so competitive in terms of technical efficiency as
models sold in the 1970s and 1990s. The results also revealed that the technical value increases with the purchasing cost,
but it diminishes with the usage cost.
As additional value to literature and practice, the method suggests insights about how: a) to compare cars in a multi-
dimension features space; b) to analyze technological trends in the car industry; c) to study the car market structure and
identify the emergence of market niches still unexploited by automotive manufacturers.
Keywords: data envelopment analysis, car, benchmarking, efficiency, product value, purchasing price, cost of usage.
Introduction
Since the mid of the last century, in all developed
countries, automotive industry has played a leading role
and become a core industry for the creation of wealth and
growth of the economical systems. Automotive industry
went through an intense transformation to meet the
challenge that is coming from the market in terms of
customers’ preferences, competition, need for
manufacturing and development cost and time
compression, environmental concerns, more pressing
safety regulations, and opportunities offered by technology
advancement (Calabrese, 2009). As a consequence,
innovation in the automotive industry has acquired major
significance, with an intensive effort of OEMs to develop
new more performing car models, increase comfort and
passengers safety, reduce manufacturing costs and fuel
consumption, meet challenging environment needs, and a
differentiated consumer demand (Goldberg, 1995; Klepper,
2002). In the last decades, due to this continuous pressure
to innovate, increasing product complexity and rapid
technology progress, the amount of R&D expenses that
OEMs have to budget every year has achieved about 4.5%
of total costs in their profit and loss statement, while about
5 % of the final market price of a car model accounts for
R&D costs. Statistics also show that about 40% of total
R&D expenses are absorbed by car models which are
unable to achieve the targeted business revenue (Oliver
Wyman Automotive, 2012). For these reasons, a sound
technical or product benchmarking practice can be a
valuable means that might assist car manufacturing
companies to improve their innovative performance
identifying trajectories for improving products and make
them more competitive and appealing in the market
(Griffin, 1997; Neely, 1999; Shetty, 1993). Product
benchmarking is carried out in companies to compare the
characteristics and performance of products they sell in the
market with those of excellent competing companies with
the aim to evaluate the state-of-the-art of the embodied
technology, improve their design, manufacturing process,
and marketing strategy and, finally, achieving competitive
advantage (Lema & Price, 1995; Schumann, 1996). A
major issue in the benchmarking analysis is identification
of benchmark measurements, e.g. the standards of
excellence against which to measure and compare product
characteristics performance and carry on performance gap
analysis (Bowman & Faulkner, 1994). Within the product
development and manufacturing environment engineers
and technical managers implement different approaches
and adopt several tools that help collecting data and
process information for product benchmarking purposes,
i.e. Reverse Engineering, patent analysis and mapping,
QFD, Taguchi DOEs, FMEA, DFMA, AHP (Bergquist &
Abeysekera, 1996; Bradley & Guerrero, 2011; Hauser &
Clausing, 1988; lo Storto, 2006; Nair, 1992; Tsui, 1992;
Otto & Antonsson, 1993; Partovi, 1994; Samuelson &
Scotchmer, 2002). However, many times collecting of data
and implementing of benchmarking analysis may be a very
costly and time consuming activity.
Corrado lo Storto. Two-Step Method Useful For Support of Technical Benchmarking Practice in the Automotive Market
- 321 -
The aim of this paper is to present a two-step method
that supports benchmarking practice in the automotive
industry in the preliminary phase of the development
process using data freely available and expert judgments.
This method measures technical value of a car model
and investigates how this is associated to some economic
variables, i.e. the purchasing price and cost of usage of the
car. Measuring the value that a product delivers to users
and investigating its determinants is of paramount
importance to design and sell in the market the products
that meet the consumers’ expectation (Maleki et al., 2013).
In the first step, the method implements Data
Envelopment Analysis (DEA) to calculate relative technical
efficiency of a car model (CTE) as a weighted benefit to
cost ratio where benefits are measured by a set of
functional features performance measurements (i.e., engine
performance, quality, etc.) and costs are the car purchasing
and usage costs. A sample of car models is used to
generate a benchmark for comparison. In the second step, a
regression analysis is run to investigate the existence of
any relationships between the technical value measure of
cars in the sample and the economic variables associated
to them, using CTE measure to split sample into
meaningful groups. The technical value is measured as a
function of the benefits provided by car. Henceforth, while
in the first step benchmarking takes into account single car
models, even though each one is compared to the others or
a reduced number of them, in the second step
benchmarking is aimed at investigating general trends.
In terms of additional value to literature and practice,
the suggested method provides useful insights as to: a) how
to compare cars in a multi-dimension features space; b)
how to compare cars in terms of the objective technical
value delivered to customers; c) how to analyze
technological trends in the car industry; d) how to study
the car market structure and identify the emergence of
market niches still unexploited by automotive
manufacturers. Moreover, this method is flexible and its
implementation can be easily extended to other industries
such as aircraft, computers and printers, household
appliances, cellular phones, etc.
This paper is organized as follows. After the
introductory issues in the first section, the second section
presents the general framework of the benchmarking
method and explains how variables are measured. In this
section, steps 1 and 2 of the method are illustrated, too.
The last two sections show the results relative to the
implementation of the method in the Italian domestic car
market in the years 1970s-1990s, and present some
concluding remarks.
The Method
A General Framework
In the method, a car is conceptualised as a set of
technological features that deliver measurable
functionalities to the users. Technological features relate to
what a product is, while functional features relate to what a
product does (Saviotti & Metcalfe, 1984).
Technological features include all technological
subsystems and components that are embodied in the
tangible products. For instance, for a car these features are
engine type, suspension type, transmission system, air
conditioning equipment, etc. All subsystems and
components are working according to certain scientific
principles and design rules. These technological features
are the outcome of the choices of engineers, technological
advancement, and best engineering practices adopted in the
automotive industry at the time a car model is developed.
Functional features include the set of functions the product
delivers to the users. For instance, for a car these functions
are mobility, safety, comfort, quality, etc. Usually, one
technological feature affects more than one functional
feature. So, there is no one-to-one mapping between the
two sets of technological and functional features.
This conceptualisation of a car is consistent with what
happens in the market. Indeed, Lancaster (1966, 1971)
suggests that consumers choose and buy product
characteristics rather than products themselves that are
considered just as black boxes. Often, the users are fully
ignorant of the technological components and systems
embodied in a car and how these work integrated together.
Thus, for passenger car users it is not relevant if a four or
six cylinder engine is assembled in their car, but engine
power or speed are surely more important when they
choose a particular car model and decide to buy it. As in
the model suggested by Saviotti & Metcalfe (1984), the
method proposed in this paper takes into account
technological features (TF) and functional features (FF) of
a car, but uses the set of functional performance (FP) that
is associated to the functional features of a car, which are
more easily measurable than technological features. The
functional performance items are finally clustered into a
number of functional performance categories (FPC) that
measure the performance of groups of homogeneous
functionalities delivered by a car to the users (Figure 1,a).
Measurements for these features give a quantitative
indication of the benefits offered to car users and, at the
same time indirectly, of the nature of the technology
embodied in a car model. The technical value of a car
model (CTV) is thus assumed to be a function of the
functional performance category set (FPCi) associated to
functional features FF1, FF2, ..., FFm:
CTV = f(FPC1, FPC2, ..., FPCs) (1)
CTV is thus a measure of the overall benefit a car
delivers to users. When using a car, the consumers are also
concerned with the price they have to pay for car
availability, i.e. the ownership price of the product, and the
cost they have to bear to use the car. The decision to buy a
car is thus influenced by the product benefit/cost ratio. The
overall car technical cost (CTC) that users have to bear to
benefit by functional features FF1, FF2, …, FFm is a
function of the amount of these partial costs C1, C2, …, Cp
CTC = g(C1, C2, ..., Cp) (2)
The technical efficiency of a car can be measured as
the ratio of CTV to CTC measurements (Fig. 1,b):
CTVCTE=
CTC (3)

Inzinerine Ekonomika-Engineering Economics, 2014, 25(3), 320–332
- 322 -
b)
overall car
technical cost (CTC)
car technical
efficiency (CTE)
cost categories
CTV
functional performance
categories (FPC)
car technical
value (CTV)
CTC
FPC1
FPC2
FPC3
FPCs
. . .
C1
C2
C3
Cp
. . .
a)TF1
TF2
TF3
…
…
TFn-1
TFn
FF1
FF2
FF3
…
…
FFm-1
FFm
FP1
FP2
FP3
…
…
FPr-1
FPr
FPC1
FPC2
...
…
…
FPCs-1
FPCs
technological
features (TF)
functional
features (FF)
functional
performance set (FP)
functional performance
categories (FPC)
Figure 1. The framework
Thus, a car’s technical efficiency measures the relative
benefit the users gain when they are using a particular car
model charged by certain costs.
Table 1
Variables used for measuring benefits and costs
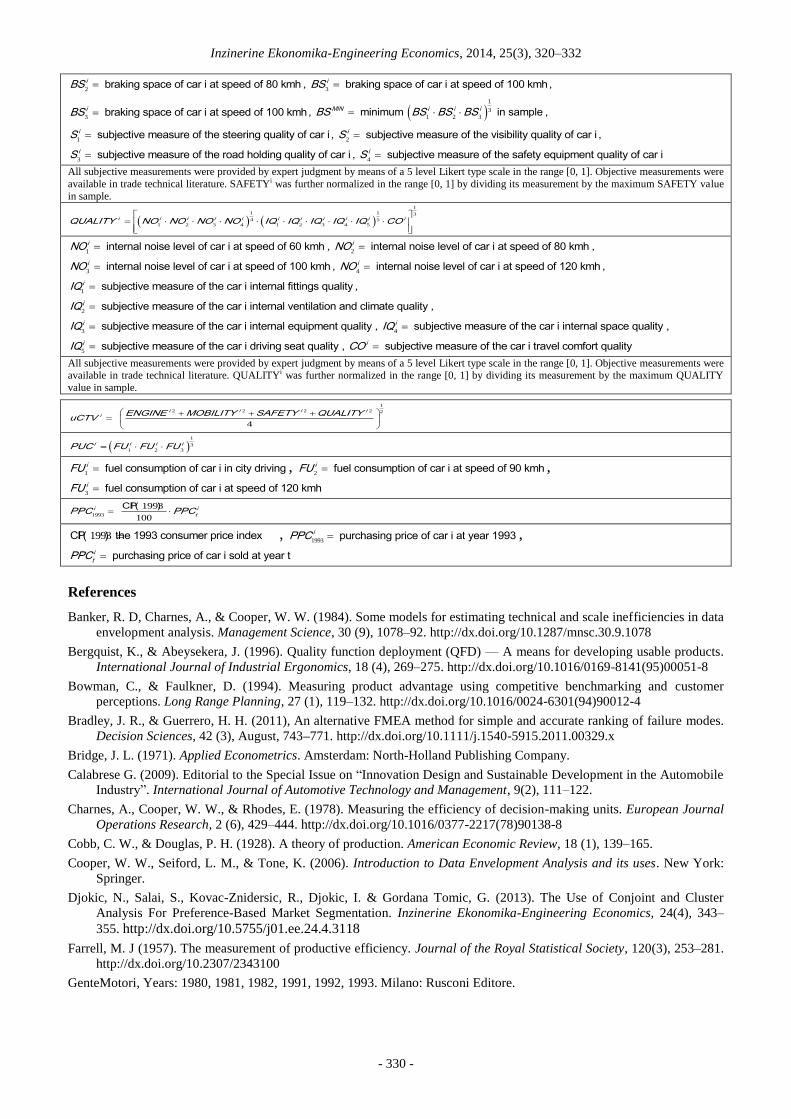
The Measurement of Variables
For convenience, it is assumed that both CTV and
CTC can be formulated respectively as the weighted
summation of the normalized measurements of a set of
four functional features performance, ENGINE,
MOBILITY, SAFETY, and QUALITY, and the weighted
sum of the normalized measurements of the car ownership
price, PPC, and usage cost, PUC (Table 1). Particularly, as
to the measurement of benefits, the ENGINE variable is
used as a proxy for measuring the performance of the car
engine; it depends on the engine power, engine torque,
engine capacity, and car mass. The MOBILITY variable is
a proxy which measures the car moving performance in
terms of its maximum speed, acceleration and pick up
functional features. In order to take into account several
operational conditions of a car, this variable is measured
by averaging several measurements relative to the
acceleration and pick up car performance. The SAFETY
measures the performance of the capability of a car to
assure safety for the passengers and pedestrians. The
measurement of this variable requests both subjective and
objective evaluation of the braking performance, safety
equipment, and driving quality of a car. The QUALITY
functional performance variable relates to the extent a car
provides the users (passengers and driver) with expected
quality standards as to the internal fittings, comfort,
driving easiness, etc. As to the measurement of costs, the
car purchasing price, PPC, is used as a measure of the
ownership cost, while fuel consumption, PUC, is used for
measuring the cost of product usage. As to the cost of car
usage, the operational costs of a car which are reported in
trade literature are calculated assuming that the driver will
travel a fixed distance every year (i.e., 5,000 km, 10,000
km, or 20,000 km), and include the product depreciation
too; the consequence is a strong correlation between the
purchasing price of a car and the operational cost on one
side. Moreover, the cost of car usage might be
exaggeratedly affected by the oil price. Consequently, to
avoid any bias due to correlation between variables and
market context variables, fuel consumption may be
conveniently adopted as a proxy for measuring the cost of
product usage. Major details are reported in Table A.1 in
the Appendix.
functional performance set
Benefits
ENGINE engine power, torque, capacity, car mass
MOBILITY max speed, acceleration, pick up
SAFETY braking space and quality, safety equipment
QUALITY noise, comfort, internal fittings, space, ventilation,
equipment, driving
Costs
PPC car price
PUC (average) fuel consumption

Corrado lo Storto. Two-Step Method Useful For Support of Technical Benchmarking Practice in the Automotive Market
- 323 -
Step 1: measuring the car model technical efficiency
Data Envelopment Analysis (DEA) is used to calculate
technical efficiency rate (CTE) of a car model. DEA is a
flexible non-parametric linear programming method
developed as a reformulation of the Farrell (1957)
efficiency measure to the multiple-output, multiple-input
case that evaluates relative efficiency of a number of units,
comparing the levels of inputs and outputs of one unit with
its competitors, and generating a discrete piece-wise
frontier determined by a set of efficient reference units
(Charnes et al., 1978). A unit (here, a car model) is
considered technically 100 % efficient when any other unit
uses a larger quantity of at least one of the input factors to
achieve the same output amount. Efficient cars with
“unusual” combinations cannot be directly compared to a
reference car. A car model is found to be inefficient if it is
possible to construct a “virtual” reference car as a linear
combination of other cars, such as the virtual car produces
at least the same amount of performance outputs while it
uses a lower amount of inputs than the real car under
examination. As an optimization method, DEA neither relies
on the traditional assumptions required by many other types
of analysis such as regression, nor requires any explicit
specification of underlying functional relationship that links
inputs to outputs or any weights to be assigned a priori.
The example in Figure 2 graphically illustrates how
DEA works and measures technical efficiency of units. For
simplicity, three units - Unit A, Unit B, and Unit C - are
compared, and two outputs O1 and O2 and one input I1 are
respectively produced and consumed by each unit. For
further simplification, let us assume that each unit uses the
same amount of input I1 and that the measure of such
amount is 10. The measures of the output produced by the
three units are as follows: Unit A (O1=180, O2=35), Unit B
(O1=90, O2=45), Unit C (O1=40, O2=105).
18040 90 O1
O2
A
V
B
C
45
105
35
O
Figure 2. How DEA works
DEA determines if there exists a virtual unit that
performs better than one or more of the real three units in
the example. The line segment linking Unit A to Unit C is
called the efficient frontier under the assumption of
convexity. This frontier defines the maximum
combinations of outputs that can be produced for the
assigned input. Indeed, the segment AC lies beyond both
the segment AB that can be drawn between Unit A and
Unit B and segment BC drawn between Unit B and Unit C.
As a consequence, a convex combination of Unit A and
Unit C has the capability to generate the most output for a
given set of inputs. Since Units A and C lie on the efficient
frontier they are considered 100% efficient, but as Unit B
lies under the efficient frontier, it is considered inefficient
and its efficiency (or inefficiency) can be measured as the
ratio OB/OV, where V is a virtual Unit formed through a
combination of Unit A and Unit C. Units A and C are the
reference set for Unit B. The efficiency rate of B is 70,7 %,
while it is 100% for both A and C.
DEA has revealed to be a very useful method in the
practice of benchmarking, as it provides insights as to the
potential improvement capabilities of a unit, indicates
sources of inefficiency, and also makes it possible to take
into account the existence of preferences when efficiency
rates are calculated (lo Storto, 2013; lo Storto & Ferruzzi,
2013).
DEA supplies several information that can be used in
the benchmarking analysis: a) a relative rating of products
classifying them as “efficient” or “inefficient”; b) the
reference set for each inefficient product, that is the set of
relatively efficient products to which it has been most
directly compared in calculating its efficiency rating; c) the
relative amount of specific inputs over-utilized or outputs
under-produced by inefficient products.
Several DEA models are available for measuring unit
efficiencies (Cooper et al., 2006). The proposed method
uses BCC DEA model introduced by Banker et al. (1984)
which allows taking into account scale economies due to
size difference. As car models compared in the
benchmarking study can be very different, one might
suspect that the relationship between inputs and outputs
involves variable returns to scale, i.e., that there exists a
varying relationship between increasing output and input.
The formulation of the input-oriented DEA BCC
model in the envelopment form is as follows (Cooper et
al., 2006):
, λ
0
min
subject to - 0
= 1
0,
BB
B x X
0Y y
e
(4)
where
X = (xj) Rm x n
and Y = (yj) Rs x n
are a given data set,
Rn is a column vector with all elements non-negative, e
is a row vector with all elements equal to 1, and ΘB is a
scalar.
Step 2: investigating the relationship between CTV,
PUC, and PPC
Even though BCC DEA model does not allow to have
a ranking of car models based on the calculated technical
efficiency rate, this later can be used to cluster car models
into homogeneous groups as to the efficiency score, i.e. a
group including only 100% efficient car models, and a
number of remaining groups that contain not efficient car
models. At this step of the analysis, the measurements of the
4 functional features performance categories, ENGINE,
MOBILITY, SAFETY, and QUALITY are aggregated to
get an unweighted measure of the car technical value uCTV.
The quadratic mean is calculated to aggregate measurements
of the four functional performance variables, as the

Inzinerine Ekonomika-Engineering Economics, 2014, 25(3), 320–332
- 324 -
quadratic mean is particularly sensitive either to high or low
values, thus making it possible to emphasize evident
differences. At this stage of the benchmarking analysis, the
relationships between the dependent variable uCTV, and the
independent variables PUC and PPC can be investigated
adopting the technical efficiency score class as a moderating
variable of this relationship. This analysis is complementary
to the analysis performed in step 1. As in step 1, the Cost of
Product Usage (PUC) and the Product Purchasing Cost
(PPC) can be imagined as resources that the users have to
give up to use a car model and to enjoy its functionalities
that provide them with a benefit measured by the
unweighted Car Technical Value (uCTV). Thus, both PUC
and PPC variables can be considered as factors of a
production function that produces value (uCTV) to the car
user. A convenient way to identify a formal relationship
linking together these variables is to use the Cobb-Douglas
formulation (Bridge, 1971; Cobb & Douglas, 1928;
Richmond, 1974):
b cauCTV PUC PPC (5)
Here a is a constant, which depends on the units in
which inputs and outputs are measured, while b and c are
constants that take into account the relative importance of
PUC and PPC in delivering technical value uCTV to car
users. No particular assumptions or constraints relative to
values assumed by these constants are imposed in the
estimation of these parameters.
An Example: the Italian Domestic Car Market
from the 1970s to 1990s
The Italian passenger car domestic market from the
early 1970s to the 1990s was considered to implement the
benchmarking method. All the car models selected for the
analysis were ordinary passenger cars that have been
equipped with conventional spark ignition petrol engines
or turbocharged spark ignition engines. Data relative to
cars have been collected from trade literature having as a
reference three temporal market windows, the 1970-72s
market (37 car models), the 1980-82s market (82 car
models), and the 1990-93s market (97 car models). Each
sub-sample was selected with the aim of having a good
mix of all passenger cars sold in Italy in that period. The
data were collected from trade literature (GenteMotori,
1980 to 1993; Quattroruote, 1970 to 1993). The use of
published data found in the automotive press has the
advantage of standardization, completeness, and
impartiality of measurement. However, the need to assess
and compare subjectively features required the researcher
to consult an expert of the automotive field. In this case, a
five points Likert-type scale was used to measure
functional features’ performance that could be measured
only by means of subjective expert judgements (Table A.1
in Appendix). Moreover, to get comparable data, the
purchasing prices for all cars were measured with
reference to the year 1993 using the consumer price index
CPI(1993). Next, the results relative to step 1 and step 2
are illustrated.
Table 2
The outcome of DEA: means of variables across groups*
variable G1 CTE=100%
# 35
G2 82,91%<CTE<100%
# 90
G3 CTE<=82,91%
# 91
engine capacity (cc) 2,070,31
[1,359]
1,514,91
[642,71]
1,774,59
[618,36]
car price (€, CPI 1993) 26,055
[34,161]
14,620
[15,390]
15,568
[12,738]
# cars in the 1970s 5 (14%) 19 (51%) 13 (35%)
# cars in the 1980s 3 (4%) 22 (27%) 57 (69%)
# cars in the 1990s 27 (28%) 49 (51%) 21 (22%)
efficiency score 100% 89,99%
[4,67%]
73,17%
[7,60%]
PUC 0,470
[0,156]
0,412
[0,077]
0,476
[0,085]
uCTV 0,626
[0,104]
0,533
[0,088]
0,535
[0,057]
ENGINE 0,463
[0,154]
0,382
[0,112]
0,383
[0,074]
MOBILITY 0,479
[0,142]
0,393
[0,088]
0,408
[0,064]
SAFETY 0,704
[0,129]
0,595
[0,115]
0,565
[0,085]
QUALITY 0,772
[0,123]
0,689
[0,114]
0,708
[0,075]
*In square brackets standard deviations and in round brackets percentages are respectively indicated

Corrado lo Storto. Two-Step Method Useful For Support of Technical Benchmarking Practice in the Automotive Market
- 325 -
Step 1
Table 2 shows the outcome of DEA. The sample was
split into three groups, depending on technical efficiency
score. Particularly, group G1 contains 100 % efficient car
models. The second group G2 contains car models whose
technical efficiency rate is between 82,91 % and 100 %,
while group G3 includes car models having technical
efficiency lower than 82,91 %. The 82,91 % threshold is the
median of the smaller sample made of 181 non efficient
cars. The average sample technical efficiency is 81,53 %,
while the minimum score is 45,21 %. Thus, there is a great
variance as to efficiency of passenger cars in sample.
Table 3
The outcome of DEA: the 100 % efficient car models
car model year engine
capacity
engine
power
max
speed price
occurrence in
reference sets
type of
market
Fiat 127 1970s 903 47 143,85 5,153 61
Mazda RX2 Coupè 1970s 1,146 130 183,54 12,756 0 niche
Innocenti Mini Cooper 1300 1970s 1,275 71 160,71 7,398 12
Fiat 128 Rallye 1970s 1,290 67 152,93 6,939 5
Simca 1000 Rallye 1 1970s 1,294 60 153,03 5,505 40
Renault Alpine Turbo 1980s 1,397 110 184,5 11,386 7
Talbot Sunbeam Lotus 1980s 2,172 155 197,1 15,357 0 niche
Jaguar XJ 5.3 1980s 5,345 287 227,8 47,249 0 niche
Fiat 500 new (700) 1990s 704 30 119,76 5,060 32
Subaru M80 5P 1990s 758 42 142,75 6,027 94
Fiat 500 new (900) 1990s 903 41 136,03 5,871 11
Daihatsu Charade Gti Turbo 1990s 993 101.35 194,9 11,131 145
Autobianchi Y10 Avenue 1990s 1,108 50.5 147,88 8,547 50
Peugeot 306XT 1.4 1990s 1,360 75 165,6 11,349 7
Fiat Uno 1.4 IE sx 5P 1990s 1,372 71 166,7 9,270 9
Opel Corsa Swing 1.4 ie 3P 1990s 1,388 60 155,6 7,953 10
Renault Clio automatic 1990s 1,390 76.5 163,83 11,104 17
Opel Astra 1.6i GLS 5P 1990s 1,598 100.5 190 11,110 13
Peugeot 306XT 1990s 1,761 102.8 184,7 11,938 4
Audi 100 2.0 16V Avant 1990s 1,984 140 204,21 26,722 1
Audi 100 2.0 Ecat 1990s 1,984 115.5 188,08 23,250 6
Volvo 850 GLT L 1990s 1,984 143 202,3 20,710 2
SAAB 900 Saero 1990s 1,985 112.9 208,2 21,095 0 niche
Ford Mondeo 2000 Ghia 1990s 1,988 134 206,99 15,205 16
Ford Superescort RS luxury 1990s 1,993 223.35 224,3 28,121 0 niche
Rover 220 Turbo 1990s 1,994 200 237,8 19,548 17
Honda Accord 2.0i 16V Coupè 1990s 1,997 133 202,15 20,090 3
Nissan Sunny Gti - R 1990s 1,998 220 22,37 25,554 1
Opel Astra Gsi 16V 1990s 1,998 150 218,79 15,748 11
Maserati Ghibli 1990s 1,998 306 262,6 41,774 8
Mercedes 280E-24V 1990s 2,799 197 230 38,815 0 niche
Alfa Romeo 164 V6 24V super 1990s 2,959 210 240 33,505 1
Ferrari 512 TR 1990s 4,943 428 314 143,916 12
Lamborghini Diablo VT 1990s 5,707 492 325 157,668 0 niche
Jaguar XJR-s 1990s 5,993 333,5 253,45 69,092 1
Table 2 shows some relevant findings from DEA:
car models that are 100% technical efficient are
more expensive having a higher purchasing price (or, the
normalized PPC), even though the standard deviation of
this variable is great;
unexpectedly, most cars (69 %) in group G3 that
includes less efficient models were sold in the 1980s, while
only 4 % of passenger cars in these years is 100 % efficient;
the amount of car models sold in the market in the
1970s and belonging to group G2 is the same of cars sold

Inzinerine Ekonomika-Engineering Economics, 2014, 25(3), 320–332
- 326 -
in the 1990s, while the amount of 1980s cars in this group
remains smaller. These figures clearly make evident that
passenger cars sold in the Italian market in the 1980s were
not as competitive as cars in the 1970s and 1990s. That is
not surprising, as between the end of the 1970s and the mid
of the 1980s there was a profound restructuring of the
manufacturing and product development processes in
search of a higher production efficiency to decrease costs
and achieve better product quality. Indeed, there was a
great effort to survive competition coming from the Far
East car manufacturers, primarily from Japan. This effort
was successful as the automotive industry was able to
improve performance of both manufacturing and product
development processes;
on the average, car models in group G1 have
higher functional feature performance measures and an
overall uCTV, but – in the same time – are more
expensive, even though with a great price variance.
Table 3 illustrates some details relative to 35 car
models identified by DEA as 100 % efficient. As the
previous table showed, this group of cars is rather
variegated as it contains models that belong to several
market segments classified, for instance, as A (i.e., Fiat
127), B (Simca 1000 Rallye), or even sport cars
(Lamborghini Diablo VT). That should not be surprising,
as DEA identifies efficient units on the base of the ratio of
weighted outputs to weighted inputs. The last column but
one presents information that is useful to assess the
competitiveness of cars, i.e. the number of times each
model compares in the reference set of an inefficient car.
Seven passenger cars – Mazda RX2 Coupè, Talbot
Sunbeam Lotus, Jaguar XJ5.3, Saab 900 Saero, Ford
SuperEscort RS luxury, Mercedes 280E-24V, and
Lamborghini Diablo VT – have only themselves as a
reference car, not being in any reference set. This
information can be used to identify market niches of the
product offering. “A niche market is a relatively small
segment of a market that the major competitors or
producers may overlook, ignore, or have difficulty serving.
The niche may be a narrowly defined geographical area, it
may relate to the unique needs of a small and specific
group of customers, or it may be some narrow, highly
specialized aspect of a very broad group of customers”
(Gross et al., 1993, p. 360). Effective niche strategies may
be sometimes very profitable, because a niche market may
actually be very large. Emphasis on niche marketing
provides a very clear focus for the development of business
strategies and action plans. As a final comment about
figures in the “occurrence in reference sets” column, two
car models merit particular attention, Daihatsu Charade Gti
Turbo and Subaru M80 5P, the first one in the reference
sets of 145 cars and the second in those of 94 cars. So,
even though both cars are efficient, they occupy a market
position that clearly is not defendable. Unexpectedly, the
Ferrari 512 TR that was sold in the market in the 1990s
appears in the reference sets of 12 cars, including some
cars that do not belong to the same market segments (e.g.,
BMW 318i and BMW 730i). Of course, customers who
buy a Ferrari car do not expect to have higher technical
value as the only benefit for their expensive purchase!
The analysis of the reference sets of inefficient car
models provides insights about the nature of competition in
the market. Table 4 reports the reference sets for some
inefficient car models extracted from sample. As to the
first car in table, Volkswagen Golf 2,8 vr6, three cars of its
reference set are clearly in the same market segment (Ford
Mondeo 2000 Ghia, Rover 220 Turbo, and Alfa Romeo
164). Even, this car has as its reference a Ferrari. The
second car, Citroen Gs Club, has in its reference set two
car models sold in the market twenty years later (both Fiat
500) and one car that in the 1970s was in a higher market
segment (Fiat 128 Rallye). Two cars, Fiat Ritmo 75s and
Fiat Argenta 2000, have the same reference set made of
cars positioned in a lower market segment (A). But, the
comparison of Fiat Argenta with cars of the reference set is
much more unfavorable (as emphasized by the efficiency
score). Indeed, in the automotive market positioning Fiat
Argenta is much more distant from segment A than Fiat
Ritmo. Finally, Jaguar XJS 4.2, which is the lower
performing car in sample in terms of technical efficiency,
is compared with cars that position between the A and B
market segments, even though the reference cars appeared
in the market ten years later.
Table 4
The reference sets of some inefficient car models
car model reference set
VOLKSWAGEN Golf
2,8 vr6
Ford Mondeo 2000 Ghia, Rover 220
Turbo, Alfa Romeo 164 V6 24V super, Ferrari 512 TR
CITROEN Gs Club Fiat 127, Fiat 128 Rallye, Fiat 500 new
(700), Fiat 5oo new (900)
FIAT Ritmo 75S Subaru M80 5P, Daihatsu Charade Gti
Turbo, Autobianchi Y10 Avenue
FIAT Argenta 2000 Subaru M80 5P, Daihatsu Charade Gti Turbo, Autobianchi Y10 Avenue
JAGUAR XJS 4.2 Daihatsu Charade Gti Turbo, Renault Clio
automatic
Table 5 shows some information that further makes
evident the strength of DEA in the practice of product
benchmarking. In particular, this table illustrates how DEA
can be used to identify some improvement trajectories for
inefficient car models. The efficiency rating provided by
DEA suggests the degree of inefficiency of a car model
compared with a virtual car on the frontier defined by its
reference set. However, it does not provide any ranking of
cars. Thus, for instance, the car model Fiat Argenta 2000 is
about 63,66 % efficient compared with its reference set
cars, while Citroen Gs Club is about 82,91 % efficient if
compared with cars on its reference frontier segment (Fiat
127, Fiat 128 Rallye, and both Fiat 500 new models).
Generally, this means that Fiat Argenta should reduce the
cost of usage and purchasing price by approximately 36,34
% = 100 % - 63,66 % without decreasing the performance of
any functional features delivered to users in order to increase
its overall efficiency score. In theory, technical efficiency of
inefficient cars might be improved either by increasing the
functional performance outputs or by decreasing inputs used
(e.g., cost of usage and purchasing price).
Table 5 summarizes the DEA outcome regarding
specific inputs that inefficient cars over-utilize or outputs
that they under-produce. The extent to which inputs can be
reduced is indicated as a negative percentage by figures in
columns “PPC” and “PUC”, while extra output generated
Corrado lo Storto. Two-Step Method Useful For Support of Technical Benchmarking Practice in the Automotive Market
- 327 -
by the inefficient car moving toward the efficient frontier
as positive percentage in the remaining columns (Engine,
Mobility, Safety, and Quality) that indicate the extent to
which output benefits should be increased to move the car
to the efficient frontier. For instance, the car model Fiat
Ritmo 75s can become efficient by decreasing its
purchasing price by about 29 %. As a general rule for
decision-making, if on the average the excess of a certain
input is extremely high, that input is not critical because
there might be large room for improvement. Vice versa, if the input excess is very low, that input variable might be
seriously critical when redesigning that car model because
of a limited space of action.
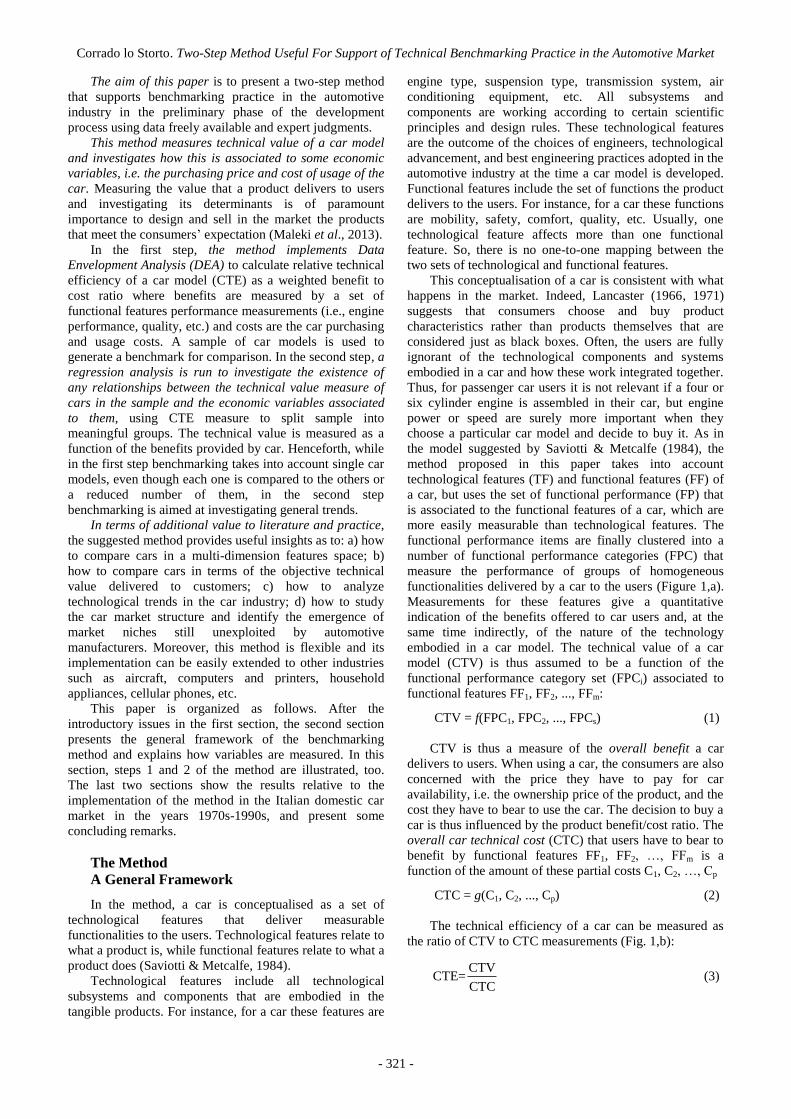
Table 5
Potential improvement of functional features/potential reduction of costs for some car models
car model years CTE (%) PPC PUC ENGINE MOBILITY SAFETY QUALITY
VOLKSWAGEN Golf 2.8 vr6 1990s 89,60 -10,4 % -10,4 % 17,0 % 0 % 0 % 3,8 %
CITROEN Gs Club 1970s 82,91 -17,1 % -17,1 % 1,0 % 0 % 0 % 9,1 %
FIAT Ritmo 75S 1980s 74,29 -29,4 % -25,7 % 1,4 % 0 % 21,91 % 0 %
FIAT Argenta 2000 1980s 63,66 -42,4 % -36,4 % 0 % 0 % 31,23 % 0,77 %
JAGUAR XJS 4.2 1980s 45,21 -67,3 % -54,8 % 2,2 % 0 % 10,6 % 0 %
Table 6
The outcome of the nonlinear regression analysis
G1 (CTE = 100%) G2 (82,91% < CTE < 100%) G3 (CTE≤ 82,91%)
parameter estimate t-value p-level estimate t-value p-level estimate t-value p-level
a 0,831 32,759 0,000 0,810 27,611 0,000 0,756 32,994 0,000
b -0,370 -4,299 0,000 -0,268 -4,466 0,000 -0,224 -4,296 0,000
c 0,269 9,343 0,000 0,252 15,855 0,000 0,211 12,628 0,000
loss function final value=0,0642 loss function final value=0,1409 loss function final value=0,0914
% variance explained=83,7 % % variance explained=79,6 % % variance explained=68,5 %
R=0,915 R=0,892 R=0,828
Step 2
In step 2, benchmarking study is conducted at a more
aggregate level, in order to identify some general trends
which can guide marketing professionals, engineers and
designers in their search for a better and more successful
product.
Table 6 shows the outcome of the regression analysis
between the unweighted car technical value (uCTV) as a
dependent variable and the car cost of usage (PUC) and
purchasing price (PPC) as independent variables.
Particularly, using the equation presented in (5) and the
Livenberg-Marquardt least square estimation method, a
nonlinear regression was performed for each group. Table
6 provides information relative to parameter estimates,
statistical significance, and predictive reliability. All
parameters are significant at least 1 %, and variance
absorbed is between 68,5 % and 83,5 %. In all cases,
estimate of parameter b is negative, while estimate of c is
positive. Thus, uCTV increases when the purchasing price
(PPC) increases, and diminishes when the cost of usage
(PUC) of a car increases. The uCTV sensitiveness to PUC
increase is higher in group G1. A graphical visualization of
these relationships may better support the analysis.
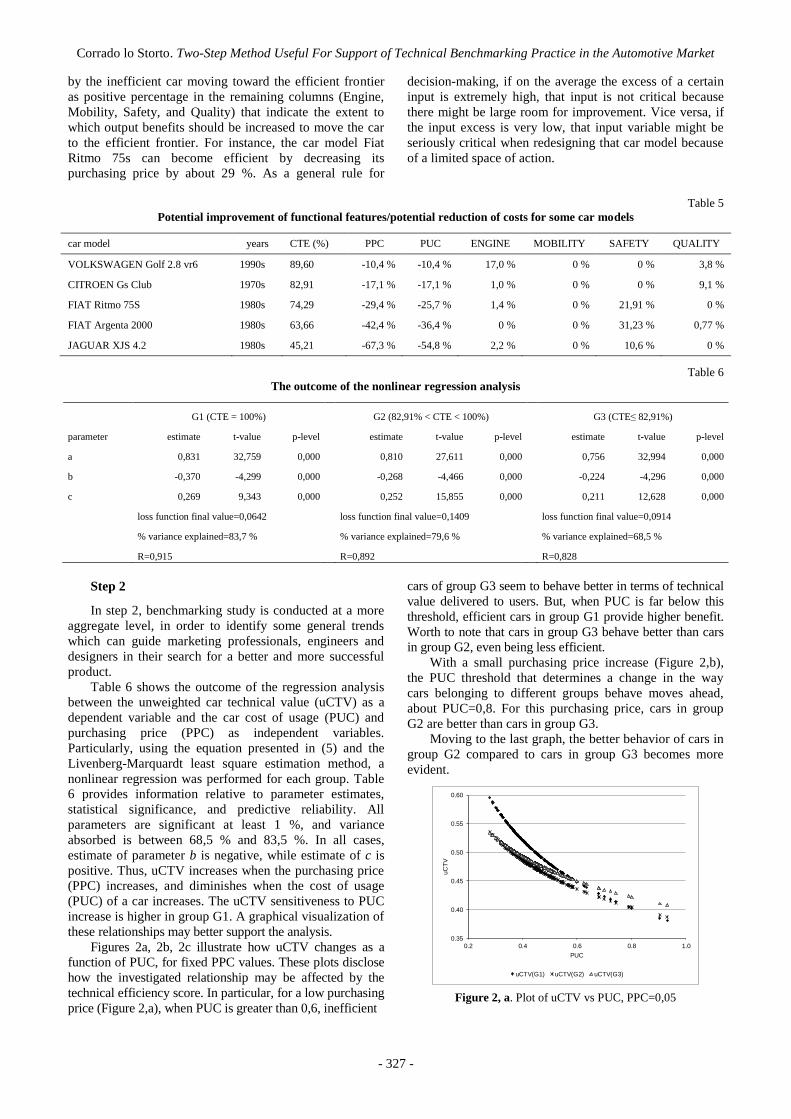
Figures 2a, 2b, 2c illustrate how uCTV changes as a
function of PUC, for fixed PPC values. These plots disclose
how the investigated relationship may be affected by the
technical efficiency score. In particular, for a low purchasing
price (Figure 2,a), when PUC is greater than 0,6, inefficient
cars of group G3 seem to behave better in terms of technical
value delivered to users. But, when PUC is far below this
threshold, efficient cars in group G1 provide higher benefit.
Worth to note that cars in group G3 behave better than cars
in group G2, even being less efficient.
With a small purchasing price increase (Figure 2,b),
the PUC threshold that determines a change in the way
cars belonging to different groups behave moves ahead,
about PUC=0,8. For this purchasing price, cars in group
G2 are better than cars in group G3.
Moving to the last graph, the better behavior of cars in
group G2 compared to cars in group G3 becomes more
evident.
0.35
0.40
0.45
0.50
0.55
0.60
0.2 0.4 0.6 0.8 1.0
uC
TV
PUC
uCTV(G1) uCTV(G2) uCTV(G3)
Figure 2, a. Plot of uCTV vs PUC, PPC=0,05

Inzinerine Ekonomika-Engineering Economics, 2014, 25(3), 320–332
- 328 -
0.40
0.45
0.50
0.55
0.60
0.65
0.70
0.75
0.2 0.4 0.6 0.8 1.0
uC
TV
PUC
uCTV(G1) uCTV(G2) uCTV(G3)
Figure 2, b. Plot of uCTV vs PUC, PPC=0,10
0.50
0.55
0.60
0.65
0.70
0.75
0.80
0.2 0.4 0.6 0.8 1.0
uC
TV
PUC
uCTV(G1) uCTV(G2) uCTV(G3)
Figure 2, c. Plot of uCTV vs PUC, PPC=0.20
Conclusion
This paper has proposed a two-step method useful for
implementation of the benchmarking practice to compare
products in the automotive market. It is assumed that a car
is a bundle of objectively and subjectively measurable
attributes or functional features delivered to the users.
In the first step, the method adopts Data Envelopment
Analysis to calculate the relative technical efficiency of a
car model (CTE) as a weighted benefits to costs ratio
where benefits are associated to a set of functional features
performance measures (Engine, Mobility, Safety, and
Quality) and costs are measured by the car purchasing and
usage costs. A sample of car models is used to generate a
benchmark for comparison. In the second step, a nonlinear
regression analysis is run to investigate the existence of
relationships between the measure of technical value of car
models and the associated economic variables, using the
CTE measure to split the sample into meaningful groups.
The technical value is measured as a function of the
benefits provided by a car. Henceforth, while in the first step
product benchmarking has a micro-analytic perspective,
focusing on single car models and taking into account the
specific measurements of their features, even though each
car is compared to the others or to a reduced number of
them, in the second step benchmarking has a macro-
analytic perspective, aimed at investigating general trends
in the market.
As an illustrative case, the method has been
implemented to benchmark a sample of 216 cars that were
sold in the Italian domestic market between the 1970s and
the early 1990s. The results show that passenger cars in the
sample differ remarkably as to their technical efficiency,
but only 35 car models have been classified by DEA as
100 % efficient. This group of efficient cars includes
models that belong to several market segments, i.e. city
cars or sport cars. Generally, 100 % efficient car models
tend to be more expensive than not efficient cars having a
higher purchasing price. In the second step of the method
the findings revealed that car’s technical value CTV
increases when the car’s purchasing price (PPC) increases,
but it diminishes when the cost of usage of a car (PUC)
goes up. Passenger car models sold in the market in the
1980s resulted not so competitive in terms of technical
efficiency as models sold in the 1970s and 1990s. The
method has also provided useful insights as to the nature of
competition in the Italian car market from 1970s to 1990s.
In particular, seven market niches have been identified.
Car models that are in these niches such as the Mazda RX2
Coupè, Talbot Sunbeam Lotus, Jaguar XJ 5.3, Saab 900
Saero, Ford SuperEscort RS luxury, Mercedes 280E-24V,
and Lamborghini Diablo VT had some specific
combinations of functional features that made them unique
car models in the market. Unexpectedly, the Ferrari 512 TR
sold in the market in the 1990s was not a market niche car,
as it was a benchmark for 12 different car models, even not
belonging to the same market segment, such as the BMW
318i and BMW 730i models. Furthermore, some car models
sold in the 1970s remained still competitive in the 1980s and
1990s, as the Citroen Gs Club, while some others were
competitive in different market segments, e.g. the Fiat Ritmo
75s. The method also suggested how to improve specific
performance categories for each inefficient car model to
make them more competitive in the market.
Even though the method has been applied to conduct a
retrospective analysis of the Italian car market, the
utilization of a set of objective and subjective metrics for
measuring performance of functional features delivered to
the users and cost parameters rather than technology features
embodied in a car makes it simple, flexible and easily
implementable to study the present country-specific car
markets worldwide. The method may easily incorporate
further functional features measurements. That is the case of
parameters that measure the extent to which a car is
environment respectful. Until the 1990s environmental
concerns were not challenging in the Italian car market, and
for this reason - given the specificity of the sample that
collects cars sold between 1970s and 1990s – the
implementation of the method has not taken into account
any environmental concerns, i.e. tailpipe emissions, carbon
dioxide production, and recycling. When a more refined
analysis is needed, all or some functional measurements
may be fragmented into their components using these later
as the outputs in DEA implementation. Finally, the
method’s flexibility allows introducing a weighting system
that accounts for the preferences that consumers have
either for certain functional categories or some functional
features by adding further constraints in DEA model
formulation.
Furthermore, application of the method can be
extended to other industries such as aircraft, computers and
printers, cellular phones, household appliances, etc.

Corrado lo Storto. Two-Step Method Useful For Support of Technical Benchmarking Practice in the Automotive Market
- 329 -
The adoption of such a method as a technical
benchmarking and product analysis tool could help
managers to make sound decisions and plans. Indeed, the
positioning of a product based on a sound benchmarking of
functional features is useful to explore the market
competitive inter-relationships among different products in
the same segment or belonging to different segments, and
to identify temporal changes in a manner that is similar in
appearance to a perceptual map. Generating measurements
for the technical value and the technical efficiency of a
product linked to its capability to provide the users with
benefits associated to a set of functional features suffering
some ownership and usage costs helps to get information
and alleviate ambiguity related to a number of issues, i.e.
an in-depth comprehension of the nature of competition
relative to certain types of product features, the relative
assessment of the whole set of product performance, how
to increase product performance by improving specific
functional and technological features, the correct product
pricing and advertising strategy, the identification of gaps
or niches within some segments of the market, etc. In
general, the comparative assessment of products provides
managers with important insights as to how products can
be improved or new product can be developed to fit more
closely with the opportunities offered by technology and
market needs, giving the company a competitive edge.
Indeed, measuring the technical efficiencies of products
and mapping their functional features may contribute to
gain insights related to current and prospective product
offering, helping to find business opportunities for
improving the existing products or launch new product in
the market. As the state of technology does not remain
static either in the short or the long run, and new
technology devices can be mounted in a product to have
better or new functionalities at disposal of the users, the
method can also be usefully adopted to implement
dynamic benchmarking studies, as it was illustrated by the
analysis of the Italian car market presented in this paper.
For instance, in the short run one way that products
compete in the market is by leapfrogging each other in
terms of performance - whether measured in speed, safety,
quality, comfort, reliability, etc. When the measurements
of the technical efficiencies of a sample of products either
in the same or in different segments are averaged and used
as a single efficiency score, the product’s technical
efficiency can be utilized to have a picture of the
technology state in that product market, or to trace the
evolution of the technical value of the product in its market
segment over time, and analyze the relationships between
performance, technology, and costs.
Of course, the benchmarking studies which adopt the
proposed method that is fundamentally based on the
analysis of product features support rather than substitute
for the perceptual data that can be provided by customers
when market demand should be analyzed (see, for
instance, Djokic et al., 2013). Methods that take into
account perceptual data remain critical to understand the
determinants of the consumers purchasing behavior and the
relation between this and their perception of product value
(Kazakeviciute & Banyte, 2012).
Appendix Table A.
Measurements of variables
1
2
i ii ENG ENG
i i
ENG
POW TORENGINE
CAP MASS
max engine power of car ii
ENGPOW , max engine torque of car ii
ENGTOR , engine capacity of car ii
ENGCAP ,
mass of car iiMASS All measurements are objective and available in trade technical literature. ENGINEi was further normalized in the range [0, 1] by dividing its
measurement by the maximum ENGINE value in sample.
1
1 1 3
6 41 2 3 4 5 6 1 2 3 4
i i i i i i i i i i i iMAX
MOBILITY AC AC AC AC AC AC U U U U V
1 acceleration of car i in the space [0 - 1 km]iAC ,
2 acceleration of car i after 400 miAC ,
3 acceleration of car i to increase speed from 0 to 60 kmhiAC ,
4 acceleration of car i to increase speed from 0 to 80 kmhiAC ,
5 acceleration of car i to increase speed from 0 to 100 kmhiAC ,
6 acceleration of car i to increase speed from 0 to 120 kmhiAC ,
1 pick up of car i to increase speed from 40 kmhiU ,
2 pick up of car i to increase speed from 70 to 80 kmhiU ,
3 pick up of car i to increase speed from 70 to 100 kmhiU ,
4 pick up of car i to increase speed from 70 to 120 kmhiU ,
4 pick up of car i to increase speed from 70 to 120 kmhiU , max speed of car i
MAXV
All measurements are objective and available in trade technical literature. MOBILITYi was further normalized in the range [0, 1] by dividing its
measurement by the maximum MOBILITY value in sample.
1
1 1 2
2 41 2 3 4
i i i i i i iSAFETY BRAS BQ S S S S
1
31 2 3
i
MAXi
i i i
MIN
MASS
MASSBRAS
BS BS BS
BS
subjective measure of the braking quality of car iiBQ , braking space of car iiBRAS , mass of car iiMASS ,
maximum car mass in sampleMAXMASS , 1
braking space of car i at speed of 60 kmhiBS ,
Inzinerine Ekonomika-Engineering Economics, 2014, 25(3), 320–332
- 330 -
2 braking space of car i at speed of 80 kmhiBS ,
3 braking space of car i at speed of 100 kmhiBS ,
3 braking space of car i at speed of 100 kmhiBS ,
1
31 2 3
minimum in sample MIN i i iBS BS BS BS ,
1 subjective measure of the steering quality of car iiS ,
2 subjective measure of the visibility quality of car iiS ,
3 subjective measure of the road holding quality of car iiS ,
4 subjective measure of the safety equipment quality of car iiS
All subjective measurements were provided by expert judgment by means of a 5 level Likert type scale in the range [0, 1]. Objective measurements were
available in trade technical literature. SAFETYi was further normalized in the range [0, 1] by dividing its measurement by the maximum SAFETY value
in sample.
1
1 1 3
4 51 2 3 4 1 2 3 4 5
i i i i i i i i i i iQUALITY NO NO NO NO IQ IQ IQ IQ IQ CO
1 internal noise level of car i at speed of 60 kmhiNO ,
2 internal noise level of car i at speed of 80 kmhiNO ,
3 internal noise level of car i at speed of 100 kmhiNO ,
4 internal noise level of car i at speed of 120 kmhiNO ,
1 subjective measure of the car i internal fittings qualityiIQ ,
2 subjective measure of the car i internal ventilation and climate qualityiIQ ,
3 subjective measure of the car i internal equipment qualityiIQ ,
4 subjective measure of the car i internal space qualityiIQ ,
5 subjective measure of the car i driving seat qualityiIQ , subjective measure of the car i travel comfort qualityiCO
All subjective measurements were provided by expert judgment by means of a 5 level Likert type scale in the range [0, 1]. Objective measurements were available in trade technical literature. QUALITYi was further normalized in the range [0, 1] by dividing its measurement by the maximum QUALITY
value in sample.
1
2 2 2 2 2
4
i i i ii ENGINE MOBILITY SAFETY QUALITY
uCTV
1
31 2 3
i i i iPUC FU FU FU
1 fuel consumption of car i in city drivingiFU ,
2 fuel consumption of car i at speed of 90 kmhiFU ,
3 fuel consumption of car i at speed of 120 kmhiFU
1993
1993
100
CP(I ) i i
tPPC PPC
1993CP(I ) the 1993 consumer price index , 1993
purchasing price of car i at year 1993iPPC ,
purchasing price of car i sold at year ti
tPPC
References
Banker, R. D, Charnes, A., & Cooper, W. W. (1984). Some models for estimating technical and scale inefficiencies in data
envelopment analysis. Management Science, 30 (9), 1078–92. http://dx.doi.org/10.1287/mnsc.30.9.1078
Bergquist, K., & Abeysekera, J. (1996). Quality function deployment (QFD) — A means for developing usable products.
International Journal of Industrial Ergonomics, 18 (4), 269–275. http://dx.doi.org/10.1016/0169-8141(95)00051-8
Bowman, C., & Faulkner, D. (1994). Measuring product advantage using competitive benchmarking and customer
perceptions. Long Range Planning, 27 (1), 119–132. http://dx.doi.org/10.1016/0024-6301(94)90012-4
Bradley, J. R., & Guerrero, H. H. (2011), An alternative FMEA method for simple and accurate ranking of failure modes.
Decision Sciences, 42 (3), August, 743–771. http://dx.doi.org/10.1111/j.1540-5915.2011.00329.x
Bridge, J. L. (1971). Applied Econometrics. Amsterdam: North-Holland Publishing Company.
Calabrese G. (2009). Editorial to the Special Issue on “Innovation Design and Sustainable Development in the Automobile
Industry”. International Journal of Automotive Technology and Management, 9(2), 111–122.
Charnes, A., Cooper, W. W., & Rhodes, E. (1978). Measuring the efficiency of decision-making units. European Journal
Operations Research, 2 (6), 429–444. http://dx.doi.org/10.1016/0377-2217(78)90138-8
Cobb, C. W., & Douglas, P. H. (1928). A theory of production. American Economic Review, 18 (1), 139–165.
Cooper, W. W., Seiford, L. M., & Tone, K. (2006). Introduction to Data Envelopment Analysis and its uses. New York:
Springer.
Djokic, N., Salai, S., Kovac-Znidersic, R., Djokic, I. & Gordana Tomic, G. (2013). The Use of Conjoint and Cluster
Analysis For Preference-Based Market Segmentation. Inzinerine Ekonomika-Engineering Economics, 24(4), 343–
355. http://dx.doi.org/10.5755/j01.ee.24.4.3118
Farrell, M. J (1957). The measurement of productive efficiency. Journal of the Royal Statistical Society, 120(3), 253–281.
http://dx.doi.org/10.2307/2343100
GenteMotori, Years: 1980, 1981, 1982, 1991, 1992, 1993. Milano: Rusconi Editore.

Corrado lo Storto. Two-Step Method Useful For Support of Technical Benchmarking Practice in the Automotive Market
- 331 -
Goldberg, P. K. (1995). Product differentiation and oligopoly in international markets: The case of the U.S. automobile
industry. Econometrica, 63(4), 891–951. http://dx.doi.org/10.2307/2171803
Griffin A. (1997). PDMA research on new product development practices: Updating trends and benchmarking best
practices. Journal of Product Innovation Management, 14 (6), 429–458. http://dx.doi.org/10.1016/S0737-
6782(97)00061-1
Gross, A. C., Banting, P. M., Meredith, L. N., & Ford, I. D. (1993). Business Marketing. Houghton Mifflin Company.
Hauser, J. R., & Clausing, D. (1988). The House of Quality. Harvard Business Review, May-June, 63-73.
Kazakeviciute, A. & Banyte, J. (2012). The Relationship of Consumers Perceived Hedonic Value and Behavior. Inzinerine
Ekonomika-Engineering Economics, 23(5), 532–540. http://dx.doi.org/10.5755/j01.ee.23.5.1975
Klepper, S. (2002). The capabilities of new firms and the evolution of the US automobile industry. Industrial and
Corporate Change, 11 (4), 645–666. http://dx.doi.org/10.1093/icc/11.4.645
Lancaster, K. J. (1966). A new approach to consumer theory. Journal of Political Economy, 74 (2), 132–157.
http://dx.doi.org/10.1086/259131
Lancaster, K. J. (1971). Consumer demand: A new approach. New York: Columbia University Press.
Lema, N. M., & Price, A. D. F. (1995). Benchmarking: performance improvement toward competitive advantage. Journal
of Management in Engineering, 11 (1), 28–37. http://dx.doi.org/10.1061/(ASCE)0742-597X(1995)11:1(28)
lo Storto, C. (2006). A method based on patent analysis for the investigation of technological innovation strategies: the
European medical prostheses industry. Technovation, 26(8), 932–942. http://dx.doi.org/10.1016/j.technovation.
2005.10.005
lo Storto, C. (2013). A DEA based model for ranking air freighters operational efficiency. Applied Mechanics and
Materials, 390, 155–160. http://dx.doi.org/10.4028/www.scientific.net/AMM.390.155
lo Storto, C., & Ferruzzi, G. (2013). Benchmarking economical efficiency of renewable energy power plants: A Data
Envelopment Analysis Approach. Advanced Materials Research, 772, 699–704. http://dx.doi.org/10.4028/
www.scientific.net/AMR.772.699
Maleki, M., Shevtshenko, E., & Cruz-Machado, V. (2013). Comparative Analysis of Customer Value Dimensions.
Inzinerine Ekonomika-Engineering Economics, 24(5), 488–495. http://dx.doi.org/10.5755/j01.ee.24.5.3241
Nair, V. N. (1992). Taguchi's Parameter Design: A panel discussion. Technometrics, 34(2), 127–161.
http://dx.doi.org/10.1080/00401706.1992.10484904
Neely, A. (1999). The performance measurement revolution: why now and what next. International Journal of Operations
and Production Management, 19 (2), 205–228. http://dx.doi.org/10.1108/01443579910247437
Oliver Wyman Automotive, (2012). 2015 Car innovation: A comprehensive study on innovation in the automotive
industry, http://www.e-motility.com/Oliver_Wyman_Car_Innovation.pdf (retrieved on line Aug 10, 2012).
Otto, K. N., & Antonsson, E. K. (1993). Extensions to the Taguchi method of product design. Journal of Mechanical
Design, 115 (1), 5–13. http://dx.doi.org/10.1115/1.2919325
Partovi, F. Y. (1994). Determining what to benchmark: an analytic hierarchy approach. International Journal of
Operations & Production Management, 14 (6), 25–39. http://dx.doi.org/10.1108/01443579410062068
Quattroruote, Years: 1970, 1971, 1972, 1980, 1981, 1982, 1991, 1992, 1993. Milano: Editoriale Domus.
Richmond, J. (1974). Estimating the efficiency of production. International Economic Review, 15 (2), 515–521.
http://dx.doi.org/10.2307/2525875
Samuelson, P., & Scotchmer, S. (2002). The law and economics of reverse engineering. The Yale Law Journal, 111 (7),
1575–1663. http://dx.doi.org/10.2307/797533
Saviotti, P. P., & Metcalfe, J. S. (1984). A theoretical approach to the construction of technological output indicators.
Research Policy, 13 (3), 141–151. http://dx.doi.org/10.1016/0048-7333(84)90022-2
Schumann, C. A. W. (1996). Discussion of “Benchmarking: performance improvement toward competitive advantage”.
Journal of Management in Engineering, 12 (1), 59–61. http://dx.doi.org/10.1061/(ASCE)0742-597X(1996)12:1(59)
Shetty, Y. K. (1993). Aiming high! Competitive benchmarking for superior performance. Long Range Planning, 26 (1),
39–44. http://dx.doi.org/10.1016/0024-6301(93)90231-4
Tsui, K. L. (1992). An overview of Taguchi method and newly developed statistical methods for robust design. IIE
Transactions, 24 (5), 44–57. http://dx.doi.org/10.1080/07408179208964244
Inzinerine Ekonomika-Engineering Economics, 2014, 25(3), 320–332
- 332 -
Corrado lo Storto
Dviejų etapų metodo taikymas automobilių rinkos lyginamajai analizei
Santrauka
Technikos pramonės gaminių palyginimas gali būti vertinga priemone, padedančia automobilių pramonės gamintojams sustiprinti savo inovacinę
veiklą, numatyti perspektyvą kaip pagerinti savo gamybą ir padaryti ją konkurencinga ir patrauklia rinkoje. Gaminių palyginimas leidžia kompanijoms ne
tik palyginti ar įvertinti savo gaminių savybes ir veiklą su konkuruojančių kompanijų gaminių savybėmis ir veikla, tačiau ir įvertinti įdiegtos technologijos šiuolaikiškumą, taip pat gerinti jų projektavimą, gamybos procesą, rinkodaros strategiją ir taip įgyti tvirtą konkurencinį pranašumą.
Šiame darbe pasiūlytas dviejų etapų metodas: a) leidžiantis palyginti gaminius automobilių pramonėje, prieš tai įvertinus jų techninę vertę, kurią
automobilis suteikia vartotojams ir b) išsiaiškinti, kaip tai siejasi su automobilio pirkimo kaina ir naudojimo kaštais. Šioje analizėje, automobilis yra suvokiamas kaip techninių charakteristikų rinkinys, kuris suteikia tam tikras funkcijas ir kurios yra vertinamos
vartotojų. Techninės charakteristikos asocijuojasi su pačiu gaminiu, o funkcionalumo savybės asocijuojasi su gaminio veiksmu. Techninės
charakteristikos apima visas technologines posistemes ir sudėtines dalis, kurios yra automobilyje, t. y. variklio tipas, pakabos tipas, transmisijos sistema, oro kondicionavimo įranga ir t. t. Visos posistemės ir sudėtinės dalys veikia pagal tam tikrus techninius principus ir projektavimo taisykles. Šios
techninės charakteristikos yra inžinierių pasirinkimo, technologinės pažangos, automobilio kūrimo laiko ir automobilių pramonėje pritaikytų geriausių
inžinerinių praktikų rezultatas. Funkcionalumo savybės atlieka daug funkcijų, kurias automobilis suteikia vartotojams, t. y. mobilumas, saugumas, komfortas, kokybė ir t. t. Dažniausiai viena techninė charakteristika daro įtaką kartais vienai, kartais daugiau nei vienai funkcinei savybei. Iš tiesų,
vartotojai renkasi ir perka greičiau jau gaminio charakteristikas, negu patį gaminį, kuris tiesiog yra laikomas tarsi „juoda dėže“. Dažnai vartotojai visiškai
ignoruoja automobilio technologinius komponentus ir sistemas bei tai, kaip jie veikia visi kartu. Keleivinių automobilių vartotojams ne taip svarbu ar automobilyje įmontuotas keturių ar šešių cilindrų variklis, tačiau variklio galia arba greičio matai tikrai yra labai svarbūs jiems renkantis konkretų
automobilio modelį ir nusprendus jį pirkti. Metodas panaudoja seriją funkcinės veiklos (FV), siejamos su automobilio funkcinėmis savybėmis (FS), kurią
įvertinti yra daug lengviau negu technines charakteristikas. Funkcinės veiklos punktai yra sugrupuojami į keletą funkcinės veiklos kategorijų (FVK), kurios įvertina homogeniškų funkcijų, kurias automobilis suteikia vartotojams, veiklą. Šių savybių įvertinimai parodo automobilio naudotojams siūlomos
naudos kiekybinę indikaciją ir tuo pat metu netiesiogiai, automobilio modelyje apjungtų technologijų pradinę kiekybinę indikaciją. Pirmame etape
metodas pritaiko Duomenų apsupties analizę (DAA), kad apskaičiuotų santykinį techninį automobilio modelio efektyvumą (ATE), nes svertinis naudos ir kaštų santykis yra siejamas su serija funkcinių savybių, kategorijos veiklos įvertinimų, galinčių apibūdinti konkretų automobilio modelį (variklis,
mobilumas, saugumas, ir kokybė), o kaštai yra įvertinami pagal automobilio pirkimo ir naudojimo kaštus. Norint sukurti palyginimui rodiklį, yra
naudojamas automobilių modelių pavyzdys. Antrame etape, norint išsiaiškinti ryšį tarp automobilių modelių techninės vertės įvertinimo ir susijusių ekonominių kintamųjų egzistavimo, atliekama nelinijinė analizė, tam panaudojant ATE įvertinimą Techninė vertė įvertinama kaip automobilio teikiamos
naudos funkcija. Nors pirmame etape gaminių palyginimas turi mikroanalitinę perspektyvą, tačiau šiuo atveju sutelkiamas dėmesys į atskirus automobilių
modelius ir atsižvelgiama į jų charakteristikų specifinius įvertinimus. Antrame etape palyginimas turi makroanalitinę perspektyvą, nukreiptą į bendrų rinkos krypčių nagrinėjimą.
Metodas buvo įdiegtas norint ištirti rodiklius Italijos vietinių keleivinių automobilių rinkoje 1970-1990 metais. Pirmame etape rezultatai parodė, kad
keleiviniai automobiliai, parduoti Italijos rinkoje nuo aštuntojo iki dešimtojo dešimtmečio, labai skyrėsi vertinant jų techninį efektyvumą. Tik 35 automobilių modeliai paimti pavyzdžiais, DAA buvo klasifikuoti kaip 100% efektyvūs. Šioje efektyvių automobilių grupėje yra modelių, kurie priklauso
keliems rinkos segmentams, t. y. miesto arba sportiniai automobiliai. Iš tikrųjų, 100% efektyvūs automobilių modeliai yra brangesni už neefektyvius
automobilius. Didelis automobilių modelių skaičius (90) pasiekia aukštą techninio efektyvumo laipsnį, nuo 100% iki 82.91%, kur paskutinis efektyvumo įvertinimas yra „vidutinis efektyvumo matmuo“ kitame, mažesniame pavyzdyje, kuris apima tik 181, o ne 100% efektyvių automobilių modelių.
Keleivinių automobilių modeliai, parduoti rinkoje devintajame dešimtmetyje, buvo ne tokie konkurencingi techninio efektyvumo prasme kaip modeliai,
parduoti aštuntajame ir dešimtajame dešimtmečiuose. Iš tiesų, tik 4% keleivinių automobilių yra 100% efektyvūs. Nuo aštuntojo dešimtmečio pabaigos iki devintojo dešimtmečio vidurio Europos ir JAV automobilių gamintojai investavo daug pinigų, kad padidintų gaminių efektyvumą ir kokybę savo
gamyklose ir pateiktų rinkai geresnių gaminių. Metodas taip pat pateikė naudingas įžvalgas apie konkurencijos esmę Italijos automobilių rinkoje nuo
aštuntojo iki dešimtojo dešimtmečio. Buvo nustatytos septynios rinkos nišos, įskaitant automobilių modelius, turinčius tam tikras funkcinių savybių kombinacijas, kurios daro juos unikaliais Italijos automobilių rinkoje.
Antrame etape buvo atliktas lyginamasis tyrimas bendresniu lygiu, turint tikslą nustatyti bendras kryptis, kurios galėtų būti naudingos rinkodaros
profesionalams, inžinieriams ir projektuotojams, kuriant geresnį ir sėkmingesnį gaminį automobilių pramonėje. Rezultatai parodė, kad automobilio techninė vertė didėja, kai didėja automobilio pirkimo kaina, bet mažėja, kai kyla automobilio naudojimo kaštai.
Pasiūlytas metodas buvo pritaikytas norint atlikti retrospektyvinę Italijos keleivinių automobilių rinkos analizę, tačiau ir objektyvių ir subjektyvių
rodiklių panaudojimas, norint geriau įvertinti efektyvumą, kurį automobilis suteikia vartotojui, ir kaštų parametrus, o ne technines charakteristikas, apjungtas automobilio modelyje, daro šį metodą tinkamu taikyti, net jei būtų analizuojamos dabartinės pasaulio automobilių rinkos, turinčios savos šalies
specifiką. Siūlomas metodas kaip papildomą vertę siūlo naudingas įžvalgas: a) kaip palyginti automobilius, vertinant kelių matmenų savybes erdvėje,
vartotojams prieš tai pateikiant objektyvias techninės vertes; b) kaip analizuoti technologines kryptis automobilių pramonėje; c) kaip nagrinėti automobilių pramonės struktūrą ir nustatyti rinkos nišas, kurių dar neeksploatuoja automobilių gamintojai, atsiradimą. Tokio metodo taikymas gali būti
labai naudingas rinkodaros ir techniniams vadovams priimant teisingus sprendimus ir planus. Metodo privalumą sudaro didelis taikymo paprastumas, nes jis panaudoja nemažai objektyviai ir subjektyviai vertinamų funkcinių savybių bei kaštų parametrų, kurių dauguma yra pateikiami techninėje literatūroje.
Dar daugiau, metodas yra labai lankstus ir gali lengvai įtraukti tolesnius funkcinius instrumentus. Tai toks rodiklis, kuriuo įvertinama ar automobilis yra
tausojantis aplinką (tai nebuvo įtraukta į analizuojamą Italijos automobilių rinkos atvejį, nes tai nebuvo aktualu pavyzdyje įtrauktiems to meto automobilių modeliams, parduotiems rinkoje). Taip pat, šį metodą galima pritaikyti ir kitose srityse, pvz.: lėktuvų, kompiuterių ir spausdintuvų, namų
ūkio prekių, mobiliųjų telefonų ir t.t.
Raktažodžiai: duomenų apsupties analizė, automobilis, palyginimas, efektyvumas, gaminio vertė, pirkimo kaina, naudojimo kaštai.
The article has been reviewed.
Received in October, 2012; accepted in June, 2014.