Two-phase heat transfer and pressure drop of propane during saturated flow boiling inside a...
10
Two-phase heat transfer and pressure drop of propane during saturated flow boiling inside a horizontal tube S. Wang a,b , M.Q. Gong a, *, G.F. Chen a , Z.H. Sun a , J.F. Wu a, ** a Key Laboratory of Cryogenics, Technical Institute of Physics and Chemistry, Chinese Academy of Sciences, Beijing 100190, China b University of Chinese Academy of Sciences, Beijing 100039, China article info Article history: Received 5 December 2012 Received in revised form 9 March 2013 Accepted 31 March 2013 Available online xxx Keywords: Propane Flow boiling Heat transfer Pressure drop Flow pattern Correlation abstract Comprehensive heat transfer coefficient and pressure drop data of the two-phase satu- rated flow boiling for propane were obtained in a smooth horizontal tube at conditions covering mass fluxes from 62 to 104 kg m 2 s 1 , heat fluxes from 11.7 to 87.1 kW m 2 , and saturated temperatures from 35.0 to 1.9 C. Results indicate that heat transfer co- efficients increase with mass and heat flux. For saturation temperature and vapor quality, distinct variation trends were observed depending on different test conditions. The heat transfer experimental data were compared with five well-known correlations. Among those, LiueWinterton correlation shows the best agreement with a mean absolute relative deviation less than 10%. For two-phase frictional pressure gradients, the influences of saturation temperature, mass flux and vapor quality were also presented. The predicted method of Mu ¨ ller-Steinhagen & Heck correlation gives the best fit to the data with a mean absolute relative deviation less than 20%. ª 2013 Elsevier Ltd and IIR. All rights reserved. Transfert de chaleur diphasique et chute de pression du propane pendant l’e ´ bullition en e ´ coulement sature ´a ` l’inte ´ rieur d’un tube horizontal Mots cle ´s : Propane ; Ebullition en a ´ coulement ; Transfert de chaleur ; Chute de pression ; Sche ´ma d’e ´ coulement ; Corre ´ lation * Corresponding author. Tel./fax: þ86 10 82543728. ** Corresponding author. Tel./fax: þ86 10 62627843. E-mail addresses: [email protected] (M.Q. Gong), [email protected] (J.F. Wu). www.iifiir.org Available online at www.sciencedirect.com journal homepage: www.elsevier.com/locate/ijrefrig international journal of refrigeration 41 (2014) 1 e10 0140-7007/$ e see front matter ª 2013 Elsevier Ltd and IIR. All rights reserved. http://dx.doi.org/10.1016/j.ijrefrig.2013.03.019
Transcript of Two-phase heat transfer and pressure drop of propane during saturated flow boiling inside a...
nline at www.sciencedirect.com
i n t e r n a t i o n a l j o u r n a l o f r e f r i g e r a t i o n 4 1 ( 2 0 1 4 ) 1e1 0
Available o
www. i ifi i r .org
journal homepage: www.elsevier .com/locate/ i j refr ig
Two-phase heat transfer and pressure drop ofpropane during saturated flow boiling inside ahorizontal tube
S. Wang a,b, M.Q. Gong a,*, G.F. Chen a, Z.H. Sun a, J.F. Wu a,**aKey Laboratory of Cryogenics, Technical Institute of Physics and Chemistry, Chinese Academy of Sciences, Beijing
100190, ChinabUniversity of Chinese Academy of Sciences, Beijing 100039, China
a r t i c l e i n f o
Article history:
Received 5 December 2012
Received in revised form
9 March 2013
Accepted 31 March 2013
Available online xxx
Keywords:
Propane
Flow boiling
Heat transfer
Pressure drop
Flow pattern
Correlation
* Corresponding author. Tel./fax: þ86 10 825** Corresponding author. Tel./fax: þ86 10 626
E-mail addresses: [email protected]/$ e see front matter ª 2013 Elsevhttp://dx.doi.org/10.1016/j.ijrefrig.2013.03.019
a b s t r a c t
Comprehensive heat transfer coefficient and pressure drop data of the two-phase satu-
rated flow boiling for propane were obtained in a smooth horizontal tube at conditions
covering mass fluxes from 62 to 104 kg m�2 s�1, heat fluxes from 11.7 to 87.1 kW m�2, and
saturated temperatures from �35.0 to �1.9 �C. Results indicate that heat transfer co-
efficients increase with mass and heat flux. For saturation temperature and vapor quality,
distinct variation trends were observed depending on different test conditions. The heat
transfer experimental data were compared with five well-known correlations. Among
those, LiueWinterton correlation shows the best agreement with a mean absolute relative
deviation less than 10%. For two-phase frictional pressure gradients, the influences of
saturation temperature, mass flux and vapor quality were also presented. The predicted
method of Muller-Steinhagen & Heck correlation gives the best fit to the data with a mean
absolute relative deviation less than 20%.
ª 2013 Elsevier Ltd and IIR. All rights reserved.
Transfert de chaleur diphasique et chute de pression dupropane pendant l’ebullition en ecoulement sature al’interieur d’un tube horizontal
Mots cles : Propane ; Ebullition en acoulement ; Transfert de chaleur ; Chute de pression ; Schema d’ecoulement ; Correlation
43728.27843.(M.Q. Gong), [email protected] (J.F. Wu).
ier Ltd and IIR. All rights reserved.
Nomenclature
Bo boiling number
Cp specific heat capacity (J kg�1 K�1)
D inner diameter of the tube (mm)
g gravity (m s�2)
G mass flux (kg m�2 s�1)
h heat transfer coefficient (kW m�2 K�1)
Hlv latent heat (J kg�1)
L length of the pressure drop test section (mm)
m mass flow rate (kg s�1)
p pressure (kPa, MPa)
q heat flux (W m�2)
Q thermal power (W)
Re Reynolds number
T temperature (K)
x vapor quality
Greek symbol
r density (kg m�3)
s surface tension (N m�1)
l30% percentage of experimental points predicted
within �30%
Subscripts
cal calculated value
exp experimental value
frict frictional pressure drop
in inlet of the test section
l liquid phase
mom momentum pressure drop
out outlet of the test section
sat saturation state
sub subcooled state
v vapor phase
w wall
i n t e rn a t i o n a l j o u rn a l o f r e f r i g e r a t i o n 4 1 ( 2 0 1 4 ) 1e1 02
1. Introduction
The increasing awareness of the environmental protection
has led to a demand for natural refrigerants in the refrigera-
tion and air conditioning industries. Hydrocarbons (HC’s), in
particular like propane (R290), are well known as excellent
refrigerants. It has been verified to be used as a long term
alternative refrigerant both as a pure refrigerant or a major
component for several mixed refrigerants due to its good
cooling performance and its less impact on the environment
(Blanco et al., 2005; Cavallini et al., 2010; Fernando et al., 2004;
Jung et al., 2000; Lee et al., 2012; Navarro et al., 2005). With the
substitution of old refrigerants by new environmentally
friendly ones, characteristics of the heat transfer coefficients
are of great significance, as well as the two-phase frictional
pressure drop features.
For recent decades, researches of boiling characteristics on
natural refrigerants have become more active (Thome, 1996).
Some experiments on pool boiling of propane have been un-
dertaken (Shen et al., 1997). However, relevant experimental
data about flow boiling heat transfer and pressure drop
characteristics of pure propane in tubes are still not enough.
A number of studies of mixtures with propane as a
componentwere reported (Thome et al., 2008). Zou et al. (2010)
presented saturated flow boiling heat transfer coefficients in a
horizontal tube of the binary mixtures of R170/R290. The
degradation of mixtures increases as increasing the heat flux
and decreases as the vapor quality or the mass flux increases.
The influence of saturation pressure is unapparent, while the
mass flux does have a significant effect. Amodified correlation
was developed based on their previous pool boiling heat
transfer database, which shows an acceptable agreement
with the experimental data for predicting the heat transfer
coefficients of both pure refrigerants and mixtures. Grauso
et al. (2011) conducted an experimental study on flow boiling
of CO2 and propanemixtures in a smooth horizontal tubewith
an internal diameter of 6 mm. The results confirm a strong
degradation of heat transfer respect to the ideal heat transfer
coefficient for mixtures. Results show the heat transfer
coefficients are only slightly dependent on the mass flux and
the working temperature, while strongly influenced by the
heat flux.
A few researches on pure propane two-phase flow boiling
characteristics were reported. Watel and Thonon (2002) con-
ducted an experimental study on propane flow boiling during
a vertical upflow inside a compact serrated plate-fin
exchanger. The experimental conditions reflect those occur-
ring in industrial applications. An analysis of measured
convective boiling heat transfer coefficients, without nucleate
boiling, shows the separate effects of quality, mass flux, and
pressure. Lee et al. (2005) presented experimental results of
heat transfer characteristic and pressure gradients of such
hydrocarbon refrigerants as R290, R600a, R1270 and HCFC
refrigerant R22 during evaporating inside horizontal tubes.
Similar results were observed that the local evaporating heat
transfer coefficients and pressure drop of hydrocarbon re-
frigerants were higher than those of R22. Moreover, in their
study, the average evaporating heat transfer coefficient in-
creases with themass flux, and a peak point appears at 0.85 as
for the influence of vapor quality. As for the influence of vapor
quality on the pressure drop, a highest value of pressure drop
is shown at 0.6 quality point. Compared with existing corre-
lations, the heat transfer coefficient experimental results are
well matched with Shah’s correlation, Kandlikar’s correlation
and GungoreWinterton’s correlation. Choi et al. (2009) re-
ported the convective boiling pressure drop and heat transfer
experiments of propane in horizontal smooth minichannels
with inner diameters of 1.5 mm and 3 mm. The experimental
results show that pressure drop is a function of mass flux,
inner tube diameter, surface tension, density and viscosity. A
new pressure drop correlation was developed on the basis of
the LockharteMartinelli method as a function of the two-
phase Reynold number and Webber number. Mass flux, heat
flux and saturation temperature have an effect on the heat
i n t e r n a t i o n a l j o u r n a l o f r e f r i g e r a t i o n 4 1 ( 2 0 1 4 ) 1e1 0 3
transfer coefficient. Despite the conventional parameters, the
influence of inner tube diameter was also discussed.
Some literature both reported saturation flow boiling
characteristics of pure propane and mixture containing pro-
pane as a component. Shin et al. (1997) conducted an experi-
mental study of convective boiling heat transfer coefficients of
pure refrigerants (R22, R32, R134a, R290, and R600a) and
several refrigerant mixtures inside a 7.7 mm seamless stain-
less steel tube. Their results indicate that the density ratio of
liquid and vapor phases is a weak function of physical prop-
erties, so the influence on heat transfer coefficients is negli-
gible at the same quality. However, they have presented only a
little experimental data for propane. Wen and Ho (2005) con-
ducted an experimental investigation of heat-transfer and
pressure drop behavior of R290, R600, and R290/R600 in a
three-line serpentine small-diameter (2.46 mm) tube bank.
The influences of mass velocity and heat flux to the evapo-
ration heat transfer and pressure drop characteristic were
examined and discussed. The heat transfer coefficients in-
crease with mass flux and heat flux. As the refrigerant mass
flow rate increases, the pressure drop also increases. A new
heat transfer correlation was proposed by using a super-
position model to predict the experimental data for both pure
refrigerants and refrigerant mixtures with a mean absolute
deviation of 11.5%.
The above bibliographic review shows that only a few
studies are available for boiling characteristics of propane,
especially for forced two-phase flow boiling. Moreover,
experimental data in literature mentioned above covers only
near zero centigrade degree ranges or even higher, while
relatively lower saturation temperature ranges have not been
studied. Therefore, more comprehensive and fundamental
experimental data of propane are still required to develop a
widely adaptable correlation. In this study, extensive mea-
surements on the two-phase flow boiling heat transfer coef-
ficient and frictional pressure drop have been performed. The
experimental conditions summarized in Table 1 cover a wide
range of vapor qualities, and some specific mass fluxes, heat
fluxes, and saturation temperatures.
2. Experimental setup
2.1. Test facility
The test rig of this experiment, newly modified on the previ-
ous work (Zou et al., 2010), is shown in Fig. 1. It consists of a
test loop and a condensation loop. The test fluid condensation
Table 1 e Experimental conditions.
Refrigerant Propane
Tube Copper
Internal diameter (D) 6 mm
Length of pressure drop test section (L) 1550 mm
Saturation temperature (T ) �35.0 to �1.9 �CMass flux (G) 62e104 kg m�2 s�1
Heat flux (q) 11.7e87.1 kW m�2
Heating medium Electrical heating
is achieved in a tubular heat exchanger which is also the
evaporator of a low temperature refrigerator (Gong et al.,
2004). The test loop consists of a magnetic gear pump, a
mass flow meter, a preheater, two sight glasses, a diabatic
heat transfer test section and an adiabatic pressure drop test
section. The magnetic gear pump drives the test fluid to
circulate in the test circle. The mass flux can be modified by
varying the electric motor speed. Then a coriolis effect mass
flow meter is used to measure the flow rate. The test fluid at
the outlet of the magnetic pump is kept subcooled to avoid
any vapor flow through the mass flow meter. The refrigerant,
in subcooled condition, passes through the preheater where
heat is supplied to the fluid by a sheathed heater, which is
controlled by a DC regulator; changing the voltage, it is
possible to modify the thermal power and to obtain the
desired inlet vapor quality of the diabatic heat transfer test
section. At the inlet and outlet of the diabatic test section, two
sight glasses with the same inner diameter of the test tube are
separately set to observe the flow pattern.
The test sections are smooth horizontal tubes with an
inner diameter of 6 mm. The refrigerant evaporates in the
diabatic heat transfer test section where the local heat
transfer coefficient can be measured with four individual
heating segments. Each segment is a 50 mm long copper tube
with an inner diameter of 6 mm and an outer diameter of
30 mm. Then four segments are connected by five 60mm long
stainless steel tubes with an inner diameter of 6 mm and an
outer diameter of 6.4 mm.
The wall temperatures of each heating copper segment are
measured with three four-wire PT100 platinum resistance
thermometers embedded in the wall of each heating segment
by drilling a through-hole inside the wall at the top, bottom,
and right side position as shown in Fig. 2. The lead wire is tied
to the wall in the axial direction in order to minimize the heat
conduction through the wire to or from the surroundings. The
heat flux transferred to the test fluid at the test section can be
calculated by the value of voltage and current of thin-film
electric heaters tightly adhered to the tube outer surface.
The locations of the temperature, absolute pressure, and dif-
ferential pressure measurement sensors are also indicated in
Fig. 1.
The two-phase frictional pressure drop test section is set
after the outlet sight glass. The mass flux, saturation tem-
perature and vapor quality at the inlet of the pressure drop
test section are assumed to be the same as the outlet of the
heat transfer test section. To avoid heat gain or heat loss,
heavy insulation is provided by a glass wool insulator for the
heat exchanger, the liquid reservoir, the magnetic gear pump
and the mass flowmeter; by an aluminum plating film for the
preheater and the two test sections which are also placed in a
vacuum chamber with a vacuum consistently less than 6 Pa
during the test. Regarding the single-phase energy balance,
the maximum heat loss is always no more than 3.75% in the
heat flux range of this work.
2.2. Data reduction
For each heating segment of the heat transfer test section, the
local heat transfer coefficient in the flow boiling process can
be calculated by the following equation:

Fig. 1 e Schematic view of the experimental apparatus.
i n t e rn a t i o n a l j o u rn a l o f r e f r i g e r a t i o n 4 1 ( 2 0 1 4 ) 1e1 04
h ¼ qðTw � TsatÞ (1)
where q represents the inner wall heat flux, calculated on the
basis of the total heat input by measuring the voltage and
current of the DC regulator. Tw is the inner wall temperature,
calculated from the measured temperature by applying the
one-dimensional, radial, steady-state heat conduction equa-
tion for a hollow cylinder, based on the assumption that the
heat flux is uniform inside the tube and a negligible heat loss
to the surroundings. Tsat is the local saturation temperature of
the test fluid, which is the thermodynamic equilibrium tem-
perature corresponding to the saturation pressure. An abso-
lute pressure sensor set at the inlet of the test section and a
linear pressure drop assumption along the test section is used
to determine the local saturation pressure. The saturation
temperature and thermophysical properties of the propane
presented in this work are from Refprop v8.0 (Lemmon
et al., 2007).
The vapor quality is obtained from an energy balance
between the enthalpy increment of the fluid and the thermal
power input. The vapor quality at the inlet of the heat transfer
test section can be calculated as follows:
xin ¼ Qpreh � CpmðTin � TsubÞmHlv
(2)
Fig. 2 e Schematic view of the basic unit of the heat transfer te
thermometers; (b) Transversal surface of the heating segment.
Considering the amount of heat applied to the preheater
and the flow rate of the test fluid, and then the vapor quality at
the exit of the first unit x1 is:
x1 ¼ xin þ Q1
mHlv(3)
where Q1 is the thermal power applied to the first test section.
Similarly, the vapor quality at the inlet and outlet of each
heating segment can be obtained. With the linear interpola-
tion method, the average vapor quality for each test section is
acquired.
2.3. Experimental uncertainties
The uncertainty analysis for the present experiments is
summarized in Table 2. The final uncertainties are estimated
with the method suggested by Moffat (1985). Under the
employed operation conditions, the uncertainties for the heat
transfer coefficient with a 95% confidence interval range from
6.5% to 17.2%, and are less than 2% for the vapor quality.
3. Results and discussion
With the apparatus described above, extensive measure-
ments have been carried out. Local heat transfer coefficients
st unit: (a) The location of three platinum resistance
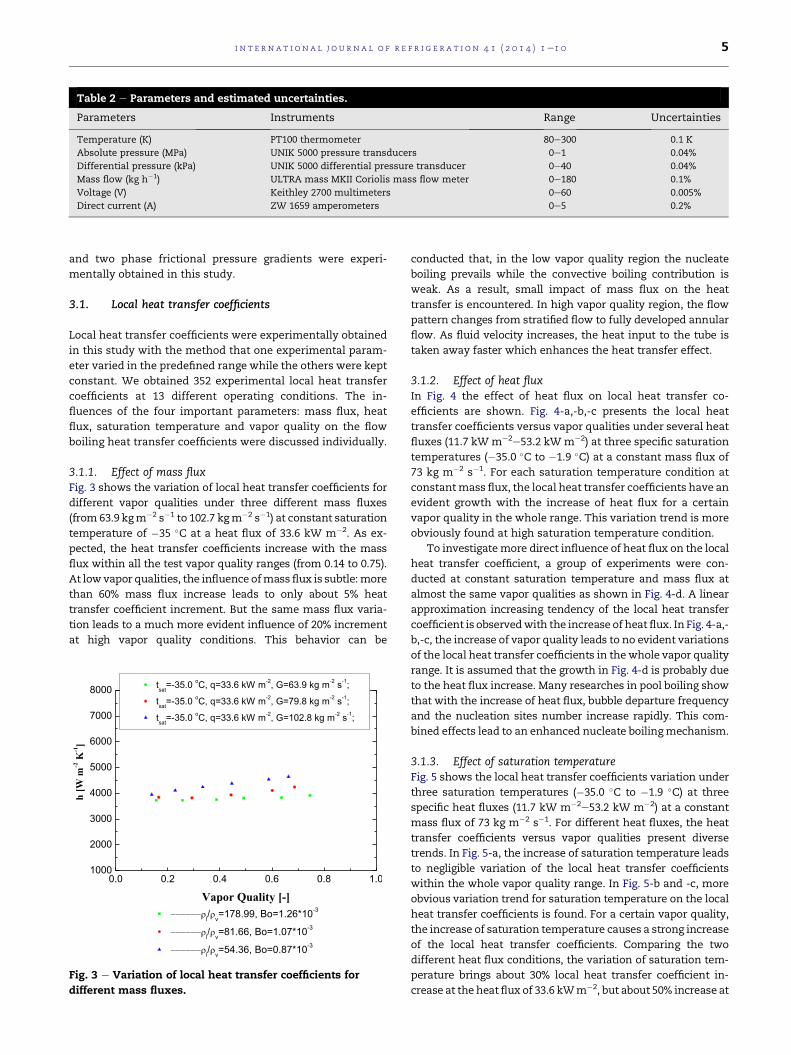
Table 2 e Parameters and estimated uncertainties.
Parameters Instruments Range Uncertainties
Temperature (K) PT100 thermometer 80e300 0.1 K
Absolute pressure (MPa) UNIK 5000 pressure transducers 0e1 0.04%
Differential pressure (kPa) UNIK 5000 differential pressure transducer 0e40 0.04%
Mass flow (kg h�1) ULTRA mass MKII Coriolis mass flow meter 0e180 0.1%
Voltage (V) Keithley 2700 multimeters 0e60 0.005%
Direct current (A) ZW 1659 amperometers 0e5 0.2%
i n t e r n a t i o n a l j o u r n a l o f r e f r i g e r a t i o n 4 1 ( 2 0 1 4 ) 1e1 0 5
and two phase frictional pressure gradients were experi-
mentally obtained in this study.
3.1. Local heat transfer coefficients
Local heat transfer coefficients were experimentally obtained
in this study with the method that one experimental param-
eter varied in the predefined range while the others were kept
constant. We obtained 352 experimental local heat transfer
coefficients at 13 different operating conditions. The in-
fluences of the four important parameters: mass flux, heat
flux, saturation temperature and vapor quality on the flow
boiling heat transfer coefficients were discussed individually.
3.1.1. Effect of mass fluxFig. 3 shows the variation of local heat transfer coefficients for
different vapor qualities under three different mass fluxes
(from 63.9 kgm�2 s�1 to 102.7 kgm�2 s�1) at constant saturation
temperature of �35 �C at a heat flux of 33.6 kW m�2. As ex-
pected, the heat transfer coefficients increase with the mass
flux within all the test vapor quality ranges (from 0.14 to 0.75).
At lowvapor qualities, the influence ofmass flux is subtle:more
than 60% mass flux increase leads to only about 5% heat
transfer coefficient increment. But the same mass flux varia-
tion leads to a much more evident influence of 20% increment
at high vapor quality conditions. This behavior can be
Fig. 3 e Variation of local heat transfer coefficients for
different mass fluxes.
conducted that, in the low vapor quality region the nucleate
boiling prevails while the convective boiling contribution is
weak. As a result, small impact of mass flux on the heat
transfer is encountered. In high vapor quality region, the flow
pattern changes from stratified flow to fully developed annular
flow. As fluid velocity increases, the heat input to the tube is
taken away faster which enhances the heat transfer effect.
3.1.2. Effect of heat fluxIn Fig. 4 the effect of heat flux on local heat transfer co-
efficients are shown. Fig. 4-a,-b,-c presents the local heat
transfer coefficients versus vapor qualities under several heat
fluxes (11.7 kW m�2e53.2 kW m�2) at three specific saturation
temperatures (�35.0 �C to �1.9 �C) at a constant mass flux of
73 kg m�2 s�1. For each saturation temperature condition at
constantmass flux, the local heat transfer coefficients have an
evident growth with the increase of heat flux for a certain
vapor quality in the whole range. This variation trend is more
obviously found at high saturation temperature condition.
To investigatemore direct influence of heat flux on the local
heat transfer coefficient, a group of experiments were con-
ducted at constant saturation temperature and mass flux at
almost the same vapor qualities as shown in Fig. 4-d. A linear
approximation increasing tendency of the local heat transfer
coefficient is observedwith the increase of heat flux. In Fig. 4-a,-
b,-c, the increase of vapor quality leads to no evident variations
of the local heat transfer coefficients in thewhole vapor quality
range. It is assumed that the growth in Fig. 4-d is probably due
to the heat flux increase. Many researches in pool boiling show
that with the increase of heat flux, bubble departure frequency
and the nucleation sites number increase rapidly. This com-
bined effects lead to an enhanced nucleate boilingmechanism.
3.1.3. Effect of saturation temperatureFig. 5 shows the local heat transfer coefficients variation under
three saturation temperatures (�35.0 �C to �1.9 �C) at three
specific heat fluxes (11.7 kW m�2e53.2 kW m�2) at a constant
mass flux of 73 kg m�2 s�1. For different heat fluxes, the heat
transfer coefficients versus vapor qualities present diverse
trends. In Fig. 5-a, the increase of saturation temperature leads
to negligible variation of the local heat transfer coefficients
within the whole vapor quality range. In Fig. 5-b and -c, more
obvious variation trend for saturation temperature on the local
heat transfer coefficients is found. For a certain vapor quality,
the increase of saturation temperature causes a strong increase
of the local heat transfer coefficients. Comparing the two
different heat flux conditions, the variation of saturation tem-
perature brings about 30% local heat transfer coefficient in-
crease at the heat flux of 33.6 kWm�2, but about 50% increase at

0.0 0.2 0.4 0.6 0.8 1.01000
2000
3000
4000
5000
6000
7000
8000
0.0 0.2 0.4 0.6 0.8 1.01000
2000
3000
4000
5000
6000
7000
8000
0.0 0.2 0.4 0.6 0.8 1.01000
2000
3000
4000
5000
6000
7000
8000
0 10 20 30 40 50 60 70 80 901000
2000
3000
4000
5000
6000
7000
8000
tsat
=-35.0 oC; G=71.5 kg m-2 s-1;q=11.8 kW m-2
tsat
=-35.0 oC; G=73.5 kg m-2 s-1;q=33.6 kW m-2
tsat
=-35.0 oC; G=70.8 kg m-2 s-1;q=53.2 kW m-2
h [W
m
-2
K
-1
]
Vapor Quality [-]
tsat
=-14.1 oC; G=74 kg m-2 s-1;q=11.7 kW m-2
tsat
=-14.1 oC; G=74 kg m-2 s-1;q=33.6 kW m-2
tsat
=-14.1 oC; G=73 kg m-2 s-1;q=53.1 kW m-2
h [W
m
-2
K
-1
]
Vapor Quality [-]
tsat
=-1.9 oC; G=72 kg m-2 s-1;q=11.7 kW m-2
tsat
=-1.9 oC; G=73 kg m-2 s-1;q=33.6 kW m-2
tsat
=-1.9 oC; G=74 kg m-2 s-1;q=53.2 kW m-2
h [W
m
-2
K
-1
]
Vapor Quality [-]
dc
b
tsat
=-32.6 oC; G=99 kg m-2 s-1; x=0.29-0.35
h [W
m
-2
K
-1
]
Heat Flux [ kW m-2
]
a
Fig. 4 e Comparison of local heat transfer coefficients of propane at constant saturation temperature and mass flux, for
several heat fluxes.
i n t e rn a t i o n a l j o u rn a l o f r e f r i g e r a t i o n 4 1 ( 2 0 1 4 ) 1e1 06
the heat flux of 53.3 kW m�2 at low vapor quality region, and
finally tends to slight distinctions at high vapor quality region.
This can be concluded that the more obvious promotion effect
of saturation temperature on the local heat transfer coefficient
occurs at higher heat flux condition.
3.1.4. Effect of vapor qualityThe influence of vapor quality on the local heat transfer co-
efficient is an important consideration in studying the relative
contributions of the nucleate boiling mechanism and
convective boiling mechanism. Figs. 3e5 also show the local
heat transfer coefficient variation versus vapor quality for
different mass fluxes, heat fluxes and saturation tempera-
tures. It is shown that the local heat transfer coefficient can
either increase with quality, remain constant, or decrease
with quality. Kandlikar and Steinke (2002) considered it
mainly due to two important parameters e Boiling number,
Bo ¼ q/(GHlv), and liquid to vapor density ratio (rl/rv). They
pointed out that for a high density ratio, the convective effects
dominate which leads to an increasing trend for the local heat
transfer coefficient with the increase of vapor quality. On the
other hand, a high boiling number leads to a high nucleate
boiling contribution, which tends to decrease as the vapor
quality increases. This leads to a decreasing trend for the heat
transfer coefficient with increasing vapor quality.
In Kandlikar’s previous work (1991), a flow boiling map is
given, which shows the function relationship between heat
transfer coefficient and vapor quality based on two major
parameters (liquid and vapor density ratio and a modified
boiling number). The map indicates that at rl/rv ¼ 1000, the
heat transfer coefficient increases with vapor quality, while at
rl/rv ¼ 10, the heat transfer coefficient decreases with vapor
quality For the given set conditions in this study, take Fig. 3 for
instance, the liquid and vapor density ratios are within the
range of 50e200. Thus it may cause a slight increase of the
heat transfer coefficient. Meanwhile, the low boiling number
which leads to a heat transfer coefficient increase trend,
eventually strengthen the tiny increasing rate due to the low
liquid and vapor density ratio. Thus the total effect of the
vapor quality increase is still positive. Similar conclusions can
be drawn for Figs. 4 and 5 with litter difference in the
increasing rate.
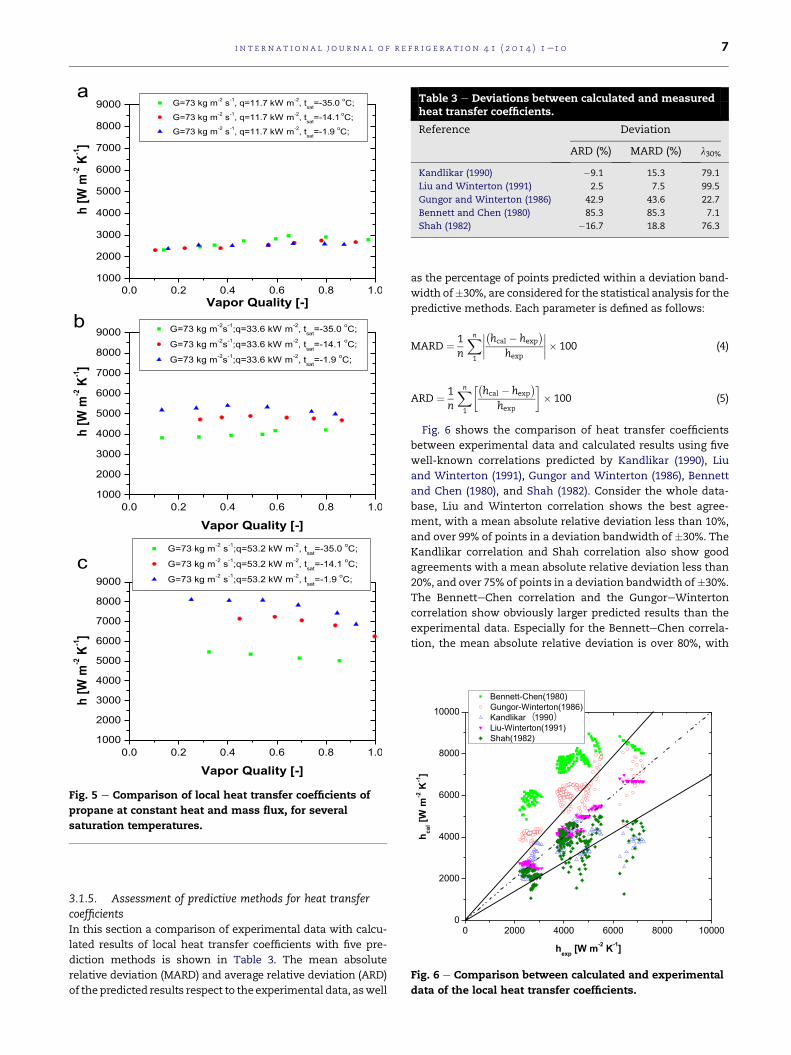
Fig. 5 e Comparison of local heat transfer coefficients of
propane at constant heat and mass flux, for several
saturation temperatures.
Table 3 e Deviations between calculated and measuredheat transfer coefficients.
Reference Deviation
ARD (%) MARD (%) l30%
Kandlikar (1990) �9.1 15.3 79.1
Liu and Winterton (1991) 2.5 7.5 99.5
Gungor and Winterton (1986) 42.9 43.6 22.7
Bennett and Chen (1980) 85.3 85.3 7.1
Shah (1982) �16.7 18.8 76.3
0 2000 4000 6000 8000 100000
2000
4000
6000
8000
10000Bennett-Chen(1980)Gungor-Winterton(1986)KandlikarLiu-Winterton(1991)Shah(1982)
hc
al[W
m
-2
K
-1
]
hexp
[W m-2
K-1
]
Fig. 6 e Comparison between calculated and experimental
data of the local heat transfer coefficients.
i n t e r n a t i o n a l j o u r n a l o f r e f r i g e r a t i o n 4 1 ( 2 0 1 4 ) 1e1 0 7
3.1.5. Assessment of predictive methods for heat transfercoefficientsIn this section a comparison of experimental data with calcu-
lated results of local heat transfer coefficients with five pre-
diction methods is shown in Table 3. The mean absolute
relative deviation (MARD) and average relative deviation (ARD)
of thepredicted results respect to the experimental data, aswell
as the percentage of points predicted within a deviation band-
width of�30%, are considered for the statistical analysis for the
predictive methods. Each parameter is defined as follows:
MARD ¼ 1n
Xn
1
�����hcal � hexp
�hexp
����� 100 (4)
ARD ¼ 1n
Xn
1
��hcal � hexp
�hexp
�� 100 (5)
Fig. 6 shows the comparison of heat transfer coefficients
between experimental data and calculated results using five
well-known correlations predicted by Kandlikar (1990), Liu
and Winterton (1991), Gungor and Winterton (1986), Bennett
and Chen (1980), and Shah (1982). Consider the whole data-
base, Liu and Winterton correlation shows the best agree-
ment, with a mean absolute relative deviation less than 10%,
and over 99% of points in a deviation bandwidth of �30%. The
Kandlikar correlation and Shah correlation also show good
agreements with a mean absolute relative deviation less than
20%, and over 75% of points in a deviation bandwidth of�30%.
The BennetteChen correlation and the GungoreWinterton
correlation show obviously larger predicted results than the
experimental data. Especially for the BennetteChen correla-
tion, the mean absolute relative deviation is over 80%, with
10
1
]
tsat
=-35.0oC, G=62 kg m-2 s-1
t =-35.0oC, G=80 kg m-2 s-1
i n t e rn a t i o n a l j o u rn a l o f r e f r i g e r a t i o n 4 1 ( 2 0 1 4 ) 1e1 08
the percentage of points predicted within a deviation band-
width of �30% less than 10%.
0.0 0.2 0.4 0.6 0.8 1.00
2
4
6
8
Fric
tio
na
l p
re
ss
ure
g
ra
die
nt [k
Pa
m
-
Vapor Quality [-]
sat
tsat
=-35.0oC, G=104 kg m-2 s-1
Fig. 8 e Frictional pressure gradients for different mass
fluxes.
3.2. Two-phase frictional pressure gradients
The two-phase pressure drop for flows inside tubes are the
sum of three parts: the static pressure drop Dpstatic, the mo-
mentum pressure drop Dpmom, and the frictional pressure
drop Dpfrict as:
Dptotal ¼ Dpstatic þ Dpmom þ Dpfrict (6)
For a horizontal tube, the static pressure drop change is
zero. Themomentum pressure drop reflects the phase change
in kinetic energy of the flow, is given by:
�Dpmom ¼ G2
("x2
rvεþ ð1� xÞ2rlð1� εÞ
#out
�"x2
rvεþ ð1� xÞ2rlð1� εÞ
#in
)(7)
where rl and rv is the liquid and vapor density respectively, G
is the mass flux and x is the vapor quality. The void fraction ε
is obtained using the Rouhani and Axelsson (1970) model for
horizontal tubes which is given as:
ε¼ xrv
�ð1þ0:12ð1�xÞÞ
�xrv
þ1�xrl
�þ1:18ð1�xÞ½gsðrl�rvÞ�0:25
Gr0:5l
��1
(8)
where g is gravity, s is the surface tension. After calculating
themomentum pressure drop, hence the two-phase frictional
pressure drop is obtained by subtracting the calculated mo-
mentum pressure drop from the measured total pressure
drop.
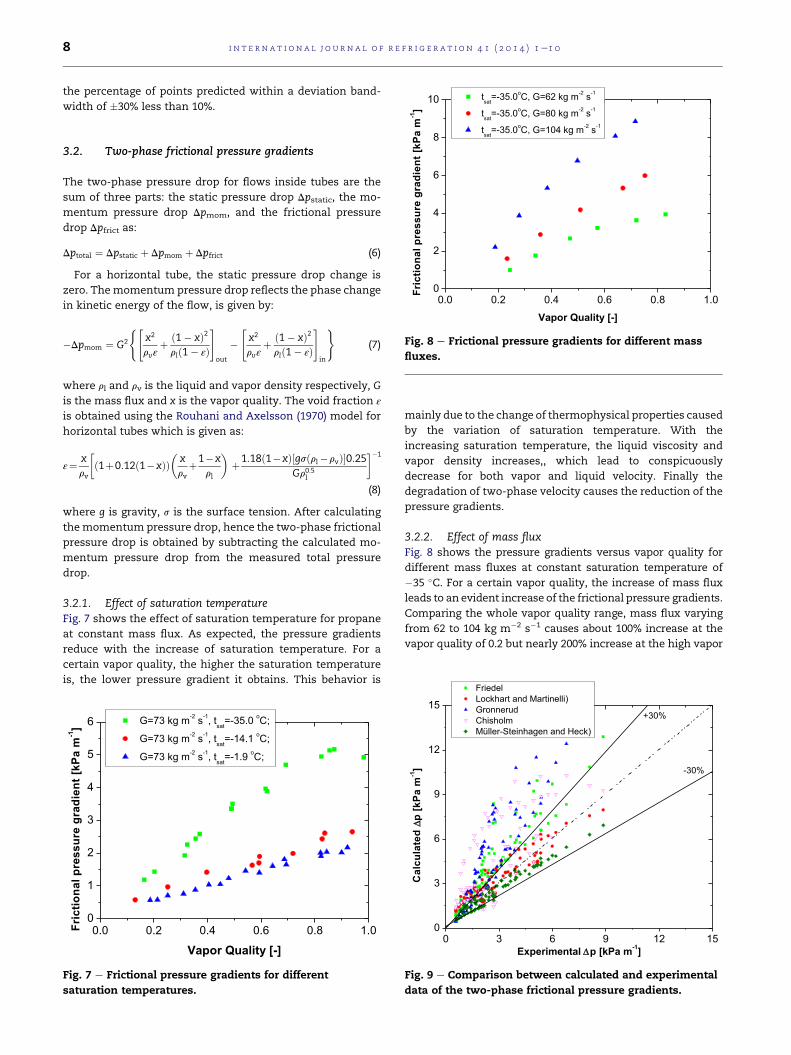
3.2.1. Effect of saturation temperatureFig. 7 shows the effect of saturation temperature for propane
at constant mass flux. As expected, the pressure gradients
reduce with the increase of saturation temperature. For a
certain vapor quality, the higher the saturation temperature
is, the lower pressure gradient it obtains. This behavior is
0.0 0.2 0.4 0.6 0.8 1.00
1
2
3
4
5
6
Fric
tio
na
l p
re
ss
ure
g
ra
die
nt [k
Pa
m
-1
]
Vapor Quality [-]
G=73 kg m-2 s-1, tsat
=-35.0 oC;
G=73 kg m-2 s-1, tsat
=-14.1 oC;
G=73 kg m-2 s-1, tsat
=-1.9 oC;
Fig. 7 e Frictional pressure gradients for different
saturation temperatures.
mainly due to the change of thermophysical properties caused
by the variation of saturation temperature. With the
increasing saturation temperature, the liquid viscosity and
vapor density increases,, which lead to conspicuously
decrease for both vapor and liquid velocity. Finally the
degradation of two-phase velocity causes the reduction of the
pressure gradients.
3.2.2. Effect of mass fluxFig. 8 shows the pressure gradients versus vapor quality for
different mass fluxes at constant saturation temperature of
�35 �C. For a certain vapor quality, the increase of mass flux
leads to an evident increase of the frictional pressure gradients.
Comparing the whole vapor quality range, mass flux varying
from 62 to 104 kg m�2 s�1 causes about 100% increase at the
vapor quality of 0.2 but nearly 200% increase at the high vapor
0 3 6 9 12 150
3
6
9
12
15+30%
FriedelLockhart and Martinelli)GronnerudChisholmMüller-Steinhagen and Heck)
Ca
lc
ula
te
d
p [k
Pa
m
-1
]
Experimental p [kPa m-1
]
-30%
Fig. 9 e Comparison between calculated and experimental
data of the two-phase frictional pressure gradients.
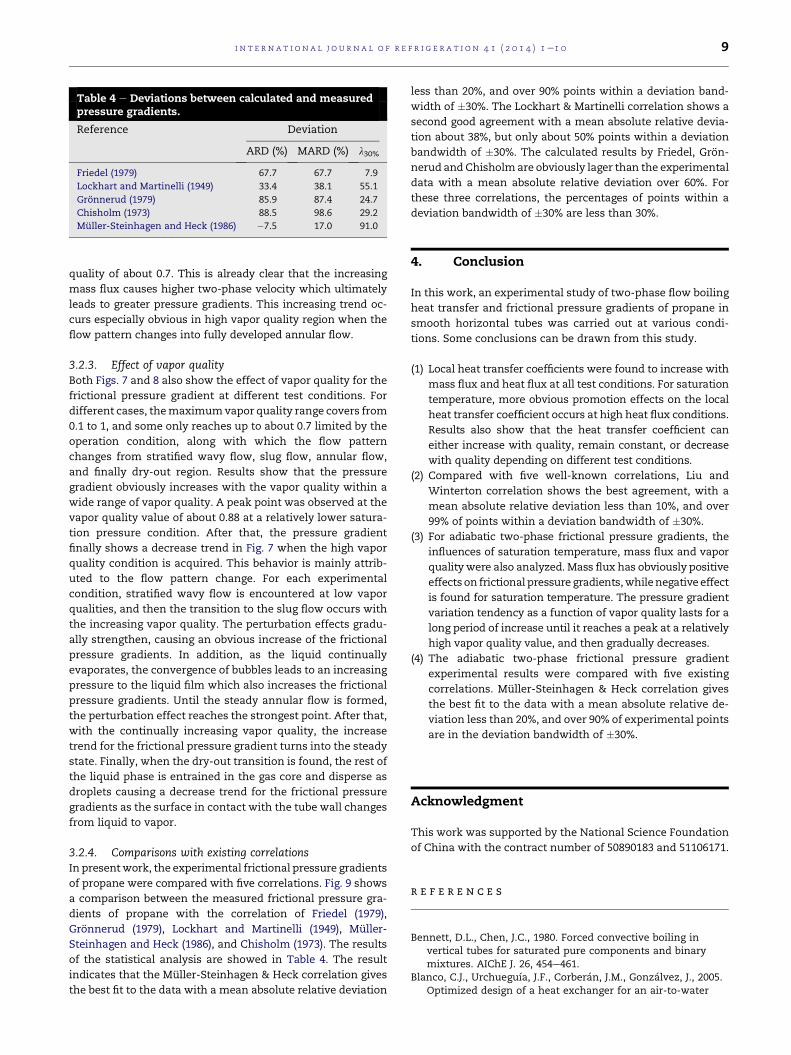
Table 4 e Deviations between calculated and measuredpressure gradients.
Reference Deviation
ARD (%) MARD (%) l30%
Friedel (1979) 67.7 67.7 7.9
Lockhart and Martinelli (1949) 33.4 38.1 55.1
Gronnerud (1979) 85.9 87.4 24.7
Chisholm (1973) 88.5 98.6 29.2
Muller-Steinhagen and Heck (1986) �7.5 17.0 91.0
i n t e r n a t i o n a l j o u r n a l o f r e f r i g e r a t i o n 4 1 ( 2 0 1 4 ) 1e1 0 9
quality of about 0.7. This is already clear that the increasing
mass flux causes higher two-phase velocity which ultimately
leads to greater pressure gradients. This increasing trend oc-
curs especially obvious in high vapor quality region when the
flow pattern changes into fully developed annular flow.
3.2.3. Effect of vapor qualityBoth Figs. 7 and 8 also show the effect of vapor quality for the
frictional pressure gradient at different test conditions. For
different cases, themaximumvapor quality range covers from
0.1 to 1, and some only reaches up to about 0.7 limited by the
operation condition, along with which the flow pattern
changes from stratified wavy flow, slug flow, annular flow,
and finally dry-out region. Results show that the pressure
gradient obviously increases with the vapor quality within a
wide range of vapor quality. A peak point was observed at the
vapor quality value of about 0.88 at a relatively lower satura-
tion pressure condition. After that, the pressure gradient
finally shows a decrease trend in Fig. 7 when the high vapor
quality condition is acquired. This behavior is mainly attrib-
uted to the flow pattern change. For each experimental
condition, stratified wavy flow is encountered at low vapor
qualities, and then the transition to the slug flow occurs with
the increasing vapor quality. The perturbation effects gradu-
ally strengthen, causing an obvious increase of the frictional
pressure gradients. In addition, as the liquid continually
evaporates, the convergence of bubbles leads to an increasing
pressure to the liquid film which also increases the frictional
pressure gradients. Until the steady annular flow is formed,
the perturbation effect reaches the strongest point. After that,
with the continually increasing vapor quality, the increase
trend for the frictional pressure gradient turns into the steady
state. Finally, when the dry-out transition is found, the rest of
the liquid phase is entrained in the gas core and disperse as
droplets causing a decrease trend for the frictional pressure
gradients as the surface in contact with the tube wall changes
from liquid to vapor.
3.2.4. Comparisons with existing correlationsIn presentwork, the experimental frictional pressure gradients
of propane were compared with five correlations. Fig. 9 shows
a comparison between the measured frictional pressure gra-
dients of propane with the correlation of Friedel (1979),
Gronnerud (1979), Lockhart and Martinelli (1949), Muller-
Steinhagen and Heck (1986), and Chisholm (1973). The results
of the statistical analysis are showed in Table 4. The result
indicates that the Muller-Steinhagen & Heck correlation gives
the best fit to the data with a mean absolute relative deviation
less than 20%, and over 90% points within a deviation band-
width of �30%. The Lockhart & Martinelli correlation shows a
second good agreement with a mean absolute relative devia-
tion about 38%, but only about 50% points within a deviation
bandwidth of �30%. The calculated results by Friedel, Gron-
nerud and Chisholmare obviously lager than the experimental
data with a mean absolute relative deviation over 60%. For
these three correlations, the percentages of points within a
deviation bandwidth of �30% are less than 30%.
4. Conclusion
In this work, an experimental study of two-phase flow boiling
heat transfer and frictional pressure gradients of propane in
smooth horizontal tubes was carried out at various condi-
tions. Some conclusions can be drawn from this study.
(1) Local heat transfer coefficients were found to increase with
mass flux and heat flux at all test conditions. For saturation
temperature, more obvious promotion effects on the local
heat transfer coefficient occurs at high heat flux conditions.
Results also show that the heat transfer coefficient can
either increase with quality, remain constant, or decrease
with quality depending on different test conditions.
(2) Compared with five well-known correlations, Liu and
Winterton correlation shows the best agreement, with a
mean absolute relative deviation less than 10%, and over
99% of points within a deviation bandwidth of �30%.
(3) For adiabatic two-phase frictional pressure gradients, the
influences of saturation temperature, mass flux and vapor
quality were also analyzed. Mass flux has obviously positive
effects on frictional pressure gradients,whilenegative effect
is found for saturation temperature. The pressure gradient
variation tendency as a function of vapor quality lasts for a
long period of increase until it reaches a peak at a relatively
high vapor quality value, and then gradually decreases.
(4) The adiabatic two-phase frictional pressure gradient
experimental results were compared with five existing
correlations. Muller-Steinhagen & Heck correlation gives
the best fit to the data with a mean absolute relative de-
viation less than 20%, and over 90% of experimental points
are in the deviation bandwidth of �30%.
Acknowledgment
This work was supported by the National Science Foundation
of China with the contract number of 50890183 and 51106171.
r e f e r e n c e s
Bennett, D.L., Chen, J.C., 1980. Forced convective boiling invertical tubes for saturated pure components and binarymixtures. AIChE J. 26, 454e461.
Blanco, C.J., Urchueguıa, J.F., Corberan, J.M., Gonzalvez, J., 2005.Optimized design of a heat exchanger for an air-to-water
i n t e rn a t i o n a l j o u rn a l o f r e f r i g e r a t i o n 4 1 ( 2 0 1 4 ) 1e1 010
reversible heat pump working with propane (R290) asrefrigerant: modelling analysis and experimentalobservations. App. Therm. Eng. 25, 2450e2462.
Cavallini, A., Da Riva, E., Del Col, D., 2010. Performance of a largecapacity propane heat pump with low charge heatexchangers. Int. J. Refrigeration 33, 242e250.
Chisholm, D., 1973. Pressure gradients due to friction during theflow of evaporating two-phase mixtures in smooth tubes andchannels. Int. J. Heat Mass Trans. 16, 347e358.
Choi, K.I., Pamitran, A.S., Oh, J.T., Saito, K., 2009. Pressure dropand heat transfer during two-phase flow vaporization ofpropane in horizontal smooth minichannels. Int. J.Refrigeration 32, 837e845.
Fernando, P., Palm, B., Lundqvist, P., Granryd, E., 2004. Propaneheat pump with low refrigerant charge: design and laboratorytests. Int. J. Refrigeration 27, 761e773.
Friedel, L., 1979. Improved friction pressure drop correlations forhorizontal and vertical two-phase pipe flow. In: EuropeanTwo-Phase Flow Group Meeting, Paper E2, Ispra, Italy.
Gong, M.Q., Wu, J.F., Luo, E.C., 2004. Performances of the mixed-gases Joule-Thomson refrigeration cycles for cooling fixed-temperature heat loads. Cryogenics 44, 847e857.
Gronnerud, R., 1979. Investigation of liquid hold-up, flow-resistance and heat transfer in circulation type evaporators,part IV: two-phase flow resistance in boiling refrigerants.Bull. de l’Inst. du Froid 59, Annexe 1972-1.
Grauso, S., Mastrullo, R., Mauro, A.W., Vanoli, G.P., 2011. CO2 andpropane blends: experiments and assessment of predictivemethods for flow boiling in horizontal tubes. Int. J.Refrigeration 34, 1028e1039.
Gungor, K.E., Winterton, R.H.S., 1986. A general correlation forflow boiling in tubes and annuli. Int. J. Heat Mass Trans. 29,351e358.
Jung, D., Kim, C.B., Song, K., Park, B., 2000. Testing of propane/isobutane mixture in domestic refrigerators. Int. J.Refrigeration 23, 517e527.
Kandlikar, S.G., 1990. A general correlation for saturated two-phase flow boiling heat transfer inside horizontal and verticaltubes. ASME J. Heat Trans. 112, 219e228.
Kandlikar, S.G., 1991. Development of a flow boiling map forsubcooled and saturated flow boiling of different fluids incircular tubes. J. Heat Trans. 113, 190e200.
Kandlikar, S.G., Steinke, M.E., 2002. Flow boiling heat transfercoefficient in minichannels-correlation and trends. In: Proc.12th International Heat Transfer Conference, Grenoble,France. Paper #1178.
Lee, H.S., Yoon, J.I., Kim, J.D., Bansal, P., 2005. Evaporating heattransfer and pressure drop of hydrocarbon refrigerants in 9.52and 12.70 mm smooth tube. Int. J. Heat Mass Trans. 48,2351e2359.
Lee, I., Tak, K., Lim, W., Choi, K., Moon, I., 2012. Optimization ofpure-refrigerant cycle compressing ratio on C3-MR process. In:
Iftekhar, A.K., Rajagopalan, S. (Eds.). Computer AidedChemical Engineering, vol. 31, pp. 1472e1476.
Lemmon, E.W., Huber, M.L., Mclindon, M.O., 2007. NIST StandardDatabase 23. Version 8.0. Physical and Chemical PropertiesDivision.
Liu, Z., Winterton, R.H.S., 1991. A general correlation for saturatedand subcooled flow boiling in tubes and annuli, based on anucleate pool boiling equation. Int. J. Heat Mass Trans. 34,2759e2766.
Lockhart, R.W., Martinelli, R.C., 1949. Proposed correlation of datafor isothermal two-phase, two-component flow in pipes.Chem. Eng. Prog. 45, 10.
Muller-Steinhagen, H., Heck, K., 1986. A simple friction pressuredrop correlation for two-phase flow in pipes. Chem. Eng. Prog.Process. Intensification 20.
Moffat, R.J., 1985. Using uncertainty analysis in the planning of anexperiment. J. Fluid Eng-T ASME 107, 173e178.
Navarro, E., Urchueguıa, J.F., Gonzalvez, J., Corberan, J.M., 2005.Test results of performance and oil circulation rate ofcommercial reciprocating compressors of different capacitiesworking with propane (R290) as refrigerant. Int. J. Refrigeration28, 881e888.
Rouhani, Z., Axelsson, E., 1970. Calculation of void volumefraction in the subcooled and quality boiling regions. Int. J.Heat Mass Trans. 13, 383e393.
Shah, M.M., 1982. Chart correlation for saturated boiling heattransfer: equations and further studies. ASHRAE Trans. 88,185e196.
Shen, J., Spindler, K., Hahne, E., 1997. Pool boiling heat transfer ofpropane from a horizontal wire. Int. Commun. Heat MassTrans. 24, 633e641.
Shin, J.Y., Kim, M.S., Ro, S.T., 1997. Experimental study on forcedconvective boiling heat transfer of pure refrigerants andrefrigerant mixtures in a horizontal tube. Int. J. Refrigeration20, 267e275.
Thome, J.R., 1996. Boiling of new refrigerants: a state-of-the-artreview. Int. J. Refrigeration 19, 435e457.
Thome, J.R., Cheng, L., Ribatski, G., Vaies, L.F., 2008. Flow boilingof ammonia and hydrocarbons: a state-of-the-art review. Int.J. Refrigeration 31, 603e620.
Watel, B., Thonon, B., 2002. An experimental study of convectiveboiling in a compact serrated plate-fin heat exchanger. J.Enhanc. Heat Trans. 9, 1e15.
Wen, M.Y., Ho, C.Y., 2005. Evaporation heat transfer and pressuredrop characteristics of R-290 (propane), R-600 (butane), and amixture of R-290/R-600 in the three-lines serpentine small-tube bank. App. Therm. Eng. 25, 2921e2936.
Zou, X., Gong, M.Q., Chen, G.F., Sun, Z.H., Zhang, Y., Wu, J.F., 2010.Experimental study on saturated flow boiling heat transfer ofR170/R290 mixtures in a horizontal tube. Int. J. Refrigeration33, 371e380.