Twist Compression and Four-Ball Test Device Redesign
142
Twist Compression and Four-Ball Test Device Redesign ME 450, Winter 2010, Team 6 Rachel R. Gunderson Justin G. Hopkins Richard C. Main Scott E. Malinowski Professor Gordon Krauss April 20, 2010 Department of Mechanical Engineering University of Michigan Ann Arbor, MI 48109-2125
-
Upload
khangminh22 -
Category
Documents
-
view
0 -
download
0
Transcript of Twist Compression and Four-Ball Test Device Redesign

Twist Compression and Four-Ball Test
Device Redesign
ME 450, Winter 2010, Team 6
Rachel R. Gunderson
Justin G. Hopkins
Richard C. Main
Scott E. Malinowski
Professor Gordon Krauss
April 20, 2010
Department of Mechanical Engineering
University of Michigan
Ann Arbor, MI 48109-2125
2
ABSTRACT
In countless industries and applications, lubricants and their combinations with additives are vitally
important to machine performance, functionality, and safety. Two industrial tests that are used to study
lubricants in various environments and scenarios are the Four-Ball Test and the Twist Compression Test.
Each test involves applying a normal load to a lubricated surface and turning a tool against the surface at
varying speeds to measure lubricant response and conditions at seizure. This project serves to combine
the two tests into a single, safe, and interchangeable machine with the speed capability of a Four-Ball
Test and the loading capability of a Twist Compression Test. This design will also incorporate
measurement of the environmental conditions around the lubricant, as well as a robust data acquisition
system with the capability to control turning speed, lubricant temperature, and test volume relative
humidity.

3
EXECUTIVE SUMMARY
In both industry and research, tribologists use a variety of different machines to simulate different
lubrication applications. The two tests being focused on in this project are the Four-Ball and Twist
Compression tests. Our project sponsor, Professor Gordon Krauss, has requested the development of a
single, cost-effective machine that can run each test interchangeably. The capabilities of our machine
stem from Tribsys Inc. industry standards combined with a half to double extension of Four-Ball ASTM
standards D2266, D2596, D2783, D4172, and D5183 as desired by our sponsor. Alongside desired
environmental control capabilities of 0-150ºC and 0-100% humidity, our machine needs to run at speeds
of 2 to 3600 rpm with normal loads extending up to 100kN. Data acquisition capabilities are required so
that monitored rotational speeds, normal loads and resultant forces can be used to calculate coefficients
of friends and other parameters for various tests.
Beginning with a very detailed functional decomposition, we brainstormed and researched numerous
concepts to perform our functions. Pugh charts were used to perform rigorous comparisons and concept
selection for each function. Keeping in mind our time constraints, our alpha design focused on only
specific changes to the existing prototype, encompassing improvements in functionality, safety and data
acquisition. Several key engineering concerns arose during concept compilation and inspection. These
included the gear ratios, lateral force beam and beam bracket bending, compressive blocks stress,
specimen cup and specimen cup teeth stress, heat transfer from the heating coil, and driveshaft and
alignment plate deflection. Calculations of the appropriate gear ratios, bending, shear, and compressive
stresses, and amount of conductive heat transfer allowed us to approve the majority of our concepts,
while a few others required changes before our final design. Due to the cost of the required gear ratios
for our load and speed ranges, we were forced to change the power transmission system in our final
design from a gearbox to an open gear transmission. We also adjusted our gear ratios slightly due to
availability and long manufacturing time. This reduced the maximum normal loads for the Twist
Compression and Four-Ball tests to 85,000 N and 13,500 N, respectively, and also reduced the maximum
driveshaft speed for the Four-Ball test to 2100 rpm. Although these numbers do not meet our initial
engineering specifications, they still capture the entire range of speeds and loads from the ASTM and
industry standards for each test. Other concept changes to our final design included using a heating
cartridge instead of a heating coil to control the temperature of the lubricant and implementing a
tachometer instead of an optical encoder for shaft speed measurement. These changes were mainly
driven by improved or equal functionality and lower cost of the replacement part. A combination of data
acquisition instrumentation and hardware was also chosen for accurate and precise load, speed,
temperature, and humidity readings.
Over the course of the purchasing, manufacturing and assembly phases of our redesign, we adjusted
numerous aspects of our Final Design as it evolved into our current prototype. Our goals in any
adjustment were to evaluate what can be removed with the least impact on capability. Mechanically, our
prototype is in good working order, as is the software programming on the data evaluation end.
Electronically, the data acquisition has proven to be the most troublesome. Though tachometer
measurement and motor control work fine, climate control has been scaled back to simply humidity
logging, temperature measurement and interface cooling capabilities and strain measurement capabilities
are limited to the Lateral Force Beams. Where our prototype stands, we still satisfy our sponsor‟s
ranking of the most important prototype functions as well as keeping consistent with what we, as a team,
feel is most important to provide for this project as it moves forward, potentially still in this class. For
everything that we either couldn‟t complete for hardware reasons, for time constrains, or for interference
with another aspect of the prototype, we provide ample information and reasoning behind the choices we
made.
4
TABLE OF CONTENTS
ABSTRACT ................................................................................................................................................ 2 EXECUTIVE SUMMARY ......................................................................................................................... 3 INTRODUCTION ....................................................................................................................................... 9
Twist Compression Test .......................................................................................................................... 9 Four-Ball Test ......................................................................................................................................... 9
ENGINEERING SPECIFICATIONS ....................................................................................................... 10 Customer Requirements ........................................................................................................................ 10 Establishing Testing Standards and Benchmarking .............................................................................. 11 Safety Quantification ............................................................................................................................. 11 Target Engineering Specifications ........................................................................................................ 11 Quality Function Deployment (QFD) ................................................................................................... 13
CONCEPT GENERATION AND SELECTION PROCESS ................................................................... 15 Functional Decomposition .................................................................................................................... 15 Concept Generation ............................................................................................................................... 16
New Concepts ................................................................................................................................... 17 Secure Tool Fixture ........................................................................................................................... 17 Secure Specimen ............................................................................................................................... 18 Secure Specimen Fixture ................................................................................................................... 18 Apply Lateral Forces to Sensor ......................................................................................................... 19 Existing Concepts .............................................................................................................................. 19
Pugh Charts ........................................................................................................................................... 20 Concept Selection .................................................................................................................................. 22
Accept External Energy..................................................................................................................... 22 Convert Energy to Rotational Motion ............................................................................................... 23 Apply Motion to Tool Fixture ........................................................................................................... 24 Secure Tool Fixture ........................................................................................................................... 24 Secure Specimen ............................................................................................................................... 25 Secure Specimen Fixture ................................................................................................................... 27 Alignment of Specimen to Tool (x-y plane)...................................................................................... 28 Alignment of Specimen to Tool (z-axis) ........................................................................................... 29 Apply Normal Load to Tool Fixture/Specimen Interface ................................................................. 30 Apply Lateral Forces to Sensor ......................................................................................................... 31 Measure Lateral Forces ..................................................................................................................... 32 Measure Shaft Speed ......................................................................................................................... 33 Cool Lubricant ................................................................................................................................... 33 Heat Lubricant ................................................................................................................................... 34 Measure Lubricant Temperature ....................................................................................................... 35 Heat Water for Humidity Control ..................................................................................................... 36 Enclose Water Vapor Around Test Control Volume ........................................................................ 36 Measure Humidity of Test Environment ........................................................................................... 37 Measure Normal Force ...................................................................................................................... 38
REASSESSMENT OF SELECTED CONCEPTS .................................................................................... 39 Convert Energy to Rotational Motion ............................................................................................... 39 Secure Test Fixture ............................................................................................................................ 39
ALPHA DESIGN: FOUR BALL AND TWIST COMPRESSION TEST DEVICE ................................ 40 ENGINEERING ANALYSIS ................................................................................................................... 41
Statics .................................................................................................................................................... 41 Dynamics ............................................................................................................................................... 41 Heat Transfer ......................................................................................................................................... 42

5
PARAMETER ANALYSIS ...................................................................................................................... 43 Power Transmission .............................................................................................................................. 43 Twist Compression Test ........................................................................................................................ 43 Four-ball Test ........................................................................................................................................ 44 Lateral Force Beams .............................................................................................................................. 44 Lateral Force Beam Brackets ................................................................................................................ 45 Compressive Block ............................................................................................................................... 45 Specimen Cup ....................................................................................................................................... 46 Heating and Cooling .............................................................................................................................. 46 Alignment Plates ................................................................................................................................... 47 Shaft Deflection ..................................................................................................................................... 49 Safety Shield ......................................................................................................................................... 50 What We Learned .................................................................................................................................. 50
Material and Manufacturing Process Selection ................................................................................. 50 Design for Environmental Sustainability .......................................................................................... 51 Design for Safety ............................................................................................................................... 51
FINAL DESIGN DESCRIPTION............................................................................................................. 51 Power Transmission .............................................................................................................................. 52 Open Gear Selection .............................................................................................................................. 52 Normal Force Measurement System ..................................................................................................... 53 Specimen Cup Assembly ...................................................................................................................... 54 Lateral Force Measurement System ...................................................................................................... 55 Temperature Measurement and Control ................................................................................................ 56 Humidity Measurement and Control ..................................................................................................... 57 Shaft Speed Measurement ..................................................................................................................... 57 Motor Control ........................................................................................................................................ 57 Heating Cartridge .................................................................................................................................. 58 Data Acquisition System ....................................................................................................................... 58 Safety Shields ........................................................................................................................................ 58
PROTOTYPE DESCRIPTION ................................................................................................................. 59 Temperature Measurement and Heat-Control ....................................................................................... 59 Humidity Measurement ......................................................................................................................... 59
FABRICATION PLAN ............................................................................................................................. 60 Manufacturing ....................................................................................................................................... 60 Modification and Adjustment ................................................................................................................ 62 Assembly of Final Prototype ................................................................................................................. 62 Changes between Final Design and Prototype ...................................................................................... 63
VALIDATION PLAN ............................................................................................................................... 63 VALIDATION RESULTS ........................................................................................................................ 67 DESIGN CRITIQUE ................................................................................................................................. 68
Disassembly ...................................................................................................................................... 68 Power Transmission System ............................................................................................................. 68 Peltier Cooling System ...................................................................................................................... 68 Software and Electronics ................................................................................................................... 69 Force Measurement System Assembly ............................................................................................. 69
Prototype Strengths ............................................................................................................................... 69 Interchangeable Gear System ............................................................................................................ 69 Redesigned Motor and Drive Shaft Stability System ........................................................................ 70 Safety Shielding ................................................................................................................................ 70 Redesigned Test Cup ......................................................................................................................... 70 Drive Shaft Speed Measurement and Motor Control ........................................................................ 70

6
Prototype Weaknesses and Solutions .................................................................................................... 71 LabVIEW Software ........................................................................................................................... 71 Temperature Measurement System ................................................................................................... 71 Force Measurement System .............................................................................................................. 71 Motor Controller Operational Amplifier ........................................................................................... 72 Peltier Cooling System ...................................................................................................................... 72 Cartridge Heating System ................................................................................................................. 72 Stability of Bottle Jack When Shop Press is Highly Loaded ............................................................ 73 Strength of Test Cup Material to Indentations .................................................................................. 73
FUTURE RECOMMENDATIONS .......................................................................................................... 73 Gearbox ................................................................................................................................................. 73 Tool Fixture Drive Shaft Modification ................................................................................................. 74 Hard Material Layer Around Engaging Surface of Test Cup ................................................................ 74 Alternate Heating Source ...................................................................................................................... 74 Improved Safety/Environmental Enclosure Around Test Area ............................................................. 74 Horizontal Constraints on Bottle Jack Cross Beam .............................................................................. 75 DAQ System ......................................................................................................................................... 75
CONCLUSIONS ....................................................................................................................................... 75 ACKNOWLEDGEMENTS ...................................................................................................................... 78 INFORMATION SOURCES .................................................................................................................... 78
Google Web Search/YouTube............................................................................................................... 78 Company Websites ................................................................................................................................ 78 Official Standards .................................................................................................................................. 78 Technical Benchmarks .......................................................................................................................... 79
ADDITIONAL RESEARCH .................................................................................................................... 79 AC Motor .............................................................................................................................................. 79 Gearbox ................................................................................................................................................. 79 Optical Encoder ..................................................................................................................................... 79 Thermocouple........................................................................................................................................ 80
REFERENCES .......................................................................................................................................... 81 APPENDIX A: Bill of Materials ............................................................................................................... 84 APPENDIX B: Description of Engineering Changes since Design Review #3 ........................................ 86 APPENDIX C: Design Analysis Assignment from Lecture ..................................................................... 88 APPENDIX D: Analysis Calculations ...................................................................................................... 95 APPENDIX E: DAQ Specification Sheets ............................................................................................... 98 APPENDIX F: Additional Engineering Drawings and Basic Manufacturing Plans ............................... 111 APPENDIX G: Supplementary Safety Report for Fabrication and Assembly ....................................... 116 APPENDIX H: LabVIEW Encompassing Program (Block Diagram) ................................................... 141 APPENDIX I: Power Electronics Diagram ............................................................................................. 142

7
LIST OF TABLES Table 1: Target Engineering Specifications .............................................................................................. 12 Table 2: Functions Requiring Design of New Concepts ........................................................................... 17 Table 3: Potential Concepts for Functions Requiring Existing Components ............................................ 20 Table 4: Sample Pugh Chart with Idea #5 Selected as Solution to Function ............................................ 21 Table 5: Pugh Chart for Accepting External Energy................................................................................. 22 Table 6: Pugh Chart for Converting Energy to Rotational Motion ........................................................... 23 Table 7: Pugh Chart for Applying Motion to Tool Fixture ....................................................................... 24 Table 8: Pugh Chart for Securing Tool Fixture ......................................................................................... 25 Table 9: Pugh Chart for Securing Specimen ............................................................................................. 27 Table 10: Pugh Chart for Securing Specimen Fixture ............................................................................... 28 Table 11: Pugh Chart for Aligning the Speciment to the Tool in the x-y plane ........................................ 28 Table 12: Pugh Chart for Aligning the Speciment to the Tool in the z-axis ............................................. 29 Table 13: Pugh Chart for Applying Normal Load to Tool Fixture/Specimen Interface ........................... 31 Table 14: Pugh Chart for Applying Lateral Forces to a Sensor ................................................................ 32 Table 15: Pugh Chart for Measuring Lateral Forces ................................................................................. 32 Table 16: Pugh Chart for Measuring Shaft Speed ..................................................................................... 33 Table 17: Pugh Chart for Cooling Lubricant ............................................................................................. 33 Table 18: Pugh Chart for Heating Lubricant ............................................................................................. 34 Table 19: Pugh Chart for Measuring Lubricant Temperature ................................................................... 36 Table 20: Pugh Chart for Heating Water for Humidity Control ............................................................... 36 Table 21: Pugh Chart for Enclosing Water Vapor around the Test Control Volume................................ 37 Table 22: Pugh Chart for Measuring Humidity of Test Environment ....................................................... 38 Table 23: Pugh Chart for Measuring Normal Force .................................................................................. 38 Table 24: Results of Shaft Deflection Calculations .................................................................................. 49 Table 25: Gear Specifications ................................................................................................................... 53 Table 26: Bill of Materials for Gear System ............................................................................................. 53 Table 27: Summary of Material and Cost ................................................................................................. 56 Table 28: Summary of Data Acquisition Products .................................................................................... 58 Table 29: Force Measurement Systems ..................................................................................................... 64 Table 30: Motor Control ........................................................................................................................... 64 Table 31: Temperature Control ................................................................................................................. 65 Table 32: Transmission System ................................................................................................................ 65 Table 33: Full Tests ................................................................................................................................... 66 Table 34: Benchmarking Standards .......................................................................................................... 79 Table 35: Summary of Compressive Blocks and their Corresponding Forces .......................................... 86 Table 36: Summary of Lateral Force Beams and their Corresponding Forces ......................................... 86 Table 37: Function, Objective, and Constraints of Selected Components ................................................ 88 Table 38: Characteristics of Five Possible Materials to be Used as a Compressive Block ....................... 89 Table 39: Characteristics of Five Possible Materials to be Used as a Lateral Force Beam ...................... 90 Table 40: Mass Data for the Two Selected Materials ............................................................................... 90

8
LIST OF FIGURES Figure 1: Twist Compression Test .............................................................................................................. 9 Figure 2: Four-Ball Test ............................................................................................................................ 10 Figure 3: Quality Function Deployment (QFD) Diagram ......................................................................... 14 Figure 4: Functional Decompsition for Twist Compression and Four-Ball Tester ................................... 16 Figure 5: Concept Sketches for Securing Tool Fixture ............................................................................. 18 Figure 6: Concept Sketches for Securing Specimen ................................................................................. 18 Figure 7: Concept Sketches for Securing Specimen Fixture ..................................................................... 19 Figure 8: Concept Sketches for Applying Forces to Sensor ...................................................................... 19 Figure 9: AC Motor CAD Model .............................................................................................................. 22 Figure 10: Example of a Gearbox ............................................................................................................. 23 Figure 11: Shaft Model ............................................................................................................................. 24 Figure 12: Interchangeable Threaded Collar Sketch ................................................................................. 25 Figure 13: Specimen Fixture with Four-Ball Test Setup ........................................................................... 26 Figure 14: Specimen Fixture with TCT Setup .......................................................................................... 26 Figure 15: Example of tooth from speciment fixture (blue) fitting into groove of bottom plate .............. 27 Figure 16: Ball Joint and Two Plates for x-y Plane Alignment ................................................................ 28 Figure 17: Two Plates with Four Slots for z-axis Alignment .................................................................... 29 Figure 18: Combined Two Plate Alignment Fixture ................................................................................. 30 Figure 19: 25-ton Omega Shop Press ........................................................................................................ 30 Figure 20: Plate with Deflecting Beam for Measuring Lateral Forces...................................................... 31 Figure 21: Typical Strain Gauge Attached to a Beam ............................................................................... 32 Figure 22: Typical Optical Encoder .......................................................................................................... 33 Figure 23: Peltier Cooler ........................................................................................................................... 34 Figure 24: Resistive Heat Coils ................................................................................................................. 35 Figure 25: A Typical Thermocouple ......................................................................................................... 35 Figure 26: Clear Plastic Case .................................................................................................................... 37 Figure 27: Humidity Meter ....................................................................................................................... 37 Figure 28: Compressive Material Between Hydraulic Press and bottom Alignment Plate ....................... 38 Figure 29: Helical Gears ........................................................................................................................... 39 Figure 30: Tool Fixture ............................................................................................................................. 39 Figure 31: Full Prototype .......................................................................................................................... 40 Figure 32: Cantilevered Shaft.................................................................................................................... 42 Figure 33: Shaft Between Long Bearings ................................................................................................. 42 Figure 34: Lateral Force Beam Model ...................................................................................................... 45 Figure 35: Lateral Force Beam Bracket Model ......................................................................................... 45 Figure 36: Compressive Block Model....................................................................................................... 46 Figure 37: Specimen Cup Teeth Model for Shearing ................................................................................ 46 Figure 38: Heat Transfer Model ................................................................................................................ 47 Figure 39: Metal Sphere in Twist Compression Test Alignment Plate Setup ........................................... 47 Figure 40: Twist compression test alignment plate stability concerns showing (a) maximum annulus
offset angle and (b) maximum vertical axes offset ................................................................................... 48 Figure 41: Maximum opening between alignment plates and offset angle ............................................... 48 Figure 42: Maximum offset of annulus axis from ball axis ...................................................................... 49 Figure 43: Numbered shafts that could possibly deflect ........................................................................... 50 Figure 44: Specimen cup and lateral force measurement system assembly .............................................. 55 Figure 45: Mass of Emissions from PVC and Polybutadiene E Rubber ................................................... 91 Figure 46: EcoIndicator 99 Damage Classifications ................................................................................. 91 Figure 47: Damage Meta – Categories ...................................................................................................... 92 Figure 49: EcoIndicator 99 Total Point Values ......................................................................................... 93 Figure 50: Water Jet Cutting Specifications .............................................................................................. 94
9
INTRODUCTION
In the field of Tribology, the science and technology of interacting surfaces in relative motion, there are
many test procedures used to study lubrication and wear properties. We have been requested to focus on
two standard tests: the Twist Compression Test (TCT) and Four-Ball Test. Currently, two separate
machines are used to perform the tests in industry. Furthermore, both machines are extremely expensive.
This poses a significant problem since little funding is available for University of Michigan professor
Gordon Krauss, the sponsor of this project. With this limited funding, our goal is to spend it as
effectively as possible. It was requested of a previous mechanical engineering student group to design an
efficient and inexpensive machine that incorporates both the Four-Ball test and the TCT. The team
developed a preliminary prototype but it is inoperable at this time due to safety concerns and lack of
completeness. The student team has since moved on and the project has been passed on for re-design and
enhancement. The goal of this project is to re-design, prototype, and test a machine that will perform all
standard test requirements and in some cases outperform current standards in a safe and cost effective
manner. If this project is completed and meets the required specifications, this apparatus could be used in
the industry.
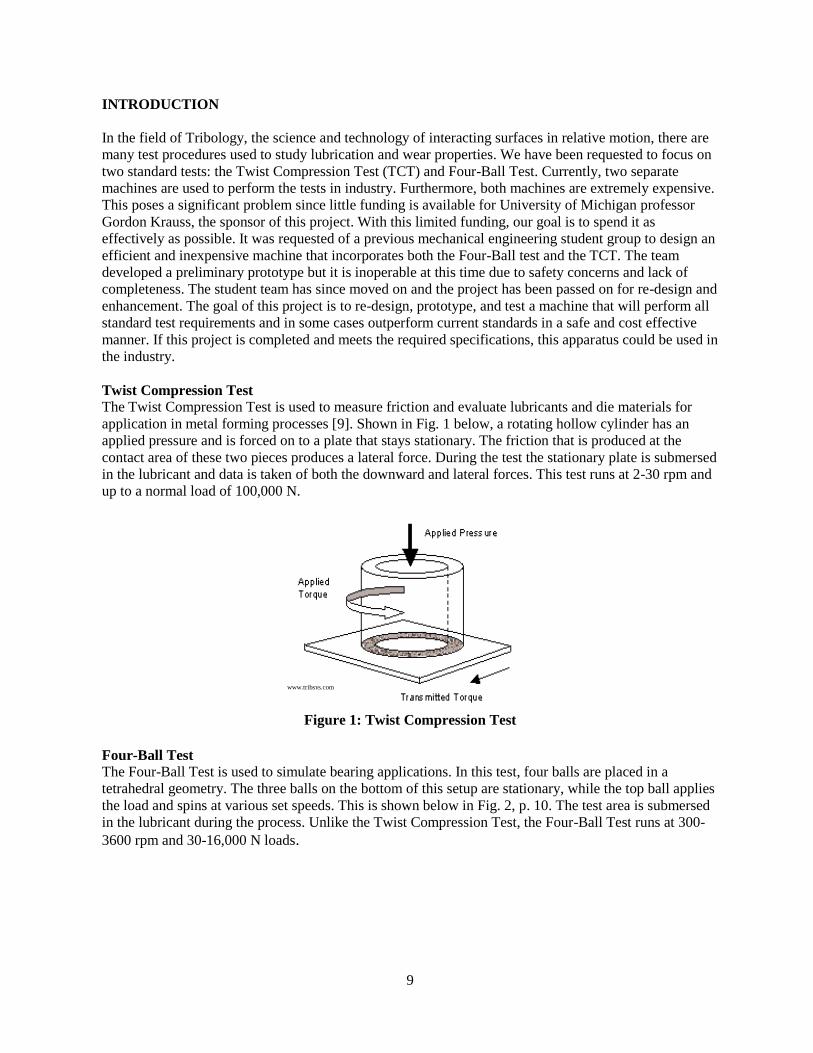
Twist Compression Test
The Twist Compression Test is used to measure friction and evaluate lubricants and die materials for
application in metal forming processes [9]. Shown in Fig. 1 below, a rotating hollow cylinder has an
applied pressure and is forced on to a plate that stays stationary. The friction that is produced at the
contact area of these two pieces produces a lateral force. During the test the stationary plate is submersed
in the lubricant and data is taken of both the downward and lateral forces. This test runs at 2-30 rpm and
up to a normal load of 100,000 N.
Figure 1: Twist Compression Test
Four-Ball Test
The Four-Ball Test is used to simulate bearing applications. In this test, four balls are placed in a
tetrahedral geometry. The three balls on the bottom of this setup are stationary, while the top ball applies
the load and spins at various set speeds. This is shown below in Fig. 2, p. 10. The test area is submersed
in the lubricant during the process. Unlike the Twist Compression Test, the Four-Ball Test runs at 300-
3600 rpm and 30-16,000 N loads.
www.tribsys.com

10
Figure 2: Four-Ball Test
ENGINEERING SPECIFICATIONS
To begin determining the engineering specifications for the project, an initial meeting was organized
with our sponsor, Professor Krauss. In this meeting, Professor Krauss shared his concerns with the
existing model, requirements and his desires for the redesigned model. By combining our customer‟s
requirements and desires with the ASTM standards and technical benchmarking results from the
literature search, non –safety engineering specifications were established. The customer‟s safety
concerns with the existing model were then broken down into quantifiable engineering parameters, and
further literature search allowed these parameters to be translated into additional engineering
specifications. The level of importance of each requirement and specification was also gauged for later
use in the formation of the Quality Function Deployment (QFD) diagram. A complete table of the
engineering specifications for the redesigned model can be seen in Table 1, p. 12.
Customer Requirements
The customer‟s main concerns with the existing model focused on its unsafe operational state.
Specifically, the customer was concerned with the stability of the shaft that turns the interchangeable test
fixture (hereafter referred to as the shaft), the number of moving parts that are covered from contact, and
the ability of these covers to withstand catastrophic failures. In the current model, the shaft experiences
deflections and oscillation due to the lack of constraints holding it in place and its pinned, multi-shaft
design. These effects are very undesirable because they inhibit torque transmission along the shaft and
could be extremely dangerous if the deflections become large enough to cause the shaft to yield or
fracture. In this case, the current model lacks any safety covers around the shaft that might control the
damage. Safety covers are also missing from the gear and motor setup, and the safety covers that are
present surrounding the test area seem to lack the required fracture toughness to reduce the effects of
failure. Besides containing failure, adequate safety covers over these moving parts would also protect
foreign objects from interrupting the operation of the model.
The customer also had both qualitative requirements and quantitative desires for the redesigned model.
The qualitative requirements included meeting the industry-accepted testing standards for both the four-
ball and twist compression tests in the areas of shaft rotational speed, applied normal load, test fixture
geometry, and test area temperature control and measurement. In addition, the customer required that the
redesigned model be designed at low cost and be able to measure humidity in the test area. With the
hope of being able to outperform industrial machines, the customer also had desires for both the
redesigned model and the specific four-ball and twist compression tests. The redesigned model should be
able to measure and control test surface temperatures of 0-150 ºC, measure and control relative humidity
from 0-100% at 10% intervals, and cost a maximum of 10% of the cost of an industrial four-ball or twist

11
compression tester. The four-ball test should be able to operate at rotational speeds up to 3600 rpm and
normal forces of 0.5-2 times the accepted testing standards, while the twist compression test should be
able to operate at rotational speeds up to 30 rpm and normal forces up to 100 kN.
Establishing Testing Standards and Benchmarking
To translate the qualitative customer requirements into quantitative engineering targets, a literature
search was performed to obtain the industry-accepted testing standards for the two tests. As detailed in
the Information Sources section (p. 78), four ASTM standards that gave shaft speed, normal load, and
test surface temperature ranges were found relating to the four-ball test. Two industrial four-ball test
machines, one manufactured by Koehler Instruments and one by Falex Corporations, were also studied
to obtain their normal load and shaft speed capabilities. Because the twist compression test is relatively
new to the tribology industry, no complete and published ASTM standards were available for study.
Instead, because Tribsys is the only company that produces twist compression test machines, the shaft
speed, normal load, and test surface temperature capabilities of their machines were taken to be the
testing standards of the twist compression test. A table of the test standard and benchmarking results can
be seen in Table 2, p. 17.
Safety Quantification
Each of the customer‟s safety concerns with the existing model was looked at individually to assess the
engineering principles behind each issue. The main reason for the instability of the shaft on the existing
model is the amount of beam deflection that it undergoes from the force of the motor. This beam
deflection will be minimized in the redesigned model, with a target specification to follow, after an
analysis of the forces and moments applied to the shaft from the gear and motor setup. Concerning the
moving components of the existing model, two quantifiable specifications were created. Because the
moving components are likely to transfer their high temperatures to the external parts of the existing
model, the redesigned model will have external temperatures of less than 38 ºC (100 ºF). This
temperature will allow for a safe enough time period of human contact with the external components to
avoid burning. Also, because of the dangers of failure of the moving components and their interruption
while operating, 100% of the moving parts of the redesigned model will have safety coverings. These
safety coverings will also require high fracture toughness so that they contain any dangerous shrapnel in
case of failure. Target specifications for fracture toughness will follow after force analyses of each
component after potential failure are undergone.
Target Engineering Specifications
Based on our sponsor‟s requirements, literature search, benchmarking, and safety quantification, we
have developed a complete list of engineering specifications. Some specifications are specific to only the
Four-ball test or the TCT, while others are indicative of the device itself. The complete list of
specification targets can be seen in Table 1, p. 12.
The target shaft speed for the Four-ball test is based on ASTM standard speeds ranging from 600 to 1760
rpm [1-5], and the fact that our customer desires that the device be capable of producing speeds that are
half to double those of the standard tests. Therefore, the speeds range from 300 to 3600 rpm fort the
Four-ball test. For the TCT, the shaft speed target of 2 to 30 rpm was set by standard tests used by
Tribsys, Inc. and our customer requirements [9].
Similar to shaft speed target specifications, normal force target specifications for the Four-ball test were
obtained from ASTM standard normal forces ranging from .059 to 7.84 kN [1-5] and our customer
requirement of producing half to double the normal forces used in standard tests. Therefore, our target
for normal force in the Four-ball test is from 0.03 to 16 kN. For the TCT, the normal force target of up to
100 kN was set by standard tests used by Tribsys, Inc. and our customer requirements [9].
12
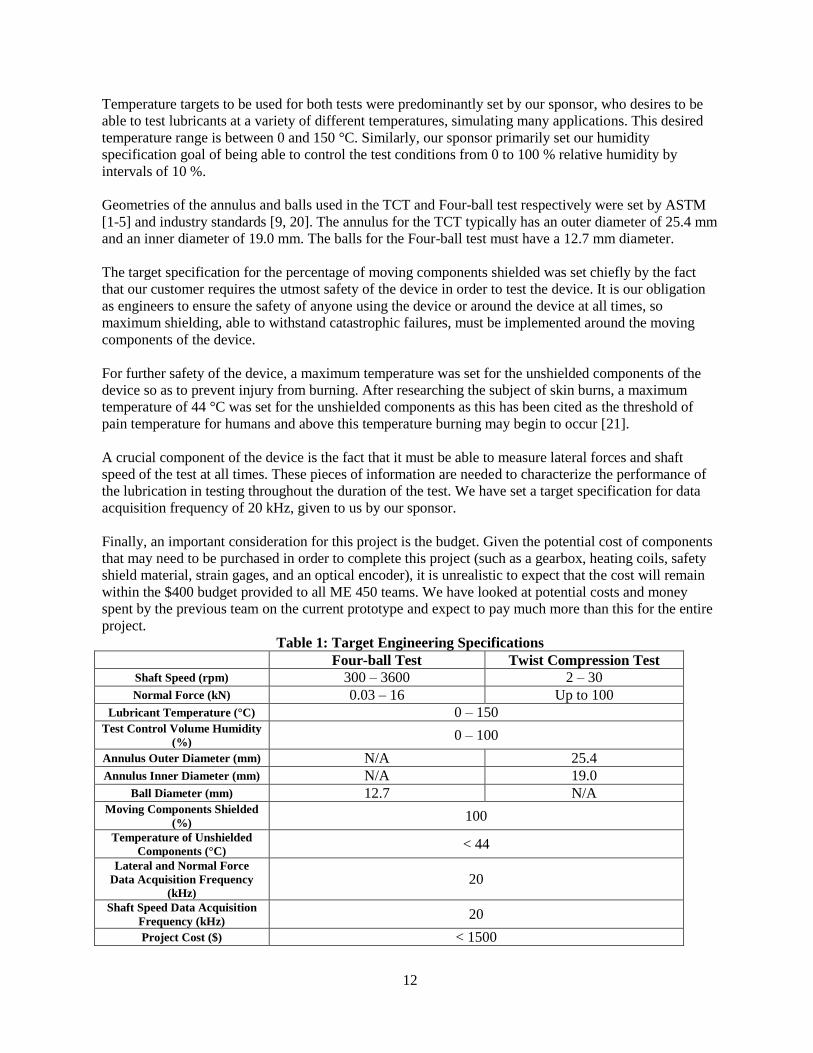
Temperature targets to be used for both tests were predominantly set by our sponsor, who desires to be
able to test lubricants at a variety of different temperatures, simulating many applications. This desired
temperature range is between 0 and 150 °C. Similarly, our sponsor primarily set our humidity
specification goal of being able to control the test conditions from 0 to 100 % relative humidity by
intervals of 10 %.
Geometries of the annulus and balls used in the TCT and Four-ball test respectively were set by ASTM
[1-5] and industry standards [9, 20]. The annulus for the TCT typically has an outer diameter of 25.4 mm
and an inner diameter of 19.0 mm. The balls for the Four-ball test must have a 12.7 mm diameter.
The target specification for the percentage of moving components shielded was set chiefly by the fact
that our customer requires the utmost safety of the device in order to test the device. It is our obligation
as engineers to ensure the safety of anyone using the device or around the device at all times, so
maximum shielding, able to withstand catastrophic failures, must be implemented around the moving
components of the device.
For further safety of the device, a maximum temperature was set for the unshielded components of the
device so as to prevent injury from burning. After researching the subject of skin burns, a maximum
temperature of 44 °C was set for the unshielded components as this has been cited as the threshold of
pain temperature for humans and above this temperature burning may begin to occur [21].
A crucial component of the device is the fact that it must be able to measure lateral forces and shaft
speed of the test at all times. These pieces of information are needed to characterize the performance of
the lubrication in testing throughout the duration of the test. We have set a target specification for data
acquisition frequency of 20 kHz, given to us by our sponsor.
Finally, an important consideration for this project is the budget. Given the potential cost of components
that may need to be purchased in order to complete this project (such as a gearbox, heating coils, safety
shield material, strain gages, and an optical encoder), it is unrealistic to expect that the cost will remain
within the $400 budget provided to all ME 450 teams. We have looked at potential costs and money
spent by the previous team on the current prototype and expect to pay much more than this for the entire
project.
Table 1: Target Engineering Specifications
Four-ball Test Twist Compression Test
Shaft Speed (rpm) 300 – 3600 2 – 30
Normal Force (kN) 0.03 – 16 Up to 100
Lubricant Temperature (°C) 0 – 150 Test Control Volume Humidity
(%) 0 – 100
Annulus Outer Diameter (mm) N/A 25.4
Annulus Inner Diameter (mm) N/A 19.0
Ball Diameter (mm) 12.7 N/A Moving Components Shielded
(%) 100
Temperature of Unshielded
Components (°C) < 44
Lateral and Normal Force
Data Acquisition Frequency
(kHz) 20
Shaft Speed Data Acquisition
Frequency (kHz) 20
Project Cost ($) < 1500

13
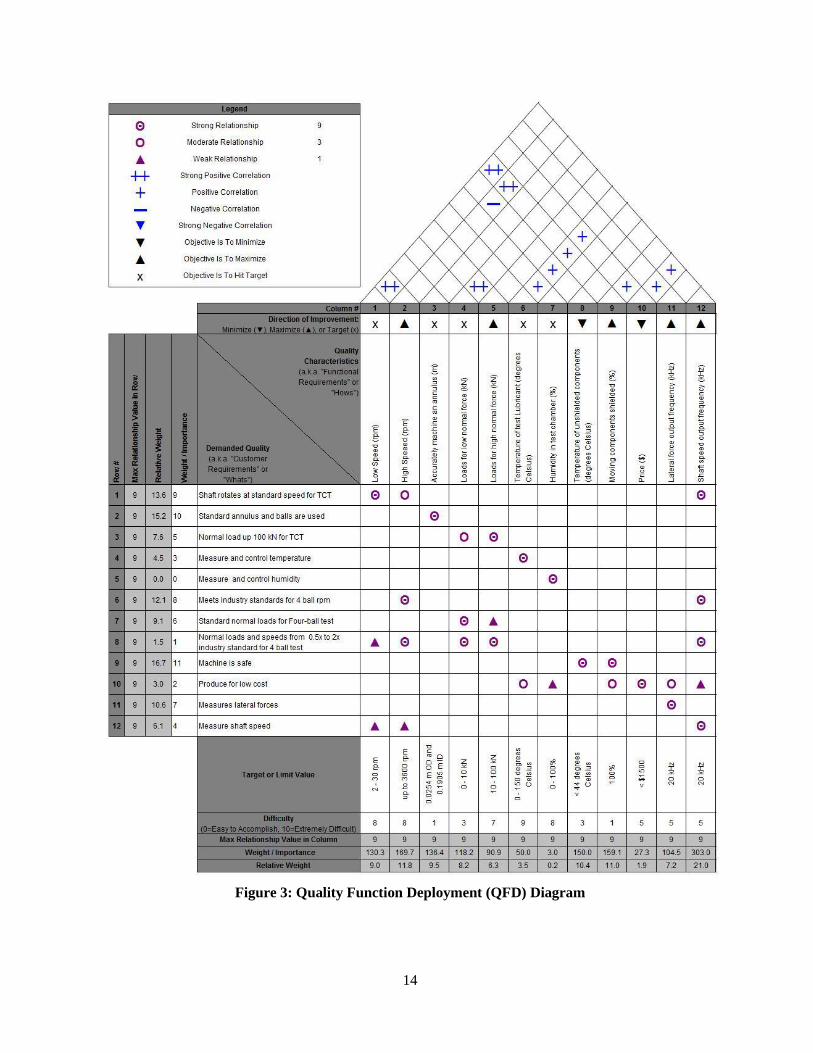
Quality Function Deployment (QFD)
The Quality Function Deployment (QFD) diagram, shown in Fig. 3, p. 14, was used as a tool to prioritize
each engineering specification target we have set (bottom of QFD). It can be seen from the
Weight/Importance row at the bottom of the QFD that the shaft speed measurement output is extremely
important to the device. Without the shaft speed output, no information about the performance can be
validated due to the fact that the speed wouldn‟t be able to be verified. Along with the measurement of
the shaft speed, the ability of the device to reach high shaft speeds is crucial. Without the capability of
reaching high speeds, the Four-ball test would be inoperable and thus we would have failed at combining
the two tests into one device. The next most important specifications deal with the safety of the device. It
is necessary that the moving components are shielded and the temperature of any unshielded (static)
components is within the threshold of pain and burning of 44 °C. Of midrange importance for the device
is accuracy of the geometries of the annulus and balls for the TCT and Four-ball tests, the low speed rpm
for performing the TCT, producing low loads used in the Four-ball test, and obtaining the lateral force
output. These midrange importance target specifications are still quite important in order to say that we
have created a device that successfully integrates both the TCT and Four-ball tests, but these get trumped
by the sheer necessity of safety, shaft speed measurement and producing high normal force. The
remaining target specifications of controlling and measuring the temperature of lubricants, keeping costs
low, and controlling the humidity of the test control volume, although desirable, are not critical to the
end result of the project. If we are unable to implement the environmental control precisely or keep the
costs below our budget, but achieve all other target specifications, the device would at least be functional
and further improvements could be made relatively easily.
The QFD is also a valuable tool in that difficulty ratings can be placed within it for each target
specification. It can be seen that the most difficult specification to achieve for this project is the
temperature control of the lubricant. This control involves the use of a computer controller, precise
implantation of both heating and cooling elements, and careful monitoring. It will be very hard to
accurately adjust temperature and achieve the extreme ends of the temperature range. Slightly less
difficult than temperature control will be achieving the appropriate shaft speeds and controlling them, as
well as controlling humidity. It is very important to us and our sponsor that the motor is correctly
connected to our driveshaft for proper functionality. Without a proper connection, it will be extremely
hard to safely run the device and obtain the correct shaft speeds. The humidity control will be difficult to
control due to the fact that we are simply heating water to form vapor in the test volume and are not
continuously measuring and adjusting the heating coil for a specified humidity. Another fairly difficult
target specification to achieve will be the maximum normal forces needed for the TCT. These loads are
extremely high and introduce large stresses to the entire device. It is very important that we design for
structural integrity and safety so that the device will be sturdy during high load conditions.
Other specifications, such as obtaining correct lateral force outputs, shaft speed outputs and keeping the
cost under budget will be of medium difficulty with careful planning and wise use of resources on and
off campus. Easier yet will be keeping the temperature of unshielded components low (since we don‟t
expect much other than the lubricant and water for humidity control to get hot), obtaining low normal
loads for the Four-ball test since the press should be very sturdy with low loading, machining the
annulus with high accuracy and shielding all moving components.
14
Figure 3: Quality Function Deployment (QFD) Diagram
15
CONCEPT GENERATION AND SELECTION PROCESS
After establishing our main engineering specifications from our sponsor‟s customer requirements and
ranking their relative levels of importance in the QFD, we began the concept generation and selection
process of our prototype redesign. The first step in this process was to create a functional decomposition
of our desired prototype to expose the full list of functions that we needed to account for in our concept
generation. We based this loosely on the current prototype, but made sure to list the functions generally
so that we would not be biased towards the current methods of satisfying them. After we had developed
a list of these functions, we began to brainstorm ideas to fulfill them. This stage included disassembly of
the current prototype to more closely examine their implemented concepts, as well as research of other
methods to satisfy the functions. Because our list of functions was extensive, we decided to develop
several concepts and choose the best one for each function individually. The best concepts were judged
using weighted selection criteria, and after checking to ensure that they could all coexist in a full design,
they were put together to form our alpha design. This section will explain our concept generation and
selection process in greater detail, as well as provide renderings of our individual chosen concepts and
the assembled alpha design.
Functional Decomposition
In order to identify the functions that the device needs to be able to perform, a functional decomposition
was developed. Through literature reviews, in-depth research, and sponsor meetings, the functional
decomposition, Fig. 4, p. 16, was made to capture the major functions that the device will eventually
need to be able to do. The inputs (energy, material, or signal) are listed on the left, and likewise the
outputs are listed on the right. The center box contains the many functions that the device needs to be
able to perform. The functions that are highlighted yellow are the functions that required concept
generation selected solutions for and will describe in further detail throughout this report. These
functions are mainly mechanically based or deal with sensing the forces, shaft speed, and climate
conditions that are necessary outputs from the device. The five functions that have not been highlighted
are not functions that we can choose at this point. Four of them deal with computer control and will need
to be analyzed further at a later date; these include sensing failure of the lateral force sensor, stopping the
motor in the case of failure, and checking the temperature and humidity (in a closed loop feedback
system). The fifth is the function of actually applying thermal energy to the lubricant. Because applying
thermal energy is more of an effect than an actual function, we have incorporated this function into the
convert external energy to thermal energy function.

16
Figure 4: Functional Decompsition for Twist Compression and Four-Ball Tester
Concept Generation
The functional decomposition shows that we have generated 22 total functions for our device. Out of
these, 17 were highlighted and researched for this report. However, two of these 17 are actually
combined functions with two parts. The first is the conversion of external energy to thermal energy. This
is really two functions because we need the device to be able to cool the lubricant down to 0°C and heat
the lubricant to 150°C. The second combined function is the alignment adjustment. There are two
functions involved due to the fact that we need to account for x-y plane adjustment for the TCT (making
sure the annulus is flush with the plate) and z-axis adjustment for the Four-ball test (making sure the
center of the bottom three balls is aligned with the center of the top ball). Because of these two
combination functions, we are essentially dealing with 19 total functions, excluding the computer
programming and application of thermal energy to the lubricant. Potential concepts that can satisfy these
19 functions conveniently split up into two distinct categories: new concepts that we must design and
manufacture and existing concepts that we must research and purchase.

17
New Concepts: The functions that needed to be satisfied by the design of new concepts were the ones
that required components specific to our prototype. A list of these functions is shown in Table 2, below.
Each team member developed and sketched a few concepts for these functions, and after gauging their
feasibility of manufacturing and functionality in our application, we compiled a list of the realistic
concepts.
Table 2: Functions Requiring Design of New Concepts
Function Component on
Current Model Function
Component on
Current Model
Apply motion to tool
fixture Keyed shaft
Alignment of
specimen tool (xy-
plane)
Ball joint
Secure tool fixture Removable rod
through tool fixture
Alignment of
specimen tool (z-
axis)
Four slots
Secure specimen Square cut and ball
groove
Apply lateral forces to
sensor
Beam on beam
(sensor on support
structure beam)
Secure specimen
fixture Bolts through cup
Note: bolded items denote components that were deemed suitable for keeping in redesign
Our conception of ideas was helped greatly by our disassembly of the current prototype, which allowed
us to view the concepts implemented for some of our functions by the last team. Viewing the pros and
cons of the current designs played a large role in our selection of which concepts we should keep for our
redesign and allowed us to produce improve concepts for the other functions. The current designs that
we felt were suitable for keeping in our redesign are bolded in Table 2, above. Several design sketches
for methods to satisfy the other functions are shown in Figs. 5-8.
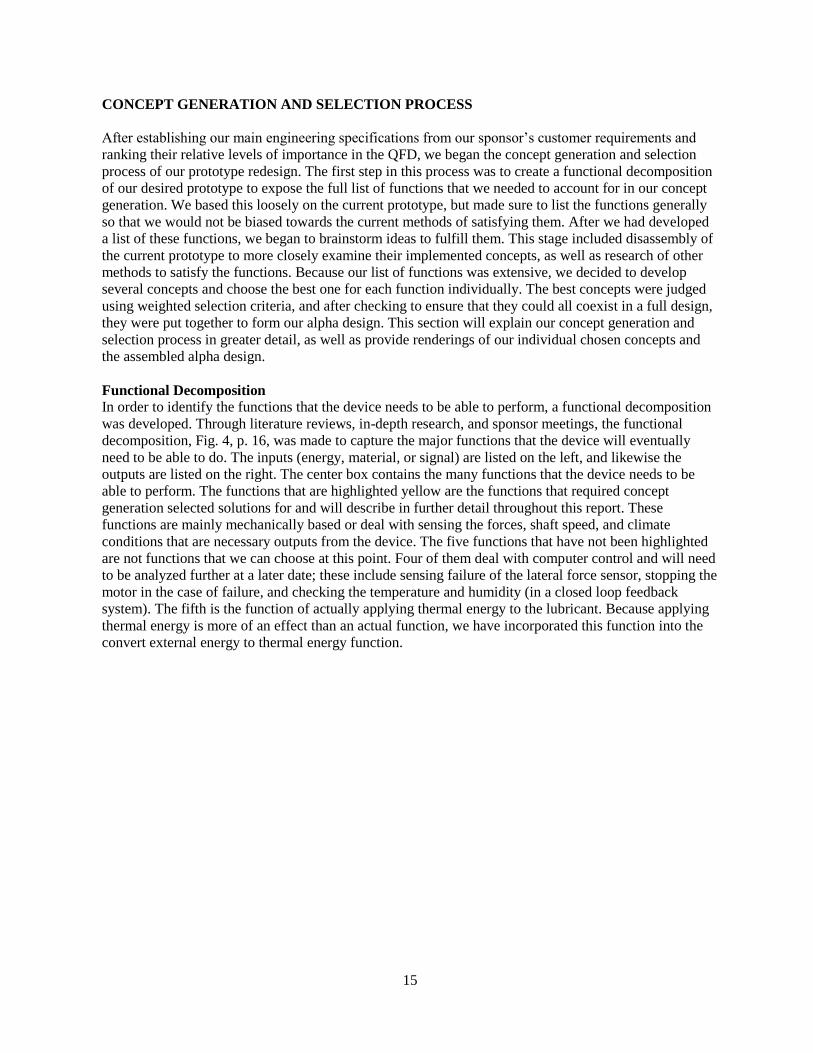
Secure Tool Fixture: The design for securing the tool fixture on the current model has a through hole in
the shaft and the tool fixture into which a rod is placed to hold the fixture in place until the device is
loaded. Because we felt that this requirement of removing the rod while the device was loaded was
unsafe, we designed other concepts that did not implement this feature. Most of the designs center
around securing the tool fixture into the shaft using threads, whether they be in a collar outside the shaft
or on the tool fixture itself. Another idea was a variation of the current model that used a screw and bolt
to hold the tool fixture in the shaft, with the main difference being that the bolt remained in place during
the test.
18
Figure 5: Concept Sketches for Securing Tool Fixture
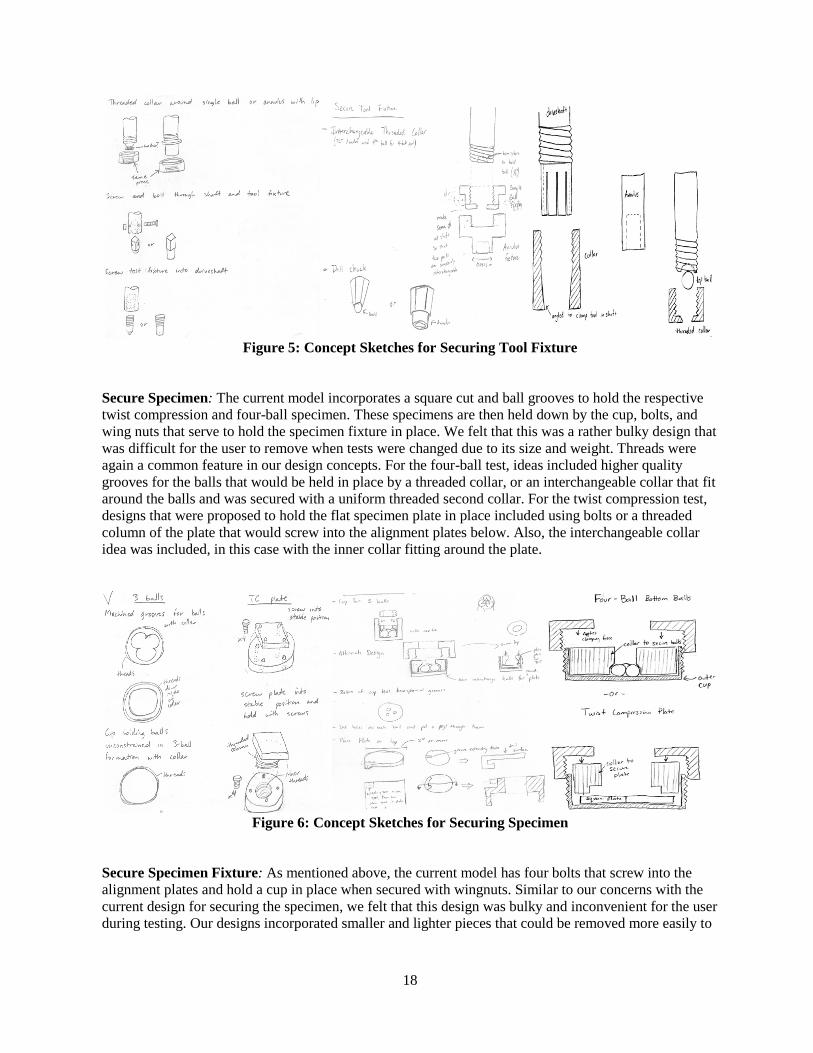
Secure Specimen: The current model incorporates a square cut and ball grooves to hold the respective
twist compression and four-ball specimen. These specimens are then held down by the cup, bolts, and
wing nuts that serve to hold the specimen fixture in place. We felt that this was a rather bulky design that
was difficult for the user to remove when tests were changed due to its size and weight. Threads were
again a common feature in our design concepts. For the four-ball test, ideas included higher quality
grooves for the balls that would be held in place by a threaded collar, or an interchangeable collar that fit
around the balls and was secured with a uniform threaded second collar. For the twist compression test,
designs that were proposed to hold the flat specimen plate in place included using bolts or a threaded
column of the plate that would screw into the alignment plates below. Also, the interchangeable collar
idea was included, in this case with the inner collar fitting around the plate.
Figure 6: Concept Sketches for Securing Specimen
Secure Specimen Fixture: As mentioned above, the current model has four bolts that screw into the
alignment plates and hold a cup in place when secured with wingnuts. Similar to our concerns with the
current design for securing the specimen, we felt that this design was bulky and inconvenient for the user
during testing. Our designs incorporated smaller and lighter pieces that could be removed more easily to
19
hold the specimen fixture in place. The designs were secured with either multiple set screws, machined
teeth on the bottom of the fixture, or a large threaded collar.
Figure 7: Concept Sketches for Securing Specimen Fixture
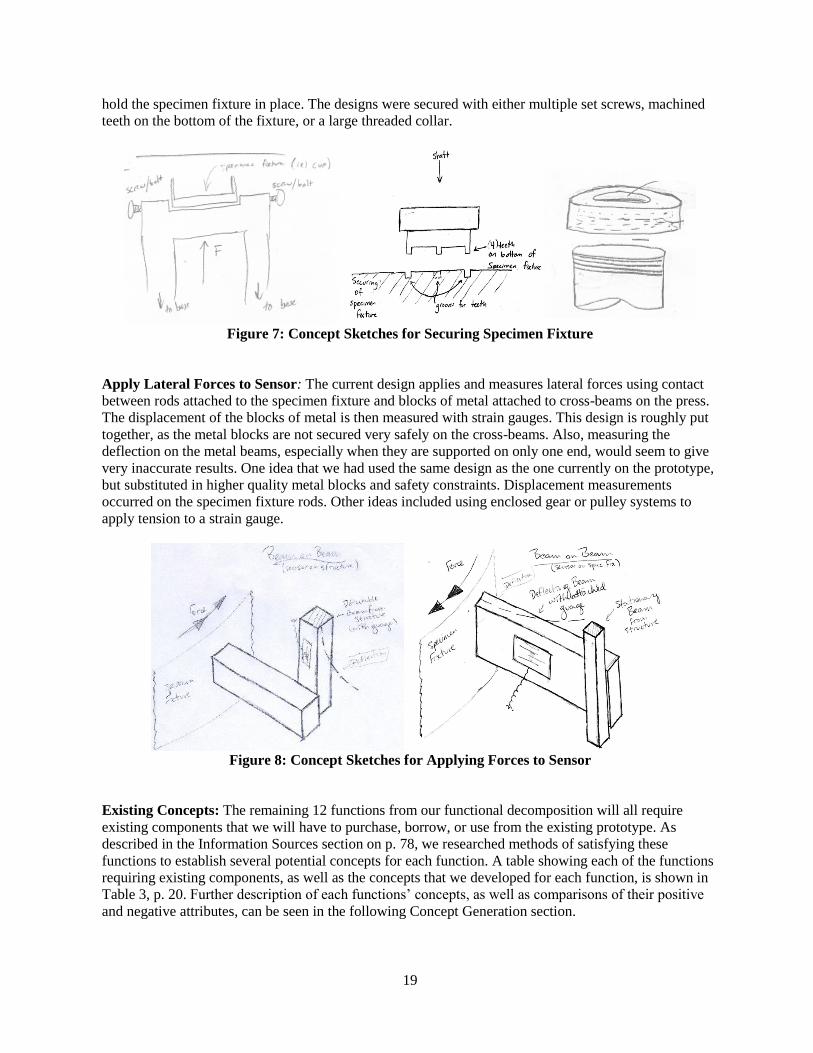
Apply Lateral Forces to Sensor: The current design applies and measures lateral forces using contact
between rods attached to the specimen fixture and blocks of metal attached to cross-beams on the press.
The displacement of the blocks of metal is then measured with strain gauges. This design is roughly put
together, as the metal blocks are not secured very safely on the cross-beams. Also, measuring the
deflection on the metal beams, especially when they are supported on only one end, would seem to give
very inaccurate results. One idea that we had used the same design as the one currently on the prototype,
but substituted in higher quality metal blocks and safety constraints. Displacement measurements
occurred on the specimen fixture rods. Other ideas included using enclosed gear or pulley systems to
apply tension to a strain gauge.
Figure 8: Concept Sketches for Applying Forces to Sensor
Existing Concepts: The remaining 12 functions from our functional decomposition will all require
existing components that we will have to purchase, borrow, or use from the existing prototype. As
described in the Information Sources section on p. 78, we researched methods of satisfying these
functions to establish several potential concepts for each function. A table showing each of the functions
requiring existing components, as well as the concepts that we developed for each function, is shown in
Table 3, p. 20. Further description of each functions‟ concepts, as well as comparisons of their positive
and negative attributes, can be seen in the following Concept Generation section.

20
Table 3: Potential Concepts for Functions Requiring Existing Components
Function Concept 1 Concept 2 Concept 3 Concept 4 Concept
5
Concept
6
Accept
external
energy
AC motor DC Motor
Internal
combustion
engine
Hand crank Wind
mill
Convert
energy to
rotational
motion
Chain drive Belt drive
Continuously
variable
transmission
Gear-to-
gear (spur)
Gear-to
gear
(helical)
Gear
box
Apply
normal load
to specimen
Hydraulic/
Pneumatic
press
Free weights Thermal
expansion
Measure
lateral
forces
Strain gauges Load cell Piezoresistive
strain gauges
Measure
shaft speed
Optical
encoder
Contact
tachometer
Laser
Tachometer
Cool
lubricant Peltier coolers
Refrigeration
cycle
Pump
gas/liquid
Heat
lubricant Peltier coolers Fire
Resistive
heat coil
Conductive
material
(heat
recycling)
Measure
lubricant
temperature
Thermocouple Mercury
thermometer Thermistor
Resistive
temperature
detector
Heat water
(humidity) Fire
Resistive
heat coil
Reverse
Peltier
coolers
Enclose
water vapor
Transparent
box Wooden box Metal box
Measure
humidity Hygrometer
Humidity
meter
Measure
normal
force
Compressive
material
Internal
beam
deflection
Compressive
load cell
Pugh Charts
For selecting which idea would be best, we had to use some sort of system for selection that allowed us
to analyze each individual function. The most logical way we knew of to accomplish this was to use
Pugh Charts for each of the 19 functions.
Our Pugh Charts consist of a column of selection criteria that are weighted to the needs of the project
and columns of each idea for the function in question. The ideas in the columns were scored and the
scores were multiplied by the weight of each selection criteria. The sums of the weighted scores for each
idea were compared and the highest scoring idea was deemed the desired solution to the function. A
sample Pugh Chart outline is shown in Table 4, p.21. The selection criteria and scores are listed.

21
Table 4: Sample Pugh Chart with Idea #5 Selected as Solution to Function
Function
Weight Idea #1 Idea #2 Idea #3 Idea #4 Idea #5
Safety 9 -2 -1 0 1 2
Cost 7 -2 -1 0 1 2
Manufacturability 7 -2 -1 0 1 2
Functionality 7 -2 -1 0 1 2
Ease of Operation 5 -2 -1 0 1 2
Maintenance 3 -2 -1 0 1 2
Environmental Impact 1 -2 -1 0 1 2
Total Score -78 -39 0 39 78
As seen in this sample Pugh Chart, we developed seven selection criteria: Safety, Cost,
Manufacturability, Functionality, Ease of Operation, Maintenance, and Environmental Impact. A weight
was given to each of the selection criteria and this weight indicated the relative importance of the criteria
to the overall scope of the project. Due to the fact that the device is practically useless if it is not safe, we
gave safety the top priority on the criteria list. The point of the project is to produce a machine that can
perform industry quality tests for a fraction of the price, therefore, the cost of the device was considered
to be the second most important criterion. Tied with cost are manufacturability and functionality of the
device with a weight of seven each. Since we are all students and have limited experience in
manufacturing and machining, and that time is very limited for the project, it is imperative that the
device is easy to manufacture and assemble. Furthermore, along with designing for manufacturability,
we are very concerned with designing for functionality. We have set ambitious goals (along with our
sponsor) for the performance of the device and in order to successfully replicate industry tests, the device
must be designed with functionality in mind. Following cost, manufacturability and functionality in the
list of selection criteria is the ease of operation of the device. Since the device is being designed and built
by a student group for a fraction of the price of industry built machines, ease of operation is of lesser
importance than the functionality and manufacturability. Some things that industry machines have are
rather luxurious and simply unnecessary for our goals to be met. Some intricacies can be sacrificed on
our design and therefore we gave ease of operation a weight of 5, in the middle of the list. Along those
same lines, the maintenance and environmental impact of the device are of little importance to us since
we are only building one prototype machine. Since there will only be one device, it won‟t be an
insurmountable task to repair it and the environmental impact will not have to be optimized since we are
not mass producing it. Therefore, we gave maintenance a weight of 3 and environmental impact a weight
of 1, making it the least important criterion.
After coming up with our criteria and weights, we had to think of a way to score the various ideas listed
for each function. To do this, we decided to rank each idea on a scale of -2 to 2 for each of the listed
criterion. A -2 indicates that the idea negatively meets the criterion to a high degree. A -1 indicates that
the idea somewhat negatively meets the criterion. A 0 indicates that the idea neither positively nor
negatively meets the criterion. A +1 indicates that the idea somewhat positively meets the criterion. A +2
indicates that the idea positively meets the criterion to a high degree. The ranking was then multiplied by
the weight of the criterion and the sum of all rankings and criteria weights were added and totaled on the
bottom of the chart beneath each idea. The idea with the highest total was chosen as the best solution for
each function that needed to be met. In the example Pugh chart in Table 4, above, the 5 rankings are
demonstrated for five ideas and the idea with the highest total is highlighted green, meaning it is the
selected idea. In the example, the chosen idea is Idea #5.

22
Concept Selection
The example Pugh chart described in the previous section was used in selecting all of our 19 function‟s
solutions. This section will list all of the functions associated with our device and explain how we
arrived at our chosen solution and how that solution works to achieve the desired function.
Accept External Energy: Last semester‟s team used an AC motor to accept their external energy and
using the Pugh chart below, we compared this motor to other possible sources of energy. The internal
combustion engine, hand crank, and wind mill were our extravagant ideas. The internal combustion
engine is too unsafe for our working environment and hard to operate and maintain. The wind mill
would be too expensive, unsafe for our working area and lacking in functionality. Even though the hand
crank came in second place, we concluded it wouldn‟t be easy to produce the loads we needed by
cranking it by hand. It would also cost money and take time to design and manufacture it. Between the
AC and DC motor, we decided to use the AC motor. The main deciding factor was that the AC was
already being used by the previous team and it worked and met the specifications that it needed to
(speed, etc.). Changing the AC motor to a DC motor would cost us lots of time, money and energy. As
long as the AC motor still works there is no need to change it. Figure 9, below shows the current AC
motor.
Figure 9: AC Motor CAD Model
Table 5: Pugh Chart for Accepting External Energy
Weight AC Motor DC
Motor
Internal
Combustion
Engine
Hand
Crank
Wind
Mill
Safety 9 -1 -1 -2 1 0
Cost 7 -1 -1 0 1 -1
Manufacturability 7 2 2 2 0 1
Functionality 7 2 1 1 -1 0
Ease of Operation 5 2 2 -2 1 2
Maintenance 3 2 2 -2 1 1
Environmental Impact 1 1 1 -2 2 2
Total Score 29 22 -15 19 15

23
Convert Energy to Rotational Motion: During our brainstorming process, we developed six different
ideas for converting the energy produced by our power source into rotational motion to be applied to the
tool (top ball of Four-ball test or annulus of TCT). The previous team‟s prototype utilizes a chain drive
system, so we considered this as a contender for our solution. We thought of switching out the chain for
a belt to make a belt drive system, using a Continuously Variable Transmission (CVT) system, using
conventional gears with either vertical or slanted teeth, or using a pre-fabricated gear box. After ranking
all of these ideas in a Pugh chart, shown in Table 6, below, we came to the conclusion that the gear box
would be the best way to get rotational motion from our energy source since it would be safe, easy to
manufacture due to the fact that we would purchase it, and function well. An example of a gearbox is
shown in Figure 10, below. However, after researching gear boxes for a configuration such as our
device, we are finding that obtaining a gear box that is able to withstand the testing torques at the
specific gear ratios is nearly impossible unless we have one custom made for our application. There are
also issues in mounting the power source and gear box to the device if a gear box were to be used.
Because of the potential problems that are arising, we find that it may be more beneficial to go with our
second place idea for this function, using slanted tooth gears without a drive chain or belt.
Figure 10: Example of a Gearbox
Table 6: Pugh Chart for Converting Energy to Rotational Motion
Weight Chain
Drive Belt Drive CVT
Gear to Gear
(vertical
teeth)
Gear to Gear
(slanted
teeth)
GearBox
Safety 9 -1 -1 -1 0 0 1
Cost 7 1 1 -1 1 1 0
Manufacturability 7 1 1 -1 1 1 2
Functionality 7 1 0 2 0 1 1
Ease of Operation 5 1 1 -1 1 1 0
Maintenance 3 -1 -1 -2 1 1 0
Environmental Impact 1 -1 0 -1 -1 -1 -1
Total Score 13 7 -21 21 28 29
24
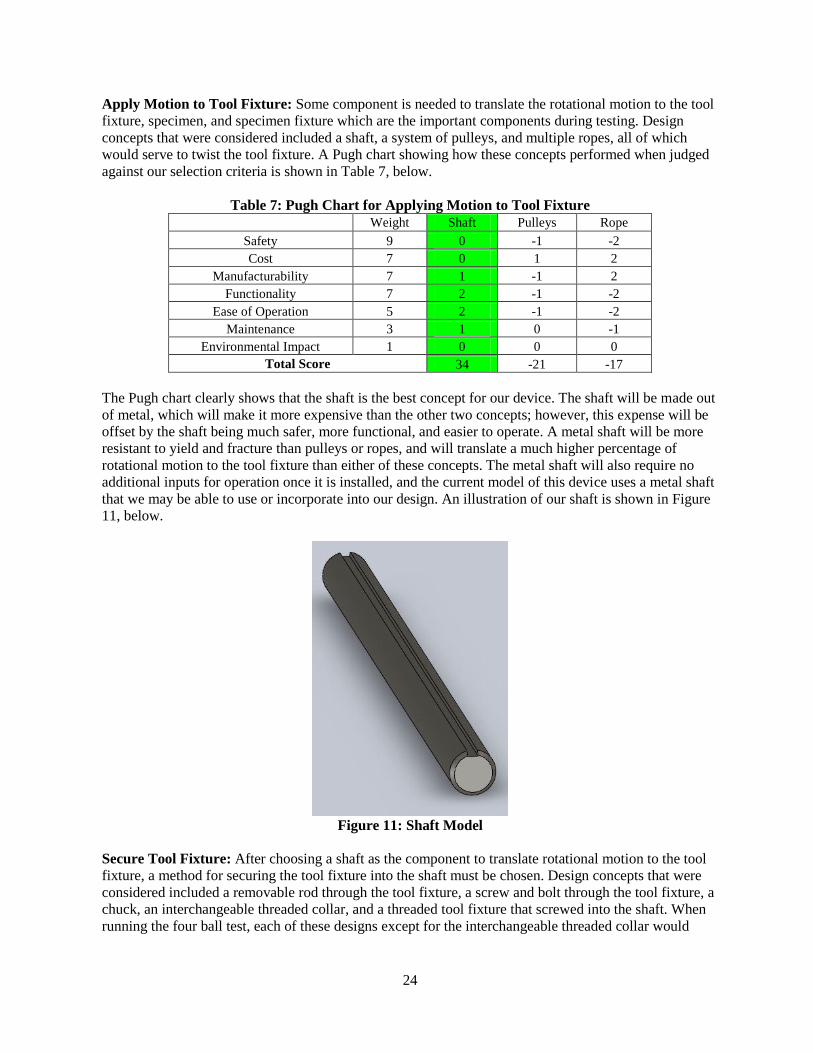
Apply Motion to Tool Fixture: Some component is needed to translate the rotational motion to the tool
fixture, specimen, and specimen fixture which are the important components during testing. Design
concepts that were considered included a shaft, a system of pulleys, and multiple ropes, all of which
would serve to twist the tool fixture. A Pugh chart showing how these concepts performed when judged
against our selection criteria is shown in Table 7, below.
Table 7: Pugh Chart for Applying Motion to Tool Fixture
Weight Shaft Pulleys Rope
Safety 9 0 -1 -2
Cost 7 0 1 2
Manufacturability 7 1 -1 2
Functionality 7 2 -1 -2
Ease of Operation 5 2 -1 -2
Maintenance 3 1 0 -1
Environmental Impact 1 0 0 0
Total Score 34 -21 -17
The Pugh chart clearly shows that the shaft is the best concept for our device. The shaft will be made out
of metal, which will make it more expensive than the other two concepts; however, this expense will be
offset by the shaft being much safer, more functional, and easier to operate. A metal shaft will be more
resistant to yield and fracture than pulleys or ropes, and will translate a much higher percentage of
rotational motion to the tool fixture than either of these concepts. The metal shaft will also require no
additional inputs for operation once it is installed, and the current model of this device uses a metal shaft
that we may be able to use or incorporate into our design. An illustration of our shaft is shown in Figure
11, below.
Figure 11: Shaft Model
Secure Tool Fixture: After choosing a shaft as the component to translate rotational motion to the tool
fixture, a method for securing the tool fixture into the shaft must be chosen. Design concepts that were
considered included a removable rod through the tool fixture, a screw and bolt through the tool fixture, a
chuck, an interchangeable threaded collar, and a threaded tool fixture that screwed into the shaft. When
running the four ball test, each of these designs except for the interchangeable threaded collar would

25
have a threaded cap piece to hold the single ball in place. A Pugh chart showing how we evaluated these
concepts using our selection criteria is shown in Table 8, below.
Table 8: Pugh Chart for Securing Tool Fixture
Weight
Removable
Rod
through
Tool
Fixture
Screw
and
Bolt
through
Tool
Fixture
Chuck Interchangeable
Threaded Collar
Threaded
Tool Fixture
that Screws
into Shaft
Safety 9 0 -1 1 1 -1
Cost 7 2 1 -1 1 1
Manufacturability 7 1 1 -1 0 1
Functionality 7 1 0 1 1 1
Ease of Operation 5 0 1 1 1 1
Maintenance 3 0 -1 1 0 0
Environmental Impact 1 0 0 0 0 0
Total Score 28 7 10 28 17
The results of our Pugh chart show that the interchangeable threaded collar is the best concept for our
device followed closely by the removable rod through the tool fixture and the threaded tool fixture that
screw into the shaft. Although the machining and material costs of the interchangeable threaded collar
will be slightly higher than the other two competitive designs, its safety grade separates it from them. We
reasoned that the collar will face the least stress from rotation under a load due to its placement outside
the shaft and tool fixture, giving it the best chance to keep the tool fixture aligned with the shaft. Also,
we designed for the chance that the collar might come undone from the shaft to be minimized by
threading the shaft in the opposite direction from that of the rotation. A sketch of the interchangeable
threaded collar design is shown in Fig. 12, below.
Figure 12: Interchangeable Threaded Collar Sketch
Secure Specimen: Securing the specimen, either the bottom three balls for the Four-ball test or the plate
for the TCT, is a crucial function. The specimen needs to be securely fixed in order for the test results to
be valid, so when it comes time to actually manufacture the specimen fixture, the utmost precision must

26
be achieved. In brainstorming ideas for the specimen fixture, we kept in mind that the component needs
to be very functional but also able to be produced in a timely and effective fashion. The current
prototype has a cup with a square cut out on the bottom that can house either the plate for the TCT or a
plate with three ball indents for the Four-ball test. A large collar fits over the cup and is bolted down to it
to ensure that the plate or three balls are securely fastened. In a similar fashion, we have developed an
iteration of this idea that is very similar to what is used on industry Four-ball testers. We call it the Three
Piece Cup with Ring and Outer Cylinder, seen in Fig. 13 for the Four-ball test and Fig. 14, for the TCT.
Essentially, it consists of a similar bottom cup that will house the square plate and three bottom balls, an
interchangeable ring (one to secure the plate, and one to secure the three balls), and a top collar that will
be screwed onto the cup itself, eliminating the time consuming task of bolting down the collar on the
current device. After ranking the ideas in a Pugh Chart, shown in Table 6 below, we came to the
conclusion, that indeed we were going to scrap what is present in the device and manufacture a new
specimen fixture as described above.
Figure 13: Specimen Fixture with Four-Ball Test Setup
Figure 14: Specimen Fixture with TCT Setup
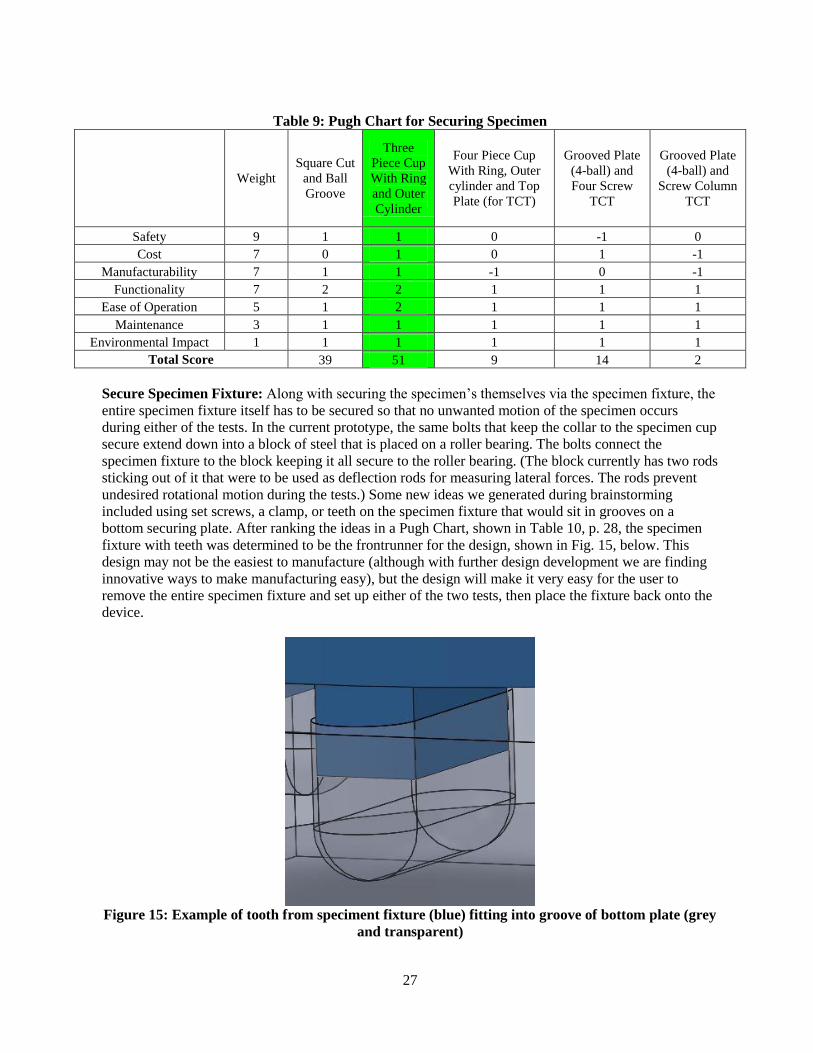
27
Table 9: Pugh Chart for Securing Specimen
Weight
Square Cut
and Ball
Groove
Three
Piece Cup
With Ring
and Outer
Cylinder
Four Piece Cup
With Ring, Outer
cylinder and Top
Plate (for TCT)
Grooved Plate
(4-ball) and
Four Screw
TCT
Grooved Plate
(4-ball) and
Screw Column
TCT
Safety 9 1 1 0 -1 0
Cost 7 0 1 0 1 -1
Manufacturability 7 1 1 -1 0 -1
Functionality 7 2 2 1 1 1
Ease of Operation 5 1 2 1 1 1
Maintenance 3 1 1 1 1 1
Environmental Impact 1 1 1 1 1 1
Total Score 39 51 9 14 2
Secure Specimen Fixture: Along with securing the specimen‟s themselves via the specimen fixture, the
entire specimen fixture itself has to be secured so that no unwanted motion of the specimen occurs
during either of the tests. In the current prototype, the same bolts that keep the collar to the specimen cup
secure extend down into a block of steel that is placed on a roller bearing. The bolts connect the
specimen fixture to the block keeping it all secure to the roller bearing. (The block currently has two rods
sticking out of it that were to be used as deflection rods for measuring lateral forces. The rods prevent
undesired rotational motion during the tests.) Some new ideas we generated during brainstorming
included using set screws, a clamp, or teeth on the specimen fixture that would sit in grooves on a
bottom securing plate. After ranking the ideas in a Pugh Chart, shown in Table 10, p. 28, the specimen
fixture with teeth was determined to be the frontrunner for the design, shown in Fig. 15, below. This
design may not be the easiest to manufacture (although with further design development we are finding
innovative ways to make manufacturing easy), but the design will make it very easy for the user to
remove the entire specimen fixture and set up either of the two tests, then place the fixture back onto the
device.
Figure 15: Example of tooth from speciment fixture (blue) fitting into groove of bottom plate (grey
and transparent)

28
Table 10: Pugh Chart for Securing Specimen Fixture
Weight Set Screws Clamp Teeth
Safety 9 -2 0 0
Cost 7 1 0 0
Manufacturability 7 1 1 -1
Functionality 7 -2 -1 2
Ease of Operation 5 -1 1 1
Maintenance 3 0 0 0
Environmental Impact 1 0 0 0
Total Score -23 5 12
Alignment of Specimen to Tool (x-y plane): For the TCT, it is critical that the specimen plate face is
aligned to the face of the annulus. Due to imperfections in manufacturing, it cannot be guaranteed that
the alignment will be perfect, so some sort of alignment mechanism must be implemented. The current
prototype uses a two plate design with a ball joint in between them in order to allow for x-y plane
alignment. The plates are secured together at the desired position using four bolts. Other ideas we
thought of for x-y plane alignment included a three plate, two hinge system, and a complicated four rod
system that would allow for the specimen fixture to be adjusted freely and screwed down onto four rods.
The ball joint system was the clear choice after ranking the ideas in a Pugh Chart, shown in Table 11
below. A drawing of the design is shown in Fig. 16 below. Given that the previous team had the plates
and ball manufactured for them, it makes sense to use what they already have, leaving more time for us
to focus on other components for re-design. However, if we find that modifications have to be made to
the plates or ball in order to support the large normal loads achieved during testing, we may have to vary
the design and have the plates and ball re-manufactured.
Figure 16: Ball Joint and Two Plates for x-y Plane Alignment
Table 11: Pugh Chart for Aligning the Speciment to the Tool in the x-y plane
Weight Ball Joint Hinges Four Rods
Safety 9 0 -1 -1
Cost 7 1 1 1
Manufacturability 7 1 0 -1
Functionality 7 1 1 0
Ease of Operation 5 1 1 -1
Maintenance 3 1 0 1
Environmental Impact 1 0 0 0
Total Score 29 10 -11

29
Alignment of Specimen to Tool (z-axis): For the Four-ball test, it is critical that the center (z-axis) of
bottom three balls is aligned exactly to the center (z-axis) of the tool. Similarly to the x-y alignment of
the TCT, it cannot be guaranteed that the two axes will be aligned without some sort of alignment
device. The current prototype uses a two plate system to allow for z-axis alignment during the Four-ball
test. Each plate contains four machined slots that allow for the insertion of bolts that are used to hold the
two plates together. The slots on one plate are aligned on the x-axis and on the other plate they are
aligned on the y-axis so that the plates can be positioned in such a way that the center of the top plate is
aligned with the tool. Fig. 17 below shows the design and allows one to visualize how the two plates can
be positioned within a 360° circle, the diameter of with is the length of one of the slots. Another idea we
came up with was essentially another two plate system, but much simpler than the four slot idea. It
would just be two flat plates with no additional features that would be clamped together. After evaluating
the two ideas in a Pugh Chart, shown in Table 12 below, we decided that the current four slot plate
design would suite our needs most appropriately.
Figure 17: Two Plates with Four Slots for z-axis Alignment
Table 12: Pugh Chart for Aligning the Speciment to the Tool in the z-axis
Weight Four
Slots
Moving
Plate
Clamp
Safety 9 1 0
Cost 7 0 0
Manufacturability 7 -1 -1
Functionality 7 1 0
Ease of Operation 5 1 0
Maintenance 3 0 1
Environmental Impact 1 0 0
Total Score 14 -4
When brainstorming these ideas for the x-y plane and z-axis alignment, we originally assumed that we
would design two separate plate systems, one for the TCT, and one for the Four-ball test. However, we
have recently disassembled the current prototype and we realized that manufacturing two separate
systems would be unnecessary. The current two plate system incorporates both the ball joint and four
slot designs. When performing the TCT, the ball is inserted in between the two plates and the plates are
bolted together. When performing the Four-ball test, the ball is removed, allowing the 360° movement

30
for z-axis alignment, and the plates are once again bolted together. Fig. 18 below shows how the two
functions are combined.
Figure 18: Combined Two Plate Alignment Fixture
Apply Normal Load to Tool Fixture/Specimen Interface: Based both on our Pugh Chart, Table 13 p.
31, and our choices with remaining with most of the current model, we elected to continue using the
Omega 625 Shop Press to apply a normal load to the tool and fixture interface. Replacing this would be a
waste of money and time, and this structure is more than sufficient for our test needs. Fig. 19 below
shows the shop press from the current prototype.
Figure 19: 25-ton Omega Shop Press

31
Table 13: Pugh Chart for Applying Normal Load to Tool Fixture/Specimen Interface
Weight
Hydraulic/
Pneumatic
Free
Weights
Thermal
Expansion
Safety 9 1 -1 -1
Cost 7 0 1 -1
Manufacturability 7 2 2 1
Functionality 7 2 2 -1
Ease of Operation 5 2 -1 -1
Maintenance 3 0 0 0
Environmental Impact 1 0 0 -1
Total Score 47 21 -22
Apply Lateral Forces to Sensor: In the same vein as the current model, we are using a deflecting beam
with an attached strain-gauge to measure the lateral forces that arise as a result of friction. However,
based on our Pugh Chart, Table 14, p. 32, we are going to rearrange the current structure and use a non-
deformable block to cause deflection on a beam attached near the specimen fixture. The previous design
placed the strain gauge on a beam attached to the press structure. That beam was deflected by another
one attached to the fixture. We figured that this would cause undue losses since both beams could
potentially deflect. We are also going to make our deflecting beams interchangeable so we can insert
different materials and thicknesses to account for normal forces across the entire test range. Fig. 20
below shows a beam attached the plate that will secure the specimen fixture. This beam will house a
sensor (talked about in following section) that will measure the lateral forces.
Figure 20: Plate with Deflecting Beam for Measuring Lateral Forces

32
Table 14: Pugh Chart for Applying Lateral Forces to a Sensor
Weight
Beam on
Beam
(sensor on
support
structure
beam)
Beam on
Beam
(sensor on
specimen
fixture
beam)
Pulley
attached to
sensor
Gear
system
Safety 9 0 0 0 0
Cost 7 1 1 0 0
Manufacturability 7 1 2 0 0
Functionality 7 0 0 1 1
Ease of Operation 5 1 1 0 0
Maintenance 3 0 0 0 0
Environmental Impact 1 0 0 0 0
Total Score 19 26 7 7
Measure Lateral Forces: As mentioned and implied above, we are going to stick to using a strain gauge
to measure lateral forces. The previous team used them, and they are cheap and simple to affix and
implement. Proper consultation and preparation will be sought to ensure proper functionality and
electrical implementation of each gauge. The Pugh Chart used to select a device for measuring the lateral
forces is shown in Table 15, below. Fig. 21, below, shows a typical strain gauge.
Figure 21: Typical Strain Gauge Attached to a Beam
Table 15: Pugh Chart for Measuring Lateral Forces
Weight
Strain
Gauge
Load
Cell
Piezoresistive
strain gauge
Safety 9 2 2 2
Cost 7 2 -2 0
Manufacturability 7 1 2 0
Functionality 7 1 2 1
Ease of Operation 5 1 2 0
Maintenance 3 1 2 1
Environmental Impact 1 0 0 0
Total Score 54 48 28

33
Measure Shaft Speed: We are going to continue using an optical encoder to measure shaft speed. Based
on our evaluations in our Pugh Chart, Table 16, below, they are cheaper, safer and easier to implement
than a contact tachometer or laser tachometer. However, we can‟t reuse the previous team‟s encoder as it
was shorted sometime during their prototyping. Fig. 22, below shows a typical optical encoder for
measuring shaft speeds.
Figure 22: Typical Optical Encoder
Table 16: Pugh Chart for Measuring Shaft Speed
Weight
Optical
Encoder
Contact
Tachometer
Laser
Tachometer
Safety 9 2 1 2
Cost 7 2 2 0
Manufacturability 7 1 0 0
Functionality 7 1 0 2
Ease of Operation 5 1 1 1
Maintenance 3 0 -1 1
Environmental Impact 1 0 0 -1
Total Score 51 25 39
Cool Lubricant: To achieve the lower temperatures in our engineering specifications in the lubricant,
specifically the range below room temperature (0-20 ºC), a means of cooling the lubricant must be
implemented. Because it will be extremely difficult to uniformly cool only the lubricant, the component
that accomplishes this function will likely be attached to either the specimen or the specimen fixture, and
will have losses into these components. The design concepts that were considered included Peltier
coolers, a refrigeration cycle, and pumping cold gas or liquid around the test volume. A Pugh chart
showing how these concepts scored against our selection criteria is shown in Table 17, below.
Table 17: Pugh Chart for Cooling Lubricant
Weight
Peltier
Coolers
Refrigeration
Cycle
Pump
Gas/Liquid
Safety 9 0 -1 -1
Cost 7 0 -2 -1
Manufacturability 7 1 -1 -1
Functionality 7 2 2 2
Ease of Operation 5 1 1 1
Maintenance 3 0 -1 -1
Environmental Impact 1 0 -2 0
Total Score 26 -21 -9
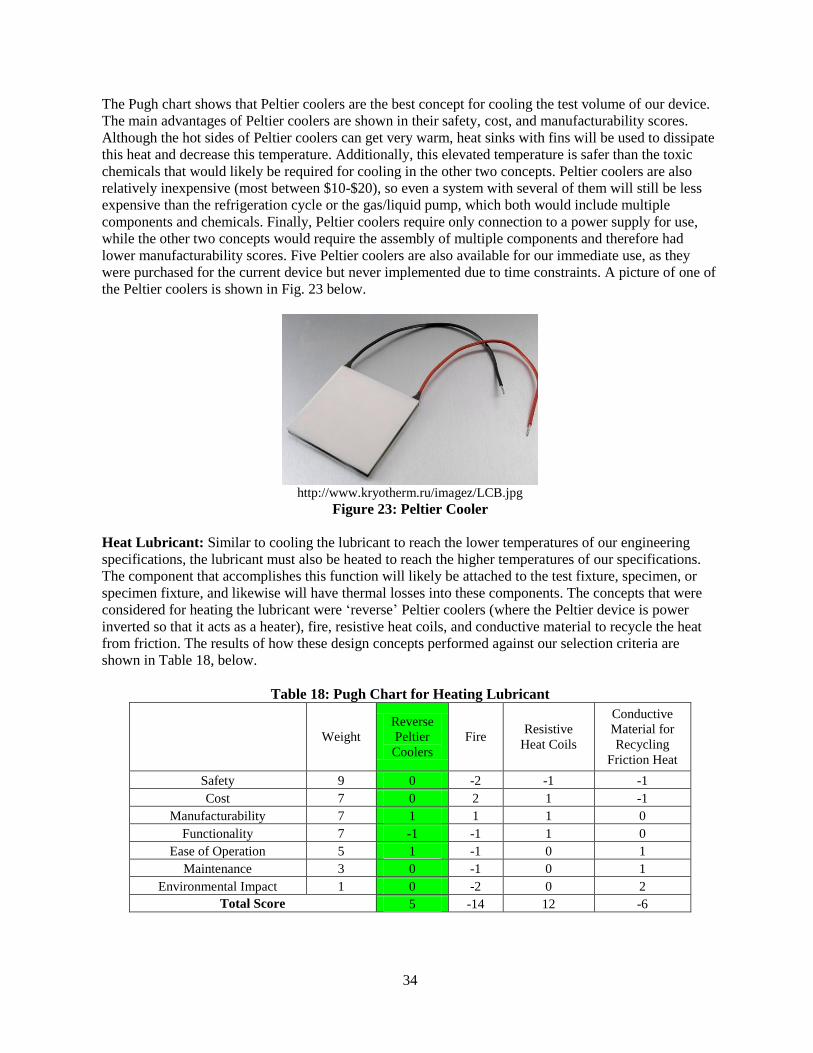
34
The Pugh chart shows that Peltier coolers are the best concept for cooling the test volume of our device.
The main advantages of Peltier coolers are shown in their safety, cost, and manufacturability scores.
Although the hot sides of Peltier coolers can get very warm, heat sinks with fins will be used to dissipate
this heat and decrease this temperature. Additionally, this elevated temperature is safer than the toxic
chemicals that would likely be required for cooling in the other two concepts. Peltier coolers are also
relatively inexpensive (most between $10-$20), so even a system with several of them will still be less
expensive than the refrigeration cycle or the gas/liquid pump, which both would include multiple
components and chemicals. Finally, Peltier coolers require only connection to a power supply for use,
while the other two concepts would require the assembly of multiple components and therefore had
lower manufacturability scores. Five Peltier coolers are also available for our immediate use, as they
were purchased for the current device but never implemented due to time constraints. A picture of one of
the Peltier coolers is shown in Fig. 23 below.
http://www.kryotherm.ru/imagez/LCB.jpg
Figure 23: Peltier Cooler
Heat Lubricant: Similar to cooling the lubricant to reach the lower temperatures of our engineering
specifications, the lubricant must also be heated to reach the higher temperatures of our specifications.
The component that accomplishes this function will likely be attached to the test fixture, specimen, or
specimen fixture, and likewise will have thermal losses into these components. The concepts that were
considered for heating the lubricant were „reverse‟ Peltier coolers (where the Peltier device is power
inverted so that it acts as a heater), fire, resistive heat coils, and conductive material to recycle the heat
from friction. The results of how these design concepts performed against our selection criteria are
shown in Table 18, below.
Table 18: Pugh Chart for Heating Lubricant
Weight
Reverse
Peltier
Coolers
Fire Resistive
Heat Coils
Conductive
Material for
Recycling
Friction Heat
Safety 9 0 -2 -1 -1
Cost 7 0 2 1 -1
Manufacturability 7 1 1 1 0
Functionality 7 -1 -1 1 0
Ease of Operation 5 1 -1 0 1
Maintenance 3 0 -1 0 1
Environmental Impact 1 0 -2 0 2
Total Score 5 -14 12 -6
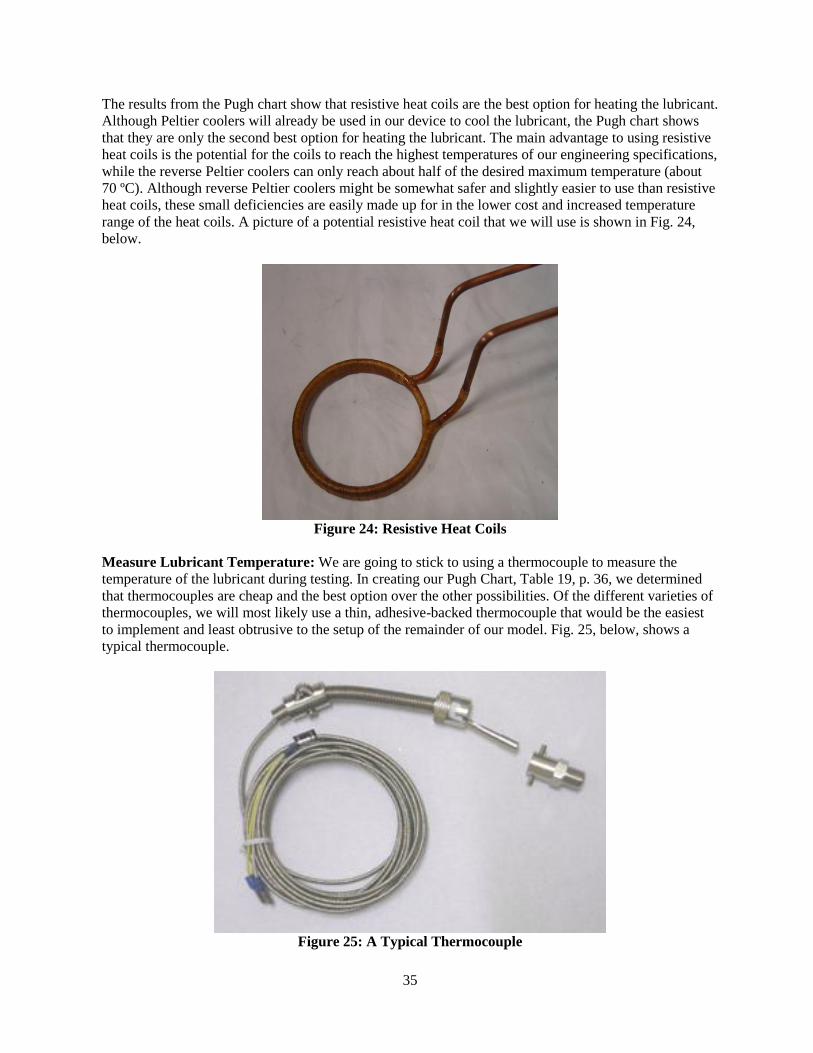
35
The results from the Pugh chart show that resistive heat coils are the best option for heating the lubricant.
Although Peltier coolers will already be used in our device to cool the lubricant, the Pugh chart shows
that they are only the second best option for heating the lubricant. The main advantage to using resistive
heat coils is the potential for the coils to reach the highest temperatures of our engineering specifications,
while the reverse Peltier coolers can only reach about half of the desired maximum temperature (about
70 ºC). Although reverse Peltier coolers might be somewhat safer and slightly easier to use than resistive
heat coils, these small deficiencies are easily made up for in the lower cost and increased temperature
range of the heat coils. A picture of a potential resistive heat coil that we will use is shown in Fig. 24,
below.
Figure 24: Resistive Heat Coils
Measure Lubricant Temperature: We are going to stick to using a thermocouple to measure the
temperature of the lubricant during testing. In creating our Pugh Chart, Table 19, p. 36, we determined
that thermocouples are cheap and the best option over the other possibilities. Of the different varieties of
thermocouples, we will most likely use a thin, adhesive-backed thermocouple that would be the easiest
to implement and least obtrusive to the setup of the remainder of our model. Fig. 25, below, shows a
typical thermocouple.
Figure 25: A Typical Thermocouple

36
Table 19: Pugh Chart for Measuring Lubricant Temperature
Weight Thermocouple Finger
Test
Mercury
Thermometer Thermistor
Resistor
Temperature
Detector
Safety 9 1 -2 0 1 1
Cost 7 1 2 1 1 -1
Manufacturability 7 2 2 2 2 2
Functionality 7 2 -2 0 1 2
Ease of Operation 5 2 2 2 2 2
Maintenance 3 1 2 2 1 1
Environmental Impact 1 0 0 -1 0 0
Total Score 57 12 36 50 43
Heat Water for Humidity Control: Measuring humidity is one of the functions we are adding to the
project this semester per our sponsor‟s request of adequate environmental control. In order to increase
humidity we will be placing a boiling container of water into the environmentally controlled area, which
will be explained in the next section. The resistive heating coils will fit around the container and heat it
until desired. The other ideas we came up with were heating the water with fire and a peltier. The main
reasons fire wasn‟t chosen were due to its lack in safety and its overall lack in functionality and ease of
use. It is also not environmentally friendly. The peltier wasn‟t chosen due to the fact that it doesn‟t heat
to the temperature that is needed and it‟s more expensive. An example of a resistive heating coil can be
seen in Fig. 24, p. 35.
Table 20: Pugh Chart for Heating Water for Humidity Control
Weight Fire
Resistive
Heat Coils Peltier
Safety 9 -2 -1 0
Cost 7 2 1 0
Manufacturability 7 1 1 1
Functionality 7 -1 1 -1
Ease of Operation 5 -1 0 1
Maintenance 3 -1 0 0
Environmental Impact 1 -2 0 0
Total Score -14 12 5
Enclose Water Vapor Around Test Control Volume: In order to regulate and measure humidity we
need to enclose the test area. We have decided that the casing we chose needs to enclose and keep the
humidity in, be clear so we can see through it, and be a durable material. Ideally we will be able to have
a door that would allow us to get in and out of the test area easily. The other options we thought of were
a wooden box and an aluminum foil tent. The wooden box was cheap but instead of containing the
humidity, the wood would soak up the water, which would prevent it from functioning correctly. The
other large disadvantage is that wood is not see through, which prevents from visually regulating the
humidity and reading the humidity meter. The aluminum foil tent has a lot of the same downfalls. Even
though it is relatively cheap, aluminum is not see through which prevents us from reading the humidity
meter inside. Fig. 26, p. 37, shows an example of a plastic case enclosure.
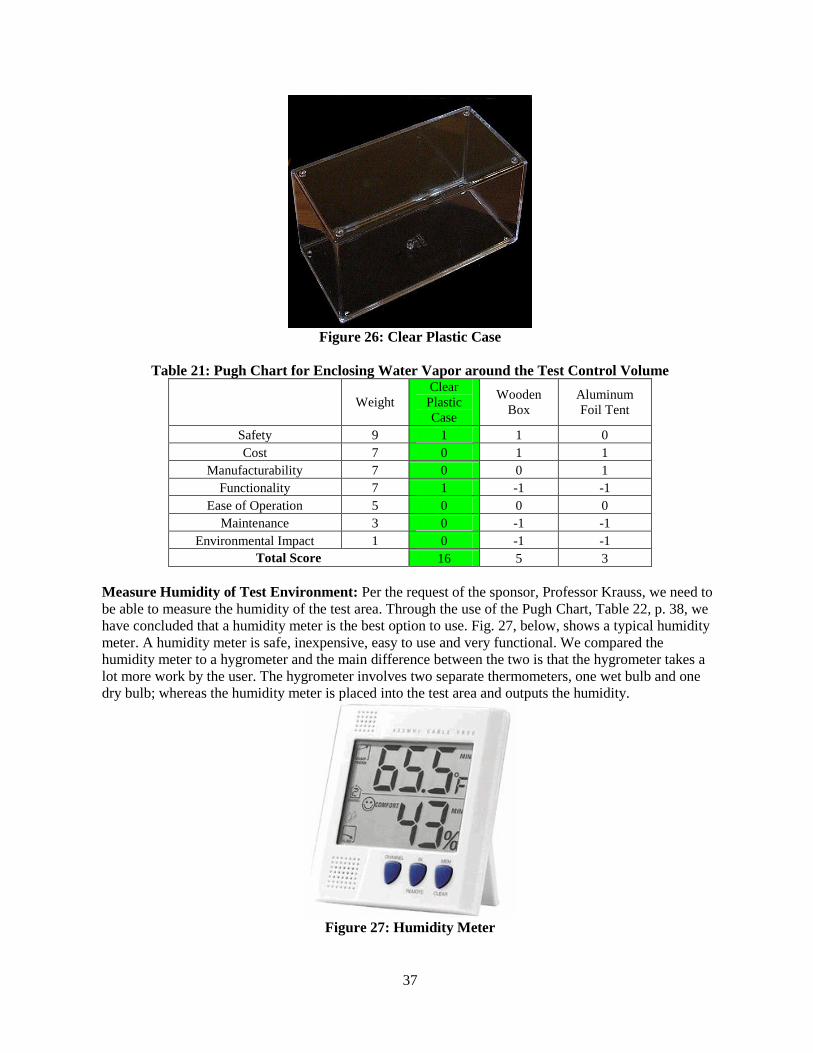
37
Figure 26: Clear Plastic Case
Table 21: Pugh Chart for Enclosing Water Vapor around the Test Control Volume
Weight
Clear
Plastic
Case
Wooden
Box
Aluminum
Foil Tent
Safety 9 1 1 0
Cost 7 0 1 1
Manufacturability 7 0 0 1
Functionality 7 1 -1 -1
Ease of Operation 5 0 0 0
Maintenance 3 0 -1 -1
Environmental Impact 1 0 -1 -1
Total Score 16 5 3
Measure Humidity of Test Environment: Per the request of the sponsor, Professor Krauss, we need to
be able to measure the humidity of the test area. Through the use of the Pugh Chart, Table 22, p. 38, we
have concluded that a humidity meter is the best option to use. Fig. 27, below, shows a typical humidity
meter. A humidity meter is safe, inexpensive, easy to use and very functional. We compared the
humidity meter to a hygrometer and the main difference between the two is that the hygrometer takes a
lot more work by the user. The hygrometer involves two separate thermometers, one wet bulb and one
dry bulb; whereas the humidity meter is placed into the test area and outputs the humidity.
Figure 27: Humidity Meter

38
Table 22: Pugh Chart for Measuring Humidity of Test Environment
Weight
Hygrometer
(bulb test)
Humidity
Meter
Safety 9 1 2
Cost 7 1 1
Manufacturability 7 1 2
Functionality 7 2 2
Ease of Operation 5 0 2
Maintenance 3 0 1
Environmental Impact 1 2 2
Total Score 39 68
Measure Normal Force: Throughout both the twist compression and four-ball test we need to be able to
measure the normal force. Last semester‟s team decided to use a block of compressive material with a
strain gauge attached and it functioned well. Through the use of a Pugh Chart, Table 23, below, we have
decided that keeping this implemented in the design is the best decision. This compressive material is
very safe, inexpensive and easy to use. In the figure below, the compressive material can be seen directly
above where the load will be applied and directly below where the alignment will be assessed. As the
load is applied the strain gauge will measure the normal force. Our other options were using an internal
beam deflection, or a compressive load cell. We decided not to use the internal beam deflection due to
the fact that it was going to add a lot of time and money to design and implement. The other option, the
compressive load cell, would be easy to manufacture and safe, but it costs too much.
Figure 28: Compressive Material Between Hydraulic Press and bottom Alignment Plate
Table 23: Pugh Chart for Measuring Normal Force
Weight Compressive
Material
Internal
Beam
Deflection
Compressive
Load Cell
Safety 9 2 1 2
Cost 7 2 1 -1
Manufacturability 7 1 -1 2
Functionality 7 1 1 1
Ease of Operation 5 1 0 1
Maintenance 3 1 -1 2
Environmental Impact 1 0 0 0
Total Score 54 13 43

39
REASSESSMENT OF SELECTED CONCEPTS
After presenting our initial chosen concepts for each function to our colleagues and our sponsor, it was
recommended to us that we reassess which components of the current device actually required redesign.
This stemmed from the number of additions that we needed to make to the current device so that it
incorporated some of the engineering specifications that were new to our redesign, including
environmental control and improved safety shielding. From this high-level overview, we concluded that
two of our chosen concepts could be adjusted to different concepts that would require less time and work
and allow us to focus on the necessary additions to our device. The reasons for changing each concept
and the new proposed concepts for each function are detailed below.
Convert Energy to Rotational Motion: As mentioned in the previous section, a gearbox may not be the
most feasible solution to the problem. The Pugh Chart, Table 6, p. 23, shows that the second highest
rated idea (highlighted in yellow) is the gear system with slanted teeth. At this point, after some research
has been done, we are thinking that an open gear system may be more feasible given limited time and
resources for producing a working device. A sample of a helical gear system that may be implemented
on our device is shown in Fig. 29, below.
Figure 29: Helical Gears
Secure Test Fixture: The proposed concept for securing the tool fixture was changed from the
interchangeable threaded collar to the removable rod through the tool fixture, which was a close second
in our Pugh chart for securing the tool fixture. The main factor in our initial choosing of the
interchangeable cup over the removable rod was safety, but because the removable rod concept is the
one used on the current device, we were able to physically study it more closely. Upon closer inspection,
the tool fixture in the removable rod design was manufactured to be a press fit into the shaft, providing
additional stability and security. This gave us confidence that the removable rod design could be used
again in our redesign, which would also eliminate the need to manufacture a new tool fixture. An
illustration of the removable rod through the shaft design of our tool fixture is shown in Fig. 30 below.
Figure 30: Tool Fixture
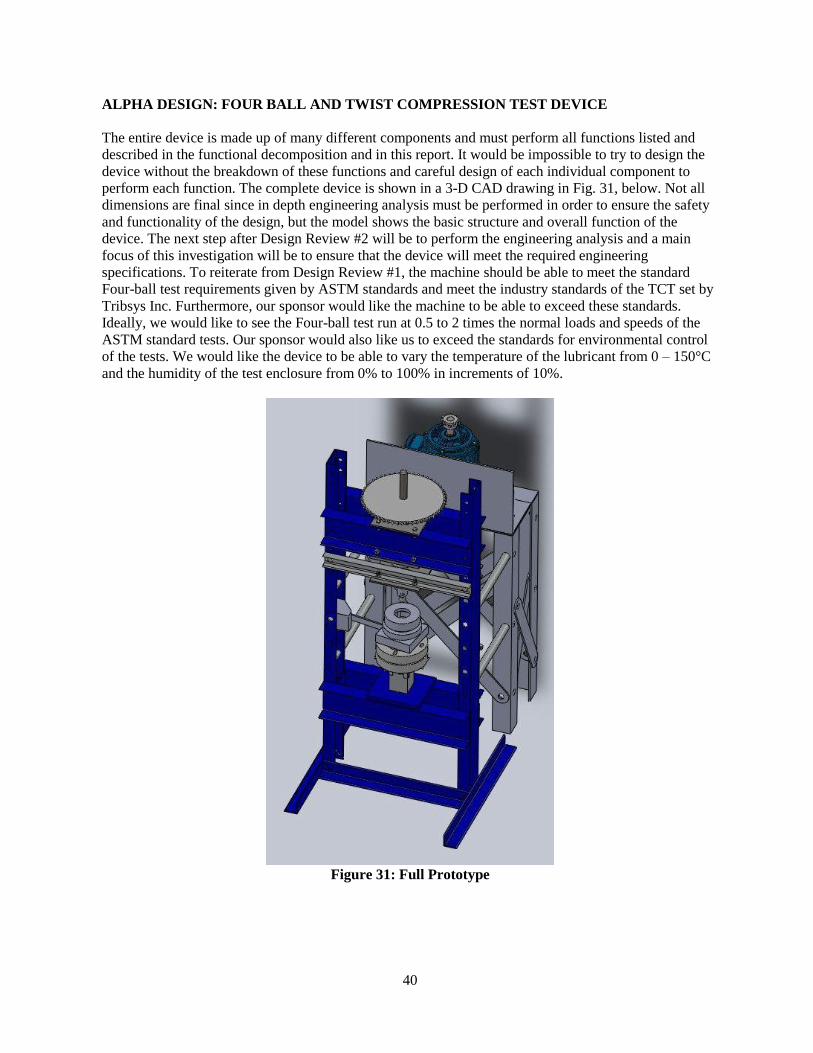
40
ALPHA DESIGN: FOUR BALL AND TWIST COMPRESSION TEST DEVICE
The entire device is made up of many different components and must perform all functions listed and
described in the functional decomposition and in this report. It would be impossible to try to design the
device without the breakdown of these functions and careful design of each individual component to
perform each function. The complete device is shown in a 3-D CAD drawing in Fig. 31, below. Not all
dimensions are final since in depth engineering analysis must be performed in order to ensure the safety
and functionality of the design, but the model shows the basic structure and overall function of the
device. The next step after Design Review #2 will be to perform the engineering analysis and a main
focus of this investigation will be to ensure that the device will meet the required engineering
specifications. To reiterate from Design Review #1, the machine should be able to meet the standard
Four-ball test requirements given by ASTM standards and meet the industry standards of the TCT set by
Tribsys Inc. Furthermore, our sponsor would like the machine to be able to exceed these standards.
Ideally, we would like to see the Four-ball test run at 0.5 to 2 times the normal loads and speeds of the
ASTM standard tests. Our sponsor would also like us to exceed the standards for environmental control
of the tests. We would like the device to be able to vary the temperature of the lubricant from 0 – 150°C
and the humidity of the test enclosure from 0% to 100% in increments of 10%.
Figure 31: Full Prototype

41
ENGINEERING ANALYSIS
The construction and basic operation of our project encompasses four different fundamental fields of
mechanical engineering: statics, dynamics, heat transfer and materials. In each of the four fields, we
cover what applications they apply to as well as what equations and considerations we will make with
regards to specific engineering functions of our design.
Statics
Under operation, there will be a number of loads, stresses and strains present and acting throughout the
entire prototype. All of these forces result from the load application to the test interface. The hydraulic
press will exert a load on the interface, resulting in pressures at the test interface. In regards to the Twist
Compression Test, the pressure will be equal to:
P = F/A
P is the pressure in N/m2 , F is in N and A is in m
2.
In order to sense what normal load is being applied to the interface, a compressive block will be affixed
with a strain gauge in order to provide a force reading. The sensitivity of the measurement will be
determinant on what kind of material is used in the application. When we measure the lateral loads as a
result of friction, a deflectable beam (sensitivity will be width-dependent) will be affixed with a strain
gauge to provide an analogous range of force detection.
Because of the extent of normal loads being applied, coupled with friction-induced torques, residual
moments and stresses will result throughout the prototype. FEA analysis procedures available to us
through SolidWorks will allow us to see how severe these moments and stress concentrations will be and
allow us to design additional supports and mechanical constraints to ensure that failure is preventable
and accounted for.
Dynamics
The principle function of this prototype is the rotation of a tool fixture on the test interface. This is
driven by an AC motor which has been provided for our use. The motor, by itself, is not capable of
producing the complete range of speeds for our model, so we have to delve into gear ratios to
complement the connection between the motor and drive shaft. The gear ratios that will be established
will relate both speed and torque between the drive shaft and motor according to:
Toutput (or ωoutput) = NDriven/NDriving * Tinput (or ωinput)
N is the number of teeth on either the driving or driven gear in the gearing setup. By having different
gear ratios available, our motor will be able to alternate between overdriving in order to produce 3600
RPM at the drive shaft for the 4-Ball Test, or a greatly amplified Torque output for the Twist
Compression Test.
These two tests that we are designing operate around Friction. One aim of each test performed with these
kinds of machines would be to evaluate coefficients of friction across load and speed ranges. Frictional
force is evaluated using the equation:
FFriction = FNormal * μ
Additional overhead will be accounted for under force sensing because fluids like the oils and greases
testable will no doubt be somewhat speed-dependent.
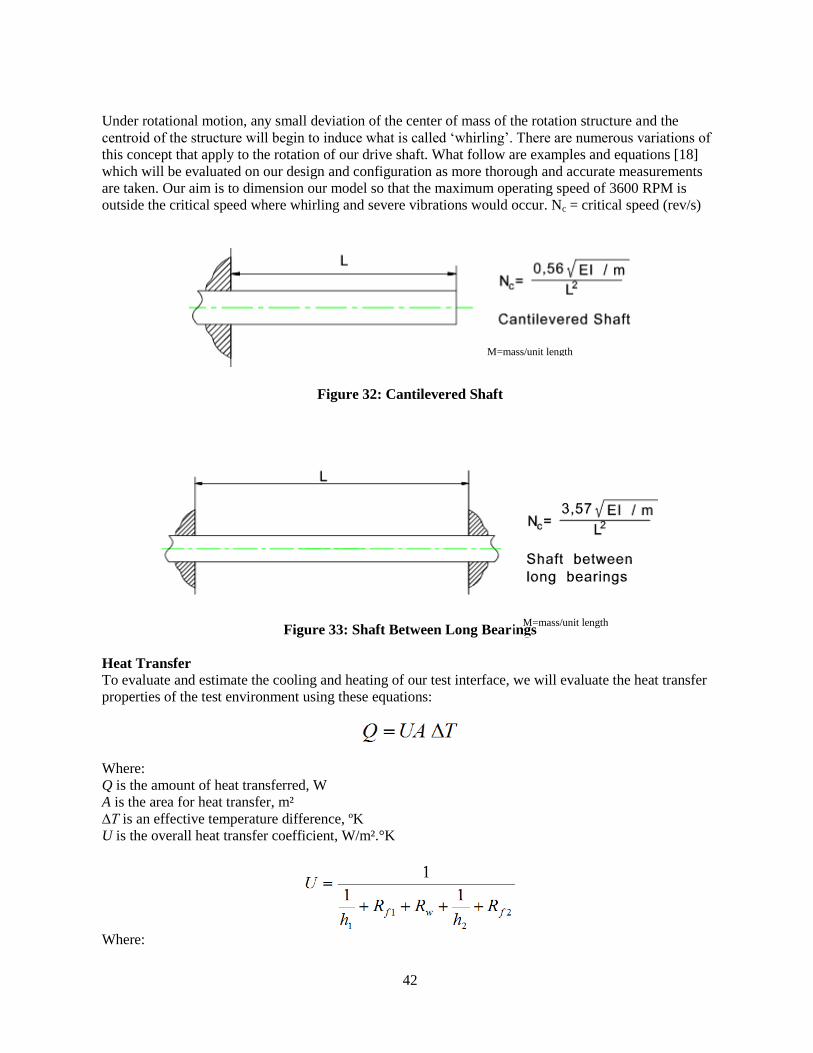
42
Under rotational motion, any small deviation of the center of mass of the rotation structure and the
centroid of the structure will begin to induce what is called „whirling‟. There are numerous variations of
this concept that apply to the rotation of our drive shaft. What follow are examples and equations [18]
which will be evaluated on our design and configuration as more thorough and accurate measurements
are taken. Our aim is to dimension our model so that the maximum operating speed of 3600 RPM is
outside the critical speed where whirling and severe vibrations would occur. Nc = critical speed (rev/s)
Figure 32: Cantilevered Shaft
Figure 33: Shaft Between Long Bearings
Heat Transfer
To evaluate and estimate the cooling and heating of our test interface, we will evaluate the heat transfer
properties of the test environment using these equations:
Where:
Q is the amount of heat transferred, W
A is the area for heat transfer, m²
∆T is an effective temperature difference, ºK
U is the overall heat transfer coefficient, W/m².°K
Where:
M=mass/unit length
M=mass/unit length
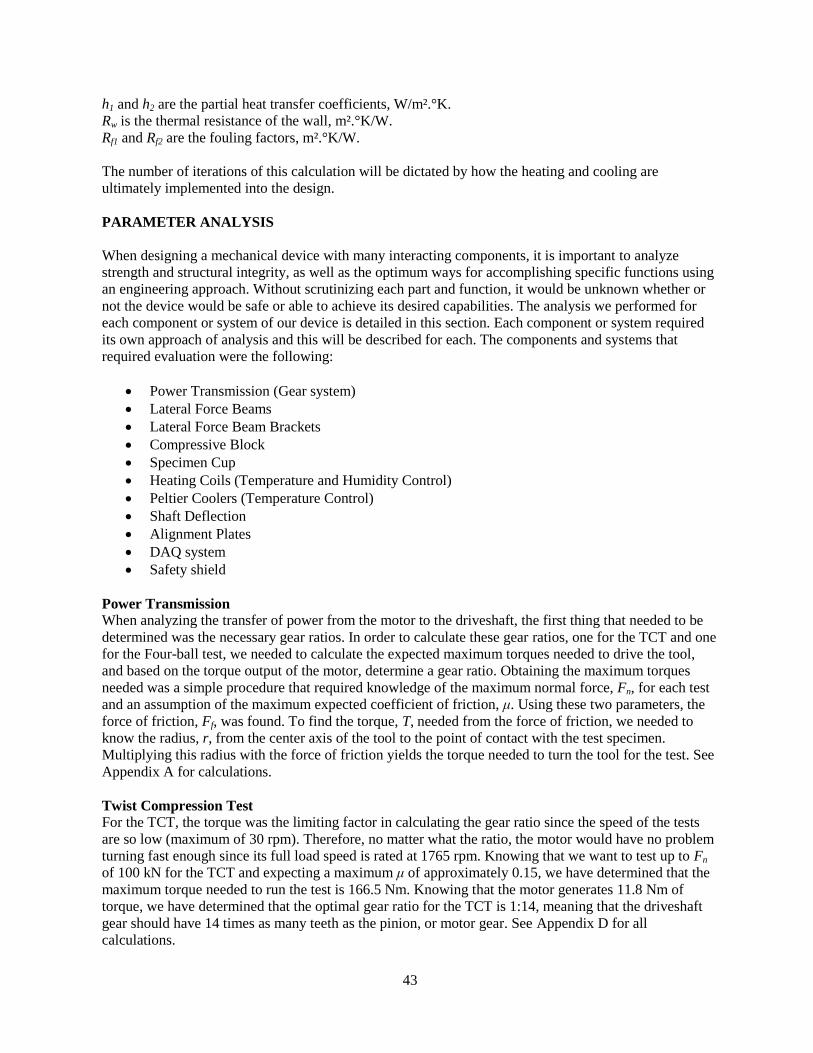
43
h1 and h2 are the partial heat transfer coefficients, W/m².°K.
Rw is the thermal resistance of the wall, m².°K/W.
Rf1 and Rf2 are the fouling factors, m².°K/W.
The number of iterations of this calculation will be dictated by how the heating and cooling are
ultimately implemented into the design.
PARAMETER ANALYSIS
When designing a mechanical device with many interacting components, it is important to analyze
strength and structural integrity, as well as the optimum ways for accomplishing specific functions using
an engineering approach. Without scrutinizing each part and function, it would be unknown whether or
not the device would be safe or able to achieve its desired capabilities. The analysis we performed for
each component or system of our device is detailed in this section. Each component or system required
its own approach of analysis and this will be described for each. The components and systems that
required evaluation were the following:
Power Transmission (Gear system)
Lateral Force Beams
Lateral Force Beam Brackets
Compressive Block
Specimen Cup
Heating Coils (Temperature and Humidity Control)
Peltier Coolers (Temperature Control)
Shaft Deflection
Alignment Plates
DAQ system
Safety shield
Power Transmission
When analyzing the transfer of power from the motor to the driveshaft, the first thing that needed to be
determined was the necessary gear ratios. In order to calculate these gear ratios, one for the TCT and one
for the Four-ball test, we needed to calculate the expected maximum torques needed to drive the tool,
and based on the torque output of the motor, determine a gear ratio. Obtaining the maximum torques
needed was a simple procedure that required knowledge of the maximum normal force, Fn, for each test
and an assumption of the maximum expected coefficient of friction, μ. Using these two parameters, the
force of friction, Ff, was found. To find the torque, T, needed from the force of friction, we needed to
know the radius, r, from the center axis of the tool to the point of contact with the test specimen.
Multiplying this radius with the force of friction yields the torque needed to turn the tool for the test. See
Appendix A for calculations.
Twist Compression Test
For the TCT, the torque was the limiting factor in calculating the gear ratio since the speed of the tests
are so low (maximum of 30 rpm). Therefore, no matter what the ratio, the motor would have no problem
turning fast enough since its full load speed is rated at 1765 rpm. Knowing that we want to test up to Fn
of 100 kN for the TCT and expecting a maximum μ of approximately 0.15, we have determined that the
maximum torque needed to run the test is 166.5 Nm. Knowing that the motor generates 11.8 Nm of
torque, we have determined that the optimal gear ratio for the TCT is 1:14, meaning that the driveshaft
gear should have 14 times as many teeth as the pinion, or motor gear. See Appendix D for all
calculations.
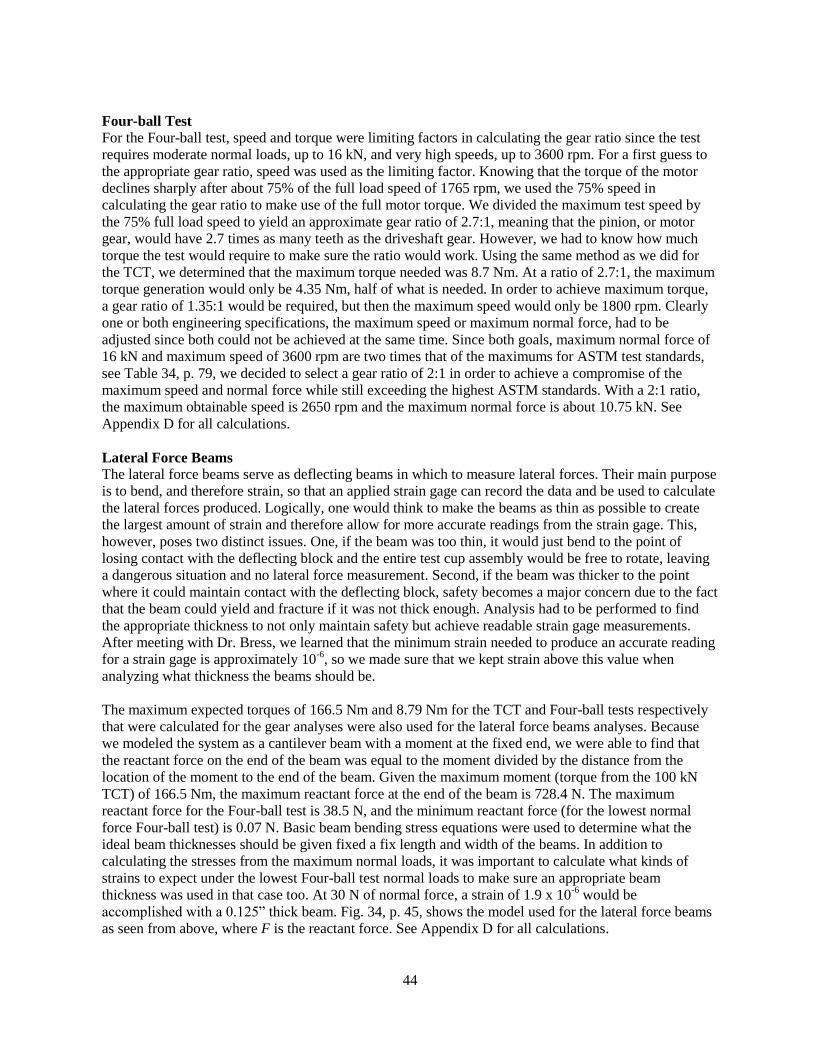
44
Four-ball Test
For the Four-ball test, speed and torque were limiting factors in calculating the gear ratio since the test
requires moderate normal loads, up to 16 kN, and very high speeds, up to 3600 rpm. For a first guess to
the appropriate gear ratio, speed was used as the limiting factor. Knowing that the torque of the motor
declines sharply after about 75% of the full load speed of 1765 rpm, we used the 75% speed in
calculating the gear ratio to make use of the full motor torque. We divided the maximum test speed by
the 75% full load speed to yield an approximate gear ratio of 2.7:1, meaning that the pinion, or motor
gear, would have 2.7 times as many teeth as the driveshaft gear. However, we had to know how much
torque the test would require to make sure the ratio would work. Using the same method as we did for
the TCT, we determined that the maximum torque needed was 8.7 Nm. At a ratio of 2.7:1, the maximum
torque generation would only be 4.35 Nm, half of what is needed. In order to achieve maximum torque,
a gear ratio of 1.35:1 would be required, but then the maximum speed would only be 1800 rpm. Clearly
one or both engineering specifications, the maximum speed or maximum normal force, had to be
adjusted since both could not be achieved at the same time. Since both goals, maximum normal force of
16 kN and maximum speed of 3600 rpm are two times that of the maximums for ASTM test standards,
see Table 34, p. 79, we decided to select a gear ratio of 2:1 in order to achieve a compromise of the
maximum speed and normal force while still exceeding the highest ASTM standards. With a 2:1 ratio,
the maximum obtainable speed is 2650 rpm and the maximum normal force is about 10.75 kN. See
Appendix D for all calculations.
Lateral Force Beams
The lateral force beams serve as deflecting beams in which to measure lateral forces. Their main purpose
is to bend, and therefore strain, so that an applied strain gage can record the data and be used to calculate
the lateral forces produced. Logically, one would think to make the beams as thin as possible to create
the largest amount of strain and therefore allow for more accurate readings from the strain gage. This,
however, poses two distinct issues. One, if the beam was too thin, it would just bend to the point of
losing contact with the deflecting block and the entire test cup assembly would be free to rotate, leaving
a dangerous situation and no lateral force measurement. Second, if the beam was thicker to the point
where it could maintain contact with the deflecting block, safety becomes a major concern due to the fact
that the beam could yield and fracture if it was not thick enough. Analysis had to be performed to find
the appropriate thickness to not only maintain safety but achieve readable strain gage measurements.
After meeting with Dr. Bress, we learned that the minimum strain needed to produce an accurate reading
for a strain gage is approximately 10-6
, so we made sure that we kept strain above this value when
analyzing what thickness the beams should be.
The maximum expected torques of 166.5 Nm and 8.79 Nm for the TCT and Four-ball tests respectively
that were calculated for the gear analyses were also used for the lateral force beams analyses. Because
we modeled the system as a cantilever beam with a moment at the fixed end, we were able to find that
the reactant force on the end of the beam was equal to the moment divided by the distance from the
location of the moment to the end of the beam. Given the maximum moment (torque from the 100 kN
TCT) of 166.5 Nm, the maximum reactant force at the end of the beam is 728.4 N. The maximum
reactant force for the Four-ball test is 38.5 N, and the minimum reactant force (for the lowest normal
force Four-ball test) is 0.07 N. Basic beam bending stress equations were used to determine what the
ideal beam thicknesses should be given fixed a fix length and width of the beams. In addition to
calculating the stresses from the maximum normal loads, it was important to calculate what kinds of
strains to expect under the lowest Four-ball test normal loads to make sure an appropriate beam
thickness was used in that case too. At 30 N of normal force, a strain of 1.9 x 10⁻⁶
would be
accomplished with a 0.125” thick beam. Fig. 34, p. 45, shows the model used for the lateral force beams
as seen from above, where F is the reactant force. See Appendix D for all calculations.

45
Figure 34: Lateral Force Beam Model
Lateral Force Beam Brackets
Similarly to how we calculated whether or not the lateral force beams themselves would be safe under
maximum normal load conditions, we modeled the brackets supporting the beams as cantilever beams
under bending stress. The force applied to the brackets is equal to that of the force applied to the beam
itself. This maximum force is equal to 728.4 N. The bending stress equation was used in this case to
verify that the chosen thickness of the brackets would be sufficient to withstand the maximum forces
expected. In the case of these brackets, we were not concerned with strain since the only purpose of the
brackets is to hold in place the lateral force beams that will be the measurement tool of lateral force
output. Fig. 35, below shows the model used for the brackets, where F is the reactant force. See
Appendix D for all calculations.
Figure 35: Lateral Force Beam Bracket Model
Compressive Block
The compressive block‟s purpose is to compress, and therefore strain, in the vertical direction so that an
attached strain gage can measure the normal force applied to the device. Like the lateral force beams,
safety and strain are key issues for the compressive block. Using the very basic stress and strain
equations for tension or compression, we were able to determine the maximum stress and minimum
strains for the tests and determine the most appropriate material for the block. Under the maximum
normal load of 100 kN, the block material must be capable of withstanding a compressive stress of 17.2
MPa. Under the minimum normal load of 30 N, stress is not an issue for most materials, but a material
had to be chosen that would compress by a strain of 1.0 x 10⁻⁶
or more. Fig. 36, p. 46, shows the model
used for the compressive block, where FN is the applied normal force. See Appendix D for all
calculations.
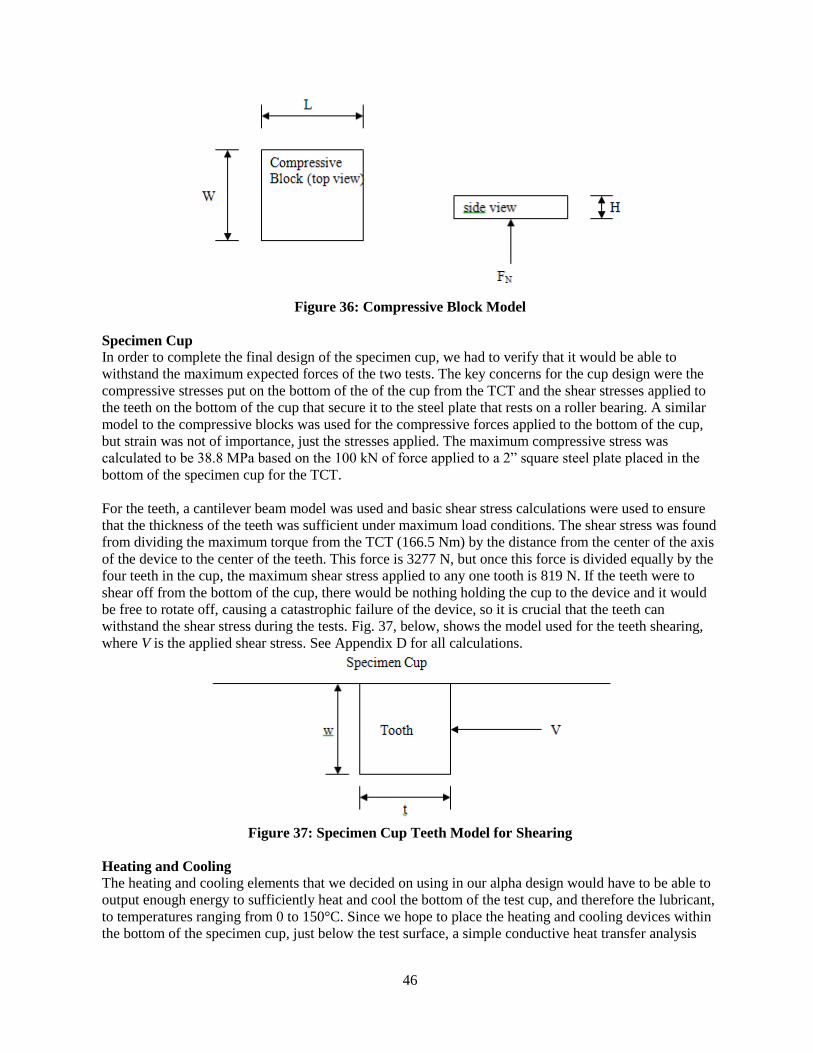
46
Figure 36: Compressive Block Model
Specimen Cup
In order to complete the final design of the specimen cup, we had to verify that it would be able to
withstand the maximum expected forces of the two tests. The key concerns for the cup design were the
compressive stresses put on the bottom of the of the cup from the TCT and the shear stresses applied to
the teeth on the bottom of the cup that secure it to the steel plate that rests on a roller bearing. A similar
model to the compressive blocks was used for the compressive forces applied to the bottom of the cup,
but strain was not of importance, just the stresses applied. The maximum compressive stress was
calculated to be 38.8 MPa based on the 100 kN of force applied to a 2” square steel plate placed in the
bottom of the specimen cup for the TCT.
For the teeth, a cantilever beam model was used and basic shear stress calculations were used to ensure
that the thickness of the teeth was sufficient under maximum load conditions. The shear stress was found
from dividing the maximum torque from the TCT (166.5 Nm) by the distance from the center of the axis
of the device to the center of the teeth. This force is 3277 N, but once this force is divided equally by the
four teeth in the cup, the maximum shear stress applied to any one tooth is 819 N. If the teeth were to
shear off from the bottom of the cup, there would be nothing holding the cup to the device and it would
be free to rotate off, causing a catastrophic failure of the device, so it is crucial that the teeth can
withstand the shear stress during the tests. Fig. 37, below, shows the model used for the teeth shearing,
where V is the applied shear stress. See Appendix D for all calculations.
Figure 37: Specimen Cup Teeth Model for Shearing
Heating and Cooling
The heating and cooling elements that we decided on using in our alpha design would have to be able to
output enough energy to sufficiently heat and cool the bottom of the test cup, and therefore the lubricant,
to temperatures ranging from 0 to 150°C. Since we hope to place the heating and cooling devices within
the bottom of the specimen cup, just below the test surface, a simple conductive heat transfer analysis
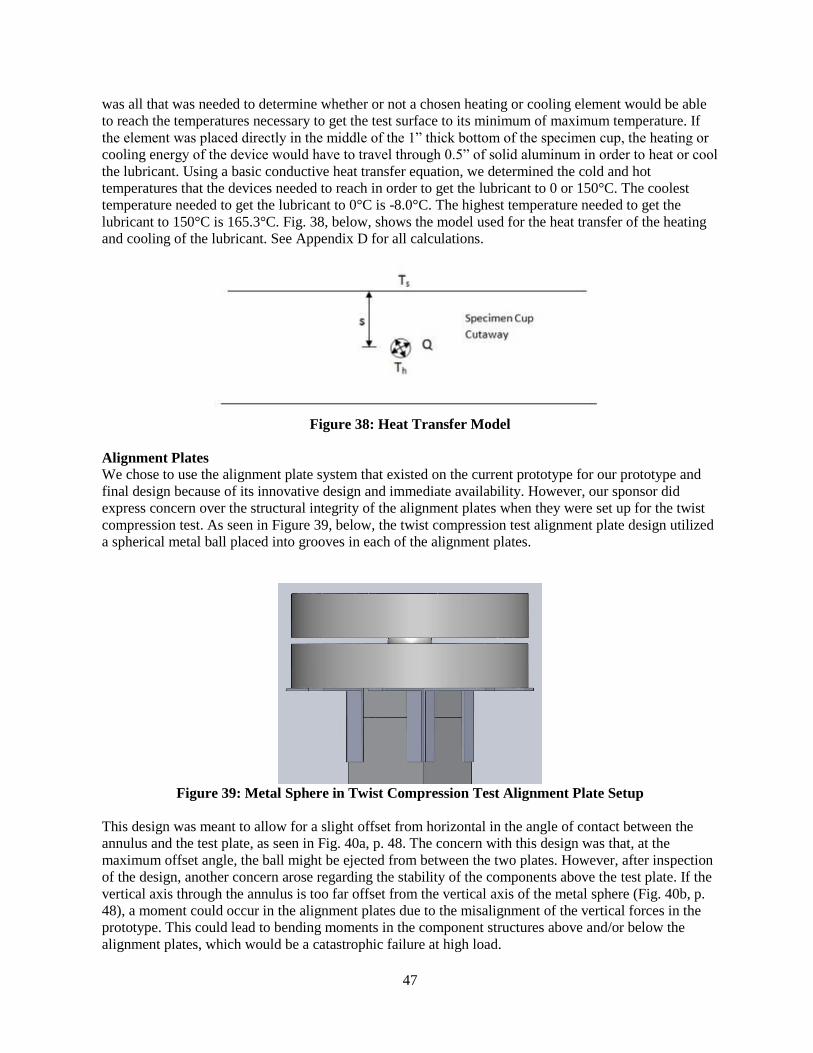
47
was all that was needed to determine whether or not a chosen heating or cooling element would be able
to reach the temperatures necessary to get the test surface to its minimum of maximum temperature. If
the element was placed directly in the middle of the 1” thick bottom of the specimen cup, the heating or
cooling energy of the device would have to travel through 0.5” of solid aluminum in order to heat or cool
the lubricant. Using a basic conductive heat transfer equation, we determined the cold and hot
temperatures that the devices needed to reach in order to get the lubricant to 0 or 150°C. The coolest
temperature needed to get the lubricant to 0°C is -8.0°C. The highest temperature needed to get the
lubricant to 150°C is 165.3°C. Fig. 38, below, shows the model used for the heat transfer of the heating
and cooling of the lubricant. See Appendix D for all calculations.
Figure 38: Heat Transfer Model
Alignment Plates
We chose to use the alignment plate system that existed on the current prototype for our prototype and
final design because of its innovative design and immediate availability. However, our sponsor did
express concern over the structural integrity of the alignment plates when they were set up for the twist
compression test. As seen in Figure 39, below, the twist compression test alignment plate design utilized
a spherical metal ball placed into grooves in each of the alignment plates.
Figure 39: Metal Sphere in Twist Compression Test Alignment Plate Setup
This design was meant to allow for a slight offset from horizontal in the angle of contact between the
annulus and the test plate, as seen in Fig. 40a, p. 48. The concern with this design was that, at the
maximum offset angle, the ball might be ejected from between the two plates. However, after inspection
of the design, another concern arose regarding the stability of the components above the test plate. If the
vertical axis through the annulus is too far offset from the vertical axis of the metal sphere (Fig. 40b, p.
48), a moment could occur in the alignment plates due to the misalignment of the vertical forces in the
prototype. This could lead to bending moments in the component structures above and/or below the
alignment plates, which would be a catastrophic failure at high load.

48
Figure 40: Twist compression test alignment plate stability concerns showing (a) maximum
annulus offset angle and (b) maximum vertical axes offset
Two separate analyses were done to study the stability in each scenario. In the first, geometry was used
to examine the maximum angular offset of the annulus and the possibility of the ball ejecting. A
simplified schematic of the alignment plates system showing the plates when they are parallel and when
they are at their maximum angular offset is shown in Fig. 41, below. As seen in this portrayal, the
maximum opening between the two plates (when their opposite sides come in contact) is 0.8 in., while
the diameter of the ball is 1.5 in. Using geometry, it can be seen that the maximum offset angle of the
plates (and the annulus) is only 5.71º. Additionally, the grooves holding the ball in place are 0.55 in.
deep into the alignment plates, so we can say with high confidence that the ball will never be ejected
from between the plates.
Figure 41: Maximum opening between alignment plates and offset angle
In the second stability analysis, the maximum offset of the vertical axis of the annulus from the vertical
axis of the ball was calculated to see if a large enough moment would be created to cause failure. As
seen in Fig. 42, p. 49, the 2.0 in. diameter specimen cup restricts the vertical axis of the 1.0 in. annulus to
move a maximum of 0.5 in. from the axis of the ball. When the vertical axis of the annulus is at this
maximum 0.5 in. offset, it still passes through the 1.5 in. diameter ball at 0.25 in. inside the surface of the
ball. Also, at this 0.5 in. offset, the vertical axis of the annulus passes through the compressive block and
aluminum inverted cup that stabilizes the ram of the press. These two components form a 3 in. by 3 in.
by 7 in. block centered on the axis of the ball that not only stabilizes the ram of the press, but also should
serve to cancel the maximum moment of 1270 N-m that can be produced by a 0.5 in. axis offset and 100
kN of force. This maximum moment was calculated in the same manner as the maximum torques when
calculating the gear ratios. This information leads us to believe that it is highly unlikely that a bending
moment would lead to failure in the components near the alignment plates.

49
Figure 42: Maximum offset of annulus axis from ball axis
Shaft Deflection
One collection of concerns of both our team and of our sponsor is the possibility of deflection or
buckling of the three long shafts that are present in our design. Under load, there is always the possibility
that any slight deflection could have a potentially catastrophic result. In order to evaluate the severity of
deflection in a particular section of beam, we performed worst-case calculations. The four segments are
1) the ram of the shop press, 2) the segment of the main driveshaft that encompasses the tool fixture, 3)
the segment of the main driveshaft that is attached to the gears, and 4) the shaft extending from the
motor that will be affixed with gears. Fig. 43, p. 50 shows the shafts. In order to establish worst case
scenarios, a number of assumptions will be made. For the ram and tool fixture segments, it will be
assumed that a lateral force will be introduced by the available tilting of the alignment blocks during a
twist compression test. In order to underestimate the capabilities of the prototype and exaggerate the
forces that will be present, simplifications to complex forms will amount to taking a single shaft of the
smallest diameter present and low-end estimates of Young‟s Modulus. In addition as previously
mentioned in the analysis of the alignment plates, the maximum travel of the top block would create a
5.7° angle, and therefore a resultant lateral force. For deflection evaluation, the beams are modeled as
cantilever beams. Shaft deflection and buckling equations were used to evaluate deflection (δ) and the
critical force required to instigate buckling in a beam (Fc). In the equations, K is a factor based on the
end supports of the beam. In this case, K = 2.0 because one end of the beam is fixed while the other is
free to move laterally. For the deflection in beams 3 and 4, the situation evaluated would be the case
where beam 3 is frozen, when climbing would be most severe. The resultant force on the cantilevered-
beam model is derived from the maximum torque we‟re designing to output evaluated as a point force at
the top end of the dimensions of the gear. Table 24, below, shows the resultant deflections on each of the
beams.
Table 24: Results of Shaft Deflection Calculations
Givens Results
Shaft
Segment D (m) L (m) E (GPa) FR (N) δ (m) Fc (·10
6 N)
1 0.0349 0.1207 210 9.93·103 0.0011 2.5901
2 0.0254 0.0762 70 9.93·103 0.0031 6.0776
3 0.0254 0.0762 210 728 2.2243·10-5
77.4 1.4712·10-6
(2.0783·105) 0.00635
4 0.0191 0.0762 210 728 6.9566·10-4
77.4 7.3962·10-4
(6.6452·104) 0.00635

50
Figure 43: Numbered shafts that could possibly deflect
As is evidenced in the results given gross overestimates of the possible forces that will be present under
loading, we do not need to worry about beams deflecting to a point where catastrophic failure will occur.
Safety Shield
The safety shield acts as a protective barrier against any broken parts that may fly off the device in the
case of failure and therefore must be able to withstand high forces. In order to safely choose a material
for the safety shield, an analysis of the maximum stress the material would have to endure was
necessary. To do this, we looked at the maximum force of impact the shield would ever have to tolerate.
We took into account that the specimen cup acts as a shield for the balls or plate, meaning we didn‟t
have to worry about those impacting the safety shield, but in the case that the stress on the lateral force
beams became too much, we had to look at the maximum force one could impact the shield with. To do
this, we determined the maximum mass and speed of the beam if it were to break off, the momentum
they would have and the impulsive force they would hit the shield with. Then, we divided this force by
the smallest contact area of the beam and found the stress that the shield would have to endure. From this
calculation we were able to choose a material for our safety shield. See Appendix D for all calculations.
What We Learned
Over the course of this project, we as individuals and as a team have learned a tremendous amount about
the design process, including material and manufacturing process selection, designing for environmental
sustainability, and practicing the safest possible work habits. In this section we will outline briefly the
key points that we have learned about each one of these categories.
Material and Manufacturing Process Selection
Analyzing material and manufacturing process selection was in fact very beneficial to us since we chose
two critical components in which to choose material for. When we were designing the compressive
block and lateral force beam systems, and choosing materials to use, we had not completed the
assignment, seen in Appendix C, and used multiple iterations of math in Microsoft Excel to determine

51
the appropriate materials and thickness beams to use for the force measurement systems. We ended up
using three different materials for the compressive block and four different lateral beams made out of
two different materials. After completing the selection assignment, we realize the benefits of using a
software program and determining material indices to choose materials. After completing the assignment
we see that we could have gotten away with just one compressive and two lateral beams block (able to
withstand the highest forces and produce the minimum strains at all times). Starting a material selection
process requires some thought and careful planning in order to properly constrain the component and
choose a correct material index, but the benefits are clear. You can spend less time solving equations to
find the right material and less time machining if you choose the best one.
The manufacturing process selection assignment was only marginally beneficial to us in comparison to
the material selection assignment. This is because we were looking at production processes for a
production run of 100 instead of producing our one-off prototype, and the fact that for the time we had
available to us, machining the parts using the mill in our shop was the smartest decision. In terms of our
long term careers as engineers however, we have all learned the benefits of using the CES software for
assisting in choosing appropriate, cost effective manufacturing solutions for individual components.
Design for Environmental Sustainability
Before taking ME 450 and delving into this project, we had little knowledge of how to know if our
design choices and material selections would affect the environment. After completing the assignment,
we now understand, at least to a degree, how to use the SimaPro software package to compare material
choices. The software makes it very intuitive to analyze the material choices and their impacts on the
environment. Given the variety of different charts the program outputs, one can chose a specific
emission to analyze or the environmental impact on a whole. With more time using the program, we
understand that the possibilities are endless when designing for the environment and that determining
impact for life cycles of products can also be performed. We also know that it is difficult to choose a
material based on the SimaPro software alone because there are so many other factors that go into
choosing materials like manufacturing processes and cost which may outweigh the benefits of using a
slightly more environmentally friendly material.
Design for Safety
Safety in engineering and manufacturing is stressed to students from the beginning of their college
careers, but the safety reporting that is a staple of ME 450 takes safety to a new and necessary level. At
first, we collectively thought that the need for safety reports was excessive and disliked having to do
them. We wrote three throughout the course of the semester, one for disassembly, one for manufacturing
and fabrication, and one for testing. As we progressed into our fabrication of parts and assembly of the
device, it became apparent that the reports were beneficial to our progress and kept us safer due to the
fact that they had to be approved by not only our instructor and graduate student instructor, but by Bob
Coury, our machine shop expert whose primary concern is safety. Getting a report approved assured us
that our methods for completing tasks were going to be very safe if carried out with care and caution.
Although the safety reports were long and often tedious, they do have the potential to speed up the actual
process of fabrication or testing since they force team members to know exactly how to perform a given
task. This rigorous planning and writing will only help all of us in the professional world when we have
to perform potentially hazardous and time consuming tasks.
FINAL DESIGN DESCRIPTION
During the parameter analysis of all components and systems, we began selecting and parts for purchase,
materials for fabrication and final dimensions and specifications of all components. The engineering
examination made it possible for us to intelligently design all new parts and purchase parts that we know
will work for our device. This section of the report will describe how we arrived at the appropriate

52
solutions and conclusions for each piece of our device, including power transmission, test cup design,
lateral and compressive force measurement, temperature and humidity control, safety shielding and Data
Acquisition (DAQ) of forces, shaft speed, temperature, and humidity. It encompasses everything that is
necessary for all engineering specifications to be met to the highest degree possible. A full description
will be included for each piece or system of the device and where applicable, engineering drawings will
be shown.
Power Transmission
As described in the Concept Selection section, we first selected to use a gearbox to transfer the rotational
motion of the motor to the driveshaft. With the two gear ratios calculated, we went on to trying to select
an appropriate gearbox that would allow us to run either the TCT or Four-ball test. As we searched, it
became apparent that a 2:1 ratio gearbox was readily available in a variety of styles including parallel
input/output shafts, right-angle, and bevel, but a 1:14 ratio gearbox was uncommon and usually would
only be available in a worm gear style due to the large ratio. This meant that there would be no way to
have both gear ratios housed in one box and we would have to interchange the two depending on what
test was being run. As we searched more, we realized that not only were the correct gear ratios hard to
find, but we have a set driveshaft diameter of 1 in. and a motor shaft diameter of 1.125 in. and the gear
box would need to be able to house these diameters, or we would have to purchase the right size shafts to
fit the gear box, and couple the shafts to the motor and drive shafts. We decided to inquire about
ordering a custom gearbox but were informed that companies would not be willing to invest the time and
money into designing a custom gearbox and only produce one of them to be used in our prototype.
Open Gear Selection
Due to the fact that finding an appropriate gearbox or even two separate gearboxes that matched our gear
ratios, input/output shaft diameters and power ratings was proving to be extremely difficult, we began
exploring the option of replacing the current chain drive system with an open gear system using
interchangeable gears to match the required gear ratios as first described in the Concept Selection
section. In this case, we would eliminate the complexity associated with gearbox parameters but add
several components that would be necessary in order to support open gears. Since the search for a
gearbox was extremely difficult, and stock gears of many sizes are readily available, we focused our
attention on choosing appropriate gears for the implementation of an open gear transmission.
Determining what gears to use was no easy task, but needed close attention to detail to ensure the device
will work as expected. We want to mount the motor in the upright position as it is on the current
prototype and make sure that it remains in a fixed position for each of the two tests. This means that the
center distance between the two interchangeable sets of gears must be the same. Additionally, meeting
the 1:14 gear ratio is limited by the amount of space available between the shop press supports where the
driveshaft gear will be placed. Lastly, the bore size, or inner diameter of the gears had to meet the shaft
diameters of the motor and drive shafts. These three constraints had to be considered when selecting
gears and led to slight deviations in the gear ratios we had originally chosen. After modifications had
been made to the ratios so that we could select stock gears in order to keep costs lower, we ended up
with ratios of 1:12 and 1.6:1 for the TCT and Four-ball tests respectively. See Appendix Afor
calculations. After receiving a quote from several companies and weighing the costs and benefits
between the open gears and finding a gearbox, we decided the extra work of implementing the open
gears would be our best option to ensure that we are able to produce a working prototype and test it by
the Design Expo on April 15. The three largest gears are made out of cast iron, while the smallest gear
(pinion for the TCT) is made out of steel. Two gears are manufactured by Martin Sprocket and Gear, Inc.
and two are manufactured by Browning Gears. Table 25, p. 53, gives specifications for all of the gears.

53
Table 25: Gear Specifications
TCT Pinion TCT Gear Four-ball Pinion Four-ball
Gear
Teeth 12 144 96 60
Bore (in.) 0.75 1 0.75 1
PD (in.) 1.5 18 12 7.5
Pressure Angle (°) 20
Center Distance (in.) 9.75
In order to successfully implement the open gears, several other components have to be purchased and/or
fabricated. First of all, since AC motors do not like lateral forces applied to their shafts, the pinion gear
will have to be attached to a separate shaft that will be fully supported with two ball bearings. The new
shaft and motor shaft will have to coupled using a flexible coupler to be sure that no lateral force is
applied to the motor shaft. In order to support the bearings, steel plates will be attached to the shop press
support structure and flange mounted ball bearings will be used to support lateral forces from the
interactions of the gears. Finally, key stock will be needed to secure the gears to their respective shafts,
guaranteeing that they cannot slip while rotating. A bill of materials for the gears and accessory parts
needed to implement them is given in Table 26, below.
Table 26: Bill of Materials for Gear System
Component Manufacturer Part Number Cost
TCT Pinion Gear Browning Gear YSS812 $28.86
TCT Driveshaft Gear Martin Sprocket, Inc. TC8144 $314.27
Four-ball Pinion Gear Martin Sprocket, Inc. TC896 $208.5
Four-ball Driveshaft
Gear Martin Sprocket, Inc. YSS860 $136.57
Flange Mount Ball
Bearing (x2) Import 05550637 $49.34
Pinion Gear Shaft McMaster-Carr 1497K956 $25.96
Flexible Coupler DieQua Corporation EK2-60 $132.00
Key Stock McMaster-Carr 98535A150 $3.55
Steel Sheet McMaster-Carr 1388K131 $219.58
Total Cost $1130.43
Normal Force Measurement System
For our alpha design, we chose to use a compressive block with a strain gage attached to it in order to
measure the normal forces applied to the tool/specimen interface. We have determined the maximum
stress that the material needs to endure (for the TCT) is 17.2 MPa. We originally wanted to use PVC as
the material for the compressive block material, which would be appropriate due to the fact that PVC has
a compressive strength of about 55.5 MPa [36]. However, if subjected to this force for any length of
time, we were informed that creep may become an issue, so PVC may not be the material of choice for
the high normal force tests, and that aluminum or steel would be better for those applications. Since 6061
aluminum has a compressive stress of 249 MPa, we knew it would be fine under the highest loads, but
were concerned that it may not strain enough to be detected by standard foil strain gages, which require a
minimum strain of 1.0 x 10⁻⁶
. Therefore, we had to analyze the force range that the aluminum block
could be used for and still detect the minimum required strain. At 100 kN of normal force, the aluminum
block would compress to a strain of 2.5 x 10⁻⁴
, well above the minimum required. We wanted to use the
aluminum block for the widest possible range, so we calculated how low the normal force could be so
that aluminum was still suitable. This low normal force was found to be 401 N. We decided to start the

54
use of aluminum at normal forces of 1000 N or more. At 1000 N of normal force, the aluminum would
compress to a strain of 2.5 x 10⁻⁶
. We also checked to verify that the strain of the PVC would be above
the minimum required at the lowest normal force of 30 N. At this normal force, the PVC would
compress to a strain of 1.9 x 10⁻⁶
, above the minimum required. Also, at the maximum normal force we
would use PVC for, the stress on the block would be 0.172 MPa.
As mentioned, foil strain gages would be used to detect the strain of the compressive blocks, and they
need a minimum of 1.0 x 10⁻⁶
strain to be effective. These strain gages will be discussed below under
Lateral Force Measurement.
Specimen Cup Assembly
The specimen cup assembly design includes four 6061 alloy aluminum components: specimen cup, TCT
ring, and outer collar. The cup itself houses the bottom three balls of the Four-ball test or the 2 in. square
steel plate of the TCT. It also bears the compressive normal loads of each test. Fig. 44, p. 55 shows the
parts of the four parts associated with the specimen cup assembly. We originally designed the cup to
have a 1 in. thick bottom surface and after determining the maximum compressive stress on the cup to be
38.8 MPa, we saw no need to change the design, since the compressive strength of 6061 aluminum is
249 MPa [36], giving us a safety factor of 6.4. Along with the compressive stresses from the normal
forces, we analyzed the teeth design against shear stress. The four teeth are located underneath the
bottom of the cup and fit into machined grooves in a steel plate that sits below the cup. This plate rests
on a roller bearing and houses the brackets for the lateral force beams as well. We determined that the
maximum shear stress the teeth would have to endure would be 3.8 MPa. The maximum allowable shear
stress for 6062 aluminum is 120.5 MPa [36], half of the yield stress. Due to a safety factor of 31.7, we
felt no need to change the design.
The rings and outer collar work in conjunction with one another to secure the three balls or steel plate to
the bottom of the cup depending on the test. Both rings simply rest in the cup on top of the specimen.
They are designed to be secured to the cup by pressure applied by the outer collar, which screws onto the
cup. As the collar is tightened, it presses down onto the top of the ring and the pressure is applied to the
specimen, ensuring that it doesn‟t move during testing. The Four-ball collar sits over the bottom three
balls and relies on the pressure from the outer collar alone to secure the balls. The TCT ring however,
has built in teeth that sit into milled grooves on the bottom surface of the specimen cup, disallowing
rotational motion of the steel plate used in the TCT. The rings and outer collar do not support the lateral
force of the tests and therefore no analysis was needed to make sure that they would not fail under
various test conditions.

55
Figure 44: Specimen cup and lateral force measurement system assembly
Lateral Force Measurement System
The lateral force system we developed for our alpha design includes a 1 in. thick, strain gage equipped
beam connected to a steel plate that supports the specimen cup via brackets, and a deflecting block that
allows the beam to be bent so that strain can be measured. The two brackets are attached to the steel
plate and securely hold the beam in place. Figure 44 above shows the parts associated with the lateral
force measurement system. In order make sure that our design would be adequate for safety and strain
detection, we performed bending stress and strain analysis on the beam and brackets which were
modeled as 0.5 in. thick cantilever beams. For the TCT, a maximum force of 728.4 N would be put on
the end of the beam. With a 1 in. thickness, the maximum bending stress would be 20.3 MPa. 6061
aluminum has a maximum compressive stress of 249 MPa, giving a more than adequate safety factor of
12.3. We next checked to ensure that the beam would strain enough for the foil strain gage to record an
accurate reading at the lowest normal force setting of the Four-ball test of 30 N. For this low normal
force, the reactant force at the end of the beam would be 0.07 N, yielding a strain of 2.9 x 10⁻⁸
, much
below the necessary minimum strain. Using the Four-ball test normal force of 2 kN, the 1 in. thick beam
would deflect enough to output a strain of 2.0 x 10⁻⁶
, above the necessary minimum strain.
Because we need to be able to record lateral forces at normal loads less than 2 kN, another beam will
need to be used. This second beam has a thickness of 0.125 in. so that it will be more sensitive to strain
at lower forces. At the low strain of 30 N for the Four-ball test, the thin beam will give a strain of 1.9 x
10-6
, more than what is required for the strain gages. It also needed to be verified that the thin beam
would be safe operating at normal forces up to 2 kN, so the stresses were calculated at 2 kN of normal
force. At this normal force, the maximum reaction force of 14.6 N on the beam would occur during the
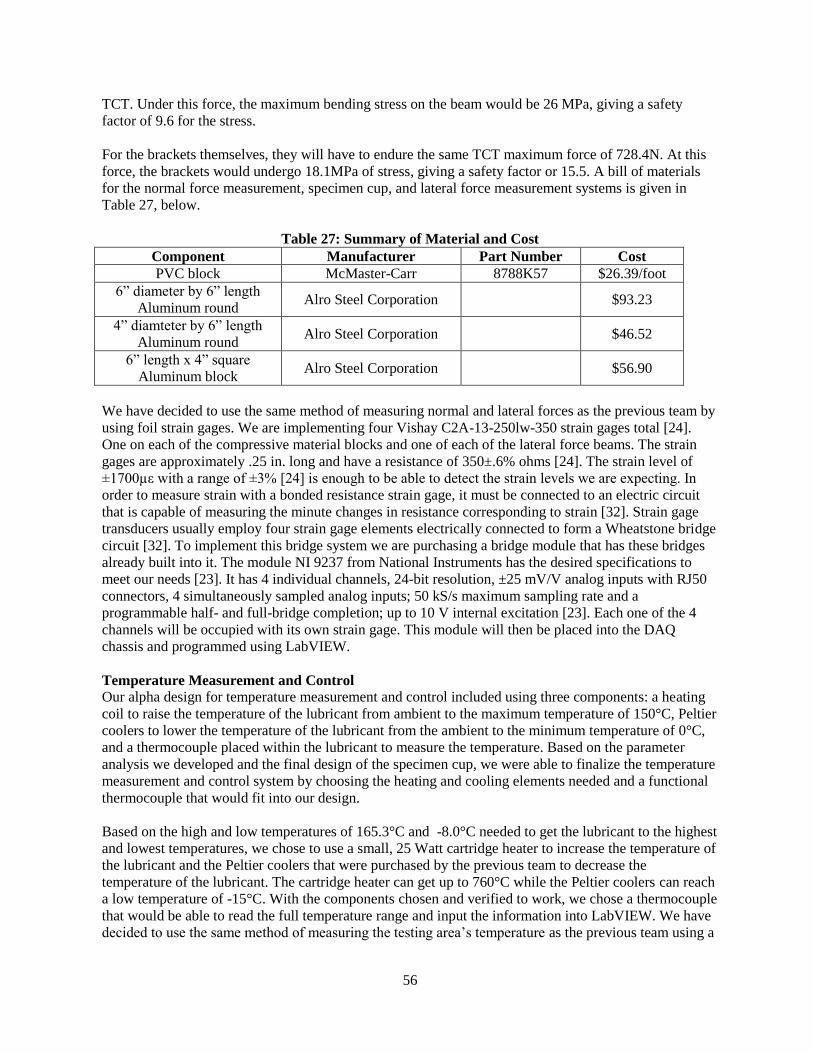
56
TCT. Under this force, the maximum bending stress on the beam would be 26 MPa, giving a safety
factor of 9.6 for the stress.
For the brackets themselves, they will have to endure the same TCT maximum force of 728.4N. At this
force, the brackets would undergo 18.1MPa of stress, giving a safety factor or 15.5. A bill of materials
for the normal force measurement, specimen cup, and lateral force measurement systems is given in
Table 27, below.
Table 27: Summary of Material and Cost
Component Manufacturer Part Number Cost
PVC block McMaster-Carr 8788K57 $26.39/foot
6” diameter by 6” length
Aluminum round Alro Steel Corporation $93.23
4” diamteter by 6” length
Aluminum round Alro Steel Corporation $46.52
6” length x 4” square
Aluminum block Alro Steel Corporation $56.90
We have decided to use the same method of measuring normal and lateral forces as the previous team by
using foil strain gages. We are implementing four Vishay C2A-13-250lw-350 strain gages total [24].
One on each of the compressive material blocks and one of each of the lateral force beams. The strain
gages are approximately .25 in. long and have a resistance of 350±.6% ohms [24]. The strain level of
±1700µε with a range of ±3% [24] is enough to be able to detect the strain levels we are expecting. In
order to measure strain with a bonded resistance strain gage, it must be connected to an electric circuit
that is capable of measuring the minute changes in resistance corresponding to strain [32]. Strain gage
transducers usually employ four strain gage elements electrically connected to form a Wheatstone bridge
circuit [32]. To implement this bridge system we are purchasing a bridge module that has these bridges
already built into it. The module NI 9237 from National Instruments has the desired specifications to
meet our needs [23]. It has 4 individual channels, 24-bit resolution, ±25 mV/V analog inputs with RJ50
connectors, 4 simultaneously sampled analog inputs; 50 kS/s maximum sampling rate and a
programmable half- and full-bridge completion; up to 10 V internal excitation [23]. Each one of the 4
channels will be occupied with its own strain gage. This module will then be placed into the DAQ
chassis and programmed using LabVIEW.
Temperature Measurement and Control
Our alpha design for temperature measurement and control included using three components: a heating
coil to raise the temperature of the lubricant from ambient to the maximum temperature of 150°C, Peltier
coolers to lower the temperature of the lubricant from the ambient to the minimum temperature of 0°C,
and a thermocouple placed within the lubricant to measure the temperature. Based on the parameter
analysis we developed and the final design of the specimen cup, we were able to finalize the temperature
measurement and control system by choosing the heating and cooling elements needed and a functional
thermocouple that would fit into our design.
Based on the high and low temperatures of 165.3°C and -8.0°C needed to get the lubricant to the highest
and lowest temperatures, we chose to use a small, 25 Watt cartridge heater to increase the temperature of
the lubricant and the Peltier coolers that were purchased by the previous team to decrease the
temperature of the lubricant. The cartridge heater can get up to 760°C while the Peltier coolers can reach
a low temperature of -15°C. With the components chosen and verified to work, we chose a thermocouple
that would be able to read the full temperature range and input the information into LabVIEW. We have
decided to use the same method of measuring the testing area‟s temperature as the previous team using a

57
thermocouple. We are implementing an Omega TJ96-CASS-18G-12 thermocouple. This thermocouple
is „K‟ type, has a diameter of 1/8 in. and a length of 12 in [26]. They have an accuracy of ±1.1° of
accuracy (or .4% of temp) and a temperature range of -200°C to 1250°C [26]. These thermocouple
specifications fit into our needs of temperature expectations. In order to measure the temperature using
the thermocouple, one of the wires needs to be kept at a set (reference) temperature while the other wire
measures the temperature of the test area. This will output a voltage difference which is temperature
dependent. To implement the thermocouple, we are using another module to insert into the DAQ chassis.
The module NI 9211 from National Instruments has the desired specifications to meet our needs [25]. It
has 4 individual channels, 14 S/s, 24-bit resolution; 50/60 Hz noise rejection, ±80 mV analog inputs, and
an operating temperature range of -40 to 70°C [25]. This module will be placed into the DAQ chassis
and programmed using LabVIEW.
Humidity Measurement and Control
In our alpha design, we selected to use a humidity meter that would be placed within the limits of the
safety shield and allow for data acquisition into LabVIEW for the measurement of humidity. For
humidity control, we selected to use a small beaker of water as the source for more humidity. Our
thoughts were to place the small beaker on top of the deflecting block of the lateral force measurement
system and place a second small 25 Watt cartridge heater within the block to heat and therefore
evaporate the water in the beaker, creating water vapor within the limits of the safety shield and
increasing the humidity of the test. We have changed our method of measuring humidity in our Alpha
Design from a simple humidity meter that only displays the current humidity to product that measures
humidity and relays the information to LabVIEW. We have decided to use a Vaisala INTERCAP
HMP50 Humidity and Temperature Probe [31]. This probe has a humidity measurement range of 0 to
98% relative humidity [31]. The accuracy from 0 to 90% relative humidity is ± 3% relative humidity,
and from 90 to 98% relative humidity the accuracy is ± 5% relative humidity [31]. To implement this
humidity probe we will be purchasing a third module to insert into the DAQ chassis. This National
Instruments 9201 module is an 8-channel, ± 10 V input range, 500 kS/s aggregate sampling rate, 12-bit
resolution analog input module [30].
Shaft Speed Measurement
We have decided to use an infrared tachometer to measure the shaft speed. The previous semester‟s team
used an optical encoder that was short-circuited during a test. Due to the fact that tachometers cost less
than optical encoders and still have the function we need of measuring shaft speed, we are now
implementing a tachometer into our device. The tachometer is mounted and its infrared light is directed
at the shaft that has a piece of reflective material on it. As the shaft spins, the light senses the reflective
material and measures the speed. This Monarch Instrument, IRS-P infrared sensor measures speed from
1-999,990 rpm, has an operating distance of .5 to 1 in., is able to operate at a temperature range of -23°
to 100°C and produces an analog voltage output [28]. To implement this infrared tachometer we are
using last semester‟s NI USB-6009 Multifunctional DAQ system [27]. This DAQ system has 8 analog
inputs (14-bit resolution, 48 kS/s), 2 analog outputs (12-bit resolution, 150 S/s); 12 digital I/O; 32-bit
counter and is compatible with LabVIEW [27]. This DAQ system will be hooked up to and programmed
using LabVIEW.
Motor Control
We have decided to use the same method of controlling the motor as last semester‟s team using the
Inverter Drive ABB ACS150 motor control [29]. This motor control is 0.5-3 HP, 200-240 V, 3 phase
motor compatible [29]. It has 1 analog input, 5 digital inputs and 1 relay contact set [29]. This motor
control and its specifications have not changed since our Alpha Design. To implement this motor control
we are using the same DAQ system as above in shaft speed measurement. This NI USB-6009 will also
be compatible to control the motor through the use of LabVIEW [27].

58
Heating Cartridge
To control the temperature of the testing area and the water for regulating humidity, we have decided to
use a McMaster-Carr Miniature High-Temperature Cartridge Heater [33]. One heater will be inserted
into the specimen cup and one into deflection block. These cartridges are made for very small hot plates
or spot heating of small dies [33]. Their diameter is 1/8 in., and has a maximum wire lead temperature of
249°C [33]. These product specifications fit our engineering specifications and sponsor requirements of
controlling the temperature from 0 - 150°C. To implement the heating cartridges we will be purchasing a
temperature controller from Thermal Corporation [34]. This Basic Unit – No Alarm device, model
number 5040-10, accepts temperature and process inputs and offers a choice of three kinds of outputs to
meet a wide variety of needs, whether it‟s a single or dual outputs include relay, SSR driver, or 4-10mA
[34].
Data Acquisition System
The DAQ system we have decided to implement is the NI cDAQ-9174 [22]. This system holds up to 4 C
Series I/O modules, runs analog input modules at different rates with multiple timing engines, has four
general-purpose 32-bit counter/timers built into the chassis and is compatible with LabVIEW [22].
Based on our need of controlling normal and lateral force using a strain gage and temperature control
using thermocouples, this is the best option that we have decided to implement. We are also
implementing a DAQ card that the previous team used last semester, the NI USB-6009 [27]. This has the
capabilities of measuring the shaft speed using the tachometer and controlling the motor using the AC
drive speed motor controller. It has 8 analog inputs (14-bit, 48 kS/s), 2 analog outputs (12-bit, 150 S/s),
12 digital I/O, 32-bit counter and is compatible with LabVIEW [27]. Table 28, below, summarizes the
components and their prices.
Table 28: Summary of Data Acquisition Products
Function Module Price ($) Product Model Price ($)
Normal and Lateral
Force Measurement NI 9237 1149.00
Strain Gage
(Vishay) C2A-13-250lw-350
Pk. of 10 for
71.25
Temperature
Measurement NI 9211 329.00
Thermocouple
(Omega) TJ96-CASS-18G-12 33.00
Shaft Speed
Measurement
NI USB-
6009
Already
Own
Infrared Tachometer
(Monarch) IRS-P 200.00
Motor Control NI USB-
6009
Already
Own
AC Drive Speed Controller
(Inverter Drive) ABB ACS150 Already Own
Humidity
Measurement NI 9201 379
Humidity and
Temperature Probe
(Vaisala)
HMP50 240
Heating Cartridge
Basic Unit –
Temperature
Controller
179
2 Miniature High-
Temperature Cartridge
Heater
8376T21 27.35 each
Total Price 2036 598.70
Grand Total Price $2634.95
Safety Shields
As part of the alpha design, we selected to use a clear plastic as an outer shell for the test area that serves
two purposes: one is to retain any flying objects that may break in the case of failure of the device
keeping the user safe, and two is to retain the water vapor produced by the heated beaker of water to
maintain constant humidity for the tests. From the procedure described in the Parameter Analysis
section, p. 43, we calculated that the Four-ball beam produced the maximum force of 160.9 N that the
shield would have to withstand. Even though the TCT beam is thicker and therefore more massive, the
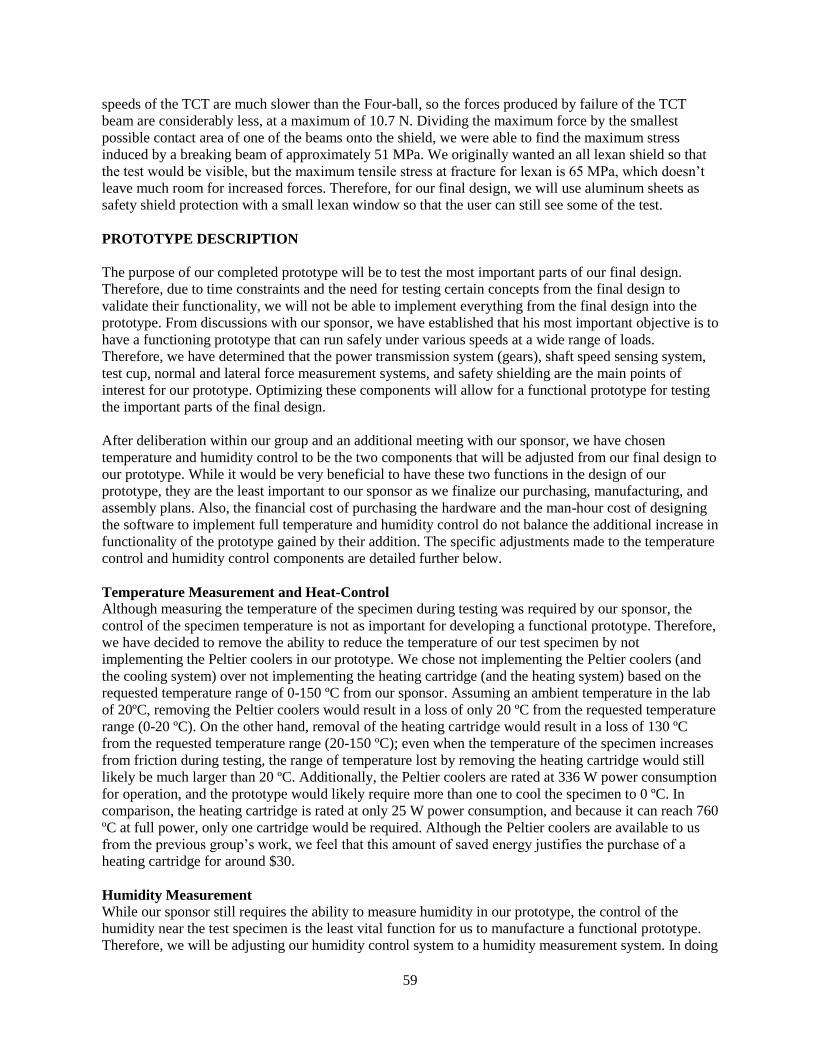
59
speeds of the TCT are much slower than the Four-ball, so the forces produced by failure of the TCT
beam are considerably less, at a maximum of 10.7 N. Dividing the maximum force by the smallest
possible contact area of one of the beams onto the shield, we were able to find the maximum stress
induced by a breaking beam of approximately 51 MPa. We originally wanted an all lexan shield so that
the test would be visible, but the maximum tensile stress at fracture for lexan is 65 MPa, which doesn‟t
leave much room for increased forces. Therefore, for our final design, we will use aluminum sheets as
safety shield protection with a small lexan window so that the user can still see some of the test.
PROTOTYPE DESCRIPTION
The purpose of our completed prototype will be to test the most important parts of our final design.
Therefore, due to time constraints and the need for testing certain concepts from the final design to
validate their functionality, we will not be able to implement everything from the final design into the
prototype. From discussions with our sponsor, we have established that his most important objective is to
have a functioning prototype that can run safely under various speeds at a wide range of loads.
Therefore, we have determined that the power transmission system (gears), shaft speed sensing system,
test cup, normal and lateral force measurement systems, and safety shielding are the main points of
interest for our prototype. Optimizing these components will allow for a functional prototype for testing
the important parts of the final design.
After deliberation within our group and an additional meeting with our sponsor, we have chosen
temperature and humidity control to be the two components that will be adjusted from our final design to
our prototype. While it would be very beneficial to have these two functions in the design of our
prototype, they are the least important to our sponsor as we finalize our purchasing, manufacturing, and
assembly plans. Also, the financial cost of purchasing the hardware and the man-hour cost of designing
the software to implement full temperature and humidity control do not balance the additional increase in
functionality of the prototype gained by their addition. The specific adjustments made to the temperature
control and humidity control components are detailed further below.
Temperature Measurement and Heat-Control
Although measuring the temperature of the specimen during testing was required by our sponsor, the
control of the specimen temperature is not as important for developing a functional prototype. Therefore,
we have decided to remove the ability to reduce the temperature of our test specimen by not
implementing the Peltier coolers in our prototype. We chose not implementing the Peltier coolers (and
the cooling system) over not implementing the heating cartridge (and the heating system) based on the
requested temperature range of 0-150 ºC from our sponsor. Assuming an ambient temperature in the lab
of 20ºC, removing the Peltier coolers would result in a loss of only 20 ºC from the requested temperature
range (0-20 ºC). On the other hand, removal of the heating cartridge would result in a loss of 130 ºC
from the requested temperature range (20-150 ºC); even when the temperature of the specimen increases
from friction during testing, the range of temperature lost by removing the heating cartridge would still
likely be much larger than 20 ºC. Additionally, the Peltier coolers are rated at 336 W power consumption
for operation, and the prototype would likely require more than one to cool the specimen to 0 ºC. In
comparison, the heating cartridge is rated at only 25 W power consumption, and because it can reach 760
ºC at full power, only one cartridge would be required. Although the Peltier coolers are available to us
from the previous group‟s work, we feel that this amount of saved energy justifies the purchase of a
heating cartridge for around $30.
Humidity Measurement
While our sponsor still requires the ability to measure humidity in our prototype, the control of the
humidity near the test specimen is the least vital function for us to manufacture a functional prototype.
Therefore, we will be adjusting our humidity control system to a humidity measurement system. In doing
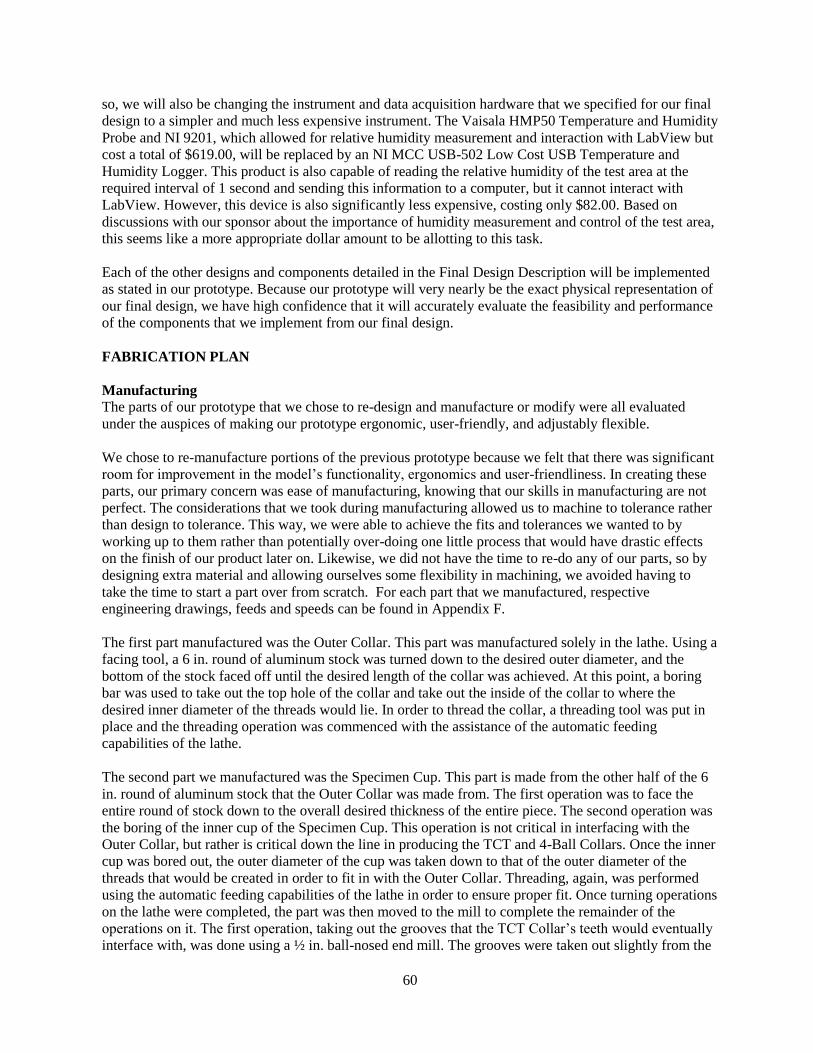
60
so, we will also be changing the instrument and data acquisition hardware that we specified for our final
design to a simpler and much less expensive instrument. The Vaisala HMP50 Temperature and Humidity
Probe and NI 9201, which allowed for relative humidity measurement and interaction with LabView but
cost a total of $619.00, will be replaced by an NI MCC USB-502 Low Cost USB Temperature and
Humidity Logger. This product is also capable of reading the relative humidity of the test area at the
required interval of 1 second and sending this information to a computer, but it cannot interact with
LabView. However, this device is also significantly less expensive, costing only $82.00. Based on
discussions with our sponsor about the importance of humidity measurement and control of the test area,
this seems like a more appropriate dollar amount to be allotting to this task.
Each of the other designs and components detailed in the Final Design Description will be implemented
as stated in our prototype. Because our prototype will very nearly be the exact physical representation of
our final design, we have high confidence that it will accurately evaluate the feasibility and performance
of the components that we implement from our final design.
FABRICATION PLAN
Manufacturing
The parts of our prototype that we chose to re-design and manufacture or modify were all evaluated
under the auspices of making our prototype ergonomic, user-friendly, and adjustably flexible.
We chose to re-manufacture portions of the previous prototype because we felt that there was significant
room for improvement in the model‟s functionality, ergonomics and user-friendliness. In creating these
parts, our primary concern was ease of manufacturing, knowing that our skills in manufacturing are not
perfect. The considerations that we took during manufacturing allowed us to machine to tolerance rather
than design to tolerance. This way, we were able to achieve the fits and tolerances we wanted to by
working up to them rather than potentially over-doing one little process that would have drastic effects
on the finish of our product later on. Likewise, we did not have the time to re-do any of our parts, so by
designing extra material and allowing ourselves some flexibility in machining, we avoided having to
take the time to start a part over from scratch. For each part that we manufactured, respective
engineering drawings, feeds and speeds can be found in Appendix F.
The first part manufactured was the Outer Collar. This part was manufactured solely in the lathe. Using a
facing tool, a 6 in. round of aluminum stock was turned down to the desired outer diameter, and the
bottom of the stock faced off until the desired length of the collar was achieved. At this point, a boring
bar was used to take out the top hole of the collar and take out the inside of the collar to where the
desired inner diameter of the threads would lie. In order to thread the collar, a threading tool was put in
place and the threading operation was commenced with the assistance of the automatic feeding
capabilities of the lathe.
The second part we manufactured was the Specimen Cup. This part is made from the other half of the 6
in. round of aluminum stock that the Outer Collar was made from. The first operation was to face the
entire round of stock down to the overall desired thickness of the entire piece. The second operation was
the boring of the inner cup of the Specimen Cup. This operation is not critical in interfacing with the
Outer Collar, but rather is critical down the line in producing the TCT and 4-Ball Collars. Once the inner
cup was bored out, the outer diameter of the cup was taken down to that of the outer diameter of the
threads that would be created in order to fit in with the Outer Collar. Threading, again, was performed
using the automatic feeding capabilities of the lathe in order to ensure proper fit. Once turning operations
on the lathe were completed, the part was then moved to the mill to complete the remainder of the
operations on it. The first operation, taking out the grooves that the TCT Collar‟s teeth would eventually
interface with, was done using a ½ in. ball-nosed end mill. The grooves were taken out slightly from the

61
initially-designed width of 0.5 in. in order to accommodate for both deflection in the end mill while
machining the grooves, but also for inconsistencies in machining out the teeth on the bottom of the TCT
Collar. On the underside of the cup, four teeth were milled out that would interface with four grooves in
the Lower Block. From there, two more holes were machined in order to provide a setting for our
resistive heating cartridge, and also for our thermocouple. A final little modification to the original
design was a slight, ¾ in. indentation at the center of the cup using a flat end mill. This provides a small
resting area for the three specimen balls used in the 4-Ball test so they don‟t easily separate and
inconveniently fall into a groove.
Third in the process order is the 4-Ball Collar. Although this piece could have been done in tandem with
the TCT Collar, we were only on one lathe at the time, and this one required the most work. Working
down from the 4 in. round of aluminum, the outer diameter was taken down to what the inner diameter
of the Specimen Cup was measured to once that aspect of the machining was done. Boring out the
through-hole was done next, followed by the bottom, 45° chamfer. The part was flipped around and the
entire block was faced down until the piece was of desired length. The inner recess was then created,
again using the boring bar, until the opening of the through-hole was just inside of 1 in. in diameter.
The TCT Collar followed the 4-Ball collar in the lathe, and was started off in a similar fashion. The outer
diameter was turned down until it fit in the Specimen Cup, and the through hole was created using a
boring bar. Another chamfer was done, though not to the same extent as the 4-Ball Collar. The round
was then flipped around and faced on the other side to the desired length of the piece. Once this length
was established, the piece was taken to the mill to have the teeth cut out from the excess stock at the end
of the round. Once the teeth were milled out, the Specimen Cup and TCT Collar were both touched up
until the collar fit down into the teeth at full engagement in each possible orientation. Touching up
involved both filing down burrs on the teeth and grooves and also taking the width of the grooves out
slightly, compensating for the deflection that occurred in the end mill during those operations.
During the time that was spent on the lathe, the Lateral Force Beam Brackets were being machined on
the mill. In order to ensure proper alignment between the two brackets, a coincident origin was
established from which to center all measurements. Facing was done using a ½ in. end mill, as were the
large-diameter holes. The slots and smaller holes were done using a ¼ in. end mill to ensure uniformity
between the two brackets.
Deflecting Beams are cut individually out of a length of appropriate material stock, and then milled
down to exact size and finish. Where the ½ in. drill was initially design, a slot is additionally taken down
from the hole in order to allow easier changeability between tests.
The two bearing alignment plates were designed to facilitate proper alignment between the two shafts in
our system. The top of the pair replaced a plate that was already present in the previous prototype, and
the bottom fit between the shop press and the thrust bearing plate. Because the plates were made out of
steel, extra attention had to be exercised in order to get the machining done right the first time. From
larger plates of the steel, the two plates were cut down to relative size on the band saw. The remaining
operations, those being drilling, slotting and edge-finishing were performed on a mill to ensure precise
measurement techniques. The slotting of fastener holes and bearing mounts was necessary to allow the
implementation of these plates to be flexible. Because we had to adjust to inconsistencies in the drilling
of the previous prototype, slotting of these plates would allow us to make small adjustments during final
assembly in order to create a well-aligned system.
Because of the shaft alignment redesign we incorporated to accommodate our new power transmission
system, we need a shorter shop bench to hold our motor. The shorter bench was drilled and assembled in
the same fashion that the previous one was.

62
The gear enclosure box was bent and bolted together out of a flat piece of 0.025 in. aluminum sheet
stock. Holes were drilled on the top side of it to accommodate the ends of the driveshafts, and brackets
were mounted along the side to be bolted to the outer C-Beams of the shop press. The Humidity
Enclosure was designed out of clear ABS plastic, secured together with brackets.
Modification and Adjustment
The parts of the previous prototype that we chose to modify or append to were done so in order to make
the prototype slightly adjustable in key areas. Because we performed these modifications, we were able
to accommodate slight errors both in what we manufactured and what was left for us on the previous
prototype.
Just like we had to machine adjustability into the bearing alignment plates, we had to machine some
adjustability into the parts we were left with. The thrust bearing plate and the bottom-most bearing plate
both required slotting in order to allow for complete flexibility along the main drive shaft.
We had to make some slight adjustments to the shop press structure in order to eliminate already-present
alignment issues. By loosening and re-tightening the bolts that secured the horizontal C-Beams to the
vertical ones, we were able to level the mounting surface of each of the driveshaft bearing plates.
The Lower Block required a number of modifications to accommodate our redesigns. On the top side of
the block, four grooves were milled out in order to interface with the four teeth on the underside of the
Specimen Cup. On one side of the block, six small holes were drilled and tapped where the Beam
Brackets would bolt down to. The peltier setup, covering two other sides of the block, involved using
Arctic Silver thermal adhesive to bind the peltiers to the block, and their respective heatsink and fan
assemblies on top of that.
Assembly of Final Prototype
There are two halves to the assembly process involved with this prototype. The first, and most important,
is the aligning of the motor driveshaft to the tool-fixture driveshaft. The second half, and the one that is
inherently more flexible, is the assembly of the Specimen Fixture down through the bottle jack of the
shop press.
In assembling the driveshaft interface, we started from the tool fixture and worked our way back to the
motor. By leaving every fastener loose by a turn or two, we could put everything together, and then
tighten down each piece from the bottom up as we spun the tool-fixture driveshaft to ensure that the
bearings were properly in line.
The same process was applied to the motor driveshaft. The motor, once secured to its mount, was moved
into roughly the proper place underneath its bearings. Sitting loosely in untightened and loosely-secured
bearings, the smaller shaft was then coupled to the motor‟s driveshaft using the flexible coupler. Once
this coupling was tightened down, final adjustments were made to the positioning of the motor mount
relative to the shop press in order to adjust tooth engagement in the gears. We set this engagement using
the TCT gear ratio since the 1.5 in. sprocket did not create undue forces on the driveshaft. Once tooth
engagement was in place, the motor shaft was turned, by hand, so that the motor driveshaft bearings
could be tightened down while still ensuring that the flexible coupler was not under a significant amount
of misalignment stress.
Putting together the bottom assembly was kept simple. From the bottle jack on up, the aluminum block is
placed over the jack, followed by a compressive block of a desired material, followed by the pair of steel
alignment plates. Depending on the test being run, either the large steel ball or the 4 bolts are put in

63
place. The modified Lower Block, complete with the peltier setup, is placed over the bearings on the top
side of the upper steel alignment plate. The block is oriented so that the affixed Deflecting Beam
interfaces with the Deflecting Block. The Deflecting Block is bolted to the left C-Beam of the shop
press.
Once the specimen assembly, tool fixture selection and gear ratio selections are complete, the safety
shields can be bolted down at their respective locations. The environmental enclosure only requires that
the specimen cup and tool fixture be close to engagement, so necessary preparations in per-experiment
setup are required before initial loading of the shop press can commence.
Changes between Final Design and Prototype
Two changes between the Final Design and Prototype were the use of an aluminum safety shield instead
of the large humidity chamber, as well as the use of steel dowels instead of teeth to interface the
Specimen Cup and Lower Block.
The new safety shield, an environmental enclosure, was bent around the specimen assembly, and
bracket-mounted to the motor mount, creating a thin wall that will prevent errant human contact with the
interface during testing.
The steel dowels replaced the teeth that would have been used underneath the Specimen Cup. The
dowels were press-fit into the steel Lower Block, and slip-fit into the Specimen Cup. The slip-fit holes in
the bottom of the Specimen Cup had a chamfer added to make placing were additionally reamed out in
order to provide flexibility in what direction the cup could fit over the dowels nicely. The dowels in the
Lower Block were glued into place to ensure rigidity. Over the course of curing, one cured off-angle, so
it was removed. The three dowels that are currently in place provide more than adequate shearing
protection and security for the Specimen Cup.
VALIDATION PLAN
Fundamentally, we will have 4 major preliminary tests that will prove/disprove our mechanical and
electrical systems before we test the entire device and everything all at once. These tests will occur as
assembly is in progress. The 4 preliminary tests can be broken down as:
1. Force Measurement Systems
2. Motor Control
3. Temperature Control
4. Transmission System
The rest of this section presents tables that breakdown the specifics about each of the four preliminary
tests as well as one that describes the nature of the full prototype tests where all systems will be working
in conjunction with one another.
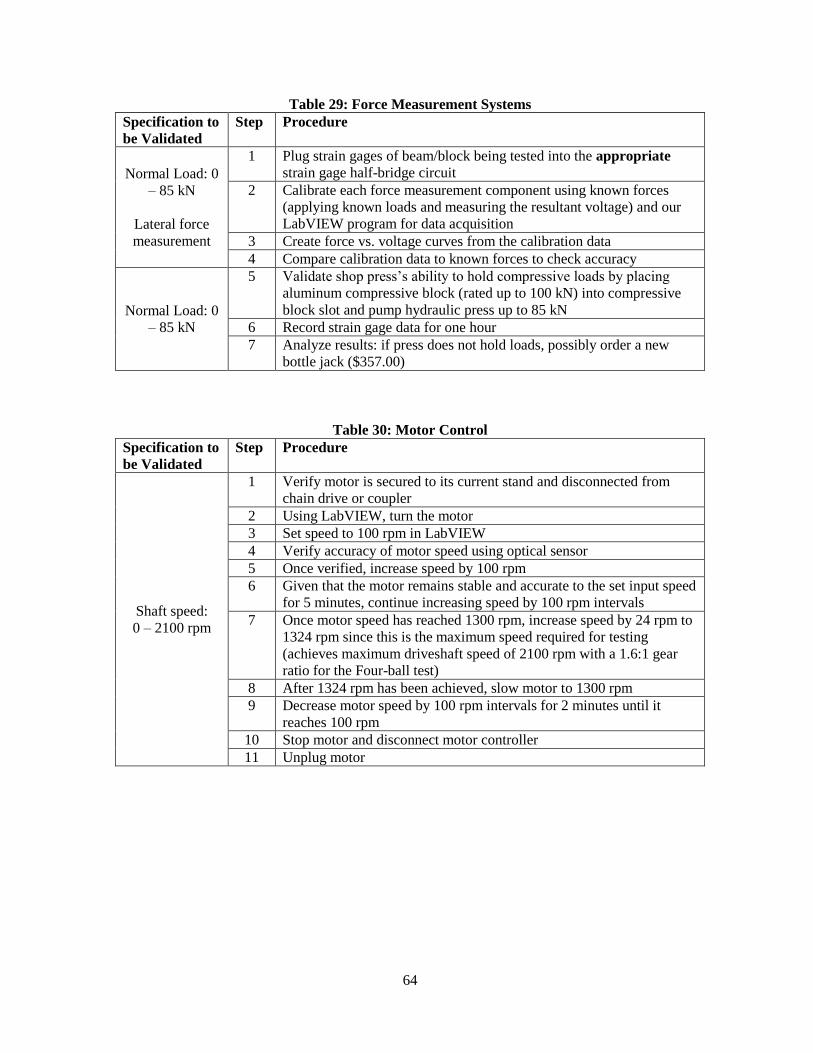
64
Table 29: Force Measurement Systems
Specification to
be Validated
Step Procedure
Normal Load: 0
– 85 kN
Lateral force
measurement
1 Plug strain gages of beam/block being tested into the appropriate
strain gage half-bridge circuit
2 Calibrate each force measurement component using known forces
(applying known loads and measuring the resultant voltage) and our
LabVIEW program for data acquisition
3 Create force vs. voltage curves from the calibration data
4 Compare calibration data to known forces to check accuracy
Normal Load: 0
– 85 kN
5 Validate shop press‟s ability to hold compressive loads by placing
aluminum compressive block (rated up to 100 kN) into compressive
block slot and pump hydraulic press up to 85 kN
6 Record strain gage data for one hour
7 Analyze results: if press does not hold loads, possibly order a new
bottle jack ($357.00)
Table 30: Motor Control
Specification to
be Validated
Step Procedure
Shaft speed:
0 – 2100 rpm
1 Verify motor is secured to its current stand and disconnected from
chain drive or coupler
2 Using LabVIEW, turn the motor
3 Set speed to 100 rpm in LabVIEW
4 Verify accuracy of motor speed using optical sensor
5 Once verified, increase speed by 100 rpm
6 Given that the motor remains stable and accurate to the set input speed
for 5 minutes, continue increasing speed by 100 rpm intervals
7 Once motor speed has reached 1300 rpm, increase speed by 24 rpm to
1324 rpm since this is the maximum speed required for testing
(achieves maximum driveshaft speed of 2100 rpm with a 1.6:1 gear
ratio for the Four-ball test)
8 After 1324 rpm has been achieved, slow motor to 1300 rpm
9 Decrease motor speed by 100 rpm intervals for 2 minutes until it
reaches 100 rpm
10 Stop motor and disconnect motor controller
11 Unplug motor

65
Table 31: Temperature Control
Specification to
be Validated
Step Procedure
Temperature:
Ambient –
150°C
1 Place heating cartridge into test cup
2 Fill bottom of test cup with Olive Oil (MSDS in section 8.3)
3 Set up the four ball test in the test cup
4 Using LabVIEW, set a temperature for the lubricant to 25°C
5 Verify that the cartridge heater warms the lubricant up to the set
temperature and wait to ensure that if the temperature increases over
the set temperature that the Peltier fans will come on and the Peltiers
cool the lubricant until it reaches the set temperature again
6 After this test has been verified, increase the temperature to 30°C and
wait again
7 Upon each successful temperature, increase temperature by intervals
of 10°C until the maximum desired temperature of 150°C has been
reached
Temperature:
0°C – Ambient
8 Set temperature to 15°C and observe Peliters cool the lubricant to this
temperature
9 If successful, continue cooling to 0°C by 5°C intervals
10 Turn off both power supplies
Table 32: Transmission System
Specification to
be Validated
Step Procedure
Shaft speed:
2 – 30 rpm for
TCT
1 Attach 1:12 gear ratio for TCT
2 Connect the pinion gear driveshaft to the motor shaft via the flexible
coupler
3 Plug in motor
4 Input gear ratio to LabVIEW and set driveshaft speed to 2 rpm
5 Verify that the measured shaft speed is 2 rpm
6 Increase shaft speed to 5 rpm
7 Continue increasing speed by 5 rpm increments until max speed of 30
rpm is reached
8 Turn off motor
9 Unplug motor
Shaft speed:
0 – 2100 rpm
for Four-ball
test
10 Swap gears for the 1.6:1 ratio of the Four-ball test
11 Plug in motor
12 Input new gear ratio to LabVIEW and set driveshaft speed to 100 rpm
13 Verify that the measured speed is 100 rpm
14 If verified, continue increasing speed by 100 rpm intervals until 2100
rpm (max speed of Four-ball test) has been reached
15 Turn off motor
16 Unplug motor and disconnect motor controller

66
Table 33: Full Tests
Specification to be
Validated
Step Procedure
TCT Specifications
1 Attach 1:12 gear ratio for TCT
2 Place Polyethylene compressive block beneath alignment plates
3 Place steel plate and olive oil into bottom of test cup
4 Place TCT ring into test cup
5 Screw collar down to secure the steel plate and ring
6 Attach the Polyethylene lateral force beam to the steel plate and put test cup on the
steel plate
7 Align the x-y plane using the alignment plates and tighten the plates
8 Place Humidity meter within the device and start data
9 Attach the safety shield over test cup assembly
10 Attach gear safety shield over transmission
11 Load the shop press to 100 N
12 Input the temperature setting and speed (start at 25°C and 2 rpm)
13 Start the motor
14 Verify that the whole system is working (normal force, lateral force, speed,
temperature readings)
15 Stop test. Check that lubricant is still able to be tested
16 Replace the lateral force beam with 0.125” aluminum beam
17 Keep the Polyethylene compressive block
18 Repeat steps 7 – 15 with 1000 N and 5 rpm
19 Replace the lateral force beam with 0.25” aluminum beam
20 Replace the compressive block with the PVC block
21 Repeat steps 7 – 15 with 10000 N and 15 rpm
22 Replace lateral force beam with 0.5” aluminum beam
23 Replace the compressive block with the aluminum block
24 Repeat steps 7 – 15 with 85000 N and 30 rpm (maximum TCT capabilities)
25 Take out test cup and remove the TCT ring and steel plate
Four-ball Test
Specifications
26 Place 3 bottom balls of Four-ball test into test cup
27 Place Four-ball ring into test cup
28 Screw collar down to secure the 3 balls and ring
29 Place polyethylene compressive block beneath the alignment plates
30 Attach the Polyethylene lateral force beam to the steel plate and put test cup on the
steel plate
31 Align the z-axis using the alignment plates and tighten the plates
32 Place Humidity meter within the device and start data
33 Attach the safety shield over test cup assembly
34 Attach gear safety shield over transmission
35 Load the shop press to 30 N
36 Input the temperature setting and speed (start at 25°C and 600 rpm)
37 Start the motor
38 Verify that the whole system is working (normal force, lateral force, speed,
temperature readings)
39 Stop test. Check that lubricant is still able to be tested
40 Increase load to 392 N (ASTM 5183) and keep speed at 600 rpm
41 Repeat steps 37 – 39

67
42 Replace lateral force beam with 0.125” aluminum beam
43 Replace compressive block with PVC block
44 Load shop press to 7840 N and set speed to 1770 rpm (ASTM D2783 and D2596)
45 Repeat steps 37 – 39
46 Increase load to 13500 N and set speed to 2100 rpm (max Four-ball capabilities)
47 Repeat steps 37 – 39
48 Stop the motor, disconnect power to motor and power supplies
Of course, the fifth table of complete tests is just scraping the surface of the amount of tests that can
performed but we feel that these will give us a great start and we can build upon these preliminary tests.
VALIDATION RESULTS
In order to validate that our design works, we needed to start with small, individual functions and work
our way in to more complex and complete configurations within our prototype. There are three primary
regimes where validations are required: Mechanics, Electronics and Software.
Within the mechanical regime of our prototype, our primary goal is to make sure our prototype would be
capable of running a normal test for both the 4-Ball and TCT setups. An initial mechanical validation
was that the individual shafts rotated without undue friction on the bearings. By getting the shafts in line,
and spinning them by hand, we could adjust the bearing seating when a spot of friction came around.
Ensuring that the motor ran by itself was step two. Running the motor through local control on the motor
drive, we were able to run the motor at a few different speeds and concluded that the motor runs very
smoothly and free of vibrations. Step three was to ensure that the two shafts rotated together well when
combined with the two gear ratios. Turning the gears and shafts by hand allowed us to again check for
undue friction in the bearings. Once the motor shaft was connected and properly aligned with the motor
driveshaft, we tested, again, to make sure that there were no undue frictional forces present in the
bearings as the motor turned. Manual turning again allowed us to determine whether undue frictional
forces were present during rotation. The final validation we could do was put a low load on the hydraulic
press to evaluate how it moved while being loaded. The press moved the assembly up easily, and the
pressure release valve worked properly.
The software side of the project was the next group of items that could be evaluated separate from the
other aspects of the model. All of our code was written in LabVIEW, and initially split up into four
separate loops. One is responsible for controlling the motor, the second controls the Tachometer, the
second reads in and evaluates the strain gauge data, and the fourth is the encompassing temperature
control system. To evaluate the motor control and tachometer loops, we were able to run those with the
motor and tachometer in order to explicitly test that the specified device worked with its respective
LabVIEW loop. In order to validate the logic and capabilities of the strain loop, we used a dummy data
input to replicate how data from the DAQ would be supplied to the loop. We tested the Temperature
Control loop in the same fashion, supplying dummy values and making sure the logic in the system is
sound. Every loop functioned flawlessly separately. Completing the validation for this will be to run
each loop in parallel in the singular, encompassing LabVIEW program. A diagram of the encompassing
program can be found in Appendix H.
The electrical portion of our project was validated as portions of it were made available to test.
Validation of the motor control implementation was done in part, as the electrical wiring necessary to go
straight from the DAQ to the motor drive was able to be implemented and tested successfully, but the
full amplification desired to reach full load was not yet wired into the system. The same regard holds for
the Tachometer implementation. The Tachometer was successfully wired into the DAQ and the loop run
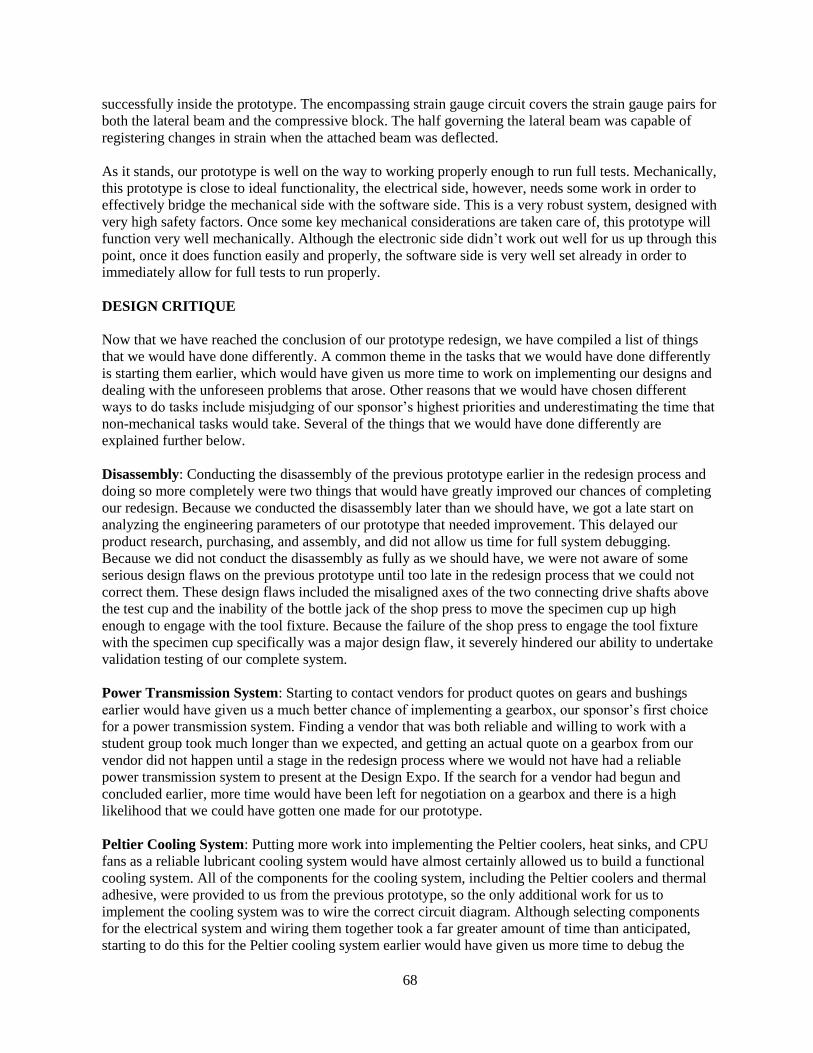
68
successfully inside the prototype. The encompassing strain gauge circuit covers the strain gauge pairs for
both the lateral beam and the compressive block. The half governing the lateral beam was capable of
registering changes in strain when the attached beam was deflected.
As it stands, our prototype is well on the way to working properly enough to run full tests. Mechanically,
this prototype is close to ideal functionality, the electrical side, however, needs some work in order to
effectively bridge the mechanical side with the software side. This is a very robust system, designed with
very high safety factors. Once some key mechanical considerations are taken care of, this prototype will
function very well mechanically. Although the electronic side didn‟t work out well for us up through this
point, once it does function easily and properly, the software side is very well set already in order to
immediately allow for full tests to run properly.
DESIGN CRITIQUE
Now that we have reached the conclusion of our prototype redesign, we have compiled a list of things
that we would have done differently. A common theme in the tasks that we would have done differently
is starting them earlier, which would have given us more time to work on implementing our designs and
dealing with the unforeseen problems that arose. Other reasons that we would have chosen different
ways to do tasks include misjudging of our sponsor‟s highest priorities and underestimating the time that
non-mechanical tasks would take. Several of the things that we would have done differently are
explained further below.
Disassembly: Conducting the disassembly of the previous prototype earlier in the redesign process and
doing so more completely were two things that would have greatly improved our chances of completing
our redesign. Because we conducted the disassembly later than we should have, we got a late start on
analyzing the engineering parameters of our prototype that needed improvement. This delayed our
product research, purchasing, and assembly, and did not allow us time for full system debugging.
Because we did not conduct the disassembly as fully as we should have, we were not aware of some
serious design flaws on the previous prototype until too late in the redesign process that we could not
correct them. These design flaws included the misaligned axes of the two connecting drive shafts above
the test cup and the inability of the bottle jack of the shop press to move the specimen cup up high
enough to engage with the tool fixture. Because the failure of the shop press to engage the tool fixture
with the specimen cup specifically was a major design flaw, it severely hindered our ability to undertake
validation testing of our complete system.
Power Transmission System: Starting to contact vendors for product quotes on gears and bushings
earlier would have given us a much better chance of implementing a gearbox, our sponsor‟s first choice
for a power transmission system. Finding a vendor that was both reliable and willing to work with a
student group took much longer than we expected, and getting an actual quote on a gearbox from our
vendor did not happen until a stage in the redesign process where we would not have had a reliable
power transmission system to present at the Design Expo. If the search for a vendor had begun and
concluded earlier, more time would have been left for negotiation on a gearbox and there is a high
likelihood that we could have gotten one made for our prototype.
Peltier Cooling System: Putting more work into implementing the Peltier coolers, heat sinks, and CPU
fans as a reliable lubricant cooling system would have almost certainly allowed us to build a functional
cooling system. All of the components for the cooling system, including the Peltier coolers and thermal
adhesive, were provided to us from the previous prototype, so the only additional work for us to
implement the cooling system was to wire the correct circuit diagram. Although selecting components
for the electrical system and wiring them together took a far greater amount of time than anticipated,
starting to do this for the Peltier cooling system earlier would have given us more time to debug the
69
system and test the limits of its cooling ability. Because of a brief elimination of the Peltier cooling
system from our design and not beginning to install it until later in the assembly process, our system
does not function although it is seemingly wired correctly.
Software and Electronics: The two parts of our redesign whose required workloads and times to
complete we underestimated the most were the compiling of the LabVIEW program for data acquisition
and instrument control, and the purchasing and connecting of the electrical components and instruments.
Although our LabVIEW code is nearly complete for each of the separate tasks of our data acquisition
and control system, it has not been optimized to function together correctly in one block diagram. The
individual LabVIEW codes also need to be adjusted slightly after the calibration of their respective
measurements to provide the desired outputs from the codes. Starting the compiling of our LabVIEW
code earlier would have allowed us to combine each of the separate codes into one block diagram, but
calibration testing would still have been required to finalize the entire code. A discussion of what we
would change about our calibration and validation testing plans is provided in the next section.
The purchasing and implementing of our electronic system was a struggle throughout the assembly
process and took much longer than expected. Our very minimal knowledge of electronics and their
connections required us to seek constant instruction and led even small tasks such as wiring circuits to
take far longer than we expected. Because of the multitude of electronic components in our redesign
(seen in the Power and Electronics Diagram in Appendix I), we were able to connect all of the
components in our system but were left with very minimal time to debug and troubleshoot. This resulted
in only the motor controller and optical encoder working functionally out of all of the electronic
components in our prototype. Starting the installation and connection of these electronic components
earlier would have given us more time to debug and troubleshoot, but because of our lack of knowledge
on the topic even this would not have guaranteed a fully functional system.
Force Measurement System Assembly: Earlier assembly of the necessary components to conduct
calibration for several of the instruments on our prototype would have been one of the most crucial
changes towards running validation tests of our full system. Specifically, attaching the strain gages to
both the deflecting beams and the compressive blocks earlier would have allowed for more time for
troubleshooting the strain gauge amplification circuit, which appeared to be faulty during attempted
calibration testing. Because the strain-gage-based force measurement system was not functional and
calibration testing could not be completed, the LabVIEW program could not be finalized to output the
desired quantities and no validation testing was able to be undergone of our entire system. Although the
outsourcing of the attachment of the strain gages to their respective blocks and beams took longer than
expected, we could have ordered the parts earlier so that this process was begun and completed earlier.
Having time to troubleshoot the strain gage amplification circuit and get it to work functionally would
have allowed us to at least run a test of our complete system besides the environmental control, which
was the most prominent desire of our sponsor as our project progressed.
Prototype Strengths The strengths of our prototype lie mainly in its mechanical components. Vast improvements were made
in many of the mechanical systems of the prototype that made it safer, more stable, more functional, and
easier to operate by the user. The functioning aspects of the software and electrical systems also add
important capabilities to the prototype that make it both more convenient for the user and more precise in
its operation. Specific strengths of our prototype are outlined below.
Interchangeable Gear System: The interchangeable gear system is much more stable and has the
potential to be much more effective towards achieving our sponsor‟s desired specifications than the
chain drive on the previous prototype. It allows for quick and easy interchangeability between the Twist
Compression and Four-Ball Tests by simply removing and replacing two sets of gears. Because each set

70
of gears fits into the set distance between motor shaft and drive shaft, a much safer and more robust
stability system for the shafts, gears, and motor was able to be implemented (which will be detailed
further below). The gear ratios for the two sets of gears were assigned so that each test is able to be run
at speeds and normal loads that meet or exceed the ASTM standards (Four-Ball Test) or industry
standards (Twist Compression Test). The interchangeable gear system can also handle larger levels of
stress than the chain drive and is likely quieter while in operation.
Redesigned Motor and Drive Shaft Stability System: As mentioned briefly in the discussion of the
interchangeable gear system, our prototype features a vastly improved motor and drive shaft stability
system over the previous prototype. The drive shafts are held in place by two 0.25 inch thick steel plates,
which are fixed to a cross beam of the shop press. The steel plates serve as constraints on the drive
shafts when they want to bend from the interaction of the gears, and are structurally stable enough to
handle the stresses of the drive shafts at the maximum speeds and torques that the sponsor desires the
prototype to run at. Bearings are affixed to these steel plates to ensure that the shafts are able to rotate
smoothly, and the bearings are proven to be aligned properly by the ease with which the shafts can be
slid up and down inside them. As additional stress relief for the motor shaft, a flexible coupler is used as
a connector between the motor shaft and the drive shaft directly on top of it. Finally, the motor has been
relocated so that it is positioned at a lower level, closer to the rest of the prototype, and with its
supporting wall facing the prototype. Having the motor positioned closer to the rest of the prototype
reduces the distance that torques have to be transmitted between the drive shafts and allows the rods
connecting the shop press and motor table to provide additional stability to the motor table.
Safety Shielding: A main concern that our sponsor had with the previous prototype was its lack of
safety shielding around the chain drive power transmission system and its inadequate safety shielding
around the test area. We have implemented aluminum sheet safety shielding around each of these areas
of our prototype. The box-shaped shielding around our gear system covers all dangerous moving parts,
prevents objects from getting into the gears while they are operating, and provides some level of
containment or restraint of dangerous flying pieces in the case of fracture. The aluminum sheet was bent
into a half-cylindrical shape to fit around the test area and is held in place by bolts through the motor
support wall. It prevents objects from interfering with the rotating tool fixture and the potentially high-
temperature heat sinks of the Peltier coolers, as well as provides some resistance in case of fracture.
Redesigned Test Cup: We manufactured a completely new test cup that is lighter, less bulky, and much
easier to use than the test cup from the previous design. It implements a three piece design, where one of
the three pieces is interchangeable depending on which test is being run. The appropriate interchangeable
piece fits inside the test cup and is held in place by the outer collar, which simply screws on to the test
cup. This design is much for convenient than the design in the previous prototype, which required the
user to blindly thread four holes through the test cup and lower steel block. The redesigned test cup is
smaller than the previous test cup and is made of aluminum so that it is lighter and easier to remove from
the lower block. It is held in place on the lower block by three steel dowels which also contribute to the
easy removal and replacement.
Drive Shaft Speed Measurement and Motor Control: The drive shaft speed measurement system and
the motor control system provide great convenience and higher confidence to the user than the systems
implemented in the previous design. Our motor control system has been connected so that a user can
input a desired test fixture shaft speed into our LabVIEW program and the motor will run at this speed,
instead of requiring the user to manually turn the dial on the motor controller. A control of this inputted
shaft speed is also in place using an optical encoder to measure the shaft speed. The measurements from
the optical encoder are fed back into the LabVIEW program to ensure the shaft is rotating at its inputted
speed and to adjust for any variations. The feedback system allows for higher user confidence that the
test is running at the desired speed.

71
Prototype Weaknesses and Solutions
The weaknesses of our prototype lie mainly in the electronic components and their interactions with the
data acquisition system and the LabVIEW software. As spoken about in the What Could Have Been
Done Differently section, our lack of knowledge of electronics led us to struggle mightily with their
implementation throughout the duration of our prototype assembly. Two components that some of these
electronics were connected to, the strain gage and thermocouple amplifier circuit boards, were
experimental parts that we used in our data acquisition system but that had never been tested or
debugged. Finally, although we feel that our LabVIEW software program is adequate and functional, we
were never able to test its robustness because of our combined uncertainty with the electronics and the
data acquisition circuitry. Because the electronics, the data acquisition circuits, and the software all must
function properly both independently and together for the measurement and control systems of our
prototype to work, the chance for errors was great. This was unfortunately the case in our prototype, and
is the main reason that this part of our prototype produced the majority of the weaknesses. Though the
mechanical portions of our prototype tended to be much more functional, there were also a few
weaknesses in our mechanical design. These stemmed both from design flaws of the previous prototype
that we found too late to change and oversights in potential problems by our group in our designs. The
main weaknesses of our prototype are described below, along with direction towards possible next steps
and solutions make them better.
LabVIEW Software: As mentioned several times in the preceding paragraphs, we have high confidence
that our LabVIEW program for data acquisition and instrument control is nearly complete and
functional. However, the two major weaknesses of the program right now are that each function is in its
own block diagram and that the functions do not provide the appropriate outputs. The first weakness
could be solved fairly quickly by implementing each of the block diagrams into one main program for
our DAQ to run and troubleshooting this program. The issue of the functions not producing the correct
outputs requires slightly more work to solve, as it relies on several other non-functional parts of the
prototype to be fixed before it can be resolved. To get the proper algebra that can be inputted into the
LabVIEW program so that the outputs are correct, several of this instruments must be calibrated to
correlate their voltage outputs to the appropriate outputs. These instruments include the strain gages on
the lateral and normal force sensing blocks and the thermocouple, all of which currently have their own
issues that must be debugged first. These will be explained in further detail below, but once they are
resolved then the instruments simply require calibration for the LabVIEW software to be finalized.
Temperature Measurement System: The temperature measurement system (Appendix I), comprised of
a thermocouple, a cold-junction amplification circuit, and an input to our DAQ module, was never found
to work functionally. As we purchased the thermocouple from a reliable vendor and tested to confirm
that the appropriate power level was reaching the cold-junction amplification circuit, we suspect that the
circuit itself is the location of the problem. After several hours of work with the creator of the circuit,
John Baker, we were unable to achieve a successful temperature reading. Recent further research by
John Baker has led us to believe that the circuit indeed is where the malfunction is occurring, but that
there should be a simple fix as long as the circuit is not blown. Replacing the 20 kohm resistor on the
circuit with a 50 kohm or higher resistor should bring the output current of the thermocouple to a low
enough level that it can be read accurately by the DAQ module.
Force Measurement System: The temperature measurement system (Appendix I), comprised of two
sets of two strain gages (two each on the lateral force sensing beam and the compressive block), two
half-bridge strain gage circuit boards, and a strain gage amplifier board, was found to work on occasion
but was very unreliable. Similar to the thermocouple circuit board, we believe that the combination of
the half-bridge circuit boards and the strain gage amplifier board are the location of the problem in this
72
system. The lateral force measurement system was found to work on occasion, proving that the strain
gages and LabVIEW program for collecting this data work. However, the data from collected from the
lateral force measurement tests was very sporadic and depended on unreliable factors like the connection
between the half-bridge circuit board and the strain gage amplifier circuit board, the orientation of the
boards, and the amount of noise in the room. Also, the compressive force blocks (using the same strain
gages) were found to not work during testing of up to 80 kN on an Instron machine. This is near the
maximum compressive loads that the block should be able to sustain and give readings on in our
prototype, but in this testing the data showed only noise. The poor results of attempted tests with both
the lateral force beams and compressive force blocks are our justification that the unreliability of the
circuit boards is where the error occurs in the force measurement system. Further work with John Baker,
who also designed these chips, should be undertaken to troubleshoot this problem.
Motor Controller Operational Amplifier: Although the LabVIEW program and motor controller allow
the user to control the shaft speed through a computer interface, an operational amplifier is required to
get the signal from the DAQ to the appropriate level for the motor controller to run the motor at its full
range of speeds (Appendix I). The DAQ module (which receives the desired shaft speed) outputs signals
between a range of 0 and 5V, but the motor controller requires a 0 to 10V range to run the motor from 0
rpm to 1765 rpm (the motor‟s top speed, which we need to achieve the ASTM standard for the Four-Ball
test). We created an operational amplifier on our breadboard through which the DAQ output signal could
be run to get to this level, but due to the amount of time we spent on other electronics we were unable to
test the operational amplifier that we made. We are unsure whether the resistors that we used in our op
amp will allow for the signal to get amplified to the full 0 to 10V range, but testing could be done to see
if this is the case. We are confident in the op amp circuit that was created, so if the full 0 to 10V range is
not achieved the problem could be easily solved by testing different combinations of resistors in place of
the ones that we used.
Peltier Cooling System: As mentioned above in the What Could Have Been Done Differently section,
we did not get the Peltier coolers, heat sinks, and CPU fans to function appropriately. The circuit for this
system proved to be very complicated (Appendix I), but with guidance from John Baker we feel that the
series-parallel circuit that we wired should work to operate all four Peltier coolers and all four CPU fans.
In attempting to troubleshoot this circuit, we found that the digital DAQ output to the optical isolator
was not providing enough power to close the relay and turn on these eight devices, so we believe an
issue may be occurring in the optical isolator. Upon further review by John Baker, it was recommended
to us that two obscure elements in the circuit diagram for the optical encoder need to be added to our
circuit. These are a 270 ohm resistor between the digital signal from the DAQ and the anode pin on the
optical encoder, and a 0.1μF capacitor between the +12V and COMM lines from the power supply.
Considering the placement of these circuit elements, there is also a chance that the optical isolator is
blown, so that may also need to be replaced.
Cartridge Heating System: The cartridge heating system (Appendix I), comprised of a cartridge heater
and a solid state relay, was the last electronic element that was considered when we had a very short time
frame left before our prototype was completed, so we do not have a complete understanding of its
implementation. However, we do know that the cartridge heater requires AC power, which is different
from all of the other electronic systems in our prototype. Although the connection between the solid state
relay and the cartridge heater seems fairly simple, we are unsure how to safely connect the cartridge
heater to the AC power coming out of the wall. This task should be considered with extreme caution, as
wall outlets can provide 120 VAC if their connections are short circuited. Consultation with John Baker
or another electronics expert would be greatly advised before undertaking the installation of the cartridge
heaters that are currently available on the prototype.
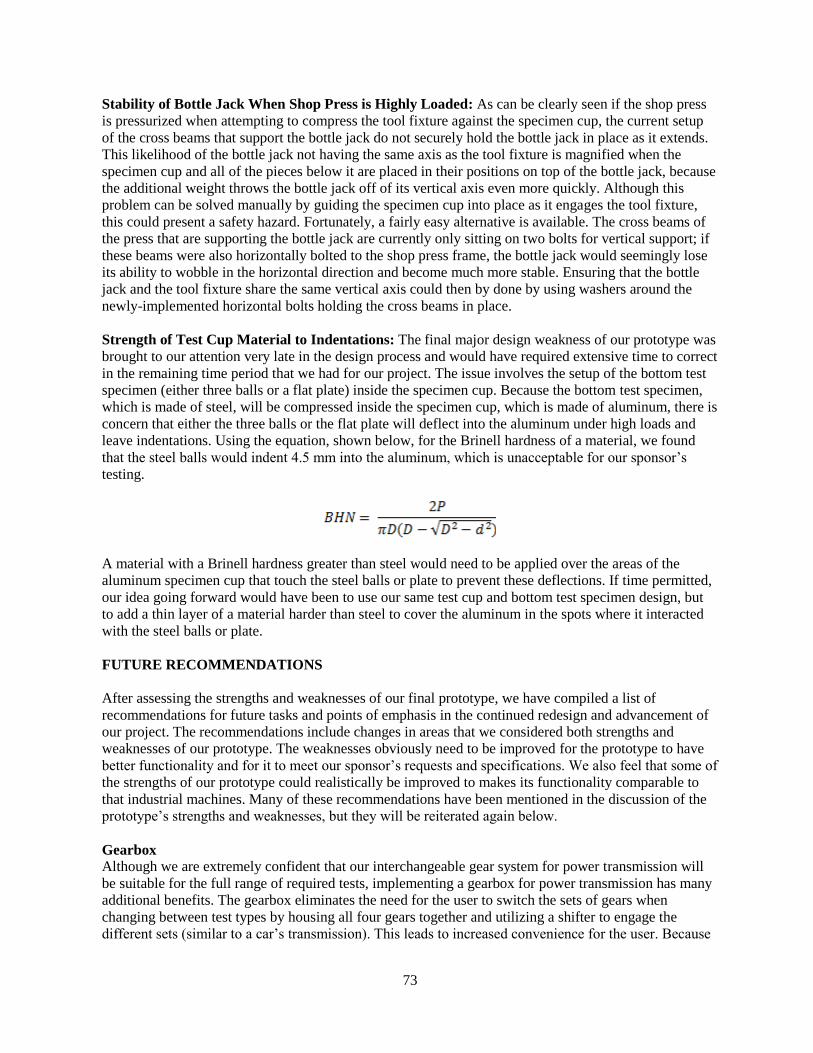
73
Stability of Bottle Jack When Shop Press is Highly Loaded: As can be clearly seen if the shop press
is pressurized when attempting to compress the tool fixture against the specimen cup, the current setup
of the cross beams that support the bottle jack do not securely hold the bottle jack in place as it extends.
This likelihood of the bottle jack not having the same axis as the tool fixture is magnified when the
specimen cup and all of the pieces below it are placed in their positions on top of the bottle jack, because
the additional weight throws the bottle jack off of its vertical axis even more quickly. Although this
problem can be solved manually by guiding the specimen cup into place as it engages the tool fixture,
this could present a safety hazard. Fortunately, a fairly easy alternative is available. The cross beams of
the press that are supporting the bottle jack are currently only sitting on two bolts for vertical support; if
these beams were also horizontally bolted to the shop press frame, the bottle jack would seemingly lose
its ability to wobble in the horizontal direction and become much more stable. Ensuring that the bottle
jack and the tool fixture share the same vertical axis could then by done by using washers around the
newly-implemented horizontal bolts holding the cross beams in place.
Strength of Test Cup Material to Indentations: The final major design weakness of our prototype was
brought to our attention very late in the design process and would have required extensive time to correct
in the remaining time period that we had for our project. The issue involves the setup of the bottom test
specimen (either three balls or a flat plate) inside the specimen cup. Because the bottom test specimen,
which is made of steel, will be compressed inside the specimen cup, which is made of aluminum, there is
concern that either the three balls or the flat plate will deflect into the aluminum under high loads and
leave indentations. Using the equation, shown below, for the Brinell hardness of a material, we found
that the steel balls would indent 4.5 mm into the aluminum, which is unacceptable for our sponsor‟s
testing.
A material with a Brinell hardness greater than steel would need to be applied over the areas of the
aluminum specimen cup that touch the steel balls or plate to prevent these deflections. If time permitted,
our idea going forward would have been to use our same test cup and bottom test specimen design, but
to add a thin layer of a material harder than steel to cover the aluminum in the spots where it interacted
with the steel balls or plate.
FUTURE RECOMMENDATIONS
After assessing the strengths and weaknesses of our final prototype, we have compiled a list of
recommendations for future tasks and points of emphasis in the continued redesign and advancement of
our project. The recommendations include changes in areas that we considered both strengths and
weaknesses of our prototype. The weaknesses obviously need to be improved for the prototype to have
better functionality and for it to meet our sponsor‟s requests and specifications. We also feel that some of
the strengths of our prototype could realistically be improved to makes its functionality comparable to
that industrial machines. Many of these recommendations have been mentioned in the discussion of the
prototype‟s strengths and weaknesses, but they will be reiterated again below.
Gearbox
Although we are extremely confident that our interchangeable gear system for power transmission will
be suitable for the full range of required tests, implementing a gearbox for power transmission has many
additional benefits. The gearbox eliminates the need for the user to switch the sets of gears when
changing between test types by housing all four gears together and utilizing a shifter to engage the
different sets (similar to a car‟s transmission). This leads to increased convenience for the user. Because

74
the gearbox would likely have to be professionally machined, its structural stability would likely be
higher than the steel plates used in the current interchangeable gear system. This would allow for better
protection against the stresses from the gears‟ interactions for both the drive shafts and the motor.
Finally, the gearbox would house the gears in an enclosed structure, so it would be safer than the current
design and would eliminate the need for an external safety shield. We feel that the additional benefits
provided by implementing a gearbox would easily outweigh the moderate amount of additional design
work and time searching for a manufacturer.
Tool Fixture Drive Shaft Modification
Although we found the misalignment of the axes of the two pieces of the drive shaft above the tool
fixture too late in the assembly stage to fix this problem, we strongly recommend that this issue get fixed
early in the next stage of the redesign of this prototype. The misalignment is not a huge issue at low shaft
speeds and low normal loads, but once the device is ready to perform tests over the full range of speeds
and forces this design flaw presents the potential for severe bending of the drive shaft and possible
ejection of the tool fixture. Our suggestion for resolving this issue is to bore out the hole in the flared
section of the lower of piece where the top piece slides in until the misalignment has been completely
removed, and then to add a bushing to this newly bored hole so that it returns to the diameter of the top
piece. Care needs to be taken to ensure that the boring occurs on the same axis as the bottom piece so
that design flaw is not repeated. Once the bushing is placed in so that the axes of the two pieces will be
aligned, the shafts and bushed hole will both also need to be re-keyed.
Hard Material Layer Around Engaging Surface of Test Cup
As mentioned above, the Brinell hardness of the steel bottom test specimen (whether it is the three balls
or the steel plate) is much higher than the Brinell hardness for the aluminum specimen cup that is
compressed around it. To prevent indentation into the aluminum, we recommend that a thin layer of
material with a Brinell number higher than the steel used in the bottom test specimen pieces be machined
to fit over the parts of the specimen cup that interact with the bottom test specimen. Although it will
likely be expensive to purchase a material with a higher Brinell number than steel and very tedious to
machine this material to the desired shape, this was the best solution that we could think of that would
definitively solve the problem.
Alternate Heating Source
Because the heating source that we purchased is the only electronic device in our prototype that requires
AC power, we recommend purchasing a different heating cartridge or a different heating source
altogether that can run on DC power. There are two DC power supplies (one low-voltage, one high-
voltage) already being used to power other electronics on the prototype, so using a heating source that
could operate off of either of their power outputs would greatly increase its ease of installation.
Implementing a heating source that could operate off DC power would also be much safer than working
with AC power, as the fluctuating current in AC power can produce voltages up to 120 VAC if shorted.
Additionally, the AC power would need to be drawn from a wall power supply, which would require the
power to be turned off to the test room for safe wiring and could lead to surges and other interruptions in
power during testing if other devices are plugged into the same wall‟s AC power line.
Improved Safety/Environmental Enclosure Around Test Area
One of our sponsor‟s requirements that we deemed to have a low level of importance relative to the other
requirements was the ability to control humidity in the test area. This would require a fully sealed
enclosure around the test area, as well as a means of creating or eliminating water vapor in this
enclosure. Because this enclosure would be similar in size, shape, and location to the safety shielding
around the safety area, we recommend designing an enclosure that acts as both an improved safety shield
and a humidity-controllable enclosure. Though the safety shield around the test area on our prototype is
an improvement over the previous prototype‟s safety shield, it provides only shielding only around the

75
sides of the test area and leaves the test area exposed and accessible on top of the shield and underneath
it. The incorporation on an improved safety shield with the design of a sealed humidity chamber would
solve combine two functions into one component, and also would improve the maintenance and control
of the temperature around the test area.
Horizontal Constraints on Bottle Jack Cross Beam
To improve the stability of the bottle jack of the shop press, we recommend installing bolts horizontally
through the cross beam supporting the bottle jack and the frame of the press. Installing these bolts as
horizontal constraints would greatly reduce the tendency of the bottle jack, especially when loaded with
the weight of the specimen cup and all of the components beneath it, to deflect horizontally so that its
vertical axis was not aligned with the vertical axis of the tool fixture. This would also be a fairly easy
process to complete, as it requires only measuring, drilling accurate and appropriately sized holes
through the frame and the cross beams, and aligning the vertical axes of the tool fixture and the bottle
jack with washers.
DAQ System
Because we believe that the crucial electronic failures of the strain gage and thermocouple amplification
systems on our prototype are directly due to the unreliable circuit boards that we used for data
acquisition, we recommend purchasing externally made, industrial-quality DAQ modules to collect this
data. We presented a large package of National Instruments data acquisition hardware (Appendix E) as
part of a previous design review, but this instrumentation was not approved due to its high cost of
$2634.95. Though the NI 9211 Thermocouple Input Module ($329), 9237 4-Channel Simultaneous
Bridge Module ($1149), and NI cDAQ 9174 4-Slot Chassis ($699) required for strain gage and
thermocouple data acquisition constituted a large portion of this cost, no validation testing of any sort
can be run on the prototype without functional strain gage and thermocouple data acquisition. We
believe that our thermocouple, strain gages, and lateral and normal force measurement systems all
function properly and that with the implementation of these industrial-quality DAQ modules we would
have been able to measure compressive force, lateral force, and temperature, and therefore would have
been able complete at least some validation testing. Having these DAQ modules also would have
allowed us to spend more time troubleshooting and debugging our other electronic systems that did not
function properly, which would have presumably led to further improvement of our prototype. We
strongly recommend the reconsideration of the purchase of National Instrument DAQ modules for strain
gage and thermocouple data acquisition.
CONCLUSIONS
The study of tribology allows mechanical engineers to study friction and wear, as well as various
lubrications using devices known as tribometers. Two of the many types of tribometers perform what are
known as the Twist Compression Test (TCT) and the Four-Ball Test. These two tests can model real
world applications such as bearing performance and sliding contact which are of great importance to
Professor Gordon Krauss at the University of Michigan. In the fall of 2009, Professor Krauss sponsored
an ME 450 project that involved developing a single device capable of performing both the Twist
Compression and Four-Ball tests. Both tests require a rotating tool (annulus for TCT and secured steel
ball for Four-ball test) interfaced with a stationary specimen (steel plate for TCT and three secured balls
for Four-ball test) while a set amount of compressive force is applied between them. The challenging
part of developing the machine is the fact that required rotational speeds and compressive forces are
vastly different for the two tests, creating many mechanical issues in the design including the power
source, transmission for the driveshaft, and force measurement systems (compressive and resultant
lateral) required for data analysis. In addition to these requirements, the machine also requires thermal

76
control for the broadest range of uses. The ME 450 from the fall of 2009 was able to build an unusable
prototype that could be used a starting point for a redesign to another team.
Our team acquired the project in January 2010 as a redesign project and it was our goal to take the basis
of the previous design and develop a machine capable of achieving the requirements set by Professor
Krauss‟s desires, industry standards and ASTM standards. We quantified these requirements into
engineering specifications and target values were given as goals of the final prototype to achieve. From
that point, we produced a functional decomposition of the device and generated a list of functions that
the device needed to perform. This allowed us to generate concepts for each of the functions and
compare them to the methods that were currently integrated onto the previous team‟s prototype. Using
Pugh charts as a selection tool, we chose methods of achieving each of the functions and modeled an
Alpha Design of what we wanted our prototype to be. This design utilizes a 3 HP AC motor for power to
the driveshaft, a gearbox with two gear ratios for the two separate tests, a modular driveshaft with the
ability to interchange the annulus and top ball for different tests, a modular specimen cup able to hold the
lubricant and both the steel plate and bottom three balls, a cantilever beam lateral force measurement
system, a compressive block normal force measurement system, and a 25-ton shop press used to generate
the compressive forces.
To ensure that our Alpha Design would adequately meet the pre-described specification targets, we went
on to perform an extensive analysis of the entire device. Due to inability to acquire a gearbox and
physical constraints with interchangeable gears (chosen as our second option for transmission), the final
design is limited to a maximum compressive load of 85 kN during TCT‟s instead of the desired 100 kN.
Furthermore, the maximum compressive load is limited to 13.5 kN during Four-ball tests due to a lack of
power in the motor to achieve the desired loading of 16 kN. Along with this reduction in compressive
load came a reduction in maximum speed capabilities for the Four-ball test. It was determined that the
maximum achievable speed could be 2100 rpm, below the desired speed of 3600 rpm. We also
researched various options for recording data and determined what instruments we would use to record
forces, temperature, and driveshaft speed. Our initial plan was to purchase instruments that could be
directly plugged into one or several central National Instruments DAQ cards, but after analyzing the cost
of such a system and our abilities to incorporate the instruments into a single, cheap DAQ card with the
use of signal conditioning, we decided to dismiss the notion of purchasing the very expensive central
DAQ system.
With analysis complete, we began fabrication and assembly of the prototype, the final phase of the
project. The first physical work produced was the fabrication of the specimen cup and lateral force
measurement system components. As this work progressed, we simultaneously developed a plan for the
electrical system and designed a LabVIEW program capable of recording all necessary and desired data
as well as allow the user to input a desired driveshaft speed and temperature. When we completed the
fabrication of the initial components, physical work shifted towards fabricating an open, interchangeable
gear system. The hopes of a gearbox as part of the prototype dwindled as we progressed due to odd
required gear ratios as well as available time and money. Therefore, we had to design a system that
would be able to allow for easy interchangeability of gear ratios while offering ample support under
extreme test conditions. The work load necessary for completing the project was extremely heavy so the
work was divided amongst our team. We worked diligently on completing a working mechanical
prototype, electrical system, and LabVIEW program in the final days leading up to the Design Expo,
held on campus.
The result of our efforts was a complete physical prototype with a working transmission system,
specimen cup assembly, and lateral force measurement system assembly. Strain gages were attached to
the three chosen compressive blocks (made of Aluminum, PVC, and LDPE Polyethylene in order to
achieve requested resolution of force) and the four chosen lateral force beams (three made of Aluminum

77
(0.5”, 0.25”, and 0.125” thicknesses) and one made of HDPE Polyethylene (0.125” thickness) in order to
achieve requested resolution of force). Peltier coolers were attached to the steel plate that supports the
specimen cup by way of high strength thermal adhesive. The tachometer that we chose was mounted to
the shop press and a strip of optical tape was attached to the driveshaft. The motor was wired to our ABB
motor controller. The thermocouple, Peltier Coolers (with heat sink fans), strain gages, and tachometer
were wired to appropriate circuits and power supplies. We were unable to wire the heating cartridge that
was going to be used as a heat source for high temperature tests due to unforeseen AC circuit
requirements that we ran out of time to implement. Finally, two safety shields, one covering the test
region and one covering the open gears, were produced to provide protection against moving parts of the
device.
After a tireless effort, we were unable to achieve a working status of the prototype as a whole, but were
able to validate that the mechanical aspects of the device including the specimen cup, lateral force
measurement system, and transmission are all mechanically sound and safe to use. The motor controller
is connected and working, albeit only able to output have the desired speed at this point due to the fact
that we still have to connect an amplifier to the circuit in order to achieve full speed range usage.
Furthermore, the tachometer was able to record a rotational speed when turning the gears and driveshaft
by hand. We achieved a working lateral force strain gage circuit, but are unsure of the compressive force
circuit, and were unable to calibrate the blocks and beams, but are hoping to perform this task before
final completion of the prototype. We ran into a variety of problems when connecting the thermocouple
circuit to the DAQ card, and will be investigating ways to remedy this issue. The most incomplete part
of the prototype other than the heating cartridge connection is the Peltier cooling system. We have a very
potent power supply able to run the four Peltiers and heat sink fans, but experienced difficulties in wiring
a working circuit and relay switch that allows for control of the devices.
Overall, the qualities of the mechanical aspects within the prototype are very high and we hope to
completely validate their capabilities prior to delivering a final prototype. Certain components of the
electrical system are working to at least some degree, but others are not working at all and the whole
circuit system and wiring can certainly be improved upon. We hope to be able to implement a complete
working model by April 27, but at a minimum, want to complete strain gage calibration and full
validation of all mechanical aspects of the design. The ability of the machine to run at the specified
speeds and loads, while recording both compressive and lateral forces as well as outputting the
driveshaft speed, is far more important and essential than the ability to control test temperatures. These
systems are the first priority of our group to improve upon and should be the primary focus of future
student groups or faculty members who work on this project.
78
ACKNOWLEDGEMENTS
Throughout the course of the semester, we have received assistance from many different people. Without
their help, we could not have made it as far as we have to this point of the project. For their time,
generosity and support in this project, we‟d like to thank the following people:
• Professor Gordon Krauss for his knowledge of tribology, the engineering design process and the
ability to motivate us to achieve larger goals and the highest standards possible
• Dr. Tom Bress for his knowledge and assistance with LabVIEW programming
• John Baker for his assistance with the electronics and circuits, including the circuit design for
the strain gage bridge and thermocouple amplifier circuits
• Bob Coury and Marv Cressey for their infinite wisdom of machining processes and ensuring our
safety while fabricating parts
• Dr. Arup Gangopadhyay at Ford for giving us a tour of an industrial tribology lab and enhancing
our knowledge of the project
• Jeff Emerson and the workers at American Gear and Engineering for their expertise in gears and
machining
• Todd Wilber for mounting all of our strain gauges for us, and assisting us in finding Instron
machines to test our samples with
INFORMATION SOURCES
When first assigned this project, little was known about how a Twist Compression Test and Four-ball
Test were run or what they were used for. To begin to fully understand the Twist Compression Test and
Four Ball Test, it was necessary for our team to research each of the tests and meet with the sponsor.
Once a basic understanding of the tests was achieved, the team began obtaining customer requirements
and benchmarking what would become the engineering specifications and targets.
Google Web Search/YouTube
The internet was used to find the basic definitions of tribology as well as information about the
individual Four-Ball and Twist Compression tests. The Google search engine was primarily used for all
of online research. After preliminary definitions were found, YouTube was searched in the hopes of
finding any videos of the tests that would further reinforce an understanding of them. One video for
Twist Compression Test and two videos for the Four-Ball Test were found. The videos were very helpful
in the beginning stages of research in that they allowed for easy visualization of how the tests are
conducted. [15-17]
Company Websites
Based on information obtained by the project sponsor and internet searches, companies that lead the
industry were determined and their websites were scrutinized for information. Tribsys is currently the
only company that manufactures a Twist Compression Test machine. Two of the industry leaders of the
Four-ball test machine are Falex Corporation and Koehler Instruments.
Official Standards
In addition to the information gathered by company websites, ASTM standards used for the Four-ball
test were analyzed. The standards were obtained using the University of Michigan‟s Library services.
There are five main standards that pertain to the Four-ball test: ASTM D2266 [1], titled “Standard Test
Method for Wear Preventive Characteristics of Lubricating Grease (Four-Ball Method),” ASTM D2595
[2], titled “Standard Test Method for Measurement of Extreme-Pressure Properties of Lubricating
Grease (Four-Ball Method),” ASTM D2783 [3], titled “Standard Test Method for Measurement of the
Extreme-Pressure Properties of Lubricating Fluids (Four-Ball Method),” ASTM D4172 [4], titled

79
“Standard Test Method for Wear Preventive Characteristics of Lubricating Fluid (Four-Ball Method),”
and ASTM D5183 [5], titled “Standard Test Method for Determination of the Coefficient of Friction of
Lubricants Using the Four-Ball Wear Test Machine.”
Technical Benchmarks
The technical benchmarks compiled from our Google web searches, company websites, and official
standards are summarized below in the table.
Table 34: Benchmarking Standards
Resource Speed Range Normal Load Range Temperature Range
ASTM Standards*
(4-Ball) 600 - 1760 rpm 59 - 7840 N 18 - 75°C
Falex [6] [7] (4-Ball) 100 - 3600 rpm 0 - 9800 N Tamb - 175°C
Koehler [8] (4-Ball) 300 - 3000 rpm NA NA
Tribsys [9] (Twist
Compression Test) 5 - 30 rpm Up to 60,000 psi NA
*A complete and detailed list of ASTM standards [1-5]
Information Gaps
As seen in the table above, a few of the ranges for both tests are missing. The Four-Ball test
specifications can be found in the ASTM standards [1-5]. Because Tribsys is the only company that
produces the TCT, and there are no current ASTM standards available on the TCT, only the information
given on the Tribsys website and sponsor requests have been used to determine TCT benchmarks. We
have been able to locate a standard in development but it is not available for viewing at this time.
ADDITIONAL RESEARCH
For each of our functions we have done additional research to aid in our decisions on which concepts to
pick. This research was primarily done on the internet, contacting companies and interviews with people
knowledgeable in the field.
AC Motor
Due to the fact that the previous team‟s motor was donated, they had not received the proper torque vs.
speed and current vs. speed curves. They also did not have information about the motor‟s full load torque
and full load speed. These curves allow us to determine what gear ratios will be implemented in the
motor. To obtain this information we contacted both the manufacturer (A.O. Smith) and the distributor
(Packard Inc.)
Gearbox
This is an area of research that is still ongoing. We have primarily been using the internet to research
different gearboxes with specific gear ratios and testing torques. At first glance we thought obtaining a
gearbox with these specific requirements was going to be impossible and require us to purchase an
expensive, custom made one. We switched our focus to using gears and researched lecture slides from
our ME 350 class [11] but decided this was not going to be a big improvement from the chain drive that
is currently being used. After more research looking at a specific custom gearbox website [10], we have
decided that using a gearbox is feasible.
Optical Encoder
The previous team used an optical encoder which was very functional. To solidify our decision to keep
this we used the internet to search optical encoders and laser tachometers to compare pricing and

80
functionality. [12] These two options were our top two when using a pugh chart to decide which one to
use. After further research we decided to keep the optical encoder but did discover we need to purchase a
new one due to the previous team‟s being short-circuited and inoperable.
Thermocouple
The previous team had purchased a thermocouple and had anticipated using it, but due to time
constraints never got the opportunity to implement it into the design. To make sure this was the best way
to measure the lubricant temperature research using the internet was performed [13].
Humidity Meter
The internet was used to research different humidity meters to find one that measured humidity up to
100% as well as being inexpensive [14].

81
REFERENCES
[1] ASTM, 2008, “Standard Test Method for Wear Preventive Characteristics of Lubricating Grease
(Four-Ball Method)”, ASTM D 2266, PA
[2] ASTM, 2008, “Standard Test Method for Measurement of Extreme-Pressure Properties of
Lubricating Grease (Four-Ball Method)”, ASTM D 2596, PA
[3] ASTM, 2009, “Standard Test Method for Measurement of Extreme-Pressure Properties of
Lubricating Fluids (Four-Ball Method)”, ASTM D 2783, PA
[4] ASTM, 2004, “Standard Test Method for Wear Preventive Characteristics of Lubricating Fluid
(Four-Ball Method)”, ASTM D 4172, PA
[5] ASTM, 2005, “Standard Test Method for Determination of the Coefficient of Friction of Lubricants
Using the Four-Ball Wear Test Machine”, ASTM D 5183, PA
[6] Falex Corporation. FALEX Four-Ball Extreme Pressure Test Machine. January 21, 2010.
http://www.compass-instruments.com/downloads/falex_pdfs/Falex_Four_Ball_EP_2006.pdf
[7] Falex Corporation. FALEX Four-Ball Wear Test Machine. January 21, 2010.
http://www.compass-instruments.com/downloads/falex_pdfs/Falex_Four_Ball_Wear_2006.pdf
[8] K93100 Four Ball Wear and EP Tester, January 13, 2010,
http://www.koehlerinstrument.com/tribology-index.html
[9] The TribSys Twist Compression Test, January 13, 2010, http://www.tribsys.com/TCT.htm
[10] Rino Mechanical Components Inc., Custom and Customized Gearboxes, February 17, 2010.
www.rinomechanical.com/gearbox_custom.htm.
[11] “Power/Energy Transmission: Gears,” ME 350 Mechanical Design and Manufacturing II, Lecture
10, Professor Diann Brei, February 17, 2010.
[12] “HB6M Hollow Bore Optical Encoder,” US Digital, Copyright 2010. February 13, 2010.
http://usdigital.com/products/encoders/incremental/rotary/hollow-bore/hb6m/.
[13] “Thermocouple – An Introduction,” OMEGA Engineering Technical Reference, Copyright 2003-
2009. February 12, 2010. http://www.omega.com/thermocouples.html.
[14] “Extech 445703 Hygro-Thermometer,” Instrumart. February 17, 2010.
http://www.instrumart.com/Product.aspx?ProductID=22637.
[15] “Onyx 4ball Weld Point test. ASTM D-2596,” January 21, 2010.
http://www.youtube.com/watch?v=ftQmUBVo-bo
[16] “Four BALL Wear Test,” January 21, 2010. http://www.youtube.com/watch?v=J22EecbpJ8w
[17] “IRMCO Lab: Twist Compression Test (TCT),” January 21, 2010.
http://www.youtube.com/watch?v=QvtIhzAKKX8

82
[18] “Critical (Whirling) Speeds of Shafts,” February 15, 2010.
http://www.roymech.co.uk/Useful_Tables/Drive/Shaft_Critical_Speed.html
[19] “Heat Transfer Fundamentals,” HRS Spiratube, February 17, 2010. http://www.hrs-
spiratube.com/en/resources/heat_transfer_fundamentals_01_05.aspx
[20] G Ngaile, J Cochran, D Stark, “Formulation of polymer-based lubricant for metal forming,”
February 16, 2010.
http://www.mae.ncsu.edu/homepages/ngaile/JournalPapers/Formulation%20of%20polymer-
based%20lub%20for%20metal%20forming.pdf
[21] “Scalds and Burn Injuries,” Exponent. February 17, 2010.
http://www.exponent.com/scalds_burn_injuries/
[22] National Instruments, NI cDAQ-9174, NI Compact DAQ 4-Slot Chassis, March 14, 2010.
http://sine.ni.com/nips/cds/view/p/lang/en/nid/207535
[23] National Instruments, NI 9237, 4-Channel, ±25 mV/V, 24-Bit Simultaneous Bridge Module, March
14, 2010. http://sine.ni.com/nips/cds/view/p/lang/en/nid/202632
[24] Vishay Micro-Measurements, General Purpose Strain Gage - Linear Pattern, March 14, 2010.
http://www.vishay.com/docs/11297/250lw.pdf
[25] National Instruments, NI 9211, 4-Channel, 14 S/s, 24-Bit, ±80mV Thermocouple Input Module,
March 14, 2010. http://sine.ni.com/nips/cds/view/p/lang/en/nid/14165
[26] Omega, Rugged Transition Joint Probes with Standard Dimensions, March 14, 2010.
http://www.omega.com/toc_asp/frameset.html?book=Temperature&file=TJ36-ICIN
[27] National Instruments, NI USB-6009, 14-Bit, 48 kS/s, Low-Cost Multifunction DAQ, March 14,
2010. http://sine.ni.com/nips/cds/view/p/lang/en/nid/14605
[28] Monarch Instrument, Infrared Sensor, March 14, 2010.
http://www.monarchinstrument.com/product.php?ID=42
[29] Inverter Drive Supermarket, ABB ACS150, AC Inverter Drive Speed Controller, March 14, 2010.
http://www.inverterdrive.com/group/AC-Inverter-Drives-230V/ABB-Drives-ACS150-01E-04A7-2-0-
75kW-230V/default.aspx
[30] National Instruments, NI 9201, 8-Ch, ±10 V, 500 kS/s, 12-Bit Analog Input Module, C Series,
March 14, 2010. http://sine.ni.com/nips/cds/view/p/lang/en/nid/14588
[31] Vaisala Industrial Instruments, INTERCAP Humidity and Temperature Probe HMP50, March 14,
2010. http://www.vaisala.com/instruments/products/hm-hmp50.html
[32] Omega, The Strain Gage, March 19, 2010.
http://www.omega.com/Literature/Transactions/volume3/strain2.html
[33] McMaster-Carr, Cartridge Heaters, March 19, 2010.
http://www.mcmaster.com/#cartridge-heaters/=6bud6x

83
[34] Thermal Corporation, Temperature Controllers, March 19, 2010.
http://www.thermalcorp.com/control_controllers.php
[35] Chua, Yi Jie, Chu, Kok-Shing, Ho, Ren Jie Keith, Lim, Adolphus, Lim, Ying Yi. Project 22:
Combination Twist Compression and Four-Ball Test Device. February 17, 2010.
[36] "Granta's CES EduPack." Granta Material Intelligence. Granta Design Limited 2007.

84
APPENDIX A: Bill of Materials
Quantity Unit Item
Number Source Item Description
Unit
Price
($)
Total
($)
1 Ea 00371946 Motion
Industries, Inc. YSS812 20 Spur Gear 28.86 28.86
1 Ea 00375736 Motion
Industries, Inc. YSS860 20 Spur Gear 136.57 136.57
1 Ea 00372003 Motion
Industries, Inc. TC896 20 Spur Gear 208.56 208.56
1 Ea 00374906 Motion
Industries, Inc. TC8144 20 Spur Gear 314.27 314.27
2 Ea 05550637 MSC Industrial
Supply Co.
2 Bolt Mounted Flange
Bearing: Diam. = 0.75” 24.67 49.34
1 Ea 8975K423 McMaster-Carr 3‟ x 1.5” x 0.5” Aluminum
Block 15.81 15.81
1 Ea 8975K563 McMaster-Carr 3‟ x 1.5” x 0.25” Aluminum
Block 9.45 9.45
1 Ea 8975K34 McMaster-Carr 6‟ x 1.5” x 0.125” Aluminum
Block 8.80 8.80
1 Ea 8671K19 McMaster-Carr 4‟ x 1.5” x 0.125”
Polyethylene HDPE Block 2.40 2.40
1 Ea 8975K313 McMaster-Carr 1‟ x 3” x 1” Aluminum Block 17.86 17.86
1 Ea 8788K57 McMaster-Carr 1‟ x 3” x 1” PVC Block 26.39 26.39
1 Ea 8588K17 McMaster-Carr 1‟ x 3” x 1” Polyethylene
LDPE Block 5.46 5.46
1 Ea 1497K956 McMaster-Carr
18” Long by ¾” Diameter
Driveshaft with 3/16” Wide by
3/32” Deep Key
25.97 25.97
1 Ea 98535A140 McMaster-Carr 3/16” x 3/16” High-Carbon
Plain Steel Key Stock 2.74 2.74
1 Ea 98535A150 McMaster-Carr ¼” x ¼” High-Carbon Plain
Steel Key Stock 3.55 3.55
2 Ea 8376T21 McMaster-Carr 25W, 120 VAC, 1 ¼”
Cartridge Heater 27.35 54.70
1 Ea EK2-60-A-1 DieQua
Corporation
1.125” and 0.75” Flexible
Coupler with Standard Keys 132.00 132.00
1 Ea 1388K131 McMaster-Carr Steel Sheet 219.58 219.58
1 Ea Alro Steel
Corporation
6” Diameter by 6” Length
Aluminum Round 93.23 93.23
1 Ea Alro Steel
Corporation
4” Diamteter by 6” Length
Aluminum Round 46.52 46.52
1 Ea Alro Steel
Corporation
6” Length x 4” Square
Aluminum Block 56.90 56.90
2 Pkg. C2A-13-
250lw-350 Vishay Strain Gage 71.25 142.50
1 Ea TJ96-CASS-
18G-12 Omega Thermocouple 33.00 33.00

85
1 Ea 6180-056 Monarch ROS-W Optical Sensor 144.00 144.00
2 Ea 8376T21 McMaster-Carr 2 Miniature High-Temperature
Cartridge Heater 27.35 54.70
1 Pkg. 91201A031 McMaster-Carr 3/8” ID by 7/8” OD Washers 11.55 11.55
1 Ea 8973K63 McMaster-Carr 36” x 24” x 0.025” Aluminum
Sheet 16.52 16.52
1 Ea 8973K53 McMaster-Carr 48” x 36” x 0.025” Aluminum
Sheet 28.69 28.69
1 Ea 46715T31 McMaster-Carr 24” x 18” Medium Duty Table
with 30” Height (Stationary) 121.39 121.39
2 Ea 9517K106 McMaster-Carr 24” x 8” x ¼” Steel Plate 86.08 172.16
16 Ea 218 Bolt Depot Hex Bolt 3/8-16 x 1 0.14 2.24
4 Ea 232 Bolt Depot Hex Bolt 3/8-16 x 5 ½ 0.52 2.08
1 Ea 7071K153 McMaster-Carr
Continuous-Flex Miniature
Wire, 30 Awg, 0.031” OD, 600
VAC, Red, 30 Ft
20.40 20.40
1 Ea 2103960 Jameco
Electronics
Mean Well Net-35B 35W
Power Supply (±12 V) 26.95 26.95
1 Ea G3MC-
201PL Omron DC5 Steady State Relay 4.36 4.36
1 Ea 8443K41 McMaster-Carr A2 Tool Steel Oversize Rod,
2" Diameter, 1" Length 10.39 10.39
1 Ea 8443K51 McMaster-Carr A2 Tool Steel Oversize Rod,
3" Diameter, 1" Length 13.44 13.44
1 Pkg. 99604A101 McMaster-Carr
Silicone Sealing Washer, No. 6
Screw Size, 1/4" Od, .093"
Thick
11.04 11.04
1 Ea 5852T28 McMaster-Carr
A2 Tool Steel Tight-tol Flat
Stock W/ Cert, 1/4" Thick, 2"
Width, 18" Length
67.19 67.19
1 Pkg. 98381A714 McMaster-Carr Alloy Steel Dowel Pin, 1/2"
Diameter, 1-1/4" Length 8.37 8.37
1 Ea RadioShack 16-Ft. USB 2.0 Cable with A-
B Male Connectors 42.99 42.99
1 Ea 278-1218 RadioShack 90-Ft. UL-Recognized Hookup
Wire (22AWG) 6.59 6.59
2 Ea 278-1611 RadioShack Heat-Shrink Tubing Set (36-
Pack) 3.49 6.98
1 Ea MCC USB-
502
National
Instruments
Temperature and Humidity
Logger from Measurement
Computing
82.00 82.00
1 Ea Meijer Olive Oil 18.99 18.99
2 American Gear
& Engineering Work on Gears 100.00 100.00
Total 2607.48
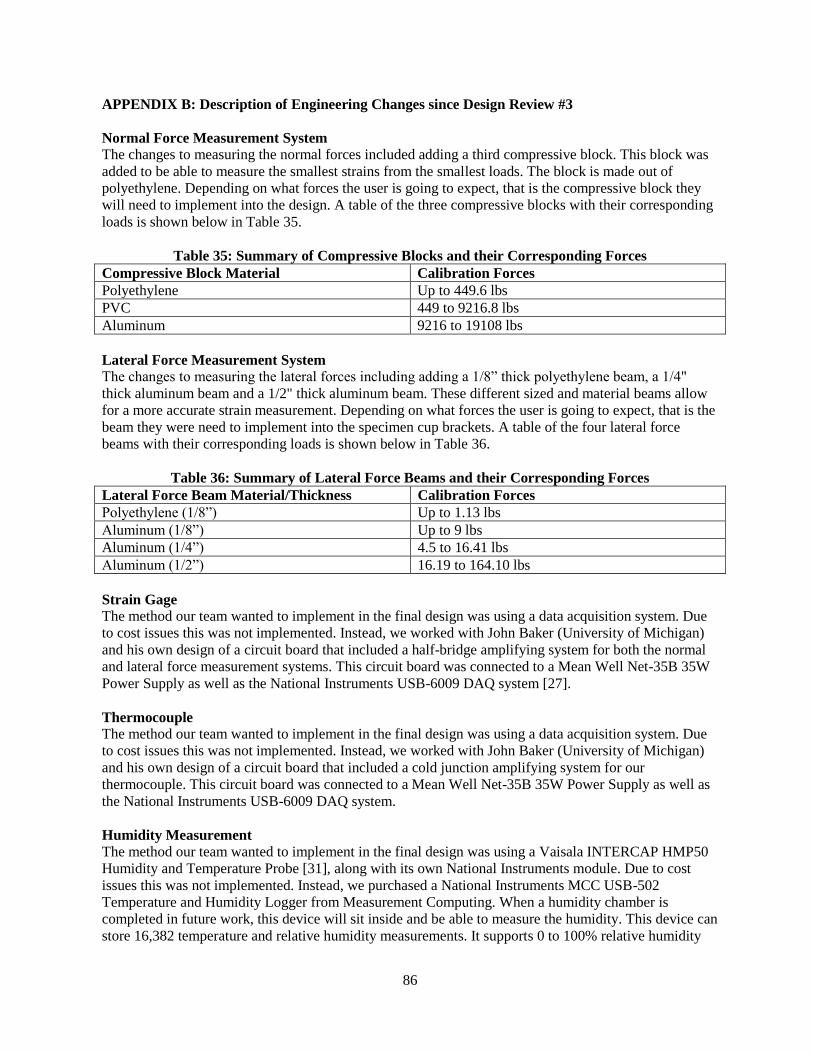
86
APPENDIX B: Description of Engineering Changes since Design Review #3
Normal Force Measurement System
The changes to measuring the normal forces included adding a third compressive block. This block was
added to be able to measure the smallest strains from the smallest loads. The block is made out of
polyethylene. Depending on what forces the user is going to expect, that is the compressive block they
will need to implement into the design. A table of the three compressive blocks with their corresponding
loads is shown below in Table 35.
Table 35: Summary of Compressive Blocks and their Corresponding Forces
Compressive Block Material Calibration Forces
Polyethylene Up to 449.6 lbs
PVC 449 to 9216.8 lbs
Aluminum 9216 to 19108 lbs
Lateral Force Measurement System
The changes to measuring the lateral forces including adding a 1/8” thick polyethylene beam, a 1/4"
thick aluminum beam and a 1/2" thick aluminum beam. These different sized and material beams allow
for a more accurate strain measurement. Depending on what forces the user is going to expect, that is the
beam they were need to implement into the specimen cup brackets. A table of the four lateral force
beams with their corresponding loads is shown below in Table 36.
Table 36: Summary of Lateral Force Beams and their Corresponding Forces
Lateral Force Beam Material/Thickness Calibration Forces
Polyethylene (1/8”) Up to 1.13 lbs
Aluminum (1/8”) Up to 9 lbs
Aluminum (1/4”) 4.5 to 16.41 lbs
Aluminum (1/2”) 16.19 to 164.10 lbs
Strain Gage
The method our team wanted to implement in the final design was using a data acquisition system. Due
to cost issues this was not implemented. Instead, we worked with John Baker (University of Michigan)
and his own design of a circuit board that included a half-bridge amplifying system for both the normal
and lateral force measurement systems. This circuit board was connected to a Mean Well Net-35B 35W
Power Supply as well as the National Instruments USB-6009 DAQ system [27].
Thermocouple
The method our team wanted to implement in the final design was using a data acquisition system. Due
to cost issues this was not implemented. Instead, we worked with John Baker (University of Michigan)
and his own design of a circuit board that included a cold junction amplifying system for our
thermocouple. This circuit board was connected to a Mean Well Net-35B 35W Power Supply as well as
the National Instruments USB-6009 DAQ system.
Humidity Measurement
The method our team wanted to implement in the final design was using a Vaisala INTERCAP HMP50
Humidity and Temperature Probe [31], along with its own National Instruments module. Due to cost
issues this was not implemented. Instead, we purchased a National Instruments MCC USB-502
Temperature and Humidity Logger from Measurement Computing. When a humidity chamber is
completed in future work, this device will sit inside and be able to measure the humidity. This device can
store 16,382 temperature and relative humidity measurements. It supports 0 to 100% relative humidity

87
and -35 to +80 °C (±1 °C accuracy). It can also be programmed to log humidity at rates of every 10
seconds, 1 minute, 5 minutes, 1 hour, 6 hours and 12 hours.
Safety Shields
Due to time restraints, we were unable to implement the small Lexan window into our safety shield
that‟s implemented over the specimen cup area. We were able to manufacture a safety shield for both the
specimen cup area and over the gear system. Both shields are easy to put on and remove.
Specimen Cup
Our team‟s final design wanted to manufacture teeth out of the base of the specimen cup. Due to the
amount of time that we were told it was going to take to manufacture these teeth, we changed the teeth
design to three steel dowels. Three holes were drilled into the base of the specimen cup (replacing where
the teeth would have been) as well as the top face of the securing block that holds the brackets and
lateral force beams.
Peltier Coolers
In our team‟s final design we did not implement the Peltier coolers. For the design expo we did end up
attaching four Peltier coolers to the securing block; two were placed on the front face (facing away from
the motor) and two on the face that is one side counter-clockwise from it. Along with the Peltier coolers,
Masscool 5C12B3 CPU Cools and Fans were also attached on top.

88
APPENDIX C: Design Analysis Assignment from Lecture
1. Material Selection Assignment (Functional Performance)
Two major components of our final design include the compressive (normal) and lateral (frictional) force
measurement systems. These systems are rudimentary in concept and design in that they both involve a
block of material that can be deformed and strained due to the applied force and two strain gages
attached in order to measure the strain. This is a very simple method for measuring forces but the blocks
of material for both the compressive and lateral forces must be able to be strained to a level that is able to
be detected by our strain gages with a 1% resolution error (equivalent to a strain of 0.0001) and
withstand the stresses with a minimum safety factor of 2. Therefore, it is vitally important to select an
appropriate material based on given constraints. Table 37, below summarizes the function, objective and
constraints for each force measurement block of material.
Table 37: Function, Objective, and Constraints of Selected Components
Compressive Force Block Lateral Force Beam
Function Column in compression Beam in bending
Objective Maximize strain Maximize strain
Constraints
Shape and volume fixed;
maximum force fixed;
cannot fail in compression
Shape and volume fixed;
cannot fail in bending
Compressive Block
Selecting the material index for both of these components is somewhat unique since the goal is to
maximize the strain while disallowing stress failures. For the compressive block, we know that the strain
is equal to the normal stress, σ, divided by the Young‟s modulus, E, of the material, shown below.
Furthermore, we know that the normal stress is equal to the compressive force divided by the normal
surface area of the block of material, A, shown below.
The surface area has been set to 0.00580644 m2 (a 3” x 3” block), and the maximum compressive force
that the machine is designed to be capable of withstanding is 85,000 N. Using the stress equation, we
know that the block must be able to withstand 14.64 MPa and with a safety factor of 2, the block must be
able to withstand approximately 30 MPa at a minimum. Therefore, its compressive strength must be
greater than 30 MPa. However, we must also look at the minimum force applied to ensure that that the
material can produce enough strain for the strain gages to pick it up with no more than a 1% resolution
error. The minimum compressive force is set to be 30 N, which yields the minimum compressive stress
of 5.166 kPa. Now that we know the minimum expected stress and minimum acceptable strain, we can
solve for the maximum Young‟s modulus by rearranging the above equation. Dividing the minimum
stress by the minimum strain gives a maximum Young‟s modulus of 5.166 GPa. Knowing this as well as
the range of expected stresses, we used CES software to determine applicable materials. The only other
constraint that we decided to put onto our selected material was a maximum cost of $5/kg.
With all parameters set, we were given a list of 12 materials in which to choose from. The five front
runners were chosen and we took down information about price, Young‟s modulus, and compressive
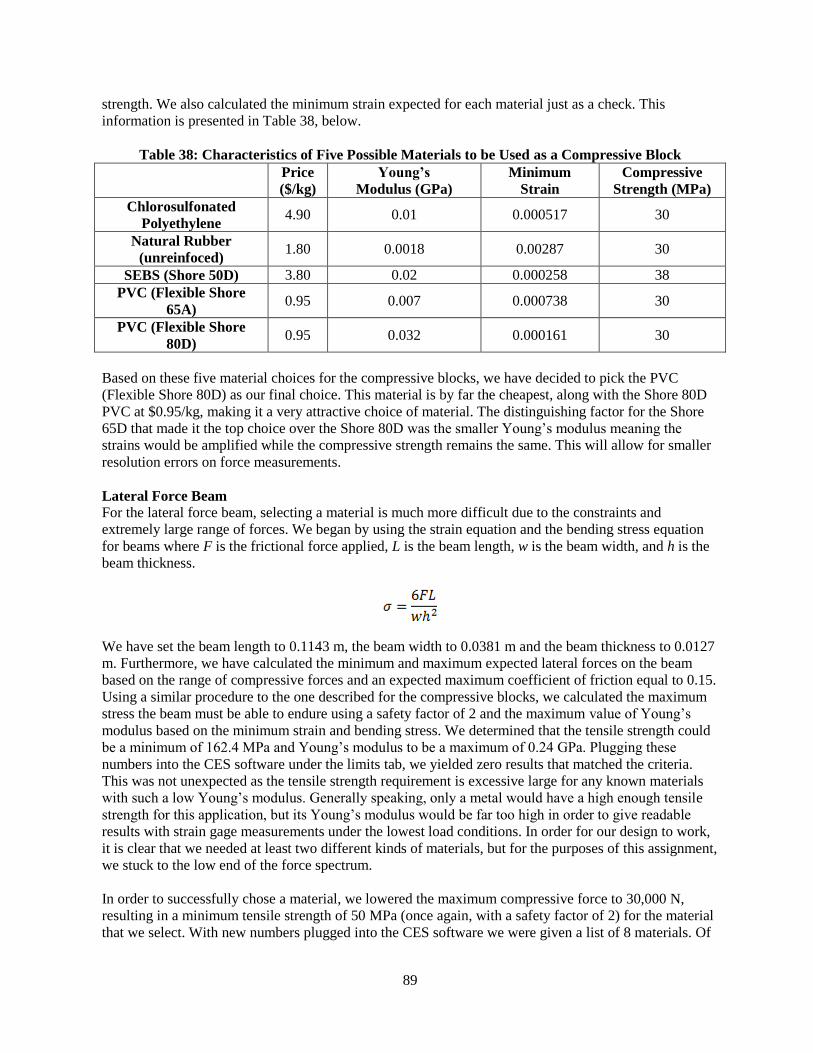
89
strength. We also calculated the minimum strain expected for each material just as a check. This
information is presented in Table 38, below.
Table 38: Characteristics of Five Possible Materials to be Used as a Compressive Block
Price
($/kg)
Young’s
Modulus (GPa)
Minimum
Strain
Compressive
Strength (MPa)
Chlorosulfonated
Polyethylene 4.90 0.01 0.000517 30
Natural Rubber
(unreinfoced) 1.80 0.0018 0.00287 30
SEBS (Shore 50D) 3.80 0.02 0.000258 38
PVC (Flexible Shore
65A) 0.95 0.007 0.000738 30
PVC (Flexible Shore
80D) 0.95 0.032 0.000161 30
Based on these five material choices for the compressive blocks, we have decided to pick the PVC
(Flexible Shore 80D) as our final choice. This material is by far the cheapest, along with the Shore 80D
PVC at $0.95/kg, making it a very attractive choice of material. The distinguishing factor for the Shore
65D that made it the top choice over the Shore 80D was the smaller Young‟s modulus meaning the
strains would be amplified while the compressive strength remains the same. This will allow for smaller
resolution errors on force measurements.
Lateral Force Beam
For the lateral force beam, selecting a material is much more difficult due to the constraints and
extremely large range of forces. We began by using the strain equation and the bending stress equation
for beams where F is the frictional force applied, L is the beam length, w is the beam width, and h is the
beam thickness.
We have set the beam length to 0.1143 m, the beam width to 0.0381 m and the beam thickness to 0.0127
m. Furthermore, we have calculated the minimum and maximum expected lateral forces on the beam
based on the range of compressive forces and an expected maximum coefficient of friction equal to 0.15.
Using a similar procedure to the one described for the compressive blocks, we calculated the maximum
stress the beam must be able to endure using a safety factor of 2 and the maximum value of Young‟s
modulus based on the minimum strain and bending stress. We determined that the tensile strength could
be a minimum of 162.4 MPa and Young‟s modulus to be a maximum of 0.24 GPa. Plugging these
numbers into the CES software under the limits tab, we yielded zero results that matched the criteria.
This was not unexpected as the tensile strength requirement is excessive large for any known materials
with such a low Young‟s modulus. Generally speaking, only a metal would have a high enough tensile
strength for this application, but its Young‟s modulus would be far too high in order to give readable
results with strain gage measurements under the lowest load conditions. In order for our design to work,
it is clear that we needed at least two different kinds of materials, but for the purposes of this assignment,
we stuck to the low end of the force spectrum.
In order to successfully chose a material, we lowered the maximum compressive force to 30,000 N,
resulting in a minimum tensile strength of 50 MPa (once again, with a safety factor of 2) for the material
that we select. With new numbers plugged into the CES software we were given a list of 8 materials. Of

90
the eight, we chose 5 finalists and once again recorded, price, Young‟s modulus, and tensile strength. We
also calculated the minimum strain expected for each material just as a check. This information is
presented in Table 39, below.
Table 39: Characteristics of Five Possible Materials to be Used as a Lateral Force Beam
Price
($/kg)
Young’s
Modulus (GPa)
Minimum
Strain
Compressive
Strength (MPa)
Leather 18.00 0.1 0.00024 50
PEBA (Shore 55D) 8.40 0.145 0.000166 55
Polyurethane Rubber 5.10 0.03 0.0008 50
TPU (Shore 50D) 6.10 0.16 0.00015 50
TPU (Shore 60D) 6.10 0.235 0.000102 51
Based on these five material choices for the lateral force beam, we have decided to pick the Polyurethane
Rubber as our final choice. This material is the cheapest by $1.00/kg and has the mandatory minimum
tensile strength of 50 MPa while having the smallest Young‟s modulus, meaning it will give the best
resolutions in strain over the range of tests.
2. Material Selection Assignment (Environmental Performance)
Since we have set the dimensions set for both the compressive block and the lateral force beam, it is very
simple to calculate the needed mass of each of the selected materials. To calculate the mass, we m3
multiplied the volume, V, of the component by the density, ρ, shown below.
Table 40: Mass Data for the Two Selected Materials
Polyurethane Rubber for
Lateral Force Beam
PVC (Flexible Shore 65A) for
Compressive Block
Volume (m3) 0.000055 0.000049
Density (kg/ m3) 1200 1300
Mass (kg) 0.066368 0.06391
Once we calculated the masses of each component, we used the SimaPro software package to assist us in
determining the environmental impacts each component would have. Within SimaPro, it was difficult to
find exact matches of the materials we chose in CES, but we were able to choose very similar materials.
For the PVC (Flexible Shore 65A), we chose PVC (suspension polymerisation) E. For the Polyurethane
Rubber, we chose Polybutadiene E Rubber within SimaPro. By way of comparison in the software, we
were able to calculate the total mass of air emissions, water emissions, use of raw materials, and solid
waste. This information is shown in Figure 45, below.
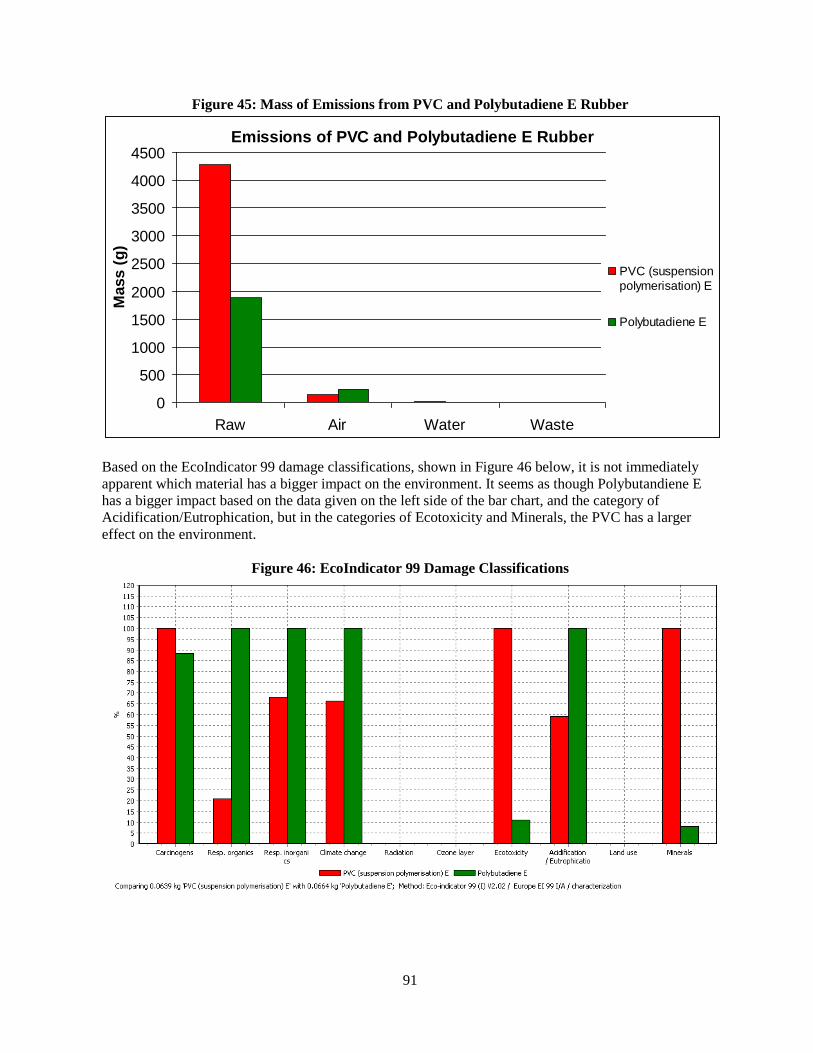
91
Figure 45: Mass of Emissions from PVC and Polybutadiene E Rubber
Emissions of PVC and Polybutadiene E Rubber
0
500
1000
1500
2000
2500
3000
3500
4000
4500
Raw Air Water Waste
Mass (
g)
PVC (suspension
polymerisation) E
Polybutadiene E
Based on the EcoIndicator 99 damage classifications, shown in Figure 46 below, it is not immediately
apparent which material has a bigger impact on the environment. It seems as though Polybutandiene E
has a bigger impact based on the data given on the left side of the bar chart, and the category of
Acidification/Eutrophication, but in the categories of Ecotoxicity and Minerals, the PVC has a larger
effect on the environment.
Figure 46: EcoIndicator 99 Damage Classifications

92
Looking deeper into the matter, we looked at the damage meta-categories of Human Health, Ecotoxicity
and Resources. The point values for each of these categories are given in Figure 47, below. From the
chart, it is clear that Human Health is the most important category and should be of greatest importance
when considering material usage for the two components. The point values of the two materials for
Ecosystem Quality are very low and only the PVC has a relatively high value for the Resources
category.
Figure 47: Damage Meta – Categories
In the SimaPro software, the total point values were calculated and plotted, seen in Figure 49, p.92.
Consistent with our conclusions from the meta-categories chart above, we see that the Polybutadiene E
has a higher point value on the EcoIndicator 99 scale. When the life cycle of the whole product is taken
into consideration, it is hard to say which component material would have a bigger impact. This is
because the Polybutadiene E rubber lateral beam has a larger point value on a one time basis, but over
the life of the product, we believe the PVC compressive block would be the component to wear faster
due to a longer amount of time exposed to high forces than the lateral beam, and have to be replaced
more often than the lateral beam. Because of this increased replacement of the compressive block, it may
be more damaging to the environment over the products life cycle, which will likely be several decades.

93
Figure 48: EcoIndicator 99 Total Point Values
It is hard to say that we would pick different materials based on this environmental assessment. The
environmental impact seems relatively low for both materials, making them both attractive to be used.
However, if we were to try to eliminate some of the damage caused by using Polybutadiene E, we could
switch to a different material, like TPU and spend slightly more money, or use several beams of different
low impact materials and thicknesses in order to satisfy the requirements of the tests. This is in fact what
we did, using a high density polyethylene for the lowest force range, and three different thickness
aluminum beams for the mid to upper range force levels expected on the lateral force beam.
3. Manufacturing Process Selection Assignment
Our product is being developed specifically for the use of our sponsor, Professor Gordon Krauss, but
could potentially have a use in other University laboratories for tribology research purposes. Based on
the research we conducted early in the project and our knowledge of industry testing, we believe a
starting estimate for the production volume is roughly 100 units. Being a relatively small number in the
way of producing products as basic as the two components we are examining, we had to come up with
manufacturing approaches that would keep costs low but quality high.
Using the CES software once again, we were able to analyze the many different forming and
manufacturing processes available for each of the two materials. When we actually made the
components, we ordered raw material that had most likely been extruded to stock bars and sheets and
machined it using milling machines to the specifications we had set. However, in looking at the
processes on CES, we saw that there is a very high equipment cost associated with milling and other
options can yield a cheaper unit investment with a limited production run of 100 units. After examining
the processes for both materials, we determined that water jet cutting (WJC) the two components as if
we were producing multiple prototypes would be a more cost effective and accurate method of
manufacturing. The specifications for WJC are given in Figure 50, p.93.
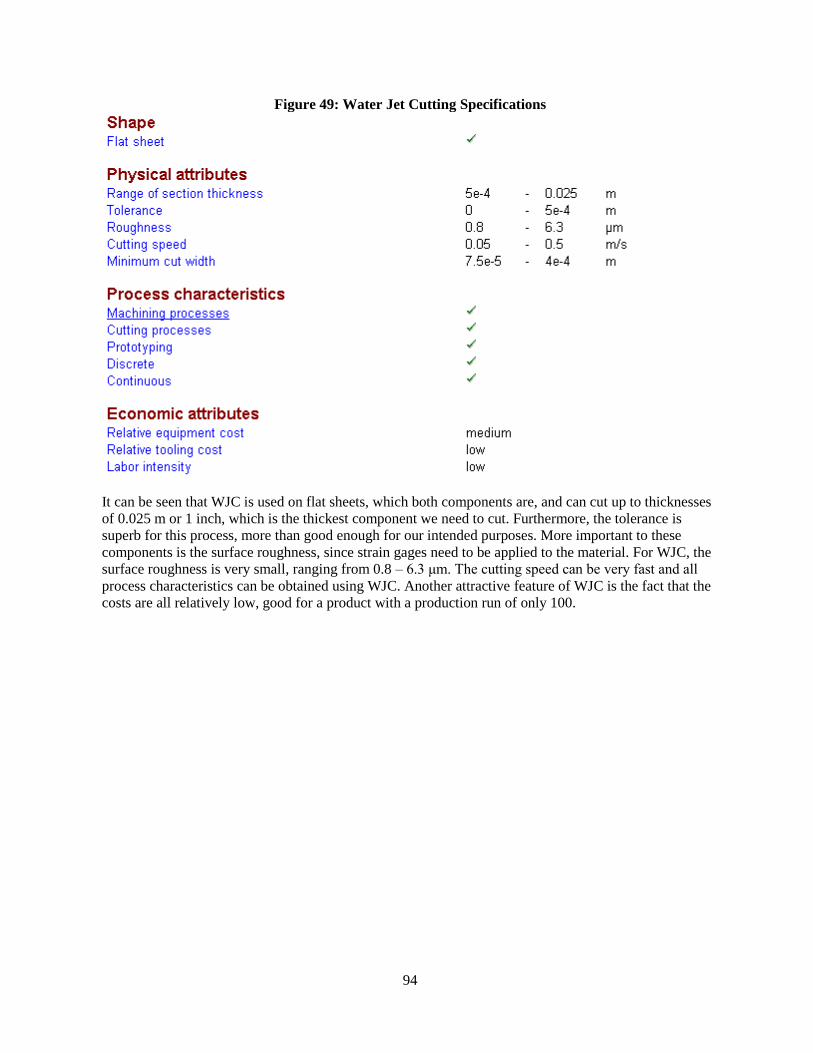
94
Figure 49: Water Jet Cutting Specifications
It can be seen that WJC is used on flat sheets, which both components are, and can cut up to thicknesses
of 0.025 m or 1 inch, which is the thickest component we need to cut. Furthermore, the tolerance is
superb for this process, more than good enough for our intended purposes. More important to these
components is the surface roughness, since strain gages need to be applied to the material. For WJC, the
surface roughness is very small, ranging from 0.8 – 6.3 μm. The cutting speed can be very fast and all
process characteristics can be obtained using WJC. Another attractive feature of WJC is the fact that the
costs are all relatively low, good for a product with a production run of only 100.

95
APPENDIX D: Analysis Calculations
GEAR ANALYSES CALCULATIONS
Motor Specifications:
Full load torque = 11.8 N-m
Full load speed = 1765 rpm
75% motor speed = 1324 rpm
TCT Gear Ratio:
Max normal force = 100 kN
Max expected coefficient of friction, μ = 0.15
Max friction force = μF = 15 kN
Radius of Annulus = 0.0111 m
Max moment about center of cup = r*Ff = 166.5 N-m
Gear ratio = Max torque/full load torque of motor = 166.5/11.8 = 14
Gear ratio (pinion:gear) = 1:14
Four-ball Gear Ratio:
Max normal force = 16 kN
Max expected coefficient of friction, μ = 0.15
Max friction force = μF = 2.4 kN
Radius of Annulus = 0.00367 m
Max moment about center of cup = r*Ff = 8.79 N-m
Gear ratio = Max motor speed/75% motor speed = 3600/1324 = 2.7
Gear ratio (pinion:gear) = 2.7:1
STRESS ANALYSES CALCULATIONS
Compressive Block:
Max normal force (TCT) = 100 kN
Compressive block area = 0.0058 m2
Compressive stress = F/A = 17.2 MPa
PVC (30 – 999 N)
Max Compressive stress = 999 N/ 0.0058 m2 = 0.172 MPa
Young‟s Modulus = 2.74 GPa
Minimum strain = min stress/modulus = (30 N/ 0.0058 m2)/2.74 GPa = 1.9 x 10⁻⁶
Aluminum (1 – 100 kN)
Max Compressive stress = 100 kN/ 0.0058 m2 = 17.2 MPa
Young‟s Modulus = 68.9 GPa
Minimum strain = min stress/modulus = (1000 N/ 0.0058 m2)/68.9 GPa = 2.5 x 10⁻⁶
Bottom of Specimen Cup:
Max normal force (TCT) = 100 kN
Specimen plate area = .0508m x .0508 m = 0.002581 m2
Maximum stress on cup [F/A] = 100,000/0.002581 N/m2 = 38.75 MPa
Compressive strength of 6061 Aluminum (from CES EduPack) = 249 MPa

96
Specimen Cup Teeth Shear Stress:
Max normal force (TCT) = 100 kN
Max expected coefficient of friction, μ = 0.15
Max friction force = μF = 15 kN
Radius of Annulus (TCT) = 0.0111 m
Max moment about center of cup = r*Ff = 166.5 N-m
Distance from tooth midpoint to center of cup = 0.0508 m
Max Shear force, V = M/d = 3277 N
Number of teeth = 4
Max shear force per tooth, V = 819 N
Tooth base, b = 0.0254 m
Tooth height, h = 0.0127 m
Moment of inertia, I = (1/12)bh3 = 4.3357 x 10
-9 m
4
Statical moment of area, Q = (bh/2)(h/4) = 5.12096 m3
Shear Stress = VQ/It = 3.81 MPa
Max allowable shear stress for 6061 Aluminum = 120.5 MPa
Lateral Beams:
TCT:
Max moment about center of cup, M1 = 166.5 N-m
Distance from end of beam to center of cup = 0.2286 m
Max Reaction force at end of beam, F = M1/d = 728.35 N
Base of beam, b = 0.0381 m
Height (thickness) of beam, h = 0.0254 m
Beam length, l = 0.1143 m
Beam moment arm, M2 = Fl = 83.25 N-m
Moment of inertia = (1/12)bh3 = 6.50362 x 10
-9 m
4
1/2 height of beam, y = 0.0127 m
Max bending stress = M2y/I = 20.3 MPa
Tensile stress of 6061 Aluminum = 280 MPa
Four-ball:
Max moment about center of cup, M1 = 8.79 N-m
Distance from end of beam to center of cup = 0.2286 m
Max Reaction force at end of beam, F = M1/d = 14.6 N
Base of beam, b = 0.0381 m
Height (thickness) of beam, h = 0.003175 m
Beam length, l = 0.1143 m
Beam moment arm, M2 = Fl = 4.40 N-m
Moment of inertia = (1/12)bh3 = 1.0162 x 10
-10 m
4
1/2 height of beam, y = 0.0015875 m
Max bending stress = M2y/I = 26 MPa
Tensile stress of 6061 Aluminum = 280 MPa
Brackets (modeled as beams in bending):
Beam length, l = 0.0254 m
Beam base, b = 0.0381 m
Beam height, h = 0.0127 m
Force at end of beam, F = 728.35 N
Moment arm on beam, M = Fl = 18.5 N-m
Moment of inertia = (1/12)bh3 =6.50362 x 10⁻⁹ m
4

97
1/2 beam height, y = 0.00635 m
Bending stress = My/I = 18.06 MPa
Tensile stress of 6061 Aluminum = 280 MPa
Safety Shield (withstanding broken lateral force beams)
TCT beam (0.0254 m thick)
Length of broken beam, l = 0.1143 m
Angular velocity, w = 30 rpm
Max velocity of broken beam = lw = 0.359 m/s
Mass of beam = volume x density = 0.1143 m x 0.0254 m x 0.0381 m x 2700 kg/m3 = 0.299 kg
Impulse = mass x change in velocity (when hitting the shield) = 0.107 kg-m/s
Force = impulse/time = 10.7 N
Stress shield needs to endure = force/smallest area of beam = 3.4 MPa
TCT beam (0.0254 m thick)
Length of broken beam, l = 0.1143 m
Angular velocity, w = 3600 rpm
Max velocity of broken beam = lw = 43.1 m/s
Mass of beam = volume x density = 0.1143 m x 0.003175 m x 0.0381 m x 2700 kg/m3 = 0.03733 kg
Impulse = mass x change in velocity (when hitting the shield) = 1.609 kg-m/s
Force = impulse/time = 160.9 N
Stress shield needs to endure = force/smallest area of beam = 51 MPa
HEAT TRANSFER CALCULATIONS
Heating:
Area of heating, A = 0.0001 m2
Distance from heating cartridge to bottom surface of cup, s = 0.0111 m
Thermal conductivity of 6061 aluminum, k = 180 W/m-K
Rate of heat transfer, Q = 25 Watts
Surface temperature of cup, Ts = 150°C
Needed temperature of heating cartridge = (Qs)/(kA)+ Ts = 165.3°C
Cooling:
Area of heating, A = 0.002581 m2
Distance from heating cartridge to bottom surface of cup, s = 0.0111 m
Thermal conductivity of 6061 aluminum, k = 180 W/m-K
Rate of heat transfer, Q = -335 Watts
Surface temperature of cup, Ts = 0°C
Needed temperature of heating cartridge = (Qs)/(kA) + Ts = -8.0°C

98
APPENDIX E: DAQ Specification Sheets
NI 9211 4-Channel, 14 S/s, 24-Bit, ±80 mV Thermocouple Input Module 4 thermocouple or ±80 mV analog inputs
-40 to 70 °C operating range
24-bit resolution; 50/60 Hz noise rejection
Hot-swappable operation
NIST-traceable calibration
Overview The National Instruments NI 9211 thermocouple input module for use with NI CompactDAQ and CompactRIO chassis includes
a 24-bit delta-sigma ADC, antialiasing filters, open-thermocouple detection, and cold-junction compensation for high-accuracy
thermocouple measurements. The NI 9211 contains NIST-traceable calibration and channel-to-earth ground double isolation
barrier for safety, noise immunity, and high common-mode voltage range.
Specifications Specifications Documents
Detailed Specifications
Data Sheet
Product Family Industrial I/O
Form Factor CompactRIO , CompactDAQ
Operating System/Target Windows , Real-Time
Measurement Type Temperature , Thermocouple , Voltage
Isolation Type Ch-Earth Ground Isolation
RoHS Compliant Yes
Signal Conditioning Cold-junction compensation
Analog Input Channels 0 , 4
Single-Ended Channels 0
Differential Channels 4
Resolution 24 bits
Sample Rate 14 S/s
Max Voltage 80 mV
Maximum Voltage Range -80 mV , 80 mV
Minimum Voltage Range -80 mV , 80 mV
Simultaneous Sampling No
Analog Output Channels 0
Bidirectional Channels 0
Input-Only Channels 0
Output-Only Channels 0
Number of Channels 0 , 0 , 0
Counter/Timers
Counters 0
Physical Specifications
Length 9 cm

99
Width 2.3 cm
Minimum Operating Temperature -40 °C
Maximum Operating Temperature 70 °C
Minimum Storage Temperature -40 °C
Maximum Storage Temperature 85 °C

100
NI 9237 4-Channel, ±25 mV/V, 24-Bit Simultaneous Bridge Module
24-bit resolution, ±25 mV/V analog inputs with RJ50 connectors
4 simultaneously sampled analog inputs; 50 kS/s maximum sampling rate
Programmable half- and full-bridge completion; up to 10 V internal excitation
Smart-sensor (TEDS) compatible
1,000 Vrms transient isolation
-40 to 70 °C operating range
Overview
The National Instruments 9237 simultaneous bridge module for use with NI CompactDAQ and CompactRIO contains all the
signal conditioning required to power and measure up to four bridge-based sensors simultaneously. The four RJ50 jacks provide
direct connectivity to most torque or load cells and offer custom cable solutions with minimal tools. The high sampling rate and
bandwidth of the NI 9237 offer a high-quality, high-speed strain or load measurement system with zero interchannel phase
delay. With 60 VDC isolation and 1,000 Vrms transient isolation, the NI 9237 has high common-mode noise rejection and
increased safety for both the operator and test system.
The NI 9237 can perform offset/null as well as shunt calibration and remote sense, making the module the best choice for strain
and bridge measurements.
The NI 9944 and NI 9945 are accessories for use with quarter-bridge sensors. These accessories have a female RJ50 connector
on one end and screw terminals on the other end. Purchase these accessories with a kit of RJ50 cables (qty 4).
For screw terminals without the quarter-bridge completion, purchase the NI 9949 and a kit of RJ50 cables (qty 4). This setup
exposes all 10 pins for each channel as screw terminals.
Specifications Documents
Detailed Specifications
Data Sheet
Specifications Summary General
Product Name NI 9237
Product Family Industrial I/O
Form Factor CompactDAQ , CompactRIO
Operating System/Target Windows , Real-Time
Measurement Type Bridge-based sensor
Isolation Type Ch-Earth Ground Isolation
RoHS Compliant Yes
Signal Conditioning Bridge completion , Voltage excitation , Anti-aliasing filter
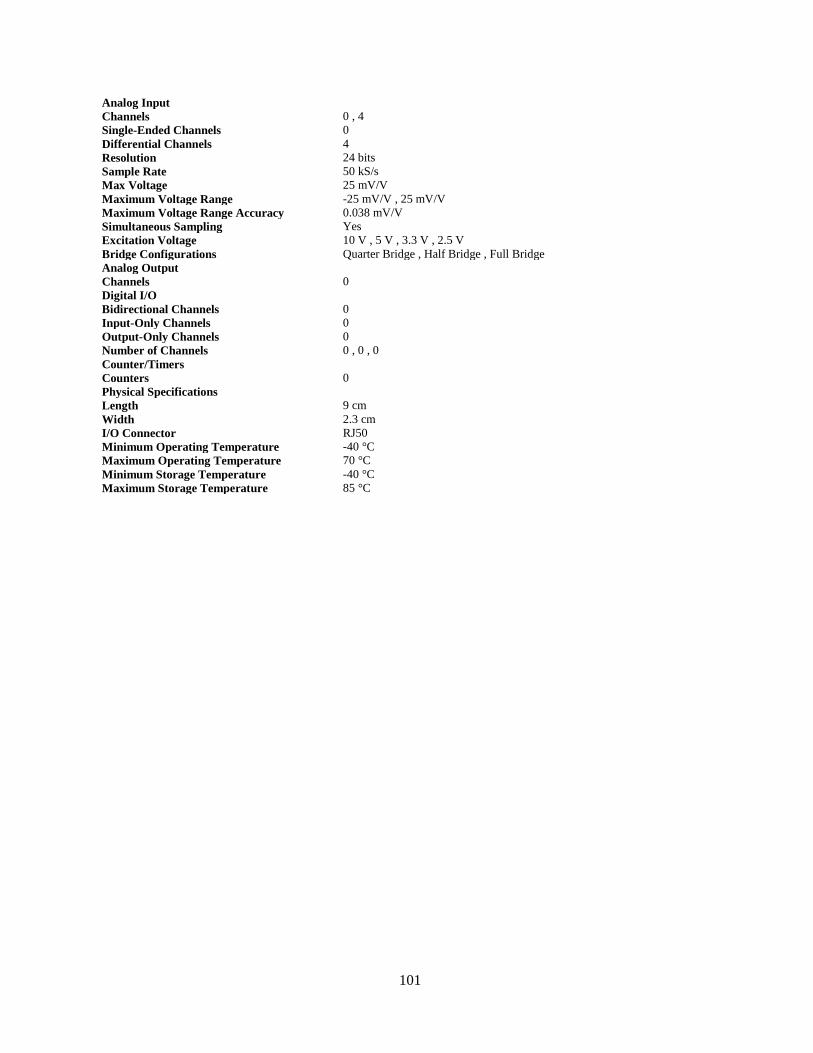
101
Analog Input
Channels 0 , 4
Single-Ended Channels 0
Differential Channels 4
Resolution 24 bits
Sample Rate 50 kS/s
Max Voltage 25 mV/V
Maximum Voltage Range -25 mV/V , 25 mV/V
Maximum Voltage Range Accuracy 0.038 mV/V
Simultaneous Sampling Yes
Excitation Voltage 10 V , 5 V , 3.3 V , 2.5 V
Bridge Configurations Quarter Bridge , Half Bridge , Full Bridge
Analog Output
Channels 0
Digital I/O
Bidirectional Channels 0
Input-Only Channels 0
Output-Only Channels 0
Number of Channels 0 , 0 , 0
Counter/Timers
Counters 0
Physical Specifications
Length 9 cm
Width 2.3 cm
I/O Connector RJ50
Minimum Operating Temperature -40 °C
Maximum Operating Temperature 70 °C
Minimum Storage Temperature -40 °C
Maximum Storage Temperature 85 °C

102

103
Infrared Sensor
1-999,990 RPM. Both the IRS-P and IRS-W Infrared Sensors are proven to be reliable
high speed sensors. With a working range of 12 to 25 mm from very high speed
equipment or an application providing contrasting light and dark surfaces.
TACHOMETERS
Rechargers/Power
Supplies
SENSORS W=Tinned Wires; P =
1/8" Phone Plug
R-5 (115
Vac)
R-6 (230
Vac) IRS-W IRS-P
PT99 N/A N/A
PLT-200 N/A N/A X
Pocket-Tach 100 N/A N/A
Pocket-Tach Plus
Kit N/A N/A X
Phasar-LCD X X
Phasar-LCD-R X X
Phasar-Laser X X
Phasar-Laser-R X X
Tach-4A X X
Tach-4AR X X X
ACT-1B
12 Vdc or
AC Powered
X
ACT-2A X
ACT-3 X
ACT-3A X
STROBOSCOPES
Sensors - P = 1/8" Phone Plug all
SPS products work with Nova-
Strobe Series
Lamps
IRS 5P L1902 L1903 L1904
Nova-Strobe AA * X
Nova-Strobe AB * X
Nova-Strobe BA X
Nova-Strobe BB X
Nova-Strobe DB * X
Nova-Strobe DB Plus X X
Nova-Strobe DA Plus X X
Palm Strobe X X
Phaser-Strobe PB X X
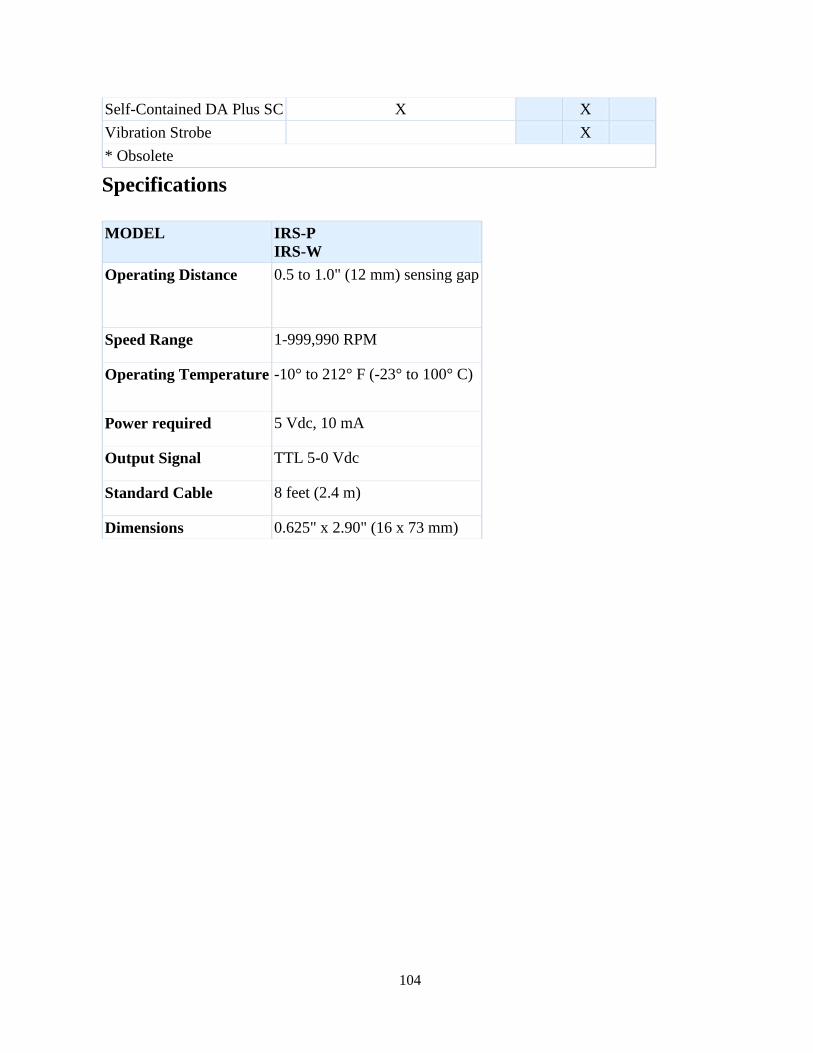
104
Self-Contained DA Plus SC X X
Vibration Strobe X
* Obsolete
Specifications
MODEL IRS-P
IRS-W
Operating Distance 0.5 to 1.0" (12 mm) sensing gap
Speed Range 1-999,990 RPM
Operating Temperature -10° to 212° F (-23° to 100° C)
Power required 5 Vdc, 10 mA
Output Signal TTL 5-0 Vdc
Standard Cable 8 feet (2.4 m)
Dimensions 0.625" x 2.90" (16 x 73 mm)
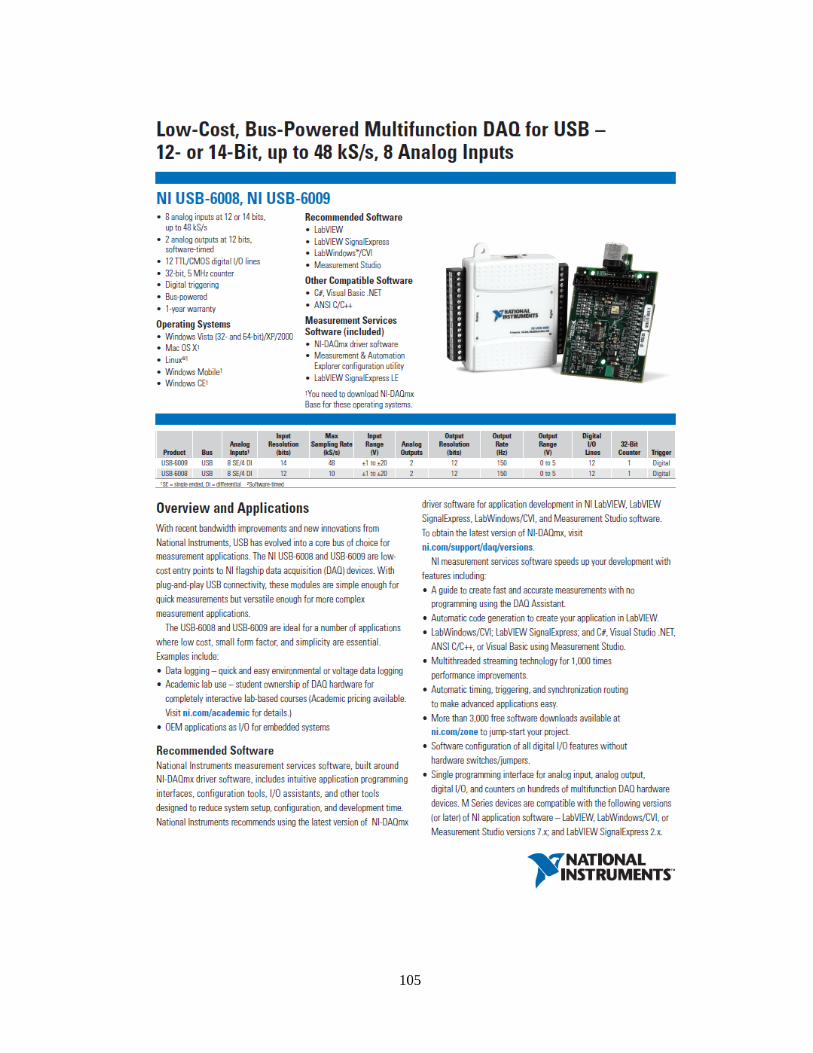
105

106

107
ABB ACS150 - 0.75kW & 0.55kW 230V 1ph to 3ph - AC Inverter Drive Speed Controller
Range: ACS150
Part No: ACS150-01E-04A7-2
Description:
ABB Drives ACS 150 AC Inverter for 0.75kW (1.0HP) 230V 3 Ph
motor in VxF control to 4.7A and 0.55kW (0.75HP). Simple to set-up
and converts single phase 230V input to three phase 230V for a
standard AC Induction motor.
R1 Size - 70mm Wide x 144mm Deep x 201mm high (plus cable
clamp plate at 38mm) IP20 case.
Overload - 150% x 60seconds.
Speed Control Range - 0/500Hz.
Braking - To 56 Ohm minimum external resistor (not supplied) - use the 'Which Resistor' button on this
page.
Features - Front Mounted Potentiometer, 1 x Analogue Input, 5 Digital Inputs, 1 Relay Contact set.
Programmable from a pc via 'Flashdrop'.
EMC Filters to EN61800-3 to the 2nd Environment C3 (Industrial). See linked products below for
external 1st Environment (Domestic) EMC Filter.
Can be used with supplies protected by RCD Type A.
Input Current - 11.4A.
Input Voltage - 200/240V single phase +-10% at 50/60Hz.
Wall mount in clean environment or cubicle mount.
Rated at 40C Ambient.
Ventilation space above and below - 75mm.
Ventilation space at sides - 0mm.
Heat Loss at max output - 62W.
Mounting onto symmetrical DIN rail or use the screw fixings for side or rear mounting.
Full part number is - ACS150-01E-04A7-2
View alternatives - search for 0.75kW.

108
NI 9201 8-Ch, ±10 V, 500 kS/s, 12-Bit Analog Input Module,
C Series 8 analog inputs, ±10 V input range
500 kS/s aggregate sampling rate
12-bit resolution, single-ended inputs, screw terminal or D-Sub connectors
Hot-swappable operation; overvoltage protection; isolation
NIST-traceable calibration
-40 to 70 °C operating range
Overview
The NI 9201 is a C Series module for 8-channel analog input at a maximum aggregate rate of 500 kS/s. The NI 9201 represents
a good combination of channel count and speed at a low price for an economical multifunction system.
As with the majority of C Series modules, the NI 9201 is protected from harmful voltage spikes of up to 2,300 Vrms. This
means that no harmful voltage within the isolation rating can harm other modules in the system, the chassis, or any connected
computer equipment. In addition to the absolute protection from the isolation, there is up to 100 V of overvoltage protection for
errant signal connection or unexpected outputs to the individual channels.
There are two connector options for the NI 9201 – a 10-position screw terminal connector for direct connectivity and a 25-
position D-Sub connector. The industry-standard 25-position D-Sub connector provides low-cost cabling to a wide variety of
accessories available from NI or other vendors. A number of vendors also provide custom D-Sub cable fabrication services, and
can provide cables with a pin-out that matches your exact application needs.
NI recommends the NI 9932 strain-relief connector accessory for the NI 9201. The NI 9934 (or other 25-pin D-Sub connector)
is required for use with the NI 9201 with D-Sub module. The NI 9934 includes a screw-terminal connector with strain relief as well as a D-Sub solder cup backshell for creating custom cable assemblies.
Specifications General
Product Name NI 9201
Product Family Industrial I/O
Form Factor CompactDAQ , CompactRIO
Operating System/Target Windows , Real-Time
Measurement Type Voltage
Isolation Type Ch-Earth Ground Isolation
RoHS Compliant Yes
Product Name NI 9201 D-Sub
Product Family Industrial I/O
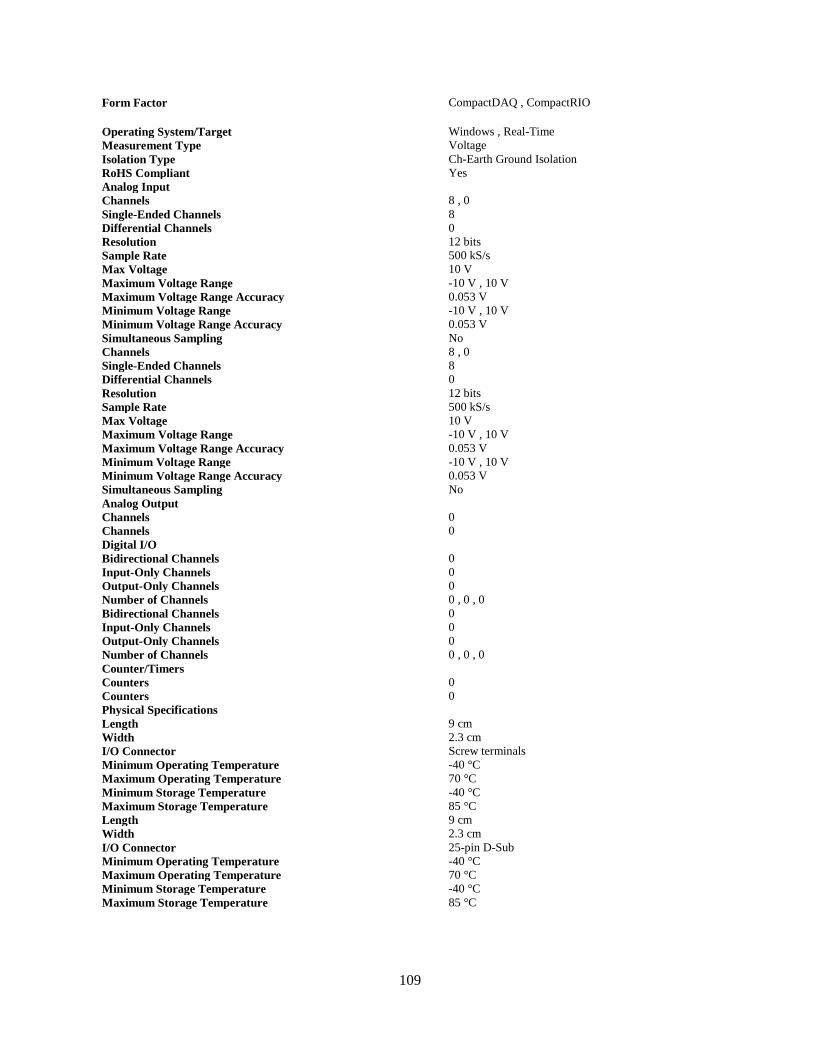
109
Form Factor CompactDAQ , CompactRIO
Operating System/Target Windows , Real-Time
Measurement Type Voltage
Isolation Type Ch-Earth Ground Isolation
RoHS Compliant Yes
Analog Input
Channels 8 , 0
Single-Ended Channels 8
Differential Channels 0
Resolution 12 bits
Sample Rate 500 kS/s
Max Voltage 10 V
Maximum Voltage Range -10 V , 10 V
Maximum Voltage Range Accuracy 0.053 V
Minimum Voltage Range -10 V , 10 V
Minimum Voltage Range Accuracy 0.053 V
Simultaneous Sampling No
Channels 8 , 0
Single-Ended Channels 8
Differential Channels 0
Resolution 12 bits
Sample Rate 500 kS/s
Max Voltage 10 V
Maximum Voltage Range -10 V , 10 V
Maximum Voltage Range Accuracy 0.053 V
Minimum Voltage Range -10 V , 10 V
Minimum Voltage Range Accuracy 0.053 V
Simultaneous Sampling No
Analog Output
Channels 0
Channels 0
Digital I/O
Bidirectional Channels 0
Input-Only Channels 0
Output-Only Channels 0
Number of Channels 0 , 0 , 0
Bidirectional Channels 0
Input-Only Channels 0
Output-Only Channels 0
Number of Channels 0 , 0 , 0
Counter/Timers
Counters 0
Counters 0
Physical Specifications
Length 9 cm
Width 2.3 cm
I/O Connector Screw terminals
Minimum Operating Temperature -40 °C
Maximum Operating Temperature 70 °C
Minimum Storage Temperature -40 °C
Maximum Storage Temperature 85 °C
Length 9 cm
Width 2.3 cm
I/O Connector 25-pin D-Sub
Minimum Operating Temperature -40 °C
Maximum Operating Temperature 70 °C
Minimum Storage Temperature -40 °C
Maximum Storage Temperature 85 °C

110

111
APPENDIX F: Additional Engineering Drawings and Basic Manufacturing Plans
1. Shaft Support Sheet – Top
Task # Purpose Machine Tool Spindle Speed (rpm)
1 Cut to Size Band
Saw
Fast
2 Drill 2 in. hole Drill
Press
2” Drill Fast
3 Drill ¾ in. hole Drill
Press
¾” Drill Bit Fast
The primary dimensions are those between the two through holes, after the distance from the datum edge
to the center of the 2 in. hole. Additional drilling will be done to account for the mounting of the
bearings. This sheet will be ½ in. thick Low-Carbon Steel

112
2. Shaft Support Sheet – Lower
Task # Purpose Machine Tool Spindle Speed (rpm)
1 Cut to Size Band
Saw
Fast
2 Drill 2 in. hole Drill
Press
2” Drill Fast
3 Drill Counterbore
(possibly)
Drill
Press
Fast
4 Drill ¾ in. hole Drill
Press
¾” Drill Bit Fast
The primary dimensions are those between the two through holes. The counterbore might not exist, that
will depend on how the Thrust Bearing needs to be mounted. This sheet will be ½ in. thick Low-Carbon
Steel

113
3. Shaft Support Sheet – Rear
Task # Purpose Machine Tool Spindle Speed (rpm)
1 Cut to Size Band
Saw
Fast
2 Drill Brackets for Top
Sheet
Drill
Press
½” Drill Fast
3 Drill Brackets for Lower
Sheet
Drill
Press
½” Drill Fast
Once the Top and Lower sheets are in place, measurements for bracket placement will be finalized. This
sheet will be ½ in. thick Low-Carbon Steel

114
4. Gear Enclosure
This enclosure is constructed from multiple sheets of ¼ in. material. Once the final shaft lengths are
established and the Top Shaft Support sheet is in place, then one inch will be afforded outside of the
largest gear dimensions and on top of the shafts.

115
5. Environment Enclosure
This box is constructed of multiple sheets of ¼ in. material that are fitted to where the final Shaft
Support Sheets fall. The sides will be secured to the outer edges of the shop press, and the front will
eventually be able to be opened.
116
APPENDIX G: Supplementary Safety Report for Fabrication and Assembly
ME 450 Safety Reporting: Winter 2010
Project #: ____6_____ Date: _____3/10/10______________
Report Version #: ____1.0_____
Project Title: _Twist Compression and Four Ball Test Device Redesign__
Team Member Names:_Justin Hopkins, Rachel Gunderson, Rich Main, Scott Malinowski__
Team Member Uniquenames:_jghop, rachelrg, richacha, scomal__
Attach your Safety Report to this cover page and instructions found on Pages 2 and 3.
The Safety Report is to be completed by your team and must be approved by your section instructor
(or approved substitute) prior to any hands-on experimentation, manufacturing or testing of your
prototype.
The safety hazards inherent in your experimental plans, component selection, manufacturing
methods, assembly techniques, and testing must be expressed and evaluated before any hands-on
work with safety consequences will be allowed to proceed.
The purpose of this safety report is to assure that you have thought through your hands-on work
before it begins, and that you have shared your plans with your Section Instructor. You may submit
more than one version. This will likely be necessary as your project evolves.
APPROVAL:
Name: __________________________
Signature: __________________________
Date: __________________________

117
1. Executive Summary
To implement our redesign concepts for securing the specimen, securing the specimen fixture, and
applying and measuring the lateral forces from the specimen fixture, we need to manufacture new
components. This report will present the materials needed to produce our new components. It will also
include manufacturing and assembly plans for our redesign concepts, as well as precautions that we will
take in the shop to ensure safe and successful machining.
Because the maximum proposed loads for our prototype are very high, the engineering analyses done on
our redesigned components studied how each component would respond under maximum stress. Specific
areas that were considered included the shear stress on the bottom teeth of the specimen fixture, the
compressive stress on the bottom of the specimen fixture, the bending stress on the lateral force beams,
and the bending stress on brackets holding the lateral force beams. Using the torques from the maximum
proposed loads and the distances from our redesign concepts, we calculated that the yield stresses of our
components had a safety factor of at least 2 over the maximum stresses that they could be subject too.
This led us to conclude that our redesign concepts were low-risk and ready for manufacture. All
calculations are shown in Appendix B. We also conducted a Designsafe risk assessment on our redesign
concepts to ensure that we did not miss any design alterations that would make the concepts safer.
To ensure that we do safe and efficient work in the shop, we have developed thorough manufacturing
and assembly plans. These include an inventory of purchased material, detailed engineering drawings,
cutting speeds and feed rates for each component and material, a machining procedure list, and an
assembly procedure list. We have purchased one block and two rounds of aluminum to produce our
components. Our machining will be done using a mill, a lathe, and a band saw.
As we will be using large and powerful machinery in the shop, safety precautions will need to be
implemented and followed closely to ensure that there are no injuries. We have identified several
hazards involved when using this machinery, and even when simply being present in the shop using
DesignSafe. These include, but are not limited to, human contact with running machines, tool failure and
fracture leading to flying debris, and machine instability or faulty functionality. Several of our proposed
safety precautions are rules of the shop, including wearing safety glasses and appropriate clothing. Other
precautions that we will follow include double-checking that machines are set to their proper cutting
speeds and feed rates for given materials, that the tools are in good condition and fixed securely in the
machines, and that the pieces of stock that we are machining are tightly secured in vices. Finally, we will
consult with Bob or Marv to ensure that the machines are set up correctly before we begin any
manufacturing.

118
3. Material Inventory
Since we designed entirely new components for securing the specimen, securing the specimen fixture,
and applying and measuring the lateral forces from the specimen fixture, we purchased the raw material
necessary for fabricating them. The raw material we purchased was 6061 aluminum alloy. Three pieces
of various sizes and prices of the alloy were purchased:
1. 4” x 4” x 6” block $56.90
2. 4” diameter x 6” long round $46.52
3. 6” diameter x 6” long round $93.23
From the 4” square block, the lateral force deflecting block and lateral force beam brackets will be
fabricated.
From the 4” diameter round, the two rings, one for the Four-ball test and one for the Twist Compression
Test (TCT) will be fabricated. The two rings are used to secure either the four balls or flat plate.
From the 6” diameter round, the specimen cup and the outer collar of the cup will be fabricated. The cup
houses the lubrication and specimen, while the outer collar secures the ring within the cup.
All components can be seen interacting with one another on page 7.
4. CAD Drawings and DesignSafe Summary for Design Parts
For the components that we will be manufacturing, detailed engineering drawings are provided in this
section. In addition to the drawings (beginning on page 7), a safety evaluation has been performed not
only on the parts themselves but the manufacturing processes that will be used to fabricate them using
the DesignSafe software package. Complete tables summarizing the hazards, risks associated and ways
to reduce these risks can be found in Appendix A.
Using the software, it was determined that there were very few hazards involved with the actual parts.
None of the components we are producing involve the use of any chemicals or high internal pressures.
They are simply external housings and support structures. The three main hazards we recognize as
pertinent to the components are cutting/severing, fatigue, and lifting/bending/twisting. The parts could
have been designed with many sharp points or edges which could potentially hurt the user or anyone
handling them. In order to avoid injury, we have designed the parts with mainly blunt ends and only 90°
edges when possible. Unless the user is careless, it should be very low risk that they get cut by any of the
components. More important to the design of the components is the risk of fatigue once they are
implemented onto the device and experience high loads. If the parts had been designed with insufficient
thicknesses in regions that experience the loading, they could yield or fracture resulting in a complete
failure of the test region which would be extremely risky and dangerous for anyone in the area. To avoid
fatigue, we had to make sure that the specimen cup, beams and brackets would be able to withstand
loading. Stress analysis was performed on all parts to ensure that they would not fail using a safety factor
of at least 2. See Appendix B for calculations. Finally, since several of the components that we are
fabricating will be removed from the device by hand on a regular basis to set up different tests, close
attention had to be paid to ergonomics. If too heavy, the parts could injure the user when being lifted out
of the device, so we made sure not to use too much metal in places where it was not necessary. Also, we
chose to use standard 6061 aluminum over steel due to its lightweight.

119
For the actual fabrication of the components, there are many more inherent dangers, simply due to the
hazards associated with many common machining processes that we will be using. The main hazards
associated with fabricating the parts are as follows:
Cutting/severing
Drawing-in/trapping/entanglement
Pinch point
Unexpected start
Fatigue
Break up during operation
Machine instability
Impact
Debris
Human errors/behaviors
Deviations from safe work practices
Interactions between persons
In general, if we have not set up work pieces properly or use incorrect tools/feeds/speeds, become
distracted, behave inappropriately or fail to follow safety precautions, serious injury could occur. Most
of the possible hazards have low to moderate levels of risk, but are nonetheless possible. Therefore, we
have developed a list of precautions that must be taken before any work within the ME 450 machine
shop can begin.
Remain focused on task at hand
Remove loose articles of clothing such as jewelry, tuck in shirts, put up hair
Be aware of surroundings including other people and machines, as the shop can become
crowded
Know the expected tool life to avoid tool breakage
Understand federates and use emergency stop if machine instability occurs
Ask for help from machine shop supervisors if ever hesitant or unsure about a correct work piece
setup or machine operation
Wear safety glasses at all times and gloves if necessary
Use brushes to remove shavings from work surface and wood block to remove material from
band saw
Double check setup and machine speeds/feeds before beginning to cut any material
If all of the above procedures and precautions are used at all times throughout the machining process, we
should have no issues of safety and the risk level for any hazards will be very low. Once again, for a
complete listing and table of all hazards and ways to reduce their risks, refer to Appendix B.a.

120
All engineering CAD drawings of components to be manufactured are shown below and on the next
several pages.
Complete Specimen Cup Assembly
Manufacturing Order:
1. Outer Collar
2. Specimen Fixture Cup
3. TCT Ring
4. Four-ball Ring
5. Securing Block Modification
6. Bracket Mounts
7. Lateral Force Beam
8. Deflecting Block
1
2
3
4
5
6
7
8

121
1. Outer Collar
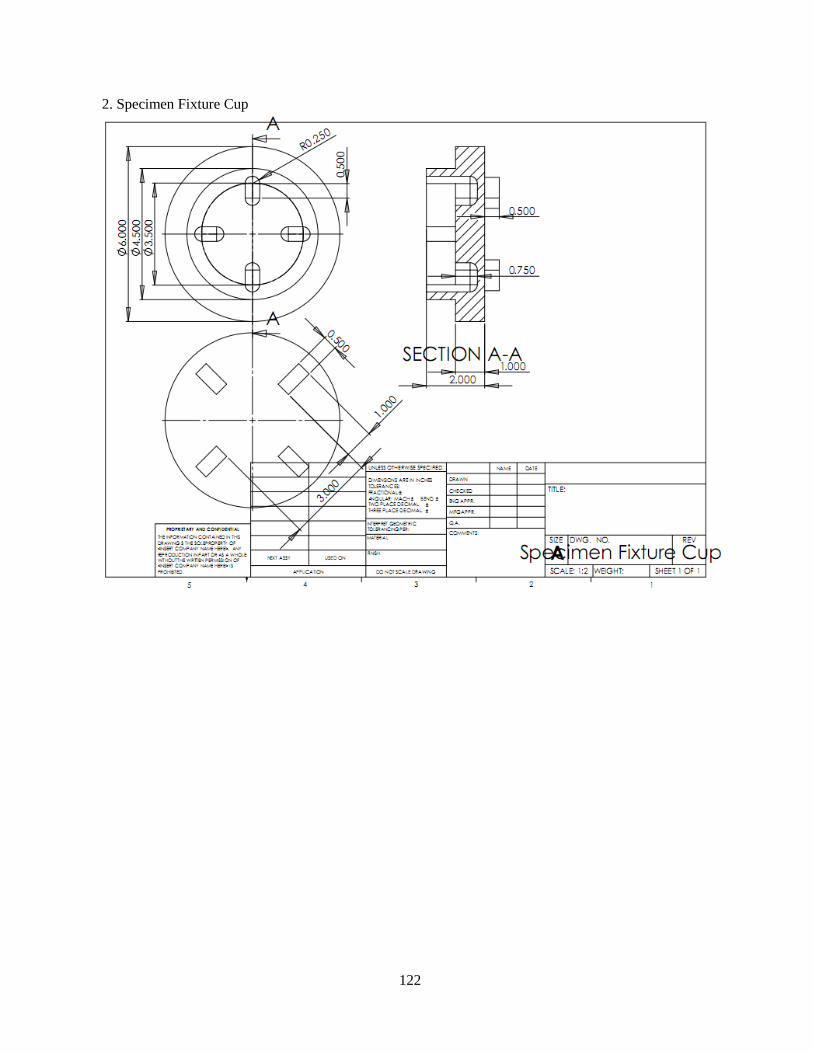
122
2. Specimen Fixture Cup

123
3. TCT Ring
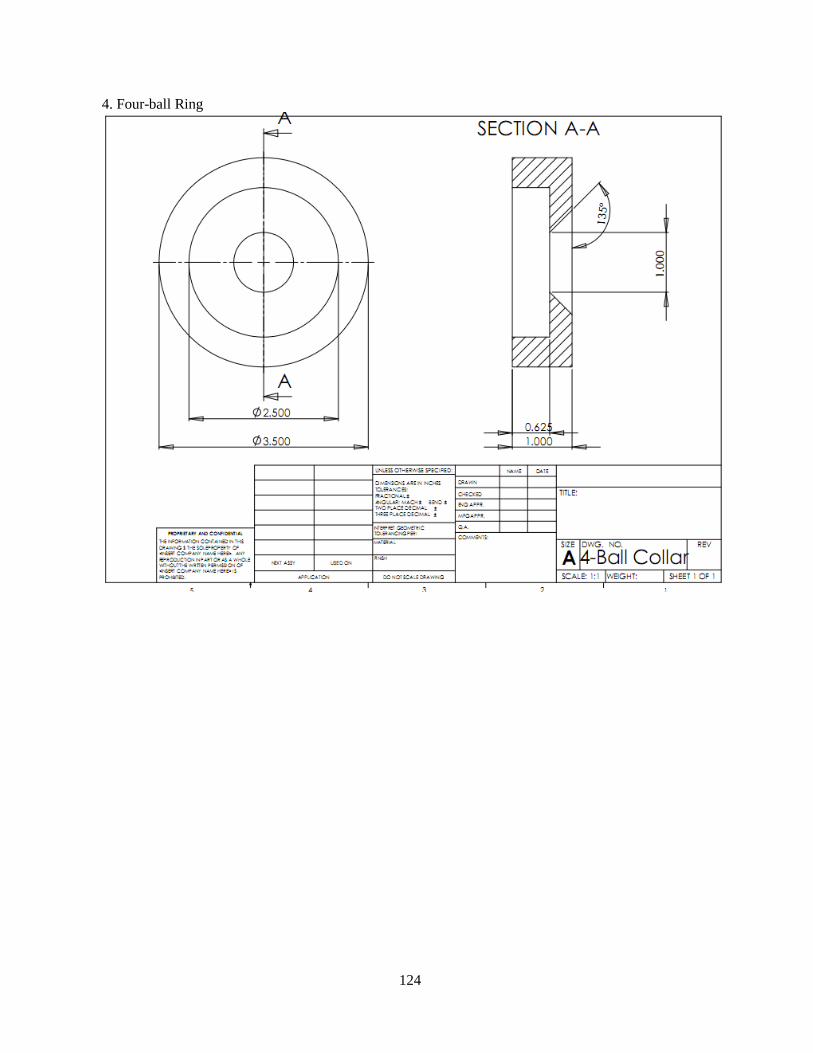
124
4. Four-ball Ring
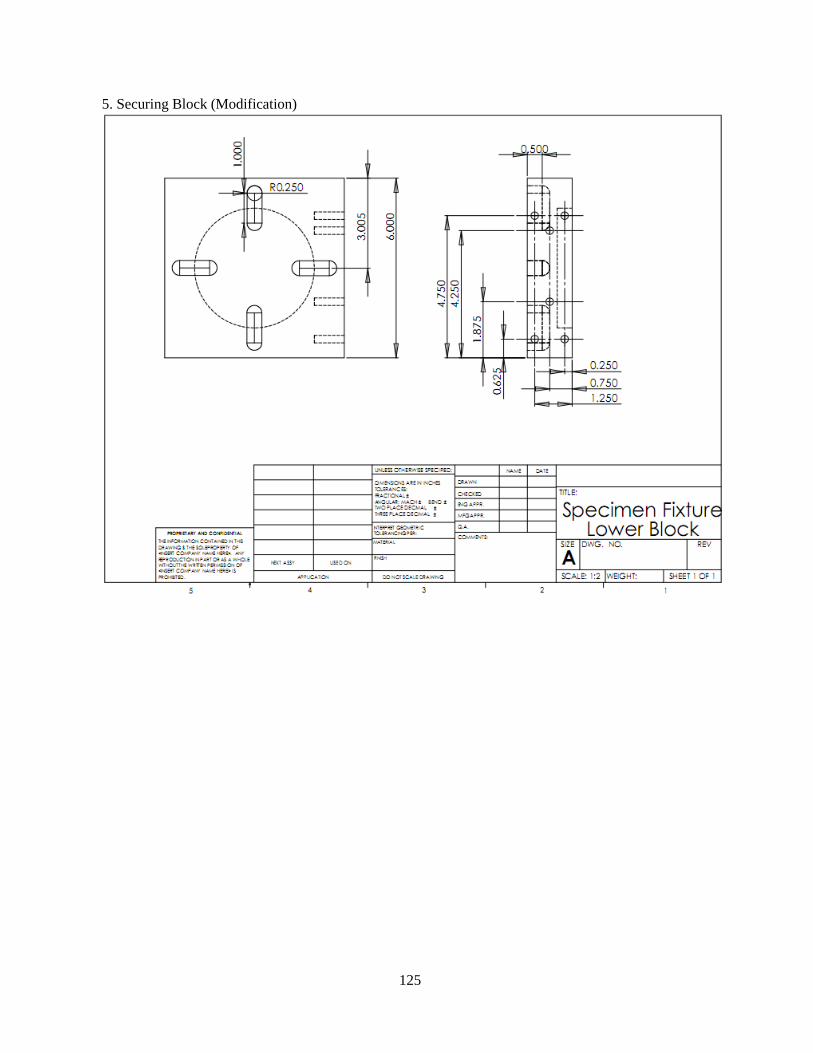
125
5. Securing Block (Modification)

126
6. Lateral Force Beam Mounting Brackets

127
7. Lateral Force Beam

128
8. Deflecting Block

129
5. Manufacturing
This section will describe in detail the manufacturing process for each component. All fabrication will
take place in the ME 450 machine shop in the G.G. Brown building. Every task listed below each
drawing is necessary to achieve the desired shapes and contours of our components.
1. Outer Collar
Task # Purpose Machine Tool Spindle Speed (rpm)
1 Face out inner recession Lathe Bore Bar 650
2 Thread inner face Lathe Threading tool 15
3 Drill center circle Mill Drill Bit 2520
4 Facing of thinner wall Mill ½” End Mill 1260
Notes: Threading will be approximately 8 threads per inch. This part is manufactured first and the
Specimen Fixture Cup is fit to this part. The thin wall facing will be later to ensure adequate travel for
securing the inner rings.

130
2. Specimen Fixture Cup
Task # Purpose Machine Tool Spindle Speed (rpm)
1 Face outside of cup Lathe Facing tool 380
2 Thread outside of cup Lathe Threading Tool 15
3 Face inside of cup Lathe Bore Bar 600
4 Mill out grooves inside of cup Mill 3/8” Ball Mill 1680
5 Mill out teeth Mill ½” End Mill 1260
6 Face down teeth Mill ½” End Mill 1260
Notes: The facing and threading of the cup will be done to fit inside of the Outer Collar. Using the 3/8”
ball mill to do the interior grooves is an adaptation from using a ½” ball mill due to the limited cutting
depth possible. It is to be determined into the process whether step 3 will be covered by facing the
Specimen Fixture Cup or the Outer Collar.

131
3. TCT Ring
Task # Purpose Machine Tool Spindle Speed (rpm)
1 Face outer diameter Lathe Facing tool 650
2 Mill out teeth Mill ½” End Mill 1260
3 Face down teeth Mill ½” End Mill 1260
4 Face down top surface Mill ½” End Mill 1260
5 Drill out center hole Mill 2” Drill 415

132
4. Four-ball Ring
Task # Purpose Machine Tool Spindle Speed (rpm)
1 Face outer diameter Lathe Facing tool 650
2 Angular face Lathe Angled facing tool 650
3 Face out inner recession Lathe Bore Bar 650
4 Face bottom of ring Mill ½” End Mill 1260
5 Face top of ring Mill ½” End Mill 1260
Notes: Facing out the inner recession will occur to allow for easier manufacturing of the part, machining
to tolerance, rather than designing to it.

133
5. Securing Block (Modification)
Task # Purpose Machine Tool (HSS) Spindle Speed (rpm)
1 Cut top grooves Mill ½” Ball Mill 1528
2 Drill bracket mounting holes Mill ¼” Drill 3060
3 Thread ¼”-20 Hand ¼”-20 thread tool By Hand

134
6. Lateral Force Beam Mounting Brackets
Task # Purpose Machine Tool (HSS) Spindle Speed (rpm)
1 Face width Mill ½” End Mill 1260
2 Face depths Mill ½” End Mill 1260
3 Drill holes / slots Mill ¼” Ball Mill 2520
4 Drill big hole Mill ½” End Mill 1260
5 Face height Mill ½” End Mill 1260
Notes: Measurements will be taken from the bottom face in terms of how they‟re oriented, in order to
ensure proper alignment once in place on the block.

135
7. Lateral Force Beam
Task # Purpose Machine Tool Spindle Speed (rpm)
1 Cut down beam to size Band
Saw
1260
2 Drill bracket mounting holes Mill ½” 2520
3 Thread ¼”-20 Hand ¼”-20 thread tool By Hand
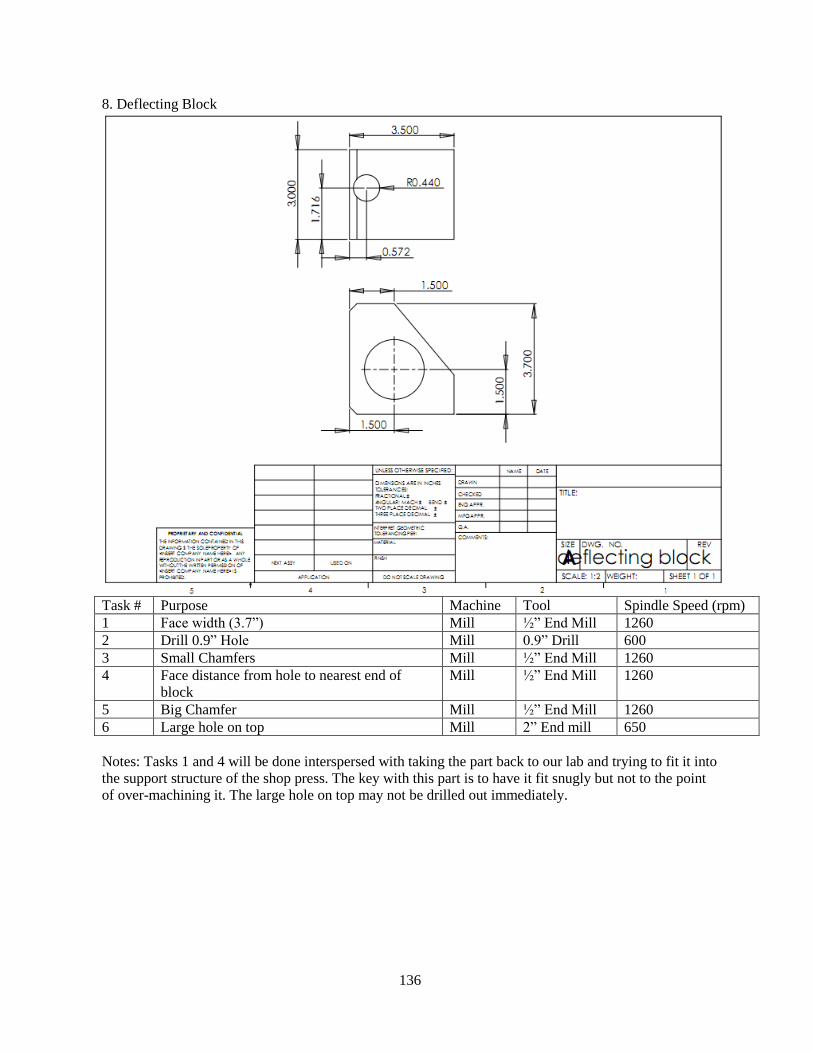
136
8. Deflecting Block
Task # Purpose Machine Tool Spindle Speed (rpm)
1 Face width (3.7”) Mill ½” End Mill 1260
2 Drill 0.9” Hole Mill 0.9” Drill 600
3 Small Chamfers Mill ½” End Mill 1260
4 Face distance from hole to nearest end of
block
Mill ½” End Mill 1260
5 Big Chamfer Mill ½” End Mill 1260
6 Large hole on top Mill 2” End mill 650
Notes: Tasks 1 and 4 will be done interspersed with taking the part back to our lab and trying to fit it into
the support structure of the shop press. The key with this part is to have it fit snugly but not to the point
of over-machining it. The large hole on top may not be drilled out immediately.

137
6. Assembly
Once the individual components have all been fabricated, they will need to be assembled either to each
other or to the shop press in the case of the lateral force deflecting block. Components that will be
assembled after fabrication are the specimen cup, ring(s), specimen cup collar, and steel securing plate.
The specimen cup will be inserted into the steel securing plate via teeth and grooves, the ring(s) will be
placed inside the cup, and the collar will be screwed onto the top of the cup via threads which will safely
secure the ring within the cup. This assembly process will not require the use of any tools, powered or
otherwise, simply the use of our hands.
Furthermore the lateral force beam brackets will be attached to the steel securing plate and the lateral
force deflecting beam will be attached to the shop press. In order to fasten the brackets to the steel
securing plate, we will be using 1/4" – 20 thread screws, and a screwdriver to tighten them. In order to
fasten the lateral force deflecting block to the shop press, we will be using a 7/8” bolt and a nut that will
go through the block and press structure. The bolt and nut will be tightened using a wrench.
These assembly processes will take place within our designated workstation in lab 2190A within the
G.G. Brown building. Based on analysis of the individual components and the maximum expected
stresses exerted on them, we have designed all components to withstand all forces with a safety factor of
at least 2, and are therefore certain that they will not fail under any circumstances, even after testing has
begun. However, for the time being we do not plan to test the new components, just fabricate and
assemble them.

138
8. Additional Appendices
APPENDIX B.a: DesignSafe
DesignSafe for Components

DesignSafe for Fabrication Processes

140

141
APPENDIX H: LabVIEW Encompassing Program (Block Diagram)
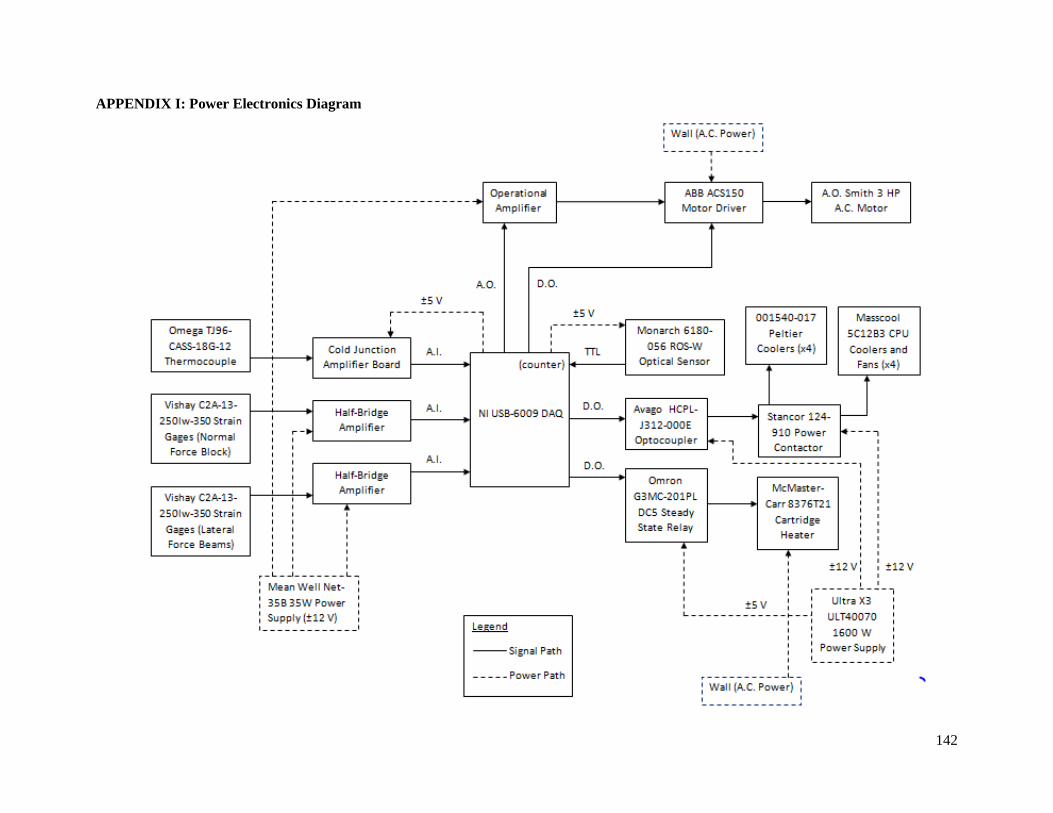
142
APPENDIX I: Power Electronics Diagram