tus and Management of - a1 Coastal Fisheries in Asia
218
Sih ~
-
Upload
khangminh22 -
Category
Documents
-
view
3 -
download
0
Transcript of tus and Management of - a1 Coastal Fisheries in Asia

Sih ~

tus and Management of a1 Coastal Fisheries in Asia
Edited by
Geroni re
Daniel Pauly
ASIAN DEVELOPMENT BANK 6 ADB Avenue, Mandaluyong City, Philippines
INTERNATIONAL CENTER FOR LIVING AQUATIC RESOURCES MANAGEMENT MCPO Box 2631, 0718 Makati City, Philippines

Status and Management of Tropical Coastal Fisheries in Asia NOV 2 4 1997
Edited by
GERONIMO SILVESTRE and DANIEL PAULY
Printed in Manila, Philippines.
Published by the Asian Development Bank (ADB), 6 ADB Avenue, Mandaluyong City, and the International Center for Living Aquatic Resources Management, MCPO Box 2631, 0718 Makati City, Philippines.
Silvestre, G.T. and D. Pauly, Editors. 1997. Status and management of tropical coastal fisheries in RM Conf. Proc. 53,208 p.
Technical editorial support: Len R. Garces and Rowena Andrea V. Santos Copyediting: Danny B. Abacahin, Rita Kapadia and Marie Sol M. Sadorra Proofreading: Kristine F. Santos, Rita Kapadia and Len R. Garces Layout: Albert B. Contemprate Cover concept: Geronimo Silvestre, Len R. Garces and Daniel Pauly Cover design: Alan Siegfrid C. Esquillon Artwork: Roberto N. Cada, Albert B. Contemprate and Alan Siegfrid C. Esquillon Indexing: Kristine F. Santos, Francisco Torres, J r . and Ma. Graciela R. Balleras
Cover: Design emphasizes the duality of coastal fisheries in South and Southeast Asia. The need for management planning through participatory consultation among stakeholders is also emphasized in resolving the conflict between small- and large-scale fisheries and attaining sustainable exploitation of fisheries resources.
ISSN 0115-4435 ISBN 971-8709-02-9
ICLARM Contribution No. 1398

Contents
................................................................................. Foreword Muhammad A. Mannan v Foreword Meryl J. Williams .......................................................................................... vi
............................................................................................................................ Preface vii
Synopsis and Recommendations of the ADBIICLARM Workshop on Tropical Coastal Fish Stocks in Asia
....................................................................................... G. Silvestre and D. Pauly 1
Management of Tropical Coastal Fisheries in Asia: An Overview of Key Challenges and Opportunities
G. Silvestre and D. Pauly ...................................................................................... 8
The Coastal Fisheries of Bangladesh 0 M.G. Khan, M. Alamgir and M.N. Sada ................................................................ 26
The Marine Fisheries of Indonesia, with Emphasis on the Coastal Demersal Stocks of the Sunda Shelf
............................................................................... B.E. Priyono and B. Sumiono 38
Status of Fisheries in Malaysia - An Overview A. Abu Talib and M. Alias ..................................................................................... 47
Overview of Philippine Marine Fisheries 0 N.C. Barut, M.D. Santos and- L.R. Garces ............................................................ 62
The Coastal Fisheries of Sri Lanka: Resources, Exploitation and Management
................................................................................................... R. Maldeni~a 72
The Marine Fisheries of Thailand, with Emphasis on the Gulf of Thailand Trawl Fishery
M. Eiamsa-ard and S. Amornchairojkul ................................................................ 85
Overview of the Coastal Fisheries of Vietnam Pham Thuoc and Nguyen Long ............................................................................ 96
FA0 Program Perspectives in the Fisheries Sector, with Emphasis on South and Southeast Asia
P. Martosubroto ................................................................................................. 197
Program Perspective: SEAFDEC-MFRDMD in Fisheries Resources Development and Management
Mansor bin Mat Isa and M.N. Mohd-Taupek ....................................................... 112
Toward a Generic Trawl Survey Database Management System
F.C. Gayanilo, Jr., T. Str0mrne and D. Pauly ....................................................... 116
Ecological Community Structure Analysis: Applications in Fisheries Management
J. W . McManus ................................................................................................... 133
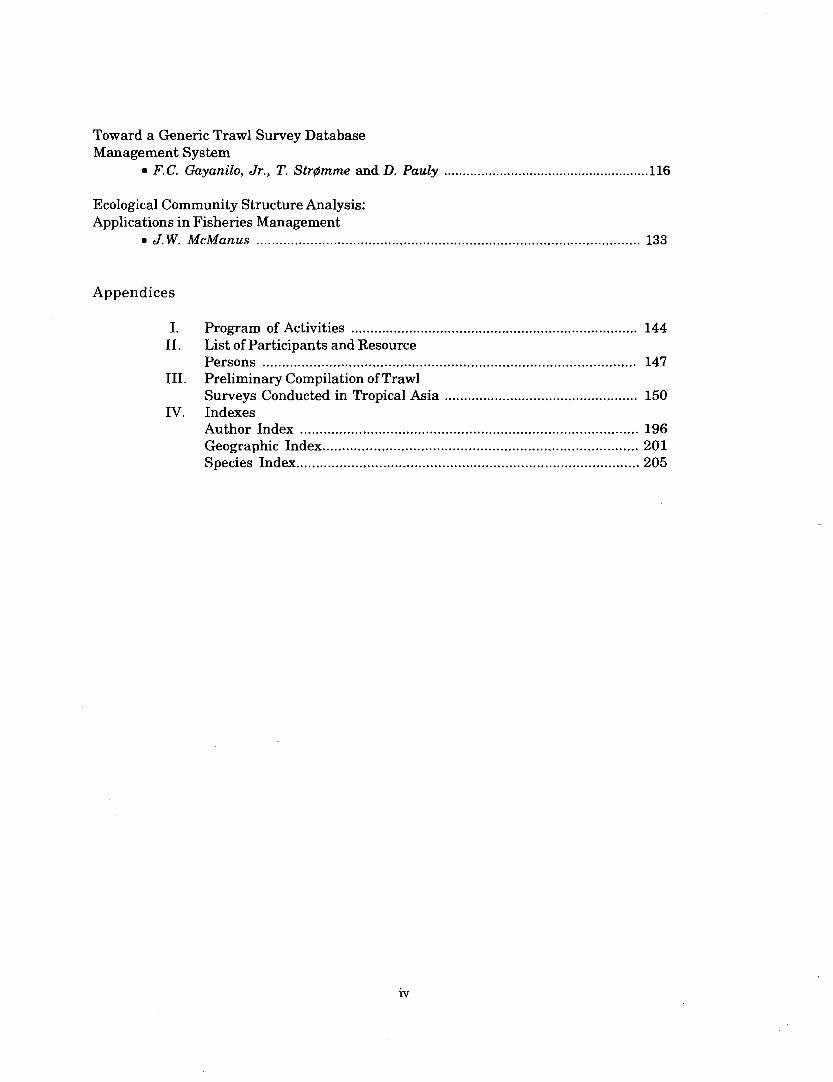
Appendices
IV.
Program of Activities .......................................................................... 144 List of Participants and Resource Persons ............................................................................................... 147 Preliminary Compilation of Trawl
.................................................. Surveys Conducted in Tropical Asia 150 Indexes
...................................................................................... Author Index 196 ............................................................................... Geographic Index. 201
....................................................................................... Species Index 205

Foreword
The fisheries sector employs more than 10 million families in the Asia Pacific region, and earns about $8 billion in foreign exchange for the Bank's developing member countries (DMCs) each year. At a per capita consumption of about 12 kg per annum, fish supplies 30 percent of the total animal protein consumption in the region. The region's fisheries contributed 38 million t or 45 percent of the world catch in 1993. Keeping in view the contribution of the fisheries sector to the economy and the well-being of the people of the region, the Bank has always attached a high priority to the fisheries sector. Commencing with its first fisheries loan in 1969, the Bank has made loans of over US$1055 milion to a total of 51 fisheries projects in 17 DMCs. The Bank has also provided technical assistance grants amounting to about US$28 million for 82 country-specific project preparation and advisory services and 15 regional programs.
The fisheries sector has undergone many changes in emphasis and direction over time. The Bank has attempted to respond to these changes by reorienting its own policies. One of the fundamental developments in the sector during the last few decades was that marine capture fisheries came under heavy pressure, with marine fisheries resources, particularly in the coastal areas, being excessively exploited in many coastal nations in Asia. There is an urgent need for sound fisheries resources management measures to arrest the continued deterioration of coastal fisheries resources. To adapt its operations to these changes, the Bank has redirected its lending focus from marine capture fisheries development in 1970s to aquaculture development and coastal fisheries resources management and related environment conservation in the 1980s and 1990s.
Recognizing the problems of degradation of coastal fisheries resources and the resultant adverse impact on fishing communities in the coastal areas, most DMC governments have made efforts to improve coastal fisheries resources management and initiated various programs to improve the social and economic condi- tions of coastal communities. However, effective fisheries resources management strategies have not been put into place in many countries partly due to a lack of reliable fisheries resource information and databases essential for this exercise.
In support of national government initiatives in improving the management of coastal fish stocks, the Bank approved a technical assistance (TA) for the Regional Study and Workshop on Sustainable Exploitation of Coastal Fish Stocks in Asia. As part of the TA, a Workshop was organized which brought together re- searchers and resource managers to review the status of coastal fish stocks and existing resource databases, and propose appropriate follow-up actions and activities. The Workshop also provided an opportunity for participants to share and exchange experiences in fisheries resource assessment and management relevant to the development of appropriate strategies for coastal fisheries management.
The Workshop has identified constraints and issues related to this sector and recommended appropriate management directions and follow-up actions. The prototype database presented in the Workshop has been well received by the participants and should be further modified, improved and adapted by the participating countries for their coastal fisheries management programs. The Workshop is the first step towards assessing the prevailing situation and elaborating directions for the rehabilitation and improved management of coastal fisheries in the reson.
The Workshop participants also reached a consensus on the need for regional efforts in addressing the problems at hand. ICLARM should play a lead role in coordinating the regional efforts and assisting the participating governments.
The success of the Workshop should ultimately be measured by the implementation of its recommenda- tions. Therefore, we must find the means to realize the follow-up activities. The Bank will continue its support to regional efforts for coastal fisheries management and sustainable utilization of coastal fish stocks in Asia. We hope that the country participants will convey the workshop recommendations to their Govern- ments to seek the necessary support for carrying out follow-up actions and activities.
Muhammad A. Mannan Manager
Forestry and Natural Resources Division
Asian Development Bank

Foreword
This Workshop, made possible by a grant from the Asian Development Bank (ADB) to the International Center for Living Aquatic Resources Management (ICLARM), brought together resource researchers and managers to examine the management of coastal fish stocks and existing resource databases in South and Southeast Asia.
The vision of ICLARM is to enhance the well-being of present and future generations of poor people in the developing world through improved production, management and conservation of living aquatic resources. The coastal fish stocks of Asia are among the most important in the world for the protein they provide, the livelihoods and communities they support and marine environments which sustain them.
This Workshop on 'Sustainable Exploitation of Tropical Coastal Fish Stocks in Asia' was one of the activi- ties undertaken by the Center and its partners in Asia.
The results of the Workshop, documented in this volume, highlight the severe problems related to the management of coastal fish stocks throughout the region. All countries recognize that it is time to remedy these problems and that solutions require multiple action. During the Workshop it became clear that effec- tive and broad-based action plans must be developed and adopted by the participating countries to deal with the problems identified. National capabilities in all aspects of coastal resources management should be strengthened to provide a base for formulating national policies, strategies and programs of action for the management and sustainable utilization of coastal fish stocks. Information on the state of the resources and the environment are at the core of management plannning
Following the Workshop, we anticipate the development of fish resource databases as a solid foundation for appropriate strategies and action plans at the regional and national levels. We will also look towards the strengthening of personnel and technical capabilities for coastal fisheries assessment and management in the region.
Meryl J. Williams Director General
ICLARM

Preface
Coastal fisheries are an important component of the agricultural sector and rural economy of developing countries of South and Southeast Asia. In 1994, coastal fisheries employed roughly 8 million fishers, and contributed the bulk of the 13.3 million t of marine landings and US$9 billion of fishery exports from these countries. Fish comprises an important part of the diet, contributing as much as 70% of the animal protein intake in many coastal areas. Many of the coastal fisheries, however, are impacted by a number of issues, such as overfishing and habitat degradation, with adverse consequences on fishing incomes, fish supply to consumers and living conditions in coastal communities. Moreover, competition among small and large-scale fishers in shallow fishing grounds has intensified resource depletion and increased social conflicts. Several major fishing grounds in the region, such as Manila Bay, Gulf of Thailand, Java Sea, are heavily fished, with the abundance of fish stocks as low as 10-15% of their unexploited levels.
In view of these problems and their impact on coastal communities, many developing countries in the region are placing a greater emphasis on improving the management of their coastal fisheries. A number of policies and action programs for dealing with these issues have been established. The question is whether their magnitude and comprehensiveness are sufficient to reverse the numerous interrelated problems, and whether they have considered the available resources and related information. Many surveys of coastal fishery resources were undertaken in these areas from the 1960s to the 1980s to help guide fisheries develop- ment and management efforts. Much of the information in these surveys remains underutilized, having been only superficially analyzed. No account was taken of the diversity of fish stocks and its effects on the yields which the resources can sustain. These surveys can potentially provide an independent statistical baseline of resource conditions, as well as directions and strategies for improved management.
The Workshop on 'Sustainable Exploitation of Tropical Coastal Fish Stocks in Asia' was organized by ICLARM, with funding from the Asian Development Bank (ADB) to help assess the prevailing situation and identify follow-up actions for improved management of coastal fisheries in South and Southeast Asia. The Workshop was conducted in Manila, Philippines, on 2-5 July 1996. It aimed to:
1. examine the status of coastal fish stocks and fisheries in developing South and Southeast Asian countries and directions for their improved management;
2. review previous fish stock surveys and their potential for retrospective analyses in support of manage- ment efforts;
3. elaborate relevant database guidelines in support of such retrospective analyses; and 4. explore follow-up action and support activities for regional collaboration in coastal fisheries manage-
ment.
These proceedings document the papers presented at the Workshop and include a synopsis of the Workshop's main results and recommendations.
The Workshop program (see Appendix I) was divided into (four) sessions designed to include inputs to five interrelated working group discussions: (1) Management Issues, (2) Management StrategiesIActions, (3) Scope for Regional Collaborative Efforts, (4) Trawl Database Guidelinesffrototype, and (5) Indicative Planning for Follow-up Regional Collaboration. A total of 27 resource persons (see Appendix 11) actively participated in the workshop sessions and working group discussions. The overview paper by the editors and the seven country papers (Khan et al. - Bangladesh; Priyono and Sumiono - Indonesia; Abu Talib and Alias - Malaysia; Barut et al. - Philippines; Maldeniya - Sri Lanka; Eiamsa-ard and Amornchairojkul - Thailand; and Thuoc and Long - Vietnam) give situational updates and provided key inputs for the first two working group discussions on management issues and strategieslactions. The contributions by Martosubroto and by Mansor and Mohd- Taupek provided important perspectives of issues and strategieslactions by outlining the activities of two important international fisheries organizations, FA0 and SEAFDEC, respectively, involved in this region. All the papers outlined ongoing efforts and activities and, hence, provided a basis for discussions on regional collaboration efforts in support of coastal fisheries management.
The paper by Gayanilo et al. outlines a trawl survey database prototype - a key element required to assemble, standardize and analyze the large number of extant but underutilized surveys. The contribution
vii

by McManus on community structure analyses illustrates how potential analyses can be conducted on exis- ting trawl surveys, once these are entered in a database, to provide insights and options for improved management. These two papers, together with the information on trawl surveys summarized in Appendix 111, were the main inputs for the working group discussion on trawl database guidelines/prototype. The paper by Gayanilo et al. incorporates the revisions and suggestions resulting from the deliberations of the working group. It also includes the insights gained by Mr. Tare Stramme, the leader of the Norwegian project whose vessel, the Dr. Fridtjoft Nansen, has surveyed the waters of the majority of countries included in this Workshop and many more in Africa and south and central America.
A synopsis of the main results and recommendations of the Workshop is given by Silvestre and Pauly. It includes the outcome of the working group discussion on indicative planning for follow-up regional collabora- tion. The Workshop points to the need for action on a broad range of issues at the local, national and international levels. Consensus was achieved on a number of interventions which can assist these countries in the management of coastal fisheries. Of these, catalytic elements (consisting of training, research and planning activities) have been packaged into a proposal for expanded regional technical assistance for possible funding by ADB.
The Workshop and the proceedings presented here would not have been possible without the assistance of various agencies and colleagues. We particularly wish to acknowledge the funding support provided by ADB. The assistance of BFAR and PCAMRD during the conduct of the Workshop is also gratefully acknowledged. Dr. M.J. Williams, Dr. M.V. Gupta, Dr. M. Mannan, Mr. W.D. Zhou and Dr. T. Gloerfelt-Tarp gave valuable advice and assistance during the preparation and conduct of the Workshop and the completion of the pro- ceedings. Mr. P.V. Manese, Ms. R. Funk and Ms. L. Arenas provided administrative support. Mr. L. Garces, Ms. R.A.V. Santos, Mr. R. Pabiling, Mr. D. Bonga and Ms. K.F. Santos provided technical support during the Workshop and the preparation of the proceedings. Thanks are also due, for editorial assistance, to Ms. M.S.M. Sadorra, Ms. R. Kapadia, Mr. D. Abacahin, Mr. D. Satumba, Mr. A.B. Contemprate, Mr. R.N. Cada and Mr. A.S. Esquillon.
The Editors
viii

Synopsis and Recommendations of the ADBIICLARM Workshop on Tropical Coastal Fish Stocks in Asia1
G. SILVESTRE International Center for Living Aquatic Resources Management
MCPO Box 2631, Makati City 0718, Philippines
D. PAULY International Center for Living Aquatic Resources Management
MCPO Box 2631, Makati City 0718, Philippines and
Fisheries Centre, University of British Columbia 2204 Main Mall, Vancouver, BC, Canada V6T 124
SILVESTRE, G. and D. PAULY. 1997. Synopsis and recommendations of the ADBACLARM Workshop on tropical coastal fish stocks in Asia, p. 1-7. In G. Silvestre and D. Pauly (eds.) Status and management of tropical coastal fisheries in Asia. ICLARM Conf. Proc. 53, 208 p.
Abstract
A summary is presented of the results of a Workshop held in Manila on 2-5 July 1996 devoted to the 'Sustainable Exploitation of Tropical Coastal Fish Stocks in Asia'. Participants came from Bangladesh, Indonesia, Malaysia, the Philippines, Sri Lanka, Thailand and Vietnam, and from FAO, SEAFDEC, ADB and ICLARM. The regional overview and country reports document the prevailing coastal fisheries situation and the host of issues impacting the sustainability of, and improvement of benefits derived from, coastal fisheries in South and Southeast Asia. Management directions and interventions requiring increased attention include: limited entry and effort rationalization schemes; gear, area and temporal restrictions on fishing; improvement of marketing and post-harvest facilities; enhancement of stakeholders awareness and participation; reduction of coastal environmental impacts; institutional upgrading and strengthening; and enhancement of fisheries research and information.
Consensus was achieved on the usefulness of compiling and analyzing past trawl surveys to establish benchmarks for stock rehabilitation, supplement existing statistical baselines and improve management directions and strategies. A prototype database and analytic tool for this purpose (i.e., TrawlBase) was presented and evaluated during the Workshop using data from available surveys conducted in South and Southeast Asia. The potential scope for regional collaborative efforts in the area of coastal fisheries re- search and management was also evaluated given the background of (planned and ongoing) activities a t the local, national and regional levels. Consensus was achieved on selected elements which can act as catalysts in assisting these countries in research and management of their coastal fisheries. An indicative frame- work for a regional project incorporating these elements is briefly outlined.
Introduction
The Workshop on Sustainable Exploitation of Tropi- cal Coastal Fish Stocks in Asia' was conducted on 2-5 July 1996 a t the Hyatt Regency Hotel, Manila, Philippines. The Workshop was organized by ICLARM with funding support from ADB. It aimed, as an initial step, to bring together fishery scientists and managers to evaluate the fisheries management situation and the relevant resource databases in the South and South-
east Asian region, and to propose directions for follow-up actions toward improved management of coastal fisheries. The specific objectives of the work- shop were to:
examine the status of coastal fish stocks and fisheries in the region and directions for their improved management; review previous fish stock surveys and their
ICLARM Contribution No. 1386.

potential for retrospective analyses in support of management efforts; elaborate database guidelines for such retros- pective analyses; and explore follow-up action and support activities for regional collaboration in coastal fisheries management.
The Workshop program and list of participants is given in Appendix I and 11, respectively. A total of 27 participants attended the Workshop. Of these, 12 were representatives from seven of the ADB's deve- loping member countries, namely: Bangladesh, Indo- nesia, Malaysia, the Philippines, Sri Lanka, Thai- land and Vietnam. Three of the participants were from international fisheries organizations with ma- jor involvement in the region (FA0 and SEAFDEC). The other participants were staff members of ADB and ICLARM, and observers from various fisheries institutions.
To realize the objectives of the Workshop, the program was divided into four sessions: (1) status of coastal fisheries in tropical Asia; (2) coastal fisheries management issues, strategies and actions; (3) retrospective analysis of trawl surveys; and (4) work- shop summary and recommendations. The papers presented and the discussions during the first three sessions were intended to provide inputs to five inter- related working group discussions on: (1) manage- ment issues, (2) management strategies and actions, (3) scope for regional collaborative efforts, (4) trawl database guidelineslprototype, and (5) indicative plan- ning for follow-up regional collaboration.
Management Issues and Interventions
The overview paper by Silvestre and Pauly (this vol.) and the seven country papers in this volume (i.e., Khan et al. - Bangladesh; Priyono and Sumiono - Indonesia; Abu Talib and Alias - Malaysia; Barut et al. - Philippines; Maldeniya - Sri Lanka; Eiamsa-ard and Amornchairojkul - Thailand; and Thuoc and Long - Vietnam) provided regional and country-specific up- dates of the coastal fisheries situation. These were supplemented by perspectives from representatives of two important international fisheries organizations (i.e., Martosubroto - FAO; Mansor and Mohd-Taupek - SEAFDEC) involved in the region. These contribu- tions provided the key inputs to the first two working group discussions on management issues, strategies and actions.
The working group discussions on management issues covered a multiplicity of issues impacting coastal fisheries in South and Southeast Asia (Table 1). The consensus was that the coastal fish stocks and fisheries in the region sorely need improved management to sus- tain and/or improve the benefits derived from them. The main issues requiring attention are:
overfishing, i.e., excessive fishing effort; inappropriate exploitation patterns; post-harvest losses; large vs. small-scale fisheries conflicts; habitat degradation; information and research inadequacies; and institutional weaknesses and constraints.
The working group discussions on management strategies and actions covered a number of interven- tions to resolve or mitigate these issues. A range of management directions and interventions were dis- cussed (Table 2). It was acknowledged that some poli- cies and programs of action in line with the interven- tions listed in Table 2 do exist in the developing coun- tries of South and Southeast Asia. The concern, how- ever, is about the adequacy of the scale and scope of these to reverse or mitigate the problems which have been identified .
There was consensus on the need for increased at- tention in the following areas:
i.
11. . . . 111.
iv.
v. vi.
vii.
limited entry and effort rationalization schemes; gear, area and temporal restrictions; improved marketing and post-harvest facili- ties; enhancement of stakeholders awareness and participation; reduction of coastal environmental impacts; institutional upgrading and strengthening; and enhancement of fisheries information and re- search.
Several of the contributions to this volume dis- cussed these issues. The developing member coun- tries of the ADB and the relevant international orga- nizations were encouraged to support and strengthen their programs in these areas.
The host of management interventions requiring increased attention entails concerted action at various levels of the institutional hierarchy. Consensus was achieved that enhancement of research and informa- tion inputs into the policy and decision-making pro- cess, however, deserves higher priority to facilitate progress in the other intervention areas. For instance, the failure to properly assess and/or communicate the gravity of the resource situation in many areas has held up the adoption of effective entry and effort ra- tionalization schemes, and relevant gear, area and temporal restrictions on fishing. Coastal environmen- tal impacts which aggravate the fisheries resource situation are subsequently viewed with less urgency -- given limited appreciation of resource conditions. Lack of information on the distribution (both spatial and temporal) of resources and landings, as well as


4
Table 2. List of key management interventions.
Limited entry and effort reduction zoning or establishment of marine protected areas restructuring of relevant policy and regulatory frameworks redirection of systems of subsidieslsupport direct exit interventions enhancement of alternative livelihood and occupational mobility
Gear, area and temporal restrictions technological controlllimitations (i.e., trawl ban) gear selectivity spatial restrictions (i.e., marine sanctuaries) temporal restrictions (i.e., seasonal closures)
Improvement of marketing and post-harvest facilities strategic location of salt, ice and cold storage facilities enhanced private sector participation improved processing and handling techniques strategic rural road infrastructure extension, training and credit support
Enhancement of awareness and participation of stakeholders stakeholder participation in the decision-making process enhancement of fishers organizations educationlawareness programs devolutionldecentralization of management authority
Reduction of environmental impacts adoption of ICZM and integrated coastal fisheries management approaches adoption of multiple use zonation schemes coastal habitat restorationlrehabilitation ban on destructive fishing methods establishment of EIA systems and precautionary approach enforcement of regulat~ons and penaltieslincentive systems
Institutional strengtheninglupgrading technical, personnel and facilities upgrading improvement of financial capability and mandates of organizations enhancement of organizational coordinationlcollaboration improvement of transparency, accountability and participation in decision-making process
Enhancement of research and information appropriate size and siting of fish sanctuaries or marine protected areas resource enhancement and habitat rehabilitation techniques selective fishing appropriate fisheries management reference points ecosystem modeling policy and institutional studies
the extent of post harvest losses, has impaired progress in improving marketing and post-harvest facilities. These in turn have affected the urgency of making the recquisite institutional reforms and fostering stakeholders participation in the management pro- cess. Obviously, problems must first be assessed and perceived as one before solutions to them may be prescribed. Information and research are indispen- sable in this process of 'problem-solution' identifica- tion and the empirical debate that fisheries manage- ment entails.
Substantive discussions were generated relative to the limited resources and support given to research
and information activities in many South and South- east Asian countries. Moreover, it was noted that full utilization of available information and research re- sults for improved management requires emphasis. Particular attention in this regard was drawn to the numerous trawl surveys conducted in South and Southeast Asia from the 1960's to the 1980's. Much of the data generated during these surveys have been analyzed only superficially and much of their infor- mation content remain underutilized. While enhanced support and resources for information and research remain largely valid, full utilization of information for which resources have already been expended deserve

Table 3. Main activity areas for expanded regional collaborative efforts in coastal fisheries research and management.
Researchlinformation activities a. Trawl survey database development
i. national workshops ii. database programminglimprovements iii. data inputting
b. Trawl survey and related data analyses i. populationlstock analyses ii. community analyses iii. biosocioeconomic analyses
Management policylplanning a. National strategies and action plans
i. strategic coastal fisheries management reviews
ii. strategic policy and management planning
iii. action planning and indicative investment programs
b. Regional strategies for resources rehabilitation i. resource baselines comparative
analyses ii. issueslinterventions reviews iii. problemlopportunity structures
reviews iv. action planning and indicative
investment programs
Training and networking activities a. Traininglnetworking
i. stock assessments (particularly methods standardization)
ii. community analyses iii. biosocioeconomic analyses iv. fisheries policy analyses and planning
b. Workshops i. regional (comparisons, lessons, synthesis) ii. national (database developmentlplanning)
increased attention. Consensus was achieved that assembling and analyzing extant trawl surveys in the region can help elaborate, among others, the following:
resource condition, potential and exploitation level through time essential for limited entry and effort rationalization schemes; spatio-temporal trends for operationalizing gear, area and temporal restrictions on fishing; resource distribution for strategic location of marketing and post-harvest facilities; combined effect of fishing and environmental impacts on resource condition; historical (i.e., sustainability) baselines as benchmark for resource rehabilitation; and improved agenda for resource research and monitoring.
These elements, in turn, can help foster attention on the requisite institutional intervention areas.
5 Trawl Database Prototype
The contribution by Gayanilo et al. (this vol.) and McManus (this vol.) provided key inputs for the wor- king group discussion on database guidelineslproto- type. The former presented a prototype for a trawl survey database (TrawlBase) - an important tool to assemble and analyze the numerous surveys conducted in the region which remain largely underutilized. The latter illustrated the utility of ecological commu- nity structure analysis (which can be conducted using extant surveys) in developing improved management strategieslactions. Trawl surveys conducted in the region (Appendix 111) and representative data sets from these surveys were examined for both resource trends and improvement of the database prototype. The re- source trends that we identified were incorporated into the country-specific contributions to this volume and the suggested database revisions were incorporated into the TrawlBase prototype of Gayanilo et al. (this vol.).
The consensus was that the retrospective analysis of these surveys and their collation into TrawlBase (in terms of stock size, community structure, bio-socioeconomic and management implications) hold great potential for improvement in the management of coastal fisheries. Moreover, TrawlBase can serve as a resource database, independent of existing fisheries statistical systems, to provide a baseline for sustainability and help improve information inputs into the management process. En- suring the regional coverage of TrawlBase will strongly supplement national and regional (e.g., FAO, SEAFDEC) initiatives to strengthen the fisheries statistical systems of developing countries in South and Southeast Asia.
Scope for Regional Collaboration
Substantive inputs were elicited during the working group discussions on the potential scope for regional col- laborative efforts. The primary emphasis was given to initiatives which can act as catalysts in the efforts of the developing countries of South and Southeast Asia to address the seven management issues listed above. These initiatives were considered in the light of efforts and activities (both planned and ongoing) at the local, national and regional levels, so as to avoid duplica- tion and assure complementarity. A preliminary list of activities for regional collaboration was assembled and refined through several stages of discussion. Fol- lowing the working group discussion on database guide- lineslprototype, the list was finalized and the results are summarized in Table 3. The potential activities for regional collaboration include elements for research and information support, management policy and plan- ning, and training and networking.

Table 4. Indicative framework for regional collaborative project in the area of coastal fisheries research and management.
Design summary Target
1. Sectorlarea goal Help improve management and sustainable utilization of coastal fishery resources in developing countries of South and Southeast Asia.
2. Objectives Enhance resource databases and management infor- mation consistent with resource management needs of developing South and Southeast Asian countries.
Assist selected countries in South and Southeast Asia in developing appropriate strategies and action plans for improved management of coastal fisheries.
Strengthen national capabilities in coastal fisheries as- sessment and management.
3. Components/activities 3.1. Research, information and training
Trawl database development - TrawlBase design, programming, revisions and
distribution - national data inputting - regional database consolidation Training - training of national staff in the uselelaboration of
TrawlBase - national staff training in stock assessment,ecolo-
gical community analyses, biosocioeconomic analy- ses and CRMIfisheries policy and planning
Data analyseslassessments - analysis of resource situation using TrawlBase
and related information - stock, community structure, biosocioeconomic and
policy analysis, and implications for fisheries management
- nationallregional trends, issues and interventions 3.2. Management policy and planning
National and regional workshops - national strategic action planning and consultative
workshops - regional strategic action planning and lessonslsyn-
thesis workshops National strategies and action planning - strategic national fisheries management reviews
incorporating research results - strategies and problem-opportunity structures - action planning and indicative investment
programming Regional strategies and action planning - strategic regional fisheries management reviews
incorporating research results - regional strategies and problem-opportunity
structures - regional action planning and indicative investment
programming
Enhance personnel capabilities and information at the national level and develop action plans for improved coastal fisheries management.
Develop a trawl survey database (TrawlBase) and elaborate national and (South and Southeast Asia) re- gional resource situation.
Elaborate nationallregional fisheries situation and de- velopment of strategies and action plans (including indicative investment program) for improved coastal fisheries management. Training of national staff in TrawlBase use and relevant analytic tools, and provision of requisite hardwarelsoft- ware support and technical advice.
Development of TrawlBase in support of resource as- sessment and management efforts.
Upgrading of technicallpersonnel capabilities in resource assessment and management.
Detail and update assessment of coastal resource and fisheries situation in support of management planning.
Facilitate consultation and adoption of management stra- tegies and action plans (including indicative investment program) at the national and regional levels.
Draft national management strategies and action plans.
Draft regional management strategies and action plans.
4. lnputslindicative cost US$3.3 million Contributions by national governments and international
donorslorganizations.

The working group discussion on indicative plan- ning for follow-up regional collaboration elicited substantive inputs on the nature, scope and scale of a future regional project for coastal fisheries management. Building upon the results of the four other working group &scussions, the elements of a project framework emerged after several iterations. The results of the final itera- tion are summarized in Table 4. They outline the goal, objectives, componentdactivities and corresponding tar- gets (as well as funding input) for a collaborative re- gional project.
The project requires collaborative work among multidisciplinary teams of scientists from select de- veloping member countries of ADB and from I C W M , to be performed in close coordination with managers at the national level and the staff of concerned inter- national organizations. The scope of the proposed re- gional project includes the following main activities:
training in the use of TrawlBase; development ofresource databases principally on extant surveys and their consolidation into a single TrawlBase with regional coverage; regional training courses (involving national scientists andlor managers) in the fields of stock assessment, assemblage/community, and biosocioeconomic analyses, and CRMI fisheries policy analysis and planning; review and analysis (including stock, com- munity, and biosocioeconomic) of the resource base and related information in terms of their management implications; national workshops for data consolidationlge- neration and consultative planning; strategic review of the fisheries management situation and programs at the national and regional levels (including resourcelmanage- ment trends and opportunities); regional workshops to consolidate results of data analyses and to elaborate on regional trends, strategies and action programs; and
7 development of strategies, action plans and indicative investment programs at the national and regional levels, based on the reviews and assessments conducted during the course of the project.
The consensus was that the proposed regional project will be invaluable in assisting the developing countries in South and Southeast Asia in formulating resource databases and action plans for the improved management of their coastal fisheries.
ICLARM was requested by the Workshop partici- pants to build upon these elements and package a pro- posal for funding by ADB and other interested donors2.
Conclusion
The results outlined above were discussed and re- vised during the last plenary session of the Workshop. The participants acknowledged that improved coastal fisheries management in South and Southeast Asia rests largely on the support that will be made avai- lable for the purpose in the context of other equally pressing social and developmental needs in these coun- tries. The general consensus was that focusing avai- lable resources on the management intervention areas outlined above should pay substantive dividends for the region. Moreover, support for the regional col- laborative efforts will assist these countries in strengthening institutional capabilities and develo- ping policy interventions for the improved ma- nagement of, and sustained benefits from, their coastal fisheries.
Acknowledgements
Thanks are due Mr. Len Garces and Ms. Bing Santos for assistance in compiling the information given in Table 1.
A detailed project proposal to this effect has been prepared by ICLARM and submitted to ADB for possible funding.

7 ~ - ~ G G ~ I , ; I t ; - APR 1 4
* I
Management of Tropical Coastal Fisheries in Asia: An Overview of Key Challenges and Opportunities1
G. SILVESTRE International Center for Living Aquatic Resources Management
MCPO Box 2631, Makati City 0718, Philippines
D. PAULY International Center for Living Aquatic Resources Management
MCPO Box 2631, Makati City 0718, Philippines and
Fisheries Centre, University of British Columbia 2204 Main Mall, Vancouver, BC, Canada V6T 124
SILVESTRE, G. and D. PAULY. 1997. Management of tropical coastal fisheries in Asia: an overview of key challenges and opportunities, p. 8-25. In G. Silvestre and D. Pauly (eds.) Status and management of tropical coastal fisheries in Asia. ICLARM Conf. Proc. 53, 208 p.
Abstract
Coastal fisheries are an important component of the fisheries sector and rural economy of tropical developing countries in Asia - generating food, employment and foreign exchange. In 1994, marine landings of these countries were about 13.3 million t (roughly 16% of world marine landings), most origina- ting from coastal areas. The coastal fishery resources consist dominantly of species with relatively high growth, natural mortality and turnover rates; and exhibit maximum abundance in shallow depths (less than 50 m). Fishers use a multiplicity of gears, with heavy concentration in nearshore areas where abundance, catch rates and shrimp availability are highest. The management of these coastal fisheries attempts to promote three main objectives: (1) productivity/efficiency, (2) distributional equity and (3) environmental integrity. Efficient institutionaYadministrative arrangements are sought to attain these objectives and to maintain a balance among them.
Coastal fisheries operate in a spectrum ranging from light fishing, essentially single sector (i.e., fishe- ries) situations to intense fishing and multisector use of the coastal area (and its adjacent terrestrial and marine zones). Issues impacting coastal fisheries multiply through this range, requiring increasingly com- prehensive and integrated analytic frames and scope of action to sustain fisheries benefits. The key issues impacting coastal fisheries in the region include: (1) overfishing, (2) inappropriate exploitation patterns, (3) post harvest losses, (4) conflicts between large and small-scale fisheries, (5) habitat degradation, (6) ina- dequacy of management information and research and (7) institutional weaknesses and constraints. Appropriate management strategies and actions on a broad front are necessary, and success is largely premised on institutional capabilities and resources mobilization. Moreover, the ultimate mitigation of these factors rests on effectively addressing poverty and promoting overall economic development.
Introduction
Coastal fisheries are important components of the fisheries sector and rural economy of tropical develo- ping countries in Asia. These fisheries provide food and employment to a significant portion of the popu- lation, as well as valuable foreign exchange to the economy (Hotta 1996). In 1994, marine landings of these developing countries were about 13.3 million t (i.e., 16% of world marine landings and 12% of
ICLARM Contribution No. 1379.
world fisheries production). Roughly 8 million fishers were involved in marine fisheries and aggregate fishery exports were about $9 billion per year. Most of the marine landings originated from fishing operations in coastal shelves (between the shoreline and 200 m depth) especially on their shallower parts (from 0 to 50 m). However, these fisheries are adversely affected by a number of problems and constraints, with serious
consequences for the income of fishers, the supply of fish to consumers and poverty in rural communities.
This paper attempts to provide an overview of the main issues confronting coastal fisheries in tropical developing Asian countries as well as the correspon- ding management directions to help resolve or miti- gate them. Numerous works provide detailed reviews of the overall situation through time and represent a substantive background and source of materials for this synopsis. Among others, the work of Aoyama (19731, Shindo (1973), Marr (1976,1981) and Pauly (1979) and the contributions in Tiews (1973), Pauly and Murphy (1982), and Pauly and Martosubroto (1996) elaborate the situation in the 1970s. For the 1980s, reviews include Soysa et al . (1982), Sivasubramaniam (19851, IPFC (1987 a and b), APO i l988), Pauly and Chua (19881, and Pauly (1989). More recently, FA0 (1992, 1995a and b), Yanagawa and Wongsanga (1993) and Hotta (1996) provide detailed situational updates.
We have avoided the detailed conventional review approach for this synopsis. The works cited above and the country specific contributions to this volume provide sufficiently detailed treatments. We have con- centrated instead on drawing from the available li- terature the commonalities in the main issues and opportunities occurring across the countries and logi- cally structuring them into generic categories. Many of the problems have been building up for some time and now lead to inescapable conclusions. In many respects the substance of the required solutions re- mains the same, though the debate over implementa- tion strategies to effectively resolve the problems con- tinues vigorously.
We first provide, by way of background, some ba- sic features of coastal fisheries in tropical developing countries in Asia. A synopsis of the main fisheries management objectives pursued in these countries is then presented in generic categories based on the multiplicity of detailed objectives sought by manage- ment. Consideration of the objectives is a logical ne- cessity for evaluating the existing situation versus the desired state. The main management issues are presented, using selected site-specific assessments for illustration. The key management interventions cur- rently being emphasized to address these issues are then briefly discussed. Lastly, the structure of the objectives, issues and interventions is summarized and trends affecting the feasibility of management suc- cess are briefly discussed.
Sectoral Background
The scope of this study includes fisheries in coastal areas, from the shoreline to 200 m depth, situated within the area bounded by 60°E longitude in the west, 135"E longitude in the east, 10"s latitude in
9 the south, and 20°N latitude or the coast of mainland Asia in the north (Fig. 1). This geographical delinea- tion includes the fisheries of 13 developing coastal states (excluding Singapore given its level of economic development and limited shelf area). Table 1 provides selected statistics pertaining to these countries, 5 in South Asia and 8 in Southeast Asia. They had a com- bined population of about 1.7 billion in 1996, the highest being in India and the lowest in the Maldives and Brunei Darussalam. Gross national product (GNP) per capita varied between US$215 per annum (Cambodia) and US$20 400 (Brunei Darussalam). It is generally low, with only 3 countries having a per capita GNP above $2 000 (Brunei Darussalam, Ma- laysia and Thailand). High population growth, low incomes and underdevelopment characterize many of these countries, though accelerated economic growth is improving these conditions, particularly in South- east Asia (ADB 1996).
The marine jurisdictorial area of the countries co- vered here is extensive, spanning an aggregate of about 13 million km2. This is roughly 1.5 times the extent of their combined land area, totaling 8.5 million km2. The extent of the declared exclusive economic zones (EEZ) is highest for Indonesia, India and the Philip- pines and is lowest for Brunei Darussalam, Cambo- dia and Bangladesh (WRI 1995). Despite the large marine area, however, only 35% (4.6 million km2) of the aggregate EEZ consists of shallow, productive con- tinental shelves. The most extensive shelves are found off Indonesia, India, Malaysia and Vietnam. The highest shelf to EEZ ratios are found in Malaysia, Bangladesh and Indonesia where over 50% of the EEZ consists of shelves. Longhurst and Pauly (1987) pro- vide a review of the biophysical characteristics and ecology of the tropical waters discussed here and point to the significance of coastal shelves to fisheries pro- ductivity. Moreover, mangroves, coral reefs and seagrasses line the coastal fringes of these shelves and enhance their productivity particularly in Southeast Asia where the peak in biodiversity of these habitats occur (McManus 1988; Fortes 1988, 1995). These coastal habitats are coming under increased stress from various human activities due to expanding popu- lations and economies (Gomez et al. 1990; Sen Gupta et al. 1990; Chou 1994; I-Iolmgren 1994; and Wilkinson et al. 1994).
Table 2 summarizes selected fisheries statistics of these countries for 1994. Annual fisheries production range from 6 000 t (Brunei Darussalam) to 4 540 000 t (India), with over half of the countries producing over 1 million t each. Overall fisheries pro- duction, including inland fishery and aquaculture, was about 20 million t, or a little over 18% of global fishe- ries production. Exports of fish and fishery products was about $8.8 billion, representing a significant source of foreign exchange for these economies. Over $1 billion

Longitude (OE) I Fig. 1. Map il lustrating geographical scope of this study and the location of the developing countries covered.
Table 1. Selected statistics for tropical developing countries in Asia. (Sources: ADB 1995, 1996; WRI 1995)
Country Population Per Capita GNP Land Area Exclusive Economic Continental Shelf (0-200 m depth) (x 1 06; 1996) (US$; 1995) (x 1 O3 km2) Zone (EEZ) Area (x1 O3 km2) As % of EEZ
(x 1 O3 km2) Bangladesh 124.0 283 144.0 76.8 55 72 Brunei Darussalam 0.3 20 400 5.8 38.6 9 22 Cambodia 10.2 21 5 181.0 55.6 15 27 India 943.7 335 3 287.6 2 014.9 452 22 Indonesia 197.6 940 1 904.6 5 408.6 2 777 5 1 Malaysia 20.6 3 930 329.8 475.6 374 79 Maldives 0.3 900 0.3 959.1 Myanmar 47.7 890 676.6 509.5 230 45 Pakistan 133.2 465 796.1 31 8.5 59 18 Philippines 69.3 1 130 300.0 178 10 1 786.0 Sri Lanka 18.2 660 65.6 51 7.4 27 5 Thailand 61.4 2 680 513.1 257.6 86 33 Vietnam 76.3 250 331.7 722.1 328 45 Total 1 702.8 8 536.2 13 140.3 4 588 35
in fishery exports was registered by three countries, followed by the Philippines, Malaysia, Thailand and Thailand, Indonesia and India. Hotta (1996) estimates Brunei Darussalam, with annual consumption exceed- employment in fisheries (inland and marine fisher- ing 25 kg. The lowest per capita consumption is in ies, as well as aquaculture) to be about 11 million. the three South Asian countries, namely: Pakistan, Fish has traditionally been an important part of the India and Bangladesh. These statistics indicate fish- diet of the population, particularly in Southeast Asia. eries to be an important source of food, employment Per capita fish consumption is highest in the Maldives, and foreign exchange.

Table 2. Selected 1994 fisheries statistics for tropical developing countries in Asia. (Sources: FA0 1994; Hotta 1996).
Country Total fisheries Marine fisheries Fishery exports Per capita fish Number of fishers production production (US$ x l o 6 year1) ConsumPtion (x lo3)
(x l o 3 t year1) (x l o 3 t yeari) (kg.year-I)
Bangladesh Brunei Darussalam Cambodia India Indonesia Malaysia Maldives Myanmar Pakistan Philippines Sri Lanka Thailand Vietnam Total
Table 2 also summarizes marine fisheries catches. Aggregate marine fisheries catches were about 13.3 million t (representing roughly 16% of world marine landings), which constitutes 67% of the total fishe- ries production for these countries. Hence, marine fisheries contributes the bulk of fisheries production. Marine fisheries production varied between 6 000 t (Brunei Darussalam) and about 3 million t (Indone- sia). Five countries, Indonesia, Thailand, India, the Philippines and Malaysia, registered marine fishe- ries landings exceeding 1 million t , which is indica- tive of extensive coastal fisheries. It is estimated that about 7.8 million fishers are working in marine fisheries in the 13 countries covered here. The num- ber of full-time and part-time fishers varies between 1 600 in Brunei Darussalam and about 3.8 million in India, and millions more are involved part time, in- cluding women and children (Pauly 1997). The bulk of marine fisheries yields and employment originates from fishing operations in shallow, coastal shelves, indicating that coastal fisheries account for a substan- tial part of the food and employment generated by the fishing sector and contributes significantly to foreign exchange earnings via export of shrimps, small pelagics and demersals.
The coastal fishery resources consist of highly di- verse, multispecies complexes ( Pauly 1979, Longhurst and Pauly 1987 ). These are dominantly species with relatively high growth, natural mortality and turn- over rates (Raja 1980; Ingles and Pauly 1984; Sivasubramaniam 1985; Chullasorn and Martosubroto 1986; Dwiponggo et al. 1986; and data in FishBase, Froese and Pauly 1996). A common fea- ture of these resources is that they frequently exhibit maximum abundance in nearshore, shallow areas. Fig. 2 illustrates the depth distribution of resource abundance off Brunei Darussalam. Note that catch
rates observed through time consistently show peak abundance in waters less than 50 m. Such a distribu- tion of resource abundance is widespread across the South and Southeast Asian area. This is very diffe- rent from the situation prevailing in the North Atlan- tic (which provided the early models for fisheries de- velopment and industrialization in South and South- east Asia), where commercially viable fish abundance occurs down to depths of one kilometer and more.
Another feature of these coastal fishery resources is that many of the species exhibit increasing size with depth. Fig. 3 illustrates the size range of fishes in shallow (less than 15 m depth) versus deeper waters off Brunei Darussalarn (Silvestre and Matdanan 1992). This highlights the significance of nearshore areas as nursery grounds and the serious implications of con- centrated small and large-scale fishing in these areas. The abundance of very valuable shrimps only in nearshore waters and the favorable concentration of finfishes in areas less than 50 m depth has encou- raged the concentration of fishing effort and incursion of trawlers in shallow grounds.
The abundance and diversity of coastal fishery re- sources has supported vibrant, small-scale fisheries for centuries in these countries (Butcher 1996). The period between the two world wars saw various attempts to 'moderniye' these fisheries. These efforts were generally unsuccessful for a variety of technical and social reasons, not least of which includes the lack of dynamism of late colonial societies (Butcher 1994). The period immediately following the Second World War was different. Starting in the Philippines, a wave of technology and investments occurred which rapidly developed the demersal and, later, the pelagic fishe- ries in Southeast Asia (Pauly and Chua 1989). Mecha- nization of coastal fisheries also occurred in South Asia, although it appears to have been more diffuse.

Depth (m)
Species ..... .... Leiognathus splendens ..:. ..,
L. bhdus , _ _ _ _ _ _ _ _ _ , Upeneus sulphureus ...... ., Johnius coitor , .................... Saurida tumbil , ................................., Pomadasys argyreus ................, Arius thalassinus , ................................, Carangoides malabaricus .................., L. elongatus , .........
..... .... Pennahia macrophthalmus ..1.. ., L. equulus .................,
Pomadasys maculatus ............., Trichiurus lepturus , ............., Gazza minuta - , ...... ., Therapon teraps , .............. Lactarius lactarius ,...... Secutor ruconius - , .......... , Gerres spp. , ..............., Lufjanus spp. ,.................. * Epinephelus spp. -
I I I I
0 10 20 30 40 50 Total length (cm)
Fig. 2. Fish abundance off Brunei Darussalam (based on t rawl surveys conducted around 1970, 1980 and 1990) typical of variation in resource abundance with depth observed in South and Southeas t Asia. (Source: Silvestre and Matdanan 1992).
Fig. 3. Size range of fishes caught in areas less than (dashed line) and more than (solid line) 15 m depth off Brunei Darussalam illustrating trend of increasing fish sizes with depth observed in South and Southeas t Asia. (Source: Silvestre and Matdanan 1992).
A multiplicity of gears are currently used to ex- ploit the multispecies resources. These vary from rela- tively simple, inexpensive gears, like handlines and gillnets, using no water craft or dug-outs, to large trawls and purse seines using boats with powerful in- board engines. Sequential (and overlapping) deploy- ment of these gears and small-/large-scale duality of coastal fisheries are common features. Fig. 4 illus- trates these features in the case of Brunei Darussalam. The mix of gears used are concentrated in shallow grounds where abundance, catch rates and shrimp availability is highest. Many of the species are fished sequentially by different gears as they grow and move to deeper, offshore areas. Varied technological and biological interactions characterize the coastal fishe-
ries exploitation regimes, making assessment and management rather difficult (FA0 1978; Pauly 1979; and Pauly and Murphy 1982).
The situation in Brunei Darussalam is unique in that the levels of exploitation are so low that major management problems have not occurred so far (Silvestre and Matdanan 1992). In the other coun- tries, however, a heavy concentration of small and large-scale gears in many shallow coastal waters has led to overfishing, gear conflicts and dissipation of eco- nomic rent. Recent assessments have noted the in- creasing trend of overfishing of coastal fish stocks and habitat degradation (FA0 1995a; APFIC 1996). This has serious implications for fish supply as well as other benefits derived from coastal fisheries. In these

~ r ~ f t ~ I I I net
[IIIIII] Trammel net
Beach seine
Troll
Rmg net
1 Potitrap
Purse seine
Demersal trawl
Fig. 4. Fishing area by gear type off Brunei Darussalam typical of those observed in other coastal areas in South and Southeast Asia. (Source: Khoo et al. 1987).
countries, food fish consumption is projected to grow from an aggregate of 14.2 million t i n 1992 to 20 mil- lion t by 2010 (Hotta 1996).
Overview of Main Fisheries Management Objectives
Fisheries management may be viewed as a dy- namic resource allocation process where the ecologi- cal, economic and institutional resources of a fishe- ries exploitation system are distributed with value to society (in the broad sense) as the overall goal. Some recent works covering the status of fisheries manage- ment science and related concepts are Anderson (1987), Caddy and Mahon (1995), Olver et al. (1995), Stephenson and Lane (19951, Williams (1996) and Caddy (in press). The fisheries management process includes the resolution of normative and empirical debates to determine the direction of resource alloca- tion decisions. What constitutes value to society is ultimately determined in the political field, and highly influenced by existing needs (or perceptions of such needs), available knowledge and information (or ac- cess to them), and religious and cultural values or norms in society.
The coastal fisheries discussed here are set in a variety of natural and human conditions. There is, therefore, a wide diversity of specific objectives being pursued in their management. These objectives may be gleaned from national legislations, development plans and fisheries project documents. Some objec- tives are implicitly rather than explicitly stated, and many have been noted to be conflicting or incompa- tible when pursued simultaneously (Lawson 1978; Lilburn 1987). From the available literature we will summarize these diverse objectives into generic ca- tegories of objectives and management directions.
Fig. 5 gives a schematic representation of the con- ventional 'fishing system' framework in fisheries ma- nagement. The arrows indicate the interactions between and among components of fishery resources and the fisheries relying on these. The framework emphasizes the essential dependence of fisheries on available resources for continued viability and a sus- tained flow of goods and benefits. It is a widely recog- nized principle of management in these countries that fisheries management systems must set up fishing regimes that appropriately match the productive ca- pacity of the resource base.
Another feature of coastal fisheries management is the widening scope of'fisheries management' itself.

I Human dimension
dimension
~ -~~
Fig. 5. Schematic representation of the conventional 'fishing system' framework in fisheries management.
Given the increasing multiplicity of issues impacting many coastal fisheries, fisheries management concerns (and objectives) have taken on a wider framework and scope of action in many areas. Fig. 6 illustrates an example of the scope of multidisciplinary work con- ducted in San Miguel Bay, Philippines (Silvestre 1996).
This encompasses: (1) fishery resources and the habi- tats (e.g., coral reefs, mangroves) and habitat cha- racteristics (e.g., water quality) which sustains them; (2) other activities (e.g., forestry) which impact fisheries, the fishery resources and the natural envi- ronment; and (3) the socioeconomic development and policy framework within which fisheries and other economic activities operate. Similar to the situation in San Miguel Bay, coastal fisheries management in the South and Southeast Asian region increasingly en- tails the implementation of a wide range of measures within the confines of the traditional fisheries sector, as well as interventions requiring coordination with other sectoral agencies (e.g., forestry, agriculture) at various levels of the institutional hierarchy.
Within this frame of reference, Fig. 7 gives the typical hierarchy of objectives sought in the manage- ment of coastal fisheries in these countries. Consis- tent with sustainable coastal fisheries development as the overall goal, management entities attempt to: (1) optimize productivity/efficiency of the fisheries ex- ploitation regime; (2) ensure that the benefits of pro- duction or improved productivity are distributed equitably; and (3) ensure that the productivity gene- rated results in minimum damage to the resource
framework env~ronmental soc~al economlc polltlcal
F~sher~es ( ' Other economlc actlvltles +
e.g , Agr~culture/Forestry Human ,
d~mens~on A A
Natural d~mens~on - F~sher~es resources
A
J . 1 Others
Coral Seagrassl , e g , soft bottoms algal beds '
Land and related natural
r
Water quality
Fig. 6. Schematic representation of an expanded framework for fisheries management. Interrelations among the fisheries resources, the fisheries exploiting them, and other components of the human and natural dimensions are illustrated by arrows. (Source: Silvestre 1996).

I . high fish productionlrevenue Productivity1 . high catchleffofl
efficiency I . high foreign exchange earnings
I . supply stability I . high returns on investments
Sustainable I I . equal access to production factors coastal Distributional I . reasonable artisanal catches
fisheries equity I . reasonable fish prices development
I . reasonable artisanal incomes
1 . high employment level
Environmental . reasonable water quality integrity 1 . reduced impact on critical habitats
I 1 ' 1 . reduced stress on biodiversity
Illustrative 'third level' objectives
'First level' objective
I
I . use of nondestructive gears
'Second level' objectives
base and the supporting natural environment. Envi- ronmental integrity also encompasses the intergenerational equity concerns embodied in the sustainable development concept of the Brundtland Commission report (WCED 1987). These three objec- tives are not always mutually compatible and the op- timal balance among the three is highly dependent on situational realities and have been noted to vary tem- porally and spatially within individual countries. Apart from the three generic ('ends') objectives above, appropriate management systems/regimes are sought to effectively attain a balance among these objectives. Hence, institutional effectiveness is a fourth generic category of ('means') objective sought in coastal fisheries management in South and Southeast Asia.
Fig. 7 also gives typical 'third-level' objectives com- monly encountered. These are translated into a num- ber of policy instruments and management measures taking the form of regulatory instruments, market- based incentives, institutional measures, research agendas and/or government support investments. For example, the licensing scheme in many countries has productivity as the main rationale. The Indonesian trawl ban (Sardjono 1980) and the 15-km exclusive municipal fishing zones in the Philippines had equity as their primary consideration. The ban on the use of poisons and explosives in fishing in many countries has environmental integrity as the main driving force.
The Challenges: Overview of Key Management Issues
Coastal fisheries in the tropical developing coun- tries of South and Southeast Asia operate in a spec- trum ranging from light fishing, essentially single sector (i.e., fisheries) situations, to intense fishing and multisector use of the coastal area (and its adjacent
Fig. 7. General goal and objectives in fisheries management.
terrestrial and marine zones). The number of nega- tive factors impacting coastal fisheries multiply through this range, requiring increasingly comprehen- sive approaches and wider scope of action to sustain fisheries benefits. Many coastal fisheries are in (or moving into) the more industrialized, intensive stages of the fishing and coastal use spectrum, necessitating improved management efforts. We briefly outline below the main issues which require increased management attention.
Excessive Fishing Effort
High levels of fishing effort on coastal fish stocks, particularly in nearshore tradj tional fishing grounds, is a common management concern (Yanagawa and Wongsanga 1993; FA0 1995a and b; APFIC 1996; Hotta 1996). High fish demand (due to increasingpopu- lation and incomes), burgeoning fishing populations combined with a lack of livelihood opportunities in rural areas, advances in fishing technology and accelerated industrial fisheries development has led to excessive fishing pressure and overfishing in many coastal areas. This has resulted in a leveling-off (if not decline) in landings; reduced catch rates, incomes and resource rents, and; intense competition and conflict among fishers. Fig. 8 illustrates the gravity of the issue of excessive fishing effort evident in some areas. In the case of the demersal and small pelagic fisheries in the Philippines (which are concentrated in very shallow waters), by the mid-1980s the level of effort exceeded what was required to harvest maximum economic yield by 150%-300% and maximum sustainable yield by 30%-130%. This implies dissipation of resource rents of about $450 million annually for the demersal and small pelagic fisheries combined. The developing coun- tries of South and Southeast Asia can ill afford the economic losses resulting from overfishing. Although there are coastal areas which remain lightly fished

0 100 200 300 400 500 600
Mean annual total adjusted fleet horsepower (hp x lo3)
0 0.2 0.4 0.6 0.8 1 .O
Fishing mortality (F = YIB; yeai')
Fig. 8. Surplus production models of the Philippine small pelagic and demersa fisheries. (Sources: Silvestre and Pauly 1986; Dalzell et al. 1987).
ment are well documented in the litera- ture (Hamley 1975; Pope et al. 1975; Sainsbury 1984; Silvestre et al. 1991). The theory of fishing illustrates the uti- lity of influencing selectivity to maximize fish yields and related benefits (Beverton and Holt 1957; Ricker 1975; Gulland 1983). Armstrong et al. (1990) provides an update on the importance of selecti- vity to the conservation of fish stocks.
The concentration of fishing effort in shallow, coastal shelves is a problem across many areas in South and South- east Asia. The use of explosives and poi- sons in fishing is also rampant in cer- tain places. The use of fine-meshed nets by artisanal fishers in nearshore areas to catch fish (as well as milkfish and shrimp seeds for aquaculture) is a serious concern. The use of small- meshed nets by trawlers is leading to substantial losses. Fig. 9 illustrates the results of multispecies yield and value per recruit assessment of the trawl fishery operating in the Lingayen Gulf, Philippines. Note that the use of small- meshed (i.e., 2 cm) trawl codends is lea- ding to losses of up to 20% and 35% of potential yield and value, respectively.
Post Harvest Losses
The magnitude of post harvest losses
(e.g., sparsely populated eastern Indonesia, parts of East Malaysia), the general consensus is that few coastal fish stocks can accommodate an expansion in fishing effort, and that many coastal fisheries in nearshore areas (particularly in the Gulf of Thailand, the Philippines, Bay of Bengal and western Indone- sia) require significant reductions in fishing effort (Pauly and Chua 1988; FA0 1995a; APFIC 1996; Hotta 1996).
Inappropriate Exploitation Patterns
Inappropriate patterns of exploitation have led to suboptimal benefits from the exploitation of coastal fishery resources. This stems from the species and size selectivity of the mix of fishing gears used, i.e., their technological characteristics and spatio-temporal deployment in coastal fishing grounds. The selecti- vity of fishing gears and techniques for their assess-
is another major concern. Alverson et al. (1994) estimates the extent of discards
for the fishing areas discussed here to be over 5 mil- lion t. This is broken down as follows: western cen- tral Pacific - 2.8 million t; eastern Indian Ocean - 0.8 million t; and western Indian Ocean - 1.5 million t. This level of discards is high at roughly 40% of ma- rine landings of the 13 developing countries covered here. There are doubts about the accuracy of these estimates, based as they are on limited observations with small spatio-temporal coverage, and better fi- gures will become available in the coming years. How- ever, we believe the level to be significant (see for example Khan and Alamgir, this vol.) for countries with substantial trawl fleets and a limited market for low-value marine fishes. Apart from discards, the extent of physical losses due to spoilage of landings should be limited given the possibility of conversion to fish sauce and related products (Pauly 1996a). Value loss of harvests due to reduced quality is a com- mon concern.
Large and Small-scale Fisheries Conflicts
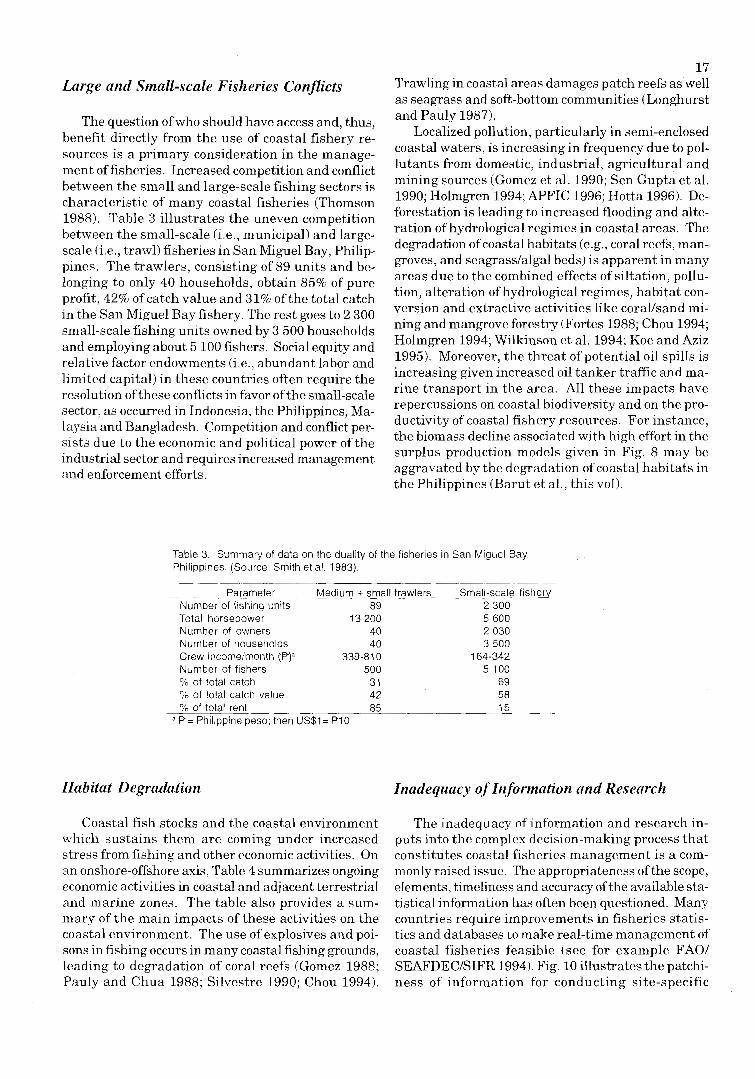
The question of who should have access and, thus, benefit directly from the use of coastal fishery re- sources is a primary consideration in the manage- ment of fisheries. Increased competition and conflict between the small and large-scale fishing sectors is characteristic of many coastal fisheries (Thornson 1988). Table 3 illustrates the uneven competition between the small-scale (i.e., municipal) and large- scale (i.e., trawl) fisheries in San Miguel Bay, Philip- pines. The trawlers, consisting of 89 units and be- longing to only 40 households, obtain 85% of pure profit, 42% of catch value and 31% of the total catch in the San Miguel Bay fishery. The rest goes to 2 300 small-scale fishing units owned by 3 500 households and employing about 5 100 fishers. Social equity and relative factor endowments (i.e., abundant labor and limited capital) in these countries often require the resolution of these conflicts in favor of the small-scale sector, as occurred in Indonesia, the Philippines, Ma- laysia and Bangladesh. Competition and conflict per- sists due to the economic and political power of the industrial sector and requires increased management and enforcement efforts.
17 Trawling in coastal areas damages patch reefs as well as seagrass and soft-bottom communities (Longhurst and Pauly 1987).
Localized pollution, particularly in semi-enclosed coastal waters, is increasing in frequency due to pol- lutants from domestic, industrial, agricultural and mining sources (Gomez et al. 1990; Sen Gupta et al. 1990; Holmgren 1994; APFIC 1996; Hotta 1996). De- forestation is leading to increased flooding and alte- ration of hydrological regimes in coastal areas. The degradation of coastal habitats (e.g., coral reefs, man- groves, and seagrasslalgal beds) is apparent in many areas due to the combined effects of siltation, pollu- tion, alteration of hydrological regimes, habitat con- version and extractive activities like corallsand mi- ning and mangrove forestry (Fortes 1988; Chou 1994; Holmgren 1994; Wilkinson et al. 1994; Koe and Aziz 1995). Moreover, the threat of potential oil spills is increasing given increased oil tanker traffic and ma- rine transport in the area. All these impacts have repercussions on coastal biodiversity and on the pro- ductivity of coastal fishery resources. For instance, the biomass decline associated with high effort in the surplus production models given in Fig. 8 may be aggravated by the degradation of coastal habitats in the Philippines (Barut et al., this vol).
Table 3. Summary of data on the duality of the fisheries in San Miguel Bay, Philippines. (Source: Smith et al. 1983).
- -
Parameter Med~um + small trawlers Number of frshrng unrts 89 Total horsepower 13 200 Number of owners 40 Number of households 40 Crew rncometmonth (B)" 339-81 0 Number of f~shers 500 O/O of total catch 3 1 % of total catch value 42 % of total rent 85 --
T= Ph~l~pp~ne peso, then US$I=P10
Small-scale frshery 2 300 5 600 2 030 3 500
164-342 5 100
69 58 15
Habitat Degradation Inadequacy of Zizformation and Research
Coastal fish stocks and the coastal environment which sustains them are coming under increased stress from fishing and other economic activities. On an onshore-offshore axis, Table 4 summarizes ongoing economic activities in coastal and adjacent terrestrial and marine zones. The table also provides a sum- mary of the main impacts of these activities on the coastal environment. The use of explosives and poi- sons in fishing occurs in many coastal fishing grounds, leading to degradation of coral reefs (Gomez 1988; Pauly and Chua 1988; Silvestre 1990; Chou 1994).
The inadequacy of information and research in- puts into the complex decision-making process that constitutes coastal fisheries management is a com- monly raised issue. The appropriateness of the scope, elements, timeliness and accuracy of the available sta- tistical information has often been questioned. Many countries require improvements in fisheries statis- tics and databases to make real-time management of coastal fisheries feasible (see for example FA01 SEAFDECISIFR 1994). Fig. 10 illustrates the patchi- ness of information for conducting site-specific

18 Table 4. Generic coastal transect summarizing main activities and issues relevant to coastal fisheries and integrated coastal zone management in South and Southeast Asia.
Terrestrial Coastal Marine
Major zones Upland Midland Lowland Interface Nearshore Offshore Deep sea (>la% (84% (043% (1 km inland from (30m-200m (>Zoom depth (beyond s lope) slope) slope) HHWL-30 m depth) depth) -EEZ) E EZ)
Main resource Logging Mining Urban Mining (corallsand) Artisanal Marine Marine useslact ivi t ies Mining Agriculture development Mangrove fisheries transport transport
Agriculture Industries forestry Commercial Industrial Industrial Agriculture Aquaculture fishing fishing fishing Tourism Fisheries Marine Offshore
Tourism transport development Industries Oil drilling Urban development
Main Siltation Agrochemical Siltation Reduced Reduced Overfishing Oil spills environmental Flooding loading Domestic biodiversity biodiversity Oil spills issuesl impacts Toxic mine Erosion pollution Habitat degradat~on Overfishing on the coastal tailings Siltation and destruction Oil spills zone Flooding Overfishing
Industrial pollution
Fishing efforVcost
0 0.5 1 .O 1.5 2.0 2.5 3.0 3.5
Fishing mortality o&')
Fig. 9. Multispecies yield and value per recruit assessment of the trawl fishery in Lingayen Gulf. Philippines (Source: Silvestre 1990). Intersections of the .eumetric' and 'cacometric' lines for yield (A and B) and gross value (A' and B') indicate mesh size and fishing mortality combinations where yield and value are maximized. Note excessively high effort and low mesh sizes in Lingayen Gulf which lead to losses of up to 20% and 35% relative to maxima in yield and value, respectively.
assessment in these countries. In this example from the Lingayen Gulf (Philippines), the spatial scope of avail- able catch statistics does not meet as- sessment needs and effort information is not available. Assessment of the sta- tus of fisheries in the area is, there- fore, possible only based on the results of independent trawl surveys and popu- lation censuses conducted in the past. The published results of these surveys and censuses allowed Silvestre (1990) to show that resource biomass was down to about 13% of its original level in the late 1940s, precludmg further expansion of the fisheries.
The inadequacy of fisheries re- search in support of fisheries manage- ment efforts is also commonly cited. Much of the fisheries research is criti- cized for being too academic and pe- ripheral to the management questions at hand, and for failing to take the ex- tra step to elaborate requisite manage- ment options and measures. Many re- search results also remain unpub- lished leading to what Pauly (1995) refers to as the "shifting baseline syn- drome" in fisheries. The short history of quantitative fisheries research, limi- tations in the available statistical baseline and limited research resources requires that past studies be docu- mented, analyzed and made available for fisheries management purposes. For example, trawl surveys conducted

I I I I I I I I I I I 1940 1950 1960 1970 1980 1990
Year
Legend:
0 - - Demersal b~omass (based on actual values) 0 - - 0 Demersai biomass (corrected for learnng') Di3 Number of mun~cipal fishers H Number of commercial trawlers
Fig. 10. Relative indices of demersal biomass, number of fishers, and number of commercial trawlers in Lingayen Gulf, Philippines from the 1930s to the 1980s. (Source: Silvestre 1990).
in many countries remain underutilized and poten- tially offer many insights for fisheries management (Silvestre et al. 1986; Pauly and Martosubroto 1996). Other areas commonly lacking research and infor- mation include: site-specific fisheries assessments; selectivity research; research on location and size of underfished stocks; marine protected areas; fish pro- cessing and marketing; socioeconomic research; and policy and institutional studies (IPFC 1987b; Yanagawa and Wongsanga 1993; FAOISEAFDECI SIFR 1994; APFIC 1996; Hotta 1996).
Institutional Weaknesses and Constraints
All these issues and concerns arise and persists due to the inability of existing institutions to deal with the changing realities of coastal fisheries. Problems and constraints commonly cited include: inadequa- cies in the policy and legal framework; limited per- sonnel and technical capabilities; shortage of resources1 funding; inadequate or overlapping mandates and func- tions; and a lack of institutional collaboration/coordi- nation (IPFC 1987a and b; APFIC 1996; Hotta 1996). An increased emphasis on the participation of stake- holders and devolution of management authority to local levels are notable trends in many of the coun- tries included in this study.
19 The Opportunities: Overview of Key
Management Interventions
Given the multiplicity of issues impacting coastal fisheries, a variety of management interventions are prescribed in the available literature for their resolu- tion or mitigation (Yanagawa and Wongsanga 1993; FA0 1995a and b; APFIC 1996; and Hotta 1996). We briefly outline below seven main categories of ma- nagement interventions which we believe to be appro- priate, given the status of coastal fisheries in these countries. Though many of these are in place, there is a common concern about the comprehensiveness and scale of the existing mix of measures to sufficiently reverse or mitigate the multiplicity of impacts on, and sustain the benefits derived from, coastal fisheries. Successful fisheries management will require effec- tive implementation of a wide range of measures as well as fundamental shifts in management perspec- tives (Anderson 1987; Hilborn and Walters 1992; Pauly 1994,1996b; Olver et al. 1995; Stephenson and Lane 1995; Caddy, in press).
Limited Entry and Effort Reduction
The establishment of viable systems of rights and access to limit entry into coastal fisheries is sorely lacking. Licensing schemes in many countries are still viewed as statistical and revenue generating exercises, rather than as effective management handles to limit entry and control fishing effort. In overfished coastal areas, the obvious need is for a re- duction of fishing effort, particularly in nearshore, traditional fishing grounds. The requisite effort re- duction in some areas is quite substantial as in the example for Philippine demersal and small pelagic fisheries shown in Fig. 8. In this case the reduction required is about half of prevailing effort levels. This kind of situation requires direct exit interventions, enhancement of alternative livelihood prospects and occupational mobility of fishers, restructuring of re- levant policy and regulatory frameworks, and the re- direction of subsidies and support towards improved ruraYcommunity development. Other measures out- lined below are also directly relevant to requisite ef- fort reduction schemes in overfished coastal fisheries.
Gear, Area and Temporal Restrictions
Measures influencing the species and size, and to a certain extent the sex and maturity stage, composi- tion of catches include: (1) technological controls or limitations, e.g., gear restrictions such as mesh regu- lations, hook size control, trawl bans; (2) spatial restrictions, e.g., marine sanctuaries, area closures;

20 and (3) temporal restrictions, e.g., seasonal closures. Regulatory instruments include various forms of spe- cies and size restrictions on landings, as well as pro- hibitions on landing of gravid females. Table 5 uses selected regulations in effect in the Philippines to illustrate some of the forms that these selectivity mea- sures may take. I t should be noted that a creative use of other measures, such as incentivesldisincen- tives, can be made to influence selectivity and the re- sulting exploitation patternsAevels of coastal fisheries.
While much of the theoretical and methodological aspects of gear selectivity are covered in the litera- ture, there is a considerable scope for in situ informa- tion on selectivity to set up measures for site-specific management. Considerable opportunities exist for a more creative use of gear restrictions, zonation schemes, marine sanctuaries or protected areas (Bohnsack 1994), and seasonal closures to influence the selectivity of coastal fisheries (Silvestre 1995). The design and operation of measures to improve selecti- vity will vary depending on the number of species and fishing gears used. The complexity of the selectivity problem increases from single species, single gear situations to multigear, multispecies situations (Pauly 1979; Gulland 1983). This has hindered the more creative use of gear, area and temporal restrictions.
McManus (this vol.) points to faunal assemblages associated with spatial elements which can be tapped by managers i n designing a r ea restrict ions, sanctuaries or zonation schemes (see also McManus 1986, 1989, 1996). The opening and closing of the fishing season for shrimps in Australia illustrates the potential for temporal restrictions, given similarities i n the dynamics of exploited shr imp species (Rothlisberg e t al. 1988; Staples 1991). Attention is also required in developing and dispersing appropriate hatchery techniques for cultured species, e.g., milk- fish, shrimps, groupers. The restriction of gears with small-meshed nets in nearshore areas can succeed only if aquaculture dependence on wild seeds is curtailed.
Inzprovenzent of Marketing and Post Harvest Facilities
The level of discards and (value) loss in catches require increased management intervention (Alverson et al. 1994). Post harvest facilities (i.e., salt, ice and cold storage) are lacking in strategic locations in many areas. Private-sector participation in providing these facilities needs to be enhanced given the noted ineffi- ciency of the public sector in maintaining such facili- ties. Development and dissemination of appropriate processing (e.g., surimi) and handling techniques also require attention, as does the development and main- tenance of rural road infrastructures. Improved se-
lectivity of coastal fisheries is also important in re- ducing the magnitude of discards.
Enhancement of Awareness and Participation of Stakeholders
Enhancing the awareness and participation of stakeholders is necessary for better and more cost- effective management of coastal fisheries. Improved transparency and institutionalized participation of stakeholders in the management decision-making process is desirable. Other measures that can be implemented include: enhancement of fishers' orga- nizations and other NGOs; educationlawareness programs; devolution/decentralization of management authority; and appropriate extension, training and credit support for nonfishing activities.
Reduction of Environmental Impacts
The need for a reduction of the impacts of fishing and other economic activities on the coastal environ- ment that sustains fisheries is evident in many coun- tries. Efforts toward integrated coastal zone ma- nagement (Chua and Pauly 1989; Clark 1992) and the adoption of integrated coastal fisheries manage- ment approaches (Silvestre 19961, will be necessary for the reduction of undesirable impacts on the coastal environment. Other areas requiring intervention in- clude: wider adoption of multiple-use zonation schemes; restorationhehabilitation of coastal habitats; curtailment of destructive fishing methods; adoption of appropriate environmental impact assessment sys- tems; and improvement and enforcement of penalties1 incentives systems. Progress in the wider use of the precautionary approach and (development of mecha- nisms for) 'internalization' of environmental costs is highly relevant to reducing coastal environmental impacts.
Institutional Strelzgtlzeizing/Upgrading
Concern about the issues above persists due to the inability of existing institutions to elaborate and ef- fect the requisite management interventions. Strengthening of the policy, regulatory and organiza- tional frameworks relevant to fisheries is urgently re- quired. The areas identified as needing attention in- clude: technical, personnel and facilities upgrading; improvement of financial capability and strengthening of mandates of organizations; enhancement of organi- zational coordination/collaboration; increased trans- parency, accountability and participation in the ma- nagement decision-making process, and; the deve- lopment of effective and cost-efficient monitoring,

21 Table 5. illustrative examples of regulatory instruments affecting the selectivity of fishing operations in the Philippines. (Source: Silvestre 1995).
Regulatory instrument Law/ordinancea Specifications
1. Technological controls - mesh regulation PD 704 (1 975) Prohibition of use of nets with mesh sizes less
than 3 cm when stretched (nationwide). FA0 155 (1 986) Regulating the use of fine-meshed nets in fisling
(nationwide).
- 'gear' ban
2. Spatial restrictions - area closure
3. Temporal restrictions
4. Others
PD 704 (1 975) Prohibition of commercial trawling (less than 3 GT) in waters 7 fathoms deep or less (nationwide).
FA0 163 (1 986) Prohibition on the operation of muro-am! and kayakas in all Philippine waters (nationwide).
FA0 188 (1993) Regulations governing the operation of commercial fishing boats in Philippine waters using tuna purse seine nets (nationwide).
FA0 190 (1994) Regulations governing pa-aling fishing operation in Philippine waters (nationwide).
PD 704 (1 975) Prohibition on the use of explosives and poisons in fishing (nationwide).
PD 704 (1 975) Prohibition of commercial fishing (with the use of boats more than 3 GT) in waters less than 7 fathoms (nationwide).
LO1 1328 (1983) Extended the ban on commercial trawls and purse seines within 7 km of the coastline in all provinces (nationwide).
RA 7160 (1992) Extended boundaries of municipal waters from 3 nautical miles (5.5 km) to 15 km from the shoreline (nationwide).
FA0 9 (1950) Regulation governing the conservation of the ipon goby fisheries of the llocos provinces; open season from November to January; closed season in September, October and February (area specific i.e., llocos Norte).
FA0 136 (1982) Closed season of five years for the operation of commercial fishing boats in San Miguel Bay (area specific).
FA0 129 (1980) Ban on the taking or catching, selling, possession, and transportation of sabalo (full grown bangus or milkfish) (nationwide).
FA0 148 (1 984) Regulation for gathering, catching, taking or removing of marine tropical aquarium fish (nationwide).
a FA0 = Fishery Administrative Order; PD = Presidential Decree; LO1 = Letter of Instruction
control and surveillance (MCS) systems (Flewelling 1995). The costs of improved management are substantial and exploration of appropriate cost-sharing schemes with industry (as the ultimate beneficiary) needs to be developed.
Enhancement of Research and Information
Management systems have to be supported by re- search and information. There is need for research in: appropriate size and siting of sanctuaries or pro- tccted areas; resource enhancement and habitat re- habilitation techniques; selective fishing; appropriate
fisheries management reference points; ecosystem modeling (Christensen and Pauly 1995, 1996); and policy and institutional support. Documentation and retrospective analysis of existing information and past studies (e.g., trawl surveys) is important for purposes of comparison and for the potential insights they pro- vide for the management of coastal fisheries. Esta- blishment of statistical baseline information should be consistent with the MCS and management reference points appropriate to the situational realities obtaining in the individual countries. There should be more re- search collaboration and exchange of research and expe- riences between the countries given similarities in their resource base and development context.

Conclusion
I11 the 13 developing South and Southeast Asian countries covered in this study coastal fisheries ge- nerate food, employment and foreign exchange. Many factors impact the magnitude and sustainability of these benefits. Fig. 11 shows a logical structuring of the main objectives, issues and interventions relevant to coastal fisheries management in these countries and also provides a summary of the main points co- vered in this paper. There are three generic catego- ries of ('ends') objectives for the management of coastal fisheries, viz., productivitylefficiency, distributional equity and environmental integrity. A fourth generic ('means') category, institutional effectivenessleffi- ciency, is often considered necessary for success in attainment of the main ('ends') objectives. Seven key issues affect the attainment of these objectives and the benefits derived from coastal fisheries. Seven key management interventions for the resolution or miti- gation of these issues are listed. The issues are in- terconnected and have cross-reinforcing tendencies, e.g., overfishing intensifies conflicts between small and large-scale fisheries leading to the use of destruc- tive gears and increased habitat degradation. The management interventions are also interconnected, although only the link to the main issues being addressed is illustrated. Apart from providing a sum- mary, Fig. 11 in essence presents a systems matrix of generic elements which should be considered in advancing coastal fisheries management efforts in South and Southeast Asia.
Beyond the reflection and debate, Fig. 11 illustrates the need for effective action on a wide front at various levels of the institutional hierarchy. The manage- ment interventions outlined in this paper show scope for action at the local, national and international le- vels. Much of the overall success will depend on na- tional institutional capabilities. The strengthening and upgrading of these capabilities and effective imple- mentation of the interventions outlined are in turn dependent on the resources that can be mobilized for such purposes. In the context of the development needs of these countries, there is competition for resources given other equally pressing developmental and so- cial needs. The reviews given by Holdgate et al. (19821, Tolba and El-Kholy (19921, and FA0 (1995b) identify positive and negative international trends affecting the environment, food, agriculture and fisheries par- ticularly relevant to this study. High population growth, external debt burden, declining commodity prices, market access difficulties and the shrinking international aid 'pot' are minuses for the ability of most countries to devote sufficient resources to the problems at hand. The positive developments are in- creased economic growth (although this can lead to more pollution problems), environmental awareness, democratization and regional collaboration. Thus, the ultimate solutions to the multiplicity of issues impac- ting coastal fisheries are also premised on addressing poverty and promoting overall development in South and Southeast Asia.
Management I Key Issues Key Interventions Obiectives I (ProblemslConstraints) I (StrategiesIActions)
I limited entry1
effort reduction
exploitation gearlareal temporal restrictions
improved marketing1 post-halvest facilities
I enhance stakeholder awareness1 participation
I
reduction of coastal integrity environment impacts
I f research \ 4 / I Innance .. . .< 1 rnanagemenr mrorrnation I efficiency1 I I i--*+~~+ifinal strengthening, I
Fig. 11. Summary of management objectives, key management issues and constraints , and intervent ions (strategies and actions) for the coastal fisheries of the developing countries of tropical Asia. Management in te r - ventions have crosscutting benefits1 implications, but only the connections to the main issue being addressed are illustrated.

Acknowledgments
Thanks are due Mr. Len Garces and Ms. Bing Santos for assistance in assembling some of the in- formation given in the tables, and for locating impor- tant references used in this study.
References
ADB. 1995. Key indicators of developing Asian and Pacific countries. Vol. XXVI. Asian Development Bank, Manila. 417 p.
ADB. 1996. Asian development outlook - 1996 and 1997. Asian Developmedt Bank, Manila. 245 p.
Alverson, D., M. Freeberg, S. Murawski and J.G. Pope. 1994. A global assessment of fisheries bycatch and discards. FA0 Fish. Tech. Pap. (339): 233 p.
Anderson. L.G. 1987. Expansion of the fishery management paradigm to include institutional structure and function. Trans. Am. Fish. Soc. 116(3): 396-404.
Aoyama, T. 1973. The demersal fish stocks and fisheries of the South China Sea. FA0 and UNDP, Rome. SCS/DEV/73/3: 80 p.
APFIC. 1996. Summary report of the APFIC Symposium on Environmental Aspects of Responsible Fisheries, Seoul, Republic of Korea, 15-18 October 1996. RAP Publ. 19961 42. Asia Pacific Fisheries Commission, Bangkok, Thailand. 27 p.
APO. 1988. Fishing industry in Asia and the Pacific. Asian Productivity Organization, Tokyo. 481 p.
Armstrong, D., R. Ferro, D. MacLennan and S. Reeves. 1990. Gear selectivity and the conservation of fish. J . Fish. Biol. 37(A): 261-262.
Beverton, R. and S. Holt. 1957. On the dynamics of exploited fish popalations. Fishery Invest., London, Ser. 2, 19: 533 p.
JBohnsack, J.A. 1994 Marine reserves: they enhance fisheries, reduce conflicts, and protect resources. Naga, ICLARM Q. 17(3): 4-7.
Butcher, J . 1994. Harvesting the sea. An ecological history of the marine fisheries of Southeast Asia. Research School of Pacific and Asian Studies , Australian National
J University. 116 p. Butcher, J . 1996. The marine fisheries of t h e Western
Archipelago: towards an economic history, 1850 to the 1960s. p. 24-39. In D. Pauly and P. Martosubroto (eds.) Baseline studies of biodiversity: the fish resources of Western Indonesia. ICLARM Stud. Rev. 23, 312 p.
Caddy, J.F. and R. Mahon. 1995. Reference points for fishery management. FA0 Fish. Tech. Pap. (347): 82 p.
Caddy, J . F . Fisheries management after 2000: will new paradigms apply? Rev. Fish Biol. Fish. (In press).
Christensen, V, and D. Pauly. 1995. Fish production, catches and the carrying capacity of the world oceans. Naga, the ICLARM Q. 18(3): 34-40.
Christensen, V. and D. Pauly. 1996. Ecological modeling for all. Naga, the ICLARM Q. 19(2): 25-26.
Chou, L.M. 1994. Marine environmental issues of Southeast Asia: state and development. Hydrobiologia 285: 139-150.
Chua, T. E. and D. Pauly (eds.) 1989. Coastal area management in Southeast Asia: policies, management strategies and case studies. ICLARM Conf. Proc. 19, 254 p.
Chullasorn, S. and P. Martosubroto. 1986. Distribution and important biological features of coastal fish resources in Southeast Asia. FA0 Fish Tech. Pap. (278): 84 p.
23 Clark, J.R. 1992. Integrated management of coastal zones. FA0
Fish. Tech. Pap. (327): 167 p. Dalzell, P., P. Corpuz, R. Ganaden and D. Pauly. 1987. Estimation
of maximum sustainable yield and maximum economic rent from the Philippine small pelagic fisheries. Bureau of Fisheries and Aquatic Resources Tech. Pap. Ser. 10(3), 23 p.
Dwiponggo, A,, T. Hariati, S. Banon, M.L. Palomares and D. Pauly. 1986. Growth, mortality and recrui tment of commercially important fishes and penaeid shrimps in Indonesian waters. ICLARM Tech. Rep. 17: 91 p.
Dwiponggo, A. 1988. Recovery of overexploited demersal resources and growth of its fishery on the north coast of Java. Indones. Agric. Res. Dev. J., lO(3): 65-72.
FAO. 1978. Some scientific problems of multispecies fisheries. Report of the Expert Con.sultation on Management of Multispecies Fisheries. FA0 Fish. Tech. Pap. (181): 42 p.
FAO. 1992. Review of the state of world fishery resources. Part 1. The marine resources. FA0 Fish. Circ. (710), Rev. 8, Part 1. 114 p.
FAO. 1994. FA0 yearbooks. Fishery Statistics. Vol. 78, 702 p. FAO. 1995a. Review of t,he state of world fishery resources:
marine fisheries. FA0 Fish Circ. (884): 105 p. FAO. 1995b. The state of world fisheries and aquaculture. FAO,
Rome. 57 p. FAOISEAFDECISIFR. 1994. Status of fishery information and
statistics in Asia. Proceedings of the Regional Workshop on Fishery Information and Statistics in Asia, Bangkok, Thailand, 18-22 January 1994. Vol. I and 11.
Flewwelling, P. 1995. An introduction to monitoring, control and surveillance for capture fisheries. FA0 Fish. Tech. Pap. (338): 217 p.
Fortes, M.D. 1988. Mangrove and seagrass beds of East Asia: habitats under stress. Ambio 17(3): 207-213.
Fortes, M.D. 1995. Seagrasses of East Asia: environmental management perspectives. RCUIEAS Technical Reports Series No. 6.
Froese, R. and D. Pauly. 1996. FishBase 96: concepts, design and data sources. ICLARM, Manila. 179 p.
Gomez, E.D. 1988. Overview of environmental problems in the East Asian Seas region. Ambio 17(3): 166-169.
Gomez, E.D., E. Deocadiz, M. Hunspreugs, A.A. Jothy, Kuan Kwee Jee, A. Soegiarto and R.S.S. Wu. 1990. State of the marine environment in the East Asian Seas Region. UNEP Regional Seas Reports and Studies No. 126. 63 p.
Gulland, J. 1983. Fish stock assessment: a manual of basic methods. E'Ao~Wiley, New York. 223 p.
Hamley, J.M. 1975. Review of gillnet selectivity. J . Fish. Res. Board Can. 32(11): 1943-1969.
Hilborn, R. and C.J. Walters. 1992. Quantitative fisheries stock assessment: choice, dynamics and uncertainty. Chapman and Hall, New York. 570 p.
Holdgate, M., M. Kassas and G. White (eds.) 1982. The world environment, 1972-1982. A Report by UNEP. Tycooly International, Dublin.
Holmgren, S. 1994. An environmental assessment of the Bay of Bengal region. Bay of Bengal Programme, Madras. BOBPiREPl67: 256 p.
Hotta, M. 1996. Regional review of the fisheries and aquaculture situation and outlook in South and Southeast Asia. FA0 Fish. Circ. (904): 45 p. FAO, Rome.
Ingles, J . and D. Pauly. 1984. An atlas of the growth, mortality and recruitment of Philippine fishes. ICLARM Tech. Rep. 13:127 p.
IPFC. 1987a. Papers presented a t the Symposium on the exploitation and management of marina, fishery resources in Southeast Asia. Darwin, Australia, 16-19 February 1987. RAPA Rep. 1987110: 552 p.

24 IPFC. 1987b. Report of the symposium on the exploitation and
management of marine fishery resources in Southeast Asia. Darwin, Australia, 16-19 Feb. 1987. RAPA Rep. 198'71
J 9: 39 p. Khoo, H.W., S. Selvanathan and H.A.M.S. Halidi. 1987. Capture
fisheries, p. 89-109. In T.E. Chua, L.M. Chou and M.S.M. Sadorra (eds.) The coastal environmental profile of Brunei Darussalam: resource assessment and management issues. ICLARM Tech. Rep. 18, 193 p.
Koe, L.C.C. and M.A. Aziz. 1995. Regional programme of action on land-based activities affecting coastal and marine areas in the East Asian Seas. UNEP, Bangkok. RCU/EAS Tech. Rep. Ser. (5): 117 p.
Lawson, R. 1978. Incompatibilities and conflicts in fisheries planning in Southeast Asia. Southeast Asian J. Soc. Sci. 6(1-2): 115-136.
Lilburn, B.V. 1987. Formulation of fisheries management plans. p. 507-527. In IPFC. Papers presented at the symposium on the exploitation and management of marine fishery resources in Southeast Asia. Darwin, Australia. 16-19 February 1987. RAPA Rep. 1987110: 552 p.
Longhurst, A. and D. Pauly. 1987. Ecology of tropical oceans. Academic Press, New York. 407 p.
Marr, J.C. 1976. Fishery and resource management in Southeast Asia. RFFPISFA Pap. 7, 62p.
Marr, J.C. 1981. Southeast Asian marine fishery resources and fisheries. pp. 75-109. In L.S. Chia and C. MacAndrews (eds.). Southeast Asian Seas: Front iers for Development.
,/ McGraw-Hill, Singapore. McManus, J.W. 1986. Depth zonation in a demersal fishery in
the Samar Sea, Philippines, p. 483-486. In Maclean, J.L., Dizon, L.B., Hosillos, L.V. (eds.) The First Asian Fisheries Forum. Asian Fisheries Society, Manila, Philippines.
McManus, J.W. 1988. Coral reefs of the ASEAN region: status and management. Ambio 17(3): 189-193.
McManus, J.W. 1989. Zonation among demersal fishes in Southeast Asia: the southwest shelf of Indonesia, p. 1011- 1022. In Proceedings of the Sixth Symp. On Coastal and Ocean ManagemenUASCE , 11-14 July 1989. Charleston,
1 South Carolina. McManus, J.W. 1996. Marine bottom fish communities from
the Indian Ocean coast of Bali to mid-Sumatra, p. 91-101. In D. Pauly and P. Martosubroto (eds.) Baseline studies of biodiversity: the fish resources of Western Indonesia. ICLARM Stud. Rev. 23: 312 p.
Olver, C.H., B.J. Shuter and C.R. Minns. 1995. Towards a definition of conservation principles for fisheries management. Can. J . Fish. Aquat. Sci. 52: 1584-1594.
Pauly, D. 1979. Theory and management of tropical multispecies stocks: a review, with emphasis on the Southeast Asian demersal fisheries. ICLARM Stud. Rev. 1, 35 p.
Pauly, D. and G.I. Murphy (eds.). 1982. Theory and management of tropical fisheries. Proceedings of the ICLARMICSIRO Workshop on t h e Theory and Management of Tropical Multispecies Stocks, 12-21 January 1981, Cronulla, Australia. ICLARM Conf. Proc. 9, 360 p.
Pauly, D. and T.E. Chua. 1988. The overfishing of marine resources: socioeconomic background in Southeast Asia. Ambio 17(3): 200-206.
Pau ly , D. 1989. F i sher ies resources management i n Southeast Asia: why bother? p. 1-10. In T.E. Chua and D. Pauly (eds.) 1989. Coastal a rea management i n Southeast Asia: policies, management strategies and case studies. ICLARM Conf. Proc. 19, 254 p.
Pauly, D. 1994. From managing fisheries to managing ecosystems. ICES, Copenhagen. ICES Inf. 24:7.
Pauly, D. 1995. Anecdotes and the shifting baseline syndrome of fisheries. Trends in Ecol. Evol. 10 (10): 430.
Pauly, D. and P. Martosubroto. 1996. Baseline studies of biodiversity: the fish resources of Western Indonesia. ICLARM Stud. Rev. 23, 321 p.
Pauly, D. 1996a. Fleet-operational, economic, and cultural determinants of by-catch uses in Southeast Asia, p. 285- 288. In Solving by-catch: considerations for today and tomorrow. Alaska Sea Grant College Prog. Rep. No. 96- 03. University of Alaska, Fairbanks.
Pauly, D. 1996b. One hundred tons of fish and fisheries research. Fish. Res. 25(1): 25-38.
Pauly, D. 1997. Small-scale fisheries in the tropics: marginality, marginalization, and some implications for fisheries management. In E.K. Pikitch, D.D. Huppert and M.P. Sissenwine (eds.) Global trends: fisheries management. American Fisheries Society Symposium 20, Bethesda, Maryland.
Pope, J., A. Margetts, J . Hamley and E. Akjiiz. 1975. Manual of methods for fish stock assessment, part 111. Selectivity of fishing gear. FA0 Tech. Pap. 41 (Rev. l) , 65 p.
Raja, B.T.A. 1980. Current knowledge of fisheries resources in the staff a rea of t h e Bay of Bengal. Bay of Bengal Programme, Madras. BOBPlWP8, 23 p.
Ricker, W.E. 1975. Computation and interpretation of biological statistics of fish populations. Bull. Fish. Res. Board. Can.
,/ (191), 382 p. Rothlisberg, P., D. Staples and B. Hill. 1988. Factors affecting
recruitment in penaeid prawns in tropical Australia. p. 241-248. In A. Yaiiez-Arancibia and D. Pauly (eds.) IOCl F A 0 Workshop on Recruitment in Tropical Coastal Demersal Communities. IOC Works. Rep. No. 44.
Sainsbury, K. 1984. Optimum mesh size for tropical
J multispecies trawl fisheries. J. Cons. CIEM 41: 129-139.
Sardjono, I. 1980. Trawlers banned in Indonesia. ICLARM Newsl. 3(4): 3.
Sen Gupta, R., M. Ali, A.L. Bhuiyan, M.M. Hossain, P.M. Sivalingam, S. Subasinghe and N.M. Tirmizi. 1990. State of the marine environment in the South Asian Seas Region. UNEP Reg. Seas Rep. Stud. No. 123.
Shindo, S. 1973. General review of the trawl fishery and the demersal fish stocks of the South China Sea. FA0 Fish. Tech. Pap. 120, 49 p.
Silvestre, G.T., R.B. Regalado and D. Pauly. 1986. Status of Philippine demersal stocks-inferences from underutilized catch rate data, p. 47-96. In D. Pauly, J . Saeger and G. Silvestre (eds.) Resources, management and socio- economics of Philippine marine fisheries. Tech. Rep. Dep. Mar. Fish. Tech. Rep. 10, 217 p.
Silvestre, G.T. and D. Pauly. 1986. Estimate ofyield and economic rent from Philippine demersal stocks, 1946-1984. Paper presented at the WESTPAC Symposium on Marine Science in the Western Pacific, Townsville, Australia, 1-6 December 1986.
Silvestre, G.T. 1990. Overexploitation of demersal stocks in Lingayen Gulf, Philippines, p. 973-876. In R. Hirano and I. Hanyu (eds.) The Second Asian Fisheries Forum, Asian Fisheries Society, Manila, Philippines.
Silvestre, G.T., M. Soriano and D. Pauly. 1991. Sigmoid selection and the Beverton and Holt yield equation. Asian Fish. Sci. (4): 85-98.
Silvestre, G.T. and H.J.H. Matdanan. 1992. Brunei Darussalam capture fisheries: A review of resources, exploitation and management, p. 1-38. In G. Silvestre, H.J.H. Matdanan, P.H.Y. Sharifuddin, M.W.R.N. De Silva and T.E. Chua(eds.). The coastal resources of Brunei Darussalam: s tatus , utilization and management. ICLARM Conf. Proc. 34,214 p.

Silvestre, G.T. 1995. Fisheries management and the selectivity of fishing operations. FA0 Consultation of Experts and Industry on Selective Fishing for Responsible Exploitation of the Resources in Asia, Beijing, 12-17 October 1995. Inf. Pap. (12): 25 p.
Silvestre, G.T. 1996. Integrated management of coastal fisheries: lessons from initiatives in San Miguel Bay, Philippines. ICLARM, Manila, 13 p.
Sivasubramaniam K. 1985, Marine fishery resources of the Bay of Bengal. Bay of Bengal Programme, Madras. BOBPIWPI36: 66 p.
Smith, I.R., D. Pauly and A.N. Mines. 1983. Small-scale fisheries of S a n Miguel Bay, Philippines: options for management and research. ICLARM Tech. Rep. 11, 80 p.
Soysa, C.H., L.S. Chia and W.L. Collier (eds.) 1982. Man, land and sea: coastal resource use and management in Asia and the Pacific. Agricultural Development Council, Bangkok, 320 p.
Staples, D. 1991. Penaeid prawn recruitment: geographic comparison of recruitment patterns within the Indo-West Pacific Region. Mem. Queensland Mus. 31: 337-348.
Stephenson, R.L. and D.E. Lane. 1995. Fisheries management science: a plea for conceptual change. Can. J. Fish. Aquat.
J Sci. 52: 2051-2056. Thomson, D. 1988. The world's two marine fishing industries -
how they compare. Naga, ICLARM Q. ll(3): 17.
25 Tiews, K. (ed.). 1973. Fisheries resources and the i r
management in Southeast Asia. German Foundation for International Development, Federal Research Board for Fisheries and FAO. Berlin (West), 511 p.
Tolba, M. and 0. El-Kholy (eds.). 1992. The world environment, 1972-1992. Two decades of challenge. Chapman and Hall for UNEP, London.
WCED. 1987. Our common future. World Commission for Environment and Development. Oxford University Press,
J Oxford. Williams, M. 1996. The transition i n t h e contribution of
l iving aqua t ic resources to food secur i ty . Food, Agriculture, and the Environment Discussion Paper 13, 41 p. International Food Policy Research Institute, Washington D.C.
Wilkinson, C.R., S. Sudara and L.M. Chou (eds.) 1994. Proceedings, Third ASEAN-Australia Symposium on Living Coastal Resources. Vol. 1: S t a t u s reviews. Australian Inst i tute of Marine Science, Townsville, Australia. 454 p.
WRI. 1995. People and the environment. WRI in collaboration with UNEP and the UNDP.
Yanagawa, H. and P. Wongsanga. 1993. Review of fishery production, provisional estimation of potential yield and the situation of fisheries in the Southeast Asian region - 1976 to 1989. SEAFDEC Spec. Publ. (18), 114 p.

The Coastal Fisheries of Bangladesh
M.G. KHAN Marine Fisheries Survey Department of Fisheries
Chittagong 4100, Bangladesh
M. ALAMGIR Fisheries Research Institute
Marine Fisheries and Technology Station Cox's Bazar, Bangladesh
M.N. SADA Marine Fisheries Survey Department of Fisheries
Chittagong 4100, Bangladesh
Khan, M.G. and M. Alamgir and M.N. Sada. 1997. The coastal fisheries of Bangladesh, p. 26-37. In G. Silvestre and D. Pauly (eds.) Status and management of tropical coastal fisheries in Asia. ICLARM Conf. Proc. 53, 208 p.
Abstract
This contribution provides a n overview of coastal fisheries in Bangladesh and covers the coastal environment, capture fisheries characteristics and trends, and management issues relevant to the sector. The country's coastal fisheries accounted for 28% of the annual fisheries production of 1 087 000 t in 1993- 1994. The industrial and artisanal fisheries operate in shallow, coastal waters; the former mainly in 40- 100 m depth and the latter mainly between the shoreline and 40 m depth.
A multiplicity of issues adversely affect the coastal fisheries of Bangladesh. Excessive fishing effort and growth overfishing impact currently fished resources (particularly shrimp and demersal finfish). Com- petition and conflict among artisanal and industrial gears are intense. About 80% of the catch of trawlers is not landed but discarded a t sea. Moreover, shrimp seed collection in nearshore waters is causing severe damage to coastal resources. In addition to fisheries-specific issues, a number of cross-sectoral issues (e.g., mangrove denudation, siltation) impact the coastal zone and the long-term sustainability of coastal fishe- ries. Management measures in response to these issues are briefly discussed.
Introduction
The fisheries sector in Bangladesh is important as a source of food, livelihood and foreign exchange. The country's annual fish production has increased from 640 000 t i n 1975-1976 to about 1 087 000 t i n 1993- 1994. Per capita fish consumption has declined dn- ring the same period from 33.4 kg to 21.0 kg because production has not kept pace with the rapid popula- tion increase. Nevertheless, the fisheries sector still supplied 80% of animal protein consumed in the coun- try in 1993-1994.
The marine capture fisheries sector generated only 28% of fisheries production in 1993-1994. The sector is subdivided into industrial and artisanal fisheries, the former involving solely the use of trawlers and the latter involving the use of relatively simple gear such as gillnets and bagnets. The marine capture fisheries in Bangladesh operate in shallow, coastal wa- ters principally between the shoreline and 100 m depth. This contribution attempts to provide an overview of the marine capture fisheries of Bangladesh and the main issues impacting their management.
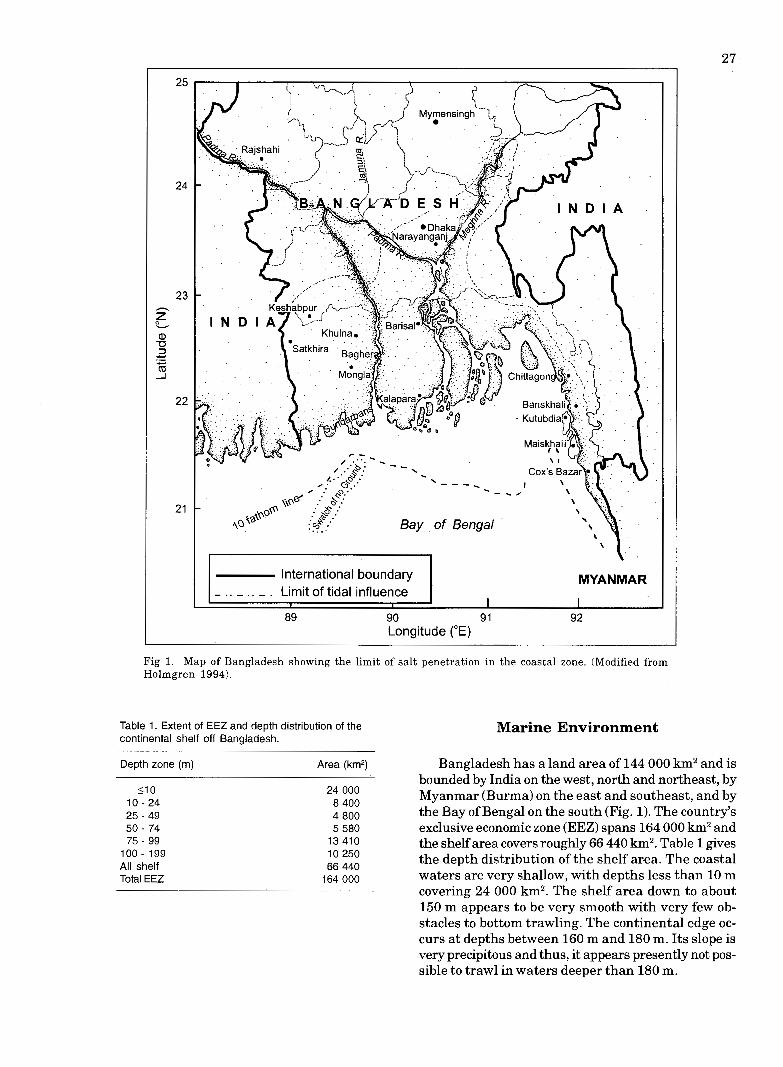
International boundary MYANMAR - .. - .. - . Limit of tidal influence
I I I 89 90 91 92
Longitude ("E)
Fig 1. Map of Bangladesh showing the limit of salt penetration in the coastal zone. (Modified from Holmgren 1994).
Table 1. Extent of EEZ and depth distribution of the continental shelf off Bangladesh.
Marine Environment
Depth zone (m) Area (km2)
51 0 10 - 24 25 - 49 50 - 74 75 - 99
100 - 199 All shelf Total EEZ
Bangladesh has a land area of 144 000 km2 and is bounded by India on the west, north and northeast, by Myanmar (Burma) on the east and southeast, and by the Bay of Bengal on the south (Fig. 1). The country's exclusive economic zone (EEZ) spans 164 000 km2 and the shelf area covers roughly 66 440 km2. Table 1 gives the depth distribution of the shelf area. The coastal waters are very shallow, with depths less than 10 m covering 24 000 km2. The shelf area down to about 150 m appears to be very smooth with very few ob- stacles to bottom trawling. The continental edge oc- curs at depths between 160 m and 180 m. Its slope is very precipitous and thus, it appears presently not pos- sible to trawl in waters deeper than 180 m.

28 The southwest monsoon, characterized by hot and
humid winds blowing from the Bay of Bengal, occurs from May to around August/September. About 80% of the total annual rainfall is recorded during this pe- riod. The northeast monsoon blows from November to around MarchIApril, bringing cool, dry air from the continental areas. Between the two monsoons, winds are variable and unstable and cyclones may occur. Coastal waters are characterized by a prolonged low saline regime due to river discharges (which peak during the southwest monsoon). A strong (3 m) semidiurnal tide mixes the highly turbid coastal wa- ters which receives sediments from as far as the Himalayas (FA0 1968; Eysink 1983). Monsoon sea- sonality governs surface current patterns (Lamboeuf 1987).
Fig. 2 gives typical surface and subsurface distri- butions of salinity, temperature and oxygen off Bangladesh during the summer. The surface salinity distribution shows a strong gradient in a north-south direction. This is reflected by the subsurface salinity
distribution, which shows a 32% frontal zone or 'tongue' due to river discharges. Surface water tem- perature varies from 29.5"C to 38.B°C with higher values prevailing offshore. Thermocline depth is around 30-40 m in summer (compared to about 70 m during winter months). In the more offshore areas the upper layer is more homogenous, a t least down to the thermocline. Oxygen content declines rapidly with depth, the 1 ml.1-I isoline being situated around 80 m depth in summer (compared to about 60 m in winter). Oxygen deficits are prominent in the subsurface layer of the outer shelf area.
Primary production in the Bay of Bengal is known to be high during the northeast monsoon, i.e., 0.15- 1.45 gC.m-2.day1, but similar information during the southwest monsoon is lacking. Zooplankton biomass in the area has been reported to vary between 0.98 and 3.90 gC.m-2.day1 (Sivasubramaniam 1985).
Coral reefs are quite limited off Bangladesh due to high river discharge and turbidity. Four species of Acropora (A. pulchra, A. horrida, A. humilis and A.
19 t =i Salinity (%o)
18 , 1 90 91 92
Longitude ("E)
Temperature ("c) 11- Salinity (%o) I Dissolved 0, (rn1.l') 1 Fig 2. Surface (A) and subsurface (B-D) distribution of temperature, salinity and oxygen off Bangladesh. (Source: Saetre 1981).

variabilis) and ten other coral reef genera have been reported from offshore islands (Mahmood and Haider 1992). Information about seagrasses in Bangladesh is lacking, although seafronts of newly-formed islands and some low-lying coastal areas are often carpeted with seagrass. Halodule uninervis has been reported from sandy littoral zones (Islam 1980).
Mangroves are useful buffers against cyclones and tidal surges. The country has 587 400 ha of natural mangroves, with a further 100 000 ha replanted with various mangrove species (Mahmood 1995). Mangroves also provide a habitat for numerous crustaceans and finfishes (Mahmood et al. 1994). However, the man- groves of Bangladesh are under severe stress due to a reduced freshwater flow (resulting from construction of dams, barrages and embankments) and conversion to shrimp ponds (Mahmood 1995). Numerous studies have shown the relationship between fishhhrimp yields and the extent of mangrove cover (Martosubroto and Naamin 1977; Turner 1977; Pauly and Ingles 1986). Mangrove destruction in Bangladesh may be partly responsible for the observed decline of Penaeus
Table 2. Commercially important fishes and shrimps exploited in Bangladesh.
Scientific name Common name Demersallsmall pelagics
Parnpus argentek P. chinensis Pornadasys argenteus Lutjanus johnii Mene rnaculata Tenualosa ilisha Polydactylus indicus Lepturacanthus savala Arius spp. Johnius belangerii Otolithes ruber Nernipterus japonicus Upeneus sulphureus Saurida turnbil llisha filigera Sphyraena barracuda Congresox talabonoides
Larger pelagics Euthynnus affinis Katsuwonus pelarnis Thunnus rnaccoyii Thunnus obesus Thunnus tonggol Auxis rochei Auxis thazard
Shrimps Penaeus rnonodon I? sernisulcatus I? japonicus I? indicus I? rnerguiensis Metapenaeus rnonoceros M. brevicornis M. spinulatus Parapenaeopsis sculptilis I? stylifera
Silver pomfret Chinese pomfret White grunter Red snapper Moonfish Hilsa shad Indian salmon Ribbonfishlhairtail Catfish Croaker Croaker Japanese threadfin bream Goatfish Lizardfish Bigeye ilisha Great barracuda Indian pike conger
Eastern little tuna Skipjack tuna Southern bluefin tuna Bigeye tuna Longtail tuna Bullet tuna Frigate tuna
Giant tiger Tiger shrimp Tiger shrimp White shrimp Bananalwhite shrimp Brown shrimp Brown shrimp Brown shrimp Pink shrimp Pink shrimp
29 monodon post larvae in various areas and the decli- ning shrimp catch rates of fishers.
Capture Fisheries
The capture fisheries of Bangladesh exploit a com- plex, multispecies resource. A single trawl haul, for instance, usually catches over a hundred species (Khan 1983; White and Khan 1985). A number of species, however, are targetted by the fishery. Table 2 gives a list of the commercially important fish and shrimp exploited in Bangladesh waters. A number of studies (particularly demersal trawl surveys - see Appendix 111) have been undertaken to examine the development potential and status of these resources. In the case of trawlable (dominantly demersal) stocks, estimates of standing stockvary widely, from the 40 000-55 000 t given by Penn (1983) to the 260 000-370 000 t figure given by West (1973). The current consensus based on reassessment of these and related studies (Chowdhury and Khan 1981; Saetre 1981; Khan 1983; White and Khan 1985; Lamboeuf 1987) is a trawlable standing stock of 150 000-160 000 t in the coastal waters off Bangladesh. The composition and depth distribution of this stock is shown in Table 3 using the results of Lamboeuf (1987). The trawlable stock is dominated by sciaenids, catfishes, threadfin breams, carangids and goatfishes. Roughly 53% (85 400 t) of the standing stock consists of commercially important demersals, while 16% (25 700 t) consists of commercially impor- tant pelagics.
Studies of the shrimp resources provide standing stock estimates of 1 500-9 000 t of shrimps (West 1973; Penn 1983; White and Khan 1985; Van Zalinge 1986; Mustafa et al. 1987). Recent work suggests a maxi- mum sustainable yield (MSY) figure of 7 000-8 000 t of penaeid shrimps (Khan et al. 1989). Available infor- mation on the magnitude of the pelagic resources of the country are quite limited. The only available esti- mate is that of Saetre (1981) who gives a pelagic stan- ding stock figure of 90 000-160 000 t based on acoustic survey results. This figure is believed to be a very preliminary and conservative estimate which requires further research. Information pertaining to the country's tuna and large pelagic resources are quite patchy, emanating mostly from exploratory fishing trials. More reliable estimates await the results of assessment efforts further offshore.
A multiplicity of gear is used by fishers in Bangladesh to exploit the multispecies resources. Table 4 gives a summary of the fishing gear used in the country, together with their common target species1 groups and depth of operation or deployment. The gear is subdivided into industrial and artisanal categories. The industrial gear consists of fish and shrimp traw- lers which were introduced in 1974 and 1978,

3 0 Table 3. Estimate of biomass by familylgroup and depth strata off Bangladesh. (Adapted from Lamboeuf 1987).
Common name Biomass Relative Distribution by 0) abundance depth strata
("/.) (W
10-20 20-50 50-80 80-1 00 m m m m
1. Sciaenidae 2. Ariidae 3. Nemipteridae 4. Carangidae 5. Mullidae 6. Synodontidae 7. Trichiuridae 8. Leiognathidae 9. Pomadasyidae
10. Clupeidae 11. Scombridae 12. Priacanthidae 13. Stromateidae 14. Cephalopods 15. Engraulidae 16. Gerreidae 17. Harpadontidae 18. Lutjanidae 19. Rajidae 20. Others
Croakers Catfishes Threadfin breams Jacks, scads Goatfishes Lizardfishes Hairtailfishes Ponyfishes Grunters Sardines Mackerels Bullseyes White Chinese pomfrets Squids, cuttlefishes Anchovies Silver-biddies Bombay duck Snappers Rays, skates
Commercially important demersals Commercially important pelagics Total
respectively. From a few units in 1974, fish trawlers expanded to a high of 137 units in 1980 and declined to 100 units in 1985. Currently, there are 13 fish trawlers ranging in size from 17.5 m to 28 m (350-1 200 hp). Fish trawlers have headrope lengths of 18-32 m with 60-65 mm codend mesh size. From 4 shrimp trawlers operating in 1978, the number in- creased to 100 units in 1984 (White and Khan 1985). At present, there are 39 shrimp trawlers with overall length from 20.5 m to 44.5 m. Shrimp trawlers use riggers and operate twin nets with 45-50 mm codend mesh size. Trawlers commonly operate in waters 40- 100 m deep. In the early 1990s, trawlers landed an average of 3 500 t of shrimps and 100 000 t of fish annually (Table 5). I t is estimated that 80% of the fish catch is not landed by trawlers but discarded a t sea (White and Khan 1985). Table 5 shows the an- nual shrimp catch and fishing effort of trawlers from 1981 to 1991.
The artisanal fisheries utilize a variety of gear to exploit the multispecies mix. These include five types of gillnets, three types of set bagnets, trammel nets, bottom longlines, beach seines and other gear deployed in shallow estuarine and coastal areas (Table 4). With the exception of bottom set gillnets, artisanal gear is commonly deployed in depths of only up to 30 m. With the exception of drift gillnets, marine set bagnets and bottom longline operations, artisanal fishing involves
the use of non-motorized boats. I t is estimated that the artisanal fishery in the early 1990s used about 4 900 boats (using roughly 5 500 artisanal gear units) and landed about 247 000 t of fish and shrimps annually. About 55% of the annual production was con- tributed by drift gillnets and 30% by estuarine set bagnets.
Fig. 3 illustrates the common areas of operation or deployment of the more important fishing gear used in the coastal waters off Bangladesh. The pushnets, estuarine set bagnets and beach seine are used in the shallow, estuarine parts throughout the country's coast. The bottom longlines, trammel nets and ma- rine set bagnets are deployed with increasing depth (up to about 30 m). Drift gillnets are also deployed in these areas, targeting principally small pelagics (i.e., Tenualosa ilisha, T. kelee, T. toli). Trawlers predomi- nate in the deeper areas from 30 m to 100 m depth. Given that the size of fish and shrimps increases with depth, they sequentially exploit many species. Ma- nagement of fisheries, therefore, requires consideration of this overlapping of target species and their sequen- tial exploitation.
Moreover, fishing in shallow areas down to 30 m depth is quite intense and competition between artisanal and industrial gear has increased (Islam et al. 1993; Paul et al. 1993; Rahman 1993; Khan et al. 1994).

Table 4. Fishing gear used in Bangladesh with common target specieslgroup and depth of operation
Fisherylgear Target specieslgroup Depth of operation (m)
A. Industrial 1. Trawl
a. Shrimp trawl b. Fish trawl
B. Artisanal 1. Gillnet
a. Drift gillnet b. Fixed gillnet c. Large mesh drift gillnet d. Bottom set gillnet e. Mullet gillnet
2. Set bagnet a. Estuarine set bagnet
b. Marine set bagnet
c. Large mesh set bagnet 3. Trammel net
4. Bottom longline
5. Beach seine
6. Char pata jal 7. Cast net 8. Push net 9. Fixed bagnet 10. Dragnet
Metapenaeus monoceros Penaeus monodon P semisulcatus, Fi merguiensis, sciaenids, catfish, Indian salmon (Polynemus indicus), sharks and rays, pomfret
Tenualosa ilisha Tenualosa ilisha Sharks Indian salmon Grey mullet
Brown and pink shrimp, Bombay duck (Harpadon nehereus), sciaenids, anchovies, clupeids, hairtail Brown and pink shrimp, hairtail, Bombay duck, anchovies, clupeids Lates calcarifer (sea perch) White, tiger, and brown shrimp, sciaenids, catfish Sciaenids
Small brown and pink shrimp, clupeids, anchovies, sciaenids hairtail Brown, white and tiger shrimp Brown, white and tiger shrimp Larvae of P monodon Larvae of P monodon Larvae of P rnonodon
down to 30 8 - 1 0
down to 30 down to 80 5 - 1 0
down to 10 down to 10 down to 10 down to 5 down to 2
Table 5 Annual shr~mp catch and f~sh~ng effort of trawlers In Bangladesh dur~ng the per~od 1981-1982 to 1990-1991 (Sources. Mustafa and Khan 1993, Khan and Lat~ff 1995)
Standard effort Shr~mp catch (days) (t) Catch per
Flshlng effort season Shr~mp Flsh Total Shr~mp F~sh Total (kg day ')
trawlers trawlers trawlers trawlers

Fig 3. Depth distribution and area of operations of dominant fishing gears used in the coastal waters off ~ a n ~ l a d e i h . (Source: Khan et al. 1994).
Sequential exploitation of target resource groups off Bangladesh may be best illustrated by the case of penaeid shrimps (particularly Penaeus monodon). Fig. 4 illustrates graphically the various stages of the life cycle history of penaeid shrimps and the variety of gear used to exploit them at each stage. Push nets or larval nets exploit the postlarval stage to supply the wild seed demand of the expanding shrimp aqua- culture industry. Estuarine set bagnets exploit the juvenile shrimp, while beach seines and marine set bagnets exploit the subadults. Trammel nets and trawlers are used to harvest the adult shrimps in deeper waters.
Paul et al. (1993) provided estimates of the size distribution of P. monodon catches resulting from the sequential fisheries operating in Bangladesh coastal waters (Fig. 5). This study noted that over 2 billion P. monodon postlarvae were caught by seed collec- tors annually (i.e., 99.6% of the total number har- vested, the rest coming from other types of gear). The shrimp seed collection wreaks tremendous damage on the larvae and juveniles of other species, apart from the danger of growth and recruitment overfishing for the target P. monodon stock. Fig. 5 also illustrates the considerable growth overfishing resulting from es- tuarine set bagnet operations. Suggestions for the gradual phaseout of estuarine set bagnets have been made (Islam et al. 1993; Paul et al. 1993; Khan et al.
1994). However, the socioeconomic dislocation of 200 000 people directly dependent on the estuarine set bagnet fishery requires serious consideration and more innovative approaches (e.g. in the area of alternative livelihood development). The problem of growth over- fishing illustrated here for P. monodon is one which impacts other species exploited in Bangladesh, given the sequential fisheries operating therein and the in- tense fishing effort in the shallow, coastal areas.
Management Issues and Opportunities
A number of comprehensive assessments of coastal capture fisheries and the environment of Bangladesh have been conducted in recent years (BOBP 1993; Rahman 1993; Mahmood 1995). These studies raise a host of management issues and also make various recommendations. In this contribution, we have cho- sen to simply highlight some of the issues which we believe require the most immediate attention. The studies referred to above give a more detailed treatment.
Excessive fishing effort in nearshore waters (par- ticularly between the shoreline and 40 m depth) is the primary issue requiring attention. The increa- sing fisher population and intense competition in nearshore waters between artisanal gears has led to a decline in their incomes. In the case of industrial

----
Estuarine set bagnet \ Mysis
\
rotozoea
Fig 4. Graphical illustration of penaeid shrimp life cycle and fishing gears used to exploit them a t various stages in Bangladesh. (Source: Khan and Latiff 1995).
fisheries, the existing number of trawlers is deemed sufficient to exploit the available shrimp and demer- sal fish stocks and no expansion in trawler effort is foreseen. The incursion of trawlers in nearshore, artisanal fishing grounds increases competition and conflict in these areas and requires increased enforce- ment efforts.
The intense fishing pressure on currently exploited resources may be gleaned from the results of recent assessments. Table 6 gives the population parameters of species caught by estuarine set bagnets obtained by Khan et al. (1992). Estimates of asymptotic length (L-1, growth constant (K) and natural mortality rate (M) are consistent with those available in other li- terature. Note the very high fishing mortality (F) and exploitation rates (E) of most species, as well as the relatively small length at first capture (LC). Apart from
Acetes indicus and Setipinna taty, these species are evidently fished heavily. Table 7 gives the results of various assessments conducted for trawl-caught spe- cies in Bangladesh. There is also a preponderance of very high F and E values for the species investigated.
Growth overfishing is a serious problem and re- sults principally from the heavy concentration of push nets and estuarine set bagnets (and marine set bagnets to some extent) in nearshore waters (see Figs. 3 to 5 and LC values in Table 6). Push nets supply shrimp seeds to the expanding shrimp aquaculture industry. The development of hatcheries to supply shrimp seeds and the improvement of handling and transport of these seeds could reduce push net effort and the da- mage it entails. In the case of estuarine set bagnets, area and seasonal closures for operation of the gear
-and the development of alternative livelihood projects

2,035
Shrimp seed collection
Beach seine
-!I -Estuarine set bagnet
ammel net
Total length (cm)
Fig 5. Size distribution of giant tiger shrimp (Penaeus monodon) catches by various gears used in Bangladesh. (Source: Khan et al. 1994).
Table 6. Population parameters of some species common in the catch of estuarine set bagnets in Bangladesh. (Source: Khan et al. 1992).
Spec~es L- (cm)" K (year-') M (year ' ) F (year-') L ( ~ m ) ~
Crustaceans Penaeus monodon P indicus Metapenaeus monoceros M. brevicornis M. spinulatus Parapenaeopsis sculptilis P stylifera Acetes indicus Macrobrachium rosenbergii Palaeomon styliferus
Fish Raconda russelliana 23.6 0.43 Setipinna taty 21.3 0.53 Stolephorus tri 16.8 0.65 Harpadon nehereus 34.9 0.38 Lepturacanthus savala 93.0 0.29 Eleutheronema tetradactylurn 38.1 0.10 Polynemus paradiseus 21.6 0.52 Sillaginopsis panijus 43.3 0.38 Sillago sihama 27.4 0.39
a Asymptotic total length in the von Bertalanffy growth equation.
Mean total length at first capture

Table 7. Population parameters of some trawl-caught species in Bangladesh. (Source: DOF internal reports). - -
Species L- (cm)" K (year ') M (year-') F (year-')
Crustaceans Penaeus monodon ( F ) P monodon (M) Metapenaeus monoceros (M) M. monoceros (F)
Fish Pampus argenteus Upeneus sulphureus Nemipterus japonicus Saurida tumbil Pomadasys argenteus Lepturacanthus savala Harpadon nehereus Lutjanus johnii Ariomma indica
a Asymptotic total length in the von Bertalanffy growth equation.
Mean total length of first capture.
Table 8. Typical coastal transect showing main activities and issues relevant to effective integrated coastal zone and coastal fisheries management in Bangladesh -
-- -- T e r r e s t r i a l Major zones Upland Midland
(> la% slope) (8-18% slope)
Main resource Logging useslactivities Mining
Urban development Agriculture
- -- -- -- . - - - Main environmental Slltatlon
issues/impacts Eroslon on the coastal Floodmg zone Agrochemlcal
loadlng Water pollution
TOXIC mlne talllnas
Logging Mining Urban development Industries Agriculture Bricklboulder extraction - ---
Siltation Erosion Flooding Toxic mine tailings
Lowland Coastal
Interface Nearshore Marine
Of fshore Deepsea (043% slope) (1 km inland from (30 m-200 m depth) (>200 m depth- (beyond EEZ)
HHWL-30 m depth EEZ)
Logging Mangrove forestry Artisanal fishing CommerciallindustriaI Marine transport Agriculture Aquaculture Commercial/industriaI fishing Urban Portslmarine fishing development transport Marine transport Industries Artisanal fishing Pearl collection Tourism
Siltation Erosion Flooding Agrochemical
loading Sewage pollution
Industrial ~ollution
- -. --
Reduction of Reduced Overfishing Oil spills/slicks biodiversity biodiversity Oil spills/slicks
Habitat degradation Overfishing Overfishing Oil spills/slicks Beach erosion Organic loading Oil spillslslicks

36 in the context of integrated community development have been suggested (Khan et al. 1994).
The evident need for the capture fisheries sector in Bangladesh is to reduce fishing effort (particularly in nearshore waters) and rationalize current exploi- tation and utilization of fishery resources. Given the country's development context it is a clear challenge to find means to achieve this. Briefly, the following points deserve attention in this regard:
introduction of a zoning scheme governing artisanal and industrial gear deployment to minimize conflicts and optimize utilization of exploited resources; development of small and large pelagics fisheries to relocate effort away from the heavily fished shrimps and demersals; reduction of by-catch and discards, particu- larly in the industrial fisheries; enhancement of participatory management and an integrated, community-based deve- lopment approach; improvement of the information and exten- sion capabilities of the Department of Fishe- ries in support of fisheries management efforts; computerization and improvement of the cap- ture fisheries statistical system; improvement of research, enforcement and monitoring capabilities consistent with re- quirements of the Marine Fisheries Ordi- nance; and improvement of the information and exten- sion capabilities of the Department of Fishe- ries in support of fisheries management efforts; and reactivation of the Bangladesh National Fishermens' Cooperative Society to enhance support, management and rehabilitation programs.
Apart from these evident fisheries-specific issues, a number of cross-sectoral issues require attention for long-term sustainability of coastal fisheries. Table 8 summarizes the main activities and issues which impact the coastal zone (and ultimately coastal fisheries) in Bangladesh. The multiple issues impac- ting the country's coastal zone require multiple, but integrated, interventions. Integrated coastal zone ma- nagement (ICZM), therefore, requires increased em- phasis and support to resolve the multiple impacts (both actual and potential) on the coastal ecosystem. Various ICZM initiatives in the country emphasize the need for improved collaboration and coordination among relevant government agencies (e.g., Ministry of Fisheries and Livestock, Marine Mercantile Depart-
ment, Ministry of Land, Ministry of Environment and Forests, Ministry of Defense) as well as an upgradmg of their capabilities to effectively resolve coastal zone im- pacts.
References
BOBP. 1993. Studies of interactive marine fisheries of Bangladesh. Bay of Bengal Programme, Madras, India. 117 p.
Chowdhury, W. and M.G. Khan. 1981. A report on results of the fisheries survey cruise no.3 (Oct. 1981) of the R.V. Anusandhani to the shrimp grounds in the Bay of Bengal of Bangladesh. Marine Fisheries Exploration and Biological Research Station, Chittagong.
Eysink, W.D. 1983. Basic consideration on the morphology and land accretion potentials in the estuary of the Lower Meghna River. Tech. Rep. 15. 39 p. Land Reclamation Project. Bangladesh Water Development Board.
FAO. 1968. Report to the government of East Pakistan on oceanography of the North Eastern Bay of Bengal useful to the fisheries development and research in East Pakistan based on the work of Dr. Z. Popovioi. PAWFl 102 p. United Nations Development Programme.
Holmgren, S. 1994. An environmental assessment of the Bay of Bengal Programme, Madras. BOBPIREPI67: 256 p.
Islam, A.K.M.N. 1980. A marine angiosperm from St. Martin's Island. Bangladesh J . Bot. 9(2): 177-178.
Islam, M.S., M.G Khan, S.A. Quayum, M.N.U. Sada and Z.A. Chowdhury. 1993. The estuarine set bagnet fishery. In Studies of interactive marine fisheries of Bangladesh. BOBPtWPl89. 19-50 p. Bay of Bengal Programme. Madras, India.
Khan, M.G. 1983. Results of the 13th cruise (July 1983) with the R.V. Anusandhani of the demersal fish and shrimp ground of the Bay of Bengal, Bangladesh. Marine Fisheries Research, Management and Development Project, Chittagong.
Khan, M.G. and M.A. Latif. 1995. Potentials, constraints and strategies for conservation and management of open brackishwater and marine fishery resources. Paper presented a t the National Seminar on Fisheries Resources Development and Management organized by MOFL, Bangladesh, with F A 0 and ODA, 29 October to 3 1 November 1995. Dhaka, Bangladesh. 19 p.
Khan, M.G., M.G. Mustafa, M.N.U. Sada and Z.A. Chowdhury. 1989. Bangladesh offshore marine fishery resources studies with the special reference in the penaeid shrimp stock 1988-89. Annual report: Marine Fisheries Survey, Management and Development Project. GOB, Chittagong. 213 p.
Khan, M.G., M.S. Islam, M.G. Mustafa, M.N.U. Sada and Z.A. Chowdhury. 1994. Biosocioeconomic assessment of the effect of the estuarine set bagnet on the marine fisheries of Bangladesh. BOBPMrPI94.28 p. Bay of Bengal Program, Madras, India.
Khan, M.G., M.S. Islam, S.A. Quayum, M.N.U. Sada and Z.A. Chowdhury. 1992. Biology of the fish and shrimp population exploited by the estuarine set bagnet. Paper presented at the BOBP Seminar, 12-15 January 1992, Cox's Bazar, Bangladesh. 20 p.
Lamboeuf, M. 1987. Bangladesh demersal fish resources of the continental shelf. FAOiBGD. FE:DP/BGD/80/075. 26 p. Marine Fisheries Research Management and Development Project.

IVlahmood, N . IYYS. u n the tlshery signiricance or tne mangroves of Bangladesh. Paper presented a t the Workshop on Coastal Aquaculture and Environmental Management, 25-28 April 1995. Cox's Bazar. Organized and sponsored by Institute of Marine Science, Chittagong University (IMS, CU) UNESCO.
Mahmood, N., N.J.U. Chowdhury, M.M. Hossain, S.M.B. Haider and S.R. Chowdhury. 1994. Bangladesh, p. 75-129. In An environmental assessment of the Bay of Bengal region. Swedish Centre for Coastal Development and Management of Aquatic Resources, Bay of Bengal Programme. BOBPlRepl67.
Mahmood, N. and S.M.B. Haider. A note on corals of the St. Martin's Island. Bangladesh. Chittagong University Studies. (In press).
Martosubroto, P. and N. Naamin. 1977. Relationship between tidal forests (mangroves) and commercial shr imp production in Indonesia. Mar. Res. Indones. No. 8: 81-86.
Mustafa, M.G. and M.G. Khan. 1993. The bottom trawl fishery, p. 89-106. In studies of interactive marine fisheries of Bangladesh. BOBPlWPl89. 117 p. Bay of Bengal Programme, Madras, India.
Mustafa, M.G., M.G. Khan and M. Humayon. 1987. Bangladesh Bay of Bengal penaeid shrimp trawl survey results, R.V. Anz~sandhani, November 1985, January 1987. UNDP/FAO/ GOB. Marine Fisheries Research, Management and Development Project, Chittagong. 15 p.
Paul, S.C., M.G. Mustafa, Z.A. Chowdhury and M.G. Khan. 1993. Shrimp seed collection. In Studies of interactive marine fisheries of Bangladesh. BOBPlWPI89, 3-17 p. Bay of Bengal Programme, Madras, India.
.- . 7 . 7 - - - - - . " , . . - ,. . 3 J 37 Pauly, D. and J. Ingles. 1986. The relationship between shrimp
yields and intertidal vegetation (mangroves). p. 277-283. In IOC/FAO Workshop on Recruitment in Tropical Coastal Demersal Communities, Ciudad del Carmen, Campeche, Mexico, 21-25 April 1986.
Penn, J.W. 1983. An assessment of potential yield from the offshore demersal shrimp and fish stock in Bangladesh water (including comments on the trawl fishery 1981-1982). FE:DP/BGD/81. 634. Field Doc. 22 p. Fishery Advisory Service (Phase-11) Project, Rome, FAO.
Rahman, A.K.A. 1993. Marine small scale fisheries in Bangladesh. Regional Office for Asia and the Pacific, Bangkok. 55 p.
Saetre , R. 1981. Survey on the marine fish resources of Bangladesh, November-Dececember 1979 and May 1980. Report on surveys in the R.V. Dr. FridtjofNansen. Institute of Marine Research, Bergen. 67 p.
Sivasubramaniam, K. 1985. Marine fishery resources of the Bay of Bengal. Bay of Bengal Programme, Madras, India. 66 p.
Turner, R.E. 1977. Intertidal vegetation and commercial yields of penaeid shrimps. Trans. Am. Fish. Soc. 106: 411-416.
Van Zalinge, N.P. 1986. Bangladesh shrimp resources. Field Doc. BADl801025.
West, W.Q.B. 1973. Fishery resources of the upper Bay of Bengal. Indian Ocean Programme. FAOIUNDPIIOFCIDEVI 73/28. 42 p.
White, T.F. and M.G. Khan. 1985. Marine fishery resources survey. Demersal Trawling Survey Cruise Rep. 1. FA01 BGDl80/025/CRI. 67 p. Chittagong.

The Marine Fisheries of Indonesia, with Emphasis on the Coastal Demersal Stocks of the Sunda Shelf
B. E. PRNONO Directorate General of Fisheries
Department ofAmiculture , - 2 Jakarta, Indonesia
APR 1 4 7890 B. SUMIONO Agency for Agricultural Research and Development
Institute for Marine Fisheries Jakarta, Indonesia
PRIYONO, B.E. and B. SUMIONO. 1997. The marine fisheries of Indonesia, with emphasis on the coastal demersal stocks of the Sunda shelf, p. 38-46. In G. Silvestre and D. Pauly (eds.) Status and management of tropical coastal fisheries in Asia. ICLARM Conf. Proc. 53, 208 p.
Abstract
Indonesia, with a combined fisheries catch and aquaculture production of 2.8 million t.year-I, has the tenth largest fishery in the world. A potential for future development through mariculture still exists in the eastern part of the archipelago. In coastal waters, especially in the western part, the increasing number of small fishing vessels, with either inboard or outboard motors, has caused overfishing of coastal resources. This problem has led the Indonesian government to put emphasis on developing offshore fisheries, notably for large pelagics.
Following trawl surveys conducted in the early 1960s, demersal trawling -- mainly for shrimp and high-value fish -- started in the mid-1960s in the Malacca Strait. From there it expanded throughout the waters of the western part of the archipelago. In the east, trawl surveys by Indonesian vessels in the Arafura Sea began in 1964. A ban on trawling in all parts of Indonesia (except in the Arafura Sea) was implemented in 1980. This paper briefly assesses some effects of the ban and of other coastal fisheries management policies in Indonesia.
Introduction Indonesian Marine Environment
Indonesia is an archipelagic country located in Southeast Asia. Consisting of over 17 000 large and small islands, it straddles the equator between 6"N and 11"s latitude (Fig. 1). When it claimed a 200 nautical mile exclusive economic zone (EEZ) in 1980, Indonesia became the world's largest archipelago, stretching some 3 000 miles along the equator.
With combined fishery catches and aquaculture production of 2.8 million tsyear ', Indonesia is the tenth largest fishing nation in the world. The following account, updating some issues raised in Martosubroto and Badrudin (1984) and Bailey et al. (19871, reviews key aspects of the fisheries sector in Indonesia, with some emphasis on the coastal fisheries of the western archipelago he . , the Sunda Shelf area).
The total water area claimed by Indonesia covers 5.8 million km2, of which 3.1 million km2 are territo- rial and archipelagic waters with the remainder being claimed as part of the Indonesian EEZ. These waters consist of productive continental shelves (the Sunda Shelf in the west and the Sahul Shelf in the east) and deeper, less productive waters in between (Dalzell and Pauly 1989).
The demersal fishng grounds (including shrimping grounds) and the fishing grounds for small pelagic fishes are found in the shallow parts of the shelves, usually down to 50 m depth (Martosubroto 1996; Martosubroto et al. 1996). These include a variety of habitat types such as soft (muddy or sandy) bottoms and hard, rocky areas generally interspersed with coral

100 11 0 120
Longitude ( O E )
Fig. 1. Indonesian territorial waters and exclusive economic zone.
reefs. The oceanic pelagic species are found in deep off- shore and oceanic waters where water depth exceeds 100 m.
Sea conditions in Indonesia are governed by the alternating southwest (December to February) and northeast (June to August) monsoons. During the southwest monsoon, northeasterly currents intensify in the western part of the South China Sea domina- ting surface water flows, while the Pacific Ocean wa- ters from the Flores and Celebes Seas flow into the Java Sea. During the northeast monsoon, these sur- face flows are reversed (Wyrtki 1961; Roy 1996; Sharp 1996).
In general, average annual variations of sea sur- face temperatures are less than 2°C in western Indo- nesian waters, with slightly higher differences, of 3°C to 4"C, in the Banda, Arafura and Timor Seas, and South of Java (Soegiarto and Birowo 1975; Roy 1996).
On the Sunda Shelf and Sahul Shelf, primary pro- duction is generally high due to the influence of river water discharges. Primary production is also high during seasonal localized upwellings, notably along the south coast of Java and especially the Bali Strait, where they support a relatively large stock of Sardinella lemuru, which in turn supports an impor- tant fishery (Dwiponggo 1974; Ghofar and Mathews 1996; Venema 1996).
Coral reefs are of great economic importance for Indonesia, particularly in the eastern part, where they contribute to the food resources of the local population with a supply of fish, invertebrates and plants. Coral reefs are also used as a source of building materials. This, combined with other stresses, has led to the de-
gradation of many Indonesian coral reefs. Overexploitation has also reduced other valuable re- sources, e.g., spiny lobster, ornamental fish and sea turtle populations. A particularly insidious and re- cent stress is cyanide fishing for the Hong Kong live fish market. This has resulted in the decline of live coral cover and of large coral reef fishes, such as Na- poleon or humphead wrasses, Cheilinus undulatus (Johannes 1995; Johannes and Riepen 1995; Erdmann and Pet-Soede 1996; and see p. 44).
Live coral cover, which determines reef carrying capacity for fishes, is declining. Only 7% of coral reefs still have an excellent coral cover (i.e., 75%-loo%), 34% good (50%-75%), 49% fair (25%-50%) and 11% poor (0-25%).
Indonesia has approximately 3.8 million ha of man- grove. Of these, over 2.9 million are located in Irian Jaya; 417 000 ha in Sumatra; 275 000 hain Kalirnantan; and 34 300 ha in Java. Mangroves are distributed throughout coastal areas, often near estuaries, and between tidal swamp forests and seagrass beds.
In many areas, mangroves have been considerably reduced due to logging for timber and firewood, recla- mation for port and industrial sites, and transforma- tion into brackishwater fishponds. Most of the origi- nal mangrove forests have disappeared from the north coast of Java, and the areas have been converted to shrimp and fish ponds. This may have effects on coastal shrimp fisheries, as there is a relationship between the surface area of mangroves and shrimp yields in Indonesia (Martosubroto and Naamin 1977), similar to that reported from other parts of the world (Turner 1977; Pauly and Ingles 1986).
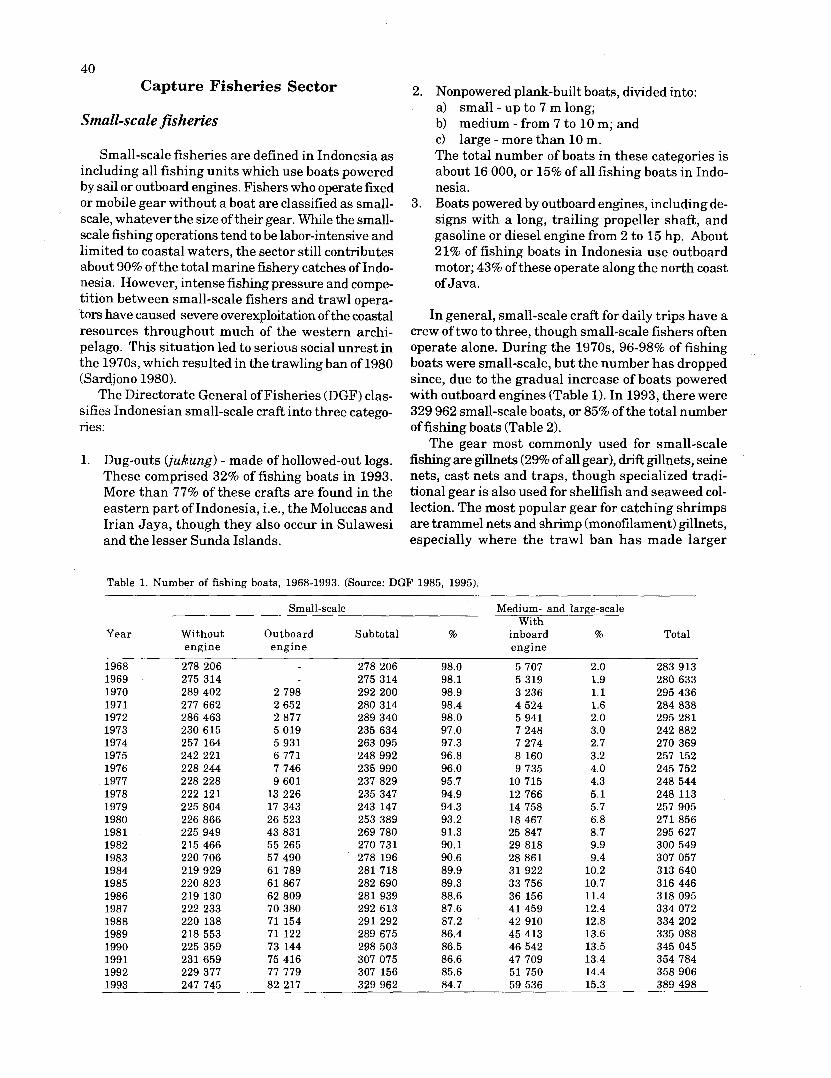
40 Capture Fisheries Sector
Small-scale fisheries
Small-scale fisheries are defined in Indonesia as including all fishing units which use boats powered by sail or outboard engines. Fishers who operate fixed or mobile gear without a boat are classified as small- scale, whatever the size of their gear. While the small- scale fishing operations tend to be labor-intensive and limited to coastal waters, the sector still contributes about 90% of the total marine fishery catches of Indo- nesia. However, intense fishing pressure and compe- tition between small-scale fishers and trawl opera- tors have caused severe overexploitation of the coastal resources throughout much of the western archi- pelago. This situation led to serious social unrest in the 1970s, which resulted in the trawling ban of 1980 (Sardjono 1980).
The Directorate General of Fisheries (DGF) clas- sifies Indonesian small-scale craft into three catego- ries:
1. Dug-outs (jukung) - made of hollowed-out logs. These comprised 32% of fishing boats in 1993. More than 77% of these crafts are found in the eastern part of Indonesia, i.e., the Moluccas and Irian Jaya, though they also occur in Sulawesi and the lesser Sunda Islands.
2. Nonpowered plank-built boats, divided into: a) small - up to 7 m long; b) medium - from 7 to 10 m; and C) large - more than 10 m. The total number of boats in these categories is about 16 000, or 15% of all fishing boats in Indo- nesia.
3. Boats powered by outboard engines, including de- signs with a long, trailing propeller shaft, and gasoline or diesel engine from 2 to 15 hp. About 21% of fishing boats in Indonesia use outboard motor; 43% of these operate along the north coast of Java.
In general, small-scale craft for daily trips have a crew of two to three, though small-scale fishers often operate alone. During the 1970s, 96-98% of fishing boats were small-scale, but the number has dropped since, due to the gradual increase of boats powered with outboard engines (Table 1). In 1993, there were 329 962 small-scale boats, or 85% of the total number of fishing boats (Table 2).
The gear most commonly used for small-scale fishing are gillnets (29% of all gear), drift gillnets, seine nets, cast nets and traps, though specialized tradi- tional gear is also used for shellfish and seaweed col- lection. The most popular gear for catching shrimps are trammel nets and shrimp (monofilament) gillnets, especially where the trawl ban has made larger
Table 1. Number of fishing boats, 1968-1993. (Source: DGF 1985, 1995).
Year
1968 1969 1970 1971 1972 1973 1974 1975 1976 1977 1978 1979 1980 1981 1982 1983 1984 1985 1986 1987 1988 1989 1990 1991 1992 1993
Without engine
278 206 275 314 289 402 277 662 286 463 230 615 257 164 242 221 228 244 228 228 222 121 225 804 226 866 225 949 215 466 220 706 219 929 220 823 219 130 222 233 220 138 218 553 225 359 231 659 229 377 247 745
Small-scale
Outboard Subtotal % engine
278 206 98.0 275 314 98.1
2 798 292 200 98.9 2 652 280 314 98.4 2 877 289 340 98.0 5 019 235 634 97.0 5 931 263 095 97.3 6 771 248 992 96.8 7 746 235 990 96.0 9 601 237 829 95.7
13 226 235 347 94.9 17 343 243 147 94.3 26 523 253 389 93.2 43 831 269 780 91.3 55 265 270 731 90.1 57 490 278 196 90.6 61 789 281 718 89.9 61 867 282 690 89.3 62 809 281 939 88.6 70 380 292 613 87.6 7 1 154 291 292 87.2 71 122 289 675 86.4 73 144 298 503 86.5 75 416 307 075 86.6 77 779 307 156 85.6 82 217 329 962 84.7
Medium- and large-scale With
inboard 8 engine
5 707 2.0 5 319 1.9 3 236 1.1 4 524 1.6 5 941 2.0 7 248 3.0 7 274 2.7 8 160 3.2 9 735 4.0
10 715 4.3 12 766 5.1 14 758 5.7 18 467 6.8 25 847 8.7 29 818 9.9 28 861 9.4 31 922 10.2 33 756 10.7 36 156 11.4 41 459 12.4 42 910 12.8 45 413 13.6 46 542 13.5 47 709 13.4 51 750 14.4 59 536 15.3
Total
283 913 280 633 296 436 284 838 295 281 242 882 270 369 257 152 245 752 248 544 248 113 257 905 271 856 295 627 300 549 307 057 313 640 316 446 318 095 334 072 334 202 335 088 345 045 354 784 358 906 389 498

Table 2. Number of fishing boats, by sector.and size, 1993. (Source: DGF 1995).
Boat type Number of boats Small-scale fishery: Dug out boats 123 760 Plank-built boats
- small 73 452 - medium 41 822 - large 8 711
Boats with outboard engines 82 217 Subtotal 329 962
Medium-scale fishery: Boats with inboard engines
- less than 5 GT - 5-10 GT - 10-20 GT - 20-30 GT
Subtotal
Large-scale fishery: Boats with inboard engines
- 30-49 GT - 50-100 GT - 100-200 GT - more than 200 GT
Subtotal 1 979 Total 389 498
shrimps more accessible to small-scale fishers. The use of such gear has expanded rapidly in recent years along the southeast and north coast of Java, the east coast of Sumatra and in the Malacca Strait.
Medium-scale fisheries
Medium-scale fisheries in Indonesia include boats of generally less than 30 GT that use inboard engines (about 15% of the Indonesian fishing fleet in 1993). The owners of medium-scale fishing boats tend to have access to few or none ofthe shore-based amenities such as ice plants, cold storage facilities or workshops, the use of which characterize tke large-scale fisheries. In- vestment levels for medium-scale fishing units (boat and gear) are commonly in the range of Rp.5-20 million. Individual operators own one or, at most, a few fishing units.
Medium sized vessels are based mainly in the Ma- lacca Strait, the Moluccas and Irian Jaya. After the trawl ban of 1980, the number of medium boats and artisanal trawlers increased, i.e., modernvessels with sizes ranging from 10 to 35 GT (Tables 1 and 2).
Medium-scale fishers use gear such as skipjack poles and lines, purse seines, gillnets and otter trawls (until the 1980 trawl ban). Many of them also catch shrimp using trammel nets along the south coasts of ,Java. Thus, medium-scale fisheries in Indonesia can- not be differentiated from other fisheries on the basis of the gear type they use.
4 1 Large-scale fisheries
Indonesia's large-scale fisheries operate in isola- tion from medium and small scale fisheries, due to their strong export orientation (which limits competi- tion in the local market) and the offshore location of their fishing operations. Most of these fisheries target high-value commodities, especially shrimp and tuna. They use shrimp nets (equipped with by-catch excluder devices which have gradually replaced standard de- mersal trawls since 1992) and tuna longlines, i e . , large-scale gear deployed mainly in the eastern part of Indonesia.
Trawling for shrimp in the Arafura Sea began in 1969 with nine trawlers, ranging in size from 90 to 600 GT, and from 260 to 1 200 hp. By the end of 1982, the number of shrimp trawlers in the Moluccas and Irian Jaya had peaked at 188 units. In the 1990s, there were 87 trawlers equipped with the by-catch excluder device (Sujastani 1984), operated by eight joint-venture companies.
Aside from shrimp, tuna and skipjack are among the most important export commodities from Indone- sian fisheries. About 80% of the landings come from the eastern part of Indonesia, mainly Irian Jaya, the Moluccas, and North Sulawesi.
To estimate fisheries resource potential, a study was conducted by the DGF in cooperation with other institutions such as the Research Institute for Ma- rine Fisheries (RIMF). The results of the study indi- cate a potential yield estimate of about 580 000 t.year-l of fishery resources, including tunas, skipjacks, shrimps, small pelagic and demersal fishes (Table 3). The landings in 1990 were about 48% of the estimated potential yield.
Development of the Sunda Shelf Trawl Fisheries
Trawl fisheries started commercially in 1966 in the Malacca Strait, particularly in the area surroun- ding the estuary of the Rokan River, with Bagansiapi- api as its base. This fishery was characterized by wooden sampan-like motorized vessels of 5-20 GT, employing a single gulf-type shrimp trawl of 12-15 m headrope length. This fishery developed rapidly and by the end of 1971, over 800 vessels were engaged in it.
The development of trawl fishery in Indonesia may have been influenced by western Peninsular Malaysia. The ancestors of many Chinese fishers in Riau Pro- vince, Indonesia, have migrated from there and still maintain contact with their relatives in Malaysia. Another strong input came from Thailand (Eiamsa-ard and Amornchairojkul, this vol.) which had long influenced Indonesian fisheries developments (Butcher 1996).

Table 3. Estimate of potential yield and landings. (Source: DGF 1991).
Fish resources Potential yield (t.year-')
1990 landings ( t )
1. Tuna and skipjack - Tuna - Skipjack
2. Shrimp - Penaeid
Nonpenaeid
3. Small pelagics
4. Other resources - Carangidae - Demersal fishes - Seaweeds
Total 5 762 430 2 737 693
Acknowledged to be an overestimate. '' Acknowledged to be an underestimate.
The number of Chungking trawlers (of type 15 GT) operating from Bagansiapi-api had increased to 227 in 1976. In the following years, the trawl fishery spread throughout western Indonesia, via south- eastern Sumatra to the north and south coasts of Java and to southern Sulawesi. The sizes of the traw- lers gradually increased from 15 to 35 GT and those of their engines from 66 to 120 hp. Polyethylene nets were used, with headrope length ranging from 13.5 to 22.5 m, and codend mesh size of 2 cm.
Data from the Provincial Fisheries Offices of the Malacca Strait provinces of Aceh, North Sumatra, and Riau showed that in the early to mid-1970s about 20% of trawler catch was shrimp (Martosubroto et al. 1996). Along the south coast of Java, the contri- bution of shrimps to trawler landings was about 28%.
The most important shrimp caught by trawl are banana, or jerbung (Penaeus merguiensis, P. indicus, P. chinensis); tiger, or windu (P . monodon, P. semisulcatus, P. Latisulcatus); endeavour, or dog01 (Metapenaeus monoceros, M. ensis, M. elegans); rain- bow, or krosok (Parapenaeopsis sculptilis, P. stylifera); and pink (Solenocera subnuda, Solenocera spp.). The first three groups are well defined in DGF fisheries statistics, while rainbow and pink shrimps belong to the 'other shrimps' category.
The ban on trawling in Indonesia has reduced shrimp and demersal fish yields. In the first year after the trawl ban, shrimp catches in artisanal fisheries decreased by about 60%, while the catches of deinersal fish declined by about 40%. In the third year (1983), shrimp catches and exports were still lower than in 1979, the year immediately preceding the ban (Naamin and Martosubroto 1984; Chong et al. 1987).
Some demersal fish (e.g., of the genera Harpadon, Setipinna, Leiognathus and Cynoglossus), which had formed a major component of the by-catch of trawlers before the ban, are not common in the catches of tram- mel nets (which is the gear that many fishers use as a substitute for trawls).
Similarly, there was a significant reduction of the by-catch of trawlers operating in the Arafura Sea be- cause of their use of by-catch excluder devices, although these did not significantly affect the catch of shrimps, their target group.
Monitoring of demersal stocks has been done through trawl surveys, performed mainly by RIMF with or without foreign partners and using either re- search trawlers or chartered commercial trawlers. The contributions in Pauly and Martosubroto (1996) re- view the knowledge that has been gained from trawl surveys conducted between 1976 to 1980 in western Indonesia, so we shall not duplicate these contribu- tions (but see Dwiponggo et al. 1986; Silvestre and Pauly, this vol., Appendix 111, this vol.
Management Issues
The coastal zone faces a wide array of problems due to multiple uses that are not always compatible. Table 4 summarizes management issues relevant to fisheries in Indonesia. These issues or problems are mostly site-specific, particularly in highly urbanized areas. Most are consistent with those identified by Silvestre and Pauly (this vol.), but some need to be elaborated upon, such as unsustainable aquaculture development, overfishing and destructive fishing.
Large areas for brackishwater culture production have been unproductive because of disease and

Table 4. Typical transect across an Indonesian coastline, illustrating range of activities and issues that must be addressed by integrated coastal management schemes.
Terrestrial Coastal Marine
Major zones Upland Midland Lowland Interface Near shore Offshore Deep sea (>18% slope) (8-18% slope) (0 -~8% slope) (1 km inland from (30 m-200 m depth) (>200 m depth- (beyond EEZ)
depth) HHWL-30 m) EEZ)
Main resource Logging useslactivities Mining
Agriculture Freshwater
aquaculture
Mining Agriculture Freshwater
aquaculture
Urban development Industries Agriculture Tourism Sandlgravel mining
Main environ- Siltation mental issues1 Erosion impacts on the Flooding coastal zone Toxic mine
tailings Sewage
Siltation Erosion Flooding Water pollution Sewage
Siltation Erosion lndustrial pollution Agriculture run-off
Mangrove forestry Brackishwater
fish culture Ports Fish processing Marine recreation
and ecotourism Artisanal fisheries
Habitat degradation Denudation of
coastal wetlands Endangered wildlife Coastal erosion Sedimentation
Artisanal fisheries lndustrial fishing Marine transport Mariculture Recreational fishing, sailing, swimming and diving
Artificial reef
Reduced biodiversity Gear conflicts Oil spills Destructive fishing
practices
Marine transport Marine Industrial fishing transport Offshore development Industrial
fishing Offshore development
Overfishing Oil spills Oil spills Poaching Poaching Capture of Destructive whales and
fishing practices dolphins

44 declining water quality (pollution). In 1989, there were 270 000 ha of brackishwater ponds in Indonesia, with 155 136 farmers involved in brackishwater cul- ture. Since 1987, total shrimp and prawn production contributed substantially to the fishing industry.
Fisheries data from 1969 to 1990, consisting of to- tal catch and total effort of Arafura trawler fisheries, showed that catch per effort is declining significantly while total effort is increasing. Such data indicate that the prawn stock population in the area is overexploited. Previous studies in the Arafura Sea (Naamin and Farid 1980; Priyono 1991,1994) also showed that the shrimp resources are fully exploited.
In the Bali Strait, Sardinella lemuru is the main t,arget fish. The fishers there use several traditional boats, medium and large sizes ofperahu with outboard engines. 'Payao' and purse seine gear are commonly used by the fishers. Analysis of the potential of S. lemuru resources showed that total existing catch is more than the estimated MSY, which means that the fishing operation may be in peril (DGF 1992).
Marine fishing development in Malacca Strait (Indo- nesian side) is dominated by smaller boats, mostly con- centrated in the coastal areas. From 1986 to 1990, the major fishing gear used by the Indonesian fishers in the Malacca Strait were gdlnets and seine nets. In 1992 and 1993, handlines became the second most commonly used gear.
Using data on catch and purse seine standard ef- fort from 1976 to 1990, a trend of consistently increa- sing total catch and decreasing total effort during the period indicates that the total existing effort exceeds the effort required to generate MSY, which indicates overcrowded conditions.
The use of sodium cyanide for catching aquarium fish is rapidly growing. Humphead or Napoleon wrasse, Clzeilinus undulatus, and the light fin grou- per (or polka dot grouper) Cromileptus altifalis are the main target species. Prime, plate-size specimens sell to Hong Kong consumers for as much as $180.kg-'. The industry currently exports about 25 000 t of' live reef fishes annually, with about 60% caught from the wild. The estimated wholesale value is about US$l billion. The premium prices paid for these kinds of fish encourage the use of fishing prac- tices that cause widespread devastation of coral reefs.
Conclusion
Integrated planning and coastal zone manage- ment could still reverse the evident degradation and decline of coastal resources in Indonesia.
Indonesia's marine fisheries sector has expe- rienced rapid technological changes over the past decades. The most prominent has been the tremen- dous increase in the number of powered boats and
the decline in the number of nonmotorized craft. The ban on trawl fishing in Indonesia has not caused as much social friction and dislocation as expected. Although catches of some commodities have been af- fected, the income of traditional fishers has increased. The ban seems to have achieved its main objectives. However, what has been gained in the short term will be lost in the long term if the pattern of degradation is not reversed (Chong et al. 1987; Martosubroto and Chong 1987).
The importance of effective fisheries resource ma- nagement is clearly understood in Indonesia. None- theless, most government efforts have been directed towards resource development through expanded use of more productive fishing gear and boats, rather than through effort controls. The most serious management problem facing policymakers is related to the coastal resources exploited by the vast majority of fishers. Existing management regulations attempt to protect both vulnerable resources and small-scale fishers' rights of access to fishing grounds. Over the long term these objectives will turn out to be incompatible, and hard choices will have to be made.
Action is needed to address the issues in aquacul- ture, overfishing and irresponsible fishing so that the advantages of fundamental productivity can be effec- tively exploited. In formulating the action plans, two broad options should be considered: (1) a 'status quo' option in which there will be no increase in marine and coastal development in overcrowded conditions; and (2) an 'agri-business concept' for fisheries development, with emphasis on the shrimp brackishwater culture and marine fishing in the offshore areas and the EEZ.
In the short term, option 1 has the least implica- tions for government funding and organizational arrangements. However, it fails to exploit the poten- tial benefits of improved cross-sectoral management and ignores long-term productivity and tax revenue losses resulting from illicit activities and negative cross- sectoral impacts. Adopting this option without any improvement on monitoring, control and surveillance (MCS) and enforcement (to limit poachers) runs the risk of destruction of marine resources and may fore- close future sustainable development options in the coastal waters. Thus, for long-term planning, option 1 is not preferred. Option 2 considers the very basic problem in fisheries development, i.e., poverty alleviation of the coastal community. Therefore, the Indonesian govern- ment should improve the income-generating programs for these communities. If profit is a function of reducing the cost of production, then the government can run a simultaneous program to increase this profit mar- gin (Fig. 2).
If option 2 is selected, the government should improve MCS and enhancement activities to improve fisheries management as a whole, so that the goal of sustainable development can be reached in the long term.

- Infrastructure (fishing ports, landing places) - Education and training - Research and information on resources potential
(fishing grounds, gear and methods)
- Ice plant and cold storage
reducing the cost of
___+
Interest rates of c= 12% Fisheries management (sustainable development) Diversification of market and products Small-scale credit schemes 'Dana Menggulin' under property alleviation project Special aid to reduce poverty in the villages
I development I Fig. 2. A concept of sustainable development of fisheries for Indonesia.
References
I Bailey, C., A. Dwiponggo and F. Marahudin. 1987. Indonesian
marine capture fisheries. ICLARM Stud. Rev. 10, 196 p. Bell, J.D. and R. Galzin. 1984. Influence of live coral cover on
coral-reef fish communities. Mar. Ecol. Prog. Ser. 15: 265- J 274.
Butcher, J . 1996. The marine fisheries of t h e western archipelago: towards a n economic history, 1850 to the 1960s, p. 24-39. In D. Pauly and P. Martosubroto (eds.) Baseline studies of biodiversity: the fish resources of western Indonesia. ICLARM Stud. Rev. 23, 321 p.
Chong, K.C., A. Dwiponggo, S. Ilayas and P. Martosubroto. 1.987. Some experiences and highlights of the Indonesia trawl ban: bioeconomics and socioeconomics, p. 458-477. In Papers presented a t the Symposium on the Exploitation and Management of Marine Fishery Resources in Southeast Asia, 16-26 February 1987, Darwin, Australia. RAPA Rep. 1987110.
'Dalzell, P. and D. Pauly. 1989. Assessment of the fish resources of southeast Asia, with emphasis on the Banda and Arafura seas. Neth. J. Sea Res. 24(4): 641-650.
DGF (Directorate General Fisheries). 1985. Fisheries Statistics. DGF (Directorate General Fisheries). 1995. Fisheries Statistics. Dwiponggo, A. 1974. The fishery for and preliminary study on
the growth rate of 'lemuru' (oil sardine) a t Muntjar, Bali Strai t . Symposium on Coastal and High Sea Pelagic Resources. Pro. Indo-Pac. Fish Counc. 15 (Section 111): 221-
J 240. Dwiponggo, A,, T. Hariati, S. Banon, M.L. Palomares and D.
Pauly. 1986. Growth, mortality and recrui tment of commercially important fishes and penaeid shrimps in
J Indonesian waters. ICLARM Tech. Rep. 17, 91 p. Erdmann, M.V. and L. Pet-Soede. 1996. How fresh is too fresh?
The live reef food fish trade in eastern Indonesia. Naga, J ICLARM Q. 19(1): 4-8.
Ghofar, A. and C.P. Mathews. 1996. The Bali Straits lemuru fishery, p. 146. In D. Pauly and P. Martosubroto (eds.) Baseline studies of biodiversity: the fish resources of western Indonesia. ICLARM Stud. Rev. 23, 321 p.
Johannes, R.E. 1995. Fishery for live reef food fish trade is spreading human death and environmental degradation. Coast. Manage. Trop. Asia (September): 8-9.
Johannes, R.E. and M. Riepen. 1995. Environmental, economic and social implications of the live reef fish trade in Asia and the western Pacific. The Nature Conservancy, Jakarta Selatan, Indonesia.
Martosubroto, P. and K.C. Chong. 1987. An economic analysis of the 1980 Indonesian trawl ban. IARD J. 9(1-2): 1-12.
Martosubroto, P. and M. Badrudin. 1984. Notes on the status of the demersal resources off the north coast of Java, p. 33- 36. In Report of the Fourth Session of the Standing Committee on Resources Research and Development of the Indo-Pacific Fisheries Commission, Jakarta, Indonesia, 23-29 August 1984. FA0 Fish. Rep. (318).
Martosubroto P. and N. Naamin. 1977. Relationship between tidal forests (mangroves) and commercial shr imp
J production in Indonesia. Mar. Res. Indones. 8: 81-86. Martosubroto, P., T. Sujastani and D. Pauly. 1996. The mid-
1970s demersal resources in the Indonesian side of the Malacca Strait, p. 40-46. In D. Pauly and P. Martosubroto (eds.) Baseline studies of biodiversity: the fish resources of
J western Indonesia. ICLARM Stud. Rev. 23, 321 p. Martosubroto, P. 1996. Structure and dynamics of the demersal
resources of the Java Sea, 1975-1979, p. 62-76. In D. Pauly and P. Martosubroto (eds.) Baseline studies of biodiversity: the fish resources of western Indonesia. ICLARM Stud. Rev. 23, 321 p.
Naamin, N. and A. Farid. 1980. A review of the shrimp fisheries in Indonesia, p. 33-48. In Report of the Workshop on the Biology and Resources of Penaeid Shrimps in the South China Sea area - Part I. SCS/GENI80126. 162 p. South China Sea Fisheries Development and Coordination Program, Manila.
Naamin, N. and P. Martosubroto. 1984. Effect of gear changes in the Cilacap shrimp fishery, p. 25-32. In Report of the Fourth Session of the Standing Committee on Resources Research and Development of the Indo-Pacific Fisheries

46 Commission, Jakarta, Indonesia, 23-29 August 1984. FA0
/ Fish. Rep. (318). Pauly, D. and J. Ingles. 1986. The relationship between shrimp
yields and intertidal vegetation (mangroves). p. 277-283. In A. Yafiez-Arancibia and D. Pauly (eds.) Proceedings of the IREPIOSLR Workshop on the Recruitment in Tropical Coastal Demersal Communities, 21-25 April 1986, Campeche, Mexico, IOC (UNESCO) Workshop Rep. No.
/ 44 (Suppl.). Pauly, D. and P. Martosubroto (eds). 1996. Baseline studies of
biodiversity: the fish resources of western Indonesia.
J ICLARM Stud. Rev. 23, 321 p.
Roy, C. 1996. Variability of sea surface features in the western Indonesian archipelago: inferences from the COADS dataset, p. 15-23. In D. Pauly and P. Martosubroto (eds.) Baseline studies of biodiversity: the fish resources of
j western Indonesia. ICLARM Stud. Rev. 23, 321 p. Sarjono, I. 1980. Trawlers banned in Indonesia. ICLAFLM Newsl.
, 3(4): 3. ' Sharp, G.D. 1996. Oceanography of the Indonesian archipelago
(eds.) Baseline studies of biodiversity: the fish resources of western Indonesia. ICLARM Stud. Rev. 23, 321 p.
Soegiarto, A. and S. Birowo (eds). 1975. Atlas oseanologi perairan Indonesia dan sekitarnya. Book 1. Lembago Oseanologi Nasional, Jakarta.
Sujastani, T. 1984. The by-catch excluder device, p. 91-95. In Report of the Fourth Session of the Standing Committee on Resources Research and Development of the Indo-Pacific Fisheries Commission, Jakarta, Indonesia, 23-29 August 1984. FA0 Fish. Rep. (318).
Turner, R.E. 1977. Intertidal vegetation and commercial yields
j of penaeid shrimps. Trans. Am. Fish. Soc. 106: 411-416. Venema, S.C. 1996. Results of surveys for pelagic resources in
Indonesian waters with the R.V. Lemuru, December 1972 to May 1976, p. 102-122. In D. Pauly and P. Martosubroto (eds.) Baseline studies of biodiversity: the fish resources of western Indonesia. ICLARM Stud. Rev. 23, 321 p.
Wyrtki, K. 1961. Naga report: scientific results of marine results investigations of the South China Sea and the Gulf of Thai land, 1959-1961. Vol. 2. Scripps Inst i tut ion of
and adjacent areas, p.7-14. In D. Pauly and P. ~artosubroto Oceanography, La Jolla, California.
Status of Fisheries in Malaysia - An Overview
A. ABU TALIE3 Department of Fisheries
Wisma Tani, Jln Sultan Salahuddin 50628 Kuala Lumpur, Malaysia
M. ALIAS Fisheries Research Institute
11960 Batu Maung, Pulau Penang, Malaysia
ABU TALIB, A. and M. ALIAS. 1997. Status of fisheries in Malaysia - an overview, p. 47-61. In G. Silvestre and D. Pauly (eds.) Status and management of tropical coastal fisheries in Asia. ICLARM Conf. Proc. 53, 208 p.
Abstract
The marine fisheries sector in Malaysia provides a significant contribution to the national economy in terms of income, foreign exchange and employment. In 1994, marine fisheries production contributed to 90% of total fish production and was valued a t US$1.04 billion. This paper reviews the status of the marine environment and coastal resources in Malaysia with emphasis on coastal fisheries resources and the development of trawl fisheries. Trawl fisheries were initiated in 1963 and the first trawl survey was conducted in 1970.
Fishery resources are being intensively exploited and the sustainability of these resources is affected by various activities in the coastal zone. Currently the government is implementing several management strategies and measures to ensure the sustainability of coastal fishery resources.
Introduction
The fisheries sector in Malaysia plays an impor- tant role in the national economy in terms of income, foreign exchange and employment. Marine fisheries alone contributed 1 066 000 t in 1994, or 90% bf total fish production. This production, valued at RM 2.6 billion1 (US$1.04 billion), constitutes about 1.5% of the national Gross Domestic Product (GDP). The de- mand for fish, as the main source of protein, is ex- pected to increase from an annual consumption of 630 000 t to over 1 580 000 t by year 2010 (DOF 1995b). The exports of fishery products increased from RM577 million (US$231 million) in 1989 to RM740 million (US$296 million) in 1991, consisting of 175 000 t offishery products.
While the demand for fish continues to increase, the task of managing fisheries resources on a sus- tainable basis has become increasingly complex. The
threat of overexploitation as well as the decrease in recruitment due to the destruction of aquatic habi- tats and the degradation of the aquatic environment have become serious problems that need to be solved. Some mangrove forest, which provide important breeding, nursery and feeding grounds for fish, prawns and a variety of invertebrates, have been converted to agriculture and aquaculture or have been decimated by pollution or diversion of drainage water. Coastal areas are threatened by severe erosion along large parts of the coastline. Continued economic growth and in- dustrialization are exerting considerable pressure on the sensitive coastal ecosystems. Effluents from in- dustrial and domestic discharges, land reclamation as well as illegal dumping and accidental spills con- tribute to the degradation of water quality in the aquatic environment.

48 Marine Environment
Malaysia is a confederation comprising the Malay peninsula (or Peninsular Malaysia) situated a t the southeastern tip of the Asian mainland and the States of Sabah and Sarawak in the northwestern part of Borneo Island (Fig. 1). I t has a land area of 332 600 km2, making it the third largest nation in the MEAN region, after Indonesia and Thailand. The continental shelf area up to 200 m depth is 373 500 km2. With the extension of maritime juris- diction, Malaysian claims expanded to 138 700 km2 or about 42% of its total land area.
The Strait of Malacca is one of the busiest naviga- tional passage in Southeast Asia. Given such a stra- tegic location, issues such as sovereignty, security, sea lanes and environmental protection are of consi- derable importance to Malaysia's maritime develop- ment (Kent and Valencia 1985). Malaysian waters are generally divided into four sub-areas: the west coast and the east coast of Peninsular Malaysia, the coast of Sarawak and the coast of Sabah.
The depth of water off the west coast of Peninsu- lar Malaysia seldom exceeds 120 m within the exclu- sive economic zone (EEZ). The deepest part is at the
northern tip of the Strait of Malacca or the eastern part of the Bay of Bengal where the two water bodies meet. The east coast of Peninsular Malaysia has a rela- tively flat sea bottom and water depth less than 100 m. Deep waters occur off the north coast of Sarawak, with soundings in excess of 1 000 m. In the west and north of Sabah, a deep water trench comes in from the north- east and runs parallel to the coast. The trench has steep sides and the water depth exceeds 2 000 m.
Throughout the year, the flow of the current in the Strait of Malacca is in the northwest direction through the central part of the Strait. During the northeast monsoon, from October to April, the current flows from the south going into the South China Sea and passes the extremity of the Malay peninsula. During the southwest monsoon period, from May to September, water flows westward in the Java Sea and northwest- ward through the Karimata Strait towards the South China Sea then passes directly into the Malacca Strait (Hydrographic Department 1964). Current speed ex- ceeding 1 knot may be experienced throughout the year in the Malacca Strait.
Surface currents in the South China Sea flow in accordance with the monsoon-driven wind system. The southwesterly current of the northeast monsoon is
105 11 0 Longitude ("E)
L
Fig. 1. Location of Malaysia (shaded area) in the Southeast Asian region.

stronger and more constant than the northeasterly current of the southwest monsoon. This behavior is due to stronger and more constant winds (Hydrogra- pher 1975). The southwesterly flow of the northeast monsoon prevails from October to February. Cur- rent flow reaches its greatest rate and constancy from December to January. The northeasterly current of the southwest monsoon occurs in May. The current attains its greatest rate and constancy from June to August-September. During the monsoons, the winds fluctuate considerably in strength owing to variations in the distribution of atmospheric pressure. The northeast monsoon winds are stronger and less liable to interference than the southwest monsoon winds. The direction of water movement over the eastern side of the South China Sea is controlled, to a large ex- tent, by the position of eddies, which occur in most months, and by the flow of water to or from the Sulu Sea and through the broad straits between Peninsu- lar Malaysia and Borneo. These features are con- trolled by varying oceanographic and meteorological conditions outside the area. Moreover, the currents are generally weak with mean rates less than 0.5 knot in most regions. When monsoons are fully developed (July to August and December to February) the mean rates increase to between 0.5 to 1 knot. On rare occa- sions the current may run up to 3 knots between Penin- sular Malaysia and Borneo and 4 knots through some of the passages linking the South China Sea to the Sulu Sea.
The sea surface temperatures are relatively constant throughout the year, ranging from 26 to 32°C (FRI 1987). Water temperature varies from 26 to 29°C during the northeast monsoon. The off monsoon period has water temperatures of 28 to 30°C. The average surface water temperature during the south- west monsoon period ranges from 29 to 32°C (Hamid 1989).
Surface salinity in the west coast of Peninsular Ma- laysia ranges from 27%0 to 33 %o during the northeast monsoon. At depths of 13 m to 21 m salinity ranges from 25 %o to 33 76 (Samsuddin 1995). From 100 to 1 000 m the salinity off Sarawak waters averages 34 %O
during the southwest monsoon period (Saadon et al. 1988). At 2 000 m depth the vertical profile of salinity increases from 35 %O at the surface to 36 %o while tem- perature drops from 29°C at the surface to Ci"C (Hamid 1993).
In most cases, the thermocline is found at 20 m to 50 m (FRI 1987;Saadon et al. 1988). The typical water temperature above the thermocline ranges from 28°C to 30°C, except in a few areas in the west coast of Peninsu- lar Malaysia. In some shallow waters (less than 50 m), a thermocline may be lacking.
On the east coast of Peninsular Malaysia, particu- late organic carbon ranges from 3.9 gC.m-2 on the surface to 6.0 gC.m-2 at 50 m depth (Ichikawa 1986),
49 and from 3.7 g C m 2 to 6.0 gC-m-2 respectively in Sarawak waters (Ichikawa and Law 1988).
The average surface concentration of chlorophyll a in the waters off the east coast of Peninsular Malay- sia is 0.08 mgarn-" with an average value of 0.208 mg.m-3 considering all depth strata (Raihan and Ichikawa 1986). Similarly low content of chlorophyll a is observed in Sarawak waters ranging from 0.049 mg.m-3 to 0.150 mg.m-g(Shamsudin et al. 1988).
Table 1 gives a synoptic description of activities and issues in the coastal area of Malaysia. Mangrove forests are an important source of commercial tim- ber, i.e., the Matang Mangrove Forest Reserve in Perak which has been sustainably managed for tim- ber since the 1920s. Other activities in the lowland areas include urban development, aquaculture, agri- culture and industries. The marine sector also con- tributes significantly to the country's economy from the traditional marine-related uses such as commer- cial fishing and shipping to more dynamic high-growth industries such as petroleum and gas. The problems associated with these activities are generally site- specific and most obvious in urbanized coastal areas.
Mangrove forests cover a total area of 641 000 ha. More than half of the mangrove forests are found in eastern Sabah with the remaining primarily distributed along the west coast of Peninsular Malay- sia and in northern and southwestern Sarawak. About 446 000 ha of these forests are gazetted as forest reserves while the remaining are state land forests (Chew 1996). The total area of mangrove forests in Peninsular Malaysia is estimated to be around 103 000 ha and is mainly located on the west coast (Tang et al. 1990). The major mangrove areas in Peninsular Malaysia include the Larut Matang man- groves in the state of Perak (40 000 ha), the man- groves in Johor (25 700 ha), Kelang in Selangor (22 500 ha) and Merbok in Kedah (9 000 ha) (Choo et al. 1994). The Larut Matang mangroves is reported to be the largest mangrove forest in Peninsular Ma- laysia and cited as the best managed mangrove forest in the world (Gong et al. 1980). However, mangrove forests are being extensively exploited. The threat to Malaysia's mangroves lies in land conversion or de- forestation for agriculture, industry and aquaculture.
The coral reef areas of Peninsular Malaysia are found around the islands located off the coast of Terengganu (Pulau Redang, Pulau Perhentian and Pulau Tenggol) and PahangIJohor (Pulau Tioman groups) in the east, the Payar group of islands in the north of Kedah, and the Sembilan group of is- lands off Perak in the west coast. There are also fringing reefs along the mainland coast, particu- larly on the east coast, with small isolated reefs occurring along the west coast. The more exten- sive and exotic coral reef areas are located in the north coast of Sabah and the Spratleys.

50 The biggest threat to coral reefs has been their
exploitation for commercial and tourism purposes, coupled with siltation and sedimentation caused by development projects (Liew and Hoare 1982). These activities have subjected corals to stress and leaching which have resulted in the deterioration of coral reefs. The Department of Fisheries has taken steps to con- serve and rehabilitate the country's coral reefs by clas- sifying many of the islands where these corals occur as marine parks.
In a recent review of seagrass distribution off the west coast of Peninsular Malaysia (Kushairi 1992), five species were noted in shallow waters (0.2 m to 1.8 m), i.e., Halophila ovalis, H. minor, Halodule uninervis, H. pinifolia and Enhalus acoroides. The seagrass beds are prone to erosion, fecal contamina- tion and heavy metal pollution (Phang 1990; Kushairi 1992).
In terms of water quality of Malaysian coastal waters, loading of suspended solids has been a major environmental problem for the past few years. Activities associated with continuous and intensive land clearing, uncontrolled development, and mining and logging in the catchment areas may be respon- sible for the increased siltation (Table 1). The high fecal coliform levels come from both domestic and ani- mal waste, especially pig waste. Indiscriminate use of pesticides has resulted in organochlorines contami- nating some of Malaysia's river systems and aquatic life.
A high quantity of oil and grease have also been found along the coast of Perak. Heavy metal concen- trations of lead, copper and cadmium exceed the pro- posed standard of 0.05 mg.1-' for Pb, 0.01 mg.1-l for Cu and 0.005 mg.1-l for Cd. Despite the elevated concen- tration of these metals in the water, studies indicate that the levels of these elements found in fish and shellfish samples do not pose a threat to public health (Shahunthala 1989).
Effluents of palm oil and rubber processing con- tain very high concentrations of organic material, suspended solids and nutrients like nitrogen and phos- phorus. Land development, agriculture and high popu- lation density are among the main causes of water pollution in Malaysia through increased sediment load, pesticide run-offs, discharges from agro-based indus- tries and sewage.
Development activities that resulted in a severe destruction of marine resources caused several na- tional agencies, like the Department of Fisheries, the Department of Environment and the Na- tional Working Group for Mangroves, to initiate con- servation and rehabilitation measures for proper uti- lization and management of marine resources.
Fishery Resources and Exploitation
Total landings have stabilized in most of the coastal fisheries and it is believed that the yield has already reached its maximum. The local supply of fish to the local market has been greatly reduced and fish has to be imported from neighboring countries to overcome the shortage. This can only serve as a temporary remedy. In the long run fisheries resources have to be managed for the increasing nutritional needs and economic improvement. In addition to venturing into aquaculture and deep-sea fishing, sustainable exploitation of the resources in coastal waters is very important.
Resources
A demersal survey conducted in 1986-1987 in the Malaysian EEZ beyond 25 nm from the coastline re- vealed a potential yield of 167 000 t of demersal re- sources (Table 2). The most promising area was off the east coast of Peninsular Malaysia followed by areas off Sarawak and Sabah. Pelagic resources have a po- tential yield of 171 000 t, mostly off Sarawak and the east coast of Peninsular Malaysia
An acoustic survey conducted in 1986-1987 in the EEZ beyond 12 nm from the coastline indicated a po- tential yield of 255 000 byear-'. However, the greatest concentrations of fish were found close to shore, par- ticularly outside the monsoon period. An offshore- onshore migration pattern between the two monsoon seasons was also observed.
A new fishery product in Malaysia is oceanic tuna. Tuna such as skipjack and yellowfin are found in deeper waters off the Sarawak and Sabah coasts. With the expansion of maritime jurisdiction, tuna is seen as an important fishery resource to be exploited. In 1984, Malaysian and Thai fishers operating in the Gulf of Thailand and off the east coast of Peninsular Ma- laysia landed an estimated 84 000 t of tuna. The domi- nant species in this catch was longtail tuna. The po- tential yield of longtail tuna from the east coast of Peninsular Malaysia was estimated to be about 50 000 t and off Sabah and Labuan about 50 000 t . A recent study conducted in the waters off Sarawak found skipjack and yellowfin tuna. It is believed that the area serves as an important migratory route to and from the adjacent waters (Hamid 1993).
As traditional coastal resources are being fully ex- ploited, 'new' non-conventional products such as shell- fish, jellyfish and bivalves are emerging. Landings of shellfish and bivalves have increased but landings of jellyfish have declined. This sometimes creates

Table 1. Synoptic transect of activities and issues relevant to coastal fisheries management in Malaysia.
Terrestr ial Coastal Marine -
Major zones Upland Midland Lowland Interface Nearshore Offshore Deepsea (> 18% slope) (8-18% slope) ( 0 4 % slope) (1 km inland from HHWL- (30 m - 200 m depth) (>200 m depth- (beyond
30 m depth) EEZ) EEZ)
Main resource useslactivities
Upstream Logging Land use conversion to Sand mining Commercial fishing Offshore Marine development rubber and palm oil Mangrove conversion to Marine transport development transport
Mining plantation aquaculture, agriculture Marine transport Logging Palm oil mills and Industrial and tourism Resort pineapple processing development development Residential, industrial Dredging and reclamation
and tourism development Port and shipyard Charcoal processing Petrochemical/industrial
estate Pig farming
- Aquaculture Main environmental Limited water Erosion Agrochemical pollution issuesl lmpacts ~ U P P ~ Y Domestic and on the coastal Flashfloods sewage pollution zone High sediment Industrial pollution
load Organic pollution Pollution Landuse conflict of
industries sited in aquaculture areas
. . activities
Artisanal fishing Tourism
Sedimentation and Conflicts between Sewage and solid Oil pollution water turbidity traditional and waste disposal
Coastline erosion and commercial fisheries Limited water siltation Competition for the use supply
Destruction of mangrove of the coastal zone Sedimentation forest Oil pollution Water pollution
Deterioratmn of water quality due to chemical effluents
Landuse conflict of industries sited in aquaculture areas
Aquaculture development above carrying capacity
Oil pollution Use of destructive fishmg methods
Overf~shing Illegal collection of corals Coral reefs damaged by
anchorage of boats

Table 2. Estimates of potential yield and commercial landings for offshore grounds in 1994.
Area Potential yield estimate Offshore
(t.year1) landings in 1994 (t) Pelagic Demersal Tuna Total Total
East Coast of Pen. Malaysia 54 600 82 200 50 000 186 800 69 506 West Coast of Pen. Malaysia 16 950 11 300 28 250 28 370 Sarawak 81 550 62 300 143 850 28 429 Sabah and Labuan 17 750 10 900 50 000 78 650 9 231 Total 170 850 166 700 100 000 437 550 135 536
conflicts among fishers, especially if the resources com- mand good prices, as in the high-profit bivalve fishery in the west coast of Peninsular Malaysia.
Capture Fishery Sector
Marine capture fisheries in Malaysia can be di- vided into two categories, coastal or inshore fisheries and deep-sea fisheries. The coastal fishery is the most important subsector of the fisheries industry from the socioeconomic point of view. The fishing vessels operate within 30 nm from the coastline. They range from traditional craft to commercial vessels of less than 70 Gross Registered Tonnage (GT). A large pro- portion of the licensed traditional vessels are below 9.9 GT. In 1994 inshore fisheries contributed 930 000 t or about 87% of the total marine fish landings (Table 3). The west coast of Peninsular Malaysia contrib- uted 47%, east coast of Peninsular Malaysia 27%, Sabah coast 19% and Sarawak coast 7% of the total landings of the coastal fisheries. Using surplus pro- duction models, the maximum sustainable yield (MSY) for the west coast of Peninsular Malaysia was estimated to be about 430 000 t (Alias 1994). Hence, the present exploitation level has exceeded the esti- mated MSY level in the area.
Deep-sea fishing vessels operate beyond 30 nm from shore. In 1994 deep-sea fisheries contributed 13% (136 000 t) of the total marine fish landings in the country. The east coast of Peninsular Malaysia contributed 51%, west coast of Peninsular Malaysia 21%, Sarawak 21%, Labuan 5% and Sabah 2% of the deep-sea fish landings. The fishing vessels in opera- tion are fairly large (more than 70 GT) and commer-
cial gear such as trawl and purse seines are used. In 1994 a total of 31 403 fishing vessels were licensed, of which 520 units were deep-sea fishing vessels.
Marine capture fisheries also use various types of fishing gear. The fishing gear are classified into com- mercial and traditional. The commercial fishing gear consist of trawl and purse seine while the traditional fishing gear are drifUgillnets, bagnets, hook and lines, trammelnets, liftnets and traps. The number ofves- sels declined from 43 492 units in 1980 to 31 403 in 1994 (Table 4). The number of offshore/commercial fishing vessels (70 GT and above) increased in 1988- 1989, following government encouragement of offshore fishing.
Total landings from marine capture fisheries were reported to be 1.07 million t in 2994. Commercial fishing gear landed 789 000 t or 74% and traditional fishing gear landed 278 000 t or 26% (Table 5). From 1987 to 1994 marine capture fisheries increased their landings at an average annual rate of around 10%.
The landings of demersal fish show a fluctuating trend (Table 6). Trawl landings in 1994 were about 588 000 t. The west coast of Peninsular Malaysia is the main contributor. The majority of trawls are also registered in the west coast. The east coast of Penin- sular Malaysia and the coast of Sabah contributed about half, while the Sarawak coast contributed a quarter of the amount landed on the west coast of Peninsular Malaysia. In general, the landings of demersal fish from all coasts were stable from 1990 to 1994. In terms of fishing gear, trawl is the main gear used for the exploitation of the resource, except for the Sarawak and the Sabah coasts where traditional gear is still very much in use.
Table 3. Marine landings in 1994 from the inshorelcoastal and offshore fishing areas in Malaysia. (See text).
Area Inshore/coastala Offshoreb Total landings (t) landings (t) (t)
West Coast of Peninsular Malaysia 431 932 28 370 460 302 East Coast of Peninsular Malaysia 255 271 69 506 324 777 Sarawak 67 195 28 429 95 624 Sabah 175 651 9 231 184 882 Total 930 049 135 536 1 065 585 a Inshorelcoastal grounds are c30 nm from shore.
Offshore grounds are >30 nm from shore.

Table 4. Number of licensed fishing vessels in the commer- cia1 and traditional fisheries sector in Malaysia from 1980 to 1994. (Source: Annual fisheries statistics 1980-1 994).
Year Commerciala Traditionala Total 1980 (6 969) (23 551) 43 492 1981 (6 870) (23 520) 44 595 1982 (6 589) (21 741) 41 497 1983 (5813) (19 882) 40 168 1984 (6 263) (19 410) 41 079 1985 (5 590) (17 781) 38 933 1986 (5 404) (17 072) 40 383 1987 (6 042) (16 096) 35 429 1988 8 951 28 851 37 802 1989 9 162 30 808 39 970 1990 8 906 30 635 39 541 1991 8 727 24 174 32 901 1992 8 426 24 124 32 550 1993 8 234 23 341 31 575 1994 7 923 23 480 31 403
a Figures in bracket are for Peninsular Malaysia only, as the breakdown into traditional or commercial category for Sabah and Sarawak is unavailable for 1980-1 987.
53 Table 5. Marine landings by the commercial and traditional fisheries sector in Malaysia from 1980 to 1994. (Source: Annual fisheries statistics 1980-1 994).
Year Marine landings (t) Commercial Traditional Total 515 590 254 590 770 180 481 680 315 669 797 349 433 747 286 669 720 416 479 672 295 821 775 493 429 118 227 154 656 272 408 707 200 046 608 753 391 828 222 046 613 874 667 277 191 869 859 146 667 277 191 851 859 128 676 123 206 369 882 492 765 242 186 065 951 307 707 343 204 590 911 933 771 371 252 145 1 023 516 766 574 280 776 1 047 350 787 877 277 708 1 065 585
Table 6. Landing and effort data for Malaysian trawl fishery, 1968-1994. (Source: Annual fisheries statistics 1968-1994). Trawl landings (t) Licensed trawlers
Year Pen. Malaysia Sarawak Sabah Total Pen. Malaysia Sarawak Sabah Total West East West East
1968 6 973 230
The landings of the pelagic and semi-pelagic fish Sabah and Sarawak, respectively. The great majority in 1994, of 856 100 t , were more than four times of the pelagic and semi-pelagic fish are landed by com- greater than the demersal fish landed (DOF 1995a). mercial fishing gear, which contributed about 70%. About 43% comes from the west coast of Peninsular The traditional fishing gear is as important as the Malaysia, 32% from the east coast of Peninsular Ma- commercial gear for this fishery along the coast of laysia, while 15% and 10% come from the coasts of Sabah.

54 Trawl fisheries
Trawling was introduced into Malaysia indirectly, through a German project in Thailand. The success of the Thais provided the impetus for Malaysian fishers to venture into trawling operations in 1963. In the early stages, only vessels of 50 GT were al- lowed to operate but later 25 to 30 GT boats were also given permission to operate beyond 7 miles from shore. Later still, small boats below 25 GT were allowed to operate and this made investment more attractive because small trawlers had better access to the richer inshore areas. However, in early 1964 the Malaysian Government banned trawling on the ground that it would deplete the fish stocks in inshore waters and ruin the livelihood of the traditional fishers. The ban resulted in illegal trawling. The highly profitable na- ture of fish trawling, coupled with the need to increase fish landings to meet the growing demand for food, made it impossible to enforce the ban. The trawl ban was lifted in October 1964 and a pilot trawling scheme was launched with the goal of devising methods for better control and regulation of trawling. A survey of the coastal waters off the east coast of Peninsular Malaysia was carried out by Malaysia in cooperation with Thailand and the Federal Republic of Germany in 1967 to assess the potential demersal fish resources in the area. Following this survey, the government introduced a pilot scheme in mid-1968 to promote the development of trawl fishing in the area. By 1975 there were about 910 trawlers operating around the coastal waters off the east coast of Peninsular Malay- sia. In Sabah, trawling was first introduced in the early 1960s and within five years there were 350 trawl- ers recorded in the area. The mainstay of the coastal fisheries in Sabah was still prawn capture, mainly within the 3 nautical mile-belt. By the mid-1980s, coastal fisheries had an upturn as the exploitation of demersal fish became as profitable as the prawn fisher- ies. Presently there are 1 548 licensed trawlers operat- ing in the area.
Trawl fishing is firmly established in Malaysia but remains under the strict control stipulated by the Fisheries Act of 1963 and 1985. Currently trawls yield about 55% of the total marine landings in the country compared to only 34% in 1974 (Annual fish- eries statistics 1974,1994). Table 7 details the major events with impact on trawl fisheries development in Malaysia.
Currently, the otter bottom trawl net is the main fishing gear used to harvest the demersal finfish and penaeid prawn resources in the waters off Malaysia. Of the 580 000 t total marine landings from trawl fishery in 1994, 540 000 t (92%) were finfish and cephalopods while the remainder (8%) consists of penaeid prawns. A large number of fish species are
landed by the trawls. While demersal finfish still re- main the dominant catch of trawl nets, the develop- ment of 'high opening' trawl nets have resulted in the ability to catch pelagic finfish, mainly the Indo-Pacific mackerel Rastrelliger brachysoma, on the west coast of Peninsular Malaysia. Here, penaeid prawns constitute an important component of the catches of trawls operating in inshore waters. Although penaeid prawns landed by trawl nets contributed only 4.4% to the total marine fisheries landings in 1994, they are the mainstay of the trawl fishery due to their high commercial value and market demand. The rapid development and concentration of the trawl fishery within the coastal waters has resulted in intensive exploitation of coastal demersal finfish and penaeid prawn resources. While the total landings of the coastal demersal finfish and penaeid prawn fisheries may appear to be stable or even increasing, the disap- pearance of certain species, notably Lactarius lactarius, from the coastal waters of Peninsular Ma- laysia indicates overexploitation of the resource. This is further evidenced by the relatively high catch of 'trash fish', usually consisting of the juveniles of com- mercial fish. The trawl landing data from 1968 to 1994 is presented in Table 6.
The highest number of trawls licensed in coastal fisheries (6 429 units) was recorded in 1985. Since then it has been fluctuating at a somewhat lower level. The distribution of vessels by area in 1994 shows that 55% of them were located on the west coast of Penin- sular Malaysia, 18% in Sarawak, 16% on the east coast of Peninsular Malaysia and 10% in Sabah.
Trawl Surveys in Malaysia
To further develop commercial trawl fisheries, the status ofthe industry and the state of the resources have to be determined. Thls is possible by collecting commer- cial catch statistics and by conducting regular and sys- tematic surveys. With this information the catch trends resulting from the operation of trawlers can be studied and further expansion and rational management of the trawl fisheries can be planned.
Trawl surveys were first initiated on the east coast of Peninsular Malaysia with assistance from the Fed- eral Republic of Germany under a bilateral agreement. The first trawl survey was conducted in 1970, followed by surveys in 1971, 1972 and 1974. These surveys covered coastal waters 10 to 60 m deep and 5 to 60 nm offshore, with the survey area stretching from the ThaiIMalaysian border in the north to Johore in the south.
The survey area was divided into sub-areas on the east and west coast (Figs. 2 and 3). All trawl surveys were carried out with a standard German otter trawl net with a codend mesh size of 40 mm. The same

55 Table 7. Key events with impact on the trawl fisheries of Malaysia.
Date Events, facts and related information Source
Before 1962 Trawling trials using large seagoing vessels (S. T: Tongkol - 1926, Kembong - 1954 and Mannihine - 1955) in offshore trawling waters off the East Coast of Peninsular Malaysia were conducted and trawling deemed unviable due to economic reasons.
Mohamed (1 984)
A few Malaysian fishers from the northwest coast of Peninsular Malaysia go to Thailand to observe trawling operation and bring back 2 types of trawl nets (otter trawl and beam trawl).
Selvadurai and Andrew (1 977)
Early 1964 Ban on trawling imposed by the Government because it would deplete inshore fish stocks and ruin the livelihood of traditional fishers. Physical conflicts between traditional fishers an3 trawlers are reported.
October 1964 Pilot project on the use of otter trawl launched in Pulau Langkawi (in waters deeper than 15 fathoms using 42 boats from Penang and Kuala Kedah). The ban is lifted and trawling licenses issued on a limited scale to fishers from fishing centers such as Kuala Kedah, Penang and Pulau Pangkor.
Lam and Pathansali (1 977)
The Government legalizes trawling in Kedah.
I966
July I966
The Government legalizes trawling in Penang.
Mohamed (1 984) Ten boats in Pulau Pangkor converted to trawlers. Within three months, the number increases to 40.
Selvadurai and Andrew (1 977)
January 1966 August 1967
Analysis of trawl fishery in Peninsular Malaysia at its nascent stage indicates that the catch rate is very high.
Fisheries (Maritime) Regulation
Trawling subjected to stipulations listed under Fisheries (Maritime) Regulation 1967, made under the Fisheries Act of 1963. The terms and conditions are not only for codend mesh size but also the distance from the shore where trawling may be carried out, and the places where the catch should be landed.
The minimum mesh size shall not be less than 1 inch internal measure at the cod end.
The operational zones are: - 100 gross tons (GT) and above shall be used only water beyond 12 miles; - 25 GT and above shall be used only in waters beyond seven miles; - 25 GT and below shall be used only in waters beyond three miles.
Time restriction for operation are: - vessel of 25 GT and below can only operate within 06:OO-18:OO hours; - vessel above 25 GT are permitted to operate day and night.
Fish caught by trawlers can be landed only at 49 specified places spread out between east and west coast of Peninsular Malaysia.
1967
1968
1968
Mid 1968
1969 -1 970
1970
A survey of the coastal waters off the east coast of Peninsular Malaysia is carried out jointly by Malaysia, Thailand and the Federal Republic of Germany to assess potential demersal fish resource.
Mohamed (1 984)
Selvadurai and Andrew (1 977)
Trawling becomes popular among fishers along the west Coast of Peninsular Malaysia. Authorities decided to issue trawling licenses to fishers' cooperatives but not to individual fishers.
Trawling starts in Penang waters. Initially, five licenses are granted to a trawler society in Telok Bahang, Penang which bought five trawlers from Pangkor Island.
Lam and Pathansali (1 977)
The Government introduces a pilot scheme to promote development of trawl fishing off the east coast of Peninsular Malaysia. About 7 000 t landed by the estimated 300 trawlers in the area.
Costs and earnings survey of Malaysian trawl fisheries conducted by Peace Corps. Volunteers illustrates changes in the trawling industry between the nascent stage and the present.
The Government initiates a Droqram, with assistance from the Federal Republic of Lam et al. (1 975) Germany, to survey the coa.staiwaters off the west coast of Peninsular Malaysia.

56 continued ...
Date Events, facts and related information Source
April 1980
May 1985
May 1985
A total of 4 surveys were carried out (in 1970, 1971, 1972 and 1974) covering coastal waters 10-60 m deep and 5-60 nautical miles from the shore.
Trawling in inshore waters highly successful that within a year, a total of 1 709 trawl licenses are issued in Perak State.
Study on economics of fish trawling in Penang concludes that the demersal re- sources in the West Coast of Peninsular Malaysia are overexploited.
Landings by trawlers increase four-fold from 67 323 t in 1970 to 276 234 t in 1973. The 1973 figure is about 34% of total fish landings in the country.
Trawlers account for 39% of the total flshing gear in operation and described as having "over-expanded.
Five-year German Technical Aid Program commences to develop, modernize and spearhead fishery development through improved technology. Efforts targeted to modernize shrimp trawling in Sarawak by deploying double-rigloutrigger vessels.
Introduction of large-scale (corporate) fishing in offshore areas in the South China Sea.
Malaysia proclaims its Exclusive Economic Zone (EEZ).
Malaysia enforces the EEZ Act.
Fisheries Act of 1985 is gazetted introducing more comprehensive provisions on enforcement, marine fishery management and conservation within the extended jurisdiction. The main focus is allocation of fishing grounds through the zoning concept. The license limitation program allocates fishing grounds by type of fishing gear, size of vessel and ownership status as follows:
Zone A: Within 5 miles from the shoreline - reserved only for artisanal, owner- operated vessels.
Zone B: Between 5 and 12 miles - reserved for owner-operated trawlers and purse seines of less than 40 GT.
Zone C: Between 12 and 30 miles - reserved for trawlers and purse seines greater than 40 GT, wholly owned and operated by Malaysian fishers.
Zone D: Beyond 30 miles - resewed for deep sea fishing vessels of 70 GT and above. Foreign fishing through joint-ventures or charter are re stricted to this zone.
Government launches 'National Fisheries Development Plan' under the 1984 'Na- tional Agriculture Policy'. Main components attempt to restrict fishing effort in in- shore areas and develop fishing in offshore grounds through commercialization and modernization of fishing activities.
Deep sea fishing campaign is launched to bring about awareness of potential resources in the EEZ.
Licensed trawl fishing vessels recorded as many as 5 679 units which landed 587 928 t or 55% of total marine landings in the country.
Mohamed (1 984)
Selvadurai and Andrew (1 977)
DOF (1 995a)
Saharuddin (1 995)
Mohamed (1 984)
DOF (1 994)
DOF (1994,1995b)
DOF (1 995a)
survey methodology was followed in the surveys con- ducted in the 1980s and 1990s. On the west coast of Peninsular Malaysia at least 11 demersal fish resource surveys have been carried out since 1970. The fishing ground covered during the surveys was relatively shal- low water of 10 to 60 m. Standard German otter trawls with codend mesh size of 40 mm were used in all the surveys. The west coast of Peninsular Malay- sia is also known as an important prawn fishing ground. A total of six prawn surveys have been car- ried out since 1972. During the first survey, German trawl nets with a codend mesh size of 30 mm and 35
mm were used. These nets were replaced by locally designed prawn trawl nets with 40 mm codend mesh size in the next five surveys. The first survey carried out on the coast of Sarawak and Sabah was in March/ May 1972 using a standard German otter trawl with codend mesh size of 40 mm. The survey area ranged between 5 nm and 60 nm from the shoreline with depths of 10 m to 60 m. The whole coast was divided into six sub-areas as shown in Fig 3. At least six prawn trawl surveys have been conducted in the area since 1980. A double rigger trawler using 31.5 mm codend mesh size trawl gear was employed during the

Longitude ("E) Fig. 2. The EEZ off Peninsular Malaysia indicating sub-areas covered by demersal trawl surveys. (See able 7 and text).
-
surveys. A survey of demersal resources in the EEZ was also conducted in 1986187 by the FA0 vessel the R. V. Rastrelliger. The survey covered areas beyond 30 nm from shore. A summary of the information from these surveys is given in Appendix I11 to this volume.
The average catch rates obtained from surveys con- ducted in the east coast of Peninsular Malaysia indi- cate that these have declined from 516 kgahour-l in 1970 (Pathansali et al. 1974) to 255 kgahour-l in 1972 (Lam et al. 1975). The rate further declined to 72 kgahour-l in 1988 (Ahmad Adnan 1990). The re- cent survey carried out in 1995 showed a catch rate of 29 kg-hour-' (Table 8). The same situation has also been observed for resources on the west coast of Pe- ninsular Malaysia. Seasonal variability and natural fluctuations occur in fish populations, but the impact of fishing itself is unmistakable.
Ahmad Adnan (1990) reviewed the changes in the composition of major species or fish groups in terms of changes of dominance, based on the surveys con- ducted in Malaysia. He noted that the most domi- nant fish during the survey in 1970 were the thread-
fin breams (Nemipterus spp.) (Table 9). However, after 1990 the dominance of this group appeared to have declined. The decreasing dominance of sharks, sciaenids, carangids and leiognathids has also been observed, while squids, priacanthids and synodontids show increasing dominance. A very clear decline in dominance is also seen for sciaenids, which were third in 1970 and became almost negligible in 1995. On the other hand, squids and lizardfish have shown marked increases. Squids, which ranked 14th in 1970, have become the dominant group in the 1990s. Another group that shows a major increase in their degree of dominance, particularly since the 1980s, are the priacanthids.
The survey data are kept in a DBase IV database and in a simple database developed by an individual researcher using the BASIC programming language. Also, the SEAFDEC research center in Terengganu has developed a database for biological and survey data using INFORMIX, while the Department of Fisheries has developed an integrated database comprising most of the information about fisheries (licensing, enforce- ment, catchleffort, aquaculture, etc.) using ORACLE.

- EEZ boundary of Malaysia
. . . . . .
I I 110 112 114 116
Longitude ("E)
Fig. 3. The EEZ off Sarawak and Sabah indicating the sub-areas covered by demersal trawl surveys.
Table 8. Mean catch rates (kg.hour) of demersal trawl surveys in Malaysia. (See also Figs. 2 and 3). Year Peninsular Malaysia Sarawak - Sabahd
West coast East coast West coast
1995 29.3
"Sub-area I and Il only. The east coast of Sabah was not surveyed. bSub-area Ill, IV, V and VI only. ? Indicate inaccessible/unstandardized data.
Sub-area I only.
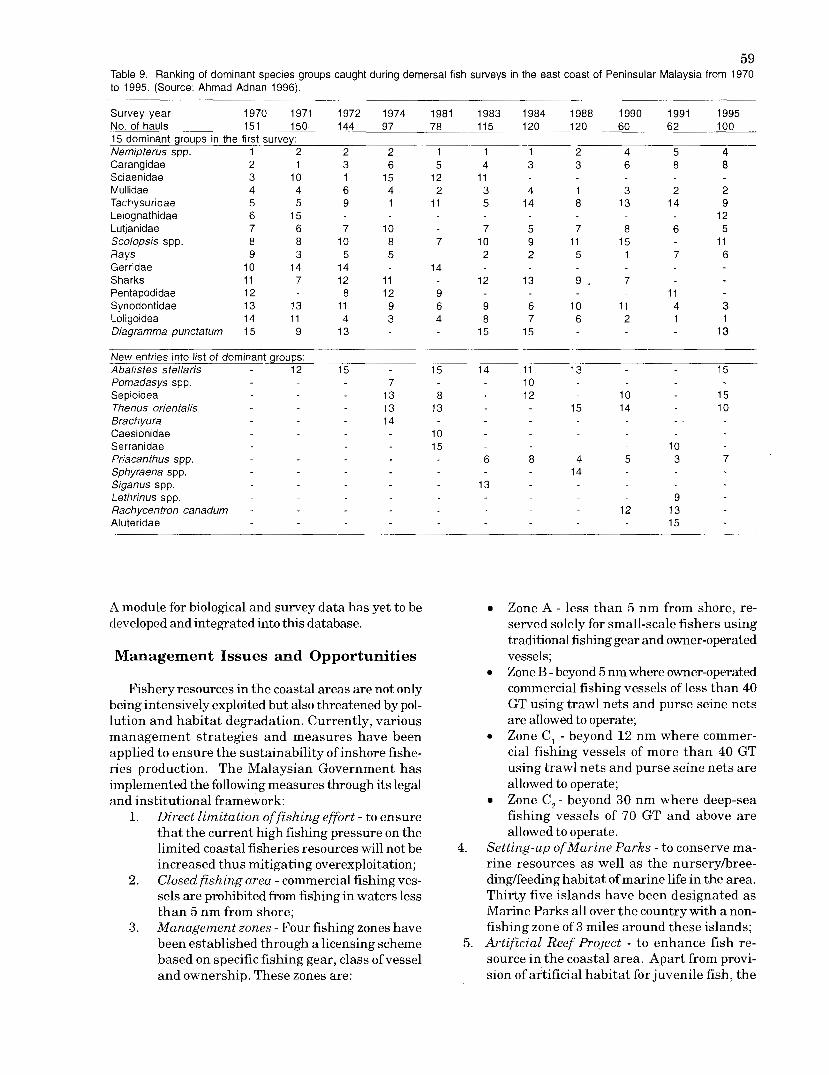
59 Table 9. Ranking of dominant species groups caught during demersal fish surveys in the east coast of Peninsular Malaysia from 1970 to 1995. (Source: Ahmad Adnan 1996).
Survey year 1970 1971 1972 1974 1981 1983 1984 1988 1990 1991 1995 No. of hauls 151 150 144 97 78 115 120 120 60 62 100 15 dominant groups in the first survey: Nernipterus spp. 1 2 2 2 1 1 1 2 4 5 4 Carangidae Sciaenidae Mullidae Tachysuridae Leiognathidae Lutjanidae Scolopsis spp. Rays Gerridae Sharks Pentapodidae Synodontidae Loligoidea Diagramma punctatum
New entries into list of dominant groups: Abalistes stellaris 12 15 15 14 11 13 15 Pomadasys spp. Sepioidea Thenus orientalis Brachyura Caesionidae Serranidae Priacanthus spp. Sphyraena spp. Siganus spp. Lethrinus spp. Rachycentron canadurn Aluteridae
A module for biological and survey data has yet to be developed and integrated into this database.
Management Issues and Opportunities
Fishery resources in the coastal areas are not only being intensively exploited but also threatened by pol- lution and habitat degradation. Currently, various management strategies and measures have been applied to ensure the sustainability of inshore fishe- ries production. The Malaysian Government has implemented the following measures through its legal and institutional framework:
1. Direct limitation of fishing effort - to ensure that the current high fishing pressure on the limited coastal fisheries resources will not be increased thus mitigating overexploitation;
2. Closed fishing area - commercial fishingves- sels are prohibited from fishing in waters less than 5 nm from shore;
3. Management zones - Four fishing zones have been established through a licensing scheme based on specific fishing gear, class of vessel and ownership. These zones are:
Zone A - less than 5 nm from shore, re- served solely for small-scale fishers using traditional fishng gear and owner-operated vessels; Zone B -beyond 5 nm where owner-operated commercial fishing vessels of less than 40 GT using trawl nets and purse seine nets are allowed to operate; Zone C, - beyond 12 nm where commer- cial fishing vessels of more than 40 GT using trawl nets and purse seine nets are allowed to operate; Zone C, - beyond 30 nm where deep-sea fishing vessels of 70 GT and above are allowed to operate.
Setting-up ofMarine Parks - to conserve ma- rine resources as well as the nurseryhree- dinglfeeding habitat of marine life in the area. Thirty five islands have been designated as Marine Parks all over the country with anon- fishing zone of 3 miles around these islands; Artificial Reef Project - to enhance fish re- source in the coastal area. Apart from provi- sion of artificial habitat for juvenile fish, the

60 reefs also prevent the encroachment of trawl- ers into shallow waters. A total of 54 tire reefs, 10 boat reefs and 10 concrete reefs have been constructed. An experimental reef using PVC pipes has also been set up to study the effect of the artificial reef;
6 . Set-up agood MCS system - the Monitoring, Control and Surveillance (MCS) system pro- vides effective and efficient scientific data acquisition for resource evaluation. It also provides for the effective monitoring and con- trol of fisheries enforcement activities to en- sure that only authorized fishing vessels con- duct their fishing activities within designated areas in Malaysian waters;
7. Deep-sea Fishing - the fisheries resources within inshore water appear to have reached their maximum level of exploitation, but the declaration of the EEZ has enabled the Ma- laysian Government to actively encourage the development of offshore fisheries.
Several ordinances and acts were introduced to regulate the fishing industry. The first one was the Fisheries Ordinance of 1909. This ordinance was sub- sequently amended in 1912, 1924, 1926 and was finally repealed in 1951. The Fisheries Rules of 1951 was enforced on 10 August 1951. During this time there were also seven Fisheries Ordinances1 Enactments enforced by the various states. The fishing industry at that time consisted mainly of tra- ditional fishing and regulation was minimal. The introduction of trawling in the coastal waters in the 1960's created much conflict between traditional fishers and trawl operators. This led to the formula- tion of the Fisheries Act of 1963 that provided a more comprehensive legal framework to manage fisheries in Malaysian waters. This Act was subsequently re- pealed and replaced by the Fisheries Act of 1985 with the
a.
b. C.
d.
e.
following objectives:
to integrate and strengthen the legal framework relating to marine and inland fisheries; to protect the natural living resources; to protect the interest of the fishers; to ensure equitable allocation of fishery resources; and to strengthen administrative activities to reduce conflict among the fishing communities.
Presently fish resources in the nearshore area are heavily exploited causing a reduction in catch rates. There has been a drastic reduction in the licensing of small vessels (of less than 9.9 GT) because of govern- ment policies. In contrast, there has been a signifi- cant increase in the number of large vessels (more
than 70 GT), which contribute about 11% of the total value of fish landings. The fishers have also been given the opportunity to leave the fishing industry and participate in other economic activities such as fish processing and aquaculture. This will help sus- tain fish production in inshore waters as well as in- crease income in the industry.
To ensure successful long term fisheries manage- ment, there is a need to look at the marine environ- ment as a multiple-use area (see Table 1). Pollution due to sewage, solid waste and chronic oil spills re- quires careful monitoring and regulation in order to conserve marine habitats. Malaysia needs to explore new species with market potential for mariculture. The present monoculture practice is open to diseases and market instability. The cutting of mangroves for aquaculture, agriculture activities and factories re- quire stringent control and close monitoring as this ecosystem is the breeding and feeding ground of many commercial species.
Acknowledgments
Thanks are due the Director General, Department of Fisheries, Malaysia, Y. Bhg. Dato' Shahrom bin Hj. Abdul Majid for his kind permission to present this paper. Thanks are also due to the Director of Fisheries Management and Protection Branch and the Director of Research, Fisheries Research Institute. The authors are also grateful for the assistance rendered by staff of ICLARM, Manila, in the prepara- tion of this report.
References
Ahmad Adnan, N. 1990. Demersal fish resources in Malaysian waters (16). Fifth trawl survey of the coastal waters off the east coast of Peninsular Malaysia (June-July 1981) Fish. Bull. Dep. Fish Malays. Bul. Perikanan Jabatan Perikanan Malays~a. 60, 36 p.
Ahmad Adnan, N. 1996. Changes in the species composition of demersal fish based on trawl surveys in the east coast of Peninsular Malaysia. Unpublished report. Department of Fisheries, Malaysia.
Alias. M. 1994. Mechanization of fishing boats and i ts - consequences on the management of the fishery in the West Coast of Peninsular Malaysia, p. 1-27. In Proceedings of Fisheries Research Conference, DOF, Malaysia, Kuala Terrenganu. 27 p.
Chew, Y. F. 1996. Wetland resources in Malaysia. In State of the Malaysian environment. CAP-SAM National Conference, 5-9 J a n u a r y 1996. Penang, Malaysia. Unpublished.
Choo, P.S., I. Ismail and H. Rosly. 1994. The west coast of Peninsular Malaysia, p. 33-54. In S. Holmgren (ed). An environmental assessment of the Bay of Bengal Region. ROBPlREPl67. Bay of Bengal Programme and Swedish

Centre for Coastal Development and Management of Aquatic Resources, Madras.
DOF. 1994. Perikanan seratus tahun: menuju era dinamik. Ministry of Agriculture, Malaysia.
DOF. 1995a. Annual fisheries statistics, 1968-94. Department of Fisheries, Ministry of Agriculture, Malaysia, Kuala Lumpur, Malaysia.
DOF. 1995b. Review of national fisheries management policy - implications for the Malaysian fisheries sector. Paper presented a t the Workshop on Fisheries Management in Malaysia: Alternatives and Directions, 6-7 November 1995. MIMA (Malaysian Institute of ~ a r i t i m e Affairs), Kuala Lumpur, Malaysia.
FRI. 1987. Deep-sea fisheries resources survey within the Malaysian Exclusive Economic Zone. Fisheries Research Institute, Penang, Malaysia.
Gong, W. K., J.E. Ong, C. H. Wong and G. Dhanarajah. 1980. Productivity of mangrove trees and its significance in a managed mangrove ecosystem in Malaysia. Paper presented a t t h e Asian Symposium on Mangrove Environmental Research and Management, UNESCO and University of Malaya, 25-29 August 1980.
Hamid, Y. 1989. Physical oceanography and plankton survey in the east coast of Peninsular Malaysia. In A.A.Jothy (ed.), Proc. Res. Sem. DOF Malaysia. Kuala Lumpur. 18 p.
Hamid, Y. 1993. On biological aspects of skipjack (Katsuwonus pelamis) and yellowfin (Thunnus albacares) off the Sarawak waters . FAOIUNDP Indo-Pacific Tuna Development and Management Programme. Unpublished report.
Hashim, A. 1993. Socio-economic issues in the management of coastal fisheries in Malaysia. Paper presented at the IPFC (Indo-Pacific Fishery Commission) Symposium on Socio- economic Issues in Coastal Fisheries Management, 23-26 November 1993, Bangkok, Thailand.
Hydrographic Department, Admiralty. 1964. Malacca Strait Pilot. 3rd ed. London.
Hydrographer of the Navy. 1975. China Sea Pilot. Vol. 2. London.
Ichikawa, T. 1986. Particulate organic carbon in the waters off the Terengganu coast, p. 87-92. In A.K.M. Mohsin, M.I. Mohamed and M.A. Ambak (eds.) Ekspedisi Matahari '85: A study on the offshore waters of the Malaysian EEZ. Occas. Pap. 3. Faculty of Fisheries and Marine Science, Universiti Pertanian Malaysia.
Ichikawa, T. and A.T. Law. 1988. Particulate organic carbon of the south-eastern portion of the South China Sea, p. 37- 42. In A.K.M. Mohsin and M.I. Mohamed (eds.) Ekspedisi Matahari '87: A study on the offshore waters of the Malaysian EEZ. Occas. Publ. 8. Faculty of Fisheries and Marine Science, Universiti, Pertanian Malaysia.
Kent , G. and M.J. Valencia. 1985. Marine policy in Southeast Asia. University of California Press, Berkeley.
Kushairi, R. 1992. The areas and species distribution of seagrasses in Peninsular Malaysia. Paper presented a t the 1s t National Natural Res. Symp., FSSA, Universiti Kebangsaan Malaysia, Kota Kinabalu, Sabah, 23-26 July 1992.
6 1 Lam, W.C., S.A.L. Mohammed Shaari, A.K. Lee and W. Weber.
1975. Demersal fish resources in Malaysian waters. Second trawl survey off the west coast of Peninsular Malaysia (30 November 1971-11 January 1972). Fish Bull. 7. Ministry of Agriculture, Malaysia. 29 p.
Lam, W.C. and D. Pathansali. 1977. An analysis of Penang trawl fisheries to determine the maximum sustainable yield. Fish. Bull. No. 16. Ministry of Agriculture, Malaysia. 10 p.
Liew, H.C. and R. Hoare. 1982. The effects of sediment accumulation and water turbidity upon the distribution of Scleractinian corals a t Cape Rachado, Malacca Strait. In Proc. of the Conf. on Trends in App. Biol. in Southeast Asia. 11-14 October 1979, Penang, Malaysia. SBS, USM.
Mohammed Shaari, S.A.L. 1976. Demersal fish resources surveys and problems of fisheries resources development, p. 1-26. In Fish. Bull. 15. Ministry of Agriculture and Rural Development, Kuala Lumpur, Malaysia.
Mohamed, M.I. 1984. The development of fishing technology in Malaysia. Bull. Jentera 3(1): 20 p.
Pathansali, D. G. Rauck, A.A. Jothy, S.A.L. Mohammed Shaari and T.B. Curt in . 1974. Demersal fish resources i n Malaysian waters. Min. of Agric. and Fish. Malays. Fish. Bull. 1, 46 p.
Phang, S.M. 1990. Seagrass - A neglected natural resource in Malaysia. Proc. 12th Ann. Sem. Mal. Mar. Sci. Kuala Lumpur.
Raihan, A. and T. Ichikawa. 1986. Chlorophyll a content off the Terengganu coast, p. 117-120. In Ekspedisi Matahari '85: A study on the offshore waters of the Malaysian EEZ. Occas. Publ. 8. Faculty of Fisheries and Marine Science, Universiti, Pertanian Malaysia.
Saadon, M.N., L.H. Chark and M. Uchiyama. 1988. Salinity and temperature vertical profiles of the Sarawak coasts, p. 29- 36. In A.K.M. Mohsin and M.I. Mohamed (eds.) Ekspedisi Matahari '87: A study on the offshore waters of the Malaysian EEZ. Occas. Publ. 8. Faculty of Fisheries and Marine Science, Universiti Pertanian Malaysia.
Saharuddin, A.H. 1995. Development and management of Malaysian marine fisheries: Technical conservation measures. Mar. Policy 19(2): 115-126 p.
Samsuddin, B. 1995. Kajian oseanograpi perikanan pantai perairan KedahlPulau Langkawi (internal report).
Selvadurai, S. and L.K.K. Andrew. 1977. Marine fish trawling in Peninsular Malaysia: A case study of costs and earnings. Fish. Bull. No. 19. Ministry of Agriculture, Malaysia. 30 p.
Shahunthala, D.V. 1989. Heavy metal levels in Malaysian fish. Fish. Bull. 58, Ministry of Agriculture, Malaysia.
Shamsudin, L.B., K.B.B. Kaironi and M.N.B. Saadon. 1988. Chlorophyll a content off the Sarawak waters of the South China Sea, p. 87-90. In A.K.M. Mohsin and M.I. Mohamed (eds.) Ekspedisi Matahari '87: A study on the offshore waters of the Malaysian-EEZ. Occas. Publ. 8. Faculty of Fisheries and Marine Science, Universiti Pertanian Malaysia. 233 p.
Tang, H. T., Haron Hj. Abu Hassan and E.K. Cheah. 1990. Mangrove forest of Peninsular Malaysia - A review of management and research objectives and priorities. Unpublished report.

Overview of Philippine Marine Fisheries1
N.C. BARUT -- 1 ^-C, . ( ENTERLO IN NAjA
M.D. SANTOS Bureau of Fisheries and Aquatic Resources
I r.J Department ofAgriculture
APR 1 4 1998 Quezon City, Philippines
L.R. GARCES International Center for Living Aquatic Resources Management
MCPO Box 2631, Makati City 0718, Philippines
BARUT, N.C., M.D. SANTOS and L.R.. GARCES. 1997. Overview of Philippine marine fisheries, p. 62-71. In G. Silvestre and D. Pauly (eds.) Status and management of tropical coastal fisheries in Asia. ICLARM Conf. Proc. 53, 208 p.
Abstract
Marine fisheries are an important source of protein, livelihood and export earnings for the Philip- pines. In 1994, total marine fisheries catch was 1.67 million t (62% of total fisheries production) valued a t about US$1.65 billion. Of this total, 277 thousand t were demersal fishes, 885 thousand t small pelagics, 305 thousand t tunas and 203 thousand t other species or groups. Current catches have leveled off since 1991 (at a level near estimated maximum sustainable yield) and existing fishing effort is clearly too high.
This paper reviews the s tatus of marine fisheries and the development of trawl fisheries in the Philippines. The combined effects of excessive fishing effort and environmental degradation have contri- buted to the depletion of fishery resources, particularly coastal demersal and small pelagic fishes.
Introduction
Fisheries are an important component of the agri- cultural sector in the Philippines. In 1994, they accounted for 4.3% of gross domestic product and 18% (US$2.5 billion) of gross value added by the agricul- ture, fishery and forestry sectors. Fisheries provide livelihood to about 1 million individuals or about 5% of the country's labor force. Fishery exports were about 172 000 t in 1994 valued at US$578 million2. Fish consumption in the Philippines is high at about 28.5 kglcapitdyear.
Marine fisheries landings in 1994 were about 1.67 million t valued at about US$1.65 billion. This repre- sented roughly 62% of the total fisheries production in the country; the rest was contributed by the aquaculture and inland fisheries sectors. The mu- nicipal (i.e., small-scale) fisheries sector contributed
47% (787 000 t) of marine fisheries catches, while the balance (885 000 t ) came from the commercial fisheries sector.
The increased demand for fish from a rapidly growing population and increasing exports has sub- stantially increased fishing pressure on the ma- rine fishery resources in the past two decades. In February 1996 the National Fisheries Workshop on Policy Planning and Industry Development pointed to resources depletion and environmental degrada- tion as the key issues facing the fisheries sector. Declining catch rates in many traditional fishing grounds and the leveling off of marine landings since 1991 support these conclusions. The sections be- low provide an overview of the status of Philippine marine fisheries.
ICLARM Contribution No. 1390. In 1994: US$1 = P23.75.

63 Marine Environment and Activities 2.2 million km2. The shelf area, down to 200 m
covers 184 600 km2. The Philippines is an archipelago consisting of more Pioneering expeditions that contributed signifi-
than 7 100 islands. It extends about 2 000 km in a cantly to information on Philippine hydrography were south-north direction, between 4'05' and 4"30' N lati- those of the Nuestra Seiiora de Buena Esperanza tude, from the northeast coast of Borneo to 150 km off (1587), Desire (1588), Cygnet (1688), Elizabeth (1762), Taiwan (Fig. 1). The total territorial water area, Atrevida and Descibierta (1792)' Santa Lucia and including the Exclusive Economic Zone (EEZ), is about Magallanes (1800), Rhone (1819), Samarang (1843),
115 120 125
Longitude ( O E )
Straight baselines - Republic Act no. 3046 amended by Republic Act 5446 -- ---- - - - - -. Treaty limits - Treaty of Paris 1898 ............... 200 EEZ - Presidential Decree no.1599;1970 ....................... Kalayaan claim - Presidential Decree no.1596; 1971
Fig. 1. Marine jurisdictional boundaries of the %public of the Philippines.

64 Royalist (1850-1854), Riflemann and Nassau (1868- 1869) (Sebastian 1951). Oceanographic data were also made available through similar explorations during the late 19th to the mid-20th centuries. The Danish Galathea collected oceanographic information in Ma- nila Bay, Dinagat and Surigao between 1845 and 1847. In 1875, the British H.M.S. Challenger Deep Sea Ex- pedition conducted investigations in the Sulu Sea and the Visayas. From 1907 to 1909 the marine life of the islands was surveyed extensively by the Albatross Philippine expedition which was sponsored by the US Bureau of Fisheries. Other explorations that fol- lowed were the German survey vessel Planet (1907- 19121, the German cruiser Emden (1927), the Danish research vessel R.S.S. Dana I1 (1929), the Dutch H.M.S. Willebrord Snellius (1903), the Japanese Manshu, Yamato, andMusashi (1934-1942) and the US naval vessel Cape Johnson (1945). In 1947- 1950, the S.F. Baird, under the Philippine Fishery Program of the US Fish and Wildlife Service, con- ducted an extensive investigation of the Celebes Sea, Sulu Sea, South China Sea and the waters of the Philippine Sea covering an area of more than 2 074 500 km2. In 1951-1952, the Galathea made an intensive biological survey of the Philippine Deep.
The waters east of the Philippines are affected by the major large-scale ocean currents of the Pacific. The major current system affecting the Philippines is the North Equatorial Current which flows westward across the Pacific, hits the eastern coast of the coun- try and splits into northward and southward branches. The northward branch flows along the east coast of the Visayas and Luzon, moving to Taiwan and Japan as the Kuroshio Current. The southward branch be- comes the Mindanao Current, moving southward along the east coast of Mindanao. The influence of the strong seasonally reversing monsoon winds on water circulation is more pronounced on the western side of the Philippines. During the northeast mon- soon a cyclonic pattern of surface water movement develops in the South China Sea with a northwesterly flow along the western coasts of Palawan and Luzon. During the southwest monsoon water movement in the South China Sea is generally northeasterly, flo- wing out through the straits between Luzon and Tai- wan (Wyrtki 1961; Soegiarto 1985). The work of Wyrtki (1961) described the water masses in the area. Historical hydrographic data indicated that Philippine waters are very similar to those of the western Pacific.
The country's marine environment is distinctly tropical in character, with relatively warm and less saline waters. Sea surface temperatures are generally above 28°C in summer and only a few degrees lower during the cold months. Salinity variations are very small, especially in the eastern parts of the coun- try. These variations increase during the moisture- laden southwest monsoon in the western parts of the
country. The waters are typically poor in nutrients, with small upwellings, gyres and mixing processes occasionally enhancing local productivity. Nutrient depletion can extend to depths of 50-100 m in open waters. The thermocline depth is usually about 150 m and varies seasonally. Nutrient concentrations and biological productivity are highest over the shelves, declining rapidly with depth and distance from the coast.
Water quality studies in the country are limited to highly localized and pollution-prone areas. Evident in all these studies is the deterioration of water quality brought about by mine tailings, agricultural runoffs, siltation, domestic sewage and oil spills. Al- most all results indicate abiotic and biotic parameters (e.g., pH, salinity, turbidity, dissolved oxygen, heavy metal content, coliform count) exceeding standards set by the Environmental Management Bureau of the Department of Environment and Natural Resources.
Coral reefs abound in shallow water areas not sub- jected to low salinity from freshwater inflows, sedi- mentation and physical perturbations, with about 27 000 km2 of coral reef area within the 30 m depth contour. There are more than 70 genera and 400 spe- cies of hard corals documented, as well as about a thousand associated fish species (Gomez et al. 1994). Reef areas contribute substantially to fisheries pro- ductivity, with fish yields ranging from 5 to 37 t.km-2 (Alcala and Gomez 1985). Extensive coralline or hard bottoms are found around Palawan, Sulu, the Visayas and the central part of the country's Pacific coast. A large portion of Philippine coral reefs have been subjected to serious degradation which reduced their productivity (Yap and Gomez 1985). Major destructive factors are sedimentation and siltation from coastal development and activities, illegal and destructive methods of fishing and over- fishing (Gomez et al. 1994). Coral cover data from various surveys of Philippine reefs indicate that 5% are in excellent condition (more than 75% living coral cover), 25% in good condition (50%-75% living coral cover) and the rest in fair and poor condition (below 50% living coral cover) (Gomez 1991).
Mangrove communities are integral and important components of the coastal ecosystem. These are ca- tegorized into mangrove swamps composed mainly of large trees and associates, and nipa swamps which are characterized by stemless palm growths. Forty- one species of mangroves have been identified in the Philippines. These yield by-products such as timber and other building materials, high grade charcoal, tannins, resins, dyes and medicines. Mangrove areas are under pressure for conversion to other uses, nota- bly aquaculture and human settlement. In 1965, man- grove areas covered about 4 500 km2. Ten years later only about 2 500 km2 were left. Sixty percent of this decline was due to conversion into aquaculture ponds

for milHsh and prawns (Primavera 1991). By 1981 an aggregate cover of only 1 460 km2 was intact. This prompted government and nongovernment agen- cies to suspend permits for mangrove conversion to fishponds, accelerate reforestation activities and spur community-based management.
Seagrass communities regulate water flow and wave energy together with coral reefs and mangroves. There are 16 seagrass species recorded in the Philip- pines, second only to Western Australia among the 27 countries of the Indo-Pacific region. Extensive seagrass beds have been identified in Bolinao, Palawan, Cuyo Island, Cebu, Bohol, Siquijor, Zamboanga and Davao. Seagrass communities in the country mani- fest signs of degradation due to the combined effects of natural calamities, predation, aquaculture, defo- restation, siltation and destructive fishing methods (Fortes 1990).
Seaweed beds, like coral reef, mangrove and seagrass communities, play a vital role in the coastal environment. They provide feeding and nursery grounds for different types of marine macro and mi- croorganisms and interact with seagrasses to control ocean wave action. Aside from its ecological function this group of marine macrobentic algae is also an important human food source. There are 190 species of seaweed recorded in the Philippines. About 150 spe- cies are considered economically important but only a few are cultivated (particularly Eucheuma spp.). Other species under the genus Sargassum and Gracilaria are harvested from natural beds. To date,
65 the Philippines is the world's leading supplier of Eucheuma, producing about 80% of total world supply. There are about 80 000 seaweed farmers with 350 000 dependents that rely on the seaweed industry in the country (Dacay 1992).
Marine Capture Fisheries
Philippine marine fisheries are conventionally sub- divided into municipal (small-scale) and commercial fisheries on the basis of vessel gross tonnage. Mu- nicipal fisheries include capture operations using boats less than 3 GT and those that do not involve the use of watercraft. A license is issued by the municipality where the boat is registered, hence the name. Fishing permits are issued to fishing boats by the mu- nicipality where they intend to fish. Commercial fisheries include capture fishing operations using ves- sels of 3 GT and above. Commercial fishing vessels are required to secure a commercial fishing boat li- cense from the Bureau of Fisheries and Aquatic Re- sources (BFAR) before they can operate. Until recently commercial fishing vessels were only allowed to ope- rate in waters beyond 7 km from the shoreline. With the implementation of the Local Government Code in 1992, coastal waters within 15 km from the shoreline are now considered municipal waters and commer- cial fishing is not allowed within this area.
Fig. 2 illustrates the total marine, commercial and municipal fisheries catches in the Philippines from 1950 to 1994. Total marine landings showed
+ total + commercial + municipal
Year
Fig. 2. Philippine marine fisheries production by sector from 1950 to 1994. (Source: BFAR and BAS statistics, 1994).

- + Small pelagic - Demersal
-
I I I I I 1970 1975 1980 1985 1990 1995
Fig. 3. Demersal and small pelagic fisheries in the Philippines from 1970 to 1994. (Source: BFAR and BAS
accelerated growth during the periods 1962-1975 and 1985-1991, but leveled off to around 1.65 million t in the early 1990s. This was brought about by the de- cline in municipal fisheries landings being compen- sated by the commercial fisheries sector, which may be indicative of increasing resource depletion and competition in nearshore fishing grounds.
In 1994 the marine landings of 1.67 million t con- sisted of 17% (277 000 t ) demersal fishes, 53% (885 000 t) small pelagics, 18% (305 000 t) tunas and 12% (203 000 t) miscellaneous species or groups. Fig. 3 illustrates the trend in demersal and small pelagic fish production in the Philippines from 1970 to 1994. Note that the catch of demersals has leveled off since 1976. The catch of small pelagics, on the other hand, was almost the same from 1976 to 1988, increased rapidly from 1988 to 1992, then declined from 1992 to 1994. These catch trends in the face of continuously increasing fishing effort reflect assessments indicating overfishing of demersal and small pelagic fish stocks.
The trawl is commonly used by the commercial sector to exploit demersals while gillnets, hook and lines and 'baby' trawls are most commonly used by municipal fishers in catching demersal species or groups. Silvestre et al. (1986) provide a detailed re- view of trawl and demersal fisheries development in the Philippines and the consequent decline of demersal biomass in the country's coastal wa- ters. Numerous trawl surveys have been conducted in Philippine waters (see Appendix 111) which docu- ment this decline and which potentially offer nume- rous insights for improved fisheries management if standardized and analyzed more exhaustively.
The commercial sector commonly used bagnets, purse seines and ringnets for catching small pelagics while municipal fishers dominantly use gillnets, beach seines and round haul seines. Roundscads, sardines, anchovies, mackerels, big-eye scads, round herrings and fusiliers dominate small pelagic catches in the Philippines.
Six species of tuna dominate Philippine landings, i.e., yellowfin tuna (Thunnus albacares), big-eye tuna (Thunnus obesus), skipjack tuna (Katsuwonus pelamis), eastern little tuna (Euthynnus affinis), fri- gate tuna (Auxis thazard) and bullet tuna (Auxis rochei). The most common gear used by the commer- cial sector in catching tuna are purse seines and ringnets, while municipal fishers mainly use handlines. All these gears are operated jointly with fish aggregating devices known as 'payao'. Tuna pro- duction increased from about 9 300 t in 1970 to 125 000 in 1976 with the introduction of'payao' in 1975. Wider use of 'payao'has contributed to the high level of tuna catches in the country.
The available information on fishing effort is limited. Table 1 gives a summary of the number of commercial fishing vessels in the Philippines, by gear type, and gross tonnage from 1967 to 1987. Note that the trawl, bagnet and purse seine were the most widely used gear during this period; also a shift to larger ves- sels (i.e., from 3-5 GT to 10-<50 GT) is evident. Simi- lar vessel information prior to 1967 is unavailable, while information after 1987 is difficult to extract due to changes in methods of fishery statistics collection resulting from the transfer of such functions from BFAR to the Bureau ofAgricultura1 Statistics (BAS). Information pertaining to municipal fisheries is far more limited, although periodic information may be available from national censuses occasionally con- ducted in the past (Dalzell et al. 1987).
The potential yield from the marine fishery re- sources of the Philippines has been studied extensively (Munro 1986; Silvestre et al. 1986; Dalzell and Ganaden 1987). Estimates of maximum sustainable yield (MSY) from conventional fishery resources vary widely between 1.1 and 3.7 million t. The higher esti- mates are based on overly optimistic yield-per-unit- area figures and do not consider productivity decline with depth. The scientific consensus since the 1980s i s t h a t MSY from conventional resources is

T a b l e 1 . To ta l n u m b e r o f c o m m e r c i a l f i s h i n g v e s s e l s in t h e P h i l i p p i n e s b y g e a r t y p e and t o n n a g e f r o m 1 9 6 7 to 1987. (Source : BFAR sta t is t i cs ) .See tex t .
Category 1967 1968 1969 1970 1971 1972 1973 1974 1975 1976 1977 1978 1979 1980 1981 1982 1983 1984 1985 1986 1987 Total number of vessels 2 361 2 225 2 273 2 284 2 180 2 222 2 513 2 286 2 543 2 571 2 269 2 133 2 464 2 407 2 349 2 580 2 634 2 666 2 484 2 283 2 516 Tolal gross tonnage Powered vessels Nonpowered vessels
Number by gear Bagnet Beach seine Gillnet Hook and line (handline) Longline Drive-in-net (muro-ami) Purse seine (ringnet) Pushnel Olter trawl Round haul seine Others Not reported
Number by tonnage 3 to less than 5 5 to less than 10 10 to less than 20 20 to less than 50 50 to less than 100 100 to less than 200 200 to less lhan 500 500 and over Not reported

68 1.650&0.250 million t, i.e., 600d00 thousand t of demersals, 800i100 thousand t of coastal pelagics and 250k50 000 t of tunas or oceanic pelagics (BFAR 1995).
Fig. 4 illustrates the results of the assessment of demersal fisheries. The figure indicates the following: MSY for exploited demersal resources (i.e., excluding offshore hard bottoms around Palawan, southern Sulu Sea area, and the central part of the country's Pa- cific coast) is about 340 000-390 000 t, while the maxi- mum economic yield (MEY) ranges from 280 000 to 300 000 t worth of fish and invertebrates. Subsequent refinements of this assessment yielded similar results (Silvestre and Pauly 1987). Note that the MSY of 340 000-390 000 t, when combined with the MSY estimates for unexploited or lightly fished hard bottom areas of 200 000 t, come very close to the consensus demersal MSY of 6OO+lOO 000 t noted above.
Assessment of the exploitation status of currently fished demersal stocks indicates that these resources are biologically and economically overfkhed. Studies
indicate that the biomass of currently fished stocks has declined to about 30% of its original levels in the late 1940s (Silvestre et al. 1986). It can also be noted in Fig. 4 that fishing effort could be reduced by 3/5 without substantially reducing demersal yields. The annual rent dissipation fiom overfishing of the demersal stocks is about US$130 million per year. Reduction of fishing effort and reallocation of those displaced to lightly fished, hard-bottom areas is required.
Fig. 4 also illustrates the results of the assessment of small pelagic fisheries. The data indicates the fol- lowing: MSY for small pelagics of about 550 000 t; MEY of 250 000 t for fish and invertebrates in the exploited fishing grounds, and;'a maximum economic rent (MER) of US$29O million worth of fish and inver- tebrates (Dalzell et al. 1987). Subsequent refinements of this assessment have yielded similar results (Trinidad et al. 1993). The MSY figure of 550 000 t , when combined with MSY estimates of 250 000 t for lightly fished small pelagic resources or fishing grounds
Mean annual total adjusted fleet horsepower (hp x lo3)
0 0.2 0.4 0.6 0.8 1.0
Fishing mortality (F = YB; yea:) L Fig. 4. Surplus production model of demersal and small pelagic fisheries in the Philippines providing estimates of MSY and economic rent for exploited areashesources. (Sources: Silvestre and Pauly 1986; Dalzell et al. 1987).

Table 2. Coastal transect indicating activities and issues relevant to integrated coastal zone and coastal fisheries management in the Philippines.
Maior zones Terrestrial
U ~ l a n d Midland Lowland Coastal
Intertidal Nearshore Marine
Offshore D e e ~ s e a - - -
(>18% slope) (8-18% slope) (0-<8% slope) (1 km inland from (30 111-200 m depth) (>200 m depth-EEZ) (beyond- EEZ) HHWL-30 m depth)
Main resource Logging Logging Agriculture useslactivities Mining Farming Urban development
Upland Mining Industrial development agriculture Dams Tourism
Livestock Human settlement production Freshwater fisheries
Freshwater aquaculture
Main environmental Siltation1 Siltation Agrochemical loading issueslimpacts sedimentation Agrochemical Sewage disposal on the coastal Flooding loading Industrial wastes zone Heavy metal Flooding Solid wastes
pollution Increased salinity Siltation Agrochemical Organic loading Overfishing loading
Aquaculture Municipal fisheries Commercial fisheries Fisheries Municipal fisheries Commercial fisheries Marine transport Marine transport Mangrove forestry Marine transport Tourism Ports/marine transport Human settlements Salt production Sandlgravel mining
Agrochemical loading Overfishing Overfishing Oil spills Overfishing Solid wastes Oil spills Overfishing Mangrove depletion Oil spills Poaching Coral reef degradation Oil spills Sewage disposal Habitat conversion Organic loading Siltation Red tides Reduced biodiversitv

70 (i.e., in waters off Palawan, parts of the country's Pacific coasts and some parts of Mindanao), virtually equals the consensus small pelagic MSY of 800.+100 000 t noted above. Thus, available informa- tion also indicates that the small pelagics are biologi- cally and economically overfished. The consequent rent dissipation is about US$290 million annually. Fishng effort is particularly high in nearshore coastal areas, especially the traditional fishing grounds. Effort level in the mid-1980s was already more than twice the level necessary to harvest MSY (Fig. 4). The obvious need for small pelagic fisheries is to reduce effort and reallocate the excess to lightly fished areas. There are indications that this expansion has occurred since the work of Dalzell et al. (1987).
The assessment of tuna indicates that the fishing pressure on the stocks in Philippine waters is high (Dalzell and Corpuz 1990; BFAR 1995). The magni- tude of the catches and the concentration of fishing effort within a small surface area indicate a very high local fishing mortality. There is a need to expand to other fishing areas (further offshore) off the South China Sea and the Pacific coast of the country. Such a move may increase the size of tuna catches in Philippine waters, which largely do not meet export market requirements. Commercial fishing operations are known to have expanded to Indonesia, Micronesia and Papua New Guinea though joint venture arrange- ments from private sector initiatives.
The oceanic large pelagics such as marlin, sword- fish and sailfish are not fully exploited at present. From a landing of 17 000 t-25 000 t i n the 1980s, the large pelagic landings have declined to 9 000-15 000 t in the 1990s.
Nonconventional resources such as oceanic squid and deep-sea shrimp occur in Philippine waters. At present there is no established fishery for these re- sources and there is very little information to assess resource potential.
Management Issues and Opportunities
An excessive fishing effort level is evident from the various country-wide site-specific fisheries assess- ments conducted in the Philippines. Species compo- sition changes reflective of growth, recruitment and ecosystem overfishing have occurred in many areas ( Silvestre et al. 1986; Pauly et al. 1989;Cinco et al. 1994). Economic overfishing is also quite evi- dent. There is a need to improve fisheries manage- ment, in general, and to effect effort reduction, in particular. It should be noted, moreover, that distri- butional inequity and conflict between municipal and commercial fisheries is an issue in many areas, par- ticularly in nearshore, traditional fishing grounds. For instance, in the San Miguel Bay fisheries in the early 1980s, 50% of pure profits went to 95 trawlers
owned by 35 households. and the rest went to 2 288 municipal gear units owned by 2 030 households (Smith et al. 1983). Thus, effort reduction should be sensitive to considerations of distributional equity.
The decline of fishery resources in the Philippines, particularly of demersals and small pelagics, is pre- sumably a combined effect of excessive fishing effort and coastal environmental degradation. The quanti- tative link of resource decline to habitat degradation, however, is difficult to document. Habitat degrada- tion is more complex and serious in highly populated coastal areas. Habitat degradation due to pollution is mostly site specific. Table 2 illustrates a typical coastal transect, indicating activities and issues which require attention for effective coastal fisheries management in the Philippines. These issues, taken within the larger framework of integrated coastal zone management (ICZM), require increased attention and support in the Philippines. ICZM schemes have been implemented in 12 selected coastal areas in the coun- try under the ADB-funded Philippine Fisheries Sec- tor Program (1991-1997). Participatory schemes that develop the knowledge and capability of stakeholders and local governments (consistent with the 1992 Lo- cal Government Code) to manage their resources have been initiated successfully, requiring dider replica- tion and continued support.
Improvement of information inputs into the fisheries management decision-making process re- quires immediate action in the Philippines. The sta- tistical gaps resulting from the transfer of fisheries sta- tistics collection from BFAR to BAS after 1987 need urgent attention. In this context we note the avail- ability of numerous trawl surveys conducted in the Philippines (Appendix 111). The work of Silvestre et al. (1986) and Silvestre and Pauly (1987) illustrate some of the insights which can be derived from these underutilized data. Retrospective analyses of these surveys using recently developed techniques such as population, community analysis (McManus 1986,1989 and this vol.) and ecosystem analysis (Christensen and Pauly 1993,1996) and along the lines suggested in Pauly and Martosubroto (1996) can provide numerous insights which can improve fisheries ma- nagement in the Philippines. The availability of sound, scientific information will facilitate the eleva- tion of resource allocation decisions into objective rather than emotional debates.
Acknowledgments
We wish to thank the staff of the Pelagic Resources Section, BFAR, particularly Ana Marie Coronel, Criselda Malit, Jenneth Manzano, Clarita Ulanday and Val Manlulu for their assistance in locating, prepa- ring and encoding statistical information used in this

/ 7 1 DaDer. Thanks are also due to Salud Ganaden. Luz McManus, J.W. 1986. Depth zonation in a demersal fishery in L A
Regis and Leony Mijares for their assistance and sug- the ~ a m a r Sea, phi1ippines, p. 483-486. In J. ~ a c l e k , L. Dizon and L. Hosillos (eds.) The First Asian Fisheries gestions in the preparation Of the paper> and F o m Asian Fisheries Society, Manila.
Silvestre of ICLARM for his technical guidance. McManus. J.W. 1989. Zonation among demersal fishes of - Southeast Asia: the southwest shelf of Indonesia. p. 1011- 1022. In 0. Magoon, H. Converse, D. Miner, L. Thomas
References Tobin and D. Cark (eds.) Coastal Zone '89. Proceedings of the Sixth Symposium on Coastal and Ocean Management. American Society of Civil Engineers, New York.
Alcala, A.C. and E.D. Gomez. 1985. Fish yields of coral reefs in Munro, J.L. 1986. Marine fishery resources in the Philippines: Central Philippines. Proc. 5th Int. Coral Reef Symp. 5: 521- catches and potential, p. 19-45. In D. Pauly, J. Saeger and 524. G. Silvestre (eds.) Resources management and socio-
BFAR (Bureau of Fisheries and Aquatic Resources). 1950-1987. economics of Philippine marine fisheries. Dep. Mar. Fish. Fisheries statistics of the Philippines. Tech. Rep. 10: 217.
BFAR 1995. On the allocation of fishing area for exclusive use 'Pauly, D., G.T. Silvestre and I.R. Smith. 1989. On development, by the municipal fisheries sector: a policy brief. Bureau of fisheries and dynamite: a brief review of tropical fisheries Fish. and Aquatic Res., Quezon City, Philippines.
J management. Nat. Resour. Modelling 3(3): 307-329.
'christensen, V. and D. Pauly (eds.) 1993. Trophic models of Pauly, D. and P. Martosubroto, Editors. 1996. Baseline studies
J aquatic ecosystems. ICLARM Conf. Proc. 26, 390 p. of biodiversity: the fish resources of Western Indonesia.
Christensen, V. and D. Pauly. 1996. Ecological modeling for all. ICLARM Stud. Rev. 23, 312. Naga, ICLARM Q. 19(2): 25-26. Primavera, J .H. 1991. Intensive prawn farming i n t h e ' Cinco, E.A., J.C. Diaz, R. Gatchalian and G.T. Silvestre. 1994. Philippines: ecological, sound and economic implications. Results of the San Miguel Bay trawl survey. In G. Silvestre, Ambio 20: 28-31. C. Luna and J. Padilla (eds.) Multidisciplinary assessment Sebastian, A.R. 1951. Oceanographic research in the Philippines. of the fisheries in San Miguel Bay, Philippines (1991-1993). Philipp. J . Fish. (1): 147-153. ICLARM Tech. Rep. 47 (CD-ROM). Silvestre, G. and D. Pauly. 1986. Estimate of yield and economic
Dacay, B.U. 1992. The state of the seaweed industry in the rent from Philippine demersal stocks 1946-1984. Paper Philippines, p. 23-27. In C. Calumpong and E. Mines (eds.). presented a t the IOCIWESTPAC Symposium on Marine Proceedings of the Second Philippine-U.S. Phycology Science i n the Western Pacific: t h e Indo-Pacific Symposium/Workshop, 6-10 January 1992, Silliman Convergence, 1-6 December 1986, Townsville, Australia. University Press, Dumaguete City, Philippines. 376 p. Silvestre, G.T., R.B. Regalado and D. Pauly. 1986. Status of
Dalzell, P. and P. Corpuz. 1990. The present status of small Philippine demersal stocks-inferences from underutilized pelagic fisheries in the Philippines, p. 25-51. In Pagdilao, catch rate data, p. 47-96. In D. Pauly, J . Saeger and G. C.R. and C.D. Garcia (eds.) Philippine tuna and small Silvestre (eds.) Resources, management and pelagic fisheries: status and prospects for development. socioeconomics of Philippine marine fisheries. Tech. Rep. Proc. of the Sem. Workshop, 27-29 July 1988. Zamboanga J Dep. Mar. Fish. Tech. Rep. 10: 217. S t a t e College of Marine Science and Technology, Silvestre, G.T. and D. Pauly. 1987. Estimate ofyield and economic Zamboanga City, Philippines. Philippine Council for rent from Philippine demersal stocks (1946-1984) using Aquatic and Marine Research and Development Book vessel horsepower as a n index of fishing effort. Univ. Ser. No. 7. J Philipp. Visayas. Fish. J 3(1-2): 11-24.
Dalzell, P. and R.A. Ganaden 1987. A review of the fisheries for Smith, I.R., D. Pauly and A.N. Mines. 1983. Small-scale fishing small pelagic fishes in Philippine waters. BFAR Tech. Pap. of San Miguel Bay, Philippines: Options for management Ser. 10(1), 58 p. ICLARM, Manila, Philippines and Bureau and research. ICLARM Tech. Rep. 11. 80 p. of Fisheries and Aquatic Resources, Quezon City, Soegiarto, A. 1985. Oceanographic assessment of East Asian Philippines. seas. In Environment and resources of the Pacific, p. 173-
'Dalzell, P., P. Corpuz, R. Ganaden and D. Pauly. 1987. Estimation / 184. UNEP Reg. Seas Rep. Stud. 69: 244. of maximum sustainable yield and maximum economic Trinidad, A.C., R.S. Pomeroy, P.V. Corpuz and M. Aguero. 1993. rent from the Philippine small pelagic fisheries. BFAR Tech. Bioeconomics of the Philippine small pelagic fishery.
] Pap. Sci. lO(3): 23 p. ICLARM Tech. Rep. 38, 74 p. Fortes, M.D. 1990. Seagrasses: A resource unknown in the Wyrtki, K. 1961. Physical oceanography of the southeast Asian
ASEAN region. ICLARM Educ. Ser. 5, 46 p. waters: scientific results of marine investigations of the Gomez, E.D. 1991. Coral reef ecosystems and resources in the South China Sea and Gulf of Thailand 1951-1961. Naga
.Philippines. Canopy Int. 16(5): 1-12. Rep. Vol. 2. Neyenesch Printers, California. 195 p. Gomez, E.D., P.M. Alifi~, H.T. Yap and W Y. Licuanan. 1994. A Yap, H.T. and E.D. Gomez. 1985. Coral reef degradation and
review of the status of Philippine reefs. Mar. Pollut. Bull. pollution in the East Asian Seas, p. 185-207. UNEP Reg. 29(1-3): 62-68. Seas Rep. Stud. 69: 294.

I ElrTERtD tW i - The Coastal Fisheries of Sri Lanka: lsss keeources, Exploitation and Management
R.MALDENIYA National Aquatic Resources Agency
Crow Island, Mattakkuliya, Sri Lanka
MALDENIYA, R. 1997. The coastal fisheries of Sri Lanka: resources, exploitation and management, p.72- 84. In G. Silvestre and D. Pauly (eds.) Status and management of tropical coastal fisheries in Asia. ICLARM Conf. Proc. 53, 208 p.
Abstract
Fisheries a re a n important source of animal protein, employment, income and foreign exchange earnings for Sri Lanka, whose Exclusive Economic Zone (EEZ) is over 20 times larger than its land area. This paper reviews the marine environment and the results of surveys of the marine resources of Sri Lanka with emphasis on trawl surveys, including actual catches, potential yield, catch composition and the tech- nology in use. Coastal fisheries in Sri Lanka today are in a stage of stagnation due to overexploitation, environmental degradation and breakdown of traditional sea tenure arrangements. The government has formulated a five-year plan with community-based approaches to develop the sector in a sustainable manner.
Introduction Marine Environment
The fisheries of Sri Lanka are a primary source of animal protein, employment and foreign exchange for the country. Fisheries contributed 65% of the animal protein consumed in Sri Lanka in 1995, provided full time and part time employment to around 115 000 persons (Anon. 1992) and contributed 2.3% to the Gross Domestic Product (GDP) of the country in 1995 (Anon. 1995), while exports of fish and aquatic products were valued a t Rs.2 893 million1 in foreign exchange.
Marine fisheries account for 90-95% of the total landings, their backbone being the coastal fisheries which contribute 70-80% of the total marine landings. The offshore fisheries are still in a developing stage.
In this paper, the status of Sri Lanka's marine fisheries is reviewed in terms of their resources and stage of development, exploitation patterns and the management issues they raise. Emphasis is given to the coastal fisheries and bottom trawl surveys - both historic and recent - that were conducted around Sri Lanka to explore and monitor the coastal demersal resources.
Sri Lanka (formerly Ceylon) is an island in the Indian Ocean situated close to the southeastern cor- ner of the Indian subcontinent. India and Sri Lanka are separated by the shallow Palk Strait and the Gulf of Mannar. The island, which has a land area of 65 610 km2, is surrounded by highly productive eco- systems such as mangrove forests, seagrass beds, salt marshes, and coral reefs. The island's Exclusive Eco- nomic Zone (EEZ), declared in 1978, at 536 000 km2 is over 20 times larger than its land area and consists of a territorial sea extending up to 12 nm, a contiguous zone extending from 12 to 24 nm and an EEZ proper extending from 24 to 200 nm (Fig. 1). The continen- tal shelf of about 26 000 km2 is narrow, with an average width of around 22 km. To the north and northwest the shelf widens to an extensive shallow bank where it forms the Gulf of Mannar, Palk Bay and Pedro Bank. With the exception of a few restricted areas in the Gulf of Mannar, off Pedro Bank and southeast of Hambantota, the edge of the continental shelf falls off rapidly from 20-65 m to 1 500-3 500 m.

I I I I I I
77 78 79 80 81 82
Longitude ("E)
Fig. 1. Location of Sri Lanka and its EEZ.
The bottom sediment in the shelf area is generally rocky, particularly between Colombo and Batticaloa. However, the bottom of the northern shelf, particu- larly the Palk Strait, is predominantly muddy or muddy sand and hence trawlable (Fig. 2.).
Sri Lanka is subject to the influence of a monsoonal wind system. The southwest monsoon occurs from May to September causing heavy rains, mainly in t h ~ western part of the country. The northeast monsoon occurs from December to February, with the heaviest rainfall in the north and east and on the northeastern slope of the central hills. The sea surface currents are influenced by the monsoons and are often strong a t the beginning and end of the southwest monsoon, and during the northeast monsoon, as shown by hy- drographic observations made on board the R.V. Dr. FridtjofNansen in the three surveys made from 1978 to 1980. During April-June and August-September, the currents are governed by the southwest monsoon and the general oceanic circulation is from west to east with current velocities of up to 2-3 knots near
the shelf edge. During the northeast monsoon, the circulation is reversed and current velocities are only 1-2 knots. The depth of the thermocline also varies with the monsoon reaching 100-125 m on the west coast during the northeast monsoon and 40-60 m du- ring the southwest monsoon. On the east coast, south of Pedro Bank, the depth of the thermocline is at 50- 70 m from the end of the southeast monsoon to the start of the northeast monsoon, and 20-40 m at the start of the southwest monsoon. Upwellings are not observed. The tides around Sri Lanka are predomi- nantly semidiurnal and microtidal, with the highest amplitudes in the Colombo area and the lowest around Jaffna and Trincomalee (Dassanayake 1994).
The better known fringing coral reefs in the coun- try are located around Hikkaduwa, Galle, Batticaloa, Trincomalee, Mannar and around the Jaffna penin- sula (Fig. 2); most show signs of degradation. The mangroves of Sri Lanka, never abundant due to the low tidal ranges, were estimated to cover about 12 000 ha in 1986 but have declined since. However, a man-

Fig. 2. Bottom structure around Sri Lanka. (After Pearson and Malpas 19: and other sources)
grove park has been established in Negombo to pro- mote research, education and public awareness of mangrove ecosystems, while several nongovernment organizations (NGOs) have launched mangrove re- planting projects. Seagrass beds are composed of seed bearing, rooted marine plants that require clear shallow waters sheltered from high wave energy. They provide habitats and shelter for numerous species of fish and endangered animals, i.e., dugong and green sea tur t le . Twelve species of seagrass have been recorded around Sri Lanka but the area covered by them has not been precisely estimated (Dassanayake 1994). Seaweed resources also occur around Sri Lanka but their types, extent and poten- tial have not been adequately investigated. Some 260 species belonging to the Chlorophyceae (green), Rhodophyceae (red) and Phaeophyceae (brown algae) have been reported but only 20 of them are of com-
mercial importance in different parts of the world (Durairatnam 1961). Two species, Gracilaria verrucosa and G. edulis, are exploited in Sri Lanka (Jayasuriya 1989). Sargassum is another abundant species found in large quantities along the northern coast. A potential yield of 800 t.year-l has been esti- mated for the southwestern and southern areas of the island (Durairatnam 1966).
Capture Fisheries Sector
The fishing industry provides full time employment to around 100 000 persons, part-time employment to around 10 000, while 5 000 persons work in related industries (Anon. 1992). Marine fisheries in Sri Lanka have traditionally been small-scale, producing largely for internal consumption. Foreign exchange is earned

through export of tuna, shrimp, lobsters and nonconventional resources such as b&che-de-mer (sea cucumbers) and seaweed. Fishing effort is concen- trated on a nearshore band of brackishwater and in- shore waters. Traditional fishing gear made of natu- ral fibers are deployed, with or without craftshoats. Formerly the primary gear was the beach seine, the backbone of the small-scale industry, though hand lines, bottom-set gillnets, bottom longlines, set nets, set bags and stakes were also used. Fishing was also carried out with pole and line from outrigger canoes, the only craft used for fishing operations beyond im- mediate inshore areas (Table 1).
From the 1950s on, motorization gradually began to replace the traditional crafts operating in the outer range of the continental shelf (large outrigger canoes and vallams). This was followed by the replacement of log rafts (teppam and kattumaram), with 5.2-6.2 m fiberglass reinforced plastic (FRP), and outboard mo- tor (OBM) boats, which expanded the coverage of the fishing grounds for small pelagics and demersals. However, there is sti l l a high proportion of nonmechanized crafts in coastal fisheries. Newly de- signed boats of 3.5 GT, with lengths of 8-10 m and inboard engines have started fishing for large pelagics
Table 1. Types of fishing craft operating around Sri Lanka. Craft type Local name Length (rn)
Indigenous crafts Log rafts Teppam 3-5
Kattuman 4-7 Outrigger canoes Oru, thony 3-5
10-1 2 Plan beach seine Paru, padu 10-12 Dugout beach seine crafts Karavalai vallam 10-1 2 Dugout with outrigger Vallam 3-6
Introduced crafts Fiberglass reinforced boat FRP boat 5.2-6.2 3.5-4.5 t boats 3.5 boats 8-10.3 11 t boats Abu Dhabi 10.4-18
75 without venturing far from shore and performing only day trips.
Prior to 1980, offshore fishing was dominated by botto~n trawling on Wadge Bank, a fishery which closed in late 1978 as a result of the demarcation of the EEZ boundary between India and Sri Lanka. In the early 1980s 'Abu Dhabi boats' were built by the Northwest Coast Fisheries Development Project. These have an overall length of 34 ft, a 60 hp engine and are equipped with an insulated fish hold and crew accommodations allowing trips lasting several days. They were followed by even larger boats and, at present, 84% of the fishing boats have an overall length of between 34 and 36 ft (10 and 12 m) (Table 2).
From 1950 to 1975 the contribution of tuna to the total catch increased from 3.4 to 26% while that of rock fish or demersals declined from 24 to 11%, mainly due to shifts in effort. In 1990 clupeids accounted for 21% oftotal catch, while 19% was contributed by tuna. In the early 1990s 60% of total inshore landings origi- nated from gillnets followed by bottom trawling (15%) and trolling (5%). In the offshore areas gillnets ac- counted for 80%, longlines 15% and troll lines 4% of landings (Joseph 1993). Fish production by fishing craft during 1979-1987 is given in Table 3.
Remarks Operative offshore distance (km)
Non-motorized1 1-2 motorized OBMa 1-3 Saillhand drivenlmechanized OBMa 1-3 Hand driven 1-15 Hand driven 1-3 Saillhand drivenlmechanized OBMa 1-3 OBMa, 8-25 hp 1-5
1-10
lnboard engine 39-54 hp lnboard engine 54-75 hp
a Outboard motor. Fiberglass reinforced plastic.
Table 2. Age and size profile of the offshore fishing fleet of Sri Lanka. (Source: Joseph et at. 1995).
Year of construction 1981 -83 1984-86 1987-89 1990-92 1993-95 Percentage
Length overall (feet) 28-32 34-36 38 40-45 > 50 Total %
2 02 1.6 1 2 03 2.5 2 3 05 4.1 4 29 1 1 35 28.7 2 67 4 4 77 63.1 7.4 84.4 4.1 3.3 0.8 100.0
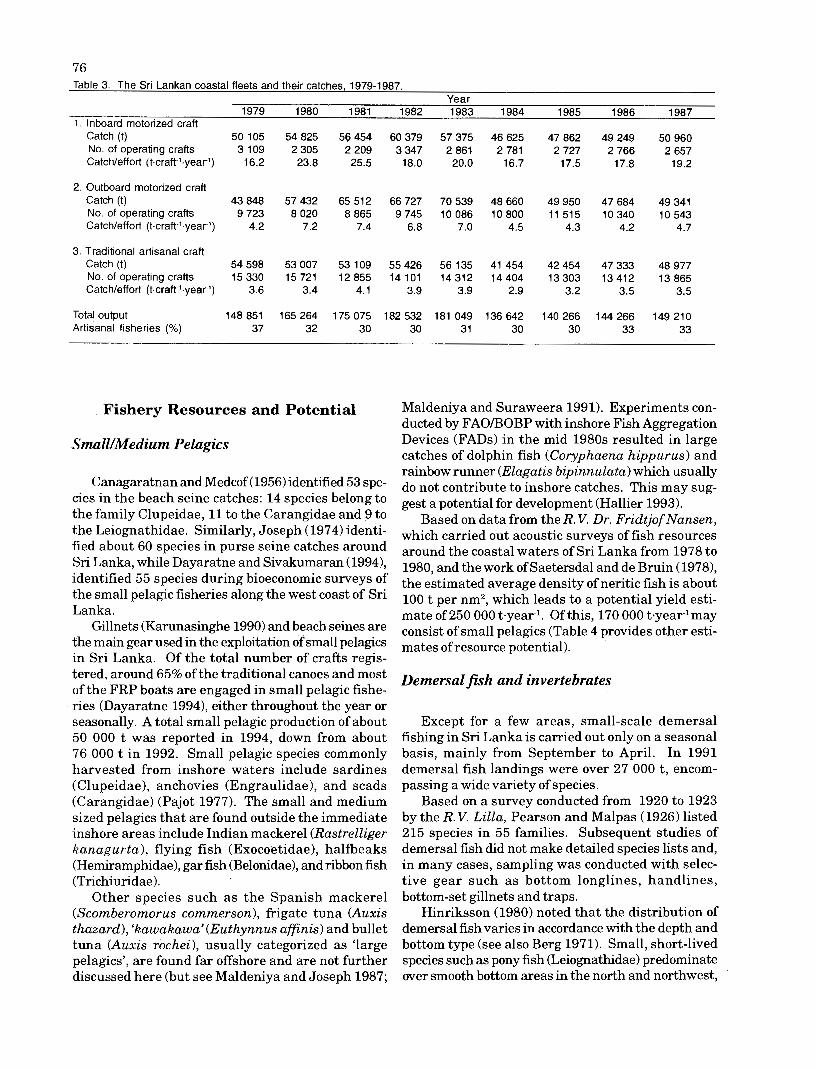
76 Table 3. The Sri Lankan coastal fleets and their catches, 1979-1987.
Year 1979 1980 1981 1982 1983 1984 1985 1986 1987
Inboard motorized craft Catch (t) No. of operating crafts Catchleffort (tcraft-'.yeari)
Outboard motorized craft Catch (t) No. of operating crafts Catchleffort (t.craWi.year-')
Traditional artisanal craft Catch (t) No. of operating crafts Catchieffort (txraft-'.year-')
Total output 148851 165264 175075 182532 181049 136642 140266 144266 149210 Artisanal fisheries (%) 37 32 30 30 3 1 30 30 33 33
Fishery Resources and Potential
Small/Medium Pelagics
Canagaratnan and Medcof (1956) identified 53 spe- cies in the beach seine catches: 14 species belong to the family Clupeidae, 11 to the Carangidae and 9 to the Leiognathidae. Similarly, Joseph (1974) identi- fied about 60 species in purse seine catches around Sri Lanka, while Dayaratne and Sivakumaran (1994), identified 55 species during bioeconomic surveys of the small pelagic fisheries along the west coast of Sri Lanka.
Gillnets (Karunasinghe 1990) and beach seines are the main gear used in the exploitation of small pelagics in Sri Lanka. Of the total number of crafts regis- tered, around 65% of the traditional canoes and most of the FRP boats are engaged in small pelagic fishe- ries (Dayaratne 1994), either throughout the year or seasonally. A total small pelagic production of about 50 000 t was reported in 1994, down from about 76 000 t in 1992. Small pelagic species commonly harvested from inshore waters include sardines (Clupeidae), anchovies (Engraulidae), and scads (Carangidae) (Pajot 1977). The small and medium sized pelagics that are found outside the immediate inshore areas include Indian mackerel (Rastrelbiger kanagurta), flying fish (Exocoetidae), halfbeaks (Hemiramphidae), gar fish (Belonidae), and ribbon fish (Trichiuridae).
Other species such as the Spanish mackerel (Scomberomorus commerson), frigate tuna (Auxis thazard), 'kawakawa'(Euthynnus affinis) and bullet tuna (Auxis rochei), usually categorized as 'large pelagics', are found far offshore and are not further discussed here (but see Maldeniya and Joseph 1987;
Maldeniya and Suraweera 1991). Experiments con- ducted by FAOA3OBP with inshore Fish Aggregation Devices (FADS) in the mid 1980s resulted in large catches of dolphin fish (Coryphaena hippurus) and rainbow runner (Elagatis bipinnulata) which usually do not contribute to inshore catches. This may sug- gest a potential for development (Hallier 1993).
Based on data from the R. V. Dr. Fridtjof Nansen, which carried out acoustic surveys of fish resources around the coastal waters of Sri Lanka from 1978 to 1980, and the work of Saetersdal and de Bruin (1978), the estimated average density of neritic fish is about 100 t per nm2, which leads to a potential yield esti- mate of 250 000 teyear-l. Of this, 170 000 tayear-lmay consist of small pelagics (Table 4 provides other esti- mates of resource potential).
Demersal fish and invertebrates
Except for a few areas, small-scale demersal fishing in Sri Lanka is carried out only on a seasonal basis, mainly from September to April. In 1991 demersal fish landings were over 27 000 t, encom- passing a wide variety of species.
Based on a survey conducted from 1920 to 1923 by the R. V. Lilla, Pearson and Malpas ( 1926) listed 215 species in 55 families. Subsequent studies of demersal fish did not make detailed species lists and, in many cases, sampling was conducted with selec- tive gear such as bottom longlines, handlines, bottom-set gillnets and traps.
Hinriksson (1980) noted that the distribution of demersaI fish varies in accordance with the depth and bottom type (see also Berg 1971). Small, short-lived species such as pony fish (Leiognathidae) predominate over smooth bottom areas in the north and northwest,

Table 4. Fisheries resource potential in Sri Lanka. (Source: Sivasubramaniam 1995). Resource Potential vield Aooroach
(t.year'l) (r'einarks) Demersals 60 000 Exoloratorv trawl fisherv Demersals 52 000 ~r i inary Demersals 80 000 Acoustic survev Demersals 74 000 Acoustic and swept area Pelagics 90 000 Primary production Pelagics 170 000 Acoustics (inshore and offshore) Large pelagics 27 000 Production trend and
survey catches (only for offshore area)
Author
Tiews (1 966) Jones and Bannerji (1973) Blindheim and Foyn (1980) Sivasubramaniarn (1 983) Jones and Bannerji (1 973) Blindheim and Foyn (1 980) Sivasubramaniam (1 977)
while larger, long-lived species such as snappers (Lutjanidae), emperors (Lethrinidae), groupers (Serranidae) and elasmobranchs (sharks and rays) dominate where the bottom is rough and uneven.
Based on the above-mentioned acoustic surveys, Saetersdal and de Bruin (1978) estimated a potential yield of demersal fish from the continental shelf area of 75 000-80 000 t-year-', 30 000 t.year-' in the Palk BayPalk Strait area and 45 000 t.year-l from the rest of the shelf.
Additionally, deep-sea fish such as Clzlorophthalmus bicornis, C. agassizi, Cubiceps sp., and lanternfish (family Myctophidae) may represent a resource at 200-300 m depth along the shelf edge (Demidenko 1972; Saetersdal and de Bruin 1978; Dalpadado and Gjosaeter 1993).
A total of 32 species of penaeid shrimps have been recorded from Sri Lanka (de Bruin 1970). Of these, four species are of commercial importance, i.e., Pcnaeus indicus, P. monodon, P. semisulcatus and P. merguiensis. P. indicus constitute about 50-70% of the total annual shrimp catch. In 1989 total shrimp production in Sri Lanka was 5 300 t , the bulk being from capture fisheries. In 1994 the 2 300 t of penaeid shrimp exported represented over 50% of the value of fishery exports from Sri Lanka.
Six species of spiny lobster occur in Sri Lankan coastal waters down to 50 m, but most are confined to 30 m. Preferred depth ranges vary among spe- cies: 1-5 m for Panulirus penicillatus; 1-20 m for P. homarus; 11-20 m for P. versicolor and P. polyphaus; and 11-30 m for P. longipes and P. ornatus.
Lobster resources are heavily exploited to meet the demand for export and tourist hotels. In 1989, export of lobsters was 663 t , 80% of which consisted of P. homarus, valued a t Rs.278 million.
B&che-de-rner or sea cucumbers (Holothurians) are harvested from larger, high salinity lagoons in the northwest, north and northeast and represent an important export product. Out of 70 species recorded from Sri Lanka, 13 species are consumed in many
parts of the world. The dominant species, Holothuria scabra, is selectively harvested (Joseph and Moiyadeen 1990).
There has been little effort directed towards the exploitation of cephalopods on a commercial scale but incidental catches are made by purse seines, scoop nets, shrimp trawlers, and hand lines. Perera (1975) identified only two species of cuttlefish and six species of squid in commercial catches. However, cephalo- pods represent a relatively high fraction of the prey of yellowfin tuna when these feed in coastal waters. Four species of cuttle fish and eight species of squid were recovered from their stomach contents (Maldeniya 1992).
Trawl fisheries and surveys
The first attempt to trawl in Sri Lanka occurred in 1902 when a private party deployed a steam trawler on the west coast off Colombo. Later an English steam trawler, the Violet, continued the operations off Co- lombo and extended them to the east coast (Malpas 1926). No details are available of these ventures but it appears that they encountered fierce resistance from artisanal fishers who attacked the vessels and damaged the gear. The survey carried out by the Ceylon Government trawler the R. V. Lilla in 1920- 1923 indicated that the grounds off the southwest coast were small and rough and that catches were too small to justify the deployment of large steam trawlers. Therefore, large trawlers have not operated off the southwest coast except for the Halpha in 1952. How- ever, trawling was done in this area by small boats such as paddled log rafts working in pairs and drag- ging a trawl known in Sinhalese as katumaran dela (Pearson and Malpas 1926). Sri Lanka had a well established commercial trawler fishery on the Wadge Bank, which the survey of the R.V. Lilla had identi- fied as supporting high fish concentrations along with Pedro Bank and the Palk Strait (Malpas 1926). This fishery lasted from 1920 to 1975 with sporadic

78 trawling on Pedro Bank during the same period. Fol- lowing the demarcation of these waters and of the India-Sri Lanka sea boundaries in 1976, the whole of the Wadge Bank and one-third of Pedro Bank became part of the Indian EEZ and no further commercial trawling was undertaken by Sri Lanka-based trawlers. This paper, therefore, does not discuss the rich data set generated by these hstoric fisheries now lost to Sri Lanka.
Trawling was initially done with large mesh nets which did not retain small fish and invertebrates. The first attempt at trawling with a small mesh net was made by the Halpha in 1950 off Colombo and in the north, northwest and northeast of Sri Lanka. From 1953 to 1957 a series of trials with 45 ft trawlers, the North Star and the Canadian, were conducted on Pedro Bank and other areas around Sri Lanka. A summary of operations by the former vessel is given in Table 5. Trawling is now well established in some parts of Sri Lanka. The major surveys carried out in Sri Lankan waters are summarized in Table 6 (see also Appendix 111). The majority of these surveys cov- ered coastal waters down to about 60 m, while the surveys of the R. V. Optimis and the R. V. Dr. Fridtjof Nansen extended up to 300 m and 340 m, respectively, in some areas. Surveys in different areas are sum- marized in Tables 7 and 8. However, as the trawler size, engines and gear used were different, their catch rates cannot be compared directly to evaluate the stock status at different times.
During surveys of the R. V. Lilla (1920-1923) catch rates ranged from 1 to 120 kghour-l (Fig. 3), with the highest densities occurring in the northern strata (Table 9). The catch rates of the the Canadian (1955-
1956) ranged from 2 to 28 kg-hour1 and were system- atically lower than those of the R.V. Lilla even in the same strata. The gear was probably inappropriate. The catch rates of the R. V. Dr. FridtjofNansen (1978- 1980) were higher than those reported by any of the previous surveys. Sivasubramaniam and Maldeniya (1985) analyzed the bulk of the available data on trawl surveys in Sri Lanka and noted that snappers (Family Lutjanidae), especially Lutjanus malabaricus, L. rivulatus and L. lutjanus, had dominated the catch of the R.V. Lilla, while emperors (Lethrinidae), espe- cially Lethrinus nebulosus and L. miniatus, were very abundant in the catches of the R.V. Dr. Fridtjof Nansen. Hinriksson (1980) noted that shallow water demersal catches in the northern part of the island were dominated by pony fish (Leiognathidae), sharks and skates. In deeper waters, the surveys of the R.V. Optimist (1972) and the R.V. Dr. Fridjoft Nansen on the continental slope off the northeast coast revealed the occurrence of deep sea fish concentrations (Sivasubramaniam and Maldeniya 1985).
Fisheries Management in Sri Lanka
The administrative and policy making organiza- tion for fisheries in Sri Lanka is the Ministry of Fisheries and Aquatic Development (Fig. 4). The Department of Fisheries and Aquatic Resource (DFAR) is the line agency responsible for the func- tions of management, development and enforcement of the provisions of the fisheries and other related ordinances and acts. The National Aquatic Resource Agency (NARA) is the research arm of the Ministry
Table 5. Summary record of otter trawler North Star (Source: Medcof 1963). Area Period D e ~ t h (rn) No. of Haul duration Catchleffort . ~,
hauls (hours) (kg.hour-l) Colombo West 1953 10-33 10 11.75 62.5
N.W. Talairnanaar 1953 6-7 3 2.5 121.8
N.E. Mullaitivu
Trincomalee
Point Pedro North 1953 7-22 5 4 64.8 Alampil North 1954 7-20 4 5 4.5
11 -25 6 11.6 14.3
Kayts North 1954 4-8 11 15.8 10.3

79 Table 6. Summary of information on demersal trawl surveys conducted in Sri Lanka.
Years (months) Vessel Trawl gear Depth range Towing speed (m) (knots)
mainly 4-35; 4 R. V I Lilla Bottom trawl 38 m LOA 500 hp
head rope 21 m Foot rope 30 m 13 cm tapering to 2.5 cm codend
few location 73.5-95
1955 (Jun) - 1956 (Oct)
R. V I Canadian 14 m LOA 80 hp
Bottom trawl Yankee 351 9.5 cm codend
1963 (Nov) - 1967 (Apr)
R. VI Canadian 14 m LOA 80 hp
Shrimp trawl 3.5 cm codend
R. VI Myliddy 30 m LOA 240 hp
Granton trawl 8.0 cm codend, shrimp trawl 4.0 cm codend
1.5-3.0 for prawn 3-4 for fish
1971 (Mar) - 1992 (Dec)
R. V I Optimist
R. V I Huru//a I l m LOA 96 hp
3.2-3.6 cm codend 1975 (Nov) - 1978 (Jun)
1978 (Aug-Sep) 1979 (Apr-Jun) 1980 (Jan-Feb)
R. V. Dr. Fridtjof Nansen 2.0, 3.0, 4.0 cm 45 m LOA codend
and undertakes and coordinates research activities rela-ting to fisheries and aquatic resources. The training of fisheries personnel is undertaken by the National Institute of Fisheries Training (NIFT). The Ceylon Fisheries Corporation (CFC) buys and sells fish in competition with private traders and in this process tries to regulate fish prices to help the producer and the consumer. The Ceylon Fishery Harbours Cor- poration (CFHC) is responsible for the maintenance of fishery harbors and related onshore facilities. The Cey-Nor-Foundation (CNF) is a state-owned company engaged in the building of boats and in the manufac- ture of fishing gear and nets. The primary responsi- bilities of the Coast Conservation Department (CCD) are policy formulation, planning and research, is- suance of permits regulating coastal development ac- tivities and the construction and maintenance of shore- line protection works within designated coastal zones.
In accordance with national development policies, the Ministry of Fisheries and Aquatic Resources De- velopment formulated a five-year plan for fisheries de- velopment (1996-2000), with the following objectives: 1. promoting economic growth through the optimal
production of fish to improve the nutritional status of the population and to increase foreign exchange earnings;
2. reducing poverty by increasing gainful employ- ment and income opportunities; and
3. enhancing resources and environment protection through improved resource management and con- servation measures.
Usually a fishery can be expected to pass through three phases: developing, stable and declining. During the early part of the developing phase in Sri Lanka growth was slow due to the limitations of the tradi- tional fishing systems, notably their being confined to inshore waters. With the introduction of modern, motorized craft and improved fishihg methods the de- velopment of the fishing industry accelerated in the 1950s. It then began to stagnate, leading to the stable phase presently prevailing throughout most of the country's coastal fisheries. The stable phase exhibits declining catch rate with a leveling off in fishery pro- duction. This stage is characterized by endemic poverty among small-scale fishing communities, which pushes excess labor into coastal fisheries that are largely open access. This has led to conflicts among competing groups of fishers, which are worsened by subsidies, well-meaning incentives schemes and lack of enforce- ment of existing regulations.
Ironically fisheries management itself is not a new concept in Sri Lanka. Traditional sea tenure arrange- ments existed to regulate the deployment of fishing effort. Since the later part of the previous century these arrangements have been gradually replaced by
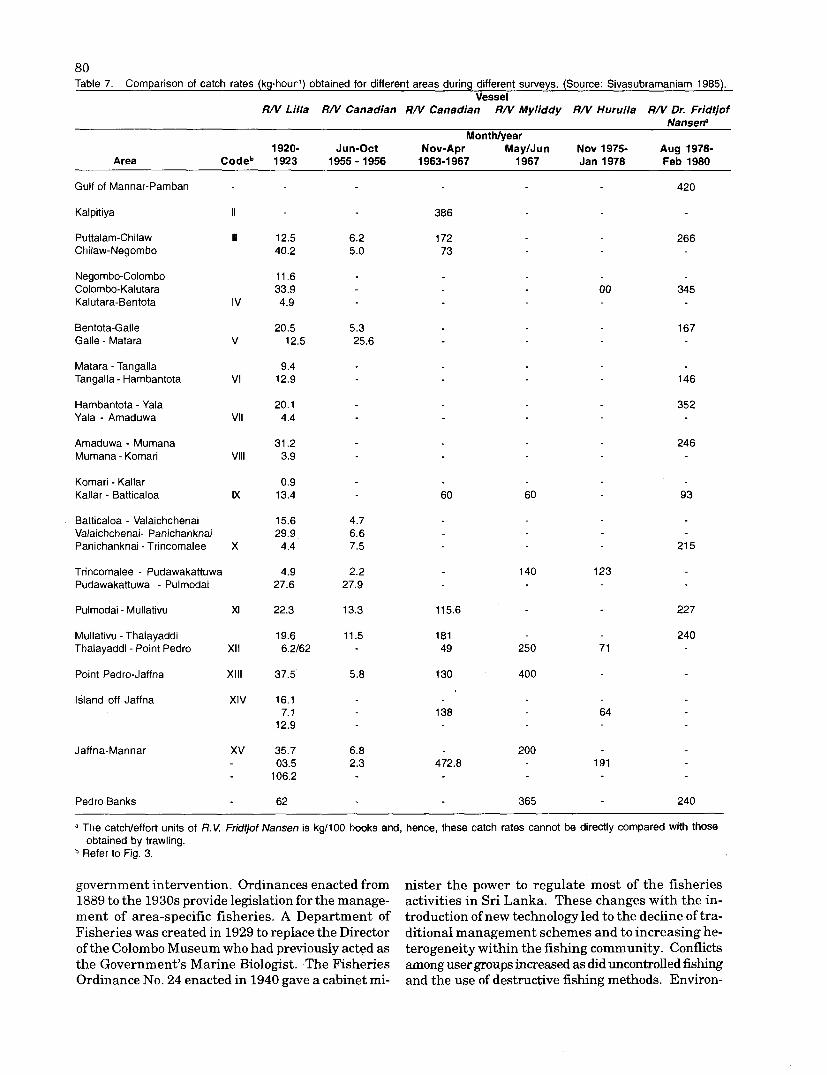
Table 7. Comparison of catch rates (kgshour-l) obtained for different areas during different surveys. (Source: Sivasubramaniam 1985). Vessel
R N Lilla R N Canadian R N Canadian R N Myliddy R N Hurulla R N Dr. Fridtjof Nansen"
Monthlyear 1920- Jun-Oct Nov-Apr MayIJun Nov 1975- Aug 1978-
Area Codeb 1923 1955 - 1956 1963-1 967 1967 Jan 1978 Feb 1980
Gulf of Mannar-Pamban
Kalpitiya
Puttalam-Chilaw Chilaw-Negombo
Negombo-Colombo Colombo-Kalutara Kalutara-Bentota
Bentota-Galle Galle - Matara
Matara - Tangalla Tangalla - Hambantota
Hambantota - Yala Yala - Amaduwa
Amaduwa - Mumana Mumana - Komari
Komari - Kallar Kallar - Batticaloa
Batticaloa - Valaichchenai Valaichchenai- Panichanknai Panichanknai - Trincomalee
Trincomalee - Pudawakattuwa Pudawakattuwa - Pulmodai
Pulmodai - Mullativu XI
Mullativu - Thalayaddi Thalayaddi - Point Pedro XI1
Point Pedro-Jaffna Xlll
Island off Jaffna XIV
Jaffna-Mannar XV
Pedro Banks
a The catchleffort units of R.V. Fridtjof Nansen is kg1100 hooks and, hence, these catch rates cannot be directly compared with those obtained by trawling.
Refer to Fig. 3.
government intervention. Ordinances enacted from nister the power to regulate most of the fisheries 1889 to the 1930s provide legislation for the manage- activities in Sri Lanka. These changes with the in- ment of area-specific fisheries. A Department of troduction of new technology led to the decline of tra- Fisheries was created in 1929 to replace the Director ditional management schemes and to increasing he- of the Colombo Museum who had previously acted as terogeneity within the fishing community. Conflicts the Government's Marine Biologist. The Fisheries among user groups increased as did uncontrolled fishing Ordinance No. 24 enacted in 1940 gave a cabinet mi- and the use of destructive fishing methods. Environ-

Table 8. Average catch rates reported by trawlers in different areas of Sri Lanka. (Source: Medcof 1963).
Region and fishing vessel Catchleffort (kg.hourl) N.E. Pedro Bank Region
Lilla (1 920-1 923) 84 Bulbul and Tongkol 130 Raglan Castle 185 Halpha 0 North Star 36 Canadian 12
N.W. Palk Strait Region Lilla (1 920-1 923) Halpha Northstar (1 953) Canadian (1 954)
Regular hauls Special hauls Towing alone Tandem towing with North Star
S.W. Galle to Chilaw Lilla (1 920-1 923) 2 1 Halpha 46 North Star (1 953) 107 Katumaram dela 9
- d i ' )
-
I
Fig 3 Mean catch rates of demersal fish by area (down to 200 m) by 50 to 60 f t trawlers of approximately 100 hp (After Sivasubramanlam and Maldeniya 1985).

82 mental problems such as pollution are affecting the The DFAR has the tasks of implementing this Act as sustainability of coastal fishery resources (see Table 10). is reflected in its structure (Fig. 5).
As the provision of the Fisheries Ordinance of 1940 Because of the problems facing coastal fisheries and appeared to be inadequate to meet these challenges, a the failure of top-down approaches, attention has been new Fisheries and Aquatic Resources Act was enacted given in recent years to community-based approaches in 1995. This emphasizes the management of fishe- - in effect the re-establishment of some aspects of ries and their sustainable development, with traditional management schemes. The National due recognition of the need for conservation measures. government and the communities are to share the
Table 9. Catch rates in different depth ranges from the R.V. Lilla cruises (kg.hourl). (Source: Sivasubramaniam 1985). Depth range Stratum
(m) IVa Va Vlla Xla Xlb Xlc Xllc Xlll
Minister of Fisheries and Aquatic Resources Development
I Deputy Minister
Secbtary
I Parliamentary Consultative
Committee
I I I I I I I Iepartment of Fisheries and National Aquatic National Institute of Ceylon Fisheries Ceylon Fisheries Cey-Nor Coast
Aquatic Resources Resources Agency Fisheries Training Corporation Harbours Cooperation Foundation Conservation Development (DFAR) (NARA) (NIFT) (CFC) (CFHC) (CNF) (CCD)
pig. 4. Organizational structure of the Ministry of Fisheries, Sri Lanka.
Director I
1 Deputy Director Fishery Deputy Director
Fisheries Management Unit Fisheries Management and Industries Division Social Development Division
I Asst. Directors
A Asst. Directors Legal Officer
I 1 I District Fisheries I
Extension Officer 1 ( D y
Fisheries Inspector (FI) & Fisheries Social Development
Assistant (FSDA) I / Preventive skrgeants (PS) I I / Preventive Guards (PG) I
Fig. 5. Organizational structure of the Department of Fisheries and Aquatic Resources.

Table 10. A generic coastal transect in Sri Lanka illustrating impacts on the coastal zone. Terrestrial Coastal Marine
Major zones Upland Midland Lowland Tidal zone Coastal Offshore (>18% slope) (8-18% slope) (0-<8% slope) (1 km inland from (30 m-200 m (>200 m depth-EEZ)
HHWL-30 m depth) depth) Main resource Deforestation Agriculture Tourism Aquaculture Artisanal fishery Commercial fishing useslactivities Irrigation Irrigation Industry Land reclamation Coral mining Marine transport
Agriculture Deforestation Urbanization Tourism Marine transport Animal Urbanization Land reclamation Artisanal fishery
husbandry Animal Mining husbandrv Aauaculture
sitpans Main Soil erosion Soil erosion Waste and Reduce biodiversity Overfishing Oil spills environmental Flooding Flooding industrial Habitat destruction Reduced issueslimpacts Sedimentation Sedimentation pollution and degradation biodiversity on the coastal Agrochemical Water pollution Agrochemical Overfishing Oil spills zone pollution pollution
Sedimentation Soil erosion Floodina
authority for fisheries management through schemes that involve fisheries cooperative societies established at the village level (there were over 750 such societies with a membership of about 90 000 in 1995). Community-based approaches through these societies and similar self-help groups may be more successful than the earlier centralized ap- proach as the resource users themselves are involved in the decision-making. Only through schemes involving .some form of limited entry will i t be possible to prevent Sri Lankan coastal fisheries from slipping into a declining phase.
References
Anon. 1992 Fisheries for Sri Lanka. Statistical Division, Department of Fisheries and Aquatic Resources.
Anon. 1995. Fisheries statistics, 1995. Data Management Unit. Department of Fisheries and Aquatic Resources.
Berg, S.E. 1971. Investigation on the bottom conditions and possibility for prawn and fish trawling in the north and east of Ceylon. Bull. Fish. Res. Stn. Ceylon, 22 (1852): 53- 88 p.
Blindheim, J . and L. Foyn. 1980. A survey of the coastal fish resources of Sri Lanka. Report No. 3, January-February 1980. Reports on the survey of the R.V. Dr. FridtjofNansen. Fisheries Research Station, Colombo and Institute of Marine Research, Bergen. 78 p.
Canagaratnan, P. and J.C. Medcof. 1956. Ceylon's beach seine fishery. Fisheries Research Station, Department of Fisheries, CeyIon, 4(4): 1-32 p.
Dalpadado, P. and J . Gjmaete r . 1993. Lantern fishes (Myctophidae) in Sri Lankan waters. Asian Fish. Sci. 6(2): 161-168.
Dassanayake, H. 1994. Sri Lanka, p. 209-235. In S. Holmgren (ed). An environmental assessment of the Bay of Bengal region. Swedish Centre for Coastal Development and
Management of Aquatic Resources and the Bay of Bengal Programme (BOBP/REP/67).
Dayaratne, P. 1994. Information needed for strategic planning of fishery management . S r i LankalFAO National Workshop on Development of Community-based Fishery Management Systems. Colombo, Sri Lanka. SRLl9412. 41- 51 p.
Dayaratne, P. and K.P. Sivakumaran. 1994. Biosocioeconomics of fishing for small pelagics' along the southwestern coast of Sri Lanka. Bay of Bengal Programme. BOBPAVPl96. 38 P.
de Bruin, G.H.P. 1970. Small mesh trawling. Bull. Fish. Res. Stn., Ceylon. 21(1): 35-38.
Demidenko, U. 1972. Information about the results of the joint Soviet-Lankan fishery investigation carried out in waters adjacent to Ceylon island. Manuscript report. Fisheries Research Station, Colombo.
Durairatnam, M. 1961. Contribution to the study of the marine algae of Ceylon. Bull. Fish. Res. Stn. (Ceylon) No. 10: 1181.
Durairatnam, M. 1966. Quantitative survey of Sargassum along the southwest coast of Ceylon, Bull. Fish Res. Stn. (Ceylon) 19(1/2) No. 182.
Hallier, J.P. 1994. Purse seine fishery on floatihg objects: what kind of fishing effort? what kind of abundance indices? p. 192-198. In Proceedings of the Fifth Expert Consultation on Indian Ocean Tunas, Mahe, Seychelles, 4-8 October 1993. FAO-UNDP-Indo-Pacific Tuna Development and Management Programme, Colombo, Sri Lanka. FAO-IPTP- TWS/92/2/25.
Hinriksson, T.G. 1980. Survey for demersal fish resources off the northwest, north and northeast coasts of Sri Lanka. Food and Agriculture Organization of the United Nations, Rome. DP/SR/72/051.
Jayasuriya, P.M.A. 1989. Preliminary observation of the culture of Gracilaria edulis using spore-setting techniques. Seminar on Gracilaria production and utilization in the Bay of Bengal Region, Songkhla, Thailand. Bay of Bengal Programme of the Food and Agriculture Organization (FAO). BOBP/REP/45.
Joseph, B.D.L. 1974. Preliminary report on experimental fishing with purse seine and lampara nets for small pelagic fish varieties around Sri Lanka. Bull. Fish. Res. Stn., Sri Lanka. 25(1/2): 1-3.
84 Joseph, L. and N.M. Moiyadeen. 1990. Ecology of commercially
exploitable holothuroids on the northwest coast (Puttalam District). National Aquatic Resources Agency. Terminal Report - Natural Resources Energy and Science Authority, 166 p. (Unpublished).
Joseph, L. 1993. Coastal fisheries and brackishwater aquaculture in Sri Lanka. Coastal Resource Management Project of the University of Rhode Island, The Government of Sri Lanka, United States Agency for International Development.
Joseph, L., P. Dayaratne and R. Maldeniya. 1995. A profile of the offshore fishing fleet of Sri Lanka. Sri Lanka Fisheries Sector Development Project, Asian Development Bank. ADBlNRSl3 (Unpublished).
Karunasinghe: W.P.N. 1990. Some aspects of biology and fishery of trenched sardine Amblygaster sirm (Pisces: Clupeidae) from the coastal waters around Negombo, Sri Lanka. M. Phil. Thesis, University of Kelaniya, Sri Lanka, 102 p.
Maldeniya, R. and L. Joseph. 1987. On the distribution and biology of yellowfin tuna (T. albacares) from the western and southern coastal waters of Sri Lanka, p. 23-32. In Collective volume of working documents presented a t the expert consultation on stock assessment of tunas in the Indian Ocean held in Colombo, Sr i Lanka, 4-8 December 1986. FAO-UNDP-IPTP-TWSl86118.
Maldeniya, R. and S.L. Suraweera. 1991. Exploratory fishing for large pelagic species in Sri Lanka. Bay of Bengal Programme. BOBPtREPl47. 53 p.
Maldeniya, R. 1992. Food and feeding habits of yellowfin tuna (Thnnnus albacares) in Sri Lankan waters. M. Phil. Thesis. University of Bergen, Norway, 55 p.
Malpas, A.H. 1926. Marine biological survey of the littoral waters of Ceylon. Bull. Ceyl. Fish. 2: 13-165 p.
Medcof, J.C. 1963. Partial survey and critique of Ceylon's marine fisheries, 1953-55. Bull. Fish. Res. Stn. Ceylon 16(2): 29-118.
Pajot, G. 1977. Exploratory fishing for live bait and commercially important small pelagic species. UNDP-Sri Lanka Fishery Development Project. Technical Report No. 3. SRLl72105 (Unpublished).
Pearson, J. and A.H. Malpas. 1926. A preliminary report on the possibilities of commercial trawling in the seas around Ceylon, Bull. Ceyl. Fish. 2: 1-12.
Perera, N.M.P.J. 1975. Taxonomic study of the cephalopods, particularly the Teuthoidea (squids) and Sepioidae (cuttle fish) in the waters around Sri Lanka. Bull. Fish. Res. Stn., Sri Lanka 26(1): 45-60.
Saetersdal, G.S. and G.H.P. de Bruin. 1978. A survey of the coastal fish resources of Sri Lanka, August-September 1978, Institute of Marine Research, Bergen, 88 p.
Sivasubramaniam, K. 1977. Experimental fishery survey for skipjack and other tunas by pole and line and driftnet fishery method in S r i Lanka. UNDPISri Lanka Fishery Development Project. SRLl721051 (Unpublished).
Sivasubramaniam, K. 1983. A fresh look a t Sri Lanka's demersal resources. Bay of Bengal News, 10: 14-17.
Sivasubramaniam, K. 1985. Sri Lanka's fisheries resources development and management in the past. Presented a t the workshop on 25th anniversary of the Ministry of Fisheries and Aquatic Resources Development. 11 p. (Unpublished).
Sivasubramaniam, K. and R. Maldeniya. 1985. The demersal fisheries of Sri Lanka. Bay of Bengal Programme Work. Pap. 41, 41 p.

The Marine Fisheries of Thailand, with Emphasis on the Gulf of Thailand Trawl Fishery
M. EIAMSA-ARD and
s. AMORNCHAIROJKUL Southern Marine Fisheries Development Center
Department of Fisheries Wichianchom Road
Muang District, Songkhla, Thailand
EIAMSA-ARD, M. and S. AMORNCHAIROJKUL. 1997. The marine fisheries of Thailand, with emphasis on the Gulf of Thailand trawl fishery, p. 85-95. In G.T. Silvestre and D. Pauly (eds.) Status and manage- ment of tropical coastal fisheries in Asia. ICLARM Conf. Proc. 53, 208 p.
Abstract
The Gulf of Thailand and Andaman Sea are the two major fishing areas of Thailand, jointly covering 394 000 km? The fisheries are diverse in size and type of operation, gear and techniques. In 1991, total fishery production reached about 2.5 million t, valued a t 26 billion baht (US$l 040 million). Of this, the marine fisheries catches contributed about 82%. Catches in the Gulf consist of pelagic fishes (40%), demersal fishes (8%), shrimps (5%), squids (6%) and other groups including 'trash fish' (41%).
The demersal fisheries have developed rapidly since trawling was introduced in the late 1960s. Regis- tered trawlers increased from 3 206 units in 1970 to 15 037 in 1989. Demersal catches grew from 51 000 t in 1978 to 149 000 t in 1992. In 1992, demersal catches of 149 000 t and 58 000 t were recorded from the Gulf of Thailand and the Andaman Sea coast, respectively. However, demersal trawl surveys conducted since 1961 found that the average catch/effort decreased from 298 kg.hour-I in 1961 to 39 kghour-I in 1981; the decline continuing in later years.
This paper reviews the status of'Thailand's coastal environment and fishery resources. I t emphasizes demersal fisheries and trawl surveys in the Gulf of Thailand.
Introduction
Marine fisheries are important in Thailand. How- ever, the overexploitation of coastal resources, such as coastal demersal and small pelagic fishes, mangrove forests and coral reefs, and the deterioration of coastal water quality, are critical problems.
The Thai fisheries are diverse in size and type of operations. In 1991, total fishery production reached about 2.5 million t, worth 26 billion baht (US$1 040 million). Marine fisheries catches accounted for about 82% of the total.
This contribution reviews the status ofthe country's coastal environment and fishery resources, emphasi- zing demersal trawl surveys in the Gulf of Thailand (Fig. 1).
Coastal Environment
The Gulf of Thailand covers approximately 350 000 km2. Four large rivers discharge their waters
into the inner gulf. Mean water depth is 45 m; maxi- mum is 80 m. This basin is enclosed by underwater ridges that cause an inadequate interchange of water between the gulf and the South China Sea, thus justi- fying its treatment as a large marine ecosystem (Piyakarnchana 1989) or as an ecologically distinct subset of the South China Sea (Pauly and Christensen 1993). The bottom of the inner gulf consists of loose mud, that of the central basin of soft mud, and that of the outer basin of soft or sandy mud (Shepard et al. 1949; Naval Hydrographic Department 1995).
Water temperature ranges from 28.4 to 30°C; sur- face salinity in the outer part of the gulf, from 31.4 to 32.7%0; and oxygen concentration at the surface, from 4.5 to 4.6 rnl.1-' (Naval Hydrographic Department 1995). The Gulf of Thailand functions as a two-layered shallow estuary with lower-salinity surface water flo- wing out of the Gulf, while high-salinity, colder water enters from the South China Sea over a 67 m sill. Monsoon winds and tidal currents create complex cir- culation patterns, including localized upwellings and

96 97 98 99 100 101 102 103 104 105
Longitude ( O E )
Fig 1. Fishing areas of Thailand, and locations mentioned in the text.
downwellings. Mean residual flow in the inner gulf is clockwise during the northeast monsoon and coun- terclockwise during the southwest monsoon.
In the Gulf of Thailand, as elsewhere, primary production is high in coastal areas near river mouths, and decreases with depth. Average primary produc- tion is- 2.49 gC.m-2.d-1 in the inner gulf and 2.96 gC. m-2-d-1 off the western coast.
The concentration of phosphate in the inner gulf ranged from 1.02 to 1.59 mg-at N 1-I from 1984 to 1989. Nitrate concentration ranged from 9.15 mg-at N 1-I in 1984 to 24.86 mg-at N 1-' in 1989 (Suvapepun 1991); Secchi disk transparency varies from 14 to 17 m.
In general, red tide occurrences reported in the inner gulf since 1958 have tended to be harmless. However, their frequency has increased of late: there were 7,12 and 19 occurrences in 1991,1992 and 1993, respectively. These events were mostly caused by
Noctiluca, generally from July to September in the eastern part of the inner gulf, and from December to February in the western part (Lirdwitayaprasit et al. 1995).
Along the gulf coast, most cases of marine food poisoning are caused by Vibrio parahaemolyticus, while cases of diarrhea are caused by V. cholearae, Salmonella and Shigella. Vibrio parahaemolyticus tends to occur in higher concentration in sediment and mollusc samples than in the surrounding waters. This contrasts with coliform bacteria, which tend to occur more frequently in surface waters than near the bottom.
Water circulation along the Andaman coast of Thailand is dominated by tidal currents, and along- shore flows. During the northeast monsoon, the nearshore surface waters generally move northward, with speeds of 2-4 cm.s-l; during the southwest mon- soon, these waters flow southward a t a speed of

5-8 cms l . The hydrography of the region has been extensively studied. The northern stretch from Ranong to Phuket province is influenced by deep sea up- welling resulting in high salinity (32.9-33.4 %), while the southern stretch (Phuket to Satun Province) is influenced mainly by surface run-off, resulting in lower salinity (32.6-32.8 %o) . Dissolved oxygen, pH and temperature ranges are 5.5-6.4 mg.1-l, 8.06-8.15 and 27.6-29.3"C, respectively. Nitrate and phosphate range from 0.12-3.40 mg.1-I and 0.08-0.87 mg.1-', respectively.
Over 300 major coral reefs have been identified along the Thai coast (both the gulf and Andaman Sea), covering approximately 12 000 km2. The condition of coral reefs in Thailand ranges from very good to very poor. Over 60% of major reefs are in either poor or fair condition; less than 36%, good or very good. The provinces that still have significant areas of coral reefs in good and very good condition are Trad, Phangnga and Trang. The provinces where coral reef deteriora- tion is most severe, due to human activities, are Chon Buri, Rayong, Surat Thani, Phuket and Satun.
Mangrove forests, the nursery area for many spe- cies of coastal fishes, are found along the muddy coast- line and in the estuaries of rivers. Their distribution ranges from Trad in the eastern part of the gulf to Prachuap Kuirikhan in the west. Large areas are covered by mangroves on the southern region of the eastern coast from Chumphon to Pattani and, on the west coast, from Satun northward to Ranong. In 1991, the mangroves of Thailand were estimated to cover 1 734 000 ha, or 0.33 % of the country's land area. Loss of cover was approximately 6 500 haayear-l, attributable to legal and illegal log- ging, mining, human settlements, industrial deve- lopment, ports and harbors, dredging, road construc- tion and conversion into shrimp ponds.
Seven species of seagrass are found along the Gulf of Thailand, with Halodulepinifolia dominant along the east coast and Enhalus acoroides on the coarse sand of the west coast, at depth of 1-2 m (Sudara 1989). Along the Andaman Sea coast, nine species of seagrass range from Phuket to Satun Province. The largest seagrass beds are located in the shallow waters of Haad-Chaomai to Muk Island and Talibong Island, Trang Province (Phuket Marine Biological Center 1988).
Capture Fisheries Sector
Marine fisheries, which dominate Thai fisheries production, are conveniently divided into three categories: small, medium and large scale. Small-scale fisheries use specialized traditional gears such as shrimp gill net, crab gill net and mullet gill net, operated by local fishers in nearshore areas (Table 1). The medium-scale fisheries generally operate fishing
Table 1. Major fishing gears used in Thai waters. Small-scale sector Medium-scale sector Pomfret gillnet Otterboard trawl Shrimp gillnet Pair trawl Mullet gillnet Beam trawl Mackerel gill net Push net Snapper gillnet Anchovy purse seine Threadfin gillnet Thai purse seine Sardinella gillnet Chinese purse seine Wolf-herring gillnet Luring purse seine Sand whiting gillnet Mackerel encircling gill net Marine striped catfish gillnet King mackerel gill net Crab and other gillnet Bamboo stake trap Squid and other cast net Acetes and other scoop net Shell rake with powered boat Hook and line, long line Squid hook and line Set bag net
boats less than 18 m and remain in Thai waters, using gears such as trawls, purse seines and mackerel gill nets. The large-scale fisheries are equipped with modern, highly efficient gear, and operate mostly in international waters. Table 2 gives the number of registered fishing boats by major fishing gear from 1970 to 1989. Trawlers (otterboard and pair trawls) and push nets dominated the registered fishing boats in Thailand.
Catch and effort data are recorded in various forms. The information includes catches of economically im- portant species, by fishing gear and fishing area. Analyses of catch, effort and biological data are car- ried out, the last with emphasis on length-frequency data of commercially important groups such as an- chovy, shrimps, squids, scads and jacks. The data are collected through four different approaches: (1) marine fisheries census; (2) fishing logbook survey; (3) fishing community survey; and (4) researchvessel survey.
The first marine fisheries census was initiated in 1967, and is done every 10 years. The census includes data on the number and nature of fish production fac- tors such as fishing households, fishing boats and crew.
The fishing logbook survey emphasizes catch and effort data, particularly on medium-scale fisheries such as otterboard trawls, pair trawls, push nets, Chinese purse seines, Thai purse seines, luring purse seines, anchovy purse seines and king mackerel gill nets. Data collection, which began in 1969, involves random selection from a list of registered fishing units. Fishing logbooks were designed separately for each fishery to accommodate their different target species. The fishing areas in Thai waters were also identified for the survey: 5 subareas in the Gulf of Thailand; 5 along the Andaman Sea coast; and 2 in the South China Sea.
The fishing units are classified according to the type of gear and length of boat: (1) otterboard trawl,

88 divided into 4 size classes (boats of less than 14 m, 14-18 m, 18-25m and over 25 m); (2) pair trawl, in 3 size classes (less than 14 m, 14-18 m and over 18 m); and (3) Thai purse seines, in 2 size classes (less than 14 m and over 14 m). Other fishing units monitored include beam trawls, push nets, Chinese purse seines, anchovy purse seines, luring purse seines, King mackerel encircling gill nets and bamboo stake traps.
The fishing community surveys are used to collect catch (by species and gearlvessel type) and effort data from small-scale fisheries. These are conducted at se- lected fishing ports. Also, length-frequency data are collected monthly for key species, along with related catch and effort data by fishing area.
Research and monitoring trawl surveys are con- ducted with a standard bottom trawl net, at depths from 10 to 60 m. Data are studied in terms of changes in species composition and stock density and for esti- mating fishing impacts and future yields. Moreover, research surveys using purse seines and gill nets in the Exclusive Economic Zone (EEZ) are also being carried out to evaluate deeper fishing grounds for pos- sible expansion of fishing activities.
Prior to World War 11, fishing in Thai waters occurred mostly in inshore areas, using sailing ves- sels with inboard engines. In the 1930s, purse seines made of cotton twine were introduced from China, to implement a technique known as Chinese purse seine, which employs a sailboat with two small row boats for setting the net targeting pelagic fishes. Subsequent modification of this technique, leading to Thai purse seine, involved the transition to motorized vessels. Tra- ditional gear such as the hand and troll lines, lift nets, cast nets, purse seines, nylon gill nets and bamboo stake traps were also used.
The development of trawling started in the 1950s. Between 1952 and 1960, several trials were conducted by private companies, using pair trawlers. However, these attempts failed due to lack of technical exper- tise and low price for the catch, given the lack of fa- miliarity of local consumers with demersal fish. In the 1960s, otterboard trawling was introduced in Thai- land by a German fisheries development project (Tiews 1962), and quickly became popular, first in Samut Prakan Province, then in the entire gulf coast (see below). However, subsequent developments soon led to excess capacity, a rapid decline of catcweffort and massive changes in catch composition (Tiews et al. 1967; Beddington and May 1982), including an increase of the proportion of small-size classes of commercial fishes, landed as ' trash fish' (Boonyubol and Pramokchutima 1984).
The Department of Fisheries (DOF) is composed of 28 divisions, with various responsibilities, notably: 1. implement various acts~laws, such as the Fishe-
ries Act B.E. 2490 (1947) and Wildlife Conserva- tion and Protection Act B.E. 2535 (1992);
2. conduct research in every field of fisheries,with emphasis on income generation; and
3. explore fishing grounds outside of Thai waters and promote fisheries cooperation with other states.
Of the 28 divisions, eight deal with ma- rine fisheries and environment: (1) Fishery Planning and Policy Division; (2) Marine Fisheries Division; (3) Oceanic Fisheries Division; (4) Phuket Marine Bio- logical Center; (5) Fishery Environment Division; (6) Fishery Resources Conservation Division; (7) Fishery Economics Division; and (8) Training Division.
The Fishery Planning and Policy Division plans and formulates fisheries development policy in con- formity with the National Economic and Social De- velopment Plan and government policy. This division prepares the department's annual budget.
The Marine Fisheries Division (MFD) is respon- sible for the study and restoration of fisheries resources, for marine environment, development of fishing gear, and professional development in the fisheries sector. MFD is divided into five 'centers': (1) Bangkok Ma- rine Fisheries Development Center; (2) Eastern Ma- rine Fisheries Development Center; (3) Central Ma- rine Fisheries Development Center; (4) Southern Ma- rine Fisheries Development Center; and (5) Andarnan Sea Marine Fisheries Development Center.
The Oceanic Fisheries Division is responsible for exploration and analysis, development of fishing gear and techniques, and fishing grounds in foreign wa- ters and deeper waters off Thailand. The Phuket Ma- rine Biological Center is responsible for experimental research in marine biology and ecology, and for moni- toring pollution impacts on fisheries.
The Fishery Environment Division is responsible for fishery environment planning and monitoring pol- lution impacts on fisheries. The Fishery Resources Conservation Division takes charge of enforcement of fisheries acts, ministerial decrees and regulations; surveillance of fisheries; and registration of vessels and fishing gear. The Fishery Economics Division is responsible for economic research, national and inter- national fish market analyses, and fishery statistics. The Training Division plans and organizes courses for department personnel, fishing crews and other persons interested in fishery resources conservation.
Fishery Resources and Exploitation
In 1992, catches from the Gulf of Thailand con- tributed approximately 75% of total marine catches of the country; those from the Andaman Sea coast ac- counted for the rest. Total catches in the Gulf of Thai- land in 1992 were 154 000 t for t he small- scale fisheries, and 1 760 000 t for the medium-scale

Table 2. Registered fishing boats in Thailand, 1970-1989. (Source: Department of Fisheries).
Year Otterboard Pair Push Mackerel Purse Anchovy King trawl trawl net encircling seme purse mackerel
net seine gillnet
1970 2 452 440 31 4 1971 2 967 520 554 1972 3 783 698 1 327 1973 4 967 81 8 1 628 1974 4 415 848 1 213 1975 4 106 846 1 075 1976 4 371 832 844 1977 5 378 904 1 177 1978 5 599 854 1 426 1979 7 566 1 172 1 923 1980 9 181 I 240 2 257 307 747 34 296 1981 6 510 1 008 1214 258 801 32 327 1982 10 067 1 406 1 899 238 784 56 281 1983 8 123 1 266 1 236 144 749 97 264 1984 8 096 1 166 960 245 806 155 265 1985 7 103 1218 759 227 836 197 269 1986 6 322 1 084 664 203 853 143 329 1987 6 133 1 164 624 223 1 057 117 365 1988 5 807 1 130 531 146 1 255 199 46 1 1989 10 940 2 193 1 904 114 I 095 348 282
Fig. 2. Annual catch of demersal fish by trawlers in the Gulf of Thailand (1978-1992).
fisheries. The landed catch in the gulf consisted of 37% pelagic fish, 8% demersal fish, 6% squids, 5% shrimp, 10% miscellaneous fishes, and 34% 'trash fish'.
Demersal fish are caught mainly by otterboard trawlers, pair trawlers, beam trawlers and push netters. In the gulf, the number of registered trawlers increased from 3 206 units in 1970 to 15 037 in 1989 (Table 2). The annual catch of demersal fish increased from 51 000 t in 1978 to 149 000 t in 1992 (Fig.2); 78% of the catch originated from the gulf and the rest from the Andaman Sea coast.
The dominant genera in demersal catches are Nemipterus, Saurida and Priacanthus. Trawl sur- veys conducted in 1981 indicated that the catch con- sisted of squids (19%), Priacanthidae (11%), Nemipteridae (11%), Synodontidae, i.e., Saurida (7%), and other fish and invertebrates (54%). The 'trash
fish' included the following important groups: juve- nile commercial fish (32%), small squids (2%), juve- nile pelagic fish (2%) and early stages of various in- vertebrates (0.2%).
The demersals in Thai waters were overfished by the mid-1970s (Pauly 1979; Pope 1979), a situation that has not changed since (Pauly 1987,1988; Pauly and Chua 1988; Fig. 4).
Several factors may have contributed to this, no- tably: increasing human population; decreased access to foreign fishing grounds by Thai trawlers, due to the declaration of EEZ by neighboring countries; de- velopment of processing techniques for turning low- price demersal fish into human food; and increasing number of animal feed plants that utilize trash fish.
Important small pelagic fish in Thailand are the mackerels (Rastrelliger spp. ), scads (Decapterus spp. ), sardines (Sardinella spp.) and anchovies (Stolephorus spp.). King mackerel (Scomberomorus spp.) and tuna are large pelagic fish not covered in this contribution.
In the past, Indo-Pacific mackerel (R. neglectus), or pla tu, was the most popular fish for Thai consu- mers. Hence, this species was extensively studied (see, e.g., Hongskul 19743, indicating that pla tu exhibit two spawning peaks, from February to March and from June to August. Following hatching, the larvae are transported into inshore waters; the young fish then migrate northward along the west coast, toward the inner gulf, from which they gradually move south- ward to spawn in the waters off Prachuap Kirikhan and Chumporn Provinces. The size at first maturity is about 17.5 cm.

102
Longitude ( O E )
Fie. 3. Areas (I-IX) used for stratification of trawl survevs in 1966-1973 in the ~ i l f of haila and. The numbers refer to successive statio&.
Mesh 40 mrn ................. 7-140 -
100
80 . r ............ ..... ..I .._ .- -._.
............................. c
'." 3 20 -
0 0 - ' 66 68 70 72 74 76 78 80 82 84 86 88 90
Year
Fig. 4. Mean demersal catch rate in the Gulf of Thailand by year (1966-1991) and mesh size of trawl used in deriving catch rate.

The fishers use stationary gears such as bamboo stake trap, Chinese purse seine, Thai purse seine and luring purse seine. Catches of Indo-Pacific mackerel were about 40 000 t in 1971, or 47% of pelagic fish catches. However, following the development of improved pelagic fishing gears and techniques, the major contributors to the small pelagic catches in 1977 were sardines and roundscads, with 205 000 t and 131 000 t, or 41% and 26% of the total pelagic catches, respectively. These high percentages have declined since, due to the development of an offshore fishery for large pelagics, especially tuna.
The cephalopods in Thai waters consist of 10 fami- lies, 17 genera and over 30 species. The more impor- tant species for the squid fishery are Loligo chinensis, L. duvauceli, L. singhalensis, L. edulis, Loliolus sumatrensis and Sepioteuthis lessoniana; the cuttle- fishes; Sepia pharaonis, S . aculeata, S. recurvirostra, S . lycides, S . brevimana and Sepiella inermis and the octopus; Octopus membranaceous, 0. dollfusi and Cistopus indicus (Chottiyaputta 1993). The squids L. chinensis, L. duvauceli, Sepioteuthis lessoniana and Loliolus sumatrensis were abundant both in the gulf and the Andaman Sea; Supongpan (1988) assessed the first two species in the gulf. L. edulis and L. singhalensis are rare in the gulf, but more abun- dant in the deeper parts of the Andaman Sea coast. Cuttlefish, S . pharaonis, S . aculeata, S. recurviorostra, S . brevimana and Sepiella inermis occur both in the gulf and the Andaman Sea. S. lycidas is common along the Andaman Sea coast, but in the gulf occurred only south of 10°N. Octopus, 0. mem- branaceous, 0. dalifusi and Cistopus indicus are widely distributed in the gulf and the Andaman Sea. From 1985 to 1988, cephalopod catches consisted of squid (56%), cuttlefish (37%) and octopus (7%).
9 1 program was conducted using both research vessels.
The first trawl surveys conducted in the gulf, from 1961 to 1965, did not involve any stratification scheme. From 1966 to 1973, the survey design was improved by dividing the gulf into nine survey areas (I-IX in Fig. 3), covered with 80 one-hour hauls, from shallow to deeper waters, i.e., a maximum of 720 hauls.
From 1974 to 1976, in response to budgetary limi- tations due to the 1973 oil crisis, the number of sta- tions per area was decreased from 80 to 60, with an annual survey thus covering up to 540 hauls.
In 1977, a second trawler, R. V. Pramong 9, was added to R.V. Pramong 2. From 1977 to 1990, the two vessels covered an average of 67 stations per area. This generated a large amount of catchleffort and bio- logical data, including length-frequency data, still being analyzed (see Table 3 for a set of intermediate results).
In 1991, the Marine Fisheries Division was divided into four centers (see above), each responsible for a research vessel and for monitoring a section of the Thai coast (Table 4).
Table 5 summarizes the key features of trawl sur- veys in the Gulf of Thailand from 1966 to 1995 (see also Appendix 111, this vol.).
Based on the results of trawl surveys in the Gulf of Thailand, average catch of trawl with 40-mm mesh has declined from 132 kg-hour-' i n 1966 to 52 kg-hour-' in 1973. In 1981, an average catch rate of 39 kg-hour-' was obtained for the same mesh size. Likewise, eatch rates of 53 kg.hour-I in 1982 to 28 kg-hour-' in 1981 were obtained using trawl net cod- ends with 25-mm mesh (Fig. 4). Catch rates have been decreasing steadily in the entire gulf, as shown by catch rates in specific survey areas (Fig. 5).
Management Issues
Trawl Surveys in Thailand
In 1961, under bilateral agreements between the Federal Republic of Germany and the Government of Thailand, several trawling surveys were conducted in the Gulf of Thailand, using different types of trawl (see Appendix 111, this vol). The results showed that otterboard trawling was suitable for the Gulf of Thailand (Tiews 1965, 1972). Hence, the DOF and the Manila-based Asian Development Bank encou- raged investments in the otterboard trawl fishery, and the number of trawlers and the landings of demersal fishes increased rapidly through the 1960s.
Stock monitoring was achieved via regular trawl surveys, which started in 1963, using the research vessel R. V. Pramong 2 with two-sheet German trawl, 40 mm meshes in the codend. In 1977, the Marine Fisheries Division had acquired a new research vessel R.V. Pramong 9, and from 1978 to 1990, the survey
In general, the coastal resources are in relatively good condition. However, in some areas, problems are evident because of multiple uses of the resources. The synoptic transect of key activities and issues relevant to coastal fisheries management in Thailand is shown in Table 6.
Problems continue to beset the Thai fisheries, par- ticularly the demersal trawl fishery of the Gulf of Thailand. The issues include: (1) excessive fishing; (2) destruction ofjuvenile fish by shrimp fishing; and (3) small mesh sizes in codend of trawls.
From the coast to 50 m depth, the amount of fishing largely exceeds that required to extract maximum sus- tainable yield (MSY) - i.e., the stocks are overfished (Fig. 6) and the fleet is overcapitalized (Panayotou and Jetanavanich 1987).
A large number ofjuveniles of commercially valuable species are caught along with penaeid shrimps, the
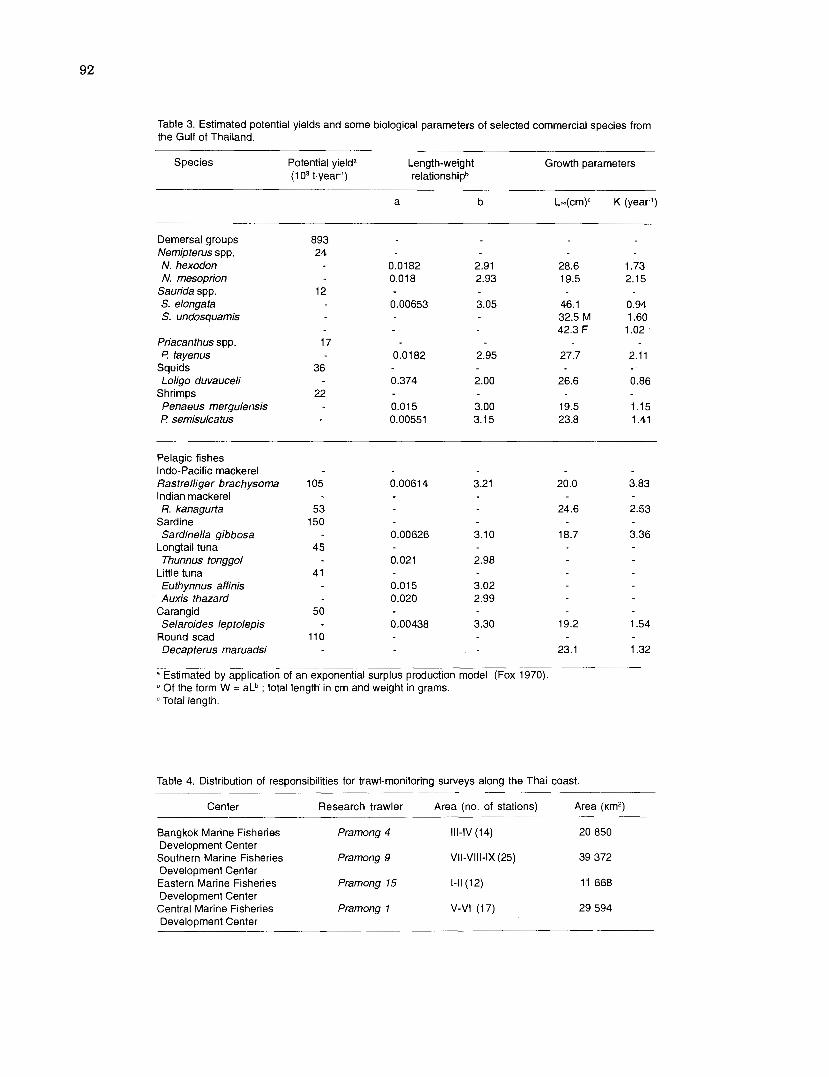
Table 3. Estimated potential yields and some biological parameters of selected commercial species from the Gulf of Thailand.
Species Potential yielda Length-weight Growth parameters (1 O3 t,yearl) relationshipb
Demersal groups Nemipterus spp. N. hexodon N. mesoprion
Saurida spp. S. elongata S. undosquamis
Priacanthus spp. I? tayenus
Squids Loligo duvauceli
Shrimps Penaeus merguiensis P semisulcatus
Pelagic fishes Indo-Pacific mackerel Rastrelliger brachysoma Indian mackerel R. kanagurta
Sardine Sardinella gibbosa
Longtail tuna Thunnus tonggol
Little tuna Euthynnus affinis Auxis thazard
Carangid Selaroides leptolepis
Round scad Decapterus maruadsi
a Estimated by application of an exponential surplus production model (Fox 1970) Of the form W = aLb ; total length in cm and weight in grams. Total length.
Table 4. Distribution of responsibilities for trawl-monitoring surveys along the Thai coast.
Center Research trawler Area (no. of stations) Area (km2)
Bangkok Marine Fisheries Pramong 4 Ill-IV (14) 20 850 Development Center Southern Marine Fisheries Pramong 9 Vll-Vlll-lX (25) 39 372 Development Center Eastern Marine Fisheries Pramong 15 1-11 (12) 11 668 Development Center Central Marine Fisheries Pramong 1 V-Vl (17) 29 594 Development Center

Table 5. Key statisticdfeatures of otter trawl surveys in the Gulf of Thailand at 10-50 m depth'.
Yeara No. of haulsb Year No. of hauls
1966 71 2 1981 159 1967 71 3 1982 211 1968" 71 9 1983 328 1969' 720 1984 172 1970' 71 8 1985' 228 1971 * 720 1986* 260 1972* 720 1987 1973' 71 8 1988' 125 1974* 540 1989* 179 1975 480 1990' 21 1976 261 1991 21 1977 579 1992' 2 1 1978 442 1 993' 22 1979 235 1994' 24 1980' 245 1995' 23
+ Vessels used: R N Pramong 2 (1 966-1 989) and R N Pramong 9 (1 978-1 995) in areas I-IX (1 966- 1989) and areas VII-IX (1 990-1995).
a Years with * are those for which raw data are still available; all with UF data, except for 1966-1969. Towing speed: 2.5 knots; duration: 1 hour.
I-~reavll- .--Area V I I I - -Area IX- - - I
Year
Fig. 5. Mean catch rate by year (1966-1991) and areas of the Gulf of Thailand.

Table 6. Synoptic transect of key activities and issues relevant to coastal fisheries management in Thailand.
Terrestrial Coastal Marine Major zones Upland Midland Lowland Intertidal zone Nearshore Offshore
(>la% slope) (8-18% slope) (0-<8% slope) (1 km inland from (>30 m-200 m (>200 m depth-EEZ) HHWL-30 m depth) depth)
Main resource useslactivities
Tourism Rubber plantation Agriculture Mangrove forestry Tourism Industrial fishing Logging Mining Human Aquaculture Fishing
settlements Land reclamation Marine transport Industries Tin mining
Tourism Artisanal fishina - Ports
Main Siltation Endangered Oganic loading Agriculture runoff Mangrove Change in catch environmental fauna Sewage Improper agricultural destruction1 composition issueslimpacts Siltation pollution practices conversion Overfishing on the coastal Agrochemical loading Water pollution zone Water pollution Oil spills
Organic loading Inequitable Coral reef destruction distribution
of tourism benefits
Overfishinq
Fishing effort (x lo6 trawler hours)
Fig. 6. Relationship between catch and effort of demersal resources in the Gulf of Thailand.
target of trawlers operating nearshore (Eiamsa-ard and Shamniyom 1979,1980; Eiamsa-ard 1981; Charnprasertporn 1982). These small fish have no value for human consumption, so they are either dumped or used for fishrneal or duck feed. These losses are added to those generated by the collection ofjuve- uile shrimps in coastal waters using push net and small shrimp trawls.
The mesh sizes in the codends of commercial trawls are mostly 20-25 mm. Fish are thus caught at sizes that generate much less than optimum yield per re- cruit (Meemeskul1979,1988; Sinoda et al. 1979). Also, such small-meshed nets have a high drag, thus in-
creasing the amount of fuel required for trawling and decreasing the efficiency of capture of larger fish. Ini- tiatives to address these issues are sorely needed.
Acknowledgments
We would like to thank ICLARM and ADB for or- ganizing, and inviting us to, the workshop a t which this contribution was presented. We also thank the director and our colleagues at the Southern Marine Fisheries Development Center for their valuable sug- gestions during the preparation of this paper.

95 References
/ Beddington, J.R. and R.M. May. 1982. The harvesting of Pauly, D. and T.E. Chua. 1988. The overfishing of marine
interacting species in a natural system. Sci. Am. 247(5): resources: socioeconomic background in Southeast Asia. J 42-49. J Ambio 17(3): 200-206.
Boonvubol. M. and S. Pramokchutima. 1984. Trawl fisheries Pauly, D. and V. Christensen. 1993. Stratified models of large " . in the Gulf of Thailand. ICLARM Trans. 4, 12 p.
Charnprasertporn, T. 1982. An analysis of demersal fish catches taken from otterboard trawling surveys in the Gulf of Thailand, 1980. Demersal Fish. Rep. No.1, Mar. Fish. Div., Department of Fisheries, Bangkok. (In Thai.)
Chottiyaputta, C. 1993. Cephalopod resources of Thailand. Recent advances in Cephalopod fisheries biology. p. 69- 78.
Eiamsa-ard, M. 1981. An analysis of demersal fish catches taken from otterboard trawling survey in the Gulf of Thailand, 1979. Demersal Fish. Rep. No.1, Mar. Fish. Div., Department of Fisheries, Bangkok. (In Thai.)
Eiamsa-ard, M. and D. Shamniyom. 1979. An analysis of demersal fish catches taken from otterboard trawling surveys in the Gulf of Thailand, 1977. Demersal Fish. Rep. No.1, Mar. Fish. Div., Department of Fisheries, Bangkok. otterboard trawling surveys in the Gulf of Thailand, 1978. Demersal Fish. Rep. No. 2, Mar. Fish. Div., Department of Fisheries, Bangkok. (In Thai.)
Fox, W.W., Jr . 1970. An exponential surplus-yield model for optimizing exploited fish populations. Trans. Am. Fish. Soc. 99: 80-88.
Hongskul, V. 1974. Population dynamics of pla tu Rastrelliger neglectus (van Kampen). Proc. Indo-Pac. Fish Counc. 12(2): 297-342.
Lirdwitayaprasit, T., T. Vicharangsan and N. Sawetwong. 1994. Occurrences of red tide phenomenon in the inner Gulf of Thai land during 1991-1993. I n A. Snidvongs, W. Utoomprukporn and M. Hunspreugs (eds.) Proceedings of t h e NRCT-JSPS Jo in t Seminar on Marine Science Bangkok, Thailand. Chulalongkorn University.
Meemeskul, Y. 1979. Optimum mesh size for the trawl fishery in the Gulf of Thailand. Indo-Pac. Fish. Counc., RRD/IIf79/
J INF13,20 p. Meemeskul, Y. 1988. Effects of a partial increase of the mesh
size in the multispecies and multifleet demersal fisheries in the Gulf of Thailand, p. 493-506. In S.C. Venema, J.M. Christensen and D. Pauly (eds.) Contributions to tropical fisheries biology. Papers by the participants of FA01 DANIDA follow-up t raining courses on fish stock assessment in the tropics. Hirtshals, Denmark, 5-30 May 1986, and Manila, Philippines, 12 January-6 February 1987. FA0 Fish. Rep. (389).
Naval Hydrographic Department. 1995. Report on the analysis of hydrographic data in the central part of the Gulf of Thailand during 1982-1993, 269 p. (In Thai.)
'Panayotou, T and S. Jetanavanich. 1987. The economics and management of Thai fisheries. ICLARM Stud. Rev. 14, 82 p.
JPauly, D 1979. Theory and management of tropical multispecies stocks: a review, with emphasis on the southeast Asian demersal fisheries. ICLARM Stud. Rev. 1, 35 p.
Pauly, D. 1987. Theory and practice of overfishing: a southeast Asian perspective, p. 146-163. In Papers presented a t the Symposium on the Exploitation and Management of Marine Fishery Resources i n Southeast Asia, 16-19 February 1987, Darwin, Australia. RAPA Rep. 1987110.
,/ Pauly, D. 1988. Fisheries research and the demersal fisheries of Southeast Asia, p. 329-348. In J.A. Gulland (ed.) Fish population dynamics. John Wiley and Sons, Chichester and New York.
marine ecosystems: a general approach and an application to the South China Sea, p. 148-174. In K. Sherman, L.M. Alexander and B.D. Gold (eds.) Large marine ecosystems: s t ress , mitigation and sustainabi l i ty . AAAS Press , Washington, D.C.
Phuket Marine Biological Center. 1988. Project 11: Living resources in coastal areas with emphasis on mangrove and coral reef ecosystems. Subproject on inventory and monitoring on coral reefs, seagrass and soft bottom communities in the Andaman Sea. ASEAN-Australia Cooperative Program on Marine Science. 244 p.
Piyakarnchana, T. 1989. Yield dynamics as an index of biomass shifts in the Gulf of Thailand, p. 95-142. In K. Sherman and L.M. Alexander (eds.) Biomass yields and geography of large marine ecosystems. AAAS Symposium 111. Westview Press Inc., Boulder.
Pope, J.G. 1979. Stock assessment in multispecies fisheries, with special reference to the trawl fishery in the Gulf of Thailand. South China Sea Fisheries Development and Coordinating Programme, SCS/DEV/79/19, Manila, 106 p.
Shepard, F.P., K.D. Emery and H.R. Gould. 1949. Distribution of sediments on east Asiatic continental shelf. Allan Hancock Foundation, Occas. Pap. 9. University of Southern California Press, Los Angeles.
Sinoda, M., S.M. Tan, Y. Watanabe and Y. Meemeskul. 1979. A method for estimating the best codend mesh size in the South China Sea area. Bull. Choshi Mar. Lab., Chiba University, 11: 65-80.
Sudara, S. and Team. 1989. ASEAN-Australia Cooperative Program on Marine Science. Project 11: Living resource in coastal areas, with emphasis on mangrove and coral reef ecosystems. Site selection survey report: the Gulf of Thailand, a seagrass community. Department of Marine
/ Science, Chulalongkorn University, Bangkok. 68 p. Supongpan, M. 1988. Assessment of Indian squid (Loligo
duvauceli) and mitre squid (L. chinensis) in the Gulf of Thailand, p. 25-41. In S.C. Venema, J.M. Christensen and D. Pauly (eds.) Contributions to tropical fisheries biology. Papers by the participants of FAODANIDA follow-up training courses on fish stock assessment in the tropics. Hirtshals, Denmark, 5-30 May 1986, and Manila, 12 January-6 February 1987. FA0 Fish. Rep. (3891, 519 p.
Suvapepun, S. 1991. Long-term ecological changes in the Gulf of Thailand. Mar. Pollut. Bull. 23: 213-217.
Tiews, K. 1962. Experimental trawl fishing in the Gulf of Thailand and its results regarding the possibilities of trawl fisheries development in Thailand. Veroff. Inst. Kiist. Binnenfisch. (25): 53 p.
Tiews, K. 1965. Bottom fish resources investigations in the Gulf of Thailand and an outlobk on further possibilities to develop the marine fisheries in Southeast Asia. Arch. FischWiss. 16(1): 67-108.
Tiews, K. 1972. Fishery development and management in Thailand. Arch. FischWiss. 24(1-3): 271-300.
Tiews, K., P. Sucondharman, A. Isarankura. 1967. On the changes in the abundance of demersal fish stocks in t h e Gulf of Tha i land from 196311964 to 1966 a s consequence of t r a w l f i sher ies development . Department of Fisheries, Bangkok. Mar. Fish. Lab. Contr. 8: 1-39.
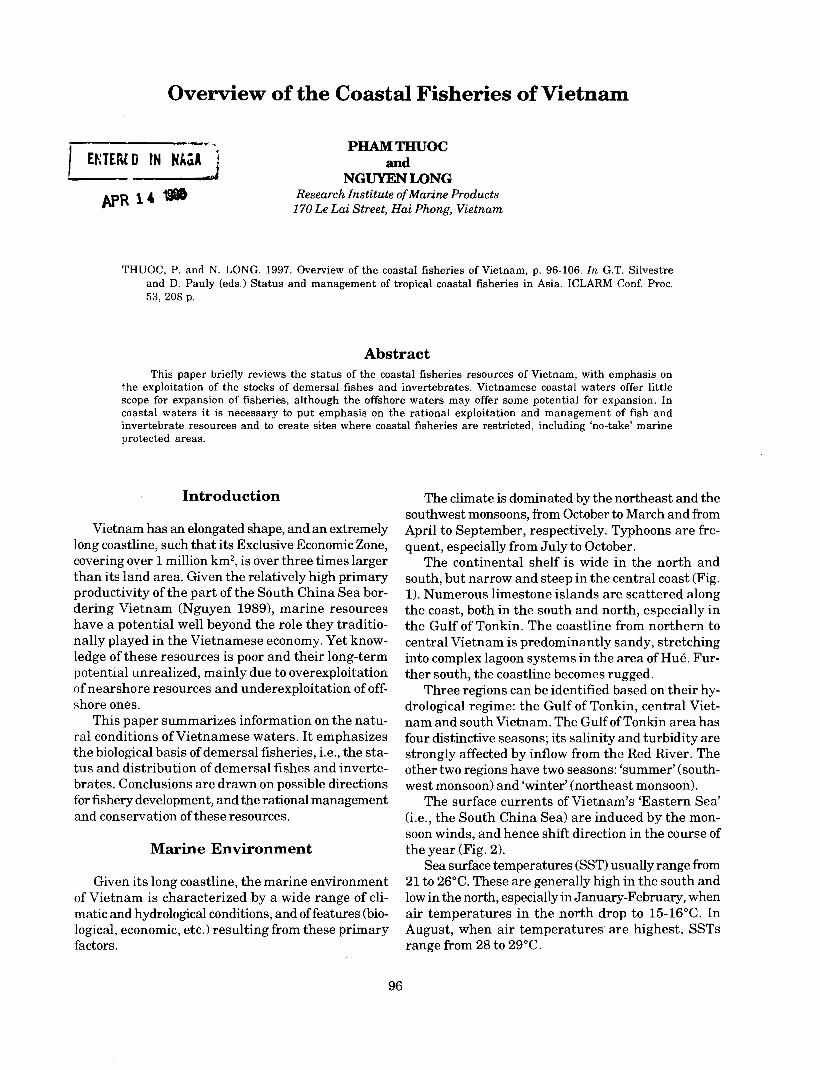
Overview of the Coastal Fisheries of Vietnam
--I. PHAM THUOC I EKTERO IN NAG1 and NGUYEN LONG
APR 1 4 - Research Institute of Marine Products 170 Le Lai Street, Hai Phong, Vietnam
THUOC, P. and N. LONG. 1997. Overview of the coastaI fisheries of Vietnam, p. 96-106. In G.T. Silvestre and D. Pauly (eds.) Status and management of tropical coastal fisheries in Asia. ICLARM Conf. Proc. 53, 208 p.
Abstract This paper briefly reviews the status of the coastal fisheries resources of Vietnam, with emphasis on
the exploitation of the stocks of demersal fishes and invertebrates. Vietnamese coastal waters offer little scope for expansion of fisheries, although the offshore waters may offer some potential for expansion. In coastal waters it is necessary to put emphasis on the rational exploitation and management of fish and invertebrate resources and to create sites where coastal fisheries are restricted, including 'no-take' marine protected areas.
Introduction
Vietnam has an elongated shape, and an extremely long coastline, such that its Exclusive Economic Zone, covering over 1 million km2, is over three times larger than its land area. Given the relatively high primary productivity of the part of the South China Sea bor- dering Vietnam (Nguyen 1989), marine resources have a potential well beyond the role they traditio- nally played in the Vietnamese economy. Yet know- ledge of these resources is poor and their long-term potential unrealized, mainly due to overexploitation of nearshore resources and underexploitation of off- shore ones.
This paper summarizes information on the natu- ral conditions of Vietnamese waters. It emphasizes the biological basis of demersal fisheries, i.e., the sta- tus and distribution of demersal fishes and inverte- brates. Conclusions are drawn on possible directions for fishery development, and the rational management and conservation of these resources.
Marine Environment
Given its long coastline, the marine environment of Vietnam is characterized by a wide range of cli- matic and hydrological conditions, and of features (bio- logical, economic, etc.) resulting from these primary factors.
The climate is dominated by the northeast and the southwest monsoons, from October to March and from April to September, respectively. Typhoons are fre- quent, especially from July to October.
The continental shelf is wide in the north and south, but narrow and steep in the central coast (Fig. 1). Numerous limestone islands are scattered along the coast, both in the south and north, especially in the Gulf of Tonkin. The coastline from northern to central Vietnam is predominantly sandy, stretching into complex lagoon systems in the area of Hue. Fur- ther south, the coastline becomes rugged.
Three regions can be identified based on their hy- drological regime: the Gulf of Tonkin, central Viet- nam and south Vietnam. The Gulf of Tonkin area has four distinctive seasons; its salinity and turbidity are strongly affected by inflow from the Red River. The other two regions have two seasons: 'summer' (south- west monsoon) and 'winter' (northeast monsoon).
The surface currents of Vietnam's 'Eastern Sea' (i.e., the South China Sea) are induced by the mon- soon winds, and hence shift direction in the course of the year (Fig. 2).
Sea surface temperatures (SST) usually range from 21 to 26°C. These are generally high in the south and low in the north, especially in January-February, when air temperatures in the north drop to 15-16°C. In August, when air temperatures are highest, SSTs range from 28 to 29°C.

106 108 110 112
Longitude (OE)
Fig. 1. Sediment types off Vietnam, 0-200 m. (After Nguyen Tien Canh 1984).
Seasonal upwellings occur in various areas, espe- cially in the central region, mainly from June to Sep- tember (Fig. 2).
Primary production along the Vietnamese coast is high (Nguyen 1989); this supports high biomasses of zooplankton (Fig. 3) and, via detrital pathways, of zoobenthos as well (Fig. 4). A model of the Vietnamese shelf ecosystem presented by Pauly and Christensen (1993) which suggested that, in the late 1980s, 85% of fish production based was itself consumed by fish, and 4% by invertebrates, while fishery took about 11%, a low value compared with similar areas off Malaysia and Thailand.
Coral reefs have long been regarded in terms of biodiversity as the marine equivalent of tropical rainforests. Coral reefs are useful for fisheries, coast- line protection and marine tourism. In Vietnam, coral reefs are distributed over a wide range of latitudes, with increasing coverage and structural and species diversity from north to south.
97 All coral reefs in North Vietnam are
of the fringing type. Most are short and narrow or in the form of patches, and then to be shallow. In South Vietnam, where natural conditions are more fa- vorable, coral reefs can be found along the coast from Da Nang to Binh Thuan Province, around islands and sub- merged banks in the southeast, and around most islands in the Gulf of Thailand.
Recent faunal studies of coral reef fish generated a consolidated list of only 346 species.
Some 20 sandy lagoons making up a total area of 50 000 ha are scattered along the coast of Vietnam, especially in the central region. These lagoons, varying from a few hundred to 21 000 ha (the largest, Tam Giang - Cau Hai, near Hue), also range widely in hydrological and biotic characteris- tics and resource utilization (capture fisheries and aquaculture), depending on freshwater influx and exchanges with the sea.
Mangrove ecosystems are found in tidal mudflats along most estuaries and seashores of Vietnam. The biologi- cal resources of these areas are diverse and abundant, with many aquatic spe- cies of high value. Also, mangroves serve as temporary feeding, overwin- tering andlor breeding ground for nu- merous species of migratory and other birds, and as permanent habitat for several mammal species.
Mangrove areas in Vietnam are becoming degraded; the areas of barren land are increasing; and saline water is moving farther and farther inland (Le Xuan Sinh 1994). This has led to the loss of nurseries for many species of shrimp, crab and fish, whose popula- tions have subsequently declined. There are no effec- tive measures to counteract mangrove deforestation, as this is driven by the lucrative and powerful shrimp aquaculture industry.
Fishery Resources and Exploitation
Demersal and Pelagic Fish, and Invertebrate Resources
The Vietnamese fisheries sector depends mainly on pelagic and demersal fish, which contribute 80 to 90% of fisheries yield. The rest is contributed by valuable invertebrates such as penaeid shrimp, crab, lobster, cuttlefish and squid.

S o u t h C h i n a S e a I I I I I I I I
104 106 108 110 106 108 110 112 1
Longitude ("E)
Fig. 2. Sea surface currents. u~wel l ine and downwelline areas in summer (southwest monsoon; left) and winter (northeast m&oon; right). (After guyed Tien Canh 1984).
.,
Overall, the total number of marine fish species reported exceeds 2 000, belonging to over 700 genera and nearly 200 families. Around 70% of these species are demersals with tropical affinities. Subtropical spe- cies are found mainly in the Gulf of Tonkin.
Some dominant species of demersal fish are Lutjanus erythropterus (snapper), Priacanthus macracanthus (red big-eye), Saurida undosquamis (true lizardfish), Upeneus sulphureus (yellow goatfish) and Nemipterus zysron (slender threadfin bream). Table 1 lists the percentage distribution of demersal species frequently encountered in demersal trawl catches in different areas of Vietnam.
Pelagic fish schools tend to be small and scattered. The major species of pelagic fish are Sardinella jussieui (spotted herring), Sardinella aurita (gilt sardine), Pampus argenteus (silver pomfret), Decapterus maruadsi (yellowtail roundscad), Decapterus russelli (roundscad), and various mackerel and tunas.
The demersal and pelagic fishes in shallow waters tend to be small, generally ranging from 10 to 30 cm. Most species are batch spawners with short life cycles of one to five years.
The fish spawn throughout the year, with seasonal peaks, and individual fecundity is high. Food types are varied and feeding intensity does not exhibit strong

111 105 107 111 113 Longitude ("E)
Fig. 3. Zooplankton distribution off Vietnam during the southeast (left) and northeast monsoon (right). (After Nguyen Tien Canh 1984).
seasonal fluctuations. Seasonal mitigations occur lea- ding to fish biomass increases e g , during the north- east monsoon, in the Gulf of Tonkin.
More than a 100 species of shrimp are found in Vietnam, and over half of these are of commercial in- terest. Shrimps are concentrated in shallow waters (< 30 m), especially in estuaries and river mouths. Vietnam's main shrimping grounds are along the coast of the Gulf of Tonkin and in the Mekong Delta.
Squat lobster (Thenus orientalis) is exploited down to a depth of 50 m. The important cephalopods are cuttlefish (Sepia tigris), squid (Loligo edulis) and oc- topus.
Table 2 summarizes the key features of the trawl surveys conducted in Vietnamese waters between 1977 and 1987. These surveys led to the establishment of some of the general patterns presented above (Fig. 5).
Status of Coastal Resources and Trawl Fisheries
In 1995, Vietnam's marine fisheries landed 929 000 t, of which over 80% came from the south and central-southern regions. Catches from the north (above 20°N) and central-north (North of Da Nang) amounted to only 20% (Table 3).

g wet weightm-2 1 .
' South
C h i n a
S e a
105 107 109 105 111 Longitude ( O E )
Fig. 4. Zoobenthos biomass off Vietnam during the southeast (left) and northeast monsoon (right). (After Nguyen Tien Canh 1984).
Standing stocks and some earlier rough estimates of potential yields of demersal and pelagic fish in various areas of Vietnam are presented in Table 4.
Overexploitation of coastal resources is clearly shown by the decline in catcweffort, related to the recent massive increase of fishing effort (Table 5). Thus, catcweffort in the Gulf of Tonkin dropped from 0.75 tvhp-'.year1 in 1980 to 0.66 t.hp-'.year-' in 1990. Similarly, in the central part of Vietnam, catcweffort declined from 1.06 tehp-'.year1 in 1986 to 0.66 tehp-l-year1 in 1991; in southern Vietnam, i t declined from 2.05 tehp-leyear-' in 1988 to 1.2 tehp-'.year1 in 1995.
The general decline of the coastal resources of Vietnam is also reflected in individual species. Thus,
Nematalosa nasus, of which 1 000 tayear-' were landed three decades ago, is now extremely rare. In the north, the catches of three Clupeidae - Tenualosa reveesi, Clupanodon thr issa and Konosirus punctatus - have plummeted over the last two de- cades. The catches of invertebrates such as lobsters (Panulirus), abalone (Haliotis), scallop (Chlamys) and squid (Loligo) have also declined markedly.
Most of the fishing effort is exerted by relatively small vessels: 98% of all fishing craft in Vietnam either have no engine (33% of all craft) or have engines with less than 60 hp. In 1995 there were about 420 000 fishers in Vietnam, mostly engaged in small-scale, nearshore operations. The government encourages

101
Table 1. Contribution of major species to the catches of research trawlers in various areas of Vietnam (% weight).
Major species
Pennahia argentata Netuma thalassina Decapterus kurroides Decapterus maruadsi Leiognathus equulus Leiognathus splendens Loligo edulis Malakichthys wakiyae Parargyrops edita Priacanthus macracanthus Promethichthys prometheus Rastrelliger kanagurta Saurida tumbil Saurida undosquamis Selaroides leptolepis Trichiurus lepturus Upeneus mollucensis Others
Southwest (1 979-1 983)
Southeast (1 979-1 983)
Central Vietnam (1 979-1 983)
Tonkin Gulf 1974 1975
Table 2. Summary information on demersal resources survev (bottom trawl) in the coastal waters of Vietnam, 1977-1987. -
Monthlyear Vessel Area Engine (hp)
-
R. V. Bien Dong R. V. Bien Dong R. V. Bien Dong R. V: Bien Dong Aelita Kalper Elsk Yalta Nauka Semen Volkov R. V. Bien Dong Marlin Vozrozdenhie Za vetinsk Milogradovo Trud Gerakl Antiya Gidrobiolog Uglekamensk Ochakov Omega Shantar Mux Dalnhi Mux Tichi Kizveter
Tonkin Gulf Tonkin Gulf S.E. Vietnam S.E. Vietnam Centr. and S. Vietnam
S.E. Vietnam
South Vietnam
No. of hauls Depth range (m)
20 - 100 20 - 60 30 - 100 30 - 80 20 - 80 40 - 300 20 - 100 20 - 150 20 - 150 20 - 100 30 - 80 20 - 80 40 - 300 20 - 80 30 - 150 20 - 80 30 - 150 20 - 100 20 - 100 20 - 100 30 - 150 30 - 150 30 - 150 30 - 150 30 - 150 30 - 150

Longitude ( O E )
Fig. 5. Exploratory trawl survey stations off Vietnam, 1979-1983 and 1993-1995.
fishers to invest in larger boats capable of operating offshore, while some provinces do not permit construc- tion of boats with engines of less than 33 hp.
Based on the number of units and production, ma- jor fishing gear includes trawls (fish and shrimp), gillnets, lift nets, longlines and handlines. Gillnets are widely used by fishers in the northern provinces - . ..:& :Vl15:;11G3 a d ildi&d:;lrr;s p l bu.,,nmate in the cen- tral region. Trawl fishing contributes almost 50% of fish production in the southern provinces ofVietnam.
The technical characteristics of various fishing gear and methods are described in Vinh and Long (1994). Trawling was a traditional form of fishing in Viet- nam, conducted from pairs of sailing boats. In 1959 motorized pair trawlers of 80-90 hp were introduced, followed by single trawlers with motors of 250 hp. 1967 saw the deployment of even larger trawlers, with 800 - 1 000 hp engines and refrigerating systems,
allowing longer trips, and hence offshore fishing. The deployment of effort still remains unbalanced, with most applied to the nearshore resources, which are clearly overexploited, while offshore resources remain underutilized.
Management Issues and Opportunities
Overfishing, habitat degradation, industrial and domestic pollution and siltation are the major prob- lems faced in the management of coastal resources in Vietnam (Table 6). These problems are collectively caused by various resource uses and activities. They are localized in highly urbanized or developed areas.
The management of coastal resources, especially the sustainable use of fishery resources, will require: (1) strengthening of fishery laws and regulations as well as their enforcement; (2) establishment of marine

Table 3. Fishery and aquaculture production of Vietnam (1981-1995).
Year Marine fisheries Aquaculture (t) ( t )
1981 419 740 180 380 1982 476 597 188 901 1983 519 384 204 530 1984 530 650 223 279 1985 550 000 230 400 1986 582 077 242 866 1987 624 445 251 000 1988 622 364 253 791 1989 651 525 283 327 1990 672 130 306 750 1991 730 420 335 910 1992 737 150 349 630 1993 793 324 372 845 1994 878 474 333 022 1995 928 860 415 280
Total Export value (t) (US$ '000 )
600 120 19 000 665 490 55 063 723 914 64 000 753 929 80 000 780 400 90 000 824 743 100 000 875 445 138 900 876 155 166 744 934 852 174 196 978 880 205 000
1 066 330 252 000 1086 800 305 300 1 166 169 368 604 1 211 496 458 200 1 344 140 550 100
Table 4. Estimates of standing stock and potential yields of demersal and pelagic resources in Vietnamese waters. (Thuoc 1985).
Area Year Group Standing Potential stock (t) yield (t.yearl)
Tonkm Gulf 1981 1977
Central Areas 1976 1985
Southeast Areas 1981 1985
Southwest Areas 1973 1985
Total
Pelagics Demersals Pelagics Demersals Pelagics Demersals Pelagics Demersals Pelagics Demersals
protected areas; and (3) monitoring of fisheries stocks or resources.
The principal responsibility for fisheries in Viet- nam lies with the Ministry of Fisheries and its asso- ciated departments, enterprises, research institutions and technical training schools. The main tasks of the ministry are to control and coordinate fisheries ac- tivities (including aquaculture) of the country and to oversee enterprises which are centrally owned.
The Ministry is organized into specialized departments: fisheries economics and planning, management, research and technology, finance, international cooperation, control, transport and idi-astructure. It coordinates the operations of four national fisheries research institutes, three voca- tional schools and one technical training school.
Under the Ministry of Fisheries are the provincial, district and village Fisheries Authorities established within relevant People's Committees. They are respon- sible for fisheries and aquaculture activities in their own lurisdictions, setting up plans, collecting statistics and controlling local fisheries enterprises. These groups en- gage in fishing, aquaculture operations andlor export of fisheries products, when authorized by the central go- vernment.
The most recent fisheries-related legislation in Vietnam is the Ordinance on Fisheries Resources Protection promulgated in April 1989 and updated in 1996. This covers a wide range of issues, inclu- ding fishing seasons and catch quotas, prevention of pollution in fishing grounds, stock assessment research, technology development, local and inter- national investments in fisheries and aquaculture, and improvement of fishers' livelihood.
The realization of the aims of this legislation will require transcending conventional approaches to fisheries management, as these have failed to protect the stocks on which coastal fisheries depend. One of these nonconventional approaches is the setting up of marine protected areas (MPAs). There is currently no MPA in Vietnam. The only restricted areas are 12 fisheries control zones, from which only limited catches may be extracted, a small marine park around Hon Mun (Box 11, and Cat Ba National Park, which en- compasses only 5 400 ha of coastal seascape. Other sites, notably the Tam Giang (Hue) and 0 Loan (Phy Yen) lagoons and tidal marshes near the Red River and Mekong Delta, have been proposed as possible MPAs.
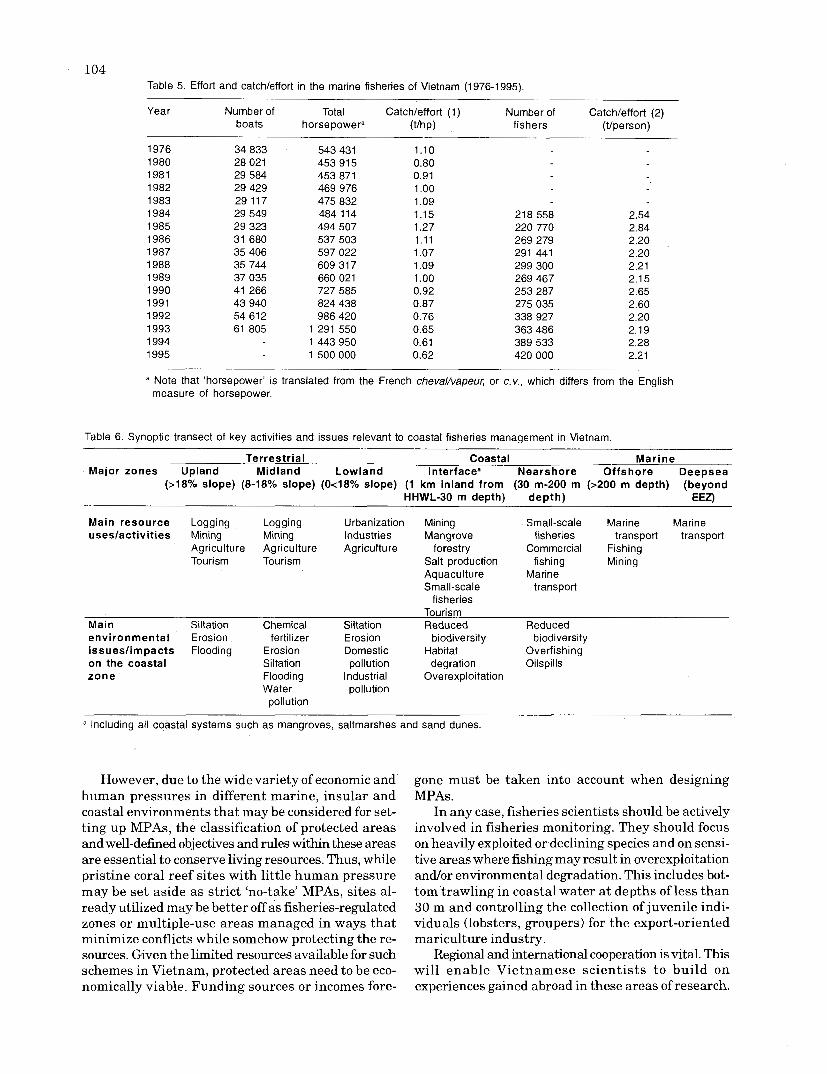
Table 5. Effort and catchleffort in the marine fisheries of Vietnam (1976-1995).
Year Number of Total Catchleffort (1) Number of Catchleffort (2) boats horsepowera W P ) fishers (tlperson)
1976 34 833 543 431 1.10 1980 28 021 453 915 0.80 1981 29 584 453 871 0.91 1982 29 429 469 976 1 .OO 1983 29 117 475 832 1.09 1984 29 549 484 114 1.15 218 558 2.54 1985 29 323 494 507 1.27 220 770 2.84 1986 31 680 537 503 1.11 269 279 2.20 1987 35 406 597 022 1.07 291 441 2.20 1988 35 744 609 317 1.09 299 300 2.21 1989 37 035 660 021 1 .OO 269 467 2.15 1990 41 266 727 585 0.92 253 287 2.65 1991 43 940 824 438 0.87 275 035 2.60 1992 54 612 986 420 0.76 338 927 2.20 1993 61 805 1 291 550 0.65 363 486 2.19 1994 1 443 950 0.61 389 533 2.28 1995 1 500 000 0.62 420 000 2.21
a Note that 'horsepower' is translated from the French cheval/vapeur, or c.v., which differs from the English measure of horsepower.
Table 6. Synoptic transect of key activities and issues relevant to coastal fisheries management in Vietnam.
Terrestr ial Coastal Mar ine Major zones Upland Midland Lowland Interfacea Nearshore Of fshore Deepsea
(>18% slope) (8-18% slope) ( 0 4 8 % slope) (1 km inland from (30 m-200 m (>200 m depth) (beyond HHWL-30 m depth) depth) EEZ)
Main resource Logging Logging Urbanization Mining Small-scale Marine Marine useslact iv i t ies Mining Mining Industries Mangrove fisheries transport transport
Agriculture Agriculture Agriculture forestry Commercial Fishing Tourism Tourism Salt production fishing Mining
Aquaculture Marine Small-scale transport
fisheries Tourism
Main Siltation Chemical Siltation Reduced Reduced envi ronmenta l Erosion fertilizer Erosion biodivers~ty biodivers~ty issuesl impacts Flooding Erosion Domestic Habitat Overfishing on the coastal Siltation pollution degration Oilspills zone Flooding Industrial Overexploitation
Water pollution pollution
a Including all coastal systems such as mangroves, saltmarshes and sand dunes
However, due to the wide variety of economic and human pressures in different marine, insular and coastal environments that may be considered for set- ting up MPAs, the classification of protected areas and well-defined objectives and rules within these areas are essential to conserve living resources. Thus, while pristine coral reef sites with little human pressure may be set aside as strict 'no-take' MPAs, sites al- ready utilized may be better off as fisheries-regulated zones or multiple-use areas managed in ways that minimize conflicts while somehow protecting the re- sources. Given the limited resources available for such schemes in Vietnam, protected areas need to be eco- nomically viable. Funding sources or incomes fore-
gone must be taken into account when designing MPAs.
In any case, fisheries scientists should be actively involved in fisheries monitoring. They should focus on heavily exploited or declining species and on sensi- tive areas where fishing may result in overexploitation andlor environmental degradation. This includes bot- tom trawling in coastal water at depths of less than 30 m and controlling the collection of juvenile indi- viduals (lobsters, groupers) for the export-oriented mariculture industry.
Regional and international cooperation is vital. This will enable Vietnamese scientists to build on experiences gained abroad in these areas of research.
Box 1. Lessons from Vietnam's first marine parka.
The recent establishment of a marine park in Vietnam offers lessons for future marine reserves in the country as well as for other countries considering their establishment.
The waters around Hon Mun, a small (1.1 km2) island in the Nha Trang, and a famous beach-side tourist town in southern Vietnam, have recently been designated as Vietnam's first marine park. The park proposal was initiated after a survey by a World Wild- life Fund (WWF) funded team of marine scientists from the Institute of Oceanography. The purpose is to conserve its coral reef biodiversity while encour- aging low-impact marine tourism and maintaining a sustainable fishery. However, there have been prob- lems as well as successes.
"Marine Parks" - a Mistake
The term "marine p a r k led to overuse of the park before any controls and management capability could develop. The loss of all six moorings (to prevent an- chor damage) in two weeks was one result. A better term would be "marine reserve" or "fisheries sanctu- ary" which emphasize protection and the value of the site in terms of fisheries. The naming of future ma- rine protected areas (MPAs) should be done with cau- tion and in line with their main objectives.
On one hand, publicity hastened up the approval of the park by showing the government what there was to protect at Hon Mun. On the other hand, it created an influx of visitors to the island. Tourist boat operators were successfully selling their "Trips to Hun Mun Marine P a r k even before the designa- tion of the park, while fishers took their last chance before legislation took control.
The negative impacts of the publicity could have been prevented if the rules and the authority for imple- mentation had been ready during the promotion of the park.
Concepts New and Foreign
MPAs are a new concept in Vietnam. There is no government agency with a clear mandate to deal with them, although an array of departments from fishe- ries science to military services are involved.
A greater involvement of Vietnamese scientists might have convinced the government of the impor-
tance and urgency of park protection. It is hoped that they will become more active in this area. Changes in the status of the coral reefs in and out of the park, before and after protection, should be monitored, docu- mented and publicized regularly for evaluation and encouragement.
Lack of Public Participation
The park was developed without consultation with its resource users - tourist boat operators and fishers. The customary barrier between the government and users was too strong to remove. The exclusion of the users from the project has resulted in a total lack of understanding and support from the users who un- doubtedly continue to exert pressure on the resources.
Meetings between the park authority (yet to be identified) and tourist boat operators and fishers, are needed to incorporate opinions from all park users for the establishment of park rules and management strategies.
Insufficient Funding
Insufficient funds are partly a reflection of the low priority given to marine conservation by both local and foreign agencies with financial potential. The situa- tion was worsened by the waste of available funds. All the money spent on the moorings was wasted because no authority would take the responsibility of protec- ting them.
With the thriving tourism of Nha Trang, Hon Mun Marine Park is fully capable of generating its own operational funds. Tourist boat operators, tourists and fishers should contribute to the maintenance of the park. Fund-raising events such as photo contests can be encouraged. A well-managed protected area will attract sponsors.
Six other coral reef sites have been surveyed. and shown to have high conservation priorities. The les- sons from Hon Mun are useful for the planning of these sites to avoid "paper parks" with no protection or man- agement such that their value for conservation, fishe- ries and tourism is eventually lost.
a Adapted from Cheung (1994).

106 Acknowledgements Kyokuyo Co. Ltd. 1972. Trawling survey in the South China
J Sea and the Gulf of Thailand (1969-1971). Final Report.
Le Xuan Sinh. 1994. Mangrove forest and shrimp culture in We thank the workshop organizers for this Ngoc Xien District, Minh Hai Province, Vietnam. Naga,
opportunity to present this review of the state of ICLARM Q. 17(4): 15-16. Vietnam'sfisheryresourcestoanin~ernationalforum. Marine Environment and Resources. 1991. Some
hydrogeochemical characteristics and rational utilization of brackishwater ponds in the coast of North Vietnam. Vol. 1. 89 p.
References MOFINACA. 1995. Vietnam National Workshop on Environment and Aquaculture Development, 17-19 May
Canh, N.T. 1989. An attempt to assess fish biomass and potential 1994. NACA Environment and Aquaculture Development,
production in the sea of Vietnam from studies on plankton Haiphong. Ser. No. 2. Ministry of Fisheries, Hanoi, Vietnam
J and benthos. Akademia Rolnicza W. Szczecinie No. 118. and Network of Aquaculture Centers in Asia-Pacific,
cheung, C. 1994. Lessons from Vietnam's first marine park. Bangkok, Thailand. 507 p.
Naga, ICLARM Q. 17(4): 13. Nguyen, Tac An. 1989. Energy balance of the major tropical
Kyokuyo Hogel Co. Ltd. 1970a. Trawling survey in the South marine shelf of Vietnam. Biol. MoryaISoviet J. Mar. Biol.
China Sea off the coast of the Republic of Vietnam. First J 15(2): 78-83.
Annual Report to FAO, March 1970, Tech, Rep, No, Pauly, D. and V. Christensen. 1993. Stratified models of large
Kyokuyo Hogel Co. Ltd. 1970b. Offshore fishery development, marine ecosystems: a general approach and an application
the Republic of Vietnam trawling survey in the northern to the South China Sea, p. 149-174. In K. Sherman, L.M.
South China Sea. Annual Report prepared for FAO. Tech. Alexander and B.D. Gold (eds.) Large marine ecosystems:
Rep. No. 2, July 1970. s t ress , mitigation and sustainabi l i ty . AAAS Press ,
Kyokuyo Hogel Co. Ltd. 1970c. Offshore fishery development Washington, D.C.
Rep. of Vietnam: trawling survey in the South China Sea Thuoc, P. 1986. Fish resources of Vietnamese seas: biological
and Gulf of Thailand. Semi-annual Report prepared for and fisheries characteristics, biomass assessment, and
FAO. Tech. Rep. No. 3, December 1970. exploitation potentials. Akademia Polnicza W. Szczecinie.
Kyokuyo Co. Ltd. 1972. Offshore fishery development, the No. 106, 157 p.
Republic of Vietnam trawling survey in the northern South Thuoc, P. 1986. Regional study and workshop on environmental
China Sea. Annual Report prepared for FAO. Tech. Rep. assessment and management of aquaculture development.
No. 4, March 1972. TCPlRASl2253. Vinh. C.T. and N. Lone. 1994. Marine fish harvesting in Vietnam.
~NFOFISH Int. i: 54-56, 58.

FA0 Program Perspectives in the Fisheries Sector, with Emphasis
on South and Southeast Asia
P. MARTOSUBROTO Marine Resources Service
Fishery Resources Division Food and Agriculture Organization of the United Nations
Via delle Terme di Caracalla, 00100 Rome, Italy
MARTOSUBROTO, P. 1997. FA0 program perspectives in the fisheries sector, with emphasis on South and Southeast Asia, p. 107-111. In G.T. Silvestre and D. Pauly (eds.) Status and management of tropical coastal fisheries in Asia. ICLARM Conf. Proc. 53, 208 p.
Abstract
This paper provides an overview of the goals, objectives and strategies pursued under FAO's fisheries program for the 1996-1997 biennium. Priority activities under the program include: (1) promoting responsi- ble fisheries a t the global, regional and national levels; (2) increasing the contribution of responsible fishe- ries and aquaculture to world food supply and security; and (3) global monitoring and strategic analysis of fisheries. Activities of FA0 projects (particularly the Bay of Bengal Program) and fisheries bodies (particu- larly the Asia-Pacific Fishery Commission) relevant to assessment and management of coastal fisheries in South and Southeast Asia aEe briefly discussed.
Introduction
The UN Food and Agrrculture Organization (FAO) program of work is developed every biennium under the close scrutiny of the governing bodies represen- ting its member states. In the early process of program development, the proposed sectoral programs deve- loped by the respective departments (agriculture, for- estry, fisheries) are first presented to and discussed in the corresponding sectoral committees (e.g., Com- mittee on Fisheries, or COFI). Each sectoral committee then submits its report to the FA0 Council. The re- port of the council on the program is theh discussed at the FA0 Conference for final endorsement.
The Program Committee, whose members consist of selected representatives of member states, scruti- nizes the proposed program of the sectoral depart- ments and takes into account the financial situation of FA0 as discussed and reported by the Finance Committee. In the fisheries sector, program develop- ment starts with the discussion of the governing bo- dies in COFI's session, which convenes every two years. The present program, which covers the 1996-1997 biennium, was developed with inputs from the last (21st) session of COFI in March 1995.
The Fisheries Program of 1996-1997l
The long-term goal of the fisheries program is to promote and enhance sustainable food supplies from fisheries and aquaculture through improved planning, management and technology. In formulating goals and objectives, various considerations have to be taken into account, including current problems. These include the following: 1. Managers responsible for national policies for the
management and development of fisheries face: increasing fishing and environmental pressure on fishery resources; high and increasing natural variability of fishery stocks; stagnating or decrea- sing institutional and financial resources to meet these challenges in the developing world; and inadequate information bases to work on.
2. The catchng capacity of fishing fleets exceeds sig- nificantly the quantities that could be harvested in a sustainable manner, and much is wasted through discarding.
3. High-seas fisheries, including those of straddling stocks and highly migratory stocks, are insuffi- ciently regulated, often overfished and a cause of high political tension at the international level.
The programme for the next biennium (1988-1999) is being finalized and subject to the FA0 Conference scheduled in November 1997.

108 Main Objectives and Strategies
While meeting these challenges, various objectives must also be met:
Improve the social and economic performance of fisheries and aquaculture through responsible management and development, enhanced trade and more responsible harvesting and utilization, recognizing the need to balance fishing, capital and labor at sustainable levels. Rehabilitate the natural resource base and pro- mote the protection of critical fishery habitats, through the design of improved fishery manage- ment scheme, promotion of applied fishery research and enhancement of international collaboration. Increase the contribution of fisheries to food pro- duction and security, through enhancement of in- land and coastal fisheries, development of aqua- culture, reduction ofwaste and discards, and bet- ter use of small pelagic and underutilized species.
These objectives and the strategies developed for meeting them are then translated into priority action that takes into account the current financial situa- tion of FAO.
Priority Areas and Activities
In 1996-1997, the efforts of the Fisheries Depart- ment are concentrated on the priority areas and ac- tivities outlined below.
PROMOTING RESPONSIBLE FISHERIES SECTOR MANAGEMENT AT THE GLOBAL, REGIONAL AND NATIONAL LEVELS
Priority activities: Finalize the guidelines for implementing the Code of Conduct for Responsible Fisheries. Identify, adapt and transfer improved strate- gies for sustainable development and manage- ment of capture fisheries, including inland fisheries, considering natural fluctuations in productivity, socioeconomic factors, food needs and competing demands from other sectors. Enhance the role of the FA0 fishery bodies, through appropriate extrabudgetary support and increase in management powers, with focus on shared stocks, straddling stocks and other high-seas resources and trade. Transfer technologies to improve selectivity of fishing gear and optimize energy usage. Collect, analyze and distribute information on management approaches and systems, and their performance.
Adapt and transfer methodologies and technolo- gies to raise national capacity in management- oriented fishery research. Follow up UN initiatives such as the UN Con- vention on the Law of the Sea, UN Conference on Environment and Development, and UN Conference on Straddling Fish Stocks and Highly Migratory Fish Stocks.
INCREASING CONTRIBUTION OF RESPONSIBLE FISHERIES AND AQUACULTURE TO WORLD FOOD SUPPLIES AND FOOD SECURITY
Priority activities: Identify and transfer approaches to sustain- able fisheries enhancement and aquaculture development. Integrate culture systems into more genera- lized rural and coastal contexts. Improve national capacity in fish utilization and marketing by promoting and coordinating the adaptation and transfer of methodologies, technologies and information. Promote better utilization of underexploited spe- cies (particularly small pelagics), reduction of waste and postharvest losses, and improved quality as a means for development and im- proved food security.
GLOBAL MONITORING AND STRATEGIC ANALYSIS OF FISHERIES
Priority activities: Conduct biennial review on the state of world fisheries and aquaculture. Collect, analyze, interpret and disseminate sta- tistics on fisheries, including catches, commodities and fleets; and monitor world fisheries, with focus on the high seas, as well as information on the state of fish stocks. Compile and distribute data and information on trade in fish and fishery products. Initiate development of a global Geographic In- formation System on fisheries, their resources and their environment, and contribute to the FA0 Digital Atlas on Agriculture, Forestry and Fisheries.
Support to FA0 Member Countries
The assistance of FA0 to member countries takes various forms such as: providing technical guidelines, policy advice, training and extension; strengthening regional fisheries bodies; and enhancing technical co- operation among developing countries and other forms of partnership programs. The assistance can

be executed in the form of technical and investment projects to be funded by donor agencies or by FA0 itself (through the Technical Cooperation Program -- TCP). The projects can be national, regional and glo- bal. Continued financial constraints faced by the United Nations System in recent years have, how- ever, lowered the number of FA0 projects. A single regional project remains in South and Southeast Asia, called the Regional Program for Coastal Fisheries Man- agement in the Bay of Bengal, or, in short, the Bay of Bengal Project (BOBP). The BOBP covers seven coun- tries: Bangladesh, India, Indonesia, Malaysia, Maldives, Sri Lanka and Thailand (Box 1). Another project, the Fishery Resources Training Project (GCPI INT/575/DEN), is global and relevant to member coun- tries in tropical Asia.
109 Regional Fisheries Bodies
There are a number of regional fisheries commis- sions under FAO. In the South and Southeast Asian regions, two commissions are relevant. One is the In- dian Ocean Fishery Commission (IOFC) covering the countries around the Indian Ocean, extending from South Asia to East Africa, and dealing with marine fisheries in the Indian Ocean. The other is the Asia- Pacific Fishery Commission (APFIC), covering both inland and marine fisheries, and embracing countries in Asia (including landlpcked Nepal) and countries bordering the Western Pacific Ocean and South Pacific.
One of the recent developments under IOFC is the establishment of the Indian Ocean Tuna Commission, which is intended to take care of a large part of the
- - - -- - -
Box 1. The Bay of Bengal Program.
The Bay of Bengal Program (BOBP) of the United Nations Food and Agriculture Organization (FAO) is a multiagency regional fisheries program composed of seven countr ies border ing t h e Bay of Bengal: Bangladesh, India, Indonesia, Malaysia, Maldives, Sri Lanka and Thailand. The program started in 1979; it is funded by the United Nations Development Fund (New York), ODA (U.K.), DANIDA (Denmark), SIDA (Sweden) and the International Maritime Organiza- tion (Vienna).
In its first two phases (1979-19941, BOBP assisted in developing, demonstrating and promoting new tech- niques, technologies and development ideas to achieve its mission. The key activities during these phases were: (1) development of more efficient fishing technol- ogy; (2) aquaculture techniques; (3) postharvest fisheries; (4) assessment of fishery resources; (5) bio- socioeconomics; (6) people's participation; (7) fisherfolk education; (8) facilitating credit; (9) fisheries exten- sion services; and (10) dissemination of information.
The goal of the third phase (1995-2000) is to serve as catalyst for developing innovative participatory ap- proaches and solutions to small-scale fisheries manage- ment. Specifically, during this phase the program aims to achieve: (1) sustainable exploitation of fisheries resources; (2) equitable access to and use of aquatic resources for livelihood security; (3) promotion of integrated coastal area management; and (4) promotion of resource users as resource managers and decentralization of fisheries ma- nagement responsibility and authority.
The components of the third phase are: (1) building and increasing awareness and public opinion among stakeholders on the needs, benefits of and options for fisheries management; (2) building the capacities of local fishing communities and national fisheries agen-
cies to plan and carry out integrated fisheries manage- ment; (3) human resources planning and development, emphasizing utilization of local capacity; and (4) pro- viding technical assistance and other identical needs of member countries for implementation.
Moreover, the third phase is centered on the follo- wing general strategic principles: (1) reduce excess or surplus fishing capacity; (2) create awareness to instill in resource users a pride of ownership of the ideas and concept of management; (3) reexamine fishing technolo- gies to educate fisherfolk on gears that deplete living resources and impair resource habitat; (4) promote action-oriented projects t h a t produce measurable positive effects; (5) implement program activities that reflect the opinions of the public involved in fisheries and coastal communities; (6) for BOBP's national coun- terparts to assume greater responsibility and leader- ship in project implementation (national execution); (7) encourage government to allocate necessary financial resources for fisheries management; (8) coordinate na- tional and regional information systems and exchanges; (9) integrate the environmental impacts of fishing prac- tices and vice-versa into fisheries management deci- sions; (10) coordinate a n d consult i n f isher ies management decisions among national agencies with jurisdiction in the coastal zone; and (11) establish a regional forum or mechanism to reduce fishing conflicts between member countries and minimize arrests of fisherfolk caught illegally fishing in the national wa- ters of BOBP member and nonmember countries.
The third phase of BOBP is funded by the govern- ments of Denmark and Japan. In addition, member countries contribute funds for specialized project ac- tivities, such as information services, and make in-kind and cash contributions for project implementation.
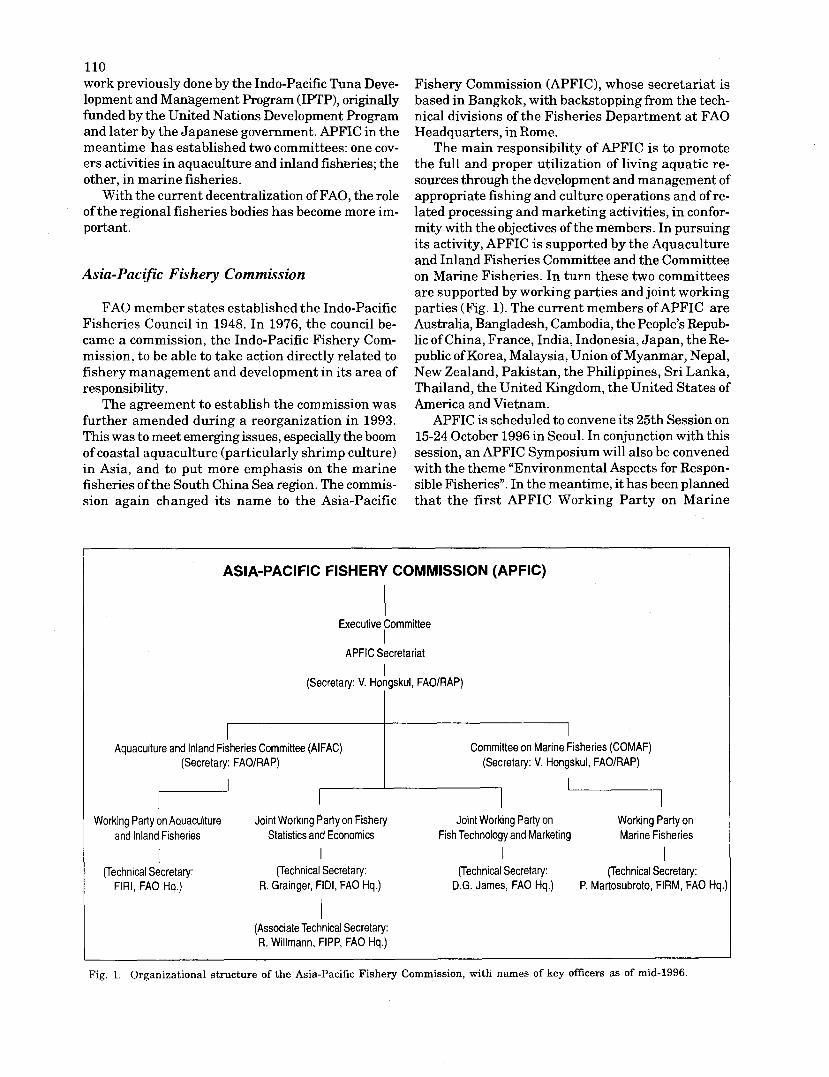
110 work previously done by the Indo-Pacific Tuna Deve- lopment and Management Program (IPTP), originally funded by the United Nations Development Program and later by the Japanese government. APFIC in the meantime has established two committees: one cov- ers activities in aquaculture and inland fisheries; the other, in marine fisheries.
With the current decentralization of FAO, the role of the regional fisheries bodies has become more im- portant.
Asia-Pacifc Fishery Commission
FA0 member states established the Indo-Pacific Fisheries Council in 1948. In 1976, the council be- came a commission, the Indo-Pacific Fishery Com- mission, to be able to take action directly related to fishery management and development in its area of responsibility.
The agreement to establish the commission was further amended during a reorganization in 1993. This was to meet emerging issues, especially the boom of coastal aquaculture (particularly shrimp culture) in Asia, and to put more emphasis on the marine fisheries of the South China Sea region. The commis- sion again changed its name to the Asia-Pacific
Fishery Commission (APFIC), whose secretariat is based in Bangkok, with backstopping from the tech- nical divisions of the Fisheries Department at FA0 Headquarters, in Rome.
The main responsibility of APFIC is to promote the full and proper utilization of living aquatic re- sources through the development and management of appropriate fishing and culture operations and of re- lated processing and marketing activities, in confor- mity with the objectives of the members. In pursuing its activity, APFIC is supported by the Aquaculture and Inland Fisheries Committee and the Committee on Marine Fisheries. In turn these two committees are supported by working parties and joint working parties (Fig. 1). The current members ofAPFIC are Australia, Bangladesh, Cambodia, the People's Repub- lic of China, France, India, Indonesia, Japan, the Re- public of Korea, Malaysia, Union of Myanmar, Nepal, New Zealand, Pakistan, the Philippines, Sri Lanka, Thailand, the United Kingdom, the United States of America and Vietnam.
APFIC is scheduled to convene its 25th Session on 15-24 October 1996 in Seoul. In conjunction with this session, an APFIC Symposium will also be convened with the theme "Environmental Aspects for Respon- sible Fisheries". In the meantime, it has been planned that the first APFIC Working Party on Marine
ASIA-PACIFIC FISHERY COMMISSION (APFIC)
Executive committee I
APFIC Secretariat
I (Secretary: V. Hongskul, FAOIRAP)
I I
Aquaculture and Inland Fisheries Committee (AIFAC) (Secretary: FAOIRAP)
I Committee on Marine Fisheries (COMAF)
(Secretary: V. Hongskul, FAOIRAP)
Working Party on Aquaculture Joint Working Party on Fishery Joint Working Party on Working Party on and Inland Fisheries Statistics and Economics Fish Technology and Marketing Marine Fisheries
(Technical Secretary: (Technical Secretary: (Technical Secretary: (Technical Secretary: FIRI, FA0 Hq.) R. Grainger, FIDI, FA0 Hq.) D.G. James, FA0 Hq.) P. Martosubroto, FIRM, FA0 Hq.
I (Associate Technical Secretary: R. Willmann, FIPP, FA0 Hq.)
Fig. 1. Organizational structure of the Asia-Pacific Fishery Commission, with names of key officers as of mid-1996.

Fisheries will convene in early 1997, with a special agenda to discuss status, trends and issues of the small pelagic fisheries in the region.
FA0 promotes the establishment of regional fisheries bodies with a mandate in certain aspects of fisheries that member states wish to have. For example, FA0 was instrumental in establishing the Network of Aquaculture Centers in Asia and the Pacific, based in Bangkok, and INFOFISH, in Kuala Lumpur. FA0 has worked closely with ICLARM in developing computer software relevant to fisheries management (FishBase, FiSAT; Gayanilo et al., this vol.), and with the Southeast Asian Fisheries Deve- lopment Center in organizing various regional work-
111 shops that dealt with shared stocks, fishery informa- tion and statistics, and fisheries planning. FAO, within available means, will continue to support regional activities and keep the spirit of cooperation with existing regional fisheries bodies for the benefit of member states.
References
APFIC. 1995. Asia-Pacific Fishery Commission: Structure, Function and Directory of its Subsidiary Bodies. RAP Publ. 1995/1: 25 p.
FAO. 1995. The Director-General's Programme of Work and Budget for 1996-97. FA0 Rome: C 9513: 330 p.

Program Perspective: SEAFDEC-MFRDMD in Fisheries Resources Development and Management
M.I. MANSOR and
I w M.N. MOHD-TAUPEK APR i 4 Marine Fishery Resources Development
and Management Department Southeast Asian Fisheries Development Center
Chendering 21080 Kuala Terengganu, Malaysia
MANSOR, M.I. and M.N. MOHD-TAUPEK. 1997. Program perspective: SEAFDEC-MFRDMD in fish- eries resources development and management, p. 112-115. In G.T. Silvestre and D. Pauly (eds.) Status and management of tropical coastal fisheries in Asia. ICLARM Conf. Proc. 53, 208 p.
Abstract
This paper illustrates the active role of the Southeast Asian Fisheries Development Center-Marine Fishery Resources Development and Management Department (SEAFDEC-MFRDMD) in fishery resources development and management in Southeast Asia. It summarizes the various research activi- ties of SEAFDEC-MFRDMD in its current three-year (1995-1997) program. MFRDMD studies in the Marine Fisheries Biology and Stock Assessment Division cover marine fisheries biology, fish and invertebrate stock assessment, and turtle ecology, conservation and management. The Oceanography and Resource Exploration Division has conducted researches on fisheries oceanography, remote sensing, resource exploration, fishing gear technology and resource rehabilitation.
Background of MFRDMD
The establishment of the Marine Fishery Resources Deveiopment and Management Department (MFRDMD) in Kuala Terengganu, Malaysia, as the fourth department of the Southeast Asian Fisheries Development Center (SEAFDEC) was agreed on a t the 23rd SEAFDEC Council Meeting in December 1990. The general objective of MFRDMD, which started its activities in 1992, is to assist member coun- tries of SEAFDEC in developing and managing the marine fishery resources in the Exclusive Economic Zone (EEZ) waters of Southeast Asia.
The functions of MFRDMD are to: act as a center for providing guidelines for the proper development and management of fishery resources in the EEZs of member countries; monitor the state of the marine fishery re- sources; provide the scientific basis for the proper de- velopment and management of the marine fishery resources of member countries;
serve as a regional forum for cooperation and con- sultation on marine fishery resources research and management among member countries; and coordinate and implement programs to improve the capability of member countries in develo- ping, managing and conserving fishery re- sources in their respective EEZs.
To fulfill its functions, MFRDMD: carries out regular research on biology, ecology and population dynamics of fish stocks; participates in monitoring surveys in the EEZs of member countries; undertakes programs for regional cooperation on research, management and exploitation of shared stocks; provides training on methodologies for marine fishery resources assessment and management; carries out research on methods to enhance and rehabilitate the productivity of marine fishery resources in the region;

establishes a marine fishery resource informa- tion center to collect and disseminate infor- mation on the conservation and management of marine fishery resources; and disseminates information in the form of publi- cations, documents and other media.
Overall, MFRDMD's research, training and infor- mation dissemination activities (as approved by the SEAFDEC Council) aim to promote sustainable de- velopment and management of fishery resources in Southeast Asia.
MFRDMD Activities
MFRDMD's research activities are conducted through two main divisions: (1) the Marine Fisheries Biology and Stock Assessment Division, and (2) the Oceanography and Resource Exploration Division. Both divisions are responsible for research at the na- tional (Department of Fisheries, Malaysia) and re- gional (SEAFDEC) levels. Research under the Fishe- ries Biology and Stock Assessment Division covers: (a) marine fisheries biology; (b) fish and invertebrate stock assessment; and (c) turtle conservation, ma- nagement and ecology. The Oceanography and Re- source Exploration Division conducts research on: (a) fisheries oceanography; (b) remote sensing; (c) resource exploration; (d) fishing gear technology; and (e) re- source rehabilitation and enhancement.
A brief account of MFRDMD research projects is given below. These are part of SEAFDEC's current three-year (1995-1997) program.
Marine Fisheries Biology in Southeast Asia
Substantial biological data on migratory fishes have been produced by research institutions in South- east Asia. These need to be compiled regionally (and should include recent and updated information) to provide inputs for assessing regionallshared stocks. MFRDMD proposes to continuously update this com- pilation via occasional publications for fishery ma- nagers and scientists in Southeast Asia.
Distribution of Marine Fish Species in Southeast Asia
A complete list of marine fish species would be useful to fishery scientists studying fishes in South- east Asia. Among other things, such list could be used as a reference for accurate identification, and to fa- cilitate studies on population structure and dynamics. Thus, a checklist of the important marine fish spe-
113
cies in SEAFDEC member countries was made from published materials as well as through personal com- munication with other scientists (especially taxono- mists) in the region. The list includes species coding for the data information system of SEAFDEC/ MFRDMD. This draft checklist of marine species is being reviewed by experts from Japan.
Regional Tuna-Tagging Program
Tunas are commercially important migratory fish whose stocks are believed to be extensively shared by Southeast Asian countries. Thus, excessive fishing pressure imposed on the tuna stocks in one country will have a negative effect on the fishery of another country. Collaborative tuna tagging would help iden- tify migration routes within the South China Sea.
The tuna-tagging project was approved by the SEAFDEC Council in 1994. It aims to tag tunas off the coasts of Malaysia, Thailand, Brunei, Vietnam, the Philippines and Indonesia. Preliminary results from the Malaysian National Tuna-Tagging Program in 1992 and 1994 suggest that tuna migration in the region generally resembles the pattern shown by sur- face water currents in the South China Sea.
Tuna Resources and Statistics in Southeast Asia
International management of living resources is important to ensure that they are exploited on a sus- tainable basis. To this end, collection of comprehen- sive tuna-catch statistics and related information is included as part of SEAFDECNFRDMD main activi- ties. The objective is to carry out a regional collabora- tive study to identify the various tuna resources in Southeast Asia, including, where possible, sampling at the major landing centers. Questionnaires, rela- ting to tuna landings and size-frequency distribution, will be sent to liaison officers from countries borde- ring the South China Sea, i.e., Malaysia, Thailand, Singapore, the Philippines, Brunei Darussalam, Viet- nam and Indonesia. The information obtained will be compiled, published annually and disseminated.
Results from the Indo-Pacific Tuna Development and Management Program (IPTP) sampling activi- ties have indicated that interactions exist between the tuna fisheries among the SEAFDEC member coun- tries. So far, however, the mutual impact of these fisheries has not been well established. It is hoped that close collaboration among the scientists of mem- ber countries will promote a better understanding of the tuna stocks and help develop a framework for ra- tional management strategies.
114
Regional Squid-Tagging Program
Like tunas, squids are also one of the most com- mercially important pelagic species, and some of their stocks may be shared by Southeast Asian countries. Collaborative squid tagging would help identify mi- gration patterns within the South China Sea, besides establishing closer cooperation between personnel of the various countries involved.
Fishery Oceanography
Information on oceanographic parameters of the South China Sea is scant and not well documented, and come mostly from the coastal waters. Most of the information is not generally available to researchers, but kept a t individual research institutions of the SEAFDEC member countries.
The objectives of this project are to: (1) carry out oceanographic surveys using M.V. SEAFDEC in wa- ters off the coasts of Malaysia, Thailand, the Philip- pines and Vietnam; (2) compile the oceanographic data from the countries bordering the South China Sea; and (3) apply remote-sensing techniques in mapping oceanographic parameters. M.V. SEAFDEC was deployed to conduct
collaborative resource and oceanographic surveys in the South China Sea involving a number of Malay- sian and Thai researchers (box). In most cases, fish resource is assessed as part of the acoustic survey (using the FQ 70 scientific echosounder), while oceanographic parameters are measured simultaneously using stan- dard methods.
Oceanographic data will be obtained daily .from the NOAA receiver and processed to produce maps of sea- surface temperatures and to locate fronts and other productive areas.
Premonsoon and postmonsoon surveys were suc- cessfully completed by MFRDMD and Thailand De- partment of Fisheries researchers in September 1995 and April-May 1996, covering the waters of the Gulf of Thailand and East Coast Peninsular Malaysia, re- spectively. The next surveys were scheduled for July- August 1996 and April-May 1997 in the waters off Sarawak, Sabah and Brunei.
Marine Turtle Research and Conservation
The waters of the South China Sea, the Strait of Malacca and the Andaman Sea host a number of ma- rine turtle species. However, in recent years, the turtle populations have drastically declined. Current infor- mation on the biology and ecology of the turtles is scant. Concerted efforts and serious commitments
from the various relevant agencies and parties are necessary to ensure that marine turtles are conserved and will survive for future generations.
The project aims to: (1) compile and disseminate marine turtle statistics of this region; (2) carry out a collaborative program for tagging marine turtles in the region; and (3) analyze the marine-turtle tagging data for estimation of growth and the sexual matu- rity of some of the major species.
The first workshop on marine turtle research and conservation was conducted on 15-18 January 1996 at MFRDMD in Kuala Terengganu, with delegates from Malaysia, Thailand, the Philippines, Singapore, Brunei Darussalam and Japan.
Fishing Gear Selectivity
The trawl is the main fishing gear in most coun- tries of this region. Despite its major contribution to marine fish landings, the gear is found to be destruc- tive as it generates large quantities of by-catch, con- sisting mostly of small juveniles of commercial fish. Steps should be taken to reduce this by-catch.
The objective of the project is to study the selecti- vity and efficiency of selected fishing gear in order to eventually reduce their by-catch. A trouser trawl has been designed, constructed and tested in collabora- tion with the SEAFDEC Training Department. A com- parative study on the 38-mm diamond- and square- mesh cod end has been carried out. Also, a workshop on 'Research in the Selectivity of Fishing Gear in Southeast Asia and Selective Shrimp Fishing' was jointly organized by SEAFDECIMFRDMD, INFOFISH and FA0 on 28-30 May 1995.
Fish Stock Assessment
The major marine fish stocks within the EEZ of SEAFDEC member countries need to be studied by region; the results obtained should be relayed back to the fishery managers of the countries concerned. The objectives of this project are to: (1) establish a t MFRDMD a system for the computerization of fishe- ries data; (2) undertake compilation, review and pub- lication of historical regional catch and effort data in the new, improved format; and (3) perform analyses on the status of fish stocks in the region, using avai- lable historical catch and effort data, combined with data obtained by the M.V. SEAFDEC acoustic sur- vey.
Catch-effort data are being compiled based on ques- tionnaires sent to SEAFDEC member countries. Also, acoustic surveys using M.V. SEAFDEC have been con- ducted in September 1995 and April/May 1996.

Box 1. SEAFDEC collaborative research projects (1995-1997).
By SEAFDECITraining Department and Thai local institutions
Distribution, Abundance and Species Composi- tion of Macrobenthos Distribution, Abundance and Species Composi- tion of Phytoplankton: (1) in the Gulf of Thailand and East Coast of Peninsular Malaysia, and (2) in the West Coast of Sabah, Sarawak and Brunei Distribution, Abundance and Composition of Zooplankton in the Gulf of Thailand and Malaysia Species Composition, Diversity and Biology of Economically Important Fishes Composition, Abundance and Distribution of Fish Larvae in Thai-Malaysian Waters Distribution of Dinoflagellate Cysts in the Sur- face Sediments of Asian Waters: (1) the Gulf of Thailand and the East Coast of Peninsular Ma- laysia, and (2) the West Coast of Sabah, Sarawak and Brunei Darussalam Fishery Oceanography of Southeast Asian Conti- nental Shelf Waters: (1) Numeric Modeling of Shelf Circulation, (2) Pelagic Food-Chain Analysis, (3) Marine Pollution Studies , and (4) Remote Sensing and G I s Applications Biomass Estimation in Southeast Asian Waters Study on the Physical and Chemical Characteris- tics of Bottom Sediments in the Thai-Malaysian Waters
By SEAFDEC IMFRDMD and Malaysian local institutions
Longitudinal Variability of Physical Parame- ters on the Western Side of South China Sea Trace Metals and Mineral Composition of Sedi- ments of the Gulf of Thailand and South China Sea Chlorophyll a Content of the South China Sea and the Gulf of Thailand Photosynthetic Vahes, Light Intensity and Re- lated Parameters of South China Sea and the Gulf of Thailand Microplankton of the South China Sea and the Gulf of Thailand Microzooplankton (including Dinoflagellate and Foraminiferans) of the South China Sea and the Gulf of Thailand Distribution, Abundance, Species Composition and Biological Studies of Economically Impor- tant Pelagic Fishes in the East Coast of Penin- sular Malaysia Distribution of Nutrients in the South China Sea Distribution, Abundance and Species Composi- tion of Phytoplankton in the South China Sea and the Gulf of Thailand Distribution, Abundance and Species Composi- tion of Benthos in the Gulf of Thailand and South China Sea Density, Biomass, Species Composition and Distribution of Pelagic Fish Species
Workshops and Training Activities
A workshop on shared stocks involving the coun- tries of Southeast Asia was organized to discuss the status of the fisheries (including catch-effort informa- tion, fishing gear, population dynamics and biological parameters of the shared stocks). Similar workshops will be held to analyze oceanographic and environ- mental data related to the shared stocks, and to dis- cuss collaborative research on the marine environ- ment and resource surveys among SEAFDEC mem- ber countries.
Conclusion
This paper documents the active role taken by SEAFDECIMFRDMD in fisheries resource assess-
ment and management in Southeast Asia. The depart- ment welcomes any comments concerning its research activities, and would be greatly interested to partici- pate in any collaborative efforts for the benefit of fisheries in the region.
Acknowledgments
I thank the workshop organizers for the opportunity to present this paper and to participate in the meeting, the Director General of Fisheries (Malaysia) for permis- sion to attend the workshop, the Chief of MFRDMD for comments on the manuscript, and SEAFDEC for fun- ding support to attend the workshop.

Toward a Generic Trawl Survey Database Management System1
1 NWD M N E ~ F.C. GAYANILO, JR. ternational Center for Living Aquatic Resources Management
ppR 1 4 19g8 MCPO Box 2631, 0718 Makati City, Philippines
T . STRQIMME Nansen Programme, Institute of Marine Science
PO 1870,5024 Bergen, Norway
and
D. PAULY International Center for Living Aquatic Resources Management
MCPO Box 2631, Makati City 0718, Philippines and
Fisheries Centre, University of British Columbia Vancouver, B.C., V6T 124, Canada
GAYANILO, F.C., JR., T. STRBMME and D. PAULY. 1997. Toward a generic t rawl survey da ta - base management system, p. 116-132. In G. Silvestre and D. Pauly (eds.) Status and management of tropical coastal fisheries in Asia. ICLARM Conf. Proc. 53, 208 p.
Abstract
The first assessments of fisheries potential in tropical Asia were based largely on various demersal trawl surveys. In many countries, trawl surveys continue to be used for monitoring the status of stocks. This contribution presents the concept of a trawl survey database management system to organize, store, retrieve and exchange historical and contemporary trawl survey data. Some of the data analyses that can be made based on trawl survey data are also discussed. The prototype of a trawl survey database manage- ment system developed along these lines (called TrawlBase) is presented.
Introduction
Trawl surveys constitute an important fisheries- independent method for assessing and monitoring de- mersal stocks. To a large extent, data collected through this method, as well as analyses performed, are fairly standard in form (Pauly 1996). Whether surveys are random, systematic, stratified-random or encounter-response in design, the data they generate can be easily handled by a database ma- nagement system (DBMS). A number of DBMSs can accommodate trawl survey data. These are either generic, such as the NAN-SIS software (Str~mme 1992), or tailored to the needs of a given country (Vakily 1992).
Recent development. in computer technology - such as higher speed, large increases in memory, the Win- dows multitasking environment and standard methods for data exchange - open potentials for powerful analy- ses that in the past were reserved for scientists with specialized skills in computer programming.
For a DBMS to be effective and efficient, special attention should be given to how data are stored (Dates 1981). The design of the DBMS should guarantee that: (1) redundanj of stored data is avoided; (2) inconsis- tencies within the database are avoided; (3) data are or can be shared and exported to other forms and stan- dards; (4) standards in data entry are enforced; (5)
ICLARM Contribution No. 1380.

conflicting requirements are balanced among users; and ( 6 ) integrity of data is maintained through data validation andlor controls in data encoding.
This paper represents an attempt to identify the essential features of a generic DBMS for trawl sur- veys, given DBMS design considerations and computer technology developments. A special effort was made to include all the functionalities of NAN-SIS, plus other routines thought to be important, given the develop- ment ofrelated systems, notably FishBase 97 (Froese and Pauly 1997), ReefBase (McManus and Ablan 1996) and FiSAT (Gayanilo et al. 1996).
Trawl-Survey Data
A description of equipment used in a survey is the first step in designing a trawl survey DBMS. This includes a general description of the vessel or boat used. The items usually included here are:
Vessel Particulars name of the vessel; total length; gross tonnage; name and horsepower of the main engine; and cruising speed.
Gear Particulars The trawl gear is identified by:
length of the headrope; circumference; length of footrope; headline width and height; codend mesh size; bottom gear; otter boards (type, size); bridles (length); and estimated mean door distance.
Survey Particulars A cruise logbook is also accomplished before and
after a trip, usually with the following items:
cruise number (related to a project); positioning system (geographic positioning system, or GPS, radar, etc.) position accuracy; log system (surface referenced, bottom referenced); names and watch duties; head of fishing operation; trawl-monitoring system with list of sensors; sampling scheme (random, stratified random, adaptive);
117 universal time convention, or UTC, for onset and offset of daylight; dates of sailing and return to port; and time and position of important events along cruise tracks (course change, conductivity-temperature- depth, or CTD, stations, etc.).
Station Particulars At each trawling station, the following items are
recorded:
station number (or ID); date; purpose code (biomass estimation, experimental station, etc.); starting and ending time (UTC); starting and ending positions (latitude and longi- tude); starting and ending fishing depths; starting and ending bottom depths; starting and ending time of trawling; gear damage code; haul validity code; and quality control code.
In some applications, the ending positions are not recorded, i.e., they are replaced by the towing direc- tion and speed. The final position can be computed using a simple geometric relationship (Box 1) and may be plotted (Box 2).
Box 1. Estimating final position, given initial position, speed and bearing.
Assuming a constant towing speed and that the effects of the surface current and wind speed are negli- gible, the following relationship may be used to esti- mate the final position of a trawler.
If we let
'ong = starting latitude position 'final = final latitude position
'ong = starting longitude position Yfinzd = final longitude position 'towmg = towing speed 'start = time trawling started 'end = time trawling ended 'total
= total trawling time (=Tend - Tsta,J D = distance traveled (=Stowing . TtOt,,)
dtowlng = towing direction (in degrees) then
'final = 'ang + sin dtawmg
'final = Yonp + 'OS dtowlng
Wind speed and direction have a negligible effect on the direction of the vessel during normal trawling operations. On the other hand, water currents do affect vessels and the geometry of the trawl gear. In
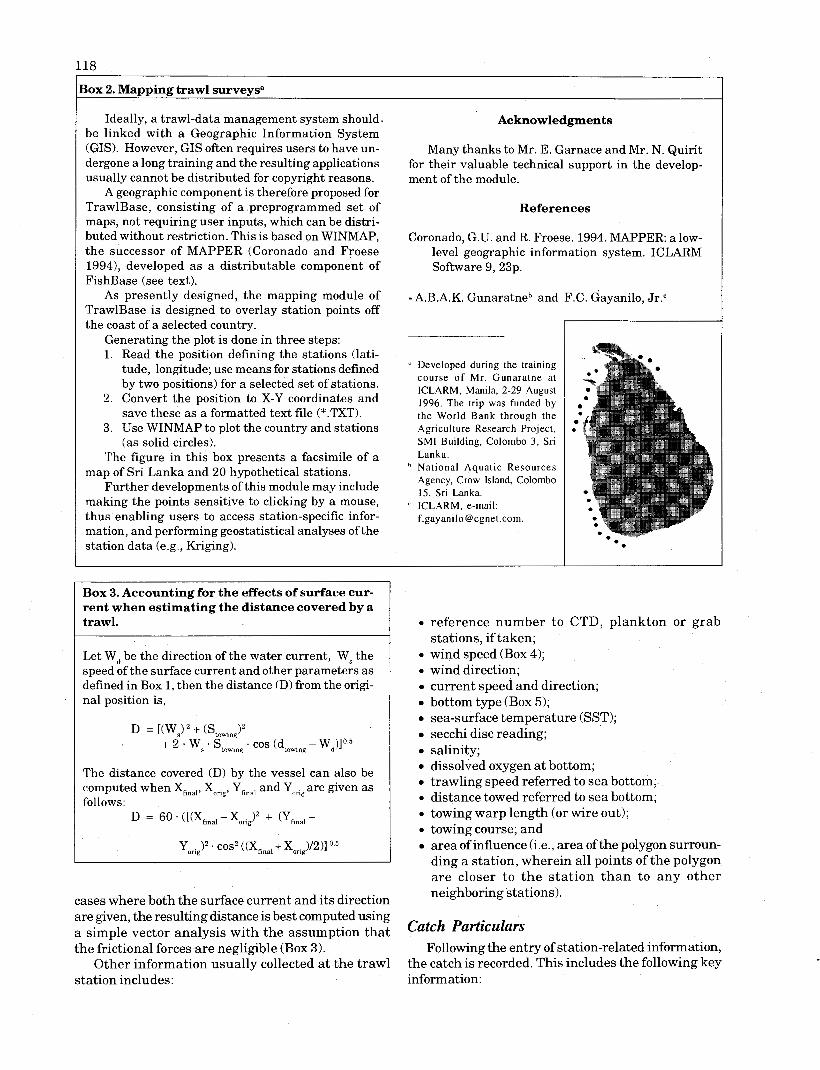
-
30x 2. Mapping trawl surveysa
Ideally, a trawl-data management system should. be linked with a Geographic Information System (CIS). However, GIs often requires users to have un- dergone a long training and the resulting applications usually cannot be distributed for copyright reasons.
A geographic component is therefore proposed for TrawlBase, consisting of a preprogrammed set of maps, not requiring user inputs, which can be distri- buted without restriction. This is based on WINMAP, the successor of MAPPER (Coronado and Froese 19941, developed a s a distributable component of FishBase (see text).
As presently designed, the mapping module of TrawlBase is designed to overlay station points off the coast of a selected country.
Generating the plot is done in three steps: 1. Read the position defining the stations (lati-
tude, longitude; use means for stations defined by two positions) for a selected set of stations.
2. Convert the position to X-Y coordinates and save these as a formatted text file (*.TXT).
3. Use WINMAP to plot the country and stations (as solid circles).
The figure in this box presents a facsimile of a map of Sri Lanka and 20 hypothetical stations.
Further developments of this module may include making the points sensitive to clicking by a mouse, thus enabling users to access station-specific infor- mation, and performing geostatistical analyses of the station data (e.g., Kriging).
Acknowledgments
Many thanks to Mr. E. Garnace and Mr. N. Quirit for their valuable technical support in the develop- ment of the module.
References
Coronado, G.U. and R. Froese. 1994. MAPPER: a low- level geographic information system. ICLARM Software 9, 23p.
- A.B.A.K. Gunaratneb and F.C. ~ a ~ a n i l o , Jr .c
"eveloped during the training course of Mr. Gunaratne at ICLARM, Manila, 2-29 August 1996. The trip was funded by the World Bank through the Agriculture Research Prosect, SMI Building, Colombo 3, Sri Lanka. National Aquatic Resources Agency, Crow Island, Colombo 15, Sri Lanka.
' ICLARM, e-mail: [email protected].
Box 3. Accounting for the effects of surface cur- rent when estimating the distance covered by a trawl.
Let W, be the direction of the water current, Ws the speed of the surface current and other parameters as defined in Box 1, then the distance (D) from the origi- nal position is,
The distance covered (D) by the vessel can also be computed when Xfinal, Xang, Yfinal and Y,,,,are given as follows:
D = 60 . ([(Xfinal - XongY + (Ye,,l -
cases where both the surface current and its direction are gven, the resulting distance is best computed using a simple vector analysis with the assumption that the frictional forces are negligible (Box 3).
Other information usually collected at the trawl station includes:
reference number to CTD, plankton or grab stations, if taken; wind speed (Box 4); wind direction; current speed and direction; bottom type (Box 5); sea-surface temperature (SST); secchi disc reading; salinity; dissolved oxygen at bottom; trawling speed referred to sea bottom; distance towed referred to sea bottom; towing warp length (or wire out); towing course; and area of influence (i.e., area of the polygon surroun- ding a station, wherein all points of the polygon are closer to the station than to any other neighboring stations).
Catch Particulars Following the entry of station-related information,
the catch is recorded. This includes the following key information:

name of taxon (preferably species name; genus or higher when specific identification is not possible); weight of catch (by species or higher groupings); numbers caught (by species or higher groupings); reference number or tag indicating whether a length sample was taken; and reference number or tag indicating whether bio- logical samples or specimens were taken.
119 For target species, length-frequency samples are
usually taken (and weighted), with the length fiequen- cies (total length, fork length or standard length) usually grouped by constant class intervals. Ungrouped length records are sometimes collected, along with individual weights, for some target fish. In some surveys the sex, maturity stage and stomach contents of some of the fish caught are also recorded.
Box 4. Recording wind observations.
Wind speed and direction can be observed through the use of a wind vane or an electronic instrument. Rough estimates of wind speeds can be recorded using the Beaufort scale.
Beaufort scale, as used to record wind speed (Branson 1987):
Beaufort scale
0 1 2 3 4 5 6 7 8 9 10 11 12
Wind speed (knots)
Descriptive term
Calm Light air
Light breeze Gentle breeze
Moderate breeze Fresh breeze Strong breeze
Near gale Gale
Strong gale Storm
Violent storm Humcane
Box 5. Recording bottom types.
Ave. height of waves
(m)
0.1 0.2 0.6 1.0 2.0 3.0 4.0 5.5 7.0 9.0
11.5
Bottom types can be assessed using a core sampler or a Petersen's grab sampler or by examining the un- derside of the doors of a trawl net. There are qualita- tive and quantitative methods of classifying bottom type. One useful classification of bottom types is the Wentworth grade scale.
Max. height of waves
(m)
0.1 0.3 1.0 1.5 2.5 4.0 5.5 7.5
10.0 12.5 16.0
Wentworth made scale (English et al. 1994):
Name Grade Limits (mm) Boulder >256 Cobble Pebble Granule Very coarse sand Coarse sand Medium sand Fine sand Very fine sand Silt Clay
A frequently used maturation scale consists of these stages: immature, developing, active, developed, gravid, ripe-running or spent (Munro and Thompson 1983).
Data Storage
When laying down the specifications for a trawl- survey database, the amount of data that will have to be recorded must be estimated.
To avoid the need for the user to enter vast num- bersof characters (hence minimize encoding errors and conserve storage space), codes were utilized in the early 1970s for most elements of a trawl survey (vessel and gear type, cruise, station, and taxa caught). The use of codes is obsolete, with recent advances in computer technology and new interfaces involving the use of choice fields. However, a generic trawl-survey DBMS should support the use of codes in important routines to allow incorporation and transfer of older data sets. Codes are still used in modern computer programs to classify and sort data sets. However, this occurs 'behind the scene' and is of no direct concern to users of the software.

120 It is also important that the database is organized
so it can work on subsets of data. A subset could be one survey or a group of surveys, forming what in NAN-SIS is called a 'project' and organized in sepa- rate files or group files. The grouping could make use of directories or filename suffixes, as in NAN-SIS. This will facilitate data maintenance and exchange. The analytical programs in the package must be able to pool 'projects', to enable comparative and time se- ries analyses.
Fig. 1 summarizes the concepts presented above, which can be straightforwardly realized using com- mercially available relational database systems such as Foxbase, Visual FoxPro, Oracle, Visual dBase, PowerBuilder or Microsoft Access. The choice of the system is not very important and any of the commer- cially available database development systems can be used since the data are either alphanumeric or nu- meric. The relationship among tables is so simple that even first-generation database systems such as dBase I1 (once distributed by Ashton-Tate Co., USA)
can easily be configured to fit the main requirements. Moreover, most of the commercially available data- base systems include utilities to export and import data from other database systems, making problems of intersoftware communication a thing of the past (Box 6).
The choice of a database system to use is more a question of maintenance. The DBMS should be deve- loped using a system that guarantees both the long- term availability of knowledgeable programmers and a commitment of the company that initially developed the database system to continue to support and up- grade it.
Data Analysis
Storing the data from a trawl survey is only the first step. To be useful, the data must be interpreted, analyzed or presented in some other form. The most useful analysis, and the one most commonly required, is the estimation of biomass or 'standing stock'.
Country Table
Selected from FishBase list of
countries
I
Trawler Net Description
Optional: Description
I
Trawler Description
Oolional: Description
I
Cruise Table * Describes the cruise
Station Records
Describes the observations Selected from made on each station made FishBase list of during the cruise (species
Fig. 1. Schematic representation of the data gathered in a trawl survey. The relationship is one-is-to-many for all the data.
I
Grouped LA?
Length:frequencies grouped in classes are
recorded here
Ungrouped 1ength:frequencies are recorded here

Box 6. Towards a common fisheries resources survey information system.
In monitoring and assessing fisheries resources, surveys play an essential role. Various generic op- tions for storing and processing survey data are available, but often institutions develop in-house applications tailored to specific needs. In the worst but not uncommon case, data storage is left to the responsibility of the individual scientists, leading to formats that make data exchange even within the institution complicated. Another problem is that well- developed systems may wither away when contracts with computer companies expire, maintenance funds go dry or scientists andlor computer experts quit the institution.
In the light of recent developments in computer systems and database applications, the creation of a Common Fisheries Data Format (CFDF) is proposed to accompany a toolbox of analytical applications that can be composed of a menu-driven shell system tai- lored for the specific needs of institutions.
By agreeing on a common format for data storage, exchange of data is facilitated and scientists and programmers are invited to contribute to the deve- lopment of a common box of analytical tools which will be open and transparent to all. Rules for cre- diting a subprogram to an authorldeveloper should be established and it should be adopted to a common toolbox that will be available on the Internet follo- wing a peer review procedure. It is envisaged that after the initial phase, such an arrangement will be self-perpetuating and reinforcing, and the ownership will belong to the scientific community at large, free of commercial interests.
If the CFDF meets acceptance, the Dr. Fridtjoft Nansen Project will port the main functions of the NAN-SIS software package to the new environment.
By transfering historic data to CFDF, global analy- ses in fisheries ecology will be facilitated as well. It is also suggested that this procedure be followed when building a common database and analytical programs for the Southern African BENEFIT Project.
Scientists, programmers or others who would sup- port the idea of a common format for survey data are requested to contact the author in order to create an Internet forum for development of the idea.
" E-mail: [email protected] or in writing to T. Strermme, The Nansen Programme, Institute of Marine Science, PO 1870, 5024 Bergen, Norway.
iiomass Estimation The biomass (B) of demersal fishes can be esti-
mated using the "swept-area" method (Pauly 1984a, 1984b). It is defined by the equation:
12 1 where Clf is the mean catch per unit effort; A is the total area covered by the survey; XI is the escapement factor, i.e., the fraction of the fish in the path of the trawl that was actually retained; and 'a' is the area swept by the trawl in one unit of effort (usually mea- sured in one hour). The swept area is defined by:
where 'v' is the trawling speed; 'h' is the length of the trawl's headrope; 't' is the duration of trawling; and X, is the effective width of the trawl relative to the length of its headrope. Commonly used values of X, range from as low as 0.4 (SCSP 1978) to a s high as 0.66 (Shindo 1973), with a value of 0.5 probably being the best compromise (Pauly 1980). Similarly, the value of X, in Equation 1, usually ranges from 0.5 (Pauly 1980) to 1.0 (Gulland 1979). Few studies have been made to actually estimate values of X, and X,, even though they drastically affect the standing stock esti- mates. Pauly (1980) showed that X, = 0.5 andX, = 0.5 generated fishing mortalities compatible with those estimated for various species in the Gulf of Thailand.
To increase the precision of the biomass estimate, a survey area can be divided into several strata. For stratified random sampling, Equation 1 is re-expressed as:
where 'n' is the number of strata considered in the analysis and 'i' is the stratum. The variance of B can be computed based on Equation 3 as follows:
Alternatives to Equation 4 exist (Box 7). One of these assumes the catchleffort data to be log-normally distributed. In this case, an arbitrary value of 1 is added to each catchleffort value (before taking logs) to allow for analysis of data sets with zero entries (as frequently occurs when analyzing catchleffort data pertaining to a single taxon rather than to the total catch). Also, the "D-distribution" (Aitchinson 1955) can be used, which explicitly accounts for the occurrence of zeroes and of rare but extremely high catches (Smith 1981; Pennington 1983).
As a n alternative to Equation 4 and its variants, Monte-Carlo analysis can be used to estimate the variance of the biomass estimate from trawl-survey data.
The advantage of this method is that it allows con- sideration of the uncertainty i n the value of all parameters used in estimating biomass, rather than considering only the variance of Clf (Box 8).

Box 7. Non-normal distributions and the estimation of biomass.
Estimating biomass when there are lots of small catches and a few very large ones can be done using a log-transformation of the catches, as follows (Som 1973; Cochran 1977; Pauly 1984b):
Step 1. Compute the catch per-hour ( c l f ), per stratum 6). Add 1 to all catches if hauls
with zero catch occurs.
Step 2. Take the natural logarithm (In) of each value ( x i , j = In((c 1 f ) , )) in Step 1.
Step 3. Compute the uncorrected geometric mean ( ( ~ 1 f 1,) (C I f = e x p ( e X , , ) ) ; where n is the number of hauls in a stratum.
,=I
Step 4. Subtract the value of 1 previously added to obtain partially corrected mean
( ( a f ) ; = ( C / f ) ; - I ) ,
Step 5. Compute the corrected mean catch per unit of effort ( E / f ) 2
( f ) = ( I f ) e x p ( v a r ( x . ))) where Var (x,,,) = x , , , ~ ( n - 1 )
Step 6. Estimate the variance of the corrected mean ( v a r ( ( 2 I f ) , )) Var ((F! f ) ,) = (C 1 f ) , j exp(~ar(~,,~)).((ex~(~ar(~~,,,)))- I ) / n
Note: Step 1 to 6 should be done for each stratum separately. Step 7. Compute the biomass (Bj) per stratum
Step 8. Compute the overall biomass per stratum.
'total = ' BJ
Step 9. Compute the standard error of the overall biomass (Bto,,,).
The degrees of freedom (d.0 is the number of all the hauls for all strata minus the number of strata used in the analysis.
Box 8. A Monte-Carlo approach for estimating the variance of the biomass estimates.
The procedure outlined in Box 7 does not consider the uncertainties associated with the estimates of parameters such as the trawling speed, the escapement factor (XI) and the effective width of the headrope (X,). A Monte-Carlo approach can be used to obtain a picture of the confidence region of the biomass estimate. Using a 'triangular' probability function given the lower limit (i.e., smallest acceptable value), the upper limit (the largest acceptable value), and the 'best' estimate (the value found most credible), and drawing several random values from each of the probability functions, a series of biomass estimates can be computed using the procedure in Box 7. The estimates obtained can be plotted in the form of a histogram from which an estimate of the variance of the biomass can be obtained. The 'triangular' probability function may not necessarily be symmetrical (i.e., the 'best' estimate does not have to be the midpoint between the lower and upper limits). Theoretically, a log-normal distribution of the biomass estimates is expected when drawing a large number (e.g., 10 000 runs) of random samples.

Other Analyses 123
Installation
Trawl surveys are usually conducted in highly heterogenous environments, with distinct fish assem- blages associated with a variety of identifiable habi- tats (McManus 1985, this volume., Bianchi 1996). Se- veral classification techniques can be used to define such assemblages and their relationships to their habi- tat. Two-way indicator analysis (TWIA, Hill 1979) is widely used for this (McManus 1985,1986; Bianchi 1991,1996). Several software like PRIMER (Clarke and Warwick 1994), CANOCO (ter Braak 1991), TWINSPAN (Hill 1979) and other commercially avai- lable statistical packages can also execute the required routines. However, unlike biomass estimation, which can easily be programmed as part of a DBMS, the data required for community analysis are best ex- ported to formats that can be read by specialized soft- ware.
Often, these independent software will contain other functions such as ordination methods, e.g., DCA (detrended correspondence analysis) and MDS (mul- tidimensional scaling analysis), to further support the results of the community analyses. On the other hand, approaches designed to measure ecological stresses (Pielou 1977; Warwick 1986; McManus and Pauly 1990) which can use trawl survey data can be made a part of the DBMS as they require relatively little pro- gramming.
When length frequencies are available, they can be used to estimate growth and mortality parameters useful for predicting the behavior of the stock with changes in fishing pressure through variants of the models of Beverton and Holt (1957) and Thompson and Be11 (1934), as incorporated in the FiSAT soft- ware (Gayanilo et al. 1996). Thus, exporting length- frequency data to FiSAT is a straightforward way for a trawl-survey DBMS to accommodate length- frequency data.
The Prototype
The following presents the prototype of a generic DBMS for trawl surveys called TrawlBase. The pro- totype is structured around the principles discussed above.
System Requirements
TrawlBase was developed for use with microcom- puters running on Microsoft Windows 3.x (or Win- dows 95 and NT). It requires a minimum of 4 mega- bytes of free disk space. Although the software will run on 4 megabytes of memory (RAM), 16 megabytes is highly recommended.
A SETUP.EXE is available on the first disk (Disk No. 1) to install TrawlBase on a computer. It may also be installed on a network server, but this should have control functions to prevent two users from up- dating the database at the same time. SETUP.EXE creates a group in the Program Manager with an icon which can be used to activate the program.
Main Menu
The first screen display is the Main Menu con- taining five command buttons: (1) Trawl Survey, (2) View Species List, (3) View Country List, (4) Import1 Export Data and (5) Exit (Fig. 2). The Trawl Survey command button will open the form that allows the user to enter and retrieve survey data and estimate biomasses. The View Species List and View Cormtry List buttons open forms that display information im- ported from FishBase 97 (Froese and Pauly 1997). The ImportlExport Data command button opens forms that allow users to export data to a LOTUS 1-2-3, Microsoft Excel or FiSAT data formats, and to import NAN-SIS data files.
Trawl Survey
This command button opens the main form of TrawlBase (Fig. 31, and the default view is the first record in the database. There are 12 command but- tons on the lower portion of the working screen. The first of the two command buttons allow Biomass esti- mation, based on the approaches presented above. Im- mediately following the Biomass command buttons are two reserved buttons: EcoStress, for estimating indices of ecological stresses as briefly mentioned above; and Plot, for plotting the locations of the sta- tions, by survey, in the form of a simple map. The next four command buttons are (from left to right) Print Record, Add a Record, Delete Record and Find a Record. Sample table outputs under the Print Record command - typical of outputs frequently re- quired from trawl surveys - are given in Tables 1 to 5. The next four buttons are used to scroll through the database, and the last is to close the form and return to the Main Menu.
Data entry starts by clicking the Add a Record command button. The entry form is displayed, and the user will be asked to provide values for the fields. The name for the country where the data were col- lected is the first input. The country list imported from FishBase 97 (Froese and Pauly 1997) is used for this purpose and can be modified or added to. The com- mand button at the right of the country name may be used to view key information on the country selected.

124 The gear code is the next input. If the code is not
on the list, the program will automatically open the entry form for gear description. The command button located on the right of the gear name may also be used to add a gear record. The entry form to describe the gear (Fig. 4) includes data that describe the trawl. The data enable the software to estimate the bio- masses based on the swept-are method described above.
The trawler used during the survey is the next input.The command button on the right of trawler's name opens the form to record data about the trawler (Fig. 5). The next input is the cruise number. The command button on the right of the cruise's descrip- tion opens the form to record details concerning the cruise (Fig. 6 ) . The station number is the next input, and the command button on the right of the sampling date opens the form to enter station-related data (Fig. 7a and 7b).
The next set of inputs are the catches. These in- clude the name of the taxon, the weight of the catch, and the numbers caught. When the species name en- tered is not in the TrawlBase list (imported from FishBase 97), the program will search the database for synonyms (also from FishBase 97). It will display the valid name if found, or alert the user to a possible error. It will accept the entry, nonetheless, if the user chooses to proceed with the name entered (this allows
the entry of names of invertebrates, not included in FishBase).
When length frequencies are available, two but- tons can be used to open the form designed for these data. For grouped length frequencies (as in NAN-SIS), the class interval and the smallest (lower) class limit are the first required inputs, along with the length type (Fig. 8). When available, sample weights may also be entered. Ungrouped length measurements these may be entered along with individual weight (in g), sex (male, female or unknown), as well as sexual maturity code (Fig. 9).
The length frequencies (grouped and ungrouped) can be readily exported to FiSAT (Gayanilo et al. 1996). FiSAT allows for growth, mortality and related pa- rameters to be estimated from these data, and for yield- per-recruit and other analyses to be performed based on the parameters estimated.
View Species List
This command button opens the form containing species information imported from FishBase 97 (Fig. 10). This cannot be modified by users (but will be periodically updated using new releases of FishBase). A click in any of the fields opens a dialog box allowing users to search the database.
Fig. 2. Trawl survey Main Menu.

Fig. 4. Entry form to describe the trawl net
Fig. 3. Main form of TrawlBase

Table 1. Table output summarizing the catches at one station.
Country Trawler Trawl net Cruise Station Date of Sampling
............... Species n Tntal
Species name Species 1 Species 2 Species 3 ...............
Table 2. Summary output for grouped length-frequencies by country and project.
Weight (kg)
Table 3. Table output summarizing the inputs for ungrouped frequencies by country and project.
Count (n)
Country Trawler Trawl net Cru~se Spec~es name Length un~t
Country Trawler . Trawl net . - Cruise Species name
Total
-
-
Species 2 Species 3 ............... ............... Species n
Date n Length Class
Total
Species name
Total weight
I Total ( Fork I Standard 1 Length (cm)
. Date 1
Weight I Sex ( Maturity stage
Date 2 Date 3

Table 4. Table output of biomass analysis. The definition of the strata (here by depth in rn) and the breakdown for the catchleffort data are user-defined.
Species name
...............
...............
............... Species n
S u m
Species 1 Species 2 Species 3
Table 5. Table output summarizing the catches for all stations by species and by cruise for a particular country
Catch per unit effort (kglhr)
t-' c.3 4
<30
Mean density by stratum (tlm2) YO incidence
30-90
Mean density
(tlmz)
90-300 300-900 900-3000 ~ 3 0 0 0 <50m 50-90m 100-1 99m 200-399m 2400
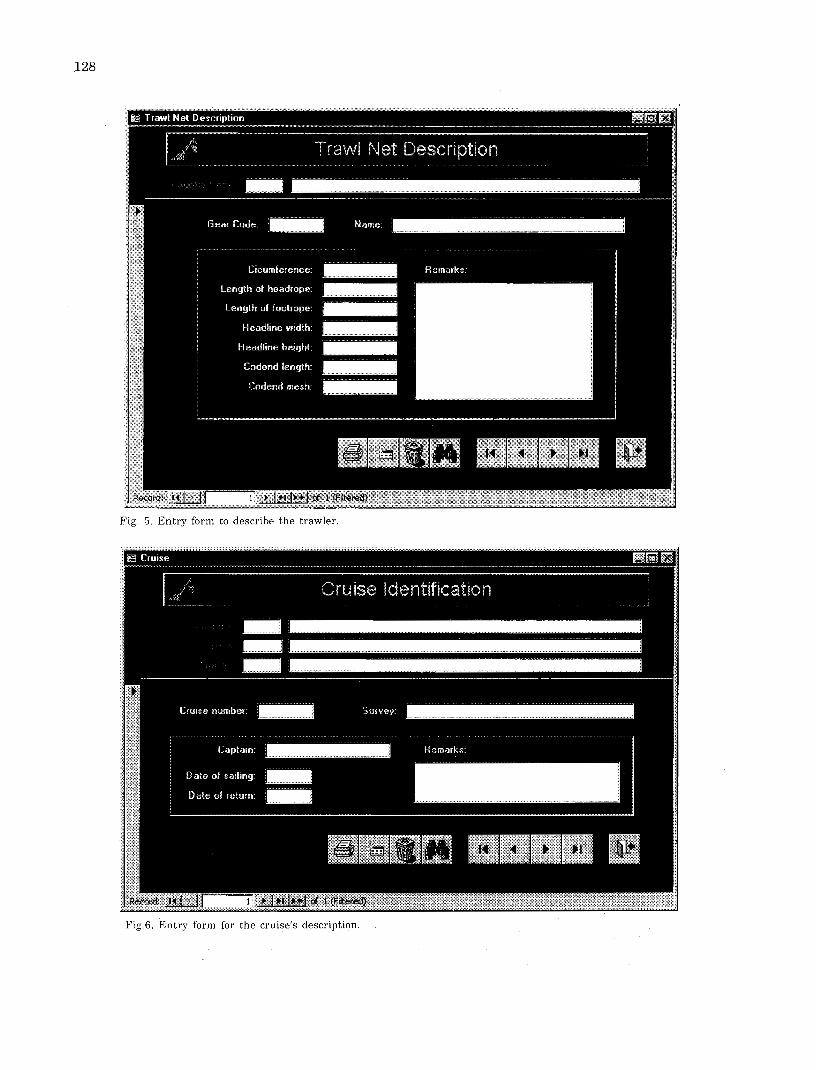
Fig. 5. Entry form to describe the trawler
Fig.6. Entry form for the cruise's description.

Fig.7b. Subform for station-related data

Fig. 8. Entry form for grouped length frequencies.
Fig. 9. Entry form for ungrouped length frequencies.

Fig.10. The View form containing species information imported from FishBase 97.
View Country List
This command button displays key country infor- mation, to be updated with each new release of FishBase. Clicking any of the fields opens a dialog box that allows users to search the database.
Import/Export Data
The Import /Export Data routine allows users to import NAN-SIS data files, or to export any part of a table (or a combination of tables) in TrawlBase to a spreadsheet file. The difference between this routine and the routine available in the Trawl Survey forms is that users are not limited to exporting data for community analyses.
The following are the available options when ex- porting a data file:
1. Microsoft Excel format (ver. 2.0 to 4.0, or 5.0); 2. LOTUS (wkl); 3. LOTUS (wks); 4. LOTUS (wk3); and 5. FiSAT (ver. 1.10)
Acknowledgments
The authors thank Mr. E. Garnace for assistance in developing the NAN-SIS import routine and Mr. F. Torres, J r . for initial testing of the pyototype.
References
Aitchinson, J. 1955. On the distribution of a positive random variable having a discrete probability mass origin. J. Am. Stat. Assoc. 50: 901-908.
Beverton, R J .H. and S.J. Holt. 1957. On the dynamics of exploited fish populations. Fish. Invest. London Ser. 2 (19): 533 p.
Bianchi, G 1991. Demersal assemblages of the continental shelf and slope edge between the gulf of Tehuantepec (Mexico) and the Gulf of Papagayo (Costa Rica). Mar. Ecol. (Prog.
J Ser.) 81: 101-120. Bianchi, G. 1996. Demersal fish assemblages of trawlable
grounds off northwest Sumatra, p.123-130. In D. Pauly and P. Martosubroto (eds.) Baseline studies of bi'odiversity: the fish resources of Western Indonesia. ICLARM Stud. Rev. 23, 312 p.
Branson, P. 1987. Fishermen's handbook. Fishing News Books Ltd., Farnham, Surrey, England.

132 Clarke, K.R. and R.M. Warwick. 1994. Change in marine
communities: a n approach to statistical analysis and interpretation. Plymouth Marine Laboratory, UK.
Cochran, W.G. 1977. Sampling techniques (3rd edition). John Wiley and Sons, Inc., New York.
'Coronado, G.U. and R. Froese. 1994 MAPPER: a low-level geographic information system. ICLARM Software 9. 23 p.
Dates, C.J. 1981. An introduction to database systems (3rd edition). Addison-Wesley Pub., Reading, Massachusetts, USA.
English, S., C. Wilkinson and V. Baker (eds.) 1994. Survey manual for tropical marine resources. Australian Institute of Marine Science. Townsville, Qld., Australia.
Froese, R. and D. Pauly (eds.) 1997. FishBase 97: concepts, design and data sources. ICLARM, Manila.
Gayanilo, F.C., Jr., P. Sparre and D. Pauly. 1996. The FAO- ICLARM stock assessment tools (FiSAT) user's guide. FA0 Comput. Info. Ser. (Fish.) No. 8. FAO, Rome. 126 p.
Gulland, J.A. 1979. Report of the FAOIIOP workshop on the fishery resources of the Western Indian Ocean South of the Equator. IOFC/DEV/79/45. FAO, Rome.
Hill, M.O. 1979. TWINSPAN - a FORTRAN program for arranging multivariate data in an ordered two-way table by classification of individuals and attributes. Cornell University, Ithaca, New York.
McManus, J .W. 1985. Descriptive community dynamics: background and a n application to tropical fishes management. University of Rhode Island. Narragansett, R.1; 217 p. Ph.D. dissertation.
McManus, J.W. 1986. Depth zonation in a demersal fishery in Samar Sea, Philippines, p. 483-486. In J.L. Maclean, L.B. Dizon and L.V. Hosillos (eds.) The First Asian Fisheries Forum. Asian Fish. Soc., Manila.
McManus, J.W. and D. Pauly. 1990. Measuring ecological stress: variations on a theme by R.M. Warwick. Mar. Biol. 106:
j 305-308. McManus, J.W. and M.C.A. Ablan (eds.) 1996. ReefBase: a global
database on coral reefs and their resources. ICLARM, J Manila. 150 p.
Munro, J .L . and R. Thompson. 1983. Areas investigated, objectives and methodology, p. 15-25. In J.L. Munro (ed.) Carribean coral reef fishery resources. ICLARM Stud. Rev. 7, 276 p.
Pauly, D. 1980. A new methodology for rapidly acquiring basic information on tropical fish stocks: growth, mortality and stock-recruitment relationships, p. 154-172. In S. Saila and P. Roedel (eds.) Stock assessment for tropical small-
scale fisheries. Proc. of a workshop held 19-21 September 1979 a t the University of Rhode Island. Int. Cent. Mar. Res. Dev., University of Rhode Island, Kingston, R.I.
Pauly, D. 1984a. Methods for assessing the marine stocks of Burma, with emphasis on the demersal species. BURJ771 003. FA0 Field Doc. 6. FAO, Rome. 22 p.
Pauly, D. 1984b. Fish population dynamics in tropical waters: a manual for use with programmable calculators. ICLARM Stud. Rev. 8, 325 p.
Pauly, D. 1996. Biodiversity and the retrospective analysis of demersal trawl surveys: a programmatic approach, p. 1-6. In D. Pauly and P. Martosubroto (eds.) Baseline studies of biodiversity: the fish resources of Western Indonesia. ICLARM Stud. Rev. 23, 312 p.
Pennington, M. 1983. Efficient estimator of abundance for fish and plankton surveys. Biometrics 39: 281-286.
Pielou, E.C. 1977. Mathematical ecology. John Wiley and Sons, New York.
SCSP. 1978. Report of the workshop on the demersal resources of the Sunda Shelf, 31 October-6 November 1977, Penang, Malaysia. Par t 11. SCS/GEN/77/13. South China Sea Fisheries Development and Coordinating Programme, Manila.
Shindo, S. 1973. General review of the trawl fishery and demersal fish stocks of the South China Sea. FA0 Fish. Tech. Pap. 120. 49 p.
Smith, S.J . 1981. A comparison of estimators of location for skewed populations with application to ground fish trawl surveys, p. 154-163. In W.G. Doubleday and D. Rivard (eds.) Bottom trawl surveys. Can. Pub. Fish. Aquat. Sci. 58.
Som, R.K. 1973. A manual of sampling techniques. Heinemann Educational Books, Ltd., London.
Stramme, T. 1992. NAN-SIS: Software for fishery survey data logging and analysis. User's manual. FA0 Comput. Info. Ser. (Fish.) No. 4.
ter Braak, C.J.F. 1991. CANOCO - a FORTRAN program for canonical community ordination by (partial) (detrended) (canonical) correspondence analysis, principal components analysis and redundancy analysis (version 3.10) ITI-TNO. Wageningen, the Netherlands. (manual and update notes.)
Thompson, W.F. and F.H. Bell. 1934. Biological statistics of the Pacific halibut fishery. Rep. Int. Fish. (Pacific Halibut)
J Comm. 8. Vakily, J.M. 1992. Assessing and managing the marine fish
resources of Sierra Leone, West Africa. Naga, ICLARM Q. 15(1): 31-35.
Warwick, R.M. 1986. A method for detecting pollution effects on - - marine macrobenthic communities. Mar. Biol. 92: 557-562.

Ecological Community Structure Analysis: Applications in Fisheries Management1
J. McMANUS International Center for Living Aquatic Resources Management
MCPO Box 2631, Makati City 0718, Philippines
McMANUS, J .W. 1997. Ecological community structure analysis: applications in fisheries manage- ment, p. 133-142. Zn G. Silvestre and D. Pauly (eds.) Status and management of tropical coastal fisheries in Asia. ICLARM Conf. Proc. 53, 208 p.
Abstract
This paper describes some of the analytical options for the application of ecological community analysis to fisheries management. The methods of community analysis are useful in determining the boundaries of assemblages of fish, which may be used as the basis for assigning particular parts of the fishery to specific groups of fishers, gear types and harvest pressures. They can also be useful in identifying the effects of environmental change on a fish community. A very valuable use of these techniques is in determining fundamental patterns of species abundances within harvested ecosystems which can be a basis for identifying the effects of fishing and for reconstructing the nature of the original ecosystems. Through extensive analyses of the dynamic variability of assemblages and their responses to fishing pressure, i t may be possible to manage fisheries to optimize the ecosystems for resilience, sustainability and productive yield. An example of the application of community analyses to a trawl fishery in the Philippines is presented.
Introduction
Modern fisheries science evolved principally from early 20th century analyses of the population dynamics of individual species of commercially im- portant fish and invertebrates. The emphasis has generally been on applied population ecology, with ex- tensions to the multispecies case (Pauly 1979; Pauly and Murphy 1982). More recently, emphasis has been placed on system ecological approaches, involving cnergy, nutrient and trophodynamic analyses (Sherman et. a1 1990; Christensen and Pauly 1993). However, a third, intermediary approach has seen only occasional applications in fisheries management, and holds considerable promise as a tool for facilita- ting the management of multispecies fisheries. Com- munity ecology arose primarily from vegetation eco- logy, and focuses on identifying patterns in the abun- dances of species in geographical space, their varia- tions over time, and the causes thereof. The methods of community analysis are particularly useful in de- termining the boundaries of assemblages of fish that can be considered to be "Assemblage Production Units
(APUs)" (Tyler et al. 1982), and used as the basis for assigning particular parts of the fishery to specific groups of fishers, gear types and harvest pressures. They can also be useful in identifying the effects of environmental change on a fish community, as with pollution or siltation (Shepard et al. 1992). A third, and ultimately very valuable, use of these techniques is in determining fundamental patterns of species abundances within harvested ecosystems as a basis for identifymg the effects of fishng and for reconstruc- ting the nature of the original ecosystems. Finally, it may be possible, through extensive analyses of the dynamic variability of assemblages and their responses to fishing pressure, to manage fisheries to optimize the ecosystems for resilience, sustainability and pro- ductive yield.
There is a small but growing literature on applica- tions of ecological community analysis to fisheries situations (e.g., Fager and Longhurst 1968; Martosubroto 1982; Ralston and Polovina 1982; Tyler et al. 1982; McManus 1985,1986,1989 and 1996; Nafiola
' TCLARM Contribution No. 1391

134 et al. 1990; Bianchi 1992, 1996; Federizon 1992; Bianchi et al. 1996; McManus et al. 1996). This paper briefly describes some of the analytical options, and ends with an application example to a trawl fishery in the Philippines (to illustrate potential analyses which can result fiom increased availability of trawl survey data).
Community Structure Analysis
The term 'community structure' refers to patterns in the abundance of individuals, biomasses or impor- tance values among species. Generally, the patterns are studied with respect to two-or occasionally three- dimensional space, based on sampling at a particular time. This type of analysis can clarify the patterns of diversity related to habitat heterogeneity and so may be considered to be a form of beta diversity analysis. An extension to this analysis of a 'static' community structure is the analysis of patterns in the way the community varies over time, or 'community struc- ture dynamics' (McManus 1985).
One can distinguish between inferential and ex- ploratory statistical analysis. Inferential analy- sis usually involves the choice of one hypothesis among two or more preconceived hypotheses and an assess- ment of the probability of having made the wrong choice. Exploratory analysis is often thought of as a process of generating hypotheses through various ma- nipulations and simplifications of the data set. Propo- nents of exploratory analysis often suggest that the analysis should be carried out with no preconceived hypotheses, to avoid limiting the hypotheses which may be generated.
Increasingly, analyses are carried out with the express purpose of identifying patterns in tables of ecological data, wherein the rows represent species, the columns represent sample sites, and each cell con- tains the abundance of a species in a site. Ideally, the data are generated from a sampling design based on specific hypotheses developed from prior experience as derived from studies of similar ecological commu- nities. The analyses, therefore, are also based on a set of preconceived analyses, although the possibility exists of generating new explanatory hypotheses and finding convincing evidence in favor of the acceptance of a newly generated hypothesis. There are even statisti- cal analyses which can be conducted to determine the probability that an identified pattern or value for an index could have been the result of random data, often involving computer-intensive randomization. This hybrid of inferential and exploratory analyses has been described as 'pattern analysis', and involves the use of an open-ended set of hypotheses (Williams 1976; McManus et al. 1996).
The fundamental analysis of species abundance data with respect to the factors believed to cause it to
vary is known as 'direct gradient analysis' (Whittaker 1970). For example, one may graph the abundance of a species of fish against depth or sediment grain size. Statistical analyses may be correlational, perhaps with respect to a distribution model such as a Gaussian frequency curve for cases wherein a species maximum along a gradient is suspected to exist ( ~ a u c h 1982).
Direct gradient analysis may not reveal patterns which are best identified through multivariate analy- sis. Here, we will briefly discuss ordination, classifi- cation and skewer analysis.
Ordination
Suppose that a trawl catch involves 10 individuals of species A and 20 of species B. One can plot the posi- tion of that haul as a point on a graph wherein the x-axis (for example) is the amount of species A (=lo), and the y-axis is the amount of species B (=20). Thus, it is possible to plot sample units in species space, i.e., the Cartesian space defined by axes representing abun- dance by species. A set of such sample units from the same ecological community plotted similarly will generally form a cloud of points, or data cloud. For a community ofthree species, it is possible to plot the cloud in a three-dimensional graph, perhaps with 'pins' indicating the positions of the points in one of three planes. However, it is difficult to plot sample units in a species space defined by four or more axes. It is often not possible to represent the cloud of points defined by three or more species into a two- dimensional graph without distortion. The problem is similar to that of cartographers, whose two- dimensional maps of the three-dimensional Earth in- variably involve distortion of distances. However, se- veral methods are available to provide for minimal distortion in the graphing of points from spaces of high dimension into graphs of two or three dimensions. In the context of ecological analysis, these techniques are known as ordination analysis. Common techniques particularly well-suited to ecological abundance data include Correspondence Analysis and Multidimen- sional Scaling. These techniques are described in a variety of recent texts, including Pielou (1984a1, Jongman et al. (1995) and others. Canonical Cor- respondence Analysis is a method in which ecological data are analyzed simultaneously with environmen- tal factors such as salinity and temperature, and per- mits these factors to be plotted on the ordination of species and sample units (ter Braak 1987).
The most common ordination method, principal components analysis (PCA), works by rotating an axis into such a direction into the multidimensional cloud of points (e.g., sites), until the projection of those sites onto the axis explains the greatest possible variance ('spreads out' the points best). This becomes the

principal axis. The second axis is limited to being at right angles to the first, but rotated through the di- mensions until it explains most of the residual vari- ance. A third, fourth and fifth axis can be constructed accordingly, but this is difficult to seein one's mind. The data cloud projected onto those axes and plotted on a piece of paper then represents the most variance possible in the data cloud in a two-dimensional picture.
Correspondence analysis (CA) and the nearly iden- tical reciprocal averaging (RA) works similarly to PCA. However, the final axes are not rotated to ac- count for each relative to the other. The final graph can include both species and sites on the same plane, something which is not possible in simple PCA.
Multidimensional scaling (MDS) differs from these methods in that the objective is to more clearly dis- play the data in a given set of dimensions with as little distortion as possible. Thus, there is no rotation of axes. Rather, the data are shifted into place in an algorithm that minimizes the distortion in the dis- tances between the points as it proceeds. Mathemati- cally, this involves the creation of a distance matrix. Frequently, the data are transformed to ln(x+l) to minimize effects of spurious abundances, and then converted to a Euclidean distance matrix for analy- sis. As with PCA, a major portion of the variance tends to be associated with the first axis (although not in such an 'international manner'), and thus it is rea- sonable to plot the sites based on the first axis coordi- nates against environmental parameter values such as depth.
PCA is particularly problematic when dealing with nonlinearly related points, such as sites related by species abundances. Both PCA and MDS tend to form arches where one would expect straight lines reflecting known gradients. CA also arches, but less so, and avoids problems such as inversion of points at ends of a gradient. The arch can even be minimized through 'detrending' (see Bianchi 1996; Bianchi et al. 1996). Thus CA or detrended CA (DCA) is preferred by many ecologists. Other ecologists prefer MDS because of its philosophical orientation (minimizing distortion). Still others prefer to use both, to check that results are robust, i.e., not an artifact of a particular method. In the end, the choice may be simply one depending on the availability of working, reliable software.
Classification
An alternative approach to the analysis of data of high species dimensionality is classification or clus- ter analysis. These techniques involve the grouping together of similar sample units based on compari- sons of the abundances of each species in one sample unit with those of all other sample units. In hierar- chical classification methods, sample units are related through connected lines showing the relationships
135 among units, sets of units, sets of sets of units and so on up to the level of the whole sample. This diagram may be formed either by grouping from the unit to the whole as just described (agglomerative clustering), or by successively dividing the whole into smaller and smaller sets of units (divisive classification). An example of an agglomerative clustering method is the unweightedpairgroups method (UPGM). A common method for divisive classification is two-way indicator species analysis (TWIA), as implemented in the TWINSPAN program (Hill 1979). These and many other classification methods are described in Gauch (1982)., Pielou (1984a), Jongman et al. (1995) and others. Often, a particular grouping of data points revealed by classification analysis is indicated on an ordination of the same data through the use of differential graphing symbols such as 'x' for points in one group and '0' for points in another group.
TWIA is a method for rearranging tables of spe- cies abundances by site and dividing the table into distinct sets of similar species (based ori where they are found in what abundance) and similar sites (based on what species are found in them in what abundance). A successful classification yields data arranged in clear blocks within the table. In the early days of plant com- munity ecology ('phytosociology'), such tables were created by tediously rearranging raw data tables by hand, with repetitive cutting and pasting of co- lumns and rows. The TWIA approach, embodied in the TWINSPAN program of Hill (1979) revolutionized the field by automating the procedure.
TWIA begins by turning a table of abundances into a table of presence-absence values. This is accom- plished by requiring an initial coding of all data into single-digit integer values, such a s a 1-5 semiquantitative scale. A species x with a maximum value of 3 in a row, becomes species x l , x2 and x3, each with a maximum value of 1 in any column. The program then arranges the sites (columns) of a table based on the scores of each site on the first axis of a reciprocal averaging (basically correspondence analy- sis) ordination axis. This procedure groups similar sites together and lines them up along the axis repre- senting the greatest variance among both sites and species taken simultaneously. The program then at- tempts to divide the table into left and right portions from the center of the columns. It analyzes the effect of this split in terms of how well the abundances of each species are clumped onto one side or the other of the division. It tries several such divisions, cutting left and right of the center, each time tallying up a score based on how well the species abundances are divided up. It then chooses the best division, and this becomes the highest level division of the classifica- tion. The program now repeats the ordination for only those sites (columns) on the left of the division, to find a good arrangement and division of this subset of

136 columns. Then it does the same on the right of the first division. Now there are four classes of sites, as indicated by two levels of division. A third level of division would yield eight classes of sites, and so on. This is the basic procedure, although the program contains corrections and adjustments for rare species weightings, etc., which can be manipulated in the analysis.
Next, the program classifies the species (rows) in a manner similar to that of the sites (columns). Once the species classification has been completed, the program switches around the species (keeping the spe- cies group intact) in such a way that the table is in an optimal 'block' form, with blocks of high species abundances arranged along one or the other diagonal of the table. The table is then converted back to the integer values, and printed with indications of the hierarchy of site and species divisions. Additionally, the program indicates what species are particularly good indicators of any site division, and helps to iden- tify 'border' species of uncertain position in a division of sites.
The method has the advantage over most agglomerative classifications that it is very easy in the end to explain why a particular set of sites or species were grouped together. This is generally obvious from studying the output table. A divisive 'top- down' approach, the method also avoids the problem of 'chaining', i.e., the tendency for a single class in agglomerative 'bottom-up' clustering to grow like a snowball, gathering new characteristics as it does, and thus obscuring the inherent structure of the data set. However, TWINSPAN does not always provide clear one-to-one matching between site and species groups due to failed divisions (based on various crite- ria for failure that the program uses). Even equal numbers of site and species groups may not match up well, such that the third group of sites may not correspond to the third group of species. This is because the method does not perform the two-way analyses simultaneously. Finally, there is no way to determine the probability that a given division could have been achieved by the mere fact that the matrix was sparse (containing lots of zero values) and patchy to begin with. Nonetheless, TWINSPAN is the most widely used program of its type currently available.
Skewer Analysis
Skewer analysis (Pielou 1984b) is an example of a technique which can be used in inferential, exploratory or pattern analysis modes. One begins with a data cloud in species space in i ts high- dimensional state-i.e., one dimension per species in the total sample. One might wish to know if there is a significantly nonrandom ordering of points in a
particular sequence of the points. For example, one might be investigating if a series of trawl sample units taken at different depths exhibit a gradual change in species composition as one moves from shallow to deep. One would then, conceptually, label the points in the data cloud according to depth. Skewer analysis then involves running tens or hundreds of axes a t random directions through the species space. Each time, the points in the data cloud are mapped onto the axis, i.e., for each point, a line is drawn in the shortest possible distance to the axis, and the new point on the axis is a mapping of the original point in species space. This mapped set of points is compared with the natu- ral ordering 1,2,3 ... etc. using a rank correlation coefficient. If there is a significant ordering of the data as hypothesized, then some of the random axes will show mappings of the points which correlate very highly with the natural ordering. The distribution of the absolute values of correlation coefficients generated in the analysis will be distributed primarily around some non-zero correlation value. If the ordering of points you hypothesized existed was in reality a ran- dom ordering of points, then the values will be clus- tered near zero (the right half of a normal distribu- tion if one uses absolute values of coefficients). In that case, one can determine that the hypothesized gradient does not exist. In the case of the sample units taken over depth, it would mean that there is no reason to believe that depth (for the depths studied) has any effect in determining continuous differences in community composition. Skewer analysis requires special software that is not widely available. A program for such analy- ses, written by the present author, is available on a dis- kette in the recent book by Gallucci et al. (1996).
Dynamic Approaches
The basic unit of data in an ordination, classifica- tion or skewer analysis is a two-dimensional table. A time series of community data may consist of a block of tables of sites (sample units) by species, each repre- senting the community at a specific time-a 'time slice'. The third axis of the block is time, and extends across the tables. Analyses can be performed on each time slice independently. This results in ordinations and classifications which can be viewed in sequences as if they were frames in a movie.
Alternatively, the data can be summarized into three tables of average values along each of the site, species and time axes, resulting in tables of average times by species, sites by times and sites by species, respectively (Williams et al. 1982). Of these, the most useful set of analyses is often those based on the times by species table. An ordination of 'times' in species space is a representation of the mean states of the community as it varies in composition over time. By connecting the states in sequence with arrows, one

can begin to understand the dynamics of community change. These and similar analyses can be used to identi@ dynamic behaviors such as cyclic change (pos- sibly indicating seasonality), attraction to a limited, bounded region of species space (such as may be caused by an attrador or climax state), motion within bounds, departures and returns to a bounded state (indica- tions of system resilience), and shifts among bounded states (community phase shifts).
Unfortunately, the dimensional reduction involved in ordination analysis may obscure dynamic patterns. An alternative approach which does not involve di- mensional reduction is Ordered Similarity Analysis. This consists of analyses of painvise distances (or simi- larities) among community states. The original method by Pielou (1979) has been expanded by McManus (1985) and utilized subsequently by Licuanan (1991) to analyze coral reef data. The method facilitates the identification of dynamic community
137 behaviors such as full cycles, reversing cycles, constant and sporadic progression, acceleration and deceleration.
Example of Application: Samar Sea Trawl Survey
The University of the Philippines College of Fisheries conducted trawl surveys in the Samar Sea of the Philippines eleven times from March 1979 to May 1980 (McManus 1985). The analysis using TWINSPAN indicated that there were distinct deep (to 100 m) and shallow fish assemblages, divided at approximately 40 m depth, but that several species of fish were also relatively ubiquitous with respect to depth (Table 1). The results were confirmed through detrended correspondence analysis (Fig. I), and dif- fered relatively little when the analyses were conducted on individual time slices or on a table averaged over time (times by species). The classification results are
First DCA axis
Fig.l.'Detrended correspondence analysis (DCA) of sites based on the mean weight of each species caught a t each site during 11 samplings in a 16-month period in the Samar Sea, Philippines. Weights were log-transformed before analysis. Each number on the graph represents the lower depth class limit (x 10 m) for a single study site. The position of the number indicates the relationship of that site to the other sites based on scores from the first two axes produced by DCA. These two axes provide an optimal representation of the affinities among the sites based on both site and species spaces. The sites generally range from deep to shallow along the first DCA axis. This indicates that depth was the primary gradient in the community, and that the first axis is a n approximate representation of that gradient. The second axis represents one or more sources of residual variations not readily explained in terms of available environmental data. I t provides a graphic representaticl of variations not related to the primary gradient, and gives a basis for judging the overall influence of this gradient. The thick solid line shows the division into deep and shallow primary subcommunities indicated by TWINSPAN analysis. The optimal division fell within the 30 and 40 m depth classes. (Source: McManus 1985).

Table 1. Dominant species and diversity by subcommunity in the Sainar Sea, Philippines. Percents and cummulative % based on total catches (kg.) in each site group. Species ranges are ubiquitous (U), shallow (S) or deep (D) as per TWINSPAN classification of mean site. Trends are increasing (+) or neutral (0) in abundances over the 16 month study period as per classification of mean times by species table. Shannon diversities and evenness indices were computed as per Pielou (19771, and are approximations intended only for comparisons between subcommunities. Lower evenness of the deeper community is largely attributable to dominance by Leiognathus bindus. L. splendens and L. equulus characterize the shallow subcommunity. Deep stations characteristically include Saurida undosquarnis and Nernipterus nernatophorus. L. bindus dominates throughout. (Source: McManus 1985).
SHALLOW SUBCOMMUNITY ( < 40 rn ) DEEP SUBCOMMUNITY ( 40 + m ) ALL STATIONS
Rank Taxon % range Taxon % range Taxon % range cum. % trend cum. % trend cum. % trend
Leiognathus bindus 9 Leiognathus splendens 8 Loligo spp. 7 Leiognathus equulus 6 Rastrelliger brachysoma 4 Trichiurus lepturus 4 Saurida tumbil 3 Apogon spp. 3 Upeneus sulphureus 3 Alepes djedaba 2 Pentaprion longimanus 2 Selaroides leptolepis 2 Sepia spp. 2 Leiognathus brevirostris 2 Stolephorus indicus 2 ~ a s t i e l l i ~ e r kanagurta 2 Decapterus macrosoma 2 ~tolephorus tri 2 Lagocephalus lunaris 2 Nemipterus japonicus 2
Total taxa S Total catch (kg) N No. tows (1 hr. equiv.) Catch rate (kglhr) Shannon lndex (bels) H . .
Evenness B I l H'/ln(S) 0.77
Leiognathus bindus 28 28 Pentaprion longimanus 7 35 Saurida undosquamis 6 41 Loligo spp. 5 45 Nemipterus nematophorus 4 49 Saurida undosquamis 4 53 Upeneus sulphureus 3 56 Decapterus macrosoma 3 59 Apogon spp. 3 62 Fistularia spp. 2 64 Priacanthus macracanthus 2 66 Sepia spp. 2 69 Lagocephalus lunaris 2 71 Rastrelliger brachysoma 2 73 Rastrelliger kanagurta 2 75 Priacanthus tayenus 2 77 Triglidae 2 78 Trichiurus lepturus 1 80 Upeneus mollucensis 1 81 Stolephorus indicus 1 82
Total taxa 166 Total catch 37 100 No. tows 20 1 Catch rate 185 Shannon Index 3.3 Evenness 0.66
Leiognathus bindus 22 22 U 0 Loligo spp. 6 2 7 U O Pentaprion longimanus 6 33 U 0 Saurida undosquamis 4 37 D 0 Saurida tumbil 3 4 1 U O Upeneus sulphureus 3 4 4 U O Nemipterus nematophorus 3 47 D 0 Leiognathus splendens 3 49 S 0 Rastrelliger brachysoma 3 52 U 0 Apogon spp. 3 5 4 U + Decapterus macrosoma 2 57 U 0 Sepia spp. 2 5 9 U + Trichiurus lepturus 2 6 1 U O Leiognathus equulus 2 6 3 s 0 Lagocephalus lunaris 2 65 U 0 Rastrelliger kanagurta 2 67 U 0 Fistularia spp. 2 6 9 D + Priacanthus tayenus 2 7 1 U + Priacanthus macracanthus 2 72 D + Stolephorus indicus 1 7 4 U 0
Total taxa 172 Total catch 55 500 No. tows 308 Catch rate 180 Shannon Index 3.7 Evenness 0.71

Table 2. Sorted community table showing the mean abundances by site of the 20 dominant taxa in the shallow and deep subcommunities of the Samar Sea, Philippines. Within each category, sites and species are arranged by correspondence scores. TWINSPAN divisions are based on 172 taxa. Abundances are kghour ranked such that 1=0 to <2, 2=2 to <5, 3=5 to <lo, 4=10 to c20, 5=20+. The community is primarily composed of ubiquitous species interspersed with important shallow and deep preferential species that define the two relatively homogenous subcommunities. (Source: McManus 1985).
Station numbers: Depth midpoints (m):
Taxon Stolephorus tri Leiognathus splendens Leiognathus brevirostris Leiognathus equulus Alepes djedaba Selaroides leptolepis
Upeneus molluccensis Fistularia spp. Saurida undosquamis Priacanthus macracanthus Nemipterus nematophorus Triglidae
Trichiurus lepturus Upeneus sulphureus Stolephorus indicus Lagocephalus lunaris Sepia spp. Saurida tumbil Rastrelliger kanagurta Rastrelliger brachysoma Nemipterus japonicus Loligo spp. Apogon spp. Priacanthus tayenus Pentaprion longimanus Leiognathus bindus Decapterus macrosoma
SHALLOW OEEP 1 17 16 18 15 3 2 24 23 22 4 12 13 8 7 6 20 21 19 14 5 28 27 26 25 11 10 9
16 27 35 25 38 31 23 32 25 40 40 81 75 74 61 53 55 46 65 56 45 65 57 49 44 92 97 82

Sampling Periods I 1 1 0 9 8 7 6 5 4 3 2
I
Fig. 2. Subcommunities of demersal fish in Samar Sea, Philippines. The primary division (solid line) separates the "shallow" from the "deep" fish subcommunity a t around the 30-40 m depth contour. Numbers indicate depth of fishing station (x 10 m). (Source: McManus 1986).
A
Fig. 3. OSMA; March 79 to 80. Community behavior from 60 to 110 m. Comparisons of average community states by percent similarity generalized to shadings where solid represents highest values. A strong pattern of deceleration over time is apparent (Q = 475). (Source: McManus 1985).

shown in geographic space in Fig. 2. The most abun- dant species were identified for each subgroup and overall (Table 2). The combination of these and other analyses indicated that a haul of fish caught at any given depth would likely be made up of roughly half the abundance in species specific to the depth zone, and half shared between depth zones. The immediate management conclusion from this was that while kee- ping trawlers below 40 m would optimally limit the effects of trawling on the shallow, artisanal fisheries, the separation would only concern about one-half of the catch in each case.
As a preliminary investigation of the dynamics of the community over time, the data were subjected to Ordered Similarity Matrix Analysis (OSMA) analysis overall and within three depth categories. The clearest pattern was that in samples from 60 to 100 m depth (Fig. 3). This showed that during the time of the study, the community varied less and less (became more stable, in the sense of constancy over time). However, both Pielou's Q test and skewer analysis indicated that the same assemblage exhibited a trend of net change over time. Further information on this analysis may be found in McManus (1985,1986).
It is notable that subsequent analyses of trawl data covering a greater range of depth in the nearby Ragay Gulf (Federizon 1992) and off southwestern Indonesia (McManus 1989 and 1996; McManus et al. 1996) both indicated that a depth of 100 m was a far more optimal level for separating fisheries. However, the density of fish below 100 m tends to be very low, and the viability of a widespread demersal fishery restricted to depths greater than 100 m in this region would be in serious doubt (McManus 1996).
References
Bianchi, G. 1992. Demersal assemblages of tropical continental shelves. University of Bergen, Norway. 217 p. Ph.D. dissertation.
/ Bianchi, G. 1996. Demersal fish assemblages of trawlable grounds off northwest Sumatra, p.123-130. In D. Pauly and P. Martosubroto (eds.) Baseline studies of biodiversity: the fish resources of Western Indonesia. ICLARM Stud. Rev. 23, 312 p.
'~ianchi, G., M. Badrudin and S. Budihardjo. 1996. Demersal assemblages of the Java Sea: a study based on the trawl surveys of the R.V. Mutiara 4, p. 55-61. In D. Pauly and P. Martosubroto (eds.) Baseline studies of biodiversity: the fish resources of Western Indonesia. ICLARM Stud. Rev. 23, 312 p.
'christensen, V. and D. Pauly, Editors. 1993. Trophic models of aquatic ecosystems. ICLARM Conf. Proc. 26, 390 p.
Fager, E.W. and A.R. Longhurst. 1968. Recurrent group analysis of species assenblages of demersal fish in the Gulf of Guinea. J. Fish. Res. Bd. Canada 25(70): 1405-1421.
Federizon, R.R. 1992. Description of the subareas of Ragay
141 data analysis. Aust. J. Mar. Freshwat. Res. 43: 379-391.
Galucci V.F., S.B. Saila, D.J. Gustafson and B.J. Rothschild (eds.) 1996. Stock assessment: quantitative methods and applications for small-scale fisheries. CRC Lewis, N.Y.
Gauch, H.G. 1982. Multivariate analysis in community ecology. Cambridge University Press, N.Y.
Hill, M.O. 1979. TWINSPAN-A FORTRAN program for arranging multivariate data in an ordered two-way table by classification of the individuals and attributes. Cornell University, Ithaca, N.Y.
Jongman, R.H.G., C.J.F. ter Braak and O.F.R. van Tongeren (eds.) 1995. Data analysis in community and landscape ecology. Cambridge University Press, N.Y.
Licuanan, W.Y. 1991. Temporal changes in the cover of life- forms i n Puerto Galera, Mindoro Is land, western Philippines: preliminary results. Proc. Regional Symp. on Living Resources in Coastal Areas, Marine Science Institute, University of the Philippines, Quezon City, 87-96 p.
Martosubroto, P. 1982. Fishery dynamics of the demersal resources of the Java Sea. Dalhousie University. 238 p. Ph.D. dissertation.
McManus, J.W. 1985. Descriptive community dynamics: background and a n application to tropical fisheries management. University of Rhode Island, Narragansett, R.I. 217 p. Ph.D. dissertation.
McManus, J.W. 1986. Depth zonation in a demersal fishery in the Samar Sea, Philippines, p. 483-486. In J.L. Maclean, L.B. Dizon and L.V. Hosillos (eds.) The First Asian Fisheries Forum. Asian Fisheries Society, Manila.
McManus, J.W. 1989. Zonation among demersal fishes of Southeast Asia: the southwest shelf of Indonesia, p. 1011- 1022. In Proceedings of the Sixth Symposium on Coastal and Ocean ManagementIASCE, 11-14 Ju ly 1989. Charleston, South Carolina.
McManus, J.W. 1996. Marine bottomfish communities from the Indian Ocean coast of Bali to Mid-Sumatra, p. 91-101. In D. Pauly and P. Martosubroto (eds.) Baseline studies of biodiversity: the fish resources of Western Indonesia. ICLARM Stud. Rev. 23, 312 p.
McManus, J.W., C.L. Nafiola, A.G.C. del Norte, R. B. Reyes, J.N.P. Pasamonte, N.P. Armada, E.D. Gomez and P.M. Alifio. 1996. Coral reef fishery sampling methods, p. 226- 270. In V.F. Galucci, S.B. Saila, D.J. Gustafson and B.J. Rothschild (eds.) Stock assessment: quantitative methods, and applications for small-scale fisheries. CRC Lewis, N.Y.
Nafiola, C.L., J.W. McManus, W.L. Campos, A.G.C. del Norte, R.B. Reyes, J.P.B. Cabansag and J.N.D. Pasamonte. 1990. Spatio-temporal variations in community structure in a heavily fished forereef slope in Bolinao, Philippines, p. 377- 380. In R. Hirano and I. Hanyu (eds.) The Second Asian
/ Fisheries Forum. Asian Fisheries Society, Manila. Pauly, D. 1979. Theory and management of tropical multispecies
stocks: a review, with emphasis on Southeast Asian
/ demersal fisheries. ICLARM Stud. Rev. 1, 35 p. Pauly, D. and G.I. Murphy, Editors. 1982. Theory and
management of tropical fisheries. ICLARM Conf. Proc. 9, 360 p.
Pielou, E.C. 1977. Mathematical ecology. John Wiley and Sons, New York.
Pielou, E.C. 1979. Interpretation of paleoecological similarity matrices. Paleobiology 5(4): 435-443.
Pielou, E.C. 1984a. The interpretation of ecological data: a primer on classification and ordination. Wiley, N.Y.
Pielou, E.C. 1984b. Probing multivariate data with random skewers: a preliminary to direct gradient analysis. Oikos
Gulf, Philippines, and their fish assemblages by exploratory 42: 161-165.

Ralston, S. and J.J. Polovina. 1982. A multispecies analysis of the commercial handline fishery in Hawaii. Fish. Bull. 80(3): 435-448.
Sherman, K., L.M. Alexander and B. D. Gold (eds.) 1990. Large marine ecosystems: patterns, process, and yields. Amer. Assoc. Adv. Sci., Washington, D.C. 376 p.
Shepard, A.R.D., R.M. Wanvick, K.R. Clarke and B.E. Brown. 1992. An analysis of fish community responses to coral mining in the Maldives. Environ. Biol. Fish. 33(4): 367- 380.
ter Braak, C.J.F. 1987. The analysis of vegetation-environment relationships by canonical correspondence analysis. Vegetatio 69: 69-77.
Tyler, A.V., W.L Gabriel and W.J. Overholtz. 1982. Adaptive management based on structure of fish assemblages of northern continental shelves, p.149-156. In M.C. Mercer (ed.) Multispecies approaches to fisheries management advice. Can. Spec. Publ. Fish. Aquat. Sci. 59.
Whi t taker , R.H. 1970. Communi t ies a n d ecosystems. MacMillan, N.Y.
Williams, W.T., Editor. 1976. Pattern analysis in agricultural science. Elsevier Scientific Publishing Co., N.Y.
Williams, W.T., H.J. Clay and J.S. Bunt. 1982. The analysis, in marine ecology, of three-dimensional data matrices with one dimension of variable length. J. Exp. Mar. Biol. Ecol. 60: 189-196.

Appendix I
ADB Workshop on Sustainable Exploitation of Tropical Coastal Fish Stocks in Asia
2- 5 July 1996 The Hyatt Regency, Manila, Philippines
Program of Activities
Tuesday, 2 July 1996
8:00 a.m. Registration
9:00 a.m. Opening Ceremonies Master of Ceremonies: Len R. Garces
Welcome Address Modadugu V. Gupta Director, International Relations
9:20 a.m. Message Dr. Muhammad A. Mannan Manager, Forestry and Natural Resources Division
9:40 a.m. Opening Remarks Daniel Pauly Principal Science Adviser ICLARM
10:OO a.m. Photo Session Coffee Break
10:30 a.m. Workshop Overview Geronimo T. Silvestre Research Scientist ICLARM
Session 1: Status of Tropical Coastal Fisheries in Asia
Chairperson: Geronimo T . Silvestre Rapporteur: Len R. Garces
10:50 a.m. Regional Overview Paper Geronimo T . Silvestre ICLARM
11:30 a.m. Country Report: Philippines Noel C. Barut Bureau of Fisheries and Aquatic Resources Philippines
12:OO noon Lunch Break
1:15 p.m. Country Report: Bangladesh Giasuddin Khan Department of Fisheries Bangladesh
1:45 p.m. Country Report: Indonesia Bambang Edi Priyono Directorate General of Fisheries Indonesia
2:15 p.m. Country Report: Malaysia Abu Talib b. Ahmad Department of Fisheries Malaysia
2:45 p.m. Country Report: Sri Lanka Rekha Maldeniya National Aquatic Resources Agency, Sri Lanka
3: 15 p.m. Coffee Break
3:30 p.m. Country Report: Thailand Monton Eiamsa-ard Department of Fisheries Thailand
4:00 p.m. Country Report: Vietnam Pham Thuoc Research Institute for Marine Products, Vietnam

144
4:30 p.m. OpenForum Thursday, 4 July 1996
5:00 p.m. End of Session
Wednesday, 3 July 1996
Session 2: Coastal Fisheries Management: Issues, Strategies and Actions
Chairperson: Daniel Pauly Rapporteur: Geronimo T. Silvestre
9:00 a.m. Program Perspective: FA0 Purwito Martosubroto Fisheries and Aquaculture Division, FAO, Rome
9:20 a.m. Program Perspective: FA0 Bay of Bengal Programme Purwito Martosubroto Fisheries and Aquaculture Division, FAO, Rome
9:40 a.m. Program Perspective: SEAFDEC-MFRDMD Dr. Mansor bin Mat Isa Marine Fishery Resources Development and Management Department SEAFDEC, Malaysia
10:OO a.m. OpenForum
10:30 a.m. Coffee Break
10:45 a.m. Working Group Discussion: Issues Impacting Sustainable Exploitation of Tropical Coastal Fish Stocks in Asia
12:00 noon Lunch Break
1: 15 p.m. Working Group Discussion: Management Strategies and Actions for Sustainable Exploitation of Tropical Coastal Fish Stocks in Asia
3:00 p.m. Coffee Break
3: 15 p.m. Working Group Discussion: Scope for Regional Collaborative Efforts in Research and Management
Session 3: Retrospective Analysis of Trawl Surveys: Potential for Regional Collaborative Efforts Convenor: Daniel Pauly Rapporteur: Felimon Gayanilo, Jr.
9:00 a.m. Retrospective Analysis of Trawl Surveys and Database Guidelines Daniel Pauly ICIARM
9:30 a.m. Trawl Survey Database Prototype: An Overview Felimon Gayanilo, Jr . ICLARM
10:OO a.m. Community Analyses of Fish and Fishery Data John W. McManus ICLARM
10:30 a.m. Coffee Break
10:45 a.m. Working Group Session: Database Prototype
12:OO p.m. Lunch Break
1:15 p.m. Working Group Session: Database Prototype Improvement
3:00 p.m. Coffee Break
3: 15 p.m. Working Group Session: Indicative Planning for Regional Collaboration
5:30 p.m. End of Session
Friday, 5 July 1996
Session 4: Summary and Recommedations Chairperson: Geronimo T. Siluestre Rapporteur: Len R. Garces
9:00 a.m. Synopsis of Main Workshop Results and Recommendations Daniel Pauly IC m
9:30 a.m. OpenForum
5:00 p.m. End of Session

ICLARM
Closing Program Master of Ceremonies: Len R. Garces
Closing Remarks Mr. Weidong Zhou Project Specialist ADB
Remarks Selected Country Representatives
11:OO a.m. ICLARMVisit
12:00 noon Lunch a t Hyatt
1:30 p.m. Tour of ICLARM Library
3:00 p.m. Fishbase Overview
4:00 p.m. Reefbase Overview
5:00 p.m. End of Visit
Closing Remarks Dr. Daniel Pauly

Appendix I1
ADB Workshop on Sustainable Exploitation of Tropical Coastal Fish Stocks in Asia
2 - 5 July 1996 The Hyatt Regency, Manila, Philippines
Participants and Resource Persons
Bangladesh
Mr. Md. Giasuddin Khan Principal Scientific Officer Marine Fisheries Survey Management and Development Project Department of Fisheries Chittagong 4100, Bangladesh Tel : (880-31) 504206; (880-31) 504438 Fax: (880-31) 504206; (880-31) 503873
Mr. Md. Alamgir Senior Scientific Officer Fisheries Research Institute Marine Fisheries and Technology Station Motel Road, Laboni Cox's Bazar, Bangladesh Tel : (880-341) 3855; (880-341) 3976 Fax: (880-341) 3202; (880-341) 3783
8th and 9th Floor, Wisma Tani, Jln. Sultan Salahuddin, 50628 Kuala Lumpur Malaysia Tel : (60-3) 2982011 ext 3645 Fax: (60-3) 2910305 E-mail: [email protected]
Mr. Alias Man Research Officer Fisheries Research Institute 11960 Batu Maung Penang, Malaysia Tel : (60-4) 626392516 Fax: (60-4) 6262210 E-mail: [email protected]
Philippines Indonesia
Dr. Bambang Edi Priyono Chief, Sub Directorate of Fisheries Potential Resources DGF, Agriculture Department
Building B, 6th Floor, J1. Harsono Rm. No. 3; Ragunan, Pasar Minggu Jakarta, Indonesia Tel : (62-21) 7811672 Fax: (62-21) 7803196 (DGF)
(62-21) 7890624 (BADP)
Malaysia
Mr. Abu Talib bin Ahmad Research Officer Department of Fisheries
Mr. Noel C. Barut Supervising Aquaculturist Bureau of Fisheries and Aquatic Resources Department of Agriculture, 860 Arcadia Bldg. Quezon Avenue, Quezon City 1100 Philippines Tel : (63-2) 9287075; 9265428 Fax: (63-2) 9291249
Mr. Mudjekeewis DSantos Aquaculturist Bureau of Fisheries and Aquatic Resources Department of Agriculture 860 Arcadia Bldg.,Quezon Avenue, Quezon City 1100 Philippines Tel : (63-2) 92870751 9265428 Fax: (63-2) 9291249

Sri Lanka
Mrs. Rekha Maldeniya Fisheries Officer National Aquatic Resources Agency Croco Island, Mattakkuliya Colombo 15, Sri Lanka Tel : (94-1)522000; 522006 Fax: (94-1) 522932
Thailand
Mr. Monton Eiamsa-ard Senior Marine Fishery Biologist Southern Marine Fisheries Development Centre
Vichianchom Rd., Amphoe Muang Songkhla, Thailand 90000 Tel,: (66-74) 312595 Fax: (66-74) 312495
Ms. Supatra Amornchairojkul Fisheries Engineering Division Department of Fisheries Bangkok 10900, Thailand TeyFax: (66-2) 5798567
Vietnam
Dr. Pham Thuoc Deputy Director Research Institute of Marine Products 170 LeLai Street HaiPhong City, Vietnam Tel : (84-31) 846-656 Fax: (84-31) 836-812 E-mail: [email protected].
Dr. Nguyen Long Head Fishing Technology Division Research Institute of Marine Products 170 LeLai Street HaiPhong City, Vietnam Tel : (84-31) 846664 Fax: (84-31) 836-812 E-mail: [email protected]
Dr. Veravat Hongskul Senior Fishery Officer and APFIC Secretary FAO-Regional Office for Asia and the Pacific
Maliwan Mansion, 39 Phra Atit Road Bangkok 10200, Thailand Tel : (66-2) 2817844 Fax: (66-2) 2800445 E-mail: [email protected]
Dr. Purwito Martosubroto Marine Resources Service Fishery Resources Division FA0 of the United Nations Viale delle Terme di Caracalla 00100 Rome, Italy Tel : (39-6) 5225-6469 Fax: (39-6) 5225-3020 E-mail: [email protected]
Dr. Mansor bin Mat Isa Research Officer Marine Fishery Resources Development and Management Department
Southeast Asian Fisheries Development Center Chendering, 21080 Kuala Terengganu Malaysia Tel : (60-9) 6175135 Fax: (60-9) 6175136 E-mail: [email protected]
Ms. Ester C. Zaragoza Supervising Science Research Specialist Marine Research Division Philippine Council for Aquatic and Marine Research and Development
Los Baiios, Laguna, Philippines Tel : (6-49) 536-0015 to 19 Fax: (6-49) 536-4077 CompuServe: 104540,3506
PBSP
Dr. Rudolf Hermes Marine Biologist Coastal Resources Management Philippine Business for Social Progress Intramuros, Manila Philippines Tel : (63-2) 527-7741 to 51 Fax: (63-2) 527-3743

Dr. El vira Ablaza Executive Director Pacific Rim Innovation and Management Exponents, Inc. (PRIMEX)
502 Manila Luxury Condominium Pearl Drive, Pasig Metro Manila, Philippines Tel : (63-2) 633-9052/3717,(63-2) 634 513517339 Fax: (63-2) 634-7340 Telex: 66485 PINTR PN
ADB Mr. Weidong Zhou Fisheries Specialist Forestry and Natural Resources (East) Asian Development Bank 6 ADB Avenue, Mandaluyong City, Philippines Tel : (63-2) 632-4414, (63-2) 631-7961 Fax: (63-2) 636-2444,(63-2) 636-2400 E-mail: [email protected]
Dr. Thomas Gloerfelt-Tarp Fisheries Specialist Forestry and Natural Resources Division Agriculture and Social Sectors Department (West) Asian Development Bank 6 ADB Avenue, Mandaluyong City, Philippines Tel : (63-2) 632-6722 Fax: (63-2) 636-2300 E-mail: [email protected]
Dr. Daniel Pauly Principal Science Adviser International Center for Living Aquatic Resources Management 3F Bloomingdale Bldg. 205 Salcedo Street, Legaspi Village 1229 Makati City, Philippines Tel : (63-2) 818-04661 9283, (63-2) 817-52551 5163 Fax: (63-2) 816-3 183 E-mail: [email protected]
Dr. John W. McManus Program Leader, Aquatic Environments Program Project Leader, ReefBase Project E-mail: [email protected]
Mr. Geronimo T . Silvestre Research Scientist E-mail: [email protected]
Mr. Felimon C. Gayanilo, Jr. Fisheries Science Programming Specialist E-mail: [email protected]
Mr. Len R. Garces Research Associate E-mail: [email protected]
Ms. Rowena Andrea V. Santos Research Assistant E-mail: [email protected]
Mr. Dan Bonga Research Assistant E-mail: [email protected]

Appendix I11
Preliminary Compilation of Trawl Surveys Conducted in Tropical Asia1
Fisheries scientists and managers often complain about the limited availability of data and information inputs for the management decision-making process. Yet, there are numerous surveys of fisheries resources, undertaken at significant costs, which remain largely underutilized or untapped. A number of trawl sur- veys have been conducted in tropical Asia some for researchlacademic interests, but most for assessing fisheries potential and development. However, the data from most of these surveys remain underutilized, usually having been analyzed only in terms of total stock density, then stored in the files in various fisheries agencieslinstitutes. Pauly (1996) highlighted the utility of retrospective analyses of these surveys for studies of biodiversity and for improving fisheries management, using newer techniques of analysis. He emphasized the significance of standardization and computerization of these surveys in overcoming the "shifting baseline syndrome" which frequently afflicts fisheries assessment and management (Pauly 1995). Indeed, in the case of the Philippines, the work of Silvestre et al. (1986) illustrates how the use of these surveys can provide better insight of fisheries status and related fisheries policies.
In view of the potential of these trawl surveys, a compilation of the trawl surveys conducted in South and Southeast Asia was undertaken before the work- shop. Contributions to the compilation were made by: M.G. Khan, M. Alamgir and M.N. Sada (Bangladesh), B.E. Priyono and B. Sumiono (Indone- sia), A. Abu Talib and M. Alias (Malaysia), N.C. Barut ,M.D. Santos and L.R. Garces (Philippines), R. Maldeniya (Sri Lanka), M. Eiamsa-ard and S. Amornchairojkul (Thailand), P. Thuoc and N. Long (Vietnam), and M.I. Mansor (SEAFDEC). These con- tributions were supplemented by searches conducted by Dan Bonga and Len Garces (ICLARM) using ICLARM Library bibliographic databases (i.e., ASFA, NAGA and LIBRI). ASFA (Aquatic Sciences and Fisheries Abstracts) is an international bibliographic database covering information supplied from the
Aquatic Sciences and Fisheries Information System (ASFIS). ASFIS is maintained by the Food and Agri- culture Organization of the United Nations (FAO), the Intergovernmental Oceanographic Commission (IOC) of UNESCO, the UN Office for Ocean Affairs and the Law of the Sea (OALOS), the UN Environ- ment Program and a network of research centers throughout the world (Compact Cambridge 1991). Entries from ASFA covered the period 1978 to March 1996. LIBRI and NAGA are reference databases main- tained by ICLARM, the former covering reference materials and collections of the ICLARM library and the latter covering the extensive reference citations of the information section of Naga (the ICLARM quar- terly publication). Also, the extensive computerized reprintheport collection of Daniel Pauly (with over 30 000 entries on tropical fishery and related topics) was searched. Bibliographic searches were made using the following descriptors: 'trawl' and related terms (i.e., trawls, trawling and trawler), 'demersal' and 'fishery resources'. Each descriptor was tied to a particular country or region, e.g., India, Indian Ocean, Sunda Shelf. Positive responses were further screened to de- lete irrelevant entries, i.e., those not dealing with trawl and other demersal surveys in our reference area (e.g., areas outside of tropical Asia, studies on socio-economic issues, policies and management intervention resul- ting from trawl and other fishery surveys, taxonomic description of rarelfirst record species caught by trawl, idhyoplankton and zooplankton studies based on traw- ling, etc.).
Table 111.1 gives the resulting compilation of sur- veys conducted in tropical Asia. A total of 301 inde- pendent surveys have been identified thus far and in- cluded in the table. The geographical distribution of these surveys is as follows: Bangladesh - 30; Brunei - 7; Indonesia - 25; Malaysia - 58; Philippines - 41; Sri Lanka - 10; Thailand - 40; Vietnam - 29; Burma - 4; India - 35; Pakistan - 12; South China Sea area - 5; and southern Indonesialnorthern Australia - 3. It was acknowledged by Workshop participants that the
' Compiled by D. Bonga, L. Garces and G. Silvestre.

150 surveys enumerated in the table do not include all the surveys actually carried out in South and Southeast Asia, and that many more remain unpublished in the files of various agencieslinstitutes. For example, entries in the table without referencelsources are unpublished surveys that the various contributors are personally aware of. The Workshop participants were in agreement that more systematic and exhaustive searches would substantially improve the list given in Table 111.1 and resolved to make such efforts part and parcel of an expanded regional collaboration to follow-up the Workshop results.
Despite its preliminary nature, the Workshop participants deemed the compilation given in Table 111.1 as a good start. Sample data from several sur- veys in the table were brought by the individual Workshop participants. These sample data were used to test the prototype version of TrawlBase (Gayanilo, e t al . , this vol.) and explore how retrospective analyses could provide insights on ways to improve fisheries management in South and Southeast Asia.

M l e 111-1. Summary of information of trawl surveys conducted in tropical Asia, by countrylarea. Areal . . . -
survey no. Period (date) Vessel Trawl geara Trawl operations Resultslnotes References BANGLADESH
1 Nov - Dec 1958 Chosui Maru C h o w W v (1 983) 2 Jan - Apr 1960 Kagawa Maru 99 hauls extent of trawled area: 550 sy. miles
mean catch rate:127 kghou i 3 Dec 1961 - Kinki Maru sites: estuaries of Sundarbans, off the coast of
Dec 1962 greater Khulna, Barisal and Chittagong
4 1962 - 1966 Jalwa overhang other gears: shrimp n& and floating gill net depth range: 5-58 m Cushing (1 971);
bottom trawl net mean catch rate: 135 kg.houil Chowdhury (1 983),
- see also Bain (1 965)
5 Apr 1963 Anton Bruun exploratory surveys in Bay of Bengal and Hida and Pereyra (1 966) Arabian Sea, see notes/results in India (whole coastline)
6 1968 - 1971 Sagar Sandbani. Mexico type extent of trawled area: whole shelf, 26 000 km2 West (1 973) Meen Sandhani shrimp trawl depth range: 10-75 m
abundance estimate: 264 000 - 373 000 t 7 Nov 1969 - R. TM. Lesnov Anon. (1970)
Jan 1970 Jan 1972 - Tamanqo SRTM 499 - Nov 1972 Oct 1976 - M.V. Santamonical shrimp trawl 1 902 hauls extent of trawled area: 4 200 sq. miles Rachid (1 983) Oct 1977 M. V. Orion 8 catch rates; 40 kg.hour" (shrimp);
49 kg-hour (quality fish) Mar 1979 F~sheries Research bottom trawl 20 operations b depth range: 10-82 m
Vessel No. 2 other gears: drift gill netland 50 x 15 m net catch rate: 649 kg.hour
Nov - Dec 1979 R. V. Dr. Friduof shrimp trawl 49 hauls extent of trawled area: whole shelf; 42 000 km2 Chowdhury et al. (1979); Nansen HL: 96 ft
GR: 63 ft depth range: >lo-200 m Saetre (1 981) other gears used: pelagic trawl, gillnet and long-line other information collected: general water quality parameters, plankton and bathymytry mean catch rates: 19-672 kg.hour (all depths) stock densitv: 164-6 451 kg.km2 (all depths) abundance estimate: 160 000 t
May 1980 R. L? Dr. Friduof shr~mp trawl 61 hauls extent of trawled area: whole shelf; 42 000 km2 Chowdhury et al. (1980); Nansen HL: 134 ft d e ~ t h range: >lo-200 m Saetre (1 981 )
other used: pelagic trawl, gillnet and long-line other information collected: general water quality parameters, plankton and bathymytry mean catch rates: 62-995 kg.houi (all depths) stock density 453-3 267 kg.km2 (all depths) abundance estimate: 92 000 t
--
a HL: headline; HR: headrope; FR: footrope; GR: groundrope; MS: codend mesh size; TS: towing speed; TD: trawling duration; WS: wing span; GT gross tons; HP: horsepower; I-'
LOA: length overall ul I-'

I-' U1 N
Areal survey no. Period (date) Vessel Trawl gear Trawl operations Resultslnotes References
13 1981 - 1982 BFDC I other single-rig stern landing survey Penn (1 983) commercial trawler trawl/ twin-rigged standing stock of demersal fish: 54 900
shrimp trawl to 92 000 t 14 Jul 1983 R. V. Anusandhani Khan (1983) 15 Dec 1983 R. V. Anusandhani midwater trawl extent of trawled area: Hurnayon et al. (1 983);
rigged as bottom northern Bay of Bengal Khan i t al. (1983) ' . . trawl abundance estimate-1 50 000 t
16 15 - 25 Sep 1984 R. V. Anusandhani Engel type 42 hauls depth range: 15-100 m White and Khan (1985a) MS: 32 mm TD: 0.5 hour mean catch rate: 312 kg.hour-'; highest at
10-20 m depths decreasing with depth dominant species included Sciaenidae, catfish (Ariidae) and rays which made up ~ 5 0 % of total weight of catch demersal biomass: 200 000-300 000 t; around 2 000 to 3 500 t were prawns
17 3 - 13 Oct 1984 R. V. Anusandhani Engel type depth range: 10-105 m White and Khan (1985b) MS: 32 mm 45 hauls mean catch rate: 226 kg.hour-l; highest at
TD: 0.5 hour 10-20 m depths, decreasing with depth most dominant species include lndian mackerel (Rastrelliger kanagurta), croaker, catfish and rays which made up SO% of total weight of catch biomass: 100 000-1 80 000 t; around 1 700 to 5 500 t were prawns
18 20 - 31 Oct 1984 R. V. Anusandhani Engel type 43 hauls depth range: 10-105 m White and Khan (1985~) MS: 32 mm TD: 0.5 hour mean catch rate: 174 kg.hourl; highest at 20-30 m
dominant species include croakers, catfish, goatfish and rays which made up approx. 40% of total weight of catch biomass: 11 5 000-1 80 000 t; around 6 500 t were prawns
19 9 - 20 Nov 1984 R. V. Anusandhani Engel type 44 hauls depth range: 15-102 m White (1 985a) MS: 32 mm TD: 0.5 hour mean catch rate: 234 kg.hour-l; highest at
10-30 m depths dominant species include lndian mackerel, threadfin bream, catfish, goatfish and croaker biomass: 170 000-255 000 t; around 2 300 t were prawns
20 27 Nov - R. V. Anusandhani Engel type 40 hauls depth range: 16-1 05 m White (1 9856) 6 Dec 1984 MS: 32 mm TD: 0.5 hour mean catch rate: 296 kg.hour l; highest at depths
>lo0 m and lowest at 21 -30 m depth dominant species include Japanese threadfin bream, catfish, goatfish, hairtail and white pomfret penaeid prawns were abundant at 10-20 m biomass: 160 000-340 000 t; around 4 300 t were prawns

Areal survey no. Period (date) Vessel Trawl gear Trawl operations Results/notes References
2 1 13 - 21 Dec 1984 R. V. Anusandhani Engel type 41 hauls depth range 15-105 m White (1 985c) MS: 32 mm TD: 0.5 hour mean catch rate: 274 kg.hour-'; highest at
10-20 m depths dominant species were round and hard scads (Decapterus maruadsi and Megalaspis cordyla) croakers, hairtail, threadfin bream, catfish and goatfish, biomass: 230 000 t, prawns 4 %
22 6 - 16 Jan 1985 R. V. Anusandhani Engel type 45 hauls depth range: 15-107 m White (1 9854) MS: 32 mm TD: 0.5 hour mean catch rate: 198 kg.hour-'
dominant species include catfish, croaker, hairtail, scads. threadfin bream and lizard fish biomass: 40 000-294 000 t; about 100 t were prawns
23 31 Jan - R. V. Anusandhani Enael tvoe 49 hauls dewth ranae: 15-113 m White (1 985e) MS: 32;;lm TD: 0.5 hour m ian catch rate: 274 kg.hour-I; rates at 10-20 m depths
four times higher than deepest zone dominant species include scads, croaker, hairtail, Jaoanese threadfin bream, catfish and aoatfish bidmass: 220 000 t; about 3 700 t wereWprawns
24 17 Feb - R. V. Anusandhani Engel type White (1 9850 24 Feb 1985 MS: 32 mm
25 19 - 24 May 1985 R. L! Anusandhani Engel type White (1 9859) -- MS: 32 mm
26 Sep 1984 - R. V. Anusandhani Engel type 544 hauls extent of trawled area: whole shelf; 31 340 km2 Lamboeuf (1 987) Jun 1986 MS: 32 mm TD: 0.5 hour depth range: 10->I00 m
mean stock density: 2 914-7 926 kg.km2 (all depths and all species of fish)
27 Nov 1985 - R. V. Anusandhani Jan 1987
28 Oct 1988 - R.V. Anusandhani shrimp trawl net 83 hauls Apr 1989 HR: 27.8 m TD: 1.0 hour
GR: 33 m MS: 45 mm
--
29 Jun 1988 - R. V. Machhranga high opening 31 hauls Jan 1989 Enael type TD: 1.0 hour
~ ~ 2 9 ; GR: 37 m MS: 32 mm
biomass: 161 000 t '
penaeid shrimp trawl survey Mustafa et al. (1 987) --
extent of trawled area: whole shelf Khan et al. (1989a) depth range: 20-100 m other information collected: length-frequency, . oceanographic parameters biomass estimate: 1 548 t (penaeid shrimp) max. stock densitv: 141 kg . kmb t 51-80 m extent of trawled area: shallow port~on of the shelf; Khan et al. (1989b) 6 870 km2 depth range: <20 m other information collected: length-frequency, oceanographic parameters biomass estimate: 17 000 t (fish). 135 t (shrimwI
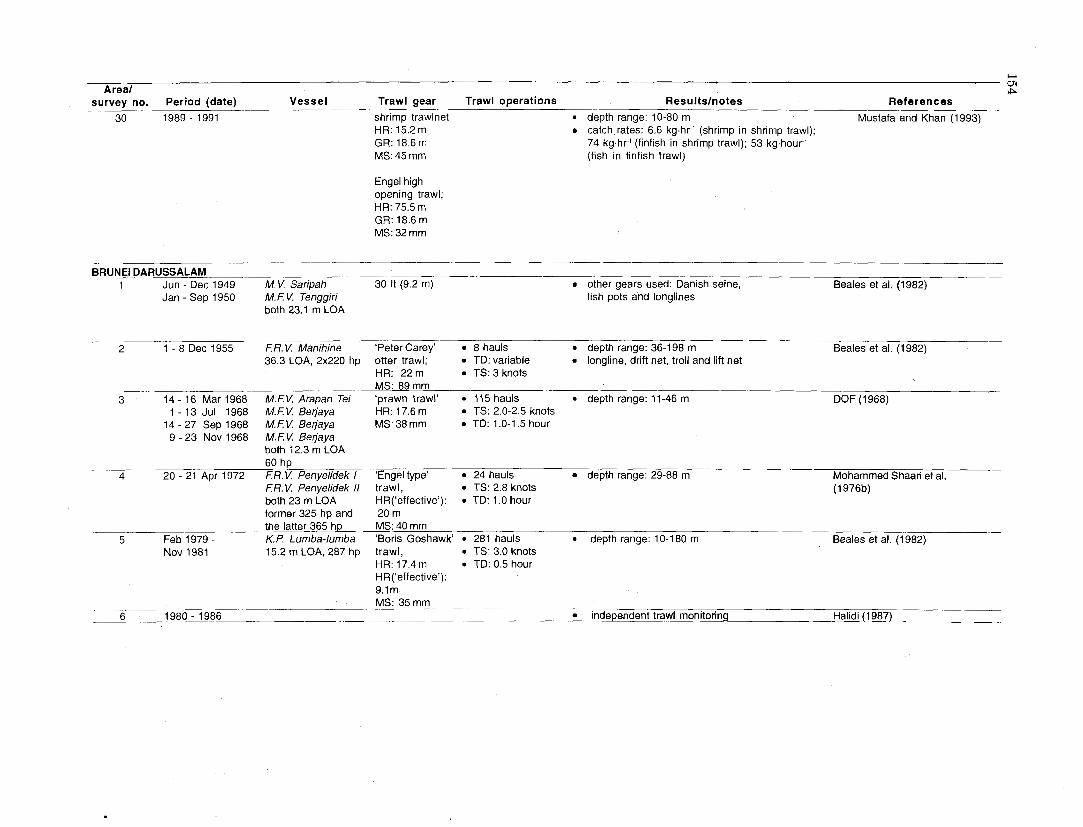
F U1
Areal t~ survey no. Period (date) Vessel Trawl gear Trawl operations Resultslnotes References
30 1989 - 1991 shrimp trawlnet depth range: 10-80 m Mustafa and Khan (1993) HR: 15.2 m catch.rates: 6.6 kg.hr~' (shrimp in shrimp trawl); GR: 18.6 m 74 kg.hr-' (finfish in shrimp trawl); 53 kg.hour-I MS: 45 mm (fish in finfish trawl)
Engel high opening trawl; HR: 75.5 m GR: 18.6 m MS: 32 mm
BRUNEI DARUSSALAM 1 Jun - Dec 1949 M.V. Saripah 30 ft (9.2 m)
Jan - Sep 1950 M.E V. Tenggiri both 23.1 m LOA
other gears used: Danish seine, fish pots and longlines
Beales et al. (1982)
2 1 - 8 Dec 1955 ER. V. Manihine 'Peter Carey' 8 hauls depth range: 36-1 98 m Beales et al. (1982) 36.3 LOA, 2x220 hp otter trawl; TD: variable longline, drift net, troll and lift net
HR: 22m TS: 3 knots MS: 89 rnm
3 14 - 16 Mar 1968 M.FIV. Arapan Tei 'prawn trawl' 115 hauls depth range: 11-46 rn DOF (1 968) 1 - 13 Jul 1968 M.EV. Berjaya HR: 17.6 m TS: 2.0-2.5 knots 14 - 27 Sep 1968 M.E K Berjaya MS: 38 mm TD: 1 .O-1.5 hour 9 - 23 Nov 1968 M.E V. Berjaya
both i 2.3 m LOA 60 hp
4 20 - 21 Apr 1972 ERV. Penyelidek I 'Engel type' 24 hauls depth range: 29-88 rn Mohammed Shaari et al. ER. V. Penyelidek I1 trawl, TS: 2.8 knots (1 976b) both 23 rn LOA HR('effective'): TD: 1.0 hour former 325 hp and 20 m the latter 365 hp MS: 40 rnm
5 Feb 1979 - K,P Lumba-lumba 'Boris Goshawk' 281 hauls depth range: 10-180 m Beales et al. (1 982) Nov 1981 15.2 m LOA, 287 hp trawl, TS: 3.0 knots
HR: 17.4 m TD: 0.5 hour HR('effective'): 9.1 m
-- MS: 35 mm 6 1980 - 1986 independent trawl monitoring Halidi (1 987)

Areal survey no. Period (date) Vessel Trawl gear Trawl operations Results/notes References
7 Jul 1989 - K.P Lumba-lumba 'Borls Goshawk' 143 hauls extent ot trawled area: 1 396 km2 Silvestre and Matdanan Jun 1990 15.2 m LOA trawl, TS: 3.0 knots depth range: 10-100 m (1 992)
287 hp HR: 17.4 m TD: 0.5 hour stock density: 8.3 HR ('effective'): biomass: 61 300 t 9.1 m MS: 35mm
INDONESIA (JAVA S E A - ~ ~ o u T H E R N SOUTH CHINA SEA) -- 1 12 Nov - R. V. Oh Dae San HR: 50 m 51 hauls South coast of Java
1 Dec 1972 GR: 63 m TS: 3.0-3.5 knots depth range: 20-290 m TD: vanable
2 11 - 22 Dec M.S Dah Choan HR: 152 ft 53 hauls South China Sea (Karimata Strait) 1973 - . ---- GR: 155 ft TD: 1.5-2.0 hours depth range: 20-80 m
3 M.S. Jeou Ta HR: 152 ft GR: 155ft 69 hauls TD: 1.5-2.0 hours South Chma Sea (Karimata Strait)
- depth range: 20-80 m 4 Nov 1974 - R. V. Mutiara IV Tha~land trawl 441 hauls extent of trawled area: Java Sea and Pauly et al. (1 996)
Jul 1976 TD: 1.0 hour Southern South China Sea; 717 562 km2 depth range: 10-70i m other information collected: length-frequency, mesh selection experiment, zooplankton and benthos sampling; back-and-forth fishing experiment biomass: 259-389 t stock density: 0.8-5.2 t.km-2
5 Jun - Dec 1976 R.V. Mutiara IV Thailand trawl 189 hauls extent of trawled area: Java Sea, south of latitude Losse and Dwiponggo (1977) TS: 3.0 knot 03's between the southeastern coast of Sumatra, TD: 1.0 hour the north coast of Java, the southern coast of
Kalimantan and eastwards to the edge of the continental shelf in southern Strait of Makassar; 467 000 km2 depth range: 10-70+ m total mean catch ,rate for the monsoon survey was 262 kg.houf and from 'aimed' fishing, 163 kg.hour the standing stock was estimated at 1.2 million t, of which 0.7 million t was estimated for offshore zone with potential annual yield of around 0.3 million t
6 Jan - Dec 1977 R.V. Mutiara IV 212 hauls Java Sea (nine subareas); 297 500 km2 Dwipongao and Badrudin depth range: 10-50 m (1 978a,-i978b) mean catch rate: 212 kqhouil stock density: 2.03 t.km- - 6.6 t.km? other information collected: catch composition by sub-area, catch rate by depth

w U1
Areal Q,
survey no. Period (date) Vessel Trawl gear Trawl operations Resultslnotes References 7 Jan - Dec 1978 R.V. Mutiara IV Thailand trawl 167 hauls Java Sea sub-areas (southeast coast of Sumatra, Dwiponggo and Badrudin
MS: 20,40 TS: 3.0 knots north coast of west and central Java and south (1 979a, 197913) and 60 rnm TD: 0.5-1.0 hour coast of Kalimantan and offshore area around
Bawean and Masalembu Island) depth range:10-90 m mean total catch rate: 143 kg.hour1 high mean catch rate recorded at north coast of Java
--- good fishing grounds were found at 10-30 m depth
8 Jan - Dec 1979 R . v ~ ~ u t i a r a IV Thailand trawl 351 hauls Java Sea, six inshore sub-areas Dwiponggo and Badrudin-- HL: 34.6 m TS: 3.0 knots depth range: 10-50 m (1 98Oa, 198Ob) FR: 42.2 m TD: 0.5-1.0 hour catch rate of food fish: 159 kg.hourl MS: 40 rnrn good fishing grounds were located at depths <40 m
other information: catch composition by sub-area,
-- by depth and by season 9 Jun -Jut 1978~- R.V. Mutiara IV Thailand trawl 64 hauls southern South China Sea between longitude 104" E Sudradjat and Beck (1978)
HL: 34.6 m TS: 3.0 knots and West Kalimantan (Borneo) and between latitudes FR: 42.2 m TD: 1.0 hour 03's and 02'N; 287 033 km2 MS: 40 mrn depth range: 10-70 m
mean catch rate: 11 9 kg.houfl mean stock density: 1.8 t.km-2 potential annual yield: 200-300 thousand t large areas of offshore fishing grounds (>30 m sounding depth) provided low catch rates; highest catch rates were obtained in near-shore waters off Kalimantan and around islands off the east coast of Sumatra
10 11 Jan - R. V. Mutiara IV HR: 34.6 m 344 hauls prevailing oceanographic conditions were discussed Java Sea
1 Dec 1979 GR: 42.2 m TS: 3.0 knots depth range: 10-70 m -
TD: 1.0 hour
11 Oct 1982 R. V. Mutiara IV HR: 34.6 rn 6 hauls South coast of Java -
GR: 23.4 m 4 TS: 2.5 knots depth range: 20-50 m
- - TD: 1 .Ohour INDONESIA (MALACCA STRAIT)
1 Jul - Sep 1973 M. V. Mutiara I double rig 61 hauls Malacca Strait Martosubroto et al. (1 996) shrimp trawl TS: 2.5-3.5 knots depth range: 10-40 m HR: 23.44 rn TD: 2.0 hour mean catch rates: 37-78 kg.houfl (all depths) GR: 27.84 m stock density: 0.5-1.1 t.km-2
~- MS: 30 mm
2 Jul - Sep 1973 M.V. Mutiara I1 double rig 87 hauls Malacca Strait shrimp trawl TS: 1.5-2.5 knots depth range: 10-40 m HR: 19.0 m TD: 2.0 hour mean catch rates: 41-65 kg.houfi GR: 22.06 m stock density: 0.9-1.4 t.km-2
~p~
MS: 30 mm

Areal survey no. Period (date) Vessel Trawl gear Trawl operations Results/notes References
3 M.V. Larasati HR: 18.4 m 5 hauls Malacca Strait GR: 22.4 m TS: 2.5-3.5 knots depth range: 10-40 m
- TD: 2.0 hour 4 Jan - Mar 1975 M. V. Mutiara IV Thailand trawl 40 hauls Malacca Strait Martosubroto et al. (1 996)
HR: 36 m TS: variable depth range: 10-70+ m MS: 40 mm TD: 2.0 hour mean catch rates: 45-158 kg.hour-'
-
5 Apr 1983 R. V. Bawal Putih I HR: 34.6 m 10 hauls stock density: 0.7-2.5 t.km Malacca Strait
GR: 42.2 m TS: 3.0-3.5 knots depth range: 20-60 m TD: 1.0 hour
HR: 24.1 m 34 hauls GR: 29.0 m TS: 3.0-3.5 knots
.. - TD: 1.0 hour -
INDONESIA (SOUTHEASTERN PART OF INDIAN OCEAN) - 1 6 - 30 Aug 1980 R. V. Dr. Fridtjof shrimp trawl 48 hauls north and west Sumatra Aglen et al. (1981a),
Nansen 1 500 hp depth range: 10-300 m Bianchi (1 996) HR: 134 ft average catch rates: 27-112 kghoui', all depths
estimated standing demersal stock was 65 000 t and about 80% of the demersal fish was found within 50 m depths (acoustic estimate of standing demersal stock was 124 000 t) Leiognathidae was the most dominant catch Trichiurus haumela and various Carangidae were caught mostly in shallow areas; the families Nemipteridae, Mullidae and Synodontidae were frequently occurring while Lutjanidae and Serranidae were restricted along the edge of shelf other gears used: pelagic trawl (22 hauls) and echo recordings other information collacted: bottom conditions,
~ -- hydrog-hy and nutrients -- -- 2 Aug 1979 - ER.V. Jurong high opening 51 5 hauls extent of trawled area: central coast of Lohmeyer (1996)
Jul 1981 bottom otter TS: 3.0 knots Sumatra to Java and Bali; 70 000 km2 trawl TD: 1.0 hour depth range: 50-200+ m
MS: 40 mm other geartinformation used: pelagic trawl (154 hauls), echosounding mean catch rates: 18-1 495 kg.houii (n= 301, all depths and seasons)
- . - . ....- biomass: 43 000-140 000 t

- -
Areal survey no. Period (date) Vessel Trawl gear Trawl operations Resultslnotes References
3 Nov 1980 - R. V. Bawal Putih 2 En~e l tvpe, 121 hauls southeastern part of Indian ocean (in the Martosubroto et al. (1 996) Oct 1981 high opening
bottom trawl MS: 40 rnrn
4 Jun 1982 R. V. Bawal Putih I HR: 32.6 m 9 hauls GR: 40.2 rn TS: 3.0 knots
TD: 1.0 hour HR: 40.6 rn 9 hauls GR: 43.7 m TS: 3.0 knots
TD: 1.0 hour 5 Feb - Mar 1984 M. V. Aman- 10 HR: 25.3 m 52 hauls
-
GR: 29.0 m TS: 2.4-3.0 knots TD: 2.5-3.3 hour
6 27 Mar - R. V. Bawal Putih I1 HR: 33.8 m 38 hauls 5 May 1985 GR: 37.7 m TS: 2.5-3.0 knots
vicinity of Lornbok, Sumbawa, Surnba, Flores and Timor); 3 270 krn2 depth range: 4 0 0 rn other information:, temperature profiles by bathythermographs catch rates: 21 1-646 kg.houii stock density: 1.9-4.5 t.km2 total potential fish yield: 163 950 byrl Arafura Sea (sub-area Dolak) depth range: 15-40 m
Arafura Sea (sub-area Bintuni Bay) depth range: 10-30 m
Arafura Sea (sub-area Dolak, Tirnika) depth range: 10-40 rn
TD: 1 .O-1.5 hour 7 May - Oct 1991 R. V. Bawal Putih I1 476 hauls Arafura Sea (sub-area Aru)
TS: 3.0 knots depth range: 10-40 TD: 2.0-3.0 hour
8 5 Nov - M. V. Baruna Jaya lV HR: 16.4 m TS: 3.0 knots Arafura Sea (sub-area Dolak) 21 Dec 1992 GR: 18.1 m TD: 1.0 hour depth range: 30-250 m
9 Sep - Oct 1995 R. V. Bawal Putih I HR: 34.6 rn 40 hauls depth range: 15-90 rn GR: 42.2 m TS: 2.5 knots West Sumatra (sub-area Bengkulu)
TD: 0.5-1.0 hour MALAYSIA (West Coast)
1 1965 M. V. Selayang otterboard trawl 31 hauls off Penang Pathansali et al. (1 967) wooden trawler depth range: 10-50 rn 16.75 m LOA range of mean catch rate: 50-234 kg.houil 95 hp highest at 30 m depth and lowest at 50 m
other information: catch rates and percent composition of species by depth, bathymetric distributions of fish fauna, increase of mean lengths of fish with depth and relationship of catch with hydrographic factors --
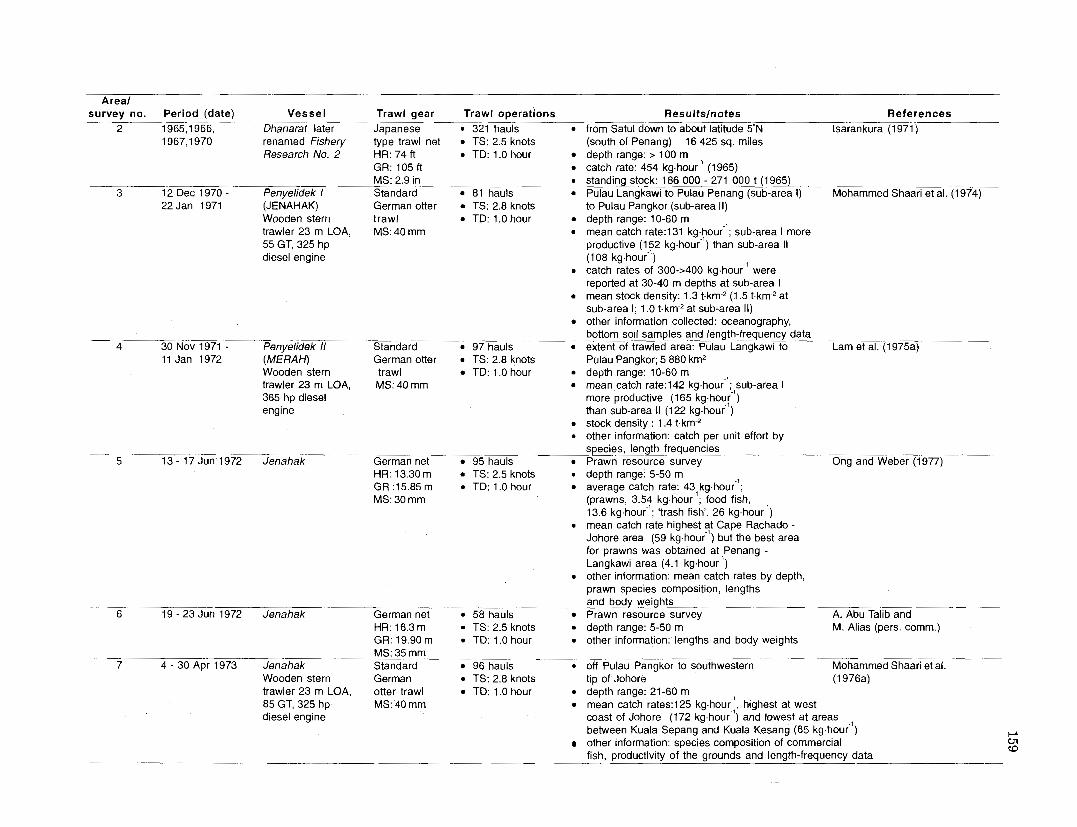
Areal survey no. Period (date) Vessel Trawl gear Trawl operations Resultslnotes References
2 1965,1966, Dhanarat later Japanese 321 hauls from Satul down to about latitude 5mN lsarankura (1 971) 1967,1970 renamed Fishery type trawl net TS: 2.5 knots (south of Penang) 16 425 sq. miles
Research No. 2 HR: 74 ft TD: 1.0 hour depth range: > 100 rn GR: 105 ft catch rate: 454 kg-hour-' (1965) MS: 2.9 in standing stock: 186 000 - 271 000 t (1965)
3 12 Dec 1970 - Penyelidek I Standard 81 hauls Pulau Langkawi to Pulau Penang (sub-area I) Mohammed Shaari et al. (1974) 22 Jan 1971 (JENAHAK) German otter TS: 2.8 knots to Pulau Pangkor (sub-area II)
Wooden stern trawl TD: 1.0 hour depth range: 10-60 rn trawler 23 m LOA, MS: 40 mm mean catch rate:131 kg.voufi; sub-area I more 55 GT, 325 hp productive (172 kg.houf ) than sub-area II diesel engine (108 kg.houf )
catch rates of 300-,400 kg.houfi were reported at 30-40 m depths at sub-area I mean stock density: 1.3 t.km-2 (1.5 t.km-2 at sub-area I; 1.0 t.km2 at sub-area II) other information collected: oceanography, bottom soil samples and length-frequency data
4 30 Nov 1971 - Penyelidek I1 Standard 97 hauls extent of trawled area: Pulau Langkawi to Lam et al. (1 975a) 11 Jan 1972 (MERAH) German otter TS: 2.8 knots Pulau Pangkor; 5 880 km2
Wooden stern trawl TD: 1.0 hour depth range: 10-60 m trawler 23 m LOA, MS: 40 mm mean catch rate:142 kg-hour-'; ,sub-area I 365 hp diesel more productive (1 65 kg.houf ) engine than sub-area 11 (1 22 kg.houf )
stock density : 1.4 t.km-2 other information: catch per unit effort by species, length frequencies
5 13-17Jun1972 Jenahak German net 95 hauls Prawn resource survey Ong and Weber (1977) HR: 13.30 m TS: 2.5 knots depth range: 5-50 m GR :15.85 m TD: 1 .O hour average catch rate: 431kg.hour-i; MS: 30 mm (prawns, 3.5f kg.hour' ; food fish,
13.6 kg.houf ; 'trash fish', 26 kg.houfi) mean catch rate highest qt Cape Rachado - Johore area (59 kg.houf ) but the best area for prawns was obtained at ,Penang - Langkawi area (4.1 kg.hour- ) other information: mean catch rates by depth, prawn species composition, lengths and body weights
6 19 - 23 Jun 1972 Jenahak German net 58 hauls Prawn resource survey A. Abu Talib and HR: 16.3 m TS: 2.5 knots depth range: 5-50 m M. Alias (pers. comrn.) GR: 19.90 m TD: 1 .O hour other information: lengths and body weights MS: 35 mm
7 4 - 30 Apr 1973 Jenahak Standard 96 hauls off Pulau Pangkor to southwestern Mohammed Shaari et al. Wooden stern German TS: 2.8 knots tip of Johore (1 976a) trawler 23 m LOA, otter trawl TD: 1.0 hour depth range: 21-60 m 85 GT, 325 hp MS: 40 mm mean catch rates125 kg.hour::, highest at west diesel engine coast of Johore (172 kg.hour ) and lowest at areas
between Kuala Sepang and Kuala Kesang (65 kg.houfi) + other information: species composition of commercial w cO fish, productivity of the grounds and length-frequency data

Areal CL 0)
survey no. Period (date) Vessel Trawl gear Trawl operations Results/notes References o 8 16 Nov - Jenahak Standard 90 hauls Pulau Langkawi to Pulau Pangkor Mohammed Shaari and Chai (1976)
11 Dec 1974 German otter TS: 3.0 knots d e ~ t h ranae: 10-60 m
17 Oct - 18 Nov 1978
Jenahak
trawl TD: 1.0 hour 0
Standard 114 hauls German otter TS: 2.8 knots trawl TD: 1.0 hour
other info;mation: length-frequency data mean catch rate: 92 kg.hour-I; rates indicated 30% decrease from previously reported values in sub-areas I and I1 higher percentage of squids and cuttle fish caught than the previous surveys; Nov. was cephalopod season Pulau Langkawi to Pulau Pangkor depth range: 10-60 m mean catch rates: 69 kg.hour I, further decline from previous surveys, sub-area I could only yield 50-100 kg.hour high catch rate recorded at 21-30 m depth (1 05 kg.hourl) other information: catch composition, catch
Lui (1981)
rates by fish grouplfamilies and length-frequency data 10 5 - 1 5 Jul 1980 R. V. Dr. Fridjoft shrimp trawl 35 hauls between latitude 6 N near the Thai-Malaysia Aglen et al. (1 981 b)
Nansen HL: 134 ft border to 3'N off Port Kelang and extending seawards to the median line between Malaysia and Sumatra depth range: 10-100 m average catch rates of 50-60 kg.houil, no strong variation with depth total standing demersal stock: 34 500 t (acoustic estimate was 300 000 t of pelagic fish and 30 000 t demersal fish) other information collected: fish distribution and catch composition, bottom conditions and hydrography vessel was equipped for acoustic surveying, bottom and midwater trawling, hydrography and plankton observations
11 20 Nov - Jenahak Standard 92 hauls depth range: 10-60 m A. Abu Talib and M. Alias 23 Dec 1980 German otter TS: 2.8 knots other information: length frequency (pers. comm.)
trawl TD: 1.0 hour 12 22 Apr - Pelaling Local design 11 7 hauls Prawn resource survey Nasir and Johari (1990)
14 Jul 1981 Wooden hull net TS: 2.2 knots depth range: 1-50 m 15.85 m LOA TL: 35.1 4 m TD: 1 .O hour prawn catch rate: 42 GT, 160 hp HR: 23.5 m 2.18 kg.houii in 1981
GR: 24.7 m 0.59 kg.houil in 1984 MS: 40 mm
13 12 Apr - 137 hauls reduction in number of fishing grounds Ahmad Adnan (1987) 29 Aug 1984 TS: 2.2 knots with high catch rates
TD: 1.0 hour other information: individual total lengths and body weights

survey no. Period (date) Vessel Trawl gear Trawl operations Resultslnotes References 14 13 Oct - Jenahak Standard 76 hauls Pulau Langkawi to Pulau Pangkor Ahmad Adnan (1987)
15 Nov 1981 German otter TS: 2.8 knots depth range: 60-120 m trawl TD: 1.0 hour mean catch rate: 55 kg.houii
other information: catch composition, catch rates by fish groupslfamilies and length-frequency
44 hauls data other information: length-frequency data
TO: 1.0 hour -pp----- -
16 6 Jul - Pelaling Local design 148 hauls Prawn resource survey A. Abu Talib and M. Alias 19 Sep 1987 net TS: 1.2 knots depth range: 5-50 m (pers. comm.)
TD: 1.0 hour ~ ~ ~
other information: lenqths and-body weights -
17 23 Oct - Kerapu IV Local design 104 hauls Prawn resource survey A. Abu Talib and M. Alias 19 Dec 1988 Wooden hull net TS: 1.2 knots depth range: 5-50 m (pers. comm.)
-- -- 110 hp, 40 GT TD: 1.0 hour other information: total lengths and body weights 18 1988 Mersuji 41 hauls other information: length-frequency data
- TD: 1.0 hour 19 1989, 1990 Mersuji 28 hauls other information: length-frequency data
- - - TO: 1.0 hour
20 31 Jul - Pelaling Local design 68 hauls Prawn resource survey A. Abu Talib and M. Alias 19 Dec 1990 net TS: 2.0 knots depth range: 5-50 m (pers. comm.)
TD: 1.0 hour other information: lengths and body weights 2 1 1990, 1991 Mersuji 58 hauls other information: length-frequency data
TD: 1.0 hour MALAYSIA (East Coast)
1 1926 S.T. Tonggol d e ~ t h ranae: 10-60 m Birtwistle and Green (1927. 1928);
3 1 Mar - Pramong I1 German type 153 hauls 11 Apr 1967 Wooden stern otterboard TD: 1.0 hour
trawler trawl net . 23 m LOA MS: 40 mm 320 hp
Menavesta (1970) Ommaney (1 961 In Menavesta . . 1970)
Thai border to Johore Marine Fisheries Laboratory, depth range: 10-60 m Department of Fisheries, Ministry mean catch rate: 428 kg,t;lour-I of Agriculture, Bangkok, Thailand (range: 23-3 000 kg.houi ) and Fisheries Research Institute, Sub-area Ill (off Kuantan and north of P. Tiotyan) Fisheries Division, Ministry of had highest mean catch rate of 745 kg.hour Agriculture and Cooperatives, while subarea lowest at yb-area IV Malaysia (1 967) (off Johore),l83 kg.hour 21-30 m depth yielded highest mean catch (646 kg.hour-'); other depths compare as follows: 31 -4O>l O-2O>41-5O>51-6O other information collected: catch composition, comparison of catch rates between fish for human consumption and 'trash fish', estimate of catch value, bottom characteristics, fish tagging and fish biology studies -~

Areal survey no. Period (date) Vessel Trawl gear Trawl operations Resultslnotes References N
G 4 10 Aug - Penyelidek l Engel type trawl 151 hauls Thai border to Johore Pathansali et al. (1 974)
4 Oct 1970 Wooden stern HR: 20 m TS: 2.8 knots depth range: 10-65 m trawler MS: 40 mm TD: 1.0 hour mean catch rate: 516 kg.howl; highest catches
85 GT, 23 m LOA * were recorded at Pahang with a mean of 325 hp 835 kg.hour-'; lowest at Johore with a mean
of 21 0 kg.hour-I 21-30 m depths yielded highest mean catch (816 kg.hour-I); other depths compare as: 1 O-2O>31-4O>51-6O other information: data on catch rates according to commercial fish and 'trash fish' as well as catch rates according to species, length frequencies, tagging of fish, soil/bottom sample, oceanography (temperature, salinity, dissolved oxygen and pH) -
5 23 Mar - R. V. Jenahak Engel type trawl 150 hauls Thai border to Johore Jothy et al. (1975) 26 May 1971 (Penyelidek I) HR: 20 m TS: 2.8 knots depth range: 10-60 m
MS: 40 mm TD: 1.0 hour other information: length frequencies, tagging of fish, soil/bottom sample, oceanography (temperature, salinity, dissolved oxygen and pH) mean catch rate: 167 kg.hourl
6 14 Aug - H.V. Jenahak tngel type trawl 145 hauls Thai border to Johore Lam et al. (19/sb) 20 Sep 1972 HR :20 m TS: 2.8 knots depth range: 10-80 m
MS: 40 mm TD: 1.0 hour mean catch rate: 255 kg.hourl, highest at sub-area II (southern two-thirds of Terengganu), 377 kg.hour-' and lowest at sub-area Ill (Pahang), 21 7 kg.hour-I other information: catch rates by depth zones, catch rate of food and 'trash fish' and catch rate by species, length-frequency data
7 13 Jul - R. K Jenahak Standard 97 hauls depth range: 10-60 m Lamp and Mohammed Shaari 12 Auq 1974 German otter TS: 2.8 knots mean catch rate : 238 ka.hour-l; hiahest at (1 976) -
trawl net TD: 1.0 hour sub-area II (southern two-thirds oi~erenaanu), " 358 kg.hour-I and lowest at sub-area I (coast of Kelantan), 145 kg.hour-I commercial fish catch highest at 31-60 m depths (155.1-233 kg.hour-l) other information: occurrence of the frequently occurring families and species of
8 Jun - Jul l981 R. V. Jenahak Standard 78 hauls commercial value were discussed Sub-areas I to IV surveyed Ahmad Adnan (1 990)
German otter TS: 2.8 knots depth range: 10-60 m trawl net TD: 1.0 hour mean catch rate: 160 kglhr-'; commercial fish,
57.8 kg.howl and 'trash fish', 102 kg.hourl other information: catch rates and percent dominance of fish groups by depth zones and subareas, length-frequency data

Areal survey no. Period (date) Vessel Trawl gear Trawl operations Resultslnotes
9 Nov 1969 - M. V. Changi 321 hauls examined population parameters of ten
References A. Abu Talib and Hayase (1984b)
Oct 1973 387 GT research vessel of the Marine Fisheries Research Department, SEAFDEC
10 10 - 25 Jun 1980 R. V. Dr. Fridtjof shrimp trawl 60 hauls Nansen HL: 134 ft
selected demersal fish and squid species taken off the southern east coast at sub- area VII (Pahang, 216 hauls) and sub-area Vlll (Johore, 105 hauls) catch and effort data (by area) and the distribution of Lutjanus spp., Mullidae, Nemipterus spp., Pomadasyidae, Priacanthus spp., Pristipomoides spp., Scomberomorous spp. and squid and cuttlefish were provided stock density: 4.5 t.km-2 (area VII) and 6.3 t.km-2 (area VIII) standing stock: 19 000 t (area VIE) and 15 000 t (area VIII) from Singapore to off Tumpat coast Aglen et al. (1981 b) areas divided into coastal areas (10-25 m depth zones) and offshore areas (26-100 m depth zones) average catch rates: coastal areas: 160 kg.hour: offshore areas: 51 kg.hour demersal stock: 80 000 t ( 32 000 t at coastal areas and 48 000 t at offshore areas) other information provided were pelagic trawl to echo-recording results
1983 R. V. Mersuji Standard 115 hauls other information: length-frequency data
R. V. Mersuji
Jul 1984 and Aug 1985
7 - 17 May 1985
Unipertama I
R. V. Kagoshima Maru
68.93 m LOA 1 293 GT
German otter trawl net Standard . German otter trawl net WS(effective): 6 m MS: 38.1 mm
otter trawl HL: 53.07 m and 42.64 m MS: 38.1 mm and 31.8 mm
TS: 2.8 knots TD: 1.0 hr 120 hauls . TS: 2.8 knots TD: 1.0 hr 15 hauls TS: 2.3-2.4 knots TD: 1.0 hr .
0
0 --
13 hauls TD: 1.0 hr
other information: length-frequency data
extent of trawled area: off Terengganu; 1 050 km2 depth range: c20 m other information: length-frequencies, biomass estimates usino ECOPATH stock density: 1 216 kg,km2 results of Ex~edisi Matahari '85 in the offshore waters of ~ a l a ~ s i a n EEZ off the coast of Terengganu, 8 147 km2, 90-220 km from the coast, between lat~tude 05"lO'N - 06"23'N and longitude 103"30'E - 140'36'E depth range: 60-80 m dominant catches were Lutjanidae, Nemipteridae, Synodontidae, Priacanth~dae, Balistidae, Carangidae, Mullidae, Loliginidae and Sepiidae biomass: 2 762 t
Chan and Liew (1986)
-- Mohamed et al. (1 986)
total catch landed: 937 ka Cu

Areal survey no. Period (date) Vessel Trawl gear Trawl operations Resultslnotes
15 1988 R. V. Mersuji Standard 120 hauls other information: length-frequency data
References
German otter TS: 2.8 knots trawl net * TD: 1.0 hour
16 1990 R. V. Mersuji Standard 60 hauls other information: length-frequency data German otter f S: 2.8 knots
R. V. Mersuji trawl net *. TD: 1.0 hour Standard 62 hauls other information: lenqth-frequency data - German otter TS: 2.8 knots trawl net TD: 1.0 hour
18 1995 R. V. Mersuj~ Standard 100 hauls other information: length-frequency data German otter TS: 2.8 knots
- trawl net TD: 1.0 hour MALAYSIA (BOTHEASTAND WEST COASTS)
1 1971 - 1980 assessment of demersal resources taken from A. Abu Talib and Hayase (1984a) total landings by trawls and dernersal landing from all types of fishing gears in the west and east coasts of Malaysia; divided into eight sub-areas data analysis of catch by trawl vs catch by all types of fishing gear were done for dernersal fish and prawns results showed that the trawl was the sole or major gear used for dernersal fishes while prawn were also strongly exploited by other gears at the same rate target species of trawls have changed from demersal fish to prawns after 1972 MSY of demersal fish: 168 810 t.yearl (west coast) and 56 870 t (east coast) MSY of prawns: 66 340 tyear-I (west coast) and
29 Mar - R V. Jenahak Standard 292 hauls off the coasts of Sarawak, BrUnel ana west 1 May 1972 Wooden vessel German otter TS: 2.8 knots coast of Sabah
23 m LOA, 85 GT trawl TD: 1.0 hour depth range: 10-60 m 325 hp; and MS: 40 mm mean catch rates: 318 kg.hourl R.V. Merah Polyethylene other information: catch composition, average Wooden vessel catch rates by sub-areas and depths and 23 m LOA. 80 GT bottom samples

Areal survey no. Period (date) Vessel Trawl gear Trawl operations Resultslnotes References
2 17 Aug - R.V. Jenahak Standard 1 1 2 hauls off the coast of Sarawak, Tanjung Datu to Miri Mohammed Shaari et al. (1976~)
18 Sep 1973 German TS: 2.8 knots depth range: 10-60 m otter trawl TD: 1.0 hour mean catch rates: 210 kg.hour-I MS: 40 mm highest mean catch rates 21-30 m depths Polyethylene (372 kg.hour-I)
'trash fish' contributed 27% to total catch by weight
0 other information: catch composition of commercial fish, locations of productive grounds and bottom characteristics
3 16 Jul - R. V. Jenahak Standard 174 hauls off the coast of Sarawak, Tanjung Datu to Miri Lui et al. (1976) 8 Aug 1975 and R. V. Merah German TS: 2.8 knots depth range: 10-60 m
otter trawl TD: 1.0 hour mean catch rates: 200 kg.hour-I MS: 40 mm Polyethylene
'trash fish' contributed 39% to total catch by weight other information: average catch rates by sub-areas and depth, catch composition of commercial fish, distribution of lutjanids and bottom samples
A 79 ,111r-i - R. V. Merah Standard 105 hauls depth range: 10-60 m A. Abu Talib and M. Alias -- 12 Aug 1977
10 Aug 1979 R.V. Merah
German otter TS: 2.8 knots other information: bottom sample and trawl TD: 1.0 hour length frequencies MS: 40 mm Polyethylene MS: 38.1 mm
6 12 May - R. V. Malong Double-rigged 25 Jul 1980 Wooden vessel HR: 15.7 m
83 GT MS: 31.5 mm 190 hp, Diesel Polyethylene Double rigger with boom trawler
120 hauls TS: 2.8 knots TD: 1.0 hour 64 hauls TS: 2.0 knots TD: 1.0 hour
0
(pers. comm.); Bejie undated; (unpublished)
depth range: 10-50 m A. Abu Talib and M. Alias other information: surface water temperature. f~ers . cdmm.): Beiie bottom characteristics and 'trash fish' composition b980; unpublished) prawn resource survey Beiie (1 985a) . \
coast of Sarawak (Pulau Burong to Kuala Bintulu) depth range: 4-20 m mean catch rate: 95.05 kglhaul (food fish, 40.51 kglhaul; prawns, 2.08 kglhaul; trash fish, 52.52 kglhaul) most abundant prawn species were Penaeus indicus and Parapeneopsis hardwickii other information: prawn species composition, general biology of prawns, length by sex and grounds suitable for trawling
7 26 Jun R.V. Merah MS: 38.1 m 133 hauls depth range: 10-60 m A. Abu Talib and M. Alias - -
8 Aua 1980 TS: 2.8 knots other information: bottom sample, surface hers. c0mm.l: ., TD: 1.0 hour water temperature and salmity Gambang (1 981 ; unpublished)
-- 8 8 - 28 Apr 1981 R. V. Malong Double-rigged 75 hauls Prawn resource survey Bejie (1 985b)
HR: 15.7 m TS: 2.8 knots coast of Sarawak, Semantan to Miri MS: 31.5 mm TD: 1 .O hour depth range: 4-28 m Polyethylene mean catch rate: 126.71 kg.houri (fish + prawn);
4.25 kg.hour-I (prawn only) other information: catch rate by species and depth, by haul and sub-area, prawn species composition,
CL length by sex, salinity and sea surface temperature Q,
01

--
Areal w survey no. Period (date) Vessel Trawl gear Trawl operations Resultslnotes References Q, Q,
9 16 Mav - R V. Merah MS 38 1 mm 120 hauls extent of trawled area. coast of Sarawak; Gambanq (1 986a) - TS: 2.8 knots 25 000 km2 TD: 1.0 hour depth range: 10-60 m
mean catch rate: 162 kg.hour-I (53% were commercial fish; 47%, 'trash fish') Sub-area II (Bintulu to Miri) had highest catch rates, 217 kg.hour-I and lowest at sub-area I (Tg. Datu - Tg. Sirik), 125 kg.hourl highest catch rate was at 41-50 m depth, but at 40 m towards shallow water, rates increased most abundant groups were Rajiformes, Mullidae and Leiognathidae other information: mean catch rates by substrate, catch composition of commercial fish, trawlable grounds, hauls with distinct catch, bottom sample, surface water temaerature and salinitv
10 11 Mar- R. V. M~long Double-rigged 82 hauls Prawn resource swvey Bejie (1986) 13 Jun 1982 HR: 15.7 m TS: 2.8 knots coast of Sarawak, Semantan to Miri
MS: 31.5 mm 8 TD: 1 .O hour depth range: 6-33 m Polyethylene catch rate: 3.9 kg.hourl (prawn only)
other information: catch rates by groups, prawn species composition, length by sex; salinity and surface sea temperature
11 20 Aor - R. V. Merah MS: 38.1 mm 103 hauls coast of Sarawak; 17 420 km2 Gambang (1 986b) 10 Jun 1982
12 16 Aug - R. V. Merah MS: 38. 18 Oct 1983
TS: 2.8 knots TD: 1.0 hour
I mm 93 hauls TS: 2.8 knots TD: 1.0 hour
1 mm 89 hauls 13 12May - R. V. Merah MS: 38. 17 Jun 1987 TS: 2.8 knots
TD: 1.0 hour
depth range: 10-60 m catch rate: 171 kg.hourl (commercial: 80 kg.hour1; trash: 91 kg.hourl) stock density: 3.98 t.km2 (commercial); 4.88 t.krw2 ('trash') total biomass: 48 957 t Rajiformes and Tachysuridae dominated the catch other information: mean catch rates by depth, mean catch rates by substrate, catch composition of commercial fish, trawlable grounds, bottom charac- teristics, surface water temperature and salinity depth range: 10-60 m A. Abu Talib and M. Alias other information: bottom sample, surface (pers. comm.) water temperature and salinity coast of Sarawak Gambana 11 987) depth range: 10-60 m mean catch rate: 79 kg.hour-l; 46% were commercial fish and 54% were 'trash fish' change in most abundant groups, Clupeidae, Lamniformes and Tachysuridae dominated other information: mean catch rates by sub-area, depth zone and substrate, catch composition of commercial fish, bottom sample, surface water temaerature and salinitv

Areal survey no. per iod (date) Vessel Trawl gear
14 1990 R V Malong Double-r~gged HR 157m MS 31 5mm Polyethylene --
15 1991 R V Malong Double-r~gged HO 1 5 7 m MS 31 5mm Polyethylene
17 5 Apr -
R. V Malong Double-rigged HO: 15.7 m MS: 31.5 mm Polyethylene
R. I/. Manchong High-opening 22 May 1991 27.5 m Fiberglass otter trawl
150 GT HO: 20.5 m 900 hp Diesel MS: 28 mm
GR with
Trawl operations Resultslnotes 26 hauls Prawn resource survey
Refec.ences A. Abu Talib and M. Alias'
TS: 2.8 knots other information: length by sex; salinity (pers. cornrn.) TD: 1.0 hour and surface sea temperature
24 hauls Prawn resource survey A. Abu Talib and M. Alias TS: 2.8 knots TD: 1.0 hour
24 hauls TS: 2.8 knots TD: 1.0 hour
46 hauls TS: 3.6 knots TD: 1.0 hour
other information: length by sex; salinity (pers. comm.) and surface sea temperature
Prawn resource survey A. Abu Talib and M. Alias other information: length by sex; salinity (pers. comm.) and surface sea temperature
depth range: 20-60 m A. Abu Talib and M. Alias other information: bottom samples, surface (pers. comm.) water temperature, salinity and length- frequency data
rubber-discs 18 1996 M. V. SEAFDEC surveyed Sarawak, Brunei and Sabah M.I. Mansor (pers. comm.)
and K.K. Manchong PHILIPPINES (exploratory surveys in different areas)
1 1845 - 1847 Galathea surveyed Manila Bay, Dinagat and Surigao Warfel and Manacop (1950); Danish vessel Sebastian (1 951);
Ronquillo (1 959) 2 1872 - 1877 British H. M. S. Challenger surveyed Philippme Deep Seas Warfel and Manacop (1950);
Deep Sea Expedition Sebastian (1 951);
-- Ronquillo (1 959) 3 1907 - 1909 Albatross Phihpplne Extensive investigation of marine life Warfel and Manacop (1950);
Expedit~on in the islands Sebastian (1 951); sponsored by the US Ronquillo (1 959) Bureau of F~shenes
4 1909 English Steam Otter trawl Explored trawlable grouncls from Warfel and Manacop (1950), trawler Man~la to V~sayas Sebastian (1 951);
--- Ronquillo (1 959)
5 1940 Experiment of the Otter trawl Warfel and Manacop (1 950) Philippme Bureau of Fisheries

w 0, 00
Areal survey no. Period (date) Vessel Trawl gear Trawl operations Resultslnotes References
6 1947 - 1949 Theodore N. Hill 'Eastern type 157 hauls exploratory trawl fishing Warfe! and Manacop (1950) 400 hp and net' 24 areas Lingayen Gulf, West of Bataan, David Star Jordan MS: 4.5 in and Manila Bay approach, Manila Bay, Tayabas Bay,
'Western type' Mangarin Bay, Ragay Gulf, Burias Pass, Alabat MS: 2.5 in Sound, Tabaco Bay, Samar Sea, Carigara Bay,
San Pedro Bay, Leyte Gulf, West Visayan Sea, Guimaras Strait, Panay Gulf, Panguil Bay, Sibuguey Bay and Off Taganak Island depth range: 4-1 80 m catch rates: 2.3-115 kg.hour-I (mean for all areas: 68.6 kg.hourl) greatest catch rates taken at 11-36 m depth 98 species (30 families) caught, slipmouths
-- predominated 7 1951 - 1952 Danish Deep Sea Trawled deepest part of Philippine trench Megia et al. (1 953)
Galathea Expedition PHILIPPINES (MANILA BAY)
1 n s h i n g - 1 0 1956 hauls per Manila Bay Manacop and Laron (1 956) 2.5-9 hp night depth range: 0.5-3 m
TS: 1-1.5 knots TD: 20-30 min
2 Nov 1956 - Otter trawl, Manila Bay between Cavite and Bataan Tiews and Caces-Borja (1 959) Oct 1958 MS: 3.2-2.8 cm depth range: 4-16 m
3 Apr 1957 - 'Dug-out' or 703 hauls Manila Bay between Cavite and Bataan Tiews and Caces-Borja(1959) Baby trawl TD:30 min depth range: 1-4 m MS: 11 mm, 314 in
4 1957--- p M. V. lldefonso Otter trawl Man~la Bay Honquillo et al. (1960) 1 18.77 GT, 80 hp (mestizo type) catch rates: 16 kg.hourl ('57); 13 kg.hourl M. V. lldefonso IV MS: 1-1.5 in ('58); 12 kg.hourl ('59) 48.37 GT, 80 hp annual mean landings: 7 165 t ('57); 6 724 t M. V. Leonor V ('58); 6 724 t ('59) 60.43 GT, 160 hp M. V. Dona Lina D 83.85 GT, 325 hp
5 1960 - 1962 commercial trawls Manila Bay Caces-Borja et at. (1972)
-- 6 Dec 1978 Commercial German Trawl A 21 hauls Manila Bay Caces-Borja (1 972)
medium-s~zed (244x160 mm) TD: 2-4 hours trawlers, 40-44 GT, German Trawl B 225 hp (418x160 mm),
Norwegian Star Trawler, Norwegian net (locally made)

-- ~p
Areal survey no. Period (date) Vessel Trawl gear Trawl operations Results/notes References
7 Nov 1970 - EB. Carlos Renato I1 German TS: 2.5-3.5 Central Manila Bay De Jesus (1976) Feb 1971 44.9 GT, 2x225 hp (Herman Engel knots
and type) trawl TD: 0.5-3.0 EB. Maria Cynthia 11 (234x1 60 rnrn) hours 40.01 GT, 2x250 hp Norwegian Star Trawl net Horsenet (locally made) German Trawl (418-160 mm)
-- -- ppp - . 8 15 - 29 Feb Fishing boat Otter trawl - - 3 hauls Manila Bay (Bulacan, Batangas and Bautista and Rubio (1981)
1980 8.18 GT Cavite coasts) depth range: 6-14 m stock density: 0.98 tkm-'
--- biomass: 1 760 t 9 Nov 1992 - Baby trawler FUSO Otter trawl TD: 1.0 hour Manila Bay: 1 782 krn2 MADECOR and National Museum
Oct 1993 2DR5 MS: 220 rnm depth range: 10-30 rn (1 994) LOA: 13.5 rn (stretched) 16 fishing stations Fishing boat CPUE: 13.8 kg.hour-I with biomass: 1 730 t outriggers stock density: 0.96 t.km2
10 Sep 1995 - commercial trawler 4 seam otter 31 hauls Manila Bay approaches Mav 1996 FUSO 4DR5 trawl TS: 3.8 knots CPUE: 64 ka.hfl
Pura et al. (1996b) -
LOA: 13.5 rn HR: 61.5 rn TD: 1.0 hour MS: 4.2 cm
PHILIPPINES (SAN MIGUEL BAY) 1 1957158 Arca I and Arca 11 >I00 hauls San Miquel Bay dailv re~or ts of a ~r ivate
stock ,&sity: 5.20 t.krn4 trawlable biomass: 4 370 t
operato; to BFAR '~esearch Division In Pauly (1 982)
2 Jul1967 R. V. Maya Maya 2 hauls San Miguel Bay logbook of R. V. Maya Maya stock density: 3.91 t.km 2 (BFAR Research Division) trawlable biomass: 3 280 t In Pauly (1 982)
- 3 20 Apr - Commercial Boat San Miguel Bay Legasto et al. (1975a)
17 May 1975 (Baby trawl) . - 9 - 1 0 ~ 0 ~ 1 9 7 5 35ton,9hp'
4 Sea 1977 'a baby trawl' 6 hauls San Micluel Bay Manuscriat. BFAR Research . . stock d&sity: 3.49 t.km2 trawlable biomass: 2 930 t
5 Jul1979 EB. Gemma 3 hauls San Miguel Bay Manuscript, BFAR Research stock densitv: 1.84 t.km-' Division In Paulv (1 982) , . , trawlable biomass: 1 560 t - +
6 Feb 1980 EB. Sandeman 25 hauls San Miguel Bay Manuscr~pt, BFAR Research a cn stock density: 1.89 t.km" Division In Pauly (1 982) trawlable biomass: 1 590 t

Areal survey no. Period (date) Vessel Trawl gear Trawl operations Resultslnotes References -
7 1980 - 1981 average small San Miguel Bay Vakily (1 982) trawler stock density: 2.13 t.km.2
trawlable biomass: 1 790 t 8 ~ e p 1992 - EB. Ryan IV 4-seam bottom 56 hauls San Miguel Bay; 1 115 km2 Cinco et al. (1 995)
Jun 1993 1.93 GT, 65 hp. trawl TS: 3.0 knots depth range: 7.4-18 m MS: 0.9 cm TD: 1.0 hour 9 fishing stations . CPUE: 32.3 kg.houil . biomass: 1 636 t
stock density: 1.96 t.km-2 PHILIPPINES (OTHER AREAS SOUTHEAST OF LUZONl
1 Dec 1967 Japanese type two- 4-seam type, Tayabas Bay and Samar Sea Encina (1 972) boat trawler, 100 GT MS: 51.2 mm depth ranges: 35-38 m; 36-39 m
2 18 - 28 Apr 1972 Commercial boat MS: 4 cm 4 hauls Sorsogon Bay Ordoiiez et al. (1975) Baby trawler (stretched) TS: 1 .O-2.0 knots depth range: 10-20 m 30 hp TD: 0.5 hour
3 13 - 26 Mar 1974 R. V. Researcher Norwegian type 2 hauls extent of trawled area: Tayabas Bay Ordoiiez et al. (1977) 508.59 GT otter trawl TD: 2.25 hour (area north of Marinduque Is. and
Mompog Pass); 4 000 km2 depth range: 25-45 rn
4 Oct 1975 Commercial Boat Baby trawl 6 hauls Maqueda Bay, Villareal Bay and Legasto et al. (1975b) 10 hp MS: 1.0 crn TS: 2.0-3.0 knots Zurnarraga Channel
TD: 0.5-1.0 hour 5 Nov 1981 - R. V. Sardinella HR: 35.3 m extent of trawled area: Ragay Gulf, Mines (1 984)
Jan 1983 FR: 50.6 m Burias Pass, Ticao Pass and waters north of MS: 180 mm Samar Sea; 10 830 km2 (stretched) catch rates: 156-350 kg.houil (mean: 257 kg.hil)
stock density: 2.25-2.85 t.km2 standing stock: 1 704-6 073 t
6 Mar 1994 - Mini trawler 2-seam trawl . 84 hauls Sorsogon Bay; 256 km2 Cinco and Perez (1996) Jan 1995 0.5 GT, 16 hp MS: 1.38 cm & TS: 2.0 knots CPUE: 6.64 kg.houfl
1 .17 cm TD: 15-30 min stock densitv: 1.04 t.km.2 biomass: 143 495 t
PHILIPPINES (VISAYAN SEA) 1 Apr 1976 - M.V. Albacore 4-seam trawl, 144 hauls extent of trawled area: Visayan Sea; Aprieto and Villoso (1979)
Mar 1977 190 GT, 600 hp MS: 1.5 cm TD: 2.0 hour 5 184 km2 (stretched) depth range: 14-140 m
2 Jul 1976 - M.V. Albacore 2-seam high . 107 hauls depth range: 20-40 m Ordoiiez (1985) Mar 1977 190 GT, 600 hp opening otter Visayan Sea; 5 184 km2
trawl MS: 15 mm (stretched)
3 16 - 20 May Commercial Otter trawl 17 hauls Visayan Sea Gonzales et al. (1981) 1979 vessel TD: 1.0 hour

Areal survey no. Period (date) Vqssel Trawl gear Trawl operations Resultslnotes References PHILIPPINES [SAMAR SEA AND CARIGARA BAY)
1 Mar 1979 - M. V. Albacore 2-seam bottom 301 hauls Samar Sea and Carigara Bay; 3 050 km2 Armada and Silvestre (1 981) Mar 1980 190 GT, 600 hp trawl TS: 3.0 knots depth range: 10-1 00 m
MS: 40 mrn TD: 1.0 hour mean CPUE: 174 kg.hour" (stretched) standing stock: 3.1 t.km-z
2 11 - 12 May R. V. Sardinella 2-seam high TS: 4.0 knots SarnarSea Silvestre et al. (1986) 1982 411 GT opening bottom TD: 15-40 min depth range: 18.5-85 m
trawl MS: 40 rnm (stretched)
3 Dec 1983 R. V. Albacore 2-seam high 28 hauls Samar Sea Armada et al. (1 983) 600 hp opening bottom TS: 3.0 knots depth range: 9.9-90 m
trawl TD: 1.0 hour mean CPUE: 91.8 kg.houfl (period I) and MS: 40 mm 191.8 kg.houfl (period II)
density: 1.0 t.km-2 (period I) and 2.1 t.km2 (period I I)
4 Oct 1991 - Baby trawl 69 hauls Carigara Bay; 51 2 km2 Calumpong et al. (1 993) Aug 1992
5 Jul 1995 - Baby trawler 2 seam bottom 40 hauls Carigara Bay; 512 km2 Pura et al. (1996a) Apr 1996 85 hp, 36 GT trawl TS: 2.5 knots depth range: 10-50 m
LOA: 10 m HR: 10m TD: 1 .O-2.0 hour eight fishing stations MS: 2.0 cm CPUE: 12 kg.houil
biomass: 533 t stock density: 1.04 t.km-2
PHILIPPINES (OTHER AREAS) 1 13 - 16 Dec EB. Maharlika de Star trawl net 16 hauls Central Asid Gulf (near Circe Bank) De Jesus and Maniulit (1 973)
1969 Visayas 560x170 mm TS: 3.0-3.7 knots depth range: 12-54 m 83.8 GT, 380 hp Horsenet TD: 3.0 hour
600x4 knots (4 inch mesh)
2 Oct 1975 R. V. Researcher Norwegian TD: 0.5 hour Maiampaya Sound Barut (pers. cornm) 508.59 GT type otter
trawl
3 1977 - 1988 R. V. Researcher Norwegian Malampaya Sound, Bacuit Bay, lmman Bay, Unprocessed, unpublished 508.59 GT type otter Manila Bay and Ulugan Bay documents
tiawl 4 Feb 1978 - M. V. Albacore Otter trawl TD: 2.0 hour Lingayen Gulf, 1 900 km2 Aprieto and Villoso (1 982)
Jan 1979 190 GT, 600 hp depth range: 30-90 m 5 Apr 1983 - Medium trawl 97 hauls each extent of trawled area in Mines (1 986)
Apr 1984 Large trawl TD: 2.0-4.0 hour Lingayen Gulf; 2 109 km2 6 Mar - Dec 1991 Small otter trawl TD: 1.0 hour Panguil Bay MSU (1 993)
MS: 15 cm depth range: 10-1 5 m

Areal survey no. Period (date) Vessel Trawl gear Trawl operations Results/notes References SRl LANKA
1 1920 - 1923 R. V. Lilla Bottom trawl 395 hauls 126' LOA, HR: 70' (21.8 m) TS: 7 mi.hourl 500 hp FR: 100' (31.2 m) TD: 1.0 hour
mesh 5 (2 cm) tapering to 1" (0.4 cm) codend
0
2 1954 - 1957 R. V. Northstar 45 LOA, 80 hp
around Sri Lanka including Wadge and Pearson and Malpas (1 926) In Pedro Banks Sivasubramaniam and Maldeniya depth range: mainly 4-35 m (1 985) other information collected: echosounding, topography and bottom profiling hydrology, length frequencies, sex and stage of maturity, stomach contents catch rates: 0.9-203.5 kg.hourl Inshore waters around Sri Lanka Jean (1 957) In Sivasubramaniam catch rates: and Maldeniya (1 985) bottom longlining: 1.5-17.3 kg1100 hooks hand lining: 0.2-9.9 kg4ne.hour1 shark longline: 84.8-637 kg11 00 hooks
3 Jun 1955 - R. V. Canadian Bottom trawl TS: 1 .O-2.0 Inshore waters around Sri Lanka Jean 1957 In Sivasubramaniam Oct 1956 45' LOA, 80 hp HR: 40' (12.5 m) knots catch rates: 2.2-27.9 kg.hour-I
FR: 50' (1 9.7 m) Yankee 35 MS: 3 314"
and Maldeniya (1 985)
(1.5 cm) 4 Nov 1963 - R.V. Canadian Shrimp trawl North and East coasts Sivasubramaniam and Maldeniya
Apr 1967 45' LOA, 80 hp HR: 30' catch rates: 49-472.8 kg.hour-I (1 985) MS: 35 mm
5 May - Jun 1967 R. V. Myliddy Granton trawl TS: 1.5-3.0 North and East coasts Berg (1 971) In Sivasubramaniam 30 m LOA, MS: 80 mm (prawn trawl), depth range: 2-80 fathom (12-48 m) and Maldeniya (1985) 240 hp Shrimp trawl 3.0-4.0 other information: acoustic recordings,
MS: 40 mm (fish trawl) water temperature and salinity TD: 1.0 hour catch rates: 60-1200 kg.hour-I (8 stations,
fish and shrimp trawls) 6 Mar - Dec 1972 S.R. T.M. Optimist Bottom trawling 400 trawls northwest and northeast of Sri Lanka Demidenko (1 972) In Saetersdal
in deep waters and the Wadge Bank and de ruin (1979) depth range: 200-350 m other information: hydrology, composition of seawater, length frequencies in trawl and gill net fisheries total catch including fish: 22 344 kg; 4 781 kg (prawn catch); 5 892 kg (lobster catch) catch rates: 175.24 kg.hour-I (prawns, lobsters, fish); 46.21 kg.hour-I (lobsters); 37.40 kg.hourl (prawns)
7 Nov 1975 - R. V. Hurulla Bottom trawl TS: 6.0 knots depth range: 3-28 m Henriksson (1 980) In Sivasubra- Jun 1978 11 m length, 96 hp MS: 32-36 mm TD: 1 .O hour Palk Bay and Gulf of Mannar maniam and Maldeniya (1 985)
other information collected: economics of operations catch rates: 64-123 kg.hour-' (4 stations)

Areal survey no. Period (date) Vessel Trawl gear Trawl operations Resultslnotes References
8 Aug - Sep 1978 H.V. Dr. Fridtjof shrimp trawl five areas: Negombo-Gane, Hambantota, Saetersdal and de Bruin ( 1 9 7 9 7 Nansen HL. 96 ft (32 m) east coast, Trincomalee to Mullaitivu and
Pedro Bank; 5 000 nm2 main survey effort provided distribution of observed echo intensity of fish; average density of fish biomass in the whole area was 100 t.km2; biomass: 500 000 t annual potential yields: 70 000 t of demersal fish and 100 000 t of pelagic fish most important demersals were snappers, groupers, breams and trevallys other information collected: bottom conditions and hydrography
9 Apr - Jun 1979 R.V. Dr. Fridtjof shrimp trawl six areas: northwest coast, southwest coast Blindheim et al. (1979) Nansen HL: 96 ft (32 m) from Negombo to Galle, Hambantota Banks, east
coast and Batticaloa Banks, Trincomalee- Mullaitivu and Pedro Banks main survey effort provided distribution of observed echo intensity of fish other gears: mesh pelagic trawl and bottom long lines other information collected: bottom conditions and hydrography demersal resources at Pedro Bank based on trawl survey: 8 000 t; based on acoustic survey: 11 000 t highest echo intensities at the northwest coast north of Neqombo biomass ofdemersa~s: 330 000 t
10 Jan - Feb 1980 R.V. Dr. Fridtjof shrimp trawl six areas: northwest coast, southwest coast Blindheim and Foyn (1980) Nansen HL: 96 ft (32 m) from Negombo to Galle, Hambantota Banks, east
coast and Batticaloa Banks. Trincomalee- Mullaitivu and Pedro Banks main survey effort provided distribution of observed echo intensity of fish other gears used: 1 600 mesh pelagic trawl bottom longline other information collected: hydrography and bottom sediment biomass of demersals: 250 000 t at Pedro Bank, 8 000 t demersals were estimated using trawl survey and 15 000 t using acoustic records
THAILAND (GULF OF THAILAND) 1 1961 R. V.2 Otterboard 133 hauls stations: I-IX (Gulf of Thailand)
TS: 2.5 knots depth range: 10-50 m ,
TD: 1.0 hour catch rate: 298 kg,houi' Otterboard 200 hauls stations I-lX
TS: 2.5 knots depth range: 10-50 m TD: 1.0 hour catch rate: 256 kg-hour''
3 1964 R. V.2 Otterboard 122 hauls stations I-lX C,
TS: 2.5 knots depth range: 10-50 m il w TD: 1.0 hour catch rate: 226 kg-houi'

Areal ~i
survey no. Period (date) Vessel Trawl gear Trawl operations Resultslnotes References -3 @
4 1965 R. V.2 Otterboard 192 hauls stations I-IX TS: 2.5 knots depth range: 10-50 m
-- -- TD: 1.0 hour catch rate:. 179 kg,hour:: 5 1966 R. V.2 Otterboard 712 hauls stations I-IX ~ i t r a ~ s a e t al. 1968
TS: 2.5 knots depth range: 10-50 rn TD: 1.0 hour average catch rate: 131 kg.hour-I
analysis of catch composition by species of economical value in relation to the depth, area and comparison of catches in the morning and afternoon, and by seasons (dry, wet)
- - were made -- 6 1967 R. V.2 Otterboard 713 hauls stations: I-IX and by seasons (dry, rainy)
TS: 2.5 knots d e ~ t h ranae: 10-50 rn TD: 1.0 hour caich rate: 115 kg.hour~'
7 1968 R. V.2 Otterboard 719 hauls stations I-lX Ritragsa et al. (1969); TS: 2.5 knots depth range: 10-50 rn Ritragsa and Pramokchutima TD: 1.0 hour average catch rate: 106 kg.hour -I (1 970)
highest catch rate of 132 kg.hour-' at 44 rn depth; lowest catch of 89 kg.hourl at 10-1 9 m depth detailed analysis of catch rate by depth in each sub-area, comparison of catch rate between each subarea, comparison of fish of economic value and other fish, catch composition by weight, catch rate by grid square and by region, catch rates in relation to time of the day (and night) were presented
8 1969 R. V.2 Otterboard 720 hauls stations I-lX TS: 2.5 knots depth range: 10-50 m TD: 1.0 hour average catch rate: 103 kg.hour-I
R. V.2 Otterboard 718 hauls stations I-lX TS: 2.5 knots depth range: 10-50 m TD: 1.0 hour other information: length-frequency data
catch rate: 97 kg.hour-' - Otterboard 720 hauls stations I-IX
TS: 2.5 knots depth range: 10-50 rn TD: 1.0 hour other information: length-frequency data
catch rate: 66 kg.hourl 11 1972 R. V.2 Otterboard 720 hauls stations I-IX
TS:,22.5 knots depth range: 10-50 rn TD: 1.0 hour other information: length-frequency data
Otterboard 718 hauls -.hour-'
stations I-IX TS: 2.5 knots depth range: 10-50 rn TD: 1.0 hour other information: length-frequency data
catch rate: 52 kg.hour ' - --

Areal survey no. Period (date) Vessel Trawl gear Trawl operations Resultslnotes References
13 1974 R. V.2 Otterboard 540 hauls stations I-IX TS: 2.5 knots TD: 1.0 hour
depth range: 10-50 m other informat~on: length-frequency data catch rate: 58 kg,hour-' stations I-IX
-. - - - 14 1975 R V 2 Otterboard .
0
0
-- 480 hauls TS: 2.5 knots TD: 1.0 hour
depth range: 10-50 m other information: length-frequency data catch rate: 47 kg.hour-I stations I-IX depth range: 10-50 m other information: length-frequency data
.-
Otterboard . 0 .
261 hauls TS: 2.5 knots TD: 1.0 hour
catch rate: 57 kg.houri - stations I-IX Eiamsa-ard et al. (1 979); Eiamsa-
- - - -- 16 1977 R. V.2 Otterboard .
0
0
579 hauls TS: 2.5 knots depth range: 10-50 m ard and Dhamniyom (1 979) TD: 1.0 hour other information: length-frequency data
catch rate: 47 kg.hour-I 442 hauls stations I-IX Eiamsa-ard and Dhamniyom (1980)
- - 17 1978 R.V.2, R.V.9 Otterboard . .
0
TS: 2.5 knots TD: 1.0 hour
depth range: 10-50 m other information: length-frequency data catch rate: 52 kg.hour-' stations I-IX Eiamsa-ard and Dhamniyorn
(1 981 ); Eiamsa-ard (1 981)
- 18 1979 R.V.2, R.V.9 Otterboard
0 . 235 hauls TS: 2.5 knots TD: 1.0 hour
depth range: 10-50 m other information: length-frequency data mean catch rate: 512 kg.hour catch rate highest at station V (75 kg.hour-I) and lowest at station 111 (24 kg.hour-') stations: I-IX Charnprasertporn (1 982)
- - ~p
19 1980 R. V.2, R. V.9 Otterboard . 0
245 hauls TS: 2.5 knots . TD: 1.0 hour . .
depth range: 10-50 m other information: length-frequency data mean catch rate: 48 ka.hour-' - economic fish (23 kg.hour-I), juveniles of economic fish (9 kg.hour-I) and 'trash fish' (16 kg.hour-') dominant species were cephalopods, Nemipteridae, Priacanthidae, Synodontidae and Carangidae catch rate highest at station V (51 kg.hour~I) and lowest at station 1 1 1 (13 kg.hour ') stations I-IX
-- -- - -- .
20 1981 R V2, R V9 Otterboard 0
0
159 hauls . TS: 2.5 knots TD: 1.0 hour . 21 1 hauls TS: 2.5 knots i
depth range: 10-50 m other rnformation: length-frequency data stations I-IX depth range: 10-50 m
- .. 21 1982 R. V.2, R. V.9 Otterboard .
0 TD: 1.0 hour other information: length-frequency data --
I-' -3 cn

P 4
Areal 0,
survey no. Period (date) Vessel Trawl gear Trawl operations Resultslnotes References 22 1983 R. V.2, R.v.9 Otterboard 328 hauls stations I-IX
TS: 2.5 knots depth range: 10-50 m TD: 1.0 hour other information: length-frequency data
catch rate: 30 kg.hour-' 23 1984 R.V.2, R.V.9 Otterboard 172 hauls stations I-IX
TS: 2.5 knots depth range: 10-50 rn TD: 1.0 hour other information: length-frequency data
24 1985 R.V.2, R.V.9 Otterboard 228 hauls stations I-IX TS: 2.5 kncts depth range: 10-50 m TD: 1.0 hour other information: length-frequency data
25 1986 R.V.2, R.V.9 Otterboard 260 hauls stations I-lX TS: 2.5 knots depth range: 10-50 m TD: 1.0 hour other information: length-frequency data
26 1988 R.V.2, R.V.9 Otterboard 125 hauls stations I-IX TS: 2.5 knots depth range: 10-50 m TD: 1.0 hour length-frequency data
Otterboard 179 hauls stations I-IX TS: 2.5 knots depth range: 10-50 rn TD: 1.0 hour other information: length-frequency data
28 1990 R. V.9 Otterboard 21 hauls stations VII-IX TS: 2.5 knots depth range: 10-50 m TD: 1.0 hour other information: length-frequency data
29 1991 . . Otterboard 2niZGI.s statlons VII-IX TS: 2.5 knots depth range: 10-50 m TD: 1.0 hour other information: length-frequency data
Otterboard 21 hauls stations VII-IX TS: 2.5 knots depth range: 10-50 rn TD: 1.0 hour other information: length-frequency data
3 1 1993 R. V.9 Otterboard 22 hauls stations VII-IX TS: 2.5 knots depth range: 10-50 m TD: 1.0 hour other information: length-frequency data
32 1994 R. v.9 Otterboard 24 hauls stations VII-IX TS: 2.5 knots depth range: 10-50 m TD: 1.0 hour other information: length-frequency data
33 1995 R.V.9 Otterboard 23 hauls stations VII-IX TS: 2.5 knots depth range: 10-50 m TD: 1.0 hour other information: length-frequency data
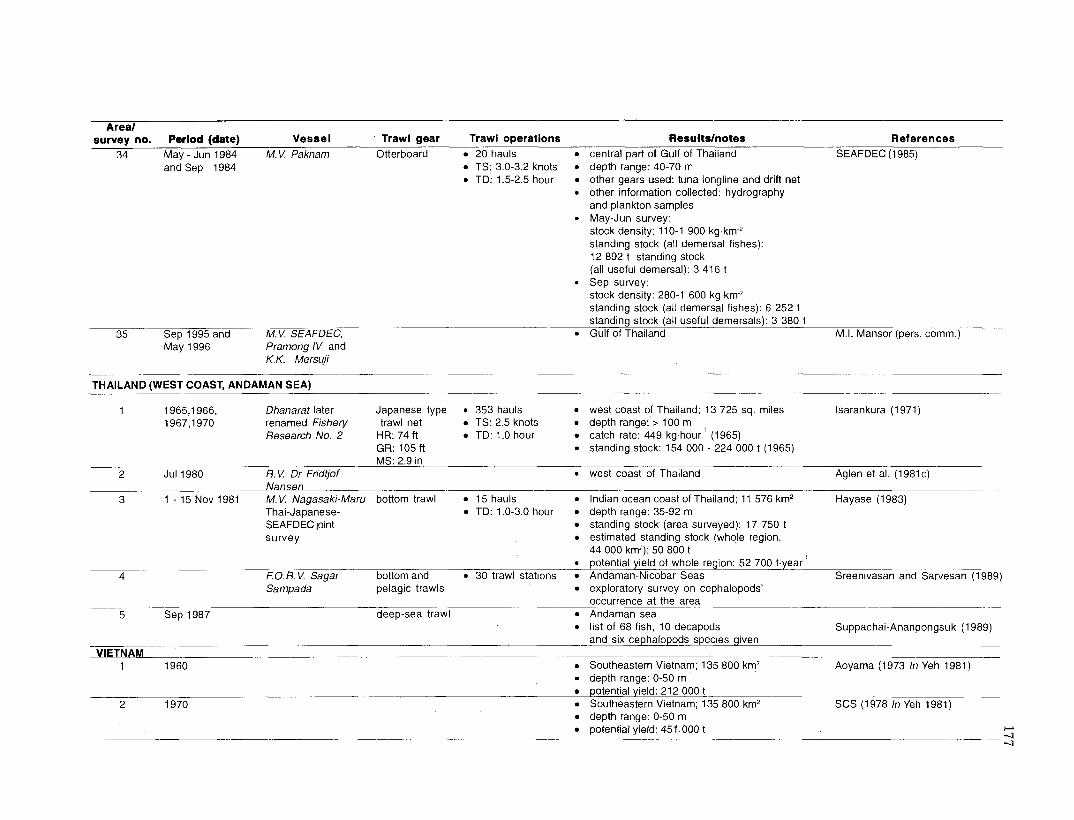
Areal survey no. Period (date) Vessel Trawl gear Trawl operations Resultslnotes References
34 May - Jun 1984 M. V. Paknam Otterboard 20 hauls central part of Gulf of Tha~land SEAFDEC (1 985) and Sep 1984 TS: 3.0-3.2 knots
TD: 1.5-2.5 hour 0
35 ~ e p 1995 a n b - M.V. SEAFDEC, ~a~ 1996 Pramong IV and
K.K. Mersuji
THAILAND (WEST COAST, ANDAMAN SEA)
1 1965,1966, Dhanarat later Japanese type 353 hauls 1967,1970 renamed Fishery trawl net TS: 2.5 knots
Research No. 2 HR: 74 ft TD: 1.0 hour GR: 105 ft
- MS: 2.9 in 2 Jul 1980 R. V. Dr Fridtjof .
-- Nansen -
3 1 - 15 Nov 1981 M. V. Nagasaki-Maru bottom trawl 15 hauls Thai-Japanese- TD: 1 .O-3.0 hour SEAFDEC joint survey
0 -- 4 E 0. R. V. Sagar bottom and 30 trawl stations
Sampada pelagic trawls
depth range: 40-70 m other gears used: tuna longline and drift net other information collected: hydrography and plankton samples May-Jun survey: stock density: 11 0-1 900 kg. km~' standing stock (all demersal fishes): 12 892 t standing stock (all useful dernersal): 3 41 6 t Sep survey: stock density: 280-1 600 kg.krw2 standing stock (all demersal fishes): 6 252 t standing stock (all useful dernersals): 3 380 t Gulf of Thailand M.I. Mansor (pers. comm.)
west coast of Thailand; 13 725 sq. miles lsarankura (1 971) depth range: > 100 m catch rate: 449 kg.hour1 (1965) standing stock: 154 000 - 224 000 t (1 965)
west coast of Thailand Aglen et al. (1981~)
Indian ocean coast of Thailand; 11 576 krn2 Hayase (1 983) depth range: 35-92 rn standing stock (area surveyed): 17 750 t estimated standing stock (whole region, 44 000 krn": 50 800 t potential yield of whole region: -- 52 700 t.yearl Andarnan-Nicobar Seas Sreenivasan and Sarvesan (1 989) exploratory survey on cephalopods'
ppppp-
occurrence at the area -pppppp--
5 Sep 1987 deep-sea trawl Andaman sea list of 68 fish, 10 decapods Suppachai-Ananpongsuk (1989)
ppp--p
and SIX cephalopods specles given VIETNAM -- -- --
Southeastern Vietnam; 135 800 krn2 Aoyama (1973 In Yeh 1981) depth range: 0-50 rn potential Geld: 212 000 t Southeastern Vietnam; 135 800 km2 SCS (1978 In Yeh 1981) depth range. 0-50 rn potential yield: 451 000 t r
-- -3 4

Areal
- Resultslnotes References
Southeastern V~etnam, 135 800 km2 Yeh (1981) d e ~ t h ranae 0-50 m
survey no. Period (date) Vessel Trawl gear Trawl operations 3 1970 - 1977 Taiwanese pair trawl
commercial
4 ~ u n 1977 Jun 1978
t rawlers --_. ..
Blen Dong 1 500 hp
potent~al Geld. 250 000 tyear ' -- - -- - Tonkm Gulf (V~nh Bac Bo), 7 872 km2 ~ o d o (1979) 111 hauls
TD: 2.0-3.0 hour depth range: 20-1 00 m other informat~on collected: pelagic trawl, hydrography and echo survey mean catch rate: 148 kg.hour ' biomass: 580 000 - 740 000 t
5 Jul 1978 - Dec 1979
Bien Dong 1 500 hp
100 hauls Southeastern Vietnam; 16 793 kmz Godo (1980) depth range: 0-1 50 m other information collected: hydrography and echo survey mean catch rate: 284 kg.houT stock density: 8.3-22.2 kg.ha~ biomass: 222 700 t Tonkin Gulf Bien Dong
1 500 hp 33 hauls TD: 1 .O-2.0 hour depth range: 20-60 m
Pelagic trawl Southeastern Vietnam depth range: 30-80 m Pelaaic trawl
-- 7 Jan, May - Jul, Bien Dong 80 hauls a
Sep - Nov 1979 1 500 hp TD: 1 .O-2.0 hour 0
.- -- 8 Jan - Feb, A elita 1 482 hauls
May, Jul, Oct, 800 hp TD: 1 .O-2.0 hour Dec 1979 -
9 Jan - Apr 1979 Kalper 507 hauls . 3 800 hp - TD: 1 .O-2.0 hour
10 Jan - Jul 1979 Elsk 504 hauls . 1 000 hp -.-- ~ - . ~ ---------ppp-----p----.--p-- -.-- TD: I .O-2.0 hour
11 Apr - Jun 1979 Yalta 578 hauls
~enGa l and South Vietnam depth range: 20-80 m
depth range: Pelagic trawl depth range: 20-1 00
- - -
depth range: 20-150 m 1 350 hp -- -. Nauka
TD. 1 0-2 0 hour _ -
808haul u - -pp --
depth range. 20-150 m Nov - ~ e c 1979 1 350 hp Jan - Mar, ~ u g 1980 - - - _ .- --
13 Dec 1979, Semen Volkov Jan 1980, 1 000 hp Jan - Mar.
TD: 1 .O-2.0 hour
-. - - .- - depth range: 20-100 m 803 hauls .
TD: 1.0-2.0 hour
Jun - Jul 1981 - - - .. - - 14 Jan - May, Blen Dong
Jul 1980 1 500 hp
- -- - 63 hauls . TD: 1 .O-2.0 hour
- --- - Southeastern V~etnam depth range, 30-80 m Pelag~c trawl

Areal survey no. Period (date) Vessel Trawl gear Trawl operations Resultslnotes References
15 Jul - Sep 1980 Marlin 362 hauls depth range: 20-80 m Jan - Mar 1981 800 hp TD: 1.0-2.0 hour
. - -- - - . . -- . - - --- - -
16 Nov - Dec 1980 Vozrozdenhie 109 hauls depth range: 40-300 m Jan 1981 ~ 3 800 hp TD: 1.0-2.0 hour__. -- -
17 Nov - Dec 1981 Zavetinsk 644 haul depth range: 20-80 m Jan - Mar 1982 .800h!? . - - -. - -----A- --
TD: 1.0-2.0. hour .- --
18 Jul - Oct 1982 Milogravcdo 246 hauls depth range: 30-150 m
p- .~ ~ ~~- 2 3 0 0 h . . 2 3 : 1.0-2.0 hour 19 Sep 1982 Trud 154 hauls depth range: 20-80 m
__-. 800he-~-- - TD: 1.0-2.0 h o g - --
20 Ju l - Sep 1983 Gerakl 347 hauls depth range:: 30-150 m May - Jun 1987 2 300 hp
-- - TD: 1 .O-2.0 hour
2 1 Dec 1983 - Antiya 137 hauls depth range: 20-1 00 m
-- Mar 1984 1 000 TD: 1 .O-2.0 hour 22 Jan - Mar 1 9 8 4 Gidrobiolog 33 hauls depth range: 20-1 00 m
-- 1 000 hp TD: 1 .O-2.0 hour 23 Oct - Dec 1984 Uglekamensk 55 hauls depth range: 20-100 m
1 000 hp 8 TD: 1.0-2.0 hour -
24 Dec 1984 Ochakov 808 hauls depth range: 20-150 m Oct - Dec 1987 2 300 hp TD: 1 .O-2.0 hour
25 Nov - Dec 1985 Omega 162 hauls depth range: 30-150 m Jan - Feb 1986 2 300 hp - - -. --
TD: 1 .O-2.0 hour 26 Mav - Jun 1986 Shantar 61 hauls depth range: 30-150 m - -
2 300 hp - TD 1 0-2 0 hour -- - -
27 AT-~C 1987- Mux Dalnhi 213 hauls . 2 300 hp
- ---- TD 1 0-2 0 hour
-- - -- - -_ 28 Feb - Mar Mux T~chr 194 hauls . -.
May - Jun 1987 2 300 hp -- - ---
29 Jan - Mav 1988 Kizveter TD: 1 .O-2.0 hour
--
205 hauls .
MS: 2 inches
--
depth range: 30-150 m
~
South Vietnam depth range: 30-150 m depth range:-
-- off Burma ~n Gulf of Martaban Ba Kyaw (1956) largest catches were made In depths around 54 m most common f~shes were croakers, grunts, snappers, le~ognath~ds and l~zardf~shes from one-fourth to one-th~rd of the catch compr~sed small f~shes of no commerc~al value

Areal survey no. Period (date) Vessel Trawl gear Trawl operations Resultslnotes References F
Co 2 9 - 25 Sep 1966 F V Lmzm otterboard 170 hauls southern Burma Druzhlnin and Hliana (1 972) 0
10 - 28 Oct 1966 5 - 20 Jan 1968
HR: 38.6 m total 711 . G R: 53.7 m trawling hours MS: 72 mm were expended
-- 3 Sep - Nov 1979 R. V. Dr. Fridtjof .
and Nansen Mar - Apr 1980
BAY OF BENGAL AND EAST COAST OF INDIA - 1 NOV 1959 - M.T. Ashok
Oct 1960
0
2 1959 - 1974 24 vessels of sh r im~ and fish varying sizes and hp ranging from 42-578
- -- 3 FISH Tech No. 7
wooden stern trawler, 12.16 m LOA and 7 GT
trawls of different specifications
otter trawl HR: 18.36 m
- . ,
mean catch fates: 226 kg-hour (Sep 1966); 164 kg.hour (Oct 1966); 282 kg.hour (Jan 1968) most important fish were four species of Sciaenidae; Pomadasys hasta, Lutjanus spp., Trichiurus savala, llisha filigera and carangids analysis of biological data on 23 species is given (ripeness of gonads, diet composition and condition coefficient) between border with Bangladesh in the Strermme et al. (1981) north and with Thailand in the south (three divisions: Arakan coast, Delta area and the Tenasserim coast) survey combined acoustic and exploratory fishing using bottom and mid-water trawls demersal fish resources of continental shelf Rijavec and Htun Htein (1984) and slope -.
exploratory trawling for demersal fishes, Rao and Krishnamoorthi (1982) day and night, off the coasts of Andhra and Orissa between latitudes 1740' and 207 0'N depth range: 5-64 m sharks, skates, rays, catfishes, miscellaneous large and small fishes and prawns showed diurnal variations no definite trends were seen in areawise and depthwise analysis of fish groups east coast of India (entire coastline of West Joseph et al. (1976a) Bengal, Orissa, Andhra Pradesh and the east coast of Tamil Nadu standing stock: 3.88 t.km potential yield: 206 000 byeat' other information: catch rates, catch composition by area and depth, relative abundance by area and depth, and seasonality of catch off Kakinada between latitude l6"5O'N - 17'N Narayanappa et al. (1 972) and longitude 8220'E - 82"403E depth ranges: 15-50 m (inshore) and 51-100 m (offshore) average catch rate: 340 kg.hour '; catch rate found to be 5.7 times higher in the 51-100 m depth range differences in catch composition between the two depth ranges were noted
4 1961 - 1970 M.T. Ashok northwestern Bay of Bengal, off Krishnamoorthi (1 976) Andhra-Orissa coast; 41 478 km2 max. standing stock: 418 682 ,t potential yield: 251 209 t.year

Areal survey no. Period (date) Vessel Trawl gear Trawl operations Resultslnotes References
5 1961 - 1985 bottom trawl off northeast coast between 15=21°N and Reuben et al. (1988) 80"-88"E; 81 341 km2 exploratory fishery surveys potential yield: 14 620 t.yeai' (range: 1 396-23 429 t) sharks and skates, rays, catfishes, mackerel, threadfin breams, jacks and goatfishes were underexploited lizard fishes and croakers have reached o~timum level of exploitation
6 1972 - 1978 off Visaknapatnam between latitudes 15'40'N CMFRI (1 980) and 1940'N industrial fisheries based on exploratory surveys depth range: 10-90 m
7 1973 - 1981 M. V. Meenagaveshak 20 m trawl TS: 2.75 knots off North Tamil Nadu - South Andhra coasts Vivekanandan and Krishnamoorthi (17.5 m) and with a sweep between latitude 10°40'N (off Velanganni) and (1 985) M. V. Meenasitara of 0.1 02 km.hour-' 15"40'N (off Nizampatnam) (17.5 m) potential yield: 1.09 t.km4.year-'
latitude-wise potential was estimated for certain major categories of demersal fishes and crus- taceans. Silver bellies (leiognathids) ranked first (0.4 t.km2) followed by 'perches' (0.1 t.km.') for prawns, the most productive zone was located off Ramavapatnam in the north and off
8 M. V. Matsya Vigyani Porto ~ovo /~udd&re in the south location of potentially rich fishing ground off Sudarsan and Joseph (1975) West Benaal was reported concentration of prawns at depths 50 -80 m Metapeneaus ensis formed an important constituent, M. monoceros was also abundant commercial feasibility of outrigger trawl fishing is indicated
9 1980 - 1981 off Rameswaram Pillai et al. (1983) ~,
a given catch trends and catch compositions 10 1981 - 1983 trawl survey Wadge Bank; 12 505 km2 Philip and Ali (1 989)
conducted by depth range: 0-200 m Fishery Survey stock assessment of cuttle fish, Sepia pharaonis of India total biomass: 2 060 t
20-50 m depth contained 74% of biomass.
- lowest at 100-200 m depths
11 off the coast of Visakhapatnam, Andhra Pradesh Mohan and Rayudu (1986) squid and cuttlefish survey Sepia pharaonis and S. aculeata contributed 50% to catch from Sep. to May

Areal survey no. Period (date) Vessel Trawl gear Trawl operations Resultslnotes References CL 00
12 Oct - Dec 1991 Matsva Shikari shrimo trawl: total fishina u ~ o e r east coast of India between latitude Anon. (1 994a) N 45 m effort: 73.50 fish trawl: 34 m hours .
0
13 Oct - Dec 1991 Matsya Darshini
1 8 ' ~ and 20'N depth range: 0-100 m catch rate (shrimp trawl): 614 kg.hour-' (0-50 m depth) major fish catch (Dec): goat fishes and silver bellies a single haul consisting of 1400 kg of Ariomma indica was recorded at 50-100 m depth along upper east coast between latitudes Anon. (1 994b) 16'N and 18"N threadfin breams, goat fishes and ribbon fishes were major catches at 50-100 m depth zone
14 Oct - Dec 1991 Matsya Jeevan fish trawl 27 m total fishing lower east coast of India (Tamil Nadu coast) Anon. (1993) effort: 109 hours between latitudes 10'N and 16"N
depthwise analysis of catch rates were presented; silver bellies were major fish catch in Dec -
ARABIAN SEA AND WEST COAST OF INDIA 1 1948 - 1973 16 vessels; their different types total fishing north west coast of India between latitude Joseph (1 974)
15'N and 23'N and lonaitude 67'E and 74"E hp ranged from and sizes of fish effort: 42 to 475 trawls; starting 37 000 hours
1959 vessels used two-seam Russian type trawl
2 1957 - 1974 18 vessels of fish and shrimp total fishing various designs trawls with effort: and size with hp different 29 400 hours ranging from 42 specifications to 240
(entire coastline of ~ i a r a t , Maharashtra and part of coastline of the Union territory of Goa, Daman and Diu; bulk of effort expended near Bombay and Veraval) around 90% of the effort was expended in areas within 25 fathom depth, the depth zone 24-40 fathom were surveyed in part latent demersal f i s h y potential at Marashtra was 120 000 byear- standing stock: 4.38 t.km-2 abundant catches include elasmobranchs and 'dhoma' other information: catch composition by area and depth, relative abundance by area and depth, and seasonality of catch south west coast of India between latitudes Joseph et al. (1976b) 7'N ana 15'N and longitude 73"E and 78"E (entire coast of Kerala and Karnataka and west coast of Tamil Nadu) effort expended at 0-19 m and 40-59 m depth were 23% and 10% respectively, little effort at 60-79 m and 80-99 m prawns in c20 m depths were abundant, elasmo- branch in 40-59 m and catfish in 40-79 m standing stock: 3.8 t.km-' potential yield: 124 000 t.year other information: catch composition by area and depth, relative abundance by area and depth, and seasonalitv of catch

Areal survey no.
3 Period (date) Vessel Trawl gear Trawl operations Resultslnotes References
1961 - 1967 11 vessels of the otter trawls of total fishing effort: northwestern part of India between latitudes Virabhadra et al. (1972) Government of different 1 896 hours 15"N to 23'10'N and longitudes 68"lO'E and India; their hp specifications 73'50'E; 25,100 nautical sq. miles ranged from 42- vessels were grouped into : 201-300 hp; 300 and GT ranged 101-200 hp and below 100 hp from 9.95-1 23.24 earlier operations covered as many areas as
possible but from Dec 1963, the operations involved systematic linear bottom trawling repeated at monthly intervals annual average of catch was 391 568 kg (range: 309 133-489 519 kg) and of catch rytes were 207 kg.hour- (range: 165-251 kg-hour- ) mixed sciaenids, 'dhoma', formed a third and rays about a quarter of the total catch seasonal trends showed highest yields in the 4th quarter; species catch trend was also discussed datch rates were high in 40-60 m depths
4 Nov 1963 - Karwar-1, MlIM4, shrimp trawl total fishing effort: exploratory surveys near Karwar between Bapat et al. (1 972)
May 1966 and INP 167 with 2 303 hours latitudes 14"30'-15'00' and longitude 90. 48 and 24 h~ 7334'-74'20', roughly 10-15 nautical engines r e ~ ~ e c i i v e ~ ~
-- 1962 - 1963 and M.E V. Silver shrimp and 1967 - 1968 Pomfret, M.E V. cotton trawls
Indian Salmon
6 1968 - 1970 M. T Kalyani IV and ~ . f Kalyani V
miles from shore;900 sq. miles, overall catch rate: 192 kg.hour catches include Leiognathus spp. and Opisthopterus tardoore, accounting for more than 50% of the catch, others include Lactarius lactarius, sciaenids, sharks, rays and prawn and M.E V. Gulf Shrimp; all boats are 14.93 m in length and powered 87 hp South Gujarat, Veraval, Porbundar, Dwarka Survey and Research Division, and Gulf of Kutch; 25 000 km2 Directorde of Fisheries, Govern-
* depth range: 8-90 m ment of Gujarat, India (1 972) the sciaenids (Otolithus ruber), contributed 50%-75% of the catches, followed by rays and miscellaneous other f~shes new fishing grounds for prawns and lobster were located the most productive area was Veraval, followed by Porbundar and Dwarka; the gulf of Kutch and South Gujarat did not contain potential trawling grounds
total fishing effort: Bombay-Saurashtra waters Nair (1 976) 100 hours areawise abundance and seasonal distribution
of 10 categories of fishes in 8 major areas were examined
7 1975 - 1983 R. V. Dr. Fridtjof pelagic trawl northern and western Arabian Sea Gjaesaeter (1 984) Nansen with 750 mm abundances measured by echosounders
opening and echo-integrators during daytime mesopelagic fish were found at P
00 250-350 m depth, in night at the upper 100 m w total abundance: 100x1 0" in Gulf of Oman, biomass range: 6-20x106 t
--

survey no. Period (date) Vessel Trawl gear Trawl operations Resultslnotes References 00 I&
8 Mar 1976 - bottom trawl off Mangalore between Suratkal Mallel (1 979) Mar 1977 and Someswar, 850 km2up to 50 m lsobath
other lnformatlon collected' hydrographlcal parameters (I e , temperature, salrnlty, dlssolved oxygen and denslty) stock assessment studles lndlcate abundance of Nemlpterus lapon~cus, Saunda turnbll and Grammophtes scaber hlgh correlations observed between temperature and dlssolved oxygen, and flsh catches durmg various months
9 1980 - 1983 Bari oceanic fleet along the Somalian coasts of Indian Ocean Vacarella et al. (1985) survey deals with identification of fishes cauaht
and Jan - Mar 1985
" 97 fish species classifiedlidentified
10 --
0ct - Dec 1984 3 types of trawl off Veraval, Gujarat Rao and Kunjipalu (1 989) depth range: 25-35 m and 35-45 m abundance highest at 25-35 m depth from Oct to Dec ribbon fish and Lactarius common from Oct to Dec sciaenids and other quality fish and
12 trawl survey collected by 17.5 m and larger vessels
. . cephalopods common from Jan to Mar
bottom trawl northwest coast, between 15" and 22"N Biradar (1 989)
13 0ct - Dec 1991 shrimp and fish
% ~~, depth range: 3 depth strata, <50; 50-1 00; 100-200 m paper focused on Priacanthus harnrur total biomass 88 560 t max. sustainable yield 25 000 t.yi ' Kerala and Karnataka ; between 8" and 15"N Sudarsan et al. 11 988)
% - - , depth ranges: small vessels, up to 50 rn; larger vessel, down to continental slope catch and effort standing stock and MSY parameters were estimated Karnataka, Goa and South Maharashtra Naik et al. (1 993)
\ ,
trawl 14 Matsya Nireekshani
-- along north west coast beteeen 18N and 23N Shamsudeen and Raj (1 993) INDIA (WHOLE COASTLINE)
1 1963 R. V. Anton Bruun 13 m Gulf of 104 hauls surveys in Bay of Bengal and in the Arabian Hida and Perevra (1 9661 Mexico shrimp trawl
, \ ~ - , Sea (Cruise 1- included survey at Andaman Islands, Thailand, Burma and East Pakistan while Cruise 4B covered India, West Pakistan, Gulf of Oman and Arabia) in Bay of Bengal, highest catch rates were obtained in 15-37 m depths; in Burma and East Pakistan, stingrays, guitarfish and croakers were the most important groups in Arabian Sea, highest catch rates were obtained in 38-73 m depths off the southeastern Arabian coast; stingrays, crabs, sciaenids, croakers, lizardfish, cardinal fish and threadfins were the most important Qroups

Areal survey no. Period (date) Vessel Trawl gear Trawl operations Resultslnotes References
2 Apr 1970 - 17.5 m commerc~al 24 m fish trawl alonq both the coasts of Indian sub-continent, Joseph (1980) Mar 1980 trawl vessel and 28 m shrimp
commisioned for trawl the Exploratory Fisheries Project; 200 hp and 56.8 GT
EO. R. V. Sagar 5 m Isaacs- 364 stations Sampada Kiddwater
midwater trawl
from-24' to TN, spanning 273 000 km2; west coast: 184 200 km2and east coast: 89 600 km2 depth range: up to about 80 m potential yield: whole region: 1 .7x106 tyeat1 west coast: 1.1 x1 O6 t.yeail relative abundance of important fish by region and depth were presented along west coast, the most productive depth is at 40-79 m and at the east, at 0-39 m, except for Visakhapatnam, where the most productive zone was at 60-79 m exploratory surveys of cephalopod resources Silas et al. (1985) in Bombav-Guiarat: catch maximum at 7 609 kg.houi3 a year and catch rate of 7 kg.hourl d e e ~ scatterina lavers of EEZ of India Menon (1 990) study described distribution and abundance of fish fauna along various latitudes, depths and seasons
5 Feb 1985 - E O.R. V. Sagar bottom trawl 378 hauls entire coastline of India Suseelan et al. (1 990) Aug 1988 Sampada depth range: 30-450 m
data on catch and abundance and productive areas of edible crustacea
6 E 0 . R. V. Sagar Isaacs-Kidd deep scattering layer of Indian EEZ Meiyappan and Nair 1990 Sampada midwater trawl preliminary studies on cephalopods
7 E0.R.V. Saaar Bay of Bengal: within 15'00' -19'00'N and Nair et al. (1 990) u
Sampada 8240'-87'25~ Arabian Sea; within 6'30' - 22'07'N and 64'1 6' - 78'00'E survey for oceanic squids occurrence of Symplectoteuthis oualaniensis at depths over 1 000 m
-- 95% of the squids taken at night
PAKISTAN 1 1921 - 1922 S. T. William Garrick off the coast of Sind Cushing (1971)
best catches made on mud from 10 to 30 fm 2 1947 --%%ir M. V. Ala 314 hauls off the coast of Cape Monze (west of Karachi) Qureshi (1955 In Cushing 1971)
catch composition: elasmobranchs (25%), croakers (23.0%), perches (lo%), threadfins (2.5%), catfish (14%), pomfrets (1 3%)
-
3 Nov 1948 - M.ET Ala 43 effective mean catch rate: 57.3 kg.hour" Hussain et al. (1 972) Dec 1956 19 trips
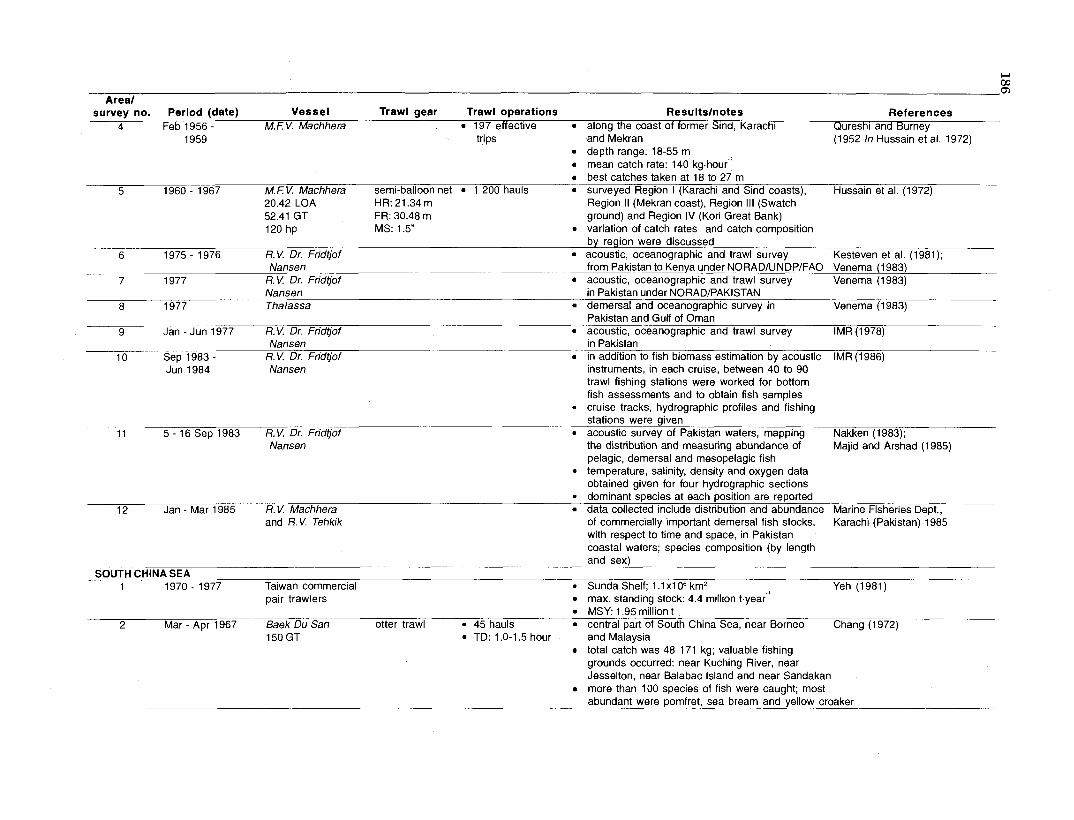
Areal survey no. Period (date) Vessel Trawl gear Trawl operations Resultslnotes References
4 Feb 1956 - M.E V. Machhera 197 effective along the coast of former Sind, Karach~ Quresh~ and Burney 1959 trips and Mekran (1 952 In Hussain et al. 1972)
depth range: 18-55 m mean catch rate: 140 kq.hour best catches taken at 18 to 27 m
5 1960 - 1967 M.E V. Machhera semi-balloon net 1 200 hauls surveyed Region I (Karachi and Sind coasts), Hussain et al. (1972) ~. 20.42 LOA HR: 21.34 m ~ e ~ i o n II ( ~ ~ k r a n cbast), Region Ill (Swatch ' 52.41 GT FR: 30.48 m ground) and Region IV (Kori Great Bank) 120 hp MS: 1.5" variation of catch rates and catch composition
by region were discussed 6 1975 - 1976 R. V. Dr. Fridtjof acoustic, oceanographic and trawl survey Kesteven et al. (1981);
Nansen from Pakistan to Kenya under NORADIUNDPIFAO Venema (1 983) 7 1977 R. V. Dr. Fridtjof acoustic, oceanographic and trawl survey Venema (1 983)
Nansen in Pakistan under NORADJPAKISTAN 8 1977 Thalassa demersal and oceanoaraphic survev in Venema f 19831 , ,
Pakistan and Gulf of 0&n 9 Jan - Jun 1977 R. V. Dr. Fridtjof acoustic, oceanographic and trawl survey IMR (1978)
Nansen in Pakistan 10 Sep 1983 - R. V. Dr. Fridtjof in addition to fish biomass estimation bv acoustic IMR (1986)
Jun 1984 Nansen
11 5 - 16 Sep 1983 R. V. Dr. Fridtjof Nansen
12 Jan - Mar 1985 R. V. Machhera and R.V. Tehkik
. ,
instruments, in each cruise, between 4'0 to 90 trawl fishing stations were worked for bottom fish assessments and to obtain fish samples cruise tracks, hydrographic profiles and fishing stations were given acoustic survey of Pakistan waters, mappinq Nakken (1983): the distribution-and measuring abundance o t Majid and ~ r s h a d (1985) pelagic, demersal and mesopelagic fish temperature, salinity, density and oxygen data obtained given for four hvdroaraphic sections dominant species at each poskon are reported data collected include distribution and abundance Marine Fisheries Dept.. of commercially important demersal fish stocks, Karachi (Pakistan) 1'985 with respect to time and space, in Pakistan coastal waters; species composition (by length and sex) --
SOUTH CHINA SEA 1 1970 - 1977 Taiwan commercial Sunda Shelf; 1 .l x l O6 km2 Yeh (1981)
pair trawlers max. standing stock: 4.4 million tqear MSY: 1.95 mi ion t
2 Mar - Apr 1967 Baek Du San otter trawl 45 hauls central part of South China Sea, near Borneo Chang (1972) 150 GT TD: 1 .O-1.5 hour and Malaysia
total catch was 48 171 kg; valuable fishing grounds occurred: near Kuching River, near Jesselton, near Balabac Island and near Sandakan more than 100 species of fish were caught; most abundant were pomfret, sea bream and yellow croaker

survey no. Period (date) Vessel Trawl gear Trawl operations
- --
Areal
-
5 this report described past and "present" situations relative to the author's visit to five countries in the area in May-July 1973
Taiwan commercial pair trawlers
0
0
Taiwanese pair trawlers
the demersal species reported were those caught by demersal gears: trawls (otter, pair and beam); bottom gillnets and bottom longlines; and other traditional demersal gears
Resultslnotes References
Sunda Shelf Liu et al. (1 978) data from catch statistics of commercial trawlers from Taiwan authors made investigations on history of the fishery, species composition and distribution abundant species: golden thread, lizard fish, goat fish, big eye, red snapper, cuttle fish and catfish max. standinq stock: 5 819 000 t.vear-' potential 2 586 000 t.year~' Sunda Shelf Yeh et al. (1981) data from catch statistics of commercial trawlers from Taiwan and the national catch information compiled by FA0 South China Sea Fisheries Development and Coordinating Programme max. standing stock: 4 362 000 t-year-' potential yield: 1 950 000 t peak catches in the 1970s of (1 090 000 t) ;epresented 56% of the potential whole South China Sea encompassing Aoyama (1 973) 3.7 million km2 divided into 12 sub-areas about half is in the South China basin in the middle of the South China Sea; two wide continental shelves are located in the area, the mainland shelf in the north and the Sunda Shelf in the south about 15 000 trawlers operate in the area catches of demersal species, numbers of vessels, etc. are given for Japan, China (Taiwan), Hongkong, China, North Vietnam, Vietnam Republic, Khmer, Thailand, Malaysia, Singapore, Indonesia and the Philippines high densities shown in Malacca Strait, Tonkin Gulf, east coast of south Malay Peninsula and the coastal zones of Sarawak and Sabah total stock size for the region: 301 million t stock density: Zone A(<50 m):130 kg.hourl Zone B(<500 m): 104 kg houf' Average (A+B): 114 kg.hour- estimated standing stock: 3.8 million tyeaf ' overexploitation has taken place in Northern Mainland and in the Gulf of Thailand

t-' Areal 00
survey no. Period (date) Vessel Trawl gear Trawl operations Resultslnotes References 00
AUSTRALIAN - WATERS, SOUTHERN INDONESIA 1 1970 - 1976 Taiwan pair
trawlers Australian waters data from catch statistics of commercial trawlers from Taiwan authors reported on history of the fishery, species composition and distribution abundant species: golden thread, big eye, red snapper, lizard fish, porgies, grunt, squid, cuttle fish and pompanos max. standing stock: 2 066 000 ,t potential yield: 1 033 000 byear-
Liu et al. (1978)
2 1979 - 1981 exploratory southern-lndonesia and ndrthwestern Australia Gloerfelt-Tarp and fishing survey total of 1 100 species sampled with information Kailola (1 984)
on color photography, species name, morphological data and distribution; all records updated in FishBase 97
3 1980 - 1981 E R. V. Soela New Zealand 53 m and 1800 Frank and hp stern trawler Bryce net
FR: 32 m MS: 10,20 mm
German Engel FR: 49 m MS: 10,20 mm
(Froese a n d ~ a u l ~ 1997) Australian Fishing Zone Sector of the Timor- Okera and Gunn (1986) . . Arafura Seas a n i in Gulf of Carpentaria the composition of the catches, with indications of the utility and abundance of the different species, total catch rates by depth and the catch rates by depth of 291 species of economic importance were presented significance of cruise results to fisheries management and development in the region were briefly discussed
prawn net FR: 43 m
References
Abu Talib A. and S. Hayase. 1984a. An assessment of demersal fisheries resources in Peninsular Malaysia, 1971-80. TrainingDepartment, SEAFDEC, Samutprakarn, Thailand. TD/CTP/27,40 p.
Abu Talib A. and S. Hayase. 198413. Population parameters of t en demersal species off the southern east coast of Peninsular Malaysia. Training Department, SEAFDEC, Samutprakarn, Thailand. TDlCTPl29, 30 p.
Aglen, A,, L. Foyn, O.R. Godo, S. Myklevoll and O.J. Ostvedt. 1981a. A survey of the marine fish resources of the north and west coasts of Sumatra, August 1980. Reports on surveys with R.V. Dr. Fridtjof'Nansen. Institute of Marine Research, Bergen, Norway. 55 p.
Aglen, A,, L. Foyn, O.R. Godo, S. Myklevoll and O.J. Ostvedt. 1981b. Surveys of the marine fish resources of Peninsular Malaysia, June-July, 1980. Reports on surveys with the R.V. Dr. Fridtjof Nansen. Institute of Marine Research, Bergen, Norway. 69 p.
Aglen, A,, L. Foyn, O.R. Godo, S. Myklevoll and O.J. Ostvedt. 1 9 8 1 ~ . A survey of the marine fish resources of the west coast of Thailand, July 1980. Reports on surveys with the R.V. Dr. Fridtjof Nansen. Institute of Marine Research, Bergen, Norway. 57 p.
Ahrnad Adnan, N. 1987. Demersal fish resources in Malaysian waters (17). Sixth trawl survey of the coastal waters of west coast of Peninsular Malaysia, October-November 1981. Buletin Perikanan (Malays.) Fish. Bull. No. 47, 39 p. Department of Fisheries. Ministry of Agriculture, Malaysia.
Ahmad Adnan, N. 1990. Demersal fish resources in Malaysian waters (16). Fifth trawl survey of the coastal waters off the east coast of Peninsular Malaysia (June-July, 1981). Fish. Bull. Dep. Fish. Malays. Buletin Perikanan Jabatan Perikanan Malays. 60, 36 p.
Anon. 1970. The report of R.T.M. Lesnoy on the results of the scientific research expedition off the coast of East Pakistan (November 1969 - January 1970). Yugrybpromrazvedka, Ministry of Fishing Industry, Kerch, USSR. 58 p.
Anon. 1993. Results of demersal resources survey along the lower east coast between latitudes 1O0N and 16"N. Seafood Export J . 25(10): 41-42.
Anon. 1994a. Results of demersal resources along upper east coast between latitudes 18"N and 21°N by Matsya Shikari. Seafood Export J. 25(11): 45-48.
Anon. 199413. Results of demersal trawl survey along the upper east coast between latitudes 16"N and 18"N by Matsya Darshini. Seafood Export J. 25(12): 39-41.
Aoyama, T. 1973. The demersal fish stocks and fisheries of the south China Sea. SCS/DEV/73/3. 80 p. Food and Agriculture Organization of the United Nations Development Programme, Rome.
Aprieto, V.L. and E.P. Villoso. 1979. Catch composition and relative abundance of trawl-caught fishes in the Visayan Sea. Fish. Res. J . Philipp. 4(1): 9-18.
Aprieto, V.L. and E.P. Villoso. 1982. Demersal fish resources of Lingayen Gulf. Fish. Res. J. 7(2): 40-48.
Armada, N.B. and G.T. Silvestre. 1981. Demersal fish resource survey in Samar Sea and Carigara Bay. UP-NSDB Project Report. College of Fisheries, University of the Philippines in the Visayas. 56 p.
Armada, N.B., C. Hammer, J. Saeger and G.T. Silvestre. 1983. Results of the Samar Sea trawl survey, p. 1-46. I n J . Saeger (ed.) Technical reports of the Department of Marine Fisheries No. 3, College of Fisheries, UP in the Visayas and GTZ, Federal Republic of Germany. 191 p.
Bain, K.H. 1965. Trawling operations in the Bay of Bengal. EPTA 2121, 38 p. FAO, Rome.
Ba Kyaw, U. 1956. Trawling results of Taiyo Maru No. 11 in Burmese waters. Proc. Indo-Pac. Fish. Counc. 6(2): 261- 264.
Bapat, S.V., N. Radhakrishnan and K.N. Rasachandra Kartha. 1972. A survey of the trawl fish resources off Karwar, India. Proc. Indo-Pac. Fish. Counc. 13(3): 354-383.
Bautista, R.D. and A.H. Rubio. 1981. Preliminary report on the Manila Bay survey. Fish. Res. Div. Tech. Rep.
Beales, R., D. Currie and R. Lindley (eds.). 1982. Investigations into fisheries resources in Brunei. Monogr. of the Brunei Darussalam Mus.: (5): 204 p. Brunei Museum, Brunei.
Bejie, A.B. n.d. Demersal fish resources in Malaysian waters. Fourth trawl survey off the coast of Sarawak (29 June-12 August 1977). (Unpublished).
Bejie, A.B. 1980. Demersal fish resources in Malaysian waters. Fifth trawl survey off the coast of Sarawak (10 July-10 August 19791. (Unpublished).
Bejie, A.B. 1985a. First prawn resource survey along the coast of Sarawak (May-July 1980). Bul. Perikanan No. 30. 21 p. Dicetak Oleh Jabatan Percetakan Negara, Kuala Lumpur, Malaysia.
Bejie, A.B. 198513. Second prawn resource survey along the coast of Sarawak (8-28 April 1981). Bul. Perikanan No. 31. 14 p. Dicetak Oleh Jabatan Percetakan Negara, Kuala Lumpur, Malaysia.
Bejie, A.B. 1986. Third prawn resource survey along the coast of Sarawak (18 March-13 June 1982). Bul. Perikanan No. 32. 23 p. Dicetak Oleh Jabatan Percetakan Negara, Kuala Lumpur, Malaysia.
Berg, S.E. 1971. Investigations on the bottom conditions and possibilities for marine prawn and fish trawling on the north and east coasts of Ceylon. Bull. Fish. Res. Stn. Ceylon
J 22(112): 53-88. Bianchi, G. 1996. Demersal fish assemblages of trawlable
grounds off northwest Sumatra, p. 123-130. I n D. Pauly and P. Martosubroto (eds.) Baseline studies of biodiversity: the fish resources of Western Indonesia. ICLARM Stud. Rev. 23, 312 p.
Biradar, R.S. 1989. Estimates of stock density, biomass and maximum sustainable yield of Pr iacan thus h a m r u r (ForsskHl) off the north west coasts of India, p. 55-65. I n Studies on fish stock assessment in Indian waters. Spec. Publ. Fish. Surv. India, 2.
Birtwistle, W. and C.F. Green. 1927. Report on the workings of the S.T . Tongol for the period 28 May-31 December 1926. Pt. 1 by C.F. Green and Pt. 2 by W. Birtwistle. Government Printing Office, Singapore.
Birtwistle, W. and C.F. Green. 1928. Report on the workings of the S.T . Tongol for the year 1927. Pt. 1 by C.F. Green and P t . 2 by W. Birtwistle. Government Printing Office, Singapore.
Blindheim, J . , and L. Foyn. 1980. A survey of the coastal fish resources of Sri Lanka, No. 3, Jan-Feb 1980. Reports on the Survey with the R.V. Dr. Frrdtjof Nansen. Fisheries Research Station, Colombo and Inst i tute of Marine Research, Bergen, Norway.
Blindheim, J., G.H.P. de Bruin and G. Saetersdal. 1979. A survey of the coastal fish resources of Sri Lanka, No. 2, April-June 1979. Reports on the Survey with the R.V. Dr. Fridtjof Nansen. Fisheries Research Station, Colombo and Institute of Marine Research, Bergen, Norway.
Caces-Borja, P. 1972. On the ability of otter trawls to catch pelagic fish in Manila Bay. Philipp. J . Fish. 10(1/2): 39- 56.
Caces-Borja, P., R. Bustillo and S. Ganaden. 1972. Further observations on the commercial trawl fishery of Manila

190 Bay (1960-1962), p. 631-637. In IPFC, Proceedings of the 13th Session, 14-25 October 1968, Brisbane, Queensland, Australia. Section I11 - Symposium on Demersal Fisheries. IPFC Proc. 13(3), 664 p.
Calumpong, H.P., L.J. Raymundo, E.P. Solis and R.O. de Leon (eds.) 1993. Resource and Ecological Assessment of Carigara Bay, Leyte, Philippines. Volume 2. Fisheries Resources and Exploitation - Final Report. Silliman University Marine Laboratory, Dumaguete City, Philippines.
Chan, E.H. and H.C. Liew. 1986. A study on tropical demersal species (Malaysia). Final report submitted to IDRC. Faculty of Fisheries and Marine Science, Universiti Pertanian Malaysia. 64 p.
Chang, J.H. 1972. The result of experimental trawl fishing in South China Sea, p.585-596. In IPFC, Proceedings of the 13th Session, 14-25 October 1968, Brisbane, Queensland, Australia. Section I11 - Symposium on Demersal Fisheries. IPFC Proc. 13(3), 664 p.
Charnprasertporn, T. 1982. An analysis of demersal fish catches taken from the otterboard trawling survey in the Gulf of Thailand, 1980. Demersal Investigation Section, Marine Fisheries Division, Fisheries Department, Ministry of Agriculture and Cooperative, Bangkok, Thailand. 91 p.
Chowdhury, S.H. 1983. Completion reports of sea exploratory fishing scheme, East Pakistan. In Survey report of the fishery resources of Bay of Bengal by the survey research vessels Chosui Maru, Kagawa Maru, Kinki Maru and Jalwa. Research survey of marine fisheries under Directorate of Fisheries, Government of Bangladesh 1983. Mar. Fish. Bull. 1, 24 p.
Chowdhury, W.N., G. Khan, S. Myklevoll and R. Saetre. 1979. Preliminary results from a survey on the marine fish resources of Bangladesh, November-December 1979. Reports on surveys with R.V. Dr. Fridtjof Nansen, May 1980. Institute of Marine Research, Bergen, Norway.
Chowdhury, W.N., S.A. Iverserr, G. Khan and R. Saetre. 1980. Preliminary results from .a survey on the marine fish resources of Bangladesh, May 1980. Reports on surveys with R.V. Dr. Fridtjof Nansen. Inst i tute of Marine Research, Bergen, Norway.
Cinco, E. and L. Perez. 1996. Results of the Sorsogon Bay trawl survey. In E. Cinco, G. Trono and D.J. Mendoza (eds.) Resource and Ecological Assessment of Sorsogon Bay, Vol. 111. Final Reports. UB Tech, Inc. and FSP-Department of Agriculture.
Cinco, E., J. Diaz, R. Gatchalian and G.T. Silvestre. 1995. Results of the San Miguel Bay trawl survey. In G. Silvestre, C. Luna and J . Padilla (eds.) Multidisciplinary assessment of the fisheries in San Miguel Bay, Philippines (1992-1993). ICLARM Tech. Rep. 47.
CMFRI (Central Marine Fisheries Research Institute), Cochin, India. Waltair Research Center. 1980. Industrial fisheries off Visakhapatnam coast based on exploratory surveys during 1972-1978. Mar. Fish. Inf. Serv. Tech. Ext. Ser. 15: 1-15.
Compact Cambridge. 1991. ASFA (Aquatic Sciences and Fisheries Abstract) CD-ROM Reference Manual. Cambridge Scientific Abstracts, Bethesda, MD, USA.
Cushing, D.H. 1971. Survey of resources in the Indian and Indonesian area. Dev. Rep. Indian Ocean Programme, 2. 123 p.
de Jesus, A.S. 1976. A report on the design, construction and operation of German (Herman-Engel type) trawl net in Manila Bay. Philipp. J. Fish. 117-145 p.
de Jesus, A.S. and A.R. Maniulit. 1973. Preliminary report on the trial of bottom trawl rigged with plastic roller bobbins and oval board. Philipp. J. Fish. 11 (112): 36-50.
Demidenko, U. 1972. Information about the results of the joint Soviet-Lankian fishery investigations carried out in waters
adjacent to Ceylon Island. Manuscript report Fisheries Research Station, Colombo.
DOF (Department of Fisheries) 1968. Report on the 1968 trawling survey. Fisheries Department, Ministry of Development, Brunei Darussalam (Unpublished).
Druzhinin, A.D. and U. Phone Hliang. 1972 Observations on the trawl fishery of Southern Burma, p. 151-209. In IPFC, Proceedings of the 13th Sesslon, 14-25 October 1968, Brisbane, Queensland, Australia. Section 111 - Symposium on Demersal Fisheries. IPFC Proc. 13(3), 664 p.
Dwiponggo, A. and M. Badrudin. 1978a. Demersal resources survey in coastal areas of the Java Sea, 1977. Contribution of the Demersal Fisheries Project, No. 5. Marine Fisheries Research Institute, Indonesia. 14 p.
Dwiponggo, A. and M. Badrudin. 1978b. R.V. Mutrara N survey data in 1977. Mar. Fish. Res. Rep. (Spec. Rep.)/Contrib. Demersal Fish. Proj., Jakarta. 5A. 133 p.
Dwiponggo, A. and M. Badrudin. 1979a. Variation in catch rates and species composition of trawl surveys in Java Sea subareas, 1978. Contribution of the Demersal Fisheries Project, No. 6. Marine Fisheries Research Institute, Indonesia. 19 p.
Dwiponggo, A. and M. Badrudin. 1979b. Data of trawl survey by R.V. Mutlara IV In the J a v a Sea subareas, 1978. Contribut~on of the Demersal Fisheries Project, No. 6A. Marine Fisheries Research Institute, Indonesia. 128 p.
Dwiponggo, A. and M. Badrudin. 1980a. Results of the Java Sea inshore monitoring survey, 1979. Contribution of the Demersal Fisheries Project, No. 7. Marine Fisheries Research Institute, Indonesia.
Dwiponggo, A. and M. Badrudin. 1980b. Data of the Java Sea inshore monitoring survey by R.V. Mutrara IV, in 1979. Contribution of the Demersal Fisheries Project, No. 7A. Marine Fisheries Research Institute, Indonesia.
Eiamsa-ard, M. 1981. An analysis of demersal fish catches taken from otterboard trawling survey in the Gulf of Thailand, 1979. Demersal Fish. Rep. No. 1, Mar. Fish. Div., Dept. of Fish., Bangkok. (in Thai).
Eiamsa-ard, M. and D. Dhamniyom. 1979. An analysis of demersal fish catches from the otterboard trawling survey in the Gulf of Thailand, 1977. Demersal Fish. Rep. No. 1, Mar. Fish. Div., Dept. of Fish., Bangkok. (in Thai).
Eiamsa-ard, M. and D. Dhamniyom. 1980. An analysis of demersal fish catches from the otterboard trawling survey in the Gulf of Thailand, 1978. Demersal Fish. Rep. No. 2, Mar. Fish. Div., Dept. of Fish., Bangkok. (in Thai).
Eiamsa-ard, M. and D. Dhamniyom. 1981. An analysis of demersal fish catches from the otterboard trawling survey in the Gulf of Thailand, 1979. Demersal Investigation Section, Marine Fish. Div., Fisheries Department, Ministry of Agriculture and Cooperative, Bangkok Thailand. 105 p.
Eiamsa-ard, M., D. Dhamniyom and S. Pramokchutima. 1979. An analysis of demersal fish catches taken from trawling survey in the Gulf of Thailand, 1977. Department of Fisheries. Demersal Fish. Rep. 1. 21 p.
Encina, V.B. 1972. A report on two-boat bottom trawl fishing in the Philippines, p. 653-664. In IPFC, Proceedings of the 13th Session, 14-25 October 1968, Brisbane, Queensland, Australia. Section I11 - Symposium on Demersal Fisheries. IPFC Proc. 13(3), 664 p.
'~roese, R. and D. Pauly. 1997. FishBase 97: Concepts, design and data sources. ICLARM, Manila.
Gambang, A.C. 1981. Demersal fish resources in Malaysian waters. Sixth trawl survey off the coast of Sarawak (26 June-8 August, 1980) (Unpublished)
Gambang, A.C. 1986a. Demersal fish resources in Malaysian waters. Seventh trawl survey off the coast of Sarawak (16 May-6 July 1981). Bul. Perikanan (Malays.) Fish. Bull. No. 36, 41p. Department of Fisheries. Ministry of Agriculture, Malaysia.

Gambang, A.C.1986b. Demersal fish resources in Malaysian waters. Eight trawl survey off the coast of Sarawak (20 April - 10 June 1982). Bul. Perikanan (Malays.) Fish. Bull. No. 37, 43 p. Department of Fisheries. Ministry of Agriculture, Malaysia.
Gambang, A.C.1987. Demersal fish resources in Malaysian waters. Tenth trawl survey off the coast of Sarawak (12 May - 17 June 1987). Bul. Perikanan (Malays.) Fish. Bull. No. 51, 30 p. Department of Fisheries. Ministry of Agriculture, Malaysia
Gjaesaeter, J . 1984. Mesopelagic fish, a large potential resource in the Arabian Sea, p.1019-1035. In M.V. Angel (ed.) Marine science of the northwest Indian Ocean and adjacent waters. Deep-sea Res. 31(6-84).
Gloerfelt-Tarp, T. and P.J. Kailola (eds.) 1984. Trawled fishes of southern Indonesia and northwestern Australia. NP- Australia-Australian Development Assistance Bureau. 406 p.
Godo, O.R. 1979. Fish resources off Vietnam, Part I. Report on the Investigation by R.V. Bien Dong in Vinh Bac Bo (Gulf of Tonkin), J u n e 1977-June 1978. Marine Fisheries Research Institute, Haipong Vietnam and Institute of Marine Research, Bergen Norway. September 1979.
Godo, O.R. 1980. Fish resources off Vietnam, Part 11. Report on the Investigation by R.V. Bien Dong off the Southeastern par t of Vietnam, Ju ly 1978-December 1979. Marine Fisheries Research Inst i tute , Haipong Vietnam and Institute of Marine Research, Bergen, Norway. August 1980.
Gonzales, C.C., J.C. Mufioz, A.R. Tanedo and F.N. Lavapie. 1981. Report on the first finding survey of the Visayan Sea. Fish. Res. Div. Tech. Rep.
Grosslein, M.D. and A. Laurec. 1982. Bottom trawl surveys: design, operation and analysis. Interregional Fisheries Development and Management Programme - INTl791019,
j CECAFIECAF Ser. 81/22, 25 p. Halidi, H.A.M.S. 1987. A preliminary analysis of catch-per-effort
data from demersal trawl surveys off Negara Brunei Darussalam (1979-1986). Report of a training stage a t ICLARM, Mar-Apr 1987. Manila, Philippines.
Hayase, S. 1983. Preliminary assessment of the demersal stocks along the Indian Ocean coast of Thailand. Cur. Tech. Pap. Train. Dep. Southeast Asian Fish. Dev. Cent. Pharpradaeng Thailand-SEAFDEC. 18, 32 p.
Henriksson, T.G. 1980. Survey of demersal fish resource off the northwest, north and northeast coasts of Sri Lanka. Field Document 7. FAO, February 1980. FI:DP/SRL/72/051.
Hida, T.S. and W.T. Pereyra. 1966. Results of bottom trawling in Indian Seas by R.V. Anton Bruun in 1963. Proc. Indo- Pac. Fish. Counc. 11:156-171.
Humayon, M., G. Mustafa, M. Begum, S.C. Paul, N. Sada and G. Khan. 1983. Results from the 15th cruise (Dec. '83) of the R.V. Anusandhani to the demersal fishing grounds of t h e n o r t h e r n Bay of Bengal . Marine Fisheries Research, Management and Development, Chittagong, Bangladesh.
Hussain, A.G., M.A. Burney, S.Q. Mohiuddin and S. Zupanovic. 1972. Analysis of demersal catches taken from exploratory fishing off the coast of West Pakistan, p.61-84. In IPFC, Proceedings of the 13th Session, 14-25 October 1968, Brisbane, Queensland, Australia. Section 111 - Symposium on Demersal Fisheries. IPFC Proc. 13(3), 664 p.
IMR (Institute of Marine Research, Bergen, Norway). 1978. Survey results of R.V. Dr. Fridtjof Nansen Jan-Jun 1977. Joint NORADPakistan project fish assessment survey, Pakistan waters. Bergen Norway Inst. Mar. Res. 39 p.
IMR (Institute of Marine Research, Bergen, Norway). 1986. R. V. Dr. Fridtjof Nansen surveys of Pakistan fishery resources, September 1983 to June 1984. Summary of findings. UNDPIFAO Programme-GL0/82/001. 52 p.
19 1 Isarankura, A.P. 1971. Assessment of stocks of demersal fish
off the west coasts of Thailand and Malaysia. FAOIUNDP Dev. Rep. Indian Ocean Programme.
Jean, Y. 1957. Summary of operations of Canadian and North Star, April 1954-March 1957, Colombo Plan (Manuscript).
Joseph, K.M. 1974. Demersal fisheries resources off the northwest coast of India. Bull. Expl. Fish. Proj., India No. 1, 47 p.
Joseph, K.M. 1980. Comparative study of the demersal fishery resources of the Indian waters as assessed by the 17.5 m trawlers. Bull. Expl. Fish. Proj. 10, 46 p.
Joseph, K.M., N. Radhakrishnan and K.P. Philip. 1976a. Demersal fisheries resources off the west coast of India. Bull. Expl. Fish. Proj., India, No. 3, 56 p.
Joseph, K.M., N. Radhakrishnan, A. Joseph and K.P. Philip. 1976b. Results of demersal fisheries resources survey along the east coast of India, 1959-1974. Bull. Expl. Fish. Proj., India, No. 5, 53 p.
Jothy, A.A., G. Rauck. S.A.L. Mohammed Shaari, K.S. Ong, P.T. Liong and J.L. Carvalho. 1975. Demersal fish resources in Malaysian waters. Second trawl survey of the coastal waters off the east coast of Peninsular Malaysia (March- May, 1971). Fish. Bull. (Malaysia) No. 4. 36 p.
Kesteven, G.L., 0 . Nakken, T. Str0mme (eds.). 1981 The small pelagic and demersal fish resources of the northwest Arabian Sea, further analysis of the results of the IMR (Institute of Marine Research, Bergen, Norway). 1978. Survey results of R.V. Dr. Fridtjof Nansen Jan-Jun 1977. Joint NORADIPakistan project fish assessment survey Pakistan waters. Bergen, Norway Inst. Mar. Res. 39 p.
Khan, G., G. Mustafa, N.U. Sada and Z.A. Chowdhury. 1989a. Bangladesh: Offshore marine fishery resources studies with special reference to the Penaeid shrimp stocks, 1988- 89. A report based on R.V. Anusandhani shrimp trawling survey results (Cruise# GOB 49 to 54). Marine Fisheries Survey Management and Development Project, Department of Fisheries.
Khan, G., G. Mustafa, N.U. Sada and Z.A. Chowdhury. 1989b. Bangladesh: Inshore water fishery resources survey, demersal trawling with R. V. Machhranga, 1988-1989. A report based on R.V. Machhranga (Cruise # 8801106-89031 11). Marine Fisheries Survey Management and Development Project, Department of Fisheries.
Khan, M.G. 1983. Results of the 13th cruise (July 1983) with the R.V. Anusandhani to the demersal fish and shrimp grounds of the Bay of Bengal, Bangladesh. A cruise report submitted to the Project Director Marine Fisheries Research Management and Development Project, Chittagong, 11 p. (Mimeo).
Khan, M.G., M. Humayon, M.G. Mustafa, B. Mansura, S.C. Paul, and M.N. Sada. 1983. Results from the 15th cruise (December 1983) of the R.V. Anusandhani to the demersal fishing grounds of the northern Bay of Bengal (Bangladesh). Report submitted to the Project Director Marine Fisheries Research Management and Development Project, prepared by M. Humayon, M. Golam, M. Begum, C.P. Swapan and M.N. Sada. 8 p. (Mimeo).
Krishnamoorthi, B. 1976. An assessment of the demersal fishery resources off the Andhra-Orissa coast based on exploratory trawling. Indian J. Fish. 21(2): 557-565.
Lam, W.C., S.A.L. Mohammed Shaari, A.K. Lee and W. Weber. 1975a. Demersal fish resources in Malaysian waters-5. Second west coast trawl survey off the west coast of Peninsular Malaysia. Fish. Bull. 7. 29 p. Ministry of Agriculture and Rural Development, Kuala Lumpur, Malaysia.
Lam, W.C., W. Weber, A.K. Lee, K.S. Ong and P.C. Liong. 1975b. Demersal fish resources in Malaysian waters-7. 3rd East coast trawl survey off the east coast of Peninsular Malaysia, 14 August - 20 September 1972. Fish. Bull. 9. 18

p. Ministry of Agriculture and Rural Development, Kuala Lumpur, Malaysia.
Lamboeuf, M. 1987. Bangladesh demersal fish resources of the continental shelf, R.V. Anusandhani trawling survey results September 1984June 1986. A report prepared for the FAOIUNDP Project, Strengthening of the National Programme for Marine Fisheries Resources Management, Research and Development.
Lamp, F. and S.A.L. Mohammed Shaari. 1976. Demersal fish resources in Malaysian waters-10. Fourth trawl survey of the coastal waters off the east coast of the Peninsular Malaysia, 13 July-12 August 1974. Fish. Bull. 12, 25 p. Ministry of Agriculture and Rural Development, Kuala Lumpur, Malaysia.
Legasto, R.M., C.M. del Mundo and K.E. Carpenter. 1975a. On the hydrobiological and socio-economic surveys of San Miguel Bay for the proposed fish nurseries/reservations. Philipp. J. Fish. 13(2): 205-246.
Legasto, R.M., C.M. del Mundo and K.E. Carpenter. 1975b. On the socio-economic and hydrobiological surveys of Maqueda Bay, Villareal Bay and part of Zumarraga Channel for the proposed nurseries/reservations. Philipp. J . Fish. 13(1): 102-146.
Liu, H.C., H.L. Lai and S.Y. Yeh. 1978. General review of demersal fish resources in the Sunda Shelf and the
J Australian waters. Acta Oceanogr. Taiwan 8: 109-140.
Lohmeyer, U. 1996. Narrat ive and major results of the Indonesian-German Module (11) of the JETINDOFISH Project, August 1979-July 1981, p. 77-90. In D: Pauly and P. Martosubroto (eds.) Baseline studies of biodiversity: the fish resources of Western Indonesia. ICLARM Stud. Rev. 23, 312 p.
Losse, G.F. and A. Dwiponggo. 1977. Report of the Java Sea southeast monsoon trawl survey, June-December 1976. Contribution of the Demersal Fisheries Project, No. 3. Marine Fisheries Research Institute, Indonesia. 119 p.
Lui, Y.P. 1981. Demersal fish resources in Malaysian waters- 14. Fourth trawl survey off the west coast of Peninsular Malaysia, 17 October-18 November 1978. Fish. Bull. 26. 19 p. Ministry of Agriculture and Rural Development, Kuala Lumpur, Malaysia.
Lui, Y.P., S.A.L. Mohammed Shaari, M. Ismail Taufid and F. Lamp. 1976. Demersal fish resources in Malaysian waters- 12. Third trawl survey off the coast of Sarawak (16 July-8 August 1975). Fish. Bull. 14. 35 pp. Ministry of Agriculture and Rural Development, Kuala Lumpur, Malaysia.
MADECOR (Mandala Agricultural Development Corporation) and National Museum. 1994. FSP-Resource and Ecological Assessment in Manila Bay. Vol. 2. Fishery Stock and Habitat Assessment Studies. Final Report. MADECOR and FSP, BFAR, Quezon City.
Majid, A. and M. Arshad. 1985. Survey of demersal fish resources along Pakistan coast by R. V. Dr. Fridtjof Nansen in autumn 1983. Fish. Newsl. Mar. Fish. Dep. Pak. 3(1-2): 33-41.
Maliel, M.M. 1979. Exploratory fishing in the inshore waters of Arabian Sea of Mangalore. Mysore J . Agric. Sci. 13(1): 122 (Summary only).
Manacop, P.R. and S.V. Laron. 1956. The 'dug-out' trawl fishing of Manila Bay. Philipp. J. Fish. 4(2): 103-113.
Marine Fisheries Dep., Karachi (Pakistan). 1985. Activities of the two departmental research vessels Machhera and Tehkilr during January-March, 1985. Fish. Newsl. Mar. Fish. Dep. Pak. 3(1-2): 23-31.
Marine Fisheries Laboratory, Ministry of Agriculture, Thailand and the Fisheries Research Inst i tute , Ministry of Agriculture and Cooperatives, Malaysia. 1967. Results of the joint Thai-Malaysia-German trawling survey off the coast of Malay Peninsula, 1967. Ministry of Agriculture, Thailand and the Ministry of Agriculture and Cooperatives, Malaysia. 64 p.
Martosubroto, P. 1996. Structure and dynamics of the demersal resources of the Java Sea, 1975-1979, p. 62-76. In D. Pauly and P. Martosubroto (eds.) Baseline studies of biodiversity: the fish resources of Western Indonesia. ICLARM Stud. Rev. 23, 312 p.
'Martosubroto, P., . Sujastani and D. Pauly. 1996. The mid- 1970s demersal resources in the Indonesian side of the Malacca Strait, p. 40-46. In D. Pauly and P. Martosubroto (eds.) Baseline studies of biodiversity: the fish resources of Western Indonesia. ICLARM Stud. Rev. 23, 312 p.
Megia, T.G., I.A. Ronquillo and R.R. Medina. 1953. Notes and observation on the Danish deep-sea expedition of the Galathea to the Mindanao Deep. Philipp. J. Fish. 2(1/2): 197- 204.
Meiyappan, M.M. and K.P. Nair. 1990. Preliminary studies on the cephalopods collected from the deep scattering layers of the Indian Exclusive Economic Zone and adjacent seas, p. 397-401. In K.J. Mathew (ed.) Proceedings of the First Workshop on Scientific Results of F.O.R.V. Sagar Sampada, 5-7 June 1989. Central Marine Fisheries Research Institute, Cochin, India.
Menavesta, D. 1970. Potential demersal fish resources of the Sunda Shelf, p. 525-559. In J . Marr (ed.) The Kuroshio, a symposium on the Japan current. Honolulu, East-West Center Press.
Menon, N.G. 1990. Preliminary investigation on the fish biomass in the deep scattering layers of the EEZ of India, p.273-280. In K.J. Mathew (ed.) Proceedings of the First Workshop on Scientific Results of F. O.R.V. Sagar Sampada, 5-7 June 1989. Central Marine Fisheries Research Institute, Cochin, India.
Mines, A.N. (ed.) 1984. Assessment of the trawlable areas in the Philippines 11: Ragay Gulf, Burias Pass, Ticao Pass and waters north of Samar Sea. Tech. Rep. Dept. Mar. Fish. 5, 66 p.
Mines, A.N. 1986. An assessment of the fisheries of Lingayen Gulf. PCARRDINSTA-UPV. 26 p.
Mohamed, M.I.H., G. Kawamura and Z. Haron. 1986. Trawl catch composition and fish abundance of Matahar i Expedition '85, p. 147-163. In A study on the offshore waters of the Malaysian EEZ. Occ. Pap. 3. Faculty of Fisheries and Marine Science, Universiti Pertanian Malaysia. 233 p.
Mohammed Shaari, S.A.L. and H.L. Chai. 1976. Demersal fish resources in Malaysian waters-11. Third trawl survey off the west coast of Peninsular Malaysia (16 November-11 December 1974). Fish. Bull. 13. 17 p. Ministry ofAgriculture and Rural Development, Kuala Lumpur, Malaysia.
Mohammed Shaari, S.A.L., G. Rauck, K.S. Ong and S.P. Tan. 1974. Demersal fish resources in Malaysian waters-2. Trawl survey of the coastal waters off the west coast of Peninsular Malaysia (12 December 1970-22 January 1971) Fish. Bull. 3. 41 p. Ministry of Agriculture and Rural Development, Kuala Lumpur, Malaysia.
Mohammed Shaari, S.A.L., W. Weber and P.C. Liong. 1976a. Demersal fish resources in Malaysian waters-8. Trawl survey off the west coast of Peninsular Malaysia (Southern part of the Malacca Straits). Fish. Bull. 10. 21 p. Ministry of Agriculture and Rural Development, Kuala Lumpur, Malaysia.
Mohammed Shaari, S.A.L., W. Weber, A.K. Lee and W.C. Lam. 197613. Demersal fish resources in Malaysian waters. First trawl survey off the coasts of Sarawak, Brunei and the west coast of Sabah, 27 March - May 1972. Fish. Bull. 8. 64 p. Ministry of Agriculture and Rural Development, Kuala Lumpur, Malaysia.
Mohammed Shaari, S.A.L., W. Weber and A.K. Lee. 1976c. Demersal fish resources in Malaysian waters-9. Second trawl survey off the coast of Sarawak, 17 August-18 September 1973. Fish. Bull. 11. 28 p. Ministry ofAgriculture and Rural Dbvelopment, Kuala Lumpur, Malaysia.

193 Mohan, P.C. and G.V. Rayudu. 1986. Squid and cuttlefish in Ordoiiez, J.A., J.S. Ginon and A.M. Maala: 1977. Report on the
nearshore bottom waters off Visakhapatnam, India, p.373- fishery-oceanographic observations in Tayabas Bay and 378. In M.F. Thompson, R. Sarojini and R. Nagabhushanam adjacent waters. Philipp. J . Fish. 15(1): 41-78. (eds.) Biology of benthic marine organisms: techniques Pathansali, D., G. Rauck, A.A. Jothy, S.A.L. Mohammed Shaari and methods as applied to the Indian Ocean. Indian Ed. and T.B. Curt in . 1974. Demersal fish resources in Ser. 12. Malaysian waters. Min. Agric. Fish. Malaysia Fish. Bull. 1,
MSU (Mindanao State University at Naawan). 1993. Resource 46 p. and ecological assessment of Panguil Bay. Terminal report. Pathansali, D., K.S. Ong, S.S. Latiff and J. Carvalho. 1967. MSU and FSP, BFAR, Quezon City. Preliminary results of trawling investigations off Penang.
Mustafa, M.G. and M.G. Khan. 1993. The bottom trawl fishery, Proc. Indo-Pac. Fish. Coun. 12(11): 181-201. p.89-106. In Studies of interactive marine Fisheries of Pauly, D. 1982. History and status of the San Miguel Bay Bangladesh. Bay of Bengal Programme for Fisheries Fisheries, p. 95-124. In D. Pauly and A.N. Mines (eds.) Small- Development, Madras, India. BOBPAVPl89. scale fisheries of San Miguel Bay, Philippines:. biology and
Mustafa, M.G., M.G. Khan and M. Humayon. 1987. Bangladesh, stock assessment. University of the Philippines, Quezon Bay of Bengal penaeid shrimp trawl survey result, R.V. City Philippines. ICLARM Tech. Rep. 7, 124 p. Anusanclhani, November 1985-January 1987. Marine '~auly, D. 1995. Anecdotes and the shifting baseline syndrome Fisheries Research Management and Development of fisheries. Trends Ecol. Evol. lO(10): 430. Project. J ~ a u l y , D. 1996. Biodiversity and the retrospective analysis of
Naik, S.S., A.K. Malik, A. Tiburtias, K.N.V. Nair and S.G. demersal trawl surveys: A programmatic approach, p: 1-6. Patwari. 1993. Results of demersal resources survey along In D. Pauly and P. Martosubroto (eds.) Baseline studies of Karnataka-Goa-South Maharashtra coast between biodiversity: the fish resources of Western Indonesia. latitudes 11"N and 18"N. Seafood Export J. 25(7): 39-43. J ICLARM Stud. Rev. 23, 312 p.
Nair, K.P. 1976. Exploratory t rawl fishing i n Bombay- Pauly, D., P. Martosubroto and J. Saeger. 1996. The Mutiara 4 Saurashtra waters during 1968-70. Indian J . Fish. 21(2): surveys in the Java and southern South China Seas, 406-426. November 1974 to July 1976, p.47-54. In D. Pauly and P.
Nnir, K.P., K.S. Rao, R. Sarvesan, M.M. Meiyappan, G.S. Rao, Martosubroto (eds.) Baseline studies of biodiversity: the M. Joseph and D. Nagaraja. 1990. Oceanic squid resources fish resources of Western Indonesia. ICLARM Stud. Rev. of the EEZ of India, p. 403-407. In K.J. Mathew (ed.) 23, 312 p. Proceedings of the First Workshop on Scientific Results of Pearsons, J. and A.H. Malpas. 1926. A preliminary report on F.O.R.V. Sagar Sampada, 5-7 June 1989. Central Marine the possibilities of commercial trawling in the sea around Fisheries Research Institute, Cochin, India. Ceylon. Ceylon J. Sci. 2: 1-12.
Nalilren, 0. 1983. Cruise report Dr. Fridtjof Nansen. Fisheries Penn, J.W. 1983. Bangladesh, an assessment of potential yields resources survey. Pakistan. 5-16 September 1983. NORADI from offshore demersal shr imp and fish stocks in UNDPIFAO-programme-GL0/82/001. 28 p. Bangladesh waters (including comments on the trawl fishery
Narayanappa, G., D.A. Narasimha Raju and A.V.V. 1981-82). A report prepared for the Fisheries Advisory Satyanarayana. 1972. Certain observations on the otter Service (Phase 11) Project. Rome, FAO, FI:DP/l3GDl811034. trawl operations carried out in the inshore and deep-waters Field Document 4, 22 p. --\ off Kakinada, p. 450-455. In IPFC, Proceedings of the 13th Philip, K.P. and D.M. Ali. 1989. Population dynamics and stock Session, 14-25 October 1968, Brisbane, Queensland, assessment of the cuttle fish, Sepia pharaonis (Ehrenberg) Australia. SectionfIII - Symposium on Demersal Fisheries. in Wadge Bank, p. 66-75. In Studies of fish stock assessment IPFC Proc. 13(3): 664 p. in Indian waters. Spec. Publ. Fish. Sum. India, 2.
Nasir, M.T.M., and I. Johari. 1990. The second and third prawn Pillai, P.K.M., N. Jayabalan, M. Srinath and S. Subramani. 1983. trawling surveys off the west coast of Peninsular Malaysia. The catch trend of the commercial trawl fisheries off Fish. Bull. Dep. Fish. Malays. Bul. Perikanan Jabatan Rameswaram. Mar. Fish. Inf. Serv. Tech. Ext. Ser. 48: 17- Perilcanan Malays. 61. 81 p. J 19.
Ochavillo. D.. H. Hernandez. S. Resma and G.T. Silvestre. 1989. Pura, L.R., E.A. Cinco, Q.P. Sia 111, F.C. Alducente, M.J.N. Ayon, F.G. Balleta, A.R. Enerlan, B.E. Llevado and F.V. Lumagod. -
1996a. Chapter 1, Assessment of the fishery resources of Carigara Bay. In G.T. Silvestre, L.R. Garces and A.C. Trinidad (eds.) Resource and ecological assessment of Carigara Bay, Philippines: results of the monitoring
/ activities (1995-1996). Pura, L.R., E.A. Cinco, Q.P. Sia 111, F.L Gonzales, A.P. Luistro
and L.M. Rueca. 1996b. Chapter 1, Assessment of the fishery resources of M.anila Bay. In G.T. Silvestre, L.R. Garces and A.C. Trinidad (eds.) Resource and ecological assessment of Manila Bay, Philippines: results of the monitoring activities (1995-1996).
Qureshi, M.R. 1955. Marine fishes of Karachi and the coasts of Sind and Makram. Government of Pakistan, 80 p.
Qureshi, M.R. and M.A. Burney. 1952. A preliminary report on trawling in Pakistan. Invest. Rep. 1: 1-53.
Rachid, M.H. 1983. Mitsui-Taiyo survey 1976-77 by the survey research vessels M.V. Santamonica and M.V. Orion-8 in the marine waters of Bangladesh. Researchlsurvey of Marine Fisheries under the Directorate of Fisheries, Government of Bangladesh. Mar. Fish. Bull. 2.
Rao, T.A. and B. Krishnamoorthi. 1982. Diurnal variation in the catches of demersal fishes in the north west region of Bay of Bengal during 1959-60. Indian J. Fish. 29(1-2): 134- 143.
Preliminary results of a study of the commercial trawl fisheries in Lingayen Gulf, Philippines, p.31-42. In G.T. Silvestre, E. Miclat and T.E. Chua (eds.) Towards sustainable development of the coastal resources of Lingayen Gulf, Philippines. ICLARM Conf. Proc. 17, 200 p.
Okera, W. and J.S. Gunn. 1986. Exploratory trawl surveys by F.R.V. Soda in the Australian fishing zone sector of the Timor-Arafura seas and in the Gulf of Carpentaria, 1980- 81. CSIRO Marine Laboratory Report 150, Commonwealth Scientific and Industrial Research Organization, Marine Research Laboratory, Australia. 104 p.
Ommaney, F.D. 1961. Malayan offshore trawling grounds. The experimental and exploratory fishing cruises of the F.R.V. Manihine in Malayan and Borneo waters, 1955-56 with a note on temperatures and salinities in the Singapore Strait. Colonial Office Fisheries Publications No. 18. H.M.S.O., London.
Oug, K.S. and W. Weber. 1977. First prawn trawling survey off the west coast of Peninsular Malaysia. Fish. Bull. 18. 28 p. Ministry of Agriculture, Kuala Lumpur, Malaysia.
Ordoiiez, J.A. 1985. A study of the trash fish caught by the otter t,rawl in the Visayan Sea. Philipp. J. Fish. 18(1/2): 1-76.
Ordoiiez, J.A., F.M. Arce, R.A. Ganaden and N.N. 'Metrillo, Jr . 1975. On the hydro-biological and fisheries survey of Sorsogon Bay, Lnzon Island. Philipp. J . Fish. 13(2): 178-204.

194 Rao, K.K. and K.K. Kunjipalu. 1989. Estimation of fishery
resources based on trawl surveys off Veraval, Gujarat, India, p. 63-68. In S.C. Venema and N.P. van Zalinge (eds.) Contributions to tropical fish stock assessment in India. Papers prepared by the participants at the FAO-DANIDA- ICAR National Follow-up Training Course on Fish Stock Assessment, Cochin, India, 2-28 November 1987. GCP/ INT/392/DEN/l.
Reuben, S., G.S. Rao, G. Luther, T.A. Rao, K. Radhakrishnan, Y.A. Sastry and G. Radhakrishnan. 1988. An assessment of the demersal fishery resources of the northeast coast of India. CMFRI Spec. Publ. 40: 15 (Summary only).
Rijavec, L. and Htun Htein. 1984. Burma demersal fish resources of continental shelf and slope (results of trawling surveys, 1981-1983). Marine Resources Survey and Exploratory Fishing Project, Rome, FA0 FI:DP/BUR/77/ 003. Field Document 3, 73 p. and 24 figures.
Ritragsa, S. and S. Pramokchutima. 1970. The analysis of demersal fish catches taken from the otterboard trawling survey in the Gulf of Thailand, 1968. Div. Res. Inv. Thailand Contrib. 16: 1-61.
Ritragsa, S., D. Dhamniyom and S. Sittichaikasem. 1968. An analysis of demersal fish catches taken from the otterboard trawling survey in the Gulf of Thailand, 1966. Div. Res. Inv. Thailand Contrib. 11, 104 p. (In Thai)
Ritragsa, S., D. Dhamniyom and S. Sittichaikasem. 1969. An analysis of demersal fish catches taken from the otterboard trawling survey in the Gulf of Thailand, 1968. Contrib. Mar. Fish. Lab., Bangkok. 16. 61 p. (In Thai)
Ronquillo, I.A. 1959. Oceanographic research in the Philippines. Philipp. J. Fish. 7(2): 87-96.
Ronquillo, I .A., P . Caces-Borja and A.N. Mines. 1960. Preliminary observations on the otter trawl fishery of Manila Bay. Philipp. J. Fish. 8(1): 47-56.
Saetersdal, G.S. and G.H.P. de Bruin (eds.) 1979. Report on the survey of the coastal fish resources of Sri Lanka, August - September 1978. Reports on Surveys with the R.V. Dr. Fridtjof Na,nsen. Fisheries Research Station, Colombo and Institute of Marine Research, Bergen. 36 p.
Saetre, R. 1981. Surveys on the marine fish resources of Bangladesh. Nov.-Dec. 1979 and May 1980. Reports on surveys with the R.V. Dr. Fridtjof' Nansen. Institute of Marine Research, Bergen.
SCS. 1978. Report of the workshop on the demersal resources of the Sunda Shelf, 31 October-6 November 1977, Penang, Malaysia. Part 11. SCS/GEN/77/13. 120 p. South China Sea Fisheries Development and Coordinating Programme, Manila.
SEAFDEC (Southeast Asian Fisheries Development Center). 1985. Report of the Thai-SEAFDEC joint fishery oceanographic survey in the central Gulf of Thailand, (16 May-9 June 1984). Res. Pap. Ser. No. 4, SEAFDEC, Training Department.
Sebastian, A.R. 1951. Oceanographic research in the Philippines. Philipp. J. Fish. 1: 147.153.
Shamsudeen, A.R., and K.G. Raj. 1993. Results of demersal resources survey along north west coast between latitudes 18"N and 23"N by Matsya Nireekshani. Seafood Export J. 25(9): 39-43.
Silas, E.G., K. Vidyasagar, K.P. Nair and B.N. Rao. 1985. Cephalopod resources revealed by exploratory surveys in Indian seas, p. 129-136. In E.G. Silas (ed.) Cephalopod- bionomics, fisheries and resources of the Exclusive Economic Zone of India. CMFRI Bull. 37. Central Marine Fisheries Research Institute, Cochin, India.
Silvestre, G.T. and H.J.H. Matdanan. 1992. Brunei Darussalam capture fisheries: A review of resources, exploitation and management, p.1-38. In G. Silvestre, H.J.H. Matdanan, P.H.Y. Sharifuddin, M.W.R.N. De Silva and T.-E. Chua (eds.) The coastal resources of Brunei Darussalam: s tatus , utilization and management. ICLARM Conf. Proc. 34,214 p.
Silvestre, G.T., R.B. Regalado and D. Pauly. 1986. Status of Philippine demersal stocks-inferences from underutilized catch rate data, p.47-96. In D. Pauly, J . Saeger-and G. Silvestre (eds.) Resources, management and socio- economics of Philippine marine fisheries. Tech. Rep. Dep. Mar. Fish. Tech. Rep. 10 , 217 p.
Sivasubramaniam, K. and R. Maldeniya. 1985. The demersal fisheries of Sri Lanka. Work. Pap. Bay Bengal Programme, No. 41, 41 p.
Sparre, P., E. Ursin and S.C. Venema. 1989. Introduction to tropical fish stock assessment, Part 1-Manual. FA0 Fish. Tech. Pap. 30611, 337 p.
Sreenivasan, P.V. and R. Sarvesan. 1989. On the cephalopods collected during the exploratory survey by F.O.R.V. Sagar Sampada in the Andaman-Nicobar Seas, p.409-413. In K.J. Mathew (ed.) Proceedings of the First Workshop on Scientific Results of F.O.R.V. Sagar Sampada, 5-7 June 1989. Central Marine Fisheries Research Institute, Cochin, India.
S t r ~ m m e , T., 0. Nakken, Sann Aung and G. Saetersdal (eds.) 1981. Surveys on the marine fish resources of Burma, September to November 1979 and March-April 1980. Reports on surveys with the R.V. Dr. Fridtjof Nansen. Institute of Marine Research. Bergen, Norway.
Sudarsan, D., and P . J . Joseph. 1975. On the location of a potential prawn fishing ground off the west Bengal coast. J . Mar. Biol. Assoc. India. 17(2): 247-249.
Sudarsan, D. M.E. John and A. Joseph. 1988. An assessment of demersal stocks in the southwest coast of India with particular reference to the exploitable resources in outer continental shelf and slope. CMFRI Spec. Publ. 40: 102- 103.
Sudradjat, A. and U. Beck. 1978. Report on southern South China Sea demersal trawl survey, June and July 1978, p. 81-140. In Contribution of the Demersal Fisheries Project, No. 4. Marine Fisheries Research Institute, Indonesia.
Suppachai-Ananpongsuk. 1989. Report on some offshore demersal resources of the Andaman Sea. Res. Pap. Ser. Train. Dep. Southeast Asian Fish. Dev. Cent. Samutparakarn , Thai land, SEAFDEC Training Department, No. 20, 30 p. SEAFDEC TD/RES/20.
Survey and Research Division, Directorate of Fisheries, Government of Gujarat , India . 1972. Exploratory operations off Gujarat coast. Proc. Indo-Pac. Fish. Counc. 13(3): 456-567.
Suseelan, C., G. Nandakumar and K.N. Rajan. 1990. Results of bottom trawling by F. O.R.V. Sagar Sampada with special reference to catch and abundance of edible crustaceans, p. 337-346. In K.J. Mathew (ed.) Proceedings of the First Workshop on Scientific Results of F. O.R. V. Sagar - Sampada, 5-7 June, 1989, Cochin. Cochin India Central Marine Fisheries Research Institute.
Tiews, K. and P. Caces-Borja. 1959. On the availability of fish of the family Leiognathidae Lacepede in Manila Bay and San Miguel Bay and on their accessibility to controversial fishing gears. Philipp. J. Fish. 7(1): 59-86
Vacarella, R., A.M. Pastorelli and G. Marano. 1985. Observations on the trawl fisheries of the Bari oceanic fleet carried out along the Somalian coasts (Indian Ocean). Oebalia ll(2): 633-653.
'Vahily, J.M. 1982. Catch and effort in the trawl fishery, p 65- 94. In D. Pauly and A.N. Mines (eds.) Small Scale Fisheries of San Miguel Bay, Philippines: Biology and Stock Assessment. University of the Philippines, Quezon City, Philippines. ICLARM Tech. Rep. 7.
Venema, S.C. (ed.). 1983. Fishery resources in the North Arabian Sea and adjacent waters, p.lOO1-1018. In M.V. Angel Marine science of the Northwest Indian Ocean and adjacent waters. Deep-sea Res. 31(6-8A).
Virabhadra Rao K., K. Dorairaj and P.V. Kagwade. 1972. Results of the exploratory fishing operations of the Government

of India vessels a t Bombay base for the period 1961-1967. Proc. Indo-Pac. Fish. Counc. 13(3): 402-430.
Vivekanandan, E.V. and B. Krishnamoorthi. 1985. Estimated resources of demersal fisheries off North Tamil Nadu- South Andhra coasts based on exploratory surveys, p.64- 76. In Harvest and Postharvest Technology of Fish. Society of Fisheries Technologists, Cochin, India.
Warfel, H.E. and P.R. Manacop. 1950. Otter trawl explorations in Philippines waters. Research Report 25, Fish and Wildlife Service, U.S. Department. of the Interior, Washington, D.C.
West, W.Q.B. 1973. Fishery resources of the Upper Bay of Bengal. Indian Ocean Programme, Indian Ocean Fisheries Commission, Rome, FA0 IOFC/DEV/73/28, 44 p.
White, T.F. 1985a. Marine fisheries resource survey: demersal trawling. Survey cruise report, No.4, November 9-20, 1984. BGD/80/025/CR4, 72 p. Marine Fisheries Research, Management and Development Project, UNDPIFAO, Chittagong, Bangladesh.
White, T.F. 1985b. Marine fisheries resource survey: demersal trawling. Survey cruise report, No. 5, November 27- December 6, 1984. BGD/80/025/CR5,65 p. Marine Fisheries Research, Management and Development Project, UNDPI FAO, Chittagong, Bangladesh.
White, T.F. 1985c. Marine fisheries resource survey: demersal trawling. Survey cruise report, No.6, December 13-21, 1984. BGD/80/025/CR6, 68 p. Marine Fisheries Research, Management and Development Project, UNDPIFAO, Chittagong, Bangladesh.
White, T.F. 1985d. Marine fisheries resource survey: demersal trawling. Survey cruise report, No.7, January 6-16, 1984. BGD/80/025/CR7, 78 p. Marine Fisheries Research, Management and Development Project, UNDPIFAO, Chittagong, Bangladesh.
White, T.F. 1985e. Marine fisheries resource survey: demersal trawling. Survey cruise report, No.8, January 31-February
195 11, 1984. BGD/80/025/CR8, 7 1 p. Marine Fisheries Research, Management and Development Project, UNDPI FAO, Chittagong, Bangladesh.
White, T. F. 1985f. Marine fisheries resource survey: demersal trawling. Survey Cruise Report, No.9, February 17-24, 1985. BGD/80/025/CR9, 48 p. Marine Fisheries Research, Management and Development Project, UNDPIFAO, Chittagong, Bangladesh.
White, T. F. 1985g. Marine fisheries resource survey: demersal trawling. Survey Cruise Report, No.11, May 19-24, 1985 and July 12-17, 1985. BGD/80/025/CRll, 35 p. Marine Fisheries Research, Management and Development Project, UNDPFAO, Chittagong, Bangladesh.
White, T.F. and M.G. Khan. 1985a. Marine fisheries resource survey: demersal trawling. Survey cruise report, No.1, September 15-25, 1984. BGD/80/025ICRl, 73 p. Marine Fisheries Research, Management and Development Project, UNDPIFAO, Chittagong, Bangladesh.
White, T.F. and M.G. Khan. 198513. Marine fisheries resource survey: demersal trawling. Survey cruise report, No.2, October 3-13, 1984. BGD/80/025lCR2,81 p. Marine Fisheries Research, Management and Development Project, UNDPI FAO, Chittagong, Bangladesh.
White, T.F. and M.G. Khan. 1985c. Marine fisheries resource survey: demersal trawling. Survey cruise report, No. 3, October 20-31, 1984. BGD/80/025/CR3, 62 p. Marine Fisheries Research, Management and Development Project, UNDPFAO, Chittagong, Bangladesh.
Yeh, S.Y. 1981. Dynamics of the demersal fish resources in the Sunda Shelf area of the South China Sea., University of Washington. Ph.D. dissertation.
Yeh, S.Y., L.L. Loow and H.-C. Liu. 1981. Assessment on groundfish resources in the Sunda Shelf area of the South China Sea. Acta Oceanogr. Taiwan. 12: 175-189.

Appendix IV
Author Index
Ablan, M.C.A. 117, 132 Ablaza, E. 148 Abu Taiib, A. vii, 2, 47, 143, 146, 149, 159-161, 163-167, 189 ADB 9, 10, 23 Aglen, A. 157, 160, 163, 177, 189 Agiiero, M. 68, 71 Ahmad Adnan, N. 57, 59-60, 160-162, 189, Aitchinson, J. 121, 131 Akjiiz, E. 16, 24 Alamgir, M. vii, 2, 16, 26, 146, 149 Alcala, A.C. 64, 71 Alducente, F.C. 171, 193 Alexander, L.M. 95, 106, 133, 142 Ali, D.M. 181,193 Ali, M. 9, 17, 24, Alias, M. vii, 2, 47, 52, 60, 146, 149, 159, 160-161, 165-167 Alirio, P.M. 64, 71, 134, 141 Alverson, D. 16, 20, 23 Ambak, M.A. 61 Amornchairojkul, S. vii, 2, 41, 85, 147, 149 Anderson, L.G. 13, 19, 23 Andrew, L.K.K. 55-56, 61 Annual Fisheries Statistics 53-54 Anon. 72, 74, 83, 151, 182, 189 Aoyama, T. 9, 23, 177, 187, 189 APFIC 12, 15-17, 19, 23, 111 APO 9, 23 Aprieto, V.L. 170-171, 189 Arce, P.M. 170, 193 Armada, N.B. 134, 141, 171, 189 Armstrong, D. 16, 23 Arshad, M. 186, 192 Ayon, M.J.N. 171, 193 Aziz, M.A. 17, 24 Ba Kyaw, U. 179, 189 Badrudin, M. 38, 45, 134-135, 141, 155.156, 190 Bailey, C. 38, 45 Bain, K.H. 151, 189 Baker, V. 119, 132 Balleta, F.G. 171, 193 Banon, S. 11, 23, 42, 45 Bapat, S.V. 183, 189 Barut, N.C. vii, 2, 17, 62, 143, 146, 149, 171 Bautista, R.D. 169, 189 Beales, R. 154, 189 Beck, U. 156, 194 Beddington, J.R. 88, 95 Begum, M. 152, 191 Bejie, A.B. 165-166, 189 Bell, F.H. 123, 132 Bell, J.D. 45 Berg, S.E. 76, 83, 172, 189 Beverton, R.J.H. 16, 23, 123, 131 BFAR 68, 70-71 BFAR and BAS Statistics 65-66 BFAR Statistics 67 Bhuiyan, A.L. 9, 17, 24 Bianchi, G. 123, 131, 134-135, 141, 157, 189 Biradar, R.S. 184, 189 Birowo, S. 39, 46 Birtwistle, W. 161, 189
Blindheim, J. 83, 173, 189 BOBP 32, 36 Bohnsack, J.A. 20, 23 Bonga, D. 148-149 Boonyubol, M. 88, 95 Branson, P. 119, 131 Brown, B.E. 133, 142 Budihardjo, S. 134-135, 141 Bunt, J.S. 136, 142 Burney, M.A. 185-186, 191, 193 Bustillo, R. 168, 189 Butcher, J. 11, 23, 41, 45 Cabansag, J.P.B. 133, 141 Caces-Borja, P. 168, 189, 194 Caddy, J.F. 13, 19, 23 Calumpong, C. 71 Calumpong, H.P. 171, 190 Campos, W.L. 133, 141 Canagaratnan, P. 76, 83 Canh, N.T. 97-100, 106 Cark, D. 71 Carpenter, K.E. 169-170, 192 Carvalho, J. 158, 162, 191, 193 Chai, H.L. 160, 192 Chan, E.H. 163, 190 Chang, J.H. 186, 190 Chark, L.H. 49, 61 Charnprasertporn, T. 94-95, 175, 190 Cheah, E.K. 49, 61 Cheung, C. 105-106 Chew, Y.F. 49, 60 Chia, L S. 9, 24-25 Chong, K.C. 42, 44-45 Choo, P.S. 49, 60 Chottiyaputta, C. 91, 95 Chou, L.M. 9, 17, 23-25 Chowdhury, N.J.U. 29, 37, 151 Chowdhury, S.R. 29, 37 Chowdhury, S.H. 151, 190 Chowdhury, W. 29, 36 Chowdhury, W.N. 151, 190 Chowdhury, Z.A. 29-30, 32-34, 36-37, 153, 191 Christensen, J.M. 95 Christensen, V. 21, 23, 70-71, 85, 95, 97, 106, 133, 141 Chua, T.E. 9, 11, 16-17, 20, 23-24, 89, 95, 193-194 Chullasorn, S. 11, 23 Cinco, E.A. 70-71, 169-171, 190, 193 Clark, J.R. 20, 23 Clarke, K.R. 123, 132-133, 136, 142 Clay, H.J. 136, 142 CMFRI 181, 190 Cochran, W.G. 122, 132 Collier, W.L. 9, 25 Compact Cambridge 190 Converse, H. 71 Coronado, G.U. 118, 132 Corpuz, P. 16, 23, 66, 68, 70-71 Currie, D. 154, 189 Curtin, T.B. 57, 61, 158, 162, 193 Cushing, D.H 151, 185, 190 Dacay, B.U. 65, 71

Dalpadado, P. 77, 83 Dalzell, P. 16, 23, 38, 45, 66, 68, 70-71 Dassanayake, H. 73-74, 83 Dates, C.J. 116, 132 Dayaratne, P. 75-76, 83-84 de Bruin, G.H.P. 76-77, 83-84, 172-173, 189, 194 de Jesus, A.S. 169, 171, 190 de Leon, R.O. 171, 190 De Silva, M.W.R.N. 24, 194 del Mundo, C.M. 169-170, 192 del Norte, A.G.C. 133-134, 141 Demidenko, U. 77, 83, 172, 190 Deocadiz, E. 9, 17, 23 Department of Fisheries 61, 89 DGF 40-41, 44-45 Dhamniyom, D. 49, 61, 174-175, 190, 194 Dhanarajah, G. 49, 61 Diaz, J . 70-71, 170, 190 Dizon, L.B. 71, 132, 141 DOF 47, 53, 56, 61, 154, 183, 190 DOF Internal Reports 35 Dorairaj, K. 183, 194 Doubleday, W.G. 132 Druzhinin, A.D. 180, 190 Duraraitnam, M. 74, 83 Dwiponggo, A. 11, 23, 38-39, 42, 44-45, 155-156, 190, 192 Eiamsa-ard, M. vii, 2, 41, 85, 94-95, 143, 147, 149, 175, 190 El-Kholy, 0. 22, 25 Emery, K.D. 85, 95 Encina, V.B. 170, 190 Enerlan, A.R. 171, 193 English, S. 119, 132 Erdmann, M.V. 39, 45 Eysink, W.D. 28, 36 Fager, E.W. 133, 141 FA0 9, 11-12, 15-16, 22-23, 28, 36, 111 FAOISEAFDECISIFR 17, 19, 23 Farid, A. 44-45 Federizon, R.R. 134, 141 Ferro, R. 16, 23 Fisheries (Maritime) Regulation 55 Flewelling, P. 21, 23 Fortes, M.D. 9, 17, 23, 65, 71 Fox, W.W. 92, 95 Foyn, L. 83, 157, 160, 163, 173, 177, 189 Freeberg, M. 16, 20, 23 FRI 49, 61 Froese, R. 11, 23, 117-118, 123, 132, 190 Gabriel, W.L. 133, 142 Gallucci, V.F. 136, 141 Galzin, R. 45 Gambang, A.C. 165-166, 191 Ganaden, R. 16, 23, 66, 68, 70, 71, 168, 170, 193 Ganaden, S. 189 Garces, L.R. vii, 2, 17, 62, 143-145, 148-149, 193 Garcia, C.D. 71 Gatchalian, R. 70-71, 170, 190 Gauch, H.G. 134, 141 Gayanilo, F.C., Jr. vii-viii, 5, 111, 116-118, 123-124, 132, 144,
148-150 Ghofar, A. 39, 45 Ginon, J.S. 170, 193 Gjeesaeter, J. 77, 83, 183, 191 Gloerfelt-Tarp, T. 148, 188, 191 Godo, O.R. 157, 160, 163, 177-178, 189, 191 Golam, M. 191 Gold, B.D. 95, 106, 133, 142 Gomez, E.D. 9, 17, 23, 64, 71, 134, 141 Gong, W.K. 49, 61 Gonzales, C.C. 170, 191 Gonzales, F.L. 169, 193
Gould, H.R. 85, 95 Green, C.F. 161, 189 Grosslein, M.D. 191 Gulland, J.A 16, 20, 23, 95, 121, 132 Gunaratne, A.B.A.K. 118 Gunn, J.S. 188, 193 Gupta, M.V. 143 Gustafson, D.J. 136, 141 Haider, S.M.B. 29, 37 Halidi, H.A.M.S. 13, 24, 154, 191 Hallier, J.P. 76, 83 Hamid, Y. 49-50, 61 Hamley, J.M. 16, 23-24 Hammer, C. 171, 189 Hanyu, I. 141 Hariati, T. 11, 23, 42, 45 Haron, Z. 163, 192 Hashim, A. 61 Hassan, H.H.A. 49, 61 Hayase, S. 163-164, 177, 189, 191 Henriksson, T.G. 172, 191 Hermes, R. 147 Hernandez, H. 193 Hida, T.S. 151, 184, 191 Hilborn, R. 19, 23 Hill, B. 20, 24 Hill, M.O. 123, 132, 135, 141 Hinriksson, T.G. 76, 78, 83 Hirano, R. 141 Hliang, U.P. 180, 190 Hoare, R. 50, 61 Holdgate, M. 22-23 Holmgren, S. 9, 17, 23, 27, 36, 60, 83 Holt, S.J. 16, 23, 123, 131 Hongskul, V. 89, 95, 147 Hosillos, L.V. 71, 132, 141 Hossain, M.M. 9, 17, 24, 29, 37 Hotta, M. 8-11, 15-17, 19, 23 Htun Htein 180, 194 Humayon, M. 29, 37, 152-153, 191,193 Hunspreugs, M. 9, 17, 23, 95 Huppert, D.D. 24 Hussain, A.G. 185-186, 191 Hydrographer 49 Hydrographer of the Navy 61 Hydrographic Department 48 Hydrographic Department, Admiralty 61 Ichikawa, T. 49, 61 Ilayas, S. 42, 44-45 IMR 186, 191 Ingles, J. 11, 23, 29, 37, 39, 46 IPFC 9, 19, 23-24 Isarankura, A.P. 88, 95, 159, 177, 191 Islam, A.K.M.N. 29, 36 Islam, MS. 30, 32-34, 36 Ismail Taufid, M. 165, 192 Ismail, I. 49, 60 Iversen, S.A. 151, 190 Jayabalan, N. 181, 193 Jayasuriya, P.M.A. 74, 83 Jean, Y. 172, 191 Jetanavanich, S. 91, 95 Johannes, R.E. 39, 45 Johari, I. 160, 193 John, M.E. 184, 194 Jongman, R.H.G. 134-135, 141 Joseph, A. 182, 184, 194 Joseph, B.D.L. 76, 83 Joseph, K.M. 180, 182, 185, 191 Joseph, L. 75-77, 83-84 Joseph, M. 185, 193

198 Joseph, P.J. 181, 194 Jothy, A.A. 9, 17, 23, 57, 61, 162, 191, 193 Kagwade, P.V. 183, 194 Kailola, P.J. 188, 191 Kaironi, K.B.B. 49, 61 Karunasinghe, W.P.N. 76, 84 Kassas, M. 22-23 Kawamura, G. 163, 192 Kent, G. 48, 61 Kesteven, G.L. 186, 191 Khan, M.G. vii, 2, 16, 26,.29-34, 36-37, 143, 146, 149, 151,
152-154, 190-191, 193, 195 Khoo, H.W. 13, 24 Koe, L.C.C. 17, 24 Krishnamoorthi, B. 180-181, 191, 193-194 Kuan Kwee Jee 9, 17, 23 Kunjipalu, K.K. 184, 193 Kushairi, R. 50, 61 Kyokuyo Hogel Co. Ltd. 106 Lai, H.L. 187-188, 192 Lam, W.C. 55, 57, 61, 154, 159, 162-163, 191-192 Lan~boeuf, M. 28-30, 36, 153, 192 Lamp, F. 162, 165, 192 Lane, D.E. 13, 19, 25 Laron, S.V. 168, 192 Latiff, M.A. 31, 33, 36 Latiff, S.S. 158, 193 Laurec, A. 191 Lavapie, F.N. 170, 191 Law, A.T. 49, 61 Lawson, R. 13, 24 Le Xuan Sinh 97, 106 Lee, A.K. 55, 57, 61, 154, 159, 162, 191-192 Legasto, R.M. 169-170, 192 Licuanan, W.Y. 64, 71, 137, 141 Liew, H.C. 50, 61, 163, 190 Lilburn, B.V. 13, 24 Lindley, R. 154, 189 Liong, P.C. 159, 191-192 Liong, P.T. 162, 191 Lirdwitayaprasit, T. 86, 95 Liu, H.C. 187-188, 192, 195 Llevado, B.E. 171, 193 Lohmeyer, U. 157, 192 Long, N. vii, 2, 96, 102, 106, 147, 149 Longhurst, A.R. 9, 11, 24, 133, 141 Longhurst, M. 17 Loow, L.L. 187, 195 Losse, G.F. 155, 192 Lui, Y.P. 160, 165, 192 Luistro, A.P. 169, 193 Lumagod, F.V. 171, 193 Luna, C. 71, 190 Luther, G. 181, 194 Maala, A.M. 170, 193 MacAndrews, C. 24 Maclean, J.L. 71, 132, 141 MacLennan, D. 16, 23 MADECOR 169, 192 Magoon, 0. 71 Mahmood, N. 29, 32, 37 Mahon, R. 13, 23 Majid, A. 186, 192 Maldeniya, R. vii, 2, 72, 75-78, 81, 84, 143, 147, 172, 194 Maliel, M.M. 184, 192 Malik, A.K. 184, 193 Malpas, A.H. 74, 76-77, 84, 172, 193 Manacop, P.R. 167-168, 192, 194 Maniulit, A.R. 171, 190 Mannan, M.A. 143 Mansor, M.I. vii, 2, 112, 144, 147, 149, 167, 177
Mansura, B. 152, 191 Marahudin, F. 38, 45 Marano, G. 184, 194 Margetts, A. 16, 24 Marine Environment and Resources 106 Marine Fisheries Department, Karachi 186, 192 Marine Fisheries Laboratory 161, 192 Marr, J.C. 9, 24, 192 Martosubroto, P. vii, 2, 9, 11, 19, 23-24, 29, 37-39, 42, 44-46,
70-71, 107, 131-133, 141, 144, 147, 155-158, 189, 192-193 Matdanan, H.J.H. 11-12, 24, 155, 194 Mathew, K.J. 192-194 Mathews, C.P. 39, 45 May, R.M. 88, 95 McManus, J.W. vii, 5, 9, 20, 24, 70-71, 117, 123, 132-134, 137-
141, 144, 148 Medcof, J.C. 76, 78, 81, 84 Medina, R.R. 168, 192 Meemeskul, Y. 94-95 Megia, T.G. 168, 192 Meiyappan, M.M. 185, 192-193 Menavesta, D. 161, 192 Mendoza, D.J. 190 Menon, N.G. 185, 192 Mercer, M.C. 142 Metrillo, N.N., Jr. 170, 193 Miclat, E. 193 Miner, D. 71 Mines, A.N. 25, 70-71, 168, 170-171, 192-194 Mines, E. 71 Minns, C.R. 13, 19, 24 MOFNACA 106 Mohamed, M.I.H. 55-56, 61, 163, 192 Mohammed Shaari, S.A.L. 55, 57, 61, 154, 158-160, 162, 164-
165, 191-193 Mohan, P.C. 181, 192 Mohd-Taupek, M.N. 2, 112 Mohiuddin, S.Q. 185-186, 191 Mohsin, A.K.M. 61 Moiyadeen, N.M. 77, 83 MSU 171, 193 Muiioz, J.C. 119, 170, 191 Munro, J.L. 66, 71, 119, 132 Murawski, S. 16, 20, 23 Murphy, G.I. 9, 12, 24, 133, 141 Mustafa, M.G. 29-32, 34, 36-37, 152-154, 191-193 Myklevoll, S. 157, 160, 163, 177, 189-190 Naamin, N. 29, 37, 39, 42, 44-45 Nagabhushanam, R. 192 Nagaraja, D. 185, 193 Naik, S.S. 184, 193 Nair, K.N.V. 184, 193 Nair, K.P. 183, 185, 192-194 Nakken, 0 . 180, 186, 191, 193-194 Nandakumar, G. 185, 194 Naiiola, C.L. 133-134, 141 Narasimha Raju, D.A. 180, 193 Narayanappa, G. 180, 193 Nasir, M.T.M. 160, 193 National Museum 169 Naval Hydrographic Department 85, 95 Nguyen, T.A. 96-97, 106 Ochavillo, D. 193 Okera, W. 188, 193 Olver, C.H. 13, 19, 24 Ommaney, F.D. 161, 193 Ong, J.E. 49, 61 Ong, K.S. 158-159, 162, 191-193 Ordoiiez, J.A. 170, 193 Ostvedt, O.J. 157, 160, 163, 177, 189 Overholtz, W.J. 133, 142

Padilla, J. 71, 190 Pagdilao, C.R. 71 Pajot, G. 76, 84 Palomares, M.L. 11, 23, 42, 45 Panayotou, T. 91, 95 Pasamonte, J.N.D. 133-134, 141 Pastorelli, A.M. 184, 194 Pathansali, D. 55, 57, 61, 158, 162, 193 Patwari, S.G. 184, 193 Paul, S.C. 30, 32, 37, 152, 191 Pauly, D. vii-viii, 1-2, 5, 8-9, 11-12, 16-21, 23-26, 29, 37-39, 42,
45-47, 62, 66, 68, 70-72, 85, 89, 95-97, 106-107, 111-112, 116-117, 121-124, 131-133, 141, 143-145, 148, 150, 155- 158, 169, 171, 189, 192-194
Pearson, J. 74, 76-77, 84, 172, 193 Penn, J.W. 29, 37, 152, 193 Pennington, M. 121, 132 Perera, N.M.P.J. 77, 84 Pereyra, W.T. 151, 184, 191 Perez, L. 170, 190 Pet-Soede, L. 39, 45 Phang, S.M. 50,61 Philip, K.P. 180-182, 191, 193 Phuket Marine Biological Center 95 Pielou, E.C. 123, 132, 134-138, 141 Pikitch, E.K. 24 Pillai, P.K.M. 181, 193 Piyakarnchana, T. 85, 95 Polovina, J.J. 133, 142 Pomeroy, R.S. 68, 71 Pope, J.G. 16, 23-24, 89, 95 Pramokchutima, S. 88, 95, 174-175, 190, 194 Primavera, J.H. 65, 71 Priyono, B.E. vii, 2, 38, 44, 143, 146, 149 Pura, L.R. 169, 171, 193 Quayum, S.A. 30, 32-34, 36 Qureshi, M.R 185-186, 193 Rachid, M.H. 151, 193 Radhakrishnan, G. 181, 194 Radhakrishnan, K. 181-183, 194 Radhakrishnan, N. 180, 189, 191 Rahman, A.K.A. 30, 32, 37 Raihan, A. 49, 61 Raj, K.G. 184, 194 Raja, B.T.A. 11, 24 Rajan, K.N. 185, 194 Ralston, S. 133, 142 Rao, B.N. 185, 194 Rao, G.S. 181, 185, 193-194 Rao, K.K. 180, 184-185, 193-194 Rao, K.S. 185, 193 Rao, T.A. 181, 193 Rasachandra Kartha, K.N. 183, 189 Rauck, G. 57, 61, 158, 162, 191-193 Raymundo, L.J. 171, 190 Rayudu, G.V. 181, 192 Reeves, S. 16, 23 Regalado, R.B. 19, 24, 66, 68, 70-71, 171, 194 Resma, S. 193 Reuben, S. 181, 194 Reyes, R.B. 133-134, 141 Ricker, W.E. 16, 24 Riepen, M. 39, 45 Rijavec, L. 180, 194 Ritragsa, S. 174, 194 Rivard, D. 132 Roedel, P. 132 Ronquillo, LA. 167-168, 192, 194 Rosly, H. 49, 60 Rothlisberg, P. 20, 24 Rothschild, B.J. 136, 141
Roy, C. 39, 46 Rubio, A.H. 169, 189 Rueca, L.M. 169, 193 Saadon, M.N.B. 49, 61 Sada, M.N.U. 2, 26, 29-30, 32, 34, 36, 149, 152-153, 191, 193 Sadorra, M.S.M. 24 Saeger, J. 71, 155, 171, 189, 193-194 Saetersdal, G.S. 76-77, 84, 172-173, 180, 189, 194 Saetre, R. 29, 37, 151, 190, 194 Saharuddin, A.H. 56, 61 Saila, S.B. 132, 136, 141 Sainsbury, K. 16, 24 Samsuddin, B. 49, 61 Sann Aung 180, 194 Santos, M.D. vii, 2, 17, 62, 146, 149 Santos, R.A.V. 148 Sardjono, I. 15, 24, 40, 46 Sarojini, R. 192 Sarvesan R. 177, 185, 193-194 Sastry, Y.A. 181, 194 Satyanarayana, A.V.V. 180, 193 Sawetwong, N. 86, 95 SCS 177, 194 SCSP 121, 132 SEAFDEC 177, 194 Sebastian, A.R. 64, 71, 167, 194 Selvadurai, S. 55-56, 61 Selvanathan, S. 13, 24 Sen Gupta, R. 9, 17, 24 Shahunthala, D.V. 50, 61 Shamniyom, D. 94-95 Shamsudeen, A.R. 184, 194 Shamsudin, L.B. 49, 61 Sharifuddin, P.H.Y. 24, 194 Sharp, G.D. 39, 46 Shepard, A.R.D. 133, 142 Shepard, F.P. 85, 95 Sherman, K. 95, 106, 133, 142 Shindo, S. 9, 24, 121, 132 Shuter, B.J. 13, 19, 24 Sia, Q.P. I11 169, 171, 193 Silas, E.G. 185, 194 Silvestre, G.T. 1-2, 8, 11-12, 14, 16-21, 24-26, 38, 42, 47, 62,
66, 68, 70-72, 85, 96, 107, 112, 116, 133, 143-145, 148-149, 155, 170-171, 189, 190, 193-194
Sinoda, M. 94-95 Sissenwine, M.P. 24 Sittichaikasem, S. 174, 194 Sivakumaran, K.P. 76, 83 Sivalingam, P.M. 9, 17, 24 Sivasubramaniam, K, 9, 11, 25, 28, 37, 77, 78, 80-82, 84, 172,
194 Smith, I.R. 25, 70-71 Smith, S.J. 121, 132 Snidvongs, A. 95 Soegiarto, A. 9, 17, 23, 39, 46, 64, 71 Solis, E.P. 171, 190 Som, R.K. 122, 132 Soriano, M. 16, 24 Soysa, C.H. 9, 25 Sparre, P. 117, 123-124, 132, 194 Sreenivasan, P.V. 177, 194 Srinath, M. 181, 193 Staples, D. 20, 24-25 Stephenson, R.L. 13, 19, 25 S t r~mme, T. vii-viii, 5, 111, 116, 121, 132, 150, 180, 186, 191,
194 Subansinghe, S. 9, 17, 24 Subramani, S. 181, 193 Sucondharman, P. 88, 95 Sudara, S. 9, 17, 25

200 Sudara, S. and Team 87, 95 Sudarsan, D. 181, 184, 194 Sudradjat, A. 194 Sujastani, T. 38, 41-42, 45-46, 156-158, 192 Sumiono, B. vii, 2, 38, 149 Supongpan, M. 91, 95 Suppachai-Ananpongsuk 177, 194 Suradjat, A. 156 Suraweera, S.L. 76, 84 Survey and Research Div., DOF 183, 194 Suseelan, C. 185, 194 Suvapepun, S. 86, 95 Swapan, C.P. 191 Tan, S.M. 94-95 Tan, S.P. 159, 165, 192 Tanedo, A.R. 170, 191 Tang, H.T. 49, 61 ter Braak, C.J.F. 123, 132, 134-135, 141-142 Thomas Tobin, L. 71 Thompson, M.F. 192 Thompson, R. 119, 132 Thompson, W.F. 123, 132 Thomson, D. 17, 25 Thuoc, P. vii, 2, 96, 103, 106, 144, 147, 149 Tiburtias, A. 184, 193 Tiews, K. 9, 25, 88, 91, 95, 168, 194 Tirmizi, N.M. 9, 17, 24 Tolba, M. 22, 25 Trinidad, A.C. 68, 71, 193 Trono, G. 190 Turner, R.E. 29, 37, 39, 46 TWIA 123 Tyler, A.V. 133, 142 Uchiyama, M. 49, 61 Ursin, E. 194 Utoomprukporn, W. 95 Vacarella, R. 184, 194 Vakily, J.M. 116, 132, 170, 194
Valencia, M.J. 48, 61 van Tongeren, O.F.R. 134-135, 141 van Zalinge, N.P. 29, 37, 193 Venema, S.C. 39, 46, 95, 186, 194 Vicharangsan, T. 86, 95 Vidyasagar, K. 185, 194 Villoso, E.P. 170-171, 189 Vinh, C.T. 102, 106 Virabhadra R.K. 194 Virabhadra Rao, K. 183, 194 Vivekanandan, E.V. 181, 194 Walters, C.J. 19, 23 Warfel, H.E. 167-168, 194 Warwick, R.M. 123, 132-133, 142 Watanabe, Y. 94-95 WCED 15, 25 Weber, W. 55, 57, 61, 154, 159, 162, 191-193 West, W.Q.B. 29, 37, 151, 195 White, T.F. 29-30, 37, 152-153, 195 White, G. 22-23 Whittaker, R.H. 134, 142 Wilkinson, C.R. 9, 17, 25, 119, 132 Williams, M. 13, 25 Williams, W.T. 134, 136, 142 Wong, C.H. 49, 61 Wongsanga, P. 9, 15, 19, 25 WRI 9, 10,25 Wu, R.S.S. 9, 17, 23 Wyrtki, K. 39, 46, 64, 71 Yanagawa, H. 9, 15, 19, 25 Yanez-Arancibia, A. 24 Yap, H.T. 64, 71 Yeh, S.C. 186 Yeh, S.Y. 177-178, 187-188, 192, 195 Zaragoza, E.C. 147 Zhou, W. 145, 148 Zupanovic, S. 185-186, 191

Geographic Index
Aceh (Indonesia) 42 Africa viii
East 109 Alabat Sound (Philippines) 168 Alampil North (Sri Lanka) 77 Amaduwa (Sri Lanka) 80 America Central viii
South viii Andaman Islands (Thailand) 184
Sea (Thailand) 48, 85-89, 91, 95, 114, 177, 197 Andhra (India) 180, 193
Orissa coast 193 Pradesh 180, 181 South 181, 197
Arabia, Gulf of 184 Arabian coast 184
Sea 151, 182, 184, 185, 191, 193 North(ern) 183, 197
northwest 192 western 183
Arafura Sea (Indonesia) 38, 39, 41, 42, 44, 45, 158, 188, 195 Arakan coast (Myanmar) 180 Aru (Indonesia) 158 ASEAN (region) 24, 25, 48, 71, 95 Asia v, vi, vii, 1-3, 8-10, 11, 23, 25, 26, 38, 45, 47, 62, 72, 85, 96,
107, 109-112, 115, 116, 133, 143, 144, 146 East 23 mainland 9, 48 Pacific (region) v, 107, 109, 110 South vi, vii, 1-2, 4-7, 9-11- 13-15, 16, 18, 22, 23, 107, 109, 149, 150 Southeast vi, vii, 1-2, 4-7, 9-15, 16, 18, 22-25, 38, 45, 48, 61, 71, 95, 107, 109, 111-115, 141, 149, 150 Tropical 22, 116, 149, 151
Asian Seas South Region 24 East 23, 24, 7 1 Southeast 24, 71, 115
Asid Gulf, Central (Philippines) 171 Atlantic, North 11 Australia 20, 23-25, 39, 45, 71, 95, 110, 188, 190-193, 195
northern 149 northwestern 188, 192 Western 65
Racuit Bay (Philippines) 171 Bagansiapi-api (Indonesia) 41, 42 Baghera (Bangladesh) 27 Balabac Island (Philippines) 186 Bali (Indonesia) 24, 39, 141, 157
Strait (Indonesia) 39, 44, 45 Banda Sea (Indonesia) 39, 45 Bandar Seri Begawan (Brunei) 13 Bangkok, Thailand 23, 61, 86, 88, 90, 92, 95, 110, 111, 147 Bangladesh vii, 1-3, 9-11, 17, 26-37, 109, 110, 143, 149, 151,
180. 190, 192-198 Banskhali (Bangladesh) 27 Darisal 27, 151 Bataan (Philippines) 168 Batangas (Philippines) 169 Batticaloa (Banks) (Sri Lanka) 73, 80, 173 Bawean (Indonesia) 156 Bengal, Bay of 16, 23-, 27, 28, 36, 37, 60, 73, 83, 107, 109, 151,
179, 180, 184, 185, 189, 190, 193, 194 North Eastern 36 north westfern) 180, 196 northern 152, 192, 193 eastern 48 Upper 37, 197
West 180, 181, 197 Beijing (China) 25 Bengkulu (Indonesia) 158 Bentota (Sri Lanka) 80 Bergen, Norway 121 Biliran Island (Philippines) 140 Binh Thuan Province (Vietnam) 97 Bintulu (Malaysia) 166 Bintuni Bay (Indonesia) 158 Bohol (Philippines) 63, 65 Bolinao, Philippines 65, 141 Bombay (India) 182, 183, 185, 194, 197 Borneo (Island) (Malaysia) 48, 49, 63, 156, 186, 195 Brisbane, Queensland, Australia 190-192, 195 Brunei Darussalam, Negara 9-13, 24, 39, 48, 113-115, 149,
154, 164, 167, 189, 191, 192, 194, 196 Bulacan (Philippines) 169 Burias Pass (Philippines) 168, 170, 194 Burma 132, 149, 179, 184, 189, 196, 197
Southern 180. 191
Cambodia 9-11, 48, 86, 90, 98, 110 Campeche, Mexico 37, 46 Cape Comorin (Sri Lanka) 73 Cape Monze (Pakistan) 185 Cape Rachado, Malacca Strait (Malaysia) 61, 159 Carigara Bay, Leyte, Philippines 168, 171, 189, 190, 195 Carpentaria, Gulf of (Australia) 188, 195 Carribean 132 Cat Ba National Park (Vietnam) 103 Catbalogan 140 Cau Hai (Vietnam) 97 Cavite (Philippines) 168, 169 Cebu (Philippines) 63, 66 Celebes Sea (Philippines) 39, 63, 64 Ceylon (Island) 76, 79, 83, 84, 191, 195 see Sri Lanka
east 190 north 190 southwest 83
Chachoengsao (Thailand) 86 Chanthaburi (Thailand) 86, 90 Charleston, South Carolina (USA) 141 Chilaw (Sri Lanka) 80, 81 China, People's Republic of 10, 63, 88, 98, 102, 110
Sea 6 1 South 13, 23, 24, 39, 45, 46, 48, 49, 56-58, 61, 63, 64,
70, 71, 85-87,95-100, 106, 110, 113-115, 132, 149, 155, 186, 187, 189, 190, 198
northern 106 south-eastern 6 1 Southern 155, 156, 195, 197 Western 115
Chittagong, Bangaldesh 27, 28, 32, 146, 151, 197, 198 Chon Buri (Thailand) 86, 87, 90 Chumphon (Province) (Thailand) 86, 87, 89, 90 Cilacap (Indonesia) 45 Circle Bank (Philippines) 171 Ciudad del Carmen, Campeche, Mexico 37 Cochin, India 190, 194-197 Colombo, Sri Lanka 73, 76, 77, 80, 82, 83, 118, 147, 191, 192 Cox's Bazar, Bangladesh 27, 28, 32, 36, 37 146 Cronulla, Australia 24 Crow Island, Colombo, Sri Lanka 118 Cuddalore (India) 181 Cuyo Island (Philippines) 63, 65
Da Nang (Vietnam) 97-99, 102 Daman (India) 182

202 Darwin, Australia 23, 24, 45, 95 Davao (Philippines) 63, 65 Delta area (Myanmar) 180 Denmark 95, 109 Dhaka (Bangladesh) 27 Dinagat (Philippines) 64, 167 Diu (India) 182 Dolak (Indonesia) 158 Dubla (Bangladesh) 32 Dumaguete City, Philippines 71 Dwarka (India) 183
Eastern Sea, Vietnam's (i.e., the South China Sea) 96
Flares (Indonesia) 158 Sea (Indonesia) 39
France 110
Gnlle (Sri Lanka) 73, 80, 81, 173 Germany, Federal Republic of 54, 55, 91 Goa, Union territory of (India) 182, 184, 194 Guimaras Strait (Philippines) 168 Gujarat, India 182-185, 196, 197 Guinea, Gulf of (Africa)l41
Haad-Chaomai (Thailand) 87 Hai Phong (City), Vietnam 97, 98, 102, 106, 147 Hainan (Vietnam) 97, 98, 102 Hambantota (Sri Lanka) 72, 73, 80, 173 Hanoi (Vietnam) 98, 102 Ilatiya (Bangladesh) 32 Hawaii (USA) 142 Hikkaduwa (Sri Lanka) 73 Himalayas (Nepal) 28 Ilirtshals, Denmark 95 Ho Chi Minh City (Vietnam) 97, 98, 102 Hon n h n (Island) (Vietnam) 103, 105 Hang Kong 39, 44, 187 HuaHin (Thailand) 86, 90 Hue (Vietnam) 96, 97 Ilocos Norte (Philippines) 21
Provinces (Philippines) 21 Imman Bay (Philippines) 171 India 9-11, 27, 72-74, 76, 109, 110, 149, 151, 181-185, 189-192,
194-197 East 180, 182, 192 Exclusive Economic Zone 76, 194, 196 northeast 196 northwest 182, 190, 192 southwest 197 West 182, 192
Indian Ocean 10, 24, 39, 72, 73, 83, 109, 141, 149, 177, 192, 194, 197 eastern 16 Northwest 191,197 Seas 192, 196 Somalian coasts of 184 Southeastern 157, 158 subcontinent 72 Western 16, 132
Indo-Pacific (region) 65, 110, 113 West 25
Indonesia vii, 1-3, 9-11, 15, 17, 23, 24, 37-46, 48, 57, 58, 70, 71, 86, 109, 110, 113, 143, 149, 155-157, 187; 191 eastern 16, 40, 41, 45 southern 149, 188, 192 southwestern 141 Western 16, 23, 24, 42, 46, 71, 131, 141, 193-195
Intramuros, Manila, Philippines 147 Irian Jaya (Indonesia) 39-41
Jaffna (Island) (Sri Lanka) 73, 81 Jakarta, Indonesia 45, 46, 146, 191 Jamuna River (Bangladesh) 27 Japan 64, 109, 110, 113, 114, 187 Java 39, 157
central 156 north 23, 39-42, 45, 155 Sea vii, 39, 45, 48, 141, 155, 156, 191, 193-195 South 41, 42, 155, 156 southeast 41 west 156
Jerudong (Brunei) 13 Jesselton (Malaysia) 186 Johor (Malaysia) 49 Johore (Malaysia) 54, 159, 161-163
Kakinada (India) 180, 195 Kalapara (Bangladesh) 27 Kalayaan (Philippines) 63 Kalimantan (Malaysia) 39, 156
south(ern) (Malaysia) 155, 156 West (Borneo) (Malaysia) 156
Kallar (Sri Lanka) 80 Kalpitiya (Sri Lanka) 73, 80 Kalutara (Sri Lanka) 80 Karachi (Pakistan) 185, 186, 193, 196 Karimata Strait (Indonesia) 48, 155 Karnataka (India) 182, 184, 194 Karwar, India 183, 189 Kayts North (Sri Lanka) 77 Kedah (Malaysia) 49, 55, 61 Kelang (Malaysia) 49 Kelantan (Malaysia) 162 Kenya 186 Kerala 182, 184 Keshabpur (Bangladesh) 27 Khmer 187 see Cambodia Khulna (Bangladesh) 27, 151 Kingston, Rhode Island (USA) 132 Komari (Sri Lanka) 80 Korea, Republic of 23, 110 Kori Great Bank (Pakistan) 186 Kota Kinabalu, Sabah (Malaysia) 61 Krabi (Thailand) 86 Kuala Belait (Brunei) 13
Bintulu (Malaysia) 165 Kedah (Malaysia) 55 Kesang (Malaysia) 159 Lumpur, Malaysia 61, 111, 146 Sepang (Malaysia) 159 Terengganu, Malaysia 60, 112, 114,147
Kuantan (Malaysia) 161 Kuching River (Malaysia) 186 Kutch, Gulf of (Iindia) 183 Kutubdia (Sri Lanka) 27, 32
Labuan (Malaysia) 48, 50, 52 Laguna, Philippines 147 Langkawi (Malaysia) 159 Laos 98, 102 Larut Matang (Malaysia) 49 Leyte, Philippines 140, 190
Gulf ( P h i l i ~ ~ i n e s ) 168 Lingayen GU$ Philippines 16, 18, 19, 24, 63, 168, 171, 189,
194. 195 Lombok (Indonesia) 158 Los Baiios, Laguna, Philippines 147 Luzon (Island) (Philippines) 63, 64, 170, 195
Maharashtra (India) 182 Maharashtra, South (India) 184, 194

Mahe, Seychelles 83 Maiskhal (Bangladesh) 27 Makassar Strait 39, 155 Makati City, Philippines 124, 148 Makram coast (Pakistan) 196 Malacca Strait (Indonesia) 38, 39, 41, 42, 44, 45, 48, 57, 61,
114,156,157,187,194 Malampaya Sound (Philippines) 171 Malay peninsula 48, 187, 193 see Peninsular Malaysia Malaysia vii, 1-3, 9-11, 17, 41, 47-61, 86, 97, 109, 110, 112-115,
143, 144, 149, 160, 163, 186, 187, 189, 191-195 EEZ (Exclusive Economic Zone) 50, 61, 194 Peninsular 39, 48, 49, 53-55, 57, 58, 61, 189
East 16, 39, 48, 49, 50, 52-55, 57-59, 60, 114, 115, 161, 164, 189, 192, 193
northwest 55 West(ern) 41, 48-50, 52-58, 60, 61, 158, 164, 189,
192-195 Maldives 9-11, 73, 109, 142 Mandaluyong City, Philippines 148 Mangalore (India) 184, 193 Mangarin Bay (Philippines) 168 Manila (Philippines) vii, 1, 60, 91, 95118, 143, 146, 167, 192
Bay, (Philippines) vii, 63, 64, 167-169, 171, 189-191, 193, 196, 197
Mannar (Sri Lanka) 73, 81 Gulf of (Sri Lanka) 72, 73, 80, 172
Maqueda Bay (Philippines) 170, 193 Marashtra (India) 182 Marinduque Island (Philippines) 170 Martaban, Gulf of (Myanmar) 179 Masalembu Island (Indonesia) 156 Matang Mangrove Forest Reserve (Malaysia) 49 Matara (Sri Lanka) 73, 80 Meghna River (Bangladesh) 27, 36 Mekong Delta (Vietnam) 99, 103 Mekran (Pakistan) 186 Merbok (Malaysia) 49 Metro Manila (Philippines) 124 Mexico 37, 46 Micronesia 70 Mindanao (Philippines) 39, 63, 64, 70, 194
Deep 194 Mindoro Island (Philippines) 141 Minh Hai Province (Vietnam ) 106 Miri (Malaysia) 165, 166 Mollucas (Indonesia) 39-41 Mompog Pass (Philippines) 170 Mongla (Bangladesh) 27 Muara (Brunei) 13 Muk (Island) (Thailand) 86, 87 Mullaitivu (Sri Lanka) 77, 81, 173 Mumana (Sri Lanka) 80 Muntjar, Bali Strait (Indonesia) 45 Myanmar, Union of (Burma) 10, 11, 27, 86, 110 Mymensingh (Bangladesh) 27
Naawan (Philippines) 194 Nakhon Si Thammarat (Thailand) 86, 90 Narathiwat (Thailand) 86, 90 Narayanganj (Bangladesh) 27 Negombo, Sri Lanka 73, 80, 83, 173 Nepal 109, 110 New York (USA) 109 New Zealand 110, 188 Ngoc Xien District, Minh Hai Province, Vietnam 106 Nha Trang (Vietnam ) 97, 98, 102, 105 Nicobar Sea (Thailand) 177, 197 Nizampatnam (India) 181
0 Loan (Phy Yen) (Vietnam )I03 Oman, Gulf of (Oman)183, 184, 186 Orissa (India) 180, 193
Pacific 23, 25, 64, 68, 70, 109, 111, 132 Ocean 10, 39, 63
Western 109 Western 24, 45, 64
Central 16 Padma River (Bangladesh) 27 Pahang (Malaysia) 49, 162, 163 Pakistan 10, 11, 73, 110, 149, 185, 186, 192, 193, 195, 196
East 36, 184, 189, 190 West 184, 192
Palawan (Philippines) 63, 64, 65, 68, 70 Palk Bay (Sri Lanka) 72, 73, 76, 172
Strait (Sri Lanka) 72, 73, 76, 77, 81 Pamban (Sri Lanka) 80 Panay Gulf (Philippines) 168 Pangkor Island (Malaysia) 55 Panguil Bay (Philippines) 168, 171, 194 Panichanknai (Sri Lanka) 80 Papagayo, Gulf of (Costa Rica) 131 Papua New Guinea 39, 70 Paris (France) 63 Pasig, Metro Manila, Philippines 148 Pattani (Thailand) 86, 87, 90 Payar group of islands (Malaysia) 49 Pedro Bank(s) (Sri Lanka) 72, 73, 76, 77, 81, 172, 173
Point (Sri Lanka) 77, 81 Penang, Malaysia 55, 56, 60, 61, 132, 146, 158, 159, 195, 196 Perak (State) (Malaysia) 49, 50, 56 Phangnga (Thailand) 86, 87 Phetchaburi (Thailand) 86, 90 Philippines (Republic of the) vii, 1-3, 9-11, 14-21, 23-25, 39, 62-
71, 95, 110, 113, 114, 124, 132-134, 137-141, 143, 149, 167- 171, 187, 190-192, 194, 195, 196, 197 Deep (trench) 64, 168 see alsoMindanao Deep Sea 63, 64
Phuket (Province) (Thailand) 86-88, 95 Porbundar (India) 183 Port Kelang (Malaysia) 160 Porto Novo (India) 181 Prachuap Khiri Khan (Thailand) 86, 87, 89, 90 Pudawakatuwa (Sri Lanka) 81 Puerto Galera, Mindoro Island, western Philippines 141 Pulau Burong (Malaysia) 165
Langkawi (Malaysia) 55, 61, 159-161 Pangkor (Malaysia) 55, 159-161 Penang (Malaysia) 159 Perhentian (Malaysia) 49 Redang (Malaysia) 49 Tenggol (Malaysia) 49 Tioman (Malaysia) 49, 161
Pulmodai (Sri Lanka) 81 Puttalam (District) (Sri Lanka) 80, 83
Queensland (Australia) 190-192, 195 Quezon City, Philippines, 141, 146 Qui Nhon (Vietnam) 97, 98, 102
Ragay Gulf (Philippines) 141, 168, 170, 194 Rajshahi (Bangladesh) 27 Ramayapatnam (India) 181 Rameswaram (India) 181, 195 Ranong (Thailand) 86, 87 Rayong (Thailand) 87, 90 Red River (Vietnam) 96, 103 Rhode Island (USA1132

204 Riau (Province), Indonesia 41,42 Rokan River (Indonesia) 41 Rome, Italy 110, 144, 147
Sabah (Malaysia) 48-50, 52-54, 56, 58, 61, 114, 115, 164, 167, 187, 194
Sahul Shelf (Indonesia) 38, 39 Saint Martin Island (Bangladesh) 32, 36, 37 Samar (Philippines) 140
Sea, Philippines 24, 71, 132, 137-141, 168, 170, 171, 194, 189
Samut Prakan Province (Thailand) 86, 88, 90 Sakhon (Thailand) 86, 90 Songkhram (Thailand) 86, 90
San Miguel Bay, Philippines 14, 17, 21, 25, 70, 71, 169, 170, 190, 193, 195, 197
San Pedro Bay (Philippines) 168 Sandalran (Malaysia) 186 Sarawak (Malaysia) 48-50, 52-54, 56, 58, 61, 114, 115, 164-
167, 187, 189-191, 193, 194 Satkhira (Bangladesh) 27 Satul (Malaysia) 159 Satun Province (Thailand) 86, 87 Saurashtra waters (India) 183, 194 Selangor (Malaysia) 49 Semantan (Malaysia) 165, 166 Sembilan group of islands (Malaysia) 49 Seoul (South Korea) 23, 110 Seria (Brunei) 13 Seychelles 83 Sibuguey Bay (Philippines) 168 Sierra Leone, West Africa 132 Sind (coast) (Pakistan) 185, 186, 196 Singapore 9, 10, 48, 57, 113, 114, 163, 187, 190 Singapore Strait 195 Siqu~jor (Philippines) 65 Someswar (India) 184 Sonachar (Bangladesh) 32 Songkhla, Thailand 83, 86, 90, 147 Sorsogon Bay, Luzon Island (Philippines) 170, 190, 195 South Africa 121 Spratleys (Malaysia) 50 Sri Lanka (formerly Ceylon) vii, 1-3, 10, 11, 72-84, 109, 110,
118, 143, 149, 172, 173, 190, 192, 196 Sulawesi (Indonesia) 39, 40, 42
North (Indonesia) 41 Sulu (Philippines) 64
Sea (Philippines) 49, 63, 64, 68 Sumatra 24, 39, 41, 48, 156, 157, 160, 189
(mid-) central 141, 157 North (Province) 42 northwest 131, 141, 190 southeast 42, 155, 156
Suinba (Indonesia) 158 Sumbawa (Indonesia) 158 Sunda Islands, Lesser (Indonesia) 39, 40
Shelf Undonesia) 38, 39, 48, 132, 149, 186, 187, 193, 194, 196, 198
S~lndarbans (Bangladesh) 27, 151 Surnt Thani (Thailand) 86, 87, 90 Surntkal (India) 184 Surigao (Philippines) 64, 167 Swatch ground (Pakistan) 186 Sworlen 109
Tabaco Bay (Philippines) 168 Tnganak Island (Philippines) 168 Taiwan 63, 64, 186-188 'I':daimanaar, N.W. 77 (Sri Lanka) 'I'alibong Island, Trang Province (Thailand) 86, 87
Tam Giang-Cau Hai (Hub) (Vietnam) 97, 103 Tamil Nadu (India) 180, 182
North 181, 197 Tangalla (Sri Lanka) 80 Tanjung Datu (Malaysia) 165, 166
Sirik (Malaysia) 166 Tayabas Bay (Philippines) 168, 170, 195 Tehuantepec, Gulf of (Mexico) 131 Teknaf (Bangladesh) 32 Telok Bahang, Penang (Malaysia) 55 Tenasserium coast (Myanmar)l80 Terengganu (Malaysia) 49, 57, 61,162, 163 see Kuala
Terengganu Thailand vii, 1-3, 9-11, 23, 39, 41, 48, 54, 55, 57, 61, 83, 85-92,
94, 95, 97, 109, 110, 113-115, 143, 149, 155-157, 173, 177, 180, 184, 187, 192, 193 West Coast 177, 189, 192 see Andaman Sea Gulf of vii, 16, 46, 48, 50, 71, 85-95, 97, 98, 106, 114, 115, 121, 173-177, 187, 190, 191, 196
central 85, 95, 177, 196 inner 85, 86, 95 outer basin 85
Thalayaddi (Sri Lanka) 81 Thanh Hoa (Vietnam) 97 Ticao Pass (Philippines) 170, 194 Timika (Indonesia) 158 Timor (Indonesia) 158
Sea 39, 188, 195 Tonkin Gulf (Vinh Bac Bo) Vietnam 96, 98-101, 103; 178, 187,
192 Townsville, Australia 24, 25, 7171 Trad (Thailand) 86, 87 Trang (Province) Thailand 86, 87 Trat (Thailand) 86, 90 Trincomalee (Sri Lanka) 73, 77 81, 173 Tumpat coast (Malaysia) 163 Tutong (Brunei) 13
U.K (United Kingdom) 109, 110 Ulugan Bay (Philippines) 171 USA (United States of America) 110, 120
Valaichchenai (Sri Lanka) 80 Vaola (Bangladesh) 32 Velanganni (India118 1 Veraval, Gujarat, India 182-184, 196 Vienna (Austria) 109 Vietnam (Republic) vii, 1-3, 9-11, 48, 96-106, 110, 113, 114,
144, 149, 177,187, 192 Central 96, 97, 99, 100-103, 178 North 187 North(ern provinces) 96, 97, 99, 100, 102 South(ern provinces) 96, 97, 99-102, 105, 178, 179 Southeast(ern) 97, 101, 103, 177, 178, 192 Southwest 101, 103 Sea of 106 see also South China Sea
Villareal Bay (Philippines) 170,193 Vinh (Vietnam) 97 Vinh Bac Bo, Vietnam 178, 192 see Tonkin Gulf Visakhapatnam, India 181, 185, 190, 194 Visayas (Philippines) 39, 63, 64, 167 Visayan Sea (Philippines) 168, 170, 189, 192, 195
Wadge Bank (Sri Lanka) 73, 74, 76, 172, 181, 195
Yala (Sri Lanka) 80
Zamboanga (City), Philippines 63, 65,71 Zumarraga Channel (Philippines) 170, 193

205 Species Index
Abalistes stellaris 59 abalone see Haliotis Acetes 87
indicus 33, 34 Acropora 28
horrida 28 humilis 28 pulchra 28 variabilis 28-29
Alepes djedaba 138, 139 algae, brown see Phaeophyceae
green see Chlorophyceae macrobenthic 65 marine 83 red see Rhodophyceae
Aluteridae 59 Amblygaster sirm 84 Anchovy(-ies) 30, 31, 66, 76, 87-89 see also Engraulidae,
Stolephorus spp. Apogon spp. 138, 139 Ariidae 30, 152 see also Catfishes Ariomma indica 35, 182 Arius spp. 29 see also Catfish
thalassinus 12 Auxis rochei 29, 66, 76 see also tuna, Bullet
thazard 29, 66, 76, 92 see also tuna, Frigatekittle
Balistidae 163 bangus 2 1 see milkfish Barracuda, Great see Sphyraena barracuda Btche-de-mer 75, 77 see also sea cucumber, Holothurians Belonidae 76 Benthos 106, 115, 155 Big eye 187, 188 see also Priacanthids
red see Priacanthus macracanthus Bigeye ilisha see Zlisha filigera bivalve(s) 50, 52 Bombay duck 30, 31 see Harpadon nehereus, Harpadontidae Brachyura 59 breams 173 Bulls eyes 30 see Priacanthidae
Caesionidae 59 Carangids (-ae) 29, 30, 42, 57, 59, 76, 92, 157, 163, 175, 180
see also Jacks, Scads, Pomfrets Carangoides malabaricus 12 cardinal fish 184 Catfish(es) 29-31, 152, 153, 180-182, 185, 187
Marine striped 87 Cephalopod(s) 30, 54, 77, 84, 91, 95, 99, 160, 175, 177, 184,
185, 194, 196, 197 see also Cuttlefishes, Squids Cheilinus undulatus 39, 44 Chlamys 100 Clzlorophthalmus agassizi 77
hicornis 77 Chlorophyceae 74 Chlorophyll-a 115 Cistopus indicus 9 1 Clu.panodon thr i s sa 100 Clupeids(-ae) 30, 31, 75-76, 84, 100, 166 see also Sardines,
Sardinella spp. conger, Indian pike see Congresox talabonoides Corzgresox talabonoides 29 coral(s) 37, 39, 45, 50, 64, 142
hard 64 Scleractinian 61
Cor,yphaena hippurus 76 Crabbi 87, 97, 184
CroakerW 29, 30, 152, 153, 179, 181, 184, 185 see also Sciaenidae, Johnius belangerii, Otolithes ruber yellow 186
Cromileptus altifalis 44 Crustacean(s) 29, 34, 35, 181
edible 185, 197 Cubiceps sp. 77 Cuttlefish(es) 30 , 77, 84, 91, 97, 99, 160, 163, 181, 187, 188,
194, 195 see also Cephalopods, Sepia spp. Cynoglossus 42
decapod 177 Decapterus spp. 89 see also scads
kurroides 101 macrosoma 138, 139 maruadsi 92, 98, 101, 153 russelli 98
Demersal(s) /fish(es) 11, 15, 16, 19, 23, 24, 26, 29, 30, 33, 36- 38, 41, 42, 50, 52-57, 59-62, 66, 68, 70-72, 75-78, 83-85, 88- 92, 94-98, 100, 101, 103, 116, 121, 131, 132, 140, 141, 149, 152, 157, 160, 163, 164, 173, 177, 180-182, 186, 187, 189-198 see also snappers, groupers, breams, trevallys, Cynoglossus, Harpadon, Leiognathus, Setipinna
dhoma 182, 183 Diagramma punctatum 59 Dinoflagellate 115 dog01 42 see shrimp, endeavour dolphin fish see Coryphaena hippurus dugong 74
Elagatis bipinnulata 76 Elasmobranch(s) 77, 182, 185 see also sharks and rays Eleutheronema tetradactylum 34 emperors see Lethrinidae Engraulidae 30, 76 see Anchovies Enhalus acoroides 50, 87 Epinephelus spp. 12 Eucheuma (spp.) 65 Euthynnus affinis 29, 66, 76, 92 see also tuna, Eastern
(Little) Exocoetidae 76
fish(es), aquarium 21, 44 Bottom 95, 141, 186 deep-sea 52, 77-78 ground 132, 198 mesopelagic 183, 186, 191 neritic 76 ornamental 39 reef 39, 44, 45 rock 75 see also demersals trash 54, 85, 88, 89, 159, 161, 162, 165, 166, 175, 195 Trawl(ed)-caught 189, 192
Fistularia spp. 138, 139 Flying fish see Exocoetidae Foraminiferans 115 fusiliers 66
garfish see Belonidae Gazza mrnuta 12 Gerres spp. 12 Gerridae 30, 59 Goatfish(es1 29, 30, 152, 153, 181, 182, 187 see also Mullidae,
Upeneus sulphureus goby 2 1 golden thread 187, 188 see Nemipterus spp. Graczlarra 65, 83
edulis 74, 83

206 verrucosa 74
Grammoplites scaber 184 Grouper(s) 20, 76, 104, 173 see also Serranidae
light fin see Cromileptus altifalis polka dot see Cromileptus altifalis
Grunts(-ers) 30, 179, 188 see also Pomadasyidae White see Pomadasys argenteus
guitarfish 184
HairtaiKfishes) 29-31, 152, 153 see also Trichiuridae, Ribbonfish, Lepturacanthus savala
halfbeaks see Hemiramphidae Halibut, Pacific 132 Haliotis 100 Halodule pinifolia 50, 87
uninervis 29, 50 Halophila minor 50
ovalis 50 Harpadon 42 Harpadon nehereus 31, 34, 35 Harpadontidae 30 see Bombay duck Hemiramphidae 76 Herring(s), round 66
spotted see Sardinella jussieui wolf 87
Holothuria scabra 77 Holothurians 76 see also sea cucumber or B&che-de-mer holothuroids 83
ichthyoplankton 149 Zlisha filigera 29, 180 Invertebrate(s) 39, 47, 68, 76, 89, 96, 97, 100, 112, 113, 124,
133 ipon see goby
Jacks 30, 87, 181 see also Carangidae jellyfish 50 jerbung 42 see shrimp, banana jewfish 153 Johnius belangerii 29 see also Croakers
coitor 12
Katsuwonus pelamis (Skipjack tuna) 29, 61, 66 kawakawa 75 see Euthynnus affinis Konosirus p u n c t a t u s 100 krosok see shrimp, rainbow
Lactarius 184 lactarius 12, 54, 183
Lagocephalus lunaris 138, 139 Lamniformes 166 Lanternfish(es) see Myctophidae Lutes calcarifer 3 1 Leiognathids(-ae) 30, 57, 59, 76-78, 157, 166, 179, 197 Leiognathus (spp.) 42, 183
bindu.s 12, 138, 139 brevirostris 138, 139 elongatus 12 equulus 12, 101, 138, 139 splendens 12, 101, 138, 139
lemuru see Sardinella lemuru Lepturacanthus savala 29, 34, 35 see also Ribbonfishhairtail Lethrinidae 78 Lethrinus spp. 59
miniatus 78 nebulosus 78
Lizardfish(es) 29, 30, 57, 153, 179, 181, 184, 187, 188 see also Synodontidae, Saurida tumbil true 98 see Saurida undosquamis
lobster(s) 75, 77, 97, 100, 104, 172, 183 see Panulirus spp. spiny 39, 77
Squat see Thenus orientalis Loliginidae 163 Loligo (spp.) 100, 138, 139 also Squids
chinensis 9 1 duvauceli 91, 92 see also Squids edulis 91, 99, 101 see also Squids singhalensis 9 1
Loligoidea 59 Loliolus sumatrensis 9 1 Lutjanidd-ae) 30, 59, 78, 157, 163, 165 see also Snappers Lutjanus spp. 12, 163, 180
erythropterus 98 see snappers johnii 29, 35 see also snapper, Red lutjanus 78 malabaricus 78 rivulatus 78
Mackerel(s) 30, 66, 87, 89, 98, 181 see also Rastrelliger spp., Scombridae Indian see Rastrelliger kanagurta Indo-Pacific 89, 9 1 see Rastrelliger brachysoma King 87-89 see Scomberomorus spp. Spanish see Scomberomorus commerson
Macrobenthos 115 Macrobrachium rosenbergii 34 Malakichthys wakiyae 101 mammal species 97 marlin 70 see also pelagics, large Megalaspis cordyla 153 Mene maculata 29 Metapenaeus brevicornis 29, 34
elegans 42 ensis 42, 181 monoceros 29, 31, 34, 35, 42, 181 spinulatus 29, 34
Microplankton 115 Microzooplankton 115 milkfish X, 20, 21, 65 mollusc 86 Moonfish see Mene maculata Mullet 87
Grey 3 1 Mullidae 30, 59, 157, 163, 166 see Goatfishes Myctophidae 77, 83
Nematalosa nasus 100 Nemipteridae 30, 89, 157, 163, 175 see also Threadfin breams Nemipterus (spp.) 57, 59, 89, 92, 163 see also Threadfin
breams hexodon 92 japonicus 29, 35, 138, 139, 184 mesoprion 92 nematophorus 138, 139 zysron 98
Netuma thalassina 101 Noctiluca 86
Octopus 91, 99 Octopus dollfusi 9 1
membranaceous 9 1 Opisthopterus tardoore 183 Otolithes ruber 29, 183 see also Croakers, sciaenids
Pampus argenteus 29, 35, 98 chinensis 29
Panulirus 100 homarus 77 longipes 77 ornatus 77 penicillatus 77 polyphaus 77

versicolor 77 Parapenaeopsis sculptilis 29, 34, 42
stylifera 29, 34, 42 Parargyrops edita 101 Pelagic(s) 29, 30, 46, 52-54, 76-77, 85, 88, 89, 91, 92, 97, 98,
100, 103, 114,115, 160, 173, 186, 190 coastal 68 juvenile fish 89 large 29, 36, 38, 70, 77, 84, 89, 9 1 medium sized 76 oceanic 39, 68, 70 see also tunas semi- 53 small 11, 15, 16, 19, 23, 29, 30, 36, 38, 41, 42, 62, 66, 68, 70, 71, 76, 83, 84, 85, 89, 91, 108, 111, 192 see also Tenualosa ilisha, T . kelee, T . toli
Penaeus chinensis 42 indicus 29, 34, 42, 77 japonicus 29 latisulcatus 42 merguiensis 29, 31, 42, 77, 92 see also Shrimps monodon 29, 31, 32, 34, 35, 42, 77 semisulcatus 29, 31, 42, 77, 92 see also Shrimps
Pennahia argentata 101 rnacrophthalmus 12
Pentapodidae 59 Pentaprion longimanus 138, 139 perches 181, 185 Phaeophyceae 74 Phytoplankton 115 pla tu 89, 95 see Rastrelliger neglectus plankton 106, 132, 151 Polydactylus indicus 29, 3 1 Polynemus indicus see Polydactylus indicus
paradiseus 34 Pomadasyidae 30, 163 see also Grunters Pomadasys spp. 59
argenteus 29, 35 argyreus 12 hasta 180 maculatus 12
Pomfret(s) 31, 87, 185, 186 Black 30 see also Carangidae Chinese 29, 30 see Pampus chinensis, see also Stromateidae Silver see Pampus argenteus Whi t e 30,152 see also Stromateidae
pompanos 188 Ponyfish(es) see Leiognathidae porgies 188 prawrds) 44, 54, 56, 47, 65, 71, 83, 152-154, 159-161, 164-167,
172, 180-183, 188-190, 195, 197 see also Penaeus indicus, Parapeneopsis hardwickii penaeid 24, 25, 54, 152
Priacanthids(-ae) 30, 57, 89, 163, 175 Priacanthus (spp.) 59, 89, 92, 163
hamrur 184, 190 macracanthus 98, 101, 138, 139 tayenus 92, 138, 139
Pristipomoides spp. 163 Promethichthys prometheus 101
Rachycentron canadum 59 Raconda russeliana 34 rainbow runner see Elagatis bipinnulata Rajidae 30 see Rays, skates Rajiformes 166 Rastrelliger spp. 89
brachysorna 54, 92, 138, 139 kanagurta 76, 92, 101, 138, 139, 152 neglectus 89, 95 Rastrelliger brachysoma
Rayb) 30, 31, 59, 77, 152, 180, 181, 183
Rhodophyceae 74 Ribbonfish(es) 29, 75, 182, 184 see also Hairtail, Trichiuridae,
Lepturacanthus savala roundscads 9 1 see scads, round
sabalo 2 1 see milkfish sailfish 70 see also pelagics, large salmon, Indian see Polydactylus indicus Salmonella 86 Sardine(s) 30, 66, 76, 89, 91, 92 see Clupeidae, Sardinella spp.
gilt see Sardinella aurita oil 45 see Sardinella 1em.uru trenched see Amblygaster sirm
Sardinella (spp.) 87, 89 aurita 98 gibbosa 92 jussieui 98 lemuru 39, 44
Sargassum 65, 74, 83 Saurida (spp.) 89, 92
elongata 92 tumbil 12, 29, 35, 101, 138, 139, 184 see also Lizardfish(es) undosquamis 92, 98, 101, 138, 139
Scad(s) 30, 76, 87, 89, 153 see also Carangidae Big-eye 66 Hard see Megalaspzs cordyla Round 66, 92, 98, 153 see also Decapterus maruadsi, D. russelli Round yellowtail see Decapterus maruadsi
scallop see Chlamys Sciaenids(-ae) 29, 30, 31, 57, 59, 152, 180, 183, 184 see also
Croakers, Otolithes ruber Scolopsis spp. 59 Scomberomorus spp. 89, 163
commerson 76 Scombridae 30 see Mackerels Sea bream 186 Sea cucumber(s) 75,77 see also bgche-de-mer Sea perch see Lutes calcarifer Seagrass(es) 9, 14, 17, 29, 39, 50, 65, 71-72, 74, 87, 95 Seaweed(s1 40, 42, 65, 74-75 Secutor ruconius 12 Selaroides leptolepis 92, 101, 138, 139 Sepia spp. 138, 139
aculeata 91, 181 brevimana 9 1 lycidas 9 1 pharaonis 91, 181, 195 see also cuttlefish recurvirostra 9 1 tigris 99 see also cuttlefish
Sepiella inerrnis 9 1 Sepiidae 163 Sepioidea 59, 84 see cuttlefish Sepioteuthis lessoniana 9 1 Serranidae 59, 77, 157 see also Groupers Setipinna 42
taty 33, 34 Shad, Hilsa see Tenualosa ilisha Shark(s) 31, 57, 59, 78, 172, 180, 181, 183 Shell 87 shellfish 40, 50 Shigella 86 Shrimp(s) 8, 11, 12, 16, 20, 26, 29-34, 36-42, 44-46, 56, 70, 75,
77, 85, 87, 89, 91, 92, 94, 97, 99, 102, 106, 110, 114, 151-154, 156, 157, 160, 163, 172, 173, 182-185, 192, 193, 195 see also Penaeus merguiensis, P. semisulcatus Banana 29, 42 see also Penaeus chinensis, P. indicus, P. merguiensis Brown 29, 3 1 see Metapenaeus brevicornis, M. monoceros, M. spinulatus

208 Endeavour 42 see Metapenaeus elegans, M. ensis, M. monoceros Penaeid 23, 29, 32, 33, 36, 37, 42, 45, 46, 77, 91, 97, 153, 192, 194 Pink 29, 31, 42 see also Solenocera spp., S . subnuda, Parapenaeopsis sculptilis, P. stylifera Rainbow 42 see Parapenaeopsis sculptilis, P. stylifera Tiger 29, 31, 34, 42 see Penaeus japonicus, P. latisulcatus, P. monodon, P. semisulcatus
Giant Tiger see Penaeus monodon White 29, 31 see Penaeus merguiensis, P. indicus
Siganus spp. 59 Sillaginopsis panijus 34 Sillago sihama 34 Silver bellies 181, 182 Silver-biddies 30 see Gerreidae Skates 30, 78, 180, 181 Skipjack(s) 41, 42, 50, 61, 84 see Katsuwonus pelamis slipmouths 168 Snapperb) 30, 78, 87, 98, 173, 179 see also Lutjanidd-ae),
Lutjanus spp. Red 29, 187, 188 see Lutjanus johnii
Solenocera spp. 42 see also shrimp, pink Solenocera subnuda 42 see also shrimp, pink Sphyraena spp. 59
barracuda 29 Squid(s) 30, 57, 76, 84, 85: 87, 89, 91, 92, 97, 99, 100, 114, 160,
163, 181, 185, 188, 194 see also Cephalopods, Loligo spp., Teuthoidea Indian (Loligo duuauceli) 95 Mitre (Loligo chinensis) 95 Oceanic 70, 185, 194
stingrays 184 Stolephorus spp. 89
indicus 138, 139 tri 34, 138, 139
Stromateidae 30 see also pomfrets surimi 20 swordfish 70 see also pelagics, large Symplecteuthis oualaniensis 185 Synodontids(-ae) 30, 57, 59, 89, 157, 163, 175 see also
Lizardfishes
Tachysuridae 59, 166 Tenualosa ilisha 29-31 see also pelagics, small
Izelee 30 see also pelagics, small reuees 100 toli 30 see also pelagics, small
Teuthoidea 84 see also squids
Thenus orientalis 59, 99 Therapon teraps 12 Threadfin(s) 87, 184, 185 Threadfin bream(s) 29, 30, 57, 152, 153, 181, 182 see also
Nemipteridae, Nemipterus spp. Japanese 152, 153 see Nemipterus japonicus Slender see Nemipterus zysron
Thunnus albacares 61, 66, 83 see tuna, yellowfin maccoyii 29 see tuna, Southern bluefin obesus 29, 66 see tuna, Bigeye tonggol 29, 92 see tuna, Longtail
trevallys 173 see also demersals Trichiuridae 30, 76 see Hairtailfishes Trichiurus haumela 157
lepturus 12, 101, 138, 139 sauala 180
Triglidae 138, 139 Tuna(s) 29, 41, 42, 50, 52, 62, 66, 68, 70, 71, 75, 83, 84, 89,
98,109, 110, 113, 114 see also pelagics, largeloceanic Bigeye 29, 66 see Thunnus obesus Bullet 29, 66, 76 see Auxis rochei Eastern little 29, 66, 76, 92 see Euthynnus affinis Frigate 29, 66, 76 see Auxis thazard Little 92 see also Auxis thazard, Euthynnus affinis Longtail 29, 50, 92 see Thunnus tonggol Oceanic 50 Skipjack 29, 66 see skipjack, Katsuwonus pelamis Southern bluefin 29 see Thunnus maccoyii Yellowfin 50, 61, 66, 77, 84 see Thunnus albacares
Turtle(s) 112-114 (green) sea 39, 74 Marine 114
Upeneus moluccensis 101, 138, 139 sulphureus 12, 29, 35, 98, 138, 139 see also goatfish 1 (yellow)
Vibrio cholearae 86 parahaemolyticus 86
Whiting, Sand 87 windu 42 see shrimp, tiger or Penaeus latisulcatus, P.
monodon, P. semisulcatus Wrasse, Humphead see Cheilinus undulatus
Napoleon see Cheilinus undttlatus
yellowfin 50, 61 see Thunnus albacares
Zoobenthos 97, 100 Zooplankton 21, 97, 99, 115, 149, 155