Turkish Online Journal of Educational Technology - RP2U ...
268
Turkish Online Journal of Educational Technology Volume 17, Issue 1 January 2018 Prof. Dr. Aytekin İşman Editor‐in‐Chief Prof. Dr. Jerry WILLIS ‐ ST John Fisher University in Rochester, USA Prof. Dr. J. Ana Donaldson ‐ AECT President Editors Assist.Prof.Dr. Fahme DABAJ ‐ Eastern Mediterranean University, TRNC Associate Editor Assoc.Prof.Dr. Eric Zhi ‐ Feng Liu ‐ National Central University, Taiwan Assistant Editor TOJET 01.01.2018 ISSN 2146‐7242
-
Upload
khangminh22 -
Category
Documents
-
view
2 -
download
0
Transcript of Turkish Online Journal of Educational Technology - RP2U ...
Turkish Online Journal of Educational Technology Volume 17, Issue 1 January 2018 Prof. Dr. Aytekin İşman Editor‐in‐Chief Prof. Dr. Jerry WILLIS ‐ ST John Fisher University in Rochester, USA Prof. Dr. J. Ana Donaldson ‐ AECT President Editors Assist.Prof.Dr. Fahme DABAJ ‐ Eastern Mediterranean University, TRNC Associate Editor Assoc.Prof.Dr. Eric Zhi ‐ Feng Liu ‐ National Central University, Taiwan Assistant Editor
TOJET 01.01.2018
ISSN 2146‐7242
THE
TURKISH ONLINE JOURNAL
OF
EDUCATIONAL TECHNOLOGY
January 2018
Volume 17 – Issue 1
Prof. Dr. Aytekin İşman Editor-in-Chief
Editors
Prof. Dr. Jerry Willis Prof. Dr. J. Ana Donaldson
Associate Editor
Assist. Prof. Dr. Fahme Dabaj
ISSN: 2146 - 7242
Indexed by Education Resources Information Center – ERIC
SCOPUS - ELSEVIER
TOJET: The Turkish Online Journal of Educational Technology – January 2018, volume 17 Issue 1
Copyright © The Turkish Online Journal of Educational Technology
Copyright © THE TURKISH ONLINE JOURNAL OF EDUCATIONAL TECHNOLOGY All rights reserved. No part of TOJET's articles may be reproduced or utilized in any form or by any means, electronic or mechanical, including photocopying, recording, or by any information storage and retrival system, without permission in writing from the publisher. Published in TURKEY Contact Address: Prof. Dr. Aytekin İŞMAN TOJET, Editor in Chief Sakarya-Turkey
TOJET: The Turkish Online Journal of Educational Technology – January 2018, volume 17 Issue 1
Copyright © The Turkish Online Journal of Educational Technology
Message from the Editor-in-Chief
Dear Colleagues, We are proud to say that TOJET publishes January, 2018 issue (volume 17 issue 1). This issue has international different papers from various fields are shared with professionals. It is a free online journal and offeres free Access to all articles. When the journals are free to access all published articles, it increases the level of impact factor. TOJET is a multidisciplinary peer-reviewed journal in the field of educational technology. TOJET welcomes the submission of manuscripts that meets the general criteria. TOJET is dedicated to increasing the depth of the subject across disciplines with the ultimate aim of expanding knowledge of educational technology. TOJET is seeking for qualified and high profile researchers to join its editorial team as editors or reviewers. TOJET thanks and appreciate the editorial board members (Amirul Mukminin, Ana Donaldson, Aşkın Asan Kurt, Buket Akkoyunlu, Colleen Athans-Sexton Ferhan Hatice Odabaşı, Işıl Kabakçı Yurdakul, Petek Aşkar, Sadi Seferoğlu, Servet Bayram, Teresa Franklin, Vincent Ru-Chu Shih and Yavuz Akpınar) who have acted as reviewers for one or more submissions of this issue for their valuable contributions. As always, issue v.17 i.1 - 2018 features contributions from many countries. Any views expressed in these publications are the views of the authors and are not the views of the Editor and TOJET. TOJET will organize IETC-2018 (www.iet-c.net) at Indiana University, School of Education in Bloomington, IN, USA. IETC series is an international educational activity for academics, teachers and educators. This conference is now a well known educational technology event. It promotes the development and dissemination of theoretical knowledge, conceptual research, and professional knowledge through conference activities. Its focus is to create and disseminate knowledge about the use of instructional technology for learning and teaching in education. Call for Papers TOJET invites article contributions. Submitted articles should be about all aspects of educational technology. The articles should be original, unpublished, and not in consideration for publication elsewhere at the time of submission to TOJET. Manuscripts must be submitted in English. TOJET is guided by it’s editors, guest editors and advisory boards. If you are interested in contributing to TOJET as an author, guest editor or reviewer, please send your CV to [email protected]. January 01, 2018 Editor in Chief Prof. Dr. Aytekin İŞMAN Sakarya University

TOJET: The Turkish Online Journal of Educational Technology – January 2018, volume 17 Issue 1
Copyright © The Turkish Online Journal of Educational Technology
Editorial Board Editors Prof. Dr. Aytekin İşman - Sakarya University, Turkey Prof. Dr. Jerry Willis - ST John Fisher University in Rochester, USA Prof. Dr. J. Ana Donaldson - AECT President Associate Editor Assist.Prof.Dr. Fahme Dabaj - Eastern Mediterranean University, TRNC Editorial Board Prof. Dr. Ahmet ESKICUMALI Prof.Dr. Ahmet Zeki Saka - Karadeniz Technical University, Turkey Prof.Dr. Akif Ergin - Başkent University, Turkey Prof.Dr. Ali Al Mazari - Alfaisal University, Kingdom of Saudi Arabia Prof.Dr. Ali Ekrem Özkul - Anadolu University, Turkey Prof.Dr. Anil P. Gaikwad - Yashwantrao Chavan Maharashtra Open University, India Prof.Dr. Antoinette J. Muntjewerff - University of Amsterdam Prof.Dr. Arif Altun - Hacettepe University, Turkey Prof.Dr. Arvind Singhal - University of Texas, USA Prof.Dr. Asaf Varol - Fırat University, Turkey Prof.Dr. Aytekin İşman - Sakarya University, Turkey Prof.Dr. Brent G. Wilson - University of Colorado at Denver, USA Prof.Dr. Buket Akkoyunlu - Çankaya University, Turkey Prof.Dr. Carmencita L. Castolo - Polytechnic University of the Philippines, Philippines Prof.Dr. Cengiz Hakan Aydın - Anadolu University, Turkey Prof.Dr. Chang-Shing Lee - National University of Tainan, Taiwan Prof.Dr. Charlotte N. (Lani) Gunawardena - University of New Mexico, USA Prof.Dr. Chi - Jui Lien - National Taipei University of Education, Taiwan Prof.Dr. Chih - Kai Chang - National University of Taiwan, Taiwan Prof.Dr. Chin-Min Hsiung - National pingtung university, Taiwan Prof.Dr. Colin Latchem - Open Learning Consultant, Australia Prof.Dr. Colleen Sexton - Governor State University, USA Prof.Dr. Demetrios G. Sampson - University of Piraeus, Greece Prof.Dr. Dimiter G. Velev - University of National and World Economy, Bulgaria Prof.Dr. Don M. Flournoy - Ohio University, USA Prof.Dr. Dongsik Kim - Hanyang University, South Korea Prof.Dr. Enver Tahir Rıza - Dokuz Eylül University, Turkey Prof.Dr. Eralp Altun - Ege University, Turkey Prof.Dr. Feng-chiao Chung - National pingtung university, Taiwan Prof.Dr. Ferhan Odabaşı - Anadolu University, Turkey Prof.Dr. Finland Cheng - National pingtung university, Taiwan Prof.Dr. Fong Soon Fook - Uniiversiti Sains Malaysia, Malaysia Prof.Dr. Francine Shuchat Shaw - New York University, USA Prof.Dr. Gianni Viardo Vercelli - University of Genova, Italy Prof.Dr. Gwo - Dong Chen - National Central University Chung - Li, Taiwan Prof.Dr. Hafize Keser - Ankara University, Turkey Prof.Dr. Halil İbrahim Yalın - Gazi University, Turkey Prof.Dr. Heli Ruokamo - University of Lapland, Finland Prof.Dr. Henry H.H. Chen - National pingtung university, Taiwan Prof.Dr. Ing. Giovanni Adorni - University of Genova, Italy Prof.Dr. J. Ana Donaldson - Former AECT President Prof.Dr. J. Michael Spector - University of North Texas, USA Prof.Dr. Jerry Willis - ST John Fisher University in Rochester, USA Prof.Dr. Jie-Chi Yang - National central university, Taiwan Prof.Dr. Kinshuk - Athabasca University, Canada Prof.Dr. Kiyoshi Nakabayashi - Chiba Institute of Technology, Japan Prof.Dr. Kumiko Aoki - The Open University of Japan, Japan Prof.Dr. Kuo - En Chang - National Taiwan Normal University, Taiwan Prof.Dr. Kuo - Hung Tseng - Meiho Institute of Technology, Taiwan
TOJET: The Turkish Online Journal of Educational Technology – January 2018, volume 17 Issue 1
Copyright © The Turkish Online Journal of Educational Technology
Prof.Dr. Kuo - Robert Lai - Yuan - Ze University, Taiwan Prof.Dr. Liu Meifeng - Beijing Normal University, China Prof.Dr. Marina Stock Mcisaac - Arizona State University, USA Prof.Dr. Mehmet Ali Dikermen - Middlesex University, UK Prof.Dr. Mehmet Çağlar - Near East University, TRNC Prof.Dr. Mehmet Gürol - Yıldız Technical University, Turkey Prof.Dr. Mehmet Kesim - Anadolu University, Turkey Prof.Dr. Mei-Mei Chang - National pingtung university, Taiwan Prof.Dr. Melissa Huı-Mei Fan - National central university, Taiwan Prof.Dr. Min Jou - National Taiwan Normal University, Taiwan Prof.Dr. Ming - Puu Chen - National Taiwan Normal University, Taiwan Prof. Dr. Murat Ataizi - Anadolu University, Turkey Prof.Dr. Murat Barkan - Anadolu University, Turkey Prof.Dr. Mustafa Murat Inceoğlu - Ege University, Turkey Prof.Dr. Mustafa Şahin Dündar - Sakarya University, Turkey Prof.Dr. Nabi Bux Jumani - International Islamic University, Pakistan Prof.Dr. Nian - Shing Chen - National Sun Yat - Sen University, Taiwan Prof.Dr. Paul Gibbs - Middlesex University, UK Prof.Dr. Petek Aşkar - Hacettepe University, Turkey Prof.Dr. Ramdane Younsi - Ecole polytechnique de Montreal, Canada Prof.Dr. Roger Hartley - University of Leeds, UK Prof.Dr. Rozhan Hj. Mohammed Idrus - Universiti Sains Malaysia, Malaysia Prof.Dr. Saedah Siraj - University of Malaya, Malaysia Prof.Dr. Sello Mokoena - University of South Africa, South Africa Prof.Dr. Servet Bayram - Yeditepe University, Turkey Prof.Dr. Shan - Ju Lin - National Taiwan University, Taiwan Prof.Dr. Sheng Quan Yu - Beijing Normal University, China Prof.Dr. Shi-Jer Lou - National pingtung university, Taiwan Prof.Dr. Shu - Sheng Liaw - China Medical University, Taiwan Prof.Dr. Shu-Hsuan Chang - National Changhua University of Education, Taiwan Prof.Dr. Stefan Aufenanger - University of Mainz, Germany Prof.Dr. Stephen Harmon - Georgia State University, USA Prof.Dr. Stephen J.H. Yang - National Central University, Taiwan Prof.Dr. Sun Fuwan - China Open University, China Prof.Dr. Sunny S.J. Lin - National Chiao Tung University, Taiwan Prof.Dr. Teressa Franklin - Ohio University, USA Prof.Dr. Toshio Okamoto - University of Electro - Communications, Japan Prof.Dr. Toshiyuki Yamamoto - Japan Prof.Dr. Tzu - Chien Liu - National Central University, Taiwan Prof.Dr. Vaseudev D.Kulkarni - Hutatma Rajjguru College, Rajguruunagar(Pune),(M.S.) INDIA Prof.Dr. Xibin Han - Tsinghua University, China Prof.Dr. Yau Hon Keung - City University of Hong Kong, Hong Kong Prof.Dr. Yavuz Akpinar - Boğaziçi University, Turkey Prof.Dr. Yen-Hsyang Chu - National central university, Taiwan Prof.Dr. Yuan - Chen Liu - National Taipei University of Education, Taiwan Prof.Dr. Yuan-Kuang Guu - National pingtung university, Taiwan Prof.Dr. Young-Kyung Min - University of Washington, USA Assoc.Prof.Dr. Abdullah Kuzu - Anadolu University, Turkey Assoc.Prof.Dr. Adile Aşkım Kurt - Anadolu University, Turkey Assoc.Prof.Dr. Aijaz Ahmed Gujjar - Sindh Madressatul Islam University, Pakistan Assoc.Prof.Dr. Amirul Mukminin - Jambi University - Indonesia Assoc.Prof.Dr. Anita G. Welch - Ball State University, USA Assoc.Prof.Dr. Aytaç Göğüş - Okan University, Turkey Assoc.Prof.Dr. Chen - Chung Liu - National Central University, Taiwan Assoc.Prof.Dr. Cheng - Huang Yen - National Open University, Taiwan Assoc.Prof.Dr. Ching - fan Chen - Tamkang University, Taiwan Assoc.Prof.Dr. Ching Hui Alice Chen - Ming Chuan University, Taiwan Assoc.Prof.Dr. Chiung - sui Chang - Tamkang University, Taiwan Assoc.Prof.Dr. Danguole Rutkauskiene - Kauno Technology University, Lietvenia

TOJET: The Turkish Online Journal of Educational Technology – January 2018, volume 17 Issue 1
Copyright © The Turkish Online Journal of Educational Technology
Assoc.Prof.Dr. David Tawei Ku - Tamkang University, Taiwan Assoc.Prof.Dr. Eric Meng - National pingtung university, Taiwan Assoc.Prof.Dr. Eric Zhi Feng Liu - National central university, Taiwan Assoc.Prof.Dr. Erkan Tekinarslan - Bolu Abant İzzet Baysal University, Turkey Assoc.Prof.Dr. Ezendu Ariwa - London Metropolitan University, U.K. Assoc.Prof.Dr. Fahad N. AlFahad - King Saud University Assoc.Prof.Dr. Fahriye Altinay - Near East University, TRNC Assoc.Prof.Dr. Gurnam Kaur Sidhu - Universiti Teknologi MARA, Malaysia Assoc.Prof.Dr. Hao - Chiang Lin - National University of Tainan, Taiwan Assoc.Prof.Dr. Hasan Çalışkan - Anadolu University, Turkey Assoc.Prof.Dr. Hasan KARAL - Karadeniz Technical University, Turkey Assoc.Prof.Dr. Hsin - Chih Lin - National University of Tainan, Taiwan Assoc.Prof.Dr. Huey - Ching Jih - National Hsinchu University of Education, Taiwan Assoc.Prof.Dr. Huichen Zhao - School of Education, Henan University, China Assoc.Prof.Dr. Hüseyin Yaratan - Eastern Mediterranean University, TRNC Assoc.Prof.Dr. I - Wen Huang - National University of Tainan, Taiwan Assoc.Prof.Dr. I Tsun Chiang - National Changhua University of Education, Taiwan Assoc.Prof.Dr. Ian Sanders - University of the Witwatersrand, Johannesburg Assoc.Prof.Dr. İsmail İpek - Istanbul Aydın University, Turkey Assoc.Prof.Dr. Işıl Kabakcı - Anadolu University, Turkey Assoc.Prof.Dr. Jana Birova - Comenius University in Bratislava, Slovakia Assoc.Prof.Dr. Jie - Chi Yang - National Central University, Taiwan Assoc.Prof.Dr. John I-Tsun Chiang - National Changhua University of Education, Taiwan Assoc.Prof.Dr. Ju - Ling Shih - National University of Taiwan, Taiwan Assoc.Prof.Dr. Koong Lin - National University of Tainan, Taiwan Assoc.Prof.Dr. Kuo - Chang Ting - Ming - HSIN University of Science and Technology, Taiwan Assoc.Prof.Dr. Kuo - Liang Ou - National Hsinchu University of Education, Taiwan Assoc.Prof.Dr. Lan Li - Bowling Green State University, USA Assoc.Prof.Dr. Larysa M. Mytsyk - Gogol State University, Ukraine Assoc.Prof.Dr. Li - An Ho - Tamkang University, Taiwan Assoc.Prof.Dr. Li Yawan - China Open University, China Assoc.Prof.Dr. Manoj Kumar Saxena - Central University of Himachal Pradesh, Dharamshala, Kangra, India Assoc.Prof.Dr. Mike Joy - University of Warwick, UK Assoc.Prof.Dr. Ming-Charng Jeng - National pingtung university, Taiwan Assoc.Prof.Dr. Norazah Mohd Suki - Universiti Malaysia Sabah, Malaysia Assoc.Prof.Dr. Normaliza Abd Rahim - Universiti Putra Malaysia, Malaysia Assoc.Prof.Dr. Noushad Husain - Maulana Azad National Urdu University, Hyderabad Assoc.Prof.Dr. Ping - Kuen Chen - National Defense University, Taiwan Assoc.Prof.Dr. Popat S. Tambade - Prof. Ramkrishna More College, India Assoc.Prof.Dr. Prakash Khanale - Dnyanopasak College, INDIA Assoc.Prof.Dr. Pramela Krish - Universiti Kebangsaan Malaysia, Malaysia Assoc.Prof.Dr. Tzu - Hua Wang - National Hsinchu University of Education, Taiwan Assoc.Prof.Dr. Vincent Ru-Chu Shih - National Pingtung University of Science and Technology, Taiwan Assoc.Prof.Dr. Wu - Yuin Hwang - National Central University, Taiwan Assoc.Prof.Dr. Ya-Ling Wu - National pingtung university, Taiwan Assoc.Prof Dr. Yahya O Mohamed Elhadj - AL Imam Muhammad Ibn Saud University, Saudi Arabia Assoc.Prof Dr. Yavuz Akbulut - Anadolu University Assoc.Prof.Dr. Zehra Altınay - Near East University, TRNC Assoc.Prof.Dr. Zhi - Feng Liu - National Central University, Taiwan Assist.Prof.Dr. Aaron L. Davenport - Grand View College, USA Assist.Prof.Dr. Alper Beyazıt - Yeditepe University, Turkey Assist.Prof.Dr. Andreja Istenic Starcic - University of Primorska, Slovenija Assist.Prof.Dr. Betül Özkan - University of Arizona, USA Assist.Prof.Dr. Burçin Kısa Işık - Gaziantep University, Turkey Assist.Prof.Dr. Chiu - Pin Lin - National Hsinchu University of Education, Taiwan Assist.Prof.Dr. Chun - Ping Wu - Tamkang University, Taiwan Assist.Prof.Dr. Chun - Yi Shen - Tamkang University, Taiwan Assist.Prof.Dr. Chung-Yuan Hsu - National pingtung university, Taiwan Assist.Prof.Dr. Dale Havill - Dhofar University, Sultanate of Oman
TOJET: The Turkish Online Journal of Educational Technology – January 2018, volume 17 Issue 1
Copyright © The Turkish Online Journal of Educational Technology
Assist.Prof.Dr. Devrim Akgündüz - İstanbul Aydın Üniversitesi, Turkey Assist.Prof.Dr. Emete Gerçel - Near East University, TRNC Assist.Prof.Dr. Gökhan Dağhan - Hacettepe University, Turkey Assist.Prof.Dr. Guan - Ze Liao - National Hsinchu University of Education, Taiwan Assist.Prof.Dr. Hsiang chin - hsiao - Shih - Chien University, Taiwan Assist.Prof.Dr. Huei - Tse Hou - National Taiwan University of Science and Technology, Taiwan Assist.Prof.Dr. Jagannath. K Dange - Kuvempu University, India Assist.Prof.Dr. K. B. Praveena - University of Mysore, India Assist.Prof.Dr. Kanvaria Vinod Kumar - University of Delhi, India Assist.Prof.Dr. Lotfi Salhi - University of Gafsa, Tunisia Assist.Prof.Dr. Marko Radovan - University of Ljubljana, Slovenia Assist.Prof.Dr. Min-Hsien Lee - National central university, Taiwan Assist.Prof.Dr. Mohammad Akram Mohammad Al-Zu'bi - Jordan Al Balqa Applied University, Jordan Assist.Prof.Dr. Pamela Ewell - Central College of IOWA, USA Assist.Prof.Dr. Pei-Hsuan Hsieh - National Cheng Kung University, Taiwan Assist.Prof.Dr. Pey-Yan Liou - National central university, Taiwan Assist.Prof.Dr. Phaik Kin, Cheah - Universiti Tunku Abdul Rahman, Kampar, Perak Assist.Prof.Dr. Ping - Yeh Tsai - Tamkang University, Taiwan Assist.Prof.Dr. S. Arulchelvan - Anna University, India Assist.Prof.Dr. Seçil Kaya - Anadolu University, Turkey Assist.Prof.Dr. Selma Koç Vonderwell - Cleveland State University, Cleveland Assist.Prof.Dr. Sunil Kumar - National Institute of Technology, India Assist.Prof.Dr. Tsung - Yen Chuang - National University of Taiwan, Taiwan Assist.Prof.Dr. Vahid Motamedi - Tarbiat Moallem University, Iran Assist.Prof.Dr. Wong Kung Teck - Sultan Idris Education University, Malaysia Assist.Prof.Dr. Yalın Kılıç Türel - Fırat University, Turkey Assist.Prof.Dr. Yasin Aslan - Sinap University, Turkey Assist.Prof.Dr. Yu - Ju Lan - National Taipei University of Education, Taiwan Assist.Prof.Dr. Zerrin Ayvaz Reis - İstanbul University, Turkey Assist.Prof.Dr. Zülfü Genç - Fırat University, Turkey Dr. Arnaud P. Prevot - Forest Ridge School of the Sacred Heart, USA Dr. Balakrishnan Muniandy - Universiti Sains Malaysia, Malaysia Dr. Brendan Tangney - Trinity College, Ireland Dr. Chan Shiau Wei - Universiti Tun Hussein Onn Malaysia, Malaysia Dr. Chen Haishan - China Open University, China Dr. Chin Hai Leng - University of Malaya, Malaysia Dr. Chin Yeh Wang - National Central University, Taiwan Dr. Chun Hsiang Chen - National Central University, Taiwan Dr. Chun Hung Lin - National central university, Taiwan Dr. Esra Telli - Hacettepe University, Turkey Dr. Farrah Dina Yusop - University of Malaya, Malaysia Dr. Fatma Bayrak - Hacettepe University, Turkey Dr. Gökhan Akçapınar - Hacettepe University, Turkey Dr. Hj. Issham Ismail - Universiti Sains Malaysia, Malaysia Dr. Hj. Mohd Arif Hj. Ismail - National University of Malaysia, Malaysia Dr. I-Hen Tsai - National University of Tainan, Taiwan Dr. Jarkko Suhonen - University of Eastern Finland, Finland Dr. Li Ying - China Open University, China Dr. Milani M. Austria - Casa College, Cyprus Dr. Norlidah Alias - University of Malaya, Malaysia Dr. Pınar Nuhoğlu - Hacettepe University, Turkey Dr. Rosnaini Mahmud - Universiti Putra Malaysia, Malaysia Dr. Sachin Sharma - Faridabad Institute of Technology, Faridabad Dr. Seetharam Chittoor Jhansi - Pushpa Navnit Shah Centre for Lifelong Learning, India Dr. Tam Shu Sim - University of Malaya, Malaysia Dr. Tiong Goh - Victoria University of Wellington, New Zealand Dr. Vikrant Mishra - Shivalik College of Education, India Dr. Zahra Naimie - University of Malaya, Malaysia
TOJET: The Turkish Online Journal of Educational Technology – January 2018, volume 17 Issue 1
Copyright © The Turkish Online Journal of Educational Technology
Table of Contents Analysis of Timeline Posts to a Language Teacher Organization Public Facebook Group 1 David KENT Assessing Student Performance in Hybrid versus Web-Facilitated Personal Health Courses 11 Michelle L CATHORALL, Huaibo XIN, Faustina BLANKSON, Monica KEMPLAND, Courtney SCHAEFER
Atom Core Interactive Electronic Book to Develop Self Efficacy and Critical Thinking Skills 17 Luthfia Puspa PRADINA, Agus SUYATNA Designing Optical Spreadsheets-Technological Pedagogical Content Knowledge Simulation (S-Tpack): A Case Study of Pre-Service Teachers Course
24
M. Anas THOHIR, JUMADI, WARSONO Determinants of Innovation Culture amongst Higher Education Students 37 Siti Hajar Mohd ROFFEEI, Farrah Dina YUSOP, Yusniza KAMARULZAMAN Developing a Blended Learning-Based Method for Problem-Solving in Capability Learning 51 Wasis D. DWIYOGO Developing an Online Learning Media Using Smartphone for the Electrical Machinery Course 62 MUCHLAS Graspable Multimedia: A Study of the Effect of a Multimedia System embodied with Physical Artefacts on Working Memory Capacity of Preschoolers
69
Kien Tsong CHAU, Zarina SAMSUDIN, Wan Ahmad Jaafar Wan YAHAYA How Much Videos Win Over Audios in Listening Instruction for EFL Learners 92 Burhanuddin YASIN, Faisal MUSTAFA, Rizki PERMATASARI Learner Characteristics, Learner Achievement and Time Investment in Online Courses for Dutch L2 in Adult Education
101
Liesbeth De PAEPE, Chang ZHU, Koen DEPRYCK Methods to Efficiently Achieve High-Quality Teaching of Accounting at the University – A Teaching Innovation Evaluation
113
Zdeněk HRUŠKA Pre-Service Teachers’ Perception of Distance Education 125 Abdullah Yasin GÜNDÜZ, Aytekin İŞMAN Promoting Students’ Paragraph Writing Using EDMODO: An Action Research 130 Is’haq Al-NAIBI, Maryem AL-JABRI, Iman AL-KALBANI Secondary School Students’ Use of and Attitudes toward Online Mathematics Homework 144 Nour Awni ALBELBISI, Farrah Dina YUSOP Selection of Learning Media Mathematics for Junior School Students 154Sri Adi WIDODO, WAHYUDIN Should We Add History of Science to Provide Nature of Science into Vietnamese Biology Textbook: A Case of Evolution and Genetics Teaching?
161
Huynh Thi Thuy DIEM, Chokchai YUENYONG Social Media Addiction Scale - Student Form: The Reliability and Validity Study 169 Cengiz ŞAHİN
TOJET: The Turkish Online Journal of Educational Technology – January 2018, volume 17 Issue 1
Copyright © The Turkish Online Journal of Educational Technology
The Art of Teaching Science in Secondary Schools: A Meta Analysis 183 Sharifah Sariah Syed HASSAN, Ahmad Abdullahi IBRAHIM The Degree of Applying E-Learning in English Departments at Al-Balqa Applied University from Instructors' Perspectives
192
Mohammad Akram Mohammad ALZU'BI The Development of the Virtual Learning Media of the Sacred Object Artwork 197 Sumitra NUANMEESRI, Saran JAMORNMONGKOLPILAI The Effects of Webopac Self Training Tool with Guided Exploration on Information Literacy Skills among First Year Degree Students
210
Mohd Nasir ISMAIL, Nurfaezah MAMAT, Adnan JAMALUDIN The Impact of Social Presence on Learners' Satisfaction in Mobile Learning 226 Elham ALSADOON Two Modalities of the Contextualized Courseware in Three Modalities of Classroom Use 234 Yavuz AKPINAR, Özlem ŞENGÜL University Student’s Perspectives on Using Cell Phones in Classrooms - Are They Dialing up Disaster?
246
Simon FERNANDEZ
TOJET: The Turkish Online Journal of Educational Technology – January 2018, volume 17 issue 1
Copyright © The Turkish Online Journal of Educational Technology 1
Analysis of Timeline Posts to a Language Teacher Organization Public Facebook Group David KENT Graduate School of TESOL-MALL, Woosong University, REPUBLIC OF KOREA [email protected] ABSTRACT Affordances of Facebook for enhancing communities of practice are often overlooked in studies highlighting the role of social networking in the English as a foreign language context of Korea. Taking this into account, the purpose behind this study is to determine the function a Korea-based language teacher organization Facebook group in terms of how the 3,197 members use the service as a personal learning environment for professional development, while also seeking to determine how the group supports the endeavors of those actively engaging with it. Data harvesting was undertaken using NodeXL Pro, and confined to a one-year period, with thematic content analysis then employed to group the 278 captured timeline posts into themes for analysis. Although most posts were disproportionately organizational, it is clear that professional development emerges amongst members as the largest concern. Further analysis came to illustrate the role of the group in the professional lives of members, seeing it arise as an affinity space, presenting access to professional development opportunities, content, and contacts, and providing a means for members to validate teaching material, showcase success, and access just-in-time support. Ultimately though, before becoming integral to any educator’s personal learning environment, the group could perform much better, and several means to this end are exposed. Keywords: social networking, TESOL, personal learning environments INTRODUCTION The emergence of social networking services (SNSs) like Facebook has changed what it means to be a teacher by providing 21st century educators, as part of a personal learning environment (PLE), “a space to reflect, share, and interact with other professionals” (Homan, 2014, p. 328). As new technologies emerge, and are appropriated by teachers, they reshape not only the learning landscape of students but also that of the teacher, particularly in terms of professional development opportunities (Goh, 2015; Homan, 2014). However, research on the use of Facebook groups for the professional development of practicing teachers, particularly in the Korean context, is almost non-existent (Kent, 2016), and for that matter, only very few studies have come to report on the potential for the use of SNSs to enhance professional development in education (Cevik, Celik, & Haslaman, 2014). This study aims to partially fill this gap, particularly since Facebook groups are recognized in the literature as a means where teachers can contribute and interact with professional communities of practice in education (Rego, 2009; Steinbrecher & Hart, 2012). So too, the affordances of Facebook for informal professional development is also recognized (Sumeur, Esfer, & Yildrim, 2014) in terms of providing online communities that allow for the sharing of ideas, information, practice, and resources, and it is through analysis of these networks that the relationships and arising interactions evident in these communities can be mapped and potentially better understood (Hansen, 2011; Hansen, Shneiderman, & Smith, 2011, Homan, 2014). To help fill the identified gap in the literature, this paper begins by reviewing recent research surrounding the use of social networking services for teachers’ professional development. This is undertaken to help situate the study, and to determine the affordances and potential that such technology might avail members of a Korea-based language teacher organization Facebook group (LTFG), while simultaneously highlighting the significance of forming a personal learning environment for professional development purposes. The importance and potential of a social media presence for such language teacher organizations is then discussed, followed by a qualitative analysis of the publicly available data extracted from the LTFG. This analysis is used to uncover the role of the group in the professional lives of members, and to determine if the group is operating as intended. Through such an undertaking, several key areas where improvements can be made to enhance the social networking services offered by the group can be brought to the fore, which in turn can allow for recommendations for enhancing the SNS role of the LTFG to emerge. These include: developing a means to exploit the potential which key actors (like administrators) afford the network; increasing the engagement and interaction profile of any non-engaged actors; ensuring relevancy of organizational posts; enhancing unsolicited posts; increasing group awareness to hot topics in the field; assisting members in becoming aware of those
TOJET: The Turkish Online Journal of Educational Technology – January 2018, volume 17 issue 1
Copyright © The Turkish Online Journal of Educational Technology 2
whose interests align with theirs; establishing a mechanism to provide expert-level responses to posts as required; and the need to create cyber specific roles to achieve these outcomes if required. This study captured a snapshot of posts and interactions from a professional teacher organization Facebook group during a particular time period. The purpose behind this is to review all captured content from the group timeline over a period of one calendar year in order to determine how group members are using the service, if the group is indeed functioning as a PLE and allowing for professional development, and to determine the function that the organization plays in terms of group administrator involvement in supporting the endeavors of the members who are actively engaging and interacting with the group. Consequent questions are:
1. Is the Facebook group meeting organizational goals and operating as intended, or could it be performing better?
2. What role does the Facebook group play in the professional lives of active group members, in the way that it currently operates as a social networking service, and could this role be enhanced for all members?
LITERATURE REVIEW Despite Facebook being one of the most frequently used SNSs among teachers (Soomro, Kale, & Zai, 2014), extremely little is known about how and why practicing K-12 teachers use Facebook, but they do turn to it to support their professional development (Sumeur, Esfer, & Yildrim, 2014; Carpenter, 2015). Early career educators, as Steinbrecher and Hart (2012) show, seek out teaching tips, lesson ideas and advice on various classroom or workplace predicaments, and use Facebook to “vent frustrations mainly centred around [the teaching] issues they face” (p. 80). For pre-service teachers, Cevik, Celik, and Haslaman (2014), recognize the promise of Facebook for providing teacher training as it is used in daily life. Yet, time as a constraint must be considered, as participants from Carpenter’s (2015) study show: “I was so busy … too busy lesson planning or stressed out about teaching ...” to use the SNS “... even though it could have potentially helped me out” (p. 222). However, they recognize SNSs as being able to provide access to a “wide variety of ideas, people, and resources” and, perhaps more importantly, that it can provide support for the grassroots “personalization of professional development” (Carpenter, 2015, p. 223). A number of scholars have also identified the potential of Facebook for professional development (Phillips, Baird, & Fogg 2011; Zhang, 2009), particularly of an informal nature (Ranieri, Manca, & Fini, 2012; Rutherford, 2010; Staudt, St. Clair, & Martinez, 2013), as the various features available, such as posting questions, teaching tips, comments on lesson ideas, sending messages, sharing educational resources and links, and staying in touch with peers, can allow for effective online professional development to occur (Rutherford, 2010; Staudt, St. Clair, & Martinez, 2013). However, effective teacher professional development, as Holmes, Preston, Shaw, and Buchanan (2013) see it, must be sustained over time, practical in nature, related to student learning, collaborative, involve knowledge sharing, and allow for a degree of ownership and control. This is followed by an argument that shows SNS support for these notions, along with the potential to provide a link between in- and pre-service teachers. A link that would enrich the learning process by providing access to a number of online learning communities, and a number of meaningful interactions beyond which the traditional academic and practicum contexts provide. Using networks in this manner can assist educators in generating social capital that could lead to increasing career success (Forte, Humphreys, & Park, 2012). In this regard, social capital is one benefit that emerges from participation in a network of peers where the position of an educator within a network of social relationships, like that of a Facebook group, sees a teacher gain access to not only new and varied resources, but subject matter expertise as well (Cross, Parker, Prusak, & Borgatti, 2001; Forte, Humphreys, & Park, 2012), along with the ability to discuss classroom practices and share resources in a diverse learning community that is itself a part of a PLE or personal learning environment (Homan, 2014). There is “... a growing body of evidence that points to the effectiveness of professional development which is initiated and controlled personally” (Holmes, Preston, Shaw, & Buchanan, 2013, p. 56), in the form of PLEs. A PLE is “an individual’s online learning space … conceptualized, built, and controlled by learners in their quest to become self-reliant, connected, and lifelong learners” (Shaikh & Khoja, 2014, p. 202). Heutagogy (Hase & Kenyon, 2007) is central to this definition, along with the notion that learning, particularly informal learning (Attwell, 2007), will not be delivered by a single provider but form from an aggregate of services that learners engage with independently to attain their current needs. In terms of using Facebook as one service, Rego (2009) provides a number of tips for educators looking to develop their PLE, seeing educators who maintain such a presence gaining, through online connections, easier or even exclusive access to content and resources unavailable to those who are not online (Homan, 2014).
TOJET: The Turkish Online Journal of Educational Technology – January 2018, volume 17 issue 1
Copyright © The Turkish Online Journal of Educational Technology 3
Native speakers arriving in Korea to teach English, with or without formal teacher training, are often employed as aides in the school system or as instructors at institutes where they may be isolated geographically, socially, linguistically, or professionally. As they are largely considered a transitory workforce, human resource departments are either not available or tend to be unwilling to assist in mapping the professional development of these employees (Beach, 2011; Seth, 2002). These aides and instructors would then find the development of private learning environments and access to resources like professional teacher organization Facebook groups invaluable. To this end, Goh (2015) recognizes the value of PLEs, particularly those emerging from within a community of practice for English language educators, and reliance on technologies such as Facebook groups to provide these networks, but cautions that there needs to be an emphasis on coherence, relevance, sustainability and quality. Coherence means being responsive to teacher needs and interests at different career stages, while incorporating perspectives from various stakeholders and academic research (Feiman-Nemser, 1983); relevance refers to teacher choice regarding learning opportunities based on beliefs, skill levels, and institutional roles; and sustainability and quality come from the establishment of immersive learning environments where teacher change can positively impact student learning, and is contextualized through work-based communities of practice. This, Goh (2015) determines, can see teachers emerge not only as leaders of their own learning, but be able to take on the role of professional development mentors from personalized learning spaces which are built on learning goals that involve peers, so that they can also become co-designers of their own professional development. Likewise, as Lu and Churchill (2014) state, from such dense social networks as can be found in PLEs, especially those with a foundation of continuous social interaction, knowledge construction and information sharing potential can end up benefiting educators as they afford access to high-yield learning. However, in the PLE context, as Campana’s (2014) notes, the type of learning that occurs is most often informal, situated, and self-directed, and emerges from the results of engagement with not only communities of practice, but also various other networks including online networks, learning networks, and social networks. METHODOLOGY Data collection and analysis Along the lines of a study undertaken by Isharyanti (2015), an investigation relying on data harvesting utilizing NodeXL Pro was conducted on a Korea-based language teacher organization Facebook group (LTFG). Publicly available data extracted from the group revealed a directed non-egocentric network with 680 active actors (nodes) with 29,284 interactions (edges) across 278 timeline posts. Once all timeline posts and responses were curated, thematic content analysis was then applied to this data. The advantages of using NodeXL Pro (Hansen, Shneiderman & Smith, 2011) for obtaining social networking data for analysis, as Choi, Meza, & Park (2014) recognize, is that it provides support for mapping a variety of social media landscapes, provides an advanced means of reliably collecting and sorting social networking data, and provides a variety of built-in metrics to conduct analyses. The LTFG, consisting of 3,197 members with 7 administrators (or admins), is the primary focus of this study, with this particular group selected as it is run by a long-standing teacher professional development organization. The group is representative of a diverse range of English language teacher interests in Korea across all levels of curriculum from pre-kindergarten, through university, to life-long learning. To ensure recency and to restrict data overload, data collection and analysis was confined to timeline posts and responses made over a date range spanning one calendar year. Content analysis was then used to examine the themes emerging from all of the 278 captured timeline posts and from the associated actor responses. This approach was selected as thematic content analysis (Grbich, 2007) which, as a meaning-making process, allows for the identification of themes and patterns to emerge from the data and their organization into coherent categories, and for the identification of other themes to serve as sub-categories for analysis (Taylor-Powell, 2003 in Rambe, 2013). For this study, the major benefit of this is that it provides a means of expanding the range of content being studied past that of the individual actor’s experience with the group (Guest, 2012). This analysis is undertaken in order to determine the nature and direction of all postings in regard to the relevance of posts to not only individual members but to all group members, the field/profession, and to the goals of the organization itself. In order to ensure consistency of coding the data into themes, the process was conducted twice by the researcher with a break of several weeks in between (Mackey & Gass, 2005), with all posts coded into the same major themes on both occasions. Ethical considerations In regard to the reporting of findings from publicly available data, anonymity is not perceived as being essential. There is, however, recognition that it is not relinquished simply because subjects of a study are passive participants (Zimmerman, 2010), and in line with the recommendations of the Australian Association for Research in Education (AARE, 2016), the Facebook group itself, the organization behind it, and the members who engage with it are entitled to remain anonymous in this and any other study. This is especially important in environments like Facebook where participants are more likely to engage in confessional activity, dissociative anonymity, or online disinhibition (Joinson, 1998; Suler, 2004). The results of any research may influence the
TOJET: The Turkish Online Journal of Educational Technology – January 2018, volume 17 issue 1
Copyright © The Turkish Online Journal of Educational Technology 4
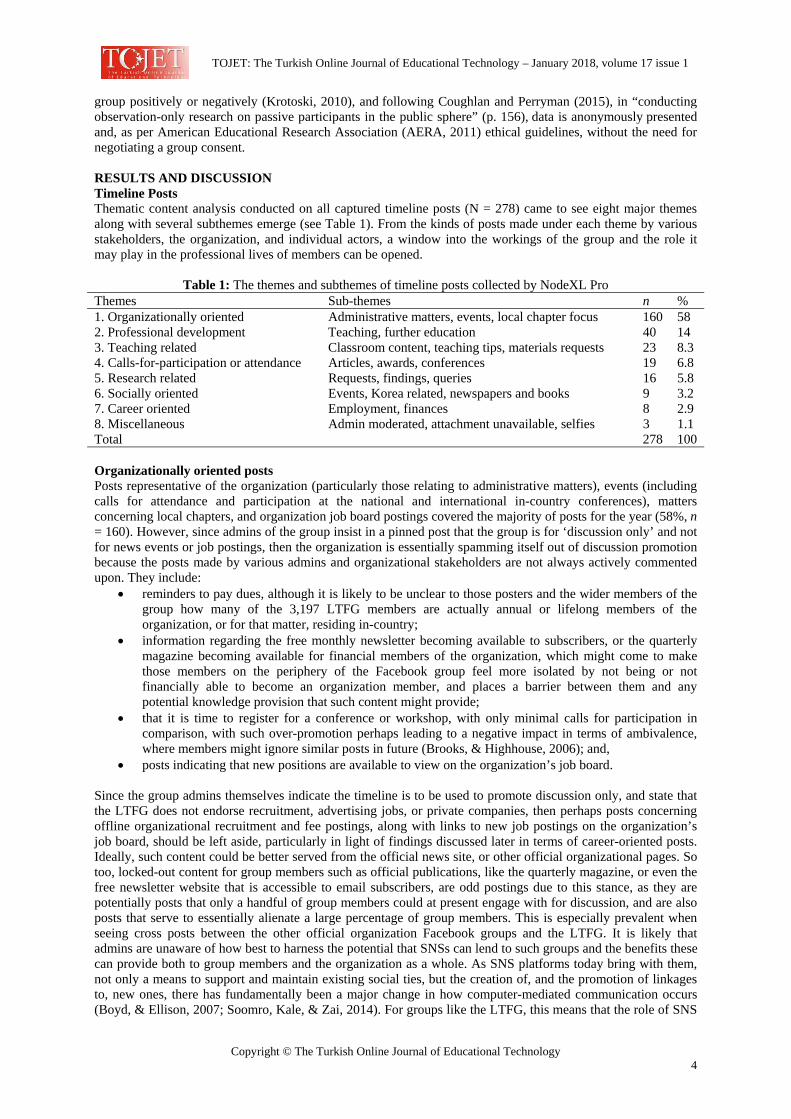
group positively or negatively (Krotoski, 2010), and following Coughlan and Perryman (2015), in “conducting observation-only research on passive participants in the public sphere” (p. 156), data is anonymously presented and, as per American Educational Research Association (AERA, 2011) ethical guidelines, without the need for negotiating a group consent. RESULTS AND DISCUSSION Timeline Posts Thematic content analysis conducted on all captured timeline posts (N = 278) came to see eight major themes along with several subthemes emerge (see Table 1). From the kinds of posts made under each theme by various stakeholders, the organization, and individual actors, a window into the workings of the group and the role it may play in the professional lives of members can be opened.
Table 1: The themes and subthemes of timeline posts collected by NodeXL Pro Themes Sub-themes n % 1. Organizationally oriented Administrative matters, events, local chapter focus 160 58 2. Professional development Teaching, further education 40 14 3. Teaching related Classroom content, teaching tips, materials requests 23 8.3 4. Calls-for-participation or attendance Articles, awards, conferences 19 6.8 5. Research related Requests, findings, queries 16 5.8 6. Socially oriented Events, Korea related, newspapers and books 9 3.2 7. Career oriented Employment, finances 8 2.9 8. Miscellaneous Admin moderated, attachment unavailable, selfies 3 1.1 Total 278 100
Organizationally oriented posts Posts representative of the organization (particularly those relating to administrative matters), events (including calls for attendance and participation at the national and international in-country conferences), matters concerning local chapters, and organization job board postings covered the majority of posts for the year (58%, n = 160). However, since admins of the group insist in a pinned post that the group is for ‘discussion only’ and not for news events or job postings, then the organization is essentially spamming itself out of discussion promotion because the posts made by various admins and organizational stakeholders are not always actively commented upon. They include:
• reminders to pay dues, although it is likely to be unclear to those posters and the wider members of the group how many of the 3,197 LTFG members are actually annual or lifelong members of the organization, or for that matter, residing in-country;
• information regarding the free monthly newsletter becoming available to subscribers, or the quarterly magazine becoming available for financial members of the organization, which might come to make those members on the periphery of the Facebook group feel more isolated by not being or not financially able to become an organization member, and places a barrier between them and any potential knowledge provision that such content might provide;
• that it is time to register for a conference or workshop, with only minimal calls for participation in comparison, with such over-promotion perhaps leading to a negative impact in terms of ambivalence, where members might ignore similar posts in future (Brooks, & Highhouse, 2006); and,
• posts indicating that new positions are available to view on the organization’s job board. Since the group admins themselves indicate the timeline is to be used to promote discussion only, and state that the LTFG does not endorse recruitment, advertising jobs, or private companies, then perhaps posts concerning offline organizational recruitment and fee postings, along with links to new job postings on the organization’s job board, should be left aside, particularly in light of findings discussed later in terms of career-oriented posts. Ideally, such content could be better served from the official news site, or other official organizational pages. So too, locked-out content for group members such as official publications, like the quarterly magazine, or even the free newsletter website that is accessible to email subscribers, are odd postings due to this stance, as they are potentially posts that only a handful of group members could at present engage with for discussion, and are also posts that serve to essentially alienate a large percentage of group members. This is especially prevalent when seeing cross posts between the other official organization Facebook groups and the LTFG. It is likely that admins are unaware of how best to harness the potential that SNSs can lend to such groups and the benefits these can provide both to group members and the organization as a whole. As SNS platforms today bring with them, not only a means to support and maintain existing social ties, but the creation of, and the promotion of linkages to, new ones, there has fundamentally been a major change in how computer-mediated communication occurs (Boyd, & Ellison, 2007; Soomro, Kale, & Zai, 2014). For groups like the LTFG, this means that the role of SNS
TOJET: The Turkish Online Journal of Educational Technology – January 2018, volume 17 issue 1
Copyright © The Turkish Online Journal of Educational Technology 5
admins has changed, requiring them to be more than just moderators, and to become active posters of timely, relevant, and engaging content; become involved with discussions; and welcome new members who join the group. The welcoming is especially important in alleviating clique formation, and it can serve as an ice-breaker when tight-knit groups have already formed in a network. This is also particularly relevant for groups that are run by organizations, as they may serve as an initial point of contact. A means to help develop discussion, and focus the LTFG more towards employing the affordances of an SNS, allowing non-organizational members a means to recognize the value of Facebook group membership, and help to foster the development of the LTFG as a PLE service among all members is to ensure that the editor of the newsletter provides highlights of the content along with the timeline post, instead of simply announcing: ‘December News out now’. So too, the quarterly magazine editor could also provide highlights from each article, or an overview of the topics discussed, rather than postings such as: ‘the newsletter is out’. In this way, group members can become more engaged with organizationally produced content, start to comment on or ponder over the concepts in light of their own teaching contexts, and relevance to their students. These highlights could push group members towards commenting on and replying to such posts. This would establish, for those members of the group who are not members of the organization, a peek into the value that organizational membership and participation can provide while establishing a means of affording cohesion between those group members who have access to the content and those who do not. Lowering the level of gatekeeping regarding such ‘knowledge’ might also serve to breakdown the perceived power differential that current practices establish (Hilferty, 2008), particularly those that might arise between organizational members and non-members. This may also start to promote an increasing familiarity among a wider range of actors throughout the network, especially those who are currently on the periphery, and establish for them a means to interact more cohesively with their peers and those more central members of the group. This is particularly poignant as the value of not only Facebook group membership, and perhaps organizational membership as well, is not clear to members of the LTFG, as a general timeline search reveals posts asking for a reason to become financial. Further, for those presentations that the organization accepts for workshops and conferences, the organization could ask presenters to post their abstracts to the LTFG timeline, and provide some biographical data about themselves along with these posts, particularly since such data is normally collected for conference programs anyway. This would serve to promote familiarity among group members, increase awareness to hot topics in the field, as well as making members more aware of peers whose interests might align with theirs, and this is something which Meyer (2012, in Holmes, Preston, Shaw, & Buchanan, 2013) describes as invaluable. Moreover, it also allows direct access to those providing expertise at professional development events. Such posts also organizationally promote back channeling (McCarthy & Boyd 2005), leading to increased content engagement for participants through the provision of interim, pre-, during-, and post-conference or workshop discussion building, which many teachers desire (Gosha, Billionniere, & Gilbert, 2010). This would afford an otherwise nonexistent level of participation and engagement to group members who may not be able to attend such events, while simultaneously offering a level of professional involvement that might also allow them to “forge and maintain professional ties outside of their local teaching context [and] become conduits for the flow of new practices and ideas in and out of their workplace” (Forte, Humphreys, & Park, 2012, p. 7). Professional development posts Posts centred on professional development (14%, n = 40), covering topics such as teaching and further education, include links to journal articles, plenary session videos, educator blogs, and links to grants and scholarships. Other posts in this category see links to free and paid courses concerning research and teaching skill improvement, methods for ensuring successful conference experiences, and teachers wanting to donate used course textbooks to others. Also, members here are successfully using the LTFG for establishing queries, including those related to undertaking teaching certificate courses, or to find those able to lecture on specialist topics. As Sumeur, Esfer, and Yildrim (2014) remind us, it is not the affordances that makes a tool valuable but it is the manner in which people use it to meet their immediate needs. So too, as Carpenter (2015) affirms, social networking services can present activities and opportunities from a discussion space where participants can construct their own knowledge concerning what it is they want to know by interacting with others. In terms of organizational support, the LTFG could be used more proactively to encourage member professional development. For example, uploading videos to the timeline of select conference presentations and workshops, of which abstracts and introductions would already have been posted previously (as mentioned under the Organizationally Oriented Posts category above), with a poll posted on the timeline to garner what content might be of most interest to members. These could, if gatekeeping was required, be provided only to organizational members as long as the value of what is being provided to them could be easily established by all group members, perhaps by providing adequate information as to what the content covers, as the interaction and
TOJET: The Turkish Online Journal of Educational Technology – January 2018, volume 17 issue 1
Copyright © The Turkish Online Journal of Educational Technology 6
discussion surrounding the content itself would be free to engage with by all members. Alternatively the virtual presentation conference format could be added, and these presentations could then be made available on the LTFG, which would provide an additional means for all members local and otherwise to participate and engage in professional development. It would also provide, for organizational members, increased currency from the conference event itself, as they may then be able to see presentations that were scheduled while they themselves presented or attended another. Seeking to focus on providing aspects of professional development through such content provision is one means of ensuring the relevancy and essentialness of the LTFG as a service in the PLE of many English language teachers in Korea and elsewhere. Teaching related posts Teaching related posts (8.3%, n = 23) focus on classroom content, teaching tips, and requests for materials. They are all indicative of the kind of posts expected (Steinbrecher & Hart, 2012), and they largely consist of instructors looking for just-in-time support, a means of validating their teaching materials or classroom tools, and an outlet for showcasing classroom successes. Even though the dream of sharing user-generated content has failed in terms of repositories consisting of reusable learning objects (Conole & Culver, 2009), such content can all be passed quickly and successfully between members of SNS communities like the LTFG, with such interactions leading to the development of an environment where teachers can be seen helping teachers, and one that is highly relevant to the immediate needs of those involved.
Importantly though, what the brief mention of these types of posts do not show is the somewhat lost nature embedded within, especially by those who appear to be early career teachers. ‘To be totally upfront, I’m a bit of a softy, maybe a pushover, which isn’t great when in front of students. I don’t know how to respond to problems with behaviour, student refusal to follow instructions, and other aspects of classroom management’. Posts like this one are likely due in part to a lack of initial training provided to new arrivals, especially those working at language institutes, where training might consist of, ‘Here is the textbook, there is your classroom, students are waiting’ (see Sperling, 2015). As a cry for help this conceivably illustrates a lack of continued workplace training, and most certainly a lack of support. This situation is created due to the need for teachers, which has seen the rise of language teacher visa categories created for non-teacher trained individuals (Ministry of Justice, 2015). This may explain why the core of professional development posts to the LTFG are ones that do not expand upon an existing educational knowledge base, but rather revolve around discussions that are attempts to create one. This perhaps is also reflective of a number of teachers at this level just starting to look at further education in order to move to better positions, such as college/university language instructor employment, and toward more long-term prospects or accreditation. Regardless, what is evident here, and also from the Professional Development category of posts, is that a kind of ‘affinity space’ (Gee, 2004) has emerged where members of the group, who come from varied backgrounds with varied degrees of knowledge and experience, are coming to interact collaboratively around topics of shared interest. This also allows for in-service educators, regardless of certification, to interact and engage in LTFG posts that could lead to learning that might not otherwise be possible, seeing the affinity space “utilized according to individual interests, needs, skills, and expertise” where it is envisioned that some participants (like admins) could become responsible for “taking on active moderator and curator roles and others primarily benefiting from the resource and idea sharing common in such spaces” (Gee, 2004, p. 211). For this to actively occur, however, admins need to have gained the education and/or experiences of a seasoned specialist educator, or educational experts from among the organizational member base need to be approached and recruited to assist in developing the space. As such, additional cyber ‘mentor’ roles may need to be created for the group, so that the expert-level responses that such a space demands can be provided to members in a timely manner. Calls-for-participation or attendance posts Other organizational type posts, predominantly posted by associated stakeholders, included calls for participation/attendance at non-organizational conferences, with these types of posts coming in at 6.8% (n = 19). Admins, as part of the commitment of establishing the LTFG as a PLE, could contact such associations asking them to provide a short overview or review of the conference so that group members can gain insight into the type of presentations that are or were available, and how attendance or participation might come to assist professional development or career networking. Admins could also encourage group members who may attend or present at such conferences to post a short report on the value obtained from their attendance. This would then be much like what the organization currently does for outreach purposes, at conferences held by affiliated organizations, in the Far East. Doing so would provide engagement to a wider range of group members, including those educators currently located outside of Korea and who were perhaps either former members of the organization and/or now members of affiliate organizations. This would lead to broadening the range of ties to the LTFG network, and perhaps also lead to professional development and collaborative teaching and learning
TOJET: The Turkish Online Journal of Educational Technology – January 2018, volume 17 issue 1
Copyright © The Turkish Online Journal of Educational Technology 7
opportunities amongst members, particularly since, as Anyanwu (2015) notes, “a top priority for teachers today is to remain current and successful in an ever-changing global educational landscape mediated by innovative technology” (p. 1). Research related posts Research related posts follow at 5.8% (n = 16), and centre for the most part around requests for study participants or survey completion, and inquiries into how to conduct research or data analysis, with only the sharing of findings from one of the previously conducted surveys made available. This means that some members are using the group to help them undertake aspects of professional development by seeking out data to assist them in fulfilling further education commitments, while a number of other educational stakeholders are using the group as a research window into the English language teaching context of the local, international, and expatriate communities. Unfortunately, with only the distributors of one survey providing research feedback, this trend, if continued, may see members become disenchanted by such requests. A means around this would be to have admins follow up those who ask members to participate in the collection of research data. In this way, feedback on studies in progress can be obtained by members, which may allow for engaging points of discussion to arise, or perhaps even prompt some members to consider implementing aspects of such research in their own classrooms, which could then in turn be reported back to the group, spurring reflective practice. Such provision would also see the values and beliefs that arise in the teachers who engage in these practices coming to mold the kind of pedagogy that they employ (Walkington, 2005), with reflective practice also allowing for teachers to review their own teaching methods in light of what is working best for students (Ho, 2009). Socially oriented posts Socially oriented topics were kept to a minimum overall, at 3.2% (n = 9), and largely centred around Korea related newspaper articles on education, culture and language; books on Korean history or language; and, even a local theatre production. Although these posts do see content arising from contexts that are anchored in and driven by individual interest, they also highlight the fact that members are turning to the LTFG not only for support regarding their local teaching context and studies, but for support regarding their local environment. Importantly, this indicates that on some level, the group is assisting in providing aspects of acculturation for those members new to Korea, and is also providing for long-termers and Korean nationals alike access to information that might impact upon them both socially as well as professionally. Further, by putting those relatively new expatriates in contact with long-term residents as well as geographically local members, access to content and contacts, that might not otherwise be as readily accessible, are provided. This is something that needs to be recognized, since being employed as an educator abroad can involve having to adjust to some radically different societal and workplace cultures (Brown, 2014; Hofstede, 1986; Hofstede & Hofstede, 2005; Kent, 2004). Career oriented posts Interestingly, the least representative topic on the timeline was career oriented at 2.9% (n = 8), which came to cover a range of inquiries regarding aspects of employment. Posts included concerns over visa related matters, and finances such as pension and savings, as well as transitional career advice. Overall, this may mean that most members of the group are very happy with their work and chosen careers, and due to the large number of timeline posts actually centring on professional development and teaching related content, they actually want to improve upon it. However, there are a number of other Facebook groups where discussions can be held more privately, and it is likely that group members would choose to exercise that option. This is especially poignant as what is discussed on Facebook in a publicly accessible group is visible to all, and it is increasingly important to be vigilant about posting content that might risk professional status (Sumeur, Esfer, & Yildrim, 2014). Miscellaneous posts Finally, a small percentage of miscellaneous posts were recorded (1.1%, n = 3). These posts include member selfies, unavailable attachments, and admin moderated posts. Overall these were rare, with the majority of participants actually using the LTFG for specific purposes and posting with specific intent, as can be seen by the scope of posts available under other categories. This also shows that members generally recognize the group as being representative of organizational values, and they are inclined to post content and queries that revolve around the mission statement. This is evidenced by individual member posts predominantly focusing on the immediate needs of educators who are seen as networked individuals attempting to “draw upon spaces both within and outside of their schools to improve their curricula and inform their practice” (Homan, 2014, p. 312). Posts to the group pertain to a wide variety of educational aspects from professional development through teaching, with social and career oriented posts, when they do occur, largely being reflective of the Korean educational context or the local environment in general.

TOJET: The Turkish Online Journal of Educational Technology – January 2018, volume 17 issue 1
Copyright © The Turkish Online Journal of Educational Technology 8
CONCLUSION Ultimately, this article finds that the LTFG has come to establish a niche where it provides a space for people of like interest, offering them the ability to engage and interact in order to develop professionally. However, there is room for improvement, and a number of areas where the group could be performing better in terms of meeting organizational goals have been uncovered. To enhance the role of the group as an SNS service, it is also clear that more can be done to provide a sense of professional belonging to all group members. Perhaps if this is promoted and focused upon more aggressively, then an increase in the quality and type of posts from all members, not just core members affiliated with the organization at some level, might then be seen. This may also be the case if the group becomes increasingly supportive of teachers in a range of contexts, and increasingly begins to establish itself as a focal PLE service for group members overall, including those on the periphery of the network. By doing so, it is likely that the LTFG may then be able to reward the organization with an ever increasing financially current member base. This aside, several limitations may have impinged upon this study. First, the owner of the group is an official organization which in a sense can be viewed as sponsoring the group, and there may have been some colouring of posts, especially those made by admins. Second, membership of the group is not controlled as it is open to all, organization affiliates or not, and although group membership is high, the emerging sample size is comparatively small. Third, significant actor credibility may need to be taken into account in terms of their links to the organization and what this might mean for how they conduct themselves in regards to an online presence. Aside from these limitations, it is also surprising to see limited research on the role of SNSs in English language teacher professional development on the Korean peninsula, particularly since Korea has long been one of the most wired countries on Earth (Hachigian, 2002). As such, there is much potential for future research. Of particular interest is the design of a study to determine the significance of SNSs in the private learning environments of native English speaking teachers at various levels of employment, from K-12 co-teachers, to private institute instructors, and those employed at college/university language institutes. This would seek to identify the importance of professional development to stakeholders, establish the current levels of engagement of in-service teachers with professional development opportunities, and trace emerging and key needs of professional development. One thing is sure: as Feiman-Nemser (2001) nigh on two decades ago warned,
if we want schools to produce more powerful learning on the part of students, then we have to offer more powerful learning opportunities to teachers [...] Unless teachers have access to serious and sustained learning opportunities at every stage of their career, they are unlikely to teach in ways that meet demanding new standards for student learning or to participate in the solution of educational problems (pp. 1013-4).
REFERENCES AARE (2016). Code of ethics. Available: http://www.aare.edu.au/pages/aare-code-of-ethics.html AERA (2011). Code of ethics. Educational Researcher, 40(3), 145-156. DOI: 10.3102/0013189X11410403 Anyanwu, K. (2015). Teachers perception in a technology integration workshop: Implications for professional
development in the digital age. Issues and Trends in Educational Technology, 3(1). Retrieved from https://journals.uair.arizona.edu/index.php/itet/article/download/18405/18315
Attwell, G. (2007). The personal learning environments - the future of eLearning? eLearning Papers, 2(1). Retrieved from http://www.informelles-lernen.de/fileadmin/dateien/Informelles_Lernen/Buecher_Dokumente/Attwell_2007-ple.pdf
Beach, J. M. (2011). Children dying inside. USA: CreateSpace. Borgatti, S. P. (2001). Centrality and network flow. Social Networks, 27, 55-71. doi:
10.1016/j.socnet.2004.11.008 Boyd, D. M., & Ellison, N. B. (2007). Social network sites: Definition, history, and scholarship. Journal of
Computer-Mediated Communication, 13(1), 210-230. Brooks, M. E., & Highhouse, S. (2006). Familiarity breeds ambivalence. Corporate Reputation Review, 9(2),
105-113. doi: 10.1057/palgrave.crr.1550016. Brown, H. D. (2014). Principles of Language Learning and Teaching: A course in second language acquisition
(6th ed.). White Plains, NY: USA. Pearson. Carpenter, J. (2015). Preservice teachers’ microblogging: Professional development via Twitter. Contemporary
Issues in Technology and Teacher Education, 15(2), 209-234. Campana, J., (2014). Learning for work and professional development: The significance of informal learning
networks of digital media industry professionals. International Journal of Training Research, 12(3), 213-226. doi: 10.1080/14480220.2014.11082043
Choi, S. C., Meza, X. V., & Park, H. W. (2014). South Korean culture goes Latin America: Social network analysis of Kpop tweets in Mexico. International Journal of Contents, 10(1), 36-42.
TOJET: The Turkish Online Journal of Educational Technology – January 2018, volume 17 issue 1
Copyright © The Turkish Online Journal of Educational Technology 9
Conole, G., & Culver, J. (2009). Cloudworks: Social networking for learning design. Australasian Journal of Educational Technology, 25(5), 763-782.
Coughlan, T., and Perryman, L. (2015). A murky business: navigating the ethics of educational research in Facebook groups. European Journal of Open, Distance and e-Learning, 146-169.
Cross, R., Parker, A., Prusak, L., & Borgatti, S. P. (2001). Knowing what we know: Supporting knowledge creation and sharing in social networks. Organizational Dynamics, 30(2), 100-120.
Feiman-Nemser, S. (1983). Learning to Teach. In Shulman, L. & Sykes, G. (Eds.) Handbook of Teaching and Policy, (pp. 150-170). New York, NY: Longman.
Feiman-Nemser, S. (2001). From preparation to practice: Designing a continuum to strengthen and sustain teaching. Teachers College Record, 103(6), 1013-1055.
Forte, A., Humphreys, M., & Park, T. (2012). Grassroots professional development: How teachers use Twitter. Sixth International AAAI Conference on Weblogs and Social Media. June 4-7, Dublin, Ireland.
Gee, J. P. (2004). Situated language and learning: A critique of traditional schooling. New York, NY: Routledge.
Goh, C. C. M. (2015, December). Professional development for teachers of 21st century English language learners. Paper presented at the 2015 TESOL Regional Conference: Excellence in Language Instruction: Supporting Classroom Teaching & Learning, Singapore.
Gosha, K., Billionniere, E., & Gilbert, J. E. (2010, March). Developing a framework for teacher professional development using online social networks. Paper presented at the Society for Information Technology & Teacher Education International Conference, USA. Retrieved from https://www.editlib.org/p/33562/
Grbich, C. (2007). Qualitative data analysis: An introduction. London, UK: Sage. Guest, G. (2012). Applied thematic analysis. Thousand Oaks, California: Sage. Hachigian, N. (2002). The internet and power in one-party East Asian states. The Washington Quarterly, 25(3),
41-58. Hansen, D. L. (2011). Exploring social media relationships. On the Horizon, 19(1), 43-51. Hansen, D. L., Shneiderman, B., & Smith, M. A. (2011). Analysing social media networks with NodeXL:
Insights from a connected world. Burlington, MA: Morgan Kaufmann. Hase, S., and Kenyon, C. (2007). Heutagogy: A child of complexity theory. Complicity: An International
Journal of Complexity and Education, 4(1), 111-118. Hilferty, F. (2008). Theorising teacher professionalism as an enacted discourse of power. British Journal of
Sociology Education, 29(2), 161-173. doi: 10.1080/01425690701837521. Ho, B. (2009). Training teachers of English to reflect critically. The Journal of Asia TEFL, 6(4), 109-130. Hofstede, G. (1986). Cultural differences in teaching and learning. International Journal of Intercultural
Relations, 10, 301-320. Hofstede, G., & Hofstede. G. J. (2005). Culture and organizations: Software of the mind (2nd ed.). New York,
USA: McGraw-Hill. Holmes, K., Preston, G., Shaw, K., & Buchanan, R. (2013). ‘Follow’ me: Networked professional learning for
teachers. Australian Journal of Teacher Education, 38(12), 44-65. Homan, E. C. (2014). The shifting spaces of teacher relationships: Complementary methods in examinations of
teachers’ digital practices. Journal of Technology and Teacher Education, 22(3), 311-331. Isharyanti, N. (2015, November). Best practices in English teachers Facebook groups. Paper presented at the
Globalization and Localization in Computer-Assisted Language Learning (GLoCALL): Ninth Joint Conference of APACALL and PacCALL, South Korea.
Kent, D. (2004). CALL initiatives and the Korean cultural learning context. In J. Son (Ed.), Computer-assisted language learning: Concepts, contexts and practices. Lincoln, NE: iUniverse, Inc.
Kent, D. (2016).Analysis of a Korea-based language teacher organization public social networking service. International Journal of Contents, 12(2), 66-74.
Krotoski, A. (2010). Introduction to the special issue: Research ethics in online communities. International Journal of Internet Research Ethics, 3, 1-5.
Mackey, A., & Gass, S. (2005). Second language research: Methodology and design. Mahwah, New Jersey: Lawrance Erlbaum Associates, Publishers.
McCarthy, J. F., & Boyd, D. (2005, April). Digital backchannels in shared physical spaces: Experiences at an academic conference. Paper presented at the CHI 2005: International Conference for Human Computer Interaction, USA. Retrieved from: http://www.danah.org/papers/CHI2005Backchannels.pdf
Ministry of Justice. (2015). The sojourn guide for foreigners. Korea Immigration Service. Phillips, L. F., Bair, D., & Fogg, B. J. (2011). Facebook for educators. Retrieved from
https://www.facebook.com/safety/attachment/Facebook%20for%20Educators.pdf Rambe, P. Converged social media: identity management and engagement on Facebook mobile and blogs.
Australasian Journal of Educational Technology, 29(3), 315-336).
TOJET: The Turkish Online Journal of Educational Technology – January 2018, volume 17 issue 1
Copyright © The Turkish Online Journal of Educational Technology 10
Ranieri, M., Manca, S., & Fini, A. (2012). Why (and how) do teachers engage in social Networks? An exploratory study of professional use of Facebook and its implications for lifelong learning. British Journal of Educational Technology, 43(5), 754-769.
Rego, B. (2009). A teachers’ guide to using Facebook [On-line]. Available: http://alex.state.al.us/staticfiles/teacherzone/docs/TeachersGuidetoUsingFacebook.pdf
Rutherford, C. (2010). Facebook as a source of informal teacher professional development. In Education 16(1), 60-74.
Seth, M. J. (2002). Education fever: Society, politics, and the pursuit of schooling in South Korea. Hawaii, USA: University of Hawaii Press.
Shaikh, Z. A., & Khoja, S. A. (2014). Personal learning environments and university teacher roles explored using Delphi. Australasian Journal of Educational Technology 30(2), 202-226.
Soomro, K. A., Kale, U., & Zai, S. A. Y. (2014). Pre-service teachers’ and teacher-educators’ experiences and attitudes toward using social networking sites for collaborative learning. Educational Media International, 51(4), 1-17.
Sperling, D. (2015). Dave’s ESL Cafe - Korean Job Discussion Forums [On-line]. Available: http://forums.eslcafe.com/korea/viewforum.php?f=3
Staudt, D., St. Clair, N., & Martinez, E. (2013). Using Facebook to support novice teachers. The New Educator, 9(2), 157-174.
Steinbrecher, T., & Hart, J. (2012). Examining teachers’ personal and professional use of Facebook: Recommendations for teaching education programming. Journal of technology and Teacher Education 20(1), 71-88.
Sumeur, E., Esfer, S., & Yildrim, S. (2014). Teachers’ Facebook use: their use habits, intensity, self-disclosure, privacy settings, and activities on Facebook. Educational Studies, 40(5), 537-553.
Walkington, J. (2015). Becoming a teacher: Encouraging development of teacher identity through reflective practice. Asia-Pacific Journal of Teacher Education, 33, 53-64.
Zhang, J. (2009). Comments on Greenhow, Robelia, and Hughes: Toward a creative social web for learners and teachers. Educational Researcher 38(4), 249-262.
Zimmer, M. (2010). “But the data is already public”: On the ethics of research in Facebook. Ethics and Information Technology, 12(4), 313-325.
TOJET: The Turkish Online Journal of Educational Technology – January 2018, volume 17 issue 1
Copyright © The Turkish Online Journal of Educational Technology 11
Assessing Student Performance in Hybrid versus Web-Facilitated Personal Health Courses Michelle L Cathorall, DrPH, MPH, Huaibo Xin, DrPH, MPH, Faustina Blankson, PhD, Monica Kempland, PhD, and Courtney Schaefer, BS Southern Illinois University at Edwardsville, Edwardsville, IL [email protected] Corresponding author: Michelle L. Cathorall, Assistant Professor of Public Health, Department of Applied Health, Southern Illinois University Edwardsville, Campus Box 1126, Edwardsville, IL 62026 E-mail: [email protected] Abstract This study aims to examine the effectiveness of web-facilitated and hybrid course delivery formats on student learning outcomes for four sections of an undergraduate Personal Health course at a public institution. This is a quasi-experimental study. Two sections were taught as hybrid classes and two sections were taught as web-facilitated classes. A total of 181 undergraduate students from across the university participated in the study. Student learning outcomes were measured by comparing quiz scores and final course grade. Instructor evaluation ratings were also compared. Results indicate that student-learning gains were similar regardless of delivery format. There were no significant differences in objective quiz scores or final grade between the delivery formats. The instructor mean evaluation score was significantly higher for the web-facilitated format. Although the students’ performance is comparable in both delivery formats students prefer web-facilitated courses with more face-to-face interactions with the instructor to hybrid courses. Examining student technological capabilities and motivation in web-facilitated and hybrid courses is necessary to improve evaluations. Keywords: Assessment; online instruction; student learning; undergraduate Introduction The economic climate for public four-year institutions is leading to the use of hybrid classes, while still utilizing the traditional, face-to-face classroom setting. The student population is ever-changing with more and more students working more than 25 hours per week and often having families to care for, making attending classes a difficult task. With the advancement of technology, hybrid and web-facilitated classes offer students flexibility, giving them the opportunity to repeat lectures and learn at their own pace and when it is more convenient for them (Kahn, 2001). Utilizing online and distance education is an attractive cost saving measure for universities (Olsen & Wisher, 2002; Allen & Seaman, 2013). With many universities facing fiscal constraints, distance education serves as a resource for finance-burdened universities to deliver quality instruction while reaching more students (Euzent, Martin, Moskal & Moskal, 2011). Many universities are now offering a variety of learning formats, including online courses, hybrid courses and web-facilitated courses in addition to traditional face-to-face learning. Research has found no significant differences between online or web-based settings and traditional face-to-face settings (Hale, Mirakian, & Day, 2009). A review of the literature found no significant differences in student performance when comparing online or web-based delivery methods and traditional face-to-face delivery methods (Chumley-Jones, Dobbie, & Alford, 2002). Most of the studies that have been conducted compared student performance in online and traditional face-to-face sections of the same course. The benefits of universities utilizing the hybrid format are: have both advantages that are in the classroom setting as in the online setting, such as access to Web information and having face-to-face interaction with the professor; students can be independent learners but also practice communication skills; students who may not feel comfortable with a class that is entirely online have the comfort of a traditional classroom; there is flexibility with time with students not always having to be physically in the classroom. While there has been debate about the effectiveness of the web-based formats versus the traditional face-to-face format, research indicates few differences in student outcomes. Results of a meta-analysis found that student scores were higher for instruction that combined face-to-face lecture and an online component than purely face-

TOJET: The Turkish Online Journal of Educational Technology – January 2018, volume 17 issue 1
Copyright © The Turkish Online Journal of Educational Technology 12
to-face instruction or purely online instruction (Angiello, 2010). McFarland and Hamilton (2005) found no significant difference in final grades between online students and traditional students. While these findings are encouraging, few studies have examined student learning in health and wellness courses (Block, Undermann, Felix, Reineke, & Murray, 2008). With financial concerns in the country’s current economic state and the inexpensive technology that is available, the use of online content delivery formats is increasing (Allen & Seaman, 2013). While the evaluation literature on web-based learning compared to face-to-face learning continues to grow, little research has examined the effectiveness of hybrid courses compared to web-facilitated courses on student learning. The purpose of this study was to assess objective student learning outcomes in an undergraduate Personal Health course when the curriculum is delivered in a hybrid format versus a web-facilitated format. METHODS Study Design The study was conducted in a three-credit hour 16-week undergraduate course. The same instructor taught all four sections of the Personal Health course: two sections of the hybrid course and two sections of the web-facilitated course. The university defines hybrid or blended courses as combining face-to-face learning with online learning, with 30% or more of the course content being delivered online. Web-facilitated courses use technology to enhance the traditional classroom experience. These courses usually meet on campus at regularly scheduled times and include some online content delivery; less than 30% of the instruction is conducted online (Southern Illinois University Edwardsville Information Technology Services, 2015). All online course material was delivered using the standard course management system offered through the university. This study used a quasi-experimental design, students self-selected into the courses. During registration students could choose between the hybrid courses or the web-facilitated courses: there was no random assignment. The same course materials, assignments and exams were used for all sections of the course. Learning outcomes were evaluated using quiz and assignment scores. Course evaluations, including both course and instructor components, were also examined. Study Population The undergraduate Personal Health course is open to all undergraduate students to fulfill the Health Experience general education requirement. A convenience sample of 181 students (108 females and 73 males) at a four-year University in the mid west was used in this study (Table 1). Half of the students were undeclared majors with 9% majoring in Psychology and 7% majoring in the Biological Sciences. The majors of the remaining 34% of the participants ranged from Accounting to Sociology, but none of them represented more than 4%. The largest proportion of students was in their junior year at the university (48%). The remaining students were sophomores (36%), seniors (15%) and freshman (2%).
Table 1 Student Characteristics
Characteristic Hybrid N=87
Web-facilitated N=94
Percent Female 55% (n=63) 56% (53) Student Rank Freshman 2% (2) 2% (2) Sophomore 35% (31) 38% (35) Junior 46% (40) 49% (46) Senior 17% (14) 12% (11) Race/Ethnicity White 78% (68) 72% (68) Black 16% (14) 15% (14) Asian 0 2% (2) Multi 1% (1) 4% (4) Pacific Islander 1% (1) 0 Hispanic 3% (3) 0
Hybrid. Student enrollment in the hybrid classes was 87. The majority of students were female (63%), juniors (46%), and undeclared majors (48%) with an additional 11% majoring in Psychology. Web-facilitated. Student enrollment in the web-facilitated classes was 94. Most of the students enrolled in these classes were undeclared majors (52%) with an additional 10% majoring in Biological Sciences. Fifty-six percent of the students were female and 49% were juniors.
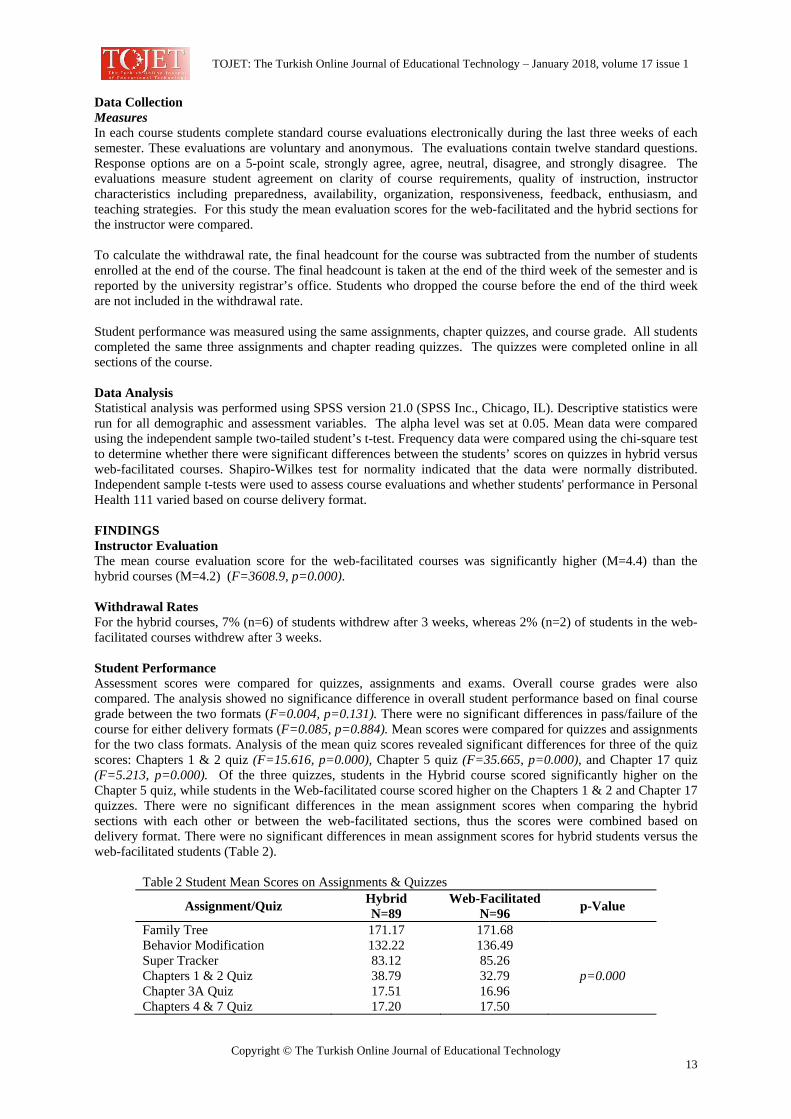
TOJET: The Turkish Online Journal of Educational Technology – January 2018, volume 17 issue 1
Copyright © The Turkish Online Journal of Educational Technology 13
Data Collection Measures In each course students complete standard course evaluations electronically during the last three weeks of each semester. These evaluations are voluntary and anonymous. The evaluations contain twelve standard questions. Response options are on a 5-point scale, strongly agree, agree, neutral, disagree, and strongly disagree. The evaluations measure student agreement on clarity of course requirements, quality of instruction, instructor characteristics including preparedness, availability, organization, responsiveness, feedback, enthusiasm, and teaching strategies. For this study the mean evaluation scores for the web-facilitated and the hybrid sections for the instructor were compared. To calculate the withdrawal rate, the final headcount for the course was subtracted from the number of students enrolled at the end of the course. The final headcount is taken at the end of the third week of the semester and is reported by the university registrar’s office. Students who dropped the course before the end of the third week are not included in the withdrawal rate. Student performance was measured using the same assignments, chapter quizzes, and course grade. All students completed the same three assignments and chapter reading quizzes. The quizzes were completed online in all sections of the course. Data Analysis Statistical analysis was performed using SPSS version 21.0 (SPSS Inc., Chicago, IL). Descriptive statistics were run for all demographic and assessment variables. The alpha level was set at 0.05. Mean data were compared using the independent sample two-tailed student’s t-test. Frequency data were compared using the chi-square test to determine whether there were significant differences between the students’ scores on quizzes in hybrid versus web-facilitated courses. Shapiro-Wilkes test for normality indicated that the data were normally distributed. Independent sample t-tests were used to assess course evaluations and whether students' performance in Personal Health 111 varied based on course delivery format. FINDINGS Instructor Evaluation The mean course evaluation score for the web-facilitated courses was significantly higher (M=4.4) than the hybrid courses (M=4.2) (F=3608.9, p=0.000). Withdrawal Rates For the hybrid courses, 7% (n=6) of students withdrew after 3 weeks, whereas 2% (n=2) of students in the web-facilitated courses withdrew after 3 weeks. Student Performance Assessment scores were compared for quizzes, assignments and exams. Overall course grades were also compared. The analysis showed no significance difference in overall student performance based on final course grade between the two formats (F=0.004, p=0.131). There were no significant differences in pass/failure of the course for either delivery formats (F=0.085, p=0.884). Mean scores were compared for quizzes and assignments for the two class formats. Analysis of the mean quiz scores revealed significant differences for three of the quiz scores: Chapters 1 & 2 quiz (F=15.616, p=0.000), Chapter 5 quiz (F=35.665, p=0.000), and Chapter 17 quiz (F=5.213, p=0.000). Of the three quizzes, students in the Hybrid course scored significantly higher on the Chapter 5 quiz, while students in the Web-facilitated course scored higher on the Chapters 1 & 2 and Chapter 17 quizzes. There were no significant differences in the mean assignment scores when comparing the hybrid sections with each other or between the web-facilitated sections, thus the scores were combined based on delivery format. There were no significant differences in mean assignment scores for hybrid students versus the web-facilitated students (Table 2).
Table 2 Student Mean Scores on Assignments & Quizzes
Assignment/Quiz Hybrid N=89
Web-Facilitated N=96 p-Value
Family Tree 171.17 171.68 Behavior Modification 132.22 136.49 Super Tracker 83.12 85.26 Chapters 1 & 2 Quiz 38.79 32.79 p=0.000 Chapter 3A Quiz 17.51 16.96 Chapters 4 & 7 Quiz 17.20 17.50
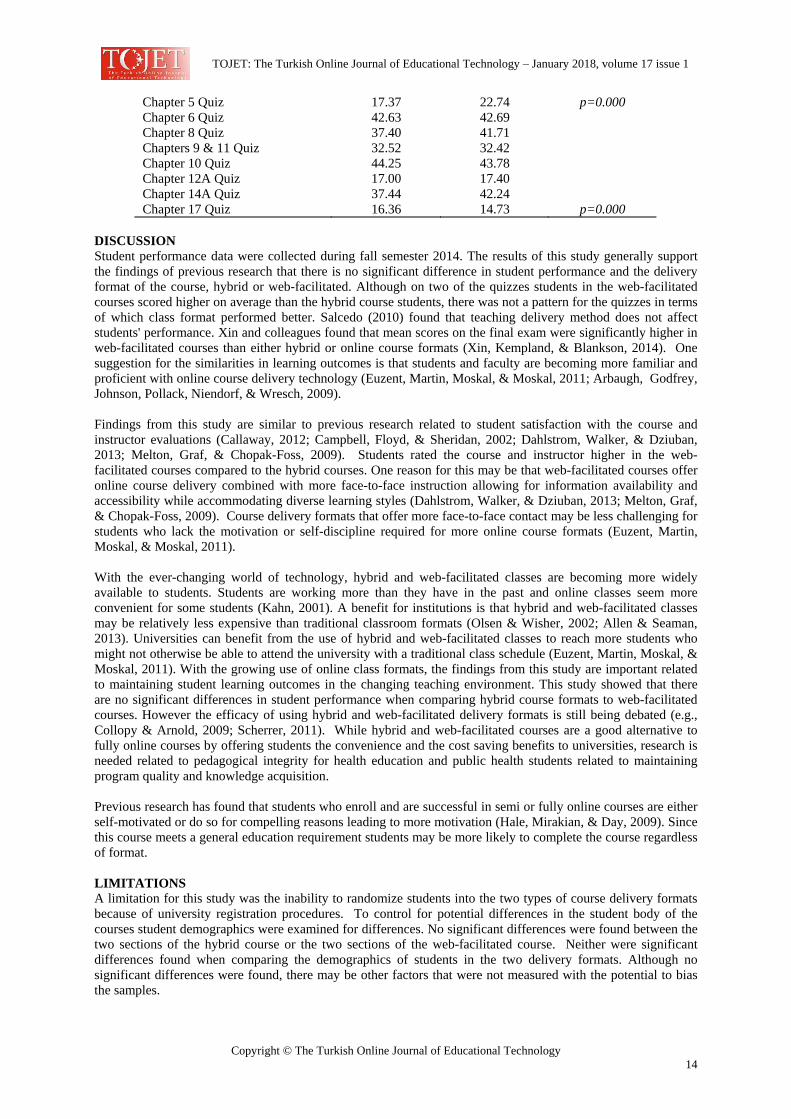
TOJET: The Turkish Online Journal of Educational Technology – January 2018, volume 17 issue 1
Copyright © The Turkish Online Journal of Educational Technology 14
Chapter 5 Quiz 17.37 22.74 p=0.000 Chapter 6 Quiz 42.63 42.69 Chapter 8 Quiz 37.40 41.71 Chapters 9 & 11 Quiz 32.52 32.42 Chapter 10 Quiz 44.25 43.78 Chapter 12A Quiz 17.00 17.40 Chapter 14A Quiz 37.44 42.24 Chapter 17 Quiz 16.36 14.73 p=0.000
DISCUSSION Student performance data were collected during fall semester 2014. The results of this study generally support the findings of previous research that there is no significant difference in student performance and the delivery format of the course, hybrid or web-facilitated. Although on two of the quizzes students in the web-facilitated courses scored higher on average than the hybrid course students, there was not a pattern for the quizzes in terms of which class format performed better. Salcedo (2010) found that teaching delivery method does not affect students' performance. Xin and colleagues found that mean scores on the final exam were significantly higher in web-facilitated courses than either hybrid or online course formats (Xin, Kempland, & Blankson, 2014). One suggestion for the similarities in learning outcomes is that students and faculty are becoming more familiar and proficient with online course delivery technology (Euzent, Martin, Moskal, & Moskal, 2011; Arbaugh, Godfrey, Johnson, Pollack, Niendorf, & Wresch, 2009). Findings from this study are similar to previous research related to student satisfaction with the course and instructor evaluations (Callaway, 2012; Campbell, Floyd, & Sheridan, 2002; Dahlstrom, Walker, & Dziuban, 2013; Melton, Graf, & Chopak-Foss, 2009). Students rated the course and instructor higher in the web-facilitated courses compared to the hybrid courses. One reason for this may be that web-facilitated courses offer online course delivery combined with more face-to-face instruction allowing for information availability and accessibility while accommodating diverse learning styles (Dahlstrom, Walker, & Dziuban, 2013; Melton, Graf, & Chopak-Foss, 2009). Course delivery formats that offer more face-to-face contact may be less challenging for students who lack the motivation or self-discipline required for more online course formats (Euzent, Martin, Moskal, & Moskal, 2011). With the ever-changing world of technology, hybrid and web-facilitated classes are becoming more widely available to students. Students are working more than they have in the past and online classes seem more convenient for some students (Kahn, 2001). A benefit for institutions is that hybrid and web-facilitated classes may be relatively less expensive than traditional classroom formats (Olsen & Wisher, 2002; Allen & Seaman, 2013). Universities can benefit from the use of hybrid and web-facilitated classes to reach more students who might not otherwise be able to attend the university with a traditional class schedule (Euzent, Martin, Moskal, & Moskal, 2011). With the growing use of online class formats, the findings from this study are important related to maintaining student learning outcomes in the changing teaching environment. This study showed that there are no significant differences in student performance when comparing hybrid course formats to web-facilitated courses. However the efficacy of using hybrid and web-facilitated delivery formats is still being debated (e.g., Collopy & Arnold, 2009; Scherrer, 2011). While hybrid and web-facilitated courses are a good alternative to fully online courses by offering students the convenience and the cost saving benefits to universities, research is needed related to pedagogical integrity for health education and public health students related to maintaining program quality and knowledge acquisition. Previous research has found that students who enroll and are successful in semi or fully online courses are either self-motivated or do so for compelling reasons leading to more motivation (Hale, Mirakian, & Day, 2009). Since this course meets a general education requirement students may be more likely to complete the course regardless of format. LIMITATIONS A limitation for this study was the inability to randomize students into the two types of course delivery formats because of university registration procedures. To control for potential differences in the student body of the courses student demographics were examined for differences. No significant differences were found between the two sections of the hybrid course or the two sections of the web-facilitated course. Neither were significant differences found when comparing the demographics of students in the two delivery formats. Although no significant differences were found, there may be other factors that were not measured with the potential to bias the samples.

TOJET: The Turkish Online Journal of Educational Technology – January 2018, volume 17 issue 1
Copyright © The Turkish Online Journal of Educational Technology 15
Another potential limitation may be the fact that more than three times the number of students withdrew from the hybrid courses than the web-facilitated courses. Although there were no significant differences between the student body in the hybrid courses; one section of the course had the majority of the students who withdrew (n=5) compared to the other section (n=1). Data on students’ experience using technology or motivation to complete hybrid courses were not collected for this study. Differences in these areas may explain the withdrawal rates. CONCLUSIONS This study was conducted to determine if hybrid and web-facilitated course delivery format resulted in comparable student learning outcomes, withdrawal rates, and course evaluations. Findings from this study support previous research that generally web-facilitated and hybrid course delivery formats offer students the flexibility and similar learning outcomes. As in other studies, students seem to prefer more interaction and communication with the course instructor. Addressing this may increase student-learning outcomes in hybrid and online courses where there is less or no face-to-face instruction. Additionally, improving communication and interaction may increase student evaluations of teaching in these courses. Overall, while hybrid courses and web-facilitated courses offer benefits to students and universities more research is needed to evaluate how students’ technological capabilities and motivation for completing course work impact student learning outcomes. REFERENCES Allen, I. E. & Seaman, J. (2013). Changing Course: Ten Years of Tracking Online Education in the United
States. Babson Survey Research Group. Retrieved from https://www.onlinelearningsurvey.com/reports/changingcourse.pdf
Angiello, R. (2010). Study looks at online learning vs. traditional instruction. The Educational Digest, 76(2): 56-9.
Arbaugh, J. B., Godfrey, M. R., Johnson, M., Pollack, B. L., Niendorf, B., & Wresch, W. (2009). Research in online and blended learning in business disciplines: Key findings and possible future directions. Internet and Higher Education, 12: 71-87.
Block, A., Undermann, B., Felix, M., Reineke, D., & Murray, S. (2008), Achievement in on-line versus a traditional health and wellness course. Merlot Journal of On-line Learning and Teaching, 4 (1).
Callaway, S. K. (2012). Implications of online learning: Measuring student satisfaction and learning for online and traditional students. Insights to a Changing World Journal, 2:67-94.
Campbell, M. C., Floyd, J., & Sheridan, J. B. (2002). Assessment of student performance and attitudes for courses taught online versus onsite. The Journal of Applied Business Research, 18(2):45-51.
Chumley-Jones, H. S., Dobbie, A. & Alford, C. L. (2002). Web-based learning: Sound educational method or hype? A review of the evaluation literature. Academic Medicine, 77(10): S86-S93.
Collopy, R. MB., & Arnold, J. M. (2009). To blend or not to blend: Online and blended learning environments in teacher education. Issues in Teacher Education, 18(2):85-101.
Dahlstrom, E., Walker, J. D., & Dziuban, C. (2013). ECAR study of undergraduate students and information technology 2013. Retrieved from https://net.educause.edu/ir/library/pdf/ers1302/ers1302.pdf
Euzent, P., Martin, T., Moskal, P., & Moskal, P. (2011). Assessing student performance and perceptions in lecture capture vs. face-to-face course delivery. Journal of Information Technology Education, 10: 295-307.
Hale, L. S., Mirakian, E. A., & Day, D. B. (2009). Online vs. Classroom Instruction: Student Satisfaction and Learning Outcomes in an Undergraduate Allied Health Pharmacology Course. Journal of Allied Health, 38(2): e-36-e42.
Kahn, B. H. (2001). Web-based training: An introduction. In B.H. Kahn (Ed.) Wed-based Training. Englewood Cliffs, NJ.: Educational Technology Publications.
McFarland, D. and Hamilton, D. (2005). Factors affecting student performance and satisfaction: Online versus traditional course delivery. The Journal of Computer Information Systems, 46(2): 25-32.
McLaren, C. H. (2004). A comparison of student persistence in online and classroom business statistics experiences. Decision Sciences Journal of Innovative Education, 2(1): 1-10.
Melton, B., Graf, H., & Chopak-Foss, J. (2009). Achievement and satisfaction in blended learning versus traditional general health course designs. International Journal for the Scholarship of Teaching and Learning, 31(1):1-13.
Olson, T. M. & Wisher, R. A. (2002). The effectiveness of web-based instruction: An initial inquiry. International Review of Research in Open and Distance Learning. 3 (2): 1-17.
Salcedo, C. S. (2010). Comparative analysis of learning outcomes in face-to-face foreign language classes vs. language lab and online. Journal of College Teaching & Learning, 7(2): 43-53.
Scherrer, C. R. (2011). Comparison of an introductory level undergraduate statistics course taught with traditional, hybrid, and online delivery methods. INFORMUS Transactions on Education, 11(3): 106-110.

TOJET: The Turkish Online Journal of Educational Technology – January 2018, volume 17 issue 1
Copyright © The Turkish Online Journal of Educational Technology 16
Southern Illinois University Edwardsville Information Technology Services. (2015). Hybrid and Online Learning at SIUE. Retrieved from https://www.siue.edu/its/idlt/learning/online.shtml
Xin, H., Kempland, M. & Blankson, F. (2015). Adaptability and replicability of web-facilitated, hybrid, and online learning in an undergraduate exercise psychology course. The Turkish Journal of Educational Technology, 14(1): 19-30.
TOJET: The Turkish Online Journal of Educational Technology – January 2018, volume 17 issue 1
Copyright © The Turkish Online Journal of Educational Technology 17
Atom Core Interactive Electronic Book to Develop Self Efficacy and Critical Thinking Skills Luthfia Puspa PRADINA Physics Education Graduate Program, Faculty of Teacher Training and Education, University of Lampung, Jl. Sumantri Brojonegoro No.1 Kedaton Bandar Lampung, Indonesia, 35145 Agus SUYATNA Physics Education Graduate Program, Faculty of Teacher Training and Education, University of Lampung, Jl. Sumantri Brojonegoro No.1 Kedaton Bandar Lampung, Indonesia, 35145 [email protected] (author correspondence) ABSTRACT The purpose of this research is to develop interactive atomic electronic school book (IESB) to cultivate critical thinking skills and confidence of students grade 12. The method used in this research was the ADDIE (Analyze Design Development Implementation Evaluation) development procedure which is limited to the test phase of product design expert. The need analyze data is collected from students in Lampung Province Indonesia using questionnaires. Electronic book design tested by experts in the field of physics education. Data were analyzed quantitatively and descriptively. Based on the results of the questionnaire 65,2% of the students said that they need the IESB which contains an interactive question exercise with feedback for exam exercises and preparing for admission to the university. The current book has not given self efficacy to 83,9% of students. Expertial test results show that the IESB will be able to cultivate self efficacy and critical thinking skills is an interactive digital format with experimental simulation, interactive question on HOTS level with feed back, and hyperlink to other learning resources. Keywords: critical thinking skills, interactive electronic book, self efficacy. INTRODUCTION Electronic books currently used in Indonesia are static and non-interactive. Meanwhile the students' needs are electronic books that can be used independently and are interactive. Books like this will get students interested in learning physics and eager in learning, especially for physics lessons are known quite difficult and abstract. In addition, the need for books that can be used independently for the grade 12 last semester is very urgent because the grade 12 last semester in Indonesia has little time to study due to being pressured by time for national exams. For example, the matter of atom core in class 12 is in the even semester. Atom core is one of the physics material that discusses abstract and abstract microscopic matter in the real world that requires extra understanding. The material of the atom core includes the development of atom theory, atom core, radioactivity, and science & technology applications. It needs an IESB to help learners understanding. One of the learning media that can be used to overcome the difficulty is interactive instructional materials in the form of electronic books. Interactive learning media can be used anywhere and anytime without teacher attendance. Thus, it is hoped that the media eliminates the learning barriers often experienced by teachers and students, especially in the learning process in the classroom and self-learning (Wu, 2016). Based on research that has been done by Bakac, Tasoglu, Akbay (2011) that learning with Computer Assisted Instruction (CAI) can improve student academic success. The activities that teachers need to implement are activities that give students the opportunity to use the technology to practice their critical thinking skills in solving a problem according to one of 21st century skills. Having knowledge or information is not enough. Students must be able to solve problems to make effective decisions, so they must be able to think critically (Peter, 2012). This is supported by research conducted by Rosida and Jalmo (2017) (2017) and Hussein, Herayanti, and Gunawan 2015), ie the effectiveness of the use of interactive e-books shows the growth of students' critical thinking skills. According to Peter (2012), the goal for educators who wish to instill critical thinking skills in a classroom is to think of students as not receiving information, but as users of information. A learning environment that actively engages students in information
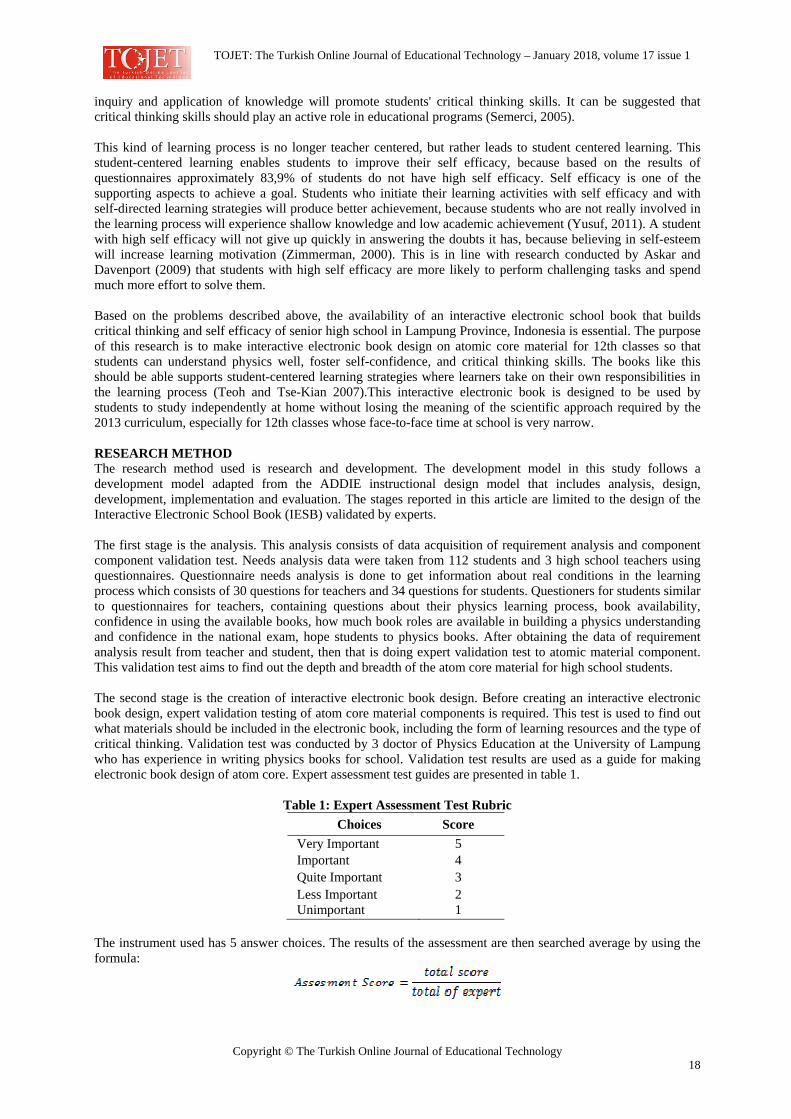
TOJET: The Turkish Online Journal of Educational Technology – January 2018, volume 17 issue 1
Copyright © The Turkish Online Journal of Educational Technology 18
inquiry and application of knowledge will promote students' critical thinking skills. It can be suggested that critical thinking skills should play an active role in educational programs (Semerci, 2005). This kind of learning process is no longer teacher centered, but rather leads to student centered learning. This student-centered learning enables students to improve their self efficacy, because based on the results of questionnaires approximately 83,9% of students do not have high self efficacy. Self efficacy is one of the supporting aspects to achieve a goal. Students who initiate their learning activities with self efficacy and with self-directed learning strategies will produce better achievement, because students who are not really involved in the learning process will experience shallow knowledge and low academic achievement (Yusuf, 2011). A student with high self efficacy will not give up quickly in answering the doubts it has, because believing in self-esteem will increase learning motivation (Zimmerman, 2000). This is in line with research conducted by Askar and Davenport (2009) that students with high self efficacy are more likely to perform challenging tasks and spend much more effort to solve them. Based on the problems described above, the availability of an interactive electronic school book that builds critical thinking and self efficacy of senior high school in Lampung Province, Indonesia is essential. The purpose of this research is to make interactive electronic book design on atomic core material for 12th classes so that students can understand physics well, foster self-confidence, and critical thinking skills. The books like this should be able supports student-centered learning strategies where learners take on their own responsibilities in the learning process (Teoh and Tse-Kian 2007).This interactive electronic book is designed to be used by students to study independently at home without losing the meaning of the scientific approach required by the 2013 curriculum, especially for 12th classes whose face-to-face time at school is very narrow. RESEARCH METHOD The research method used is research and development. The development model in this study follows a development model adapted from the ADDIE instructional design model that includes analysis, design, development, implementation and evaluation. The stages reported in this article are limited to the design of the Interactive Electronic School Book (IESB) validated by experts. The first stage is the analysis. This analysis consists of data acquisition of requirement analysis and component component validation test. Needs analysis data were taken from 112 students and 3 high school teachers using questionnaires. Questionnaire needs analysis is done to get information about real conditions in the learning process which consists of 30 questions for teachers and 34 questions for students. Questioners for students similar to questionnaires for teachers, containing questions about their physics learning process, book availability, confidence in using the available books, how much book roles are available in building a physics understanding and confidence in the national exam, hope students to physics books. After obtaining the data of requirement analysis result from teacher and student, then that is doing expert validation test to atomic material component. This validation test aims to find out the depth and breadth of the atom core material for high school students. The second stage is the creation of interactive electronic book design. Before creating an interactive electronic book design, expert validation testing of atom core material components is required. This test is used to find out what materials should be included in the electronic book, including the form of learning resources and the type of critical thinking. Validation test was conducted by 3 doctor of Physics Education at the University of Lampung who has experience in writing physics books for school. Validation test results are used as a guide for making electronic book design of atom core. Expert assessment test guides are presented in table 1.
Table 1: Expert Assessment Test Rubric Choices Score
Very Important 5 Important 4 Quite Important 3 Less Important 2 Unimportant 1
The instrument used has 5 answer choices. The results of the assessment are then searched average by using the formula:
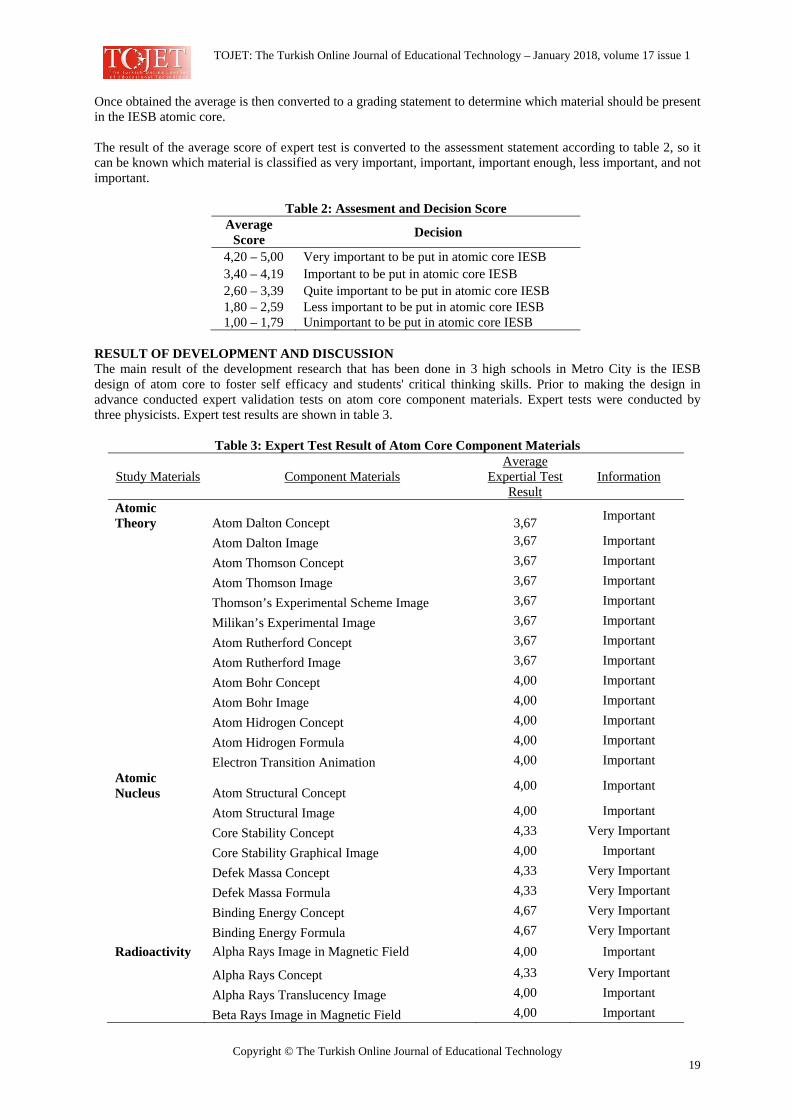
TOJET: The Turkish Online Journal of Educational Technology – January 2018, volume 17 issue 1
Copyright © The Turkish Online Journal of Educational Technology 19
Once obtained the average is then converted to a grading statement to determine which material should be present in the IESB atomic core. The result of the average score of expert test is converted to the assessment statement according to table 2, so it can be known which material is classified as very important, important, important enough, less important, and not important.
Table 2: Assesment and Decision Score Average
Score Decision
4,20 – 5,00 Very important to be put in atomic core IESB 3,40 – 4,19 Important to be put in atomic core IESB 2,60 – 3,39 Quite important to be put in atomic core IESB 1,80 – 2,59 Less important to be put in atomic core IESB 1,00 – 1,79 Unimportant to be put in atomic core IESB
RESULT OF DEVELOPMENT AND DISCUSSION The main result of the development research that has been done in 3 high schools in Metro City is the IESB design of atom core to foster self efficacy and students' critical thinking skills. Prior to making the design in advance conducted expert validation tests on atom core component materials. Expert tests were conducted by three physicists. Expert test results are shown in table 3.
Table 3: Expert Test Result of Atom Core Component Materials
Study Materials Component Materials Average
Expertial Test Result
Information
Atomic Theory Atom Dalton Concept 3,67 Important
Atom Dalton Image 3,67 Important
Atom Thomson Concept 3,67 Important
Atom Thomson Image 3,67 Important
Thomson’s Experimental Scheme Image 3,67 Important
Milikan’s Experimental Image 3,67 Important
Atom Rutherford Concept 3,67 Important
Atom Rutherford Image 3,67 Important
Atom Bohr Concept 4,00 Important
Atom Bohr Image 4,00 Important
Atom Hidrogen Concept 4,00 Important
Atom Hidrogen Formula 4,00 Important
Electron Transition Animation 4,00 Important Atomic Nucleus Atom Structural Concept 4,00 Important
Atom Structural Image 4,00 Important
Core Stability Concept 4,33 Very Important
Core Stability Graphical Image 4,00 Important
Defek Massa Concept 4,33 Very Important
Defek Massa Formula 4,33 Very Important
Binding Energy Concept 4,67 Very Important
Binding Energy Formula 4,67 Very Important Radioactivity Alpha Rays Image in Magnetic Field 4,00 Important
Alpha Rays Concept 4,33 Very Important
Alpha Rays Translucency Image 4,00 Important
Beta Rays Image in Magnetic Field 4,00 Important
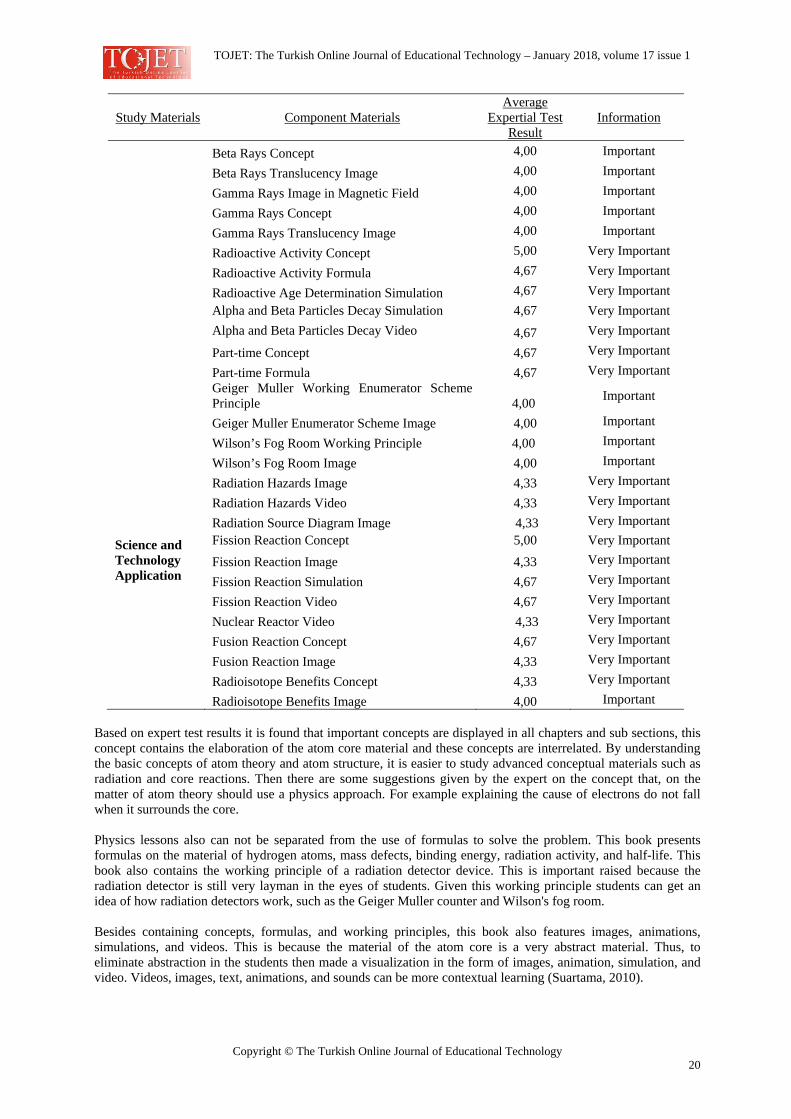
TOJET: The Turkish Online Journal of Educational Technology – January 2018, volume 17 issue 1
Copyright © The Turkish Online Journal of Educational Technology 20
Study Materials Component Materials Average
Expertial Test Result
Information
Beta Rays Concept 4,00 Important
Beta Rays Translucency Image 4,00 Important
Gamma Rays Image in Magnetic Field 4,00 Important
Gamma Rays Concept 4,00 Important
Gamma Rays Translucency Image 4,00 Important
Radioactive Activity Concept 5,00 Very Important
Radioactive Activity Formula 4,67 Very Important
Radioactive Age Determination Simulation 4,67 Very Important Alpha and Beta Particles Decay Simulation 4,67 Very Important Alpha and Beta Particles Decay Video 4,67 Very Important
Part-time Concept 4,67 Very Important
Part-time Formula 4,67 Very Important Geiger Muller Working Enumerator Scheme
Principle 4,00 Important
Geiger Muller Enumerator Scheme Image 4,00 Important Wilson’s Fog Room Working Principle 4,00 Important Wilson’s Fog Room Image 4,00 Important Radiation Hazards Image 4,33 Very Important Radiation Hazards Video 4,33 Very Important Radiation Source Diagram Image 4,33 Very Important
Science and Technology Application
Fission Reaction Concept 5,00 Very Important Fission Reaction Image 4,33 Very Important
Fission Reaction Simulation 4,67 Very Important
Fission Reaction Video 4,67 Very Important
Nuclear Reactor Video 4,33 Very Important
Fusion Reaction Concept 4,67 Very Important
Fusion Reaction Image 4,33 Very Important
Radioisotope Benefits Concept 4,33 Very Important
Radioisotope Benefits Image 4,00 Important Based on expert test results it is found that important concepts are displayed in all chapters and sub sections, this concept contains the elaboration of the atom core material and these concepts are interrelated. By understanding the basic concepts of atom theory and atom structure, it is easier to study advanced conceptual materials such as radiation and core reactions. Then there are some suggestions given by the expert on the concept that, on the matter of atom theory should use a physics approach. For example explaining the cause of electrons do not fall when it surrounds the core. Physics lessons also can not be separated from the use of formulas to solve the problem. This book presents formulas on the material of hydrogen atoms, mass defects, binding energy, radiation activity, and half-life. This book also contains the working principle of a radiation detector device. This is important raised because the radiation detector is still very layman in the eyes of students. Given this working principle students can get an idea of how radiation detectors work, such as the Geiger Muller counter and Wilson's fog room. Besides containing concepts, formulas, and working principles, this book also features images, animations, simulations, and videos. This is because the material of the atom core is a very abstract material. Thus, to eliminate abstraction in the students then made a visualization in the form of images, animation, simulation, and video. Videos, images, text, animations, and sounds can be more contextual learning (Suartama, 2010).

TOJET: The Turkish Online Journal of Educational Technology – January 2018, volume 17 issue 1
Copyright © The Turkish Online Journal of Educational Technology 21
The materials that display images are atom theory, core structure, core stability graph, radioactive ray, radiation detector, radiation source, core reaction, and radioisotope. Drawings are able to help students illustrate abstract material that students can not see visually. This is in line with research conducted by Agustina, Suyatna, and Suyanto (2017) that, still images can explain a concept concretely and realistically. Picture able to support existing material concept. Based on research conducted Herrlinger, Hoffler, Opfermann, and Leutner (2017) showed that, the picture improves learning outcomes. Furthermore, it is animation. Animation is important on electron transition material. So students get an idea of how the electrons move the trajectory. Flash animation for learning technology can be used as a help in understanding the concept and to improve students' thinking more effectively. Agustina, Suyatna, and Suyanto (2017) and Anggraini, Suyatna, and Sesunan (2017) say that the use of motion picture media/animation can improve student learning outcomes. Flash animation is able to analyze existing concepts and can provide ideas that connect students with a basic understanding of new knowledge. Findings of Salim and Tiawa (2015) shows that learning by using flash animation can help students in comprehending abstract lessons significantly. Simulations on radioactive material, fission reactions, and radioisotope benefits are essential. Simulations in learning can describe something complex or complex to be explained with only images and words only. This is in line with Moore, Chamberlain, Parson, and Perkins (2014), that the PhET simulation provides dynamic access to multiple representations, makes invisible ones visible, aids in investigations, and enables quick and secure access to multiple experiments, and makes students' fun excitement and teachers. According to expert test results, a video on science and technology applications (fission reactions and nuclear reactors) is very important to display. Nuclear reactions do not always pose a danger like nuclear bombs, but there are also benefits such as power generation and are also used in some industrial processes in the future. This is in line with Permana (2005) and Alimah and Dewita (2008) that nuclear energy generated in a nuclear reactor is utilized into electrical energy that can be a competitive contributor with other electrical energy sources such as coal, oil, gas, water, and others. It also features alpha and beta particle decay videos, as well as radiation hazards. Ljubojevic, Vaskovic, Stankovic, and Vaskovic (2014) states that integrating video clips in multimedia lecture presentations can improve students' perceptions of important information and motivation to learn. Therefore, students can better understand and remember the subject of the lecture. So even with the study of physics, students more easily understand what is learned by looking at the video material. Video is also able to increase students' interest in studying difficult material like the material of this atomic nucleus. This is in accordance with Suartama (2010) that videos can stimulate more senses. Through the video can be displayed things or real events related to the material learned so that students more easily understand the material. Having obtained the results of expert test component atomic material, then create an electronic book design interactive atom core. Figure 1 is an IESB design drawing of atom core.
Figure 1: Atom Core IESB Design
TOJET: The Turkish Online Journal of Educational Technology – January 2018, volume 17 issue 1
Copyright © The Turkish Online Journal of Educational Technology 22
This interactive electronic book is designed to foster students' critical thinking skills. The book comes with interactive questions at the High Order Thinking (HOT) level that comes with feed back and hyperlinks to other learning resources. High order thinking involves the transformation of information and ideas. This transformation occurs when students combine facts and ideas and synthesize, generalize, explain, hypothesize or arrive at some conclusions or interpretations. Manipulating information and ideas through this process allows students to solve problems, gain insight, and discover new meanings (Ramos, Dolipas, and Villamor, 2013) HOT is the best teaching and learning technique in real-world context and by varying scenarios students can use their newly acquired skills, so HOT is very important for the quality of education (Mainali, 2012). The interactive questions are multiple choices, true/false, fiil in the blank, matching, dan short essay. Interactive questions are used to determine the level of mastery of the material and the achievement of basic competence of each material. Wallace and Jefferson (2015) says that the analysis of the value of the final exam proves the effectiveness of exercises to improve students' critical thinking skills. An interactive e-learning environment that not only generates generic skills such as critical thinking, analytical reasoning, problem solving, and written communication (Chellamani, 2014). In addition to growing students' critical thinking skills, this IESB is also able to foster students' confidence. This is in line with research conducted by Alshaya and Oyaid (2017) on the effectiveness of e-books and their self efficacy in using them. The results show that students have the basic skills necessary to download and read e-books and utilize their characteristics, they also believe in their usefulness and are satisfied with it so that they intend to continue using e-books in the future. Another study by Kissinger (2013) states that students are able to have high self efficacy when using e-books. In addition to prioritizing the content of the material, this interactive electronic book also prioritizes how it looks. This is intended to get students interested in using electronic books. Through interactive books students can learn in a fun way and acquire new skills (Solcova and Magdin, 2016). As research conducted by Kao, Tsai, Liu, and Yang (2016), that interactive e-book models should display attractive art designs and not only contain simple interactive buttons that will improve students' reading performance. CONCLUSION The IESB atom core will be able to cultivate self efficacy and critical thinking skills is an interactive digital format with experimental simulation, interactive question on HOTS level with feed back, and hyperlink to other learning resources. The IESB atom core that can foster self-efficacy and students' critical thinking skills should contains concepts, working principles, formulas, images, animations, experiment simulations, and videos. IESB atom core is also equipped with interactive questions at HOT level along with feed back and hyperlinks to other learning resources. The interactive question are multiple choices, true/false, fiil in the blank, matching, dan short essay. The limitations of this research is that the book has not been tested on the students in the field, therefore the next plan is to implement the book to the students in grade 12th final semester and evaluate its impact on students' critical thinking skills and self-efficacy. ACKNOWLEDGEMENT Thanks to Directorate of Research and Community Service, Ministry of Research, Technology and Higher Education, Indonesia for funding this research. REFERENCES Agustina, D., Suyatna, A., & Suyanto, E. (2017). Perbandingan hasil belajar siswa menggunakan media gambar
bergerak dengan gambar diam (Comparison of student learning results using image moving and static image media). Jurnal Pembelajaran Fisika Unila, 5(3), 25-34.
Alimah, S., & Dewita, E. (2008). Pemilihan teknologi produksi hidrogen dengan memanfaatkan energi nuklir (Selection of hydrogen production technology by utilizing nuclear energy). Jurnal Pengembangan Energi Nuklir, 10(2).
Alshaya, H., & Oyaid, A. (2017). Designing and publication of interactive e-book for students of princess nourah bint abdulrahman university: An empirical study. Journal of Education and Practice, 8(8), 41-57.
Anggraini, D., Suyatna, A., & Sesunan, F. (2017). Studi perbandingan hasil belajar fisika antara penggunaan gambar bergerak dengan gambar statis (Comparative study of physics learning outcomes between using moving images and static images). Jurnal Pembelajaran Fisika Unila, 5(1), 83-95.
Askar, P., & Davenport, D. (2009). An investigation of factors related to self-efficacy for java programming among engineering students. TOJET: The Turkish Online Journal of Educational Technology, 8(1).
TOJET: The Turkish Online Journal of Educational Technology – January 2018, volume 17 issue 1
Copyright © The Turkish Online Journal of Educational Technology 23
Bakac, M., Tasoglu, A. K., & Akbay, T. (2010). The effect of computer assisted instruction with simulation in science and physics activities on the success of student: Electric current. Eurasian Journal of Physics and Chemistry Education, 1(1), 34-42.
Chellamani, K. (2014). Operational efficiency of interactive e-learning among post-graduation students in teacher education. i-Manager's Journal on School Educational Technology, 10(1), 44.
Herrlinger, S., Hoffler, T. N., Opfermann, M., & Leutner, D. (2017). When do pictures help learning from expository text? multimedia and modality effects in primary schools. Research in Science Education, 47(3), 685-704.
Husein, S., Herayanti, L., & Gunawan, G. (2017). Pengaruh penggunaan multimedia interaktif terhadap penguasaan konsep dan keterampilan berpikir kritis siswa pada materi suhu dan kalor (The effect of interactive multimedia usage on mastery of concepts and critical thinking skills of student on temperature and heat material). Jurnal Pendidikan Fisika dan Teknologi, 1(3), 221-225.
Kao, G. Y. M., Tsai, C. C., Liu, C. Y., & Yang, C. H. (2016). The effects of high/low interactive electronic storybooks on elementary school students’ reading motivation, story comprehension and chromatics concepts. Computers & Education, 100, 56-70.
Kissinger, J. S. (2013). The social & mobile learning experiences of students using mobile e-books. Journal of Asynchronous Learning Networks, 17(1), 155-170.
Ljubojevic, M., Vaskovic, V., Stankovic, S., & Vaskovic, J. (2014). Using supplementary video in multimedia instruction as a teaching tool to increase efficiency of learning and quality of experience. The International Review of Research in Open and Distributed Learning, 15(3).
Mainali, B. P. (2012). Higher Order Thinking In Education. Academic Voices A Multidisciplinary, 2(1), 5-10. Moore, E. B., Chamberlain, J. M., Parson, R., & Perkins, K. K. (2014). PhET interactive simulations:
Transformative tools for teaching chemistry. Journal of Chemical Education, 91(8), 1191-1197. Permana, S. (2005). Energi nuklir dan kebutuhan energi masa depan (Nuclear energy and future energy
requirements). Majalah INOVASI, 22. Peter, E. E. (2012). Critical thinking: Essence for teaching mathematics and mathematics problem solving skills.
African Journal of Mathematics and Computer Science Research, 5(3), 39-43. Ramos, J. L. S., Dolipas, B. B., & Villamor, B. B. (2013). Higher order thinking skills and academic performance
in physics of college students: A regression analysis. International Journal of Innovative Interdisciplinary Research, 1(4), 48-60.
Rosida, N. F., & Jalmo, T. (2017). Efektivitas penggunaan bahan ajar e-book interaktif dalam menumbuhkan keterampilan berpikir kritis siswa (Effectiveness usage of interactive e-book materials in growing student critical thinking skills). Jurnal Pembelajaran Fisika Unila. 5(1), 35-45.
Salim, K., & Tiawa, D. H. (2015). The student's perceptions of learning mathematics using flash animation secondary school in indonesia. Journal of Education and Practice, 6(34), 76-80.
Semerci, Cetin. (2005). The infuence of the critical thinking skills on the student’s achievement. Pakistan Journal of Social Science. 3(4), 598-602.
Solcova, L., & Magdin, M. (2016). Interactive textbook-a new tool in off-line and on-line education. TOJET: The Turkish Online Journal of Educational Technology, 15(3).
Suartama, I. K. (2010). Pengembangan mutimedia untuk meningkatkan kualitas pembelajaran pada mata kuliah media pembelajaran (Multimedia development to improve learning quality in learning media course). Jurnal Pendidikan dan Pengajaran, 43(3).
Teoh, B. S. P., & Tse-Kian, N. E. O. (2007). Interactive multimedia learning: Students' attitudes and learning impact in an animation course. TOJET: The Turkish Online Journal of Educational Technology, 6(4).
Wallace, E. D., & Jefferson, R. N. (2015). Developing critical thinking skills: Assessing the effectiveness of workbook exercises. Journal of College Teaching & Learning (Online), 12(2), 101.
Widyastuti, D., Suyatna, A., dan Wahyudi, I. (2017). Perbandingan hasil belajar siswa ditinjau dari representasi visual statis dan dinamis materi impuls dan momentum (Comparison of student learning outcomes viewed from static and dynamic visual representations of impulse and momentum materials). Jurnal Pembelajaran Fisika Unila, 5(4), 75-84.
Wu, M. (2016). Designing a digital multimedia interactive book for industrial metrology measurement learning. International Journal of Modern Education and Computer Science, 8(5), 39.
Yusuf, M. (2011). The impact of self-efficacy, achievement motivation, and self-regulated learning strategies on students’ academic achievement. Procedia-Social and Behavioral Sciences, 15, 2623-2626.
Zimmerman, B. J. (2000). Self-efficacy: An essential motive to learn. Contemporary educational psychology, 25(1), 82-91.

TOJET: The Turkish Online Journal of Educational Technology – January 2018, volume 17 issue 1
Copyright © The Turkish Online Journal of Educational Technology 24
Designing Optical Spreadsheets-Technological Pedagogical Content Knowledge Simulation (S-TPACK): A Case Study of Pre-Service Teachers Course M. Anas THOHIR Yogyakarta State University, INDONESIA [email protected] JUMADI Yogyakarta State University, INDONESIA [email protected] WARSONO Yogyakarta State University, INDONESIA [email protected] ABSTRACT In the 21st century, the competence of instructional technological design is important for pre-service physics teachers. This case study described the pre-service physics teachers' design of optical spreadsheet simulation and evaluated teaching and learning the task in the classroom. The case study chose three of thirty pre-service teacher's course at Yogyakarta State University. A bonded system explored basic knowledge and integration ability of the pre-service teacher. In addition, peers assessed the simulated performance of pre-service teachers by using Spreadsheet-Technological Pedagogical Content Knowledge (S-TPACK). Pre-service teachers transform the topic into a unique spreadsheet simulation. One of them designed with high complexity, but the others are not. However, they demonstrated different the intensity and integrity of teaching strategies, the depth of optical topics, and interactive spreadsheets. In the future, the design of instructional technology will need to pay attention to the basic knowledge of TPACK, problem-solving, and self-efficacy. INTRODUCTION Essential pre-service physics teachers’ qualification is how to integrate technology into models of learning in instruction for the 21st-century. This integration should make difficult physics content in a meaningful learning TPACK integration model (Levinz & Klieger, 2012). Technology is an influential cognitive device to facilitate both teachers’ instructional practice, student process learning, and improvement of students’ achievements (Gao & Mager, 2013; Srisawasdi, 2012). Although pre-service physics teachers have received various physical content, they will not automatically be able to integrate technology in learning (Wu, Hu, Gu, & Lim, 2016). Design-based learning (DBL) has led to an increase of TPACK-in-action knowledge, attitude, and skills (Baran & Uygun, 2016). The limitations of designing instructional technology are using hard-to-learn software or materials, requiring lots of complex scripts, costly tools. Spreadsheets are one of the many flexible application software to make easy physics learning. Spreadsheet support for modelling and analysing variables in various physics learning contexts (Margaret L. Niess, van Zee, & Gillow-Wiles, 2010). This software allows simulating a phenomenon of responsive physics processes such as magnification, rotation, and motion. Pre-service physics teachers only need to know the main principles in making algorithms that will be created in the design of media in the learning context of physics. But utilising of a spreadsheet may not necessarily be an easy task to calculate algorithms in a physical context (Baker, 2011). This study presents how pre-service physics teachers designed optic simulation and how they use it to show TPACK integration in the practice. Before presenting the designing pre service teacher’s spreadsheet, this work explains the transformative TPACK paradigm, promote S-TPACK assessment, and the method of this work. Using spreadsheets in optic simulation help student to make it easier and to reduce the cost of infrastructure. A famous designation is “optics is what physicists do in a dark room”(Thekaekara, 1964). This situation is more difficult than opening the laptop and spreadsheet. However, a teacher needs to “know better than his students” (Michael Neubrand, Nanette Seago, 2009). Spreadsheet design in transformative TPACK paradigm
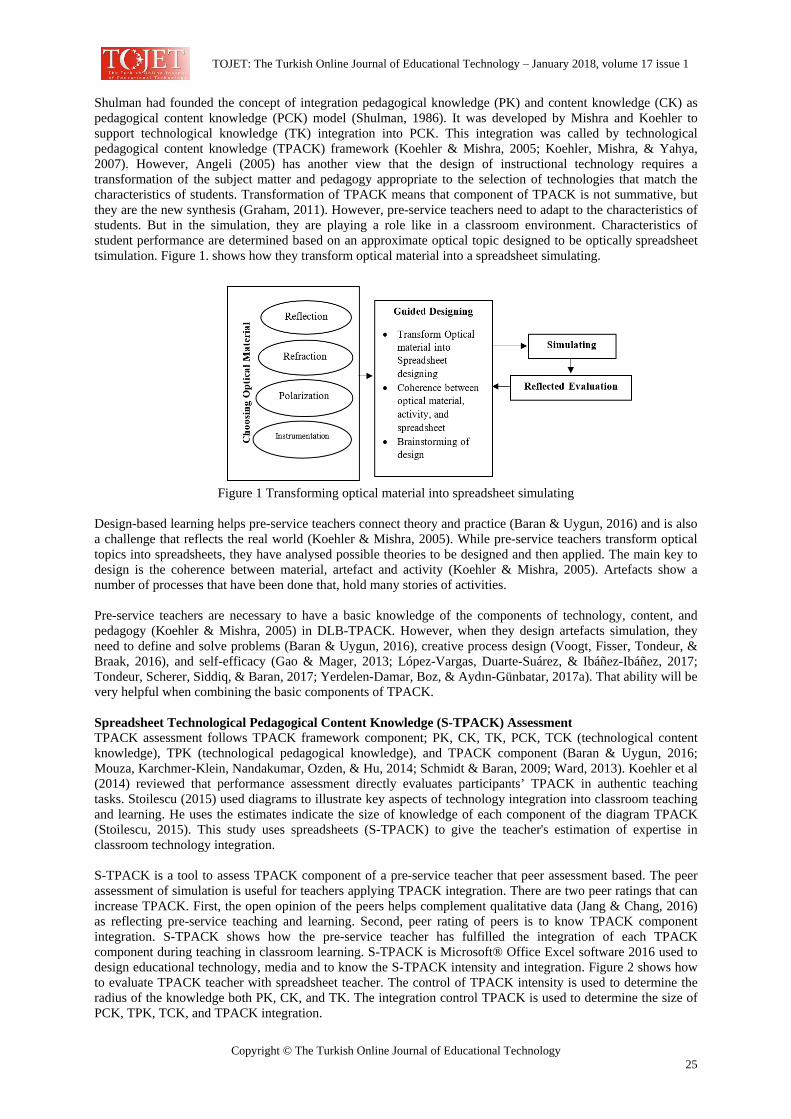
TOJET: The Turkish Online Journal of Educational Technology – January 2018, volume 17 issue 1
Copyright © The Turkish Online Journal of Educational Technology 25
Shulman had founded the concept of integration pedagogical knowledge (PK) and content knowledge (CK) as pedagogical content knowledge (PCK) model (Shulman, 1986). It was developed by Mishra and Koehler to support technological knowledge (TK) integration into PCK. This integration was called by technological pedagogical content knowledge (TPACK) framework (Koehler & Mishra, 2005; Koehler, Mishra, & Yahya, 2007). However, Angeli (2005) has another view that the design of instructional technology requires a transformation of the subject matter and pedagogy appropriate to the selection of technologies that match the characteristics of students. Transformation of TPACK means that component of TPACK is not summative, but they are the new synthesis (Graham, 2011). However, pre-service teachers need to adapt to the characteristics of students. But in the simulation, they are playing a role like in a classroom environment. Characteristics of student performance are determined based on an approximate optical topic designed to be optically spreadsheet tsimulation. Figure 1. shows how they transform optical material into a spreadsheet simulating.
Figure 1 Transforming optical material into spreadsheet simulating
Design-based learning helps pre-service teachers connect theory and practice (Baran & Uygun, 2016) and is also a challenge that reflects the real world (Koehler & Mishra, 2005). While pre-service teachers transform optical topics into spreadsheets, they have analysed possible theories to be designed and then applied. The main key to design is the coherence between material, artefact and activity (Koehler & Mishra, 2005). Artefacts show a number of processes that have been done that, hold many stories of activities. Pre-service teachers are necessary to have a basic knowledge of the components of technology, content, and pedagogy (Koehler & Mishra, 2005) in DLB-TPACK. However, when they design artefacts simulation, they need to define and solve problems (Baran & Uygun, 2016), creative process design (Voogt, Fisser, Tondeur, & Braak, 2016), and self-efficacy (Gao & Mager, 2013; López-Vargas, Duarte-Suárez, & Ibáñez-Ibáñez, 2017; Tondeur, Scherer, Siddiq, & Baran, 2017; Yerdelen-Damar, Boz, & Aydın-Günbatar, 2017a). That ability will be very helpful when combining the basic components of TPACK. Spreadsheet Technological Pedagogical Content Knowledge (S-TPACK) Assessment TPACK assessment follows TPACK framework component; PK, CK, TK, PCK, TCK (technological content knowledge), TPK (technological pedagogical knowledge), and TPACK component (Baran & Uygun, 2016; Mouza, Karchmer-Klein, Nandakumar, Ozden, & Hu, 2014; Schmidt & Baran, 2009; Ward, 2013). Koehler et al (2014) reviewed that performance assessment directly evaluates participants’ TPACK in authentic teaching tasks. Stoilescu (2015) used diagrams to illustrate key aspects of technology integration into classroom teaching and learning. He uses the estimates indicate the size of knowledge of each component of the diagram TPACK (Stoilescu, 2015). This study uses spreadsheets (S-TPACK) to give the teacher's estimation of expertise in classroom technology integration. S-TPACK is a tool to assess TPACK component of a pre-service teacher that peer assessment based. The peer assessment of simulation is useful for teachers applying TPACK integration. There are two peer ratings that can increase TPACK. First, the open opinion of the peers helps complement qualitative data (Jang & Chang, 2016) as reflecting pre-service teaching and learning. Second, peer rating of peers is to know TPACK component integration. S-TPACK shows how the pre-service teacher has fulfilled the integration of each TPACK component during teaching in classroom learning. S-TPACK is Microsoft® Office Excel software 2016 used to design educational technology, media and to know the S-TPACK intensity and integration. Figure 2 shows how to evaluate TPACK teacher with spreadsheet teacher. The control of TPACK intensity is used to determine the radius of the knowledge both PK, CK, and TK. The integration control TPACK is used to determine the size of PCK, TPK, TCK, and TPACK integration.
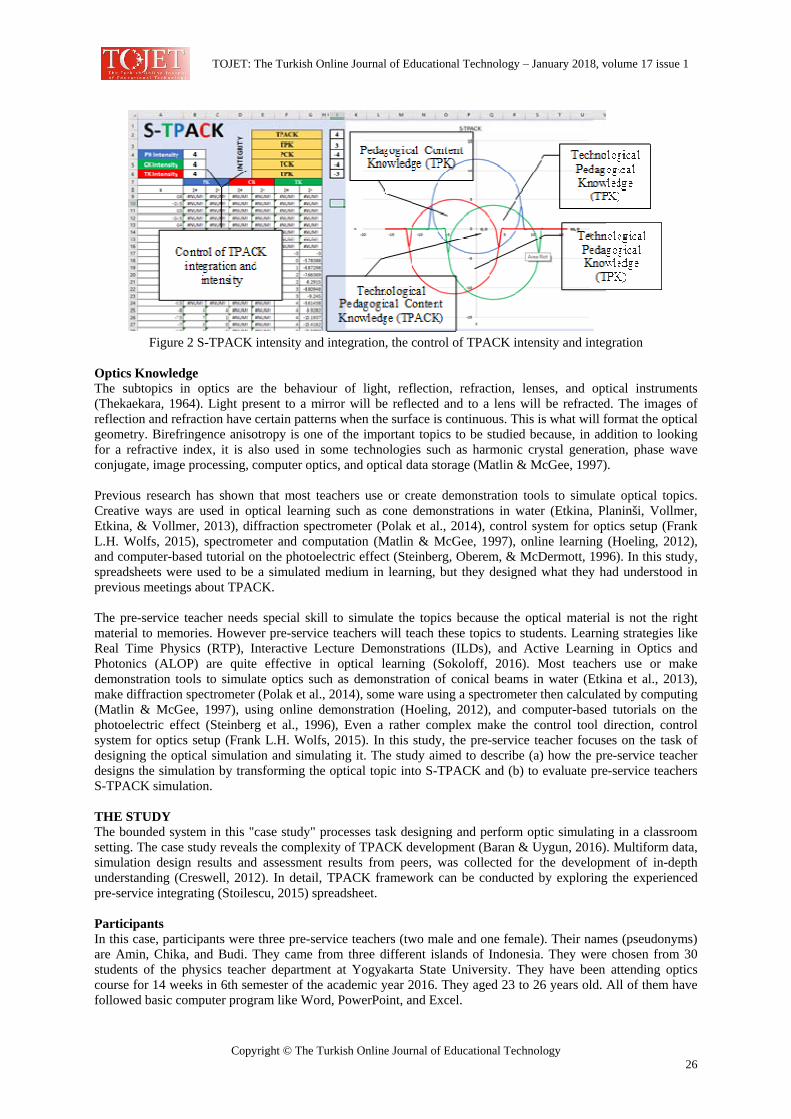
TOJET: The Turkish Online Journal of Educational Technology – January 2018, volume 17 issue 1
Copyright © The Turkish Online Journal of Educational Technology 26
Figure 2 S-TPACK intensity and integration, the control of TPACK intensity and integration
Optics Knowledge The subtopics in optics are the behaviour of light, reflection, refraction, lenses, and optical instruments (Thekaekara, 1964). Light present to a mirror will be reflected and to a lens will be refracted. The images of reflection and refraction have certain patterns when the surface is continuous. This is what will format the optical geometry. Birefringence anisotropy is one of the important topics to be studied because, in addition to looking for a refractive index, it is also used in some technologies such as harmonic crystal generation, phase wave conjugate, image processing, computer optics, and optical data storage (Matlin & McGee, 1997). Previous research has shown that most teachers use or create demonstration tools to simulate optical topics. Creative ways are used in optical learning such as cone demonstrations in water (Etkina, Planinši, Vollmer, Etkina, & Vollmer, 2013), diffraction spectrometer (Polak et al., 2014), control system for optics setup (Frank L.H. Wolfs, 2015), spectrometer and computation (Matlin & McGee, 1997), online learning (Hoeling, 2012), and computer-based tutorial on the photoelectric effect (Steinberg, Oberem, & McDermott, 1996). In this study, spreadsheets were used to be a simulated medium in learning, but they designed what they had understood in previous meetings about TPACK. The pre-service teacher needs special skill to simulate the topics because the optical material is not the right material to memories. However pre-service teachers will teach these topics to students. Learning strategies like Real Time Physics (RTP), Interactive Lecture Demonstrations (ILDs), and Active Learning in Optics and Photonics (ALOP) are quite effective in optical learning (Sokoloff, 2016). Most teachers use or make demonstration tools to simulate optics such as demonstration of conical beams in water (Etkina et al., 2013), make diffraction spectrometer (Polak et al., 2014), some ware using a spectrometer then calculated by computing (Matlin & McGee, 1997), using online demonstration (Hoeling, 2012), and computer-based tutorials on the photoelectric effect (Steinberg et al., 1996), Even a rather complex make the control tool direction, control system for optics setup (Frank L.H. Wolfs, 2015). In this study, the pre-service teacher focuses on the task of designing the optical simulation and simulating it. The study aimed to describe (a) how the pre-service teacher designs the simulation by transforming the optical topic into S-TPACK and (b) to evaluate pre-service teachers S-TPACK simulation. THE STUDY The bounded system in this "case study" processes task designing and perform optic simulating in a classroom setting. The case study reveals the complexity of TPACK development (Baran & Uygun, 2016). Multiform data, simulation design results and assessment results from peers, was collected for the development of in-depth understanding (Creswell, 2012). In detail, TPACK framework can be conducted by exploring the experienced pre-service integrating (Stoilescu, 2015) spreadsheet. Participants In this case, participants were three pre-service teachers (two male and one female). Their names (pseudonyms) are Amin, Chika, and Budi. They came from three different islands of Indonesia. They were chosen from 30 students of the physics teacher department at Yogyakarta State University. They have been attending optics course for 14 weeks in 6th semester of the academic year 2016. They aged 23 to 26 years old. All of them have followed basic computer program like Word, PowerPoint, and Excel.
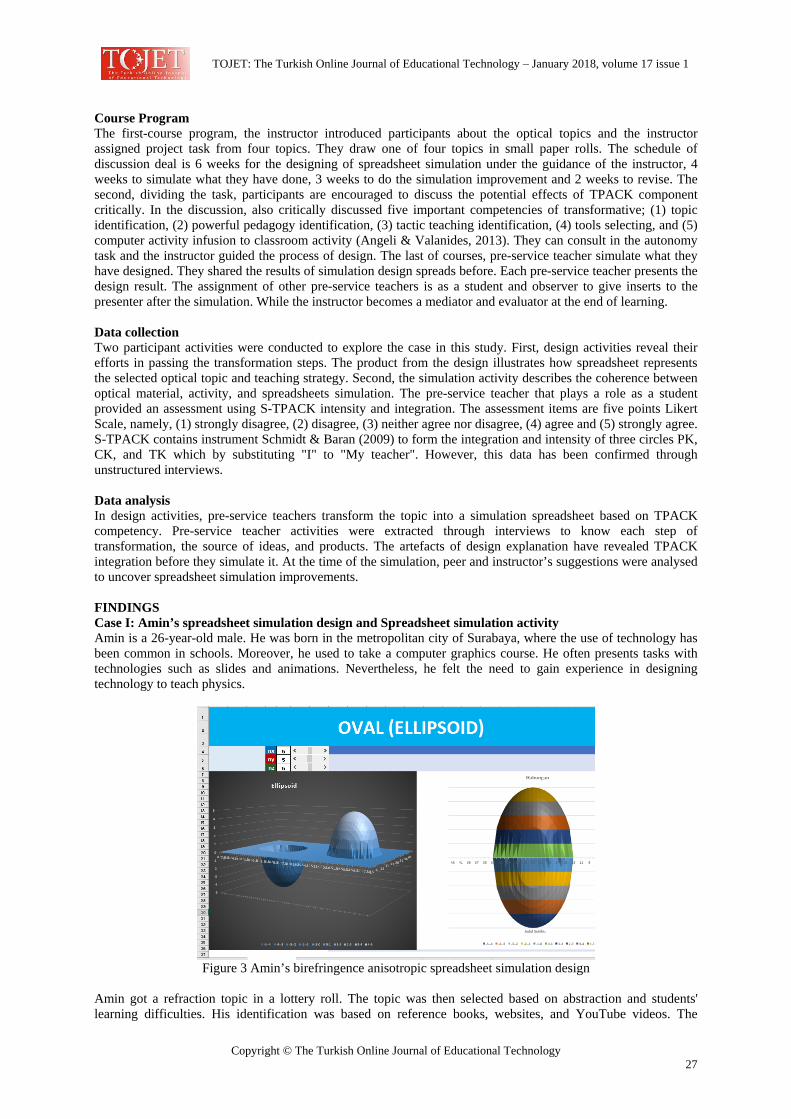
TOJET: The Turkish Online Journal of Educational Technology – January 2018, volume 17 issue 1
Copyright © The Turkish Online Journal of Educational Technology 27
Course Program The first-course program, the instructor introduced participants about the optical topics and the instructor assigned project task from four topics. They draw one of four topics in small paper rolls. The schedule of discussion deal is 6 weeks for the designing of spreadsheet simulation under the guidance of the instructor, 4 weeks to simulate what they have done, 3 weeks to do the simulation improvement and 2 weeks to revise. The second, dividing the task, participants are encouraged to discuss the potential effects of TPACK component critically. In the discussion, also critically discussed five important competencies of transformative; (1) topic identification, (2) powerful pedagogy identification, (3) tactic teaching identification, (4) tools selecting, and (5) computer activity infusion to classroom activity (Angeli & Valanides, 2013). They can consult in the autonomy task and the instructor guided the process of design. The last of courses, pre-service teacher simulate what they have designed. They shared the results of simulation design spreads before. Each pre-service teacher presents the design result. The assignment of other pre-service teachers is as a student and observer to give inserts to the presenter after the simulation. While the instructor becomes a mediator and evaluator at the end of learning. Data collection Two participant activities were conducted to explore the case in this study. First, design activities reveal their efforts in passing the transformation steps. The product from the design illustrates how spreadsheet represents the selected optical topic and teaching strategy. Second, the simulation activity describes the coherence between optical material, activity, and spreadsheets simulation. The pre-service teacher that plays a role as a student provided an assessment using S-TPACK intensity and integration. The assessment items are five points Likert Scale, namely, (1) strongly disagree, (2) disagree, (3) neither agree nor disagree, (4) agree and (5) strongly agree. S-TPACK contains instrument Schmidt & Baran (2009) to form the integration and intensity of three circles PK, CK, and TK which by substituting "I" to "My teacher". However, this data has been confirmed through unstructured interviews. Data analysis In design activities, pre-service teachers transform the topic into a simulation spreadsheet based on TPACK competency. Pre-service teacher activities were extracted through interviews to know each step of transformation, the source of ideas, and products. The artefacts of design explanation have revealed TPACK integration before they simulate it. At the time of the simulation, peer and instructor’s suggestions were analysed to uncover spreadsheet simulation improvements. FINDINGS Case I: Amin’s spreadsheet simulation design and Spreadsheet simulation activity Amin is a 26-year-old male. He was born in the metropolitan city of Surabaya, where the use of technology has been common in schools. Moreover, he used to take a computer graphics course. He often presents tasks with technologies such as slides and animations. Nevertheless, he felt the need to gain experience in designing technology to teach physics.
Figure 3 Amin’s birefringence anisotropic spreadsheet simulation design
Amin got a refraction topic in a lottery roll. The topic was then selected based on abstraction and students' learning difficulties. His identification was based on reference books, websites, and YouTube videos. The
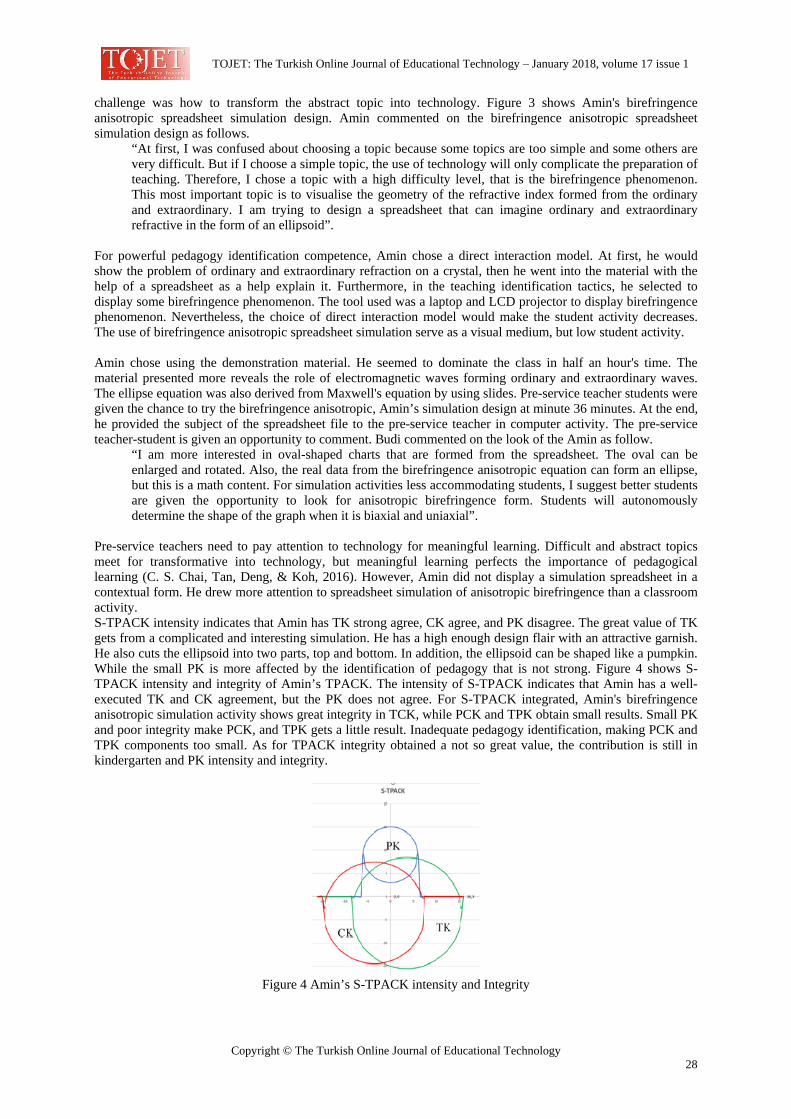
TOJET: The Turkish Online Journal of Educational Technology – January 2018, volume 17 issue 1
Copyright © The Turkish Online Journal of Educational Technology 28
challenge was how to transform the abstract topic into technology. Figure 3 shows Amin's birefringence anisotropic spreadsheet simulation design. Amin commented on the birefringence anisotropic spreadsheet simulation design as follows.
“At first, I was confused about choosing a topic because some topics are too simple and some others are very difficult. But if I choose a simple topic, the use of technology will only complicate the preparation of teaching. Therefore, I chose a topic with a high difficulty level, that is the birefringence phenomenon. This most important topic is to visualise the geometry of the refractive index formed from the ordinary and extraordinary. I am trying to design a spreadsheet that can imagine ordinary and extraordinary refractive in the form of an ellipsoid”.
For powerful pedagogy identification competence, Amin chose a direct interaction model. At first, he would show the problem of ordinary and extraordinary refraction on a crystal, then he went into the material with the help of a spreadsheet as a help explain it. Furthermore, in the teaching identification tactics, he selected to display some birefringence phenomenon. The tool used was a laptop and LCD projector to display birefringence phenomenon. Nevertheless, the choice of direct interaction model would make the student activity decreases. The use of birefringence anisotropic spreadsheet simulation serve as a visual medium, but low student activity. Amin chose using the demonstration material. He seemed to dominate the class in half an hour's time. The material presented more reveals the role of electromagnetic waves forming ordinary and extraordinary waves. The ellipse equation was also derived from Maxwell's equation by using slides. Pre-service teacher students were given the chance to try the birefringence anisotropic, Amin’s simulation design at minute 36 minutes. At the end, he provided the subject of the spreadsheet file to the pre-service teacher in computer activity. The pre-service teacher-student is given an opportunity to comment. Budi commented on the look of the Amin as follow.
“I am more interested in oval-shaped charts that are formed from the spreadsheet. The oval can be enlarged and rotated. Also, the real data from the birefringence anisotropic equation can form an ellipse, but this is a math content. For simulation activities less accommodating students, I suggest better students are given the opportunity to look for anisotropic birefringence form. Students will autonomously determine the shape of the graph when it is biaxial and uniaxial”.
Pre-service teachers need to pay attention to technology for meaningful learning. Difficult and abstract topics meet for transformative into technology, but meaningful learning perfects the importance of pedagogical learning (C. S. Chai, Tan, Deng, & Koh, 2016). However, Amin did not display a simulation spreadsheet in a contextual form. He drew more attention to spreadsheet simulation of anisotropic birefringence than a classroom activity. S-TPACK intensity indicates that Amin has TK strong agree, CK agree, and PK disagree. The great value of TK gets from a complicated and interesting simulation. He has a high enough design flair with an attractive garnish. He also cuts the ellipsoid into two parts, top and bottom. In addition, the ellipsoid can be shaped like a pumpkin. While the small PK is more affected by the identification of pedagogy that is not strong. Figure 4 shows S-TPACK intensity and integrity of Amin’s TPACK. The intensity of S-TPACK indicates that Amin has a well-executed TK and CK agreement, but the PK does not agree. For S-TPACK integrated, Amin's birefringence anisotropic simulation activity shows great integrity in TCK, while PCK and TPK obtain small results. Small PK and poor integrity make PCK, and TPK gets a little result. Inadequate pedagogy identification, making PCK and TPK components too small. As for TPACK integrity obtained a not so great value, the contribution is still in kindergarten and PK intensity and integrity.
Figure 4 Amin’s S-TPACK intensity and Integrity
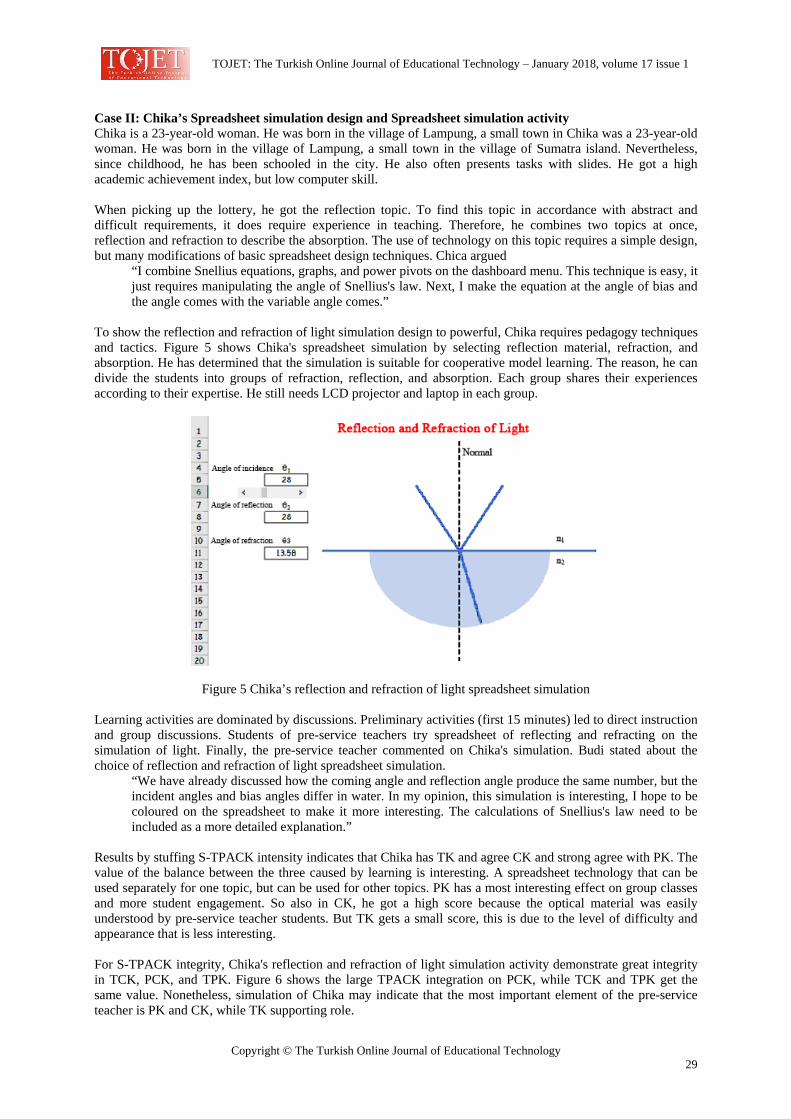
TOJET: The Turkish Online Journal of Educational Technology – January 2018, volume 17 issue 1
Copyright © The Turkish Online Journal of Educational Technology 29
Case II: Chika’s Spreadsheet simulation design and Spreadsheet simulation activity Chika is a 23-year-old woman. He was born in the village of Lampung, a small town in Chika was a 23-year-old woman. He was born in the village of Lampung, a small town in the village of Sumatra island. Nevertheless, since childhood, he has been schooled in the city. He also often presents tasks with slides. He got a high academic achievement index, but low computer skill. When picking up the lottery, he got the reflection topic. To find this topic in accordance with abstract and difficult requirements, it does require experience in teaching. Therefore, he combines two topics at once, reflection and refraction to describe the absorption. The use of technology on this topic requires a simple design, but many modifications of basic spreadsheet design techniques. Chica argued
“I combine Snellius equations, graphs, and power pivots on the dashboard menu. This technique is easy, it just requires manipulating the angle of Snellius's law. Next, I make the equation at the angle of bias and the angle comes with the variable angle comes.”
To show the reflection and refraction of light simulation design to powerful, Chika requires pedagogy techniques and tactics. Figure 5 shows Chika's spreadsheet simulation by selecting reflection material, refraction, and absorption. He has determined that the simulation is suitable for cooperative model learning. The reason, he can divide the students into groups of refraction, reflection, and absorption. Each group shares their experiences according to their expertise. He still needs LCD projector and laptop in each group.
Figure 5 Chika’s reflection and refraction of light spreadsheet simulation Learning activities are dominated by discussions. Preliminary activities (first 15 minutes) led to direct instruction and group discussions. Students of pre-service teachers try spreadsheet of reflecting and refracting on the simulation of light. Finally, the pre-service teacher commented on Chika's simulation. Budi stated about the choice of reflection and refraction of light spreadsheet simulation.
“We have already discussed how the coming angle and reflection angle produce the same number, but the incident angles and bias angles differ in water. In my opinion, this simulation is interesting, I hope to be coloured on the spreadsheet to make it more interesting. The calculations of Snellius's law need to be included as a more detailed explanation.”
Results by stuffing S-TPACK intensity indicates that Chika has TK and agree CK and strong agree with PK. The value of the balance between the three caused by learning is interesting. A spreadsheet technology that can be used separately for one topic, but can be used for other topics. PK has a most interesting effect on group classes and more student engagement. So also in CK, he got a high score because the optical material was easily understood by pre-service teacher students. But TK gets a small score, this is due to the level of difficulty and appearance that is less interesting. For S-TPACK integrity, Chika's reflection and refraction of light simulation activity demonstrate great integrity in TCK, PCK, and TPK. Figure 6 shows the large TPACK integration on PCK, while TCK and TPK get the same value. Nonetheless, simulation of Chika may indicate that the most important element of the pre-service teacher is PK and CK, while TK supporting role.
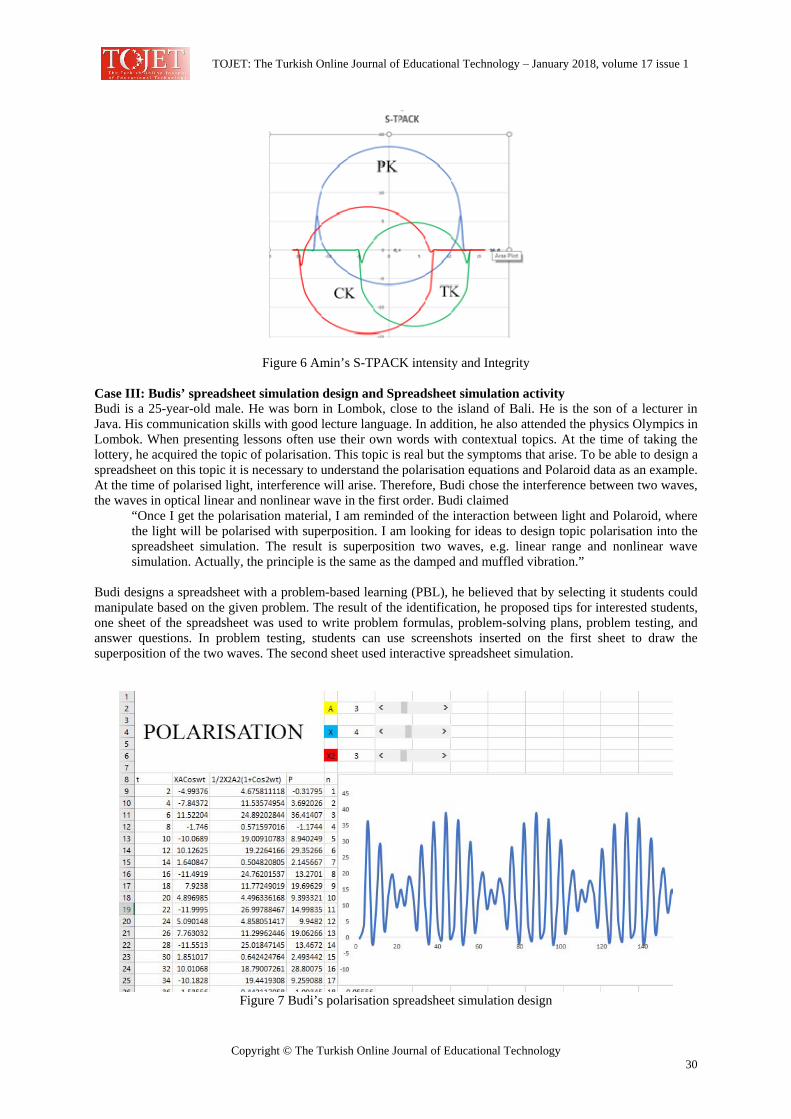
TOJET: The Turkish Online Journal of Educational Technology – January 2018, volume 17 issue 1
Copyright © The Turkish Online Journal of Educational Technology 30
Figure 6 Amin’s S-TPACK intensity and Integrity Case III: Budis’ spreadsheet simulation design and Spreadsheet simulation activity Budi is a 25-year-old male. He was born in Lombok, close to the island of Bali. He is the son of a lecturer in Java. His communication skills with good lecture language. In addition, he also attended the physics Olympics in Lombok. When presenting lessons often use their own words with contextual topics. At the time of taking the lottery, he acquired the topic of polarisation. This topic is real but the symptoms that arise. To be able to design a spreadsheet on this topic it is necessary to understand the polarisation equations and Polaroid data as an example. At the time of polarised light, interference will arise. Therefore, Budi chose the interference between two waves, the waves in optical linear and nonlinear wave in the first order. Budi claimed
“Once I get the polarisation material, I am reminded of the interaction between light and Polaroid, where the light will be polarised with superposition. I am looking for ideas to design topic polarisation into the spreadsheet simulation. The result is superposition two waves, e.g. linear range and nonlinear wave simulation. Actually, the principle is the same as the damped and muffled vibration.”
Budi designs a spreadsheet with a problem-based learning (PBL), he believed that by selecting it students could manipulate based on the given problem. The result of the identification, he proposed tips for interested students, one sheet of the spreadsheet was used to write problem formulas, problem-solving plans, problem testing, and answer questions. In problem testing, students can use screenshots inserted on the first sheet to draw the superposition of the two waves. The second sheet used interactive spreadsheet simulation.
Figure 7 Budi’s polarisation spreadsheet simulation design
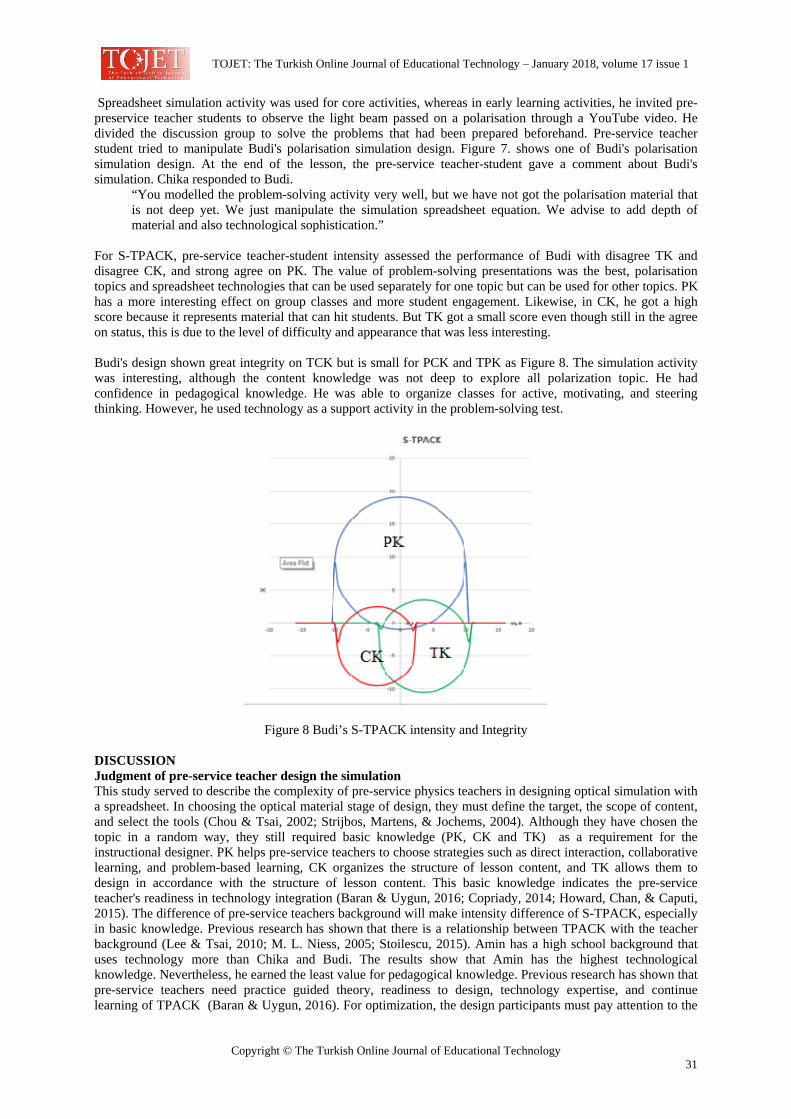
TOJET: The Turkish Online Journal of Educational Technology – January 2018, volume 17 issue 1
Copyright © The Turkish Online Journal of Educational Technology 31
Spreadsheet simulation activity was used for core activities, whereas in early learning activities, he invited pre-preservice teacher students to observe the light beam passed on a polarisation through a YouTube video. He divided the discussion group to solve the problems that had been prepared beforehand. Pre-service teacher student tried to manipulate Budi's polarisation simulation design. Figure 7. shows one of Budi's polarisation simulation design. At the end of the lesson, the pre-service teacher-student gave a comment about Budi's simulation. Chika responded to Budi.
“You modelled the problem-solving activity very well, but we have not got the polarisation material that is not deep yet. We just manipulate the simulation spreadsheet equation. We advise to add depth of material and also technological sophistication.”
For S-TPACK, pre-service teacher-student intensity assessed the performance of Budi with disagree TK and disagree CK, and strong agree on PK. The value of problem-solving presentations was the best, polarisation topics and spreadsheet technologies that can be used separately for one topic but can be used for other topics. PK has a more interesting effect on group classes and more student engagement. Likewise, in CK, he got a high score because it represents material that can hit students. But TK got a small score even though still in the agree on status, this is due to the level of difficulty and appearance that was less interesting. Budi's design shown great integrity on TCK but is small for PCK and TPK as Figure 8. The simulation activity was interesting, although the content knowledge was not deep to explore all polarization topic. He had confidence in pedagogical knowledge. He was able to organize classes for active, motivating, and steering thinking. However, he used technology as a support activity in the problem-solving test.
Figure 8 Budi’s S-TPACK intensity and Integrity DISCUSSION Judgment of pre-service teacher design the simulation This study served to describe the complexity of pre-service physics teachers in designing optical simulation with a spreadsheet. In choosing the optical material stage of design, they must define the target, the scope of content, and select the tools (Chou & Tsai, 2002; Strijbos, Martens, & Jochems, 2004). Although they have chosen the topic in a random way, they still required basic knowledge (PK, CK and TK) as a requirement for the instructional designer. PK helps pre-service teachers to choose strategies such as direct interaction, collaborative learning, and problem-based learning, CK organizes the structure of lesson content, and TK allows them to design in accordance with the structure of lesson content. This basic knowledge indicates the pre-service teacher's readiness in technology integration (Baran & Uygun, 2016; Copriady, 2014; Howard, Chan, & Caputi, 2015). The difference of pre-service teachers background will make intensity difference of S-TPACK, especially in basic knowledge. Previous research has shown that there is a relationship between TPACK with the teacher background (Lee & Tsai, 2010; M. L. Niess, 2005; Stoilescu, 2015). Amin has a high school background that uses technology more than Chika and Budi. The results show that Amin has the highest technological knowledge. Nevertheless, he earned the least value for pedagogical knowledge. Previous research has shown that pre-service teachers need practice guided theory, readiness to design, technology expertise, and continue learning of TPACK (Baran & Uygun, 2016). For optimization, the design participants must pay attention to the

TOJET: The Turkish Online Journal of Educational Technology – January 2018, volume 17 issue 1
Copyright © The Turkish Online Journal of Educational Technology 32
contradictions and tensions of each factor of the basic knowledge (Koehler & Mishra, 2005). The basic knowledge is as a knowledge capital to integrate into TPACK as well as the identified impacts (Celik, Sahin, & Akturk, 2014; C. S. . Chai, Ling Koh, Tsai, & Lee Wee Tan, 2011). Transformative competence is a process of transforming topics into technology through powerful pedagogy (Angeli & Valanides, 2005). The pre-service teacher must conduct each step of transformative competence (Angeli & Valanides, 2013). It is not easy for a pre-service teacher to determine each of Angeli & Valanides five steps. Amin got the low competence of pedagogy identification, it influenced on the competence of tactic teaching identification. However, he got a high ability in the topic transformation into spreadsheet design. The case studies of three pre-service teachers shown the level of the integrated transformation of TPACK. Niess (2011) has demonstrated levels in developing TPACK with five level, (1) recognizing, (2) accepting, (3) adopting, (4) exploring and (5) advancing. However, the pre-service physics teacher reached the level of advancing when they design spreadsheet simulation. However, all of them reached the spreadsheet adaptation level in the design with the optical topic. In fact, two of the three pre-service teachers have achieved exploring because they consistently exploited the spreadsheet and one achieved advancing because he has decided to integrate the spreadsheet as the next development topic (Margaret L Niess, 2013). The finding of this study that pre-service teacher can develop TPACK competence when pre-service teacher necessary pay attention basic knowledge, transformative process, and affective value of pre-service teacher. Brinkerhoff (2005) argue that the five main categories prevent integration technology; resources, administration support, experience, and attitudinal factor. However, Amin, Chika, and Budi have made decisions, doing problem-solving, and generate confidence. Dominantly, they have done the problem-solving process, because the experience is often associated with problem-solving (Docktor et al., 2016; Teodorescu, Bennhold, Feldman, & Medsker, 2013). Hill (1998) argued that the design process is seen as creative, dynamic and iterative processes. Problem-solving is needed to be shaped by existing sources and tools and adapts to situations specifically and changes (McCormick, Murphy, & Hennessy, 1994). In the TPACK design, the pre-service teacher has performed self-regulated learning. In a similar view, Voogt et al. (2016) presents that there is a TPACK relationship with self-regulated learning. Self-efficacy is often referred to as attitude factor in the integration of technology (Brinkerhoff, 2005; Cullen & Greene, 2011; López-Vargas et al., 2017). In evidence, besides self-efficacy, experience, and attitude toward technology also direct influence TPACK integration (Yerdelen-Damar, Boz, & Aydın-Günbatar, 2017b). TPACK assessment spreadsheet simulation activity Implementation of the spreadsheet design had led to assess optical simulation action because pre-service physics teacher needs TPACK comprehension competence to influence teaching simulation (Srisawasdi, 2012). Assessment of TPACK-in-action used questionnaire S-TPACK. This is not for self-assessment, but the pre-service teacher is detected through peer assessement which is done to assess the pre-service performance of teacher in action. Willermark (2017) revealed that there is a gap between self-reporting and performance in action where explored performance is more flow oprasional TPACK. Furthermore, Stoilescu (2015) intuitively used an adapted graph to depict teacher TPACK framework. However, he did not mention how to draw the graph. S-TPACK can be an alternative in describing the TPACK framework of teacher performance in the classroom. The result of the student assessment can show how much the main component of PK, CK, and PK, while the third intersection can be seen from S-TPACK integrity which shows PCK, TCK, and TPK. In addition, S-TPACK intensity and integrity are also very useful in analyzing the competence of pre-service after learning. Limitations of S-TPACK can not be numerically determined TPACK integrity. The area of PCK, TPK, TCK, and TPACK is not calculated. However, the extent of the intersection of PK, CK, and TK can be estimated from the spreadsheet graph. Case study of the pre-service teachers design the simulation can be seen from three types, (1) Strong topic transformation into spreadsheet but weak against pedagogy, causing values PK, PK, and PK are small, (2) Optical topic transformation of balanced pedagogy and spreadsheet leads to powerful instruction, and (3) Topics identification do not represent essential material, while the correct selection of pedagogical learning causes small TPK and PACK. A powerful learning is achieved at the maximum when there is a balance between TK, PK, and CK. An interesting case is that although TK is a small value, learning remains good. Thus, the main competence of a teacher is optical material knowledge and active meaningful learning. Meanwhile, TK is a booster to PK and CK. CONCLUSIONS This case study has three implications in design and spreadsheet simulation. The first, the study recommends using spreadsheets for easy, cheap and flexible purposes in designing physics topics. Three pre-service teachers
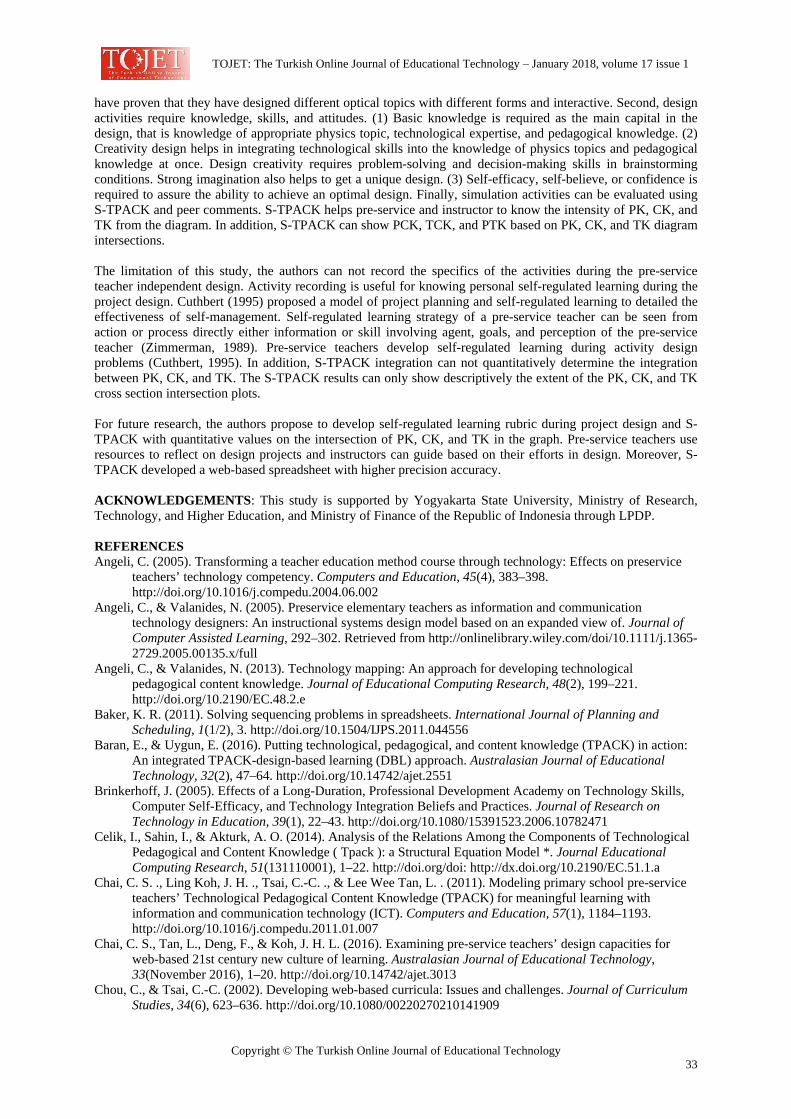
TOJET: The Turkish Online Journal of Educational Technology – January 2018, volume 17 issue 1
Copyright © The Turkish Online Journal of Educational Technology 33
have proven that they have designed different optical topics with different forms and interactive. Second, design activities require knowledge, skills, and attitudes. (1) Basic knowledge is required as the main capital in the design, that is knowledge of appropriate physics topic, technological expertise, and pedagogical knowledge. (2) Creativity design helps in integrating technological skills into the knowledge of physics topics and pedagogical knowledge at once. Design creativity requires problem-solving and decision-making skills in brainstorming conditions. Strong imagination also helps to get a unique design. (3) Self-efficacy, self-believe, or confidence is required to assure the ability to achieve an optimal design. Finally, simulation activities can be evaluated using S-TPACK and peer comments. S-TPACK helps pre-service and instructor to know the intensity of PK, CK, and TK from the diagram. In addition, S-TPACK can show PCK, TCK, and PTK based on PK, CK, and TK diagram intersections. The limitation of this study, the authors can not record the specifics of the activities during the pre-service teacher independent design. Activity recording is useful for knowing personal self-regulated learning during the project design. Cuthbert (1995) proposed a model of project planning and self-regulated learning to detailed the effectiveness of self-management. Self-regulated learning strategy of a pre-service teacher can be seen from action or process directly either information or skill involving agent, goals, and perception of the pre-service teacher (Zimmerman, 1989). Pre-service teachers develop self-regulated learning during activity design problems (Cuthbert, 1995). In addition, S-TPACK integration can not quantitatively determine the integration between PK, CK, and TK. The S-TPACK results can only show descriptively the extent of the PK, CK, and TK cross section intersection plots. For future research, the authors propose to develop self-regulated learning rubric during project design and S-TPACK with quantitative values on the intersection of PK, CK, and TK in the graph. Pre-service teachers use resources to reflect on design projects and instructors can guide based on their efforts in design. Moreover, S-TPACK developed a web-based spreadsheet with higher precision accuracy. ACKNOWLEDGEMENTS: This study is supported by Yogyakarta State University, Ministry of Research, Technology, and Higher Education, and Ministry of Finance of the Republic of Indonesia through LPDP. REFERENCES Angeli, C. (2005). Transforming a teacher education method course through technology: Effects on preservice
teachers’ technology competency. Computers and Education, 45(4), 383–398. http://doi.org/10.1016/j.compedu.2004.06.002
Angeli, C., & Valanides, N. (2005). Preservice elementary teachers as information and communication technology designers: An instructional systems design model based on an expanded view of. Journal of Computer Assisted Learning, 292–302. Retrieved from http://onlinelibrary.wiley.com/doi/10.1111/j.1365-2729.2005.00135.x/full
Angeli, C., & Valanides, N. (2013). Technology mapping: An approach for developing technological pedagogical content knowledge. Journal of Educational Computing Research, 48(2), 199–221. http://doi.org/10.2190/EC.48.2.e
Baker, K. R. (2011). Solving sequencing problems in spreadsheets. International Journal of Planning and Scheduling, 1(1/2), 3. http://doi.org/10.1504/IJPS.2011.044556
Baran, E., & Uygun, E. (2016). Putting technological, pedagogical, and content knowledge (TPACK) in action: An integrated TPACK-design-based learning (DBL) approach. Australasian Journal of Educational Technology, 32(2), 47–64. http://doi.org/10.14742/ajet.2551
Brinkerhoff, J. (2005). Effects of a Long-Duration, Professional Development Academy on Technology Skills, Computer Self-Efficacy, and Technology Integration Beliefs and Practices. Journal of Research on Technology in Education, 39(1), 22–43. http://doi.org/10.1080/15391523.2006.10782471
Celik, I., Sahin, I., & Akturk, A. O. (2014). Analysis of the Relations Among the Components of Technological Pedagogical and Content Knowledge ( Tpack ): a Structural Equation Model *. Journal Educational Computing Research, 51(131110001), 1–22. http://doi.org/doi: http://dx.doi.org/10.2190/EC.51.1.a
Chai, C. S. ., Ling Koh, J. H. ., Tsai, C.-C. ., & Lee Wee Tan, L. . (2011). Modeling primary school pre-service teachers’ Technological Pedagogical Content Knowledge (TPACK) for meaningful learning with information and communication technology (ICT). Computers and Education, 57(1), 1184–1193. http://doi.org/10.1016/j.compedu.2011.01.007
Chai, C. S., Tan, L., Deng, F., & Koh, J. H. L. (2016). Examining pre-service teachers’ design capacities for web-based 21st century new culture of learning. Australasian Journal of Educational Technology, 33(November 2016), 1–20. http://doi.org/10.14742/ajet.3013
Chou, C., & Tsai, C.-C. (2002). Developing web-based curricula: Issues and challenges. Journal of Curriculum Studies, 34(6), 623–636. http://doi.org/10.1080/00220270210141909
TOJET: The Turkish Online Journal of Educational Technology – January 2018, volume 17 issue 1
Copyright © The Turkish Online Journal of Educational Technology 34
Copriady, J. (2014). Self - Motivation as a mediator for teachers’ readiness in applying ICT in teaching and learning. Turkish Online Journal of Educational Technology, 13(4), 115–123. http://doi.org/10.1016/j.sbspro.2015.01.529
Creswell, J. W. (2012). Educational Research Planning, Conducting and Evaluating Quantitative and Qualitative Research. Boston: Pearson Education, Inc.
Cullen, T. A., & Greene, B. A. (2011). Preservice Teachers’ Beliefs, Attitudes, and Motivation about Technology Integration. Journal of Educational Computing Research, 45(1), 29–47. http://doi.org/10.2190/EC.45.1.b
Cuthbert, K. (1995). Project planning and the promotion of self-regulated learning: From theory to practice. Studies in Higher Education, 20(3), 267–277. http://doi.org/10.1080/03075079512331381545
Docktor, J. L., Dornfeld, J., Frodermann, E., Heller, K., Hsu, L., Jackson, K. A., … Yang, J. (2016). Assessing student written problem solutions: A problem-solving rubric with application to introductory physics. Physical Review Physics Education Research, 12(1), 10130. http://doi.org/10.1103/PhysRevPhysEducRes.12.010130
Etkina, E., Planinši, G., Vollmer, M., Etkina, E., & Vollmer, M. (2013). A simple optics experiment to engage students in scientific inquiry Advertisement�: A simple optics experiment to engage students in scientific inquiry. American Journal of Physics, 81(11), 815–822. http://doi.org/10.1119/1.4822176
Frank L.H. Wolfs. (2015). A low cost mirror mount control system for optics setup. American Journal of Physics, 83(2), 186–190. http://doi.org/http://dx.doi.org/10.1119/1.4895343
Gao, P., & Mager, G. M. (2013). Constructing embodied understanding of Technological Pedagogical Content Knowledge: preservice teachers’ learning to teach with information technology. International Journal of Social Media and Interactive Learning Environments, 1(1), 74. http://doi.org/10.1504/IJSMILE.2013.051654
Graham, C. R. (2011). Theoretical considerations for understanding technological pedagogical content knowledge (TPACK). Computers & Education, 57(3), 1953–1960. http://doi.org/10.1016/j.compedu.2011.04.010
Hill, A. M. (1998). Problem Solving in Real-Life Contexts: An Alternative for Design in Technology Education. International Journal of Technology and Design Education, 8, 203–220. http://doi.org/10.1023/A:1008854926028
Hoeling, B. M. (2012). Interactive online optics modules for the college physics course. American Journal of Physics. http://doi.org/10.1119/1.3677652
Howard, S. K., Chan, A., & Caputi, P. (2015). More than beliefs: Subject areas and teachers’ integration of laptops in secondary teaching. British Journal of Educational Technology, 46(2), 360–369. http://doi.org/10.1111/bjet.12139
Jang, S. J., & Chang, Y. (2016). Exploring the technological pedagogical and content knowledge (TPACK) of Taiwanese university physics instructors. Australasian Journal of Educational Technology, 32(1), 107–122. http://doi.org/https://doi.org/10.14742/ajet.2289
Koehler, M. J., & Mishra, P. (2005). Teachers learning technology by design. Journal of Computing in Teacher Education, 21(3), 94–102. http://doi.org/10.1.1.130.7937
Koehler, M. J., Mishra, P., Kereluik, K., Shin, T. S., & Graham, C. R. (2014). The Technological Pedagogical Content Knowledge Framework. In Handbook of Research on Educational Communications and Technology (pp. 101–111). New York 2014: Springer Science Business Media. http://doi.org/10.1007/978-1-4614-3185-5
Koehler, M. J., Mishra, P., & Yahya, K. (2007). Tracing the development of teacher knowledge in a design seminar: Integrating content, pedagogy and technology. Computers and Education, 49(3), 740–762. http://doi.org/10.1016/j.compedu.2005.11.012
Lee, M.-H., & Tsai, C.-C. (2010). Exploring teachers’ perceived self efficacy and technological pedagogical content knowledge with respect to educational use of the World wide Web. Instructional Science, 38(1), 1–21. http://doi.org/10.1007/s11251-008-9075-4
Levinz, A. O., & Klieger, A. (2012). How do we know they can do it? Developing TPACK in a pre-service course. International Journal of Learning Technology, 7(4), 400. http://doi.org/10.1504/IJLT.2012.052213
López-Vargas, O., Duarte-Suárez, L., & Ibáñez-Ibáñez, J. (2017). Teacher’s computer self-efficacy and its relationship with cognitive style and TPACK. Improving Schools, 136548021770426. http://doi.org/10.1177/1365480217704263
Matlin, M. D., & McGee, D. J. (1997). Photorefractive nonlinear optics in the undergraduate physics laboratory. American Journal of Physics, 65(7), 622–634. http://doi.org/10.1119/1.18619
McCormick, R., Murphy, P., & Hennessy, S. (1994). Problem-solving processes in technology education: A pilot study. International Journal of Technology and Design Education, 4(1), 5–34. http://doi.org/10.1007/BF01197581
TOJET: The Turkish Online Journal of Educational Technology – January 2018, volume 17 issue 1
Copyright © The Turkish Online Journal of Educational Technology 35
Michael Neubrand, Nanette Seago, T. W. (2009). The Balance of Teacher Knowledge: Mathematics and Pedagogy. In R. Even & D. L. Ball (Eds.), The Professional Education and Development of Teachers of Mathematics: The 15th ICMI Study (Vol. 11, p. 277). Boston, MA: Springer US. http://doi.org/10.1007/978-0-387-09601-8
Mouza, C., Karchmer-Klein, R., Nandakumar, R., Ozden, S. Y., & Hu, L. (2014). Investigating the impact of an integrated approach to the development of preservice teachers’ technological pedagogical content knowledge (TPACK). Computers & Education, 71(Advance online publication), 206–221. http://doi.org/10.1016/j.compedu.2013.09.020
Niess, M. L. (2005). Preparing teachers to teach science and mathematics with technology: Developing a technology pedagogical content knowledge. Teaching and Teacher Education, 21(5), 509–523. http://doi.org/10.1016/j.tate.2005.03.006
Niess, M. L. (2011). Investigating TPACK: Knowledge Growth in Teaching with Technology. Journal of Educational Computing Research, 44(3), 299–317. http://doi.org/10.2190/EC.44.3.c
Niess, M. L. (2013). Central Component Descriptors for Levels of Technological Pedagogical. Journal Educational Computing Research, 48(2), 173–198. http://doi.org/10.2190/EC.48.2.d
Niess, M. L., van Zee, E. H., & Gillow-Wiles, H. (2010). Knowledge Growth in Teaching Mathematics/Science with Spreadsheets. Journal of Digital Learning in Teacher Education, 27(2), 42–52. http://doi.org/10.1080/21532974.2010.10784657
Polak, R., Cua, A. J., Perez, D. J., Robertson, M. Q., Stuck, J. a., & Thomas, J. M. (2014). Low-cost student experiments in optics. The Physics Teacher, 52(7), 442–443. http://doi.org/10.1119/1.4895370
Schmidt, D., & Baran, E. (2009). Technological Pedagogical Content Knowledge (TPACK): The Development and Validation of an Assessment Instrument for Preservice Teachers. Journal of Research on Technology in Education, 42(2), 123–149. http://doi.org/http://dx.doi.org/10.1080/15391523.2009.10782544
Shulman, L. S. (1986). Those Who Understand: Knowledge Growth in Teaching. American Education Research Association, 15(2), 4–14. http://doi.org/10.1017/CBO9781107415324.004
Sokoloff, D. R. (2016). Active Learning Strategies for Introductory Light and Optics. The Physics Teacher, 54, 18–22. http://doi.org/10.1119/1.4937966
Srisawasdi, N. (2012). The Role of TPACK in Physics Classroom: Case Studies of Preservice Physics Teachers. Procedia - Social and Behavioral Sciences, 46, 3235–3243. http://doi.org/10.1016/j.sbspro.2012.06.043
Steinberg, R., Oberem, G., & McDermott, L. C. (1996). Development of a computer-based tutorial on the photoelectric effect. American Journal of Physics. http://doi.org/10.1119/1.18360
Stoilescu, D. (2015). A Critical Examination of the Technological Pedagogical Content Knowledge Framework: Secondary School Mathematics Teachers Integrating Technology. Journal of Educational Computing Research, 52(4), 514–547. http://doi.org/10.1177/0735633115572285
Strijbos, J. W., Martens, R. L., & Jochems, W. M. G. (2004). Designing for interaction: Six steps to designing computer-supported group-based learning. Computers and Education, 42(4), 403–424. http://doi.org/10.1016/j.compedu.2003.10.004
Teodorescu, R. E., Bennhold, C., Feldman, G., & Medsker, L. (2013). New approach to analyzing physics problems: A taxonomy of introductory physics problems. Physical Review Special Topics - Physics Education Research, 9(1), 1–20. http://doi.org/10.1103/PhysRevSTPER.9.010103
Thekaekara, M. P. (1964). Physics and Optics In High Schools. The Physics Teacher, 2(4), 161–164. http://doi.org/10.1119/1.2350766
Tondeur, J., Scherer, R., Siddiq, F., & Baran, E. (2017). A comprehensive investigation of TPACK within pre-service teachers ’ ICT profiles�: Mind the gap�! Australasian Journal of Educational Technology, 33(3), 46–60.
Voogt, J., Fisser, P., Tondeur, J., & Braak, J. van. (2016). Using Theoretical Perspectives in Developing an Understanding of TPACK. In Handbook of Technological Pedagogical Content Knowledge (TPACK) for Educators (Second edi, p. 33). New York: Routledge. Retrieved from https://books.google.pt/books?id=v0d-CwAAQBAJ&lpg=PA177&ots=oX7gR8R6Cm&dq=Survey of Preservice Teachers’ Knowledge of Teaching and Technology&pg=PA323#v=onepage&q=%22Survey of Preservice Teachers’ Knowledge of Teaching and Technology%22&f=false
Ward, C. L. (2013). Teaching With Technology�: Using TPACK To Understand Teaching Expertise in Online Higher Education. Journal Educational Computing Research, 48(2), 153–172. http://doi.org/http://dx.doi.org/10.2190/EC.48.2.c
Willermark, S. (2017). Technological Pedagogical and Content Knowledge: A Review of Empirical Studies Published From 2011 to 2016. Journal of Educational Computing Research, 73563311771311. http://doi.org/10.1177/0735633117713114
Wu, B., Hu, Y., Gu, X., & Lim, C. P. (2016). Professional Development of New Higher Education Teachers with Information and Communication Technology in Shanghai: A Kirkpatrick’s Evaluation Approach. Journal of Educational Computing Research, 54(4), 531–562. http://doi.org/10.1177/0735633115621922

TOJET: The Turkish Online Journal of Educational Technology – January 2018, volume 17 issue 1
Copyright © The Turkish Online Journal of Educational Technology 36
Yerdelen-Damar, S., Boz, Y., & Aydın-Günbatar, S. (2017a). Mediated Effects of Technology Competencies and Experiences on Relations among Attitudes Towards Technology Use, Technology Ownership, and Self Efficacy about Technological Pedagogical Content Knowledge. Journal of Science Education and Technology, 26(4), 394–405. http://doi.org/10.1007/s10956-017-9687-z
Yerdelen-Damar, S., Boz, Y., & Aydın-Günbatar, S. (2017b). Mediated Effects of Technology Competencies and Experiences on Relations among Attitudes Towards Technology Use, Technology Ownership, and Self Efficacy about Technological Pedagogical Content Knowledge. Journal of Science Education and Technology, 26(4), 394–405. http://doi.org/10.1007/s10956-017-9687-z
Zimmerman, B. (1989). A Social Cognitive View of Self -Regulated Academic Learning. Journal of Educational PsychologyBandura&Schunk, 81(3), 329–339. http://doi.org/10.1037/0022-0663.81.3.329
TOJET: The Turkish Online Journal of Educational Technology – January 2018, volume 17 issue 1
Copyright © The Turkish Online Journal of Educational Technology 37
Determinants of Innovation Culture amongst Higher Education Students Siti Hajar Mohd Roffeei Institute of Graduate Studies, University of Malaya [email protected] Farrah Dina Yusop, Ph.D. – Corresponding Author Department of Curriculum & Instructional Technology Faculty of Education, University of Malaya [email protected] Yusniza Kamarulzaman, Ph.D. Department of Marketing, Faculty of Business & Accountancy, University of Malaya [email protected] ABSTRACT Globalisation has made many higher educational institutions reassess their educational contents and research activities in order to enhance innovation culture amongst students of higher education. Many universities now focus on research activities and research funding in raising their reputation and ranking which in turn will improve student intakes, external funding, and student marketability. This paper aims at developing a model of innovation culture which leads to desirable student innovative behaviours. Using a literature-derived questionnaire, data were collected from 1,008 undergraduate students from five public research universities in Malaysia. Findings from structural equation modelling analysis indicate that self-efficacy, effective communications, and climate for innovation are the determinants of innovation culture. While no differences were found for climate for innovation, the findings revealed that self-efficacy, effective communication, and innovation culture to have significant effect on innovative behaviour, indicating the importance of communication and self-belief in building innovation culture and moulding intended behaviour regardless of the situations or environmental conditions. Keywords: Innovation; innovative behavior; organizational culture; higher education; determinant; Malaysia. 1. INTRODUCTION Innovation is the introduction of something new, or changes of doing or seeing things (Rubio, 2012). This ‘something’ could be ideas, behaviours, knowledge, skills, products, services, processes, methods of production, or management systems. As technological innovations are more observable (such as new machines, equipment, and tools), non-technological innovation is more abstract, less obvious, and slightly difficult to grasp. This type of innovation includes organisational innovation, management innovation, and marketing innovation. Studies on innovation culture are mostly found in the management field but not many in higher education settings. The universal definition of innovation culture is yet to be established (Jucevičius, 2007), while the applicability of this concept in education is also under-researched. Innovation culture as a concept is no doubt a part of organisational culture and management concepts. There are three cultural aspects of these concepts: culture has many layers (i.e., values, norms, beliefs, and basic assumptions); these layers need to be shared among members of the institution (students, faculty members/academics, support staff, administrators, and board members); culture is socially influenced by environment and history that shaped the member behaviour. New ideas or innovations might challenge the traditional or usual way of teaching and learning activities or application of theories in educational settings. This gap in the existing literature provides the basis of this research which reviews the literature on innovation culture from management and business organisations, and later tests the hypothesised framework on the actual public university population. There is a dire need to assess student innovativeness, receptiveness to new ideas and innovation culture, and the implementation of innovation ideas as outcomes. Hence, the study aims at developing a model to assess innovation culture from the student perspective. It seeks to understand the roles of effective communications (EC), climate for innovation (CLM), and self-efficacy (SE)
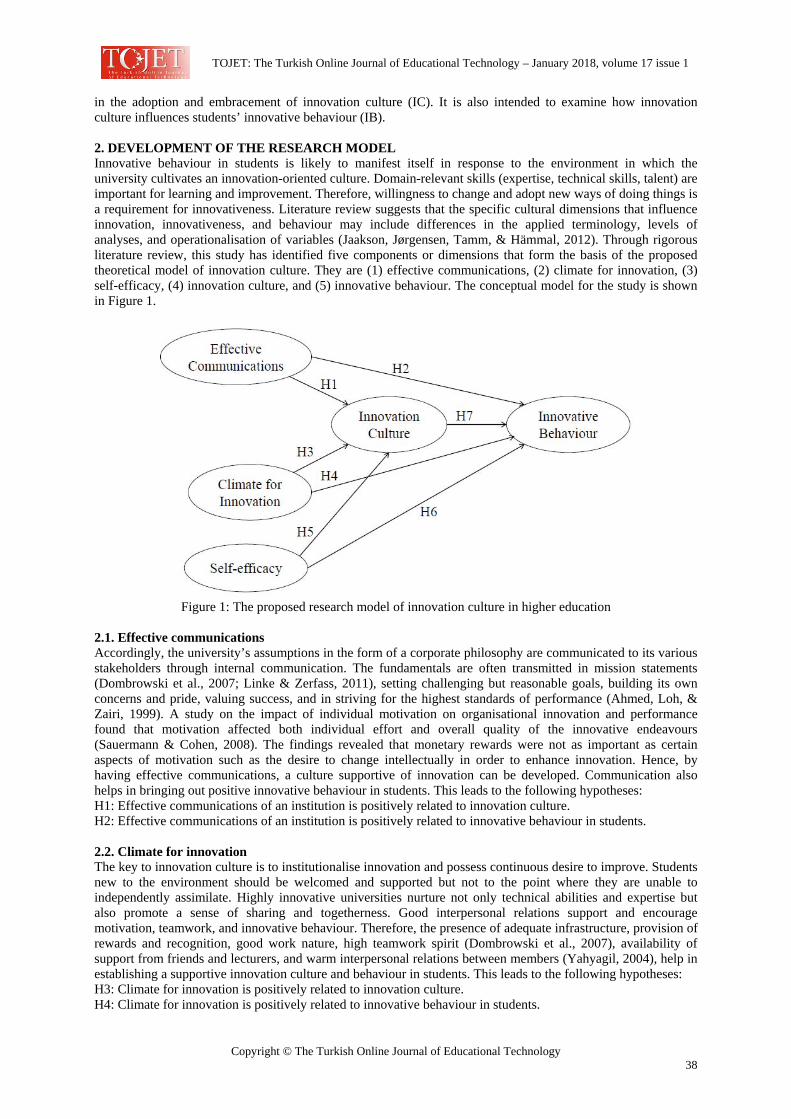
TOJET: The Turkish Online Journal of Educational Technology – January 2018, volume 17 issue 1
Copyright © The Turkish Online Journal of Educational Technology 38
in the adoption and embracement of innovation culture (IC). It is also intended to examine how innovation culture influences students’ innovative behaviour (IB). 2. DEVELOPMENT OF THE RESEARCH MODEL Innovative behaviour in students is likely to manifest itself in response to the environment in which the university cultivates an innovation-oriented culture. Domain-relevant skills (expertise, technical skills, talent) are important for learning and improvement. Therefore, willingness to change and adopt new ways of doing things is a requirement for innovativeness. Literature review suggests that the specific cultural dimensions that influence innovation, innovativeness, and behaviour may include differences in the applied terminology, levels of analyses, and operationalisation of variables (Jaakson, Jørgensen, Tamm, & Hämmal, 2012). Through rigorous literature review, this study has identified five components or dimensions that form the basis of the proposed theoretical model of innovation culture. They are (1) effective communications, (2) climate for innovation, (3) self-efficacy, (4) innovation culture, and (5) innovative behaviour. The conceptual model for the study is shown in Figure 1.
Figure 1: The proposed research model of innovation culture in higher education
2.1. Effective communications Accordingly, the university’s assumptions in the form of a corporate philosophy are communicated to its various stakeholders through internal communication. The fundamentals are often transmitted in mission statements (Dombrowski et al., 2007; Linke & Zerfass, 2011), setting challenging but reasonable goals, building its own concerns and pride, valuing success, and in striving for the highest standards of performance (Ahmed, Loh, & Zairi, 1999). A study on the impact of individual motivation on organisational innovation and performance found that motivation affected both individual effort and overall quality of the innovative endeavours (Sauermann & Cohen, 2008). The findings revealed that monetary rewards were not as important as certain aspects of motivation such as the desire to change intellectually in order to enhance innovation. Hence, by having effective communications, a culture supportive of innovation can be developed. Communication also helps in bringing out positive innovative behaviour in students. This leads to the following hypotheses: H1: Effective communications of an institution is positively related to innovation culture. H2: Effective communications of an institution is positively related to innovative behaviour in students. 2.2. Climate for innovation The key to innovation culture is to institutionalise innovation and possess continuous desire to improve. Students new to the environment should be welcomed and supported but not to the point where they are unable to independently assimilate. Highly innovative universities nurture not only technical abilities and expertise but also promote a sense of sharing and togetherness. Good interpersonal relations support and encourage motivation, teamwork, and innovative behaviour. Therefore, the presence of adequate infrastructure, provision of rewards and recognition, good work nature, high teamwork spirit (Dombrowski et al., 2007), availability of support from friends and lecturers, and warm interpersonal relations between members (Yahyagil, 2004), help in establishing a supportive innovation culture and behaviour in students. This leads to the following hypotheses: H3: Climate for innovation is positively related to innovation culture. H4: Climate for innovation is positively related to innovative behaviour in students.
TOJET: The Turkish Online Journal of Educational Technology – January 2018, volume 17 issue 1
Copyright © The Turkish Online Journal of Educational Technology 39
2.3. Self-efficacy Abilities to execute tasks successfully generate a sense of confidence. Pursuing an idea or a dream requires energy. The feeling of empowerment, self-confidence, and self-assurance, which is developed through a process of social learning, is called self-efficacy (Bandura, 1994) which relates to one’s perception of one’s ability to reach a goal (Zhang et al., 2017). In this research, we define self-efficacy as a student’s perception of his/her ability to explore and envision the development of ideas to solve problems, and to adopt and adapt suitable strategies when making decisions. In this research, five abilities characterise self-efficacy namely curiosity, creativity, flexibility, autonomy, and pro-activeness. Self-efficacy is the expectation that one can master a situation and produce a positive outcome that will bring out positive performance. Such socio-cognitive skills are learnt through observation, imitation and experience which lead to mastery (Chell & Athayde, 2009). Hence, expectations and aspirations affect self-confidence and self-efficacy, thus cultivate innovative thinking and behaviour. This leads to the following hypotheses: H5: Self-efficacy is positively related to innovation culture. H6: Self-efficacy is positively related to innovative student behaviour. 2.4. Innovation culture Innovation culture supports the creation of new ideas and their implementation. Values and beliefs are verbally and non-verbally communicated which shape the individual and organisational behaviours. In this context, these behaviours are conveyed and transmitted through stories, rituals or institutional norms, and spoken language (Fralinger & Olson, 2007; Hogan & Coote, 2014). Stories might include, for example, information about outstanding accomplishments of past alumni, charismatic chancellors and vice-chancellors, outstanding academic staff track records, and prolific research findings, innovations, and achievements. University rituals including convocations, graduations, welcoming and initiating new students, and society activities recognise the importance of rewarding and acknowledging desired student behaviours. They are repetitive activities that reinforce the values of the university, emphasise the important goals, and the people who were and are most important. Such rituals depend on a system of vocal signs or language, to communicate important ideas and feelings, but also a system for organising information and releasing thoughts and responses in other organisations. The use of appropriate language is often thought to be highly influential on students as they observe how others speak, write, and otherwise perform. This is especially true with respect to how they unconsciously learn by example (Fralinger & Olson, 2007; Kuh & Whitt, 1988). This leads to the following hypothesis: H7: Innovation culture of an institution is positively related to innovative behaviour of the students. 2.5. Innovative behaviour An individual or personal attribute, innovative behaviour is defined as the behaviour that is likely to manifest itself in response to environments in which universities practise innovation-oriented culture (Scott & Bruce, 1994). In the context of this study, it is students’ abilities and willingness to be innovative. A student may have the capability to respond to change and new ideas; have tolerance for errors and different views; have freedom to experiment and take calculated risks; and be willing to adopt change and new ways of doing things. 3. METHODOLOGY This study adopts a cross-sectional study designed to test specific hypotheses, and examined specific relationships. The data obtained were subjected to quantitative analyses. The target participants consist only of undergraduates instead of all degree levels. This is to ensure homogeneity of the samples, which in turn reduces the sample bias (Zikmund, Babin, Carr, & Griffin, 2010). Small stationery gifts were given out to respondents as a token of gratitude and to increase the likelihood of respondents’ participation as well as to tackle the non-response issue (Leary, 2014). 3.1. Population, sampling technique and analyses Data were collected from five public research universities (RUs) in Malaysia. These RUs were chosen due to their active role in research, publications, development and commercialisation activities as compared to the normal universities. Most RUs have strategies in exploring new research ideas, investigate innovative methods, and participate in intellectual initiatives to continuously expand cutting edge knowledge. This study employed cluster-sampling technique across all five RUs (the cluster). The cluster sizes (number of undergraduate students of each RU) were not equal, hence probability-proportionate-to-size (PPS) sampling was used (Malhotra, 2007).
TOJET: The Turkish Online Journal of Educational Technology – January 2018, volume 17 issue 1
Copyright © The Turkish Online Journal of Educational Technology 40
The collected data were entered into SPSS version 20 for statistical analyses. Subsequently, AMOS version 21 was used for model validation through structural equation modelling (SEM) techniques. Multivariate techniques were used in this study, comprising exploratory factor analysis (EFA) and confirmatory factor analysis (CFA using SEM). Scale reliability or internal consistency demonstrates the degree of togetherness of items in a scale by which they should be measuring the same underlying construct (Leary, 2014; Pallant, 2005). Indicators used are inter-item correlations and Cronbach’s alpha coefficient (α). Construct validity was established using factor analysis (in SPSS) and SEM (using AMOS). Additionally, construct validity was established in two ways, convergent validity and discriminant validity. To establish convergent validity, the composite reliability (CR) was calculated. A value of .7 or above is deemed acceptable. Discriminant validity on the other hand, is established by measuring the average variance extracted (AVE). A value of more than 0.5 is deemed acceptable and when the square root of the AVE is greater than its correlations with all other constructs, discriminant validity is established (Ramayah & Lee, 2012). 3.2. Instrumentation This study generated its data by using questionnaire through surveys. The questionnaire used measurements and scale items obtained from the literature based on previous empirical studies (see Table 1). The questionnaire consisted of three sections – Part A, Part B, and the Demographic Section. The 41 items in Part A measured four factors: effective communications (EC), climate for innovation (CLM), self-efficacy (SE) and innovative behaviour (IB). Part B of the survey contained 7 items to measure the artefacts of innovation culture (IC). All 48 items (in Parts A and B) used a six-point Likert-type scale ranging from Strongly Disagree (1) to Strongly Agree (6). The equal number of favourable and unfavourable categories makes for a balanced scale. This is to obtain objective data as well as to compel the respondents to answer (Malhotra, 2007; Zikmund et al., 2010). The Demographic Section of the survey was dedicated to collecting students’ demographic data including the area of study (stream), gender, ethnicity, and age group. Table 1 displays the number of items for each factor and its sources.
Table 1: Number of items and sources for factors of innovation culture
Factor Number of items Sources
1. Effective Communications (EC) 8 Dobni (2008); Yahyagil (2004)
2. Climate for Innovation (CLM) 12 Hogan & Coote (2014); Yahyagil (2004)
3. Self-Efficacy (SE) 12
Chell & Atahyde (2009); Craig & Ginter (1975); Dawson, Tan, & McWilliam (2011); Denison, Haaland, & Goelzer (2003); Dobni (2008); Hogan & Coote (2014); Yahyagil (2004)
4. Innovative Behaviour (IB) 9 Calantone, Cavusgil & Zhao (2002); Craig & Ginter (1975); Dawson, Tan, & McWilliam (2011); Denison, Haaland, &Goelzer (2003); Dobni (2008); Yahyagil (2004)
5. Innovation Culture (IC) 7 Hogan & Coote (2014) Total 48
4. RESULTS 4.1. Descriptive analysis 1,110 questionnaires were distributed with 1,059 responses returned accounting for a 95.4% response rate. 51 participants were excluded from analysis because 36 were postgraduate students (eliminated as they were not the target samples) and 15 were dismissed due to unengaged responses by which there was very little variance in answer across all 48 items in the survey questionnaire (the dismissal was based on very low standard deviation values of between .0 and .2). The remaining 1,008 responses (95.2%) were usable for subsequent analyses. Science-based respondents accounted for 56.8% as compared to the non-sciences (43.2%). This reflects the normal composition of degree courses offered in Malaysian research universities. There were more females (62.4%) than males (34.8%) respondents, while some refused to disclose their gender (2.8%). The majority of respondents (88.2%) were Malay (65.7%) and Chinese (22.5%) students. In terms of age group, the majority of respondents were between 21 and 24 years old (78.3%) and those aged 17 to 20 (17.1%). Again, this reflects the normal composition of gender, ethnicity, and age group in Malaysian undergraduates. A summary of the demographic profile of respondents is as shown in Table 2.
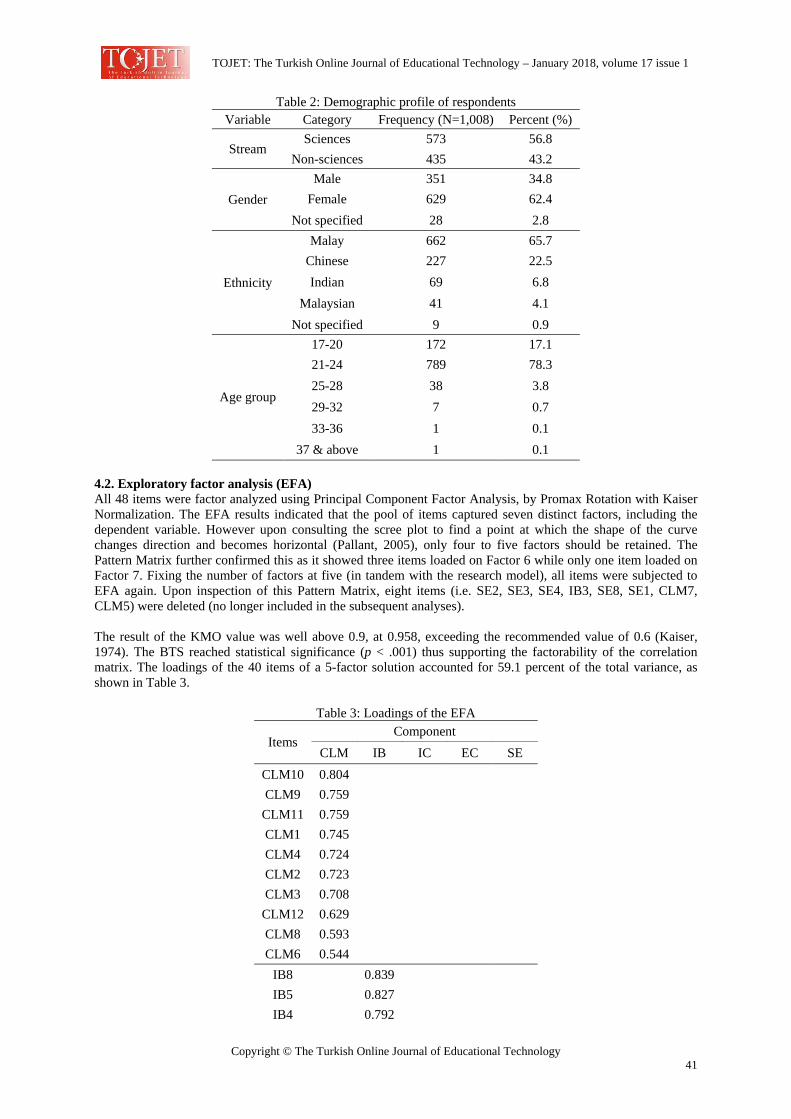
TOJET: The Turkish Online Journal of Educational Technology – January 2018, volume 17 issue 1
Copyright © The Turkish Online Journal of Educational Technology 41
Table 2: Demographic profile of respondents Variable Category Frequency (N=1,008) Percent (%)
Stream Sciences 573 56.8
Non-sciences 435 43.2
Gender Male 351 34.8
Female 629 62.4 Not specified 28 2.8
Ethnicity
Malay 662 65.7 Chinese 227 22.5 Indian 69 6.8
Malaysian 41 4.1 Not specified 9 0.9
Age group
17-20 172 17.1 21-24 789 78.3 25-28 38 3.8 29-32 7 0.7 33-36 1 0.1
37 & above 1 0.1 4.2. Exploratory factor analysis (EFA) All 48 items were factor analyzed using Principal Component Factor Analysis, by Promax Rotation with Kaiser Normalization. The EFA results indicated that the pool of items captured seven distinct factors, including the dependent variable. However upon consulting the scree plot to find a point at which the shape of the curve changes direction and becomes horizontal (Pallant, 2005), only four to five factors should be retained. The Pattern Matrix further confirmed this as it showed three items loaded on Factor 6 while only one item loaded on Factor 7. Fixing the number of factors at five (in tandem with the research model), all items were subjected to EFA again. Upon inspection of this Pattern Matrix, eight items (i.e. SE2, SE3, SE4, IB3, SE8, SE1, CLM7, CLM5) were deleted (no longer included in the subsequent analyses). The result of the KMO value was well above 0.9, at 0.958, exceeding the recommended value of 0.6 (Kaiser, 1974). The BTS reached statistical significance (p < .001) thus supporting the factorability of the correlation matrix. The loadings of the 40 items of a 5-factor solution accounted for 59.1 percent of the total variance, as shown in Table 3.
Table 3: Loadings of the EFA
Items Component
CLM IB IC EC SE CLM10 0.804 CLM9 0.759
CLM11 0.759 CLM1 0.745 CLM4 0.724 CLM2 0.723 CLM3 0.708
CLM12 0.629 CLM8 0.593 CLM6 0.544
IB8 0.839 IB5 0.827 IB4 0.792
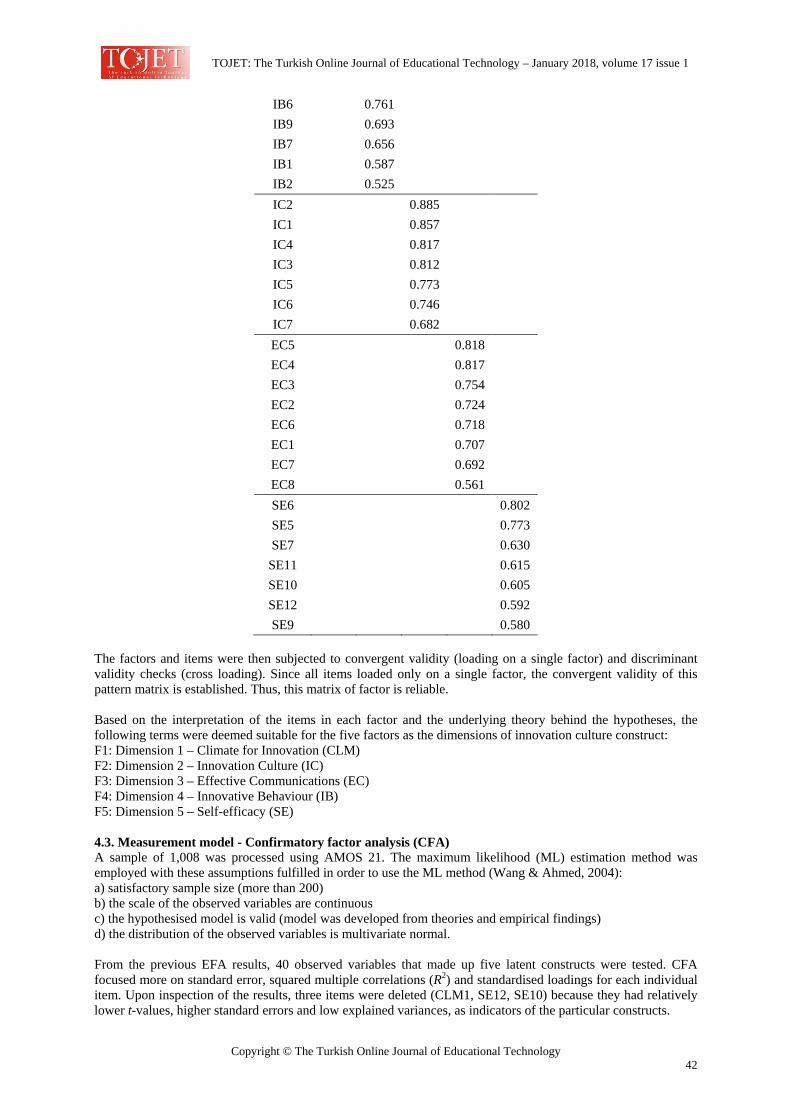
TOJET: The Turkish Online Journal of Educational Technology – January 2018, volume 17 issue 1
Copyright © The Turkish Online Journal of Educational Technology 42
IB6 0.761 IB9 0.693 IB7 0.656 IB1 0.587 IB2 0.525 IC2 0.885 IC1 0.857 IC4 0.817 IC3 0.812 IC5 0.773 IC6 0.746 IC7 0.682 EC5 0.818 EC4 0.817 EC3 0.754 EC2 0.724 EC6 0.718 EC1 0.707 EC7 0.692 EC8 0.561 SE6 0.802 SE5 0.773 SE7 0.630
SE11 0.615 SE10 0.605 SE12 0.592 SE9 0.580
The factors and items were then subjected to convergent validity (loading on a single factor) and discriminant validity checks (cross loading). Since all items loaded only on a single factor, the convergent validity of this pattern matrix is established. Thus, this matrix of factor is reliable. Based on the interpretation of the items in each factor and the underlying theory behind the hypotheses, the following terms were deemed suitable for the five factors as the dimensions of innovation culture construct: F1: Dimension 1 – Climate for Innovation (CLM) F2: Dimension 2 – Innovation Culture (IC) F3: Dimension 3 – Effective Communications (EC) F4: Dimension 4 – Innovative Behaviour (IB) F5: Dimension 5 – Self-efficacy (SE) 4.3. Measurement model - Confirmatory factor analysis (CFA) A sample of 1,008 was processed using AMOS 21. The maximum likelihood (ML) estimation method was employed with these assumptions fulfilled in order to use the ML method (Wang & Ahmed, 2004): a) satisfactory sample size (more than 200) b) the scale of the observed variables are continuous c) the hypothesised model is valid (model was developed from theories and empirical findings) d) the distribution of the observed variables is multivariate normal. From the previous EFA results, 40 observed variables that made up five latent constructs were tested. CFA focused more on standard error, squared multiple correlations (R2) and standardised loadings for each individual item. Upon inspection of the results, three items were deleted (CLM1, SE12, SE10) because they had relatively lower t-values, higher standard errors and low explained variances, as indicators of the particular constructs.
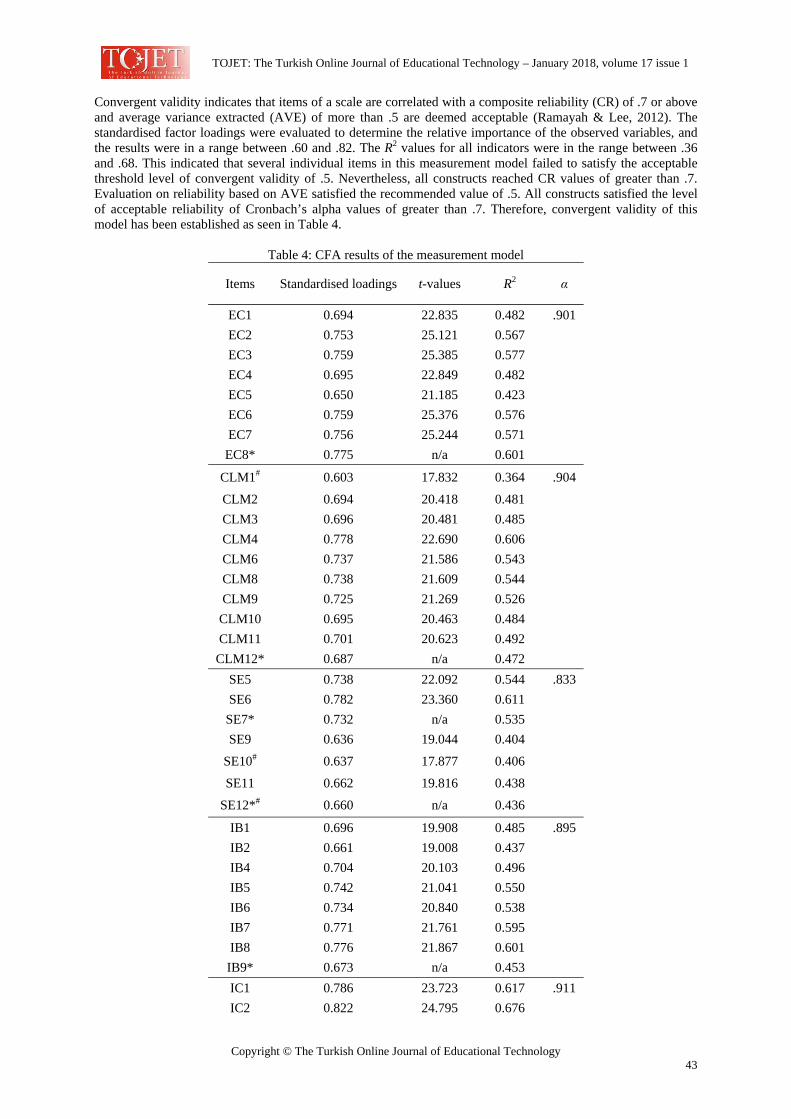
TOJET: The Turkish Online Journal of Educational Technology – January 2018, volume 17 issue 1
Copyright © The Turkish Online Journal of Educational Technology 43
Convergent validity indicates that items of a scale are correlated with a composite reliability (CR) of .7 or above and average variance extracted (AVE) of more than .5 are deemed acceptable (Ramayah & Lee, 2012). The standardised factor loadings were evaluated to determine the relative importance of the observed variables, and the results were in a range between .60 and .82. The R2 values for all indicators were in the range between .36 and .68. This indicated that several individual items in this measurement model failed to satisfy the acceptable threshold level of convergent validity of .5. Nevertheless, all constructs reached CR values of greater than .7. Evaluation on reliability based on AVE satisfied the recommended value of .5. All constructs satisfied the level of acceptable reliability of Cronbach’s alpha values of greater than .7. Therefore, convergent validity of this model has been established as seen in Table 4.
Table 4: CFA results of the measurement model
Items Standardised loadings t-values R2 α
EC1 0.694 22.835 0.482 .901 EC2 0.753 25.121 0.567 EC3 0.759 25.385 0.577 EC4 0.695 22.849 0.482 EC5 0.650 21.185 0.423 EC6 0.759 25.376 0.576 EC7 0.756 25.244 0.571
EC8* 0.775 n/a 0.601
CLM1# 0.603 17.832 0.364 .904
CLM2 0.694 20.418 0.481 CLM3 0.696 20.481 0.485 CLM4 0.778 22.690 0.606 CLM6 0.737 21.586 0.543 CLM8 0.738 21.609 0.544 CLM9 0.725 21.269 0.526
CLM10 0.695 20.463 0.484 CLM11 0.701 20.623 0.492
CLM12* 0.687 n/a 0.472 SE5 0.738 22.092 0.544 .833 SE6 0.782 23.360 0.611
SE7* 0.732 n/a 0.535 SE9 0.636 19.044 0.404
SE10# 0.637 17.877 0.406
SE11 0.662 19.816 0.438
SE12*# 0.660 n/a 0.436
IB1 0.696 19.908 0.485 .895 IB2 0.661 19.008 0.437 IB4 0.704 20.103 0.496 IB5 0.742 21.041 0.550 IB6 0.734 20.840 0.538 IB7 0.771 21.761 0.595 IB8 0.776 21.867 0.601
IB9* 0.673 n/a 0.453 IC1 0.786 23.723 0.617 .911 IC2 0.822 24.795 0.676
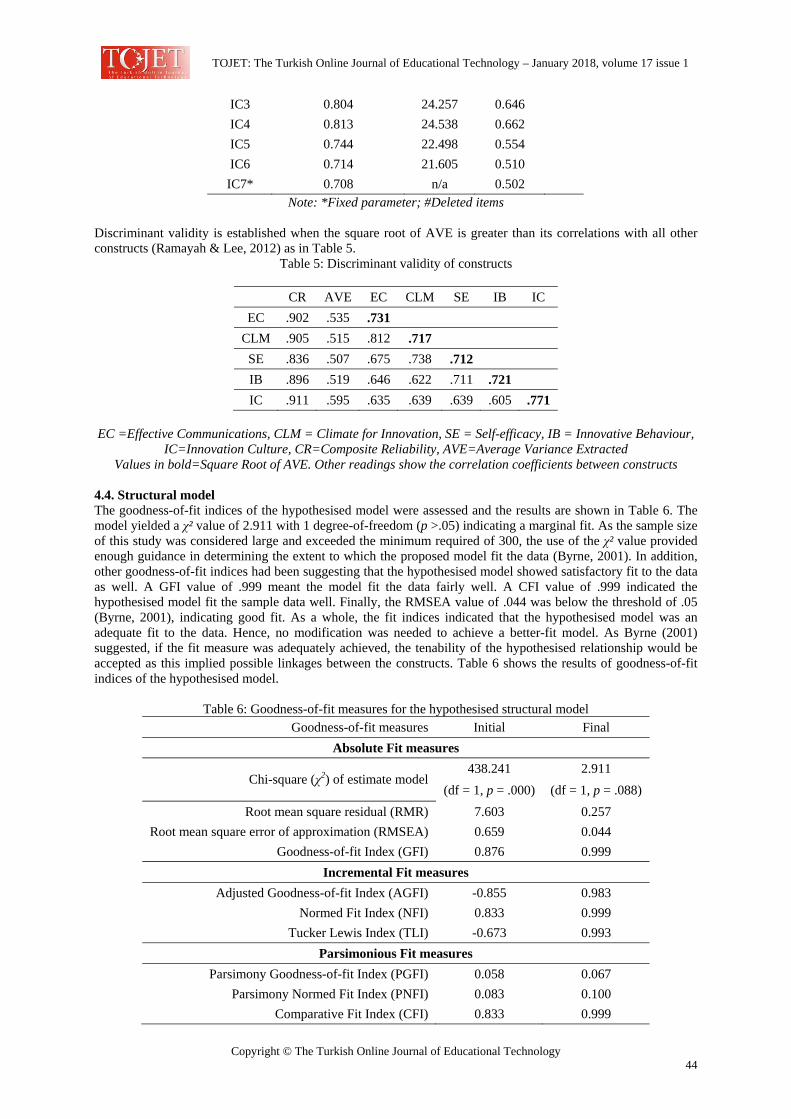
TOJET: The Turkish Online Journal of Educational Technology – January 2018, volume 17 issue 1
Copyright © The Turkish Online Journal of Educational Technology 44
IC3 0.804 24.257 0.646 IC4 0.813 24.538 0.662 IC5 0.744 22.498 0.554 IC6 0.714 21.605 0.510
IC7* 0.708 n/a 0.502 Note: *Fixed parameter; #Deleted items
Discriminant validity is established when the square root of AVE is greater than its correlations with all other constructs (Ramayah & Lee, 2012) as in Table 5.
Table 5: Discriminant validity of constructs
CR AVE EC CLM SE IB IC EC .902 .535 .731
CLM .905 .515 .812 .717 SE .836 .507 .675 .738 .712 IB .896 .519 .646 .622 .711 .721 IC .911 .595 .635 .639 .639 .605 .771
EC =Effective Communications, CLM = Climate for Innovation, SE = Self-efficacy, IB = Innovative Behaviour,
IC=Innovation Culture, CR=Composite Reliability, AVE=Average Variance Extracted Values in bold=Square Root of AVE. Other readings show the correlation coefficients between constructs
4.4. Structural model The goodness-of-fit indices of the hypothesised model were assessed and the results are shown in Table 6. The model yielded a χ² value of 2.911 with 1 degree-of-freedom (p >.05) indicating a marginal fit. As the sample size of this study was considered large and exceeded the minimum required of 300, the use of the χ² value provided enough guidance in determining the extent to which the proposed model fit the data (Byrne, 2001). In addition, other goodness-of-fit indices had been suggesting that the hypothesised model showed satisfactory fit to the data as well. A GFI value of .999 meant the model fit the data fairly well. A CFI value of .999 indicated the hypothesised model fit the sample data well. Finally, the RMSEA value of .044 was below the threshold of .05 (Byrne, 2001), indicating good fit. As a whole, the fit indices indicated that the hypothesised model was an adequate fit to the data. Hence, no modification was needed to achieve a better-fit model. As Byrne (2001) suggested, if the fit measure was adequately achieved, the tenability of the hypothesised relationship would be accepted as this implied possible linkages between the constructs. Table 6 shows the results of goodness-of-fit indices of the hypothesised model.
Table 6: Goodness-of-fit measures for the hypothesised structural model Goodness-of-fit measures Initial Final
Absolute Fit measures
Chi-square (χ2) of estimate model 438.241 2.911
(df = 1, p = .000) (df = 1, p = .088) Root mean square residual (RMR) 7.603 0.257
Root mean square error of approximation (RMSEA) 0.659 0.044 Goodness-of-fit Index (GFI) 0.876 0.999
Incremental Fit measures Adjusted Goodness-of-fit Index (AGFI) -0.855 0.983
Normed Fit Index (NFI) 0.833 0.999 Tucker Lewis Index (TLI) -0.673 0.993
Parsimonious Fit measures Parsimony Goodness-of-fit Index (PGFI) 0.058 0.067
Parsimony Normed Fit Index (PNFI) 0.083 0.100 Comparative Fit Index (CFI) 0.833 0.999
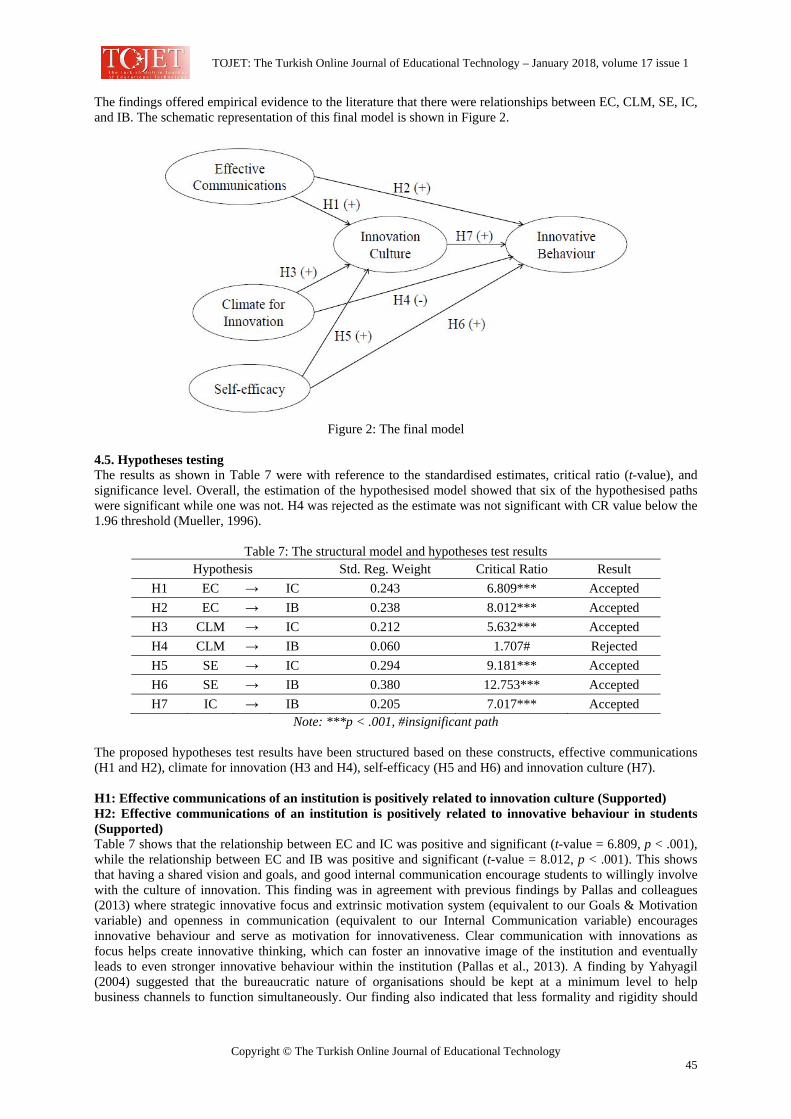
TOJET: The Turkish Online Journal of Educational Technology – January 2018, volume 17 issue 1
Copyright © The Turkish Online Journal of Educational Technology 45
The findings offered empirical evidence to the literature that there were relationships between EC, CLM, SE, IC, and IB. The schematic representation of this final model is shown in Figure 2.
Figure 2: The final model
4.5. Hypotheses testing The results as shown in Table 7 were with reference to the standardised estimates, critical ratio (t-value), and significance level. Overall, the estimation of the hypothesised model showed that six of the hypothesised paths were significant while one was not. H4 was rejected as the estimate was not significant with CR value below the 1.96 threshold (Mueller, 1996).
Table 7: The structural model and hypotheses test results Hypothesis Std. Reg. Weight Critical Ratio Result
H1 EC → IC 0.243 6.809*** Accepted H2 EC → IB 0.238 8.012*** Accepted H3 CLM → IC 0.212 5.632*** Accepted H4 CLM → IB 0.060 1.707# Rejected H5 SE → IC 0.294 9.181*** Accepted H6 SE → IB 0.380 12.753*** Accepted H7 IC → IB 0.205 7.017*** Accepted
Note: ***p < .001, #insignificant path The proposed hypotheses test results have been structured based on these constructs, effective communications (H1 and H2), climate for innovation (H3 and H4), self-efficacy (H5 and H6) and innovation culture (H7). H1: Effective communications of an institution is positively related to innovation culture (Supported) H2: Effective communications of an institution is positively related to innovative behaviour in students (Supported) Table 7 shows that the relationship between EC and IC was positive and significant (t-value = 6.809, p < .001), while the relationship between EC and IB was positive and significant (t-value = 8.012, p < .001). This shows that having a shared vision and goals, and good internal communication encourage students to willingly involve with the culture of innovation. This finding was in agreement with previous findings by Pallas and colleagues (2013) where strategic innovative focus and extrinsic motivation system (equivalent to our Goals & Motivation variable) and openness in communication (equivalent to our Internal Communication variable) encourages innovative behaviour and serve as motivation for innovativeness. Clear communication with innovations as focus helps create innovative thinking, which can foster an innovative image of the institution and eventually leads to even stronger innovative behaviour within the institution (Pallas et al., 2013). A finding by Yahyagil (2004) suggested that the bureaucratic nature of organisations should be kept at a minimum level to help business channels to function simultaneously. Our finding also indicated that less formality and rigidity should
TOJET: The Turkish Online Journal of Educational Technology – January 2018, volume 17 issue 1
Copyright © The Turkish Online Journal of Educational Technology 46
allow students to act and react with positive innovative behaviour without being intimidated by restrictions and unnecessary procedures. H3: Climate for innovation is positively related to innovation culture (Supported) Table 7 shows that the relationship between CLM and IC was positive and significant (t-value = 5.632, p < .001). Warm interpersonal relations between members support and encourage teamwork, presence of adequate infrastructure, provision of rewards and recognition, good work nature, availability of support from friends and lecturers, thus help in establishing a positive innovation culture. This finding was in agreement with previous study by Yahyagil (2004) which indicated that supportive culture or the provision of managerial support to the organisation members is a must. Being able to share all the resources and knowledge with others through teamwork and collaboration together with having warm interrelation among members, help in creating the right environment for innovative supporting activities. H4: Climate for innovation is positively related to innovative behaviour in students (Not supported) The proposed relationship in H4 was rejected (t-value = 1.707, p = .060) indicating no relationship between CLM and IB. This finding surprisingly does not contradict a previous study suggesting that support and collaboration (or teamwork) had no significant effect on innovativeness (Hurley & Hult, 1998). Values such as teamwork, stability, cooperation, and lack of conflict when highly shared do not foster innovation efforts (Jaskyte & Dressler, 2005). This could be due to the nature of current campus life. Often, students are left to themselves to figure out many things in relation to studying materials, campus layout, and details of their respective timetables. This develops their sense of independence, regardless of having support of friends or lecturers. It is also noted that the university rarely acknowledges little achievements by students especially at individual levels. When students participate in collaborative effort, it is compulsory rather than voluntary. This could be why there is no connection between climate for innovation and innovative behaviour. H5: Self-efficacy is positively related to innovation culture (Supported) H6: Self-efficacy is positively related to innovative student behaviour (Supported) Table 7 shows that relationship between SE and IC was positive and significant (t-value = 9.181, p < .001) while the relationship between SE and IB was positive and even more significant (t-value = 12.753, p < .001). Being curious, creative, flexible, pro-active, and having freedom from external control help in cultivating a positive innovation culture. Yahyagil (2004) put emphasis on personal freedom to become more creative as to encourage and enable members to take risks, make business decisions independently. Another study stated that creativity alone is not sufficient to foster innovation. It has to be complemented by curiosity, self-belief, self-assurance, feelings of empowerment, and social confidence in order to exploit opportunities, generate innovation ideas, and manage risks (Chell & Athayde, 2009). H7: Innovation culture of an institution is positively related to innovative behaviour of the students (Supported) Table 7 shows that the relationship between IC and IB was positive and significant (t-value = 7.017, p < .001). How students react towards or perceive stories, rituals, and supporting language used in their respective university campus affects their subsequent innovative behaviour. This finding was in agreement with previous study that found innovative behaviour frequently depends on artefacts that support such behaviours although empirical support for a direct link between the two is mixed. In particular, the study also found that expectations of behaviours for innovation which appeared in stories, rituals, and language supporting innovative behaviours are important in eliciting such behaviours (Hogan & Coote, 2014). Another study found critical importance of artefacts for guiding market-oriented behaviour (Homburg & Pflesser, 2000), which in the context of our study, is reflected by the innovative behaviour of students. 5. DISCUSSION The results suggested that self-efficacy (SE) is a major determinant of innovation culture (IC) followed by effective communications (EC) and climate for innovation (CLM) (see Table 7). The findings are within expectation as several previous studies have found the same effects of EC, CLM and SE on the culture supportive of innovation (Cantwell, Aiman-Smith, & Mullen, 2007; Dobni, 2008; Pallas et al., 2013; Yahyagil, 2004). SE was found to significantly influence IC. In this study, empowerment is one of the key contributors to behaviour. Students’ abilities to carry out tasks successfully within and outside the campus supported the Bandura (1994) SE theory. This finding supported Dobni’s study (2008) which found that the main dimension contributing to IC was the implementation context. In essence, Dobni’s study explained that personal level of

TOJET: The Turkish Online Journal of Educational Technology – January 2018, volume 17 issue 1
Copyright © The Turkish Online Journal of Educational Technology 47
energy and determination is essential for students in carrying out plans and action to innovate and make use of available infrastructure and innovation tools. EC was found to influence IC by which this finding validates Yahyagil’s (2004) argument about how institutions with open internal communication probably have greater access to communication channels and information. This availability or accessibility in turn will minimise restrictions on information exchange and determine how such information is interpreted and evaluated (Calantone et al., 2002; Homburg & Pflesser, 2000; Yahyagil, 2004). The universities must apply open and effective information exchange to disseminate their goals and philosophy. A clear goal and plan, high teamwork spirit along with supportive environment for innovation, provide much needed support for innovation-related activities that would engage students to be more pro-active and creative. The study found that CLM influenced IC. Hence, a university campus with diverse student intakes is more likely to produce a stimulating environment for innovation (Chell & Athayde, 2009). This is also in agreement with Ahmed’s theory (1998) which demonstrated that the presence of adequate infrastructure, provision of rewards and recognition, good work nature, high teamwork spirit, availability of support from friends and lecturers, and warm interpersonal relations between members, would help in establishing a supportive IC. This finding is supportive of previous finding by Yahyagil (2004) which concluded that interaction between cultural and climatic elements logically tends to create suitable platforms for institutional functioning. The results also clearly distinguished that SE is a major determinant of innovative behaviour (IB) followed by EC, whilst CLM had no significant direct effect on behaviour (see Table 7). SE partly governs the motivating influence on outcome expectancies and behaviour in students. This finding is very much in line with previous findings by Bandura (1977, 1994), and Staples, Hulland, and Higgins (1999) suggesting that SE is a good predictor of subsequent behaviour. With growing independence during university years, some experimentation with risky behaviour could be cultivated to expand and strengthen students’ sense of efficacy by enabling them to learn to deal with potential troubles instead of being protected from real world problems. A clear communication (EC) with innovations as focus helps create innovative thinking as this can foster a better university image and further encourage student innovative behaviour. This finding is consistent with the findings of Hogan and Coote (2014) on the positive and significant relationship between IB and norms and values (EC in this study). Another study by Verschuere, Beddeleem, and Verlet (2014) showed that IB is strongly developed when institutions entered into strategic alliances, and later proactively anticipated developments and opportunities in their environment. By adopting goals students set for themselves, academicians and support staff should provide direction to their behaviour and create incentives to persist in their efforts until they reach or fulfil their goals. Meanwhile, CLM was found not to affect IB which means that behaviour may not be predicted by the presence of infrastructure or physical arrangements. This finding surprisingly does not contradict a previous study that suggested support and collaboration (or teamwork) had no significant effect on innovativeness (Hurley & Hult, 1998). Scott and Bruce (1994) also found negative relationship between climate perceptions of support for innovation and IB. One explanation is that values such as teamwork, stability, cooperation, and lack of conflict hinder innovation efforts. Students with strong sense of independence can adopt and adapt even with little support from friends and supervisors. Diversity and open-mindedness improves innovativeness. This implies that EC along with strong sense of self-efficacy (SE) help in moulding the intended innovative behaviour regardless of the environmental situations or conditions. As this study proves, SE which focused on human self-beliefs was more significant in determining IB as compared to EC. Finally, the study found that IC had positive effect and significantly influenced student behaviour. This shows that how students perceived and reacted toward related stories, university rituals, and how information is relayed (as supportive language) in the campus, affect their subsequent behaviour. Hogan and Coote’s (2014) empirical study found mixed support for a direct link between artefacts of innovation (IC) and IB even though they were consistently positive and moderately significant. This might be due to method factor and different classification of organisational culture as factors contributing to this mixed support. Another study showed direct positive relationship between IB and IC (Verschuere et al., 2014), however, it had a different definition of culture in which it acknowledged culture as the importance of participation, learning, and collaboration. Therefore, this study has recognised that there is lack of empirical backing for this particular hypothesis. Figure 3 shows the model for innovation culture and innovative behaviour.
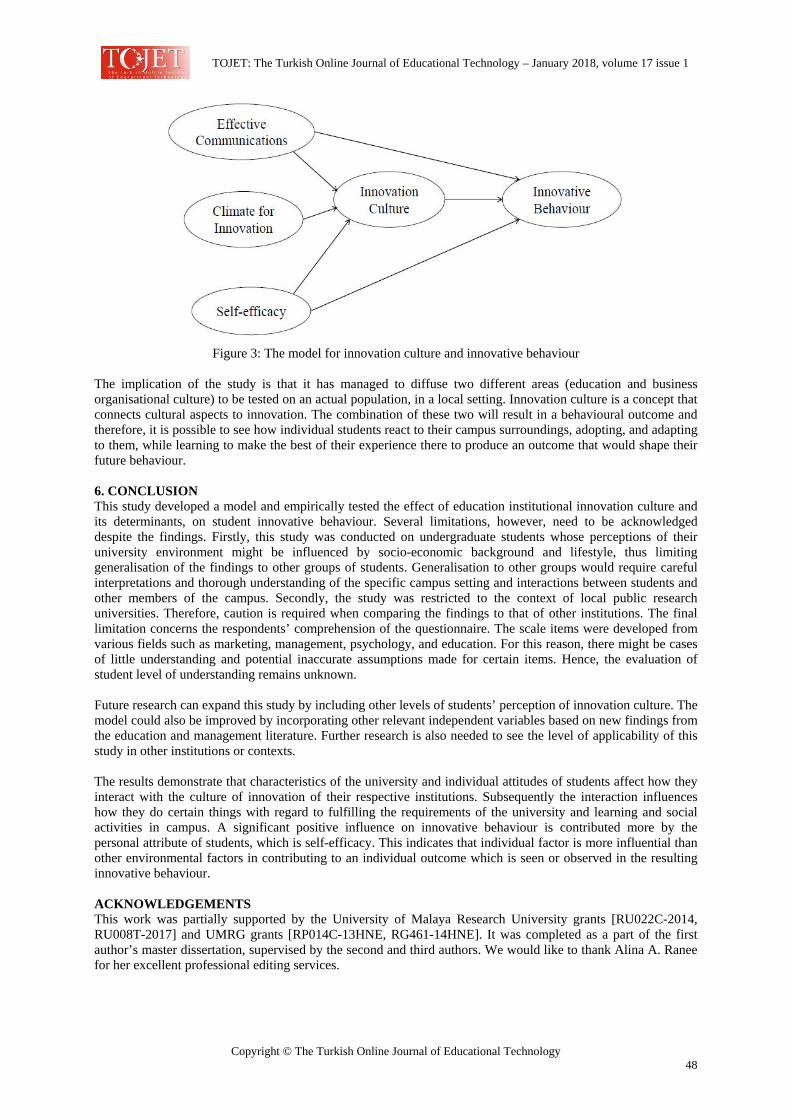
TOJET: The Turkish Online Journal of Educational Technology – January 2018, volume 17 issue 1
Copyright © The Turkish Online Journal of Educational Technology 48
Figure 3: The model for innovation culture and innovative behaviour
The implication of the study is that it has managed to diffuse two different areas (education and business organisational culture) to be tested on an actual population, in a local setting. Innovation culture is a concept that connects cultural aspects to innovation. The combination of these two will result in a behavioural outcome and therefore, it is possible to see how individual students react to their campus surroundings, adopting, and adapting to them, while learning to make the best of their experience there to produce an outcome that would shape their future behaviour. 6. CONCLUSION This study developed a model and empirically tested the effect of education institutional innovation culture and its determinants, on student innovative behaviour. Several limitations, however, need to be acknowledged despite the findings. Firstly, this study was conducted on undergraduate students whose perceptions of their university environment might be influenced by socio-economic background and lifestyle, thus limiting generalisation of the findings to other groups of students. Generalisation to other groups would require careful interpretations and thorough understanding of the specific campus setting and interactions between students and other members of the campus. Secondly, the study was restricted to the context of local public research universities. Therefore, caution is required when comparing the findings to that of other institutions. The final limitation concerns the respondents’ comprehension of the questionnaire. The scale items were developed from various fields such as marketing, management, psychology, and education. For this reason, there might be cases of little understanding and potential inaccurate assumptions made for certain items. Hence, the evaluation of student level of understanding remains unknown. Future research can expand this study by including other levels of students’ perception of innovation culture. The model could also be improved by incorporating other relevant independent variables based on new findings from the education and management literature. Further research is also needed to see the level of applicability of this study in other institutions or contexts. The results demonstrate that characteristics of the university and individual attitudes of students affect how they interact with the culture of innovation of their respective institutions. Subsequently the interaction influences how they do certain things with regard to fulfilling the requirements of the university and learning and social activities in campus. A significant positive influence on innovative behaviour is contributed more by the personal attribute of students, which is self-efficacy. This indicates that individual factor is more influential than other environmental factors in contributing to an individual outcome which is seen or observed in the resulting innovative behaviour. ACKNOWLEDGEMENTS This work was partially supported by the University of Malaya Research University grants [RU022C-2014, RU008T-2017] and UMRG grants [RP014C-13HNE, RG461-14HNE]. It was completed as a part of the first author’s master dissertation, supervised by the second and third authors. We would like to thank Alina A. Ranee for her excellent professional editing services.
TOJET: The Turkish Online Journal of Educational Technology – January 2018, volume 17 issue 1
Copyright © The Turkish Online Journal of Educational Technology 49
REFERENCES Ahmed, P. K. (1998). Culture and climate for innovation. European Journal of Innovation Management, 1(1),
30-43. Ahmed, P. K., Loh, A. Y. E., & Zairi, M. (1999). Cultures for continuous improvement and learning. Total
Quality Management, 10(4-5), 426-434. Bandura, A. (1977). Self-efficacy: Toward a unifying theory of behavioral change. Psychological Review, 84(2),
191-215. Bandura, A. (1994). Self-efficacy. In V. S. Ramachaudran (Ed.), Encyclopedia of Human Behavior (Vol. 4, pp.
71-81). New York, NY: Academic Press. Byrne, B. M. (2001). Structural equation modeling with AMOS: Basic concepts, applications, and programming.
Mahwah, NJ: Lawrence Erlbaum Associates Inc. Calantone, R. J., Cavusgil, S. T., & Zhao, Y. S. (2002). Learning orientation, firm innovation capability, and
firm performance. Industrial Marketing Management, 31, 515-524. Cantwell, A., Aiman-Smith, L., & Mullen, T. (2007). Dimensions of innovation culture: Developing a measure.
Paper presented at the April 2007 Society of Industrial Organizational Psychologists meeting, New York City, NY.
Chell, E., & Athayde, R. (2009). The identification and measurement of innovative characteristics of young people: Development of the youth innovation skills measurement tool. United Kingdom, UK: National Endowment for Science, Technology and the Arts (NESTA).
Craig, C. S., & Ginter, J. L. (1975). An empirical test of a scale for innovativeness. In M. Schlinger (Ed.), Advances in consumer research (Vol. 2, pp. 555-562). Ann Arbor, MI: Association for Consumer Research.
Dawson, S., Tan, J. P. L., & McWilliam, E. (2011). Measuring creative potential: Using social network analysis to monitor a learners’ creative capacity. Australasian Journal of Educational Technology, 27(6), 924-942.
Denison, D. R., Haaland, S., & Goelzer, P. (2003). Corporate culture and organizational effectiveness: Is there a similar pattern around the world? In J. Osland (Ed.), Advances in global leadership (Vol. 3, pp. 205-227). Boston, MA: Elsevier Science.
Dobni, B. D. (2008). Measuring innovation culture in organizations: The development of a generalized innovation culture construct using exploratory factor analysis. European Journal of Innovation Management, 11(4), 539-559.
Dombrowski, C., Kim, J., Desouza, K., Braganza, A., Papagari, S., Baloh, P., & Jha, S. (2007). Elements of innovative cultures. Knowledge and Process Management, 14(3), 190–202.
Fralinger, B., & Olson, V. (2007). Organizational culture at the university level: A study using the OCAI instrument. Journal of College Teaching & Learning, 4(11), 85-97.
Hogan, S. J., & Coote, L. V. (2014). Organizational culture, innovation, and performance: A test of Schein’s model. Journal of Business Research, 67, 1609-1621.
Homburg, C., & Pflesser, C. (2000). A multiple-layer model of market-oriented organizational culture: Measurement issues and performance outcomes. Journal of Marketing Research, 37(4), 449-462.
Hurley, R. F., & Hult, G. T. M. (1998). Innovation, market orientation, and organizational learning: An integration and empirical examination. Journal of Marketing, 62(3), 42-54.
Jaakson, K., Jørgensen, F., Tamm, D., & Hämmal, G. (2012). Investigating cultural influences on innovation: A comparison of Estonian and Danish biotechnology organizations. In E. G. Carayannis (Ed.), Innovation systems in small catching-up economies: Springer Science & Business Media.
Jaskyte, K., & Dressler, W. W. (2005). Organizational culture and innovation in nonprofit human service organizations. Administration in Social Work, 29(2), 23-41.
Jucevičius, G. (2007). Innovation culture: The contestable universality of the concept. Social Sciences, 58(4), 7-19.
Kaiser, H. F. (1974). An index of factorial simplicity. Psychometrika, 39, 31–36. Kuh, G. D., & Whitt, E. J. (1988). The invisible tapestry: Culture in American colleges and universities. (ISBN-
0-913317-45-4). Ottawa, Canada: Association for the Study of Higher Education: Canadian Association of University Teachers.
Leary, M. R. (2014). Introduction to behavioral research methods (6th ed.). Harlow, NJ: Pearson Education Limited.
Linke, A., & Zerfass, A. (2011). Internal communication and innovation culture: developing a change framework. Journal of Communication Management, 15(4), 332 - 348. doi:10.1108/13632541111183361
Malhotra, N. K. (2007). Marketing research: An applied orientation. Harlow, NJ: Pearson Education Limited. Mueller, R. O. (1996). Basic principles of structural equation modeling: An introduction to LISREL and EQS.
New York, NY: Springer-Verlag. Pallant, J. F. (2005). SPSS survival manual: A step by step guide to data analysis using SPSS for Windows
(Version 12). NSW, Australia: Allen & Unwin.
TOJET: The Turkish Online Journal of Educational Technology – January 2018, volume 17 issue 1
Copyright © The Turkish Online Journal of Educational Technology 50
Pallas, F., Böckermann, F., Goetz, O., & Tecklenburg, K. (2013). Investigating organizational innovativeness: Developing a multidimensional formative measure. International Journal of Innovation Management, 17(4), 1-41.
Ramayah, T., & Lee, J. W. C. (2012). System characteristics, satisfaction and e-learning usage: A structural equation model (SEM). TOJET-The Turkish Online Journal of Educational Technology, 11(2), 196-206.
Rubio, F. (2012). Innovation and good practices in university government and management. Universities and Knowledge Society Journal (RUSC), 9(2), 261-266.
Sauermann, H., & Cohen, W. M. (2008). What makes them tick? Employee motives and firm innovation. Retrieved from http://www.nber.org/papers/w14443
Scott, S. G., & Bruce, R. A. (1994). Determinants of innovative behavior: A path model of individual innovation in the workplace. Academy of Management Journal, 37(3), 580-607.
Staples, D. S., Hulland, J. S., & Higgins, C. A. (1999). A self-efficacy theory explanation for the management of remote workers in virtual organizations. Organization Science, 10(6), 758-776.
Verschuere, B., Beddeleem, E., & Verlet, D. (2014). Determinants of innovative behaviour in flemish nonprofit organizations: An empirical research. Public Management Review, 16(2), 173-198. doi:10.1080/14719037.2012.757347
Wang, C. L., & Ahmed, P. K. (2004). The development and validation of the organisational innovativeness construct using confirmatory factor analysis. European Journal of Innovation Management, 7(4), 303-313.
Yahyagil, M. Y. (2004). The interdependence between the concepts of organizational culture and organizational climate: An empirical investigation. Journal of Business Administration, 33(1), 69-98.
Zhang, F., Kaufman, D., Schell, R., Salgado, G., Seah, E. T. W., & Jeremic, J. (2017). Situated learning through intergenerational play between older adults and undergraduates. International Journal of Educational Technology in Higher education, 14(16), 1-16. doi:10.1186/s41239-017-0055-0
Zikmund, W. G., Babin, B. J., Carr, J. C., & Griffin, M. (2010). Business research method (8th ed.). Mason, OH: South-Western/Cengage Learning.
TOJET: The Turkish Online Journal of Educational Technology – January 2018, volume 17 issue 1
Copyright © The Turkish Online Journal of Educational Technology 51
Developing a Blended Learning-Based Method for Problem-Solving in Capability Learning Wasis D. Dwiyogo Faculty of Sports Science, Universitas Negeri Malang, Indonesia [email protected]
ABSTRACT The main objectives of the study were to develop and investigate the implementation of blended learning-based method for problem-solving. Three experts were involved in the study and all three had stated that the model was ready to be applied in the classroom. The implementation of the blended learning-based design for problem-solving was conducted between 2015 and 2016 where sixty graduate students majoring in physical education became the participants. Furthermore, the model was implemented for the second time between 2016 and 2017 in different settings where 3 (three) students became the participants. Based on the observation during the development and the evaluation process, the implementation of the blended learning-based method for problem-solving had positive effect. Implications for further implementations, suggestions for further research, and limitations of the current study are also discussed. INTRODUCTION The purpose of learning is to improve and develop the quality of learning. In order to develop the quality of learning, one should select, establish and develop an optimum learning method to achieve desired outcome (Degeng, 1991). Reigeluth (1983) defines learning design as a process to determine which learning methodology that works most effectively so that learners experience change of knowledge and skills towards the expected direction. Furthermore, Reigeluth (1983) also uses the term blue print for learning design and the blue print for learning is developed in the same proses as an architect designs a building and bridge; the design of the building should match the blue print. In order to develop learning design, one should also analyze future trends in learning especially those related to learning strategy and content. There is a tendency that learning strategy has been shifted from traditional learning method to future learning, which is called the era of knowledge, where learners can learn anywhere be it in the classroom, library or at home, anytime be it in the morning at school, in the afternoon or in the evening, from anyone that means learners can have various learning sources i.e. lecturers, experts, practitioners or the society and by any means which means learners can use numerous types of learning media, for example the internet, CDs, radio, television, laboratory or their own experience. The kind of learning that combines various learning sources and modes is currently called blended learning which is derived from the world ”blended” which means combination or mixture and ”learning” which means to learn or study. The real and most general meaning of blended learning refers to learning activity that combines or mixes face-to-face learning and computer-based learning (online and offline). Thorne (2003) describes blended learning as it represents an opportunity to integrate the innovative and technological advances offered by online learning with the interaction and participation offered in the best of traditional learning. The findings of Purcell, Boxall, and Wright’s study (2009) about the contributions of blended-learning components show that the learning components with the most contribution in blended-learning are assignments, textbooks, face-to-face presentation, and face-to-face lecture with instructors. Online learning video has also had contribution towards learning while online textbook gives average contribution towards learning. Even though they have a relatively low contribution toward learning, the learners argue they use video and online textbooks for learning occasionally. In higher education, blended learning usually consists of once-a-week face-to-face lecture where learners use online learning to finish their projects or other assignments (Molenda & Boling, 2008). It is proven by the findings of the study that reveals some of the advantages of blended learning strategy are (a) to achieve the purpose of learning, (b) to change the pattern of learning from teacher-centered to learner-centered learning,
TOJET: The Turkish Online Journal of Educational Technology – January 2018, volume 17 issue 1
Copyright © The Turkish Online Journal of Educational Technology 52
(c) to balance learner’s learning independence as well as to motivate learners to achieve learning discipline (Murphy, 2003; Osguthorpe & Graham, 2003; Voos, 2003; Dziuban, Joel, & Moskal, 2004) and learning management, (2) to facilitate access to knowledge, (3) to improve learning interaction, (4) personal agency, (5) cost effectiveness, and (6) to ease revisions of learning materials (Osguthorpe & Graham, 2003). It means blended-learning is a strategy that takes the advantage of the two learning modes, conventional learning (face-to-face) and computer-based learning, be it online or offline learning (Collis & Moonen, 2001; Graham, 2006; Korkmaz & Karakuş, 2009). Therefore, the combinations of both learning methods (online and conventional) bring more effective learning and facilitate access to learning (Morgan, 2002; Osguthorpe & Graham, 2003; Murphy, 2003). Kurtus (2004) states that “blended learning is a mixture of the various learning strategies and delivery methods that will optimize the learning experience of the user.” It contains the definition that blended learning is combination of various learning strategies and methodologies that will eventually enhance learning experience for the learners. Related to learning outcome, Gagne (1985) states that one of the highest skills is called higher order thinking or problem-solving capabilities since problem-solving requires skills in thinking, collaboration, communication and some others. The topic of thinking and problem-solving learning has been the attention of experts in psychology in 1980s; it is considered as the skill to master in the 21st century. Their interest can be traced back to rapid change and challenge in the society that requires problem-solving individuals (Bransford et al., 1986; Marzano, Brandt, Hughes, Jones, Presseisen, Rankin, & Suho, 1988; Marzano, Pickering, & McTighe, 1993). Having achieved a problem-solving ability, an individual can overcome both similar and different obstacles he or she encounters in the real-life (Gagne, 1985; Gagne, Briggs, & Wager, 1992; Bransford, Sherwood, Vey, & Reiser, 1986). Until recently, the type of learning adopted by most of education institutions in Indonesia is teacher-centered where teacher or lecturer becomes the major source of learning. However, since the printing technology has been discovered, most of learning sources are in the form of textbooks. Hence, the development of audio and audio-visual technology, computer, the internet and mobile phone (smartphone) in the 21st century enables the development of learning media using those gadgets. However, most teachers in various types and stages of education have yet used themselves and textbooks as the sources of learning. In order to develop learning that takes the advantage of technology as various learning sources, a sensitive learning model that combines learners and technology called blended-learning-based model should be developed. Blended-learning-based approach is the type of learning that combines three major sources of learning, namely face-to-face, offline and online. The findings of Dwiyogo’s (2013; 2014) studies show that the most current trends in learning is one that combines face-to-face, offline (computer interactive) and online (internet) learning. The traditional, face-to-face learning has recently been shifted towards the offline and online learning, and at the same time online learning, for example distant learning, has started to be combined with face-to-face meeting. Thus, teacher’s ability to manage learning should be directed towards blended-learning. Based on the data from the respondents, 11% of the respondents have understood the concept of blended-learning, 41% of them have yet heard about blended-learning and 48% of the respondents learn and become familiar to blended-learning from the study. Related to the need of developing blended-learning-based problem-solving learning, 97% of the respondents agree to the blended-learning-based problem-solving learning development. The remaining 3% disagrees since they are about to retire in a short time so they do not feel the need to learn blended-learning concept; limited school facilities is another reason why the respondents disagree to the learning concept. Their hesitation to using technology as an integral part of learning can be traced back to the requirements to keep themselves updated with the most current trends in technology. Based on the previous studies, the need analysis indicates that the development of blended-learning-based problem solving is urged. Based on the elaboration, the study has two main objectives. The first is to develop blended learning-based method for problem-solving (PBBL) and the second is to investigate the implementation of the blended learning-based method for problem-solving (PBBL) in order to see how the methods solve some challenges in the learning process. METHODOLOGY Phase one: Developing the blended-learning-based model design for problem-solving learning outcome The study was a research and development (R & D) research using general instructional development (ID) model that was consisted of analyze, design, develop, implementation, and evaluation (Gustafson & Branch, 2002). The study took place in 2015 until 2016.
TOJET: The Turkish Online Journal of Educational Technology – January 2018, volume 17 issue 1
Copyright © The Turkish Online Journal of Educational Technology 53
The study involved three experts in educational technology that were selected using purposive sampling. The three experts involved in the study were those having expertise in media, learning, and educational technology, teaching in the same university, holding doctoral degree, and all of them are senior lectures. The instrument was questionnaire to gather the data that consisted of two parts that was developed to collect review results from the experts. The first part used 5-point Likert scale (5= strongly agree, 4= agree, 3= neutral, 2= disagree, and 1= strongly disagree) then, the second part was addressed to get comments from experts. Before the implementation stage, the model was sent to the experts to be evaluated. The data analysis was descriptive statistics evaluating relevant data and standard deviation to describe the experts’ judgement and to revise the model developed before it was applied.
Phase two: Investigating the implementation The study consisted of 2 (two) phases. The first was survey taking place between 2015 and 2016 during the blended learning course was conducted. The purpose of the survey was to obtain data related to the implementation of blended learning-based design for problem-solving (PBBL) in Blended Learning class the graduate students majoring in physical education took on their second semester. The second phase of the study was a case study of which purpose was to obtain data related to temporary phenomena taking place in real-life context where the blended learning-based design for problem-solving (PBBL) was implemented. The subjects of the survey were all of graduate students of the State University of Malang majoring in physical education that consisted of 60 students from six classes. They were selected because they took Blended Learning course on the second semester. The objective of the survey was to obtain data related to the implementation of the blended learning-based design for problem-solving (PBBL) once the Blended Learning class had finished. In the case-study, which took place between 2015 and 2016, three students were involved as active participants. The selection criteria for students were those who (1) have taken Blended Learning course, (2) chose to write a thesis on blended learning, (3) who conducted a Research and Development type of research, and (4) used the blended learning model in its product. These three students conducted research theses related to the implementation of the blended learning-based design for problem-solving (PBBL). They tried the method out in the classroom. The data collection methods were documentation, observation, questionnaire, and semi-structure interviews. The data collection emphasized on describing several challenges the three students encountered when they applied the blended learning-based design for problem-solving (PBBL) in the real setting (classroom).
Data analysis Descriptive analysis was the data analysis method applied during the survey. The data were described in the form of percentage. Prior to distributing the questionnaire that consisted of eight components, namely organization, suitability, clarity, effectiveness, efficiency, flexibility, and user friendliness. Related to significance of the model , the researcher conducted reliability testing. The questionnaire was reliable since the Cronbach’s α score was 0.902. Triangulation, as the method to guarantee the validity of the data, was conducted during the qualitative study. The reason in choosing this reseach design is because qualitative descriptive study could expose the data gathered from implementation stages deeply. The data obtained through questionnaire were cross-checked with the ones obtained through the interview, observation, and documentation.
RESULT OF THE STUDY Phase One: Developing the blended-learning-based model design for problem-solving learning outcome Based on the need analysis, the learning theories and learning outcomes, blended learning-based approach is then developed into a model of learning design. The model is a flexible one where developers make some adjustment depend upon their need. The process of the development of the blended learning-based method is presented in Figure 1.
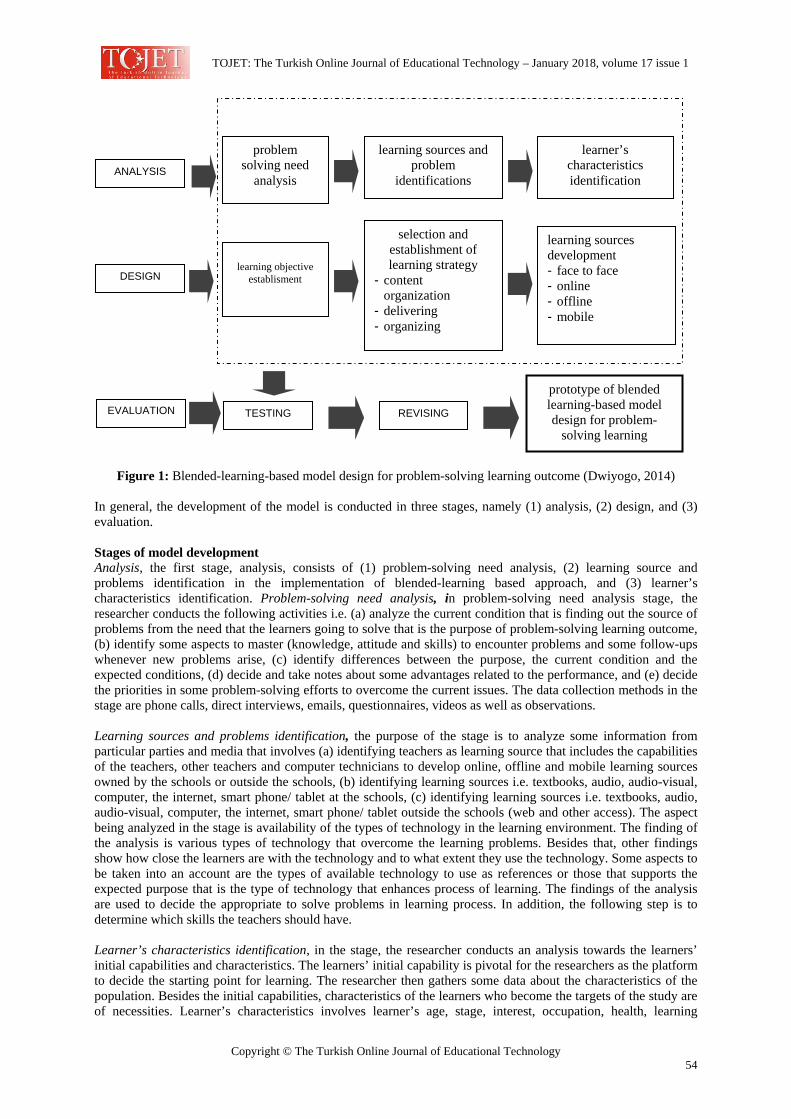
TOJET: The Turkish Online Journal of Educational Technology – January 2018, volume 17 issue 1
Copyright © The Turkish Online Journal of Educational Technology 54
Figure 1: Blended-learning-based model design for problem-solving learning outcome (Dwiyogo, 2014) In general, the development of the model is conducted in three stages, namely (1) analysis, (2) design, and (3) evaluation. Stages of model development Analysis, the first stage, analysis, consists of (1) problem-solving need analysis, (2) learning source and problems identification in the implementation of blended-learning based approach, and (3) learner’s characteristics identification. Problem-solving need analysis, in problem-solving need analysis stage, the researcher conducts the following activities i.e. (a) analyze the current condition that is finding out the source of problems from the need that the learners going to solve that is the purpose of problem-solving learning outcome, (b) identify some aspects to master (knowledge, attitude and skills) to encounter problems and some follow-ups whenever new problems arise, (c) identify differences between the purpose, the current condition and the expected conditions, (d) decide and take notes about some advantages related to the performance, and (e) decide the priorities in some problem-solving efforts to overcome the current issues. The data collection methods in the stage are phone calls, direct interviews, emails, questionnaires, videos as well as observations. Learning sources and problems identification, the purpose of the stage is to analyze some information from particular parties and media that involves (a) identifying teachers as learning source that includes the capabilities of the teachers, other teachers and computer technicians to develop online, offline and mobile learning sources owned by the schools or outside the schools, (b) identifying learning sources i.e. textbooks, audio, audio-visual, computer, the internet, smart phone/ tablet at the schools, (c) identifying learning sources i.e. textbooks, audio, audio-visual, computer, the internet, smart phone/ tablet outside the schools (web and other access). The aspect being analyzed in the stage is availability of the types of technology in the learning environment. The finding of the analysis is various types of technology that overcome the learning problems. Besides that, other findings show how close the learners are with the technology and to what extent they use the technology. Some aspects to be taken into an account are the types of available technology to use as references or those that supports the expected purpose that is the type of technology that enhances process of learning. The findings of the analysis are used to decide the appropriate to solve problems in learning process. In addition, the following step is to determine which skills the teachers should have. Learner’s characteristics identification, in the stage, the researcher conducts an analysis towards the learners’ initial capabilities and characteristics. The learners’ initial capability is pivotal for the researchers as the platform to decide the starting point for learning. The researcher then gathers some data about the characteristics of the population. Besides the initial capabilities, characteristics of the learners who become the targets of the study are of necessities. Learner’s characteristics involves learner’s age, stage, interest, occupation, health, learning
ANALYSIS
problem solving need
analysis
learning sources and problem
identifications
learner’s characteristics identification
DESIGN
learning objective
establisment
selection and establishment of learning strategy
- content organization
- delivering - organizing
learning sources development - face to face - online - offline - mobile
EVALUATION TESTING REVISING
prototype of blended learning-based model design for problem-
solving learning
TOJET: The Turkish Online Journal of Educational Technology – January 2018, volume 17 issue 1
Copyright © The Turkish Online Journal of Educational Technology 55
motivation, achievement, initial capability, capabilities in literacy, socio-economic status and/or foreign language mastery. As an addition, it is important to find some information about the learner’s attitude towards the materials they are going to study and how they study the materials.
Design The second stage of development is design consisting of (1) learning purpose establishment, (2) selection and establishment of learning strategy, and (3) learning source development. Learning purpose establishment, the purposes of the stage are to establish learning purposes that have been identified based in the previous steps and organize the learning purposes based on their level of importance. The learning purpose involves cognitive, affective, and psychomotor strands (based on the Bloom’s Taxonomy) or verbal information, intellectual capability, cognitive strategy, attitude and psychomotor (the Gagne’s (1985) Taxonomy). Selection and establishment of learning strategy, organizing the content of learning means elaboration of some steps of which purpose is to achieve the learning purpose. In other words, it is elaboration of learning purpose into some sub-skills or capabilities to achieve. Learning analysis is carried out to conduct the elaboration of general purpose of learning into specific purpose of learning. The stage is the component of variable methods to implement learning program. There are at least two functions of the strategy, namely (1) to deliver the content of learning to the learners, and (2) to provide information/ materials learners need to show their capabilities (for example assignment and test). The strategy of delivery involves physical condition, teachers/ lecturers, learning materials and other activities related to learning. In other words, media is one of the essential components in the strategy for learning delivery. Therefore, learning media is the main discussion for the strategy. The strategy is related to decision-making about organizing strategy and delivery stage that are going to be used in the learning process. The management process includes (1) scheduling, (2) taking notes on learning progress, (3) managing learner’s motivation, and (4) control of learning.
Learning source development, the source of learning that facilitates learners’ blended learning-based learning process—face-to-face, online and offline learning. The activity carried out in the stage is selecting the most appropriate learning source to deliver information or learning materials that matches the availability of the technology in particular learning environment. The bases of the analysis are availability and access to technology in learning environment, learner’s access to technology and how easy it is for the learners to use the technology, as well as ability of learning media to deliver learning materials. The result of the analysis is to decide the most suitable media to develop. Development of learning source is carried out in four stages. The first is making storyboard or describing process of delivering learning materials into pictures so that everyone has a clear idea about the programs being developed. The process involves organizing both visual images and audio recording into well-organized manner in line with learning stages. The second is production or producing every element of the program and combine all of the elements into one unified program. The third is program testing and review which involves editorial, functional and technical reviews. The goal of the testing is to evaluate some errors the program encounters, for example the function of every button to operate the program. The technical review is conducted to ensure the revisions done towards the program have been done correctly. The final stage is implementation that is implementation of media into learning activities. In the stage of development, some software is used to produce the multimedia. The VideoMakerFX is used to create user interface. The software can create interactive user interface with animations for each look/ icon. The AutoPlay Studio version 8 is the software used to create overall outlook of the interactive multimedia. Video-recording is carried out using desktop-based outlook with the help of software called the ScreenCastOMatic. Meanwhile, the Ncesoft FlipBook Maker is the software to use for e-book outlook.
Evaluation In the evaluation stage, the following activities are to be carried out: (1) formative evaluation, (2) revising, and (3) producing a prototype of blended learning-based problem-solving learning outcome. The type of evaluation carried out is formative evaluation of which purpose is revision. In the study, the formative evaluations are in the form of experts’ reviews, individual, small-group and field tests. Based on the experts’ reviews, individual, small-group and field tests, the researcher gain some feedbacks which stages of the blended-learning design to improve and revise. The researcher does some revisions and returns the revised version to the experts for another advice. Having been revised and reconfirmed, the result of the design is a prototype that is readily implemented in order to develop blended-learning-based method for problem-solving learning outcome. Having finished developing the model, the following procedure was conducting expert validation. The experts involved in the study were learning technology, media and learning experts. Based on the result of the expert validation, the
TOJET: The Turkish Online Journal of Educational Technology – January 2018, volume 17 issue 1
Copyright © The Turkish Online Journal of Educational Technology 56
blended learning-based design for problem-solving (PBBL) model had been ready to apply in the classroom. The scores were pretty high. Table 1 described the result of the expert validation.
Table 1: The results of the experts’ evaluation toward blended-learning-based model design for problem-solving learning outcome
No. Variables/ Main Statement Mean SD 1 Organization 5.000 0.000 2 Suitability 4.667 0.577 3 Clarity 5.000 0.000 4 Effectiveness 5.000 0.000 5 Efficiency 4.667 0.577 6 Flexibility 5.000 0.000 7 User friendliness 4.333 0.577 8 Significance of the model 4.667 0.577 Total 4.750 0.361
Based on Table 1, items 1, 3, 4, and 6 had the highest score ( =5.000, SD=0.000). User friendliness had the lowest score ( =4.333, SD=0.000). Overall, the eight items had high scores ( =4.750, SD=0.361). Based on the scores, blended learning-based design for problem-solving (PBBL) the researcher developed was ready to use in real-life context (classroom). Phase 2: Investigating the implementation The second phase of the study aimed at finding out the implementation of the blended learning-based design for problem-solving (PBBL). It consisted of two stages, survey and case-study. The participants of the survey were 60 graduate students majoring in physical education. The survey was conducted on the second semester of the 2014-2015 academic year after Blended Learning class finished. The survey showed that all of the graduate students agreed to all of the items of the blended learning-based design for problem-solving (PBBL) as seen in Table 2. Some students responded disagree (score 2) for cost efficiency ( =3.367, SD=0.609), clarity of description ( =3.300, SD=0.591), user friendliness (( =3.233, SD=0.563), and increasing motivation ( =3.317, SD=0.536).
Table 2: The results of the students’ opinions toward blended-learning-based model design
for problem-solving learning outcome No Variables/ Main Statement N Min Max Mean SD
1 Effective 60 3.00 4.00 3.500 0.504 2 Interactive 60 3.00 4.00 3.467 0.503 3 Flexible 60 3.00 4.00 3.450 0.502 4 Time Efficient 60 3.00 4.00 3.467 0.503 5 Cost Efficient 60 2.00 4.00 3.367 0.609 6 Clear Description 60 2.00 4.00 3.300 0.591 7 User Friendly 60 2.00 4.00 3.233 0.563 8 Increasing Motivation 60 2.00 4.00 3.317 0.536 Total 3.388 0.539
Based on Table 2, the majority of the students agreed on all of the items related to the blended learning-based design for problem-solving (PBBL) ( =3.388, SD=0.539). In other words, the students had positive attitude towards the development of the blended learning-based design for problem-solving (PBBL). The researcher conducted another survey of where the students conducted self-evaluation about their Blended Learning competence. The students described how much they understood the software introduced using the blended learning-based design for problem-solving (PBBL) in the Blended Learning class. Table 3 described the result of the self-evaluation. More than a half of the respondents (53%) stated that they could use PowerPoint well. Only 15% of the respondents stated that they could use AutoPlay and Sigil well. The students could at least operate one type of software related to Blended Learning introduced in the class.
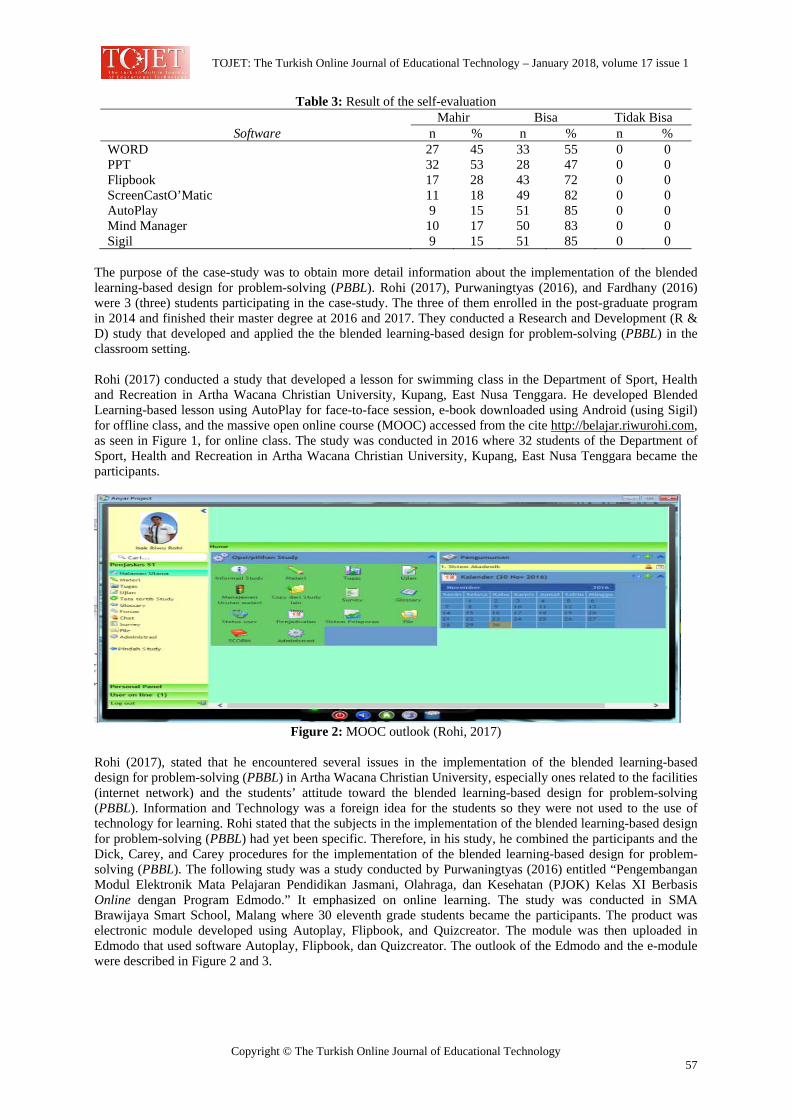
TOJET: The Turkish Online Journal of Educational Technology – January 2018, volume 17 issue 1
Copyright © The Turkish Online Journal of Educational Technology 57
Table 3: Result of the self-evaluation
Software Mahir Bisa Tidak Bisa
n % n % n % WORD 27 45 33 55 0 0 PPT 32 53 28 47 0 0 Flipbook 17 28 43 72 0 0 ScreenCastO’Matic 11 18 49 82 0 0 AutoPlay 9 15 51 85 0 0 Mind Manager 10 17 50 83 0 0 Sigil 9 15 51 85 0 0
The purpose of the case-study was to obtain more detail information about the implementation of the blended learning-based design for problem-solving (PBBL). Rohi (2017), Purwaningtyas (2016), and Fardhany (2016) were 3 (three) students participating in the case-study. The three of them enrolled in the post-graduate program in 2014 and finished their master degree at 2016 and 2017. They conducted a Research and Development (R & D) study that developed and applied the the blended learning-based design for problem-solving (PBBL) in the classroom setting. Rohi (2017) conducted a study that developed a lesson for swimming class in the Department of Sport, Health and Recreation in Artha Wacana Christian University, Kupang, East Nusa Tenggara. He developed Blended Learning-based lesson using AutoPlay for face-to-face session, e-book downloaded using Android (using Sigil) for offline class, and the massive open online course (MOOC) accessed from the cite http://belajar.riwurohi.com, as seen in Figure 1, for online class. The study was conducted in 2016 where 32 students of the Department of Sport, Health and Recreation in Artha Wacana Christian University, Kupang, East Nusa Tenggara became the participants.
Figure 2: MOOC outlook (Rohi, 2017)
Rohi (2017), stated that he encountered several issues in the implementation of the blended learning-based design for problem-solving (PBBL) in Artha Wacana Christian University, especially ones related to the facilities (internet network) and the students’ attitude toward the blended learning-based design for problem-solving (PBBL). Information and Technology was a foreign idea for the students so they were not used to the use of technology for learning. Rohi stated that the subjects in the implementation of the blended learning-based design for problem-solving (PBBL) had yet been specific. Therefore, in his study, he combined the participants and the Dick, Carey, and Carey procedures for the implementation of the blended learning-based design for problem-solving (PBBL). The following study was a study conducted by Purwaningtyas (2016) entitled “Pengembangan Modul Elektronik Mata Pelajaran Pendidikan Jasmani, Olahraga, dan Kesehatan (PJOK) Kelas XI Berbasis Online dengan Program Edmodo.” It emphasized on online learning. The study was conducted in SMA Brawijaya Smart School, Malang where 30 eleventh grade students became the participants. The product was electronic module developed using Autoplay, Flipbook, and Quizcreator. The module was then uploaded in Edmodo that used software Autoplay, Flipbook, dan Quizcreator. The outlook of the Edmodo and the e-module were described in Figure 2 and 3.
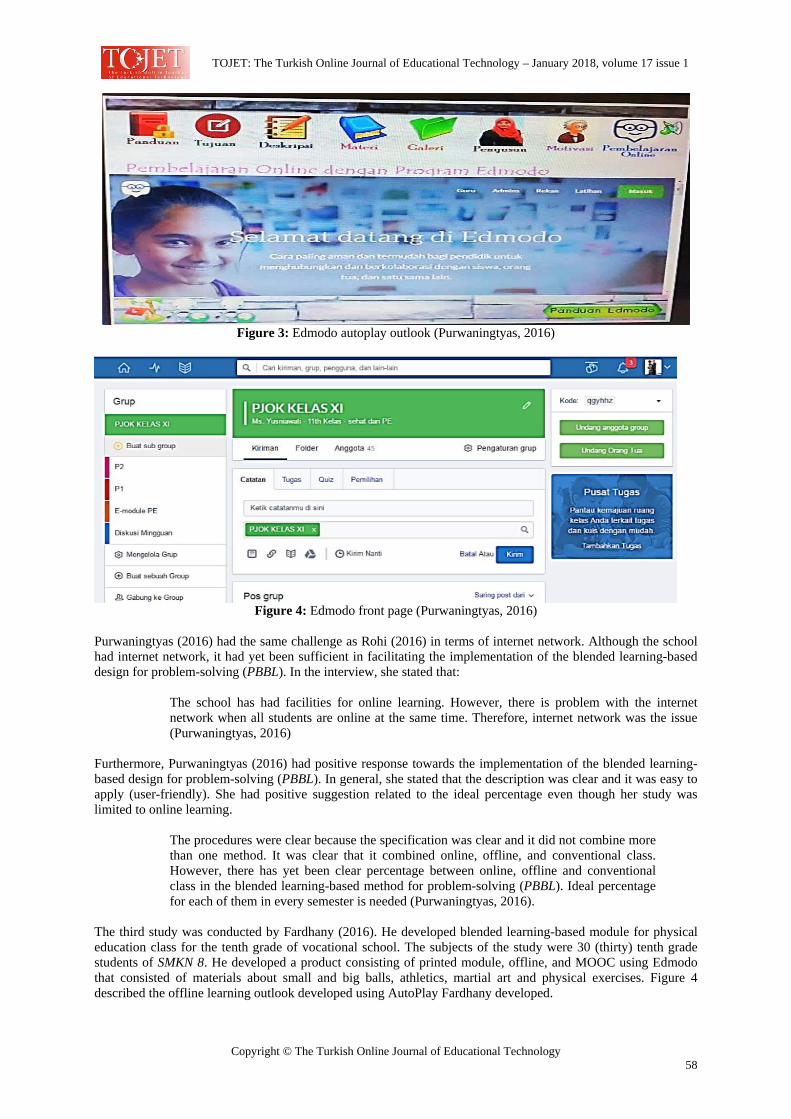
TOJET: The Turkish Online Journal of Educational Technology – January 2018, volume 17 issue 1
Copyright © The Turkish Online Journal of Educational Technology 58
Figure 3: Edmodo autoplay outlook (Purwaningtyas, 2016)
Figure 4: Edmodo front page (Purwaningtyas, 2016)
Purwaningtyas (2016) had the same challenge as Rohi (2016) in terms of internet network. Although the school had internet network, it had yet been sufficient in facilitating the implementation of the blended learning-based design for problem-solving (PBBL). In the interview, she stated that:
The school has had facilities for online learning. However, there is problem with the internet network when all students are online at the same time. Therefore, internet network was the issue (Purwaningtyas, 2016)
Furthermore, Purwaningtyas (2016) had positive response towards the implementation of the blended learning-based design for problem-solving (PBBL). In general, she stated that the description was clear and it was easy to apply (user-friendly). She had positive suggestion related to the ideal percentage even though her study was limited to online learning.
The procedures were clear because the specification was clear and it did not combine more than one method. It was clear that it combined online, offline, and conventional class. However, there has yet been clear percentage between online, offline and conventional class in the blended learning-based method for problem-solving (PBBL). Ideal percentage for each of them in every semester is needed (Purwaningtyas, 2016).
The third study was conducted by Fardhany (2016). He developed blended learning-based module for physical education class for the tenth grade of vocational school. The subjects of the study were 30 (thirty) tenth grade students of SMKN 8. He developed a product consisting of printed module, offline, and MOOC using Edmodo that consisted of materials about small and big balls, athletics, martial art and physical exercises. Figure 4 described the offline learning outlook developed using AutoPlay Fardhany developed.
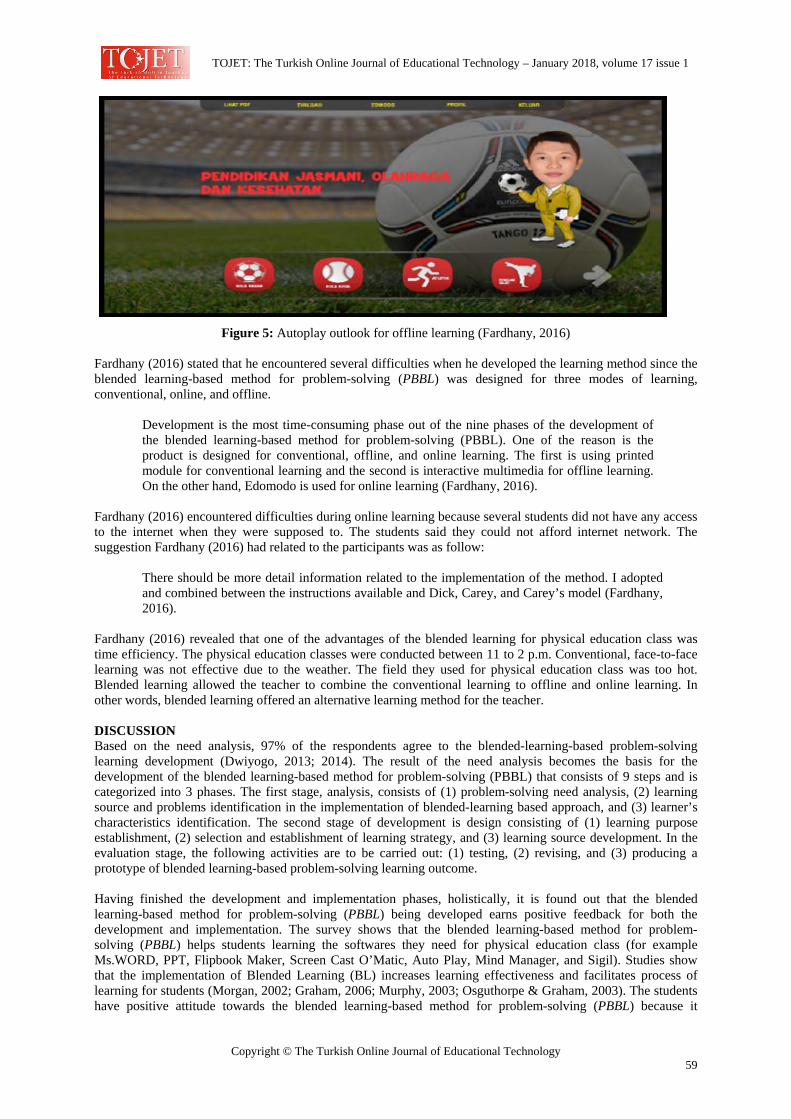
TOJET: The Turkish Online Journal of Educational Technology – January 2018, volume 17 issue 1
Copyright © The Turkish Online Journal of Educational Technology 59
Figure 5: Autoplay outlook for offline learning (Fardhany, 2016)
Fardhany (2016) stated that he encountered several difficulties when he developed the learning method since the blended learning-based method for problem-solving (PBBL) was designed for three modes of learning, conventional, online, and offline.
Development is the most time-consuming phase out of the nine phases of the development of the blended learning-based method for problem-solving (PBBL). One of the reason is the product is designed for conventional, offline, and online learning. The first is using printed module for conventional learning and the second is interactive multimedia for offline learning. On the other hand, Edomodo is used for online learning (Fardhany, 2016).
Fardhany (2016) encountered difficulties during online learning because several students did not have any access to the internet when they were supposed to. The students said they could not afford internet network. The suggestion Fardhany (2016) had related to the participants was as follow:
There should be more detail information related to the implementation of the method. I adopted and combined between the instructions available and Dick, Carey, and Carey’s model (Fardhany, 2016).
Fardhany (2016) revealed that one of the advantages of the blended learning for physical education class was time efficiency. The physical education classes were conducted between 11 to 2 p.m. Conventional, face-to-face learning was not effective due to the weather. The field they used for physical education class was too hot. Blended learning allowed the teacher to combine the conventional learning to offline and online learning. In other words, blended learning offered an alternative learning method for the teacher.
DISCUSSION Based on the need analysis, 97% of the respondents agree to the blended-learning-based problem-solving learning development (Dwiyogo, 2013; 2014). The result of the need analysis becomes the basis for the development of the blended learning-based method for problem-solving (PBBL) that consists of 9 steps and is categorized into 3 phases. The first stage, analysis, consists of (1) problem-solving need analysis, (2) learning source and problems identification in the implementation of blended-learning based approach, and (3) learner’s characteristics identification. The second stage of development is design consisting of (1) learning purpose establishment, (2) selection and establishment of learning strategy, and (3) learning source development. In the evaluation stage, the following activities are to be carried out: (1) testing, (2) revising, and (3) producing a prototype of blended learning-based problem-solving learning outcome. Having finished the development and implementation phases, holistically, it is found out that the blended learning-based method for problem-solving (PBBL) being developed earns positive feedback for both the development and implementation. The survey shows that the blended learning-based method for problem-solving (PBBL) helps students learning the softwares they need for physical education class (for example Ms.WORD, PPT, Flipbook Maker, Screen Cast O’Matic, Auto Play, Mind Manager, and Sigil). Studies show that the implementation of Blended Learning (BL) increases learning effectiveness and facilitates process of learning for students (Morgan, 2002; Graham, 2006; Murphy, 2003; Osguthorpe & Graham, 2003). The students have positive attitude towards the blended learning-based method for problem-solving (PBBL) because it
TOJET: The Turkish Online Journal of Educational Technology – January 2018, volume 17 issue 1
Copyright © The Turkish Online Journal of Educational Technology 60
increases their competence. Furthermore, the findings of Varol (2014) and Herguner’s (2016) studies revealed that teachers or teacher trainee thought it was vital to have competence in information technology. In this case, the blended learning-based method for problem-solving (PBBL) develops student’s competence in information technology as well as enables them to evaluate their IT competence independently. The implementation refers to not only the result of the survey but also the case studies conducted by the three graduate students. All three of them did not find major challenge in the implementation of the blended learning-based method for problem-solving (PBBL). The only obstacle they encountered was the amount of time they needed to develop the products. In general, the implementation had positive impact. Some suggestions given after the implementation of the blended learning-based method for problem-solving (PBBL) in the classroom are percentage of the online, offline and conventional teaching modes and subjects being involved as participants. Related to the suggestions and Gustafson and Branch’s idea (2002), instructional development model has various different characteristics. At the same time, it can be generalized that all types of instructional development consists of analysis, design, development, implementation and evaluation. Based on the interviews, the three students said that they adopted Dick, Carey, and Carey’s (2015) sets of procedures during the implementation of the blended learning-based method for problem-solving (PBBL). The procedure may be carried out when a researcher needs to alter or modify certain model to meet objective of his or her study. Dick, Carey, and Carey model is the foundation for scientific studies in various disciplines, more particularly integration of technology into learning during implementation and evaluation stages (Gustafson and Branch, 2002). The suggestions are taken into account for further studies. As an addition, internet network is the issue all three of the students encountered during the implementation of the blended learning-based method for problem-solving (PBBL). It sometimes is difficult for their students to get internet access. Internet is one of the most frequent issues in learning (Yapici & Akbayin, 2012; Zaka, 2013). Access to internet should be one of the considerations in deciding the percentage of conventional, offline and online learning. As what has been mentioned in the steps for applying the blended learning-based method for problem-solving (PBBL) into the real classroom setting, analysis is the basis for the following step.
CONCLUSSION The main objectives of the study are to develop and to investigate the implementation of blended learning-based method for problem-solving (PBBL). The findings show that the blended learning-based method for problem-solving (PBBL) the researcher developed is ready to use in the real classroom setting. The implementation of the method shows positive effect; the responses are positive. Overall, the blended learning-based method for problem-solving (PBBL) can be used as an alternative for research and development study that provides specific and thorough application of Blended Learning (BL). The implementation of the blended learning-based method for problem-solving (PBBL) consists of 3 (three) main stages. The first stage, analysis, consists of (1) problem-solving need analysis, (2) learning source and problems identification in the implementation of blended-learning based approach, and (3) learner’s characteristics identification. The second stage of development is design consisting of (1) learning purpose establishment, (2) selection and establishment of learning strategy, and (3) learning source development. In the evaluation stage, the following activities are to be carried out: (1) testing, (2) revising, and (3) producing a prototype of blended learning-based problem-solving learning outcome. The limitation of the study were focused on the study design that was used to reveal the effectiveness. This study only provided data qualitatively in order to gather the implementation stage results. Furthermore, it is needed a more sytematical quantitative research using experimental design to investigate the result of blended learning implementation to students learning capabilities in problem solving
REFERENCES Bersin, J. (2004). The blended learning book: Best practices, proven methodologies, and lessons learned. San
Francisco: Pfeiffer. Bransford, J., Sherwood, R., Vey, N., & Reiser, J. (1986). Teaching thinking and problem solving: Research
foundation. American Psychologist, 41(10), 1078-1089. Collis, B., & Moonen, J. (2001). Flexible learning in a digital world: Experiences and expectations. London:
Kogan-Page. Fardhany, P. H. (2016). Pengembangan bahan ajar berbasis blended learning dalam pembelajaran pendidikan
jasmani, olahraga, dan kesehatan siswa kelas x sekolah menengah kejuruan (SMK) (Unpublished Thesis), Universitas Negeri Malang, Indonesia.
Degeng, I.N.S. (1991). Landasan teoritik disain pembelajaran. Malang: Graduate Program, Institute of Education and Teacher Training of Malang.
Dick, W., Carey, L., & Carey, J. O. (2015). The systematic design of instruction. Upper Saddle River, NJ: Pearson Education, Inc.
TOJET: The Turkish Online Journal of Educational Technology – January 2018, volume 17 issue 1
Copyright © The Turkish Online Journal of Educational Technology 61
Dwiyogo, W.D. (2013). Analisis kebutuhan pengembangan model rancangan pembelajaran berbasis blended learning (pbbl) untuk meningkatkan hasil belajar pemecahan masalah. Malang: The Bureau of Research and community Services, Universitas Negeri Malang.
Dwiyogo, W.D. (2014). Pengembangan Model Rancangan Pembelajaran Berbasis Blended Learning (PBBL) untuk Meningkatkan Hasil Belajar Pemecahan Masalah. Malang: The Bureau of Research and community Services, Universitas Negeri Malang.
Dziuban, C.D., Joel, L.H., & Moskal, P.D. (2004). Blended learning. Research Bulletin, 7. Gagne, R.M. (1985). The conditions of learning and theory of instruction. New York: Holt, Rinehart and
Winston. Gagne, R.M., Briggs, L.J., & Wager, W.W. (1992). Principles of instructional design. New York: Holt, Rinehart
and Winston. Graham, C.R. (2006). Blended learning systems: Definition, current trends, and future directions. Dalam C.
Bonk and C. Graham (Eds.), The Handbook of Blended Learning: Global Perspectives, Local Designs. San Francisco: Pfeiffer, pp. 3-21.
Gustafson, K. L., and Branch, R. M. (2002). Survey of instructional development models. Syracuse University, Syracuse, New York 13244: ERIC Clearinghouse on Information and Technology.
Herguner, G. (2016). Tablet computer literacy levels of the physical education and sports department students. Malaysian Online Journal of Educational Technology, 4(2), 58-65.
Korkmaz, Ö., & Karakuş, U. (2009). The Impact of blended learning model on student attitudes towards geography course and their critical thinking dispositions and levels. The Turkish Online Journal of Educational Technology, 8(4), 51-63.
Kurtus, R. (2004). Blended learning, (Online), (http://www.school for champions.com /elearning/ blended.html), retrieved on January 23, 2011.
Marzano, R.J., Brandt, R.S., Hughes, C.S., Jones, V.F., Presseisen, B.Z., Rankin, S.C., & Suhor, C. (1988). Dimension of thinking: A framework for curriculum and instruction. Alexandria: Association for Supervision and Curriculum Development.
Marzano, R.J., Pickering, D., & McTighe, J. (1993). Assessing student outcomes: Performance assessment using the dimensions of learning model. Alexandria: Assosiation for Supervision and Curriculum Development.
Molenda, M., & Boling, E. (2008). Creating. In A. Januszewski and M. Molenda (Eds.), Educational technology: A definition with commentary. (pp. 82� 130).New York: Routledge.
Morgan, K.R. (2002). Blended learning: A strategic action plan for a new campus. Seminole, FL: Universityof Central Florida.
Murphy, P. (2003). The Hybrid strategy: Blending face-to-face with virtual instruction to improve large lecture courses, (Online), (http://www.uctltc.org /news/2002/ 12/feature.php), retrieved on June 11, 2012.
Osguthorpe, R., & Graham, R. (2003). Blended learning environments: Definitions and directions. The Quarterly Review of Distance Education, 4(3), 227-234.
Purcell, J., Boxall, P., & Wright, P (2009). The oxford handbook of human resource management, pp. 364-38. Oxford University Press.
Reigeluth, C.M. (Ed.). (1983). Instructional-design theories and models: An overview of their current status. Hillsdale, New Jersey: Lawrence Erlbaum Associates, Publishers.
Thorne, K. (2003). Blended learning: How to integrate online and traditional learning. London: Kagan Page Limited.
Purwaningtyas. (2016). Pengembangan modul elektronik mata pelajaran pendidikan jasmani, olahraga, dan kesehatan (pjok) kelas xi berbasis online dengan program edmodo(Unpublished Thesis), Universitas Negeri Malang, Indonesia.
Rohi, I. R. (2017). Pengembangan pembelajaran mata kuliah renang berbasis blended learning (Unpublished Thesis), Universitas Negeri Malang, Indonesia.
Varol, Y. K. (2014). The relationship between attitudes of prospective physical education teachers towards education technologies and computer self-efficacy beliefs. The Turkish Online Journal of Educational Technology (TOJET), 13(2), 157-167.
Voos, R. (2003). Blended learning: What is it and where might it take us? Sloan-C View 2(1), 2–5.Yapici, I. U. and Akbayin, H. (2012). High School Students’ Views on Blended Learning. Turkish Online Journal of Distance Education -TOJDE, 13(4), 125-139. Retrieved from http://files.eric.ed.gov/fulltext/ EJ1000418.pdf
Zaka, P. (2013). A case study of blended teaching and learning in a New Zealand secondary school, using an ecological framework. Journal of Open, Flexible, and Distance Learning, 17(1), 24-40.
TOJET: The Turkish Online Journal of Educational Technology – January 2018, volume 17 issue 1
Copyright © The Turkish Online Journal of Educational Technology 62
Developing an Online Learning Media Using Smartphone for the Electrical Machinery Course Muchlas Ahmad Dahlan University, Yogyakarta, Indonesia [email protected] ABSTRACT This research is aimed to prepare a desktop-based learning media that can be used to support an online lab activities using android smartphones in Electrical Machinery Course at the Department of Electrical Engineering for the undergraduate level. This work uses a conceptual development model which integrates some sub systems of internet connection support, desktop computer, smartphones, induction motor application based on Matlab, and remote access application. Product testing was conducted through the online practical work activities involve 19 students of Electrical Engineering as research subjects. The product’s performance in the presentation and instructional aspects was determined based on the research subject's perception, while the learning impact was determined using the portfolio assessment. The results showed that the research subjects give a positive perception of 81% and 82.2% for presentation and instructional aspects, respectively. This is indicating the product was easy to operate, interactive, informative, flexible, motivating, intriguing, and provide comfort to operate.The product implementation as an online lab activity media has also a positive learning impact, indicated by the mastery learning score of the students reached 84%. This product improves the performance of an existing induction motor simulator, which previously reported can only run offline and through this research it can be run online via smartphone. Keywords: developing, online learning media, smartphone, induction motor practical work INTRODUCTION The rapid development of information and communication technology has influenced many aspects of human life including education. As a result, there are currently at least four paradigm shifts in learning, ie: (1) from teacher-centered to student-centered, (2) from just delivering knowledge to the development of multi-context intelligence, (3) from limited place-based teaching to learning with global, local individual vision, and (4) from limited textbooks to diverse learning resources (Cheng, 2005). Even, in the lab activity, the impacts of the information technology development have changed the setting of laboratory landscape in the science and engineering education environment, from using a hands-on laboratory to information technology-based equipment through simulation (Lustigova & Lustig, 2009) . The implications of this situation will demand the education world to be more adaptive in developing various learning tools and medias by involving information technology as its base so that the whole learning process can run more effectively. In the department of Electrical Engineering, the learning processes of Electrical Machinery course currently have experienced several technical problems, especially limited availability in real tools that provides the support for doing practical work in high-power machines. This limitation is mainly due to the price of tools that is considerably costly. As the need for such teaching tool is urgent, any realistic solution has to be found by offering a simulation tool that is possible to support any lack of facilities. This tool is able to support the practical work using a virtual laboratory based on the information technology. Many research works have been carried out to perform the learning media using various simulation tools. The advantageous of this simulation is proven such of less time consuming, inexpensive, less space required (Chan & Fok, 2009). Also, the simulation offers an effective tool for increasing learning efficiency (Al-Zahrani, 2010), assisting students for improving practical work performance (Rajendran, Veilumuthu & Divya, 2010), strengthening the success of traditional learning (Rutten, van Joolingen & van der Veen, 2012), enhancing the understanding of practical work materials (Rahman, 2014), and giving the learning achievement better than real practical work (Muchlas, 2015). The other research work has found that incorporating virtual reality as a tool of simulation into the classroom for visualization of, and virtual training on, electrical equipment makes learning more interesting, motivating, and clear, and thus improves knowledge retention (Barata, Filho & Nunes, 2015). The application of virtual laboratory in the electrical machines practical work can improve students’s lab-exams score and also can reach their opinions to a positive level of the relevance, usefulness, and motivational effect of the simulation
TOJET: The Turkish Online Journal of Educational Technology – January 2018, volume 17 issue 1
Copyright © The Turkish Online Journal of Educational Technology 63
(Martinez-Roman et al., 2015). Through the practical work using a computer-based simulations, students became more interested in the power system protection course, praised the activities in the official evaluation reports, and were inspired to take their a final-year project, and also the number of students achieving high scores increased (Shahnia, Moghbel & Yengejeh, 2016). The selection of an open and portable environment for designing of the virtual laboratory allowed students to work autonomously, and optimized the use of lecturer resources (Gomez-Sacristan, et al., 2016). The current research has shown that the simulation especially in 3D-visualizations, can help students to understand basic control system concepts (Khan, et al., 2017). Implementation of lab activities using virtual labs requires a simulator software as the main component. A simulator has been defined as a two-dimensional or three-dimensional interactive multimedia objects in digital heterogeneous form, consist of text, hypertext, sound, images, animations, videos and graphics that contain explicit and implicit learning goals (Budhu, 2002). Meanwhile, Merchant, et al. (2014) has defined a simulator is a device that provides an interactive learning environment that can imitate real life situations or processes. Currently, smartphone apps that are largely used by students could be considered as a new format for supporting and enhancing the learning process in the higher education, as well as providing an online collaboration environment between the teachers and students (Vázquez-Cano, 2014). Through Wi-Fi connectivity and upload capabilities, allowing this tool will be able to support a learning media particularly in college (Khan & Chiang, 2014). Implementation of the mobile learning system based on smartphone to assist student learning had improved results on their final exams and gave a higher evaluation of the curriculum than those who did not (Wen & Zhang, 2015). The use of a simulator will offer more flexible operation when it could be accessed online via mobile devices or smartphones. In the practical work of electric machinery, nowadays there are many simulation tools for simulating of the three-phase induction motor characteristic as has been developed by Renukadevi & Rajambal (2012), Arabaci & Bilgin, (2012), Shah, Rashid & Bhatti (2012), Boora, Agarwal, & Sandhu (2013), Nithin, Jos & Rafeek (2013), Kamal & Giri (2013), Leedy (2013), and (Rafeek, et al. (2013), but the simulators are a desktop application so that still running into not online mode. The research was carried out to develop a desktop-based learning media applications that can be accessed online through android mobile devices. This application will be used to support the online practical work of three-phase induction motors in Electrical Machinery course. There are many research works has been done for showing the advantages of online courses lab in the electrical engineering. Using the online mode in the control engineering course lab will be able to give a positive effect on student examination (Chevalier, et al., 2017), and in the analog electronics course, online laboratory can produce a positive effect in students’ learning if an appropriate activity is used (Garcia-Zubia, et al., 2017). The development of desktop applications into online applications can be done by combining the simulators (desktop-based applications) with Remote Control applications. Applications produced by Team Viewer company have provided free features for running remotly a desktop applications on a computer from other computers connected via the internet network. This model will produce a learning media that can be accessed online, even though the media is a desktop-based application. In this paper we will report a novelty of the three-phase induction motor simulator can run online via smartphone. RESEARCH METHOD A. Development Model This study uses a conceptual model to direct the development process to produce a learning media that corresponds to the expected specifications. Conceptually, product components can be classified into two parts: the instructor and the student. The instructor component will serve as the host, meanwhile the student component as a client. The conceptual model of the media developed in this study is schematized as shown in Figure 1.
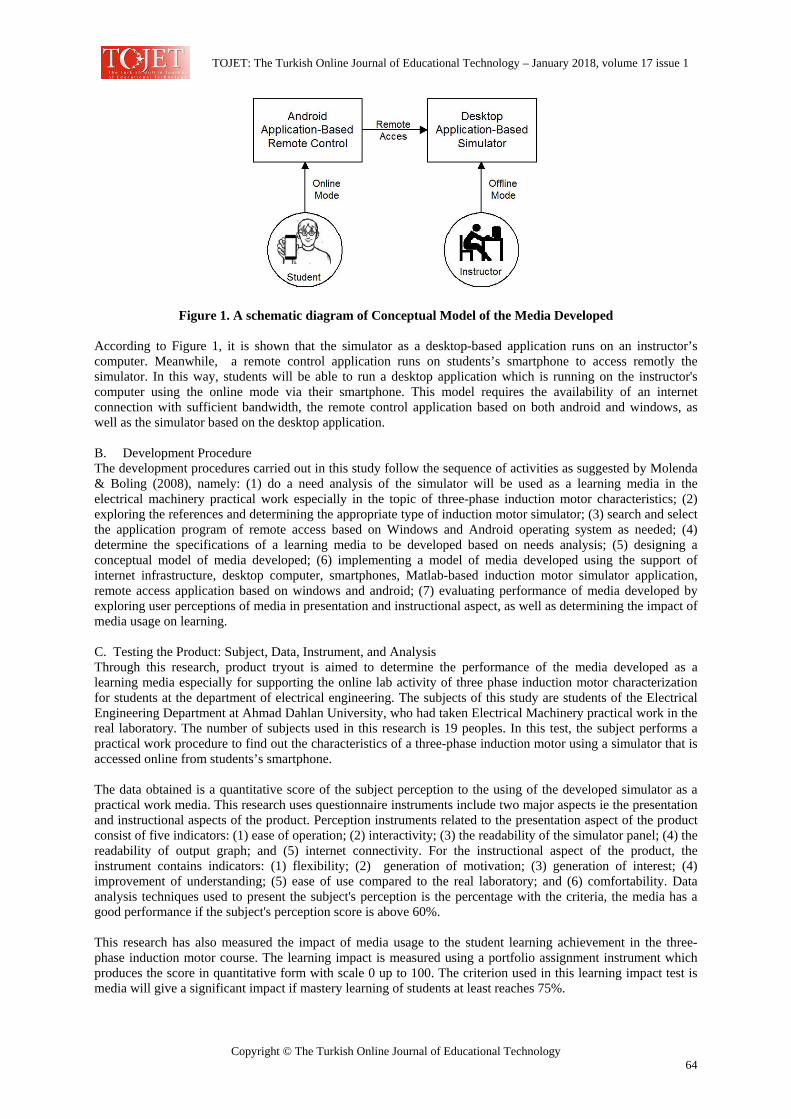
TOJET: The Turkish Online Journal of Educational Technology – January 2018, volume 17 issue 1
Copyright © The Turkish Online Journal of Educational Technology 64
Figure 1. A schematic diagram of Conceptual Model of the Media Developed
According to Figure 1, it is shown that the simulator as a desktop-based application runs on an instructor’s computer. Meanwhile, a remote control application runs on students’s smartphone to access remotly the simulator. In this way, students will be able to run a desktop application which is running on the instructor's computer using the online mode via their smartphone. This model requires the availability of an internet connection with sufficient bandwidth, the remote control application based on both android and windows, as well as the simulator based on the desktop application. B. Development Procedure The development procedures carried out in this study follow the sequence of activities as suggested by Molenda & Boling (2008), namely: (1) do a need analysis of the simulator will be used as a learning media in the electrical machinery practical work especially in the topic of three-phase induction motor characteristics; (2) exploring the references and determining the appropriate type of induction motor simulator; (3) search and select the application program of remote access based on Windows and Android operating system as needed; (4) determine the specifications of a learning media to be developed based on needs analysis; (5) designing a conceptual model of media developed; (6) implementing a model of media developed using the support of internet infrastructure, desktop computer, smartphones, Matlab-based induction motor simulator application, remote access application based on windows and android; (7) evaluating performance of media developed by exploring user perceptions of media in presentation and instructional aspect, as well as determining the impact of media usage on learning. C. Testing the Product: Subject, Data, Instrument, and Analysis Through this research, product tryout is aimed to determine the performance of the media developed as a learning media especially for supporting the online lab activity of three phase induction motor characterization for students at the department of electrical engineering. The subjects of this study are students of the Electrical Engineering Department at Ahmad Dahlan University, who had taken Electrical Machinery practical work in the real laboratory. The number of subjects used in this research is 19 peoples. In this test, the subject performs a practical work procedure to find out the characteristics of a three-phase induction motor using a simulator that is accessed online from students’s smartphone. The data obtained is a quantitative score of the subject perception to the using of the developed simulator as a practical work media. This research uses questionnaire instruments include two major aspects ie the presentation and instructional aspects of the product. Perception instruments related to the presentation aspect of the product consist of five indicators: (1) ease of operation; (2) interactivity; (3) the readability of the simulator panel; (4) the readability of output graph; and (5) internet connectivity. For the instructional aspect of the product, the instrument contains indicators: (1) flexibility; (2) generation of motivation; (3) generation of interest; (4) improvement of understanding; (5) ease of use compared to the real laboratory; and (6) comfortability. Data analysis techniques used to present the subject's perception is the percentage with the criteria, the media has a good performance if the subject's perception score is above 60%. This research has also measured the impact of media usage to the student learning achievement in the three-phase induction motor course. The learning impact is measured using a portfolio assignment instrument which produces the score in quantitative form with scale 0 up to 100. The criterion used in this learning impact test is media will give a significant impact if mastery learning of students at least reaches 75%.
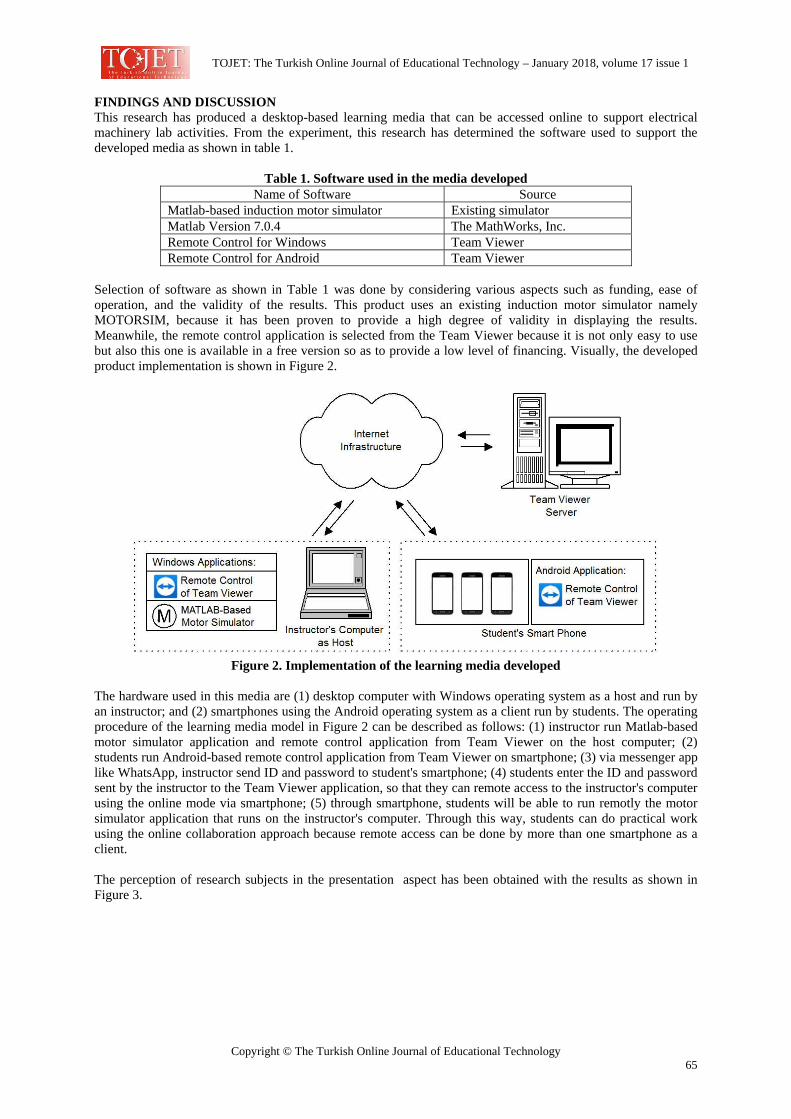
TOJET: The Turkish Online Journal of Educational Technology – January 2018, volume 17 issue 1
Copyright © The Turkish Online Journal of Educational Technology 65
FINDINGS AND DISCUSSION This research has produced a desktop-based learning media that can be accessed online to support electrical machinery lab activities. From the experiment, this research has determined the software used to support the developed media as shown in table 1.
Table 1. Software used in the media developed Name of Software Source
Matlab-based induction motor simulator Existing simulator Matlab Version 7.0.4 The MathWorks, Inc. Remote Control for Windows Team Viewer Remote Control for Android Team Viewer
Selection of software as shown in Table 1 was done by considering various aspects such as funding, ease of operation, and the validity of the results. This product uses an existing induction motor simulator namely MOTORSIM, because it has been proven to provide a high degree of validity in displaying the results. Meanwhile, the remote control application is selected from the Team Viewer because it is not only easy to use but also this one is available in a free version so as to provide a low level of financing. Visually, the developed product implementation is shown in Figure 2.
Figure 2. Implementation of the learning media developed
The hardware used in this media are (1) desktop computer with Windows operating system as a host and run by an instructor; and (2) smartphones using the Android operating system as a client run by students. The operating procedure of the learning media model in Figure 2 can be described as follows: (1) instructor run Matlab-based motor simulator application and remote control application from Team Viewer on the host computer; (2) students run Android-based remote control application from Team Viewer on smartphone; (3) via messenger app like WhatsApp, instructor send ID and password to student's smartphone; (4) students enter the ID and password sent by the instructor to the Team Viewer application, so that they can remote access to the instructor's computer using the online mode via smartphone; (5) through smartphone, students will be able to run remotly the motor simulator application that runs on the instructor's computer. Through this way, students can do practical work using the online collaboration approach because remote access can be done by more than one smartphone as a client. The perception of research subjects in the presentation aspect has been obtained with the results as shown in Figure 3.
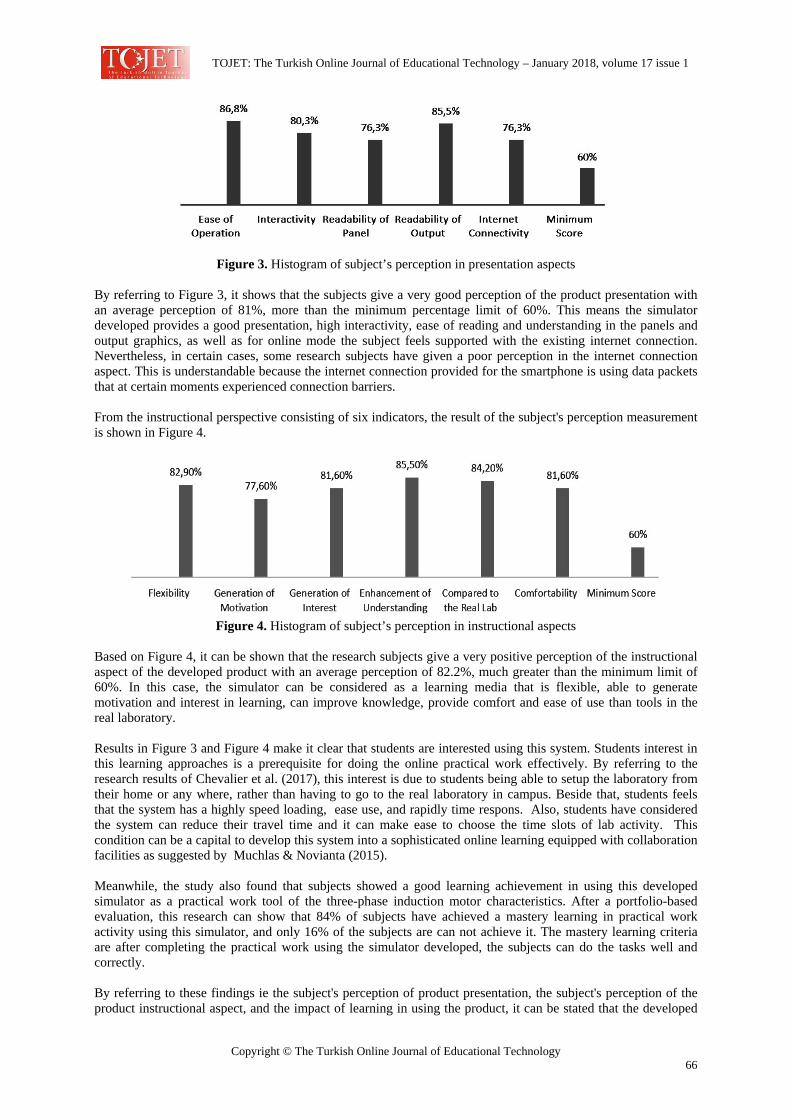
TOJET: The Turkish Online Journal of Educational Technology – January 2018, volume 17 issue 1
Copyright © The Turkish Online Journal of Educational Technology 66
Figure 3. Histogram of subject’s perception in presentation aspects By referring to Figure 3, it shows that the subjects give a very good perception of the product presentation with an average perception of 81%, more than the minimum percentage limit of 60%. This means the simulator developed provides a good presentation, high interactivity, ease of reading and understanding in the panels and output graphics, as well as for online mode the subject feels supported with the existing internet connection. Nevertheless, in certain cases, some research subjects have given a poor perception in the internet connection aspect. This is understandable because the internet connection provided for the smartphone is using data packets that at certain moments experienced connection barriers. From the instructional perspective consisting of six indicators, the result of the subject's perception measurement is shown in Figure 4.
Figure 4. Histogram of subject’s perception in instructional aspects
Based on Figure 4, it can be shown that the research subjects give a very positive perception of the instructional aspect of the developed product with an average perception of 82.2%, much greater than the minimum limit of 60%. In this case, the simulator can be considered as a learning media that is flexible, able to generate motivation and interest in learning, can improve knowledge, provide comfort and ease of use than tools in the real laboratory. Results in Figure 3 and Figure 4 make it clear that students are interested using this system. Students interest in this learning approaches is a prerequisite for doing the online practical work effectively. By referring to the research results of Chevalier et al. (2017), this interest is due to students being able to setup the laboratory from their home or any where, rather than having to go to the real laboratory in campus. Beside that, students feels that the system has a highly speed loading, ease use, and rapidly time respons. Also, students have considered the system can reduce their travel time and it can make ease to choose the time slots of lab activity. This condition can be a capital to develop this system into a sophisticated online learning equipped with collaboration facilities as suggested by Muchlas & Novianta (2015). Meanwhile, the study also found that subjects showed a good learning achievement in using this developed simulator as a practical work tool of the three-phase induction motor characteristics. After a portfolio-based evaluation, this research can show that 84% of subjects have achieved a mastery learning in practical work activity using this simulator, and only 16% of the subjects are can not achieve it. The mastery learning criteria are after completing the practical work using the simulator developed, the subjects can do the tasks well and correctly. By referring to these findings ie the subject's perception of product presentation, the subject's perception of the product instructional aspect, and the impact of learning in using the product, it can be stated that the developed
TOJET: The Turkish Online Journal of Educational Technology – January 2018, volume 17 issue 1
Copyright © The Turkish Online Journal of Educational Technology 67
simulator can be utilized as a learning tool of the three-phase induction motor characteristics in the department of Electrical Engineering, both academic or vocational program. CONCLUSION AND RECOMMENDATION This study has produced a learning media that can be used to support online practical work activities especially in the three-phase induction motor characteristics topic. The product developed is a simulator of induction motor based on Matlab programming which can be accessed online through the smartphone. The characteristics of this product are easy to operate, highly interactive, and ease to read in the panels and output graphs provided. In addition, from the instructional aspect, to support the online learning, the product are flexible, able to generate motivation and interest, can improve knowledge, as well as provide convenience and easier to use than tools in the laboratory real. The product also has a positive learning impact as shown by the high level of student mastery learning achieved through the use of this media. A recommendation that can be given is this product needs to be used as a media in both a practical work or a learning with online collaboration approach for improving the learning processes to be more efficient, effective and flexible. This research has a limited of server availability, because this product uses a server from Team Viewer so we can not setup it as needed. For that, the next product is need to use the remote access server provided by own. ACKNOWLEDGMENTS The author would like to express gratitude and appreciation to Rusydi Umar, Ph. D. and Sunardi, Ph. D., for valued discussion in this work. Thank you also to the students of the Electrical Engineering Department, Ahmad Dahlan University, who has participated in conducting the product testing. REFERENCES Al-Zahrani, F. (2010). Web-based learning and training for virtual metrology lab. Journal of
Telecommunications, 1(2), 42–54. Arabaci, H., & Bilgin, O. (2012). Squirrel cage of induction motors simulation via simulink. International
Journal of Modeling and Optimization, 2(3), 324–327. Barata, P. N. A., Filho, M. R., & Nunes, M. V. A. (2015). Consolidating learning in power systems: virtual
reality applied to the study of the operation of electric power transformers. IEEE Transactions on Education, 58(4), 255–261.
Boora, S., Agarwal, S. K., & Sandhu, K. S. (2013). Dynamic dq axis modeling of three-phase asynchronous machine using matlab. International Journal of Advanced Research in Electrical, Electronics and Instrumentation Engineering, 2(8), 3942–3951.
Budhu, M. (2002). Virtual laboratories for engineering education. In International Conference on Engineering Education. Manchester, UK.
Chan, C., & Fok, W. (2009). Evaluating learning experiences in virtual laboratory training through student perceptions: a case study in Electrical and Electronic Engineering at the University of Hong Kong. Engineering Education, 4(2), 70–75.
Cheng, Y. C. (2005). New paradigm for re-engineering education: Globalization, localization and individualization. Dordrecht: Springer.
Chevalier, A., Copot, C., Ionescu, C., & De-Keyser, R. (2017). A three-year feedback study of a remote laboratory used in control engineering studied. IEEE Transactions on Education, 60Chevalie(2), 127–133.
Garcia-Zubia, J., Hernandez-Jayo, U., Guenaga, M., & Gustavsson, I. (2017). Empirical analysis of the use of the VISIR remote lab in teaching analog electronics. IEEE Transactions on Education, 60(2), 149–156.
Gomez-Sacristan, Angel, Sempere-Paya, V. M., & Rodriguez-Hernandez, M. A. (2016). Virtual laboratory for QoS study in next-generation networks with metro ethernet access. IEEE Transactions on Education, 59(3), 187–193.
Kamal, A., & Giri, V. K. (2013). Mathematical modelling of dynamic induction motor and performance analysis with bearing fault. International Journal of Innovative Technology and Research, 1(4), 336–340.
Khan, M. M. H., & Chiang, J. C. L. (2014). Using mobile devices & social media in supporting engineering education. In Global Engineering Education Conference (EDUCON) (pp. 1077–1081). Istanbul, Turkey: IEEE.
Khan, S., Jaffery, M. H., Hanif, A., & Asif, M. R. (2017). Teaching tool for a control systems laboratory using a quadrotor as a plant in matlab. IEEE Transactions on Education, 60(4), 249–256.
Leedy, A. W. (2013). Simulink/matlab dynamic induction motor model for use as a teaching and research tool. International Journal of Soft Computing and Engineering (IJSCE), 3(4), 102–107.
Lustigova, Z., & Lustig, F. (2009). A new virtual and remote experimental and environment for teaching and learning science. In A. Tatnal & A. Jones (Eds.), Education and Technology for a Better World, 9th IFIP TC 3 World Conference on Computers in Education (pp. 75–82). New York: Springe.
TOJET: The Turkish Online Journal of Educational Technology – January 2018, volume 17 issue 1
Copyright © The Turkish Online Journal of Educational Technology 68
Martinez-Roman, J., Perez-Cruz, J., Pineda-Sanchez, M., Puche-Panadero, R., Roger-Folch, J., Riera-Guasp, M., & Sapena-Bano, A. (2015). Electrical machines laminations magnetic properties: A virtual instrument laboratory. IEEE Transactions on Education, 58(3), 159–166.
Merchant, Z., Goetz, E. T., Cifuentes, L., Keeney-Kennicutt, W., & Davis, T. J. (2014). Effectiveness of virtual reality-based instruction on students’ learning outcomes in K-12 and higher education: A meta-analysis. Computers & Education, 70, 29–40.
Molenda, M., & Boling, E. (2008). Creating. In A. Januszewsk & M. Molenda (Eds.), Educational Technology: A Definition with Commentary (pp. 81–139). New York: Taylor & Francis Group, LLC.
Muchlas. (2015). Developing a teaching model using an online collaboration approach for a digital technique practical work. The Turkish Online Journal of Educational Technology, 14(3), 63–69.
Muchlas, & Novianta, M. A. (2015). An online lab for digital electronics course using information technology supports. In Proceedings 2015 International Conference on Science in Information Technology (ICSITech) (pp. 299–302). Yogyakarta: IEEE. https://doi.org/10.1109/ICSITech.2015.7407821
Nithin, K. S., Jos, B. M., & Rafeek, M. (2013). An improved method for starting of induction motor with reduced transient torque pulsations. International Journal of Advanced Research in Electrical, Electronics and Instrumentation Engineering, 2(1), 462–470.
Rafeek, M., Jose, B. M., Nithin, K. S., & Paul, B. (2013). A novel soft starter for three-phase induction motors with reduced starting current and minimized torque pulsations. International Journal of Engineering and Innovative Technology (IJEIT), 2(8), 210–213.
Rahman, M. Z. (2014). Teaching electrical circuits using a virtual lab. In Transit: The LaGuardia Journal on Teaching and Learning, (6), 85–92.
Rajendran, L., Veilumuthu, R., & Divya, J. (2010). A study on the effectiveness of virtual lab in elearning. International Journal on Computer Science and Engineering, 2(6), 2173–2175.
Renukadevi, G., & Rajambal, K. (2012). Generalized d-q model of n-phase induction motor. International Journal of Electrical, Computer, Electronics and Communication Engineering, 6(9), 62–71.
Rutten, N., van Joolingen, W. R., & van der Veen, J. T. (2012). The learning effects of computer simulations in science. Computers & Education, 58(1), 136–153.
Shah, S., Rashid, A., & Bhatti, M. K. L. (2012). Direct quadrate (d-q) modeling of 3-phase induction motor using matlab/simulink. Canadian Journal on Electrical and Electronics Engineering, 3(5), 237–243.
Shahnia, F., Moghbel, M., & Yengejeh, H. H. (2016). Motivating power system protection course students by practical and computer-based activities. IEEE Transactions on Education, 59(2), 81–90.
Vázquez-Cano, E. (2014). Mobile distance learning with smartphones and apps in higher education. Educational Sciences: Theory and Practice, 14(4), 1505–1520.
Wen, C., & Zhang, J. (2015). Design of a microlecture mobile learning system based on smartphone and web platforms. IEEE Transactions on Education, 58(3), 203–207.
TOJET: The Turkish Online Journal of Educational Technology – January 2018, volume 17 issue 1
Copyright © The Turkish Online Journal of Educational Technology 69
Graspable Multimedia: A Study of the Effect of a Multimedia System Embodied with Physical Artefacts on Working Memory Capacity of Preschoolers
Kien Tsong Chau Centre for Instructional Technology and Multimedia, Universiti Sains Malaysia, 11800 USM, Pulau Pinang, Malaysia. [email protected] Zarina Samsudin Universiti Sains Malaysia, 11800 USM, Pulau Pinang, Malaysia. Wan Ahmad Jaafar Wan Yahaya Universiti Sains Malaysia, 11800 USM, Pulau Pinang, Malaysia. ABSTRACT Insignificant consideration in multimedia research has been given to the features that are associated with cognitive functioning in general, and working memory (WM) in particular for preschoolers. As correlational research works discovered a close association between WM and learning achievement, multimedia research works that are tapping into preschoolers’ WM not only has the potential to improve preschoolers’ academic performance, but also to close the gap in multimedia research on cognitive functioning. Baddeley’s WM and learning theories justifies the use of physical artefacts as an outstanding means to complete the set of sensory input for information processing in WM. Thus the researchers designed and developed a genre of multimedia that combined the physical artefacts. As physical artefacts graspable and manipulable for concrete experience, the researchers designated them as “graspable multimedia”. The researchers had conducted a research that inquired the potential of the prototype of such multimedia system, GraspLearn, into the WM of preschoolers. In the research, learning mode, GraspLearn and conventional multimedia (CLearn) systems were set as independent variable, WM capacity (WMC) as the dependent variable cognitive style (field-dependent and field-independent) as the moderator variables. Analyses on 248 preschoolers reveal that the GraspLearn system did not improve preschoolers’ WMC significantly more than CLearn. Interaction analyses by cognitive style with learning mode reports relationship between learning mode and did not differ by cognitive style. The culmination of such research drew a prognostic of the shortfall in capacity of the graspable multimedia in realm of cognitive functioning of preschoolers.
INTRODUCTION There has been a multitude of commercial multimedia systems developed, but very few of them attuned to preschoolers' level of cognition, such as insignificant consideration towards the design of interface that considers the capacity of working memory (WMC) of preschoolers in knowledge acquisition (Barnes, 2010). Piagetian Theory (1972, 1976) postulates that the cognition of children age eight years and below who are in state of pre-operational stage requires concrete experiences (Semmar & Al-Thani, 2015). Meanwhile there exists substantial confirmation that visual-spatial structure improves human’s ability to recall words (Çöltekin, Francelet, Richter, Thoresen, & Fabrikant, 2017). Thus, the researchers are of opinion that by embedding physical artefacts into the scope of multimedia learning for preschoolers, the researchers are not only attuning multimedia system to preschoolers’ cognitive functioning level, but also defining a feature in multimedia context potentially playing a role in WM performance. The researchers designated this genre of multimedia “graspable multimedia”. A prototype of such multimedia named GraspLearn, which structures real-life physical artefacts as a vital part of instructional medium was developed for research. The finding of the research presented adequately in the paper would render us the degree of capability of the graspable multimedia system in WM elevation with the relevant population. PROBLEM STATEMENT Preceding multimedia research works associated with cognitive functioning primarily concentrated on memory retention (Dooley, 2015; Pant, 2006), reflecting a dearth of attention given to the probability of multimedia playing a role in WM enhancement. The problem pertaining to WM among preschoolers nowadays are that children younger than eight years tend to be less proficient in tasks that access WM than those who are 10 or 19 years old (Hale, Bronik, & Fry, 1997). Substantial research works demonstrated that working memory capacity (WMC) is trainable and can be greatly improved (Harrison, Shipstead, Hicks, Hambrick, Redick, & Engle, 2013;
TOJET: The Turkish Online Journal of Educational Technology – January 2018, volume 17 issue 1
Copyright © The Turkish Online Journal of Educational Technology 70
Shipstead, Redick, & Engle, 2010; Londe, 2008). Meanwhile, multimedia has been proven accounted for fun and playing role in children education (Heidig, Müller, & Reichelt, 2015). Hence, a research which takes into account WM in general, and a multimedia system that capable of enhancing WM in particular, is of great necessity to preschoolers whose attention span and WM are weak (Conejero & Rueda, 2017; Hale, Bronik, & Fry, 1997). In recent times, there have been growing literature and research works concerned with WM tasks attempting to alter the WMC (such as Cogmed Working Memory Training program (Ralph, 2013; Chacko, et al., 2013) and JungleMemory (Alloway, 2012)) (Shipstead, Redick, & Engle, 2010). The research works show that on average, a person, including five to six years old child, is typically able to recall three to four words or digits (Szmalec, Brysbaert, & Duyck, 2012; Londe, 2008; Xu & Chun, 2006). The maximum units of information of memory capacity reported are seven, plus or minus two at a time (Miller, 1956). In this respect, it is interesting to investigate; does the capacity limit of WM of a preschooler remain at three, attenuated to less than three, or strengthened beyond the maximum capacity of nine units (seven plus two) after extensive practice using GraspLearn? As correlational research works revealed a close relationship between WM and academic learning performance (Esteban, Vivas, Fuentes, & Estévez, 2015; Torres-Fernandez, 2008; Oberauer, 2005), a multimedia system conducted with the intent of enhancing WMC not only has the potential to improve preschoolers’ short- and long-term academic achievements, but also to fill the gap in multimedia research on WM performance. OBJECTIVES OF THE RESEARCH The primary objective of the research was to design and develop a graspable multimedia learning system (GraspLearn) capable of maximising working memory capacity of preschoolers in the learning of real-life knowledge in English as Second Language (ESL). GraspLearn is a unified instructional multimedia system that unifies the strength of digital multimedia expressions and physical artefacts. RESEARCH QUESTIONS (RQ) RQ1. Do learners of the GraspLearn system demonstrate a significant difference in their working memory
capacity (WMC) (as measured by “objects-span tri-tasks” test) compared to the learners engaged in CLearn system?
RQ2. Is there any interaction effect in the dependent variables (WMC) between learners in the GraspLearn group as compared to the CLearn group with different cognitive style (field-dependent and field-independent learners)?
RQ3. Is there any significant difference in the dependent variables (WMC) between learners in the GraspLearn group as compared to the CLearn group with different cognitive style?
RESEARCH HYPOTHESES There was no prior similar research. Hence, the research has null effects on the learners. The level of significance of the research, α = 0.05. H01: There is no significant difference in working memory capacity (WMC) between learners using
GraspLearn and those using CLearn system. H02: There is no interaction effect between the learning modes (GraspLearn and CLearn systems) and
cognitive style (field-dependent and field-independent learners) on WMC. H03: There is no significant difference in WMC between field-dependent and field-independent learners in
the GraspLearn and CLearn groups. RESEARCH FRAMEWORK A quasi-experimental factorial design was deployed to assess the utility of GraspLearn system in enhancing the working memory capacity of preschoolers. The research framework was summarised as follows.
Table 1: Research Framework for the research
Independent variable (IV) Moderator variables (MV) Dependent variable (DV) Learning mode: • GraspLearn (unified with physical artefacts) • CLearn(without physical artefacts)
Cognitive style (field-dependent / field-independent)
Working Memory Capacity (WMC) score
There was a potential moderator variable (MV) which might offer contingent effects upon the cognitive style (DV). Each individual perform differently (Snow & Cronbach, 1977). Thus there is high possibility that the experimental systems yield different findings for learners of distinct personal and psychological profiles after a new component was incorporated into multimedia. Inclusion of cognitive style as MV allowed the research to identify whether preschoolers’ interactions with physical artefacts in multimedia context were sensitive to cognitive style differences. Cognitive style and functioning can be found in children as young as two years of
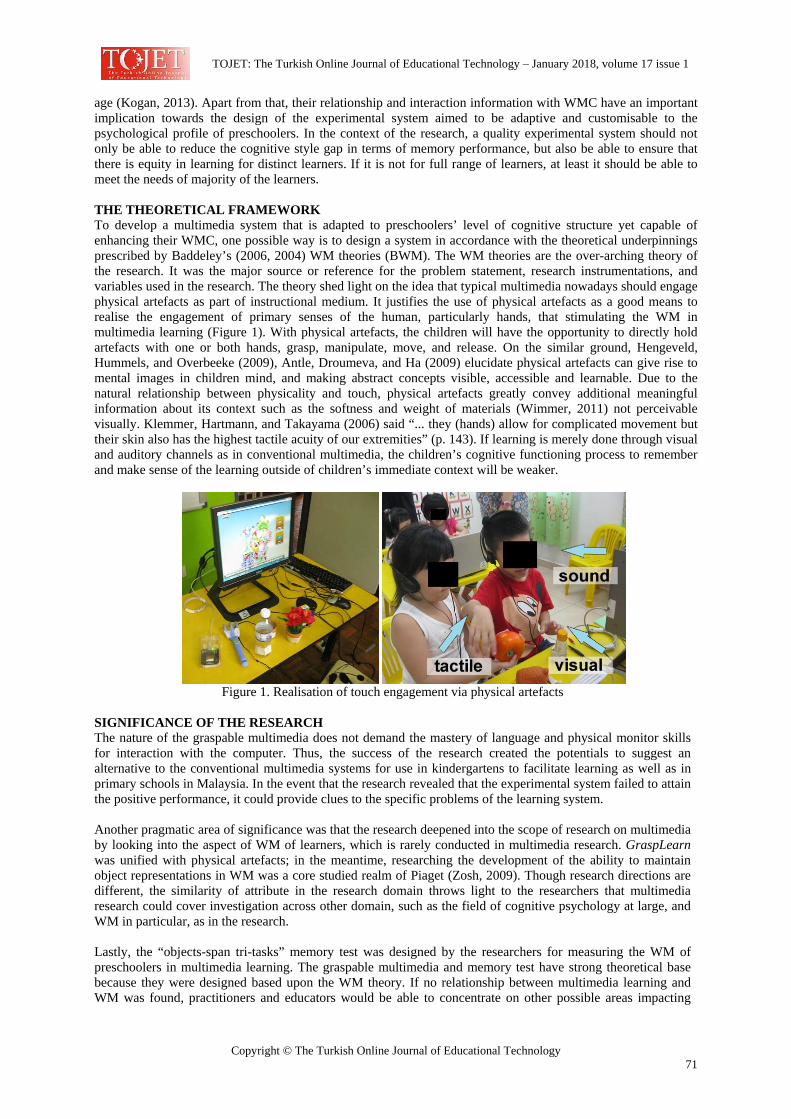
TOJET: The Turkish Online Journal of Educational Technology – January 2018, volume 17 issue 1
Copyright © The Turkish Online Journal of Educational Technology 71
age (Kogan, 2013). Apart from that, their relationship and interaction information with WMC have an important implication towards the design of the experimental system aimed to be adaptive and customisable to the psychological profile of preschoolers. In the context of the research, a quality experimental system should not only be able to reduce the cognitive style gap in terms of memory performance, but also be able to ensure that there is equity in learning for distinct learners. If it is not for full range of learners, at least it should be able to meet the needs of majority of the learners. THE THEORETICAL FRAMEWORK To develop a multimedia system that is adapted to preschoolers’ level of cognitive structure yet capable of enhancing their WMC, one possible way is to design a system in accordance with the theoretical underpinnings prescribed by Baddeley’s (2006, 2004) WM theories (BWM). The WM theories are the over-arching theory of the research. It was the major source or reference for the problem statement, research instrumentations, and variables used in the research. The theory shed light on the idea that typical multimedia nowadays should engage physical artefacts as part of instructional medium. It justifies the use of physical artefacts as a good means to realise the engagement of primary senses of the human, particularly hands, that stimulating the WM in multimedia learning (Figure 1). With physical artefacts, the children will have the opportunity to directly hold artefacts with one or both hands, grasp, manipulate, move, and release. On the similar ground, Hengeveld, Hummels, and Overbeeke (2009), Antle, Droumeva, and Ha (2009) elucidate physical artefacts can give rise to mental images in children mind, and making abstract concepts visible, accessible and learnable. Due to the natural relationship between physicality and touch, physical artefacts greatly convey additional meaningful information about its context such as the softness and weight of materials (Wimmer, 2011) not perceivable visually. Klemmer, Hartmann, and Takayama (2006) said “... they (hands) allow for complicated movement but their skin also has the highest tactile acuity of our extremities” (p. 143). If learning is merely done through visual and auditory channels as in conventional multimedia, the children’s cognitive functioning process to remember and make sense of the learning outside of children’s immediate context will be weaker.
Figure 1. Realisation of touch engagement via physical artefacts
SIGNIFICANCE OF THE RESEARCH The nature of the graspable multimedia does not demand the mastery of language and physical monitor skills for interaction with the computer. Thus, the success of the research created the potentials to suggest an alternative to the conventional multimedia systems for use in kindergartens to facilitate learning as well as in primary schools in Malaysia. In the event that the research revealed that the experimental system failed to attain the positive performance, it could provide clues to the specific problems of the learning system. Another pragmatic area of significance was that the research deepened into the scope of research on multimedia by looking into the aspect of WM of learners, which is rarely conducted in multimedia research. GraspLearn was unified with physical artefacts; in the meantime, researching the development of the ability to maintain object representations in WM was a core studied realm of Piaget (Zosh, 2009). Though research directions are different, the similarity of attribute in the research domain throws light to the researchers that multimedia research could cover investigation across other domain, such as the field of cognitive psychology at large, and WM in particular, as in the research. Lastly, the “objects-span tri-tasks” memory test was designed by the researchers for measuring the WM of preschoolers in multimedia learning. The graspable multimedia and memory test have strong theoretical base because they were designed based upon the WM theory. If no relationship between multimedia learning and WM was found, practitioners and educators would be able to concentrate on other possible areas impacting
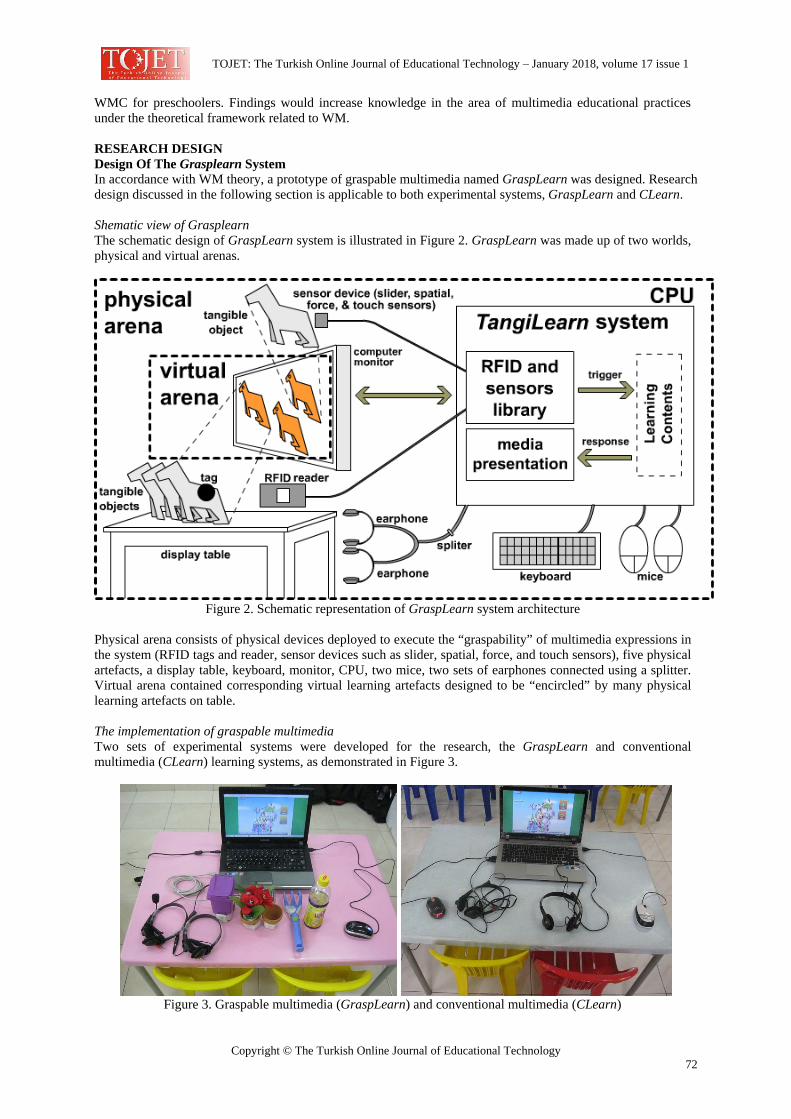
TOJET: The Turkish Online Journal of Educational Technology – January 2018, volume 17 issue 1
Copyright © The Turkish Online Journal of Educational Technology 72
WMC for preschoolers. Findings would increase knowledge in the area of multimedia educational practices under the theoretical framework related to WM. RESEARCH DESIGN Design Of The Grasplearn System In accordance with WM theory, a prototype of graspable multimedia named GraspLearn was designed. Research design discussed in the following section is applicable to both experimental systems, GraspLearn and CLearn. Shematic view of Grasplearn The schematic design of GraspLearn system is illustrated in Figure 2. GraspLearn was made up of two worlds, physical and virtual arenas.
Figure 2. Schematic representation of GraspLearn system architecture
Physical arena consists of physical devices deployed to execute the “graspability” of multimedia expressions in the system (RFID tags and reader, sensor devices such as slider, spatial, force, and touch sensors), five physical artefacts, a display table, keyboard, monitor, CPU, two mice, two sets of earphones connected using a splitter. Virtual arena contained corresponding virtual learning artefacts designed to be “encircled” by many physical learning artefacts on table. The implementation of graspable multimedia Two sets of experimental systems were developed for the research, the GraspLearn and conventional multimedia (CLearn) learning systems, as demonstrated in Figure 3.
Figure 3. Graspable multimedia (GraspLearn) and conventional multimedia (CLearn)
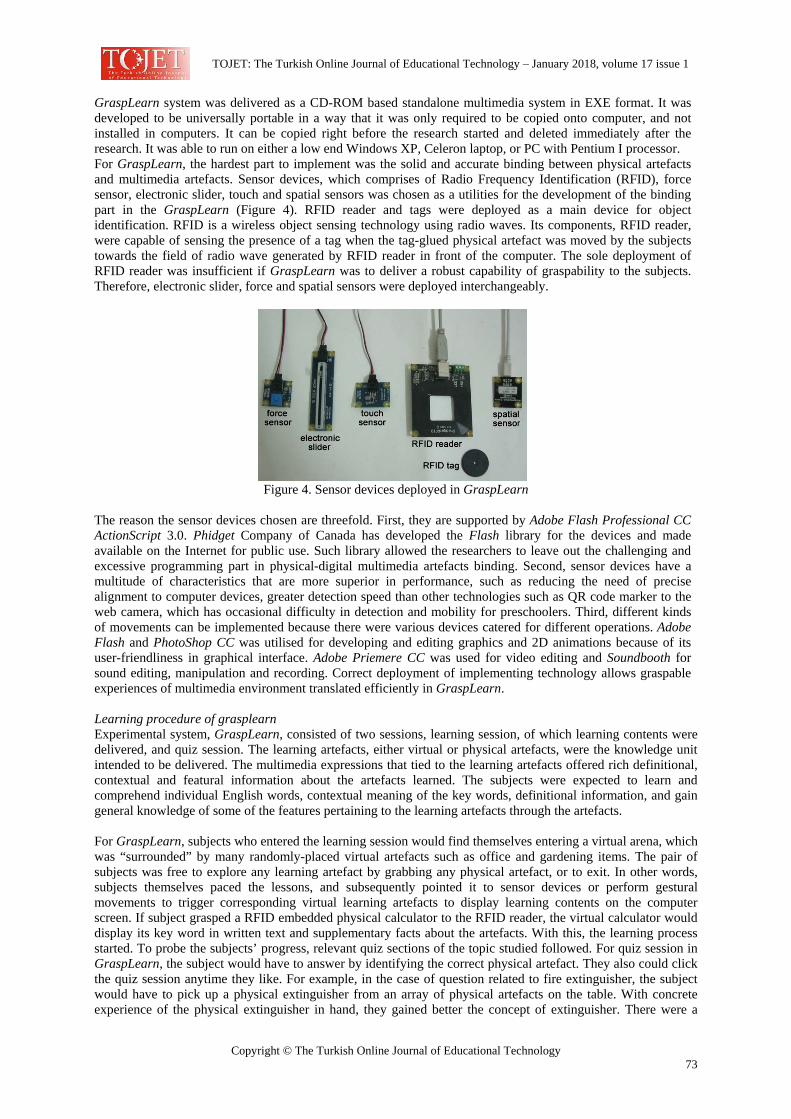
TOJET: The Turkish Online Journal of Educational Technology – January 2018, volume 17 issue 1
Copyright © The Turkish Online Journal of Educational Technology 73
GraspLearn system was delivered as a CD-ROM based standalone multimedia system in EXE format. It was developed to be universally portable in a way that it was only required to be copied onto computer, and not installed in computers. It can be copied right before the research started and deleted immediately after the research. It was able to run on either a low end Windows XP, Celeron laptop, or PC with Pentium I processor. For GraspLearn, the hardest part to implement was the solid and accurate binding between physical artefacts and multimedia artefacts. Sensor devices, which comprises of Radio Frequency Identification (RFID), force sensor, electronic slider, touch and spatial sensors was chosen as a utilities for the development of the binding part in the GraspLearn (Figure 4). RFID reader and tags were deployed as a main device for object identification. RFID is a wireless object sensing technology using radio waves. Its components, RFID reader, were capable of sensing the presence of a tag when the tag-glued physical artefact was moved by the subjects towards the field of radio wave generated by RFID reader in front of the computer. The sole deployment of RFID reader was insufficient if GraspLearn was to deliver a robust capability of graspability to the subjects. Therefore, electronic slider, force and spatial sensors were deployed interchangeably.
Figure 4. Sensor devices deployed in GraspLearn
The reason the sensor devices chosen are threefold. First, they are supported by Adobe Flash Professional CC ActionScript 3.0. Phidget Company of Canada has developed the Flash library for the devices and made available on the Internet for public use. Such library allowed the researchers to leave out the challenging and excessive programming part in physical-digital multimedia artefacts binding. Second, sensor devices have a multitude of characteristics that are more superior in performance, such as reducing the need of precise alignment to computer devices, greater detection speed than other technologies such as QR code marker to the web camera, which has occasional difficulty in detection and mobility for preschoolers. Third, different kinds of movements can be implemented because there were various devices catered for different operations. Adobe Flash and PhotoShop CC was utilised for developing and editing graphics and 2D animations because of its user-friendliness in graphical interface. Adobe Priemere CC was used for video editing and Soundbooth for sound editing, manipulation and recording. Correct deployment of implementing technology allows graspable experiences of multimedia environment translated efficiently in GraspLearn. Learning procedure of grasplearn Experimental system, GraspLearn, consisted of two sessions, learning session, of which learning contents were delivered, and quiz session. The learning artefacts, either virtual or physical artefacts, were the knowledge unit intended to be delivered. The multimedia expressions that tied to the learning artefacts offered rich definitional, contextual and featural information about the artefacts learned. The subjects were expected to learn and comprehend individual English words, contextual meaning of the key words, definitional information, and gain general knowledge of some of the features pertaining to the learning artefacts through the artefacts. For GraspLearn, subjects who entered the learning session would find themselves entering a virtual arena, which was “surrounded” by many randomly-placed virtual artefacts such as office and gardening items. The pair of subjects was free to explore any learning artefact by grabbing any physical artefact, or to exit. In other words, subjects themselves paced the lessons, and subsequently pointed it to sensor devices or perform gestural movements to trigger corresponding virtual learning artefacts to display learning contents on the computer screen. If subject grasped a RFID embedded physical calculator to the RFID reader, the virtual calculator would display its key word in written text and supplementary facts about the artefacts. With this, the learning process started. To probe the subjects’ progress, relevant quiz sections of the topic studied followed. For quiz session in GraspLearn, the subject would have to answer by identifying the correct physical artefact. They also could click the quiz session anytime they like. For example, in the case of question related to fire extinguisher, the subject would have to pick up a physical extinguisher from an array of physical artefacts on the table. With concrete experience of the physical extinguisher in hand, they gained better the concept of extinguisher. There were a
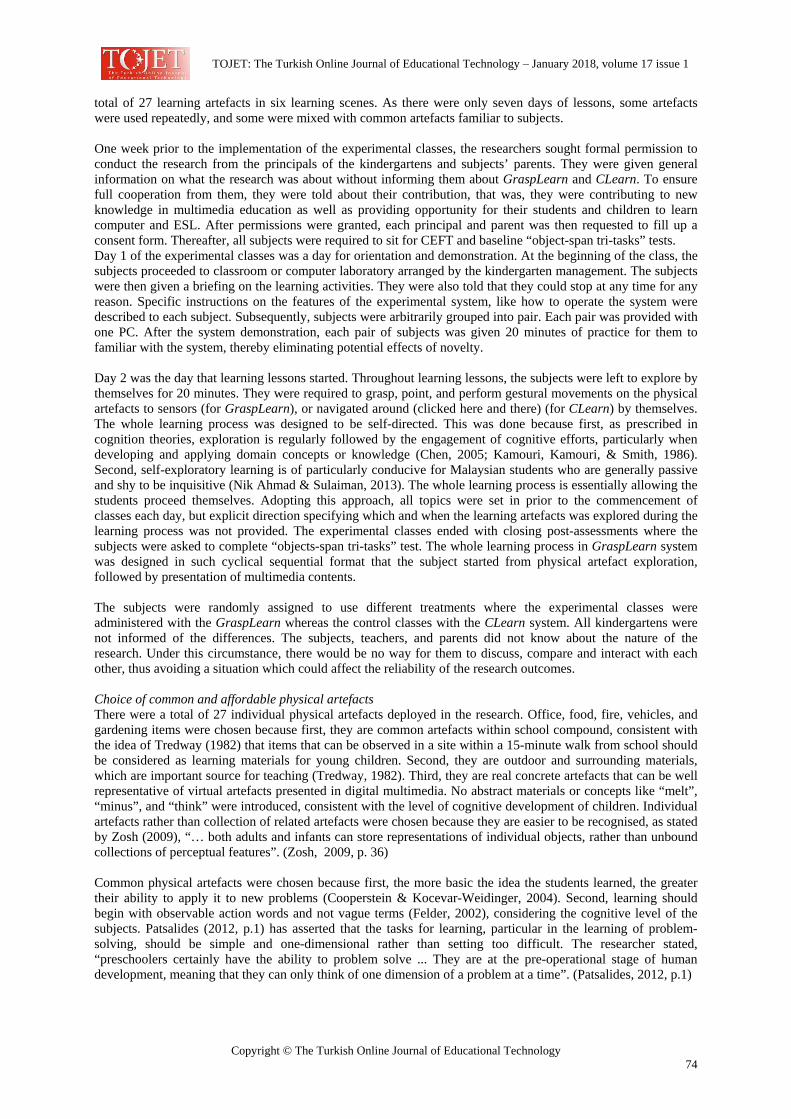
TOJET: The Turkish Online Journal of Educational Technology – January 2018, volume 17 issue 1
Copyright © The Turkish Online Journal of Educational Technology 74
total of 27 learning artefacts in six learning scenes. As there were only seven days of lessons, some artefacts were used repeatedly, and some were mixed with common artefacts familiar to subjects. One week prior to the implementation of the experimental classes, the researchers sought formal permission to conduct the research from the principals of the kindergartens and subjects’ parents. They were given general information on what the research was about without informing them about GraspLearn and CLearn. To ensure full cooperation from them, they were told about their contribution, that was, they were contributing to new knowledge in multimedia education as well as providing opportunity for their students and children to learn computer and ESL. After permissions were granted, each principal and parent was then requested to fill up a consent form. Thereafter, all subjects were required to sit for CEFT and baseline “object-span tri-tasks” tests. Day 1 of the experimental classes was a day for orientation and demonstration. At the beginning of the class, the subjects proceeded to classroom or computer laboratory arranged by the kindergarten management. The subjects were then given a briefing on the learning activities. They were also told that they could stop at any time for any reason. Specific instructions on the features of the experimental system, like how to operate the system were described to each subject. Subsequently, subjects were arbitrarily grouped into pair. Each pair was provided with one PC. After the system demonstration, each pair of subjects was given 20 minutes of practice for them to familiar with the system, thereby eliminating potential effects of novelty. Day 2 was the day that learning lessons started. Throughout learning lessons, the subjects were left to explore by themselves for 20 minutes. They were required to grasp, point, and perform gestural movements on the physical artefacts to sensors (for GraspLearn), or navigated around (clicked here and there) (for CLearn) by themselves. The whole learning process was designed to be self-directed. This was done because first, as prescribed in cognition theories, exploration is regularly followed by the engagement of cognitive efforts, particularly when developing and applying domain concepts or knowledge (Chen, 2005; Kamouri, Kamouri, & Smith, 1986). Second, self-exploratory learning is of particularly conducive for Malaysian students who are generally passive and shy to be inquisitive (Nik Ahmad & Sulaiman, 2013). The whole learning process is essentially allowing the students proceed themselves. Adopting this approach, all topics were set in prior to the commencement of classes each day, but explicit direction specifying which and when the learning artefacts was explored during the learning process was not provided. The experimental classes ended with closing post-assessments where the subjects were asked to complete “objects-span tri-tasks” test. The whole learning process in GraspLearn system was designed in such cyclical sequential format that the subject started from physical artefact exploration, followed by presentation of multimedia contents. The subjects were randomly assigned to use different treatments where the experimental classes were administered with the GraspLearn whereas the control classes with the CLearn system. All kindergartens were not informed of the differences. The subjects, teachers, and parents did not know about the nature of the research. Under this circumstance, there would be no way for them to discuss, compare and interact with each other, thus avoiding a situation which could affect the reliability of the research outcomes. Choice of common and affordable physical artefacts There were a total of 27 individual physical artefacts deployed in the research. Office, food, fire, vehicles, and gardening items were chosen because first, they are common artefacts within school compound, consistent with the idea of Tredway (1982) that items that can be observed in a site within a 15-minute walk from school should be considered as learning materials for young children. Second, they are outdoor and surrounding materials, which are important source for teaching (Tredway, 1982). Third, they are real concrete artefacts that can be well representative of virtual artefacts presented in digital multimedia. No abstract materials or concepts like “melt”, “minus”, and “think” were introduced, consistent with the level of cognitive development of children. Individual artefacts rather than collection of related artefacts were chosen because they are easier to be recognised, as stated by Zosh (2009), “… both adults and infants can store representations of individual objects, rather than unbound collections of perceptual features”. (Zosh, 2009, p. 36) Common physical artefacts were chosen because first, the more basic the idea the students learned, the greater their ability to apply it to new problems (Cooperstein & Kocevar-Weidinger, 2004). Second, learning should begin with observable action words and not vague terms (Felder, 2002), considering the cognitive level of the subjects. Patsalides (2012, p.1) has asserted that the tasks for learning, particular in the learning of problem-solving, should be simple and one-dimensional rather than setting too difficult. The researcher stated, “preschoolers certainly have the ability to problem solve ... They are at the pre-operational stage of human development, meaning that they can only think of one dimension of a problem at a time”. (Patsalides, 2012, p.1)
TOJET: The Turkish Online Journal of Educational Technology – January 2018, volume 17 issue 1
Copyright © The Turkish Online Journal of Educational Technology 75
Why was featural knowledge about the objects chosen? In the research, knowledge-building was integrated into ESL learning activities. This means the subjects were not only required to learn the name and key words of the learning artefacts, but also the featural knowledge about the artefacts. This was done because first, the researchers followed the semantic learning approach adopted in Weill’s (2011) research in the research. Weill (2011, p. 42) said, “… the more knowledge a toddler has about an object, the easier it will be for him or her to retrieve the word from memory and recognise and name the object”. Knowledge and background meaning of words form a vocabulary base for children and help them with the learning of other (Weill, 2011) and to make sense of what they read (Loraine, 2008). For instance, a child who reads about an essay of war requires a basic vocabulary such as soldier, war, and guns. Second, engaging knowledge-building experiences in word learning suggests children’s natural desire to discover new knowledge about their world. Generally, young children are eager to understand more about the world and their knowledge and understanding of the real world helps them explain phenomena and solve problems. The surrounding is also a part for young children to learn second language (Albert Shanker Institute, 2009). Albert Shanker Institute (2009, p. 20) stated, “young children are naturally curious about the world, and they regularly ask ‘why’ and ‘how’ questions that logically leads to scientific inquiry”. Third, the learning outcomes are much less satisfactory if learning process merely focuses on drilling young children in isolated skills (Albert Shanker Institute, 2009). ESL learning tied to knowledge-building activities not only cogently provides the base for enjoyable and exciting learning experiences for young preschoolers, but also makes reading and writing a meaningful and purposeful activity (Albert Shanker Institute, 2009). The research followed the English language curriculum stipulated by the Ministry of Education of Malaysia (2001) that an enjoyment of the language learning should be developed through the use of interesting means. Fourth, there is a need for the development of a computer-aided courseware that teaches both real-life knowledge and ESL at the same time. Multimedia markets in Malaysia nowadays are overwhelmed by multimedia courseware in genuine language domain (such as Malay, English, Mandarin), and thematic domain (such as Mathematics and Science) (Osman & Lee, 2014; Han, Abd Halim, Shariffuddin, Abdullah, 2013; Norhayati & Siew, 2004). Multimedia systems on real-life knowledge building in second language learning setting, particularly ESL learning for preschoolers are very scarce. Experimental Design The 2 by 2 quasi-experimental factorial design, a variation of an experimental design, was employed in the research. Each group was given a pre- and post-assessments, which would be performed and analysed separately.
Table 2: Multiple-group pre- and post-assessments quasi-experimental design GraspLearn (experimental group)
CEFT Baseline “objects-span tri-tasks” test
“Objects-span tri-tasks” test
CLearn system (controlled group)
CEFT Baseline “objects-span tri-tasks” test
“Objects-span tri-tasks” test
The quasi-experimental factorial design was chosen in the research because it allows the researchers to determine whether the effects of an experimental variable are generalisable across all levels of a control variable, or are specific to certain level of the control variable (Gay, 1996). Besides, it also allows the researchers to manipulate independent variable (IV) in order to investigate the interaction of the IV with other variables, such as moderator variables and dependent variables (Fraenkel & Wallen, 1996). Sampling of kindergarten There were seven private registered kindergartens in Malaysia participated in the research. The criteria used for the selection of kindergartens were that majorities of their students were non-English-speaking (NES) or limited-English-speaking (LES) students. The researchers used students’ demographic data and discussion with the teachers to determine the eligibility of kindergartens. The researchers scoped the areas for the selection of kindergartens to three town areas in the Kajang, Selangor, Malaysia with the exception of one chosen from another town area, Subang, Selangor because it is one of the branches of the participating kindergartens from the towns the researchers scoped. These three towns were selected because of its close proximity to the residential area of the researchers. Using stratified sampling procedure, all kindergartens in the scoped areas were randomly assigned a number. This procedure ensures that each kindergarten in the defined areas has an equal chance of being selected to take part in the research (Gall, Borg, & Gall, 1996).
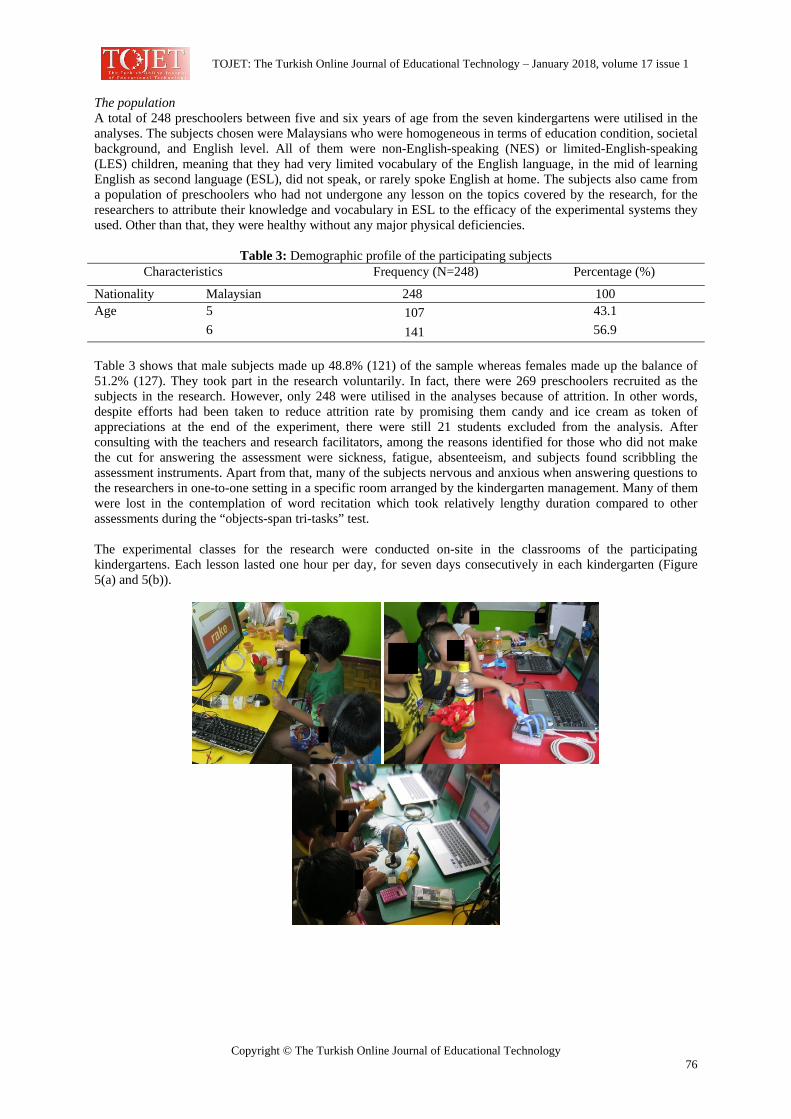
TOJET: The Turkish Online Journal of Educational Technology – January 2018, volume 17 issue 1
Copyright © The Turkish Online Journal of Educational Technology 76
The population A total of 248 preschoolers between five and six years of age from the seven kindergartens were utilised in the analyses. The subjects chosen were Malaysians who were homogeneous in terms of education condition, societal background, and English level. All of them were non-English-speaking (NES) or limited-English-speaking (LES) children, meaning that they had very limited vocabulary of the English language, in the mid of learning English as second language (ESL), did not speak, or rarely spoke English at home. The subjects also came from a population of preschoolers who had not undergone any lesson on the topics covered by the research, for the researchers to attribute their knowledge and vocabulary in ESL to the efficacy of the experimental systems they used. Other than that, they were healthy without any major physical deficiencies.
Table 3: Demographic profile of the participating subjects Characteristics Frequency (N=248) Percentage (%)
Nationality Malaysian 248 100 Age 5 107 43.1
6 141 56.9 Table 3 shows that male subjects made up 48.8% (121) of the sample whereas females made up the balance of 51.2% (127). They took part in the research voluntarily. In fact, there were 269 preschoolers recruited as the subjects in the research. However, only 248 were utilised in the analyses because of attrition. In other words, despite efforts had been taken to reduce attrition rate by promising them candy and ice cream as token of appreciations at the end of the experiment, there were still 21 students excluded from the analysis. After consulting with the teachers and research facilitators, among the reasons identified for those who did not make the cut for answering the assessment were sickness, fatigue, absenteeism, and subjects found scribbling the assessment instruments. Apart from that, many of the subjects nervous and anxious when answering questions to the researchers in one-to-one setting in a specific room arranged by the kindergarten management. Many of them were lost in the contemplation of word recitation which took relatively lengthy duration compared to other assessments during the “objects-span tri-tasks” test. The experimental classes for the research were conducted on-site in the classrooms of the participating kindergartens. Each lesson lasted one hour per day, for seven days consecutively in each kindergarten (Figure 5(a) and 5(b)).
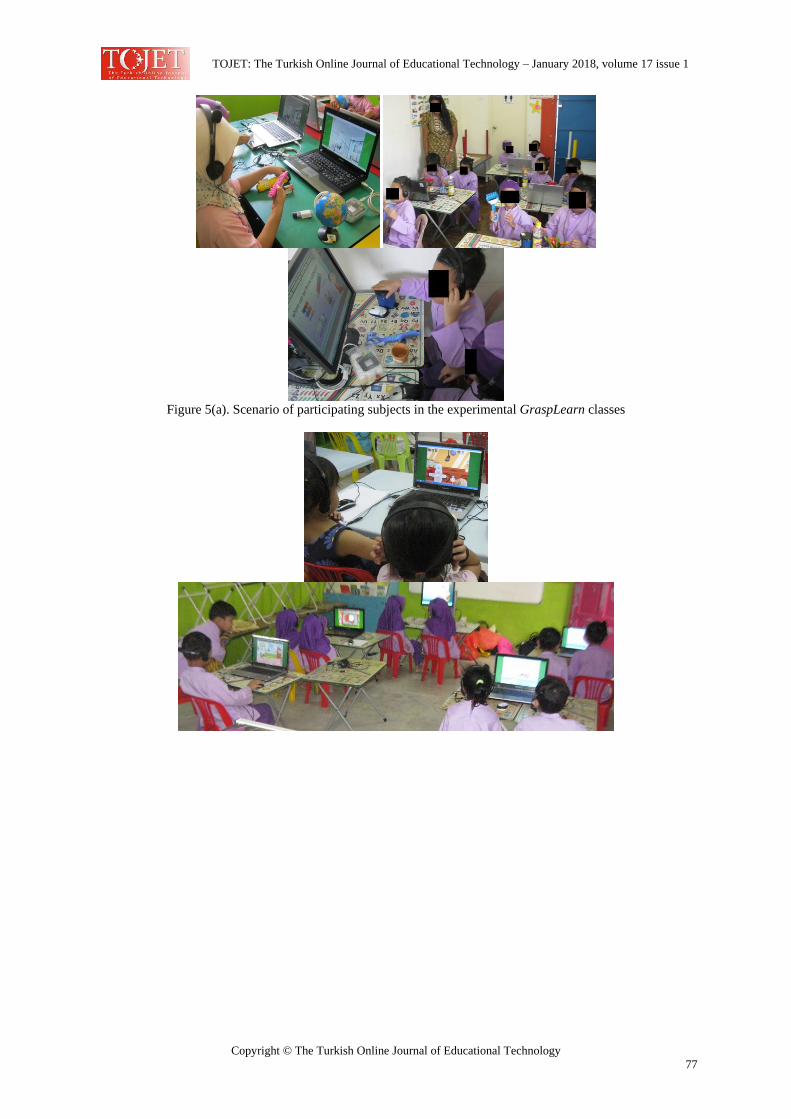
TOJET: The Turkish Online Journal of Educational Technology – January 2018, volume 17 issue 1
Copyright © The Turkish Online Journal of Educational Technology 77
Figure 5(a). Scenario of participating subjects in the experimental GraspLearn classes
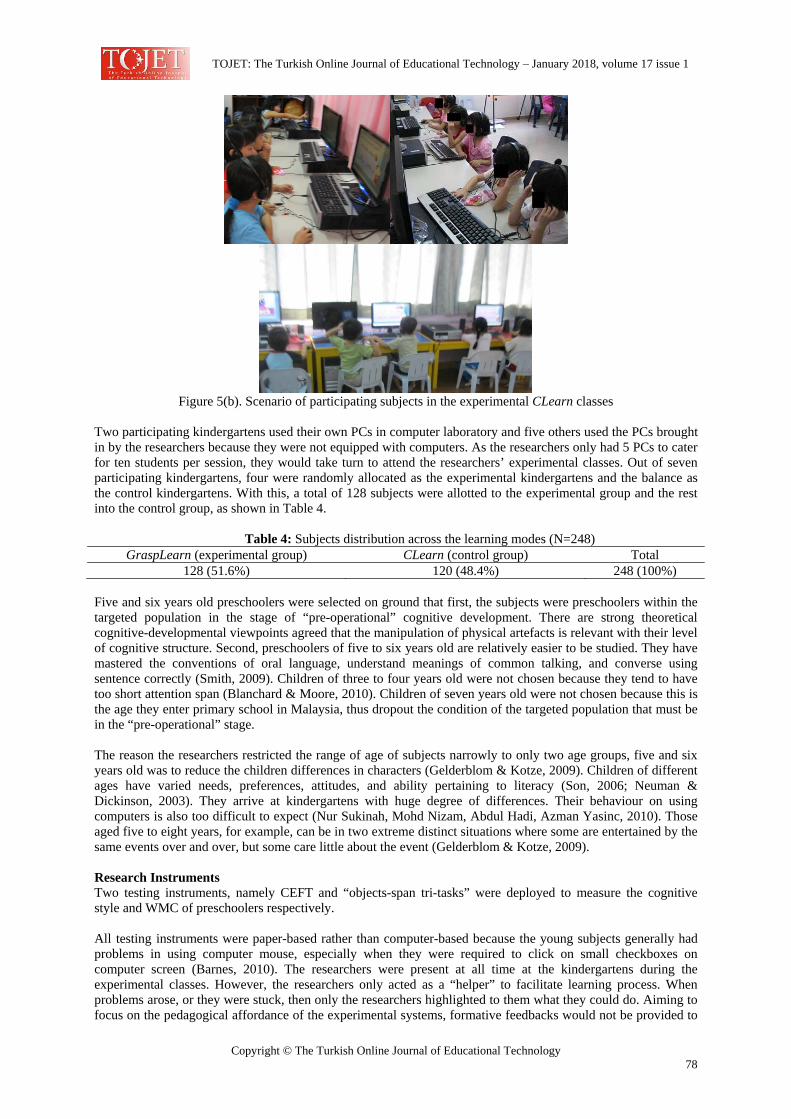
TOJET: The Turkish Online Journal of Educational Technology – January 2018, volume 17 issue 1
Copyright © The Turkish Online Journal of Educational Technology 78
Figure 5(b). Scenario of participating subjects in the experimental CLearn classes
Two participating kindergartens used their own PCs in computer laboratory and five others used the PCs brought in by the researchers because they were not equipped with computers. As the researchers only had 5 PCs to cater for ten students per session, they would take turn to attend the researchers’ experimental classes. Out of seven participating kindergartens, four were randomly allocated as the experimental kindergartens and the balance as the control kindergartens. With this, a total of 128 subjects were allotted to the experimental group and the rest into the control group, as shown in Table 4.
Table 4: Subjects distribution across the learning modes (N=248) GraspLearn (experimental group) CLearn (control group) Total
128 (51.6%) 120 (48.4%) 248 (100%)
Five and six years old preschoolers were selected on ground that first, the subjects were preschoolers within the targeted population in the stage of “pre-operational” cognitive development. There are strong theoretical cognitive-developmental viewpoints agreed that the manipulation of physical artefacts is relevant with their level of cognitive structure. Second, preschoolers of five to six years old are relatively easier to be studied. They have mastered the conventions of oral language, understand meanings of common talking, and converse using sentence correctly (Smith, 2009). Children of three to four years old were not chosen because they tend to have too short attention span (Blanchard & Moore, 2010). Children of seven years old were not chosen because this is the age they enter primary school in Malaysia, thus dropout the condition of the targeted population that must be in the “pre-operational” stage. The reason the researchers restricted the range of age of subjects narrowly to only two age groups, five and six years old was to reduce the children differences in characters (Gelderblom & Kotze, 2009). Children of different ages have varied needs, preferences, attitudes, and ability pertaining to literacy (Son, 2006; Neuman & Dickinson, 2003). They arrive at kindergartens with huge degree of differences. Their behaviour on using computers is also too difficult to expect (Nur Sukinah, Mohd Nizam, Abdul Hadi, Azman Yasinc, 2010). Those aged five to eight years, for example, can be in two extreme distinct situations where some are entertained by the same events over and over, but some care little about the event (Gelderblom & Kotze, 2009). Research Instruments Two testing instruments, namely CEFT and “objects-span tri-tasks” were deployed to measure the cognitive style and WMC of preschoolers respectively. All testing instruments were paper-based rather than computer-based because the young subjects generally had problems in using computer mouse, especially when they were required to click on small checkboxes on computer screen (Barnes, 2010). The researchers were present at all time at the kindergartens during the experimental classes. However, the researchers only acted as a “helper” to facilitate learning process. When problems arose, or they were stuck, then only the researchers highlighted to them what they could do. Aiming to focus on the pedagogical affordance of the experimental systems, formative feedbacks would not be provided to
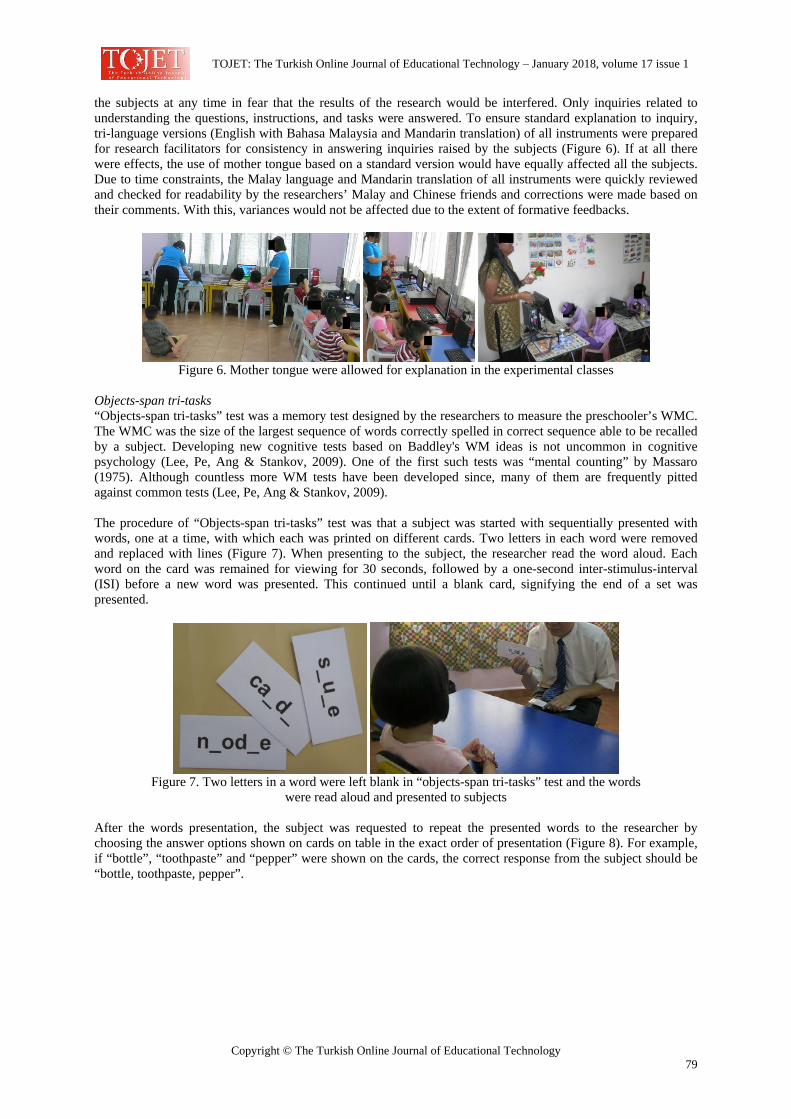
TOJET: The Turkish Online Journal of Educational Technology – January 2018, volume 17 issue 1
Copyright © The Turkish Online Journal of Educational Technology 79
the subjects at any time in fear that the results of the research would be interfered. Only inquiries related to understanding the questions, instructions, and tasks were answered. To ensure standard explanation to inquiry, tri-language versions (English with Bahasa Malaysia and Mandarin translation) of all instruments were prepared for research facilitators for consistency in answering inquiries raised by the subjects (Figure 6). If at all there were effects, the use of mother tongue based on a standard version would have equally affected all the subjects. Due to time constraints, the Malay language and Mandarin translation of all instruments were quickly reviewed and checked for readability by the researchers’ Malay and Chinese friends and corrections were made based on their comments. With this, variances would not be affected due to the extent of formative feedbacks.
Figure 6. Mother tongue were allowed for explanation in the experimental classes
Objects-span tri-tasks “Objects-span tri-tasks” test was a memory test designed by the researchers to measure the preschooler’s WMC. The WMC was the size of the largest sequence of words correctly spelled in correct sequence able to be recalled by a subject. Developing new cognitive tests based on Baddley's WM ideas is not uncommon in cognitive psychology (Lee, Pe, Ang & Stankov, 2009). One of the first such tests was “mental counting” by Massaro (1975). Although countless more WM tests have been developed since, many of them are frequently pitted against common tests (Lee, Pe, Ang & Stankov, 2009). The procedure of “Objects-span tri-tasks” test was that a subject was started with sequentially presented with words, one at a time, with which each was printed on different cards. Two letters in each word were removed and replaced with lines (Figure 7). When presenting to the subject, the researcher read the word aloud. Each word on the card was remained for viewing for 30 seconds, followed by a one-second inter-stimulus-interval (ISI) before a new word was presented. This continued until a blank card, signifying the end of a set was presented.
Figure 7. Two letters in a word were left blank in “objects-span tri-tasks” test and the words
were read aloud and presented to subjects
After the words presentation, the subject was requested to repeat the presented words to the researcher by choosing the answer options shown on cards on table in the exact order of presentation (Figure 8). For example, if “bottle”, “toothpaste” and “pepper” were shown on the cards, the correct response from the subject should be “bottle, toothpaste, pepper”.
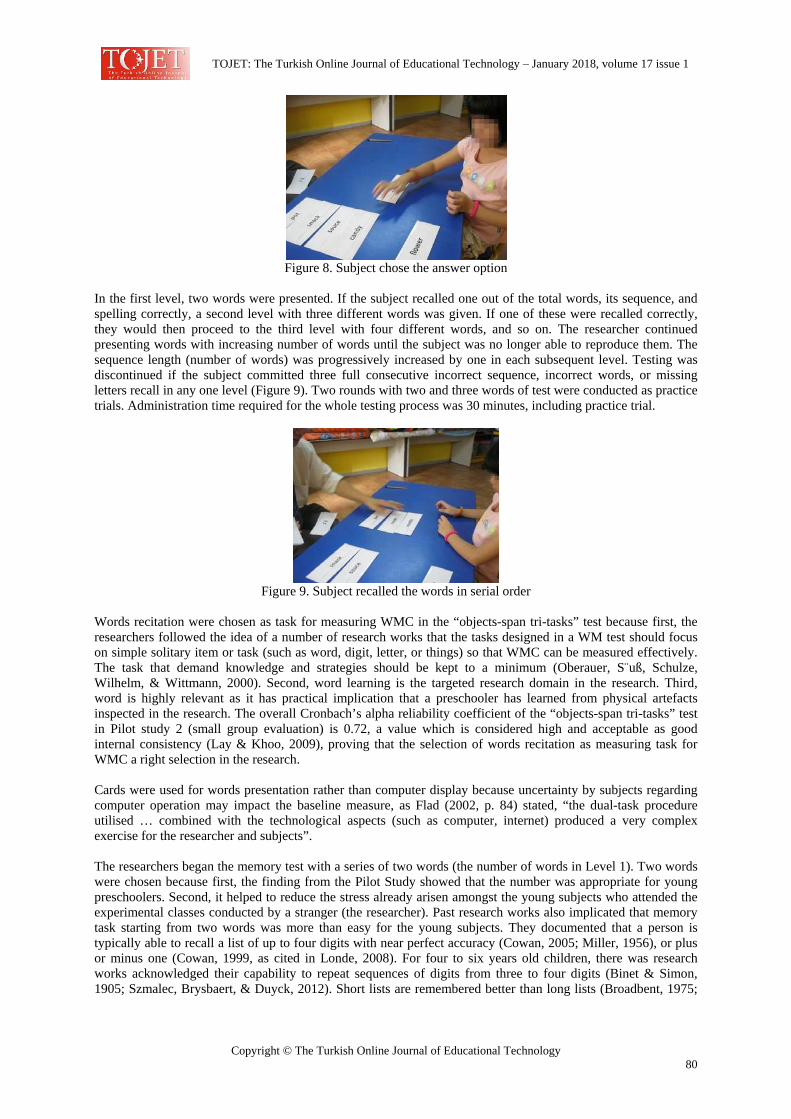
TOJET: The Turkish Online Journal of Educational Technology – January 2018, volume 17 issue 1
Copyright © The Turkish Online Journal of Educational Technology 80
Figure 8. Subject chose the answer option
In the first level, two words were presented. If the subject recalled one out of the total words, its sequence, and spelling correctly, a second level with three different words was given. If one of these were recalled correctly, they would then proceed to the third level with four different words, and so on. The researcher continued presenting words with increasing number of words until the subject was no longer able to reproduce them. The sequence length (number of words) was progressively increased by one in each subsequent level. Testing was discontinued if the subject committed three full consecutive incorrect sequence, incorrect words, or missing letters recall in any one level (Figure 9). Two rounds with two and three words of test were conducted as practice trials. Administration time required for the whole testing process was 30 minutes, including practice trial.
Figure 9. Subject recalled the words in serial order
Words recitation were chosen as task for measuring WMC in the “objects-span tri-tasks” test because first, the researchers followed the idea of a number of research works that the tasks designed in a WM test should focus on simple solitary item or task (such as word, digit, letter, or things) so that WMC can be measured effectively. The task that demand knowledge and strategies should be kept to a minimum (Oberauer, S¨uß, Schulze, Wilhelm, & Wittmann, 2000). Second, word learning is the targeted research domain in the research. Third, word is highly relevant as it has practical implication that a preschooler has learned from physical artefacts inspected in the research. The overall Cronbach’s alpha reliability coefficient of the “objects-span tri-tasks” test in Pilot study 2 (small group evaluation) is 0.72, a value which is considered high and acceptable as good internal consistency (Lay & Khoo, 2009), proving that the selection of words recitation as measuring task for WMC a right selection in the research. Cards were used for words presentation rather than computer display because uncertainty by subjects regarding computer operation may impact the baseline measure, as Flad (2002, p. 84) stated, “the dual-task procedure utilised … combined with the technological aspects (such as computer, internet) produced a very complex exercise for the researcher and subjects”. The researchers began the memory test with a series of two words (the number of words in Level 1). Two words were chosen because first, the finding from the Pilot Study showed that the number was appropriate for young preschoolers. Second, it helped to reduce the stress already arisen amongst the young subjects who attended the experimental classes conducted by a stranger (the researcher). Past research works also implicated that memory task starting from two words was more than easy for the young subjects. They documented that a person is typically able to recall a list of up to four digits with near perfect accuracy (Cowan, 2005; Miller, 1956), or plus or minus one (Cowan, 1999, as cited in Londe, 2008). For four to six years old children, there was research works acknowledged their capability to repeat sequences of digits from three to four digits (Binet & Simon, 1905; Szmalec, Brysbaert, & Duyck, 2012). Short lists are remembered better than long lists (Broadbent, 1975;
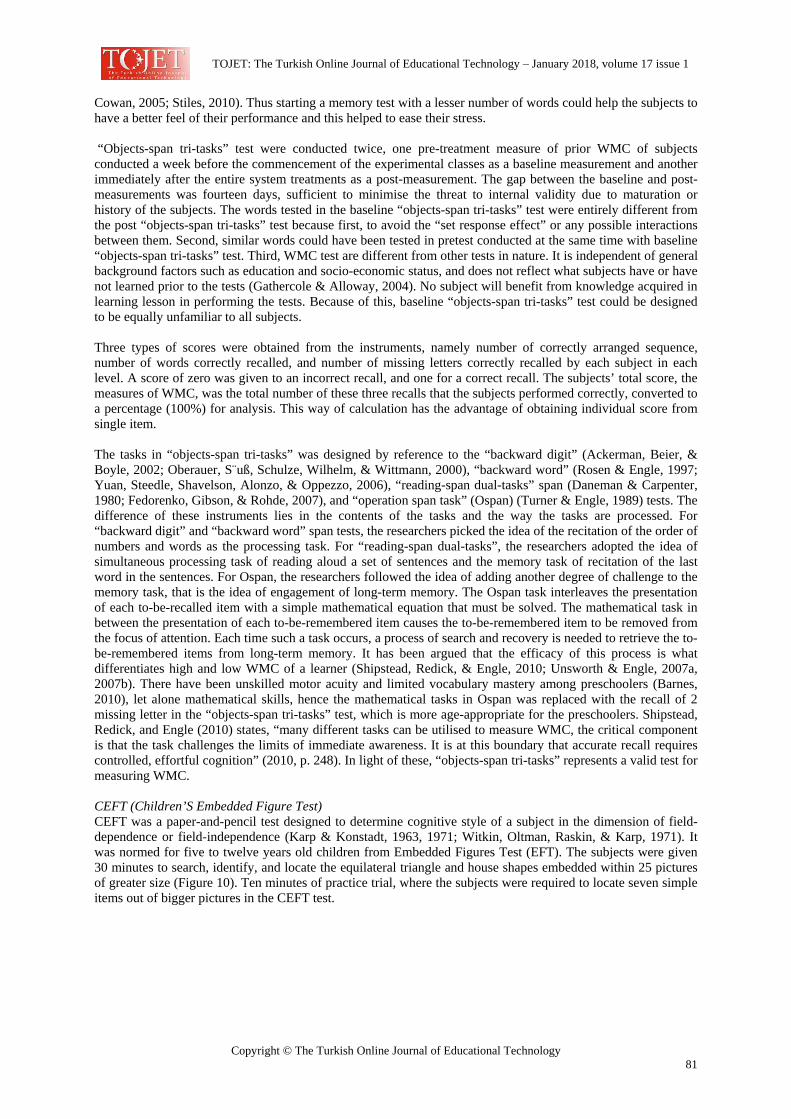
TOJET: The Turkish Online Journal of Educational Technology – January 2018, volume 17 issue 1
Copyright © The Turkish Online Journal of Educational Technology 81
Cowan, 2005; Stiles, 2010). Thus starting a memory test with a lesser number of words could help the subjects to have a better feel of their performance and this helped to ease their stress. “Objects-span tri-tasks” test were conducted twice, one pre-treatment measure of prior WMC of subjects conducted a week before the commencement of the experimental classes as a baseline measurement and another immediately after the entire system treatments as a post-measurement. The gap between the baseline and post-measurements was fourteen days, sufficient to minimise the threat to internal validity due to maturation or history of the subjects. The words tested in the baseline “objects-span tri-tasks” test were entirely different from the post “objects-span tri-tasks” test because first, to avoid the “set response effect” or any possible interactions between them. Second, similar words could have been tested in pretest conducted at the same time with baseline “objects-span tri-tasks” test. Third, WMC test are different from other tests in nature. It is independent of general background factors such as education and socio-economic status, and does not reflect what subjects have or have not learned prior to the tests (Gathercole & Alloway, 2004). No subject will benefit from knowledge acquired in learning lesson in performing the tests. Because of this, baseline “objects-span tri-tasks” test could be designed to be equally unfamiliar to all subjects. Three types of scores were obtained from the instruments, namely number of correctly arranged sequence, number of words correctly recalled, and number of missing letters correctly recalled by each subject in each level. A score of zero was given to an incorrect recall, and one for a correct recall. The subjects’ total score, the measures of WMC, was the total number of these three recalls that the subjects performed correctly, converted to a percentage (100%) for analysis. This way of calculation has the advantage of obtaining individual score from single item. The tasks in “objects-span tri-tasks” was designed by reference to the “backward digit” (Ackerman, Beier, & Boyle, 2002; Oberauer, S¨uß, Schulze, Wilhelm, & Wittmann, 2000), “backward word” (Rosen & Engle, 1997; Yuan, Steedle, Shavelson, Alonzo, & Oppezzo, 2006), “reading-span dual-tasks” span (Daneman & Carpenter, 1980; Fedorenko, Gibson, & Rohde, 2007), and “operation span task” (Ospan) (Turner & Engle, 1989) tests. The difference of these instruments lies in the contents of the tasks and the way the tasks are processed. For “backward digit” and “backward word” span tests, the researchers picked the idea of the recitation of the order of numbers and words as the processing task. For “reading-span dual-tasks”, the researchers adopted the idea of simultaneous processing task of reading aloud a set of sentences and the memory task of recitation of the last word in the sentences. For Ospan, the researchers followed the idea of adding another degree of challenge to the memory task, that is the idea of engagement of long-term memory. The Ospan task interleaves the presentation of each to-be-recalled item with a simple mathematical equation that must be solved. The mathematical task in between the presentation of each to-be-remembered item causes the to-be-remembered item to be removed from the focus of attention. Each time such a task occurs, a process of search and recovery is needed to retrieve the to-be-remembered items from long-term memory. It has been argued that the efficacy of this process is what differentiates high and low WMC of a learner (Shipstead, Redick, & Engle, 2010; Unsworth & Engle, 2007a, 2007b). There have been unskilled motor acuity and limited vocabulary mastery among preschoolers (Barnes, 2010), let alone mathematical skills, hence the mathematical tasks in Ospan was replaced with the recall of 2 missing letter in the “objects-span tri-tasks” test, which is more age-appropriate for the preschoolers. Shipstead, Redick, and Engle (2010) states, “many different tasks can be utilised to measure WMC, the critical component is that the task challenges the limits of immediate awareness. It is at this boundary that accurate recall requires controlled, effortful cognition” (2010, p. 248). In light of these, “objects-span tri-tasks” represents a valid test for measuring WMC. CEFT (Children’S Embedded Figure Test) CEFT was a paper-and-pencil test designed to determine cognitive style of a subject in the dimension of field-dependence or field-independence (Karp & Konstadt, 1963, 1971; Witkin, Oltman, Raskin, & Karp, 1971). It was normed for five to twelve years old children from Embedded Figures Test (EFT). The subjects were given 30 minutes to search, identify, and locate the equilateral triangle and house shapes embedded within 25 pictures of greater size (Figure 10). Ten minutes of practice trial, where the subjects were required to locate seven simple items out of bigger pictures in the CEFT test.
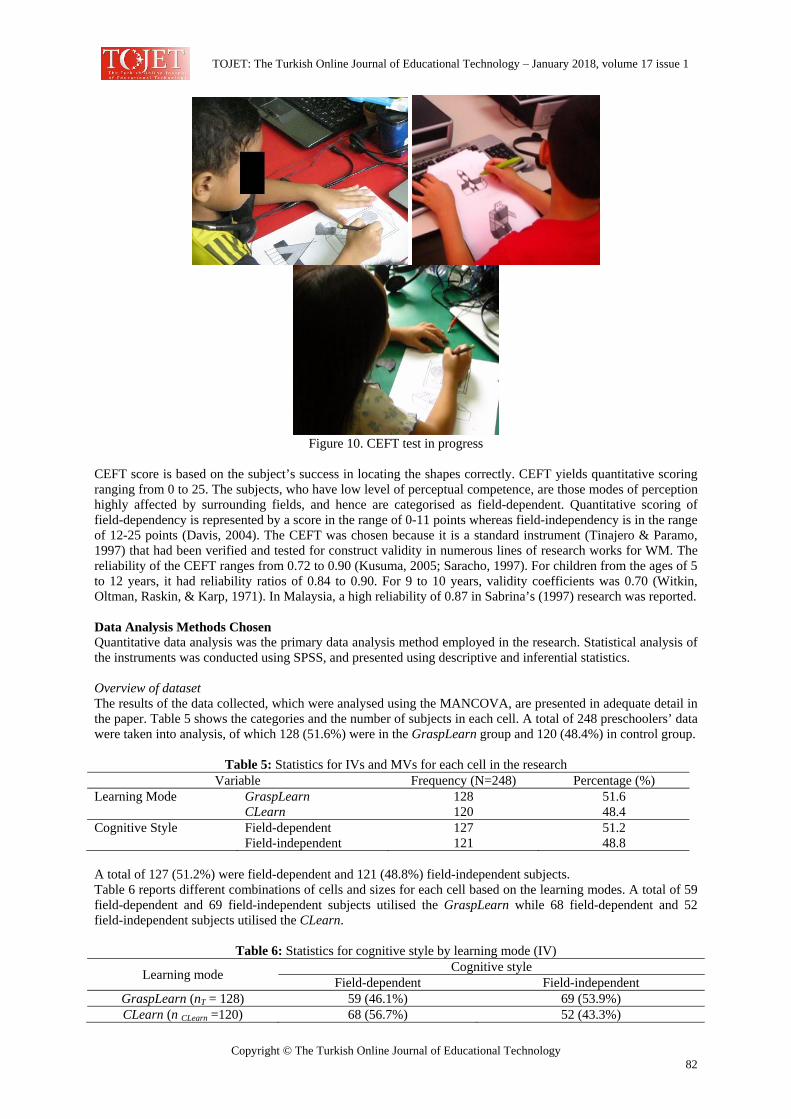
TOJET: The Turkish Online Journal of Educational Technology – January 2018, volume 17 issue 1
Copyright © The Turkish Online Journal of Educational Technology 82
Figure 10. CEFT test in progress
CEFT score is based on the subject’s success in locating the shapes correctly. CEFT yields quantitative scoring ranging from 0 to 25. The subjects, who have low level of perceptual competence, are those modes of perception highly affected by surrounding fields, and hence are categorised as field-dependent. Quantitative scoring of field-dependency is represented by a score in the range of 0-11 points whereas field-independency is in the range of 12-25 points (Davis, 2004). The CEFT was chosen because it is a standard instrument (Tinajero & Paramo, 1997) that had been verified and tested for construct validity in numerous lines of research works for WM. The reliability of the CEFT ranges from 0.72 to 0.90 (Kusuma, 2005; Saracho, 1997). For children from the ages of 5 to 12 years, it had reliability ratios of 0.84 to 0.90. For 9 to 10 years, validity coefficients was 0.70 (Witkin, Oltman, Raskin, & Karp, 1971). In Malaysia, a high reliability of 0.87 in Sabrina’s (1997) research was reported. Data Analysis Methods Chosen Quantitative data analysis was the primary data analysis method employed in the research. Statistical analysis of the instruments was conducted using SPSS, and presented using descriptive and inferential statistics. Overview of dataset The results of the data collected, which were analysed using the MANCOVA, are presented in adequate detail in the paper. Table 5 shows the categories and the number of subjects in each cell. A total of 248 preschoolers’ data were taken into analysis, of which 128 (51.6%) were in the GraspLearn group and 120 (48.4%) in control group.
Table 5: Statistics for IVs and MVs for each cell in the research Variable Frequency (N=248) Percentage (%)
Learning Mode GraspLearn 128 51.6 CLearn 120 48.4
Cognitive Style Field-dependent 127 51.2 Field-independent 121 48.8 A total of 127 (51.2%) were field-dependent and 121 (48.8%) field-independent subjects. Table 6 reports different combinations of cells and sizes for each cell based on the learning modes. A total of 59 field-dependent and 69 field-independent subjects utilised the GraspLearn while 68 field-dependent and 52 field-independent subjects utilised the CLearn.
Table 6: Statistics for cognitive style by learning mode (IV)
Learning mode Cognitive style Field-dependent Field-independent
GraspLearn (nT = 128) 59 (46.1%) 69 (53.9%) CLearn (n CLearn =120) 68 (56.7%) 52 (43.3%)
TOJET: The Turkish Online Journal of Educational Technology – January 2018, volume 17 issue 1
Copyright © The Turkish Online Journal of Educational Technology 83
Total 127 121
Testing Assumptions for Mancova MANCOVA enables the researchers to examine which group, if any, came out best in terms of learning performance (Dancey & Reidy, 2011). However, MANCOVA analyses, which at the overall pattern of DVs in combination, carry with them a number of assumptions that needs to be satisfied, which, if violated, can result in incorrect conclusions. As such, this analysis begins with the priori screening of dataset of the research. Numerical and graphical inspections will be conducted to ensure that the assumptions for MANCOVA are not violated. Appropriateness of cell combinations and sizes The cells of the dataset are appropriate for MANCOVA analyses because first, the cells were derived from the research which was a complete between-participants research. The two comparing learning modes consisted of different subjects, hence ensuring each cell is not influenced by other cells. Second, independence of cells was maintained. As each subject was appeared under only one mode, unnecessary interaction between cells was not only avoided, the scores obtained from the subjects were also independent of each other. Third, there were sufficient dataset for each cell (n>30). Fourth, a balanced number of subjects was acquired, compliant with the rule of thumb of balanced dataset that ratio of the smallest sample variance to the largest should not exceed the ratio of 1:1.5 on the range of variables tested (Coakes, Steed, & Ong, 2010). The aforesaid ratio of the dataset of the research was 52:70, indicating a ratio lesser than 1:1.5. Lastly, the ratio of the largest group variance was not more than three times the smallest group variance, thereby forming a robust dataset for testing. Normality of DV Using Skewness and Kurtosis statistical measures as numerical means of assessing normality, the normality of distributions for each DVs is satisfied. As shown in Table 7, Skewness and Kurtosis values for each DV were between -1.0 and +1.0, indicating the existence of reasonable normality of dataset.
Table 7: Statistical analyses of Skewness and Kurtosis measures of distributions Mean ( ) SD Skewness Kurtosis
WMC 59.60 4.08 -0.387 -0.449
Though the Shapiro-Wilk and Kolmogorov-Smirnov statistical measures for each variable indicated otherwise with the Sig. values of less than 0.05 that suggesting violation of the normality distribution, the dataset was acceptable for MANCOVA analyses (Dancey & Reidy, 2011). This is because first, the sample sizes for the DV were over 30, thus yielded reasonable accurate results even if the assumption is violated (Gravetter & Wallnau, 2000; Stevens, 2001). Dancey and Reidy (2011, p. 497) stated, “MANOVA is still a valid test even with modest violations of the assumption of multivariate normality, particularly when the researchers have equal sample sizes and a reasonable number of participants in each group. By “reasonable”, the researchers mean that for a completely between-participants design you have at least 12 participnats per group”. (Dancey & Reidy, 2011, p. 497). Pallant (2001) stated that non-significant results in statistical measures are quite common in large samples. Second, the dataset has fairly equal numbers of subjects in each cell (Dancey & Reidy, 2011). With this, the researchers were able to continue with MANCOVA with reasonable confidence. Homogeneity of variance-covariance matrices The assumption of equality of homogeneity of the variance-covariance matrices of the DVs across all cells has not been violated in the dataset. This is based upon the statistical supports that first, the standard deviation (SD) of subjects shows a samples of population with highly equivalent variances. There exists a balanced ratio of subjects of not exceeding 1.15 on the smallest to the largest cell size in the range of variables tested. This suggests a fairly similar variability of scores for each group, and thus can be reasonably confident that the homogeneity of variance was not violated (Dancey & Reidy, 2011). TESTING OF HYPOTHESES In view of the absence of violation of the assumptions of MANCOVA, the researchers can continue with MANCOVA to examine the possible main effects and interaction effects of using the GraspLearn and CLearn across the groups with high degree of confidence. The main effects are tested at an alpha level of 0.05. Each simple effect, if any, are tested at an α level of 0.017 (0.5 divided by three univariate tests), making use of the Bonferoni adjustments (Field, 2009) to take into account the family-wise error so as to guard against inflating Type I error (Dancey & Reidy, 2011)
TOJET: The Turkish Online Journal of Educational Technology – January 2018, volume 17 issue 1
Copyright © The Turkish Online Journal of Educational Technology 84
The Main Effect of Learning Mode The main effect of the two learning modes, GraspLearn and CLearn on the three DVs are analysed and presented based on the following hypotheses: Ho1.3 There is no significant difference in WMC between learners using the GraspLearn and those using
CLearn mode. Descriptive statistics analysis of the effects of learning mode on the dependent variables (DVs) Table 8 provides preliminary view of the assessment results of both GraspLearn and CLearn treatments in descriptive statistics.
Table 8: Mean scores ( ) and Standard Deviations (SD) of DV by learning mode Mode SD difference of
WMC GraspLearn 59.76 4.09 0.01 CLearn 59.44 4.08
For WMC scores, GraspLearn and CLearn modes were 59.76 (SD=4.09) and 59.44 (SD=4.08) respectively. Low difference of average of 0.01 signals the absence of expansion of the WMC. Inferential statistics is performed for analyses in the following section. The Interaction Effects for Cognitive Style and Learning Mode The analysis of interaction effects between the two learning modes and cognitive style on the three DVs is discussed in this section. Descriptive statistics of the analysis are presented first, followed by multivariate analyses. The hypotheses tested are: Ho2.3 There is no interaction effect between the learning modes (GraspLearn and CLearn) and cognitive style
(field-dependent and field-independent) on WMC. The interaction effects between cognitive style and learning mode on the wmc score Table 9 demonstrates descriptive statistics of WMC score achieved by field-dependent and field-independent subjects after treatment using GraspLearn and CLearn. Table 9: Descriptive statistics (mean scores ( ) and standard deviations (SD)) of WMC score by learning mode
and cognitive style Learning Mode Cognitive style CLearn ( ) GraspLearn ( ) Average Field-dependent 59.14 59.64 59.39 Field-independent 59.83 59.86 59.85
Average 59.49 59.75
Table 9 reveals that the WMC scores of field-dependent and field-independent subjects in both GraspLearn and CLearn differ by 0.46 (59.85-59.39), with field-independent subjects doing slightly better and differ by only 0.26 (59.75-59.49) for learning mode, with GraspLearn did better. GraspLearn. Figure 11 shows a visual description of it.
Figure 11. Plot of effects on WMC between learning mode and cognitive style
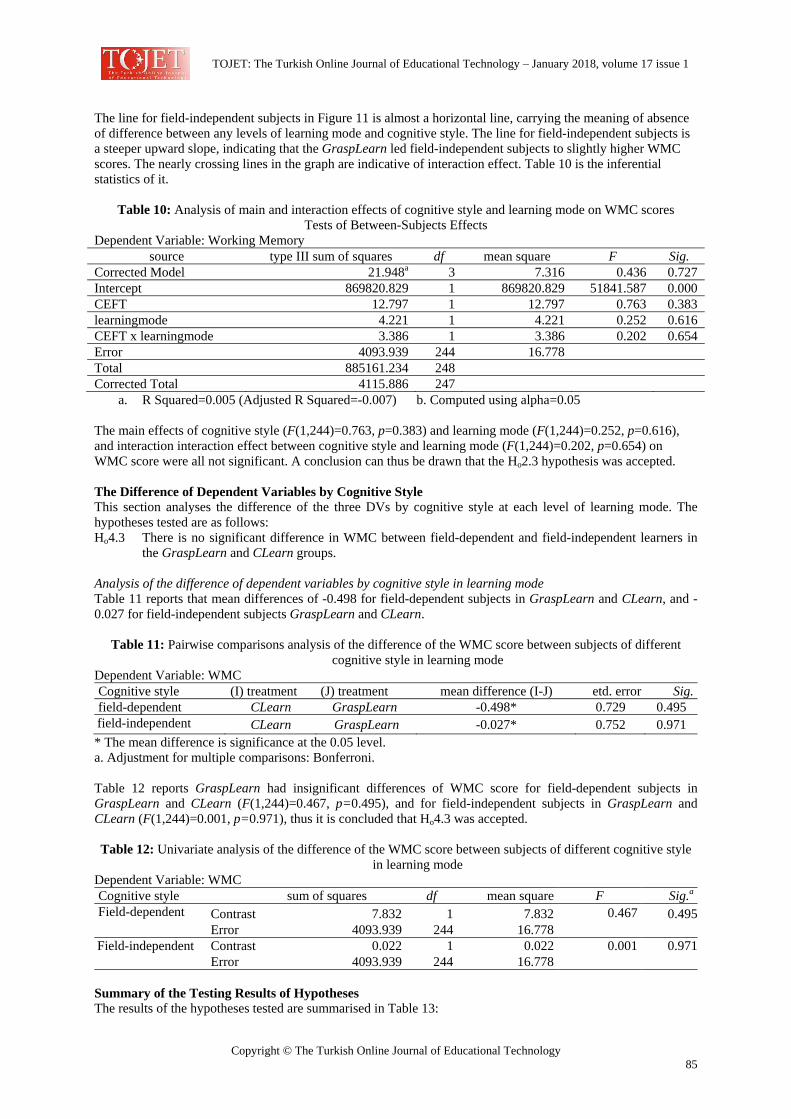
TOJET: The Turkish Online Journal of Educational Technology – January 2018, volume 17 issue 1
Copyright © The Turkish Online Journal of Educational Technology 85
The line for field-independent subjects in Figure 11 is almost a horizontal line, carrying the meaning of absence of difference between any levels of learning mode and cognitive style. The line for field-independent subjects is a steeper upward slope, indicating that the GraspLearn led field-independent subjects to slightly higher WMC scores. The nearly crossing lines in the graph are indicative of interaction effect. Table 10 is the inferential statistics of it.
Table 10: Analysis of main and interaction effects of cognitive style and learning mode on WMC scores Tests of Between-Subjects Effects
Dependent Variable: Working Memory source type III sum of squares df mean square F Sig.
Corrected Model 21.948a 3 7.316 0.436 0.727 Intercept 869820.829 1 869820.829 51841.587 0.000 CEFT 12.797 1 12.797 0.763 0.383 learningmode 4.221 1 4.221 0.252 0.616 CEFT x learningmode 3.386 1 3.386 0.202 0.654 Error 4093.939 244 16.778 Total 885161.234 248 Corrected Total 4115.886 247
a. R Squared=0.005 (Adjusted R Squared=-0.007) b. Computed using alpha=0.05 The main effects of cognitive style (F(1,244)=0.763, p=0.383) and learning mode (F(1,244)=0.252, p=0.616), and interaction interaction effect between cognitive style and learning mode (F(1,244)=0.202, p=0.654) on WMC score were all not significant. A conclusion can thus be drawn that the Ho2.3 hypothesis was accepted. The Difference of Dependent Variables by Cognitive Style This section analyses the difference of the three DVs by cognitive style at each level of learning mode. The hypotheses tested are as follows: Ho4.3 There is no significant difference in WMC between field-dependent and field-independent learners in
the GraspLearn and CLearn groups. Analysis of the difference of dependent variables by cognitive style in learning mode Table 11 reports that mean differences of -0.498 for field-dependent subjects in GraspLearn and CLearn, and -0.027 for field-independent subjects GraspLearn and CLearn.
Table 11: Pairwise comparisons analysis of the difference of the WMC score between subjects of different cognitive style in learning mode
Dependent Variable: WMC Cognitive style (I) treatment (J) treatment mean difference (I-J) etd. error Sig.field-dependent CLearn GraspLearn -0.498* 0.729 0.495 field-independent CLearn GraspLearn -0.027* 0.752 0.971 * The mean difference is significance at the 0.05 level. a. Adjustment for multiple comparisons: Bonferroni. Table 12 reports GraspLearn had insignificant differences of WMC score for field-dependent subjects in GraspLearn and CLearn (F(1,244)=0.467, p=0.495), and for field-independent subjects in GraspLearn and CLearn (F(1,244)=0.001, p=0.971), thus it is concluded that Ho4.3 was accepted. Table 12: Univariate analysis of the difference of the WMC score between subjects of different cognitive style
in learning mode Dependent Variable: WMC Cognitive style sum of squares df mean square F Sig.a
Field-dependent Contrast 7.832 1 7.832 0.467 0.495Error 4093.939 244 16.778
Field-independent Contrast 0.022 1 0.022 0.001 0.971Error 4093.939 244 16.778
Summary of the Testing Results of Hypotheses The results of the hypotheses tested are summarised in Table 13:
TOJET: The Turkish Online Journal of Educational Technology – January 2018, volume 17 issue 1
Copyright © The Turkish Online Journal of Educational Technology 86
Table 13: Summary of the testing results of hypotheses Hypotheses Decision General implications
H01 There is no significant difference in WMC between GraspLearn learners and CLearn learners.
fail to reject GraspLearn is no better in enhancing WMC than CLearn. Educators should look for other features that could enhance WMC.
H02 There is no interaction effect between the learning modes (GraspLearn and CLearn systems) and cognitive style on the WMC.
fail to reject GraspLearn is not able to enhance WMC of field-dependent and field-independent preschoolers’ WMC. Educators should look for other features that could enhance WMC.
Ho3 There is no significant difference in WMC between field-dependent and field-independent learners in the GraspLearn and CLearn groups.
fail to reject GraspLearn is same as CLearn, incapable of enhancing WMC of field-dependent and field-independent preschoolers.
DISCUSSIONS, IMPLICATIONS AND CONCLUSION The results of the research were presented according to the dependent variables by main effects and interaction effects of each level of variable. In discussion of the results, the researchers attempts to infer underlying reasons in the light of theoretical framework adopted. The Main Effect and Interaction Effect in relation to WMC GraspLearn did not enhance subjects’ WMC. The WMC was entirely similar to subjects in CLearn, irrespective of subjects’ cognitive style. There is neither main effect, nor interaction effect for cognitive style in terms of WMC scores. By average, GraspLearn subject’s WMC were in the range of three to four words, similar to CLearn groups. This signifies GraspLearn subjects, irrespective of any differences, recited as much words as the subjects in the CLearn. Such results led to no discernable sign of elevation of WMC of learners after treatment using GraspLearn. The absence of effects denote neither any relationship exists between learning mode and WMC in terms of cognitive style, nor had had any factors that could impact and alter the relationship between learning mode and WMC scores in GraspLearn and CLearn. Though there is non-existence of any effects on WMC, some subtle patterns can be observed. In respect of cognitive style, field-independent subjects in both GraspLearn and CLearn modes performed slightly better than field-dependent subjects in GraspLearn and CLearn. The research findings of where equal levels of words recitation demonstrated in GraspLearn and CLearn contradict with general consensus of theoretical viewpoints that the additional engagement of tactile sensory channel could enhance the WM of a learner (Manches, 2010). The findings were not uncommon because carrying out cognitive operations in WMC test, as in “objects-span tri-tasks” test, was error-prone and effortful (Gathercole & Alloway, 2004). It was prone to loss because it requires full attention. Although the WMC score is low, the subjects, either field-dependent or field-independent, gravitated towards physical artefacts in multimedia context somewhat shows the appropriate pedagogical strategy deployed in GraspLearn. At least, it helps to lower cognition processing load for coping with learning situations, particularly for young children with relatively lower WM. Otherwise, learning is slower, more difficult, and exposed to higher chance of failure. A common instance is learning by reading off a sentence on white board written by teachers. For low WM students, such strategy was observed to be a source of error or difficulty. Whilst having insufficient capacity to store and manipulate information, they are exposed to various difficulties in processing such as distraction and locating key information in the distant white board. Gathercole and Alloway (2004) suggest a way of improvement, which is making the key words to be available on the students’ own desk rather than a distant white board. This is exactly comparable to GraspLearn setting in which learning artefacts were placed in front of subjects. With such reduction of opportunity for error and difficulty in learning, learning knowledge are much more likely to hold in their WM (Gathercole & Alloway, 2004). This explains why while having poor WMC, the subjects were still perform in quiz questions.
TOJET: The Turkish Online Journal of Educational Technology – January 2018, volume 17 issue 1
Copyright © The Turkish Online Journal of Educational Technology 87
The research results contradict with some of the research works conducted on subject of distinct cognitive style. The research works that report the improvement of WM after certain treatments as well as the positive impact of WM are Patten and Ishii (2000), Kelly, Singer, Hicks, and Goldin-Meadow (2002), Alibali and DiRusso (1999) and Hatano and Osawa’s (1983) research works. Gathercole and his associates (Gathercole, Pickering, Knight, & Stegmann, 2004) reported 83 children aged 6 and 7 years old that have better WMC had higher abilities in both English and Mathematics than children of low WMC ability. Service’s (1992) research reported Finnish children with good immediate verbal memory performed better at ESL vocabulary learning than those with short spans. LIMITATIONS OF THE RESEARCH One of the notable limitations of the research was that the scope of the learning contents was limited to 27 concrete artefacts. In the research, the researchers chose to concentrate on learning real-life artefacts from surrounding. For this reason, the results were not readily generalised to learning contents that encompass abstract topic such as Mathematics learning. Besides, the range of age of subjects for the research was restricted to preschoolers aged five and six years old. Due to narrow setting of age range, probability of generalisation to younger or older learners is restricted. This also conveys implication that the usability of the graspable multimedia only took into account the cognitive style and WM of this category of population. On the same note, as the research was only conducted in seven urban private kindergartens, thus generalisation of the findings to rural and government kindergartens or kindergartens from western countries are less tenable. Pertaining to “objects-span tri-tasks” test, its limitation was that only words recitation was utilised as indicators of WM. Although the words chosen were highly relevant to preschoolers and the learning context of the research, it can be argued that visual elements can be included to form a more comprehensive measure of WM. IMPLICATIONS OF THE RESEARCH Concern over whether multimedia systems allow preschoolers to learn in accordance with their cognitive level have been now assuaged had the development of the GraspLearn that attuned to their cognition with the deployment of physical artefacts. The concrete nature of physical artefacts prompts graspable multimedia as the developmentally appropriately way for preschoolers in which the multimedia and ICT are used. Consistent with Haugland’s (1999) contention that ICT should be used in developmentally appropriate ways with young children, physical artefacts in multimedia context provide a ground to close the gap between preoperational state of mentality of preschoolers and digital multimedia. Due to absence of capability in elevating WMC using GraspLearn, it is now difficult for the diffusion of this innovation for use as an aid to enhance WMC of preschoolers. Multimedia researchers should now consider researching other features or components that can be satisfactorily incorporated to enhance their WMC. For practitioners and educators, they should now attempt other possible means impacting ESL learning among preschoolers in multimedia context. Despite negative findings, there is still a lot to be learned about the cognition ramifications of GraspLearn treatment. It suggests several implications, both theoretical and methodological. Amongst others, first, the embodiment of tactile and spatial sensory channels that are being overlooked in multimedia learning for preschoolers. Second, the bonding of physical artefacts in multimedia learning environment which allows preschoolers’ cognition to stay oriented to concepts not easily visualised or grasped can be manifested by the unique affordances of the technological implementation. Third, the role of the long-term memory in WM operations, manifested by the tasks designed in accordance with the fundamental cognition theories in the “objects-span tri-tasks” instruments. The successful development of the GraspLearn provides empirical evidence that its physical artefacts mediated constructivist-cognitivist environment is highly appropriate for exploratory learning purposes, and of particularly conducive for Malaysian students who are generally passive and non-participative (Nik Ahmad & Sulaiman, 2013; Halimah & Ng, 2002, Kong, 2006), to inculcate collaborative and interpersonal learning skills. The Malaysian national education system has been reformed towards constructivist based since 2001 (Kong, 2006; Vickneasvari, 2006). The finding not only implies that the graspable multimedia appears to be a right system to implement the constructivist-oriented “5E learning” classroom (Engage, Explore, Explain, Elaborate, and Evaluate) (Pusat Perkembangan Kurikulum, 2001), but also viable as institutionalised learning mechanism for preschoolers, like the set of manipulative apparatus in Montessori’s “education of the senses”. Lastly, inclusion of preschoolers’ cognitive style in the research has an imperative implication on the design of the graspable multimedia aimed to be customisable and adaptive to the psychological profile of preschoolers of distinct characteristics in learning styles and abilities. The interaction results on cognitive style by learning mode imply that GraspLearn offers a promising medium to accommodate individual differences: Irrespective of cognitive style, preschoolers were equally benefited from the GraspLearn system.

TOJET: The Turkish Online Journal of Educational Technology – January 2018, volume 17 issue 1
Copyright © The Turkish Online Journal of Educational Technology 88
RECOMMENDATIONS FOR FUTURE RESEARCH The research opens up several potential areas, directions and foci that warrant future investigation. Areas that appear worthwhile to be laid out for further investigation are research works that could bring about improvements to overcome the limitations of the research. A potential research is the questions on whether the same findings are to be observed when it is extended to National Language (Bahasa Malaysia), or replication studies to other languages (such as Korean or Mandarin language) in similar context. It is worth revamping the experimental systems using other languages to find out how system in other languages could have impacts on the learning. They enable us to ensure that the GraspLearn system benefits students from various fields of language learning. Other plausible research works addressing the limitations of the research are examining the applicability of the GraspLearn to a wider population covering kindergartens from suburban and rural areas, or replicated to a larger scale in kindergartens covering different socio-economic background. The students from urban and rural areas might differ because the socio-economic status is perceived to have influence over their academic performance as well as preferences towards computer-assisted instruction (Attewell & Battle, 1997). The efficacy of the GraspLearn system might also be different due to the age differences, thus it would be worthwhile to investigate the efficacy of similar systems among the primary school students. Besides, to determine whether GraspLearn is applicable for other personality traits or psychology domain, target users could also be extended to extroversion, introversion, anxiety, and specific aptitudes, or to include disabled persons, dyslexia and autism patients. Research may also be extended to examining incidental word learning and listening comprehension. Apart from that, research works that lasted for a longer duration, or conducted in compliance with the number of hours allocated for ESL learning stipulated in NPC are also recommended in future. This is because the research that was held seven days consecutively may be too packed and heavy for a preschooler. Lastly, it is also essential to replicate the findings of the research using a wider variety of WM testing instruments and tasks. The research could also be improved by looking into the application of the graspable multimedia in different situations. For example, it can aim to find out in which settings does graspable multimedia work best, what kind of task in multimedia environment is best suited for using physical artefacts, and which kind of physical artefacts is best suited for which task in multimedia environment. In this respect, research can be formulated as to like “what are the suitable learning domains for graspable multimedia environment?”. All these highly enlighten us on how a task or learning factor interact with the graspable multimedia to either aid or inhibit learning. Future researches may focus on systems that encompass more abstract subjects such as Mathematics and science. These subjects are perceived as amongst the difficult subjects to teach and to learn because various numerical concepts are abstract to young children. Graspable multimedia potentially overcomes the difficulty because physical manipulation assists the formulation of concrete ways of thinking about abstract phenomena. For this, the research questions can be formulated as to “what is the role of graspable multimedia in Mathematics and sciences?”. Lastly, it is therefore interesting to compare iPad with graspable multimedia. The young generation of students is very facile in using iPad and gamepad. It is possible that graspable multimedia could be better than iPad since graspable multimedia possesses tactile and spatial characteristics required by the young children. CONCLUSION The research aimed to produce a solution that could overcome the problem of the lack of the design of interface that considers the capacity of working memory (WMC) for preschoolers in digital multimedia context. One may curious about whether multimedia systems that had incorporated graspable physical artefacts yielded different finding for different category of subjects. Hence, cognitive style was constituted as moderator variable in the research. Different from the past research on multimedia, the research was one of very few research works which had tapped the research scope into the cognitive structure of a preschooler. Analyses reveal that the GraspLearn system did not improve preschoolers’ WMC significantly more than CLearn. There is no discernable sign of WMC elevation across all conditions. Interaction analyses by cognitive style with learning mode reports relationship between learning mode and did not differ by cognitive style, suggesting that GraspLearn equally accommodates preschoolers of different field-dependency. The culmination of such research drew a prognostic of the shortfall in capacity of the graspable multimedia in realm of cognitive functioning of preschoolers. REFERENCES Albert Shanker Institute. (2009). Preschool curriculum: What's in it for children and teachers. Washington,
USA. Retrieved on August 20, 2017, from http://www.shankerinstitute.org/Downloads/Early%20Childhood%2012-11-08.pdf
TOJET: The Turkish Online Journal of Educational Technology – January 2018, volume 17 issue 1
Copyright © The Turkish Online Journal of Educational Technology 89
Alloway T. (2012). Can interactive working memory training improving learning? Journal of Interactive Learning Research, 23:1–11.
Antle, A. N., Droumeva, M., & Ha, D. (2009). Hands on what? Comparing children’s mouse-based and tangible-based Interaction. Proceedings from IDC ’09: The 8th International Conference on Interaction Design and Children, 80-88.
Attewell, P., & Battle, J. (1997). Home computers and school performance. The Information Society, 15, 1-10. Baddeley, A. D. (2004). Chapter 1: The psychology of memory. In A.D. Baddeley, M.D. Kopelman, & B.A.
Wilson (Eds.) The Essential Handbook of Memory Disorders for Clinicians. USA: John Wiley & Sons. Baddeley, A. D. (2006). Working memory: Looking back and looking forward. In Leffard, Stacie, A., Jeffrey,
A., Berstein, Joshua, Mann, D., John, Mangis, Hillary A., & McCoy (2006). The substantive validity of working memory measures in major cognitive functioning test batteries for children. Applied Neuropsychology, 13(4), 230-241.
Barnes, S. K. (2010). Using Computer-Based Testing with Young Children. PhD. dissertation. The Graduate Faculty, James Madison University.
Blanchard, J., & Moore, T. (2010). The digital world of young children: Impact on emergent literacy. The white paper. Research presented by the Pearson Foundation. College of Teacher Education and Leadership, Arizona State University. Retrieved on July 26, 2017, from http://www.pearsonfoundati on.org/downloads/EmergentLiteracy-WhitePaper.pdf
Chacko, A., Bedard, A.C., Marks, D., Feirsen, N., Uderman, J., Chimiklis, A., et al. (2013). A randomized clinical trial of Cogmed Working Memory Training in school-age children with ADHD: A replication in a diverse sample using a control condition. Journal of Child Psychology and Psychiatry, 55: 247–255. doi: 10.1111/jcpp.12146
Chen, C. J. (2005). The design, development and evaluation of a virtual reality (VR)-based learning environment: Its efficacy in novice car driver instruction. Unpublished doctoral dissertation. Universiti Sains Malaysia, Penang.
Çöltekin, A., Francelet, R., Richter, K., Thoresen, J. & Fabrikant, S. I. (2017). The effects of visual realism, spatial abilities, and competition on performance in map-based route learning in men, Cartography and Geographic Information Science, DOI: 10.1080/15230406.2017.1344569, Retrieved on 16 August 2017 from http://dx.doi.org/10.1080/15230406.2017.1344569
Conejero, A. & Rueda, M.R. (2017). Early Development of Executive Attention. Journal of Child and Adolescent Behavior, 5:2. Retrieved on 20 August 2017 from https://www.omicsonline.org/open-access/early-development-of-executive-attention-2375-4494-1000341.pdf
Cooperstein, S. E., & Kocevar-Weidinger, E. (2004). Beyond active learning: A constructivist approach to learning. Reference Services Review, 32(2), 141-148. DOI 10.1108/00907320410537658
Dancey, C. P. & Reidy, J. (2011). Statistics without Maths for psychology. Pearson Education, UK. Davis, G. A. (2004). The relationship between learning style and personality type of extension community
development program professionals at the Ohio State university. Ohio State University. Dooley, A. M.(2015). A Comparison of Three Levels of Verbal Redundancy in Multimedia Learning and Its
Effects on Memory Retention and Transfer in Legal Professionals. (Doctoral dissertation). Retrieved on 10 August 2017 from http://scholarcommons.sc.edu/etd/3278
Esteban, L., Vivas, A.B., Fuentes, L.J., & Estévez, A.F. (2015). Scientific Reports 5, Article number: 17112. doi:10.1038/srep17112. Retrieved on 9 August 2017 from https://www.nature.com/articles/srep17112
Felder, R.M., (2002). Designing Tests to Maximize Learning. Journal of Professional Issues in Engineering Education and Practice, 128(1) 1, Retrieved on 10 August 2017 from http://www.ncsu.edu/felder-public/Papers/TestingTips.htm
Field, A. (2009). Discovering statistics using SPSS (3rd ed.). London: SAGE Publications Ltd. Fraenkel, J.R. & Wallen, N.E. (1996). How to Design and Evaluate Research in Education (3rd ed.). USA:
McGraw-Hill. Gall, M., Borg, W., & Gall, J. (1996). Educational research: An introduction. White Plains, NY: Longman. Gathercole, S. E., Pickering, S. J., Knight, C., & Stegmann, Z. (2004). Working memory skills and educational
attainment: Evidence from national curriculum assessments at 7 and 14 years of age. Applied Cognitive Psychology, 18, 1–16. DOI: 10.1002/acp.934
Gay, L. R. (1996). Educational research: Competencies for analysis and application (5th ed.). New Jersey: Prentice Hall.
Gelderblom, H., & Kotze. P. (2009). Ten design lessons from the literature on child development and children’s use of technology. Proceedings from IDC ’09: The 8th International Conference on Interaction Design and Children, 52-60.
Gravetter, F. J. & Wallnau, L. B. (2000). Statistics for the Behavioral Sciences (5th edition). Belmont, C.A.: Wadsworth.
TOJET: The Turkish Online Journal of Educational Technology – January 2018, volume 17 issue 1
Copyright © The Turkish Online Journal of Educational Technology 90
Han, O.B., Abd Halim, N.D.B., Shariffuddin, R.S.B., Abdullah, Z.B. (2013). Computer Based Courseware in Learning Mathematics: Potentials and Constrains. Procedia - Social and Behavioral Sciences, 103, 238-244. Retrieved on 25 August 2017 from http://www.sciencedirect.com/science/article/pii/S1877042813037762
Harrison, T., Shipstead, Z., Hicks, K., Hambrick, D., Redick, T., & Engle, R. (2013). Working memory training may increase working memory capacity but not fluid intelligence. Psychological Science, 24: 409–2419.
Haugland, S. W. (1999). What role should technology play in young children’s learning? Part 1. Young Children, 54(6), 26-31.
Heidig, S., Müller,J., & Reichelt, M. (2015). Emotional design in multimedia learning: Differentiation on relevant design features and their effects on emotions and learning. Computers in Human Behavior, 44, 81–95.
Hengeveld, B., Hummels, C., & Overbeeke, K. (2009). Tangibles for toddlers learning language. Proceedings from TEI’09: The Third International Conference on Tangible and Embedded Interaction, 161-168.
Kamouri, A., Kamouri, J., & Smith, K. (1986). Training by exploration: Facilitating the transfer of procedural knowledge through analogical reasoning. Man-Machine Studies, 24, 171-192.
Karp, S. A., & Konstadt, N. L. (1963). Children’s Embedded Figure Test. New York: Cognitive Test. Karp, S. A., & Konstadt, N. L. (1971). Children's Embedded Figures Test. In H.A. Witkin, P.K. Oltman, E.
Raskin, & S. A. Karp (Eds.), A manual for the Embedded Figures Tests. 21-26. Palo Alto, CA: Consulting Psychologists Press.
Kelly, S. D., Singer, M., Hicks, J. & Goldin-Meadow, S. (2002). A helping hand in assessing children's knowledge: Instructing adults to attend to gesture. Cognition and Instruction, 20 (1), 1-26.
Klemmer, S. R., Hartmann, B., & Takayama, L. (2006). How bodies matter: Five themes for Interaction Design. Proceedings from DIS ’06: The 6th Conference on Designing Interactive Systems, 140-149.
Kogan, N. (2013). Cognitive styles in infancy and early childhood (Psychology Revivals). New York: Psychology Press.
Kusuma, A. (2005). Creativity and cognitive styles in children. Discovery Publishing House, New Delhi, India. Londe, Z.C. (2008). Working memory and English as a second language listening comprehension test: A latent
variable approach. PhD. dissertation. University of California, Los Angeles. Loraine, S. (2008). Vocabulary development. Super Duper Handy Handouts, number 149. Retrieved on May 25,
2017, from: http://www.superduperinc.com/handou ts/pd f/149_VocabularyDevelopment.pdf Manches, A. (2010). The effect of physical manipulation on children’s numerical strategies: Evaluating the
potential for tangible technology. Unpublished doctoral dissertation. University of Nottingham, UK. Manches, A., O'Malley, C., & Benford, S. (2009). Physical manipulation: Evaluating the potential for tangible
designs. Proceedings from TEI ’09: The 3rd International Conference on Tangible and Embedded Interaction, 77-84.
Miller, G. A. (1956). The magical number seven, plus or minus two: Some limits on our capacity for processing information. Psychology Review, 63, 81-97.
Ministry of Education of Malaysia (2001). Preschool curriculum. Kuala Lumpur: Pusat perkembangan kurikulum.
Neuman, B., & Dickinson, K. (2003). Handbook of Early Literacy Research, v.1. New York, NY: The Guilford Press.
Nik Ahmad., N.N. & Sulaiman, M. (2013). Case studies in a passive learning environment: some Malaysian evidence. Accounting Research Journal, 26(3), 173-196, Retrieved on 7 July 2017 from https://doi.org/10.1108/ARJ-10-2012-0082
Norhayati Abdul Mukti, & Siew, P. H. (2004). Malaysian perspective: Designing interactive multimedia learning environment for moral values education. Educational Technology & Society, 7 (4), 143-152.
Nur Sukinah Aziz, Mohd Nizam Saad, Abdul Hadi Abdul Razak, & Azman Yasinc (2010). Redesigning the user interface of handwriting recognition system for preschool children. Proceedings of the 2nd International Conference on Education Technology and Computer (ICETC).
Oberauer, K. (2005). Binding and inhibition in working memory: Individual and age differences in short-term recognition. Journal of Experimental Psychology: General, 134(3), 368-387.
Osman, K., & Lee, T. T. (2014). Impact of Interactive Multimedia Module with Pedagogical Agents on Students' Understanding and Motivation in the Learning of Electrochemistry. International Journal of Science and Mathematics Education, 12(2), 395-421. DOI: 10.1007/s10763-013-9407-y
Pallant, J. (2001). SPSS survival manual: A step by step guide to data analysis using SPSS for windows (version 10). NSW, Australia: Allen & Unwin.
Pant, A. (2006). Multimedia effects on memory: Exploring the visual channel load explanation for the redundancy effect. PhD dissertation. School of Business, Faculty of the Graduate School, University of Kansas.
TOJET: The Turkish Online Journal of Educational Technology – January 2018, volume 17 issue 1
Copyright © The Turkish Online Journal of Educational Technology 91
Patsalides, L. (2012). Skill Building with Preschool Problem-Solving Activities. Online article on Bright Hub Education website. Retrieved on May 13, 2017, from http://www.brighthubeducation.com/preschool-crafts-activities/105486-skill-building-with-problem-solving-activities/
Patten, J., & Ishii, H. (2000). A comparison of spatial organization strategies in graphical and tangible user interfaces. Proceedings of DARE 2000 on Designing Augmented Reality Environments, 41-50.
Piaget, J. (1972). The principles of genetic epistemology. New York: Basic Books. Piaget, J. (1976). The grasp of consciousness. Cambridge: Harvard University Press. Ralph, K. (2013). Cogmed Claims and Evidence: Cogmed. Working Memory Training: Pearson Clinical
Assessment. Pearson Education. Retrieved on 3 September 2017 from https://www.psy-ed.com/cogmed-claims-and-evidence.pdf
Sabrina Bakar. (1997). Kesan mod persembahan yang berbeza dalam multimedia berasaskan komputer terhadap pencapaian matematik pelajar yang berbeza gaya kognitif. Unpublished doctoral dissertation. Universiti Sains Malaysia, Penang.
Saracho, O. N. (1997). Teachers' and Students' Cognitive Styles in Early Childhood Education. Greenwood Publishing Group.
Semmar, Y & Al-Thani, T. (2015). Piagetian and Vygotskian Approaches to Cognitive Development in the Kindergarten Classroom. Journal of Educational and Developmental Psychology; Vol. 5, No. 2; 2015, Canadian Center of Science and Education. ISSN 1927-0526 E-ISSN 1927-0534
Service, E. (1992). Phonology, working memory, and foreign-language learning. Quarterly Journal of Experimental Psychology, 45A, 21–50.
Smith, T.L. (2009). The acquisition of literacy skills in 4 and 5 years olds. Master dissertation. Education Department, Southwest Minnesota State University.
Snow, R. & Cronbach, L. (1977). Aptitude and Instructional Methods: A Handbook for Research Interactions. New York: Irvington Publishers.
Son, Seung-Hee. (2006). Getting children ready for kindergarten: The nature and impact of changes in the home learning environment on the growth of early literacy and language skills. PhD. (Education) dissertation. USA: The University of Michigan.
Stevens, J. (2001). Applied multivariate statistics for the social sciences, 4th edition. New Jersey: Lawrence Erlbaum Associates.
Szmalec, A., Brysbaert, M., & Duyck, W (2012). Working memory and (second) language processing. In J. Altarriba & L. Isurin (Eds.). Memory and Language: Theoretical and Applied Approaches to Bilingualism. Boston, MA:Walter De Gruyter. Retrieved on June 11, 2017, from http://crr.ugent.be/papers/Szmalec%20et%20al%20Working%20Memory%20and%20Second%20Language%20Processing.pdf
Tinajero, C., & Paramo, M. F. (1997). Field dependence-independence and academic achievement: A re-examination of their relationship. British Journal of Educational Psychology, 67, 199-212.
Torres-Fernandez, D. I. (2008). Gender differences in working memory and phonological awareness. PhD. Dissertation. Capella University
Tredway, D. (1982). The local environment: A learning experience. Science and Children, 20(1), 16-17. Weill, F. (2011). The role of verbal working memory in new word learning in toddlers 24 to 30 months old.
PhD. dissertation. Seton Hall University. Wimmer, R. (2011). Grasp sensing for human-computer interaction. Proceedings of TEI ’11: The Fifth
International Conference on Tangible, Embedded, and Embodied Interaction, 221-228. Witkin, H. A., Oltman, P. K., Raskin, E., & Karp, S. A. (1971). A manual for the embedded figure test. Palo
Alto, California: Consulting Psychologist Press. Xu, Y., & Chun, M.M. (2006). Dissociable neural mechanisms supporting visual short-term memory for
objects. Nature, 440(7080), 91-95. Zosh, J.M. (2009). Beyond “what” and “how many”: An investigation of working memory for objects in
infancy. PhD. Dissertation. Baltimore, Maryland: Johns Hopkins University.
TOJET: The Turkish Online Journal of Educational Technology – January 2018, volume 17 issue 1
Copyright © The Turkish Online Journal of Educational Technology 92
How Much Videos Win Over Audios in Listening Instruction for EFL Learners Burhanuddin YASIN English Education Department, Faculty of Teacher Training and Education, Syiah Kuala University Banda Aceh, Indonesia [email protected] Faisal MUSTAFA English Education Department, Faculty of Teacher Training and Education, Syiah Kuala University, Banda Aceh, Indonesia [email protected] Rizki PERMATASARI English Education Department, Faculty of Teacher Training and Education, Syiah Kuala University, Banda Aceh, Indonesia [email protected] ABSTRACT This study aims at comparing the benefits of using videos instead of audios for improving students’ listening skills. This experimental study used a pre-test and post-test control group design. The sample, selected by cluster random sampling resulted in the selection of 32 second year high school students for each group. The instruments used were listening tests and observation sheets. The test results were analyzed by applying paired-samples t-test, while the items in the observation sheets were analyzed by calculating their means. The results of the t-tests (sig. 2-tailed) were 0.000 for both the video and the audio groups, showing that the scores obtained by students in both groups improved significantly. However, the video group improvement was over 2.5 times higher than the improvement in scores of their audio counterparts. In terms of the instructional processes, the mean scores obtained by the video group were significantly higher than those from the audio group for all observed aspects, i.e. motivation, responses, teamwork and participation. Based on these results, it can be concluded that using video materials is more effective in terms of both the output and the process. Therefore, teachers are recommended to use video materials instead of their audio counterparts for teaching listening skills. Keywords: listening skills, video materials, audio materials, instructional processes INTRODUCTION Listening skills are undoubtedly important in learning a foreign language (Hamouda, 2013) and should be prioritized in learning a foreign language for two reasons. First of all, listening takes precedence over anything else when it comes to acquiring a language (Putriani, et al., 2013). Machado (2010, p. 242) says the success of children’s speaking, reading and writing skills rely on their listening abilities. Second, listening is the one of the four language skills that is most used in communication (Zhu, 2011). Although listening was once neglected in language learning (Long, 1987), the emergence of research on listening, which was started in the 1950’s, has put much more emphasis on teaching listening (Gold, 1975; Way, 1973). It was initially thought that the ability to listen developed automatically but in the mid-twentieth century, Brown (1954) proved that instruction can help develop this skill to be much better. It has been suggested that EFL learners should listen to language produced by a native speaker (Saint-Léon, 1988). As a native speaker might not be present in all language classrooms, thus an alternative is needed. Therefore, EFL teachers have been using recordings of native speakers’ voices as listening materials. They are divided into several levels to meet the EFL teachers’ expectations, usually basic, intermediate, post-intermediate, and advanced levels. However, considering current technology developments, the use of audio materials in the instructional process for learning listening skills seems rather inefficient (Chen et al., 2014). New research has found that using images with audio e.g., a video or film can greatly enhance results (Guichon & McLornan, 2008; Markham, et al., 2001). A video has advantages for learners because it is contextual and shows body language, and it can help students with “short attention spans” (Wilson, 2008, p. 49). In language testing, videos have been claimed to have greater validity compared to audio (Nation & Newton, 2009). The main disadvantages of video over audio materials is that they are more expensive (White et al., 2000) because a teacher needs a projector, a computer and a sound system, together with adequate computer skills unless all the students as well as the teacher all have laptops or hand phones that can play videos as is the case in high class, private schools today. In less developed countries like Indonesia, using videos in schools located in remote areas is even less feasible. Previous
TOJET: The Turkish Online Journal of Educational Technology – January 2018, volume 17 issue 1
Copyright © The Turkish Online Journal of Educational Technology 93
researches have shown that both videos and audios have benefited students (Pearson, 2006; Safranj, 2015); although both have some disadvantages (Wilson, 2008). However, only a few studies have compared both media. Therefore, it is desirable to find out to what extent video materials are more helpful compared to their audio counterparts in terms of students’ achievements and the instructional processes. The results should show whether using videos is worth the extra expense and trouble, especially for teachers in remote areas. LITERATURE REVIEW Lewis (1958) and Tyagi (2013) have both defined listening as the psychological process by which a listener receives oral and/or non-verbal information and focuses on the information to construct meaning from it, to understand it and to respond to it. Listening is much more complex compared to hearing, which occupies the lowest level in a scale proposed by Worden (1970), which are: hearing, listening and auditioning. Besides differentiating between listening and hearing, the above definition also forms a link between listening and understanding. According to Richards (2008, p. 3), the term “listening” and “listening comprehension” are nearly the same in meaning. This is why some scholars also define listening as the ability to comprehend spoken texts (Alonso, 2012; Andrade, 2006). Among all the four language skills (i.e. listening, speaking, reading and writing), the skill which is taught the least in schools is listening (Woottipong, 2014). The lack of listening instruction occurs because most teachers are not familiar with teaching listening, nor have they had access to training in listening (Funk & Funk, 1989; Vandergrift & Goh, 2012; Mardani, 2016). To understand how to teach listening, teachers must first understand the processes of listening as well as strategies for listening and strategies for teaching listening. Flowerdew and Miller (2010, p. 167) have proposed that there are three models of listening processes: bottom-up processing, top-down processing and interactive processing. In bottom-up processing, listeners mentally construct the meaning of information heard in chunks, starting with individual sounds to words, phrases, clauses and sentences. Unlike bottom-up processing, in top-down processing the listeners rely more on their prior knowledge and experiences to understand spoken texts. Interactive processing, on the other hand, is a mix between the two previous processes. In other words, the listeners go through bottom-up and top-down processes simultaneously. Listening Strategies Nihei (2002, pp. 17-18) and Andrade (2006, pp. 14-16) have both proposed seven listening strategies which are set out below: (1) Listening for the main idea. In this type of listening, students will most likely be asked about general
information from the text such as what the talk is about, why the speakers are talking about it, or where the conversation takes place. Students should only focus on those main ideas rather than worrying about other specific details from the text.
(2) Listening for specific details. Opposite to the above, this type of listening requires students to pay close attention to detailed information from the text. They may be asked about the time something takes place or the people involved in it.
(3) Listening to predict. Even though students cannot understand the whole of the spoken text, they can still predict what is going on by observing speakers’ gestures and facial expressions, plus rhetorical markers as well as keywords.
(4) Listening to make inferences. Making an inference is not the same as making a prediction. In this type of listening, students need to understand what an utterance really means in the context provided.
(5) Using nonverbal cues. When visual aids are available in a listening lesson, students may comprehend the spoken text better by paying close attention to non-verbal cues such as the body language of the speakers, their gestures, facial expressions and lip movements as well as the setting and timing of the conversations.
(6) Listening for taking notes. When students are listening for taking notes, they are not expected to write down everything they hear but rather to note key words which may be in the form of nouns, verbs, adjectives, adverbs or abbreviations. Nation and Newton (2009, p. 52) have mentioned two purposes of note-taking in a listening activity: 1) to have information in reserve for later use, and 2) to make opportunities to decode information.
(7) Listening for imitation or reproduction. Imitation is claimed to be “a powerful form of learning” (Meltzoff, 1999, p. 1). In this type of listening, the students are asked to imitate or reproduce what they have heard. To be able to imitate it accurately, students must have heard it correctly as well (Broughton et al., 1980, p. 58).
Since most foreign learners do not know how to listen to the foreign language being learnt, therefore, it is necessary that they should be taught listening strategies to make their listening a lot easier (Brown (2001).
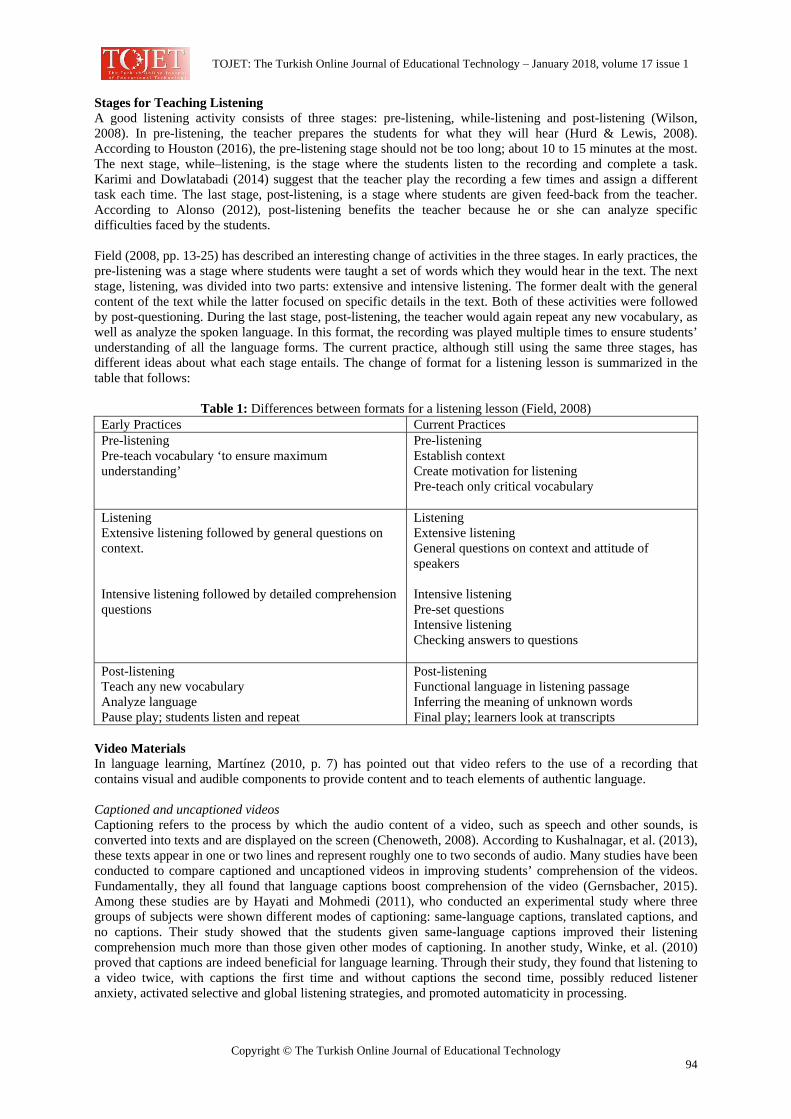
TOJET: The Turkish Online Journal of Educational Technology – January 2018, volume 17 issue 1
Copyright © The Turkish Online Journal of Educational Technology 94
Stages for Teaching Listening A good listening activity consists of three stages: pre-listening, while-listening and post-listening (Wilson, 2008). In pre-listening, the teacher prepares the students for what they will hear (Hurd & Lewis, 2008). According to Houston (2016), the pre-listening stage should not be too long; about 10 to 15 minutes at the most. The next stage, while–listening, is the stage where the students listen to the recording and complete a task. Karimi and Dowlatabadi (2014) suggest that the teacher play the recording a few times and assign a different task each time. The last stage, post-listening, is a stage where students are given feed-back from the teacher. According to Alonso (2012), post-listening benefits the teacher because he or she can analyze specific difficulties faced by the students. Field (2008, pp. 13-25) has described an interesting change of activities in the three stages. In early practices, the pre-listening was a stage where students were taught a set of words which they would hear in the text. The next stage, listening, was divided into two parts: extensive and intensive listening. The former dealt with the general content of the text while the latter focused on specific details in the text. Both of these activities were followed by post-questioning. During the last stage, post-listening, the teacher would again repeat any new vocabulary, as well as analyze the spoken language. In this format, the recording was played multiple times to ensure students’ understanding of all the language forms. The current practice, although still using the same three stages, has different ideas about what each stage entails. The change of format for a listening lesson is summarized in the table that follows:
Table 1: Differences between formats for a listening lesson (Field, 2008) Early Practices Current Practices Pre-listening Pre-teach vocabulary ‘to ensure maximum understanding’
Pre-listening Establish context Create motivation for listening Pre-teach only critical vocabulary
Listening Extensive listening followed by general questions on context. Intensive listening followed by detailed comprehension questions
Listening Extensive listening General questions on context and attitude of speakers Intensive listening Pre-set questions Intensive listening Checking answers to questions
Post-listening Teach any new vocabulary Analyze language Pause play; students listen and repeat
Post-listening Functional language in listening passage Inferring the meaning of unknown words Final play; learners look at transcripts
Video Materials In language learning, Martínez (2010, p. 7) has pointed out that video refers to the use of a recording that contains visual and audible components to provide content and to teach elements of authentic language. Captioned and uncaptioned videos Captioning refers to the process by which the audio content of a video, such as speech and other sounds, is converted into texts and are displayed on the screen (Chenoweth, 2008). According to Kushalnagar, et al. (2013), these texts appear in one or two lines and represent roughly one to two seconds of audio. Many studies have been conducted to compare captioned and uncaptioned videos in improving students’ comprehension of the videos. Fundamentally, they all found that language captions boost comprehension of the video (Gernsbacher, 2015). Among these studies are by Hayati and Mohmedi (2011), who conducted an experimental study where three groups of subjects were shown different modes of captioning: same-language captions, translated captions, and no captions. Their study showed that the students given same-language captions improved their listening comprehension much more than those given other modes of captioning. In another study, Winke, et al. (2010) proved that captions are indeed beneficial for language learning. Through their study, they found that listening to a video twice, with captions the first time and without captions the second time, possibly reduced listener anxiety, activated selective and global listening strategies, and promoted automaticity in processing.
TOJET: The Turkish Online Journal of Educational Technology – January 2018, volume 17 issue 1
Copyright © The Turkish Online Journal of Educational Technology 95
Benefits of using video materials Harmer (2001) points out three advantages of using videos for language learning. The first and main advantage of using videos is that students can see the language-in-use. Videos enable students to not only hear the language but also to see it through expressions, gestures, and other visual clues. Harmer believes that this can greatly aid students’ comprehension. The second advantage is cross-cultural awareness. Again according to Harmer, videos can expose students to situations beyond their classrooms, such as how people from another country speak to waiters, what they eat, how they dress, and so on. The last advantage is motivation. Harmer asserts that most students are more interested to learn when they have the opportunity to hear and to see the language simultaneously. Meanwhile, Köksal (2004, pp. 63-64) has added a few more benefits of using videos in language classrooms as listed below: • Videos are time-saving as they can get students' attention quickly. • Videos can be used with either large or small classes. • Videos provide unlimited sources of grammatical structures and words. • Videos contain real-life speech, including word stress and intonation. • Videos can be used to stimulate students to start a discussion. • Videos can excite the imagination of students. • Videos can improve students’ long-term memory by establishing auditory, visual and mental links. • Videos can boost students’ oral comprehension. Audio Materials Audio for teaching listening refers to recorded dialogues and monologues from native speakers. English teachers have always been inspired to teach students languages as spoken by native speakers, including pronunciation and intonation (Kaur & Raman, 2014). Since it is highly unlikely to get a native speaker in every EFL/ESL classroom as a model (Shibata, 2010), a recorded audio is a valuable alternative to achieve the same purpose. In addition, many students expect to learn to be able to understand the language produced by a native speaker with their natural speed, pronunciation, and intonation (Shibata, 2010). Nao (2011) states that even advanced learners have problems in understanding native speaker’s spoken language if they are not familiar with their pronunciation, speed, and intonation. Therefore, they need to be made familiar with the sounds of native voices. In fact, a study conducted by Díaz (2015) found that students preferred to be taught by native speaker teachers than by local teachers. For this reason, recorded audio lessons have been used for more than half a century to serve that purpose (Garrett, 2009; Rosselot, 1949). When it was first introduced to language classes, audio was considered an outstanding break-through in language teaching (Singh, 1975). It caused the establishment of language laboratories with headphone stations (Jones, 2008) where recordings were played on a master computer and transmitted to all the students in a class. Now, however, such laboratories are considered archaic (Garrett, 2009) as students can listen to language learning and generic audios through their smartphones (Al-Otaibi, et al., 2016). In addition, listening to recordings through headphones is artificial. In real communications, noises, hesitant pauses and varied sound intensities are expected, which is not the case when headphones are used. METHODS This study used quantitative methods with a true experimental design, a pre-test and a post-test, an experimental group and a control group. The population for this study was 288 eleventh-grade students in one of the public high schools in Banda Aceh, Indonesia. The sample for the study was chosen using cluster random sampling; a sampling technique where the population is divided into units or groups before being selected as the sample for the study (Best & Kahn, 2006). In this case, the population was already divided into nine classes, two of which were selected at random as the sample for this study, one for the audio class (the control group), and the other for the video class (the experimental group). Each class consisted of 32 students, and from two classes this made it 64 students in total as the participants of this research. Data Collection All student participants were given a similar listening test before and after the treatment to obtain the sample base scores and the scores after treatment to find the improvement. The test was a listening test from the National Final Examinations of 2014 and 2015. The test consisted of 30 questions, 15 questions were taken from the 2014 exam, and the other 15 from the 2015 exam. It was divided into four different parts with particular directions for each part. Aspects tested included general knowledge, specific information and expressions. In addition to investigating the differences arising from the different instructional processes, an observation sheet with a design based on Williams (2009), de Caprariis, et al. (2012), the Association of American Colleges and

TOJET: The Turkish Online Journal of Educational Technology – January 2018, volume 17 issue 1
Copyright © The Turkish Online Journal of Educational Technology 96
Universities (n.d.), and Mayer (2011) was used. The aspects observed included the motivation of students, the responses to questions, the teamwork and participation. The treatment for each group was given over four meetings, each approximately 90 minutes long. The meetings were conducted following a set of lesson plans designed in accordance with the 2013 Curriculum in Indonesia, which emphasizes the use of the scientific approach. The lesson for the first meeting was an analytical exposition text, and the focus of the lesson was to identify the main idea of a spoken text. The topic in the second meeting was similar to that of the first one except that the focus was on identifying supporting details. In the third and the fourth meetings, the topic was an exposition text and the focus was to identify the main idea of the text and to find supporting details provided in the text. The materials given for both groups were the same. However, the video group watched a video, while the audio group only listened to a recording. Data Analysis The data obtained from the two tests was analyzed, compared and interpreted statistically using SPSS. To find out whether both scores were significantly different, paired-samples t-test with a significance level of 5% was used to find whether the data was homogenous (p > 0.05) and normally distributed (p > 0.05). The homogeneity test was conducted by using Levene’s variance homogeneity test, resulting in p = 0.56 for the video group and p = 0.339 for the audio group. The Shapiro Wilks test was used to find out whether the data was normally distributed. The results showed that the p-values for the movie group were 0.793 (pre-test) and 0.280 (post-test), and those for the audio group were 0.066 (pre-test) and 0.107 (post-test) indicating that all the data was normally distributed. FINDINGS The study investigated the difference in students’ achievements and in the instructional processes to find out which type of media was the best. The students’ achievements were obtained from the tests, the pre-tests and the post-tests. The results from the pre-tests and the post-tests for both the audio and the video groups are presented in Table 2:
Table 2: Frequency distribution of the pre-test and post-test scores from both groups Score range Video Group Audio Group
Pre-test Post-test Pre-test Post-test 80 – 99 0 7 0 0 60 – 79 7 22 4 13 40 – 59 18 3 22 19 20 – 39 7 0 5 0
< 20 0 0 0 0 Table 2 shows that both the video and the audio group performed less in the pre-tests. Only seven students (21%) from the video group and four students (12%) from the audio group achieved scores higher than 60. The lowest scores, which fell in the range of 20 to 39, were achieved by seven students (21%) from the video group and five students (15%) from the audio group. However, in the post-tests, both groups demonstrated better performances compared to their pre-test results. Twenty-nine students (88%) from the video group and thirteen students (39%) from the audio group got scores higher than 60, and none of the students scored lower than 40. This improvement can also be seen from their mean scores as shown in Figure 1 that follows:
Figure 1: Comparison of the Pre-test and the Post-test Mean Scores from Both Groups
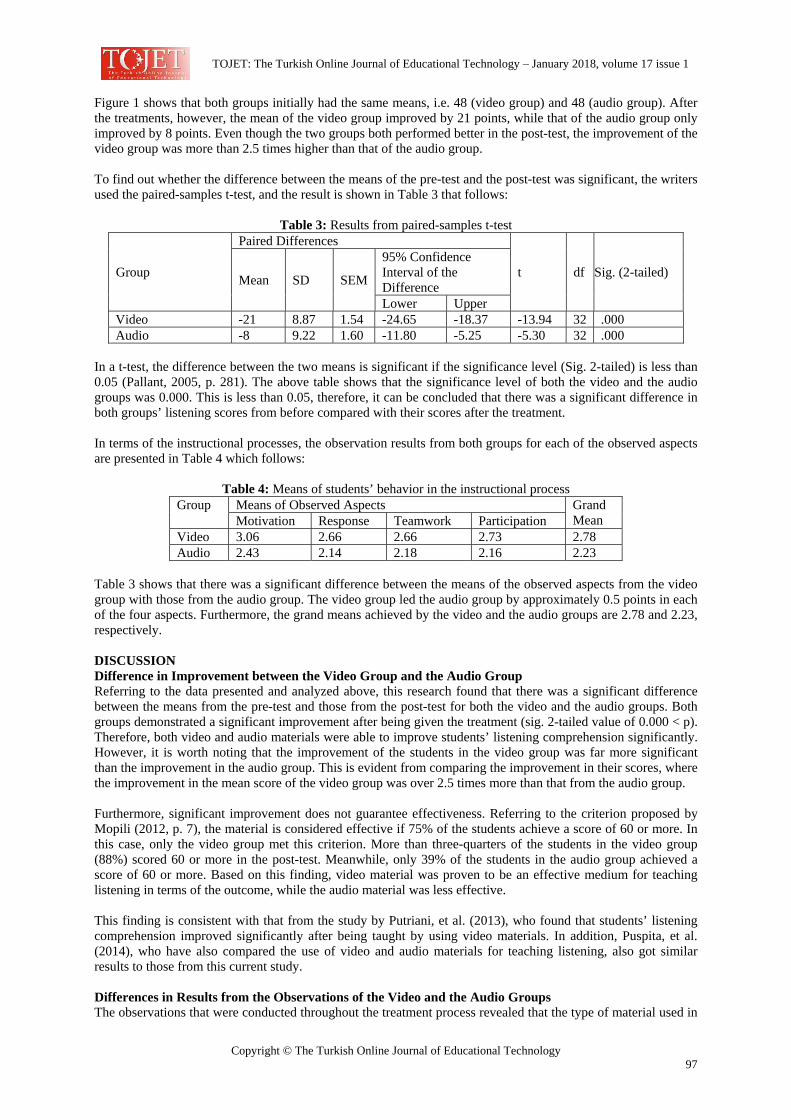
TOJET: The Turkish Online Journal of Educational Technology – January 2018, volume 17 issue 1
Copyright © The Turkish Online Journal of Educational Technology 97
Figure 1 shows that both groups initially had the same means, i.e. 48 (video group) and 48 (audio group). After the treatments, however, the mean of the video group improved by 21 points, while that of the audio group only improved by 8 points. Even though the two groups both performed better in the post-test, the improvement of the video group was more than 2.5 times higher than that of the audio group. To find out whether the difference between the means of the pre-test and the post-test was significant, the writers used the paired-samples t-test, and the result is shown in Table 3 that follows:
Table 3: Results from paired-samples t-test
Group
Paired Differences
t df Sig. (2-tailed) Mean SD SEM
95% Confidence Interval of the Difference Lower Upper
Video -21 8.87 1.54 -24.65 -18.37 -13.94 32 .000 Audio -8 9.22 1.60 -11.80 -5.25 -5.30 32 .000
In a t-test, the difference between the two means is significant if the significance level (Sig. 2-tailed) is less than 0.05 (Pallant, 2005, p. 281). The above table shows that the significance level of both the video and the audio groups was 0.000. This is less than 0.05, therefore, it can be concluded that there was a significant difference in both groups’ listening scores from before compared with their scores after the treatment. In terms of the instructional processes, the observation results from both groups for each of the observed aspects are presented in Table 4 which follows:
Table 4: Means of students’ behavior in the instructional process Group Means of Observed Aspects Grand
Mean Motivation Response Teamwork Participation Video 3.06 2.66 2.66 2.73 2.78 Audio 2.43 2.14 2.18 2.16 2.23
Table 3 shows that there was a significant difference between the means of the observed aspects from the video group with those from the audio group. The video group led the audio group by approximately 0.5 points in each of the four aspects. Furthermore, the grand means achieved by the video and the audio groups are 2.78 and 2.23, respectively. DISCUSSION Difference in Improvement between the Video Group and the Audio Group Referring to the data presented and analyzed above, this research found that there was a significant difference between the means from the pre-test and those from the post-test for both the video and the audio groups. Both groups demonstrated a significant improvement after being given the treatment (sig. 2-tailed value of 0.000 < p). Therefore, both video and audio materials were able to improve students’ listening comprehension significantly. However, it is worth noting that the improvement of the students in the video group was far more significant than the improvement in the audio group. This is evident from comparing the improvement in their scores, where the improvement in the mean score of the video group was over 2.5 times more than that from the audio group. Furthermore, significant improvement does not guarantee effectiveness. Referring to the criterion proposed by Mopili (2012, p. 7), the material is considered effective if 75% of the students achieve a score of 60 or more. In this case, only the video group met this criterion. More than three-quarters of the students in the video group (88%) scored 60 or more in the post-test. Meanwhile, only 39% of the students in the audio group achieved a score of 60 or more. Based on this finding, video material was proven to be an effective medium for teaching listening in terms of the outcome, while the audio material was less effective. This finding is consistent with that from the study by Putriani, et al. (2013), who found that students’ listening comprehension improved significantly after being taught by using video materials. In addition, Puspita, et al. (2014), who have also compared the use of video and audio materials for teaching listening, also got similar results to those from this current study. Differences in Results from the Observations of the Video and the Audio Groups The observations that were conducted throughout the treatment process revealed that the type of material used in
TOJET: The Turkish Online Journal of Educational Technology – January 2018, volume 17 issue 1
Copyright © The Turkish Online Journal of Educational Technology 98
the learning process affected the behavior of the students. The students in the video group appeared to be more motivated than those taught just using audio materials in the audio group. On a scale of one to four, the video group scored 3.05 on average in the motivation aspect, while the audio group only scored 2.43. This improved motivation is due to the fact that most students are more interested in learning a language when they can simultaneously see and hear the language in use (Harmer, 2001). Moreover, the students in the video group responded to the learning process better than those in the audio group. The average response score of both groups were 2.66 and 2.14, respectively. The video group also worked well in groups, as seen from their average teamwork score of 2.66 whilst the audio group only scored 2.18. Furthermore, the students in the video group participated more actively than those in the audio group. This can be seen from the average participation scores of 2.73 and 2.16, respectively. The fact that the video group scored higher in all three aspects (response, teamwork and participation) is due to the benefits of the video materials as proposed by Berk (2009), who points out that video materials can increase understanding, promote collaboration among students, and make learning more enjoyable than when using audio only. The average scores achieved by both groups show that the video group was in the lead. Their grand mean was 2.78, while that of the audio group was 2.23. The grand mean is an indicator of how effective the instructional process is. Referring to the category of effectiveness provided by the Indonesian Ministry of Education and Culture No. 81a, 2013, p. 22, a grand mean of 2.78 belongs in the “effective” category, while a grand mean of 2.23 belongs in the “hardly effective” category. Based on this categorization, it can be concluded that video materials are more effective in teaching listening skills compared to their audio counterparts in terms of use for instructional processes. CONCLUSIONS This current research has revealed that using video materials to teach listening skills is more effective than using their audio counterparts in terms of output. The students’ scores in listening comprehension increased significantly more after they were taught by using video materials than by using only auditory materials. In addition, using video materials to teach listening skills was also effective in terms of the processes. Therefore, it is suggested that teachers should use videos as the media of instruction to improve students’ listening comprehension and to encourage students’ learning motivation. Video materials have been found to further promote active and enjoyable learning experiences. REFERENCES Al-Otaibi, H. M., AlAmer, R. A., & Al-Khalifa, H. S. (2016). The next generation of language labs: Can
Mobiles help? A case study. Computers in Human Behavior, 59, 342-349. Alonso, R. S. (2012). The importance of teaching listening and speaking skills (Master’s Thesis). Madrid:
Complutense University of Madrid,. Andrade, M. E. A. d. (2006). Improving how listening skills are taught in the EFL classroom: Guidelines to
producing better speakers of the English language. Cape Verde: Instituto Superior de Educação, Praia. Association of American Colleges and Universities. (n.d.). Teamwork value rubric. Retrieved from
https://manoa.hawaii.edu/assessment/resources/rubrics/Teamwork_value.pdf Berk, R. A. (2009). Multimedia teaching with video clips: TV, movies, YouTube, and MTVU in the college
classroom. International Journal of Technology in Teaching and Learning, 5(1), 1-21. Best, J. W., & Kahn, J. V. (2006). Research in education (10th Ed.). Boston: Pearson Education Inc. Broughton, G., Broughton, G., Brumfit, C., Pincas, A., & Wilde, R. D. (1980). Teaching English as a foreign
language. New York: Routledge. Brown, D. (2001). Teaching by principles: An interactive approach to language pedagogy. New York: Longman. Brown, J. I. (1954). Can listening be taught? College English, 15(5), 290-291. Chen, C., Wang, L., & Xu, L. (2014). A study of video effects on English listening comprehension. Studies in
Literature and Language, 8(2), 53-58. Chenoweth, S. (2008). What is listening? Retrieved from https://www.dcmp.org/caai/nadh170.pdf de Caprariis, P., Barman, C., & Magee, P. (2012). Monitoring the benefits of active learning exercises in
introductory survey courses in science: An attempt to improve the education of prospective public school teachers. Journal of the Scholarship of Teaching and Learning, 1(2), 13-23.
Díaz, N. R. (2015). Students’ preferences regarding native and non-native teachers of English at a university in French Brittany. Procedia – Social and Behavioral Sciences, 173, 93-97.
Field, J. (2008). Listening in the Language Classroom. Cambridge: Cambridge University Press. Meltzoff, A. N. (1999). Born to learn: What infants learn from watching us. In N. A. Fox, L. A. Leavitt, & J.G.
Warhol (Eds), The role of early experience in infant development (pp. 145-164). San Francisco: Johnson & Johnson Pediatric Institute.
TOJET: The Turkish Online Journal of Educational Technology – January 2018, volume 17 issue 1
Copyright © The Turkish Online Journal of Educational Technology 99
Flowerdew, J., & Miller, L. (2010). Chapter 7: Listening in a second language. In A. D. Wolvin (Ed.), Listening and human communication in the 21st century (pp. 158-177). West Sussex: Blackwell Publishing.
Funk, H. D., & Funk, G. D. (1989). Guidelines for developing listening skills. The Reading Teacher, 42(9), 660-663.
Garrett, N. (2009). Technology in the service of language learning: Trends and issues. The Modern Language Journal, 93, 697-718.
Gernsbacher, M. A. (2015). Video captions benefit everyone. Policy Insights from the Behavioral and Brain Sciences, 2(1), 195-202.
Gold, Y. (1975). Teaching listening? Why not? Elementary English, 52(3), 421-426. Guichon, N., & McLornan, S. (2008). The effects of multimodality on L2 learners: Implications for CALL
resource design. System, 36(1), 85-93. Hamouda, A. (2013). An investigation of listening comprehension problems encountered by Saudi students in
the EL listening classroom. International Journal of Academic Research in Progressive Education and Development, 2(2), 113-155.
Harmer, J. (2001). The practice of English language teaching. Essex: Longman. Hayati, A., & Mohmedi, F. (2011). The effect of films with and without subtitles on listening comprehension of
EFL learners. British Journal of Educational Technology, 42(1), 181-192. Houston, H. (2016). The three stages of a listening activity. Retrieved from http://www.eflmagazine.com/the-
three-stages-of-a-listening-activity/ Hurd, S., & Lewis, T. (2008). Language learning strategies in independent settings (Vol. 33). Bristol:
Multilingual Matters. Jones, L. C. (2008). Listening comprehension technology: Building the bridge from analog to digital. CALICO
Journal, 25(3), 400-419. Karimi, M., & Dowlatabadi, H. R. (2014). Authenticity vs. practicality: Metacognitive awareness through
authentic materials in EFL classroom. Procedia – Social and Behavioral Sciences, 98, 844-851. Kaur, P., & Raman, A. (2014). Exploring native speaker and non-native speaker accents: The English as a lingua
franca perspective. Procedia – Social and Behavioral Sciences, 155, 253-259. Köksal, D. (2004). To kill the blackboard? Technology in language teaching and learning. TOJET: The Turkish
Online Journal of Educational Technology, 3(3), 62-72. Kushalnagar, R. S., Lasecki, W. S., & Bigham, J. P. (2013). Captions versus transcripts for online video content.
Paper presented at the Proceedings of the 10th International Cross-Disciplinary Conference on Web Accessibility (Article No. 32). May 13 – 15, Rio de Janeiro, Brazil.
Lewis, T. R. (1958). Chapter II: Listening. Review of Educational Research, 28(2), 89-95. Long, D. R. (1987). Listening comprehension: Need and neglect. Hispania, 70(4), 921-928. Machado, J. M. (2010). Early childhood experiences in language arts: Early literacy (9th Ed.). Boston, MA:
Cengage Learning. Mardani, F. (2016). A survey on the process of English teaching at nine senior high schools in Aceh Jaya.
English Education Journal, 8(3). Markham, P. L., Peter, L. A., & McCarthy, T. J. (2001). The effects of native language vs. target language
captions on foreign language students’ DVD video comprehension. Foreign Language Annals, 34(5), 439-445.
Martínez, R. G. (2010). Effects on teaching listening skills through videos to advanced students from the Foreign Language Department at the University of El Salvador during the first semester 2010 (Master’s Thesis), Universidad de El Salvador, El Salvador.
Mayer, C. (2011). Rubric for evaluation of class participation. New York: Albany Law School. Mopili, M. (2012). Efektivitas pembelajaran dan pengaruhnya terhadap hasil belajar siswa pada mata
pelajaran Sejarah di SMAN 1 Boliyohuto [Instructional effectiveness and its impacts towards students’ achievement in History in SMAN 1 Boliyohuto] (Undergraduate Thesis), State University of Gorontalo, Gorontalo.
Nao, M. (2011). The pragmatic realization of the native speaking English teacher as a monolingual ideal. Journal of Pragmatics, 43(15), 3770-3781.
Nation, I. S. P., & Newton, J. (2009). Teaching ESL / EFL listening and speaking. New York: Routledge. Nihei, K. (2002). How to teach listening. Retrieved from http://files.eric.ed.gov/fulltext/ED475743.pdf Pallant, J. (2005). SPSS survival manual: A step by step guide to data analysis using SPSS for Windows (Version
12). Crows Nest, NSW: Allen & Unwin. Pearson, L. (2006). Teaching Spanish dialectology with digital audio technology. Hispania, 89(2), 323-330. Puspita, L. B., Sukirlan, M., & Supriyadi, D. (2014). A comparative study of students’ listening comprehension
taught through video and audio. U-JET, 3(8). Putriani, D., Sukirlan, M., & Supriyadi, D. (2013). The use of video movie to improve students’ listening
comprehension achievement. U-JET, 2(6).
TOJET: The Turkish Online Journal of Educational Technology – January 2018, volume 17 issue 1
Copyright © The Turkish Online Journal of Educational Technology 100
Richards, J. C. (2008). Teaching listening and speaking: From theory to practice. New York: Cambridge University Press.
Rosselot, L. V. (1949). Audio-aids techniques in foreign language teaching. The Modern Language Journal, 33(7), 544-550.
Safranj, J. (2015). Advancing listening comprehension through movies. Procedia – Social and Behavioral Sciences, 191, 169-173.
Saint-Léon, C. B. (1988). The case for authentic materials on Videodisc. CALICO Journal, 6(2), 27-40. Shibata, M. (2010). How Japanese teachers of English perceive non-native assistant English teachers. System,
38(1), 124-133. Singh, A. B. (1975). Audio visual and other aids to language teaching. Bulletin of the Deccan College Research
Institute, 35(1/2), 154-170. Tyagi, B. (2013). Listening: An important skill and its various aspects. The Criterion: An International Journal
in English, 2(12), 1-8. Vandergrift, L., & Goh, C. C. (2012). Teaching and learning second language listening: Metacognition in
action. New York: Routledge. Way, J. G. (1973). Teaching listening skills. The Reading Teacher, 26(5), 472-476. White, C., Easton, P., & Anderson, C. (2000). Students’ perceived value of video in a multimedia language
course. Educational Media International, 37(3), 167-175. Williams, D. (2009). Assessing student learning outcomes using metacognitive rubrics and general tutoring SLO
measurement document. Retrieved from http://www.lsche.net/?page_id=675 Wilson, J. J. (2008). How to teach listening. Essex: Pearson Education Limited. Winke, P., Gass, S., & Sydorenko, T. (2010). The effects of captioning videos used for foreign language
listening activities. Language Learning & Technology, 14(1), 65-86. Woottipong, K. (2014). Effect of using video materials in the teaching of listening skills for university students.
International Journal of Linguistics, 6(4), 200-212. Worden, P. K. (1970). Are you Listening? Journal of Extension, 8(1), 30-34. Zhu, X. (2011). Study on the influence of voice on listening comprehension. Paper presented at the 2011 IEEE
3rd International Conference on Communication Software and Networks. 27-29 May, Xi'an, China.
TOJET: The Turkish Online Journal of Educational Technology – January 2018, volume 17 issue 1
Copyright © The Turkish Online Journal of Educational Technology 101
Learner Characteristics, Learner Achievement and Time Investment in Online Courses for Dutch L2 in Adult Education Liesbeth De Paepe Ph.D. Candidate Educational Sciences, Vrije Universiteit Brussel (VUB), Pleinlaan 2, 1050 Brussel, Belgium [email protected]; [email protected] Prof. Dr. Chang Zhu Educational Sciences, Vrije Universiteit Brussel (VUB), Pleinlaan 2, 1050 Brussel, Belgium [email protected] Prof. Dr. Koen Depryck Educational Sciences, Vrije Universiteit Brussel (VUB), Pleinlaan 2, 1050 Brussel, Belgium [email protected] ABSTRACT For the growing group of adult migrants, flexible solutions for second language (L2) acquisition are increasingly important, while concerns about the efficacy of online language learning abound. This study on the L2 situation in Flanders has 4 key aims: analyzing adult learner profiles in fully online Dutch beginners’ courses; comparing learner achievements in fully online and face-to-face (F2F) courses; reporting on differences in learner achievement considering learner profile variables and comparing time investment in F2F and online courses. A quantitative design was adopted, including a survey among the online students; assessment scores and data on learner profiles of online and F2F learners. The survey dealt with biographical variables and variables related to online learning. Results show that i) the online Dutch L2 learner is typically highly educated and employed; ii) online learners spend less time on the course than F2F learners, but perform significantly better in reading, listening and speaking skills; iii) writing skills are better achieved in F2F learning and iv) prior educational level and the language spoken by the host community have no significant impact on learner achievement. The findings indicate that online L2 learning can be as effective as F2F learning, even for learners with a lower educational level, or lacking contact with native speakers. Keywords: learner profiles; learner characteristics; online language learning; learner achievement INTRODUCTION Blake and Delforge (2007) and Sun (2014) call for more extensive research on fully online language courses. “Primary studies with original, empirical data in the area are still rare.” (Sun, 2014, p3). Blake (2013) reports on a lack of studies focusing on the efficacy of fully online language learning. Coleman and Furnborough (2010) state that few comparative studies exist on the outcomes of F2F and online programs. Existing studies are often situated in the context of foreign language learning (eg. Chenoweth et al, 2006; Scida and Saury, 2006; Blake and Delforge, 2007; Blake, Wilson, Cetto and Pardo-Ballester, 2008) and not on L2 learning. Other researchers don’t support comparative studies on learner achievement in F2F and online learning environments (eg. Soba, 2000) claiming the respective pedagogies are different (Coleman & Furnborough, 2010). Nevertheless, the final qualifications of online and F2F learning modes need to be the same. In this context, this study sets out to compare learner profiles in online and F2F Dutch L2 courses. For providers of online language courses, it is essential to have insight in learner characteristics, as they underpin the pedagogy of the instructional design, task development, learner support and decisions regarding technology. This study evaluates whether different modes of learning (online and F2F) can lead to the same learner achievements and whether learner achievements are influenced by learner profile variables. LITERATURE REVIEW Learner profiles in online (L2) courses “Many potential students in all sectors are not able to attend a campus/school regularly, because they are employed, carers, girls or women (in some cultures), have difficulties with access (e.g. some disabled students) or are otherwise unavailable for conventional term times (e.g. soldiers, prisoners)” (Gaskell & Mills, 2014,
TOJET: The Turkish Online Journal of Educational Technology – January 2018, volume 17 issue 1
Copyright © The Turkish Online Journal of Educational Technology 102
p197). Fully online courses appeal particularly to people with a full-time (Blake, 2013; Kahu et al, 2013, Colorado & Eberle, 2010) or part-time job (Kim et al., 2011), and to people who wish to learn autonomously (Blake, 2013). Online and blended learning increase the access to education for adults combining a job with a family (Kormos & Csizér, 2014) or for those combining study, family, social and professional commitments (White, 2003). Dolan (2008) and Johnson (2015) found that the choice for online or F2F learning is not influenced by gender, whereas Coleman and Furnburough (2010) described a gender distribution with a predominance of women (two out of three learners) in a distance Spanish course. Chu and Tsai (2009) found that adult learners select online programs/courses because the constructivist approach of self-directed learning appeals to them. Coleman and Furnborough (2010) found that adult distance language learners in a Beginners Spanish course in Open University UK were mainly highly educated and showed great variety in terms of languages spoken: nearly sixty different languages (including the mother tongue) were mentioned. Most of them had no prior experience of autonomous or distance language learning. Learner achievement in online and F2F learning modes “Few empirical research studies have examined the overall effectiveness of online language learning or compared the progress of students participating in such courses with that of those enrolled in traditional classes.” (Blake 2013, p137). Existing comparative studies include those carried out by Chenoweth, Jones and Tucker (2006) on Spanish online learning, and by Chenoweth and Murday (2003) on French, mostly online learning (1 hour F2F per week). Results show no significant differences as regards oral production, and minimal statistical differences for writing, reading, and listening. Coleman and Furnborough (2010) state that the mode of learning has no influence on pass rates. Spodark (2004) considers F2F modes the best option for learning languages at beginner levels and claims that only reading, writing, and listening skills can be acquired online, and then only at intermediate and advanced levels. Moneypenny & Aldrich (2016) state that “Concerning the assessment of oral proficiency in completely online classes, there is a noticeable dearth of research” (p109). Sánchez-Serrano (2008) asserts that the oral skills are difficult to handle in online learning; Dodigovic (2005) adds that especially the synchronous conversations are problematic. Moneypenny and Aldrich (2016) and Blake et al. (2008), however, found no significant differences in oral proficiency at the introductory level between online and F2F learners of Spanish. Moneypenny and Aldrich (2016) conclude that “online L2 instruction, even at introductory levels, is a valid form of L2 instruction for oral proficiency, which reaffirms Blake et al.’s 2008 study of oral proficiency in online and traditional classrooms.” (p125). Yanguas (2010) explained the absence of learner achievement differences: F2F communication and synchronous video-based computer-mediated communication are very similar and generate similar achievements. Blake (2008) justified the similar results: weekly conversations “make a major contribution to the level of individual practice and the extent of instructor attention, which might even exceed what can be found in traditional classrooms given their burden of 25 to 30 students” (p123). Bava Harji and Gheitanchian (2017) found that oral production in a foreign language course was influenced positively by a multimedia task-based teaching and learning approach. Learner achievement in online and F2F learning modes considering learner profile variables Pass rates are similar for male and female learners (Coleman and Furnborough, 2010). White and Le Cornu (2011), however, assert that the digital divide is not based on age nor gender. In terms of educational level, Epley and Smith (2015) found that a student’s previous level of success correlates negatively with the final grade performance. Coleman and Furnborough found that “the predictive value of prior educational level is small” (p19). DePryck, K., Zhu, C., Van Laer, H., Kupriyanova-Ashina, V. & Cools, W. (2013) found that low-literate adults in Basic Education (primary education for adults) in Flanders show interest in online and blended learning. Increased interaction with native speakers does not result in statistically significant higher scores for oral proficiency (Moneypenny and Aldrich, 2016). Coleman and Furnborough (2010) found that the students who failed, had the most personal contact, whereas the successful students had the most non-interactive contact with the target language through written and spoken media. Prior experience with independent or distance language learning does not predict the learning achievement (Coleman and Furnborough, 2010). The differences in learning achievements can rather be explained by socioeconomic status (Smith, 2012) and self-discipline (Rurato, 2015). The characteristics of a successful online learner can be analyzed by means of the SORT (Student Online Readiness Tool), based on research by Schrum and Hong (2002). Online language learners’ perceived time investment Chenoweth and Murday (2003) recorded that online students in a foreign language course spent less time on the course than F2F students, but with comparable results, whereas Chenoweth, Jones and Tucker (2006) reported an equal amount of study time in both groups. Nonis and Hudson (2010) and Wikan and Bugge (2014) stated that
TOJET: The Turkish Online Journal of Educational Technology – January 2018, volume 17 issue 1
Copyright © The Turkish Online Journal of Educational Technology 103
previous research on correlations between study time on the one hand and progress and performance on the other hand are inconclusive. As there are insufficient studies examining student time investment in online and F2F learning modes, it is important to investigate this variable. Linking time investment to learner achievement can shed light on the efficiency of online learning. Bugge and Wikan (2016) state that “progress and performance might be influenced by how the programme is organized”. RESEARCH QUESTIONS This research sets out to answer the following research questions:
• RQ1: What are the profiles of online and F2F Dutch L2 learners in the proficiency levels A1 and A2? • RQ2: Are the learning achievements significantly different in online and F2F learning modes? • RQ3: Are the learning achievements significantly different in online and F2F learning modes
considering different learner profiles variables? • RQ4: What is the perception of time investment of online Dutch L2 learners?
METHODS Research context The current study investigates the online learner profiles and compares the learner achievements of fully online and F2F students in Dutch L2 courses in adult education. The course levels are A1 and A2 in the Common European Framework of References of Languages (CEFR). These are the required outcomes of the Flemish integration program and the national language citizenship examinations in The Netherlands. The Dutch L2 courses are organized at a center for adult education in Flanders, Belgium. At the time when the research is carried out, it is the only adult education center offering fully online Dutch L2 courses in Flanders. The results of this research will provide new insights into learner profiles and efficiency of (online) Dutch L2 learning. Participants The participants are adult immigrants learning Dutch L2 either fully online or fully F2F. Data are collected among 136 learners: 67 F2F (47 at A1 level + 20 at A2) and 69 online learners (50 at A1 level + 19 at A2), mainly adult immigrants with different mother tongues (L1), but already familiar with the Roman alphabet. Prospective students of both groups are screened equally: requirements for registration include having finished secondary education and having learned a second language at school. They are asked about their ICT knowledge and about their motivation to study online. Course and assessment F2F and online courses both cover all the learning outcomes (or learning objectives) as well as the four domains of language use (personal, public, occupational and educational) and the four skills (reading, writing, listening and speaking), as described in the CEFR. Each course takes 1 semester. F2F students come to school for 120 hours; online students once, for the final exam. The online course comprises forty multimedia lessons with real-life situations, similar to those in the books used in F2F groups. Activities in the online groups are synchronous (weekly individual 15-minute skype sessions with the teacher to practice oral skills and to monitor the general follow-up) and asynchronous (oral production in Voicethread and Flipgrid; writing exercises in Google Drive; interaction in learning objects; communication with the teacher via e-mail). For both learning modes, the assessment (with a total score of 200) is split into two parts: continuous assessment (120 points) and a final exam, identical for both learning modes (80 points). Some continuous assessment questions are different for online and F2F learners; however, the content, learning outcomes, level of difficulty, question types and proportion of different types of questions are similar. Because the distance education proportion is officially maximum 95% in Flanders, the final exam is held at school. Data Online students are asked to fill out a survey covering the variables gender, level of education, occupation, mother tongue, place of living, course level, prior experience with online learning and perceived time investment. The gradebooks are collected and oral exams are recorded, unless a student does not give the permission to do so. The gradebook contains the overall exam score, separate scores for the four skills (reading, listening, writing and speaking), and the continuous assessment score. For the F2F students, the necessary data are collected from the school’s administrative system, with the learners’ consent.
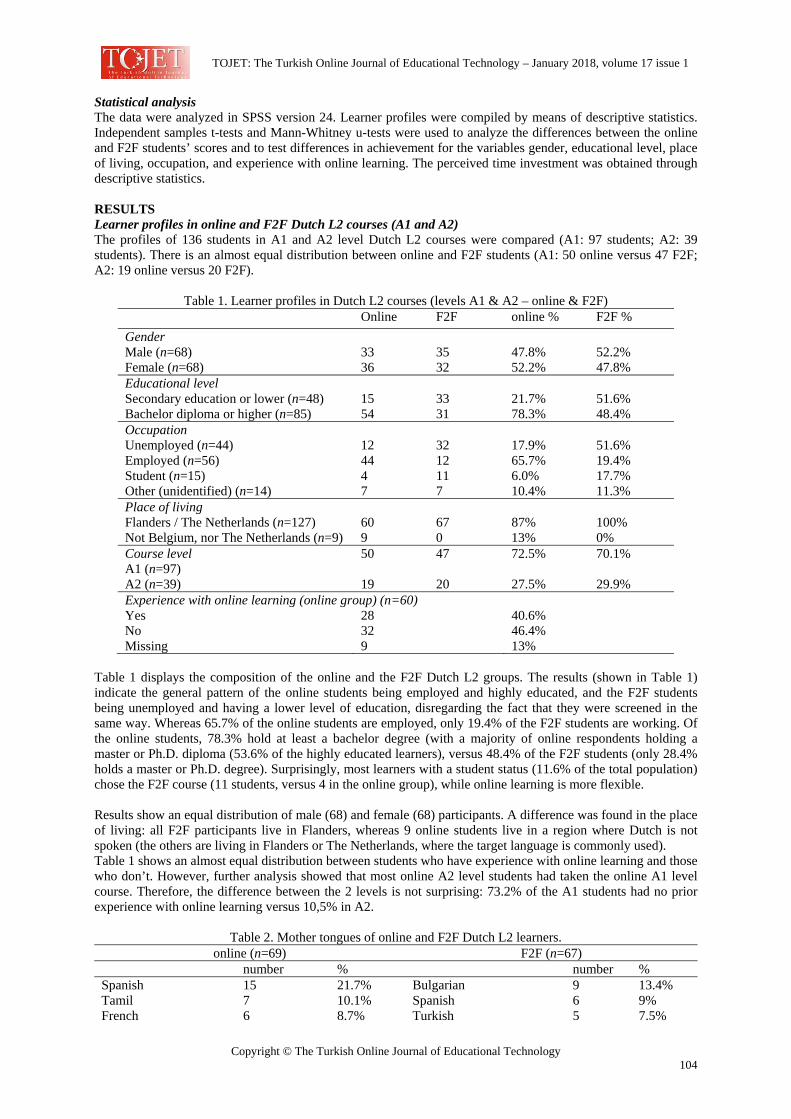
TOJET: The Turkish Online Journal of Educational Technology – January 2018, volume 17 issue 1
Copyright © The Turkish Online Journal of Educational Technology 104
Statistical analysis The data were analyzed in SPSS version 24. Learner profiles were compiled by means of descriptive statistics. Independent samples t-tests and Mann-Whitney u-tests were used to analyze the differences between the online and F2F students’ scores and to test differences in achievement for the variables gender, educational level, place of living, occupation, and experience with online learning. The perceived time investment was obtained through descriptive statistics. RESULTS Learner profiles in online and F2F Dutch L2 courses (A1 and A2) The profiles of 136 students in A1 and A2 level Dutch L2 courses were compared (A1: 97 students; A2: 39 students). There is an almost equal distribution between online and F2F students (A1: 50 online versus 47 F2F; A2: 19 online versus 20 F2F).
Table 1. Learner profiles in Dutch L2 courses (levels A1 & A2 – online & F2F) Online F2F online % F2F % Gender Male (n=68)
33
35
47.8%
52.2%
Female (n=68) 36 32 52.2% 47.8% Educational level Secondary education or lower (n=48)
15
33
21.7%
51.6%
Bachelor diploma or higher (n=85) 54 31 78.3% 48.4% Occupation Unemployed (n=44)
12
32
17.9%
51.6%
Employed (n=56) 44 12 65.7% 19.4% Student (n=15) 4 11 6.0% 17.7% Other (unidentified) (n=14) 7 7 10.4% 11.3% Place of living Flanders / The Netherlands (n=127)
60
67
87%
100%
Not Belgium, nor The Netherlands (n=9) 9 0 13% 0% Course level A1 (n=97)
50 47 72.5% 70.1%
A2 (n=39) 19 20 27.5% 29.9% Experience with online learning (online group) (n=60) Yes 28 40.6% No 32 46.4% Missing 9 13%
Table 1 displays the composition of the online and the F2F Dutch L2 groups. The results (shown in Table 1) indicate the general pattern of the online students being employed and highly educated, and the F2F students being unemployed and having a lower level of education, disregarding the fact that they were screened in the same way. Whereas 65.7% of the online students are employed, only 19.4% of the F2F students are working. Of the online students, 78.3% hold at least a bachelor degree (with a majority of online respondents holding a master or Ph.D. diploma (53.6% of the highly educated learners), versus 48.4% of the F2F students (only 28.4% holds a master or Ph.D. degree). Surprisingly, most learners with a student status (11.6% of the total population) chose the F2F course (11 students, versus 4 in the online group), while online learning is more flexible. Results show an equal distribution of male (68) and female (68) participants. A difference was found in the place of living: all F2F participants live in Flanders, whereas 9 online students live in a region where Dutch is not spoken (the others are living in Flanders or The Netherlands, where the target language is commonly used). Table 1 shows an almost equal distribution between students who have experience with online learning and those who don’t. However, further analysis showed that most online A2 level students had taken the online A1 level course. Therefore, the difference between the 2 levels is not surprising: 73.2% of the A1 students had no prior experience with online learning versus 10,5% in A2.
Table 2. Mother tongues of online and F2F Dutch L2 learners. online (n=69) F2F (n=67)
number % number % Spanish 15 21.7% Bulgarian 9 13.4% Tamil 7 10.1% Spanish 6 9% French 6 8.7% Turkish 5 7.5%
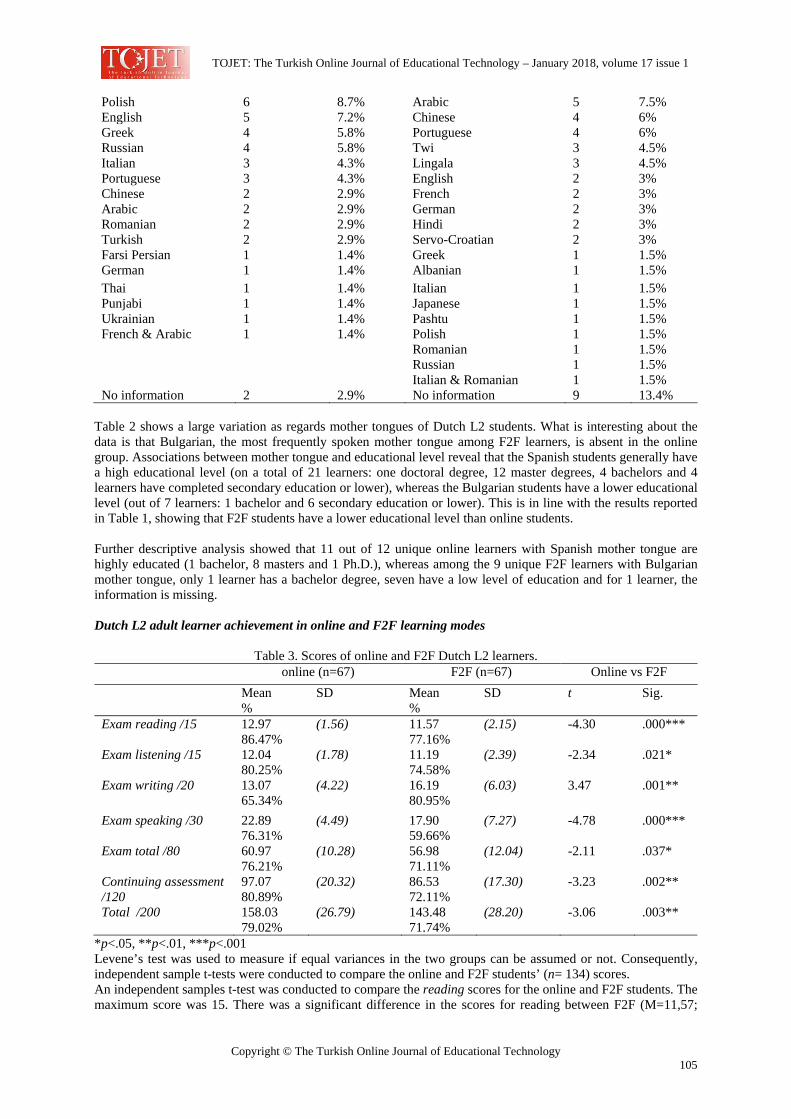
TOJET: The Turkish Online Journal of Educational Technology – January 2018, volume 17 issue 1
Copyright © The Turkish Online Journal of Educational Technology 105
Polish 6 8.7% Arabic 5 7.5% English 5 7.2% Chinese 4 6% Greek 4 5.8% Portuguese 4 6% Russian 4 5.8% Twi 3 4.5% Italian 3 4.3% Lingala 3 4.5% Portuguese 3 4.3% English 2 3% Chinese 2 2.9% French 2 3% Arabic 2 2.9% German 2 3% Romanian 2 2.9% Hindi 2 3% Turkish 2 2.9% Servo-Croatian 2 3% Farsi Persian 1 1.4% Greek 1 1.5% German 1 1.4% Albanian 1 1.5% Thai 1 1.4% Italian 1 1.5% Punjabi 1 1.4% Japanese 1 1.5% Ukrainian 1 1.4% Pashtu 1 1.5% French & Arabic 1 1.4% Polish 1 1.5% Romanian 1 1.5% Russian 1 1.5% Italian & Romanian 1 1.5% No information 2 2.9% No information 9 13.4%
Table 2 shows a large variation as regards mother tongues of Dutch L2 students. What is interesting about the data is that Bulgarian, the most frequently spoken mother tongue among F2F learners, is absent in the online group. Associations between mother tongue and educational level reveal that the Spanish students generally have a high educational level (on a total of 21 learners: one doctoral degree, 12 master degrees, 4 bachelors and 4 learners have completed secondary education or lower), whereas the Bulgarian students have a lower educational level (out of 7 learners: 1 bachelor and 6 secondary education or lower). This is in line with the results reported in Table 1, showing that F2F students have a lower educational level than online students. Further descriptive analysis showed that 11 out of 12 unique online learners with Spanish mother tongue are highly educated (1 bachelor, 8 masters and 1 Ph.D.), whereas among the 9 unique F2F learners with Bulgarian mother tongue, only 1 learner has a bachelor degree, seven have a low level of education and for 1 learner, the information is missing. Dutch L2 adult learner achievement in online and F2F learning modes
Table 3. Scores of online and F2F Dutch L2 learners. online (n=67) F2F (n=67) Online vs F2F
Mean %
SD Mean %
SD t Sig.
Exam reading /15 12.97 86.47%
(1.56) 11.57 77.16%
(2.15) -4.30 .000***
Exam listening /15 12.04 80.25%
(1.78) 11.19 74.58%
(2.39) -2.34 .021*
Exam writing /20 13.07 65.34%
(4.22) 16.19 80.95%
(6.03) 3.47 .001**
Exam speaking /30 22.89 76.31%
(4.49) 17.90 59.66%
(7.27) -4.78 .000***
Exam total /80 60.97 76.21%
(10.28) 56.98 71.11%
(12.04) -2.11 .037*
Continuing assessment /120
97.07 80.89%
(20.32) 86.53 72.11%
(17.30) -3.23 .002**
Total /200 158.03 79.02%
(26.79) 143.48 71.74%
(28.20) -3.06 .003**
*p<.05, **p<.01, ***p<.001 Levene’s test was used to measure if equal variances in the two groups can be assumed or not. Consequently, independent sample t-tests were conducted to compare the online and F2F students’ (n= 134) scores. An independent samples t-test was conducted to compare the reading scores for the online and F2F students. The maximum score was 15. There was a significant difference in the scores for reading between F2F (M=11,57;
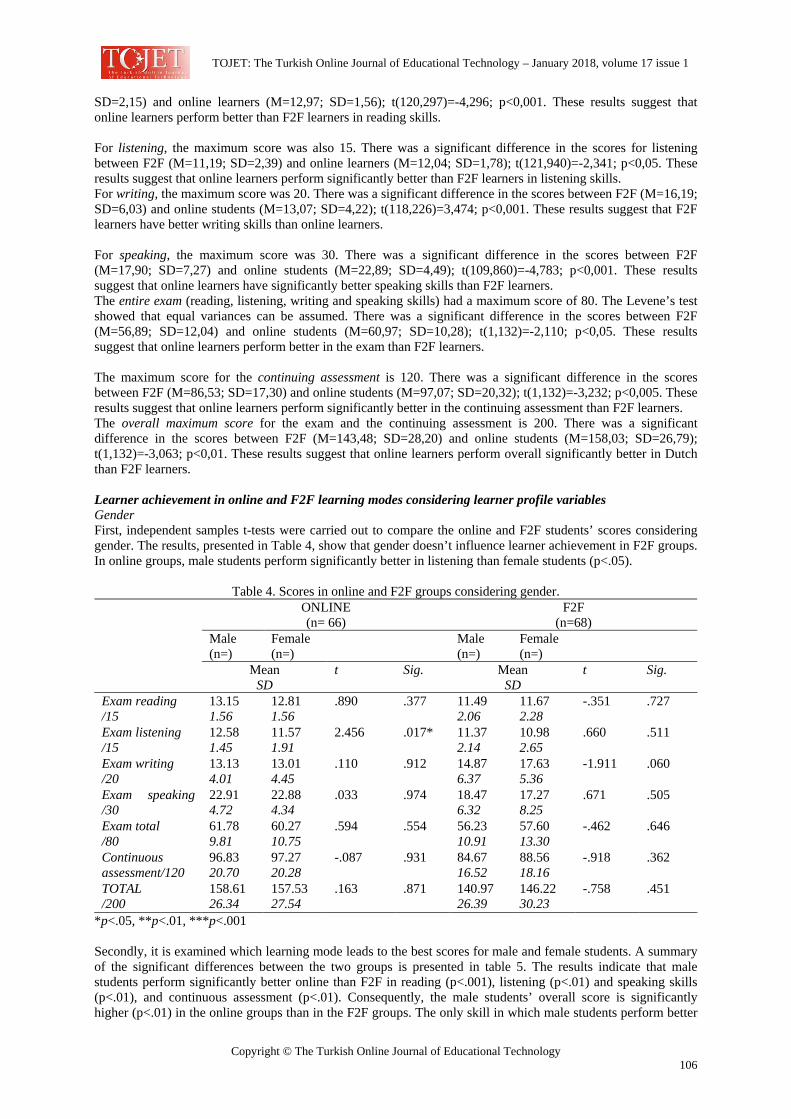
TOJET: The Turkish Online Journal of Educational Technology – January 2018, volume 17 issue 1
Copyright © The Turkish Online Journal of Educational Technology 106
SD=2,15) and online learners (M=12,97; SD=1,56); t(120,297)=-4,296; p<0,001. These results suggest that online learners perform better than F2F learners in reading skills. For listening, the maximum score was also 15. There was a significant difference in the scores for listening between F2F (M=11,19; SD=2,39) and online learners (M=12,04; SD=1,78); t(121,940)=-2,341; p<0,05. These results suggest that online learners perform significantly better than F2F learners in listening skills. For writing, the maximum score was 20. There was a significant difference in the scores between F2F (M=16,19; SD=6,03) and online students (M=13,07; SD=4,22); t(118,226)=3,474; p<0,001. These results suggest that F2F learners have better writing skills than online learners. For speaking, the maximum score was 30. There was a significant difference in the scores between F2F (M=17,90; SD=7,27) and online students (M=22,89; SD=4,49); t(109,860)=-4,783; p<0,001. These results suggest that online learners have significantly better speaking skills than F2F learners. The entire exam (reading, listening, writing and speaking skills) had a maximum score of 80. The Levene’s test showed that equal variances can be assumed. There was a significant difference in the scores between F2F (M=56,89; SD=12,04) and online students (M=60,97; SD=10,28); t(1,132)=-2,110; p<0,05. These results suggest that online learners perform better in the exam than F2F learners. The maximum score for the continuing assessment is 120. There was a significant difference in the scores between F2F (M=86,53; SD=17,30) and online students (M=97,07; SD=20,32); t(1,132)=-3,232; p<0,005. These results suggest that online learners perform significantly better in the continuing assessment than F2F learners. The overall maximum score for the exam and the continuing assessment is 200. There was a significant difference in the scores between F2F (M=143,48; SD=28,20) and online students (M=158,03; SD=26,79); t(1,132)=-3,063; p<0,01. These results suggest that online learners perform overall significantly better in Dutch than F2F learners. Learner achievement in online and F2F learning modes considering learner profile variables Gender First, independent samples t-tests were carried out to compare the online and F2F students’ scores considering gender. The results, presented in Table 4, show that gender doesn’t influence learner achievement in F2F groups. In online groups, male students perform significantly better in listening than female students (p<.05).
Table 4. Scores in online and F2F groups considering gender.
ONLINE (n= 66)
F2F (n=68)
Male (n=)
Female (n=)
Male (n=)
Female (n=)
Mean SD
t Sig. Mean SD
t Sig.
Exam reading /15
13.15 1.56
12.81 1.56
.890 .377 11.49 2.06
11.67 2.28
-.351 .727
Exam listening /15
12.58 1.45
11.57 1.91
2.456 .017* 11.37 2.14
10.98 2.65
.660 .511
Exam writing /20
13.13 4.01
13.01 4.45
.110 .912 14.87 6.37
17.63 5.36
-1.911 .060
Exam speaking /30
22.91 4.72
22.88 4.34
.033 .974
18.47 6.32
17.27 8.25
.671 .505
Exam total /80
61.78 9.81
60.27 10.75
.594 .554
56.23 10.91
57.60 13.30
-.462 .646
Continuous assessment/120
96.83 20.70
97.27 20.28
-.087 .931
84.67 16.52
88.56 18.16
-.918 .362
TOTAL /200
158.61 26.34
157.53 27.54
.163 .871
140.97 26.39
146.22 30.23
-.758 .451
*p<.05, **p<.01, ***p<.001 Secondly, it is examined which learning mode leads to the best scores for male and female students. A summary of the significant differences between the two groups is presented in table 5. The results indicate that male students perform significantly better online than F2F in reading (p<.001), listening (p<.01) and speaking skills (p<.01), and continuous assessment (p<.01). Consequently, the male students’ overall score is significantly higher (p<.01) in the online groups than in the F2F groups. The only skill in which male students perform better
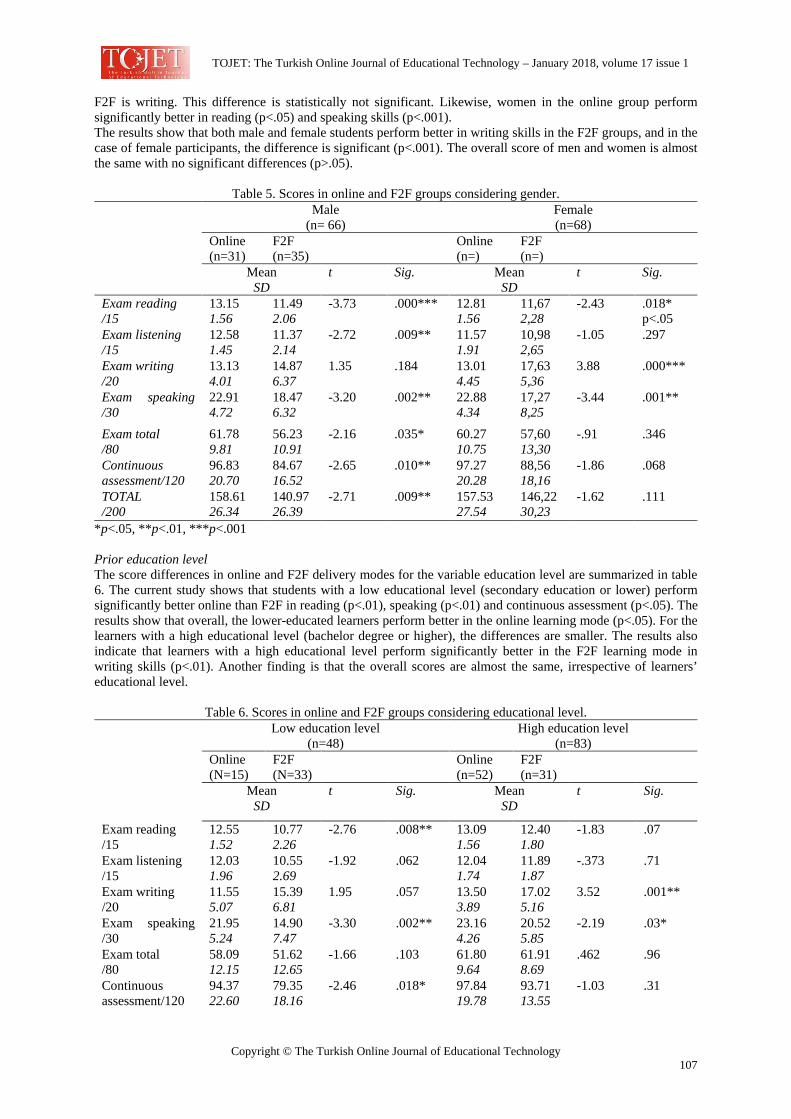
TOJET: The Turkish Online Journal of Educational Technology – January 2018, volume 17 issue 1
Copyright © The Turkish Online Journal of Educational Technology 107
F2F is writing. This difference is statistically not significant. Likewise, women in the online group perform significantly better in reading (p<.05) and speaking skills (p<.001). The results show that both male and female students perform better in writing skills in the F2F groups, and in the case of female participants, the difference is significant (p<.001). The overall score of men and women is almost the same with no significant differences (p>.05).
Table 5. Scores in online and F2F groups considering gender.
Male (n= 66)
Female (n=68)
Online (n=31)
F2F (n=35)
Online (n=)
F2F (n=)
Mean SD
t Sig. Mean SD
t Sig.
Exam reading /15
13.15 1.56
11.49 2.06
-3.73 .000*** 12.81 1.56
11,67 2,28
-2.43 .018* p<.05
Exam listening /15
12.58 1.45
11.37 2.14
-2.72 .009**
11.57 1.91
10,98 2,65
-1.05 .297
Exam writing /20
13.13 4.01
14.87 6.37
1.35 .184 13.01 4.45
17,63 5,36
3.88 .000***
Exam speaking /30
22.91 4.72
18.47 6.32
-3.20 .002**
22.88 4.34
17,27 8,25
-3.44 .001**
Exam total /80
61.78 9.81
56.23 10.91
-2.16 .035*
60.27 10.75
57,60 13,30
-.91 .346
Continuous assessment/120
96.83 20.70
84.67 16.52
-2.65 .010**
97.27 20.28
88,56 18,16
-1.86 .068
TOTAL /200
158.61 26.34
140.97 26.39
-2.71 .009**
157.53 27.54
146,22 30,23
-1.62 .111
*p<.05, **p<.01, ***p<.001 Prior education level The score differences in online and F2F delivery modes for the variable education level are summarized in table 6. The current study shows that students with a low educational level (secondary education or lower) perform significantly better online than F2F in reading (p<.01), speaking (p<.01) and continuous assessment (p<.05). The results show that overall, the lower-educated learners perform better in the online learning mode (p<.05). For the learners with a high educational level (bachelor degree or higher), the differences are smaller. The results also indicate that learners with a high educational level perform significantly better in the F2F learning mode in writing skills (p<.01). Another finding is that the overall scores are almost the same, irrespective of learners’ educational level.
Table 6. Scores in online and F2F groups considering educational level. Low education level
(n=48) High education level
(n=83) Online (N=15)
F2F (N=33)
Online (n=52)
F2F (n=31)
Mean SD
t Sig. Mean SD
t Sig.
Exam reading /15
12.55 1.52
10.77 2.26
-2.76 .008**
13.09 1.56
12.40 1.80
-1.83 .07
Exam listening /15
12.03 1.96
10.55 2.69
-1.92 .062 12.04 1.74
11.89 1.87
-.373 .71
Exam writing /20
11.55 5.07
15.39 6.81
1.95 .057 13.50 3.89
17.02 5.16
3.52 .001**
Exam speaking /30
21.95 5.24
14.90 7.47
-3.30 .002**
23.16 4.26
20.52 5.85
-2.19 .03*
Exam total /80
58.09 12.15
51.62 12.65
-1.66 .103 61.80 9.64
61.91 8.69
.462 .96
Continuous assessment/120
94.37 22.60
79.35 18.16
-2.46 .018*
97.84 19.78
93.71 13.55
-1.03 .31
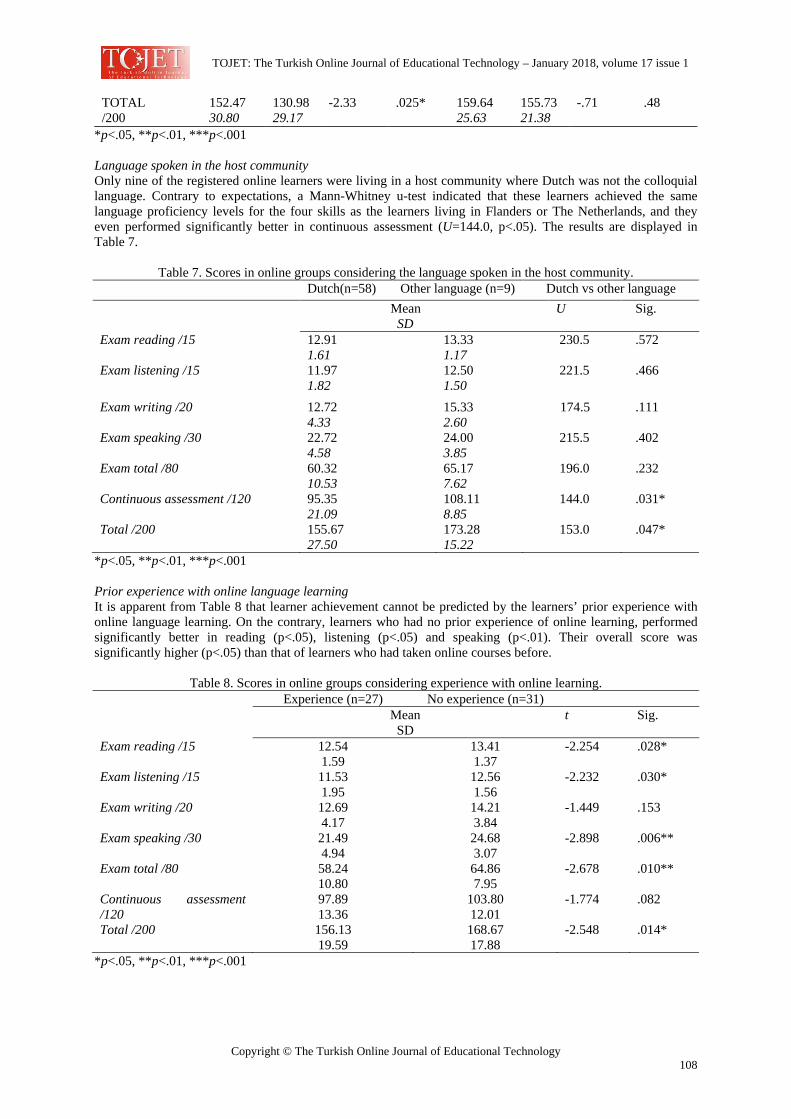
TOJET: The Turkish Online Journal of Educational Technology – January 2018, volume 17 issue 1
Copyright © The Turkish Online Journal of Educational Technology 108
TOTAL /200
152.47 30.80
130.98 29.17
-2.33 .025*
159.64 25.63
155.73 21.38
-.71 .48
*p<.05, **p<.01, ***p<.001 Language spoken in the host community Only nine of the registered online learners were living in a host community where Dutch was not the colloquial language. Contrary to expectations, a Mann-Whitney u-test indicated that these learners achieved the same language proficiency levels for the four skills as the learners living in Flanders or The Netherlands, and they even performed significantly better in continuous assessment (U=144.0, p<.05). The results are displayed in Table 7.
Table 7. Scores in online groups considering the language spoken in the host community. Dutch(n=58) Other language (n=9) Dutch vs other language Mean
SD U Sig.
Exam reading /15 12.91 1.61
13.33 1.17
230.5 .572
Exam listening /15 11.97 1.82
12.50 1.50
221.5 .466
Exam writing /20 12.72 4.33
15.33 2.60
174.5 .111
Exam speaking /30 22.72 4.58
24.00 3.85
215.5 .402
Exam total /80 60.32 10.53
65.17 7.62
196.0 .232
Continuous assessment /120 95.35 21.09
108.11 8.85
144.0 .031*
Total /200 155.67 27.50
173.28 15.22
153.0 .047*
*p<.05, **p<.01, ***p<.001 Prior experience with online language learning It is apparent from Table 8 that learner achievement cannot be predicted by the learners’ prior experience with online language learning. On the contrary, learners who had no prior experience of online learning, performed significantly better in reading (p<.05), listening (p<.05) and speaking (p<.01). Their overall score was significantly higher (p<.05) than that of learners who had taken online courses before.
Table 8. Scores in online groups considering experience with online learning. Experience (n=27) No experience (n=31) Mean
SD t Sig.
Exam reading /15 12.54 1.59
13.41 1.37
-2.254 .028*
Exam listening /15 11.53 1.95
12.56 1.56
-2.232 .030*
Exam writing /20 12.69 4.17
14.21 3.84
-1.449 .153
Exam speaking /30 21.49 4.94
24.68 3.07
-2.898 .006**
Exam total /80 58.24 10.80
64.86 7.95
-2.678 .010**
Continuous assessment /120
97.89 13.36
103.80 12.01
-1.774 .082
Total /200 156.13 19.59
168.67 17.88
-2.548 .014*
*p<.05, **p<.01, ***p<.001
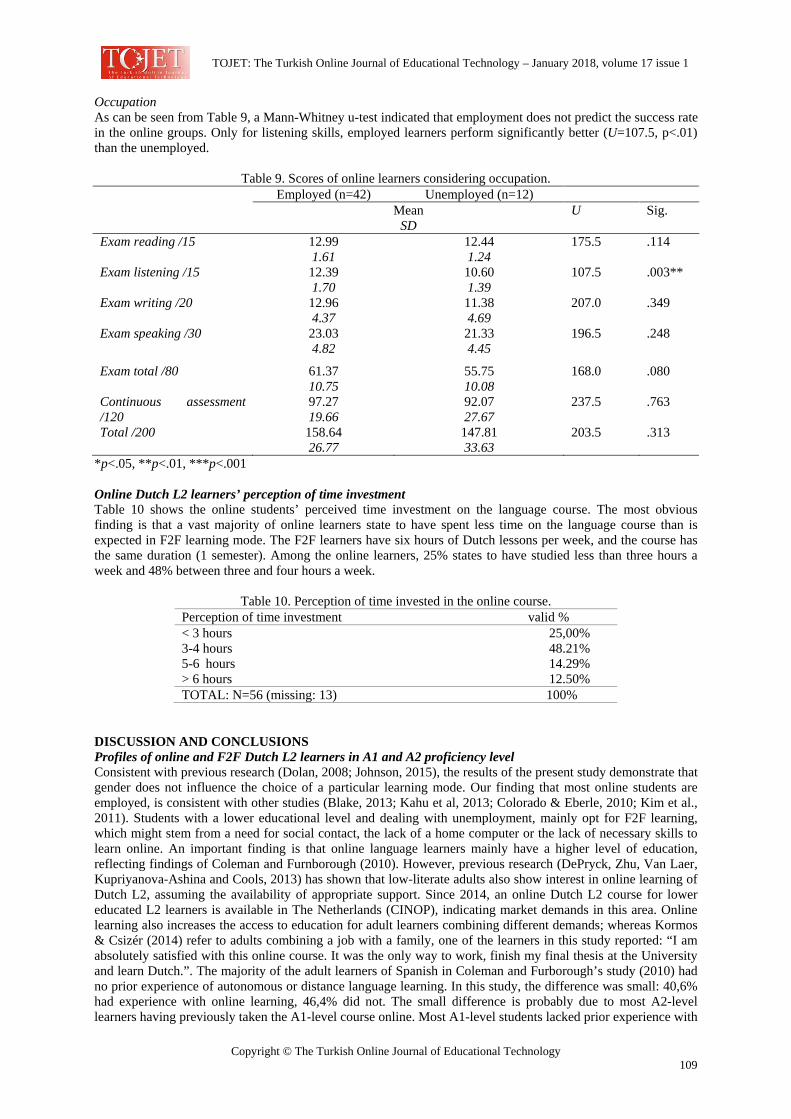
TOJET: The Turkish Online Journal of Educational Technology – January 2018, volume 17 issue 1
Copyright © The Turkish Online Journal of Educational Technology 109
Occupation As can be seen from Table 9, a Mann-Whitney u-test indicated that employment does not predict the success rate in the online groups. Only for listening skills, employed learners perform significantly better (U=107.5, p<.01) than the unemployed.
Table 9. Scores of online learners considering occupation. Employed (n=42) Unemployed (n=12) Mean
SD U Sig.
Exam reading /15 12.99 1.61
12.44 1.24
175.5 .114
Exam listening /15 12.39 1.70
10.60 1.39
107.5 .003**
Exam writing /20 12.96 4.37
11.38 4.69
207.0 .349
Exam speaking /30 23.03 4.82
21.33 4.45
196.5 .248
Exam total /80 61.37 10.75
55.75 10.08
168.0 .080
Continuous assessment /120
97.27 19.66
92.07 27.67
237.5 .763
Total /200 158.64 26.77
147.81 33.63
203.5 .313
*p<.05, **p<.01, ***p<.001 Online Dutch L2 learners’ perception of time investment Table 10 shows the online students’ perceived time investment on the language course. The most obvious finding is that a vast majority of online learners state to have spent less time on the language course than is expected in F2F learning mode. The F2F learners have six hours of Dutch lessons per week, and the course has the same duration (1 semester). Among the online learners, 25% states to have studied less than three hours a week and 48% between three and four hours a week.
Table 10. Perception of time invested in the online course. Perception of time investment valid % < 3 hours 3-4 hours 5-6 hours > 6 hours
25,00% 48.21% 14.29% 12.50%
TOTAL: N=56 (missing: 13) 100% DISCUSSION AND CONCLUSIONS Profiles of online and F2F Dutch L2 learners in A1 and A2 proficiency level Consistent with previous research (Dolan, 2008; Johnson, 2015), the results of the present study demonstrate that gender does not influence the choice of a particular learning mode. Our finding that most online students are employed, is consistent with other studies (Blake, 2013; Kahu et al, 2013; Colorado & Eberle, 2010; Kim et al., 2011). Students with a lower educational level and dealing with unemployment, mainly opt for F2F learning, which might stem from a need for social contact, the lack of a home computer or the lack of necessary skills to learn online. An important finding is that online language learners mainly have a higher level of education, reflecting findings of Coleman and Furnborough (2010). However, previous research (DePryck, Zhu, Van Laer, Kupriyanova-Ashina and Cools, 2013) has shown that low-literate adults also show interest in online learning of Dutch L2, assuming the availability of appropriate support. Since 2014, an online Dutch L2 course for lower educated L2 learners is available in The Netherlands (CINOP), indicating market demands in this area. Online learning also increases the access to education for adult learners combining different demands; whereas Kormos & Csizér (2014) refer to adults combining a job with a family, one of the learners in this study reported: “I am absolutely satisfied with this online course. It was the only way to work, finish my final thesis at the University and learn Dutch.”. The majority of the adult learners of Spanish in Coleman and Furborough’s study (2010) had no prior experience of autonomous or distance language learning. In this study, the difference was small: 40,6% had experience with online learning, 46,4% did not. The small difference is probably due to most A2-level learners having previously taken the A1-level course online. Most A1-level students lacked prior experience with
TOJET: The Turkish Online Journal of Educational Technology – January 2018, volume 17 issue 1
Copyright © The Turkish Online Journal of Educational Technology 110
online learning as well. The great variety regarding languages spoken as referred to by Coleman and Furnborough (2010) is reflected in the present results. The most obvious finding to emerge from the analysis is that the most common mother tongue of the F2F learners is Bulgarian, and Spanish in the online group. It is generally assumed that eastern European students of Dutch L2 often have a low educational level and do manual work. (The proportion of employees from the new Eastern European member states employed in Flemish agricultural and horticultural companies, increases: from 13 % in 2010 to 19 % in 2013. They mainly come from Poland (7%), Romania (7%) and Bulgaria (2%)). Dutch L2 adult learner achievement in online and F2F learning modes Our findings show that online students in the current study perform significantly better than F2F students in all parts of the assessment, except for writing. This contradicts Coleman and Furnborough’s (2010) findings, stating that the learning mode does not influence the success rates. Although several researchers stated that online L2 learning hinders the acquisition of oral skills (Dodigovic, 2005; Sánchez-Serrano, 2008; Spodark, 2004), and others found no significant differences between online and F2F acquisition of oral skills (Blake, 2008; Moneypenney & Aldrich, 2016), the learners of Dutch L2 performed significantly better online than F2F in oral skills. This is probably due to the weekly 15-minute one-on-one Skype sessions with the teacher (about 5 hours per semester), which could be comparable to the five to seven hours of synchronous small group conversations and a single one-on-one session with the tutor in Monneypenny and Aldrich’s (2016) research. Perhaps the most unexpected finding is that the F2F learners perform the lowest in speaking skills, while it is generally assumed that the classroom setting is ideal for acquiring speaking skills (Sánchez-Serrano, 2008). The cause might be the group sizes of about 25 to 30 students in elementary levels, which limits the possibilities for oral exercises and personal feedback from the teacher. This is in line with the research of Blake (2008). The present study reveals that the real challenge for online L2 learning is in writing skills. While writing is the strongest skill for the F2F learners, it is the weakest skill for the online learners. Materiality might be one of the reasons. F2F learners are used to a pen-and-paper modality: they copy notes from the blackboard and use a handbook in which they need to write. Online students, however, use online learning materials which can be re-accessed anytime, anywhere, which makes their role as writers more passive. Instructional designers should be aware of this challenge and ensure that writing skills are stimulated throughout the online L2 course. Learner achievement in online and F2F learning modes considering learner profile variables This study is consistent with that of Coleman and Furnborough (2010), who stated that gender doesn’t influence the success in distance language courses. Both males and females perform better online than F2F in reading, listening and speaking, and higher F2F than online in terms of writing skills. These consistent results might indicate that the learning mode, and not gender, was the influencing factor for learning success. On the question of prior educational level, the results of the present study are in agreement with Coleman and Furnborough’s (2010) findings, which showed that prior educational level is not significantly linked to success in learning: in the online groups, lower and higher educated learners’ scores are almost the same. One unanticipated finding was that learners with a lower educational level performed better online than F2F in speaking, reading and listening skills. It may be that these participants benefitted from the personal attention from the online tutor, the possibility to retake the lessons, or the advantage of studying at their own pace. As research by Depryck et al. (2013) had shown, low-literate adults show interest in online learning. These findings challenge the notion that online learning is not suitable for low-skilled learners. L2 learners living in a region where the target language is not used, obtained better scores for all four skills and the continuous assessment than those learners living in Flanders or The Netherlands (though the differences are only significant for the continuous assessment). An explanation for the higher scores might be that successful online language learners use more written and spoken media in the target language (Coleman and Furnborough, 2010). There are, however, other possible explanations for the different learner achievements. Learners living abroad might be highly motivated to learn Dutch in view of migration, a job in Flanders, or a partner already living in Flanders. F2F students, on the other hand, often complain that the chances for practicing speaking skills are overrated: whenever they try to speak Dutch, Flemish people tend to answer in English, French, German or even Spanish. Also, many dialects are spoken in Flanders, limiting the chances to practice standard Dutch. Likewise, Moneypenny and Aldrich (2016) found that increased interaction with native speakers did not result in better scores. Another finding is that the learners who have no prior experience with online learning, perform better in all parts of the assessment than those who do. This is in line with Coleman and Furnborough’s (2010) findings that prior experience with independent or distance language learning does not necessarily increase learner achievement.
TOJET: The Turkish Online Journal of Educational Technology – January 2018, volume 17 issue 1
Copyright © The Turkish Online Journal of Educational Technology 111
Possible explanations might be that learning online for the first time generates more enthusiasm, or that the A2 level is generally found to be more difficult than A1. In terms of occupation, employed learners generally perform better than F2F learners, but only significantly better in listening skills. This might be due to the fact that they hear more Dutch among colleagues at work. Dutch L2 online language learners’ perception of time investment Consistent with Chenoweth and Murday (2003), this research found that online learners spend less time studying online than F2F. F2F learners often lose time waiting for classmates to find the right page, to fill out exercises or to ask questions. Considering RQ2 as well, it becomes obvious that online learners study fewer hours and perform better, which shows that online language learning can be more efficient than F2F learning. LIMITATIONS AND SIGNIFICANCE OF THE STUDY In this study, in order to better understand the learner achievements of online Dutch L2 adult learners, a control group of F2F learners is included, with the key variables controlled: the teacher is the same in the online and F2F groups at the A2 level; the screening of all the online and F2F students is the same and the final exam is the same (reading, writing, listening, speaking). A possible limitation of this study is the relatively small sample size (n=134). The reason is that – at the time the research is carried out - online Dutch L2 learning had been introduced recently, and all online students in Dutch L2 courses in the context of this research were included. Notwithstanding this limitation, this study makes several contributions to the existing literature. First, it has confirmed the findings of Coleman and Furnborough (2010) which found that adult online language learners are typically highly educated and employed; they show a great variety regarding mother tongues and generally have no prior experience with online learning. Secondly, this study provides evidence that online language learning can be as effective as F2F learning for adults regarding reading, listening and speaking skills, even in the case of learners with a lower educational level and of those living abroad (lacking practice with natives). This finding highlights the potential of online learning for different target groups. Thirdly, this research indicates that writing skills can be achieved best through F2F learning, and suggests a role for instructional designers and online tutors in promoting writing in online language courses. As Moneypenny and Aldrich (2016) stated, three other main affordances of comparative research on online and F2F language learning include a potential growth of service area for schools, inclusion of nontraditional and employed students, and higher student numbers in less commonly taught language (LCTL) courses, ensuring continuation of tuition in those languages. This is especially important for the LCTL Dutch: in Flanders, centers for adult education mainly serve learners regionally, and adult participation in lifelong learning is still significantly below the European Union target for 2020. REFERENCES Bava Harji, M. and Gheitanchian, M. (2017). Effects of Multimedia Task-Based Teaching and Learning
Approach on EFL Learners’ Accuracy, Fluency and Complexity of Oral Production. TOJET: The Turkish Online Journal of Educational Technology 16 (2), 25–34.
Blake, R. J. (2013). Brave new digital classroom: Technology and foreign language learning. Washington, D.C.: Georgetown University Press.
Blake, R., & Delforge, A. (2007). Online Language Learning: The Case of Spanish Without Walls. In B. Lafford & R. Salaberry, The art of teaching Spanish: Second language acquisition from research to praxis (pp. 127–147). Georgetown: Georgetown University Press.
Blake, R., Wilson, N., Pardo Ballester, C. and Cetto, M. (2008). Measuring oral proficiency in in distance, face-to-face, and blended classrooms. Language Learning and Technology 12 (3), 114–127.
Bugge, L. S. and Wikan, G. (2016). Flexible studies as strategy for lifelong learning. TOJET: The Turkish Online Journal of Educational Technology 15 (4), 46–52.
Chenoweth, N. A., Jones, C. M. and Tucker, G. R. (2006). Language online: Principles of design and methods of assessment. In Changing Language education through CALL, edited by R. P. Donaldson and M. A. Haggstrom. Abingdon: Routledge.
Chenoweth, N. A. and Murday, K. (2003). Measuring student learning in an online French course. CALICO Journal 20 (2), 284–314.
Chu, R. J-C. and Tsai, C.-C. (2009). Self-directed learning readiness, Internet self-efficacy and preferences towards constructivist Internet-based learning environments among higher-aged adults. Journal of Computer Assisted Learning 25 (5), 489–501.
TOJET: The Turkish Online Journal of Educational Technology – January 2018, volume 17 issue 1
Copyright © The Turkish Online Journal of Educational Technology 112
Coleman, J. A. and Furnborough, C. (2010). Learner characteristics and learning outcomes on a distance Spanish course for beginners. System 38, 14–29.
Colorado, J. T. and Eberle, J. (2010). Student demographics and success in online learning environments. Emporia State Research Studies 46 (1), 4–10.
DePryck, K., Zhu, C., Van Laer, H., Kupriyanova-Ashina, V. & Cools, W. (2013). Deelnemen aan het volwassenenonderwijs in Vlaanderen vanuit de ervaring van de cursist. [Taking part in adult education in Flanders from the experience of the student.] Research project report. 31 October 2013, Ministry of education, Flemish government.
Dodigovic, M. (2005). Artificial intelligence in second language learning: Raising error awareness. Buffalo, NY: Multilingual Matters.
Dolan, K. (2008). Comparing Modes of Instruction: The Relative Efficacy of On-Line and In-Person Teaching for Student Learning. PS: Political Science and Politics, 41 (2), 387–391.
Epley, J. and Smith, D. (2015). Learner Characteristics, Online Engagement, and Student Success Rates. International Journal of Education and Social Science, 2 (4). Gaskell, A. & Mills, R. (2014). The quality and reputation of open, distance and e-learning: what are the
challenges?, Open Learning: The Journal of Open, Distance and e-Learning, 29 (3), 190–205. Johnson, G. M. (2015). On-Campus and Fully-Online University Students: Comparing Demographics, Digital
Technology Use and Learning Characteristics, Journal of University Teaching & Learning Practice, 12(1). Available at:http://ro.uow.edu.au/jutlp/vol12/iss1/4
Kahu, E. R., Stephens, C., Leach, L. & Zepke, N. (2013). The engagement of mature distance students. Higher Education Research & Development 32 (5), 1–14. Kim, J., Kwon, Y. & Cho, D. (2011). Investigating factors that influence social presence and learning outcomes
in distance higher education. Computers & Education 57 (2), 1512–1520. Kormos, J. and Csizér, K. (2014). The interaction of motivation, self-regulatory strategies, and autonomous
learning behavior in different learner groups. Tesol Quarterly, 275–299. Moneypenny, D. B. & Aldrich, R. S. (2016). Online and Face-to-Face Language Learning: A Comparative
Analysis of Oral Proficiency in Introductory Spanish. The Journal of Educators Online 13 (2), 105–133. Nonis, S. A., & Hudson, G. I. (2010). Performance of College Students: Impact of Study Time and Study Habits.
Journal of Education for Business 85, 229-238. Rurato, P. (2011). Learner characteristics in distance education (DE): Presentation of an instrument and context.
In Cibertextualidades, 4, “Distance education/ Pedagogical challenges”, Reis, P. and Silva, S., 73–88. Sánchez-Serrano, L. (2008). Initiation by fire: Training teachers for distance learning. In S. Goertler & P. Winke,
Opening doors through distance language education: Principles, perspectives, and practices. CALICO Monograph Series, Volume 7, 153–174. San Marcos, TX: CALICO.
Schrum, L. and Hong, S. (2002). Dimensions and strategies for online success: voices from experienced educators. Journal of Asynchronous Learning Networks 6(1).
Scida, E. and Saury, R. E. (2006). Hybrid courses and their impact on student and classroom performance: A case study at the University of Virginia. CALICO Journal 23 (3), 517–531.
Spodark, E. (2004). French in cyberspace: An online French course for undergraduates. CALICO Journal, 22 (1), 83–101.
Sun, S. Y. H. (2014). Learner perspectives on fully online language learning. Distance Education 35 (1), 18–42. White, D. S., & Le Cornu, A. (2011). Visitors and residents: A new typology for online engagement. First
Monday, 16 (9). Wikan, G., & Bugge, L. S. (2014). Student performance in teacher education in Norway: the impact of student,
institutional and structural factors. European Journal of Teacher Education 37(4), 442–452. Yanguas, I. (2010). Oral computer-mediated interaction between L2 learners: It’s about time. Language
Learning & Technology 14, 72–79. http://lv.vlaanderen.be/sites/default/files/attachments/20150921_focus_tewerkstelling-def.pdf http://leslla2014.org/wp-content/uploads/2014/09/Knup-Fuhri-Snethlage-NL-vaardig.pdf
TOJET: The Turkish Online Journal of Educational Technology – January 2018, volume 17 issue 1
Copyright © The Turkish Online Journal of Educational Technology 113
Methods to Efficiently Achieve High-Quality Teaching of Accounting at the University – A Teaching Innovation Evaluation Ing. Zdeněk Hruška, Ph.D. Department of Finance and Accounting, Faculty of Economics, University of West Bohemia [email protected] ABSTRACT Teaching of accounting is specific due to its frequently updated content, because Czech legal regulations significantly change annually, either because of the legislative or harmonization modifications, hence there is a need to constantly seek new ways to ensure a good quality of teaching in the efficient education process. The paper is based on the description of activities carried out within the innovation of accounting courses, it presents the results of the survey examining the views of graduates from the accounting courses on the quality of their teaching and evaluates the efficiency of teaching of accounting courses compared to the original solution. The analytical part of the paper confirms all three defined hypotheses: having implemented the innovation, the authors have found that students evaluated the teaching of accounting as the above-average one; a statistically significant correlation between the evaluation of teaching quality and the evaluation of e-learning materials has been proved, and the vast majority of benefits resulting from the implemented innovation led to an increase in efficiency, whether by saving on time, financial resources or by making the user environment more pleasant. Keywords: innovation, education, accounting, studies, results, project. INTRODUCTION In terms of time and personnel, teaching of financial accounting is a demanding activity since the accelerating pace of changes in legal regulations and internationally accepted standards leads to frequent updates of the content – i.e. teaching materials. The dynamic pace of changes in accounting legislation may also be expected in the future, because the Czech accounting legislation has gradually been converging to the international accounting standards. Individual governments have considerably participated in the dynamics because they carry out those changes in connection with the voters´ demands. In this context, it is necessary to identify the link between accounting and tax legislation, which is very strong in the Czech Republic. Changes in the tax legislation are often more intensive and more frequent than in the accounting legislation. For this reason it is necessary to search for suitable teaching methods and means or their combination to ensure efficient teaching of this specific expertise. First and foremost, it is necessary to use teaching methods and materials that may be innovated flexibly according to the current changes in the valid legislation. In the period from the 1st January 2012 to the 31st December 2014 the project entitled: A Comprehensive Innovation of Bachelor´s Degree Programme Economics and Management – under the acronym of INEM, was solved at the Faculty of Economics of the University of West Bohemia in Plzen. INEM included innovation or creation of 50 university courses in total. This paper deals with the evaluation of the quality and efficiency of teaching through the implementation of the INEM project in the key courses of business economics, which include the accounting courses (hereinafter referred to as ACC). In the Czech Republic similar projects to innovate study programmes were dealt with within the Operational Programme called Education for Competitiveness, for example, at the University of Economics, where the project innovated the study programme following the situation in the labour market (Operational Programme called Education for Competitiveness, 2017a). The Technical University in Liberec implemented a project that also addressed innovation of the study programme to respond to the demands of the labour market (Operational Programme called Education for Competitiveness, 2017b). Projects dealing with innovating study programmes of a similar nature were also implemented in the other branches of study. Examples include the Innovation of the study programme at the College of Business and Hotel Management (Operational Programme called Education for Competitiveness, 2017c), innovation of the Risk Engineering study programme and creation of quality management system in education realized at the Brno University of Technology (Operational Programme called
TOJET: The Turkish Online Journal of Educational Technology – January 2018, volume 17 issue 1
Copyright © The Turkish Online Journal of Educational Technology 114
Education for Competitiveness, 2017d), or the project called Innovation of the bachelor´s full-time study programme in the field of fishing at the University of South Bohemia in Ceske Budejovice (Operational Programme called Education for Competitiveness, 2017e). However, after completing projects of this kind, in most cases there is no evaluation of them; thus the efficiency of labour content and the satisfaction of users – i.e. students with created aids and set methods - cannot be evaluated. For these reasons, the authors evaluated the results of the innovation of the bachelor´s study programme in financial accounting courses. RESEARCH FOCUS The first step in innovating the analysed courses of financial accounting (ACC) was the selection of suitable study materials. Before the start of the innovation, students were provided with a book leading to practicing their skills and with a college textbook containing theoretical knowledge base, in addition to the contact teaching within individual courses. Both sources were provided in the printed form, and thus it was not possible to annually update them owing to legislative or harmonization changes. Based on the experience of many authors, for example Michaud, P. A. (2012), Kulier, R., Guelmezoglu, A, M., & Zamora, J. (Eds.). (2012), Al-Juboori, H. M. (2012) or Houri, D., Watanabe, T., & Hayashi, K. (Eds.). (2012), the e-learning system in LMS Unifor has been chosen to be the primary teaching method. This method has been applied in many institutions (not only at the level of higher education), and is already firmly embedded in study programmes both in the Czech Republic and abroad (Çobanoğlu, İ., Ateş, A., & Yilmaz, E., 2009). Historical roots of this teaching method date back to the 80s of the last century, when Hassanzadeh, A., Kanaani, F., & Elahi, S. (2012) stated that it is a subset of distance education. The boom of this teaching method has been caused by the development of information technologies and their gradual application in education (Jia, H., Wang, M., Ran, W. Jian, S. Liao, J., & Chiu, D., 2011). As reported by Middleton (2010), e-learning represents an alternative teaching method, the efficiency of which is particularly apparent with individual students. There are several approaches to define e-learning. Çobanoğlu, İ., Ateş, A., & Yilmaz, E. (2009) characterize it as a virtual study environment characterized by the students´ interactions with study materials according to the electronically given instructions. Welsh, E.T., Wanberg, C.R., Brown, K.G. & Simmering, M.J. (2003) conclude that it is the utilization of a computer network, especially through the Internet, to disseminate information and knowledge to individual users. The reason why e-learning study materials were the main outcomes of the INEM project in the financial accounting courses was that this teaching method has numerous advantages. The possibility of studying from anywhere and anytime and increasing the variety of teaching/learning, which is confirmed by Cojocariu, V., Lazar, I., Nedeff, V., & Lazar, G. (2014), may be stated as the main benefits. Cojocariu, V., Lazar, I., Nedeff, V., & Lazar, G. (2014) further develop this idea by concluding that e-learning makes teaching and studying more flexible and innovative. Yacob, A. Kadir, A. Zainudin, O. & Zurairah, A. (2012) add that e-learning creates all electronically aided forms of both learning and teaching. In other words, it is a transfer of knowledge via the computer network, where the content may be presented using the Internet, intranet, extranet, and other similar methods (Yacob, A. Kadir, A. Zainudin, O. & Zurairah, A., 2012). The success rate of e-learning can also be measured. For these purposes Hassanzadeh, A., Kanaani, F. & Elahi, S. (2012) have created a model to measure the success rate of e-learning at universities. The success rate of e-learning are also dealt with by Sun, P., Tsai, R., Glenn, F., Chen, Y. & Yeh, D. (2008), who, at first, summarize 6 basic success factors of this teaching method and subsequently expand them to even 13 factors. The main aim of applying the e-learning in the accounting teaching was to achieve the following benefits: 1) For students:
- an access to current and operatively modified materials, - an access to the study materials free of charge from anywhere and anytime, - the possibility to check students´ knowledge by control tests, and - the possibility of on-line communication with teachers or lecturers.
2) For teachers: - efficiency improvement in the administration of fulfilling duties to complete a course (within
the division of students into groups according to the teaching time and linking the database of students with the database of accepted seminar works)
- efficiency improvement in checking students´ knowledge using the tests, which are generated for each student from the created database of questions and after a lapse of time also automatically corrected,
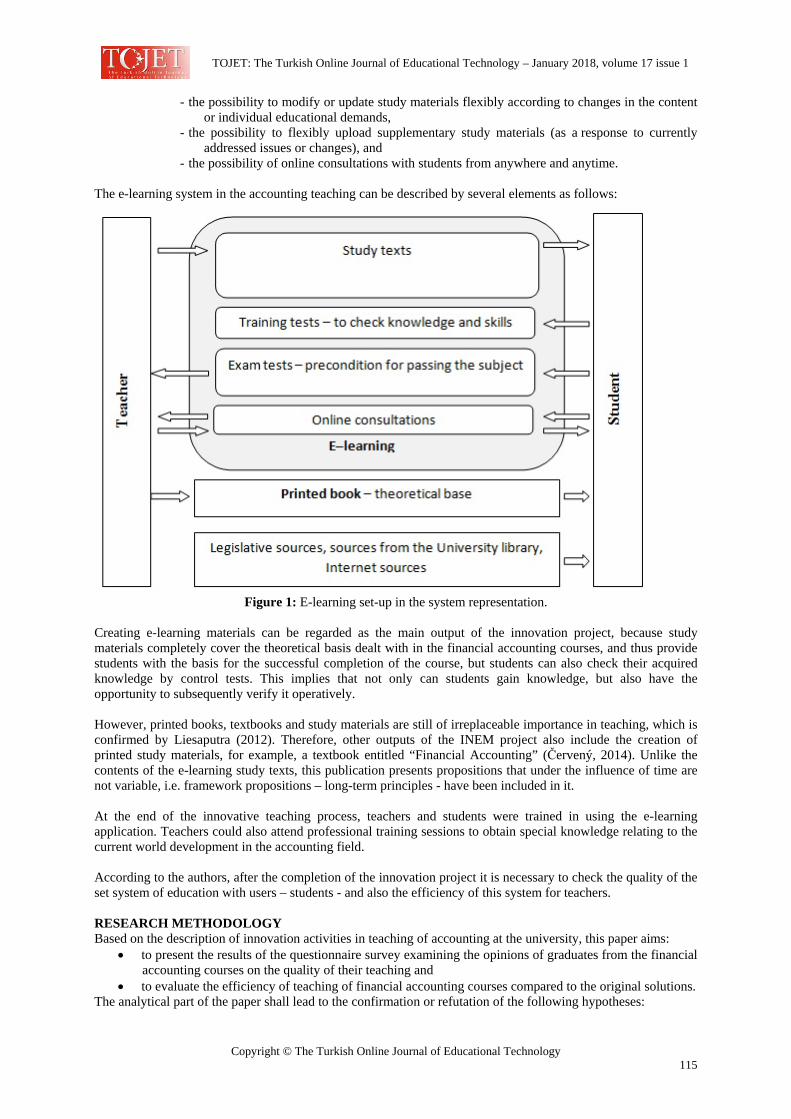
TOJET: The Turkish Online Journal of Educational Technology – January 2018, volume 17 issue 1
Copyright © The Turkish Online Journal of Educational Technology 115
- the possibility to modify or update study materials flexibly according to changes in the content or individual educational demands,
- the possibility to flexibly upload supplementary study materials (as a response to currently addressed issues or changes), and
- the possibility of online consultations with students from anywhere and anytime. The e-learning system in the accounting teaching can be described by several elements as follows:
Figure 1: E-learning set-up in the system representation.
Creating e-learning materials can be regarded as the main output of the innovation project, because study materials completely cover the theoretical basis dealt with in the financial accounting courses, and thus provide students with the basis for the successful completion of the course, but students can also check their acquired knowledge by control tests. This implies that not only can students gain knowledge, but also have the opportunity to subsequently verify it operatively. However, printed books, textbooks and study materials are still of irreplaceable importance in teaching, which is confirmed by Liesaputra (2012). Therefore, other outputs of the INEM project also include the creation of printed study materials, for example, a textbook entitled “Financial Accounting” (Červený, 2014). Unlike the contents of the e-learning study texts, this publication presents propositions that under the influence of time are not variable, i.e. framework propositions – long-term principles - have been included in it. At the end of the innovative teaching process, teachers and students were trained in using the e-learning application. Teachers could also attend professional training sessions to obtain special knowledge relating to the current world development in the accounting field. According to the authors, after the completion of the innovation project it is necessary to check the quality of the set system of education with users – students - and also the efficiency of this system for teachers. RESEARCH METHODOLOGY Based on the description of innovation activities in teaching of accounting at the university, this paper aims:
• to present the results of the questionnaire survey examining the opinions of graduates from the financial accounting courses on the quality of their teaching and
• to evaluate the efficiency of teaching of financial accounting courses compared to the original solutions. The analytical part of the paper shall lead to the confirmation or refutation of the following hypotheses:
TOJET: The Turkish Online Journal of Educational Technology – January 2018, volume 17 issue 1
Copyright © The Turkish Online Journal of Educational Technology 116
Hypothesis 1: after the implementation of innovation in accounting teaching, the quality of teaching will be identified as the above-average one based on the questionnaire survey (i.e. the ratings will range below 2.5 on the scale from 1-the best to 5-the worst rating) and positive answers will have the highest frequency. Hypothesis 2: A statistically significant correlation between the evaluation of teaching quality and evaluation of e-learning materials will be proved. Hypothesis 3: Most teachers will state an increase in efficiency through economies of time, financial resources or other factors. Research organization, data file The research resulting in the evaluation of the teaching quality was conducted among students of financial accounting courses in January 2014, i.e. after the completion and implementation of e-learning and other activities based on the INEM project. Filling in the questionnaire was completely anonymous and voluntary. 500 respondents participated in the research. The questionnaire was standardized for all courses that were included in the INEM project. The identical form of questionnaires to evaluate all courses offers more possibilities to extend the research, especially to compare the INEM success from the students´ view across individual courses. The questionnaire consisted of two parts. The first part dealt with evaluating the quality of teaching of accounting courses. The second part focused on the evaluation of e-learning materials for the course. Each part contained 15 questions. Majority of them were closed and students expressed to what extent they agreed with particular statements. The open-ended questions provided room for students´ opinions. For the purposes of this research and evaluation of innovations, the issues concerning the system itself, LMS Unifor, particularly its technical specifications, have not been taken into consideration. The research resulting in the evaluation of teaching innovation efficiency was conducted among the teachers of accounting in January 2015, with the assumption to evaluate year-long experience with the use of created study materials. The research involved 10 respondents from the ranks of teachers of accounting courses. Majority of the questions were closed again, the open-ended questions provided room for comments. All calculations, presenting the results of accounting teaching innovation, were made using the Statistica SW. Graphical outputs were created in MS Excel. RESULTS OF RESEARCH The teaching quality was checked by seven questions, which were designed to evaluate both the quality of content and forms of presenting the content – i.e. the quality of contact teaching. According to the authors, the fundamental finding is provided by the following question: “I have benefited from completing the course and I have learned a lot.” Figure 2 shows the frequency distribution of answers to individual questions in the part focusing on the evaluation of teaching quality.

TOJET: The Turkish Online Journal of Educational Technology – January 2018, volume 17 issue 1
Copyright © The Turkish Online Journal of Educational Technology 117
Figure 2: Evaluation of teaching quality – frequency distribution of answers.
The figure shows the predominant proportion of positive responses, i.e. the students evaluated the individual aspects of the teaching quality rather positively. This fact is also evident when calculating averages, where the option “I absolutely agree” was rated 1 and, vice versa, “I disagree” was rated 5. However, the latter from the given utmost replies was not recorded.
Figure 3: Evaluation of teaching quality – average rating.
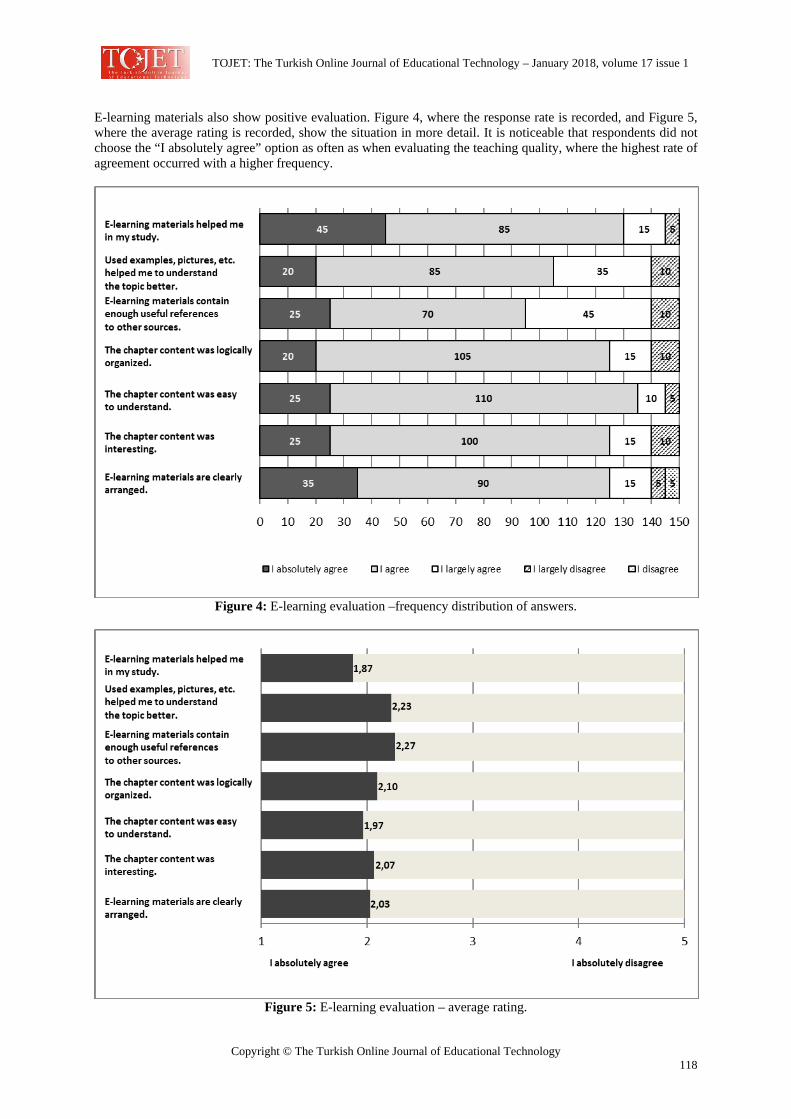
TOJET: The Turkish Online Journal of Educational Technology – January 2018, volume 17 issue 1
Copyright © The Turkish Online Journal of Educational Technology 118
E-learning materials also show positive evaluation. Figure 4, where the response rate is recorded, and Figure 5, where the average rating is recorded, show the situation in more detail. It is noticeable that respondents did not choose the “I absolutely agree” option as often as when evaluating the teaching quality, where the highest rate of agreement occurred with a higher frequency.
Figure 4: E-learning evaluation –frequency distribution of answers.
Figure 5: E-learning evaluation – average rating.
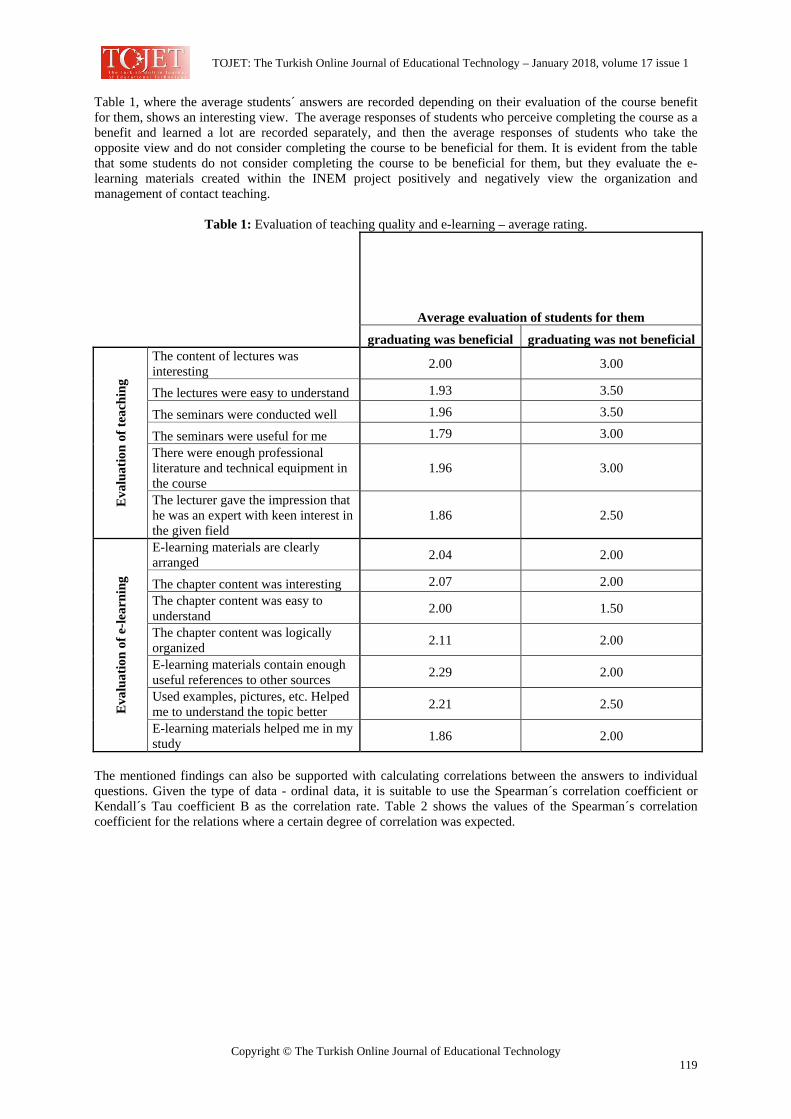
TOJET: The Turkish Online Journal of Educational Technology – January 2018, volume 17 issue 1
Copyright © The Turkish Online Journal of Educational Technology 119
Table 1, where the average students´ answers are recorded depending on their evaluation of the course benefit for them, shows an interesting view. The average responses of students who perceive completing the course as a benefit and learned a lot are recorded separately, and then the average responses of students who take the opposite view and do not consider completing the course to be beneficial for them. It is evident from the table that some students do not consider completing the course to be beneficial for them, but they evaluate the e-learning materials created within the INEM project positively and negatively view the organization and management of contact teaching.
Table 1: Evaluation of teaching quality and e-learning – average rating. Average evaluation of students for them
graduating was beneficial graduating was not beneficial
Eva
luat
ion
of te
achi
ng
The content of lectures was interesting 2.00 3.00
The lectures were easy to understand 1.93 3.50
The seminars were conducted well 1.96 3.50
The seminars were useful for me 1.79 3.00 There were enough professional literature and technical equipment in the course
1.96 3.00
The lecturer gave the impression that he was an expert with keen interest in the given field
1.86 2.50
Eva
luat
ion
of e
-lear
ning
E-learning materials are clearly arranged 2.04 2.00
The chapter content was interesting 2.07 2.00 The chapter content was easy to understand 2.00 1.50
The chapter content was logically organized 2.11 2.00
E-learning materials contain enough useful references to other sources 2.29 2.00
Used examples, pictures, etc. Helped me to understand the topic better 2.21 2.50
E-learning materials helped me in my study 1.86 2.00
The mentioned findings can also be supported with calculating correlations between the answers to individual questions. Given the type of data - ordinal data, it is suitable to use the Spearman´s correlation coefficient or Kendall´s Tau coefficient B as the correlation rate. Table 2 shows the values of the Spearman´s correlation coefficient for the relations where a certain degree of correlation was expected.
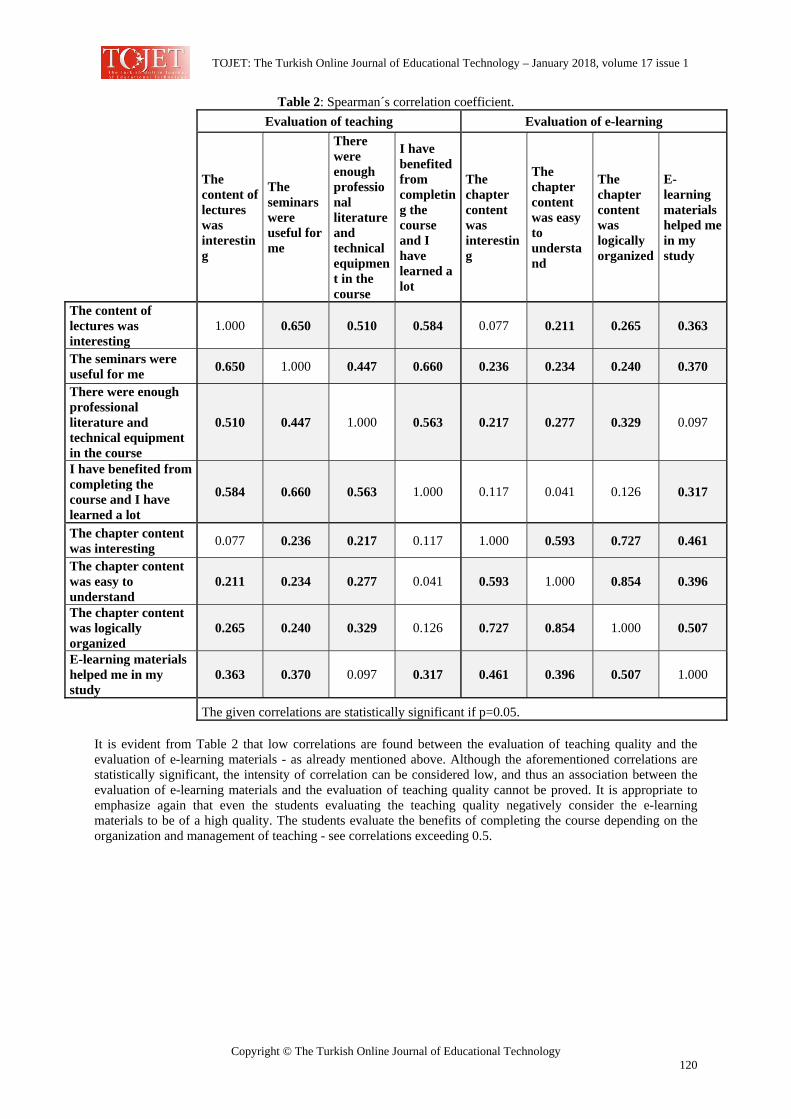
TOJET: The Turkish Online Journal of Educational Technology – January 2018, volume 17 issue 1
Copyright © The Turkish Online Journal of Educational Technology 120
Table 2: Spearman´s correlation coefficient. Evaluation of teaching Evaluation of e-learning
The content of lectures was interesting
The seminars were useful for me
There were enough professional literature and technical equipment in the course
I have benefited from completing the course and I have learned a lot
The chapter content was interesting
The chapter content was easy to understand
The chapter content was logically organized
E-learning materials helped me in my study
The content of lectures was interesting
1.000 0.650 0.510 0.584 0.077 0.211 0.265 0.363
The seminars were useful for me 0.650 1.000 0.447 0.660 0.236 0.234 0.240 0.370
There were enough professional literature and technical equipment in the course
0.510 0.447 1.000 0.563 0.217 0.277 0.329 0.097
I have benefited from completing the course and I have learned a lot
0.584 0.660 0.563 1.000 0.117 0.041 0.126 0.317
The chapter content was interesting 0.077 0.236 0.217 0.117 1.000 0.593 0.727 0.461
The chapter content was easy to understand
0.211 0.234 0.277 0.041 0.593 1.000 0.854 0.396
The chapter content was logically organized
0.265 0.240 0.329 0.126 0.727 0.854 1.000 0.507
E-learning materials helped me in my study
0.363 0.370 0.097 0.317 0.461 0.396 0.507 1.000
The given correlations are statistically significant if p=0.05. It is evident from Table 2 that low correlations are found between the evaluation of teaching quality and the evaluation of e-learning materials - as already mentioned above. Although the aforementioned correlations are statistically significant, the intensity of correlation can be considered low, and thus an association between the evaluation of e-learning materials and the evaluation of teaching quality cannot be proved. It is appropriate to emphasize again that even the students evaluating the teaching quality negatively consider the e-learning materials to be of a high quality. The students evaluate the benefits of completing the course depending on the organization and management of teaching - see correlations exceeding 0.5.
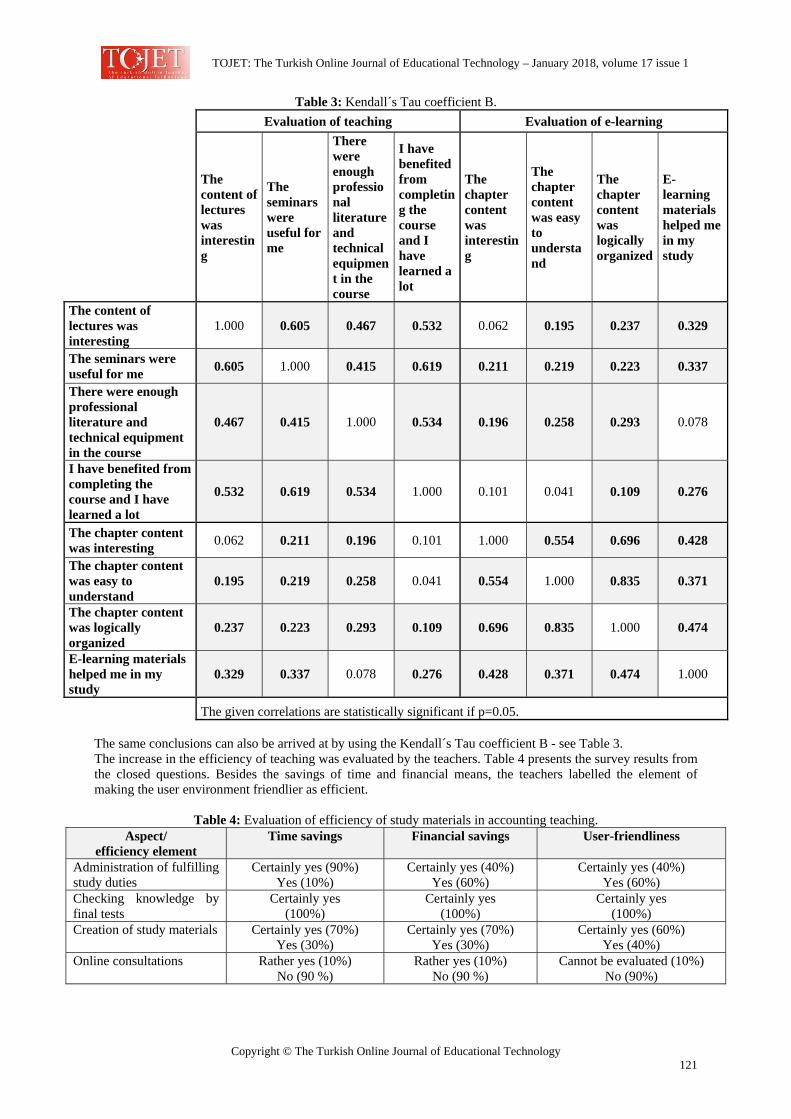
TOJET: The Turkish Online Journal of Educational Technology – January 2018, volume 17 issue 1
Copyright © The Turkish Online Journal of Educational Technology 121
Table 3: Kendall´s Tau coefficient B. Evaluation of teaching Evaluation of e-learning
The content of lectures was interesting
The seminars were useful for me
There were enough professional literature and technical equipment in the course
I have benefited from completing the course and I have learned a lot
The chapter content was interesting
The chapter content was easy to understand
The chapter content was logically organized
E-learning materials helped me in my study
The content of lectures was interesting
1.000 0.605 0.467 0.532 0.062 0.195 0.237 0.329
The seminars were useful for me 0.605 1.000 0.415 0.619 0.211 0.219 0.223 0.337
There were enough professional literature and technical equipment in the course
0.467 0.415 1.000 0.534 0.196 0.258 0.293 0.078
I have benefited from completing the course and I have learned a lot
0.532 0.619 0.534 1.000 0.101 0.041 0.109 0.276
The chapter content was interesting 0.062 0.211 0.196 0.101 1.000 0.554 0.696 0.428
The chapter content was easy to understand
0.195 0.219 0.258 0.041 0.554 1.000 0.835 0.371
The chapter content was logically organized
0.237 0.223 0.293 0.109 0.696 0.835 1.000 0.474
E-learning materials helped me in my study
0.329 0.337 0.078 0.276 0.428 0.371 0.474 1.000
The given correlations are statistically significant if p=0.05. The same conclusions can also be arrived at by using the Kendall´s Tau coefficient B - see Table 3. The increase in the efficiency of teaching was evaluated by the teachers. Table 4 presents the survey results from the closed questions. Besides the savings of time and financial means, the teachers labelled the element of making the user environment friendlier as efficient.
Table 4: Evaluation of efficiency of study materials in accounting teaching. Aspect/
efficiency element Time savings Financial savings User-friendliness
Administration of fulfilling study duties
Certainly yes (90%) Yes (10%)
Certainly yes (40%) Yes (60%)
Certainly yes (40%) Yes (60%)
Checking knowledge by final tests
Certainly yes (100%)
Certainly yes (100%)
Certainly yes (100%)
Creation of study materials Certainly yes (70%) Yes (30%)
Certainly yes (70%) Yes (30%)
Certainly yes (60%) Yes (40%)
Online consultations Rather yes (10%) No (90 %)
Rather yes (10%) No (90 %)
Cannot be evaluated (10%) No (90%)
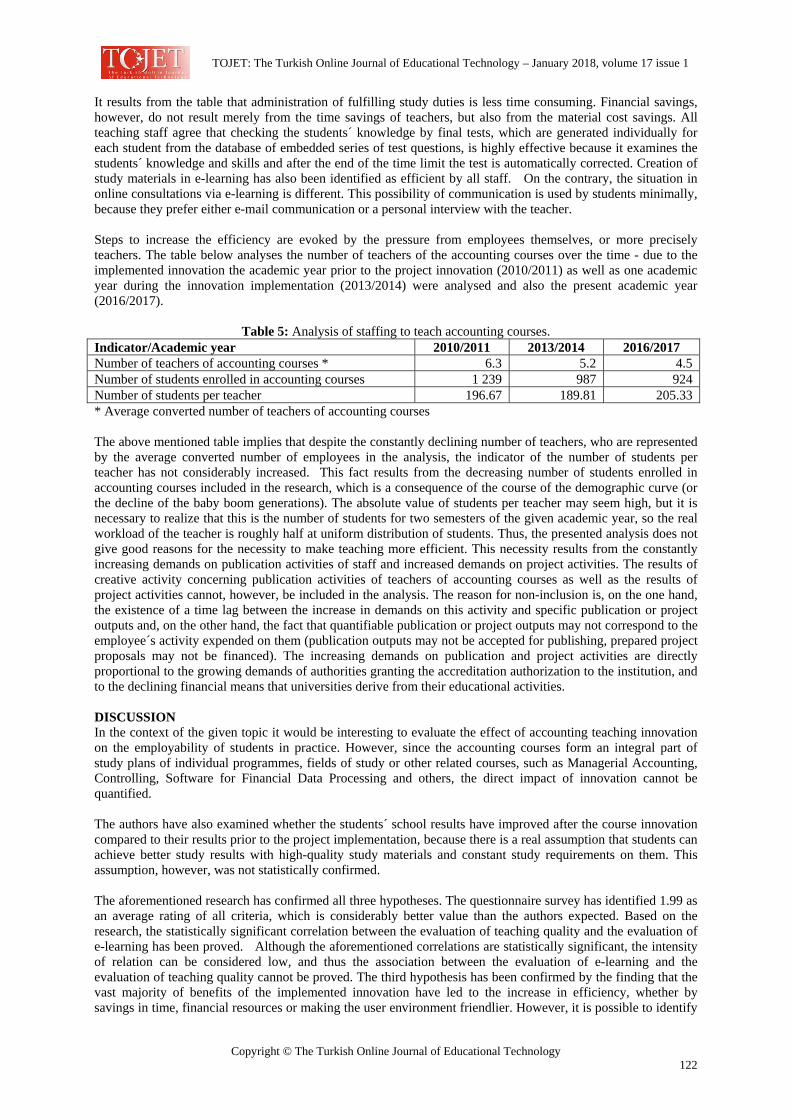
TOJET: The Turkish Online Journal of Educational Technology – January 2018, volume 17 issue 1
Copyright © The Turkish Online Journal of Educational Technology 122
It results from the table that administration of fulfilling study duties is less time consuming. Financial savings, however, do not result merely from the time savings of teachers, but also from the material cost savings. All teaching staff agree that checking the students´ knowledge by final tests, which are generated individually for each student from the database of embedded series of test questions, is highly effective because it examines the students´ knowledge and skills and after the end of the time limit the test is automatically corrected. Creation of study materials in e-learning has also been identified as efficient by all staff. On the contrary, the situation in online consultations via e-learning is different. This possibility of communication is used by students minimally, because they prefer either e-mail communication or a personal interview with the teacher. Steps to increase the efficiency are evoked by the pressure from employees themselves, or more precisely teachers. The table below analyses the number of teachers of the accounting courses over the time - due to the implemented innovation the academic year prior to the project innovation (2010/2011) as well as one academic year during the innovation implementation (2013/2014) were analysed and also the present academic year (2016/2017).
Table 5: Analysis of staffing to teach accounting courses. Indicator/Academic year 2010/2011 2013/2014 2016/2017 Number of teachers of accounting courses * 6.3 5.2 4.5 Number of students enrolled in accounting courses 1 239 987 924 Number of students per teacher 196.67 189.81 205.33 * Average converted number of teachers of accounting courses
The above mentioned table implies that despite the constantly declining number of teachers, who are represented by the average converted number of employees in the analysis, the indicator of the number of students per teacher has not considerably increased. This fact results from the decreasing number of students enrolled in accounting courses included in the research, which is a consequence of the course of the demographic curve (or the decline of the baby boom generations). The absolute value of students per teacher may seem high, but it is necessary to realize that this is the number of students for two semesters of the given academic year, so the real workload of the teacher is roughly half at uniform distribution of students. Thus, the presented analysis does not give good reasons for the necessity to make teaching more efficient. This necessity results from the constantly increasing demands on publication activities of staff and increased demands on project activities. The results of creative activity concerning publication activities of teachers of accounting courses as well as the results of project activities cannot, however, be included in the analysis. The reason for non-inclusion is, on the one hand, the existence of a time lag between the increase in demands on this activity and specific publication or project outputs and, on the other hand, the fact that quantifiable publication or project outputs may not correspond to the employee´s activity expended on them (publication outputs may not be accepted for publishing, prepared project proposals may not be financed). The increasing demands on publication and project activities are directly proportional to the growing demands of authorities granting the accreditation authorization to the institution, and to the declining financial means that universities derive from their educational activities. DISCUSSION In the context of the given topic it would be interesting to evaluate the effect of accounting teaching innovation on the employability of students in practice. However, since the accounting courses form an integral part of study plans of individual programmes, fields of study or other related courses, such as Managerial Accounting, Controlling, Software for Financial Data Processing and others, the direct impact of innovation cannot be quantified. The authors have also examined whether the students´ school results have improved after the course innovation compared to their results prior to the project implementation, because there is a real assumption that students can achieve better study results with high-quality study materials and constant study requirements on them. This assumption, however, was not statistically confirmed. The aforementioned research has confirmed all three hypotheses. The questionnaire survey has identified 1.99 as an average rating of all criteria, which is considerably better value than the authors expected. Based on the research, the statistically significant correlation between the evaluation of teaching quality and the evaluation of e-learning has been proved. Although the aforementioned correlations are statistically significant, the intensity of relation can be considered low, and thus the association between the evaluation of e-learning and the evaluation of teaching quality cannot be proved. The third hypothesis has been confirmed by the finding that the vast majority of benefits of the implemented innovation have led to the increase in efficiency, whether by savings in time, financial resources or making the user environment friendlier. However, it is possible to identify
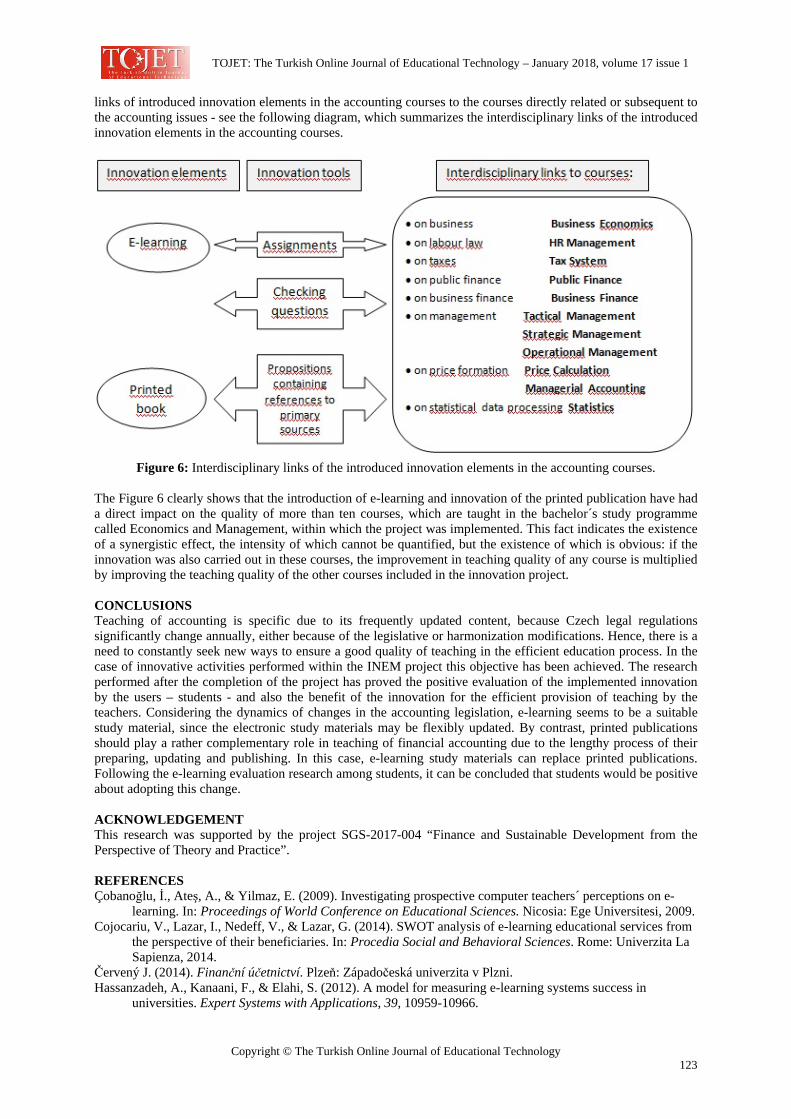
TOJET: The Turkish Online Journal of Educational Technology – January 2018, volume 17 issue 1
Copyright © The Turkish Online Journal of Educational Technology 123
links of introduced innovation elements in the accounting courses to the courses directly related or subsequent to the accounting issues - see the following diagram, which summarizes the interdisciplinary links of the introduced innovation elements in the accounting courses.
Figure 6: Interdisciplinary links of the introduced innovation elements in the accounting courses.
The Figure 6 clearly shows that the introduction of e-learning and innovation of the printed publication have had a direct impact on the quality of more than ten courses, which are taught in the bachelor´s study programme called Economics and Management, within which the project was implemented. This fact indicates the existence of a synergistic effect, the intensity of which cannot be quantified, but the existence of which is obvious: if the innovation was also carried out in these courses, the improvement in teaching quality of any course is multiplied by improving the teaching quality of the other courses included in the innovation project. CONCLUSIONS Teaching of accounting is specific due to its frequently updated content, because Czech legal regulations significantly change annually, either because of the legislative or harmonization modifications. Hence, there is a need to constantly seek new ways to ensure a good quality of teaching in the efficient education process. In the case of innovative activities performed within the INEM project this objective has been achieved. The research performed after the completion of the project has proved the positive evaluation of the implemented innovation by the users – students - and also the benefit of the innovation for the efficient provision of teaching by the teachers. Considering the dynamics of changes in the accounting legislation, e-learning seems to be a suitable study material, since the electronic study materials may be flexibly updated. By contrast, printed publications should play a rather complementary role in teaching of financial accounting due to the lengthy process of their preparing, updating and publishing. In this case, e-learning study materials can replace printed publications. Following the e-learning evaluation research among students, it can be concluded that students would be positive about adopting this change. ACKNOWLEDGEMENT This research was supported by the project SGS-2017-004 “Finance and Sustainable Development from the Perspective of Theory and Practice”. REFERENCES Çobanoğlu, İ., Ateş, A., & Yilmaz, E. (2009). Investigating prospective computer teachers´ perceptions on e-
learning. In: Proceedings of World Conference on Educational Sciences. Nicosia: Ege Universitesi, 2009. Cojocariu, V., Lazar, I., Nedeff, V., & Lazar, G. (2014). SWOT analysis of e-learning educational services from
the perspective of their beneficiaries. In: Procedia Social and Behavioral Sciences. Rome: Univerzita La Sapienza, 2014.
Červený J. (2014). Finanční účetnictví. Plzeň: Západočeská univerzita v Plzni. Hassanzadeh, A., Kanaani, F., & Elahi, S. (2012). A model for measuring e-learning systems success in
universities. Expert Systems with Applications, 39, 10959-10966.

TOJET: The Turkish Online Journal of Educational Technology – January 2018, volume 17 issue 1
Copyright © The Turkish Online Journal of Educational Technology 124
Jia, H., Wang, M., Ran, W., Jian, S., Liao, J., & Chiu, D. (2011). Design of a performance-oriented workplace e-learning system using ontology. Expert Systems with Applications, 38, 3372-3382.
Liesaputra, M. (2012). The future of education: Comparisons involving printed books, audio books and e-books looking from technology and learning style perspectives. In: Proceedings of 5th International conference of education, research and innovation. Madrid: Iated-int Assoc. Technology Education A& Development, 2012.
Middleton, D. (2010). Putting the Learning into E-learning. European Political Science, 9, 5-12. Sun, P., Tsai, R., Glenn, F., Chen, Y., & Yeh, D. (2008). What drives a successful e-Learning? An empirical
investigation of the critical factors influencing learner satisfaction. Computers & Education, 50, 1183-1202.
Welsh, E.T., Wanberg, C.R., Brown, K.G., & Simmering, M.J. (2003). E-learning: emerging uses, empirical results and future directions. International Journal of Training and Development, 7, 245-258.
Yacob, A., Kadir, A., Zainudin, O., & Zurairah, A. (2012). Student Awareness towards E-Learning In Education. In: Proceedings of 3rd International Conference on E-Learning. Bandung: Elsevier Science BV, 2012
Michaud, P. A. (2012). Reforms of the pre-graduate curriculum for medical students: the Bologna process and beyond. Swiss Medical Weekly, 142.
Kulier, R., Guelmezoglu, A, M., & Zamora, J. (Eds.). (2012). Effectiveness of a Clinically Integrated e-Learning Course in Evidence-Based Medicine for Reproductive Health Training A Randomized Trial. JAMA-JOURNAL OF THE AMERICAN MEDICAL ASSOCIATION, 308, 2218-2225.
Al-Juboori, H. M. (2012). Design of an interactive platform for computer engineering education. KUWAIT JOURNAL OF SCIENCE & ENGINEERING, 39, 119-130.
Houri, D., Watanabe, T., & Hayashi, K. (Eds.). (2012). Evaluation of an E-Learning Distance Education System in the Graduate School of Medical Sciences of Tottori University. YONAGO ACTA MEDICA, 55, 69-73.
TOJET: The Turkish Online Journal of Educational Technology – January 2018, volume 17 issue 1
Copyright © The Turkish Online Journal of Educational Technology 125
Pre-Service Teachers’ Perception of Distance Education* Abdullah Yasin GÜNDÜZ Faculty of Education, Hacettepe University, Turkey abdullahyasin @gmail.com Aytekin İŞMAN Faculty of Communication, Sakarya University, Turkey [email protected] ABSTRACT The purpose of this study is to investigate the perception of pre-service teachers towards distance education based on variables such as gender, department, class level, personal computer ownership and possession of internet connection. The study was conducted with participants who continue their education in department of education in a state university and the study group consisted of 455 female and 237 male, in total 692 pre-service teachers. The participants included first, second, third and fourth year students from the departments of primary school education, social sciences education, science and technology education, painting and music education. A scale has been developed by the researcher in order to determine pre-service teachers’ perception of distance education and a data set was generated with the responses collected according to this scale. As per the results obtained, the perception regarding distance education did not show any differentiation based on gender, personal computer ownership and possession of internet connection, while a significant difference was observed in respect to department and class level. Keywords: Distance education, pre-service teacher. INTRODUCTION In today’s societies, technological developments are paving the way to radical reforms and a dramatic increase in production of information in every field including education. Transfer of existing contents to digital environment and the opportunity to easily share ideas and experiences with the world that individuals have by connecting to internet provided our age to be named after the produced information and technology. In daily life, in an environment where “information society/information age” expressions are widely used, the reason for widespread use of computers, which has become indispensable for information management (storage, compilation, processing), is given as people’s need for tools that are capable of doing more computing than human beings to make them able to control and manage the vast amount of information in unit time (Kaya, 1999). The reason for this situation can be stated as the amount of global information is doubling in every five years and in 2020 it is expected to be doubling in every 72 days (Staudt, 2001). With the use of information and communication technologies in education, it has become easier for countries to search for solution to problems in education and to go beyond conventional methods against intensifying course of education. Especially in Turkey, the most important problem regarding education is the increasing number of students and increasing need for school buildings day by day, parallel to rapid growth in population (İşman, 2011). Population growth brings about renewal of education systems and providing grounds for making use of additional advanced methods. The process continues with provision of these renewed education systems to public service under supervision of relevant authorities thus allowing as many individuals as possible to have chance for access to good quality education within the shortest possible time (Önder, 2002). In systems where conventional education approach is insufficient, it becomes an obligation to plan radical innovations and a series of transformations in education policies and purposes, in organization and function of educational institutions and in content of education programs (Arslan ve Eraslan, 2003). Because, problems related to economy require provision of economic and high-quality services with limited resources, problems related to social issues require provision of equalitarian and widespread education service, problems related to educational content require transformation of elitist higher education to mass higher education, stereotyped and compulsory processes to flexible and multi optional processes and pre-adulthood education to lifelong learning *This study is a part of the master thesis of the first author.
TOJET: The Turkish Online Journal of Educational Technology – January 2018, volume 17 issue 1
Copyright © The Turkish Online Journal of Educational Technology 126
(Alkan, 2005). Alkan (1987) has indicated the importance of a better education opportunity, equality in opportunity and lifelong learning as increasing importance of information and education for individual freedom and good life, closing the gap between individuals who received advanced education and individuals who did not receive enough education, increasing need for people who are thinking and doing and existence of a need for continuous learning and high-quality education for everybody. Countries who cannot fulfil this need via conventional methods has revised their education programs according to changing and developing needs of society, headed towards distance education systems by effective use of technology in the field of education and made considerable progress in terms of equality in opportunity and lifelong learning. According to Çetin (2010), when the justifications for necessity of distance learning are reviewed, the aspects drawing attention include equality it provides in terms of opportunity, lower costs, to be able to provide education in line with the needs for every age group, achieving a higher number of learners therefore contributing to communication between individuals and cultural integration. Defined as an institutional education activity in which student, teacher and educational materials in different locations are brought together via communication technologies (Simonson, Smaldino, Albright ve Zvacek, 2009), distance education can be said to have laid its foundation on scientific developments in the field of education, technological developments, increase in demand for education, and the fact that cost of education has become a problem. With distance education, not only academic institutions has changed their physical burden (huge buildings, etc.) but also the students have obtained the opportunity to learn without leaving the comfortable environment of their home or office. Hardware that are able to carry data in high capacities and portable computers took the place of books in no time and online classrooms and libraries created over Internet took the place of traditional school buildings and libraries (Shachar ve Neumann, 2003). The interest toward distance education in Turkey, however, is based on lack of high-quality education that will allow permanent learning in line with interests and talents, insufficiency of physical infrastructure, rapid population growth, cultural factors in some regions and economic reasons that result in lower rates of participation to education or higher rates of absenteeism which can be handled by distance education applications (İşman, 2011). For this reason, teachers and pre-service teachers who are actively involved in or will take an active role in the distance education process should be informed about the mechanism, benefits, limitations and outcomes. The spread of distance education, the establishment of distance education centers and initiation of undergraduate and graduate educations especially in the universities in Turkey are deemed important for understanding the distance education perception. THE STUDY In this descriptive research, it is aimed to determine whether the distance education perceptions of pre-service teachers differ according to their gender, department, class levels, possession of personal computer and having internet connection. In this regard, a survey model suitable for the feature of the subject, the purpose of the study and the study group was used. In the research, a study group was formed by applying the convenience sampling method which is one of the purposeful sampling method types. The study group from which the data were collected comprised of 692 volunteers among 1473 pre-service teachers registered to first, second, third and fourth grades of primary school teaching, Turkish language teaching, social sciences teaching, art and music teaching programs in the education faculty of a state university during the academic year of 2012-2013. The “Distance Education Perception Scale” developed by the researcher was used as data collection tool in the research. The developed scale consists of two parts. In the first part, personal information are given including gender, class, department, computer and internet connection options. In the second part of the scale, there are expressions for pre-service teachers to determine their views on distance education perception. These expressions were scaled in five categories: Strongly Disagree, Disagree, Undecided, Agree, Strongly Agree. The 33-item form prepared for the pilot application of the scale was applied on 185 pre-service teachers and by selecting the convenience sampling since the sample was not intended to represent the universe. Findings Related to Validity of the Scale Construct validity of the scale was tested with factor analysis. For this purpose, it was first examined whether the data obtained from the trial application were suitable for factor analysis. Kaiser-Meyer-Olkin (KMO) measure of adequacy value, which is calculated based on the KMO and Bartlett test results showing whether the data are suitable for factor analysis, was 0,83.Tavşancıl (2010) stated that factor analysis cannot be performed below a critical value of 0.50. Comparing with the critical value, it is concluded that Kaiser-Meyer-Olkin value of the
TOJET: The Turkish Online Journal of Educational Technology – January 2018, volume 17 issue 1
Copyright © The Turkish Online Journal of Educational Technology 127
scale is High Level 0.80-0.90 (Çokluk, Şekercioğlu ve Büyüköztürk, 2010). The Bartlett Sphericity Test calculated for the same data is 858,87 and significance level is 0.01 (X2190 = 858.87). These values show that the data obtained from the trial application can be subject to factor analysis. When the results of factor analysis are examined using the principal component analysis, there are two factors greater than the value of 1. These two factors account for 34,64% of the total variance. Taking into account the initial eigenvalues, the fact that the eigenvalue of the first factor (5,01) is much higher than the eigenvalue of the second factor (1,92) can be interpreted as the scale has a general factor as a whole. Therefore, the transformation technique is not used and the data is considered as one dimension. The variance explained by a single dimension is 25,04% of the total variance. The factor loadings of the items range from 40 to 62. According to these factor loading values, the scale is one dimensional and all items have a factor loading value that can be on the scale. Factor analysis was performed on the 33-item scale and 13 items were excluded from the study because they were below the limit factor loading value, which was determined as 40. According to Tabachnick and Fidell (2001), in case the factor loading value of each item is the critical value which is 0,40, the scale is considered as “moderate” (Akt. Çokluk, Şekercioğlu and Büyüköztürk, 2010). To increase the explanatory variance of the identified factor, a factor load of 40 was defined as the limit value. 20 items higher than the limit value of 40, which are collected in one factor, form the final scale form. In the final scale form, there are 17 items with positive qualities and 3 items with negative qualities. When the correlation values are considered, it can be said the feature that can be measure by the general scale is the same as the feature that is measure by each of the items therefore all items have the qualification to be included in the scale. The total of t values obtained as a result of the analysis carried out by comparison of the means of responses to each item given by the participants among 27% (n=50) upper segment and 27% (n=50) lower segment, are significant at a level of 0,05. This is important in terms of demonstrating that all items are capable of distinguishing between the ones who have the feature that is sought to be measured by that item and the ones who do not have it. Findings Related to Reliability of the Scale For the reliability of the scale, Cronbach alpha internal consistency coefficients of the selected items were examined regarding each dimension and whole of the test. Cronbach alpha internal consistency coefficient of the scale was found to be 0,84. It can be concluded based on this value that the scale has internal consistency at acceptable level. Independet Sample T-Testi was employed for the analysis of pre-service teachers’ gender, personal computer possession and having internet connection, and One-Way Anova analysis was employed for class levels and departments. Findings obtained in the research were interpreted as follows: a pre-service teacher who obtained higher points for distance education perception has a higher perception level while a pre-service teacher who obtained lower points has a lower perception level. FINDINGS In this section, the responses of the pre-service teachers to the items in the distance education perception scale were evaluated, and it was investigated whether there is statistically significant difference in terms of variables: gender, department, class, personal computer possession and internet access. The findings obtained were considered as 95% reliable with a 5% error margin level, i.e. p<0, 05 ( Büyüköztürk, 2011). When the significance test (t-test) results were examined for the difference between the two means regarding the effect of gender on the distance education perception level, it was concluded that there was not significant difference between the distance education perception level of male pre-service teachers (X =52,24) and the female pre-service teachers (X =51,26), according to t(690)=1,06; p>,05. Therefore it can be stated that the pre-service teachers’ distance education perception does not vary according to gender. However, when the results of One Way ANOVA analysis carried out for determination of distance education perception levels of pre-service teachers based on department of participants were reviewed, it was observed that distance education perception levels of pre-service teachers displayed a significant difference based on department of participants, according to F(5-686)=3,69, p<,05. As a result of Tukey multiple comparison test, the following were found;
• The distance education perceptions of the pre-service teachers who are studying in the department of

TOJET: The Turkish Online Journal of Educational Technology – January 2018, volume 17 issue 1
Copyright © The Turkish Online Journal of Educational Technology 128
Social Sciences Teaching (X = 49,01) are significantly lower than the distance education perceptions of the pre-service teachers who are studying in Science Education Department (X = 53,39).
• Again, the distance education perceptions of the pre-service teachers who are studying in the Department of Social Sciences Teaching (X = 49,01) are significantly lower than the distance education perceptions of the pre-service teachers who are studying in the Department of Primary School Teaching (X = 53,34).
When the results of the one way ANOVA analysis that was conducted in order to determine the distance education perception level according to the class variable in which the pre-service teachers had studied were examined, it is observed that distance education perceptions differ significantly according to the class levels of the participants (F (3-688) = 16,58, p <,05). Tukey multiple comparison test was used to see for which departments there is significant difference based on class level variable. This significant differences according to the test result are as follows:
• The distance education perception of the pre-service teachers in the first grade (X =48,94) is significantly lower than the distance education perception of the pre-service teachers in the second grade (X =55,21).
• The distance education perception of the pre-service teachers in the first grade (X =48,94) is significantly lower than the distance education perception of the pre-service teachers in the fourth grade (X =54,82).
• The distance education perception of the pre-service teachers in the third grade (X =49,03) is significantly lower than the distance education perception of the pre-service teachers in the fourth grade (X =54,82).
• The distance education perception of the pre-service teachers in the third grade (X =49,03) is significantly lower than the distance education perception of the pre-service teachers in the second grade (X =55,21).
When the results of the two mean difference significance test (t-test) which was conducted to determine the distance education perception levels according to the personal computer possession variable of the pre-service teachers, are examined; it is observed that there is no significant difference between the distance education perceptions of pre-service teachers who have personal computer (X = 51,73) and the distance education perceptions of pre-service teachers who do not have personal computer (X = 51,26), according to t(690)=,48, p>,05. When the results of the two mean difference significance test (t-test) which was conducted to determine the distance education perception levels according to the internet access variable of the pre-service teachers, are examined; it is observed that there is no significant difference between the distance education perceptions of pre-service teachers who have access to internet (X = 51,40) and the distance education perceptions of pre-service teachers who do not have access to internet (X =51,81), according to t(690)= -,46, p>,05. CONCLUSIONS In the first sub-problem of the study, distance education perceptions of the pre-service teachers were examined in terms of gender variable, and as a result of the analyzes carried out, no significant difference was found in terms of gender. This can be understood as a reflection of the fact that distance education has a common influence on pre-service teachers without any effect of gender. In the second sub-problem of the study, distance education perceptions of the pre-service teachers were examined in terms of department variable, and as a result of the analyzes carried out, a significant difference was found in terms of department. Accordingly, the distance education perceptions of the pre-service teachers who are studying in Social Sciences Teaching Department were found to be lower than the distance education perceptions of the pre-service teachers who are studying in Science Education Department. In addition, distance education perceptions of the pre-service teachers who are studying in Social Sciences Teaching Department were found to be lower than the distance education perceptions of the pre-service teachers who are studying in the Department of Primary School Teaching. In the third sub-problem of the study, distance education perceptions of the pre-service teachers were examined in terms of class level, and as a result of the analyzes carried out, a significant difference was found in terms of class level. Accordingly; distance education perceptions of pre-service teachers who are studying in first grade are found to be lower than distance education perceptions of pre-service teachers who are studying in second grade and again, distance education perceptions of pre-service teachers who are studying in first grade are found
TOJET: The Turkish Online Journal of Educational Technology – January 2018, volume 17 issue 1
Copyright © The Turkish Online Journal of Educational Technology 129
to be lower than distance education perceptions of pre-service teachers who are studying in fourth grade. On the other hand, distance education perceptions of the third grade students were found to be lower than distance education perceptions of fourth grade students, similarly, distance education perceptions of the third grade students were lower than distance education perceptions of the second grade students. Based on these results, it is concluded that distance education perceptions of pre-service teachers who are studying in second and fourth grades are higher than distance education perceptions of first and third grade pre-service teachers. This situation may be thought to be arising from the fact that the pre-service teachers of second grade are encountering concepts such as distance learning and e-learning within the scope of Computer I and Computer II courses of at the second grade level, and that pre-service teachers in the fourth grade have chance to experience distance education by attending various private courses (certificate programs, KPSS preparation, etc.). In the fourth sub-problem of the research, distance education perceptions of the pre-service teachers were examined in terms of personal computer possession, and as a result of the analyzes carried out, no significant difference was found in terms of personal computer possession variable. That is, the distance education perceptions of the pre-service teachers do not show any significant difference according to the possession of the personal computer. In the last sub-problem of the research, distance education perceptions of the pre-service teachers were examined in terms of having internet connection, and as a result of the analyzes carried out, no significant difference was found in terms of having internet connection. That is, distance education perceptions of pre-service teachers do not differ significantly according to the variable of having internet connection. REFERENCES Alkan, C. (1987). Açıköğretim “Uzaktan Eğitim Sistemlerinin Karşılaştırmalı Olarak İncelenmesi”. Ankara:
Ankara Üniversitesi Basımevi. Alkan, C. (2005). Eğitim Teknolojisi. Ankara: Anı Yayıncılık Arslan, M. M. ve Eraslan, L. (2003). Yeni Eğitim Paradigması ve Türk Eğitim Sisteminde Dönüşüm Gerekliliği.
Millî Eğitim Dergisi, 160, 89-105. Büyüköztürk, Ş. (2011). Veri Analizi El Kitabı. Ankara: Pegem Akademi. Çetin, O. (2010). Fen ve Teknoloji Dersinde “Çoklu Ortam Tasarım Modeli’ne Göre Hazırlanmış Web Tabanlı
Öğretim İçeriğinin Öğrenci Başarı ve Tutumlarına Etkisi ile İçeriğe Yönelik Öğretmen ve Öğrenci Görüşlerinin Değerlendirilmesi. Yayınlanmamış Doktora Tezi. Dokuz Eylül Üniversitesi Eğitim Bilimleri Enstitüsü: İzmir.
Çokluk, Ö., Şekercioğlu, G. ve Büyüköztürk, ġ. (2010). Sosyal Bilimler İçin Çok Değişkenli İstatistik: Spss ve Lısrel Uygulamaları. Ankara: Pegem Akademi.
İşman, A. (2011). Uzaktan Eğitim. Ankara: Pegem Akademi. Kaya, Z. (2002). Uzaktan Eğitim. Ankara: Pegem A Yayıncılık. Önder, H. H. (2002). Uzaktan Eğitimde ICAI ve Yapay Zekâ Programlama Teknikleri. Açık ve Uzaktan Eğitim
Sempozyumu, Anadolu Üniversitesi, Açık Öğretim Fakültesi. Shachar, M. ve Neumann, Y. (2003). Differences Between Traditional and Distance Education Academic
Performances: A Meta-Analytic Approach. International Review of Researchin Open and Distance Learning, 4 (2).
Simonson, M., Smaldino, S., Albright, M. ve Zvacek, S. (2009). Teaching and Learning at a Distance: Foundations of Distance Education. Upper Saddle River, NJ: Pearson Education, Inc.
Staudt, E. (2001) The Future of Learning-Learning for the Future: Shapping teh Transition. 20th World Conference on Open Learning and Distance Education. Düsseldorf.
Tabachnick, B. G. & Fidell, L. S. (2001). Using multivariate statistics. Tavşancıl, E. (2010). Tutumların Ölçülmesi ve SPSS ile Veri Analizi. Ankara: Nobel Yayın Dağıtım.
TOJET: The Turkish Online Journal of Educational Technology – January 2018, volume 17 issue 1
Copyright © The Turkish Online Journal of Educational Technology 130
Promoting Students’ Paragraph Writing Using EDMODO: An Action Research Is’haq Al-NAIBI English Language Tutor, Arab Open University (Oman Branch), Oman [email protected] Maryem AL-JABRI English Language Teacher, Ministry of Education, Oman [email protected] Iman AL-KALBANI English Language Teacher, Vocational Training College, Oman [email protected] ABSTRACT This paper reports the findings of an action research that was carried out to measure the effectiveness of integrating a social networking website “Edmodo” in students’ writing performance in an EFL classroom at Arab Open University (Oman Branch). The participants were 25 students studying English in the Foundation Programme. Along with three lesson plans that were used to teach students the writing process, students conducted some quizzes, discussions and activities on Edmodo. Analysis of students’ second writing showed a statistically significant improvement in students’ writing. A post-treatment questionnaire results indicated that students have positive perceptions towards using Edmodo in language learning. Keywords: Edmodo, Social Networking Sites, Process Writing, EFL classroom, Oman INTRODUCTION With the rapid advancement of web technology and its effectiveness in various fields, a lot of teachers are delving deeper into using technology in their teaching to develop their students’ language abilities. Social networking sites have been recognised as one of the most common tools that teachers are utilising in teaching the English language. Since developing students’ writing skills is regarded as an important task for language teachers, many teachers use web tools to teach writing, such as, Learning Management System, Wikis, Social Networking Sites, Google Docs and many other tools. One of the available online tools for teachers is Edmodo which this study explores. Edmodo is an online social networking website and a smartphone application that is designed for both teachers and students and their parents. It allows teachers to communicate with their students, share materials and monitor students’ progress. It is different than other social networks because it has built-in assessment tools, such as quiz, poll, assignment, grade book and other tools that assist teachers in assessing students. The main purpose of this study is to find out if using Edmodo can affect students’ writing abilities. Another purpose is to measure students’ perceptions in using Edmodo and what challenges and barriers they have faced using it. LITERATURE REVIEW Overview of Edmodo Jeff O’Hara started Edmodo in 2008. He started the platform when he recognized the need to create a friendly and secured educational environment in which teachers and students can actively and socially involve in a holistic learning process. In 2010, the website was developed to provide a social collaboration experience between teachers and their learners (Barba, 2013). Arroyo (2011) viewed Edmodo as an inspiring teaching tool for knowledge to be constructed. It was described by Trust (2012) as an interactive platform based on a social networking and mutual collaboration between teachers and their students. Cauley (2013) further explained this useful tool as an educational website that aims to get the benefits of a social network’s features and make it more appropriate to facilitate learning and teaching (as cited in Monalisa & Ardi, 2013). Edmodo has various useful features that can help both teachers and students. Ali (2015) outlined several features of Edmodo in his study. He reported that Edmodo permits users to upload profile pictures, documents, links and

TOJET: The Turkish Online Journal of Educational Technology – January 2018, volume 17 issue 1
Copyright © The Turkish Online Journal of Educational Technology 131
videos. These uploaded materials can be stored in the Library and can be reused and shared with others (p. 40). Besides, it is free of most disturbing advertisements and games that may hamper learners’ attention and learning (Mills & Chandra as cited in Shams-Abadi et al., 2015, p. 91). This tool can help teachers in their teaching, delivering the content and sharing the files that learners can easily access. Not only documents or files teachers can upload, but they can share digital videos that can enrich the course content. Other organizational features of this platform for teachers are monitoring students’ interaction, making quizzes, assignments, posts, notes, polls and award badges. Once posted, students can read, reply or solve the quizzes or assignments electronically anywhere and anytime. Added to that, quizzes can be graded and submitted automatically to every student in a secure way (Bayne, n.d.). Edmodo offers a mobile website which can be easily accessed through smart mobile phones and tablets. This allows easy access to posts, quizzes and notifications. The Use of Edmodo in Teaching Process Writing Process writing has been distinguished from product writing in the sense that the teacher guides learners to follow a specific procedure which helps them eventually improve their writing product. Accordingly, the focus is directed mainly at raising learners’ awareness of the different steps of process writing which is recursive in nature (Seow, 2002). White and Arndt (1991) proposed a writing process model which includes a set of interrelated and recursive stages including drafting, structuring, reviewing, focusing and generating ideas and evaluation (as cited in Harmer, 2007:258). Hedge (2003) has pointed out two major issues that teachers encounter when teaching process writing which are the lack of time and the lack of a real audience for students’ writings (p. 317). Teachers usually complain of limited time to teach students through all the stages of process writing in addition to the time needed for the students to write and to give feedback. Utilizing social media websites like Edmodo facilitates communication among teachers, learners and their parents, which can provide extra time for teachers to elaborate on their lessons online and, at the same time, offer an audience from the real world for their students. The prewriting phase of process writing includes planning and organizing of ideas. Planning can be initiated by the teacher through providing a stimulus for learners to brainstorm ideas, to cluster relevant words to the writing topic and other types of strategies (Seow, 2002). Using Edmodo for this stage offers many choices for the teacher to help students embark on their thinking. The teacher, for example, can post discussion questions for students to think about or post relevant images of the writing topics for students to comment on them. Edmodo is claimed to be an effective tool for interaction, wider exposure and use of the target language among learners (Hariri & Bahanshal, 2015). Organizing ideas, on the other hand, can be guided by the teacher through posting links that provide students with model writings. Teachers can find some examples for their students to help them organize their ideas according to certain instructions. During the second stage of process writing, students write and edit their work using their prior knowledge of vocabulary and structuring. With students’ limited knowledge of language, they struggle in putting their generated ideas together. Technology use influences the overall quality of writing by provides students with mechanics that allow them to develop from focusing on the sentence level to an overall focus on a paragraph or an essay level (Hedge, 2003). The cutting, pasting and automatic correction of spelling help students to focus on major writing problems rather than minor mistakes. Students can write and edit their writings through opening a Google Docs file in Edmodo (Kongchan, 2015). Also, teachers, having virtual classes on Edmodo, can enforce their students to spell words properly and use punctuations correctly in their discussions. Consequently, students get the habit of spelling whole words like writing ‘you’ instead of ‘u’ and ‘I’ instead of ‘i’. Moreover, using Edmodo by students accelerates their improvement in writing accurate structures. Yagci (2015) conducted a research to measure the effectiveness of integrating Edmodo in teaching reading comprehension for 2nd grade students in an Iraqi institution. The experimental group received extra reading materials and exercise on Edmodo. Yagci, although the main focus of his study was reading comprehension, concluded that Edmodo has helped students to improve their grammatical structures in writing. Teachers using the traditional way of collecting students’ writings, checking each paper and writing feedback takes long time that students would have forgotten about the topic when they receive their papers back. Instant online feedback via Edmodo allows students to make changes to their drafts while the topic is still fresh in their minds (Carolan & Kyppö, 2015). Also, a long time is saved for teachers through using any type of automatic feedback processors for each student’s draft which gives them more time to give feedback on other features of students’ writings (Ware & Warschauer, 2006). Therefore, using a web-based tool like Edmodo that facilitates communication among learners and teachers offers rich resources of peer feedback and teacher feedback at the same time. In addition to that, students will have more opportunities to redraft their writings using Edmodo than in the traditional way in which students can write one or two drafts maximumly for each piece of writing before
TOJET: The Turkish Online Journal of Educational Technology – January 2018, volume 17 issue 1
Copyright © The Turkish Online Journal of Educational Technology 132
handing in their final drafts. Furthermore, Edmodo enables teachers to use certain features when giving feedback to students like using different colours in commenting and highlighting texts. According to a study on the effectiveness of using Edmodo in teaching writing, Shams-Abadi et al., (2015) concluded that students who received feedback through Edmodo became more conscious of their writing errors as a result of using these features (p. 95). Edmodo, therefore, provides an active platform through which teachers can enhance their learners’ writing skills in an engaging environment. The learners, on the other hand, have a wider range of options that guide them through all the stages of process writing. As they compose their texts, they receive various types of guidance, corrections and suggestions which are expected to accelerate students’ writing abilities. Students’ perceptions on using Edmodo People who positively perceive technology as a useful tool are more likely to get the benefits of it than those who perceive it negatively. Accordingly, there are various variables that influence learners’ perceptions on the integration of social media or web-based tools in ESL classroom. The variables that are mostly mentioned by Edmodo advocates are its practicality and simplicity (Thongmak, 2013; Balasubramanian, Jaykumar & Fukey, 2014; Kongchan, 2015). Other studies attributed students’ perceptions of Edmodo as a mean of learning to their proficiency in using technology. For example, Al -Said (2015) found that Saudi learners who were involved in his study share common preferences toward learning through Edmodo, and he ascribed that to their competence in using smartphones. Purnawarman, Susilawati and Sundayana (2016) in an Indonesian study revealed that some of the participants had positive attitudes and others had negative attitudes. The researchers explained students’ varying attitudes because of their different levels of proficiency in using such programs. Barriers of using Edmodo as a learning platform Since there is a clear shift in using Edmodo as a learning platform for educators and students, there are some studies that have examined its challenges. Though the implementation of Edmodo has its benefits for both teachers and learners, it may cause some potential challenges that hamper effective learning environment. One of the hindrances is that if a student does not have access to a computer and the internet or a mobile device, Edmodo seems not to be a useful tool for effective learning. Added to this challenge is that this platform does not provide face-to-face interaction that can allow students to express their feelings or their body language (Bayne, 2015). According to Al-Said (2015), the findings of his study that was carried out to investigate undergraduate students’ perceptions towards using Edmodo as an application for Mobile learning at Taibah University revealed that the battery does not last longer to enable students to stay up on using Edmodo. Thus, to ensure the success of Edmodo, teachers should ensure the availability of computers, the internet or mobile phones for learning to take place. METHODOLOGY Participants The study sample included 25 pre-intermediate English language learners enrolled in (EF002: English Foundation Level 2) in the foundation programme at Arab Open University (Oman Branch). The sample consisted of 10 (40%) male students and 15 (60%) female students. Their age ranges from 26 to 35 years. The majority of the students are Omanis, but there were 5 (20%) non-Omani students. The students study on a part-time mode. Setting EF002 is the second level of English foundation where the focus of the course is to develop students’ language proficiency for them to pursue their studies for a bachelor degree in a university where English is the medium of instruction. Apart from developing language proficiency, students also received training in study skills and language learning strategies. Two main commercial teaching materials are used in the course: English Skills for University and Keep writing. Teachers use in-house materials to supplement the main books. Students receive 10 hours of teaching in a week for a 15-week period. Action Research Action research is a combination of two different activities which are action and research. Action is related to the process of taking an action by introducing a treatment and intervention to a social context, and the latter includes systematic observations and data collection and analysis (Wang, 2016). Milles (2011) clarifies the stages of action research that includes, identify an area of focus, collect data, develop an action plan, and analyze and interpret data. He stated that these steps interact with each other, so the researcher can start the process by collecting data that will help in the identification of the problem (as mentioned in Creswell, 2016). This study employs action research because the problem is identified in the classroom by the teacher, an action plan was
TOJET: The Turkish Online Journal of Educational Technology – January 2018, volume 17 issue 1
Copyright © The Turkish Online Journal of Educational Technology 133
designed, data was collected from the classroom, and finally, the teacher reflected on the whole process after the analysis of the data. Action plan Students were asked to download Edmodo on their smartphones, and one group in Edmodo was created by the teacher and students enrolled in the group. The students were inducted on the features of Edmodo and how to use them. For example, the teacher explained to the students how to write and respond to a post, how to attempt a quiz, how to submit an assignment, how to upload a material, and how to view their scores. At the beginning, students were asked to write a short paragraph describing their university using the assignment feature in Edmodo. The writing was done in the lab with the presence of the teacher. Students’ writing was marked by two tutors based on a given marking rubric and the average mark was computed (Refer to Appendix 2 for the marking rubric). From the first task, it was evidently clear that students didn’t follow the writing process in performing the writing task. Students didn’t plan for their writing and they didn’t edit their writing before submission. This eventually led to poor written paragraphs. After the problem was identified, three lesson plans were designed and students were taught the writing process in the class with some activities done online using Edmodo. (Refer to Appendix 1 for the lesson plans). Students were asked to compose one writing on Edmodo following the writing process taught in the class. The writing was done in the lab with the supervision of the teacher. Students were given about 45 minutes to plan, write, edit and submit their writing. The writing was marked by two different tutors. The results of the two writing tasks were analyzed using SPSS. Paired-samples t-test was used to compare the means of both writings.
Lesson Plans Three lesson plans were developed to help students grasp the writing process and to help them compose very well-written and organized paragraphs (See Appendix 1). A mixture of various activities was included in each lesson and the activities were sequenced based upon the steps of the writing process. The activities were also graded to suit students’ level of proficiency. The first lesson plan aimed at enabling students to identify the structure of a paragraph through exposing them to some activities included paragraph structure analysis by highlighting topic sentences and supporting details, selecting topic sentences for a written paragraph, matching topic sentences to paragraphs. The use of Edmodo came as a follow-up activity in which the students were asked to attempt one quiz on Edmodo. Basically, they were given a paragraph and asked to find the topic sentence. Added to that, they were given a topic sentence and asked to match them to supporting sentences. The second lesson plan intended to familiarize the students with the writing process in general through the use of PowerPoint slides explaining the writing process. They were invited to get to know the writing process (prewriting: planning, writing, editing, rewriting); more specifically, the importance of pre-writing stage and how to be ready to start writing by planning and brainstorming. This purpose was achieved by asking students to brainstorm ideas for a given topic. Brainstorming ideas activity was also consolidated using Edmodo. Students brainstormed ideas for the given topic, they took pictures of their brainstorming and uploaded them to Edmodo where they received feedback and comments on them from their peers and their teacher. The last lesson aimed to enable students practice writing a short paragraph on a given brainstorming, edit a written paragraph using correction codes and produce a final draft of their writing. Regarding the correction criteria, the students were asked to categorize their mistakes as follows: grammar, spelling, punctuation, and organisation. By doing so, the students’ awareness of the components that contributes to a good piece of writing was raised. The “description of my hometown” was the topic of writing activity in which students worked as a group and then edited it before writing the final draft. The last Edmodo assignment was about writing a paragraph named “my university” in which the students were asked to brainstorm ideas for it in the previous Edmodo assignment. Date Collection Tools Two tools were used to collect the research data. Two descriptive writing tasks were used in the study. The writing tasks were developed by the researcher. Two EFL teachers validated the writing tasks. The first writing task was writing a paragraph “My University” describing the university used at the first stage of the research through which the research problem was identified. The second writing task “My Mobile Phone” was writing a paragraph describing their mobile phone. Both writing tasks were done on Edmodo. In order to measure students’ perceptions and barriers towards using Edmodo, a questionnaire was distributed to the students. The questionnaire was adapted from two studies (Al-Kathiri, 2015; Al-Said, 2015), The questionnaire was divided into two main parts: students’ perceptions and barriers to using Edmodo, including 26 Likert-scale items (Refer to appendix 3 for the questionnaire). The instrument was validated by a lecturer at Arab
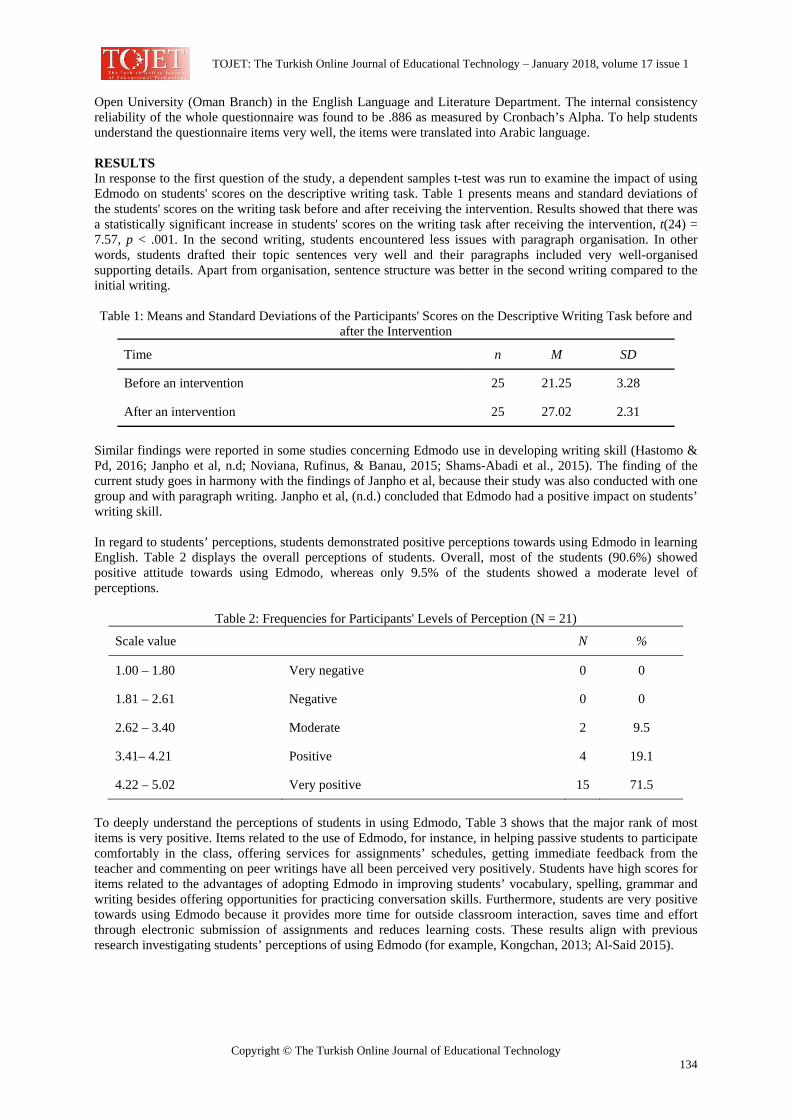
TOJET: The Turkish Online Journal of Educational Technology – January 2018, volume 17 issue 1
Copyright © The Turkish Online Journal of Educational Technology 134
Open University (Oman Branch) in the English Language and Literature Department. The internal consistency reliability of the whole questionnaire was found to be .886 as measured by Cronbach’s Alpha. To help students understand the questionnaire items very well, the items were translated into Arabic language.
RESULTS In response to the first question of the study, a dependent samples t-test was run to examine the impact of using Edmodo on students' scores on the descriptive writing task. Table 1 presents means and standard deviations of the students' scores on the writing task before and after receiving the intervention. Results showed that there was a statistically significant increase in students' scores on the writing task after receiving the intervention, t(24) = 7.57, p < .001. In the second writing, students encountered less issues with paragraph organisation. In other words, students drafted their topic sentences very well and their paragraphs included very well-organised supporting details. Apart from organisation, sentence structure was better in the second writing compared to the initial writing. Table 1: Means and Standard Deviations of the Participants' Scores on the Descriptive Writing Task before and
after the Intervention
Time n M SD
Before an intervention 25 21.25 3.28
After an intervention 25 27.02 2.31
Similar findings were reported in some studies concerning Edmodo use in developing writing skill (Hastomo & Pd, 2016; Janpho et al, n.d; Noviana, Rufinus, & Banau, 2015; Shams-Abadi et al., 2015). The finding of the current study goes in harmony with the findings of Janpho et al, because their study was also conducted with one group and with paragraph writing. Janpho et al, (n.d.) concluded that Edmodo had a positive impact on students’ writing skill. In regard to students’ perceptions, students demonstrated positive perceptions towards using Edmodo in learning English. Table 2 displays the overall perceptions of students. Overall, most of the students (90.6%) showed positive attitude towards using Edmodo, whereas only 9.5% of the students showed a moderate level of perceptions.
Table 2: Frequencies for Participants' Levels of Perception (N = 21)
Scale value N %
1.00 – 1.80 Very negative 0 0
1.81 – 2.61 Negative 0 0
2.62 – 3.40 Moderate 2 9.5
3.41– 4.21 Positive 4 19.1
4.22 – 5.02 Very positive 15 71.5
To deeply understand the perceptions of students in using Edmodo, Table 3 shows that the major rank of most items is very positive. Items related to the use of Edmodo, for instance, in helping passive students to participate comfortably in the class, offering services for assignments’ schedules, getting immediate feedback from the teacher and commenting on peer writings have all been perceived very positively. Students have high scores for items related to the advantages of adopting Edmodo in improving students’ vocabulary, spelling, grammar and writing besides offering opportunities for practicing conversation skills. Furthermore, students are very positive towards using Edmodo because it provides more time for outside classroom interaction, saves time and effort through electronic submission of assignments and reduces learning costs. These results align with previous research investigating students’ perceptions of using Edmodo (for example, Kongchan, 2013; Al-Said 2015).
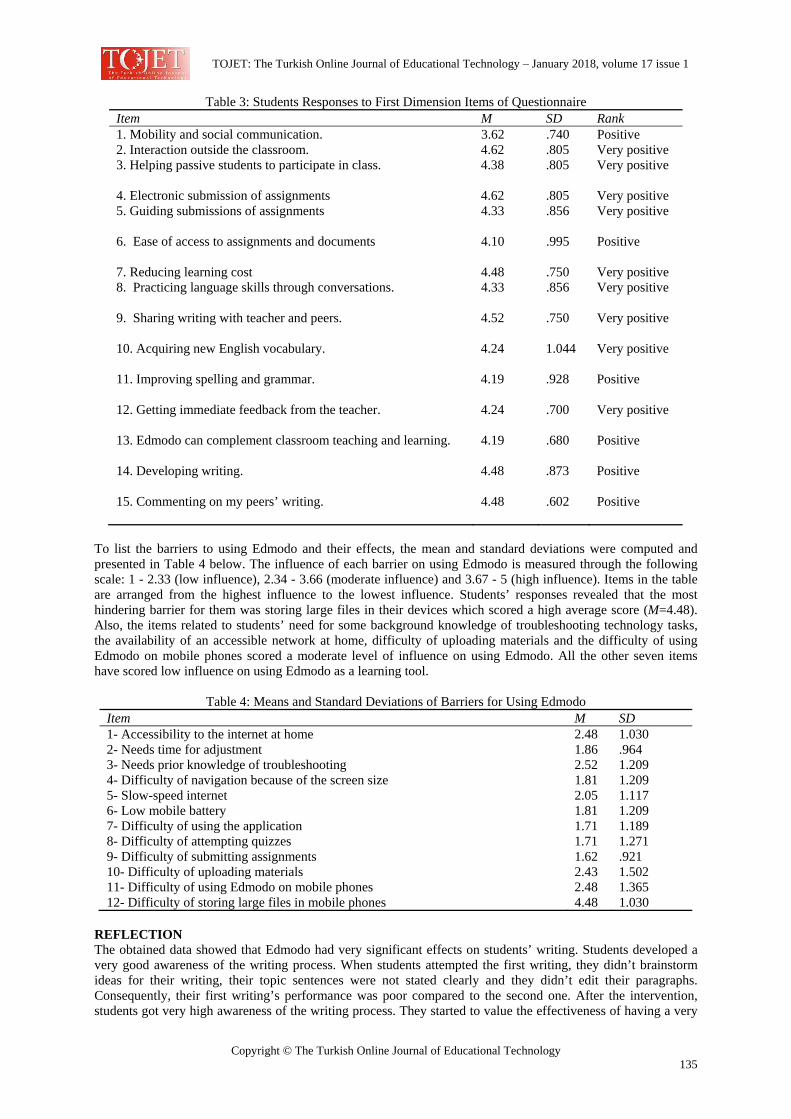
TOJET: The Turkish Online Journal of Educational Technology – January 2018, volume 17 issue 1
Copyright © The Turkish Online Journal of Educational Technology 135
Table 3: Students Responses to First Dimension Items of Questionnaire Item M SD Rank 1. Mobility and social communication. 3.62 .740 Positive 2. Interaction outside the classroom. 4.62 .805 Very positive 3. Helping passive students to participate in class. 4.38 .805 Very positive
4. Electronic submission of assignments 4.62 .805 Very positive 5. Guiding submissions of assignments 4.33 .856 Very positive
6. Ease of access to assignments and documents 4.10 .995 Positive
7. Reducing learning cost 4.48 .750 Very positive 8. Practicing language skills through conversations. 4.33 .856 Very positive
9. Sharing writing with teacher and peers. 4.52 .750 Very positive
10. Acquiring new English vocabulary. 4.24 1.044 Very positive
11. Improving spelling and grammar. 4.19 .928 Positive
12. Getting immediate feedback from the teacher. 4.24 .700 Very positive
13. Edmodo can complement classroom teaching and learning. 4.19 .680 Positive
14. Developing writing. 4.48 .873 Positive
15. Commenting on my peers’ writing. 4.48 .602 Positive
To list the barriers to using Edmodo and their effects, the mean and standard deviations were computed and presented in Table 4 below. The influence of each barrier on using Edmodo is measured through the following scale: 1 - 2.33 (low influence), 2.34 - 3.66 (moderate influence) and 3.67 - 5 (high influence). Items in the table are arranged from the highest influence to the lowest influence. Students’ responses revealed that the most hindering barrier for them was storing large files in their devices which scored a high average score (M=4.48). Also, the items related to students’ need for some background knowledge of troubleshooting technology tasks, the availability of an accessible network at home, difficulty of uploading materials and the difficulty of using Edmodo on mobile phones scored a moderate level of influence on using Edmodo. All the other seven items have scored low influence on using Edmodo as a learning tool.
Table 4: Means and Standard Deviations of Barriers for Using Edmodo Item M SD 1- Accessibility to the internet at home 2.48 1.030 2- Needs time for adjustment 1.86 .964 3- Needs prior knowledge of troubleshooting 2.52 1.209 4- Difficulty of navigation because of the screen size 1.81 1.209 5- Slow-speed internet 2.05 1.117 6- Low mobile battery 1.81 1.209 7- Difficulty of using the application 1.71 1.189 8- Difficulty of attempting quizzes 1.71 1.271 9- Difficulty of submitting assignments 1.62 .921 10- Difficulty of uploading materials 2.43 1.502 11- Difficulty of using Edmodo on mobile phones 2.48 1.365 12- Difficulty of storing large files in mobile phones 4.48 1.030
REFLECTION The obtained data showed that Edmodo had very significant effects on students’ writing. Students developed a very good awareness of the writing process. When students attempted the first writing, they didn’t brainstorm ideas for their writing, their topic sentences were not stated clearly and they didn’t edit their paragraphs. Consequently, their first writing’s performance was poor compared to the second one. After the intervention, students got very high awareness of the writing process. They started to value the effectiveness of having a very
TOJET: The Turkish Online Journal of Educational Technology – January 2018, volume 17 issue 1
Copyright © The Turkish Online Journal of Educational Technology 136
good plan before writing. They also valued the importance of editing and peer feedback. Also, the quiz feature helped the students in identifying and locating the topic sentences in written paragraphs. In the editing tasks, students could identify their own mistakes and they were able to rectify them using collaborative learning in which peer feedback was conducive. Edmodo provided students with a very safe and a friendly environment where they interacted with each other, brainstormed ideas and commented on various writings. As the students had very limited contact hours in the class, Edmodo gave them extra time to practice using English outside the classroom. Students also felt very comfortable because Edmodo’s smartphone application is very easy to use and it has friendly interface like Facebook which most of the students are familiar with. This was very evident in the analysis of students’ challenges gathered by the questionnaire. Students had very positive attitudes towards using Edmodo because it allowed them to access the materials when they didn’t attend the class, which corresponds to item number 6 in the first dimension of the questionnaire. Regarding quizzes and assignments, students showed very positive perception because they could get immediate feedback on their quizzes. Also, in terms of the assignment, students could revise their submission many times before the final submission along with the ability to upload pictures of their brainstorming. CONCLUSION R It can be concluded that using Edmodo played a remarkable impact on developing students’ writing skills. Students’ interaction using Edmodo has created a strong foundation for them to hone their abilities to write and form well-structured sentences. The analysis of the second descriptive writing has shown that students paid great emphasis on the organization of the writing pertaining paragraph structure and sentence structure. For the limitation of this study, there are some issues worth considering. First, the nature of the course in which the study was conducted. Students have many quizzes and assignments as a part of their course continuous assessment; therefore, some of the students didn’t take the two writing tasks seriously. The results of the first writing were a bit higher than expected. The marking rubric included a lot of points for capitalization and spelling which were automatically corrected in Edmodo. Further research in using Edmodo in developing writing skills is still needed. Gender differences in using Edmodo is a valuable focus of another research. This study is an action research conducting for a short period of time and with one group. A similar study can be conducted using an experimental design where two groups using Edmodo and conventional teaching methods are compared. A comparison of teacher’s feedback and students’ peer feedback in Edmodo is another further research perspective. REFERENCES Ali, Z. (2015). A Case Study of Tertiary Students’ Experiences Using Edmodo in Language Learning. The
International Journal of Language Education and Applied Linguistics (IJLEAL). 39–48. Retrieved from https://www.google.com/#q=Ali,+Z.+(2015).+A+Case+Study+of+Tertiary+Students’+Experiences+Using+Edmodo+in+Language+Learning.
Al-Said, M. K. (2015). Students' Perceptions of Edmodo and Mobile Learning and their Real Barriers towards them. TOJET: The Turkish Online Journal of Educational Technology, 14(2), 167-180
Arroyo, G. (2011). On-Line Social Networks: Innovative Ways towards the Boost of Collaborative Language Learning. ICT for Language Learning (4th ed.). Retrieved March 26, 2017, from http://conference.pixelonline.net/
Balasubramanian, K., Jaykumar, V., & Fukey, L. N. (2014). A study on “Student preference towards the use of Edmodo as a learning platform to create responsible learning environment”. Procedia-Social and Behavioral Sciences, 144, 416-422.
Barba, R. (2013). Jeff O’Hara and Edmodo: Build Tools That Support the Needs of Your Users. Retrieved from:http://tech.co/jeff-ohara-edmodo-develop-tools-2013-08
Bayne, A., G. (n.d.). Asynchronous Communication Tools. EDIT 5370-Foundations of Distance Education, 1-8. Retrieved from http://gailalleynebayne.weebly.com/uploads/2/3/5/2/23521060/module_4-asynchronous_communication.pdf
Candrasari, M. (2015). The Use of Edmodo Website to Improve Students Writing Skill (Classroom Action Research of the tenth grade students of SMKN 1 Wonosegoro in academic 2015/2016). State Institute for Islamic Studies (IAIN), Salatiga, 1-125
Carolan, F., & Kyppö, A. (2015). Teaching process writing in an online environment. Voices of pedagogical development-Expanding, enhancing and exploring higher education language learning, 13.
TOJET: The Turkish Online Journal of Educational Technology – January 2018, volume 17 issue 1
Copyright © The Turkish Online Journal of Educational Technology 137
Cresswell, J. W. (2012). Educational Research: Planning, Conducting and Evaluating Quantitative and Qualitative Research. (4th ed.). Boston: Pearson.
Hariri, O., R., & Bahanshal, A., D. (2015). Maximizing L2 Interaction Through Using Edmodo in Saudi EFL Classrooms. International Journal of Linguistics, Literature and Culture. 2(4).
Harmer, J. (2007). The Practice of English Language Teaching. London: Pearson Education. Hastomo, T., & Pd, S. (2016). the Effectiveness of Edmodo To Teach Writing Viewed from Students’
Motivation. In ICTTE 2015 Proceedings (Vol. 1, pp. 580–585). Hedge, T. (2003). Writing. Oxford: Oxford University Press. Janpho, J., Chaeturat, C., Multa, D., Harnburut, K., & Kwangsawad, T. (n.d.). Enhancing English Writing Skill
by Using Online Social Network Edmodo. Journal of Education, Mahasarakham University, 707–712. Kongchan, C. (2013). How Edmodo and Google Docs can change traditional classrooms. International
conference “ICT for Language Learning” 5th edition. Monalisa & Ardi, H. (2013). Using Edmodo Educational Social Network in Teaching English for High School
Students, Journal of English Language Teaching, 2 (1), 220-22. Purnawarman, P., Susilawati, S., & Sundayana, W. (2016). The use of Edmodo in teaching writing in a blended
learning setting. Indonesian Journal of Applied Linguistics, 5(2), 242-252. Seow, A. (2002). The Writing Process and the Process Writing. In J. C. Rhichards & W. A. Renandya (Eds.),
Methodology in Language Teaching: An Anthology of Current Practice (pp. 315–320). New York: Cambridge University Press.
Shams-Abadi, B. & Ahmadi, S. & Mehrdad, A. (2015). The Effect of Edmodo on EFL Learners’ Writing Performance. International Journal of Educational Investigations, 2 (2). 88-97.
Trust, T. (2012). Professional learning networks designed for teacher learning. Journal of Digital Learning in Teacher Education, 28 (4), 133-138. http://doi.org/10.1080/21532974.2012.10784693
Wang, W. (2016). Peer feedback in Chinese college English writing Class: using action research to promote students’ English writing. Journal of Language Teaching and Research. 7 (5), 958-966. DOI: http://dx.doi.org/10.17507/jltr.0705.17.
Ware, P. D., & Warschauer, M. (2006). Electronic feedback and second language writing. Feedback in second language writing: Contexts and issues, 105-122.
Yagci, T. (2015). Mobile Social Media in Higher Education & Implementation of “EDMODO” in reading classes. In Batur, B., & Nişancı, I (Ed.), 6th International Visible Conference on Educational Studies and Applied Linguistics (pp 436-442). Iraq: Irfan Publishing.
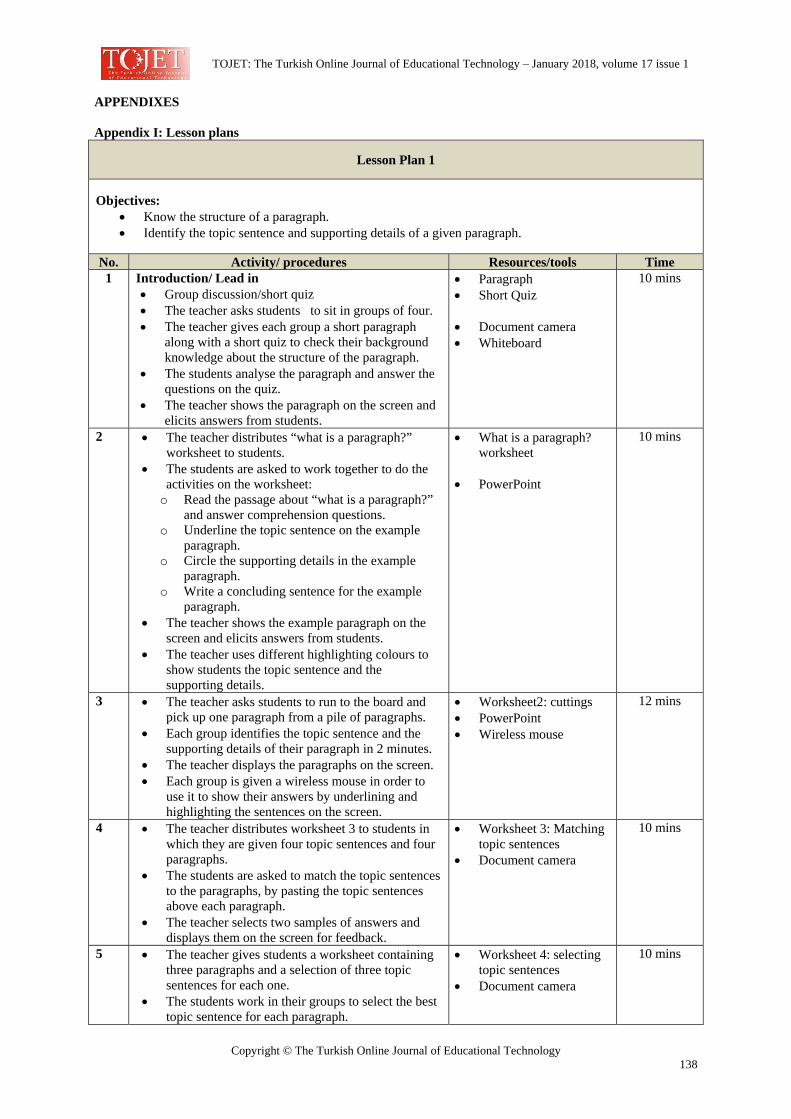
TOJET: The Turkish Online Journal of Educational Technology – January 2018, volume 17 issue 1
Copyright © The Turkish Online Journal of Educational Technology 138
APPENDIXES Appendix I: Lesson plans
Lesson Plan 1
Objectives: • Know the structure of a paragraph. • Identify the topic sentence and supporting details of a given paragraph.
No. Activity/ procedures Resources/tools Time 1 Introduction/ Lead in
• Group discussion/short quiz • The teacher asks students to sit in groups of four. • The teacher gives each group a short paragraph
along with a short quiz to check their background knowledge about the structure of the paragraph.
• The students analyse the paragraph and answer the questions on the quiz.
• The teacher shows the paragraph on the screen and elicits answers from students.
• Paragraph • Short Quiz
• Document camera • Whiteboard
10 mins
2 • The teacher distributes “what is a paragraph?” worksheet to students.
• The students are asked to work together to do the activities on the worksheet:
o Read the passage about “what is a paragraph?” and answer comprehension questions.
o Underline the topic sentence on the example paragraph.
o Circle the supporting details in the example paragraph.
o Write a concluding sentence for the example paragraph.
• The teacher shows the example paragraph on the screen and elicits answers from students.
• The teacher uses different highlighting colours to show students the topic sentence and the supporting details.
• What is a paragraph? worksheet
• PowerPoint
10 mins
3 • The teacher asks students to run to the board and pick up one paragraph from a pile of paragraphs.
• Each group identifies the topic sentence and the supporting details of their paragraph in 2 minutes.
• The teacher displays the paragraphs on the screen. • Each group is given a wireless mouse in order to
use it to show their answers by underlining and highlighting the sentences on the screen.
• Worksheet2: cuttings • PowerPoint • Wireless mouse
12 mins
4 • The teacher distributes worksheet 3 to students in which they are given four topic sentences and four paragraphs.
• The students are asked to match the topic sentences to the paragraphs, by pasting the topic sentences above each paragraph.
• The teacher selects two samples of answers and displays them on the screen for feedback.
• Worksheet 3: Matching topic sentences
• Document camera
10 mins
5 • The teacher gives students a worksheet containing three paragraphs and a selection of three topic sentences for each one.
• The students work in their groups to select the best topic sentence for each paragraph.
• Worksheet 4: selecting topic sentences
• Document camera
10 mins
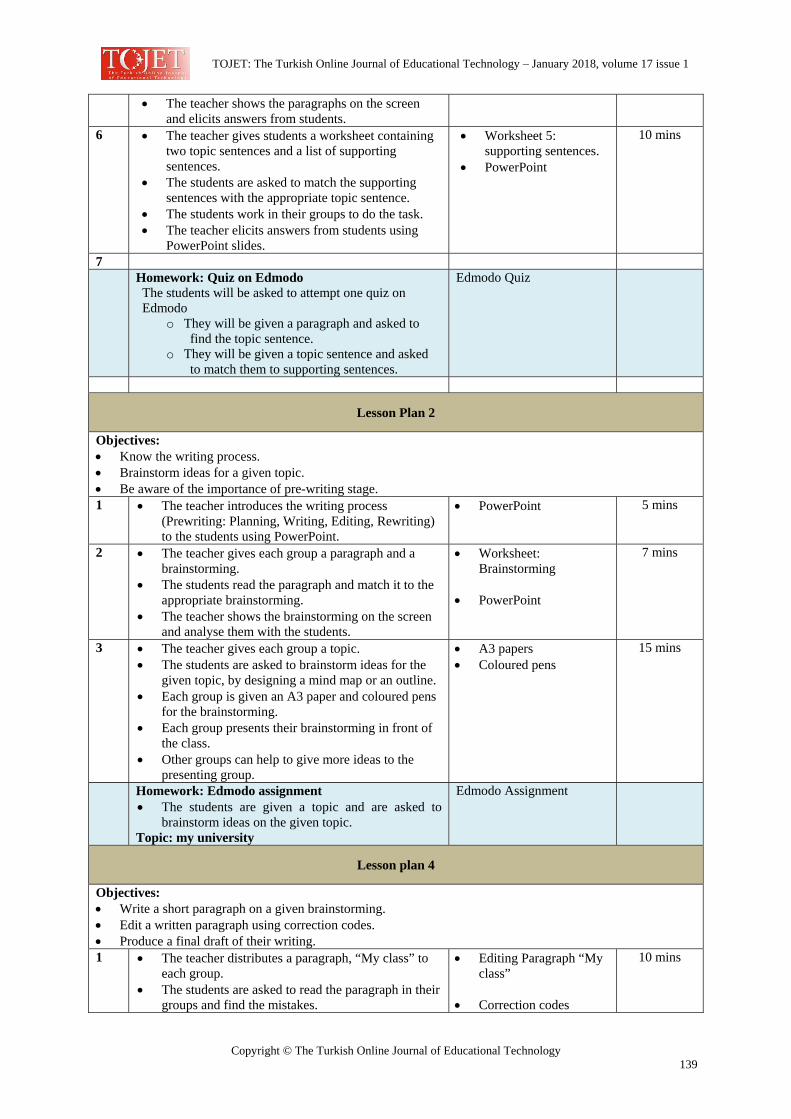
TOJET: The Turkish Online Journal of Educational Technology – January 2018, volume 17 issue 1
Copyright © The Turkish Online Journal of Educational Technology 139
• The teacher shows the paragraphs on the screen and elicits answers from students.
6 • The teacher gives students a worksheet containing two topic sentences and a list of supporting sentences.
• The students are asked to match the supporting sentences with the appropriate topic sentence.
• The students work in their groups to do the task. • The teacher elicits answers from students using
PowerPoint slides.
• Worksheet 5: supporting sentences.
• PowerPoint
10 mins
7 Homework: Quiz on Edmodo
The students will be asked to attempt one quiz on Edmodo
o They will be given a paragraph and asked to find the topic sentence.
o They will be given a topic sentence and asked to match them to supporting sentences.
Edmodo Quiz
Lesson Plan 2
Objectives: • Know the writing process. • Brainstorm ideas for a given topic. • Be aware of the importance of pre-writing stage. 1 • The teacher introduces the writing process
(Prewriting: Planning, Writing, Editing, Rewriting) to the students using PowerPoint.
• PowerPoint 5 mins
2 • The teacher gives each group a paragraph and a brainstorming.
• The students read the paragraph and match it to the appropriate brainstorming.
• The teacher shows the brainstorming on the screen and analyse them with the students.
• Worksheet: Brainstorming
• PowerPoint
7 mins
3 • The teacher gives each group a topic. • The students are asked to brainstorm ideas for the
given topic, by designing a mind map or an outline. • Each group is given an A3 paper and coloured pens
for the brainstorming. • Each group presents their brainstorming in front of
the class. • Other groups can help to give more ideas to the
presenting group.
• A3 papers • Coloured pens
15 mins
Homework: Edmodo assignment • The students are given a topic and are asked to
brainstorm ideas on the given topic. Topic: my university
Edmodo Assignment
Lesson plan 4
Objectives: • Write a short paragraph on a given brainstorming. • Edit a written paragraph using correction codes. • Produce a final draft of their writing. 1 • The teacher distributes a paragraph, “My class” to
each group. • The students are asked to read the paragraph in their
groups and find the mistakes.
• Editing Paragraph “My class”
• Correction codes
10 mins

TOJET: The Turkish Online Journal of Educational Technology – January 2018, volume 17 issue 1
Copyright © The Turkish Online Journal of Educational Technology 140
• The students have to categorize the mistakes as follows: grammar, spelling, punctuation, and organisation.
• The teacher shows the paragraph on the screen. Students read aloud the paragraph sentence-wise and the teacher marks the mistakes.
• The teacher shows the students the correction codes and each group is given a copy of it.
• Document camera
2 • Each group receives a brainstorming for a topic “description of my hometown”
• Each group writes a short paragraph based on the given brainstorming.
• The students work together in their groups to produce the writing.
• Brainstorming • “My hometown”
• A4 papers
15 mins
3 • The teacher asks students to check their writing using the given correction codes.
• The teacher monitors students as they edit their paragraphs.
8 mins
4 • The teacher asks each group to swap their writing with the other groups.
• Each group edits the writing of the other group.
8 mins
5 • The teacher shows each group’s writing on the board using the document camera.
• The students comment and re-check the writings of all the groups displayed on the screen.
8 mins
6 • The teacher gives back all the writings to the groups.
• Each group is given an A4 paper to write the final draft.
A4 papers 5 mins
Homework: Edmodo Assignment The students are asked to write a paragraph “My University” based on the previous assignment on Edmodo where students were asked to brainstorm ideas.
Edmodo Assignment
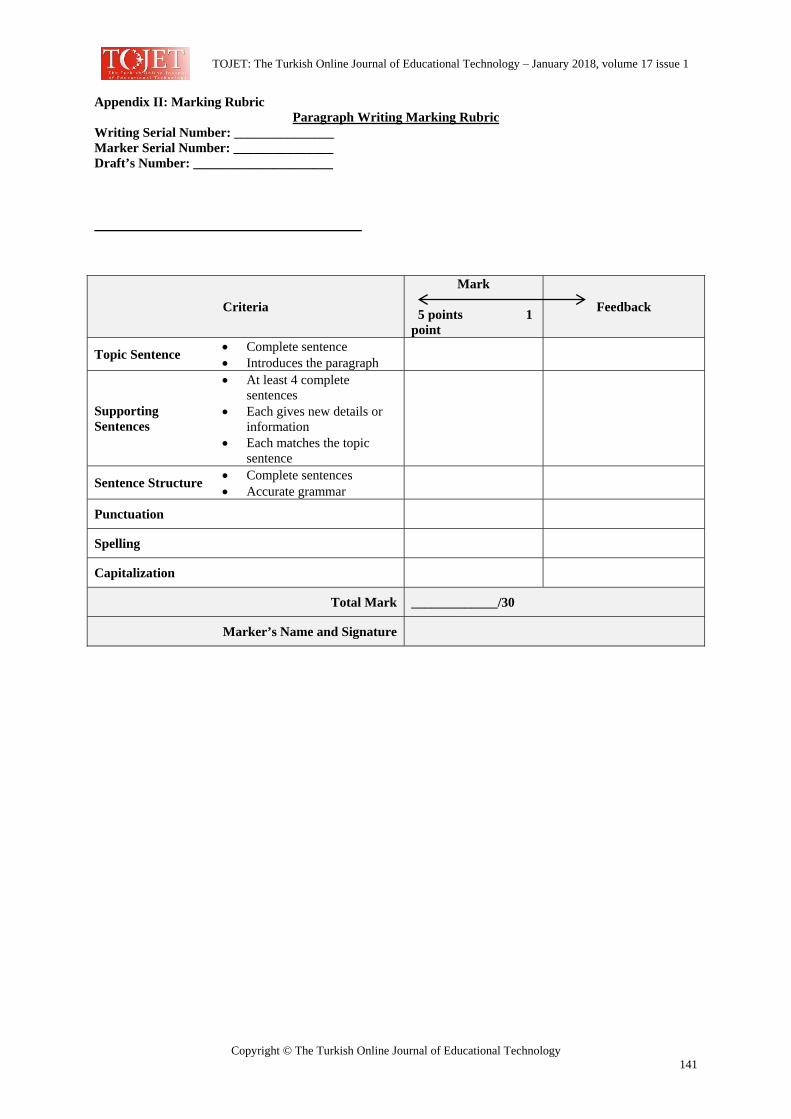
TOJET: The Turkish Online Journal of Educational Technology – January 2018, volume 17 issue 1
Copyright © The Turkish Online Journal of Educational Technology 141
Appendix II: Marking Rubric Paragraph Writing Marking Rubric
Writing Serial Number: _______________ Marker Serial Number: _______________ Draft’s Number: _____________________
Criteria
Mark
5 points 1 point
Feedback
Topic Sentence • Complete sentence • Introduces the paragraph
Supporting Sentences
• At least 4 complete sentences
• Each gives new details or information
• Each matches the topic sentence
Sentence Structure • Complete sentences • Accurate grammar
Punctuation
Spelling
Capitalization
Total Mark _____________/30
Marker’s Name and Signature
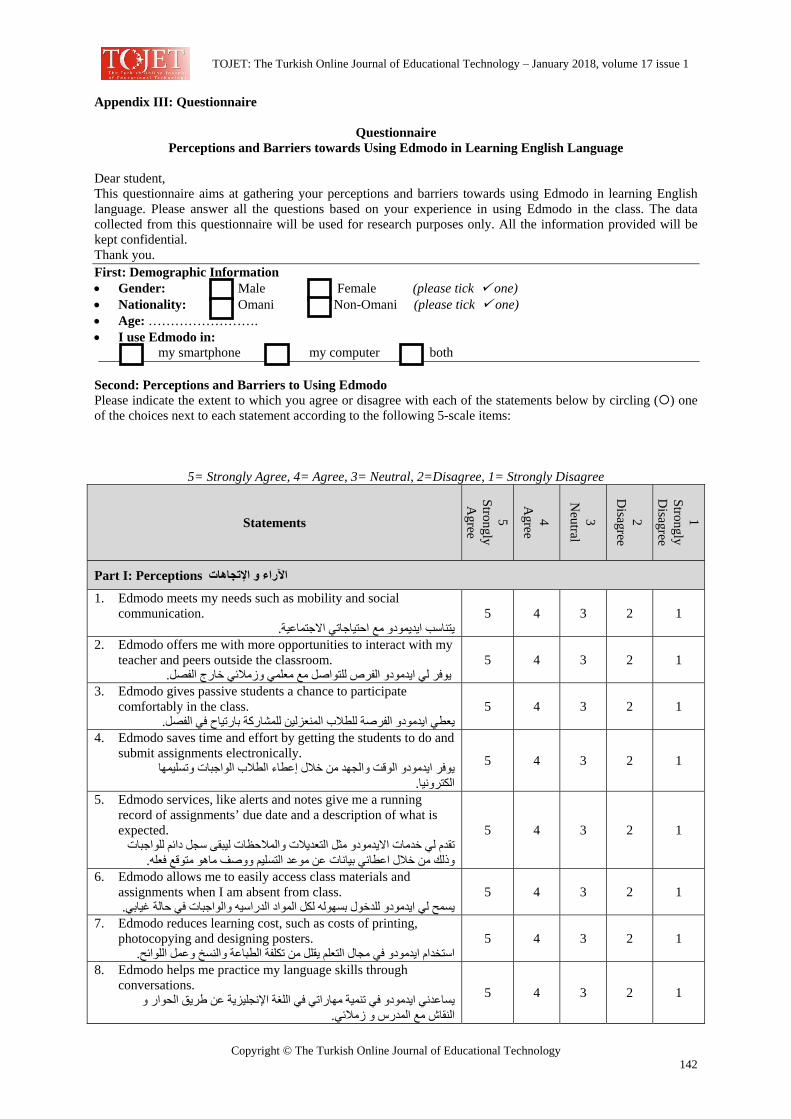
TOJET: The Turkish Online Journal of Educational Technology – January 2018, volume 17 issue 1
Copyright © The Turkish Online Journal of Educational Technology 142
Appendix III: Questionnaire
Questionnaire Perceptions and Barriers towards Using Edmodo in Learning English Language
Dear student, This questionnaire aims at gathering your perceptions and barriers towards using Edmodo in learning English language. Please answer all the questions based on your experience in using Edmodo in the class. The data collected from this questionnaire will be used for research purposes only. All the information provided will be kept confidential. Thank you. First: Demographic Information • Gender: Male Female (please tick one) • Nationality: Omani Non-Omani (please tick one) • Age: ……………………. • I use Edmodo in:
my smartphone my computer both Second: Perceptions and Barriers to Using Edmodo Please indicate the extent to which you agree or disagree with each of the statements below by circling ( ) one of the choices next to each statement according to the following 5-scale items:
5= Strongly Agree, 4= Agree, 3= Neutral, 2=Disagree, 1= Strongly Disagree
Statements 5 Strongly
Agree
4 A
gree
3 N
eutral
2 D
isagree
1 Strongly D
isagree
Part I: Perceptions اآلراء و اإلتجاهات
1. Edmodo meets my needs such as mobility and social communication.
. يتناسب ايديمودو مع احتياجاتي االجتماعية 5 4 3 2 1
2. Edmodo offers me with more opportunities to interact with my teacher and peers outside the classroom.
.يوفر لي ايدمودو الفرص للتواصل مع معلمي وزمالئي خارج الفصل 5 4 3 2 1
3. Edmodo gives passive students a chance to participate comfortably in the class.
.يعطي ايدمودو الفرصة للطالب المنعزلين للمشارآة بارتياح في الفصل 5 4 3 2 1
4. Edmodo saves time and effort by getting the students to do and submit assignments electronically.
فر ايدمودو الوقت والجهد من خالل إعطاء الطالب الواجبات وتسليمها يو.الكترونيا
5 4 3 2 1
5. Edmodo services, like alerts and notes give me a running record of assignments’ due date and a description of what is expected.
الحظات ليبقى سجل دائم للواجبات تقدم لي خدمات االيدمودو مثل التعديالت والم.وذلك من خالل اعطائي بيانات عن موعد التسليم ووصف ماهو متوقع فعله
5 4 3 2 1
6. Edmodo allows me to easily access class materials and assignments when I am absent from class.
.اجبات في حالة غيابييسمح لي ايدمودو للدخول بسهوله لكل المواد الدراسيه والو 5 4 3 2 1
7. Edmodo reduces learning cost, such as costs of printing, photocopying and designing posters.
.استخدام ايدمودو في مجال التعلم يقلل من تكلفة الطباعة والنسخ وعمل اللوائح 5 4 3 2 1
8. Edmodo helps me practice my language skills through conversations.
يساعدني ايدمودو في تنمية مهاراتي في اللغة اإلنجليزية عن طريق الحوار و .النقاش مع المدرس و زمالئي
5 4 3 2 1
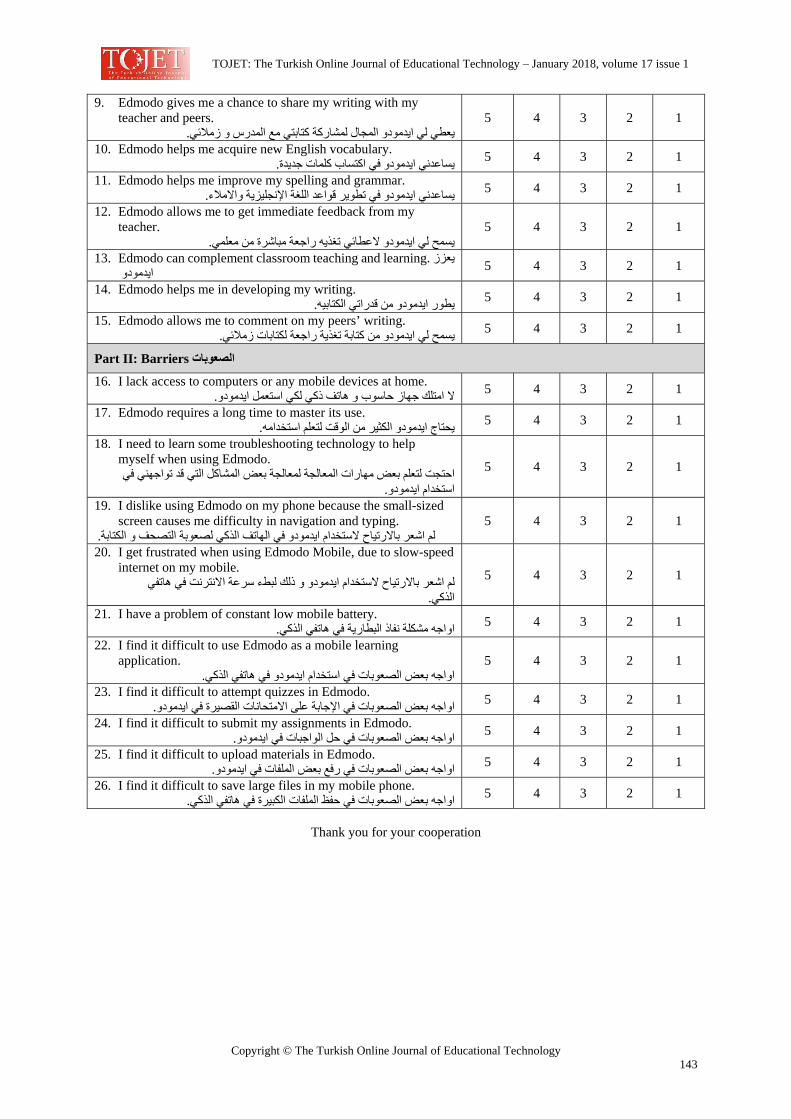
TOJET: The Turkish Online Journal of Educational Technology – January 2018, volume 17 issue 1
Copyright © The Turkish Online Journal of Educational Technology 143
9. Edmodo gives me a chance to share my writing with my teacher and peers.
.ييعطي لي ايدمودو المجال لمشارآة آتابتي مع المدرس و زمالئ 5 4 3 2 1
10. Edmodo helps me acquire new English vocabulary. .يساعدني ايدمودو في اآتساب آلمات جديدة 5 4 3 2 1
11. Edmodo helps me improve my spelling and grammar. .يساعدني ايدمودو في تطوير قواعد اللغة اإلنجليزية واالمالء 5 4 3 2 1
12. Edmodo allows me to get immediate feedback from my teacher.
.يسمح لي ايدمودو العطائي تغذيه راجعة مباشرة من معلمي 5 4 3 2 1
13. Edmodo can complement classroom teaching and learning. يعزز 1 2 3 4 5 ايدمودو
14. Edmodo helps me in developing my writing. .يطور ايدمودو من قدراتي الكتابيه 5 4 3 2 1
15. Edmodo allows me to comment on my peers’ writing. .يسمح لي ايدمودو من آتابة تغذية راجعة لكتابات زمالئي 5 4 3 2 1
Part II: Barriers الصعوبات
16. I lack access to computers or any mobile devices at home. .دوال امتلك جهاز حاسوب و هاتف ذآي لكي استعمل ايدمو 5 4 3 2 1
17. Edmodo requires a long time to master its use. . يحتاج ايدمودو الكثير من الوقت لتعلم استخدامه 5 4 3 2 1
18. I need to learn some troubleshooting technology to help myself when using Edmodo.
لتي قد تواجهني في احتجت لتعلم بعض مهارات المعالجة لمعالجة بعض المشاآل ا. استخدام ايدمودو
5 4 3 2 1
19. I dislike using Edmodo on my phone because the small-sized screen causes me difficulty in navigation and typing.
. لم اشعر باالرتياح الستخدام ايدمودو في الهاتف الذآي لصعوبة التصحف و الكتابة 5 4 3 2 1
20. I get frustrated when using Edmodo Mobile, due to slow-speed internet on my mobile.
لم اشعر باالرتياح الستخدام ايدمودو و ذلك لبطء سرعة االنترنت في هاتفي .الذآي
5 4 3 2 1
21. I have a problem of constant low mobile battery. . مشكلة نفاذ البطارية في هاتفي الذآي اواجه 5 4 3 2 1
22. I find it difficult to use Edmodo as a mobile learning application.
. اواجه بعض الصعوبات في استخدام ايدمودو في هاتفي الذآي 5 4 3 2 1
23. I find it difficult to attempt quizzes in Edmodo. .اإلجابة على االمتحانات القصيرة في ايدمودواواجه بعض الصعوبات في 5 4 3 2 1
24. I find it difficult to submit my assignments in Edmodo. . اواجه بعض الصعوبات في حل الواجبات في ايدمودو 5 4 3 2 1
25. I find it difficult to upload materials in Edmodo. . ات في ايدمودواواجه بعض الصعوبات في رفع بعض الملف 5 4 3 2 1
26. I find it difficult to save large files in my mobile phone. . اواجه بعض الصعوبات في حفظ الملفات الكبيرة في هاتفي الذآي 5 4 3 2 1
Thank you for your cooperation
TOJET: The Turkish Online Journal of Educational Technology – January 2018, volume 17 issue 1
Copyright © The Turkish Online Journal of Educational Technology 144
Secondary School Students’ Use of and Attitudes toward Online Mathematics Homework Nour Awni Albelbisi Department of Curriculum and Instructional Technology, Faculty of Education, University of Malaya, 50603 Kuala Lumpur, MALAYSIA [email protected] Biography Nour Awni Albelbisi holds a Master degree in Instructional Technology at University of Malaya, Malaysia. Farrah Dina Yusop Department of Curriculum and Instructional Technology, Faculty of Education, University of Malaya, 50603 Kuala Lumpur, MALAYSIA For correspondence: [email protected]
ABSTRACT The purposes of this study were twofold: 1) to examine the influence of performance expectancy, and effort expectancy on secondary school students attitudes toward the use of a mathematics online homework package called MyiMaths; and 2) to predict the factor that best influences their attitudes. A 15 item, five-point Likert-scale instrument was administered to 345 secondary school students, and data were analyzed using the Partial Least Squares-Structured Equation Modeling (PLS-SEM) approach. Findings revealed that there were significant relationships between performance expectancy, effort expectancy, and student attitude toward the use of an online mathematics homework tool. The findings also indicated a positive relationship between student attitudes and their actual use of online homework. Additionally, performance expectancy was found to be the best factor for predicting student attitude toward the use of online homework. The outcomes of this study will enable educators to design appropriate teaching and learning interventions for their students. Keywords: Attitude; Mathematics; Online homework; Online learning; Web-based learning INTRODUCTION Online homework (OHW), considered to be an effective alternative method to traditional homework (Riffell & Sibley, 2005). The use of web-based or OHW has become a new trend for complementing traditional paper-and-pencil assignments in the teaching and learning of mathematics (Locklear, 2012). The aim of using OHW tools is to enable students to complete and submit their homework assignments online and to receive immediate feedback. OHW makes students more actively engaged in learning activities, leading to better overall performance. Students are able to work anywhere with the help of online tutorials by receiving instant online feedback (Gates, 2014). Research on the use of OHW tools has grown significantly in education environments due to the advantages provided by this technology. Very few studies, however, have reported definite empirical evidence either in favor of the use of OHW tools or against such use (Cox and Singer, 2011, Wooten and Dillard-Eggers, 2013). For example, Lenz (2010) found high levels of perceived learning for students who used OHW systems but failed to prove that exam grades improved significantly. Therefore, more studies should be conducted to provide clear, practical evidence for understanding the influence of using OHW tools. Furthermore, existing research studies related to OHW have been directed toward higher education learners such as Peng (2009) who studied online homework with 61 participants in a college accounting course in the University of Michigan; Cox and Singer (2011), who investigated OHW used in four sections of college calculus (n=87). What would happen if OHW were to be used in more structured learning environments such as in secondary schools, which factors should be given the most consideration? OBJECTIVES AND RESEARCH QUESTIONS The first aim of this study was to examine the influence of performance expectancy, and effort expectancy on secondary school student attitudes toward the use of a mathematics OHW tool called MyiMaths. The second purpose of this study was to predict the most significant factor that influences students’ attitudes toward the use of this tool.
TOJET: The Turkish Online Journal of Educational Technology – January 2018, volume 17 issue 1
Copyright © The Turkish Online Journal of Educational Technology 145
The framework of this study was based on a combination of factors derived from two theories: Gilbert (2015) and the Unified Theory of Acceptance and Use of Technology (UTAUT). These provide a way to explain the impact of student attitude toward OHW on performance expectancy, and effort expectancy factors. They can also be used to predict the most important factor that influences student attitudes. This study was conducted to answer the following research questions: 1. Which factors (i.e., performance expectancy and effort expectancy) influence student’s attitude toward the use of OHW for mathematics learning? 2. What is the relationship between student attitude toward the use of OHW and the actual use of OHW? 3. Which factors (i.e., performance expectancy, and effort expectancy) best predict student attitude toward the use of OHW for mathematics learning? The next section presents literature related to OHW and its relationship with performance expectancy, effort expectancy, and attitude toward mathematics. LITERATURE REVIEW Homework Homework is any task assigned to students to do outside of class to prepare them for new materials. Previous research indicates that a greater amount of homework is beneficial for improving student achievement at upper-elementary and secondary levels (Kitsantas, Cheema, & Ware, 2011). Homework allows students to do the Mathematics rather than merely watching it being done by the professor. It allows the student to take an active role in improving their knowledge and perception of the material (Smolira, 2008). Homework is the best way to practice and develop problem solving and critical thinking skills ((Bonham, Deardorff, & Beichner, 2003; Palocsay & Stevens, 2008). Most studies that focus specifically on quantitative homework have indicated that the course grade and overall performance are positively affected by doing homework (Ramdass & Zimmerman, 2011). Bembenutty (2011) found if students receive shorter and more frequent homework, they are more likely to complete the assignments, which ultimately leads to increased achievement. Ramdass and Zimmerman (2011) studied how homework can influence the development of self-regulation skills and discussed how requiring homework influences far more than achievement. Doing homework has a particularly positive impact on the student learning processes when it is graded. One approach that motivates students to do homework is to collect and evaluate it as homework grade which influence the students’ overall final course grades (Cox, 2011). In the traditional mathematics course, it is nearly impossible for an instructor to grade all of the homework problems assigned to each student. Even if assignments are graded, feedback may not be received in time to help students adjust any incorrect thought processes prior to an exam. Technology has produced new models for delivering mathematics instruction—including the format of homework—and the introduction of OHW is a promising way to improve the feedback process and effectiveness of homework (Lenz, 2010). Online Homework (OHW) The terms “web-based homework” or “online homework systems” refer to any system of computerized homework problems made to provide automatic grading and immediate feedback (Leong & Alexander, 2014). In the current study, the OHW system MyiMaths followed this definition. MyiMathis is a website for mathematics homework that can be accessed online anytime via the link http://www.myimaths.com. It includes a large bank of practices for assessing mathematics skills, taking quizzes, viewing videos, obtaining live tutorial help, and providing immediate feedback. Researchers have documented that online homework plays an important role in students’ attitude (e.g. Barnsley, 2014; Halcrow & Dunnigan, 2012; Lenz, 2010). Students have positive attitudes toward the OHW tool possibly because of the immediate feedback that help to improve student learning and understanding (Leong & Alexander, 2014). Doorn, Janssen, & O’Brien (2010) indicated in their research that 90% of students thought that online homework worked well. More than 70% of the students in this study would recommend online homework to others, as they found it beneficial to their understanding of content and exam preparation. Zerr (2007) noted that 17 of 19 calculus students strongly agreed that using the OHW was a valuable addition to the course.
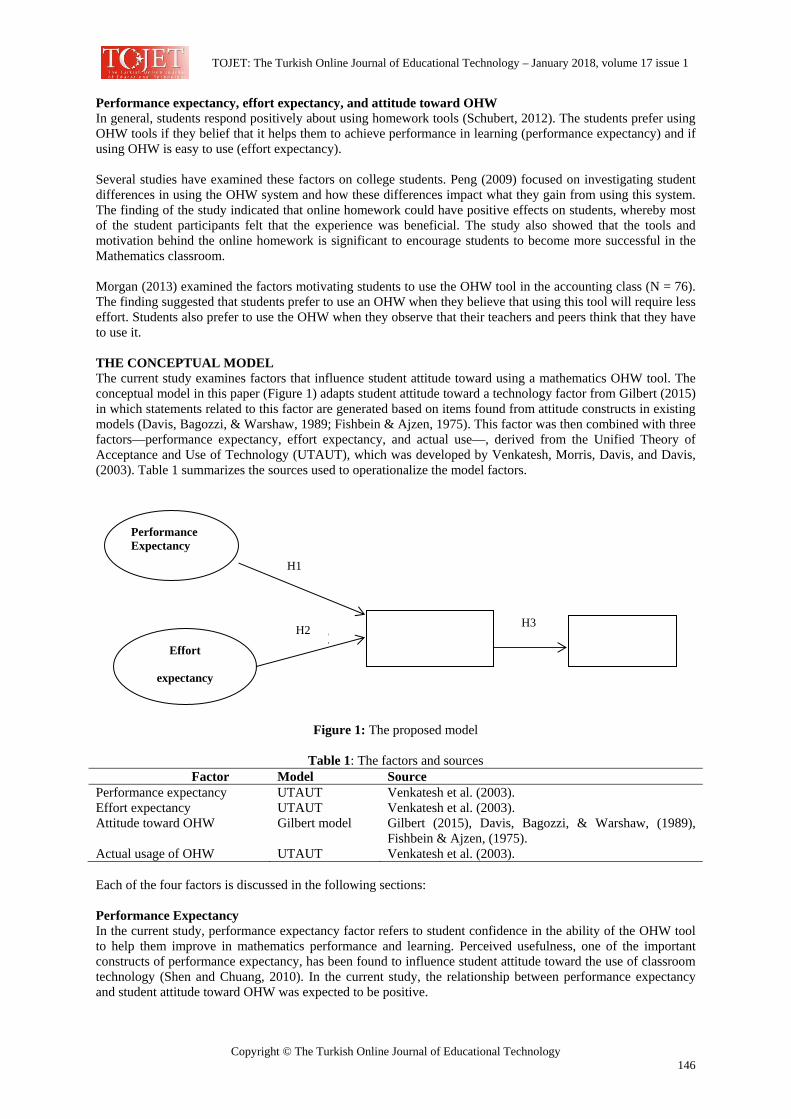
TOJET: The Turkish Online Journal of Educational Technology – January 2018, volume 17 issue 1
Copyright © The Turkish Online Journal of Educational Technology 146
Performance expectancy, effort expectancy, and attitude toward OHW In general, students respond positively about using homework tools (Schubert, 2012). The students prefer using OHW tools if they belief that it helps them to achieve performance in learning (performance expectancy) and if using OHW is easy to use (effort expectancy). Several studies have examined these factors on college students. Peng (2009) focused on investigating student differences in using the OHW system and how these differences impact what they gain from using this system. The finding of the study indicated that online homework could have positive effects on students, whereby most of the student participants felt that the experience was beneficial. The study also showed that the tools and motivation behind the online homework is significant to encourage students to become more successful in the Mathematics classroom. Morgan (2013) examined the factors motivating students to use the OHW tool in the accounting class (N = 76). The finding suggested that students prefer to use an OHW when they believe that using this tool will require less effort. Students also prefer to use the OHW when they observe that their teachers and peers think that they have to use it. THE CONCEPTUAL MODEL The current study examines factors that influence student attitude toward using a mathematics OHW tool. The conceptual model in this paper (Figure 1) adapts student attitude toward a technology factor from Gilbert (2015) in which statements related to this factor are generated based on items found from attitude constructs in existing models (Davis, Bagozzi, & Warshaw, 1989; Fishbein & Ajzen, 1975). This factor was then combined with three factors—performance expectancy, effort expectancy, and actual use—, derived from the Unified Theory of Acceptance and Use of Technology (UTAUT), which was developed by Venkatesh, Morris, Davis, and Davis, (2003). Table 1 summarizes the sources used to operationalize the model factors.
Figure 1: The proposed model
Table 1: The factors and sources Factor Model Source Performance expectancy UTAUT Venkatesh et al. (2003). Effort expectancy UTAUT Venkatesh et al. (2003). Attitude toward OHW Gilbert model Gilbert (2015), Davis, Bagozzi, & Warshaw, (1989),
Fishbein & Ajzen, (1975). Actual usage of OHW UTAUT Venkatesh et al. (2003). Each of the four factors is discussed in the following sections: Performance Expectancy In the current study, performance expectancy factor refers to student confidence in the ability of the OHW tool to help them improve in mathematics performance and learning. Perceived usefulness, one of the important constructs of performance expectancy, has been found to influence student attitude toward the use of classroom technology (Shen and Chuang, 2010). In the current study, the relationship between performance expectancy and student attitude toward OHW was expected to be positive.
Attitude toward the use of online homework
Actual usage of online homework
Effort
expectancy
Performance Expectancy
2
H1
H2 H3
TOJET: The Turkish Online Journal of Educational Technology – January 2018, volume 17 issue 1
Copyright © The Turkish Online Journal of Educational Technology 147
Therefore, the first research hypothesis is: H1: Student performance expectancy is positively influenced by student attitude toward the use of OHW for mathematics learning. Effort expectancy Effort expectancy in this study refers to the degree to which students perceive ease of use when using the OHW tool. Students are more motivated to accept and use OHW tools if they perceive that using these tools are easy (Morgan, 2013) and vice versa. Self-efficacy, enjoyment, and anxiety factors contribute to effort expectancy and may impact one’s attitude toward using technology (Celik & Yesilyurt, 2013; Shen & Chuang, 2010). The features of the OHW tool used in this study supported these factors, so student attitude toward the OHW was expected to predict effort expectancy. Therefore, the second research hypothesis is: H2: Student’s effort expectancy is positively influenced by student attitude toward the use of OHW for mathematics learning. Attitude toward Using Technology Attitude toward technology refer to positive or negative feelings about performing the target behavior (Venkatesh, 2013). The attitude toward use of technology is drawn from the attitude toward a behavior construct found in the Theory of Reasoned Action, the affective state toward use from the Model of Personal Computer Utilization, the affective state from Social Cognitive Theory, and the intrinsic motivation from Motivational Theory. All these constructs relate to an attitude conveying one’s enjoyment, pleasure, and liking connected with the use of technology. Individuals accept and use technology more easily if they have positive attitudes compared with those with negative attitudes toward technology. In this study, attitude refers to students’ feelings of favorability or unfavorability toward using OHW tools. Actual Use Actual use of technology refers to personal interests or personal evaluation of performing the system (Zanna & Rempeel, 1988). In the current study, this construct is used to assess student interest toward the OHW tool. Numerous studies have indicated that student attitude improves with the use of technology (Edmunds, Thorpe, & Conole, 2012; Maria, Persa, Ilias, & Efstanthios, 2011; Judi, Amin, Zin, & Latih, 2011), so in the current study, student attitude toward OHW was expected to predict actual use of OHW. Therefore, the third research hypothesis is: H3: Student attitude toward the use of OHW is positively influenced by the actual use of OHW for mathematics learning. METHODOLOGY A Partial Least Squares (PLS-SEM) approach was used for the current study to examine the relationships between student attitude toward OHW and factors that motivate students to use technology (i.e., performance expectancy and effort expectancy). Then, the relationship between student attitude toward OHW and actual use of an OHW tool in secondary schools was tested. The PLS-SEM technique was used to test the structural equation model for several reasons. First, PLS-SEM represents a causal model approach, whose purpose is to maximize the explained variance of the dependent latent variables (Hair, Sarstedt, Ringle & Mena, 2012). Second, PLS-SEM may be used for a small sample size; it works on reflective and formative models that contain multiple or single-item construct indicators (Hair, Hult, Ringle, & Sarstedt, 2014). Third, PLS-SEM is useful for predicting new or changeable phenomena and is an approach suitable for testing a theoretical model or measures that are not well-designed (Chin & Newsted, 1999). For these reasons this approach is well-suited to the purpose of this study. Sample The sample for this study consisted of 345 secondary students from one of the international schools in Kuala Lumpur. All students have access to the OHW tool MyiMaths, and they were able to log into their accounts and work on the mathematics homework assigned. Students were able to access their OHW at any time using a computer with an Internet connection to complete their weekly assignments.
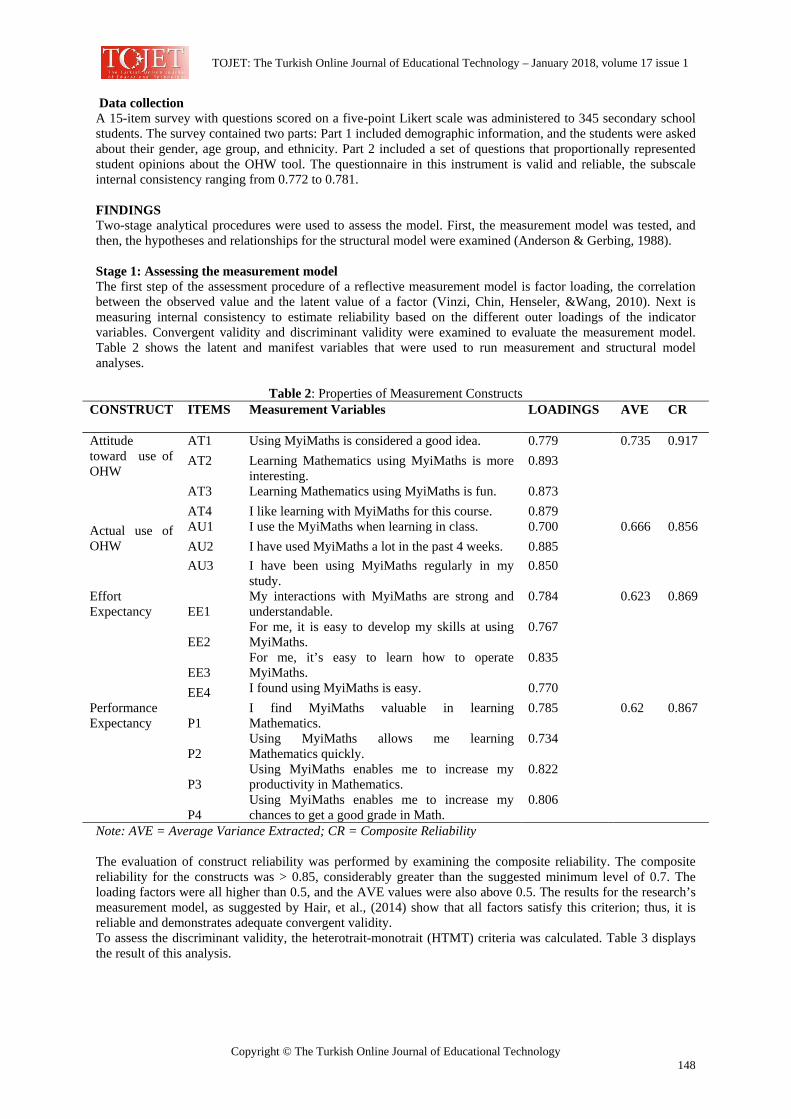
TOJET: The Turkish Online Journal of Educational Technology – January 2018, volume 17 issue 1
Copyright © The Turkish Online Journal of Educational Technology 148
Data collection A 15-item survey with questions scored on a five-point Likert scale was administered to 345 secondary school students. The survey contained two parts: Part 1 included demographic information, and the students were asked about their gender, age group, and ethnicity. Part 2 included a set of questions that proportionally represented student opinions about the OHW tool. The questionnaire in this instrument is valid and reliable, the subscale internal consistency ranging from 0.772 to 0.781. FINDINGS Two-stage analytical procedures were used to assess the model. First, the measurement model was tested, and then, the hypotheses and relationships for the structural model were examined (Anderson & Gerbing, 1988). Stage 1: Assessing the measurement model The first step of the assessment procedure of a reflective measurement model is factor loading, the correlation between the observed value and the latent value of a factor (Vinzi, Chin, Henseler, &Wang, 2010). Next is measuring internal consistency to estimate reliability based on the different outer loadings of the indicator variables. Convergent validity and discriminant validity were examined to evaluate the measurement model. Table 2 shows the latent and manifest variables that were used to run measurement and structural model analyses.
Table 2: Properties of Measurement Constructs CONSTRUCT ITEMS Measurement Variables LOADINGS AVE CR
Attitude toward use of OHW
AT1 Using MyiMaths is considered a good idea. 0.779 0.735 0.917 AT2 Learning Mathematics using MyiMaths is more
interesting. 0.893
AT3 Learning Mathematics using MyiMaths is fun. 0.873 AT4 I like learning with MyiMaths for this course. 0.879
Actual use of OHW
AU1 I use the MyiMaths when learning in class. 0.700 0.666 0.856 AU2 I have used MyiMaths a lot in the past 4 weeks. 0.885 AU3 I have been using MyiMaths regularly in my
study. 0.850
Effort Expectancy
EE1 My interactions with MyiMaths are strong and understandable.
0.784 0.623 0.869
EE2 For me, it is easy to develop my skills at using MyiMaths.
0.767
EE3 For me, it’s easy to learn how to operate MyiMaths.
0.835
EE4 I found using MyiMaths is easy. 0.770 Performance Expectancy P1
I find MyiMaths valuable in learning Mathematics.
0.785 0.62 0.867
P2 Using MyiMaths allows me learning Mathematics quickly.
0.734
P3 Using MyiMaths enables me to increase my productivity in Mathematics.
0.822
P4 Using MyiMaths enables me to increase my chances to get a good grade in Math.
0.806
Note: AVE = Average Variance Extracted; CR = Composite Reliability The evaluation of construct reliability was performed by examining the composite reliability. The composite reliability for the constructs was > 0.85, considerably greater than the suggested minimum level of 0.7. The loading factors were all higher than 0.5, and the AVE values were also above 0.5. The results for the research’s measurement model, as suggested by Hair, et al., (2014) show that all factors satisfy this criterion; thus, it is reliable and demonstrates adequate convergent validity. To assess the discriminant validity, the heterotrait-monotrait (HTMT) criteria was calculated. Table 3 displays the result of this analysis.
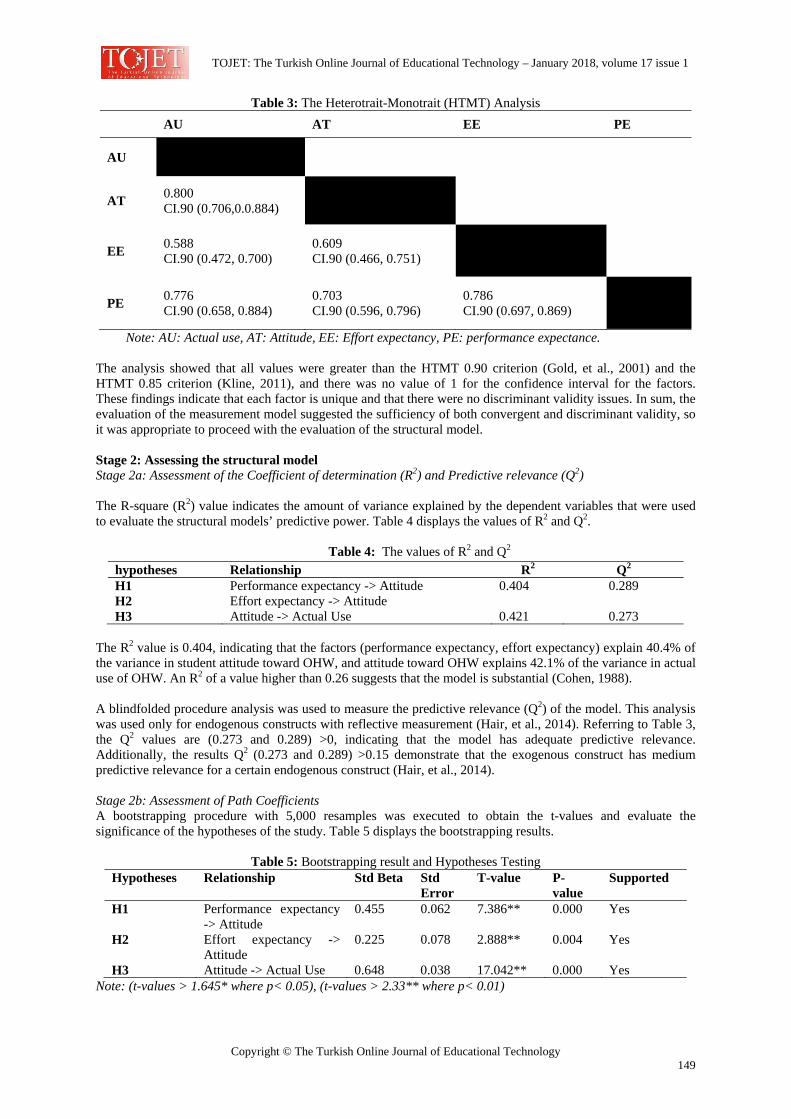
TOJET: The Turkish Online Journal of Educational Technology – January 2018, volume 17 issue 1
Copyright © The Turkish Online Journal of Educational Technology 149
Table 3: The Heterotrait-Monotrait (HTMT) Analysis AU AT EE PE
AU
AT 0.800 CI.90 (0.706,0.0.884)
EE 0.588 CI.90 (0.472, 0.700)
0.609 CI.90 (0.466, 0.751)
PE 0.776 CI.90 (0.658, 0.884)
0.703 CI.90 (0.596, 0.796)
0.786 CI.90 (0.697, 0.869)
Note: AU: Actual use, AT: Attitude, EE: Effort expectancy, PE: performance expectance. The analysis showed that all values were greater than the HTMT 0.90 criterion (Gold, et al., 2001) and the HTMT 0.85 criterion (Kline, 2011), and there was no value of 1 for the confidence interval for the factors. These findings indicate that each factor is unique and that there were no discriminant validity issues. In sum, the evaluation of the measurement model suggested the sufficiency of both convergent and discriminant validity, so it was appropriate to proceed with the evaluation of the structural model. Stage 2: Assessing the structural model Stage 2a: Assessment of the Coefficient of determination (R2) and Predictive relevance (Q2)
The R-square (R2) value indicates the amount of variance explained by the dependent variables that were used to evaluate the structural models’ predictive power. Table 4 displays the values of R2 and Q2.
Table 4: The values of R2 and Q2
The R2 value is 0.404, indicating that the factors (performance expectancy, effort expectancy) explain 40.4% of the variance in student attitude toward OHW, and attitude toward OHW explains 42.1% of the variance in actual use of OHW. An R2 of a value higher than 0.26 suggests that the model is substantial (Cohen, 1988).
A blindfolded procedure analysis was used to measure the predictive relevance (Q2) of the model. This analysis was used only for endogenous constructs with reflective measurement (Hair, et al., 2014). Referring to Table 3, the Q2 values are (0.273 and 0.289) >0, indicating that the model has adequate predictive relevance. Additionally, the results Q2 (0.273 and 0.289) >0.15 demonstrate that the exogenous construct has medium predictive relevance for a certain endogenous construct (Hair, et al., 2014).
Stage 2b: Assessment of Path Coefficients A bootstrapping procedure with 5,000 resamples was executed to obtain the t-values and evaluate the significance of the hypotheses of the study. Table 5 displays the bootstrapping results.
Table 5: Bootstrapping result and Hypotheses Testing Hypotheses Relationship Std Beta Std
Error T-value P-
value Supported
H1 Performance expectancy -> Attitude
0.455 0.062 7.386** 0.000 Yes
H2 Effort expectancy -> Attitude
0.225 0.078 2.888** 0.004 Yes
H3 Attitude -> Actual Use 0.648 0.038 17.042** 0.000 Yes Note: (t-values > 1.645* where p< 0.05), (t-values > 2.33** where p< 0.01)
hypotheses Relationship R2 Q2 H1 Performance expectancy -> Attitude 0.404 0.289 H2 Effort expectancy -> Attitude H3 Attitude -> Actual Use 0.421 0.273
TOJET: The Turkish Online Journal of Educational Technology – January 2018, volume 17 issue 1
Copyright © The Turkish Online Journal of Educational Technology 150
According to Table 5 the predictors of student attitude toward the use of OHW performance expectancy (β = 0.455, p <0.01), and effort expectancy (β = 0.225, p <0.05) were all positively related to attitude toward OHW, so H1and H2 were supported. We next looked at the predictor of the actual use of OHW. Student attitude toward OHW (β = 0.648, p <0.01) was positively related to actual use of OHW, so H3 was also supported. Stage 2c: Assessment of the Effect sizes (f2) The results of the f 2 are displayed in Table 6.
Table 6: Results of the f 2 effect sizes Hypotheses Relationship Effect Size (f2) Effect Size H1 Performance expectancy -> Attitude 0.207 medium H2 effort expectancy -> Attitude 0.05 small H3 Attitude -> Actual Use 0.726 large The effect sizes were determined to be 0.02, 0.15, and 0.35, or small, medium, and large effects, respectively (Cohen, 1988). With reference to Table 4, H1 relationship had a medium effect size, H2 had a relationship with small effects, and the H3 relationship had a large effect size, so f 2 values for (H1, H2, and H3) relationships demonstrated substantive impact. DISCUSSION This study investigated factors influencing the attitudes of secondary school students toward the use of online mathematics homework. The study combines attitude factor from Gilbert (2015) with some factors from the UTAUT model as a way to explain the relationship between these factors and students attitude toward the use of OHW for learning mathematics. The literature points to the need for identifying factors that can positively influence student achievement (Falco, Summers, & Bauman, 2010; Fast, et al., 2010). Performance expectancy and effort expectancy are factors that could change how students perform in the classroom and how they view themselves as capable learners of mathematics through online homework tools. From the proposed hypotheses, H1, H2 and H3 were supported as having a direct relationship with student attitude toward OHW. The relationship between student performance expectancy and attitude toward the use of OHW The result of this hypothesis revealed a strong and positive relationship between student performance expectancy and attitude toward the use of OHW for mathematics learning. When students have a clear understanding that using OHW can help them attain gains in mathematics learning, their attitude toward using it will be improved. The finding of this hypothesis supports the Gilbert (2015) study, which found that performance expectancy significantly contributes to student attitudes toward technology.
The relationship between student effort expectancy and attitude toward the use of OHW The finding of this hypothesis revealed that student effort expectancy was positively influenced by student attitude toward OHW for mathematics learning. Students who perceived the OHW tool to be easy to use had a more favorable attitude toward using it. The finding of this hypothesis is consistent with the Morgan (2013) study indicating that students prefer to use OHW systems when they believe that using them requires less effort. The finding of this hypothesis is also supported by existing literature indicating that effort expectancy significantly predicts student attitude toward technology (Celik & Yesilyurt, 2013; Gilbert, 2015; Shen & Chuang, 2010).
The relationship between attitude toward the use of OHW and the actual use of OHW For the second research question, the results indicated a strong positive relationship between attitude toward OHW and actual use of OHW. Student attitude toward OHW improved positively when students used OHW in class or when it was assigned for practice outside of class. This finding of the hypothesis is supported by research suggesting that student attitude improves with the use of technology (Edmunds, et al., 2012; Judi, et al., 2011; Maria, et al., 2011). The factors that best predict student attitude toward the use of OHW For the third research question, an effect-sizes technique using the PLS-SEM structural model analysis was executed to determine the factor that most influenced student attitude toward the use of OHW for mathematics learning. The findings revealed that effect size for performance expectancy (f 2=0.207) was the best predictor of student attitude toward OHW. Effect size for the effort expectancy was (f 2=0.05) which has the small effect for
TOJET: The Turkish Online Journal of Educational Technology – January 2018, volume 17 issue 1
Copyright © The Turkish Online Journal of Educational Technology 151
predicting student attitude toward the use of OHW. This finding is especially important for OHW developers, who can determine specific interventions that will help increase performance expectancy. CONCLUSION In summary, a positive relationship was found between performance expectancy, effort expectancy, and attitude toward the use of OHW. There was a positive relationship between attitude toward OHW and actual use of OHW. Performance expectancy was the best predictor of student attitude toward the use of OHW. Future studies should explore whether student attitude toward the use of OHW in these settings influences student achievement, motivation, or improvement in student attitude toward mathematics in general. In addition, more studies could be performed to confirm and expand current findings for a larger sample of participants who are more representative of the whole population of secondary school students. Another interesting study could focus more on the effect of the instructor on using OHW and consider this factor as an independent variable. Research should examine the relationship between instructor attitude toward OHW and student attitude. Instructors who prefer using OHW tools should be studied in comparison to instructors who reject to their use to obtain a more complete picture about the impact of OHW tools. Negative student attitudes toward mathematics increased as the grade level increased. The Adelson and McCoach (2011) study stated that students in lower grades enjoyed mathematics more than those in the upper grades. Students with negative attitudes toward mathematics in high school took fewer math courses in college. In this regard, it is necessary to encourage students to develop positive attitudes toward mathematics at the secondary education level by, for example, using online technologies such as OHW to help improve students’ attitudes toward mathematics and to encourage them to work harder at mathematics (Avci, 2012). The findings of this study should be useful to Mathematics instructors to encourage them to adopt online homework tools as an instructional and assessment tool for increasing students’ attitude toward learning Mathematics. The finding is especially important for OHW developers, who can determine specific interventions that help to improve students’ attitude toward mathematics. ACKNOWLEDGEMENTS This study is supported by the University of Malaya Research University Grants (no. RU008T-2017 and RU022C-2014).
Statements on open data, ethics and conflict of interest Data for this study will be stored in an institutional repository and can be accessed by public. Participants of this study have given their consent to participate in data collection processes and consent for authors to publish the findings. The following procedures were undertaken to ensure confidentiality:
• Only the Principal Investigator (PI) had access to the raw data; and • All identifiers were removed from raw data and replaced with unique ID only known to the PI.
Other than funding received, this work has no other potential conflict of interest. REFERENCES Adelson, J. L., & McCoach, D. (2011). Development and psychometric properties of the math and me survey:
Measuring third through sixth graders' attitudes toward mathematics. Measurement & Evaluation in Counseling & Development, 44(4), 225-247.
Anderson, J.C., & Gerbing, D.W. (1988). Structural Equation Modeling in practice: A review and recommended two - step approach. Psychological Bulletin, 103, 411-423.
Avci, Z., Y. (2012). Online tools in an authentic mathematics curriculum and the impacts on high school students’ attitudes and learning: A case study. (Doctoral dissertation, North Carolina State University). Retrieved from http://gradworks.umi.com/35/38/3538311.html
Barnsley, A. (2014). Analysis of the effects of online homework on the achievement, persistence, and attitude of developmental mathematics students (Doctoral dissertation). Retrieved from ProQuest Dissertations & Theses. (3624436)
Bembenutty, H. (2011). The last word: An interview with Harris Cooper—Research, policies, tips, and current perspectives on homework. Journal of Advanced Academics, 22(2), 340–349.
TOJET: The Turkish Online Journal of Educational Technology – January 2018, volume 17 issue 1
Copyright © The Turkish Online Journal of Educational Technology 152
Bonham, S. W., Deardorff, D. L., & Beichner, R. J. (2003). Comparison of student performance using web and paper-based homework in college-level physics. Journal of Research in Science Teaching, 40(10), 1050-1071. doi:10.1002/tea.10120
Celik, V., & Yesilyurt, E. (2013). Attitudes to technology, perceived computer self-efficacy and computer anxiety as predictors of computer supported education. Computers & Education, 60(1), 148–158.
Chin, W. W., & Newsted, P. R. (1999). Structural Equation Modeling Analysis with small samples using Partial Least Squares. In R. Hoyle (Ed.), Statistical strategies for small sample research (pp. 307-341). Thousand Oaks, CA: Sage,
Cohen, J. (1988). Statistical power analysis for the Behavioral Sciences. Mahwah, NJ: Erlbaum. Cox, T., & Singer, S. (2011). Taking the work out of homework. Mathematics Teacher, 104(7), 514-519. Davis, F. D., Bagozzi, R. P., & Warshaw, P. R. (1989). User acceptance of computer technology: A comparison
of two theoretical models. Management Science, 35, 982-1003. Doorn, D., Janssen, S., & O’Brien, M. (2010). Student attitudes and approaches to online homework.
International Journal for the Scholarship of Teaching and Learning, 4(1), 1-20. Retrieved from http://academics.georgiasouthern.edu/ijsotl/sm.htm
Edmunds, R., Thorpe, M., & Conole, G. (2012). Student attitudes towards and use of ICT in course study, work and social activity: A Technology Acceptance Model approach. British Journal of Educational Technology, 43(1), 71–84.
Fishbein, M., & Ajzen, I. (1975). Belief, attitude, intention and behavior: An introduction to theory and research. Reading, MA: Addison-Wesley.
Gates, M. R. (2014). Middle school mathematics and self-efficacy at a southeastern Massachusetts middle school (Doctoral dissertation, Northeastern University Boston, MA). Retrieved from http://iris.lib.neu.edu/education_theses/244/
Gilbert. A. (2015). An exploration of the use of and the attitudes toward technology in first-year instrumental music. (Doctoral dissertation, University of Nebraska). Retrieved from http://digitalcommons.unl.edu/musicstudent/79/
Gold, A. H., Malhotra, A., & Segars, A. H. (2001). Knowledge management: an organizational capabilities perspective. Journal of Management Information Systems, 18(1), 185–214.
Hair, J. F., Sarstedt, M., Ringle, C. M., & Mena, J. A. (2012). An assessment of the use of partial least squares structural equation modeling in marketing research. Journal of the Academy of Marketing Science, 40(3), 414-433.
Hair, J. F., Hult, G. T. M., Ringle, C. M., & Sarstedt, M. (2014a). A primer on partial least squares structural equation modeling (PLS-SEM). Thousand Oaks, CA: SAGE.
Halcrow, C., & Dunnigan, G. (2012). Online homework in calculus I: Friend or foe? Primu : Problems, Resources, and Issues in mathematics Undergraduate Studies, 22(8), 664-682.
Judi, H. M., Amin, H. M., Zin, N. A. M., & Latih, R. (2011). Rural students’ skills and attitudes towards information and communication technology. Journal of Social Sciences, 7(4), 619–626.
Kitsantas, A., Cheema, J., & Ware, H. (2011). Mathematics achievement: The role of homework and self efficacy beliefs. Journal of Advanced Academics, 22(2), 310-339.
Kline, R. B. (2011). Principles and practice of structural equation modeling. New York: Guilford Press. Lenz, L. (2010). The effect of web-based homework system on student outcomes in a first-year mathematics
course. Journal of Computers in Mathematics and Science Teaching, 29(3), 233-246. Leong, K., & Alexander, N. (2014). College students’ attitude and mathematics achievement using web based
homework. Eurasia Journal of Mathematics, Science & Technology Education,10(6), 609-615. Locklear, D. (2012). Using online homework in a liberal arts math course to increase student participation and
performance (Doctoral dissertation, University of North Carolina College Of Management And Technology). Retrieved from http://gradworks.umi.com/34/99/3499869.html.
Maria, K., Persa, F., Ilias, A., & Efstathios, S. (2011). Teaching art using technology: The views of high school students in Greece. Review of European Studies, 3(2), 98– 109.
Morgan, A. (2013). Factors Influencing Student Use of Online Homework Management Systems. Recognizing Excellence in Business Education, 98.Annual Edition, 3, p. 98-112. http://www.acbsp.org/p/cm/ld/fid=194.
Palocsay, S. W., & Stevens, S. P. (2008). A study of the effectiveness of web-based homework in teaching undergraduate business statistics. Decision Sciences Journal of Innovative Education, 6(2), 213-232. doi:10.1111/j.1540- 4609.2008.00167.x
Ramdass, D., & Zimmerman, B. J. (2011). Developing self-regulation skills: the important role of homework. Journal of Advanced Academics, 22(2), 194- 218.
Peng, C. (2009). Using an online homework system to submit accounting homework: role of cognitive need, computer efficacy, and perception. Journal of Education for Business, 5(84) pp. 263-268.
TOJET: The Turkish Online Journal of Educational Technology – January 2018, volume 17 issue 1
Copyright © The Turkish Online Journal of Educational Technology 153
Riffell, S., & Sibley, D. (2005). Using web-based instruction to improve large undergraduate biology courses: An evaluation of a hybrid course format. Computers & Education, 44(3), 217-235. doi: 10.1016/j.compedu.2004.01.005
Schubert, D. J. (2012). The effects of online homework on high school algebra students (Doctoral dissertation, Columbia University). Retrieved from http://gradworks.umi.com/35/45/3545651.html.
Shen, C., & Chuang, H. (2010). Exploring users’ attitudes and intentions toward the interactive whiteboard technology environment. International Review on Computers & Software, 5(2), 200–208.
Smolira, J. (2008). Student perceptions of online homework in introductory finance courses. Journal of Education for Business, 90-94.
Venkatesh, V. (2013). Technology acceptance theoretical models. Retrieved from http://www.vvenkatesh.com/it/organizations/Theoretical_Models.asp#Con=structdefs
Venkatesh, V., Morris, M. G., Davis, G. B., & Davis, F. D. (2003). User acceptance of information technology: Toward a unified view. MIS Quarterly, 27(3), 425–478.
Vinzi, V. E., Chin, W. W., Henseler, J., &Wang, H. (2010). Handbook of Partial Least Squares: Concepts, methods and applications research. Berlin: Springer.
Wooten, T. and J. Dillard-Eggers (2013), “An investigation of online homework: Required or not required?”, Contemporary Issues in Education Research, 6(2), pp. 189-198.
Zanna, M. P., & Rempel, J. K. (1988). Attitudes: A new look at an old concept. In D. Bar-Tal & A. W. Kruglanski (Eds.), The social psychology of knowledge (pp. 315-334). Cambridge, UK: Cambridge University Press.
Zerr, R., (2007). A quantitative and qualitative analysis of the effectiveness of online homework in first-semester calculus. Journal of Computers and Science Teaching, 26(1), 55-73.
TOJET: The Turkish Online Journal of Educational Technology – January 2018, volume 17 issue 1
Copyright © The Turkish Online Journal of Educational Technology 154
Selection of Learning Media Mathematics for Junior School Students
Sri Adi WIDODO
Universitas Sarjanawiyata Tamansiswa, Yogyakarta, Indonesia [email protected]
WAHYUDIN
Universitas Pendidikan Indonesia, Jl. Dr. Setiabudhi No. 229 Bandung [email protected]
ABSTRACT One of the factors that determine the success of mathematics learning is the learning media used. Learning media can help students to create mathematical abstract mathematics that is abstract. In addition to media, meaningful learning is a learning that is adapted to the students' cognitive development. According to Piaget, junior high school students are at the formal stage of thinking, but the reality in the field has not been entirely capable of formal thinking so that a learning media is needed that is able to serve students with different cognitive development. By using the principles of ASSURE and VISUALS, it is necessary to develop a medium tailored to the cognitive development of junior high school students. Semi-concrete media development can be used as an alternative to mathematics learning. Some concrete semi that can be used in learning such as number cards, number lines, and comics. Keywords: learning media, mathematics, cognitive development
INTRODUCTION Developments in science and technology are rapidly today, put the position of education as a determinant for the advancement of science and technology in the future. Although science and technology have grown rapidly, sometimes technological developments are not offset with good utilization. CELMI (Cellular Explorer Learning Movie Instruction) is a mobile-based learning media, where the development of this media is motivated by the misuse of the mobile telephone which is increasingly rampant done by students (Susanto, Dwijanto, & Siskandar, 2012). Learning media is a tools or equipment to implement processes that enable educators and learners to carry out learning activities (Prasetyo, et al., 2011: 16), whereas according to Permendikbud. 65 The year 2013 on Standard Process of Primary and Secondary Education mentioned that the preparation of learning tools that is an integral part of learning planning is designed in the form of the syllabus, lesson plans, preparation of learning media and learning resources, assessment tools, and learning scenarios. This is what causes the learning media is one of the components needed for learning. The current learning system requires students not only act as the recipient of the material but also act as a communicator or conveyor of the material resulting in two-way communication and even many-way communication (Nurseto, 2011). In learning communication, learning media is needed to improve the effectiveness of learning achievement goals. That is, the learning process will occur if there is communication between the recipient of the message with the source/channel message through the media. This is in line with the meaning of instructional media is a tool that serves to convey the message of learning (Ena, 2001; Sudrajat, 2008; Mediawati, 2011), So that the learning process using the media becomes more effective (Bulut, Akçakın, Kaya, & Akçakın, 2014; Wibowo, 2013; Ismail, Sugiman and Hendikawati, 2013; Yuniati, Purnama, and Nugroho, 2011; and Ali, 2009). This message is delivered by the teacher, accepted by students to stimulate the thoughts, feelings, attention or willingness of students so that will encourage the learning process. Messages or information brought by instructional media can be in the form of messages prepared to meet the learning needs and students' abilities so students can actively participate in the learning process. In addition, the learning media is a component that is interconnected with other components in order to create expected learning situations, abstracts the abstract so as to reduce the occurrence of verbalism disease, increase student stimuli in learning activities, reduce misunderstandings of learners to the explanations given educators, The limited experience possessed by the learners, enabling direct interaction between learners with their
TOJET: The Turkish Online Journal of Educational Technology – January 2018, volume 17 issue 1
Copyright © The Turkish Online Journal of Educational Technology 155
environment, generating uniform observation, and motivating and stimulating children to learn (Nurseto, 2011; Ali, 2009; Sudrajat, 2008). In addition to good learning planning, the success of teaching and learning process is also influenced by the suitability between the subject matter and the level of students' thinking ability (Nuroso & Siswanto, 2010; Ojose, 2008). Thus, if the new students achieve concrete cognitive development, mathematics teachers are advised not to use formal mathematical learning, but mathematical formulas are brought toward the concrete. It is like reading a book for children that every stage of cognitive development of children have different book readings, for children who still think sensory motor child does not need to be given a reading book because it still uses a stronger hearing indeed, at the pre-operational stage and Concrete reading of books accompanied by images very helpful pattern of development and understanding of books, while in the formal stage of reading a novel book that is already abstract can be given to children (Nurgiyantoro, 2005). Good learning planning, well-designed learning strategies, and learning materials adapted to the level of cognitive understanding to be meaningless in learning if the media used is not appropriate. The success of learning is determined by two main components namely teaching methods and learning media (Ali, 2009). These two components are interrelated and inseparable, the use and selection of any particular teaching method have consequences on the appropriate use of the type of instructional medium. Eyler and Giles added that the effectiveness of learning is strongly influenced by the media teachers use (Muhson, 2010). So children who are at the stage of concrete operational development (age 7 to 11 years) teachers should not use formal operations in learning. This is because formal operations are given to children after the age of 12 years. According to Piaget, individuals will experience levels of cognitive development of sensory-motor, preoperative, concrete and formal operational operations. The increasing age of a person, the more complex the arrangement of nerve cells and the increased ability. As the individual progresses to his or her adulthood, he will experience biological adaptation to his environment so that there are qualitative changes in his cognitive structure. To achieve a stage of cognitive development one to another stage of cognitive development can be achieved at various ages, the child will not skip the stages of cognitive development and the child will not retreat the stage of cognitive development (Ojose, 2008). Students of junior high school (SMP) in Indonesia averaged over 11 years, where at that age children can use concrete operations to form more complex operations or in other words students can think abstract (Nuroso & Siswanto, 2010; Widodo, 2010). So that junior high school students are informal development, but junior high school teachers still need to consider the level of operation before formal because junior high school students sometimes have not reached the stage of formal or abstract thinking. Piaget sees that the process of thinking is a gradual activity of the intellectual function, that is, from thinking concretely to the abstract thinking at a formal operational stage. The development of mental capacity provides new capabilities that have not previously existed or even existed. So that junior high school children who have not reached the process of abstract thinking, they are still in a concrete operational stage. Encountering this problem teachers have an obligation to pay attention to students who are already in the abstract thinking stage and students who are still at the concrete stage of thinking. This is done by the teacher until the last stage of cognitive development has been achieved by the child. This is the background of the importance of media selection for students should be considered by the teacher before implementing the lesson. Because by using the right media can help teachers in the learning process and students can Make it concrete concepts of learning materials that are still abstract (Muhson, 2012). So the purpose of this paper is to describe the selection of effective math learning media used for junior high school students. DISCUSSION Learning Media Tools that can be used as an intermediary between the sender of the message to the recipient of the message called the media, if the media that brings messages or information that aims instructional or contain the purposes of teaching then the media is called media learning (Mediatati, 2011). Learning media is a tool that serves to convey the message of learning (Ena, 2001). Learning media can channel the message, can stimulate the mind, feelings, and willingness of learners so as to encourage the creation of learning processes in students (Sudrajat, 2008). Based on it can be concluded that the learning media is a tool that can be used as educators to send messages to students.
TOJET: The Turkish Online Journal of Educational Technology – January 2018, volume 17 issue 1
Copyright © The Turkish Online Journal of Educational Technology 156
The function of learning media such as aids to create a more effective learning situation, one of the components that are interconnected with other components in order to create expected learning situation, abstracts the abstract so as to reduce the occurrence of verbalism disease, improve the stimulation of learners in learning activities, Reduce the misunderstanding of learners to the explanation given by educators, overcome the limited experience possessed by the learners, allowing direct interaction between learners with the environment, generate uniform observations, and generate motivation and stimulate children to learn (Nurseto, 2011; Ali, 2009; Sudrajat, 2008) One of the most widely used descriptions of the theoretical basis of media use in teaching and learning is Dale's Cone of Experience (Ali, 2009). Edgar Dale made the classification according to the level from the most concrete to the most abstract (Nurseto, 2011). Dale draws that a person's learning outcomes are derived from direct experience (concrete), the reality that exists in one's life environment than through artificial objects, to the verbal (abstract) symbol. Learning media are grouped into two groups based on technological developments, namely traditional media and advanced technology media (Ali, 2009). Audio recording media and print media are part of traditional media, while the latest media technology among them is telecommunication-based media, microprocessor-based media. In contrast to the Nurseto (2011) which classifies the learning media into seven groups based on (1) Graphic, print materials, and still images, (2) Silent media projection, (3) Audio media, (4) Silent audio media, (5) ) Live audio / movie media, (6) Television media, and (7) Multimedia. Cognitive Development Each individual is born with unique characteristics. Although a person is born a twin even though the individual still has characteristics that can distinguish between the person with the twin. Human classification based on certain criteria is very difficult. The obstacles lie in the heterogeneity and uniqueness of human nature. The classification of each individual can only be done by the approach based on somewhat similar traits to be grouped into several groups of personalities. Because personality has characteristics, characteristics, styles or traits that are typically associated with the individual self. So it can be said that the personality comes from the formations we receive from the environment, such as the formation of the family in our childhood and also the innate-brought luggage. Contrary to the fact that human personality varies widely, perhaps even as much as many people, a group of experts tries to categorize people into certain types, because they argue that it is the most effective way to know human beings well. David Keirsey distinguishes individuals based on his preference temperatures (Keirsey and Bates, 1984, Keirsey, 1998), Myers-Briggs also distinguishes individuals based on temperament or preference (Seahorse, 2010). The difference between the two experts lies in the division of individuals, if David Keirsey divides into 4 personality types namely Artisan, Guardian, Idealist and Rationals (Keirsey and Bates, 1984; Keirsey, 1998) while Myers-Briggs divides it into 16 categories, they are Introverted sensing with thinking, introverted sensing with feeling, Introverted Intuition with feeling, Introverted intuition with thinking, Introverted thinking with sensing, Introverted feeling with sensing, Introverted feeling with intuition, Introverted thinking with intuition, Extraverted sensing with thinking, Extraverted sensing with feeling, Extraverted intuition with feeling, Extraverted intuition with thinking, Extraverted thinking with sensing, Extraverted feeling with sensing, Extraverted feeling with intuition, dan Extraverted Thinking with Intuition (Seahorses, 2010) Based on cognitive development, Piaget divides the cognitive development of children into four stages: sensory-motor that occurs from birth to age about 2 years, preoperational that occurs at the age of about 2 years to about 7 years, concrete operations that occur at the age of about 7 years to 12 Years, and the last stage of formal operations that occurred at the age of about 12 years until adulthood (Alhaddad, 2012; Widodo, 2010; Ojose, 2008). In general, the cognitive development of high school students is at the formal operational stage (Widodo, 2010). This is because high school students are at least 11 years of age. The formal phase of operation is the last stage of Piaget's cognitive development (Alhaddad, 2012), where at this stage students have been able to think logically, thinking with formal theoretical thinking based on propositions and hypotheses, can draw conclusions from what can be observed then, And the abstract way of thinking starts to be understood. An important characteristic of the formal development stage is that children are able to think "scientifically", to think theoretically, to argue and to test hypotheses that prioritize thinking, children are able to solve problems
TOJET: The Turkish Online Journal of Educational Technology – January 2018, volume 17 issue 1
Copyright © The Turkish Online Journal of Educational Technology 157
logically by involving various related problems (Nurgiantoro, 2005). Flavell points out some of the characteristics of this formal operational thinking, ie, hypothesis-deductive adolescence thinking, this period is characterized by proportional thinking, a combinatorial thinking adolescent, a formal operational child of reflexive thinking (Syahbana, 2011). The cognitive development of junior-aged children is at the formal operational stage so that they have abstractive thinking abilities, abstract thinking ability can be seen from classification reasoning, conservation reasoning, theoretical reasoning, combination reasoning, proportional reasoning, functional reasoning, variable control, analogical reasoning, propositional reasoning, Correlational reasoning, probable reasoning (Nuroso & Siwanto, 2010). As a result of students who have had the ability to think formal or abstract students can be invited to use their minds in solving problems that require high-level thinking such as linking, weighing, testing, deciding, abstract thinking, understanding, analyzing and solving problems (Syahbana, 2012). Despite the age, the cognitive development of junior high school children is at the formal operational stage but they are not yet fully able to think formally. Junior high school students can not yet fully think abstractly, in the learning of things or concrete events are still needed (Syahbana, 2012)). Based on this, junior high school students are sometimes still in concrete operations, in other words, a formal operational stage has not been reached. This is in accordance with Masganti (2012) which states that every individual will pass a series of qualitative changes that are invariant (stable), always fixed, not jumping or retreating. One of the characteristics that emerged during the concrete operational stage is that at this stage the child has begun to understand the concept of eternity, the student can understand the operation (logical) with the help of concrete objects although sometimes there are students do not need the help of concrete objects When performing surgery, it is possible students have difficulty making verbal generalizations of similar examples (Alhadad, 2012). At the concrete operational stage, learning should not be glued to learning concepts but students must engage in activities that directly interact with the object being studied (Fauziah, 2011). At this stage, the child begins to understand logically stable. Characteristics of children at this stage include (a) a child can make a simple classification, classify objects based on common traits, such as color classification, certain character classification, (b) the child can make a sequence of things accordingly, according to the object, numbers, Small, and so on, (c) The child may begin to develop his or her imagination into the past and the future; The development of egocentric patterns of thinking becomes easier to identify with different points of view, and (d) the child begins to think of arguments and solve simple problems, there is a tendency to acquire ideas as adults do, yet can not think about Something abstract because the way of thinking is still limited to a concrete situation. Selecting Appropriate Learning Media mathematics Junior High School Students With Cognitive Development Learning media is a component that is interconnected with other components in order to create learning situations that are expected, abstracts the abstract so as to reduce the occurrence of verbalism disease, improve student stimuli in learning activities, reduce misunderstanding of learners to the explanations given educators, overcome the limited experience Owned by learners, enabling direct interaction between learners and their environment, generating uniform observation, and motivating and stimulating children to learn (Nurseto, 2011; Ali, 2009; Sudrajat, 2008). To be effective in learning mathematics, in the learning required a good and careful planning. One of the things that should be carefully planned in addition to the use of models, strategies, and approaches used in learning are learning tools such as syllabus, lesson plan, learning media and learning resources, assessment tools, and learning scenarios. In order to utilize learning media properly and effectively, it is necessary to consider several aspects such as Analyze Learner Characteristics, State Objectives, Select and Modify or Design Materials, utilize materials, require learner response, and evaluate (Mukminan & Saliman, 2008). The use of media in the teaching and learning process is very important. Some criteria in the selection of materials to achieve effective results include (1). Interesting, meaning the media used should appeal to students, (2). Motivate, meaning the media used can motivate students to read, (3). Relevant/appropriate, meaning that the media used must be relevant or in accordance with the topic discussed and in accordance with the age of students (Johana & Widayanti, 2007). In addition, for the media to be used appropriately and effectively in learning can consider aspects of visible, interesting, simple, useful, accurate, legitimate, and structured (Mukminan & Saliman, 2008).
TOJET: The Turkish Online Journal of Educational Technology – January 2018, volume 17 issue 1
Copyright © The Turkish Online Journal of Educational Technology 158
The use of media in the learning process needs to consider that (1) none of the media is best for all learning objectives, (2) media is an integral part of the learning process, (3) media selection should be objective based on learning objectives, Some media at the same time will be confusing learners, and (4) the goodness and lack of media is not dependent on the concreteness and abilities alone (Sungkono, 2014). Because the learning media is a communication tool to convey a message to the learner to stimulate learners to learn for the achievement of learning objectives, then choose the media need to consider the learning objectives to be delivered, tailored to the level of development of learners, the media should be tailored to the ability of teachers, and the media should adapt to the situation and conditions or at appropriate times, places and situations (Sumantri, 2001); in addition, media selection should also take into account the characteristics of the materials to be provided to students, the characteristics of learners or individual differences in learners, and learning support facilities Susilana and Riyana, 2009). At least teachers are able to select instructional media tailored to the characteristics of learners or materials to be provided to students (Reiser and Gagné, 1982; Igoe, et al, tt; Mukminan & Saliman, 2008; Susilana and Riyana, 2009), needs such as the abilities, skills and attitudes of students that we want to be mastered by students (Nursetyo, 2011). By using learning media tailored to the characteristics of learners or student learning outcomes expected to be more leverage. Effective learning activities require careful planning, as well as in media use. To use effective learning media can use the 6 steps proposed by Heinich, Molenda, and Russell namely (1) Analyze Learner Characteristics, (2) State Objectives, (3) Select, Modify Or Design Materials, (4) utilize materials, ( 5) require learner response, and (6) evaluate. The six steps are better known as ASSURE (Mukminan and Saliman, 2008). In addition to obtaining the right media used in mathematics learning, the principle known as VISUALS is visible, interesting, simple, useful, accurate, legitimate, and structured (Mukminan & Saliman, 2008). The use of instructional media should be tailored to the characteristics of students such as age, a level of intelligence, cultural factors, socioeconomic, and related characteristics and directly affect the content of the lesson (Mukminan and Saliman, 2008). In addition, media planning is based on the need, One indicator of the needs of skills, skills, and attitudes of students that we want to be mastered students (Nurseto, 2011). Cognitive development is one of the characteristics of learners that are rarely noticed by teachers or educators. Teachers are expected to pay attention to the cognitive development of students in learning, meaning that if students are still at the operational stage of concrete teachers should not use abstract concepts in learning. This is because the success of teaching and learning process, among others, is influenced by the suitability between the subject matter and the level of cognitive development of learners (Nuroso and Siswanto, 2010; Ojose, 2008). Thus, if the new students achieve concrete cognitive development, mathematics teachers are advised not to use formal mathematical learning, but mathematical formulas are brought toward the concrete. It is like reading a book for children that every stage of cognitive development of children have different book readings, for children who still think sensory motor child does not need to be given reading books because it still uses a stronger hearing indeed, at the pre-operational stage and Concrete reading of books accompanied by images very helpful pattern of development and understanding of books, while in the formal stage of reading a novel book that is already abstract can be given to children (Nurgiyantoro, 2005). The age of junior high school students according to Piaget states that they are at a formal development stage because they are over the age of 11 years (Widodo, 2010), but the age limit of children to differentiate the Piaget's cognitive developmental stages varies widely (Ojose, 2008). Based on this matter, it is possible for junior high school students still at the stage of concrete development yet formal or still concrete. This is what needs to be studied more detail on the cognitive development of students in junior high school. Whether junior high school students are in the formal age or are still at a concrete age. This is consistent with the previous opinion which states that learning mathematics will be meaningful if adapted to the child's cognitive development (Ojose, 2008) so that the teacher is expected to provide adjust the child's cognitive development in learning. Although the cognitive development of junior high school students already in the formal stage is no longer concrete, sometimes still found students are still at the stage of concrete development because the stage of formal thinking has not been achieved (Syahbana, 2012). Because students have not reached the formal stage of thinking then in mathematics learning the presence of concrete objects is still needed, it aims to concrete abstract mathematical material. Yet educators should begin to introduce semi-concrete objects in mathematics learning.
TOJET: The Turkish Online Journal of Educational Technology – January 2018, volume 17 issue 1
Copyright © The Turkish Online Journal of Educational Technology 159
The junior high school students should have begun to introduce semi-concrete objects so that their thinking patterns can be used to understand and solve problems (Syahbana, 2012). In addition, the use of semi-concrete learning media aims to reduce the dependence of students on events or concrete objects and to help students to the concrete phase of thinking immediately passed. Ismail, Sugiman & Hendikawati (2013) explains that To teach math so that learners can think abstractly starting from the concrete, semi-concrete, and finally able to think abstractly. Adi, Meter & Kristiantari (2014), the number line is one example of a concrete semi-media. Indriyani (2013), media card number that is used as a learning medium that is used to provide the understanding of the concept of numbers to students with intellectual challenges is also a media example semi-concrete. Artini, Sujana, & Wiyasa (20 114) explains that the media semi-concrete is half real props in the form of two-dimensional graphics media to distribute messages and information through visual symbols such as pictures, posters, cartoons, caricatures, and so on. Based on the semi-concrete media that can be used in teaching mathematics in secondary schools in addition to the number line and card number is comic, such as comic learning mathematics on material geometry for SMP students (Widodo, Pardimin, & Purwaningsih, 2016; Pardimin & Widodo, 2017) CONCLUSION Learning media is a tool that can be used to convey the message to the students for the purpose of learning can be achieved. Each learning medium used has unique characteristics, so it needs careful planning in using the media in learning. Planning the use of mathematics learning media can use the principles of ASSURE and VISUALS. In mathematics learning in high school, the media used in addition to using these two principles, the teacher should also pay attention to student cognitive development. Because math learning will be more meaningful if adapted to the cognitive development of students. High school students can not be entirely formal thinking so it is still needed semi-concrete learning media to bridge students who have not been able to think formally. ACKNOWLEDGEMENTS This publication does not work well without the support of Lembaga Pengelolaan Dana Pendidikan (LPDP), for which we would like to thank the LPDP who has participated as a sponsorship of our publications. REFERENCES Adi, I. M. S., Meter, I. M., & Kristiantari, R. (2014). Pengaruh Model Pembelajaran RME Berbantuan Media
Semi Konkret Terhadap Hasil Belajar Matematika Siswa Kelas V SD Gugus 8 Kecamatan Gianyar, Kabupaten Gianyar Tahun Ajaran 2013/2014. Jurnal Mimbar PGSD. 2 (1).
Ali, M. 2009. Pengembangan Media Pembelajaran Interaktif Mata Kuliah Meda Elektromagnetik. Jurnal Edukasi @Elektro. 5(1), pp 11 – 18.
Alhaddad, I. 2012. Penerapan Teori Perkembangan Mental Piaget Pada Konsep Kekekalan Panjang. Infinity. 1 (1), Hal: 31 – 44.
Artini, A. S. V., Sujana, I. W., & Wiyasa, I. K. N. 2014. Pengaruh Model Pembelajaran Scramble Berbantuan Media Semi Konkret Terhadap Hasil Belajar IPS Siswa Kelas V SD Gugus Kapten Kompiang Sujan. Jurnal Mimbar PGSD. 2 (1).
Bulut, M., Akçakın, H. U., Kaya, G., & Akçakın, V. (2014). The Effects of GeoGebra On Third Grade Primary Students’ Academic Achievement in Fractions. International Electronic Journal of Mathematics Education (IEJME). 11 (2), pp: 347 – 355.
Ena, O. T. (2001). Membuat Media Pembelajaran Interaktif dengan Piranti Lunak Presentasi. Yogyakarta: Indonesian Language and Culture Intensive Course, USD.
Fauziah, Y. N. 2011. Analisis Kemampuan Guru Dalam Mengembangkan Keterampilan Berpikir Kreatif Siswa Sekolah Dasar Kelas V Pada Pembelajaran Ilmu Pengetahuan Alam. Jurnal Penelitian Pendidikan. Special edition No 2, pp 98 – 106.
Igoe, A., et all. (Tanpa Tahun). Media Selection Models. Online. Diunduh dari http://www.florencemartin.net/site08/research/media%20selection% 20models%20-%20asu.pdf.
Indriani. 2013. Penggunaan Media Kartu Bilangan untuk Meningkatkan Kemampuan Konsep Bilangan 1-5 Pada Anak Tunagrahita Ringan. JASSI ANAKKU: Jurnal Asesmen dan Intervensi Anak Berkebutuhan Khusus. 12 (2), pp: 143 – 152.
Ismail, A. K., Sugiman & Hendikawati, P. (2013) . Efektivitas Model Pembelajaran Teams Group Tournament Dengan Menggunakan Media “3 in 1” Dalam Pembelajaran Matematika. Unnes Journal of Mathematics Education. 2 (2), pp 25 – 32.
Johana, M., dan Widayanti, A. (2007). Komik Sebagai Media Pengajaran Bahasa Yang Komunikatif Bagi Siswa SMP. Lembaran Ilmu Kependidikan, Jilid 36 No 1. Hal: 28 – 34.
TOJET: The Turkish Online Journal of Educational Technology – January 2018, volume 17 issue 1
Copyright © The Turkish Online Journal of Educational Technology 160
Keirsey, D,. dan Bates, M. (1978) . Please Understand Me: Character and Temperament Types. USA: Prometheus Nemesis Book Company.
Keirsey, D,. (1978). Please Understand Me II: Temperament Character Intelligence. USA: Prometheus Nemesis Book Company.
Masganti. 2012. Perkembangan Peserta Didik. Medan: Perdana Mulya Sarana Mediawati, E. 2011. Pembelajaran Akuntansi Keuangan Melalui Media Komik Untuk Meningkatkan Prestasi
Mahasiswa. Jurnal Penelitian Pendidikan. 12 (1), pp: 61 – 68 Muhson, A. (2010). Pengembangan Media Pembelajaran Berbasis Teknologi Informasi. Jurnal Pendidikan
Akuntansi Indonesia, 8(2), p: 1 – 10. Mukminan & Saliman. (2008). Teknologi Informasi Dan Pengembangan Media Pembelajaran IPS. Modul Untuk
Pelatihan IPS Terpadu Bagi Guru IPS SMP Di FISE-UNY. Online. http://modul ips.uny.ac.id. Nurgiantoro, B. 2005. Tahapan Perkembangan Anak Dan Pemilihan Bacaan Sastra Anak. Cakrawala
Pendidikan. XXIV (2), pp: 197 – 222. Nuroso, H., & Siswanto, J. 2010. Model Pengembangan Modul Ipaterpadu Berdasarkan Perkembangan Kognitif
Siswa. Jurnal Penelitian Pembelajaran Fisika (JP2F). 1(1), pp: 35 – 46. Nurseto, T. 2011. Membuat Media Pembelajaran Yang menarik. Jurnal Ekonomi Dan Pendidikan. 8 (1), pp: 19
– 34. Ojose, B. 2008. Applying Piaget’s Theory of Cognitive Development to Mathematics Instruction. The
Mathematics Educator. 18 (1), pp: 26 - 30 Pardimin & Widodo (2017). Development Comic Based Problem Solving In Geometry. International Electronic
Journal of Mathematics Education (IEJME). 12 (3), pp: 233 – 241. Permendikbud No. 65 Tahun 2013 tentang Standar Proses Pendidikan Dasar dan Menengah Prasetyo, K. Z., et al. 2011. Pengembangan Perangkat Pembelajaran Sains Terpadu Untuk Meningkatkan
Kognitif, Keterampilan Proses, Kreativitas serta Menerapkan Konsep Ilmiah Peserta Didik SMP. Yogyakarta: Pascasarjana UNY.
Reiser, R. A dan Gagné, R. M. (1982). Characteristics of media selection models. Review of Educational Research. 52 (4). pp: 499 – 5.
Seahorse. (2010). An Introduction To The Myers-Briggs Type Indicators To Define Personality Type. Online. http://people.cehd.tamu.edu
Sudrajat, A. (2008). Media Pembelajaran. Kuningan: UNIKU. Diunduh dari akhmadsudrajat. wordpress. Com Susanto, B., Dwijanto, & Siskandar. 2012. Celmi Media Pembelajaran Berbantuan Telephone Celluler Untuk
Meningkatkan Kompetensi Penyolderan Elektronika. Innovative Journal of Curriculum and Educational Technology. 1 (2), pp: 74 – 81.
Sungkono. (2014). Pemilihan Dan Penggunaan Media Dalam Proses Pembelajaran. Online. dari http://staff.uny.ac.id/sites/default/ files/penelitian/Sungkono,%20M.Pd. .
Sumantri, M. (2001). Strategi Belajar Mengajar. Bandung: Maulana. Susilana, R dan Riyana, C. (2009). Media Pembelajaran Hakikat, Pemanfaatan dan Penilaian.
Bandung:Wacana Prima Syahbana, A. 2012. Peningkatan Kemampuan Berpikir Kritis Matematis Siswa SMP Melalui Pendekatan
Contextual Teaching And Learning. Jurnal Pendidikan Matematika Edumatica. 2 (1), pp. 45 – 57. Wibowo, E. J. (2013). Media Pembelajaran Interaktif Matematika Untuk Siswa Sekolah Dasar Kelas IV. Seruni:
Seminar Riset Unggulan Nasional Informatika dan Komputer. Hal: 75 – 78. Widodo, S. A. 2010. Permasalahan Pengajaran Matematika Di Sekolah Menengah Ditinjau Dari Teori
Perkembangan. Majalah Ilmiah Wacana Akademika. 3 (8). Widodo, S. A.. Pardimin, Purwaningsih, I.E (2016). Pengaruh Media Komik Terhadap Kemampuan Pemecahan
Masalah dan Prestasi Belajar Matematika Ditinjau Dari Kemampuan Awal Siswa Kelas VIII. National Conference Mathematics And Mathematics Education UNY. MP-481 – MP486.
Yuniati, N., Purnama, B.P, Nugroho, G.K. (2011). Pembuatan Media Pembelajaran Interaktif Ilmu Pengetahuan Alam Pada Sekolah Dasar Negeri Kroyo 1 Sragen. Journal Speed: Sentra Penelitian Engineering dan Edukasi. 3 (4) pp: 25-29.
TOJET: The Turkish Online Journal of Educational Technology – January 2018, volume 17 issue 1
Copyright © The Turkish Online Journal of Educational Technology 161
Should We Add History of Science to Provide Nature of Science into Vietnamese Biology Textbook: A Case of Evolution and Genetics Teaching? Huynh Thi Thuy Diem
School of Education of Can Tho University, Can Tho, Vietnam Faculty of Education, Khon Kaen University, Khon Kaen, Thailand [email protected] Chokchai Yuenyong
Faculty of Education, Khon Kaen University, Khon Kaen, Thailand [email protected] ABSTRACT History of science (HOS) plays a substantial role in the enhancement of rooted understanding in science teaching and learning. HOS of evolution and genetics has not been included in Vietnamese biology textbooks. This study aims to investigate the necessity of introducing evolution and genetics HOS into Vietnamese textbooks. A case study approach integrating both quantitative and qualitative methods were employed. Of total 87 high school teachers, 68.5% were female. The percentage of biology teachers agreed to add HOS of evolution and genetics into the textbooks was 85.1%. The most common reason (73.0%) for agreement was to develop an active classroom in teaching and learning issues related to evolution and genetics. There were 14.9% of teachers did not agree to add HOS of evolution and genetics into textbooks, with the main reason that teachers must spend more time preparing and teaching evolution and genetics. Most of the teachers agreed to add more details about how the scientists state the research questions and research hypotheses into biology textbooks. Introducing HOS of evolution and genetics into Vietnamese biology textbook is necessary for biology teaching and learning in high school. Keywords: history of science, evolution and genetics, Vietnamese biology textbook INTRODUCTION The history of science (HOS) is the study of the development of science and scientific knowledge, including both the natural sciences and social sciences (Berlin, 1998). HOS is the most interesting aspect of science teaching, which conveys how science is done and engages students in the process of discovery for themselves. HOS plays a magnificent role in the improvement of rooted understanding in science teaching. It points out how scientists state the questions, design experiments, interpret results and generate alternative hypotheses; as well as, scientific concepts and advanced conceptual changes (Van Driel, Verloop, deVos, & de Vos, 1998). HOS absolutely impacts students’ attitudes and passion towards science (Heering, 2000; Kubli, 1999). It also supports public understanding of science (Kolstø, 2008; Osborne, Duschl, & Fairbrother, 2002). Therefore, HOS provides a context for the students’ fundamental scientific knowledge. HOS shows how scientific knowledge changes and guides students to appreciate both the achievements and limitations of science. HOS is a valuable instrument for an active classroom, where students build up their own knowledge by facing and developing new explanations for argument events drawn from history (Höttecke & Silva, 2011). HOS allows teachers to convey the nature of science (Henke, Hötteche, & Riess, 2009) and provide a framework of scientific understanding for students (Höttecke & Silva, 2011; Monk & Osborne, 1997). The role of HOS in science education has been emphasized in many national education standards. It is well known that HOS teaching and learning in science has been established for such a long time in many countries (Akaneme & Olaofe, 2004; Höttecke, Henke, & Riess, 2012; Höttecke & Silva, 2011; Monk & Osborne, 1997). Although, the efficiency of HOS in teachingandlearningis well established, the status of HOS implementation is far from being sufficient. Previous studies reveal the ambiguities about the usefulnessofHOS in teaching among elementary science teachers (Wang & Marsh, 2002) and HOS teaching does not relate to the objective of science teachers’ practice (Abd-El-Khalick, Bell, & Lederman, 1998). In addition, teachers lack knowledge about epistemology and HOS (Höttecke & Rieß, 2003; Irez, 2006; Palmquist
TOJET: The Turkish Online Journal of Educational Technology – January 2018, volume 17 issue 1
Copyright © The Turkish Online Journal of Educational Technology 162
& Finley, 1997) and have a weak understanding about nature of science (Craven, Hand, & Prain, 2002). A study in 2011 conducted with science teachers also found inadequate skills that related to teaching, storytelling, writing role-play scenarios and directing students’ performances or moderating open-ended discussions in HOS teaching (Höttecke & Silva, 2011). Another reason which impacts HOS teaching is the insufficiency of either epistemology or HOS in textbooks (Abd-El-Khalick, Waters, & Le, 2008; Guisasola, Almudí, & Furió, 2005; Höttecke & Silva, 2011; Leite, 2002; Pagliarini & Silva, 2007). Most of the school science textbooks today or in the past only give brief references to the HOS. The knowledge covered in the textbooks focuses on the popular, modern science; and give a little attention on the knowledge about HOS, and/or the link between HOS and science content (Höttecke & Silva, 2011). Another study also found the ignorance of HOS in most high school science textbooks and other manual guidelines (Rutherford, 2001). Due to the benefits and the role of HOS (including HOS of evolution and genetics), HOS should be integrated into both science teaching curricula and science textbooks (Monk & Osborne, 1997). A recent international conference on history and philosophy in teaching sciences emphasized the necessity of adequate HOS teaching and HOS contents in the textbooks (M P Clough, 2009; Michael P. Clough, 2006; Höttecke & Riess, 2009; Höttecke & Silva, 2011). However, integrating HOS in teaching curricula and textbooks is complicated and varies among education systems (Höttecke & Silva, 2011).
In Vietnam, the education system consists of the following levels: pre-primary education, general education (including primary, secondary and high school), professional and higher education (college, undergraduate, master and doctoral degrees). At high school level, biology is taught to all Vietnamese students in grade 10, 11 and 12 (MOET, 2008a). However, issues about evolution and genetics (in biology subject) are only taught in grade 12. The total time allotted for biology curriculum in grade 12 is 37 weeks with 52 periods (MOET, 2008b). Among the biology curricula of grade 12, the evolution and genetics teaching lasts 23 weeks with 44 periods (Vụ et al., 2007). In the Vietnamese biology textbook of grade 12, HOS has not been provided adequate information. The textbook has just mentioned marginal information about HOS, perform only passing reference of HOS (Vụ et al., 2007)
Despite the HOS benefits in biology (including evolution and genetics) teaching are well established, the Vietnamese biology textbook has not supplied it. The main question of this study is whether we should provide HOS of evolution and genetics into Vietnamese biology textbooks. To the best of our knowledge, no previous study has been investigated the necessity of including the HOS of evolution and genetics in biology textbooks. Our hypothesis is that we may need to add HOS of evolution and genetics to provide the nature of science into the Vietnamese biology textbook. This study may make a significant contribution to the evolution and genetics teaching in the Vietnamese biology curriculum and textbook. The objective of this study is to investigate the necessity of adding HOS of evolution and genetics teaching into Vietnamese biology textbook. METHODOLOGY This study employed a case study approach which integrates both quantitative and qualitative research methods (Cohen, Manion, & Morrison, 2007) in order to get in-depth investigation about the necessity of introducing HOS of evolution and genetics teaching into the Vietnamese biology textbook. Target group The research participants were biology high school teachers who are teaching in the Mekong Delta region in Southwestern Vietnam. The sampling comprised a total of 87 teachers, including 61 female (68.5%) and 26 male (29.2%) teachers. All the participants have been taught from 2 to 20 years about biology at high schools.
Methods of Inquiry The survey questionnaire combines both qualitative and quantitative questions (Bryman, 2009; Creswell, 2003). The questionnaire focuses on 3 major aspects. The first aspect was the baseline characteristics of biology high school teachers (name of high school, gender and teaching experience in years). The second aspect was the teachers’ opinions about adding HOS of evolution and genetics teaching into Vietnamese biology textbook (Agree or disagree and the reasons). The last aspect of the questionnaire was about the content of HOS that should be provided for students (including (i) Scientist biographies; (ii) How the scientists state the research questions, the research hypothesis; (iii) How the scientist design and conduct experiments; (iv) How the scientists interpret the research results; (v) How the scientists convince people; (vi) The achievements, the limitations and the open future research and the level of agreement). The questionnaire comprises 7 main questions (including both quantitative and qualitative ones).
TOJET: The Turkish Online Journal of Educational Technology – January 2018, volume 17 issue 1
Copyright © The Turkish Online Journal of Educational Technology 163
Data collection followed the paradigm of internet-based research (Cohen et al., 2007); which supplied online data. Our online survey questionnaire was designed based on Google Doc form. The online survey questionnaire approach was used due to the rapidity of responses acquisition and the firm guarantee for the anonymity of participants (Cohen et al., 2007). Data collection was conducted during the second semester of Vietnamese academic year in 2015 when emails were sent to teachers from the researchers. Data analyses depended on the type of data. The online data from Google form questionnaires were downloaded. The names and the email addresses of the teachers’ participants from the data were removed. Quantitative data were presented using percentages. Then the qualitative data was interpreted, synthesized and categorized according to the same ideas. FINDINGS Teachers’ opinions about introducing HOS of evolution and genetics into the Vietnamese biology textbook. Most of the biology teachers (85.1%) agreed to add HOS to provide the nature of science into the Vietnamese biology textbook. The percentage of disagreement teachers was 14.9%. Table 1. The reasons for agreement in adding HOS of evolution and genetics into Vietnamese biology textbook
Agreement reasons n % Encourage students’ study/discovery about evolution and genetics by themselves, to make in-depth understanding 16 21.6
Provide fundamental knowledge of evolution and genetics 31 41.9 Develop an active classroom in evolution and genetics teaching, where students can build up their own knowledge by discussion/argumentation together 54 73.0
Increase, expand and link the students’ knowledge to public understanding related to evolution and genetics 42 56.8
Leading students to appreciate the significance of evolution and genetics 42 56.8 Facilitate and promote teachers to provide the logic framework of scientific understanding in evolution and genetics teaching 35 47.3
Provide the evolution and genetics research process of scientists, including how they state the questions, hypothesis, design experiments and interpret results 50 67.6
Promote students’ attitude, enhance their characteristics and passion toward evolution and genetics science 53 71.6
The reasons for agreement of adding HOS of evolution and genetics into Vietnamese biology textbook are presented in Table 1. Of all of the teachers who agreed, the most common reason (73.0%) was to develop an active classroom in evolution and genetics teaching; following by the reason that to promote students’ attitude, enhance their characteristics and passionate toward evolution and genetics science (71.6%). The percentage of the teachers who gave a yes because HOS provides the evolution and genetics research process of scientists was 67.6%. The least fancy reason was to encourage students’ study/discovery about evolution and genetics by themselves, which accounted for 21.6%. A participant who agreed clearly states the necessity of adding evolution and genetics HOS into the Vietnamese biology textbook and biology curriculum by the extract below:
...I think we should add HOS into evolution and genetics teaching and into the biology textbook because when students learn and discuss the HOS of scientists or their research, they share knowledge with one another, which will build an active classroom. Besides, when students discuss/discover scientists, they will appreciate both achievement and characteristics for the scientists, which leads to the enhancement of their attitude, creates an idol in their mind and stimulates them to study/explore the evolution and genetics science...
Table 2. The reasons for disagreement on adding HOS of evolution and genetics into the Vietnamese biology textbook
Disagreement reasons n % Spent more time preparing, teaching and learning in evolution and genetics subject 10 76.9 Students can learn HOS of evolution and genetics by themselves 5 38.5 HOS of evolution and genetics is not required in biology curriculum 2 15.4 It is difficult to find the information about evolution and genetics HOS 1 7.7 HOS of evolution and genetics does not link science content 3 23.1
Of all of the teachers who disagreed, most of them (76.9%) do not agree to add HOS of evolution and genetics into the Vietnamese biology textbook because teachers have to more time preparing, teaching and learning about
TOJET: The Turkish Online Journal of Educational Technology – January 2018, volume 17 issue 1
Copyright © The Turkish Online Journal of Educational Technology 164
evolution and genetics. The percentage of the teachers who disagreed with the reason that students can learn HOS by themselves was 38.5%. There were 23.1% of the teachers disagreed because they believed that HOS of evolution and genetics did not link to science contents. The details of agreement reasons are performed in Table 2. As mentioned earlier, the most common reason for disagreement to add HOS of evolution and genetics into the Vietnamese biology textbook was the teaching and learning time, which was indicated in the following extract:
... Right now, the present curriculum in high school is overload, our students have to study not only biology subject. And in this grade, they need to prepare themselves for their important exam (to enrol to study in university). Therefore, students have much pressure with their homework, their activities at school and their extra-classes. I think if we add HOS of evolution and genetics into the Vietnamese biology textbook and biology curriculum, it would put more pressure on our students, which violates the objective imposed by our Ministry of Education and Training - to reduce the learning pressure for students. On the other hand, as a biology teacher at grade 12, I have normally to teach 30 periods per week at my school, I do not have enough time, even to check student regular tests in each class, how can I have more time to prepare and teach about HOS?... Table 3. The detail contents of evolution and genetics HOS should be provided in Vietnamese biology textbook
Information of scientists Strongly
Agree n (%)
Agree n (%)
Undecided n (%)
Disagree n (%)
Strongly Disagree
n (%) Scientist biographies 10 (11.5) 54 (62.1) 12 (13.8) 11 (12.6) 0 (0.0) How the scientist state the research questions, the research hypothesis 38 (43.7) 44 (50.6) 3 (3.4) 2 (2.3) 0 (0.0)
How the scientist design and conduct experiments 53 (60.9) 26 (29.9) 6 (6.9) 2 (2.3) 0 (0.0)
How the scientists interpret the research results 44 (50.6) 36 (41.4) 4 (4.6) 3 (3.4) 0 (0.0)
How the scientists convince people acknowledge their findings 11 (12.6) 44 (50.6) 21 (24.1) 11 (12.6) 0 (0.0)
The achievement, the limitation and the opening for future investigation 38 (43.7) 43 (49.4) 5 (5.7) 1 (1.1) 0 (0.0)
Table 3 indicates the detail contents of evolution and genetics HOS should be provided in the Vietnamese biology textbook. Most of the teachers (94.3%) strongly agree and agree to introduce how the scientists state the research questions and research hypothesis into the biology textbook. The percentage of teachers’ agreement and strong agreement to add the achievements, the limitations and the opening for future investigation into the textbook was 93.1%. Providing scientist biographies into the textbook was approved (strongly agree and agree) by 73.6% by teachers. The lowest percentage of teachers who agreed to provide how the scientists convince people to acknowledge their findings into biology textbook was 63.2%. DISCUSSIONS The role and the efficiency of HOS (including HOS of evolution and genetics) in biology teachingandlearningare well established. They have been asserted in many national education standards and carried out in many countries (Akaneme & Olaofe, 2004; Höttecke et al., 2012; Höttecke & Silva, 2011; Monk & Osborne, 1997). However, HOS of evolution and genetics has not been profoundly included into the Vietnamese biology textbook, it has just mentioned marginal information such as scientist names and years of invention (Vụ et al., 2007). Our study is the first study to investigate the necessity of adding HOS into evolution and genetics teaching in the Vietnamese biology textbook. Our results may make a significant contribution to the evolution and genetics teaching as well as the Vietnamese education system.
Our findings confirm the hypothesis that HOS of evolution and genetics should be added to provide the nature of science into the Vietnamese biology textbook. Introducing HOS into the biology textbook is extremely important because HOS is an essential part of science (Creath, 2010). Evolution and genetics HOS teaching is very exciting to convey how science is done and engage students enthusiastically discover towards biology science (Heering, 2000; Kolstø, 2008; Kubli, 1999; Osborne et al., 2002). It would enhance rooted and broader understanding of evolution and genetics (Heering, 2000; Kubli, 1999; Van Driel et al., 1998). In addition, textbooks are the reliable and the main source of knowledge for students and teachers in school. Therefore, adding HOS of evolution and genetics into textbook is significant crucial in biology teaching and learning.

TOJET: The Turkish Online Journal of Educational Technology – January 2018, volume 17 issue 1
Copyright © The Turkish Online Journal of Educational Technology 165
There are many reasons for adding HOS of evolution and genetics into the Vietnamese biology textbook. Most of the study participants indicated that HOS would develop a dynamic classroom. In the class, when studying about HOS of evolution and genetics, students can discuss and negotiate together and discuss with teachers. These strategy activities to enable students become the centre in the classroom. It is consistent with previous studies, which demonstrate that HOS is a valuable instrument for an active classroom, where students build up their own knowledge by facing and developing new explanations for argument events drawn from history (Höttecke et al., 2012; Höttecke & Silva, 2011). A participant in our study also suggested some strategies for HOS of evolution and genetics teaching, such as:
...I think we should add HOS of evolution and genetics into our textbook. When we teach students, we
can divide students into small group and suggest them discuss and present about the HOS. We also should find some interesting stories related to the HOS and lecturing to students, it will attract students to the HOS and nature of science. Besides that, we can organize a short dramatic science with the role-play activities from students. All above strategies will create a dynamic class, where build up interesting atmosphere for teaching and learning...
Another reason for adding HOS into the textbook is to provide evolution and genetics research process of scientists. It will perform the whole portray of research for students. It describes how scientists state the research questions, research hypothesis, design experiments; interpret research results (Van Driel et al., 1998). When students learn about the scientist biography and their research process, they will understand about science process and scientist characteristics, which will promote their attitude and imitate to their idols. Therefore, it would evoke their passion toward evolution and genetics science. Previous studies from Heering (2000) and Kubli (1999) also presented that HOS impacts students’ attitudes and passion toward science (Heering, 2000; Kubli, 1999).
HOS is not only significant for students, it also supports evolution and genetics teaching of teachers. It helps teachers to create the positive environment learning and attract students to the lessons. It simultaneously imparts more knowledge to students and connects to science contents. HOS facilitate and promote teachers provide the logical framework of evolution and genetics to students. Another study participant gave the benefits of evolution and genetics HOS teaching for teachers in the following extract:
...The useful aspects of HOS are to make impression, increase attraction to my lessons. HOS will help
me to bring the link between HOS and science contents to students, it creates framework knowledge; constitutes broader and long-term memory about scientific knowledge for my students...
Despite the roles and the benefits of HOS in evolution and genetics teaching, some of our study participants do not agree to add HOS of evolution and genetics teaching into Vietnamese biology textbook. The main reason was that the teachers had to spend more time preparing, teaching and learning about evolution and genetics. In the real situation, the high schools in Vietnam have a lot of classes with approximately 45 students per class and the inadequate biology teachers. Therefore, teachers are busy with their teaching schedule, they seem do not want to add HOS into textbook because it will add more duty to them. Another reason was that students can learn and search information about HOS of evolution and genetics by themselves. However, it is difficult to do it due to high pressure of high school curriculum and textbooks as the main source of knowledge for students. A qualitative response from one of our sampling also clearly mentioned this issue which is described in the following extract:
...I do not want to add HOS into textbook because I may have to teach it. Right now, students want to
learn short lessons. They seem do not care about scientists and how can they discover the theories. Students learn by trying to remember the information rather than understanding it, they forget that knowledge has to construct from their knower and their curiousness. Their learning purpose is to get the score results, pass the exam and they do not care about the meaningfulness of the knowledge which they have learnt...
Unfortunately, there was a little high percentage of teachers in our study disagree to add HOS into the textbook because they believed that HOS of evolution and genetics does not link to science content. Actually, the connection between HOS and science contents is well known. This issue is related to the teachers’ contents and pedagogy knowledge. The findings from previous studies also reveal the lack of knowledge about epistemology and HOS among science teachers (Höttecke & Rieß, 2003; Irez, 2006; Palmquist & Finley, 1997) and weak understanding or inadequate skill of HOS teaching about nature of science (Craven et al., 2002; Höttecke & Silva, 2011).
TOJET: The Turkish Online Journal of Educational Technology – January 2018, volume 17 issue 1
Copyright © The Turkish Online Journal of Educational Technology 166
With the overloaded curriculum at Vietnamese high schools; students have much pressure with their main learning, their activities and their extra-classes. Therefore, adding HOS of evolution and genetics in Vietnamese biology textbook need to be carefully considered in terms of which contents should be paid more attention (i.e. provide more details). Our study found that almost teachers agreed to provide the detail information about how the scientists state the research questions and research hypothesis into biology textbook. Another content should be provided more detail in textbook was the achievement, the limitation and the opening for future investigation. These important findings were in the incorporation of between teachers' reasons for adding HOS contents into biology textbooks (Table 1). In the real circumstance, if the biology textbook provides “how the scientists state the research questions, the research hypothesis” and “the achievements, the limitations and the opening for future investigation”, it would lead student understand about “the evolution and genetics research process of scientists” and “promote students’ attitude, enhance their characteristics and passion toward evolution and genetics science” (respectively). It will be good opportunities for students to create, discuss and share their ideas with other students about HOS. Therefore, students can discover the nature of science knowledge by themselves; they would get deep understanding about HOS and be attracted by HOS and the nature of science. Besides that, with these HOS contents in the biology textbook, the teachers have a good chance to “develop an active classroom in evolution and genetics teaching”. On the teachers’ reason of “Increase, expand and link the students’ knowledge to public understanding related to evolution and genetics” incorporate with the HOS contents related to “how the scientist design and conduct experiments”. A study participant shows his/her idea in the following demonstration:
...When I was a high school student, each time I learn a new law or new concept, I usually wonder that:
How can they state the question from the phenomena context? How can they do experiment and answer the questions? What are the results and anything that I can deeply explore...?
The contents about how the scientists convince people to acknowledge their findings in biology textbooks were suggested to be intensely included into the biology textbook. In order to convince people to accept the new knowledge, scientists have to present to the public. These activities lead people to discuss, negotiate, argue and make the contract to appreciate the new knowledge from scientist knower (Tobin & Tippins, 1993). It is interesting to note that when students identify the values of scientists’ work and how they convinced people to acknowledge their findings, they will understand the connection between the life, the work of scientists and their research publications. These contents from biology textbook will present the scientist characteristics for students; it would be the model for students in the scientific study process and in their normal life. During the teaching/learning time, teachers can give the chance for students practice “how to convince other people” by their lessons’ discuss results, it also leads to “an active classroom” and “be attracted students to the HOS lessons”. Actually, the skills to convey knowledge to people are very important. These skills can be developed for students through discussions and presentations during HOS of evolution and genetics learning to express students’ ideas. One illustration for this issue is the response from one of our sampling:
...What are significant skills to convey knowledge? How can the scientists convince other people? How
can students apply these skills to express their ideas/knowledge? For example, why did not people accept Menden’s laws after intervention, they only acknowledge Menden’s laws after 35 years of intervention? CONCLUSIONS In our study, we found that the strong point is the combination of qualitative and quantitative research or in other words, we use mixed methods paradigm to support the evidence to demonstrate that HOS of evolution and genetics should be added to include the nature of science into the Vietnamese biology textbook. The qualitative results supported the quantitative results. However, the findings of the current study also point out the limitations that the participants in the survey are not representative of various groups such as students, administrators, educators, pre-service teachers and teachers in the school at different levels or of different subjects. In addition, the kinds of data should be more diverse such as teachers interviews and observations in the classroom with evolution and genetics teaching and learning. Up to date, this study is the first research on this topic. It significantly contributes to better evolution and genetics teaching and learning at high schools. Our findings also support the valuable evidence to the education policymakers, to design suitable curriculum adapting the innovations of biology and to add HOS of evolution and genetics into the Vietnamese biology textbook. A collateral finding of our study is the lack of knowledge among biology high school teachers about HOS of evolution and genetics, with high percentage of teacher believed that the HOS of evolution and genetics does not link to science content (Table 2).
In summary, the role of the HOS (especially the knowledge related to evolution and genetics) is essential to the biology curricula and learning activities at high schools around the world. However, it is still beyond the
TOJET: The Turkish Online Journal of Educational Technology – January 2018, volume 17 issue 1
Copyright © The Turkish Online Journal of Educational Technology 167
appropriate consideration in the curriculum in Vietnam. In fact, most of the teachers consider HOS of evolution and genetics as an integral part of contemporary science. If it is introduced in the Vietnamese high school curriculum, it will pave the way for the teachers to design learner-centered activities and encourage the students’ creativity and critical thinking. Simultaneously, it also helps the students to realize the value of the process to explore new knowledge and stimulates their curiosity and passion for biology study. Nevertheless, some teachers have not realized the meaningfulness and the value of HOS (Evolution and Genetics), so they do not approve this knowledge to be presented in their high school biology curriculum. They just simply thought that including this knowledge would result in lesson overload, yet they did not realize why they should drill it more profoundly. Moreover, they did not see that the HOS comprehension will fulfill their knowledge, particularly researching skills, that they are still inadequate now. Therefore, an intervention study should be conducted to enhance the teachers’ knowledge about HOS of evolution and genetics.
REFERENCES Abd-El-Khalick, F., Bell, R. L., & Lederman, N. G. (1998). The nature of science and instructional practice:
Making the unnatural natural. Science Education, 82, 417–436. http://doi.org/10.1002/(SICI)1098-237X(199807)82:4<417::AID-SCE1>3.0.CO;2-E
Abd-El-Khalick, F., Waters, M., & Le, A. P. (2008). Representations of nature of science in high School chemistry textbooks over the past four decades. Journal of Research in Science Teaching, 45(7), 835–855. http://doi.org/10.1002/tea.20226
Akaneme, F. ., & Olaofe, I. A. (2004). History and Philosophy of science course development. Berlin, I. (1998). The concept of scientific history. The Proper Study of Mankind an Anthology of Essays Isaiah
Berlin, 1, 17–58. http://doi.org/10.2307/2504255 Bryman, A. (2009). Integrating quantitative and qualitative research: how is it done?
http://doi.org/10.1177/1468794106058877 Clough, M. P. (2006). Learners’ responses to the demands of conceptual change: Considerations for effective
nature of science instruction. Science and Education, 15, 463–494. http://doi.org/10.1007/s11191-005-4846-7
Clough, M. P. (2009). Humanizing Science to Improve Post-Secondary Science Education. In international History, Philosophy and Science Teaching Conference (pp. 24–28).
Cohen, L., Manion, L., & Morrison, K. (2007). Research Methods in Education. Routledge, London and New York. 270 Madison Avenue, New York, NY 10016: Routledge, Taylor & francis Group. http://doi.org/10.1080/19415257.2011.643130
Craven, J. A., Hand, B., & Prain, V. (2002). Assessing explicit and tacit conceptions of the nature of science among preservice elementary teachers. International Journal of Science Education, 24(April 2015), 785–802. http://doi.org/10.1080/09500690110110098
Creath, R. (2010). The role of history in science. Journal of the History of Biology, 43, 207–214. http://doi.org/10.1007/s10739-009-9208-x
Creswell, J. W. (2003). Research design. Qualitative, Quantitative, and Mixed methods approaches. Research Design, 86, 1–26. http://doi.org/10.4135/9781849208956
Guisasola, J., Almudí, J. M., & Furió, C. (2005). The nature of science and its implications for physics textbooks: The case of classical magnetic field theory. Science and Education, 14, 321–328. http://doi.org/10.1007/s11191-004-7936-z
Heering, P. (2000). Teaching secondary school physics through history. Science & Education, 9, 363–373. Henke, A., Hötteche, D., & Riess, F. (2009). Case Studies for Teaching and Learning with History and
Philosophy of Science: Exemplary Results of the HIPST Project in Germany. In Tenth International History, Philosophy, and Science Teaching Conference (p. 26).
Höttecke, D., Henke, A., & Riess, F. (2012). Implementing History and Philosophy in Science Teaching: Strategies, Methods, Results and Experiences from the European HIPST Project. Science and Education, 21(9), 1233–1261. http://doi.org/10.1007/s11191-010-9330-3
Höttecke, D., & Riess, F. (2009). Developing and Implementing Case Studies for Teaching Science with the Help of History and Philosophy. In Tenth International History, Philosophy, and Science Teaching Conference, (Vol. 16, pp. 1–17). http://doi.org/10.1007/s11191-008-9150-x
Höttecke, D., & Rieß, F. (2003). How Do Physics Teacher Students Understand the Nature of Science�? An Explorative Study of a Well Informed Investigational Group, (2001), 2001–2004.
Höttecke, D., & Silva, C. C. (2011). Why Implementing History and Philosophy in School Science Education is a Challenge: An Analysis of Obstacles. Science and Education, 20, 293–316. http://doi.org/10.1007/s11191-010-9285-4
Irez, S. (2006). Are we prepared?: An assessment of preservice science teacher educators’ beliefs about nature of science. Science Education, 90, 1113–1143. http://doi.org/10.1002/sce.20156
Kolstø, S. D. (2008). Science education for democratic citizenship through the use of the history of science.
TOJET: The Turkish Online Journal of Educational Technology – January 2018, volume 17 issue 1
Copyright © The Turkish Online Journal of Educational Technology 168
Science & Education, 17(123), 977–997. http://doi.org/10.1007/s11191-007-9084-8 Kubli, F. (1999). Historical aspects in Physics teaching: Using Galileo Wor in a new Swiss Project. Science &
Education, 8, 137–150. Leite, L. (2002). History of Science in Science Education: Development and Validation of a Checklist for
Analysing the Historical Content of Science Textbooks. Science & Education, 11(1992), 333–359. http://doi.org/10.1023/a:1016063432662
MOET. (2008a). Báo cáo kết quả đánh giá chương trình giáo dục và sách giáo khoa phổ thông năm 2008 [The report on the result of educational programme evaluation and the second text book year 2008].
MOET. High School Education Curriculum (2008). Monk, M., & Osborne, J. (1997). Placing the history and philosophy of science on the curriculum: A model for
the development of pedagogy. Science Education, 81, 405–424. http://doi.org/10.1002/(SICI)1098-237X(199707)81:4<405::AID-SCE3>3.0.CO;2-G
Osborne, J., Duschl, R., & Fairbrother, R. (2002). Breaking the Mould? teaching Science for public understanding.
Pagliarini, C. D. R., & Silva, C. C. (2007). History and nature of science in Brazilian ohysics textbooks: Some finding and perspectives. In Newtonian Optics in the Eighteenth Century: Discussing the Nature ogf Science. Ninth Interantional History, Philosophy and Science Teaching Confernce, Calgary Canada. (pp. 1–8).
Palmquist, B. C., & Finley, F. N. (1997). Preservice teachers’ views of the nature of science during a postbaccalaureate science teaching program. Journal of Research in Science Teaching, 34(6), 595–615. http://doi.org/10.1002/(SICI)1098-2736(199708)34:6<595::AID-TEA4>3.0.CO;2-I
Rutherford, F. J. (2001). Fostering the History of Science in American Science Education. Science & Education, 10, 569–580. http://doi.org/10.1007/978-94-010-0730-6_4
Tobin, K., & Tippins, D. (1993). The Nature of Constructivism. In Constructivism. The practice of Constructivism in Science Education (pp. 1–21).
Van Driel, J. H., Verloop, N., deVos, W., & de Vos, W. (1998). Developing Science Teachers’ Pedagogical Content Knowledge. Journal of Research in Science Teaching, 35(6), 673. http://doi.org/10.1002/(SICI)1098-2736(199808)35:6<673::AID-TEA5>3.0.CO;2-J
Vụ, V. V., Hiền, N. N., Lưu, V. Đ., Đạt, T. Đ., Mẫn, C. V., & Tạng, V. T. (2007). Biology of Grade 12th. Hanoi: Educational publish.
Wang, H. A., & Marsh, D. D. (2002). Science Instruction with a Humanistic Twist: Teachers’ Perception and Practice in Using the History of Science in Their Classrooms. Science & Education, 11(1), 169–189. http://doi.org/10.1023/A:1014455918130
TOJET: The Turkish Online Journal of Educational Technology – January 2018, volume 17 issue 1
Copyright © The Turkish Online Journal of Educational Technology 169
Social Media Addiction Scale - Student Form: The Reliability and Validity Study Cengiz Şahin
Faculty of Education, Ahi Evran University, Kirsehir, Turkey [email protected] ABSTRACT The purpose of this study is to develop a valid and reliable measurement tool to determine the social media addictions of secondary school, high school and university students. 998 students participated in the study. 476 students from secondary schools, high schools and universities participated in the first application during which the exploratory factor analysis of the scale was conducted. 298 students participated in the second application during which the confirmatory factor analysis was carried out. Test-retest method was used to determine the consistency of the scale with the participation of 224 student. Expert opinion, exploratory factor analysis, confirmatory factor analysis, total item correlations, mean differences between upper and lower groups, internal consistency coefficient and test-retest correlation coefficients were calculated within the scope of assessing the validity and reliability of the research. According to the exploratory and confirmatory factor analysis, the scale has a 4-factor structure accounting for 53.16% of the total variance. Kaiser-Meyer-Olkin (KMO) coefficient and the Bartlett’s test were found significant respectively at .96 and χ2=12680.88 (p=.00). Internal consistency coefficient (Cronbach’s alpha coefficient) was found .93 for the whole scale and at values ranging from .81 to .86 for the sub-factors. Test-retest coefficient was found .94. In conclusion, SMA-SF is a 5-point Likert-type scale consisting of 29 items grouped under 4 factors (virtual tolerance, virtual communication, virtual problem and virtual information). The statistical analysis indicates that the scale is valid and reliable enough to be used in determining the social media addictions of secondary school, high school and university students. Keywords: Social media, addiction, student, scale development, reliability and validity. INTRODUCTION The Internet is a knowledge technology that has entered into every aspect of life as a means of information, trade and communication. Although the purpose of its emergence was to reach secure, fast, inexpensive information and to facilitate communication, today it has become a means of causing significant changes in individuals and society. The fact that internet usage takes place independently of time and space over a virtual environment leads to changing forms of communication. And social media, which is an extension of internet technology, changes communication channels among people. The use of social media in Turkey and around the world is increasing, especially young people and students show intense interest in it. According to information provided by Internet World Stats (2017) based on data provided by leading organizations in Internet researches (Nielsen/NR, eTForcasts, CIAlmanac, ITU, IWS, CIA), as of March 2017 the number of Internet users worldwide has increased by approximately 3 billion 732 million people (49.6%). The rate of increase in internet usage 2000-2017 was 933.8%. In the same research, it is reported that the number of internet users in Turkey is approximately 46 million 283 people (59.6%) and the number of social media (Facebook) users is about 41 million people (53.2%). It is observed that the rate of social media usage in Turkey is higher than that of Europe (37.6%). According to the Turkish Statistical Institute (TUIK, 2016), the rate of individuals using the internet in Turkey is 61.2%. When purposes of internet usage in Turkey is taken into consideration, 82.4% of the individuals who use the internet in the first three months of 2016 have shared their social networking profile or photo, messages and content. This ratio is higher in adolescents and students compared with other age groups (TUIK, 2016). Social networks are applications that run over the internet and cannot be evaluated independently from the internet. Today, social media tools have enabled each user to become a content producer through account/profile creation with the burst of web 2.0 technologies (Tekvar, 2012). Social media contributes to the transformation of users from passive listeners to active content producers and it makes it easier to stay connected and to produce content by providing applications for different mobile devices and operating systems (Karasu & Arıkan, 2016). Therefore, people use social media more widely than expected. Excessive, problematic, and pathological use leads to personal, social, vocational and educational problems for individuals (Griffiths Kuss & Demetrovics, 2014). There is no consensus among researchers about identifying problematic social networking or Internet
TOJET: The Turkish Online Journal of Educational Technology – January 2018, volume 17 issue 1
Copyright © The Turkish Online Journal of Educational Technology 170
addiction (Wegmann, Stodt & Brand, 2015), depending on the conceptual confusion surrounding the problematic internet use classification. People think that addiction usually involves substances use such as drugs or alcohol. Uncontrollable habits or practices are also referred to as addiction (Harris, Nagy & Vardaxis, 2014). In this sense, the concept of technological dependency has also been used to describe the extreme Internet usage behaviors that arise due to developed technologies (Kuss & Griffiths, 2012; Turel & Seronko, 2012). Internet addiction (Young, 2004, Sahin, 2011), game addiction (Fisher, 1994, Griffiths & Hunt, 1998; Horzum, 2011), CyberSex addiction (Cavaglion, 2009; Schwartz & Southern, 2000); online addiction (Tüzer, 2011), Social network addiction (Griffiths, 2012), mobile phone addiction (Bianchi & Phillips, 2005; Fidan, 2016), Facebook addiction (Andreassen, Torsheim, Brunborg & Pallesen, 2012), Twitter addiction (Said, Al-Rashid & Abdullah, 2014), social media disorder (van den Eijnden, Lemmens & Valkenburg, 2016) and social media addiction (Andreassen, Torsheim, Brunborg and Pallesen, 2012; Şahin & Yağcı, 2017) have been investigated in the context of behavioral addiction and are gaining importance along with developing technology. Social media addiction is considered as a kind of internet addiction (Kuss & Griffiths, 2012). Individuals who spend too much time on social media have a desire to be notified of anything immediately, which can cause virtual tolerance, virtual communication and virtual problem. Behaviors that force the person into these actions can be explained as social media addiction. Turne & Serenko (2012) have identified three notionally different perspectives to explain the formation of social network addiction: Cognitive-behavioral model; this model emphasizes that ‘abnormal’ social networking arises from maladaptive cognitions and is amplified by various environmental factors, and eventually leads to compulsive and/or addictive social networking. Social skill model; this model emphasizes that ‘abnormal’ social networking arises because people lack self-presentational skills and prefer virtual communication to face-to-face interactions, and it eventually leads to compulsive and/or addictive use of social networking. Socio-cognitive model; this model emphasizes that ‘abnormal’ social networking arises due to the expectation of positive outcomes, combined with internet self-efficacy and deficient internet self-regulation eventually leads to compulsive and/or addictive social networking behavior (Griffiths, 2013). The transition from normal to problematic social media use is seen as an important mechanism to alleviate stress, loneliness or depression for the individual, so they become more active with more social media. This ultimately leads to many problems and exacerbates the unwanted mental states of the individual (Xu & Tan, 2012). Brown & Bobkowski (2011) stated that social media use can lead to harmful behaviors such as aggression, personality disorder, unhealthy diet, early sexuality, tobacco and alcohol use in young people. As a result, the psychological dependence level in social sharing develops when this cyclical situation is repeated in order to get rid of the unwanted mood in social media use. The researchers conducted in different countries revealed that internet usage addiction is not limited to university students, but also includes secondary school and high school students (Al-Menayes, 2015). Individuals who spend 8.5 to 21.5 hours online per week are considered to be addicted (Yang & Tung, 2007). It can be said that the determination of this situation is important when considering the problems caused by social media addiction. The diagnosis of social media addiction cannot be justified indiscriminately or just by observation. Valid and reliable scales can be used for this. In this respect, when the literature about social media addiction scales was examined, various researches, tests and scales were found (Banyai at.al, 2017; Al-Menayes, 2015). It seems that there are a few researches in Turkish literature to determine the social media addiction of university students (Tutkun Ünal & Deniz, 2015; Kırık, Arslan, Çetinkaya & Gül, 2015; Şahin ve Yağcı, 2017). However, there were no tests or scales that measured the social media addiction of 12-22 year old students in the literature. 12-18 age group is accepted as puberty or adolescence in developmental psychology literature (Gündoğdu, 2016). The term late puberty is proposed as well for 18-25 ages (Arnett, 2004). The latter is considered as the prolongation of development (Arnett, 2007). From this point of view, it can be said that 12-22 ages show similar properties. In this context, this study aims to develop a measurement for the determination of social media addiction of students and reveal the validity and reliability results. METHOD The progress of the scale development work carried out to determine the social media addiction of the students and the characteristics of the working group are presented below.
TOJET: The Turkish Online Journal of Educational Technology – January 2018, volume 17 issue 1
Copyright © The Turkish Online Journal of Educational Technology 171
Study Group The study included students from 12 to 22 years of age (M=17.26 ± SD=3.09) who were studying in different departments of a university as well as secondary and high school students in the districts representing different socio-economic levels of a city during the 2016-2017 academic year. The scale development process was carried out with the participation of a total of 998 students. 566 (56.7%) female students and 432 (43.3%) male students participated voluntarily. The participants were determined by simple random sampling. The working group has been considered to be "at least ten times the number of items" (Sönmez & Alacapınar, 2014). 476 students from secondary school, high school and university participated in the first application in which explanatory factor analysis of the scale was performed and 298 students participated in the second application in which confirmatory factor analysis was performed. The test-retest method was used to determine the consistency of the scale and the application was performed with the participation of 224 students. Development of Scale Form In order to establish a trial form for determining the social media addiction of students, it was necessary firstly to create a conceptual framework by examining the social media use and addiction research (Griffiths, 1995; Young, 2004; Şahin, 2011; Al-Menayes, 2015, Tutgun Unal & Deniz, 2015, Banya et al., 2015). In this framework, a frame for the scope of the "Social Media Addiction Scale-Student Form (SMAS-SF)" was determined in line with the information obtained from the related literature and opinions of field experts, an item pool consisting of 41 items was formed and a draft form was prepared. The scale includes 39 positive and 2 negative items. A 5-point grading is used in the scale: “(1) Definitely not appropriate”, “(2) Not appropriate”, “(3) Undecided”, “(4) Appropriate” and “(5) Quite appropriate”. The negative items are scored reversely. The collected data were uploaded to SPSS 22.00 and LISREL 8.80 programs in order to conduct statistically reliability and validity tests of the scale. Values for negative expressions are inversely encoded when loading to the programs. The Scoring of the Scale This is a 5-point Likert type scale which consists of 29 items and 4 sub-dimensions. 1-5 items are within virtual tolerance sub dimension;6-14 items are within virtual communication sub dimension, 15-23 items are under virtual problem sub dimension and 24-29 items are under virtual information sub dimension. All of the items in the scale are positive. The highest point that can be scored from the scale is 145, and the least one is 29. The higher scores indicate that agent perceives himself as a “social media addict”. Analysis of Data The construct validity of the scale was examined by the Kaiser-Meyer-Olkin (KMO) coefficient and the Bartlett Sphericity test, and it was determined whether or not to perform factor analysis (Russell, 2002; Kalayci, 2009). Explanatory factor analysis was performed on the data through the obtained data. A factor analysis method has been adopted to determine the validity structure of the scale (Balcı, 2009; Seçer, 2013). An analysis of basic components was conducted to determine the factors underlying the scale; Factor loadings were investigated by choosing Varimax rotation technique. The factorization technique was used in the analysis of the basic components (Büyüköztürk, 2002). By identifying the grouped factors observed in the scale, the number of variables was reduced (Seçer, 2013). The factor analysis was repeated by removing the items below 30 as a result of the principal components analysis and by removing the factor loadings which are distributed to two factors (Kline, 1994; Büyüköztürk, 2002; Balcı, 2009). The exploratory factor analysis was applied to a different study group in order to test the model structure. Confirmatory factor analysis was performed on the obtained data. Confirmatory factor analysis is based on the relationship between observed and unobserved variables (items and factors) that are treated as hypotheses (Pohlmann, 2004). It has been tested whether the model created through previously acquired information has been verified by the present data. Many adaptation indices are used in literature to demonstrate the adequacy of the model (Kline, 2005). As a result of the factor analysis, the item discriminative powers of the remaining scale items are determined by testing them with independent sample t test and the validity feature of the scale is determined by testing the item-total correlations with Pearson's r test (Büyüköztürk, 2002). Discrimination is considered to be one of the most important pieces of evidence used in determining the validity of a scale (Büyüköztürk, 2008). The discrimination of items on the scale is determined by testing the meaningfulness of the difference between the scale scores of the 27% upper and 27% subgroups after the raw scores are ranked from small to large.

TOJET: The Turkish Online Journal of Educational Technology – January 2018, volume 17 issue 1
Copyright © The Turkish Online Journal of Educational Technology 172
Internal consistency coefficients and stability tests were performed to determine the reliability of the scale. The internal consistency level of the scale was calculated using the Cronbach Alpha reliability coefficient and the correlation value between two peer half was calculated by using the Sperman-Brown and the Guttmann split-half reliability formula. The level of stability within the reliability of the scale was calculated by determining the correlation values between the results of the two applications which were conducted within four weeks intervals (Büyüköztürk, 2002; Balcı, 2009). Negative items on the scale are coded by reverse scoring. The scale is determined as a result of analysisand it was applied to the study group by multiplying the scale. The validity and reliability analysis of the data obtained from the application was conducted using IBM SPSS 20.0 and Lisrel 8.80 programs. FINDINGS In this section, findings on the validity and reliability studies of "Social Media Addiction Scale: Student Form (SMAS-SF)" are included. Findings Related to the Validity of the Scale The validity of a measurement tool can be defined as the degree of serving purpose of the items prepared to measure a specific feature (Seçer, 2013). In this context, the findings of content validity and construct validity, total item correlations and item discrimination levels of SMAS-SF are presented below. Content Validity The validity of the quantitative and qualitative content of the scaled items has been consulted by expert opinion (Balcı, 2009; Büyüköztürk, Çakmak, Akgün, Karadeniz & Demirel, 2015). One expert in the field of psychological counseling and guidance,one expert in psychiatric field, two experts in computer and instructional technology field, one expert in measurement and evaluation field and one expert in Turkish language education have shared their opinions about whether SMAS-SF is adequate to measure social media addiction. Opinions of these experts were obtained using a 3-point rating form. Experts were asked to respond by marking the "appropriate", "partially appropriate" and "not suitable" options for the items on the form. In the view of the experts, the content validity rate of the items has been determined (Veneziano & Hooper, 1997). The said ratios were determined by the ratio of the total number of experts who responded positively to each item to the total number of experts. The items with a coverage rate of less than 0.80 in the created item pool were subtracted from the draft scale. The draft scales were read by two Turkish literature experts in order to eliminate mistakes related to imputation and punctuation errors. Some items were removed from the scale in line with the calculated coverage validity ratios and some items were rearranged (Şahin & Beydoğan, 2016). The draft scale of 41 items has been prepared for initial implementation with the contribution of student opinions, information obtained from the literature and the literature experts. 38 of the items in the draft scale were positive and 3 of them were negative. Against the material created, five-grade options have been placed to determine the attitude levels of the students. These options were edited and scored as: (1) I do not agree at all, (2) I little agree, (3) I agree, (4) I quite agree, and (5) I strongly agree. The final scale was multiplied and applied. Construct Validity Exploratory Factor Analysis The suitability of the data obtained from the scale items for the factor analysis was determined by using the Kaiser Meyer Olkin (KMO) and Bartlett test. The values have been obtained as KMO test value, 965; Bartlett test value χ2 = 18304.06; df=400 (p=.00). In order to perform item factor analysis, it is suggested that the value of KMO should be at least .70 (Sönmez & Alacapınar, 2014) and the Bartlett test should be meaningful (Kalayci, 2009). Findings on the scale show that the data are appropriate for factor analysis. First, we conducted the basic components analysis in order to determine if the scale is one-dimensional. The basic components analysis used in the factor analysis and varimax vertical rotation technique is used to remove the items with factor loading values less than .40 and the items with two loading value at different factors (Balcı, 2009). At the end of the analysis of the basic components analysis in the factor analysis and the rotation process with the Varimax technique, 6 factors were determined with a value greater than 1.00. Due to excessive factor numbers, Cattel's scree test was done.
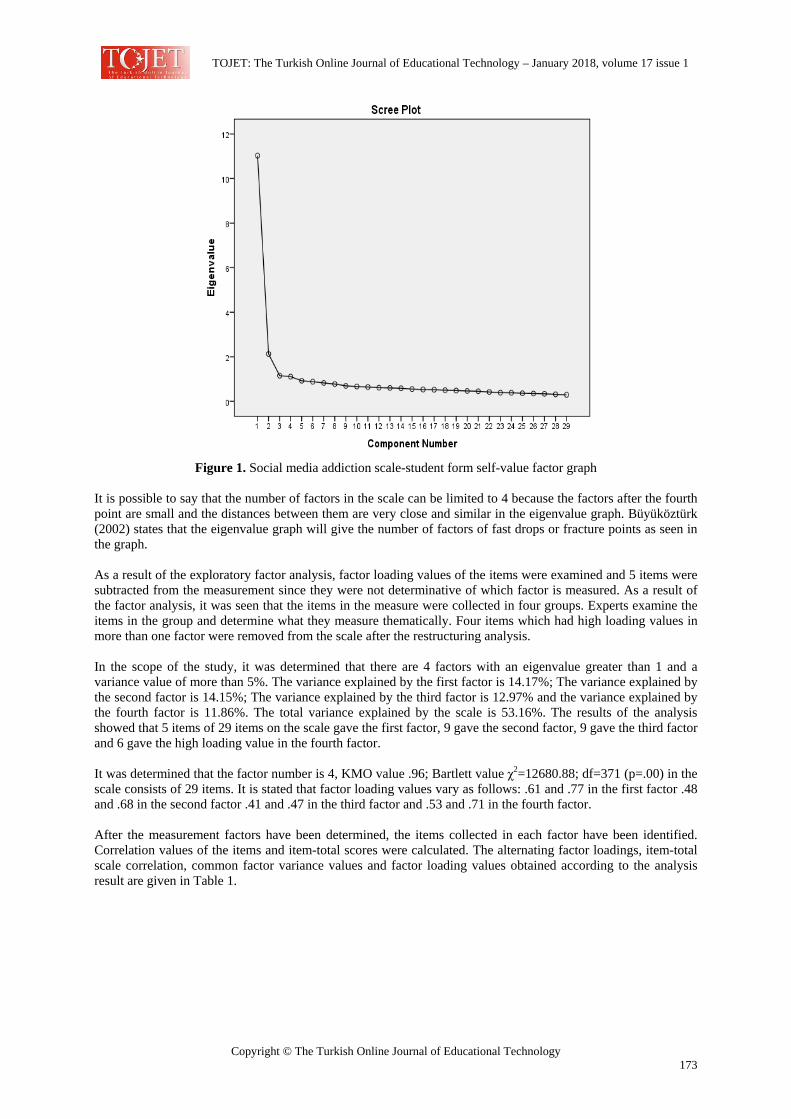
TOJET: The Turkish Online Journal of Educational Technology – January 2018, volume 17 issue 1
Copyright © The Turkish Online Journal of Educational Technology 173
Figure 1. Social media addiction scale-student form self-value factor graph
It is possible to say that the number of factors in the scale can be limited to 4 because the factors after the fourth point are small and the distances between them are very close and similar in the eigenvalue graph. Büyüköztürk (2002) states that the eigenvalue graph will give the number of factors of fast drops or fracture points as seen in the graph. As a result of the exploratory factor analysis, factor loading values of the items were examined and 5 items were subtracted from the measurement since they were not determinative of which factor is measured. As a result of the factor analysis, it was seen that the items in the measure were collected in four groups. Experts examine the items in the group and determine what they measure thematically. Four items which had high loading values in more than one factor were removed from the scale after the restructuring analysis. In the scope of the study, it was determined that there are 4 factors with an eigenvalue greater than 1 and a variance value of more than 5%. The variance explained by the first factor is 14.17%; The variance explained by the second factor is 14.15%; The variance explained by the third factor is 12.97% and the variance explained by the fourth factor is 11.86%. The total variance explained by the scale is 53.16%. The results of the analysis showed that 5 items of 29 items on the scale gave the first factor, 9 gave the second factor, 9 gave the third factor and 6 gave the high loading value in the fourth factor. It was determined that the factor number is 4, KMO value .96; Bartlett value χ2=12680.88; df=371 (p=.00) in the scale consists of 29 items. It is stated that factor loading values vary as follows: .61 and .77 in the first factor .48 and .68 in the second factor .41 and .47 in the third factor and .53 and .71 in the fourth factor. After the measurement factors have been determined, the items collected in each factor have been identified. Correlation values of the items and item-total scores were calculated. The alternating factor loadings, item-total scale correlation, common factor variance values and factor loading values obtained according to the analysis result are given in Table 1.

TOJET: The Turkish Online Journal of Educational Technology – January 2018, volume 17 issue 1
Copyright © The Turkish Online Journal of Educational Technology 174
Table 1. The factor loadings of social media addiction scale-student form and item-total correlation
Draft Scale
Item No
Scale Item No
Factor Loadings
before Rotation
Factor Loading Values Item-total Correlation Coefficients Virtual
Tolerance Virtual
Communication
Virtual Proble
m
Virtual Information
M1 1 .66 .77 .59 M2 2 .64 .75 .60 M4 3 .63 .71 .57 M3 4 .60 .70 .66 M5 5 .54 .61 .64
M18 6 .51 .68 .50 M11 7 .34 .55 .41 M21 8 .39 .54 .49 M26 9 .56 .54 .71 M24 10 .49 .53 .64 M28 11 .59 .51 .72 M20 12 .34 .50 .52 M34 13 .50 .50 .67 M27 14 .49 .48 .67 M14 15 .62 .67 .68 M30 16 .53 .66 .53 M10 17 .56 .64 .59 M31 18 .57 .57 .59 M15 19 .49 .55 .53 M17 20 .53 .54 .63 M29 21 .51 .50 .64 M22 22 .49 .48 .67 M16 23 .50 .41 .68 M38 24 .61 ,715 .62 M40 25 .62 ,703 .61 M39 26 .44 ,562 .53 M37 27 .44 ,560 .59 M35 28 .53 ,556 .65 M36 29 .58 ,539 .69
Variance (%) 14.17 14.15 12.97 11.86
Total Variance: 53.16% When Table 1 is examined, it is seen that the factor loadings of the scale items are collected in 4 sub-dimensions. According to the results of the repeated factor analysis, the items with factor loading values of less than 0,30 were eliminated from the scale which consists of 41 items. Item-test correlations were used to determine the discriminative power of the items. In the study, substances with a substance-test correlation values of 0.30 and above were taken as the basis. As a result of the analysis, 4 factor scale structure, which consists of 29 items, was reached. Factor loading values of the items were found to be between .41 and .77 for the overall measurement. These factors are named according to the information obtained from the literature and the expert opinion. According to this, the first factor is virtual tolerance, the second factor is virtual communication, the third factor is virtual problem and the fourth factor is virtual information. Confirmatory Factor Analysis First and second level confirmatory factor analysis were performed to test the accuracy of its 4-dimensional structure which is determined as the result of the exploratory factor analysis. Confirmatory factor analysis was performed on data collected from 298 students, except for the sample collected for the explanatory factor analysis. As shown in Figure 2, a model of equality has been established, which can be predicted by a four-factorial and a 29-factor structure, which is revealed by exploratory factor analysis. As a result of the confirmatory factor analysis, the Chi Square value is (χ2)=1576.98, the degree of freedom is χ2/df=4.25. It can be said that the Chi square values, which vary according to the sample size, have an acceptable concordance for the current sample to which this sample applies (Kline, 2005). For the structural suitability of
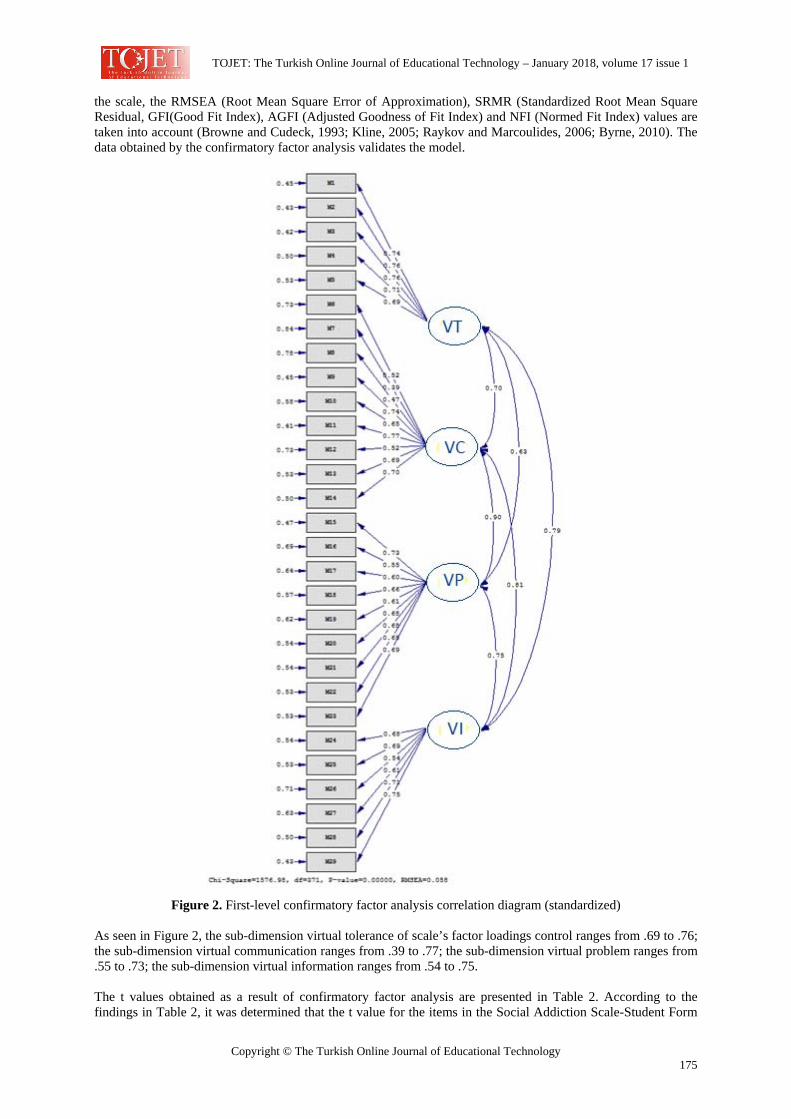
TOJET: The Turkish Online Journal of Educational Technology – January 2018, volume 17 issue 1
Copyright © The Turkish Online Journal of Educational Technology 175
the scale, the RMSEA (Root Mean Square Error of Approximation), SRMR (Standardized Root Mean Square Residual, GFI(Good Fit Index), AGFI (Adjusted Goodness of Fit Index) and NFI (Normed Fit Index) values are taken into account (Browne and Cudeck, 1993; Kline, 2005; Raykov and Marcoulides, 2006; Byrne, 2010). The data obtained by the confirmatory factor analysis validates the model.
Figure 2. First-level confirmatory factor analysis correlation diagram (standardized)
As seen in Figure 2, the sub-dimension virtual tolerance of scale’s factor loadings control ranges from .69 to .76; the sub-dimension virtual communication ranges from .39 to .77; the sub-dimension virtual problem ranges from .55 to .73; the sub-dimension virtual information ranges from .54 to .75. The t values obtained as a result of confirmatory factor analysis are presented in Table 2. According to the findings in Table 2, it was determined that the t value for the items in the Social Addiction Scale-Student Form
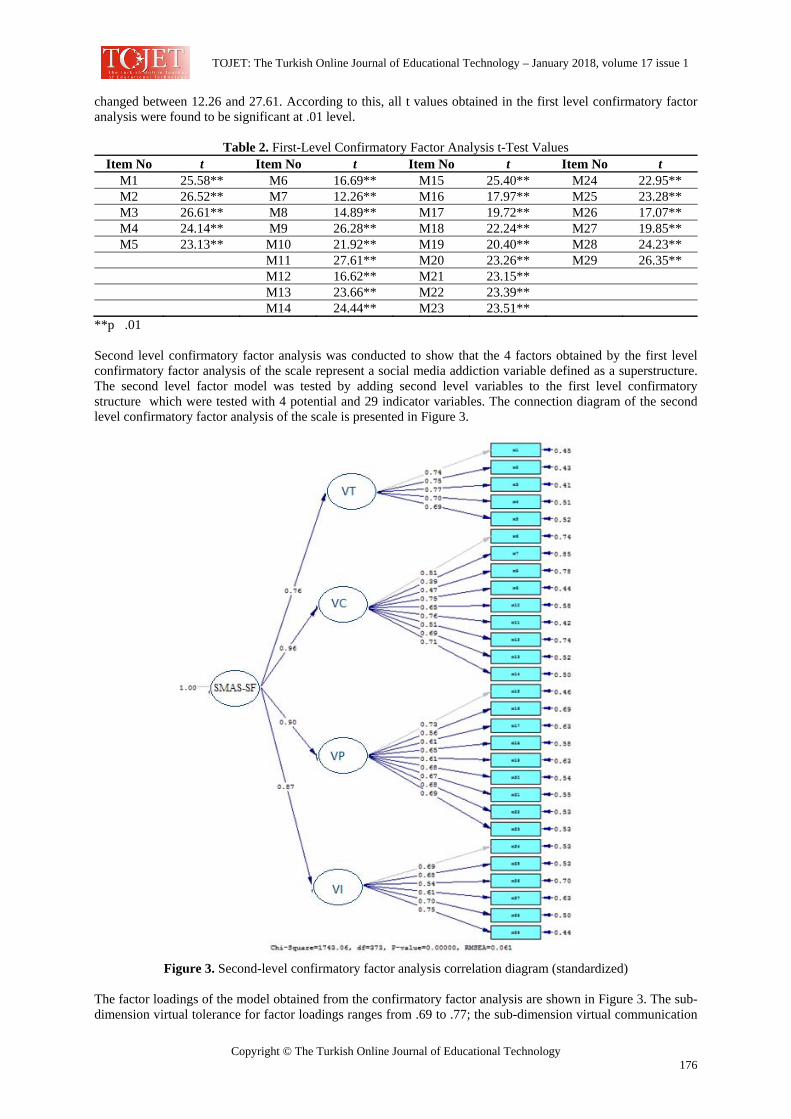
TOJET: The Turkish Online Journal of Educational Technology – January 2018, volume 17 issue 1
Copyright © The Turkish Online Journal of Educational Technology 176
changed between 12.26 and 27.61. According to this, all t values obtained in the first level confirmatory factor analysis were found to be significant at .01 level.
Table 2. First-Level Confirmatory Factor Analysis t-Test Values Item No t Item No t Item No t Item No t
M1 25.58** M6 16.69** M15 25.40** M24 22.95** M2 26.52** M7 12.26** M16 17.97** M25 23.28** M3 26.61** M8 14.89** M17 19.72** M26 17.07** M4 24.14** M9 26.28** M18 22.24** M27 19.85** M5 23.13** M10 21.92** M19 20.40** M28 24.23**
M11 27.61** M20 23.26** M29 26.35** M12 16.62** M21 23.15** M13 23.66** M22 23.39** M14 24.44** M23 23.51**
**p�.01 Second level confirmatory factor analysis was conducted to show that the 4 factors obtained by the first level confirmatory factor analysis of the scale represent a social media addiction variable defined as a superstructure. The second level factor model was tested by adding second level variables to the first level confirmatory structure which were tested with 4 potential and 29 indicator variables. The connection diagram of the second level confirmatory factor analysis of the scale is presented in Figure 3.
Figure 3. Second-level confirmatory factor analysis correlation diagram (standardized)
The factor loadings of the model obtained from the confirmatory factor analysis are shown in Figure 3. The sub-dimension virtual tolerance for factor loadings ranges from .69 to .77; the sub-dimension virtual communication
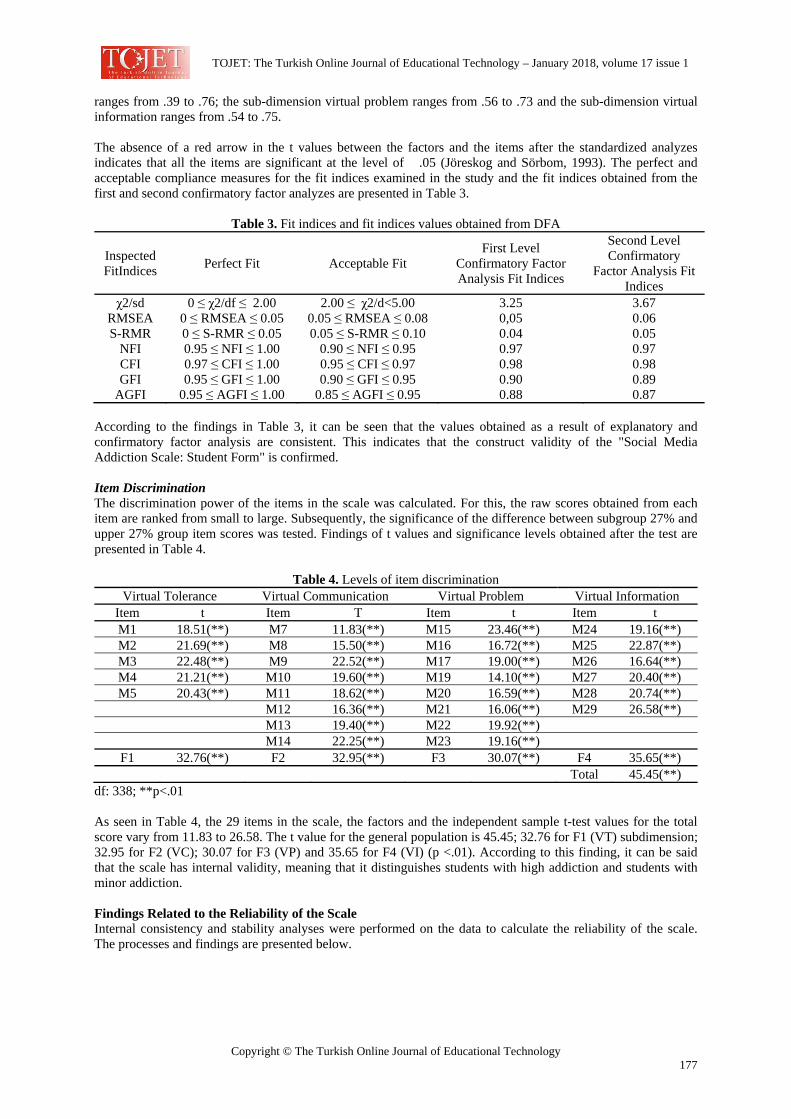
TOJET: The Turkish Online Journal of Educational Technology – January 2018, volume 17 issue 1
Copyright © The Turkish Online Journal of Educational Technology 177
ranges from .39 to .76; the sub-dimension virtual problem ranges from .56 to .73 and the sub-dimension virtual information ranges from .54 to .75. The absence of a red arrow in the t values between the factors and the items after the standardized analyzes indicates that all the items are significant at the level of �.05 (Jöreskog and Sörbom, 1993). The perfect and acceptable compliance measures for the fit indices examined in the study and the fit indices obtained from the first and second confirmatory factor analyzes are presented in Table 3.
Table 3. Fit indices and fit indices values obtained from DFA
Inspected FitIndices Perfect Fit Acceptable Fit
First Level Confirmatory Factor Analysis Fit Indices
Second Level Confirmatory
Factor Analysis Fit Indices
χ2/sd 0 ≤ χ2/df ≤ 2.00 2.00 ≤ χ2/d<5.00 3.25 3.67 RMSEA 0 ≤ RMSEA ≤ 0.05 0.05 ≤ RMSEA ≤ 0.08 0,05 0.06 S-RMR 0 ≤ S-RMR ≤ 0.05 0.05 ≤ S-RMR ≤ 0.10 0.04 0.05
NFI 0.95 ≤ NFI ≤ 1.00 0.90 ≤ NFI ≤ 0.95 0.97 0.97 CFI 0.97 ≤ CFI ≤ 1.00 0.95 ≤ CFI ≤ 0.97 0.98 0.98 GFI 0.95 ≤ GFI ≤ 1.00 0.90 ≤ GFI ≤ 0.95 0.90 0.89
AGFI 0.95 ≤ AGFI ≤ 1.00 0.85 ≤ AGFI ≤ 0.95 0.88 0.87 According to the findings in Table 3, it can be seen that the values obtained as a result of explanatory and confirmatory factor analysis are consistent. This indicates that the construct validity of the "Social Media Addiction Scale: Student Form" is confirmed. Item Discrimination The discrimination power of the items in the scale was calculated. For this, the raw scores obtained from each item are ranked from small to large. Subsequently, the significance of the difference between subgroup 27% and upper 27% group item scores was tested. Findings of t values and significance levels obtained after the test are presented in Table 4.
Table 4. Levels of item discrimination Virtual Tolerance Virtual Communication Virtual Problem Virtual Information
Item t Item T Item t Item t M1 18.51(**) M7 11.83(**) M15 23.46(**) M24 19.16(**) M2 21.69(**) M8 15.50(**) M16 16.72(**) M25 22.87(**) M3 22.48(**) M9 22.52(**) M17 19.00(**) M26 16.64(**) M4 21.21(**) M10 19.60(**) M19 14.10(**) M27 20.40(**) M5 20.43(**) M11 18.62(**) M20 16.59(**) M28 20.74(**)
M12 16.36(**) M21 16.06(**) M29 26.58(**) M13 19.40(**) M22 19.92(**) M14 22.25(**) M23 19.16(**)
F1 32.76(**) F2 32.95(**) F3 30.07(**) F4 35.65(**) Total 45.45(**)
df: 338; **p<.01 As seen in Table 4, the 29 items in the scale, the factors and the independent sample t-test values for the total score vary from 11.83 to 26.58. The t value for the general population is 45.45; 32.76 for F1 (VT) subdimension; 32.95 for F2 (VC); 30.07 for F3 (VP) and 35.65 for F4 (VI) (p <.01). According to this finding, it can be said that the scale has internal validity, meaning that it distinguishes students with high addiction and students with minor addiction. Findings Related to the Reliability of the Scale Internal consistency and stability analyses were performed on the data to calculate the reliability of the scale. The processes and findings are presented below.
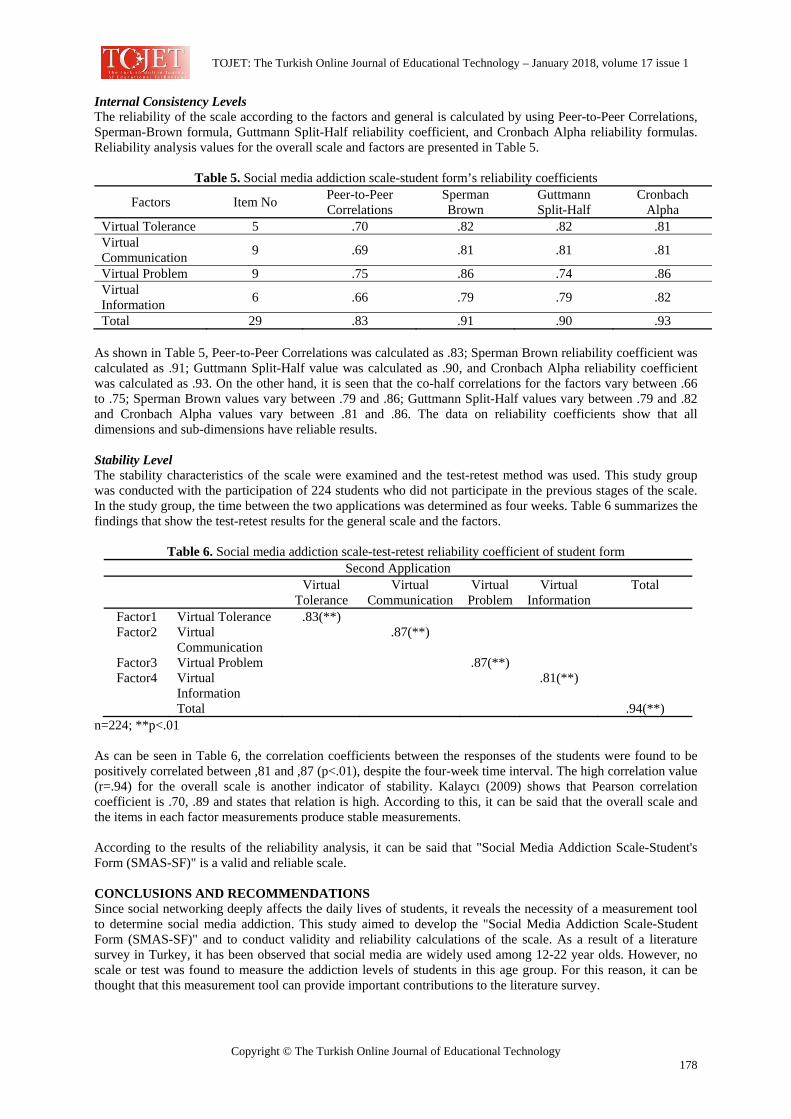
TOJET: The Turkish Online Journal of Educational Technology – January 2018, volume 17 issue 1
Copyright © The Turkish Online Journal of Educational Technology 178
Internal Consistency Levels The reliability of the scale according to the factors and general is calculated by using Peer-to-Peer Correlations, Sperman-Brown formula, Guttmann Split-Half reliability coefficient, and Cronbach Alpha reliability formulas. Reliability analysis values for the overall scale and factors are presented in Table 5.
Table 5. Social media addiction scale-student form’s reliability coefficients
Factors Item No Peer-to-Peer Correlations
Sperman Brown
Guttmann Split-Half
Cronbach Alpha
Virtual Tolerance 5 .70 .82 .82 .81 Virtual Communication 9 .69 .81 .81 .81
Virtual Problem 9 .75 .86 .74 .86 Virtual Information 6 .66 .79 .79 .82
Total 29 .83 .91 .90 .93 As shown in Table 5, Peer-to-Peer Correlations was calculated as .83; Sperman Brown reliability coefficient was calculated as .91; Guttmann Split-Half value was calculated as .90, and Cronbach Alpha reliability coefficient was calculated as .93. On the other hand, it is seen that the co-half correlations for the factors vary between .66 to .75; Sperman Brown values vary between .79 and .86; Guttmann Split-Half values vary between .79 and .82 and Cronbach Alpha values vary between .81 and .86. The data on reliability coefficients show that all dimensions and sub-dimensions have reliable results. Stability Level The stability characteristics of the scale were examined and the test-retest method was used. This study group was conducted with the participation of 224 students who did not participate in the previous stages of the scale. In the study group, the time between the two applications was determined as four weeks. Table 6 summarizes the findings that show the test-retest results for the general scale and the factors.
Table 6. Social media addiction scale-test-retest reliability coefficient of student form Second Application
Virtual Tolerance
Virtual Communication
Virtual Problem
Virtual Information
Total
Factor1 Virtual Tolerance .83(**) Factor2 Virtual
Communication .87(**)
Factor3 Virtual Problem .87(**) Factor4 Virtual
Information .81(**)
Total .94(**) n=224; **p<.01 As can be seen in Table 6, the correlation coefficients between the responses of the students were found to be positively correlated between ,81 and ,87 (p<.01), despite the four-week time interval. The high correlation value (r=.94) for the overall scale is another indicator of stability. Kalaycı (2009) shows that Pearson correlation coefficient is .70, .89 and states that relation is high. According to this, it can be said that the overall scale and the items in each factor measurements produce stable measurements. According to the results of the reliability analysis, it can be said that "Social Media Addiction Scale-Student's Form (SMAS-SF)" is a valid and reliable scale. CONCLUSIONS AND RECOMMENDATIONS Since social networking deeply affects the daily lives of students, it reveals the necessity of a measurement tool to determine social media addiction. This study aimed to develop the "Social Media Addiction Scale-Student Form (SMAS-SF)" and to conduct validity and reliability calculations of the scale. As a result of a literature survey in Turkey, it has been observed that social media are widely used among 12-22 year olds. However, no scale or test was found to measure the addiction levels of students in this age group. For this reason, it can be thought that this measurement tool can provide important contributions to the literature survey.
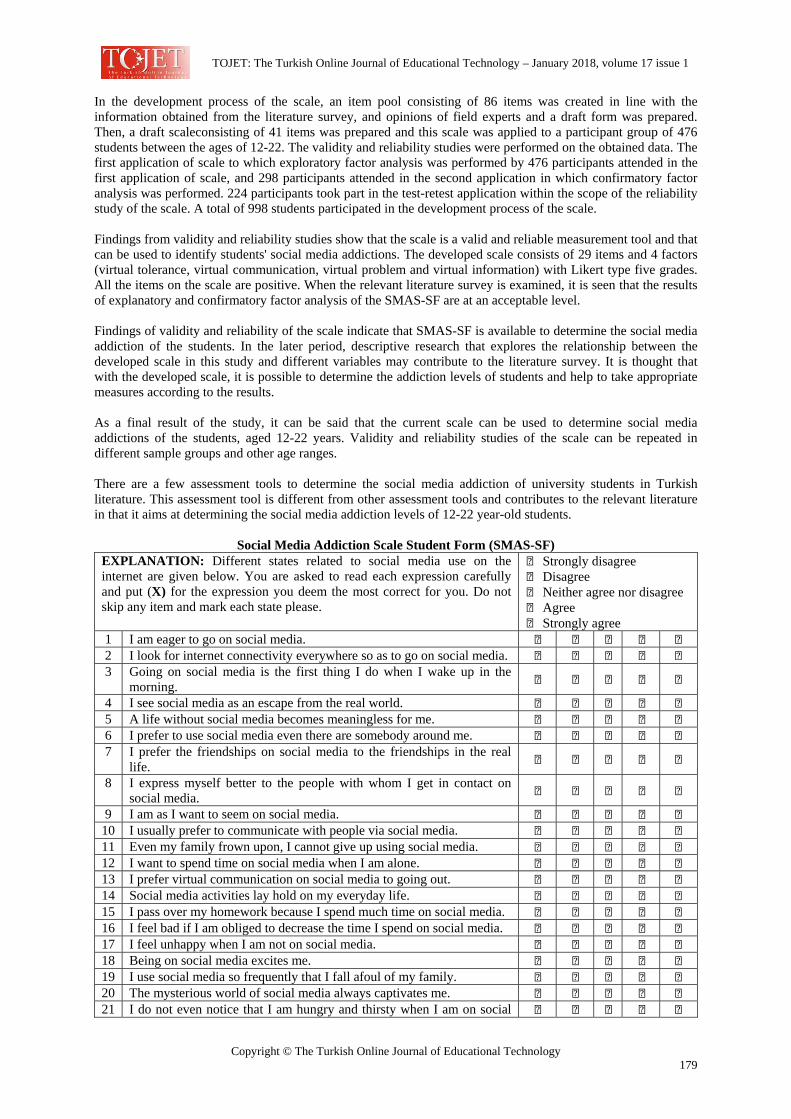
TOJET: The Turkish Online Journal of Educational Technology – January 2018, volume 17 issue 1
Copyright © The Turkish Online Journal of Educational Technology 179
In the development process of the scale, an item pool consisting of 86 items was created in line with the information obtained from the literature survey, and opinions of field experts and a draft form was prepared. Then, a draft scaleconsisting of 41 items was prepared and this scale was applied to a participant group of 476 students between the ages of 12-22. The validity and reliability studies were performed on the obtained data. The first application of scale to which exploratory factor analysis was performed by 476 participants attended in the first application of scale, and 298 participants attended in the second application in which confirmatory factor analysis was performed. 224 participants took part in the test-retest application within the scope of the reliability study of the scale. A total of 998 students participated in the development process of the scale. Findings from validity and reliability studies show that the scale is a valid and reliable measurement tool and that can be used to identify students' social media addictions. The developed scale consists of 29 items and 4 factors (virtual tolerance, virtual communication, virtual problem and virtual information) with Likert type five grades. All the items on the scale are positive. When the relevant literature survey is examined, it is seen that the results of explanatory and confirmatory factor analysis of the SMAS-SF are at an acceptable level. Findings of validity and reliability of the scale indicate that SMAS-SF is available to determine the social media addiction of the students. In the later period, descriptive research that explores the relationship between the developed scale in this study and different variables may contribute to the literature survey. It is thought that with the developed scale, it is possible to determine the addiction levels of students and help to take appropriate measures according to the results. As a final result of the study, it can be said that the current scale can be used to determine social media addictions of the students, aged 12-22 years. Validity and reliability studies of the scale can be repeated in different sample groups and other age ranges. There are a few assessment tools to determine the social media addiction of university students in Turkish literature. This assessment tool is different from other assessment tools and contributes to the relevant literature in that it aims at determining the social media addiction levels of 12-22 year-old students.
Social Media Addiction Scale Student Form (SMAS-SF)
EXPLANATION: Different states related to social media use on the internet are given below. You are asked to read each expression carefully and put (X) for the expression you deem the most correct for you. Do not skip any item and mark each state please.
Strongly disagree Disagree Neither agree nor disagree Agree Strongly agree
1 I am eager to go on social media. 2 I look for internet connectivity everywhere so as to go on social media. 3 Going on social media is the first thing I do when I wake up in the
morning.
4 I see social media as an escape from the real world. 5 A life without social media becomes meaningless for me. 6 I prefer to use social media even there are somebody around me. 7 I prefer the friendships on social media to the friendships in the real
life.
8 I express myself better to the people with whom I get in contact on social media.
9 I am as I want to seem on social media. 10 I usually prefer to communicate with people via social media. 11 Even my family frown upon, I cannot give up using social media. 12 I want to spend time on social media when I am alone. 13 I prefer virtual communication on social media to going out. 14 Social media activities lay hold on my everyday life. 15 I pass over my homework because I spend much time on social media. 16 I feel bad if I am obliged to decrease the time I spend on social media. 17 I feel unhappy when I am not on social media. 18 Being on social media excites me. 19 I use social media so frequently that I fall afoul of my family. 20 The mysterious world of social media always captivates me. 21 I do not even notice that I am hungry and thirsty when I am on social
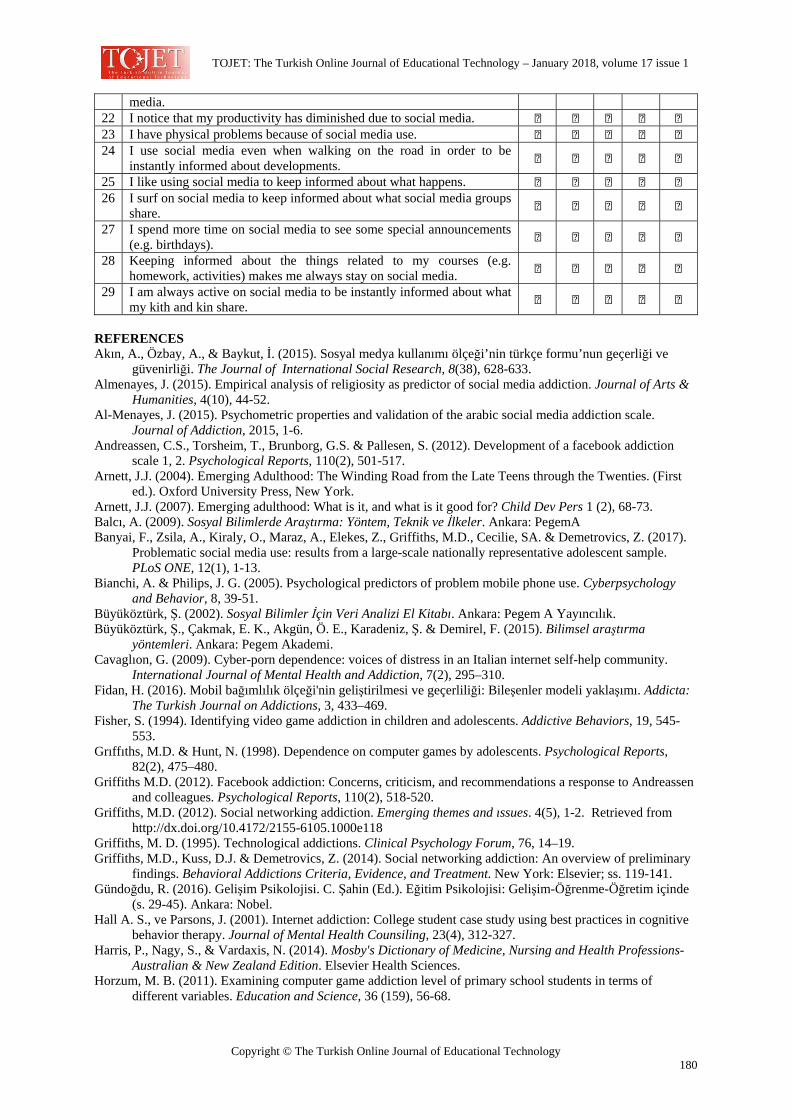
TOJET: The Turkish Online Journal of Educational Technology – January 2018, volume 17 issue 1
Copyright © The Turkish Online Journal of Educational Technology 180
media. 22 I notice that my productivity has diminished due to social media. 23 I have physical problems because of social media use. 24 I use social media even when walking on the road in order to be
instantly informed about developments.
25 I like using social media to keep informed about what happens. 26 I surf on social media to keep informed about what social media groups
share.
27 I spend more time on social media to see some special announcements (e.g. birthdays).
28 Keeping informed about the things related to my courses (e.g. homework, activities) makes me always stay on social media.
29 I am always active on social media to be instantly informed about what my kith and kin share.
REFERENCES Akın, A., Özbay, A., & Baykut, İ. (2015). Sosyal medya kullanımı ölçeği’nin türkçe formu’nun geçerliği ve
güvenirliği. The Journal of International Social Research, 8(38), 628-633. Almenayes, J. (2015). Empirical analysis of religiosity as predictor of social media addiction. Journal of Arts &
Humanities, 4(10), 44-52. Al-Menayes, J. (2015). Psychometric properties and validation of the arabic social media addiction scale.
Journal of Addiction, 2015, 1-6. Andreassen, C.S., Torsheim, T., Brunborg, G.S. & Pallesen, S. (2012). Development of a facebook addiction
scale 1, 2. Psychological Reports, 110(2), 501-517. Arnett, J.J. (2004). Emerging Adulthood: The Winding Road from the Late Teens through the Twenties. (First
ed.). Oxford University Press, New York. Arnett, J.J. (2007). Emerging adulthood: What is it, and what is it good for? Child Dev Pers 1 (2), 68-73. Balcı, A. (2009). Sosyal Bilimlerde Araştırma: Yöntem, Teknik ve İlkeler. Ankara: PegemA Banyai, F., Zsila, A., Kiraly, O., Maraz, A., Elekes, Z., Griffiths, M.D., Cecilie, SA. & Demetrovics, Z. (2017).
Problematic social media use: results from a large-scale nationally representative adolescent sample. PLoS ONE, 12(1), 1-13.
Bianchi, A. & Philips, J. G. (2005). Psychological predictors of problem mobile phone use. Cyberpsychology and Behavior, 8, 39-51.
Büyüköztürk, Ş. (2002). Sosyal Bilimler İçin Veri Analizi El Kitabı. Ankara: Pegem A Yayıncılık. Büyüköztürk, Ş., Çakmak, E. K., Akgün, Ö. E., Karadeniz, Ş. & Demirel, F. (2015). Bilimsel araştırma
yöntemleri. Ankara: Pegem Akademi. Cavaglıon, G. (2009). Cyber-porn dependence: voices of distress in an Italian internet self-help community.
International Journal of Mental Health and Addiction, 7(2), 295–310. Fidan, H. (2016). Mobil bağımlılık ölçeği'nin geliştirilmesi ve geçerliliği: Bileşenler modeli yaklaşımı. Addicta:
The Turkish Journal on Addictions, 3, 433–469. Fisher, S. (1994). Identifying video game addiction in children and adolescents. Addictive Behaviors, 19, 545-
553. Grıffıths, M.D. & Hunt, N. (1998). Dependence on computer games by adolescents. Psychological Reports,
82(2), 475–480. Griffiths M.D. (2012). Facebook addiction: Concerns, criticism, and recommendations a response to Andreassen
and colleagues. Psychological Reports, 110(2), 518-520. Griffiths, M.D. (2012). Social networking addiction. Emerging themes and ıssues. 4(5), 1-2. Retrieved from
http://dx.doi.org/10.4172/2155-6105.1000e118 Griffiths, M. D. (1995). Technological addictions. Clinical Psychology Forum, 76, 14–19. Griffiths, M.D., Kuss, D.J. & Demetrovics, Z. (2014). Social networking addiction: An overview of preliminary
findings. Behavioral Addictions Criteria, Evidence, and Treatment. New York: Elsevier; ss. 119-141. Gündoğdu, R. (2016). Gelişim Psikolojisi. C. Şahin (Ed.). Eğitim Psikolojisi: Gelişim-Öğrenme-Öğretim içinde
(s. 29-45). Ankara: Nobel. Hall A. S., ve Parsons, J. (2001). Internet addiction: College student case study using best practices in cognitive
behavior therapy. Journal of Mental Health Counsiling, 23(4), 312-327. Harris, P., Nagy, S., & Vardaxis, N. (2014). Mosby's Dictionary of Medicine, Nursing and Health Professions-
Australian & New Zealand Edition. Elsevier Health Sciences. Horzum, M. B. (2011). Examining computer game addiction level of primary school students in terms of
different variables. Education and Science, 36 (159), 56-68.
TOJET: The Turkish Online Journal of Educational Technology – January 2018, volume 17 issue 1
Copyright © The Turkish Online Journal of Educational Technology 181
Internet World Stats (2017). Internet world stats. Usage and population statistics. Retrieved http://www.internetworldstats.com/stats.htm.
Jöreskog, K. & Sörbom, D. (1993). Lisrel 8: Structural equation modeling with the simplis command language. USA: Scientific Software International.
Kalaycı, Ş. (2009). SPSS Uygulamalı Çok Değişkenli İstatistik Teknikleri. Ankara: Asil Yayınevi. Karasu, M. ve Arıkan, D. (2016). Öğretmen adaylarının sosyal medya kullanım durumları ve medya
okuryazarlık düzeyleri arasındaki ilişkinin incelenmesi. Ege Eğitim Dergisi, 17(2), 549 – 566. Kırık, A.M., Arslan, A., Çetinkaya, A. & Gül, M. (2015). A quantitative research on the level of social media
addiction among young people in Turkey. International Journal of Science Culture and Sport (IntJSCS), 3(3), 108-122.
Kline, R. B. (2005). Principles and practice of structural equation modeling. New York: The Guilford Press. Kuss, D. ve Griffiths, M. (2012). Internet gaming addiction: a systematic review of empirical research.
International Journal of Mental Health Addiction, 10, 278-296. Morahan-Martin J. & Schumacher, P. (2000). Incidence and correlates of pathological internet use among
college students. Computers in Human Behavior, 16(1), 13-29. Pohlmann, J. T. (2004). Use and interpretation of factor analysis in The Journal of Educational Research: 1992-
2002. The Journal of Educational Research, 98(1), 14-22. Raykov, T., & Marcoulides, G.A. (2006). A first course structural equation modeling. New Jersey: Lawrence
Erlbaum Assocation Inc. Russell, D. W. (2002). In search of underlying dimensions: The use (and abuse) of factor analysis. Personality
and Social Psychology Bulletin, 28, 1629–1646. Saaid, S.A., Al-Rashid, N.A.A. & Abdullah, Z. (2014). The impact of addiction to twitter among university
students. Future Information Technology. New York: Springer; ss. 231-236. Schwartz, M.F. & Southern, S. (2000). Compulsive cybersex: the new tea room. Sexual Addiction &
Compulsivity 7(1-2), 127–144. Seçer, İ. (2013). SPSS ve LISREL ile pratik veri analizi ve raporlaştırma. Ankara: Anı Yayıncılık. Shapira, N.A., Goldsmith, T.D., Keck, P.E. Jr., Khosla, U.M., & McElroy, S.L. (2000), Psychiatric features of
individuals with problematic internet use. Journal of Affective Disorders,57(1-3), 267-272. Sönmez, V. & Alacapınar, G.F. (2014). Örneklendirilmiş Bilimsel Araştırma Yöntemleri. Ankara: Anı
Yayıncılık. Şahin, C. (2011). An analysis of internet addiction levels of individuals according to various variables. The
Turkish Online Journal of Educational Technology, 10 (4), 60-66. Şahin, C. ve Beydoğan, H.Ö. (2016). Öğretmenlerin öğrencileri tanıma yeterliliği ölçeği. 21. Yüzyılda Eğitim ve
Toplum-Eğitim Bilimleri ve Sosyal Araştırmalar Dergisi, 5(14), 177-198. Şahin, C. ve Yağcı, M. (2017). Sosyal medya bağımlılığı ölçeği-yetişkin formu: Geçerlik ve güvenirlik
çalışması. Ahi Evran Üniversitesi Eğitim Fakültesi Dergisi, 18(1), 523-538. Tekvar, S.O. (2012). Yeni medya ve halkla ilişkilerde dönüşüm: farklı kurumsal yapılarda halkla ilişkiler algısı
ve sosyal paylaşım ağları. (Yayımlanmamış doktora tezi, Ankara Üniversitesi Eğitim Bilimleri Enstitüsü).
Turel, O. & Serenko, A. (2012). The benefits and dangers of enjoyment with social networking websites. European Journal of Information Systems, 21, 512–528.
Tutgun Ünal, A. & Deniz, L. (2015). Development of the social media addiction scale. Online Academic Journal of Information Technology, 6(21), 52-70.
Türkiye İstatistik Kurumu (TUİK) (2016). Hane Halkı Bilişim Teknolojileri Kullanımı Araştırması. http://www.tuik.gov.tr
Tüzer, V. (2011). İnternet, siberseks ve sadakatsizlik. Psikiyatride Güncel Yaklaşımlar, 3 (1), 100-116. van den Eijnden, R.J.J.M., Lemmens, J.S. & Valkenurg, P.M. (2016). The social media disorder scale.
Computers in Human Behavior, 61, 478-487. Veneziano, L. & Hooper J. (1997). A method for quantifying content validity of health-related questionnaires.
American Journal of Health Behavior, 21(1), 67-70. Wang, W. (2001). Internet dependency and psychosocial maturity among college students. International Journal
Human Computer Study, 55(6), 919-938. Wegmann E., Stodt B. & Brand M. (2015). Addictive use of social networking sites can be explained by the
interaction of internet use expectancies, internet literacy, and psychopathological symptoms. Journal of Behavioral Addictions, 4(3), 155-162.
Xu, H., Tan, B.C.Y. (2012). Why do I keep checking facebook: Effects of message characteristics on the formation of social network services addiction. Thirty Third International Conference on Information Systems,1-12,Orlando.Retrieved http://aisel.aisnet.org/cgi/viewcontent.cgi?article=1216& context=icis2012

TOJET: The Turkish Online Journal of Educational Technology – January 2018, volume 17 issue 1
Copyright © The Turkish Online Journal of Educational Technology 182
Yang, S., & Tung, C. (2007). Comparison of Internet addicts and non-addicts in Taiwanese high schools, Computers in Human Behavior, 23, 79-96.
Young K. S. (2004). Internet addiction: A new clinical phenomenon and its consequences. American Behaviour Scientist, 48, 402- 415.
TOJET: The Turkish Online Journal of Educational Technology – January 2018, volume 17 issue 1
Copyright © The Turkish Online Journal of Educational Technology 183
The Art of Teaching Science in Secondary Schools: A Meta Analysis Sharifah Sariah Syed Hassan Department of Curriculum and Instruction, Kulliyah of Education, International Islamic University Malaysia [email protected] Ahmad Abdullahi Ibrahim Department of Curriculum and Instruction, Kulliyah of Education, International Islamic University Malaysia [email protected] ABSTRACT This study attempted to highlight the trend of research in science related subjects specifically in schools. Articles and journals were retrieved from Google scholar under peer reviewed with the aim to highlight the trend of research methods, findings and teaching strategies. The themes were based on pedagogical approaches of teaching science, students’ motivation in learning sciences and challenges hindering effectiveness of teaching sciences. The paper contributes to policy makers and science teachers to employ appropriate strategies and integrate suitable technologies for teaching science in secondary schools. Based on the meta-analysis, tables are provided to summarise the research trend and findings. It has been found that the trend of low interest in learning science is still apparent for the past five years. The barriers of effective teaching and motivation have been the main discussion among researchers. Recommendations have been drawn to ensure teachers to involve in action research for effective intervention in teaching and learning science in schools. The limitations of study include the narrow search in the Google scholar rather than in indexed Scopus and ISI journals. Thus the quality of the research journals is not addressed. Keywords: Pedagogy, science education, motivation INTRODUCTION The demand of skilful human capital imparting scientific knowledge, values and problem solving has changed the education perspectives in the 21st century. The world continues to witness unprecedented development and challenges in science and technology. It has been a great concern for every developing country to invest hugely on children’s education from early age in facing the new wave of Information Communication Technology (ICT). Economic growth in Malaysia has grown very fast in achieving 2020 vision where the country has to accomplish scientifically driven economy and a developed nation as reported in Amardio (2015). However, Malaysia is experiencing a decline number of students who are interested to pursue their specialization in Science and Technology (S&T) (MOSTI, 2008; MOSTI, 2015). OECD (2016) has reported on the economic slowdown in Malaysia which requires the Government to venture into innovation system which is hoped to drive the growth of economy and social development. A few considerations that need to be addressed is to overcome the mismatch of skills and education, and lack of coordination of science and technology policies with other overlapping policies and initiatives. Many research has been carried out to highlight the trend of research in S&T. The findings will inform on the current status of science teaching throughout the countries in the world. Thus, a systematic review is needed to analyze previous research trend and to draw a conclusion from the analyses. FOCUS OF STUDY This paper aims to identify the research trends of teaching science subjects in secondary schools from the years 2010 to 2016. The reviews of the articles were based on identifying the areas of the research, most frequent employed methodologies; research instruments; and data analysis techniques. Finally, the researcher reviewed the major findings of the articles where teachers’ pedagogical approaches of teaching science, students’ motivation in learning sciences and challenges hindering effectiveness of teaching sciences were identified and discussed as the main themes of the analysis. The paper contributes to policy makers and science teachers to employ appropriate strategies and integrate suitable technologies for teaching science in secondary schools. Based on the focus this study, the following research questions are addressed.
TOJET: The Turkish Online Journal of Educational Technology – January 2018, volume 17 issue 1
Copyright © The Turkish Online Journal of Educational Technology 184
1. What are the main areas of STEM have been researched? 2. Which methodology most frequently employed in research related to teaching and learning science in secondary schools?
3. What is the most common research instrument used for data collection in the research? 4. Which instructional strategies do science teachers prefer for teaching science subjects? 5. What is the trend of students’ motivation in learning science? 6. What are challenges hindering the success of teaching sciences in secondary schools as reported from the findings of the reviewed articles?
RESEARCH DESIGN This study attempts to identify the directions of research of S&T in secondary schools through the analysis articles related to the area published in different online scholarly open source journals from 2010 to 2016 and available in Google scholar. Thus, meta-analysis is deemed to be the most suitable design of this study. Meta-analysis and content analysis have been interchangeably used to identify the trend of research for the literature reviews. Content analysis is referred to as a research procedure uses to systematically interpret textual materials (Hsieh & Shannon, 2005) which utilizes both quantitative and qualitative methodologies. It is also referred to the study of the content with reference to the meanings, contexts and intentions contained in messages (Parasad, nd). The content can be written texts, pictures, artefacts and recordings (Cresswell, 2012). Bauer and Gaskell (2000) denoted that one of the essences of conducting content analysis is to provide the researcher an opportunity to link data which are related to each other and generate themes that can be read conveniently; also it is useful for reserachers to use it as a reference of their potentials studies. On the other hand, meta-analysis is analysis of analysis which refers to two categories: integrative and interpretive. In this study, integrative method is used to summarize the data from the quantitative findings and provide a qualitative understanding. Parasad (nd) stated that meta-analysis has been widely used by researchers to understand different range of themes such as changing trends in the theoretical content of various fields of study, cultural symbols, social change, verification of authorship, changes in the mass media content, nature of news coverage of social issues like violence against women and children, divorce rate, truancy etc. Loy and Pamela (1979) indicated that one of the most common of meta-analysis employed by researchers is the one related to changing trends in the theoretical content and methodological approaches through analysing the contents of the journal articles related to the discipline. For instance, in the field of science education, Uzunboylu and Aşıksoy (2014) explored the trends of research in physics education by reviewing 105 articles published between the years of 2008 and 2013. The researchers reviewed the articles based of their methods, subject areas, research titles, data analysis techniques, and sampling types. The findings of the study were analysed using frequency and percentage. In addition to that, Geske (2011) analysed science text books for primary school in Latvia, Kazakhstan, Russian Federation, the Ukrain and the USA. He applied TIMSS research framework to assess the effect of textbooks on students’ achievement. Similarly, Maleknejad Amoopour and Abdi (2015) conducted a content analysis of biology book of grade three students’ viewpoint from public and private high schools in Rasht City during 2014-2015 academic year. Thus, meta-analysis specifically the critical review of previous research is employed to analyse 20 articles from open source online publications between 2010 and 2016 available in Google scholar by considering the following steps: (i) Publication year, (ii) authors, (iii) Research titles (iv) Research objective, (v) Research methods, (vi) Data collection instruments, (vii) Data analysis techniques and (viii) summary of the major findings of the study. The articles were selected from journals based on the key words of the research questions. The journals were properly selected to ensure they are peer reviewed and not listed in the predatory list. The journals are: The Malaysian Online Journal of Educational Technology, Journal of Science and Mathematics Education in Southeast Asia, British Journal of Science, Asia-Pacific Forum on Science Learning and Teaching, International Journal of Instruction, Journal Science Education Technology, Baraton Interdisciplinary Research Journal, Journal of Social Sciences, Procedia Social and Behavioral Sciences, Eurasia Journal of Mathematics, Science & Technology Education, Educational Research International, Journal of Agricultural Education, International Journal of Machine Learning and Computing, European Journal of Science and Mathematics Education,
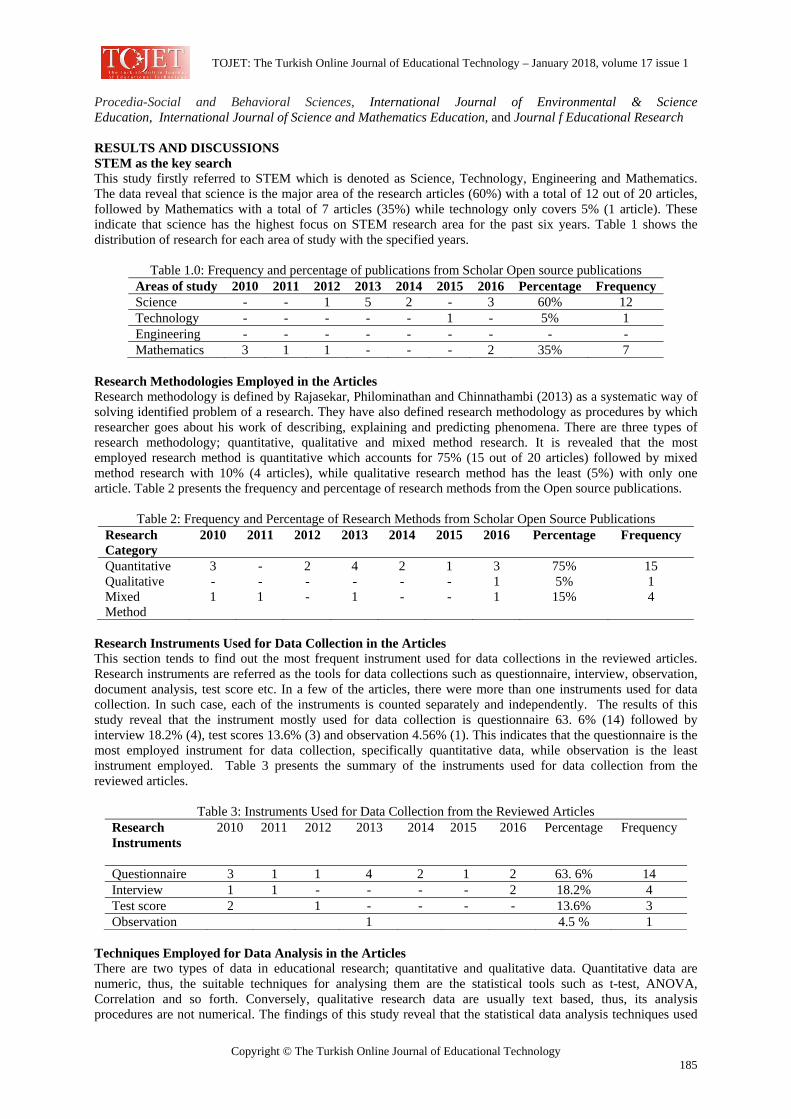
TOJET: The Turkish Online Journal of Educational Technology – January 2018, volume 17 issue 1
Copyright © The Turkish Online Journal of Educational Technology 185
Procedia-Social and Behavioral Sciences, International Journal of Environmental & Science Education, International Journal of Science and Mathematics Education, and Journal f Educational Research RESULTS AND DISCUSSIONS STEM as the key search This study firstly referred to STEM which is denoted as Science, Technology, Engineering and Mathematics. The data reveal that science is the major area of the research articles (60%) with a total of 12 out of 20 articles, followed by Mathematics with a total of 7 articles (35%) while technology only covers 5% (1 article). These indicate that science has the highest focus on STEM research area for the past six years. Table 1 shows the distribution of research for each area of study with the specified years.
Table 1.0: Frequency and percentage of publications from Scholar Open source publications
Areas of study 2010 2011 2012 2013 2014 2015 2016 Percentage Frequency Science - - 1 5 2 - 3 60% 12 Technology - - - - - 1 - 5% 1 Engineering - - - - - - - - - Mathematics 3 1 1 - - - 2 35% 7
Research Methodologies Employed in the Articles Research methodology is defined by Rajasekar, Philominathan and Chinnathambi (2013) as a systematic way of solving identified problem of a research. They have also defined research methodology as procedures by which researcher goes about his work of describing, explaining and predicting phenomena. There are three types of research methodology; quantitative, qualitative and mixed method research. It is revealed that the most employed research method is quantitative which accounts for 75% (15 out of 20 articles) followed by mixed method research with 10% (4 articles), while qualitative research method has the least (5%) with only one article. Table 2 presents the frequency and percentage of research methods from the Open source publications.
Table 2: Frequency and Percentage of Research Methods from Scholar Open Source Publications
Research Category
2010 2011 2012 2013 2014 2015 2016 Percentage Frequency
Quantitative 3 - 2 4 2 1 3 75% 15 Qualitative - - - - - - 1 5% 1 Mixed Method
1 1 - 1 - - 1 15% 4
Research Instruments Used for Data Collection in the Articles This section tends to find out the most frequent instrument used for data collections in the reviewed articles. Research instruments are referred as the tools for data collections such as questionnaire, interview, observation, document analysis, test score etc. In a few of the articles, there were more than one instruments used for data collection. In such case, each of the instruments is counted separately and independently. The results of this study reveal that the instrument mostly used for data collection is questionnaire 63. 6% (14) followed by interview 18.2% (4), test scores 13.6% (3) and observation 4.56% (1). This indicates that the questionnaire is the most employed instrument for data collection, specifically quantitative data, while observation is the least instrument employed. Table 3 presents the summary of the instruments used for data collection from the reviewed articles.
Table 3: Instruments Used for Data Collection from the Reviewed Articles
Research Instruments
2010
2011
2012
2013
2014
2015
2016 Percentage Frequency
Questionnaire 3 1 1 4 2 1 2 63. 6% 14 Interview 1 1 - - - - 2 18.2% 4 Test score 2 1 - - - - 13.6% 3 Observation 1 4.5 % 1
Techniques Employed for Data Analysis in the Articles There are two types of data in educational research; quantitative and qualitative data. Quantitative data are numeric, thus, the suitable techniques for analysing them are the statistical tools such as t-test, ANOVA, Correlation and so forth. Conversely, qualitative research data are usually text based, thus, its analysis procedures are not numerical. The findings of this study reveal that the statistical data analysis techniques used
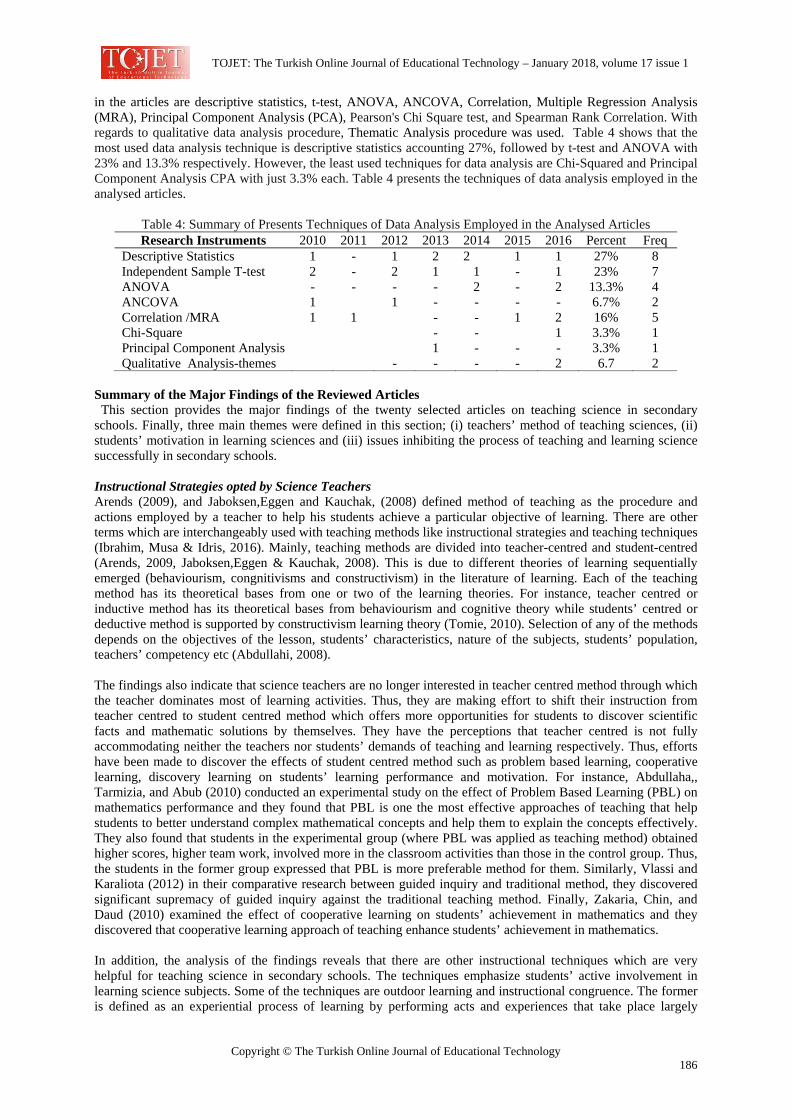
TOJET: The Turkish Online Journal of Educational Technology – January 2018, volume 17 issue 1
Copyright © The Turkish Online Journal of Educational Technology 186
in the articles are descriptive statistics, t-test, ANOVA, ANCOVA, Correlation, Multiple Regression Analysis (MRA), Principal Component Analysis (PCA), Pearson's Chi Square test, and Spearman Rank Correlation. With regards to qualitative data analysis procedure, Thematic Analysis procedure was used. Table 4 shows that the most used data analysis technique is descriptive statistics accounting 27%, followed by t-test and ANOVA with 23% and 13.3% respectively. However, the least used techniques for data analysis are Chi-Squared and Principal Component Analysis CPA with just 3.3% each. Table 4 presents the techniques of data analysis employed in the analysed articles.
Table 4: Summary of Presents Techniques of Data Analysis Employed in the Analysed Articles Research Instruments 2010 2011 2012 2013 2014 2015 2016 Percent Freq
Descriptive Statistics 1 - 1 2 2 1 1 27% 8 Independent Sample T-test 2 - 2 1 1 - 1 23% 7 ANOVA - - - - 2 - 2 13.3% 4 ANCOVA 1 1 - - - - 6.7% 2 Correlation /MRA 1 1 - - 1 2 16% 5 Chi-Square - - 1 3.3% 1 Principal Component Analysis 1 - - - 3.3% 1 Qualitative Analysis-themes - - - - 2 6.7 2
Summary of the Major Findings of the Reviewed Articles This section provides the major findings of the twenty selected articles on teaching science in secondary schools. Finally, three main themes were defined in this section; (i) teachers’ method of teaching sciences, (ii) students’ motivation in learning sciences and (iii) issues inhibiting the process of teaching and learning science successfully in secondary schools. Instructional Strategies opted by Science Teachers Arends (2009), and Jaboksen,Eggen and Kauchak, (2008) defined method of teaching as the procedure and actions employed by a teacher to help his students achieve a particular objective of learning. There are other terms which are interchangeably used with teaching methods like instructional strategies and teaching techniques (Ibrahim, Musa & Idris, 2016). Mainly, teaching methods are divided into teacher-centred and student-centred (Arends, 2009, Jaboksen,Eggen & Kauchak, 2008). This is due to different theories of learning sequentially emerged (behaviourism, congnitivisms and constructivism) in the literature of learning. Each of the teaching method has its theoretical bases from one or two of the learning theories. For instance, teacher centred or inductive method has its theoretical bases from behaviourism and cognitive theory while students’ centred or deductive method is supported by constructivism learning theory (Tomie, 2010). Selection of any of the methods depends on the objectives of the lesson, students’ characteristics, nature of the subjects, students’ population, teachers’ competency etc (Abdullahi, 2008). The findings also indicate that science teachers are no longer interested in teacher centred method through which the teacher dominates most of learning activities. Thus, they are making effort to shift their instruction from teacher centred to student centred method which offers more opportunities for students to discover scientific facts and mathematic solutions by themselves. They have the perceptions that teacher centred is not fully accommodating neither the teachers nor students’ demands of teaching and learning respectively. Thus, efforts have been made to discover the effects of student centred method such as problem based learning, cooperative learning, discovery learning on students’ learning performance and motivation. For instance, Abdullaha,, Tarmizia, and Abub (2010) conducted an experimental study on the effect of Problem Based Learning (PBL) on mathematics performance and they found that PBL is one the most effective approaches of teaching that help students to better understand complex mathematical concepts and help them to explain the concepts effectively. They also found that students in the experimental group (where PBL was applied as teaching method) obtained higher scores, higher team work, involved more in the classroom activities than those in the control group. Thus, the students in the former group expressed that PBL is more preferable method for them. Similarly, Vlassi and Karaliota (2012) in their comparative research between guided inquiry and traditional method, they discovered significant supremacy of guided inquiry against the traditional teaching method. Finally, Zakaria, Chin, and Daud (2010) examined the effect of cooperative learning on students’ achievement in mathematics and they discovered that cooperative learning approach of teaching enhance students’ achievement in mathematics. In addition, the analysis of the findings reveals that there are other instructional techniques which are very helpful for teaching science in secondary schools. The techniques emphasize students’ active involvement in learning science subjects. Some of the techniques are outdoor learning and instructional congruence. The former is defined as an experiential process of learning by performing acts and experiences that take place largely
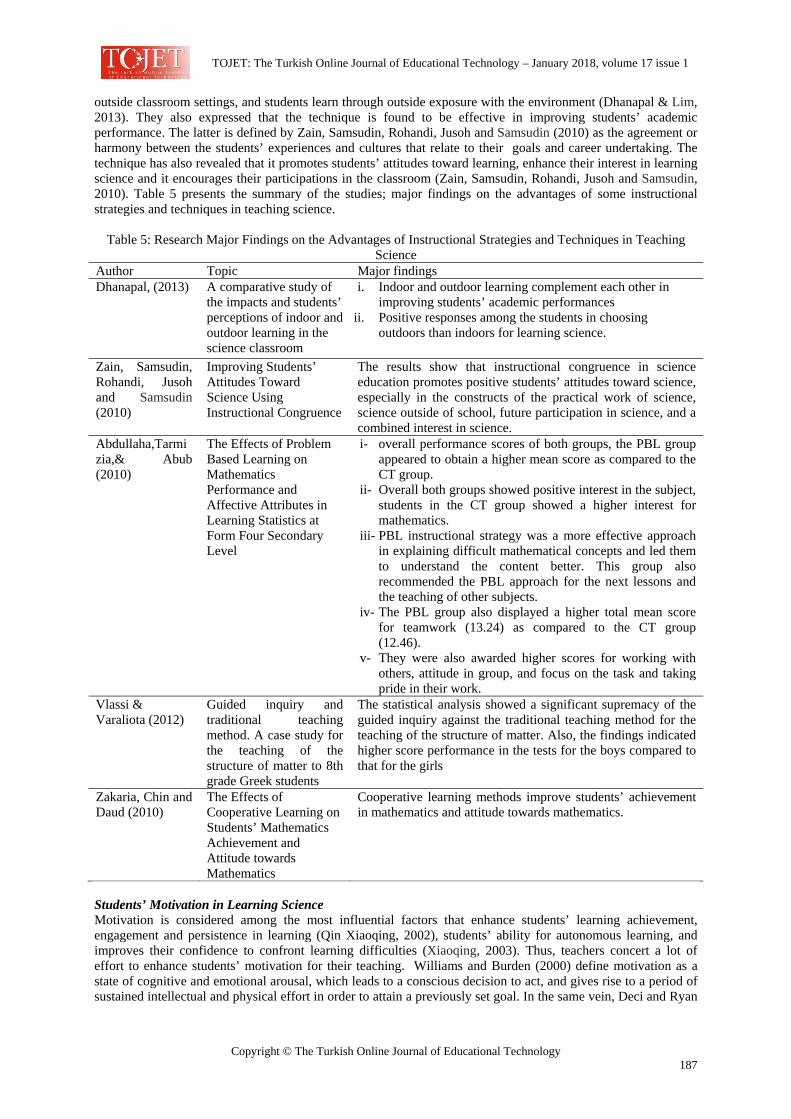
TOJET: The Turkish Online Journal of Educational Technology – January 2018, volume 17 issue 1
Copyright © The Turkish Online Journal of Educational Technology 187
outside classroom settings, and students learn through outside exposure with the environment (Dhanapal & Lim, 2013). They also expressed that the technique is found to be effective in improving students’ academic performance. The latter is defined by Zain, Samsudin, Rohandi, Jusoh and Samsudin (2010) as the agreement or harmony between the students’ experiences and cultures that relate to their goals and career undertaking. The technique has also revealed that it promotes students’ attitudes toward learning, enhance their interest in learning science and it encourages their participations in the classroom (Zain, Samsudin, Rohandi, Jusoh and Samsudin, 2010). Table 5 presents the summary of the studies; major findings on the advantages of some instructional strategies and techniques in teaching science.
Table 5: Research Major Findings on the Advantages of Instructional Strategies and Techniques in Teaching
Science Author Topic Major findings Dhanapal, (2013) A comparative study of
the impacts and students’ perceptions of indoor and outdoor learning in the science classroom
i. Indoor and outdoor learning complement each other in improving students’ academic performances
ii. Positive responses among the students in choosing outdoors than indoors for learning science.
Zain, Samsudin, Rohandi, Jusoh and Samsudin (2010)
Improving Students’ Attitudes Toward Science Using Instructional Congruence
The results show that instructional congruence in science education promotes positive students’ attitudes toward science, especially in the constructs of the practical work of science, science outside of school, future participation in science, and a combined interest in science.
Abdullaha,Tarmizia,& Abub (2010)
The Effects of Problem Based Learning on Mathematics Performance and Affective Attributes in Learning Statistics at Form Four Secondary Level
i- overall performance scores of both groups, the PBL group appeared to obtain a higher mean score as compared to the CT group.
ii- Overall both groups showed positive interest in the subject, students in the CT group showed a higher interest for mathematics.
iii- PBL instructional strategy was a more effective approach in explaining difficult mathematical concepts and led them to understand the content better. This group also recommended the PBL approach for the next lessons and the teaching of other subjects.
iv- The PBL group also displayed a higher total mean score for teamwork (13.24) as compared to the CT group (12.46).
v- They were also awarded higher scores for working with others, attitude in group, and focus on the task and taking pride in their work.
Vlassi & Varaliota (2012)
Guided inquiry and traditional teaching method. A case study for the teaching of the structure of matter to 8th grade Greek students
The statistical analysis showed a significant supremacy of the guided inquiry against the traditional teaching method for the teaching of the structure of matter. Also, the findings indicated higher score performance in the tests for the boys compared to that for the girls
Zakaria, Chin and Daud (2010)
The Effects of Cooperative Learning on Students’ Mathematics Achievement and Attitude towards Mathematics
Cooperative learning methods improve students’ achievement in mathematics and attitude towards mathematics.
Students’ Motivation in Learning Science Motivation is considered among the most influential factors that enhance students’ learning achievement, engagement and persistence in learning (Qin Xiaoqing, 2002), students’ ability for autonomous learning, and improves their confidence to confront learning difficulties (Xiaoqing, 2003). Thus, teachers concert a lot of effort to enhance students’ motivation for their teaching. Williams and Burden (2000) define motivation as a state of cognitive and emotional arousal, which leads to a conscious decision to act, and gives rise to a period of sustained intellectual and physical effort in order to attain a previously set goal. In the same vein, Deci and Ryan
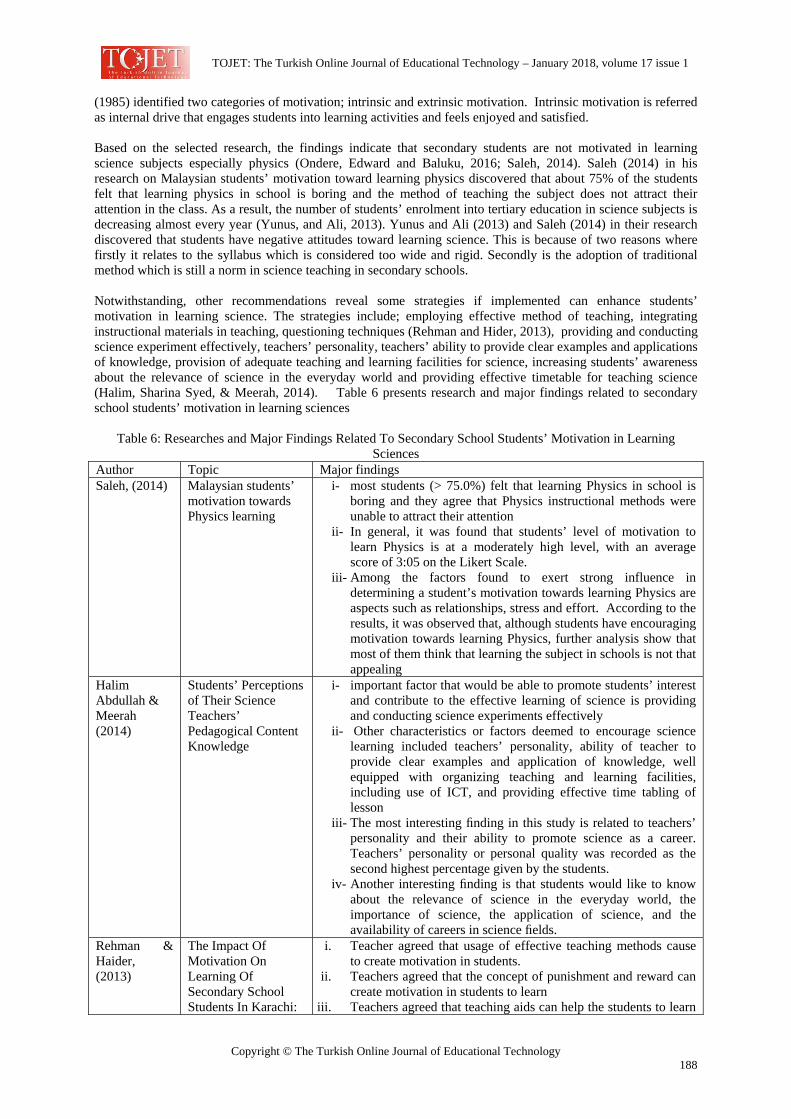
TOJET: The Turkish Online Journal of Educational Technology – January 2018, volume 17 issue 1
Copyright © The Turkish Online Journal of Educational Technology 188
(1985) identified two categories of motivation; intrinsic and extrinsic motivation. Intrinsic motivation is referred as internal drive that engages students into learning activities and feels enjoyed and satisfied. Based on the selected research, the findings indicate that secondary students are not motivated in learning science subjects especially physics (Ondere, Edward and Baluku, 2016; Saleh, 2014). Saleh (2014) in his research on Malaysian students’ motivation toward learning physics discovered that about 75% of the students felt that learning physics in school is boring and the method of teaching the subject does not attract their attention in the class. As a result, the number of students’ enrolment into tertiary education in science subjects is decreasing almost every year (Yunus, and Ali, 2013). Yunus and Ali (2013) and Saleh (2014) in their research discovered that students have negative attitudes toward learning science. This is because of two reasons where firstly it relates to the syllabus which is considered too wide and rigid. Secondly is the adoption of traditional method which is still a norm in science teaching in secondary schools. Notwithstanding, other recommendations reveal some strategies if implemented can enhance students’ motivation in learning science. The strategies include; employing effective method of teaching, integrating instructional materials in teaching, questioning techniques (Rehman and Hider, 2013), providing and conducting science experiment effectively, teachers’ personality, teachers’ ability to provide clear examples and applications of knowledge, provision of adequate teaching and learning facilities for science, increasing students’ awareness about the relevance of science in the everyday world and providing effective timetable for teaching science (Halim, Sharina Syed, & Meerah, 2014). Table 6 presents research and major findings related to secondary school students’ motivation in learning sciences
Table 6: Researches and Major Findings Related To Secondary School Students’ Motivation in Learning
Sciences Author Topic Major findings Saleh, (2014) Malaysian students’
motivation towards Physics learning
i- most students (> 75.0%) felt that learning Physics in school is boring and they agree that Physics instructional methods were unable to attract their attention
ii- In general, it was found that students’ level of motivation to learn Physics is at a moderately high level, with an average score of 3:05 on the Likert Scale.
iii- Among the factors found to exert strong influence in determining a student’s motivation towards learning Physics are aspects such as relationships, stress and effort. According to the results, it was observed that, although students have encouraging motivation towards learning Physics, further analysis show that most of them think that learning the subject in schools is not that appealing
Halim Abdullah & Meerah (2014)
Students’ Perceptions of Their Science Teachers’ Pedagogical Content Knowledge
i- important factor that would be able to promote students’ interest and contribute to the effective learning of science is providing and conducting science experiments effectively
ii- Other characteristics or factors deemed to encourage science learning included teachers’ personality, ability of teacher to provide clear examples and application of knowledge, well equipped with organizing teaching and learning facilities, including use of ICT, and providing effective time tabling of lesson
iii- The most interesting finding in this study is related to teachers’ personality and their ability to promote science as a career. Teachers’ personality or personal quality was recorded as the second highest percentage given by the students.
iv- Another interesting finding is that students would like to know about the relevance of science in the everyday world, the importance of science, the application of science, and the availability of careers in science fields.
Rehman & Haider, (2013)
The Impact Of Motivation On Learning Of Secondary School Students In Karachi:
i. Teacher agreed that usage of effective teaching methods cause to create motivation in students.
ii. Teachers agreed that the concept of punishment and reward can create motivation in students to learn
iii. Teachers agreed that teaching aids can help the students to learn
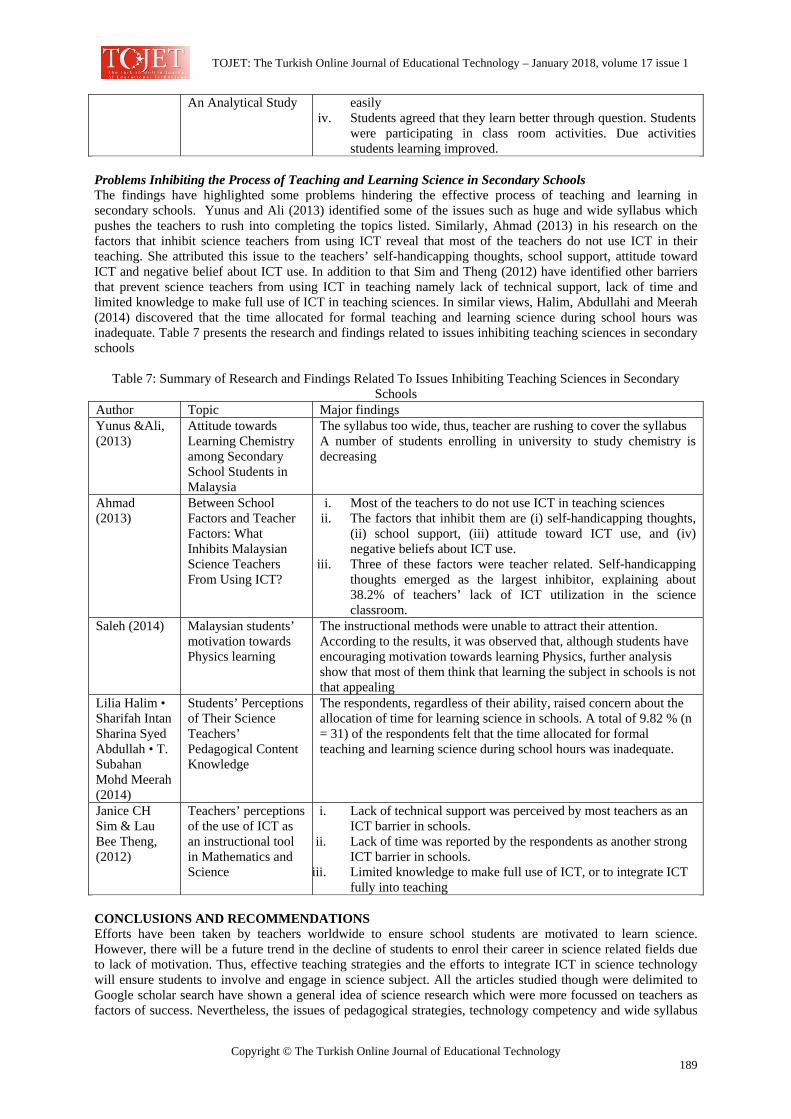
TOJET: The Turkish Online Journal of Educational Technology – January 2018, volume 17 issue 1
Copyright © The Turkish Online Journal of Educational Technology 189
An Analytical Study easily iv. Students agreed that they learn better through question. Students
were participating in class room activities. Due activities students learning improved.
Problems Inhibiting the Process of Teaching and Learning Science in Secondary Schools The findings have highlighted some problems hindering the effective process of teaching and learning in secondary schools. Yunus and Ali (2013) identified some of the issues such as huge and wide syllabus which pushes the teachers to rush into completing the topics listed. Similarly, Ahmad (2013) in his research on the factors that inhibit science teachers from using ICT reveal that most of the teachers do not use ICT in their teaching. She attributed this issue to the teachers’ self-handicapping thoughts, school support, attitude toward ICT and negative belief about ICT use. In addition to that Sim and Theng (2012) have identified other barriers that prevent science teachers from using ICT in teaching namely lack of technical support, lack of time and limited knowledge to make full use of ICT in teaching sciences. In similar views, Halim, Abdullahi and Meerah (2014) discovered that the time allocated for formal teaching and learning science during school hours was inadequate. Table 7 presents the research and findings related to issues inhibiting teaching sciences in secondary schools
Table 7: Summary of Research and Findings Related To Issues Inhibiting Teaching Sciences in Secondary
Schools Author Topic Major findings Yunus &Ali, (2013)
Attitude towards Learning Chemistry among Secondary School Students in Malaysia
The syllabus too wide, thus, teacher are rushing to cover the syllabus A number of students enrolling in university to study chemistry is decreasing
Ahmad (2013)
Between School Factors and Teacher Factors: What Inhibits Malaysian Science Teachers From Using ICT?
i. Most of the teachers to do not use ICT in teaching sciences ii. The factors that inhibit them are (i) self-handicapping thoughts,
(ii) school support, (iii) attitude toward ICT use, and (iv) negative beliefs about ICT use.
iii. Three of these factors were teacher related. Self-handicapping thoughts emerged as the largest inhibitor, explaining about 38.2% of teachers’ lack of ICT utilization in the science classroom.
Saleh (2014) Malaysian students’ motivation towards Physics learning
The instructional methods were unable to attract their attention. According to the results, it was observed that, although students have encouraging motivation towards learning Physics, further analysis show that most of them think that learning the subject in schools is not that appealing
Lilia Halim • Sharifah Intan Sharina Syed Abdullah • T. Subahan Mohd Meerah (2014)
Students’ Perceptions of Their Science Teachers’ Pedagogical Content Knowledge
The respondents, regardless of their ability, raised concern about the allocation of time for learning science in schools. A total of 9.82 % (n = 31) of the respondents felt that the time allocated for formal teaching and learning science during school hours was inadequate.
Janice CH Sim & Lau Bee Theng, (2012)
Teachers’ perceptions of the use of ICT as an instructional tool in Mathematics and Science
i. Lack of technical support was perceived by most teachers as an ICT barrier in schools.
ii. Lack of time was reported by the respondents as another strong ICT barrier in schools.
iii. Limited knowledge to make full use of ICT, or to integrate ICT fully into teaching
CONCLUSIONS AND RECOMMENDATIONS Efforts have been taken by teachers worldwide to ensure school students are motivated to learn science. However, there will be a future trend in the decline of students to enrol their career in science related fields due to lack of motivation. Thus, effective teaching strategies and the efforts to integrate ICT in science technology will ensure students to involve and engage in science subject. All the articles studied though were delimited to Google scholar search have shown a general idea of science research which were more focussed on teachers as factors of success. Nevertheless, the issues of pedagogical strategies, technology competency and wide syllabus
TOJET: The Turkish Online Journal of Educational Technology – January 2018, volume 17 issue 1
Copyright © The Turkish Online Journal of Educational Technology 190
have been consistently raised and highlighted in the past five years. Thus, there is a need to involve teachers to become active researchers to find the solutions and interventions for effective teaching. Further collaborative inquiry is also needed between teachers in schools and academicians in Higher learning institutions to work hand in hand in dealing with student motivation and achievement in learning science. Even though assessment was not documented and raised in the journals involved, it is an essential argument to be researched. Assessments are the main concerns of schools and students that direct students to learn. The way students are accessed is crucial in understanding the focus of teaching and learning in the 21st century. RFERENCES Abdullahi, H. R. (2009). An introduction to principles and methods of teaching. Kano: HMD Publishers &
Printers. Abdullah, N. I., Tarmizi, R. A., & Abu, R. (2010). The effects of problem based learning on mathematics
performance and affective attributes in learning statistics at form four secondary level. Procedia-Social and Behavioral Sciences, 8, 370-376.
Ahmad, T. B. T. (2014). Between School Factors and Teacher Factors: What Inhibits Malaysian Science Teachers from Using ICT?. Malaysian Online Journal of Educational Technology, 2(1), 1-10.
Ali, M. B., Halim, N. D. A., & Shukor, N. A. (2013). The Development of Active Learning Website for Learning Science. International Journal of Machine Learning and Computing, 3(3), 284.
Amir, K., & Muhamad, H. C. (2016). Learners’ Attitudes and Performance in Science Subjects in A-Level in Secondary Schools, in Mbarara, Uganda. Journal of Educational Research 3(2), 10-25.
Amadio,M. (2015). STEM education and the curriculum: Issues, tensions and challenges www.akademisains.gov.my/download/STEM%20education%20and%20curriculum.p df Arends, R. I. (2009). Learning to teach. Kuala Lumpor: Mc Graw- Hill Companies. Bauer, M. W., & Gaskell, G. (Eds.). (2000). Qualitative researching with text, image and sound: A practical
handbook for social research. Sage. Chumbley, S. B., Haynes, J. C., & Stofer, K. A. (2015). A Measure of Students’ Motivation to Learn Science
through Agricultural STEM Emphasis. Journal of Agricultural Education, 56(4), 107-122. Creswell, J. W. (2012). Qualitative inquiry and research design: Choosing among five approaches. Sage
publications. Dhanapal, S., & Lim, C. C. Y. (2013, December). A comparative study of the impacts and students’ perceptions
of indoor and outdoor learning in the science classroom. In Asia-Pacific Forum on Science Learning and Teaching (Vol. 14, No. 2, pp. 1-23). Hong Kong Institute of Education. 10 Lo Ping Road, Tai Po, New Territories, Hong Kong.
Deci, E. & R, Ryan. (1985). Intrinsic Motivation and Self Determination in Human Behavior. NY: Plenum Press.
Halim, L., Abdullah, S. I. S. S., & Meerah, T. S. M. (2014). Students’ perceptions of their science teachers’ pedagogical content knowledge. Journal of Science Education and Technology, 23(2), 227-237.
Hacieminoglu, E. (2016). Elementary School Students' Attitude toward Science and Related Variables. International Journal of Environmental and Science Education, 11(2), 35-52.
Hsieh, H. F., & Shannon, S. E. (2005). Three approaches to qualitative content analysis. Qualitative health research, 15(9), 1277-1288.
Hunter, J. E., & Schmidt, F. L. (2004). Methods of Meta-Analysis: Correcting Error and Bias in Research Findings (2nd ed.). Thousand Oaks, CA: Sage
Hüseyin Uzunboylua , Gülsüm Aşıksoyb (2014) Research in Physics Education: A Study of Content Analysis, Procedia - Social and Behavioral Sciences 136 ( 2014 ) 425 – 437
Ibe, E., Nworgu, L. N., & Anyaegbuna, N. J. (2016). Influence of teachers’ characteristics on academic achievement of secondary school biology students. British Journal of Science13(2), 33-44.
Idris, N., Cheong, L. S., Nor, N. M., Razak, A. Z. A., & Saad, R. M. (2007). The professional preparation of Malaysian teachers in the implementation of teaching and learning of mathematics and science in English. Eurasia Journal of Mathematics, Science & Technology Education, 3(2), 101-110.
Jacobsen, D. A., Eggen, P. D., & Kauchak, D. P. (2008). Methods for teaching: Promoting student learning in K-12 classrooms. Prentice Hall.
Loy, Pamela. (1979). Content analysis of Journal articles as a technique for historical research, Journal of the History of Sociology, 1,2, Spring: 93-101.
Masood, M. (2004). A Ten Year Analysis: Trends in Traditional Educational Technology Literature. Malaysian Online Journal of Instructional Technology, 1(2).
Mansor, N., Badarudin, M. I., & Mat, A. C. (2011). Teachers Perspective of Using English as a Medium of Instruction in Mathematics and Science Subjects. Online Submission, 4(2), 129-138.
TOJET: The Turkish Online Journal of Educational Technology – January 2018, volume 17 issue 1
Copyright © The Turkish Online Journal of Educational Technology 191
Mohammad Reza Maleknejad1 , Massoud Amoopour2 , Effat Abdi3 (2015), Content Analysis of Biology Book of Grade Three from Students of Public and Private High Schools Viewpoint in Rasht City during 2014-2015. J. Appl. Environ. Biol. Sci., 5(6)273-277, 2015
Onderi, P. O., Edward, B., & Baluku, M. (2010). Student factors related to mathematics achievement of public secondary school students of Masaba South sub county, Kenya: a qualitative study.
Prieto, E., & Dugar, N. (2016). An Enquiry into the Influence of Mathematics on Students’ Choice of STEM Careers. International Journal of Science and Mathematics Education, 1-20.
Qin, X., & Wen, Q. (2002). Internal structure of EFL motivation at the tertiary level in China. Foreign Language Teaching and Research, 34(1), 51-58.
Rehman, A., & Haider, K. (2013). The Impact of Motivation on Learning of SecondarySchool Students in Karachi: An Analytical Study. Educational Research International, 2(2), 139-147.
Saleh, S. (2014). Malaysian Students' Motivation towards Physics Learning. European Journal of Science and Mathematics Education, 2(4), 223-232.
Sim, J. C., & Theng, L. B. (2007). Teachers’ perceptions of the use of ICT as an instructional tool in Mathematics and Science.
Stack S. (2002). Media coverage as a risk factor in suicide. Injury prevention Journal. 8(Suppl 4):IV30–IV32 Uzunboylu, H., & Aşıksoy, G. (2014). Research in physics education: A study of content analysis. Procedia-
Social and Behavioral Sciences, 136, 425-437. Vlassi, M., & Karaliota, A. (2013). The Comparison between Guided Inquiry and Traditional Teaching Method.
A Case Study for the Teaching of the Structure of Matter to 8th Grade Greek Students. Procedia-Social and Behavioral Sciences, 93, 494-497.
Williams, M., Burden, R., & Lanvers, U. (2002). ‘French is the language of love and stuff’: Student perceptions of issues related to motivation in learning a foreign language. British Educational Research Journal, 28(4), 503-528.
Xiaoqing, Q. (2003). L2 Learning Motivation Research and Its Problems [J]. Foreign Language Education, 3, 003.
Yunus, F. W., & Ali, Z. M. (2013). Attitude towards learning chemistry among secondary school students in Malaysia. Journal Of Asian Behavioural Studies, 3(11), 1-11.
Zain, A. N. M., Rohandi, R., Jusoh, A., & Samsudin, M. A. (2010). Improving students’ attitudes toward science using instructional congruence. Journal of Science and Mathematics Education in Southeast Asia, 33(1), 39-64.
Zakaria, E., Chin, L. C., & Daud, M. Y. (2010). The effects of cooperative learning on students’ mathematics achievement and attitude towards mathematics. Journal of social sciences, 6(2), 272-275.
OECD (2016). OECD Reviews of Innovation Policy: Malaysia 2016 http://www.oecd.org/sti/oecd-reviews-of-innovation-policy-malaysia-9789264255340-en.htm MOSTI (2013). Malaysian, Science , Technology Indicators Report Report 2013.
http://mastic.mosti.gov.my/documents/10156/38ae84ca-b8a0-4edb-a5b8-
TOJET: The Turkish Online Journal of Educational Technology – January 2018, volume 17 issue 1
Copyright © The Turkish Online Journal of Educational Technology 192
The Degree of Applying E-Learning in English Departments at Al-Balqa Applied University from Instructors' Perspectives Dr. Mohammad Akram Mohammad Alzu'bi Al-Balqa Applied University, Ajloun University College, Jordan dralzu'[email protected] and . [email protected] ABSTRACT The study aimed at identifying the degree of applying e-learning in Al-Balqa Applied University from instructors' perspectives so the researcher designed a questionnaire of 20 items which is applied on a sample of 48 lecturers. The study showed that the percentage of (64.0%) out of 48 participants apply e-learning in English departments at Al-Balqa Applied University from instructors' perspectives so it is moderate; therefore, there are some negative perspectives towards using e-learning in the EFL environment from the viewpoints of instructors in English departments. Keywords: E-learning, English as a Foreign Language (EFL), Al-Balqa Applied University (AAU) INTRODUCTION Because of the advantages of using technology in education, the public and private Jordanian universities adopted the use of computer and Internet in education. In today’s changing world, there is a need for employing modern technologies and approaches like electronic learning (E-learning) so Al-Balqa Applied University started applying e-learning at the beginning of 2017. E-learning is defined by Liaw, Huang, and Chen (2007) as “the use of Internet technologies to deliver a broad array of solutions that enhance knowledge and performance” (p.1067). E-learning is one of the modern methods which contributes in expand educational opportunities (Salmon, 2011) and makes the teaching and learning process more effective. Also, it corresponds to the organizational needs. E-learning provides teachers and learners with useful recourses to obtain information easily and it makes learning interesting because it is suitable for the students’ ability. In English teaching and learning, e-learning offers students with appropriate materials to develop English skills (reading, writing, listening, speaking) and its components (grammar and vocabulary). From the researcher's experience, the lecturing method fails in developing English language among learners. He believed that the instructors can engage the learners to become skilled at English language by using e-learning so the research was conducted to explore the degree of applying e-learning in English departments at Al-Balqa Applied University from instructors' perspectives The problem of the study Most of the universities in Jordan use traditional ways in teaching, but Al-Balqa Applied University tried to improve their educational system by using e-learning in the class. However, the university still struggles with integrating e-learning into teaching. The researcher believes that the instructors should play a significant role in applying e-learning in teaching so the present study sought to discover if the instructors’ practice in using e-learning inside their classes effective. Objective of the study This study aims at investigating the degree of applying e-learning in English departments at Al-Balqa Applied University from instructors' perspectives. Significance of the Study This study is important because it places attention on the instructors at Al-Balqa Applied University to determine if they use e-learning effectively and seriously or not. The study also shows the advantages of using e-learning in English teaching to improve the four skills (reading, writing, listing and speaking) particularly. In addition, to the researchers’ knowledge, this is the first study which has been conducted on the degree of applying e-learning in English departments at Al-Balqa Applied University from instructors' perspectives. Finally, the study provides researchers with a supporting study for use in future research.
TOJET: The Turkish Online Journal of Educational Technology – January 2018, volume 17 issue 1
Copyright © The Turkish Online Journal of Educational Technology 193
The limitations of the study • E-Learning in this paper refers to the use of e-learning tools such as e-learning site (which is designed by Al-Balqa Applied University), e-mail, using mobiles, and Face-book. • The sample of the study consists of (48) English instructors who selected randomly from 4 colleges at Al-Balqa Applied University. • The study was applied in the summer semester in the academic year 2017. • The study is dependent upon the level of understanding, and skill level each instructor has in the use of E-learning.
THEORETICAL FRAMEWORK E-learning based on three learning theories: behaviorism, cognition, and constructivism. Firstly, the behavioral school says that learning is observable behavior caused by external stimuli in environment (Skinner, 1974) so e-learning focuses on concepts related to the principles of behaviorism such as drilling, practice, and external feedback. In contrast, cognitivism focuses on the process of thinking that occurs in the mind (Atkin, 1993) so it considers learning as an internal process that involves memory, thinking, reflection, abstraction, motivation, and meta-cognitive as mentioned by (Ally, 2004). Based on this theory, e-learning focuses on the individual differences by using a variety of e-learning tools and strategies to encourage students to think, remember and develop their problem solving skills. Finally, the constructivism school suggests that learning construct personal knowledge from the learning experience itself as stated by (McLeod, 2003). So, learning is active process and the students construct knowledge themselves not from someone else. Thus, by adopting e-learning, students fulfill their needs and interests through using interactive learning activities. THE RELATED STUDIES The related studies have been classified into three categories; 1) the first one includes studies about teachers’ attitudes towards e-learning, 2) the second one is about students’ attitudes towards e-learning and 3) the third one is about the effect of different e-learning tools on English foreign learners' achievements. Students' attitudes towards e-learning Ja’ashan (2015) conducted a survey at University of Bisha on a sample of (130) English learners by using a questionnaire to measure the students’ attitudes towards blended learning. The result of this study indicates that students' attitudes were positive. Another study was conducted by (Kargiban & Kaffash, 2011) aimed at determining the effectiveness of using E-learning on foreign language students' attitude and he concluded that the students’ perceptions were also positive. E-learning and English foreign learners' achievement Several studies (Alshehab, 2013, AbuSeileek, 2004, Alzu'bi, 2013a) have been published in international specialized journals and conferences that applied in Jordan in the recent years about the effect of using different e-learning tools on English language skills and its components. The results of the previous studies showed that using e-learning devices had positive effects on reading, writing, and translation ability. Alzu'bi (2012, 2013a,) investigated two studies that supported the positive effectiveness of using e-learning tools on improving English skills (reading, writing, listing and speaking). Moreover, he conducted three studies about the effect of using e-learning tools on English language components (vocabularies and grammar) and found out positive influence (Alzu'bi, 2010, 2013a, 2013b). Also, (Alzu'bi, 2015) claimed that e-learning is a good way to evaluate students' achievement and increase learners' motivation. Teachers' attitudes towards e-learning Although using e-learning in teaching has positive effectiveness, it faces some obstacles and challenges that relate to the teachers. Hersh, Muflih, and Aldhoon (2010) conducted a study to investigate the obstacles that hinder the application of the e-learning system and they found that teacher-related obstacles ranked first. In addition, (Husamo and Alabdullah, 2011) conducted a study aimed at identifying the e-learning nature at Tishreen university in Syria. After preparing and applying the instrument of the study on a random sample of (113) teachers and (774) students, the study concluded that the instructors were careless while using e-learning. The study showed some negatives of e-learning like decreasing the load of instruction, diseases caused by the long period of time while sitting in front of computer and unavailability of special places for e-learning.
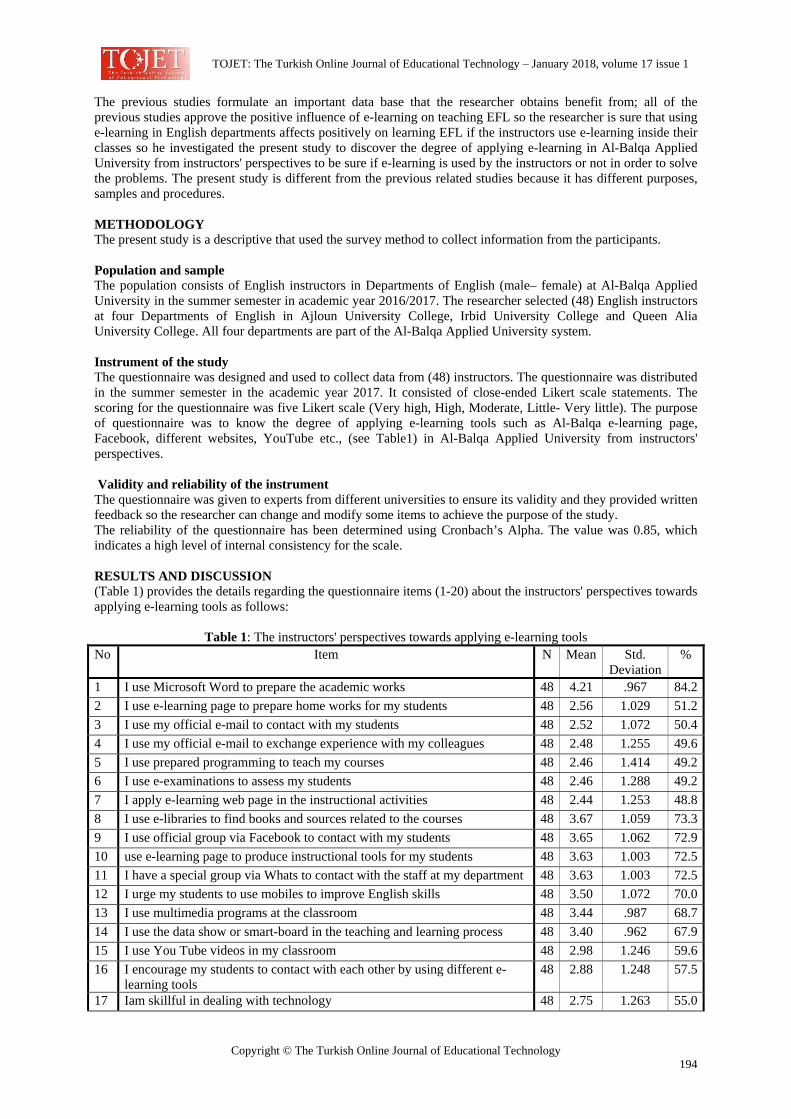
TOJET: The Turkish Online Journal of Educational Technology – January 2018, volume 17 issue 1
Copyright © The Turkish Online Journal of Educational Technology 194
The previous studies formulate an important data base that the researcher obtains benefit from; all of the previous studies approve the positive influence of e-learning on teaching EFL so the researcher is sure that using e-learning in English departments affects positively on learning EFL if the instructors use e-learning inside their classes so he investigated the present study to discover the degree of applying e-learning in Al-Balqa Applied University from instructors' perspectives to be sure if e-learning is used by the instructors or not in order to solve the problems. The present study is different from the previous related studies because it has different purposes, samples and procedures. METHODOLOGY The present study is a descriptive that used the survey method to collect information from the participants. Population and sample The population consists of English instructors in Departments of English (male– female) at Al-Balqa Applied University in the summer semester in academic year 2016/2017. The researcher selected (48) English instructors at four Departments of English in Ajloun University College, Irbid University College and Queen Alia University College. All four departments are part of the Al-Balqa Applied University system. Instrument of the study The questionnaire was designed and used to collect data from (48) instructors. The questionnaire was distributed in the summer semester in the academic year 2017. It consisted of close-ended Likert scale statements. The scoring for the questionnaire was five Likert scale (Very high, High, Moderate, Little- Very little). The purpose of questionnaire was to know the degree of applying e-learning tools such as Al-Balqa e-learning page, Facebook, different websites, YouTube etc., (see Table1) in Al-Balqa Applied University from instructors' perspectives. Validity and reliability of the instrument The questionnaire was given to experts from different universities to ensure its validity and they provided written feedback so the researcher can change and modify some items to achieve the purpose of the study. The reliability of the questionnaire has been determined using Cronbach’s Alpha. The value was 0.85, which indicates a high level of internal consistency for the scale. RESULTS AND DISCUSSION (Table 1) provides the details regarding the questionnaire items (1-20) about the instructors' perspectives towards applying e-learning tools as follows:
Table 1: The instructors' perspectives towards applying e-learning tools No Item N Mean Std.
Deviation%
1 I use Microsoft Word to prepare the academic works 48 4.21 .967 84.22 I use e-learning page to prepare home works for my students 48 2.56 1.029 51.23 I use my official e-mail to contact with my students 48 2.52 1.072 50.44 I use my official e-mail to exchange experience with my colleagues 48 2.48 1.255 49.65 I use prepared programming to teach my courses 48 2.46 1.414 49.26 I use e-examinations to assess my students 48 2.46 1.288 49.27 I apply e-learning web page in the instructional activities 48 2.44 1.253 48.88 I use e-libraries to find books and sources related to the courses 48 3.67 1.059 73.39 I use official group via Facebook to contact with my students 48 3.65 1.062 72.910 use e-learning page to produce instructional tools for my students 48 3.63 1.003 72.511 I have a special group via Whats to contact with the staff at my department 48 3.63 1.003 72.512 I urge my students to use mobiles to improve English skills 48 3.50 1.072 70.013 I use multimedia programs at the classroom 48 3.44 .987 68.714 I use the data show or smart-board in the teaching and learning process 48 3.40 .962 67.915 I use You Tube videos in my classroom 48 2.98 1.246 59.616 I encourage my students to contact with each other by using different e-
learning tools 48 2.88 1.248 57.5
17 Iam skillful in dealing with technology 48 2.75 1.263 55.0
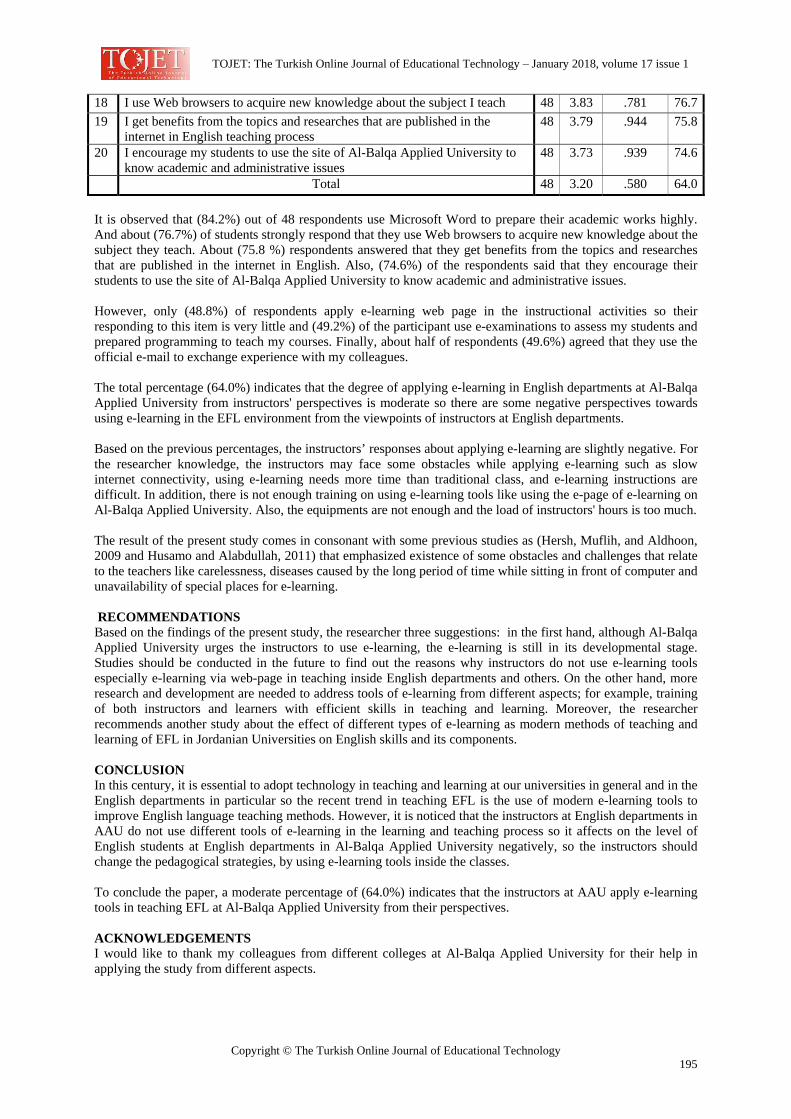
TOJET: The Turkish Online Journal of Educational Technology – January 2018, volume 17 issue 1
Copyright © The Turkish Online Journal of Educational Technology 195
18 I use Web browsers to acquire new knowledge about the subject I teach 48 3.83 .781 76.719 I get benefits from the topics and researches that are published in the
internet in English teaching process 48 3.79 .944 75.8
20 I encourage my students to use the site of Al-Balqa Applied University to know academic and administrative issues
48 3.73 .939 74.6
Total 48 3.20 .580 64.0 It is observed that (84.2%) out of 48 respondents use Microsoft Word to prepare their academic works highly. And about (76.7%) of students strongly respond that they use Web browsers to acquire new knowledge about the subject they teach. About (75.8 %) respondents answered that they get benefits from the topics and researches that are published in the internet in English. Also, (74.6%) of the respondents said that they encourage their students to use the site of Al-Balqa Applied University to know academic and administrative issues. However, only (48.8%) of respondents apply e-learning web page in the instructional activities so their responding to this item is very little and (49.2%) of the participant use e-examinations to assess my students and prepared programming to teach my courses. Finally, about half of respondents (49.6%) agreed that they use the official e-mail to exchange experience with my colleagues. The total percentage (64.0%) indicates that the degree of applying e-learning in English departments at Al-Balqa Applied University from instructors' perspectives is moderate so there are some negative perspectives towards using e-learning in the EFL environment from the viewpoints of instructors at English departments. Based on the previous percentages, the instructors’ responses about applying e-learning are slightly negative. For the researcher knowledge, the instructors may face some obstacles while applying e-learning such as slow internet connectivity, using e-learning needs more time than traditional class, and e-learning instructions are difficult. In addition, there is not enough training on using e-learning tools like using the e-page of e-learning on Al-Balqa Applied University. Also, the equipments are not enough and the load of instructors' hours is too much. The result of the present study comes in consonant with some previous studies as (Hersh, Muflih, and Aldhoon, 2009 and Husamo and Alabdullah, 2011) that emphasized existence of some obstacles and challenges that relate to the teachers like carelessness, diseases caused by the long period of time while sitting in front of computer and unavailability of special places for e-learning. RECOMMENDATIONS Based on the findings of the present study, the researcher three suggestions: in the first hand, although Al-Balqa Applied University urges the instructors to use e-learning, the e-learning is still in its developmental stage. Studies should be conducted in the future to find out the reasons why instructors do not use e-learning tools especially e-learning via web-page in teaching inside English departments and others. On the other hand, more research and development are needed to address tools of e-learning from different aspects; for example, training of both instructors and learners with efficient skills in teaching and learning. Moreover, the researcher recommends another study about the effect of different types of e-learning as modern methods of teaching and learning of EFL in Jordanian Universities on English skills and its components. CONCLUSION In this century, it is essential to adopt technology in teaching and learning at our universities in general and in the English departments in particular so the recent trend in teaching EFL is the use of modern e-learning tools to improve English language teaching methods. However, it is noticed that the instructors at English departments in AAU do not use different tools of e-learning in the learning and teaching process so it affects on the level of English students at English departments in Al-Balqa Applied University negatively, so the instructors should change the pedagogical strategies, by using e-learning tools inside the classes. To conclude the paper, a moderate percentage of (64.0%) indicates that the instructors at AAU apply e-learning tools in teaching EFL at Al-Balqa Applied University from their perspectives. ACKNOWLEDGEMENTS I would like to thank my colleagues from different colleges at Al-Balqa Applied University for their help in applying the study from different aspects.
TOJET: The Turkish Online Journal of Educational Technology – January 2018, volume 17 issue 1
Copyright © The Turkish Online Journal of Educational Technology 196
REFERENCES AbuSeileek, A. (2004). The effect of using a computer-based program on students’ writing ability in English.
Unpublished Doctoral Dissertation, Arab University, Amman, Jordan. Ally, M. (2004). Foundations of educational theory of online learning, Athabasca University, Athabasca, pp
(3-31). Alshehab, M. (2013). The impact of E-learning in students’ ability in translation from English into Arabic at
Irbid National University in Jordan. Journal of Education and Practice, 4(14). Alzu'bi, M. (2015). The effect of using electronic exams on students' achievement and test takers' motivation in
an English 101 course. The Proceedings of Conference of the International Journal of Arts & Sciences, Paris. Pp.207-215.
Alzu'bi, M. (2013a). Using mobile-based email for English foreign language learners. TOJET, 12 (1), pp. 178-186.
Alzu'bi, M. (2013b). Using mobile educational technologies in vocabularies acquisition. Journal of Alzarqa' for research and Humanities Sciences, 13 (2).
Alzu'bi, M. (2012). The role of smart-board in improving English language skills in Jordanian universities. The Proceedings of the 11th European Conference on e-Learning, University of Groningen, the Netherlands. Pp. 9-14.
Alzu'bi, M. (2010). The effect of the internet on King Saud University students' grammar achievement. Journal of Human Sciences. Issue 45.
El-Hersh, A.; Muflih, M. & Aldhoon, M. (2010). Obstacles of the application of e-learning systems as viewed by secondary school teachers at Al-Kurah district. The Jordan Journal for Educational Sciences. 6, (1).
Husamo, S. & Alabdullah, F. (2011). The e-learning nature at Tishreen university in Syria from instructors' and students' point of view. Journal of Damascus University. Issue (27).
Kargiban, Z. & Kaffash, H. (2011). The effect of e-learning on Foreign Language Students Using the student’s attitude. Middle-East Journal of Scientific Research, 10 (3), pp 398-402.
Liaw, S.; Huang, H.; & Chen, G. (2007). Surveying instructor and learner attitudes toward e-learning. Computers & Education, 49(4), pp.1066–1080.
McLeod, G. (2003). Learning theory and instructional design. Learning Matters, 2, pp. 35-43. Salmon, G. (2011). E-moderating: The key to teaching and learning online (3rd Ed), London: Routledge. Skinner, B. (1974). About behaviorism, Knopf, New York.
TOJET: The Turkish Online Journal of Educational Technology – January 2018, volume 17 issue 1
Copyright © The Turkish Online Journal of Educational Technology 197
The Development of the Virtual Learning Media of the Sacred Object Artwork Sumitra Nuanmeesri
Faculty of Science and Technology, Suan Sunandha Rajabhat University [email protected] Saran Jamornmongkolpilai Faculty of Science and Technology, Suan Sunandha Rajabhat University [email protected] ABTRACT This research aimed to develop the virtual learning media of the sacred object artwork by applying the concept of the virtual technology in order to publicize knowledge on the cultural wisdom of the sacred object artwork. It was done by designing and developing the virtual learning media of the sacred object artwork for the virtual presentation. Subsequently, the virtual media which had been developed would be evaluated with the index of item-objective congruence (IOC) by ten experts. It was found that the IOC value was more than 0.8, so it indicated that the virtual learning media of the sacred object artwork which had been developed was consistent with the content. The meaning and knowledge about the sacred object artwork could be correctly conveyed through the virtual learning media; and moreover, the virtual learning media which had been constructed was brought into use in publicizing and transferring knowledge about the sacred object artwork to the sampling group of sixty persons. It was found in the research result that the learning result about the cultural wisdom of the sacred object artwork of the sampling group increased seeing from the comparison of the difference between the pre-test and post-test results after using the virtual learning media of the sacred object artwork. The hypothesis was tested by using T-Test, and it was found that there was a statistical significant difference at the level of 0.05 and the efficiency evaluation was measured by the satisfaction of the sampling group towards the virtual learning media of the sacred object artwork. The mean value was 4.81, and the standard deviation value was 0.39. Therefore, it could be said that the virtual learning media of the sacred object artwork which had been developed gave more effective learning process. Keywords: Virtual Learning Media, Sacred Object Artwork, Artistry. INTRODUCTION The sacred object artwork was considered a cultural heritage and inherited knowledge from the ancient time which the new generation should conserve and maintain. The sacred object artwork is an intelligence property both of Thailand and the nearby countries. There has been a long story since historic period which was recorded in details like a textbook beginning with the steps of construction, the materials being used, and methods of construction as well as the consecrating procedure which was recorded in details. This secret was kept by the people involved. They all cherished it and kept it secret until there were people filled with halo to be given to, and they could transfer it to others. With the faith and respect of the monks and the sacred things according to their belief, the constructing of the sacred objects could occur. It could be considered that such thing happened from faith and the values of material. The object that one group of people or some particular people believed that they could cause some benefit or goodness to the owners one way or the others; for example, they might believe on the protecting aspect, on the aspect of being able to drive away bad things, or on inspiring some consequences to the owners according to the belief and faith that the sacred object was the supernatural influence could affect the mind of the owner. There has been a worship of the sacred object since the ancient time. It was believed that it occurred in the first period of human society because there were findings of remains of different things from digging at different historic sites of all cultures. Moreover, all races worldwide came with the faith civilization according to their doctrine or religions (Phoglong, 2009). The sacred object artwork is considered a Thai national artwork. It is the center of faith. It is the symbol of goodness of the monks whom the general people respect, and it became the center of their minds as well as being a part which tempts tourists to visit which affects the foundation of the major cultural tourism sources of Thailand. However, at present there is a storing of information, and its presentation is shown in the form of
TOJET: The Turkish Online Journal of Educational Technology – January 2018, volume 17 issue 1
Copyright © The Turkish Online Journal of Educational Technology 198
Figure and message which was not presented with any virtual forms. There was a lack of information storing and there was no publicity of information to general people. While there were some or groups of people who had faith in it and they were searching for the sacred objects according to the Buddhist belief to be able to repose their trust on them, but they did not know the construction history, the makers and the Buddhist places where they made them. If there were any storing of information, the presentation of that information and the virtual propagation, it should give cultural knowledge of the sacred object artwork and the long inherited knowledge. Moreover, it should promote the sustainable cultural tourism in the future (Jirapan, 2012). At present the computer technology, the internet communication, the website and the social network have a role in assisting the learning in different aspects. The use of learning media in an appropriate form is more necessary because the media will help the perception to be more effective. With the efficiency of the computer and the computer program that is in progressing development, it will enable the processing of the information and the presenting of the information, the picture, the sound and message to be efficient. Moreover, when it is added with the good designing, it should render good consequence to the learning. The virtual technology (Augmented Reality: AR) is a technology mixed with facts as a major phenomenon of modern communication which can be applied with different activities to stimulate the learning to accept new experience widely because it can render good consequences to the perception by merging the real world with the virtual world harmoniously by applying it with communication aspect, medical aspect, industry aspect, and entertainment and education aspect. For instance, AR was applied in advertisement for marketing promotion of Nissan Company. With the use of webcam, it allowed the users to access the products without seeing the real products. In medical science, AR was applied in the complicated operation allowing to see the required parts easily and clearly for the convenience of a particular treatment such as the virtual picture from X-ray films or ultra-sound pictures in real time during the treatment. In the aspects of military service, navigation and traffic controlling, AR eased to have interaction and enabled to see things real and perfectly clear. In the entertainment and educational aspect, AR was applied allowing to see the virtual objects in the museum, the exhibition, the virtual park and AR Quake game which is popular, etc., (Jiravarapong, 2010). AR promotes the virtual learning miraculously from the designing and the AR technology which makes AR an important technology in constructing the major learning media in the present time and in the future. This study held the concept of developing the virtual media to be a virtual learning media in publicizing the sacred object artwork. This case studied on the metal sacred objects in Ratchaburi province which is considered to be a province where there have been metal sacred objects since the ancient time of Thailand. It aimed to collect information, present the data and publicize it through the virtual media in order to present the knowledge of the cultural artwork of the sacred objects and the long inherited knowledge in order to conserve it and make known the artwork of the sacred objects which is considered a national property so that it can remain longer, and it can also promote the sustainable cultural tourism in the future. LITERATURE REVIEW The virtual technology is a technology developed to respond to the interactions between human and computer which causes the presentation of the information and the perception of the information by being able to contact new experience in the virtual dimension with the technology that merges the virtual world with the real world by using the overlaying of three-dimensional pictures in the virtual world (3D) with 360-degree angle (Volkan et al., 2013). In the present time the virtual media takes a role in assisting the education which has limitation and problems as stated above. The role of media on the aspect that, in the present time, the society is filled with information. The use of learning media in an appropriate form is more necessary because the media can assist the perception to be more effective. Moreover, with the efficiency of computer and computer programs which were in progressive development unlimitedly, the computer system can efficiently process the data, present the information, pictures, sound, and message. When added with a good program designing, it will render good result to the learning and the researching of information. Besides, the virtual technology is considered to be the type of technology innovation which can support the learning and fulfill the audience with knowledge (Tieranabunjong et al., 2011). The learners not only students, but also people or interested people in general can learn through the virtual media and may be able to practice in reality from the communicating technology process of various forms which bring interesting and virtual communication (Kaufmann, 2013). True learning requires experience. The more senses that are involved (sound, sight, touch, emotions, etc.). In this context, AR appears as an interesting emerging technology for education (Luckin and Fraser, 2011), (Lai and Hsu, 2011). Lin et al. (2011). In their project, the authors used AR and a touch-screen to enhance the educational resources about fish conservation in Taiwan. Their results focused on system usability, which was positive in an educational context. Three-dimensional renders and other virtual objects were also used to augment real objects in Chemistry (Chen, 2006). Virtual systems are useful when a laboratory is not available or when the experiences
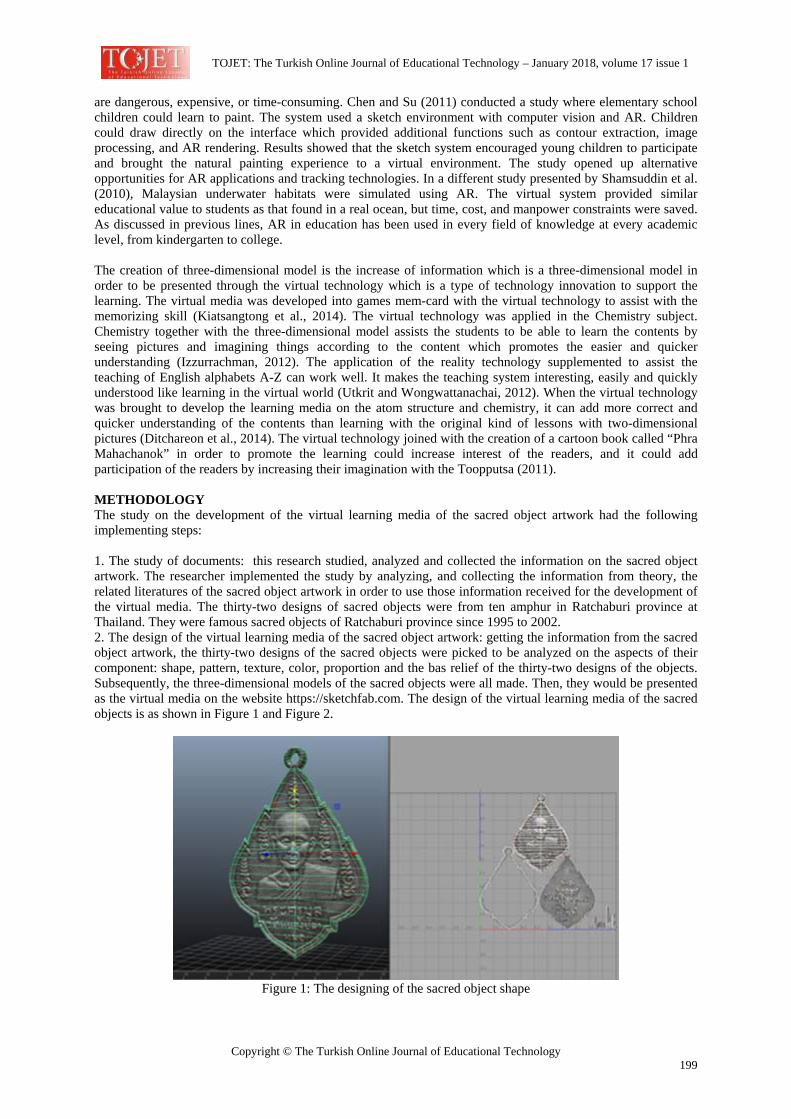
TOJET: The Turkish Online Journal of Educational Technology – January 2018, volume 17 issue 1
Copyright © The Turkish Online Journal of Educational Technology 199
are dangerous, expensive, or time-consuming. Chen and Su (2011) conducted a study where elementary school children could learn to paint. The system used a sketch environment with computer vision and AR. Children could draw directly on the interface which provided additional functions such as contour extraction, image processing, and AR rendering. Results showed that the sketch system encouraged young children to participate and brought the natural painting experience to a virtual environment. The study opened up alternative opportunities for AR applications and tracking technologies. In a different study presented by Shamsuddin et al. (2010), Malaysian underwater habitats were simulated using AR. The virtual system provided similar educational value to students as that found in a real ocean, but time, cost, and manpower constraints were saved. As discussed in previous lines, AR in education has been used in every field of knowledge at every academic level, from kindergarten to college. The creation of three-dimensional model is the increase of information which is a three-dimensional model in order to be presented through the virtual technology which is a type of technology innovation to support the learning. The virtual media was developed into games mem-card with the virtual technology to assist with the memorizing skill (Kiatsangtong et al., 2014). The virtual technology was applied in the Chemistry subject. Chemistry together with the three-dimensional model assists the students to be able to learn the contents by seeing pictures and imagining things according to the content which promotes the easier and quicker understanding (Izzurrachman, 2012). The application of the reality technology supplemented to assist the teaching of English alphabets A-Z can work well. It makes the teaching system interesting, easily and quickly understood like learning in the virtual world (Utkrit and Wongwattanachai, 2012). When the virtual technology was brought to develop the learning media on the atom structure and chemistry, it can add more correct and quicker understanding of the contents than learning with the original kind of lessons with two-dimensional pictures (Ditchareon et al., 2014). The virtual technology joined with the creation of a cartoon book called “Phra Mahachanok” in order to promote the learning could increase interest of the readers, and it could add participation of the readers by increasing their imagination with the Toopputsa (2011). METHODOLOGY The study on the development of the virtual learning media of the sacred object artwork had the following implementing steps: 1. The study of documents: this research studied, analyzed and collected the information on the sacred object artwork. The researcher implemented the study by analyzing, and collecting the information from theory, the related literatures of the sacred object artwork in order to use those information received for the development of the virtual media. The thirty-two designs of sacred objects were from ten amphur in Ratchaburi province at Thailand. They were famous sacred objects of Ratchaburi province since 1995 to 2002. 2. The design of the virtual learning media of the sacred object artwork: getting the information from the sacred object artwork, the thirty-two designs of the sacred objects were picked to be analyzed on the aspects of their component: shape, pattern, texture, color, proportion and the bas relief of the thirty-two designs of the objects. Subsequently, the three-dimensional models of the sacred objects were all made. Then, they would be presented as the virtual media on the website https://sketchfab.com. The design of the virtual learning media of the sacred objects is as shown in Figure 1 and Figure 2.
Figure 1: The designing of the sacred object shape
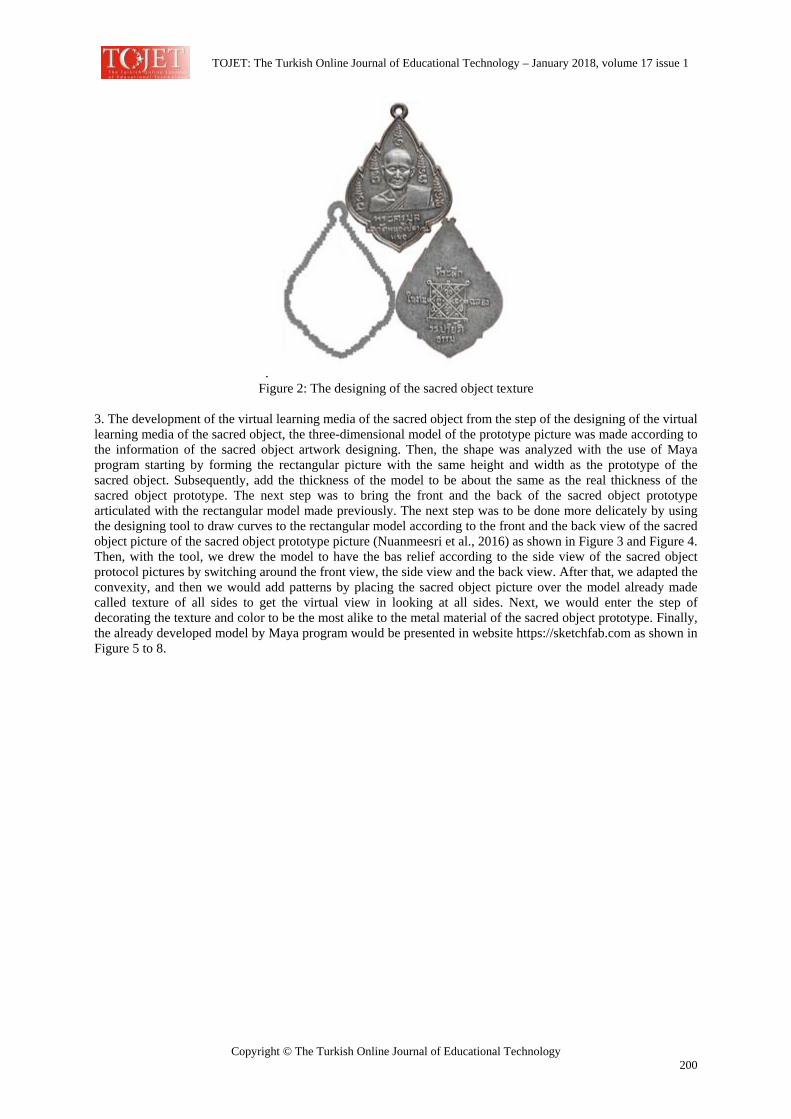
TOJET: The Turkish Online Journal of Educational Technology – January 2018, volume 17 issue 1
Copyright © The Turkish Online Journal of Educational Technology 200
. Figure 2: The designing of the sacred object texture
3. The development of the virtual learning media of the sacred object from the step of the designing of the virtual learning media of the sacred object, the three-dimensional model of the prototype picture was made according to the information of the sacred object artwork designing. Then, the shape was analyzed with the use of Maya program starting by forming the rectangular picture with the same height and width as the prototype of the sacred object. Subsequently, add the thickness of the model to be about the same as the real thickness of the sacred object prototype. The next step was to bring the front and the back of the sacred object prototype articulated with the rectangular model made previously. The next step was to be done more delicately by using the designing tool to draw curves to the rectangular model according to the front and the back view of the sacred object picture of the sacred object prototype picture (Nuanmeesri et al., 2016) as shown in Figure 3 and Figure 4. Then, with the tool, we drew the model to have the bas relief according to the side view of the sacred object protocol pictures by switching around the front view, the side view and the back view. After that, we adapted the convexity, and then we would add patterns by placing the sacred object picture over the model already made called texture of all sides to get the virtual view in looking at all sides. Next, we would enter the step of decorating the texture and color to be the most alike to the metal material of the sacred object prototype. Finally, the already developed model by Maya program would be presented in website https://sketchfab.com as shown in Figure 5 to 8.
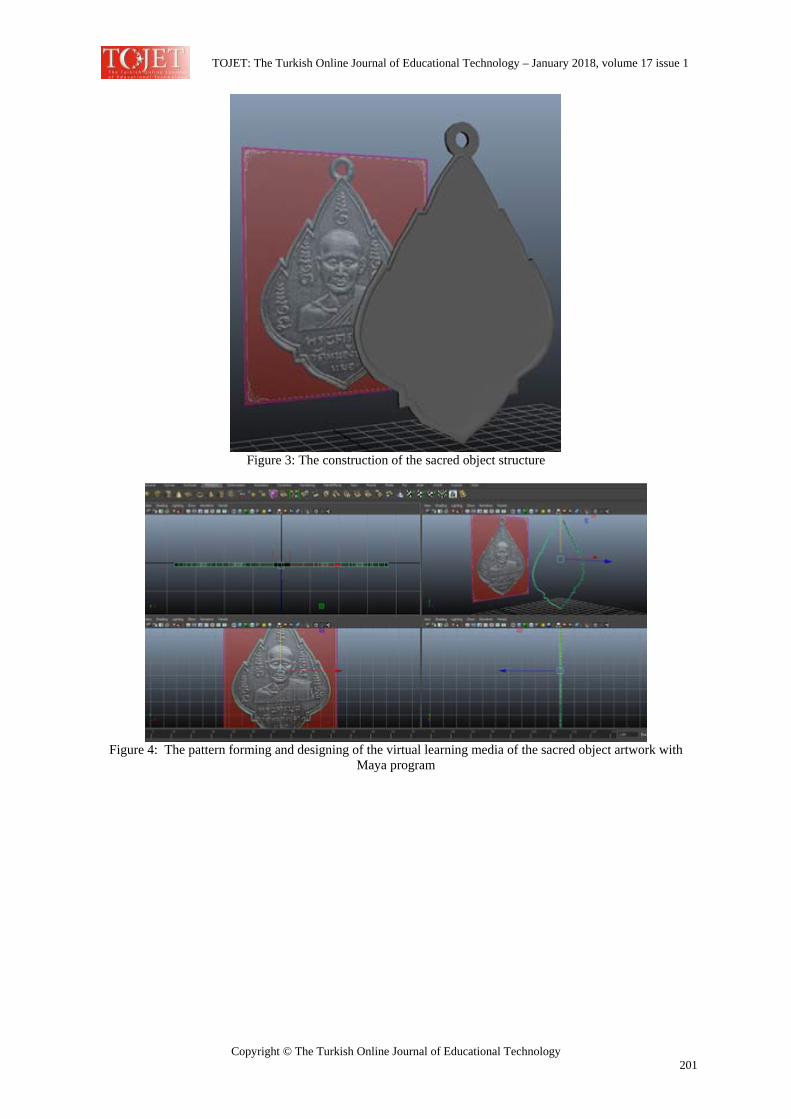
TOJET: The Turkish Online Journal of Educational Technology – January 2018, volume 17 issue 1
Copyright © The Turkish Online Journal of Educational Technology 201
Figure 3: The construction of the sacred object structure
Figure 4: The pattern forming and designing of the virtual learning media of the sacred object artwork with
Maya program

TOJET: The Turkish Online Journal of Educational Technology – January 2018, volume 17 issue 1
Copyright © The Turkish Online Journal of Educational Technology 202
Figure 5: The virtual learning media of the front part of the sacred object artwork
Figure 6: The virtual learning media of the back part of the sacred object artwork
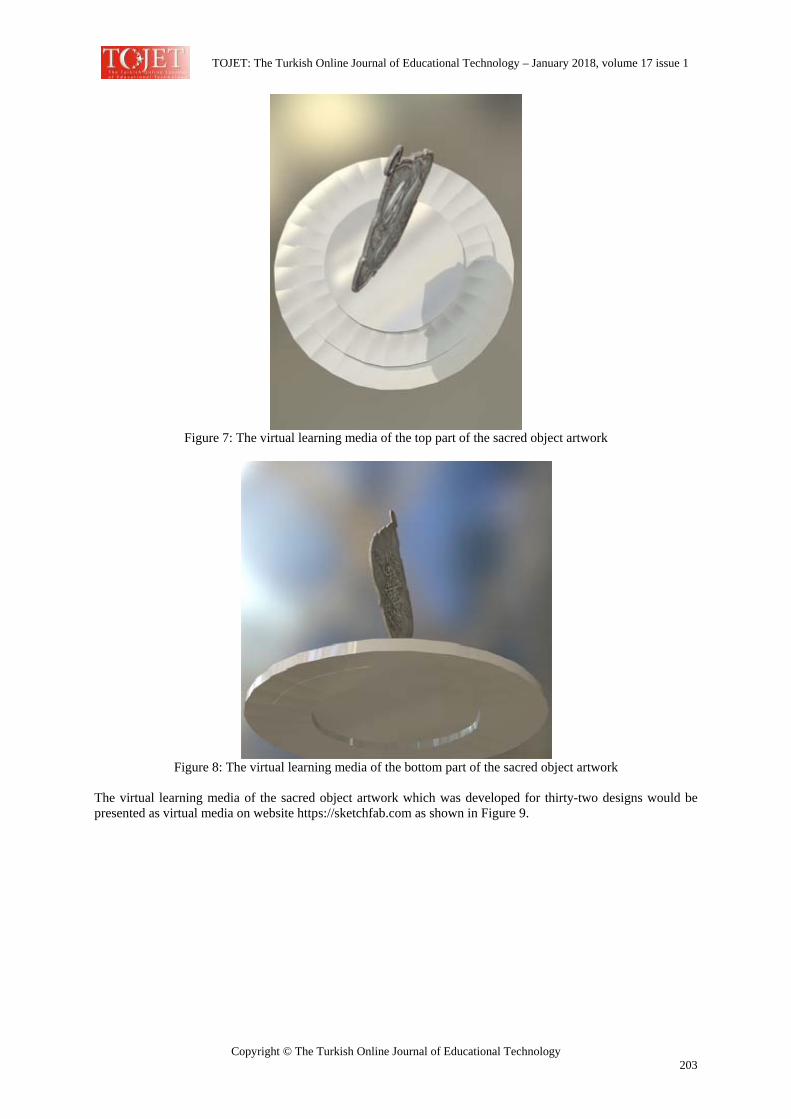
TOJET: The Turkish Online Journal of Educational Technology – January 2018, volume 17 issue 1
Copyright © The Turkish Online Journal of Educational Technology 203
Figure 7: The virtual learning media of the top part of the sacred object artwork
Figure 8: The virtual learning media of the bottom part of the sacred object artwork
The virtual learning media of the sacred object artwork which was developed for thirty-two designs would be presented as virtual media on website https://sketchfab.com as shown in Figure 9.
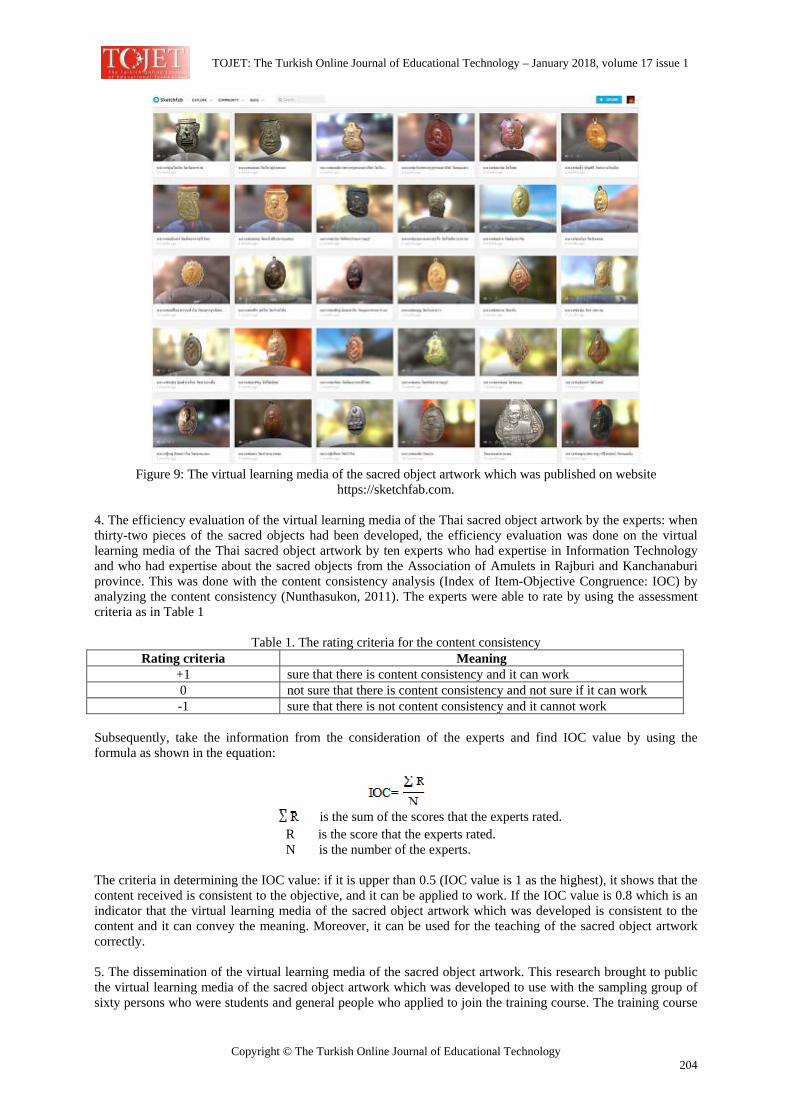
TOJET: The Turkish Online Journal of Educational Technology – January 2018, volume 17 issue 1
Copyright © The Turkish Online Journal of Educational Technology 204
Figure 9: The virtual learning media of the sacred object artwork which was published on website
https://sketchfab.com.
4. The efficiency evaluation of the virtual learning media of the Thai sacred object artwork by the experts: when thirty-two pieces of the sacred objects had been developed, the efficiency evaluation was done on the virtual learning media of the Thai sacred object artwork by ten experts who had expertise in Information Technology and who had expertise about the sacred objects from the Association of Amulets in Rajburi and Kanchanaburi province. This was done with the content consistency analysis (Index of Item-Objective Congruence: IOC) by analyzing the content consistency (Nunthasukon, 2011). The experts were able to rate by using the assessment criteria as in Table 1
Table 1. The rating criteria for the content consistency Rating criteria Meaning
+1 sure that there is content consistency and it can work 0 not sure that there is content consistency and not sure if it can work -1 sure that there is not content consistency and it cannot work
Subsequently, take the information from the consideration of the experts and find IOC value by using the formula as shown in the equation:
is the sum of the scores that the experts rated.
R is the score that the experts rated. N is the number of the experts.
The criteria in determining the IOC value: if it is upper than 0.5 (IOC value is 1 as the highest), it shows that the content received is consistent to the objective, and it can be applied to work. If the IOC value is 0.8 which is an indicator that the virtual learning media of the sacred object artwork which was developed is consistent to the content and it can convey the meaning. Moreover, it can be used for the teaching of the sacred object artwork correctly. 5. The dissemination of the virtual learning media of the sacred object artwork. This research brought to public the virtual learning media of the sacred object artwork which was developed to use with the sampling group of sixty persons who were students and general people who applied to join the training course. The training course

TOJET: The Turkish Online Journal of Educational Technology – January 2018, volume 17 issue 1
Copyright © The Turkish Online Journal of Educational Technology 205
contained lectures and workshops by demonstrating the using method for big group so that the sampling group could learn about the virtual learning media of the sacred object artwork as shown in Figure 10.
Figure 10: The dissemination of the virtual learning media of the sacred object artwork to the sampling group
6. The efficiency evaluation of the virtual learning media of the sacred object artwork which affected the learning: when the sampling group of sixty persons received the training as shown in Figure 11, the sampling group of the virtual learning media of the sacred object artwork would be evaluated of their learning result by doing the pre-test and the post-test. Before the training the sampling group would take a ten-question test which had been tested for the learning evaluation. In other words, the test had passed the content validity index: CVI (Polit and Beck, 2008) done by five experts. The CVI value is 1. The test had the same questions as the pre-test, but the questions and choices are alternately ordered. Before the training, the sampling group had to be tested with a ten-question test. After having taken the pre-test, they entered the training course which took two hours. After having finished the course, they would take a post-test. After having done the post-test, there would be an answering session for each question of the test to the sampling group (Kadmateekarun and Nuanmeesri, 2015) Subsequently, The tests were checked for correctness and assessment in order to evaluate the learning result of the sampling group of the virtual learning media of the sacred object artwork which had been developed. The tests were done to compare the learning result before and after the training using the T-Test Dependent Statistic. 7. The efficiency evaluation on the satisfaction towards the virtual learning media of the sacred object artwork of sixty persons: this research constructed questionnaire questions on the satisfaction aspect about the virtual learning media of the sacred object artwork of sixty persons in order to assess the satisfaction on the aspect of the knowledge acquisition and understanding as well as the application of the virtual learning media of the sacred object artwork which had been developed. Subsequently, the data would be brought to be analyzed for the mean value and the standard deviation value so as to find the efficiency assessment on the aspect of satisfaction towards the virtual learning media of the sacred object artwork according to the scoring criteria of Likert Scale to rate the satisfaction evaluation form (Nunthasukon, 2011) as shown in Table 2.
Table 2: The scoring criteria of the satisfaction evaluation form Scoring Criteria Meaning
Quantitative Qualitative 4.51-5.00 the most The user has the most satisfaction 3.51-4.50 much The user has much satisfaction 2.51-3.50 moderate The user has moderate satisfaction 1.51-2.50 little The user has little satisfaction 1.00-1.50 the least The user has the least satisfaction
RESULTS 1. The result of the data analysis of the sampling group, the sampling group who were used in this research was sixty persons. The profile of the survey respondents was established from the demographics section of the survey with the following general information shown in Table 3 and Table 4.
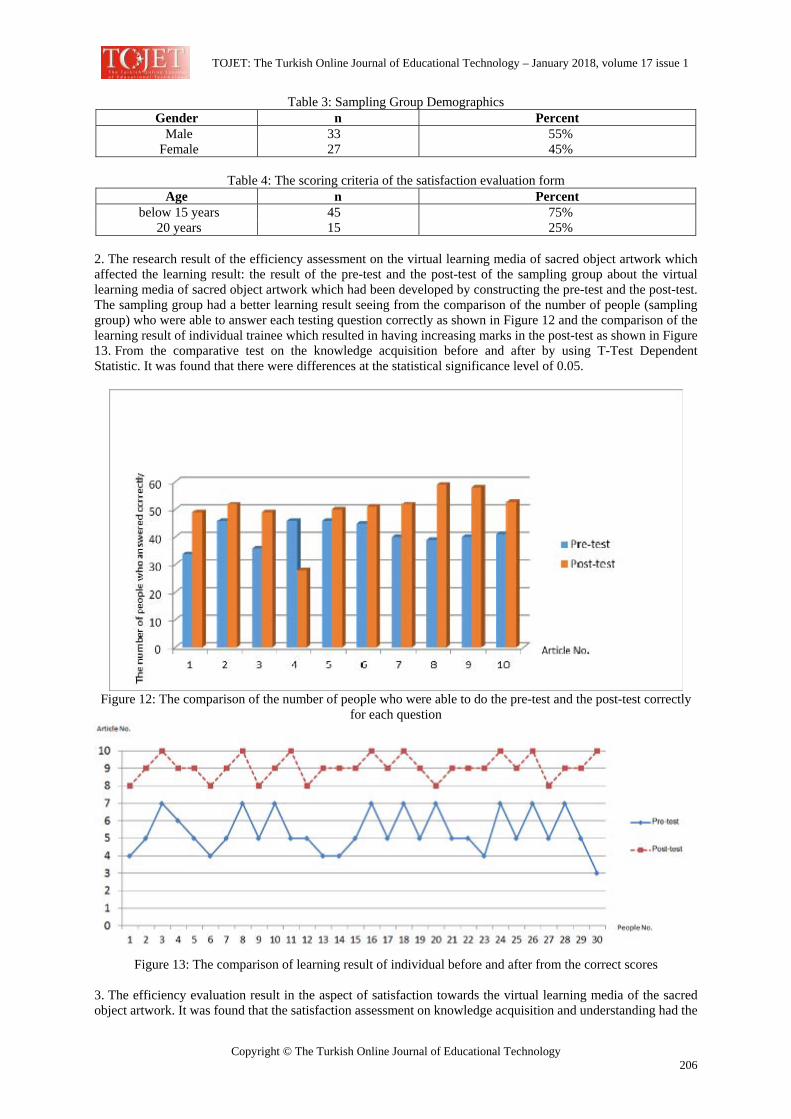
TOJET: The Turkish Online Journal of Educational Technology – January 2018, volume 17 issue 1
Copyright © The Turkish Online Journal of Educational Technology 206
Table 3: Sampling Group Demographics Gender n Percent
Male 33 55% Female 27 45%
Table 4: The scoring criteria of the satisfaction evaluation form
Age n Percent below 15 years 45 75%
20 years 15 25% 2. The research result of the efficiency assessment on the virtual learning media of sacred object artwork which affected the learning result: the result of the pre-test and the post-test of the sampling group about the virtual learning media of sacred object artwork which had been developed by constructing the pre-test and the post-test. The sampling group had a better learning result seeing from the comparison of the number of people (sampling group) who were able to answer each testing question correctly as shown in Figure 12 and the comparison of the learning result of individual trainee which resulted in having increasing marks in the post-test as shown in Figure 13. From the comparative test on the knowledge acquisition before and after by using T-Test Dependent Statistic. It was found that there were differences at the statistical significance level of 0.05.
Figure 12: The comparison of the number of people who were able to do the pre-test and the post-test correctly
for each question
Figure 13: The comparison of learning result of individual before and after from the correct scores
3. The efficiency evaluation result in the aspect of satisfaction towards the virtual learning media of the sacred object artwork. It was found that the satisfaction assessment on knowledge acquisition and understanding had the
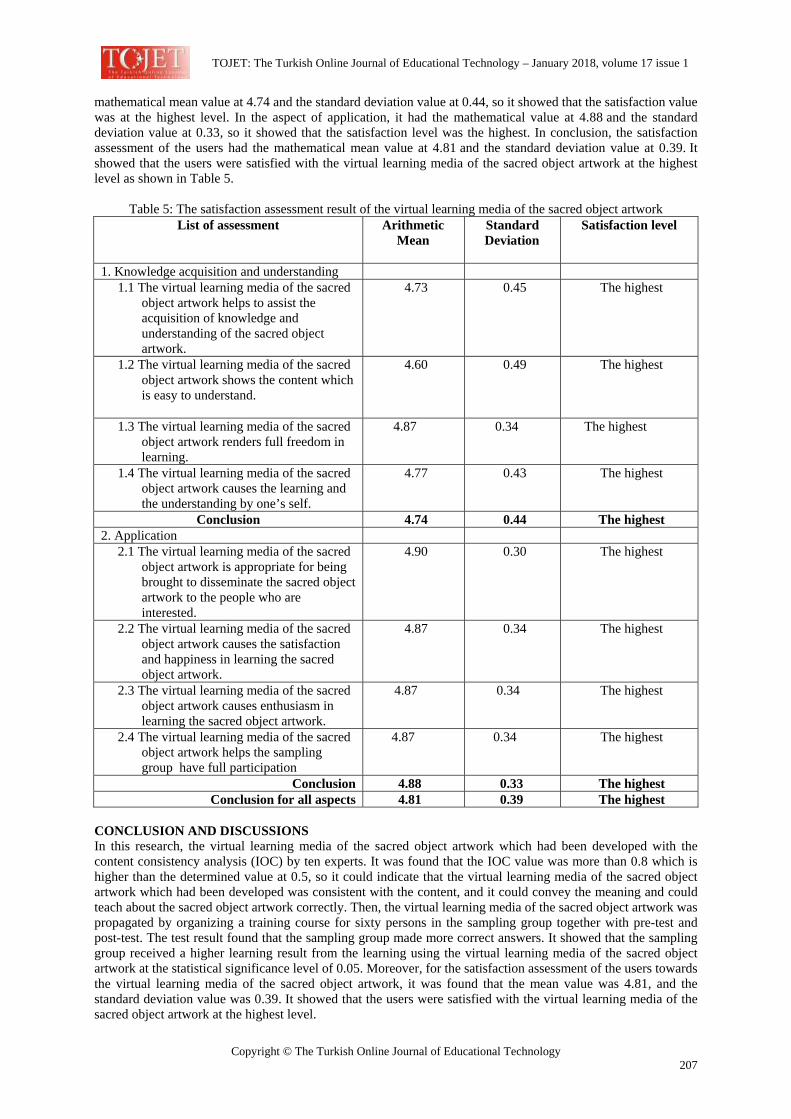
TOJET: The Turkish Online Journal of Educational Technology – January 2018, volume 17 issue 1
Copyright © The Turkish Online Journal of Educational Technology 207
mathematical mean value at 4.74 and the standard deviation value at 0.44, so it showed that the satisfaction value was at the highest level. In the aspect of application, it had the mathematical value at 4.88 and the standard deviation value at 0.33, so it showed that the satisfaction level was the highest. In conclusion, the satisfaction assessment of the users had the mathematical mean value at 4.81 and the standard deviation value at 0.39. It showed that the users were satisfied with the virtual learning media of the sacred object artwork at the highest level as shown in Table 5.
Table 5: The satisfaction assessment result of the virtual learning media of the sacred object artwork List of assessment Arithmetic
Mean Standard Deviation
Satisfaction level
1. Knowledge acquisition and understanding 1.1 The virtual learning media of the sacred
object artwork helps to assist the acquisition of knowledge and understanding of the sacred object artwork.
4.73 0.45 The highest
1.2 The virtual learning media of the sacred object artwork shows the content which is easy to understand.
4.60 0.49 The highest
1.3 The virtual learning media of the sacred object artwork renders full freedom in learning.
4.87 0.34 The highest
1.4 The virtual learning media of the sacred object artwork causes the learning and the understanding by one’s self.
4.77 0.43 The highest
Conclusion 4.74 0.44 The highest 2. Application
2.1 The virtual learning media of the sacred object artwork is appropriate for being brought to disseminate the sacred object artwork to the people who are interested.
4.90 0.30 The highest
2.2 The virtual learning media of the sacred object artwork causes the satisfaction and happiness in learning the sacred object artwork.
4.87 0.34 The highest
2.3 The virtual learning media of the sacred object artwork causes enthusiasm in learning the sacred object artwork.
4.87 0.34 The highest
2.4 The virtual learning media of the sacred object artwork helps the sampling group have full participation
4.87 0.34 The highest
Conclusion 4.88 0.33 The highest Conclusion for all aspects 4.81 0.39 The highest
CONCLUSION AND DISCUSSIONS In this research, the virtual learning media of the sacred object artwork which had been developed with the content consistency analysis (IOC) by ten experts. It was found that the IOC value was more than 0.8 which is higher than the determined value at 0.5, so it could indicate that the virtual learning media of the sacred object artwork which had been developed was consistent with the content, and it could convey the meaning and could teach about the sacred object artwork correctly. Then, the virtual learning media of the sacred object artwork was propagated by organizing a training course for sixty persons in the sampling group together with pre-test and post-test. The test result found that the sampling group made more correct answers. It showed that the sampling group received a higher learning result from the learning using the virtual learning media of the sacred object artwork at the statistical significance level of 0.05. Moreover, for the satisfaction assessment of the users towards the virtual learning media of the sacred object artwork, it was found that the mean value was 4.81, and the standard deviation value was 0.39. It showed that the users were satisfied with the virtual learning media of the sacred object artwork at the highest level.
TOJET: The Turkish Online Journal of Educational Technology – January 2018, volume 17 issue 1
Copyright © The Turkish Online Journal of Educational Technology 208
The development of the virtual learning media of the sacred object artwork: from the research result, it showed that the virtual technology helped in disseminating and promoting the learning which caused the learning to be easier and also quicker to understand. It promoted the participation and the creation of imagination which was correspondent to the research work of Utkrit and Wongwattachai (2012), Ditchareon et al. (2014), Kiatsangtong et al. (2014), Karnmart and Toopputsa (2011) and Izzurrachman (2012). In the near future the virtual technology will not be limited only to the creating of interest but also to be a part of the elaboration of knowledge, the survey exploration, and the collaborative learning which were also correspondent to the learning of the twenty first century (Meesuwan, 2011). ACKNOWLEDGEMEMTS We would like to express our thanks to the Department of Information Technology, Faculty of the Science and Technology and Institute for Research and Development, Suan Sunandha Rajabhat University for offered for this research. REFERENCES Chen, C. H., & Su, C. C. C. (2011). Developing an augmented painting interface for enhancing children painting
experience. International Journal of Digital Content Technology and its Applications, 5(1), 319-327. Retrieved from http://www.scopus.com/inward/record.url?eid=2-s2.0-79954545610&partnerID=40&md5 =ea66d36aae 30a fec6111b88dc86d0346
Chen, Y.-C. (2006). A study of comparing the use of augmented reality and physical models in chemistry education. Proceedings of the 2006 ACM international conference on Virtual reality continuum and its applications - VRCIA ’06, 1(June), 369. New York, USA: ACM Press. doi:10.1145/1128923.1128990
Ditcharoen, N., Polyiam, K., Vangkahad P., & Jarujamrus P. (2014). Development of Learning Media in Topics of Atomic Structure and Chemical Bond with Augmented Reality Technology. Journal of Research on Science Technology and Environment for Learning, 5(1).
Izzurrachman, F. (2012). Particle effect on augmented reality for chemical bond learning. Department of Electrical Engineering Faculty of Industrial Engineering. Sepuluh Nopember Institute of Technology.
Jirapan, K. (2012). Promoting Thai Cultural Art with Virtual World Technology: the Case Study of Thailand Planet Project. School Of DigitalMedia. Sripatum University.
Jiravarapong, B. (2010). Augmented Reality. Journal of Education Naresuan University, 12(3), 1-6. Kadmateekarun, P. and Nuanmeesri, S. (2015). Development of Animation Teaching Media on the Topic of The
Property of The Father. Suan Sunandha Journal of Science and Technology, 2(1), 39-43. Kanmart, N. and Toopputsa, C. (2011). Application of Mentality Reality Technology for 3D cartoon comics for
The Story of Phra Mahachanok. Ubon Ratchathani University. Kaufmann, H. (2013). Collaborative Augmented Reality in Education. Institued of Software Technology and
Interactive Systems. Vienna University of Technology. Kiatsangtong, W. Prommat, P. and Chalermsakulkit, A. (2014). A Study of Augmented Reality
Technologies:Case Study Developing “MemCards” Game. Project of Computer Science. Srinakharinwirot University.
Lai, Y.-S., & Hsu, J.-M. (2011). Development trend analysis of augmented reality system in educational applications. 2011 International Conference on Electrical and Control Engineering , 6527-6531. doi:10.1109/ICECENG.2011.6056941
Lin, H.C.K., Hsieh, M.C., Wang, C.H., Sie, Z.Y., & Chang, S.H. (2011). Establishment and usability evaluation of an interactive AR learning system on conservation of fish. Turkish Online Journal of Educational Technology-TOJET, 10(4), 181-187.
Luckin, R., & Fraser, D. S. (2011). Limitless or pointless? An evaluation of augmented reality technology in the school and home. International Journal of Technology Enhanced Learning, 3(5), 15, doi:10.1504/IJTEL.2011.042102
Meesuwan, W. (2011). Augmented reality technology for learning. Journal of Education Naresuan University, 1(2), 119-127.
Nuanmeesri, S. Kadmateekarun, P. and Poomhiran L. (2016). Publicizing Thai Dress of Royal Endorsement by Augmented Reality. Journal of The Social Science, 11(14), 3569-3564.
Nunthasukon, R. (2011). Classroom Action Research and Development of teaching research .Bangkok : Jumtong.
Phoglong, T. (2009). The Mystery of Belief’s Objects. Faculty of Painting Sculpture and Graphic Arits. Silpakorn University.
Polit, D.F. and Beck, C.T. (2008). Nursing research: Generating and assign evidence for nursing practice, Philadelphia: Lippincott.

TOJET: The Turkish Online Journal of Educational Technology – January 2018, volume 17 issue 1
Copyright © The Turkish Online Journal of Educational Technology 209
Shamsuddin, N., Rajuddin, M. K. M., Mohd, F., Ahmad, F., Ahmad, W. F. W., & Baharudin, B. (2010). An overview of augmented reality of underwater habitat. 2010 International Symposium on Information Technology, 1, 1-5. doi:10.1109/ITSIM.2010.5561379
Tieranabunjong, Y. (2001). Knowledge of multimedia for education. Bangkok : Kurusapa Press. Utkrit, N. and Wongwattanachai, N. (2012). The Application of Augmented Reality Technology to Assist in the
Teaching of English Letters A-Z. King Mongkut's University of Technology North Bangkok. Volkan, I. Bradford, W. and Ruzena, B. (2013). Building a 3D Virtual Museum of Native American Basket.
Retrieved October 10, 2016, from: http://www-users.cs.umn.edu/~isler/pub/
TOJET: The Turkish Online Journal of Educational Technology – January 2018, volume 17 issue 1
Copyright © The Turkish Online Journal of Educational Technology 210
The Effects of Webopac Self Training Tool with Guided Exploration on Information Literacy Skills among First Year Degree Students Mohd Nasir ISMAIL Faculty of Information Management, Universiti Teknologi MARA, MALAYSIA [email protected] Nurfaezah MAMAT Faculty of Information Management, Universiti Teknologi MARA, MALAYSIA [email protected] Adnan JAMALUDIN Faculty of Information Management, Universiti Teknologi MARA, MALAYSIA [email protected] ABSTRACT The purpose of this study is to investigate effects of WebOPAC Self Training Tool with Guided Exploration (WSTTG), WebOPAC Self Training Tool with non-guided exploration (WSTT) and Traditional (T) groups as the learning strategies on information literacy (IL) skills standards among first year degree students in Malaysian public university. The proposed learning strategy (WSTTG) was developed according to Ausebel’s Instructional Design Theory and Gagne‘s Nine Events of Instruction which consist of constructivist learning environment model and cognitive of multimedia learning model. This unique and novel learning strategy is used to develop individual’s logical thinking skill and access the information literacy skills which comply with Association of College and Research Libraries Information Literacy Competency Standards for Higher Education and Bloom Taxonomy standard. This study investigates the effects of the learning strategies amongst the students with high and low logical thinking level on their IL skills. Student’s logical thinking level was measured using Group Assessment of Logical Thinking Test (GALTS). Meanwhile, students’ information literacy skills were measured through a WebOPAC Training Assessment Information Literacy Skills (WTAILS). A quasi-experimental study with posttest-only nonequivalent group design that employed a 3x2 factorial design was applied in the study. The sample considered of 150 students from three academic libraries in Malaysia which were all randomly selected and assigned to the treatment and control groups. The findings of this study suggest that WSTTG is preferred compare to WSTT and T methods in developing student’s information literacy skills at both logical thinking levels. From the practical perspective, the findings should alert librarians on the need to adopt this effective learning strategy for library orientation program and to be used by both the librarians and library users for WebOPAC teaching and learning purposes. Keywords: Information literacy, logical thinking skill, WebOPAC self-training tool, learning strategy, library orientation program, academic library. INTRODUCTION Today, academic libraries are shifting their role from collection-centered to learning-centered due to continuous changing on the academic agenda and user needs. This academic library plays a significant role in the context of new learning paradigm. Based on the new perspective of learning, an academic library as a subsystem of academic organization has not been a division that is added providing services for studies and research any longer. Instead, it has become an important unit of academic's information infrastructure and an active participant in the learning process of particular study training. It is an integral part of the academic's educational system. The academic library serves two complementary purposes: to support the universities’ curriculum, and to support the research of the academic faculty and students. Past review, academic libraries are the important organization and core component with the roles to teach and support the integration of information literacy especially to the undergraduates students courses (Head, 2013; Ghaphery & White, 2012; Maitaouthong, Tuamsuk, & Tachamanee, 2012; Edzan, 2008). According to Rice & Gregor (2013)and Madhusudhan and Singh (2010), library orientation programs plays a vital role in the communication process between the library and its user, although the library orientation program formats changed with the advent of various technologies. The library orientation programs offers an introduction to the
TOJET: The Turkish Online Journal of Educational Technology – January 2018, volume 17 issue 1
Copyright © The Turkish Online Journal of Educational Technology 211
library’s resources and services, to the fresh undergraduates in the academic as well as information on study skills and academic integrity to help in the survival of the first year students throughout their studies at tertiary scores. To date, Malaysia has twenty public universities which are funded by government and governed as self-manage institutions. Generally, Malaysian academic libraries of each universities were actively conducting their various library orientation programs, library skill trainings, library research trainings, information skills trainings and other similar trainings whose main aim is to educate the user on information use (Klaib, 2011; Edzan, 2008). In Malaysia, most of these academic libraries are doing their academic orientation for their users especially for undergraduate and post graduate students. Library orientation trainings are compulsory for every new student and are conducted usually at the beginning of every academic year or semester. Throughout the year, the libraries will organize program with the aim of familiarizing the students with the various tools within the libraries. This program is a way to help new students familiarize themselves with the layout, regulations, types of services and facilities offered by the particular academic library. This library orientation has two main purposes: first is to train users to tap library resources and services and second, to instil awareness among its users about the significance of principles and practices of information skills. Madhusudhan and Singh (2010) also supported that this library orientation has to make 1) provision of guidance for understanding the features of specific information system or information in relation to user’s needs, (2) provision of guidance on the specific information sources accessible through a specific system, (3) provision of guidance in the use of specific tools (e.g. online public access catalogue (OPAC) used in specific information system; and (4) developing familiarity with the outputs obtainable through a specific system. Information Literacy (IL) is one of the critical digital-age illiteracies for higher education. Thanuskodi (2013) defined that IL is a way to move efficient access, evaluation and use of information should be taken into account and used for improving information end users. Therefore, the library orientation programs need continuously improvement to be taken seriously by academic library to develop information literacy skill among undergraduates which will allow them to function in an information society as envisioned in Malaysian Vision 2020 (Edzan, 2008). Thus, students need to be information literate to cope with the challenges in further studies and future profession. The Association of College and Research Libraries (ACRL) provided a standard which is Information Literacy Competency Standards for Higher Education as a guideline that will assist student in learning how to use the information, describe, locate, satisfies, evaluate and use the information need effectively (ACRL, 2011, 2000). Recent studies found that few problems facing during practicing information literacy training which relate to the ineffective way and strategy of conducting library tours, introductory information skills classes, and in teaching advanced information skills. The studies conclude that the academic agencies do not aware the importance and development of information literacy among students. Supporting facilities such as class spaces, funding and training coordination provided on information literacy development was not seriously manage. Previous studies also reported that logical thinking skill moderates the relationship between teaching strategy and information literacy skills (Ralph Catts, 2010; Špiranec & Pejova, 2010; King, 2007). They concluded that students are lacking of logical thinking skills to evaluate IL, to identify the most efficient search strategy, to use scholarly information resources, and to use information ethically. This problem was supported by Fabunmi and Asubiojo (2013); Sankari et al., (2013), who believed that the lack of basic skills such as logical thinking skills of IL might become serious problem among undergraduate students in using WebOPAC in any academic library. As the result, the information literacy training during the orientation sessions does not comply with ACRL’s standards (Shao & Purpur, 2016; Derakhshan, Hassanzadeh, & Nazari, 2015; Nurfaezah Mamat, Mohd Nasir Ismail & Adnan Jamaludin, 2014; Magnuson, 2013; Baro & Keboh, 2012; Husaini, Aziz, Karim, Jamin & Saad, 2011; Syamalamba, 2011; Gullikson, 2006). They major finding and supported by Nurfaezah Mamat et al. (2014); Rice and Gregor (2013); Gregory & Broussard (2011) concluded that the ineffective way and strategy of conducting these orientations programs contribute to the deficiencies of information literacy skill among university students. PROBLEM STATEMENT In most of academic libraries in Malaysia, library orientation activities are consist of library tours, hands on library system (WebOPAC), library briefings, information skills classes using online databases, lectures and multimedia presentations ( Jyoon & Ibrahim, 2015; Salleh, Halim, Yaacob, & Yusoff, 2011; Ali, Abu-hassan, Md Daud, & Jusoff, 2010; Edzan, 2008). Ironically, even though library orientation program in Malaysian academic libraries were carried out every semester to new students; Nurfaezah Mamat et al. (2014) discovered that information literacy education in Malaysia is still at infancy since year 2002. The most common problem
TOJET: The Turkish Online Journal of Educational Technology – January 2018, volume 17 issue 1
Copyright © The Turkish Online Journal of Educational Technology 212
faced by academic libraries in Malaysia that was reported in previous studies is basically due to conventional ways of conducting library orientation programs. The problems identified were regards to information overload, student’s time constraint, varying levels of information skill among trainers, limitation of classroom and with burden to the library staffs (Briggs, 2016; Koltay, Sonja, & Karvalics, 2015; Ismail, Dorner, & Oliver, 2011; Salleh, Halim, Yaacob, & Yusoff, 2011; Ranaweera, 2010; Edzan & Mohd Saad, 2005; Bahri, 2003) A needs assessment was done by Nurfaezah Mamat et al. (2014) by collecting data from interviews with five expert librarians to see in depth problems occur, which relate to the orientation programs conducted at the academic library in five different public universities in Malaysia. This needs assessment was conducted in order to elicit information concerning to the expert librarians’ experiences in conducting library orientation programs, perceptions on student’s IL skill and problems which corresponds to training strategies and content coverage during orientation programs. According to the needs assessment which also supported by previous studies, they found and concluded that the major problem among students is regarding to deficiencies of information literacy skill (Syamalamba, 2011; Madhusudhan & Singh, 2010) which were relate to these four factors: 1) lack of problem solving skills among students (Fabunmi & Asubiojo, 2013; Sankari et al., 2013; Mohd Nasir Ismail et al., 2010; Ralph Catts, 2010; Špiranec & Pejova, 2010; King, 2007); 2) lack of effective strategy of using WebOPAC (Rice & Gregor, 2013; Baro & Keboh, 2012; Yusuf, 2012; Nilsen, 2012; Gregory & Broussard, 2011; Xiao, 2010); 3) lack of proper content to conduct training of WebOPAC (Baro & Keboh, 2012; Diep & Nahl, 2011; Ranaweera, 2010); and 4) there is no standard measurement on WebOPAC to measure the scores of Information literacy (Martin (2013); Karshmer & Bryan (2011); Abdullah, Kassim, Sharif, Saad, Tarmuchi, & Aripin, 2006). To conclude, these four factors give a very accurate affect to the lack of information literacy skills among students. So, there is need improvement and idea to overcome the problems which are to increase information literacy skill among students and academic staff in university. In other words, the ability of academic libraries to develop the library orientation programs be more effectively and achieve their goals in the development of information literacy skill especially in using WebOPAC system. In this study, a unique and novel learning strategy known as WebOPAC Self Training Tool with Guided Exploration (WSTTG) was developed which is expected to train and access individual’s IL skills. This learning strategy consists of WebOPAC web based self-training tool and self-guided manual which are complies with Association of College and Research Libraries (ACRL) Information Literacy Competency Standards for Higher Education and Bloom Taxonomy standard. The WSTTG instructional design was developed according to Ausebel’s Instructional Design Theory (Ausubel, Novak, & Hanesian, 1978) and Gagne‘s Nine Events of Instruction (Gagne & Merrill, 1985) which consist of constructivist learning environment model and cognitive of multimedia learning model. RESEARCH OBJECTIVES The main purpose of this study is to investigate effects of WebOPAC Self Training Tool with Guided Exploration (WSTTG), WebOPAC Self Training Tool with non-guided exploration (WSTT) and Traditional (T) groups as the learning strategies on information literacy (IL) skills standards among first year degree students in Malaysian public university. The study also intended to find out whether a WebOPAC Self Training Tool with Guided Exploration (WSTTG) can be used to develop students’ information literacy skill for WebOPAC training provided and they had develop their logical thinking skill through guided exploration manual. The main focus of the study is the comparison between two different modes: WebOPAC Self Training Tool with Guided Exploration (WSTTG) method and WebOPAC Self Training Tool without Guided Exploration (WSTT) method, as well as comparison with WebOPAC Traditional (T) method in order to determine if other mode of self-training tool is equally effective in producing desired student information literacy outcomes. Consequently, this study conducted to further investigate if there are any significant differences in student’s information literacy skills between learners who were taught in three different instructional methods. These instructional methods are the WebOPAC Self Training Tool with Guided Exploration (WSTTG), WebOPAC Self Training Tool without Guided Exploration (WSTT) and WebOPAC Traditional (T) method.
In addition, another purpose is to investigate the effects of these instructional methods on high logical thinking (HLT) students and low logical thinking (LLT) students in information literacy skill. The study is further investigated if there are significant differences between the high logical thinking (HLT) students and low logical thinking (LLT) students on information literacy skill in WSTTG, WSTT and T group method.
TOJET: The Turkish Online Journal of Educational Technology – January 2018, volume 17 issue 1
Copyright © The Turkish Online Journal of Educational Technology 213
RESEARCH QUESTIONS With regards the research objectives, the research main question for this study are as follow:
1) Is there any significance difference in the scores between students taught via WSTTG, WSTT and via T methods in IL skills?
2) Is there any significant difference in the scores between students with HLT and LLT for IL skills? 3) Is there an interaction effect between instructional methods and logical thinking for IL skills?
Other secondary research questions include:
1) Are the effects of instructional methods factors moderated by the logical thinking factors? a) For students taught via WSTTG, is there a significant difference in the scores between HLT
students and LLT students for IL skills? b) For students taught via WSTT, is there a significant difference in the scores between HLT students
and LLT students for IL skills? c) For students taught via T method, is there a significant difference in the scores between HLT
students and LLT students for IL skills? 2) Are the logical thinking factors affected by instructional methods?
a) For HLT students, is there a significant difference in the scores between students taught via WSTTG, student taught via WSTT and students taught via T methods for IL skills?
b) For LLT students, is there a significant difference in the scores between students taught via WSTTG, student taught via WSTT and students taught via T methods for IL skills?
RESEARCH HYPOTHESES The hypotheses were given with respect to the main effects, interaction and the simple effects. The following null hypotheses for main effects were formulated from the above research questions. The hypotheses were stated in a null hypotheses form because principally it is better fitted to the statistical techniques, which are aimed at measuring the likelihood that a difference found is truly greater than zero (Gall, Gall, & Borg, 2007). The probability gain scores of 0.05 was used to test statistical significance.
H1: There is no significant difference in the gain scores for the IL skill between students taught via WSTTG, student taught via WSTT and students taught via T methods.
H2: There is no significant difference in the gain scores for IL skill between students with HLT students
and LLT students. For the interaction effect, the following hypothesis was formulated.
H3: There is no interaction effect between instructional method and students’ logical thinking skills for IL skill.
Further hypotheses were formulated for pos-hoc tests depending on the result from H1. The hypotheses for the simple main effects include:
H4: There is no significance difference in the scores for students taught via WSTTG method between HLT students and LLT students for IL skills.
H5: There is no significance difference in the scores for students taught via WSTT between HLT students and LLT students for IL skills.
H6: There is no significance difference in the scores for students taught via T method between HLT
students and LLT students for IL skills.
H7: For HLT students, there is no significant difference in the scores for students taught via the three instructional methods for IL skills.
H8: For LLT students, there is no significant difference in the scores for students taught via the three
instructional methods for IL skills.

TOJET: The Turkish Online Journal of Educational Technology – January 2018, volume 17 issue 1
Copyright © The Turkish Online Journal of Educational Technology 214
METHODOLOGY Research design The present study was compared three instructional methods, i.e. (a) WebOPAC Self Training Tool with Guided Exploration (WSTTG), (b) WebOPAC Self Training Tool with Non Guided Exploration (WSTT), and (c) traditional (T) instructional method without WebOPAC Self Training Tool either Guided Exploration or Non Guided Exploration. This is a quasi-experimental study posttest only nonequivalent groups design (Shadish & Cook, 2002) to investigate the effects independent variables (WSTTG, WSTT and T) on one dependent variable (information literacy gain score) with logical thinking skill as the moderating variables. Slavin (1996) recommended the use of such research design because it enables researchers to hold constant all factors other than the ones being studied. This is a posttest only design with nonequivalent groups where all groups are intact classrooms where the assignments of X1, X2 and X3 were random and under the experimenter’s control (Gall, Gall, & Borg, 2007). In this study, mortality factor was not being a threat since the duration of the study was not more than 2 weeks. The researcher was also obtained demographic information about the participants’ groups at the beginning of the study, identify the participants that may contribute to mortality effect and remove them from the groups. Pretests of the three dependent variables were administered to the experimental and control groups. Treatments were given only to the experimental group as the treatments relates to matter pertaining the process during the experimental period. This design is recommended when it is not possible to locate a suitable pretest or when there is a possibility that the pretest has an effect on the experimental treatment (Borg et al., 2007). In this case, the pretest would have been irrelevant. The steps involved in this posttest design with nonequivalent groups were as follows: (1) non-random assignment of subjects to the groups, (2) administer the treatment to the two experimental groups but not to the control group, and (3) administer the posttest to three groups (Borg et al., 2007). Even though the study was done using quasi-experimental design, there was some degree of randomness of sampling of the three groups. Three campuses were randomly selected from the thirteen UiTM campuses. Two classes were randomly selected from the two selected campuses which have more than three classes. For the third campus, as it has only two classes, both intact groups were chooses as the sample. A 3x2 factorial design was used to investigate the effects of the independent variable on the one dependent variable at each of the two levels of a moderating variable. The research design is illustrated as in Table 1.
Table 1: Research design
Moderating Variable (logical thinking level)
Independent Variable (Instructional Method)
WSTTG (X1) WSTT (X2) T (X3)
High (Y1) Cell 1 Cell 2 Cell 3
Low (Y2) Cell 4 Cell 5 Cell 6
R O XI (Y1) O (Cell 1) R O X2 (Y1) O (Cell 2) R O X3 (Y1) O (Cell 3) R O X1 (Y2) O (Cell 4) R O X2 (Y2) O (Cell 5) R O X3 (Y2) O (Cell 6)
Where,
X1: WSTTG X2: WSTT X3: T R: Random assignment of subjects to groups O: Posttest
TOJET: The Turkish Online Journal of Educational Technology – January 2018, volume 17 issue 1
Copyright © The Turkish Online Journal of Educational Technology 215
Instrument and measurement Two major instruments are used to assess students’ information literacy skill in using WSTTG, WSTT and T method. Group Thinking of Logical Thinking Test (GALT) was use to assess students’ logical thinking level which being used as a moderating variable in this research for the Pretest and Posttest analysis. A WebOPAC Training Assessment Information Literacy Skill (WTAILS) was used to measure information literacy skills among students based on ACRL standards for the posttest analysis. a) Group Thinking of Logical Thinking Test (GALT) The assessment on student’s logical thinking level in the study are based on instrument that has been used in prior research to measure the student’s level of logical thinking i.e. Roadrangka’s Group Assessment of Logical Thinking (GALT) (Roadrangka, Yeany, & Padila, 1983). The adoption of this instrument assured that the logical thinking test would maintain items that had been previously reported as valid measure of logical thinking ability. The GALT had a reliability of 0.85 and validity of 0.80 (Roadrangka et al., 1983). This study used the GALT instrument that was based from the revised 12-item GALT that was translated into Malay language by Syed Anwar Aly (2000) in his study. The reliability values of GALT was found in his study are 0.59 (pre-test) and 0.688 (posttest). Therefore the test is adequate to distinguish between groups of students functioning at concrete and formal stages of development. The GALT instrument consisted of 12 items measuring conservation of weight and volume displacement, proportional thinking, identification and control of variables, probabilistic thinking, correlational thinking, and combinatorial thinking posed in a pencil- and-paper format. Appendix B gives a breakdown of the thinking skill in GALT according to student’s level of logical thinking defined by Roadrangka et al. (1983). The instrument used double answers for each question; multiple choice formats for presenting options for answers, and a justification or reason for each answer. The justification for answers provided more insight into student’s logical thinking ability as well as greatly reducing the ‘guess factor’. The student was given one point for each item for which a correct response was given for both answer and justification. The instrument should be completed in 25 minutes but students will give one hour class period for the test. The test items in GALT instrument used pictorial representations of objects and the reading level was suitable for university students. Students with a score of 0 to 6 were considered to be low logical thinking student. Students who accumulated score from 7 to 12 points were classified as high logical thinking student. b) WebOPAC Training Assessment Information Literacy Skills (WTAILS) A WebOPAC Training Assessment Information Literacy Skills (WTAILS) was used to measure information literacy skills among students based on ACRL standards for the posttest analysis. The WTAILS was designed to evaluate student learning in four content areas of the ACRL Information Literacy Competency Standards for Higher Education. This instrument was designed to assist institutions in identifying students' ability to locate, evaluate, and use information effectively when it is needed (ACRL, 2011, 2000). At the same time, it measures the scores of information literacy skills that are needed by the students in daily learning process. It is a multiple choice question test that must be completed in an hour. Items those are used to measure lower-order skills with the remaining one-third measuring higher-order skills (as defined in the Information Literacy Competency Standards). According to ACRL (2011, 2000), information literacy skills was measured with five ACRL standards. However, one of the standards is not compatible with a multiple-choice item format which is standard four. This standard four refers to students who can use the information effectively to accomplish a specific purpose, the concern would be more reasonable skill assessed by examination or presentation of products produced by the students. Therefore, the item of WTAILS has been developed to measure Standard One, Two, Three and Five which is based to the ACRL standards. Based on the ACRL (2011, 2000), the standard two and three should receive a greater emphasis on the test, because it has shown that students’ scores understanding of Information Literacy. Standard One and Standard Two are shown a lower order of logical thinking skill and for the Standard Three onwards it declined to the higher order of logical thinking skill. The WTAILS was designed to evaluate student learning in four content areas of the ACRL Information Literacy Competency Standards for Higher Education. This instrument was designed to assist institutions in identifying students' ability to locate, evaluate, and use information effectively when it is needed (ACRL, 2011, 2000). At the same time it measures the scores of information literacy skills which students need to have the skills in everyday learning.
TOJET: The Turkish Online Journal of Educational Technology – January 2018, volume 17 issue 1
Copyright © The Turkish Online Journal of Educational Technology 216
The data collected with the WTAILS also can be used to provide information about the scores of student learning and at the same time can improve the scores of information literacy among students. The results of the WTAILS can be used and has been successful in meeting the efficiency of student’s information literacy performance. Population, sampling and data collection The target population of this study were about 2500 first year degree students enrolled for a degree program in various field at thirteen Universiti Teknologi MARA (UiTM) campuses. Three campuses were randomly selected from the thirteen UiTM campuses. The sample consisted of 150 male and female students who studied in first year degree program and were selected from three different UiTM campuses i.e., two classes randomly selected from each campus understudy. In each of these branch campuses, all the new students are required attend the library orientation program during orientation week on the first semester. At the beginning, the targeted samples were 180 students where 60 students were randomly selected to each group. Due to the attrition amongst student, the size of the sample was decreased to 150 students. However, the size of the classes in each campus was approximately similar. Students in the selected branches were from approximately equivalent academic status as defined by the university. The students were randomly selected by the Head of Degree Programs into different course according to the alphabetical name listing provide from the Academic Division at each UiTM campuses. Three librarian as a facilitators, one from each campus were involved in the study and each taught two groups. All the facilitators have similar levels as education (Degree of Library & Information Management) with more than seven years of experience in conducted library orientation program. The facilitators who taught the experimental groups were exposed to one day training on the instructional methods. The facilitators were informed that the purpose of this study was to examine different library orientation services and strategies that may help in the improvement of students’ information literacy skills. DATA ANALYSIS AND RESEARCH FINDINGS The analyses were carried using one-way analysis of variance (ANOVA) and the post hoc pair wise comparison using ANOVA post hoc Tukey HSD test. The data were compiled and analysed using the Statistical Package for the Social Science (SPSS) Version 22. The Homogeneity Test Homogeneity test was conducted to test equivalency between the three groups of participants in terms of academic status as defined by the university. This test was done because the three groups were from three different campuses. Although similarity between different campuses is assumed as the criteria for intake of students is the same for these campuses, the test will statistically prove or disprove this assumption. The Homogeneity test result was conducted using Box’s M Test of Equality of Covariance Matrices to determine the equivalence between the three groups WebOPAC Self Training Tool with Guided Exploration (WSTTG), WebOPAC Self Training Tool with Non-Guided Exploration (WSTT), and Traditional (T) instructional method. The mathematics and science of Malaysian Education Certificate (SPM) grades for Mathematics, Physics and Chemistry subjects were used for the testing of homogeneity as these subjects contribute in measuring the student’s logical thinking skill. The scores of mathematics across the three groups had relatively similar means, 1.04, 1.30, and 1.19 for WSTTG, WSTT and T respectively. The scores of three groups on Physics were close, (1.94, 2.22 and 2.73 for WSTTG, WSTT and T respectively). The scores of the three groups on Chemistry were also very close, (1.92, 2.68 and 2.87 for WSTTG, WSTT and T respectively). The results also shows that are no significant difference between the means of each groups (F= 1.012; p= 0.434; p > 0.05). This means that there were no statistically significant differences in the academic status across the three groups. Therefore, the assumption that the academic status across the three groups in terms of equivalency based on MEC grades was met. The Internal Reliability Test The experimental study was carried out across the three groups (WSTTG, WSTT and T) and the scores from the study tests; (i) Group Assessment of Logical Thinking (GALT) and (ii) WebOPAC Training Assessment Information Literacy Skill (WTAILS), were collected and a set of reliability tests were conducted to determine the Cronbach’s Alpha reliability coefficients. The results were obtained which show that the instruments in the study were satisfactory reliable. The reliability values of the instruments are as follows: (i) GALT: 0.804 and (ii)
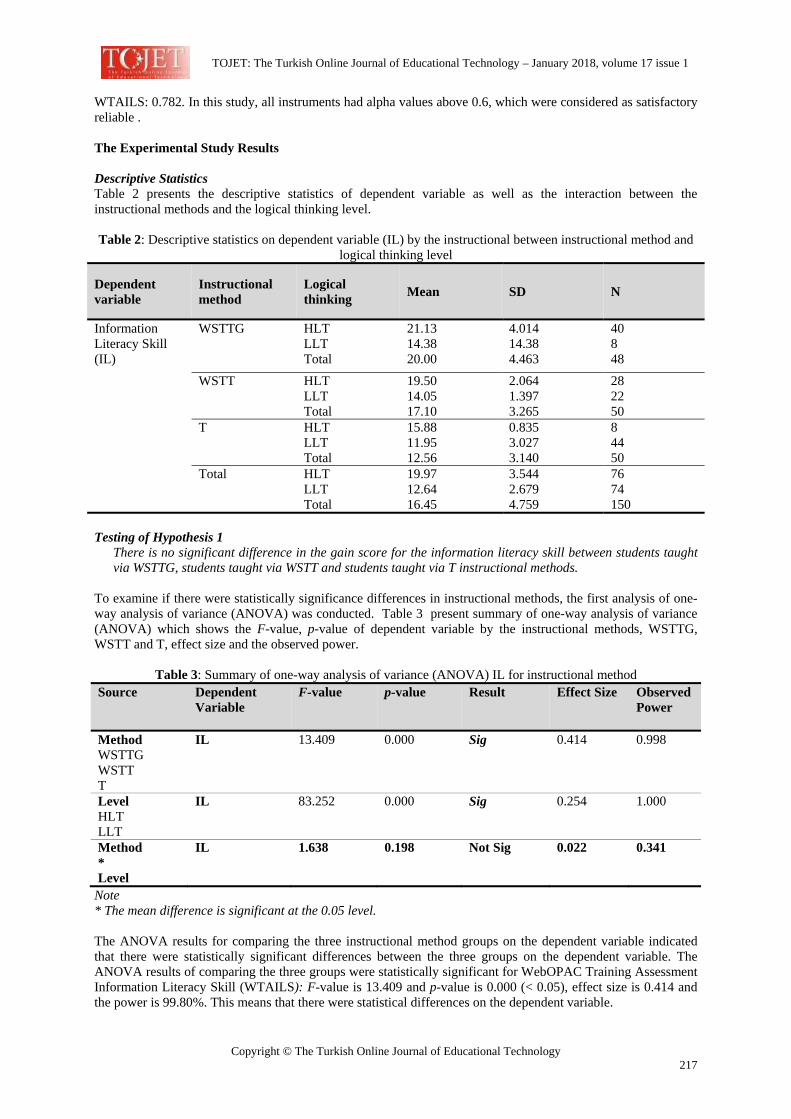
TOJET: The Turkish Online Journal of Educational Technology – January 2018, volume 17 issue 1
Copyright © The Turkish Online Journal of Educational Technology 217
WTAILS: 0.782. In this study, all instruments had alpha values above 0.6, which were considered as satisfactory reliable . The Experimental Study Results Descriptive Statistics Table 2 presents the descriptive statistics of dependent variable as well as the interaction between the instructional methods and the logical thinking level. Table 2: Descriptive statistics on dependent variable (IL) by the instructional between instructional method and
logical thinking level
Dependent variable
Instructional method
Logical thinking Mean SD N
Information Literacy Skill (IL)
WSTTG HLT LLT Total
21.13 14.38 20.00
4.014 14.38 4.463
40 8 48
WSTT HLT LLT Total
19.50 14.05 17.10
2.064 1.397 3.265
28 22 50
T HLT LLT Total
15.88 11.95 12.56
0.835 3.027 3.140
8 44 50
Total HLT LLT Total
19.97 12.64 16.45
3.544 2.679 4.759
76 74 150
Testing of Hypothesis 1
There is no significant difference in the gain score for the information literacy skill between students taught via WSTTG, students taught via WSTT and students taught via T instructional methods.
To examine if there were statistically significance differences in instructional methods, the first analysis of one-way analysis of variance (ANOVA) was conducted. Table 3 present summary of one-way analysis of variance (ANOVA) which shows the F-value, p-value of dependent variable by the instructional methods, WSTTG, WSTT and T, effect size and the observed power.
Table 3: Summary of one-way analysis of variance (ANOVA) IL for instructional method Source Dependent
Variable F-value p-value Result Effect Size Observed
Power
Method WSTTG WSTT T
IL 13.409 0.000 Sig 0.414 0.998
Level HLT LLT
IL 83.252 0.000 Sig 0.254 1.000
Method * Level
IL 1.638 0.198 Not Sig 0.022 0.341
Note * The mean difference is significant at the 0.05 level. The ANOVA results for comparing the three instructional method groups on the dependent variable indicated that there were statistically significant differences between the three groups on the dependent variable. The ANOVA results of comparing the three groups were statistically significant for WebOPAC Training Assessment Information Literacy Skill (WTAILS): F-value is 13.409 and p-value is 0.000 (< 0.05), effect size is 0.414 and the power is 99.80%. This means that there were statistical differences on the dependent variable.
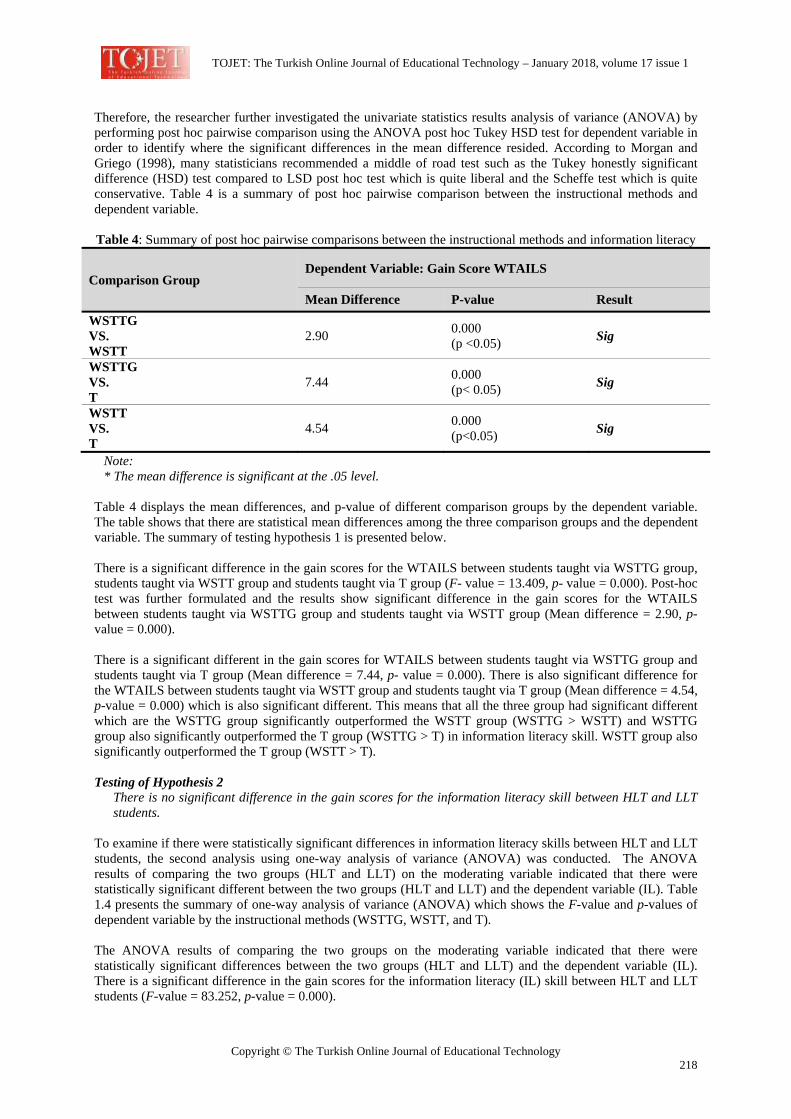
TOJET: The Turkish Online Journal of Educational Technology – January 2018, volume 17 issue 1
Copyright © The Turkish Online Journal of Educational Technology 218
Therefore, the researcher further investigated the univariate statistics results analysis of variance (ANOVA) by performing post hoc pairwise comparison using the ANOVA post hoc Tukey HSD test for dependent variable in order to identify where the significant differences in the mean difference resided. According to Morgan and Griego (1998), many statisticians recommended a middle of road test such as the Tukey honestly significant difference (HSD) test compared to LSD post hoc test which is quite liberal and the Scheffe test which is quite conservative. Table 4 is a summary of post hoc pairwise comparison between the instructional methods and dependent variable. Table 4: Summary of post hoc pairwise comparisons between the instructional methods and information literacy
Comparison Group Dependent Variable: Gain Score WTAILS
Mean Difference P-value Result WSTTG VS. WSTT
2.90 0.000 (p <0.05) Sig
WSTTG VS. T
7.44 0.000 (p< 0.05) Sig
WSTT VS. T
4.54 0.000 (p<0.05) Sig
Note: * The mean difference is significant at the .05 level.
Table 4 displays the mean differences, and p-value of different comparison groups by the dependent variable. The table shows that there are statistical mean differences among the three comparison groups and the dependent variable. The summary of testing hypothesis 1 is presented below. There is a significant difference in the gain scores for the WTAILS between students taught via WSTTG group, students taught via WSTT group and students taught via T group (F- value = 13.409, p- value = 0.000). Post-hoc test was further formulated and the results show significant difference in the gain scores for the WTAILS between students taught via WSTTG group and students taught via WSTT group (Mean difference = 2.90, p-value = 0.000). There is a significant different in the gain scores for WTAILS between students taught via WSTTG group and students taught via T group (Mean difference = 7.44, p- value = 0.000). There is also significant difference for the WTAILS between students taught via WSTT group and students taught via T group (Mean difference = 4.54, p-value = 0.000) which is also significant different. This means that all the three group had significant different which are the WSTTG group significantly outperformed the WSTT group (WSTTG > WSTT) and WSTTG group also significantly outperformed the T group (WSTTG > T) in information literacy skill. WSTT group also significantly outperformed the T group (WSTT > T). Testing of Hypothesis 2
There is no significant difference in the gain scores for the information literacy skill between HLT and LLT students.
To examine if there were statistically significant differences in information literacy skills between HLT and LLT students, the second analysis using one-way analysis of variance (ANOVA) was conducted. The ANOVA results of comparing the two groups (HLT and LLT) on the moderating variable indicated that there were statistically significant different between the two groups (HLT and LLT) and the dependent variable (IL). Table 1.4 presents the summary of one-way analysis of variance (ANOVA) which shows the F-value and p-values of dependent variable by the instructional methods (WSTTG, WSTT, and T). The ANOVA results of comparing the two groups on the moderating variable indicated that there were statistically significant differences between the two groups (HLT and LLT) and the dependent variable (IL). There is a significant difference in the gain scores for the information literacy (IL) skill between HLT and LLT students (F-value = 83.252, p-value = 0.000).
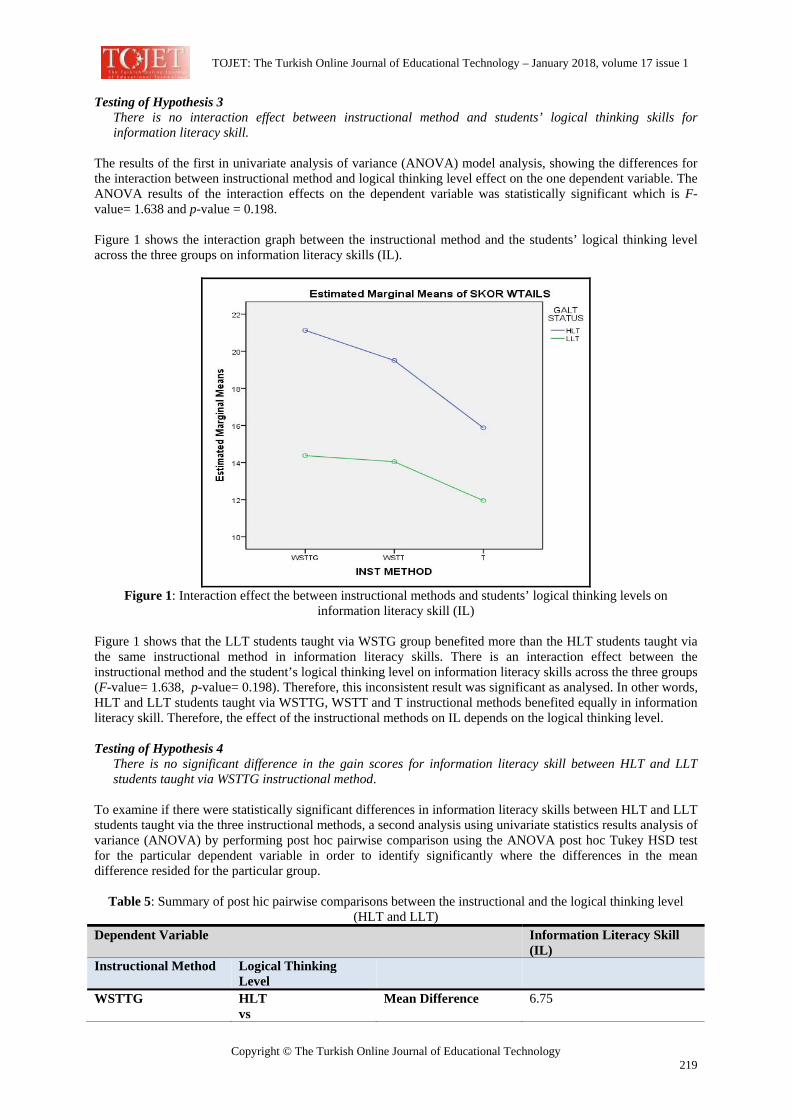
TOJET: The Turkish Online Journal of Educational Technology – January 2018, volume 17 issue 1
Copyright © The Turkish Online Journal of Educational Technology 219
Testing of Hypothesis 3 There is no interaction effect between instructional method and students’ logical thinking skills for information literacy skill.
The results of the first in univariate analysis of variance (ANOVA) model analysis, showing the differences for the interaction between instructional method and logical thinking level effect on the one dependent variable. The ANOVA results of the interaction effects on the dependent variable was statistically significant which is F-value= 1.638 and p-value = 0.198. Figure 1 shows the interaction graph between the instructional method and the students’ logical thinking level across the three groups on information literacy skills (IL).
Figure 1: Interaction effect the between instructional methods and students’ logical thinking levels on
information literacy skill (IL) Figure 1 shows that the LLT students taught via WSTG group benefited more than the HLT students taught via the same instructional method in information literacy skills. There is an interaction effect between the instructional method and the student’s logical thinking level on information literacy skills across the three groups (F-value= 1.638, p-value= 0.198). Therefore, this inconsistent result was significant as analysed. In other words, HLT and LLT students taught via WSTTG, WSTT and T instructional methods benefited equally in information literacy skill. Therefore, the effect of the instructional methods on IL depends on the logical thinking level. Testing of Hypothesis 4
There is no significant difference in the gain scores for information literacy skill between HLT and LLT students taught via WSTTG instructional method.
To examine if there were statistically significant differences in information literacy skills between HLT and LLT students taught via the three instructional methods, a second analysis using univariate statistics results analysis of variance (ANOVA) by performing post hoc pairwise comparison using the ANOVA post hoc Tukey HSD test for the particular dependent variable in order to identify significantly where the differences in the mean difference resided for the particular group.
Table 5: Summary of post hic pairwise comparisons between the instructional and the logical thinking level (HLT and LLT)
Dependent Variable Information Literacy Skill (IL)
Instructional Method Logical Thinking Level
WSTTG HLT vs
Mean Difference
6.75
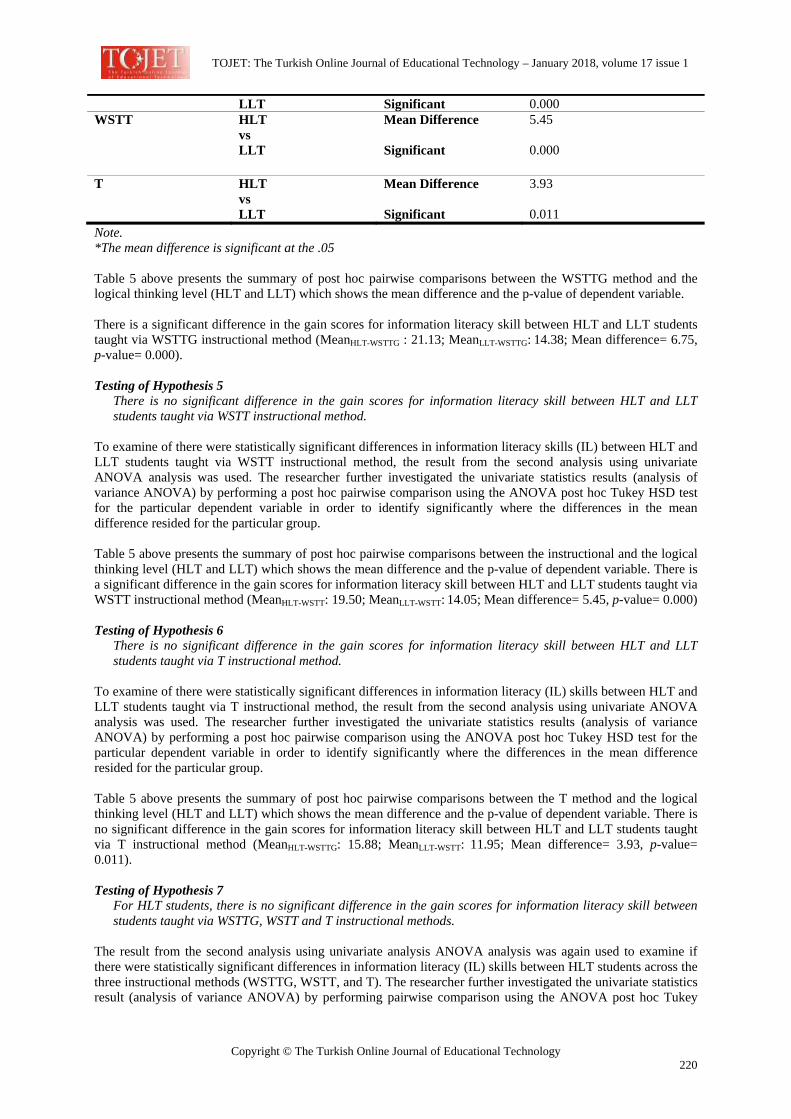
TOJET: The Turkish Online Journal of Educational Technology – January 2018, volume 17 issue 1
Copyright © The Turkish Online Journal of Educational Technology 220
LLT Significant 0.000 WSTT HLT
vs LLT
Mean Difference Significant
5.45 0.000
T HLT vs LLT
Mean Difference Significant
3.93 0.011
Note. *The mean difference is significant at the .05 Table 5 above presents the summary of post hoc pairwise comparisons between the WSTTG method and the logical thinking level (HLT and LLT) which shows the mean difference and the p-value of dependent variable. There is a significant difference in the gain scores for information literacy skill between HLT and LLT students taught via WSTTG instructional method (MeanHLT-WSTTG : 21.13; MeanLLT-WSTTG: 14.38; Mean difference= 6.75, p-value= 0.000). Testing of Hypothesis 5
There is no significant difference in the gain scores for information literacy skill between HLT and LLT students taught via WSTT instructional method.
To examine of there were statistically significant differences in information literacy skills (IL) between HLT and LLT students taught via WSTT instructional method, the result from the second analysis using univariate ANOVA analysis was used. The researcher further investigated the univariate statistics results (analysis of variance ANOVA) by performing a post hoc pairwise comparison using the ANOVA post hoc Tukey HSD test for the particular dependent variable in order to identify significantly where the differences in the mean difference resided for the particular group. Table 5 above presents the summary of post hoc pairwise comparisons between the instructional and the logical thinking level (HLT and LLT) which shows the mean difference and the p-value of dependent variable. There is a significant difference in the gain scores for information literacy skill between HLT and LLT students taught via WSTT instructional method (MeanHLT-WSTT: 19.50; MeanLLT-WSTT: 14.05; Mean difference= 5.45, p-value= 0.000) Testing of Hypothesis 6
There is no significant difference in the gain scores for information literacy skill between HLT and LLT students taught via T instructional method.
To examine of there were statistically significant differences in information literacy (IL) skills between HLT and LLT students taught via T instructional method, the result from the second analysis using univariate ANOVA analysis was used. The researcher further investigated the univariate statistics results (analysis of variance ANOVA) by performing a post hoc pairwise comparison using the ANOVA post hoc Tukey HSD test for the particular dependent variable in order to identify significantly where the differences in the mean difference resided for the particular group. Table 5 above presents the summary of post hoc pairwise comparisons between the T method and the logical thinking level (HLT and LLT) which shows the mean difference and the p-value of dependent variable. There is no significant difference in the gain scores for information literacy skill between HLT and LLT students taught via T instructional method (MeanHLT-WSTTG: 15.88; MeanLLT-WSTT: 11.95; Mean difference= 3.93, p-value= 0.011). Testing of Hypothesis 7
For HLT students, there is no significant difference in the gain scores for information literacy skill between students taught via WSTTG, WSTT and T instructional methods.
The result from the second analysis using univariate analysis ANOVA analysis was again used to examine if there were statistically significant differences in information literacy (IL) skills between HLT students across the three instructional methods (WSTTG, WSTT, and T). The researcher further investigated the univariate statistics result (analysis of variance ANOVA) by performing pairwise comparison using the ANOVA post hoc Tukey
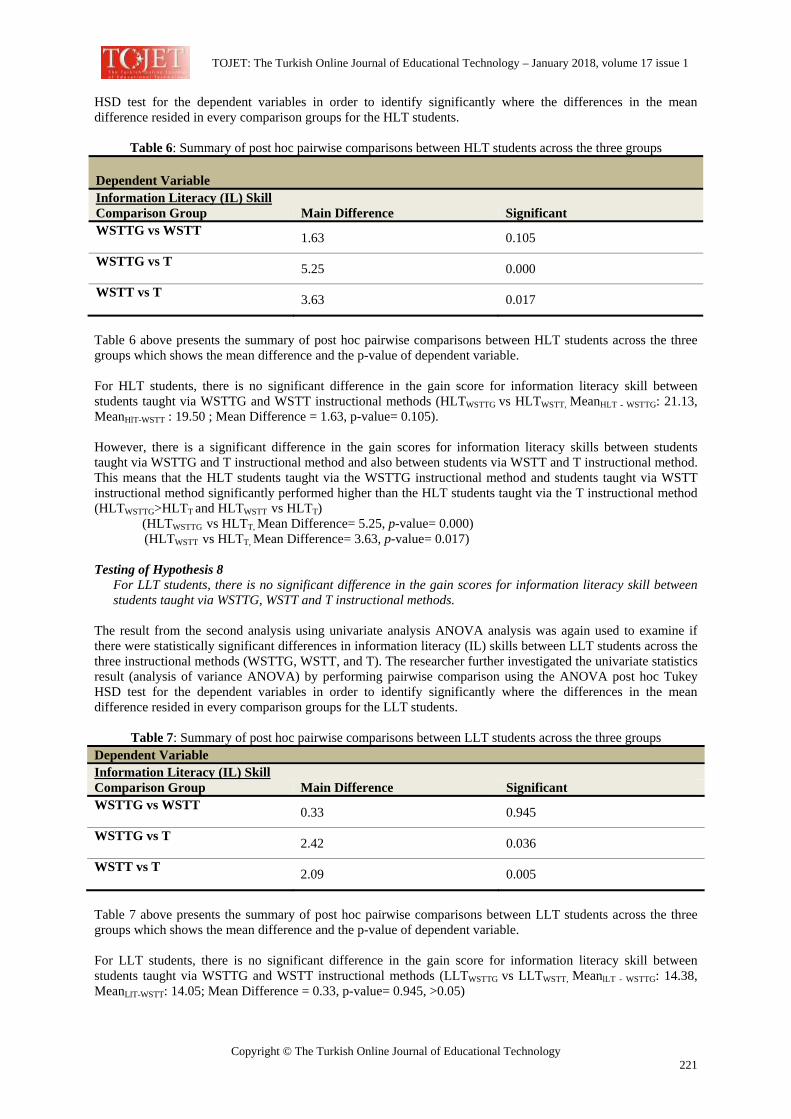
TOJET: The Turkish Online Journal of Educational Technology – January 2018, volume 17 issue 1
Copyright © The Turkish Online Journal of Educational Technology 221
HSD test for the dependent variables in order to identify significantly where the differences in the mean difference resided in every comparison groups for the HLT students.
Table 6: Summary of post hoc pairwise comparisons between HLT students across the three groups Dependent Variable Information Literacy (IL) Skill Comparison Group Main Difference Significant WSTTG vs WSTT 1.63 0.105
WSTTG vs T 5.25 0.000
WSTT vs T 3.63 0.017
Table 6 above presents the summary of post hoc pairwise comparisons between HLT students across the three groups which shows the mean difference and the p-value of dependent variable. For HLT students, there is no significant difference in the gain score for information literacy skill between students taught via WSTTG and WSTT instructional methods (HLTWSTTG vs HLTWSTT, MeanHLT - WSTTG: 21.13, MeanHlT-WSTT : 19.50 ; Mean Difference = 1.63, p-value= 0.105). However, there is a significant difference in the gain scores for information literacy skills between students taught via WSTTG and T instructional method and also between students via WSTT and T instructional method. This means that the HLT students taught via the WSTTG instructional method and students taught via WSTT instructional method significantly performed higher than the HLT students taught via the T instructional method (HLTWSTTG>HLTT and HLTWSTT vs HLTT) (HLTWSTTG vs HLTT, Mean Difference= 5.25, p-value= 0.000)
(HLTWSTT vs HLTT, Mean Difference= 3.63, p-value= 0.017)
Testing of Hypothesis 8 For LLT students, there is no significant difference in the gain scores for information literacy skill between students taught via WSTTG, WSTT and T instructional methods.
The result from the second analysis using univariate analysis ANOVA analysis was again used to examine if there were statistically significant differences in information literacy (IL) skills between LLT students across the three instructional methods (WSTTG, WSTT, and T). The researcher further investigated the univariate statistics result (analysis of variance ANOVA) by performing pairwise comparison using the ANOVA post hoc Tukey HSD test for the dependent variables in order to identify significantly where the differences in the mean difference resided in every comparison groups for the LLT students.
Table 7: Summary of post hoc pairwise comparisons between LLT students across the three groups Dependent Variable Information Literacy (IL) Skill Comparison Group Main Difference Significant WSTTG vs WSTT 0.33 0.945
WSTTG vs T 2.42 0.036
WSTT vs T 2.09 0.005
Table 7 above presents the summary of post hoc pairwise comparisons between LLT students across the three groups which shows the mean difference and the p-value of dependent variable. For LLT students, there is no significant difference in the gain score for information literacy skill between students taught via WSTTG and WSTT instructional methods (LLTWSTTG vs LLTWSTT, MeanlLT - WSTTG: 14.38, MeanLlT-WSTT: 14.05; Mean Difference = 0.33, p-value= 0.945, >0.05)
TOJET: The Turkish Online Journal of Educational Technology – January 2018, volume 17 issue 1
Copyright © The Turkish Online Journal of Educational Technology 222
However, there is a significant difference in the gain scores for information literacy skills between students taught via WSTTG and T instructional method and also between students via WSTT and T instructional method. This means that the LLT students taught via the WSTTG instructional method and students taught via WSTT instructional method significantly performed higher than the LLT students taught via the T instructional method. (LLTWSTTG > LLTT and LLTWSTT > LLTT) (LLTWSTTG vs LLTT, Mean Difference= 2.42, p-value= 0.036)
(LLTWSTT vs LLTT, Mean Difference= 2.09, p-value= 0.005) DISCUSSION Both the WSTTG and WSTT instructional methods have significant positive overall effects on the dependent variable, namely the student’s information literacy skills. Students taught via the WSTTG and WSTT method significantly outperformed the students taught via the T method in information literacy skills. Meanwhile, students taught via the WSTTG also significantly outperformed the students taught via the WSTT method in information literacy skills. There were significant effects between WSTTG, WSTT and T instructional methods on information literacy skills as shown in Table 4. For the effects of instructional methods on information literacy skills’ mean scores, there were two major findings. First, the results showed that the overall means score for information literacy skills for the students taught via WSTTG method was higher than WSTT group who, in turn, higher than the students taught via T method (Mean WSTTG > Mean WSTT > Mean T). Second, both HLT and LLT students’ means scores in information literacy skills for WSTTG method were higher compared to WSTT and T methods. Hence, the WSTTG method is preferred for HLT and LLT students compared to WSTT and T methods. The results of the study also showed that the difference between HLT and LLT students among the three instructional methods were significant in information literacy skills. It supported Edzan (2008) study where the results from her study revealed that the elements of cognitive and logical thinking skills revealed a high correlation between the student’s logical thinking level and their information literacy skills. Further analysis revealed that the HLT students taught via WSTTG, WSTT and T instructional methods significantly outperformed the LLT students taught via the same method in information literacy skills. Working cooperatively with the LLT students, all the three method gave an opportunity the HLT students to discuss, clarify and evaluate each other ideas. The findings of this study also showed the HLT students taught via both the WSTTG and WSTT methods significantly outperformed the students taught via the T method in information literacy skills. However, there were no significant differences in the mean gain score between HLT and LLT students taught via both the WSTTG and WSTT methods in information literacy skills. Moreover, for the LLT students taught via WSTTG and WSTT method significantly outperformed the students taught via T method in information literacy skills. This is to say that HLT and LLT students taught via WSTTG and WSTT method performed equally in information literacy skills. Thus, it can be concluded that WSTTG and WSTT methods significantly support HLT and LLT students in improving their information literacy skills. In studies on the information literacy skills development Bundy (2004) and Thornes (2012) report that content, skills and processes is needed that different levels of thinking skills are associated with various learning outcomes. These are the reason why students form both WSTTG and WSTT methods were outperformed their counterpart in the T method in information literacy skills. Based on the result from the study, the following recommendations are given for library user interested in using WSTTG in their instructions. CONCLUSION While this study has successfully achieved its objectives, it is however not without any limitation. The first limitation of this study chiefly revolves around the context and scope of the research. Instead of collecting data from various university academic libraries, this study only covered students enrolled in three UiTM campuses. Given these limitations, the results obtained are narrowed in terms of generalizability. The implications of this study can be viewed from both theoretical and practical perspectives. From the theoretical viewpoint, this study has developed a constructivist learning strategy which helps the students to fully benefit from the use of WSTTG method. WebOPAC self-training tool without guided exploration manual (WSTT) as the instructional method, is inadequate strategy as compare to WSTTG method. In this study, focusing was on the assessment of information literacy skills among first year degree students. Alternatively, the study can be further extended by investigating information literacy skills among final year degree and postgraduate students. From the practical viewpoint, the learning strategy that has been developed can be used as a the online tutorial for WebOPAC services and
TOJET: The Turkish Online Journal of Educational Technology – January 2018, volume 17 issue 1
Copyright © The Turkish Online Journal of Educational Technology 223
directed the students’ attention to use, understand and evaluate the information needs, which help them to access the WebOPAC services provided in the library. ACKNOWLEDGEMENT This study is supported through the Academic & Research Assimilation Scheme (ARAS) Phase 2/2016 granted from the Universiti Teknologi MARA, Malaysia (600-IRMI: 5/3/ARAS (0144/2016)). REFERENCES Abdullah, S., Kassim, N. A., Sharif, M., Saad, M., Tarmuchi, N. R., & Aripin, R. (2006). Developing
information literacy measures for higher education. Definition of Information Literacy, 219–228. Ali, R., Abu-hassan, N., Md Daud, M. Y., & Jusoff, K. (2010). Information literacy skills of engineering
students. International of Research and Reviews in Applied Science, 5(3), 264–270. Association of College and Research Libraries (2000). Information literacy competency standards for higher
education. Chicago, Illinois: American Library Association. Association of College and Research Libraries (2011). Standards for libraries in higher education. Chicago,
Illinois: Association of College and Research Libraries, a division of the American Library Association. Ausubel, D. P., & Piaget, J. (1978). Educational Psychology: A Cognitive View (2nd ed.). New York: Holt, Rinehart and Winston. Bahri, C. N. (2003). Program Literasi Maklumat Di Perpustakaan Akademik; Satu Tinjauan Kaedah dan
Pencapaian. Paper Presented at Seminar Kebangsaan Perpustakaan Malaysia, Langkawi, Kedah. Baro, E., & Keboh, T. (2012). Teaching and fostering information literacy programmes: A survey of five
university libraries in Africa. The Journal of Academic Librarianship, 38(5), 311–315. http://doi.org/10.1016/j.acalib.2012.07.001
Gall, M. D., Gall, J. P., & Borg, W. R. (2007). Educational research: An introduction (8th Ed.). Boston: Pearson Education.
Briggs, K. (2016). Learning Information Literacy Skills Through Library Instruction: An Irish Higher Education Case Study of First Year Students. GMIT Research E-Journal, (2), 1–19.
Bundy, A. (2004). Australian and New Zealand Information Literacy Framework. Retrieved from http://www.library.unisa.edu.au/learn/infolit/infolit-2nd-edition.pdf
Derakhshan, M., Hassanzadeh, M., & Nazari, M. (2015). Developing Information Literate Librarians: A Study of LIS Academics Pedagogical Approaches in the Development of Information Literacy Competencies. Journal of Academic Librarianship, 777–785. http://doi.org/10.1016/j.acalib.2015.08.021
Diep, K. C., & Nahl, D. (2011). Information literacy instruction in four Vietnamese university libraries. The International Information & Library Review, 43(4), 198–206. doi:10.1016/j.iilr.2011.10.002
Edzan, N. N. (2008). Information literacy development in Malaysia: A review. Libri, 58(4), 265–280. doi:10.1515/libr.2008.027
Edzan, N. N., & Mohd Saad, M. S. (2005). NILA: A national information literacy agenda for Malaysia. Malaysian Journal of Library & Information Science, 10(1), 91–103.
Fabunmi, O. M., & Asubiojo, B. O. (2013). Awareness and use of online public access catalogue by students of Obafemi Awolowo. Library Philosophy and Practice (E-Journal), 4(23), 1–18.
Gagne, R. M., & Merrill, M. D. (1985). Integrative goals for instructional-design. In Integrative Goals for Instructional Design, 38(23–30). http://doi.org/10.1007/bf02298245
Ghaphery, J., & White, E. (2012). Library Use of Web-based Research Guides. Information Technology and Libraries, 1, 21–32.
Gregory, A. S., & Broussard, M. J. S. (2011). Unraveling the ‘Mystery’ of the library�: A ‘Big Games’ Approach to Library Orientation (pp. 471–476).
Gullikson, S. (2006). Faculty Perceptions of ACRL’s Information Literacy Competency Standards for Higher Education. The Journal of Academic Librarianship, 32(6), 583–592. http://doi.org/10.1016/j.acalib.2006.06.001
Head, A. J. (2013). Project information literacy�: What can be learned about the information-seeking behavior of today’s college students? (pp. 472–482).
Husaini, H., Aziz, R. A., Karim, M. D. A., Jamin, J., & Saad, D. M. S. M. (2011). Keperluan modul literasi maklumat di perpustakaan akademik di Malaysia: Kajian kes (pp. 267–287).
Ismail, S. A., Dorner, D., & Oliver, G. (2011). Issues related toism information literacy education in Malaysian schools. International Conference on Sociality and Economics Development (pp.204–208).
Jyoon, M. C. L., & Ibrahim, M. Y. (2015). Information Literacy for Sustainable Advancement�: Malaysian Experience. Paper Presented at Seminar Perpustakaan Awam, Malaysia.
Karshmer, E., & Bryan, J. E. (2011). Building a first-year information literacy experience: Integrating best practices in education and ACRL IL competency standards for higher education. Journal of Academic Librarianship, 37(3), 255–266. http://doi.org/10.1016/j.acalib.2011.02.018
TOJET: The Turkish Online Journal of Educational Technology – January 2018, volume 17 issue 1
Copyright © The Turkish Online Journal of Educational Technology 224
King, L. (2007). Information literacy of incoming undergraduate Arts students at the University of the Western Cape: assessment of competencies and proficiencies. Unpublished doctoral dissertation, University of the Western Cape.
Klaib, F. J. (2011). Users ’ ratings on the improved library orientation programme at Zarqa Private University�: a comparative study. Malaysian Journal of Library & Information Science, 16(1), 63–72.
Koltay, T., Sonja, S., & Karvalics, L. Z. (2015). The shift of information literacy towards research 2.0. The Journal of Academic Librarianship, 41, 87–93. http://doi.org/10.1016/j.acalib.2014.11.001
Madhusudhan, M., & Singh, P. (2010). A multimedia-based library orientation programme at Dyal Singh College Library, New Delhi. Library Review, 59(6), 430–444. http://doi.org/10.1108/00242531011053940
Magnuson, M. L. (2013). Web 2.0 and information literacy instruction: Aligning technology with ACRL standards. Journal of Academic Librarianship, 39(3), 244–251. http://doi.org/10.1016/j.acalib.2013.01.008
Maitaouthong, T., Tuamsuk, K., & Tachamanee, Y. (2012). The roles of university libraries in supporting the integration of information literacy in the course instruction. Malaysian Journal of Library & Information Science, 17(1), 51–64.
Martin, J. L. (2013). Learnng from Recent British information literacy models" A report to ACRL’s infrmation literacy Competency Standards for Higher Education Task Force. Minnesota State University, Mankato: Faculty Research Grant.
Mohd Nasir Ismail, Nor Azilah Ngah & Irfan Naufal Umar (2010). Instructional strategy in the teaching of computer programming: A needs assessment analyses. TOJET: The Turkish Online Journal of Educational Technology, 9(2), 125-131.
Morgan, G. A., & Griego, O. V. (1998). Mastery Motivation in Preschool Children�: Relations to Aggression and Hyperactivity. National Head Start Research Conference: Annual Meeting of the American Educational Research Association (AERA).
Nilsen, C. (2012). Faculty perceptions of librarian-led information literacy instruction in postsecondary education. In IFLA General Conference (pp. 1–25). Canada: IFLA.
Nurfaezah Mamat, Mohd Nasir Ismail & Adnan Jamaludin (2014). Deficiencies in library orientation programs at Malaysian academic libraries. International Journal of Library and Information Studies (IJLIS), 4(3), 1-8.
Ralph Catts. (2010). UNESCO Information Literacy Indicators: Validation Report Prepared (pp. 1–33). Ranaweera, P. (2010). Information literacy programmes conducted by the universities in Sri Lanka. Journal of
the University Librarians Association of Sri Lanka, 14(1), 61–75. Rice, S., & Gregor, M. N. (2013). This library orientation is Fun!: Building a successful virtual tour experience
for students. In ACRL (pp. 583–588). Roadrangka, V., Yeany, R. H., & Padila, M. J. (1983, April). The construction and validation of a group
assessment of logical thinking (GALT). Paper presented at the meeting of the National Association for Research in Science Teaching, Dalla, TX.
Salleh, M. I. M., Halim, A. F. A., Yaacob, R. A. R., & Yusoff, Z. (2011). Measuring The Effect of Information Literacy on the Undergraduates’ Academic Performance in Higher Education. Measuring The Effect of Information Literacy on the Undergraduates’ Academic Performance in Higher Education, 5, 506–510.
Sankari, R. L., K., P.Balasubramanian, & R.Muthuraj. (2013). A study on the use of online public access catalogue (OPAC) by students and faculty members of Unnamalai Institute of Technology in Kovilpatti (Tamil Nadu). International Journal of Library and Information Studies, 3(1), 17–26.
Shadish, W. R., & Cook, T. D. (2002). Experimental and designs for generalized causal inference. Experimental and quasi-experimental design for causual inference. http://doi.org/10.1198/jasa.2005.s22
Shao, X., & Purpur, G. (2016). Effects of Information Literacy Skills on Student Writing and Course Performance. The Journal of Academic Librarianship, 1–9. http://doi.org/10.1016/j.acalib.2016.08.006
Slavin, R. E. (1996). Research on cooperative learning and achievement: What we know, what we need to know. Contemporary Educational Psychology, 21, 43–69. Retrieved from http://socialfamily535.pbworks.com/f/slavin1996[1].pdf
Špiranec, S., & Pejova, Z. (2010). Information literacy in South-East Europe: Formulating strategic initiatives, making reforms and introducing best practices. The International Information & Library Review, 42(2), 75–83. doi:10.1016/j.iilr.2010.04.002
Syamalamba, R. (2011). Information literacy programmes for undergraduate students. International Journal of Digital Library Services, 1(1), 49–61.
Syed Anwar Aly (2000). Kesan kaedah pembelajaran berasaskan masalah dengan perancahan berstruktur terhadap prestasi pengetahuan, prestasi taakulan dan dinamisme pembelajaran konstruktivis dalam kimia matrikulasi. Unpublished Doctoral Dissertation, University of Science Malaysia.

TOJET: The Turkish Online Journal of Educational Technology – January 2018, volume 17 issue 1
Copyright © The Turkish Online Journal of Educational Technology 225
Thanuskodi, S. (2013). ICT literacy among library professionals in the engineering college libraries of Tamil Nadu: An analytical. International Journal of Digital Library Services, 1(2), 131–141.
Thornes, S. L. (2012). Creating an online tutorial to develop academic and research skills. Journal of Information Literacy, 6(1), 82–95. http://doi.org/10.11645/6.1.1654
Xiao, J. (2010). Integrating information literacy into Blackboard: Librarian-faculty collaboration for successful student learning. Library Management, 31(8/9), 654–668. doi:10.1108/01435121011093423
Yusuf, K. (2012). Utilization of online public access catalogue (OPAC) at the Lagos State Polytechnic Library in Nigeria. Journal of Research in Education and Society, 3(3), 19–27.
TOJET: The Turkish Online Journal of Educational Technology – January 2018, volume 17 issue 1
Copyright © The Turkish Online Journal of Educational Technology 226
The Impact of Social Presence on Learners' Satisfaction in Mobile Learning Assistance professor Dr. Elham Alsadoon College of Education, King Saud University, Saudi Arabia [email protected]
ABSTRACT Distributing learning completely through mobile courses is a new trend. Social presence has been identified as a significant predictor of learner satisfaction with online learning. It is a key element that improves learner satisfaction with online learning (Cobb, 2009; Reio & Crim, 2013). This study explores whether social presence is inherent in the mobile learning environment. Results revealed that social presence was a significant predictor in learners' satisfaction as were gender and number of courses learners had previously experienced. INTRODUCTION The last decades have shown a huge improvement in technology that impacts human life directly and changes the way people deal with information. A new wave of education has arrived with the revolution of technology, especially when people replaced their static phones and desktop computers by ones that can move with them everywhere. Mobile devices in general, and particularly smartphones with their ability to access the internet, started a new generation of e-learning -- mobile learning or m-learning. M-learning is the use of mobile devices for learning. It makes learning more flexible, encourages lifelong learning and helps learners freely acquire, at their convenience and outside education institution boarders, knowledge and skills that interest them. Mobile devices have caught the interest of researchers to investigate their potential for providing ubiquitous and mobile learning ( Looi, Sun, Wu, Seow, Chia, Wong, & Norris 2014) given that learners at the undergraduate level have a favorable attitude toward mobile devices, have implemented them into their daily lives, and expect to use them more in their learning (Joo, Kim & Kim, 2016). There are a plenty of mobile applications that facilitate social communication, most of which share the same functions. For example, that most Mobile Instance Messages (MIM) applications are free, flexible and support multimedia and other advantages has made them a favored communication tool for people. MIM allows users to send and receive messages in real-time to one or more users which increases the communication and collaboration (Ogara, Koh, Prybutol, 2014). Ogara et.al. attributed the growth of MIM numbers and users to factors such as low cost, capabilities and ability to show the presence of users. WhatsApp was the mobile device used in this study. Bere (2012) summarized the features of WhatsApp thus: It allows exchange of different types of media such as text, videos, audio, images; it supports group chat which allows members to engage in discussion; it supports interaction across different platforms of different types of devices; and it can retrieve messages that arrive while the device is off. In recent days, there has been a rise in use of MIM to deliver m-learning courses delivered completely through phones. However, lack of face-to-face communication in such learning environments may have a negative impact on learning. Participating in online activities diminishes learners’ ability to create interpersonal relationships with each other which in turn affects user satisfaction. Learner satisfaction is one of the important factors that must be taken into consideration to improve the learning experience. Studies have shown that learner satisfaction impacts learning outcomes such as achievement and motivation (Martirosyan, Saxon, Wanjohi, 2014). The importance of assessing learners’ satisfaction becomes even more important when implementing a new system of delivering learning such as the m-learning environment. Social presence has been identified as a significant factor that impact a learner’s satisfaction with online learning in which computer-mediated communication is used. This study aimed to examine whether social presence is a significant predictor of learner satisfaction in a mobile learning environment in which the course is fully delivered through mobile devices application, especially MIM. Some studies have showed that satisfaction is
TOJET: The Turkish Online Journal of Educational Technology – January 2018, volume 17 issue 1
Copyright © The Turkish Online Journal of Educational Technology 227
positively related to social presence in online learning (Cobb, 2011; Zhang, 2010). This relationship needs to be examined in m-learning. The following research questions will guide this study:
1. Is there a statistically significant correlation between social presence and learner satisfaction in the mobile learning environment?
2. To what extent do social presence, age, gender, and number of mobile courses taken predict learner’s satisfaction in a mobile course?
3. Is there a statistically significant difference between males and females in their satisfaction with mobile courses?
BACKGROUND Learner’s satisfaction Learner’s satisfaction can be identified as a learner’s feeling about her or his interaction with teachers, peers, the course, the institutional support and the flexibility (Yukselturk & Yildirim, 2008). Satisfaction with their learning experiences is critical to the success of learners 'educational experience (Amro, 2014). Satisfied learners are more persistent and successful than their unsatisfied peers (Kuo, 2010). Learner satisfaction is also a key factor in evaluating the success of any learning program (Wiechowski & Washburn, 2014). Moreover, satisfaction is a factor associated with a high completion rate and a high level of learners’ motivation (Kuo, 2010). A number of studies have been conducted to investigate factors that influence learners’ satisfaction with traditional and online learning. For example, Chang (2011) aimed to identify the factors that influence learners’ satisfaction in different learning settings. He conducted a study of a sample of 916 students who studied in three different learning environments -- the traditional way of learning, online learning, and blended learning. The study found that interaction with content was the main factor in the satisfaction of all students of different learning styles. He found also that learners in the traditional method were very satisfied with interaction with teachers, and with other learners. Qureshi (2004) identified factors affecting learners' satisfaction with courses, which are: Demographic characteristics (age, job, and learner status), previous experience and learning styles’ of learners. Seaberry (2008) found that the factors that contribute to learner satisfaction with e-courses are immediate feedback, learner interaction and collaboration, interaction with the teacher, and interaction with content. McFarland and Hamilton (2005) found several factors contributing to learner satisfaction in e-learning represented by student engagement, past experience, other learners, technical skill of the learner and the effectiveness of discussion boards in helping learners understand the material. In her study on the effect of feedback on student satisfaction, Gallien and Oomen (2005) found that feedback from the teacher influences learner satisfaction, and individual feedback from the teacher to learners contributes to student satisfaction than group feedback does. What can be concluded is that perceiving the social presence of an instructor and other learners through interaction, feedback, and other ways of communication is critical in developing satisfaction. Social Presence There is no clear, unanimous definition for social presence. However, it “refers to an individual's perception of the quantity and quality of interpersonal communication in an online learning environment” (Reio & Crim, 2013, p.21). It can be further defined as “the degree to which a person is perceived as a ‘real person’ in mediated communication” (Gunawardena, 1995, p.151) and it “is an individual matter, linked to the teaching style, content delivery, and established patterns of instructor-student feedback” (Stone & Chapman, 2006, p.1). Tu and McIsaac (2002) described social presence as “the degree of feeling, perception, and reaction of being connected by CMC to another intellectual entity through a text-based encounter” (p. 140). Social presence theory was developed to study the social-psychological elements of communication and the claim that the perceived social presence varies in the degree depending on the medium used which in turn influences interactions among individuals (Short, Williams & Christie, 1976). Social presence is an important element that impacts the learning outcome. It has been known as the main element that improves learner satisfaction, contribution, online teamwork, learning, and future registration in online learning (Reio & Crim, 2013). Social presence in the learning environment is important because it gives learners the feeling of existing with the instructors and other learners which encourages learners to share information with others and learn better (Reio & Crim, 2013).There is increasing literature demonstrating the significance of social presence in online learning
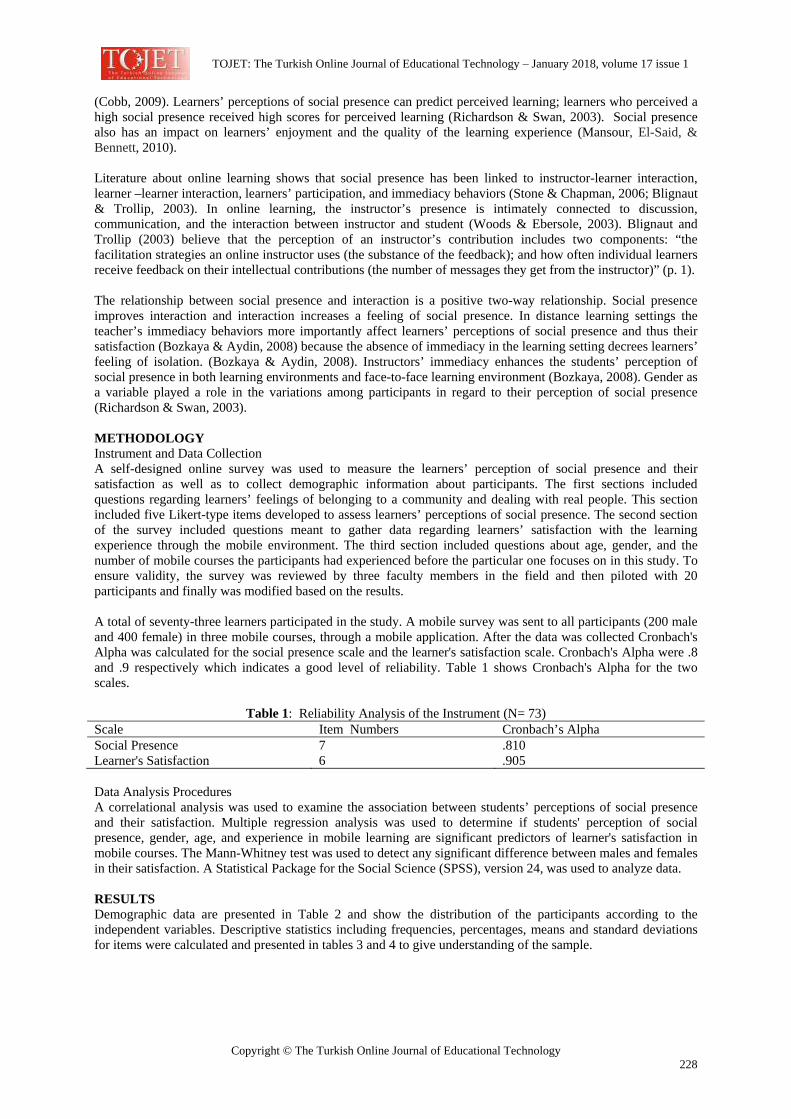
TOJET: The Turkish Online Journal of Educational Technology – January 2018, volume 17 issue 1
Copyright © The Turkish Online Journal of Educational Technology 228
(Cobb, 2009). Learners’ perceptions of social presence can predict perceived learning; learners who perceived a high social presence received high scores for perceived learning (Richardson & Swan, 2003). Social presence also has an impact on learners’ enjoyment and the quality of the learning experience (Mansour, El-Said, & Bennett, 2010). Literature about online learning shows that social presence has been linked to instructor-learner interaction, learner –learner interaction, learners’ participation, and immediacy behaviors (Stone & Chapman, 2006; Blignaut & Trollip, 2003). In online learning, the instructor’s presence is intimately connected to discussion, communication, and the interaction between instructor and student (Woods & Ebersole, 2003). Blignaut and Trollip (2003) believe that the perception of an instructor’s contribution includes two components: “the facilitation strategies an online instructor uses (the substance of the feedback); and how often individual learners receive feedback on their intellectual contributions (the number of messages they get from the instructor)” (p. 1). The relationship between social presence and interaction is a positive two-way relationship. Social presence improves interaction and interaction increases a feeling of social presence. In distance learning settings the teacher’s immediacy behaviors more importantly affect learners’ perceptions of social presence and thus their satisfaction (Bozkaya & Aydin, 2008) because the absence of immediacy in the learning setting decrees learners’ feeling of isolation. (Bozkaya & Aydin, 2008). Instructors’ immediacy enhances the students’ perception of social presence in both learning environments and face-to-face learning environment (Bozkaya, 2008). Gender as a variable played a role in the variations among participants in regard to their perception of social presence (Richardson & Swan, 2003). METHODOLOGY Instrument and Data Collection A self-designed online survey was used to measure the learners’ perception of social presence and their satisfaction as well as to collect demographic information about participants. The first sections included questions regarding learners’ feelings of belonging to a community and dealing with real people. This section included five Likert-type items developed to assess learners’ perceptions of social presence. The second section of the survey included questions meant to gather data regarding learners’ satisfaction with the learning experience through the mobile environment. The third section included questions about age, gender, and the number of mobile courses the participants had experienced before the particular one focuses on in this study. To ensure validity, the survey was reviewed by three faculty members in the field and then piloted with 20 participants and finally was modified based on the results. A total of seventy-three learners participated in the study. A mobile survey was sent to all participants (200 male and 400 female) in three mobile courses, through a mobile application. After the data was collected Cronbach's Alpha was calculated for the social presence scale and the learner's satisfaction scale. Cronbach's Alpha were .8 and .9 respectively which indicates a good level of reliability. Table 1 shows Cronbach's Alpha for the two scales.
Table 1: Reliability Analysis of the Instrument (N= 73) Scale Item Numbers Cronbach’s Alpha Social Presence 7 .810 Learner's Satisfaction 6 .905 Data Analysis Procedures A correlational analysis was used to examine the association between students’ perceptions of social presence and their satisfaction. Multiple regression analysis was used to determine if students' perception of social presence, gender, age, and experience in mobile learning are significant predictors of learner's satisfaction in mobile courses. The Mann-Whitney test was used to detect any significant difference between males and females in their satisfaction. A Statistical Package for the Social Science (SPSS), version 24, was used to analyze data. RESULTS Demographic data are presented in Table 2 and show the distribution of the participants according to the independent variables. Descriptive statistics including frequencies, percentages, means and standard deviations for items were calculated and presented in tables 3 and 4 to give understanding of the sample.
TOJET: The Turkish Online Journal of Educational Technology – January 2018, volume 17 issue 1
Copyright © The Turkish Online Journal of Educational Technology 229
Table 2: Descriptive Statistics: Participants' Distribution Based on the Independent Variables Variables Levels Numbers and Percentages Gender Female 55 (75%) Male 18 (25%) Age From 18 to 25 22 (30%) From 25 to 35 25 (34%) More than 35 26 (36%) Number of previous mobile courses This is the first one 38 (52%) Between 1 to 3 19 (26%) More than 3 16 (22%) To answer the first question, Is there a statistically significant correlation between social presence and learner’s satisfaction in the mobile learning environment? Correlation Analysis was conducted. The Pearson Correlation value (Table 5) suggests that the correlation between social presence and learner's satisfaction was statistically significant, r =63, p < .01 (two-tailed). This means that participants who perceived a high level of social presence were highly satisfied with the mobile course. Table 3: Descriptive Statistics: Participants' Distribution Based on Their Responses to the Social Presence Scale
Items Items Strongly
Agree Agree
Neutral
Disagree Strongly Disagree
Mean SD
1 Whenever I need help in the course’s materials, I email the instructor
53 72%
14 19%
4 6%
1 1%
1 1%
4.6 0.9
2 The use of WhatsApp to deliver this course provided a chance for social interaction
20 27%
21 29%
16 22%
10 14%
6 8%
3.5 1.3
3 During this course, I had the chance to get to know other participants
14 19%
16 22%
22 30%
8 11%
13 18%
3.1 1.3
4 The instructor did not take long to respond to me when I needed him
46 63%
16 21%
8 11%
1 1%
3 4%
4.4 1.0
5 It was easy to communicate with other students
20 27%
17 24%
22 30%
6 8%
8 11%
3.5 1.3
6 The instructor was always available during this course
49 67%
11 15%
8 11%
3 4%
2 3%
4.4 1.0
7 In this course, I had the feeling of belonging to a community
30 41%
17 23%
15 21%
2 3%
9 12%
3.8 1.3
Table 4: Descriptive Statistics: Participants' Distribution Based on Their responses to the Satisfaction's Scale
Items Items Strongly
Agree Agree
Neutral
Disagree Strongly Disagree
Mean SD
1 This course met my expectations 24 33%
18 25%
20 27%
6 8%
5 7%
3.7 1.2
2 I am satisfied with the technology used in this course
36 49%
21 29%
10 14%
4 6%
2 2%
4.1 1.0
3 I enjoyed participating in this course 35 48%
20 27%
11 15%
5 7%
2 3%
4.1 1.1
4 The instructor of this course was helpful
26 36%
28 38%
15 21%
2 2%
2 3%
4.0 0.9
5 I would recommend this course to other students
45 62%
12 16%
9 12%
4 6%
3 4%
4.3 1.1
TOJET: The Turkish Online Journal of Educational Technology – January 2018, volume 17 issue 1
Copyright © The Turkish Online Journal of Educational Technology 230
6 Overall, I am satisfied with this course
43 59%
17 23%
7 10%
4 6%
2 2%
4.3 1.0
Table 5: Correlation between Social Presence and Learner's Satisfaction
Social Presence Satisfaction Social Presence Pearson Correlation 1 .629**
Sig. (2-tailed) .000 N 73 73
Satisfaction Pearson Correlation .629** 1 Sig. (2-tailed) .000 N 73 73
** Correlation is significant at the 0.01 level (2-tailed).
To answer the second questions and assess whether social presence, age, gender, number of previously taken mobile courses were significant predictors of learner's satisfaction in a mobile courses, a multiple regression was performed using learner's satisfaction as the dependent variable. The assumption of multiple regression was tested and there was no violation. The overall regression to predict leaner's satisfaction from social presence, age, gender, and pervious course experience was, R = .70, R2 = .49, and adjusted R2 =.46. This result means that 50% of the variance in learner's satisfaction can be predicted by these independent variables. Results also showed that gender, social presence and number of mobile courses learners had experienced were significant predictors of satisfaction at p < 0.05.
Table 6: Model Summary Model R R Square Adjusted R Square Std. Error of the
Estimate 1 .702a .493 .463 .65078 a. Predictors: (Constant), social presence, number of courses, gender, age
Table 7: ANOVA Table
Model Sum of Squares df Mean Square F Sig. 1 Regression 27.983 4 6.996 16.518 .000b
Residual 28.799 68 .424 Total 56.782 72
a. Dependent Variable: Satisfaction b. Predictors: (Constant), _social presence, number of courses, gender, age
Table 8: Coefficientsa
Model Unstandardized Coefficients Standardized Coefficients
t Sig.
B Std. Error Beta 1 (Constant) .604 .486 1.245 .218
Age -.105 .102 -.096 -1.027 .308 Number of courses .220 .102 .201 2.165 .034 Gender .408 .189 .199 2.161 .034 Social presence .669 .101 .602 6.639 .000
a. Dependent Variable: Satisfaction To answer the third question, Is there a statistically significant difference between males and females in their satisfaction with mobile courses, a Mann-Whitney Test was conducted. The result showed a statistically significant difference between males and females in their satisfaction with mobile courses. U= 288, p < 0.01(two-tailed). Tables 9 and 10 present the results.
Table 9: Mann-Whitney Ranks Gender N Mean Rank Sum of Ranks Satisfaction Male 18 25.50 459.00
Female 55 40.76 2242.00 Total 73
TOJET: The Turkish Online Journal of Educational Technology – January 2018, volume 17 issue 1
Copyright © The Turkish Online Journal of Educational Technology 231
Table 10: Mann-Whitney Test Statisticsa Satisfaction Mann-Whitney U 288.000 Wilcoxon W 459.000 Z -2.664 Asymp. Sig. (2-tailed) .008 a. Grouping Variable: gender
DISCUSSISON The study investigated the impact of social presence on learner’s satisfaction with mobile learning courses that are fully delivered through mobile devices application as it has been found to be a significant factor in computer-mediated communication learning. The study was guided by three questions. First was to examine whether there is a statistically significant correlation between social presence and learner’s satisfaction with a mobile learning environment. The results found a statistically significant correlation between these two variables. The correlation was moderate and positive, r = 6.3, p < 0.01, indicating that participants who perceived a high level of social presence were highly satisfied with the mobile course that they were taking. This result is in consensus with results found by Cobb (2011) and Zhang (2010). This result should lead mobile instructional designers and educators who teach through mobile courses to take good care of their presence in the learning environment. This will increase the level of satisfaction of learners which in turn will impact their achievement and motivation (Martirosyan et al, 2014). The second question of the study aimed to examine whether other factors, beside social presence, would impact the learner’s satisfaction in a mobile course and be significant predictors of it. The predictors were social presence, age, gender, and number of previously taken mobile courses. Results found that the overall regression to predict leaner's satisfaction from these variables was significant, R = .70, R2 = .49, and adjusted R2 =.46. This means that these predictors can explain 50% of the variance of learner's satisfaction. Results also showed that gender, social presence and number of previous mobile courses were significant predictors of learner's satisfaction at p < 0.05. This result is in consensus with other studies that found previous experience affected learners' satisfaction in online learning (Qureshi, 2004; McFarland & Hamilton, 2005) This result should lead mobile instructional designers and educators who teach through mobile courses to give extra care to learners who have less experience in mobile learning to increase their satisfaction. Gender was another significant variable in predicting satisfaction. This can be attributed to what Richardson and Swan (2003) found, that gender as a variable played a role in the variations among participants in regard to their perception of social presence. On the other hand, results disagreed with Qureshi’s (2004) finding that age impacts the learner's satisfaction with online learning, which could be because mobile devices are comfortable tools for all ages. As the second question showed that gender was a significant predictor of learner's satisfaction, the third question was meant to give more explanation about the difference between males and females in their satisfaction with the mobile courses. Results found that females were more highly satisfied with mobile courses than were males. That means the male expectations of mobile courses are higher than those of females which should lead mobile instructional designers to consider gender variables when designing mobile learning. CONCLUSION This study aimed to explore factors affecting learners' satisfaction in mobile learning. The main factor of interest was the social presence which has been shown to be an important predictor of learners' satisfaction with online learning. Results revealed that social presence was a significant predictor in learners' satisfaction as were gender and number of courses learners had previously experienced. The results of this study should lead instructional designers and educators interested in delivering mobile learning to consider the social presence, gender, and learners' previous experience.
REFERENCES Amro, H. J. (2014). The effects of motivation, technology, and satisfaction on student achievement in face-to-
face and online classes in college algebra at a college in South Texas. Texas A&M University-Kingsville.
Bere, A. (2012, September). A comparative study of student experiences of ubiquitous learning via mobile devices and learner management systems at a South African university. In 2012 Conference.
Bozkaya (2008). The relationship between Teacher Immediacy Behaviors and Distant Learners’ Social Presence Perceptions in Videoconferencing Applications. The Turkish Online Journal of Educational Technology – TOJET July 2008 7(3) ISSN: 1303-6521.
TOJET: The Turkish Online Journal of Educational Technology – January 2018, volume 17 issue 1
Copyright © The Turkish Online Journal of Educational Technology 232
Bozkaya, M., & Aydin, İ. E. (2008). The relationship between teacher immediacy behaviors and learners' perceptions of social presence and satisfaction in open and distance education: The case of Anadolu University open education faculty. TOJET: The Turkish Online Journal of Educational Technology, 7(3).
Chang, K. Y. (2011). Factors affecting student satisfaction in different learning deliveries. Illinois State University.
Cobb, S. C. (2009). Social presence and online learning: a current view from a research perspective. Journal of Interactive Online Learning, 8(3), 241–254.
Cobb, S. C. (2011). Social presence, satisfaction, and perceived learning of RN-to-BSN students in web-based nursing courses. Nursing Education Perspectives, 32(2), 115–119. doi: 10.5480/1536-5026- 32.2.115
Gallien, T., & Oomen, J. (2005). Personalized Versus Collective Feedback in Online Health Courses: Does Type of Instructor Feedback Affect Student Satisfaction, Performance and Perceived Connectedness with the Instructor?. In E-Learn: World Conference on E-Learning in Corporate, Government, Healthcare, and Higher Education (Vol. 2005, No. 1, pp. 2062-2067).
Gunawardena, C.(1995). Social presence theory and implications for interaction and collaborative learning in computer conferences. International Journal of Educational Telecommunications, 1(2/3), 147-166.
Joo, Y. J., Kim, N., & Kim, N. H. (2016). Factors predicting online university students’ use of a mobile learning management system (m-LMS). Educational Technology Research and Development, 64(4), 611-630.
Kuo, Y. (2010). Interaction, internet self-efficacy, and self-regulated learning as predictors of student satisfaction in distance education courses (Doctoral dissertation). Available from ProQuest Dissertations and Theses database. (UMI No. 3419203).
Looi, C., Sun, D., Wu, L., Seow, P., Chia, G., Wong, L., & Norris, C. (2014). Implementing mobile learning curricula in a grade level: Empirical study of learning effectiveness at scale. Computers & Education, 77, 101–115.
Mansour, S., El-Said, M., & Bennett, L. (2010, June). Does the use of Second Life affect students’ feeling of social presence in e-learning? Paper presented at the 8th Education and Information Systems, Technologies and Applications: EISTA 2010, Orlando, Florida.
Martirosyan, N. M., & Saxon, D. P. & Wanjohi, R. (2014). Student Satisfaction and Academic Performance in Armenian Higher Education, American International Journal of Contemporary Research, Vol. 4 No. 2; February.
McFarland, D., & Hamilton, D. (2005). Factors affecting student performance and satisfaction: Online versus traditional course delivery. Journal of Computer Information Systems, 46(2), 25-32.
Nguyen, L., Barton, S. M., & Nguyen, L. T. (2015). iPads in higher education-hype and hope. British Journal of Educational Technology, 46(1), 190–203.
Ogara, S. O., Koh, C. E., & Prybutok, V. R. (2014). Investigating factors affecting social presence and user satisfaction with mobile instant messaging. Computers in Human Behavior, 36, 453-459.
Qureshi, E. (2004). Investigation of factors affecting students' satisfaction with online course components.( Doctoral dissertation, University of Windsor)
Reio Jr, T. G., & Crim, S. J. (2013). Social presence and student satisfaction as predictors of online enrollment intent. American Journal of Distance Education, 27(2), 122-133.
Richardson, J. C., & Swan, K. (2003). Examining social presence in online courses in relation to students' perceived learning and satisfaction. Journal of Asynchronous Learning Networks, 7(1), 68–88.
Seaberry, B. J. (2008). A case study of student and faculty satisfaction with online courses at a community college. University of California, Davis.
Short, J., Williams, E., & Christie, B. (1976). The social psychology of telecommunications. Stone, S. & Chapman, D. (2006). Instructor Presence in the Online Classroom. The Academy of Human
Resource Development International Conference (AHRD) (Columbus, OH, Feb 22-26, 2006) p1370-1377 Trollip, S. & Blignaut, S. (2003). Measuring Faculty Participation in ALN as a Basis for Faculty Development.
19th Annual Conference on Distance Teaching and Learning. Tu, C., & McIsaac, M. (2002). The relationship of social presence and interaction in online classes. The
American Journal of Distance Education, 16(3), 131–150. Wiechowski, L., & Washburn, T. L. (2014). Online finance and economics courses: A comparative study of
course satisfaction and outcomes across learning models. American Journal of Business Education (Online), 7(1), 37.
Woods, R., & Ebersole, S. (2003). Becoming a communal architect in the online classroom: Integrating cognitive and affective learning for maximum effect in web-based learning. Online Journal of Distance Learning Administration
Yukselturk, E., & Yildirim, Z. (2008). Investigation of Interaction, Online Support, Course Structure and Flexibility as the Contributing Factors to Students' Satisfaction in an Online Certificate Program. Educational Technology & Society, 11(4), 51-65.

TOJET: The Turkish Online Journal of Educational Technology – January 2018, volume 17 issue 1
Copyright © The Turkish Online Journal of Educational Technology 233
Zhang, C. (2010). Using virtual world learning environment as a course component in both distance learning and traditional classroom: Implications for technology choice in course delivery. Proceedings of the Southern Association for Information Systems Conference, USA, 196–200.
TOJET: The Turkish Online Journal of Educational Technology – January 2018, volume 17 issue 1
Copyright © The Turkish Online Journal of Educational Technology 234
Two Modalities of the Contextualized Courseware in Three Modalities of Classroom Use Yavuz Akpinar Bogazici University, ETA-B Blok, 508, Kuzey Kampus, Etiler, Istanbul, Turkey For correspondence: [email protected]; Özlem Şengül
Bahcesehir University, Besiktas, Turkey [email protected] ABSTRACT This study investigated the effect of various combinations of contextualization and teacher support on achievement and critical thinking. Two specially-designed sets of courseware were used to teach a unit on logic, one based on a single context and one based on multiple contexts. The participants were 151 9th graders in two vocational high schools. Each student was assigned to one of four groups: The first group used the multiple-context courseware with a teacher tutorial; the second group used the single-context courseware; the third group studied the single context courseware with a teacher tutorial; and the fourth group had a teacher tutorial only. Statistical analysis of two achievement tests on the unit and a critical thinking disposition inventory revealed that, regardless of whether the courseware employed single or multiple contexts, teacher support is beneficial. Findings are discussed in relation to comparable studies reported in the literature. Further research issues are raised in the last section.
Keywords: Contextualization, Single context, Multiple contexts, Learning logic, Critical thinking disposition
INTRODUCTION Students can manipulate, construct, re-construct and employ knowledge in a concrete or virtually concrete setting by using learning technologies. Instructional designers utilize various tools and techniques to make learning content concrete. One way to concretize is to embed a learning content into a familiar and interesting context. A context is defined as “the whole situation, background or environment relevant to a particular event” (Tessmer & Richey, 1997; p.87). However, context also has other meanings: It can refer to a particular event or phenomenon with phenomenal objects and/or operators; or it can denote a story with a series of connected events in a story that has story objects and operators in one or more places and/or timeframe. It is contexts that generally define and shape one’s cognition by relating given domain knowledge to practical use (Snow, 1994). Because cognition and reasoning are both situated (Greeno, 1989), context is an influential element of every learning activity. Students’ cognition and their learning are affected by numerous factors, including the classroom climate, learning materials, the task setting, and prior knowledge of the topic. Context may be a single interaction case or a multiple interaction pattern in the social interaction process of learning (Akpınar, 2015). Providing multiple contexts (e.g., simulation, work, street, school, lab) allows for learning experiences in multiple situations, impacting nature of learning. A context, therefore, functions as a cognitive strategy applicable to a study task.
Context is critical in learning because learners derive meaning from their surrounding environment and its components, both through perceptional experiences at different levels and through abstract filters formed by semiotic systems such as language (Boyle, 2002). In the learning process, according to Boyle (2002), there are three layers, namely cognitive, interactional and physiological. Context plays a significant role in the interactional layer of learning, for which reason teachers need to focus on embedding content into a context. Boyle asserts that context has two functions: one is the function of framing learning activities, and the other is the function of connections. Contexts are human made mentors that are thought to help students connect previously learnt information and skills with new ones and resolve their incorrect behavior patterns: One way of connecting new knowledge to prior knowledge is to anchor the situation and event (CTGV, 1992; Marx, Blumenfeld, Krajcik, & Soloway, 1997) so as to involve learners in the domain knowledge that is represented in the situation. “Anchoring events provide students with a common experience from which they can relate new information” (Sherwood, Kinzer, Bransford, & Franks, 1987; p. 419). Empirical research on anchoring events (e.g., CTGV, 1992) demonstrates that rich contextualizing features stimulate memory recall and facilitates the transfer of information to new settings. The second method is to repeatedly engage learners in meaningful
TOJET: The Turkish Online Journal of Educational Technology – January 2018, volume 17 issue 1
Copyright © The Turkish Online Journal of Educational Technology 235
problem solving over time (Marx et al., 1997). The present research aimed to (a) clarify effects of single or multiple contextualizations on learning a unit on logic, (b) identify the possible interaction between studying various contextualizations of the learning content and students’ critical thinking disposition.
Proposed Benefits of Contextualizing Instruction Contextualizing instruction focuses students’ attention on interrelationships between concepts. Blumenfeld, Marx, Patrick, Krajcik, and Soloway, (1997) point out that “contextualizing instruction helps learners to organize and integrate knowledge by engaging them with ideas from multiple perspectives while pursuing solutions to meaningful problems” (p. 830). In the process of organizing and integrating knowledge, students see how ideas are applied in different situations and construct their own representations of concepts (Marx et al., 1997). Meaningful problem situations also provide opportunities for learners to apply their knowledge and gain perspective in incorporating new knowledge into their existing schema (Edelson, Gordin, & Pea, 1999).
In his framework of meaningful learning, Ausubel (1968) suggested that learning environments should present the learners with some cues that relate to their pre-developed cognitive structure. Context thus becomes an anchoring point for embedding newly learned material in the cognitive structure. Collins, Brown and Newman (1989) employ this approach to context in their cognitive apprenticeship model, and Gagne and Merrill (1990) stress that contextual anchoring in instruction can contribute to effective problem-solving by enhancing meaning in novel tasks and by developing cognitive strategies that are needed in problem solving and transfer of learning. Other researchers have also related context and meaningful learning. Donaldson (1978) conceived context as a meaningful situation that can be a catalyzer in the process of acting and thinking. According to Köhler (1947), one’s perception of an organized situation is considered a coherent whole that determines meaning of the constituent elements. Marton and Booth (1997) approached context from a phenomenographic perspective stating that “learning is always based on experiencing a situation and discerning relevant phenomena from that situation” (p. 202). For Vygotsky (1978) activity in a context provides a foundation for meaningful engagement; he goes on to suggest that learning activities should be embedded into cultural settings as meaning-generating contexts. In the Vygotskian school of thought, context is considered in terms of a sociocultural setting, requiring tool-mediated actions, processes, and goals that are to be appreciated in the activity structure. In the framework of activity theory (Kaptelinin & Nardi, 2006), a context is an activity system that can be constituted by activity sets with which students interact in order to accomplish a particular goal. Context can shape human behaviors in a situation and can lead to a unified interpretation which gives meaning to that situation.
Contextualization versus De-contextualization The contextualization of learning and instruction involves situating learning content in a real-life context, a concrete and constrained fictitious context, or a metaphorical context, aiming to make abstract concepts concrete, to increase comprehension and retention, and to facilitate transfer of learning. Contextualizing instruction is an effective way to increase students’ interest, motivation, and achievement (Glynn & Kuballa, 2005; Rennie & Parker, 1996). Data supporting these arguments comes from Cordova and Lepper (1996), for instance, who compared the effects of contextualization and de-contextualization of a mathematics content on students’ learning in computer-based learning (CBL) settings; they reported that students who studied an abstract content embedded in a meaningful and appealing fantasy context demonstrated markedly better motivation, involvement, and learning than students who used the same activities in a de-contextualized setting. Similarly, Brenner et al (1997) cast math problems in a scenario involving a hypothetical trade company to teach functions; participants in this intervention developed greater gains in problem representation than the control group. However, the control group developed better knowledge of symbol manipulation because they had focused squarely on symbolic representations, while the experimental group was more involved more in understanding and concrete representation. There are known caveats, e.g., developing a sound understanding of the domain in multiple representations is key to learning.
In a more comprehensive three-year study in college mathematics (Shore, Shore & Boggs, 2004) students who received contextualized instruction in the first two years obtained better math scores than students receiving traditional math instruction. However, the two groups’ math scores were not different in the third year. This unexpected result was explained in terms of the fact that the contextualized problems in the third year were found particularly difficult by underprepared students. Given these seemingly contradictory findings, a firm conclusion about the practical use of contextualization/de-contextualization could not be drawn.
Earlier, psychology researchers also analyzed how changes in context affect learning and memory. A well-known study on the effect of context in learning was conducted with deep-sea divers who were asked to learn and recall word lists under water and on land. The experiment showed that altering the context between encoding and retrieval reduced the divers’ ability to recall learned words (Godden & Baddeley, 1975). Different types of
TOJET: The Turkish Online Journal of Educational Technology – January 2018, volume 17 issue 1
Copyright © The Turkish Online Journal of Educational Technology 236
contextual cues may have different effects on encoding and recall. For example, music, light, background colors/patterns (Dallett & Wilcox, 1968; Smith, Glenberg, & Bjork, 1978), mood (Jamison, 2009), and study environment (Smith, 1985) are all contextual cues. The ability of an individual to recall the source of an episode will affect the likelihood of that memory being remembered (Johnson, Hashtroudi, & Lindsay, 1993). Recall is better when the environment of the original learning is reinstated. Reinstatement of context can be accomplished either by physically returning to the encoding environment or by mentally visualizing that environment (Smith & Vela, 2001). Moreover, functional magnetic resonance imaging (fMRI) studies have indicated the role of context-dependent memory. Kalisch, Korenfeld, Stephan, Weiskopf, and Dolan (2000), for instance, determined that context-dependent extinction memory is associated with activation in hippocampus and ventromedial prefrontal cortex, which mainly orchestrate thoughts and actions in accordance with internal goals. Wagner, Desmond, Glover, and Gabrieli (2000) showed that activation of the right prefrontal cortex depends on contextual information. In a contextual cueing task, Manelis and Reder (2012) used a combination of fMRI and eye-tracking technology to explore the mechanisms that facilitate the visual search for repeated spatial configurations. They concluded that “context repetition facilitates visual search through chunk formation that reduces the number of effective distractors that have to be processed during the search” (p. 530). Context repetition allows for continuous and effective chunk updating; it therefore, influences procedural learning. In most of these studies, contextual cues were shown to be unrelated to the application of the learning content in a given contextual task, but rather, they were related to the conditions of the context.
Learning in a Single- versus Multiple-Context Learning Environment In the teaching of concepts, using multiple contexts can increase the possibility that the concept will be appropriately applied to new circumstances. In her classic experiments, Nitsch (1977) found that, when instruction used a single context, students were able to identify additional examples in the same context; while students who received instruction using multiple had difficulty applying it in new contexts. Once they learnt it, however, they were successful in applying it in new situations. Nitsch therefore suggested using a hybrid strategy where students would initially be given examples in a single context, and then in multiple contexts. Tessmer and Richey (1997), on the other hand, recommend a multi-contextual emphasis of instruction for facilitating transfer, and suggested emphasizing elements of the immediate environment for the near transfer. Clark and Voogel (1995) took these ideas further and suggested partial decontextualization claiming that “the extent of transfer is determined, in part, by the amount of decontextualization achieved during instruction” (p. 11). Rayner (2005) supports this position and argues that limiting learning content to a specific context will prevent students from being able to generalize their knowledge outside the learning context. Moreover, Bassok (1997) provides evidence that context-based instruction in math suppresses transfer of knowledge to other contexts. Taasoobsuirazi and Carr, (2008) maintain that there is insufficient research exploring whether students are better able to transfer to different real world problems what they learn in a contextualized setting versus what they learn in conventional instruction. Contextualization of Content in E-learning Once context is considered for the design of learning environment, the questions of how many contexts and which contexts should be selected are critical. In conventional classrooms, when multiple contexts are used, learning content may be reflected and conveyed in a shallow manner in different contexts. Because it impractical to conduct in-depth investigation in all contexts due to class scheduling, different parts of the content are generally examined in different contexts. A single context lesson has the advantage of providing more in-depth investigation opportunities and tools with which students can manipulate content elements under varying conditions (see Figure 1). Such interaction can help relate content elements to existing mental structures and clarify reference points to new mental structures to be constructed by students. In a learning environment with a single context, students are expected to develop a sound understanding of the concept, and sufficiently generalizable knowledge, and to improve their metacognitive and problem solving skills, all of which, to a certain extent, require de-contextualization of knowledge developed. Then when a content-related problem is presented in a new context, students will first recall the contextual framework, identify similarities and differences between that framework and the problem of the context, and find a solution. If the two contexts have common properties, finding and applying a solution path is easy. However, if there are a few common properties, a de-contextualized conceptual framework (developed during initial learning) is said to help find a solution path. Some researchers (Bjork & Richardson-Klavhen, 1989; Bransford, Brown, & Cocking, 2000; Gick & Holyoak, 1983; Johnson, Reisslein, & Reisslein, 2014; Williams, 1992) assert that single contextualization may not suffice to develop a firm conceptual framework and sound problem-solving knowledge to deal with problems, either in context that are different from the learning context or in a de-contextualized state. Hence, for the purpose of increasing students’ experiences and possibility of finding common properties in later problem states, embedding contents in contexts, whether single or multiple, may not be sufficient. Gradual de-contextualization of content is
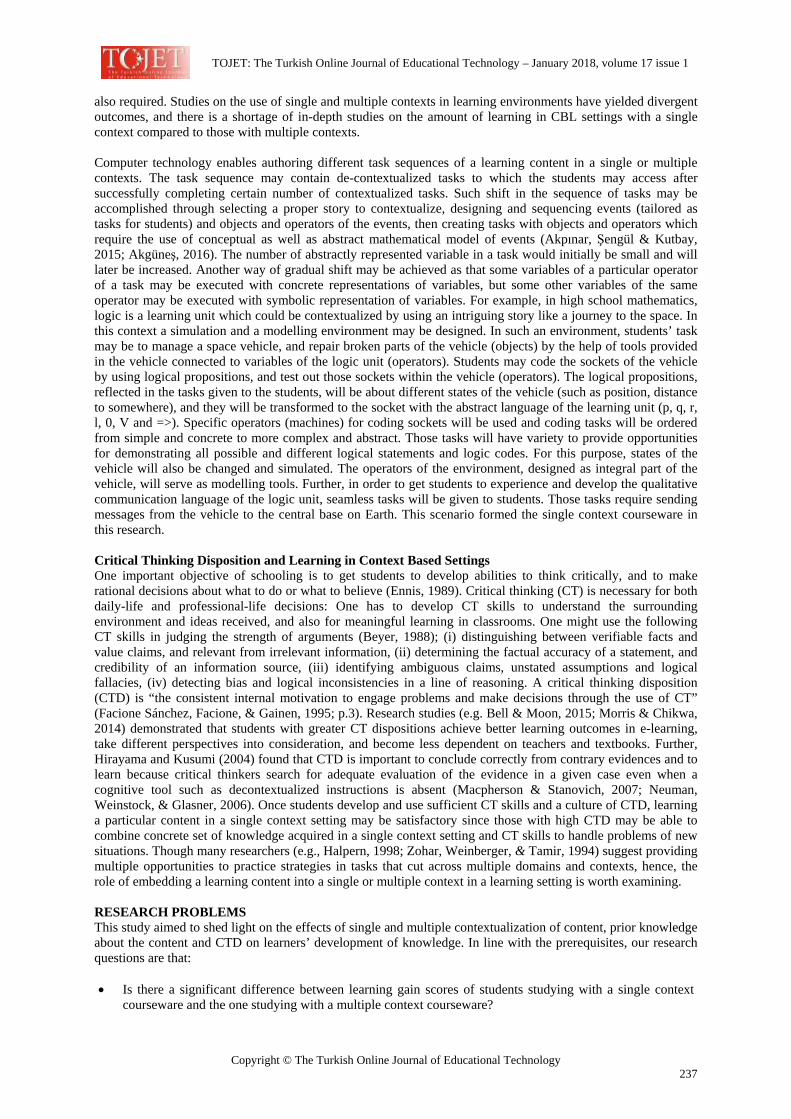
TOJET: The Turkish Online Journal of Educational Technology – January 2018, volume 17 issue 1
Copyright © The Turkish Online Journal of Educational Technology 237
also required. Studies on the use of single and multiple contexts in learning environments have yielded divergent outcomes, and there is a shortage of in-depth studies on the amount of learning in CBL settings with a single context compared to those with multiple contexts.
Computer technology enables authoring different task sequences of a learning content in a single or multiple contexts. The task sequence may contain de-contextualized tasks to which the students may access after successfully completing certain number of contextualized tasks. Such shift in the sequence of tasks may be accomplished through selecting a proper story to contextualize, designing and sequencing events (tailored as tasks for students) and objects and operators of the events, then creating tasks with objects and operators which require the use of conceptual as well as abstract mathematical model of events (Akpınar, Şengül & Kutbay, 2015; Akgüneş, 2016). The number of abstractly represented variable in a task would initially be small and will later be increased. Another way of gradual shift may be achieved as that some variables of a particular operator of a task may be executed with concrete representations of variables, but some other variables of the same operator may be executed with symbolic representation of variables. For example, in high school mathematics, logic is a learning unit which could be contextualized by using an intriguing story like a journey to the space. In this context a simulation and a modelling environment may be designed. In such an environment, students’ task may be to manage a space vehicle, and repair broken parts of the vehicle (objects) by the help of tools provided in the vehicle connected to variables of the logic unit (operators). Students may code the sockets of the vehicle by using logical propositions, and test out those sockets within the vehicle (operators). The logical propositions, reflected in the tasks given to the students, will be about different states of the vehicle (such as position, distance to somewhere), and they will be transformed to the socket with the abstract language of the learning unit (p, q, r, l, 0, V and =>). Specific operators (machines) for coding sockets will be used and coding tasks will be ordered from simple and concrete to more complex and abstract. Those tasks will have variety to provide opportunities for demonstrating all possible and different logical statements and logic codes. For this purpose, states of the vehicle will also be changed and simulated. The operators of the environment, designed as integral part of the vehicle, will serve as modelling tools. Further, in order to get students to experience and develop the qualitative communication language of the logic unit, seamless tasks will be given to students. Those tasks require sending messages from the vehicle to the central base on Earth. This scenario formed the single context courseware in this research.
Critical Thinking Disposition and Learning in Context Based Settings One important objective of schooling is to get students to develop abilities to think critically, and to make rational decisions about what to do or what to believe (Ennis, 1989). Critical thinking (CT) is necessary for both daily-life and professional-life decisions: One has to develop CT skills to understand the surrounding environment and ideas received, and also for meaningful learning in classrooms. One might use the following CT skills in judging the strength of arguments (Beyer, 1988); (i) distinguishing between verifiable facts and value claims, and relevant from irrelevant information, (ii) determining the factual accuracy of a statement, and credibility of an information source, (iii) identifying ambiguous claims, unstated assumptions and logical fallacies, (iv) detecting bias and logical inconsistencies in a line of reasoning. A critical thinking disposition (CTD) is “the consistent internal motivation to engage problems and make decisions through the use of CT” (Facione Sánchez, Facione, & Gainen, 1995; p.3). Research studies (e.g. Bell & Moon, 2015; Morris & Chikwa, 2014) demonstrated that students with greater CT dispositions achieve better learning outcomes in e-learning, take different perspectives into consideration, and become less dependent on teachers and textbooks. Further, Hirayama and Kusumi (2004) found that CTD is important to conclude correctly from contrary evidences and to learn because critical thinkers search for adequate evaluation of the evidence in a given case even when a cognitive tool such as decontextualized instructions is absent (Macpherson & Stanovich, 2007; Neuman, Weinstock, & Glasner, 2006). Once students develop and use sufficient CT skills and a culture of CTD, learning a particular content in a single context setting may be satisfactory since those with high CTD may be able to combine concrete set of knowledge acquired in a single context setting and CT skills to handle problems of new situations. Though many researchers (e.g., Halpern, 1998; Zohar, Weinberger, & Tamir, 1994) suggest providing multiple opportunities to practice strategies in tasks that cut across multiple domains and contexts, hence, the role of embedding a learning content into a single or multiple context in a learning setting is worth examining. RESEARCH PROBLEMS This study aimed to shed light on the effects of single and multiple contextualization of content, prior knowledge about the content and CTD on learners’ development of knowledge. In line with the prerequisites, our research questions are that: • Is there a significant difference between learning gain scores of students studying with a single context
courseware and the one studying with a multiple context courseware?
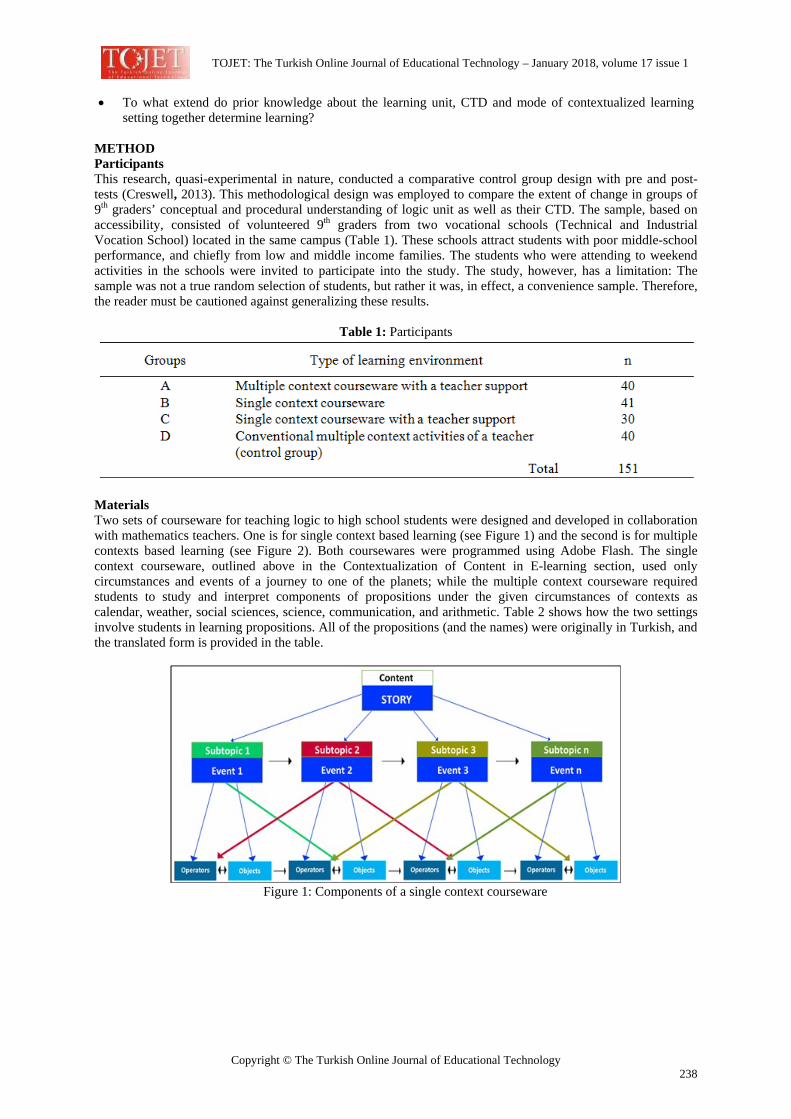
TOJET: The Turkish Online Journal of Educational Technology – January 2018, volume 17 issue 1
Copyright © The Turkish Online Journal of Educational Technology 238
• To what extend do prior knowledge about the learning unit, CTD and mode of contextualized learning setting together determine learning?
METHOD Participants This research, quasi-experimental in nature, conducted a comparative control group design with pre and post-tests (Creswell, 2013). This methodological design was employed to compare the extent of change in groups of 9th graders’ conceptual and procedural understanding of logic unit as well as their CTD. The sample, based on accessibility, consisted of volunteered 9th graders from two vocational schools (Technical and Industrial Vocation School) located in the same campus (Table 1). These schools attract students with poor middle-school performance, and chiefly from low and middle income families. The students who were attending to weekend activities in the schools were invited to participate into the study. The study, however, has a limitation: The sample was not a true random selection of students, but rather it was, in effect, a convenience sample. Therefore, the reader must be cautioned against generalizing these results.
Table 1: Participants
Materials Two sets of courseware for teaching logic to high school students were designed and developed in collaboration with mathematics teachers. One is for single context based learning (see Figure 1) and the second is for multiple contexts based learning (see Figure 2). Both coursewares were programmed using Adobe Flash. The single context courseware, outlined above in the Contextualization of Content in E-learning section, used only circumstances and events of a journey to one of the planets; while the multiple context courseware required students to study and interpret components of propositions under the given circumstances of contexts as calendar, weather, social sciences, science, communication, and arithmetic. Table 2 shows how the two settings involve students in learning propositions. All of the propositions (and the names) were originally in Turkish, and the translated form is provided in the table.
Figure 1: Components of a single context courseware
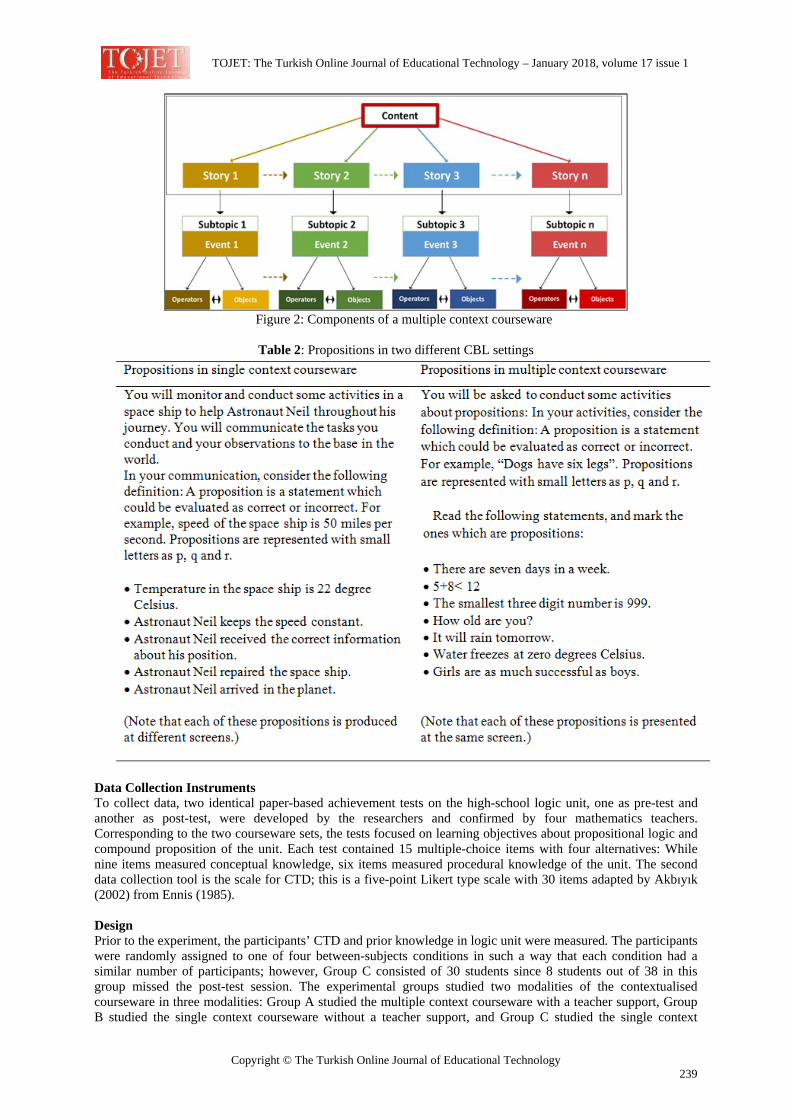
TOJET: The Turkish Online Journal of Educational Technology – January 2018, volume 17 issue 1
Copyright © The Turkish Online Journal of Educational Technology 239
Figure 2: Components of a multiple context courseware
Table 2: Propositions in two different CBL settings
Data Collection Instruments To collect data, two identical paper-based achievement tests on the high-school logic unit, one as pre-test and another as post-test, were developed by the researchers and confirmed by four mathematics teachers. Corresponding to the two courseware sets, the tests focused on learning objectives about propositional logic and compound proposition of the unit. Each test contained 15 multiple-choice items with four alternatives: While nine items measured conceptual knowledge, six items measured procedural knowledge of the unit. The second data collection tool is the scale for CTD; this is a five-point Likert type scale with 30 items adapted by Akbıyık (2002) from Ennis (1985).
Design Prior to the experiment, the participants’ CTD and prior knowledge in logic unit were measured. The participants were randomly assigned to one of four between-subjects conditions in such a way that each condition had a similar number of participants; however, Group C consisted of 30 students since 8 students out of 38 in this group missed the post-test session. The experimental groups studied two modalities of the contextualised courseware in three modalities: Group A studied the multiple context courseware with a teacher support, Group B studied the single context courseware without a teacher support, and Group C studied the single context
TOJET: The Turkish Online Journal of Educational Technology – January 2018, volume 17 issue 1
Copyright © The Turkish Online Journal of Educational Technology 240
courseware with a teacher support. The support modalities were conducted in a way that students study the courseware on their own first in a lesson hour, then the next day the same teacher held a problem solving session where she exemplified the content and solves questions in different contexts, also the teacher asked two students in A and C groups to exemplify to each subtopic of the unit and provided feedback to their responses. During students’ study with the courseware sets in the first three modalities, the teacher was available to answer any questions posed by the students. Nevertheless, the control group students studied the same content with the same teacher without using any courseware; the teacher conducted a conventional instruction describing, discussing and exemplifying the content and solving questions in multiple contexts in two sessions. Following the instructional activities, the scale for CTD and the logic post-test were administered to the students a week later.
RESULTS To establish equivalence of the level of students’ prior knowledge in logic unit in the four instructional conditions prior to attending the experiments, an analysis of variance was run on the pre-test scores. The resulting nonsignificant F (df=3/147) of 1,064 indicated that four groups were initially equivalent on prior knowledge in the unit. The descriptive statistics on the groups’ pre-test, post-test and achievement scores in Logic unit are given in Table 3.
Table 3: The groups’ pretest, posttest and achievement scores in Logic unit
Further ANOVA tests revealed that the four groups’ achievement of conceptual [F(3, 147)=11,452; p=0,0001], procedural [F(3, 147)=3,934; p=0,010] and combined knowledge [F(3, 147)= 12,415; p=0,0001] of the Logic unit differed significantly. The post hoc Bonferroni tests (Bonferroni correction alpha=0.0125) for achievement of conceptual, procedural and combined knowledge of the groups showed that;
(i) achievement of conceptual knowledge of Logic unit of the group A (M=2,3; SD=2,053) is significantly
higher than the group B (M=,487; SD=2,001) and the group D (M=,550; SD=2,074); the group C (M=2,7; SD=2,135) significantly outperformed the group B (M=,487; SD=2,001) and the group D (M=,550; SD=2,074),
(ii) achievement of procedural knowledge of Logic unit of the group A (M=0,95; SD=1,632) is significantly higher than the group D (M=0,00; SD=1,358), whereas the groups studying with one or more context software performed similar achievement.
(iii) achievement of combined knowledge of Logic unit of the group A (M=3,2; SD=2,802) is significantly higher than the group B (M=,634; SD=2,527) and the group D (M=,500; SD=2,470), whereas the group C (M=2,933; SD=2,242) outperformed the group B (M=,634; SD=2,527) and the group D (M=,500; SD=2,470).
Covariate effect of prior knowledge, prior CTD and treatments on learning A univariate general linear model with three variables (2x2x4) ANOVA test revealed the degree of interaction between students’ prior knowledge in logic (with two categories of small and moderate), students’ CTD (with two categories of small and moderate) and the type of contextualized learning environment (with four categories) to predict learning logic (Table 4). Students’ prior knowledge in logic, [F(1)= 17,997; p=0,0001)] and the type of contextualized learning environment [F(3)= 11,315; p=0,0001)] do separately influence learning logic; effect size coefficients (Partial eta squared) for prior knowledge in logic (0,118) and the type of contextualized learning environment (0,201) showed a moderate effect on learning logic. The covariate effect of students’ prior knowledge in the unit and prior CTD together F(1)= 5,157; p=0,025)] is meaningful, but small (%4). However, the covariate effect of the type of learning environment and students’ prior CTD on logic learning is not meaningful [F(3)= 0,252; p=0,860)]. Overall covariate effect of the three variables on learning logic is also moderate (Adjusted R Squared = ,321; alpha = ,05)], and they explain 32% of the variation in learning logic.
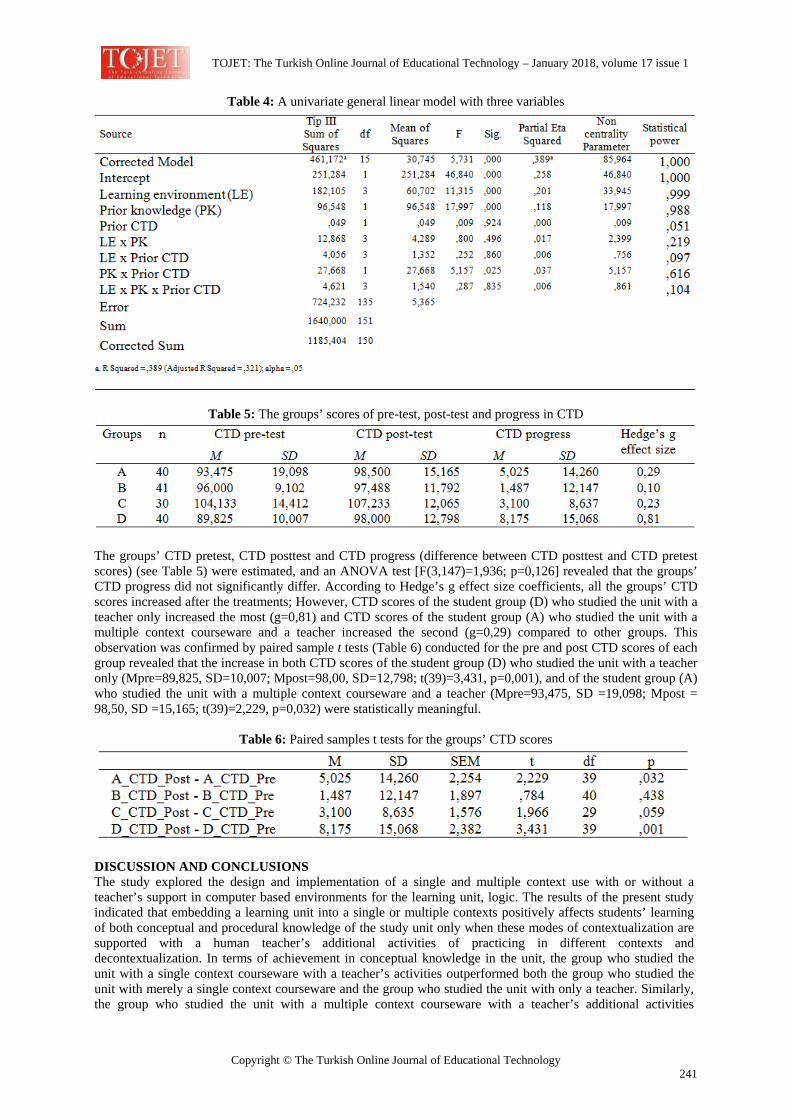
TOJET: The Turkish Online Journal of Educational Technology – January 2018, volume 17 issue 1
Copyright © The Turkish Online Journal of Educational Technology 241
Table 4: A univariate general linear model with three variables
Table 5: The groups’ scores of pre-test, post-test and progress in CTD
The groups’ CTD pretest, CTD posttest and CTD progress (difference between CTD posttest and CTD pretest scores) (see Table 5) were estimated, and an ANOVA test [F(3,147)=1,936; p=0,126] revealed that the groups’ CTD progress did not significantly differ. According to Hedge’s g effect size coefficients, all the groups’ CTD scores increased after the treatments; However, CTD scores of the student group (D) who studied the unit with a teacher only increased the most (g=0,81) and CTD scores of the student group (A) who studied the unit with a multiple context courseware and a teacher increased the second (g=0,29) compared to other groups. This observation was confirmed by paired sample t tests (Table 6) conducted for the pre and post CTD scores of each group revealed that the increase in both CTD scores of the student group (D) who studied the unit with a teacher only (Mpre=89,825, SD=10,007; Mpost=98,00, SD=12,798; t(39)=3,431, p=0,001), and of the student group (A) who studied the unit with a multiple context courseware and a teacher (Mpre=93,475, SD =19,098; Mpost = 98,50, SD =15,165; t(39)=2,229, p=0,032) were statistically meaningful.
Table 6: Paired samples t tests for the groups’ CTD scores
DISCUSSION AND CONCLUSIONS The study explored the design and implementation of a single and multiple context use with or without a teacher’s support in computer based environments for the learning unit, logic. The results of the present study indicated that embedding a learning unit into a single or multiple contexts positively affects students’ learning of both conceptual and procedural knowledge of the study unit only when these modes of contextualization are supported with a human teacher’s additional activities of practicing in different contexts and decontextualization. In terms of achievement in conceptual knowledge in the unit, the group who studied the unit with a single context courseware with a teacher’s activities outperformed both the group who studied the unit with merely a single context courseware and the group who studied the unit with only a teacher. Similarly, the group who studied the unit with a multiple context courseware with a teacher’s additional activities
TOJET: The Turkish Online Journal of Educational Technology – January 2018, volume 17 issue 1
Copyright © The Turkish Online Journal of Educational Technology 242
outperformed both the group who studied the unit with merely a single context courseware and the group who studied the unit with only a teacher. However, the group that studied in a single context courseware with a teacher support, and the group that studied in a multiple context courseware with teacher support had similar achievement in conceptual knowledge in the unit. The mode of studying the unit in a single context courseware only generated a similar outcome as the one in only teacher activities.
In terms of achievement in procedural knowledge of the unit, the group who studied the unit with a multiple context courseware with a teacher’s additional activities outperformed the group that studied the unit with only a teacher. Additionally, achievement in procedural knowledge of the unit of the groups who studied the unit with merely a single or a multiple context courseware with or without a teacher’s additional activities was identical. However, performance of the teacher only group was the least among all groups.
When two types of knowledge, conceptual and procedural, were considered together, the same result as the one in achievement of conceptual knowledge was obtained. These findings have similarities and differences to the earlier literature, though, additional contextual practice examples and decontextualization activities conducted by a teacher seem to make the current study different from the earlier works reported in the literature, To a large extent, it confirms the findings obtained in the study by Cordova and Lepper (1996) and by Nistch (1977) that computer based contextualization settings help learning, but the amount of learning increases when those contextualization modes are supported by a teacher’s additional activities of practising further in different contexts and decontextualization. Also, it has different findings from the studies by Bassok (1997) and Brenner et al (1997) that computer based contextualization settings help learning more than the teachers’ contextualisation and decontextualization; in this study both the single and multiple context groups with or without teacher support helped learning more than just a teacher support mode. In addition, this study, unlike the one by Shore et al (1997), showed that the students in computer based contextualization settings found the activities easy. To compare the results with those of the ones involving the fMRI based studies (e.g., Manelis & Reder, 2012), context repetition through either multiple context settings or a single context setting with a teacher’s practise activities help learning more than the other modes.
Covariate effect of the type of learning environment, students’ prior knowledge in the learning unit and prior CTD level was found moderate showing that these three variables may explain about one-third of the variability of learning logic; while the type of learning environment alone may explain over one-fifth of the variability of learning logic. The present study also tested whether the type of learning environment and students’ CTD interact to affect learning progress; however, covariate effect of the two variables was not significant. It may demonstrate that when learning activities are appropriately contextualised, either by technological facilities or/and by a teacher’s activities, the negative effect of lack of students’ CTD on learning may possibly be vanished or minimized. Though the intervention studies in all four groups were relatively short, it has to be noted that students in the control group developed more CTD than the ones in the experimental groups. This is perhaps due to the amount of student-teacher interaction which was, in nature, more in the control group than the one in all three experimental groups. Further, improvement of CTD of the students in the multiple context environment with a teacher’s support and the control group were significant. However, the study failed to confirm the earlier work (Angeli & Valanides, 2009; Bell & Moon, 2015; Morris & Chikwa, 2014) claiming that students with greater CTD achieve better learning outcomes; because all groups’ CTD was evenly distributed, and had an average level of CTD, therefore when their CTD scores were categorized, we used only two categories as low and moderate CTD in statistical analysis. Though CTD is a necessary component in learning (Macpherson & Stanovich, 2007), the covariate analysis showed that the type of learning environment is more dominant in learning than students’ CTD.
Learning a particular content in a single context setting is not satisfactory; teachers’ activities which combine a concrete set of knowledge acquired in a single context setting and problems of new situations is required. The study confirmed the assertions providing multiple opportunities to practice strategies in tasks that cut across varying contexts (Halpern, 1998; Zohar et al.1994) is necessary for better learning. In this study, both the group studied only with a single context courseware, and the group studied only with a teacher’s contextualization and decontextualized activities could not learn as much as the other two groups receiving a teacher’s practice example in different contexts and finally decontextualized examples.
The study has some implications for the design of online and blended learning environments: First, despite the rapid growth of K-12 online and blended education (e.g., flipped classroom) how best to support K-12 learners are not clear. This study suggests that interactive courseware to be designed for K-12 learners should consider placing learning content into contexts, but still consider a human teacher’s activities of enriching contextual cues and decontextualization for the learning content. Second, courseware providers should continue to provide

TOJET: The Turkish Online Journal of Educational Technology – January 2018, volume 17 issue 1
Copyright © The Turkish Online Journal of Educational Technology 243
guidance to students both through computer support and teachers’ face-to-face support to improve learning outcomes in different situations. Third, to provide students with different in-depth facilities, courseware developers should consider seamlessly connecting a series of single context settings to form multiple context settings.
LIMITATIONS Promising and encouraging results were obtained in increasing students’ knowledge of logic through context based settings with a teacher’s support. The study, however, had some limitations: First, the sample was selected on the basis of accessibility, and from technical and vocational high schools accepting students of poor middle-school performance; further research should consider true-random methods to select students among all type of high schools. Second, the single context courseware utilized a space-journey context in teaching logic; additionally, future research may consider different types of context settings in the same and different learning units. Third, since our findings only relate to 9th grade students who study logic unit at later grades according to their school curriculum, different results could be expected in samples of older year students, who would be more motivated to learn the unit on a timely manner. Fourth, the study should be replicated with settings covering learning units in different domains studied by younger students. Fifth, further research should investigate covariate effects of those independent variables of the study with much larger samples in order to increase statistical power of the general linear model analysis. Finally, fMRI technology may be used to provide more concrete and direct data on students’ interaction with context based settings.
ACKNOWLEDGEMENTS We thank teachers and students who participated in the design and implementation studies. This study was supported by Boğaziçi University BAP, grant #: 8384.
DECLARATION OF CONFLICTING INTERESTS The authors declared no potential conflicts of interest with respect to the research, authorship, and/or publication of this article. REFERENCES Akbıyık. C. (2002) Critical Thinking Disposition and Academic Achievement (Unpublished master thesis).
Hacettepe University, Ankara. Akgüneş, Ö. (2016). Farklı bağlamlardaki bilgisayar destekli uygulamaların lise öğrencilerinin mantık bilgisine
ve eleştirel düşünme eğilimlerine etkisi. Yüksek lisans tezi. Bahcesehir Üniversitesi. Istanbul. Akpınar, Y. (2015). Fall of contextualization in e-learning and separating learning context from others. Paper
presented at IC-ED 2015. St. Petersburg. Russia. Akpınar, Y., Sengül, Ö., & Kutbay, E. (2015). Single versus multiple contextualization in e-learning
environments. Proceedings of IAC-TLEL, pp. 42-46. Budapest, Hungary. Czech Institute of Academic Education.
Bassok, M. (1997). Two types of reliance on correlations between content and structure in reasoning about word problems. In L. English (Ed.) Mathematical Reasoning (pp. 221-246). NJ: Erlbaum.
Bell, R., & Moon, L. (2015). The impact of critical thinking disposition on learning using business simulations, International Journal of Management Education, 13(2). 119-127.
Beyer, B. K., (1988). Developing a Thinking Skills Program. Boston. Allyn and Bacon. Bjork, R.A., & Richardson-Klavhen, A. (1989). On the puzzling relationship between environment context and
human memory. In C. Izawa (ed.), Current Issues in Cognitive Processes, (pp. 313-324). NJ: Erlbaum. Blumenfeld, P.C., Marx, R.W., Patrick, H., Krajcik, J., & Soloway, E. (1997). Teaching for understanding. In:
B.J. Biddle, T.L. Good, & I.F. Goodson (Eds.). International handbook of teachers and teaching (vol. 2 pp. 819–878). Dordrecht: Kluwer.
Boyle, T. (2002). Towards a theoretical base for educational multimedia design. Journal of Interactive Media in Education, 2, Accessed online at http://jime.open.ac.uk/jime/article/view/2002-2.
Bransford, A., Brown, L., & Cocking, R. R., (2000). How People Learn. Washington, National Academies Press,
Brenner, M. E., Mayer, R. E., Modeley, B., Brar, T., Duran, R., Reed, B. S., & Webb, D. (1997). Learning by understanding. Role of multiple representations. American Educational Research Journal, 34, 663-689.
Clark, R.E. & Voogel, A. (1995). Transfer of training principles for instructional design. Educational Communication & Technology Journal, 33, 113-123
Collins, A., Brown, J.S., & Newman, S.E. (1989). Cognitive apprenticeship: Teaching the crafts of reading, writing, and mathematics. In L. B. Resnick (Ed.) Knowing, learning, and instruction (pp. 453-494). NJ: Erlbaum.
TOJET: The Turkish Online Journal of Educational Technology – January 2018, volume 17 issue 1
Copyright © The Turkish Online Journal of Educational Technology 244
Cordova, D. I. & Lepper, M. (1996). Intrinsic motivation and the process of learning. Journal of Educational Psychology. 88(4). 715-730.
Cognition and Technology Group at Vanderbilt (1992). The Jasper experiment. Educational Technology Research & Development, 40 (1), 65-80.
Creswell, J. W. (2013). Research Design. NY. SAGE. Dallett, K., & Wilcox, S. G., (1968). Contextual stimuli and proactive inhibition. Journal of Experimental
Psychology. 78, 475-480. Donaldson, M. (1978). Children’s Minds. London. Fontana. Edelson, D., Gordin, D. N., & Pea, R. D., (1999). Addressing challenges of inquiry-based learning through
technology and curriculum design. The Journal of the Learning Sciences, 8, 391–450. Ennis, R. H., (1989). Critical thinking and subject specificity. Educational Researcher, 18(3), 4-10. Ennis, R.H., (1985). A logical basis for measuring critical thinking skills. Educational Leadership, 43(2), 44-48. Facione, P.A., Sánchez, C.A, Facione, N.C., & Gainen, J. (1995). The disposition toward critical thinking.
Journal of General Education. 44(1). 1-25. Gagné, R. M. & Merrill, D. (1990) Integrative goals for instructional design. Educational Technology Research
and Development, 38(1), 22-31. Gick, M., & Holyoak, K. (1983). Scheme induction and analogical transfer, Cognitive Psychology, 15(1), 1-38. Godden, D., & Baddeley, A. (1975). Context dependent memory in two natural environments. British Journal of
Psychology, 66(3), 325–331. Greeno, J. (1998). The situativity of knowing, learning, and research. American Psychologist, 53(1), 5-26. Halpern, D. (1998). Teaching CT for transfer across domains: Dispositions, skills, structure training, and
metacognitive monitoring. American Psychologist, 53, 449–455. Hirayama, R., & Kusumi, T. (2004). Effect of critical thinking disposition on interpretation of controversial
issues. Japanese Journal of Educational Psychology, 52(2), 186-198. Jamison, K. J., (2009). An Unquiet Mind: A Memoir of Moods and Madness. NY. Random House. Johnson, A. M., Reisslein, J., & Reisslein, M. (2014). Representation sequencing in computer-based engineering
education. Computers & Education, 72, 249–261. Johnson, M.K., Hashtroudi, S., & Lindsay, D.S. (1993). Source monitoring. Psychological Bulletin, 114, 3–28. Kalisch, R., Korenfeld, E., Stephan, K.E., Weiskopf, S.B., & Dolan, R.J. (2006). Context-dependent human
extinction memory is mediated by a ventromedial prefrontal and hippocampal network. The Journal of Neuroscience, 26(37), 9503–9511.
Kaptelinin, V., & Nardi, B. A. (2006). Acting with Technology. MA: MIT Press. Köhler, W. (1947). Gestalt Psychology. NY, Liveright. Macpherson, R., & Stanovich, K. E. (2007). Cognitive ability, thinking dispositions, and instructional set as
predictors of critical thinking. Learning and Individual Differences, 17(2), 115–127 Manelis, A., & Reder, L. M. (2012). Procedural learning and associative memory mechanisms contribute to
contextual cueing. Learning & Memory, 19(11), 527-534. Marton, F. & Booth, S. (1997). Learning and Awareness. NJ: Erlbaum. Marx, R. W., Blumenfeld, P.C., Krajcik, J. S., & Soloway, E. (1997). Enacting project based science.
Elementary School Journal, 97(2), 341-358. Morris, C. & Chikwa, G. (2014). Screencasts: How effective are they and how do students engage with them?
Active Learning in Higher Education, 15(1), 25–37. Neuman, Y., Weinstock, M., & Glasner, A. (2006). The effect of contextual factors on the judgment of informal
reasoning fallacies. Quarterly Journal of Experimental Psychology, 59(3), 411–425. Nitsch, K. E. (1977). Structuring decontextualized forms of knowledge. Unpublished doctoral dissertation,
Vanderbilt University Rayner, A. (2005). Reflections on context based science teaching. Proceedings of Blended Learning in Science
Teaching and Learning Symposium. (pp.169-172). Australia. Uniserve. Rennie, L. J., & Parker, L.H. (1996). Placing physics problems in real life context. Australian Science Teachers
Journal, 42, 55-59. Sherwood, R. D., Kinzer, C. K., Bransford, J. D., & Franks, J. (1987). Some benefits of creating macro-contexts
for science instruction. Journal of Research in Science Teaching, 24(2), 417–435. Shore, M., Shore, J., & Boggs, S. (2004). Allied health applications integrated into developmental mathematics
using problem based learning. Mathematics & Computer Education, 38(2), 183-189 Smith, S. M. (1985). Effects of number of study environments and learning instructions on free-recall clustering
and accuracy. Bulletin of the Psychonomic Society, 23, 440-442. Smith, S. M., Glenberg, A., & Bjork, R. A. (1978). Environmental context and human memory. Memory &
Cognition, 6, 342-353 Smith, S., & Vela, E. (2001). Environmental context-dependent memory. Psychological Bulletin, 8(2), 203–220.

TOJET: The Turkish Online Journal of Educational Technology – January 2018, volume 17 issue 1
Copyright © The Turkish Online Journal of Educational Technology 245
Snow, R. E. (1994). Abilities in academic tasks. In R. J. Steinberg & R. K: Wrights (Eds.), Mind in Context (pp.1-389), NY, Cambridge University Press.
Taasoobsuirazi, G. & Carr, M. (2008). A review and critique of context based physics instruction and assessment. Educational Research Review, 3, 155-167.
Tessmer, M. & Richey, R. (1997). The role of context in learning and instructional design. Educational Technology Research and Development, 45 (2), 85-115.
Vygotsky, L.S. (1978). Mind in society: The development of higher mental processes. MA: Harvard University Press
Wagner, A.D., Desmond, J.E., Glover, G.H., & Gabrieli, J.D.E. (1998). Prefrontal cortex and recognition memory. Brain, 121(10), 1985–2002.
Williams, S. M. (1992). Putting case-based instruction into context. Journal of the Learning Sciences, 2(4), 367–427.
Zohar, A., Weinberger, Y., & Tamir, P. (1994). The effect of the biology critical thinking project on the development of critical thinking. Journal of Research in Science Teaching, 31(2), 183–196.
TOJET: The Turkish Online Journal of Educational Technology – January 2018, volume 17 issue 1
Copyright © The Turkish Online Journal of Educational Technology 246
University Student’s Perspectives on Using Cell Phones in Classrooms - Are They Dialing up Disaster? Simon FERNANDEZ Walter Sisulu University, SOUTH AFRICA [email protected] ABSTRACT Mobile phones are one of the fastest growing technologies in this century all over the world and these devices are extremely influencing the adolescents. The present study was sought to establish students’ views on cell phones usage in university classrooms in an educational district in the Eastern Cape Province of South Africa. The study employed a quantitative approach and the design was a survey. A purposive sample of 179 National Diploma: Information Technology students learning in the year 1, year 2 and year 3 participated in the study. The data were collected through a 5-point Likert scale questionnaire and they were captured manually into Microsoft Excel 2013 and were analysed. The findings of the study show that students were motivated by the cell phone’s use in learning. Even though, cell phones when used rarely for personnel use are causing distraction to the classmates, majority of the students believed that mobile phone usage in learning is very effective. The lecturers discourage students to use mobile phones in classrooms; however students still use it to enhance their studies. The researcher concluded that the university students are matured enough to understand that the mobile phones should be used for boons rather than letting themselves into disaster. Keywords: mobile phone, cell phone, benefits of cell phone, higher education, views of university students
INTRODUCTION The communication and information age of people has advanced tremendously in work stations, schools and colleges and all over the place through the use of digital devices such as iPhones, iPods, iPads and laptops which has highly motivated the young students to explore their potential in the universal market place and thereby increasing the demand of technology (Joseph, 2012). Recent research on communication technology (Internet seen as positive, 2015) reports that smart phones plays a significant role in all kinds of people in order to be online in the internet instead of using old fashioned fixed landline connections and computers. People all over the globe take pictures, send messages and make calls using smart phones as well as the basic feature phones. In some countries, mobile phones are sometimes referred to as cell phones which is considered as the fastest developing technologies in communication that has been ever seen with subscriptions shooting up from zero to five million through 1990s (ITU, 2002), over twenty millions in 2005 (Market data, 2014) and currently reaching to around 7.5 billion (GSMA Intelligence, 2014) internationally. The people’s craze of cell phone which started after 1980s has now been considered as an inevitable device. Shanti and Babu (2013) concurred that cell phones were used earlier for a sign of status however now it has become a necessity for the day today life and can be used by everyone. Mobile phones are used more in our society due to the influence it is making in people to communicate on a daily basis. Researches show that mobile phones can be used in any places such as movie theatres, grocery stores, restaurants, buses and trains to message someone, make a call, email, search information, take photos, use map etc. (Ling, 1997; Murtagh, 2002; Campbell & Russo, 2003; Rice & Katz, 2003; Campbell, 2004) whenever you want and wherever you need. According to Ling (2003), the impact of cell phones has highly affected our society, people’s safety, availability, security and mixing the social activities with business activities and this device has become a part of culture for everyone all over the world. The advantages of using technology for the purpose of learning has been extremely praised always (Israel, 1998). Engel and Green (2011) reported that the purchase and use of mobile phones among K-12 students is rapidly increasing and the proportion of students owning the mobile phones is at the peak point among high school students with 84% signifying the cell phone ownership to 60% of middle school students. In the United Kingdom, cell phones were not banned in any schools in 2001. However, within a short period of six years, this device has been expelled in 50% of the schools. In 2012, this total has increased again to 98%
TOJET: The Turkish Online Journal of Educational Technology – January 2018, volume 17 issue 1
Copyright © The Turkish Online Journal of Educational Technology 247
(Doward, 2015). In 2015, CNN reported that the academic skills of students have been risen up after banning cell phones in schools. All schools that prohibited the students to carry cell phones has assisted students to achieve well on exams and decreased the enticements of students to use cell phones for the purposes which are not related to academic (Kottasova, 2015). A study conducted in the US reveals that the tertiary students play games on their cell phone while the lecture was going on (Gillroy, 2004). Wash (2009) finds that Mt. Spokane High School in the state of Washington implemented a jammer to keep a barrier among students from making calls and messaging. However, they later removed jammer as it is not legal under federal law. In 2015, a school has suspended a science teacher in Florida for implementing a jammer in his classroom (Fla, 2015). In 2005, the department of education in New York declared a ban on using mobile phones for all public schools in the city. But the ban was inconsistently enforced as there were few schools that permitted students to carry phones in school as long as the teachers do not hear or see them using the cell phone in the classroom. There were some other schools where they use metal detector at the entrance to maintain a strict ban. In March 2015, the mayor of the city Bill de Blasio removed the ban for the parents to easily get connected with their children particularly in case of emergency (Sandovale, Eisinger, & Blau, 2015). Cell phones were firstly restricted for students to use in school campuses as there was a high worry that students will involve in criminal activities such as connection with drug dealers and gangs. Later, many schools surrendered to the pressure of parents for allowing their children to use cell phones in schools for the parents to contact them (Dounay, 2004; St. Gerard, 2006). Interestingly, a study conducted by Fasae and Iwari (2015) found that 87.3 % of the students in a Nigerian university use smartphones than mobile devices. 77.5% of the students use mobile devices for educational purposes and 72.5% use it to chat with people. Findings of North, Johnston, and Ophoff (2014) brought evidence that students at a university in South Africa are mostly used cell phones for the purpose of privacy, safety and social life. Furthermore, the result shows that there are some students who are even addicted to cell phones. Conversely, Ugur (2015) argues that not all cell phones use for the purpose of education is offensive. Katz (2005) suggested that technology can be used for various needs such as browsing internet sources, teaching and assisting students in performing school related activities. Smart phones are small in size, less expensive, portable device, have internet accessibility and are used for communication (Thomas & Bolton, 2012). Students and teachers use smart phones to receive and send messages as well as to communicate at all times. Thomas and Bolton (2012) further added that there are many features for cell phones such as recording audio and video, high pixel camera, calculators, GPS facility and texting messages. Mifsud (2013) have articulated that technology has a high potential feature to use it for learning at any time anywhere. It also helps to collaborate among students in distance education (Milrad, 2003). Furthermore, new apps and updates for apps for smart phones are releasing daily which makes common people especially the students more fascinating to cell phones. Many researches have taken place all over the world on the usage of cell phones by the university students in classrooms. Some of the examples are study conducted by Walsh, White, and Young (2010) in Australia, Ogunyemi (2010) in England, Beaver, Knox and Zusman (2010) in North Carolina, Baron and Campbell (2010) in Sweden, the US, Italy, Japan and Korea, Balakrishnan and Raj (2012) in Malaysia, Hong, Chiu, and Huang (2012) in Taiwan, Lobo and Joshma (2013) in Mangalore, Suominen, Hyrynsalmi, and Knuutila (2014) in Finland. However, research based on the same is inadequate in a developing country like South Africa (Kreutzer, 2009, North, Johnston and Ophoff, 2014). This clearly shows that even though cell phones are rapidly developing all over the globe, the questions of how well students are using cell phones in a South African university classroom is still pending which is a serious gap that needs to be addressed in this research. This research has been done in a South African University of the Eastern Cape Province. It investigated the impact of cell phones that are falling on students. This study sought to understand the issues students experienced and the thoughts they perceived from educational or learning perspective. The aim was to study the behaviour and perspective of university student’s cell phone usage in learning. Finally to provide the recommendations to the management or Educators who are consenting the students to use cell phones in an academy. The key question of the study is: What are the views of university students’ on the usage of Cell Phones in class room for learning purposes? LITERATURE REVIEW This section will briefly review some researches, implementation and experiences of Cell phone usage in Higher Education which supports the background of the proposed study. Belwal and Belwal (2009) conducted a research in Muscat and Sohar cities of Oman to determine the attitude of cell phone usage of the university students. 200 students participated in this survey and the findings shows that most of students use SMS service
TOJET: The Turkish Online Journal of Educational Technology – January 2018, volume 17 issue 1
Copyright © The Turkish Online Journal of Educational Technology 248
more than 10 times per day but calls less than 10 times a day. Their cell phones will be active for the whole day and they were restless if they do not have cell phones with them. The results show that students used cell phones during lecture time as well. Additionally, a case study conducted by Jumoke, Oloruntoba, and Blessing (2015) to scrutinize the relationship between the usage of cell phones in classroom and the academic performance of students. A sample of 45 questionnaires was distributed to the computer science students of Federal Polytechnic tertiary institution, Ilaro, Ogun State in Nigeria. However, only 40 students have answered and the response rate was 88.9%. Moreover, 15 students were interviewed concurrently to acquire a deep knowledge along with the data gathered through the quantitative method. This research came up with the evidence that cell phones are providing a negative influence on students due to the focus on texting and playing music and others by leaving academic activities aside. This study also pointed out that usage of cell phones are leading the students to an irrepressible stage that results in poor academic performance. Also, Javid, Malik and Gujjar (2011) conducted a research at Islamia university of Bahawalpur, Bahawalnagar Campus, Pakistan to examine the effects of academic performance of students due to the usage of cell phones in university classroom. A five point likert scale questionnaire was used to collect the data. The findings show that majority of the students were of the view that the device was wasting their time and money and it also increased the rate of telling lies among students which made an impact on their culture. Similarly, a survey was conducted at Sultan Qaboos University to explore the attitude and perspectives of students using mobile phone in learning English language. A sample of 100 students responded to a five point likert scale questionnaire and the results specified that usage of mobile phones in learning is still inadequate. Even though, students like to use the device, lecturers do not entertain due to the worry that it will make distraction to both lectures as well as students (Aamri & Suleiman, 2011). Halder, Halder, and Guha (2015) conducted a study to investigate whether mobile phones are useful for students for educational activities and whether it makes any change in the attitude for the use of study in terms of gender, level of study, academic area and place of stay. An overall total of 100 undergraduate students from arts (B.A.) and science (B.Sc.) streams were considered as the sample for the study. A five point likert scale questionnaire that consists of 28 items were used for the data collection. The findings revealed that the difference in the attitude of students were insignificant in terms of academic discipline in the classroom. However, the study noticed that there were significant differences in the attitude of students with respect to gender, level of study, academic area and place of stay. A pilot study conducted by Olufadi (2015) in a Nigerian university investigates the different reasons of student’s regular use cell phones in lecture classes. 214 students responded to a five point likert scale questionnaire for self-control, 7 point likert scale for engagement and another five point likert scale for internal addiction. The researcher executed a confirmatory analysis and the findings revealed that there were various dimensions such as class related use, addiction, emergency, boredom and social connection that are considered as a gravitational force towards cell phone. A pilot study was conducted to examine the views of lecturers on the student’s usage of cell phones during the class hours. The researchers have used a five point likert scale questionnaire to collect data through online from 32 lecturers from higher education institution and a university in Oman. This study came up with the evidence that the cell phones are leading the students to misconduct and making serious distraction in learning and teaching environment. Majority of the lecturers responded that cell phones are causing serious issues among faculty and deviating student’s focus from studies (Shrivastava & Shrivastava, 2014). The purpose of Ugur’s (2015) study was to examine students’ use of cell phones to feel safe, for cheating or phubbing during lecture hours. A sample of 349 higher education students from the faculty of business administration at Sakarya University in Turkey was used for data collection. This quantitative research study shows that only few students are using the mobile phones positively to develop learning such as gathering information for the lesson through internet, use their digital cameras to take pictures of the lecture points written on the blackboard or screen, use the feature of calculator to calculate some values and so forth. However, most of the students used the mobile phones for activities which are not part of the studies. The researcher also noticed that majority of the students distracted others and this process continues until the administrator finds a solution. Finally, Gikas and Grant (2013) conducted a research on students from three universities in the Unites States. A qualitative method was used to collect the data. The objective of the study was to investigate the effects of learning and teaching when mobile devices such as smart phones, cell phones were integrated in higher education. A focus group interview was held to obtain a grounded data from students. The findings revealed that cell phones are creating chances for the students to collaborate among each other as well as to interact and engage using social media and Web 2.0 tools with the help of device being connected online always.
TOJET: The Turkish Online Journal of Educational Technology – January 2018, volume 17 issue 1
Copyright © The Turkish Online Journal of Educational Technology 249
RESEARCH METHODOLOGY Research design This research adopted a descriptive research design. This research was conducted through a quantitative survey methodology in which the researcher himself administered the questionnaires and issued out to 179 university students who had been carefully sampled. According to Ary, Jacobs, Razavieh, and Sorensen (2006) survey or descriptive research is used to collect the information from a set of participants. “Surveys permit the researcher to summarize the characteristics of different groups or to measure their attitudes and opinions towards some issue” (Ary, Jacobs, Razavieh, & Sorensen, 2006, p. 31). The participants in this study were the registered students in National Diploma: Information Technology who had cell phones. The reason for choosing these students is due to the convenient accessibility of the researcher as he is working in the same department of the university. The research site, participant’s stream and participant’s level have been described below. Arrangement for conducting the study Eastern Cape Province is a province which has so many rural places from where the students have no access to move to cities and study in highly reputed universities due to the poor financial background. The present study was conducted at a university in the Eastern Cape Province of South Africa. This university was mainly started with an aim of delivering quality education to the students who are around this area. The university does not have any policy that restricts the students from using cell phones in classroom. Entrance into the diploma course is based on grade 12 results and Standardised Assessment Test for Access and Placement (SATAP). The scores in the SATAP are used to group entrants into extended and main streams. The level of students in the department is categorized into five. They are Diploma Extended Stream year 1, Diploma Extended Stream year 2, Diploma Main Stream year 1, Diploma Main Stream year 2 and Diploma Main Stream year 3. Students who have less score will be registered for Diploma Extended Stream year 1 and high score for Diploma Main Stream year 1. The first half of course topics, in Diploma Main Stream year 1 is included in Diploma Extended Stream year 1 and second half in Diploma Extended Stream year 2 as Diploma Extended Stream students are considered as slow students. Those who begin in the extended stream year 1 have to complete the extended stream year 2 and then they proceed to the main stream year 2 which is their third year of study in the institution. In the third year, they are mixed with main stream students who are in the second year of study in one class. Then those in the third year from the extended stream and those in the second year of main stream proceed to the final year. Therefore the population of the participants in this study are, all students who are registered for National Diploma: Information Technology that comprises of all the year levels of both streams mentioned above which makes a grand total of 479. Data collection instruments The 5-point Likert-scale was used for the collection of quantitative data and the survey questions were categorized into two ways. The first category was to put the items ranging from strongly agree = 5, agree = 4, no opinion =3, disagree = 2, strongly disagree = 1 and it includes 23 items. The second was Always = 5, frequently = 4, sometimes =3, few = 2, never=1 and it includes 10 items. The Likert-scale was validated for content validity by few experts who are in this area and the reliability was calculated and found to be 0.71. The quantitative data analysis involved a process of data cleaning and data entry. The researcher manually entered the data into Microsoft Excel 2013. The researcher used descriptive statistics to calculate Percentages to analyse the data. Tables were used to sum up the indicators. Descriptive statistics are used to arrange, classify and formulate the information directly (Shepherd, 2002). The questionnaire items were developed and were distributed to the students by the researcher himself by visiting them in the classroom. A brief idea about the questionnaire such as general purpose of survey, how to use and the questions related to the data collection tools were described in the questionnaire and given to all the participants. In addition, the researcher emphasized that the participation was voluntary and the responses of the participants will remain anonymous and confidential, no information that could reveal their identity will be used and participation of students had no bearing on their status in the course and in no ways it will affect their marks for any courses. All data collection and analysis procedures were performed in accordance with the permission received from the department of the university. The surveys given to students consist of questions focussing on their perception about the Cell phone usage in a class room. In addition, all students were asked to answer questions about their age, gender, stream and year of study.
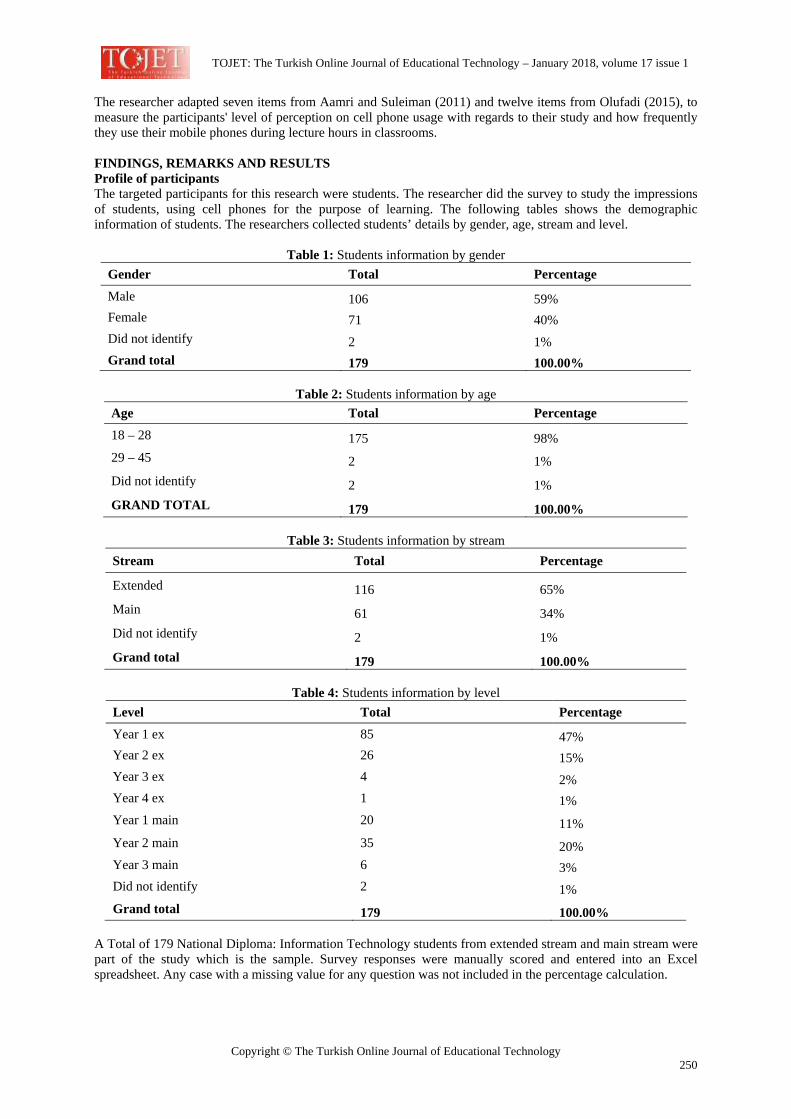
TOJET: The Turkish Online Journal of Educational Technology – January 2018, volume 17 issue 1
Copyright © The Turkish Online Journal of Educational Technology 250
The researcher adapted seven items from Aamri and Suleiman (2011) and twelve items from Olufadi (2015), to measure the participants' level of perception on cell phone usage with regards to their study and how frequently they use their mobile phones during lecture hours in classrooms. FINDINGS, REMARKS AND RESULTS Profile of participants The targeted participants for this research were students. The researcher did the survey to study the impressions of students, using cell phones for the purpose of learning. The following tables shows the demographic information of students. The researchers collected students’ details by gender, age, stream and level.
Table 1: Students information by gender Gender Total Percentage
Male 106 59% Female 71 40% Did not identify 2 1% Grand total 179 100.00%
Table 2: Students information by age
Age Total Percentage
18 – 28 175 98% 29 – 45 2 1% Did not identify 2 1% GRAND TOTAL 179 100.00%
Table 3: Students information by stream
Stream Total Percentage
Extended 116 65% Main 61 34% Did not identify 2 1% Grand total 179 100.00%
Table 4: Students information by level
Level Total Percentage
Year 1 ex 85 47% Year 2 ex 26 15% Year 3 ex 4 2% Year 4 ex 1 1% Year 1 main 20 11% Year 2 main 35 20% Year 3 main 6 3% Did not identify 2 1% Grand total 179 100.00%
A Total of 179 National Diploma: Information Technology students from extended stream and main stream were part of the study which is the sample. Survey responses were manually scored and entered into an Excel spreadsheet. Any case with a missing value for any question was not included in the percentage calculation.
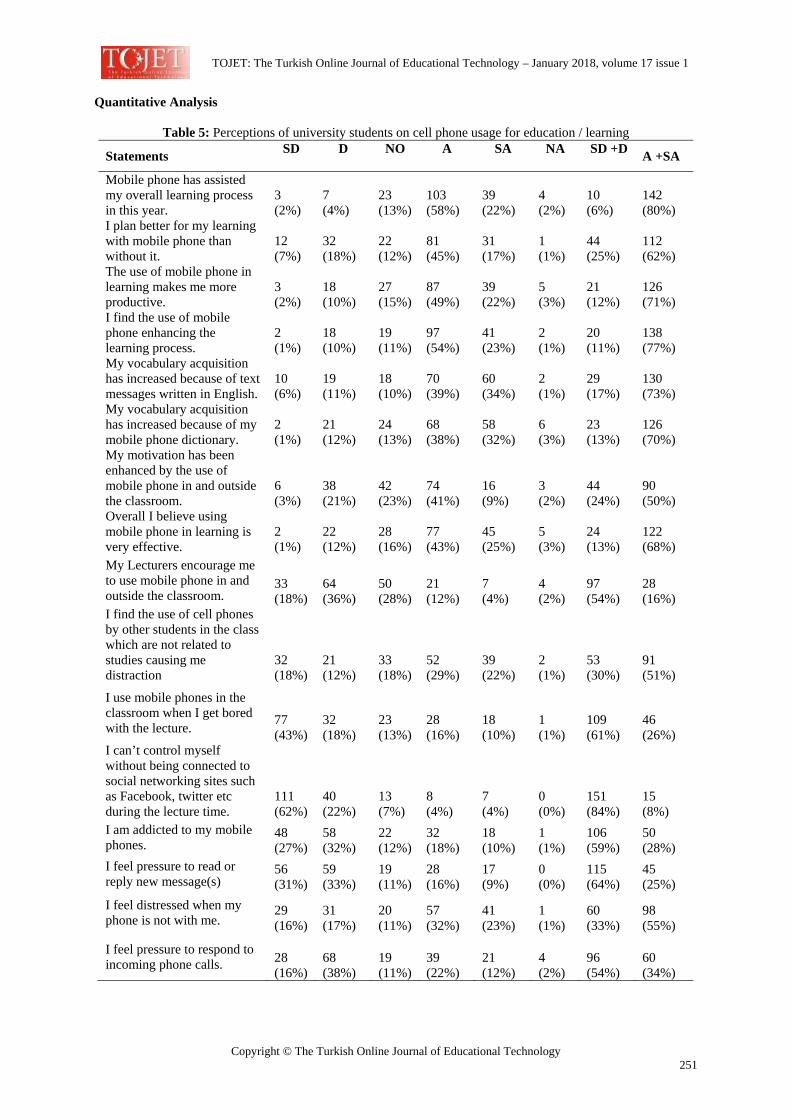
TOJET: The Turkish Online Journal of Educational Technology – January 2018, volume 17 issue 1
Copyright © The Turkish Online Journal of Educational Technology 251
Quantitative Analysis
Table 5: Perceptions of university students on cell phone usage for education / learning
Statements SD
D
NO
A
SA
NA
SD +D A +SA
Mobile phone has assisted my overall learning process in this year.
3 (2%)
7 (4%)
23 (13%)
103 (58%)
39 (22%)
4 (2%)
10 (6%)
142 (80%)
I plan better for my learning with mobile phone than without it.
12 (7%)
32 (18%)
22 (12%)
81 (45%)
31 (17%)
1 (1%)
44 (25%)
112 (62%)
The use of mobile phone in learning makes me more productive.
3 (2%)
18 (10%)
27 (15%)
87 (49%)
39 (22%)
5 (3%)
21 (12%)
126 (71%)
I find the use of mobile phone enhancing the learning process.
2 (1%)
18 (10%)
19 (11%)
97 (54%)
41 (23%)
2 (1%)
20 (11%)
138 (77%)
My vocabulary acquisition has increased because of text messages written in English.
10 (6%)
19 (11%)
18 (10%)
70 (39%)
60 (34%)
2 (1%)
29 (17%)
130 (73%)
My vocabulary acquisition has increased because of my mobile phone dictionary.
2 (1%)
21 (12%)
24 (13%)
68 (38%)
58 (32%)
6 (3%)
23 (13%)
126 (70%)
My motivation has been enhanced by the use of mobile phone in and outside the classroom.
6 (3%)
38 (21%)
42 (23%)
74 (41%)
16 (9%)
3 (2%)
44 (24%)
90 (50%)
Overall I believe using mobile phone in learning is very effective.
2 (1%)
22 (12%)
28 (16%)
77 (43%)
45 (25%)
5 (3%)
24 (13%)
122 (68%)
My Lecturers encourage me to use mobile phone in and outside the classroom.
33 (18%)
64 (36%)
50 (28%)
21 (12%)
7 (4%)
4 (2%)
97 (54%)
28 (16%)
I find the use of cell phones by other students in the class which are not related to studies causing me distraction
32 (18%)
21 (12%)
33 (18%)
52 (29%)
39 (22%)
2 (1%)
53 (30%)
91 (51%)
I use mobile phones in the classroom when I get bored with the lecture. 77
(43%) 32 (18%)
23 (13%)
28 (16%)
18 (10%)
1 (1%)
109 (61%)
46 (26%)
I can’t control myself without being connected to social networking sites such as Facebook, twitter etc during the lecture time.
111 (62%)
40 (22%)
13 (7%)
8 (4%)
7 (4%)
0 (0%)
151 (84%)
15 (8%)
I am addicted to my mobile phones.
48 (27%)
58 (32%)
22 (12%)
32 (18%)
18 (10%)
1 (1%)
106 (59%)
50 (28%)
I feel pressure to read or reply new message(s)
56 (31%)
59 (33%)
19 (11%)
28 (16%)
17 (9%)
0 (0%)
115 (64%)
45 (25%)
I feel distressed when my phone is not with me.
29 (16%)
31 (17%)
20 (11%)
57 (32%)
41 (23%)
1 (1%)
60 (33%)
98 (55%)
I feel pressure to respond to incoming phone calls. 28
(16%) 68 (38%)
19 (11%)
39 (22%)
21 (12%)
4 (2%)
96 (54%)
60 (34%)
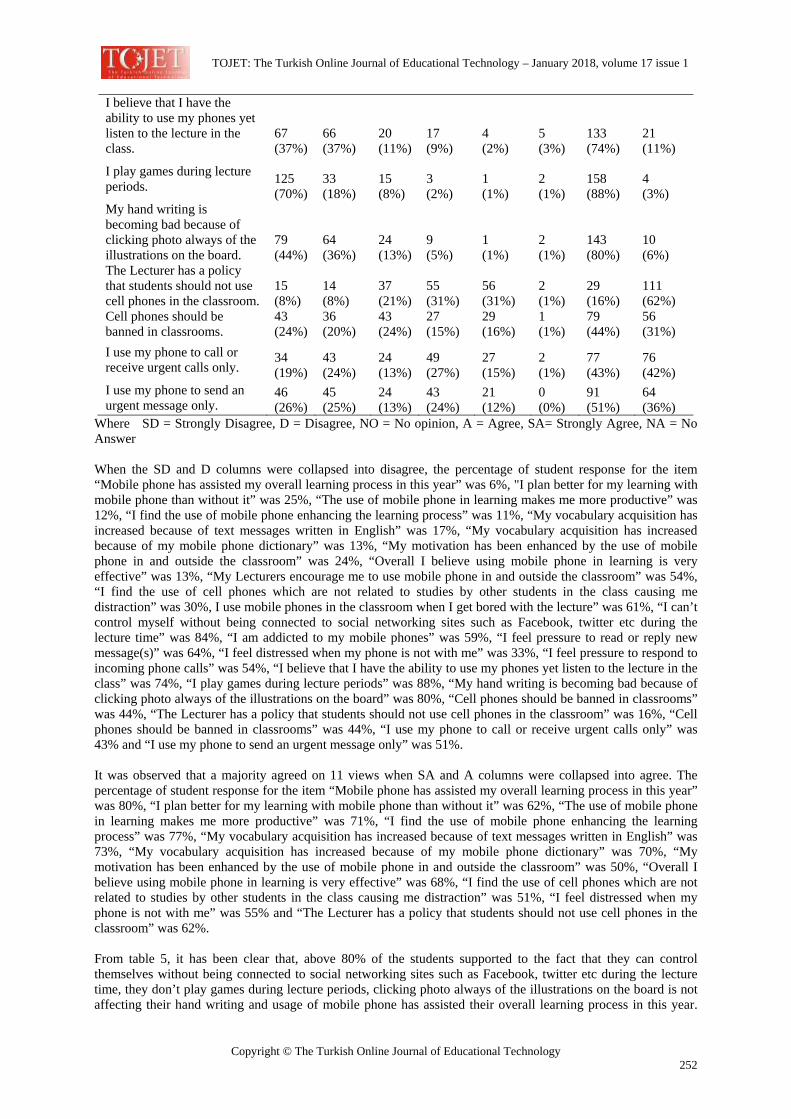
TOJET: The Turkish Online Journal of Educational Technology – January 2018, volume 17 issue 1
Copyright © The Turkish Online Journal of Educational Technology 252
I believe that I have the ability to use my phones yet listen to the lecture in the class.
67 (37%)
66 (37%)
20 (11%)
17 (9%)
4 (2%)
5 (3%)
133 (74%)
21 (11%)
I play games during lecture periods. 125
(70%) 33 (18%)
15 (8%)
3 (2%)
1 (1%)
2 (1%)
158 (88%)
4 (3%)
My hand writing is becoming bad because of clicking photo always of the illustrations on the board.
79 (44%)
64 (36%)
24 (13%)
9 (5%)
1 (1%)
2 (1%)
143 (80%)
10 (6%)
The Lecturer has a policy that students should not use cell phones in the classroom.
15 (8%)
14 (8%)
37 (21%)
55 (31%)
56 (31%)
2 (1%)
29 (16%)
111 (62%)
Cell phones should be banned in classrooms.
43 (24%)
36 (20%)
43 (24%)
27 (15%)
29 (16%)
1 (1%)
79 (44%)
56 (31%)
I use my phone to call or receive urgent calls only.
34 (19%)
43 (24%)
24 (13%)
49 (27%)
27 (15%)
2 (1%)
77 (43%)
76 (42%)
I use my phone to send an urgent message only.
46 (26%)
45 (25%)
24 (13%)
43 (24%)
21 (12%)
0 (0%)
91 (51%)
64 (36%)
Where SD = Strongly Disagree, D = Disagree, NO = No opinion, A = Agree, SA= Strongly Agree, NA = No Answer When the SD and D columns were collapsed into disagree, the percentage of student response for the item “Mobile phone has assisted my overall learning process in this year” was 6%, "I plan better for my learning with mobile phone than without it” was 25%, “The use of mobile phone in learning makes me more productive” was 12%, “I find the use of mobile phone enhancing the learning process” was 11%, “My vocabulary acquisition has increased because of text messages written in English” was 17%, “My vocabulary acquisition has increased because of my mobile phone dictionary” was 13%, “My motivation has been enhanced by the use of mobile phone in and outside the classroom” was 24%, “Overall I believe using mobile phone in learning is very effective” was 13%, “My Lecturers encourage me to use mobile phone in and outside the classroom” was 54%, “I find the use of cell phones which are not related to studies by other students in the class causing me distraction” was 30%, I use mobile phones in the classroom when I get bored with the lecture” was 61%, “I can’t control myself without being connected to social networking sites such as Facebook, twitter etc during the lecture time” was 84%, “I am addicted to my mobile phones” was 59%, “I feel pressure to read or reply new message(s)” was 64%, “I feel distressed when my phone is not with me” was 33%, “I feel pressure to respond to incoming phone calls” was 54%, “I believe that I have the ability to use my phones yet listen to the lecture in the class” was 74%, “I play games during lecture periods” was 88%, “My hand writing is becoming bad because of clicking photo always of the illustrations on the board” was 80%, “Cell phones should be banned in classrooms” was 44%, “The Lecturer has a policy that students should not use cell phones in the classroom” was 16%, “Cell phones should be banned in classrooms” was 44%, “I use my phone to call or receive urgent calls only” was 43% and “I use my phone to send an urgent message only” was 51%. It was observed that a majority agreed on 11 views when SA and A columns were collapsed into agree. The percentage of student response for the item “Mobile phone has assisted my overall learning process in this year” was 80%, “I plan better for my learning with mobile phone than without it” was 62%, “The use of mobile phone in learning makes me more productive” was 71%, “I find the use of mobile phone enhancing the learning process” was 77%, “My vocabulary acquisition has increased because of text messages written in English” was 73%, “My vocabulary acquisition has increased because of my mobile phone dictionary” was 70%, “My motivation has been enhanced by the use of mobile phone in and outside the classroom” was 50%, “Overall I believe using mobile phone in learning is very effective” was 68%, “I find the use of cell phones which are not related to studies by other students in the class causing me distraction” was 51%, “I feel distressed when my phone is not with me” was 55% and “The Lecturer has a policy that students should not use cell phones in the classroom” was 62%. From table 5, it has been clear that, above 80% of the students supported to the fact that they can control themselves without being connected to social networking sites such as Facebook, twitter etc during the lecture time, they don’t play games during lecture periods, clicking photo always of the illustrations on the board is not affecting their hand writing and usage of mobile phone has assisted their overall learning process in this year.
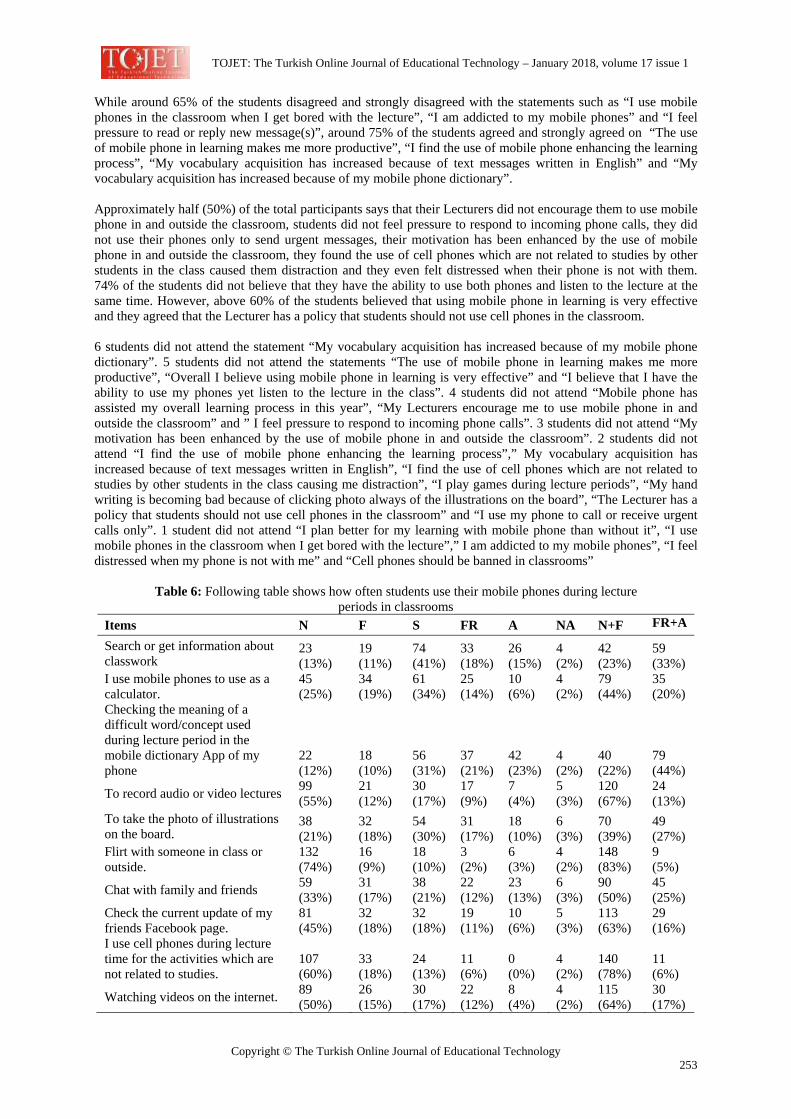
TOJET: The Turkish Online Journal of Educational Technology – January 2018, volume 17 issue 1
Copyright © The Turkish Online Journal of Educational Technology 253
While around 65% of the students disagreed and strongly disagreed with the statements such as “I use mobile phones in the classroom when I get bored with the lecture”, “I am addicted to my mobile phones” and “I feel pressure to read or reply new message(s)”, around 75% of the students agreed and strongly agreed on “The use of mobile phone in learning makes me more productive”, “I find the use of mobile phone enhancing the learning process”, “My vocabulary acquisition has increased because of text messages written in English” and “My vocabulary acquisition has increased because of my mobile phone dictionary”. Approximately half (50%) of the total participants says that their Lecturers did not encourage them to use mobile phone in and outside the classroom, students did not feel pressure to respond to incoming phone calls, they did not use their phones only to send urgent messages, their motivation has been enhanced by the use of mobile phone in and outside the classroom, they found the use of cell phones which are not related to studies by other students in the class caused them distraction and they even felt distressed when their phone is not with them. 74% of the students did not believe that they have the ability to use both phones and listen to the lecture at the same time. However, above 60% of the students believed that using mobile phone in learning is very effective and they agreed that the Lecturer has a policy that students should not use cell phones in the classroom. 6 students did not attend the statement “My vocabulary acquisition has increased because of my mobile phone dictionary”. 5 students did not attend the statements “The use of mobile phone in learning makes me more productive”, “Overall I believe using mobile phone in learning is very effective” and “I believe that I have the ability to use my phones yet listen to the lecture in the class”. 4 students did not attend “Mobile phone has assisted my overall learning process in this year”, “My Lecturers encourage me to use mobile phone in and outside the classroom” and ” I feel pressure to respond to incoming phone calls”. 3 students did not attend “My motivation has been enhanced by the use of mobile phone in and outside the classroom”. 2 students did not attend “I find the use of mobile phone enhancing the learning process”,” My vocabulary acquisition has increased because of text messages written in English”, “I find the use of cell phones which are not related to studies by other students in the class causing me distraction”, “I play games during lecture periods”, “My hand writing is becoming bad because of clicking photo always of the illustrations on the board”, “The Lecturer has a policy that students should not use cell phones in the classroom” and “I use my phone to call or receive urgent calls only”. 1 student did not attend “I plan better for my learning with mobile phone than without it”, “I use mobile phones in the classroom when I get bored with the lecture”,” I am addicted to my mobile phones”, “I feel distressed when my phone is not with me” and “Cell phones should be banned in classrooms”
Table 6: Following table shows how often students use their mobile phones during lecture periods in classrooms
Items N F S FR A NA N+F FR+A
Search or get information about classwork
23 (13%)
19 (11%)
74 (41%)
33 (18%)
26 (15%)
4 (2%)
42 (23%)
59 (33%)
I use mobile phones to use as a calculator.
45 (25%)
34 (19%)
61 (34%)
25 (14%)
10 (6%)
4 (2%)
79 (44%)
35 (20%)
Checking the meaning of a difficult word/concept used during lecture period in the mobile dictionary App of my phone
22 (12%)
18 (10%)
56 (31%)
37 (21%)
42 (23%)
4 (2%)
40 (22%)
79 (44%)
To record audio or video lectures 99 (55%)
21 (12%)
30 (17%)
17 (9%)
7 (4%)
5 (3%)
120 (67%)
24 (13%)
To take the photo of illustrations on the board.
38 (21%)
32 (18%)
54 (30%)
31 (17%)
18 (10%)
6 (3%)
70 (39%)
49 (27%)
Flirt with someone in class or outside.
132 (74%)
16 (9%)
18 (10%)
3 (2%)
6 (3%)
4 (2%)
148 (83%)
9 (5%)
Chat with family and friends 59 (33%)
31 (17%)
38 (21%)
22 (12%)
23 (13%)
6 (3%)
90 (50%)
45 (25%)
Check the current update of my friends Facebook page.
81 (45%)
32 (18%)
32 (18%)
19 (11%)
10 (6%)
5 (3%)
113 (63%)
29 (16%)
I use cell phones during lecture time for the activities which are not related to studies.
107 (60%)
33 (18%)
24 (13%)
11 (6%)
0 (0%)
4 (2%)
140 (78%)
11 (6%)
Watching videos on the internet. 89 (50%)
26 (15%)
30 (17%)
22 (12%)
8 (4%)
4 (2%)
115 (64%)
30 (17%)
TOJET: The Turkish Online Journal of Educational Technology – January 2018, volume 17 issue 1
Copyright © The Turkish Online Journal of Educational Technology 254
Where N = Never, F = Few, S = Sometimes, FR= Frequently , A = Always, NA = No Answer
When the N and F columns were collapsed into never and few, the percentage of student response for the item “Search or get information about classwork” was 23%, “I use mobile phones to use as a calculator” was 44%, “Checking the meaning of a difficult word/concept used during lecture period in the mobile dictionary App of my phone” was 22%, “To record audio or video lectures” was 67%, “To take the photo of illustrations on the board” was 39%, “Flirt with someone in class or outside” was 83%, “Chat with family and friends” was 50%, “Check the current update of my friends Facebook page” was 63%, “I use cell phones during lecture time for the activities which are not related to studies” was 78% and “Watching videos on the internet” was 64%. When FR and A columns were collapsed into agree, it was observed that a majority agreed that they have used their mobile phones during lecture periods in classrooms for 2 views. The percentage of student response for the item “Search or get information about classwork” was 33% and “Checking the meaning of a difficult word/concept used during lecture period in the mobile dictionary App of my phone” was 44%. As can be seen from Table 2b, approximately 80% of the participants responded that they never and few times flirted with someone in class or outside during lecture time and used cell phones during lecture time for the activities which are not related to studies. More than 60% of the students never and few times recorded audio or video lectures, checked the current update of their friends Facebook page and watch videos on the internet. While nearly 40% never and few times used mobile phones to use as calculator and to take the photo of illustrations on the board, 44% of the students frequently and always checked the meaning of difficult words/concepts used during lecture period in the mobile dictionary App of their phone. Exactly half of the participants never and few times chatted with family and friends in lecture time. 33% frequently and always search or get information about classwork. 4 students did not attend the statement “Search or get information about classwork”, “I use mobile phones to use as a calculator”, “Checking the meaning of a difficult word/concept used during lecture period in the mobile dictionary App of my phone”, “Flirt with someone in class or outside”, “I use cell phones during lecture time for the activities which are not related to studies” and “Watching videos on the internet.”. 5 students did not attend “To record audio or video lectures” and” Check the current update of my friends Facebook page”. 6 students did not attend “To take the photo of illustrations on the board” and “Chat with family and friends”. DISCUSSION In an effort to measure the perception of students on the usage of Cell phones in a university class room, the researcher performed quantitative method and clearly confirms that overall, the purpose for learning or education has been exhibited in a positive way. In the present study, it shows that majority of the students have found that the use of mobile phone has enhanced the learning process and vocabulary acquisition because of the mobile phone dictionary. They also plan better for their learning with mobile phone than without it. These are corroborating with the findings by Aamri and Suleiman (2011) and Javid, Malik, and Gujjar (2011). It emerged from the study that usage of Cell phones has boosted their motivation and vocabulary acquisition because of text messages written in English in and outside the classroom. As a whole, students believed that the mobile phone use in learning is very effective which has made them more productive. These results agree with the findings by Aamri and Suleiman (2011). More than 50% of the participants in this study agreed that that the use of cell phones which are not related to studies by class mates in the classroom has caused distraction to students. This statement coincides with the findings of Ugur (2015) and Aamri and Suleiman (2011). The participants in the study conducted by Ugur (2015) observed that some offending students are phubbing in class that leads to distraction for other students or instructor in classroom. Aamri and Suleiman (2011) also concurred that the use of cell phones creates distraction among students and lecturers. The present study further established that students do not use mobile phones in the classroom when they get bored with the lecture which is similar to the finding by Aamri and Suleiman (2011) as they states that “We the students do not use mobile phones in lecture at all” (p.149). However, these results does not corroborates with Olufadi (2015) and Ugur (2015). Ugur (2015) states that “the greatest portion with 60% said they start phubbing because they get bored during courses” (p. 62). Jumoke, Oloruntoba, and Blessing (2015) specified that “most of the respondent believed that the biggest issue in mobile phone usage is the addiction to usage of social network” (p. 366). They further continued and concluded that the use of social networks is a main reason for the poor academic performance of students. Findings of Olufadi (2015) also support the same. Ugur (2015) revealed that “56.9% of them indicated that they check whatsapp, 41% send messages, 32,9% surf the web, 22% use facebook during courses” (p.61). Conversely, in the present study majority of the students believed that they can control themselves without being connected to social networking sites such as Facebook, twitter etc. during the lecture
TOJET: The Turkish Online Journal of Educational Technology – January 2018, volume 17 issue 1
Copyright © The Turkish Online Journal of Educational Technology 255
time. Most of the students indicated that they are not addicted to mobile phones which contradict with the investigations by Halder, Halder, and Guha (2015), Olufadi (2015) and Jumoke, Oloruntoba and Blessing (2015). The study revealed that the students do not feel pressure to read or respond to new messages and incoming calls. They do not play games during lecture periods as well as do not have the ability to use phones and listen to lecture simultaneously. These findings are inconsistent with views of Olufadi (2015). Nevertheless, it is consistent in the case of using cell phones to send and receive only urgent messages and calls when compared with the current study. In the present study, students do not believe that their hand writing is becoming bad because of clicking photo always of the illustrations on the board which does not substantiate with the findings by Shrivastava and Shrivastava (2014). Most of the students in the current study feels that they become distressed when their phone is not with them which is similar to the results found by Olufadi (2015) and Belwal amd Belwal (2009). The current research shows that during lecture periods in classrooms, majority of the students never and few times flirt with someone in class or outside, use mobile phones as calculator, take the photo for illustrations on the board, record audio or video lectures, chat with family and friends, check the current update of their friends Facebook page, Watch videos on the internet and use phones for the activities which are not related to studies. On the other hand, Olufadi’s (2015) research shows a negative impression on all of the mentioned above. The study found that students who frequently and always searches or gets the information about classwork and checks the meaning of a difficult word/concept in the mobile dictionary App from their cell phone are more which are in line with the investigations by Olufadi (2015). The study found that Lecturers do not encourage students to use mobile phone in and outside the classroom which is consistent with the investigations made by Aamri, Suleiman (2011), Shrivastava and Shrivastava (2014). Ugur (2015) concurs that “if college instructors knew about text messaging in the classroom, they would be shocked” (p. 62). Majority of the students agrees that Lecturer has a policy that students should not use cell phones in the classroom. Shrivastava and Shrivastava (2014) revealed that “77% of respondent are agree and strongly agree that there should be instructor’s guidelines restricting mobile phone during the class” (p. 640). Participants in the study conducted by Ugur (2015) claimed that “92% of the instructors, who care about phubbing, and have a set of rules during courses” (p. 62). As such, students do not want to confront with the instructor as there is a said policy. Findings of the present study were therefore consistent with the findings by Shrivastava and Shrivastava (2014) and Ugur (2015). Shrivastava and Shrivastava (2014) indicated that “81% Participants supported that there should be clear policies restricting mobile phones in college classrooms “(p. 640). Ugur (2015) observed that there are lot of support for mobile phones to be banned from colleges. The results obtained from the current survey showed that students do not feel that cell phones should be banned in classrooms as majority of them use this tool for learning purposes Furthermore, this study shows that mobile phone has assisted students overall learning process which is stable with the investigations by Aamri and Suleiman (2011), Belwal and Belwal (2009), Javid, Malik, and Gujjar (2011) and Gikas and Grant (2013). Age, gender, level and stream did not affect students’ perceptions of learning in the class room. Overall from the findings, it has concluded that the majority of the students’ are utilizing this mobile tool effectively. CONCLUSION, IMPLICATIONS, AND LIMITATIONS The study could be concluded from the findings that students show positive attitudes about cell phones use in university classrooms during lectures. Their motivation to learn has been enhanced by the use of mobile phone in and outside the classroom. Even though, the Off-task behaviour of some students are causing distractions to the fellow classmates, majority of the students agreed that mobile phones have assisted in their overall learning process. Furthermore, this study has discovered that the university students are matured enough to handle this device excellently and not dialling “D” for disaster but “L” for learning. Ultimately, the current era is not in the world of mobile phone but in the world of smart phones which can be used not just for making calls but also for browsing and gathering information for the studies. If all the students are using this tool efficiently, the world can have not a better future but a best future. This study only covered views of students. It would be more beneficial to conduct a study to investigate the views of Lecturers on the cell phone usage of students in the classroom. It would also be interesting to conduct a comparative study on controlling the cell phones and teaching styles in other countries with the styles in South Africa. In the light of conclusion, the researcher makes three recommendations to the Faculty or Educators of the university who are consenting the students to use cell phones in an academy. (1) faculty must describe the guidelines on the first day itself to all the students, (2) lecturer must list the educational apps that the students need to be installed on their phones which will enhance their learning, and (3) avoid enrolling large number of
TOJET: The Turkish Online Journal of Educational Technology – January 2018, volume 17 issue 1
Copyright © The Turkish Online Journal of Educational Technology 256
students to a class which will help the lecturer to have a close contact with students in terms of using cell phone positively. This study is not without limitations. The students in the study were from the department of Information Technology. Thus, it would be beneficial to conduct a similar case study with the group of students from other departments too in the university and from the schools to find out whether it’s the same opinion or a different one. ACKNOWLEDGEMENT The author gratefully acknowledges the support for the research and publication of this paper from Walter Sisulu University (WSU). REFERENCES Aamri, A., & Suleiman, K. (2011). The use of mobile phones in learning English language by Sultan Qaboos
university students: Practices, attitudes and challenges. Canadian Journal on Scientific & Industrial Research, 2(3), 143- 152.
Ary, D., Jacobs, L. C., Razavieh, A., & Sorensen, C. (2006). Introduction to research in education (7th ed.). Belmont, CA: Thomson Wadsworth.
Balakrishnan, V., & Raj, R. G. (2012). Exploring the relationship between urbanized Malaysian youth and their mobile phones: A quantitative approach. Telematics and Informatics, 29(3), 263–272.
Barks, A., Searight, H., & Ratwik, S. (2011). Effects of text messaging on academic performance. Journal of Pedagogy and Psychology "Signum Temporis", 4(1), 4-9. doi: 10.2478/v10195-011-0039-0.
Baron, N., & Campbell, E. (2010). Talking takes too long: Gender and cultural patterns in mobile telephony. In conference of Association of Internet Researchers. Göteborg, Sweden.
Beaver, T., Knox, D., & Zusman, M. (2010). “ Hold the phone!”: Cell phone use and partner reaction among university students. College Student Journal, 44(3), 629–632.
Belwal, R., & Belwal, S. (2009). Mobile phone usage behaviour of university students in Oman. NISS '09 Proceedings of the 2009 International Conference on New Trends in Information and Service Science, IEEE Computer Society, 954-962.
Campbell, S., & Russo, T. (2003). The social construction of mobile telephony: An application of the social influence model to perceptions and uses of mobile phones within personal communication networks. Communication Monographs, (70), 317-334. doi: 10.1080/0363775032000179124.
Campbell, S. (2004). Normative mobile phone use in public settings. Annual Meeting of the National Communication Association, Chicago, 10-14 November. Chicago: IL.
GSMA Intelligence. Definitive data and analysis for the mobile industry. Retrieved Dec 10, 2014, from https://gsmaintelligence.corm/
Dounay. J. (2004). Pagers and cellular phones on school property. Education Commission of the States: Safety Notes. Retrieved from http://www.ecs.org/html/Document.asp?chouseid=5444
Doward, J. (2015, May 16). Schools that ban mobile phones see better academic results. Retrieved from https://www.theguardian.com/education/2015/may/16/schools-mobile-phones-academic-results.
End, C. M., Worthman, S., Mathews, M. B., & Wetterau, K. (2010). Costly cell phones: The impact of cell phone rings on academic performance. Teaching of Psychology, 37, 55–57.
Engel, G., & Green, T. (2011). Cell Phones in the Classroom: Are we Dialing up Disaster? TechTrends: Linking Research & Practice to Improve Learning, 55(2), 39–45. doi: 10.1007/s11528-011-0482-z.
Fasae, J. K., & Iwari, I. A. (2015). Mobile devices for academic practices by students of college of sciences in selected Nigerian private universities. The Electronic Library, 33(4), 749-759. doi: 10.1108/EL-03-2014-0045.
Fla, L.O.L. (2015, June 03). Teacher suspended for jamming students' cell phones. Retrieved from http://abc7chicago.com/education/teacher-suspended-for-jamming-students-cellphones/764005/
Gikas, J., & Grant, M. M. (2013). Mobile computing devices in higher education: Student perspectives on learning with cellphones, smartphones & social media. Internet and Higher Education, 19, 18- 26. doi: 10.1016/j.iheduc.2013.06.002.
Gilroy, M. (2004). Invasion of the classroom cell phones. Education Digest, 69(6), 56-60. Halder, I., Halder, S., & Guha, A. (2015). Undergraduate students’ use of mobile phones: Exploring use of
advanced technological aids for educational purpose. Journal of media and communication studies, 7(4), 81- 87. doi: 10.5897/JMCS2014.0418.
Hartley, J.T., Harker, O.J., & Walsh, D.A. (1980). Contemporary issues and new directions in adult development of learning and memory. In L.W. Poon (Ed.), Aging in the 1980’s: psychological issues. Washington: American Psychological Association.
Hong, F.-Y., Chiu, S.-I., & Huang, D.-H. (2012). A model of the relationship between psychological characteristics, mobile phone addiction and use of mobile phones by Taiwanese university female students. Computers in Human Behavior, 28(6), 2152–2159.
TOJET: The Turkish Online Journal of Educational Technology – January 2018, volume 17 issue 1
Copyright © The Turkish Online Journal of Educational Technology 257
Internet Seen as Positive Influence on Education but Negative on Morality in Emerging and Developing Nations. (2015, March 19). Retrieved from http://www.pewglobal.org/2015/03/19/internet-seen-as-positive-influence-on-education-but-negative-influence-on-morality-in-emerging-and-developing-nations/
Israel, P. (1998). Edison: A Life of Invention. New York: John Wiley and Sons. ITU. (2002). World communication indicators database (6th ed.). Geneva: International Telecommunication
Union. Javid, M., Malik, M. A., & Gujjar, A. A. (2011). Mobile Phone Culture and its Psychological Impacts on
Students’ Learning at the University Level. Language in India, 11(2), 415-422. Joseph, J. (2012). The Barriers of Using Education Technology for Optimizing the Educational Experience of
Learners. International educational technology conference, 64, 427 – 436. doi: 10.1016/j.sbspro.2012.11.051.
Jumoke, S., Oloruntoba, S. A., & Blessing, O. (2015). Analysis of Mobile Phone Impact on Student Academic Performance in Tertiary Institution. International Journal of Emerging Technology and Advanced Engineering, 5(1), 361- 367.
Katz, J. (2005). Mobile phones in educational settings: A sense of place: The gobal and the local in mobile communication, 305-317.
Kottasova, I. (2015, May 18). Kids do a lot better when schools ban smartphones. Retrieved from http://money.cnn.com/2015/05/18/technology/smartphones-schools-ban/
Kreutzer, T. (2009). Internet and online media usage on mobile phones among low-income urban youth in Cape Town. International Journal of Education and Development using ICT, 5(5), 1–21.
Lenhart, A. (2012). Teens, smartphones and texting. Retrieved from http://www.pewinternet.org/Reports/2012/Teens-and-smartphones.aspx
Lenhart, A., Ling, R., Campbell, S., & Purcell, K. (2010). Teens and mobile phones: Text messaging explodes as teens embrace it as the centerpiece of their communication strategies with friends. Retrieved from http://pewInternet.org/Reports/2010/Teens-and-Mobile-Phones.aspx.
Ling, R. (1997). One can talk about common manners!: The use of mobile telephones in inappropriate situations. Themes in mobile telephony final report of the COST 248 home and work group, 1-18. doi: 10.1.1.417.4556.
Ling, R. (2003). Fashion and Vulgarity in the Adoption of the Mobile Telephone among Teens in Norway. In Fortunati, Leopoldia and Katz, James E. and Riccini, Raimonda (Eds.), Mediating the human body: Technology, communication and fashion. Mahwah, NJ: Lawrence Erlbaum Associates.
Lobo, D., & Joshma, P. J. (2013). A study to assess the impact of mobile phone use on various dimensions of students’ life in a selected institution of Mangalore. International Journal of Nursing Education, 5(2), 62-65.
Market data and analysis on the global wireless industry. (2014, October 18). Retrieved from https://www.wirelessintelligence.com/ Index.aspx.
Mifsud, L. (2003). Learning ‘‘2go’’: Pedagogical challenges to mobile learning technology in education. Mobile learning: Essays on philosophy, psychology, and education, 165-173.
Milrad, M. (2003). Mobile learning: Challenges, perspectives, and reality. Mobile learning: Essays on philosophy, psychology, and education, 151-164.
Murtagh, G. (2002). Seeing the ‘‘rules’’: Preliminary observations of action, interaction and mobile phone use. Wireless world: Social and interactional aspects of the mobile age, 79-91.
North, D., Johnston, K., & Ophoff, J. (2014). The use of mobile phones by South African university students. Issues in Informing Science and Information Technology, 11, 115-138.
Ogunyemi, O. (2010). Consumption and (in) appropriate use of mobile phone among teenage Africans in the UK. Lincolnshire, England.
Olufadi, Y. (2015). Gravitating towards mobile phone (GoToMP) during lecture periods by students: Why are they using it? and how can it be measured?. Computers & Education, 87, 423 - 436. doi: 10.1016/j.compedu.2015.08.013.
Rice, R., & Katz, J. (2003). Mobile discourtesy: National survey results on episodes of convergent public and private spheres. Mobile democracy: Essays on society, self and politics.Vienna: Passagen Verlag.
Sandovale, E., Eisinger, D., & Blau, R. (2015, March 02). Department of Education lifts ban on cell phones in New York City schools. Retrieved from http://www.nydailynews.com/new-york/dept-education-ends-cell-phone-ban-nyc-schools-article-1.2134970.
Shanti, S., & Babu, R. P. (2013). Cell phone in the hands of students- boon or to Ban. International Journal of Commerce, Business and Management (IJCBM), 2(4). 216-223.
Shepherd, J. (2002). Sociology Journal of Mixed Research (8th ed.) Belmont: Wadsworth. Shrivastava, A., & Shrivastava, M. (2014). Classroom Distraction Due to Mobile Phones Usage by Students:
College Teachers’ Perceptions. International Journal of Computer and Information Technology, 3(3), 638-642.

TOJET: The Turkish Online Journal of Educational Technology – January 2018, volume 17 issue 1
Copyright © The Turkish Online Journal of Educational Technology 258
St. Gerard, V. (2006). Updating policy on latest risks for students with cell phone in the school. The Education Digest, 74(2), 43-45.
Suominen, A., Hyrynsalmi, S., & Knuutila, T. (2014). Young mobile users: Radical and individual – Not. Telematics and Informatics, 31(2), 266-281.
Taylor, K. (2015, January 06). Ban on Cell phones in New York City Schools to Be Lifted. Retrieved from https://www.nytimes.com/2015/01/07/nyregion/ban-on-cellphones-in-new-york-city-schools-to-be-lifted.html?_r=0 >
Thomas, K., & Bolton, N. (2012). Cell Phones in the Classroom: Educator’s Perspectives. Proceedings of Society for Information Technology & Teacher Education International Conference 2012, 2129-2140.
Tindell, D., & Bohlender, R. (2010). The use and abuse of cell phones and text messaging in the classroom: A survey of college students. College Teaching, 60(1), 1-9.
Ugur, N. G. (2015). Mobile phones as distracting tools in the classroom: college students’ perspective. The Journal of Operations Research, Statistics, Econometrics and Management Information Systems, 3(2), 57- 64.
Walsh, S., White, K., & Young, R. (2010). Needing to connect: The effect of self and others on young people’s involvement with their mobile phones. Australian Journal of Psychology, 62(4), 194–203.
Wash, S. (2009, June 03). School invests in cell phone jammer to block teenage texting. Retrieved from http://www.khq.com/Global/story.asp?S=9963126&nav=menu438_2.
Young, J. (2006). Students passing notes in class via text message. Retrieved from http://www.chronicle.com