Modelization of skin endothelium reactivity, modulation by neuro-peptides
IntroductionThe development of new blood vessels is essential for localtumour progression and the development of distant metastasis(Folkman, 1995; Paweletz and Knierim, 1989; Folkman andShing, 1992; Fidler and Ellis, 1994). Tumour angiogenesisinvolves the degradation of the basement membrane byactivated tissue or circulating endothelial precursors, migrationof endothelial cells and coalescence into vascular tubes(Ausprunk and Folkman, 1977; Nicosia et al., 1982; Hanahan,1988; Hanahan and Folkman, 1996). The individual steps intumour angiogenesis have been identified as targets fortherapies employing angiogenesis inhibitors alone or incombination with standard cancer treatments (Denekamp,1993; Denekamp and Hill, 1991; Rak et al., 1995; Gastl et al.,1997; Kerbel, 1991). Numerous investigations have focused onthe tissue origin of tumour endothelial cells (Lin et al., 2000;Asahara et al., 1997) and the individual genes that promote thegrowth and survival of tumour vessels. Recently, serial analysisof gene expression (SAGE) has provided a preliminary analysisof the genes associated with tumour angiogenesis (St Croix etal., 2000). However, the nature of this analysis precludesquantitative evaluation of gene induction by tumour cells.Analysis of endothelial gene families and the interaction
between specific genes and tumour-derived pro-angiogenicfactors is not yet available
Tumour cells are proposed to mediate tumour angiogenesisby secreting soluble factors that enhance endothelial cellproliferation, migration and tube formation as well as by directcellular interactions with endothelial cells. The interactionsbetween tumour cells and endothelial cells are complex, mightbe analogous to those observed during embryonic developmentand have been hypothesized to be important in the process oftumour angiogenesis (Darland and D’Amore, 1999).
In order to define intercellular interactions in detail, wemodelled tumour angiogenesis by developing an in vitro co-culture system consisting of a human glioma cell line(U87MG) and human umbilical vein endothelial cells(HUVECs). Using this system, we investigated the followinghypotheses.
(1) Stimulation of endothelial cells by tumour cellsestablishes an endothelial phenotype consistent with the initialstages of angiogenesis. This phenotypic switch can bemodelled by co-cultivation of tumour and endothelial cells.
(2) This phenotypic switch is preceded or accompanied bytranscriptional reprogramming of endothelial cells, which canbe detected by expressional profiling. Detection of genes
1013
Tumour angiogenesis is a complex process based upon asequence of interactions between tumour cells andendothelial cells. To model tumour/endothelial-cellinteractions, we co-cultured U87 human glioma cells withhuman umbilical vein endothelial cells (HUVECs). U87cells induced an ‘activated’ phenotype in HUVECs,including an increase in proliferation, migration and net-like formation. Activation was observed in co-cultureswhere cells were in direct contact and physically separated,suggesting an important role for soluble factor(s) in thephenotypic and genotypic changes observed. Expressionalprofiling of tumour-activated endothelial cells wasevaluated using cDNA arrays and confirmed byquantitative PCR. Matching pairs of receptors/ligandswere found to be coordinately expressed, includingTGFβRII with TGF β3, FGFRII and cysteine-rich
fibroblast growth factor receptor (CRF-1) with FGF7and FGF12, CCR1, CCR3, CCR5 with RANTESand calcitronin receptor-like gene (CALCRL) withadrenomedullin. Consistent with cDNA array data,immunohistochemical staining of expressed proteinsrevealed the upregulation of Tie-2 receptor in vitro and invivo. Our data suggest that tumour-induced activationof quiescent endothelial cells involves the expression ofangiogenesis-related receptors and the induction ofautocrine growth loops. We suggest that tumour cellsrelease growth factors that induce endothelial cells toexpress specific ligands and their cognate receptorscoordinately.
Key words: Angiogenesis, Expressional profiling, Intercellularcommunication and activation, Autocrine loops
Summary
Tumour-endothelium interactions in co-culture:coordinated changes of gene expression profiles andphenotypic properties of endothelial cellsNikolai N. Khodarev 1, Jianqing Yu 1, Edwardine Labay 1, Thomas Darga 1, Charles K. Brown 1,Helena J. Mauceri 1, Reza Yassari 2, Nalin Gupta 3 and Ralph R. Weichselbaum 1,*1Department of Radiation and Cellular Oncology, University of Chicago, Chicago, IL 60637, USA2Section of Neurosurgery, University of Chicago, Chicago, IL 60637, USA3Department of Neurosurgery, University of California San Francisco, San Francisco, CA 94143, USA*Author for correspondence (e-mail: [email protected])
Accepted 19 November 2002Journal of Cell Science 116, 1013-1022 © 2003 The Company of Biologists Ltddoi:10.1242/jcs.00281
Research Article
1014
involved in reprogramming of endothelial cells by tumour cellsis important to elucidate the molecular basis of tumour-inducedangiogenesis.(3) Tumour-induced activation of endothelial cells includes theformation of paracrine loops with soluble ligands (cytokinesand growth factors) secreted by tumour cells. It is likely thatsuch activation also involves the formation of autocrine loopsin endothelial cells.
In this report, we demonstrate that U87 cells promotephenotypic changes in HUVECs that include growthstimulation, activation of migration and morphogeneticchanges including formation of net-like structures resemblingneo-vasculature. We also detected expressional changes thatparallel phenotypic changes of endothelial cells and show thatthese alterations are induced by U87-mediated soluble factorsthat might activate the formation of autocrine loops in theendothelial compartment. We were able to define severalgroups of genes that are consistent with observed phenotypicchanges.
Materials and MethodsCell culture and imagingHUVECs (Clonetics) were maintained in EGM-2 medium(Walkersville, MD) at 37°C and 5% CO2. EGM-2 medium consistsof EMB-2 with 1% foetal calf serum and other additives, includinggrowth factors. In experiments where cells are starved, EBM-2 aloneis used. The U87 cell line was transfected with green fluorescentprotein (GFP) to aid in the discrimination of these cells. Transfectionwas performed by the standard method using LIPOFECTIN reagent(Invitrogen, Carlsbad, CA) and the pEGFP-C1 vector system(Clontech, Palo Alto, CA). For growth curves, cells were cultured insix-well plates in duplicate. Cells were counted after trypsinizationusing a haemocytometer on a fluorescence microscope to discriminatebetween the colourless HUVECs and the green U87 cells. Themicroscope system was a Nikon Diaphot TMD inverted microscopeadapted for fluorescence with an epifluorescence attachment andHigh-Q FITC filter cube. In experiments where cells werephotographed on Transwell membranes (Corning Costar, Cambridge,MA), cells were imaged using a Nikon Eclipse E800 microscope witha Sony DXC-970 colour video camera and Image Pro Plus software(Media Cybernetics, Springs, MD).
Net-like formation assaySix-well Transwell cell culture chamber (Costar) inserts with 0.4 µmpores were used with HUVECs plated in the inserts and GFP-U87 inthe chambers (in duplicate) at a 1:10 HUVEC:GFP-U87 ratio. After48 hours, the insert was removed and stained with the PROTOCOLHema 3 stain set (Biochemical Sciences, Swedesboro, NJ) andphotographed at 4× magnification. Completely enclosed spaces werecounted to quantify net-like structures. Angiostatin and endostatin(100 ng ml–1) and herbimycin A (1 µg ml–1) were purchased fromCalbiochem (La Jolla, CA). Anti-VEGF antibody (100 ng ml–1) waspurchased from R&D Systems (Minneapolis, MN).
Migration assay24-well Transwell inserts with a 5 µm pore size were coated with athin layer of collagen (Type I, rat tail, BD Biosciences, Bedford, MA).HUVECs were cultured in EGM-2 with 10% of the usual growthfactors and serum + 0.1% bovine serum albumin for 18 hours beforeswitching to media with no growth factors or serum for 4 hours beforethe start of the experiment. GFP-U87 cells or HUVECs were washedtwice with EBM-2 alone, trypsinized and plated into the lower
chambers at a ratio of one cell (in insert) to ten cells (in chamber cellnumber). HUVECs subject to serum starvation were plated on insertsand cultured for 18 hours before staining the membranes as describedabove. Cells were photographed at 10× magnification, and four fieldseach from duplicate samples were counted to quantify migration.
Transfer of activated HUVECs and induction of cytokinesexpression by tumour conditioned mediumTransWell chambers with 0.4 µm pores were loaded with GFP-U87cells or HUVECs in the inserts and HUVECs or EBM-2 only in thewells (see Fig. 6A). After 24 hours in culture, the inserts wereremoved and HUVECs in the wells were washed four times withEBM-2. Then, inserts that contained HUVECs cultured with onlyEBM-2 in the wells (acceptor HUVECs) were transferred to the wellswith HUVECs cultured with U87 cells (activated HUVECs),HUVECs cultured with HUVECs (naive HUVECs) and HUVECscultured with medium only (negative control). After 24 hours, cells inthe inserts were stained as for the net-like formation assay andstructures were counted and graphed as percent of negative control.
For induction and measurement of cytokine production, GFP-U87cells and HUVECs were set up in T150 flasks as monocultures. At80% confluence, all medium was removed, the cells were washed withEBM-2 and cultured in EBM-2 for 8 hours. Then the conditionedmedia from HUVECs or U87 was centrifuged (250 g for 5 minutes)to remove floating cells and placed on HUVEC for 18, 24 or 48 hours.The medium was centrifuged again and concentrated on a Speed-Vacfrom 20 ml to 0.7 ml. 100 µl of each (in duplicate) was assayed usingthe enzyme-linked immunosorbent serum assay (ELISA; R & DSystems, Minneapolis, MN) for RANTES or FGF-7. ConcentratedEBM-2 alone was used as a blank and was also spiked with 25 pg ofcytokine standard (22 pg was read by the assay for both cytokines) toensure that salts in the medium did not interfere with the assay.
cDNA array data analysisHUVECs were grown in flasks to 80% confluence in completemedium (EGM-2) and switched to EBM-2 at the time GFP-U87 cellswere added. After trypsinization, HUVECs were separated from GFP-U87 cells using magnetic beads coated with CD31 (Dynal ASA, Oslo,Norway). Preparation of samples and hybridization with cDNA arrayswas done as previously described (Khodarev et al., 1999; Khodarevet al., 2002). We used ImageQuant software (AmershamBiosciences, Piscataway, NJ) for data acquisition with ‘peak volume’and local average background options as previously described(Khodarev et al., 1999). Primary data were exported to Microsoft
Excel spreadsheets and intensities were assigned to each spot loadedon the cDNA array. Subsequent analysis included data transformation,normalization, filtration and clustering. All negative values producedby ImageQuant were transformed to zeroes with the aid of‘AutoFilter’ function in Excel. The data were normalized across allcompared arrays based on the average (mean) values of signalintensities. This approach is known as ‘normalization by globalmeans’ (Freeman et. al., 2000). Average intensity was calculated as
where Iav is an average intensity, Ix is the intensity of signal in cell xand n is the number of elements on the array. In all cases, controlvalues of Iav were taken as 1 and the normalization factor N wascalculated as: N=C/E, where C is an average intensity of controlsamples and E is an average intensity of experimental samples.
The data were filtered in two steps. First, the data were filtered byintensities using the receiver operating characteristic (ROC) method,which allows the estimation and control of the levels of false-positive
^x=n
x=1
Iav = (Ix ÷ n),
Journal of Cell Science 116 (6)

1015Tumour cells reprogramme endothelial cells
and false-negative data based on the levels of signal detection (Pepe,2000). To the analysis previously described, we applied cut-off levelsof signal detection equal to 10% of average intensity Iav. Second,genes were selected based on the ratios of response in co-culturerelated to monoculture. For the present experiments, we used atwofold change as the cut-off level for ratios. As an alternativeapproach, when genes were not expressed in monoculture but wereexpressed in co-culture, we used subtraction of intensities inmonoculture from the same intensities in co-culture. Subtracteddifferences were evaluated by Student’s t test and statisticallysignificant differences (P<0.05) were included in the subsequentanalysis. For genes selected by P values, zero values were arbitrarilytransformed in 100 units of intensity to estimate the ratio of response.
For data clustering, we exported normalized ratio values to JMPsoftware (SAS Institute, Cary, NC) and performed multivariateanalysis with hierarchical clustering based on the estimation ofthe Euclidian distances by Ward’s method (Watson et al., 2001).Data were visually presented using TreeView software(http://rana.lbl.gov/EisenSoftware.htm) (Eisen et al., 1998). Out of351 genes selected, 22 did not match current databases, 39 were notmatched with known functions and 290 were assigned to specificfunctions. For functional classification, we used groups previouslydescribed by us (Khodarev et al., 2001) and others (Stanton et al.,2000) with modifications according to the Proteome database(http://www.proteome.com/databases/HumanPD/reports/385.html).Experiments were performed with Research Genetics GeneFilters
GF211 arrays (Research Genetics/Invitrogen, Carlsbad, CA) and twoindependent control co-cultures and monocultures, and were furtherconfirmed by quantitative real-time PCR and/or independenthybridizations with alternative arrays Atlas Human and Atlas
Human 1.2 [BD Biosciences/Clontech, Palo Alto, CA; seesupplementary Table 1 (http://jcs.biologists.org/supplemental)].
Quantitative PCRcDNA was synthesized using Superscript II reverse transcriptase(Invitrogen Life Technologies, Carlsbad, CA) following themanufacturer’s recommendations, except that the addition of RNaseinhibitor was omitted. cDNA was diluted 1:10 in sterile water.Quantitative PCR was performed on an ABI7700 (AppliedBiosystems, Foster City, CA) using SYBR Green PCR reagents in a50 µl reaction mixture containing 5 µl 10× SYBR Green PCR Buffer,0.5 µl 10 mM primers, 4 µl dNTP mix, 6 µl 25 mM magnesiumchloride, 0.5 µl AmpErase, 0.25 µl Amplitaq Gold and 5 µl of the1:10 diluted cDNA synthesis reaction product. PCR was performedfor 40 cycles at 95°C for 15 seconds and 60°C for one minute afterinitial incubations at 50°C for 2 minutes and 95°C for 10 minutes.PCR product specificity and purity were evaluated by generating adissociation curve following the manufacturer’s recommendations.Sample Ct values were normalized to Ct values for 18S RNA, all ofwhich were calculated from triplicate reactions. Relative geneinduction values were calculated following the manufacturer’srecommendations.
ImmunohistochemistryU87 tumours were excised 17 days after implantation in the right hindlimb of female nude mice (Frederick Cancer Research Institute,Frederick, MD). The care and use of experimental animals was inaccordance with institutional guidelines. Excised tumours were placedin 10% neutral-buffered formalin, embedded in paraffin and sectionedat 6 µm thickness. Sections were deparaffinized and rehydratedthrough xylene and serial dilutions of ethanol to distilled water. Slideswere incubated in antigen retrieval buffer (DAKO, Carpinteria, CA)pH 6.0 and heated in a microwave oven at 95°C for 15 minutes. Afterrinsing, slides were incubated in 3% hydrogen peroxide for 5 minutesand then 10% normal horse serum in 0.025% Triton X-100/PBS for
30 minutes. CD31 (1 µg ml–1, #1506, Santa Cruz Biotechnology,Santa Cruz, CA) and Tie-2 (5 µg ml–1, #AF313, R&D Systems,Minneapolis, MN) were applied on the slides for 1 hour at roomtemperature in a humidity chamber. Following TBS washing, slideswere incubated with biotinylated secondary antibody (VectorLaboratories, Burlingame, CA) followed by ABC reagents (VectorLaboratories). Antigen-antibody complexes were detected using DABsubstrate chromogen system with TBS-Tween 20 (DAKO) washbuffer. The entire procedure was performed using an automatedstaining chamber (DAKO). Slides were briefly immersed inhaematoxylin for counterstaining and evaluated using lightmicroscopy.
Quantification of Tie-2 receptor and CD31For the quantification of the immunohistochemical staining, acolorimetric processing approach was employed (R. Yassari et al.,unpublished). Briefly, multiple representative images from each slidewere acquired using a Nikon Coolpix 955 camera with fixed opticalparameters, light intensity and magnification. Acquired images werestored as TIFF files and evaluated using Image Processing Tool Kit4.0 (Reindeer Games, Asheville, NC) and Adobe Photoshop 6. Areasof positive staining were selected using a fixed colour range across allimages. The hue and saturation of the selected regions were thendiscarded and luminance used to represent staining intensity rangingfrom 0 to 255. A similar procedure was employed to performbackground subtraction. We used CD31 immunostaining inmembranes and tissues as controls. Significance (P<0.05) wasdetermined with unpaired two-tail Student’st test.
ResultsStimulation of endothelial cell growth and morphologicalalterations following co-cultivation with tumour cellsU87 glioma cells were co-cultured with HUVECs to test thehypothesis that tumour cells stimulate endothelial cells toundergo changes that are characteristic of angiogenesis. WhenHUVECs were co-cultured with U87 cells in the ratio of 1:5,a significant increase (P=0.046) in HUVEC cell number wasdetected beginning at day 2 and continuing through day 6 (Fig.1A). The number of HUVECs in monoculture increased,reached a plateau at day 4 and then declined at days 5 and 6.This effect was dose dependent, such that higher U87:HUVECratios resulted in an increase in HUVEC cell number. (data notshown). No significant differences in growth kinetics wereobserved between U87 co-culture and U87 monoculture. Thesefindings demonstrate that interactions between HUVECs andU87 cells in co-culture result in an increase in HUVECnumber.
Growth stimulation of HUVECs was also examined in co-cultures in which a permeable membrane was placed betweenHUVECs and U87 cells (1:5 HUVEC:U87 ratio). At 48 hours,the number of HUVECs in co-culture was 2.0 times greaterthan the number of HUVECs in monoculture (10.7±2.2×10⁴ vs5.3±0.3×10⁴ cells; Fig. 1B). Data from these experimentssuggest that activation of HUVEC growth is associated withsoluble factor(s) produced by U87 tumour cells.
Co-cultivation of HUVECs with U87 cells also inducedsequential morphological changes in both cell types. U87 cellsbegan to aggregate and form a net-like pattern 5 hours afterthe initiation of co-culture (Fig. 1C,D). Simultaneously, themorphology of HUVECs began to change. The ‘teardrop-like’HUVECs observed in monoculture assumed a narrower

1016
extended shape as they began to align themselves with the U87cells (Fig. 1D, inset, white arrow). By 12 hours, the U87network was complete and spaces began to form between theboundaries of aligned HUVECs and U87 cells (Fig. 1E). At 24hours, HUVECs formed net-like structures resembling avascular network (Fig. 1F).
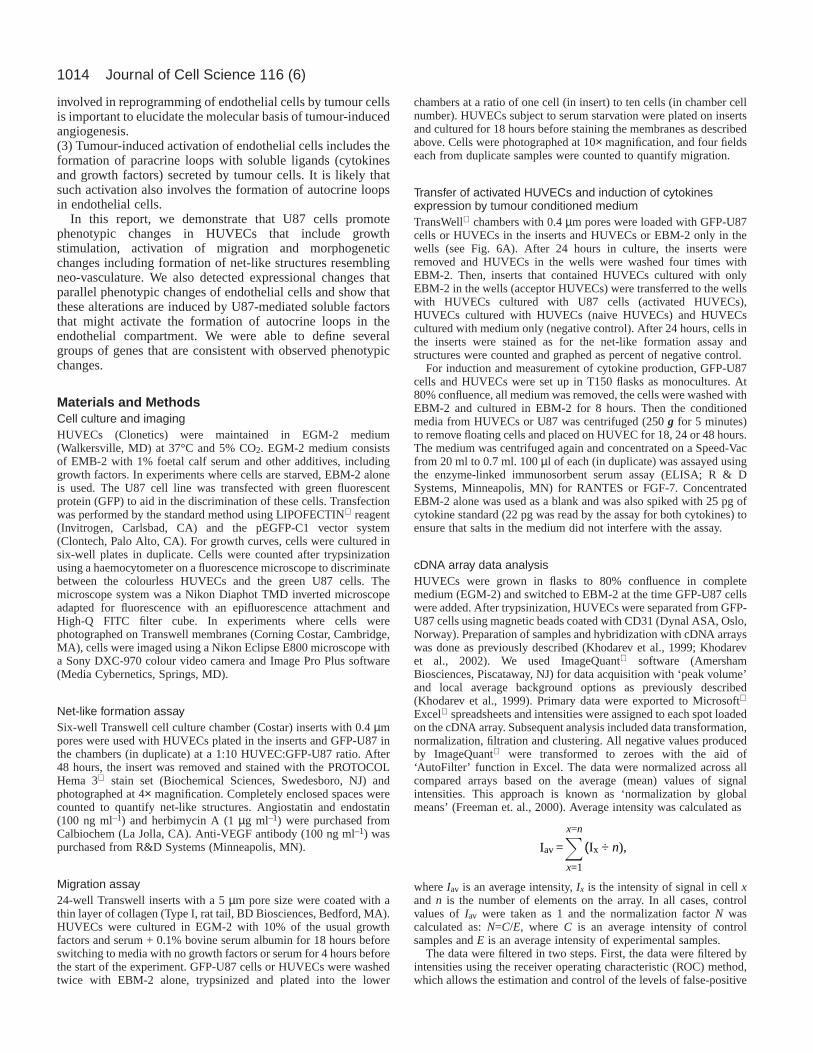
Co-culture of HUVECs with U87 cells activates HUVECmigration and net-like formation, which are suppressedby angiogenesis inhibitorsTo investigate the effects of U87 cells on HUVEC motility anddifferentiation, we employed TransWell cell culture chamberinserts to restrict interactions between cell types to solublefactors. At a 10:1 U87:HUVEC ratio, we observed an 80%increase in HUVEC migration in co-culture (347.3±6.1)compared with HUVEC monoculture (195.2±3.2, P<0.001;Fig. 2A).
Using TransWell inserts without collagen coating and apore size of 0.4 µm, HUVECs were cultured in the inserts withU87 cells in the chamber beneath at a U87:HUVEC ratio of10:1. The presence of U87 cells increased the formation of net-like structures in the HUVEC compartment (Fig. 2C,D) similarto that described for Matrigel migration assays (Donovan etal., 2001). The difference between co-culture (21±4) andmonoculture (4±1) was statistically significant (P=0.027, Fig.
2B). We noted that the morphology of the endothelial cellsinvolved in the formation of net-like structures also changed(Fig. 2E,F) In these regions, endothelial cells appearedelongated, with protruded cytoplasm and aligned themselvesalong the perimeter of the enclosed spaces (Fig. 2F, whitearrow). These data suggest that tumour cells can induceendothelial cells to differentiate into structures that resemblein vivo neo-vascularization.
As shown in Fig. 2G, angiostatin (O’Reilly, 1997) andendostatin (O’Reilly et al., 1997), two reported inhibitors of invivo angiogenesis, inhibit the formation of net-like structures.Inhibition of net-like formation in co-culture was also observedfollowing exposure to Herbimycin A and anti-VEGF antibody,whereas no inhibition was detected in HUVEC monocultures(data not shown). These data demonstrate that angiogenesisinhibitors suppress the tumour-induced endothelial phenotypeand that tumour cell/endothelial cell interactions are requiredfor specific types of growth inhibition to occur.
Expressional profiling of tumour-activated endothelialcells reveals transcriptional reprogramming coordinatedwith phenotypic switchAn advantage of our in vitro co-culture system of U87 cellsand HUVECs is the ability to evaluate molecular changes thatare otherwise too complex to model in vivo. Genes associated
Journal of Cell Science 116 (6)
Fig. 1.Growth characteristics andphenotypic changes. (A) Time course ofgrowth with HUVEC and GFP-U87 inphysical contact in co-culture. Cellswere plated at a 1:5 U87:HUVEC ratioin complete media. j, HUVECmonoculture; h, HUVEC co-culture;n, U87 monoculture; m, U87 co-culture. (B) Growth after 48 hours withcells physically separated on Transwellinserts (0.4 µm pores). HUVECsestablished on inserts with eitherHUVECs (M) or GFP-U87 cells(C) added to wells in starvationmedium. (C) Development ofangiogenic phenotype in HUVECs co-cultured with GFP-U87 cells. 0 hours isHUVEC monoculture at the start of theexperiment, with 5 hour, 12 hour and 24hour time points showing elongation(insert, 5 hours) and migration of cellsto form a morphologically distinctphenotype.
1017Tumour cells reprogramme endothelial cells
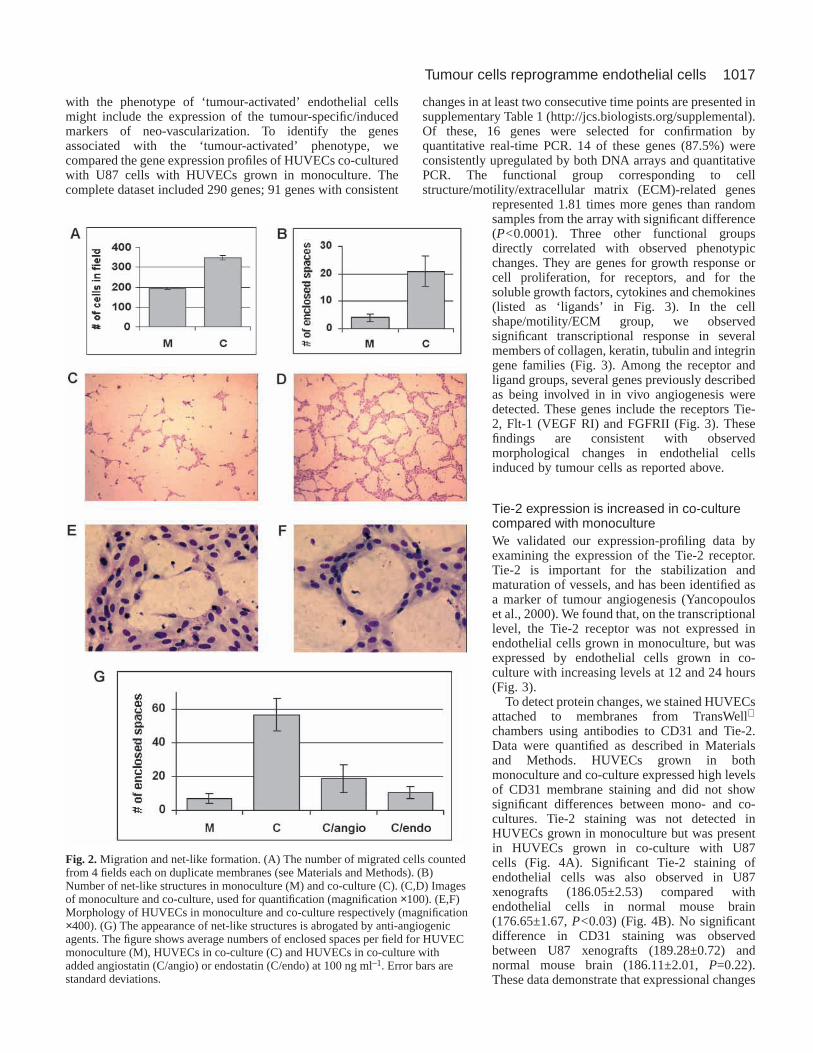
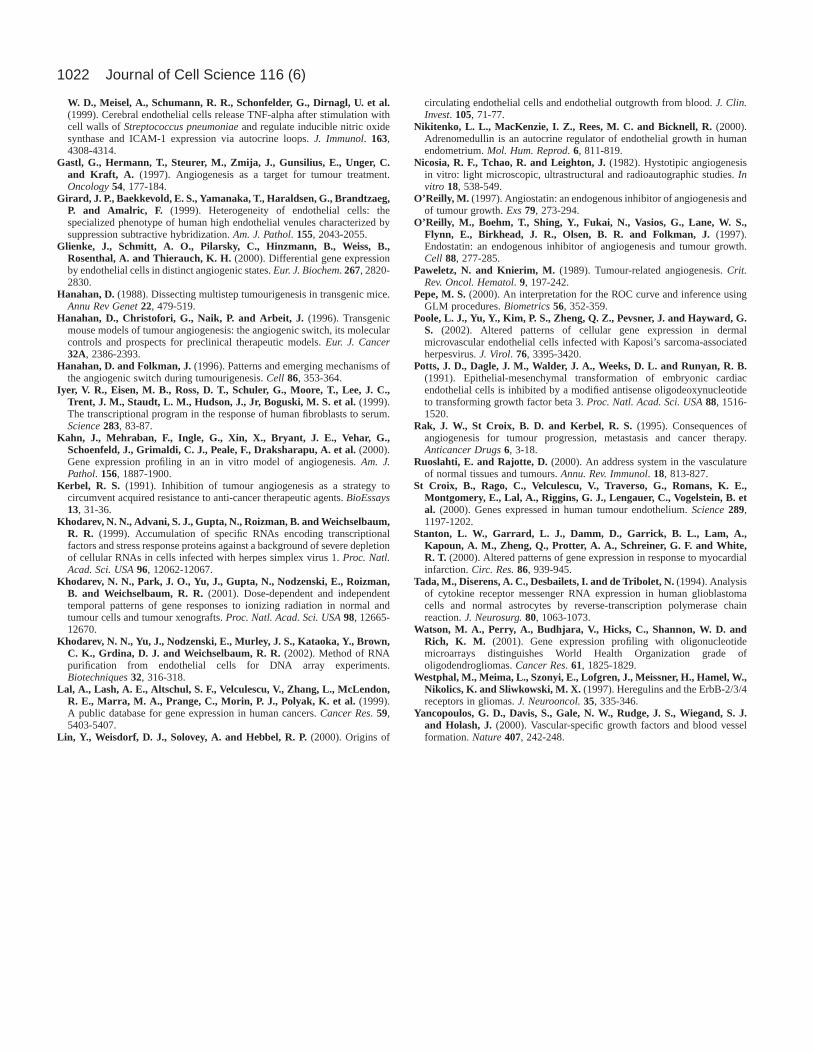
with the phenotype of ‘tumour-activated’ endothelial cellsmight include the expression of the tumour-specific/inducedmarkers of neo-vascularization. To identify the genesassociated with the ‘tumour-activated’ phenotype, wecompared the gene expression profiles of HUVECs co-culturedwith U87 cells with HUVECs grown in monoculture. Thecomplete dataset included 290 genes; 91 genes with consistent
changes in at least two consecutive time points are presented insupplementary Table 1 (http://jcs.biologists.org/supplemental).Of these, 16 genes were selected for confirmation byquantitative real-time PCR. 14 of these genes (87.5%) wereconsistently upregulated by both DNA arrays and quantitativePCR. The functional group corresponding to cellstructure/motility/extracellular matrix (ECM)-related genes
represented 1.81 times more genes than randomsamples from the array with significant difference(P<0.0001). Three other functional groupsdirectly correlated with observed phenotypicchanges. They are genes for growth response orcell proliferation, for receptors, and for thesoluble growth factors, cytokines and chemokines(listed as ‘ligands’ in Fig. 3). In the cellshape/motility/ECM group, we observedsignificant transcriptional response in severalmembers of collagen, keratin, tubulin and integringene families (Fig. 3). Among the receptor andligand groups, several genes previously describedas being involved in in vivo angiogenesis weredetected. These genes include the receptors Tie-2, Flt-1 (VEGF RI) and FGFRII (Fig. 3). Thesefindings are consistent with observedmorphological changes in endothelial cellsinduced by tumour cells as reported above.
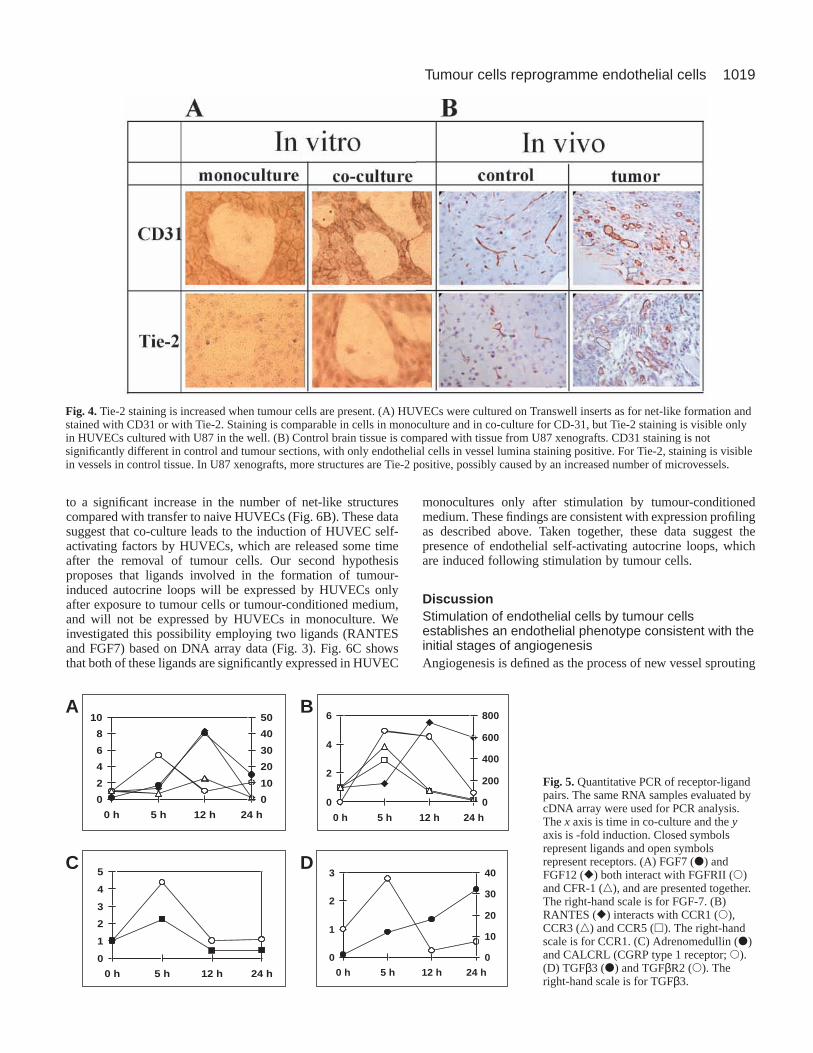
Tie-2 expression is increased in co-culturecompared with monocultureWe validated our expression-profiling data byexamining the expression of the Tie-2 receptor.Tie-2 is important for the stabilization andmaturation of vessels, and has been identified asa marker of tumour angiogenesis (Yancopouloset al., 2000). We found that, on the transcriptionallevel, the Tie-2 receptor was not expressed inendothelial cells grown in monoculture, but wasexpressed by endothelial cells grown in co-culture with increasing levels at 12 and 24 hours(Fig. 3).
To detect protein changes, we stained HUVECsattached to membranes from TransWell
chambers using antibodies to CD31 and Tie-2.Data were quantified as described in Materialsand Methods. HUVECs grown in bothmonoculture and co-culture expressed high levelsof CD31 membrane staining and did not showsignificant differences between mono- and co-cultures. Tie-2 staining was not detected inHUVECs grown in monoculture but was presentin HUVECs grown in co-culture with U87cells (Fig. 4A). Significant Tie-2 staining ofendothelial cells was also observed in U87xenografts (186.05±2.53) compared withendothelial cells in normal mouse brain(176.65±1.67, P<0.03) (Fig. 4B). No significantdifference in CD31 staining was observedbetween U87 xenografts (189.28±0.72) andnormal mouse brain (186.11±2.01, P=0.22).These data demonstrate that expressional changes
Fig. 2.Migration and net-like formation. (A) The number of migrated cells countedfrom 4 fields each on duplicate membranes (see Materials and Methods). (B)Number of net-like structures in monoculture (M) and co-culture (C). (C,D) Imagesof monoculture and co-culture, used for quantification (magnification ×100). (E,F)Morphology of HUVECs in monoculture and co-culture respectively (magnification×400). (G) The appearance of net-like structures is abrogated by anti-angiogenicagents. The figure shows average numbers of enclosed spaces per field for HUVECmonoculture (M), HUVECs in co-culture (C) and HUVECs in co-culture withadded angiostatin (C/angio) or endostatin (C/endo) at 100 ng ml–1. Error bars arestandard deviations.
1018
detected in co-culture might correlate with tumours growing invivo.
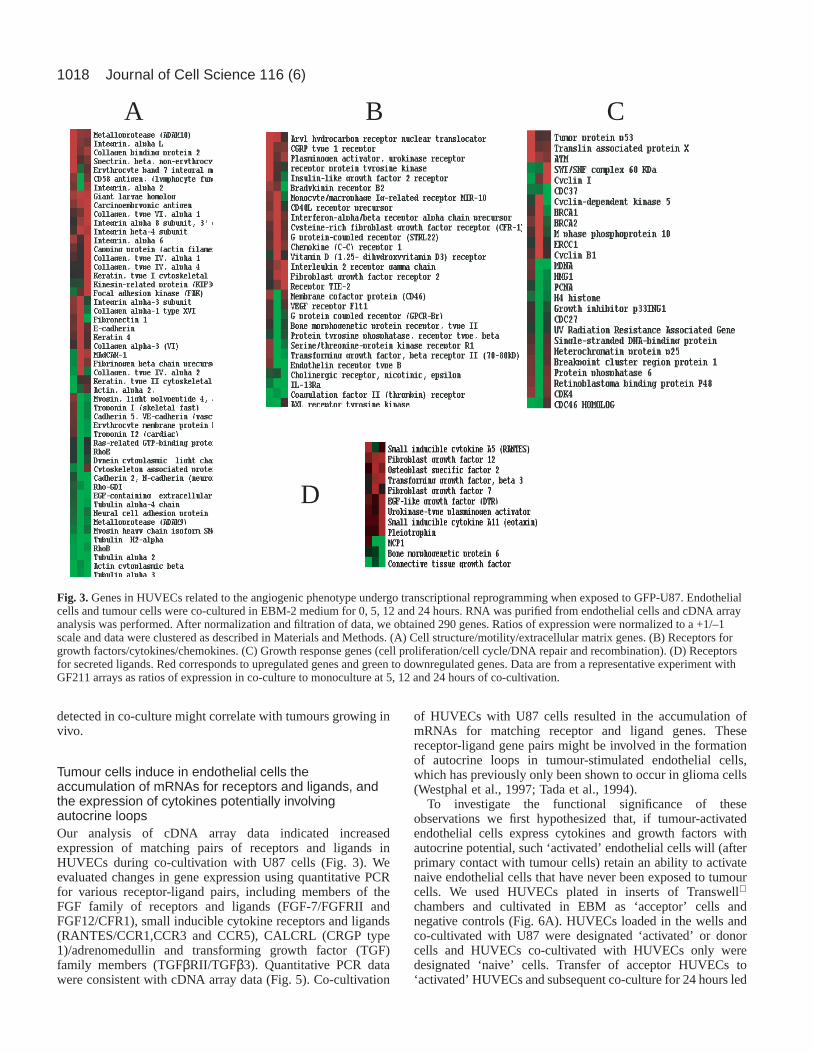
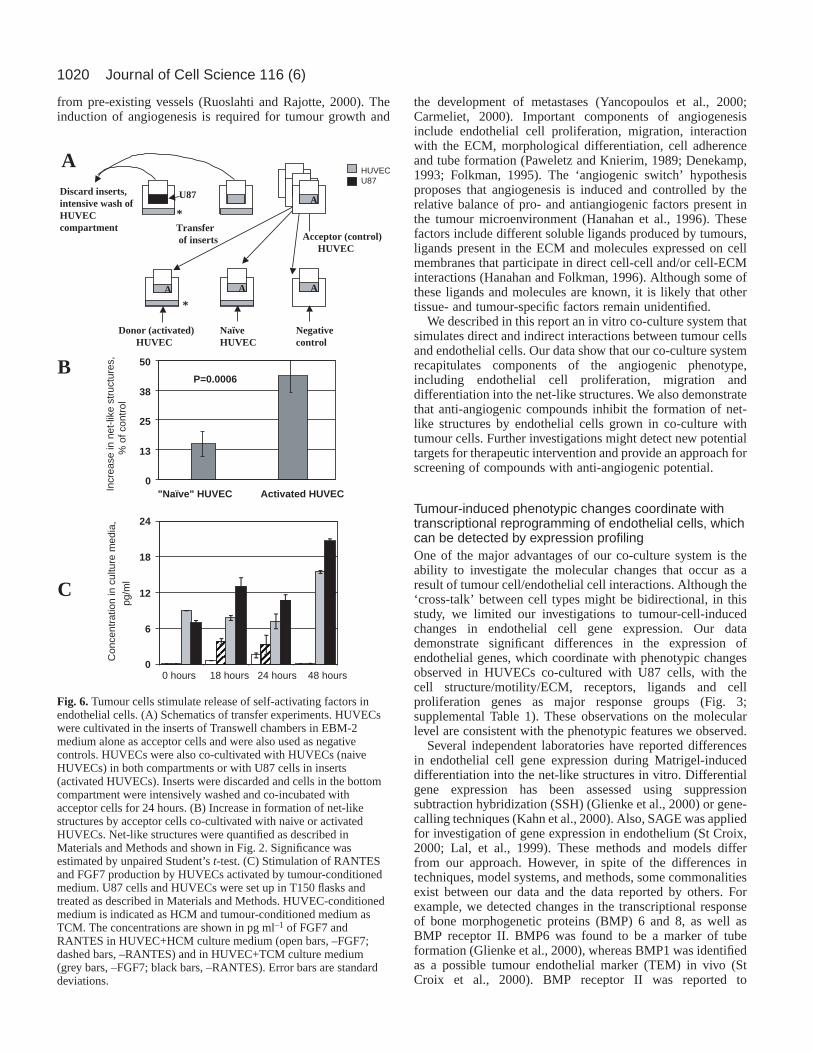
Tumour cells induce in endothelial cells theaccumulation of mRNAs for receptors and ligands, andthe expression of cytokines potentially involvingautocrine loopsOur analysis of cDNA array data indicated increasedexpression of matching pairs of receptors and ligands inHUVECs during co-cultivation with U87 cells (Fig. 3). Weevaluated changes in gene expression using quantitative PCRfor various receptor-ligand pairs, including members of theFGF family of receptors and ligands (FGF-7/FGFRII andFGF12/CFR1), small inducible cytokine receptors and ligands(RANTES/CCR1,CCR3 and CCR5), CALCRL (CRGP type1)/adrenomedullin and transforming growth factor (TGF)family members (TGFβRII/TGFβ3). Quantitative PCR datawere consistent with cDNA array data (Fig. 5). Co-cultivation
of HUVECs with U87 cells resulted in the accumulation ofmRNAs for matching receptor and ligand genes. Thesereceptor-ligand gene pairs might be involved in the formationof autocrine loops in tumour-stimulated endothelial cells,which has previously only been shown to occur in glioma cells(Westphal et al., 1997; Tada et al., 1994).
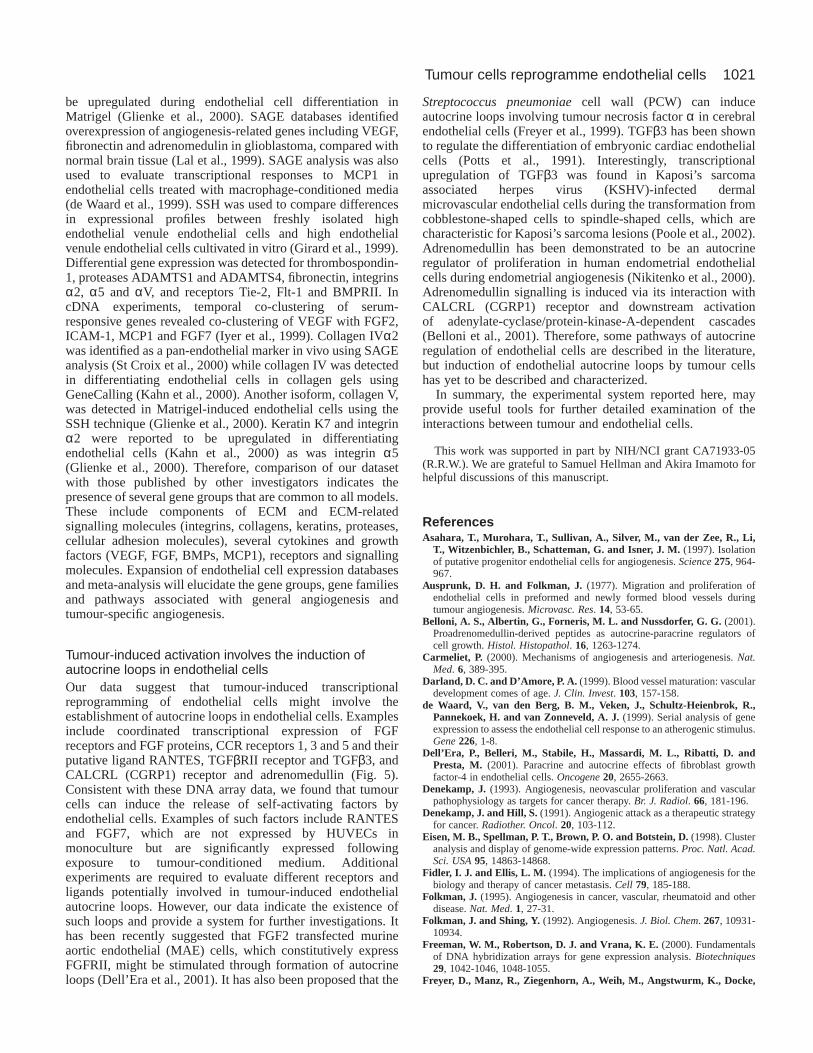
To investigate the functional significance of theseobservations we first hypothesized that, if tumour-activatedendothelial cells express cytokines and growth factors withautocrine potential, such ‘activated’ endothelial cells will (afterprimary contact with tumour cells) retain an ability to activatenaive endothelial cells that have never been exposed to tumourcells. We used HUVECs plated in inserts of Transwell
chambers and cultivated in EBM as ‘acceptor’ cells andnegative controls (Fig. 6A). HUVECs loaded in the wells andco-cultivated with U87 were designated ‘activated’ or donorcells and HUVECs co-cultivated with HUVECs only weredesignated ‘naive’ cells. Transfer of acceptor HUVECs to‘activated’ HUVECs and subsequent co-culture for 24 hours led
Journal of Cell Science 116 (6)
A B C
D
Fig. 3.Genes in HUVECs related to the angiogenic phenotype undergo transcriptional reprogramming when exposed to GFP-U87. Endothelialcells and tumour cells were co-cultured in EBM-2 medium for 0, 5, 12 and 24 hours. RNA was purified from endothelial cells and cDNA arrayanalysis was performed. After normalization and filtration of data, we obtained 290 genes. Ratios of expression were normalized to a +1/–1scale and data were clustered as described in Materials and Methods. (A) Cell structure/motility/extracellular matrix genes. (B) Receptors forgrowth factors/cytokines/chemokines. (C) Growth response genes (cell proliferation/cell cycle/DNA repair and recombination). (D) Receptorsfor secreted ligands. Red corresponds to upregulated genes and green to downregulated genes. Data are from a representative experiment withGF211 arrays as ratios of expression in co-culture to monoculture at 5, 12 and 24 hours of co-cultivation.
1019Tumour cells reprogramme endothelial cells
to a significant increase in the number of net-like structurescompared with transfer to naive HUVECs (Fig. 6B). These datasuggest that co-culture leads to the induction of HUVEC self-activating factors by HUVECs, which are released some timeafter the removal of tumour cells. Our second hypothesisproposes that ligands involved in the formation of tumour-induced autocrine loops will be expressed by HUVECs onlyafter exposure to tumour cells or tumour-conditioned medium,and will not be expressed by HUVECs in monoculture. Weinvestigated this possibility employing two ligands (RANTESand FGF7) based on DNA array data (Fig. 3). Fig. 6C showsthat both of these ligands are significantly expressed in HUVEC
monocultures only after stimulation by tumour-conditionedmedium. These findings are consistent with expression profilingas described above. Taken together, these data suggest thepresence of endothelial self-activating autocrine loops, whichare induced following stimulation by tumour cells.
DiscussionStimulation of endothelial cells by tumour cellsestablishes an endothelial phenotype consistent with theinitial stages of angiogenesisAngiogenesis is defined as the process of new vessel sprouting
Fig. 4.Tie-2 staining is increased when tumour cells are present. (A) HUVECs were cultured on Transwell inserts as for net-like formation andstained with CD31 or with Tie-2. Staining is comparable in cells in monoculture and in co-culture for CD-31, but Tie-2 staining is visible onlyin HUVECs cultured with U87 in the well. (B) Control brain tissue is compared with tissue from U87 xenografts. CD31 staining is notsignificantly different in control and tumour sections, with only endothelial cells in vessel lumina staining positive. For Tie-2, staining is visiblein vessels in control tissue. In U87 xenografts, more structures are Tie-2 positive, possibly caused by an increased number of microvessels.
0
2
4
6
8
10
0 h 5 h 12 h 24 h
0
10
20
30
40
50
0
2
4
6
0 h 5 h 12 h 24 h
0
200
400
600
800
0
1
2
3
4
5
0 h 5 h 12 h 24 h
A B
C D
0
1
2
3
0 h 5 h 12 h 24 h
0
10
20
30
40
Fig. 5.Quantitative PCR of receptor-ligandpairs. The same RNA samples evaluated bycDNA array were used for PCR analysis.The x axis is time in co-culture and the yaxis is -fold induction. Closed symbolsrepresent ligands and open symbolsrepresent receptors. (A) FGF7 (d) andFGF12 (r) both interact with FGFRII (s)and CFR-1 (n), and are presented together.The right-hand scale is for FGF-7. (B)RANTES (r) interacts with CCR1 (s),CCR3 (n) and CCR5 (h). The right-handscale is for CCR1. (C) Adrenomedullin (d)and CALCRL (CGRP type 1 receptor; s).(D) TGFβ3 (d) and TGFβR2 (s). Theright-hand scale is for TGFβ3.
1020
from pre-existing vessels (Ruoslahti and Rajotte, 2000). Theinduction of angiogenesis is required for tumour growth and
the development of metastases (Yancopoulos et al., 2000;Carmeliet, 2000). Important components of angiogenesisinclude endothelial cell proliferation, migration, interactionwith the ECM, morphological differentiation, cell adherenceand tube formation (Paweletz and Knierim, 1989; Denekamp,1993; Folkman, 1995). The ‘angiogenic switch’ hypothesisproposes that angiogenesis is induced and controlled by therelative balance of pro- and antiangiogenic factors present inthe tumour microenvironment (Hanahan et al., 1996). Thesefactors include different soluble ligands produced by tumours,ligands present in the ECM and molecules expressed on cellmembranes that participate in direct cell-cell and/or cell-ECMinteractions (Hanahan and Folkman, 1996). Although some ofthese ligands and molecules are known, it is likely that othertissue- and tumour-specific factors remain unidentified.
We described in this report an in vitro co-culture system thatsimulates direct and indirect interactions between tumour cellsand endothelial cells. Our data show that our co-culture systemrecapitulates components of the angiogenic phenotype,including endothelial cell proliferation, migration anddifferentiation into the net-like structures. We also demonstratethat anti-angiogenic compounds inhibit the formation of net-like structures by endothelial cells grown in co-culture withtumour cells. Further investigations might detect new potentialtargets for therapeutic intervention and provide an approach forscreening of compounds with anti-angiogenic potential.
Tumour-induced phenotypic changes coordinate withtranscriptional reprogramming of endothelial cells, whichcan be detected by expression profilingOne of the major advantages of our co-culture system is theability to investigate the molecular changes that occur as aresult of tumour cell/endothelial cell interactions. Although the‘cross-talk’ between cell types might be bidirectional, in thisstudy, we limited our investigations to tumour-cell-inducedchanges in endothelial cell gene expression. Our datademonstrate significant differences in the expression ofendothelial genes, which coordinate with phenotypic changesobserved in HUVECs co-cultured with U87 cells, with thecell structure/motility/ECM, receptors, ligands and cellproliferation genes as major response groups (Fig. 3;supplemental Table 1). These observations on the molecularlevel are consistent with the phenotypic features we observed.
Several independent laboratories have reported differencesin endothelial cell gene expression during Matrigel-induceddifferentiation into the net-like structures in vitro. Differentialgene expression has been assessed using suppressionsubtraction hybridization (SSH) (Glienke et al., 2000) or gene-calling techniques (Kahn et al., 2000). Also, SAGE was appliedfor investigation of gene expression in endothelium (St Croix,2000; Lal, et al., 1999). These methods and models differfrom our approach. However, in spite of the differences intechniques, model systems, and methods, some commonalitiesexist between our data and the data reported by others. Forexample, we detected changes in the transcriptional responseof bone morphogenetic proteins (BMP) 6 and 8, as well asBMP receptor II. BMP6 was found to be a marker of tubeformation (Glienke et al., 2000), whereas BMP1 was identifiedas a possible tumour endothelial marker (TEM) in vivo (StCroix et al., 2000). BMP receptor II was reported to
Journal of Cell Science 116 (6)
Donor (activated) HUVEC
Acceptor (control) HUVEC
Discard inserts,intensive wash ofHUVECcompartment
*
Naïve HUVEC
A
Transfer of inserts
A A A
*
U87
Negative control
A
B
C
0
13
25
38
50
P=0.0006
"Naïve" HUVEC Activated HUVEC
Incr
ease
in n
et-li
ke s
truc
ture
s,
%
of c
ontr
ol
0
6
12
18
24
Con
cent
ratio
n in
cul
ture
med
ia,
pg
/ml
0 hours 18 hours 24 hours 48 hours
HUVECU87
Fig. 6.Tumour cells stimulate release of self-activating factors inendothelial cells. (A) Schematics of transfer experiments. HUVECswere cultivated in the inserts of Transwell chambers in EBM-2medium alone as acceptor cells and were also used as negativecontrols. HUVECs were also co-cultivated with HUVECs (naiveHUVECs) in both compartments or with U87 cells in inserts(activated HUVECs). Inserts were discarded and cells in the bottomcompartment were intensively washed and co-incubated withacceptor cells for 24 hours. (B) Increase in formation of net-likestructures by acceptor cells co-cultivated with naive or activatedHUVECs. Net-like structures were quantified as described inMaterials and Methods and shown in Fig. 2. Significance wasestimated by unpaired Student’s t-test. (C) Stimulation of RANTESand FGF7 production by HUVECs activated by tumour-conditionedmedium. U87 cells and HUVECs were set up in T150 flasks andtreated as described in Materials and Methods. HUVEC-conditionedmedium is indicated as HCM and tumour-conditioned medium asTCM. The concentrations are shown in pg ml–1 of FGF7 andRANTES in HUVEC+HCM culture medium (open bars, –FGF7;dashed bars, –RANTES) and in HUVEC+TCM culture medium(grey bars, –FGF7; black bars, –RANTES). Error bars are standarddeviations.
1021Tumour cells reprogramme endothelial cells
be upregulated during endothelial cell differentiation inMatrigel (Glienke et al., 2000). SAGE databases identifiedoverexpression of angiogenesis-related genes including VEGF,fibronectin and adrenomedulin in glioblastoma, compared withnormal brain tissue (Lal et al., 1999). SAGE analysis was alsoused to evaluate transcriptional responses to MCP1 inendothelial cells treated with macrophage-conditioned media(de Waard et al., 1999). SSH was used to compare differencesin expressional profiles between freshly isolated highendothelial venule endothelial cells and high endothelialvenule endothelial cells cultivated in vitro (Girard et al., 1999).Differential gene expression was detected for thrombospondin-1, proteases ADAMTS1 and ADAMTS4, fibronectin, integrinsα2, α5 and αV, and receptors Tie-2, Flt-1 and BMPRII. IncDNA experiments, temporal co-clustering of serum-responsive genes revealed co-clustering of VEGF with FGF2,ICAM-1, MCP1 and FGF7 (Iyer et al., 1999). Collagen IVα2was identified as a pan-endothelial marker in vivo using SAGEanalysis (St Croix et al., 2000) while collagen IV was detectedin differentiating endothelial cells in collagen gels usingGeneCalling (Kahn et al., 2000). Another isoform, collagen V,was detected in Matrigel-induced endothelial cells using theSSH technique (Glienke et al., 2000). Keratin K7 and integrinα2 were reported to be upregulated in differentiatingendothelial cells (Kahn et al., 2000) as was integrin α5(Glienke et al., 2000). Therefore, comparison of our datasetwith those published by other investigators indicates thepresence of several gene groups that are common to all models.These include components of ECM and ECM-relatedsignalling molecules (integrins, collagens, keratins, proteases,cellular adhesion molecules), several cytokines and growthfactors (VEGF, FGF, BMPs, MCP1), receptors and signallingmolecules. Expansion of endothelial cell expression databasesand meta-analysis will elucidate the gene groups, gene familiesand pathways associated with general angiogenesis andtumour-specific angiogenesis.
Tumour-induced activation involves the induction ofautocrine loops in endothelial cellsOur data suggest that tumour-induced transcriptionalreprogramming of endothelial cells might involve theestablishment of autocrine loops in endothelial cells. Examplesinclude coordinated transcriptional expression of FGFreceptors and FGF proteins, CCR receptors 1, 3 and 5 and theirputative ligand RANTES, TGFβRII receptor and TGFβ3, andCALCRL (CGRP1) receptor and adrenomedullin (Fig. 5).Consistent with these DNA array data, we found that tumourcells can induce the release of self-activating factors byendothelial cells. Examples of such factors include RANTESand FGF7, which are not expressed by HUVECs inmonoculture but are significantly expressed followingexposure to tumour-conditioned medium. Additionalexperiments are required to evaluate different receptors andligands potentially involved in tumour-induced endothelialautocrine loops. However, our data indicate the existence ofsuch loops and provide a system for further investigations. Ithas been recently suggested that FGF2 transfected murineaortic endothelial (MAE) cells, which constitutively expressFGFRII, might be stimulated through formation of autocrineloops (Dell’Era et al., 2001). It has also been proposed that the
Streptococcus pneumoniaecell wall (PCW) can induceautocrine loops involving tumour necrosis factor α in cerebralendothelial cells (Freyer et al., 1999). TGFβ3 has been shownto regulate the differentiation of embryonic cardiac endothelialcells (Potts et al., 1991). Interestingly, transcriptionalupregulation of TGFβ3 was found in Kaposi’s sarcomaassociated herpes virus (KSHV)-infected dermalmicrovascular endothelial cells during the transformation fromcobblestone-shaped cells to spindle-shaped cells, which arecharacteristic for Kaposi’s sarcoma lesions (Poole et al., 2002).Adrenomedullin has been demonstrated to be an autocrineregulator of proliferation in human endometrial endothelialcells during endometrial angiogenesis (Nikitenko et al., 2000).Adrenomedullin signalling is induced via its interaction withCALCRL (CGRP1) receptor and downstream activationof adenylate-cyclase/protein-kinase-A-dependent cascades(Belloni et al., 2001). Therefore, some pathways of autocrineregulation of endothelial cells are described in the literature,but induction of endothelial autocrine loops by tumour cellshas yet to be described and characterized.
In summary, the experimental system reported here, mayprovide useful tools for further detailed examination of theinteractions between tumour and endothelial cells.
This work was supported in part by NIH/NCI grant CA71933-05(R.R.W.). We are grateful to Samuel Hellman and Akira Imamoto forhelpful discussions of this manuscript.
ReferencesAsahara, T., Murohara, T., Sullivan, A., Silver, M., van der Zee, R., Li,
T., Witzenbichler, B., Schatteman, G. and Isner, J. M.(1997). Isolationof putative progenitor endothelial cells for angiogenesis. Science275, 964-967.
Ausprunk, D. H. and Folkman, J. (1977). Migration and proliferation ofendothelial cells in preformed and newly formed blood vessels duringtumour angiogenesis. Microvasc. Res. 14, 53-65.
Belloni, A. S., Albertin, G., Forneris, M. L. and Nussdorfer, G. G.(2001).Proadrenomedullin-derived peptides as autocrine-paracrine regulators ofcell growth. Histol. Histopathol. 16, 1263-1274.
Carmeliet, P. (2000). Mechanisms of angiogenesis and arteriogenesis. Nat.Med. 6, 389-395.
Darland, D. C. and D’Amore, P. A.(1999). Blood vessel maturation: vasculardevelopment comes of age. J. Clin. Invest. 103, 157-158.
de Waard, V., van den Berg, B. M., Veken, J., Schultz-Heienbrok, R.,Pannekoek, H. and van Zonneveld, A. J.(1999). Serial analysis of geneexpression to assess the endothelial cell response to an atherogenic stimulus.Gene226, 1-8.
Dell’Era, P., Belleri, M., Stabile, H., Massardi, M. L., Ribatti, D. andPresta, M. (2001). Paracrine and autocrine effects of fibroblast growthfactor-4 in endothelial cells. Oncogene20, 2655-2663.
Denekamp, J.(1993). Angiogenesis, neovascular proliferation and vascularpathophysiology as targets for cancer therapy. Br. J. Radiol. 66, 181-196.
Denekamp, J. and Hill, S.(1991). Angiogenic attack as a therapeutic strategyfor cancer. Radiother. Oncol. 20, 103-112.
Eisen, M. B., Spellman, P. T., Brown, P. O. and Botstein, D.(1998). Clusteranalysis and display of genome-wide expression patterns. Proc. Natl. Acad.Sci. USA95, 14863-14868.
Fidler, I. J. and Ellis, L. M. (1994). The implications of angiogenesis for thebiology and therapy of cancer metastasis. Cell 79, 185-188.
Folkman, J. (1995). Angiogenesis in cancer, vascular, rheumatoid and otherdisease. Nat. Med. 1, 27-31.
Folkman, J. and Shing, Y.(1992). Angiogenesis. J. Biol. Chem. 267, 10931-10934.
Freeman, W. M., Robertson, D. J. and Vrana, K. E.(2000). Fundamentalsof DNA hybridization arrays for gene expression analysis. Biotechniques29, 1042-1046, 1048-1055.
Freyer, D., Manz, R., Ziegenhorn, A., Weih, M., Angstwurm, K., Docke,
1022
W. D., Meisel, A., Schumann, R. R., Schonfelder, G., Dirnagl, U. et al.(1999). Cerebral endothelial cells release TNF-alpha after stimulation withcell walls of Streptococcus pneumoniaeand regulate inducible nitric oxidesynthase and ICAM-1 expression via autocrine loops. J. Immunol. 163,4308-4314.
Gastl, G., Hermann, T., Steurer, M., Zmija, J., Gunsilius, E., Unger, C.and Kraft, A. (1997). Angiogenesis as a target for tumour treatment.Oncology54, 177-184.
Girard, J. P., Baekkevold, E. S., Yamanaka, T., Haraldsen, G., Brandtzaeg,P. and Amalric, F. (1999). Heterogeneity of endothelial cells: thespecialized phenotype of human high endothelial venules characterized bysuppression subtractive hybridization. Am. J. Pathol. 155, 2043-2055.
Glienke, J., Schmitt, A. O., Pilarsky, C., Hinzmann, B., Weiss, B.,Rosenthal, A. and Thierauch, K. H.(2000). Differential gene expressionby endothelial cells in distinct angiogenic states. Eur. J. Biochem. 267, 2820-2830.
Hanahan, D.(1988). Dissecting multistep tumourigenesis in transgenic mice.Annu Rev Genet22, 479-519.
Hanahan, D., Christofori, G., Naik, P. and Arbeit, J. (1996). Transgenicmouse models of tumour angiogenesis: the angiogenic switch, its molecularcontrols and prospects for preclinical therapeutic models. Eur. J. Cancer32A, 2386-2393.
Hanahan, D. and Folkman, J.(1996). Patterns and emerging mechanisms ofthe angiogenic switch during tumourigenesis. Cell 86, 353-364.
Iyer, V. R., Eisen, M. B., Ross, D. T., Schuler, G., Moore, T., Lee, J. C.,Trent, J. M., Staudt, L. M., Hudson, J., Jr, Boguski, M. S. et al. (1999).The transcriptional program in the response of human fibroblasts to serum.Science283, 83-87.
Kahn, J., Mehraban, F., Ingle, G., Xin, X., Bryant, J. E., Vehar, G.,Schoenfeld, J., Grimaldi, C. J., Peale, F., Draksharapu, A. et al.(2000).Gene expression profiling in an in vitro model of angiogenesis. Am. J.Pathol. 156, 1887-1900.
Kerbel, R. S. (1991). Inhibition of tumour angiogenesis as a strategy tocircumvent acquired resistance to anti-cancer therapeutic agents. BioEssays13, 31-36.
Khodarev, N. N., Advani, S. J., Gupta, N., Roizman, B. and Weichselbaum,R. R. (1999). Accumulation of specific RNAs encoding transcriptionalfactors and stress response proteins against a background of severe depletionof cellular RNAs in cells infected with herpes simplex virus 1. Proc. Natl.Acad. Sci. USA96, 12062-12067.
Khodarev, N. N., Park, J. O., Yu, J., Gupta, N., Nodzenski, E., Roizman,B. and Weichselbaum, R. R.(2001). Dose-dependent and independenttemporal patterns of gene responses to ionizing radiation in normal andtumour cells and tumour xenografts. Proc. Natl. Acad. Sci. USA98, 12665-12670.
Khodarev, N. N., Yu, J., Nodzenski, E., Murley, J. S., Kataoka, Y., Brown,C. K., Grdina, D. J. and Weichselbaum, R. R.(2002). Method of RNApurification from endothelial cells for DNA array experiments.Biotechniques32, 316-318.
Lal, A., Lash, A. E., Altschul, S. F., Velculescu, V., Zhang, L., McLendon,R. E., Marra, M. A., Prange, C., Morin, P. J., Polyak, K. et al.(1999).A public database for gene expression in human cancers. Cancer Res. 59,5403-5407.
Lin, Y., Weisdorf, D. J., Solovey, A. and Hebbel, R. P.(2000). Origins of
circulating endothelial cells and endothelial outgrowth from blood. J. Clin.Invest. 105, 71-77.
Nikitenko, L. L., MacKenzie, I. Z., Rees, M. C. and Bicknell, R.(2000).Adrenomedullin is an autocrine regulator of endothelial growth in humanendometrium. Mol. Hum. Reprod. 6, 811-819.
Nicosia, R. F., Tchao, R. and Leighton, J. (1982). Hystotipic angiogenesisin vitro: light microscopic, ultrastructural and radioautographic studies. Invitro 18, 538-549.
O’Reilly, M. (1997). Angiostatin: an endogenous inhibitor of angiogenesis andof tumour growth. Exs79, 273-294.
O’Reilly, M., Boehm, T., Shing, Y., Fukai, N., Vasios, G., Lane, W. S.,Flynn, E., Birkhead, J. R., Olsen, B. R. and Folkman, J.(1997).Endostatin: an endogenous inhibitor of angiogenesis and tumour growth.Cell 88, 277-285.
Paweletz, N. and Knierim, M. (1989). Tumour-related angiogenesis. Crit.Rev. Oncol. Hematol. 9, 197-242.
Pepe, M. S.(2000). An interpretation for the ROC curve and inference usingGLM procedures. Biometrics56, 352-359.
Poole, L. J., Yu, Y., Kim, P. S., Zheng, Q. Z., Pevsner, J. and Hayward, G.S. (2002). Altered patterns of cellular gene expression in dermalmicrovascular endothelial cells infected with Kaposi’s sarcoma-associatedherpesvirus. J. Virol. 76, 3395-3420.
Potts, J. D., Dagle, J. M., Walder, J. A., Weeks, D. L. and Runyan, R. B.(1991). Epithelial-mesenchymal transformation of embryonic cardiacendothelial cells is inhibited by a modified antisense oligodeoxynucleotideto transforming growth factor beta 3. Proc. Natl. Acad. Sci. USA88, 1516-1520.
Rak, J. W., St Croix, B. D. and Kerbel, R. S.(1995). Consequences ofangiogenesis for tumour progression, metastasis and cancer therapy.Anticancer Drugs6, 3-18.
Ruoslahti, E. and Rajotte, D.(2000). An address system in the vasculatureof normal tissues and tumours. Annu. Rev. Immunol. 18, 813-827.
St Croix, B., Rago, C., Velculescu, V., Traverso, G., Romans, K. E.,Montgomery, E., Lal, A., Riggins, G. J., Lengauer, C., Vogelstein, B. etal. (2000). Genes expressed in human tumour endothelium. Science289,1197-1202.
Stanton, L. W., Garrard, L. J., Damm, D., Garrick, B. L., Lam, A.,Kapoun, A. M., Zheng, Q., Protter, A. A., Schreiner, G. F. and White,R. T. (2000). Altered patterns of gene expression in response to myocardialinfarction. Circ. Res.86, 939-945.
Tada, M., Diserens, A. C., Desbailets, I. and de Tribolet, N.(1994). Analysisof cytokine receptor messenger RNA expression in human glioblastomacells and normal astrocytes by reverse-transcription polymerase chainreaction. J. Neurosurg. 80, 1063-1073.
Watson, M. A., Perry, A., Budhjara, V., Hicks, C., Shannon, W. D. andRich, K. M. (2001). Gene expression profiling with oligonucleotidemicroarrays distinguishes World Health Organization grade ofoligodendrogliomas. Cancer Res. 61, 1825-1829.
Westphal, M., Meima, L., Szonyi, E., Lofgren, J., Meissner, H., Hamel, W.,Nikolics, K. and Sliwkowski, M. X. (1997). Heregulins and the ErbB-2/3/4receptors in gliomas. J. Neurooncol. 35, 335-346.
Yancopoulos, G. D., Davis, S., Gale, N. W., Rudge, J. S., Wiegand, S. J.and Holash, J.(2000). Vascular-specific growth factors and blood vesselformation. Nature407, 242-248.
Journal of Cell Science 116 (6)
Copyright © 2022 FDOKUMEN