MECP2 Isoform-Specific Vectors with Regulated Expression for Rett Syndrome Gene Therapy
Upload
telethonkidsCategory
view
0download
0
Trends in the diagnosis of Rett syndrome in Australia
Stephanie Fehr, Ami Bebbington, Natasha Nassar, Jenny Downs, Gabriel M Ronen,Nicholas de Klerk, and Helen LeonardCentre for Child Health Research [S.F, A.B, N.K, H.L], The University of Western Australia, Perth,WA, 6008, Australia; Kolling Institute of Medical Research [N.N], University of Sydney, Sydney,NSW, 2065, Australia; School of Physiotherapy and Curtin Innovation Research Institute [J.D],Curtin University of Technology, Perth, WA, 6102, Australia; Department of Pediatrics [G.M.R],McMaster University, Hamilton, Ontario, L8S 4L8, Canada
AbstractModifications to diagnostic criteria and introduction of genetic testing have likely affected thepattern and timing of Rett syndrome diagnosis. The trends in incidence and prevalence of Rettsyndrome in Australia were examined; the cumulative risk of a female being diagnoseddetermined; and the impact of changes to diagnostic criteria and availability of genetic testing onthese frequencies investigated. The population-based Australian Rett Syndrome Database wasused to identify a total of 349 verified Rett syndrome females born 1976-2006 and diagnosed1982-2008. The proportion of female cases born and diagnosed per year and the cumulative risk ofa diagnosis were determined. The median age of Rett syndrome diagnosis decreased from 4.5years if diagnosed before 2000 to 3.5 years if diagnosed after 1999. The cumulative risk ofdiagnosis had almost doubled by 32 y of age [1/8,905 or 11.23 per 100,000 person-years (95% CI,10.03–12.45)] in comparison with 5 y of age [1/15,361 or 6.51 per 100,000 person-years (95% CI,5.65–7.39)]. Earlier age of diagnosis may result in families experiencing less stress and emotionalstrain compared to those with delayed diagnosis.
IntroductionRett syndrome (RTT), a severe neurodevelopment disorder occurring most frequently infemales, has only been recognised worldwide since 1983 (1). The 1985 “Vienna criteria”were the first to define its ‘classical’ characteristics (2). Additional case series (3, 4) servedas a framework for the establishment of updated guidelines (1988) (5) which included a setof supportive criteria and removed female sex as mandatory. Only in 1994 (6) were criteriafor defining atypical variants developed allowing those with more severe phenotypes such asthe ‘congenital RTT variant’ (7) and those with milder phenotypes such as the ‘preservedspeech variant’ (8) to be recognised within the RTT spectrum.
In 1999 mutations within the Methyl-CpG Binding Protein 2 gene (MECP2) were identifiedas the major cause of RTT (9). This allowed molecular confirmation of clinical cases andcontributed to additional amendment of diagnostic criteria (2002) (10). The likelihood ofgenetic confirmation has increased with both the introduction of Multiplex Ligation-dependent Probe Amplification (MLPA) (11), which detects large deletions, and through theidentification of causative mutations in exon 1 (12).
Copyright © 2011 International Pediatric Research Foundation, Inc. All rights reserved.Corresponding Author: Helen Leonard, M.B. Ch.B., Telethon Institute for Child Health Research, Centre for Child Health Research,The University of Western Australia, Perth, Western Australia, 6872, Telephone: +61 08 9489 7790, Fax: +61 08 9489 7700,[email protected].
NIH Public AccessAuthor ManuscriptPediatr Res. Author manuscript; available in PMC 2012 September 1.
Published in final edited form as:Pediatr Res. 2011 September ; 70(3): 313–319. doi:10.1203/PDR.0b013e3182242461.
NIH
-PA Author Manuscript
NIH
-PA Author Manuscript
NIH
-PA Author Manuscript

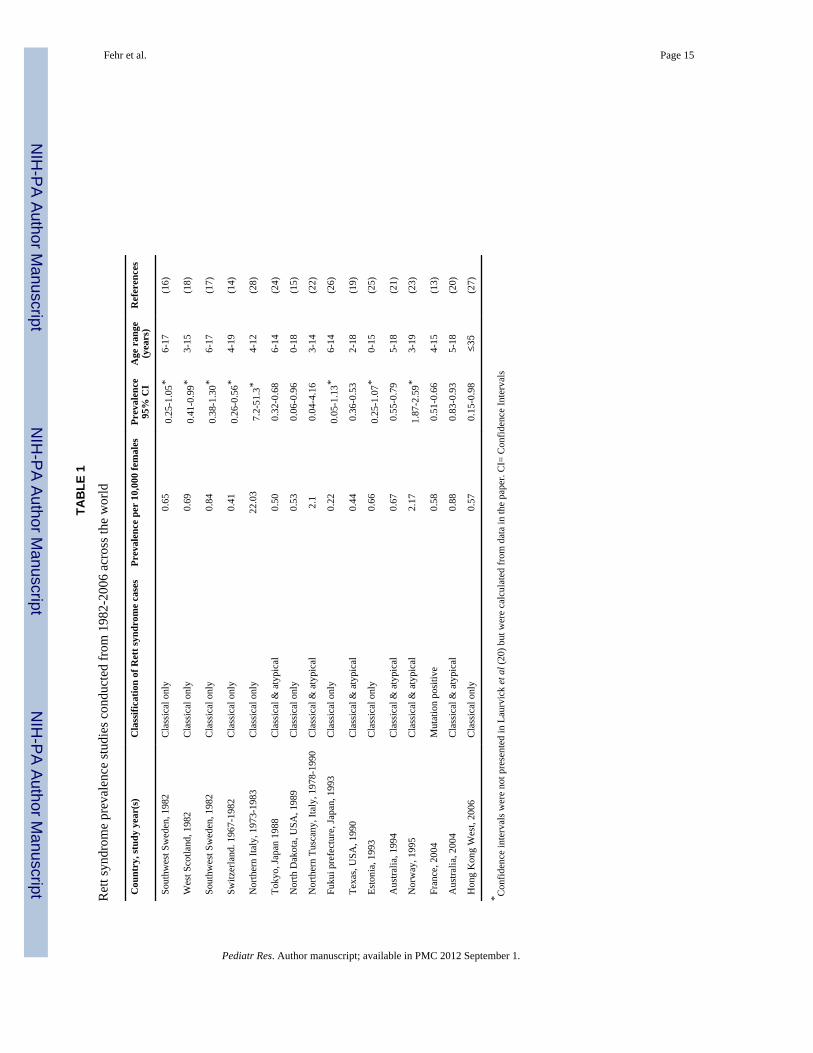
Early epidemiological studies have reported varying estimates of RTT although most studieswere conducted prior to 1999 and did not necessarily define the inclusion or otherwise ofatypical cases (Table 1 (13-28)). Recent studies (20, 27) varied in their ascertainmentmethods, inclusion criteria, measures of frequency, sample size and methods of analysis,making comparisons difficult. For example exclusion of mutation negative (13) or atypicalcases (27) could partly explain why the prevalence in France (0.58 per 10,000 females aged4-15 years) (13) and Hong Kong (0.57 per 10,000 females 35 years or younger) (27) wereonly two thirds that in Australia (0.88 per 10,000 females aged 5-18 years) (20).
Changes in clinical practice resulting both from modifications to diagnostic criteria and theintroduction of genetic testing have likely affected the pattern and timing of RTT diagnosis.This article describes the changing incidence and prevalence of RTT in Australia andexamines if and why diagnostic practices may have changed over time.
MethodsThe Australian Rett Syndrome Database (ARSD), established in 1993 is a population-baseddatabase of RTT cases born since 1976 (21). Study approval was obtained from the HumanResearch Ethics Committee of Princess Margaret Hospital and families provided informedconsent before participating. Diagnosed cases are ascertained through multiple sourcesincluding the Australian Paediatric Surveillance Unit (APSU) (29). The APSU wasestablished in 1993 and has since actively surveyed approximately 43 childhood conditions(30). Paediatricians and other medical child health specialists receive a monthly report cardby email (or mail in 20%) and are requested to indicate by return whether in the last monththey have seen any newly diagnosed cases of any of the conditions listed. If they have, theresearcher is notified by the APSU (31, 32). The researcher can then contact the doctorabout collecting further information. The diagnosis of RTT is usually made by childneurologists, clinical geneticists and general or developmental paediatricians. At the time ofthe study, only clinically suspected cases verified by the presence of a MECP2 pathogenicmutation or by fulfilment of the 2002 diagnostic criteria (10) for classical or atypical RTTwere included in this study. Contact has been maintained with families via theadministration of follow-up questionnaires at approximately two yearly intervals since 1996.
Trends in birth prevalence (the proportion of Australian female births with RTT) by birthyear and incidence of diagnosis (the number of girls diagnosed out of the pool of thoseeligible for diagnosis) each calendar year were examined by investigating the cohort andperiod-related effects, respectively over the study period (1976 to 2008), replicatingmethods used in a recent population-based study assessing autism spectrum disorders (33).The cumulative risk or probability of a girl being diagnosed with RTT by a certain age wasalso calculated and estimated separately for the periods before and during or after 1999,when the genetic cause of RTT was identified. The 2009 point prevalence of RTT (theproportion of the female population of that age range alive with RTT in that year) in femalesaged 5-32 years was also calculated and estimated separately for those aged 5-18 years andthose aged 19-32 years.
Cohort-related effectWith the cohort effect we examined how the birth prevalence (the proportion of Australianfemale births with RTT) changed by birth year for each year from 1976 to 2006. We usedbirth prevalence because the condition RTT is already present, though not clinicallyapparent, at birth as in congenital malformations. Therefore birth prevalence is the mostsuitable measure applicable (34). For the birth prevalence (expressed per 100 000 livefemale births) the numerator comprised all females born in Australia in that birth year anddiagnosed with RTT between 1982 and 2008 and the denominator was the number of live
Fehr et al. Page 2
Pediatr Res. Author manuscript; available in PMC 2012 September 1.
NIH
-PA Author Manuscript
NIH
-PA Author Manuscript
NIH
-PA Author Manuscript

female births in Australia for the given birth year (35, 36). The birth prevalence (regardlessof MECP2 mutation status) was determined separately for cases classified as either‘Classical’ or ‘Atypical’ to investigate the change over time of the recognition of variablephenotypes. Confidence intervals were calculated assuming a binomial distribution.
Period-related effectWith the period effect we examined how the occurrence of RTT diagnosis changed bycalendar year by investigating the annual incidence over time. The incidence (the number ofgirls diagnosed out of the pool of those eligible for diagnosis) was based on all female casesborn since 1976 and diagnosed each calendar year from 1982 to 2008 divided by all femalesat risk of diagnosis in a particular calendar year from 1982 to 2008 and expressed per100,000 female years. For example in 1982, only girls aged up to six years were includedwhereas in 1993, girls aged up to 17 years were included. Population data were obtainedfrom the Australian Bureau of Statistics Estimated Resident Population (ERP) (37). TheERP is based on the 2006 Census of Population and Housing and estimates the residentpopulation of Australian states and territories by single year of age and by sex as at 30 Juneof each reference year. This includes all Australian residents irrespective of their place ofbirth or resident status, however excludes foreign diplomatic personnel and their families.Specific events and time periods related to the diagnosis were then marked on the plot of theannual incidence.
Changes in the age-group specific trend per birth year and per diagnostic year were alsocalculated for children diagnosed at the ages of between 0-3, 4-7, 8-11 and, 12 or greateryears of age. These age-groups were used so that the youngest ages of possible diagnosiswere represented without being influenced by the most frequently diagnosed age-group (fourto seven years).
The cumulative risk (likelihood of a female child being diagnosed with RTT by a certainage) was estimated using survival analysis. Population denominators from the ERP (37)were used to calculate female person-years at risk for those without a RTT diagnosis, suchthat each individual at risk of diagnosis in each calendar year contributed one person-year ofrisk. The survival curve was then calculated using the Kaplan-Meier survival function (38)and risk evaluated as 1– the survival function at each age (expressed per 100,000 females).Separate curves were derived for cases diagnosed before and during or after 1999 and theirequality compared using the log-rank test. Cox regression was used to estimate the hazardratio (HR) for the two time periods.
The 2009 point prevalence of females with RTT aged between five and 32 years was definedas follows. The numerator was the number of cases aged five to 32 years alive on the 31st
June 2009 and the denominator, obtained from the ERP (37), was the number of females inthe Australia population within this age range. The point prevalence was calculatedseparately for those aged between five and 18 years and those aged 19 years and over in2009.
The age of RTT diagnosis was obtained from either the family or clinician questionnaires. Ifno age of diagnosis was available, a surrogate age was estimated using multiple sources ofinformation including date of ascertainment, date of genetic testing or through contact withfamilies. All records were updated with date of death or date last known to be alive as of31st December 2009 (estimated from the last contact with the families or their clinician). Wealso linked the cohort to the National Death Index housed at the Australian Institute ofHealth and Welfare to determine whether any of the subjects had died since their last contactwith the study. Ethics approval was received from the Australian Institute of Health andWelfare for the linkage to the National Death Index.
Fehr et al. Page 3
Pediatr Res. Author manuscript; available in PMC 2012 September 1.
NIH
-PA Author Manuscript
NIH
-PA Author Manuscript
NIH
-PA Author Manuscript

ResultsAs of 31st December 2009, the ARSD contained information on a total of 349 females (ofwhom 44 were deceased) born between 1976 and 2006 and diagnosed with RTT between1982 and 2008. Age of diagnosis ranged from one to 28 years of age (mean 5.5 years, 95%CI 5.04-5.96, Table 2). There was a decreasing trend in age of diagnosis from 6.04 years forthose born 1999 or prior to 3.03 years for those born after 1999. The point prevalence ofRTT in Australia on the 31st June 2009 was 8.6 per 100,000 females (95% CI 7.4-10.1) agedfive to 18 years and 5.8 per 100,000 females (95% CI 4.8-6.9) aged 19 years to 32 years.
The birth prevalence varied by birth year (Table 2), peaking for those born in the early tomid 1990s. For classical RTT there was a steep upward trend until 1988 followed by a rapiddecline with a later increase for atypical cases (Fig 1). In those under four years the birthprevalence increased from 1985 although in other age-groups it remained consistent overtime (Fig 2).
The period effect is shown in Figure 3, starting with the first English-speaking publication ofRTT in 1983 (1). Peaks in incidence occurred after the publication of each set of diagnosticcriteria and following the establishment of the ARSD in 1993 and its subsequent systematiccase ascertainment (21). A further peak occurred with the introduction of MECP2 testing inthe early 2000s. The subsequent availability of testing with MLPA (11) appeared to havehad little further impact.
Initially RTT was diagnosed most commonly in those aged 4-11 years. From 1986 onwards,diagnosis became more frequent in those under four years whereas fewer diagnoses weremade in those over 12 years of age (Fig 4). The age at diagnosis dropped from a median of4.5 years prior to 1999, to 3.5 years afterwards (log-rank test p = 0.01, Fig 5). This isequivalent to a 32% increase in risk of diagnosis (HR 1.32; 95% CI 1.06-1.63) from 1999onwards. Generally, over half of all girls would be diagnosed by the age of five years. Thisrepresented a cumulative risk of 6.51 per 100,000 person years (95% CI 5.65–7.39) or alikelihood of 1 in 15361 Australian girls being diagnosed with RTT by the age of five years;increasing to 1 in 10299 (9.71 per 100 000 person years (95% CI 8.64-10.78) by the age of12 years and 1 in 8905 (11.23 per 100 000 person years (95% CI 10.03–12.45) by the age of32 years.
DiscussionThis is the first study to investigate changing trends in RTT diagnosis. The mean age atdiagnosis in Australia decreased over time from approximately six years for those bornbefore 2000 to three years of age for those born since 2000, although a small proportion ofcases were still diagnosed at a later age. Active case ascertainment through the ARSD (21)and the introduction of genetic testing (9) appear to have resulted in the subsequentidentification of many previously undiagnosed individuals born since 1976. The recognitionof atypical relative to classical RTT has also increased over time, suggesting betterawareness of clinical variation. However the low birth prevalence in girls born after 2003shows that some lag time to diagnosis may still persist.
We acknowledge that obtaining complete case ascertainment for a rare disease ischallenging. However the strengths of this study are that it was population-based and usedan active system for ascertaining rare paediatric disorders in Australia. Moreover one of thesources of ascertainment, the APSU, has been found to meet all the necessary criteriadeveloped by the Centres for Disease Control and Prevention for the evaluation ofsurveillance systems (30). We have also previously shown that in comparison tointernational data, there appears to be no socio-economic bias in regards to age at diagnosis
Fehr et al. Page 4
Pediatr Res. Author manuscript; available in PMC 2012 September 1.
NIH
-PA Author Manuscript
NIH
-PA Author Manuscript
NIH
-PA Author Manuscript

of RTT in Australia (39). The use of multiple sources (provided often by clinician andfamily) to determine age at diagnosis both strengthens the precision and reduces possiblerecall bias. Thus, our data are likely to be representative of RTT in Australia and unbiased inthat respect. One unavoidable shortcoming, however, is the restriction to those born 1976and onwards. In the absence of a mechanism to ascertain adult women with RTT inAustralia in a systematic and comprehensive way this restriction was felt to be the only wayto maintain the rigor of the register. On the other hand, were some girls with RTT to havedied before diagnosis, as is possible, we may have minimally under-ascertained the birthprevalence. Furthermore we only have information on the number of diagnoses made not thenumber of genetic tests requested in order to confirm these and other diagnoses. However,we have demonstrated possible effects of the changing of diagnostic criteria (2, 5, 6, 10, 40)over time on the clinical identification, epidemiology and monitoring of trends in RTT.However, this impact has been less deleterious than the effects seen with autism spectrumdisorders over the last few decades (33).
Thirteen of the 16 previous epidemiological studies (Table 1) were conducted before thediscovery of causative mutations within MECP2. Cases were usually ascertained through asingle contact with specialists (14-18, 25, 27), child health departments (22, 23, 28) oreducation departments(15, 27), institutions (14, 25) and special schools(14, 15, 24, 26),although some used population-based sources (19-21). In one study, case ascertainmentinvolved contacting laboratories for MECP2 positive individuals or analysis of pre-collectedblood from a family RTT organization (13), and only cases with a pathogenic MECP2mutation were included. There are few study groups (17, 20) that have followed their cohortovertime and therefore, RTT may have been previously under-ascertained.
Frequency measures have also varied, in that in some studies the term ‘incidence’ was used(13, 18) (expressed, by one study, as per 10000 births) (18) and considered by another studyas an estimate of the prevalence (13). Where the term incidence has been used, thedenominators have been the annual female births, and the numerator the number of RTTcases for that period in question. For ‘prevalence’ the denominators have also differed withsome studies using the female population at risk and others the number of female births peryear. It is generally unclear whether incidence, birth prevalence or current point prevalencewere actually measured (41). In the latter, any deceased cases should be excluded from thenumerator and this may or may not have been done. Subject numbers have also varied fromone (26) to 274 (20). Some studies have been restricted to classical cases (14-18, 25-28) andone to only mutation positive individuals (13). The variation in age boundaries from zeroyears to the highest age possible can often cause an under-estimate of the prevalence due toan increased denominator. Although RTT is a condition present from birth, its observableonset is generally between six and 18 months and thus an earlier diagnosis is unlikely.
The age-specific trends were similar for both year of birth and year of diagnosis, in thatdiagnosis in the younger age groups increased and for older cases it remained fairlyconsistent over time. One difference is the peak in four to seven year olds being diagnosedbetween 2003 and 2005, which is not mirrored by any changes in the birth prevalence forthis age-group, and a decrease in birth prevalence for the eight to 11 year olds from 1995onwards. This may signify that children were being diagnosed younger. In general thecalendar year of diagnosis seems to have had more of an impact than the year of birth, withsignificant research events in the history of RTT increasing the number of diagnoses beingmade.
Our RTT frequency estimates were generally higher than in previous studies. Given thephenotypic variability in this disorder (42) it is important not to exclude or at least toseparately define atypical cases, but this was only done in seven of 16 studies (19-24), while
Fehr et al. Page 5
Pediatr Res. Author manuscript; available in PMC 2012 September 1.
NIH
-PA Author Manuscript
NIH
-PA Author Manuscript
NIH
-PA Author Manuscript

another was restricted to mutation positive cases (13). Our population-based database withassisted recruitment by the APSU (29) will have enhanced ascertainment and therefore, havereported higher subject numbers than studies not using active population-based methods ofsurveillance. Our prevalence was also higher than the 1993 population-based Texas study(19), which was undertaken prior to the identification of the relationship with MECP2 andmay have under-ascertained atypical cases which tend to be diagnosed at an older age (39).Through genetic testing and the identification of additional genes that can cause Rett-likesymptoms a broader spectrum of RTT phenotypes has emerged (7, 42, 43), from a verysevere early onset presentation to one which is much milder. In recent years in Australia, thenumber of cases diagnosed with atypical has approached that of classical RTT, indicating anincrease in the identification of atypical presentations and improvement in diagnosticpractice.
Cumulative risk has only been estimated in Australia where the necessary population-basedregister exists (20, 21). It provides an accurate estimate of the risk of RTT diagnosis by ageand is a useful and intuitive measure. The change in cumulative risk before and after 1999shows a clear increase in the risk of RTT diagnosis and a parallel decrease in age ofdiagnosis. The highest prevalence was in those aged between five and 18 years, with adecrease in those aged 19 years and older. This decrease would be expected in line with theincreased mortality in older girls and women (20). In combination, these measures providevital information about the diagnostic pattern of RTT over time so that we can discernwhether the age of diagnosis has actually decreased or whether this is an artefact due to theabsence of cases generally not diagnosed till older. An earlier diagnosis is important forfamilies in that it provides them with the ability to come to terms with the cause of theirchild's symptoms, to have a label for their child's condition, obtain earlier access toappropriate services and receive support from within parents' organizations (44).
The European Organization for Rare Diseases suggests that six to eight percent of theEuropean population suffer from a rare disease (45), so that together these conditions are nolonger rare. Many rare disorders impact not only on those diagnosed but also on their family,society and the healthcare system. Limited information and research into rare diseasesmeans that those people who suffer from them usually have delayed diagnosis and limitedaccess to support and services. Receiving an earlier diagnosis provides families withmechanisms to cope and move on with their lives whereas a delayed diagnosis may result infamilies experiencing potentially avoidable stress and emotional or financial strain. It isessential that appropriate and comparable methods, which are population-based whereverpossible, be used to research the epidemiology of RTT. Only then can real changes inincidence and prevalence over time and differences across countries be identified. Suchmethods will also help identify inequality in access to diagnostic services between andwithin countries, any true ethnic variation and any possible environmental exposures whichmight predispose to occurrence of the causative MECP2 mutations.
AcknowledgmentsThe authors would like to thank the families who have participated in the Australian Rett syndrome study. We alsogratefully acknowledge the clinicians who completed questionnaires and to extend our gratitude to the AustralianPaediatric Surveillance Unit (APSU) and the Australian Rett syndrome Association for their ongoing support incase ascertainment in Australia.
Sources of support: Supported by the National Institute of Health grant 5R01HD043100-05, NHMRC #303189.H.L. was previously funded by a NHMRC program grant (#353514); current funding is from an NHMRC SeniorResearch Fellowship #572568. N.N. is funded by a NHMRC Career Development Award (#632955).
Fehr et al. Page 6
Pediatr Res. Author manuscript; available in PMC 2012 September 1.
NIH
-PA Author Manuscript
NIH
-PA Author Manuscript
NIH
-PA Author Manuscript

References1. Hagberg B, Aicardi J, Dias K, Ramos O. A progressive syndrome of autism, dementia, ataxia, and
loss of purposeful hand use in girls: Rett's syndrome: report of 35 cases. Ann Neurol. 1983; 14:471–479. [PubMed: 6638958]
2. Hagberg B, Goutieres F, Hanefield F, Rett A, Wilson J. Rett Syndrome: criteria for inclusion andexclusion. Brain Dev. 1985; 7:372–373. [PubMed: 4061772]
3. Naidu S, Murphy M, Moser HW, Rett A. Rett syndrome - natural history in 70 cases. Am J MedGenet Suppl. 1986; 1:61–72. [PubMed: 3087204]
4. Hagberg B, Witt-Engerström I. Rett syndrome: a suggested staging system for describingimpairment profile with increasing age towards adolescence. Am J Med Genet Suppl. 1986; 1:47–59. [PubMed: 3087203]
5. Trevathan E, Moser HW. Diagnostic criteria for Rett syndrome. The Rett Syndrome DiagnosticCriteria Work Group. Ann Neurol. 1988; 23:425–428. [PubMed: 2454607]
6. Hagberg BA. Rett variants: a suggested model for inclusion criteria. Pediatr Neurol. 1994; 11:5–11.[PubMed: 7986294]
7. Ariani F, Hayek G, Rondinella D, Artuso R, Mencarelli MA, Spanhol-Rosseto A, Pollazzon M,Buoni S, Spiga O, Ricciardi S, Meloni I, Longo I, Mari F, Broccoli V, Zappella M, Renieri A.FOXG1 is responsible for the congenital variant of Rett syndrome. Am J Hum Genet. 2008; 83:89–93. [PubMed: 18571142]
8. Zappella M, Gillberg C, Ehlers S. The preserved speech variant: a subgroup of the Rett complex: aclinical report of 30 cases. J Autism Dev Disord. 1998; 28:519–526. [PubMed: 9932238]
9. Amir RE, Van den Veyver IB, Wan M, Tran CQ, Francke U, Zoghbi HY. Rett syndrome is causedby mutations in X-linked MECP2, encoding methyl- CpG-binding protein 2. Nat Genet. 1999;23:185–188. [PubMed: 10508514]
10. Hagberg B, Hanefeld F, Percy AK, Skjeldal OH. An update on clinically applicable diagnosticcriteria in Rett syndrome. Comments to Rett syndrome clinical criteria consensus panel satellite toEuropean Paediatric Neurology Society Meeting, Baden Baden, Germany, 11 September 2001.Eur J Paediatr Neurol. 2002; 6:293–297. [PubMed: 12378695]
11. Erlandson A, Samuelsson L, Hagberg B, Kyllerman M, Vujic M, Wahlstrom J. Multiplex ligation-dependent probe amplification (MLPA) detects large deletions in the MECP2 gene of SwedishRett syndrome patients. Genet Test. 2003; 7:329–332. [PubMed: 15000811]
12. Amir RE, Fang P, Yu Z, Glaze DG, Percy AK, Zoghbi HY, Roa BB, Van den Veyver IB.Mutations in exon 1 of MECP2 are a rare cause of Rett syndrome. J Med Genet. 2005; 42:e15.[PubMed: 15689438]
13. Bienvenu T, Philippe C, De Roux N, Raynaud M, Bonnefond JP, Pasquier L, Lesca G, Mancini J,Jonveaux P, Moncla A, Feingold J, Chelly J, Villard L. The incidence of Rett syndrome in France.Pediatr Neurol. 2006; 34:372–375. [PubMed: 16647997]
14. Boltshauser E, Kunzle C. Prevalence of Rett syndrome in Switzerland. Helv Paediatr Acta. 1987;42:407–411. [PubMed: 3502625]
15. Burd L, Vesley B, Martsolf JT, Kerbeshian J. Prevalence study of Rett syndrome in North Dakotachildren. Am J Med Genet. 1991; 38:565–568. [PubMed: 2063900]
16. Hagberg B. Rett's syndrome: prevalence and impact on progressive severe mental retardation ingirls. Acta Paediatr Scand. 1985; 74:405–408. [PubMed: 4003065]
17. Hagberg B, Witt-Engerström I. Rett syndrome: epidemiology and nosology--progress inknowledge 1986--a conference communication. Brain Dev. 1987; 9:451–457. [PubMed: 3324795]
18. Kerr AM, Stephenson JB. Rett's syndrome in the west of Scotland. Br Med J (Clin Res Ed). 1985;291:579–582.
19. Kozinetz CA, Skender ML, MacNaughton N, Almes MJ, Schultz RJ, Percy AK, Glaze DG.Epidemiology of Rett syndrome: a population-based registry. Pediatrics. 1993; 91:445–450.[PubMed: 8424025]
20. Laurvick CL, de Klerk N, Bower C, Christodoulou J, Ravine D, Ellaway C, Williamson S, LeonardH. Rett syndrome in Australia: a review of the epidemiology. J Pediatr. 2006; 148:347–352.[PubMed: 16615965]
Fehr et al. Page 7
Pediatr Res. Author manuscript; available in PMC 2012 September 1.
NIH
-PA Author Manuscript
NIH
-PA Author Manuscript
NIH
-PA Author Manuscript

21. Leonard H, Bower C, English D. The prevalence and incidence of Rett syndrome in Australia. EurChild Adolesc Psychiatry. 1997; 6:8–10. [PubMed: 9452912]
22. Pini G, Milan M, Zappella M. Rett syndrome in Northern Tuscany (Italy): family tree studies. ClinGenet. 1996; 50:486–490. [PubMed: 9147879]
23. Skjeldal OH, Vontetzchner S, Aspelund F, Herder GA, Lofterod B. Rett syndrome- geographicvariation in prevalence in Norway. Brain Dev. 1997; 19:258–261. [PubMed: 9187475]
24. Suzuki H, Hirayama Y, Arima M. Prevalence of Rett syndrome in Tokyo. No To Hattatsu. 1989;21:430–433. [PubMed: 2803793]
25. Talvik T, Soot A, Beilmann A, Soopld T, Nurk K. Rett syndrome in Estonia: prevalence of theclassical phenotype. Acta Paediatr. 1995; 84:1070–1071. [PubMed: 8652962]
26. Terai K, Munesue T, Hiratani M, Jiang ZY, Jibiki I, Yamaguchi N. The prevalence of Rettsyndrome in Fukui prefecture. Brain Dev. 1995; 17:153–154. [PubMed: 7625553]
27. Wong VC, Li SY. Rett syndrome: prevalence among Chinese and a comparison of MECP2mutations of classic Rett syndrome with other neurodevelopmental disorders. J Child Neurol.2007; 22:1397–1400. [PubMed: 18174559]
28. Zappella M, Cerioli M. High prevalence of Rett syndrome in a small area. Brain Dev. 1987; 9:479–480. [PubMed: 3501682]
29. Elliott EJ, Chant KG. Rare disease surveillance. J Paediatr Child Health. 1994; 30:463–465.[PubMed: 7865253]
30. He S, Zurynski YA, Elliott EJ. Evaluation of a national resource to identify and study rarediseases: the Australian Paediatric Surveillance Unit. J Paediatr Child Health. 2009; 45:498–504.[PubMed: 19702608]
31. Zurynski Y, Davey E, Elliot EJ. Australian Paediatric Surveillance Unit annual report, 2008 and2009. Commun Dis Intell. 2010; 34:285–290. [PubMed: 21090183]
32. Srikanthan, S.; Zurynski, Y.; Elliott, E. APSU Australian Paediatric Surveillance Unit: celebrating15 years of surveillance 1993-2007. Australian Paediatric Surveillance Unit; Westmead: 2008.
33. Nassar N, Dixon G, Bourke J, Bower C, Glasson E, de Klerk N, Leonard H. Autism spectrumdisorders in young children: effect of changes in diagnostic practices. Int J Epidemiol. 2009;38:1245–1254. [PubMed: 19737795]
34. Rothman, KJ.; Greenland, S.; Lash, TL. Modern Epidemiology. Wolters Kluwer Health/LippincottWilliams & Wilkins; Philadelphia: 2008. p. 47
35. Australian Bureau of Statistics. [Accessed, October 20 2009] 3105.0.65.001 Australian historicalpopulation statistics, 2006, Table 36. Available at:http://www.abs.gov.au/AUSSTATS/[email protected]/DetailsPage/3105.0.65.0012006?OpenDocument
36. Australian Bureau of Statistics. [Accessed, October 20 2009] 3301.0 - Births, Australia, 2007,Table 1. 2007. Available at:http://www.abs.gov.au/AUSSTATS/[email protected]/DetailsPage/3301.02007?OpenDocument
37. Australian Bureau of Statistics. [Accessed, October 20 2009] 3201.0 Population by age and sex,Australian states and territories, Table 9.1. 2009. Available at:http://www.abs.gov.au/AUSSTATS/[email protected]/DetailsPage/3201.0Jun%202008?OpenDocument
38. Kaplan EL, Meier P. Nonparametric estimation from incomplete observations. J Am Stat Assoc.1958; 53:457–481.
39. Fehr S, Downs J, Bebbington A, Leonard H. Atypical presentations and specific genotypes areassociated with a delay in diagnosis in diagnosis in females with Rett syndrome. Am J Med Genet.2010; 152A:2535–2542. [PubMed: 20815036]
40. Neul JL, Kaufmann WE, Glaze DG, Christodoulou J, Clarke AJ, Bahi-Buisson N, Leonard H,Bailey ME, Schanen NC, Zappella M, Renieri A, Huppke P, Percy AK. RettSearch Consortium.Rett syndrome: revised diagnostic criteria and nomenclature. Ann Neurol. 2010; 68:944–950.[PubMed: 21154482]
41. Last, JM.; Spasoff, RA.; Harris, SS.; Thuriaux, MC. International Epidemiological Association. ADictionary of Epidemiology. Oxford University Press; New York: 2001.
42. Bebbington A, Anderson A, Ravine D, Fyfe S, Pineda M, de Klerk N, Ben-Zeev B, Yatawara N,Percy AK, Kaufmann WE, Leonard H. Investigating genotype-phenotype relationships in Rettsyndrome using an international dataset. Neurology. 2008; 70:868–875. [PubMed: 18332345]
Fehr et al. Page 8
Pediatr Res. Author manuscript; available in PMC 2012 September 1.
NIH
-PA Author Manuscript
NIH
-PA Author Manuscript
NIH
-PA Author Manuscript

43. Mari F, Azimonti S, Bertani I, Bolognese F, Colombo E, Caselli R, Scala E, Longo I, Grosso S,Pescucci C, Ariani F, Hayek G, Balestri P, Bergo A, Badaracco G, Zappella M, Broccoli V,Renieri A, Kilstrup-Nielsen C, Landsberger N. CDKL5 belongs to the same molecular pathway ofMeCP2 and it is responsible for the early-onset seizure variant of Rett syndrome. Hum Mol Genet.2005; 14:1935–1946. [PubMed: 15917271]
44. Graungaard AH, Skov L. Why do we need a diagnosis? A qualitative study of parents' experiences,coping and needs, when the newborn child is severely disabled. Child Care Health Dev. 2007;33:296–307. [PubMed: 17439444]
45. European Organisation for Rare Diseases. [Accessed, March 18 2009] Rare diseases:understanding this public health priority. 2005. Available at:http://www.eurordis.org/IMG/pdf/princeps_document-EN.pdf
Abbreviations
APSU Australian Paediatric Surveillance Unit
ARSD Australian Rett Syndrome Database
ERP Estimated Residential Population
MECP2 Methyl-CpG Binding Protein 2
RTT Rett Syndrome
Fehr et al. Page 9
Pediatr Res. Author manuscript; available in PMC 2012 September 1.
NIH
-PA Author Manuscript
NIH
-PA Author Manuscript
NIH
-PA Author Manuscript

FIGURE 1.The birth prevalence of classical and atypical Rett syndrome in Australia between 1976 and2006 in those diagnosed between 1982 and 2008-smoothed over two years. ■: birthprevalence of girls with classical Rett syndrome; ✱: birth prevalence of girls with atypicalRett syndrome.
Fehr et al. Page 10
Pediatr Res. Author manuscript; available in PMC 2012 September 1.
NIH
-PA Author Manuscript
NIH
-PA Author Manuscript
NIH
-PA Author Manuscript

FIGURE 2.Age-group specific birth prevalence of Rett syndrome cases born between 1976 and 2006and diagnosed between 1982 and 2008 -smoothed over two years. ■: cases diagnosedbetween 0-3 years of age; ▲: 4-7 years of age; ✱: 8-11 years of age; ◆: over 12 years ofage.
Fehr et al. Page 11
Pediatr Res. Author manuscript; available in PMC 2012 September 1.
NIH
-PA Author Manuscript
NIH
-PA Author Manuscript
NIH
-PA Author Manuscript

FIGURE 3.The rate of Rett Syndrome diagnosis in Australia between 1982 and 2008 for girls bornbetween 1976 and 2006
Fehr et al. Page 12
Pediatr Res. Author manuscript; available in PMC 2012 September 1.
NIH
-PA Author Manuscript
NIH
-PA Author Manuscript
NIH
-PA Author Manuscript

FIGURE 4.The age-group specific yearly diagnosis of Rett syndrome cases born between 1976 and2006 and diagnosed between 1982 and 2008-smoothed over two years. ■: cases diagnosedbetween 0-3 years of age; ▲: 4-7 years of age; ✱: 8-11 years of age; ◆: over 12 years ofage.
Fehr et al. Page 13
Pediatr Res. Author manuscript; available in PMC 2012 September 1.
NIH
-PA Author Manuscript
NIH
-PA Author Manuscript
NIH
-PA Author Manuscript

FIGURE 5.Cumulative risk of obtaining a diagnosis of Rett syndrome. ■: cumulative risk of receiving adiagnosis of Rett syndrome before 2000; ▲: overall cumulative risk of diagnosis; ✱:cumulative risk of diagnosis after 1999.
Fehr et al. Page 14
Pediatr Res. Author manuscript; available in PMC 2012 September 1.
NIH
-PA Author Manuscript
NIH
-PA Author Manuscript
NIH
-PA Author Manuscript
NIH
-PA Author Manuscript
NIH
-PA Author Manuscript
NIH
-PA Author Manuscript
Fehr et al. Page 15
TAB
LE 1
Ret
t syn
drom
e pr
eval
ence
stud
ies c
ondu
cted
from
198
2-20
06 a
cros
s the
wor
ld
Cou
ntry
, stu
dy y
ear(
s)C
lass
ifica
tion
of R
ett s
yndr
ome
case
sPr
eval
ence
per
10,
000
fem
ales
Prev
alen
ce95
% C
IA
ge r
ange
(yea
rs)
Ref
eren
ces
Sout
hwes
t Sw
eden
, 198
2C
lass
ical
onl
y0.
650.
25-1
.05*
6-17
(16)
Wes
t Sco
tland
, 198
2C
lass
ical
onl
y0.
690.
41-0
.99*
3-15
(18)
Sout
hwes
t Sw
eden
, 198
2C
lass
ical
onl
y0.
840.
38-1
.30*
6-17
(17)
Switz
erla
nd. 1
967-
1982
Cla
ssic
al o
nly
0.41
0.26
-0.5
6*4-
19(1
4)
Nor
ther
n Ita
ly, 1
973-
1983
Cla
ssic
al o
nly
22.0
37.
2-51
.3*
4-12
(28)
Toky
o, Ja
pan
1988
Cla
ssic
al &
aty
pica
l0.
500.
32-0
.68
6-14
(24)
Nor
th D
akot
a, U
SA, 1
989
Cla
ssic
al o
nly
0.53
0.06
-0.9
60-
18(1
5)
Nor
ther
n Tu
scan
y, It
aly,
197
8-19
90C
lass
ical
& a
typi
cal
2.1
0.04
-4.1
63-
14(2
2)
Fuku
i pre
fect
ure,
Japa
n, 1
993
Cla
ssic
al o
nly
0.22
0.05
-1.1
3*6-
14(2
6)
Texa
s, U
SA, 1
990
Cla
ssic
al &
aty
pica
l0.
440.
36-0
.53
2-18
(19)
Esto
nia,
199
3C
lass
ical
onl
y0.
660.
25-1
.07*
0-15
(25)
Aus
tralia
, 199
4C
lass
ical
& a
typi
cal
0.67
0.55
-0.7
95-
18(2
1)
Nor
way
, 199
5C
lass
ical
& a
typi
cal
2.17
1.87
-2.5
9*3-
19(2
3)
Fran
ce, 2
004
Mut
atio
n po
sitiv
e0.
580.
51-0
.66
4-15
(13)
Aus
tralia
, 200
4C
lass
ical
& a
typi
cal
0.88
0.83
-0.9
35-
18(2
0)
Hon
g K
ong
Wes
t, 20
06C
lass
ical
onl
y0.
570.
15-0
.98
≤35
(27)
* Con
fiden
ce in
terv
als w
ere
not p
rese
nted
in L
aurv
ick
et a
l (20
) but
wer
e ca
lcul
ated
from
dat
a in
the
pape
r. C
I= C
onfid
ence
Inte
rval
s
Pediatr Res. Author manuscript; available in PMC 2012 September 1.

NIH
-PA Author Manuscript
NIH
-PA Author Manuscript
NIH
-PA Author Manuscript
Fehr et al. Page 16
TABLE 2
Birth prevalence of Rett syndrome between 1976 and 2006 for diagnoses made up until 2008.
Year of birth Number of cases(n=349)
Mean age of diagnosis (years)* Number of cases per 100,000 female births(95% CI)
1976-1979 30 10.1 6.84 (4.62-9.77)
1980-1983 40 7.8 8.67 (6.23-11.87)
1984-1987 51 5.6 10.79 (8.05-14.21)
1988-1991 54 5.7 10.92 (8.19-14.23)
1992-1995 57 5.4 11.26 (8.54-14.61)
1996-1999 54 3.9 11.04 (8.3-14.41)
2000-2003 40 3.4 8.23 (5.88-11.21)
2004-2006 23 2.5 6.11 (3.84-9.1)
Overall (1976-2006) 349 5.5 9.37 (8.41-10.41)
*These means may not be representative of the whole population, as some cases may not have been diagnosed, CI= Confidence Intervals
Pediatr Res. Author manuscript; available in PMC 2012 September 1.
Copyright © 2022 FDOKUMEN