Trends in prevalence, knowledge, attitudes, and practices of helmet use in Cambodia: results from a...
7
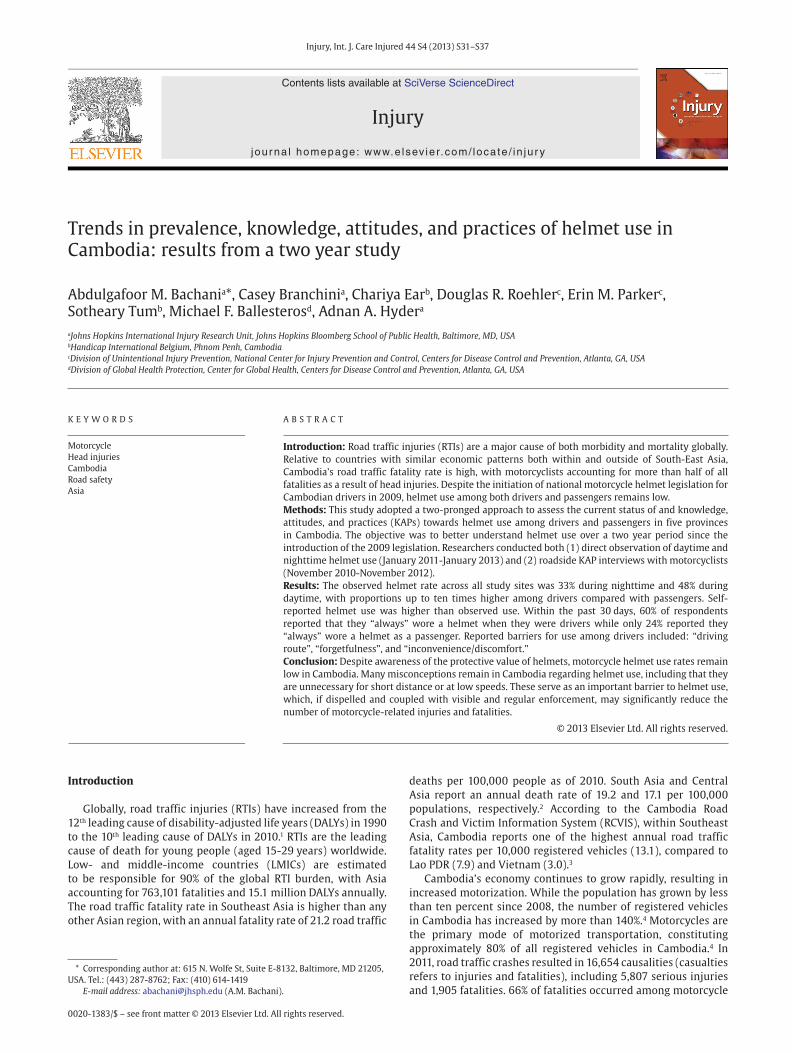
Injury, Int. J. Care Injured 44 S4 (2013) S31–S37 Introduction Globally, road traffic injuries (RTIs) have increased from the 12 th leading cause of disability-adjusted life years (DALYs) in 1990 to the 10 th leading cause of DALYs in 2010. 1 RTIs are the leading cause of death for young people (aged 15-29 years) worldwide. Low- and middle-income countries (LMICs) are estimated to be responsible for 90% of the global RTI burden, with Asia accounting for 763,101 fatalities and 15.1 million DALYs annually. The road traffic fatality rate in Southeast Asia is higher than any other Asian region, with an annual fatality rate of 21.2 road traffic deaths per 100,000 people as of 2010. South Asia and Central Asia report an annual death rate of 19.2 and 17.1 per 100,000 populations, respectively. 2 According to the Cambodia Road Crash and Victim Information System (RCVIS), within Southeast Asia, Cambodia reports one of the highest annual road traffic fatality rates per 10,000 registered vehicles (13.1), compared to Lao PDR (7.9) and Vietnam (3.0). 3 Cambodia’s economy continues to grow rapidly, resulting in increased motorization. While the population has grown by less than ten percent since 2008, the number of registered vehicles in Cambodia has increased by more than 140%. 4 Motorcycles are the primary mode of motorized transportation, constituting approximately 80% of all registered vehicles in Cambodia. 4 In 2011, road traffic crashes resulted in 16,654 causalities (casualties refers to injuries and fatalities), including 5,807 serious injuries and 1,905 fatalities. 66% of fatalities occurred among motorcycle KEYWORDS Motorcycle Head injuries Cambodia Road safety Asia ABSTRACT Introduction: Road traffic injuries (RTIs) are a major cause of both morbidity and mortality globally. Relative to countries with similar economic patterns both within and outside of South-East Asia, Cambodia’s road traffic fatality rate is high, with motorcyclists accounting for more than half of all fatalities as a result of head injuries. Despite the initiation of national motorcycle helmet legislation for Cambodian drivers in 2009, helmet use among both drivers and passengers remains low. Methods: This study adopted a two-pronged approach to assess the current status of and knowledge, attitudes, and practices (KAPs) towards helmet use among drivers and passengers in five provinces in Cambodia. The objective was to better understand helmet use over a two year period since the introduction of the 2009 legislation. Researchers conducted both (1) direct observation of daytime and nighttime helmet use (January 2011-January 2013) and (2) roadside KAP interviews with motorcyclists (November 2010-November 2012). Results: The observed helmet rate across all study sites was 33% during nighttime and 48% during daytime, with proportions up to ten times higher among drivers compared with passengers. Self- reported helmet use was higher than observed use. Within the past 30 days, 60% of respondents reported that they “always” wore a helmet when they were drivers while only 24% reported they “always” wore a helmet as a passenger. Reported barriers for use among drivers included: “driving route”, “forgetfulness”, and “inconvenience/discomfort.” Conclusion: Despite awareness of the protective value of helmets, motorcycle helmet use rates remain low in Cambodia. Many misconceptions remain in Cambodia regarding helmet use, including that they are unnecessary for short distance or at low speeds. These serve as an important barrier to helmet use, which, if dispelled and coupled with visible and regular enforcement, may significantly reduce the number of motorcycle-related injuries and fatalities. © 2013 Elsevier Ltd. All rights reserved. Trends in prevalence, knowledge, attitudes, and practices of helmet use in Cambodia: results from a two year study Abdulgafoor M. Bachani a *, Casey Branchini a , Chariya Ear b , Douglas R. Roehler c , Erin M. Parker c , Sotheary Tum b , Michael F. Ballesteros d , Adnan A. Hyder a a Johns Hopkins International Injury Research Unit, Johns Hopkins Bloomberg School of Public Health, Baltimore, MD, USA b Handicap International Belgium, Phnom Penh, Cambodia c Division of Unintentional Injury Prevention, National Center for Injury Prevention and Control, Centers for Disease Control and Prevention, Atlanta, GA, USA d Division of Global Health Protection, Center for Global Health, Centers for Disease Control and Prevention, Atlanta, GA, USA * Corresponding author at: 615 N. Wolfe St, Suite E-8132, Baltimore, MD 21205, USA. Tel.: (443) 287-8762; Fax: (410) 614-1419 E-mail address: [email protected] (A.M. Bachani). 0020-1383/$ – see front matter © 2013 Elsevier Ltd. All rights reserved. Contents lists available at SciVerse ScienceDirect Injury journal homepage: www.elsevier.com/locate/injury
-
Upload
independent -
Category
Documents
-
view
2 -
download
0
Transcript of Trends in prevalence, knowledge, attitudes, and practices of helmet use in Cambodia: results from a...
Injury, Int. J. Care Injured 44 S4 (2013) S31–S37
Introduction
Globally, road traffic injuries (RTIs) have increased from the
12th leading cause of disability-adjusted life years (DALYs) in 1990
to the 10th leading cause of DALYs in 2010.1 RTIs are the leading
cause of death for young people (aged 15-29 years) worldwide.
Low- and middle-income countries (LMICs) are estimated
to be responsible for 90% of the global RTI burden, with Asia
accounting for 763,101 fatalities and 15.1 million DALYs annually.
The road traffic fatality rate in Southeast Asia is higher than any
other Asian region, with an annual fatality rate of 21.2 road traffic
deaths per 100,000 people as of 2010. South Asia and Central
Asia report an annual death rate of 19.2 and 17.1 per 100,000
populations, respectively.2 According to the Cambodia Road
Crash and Victim Information System (RCVIS), within Southeast
Asia, Cambodia reports one of the highest annual road traffic
fatality rates per 10,000 registered vehicles (13.1), compared to
Lao PDR (7.9) and Vietnam (3.0).3
Cambodia’s economy continues to grow rapidly, resulting in
increased motorization. While the population has grown by less
than ten percent since 2008, the number of registered vehicles
in Cambodia has increased by more than 140%.4 Motorcycles are
the primary mode of motorized transportation, constituting
approximately 80% of all registered vehicles in Cambodia.4 In
2011, road traffic crashes resulted in 16,654 causalities (casualties
refers to injuries and fatalities), including 5,807 serious injuries
and 1,905 fatalities. 66% of fatalities occurred among motorcycle
K E Y W O R D S
Motorcycle
Head injuries
Cambodia
Road safety
Asia
A B S T R A C T
Introduction: Road traffic injuries (RTIs) are a major cause of both morbidity and mortality globally.
Relative to countries with similar economic patterns both within and outside of South-East Asia,
Cambodia’s road traffic fatality rate is high, with motorcyclists accounting for more than half of all
fatalities as a result of head injuries. Despite the initiation of national motorcycle helmet legislation for
Cambodian drivers in 2009, helmet use among both drivers and passengers remains low.
Methods: This study adopted a two-pronged approach to assess the current status of and knowledge,
attitudes, and practices (KAPs) towards helmet use among drivers and passengers in five provinces
in Cambodia. The objective was to better understand helmet use over a two year period since the
introduction of the 2009 legislation. Researchers conducted both (1) direct observation of daytime and
nighttime helmet use (January 2011-January 2013) and (2) roadside KAP interviews with motorcyclists
(November 2010-November 2012).
Results: The observed helmet rate across all study sites was 33% during nighttime and 48% during
daytime, with proportions up to ten times higher among drivers compared with passengers. Self-
reported helmet use was higher than observed use. Within the past 30 days, 60% of respondents
reported that they “always” wore a helmet when they were drivers while only 24% reported they
“always” wore a helmet as a passenger. Reported barriers for use among drivers included: “driving
route”, “forgetfulness”, and “inconvenience/discomfort.”
Conclusion: Despite awareness of the protective value of helmets, motorcycle helmet use rates remain
low in Cambodia. Many misconceptions remain in Cambodia regarding helmet use, including that they
are unnecessary for short distance or at low speeds. These serve as an important barrier to helmet use,
which, if dispelled and coupled with visible and regular enforcement, may significantly reduce the
number of motorcycle-related injuries and fatalities.
© 2013 Elsevier Ltd. All rights reserved.
Trends in prevalence, knowledge, attitudes, and practices of helmet use in Cambodia: results from a two year study
Abdulgafoor M. Bachania*, Casey Branchinia, Chariya Earb, Douglas R. Roehlerc, Erin M. Parkerc, Sotheary Tumb, Michael F. Ballesterosd, Adnan A. Hydera
aJohns Hopkins International Injury Research Unit, Johns Hopkins Bloomberg School of Public Health, Baltimore, MD, USAbHandicap International Belgium, Phnom Penh, CambodiacDivision of Unintentional Injury Prevention, National Center for Injury Prevention and Control, Centers for Disease Control and Prevention, Atlanta, GA, USAdDivision of Global Health Protection, Center for Global Health, Centers for Disease Control and Prevention, Atlanta, GA, USA
* Corresponding author at: 615 N. Wolfe St, Suite E-8132, Baltimore, MD 21205,
USA. Tel.: (443) 287-8762; Fax: (410) 614-1419
E-mail address: [email protected] (A.M. Bachani).
0020-1383/$ – see front matter © 2013 Elsevier Ltd. All rights reserved.
Contents lists available at SciVerse ScienceDirect
Injury
j our na l homepage: www.e lsev ie r.com/ loca te / in ju r y

S32 A.M. Bachani et al. / Injury, Int. J. Care Injured 44 S4 (2013) S31–S37
riders. Additionally, head injuries were reported in 69% of all
fatalities among motorcycle riders, and only 23% of motorcycle
riders were wearing a helmet at the time of the crash.5
Wearing a helmet is the single most effective way to reduce
head injuries and fatalities in a motorcycle crash. Research
has shown that introduction and enforcement of legislation
regarding helmet use may be an effective way to increase helmet
use and reduce head injuries.6 To be effective, however, legislation
needs to be supported by strong enforcement and effective
social marketing campaigns.7 As such, over the last few years,
two major initiatives - one by the Bloomberg Philanthropies
(Global Road Safety Programme) and the other by the Asia Injury
Prevention Foundation (the Global Helmet Vaccine Initiative),
have aimed to address the gaps in enforcement and education,
and subsequently improve helmet wearing in Cambodia.8,9
This paper presents findings from ongoing surveillance (July
2010 to January 2013) of helmet use as well as self-reported
knowledge, attitudes, and practices around helmet wearing
from roadside surveys in five provinces targeted by the above-
mentioned initiatives in Cambodia. This data will be key in not
only monitoring the impact of these initiatives, but will also
provide valuable information to inform the development and
implementation of road safety initiatives in Cambodia and other
similar countries.
Methods
Two methodologies were employed for collecting and
analyz ing data for this study: helmet observational studies, and
roadside knowledge, attitude, and practice (KAP) surveys to
examine beliefs and practices around helmet use in Cambodia
among motorcyclists. Each of these methods has been described
in detail previously.10
Helmet Observational Studies
Helmet Observational Studies were used to monitor the
prevalence of helmet use among motorcycle drivers and
passengers in the five target provinces. These involved systematic
observations at sites in each of the five target provinces: Phnom
Penh, Kandal, Kampong Speu, Siem Reap, and Kampong Cham.
This study was carried out in two phases. In phase I, beginning in
July 2010, nighttime only helmet observations were carried out
every other month in three provinces (Phnom Penh, Kandal and
Kampong Speu). In phase II, beginning in January 2011, the scope
of helmet observations was expanded to include two additional
provinces (Siem Reap and Kampong Cham) and daytime as well
as nighttime observations. This analysis is based on the first 16
rounds of data on nighttime helmet use (July 2010-January 2013)
and the first 13 rounds of data on daytime helmet use (January
2011-January 2013).
As described previously,10 a total of six observation sites were
selected in each of the five target provinces through a systematic
multi-step process. A stratified random sampling technique was
employed to select sites from all eligible locations to ensure that
the selected sites were representative of each province. These
sites remained constant throughout the study period.
Helmet observations were conducted during the third week
of every other month, at each observation site, four times a day,
beginning in July 2010. Each observation interval was 90 minutes
long, and there were observation intervals at four different times
during the day - 9 am, 12 pm, 5 pm, and 7 pm to account for
variations in traffic volume and composition at different times
of the day and to assess differences in helmet use between day
(9 am and 12 pm) and night (5 pm and 7 pm). Teams comprised
of two field assistants carried out the data collection, recording
helmet use for both drivers and passengers who drove through
the observation sites from opposite directions in order to avoid
double counting.
Roadside KAP Surveys
Roadside KAP Surveys of motorcycle drivers and passengers
were carried out in three of the study provinces - Phnom Penh,
Kandal, and Kampong Speu (phase I provinces). These surveys were
used to gain insight into the knowledge, attitudes, and practices
around helmet wearing in the three provinces, and monitor
changes in knowledge, attitude, and practices at the sites over the
study period. To ensure safety of interviewers, eligible interview
locations included places such as gas stations and rest stops that
did not require a driver to actively stop his or her motorcycle to
participate in the survey. Interview locations were selected from
among eligible locations that were close to the observational sites.
A total of 19 sites were selected across the three provinces (Phnom
Penh = 10; Kandal = 5; Kampong Speu = 4).
KAP surveys were conducted semi-annually over the study
period (November 2010, May 2011, November 2011, May 2012,
and November 2012) by trained interviewers over a five-day
period each time. Survey data were collected through face-
to-face interviews. As with observational studies, interviews
were conducted at varying times during the day, and day of
the week to ensure a mix of respondents. Through the use of a
closed-ended questionnaire, we aimed to capture respondents’
knowledge, attitudes, and self-reported behavior patterns
related to helmet use, including, but not limited to: knowledge
of legislation, perceptions on enforcement, helmet ownership,
factors influencing helmet purchase, frequency of helmet use
as drivers and passengers, and reasons for use or non-use of
helmets. Other background information on the type of motorcycle
the respondent was traveling on, motorcycle ownership, and
demographics was also collected.
Data were managed and analyzed using STATA 11 (StataCorp
2009) and Microsoft Excel. Exploratory analysis was first done
using tabulations and cross-tabulations to understand under-
lying patterns in helmet use observations and the prevailing
KAP around helmet use. Chi-square tests were conducted to
examine differences between groups. In order to account for
over-dispersion, negative binomial regression (NBR) models
were used to analyze the trend of helmet use over time.11 This
NBR was used over the more commonly used Poisson regression
model, because the assumption that the mean equals the
variance does not hold in this case. Others have also found a
negative binomial regression appropriate for count data, such as
road traffic fatalities.12 The parameters were estimated by fitting
the negative binomial regression model to the estimated rates of
helmet usage among passengers and drivers in Cambodia from
January 2011 to January 2013. Regression results are presented
as incidence rate ratios (IRR). A p-value of less than 0.05 was
considered statistically significant.
The study was approved by the Institutional Review Board at
the Johns Hopkins Bloomberg School of Public Health, as well as
the National Road Safety Committee in Cambodia.
Results
Helmet Observational Studies
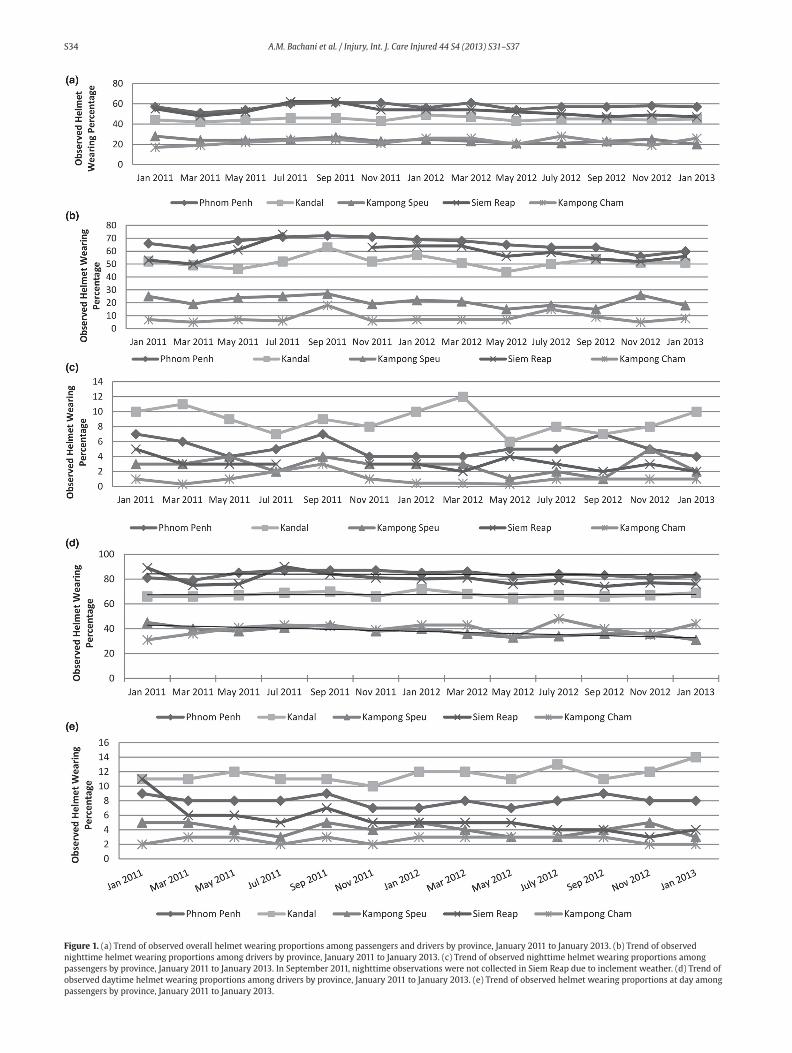
Results from the helmet observations show low rates of
overall helmet use (44.3%) across the five provinces for the period
of January 2011 to January 2013. This is due primarily to the
exceptionally low helmet use among passengers (6.4% overall)
as compared to drivers (63.8% overall) (Table 1; Figure 1a). This
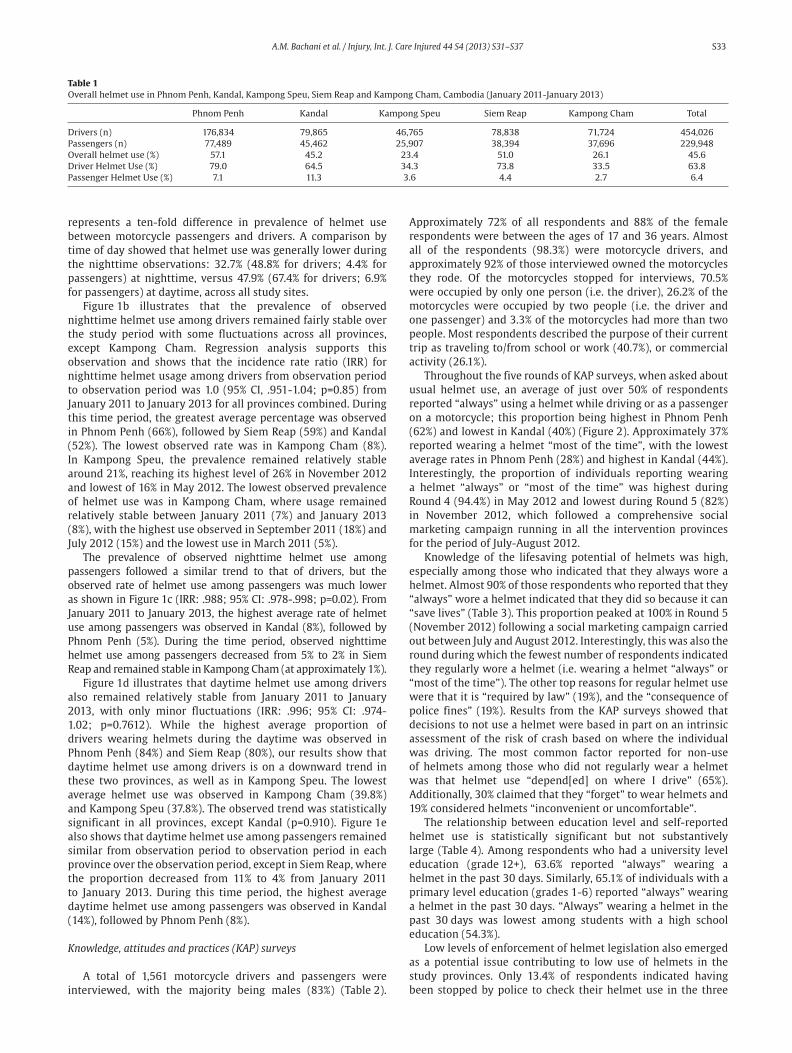
A.M. Bachani et al. / Injury, Int. J. Care Injured 44 S4 (2013) S31–S37 S33
represents a ten-fold difference in prevalence of helmet use
between motorcycle passengers and drivers. A comparison by
time of day showed that helmet use was generally lower during
the nighttime observations: 32.7% (48.8% for drivers; 4.4% for
passengers) at nighttime, versus 47.9% (67.4% for drivers; 6.9%
for passengers) at daytime, across all study sites.
Figure 1b illustrates that the prevalence of observed
nighttime helmet use among drivers remained fairly stable over
the study period with some fluctuations across all provinces,
except Kampong Cham. Regression analysis supports this
observation and shows that the incidence rate ratio (IRR) for
nighttime helmet usage among drivers from observation period
to observation period was 1.0 (95% CI, .951-1.04; p=0.85) from
January 2011 to January 2013 for all provinces combined. During
this time period, the greatest average percentage was observed
in Phnom Penh (66%), followed by Siem Reap (59%) and Kandal
(52%). The lowest observed rate was in Kampong Cham (8%).
In Kampong Speu, the prevalence remained relatively stable
around 21%, reaching its highest level of 26% in November 2012
and lowest of 16% in May 2012. The lowest observed prevalence
of helmet use was in Kampong Cham, where usage remained
relatively stable between January 2011 (7%) and January 2013
(8%), with the highest use observed in September 2011 (18%) and
July 2012 (15%) and the lowest use in March 2011 (5%).
The prevalence of observed nighttime helmet use among
passengers followed a similar trend to that of drivers, but the
observed rate of helmet use among passengers was much lower
as shown in Figure 1c (IRR: .988; 95% CI: .978-.998; p=0.02). From
January 2011 to January 2013, the highest average rate of helmet
use among passengers was observed in Kandal (8%), followed by
Phnom Penh (5%). During the time period, observed nighttime
helmet use among passengers decreased from 5% to 2% in Siem
Reap and remained stable in Kampong Cham (at approximately 1%).
Figure 1d illustrates that daytime helmet use among drivers
also remained relatively stable from January 2011 to January
2013, with only minor fluctuations (IRR: .996; 95% CI: .974-
1.02; p=0.7612). While the highest average proportion of
drivers wearing helmets during the daytime was observed in
Phnom Penh (84%) and Siem Reap (80%), our results show that
daytime helmet use among drivers is on a downward trend in
these two provinces, as well as in Kampong Speu. The lowest
average helmet use was observed in Kampong Cham (39.8%)
and Kampong Speu (37.8%). The observed trend was statistically
significant in all provinces, except Kandal (p=0.910). Figure 1e
also shows that daytime helmet use among passengers remained
similar from observation period to observation period in each
province over the observation period, except in Siem Reap, where
the proportion decreased from 11% to 4% from January 2011
to January 2013. During this time period, the highest average
daytime helmet use among passengers was observed in Kandal
(14%), followed by Phnom Penh (8%).
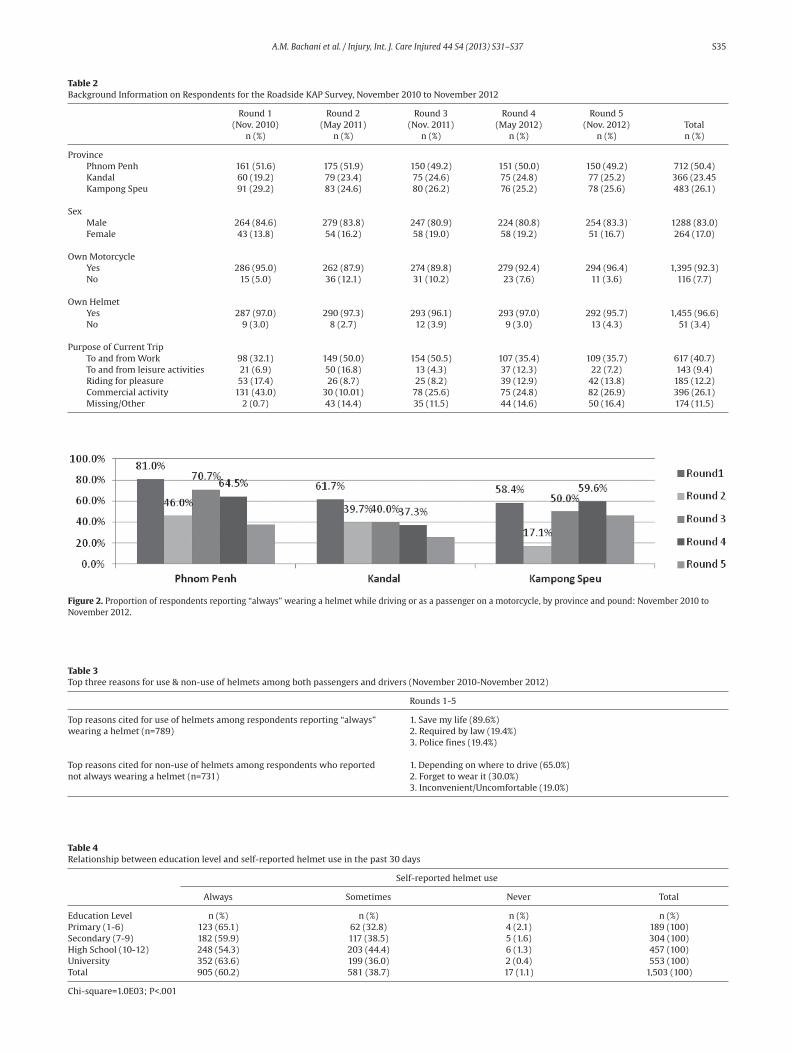
Knowledge, attitudes and practices (KAP) surveys
A total of 1,561 motorcycle drivers and passengers were
interviewed, with the majority being males (83%) (Table 2).
Approximately 72% of all respondents and 88% of the female
respondents were between the ages of 17 and 36 years. Almost
all of the respondents (98.3%) were motorcycle drivers, and
approximately 92% of those interviewed owned the motorcycles
they rode. Of the motorcycles stopped for interviews, 70.5%
were occupied by only one person (i.e. the driver), 26.2% of the
motorcycles were occupied by two people (i.e. the driver and
one passenger) and 3.3% of the motorcycles had more than two
people. Most respondents described the purpose of their current
trip as traveling to/from school or work (40.7%), or commercial
activity (26.1%).
Throughout the five rounds of KAP surveys, when asked about
usual helmet use, an average of just over 50% of respondents
reported “always” using a helmet while driving or as a passenger
on a motorcycle; this proportion being highest in Phnom Penh
(62%) and lowest in Kandal (40%) (Figure 2). Approximately 37%
reported wearing a helmet “most of the time”, with the lowest
average rates in Phnom Penh (28%) and highest in Kandal (44%).
Interestingly, the proportion of individuals reporting wearing
a helmet “always” or “most of the time” was highest during
Round 4 (94.4%) in May 2012 and lowest during Round 5 (82%)
in November 2012, which followed a comprehensive social
marketing campaign running in all the intervention provinces
for the period of July-August 2012.
Knowledge of the lifesaving potential of helmets was high,
especially among those who indicated that they always wore a
helmet. Almost 90% of those respondents who reported that they
“always” wore a helmet indicated that they did so because it can
“save lives” (Table 3). This proportion peaked at 100% in Round 5
(November 2012) following a social marketing campaign carried
out between July and August 2012. Interestingly, this was also the
round during which the fewest number of respondents indicated
they regularly wore a helmet (i.e. wearing a helmet “always” or
“most of the time”). The other top reasons for regular helmet use
were that it is “required by law” (19%), and the “consequence of
police fines” (19%). Results from the KAP surveys showed that
decisions to not use a helmet were based in part on an intrinsic
assessment of the risk of crash based on where the individual
was driving. The most common factor reported for non-use
of helmets among those who did not regularly wear a helmet
was that helmet use “depend[ed] on where I drive” (65%).
Additionally, 30% claimed that they “forget” to wear helmets and
19% considered helmets “inconvenient or uncomfortable”.
The relationship between education level and self-reported
helmet use is statistically significant but not substantively
large (Table 4). Among respondents who had a university level
education (grade 12+), 63.6% reported “always” wearing a
helmet in the past 30 days. Similarly, 65.1% of individuals with a
primary level education (grades 1-6) reported “always” wearing
a helmet in the past 30 days. “Always” wearing a helmet in the
past 30 days was lowest among students with a high school
education (54.3%).
Low levels of enforcement of helmet legislation also emerged
as a potential issue contributing to low use of helmets in the
study provinces. Only 13.4% of respondents indicated having
been stopped by police to check their helmet use in the three
Table 1Overall helmet use in Phnom Penh, Kandal, Kampong Speu, Siem Reap and Kampong Cham, Cambodia (January 2011-January 2013)
Phnom Penh Kandal Kampong Speu Siem Reap Kampong Cham Total
Drivers (n) 176,834 79,865 46,765 78,838 71,724 454,026
Passengers (n) 77,489 45,462 25,907 38,394 37,696 229,948
Overall helmet use (%) 57.1 45.2 23.4 51.0 26.1 45.6
Driver Helmet Use (%) 79.0 64.5 34.3 73.8 33.5 63.8
Passenger Helmet Use (%) 7.1 11.3 3.6 4.4 2.7 6.4
S34 A.M. Bachani et al. / Injury, Int. J. Care Injured 44 S4 (2013) S31–S37
Figure 1. (a) Trend of observed overall helmet wearing proportions among passengers and drivers by province, January 2011 to January 2013. (b) Trend of observed
nighttime helmet wearing proportions among drivers by province, January 2011 to January 2013. (c) Trend of observed nighttime helmet wearing proportions among
passengers by province, January 2011 to January 2013. In September 2011, nighttime observations were not collected in Siem Reap due to inclement weather. (d) Trend of
observed daytime helmet wearing proportions among drivers by province, January 2011 to January 2013. (e) Trend of observed helmet wearing proportions at day among
passengers by province, January 2011 to January 2013.
A.M. Bachani et al. / Injury, Int. J. Care Injured 44 S4 (2013) S31–S37 S35
Table 2Background Information on Respondents for the Roadside KAP Survey, November 2010 to November 2012
Round 1 Round 2 Round 3 Round 4 Round 5
(Nov. 2010) (May 2011) (Nov. 2011) (May 2012) (Nov. 2012) Total
n (%) n (%) n (%) n (%) n (%) n (%)
Province
Phnom Penh 161 (51.6) 175 (51.9) 150 (49.2) 151 (50.0) 150 (49.2) 712 (50.4)
Kandal 60 (19.2) 79 (23.4) 75 (24.6) 75 (24.8) 77 (25.2) 366 (23.45
Kampong Speu 91 (29.2) 83 (24.6) 80 (26.2) 76 (25.2) 78 (25.6) 483 (26.1)
Sex
Male 264 (84.6) 279 (83.8) 247 (80.9) 224 (80.8) 254 (83.3) 1288 (83.0)
Female 43 (13.8) 54 (16.2) 58 (19.0) 58 (19.2) 51 (16.7) 264 (17.0)
Own Motorcycle
Yes 286 (95.0) 262 (87.9) 274 (89.8) 279 (92.4) 294 (96.4) 1,395 (92.3)
No 15 (5.0) 36 (12.1) 31 (10.2) 23 (7.6) 11 (3.6) 116 (7.7)
Own Helmet
Yes 287 (97.0) 290 (97.3) 293 (96.1) 293 (97.0) 292 (95.7) 1,455 (96.6)
No 9 (3.0) 8 (2.7) 12 (3.9) 9 (3.0) 13 (4.3) 51 (3.4)
Purpose of Current Trip
To and from Work 98 (32.1) 149 (50.0) 154 (50.5) 107 (35.4) 109 (35.7) 617 (40.7)
To and from leisure activities 21 (6.9) 50 (16.8) 13 (4.3) 37 (12.3) 22 (7.2) 143 (9.4)
Riding for pleasure 53 (17.4) 26 (8.7) 25 (8.2) 39 (12.9) 42 (13.8) 185 (12.2)
Commercial activity 131 (43.0) 30 (10.01) 78 (25.6) 75 (24.8) 82 (26.9) 396 (26.1)
Missing/Other 2 (0.7) 43 (14.4) 35 (11.5) 44 (14.6) 50 (16.4) 174 (11.5)
Figure 2. Proportion of respondents reporting “always” wearing a helmet while driving or as a passenger on a motorcycle, by province and pound: November 2010 to
November 2012.
Table 3Top three reasons for use & non-use of helmets among both passengers and drivers (November 2010-November 2012)
Rounds 1-5
Top reasons cited for use of helmets among respondents reporting “always” 1. Save my life (89.6%)
wearing a helmet (n=789) 2. Required by law (19.4%)
3. Police fines (19.4%)
Top reasons cited for non-use of helmets among respondents who reported 1. Depending on where to drive (65.0%)
not always wearing a helmet (n=731) 2. Forget to wear it (30.0%)
3. Inconvenient/Uncomfortable (19.0%)
Table 4Relationship between education level and self-reported helmet use in the past 30 days
Self-reported helmet use
Always Sometimes Never Total
Education Level n (%) n (%) n (%) n (%)
Primary (1-6) 123 (65.1) 62 (32.8) 4 (2.1) 189 (100)
Secondary (7-9) 182 (59.9) 117 (38.5) 5 (1.6) 304 (100)
High School (10-12) 248 (54.3) 203 (44.4) 6 (1.3) 457 (100)
University 352 (63.6) 199 (36.0) 2 (0.4) 553 (100)
Total 905 (60.2) 581 (38.7) 17 (1.1) 1,503 (100)
Chi-square=1.0E03; P<.001
S36 A.M. Bachani et al. / Injury, Int. J. Care Injured 44 S4 (2013) S31–S37
months prior to the interview (data not shown). This proportion
was highest in Round 1 (November 2010) (21%), and lowest (at
about 9% each round) in Round 2 (May 2011) and Round 4 (May
2012). By Round 5 (November 2012), the proportion increased
to 13%.
Despite the relatively low prevalence of helmet use,
approximately 95.8% of respondents reported owning a helmet.
This number remained relatively stable across the rounds.
Helmet quality (37.5%) and helmet style (24.2%) were found to
be among the factors most influencing the decision to purchase
a particular helmet.
Discussion
Cambodia has one of the highest rates of road traffic related
fatalities and injuries in the Southeast Asia region.13 According to
police-reported data from the Cambodia Road Crash and Victim
Information System (RCVIS), in 2011, Phnom Penh recorded
the highest rates of road traffic fatalities in the country (13.5
per 100,000 population), followed by Kandal (9.5 per 100,000
population) and Kampong Cham (6.9 per 100,000 population). A
similar trend can be observed in terms of injuries, with Kandal
reporting the highest rate (61 per 100,000 population), followed
by Phnom Penh (45.6) and Kampong Speu (19.3).14
Comprising more than 80% of all registered vehicles in
Cambodia, motorcyclists are at increased risk of injury compared
to drivers of other vehicles. Per mile traveled, they have roughly
30 times the risk of death and five times the risk of injury, as
compared to drivers of other types of vehicles; the primary
reason for this being the non-use of helmets.15
From 2008 to 2011, according to police-reported data from
the RCVIS, the rate of road traffic fatalities increased by 9.4%
(from 11.8 to 12.9 per 100,000 population) with motorcyclists
comprising the majority (>65%) of these fatalities. Head injuries
are a major contributor to morbidity and mortality among
motorcyclists in Cambodia, with less than 18% of all riders (29%
of drivers and 6% of passengers) who were injured or killed in a
crash wearing a helmet at the time of the event.16 Many of these
head injuries could have been prevented or reduced in severity if
riders were wearing helmets.
Our study shows that helmet use in Cambodia remains
relatively low, especially at nighttime and among passengers.
There is also wide variability in helmet use between provinces.
Rates of helmet use are noticeably lower in the rural as compared
to the urban areas. In both rural and urban areas, rates were
much higher during the daytime as compared to the nighttime.
The low rate of helmet use among passengers may be due in part
to a helmet law that covers only part of the motorcycle rider
population in Cambodia. The law currently in place in Cambodia
was introduced in January 2009, and mandates helmet wearing
for drivers but not passengers.17 Efforts are currently underway
in Cambodia to revise the helmet law to include a mandate for
passengers as well. It is important to note that changing the
law alone will not necessarily lead to widespread helmet use
among motorcyclists in Cambodia. This has been demonstrated
in previous studies conducted in Viet Nam, Nigeria, and the
United States, which show that use helmet rates can remain
low despite the enactment of a law, as long as the law is not
strongly enforced.18-22 Furthermore, the low rate of helmet use
among Cambodian drivers in this study demonstrates that a
law alone will not result in all drivers wearing helmets. A law,
combined with a coordinated effort that includes awareness,
social marketing, provision of helmets, and strong enforcement,
is likely to have better success.
Our results suggest that it will take more than simply
passing a law to increase helmet use in the Provinces studied in
Cambodia. As reported in the WHO’s 2013 Global Status Report on
Road Safety, Cambodia’s enforcement of the existing helmet law
is weak, which might contribute to the low prevalence of helmet
use, especially at night.18 Individual perceptions are an important
factor in changing behavior,23,24 and as our results suggest, the
majority of respondents do not perceive any severe consequence
as a result of not wearing a helmet. This may also help explain the
higher prevalence of helmet use observed in more urban areas
such as Phnom Penh, where police presence and enforcement is
higher as compared to rural areas.
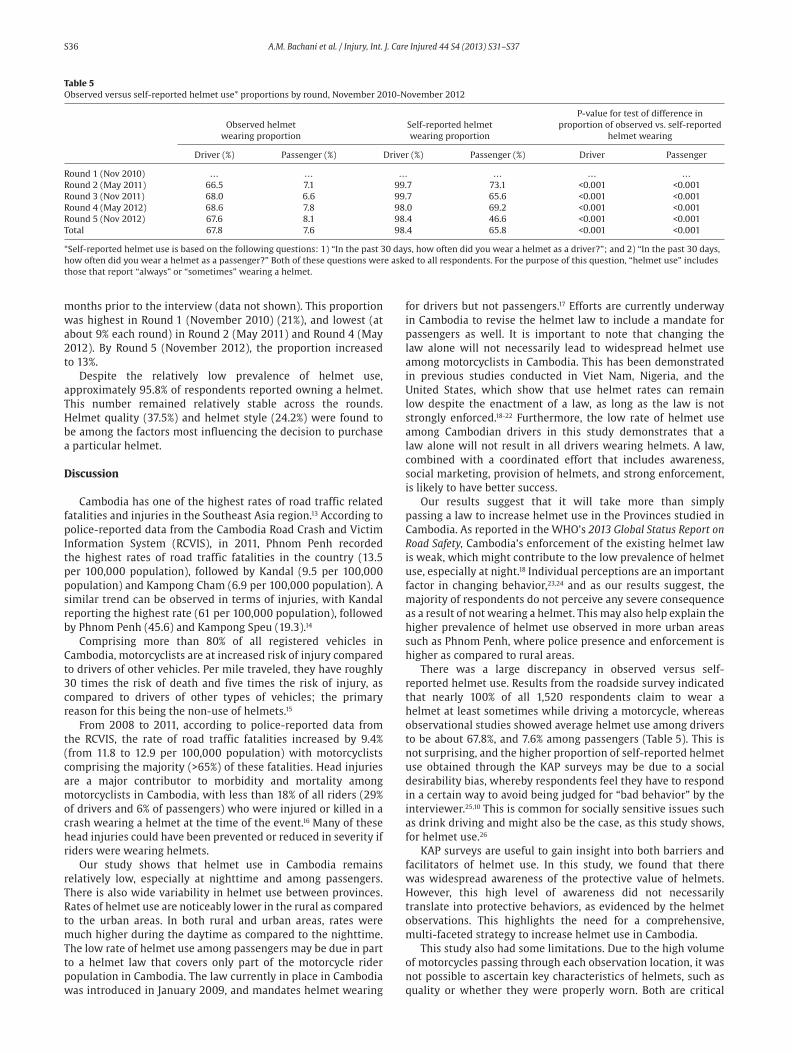
There was a large discrepancy in observed versus self-
reported helmet use. Results from the roadside survey indicated
that nearly 100% of all 1,520 respondents claim to wear a
helmet at least sometimes while driving a motorcycle, whereas
observational studies showed average helmet use among drivers
to be about 67.8%, and 7.6% among passengers (Table 5). This is
not surprising, and the higher proportion of self-reported helmet
use obtained through the KAP surveys may be due to a social
desirability bias, whereby respondents feel they have to respond
in a certain way to avoid being judged for “bad behavior” by the
interviewer.25,10 This is common for socially sensitive issues such
as drink driving and might also be the case, as this study shows,
for helmet use.26
KAP surveys are useful to gain insight into both barriers and
facilitators of helmet use. In this study, we found that there
was widespread awareness of the protective value of helmets.
However, this high level of awareness did not necessarily
translate into protective behaviors, as evidenced by the helmet
observations. This highlights the need for a comprehensive,
multi-faceted strategy to increase helmet use in Cambodia.
This study also had some limitations. Due to the high volume
of motorcycles passing through each observation location, it was
not possible to ascertain key characteristics of helmets, such as
quality or whether they were properly worn. Both are critical
Table 5Observed versus self-reported helmet use* proportions by round, November 2010-November 2012
P-value for test of difference in
Observed helmet Self-reported helmet proportion of observed vs. self-reported
wearing proportion wearing proportion helmet wearing
Driver (%) Passenger (%) Driver (%) Passenger (%) Driver Passenger
Round 1 (Nov 2010) … … … … … …
Round 2 (May 2011) 66.5 7.1 99.7 73.1 <0.001 <0.001
Round 3 (Nov 2011) 68.0 6.6 99.7 65.6 <0.001 <0.001
Round 4 (May 2012) 68.6 7.8 98.0 69.2 <0.001 <0.001
Round 5 (Nov 2012) 67.6 8.1 98.4 46.6 <0.001 <0.001
Total 67.8 7.6 98.4 65.8 <0.001 <0.001
*Self-reported helmet use is based on the following questions: 1) “In the past 30 days, how often did you wear a helmet as a driver?”; and 2) “In the past 30 days,
how often did you wear a helmet as a passenger?” Both of these questions were asked to all respondents. For the purpose of this question, “helmet use” includes
those that report “always” or “sometimes” wearing a helmet.
A.M. Bachani et al. / Injury, Int. J. Care Injured 44 S4 (2013) S31–S37 S37
factors in the effectiveness of a helmet against head injury.27,28 We
were also limited to observing helmet use during specific times
of the day and in a limited number of provinces. Thus, the data
cannot be generalized to the country as a whole. Furthermore,
the sample of respondents for our KAP surveys consists primarily
of drivers (98%), which limits our ability to compare drivers to
passengers in terms of knowledge, attitudes and behaviors
regarding helmet use.
Conclusion
This study highlights the need for a better understanding of
the attitudinal factors related to helmet use. This information
will be critical in informing the development of comprehensive,
tailor-made programmes to increase helmet use in Cambodia and
other countries in the region with a similarly high prevalence
of motorcycles and low helmet use. In Cambodia, for example,
greater efforts need to be made to eradicate the common beliefs
surrounding helmet use, including that they are not necessary at
low speeds or for travelling short distances. When coupled with
appropriate legislation and visible enforcement, Cambodia may
be able to achieve a long-term solution for reducing morbidity
and mortality from road traffic crashes among motorcyclists.
Conflict of interest
All authors have no competing interests to declare.
Acknowledgements
This work was conducted as part of the Global Road Safety
Programmes, funded by Bloomberg Philanthropies. Additional
support for some of the data collection provided by the Centers
for Disease Control and Prevention and the Asia Injury Prevention
Foundation.
Disclaimer
The findings and conclusions in this report are those of th e
author(s) and do not necessarily represent the official position of
the Centers for Disease Control and Prevention.
References
1.. Murray C, Vos T, Lozano R, Naghavi M, Flaxman AD, Michaud C, et al.
Disability-adjusted life years (DALYs) for 291 diseases and injuries in 21
regions, 1990-2010: a systematic analysis for the Global Burden of Disease
Study 2010. Lancet 2013; 380: 2197-223.
2. Cambodian National Road Safety Committee and Handicap International
Belgium. Road crash and victim information system annual report 2011.
Brussels, Belgium: Handicap International Belgium; 2011.
3. World Health Organization (WHO). Global status report on road safety 2013:
Supporting a decade of action. Geneva, Switzerland: WHO; 2013.
4. World Health Organization (WHO). Road safety in 10 countries: Cambodia.
Geneva, Switzerland: WHO; 2011.
5. Cambodian National Road Safety Committee and Handicap International
Belgium, 2011.
6. Hyder AA, Waters H, Phillips T, Trehwinkel J. Exploring the economics of
motorcycle helmet laws—Implications for low and middle-income countries.
Asia Pac J Public Health 2007;19:16-22.
7. Mayrose J. The effects of a mandatory motorcycle helmet law on helmet
use and injury patterns among motorcyclist fatalities. J Safety Res 2008;
39:429–32.
8. Craft G. Global helmet vaccine initiative. Inj Prev 2010;16:A185
9. Peden M. Road safety in 10 countries. Inj Prev 2010;16:433.
10. Bachani AM, Tran NT, Sann S, Ballesteros MF, Gnim C, Ou A,et al. Helmet use
among motorcyclists in cambodia: A survey of use, knowledge, attitudes, and
practices. Traffic Inj Prev 2012;13 Suppl 1:31-6.
11. Hilbe JM. Negative binomial regression. Cambridge, Cambridge University
Press, 2007.
12. Karlaftis MG, Tarko AP. Heterogeneity considerations in accident modeling.
Accid Anal Prev 1998;30:425–33.
13. World Health Organization (WHO). (2010). Road safety in 10 countries: Fact
Sheet – Cambodia. Retrieved from http://www.who.int/violence_injury_
prevention/road_traffic/countrywork/rs10_cambodia.pdf.
14. Cambodian National Road Safety Committee and Handicap International
Belgium, 2011.
15. National Highway Traffic Safety Administration (2010). Traffic Safety
Facts 2010: Motorcycles, Washington, DC. National Highway Traffic Safety
Administration. Available at: http://www-nrd.nhtsa.dot.gov/Pubs/811639.
pdf.
16. Cambodian National Road Safety Committee and Handicap International
Belgium, 2011.
17. The Fia Foundation. Joint statement: Motorcycle passengers, including
children, must wear helmets. Phnom Penh, Cambodia: The Fia Foundation;
2013. Available at: http://www.fiafoundation.org/Documents/Joint%20
Statement_09%20January%202013_English_final.pdf.
18. Hung D, Stevenson M, Ivers R. Barriers to, and factors associated, with
observed motorcycle helmet use in Vietnam. Accid Anal Prev 2008;40:1627-
33.
19. Solagberu B, Ofoegbu C, Nasir A, Ogundipe O, Adekanye A, Abdur-Rahman
L. Motorcycle injuries in developing country and the vulnerability of riders,
passengers, and pedestrians. Inj Prev 2006;12:266-8.
20. Ranney M, Mello M, Baird J. Helmet use among 510 injured motorcyclists in a
state with limited helmet laws. Med Health R I 2008;91:100-3.
21. Houston D. Are helmet laws protecting young motorcyclists? J Safety Res
2007;38:329-36.
22. National Highway Traffic Safety Administration. Evaluation of the repeal of
motorcycle helmet laws, 2001.
23. Prochaska JO, Velicer WF. The transtheoretical model of health behavior
change. Am J Health Promot 1997;12:38-48.
24. Rosenstock IM, Strecher VJ, Becker MH. Social learning theory and the health
belief model. Health Educ Q 1998;15:175-83.
25. Fisher RJ, Katz JE. Social-desirability bias and the validity of self-reported
values. Psychol Mark 2000;17:105–20.
26. DeMaio, TJ. Social desirability and survey measurement: A review. Surveying
subjective phenomena, 1984; 257–282. New York: Russell Sage Foundation.
27. Peek-Asa C, McArthur DL, Kraus JF. The prevalence of non-standard helmet
use and head injuries among motorcycle riders. Accid Anal Prev 1999;31:229-
33.
28. Yu WY, Chen CY, Chiu WT, Lin MR. Effectiveness of different types of
motorcycle helmets and effects of their improper use on head injuries. Int J
Epidemiol 2011;40:794-803.