Trees Wanted—Dead or Alive! Host Selection and Population Dynamics in Tree-Killing Bark Beetles
13
Trees Wanted—Dead or Alive! Host Selection and Population Dynamics in Tree-Killing Bark Beetles Kyrre L. Kausrud 1,2 , Jean-Claude Gre ´ goire 3 , Olav Skarpaas 4 , Nadir Erbilgin 5 , Marius Gilbert 6,7 , Bjørn Økland 2 , Nils Chr. Stenseth 1 * 1 Department of Biology, Centre for Ecological and Evolutionary Synthesis (CEES), University of Oslo, Oslo, Norway, 2 Norwegian Forest and Landscape Institute, A ˚ s, Norway, 3 Lutte Biologique et Ecologie Spatiale, Universite ´ Libre de Bruxelles, Bruxelles, Belgium, 4 The Norwegian Institute for Nature Research, Oslo, Norway, 5 Department of Renewable Resources, University of Alberta, Edmonton, Alberta, Canada, 6 Biological Control and Spatial Ecology, Universite ´ Libre de Bruxelles, Brussels, Belgium, 7 Fonds National de la Recherche Scientifique, Brussels, Belgium Abstract Bark beetles (Coleoptera: Curculionidae, Scolytinae) feed and breed in dead or severely weakened host trees. When their population densities are high, some species aggregate on healthy host trees so that their defences may be exhausted and the inner bark successfully colonized, killing the tree in the process. Here we investigate under what conditions participating with unrelated conspecifics in risky mass attacks on living trees is an adaptive strategy, and what this can tell us about bark beetle outbreak dynamics. We find that the outcome of individual host selection may deviate from the ideal free distribution in a way that facilitates the emergence of tree-killing (aggressive) behavior, and that any heritability on traits governing aggressiveness seems likely to exist in a state of flux or cycles consistent with variability observed in natural populations. This may have implications for how economically and ecologically important species respond to environmental changes in climate and landscape (forest) structure. The population dynamics emerging from individual behavior are complex, capable of switching between ‘‘endemic’’ and ‘‘epidemic’’ regimes spontaneously or following changes in host availability or resistance. Model predictions are compared to empirical observations, and we identify some factors determining the occurrence and self-limitation of epidemics. Citation: Kausrud KL, Gre ´goire J-C, Skarpaas O, Erbilgin N, Gilbert M, et al. (2011) Trees Wanted—Dead or Alive! Host Selection and Population Dynamics in Tree- Killing Bark Beetles. PLoS ONE 6(5): e18274. doi:10.1371/journal.pone.0018274 Editor: Matjaz Perc, University of Maribor, Slovenia Received February 4, 2011; Accepted February 25, 2011; Published May 2 , 2011 Copyright: ß 2011 Kausrud et al. This is an open-access article distributed under the terms of the Creative Commons Attribution License, which permits unrestricted use, distribution, and reproduction in any medium, provided the original author and source are credited. Funding: This work was funded by the Research Council of Norway (RCN) Project no. 170801, the Centre for Ecological and Evolutionary Synthesis (CEES), and the Norwegian Forest and Landscape Institute. The funders had no role in study design, data collection and analysis, decision to publish, or preparation of the manuscript. Competing Interests: The authors have declared that no competing interests exist. * E-mail: [email protected] Introduction Bark beetles have coexisted with their tree hosts since the early Mesozoic [1], and while often regarded as pests, bark beetles and their associated fungi also play important roles in nutrient cycling, forest dynamics and biodiversity [2–5]. But of the more than 5800 described bark beetle species, less than a dozen, mostly in the genera Dendroctonus and Ips (e.g., Ips typographus, Dendroctonus ponderosae, D. frontalis) are known to colonize and kill even healthy host trees [2] when population densities are high [3]. Aggregation pheromones released by beetles while they are boring into and excavating mating galleries in host trees elicit attraction of conspecifics of both sexes, and the greater the number of beetles attacking, the greater their probability of exhausting host defences and achieving successful oviposition [4]. The beetles also vector presumably mutualistic microorganisms (mostly fungi), some of which contribute to tree mortality [2]. The Pinaceae have evolved defences against bark beetles and their associated fungi [5]: resin-filled ducts can mechanically seal off the entrance holes, a number of compounds (terponoids and phenolics) with inhibitory or toxic effects on the beetles and fungi increases in concentration, and cell structure changes in the surrounding tissue helps contain the infection [1]. The effective- ness of these defences varies over time within and between trees, as it is vulnerable to water stress and other biological factors. While a fallen tree with remaining root contact may still have partially active defences, broken trees are defenceless [1,6] and suppressed trees have reduced defences. As modular organisms, the ‘‘death’’ of a tree is neither instantaneous nor necessarily affecting the whole individual. Here, however, we define a ‘‘dead’’ tree as one that has no effective defense against a given species of bark beetle. This often results from loss of root contact, extreme drought stress, mechanical damage or parasites. Failure to find a suitable host is a major source of beetle mortality [7], and usable breeding habitat is patchy, stochastic and transient, as dead host trees appear randomly in the landscape through wind- felling or logging, after which the phloem decays within months, while forest succession take decades to centuries. On the other hand, partaking in an unsuccessful aggregation is at best a waste of time and at worst fatal, and the risk is likely to be greatest for the ones initiating the attack. Since the maximum reproductive success may be achieved at low to intermediate gallery densities, the beetles seem to face both positive and negative density dependence, on slightly different spatial scales [12–14]. At very low densities, mate finding may be problematic, while increasing densities both cause crowding and facilitates colonization of living trees. Early colonizers of living trees meet the strongest tree defences and uncertain success, latecomers meet higher competition and, perhaps, increased predation [8]. PLoS ONE | www.plosone.org 1 May 2011 | Volume 6 | Issue 5 | e18274 5
-
Upload
independent -
Category
Documents
-
view
1 -
download
0
Transcript of Trees Wanted—Dead or Alive! Host Selection and Population Dynamics in Tree-Killing Bark Beetles

Trees Wanted—Dead or Alive! Host Selection andPopulation Dynamics in Tree-Killing Bark BeetlesKyrre L. Kausrud1,2, Jean-Claude Gregoire3, Olav Skarpaas4, Nadir Erbilgin5, Marius Gilbert6,7, Bjørn
Økland2, Nils Chr. Stenseth1*
1 Department of Biology, Centre for Ecological and Evolutionary Synthesis (CEES), University of Oslo, Oslo, Norway, 2 Norwegian Forest and Landscape Institute, As,
Norway, 3 Lutte Biologique et Ecologie Spatiale, Universite Libre de Bruxelles, Bruxelles, Belgium, 4 The Norwegian Institute for Nature Research, Oslo, Norway,
5 Department of Renewable Resources, University of Alberta, Edmonton, Alberta, Canada, 6 Biological Control and Spatial Ecology, Universite Libre de Bruxelles, Brussels,
Belgium, 7 Fonds National de la Recherche Scientifique, Brussels, Belgium
Abstract
Bark beetles (Coleoptera: Curculionidae, Scolytinae) feed and breed in dead or severely weakened host trees. When theirpopulation densities are high, some species aggregate on healthy host trees so that their defences may be exhausted andthe inner bark successfully colonized, killing the tree in the process. Here we investigate under what conditions participatingwith unrelated conspecifics in risky mass attacks on living trees is an adaptive strategy, and what this can tell us about barkbeetle outbreak dynamics. We find that the outcome of individual host selection may deviate from the ideal freedistribution in a way that facilitates the emergence of tree-killing (aggressive) behavior, and that any heritability on traitsgoverning aggressiveness seems likely to exist in a state of flux or cycles consistent with variability observed in naturalpopulations. This may have implications for how economically and ecologically important species respond to environmentalchanges in climate and landscape (forest) structure. The population dynamics emerging from individual behavior arecomplex, capable of switching between ‘‘endemic’’ and ‘‘epidemic’’ regimes spontaneously or following changes in hostavailability or resistance. Model predictions are compared to empirical observations, and we identify some factorsdetermining the occurrence and self-limitation of epidemics.
Citation: Kausrud KL, Gregoire J-C, Skarpaas O, Erbilgin N, Gilbert M, et al. (2011) Trees Wanted—Dead or Alive! Host Selection and Population Dynamics in Tree-Killing Bark Beetles. PLoS ONE 6(5): e18274. doi:10.1371/journal.pone.0018274
Editor: Matjaz Perc, University of Maribor, Slovenia
Received February 4, 2011; Accepted February 25, 2011; Published May 2 , 2011
Copyright: � 2011 Kausrud et al. This is an open-access article distributed under the terms of the Creative Commons Attribution License, which permitsunrestricted use, distribution, and reproduction in any medium, provided the original author and source are credited.
Funding: This work was funded by the Research Council of Norway (RCN) Project no. 170801, the Centre for Ecological and Evolutionary Synthesis (CEES), andthe Norwegian Forest and Landscape Institute. The funders had no role in study design, data collection and analysis, decision to publish, or preparation of themanuscript.
Competing Interests: The authors have declared that no competing interests exist.
* E-mail: [email protected]
Introduction
Bark beetles have coexisted with their tree hosts since the early
Mesozoic [1], and while often regarded as pests, bark beetles and
their associated fungi also play important roles in nutrient cycling,
forest dynamics and biodiversity [2–5]. But of the more than 5800
described bark beetle species, less than a dozen, mostly in the
genera Dendroctonus and Ips (e.g., Ips typographus, Dendroctonus
ponderosae, D. frontalis) are known to colonize and kill even healthy
host trees [2] when population densities are high [3]. Aggregation
pheromones released by beetles while they are boring into and
excavating mating galleries in host trees elicit attraction of
conspecifics of both sexes, and the greater the number of beetles
attacking, the greater their probability of exhausting host defences
and achieving successful oviposition [4]. The beetles also vector
presumably mutualistic microorganisms (mostly fungi), some of
which contribute to tree mortality [2].
The Pinaceae have evolved defences against bark beetles and
their associated fungi [5]: resin-filled ducts can mechanically seal
off the entrance holes, a number of compounds (terponoids and
phenolics) with inhibitory or toxic effects on the beetles and fungi
increases in concentration, and cell structure changes in the
surrounding tissue helps contain the infection [1]. The effective-
ness of these defences varies over time within and between trees, as
it is vulnerable to water stress and other biological factors. While a
fallen tree with remaining root contact may still have partially
active defences, broken trees are defenceless [1,6] and suppressed
trees have reduced defences. As modular organisms, the ‘‘death’’
of a tree is neither instantaneous nor necessarily affecting the
whole individual. Here, however, we define a ‘‘dead’’ tree as one
that has no effective defense against a given species of bark beetle.
This often results from loss of root contact, extreme drought stress,
mechanical damage or parasites.
Failure to find a suitable host is a major source of beetle mortality
[7], and usable breeding habitat is patchy, stochastic and transient, as
dead host trees appear randomly in the landscape through wind-
felling or logging, after which the phloem decays within months,
while forest succession take decades to centuries. On the other hand,
partaking in an unsuccessful aggregation is at best a waste of time and
at worst fatal, and the risk is likely to be greatest for the ones initiating
the attack. Since the maximum reproductive success may be achieved
at low to intermediate gallery densities, the beetles seem to face both
positive and negative density dependence, on slightly different spatial
scales [12–14]. At very low densities, mate finding may be
problematic, while increasing densities both cause crowding and
facilitates colonization of living trees. Early colonizers of living trees
meet the strongest tree defences and uncertain success, latecomers
meet higher competition and, perhaps, increased predation [8].
PLoS ONE | www.plosone.org 1 May 2011 | Volume 6 | Issue 5 | e18274
5

From an evolutionary perspective, this raises several questions:
Why do individual beetles initiate or join with unrelated
conspecifics in risky ‘‘cooperative’’ attacks? This is especially
puzzling considering that the beetles initiating the attack face the
greatest risks, and thus are the least likely to reap the benefits.
Conversely, if such attacks represent an adaptive strategy, why are
they nevertheless only sporadic, usually local and self-limiting, but
at other times forming large-scale outbreaks that kill virtually all
host trees over large areas, persisting long after the triggering
resource pulse has ceased [9,10,11,12]?
Here we develop an individual-based model, hereafter called
the Sequential Restricted Distribution (SRD), to study the adaptive
strategies of host selection (dead vs. living hosts) that lie behind the
dynamics approached at the population level by traditional
population models [13]. The model explores what behavior is
adaptive (i.e., maximizing fitness, here measured as expected
reproductive success) under what circumstances. It then uses the
results to explore the population dynamics that emerge from the
predicted behavior. Thus, we can approach the evolutionary
mechanisms behind the conditional strategies that make some
species and populations switch between endemic and epidemic
states. (The term ‘‘epidemic’’ is here used to denote all populations
that kill living trees. This does not imply that all populations
entering the ‘‘epidemic’’ state will produce large-scale tree killing,
only that large-scale forest mortality results when populations in a
large number of patches become epidemic within a relatively short
time due to a combination of dispersal and autocorrelated climate
and landscape effects. Also, some obligatory saprophagous species
are not necessarily described in this model.)
To do this, we couple a set of monotonic functions (Fig. 1)
representing the trade-offs facing the individual beetle: the
probability that a living tree will become colonisable (Eq. 1), the
risk suffered by the first beetles boring into a still living tree (Eq. 2),
the decrease in reproductive success caused by high gallery
densities (Eq. 3), and migration risk (Eq. 4). We scale the
parameters (see Analysis section belo and Table 1) so that model
runs are biologically reasonable, investigate the effect of varying
parameters representing biological differences, and calculate to
what degree our inclusions of relative risk and sequential choice
predict divergence from the Ideal Free Distribution (IFD).
The IFD (conceptually similar to the game theory term Nash
Equilibrium) is a central idea in evolution and behavioral ecology
[14,15]. It predicts that organisms should distribute themselves
proportionately to the amount of resources available in each
patch. The relationship with evolutionary game theory is that
when an IFD is achieved, no individual can do better by changing
patch. Imperfect information, unequal competitive abilities, time
lags and costs of redistribution can inhibit the formation of an IFD,
but it is a very useful null assumption, as systematic deviations
from it alerts us to the existence of costs and/or constrains that
need to be accounted for.
Finally, the results are compared to empirical data and existing
population models [13], and discussed in relation to evolutionary,
ecological and management issues.
Analysis
Scaled logistic functions are used as approximations of the
actual risk and fitness trade-offs [16,17,18], as we can assume
monotonic but not linear transitions between the biologically
plausible extremes [18]. For instance, a single beetle will never
overwhelm a tree but an infinite number of beetles always will, the
risks of attacking or migrating are between zero and certain death,
and mean number of offspring per adult is between zero and the
maximum for the species. Our results are general over a
biologically plausible range of parameters (see below), and do
not depend on the exact functions or parameter values as long as
they are monotonic and scale relatively to each other. The
following assumptions are made in the SRD model:
1) The beetles show an adaptive behavioural reactionnorm.
1) Thus, we assume that they have had time to evolve, and that
there are no strong evolutionary trade-offs with processes
invisible to this model, or manipulation from other organisms
such as parasites. Kin-selected altruism is assumed to play no
significant part, since at least some important species are
outbreeding and widely dispersing [19,20,21],
2) The beetles respond to the density of conspecifics,and to the defence level of their host trees.
2) While uncertain, the beetles’ estimates are assumed to be
unbiased. This is supported by the observation that beetles
respond to host volatiles, conspecific pheromone concentra-
tions and post-landing host inspection [22,23,24,25,26,27].
3) The beetles act sequentially, within a limited time(flight period).
3) Individuals must at some point make a choice of one resource
over the other. As they can only be aware of conspecifics that
have already settled and started releasing volatiles and
pheromones, they have no information about the presence
of unsettled individuals or about individuals that will arrive
later.
The model proceeds through several steps (Fig. 1). First, beetle
no. 1 selects the strategy (settling in a dead tree, settling in a
living tree, or migrating away) that gives it the highest expected
number of offspring. Then beetle no. 2 does the same, but the
outcome may be influenced by the choice already done by beetle
no. 1. This is repeated until all N beetles that encounter the
patch during a swarming period have settled or migrated. The
result of these choices determines the adult (gallery) densities in
dead and live trees respectively, and thus the number of realized
offspring.
The patch size is an abstraction of the maximum distance over
which the beetles integrate information about their hosts and
conspecifics using olfactory and, at close range, even visual/tactile
clues. From pheromone trapping experiments, we consider that
about a hundred meters or less in radius seems a realistic scale
approximation [28,29], and it can reasonably be visualized as a
stand of host trees. N is the number of beetles/patch, defined as
the number of beetles that will respond to a patch during the flight
period. Using the patch (stand) as the spatial unit, N is hence
referred to as ‘‘population density’’.
The amount of breeding material in a patch exists either in the
form of dead (i.e., undefended) and living (i.e., defended but
susceptible to colonization) trees, which are denoted KD and KL
respectively. This is conceptually related to the ‘‘carrying
capacity’’, and is scaled to the density at which mean
reproductive success is halved. The subscripts D, L and M are
used throughout, denoting dead trees, live trees and migration
respectively.
Assuming a probabilistic relationship [17] regulated by c0, the
expected probability of beetle i reproducing successfully if it
chooses a living host is a function of tree resistance (T), how many
conspecifics have already attacked (NL), and possibly also of how
many conspecifics have settled in the dead trees (ND) in the patch.
Since some of these may have first sampled living trees [30],
penetrating resin channels, their average contribution towards
Population Dynamics in Bark Beetles
PLoS ONE | www.plosone.org 2 May 2011 | Volume 6 | Issue 5 | e18274

successful colonization is reduced to a proportion t, where t M(0,1). Thus:
rL,i~1
1zexp {c0 NL,iztND,i{TLð Þ{ln c0ð Þ½ � ð1aÞ
rD,i~1
1zexp {c0 ND,i{TDð Þ{ln c0ð Þ½ � ð1bÞ
This is closely related to the number of trees being killed, although
some species, such as D. ponderosae, can succeed in so-called ‘‘strip-
kills’’ where only a section of the tree dies [16].
In addition, the first i beetles settling on a tree may suffer an
increased risk Ci of not rearing offspring due to the still-vigorous
tree defences. As more beetles settle, defences are exhausted and
the risk faced by subsequent settlers decrease:
CL,i~1
1zexp {cL{c1NL,i½ �
� �: ð2Þ
We assume essentially no risk for initial settlers in dead trees
(cD.3, TD,25/c0), but a substantial risk for the first settlers in
live trees (cL,3, TL.5). The number of offspring F produced by
the ith beetle can reach its maximum value of R up until the point
where competition starts reducing reproduction with increasing
gallery density (eq.3). Here a and b regulate the onset and
steepness of negative density dependence, and a1 and a2 regulate a
reduced probability of reproduction due to mate finding failure or
other Allee effects.
FL,i~R 1{1
1zexp {a NL,i{bKL
� �KL
� �0BBB@
1CCCA CL,irL,i
1zexp {a1{a2N½ �
� �ð3aÞ
FD,i~R 1{1
1zexp {a ND,i{bKD
� �KD
� �0BBB@
1CCCA CD,irD,i
1zexp {a1{a2N½ �
� �ð3bÞ
The expected reproductive output from out-of patch migration
FM,i is the better of the expected (mean) values of (12Vi)FD,i and
(12Vi)FD,i where V is the probability of dying before finding a new
patch to settle in. This may increase with time as fat reserves are
Figure 1. Schematic overview of the model, summarizing the steps and equations.doi:10.1371/journal.pone.0018274.g001
Population Dynamics in Bark Beetles
PLoS ONE | www.plosone.org 3 May 2011 | Volume 6 | Issue 5 | e18274

depleted and time runs out so that
Vi~1
1zexp {v1{v2i½ � ð4Þ
FM assume that KD and KL are mean values of a Poisson-
distributed resource landscape, and that N, NL,i and ND,i are mean
values with Gamma-distributed values in the receiving patches,
thus including a shape parameter to regulate the standard
deviance c. If the population is perfectly synchronized (c= 0), a
migrant will always meet the same NL and ND (though K still
varies). As migration range increases relative to the scale of spatial
population synchrony (c increases), the population state experi-
enced by emigrants is increasingly independent of the state they
left. Thus, the local model implicitly accounts for the larger-scale
process of migration [31].
As each beetle optimizes its expected reproductive success, the
probability P that the ith beetle will choose each strategy is
PD,i~Fn
D,i
FnD,izFn
L,izFnM,i
ð5aÞ
PL,i~Fn
L,i
FnD,izFn
L,izFnM,i
ð5bÞ
PM,i~Fn
M,i
FnD,izFn
L,izFnM,i
ð5cÞ
where n regulates the sensitivity of beetles to differences in fitness
between substrates (i.e., imperfect information).
Table 1. The model parameters which can be set independently, the interval over which they have been defined or assessed, andtheir general effect.
Parameter description Effect of increasing value over interval
N Population density 0–100 A number of ‘‘individual’’ beetles representing the whole population thatencounter a habitat patch during swarming. The parameter to whicheverything else is scaled.
KD Dead host tree abundance. 0–25 Allows offspring production by more individuals.
KL Susceptible host tree abundance. 0–25 Allows offspring production by more individuals if are successfullycolonised.
T Colonisation (defence) threshold, giving the N forwhich 50% of the broods in living host trees aresuccessful when c0 = 1
5–50 (100) Increases the swarm density (N) at which tree colonisation, may happen,and thus the pay-off relative to dead trees and migration over a range ofdensities. At very high values no trees are colonised and F(N) is unimodal.
t Proportional contribution to live treedefence exhaustion by beetles settling in dead trees
0–1 Decreases the population density (N) where living trees are beingcolonized. Thus, successful colonisations and epidemics are more likely.
c0 Per capita contribution to successful colonisationof living hosts.
0.01–1 Increasing the rate of colonisation, and thus the steepness of thecolonization threshold, and thus the pay-off from colonisation of livinghosts.
a Per capita contribution to negative density dependence. 0.11–4 Destabilises population dynamics, increasing bimodality of F(N),
v1 Logit-probability of surviving migration toanother patch at the start of the swarming season
22–3 Greater values of V (eq.4) decrease the mean proportion of beetlesmigrating. At low values it prevents living trees from being attacked,increasing values destabilizes epidemic populations by increasingovercrowding.
v2 Give the rate of changing migration mortalitywith time, with time defined as the number ofindividuals who have settled.
0–1
b Regulate point where negative densitydependence start occurring.
0–0.3 Greater values increase the density at which crowding starts reducingreproductive output, affecting population dynamics. Small impact ondynamics, none on distributions.
R Per capita contribution to the next breeding generationwhen including density-independent mortality.
1.5–50 Increase population growth rate, destabilising population dynamics andincreasing the likelihood of shifting from one dynamical regime to theother.
a1 Log-probability of successful mating when N = 1. 23–3 The swarm density under which reproductive output is decreased due toAllee effects. Impacts low-population dynamics.
a2 Steepness of Allee effects 0–3
cL Logit-probability of successful reproduction whenNX = 1, relevant in living trees where tree defencespose risk to early colonisers.
5 Decreases the payoff for early colonisers, and thus the degree ofcrowdedness and migration mortality under which initiating attacks is anadaptive strategy. When this risk is overcome, the switch to epidemicdynamics is all the more abrupt, especially when c1 is high.
cD 23–1
c1 Per capita decrease in risk from being an early coloniser. 0–3
n The precision with which individuals identifythe optimal strategy
10–100 Greater values decrease stochasticity. No effect on mean result.
doi:10.1371/journal.pone.0018274.t001
Population Dynamics in Bark Beetles
PLoS ONE | www.plosone.org 4 May 2011 | Volume 6 | Issue 5 | e18274

If the reproductive outputs of all beetles in a tree react equally to
the final density, the realized number of offspring after the
settlement process is complete becomes
N_
L~NLR 1{rL
1zexp {a NL{bKLð Þ
KL
� �0BB@
1CCA
1NL
PCL
1zexp {a1{a2N½ �
! ð6aÞ
N_
D~NDR 1{rD
1zexp {a ND{bKDð Þ
KD
� �0BB@
1CCA
1ND
PCD
1zexp {a1{a2N½ �
! ð6bÞ
The total number of offspring produced in the patch is thus
N_
~N_
LzN_
D But if each beetle monopolized the amount of bark
it can utilize for breeding when it settled, thus suffering no
interference from later arrivals, the total number of offspring
becomes
N_
~XNL
i~1
FL,izXND
i~1
FD,i ð7Þ
A summary of the SRD is given in Fig. 1. For numerical
investigation of the model, we scale KD, KL, TL and the other
parameters (Table 1) so that when 0#N#100 most model runs
will be biologically reasonable and non-trivial (i.e., populations
non-zero and not increasing to infinity, positive ‘‘carrying
capacities’’, live trees not succumbing to one single beetle etc.).
We here scale N to the range of 0–100 individuals to make
numerical analysis computationally manageable, but running the
model upscaled to more realistic population numbers gives the
same biological predictions. For an overview of model predictions
see Fig. 2a–d, and for the population dynamics following from the
model Fig. 3a–b and 4a.
Gregoire et al. [32] describe a site in Southern Belgium with 70
spruce that had been felled by wind in February 1990 and left on
site. The number of windfalls and living trees in the same stand
that were colonized by I. typographus were estimated on 13
occasions from April 10th to November 12th. From the asymptotic
increase (Fig. 4b), we assume that the number of trees settled at the
end of the period represent all that were available in the patch,
and that beetles encountered the patch at an approximately
constant rate. With dead and live trees of equal size, the data tells
us that KL/KD = 44/70, and to run the model from 0 to 100
representing the (unknown) number of real beetles that arrived
over the period, we scale this with a factor g0 = 0.1. We then
investigate whether the colonization pattern will be reproduced
using plausible values of the within the investigated range for the
other, unknown, variables. The proportion of trees observed to be
colonized is expected to increase logistically in proportion to the
number of individuals settling in them, so that the number of trees
Ct observed to be colonized at time t is
CL,t~g0KL
1zexp g1{g2NL,t½ � : ð8aÞ
CD,t~g0KD
1zexp g1{g2ND,t½ � ð8bÞ
(see Fig. 4b).
One of the few population models incorporating resources and
beetle populations is the resource depletion model by Økland and
Bjørnstad [13]. Models of this type assume that when N#T,
K = KD, and when N.T, K = KD+KL, and combine this with a
standard population growth model like the Gomperz function.
A parameterisation of eq.3, with R = 50, KD = 6, a1 = 0,a2 = 2,
b= 0 and A = N = Attack density of I.cembrae is consistent with field
data [33] (Fig. 5a)
F~ 50{50
1zexp{Az6
6
� �� �0BB@
1CCA
0BB@
1CCA 1
1zexp {2Að Þ
� �ð9Þ
The SRD obviously involves a number of assumptions and trade-
offs between process clarity and realism, being an exploratory model
of general use [34]. One key assumption is that beetles can assess
their own population density and host availability on ‘‘patch’’ scales
seems supported: highly developed olfactory systems allow them to
sense different conspecific pheromones, host tree volatiles, and their
relative concentrations [3,4,7,22]. On smaller scales other senses
may be used [35]. Tree-killing scolytids continuously produce
aggregation pheromones until the moment when the host resistance
threshold is reached [4,27]. Manipulating ratios of the predominant
monoterpene compound in Norway spruce to I. typographus
pheromones shows a strong, positive effect on attraction to
increasing monoterpene:pheromone ratios [24,36]. This is in
contrast to I. pini, which rarely attack healthy trees and shows a
parabolic attraction effect of host monoterpene:conspecific phero-
mone ratios [37], intuitively explained as a trade-off between
avoiding already densely populated trees and too vigorously
defending trees not likely to be successfully colonized.
Results
The SRD predict that only dead trees will initially be colonized
(Fig. 2a), but as the local population density increases, these grow
increasingly crowded until density dependence outweighs the risks
of either settling in a living tree or emigrating (Fig. 2a–d). The
observed dynamics emerge from a single, flexible strategy shared
by the whole population [28], but individuals maximizing their
fitness does not necessarily imply maximized population growth:
the distributions between dead and living trees mostly result in
population growth rates far from maximum (Fig. 2c). At low and
very high population densities, the SRD and IFD converge, but for
a range of population densities when living trees are being
colonized, they diverge considerably (Fig. 2d).
Population dynamicsThere is a considerable volume of parameter space where
aggregative attacks may occur (Fig. 3 summarizes model
behaviour for such a case), and in a subset of these the population
growth function gives three non-zero population equilibrium
points. The population trajectories can thus be rather complex,
Population Dynamics in Bark Beetles
PLoS ONE | www.plosone.org 5 May 2011 | Volume 6 | Issue 5 | e18274

and have two attractor basins; one lower (‘‘endemic’’) and one
higher (‘‘epidemic’’) (Fig. 3a). The position of the attractor basins
are found to depend on the expected payoff from migration (v,c),
the risks incurred by initiating an attack (cL), the beetles having a
substantial effect on the trees (c0), the degree to which beetles
settling in dead trees first sample random live trees (t), and of
course the abundance of dead (KD) and living trees (KL) that are
not too vigorously defended (TL) (see Analysis section).
The population can shift between the endemic and epidemic
attractor basins (Fig. 3) by several mechanisms. An epidemic state
can be triggered by increased population density, such as following
an increased abundance of dead hosts (KD), immigration, or
increased survival rates. It can also be triggered by drought stress,
or increased aggressiveness (in the beetles or the composition of
their host-pathogenic fungi), both in effect lowering the coloniza-
tion threshold (TL), increasingly explorative search patterns
(increased t), or even spontaneously when the dynamics are
unstable. Even increased environmental variability alone can
increase the odds that a population will enter the epidemic
attractor basin within a given time period.
Figure 2. Predictions of the SRD for a set of parameters giving potential tree mortality. a) The density of beetles settling in dead trees(brown), living trees (green) or migrating (blue) in one flight season as functions of swarm density (N). Here KD = 5, KL = 10, median V= 0.6, a= 1,c0 = 0.2, cT = 22, b= 0.05, c1 = 0.5, a1 = 21, a2 = 5,R = 10, t= 0.5. The threshold T = 15 is marked and shows where living trees would be colonized withP = 0.5 if all beetles had joined attacks. b) The resulting fitness functions (expected number of offspring per capita) when early-arriving individuals areable to monopolize resources (dotted lines) and when they are not solid). The grey line shows the probability of successful colonisation of living treesincreasing with population density. c) The colours show total population growth rates as a function of beetle distributions, showing the stabledistributions as predicted by the IFD (dotted) and SRD (green and brown solid) lines. Below the diagonal, the horizontal axis shows populationdensity(N), the vertical axis the number of beetles settling in dead trees (Nd). Above the diagonal, the vertical axis shows population density, thehorizontal axis the number of beetles settling in living trees (Ns). d) As in (c), except that colours show per cent difference in fitness between beetlesin dead and living trees. Following the brown (dead-tree) line, we see that at low densities (interval A) both the SRD and IFD predict all beetles tosettle in dead trees. As living trees are settled (interval B) we see marked deviations from the IFD as individuals colonizing living trees enjoy increasedfitness. However, as population density increases further, the SRD and IFD converge (interval C) as both resources become crowded.doi:10.1371/journal.pone.0018274.g002
Population Dynamics in Bark Beetles
PLoS ONE | www.plosone.org 6 May 2011 | Volume 6 | Issue 5 | e18274

Likewise, epidemics may cease from density-dependent off-
spring reduction, emigration, poor survival (low R), lack of
resources (low K), abundant rainfall (increased TL) or decreased
aggressiveness or exploration (increased T or decreased t).Another factor shaping dynamic structure is whether early-
arriving individuals are able to monopolize resources, thus making
them less affected by increasing density than latecomers (Fig. 2b)
and stabilizing the dynamics around an equilibrium point.
Low-threshold systems where few beetles are needed to kill
moderately healthy hosts can appear stable and endemic as long as
beetle populations are low (for instance due to winter mortality,
predation and low host abundance), but can easily switch to stable
epidemic (i.e., potentially causing large outbreaks) when popula-
tions increase (for instance due to increased survival or decreased
predation). However, when defence thresholds are very high,
living trees are colonized only at densities where reproduction is
severely depressed by density dependence and migration mortal-
ity, and the population tends to decline rapidly and return to the
endemic cycle.
Evolutionary dynamicsThe Ideal Free Distribution (IFD) is a central theoretical
concept in ecology, behavioral ecology and evolutionary biology.
The term was first coined by Fretwell and Lucas in 1970 to 1971,
Figure 3. Population dynamics of the SRD. a) Offspring density as a function of swarm density shows three non-zero equilibrium points (bluedots), and the population trajectories have two attractor basins; a lower (endemic) and higher (epidemic). b) As (a), showing one endemic (brownarrows) and one epidemic (green arrows) trajectory. A population may be transported from one attractor basin to the other by several mechanisms ineither direction (blue and yellow arrows). For instance a large windfelling (giving a brief doubling of KD, upper grey line, blue arrows), or a winter ofpoor survival (a decreased R, lower grey line, yellow arrows).doi:10.1371/journal.pone.0018274.g003
Population Dynamics in Bark Beetles
PLoS ONE | www.plosone.org 7 May 2011 | Volume 6 | Issue 5 | e18274
and has been of central importance in theory development and
studies for a range of ecological and evolutionary systems
[14,15,38,39]. It describes the way in which animals distribute
themselves among resource patches, stating that individual
animals will aggregate proportionately to the amount of resources
available in each patch. So for instance, if patch A contains twice
as much food as patch B, there will be twice as many individuals
foraging in patch A as in patch B. The relationship with
evolutionary game theory is that when an IFD is achieved, no
individual can do better by changing patch. Simple IFDs are
rarely observed in nature, as imperfect information, unequal
competitive abilities, time lags and costs of redistribution can
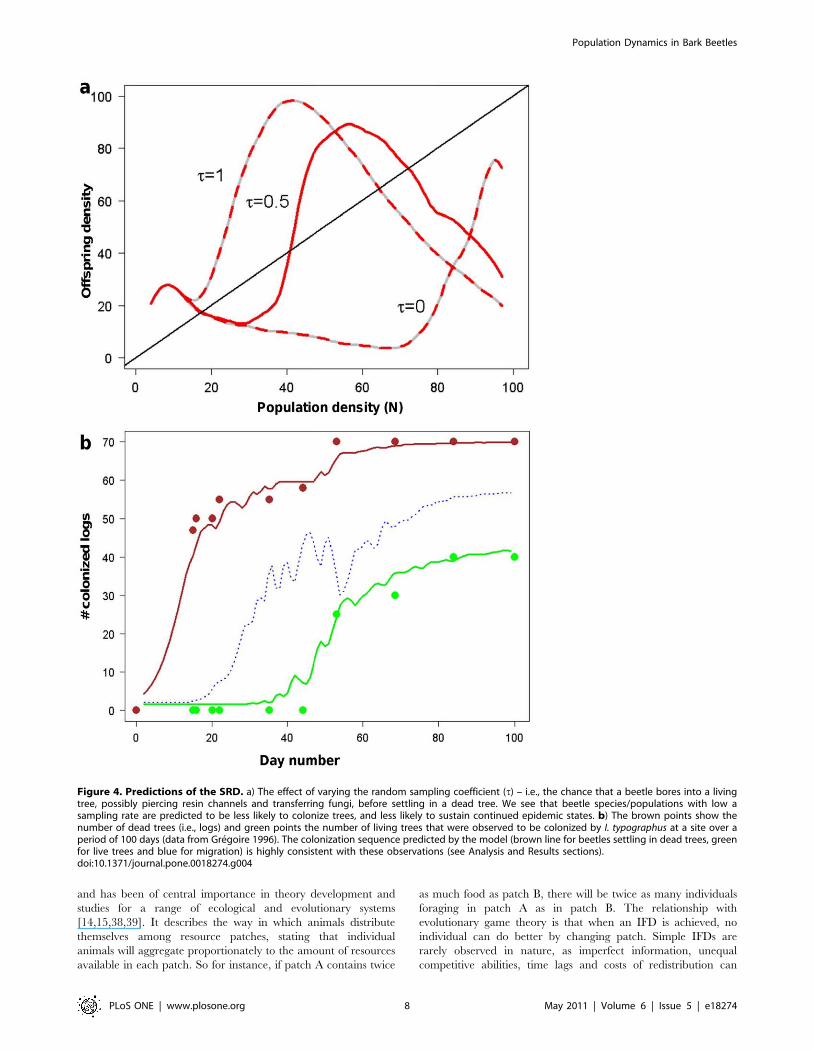
Figure 4. Predictions of the SRD. a) The effect of varying the random sampling coefficient (t) – i.e., the chance that a beetle bores into a livingtree, possibly piercing resin channels and transferring fungi, before settling in a dead tree. We see that beetle species/populations with low asampling rate are predicted to be less likely to colonize trees, and less likely to sustain continued epidemic states. b) The brown points show thenumber of dead trees (i.e., logs) and green points the number of living trees that were observed to be colonized by I. typographus at a site over aperiod of 100 days (data from Gregoire 1996). The colonization sequence predicted by the model (brown line for beetles settling in dead trees, greenfor live trees and blue for migration) is highly consistent with these observations (see Analysis and Results sections).doi:10.1371/journal.pone.0018274.g004
Population Dynamics in Bark Beetles
PLoS ONE | www.plosone.org 8 May 2011 | Volume 6 | Issue 5 | e18274

Figure 5. Comparisons with observations. a) Field data on the number of offspring per adult Ips cembrae as a function of gallery density (blackline with 62SD), showing a strong negative density-dependence. This is consistent with the model density dependence (red line; part of eq. 3, seebelow as eq. 8) b) The density per m2 of newly emerging I. typographus for 68 trees with fitted regression lines. Partially defended trees (i.e. trees withpartial root contact, grey points) are colonized together with lower dead-wood densities, corresponding to expectations (see Results).doi:10.1371/journal.pone.0018274.g005
Population Dynamics in Bark Beetles
PLoS ONE | www.plosone.org 9 May 2011 | Volume 6 | Issue 5 | e18274

inhibit the formation of an IFD. However, it is a very useful null
assumption, because systematic deviations from it alerts us to the
existence of costs and/or constrains that need to be accounted for,
or to search for a cause of maladaptive behavior.
The density at which living trees are settled is determined by the
beetles’ evolved ‘‘expectations’’ of density dependence, but also
migration mortality and probability of successfully colonizing
living trees. Thus, the patchy and unpredictable distribution of
dead trees is a prerequisite for the risky colonization strategy to
arise.
As long as redistribution is penalized, there is a considerable
population density interval over which individuals settling in living
trees, despite the risks from tree defences, have higher expected
reproductive output than those in dead trees (Fig. 2d), thus
deviating from the IFD. However, selection for aggressiveness is
decreased at very high densities, and reversed at very low densities
(Fig. 2d), and as all populations exhausting their local host base
quicker than it replenishes sooner or later are likely to return to
low population densities, selection is highly unlikely to stay
directional. As the selective pressure changes depending on the
time scale of population fluctuations, this suggests a fitness
premium on rapid trait selection such as maternal or epigenetic
effects. Such rapid responses to selection would materialize as
heterogeneities in aggressive behaviour between otherwise genet-
ically homogenous populations. (It also suggests that if some
species could redistribute so as to follow the IFD, this would be
antagonistic to the evolution of aggressive strategies, as the best a
beetle could hope for when initiating a risky attack on a healthy
host would be to break even with its conspecifics in the same
patch.)
The ‘‘random sampling coefficient’’ t represents a little explored
effect of beetle behaviour. It denotes the proportion of beetles in a
patch that will sample one or more trees by burrowing, and thus
contribute to the depletion of tree defences, before they decide to
settle in a dead tree. The density threshold at which colonization
occurs increases markedly with low values of t (Fig. 4a), suggesting
that species with finely grained host localisation will have fewer
outbreaks.
Simulations of the model suggests that there is selection for
different levels of ‘‘aggressiveness’’ depending on population
density (N) relative to defence threshold (T) and landscape
connectivity/patch abundance (V).
Comparing with observationsAs predicted by the SRD, Ips typographus’ reproductive success
has been found [40] to be consistently higher in trees colonized
while still living than in dead trees at the same sites, despite a clear
general preference (i.e., when sufficient amounts are available for
both substrates) for dead trees [41].
Experiments suggest that host tree volatiles attract beetles on a
‘‘patch’’ scale, and that most trees are visited and assessed [42] by
beetles landing randomly on a finer spatial scale [30]. Using close
range chemical signals and/or penetrating into the phloem to
assess host suitability, they simply abort the attempt if the tree is
either too strongly defended or crowded [25,35], implying that
t.0 for some aggressive species.
Fat content is negatively affected both by activity (migration)
and density [7,22], and less fat means less chance of surviving to
find another host. The SRD model implies that an adaptive
reaction norm to signs of increasing migration risk include a higher
propensity for attacking trees. Thus, beetles emerging from
crowded, brood trees should be more likely to start an infestation
close to their parental tree instead of migrating, both due to their
density and to their lower energy reserves. This seems to be
supported by multiple observations [5,7,43,44].
The colonization sequence observed by by Gregoire et al. [32]
were easily reproduced and predicted by the SRD model (see
Fig. 4b). Best fit was found when assuming increasing migration
risk as the season progresses (v1 = 22, v2 = 0.05), density
dependence is moderately steep (c0 = 0.2, a= 2), some random
sampling from early settlers occur (t= 0.5), and a medium-range
tree defence (TL = 15).
Field data on the number of offspring per adult I. cembrae as a
function of gallery density suggest a steep density-dependence for
this species. If about 20% of the offspring survive to breed,
populations will decrease for all but the lowest recorded attack
densities [33]. This indicates that density dependence can be a
local demographic force, without which the SRD predicts that no
beetle would take the risk of initiating an attack on a living tree,
and the shape is consistent with the SRD general function choice
(Fig. 5a).
The density per m2 of newly emerging I. typographus in 68 trees
was recorded at six sites over two years in the Vosges mountains of
France ( Gregoire unpublished data). The living trees were
colonized only when the dead trees nearby were colonized at high
density, as measured by emergence (Fig. 5b). Living trees with
decreased defences (low T) (i.e., trees with partial root contact)
follow the expected pattern, being colonized at lower levels of
crowding in nearby dead trees.
The assumption implicit in some population models that beetles
colonize trees to produce new resources when possible (i.e.,
whenever N.T) creates considerable discrepancies with the SRD,
both with respect to densities at which a population can enter an
epidemic phase, and to how stable the epidemic can be (Fig. 6).
The beetle density at which tree mortality will occur responds in
a strongly non-linear fashion to the interaction between the
colonization threshold and the amount of dead trees present. This
may be one of the reasons why classical risk and population
models have shown relative rather than absolute predictive
capability [17] (Fig. 6).
Discussion
The SRD model supports and provides mechanistic underpin-
nings for the proposed bimodal population growth curve of
aggressive bark beetles [5,13,18,45]. The bimodal density
dependence suggests that zones of moderate beetle density may
attract individuals from surrounding areas, facilitating waves of
attack emanating from outbreak patches. A good example may be
the D. ponderosae on the Chilcotin Plateau, where strong spatial and
temporal dependencies at small scales (,18 km), indicate feedback
from local epidemic processes [46].
The beetles may position galleries so as to minimize interference
from later arrivals [44], and the larvae develop quickly. But larvae
also have a limited ability to cross consumed phloem [47], and the
net outcome seems to be a strong decrease in reproductive success
with increasing gallery densities [6,33,41,48,49,50,51]. Whatever
the consequences for the residents, late-arriving beetles will be
selected for entering a crowded bole. The exception would be under
strong kin selection, which is unlikely in widely dispersing species
[19,21,43]. We see that simply dividing the number of beetles on the
available resources may give wrong estimates of population growth
and stability properties, as the population distributions may not
follow an IFD or maximize tree colonization.
The exact host defence threshold (T) only matters when it is
higher than the beetle density at which crowding occur in dead
trees, meaning that there is no fixed defence threshold below
Population Dynamics in Bark Beetles
PLoS ONE | www.plosone.org 10 May 2011 | Volume 6 | Issue 5 | e18274

which trees become at risk (complicating predictive risk models
[17]). Thus, the gallery densities found in colonized trees are not
just a reflection of how many beetles it takes to kill a tree, but the
risk of initiating a colonization attempt in a living tree. This is in
accordance with the observation that even healthy hosts can be
successfully colonized if pheromone-baited [18].
When the SRD and IFD deviate, the ‘‘random landing’’ on a
stand scale observed for several species [30] may be adaptive:
beetles sampling living trees may increase their fitness (Fig. 2b) by
being more likely to become part of an early-stage attack on a
living tree than beetles that steer directly to the available dead
trees. The exploratory landing pattern is therefore in a feedback
Figure 6. Comparisons with other model formulations. a) Comparing the offspring density for the model (red) with an established resource-based bark beetle model by Økland and Bjørnstad (2006), see Analysis section (blue lines, upper line scaled for better fit). The dotted blue line is thepopulation model presented here, but with the simplification that living trees are colonised immediately when N.T, as is implicit in most currentpopulation models that do not take adaptive behaviour into account. b) Swarm density for which colonizing living trees has a 50% chance of success,as a function of colonization threshold (T) and dead trees present (Kd). The interaction is strongly non-linear.doi:10.1371/journal.pone.0018274.g006
Population Dynamics in Bark Beetles
PLoS ONE | www.plosone.org 11 May 2011 | Volume 6 | Issue 5 | e18274

relationship with aggressiveness, as less aggressive species will have
less to gain by exploratory sampling of living hosts, which again
makes colonization less likely and selects for more precise
localisation of dead hosts etc. Landing and search patterns are
thus predicted to also shape larger-scale spatial dynamics: if the
beetles do not sample living hosts to assess defence levels and
quality, and are ‘‘invisible’’ to each other while flying (i.e., not
emitting pheromones), no living trees will be colonized without
sufficient dead hosts nearby to inform beetles about high
conspecific densities. Thus landing patterns determine to what
degree epidemics can start at random locations and spread
efficiently through healthy forests.
The deviation from the IDF may point to a feedback process
facilitating the evolution of aggressiveness: as sex pheromones
easily lead to beetles aggregating in considerable numbers there is
a fitness gain from settling in a living but possibly succumbing tree
at the right moment. However, the expected fitness differences
converge when dead wood is scarce and beetle densities are high
(Fig. 2d), and the selection pressure is reversed when resource
depletion, density dependence or reduced survival (cold winters,
predation, etc.) depresses the population below the threshold
where successful colonization is likely. Thus, ‘‘aggressiveness’’ in
bark beetles and their associated fungi seem likely to exist in a state
of evolutionary flux or cycles. As heritability on the traits shaping
aggressiveness might be mediated through maternal [52] and
epigenetic [53] effects as well as allele differences, this may explain
evidence for multiple strategies and strongly heritable differences
between individuals and populations of the same species when it
comes to aggressiveness [5,18,41,54,55].
Also, the similarities in selective forces and starting points
suggest that aggressive life strategies may easily have evolved
independently from non-aggressive ancestors in different genera
such as Ips and Dendroctonus.
If beetles continue to be aware of the rest of the patch after
starting to burrow into a host, and can relocate without fitness
costs, they will distribute proportionally between dead and live
trees, and an IFD state will be reached. However, once gallery
construction has begun, this is not likely to be the case. Beetles
may re-emerge to start a second brood after some time, but for the
purposes of this model, any re-emerged individuals are treated as
new arrivals and fitness is calculated per brood. The possibility of
re-emergence is an incentive to breed as soon as possible. For some
individuals, it may still be adaptive to ‘‘wait and see’’ instead of
being the first to attack, and the complex pheromone systems of
many bark beetles show signs of individual variation [42]. But time
is limited, and the beetles with the least fat reserves must commit
first, enforcing the sequential individual decisions driving the
SRD.
While increasing migration range generally may increase the
range of spatial synchrony, this may not be the case under chaotic
or strongly resource-driven population dynamics, with conse-
quences for adaptive dispersal patterns. Everything else being
equal, species with a lower cost of migration are less prone to
attack living trees. But when they do, the epidemics may be more
prolonged, as individuals can migrate away rather than cause
population crashes. Similarly, if early settlers can monopolize
gallery space, density dependence will rarely cause populations to
crash.
Integrating data and processes on different scales is difficult, but
these results show the need to examine population models for
implicit evolutionary assumptions, and doing so generates
hypotheses that may explain otherwise puzzling aspects of the
species’ ecology. In general, the inherent bistability and strong
endogenous feedbacks of bark beetle systems makes them
particularly sensitive to perturbations such as climate change [3],
and adaptations to rapidly fluctuating selective pressures [52] may
allow species to respond quickly to ecological changes such as
decreased host defences following changes in climate or forestry.
Acknowledgments
We thank Derek Johnson, Sandy Liebhold, James Powell, Mark Lewis and
two anonymous referees for valuable discussions.
Author Contributions
Designed and implemented the model: KLK. Contributed data: J-CG.
Designed research: J-CG OS NE MG NCS BØ. Wrote the manuscript:
KLK J-CG OS NE MG NCS BØ.
References
1. Franceschi VR, Krokene P, Christiansen E, Krekling T (2005) Anatomical and
chemical defenses of conifer bark against bark beetles and other pests. New
Phytologist 167: 353–376.
2. Bourtzis K, Miller TA, eds. Insect Symbiosis CRC.
3. Raffa KF, Aukema B, Bentz B, Carroll AL, Hicke JA, et al. (2008) Cross-scale
Drivers of Natural Disturbances prone to Anthropogenic Amplification: The
Dynamics of Bark Beetle Eruptions. Bio Science 58: 501–517.
4. Paine TD, Raffa KF, Harrington TC (1997) Interactions among scolytid bark
beetles, their associated fungi, and live host conifers. Annual Review of
Entomology 42: 179–206.
5. Raffa KF, Aukema B, Erbilgin N, Klepzig K, Wallin KF (2005) Interactions
among conifer terpenoids and bark beetles across multiple levels of scale: an
attempt to understand links between population patterns and physiological
processes. Recent Advances in Phytochemistry 39: 79–118.
6. Weslien J (1994) Interactions within and between species at different densities of
the bark beetle Ips typographus and its predator Thanasimus formicarius. Entomologia
Experimentalis et Applicata 71: 133–143.
7. Wermelinger B (2004) Ecology and management of the spruce bark beetle Ips
typographus—a review of recent research. Forest Ecology and Management 202:
67–82.
8. Aukema B, Raffa K (2004) Gender- and sequence-dependent predation within
group colonizers of defended plants: a constraint on cheating among bark
beetles? Oecologia 138: 253–258.
9. Christiansen E, Bakke A, eds. The spruce bark beetle of Eurasia New York
Plenum Press. pp 479–503.
10. McGregor MD (1985) Mountain pine beetle – the conflict between people and
the beetle. In: Loomis RC, Tucker S, Hofacker TH, eds. Insect and disease
conditions in the United States USDA For Serv General Technical Report WO-
46. Asheville, NC. pp 16–23.
11. Carroll AL, Regniere J, Logan JA, Taylor SW, Bentz BJ, et al. (2006) Impacts of
climate change on range expansion by the mountain pine beetle. VictoriaBritish
Columbia: Canadian Forest Service.
12. Holt RD (2008) Theoretical perspectives on resource pulses. Ecology 89.
13. Økland B, Bjørnstad ON (2006) A resource-depletion model of forest insect
outbreaks. Ecology 87: 283–290.
14. Fretwell SD, Lucas HL (1969) On territorial behavior and other factors
influencing habitat distribution in birds. Acta Biotheoretica 19: 16–36.
15. Cressman R, Krivan V (2006) Migration Dynamics for the Ideal Free
Distribution. The American Naturalist 168: 384–397.
16. Nelson WA, Potapov A, Hundsdorfer A, Lewis M, Carroll A, et al. (2005)
Mountain Pine Beetle Population Dynamics: Insights from empirical evidence
and modeling. Literature review on the spatial modeling of Mountain Pine
Beetles (report) for NRC project # 819. http://www.math.ualberta.ca/,mpb/
Project.htm.
17. Nelson WA, Potapov A, Lewis MA, Hundsdorfer AE, He F (2008) Balancing
ecological complexity in predictive models: a reassessment of risk models in the
mountain pine beetle system. Journal of Applied Ecology 45: 248–257.
18. Raffa KF (2001) Mixed messages across multiple trophic levels: the ecology of
bark beetle chemical communication systems. Chemoecology 11: 49–65.
19. Allender CJ, Clancy KM, DeGomez TE, McMillin JD, Woolbright SA, et al.
(2008) Lack of genetic differentiation in aggressive and secondary bark beetles
(Coleoptera: Curculionidae, Scolytinae) from Arizona. Environmental Entomol-
ogy 37: 817–824.
20. Piel F, Gilbert M, Franklin A, Gregoire J-C (2005) Occurrence of Ips typographus
(Col., Scolytidae) along an urbanization gradient in Brussels, Belgium.
Agricultural and Forest Entomology 7: 161–167.
21. Salle A, Arthofer W, Lieutier F, Stauffer C, Kerdelhue C (2007) Phylogeography
of a host-specific insect: genetic structure of Ips typographus in Europe does not
Population Dynamics in Bark Beetles
PLoS ONE | www.plosone.org 12 May 2011 | Volume 6 | Issue 5 | e18274

reflect past fragmentation of its host. Biological Journal of the Linnean Society
90: 239–246.
22. Byers JA, ed. Chemical ecology of bark beetles in a complex olfactory landscape.
Dordrecht, The Netherlands: Kluwer Academic Publishers. pp 89–134.
23. Zhang Q-H, Schlyter F (2004) Olfactory recognition and behavioural avoidance
of angiosperm nonhost volatiles by conifer-inhabiting bark beetles. Agricultural
and Forest Entomology 6: 1–20.
24. Erbilgin N, Krokene P, Kvamme T, Christiansen E (2007) A host monoterpene
influences Ips typographus (Coleoptera: Curculionidae, Scolytinae) responses to its
aggregation pheromone. Agricultural and Forest Entomology 9: 135–140.
25. Byers JA (1984) Nearest Neighbor Analysis and Simulation of Distribution
Patterns dicates an Attack Spacing Mechanism in the Bark Beetle, Ips typographus
(Coleoptera: Scolytidae). Environmental Entomology 13: 1191–1200.
26. Byers JA, Wood DL, Craig J, Hendry B (1984) Attractive and inhibitory
pheromones produced in the bark beetles, Dendroctonus brevicomis during host
colonization: regulation of inter- and intraspecific competition. Journal of
Chemical Ecology 10: 861–877.
27. Sun X-l, Yang Q-Y, Sweeney J, Gao C-Q (2006) A review: chemical ecology of
Ips typographus (Coleoptera, Scolytidae). Journal of Forestry Research 17: 65–70.
28. Byers JA (1999) Effects of Attraction Radius and Flight Paths on Catch of
Scolytid Beetles Dispersing Outward Through Rings of Pheromone Traps.
Journal of Chemical Ecology 25: 985–1005.
29. Franklin AJ, Gregoire J-C (2001) Dose-Dependent Response and Preliminary
Observations on Attraction Range of Ips typographus to Pheromones at Low
Release Rates. Journal of Chemical Ecology 27: 2425–2435.
30. Saint-Germain M, Buddle CM, Drapeau P (2007) Primary attraction and
random landing in host-selection by wood-feeding insects: a matter of scale?
Agricultural and Forest Entomology 9: 227–235.
31. Powell JA, Logan JA, Bentz BJ (1996) Local Projections for a Global Model of
Mountain Pine Beetle Attacks. Journal of Theoretical Biology 179: 243–260.
32. Gregoire J-C, Raty L, Drumont A, Windt Nd (1996) Pheromone mass trapping:
does it protect windfalls from attack by Ips typographus L. (Coleoptera:
Scolytidae)? 1–4 Septembre; Vallombrosa. USDA, Forest Service general.
33. Zhang QH, Byers JA, Schlyter F (1992) Optimal attack density in the larch bark
beetle, Ips cembrae (Coleoptera: Scolytidae). Journal of Applied Ecology 29:
672–678.
34. Taylor P (2000) Socio-Ecological Webs and Sites of Sociality:Levins’ Strategy of
Model Building Revisited. Biology and Philosophy 15: 197–210.
35. Campbell SA, Borden JH (2006) Integration of visual and olfactory cues of hosts
and non-hosts by three bark beetles (Coleoptera: Scolytidae). Ecological
Entomology 31: 437–449.
36. Hulcr J, Ubik K, Vrkoc J (2006) The role of semiochemicals in tritrophic
interactions between the spruce bark beetle Ips typographus, its predators and
infested spruce. Journal of Applied Entomology 130: 275–283.
37. Erbilgin N, Powell JS, Raffa KF (2003) Effect of varying monoterpene
concentrations on the response of Ips pini (Coleoptera: Scolytidae) to its
aggregation pheromone: implications for pest management and ecology of bark
beetles. Agricultural and Forest Entomology 5: 269–274.
38. Haugen TO, Winfield IJ, Vøllestad A, Fletcher JM, James JB, et al. (2006) The
ideal free pike: 50 years of fitness-maximizing dispersal in Windermere.Proceedings of the Royal Society B; Biological Sciences 273: 2917–2924.
39. van Baalen M, Sabelis MW (1999) Nonequilibrium Population Dynamics of
‘‘Ideal and Free’’ Prey and Predators. The American Naturalist 154: 69–88.40. Hedgren PO, Schroeder LM (2004) Reproductive success of the spruce bark
beetle Ips typographus (L.) and occurrence of associated species: a comparisonbetween standing beetle-killed trees and cut trees. Forest Ecology and
Management 203: 241–250.
41. Wallin KF, Raffa KF (2004) Feedback between individual host selectionbehavior and population dynamics in an eruptive herbivore. Ecological
Monographs 74: 101–116.42. Raffa KF, Phillips TW, Salom SM (1993) Strategies and mechanisms of host
colonization by bark beetles. In: Schowalter TD, Filip GM, eds. Beetle-PathogenInteractions in Conifer Forests. N.Y.: Academic Press. pp 103–120.
43. Franklin AJ, Debruyne C, Gregoire J-C (2000) Recapture of Ips typographus L.
(Col., Scolytidae) with attractants of low release rates: localized dispersion andenvironmental influences. Agricultural and Forest Entomology 2: 259–270.
44. de Jong MCM, Sabelis MW (1988) How bark beetles avoid interference withsquatters: an ESS for colonization by Ips typographus. Oikos 51: 88–96.
45. Økland B, Berryman A (2004) Resource dynamic plays a key role in regional
fluctuations of the spruce bark beetles Ips typographus. Agricultural and ForestEntomology 6: 141–146.
46. Aukema BH, Carroll AL, Zheng Y, Zhu J, Raffa KF, et al. (2008) Movement ofoutbreak populations of mountain pine beetle: influences of spatiotemporal
patterns and climate. Ecography 31: 348–358.47. de Jong MCM, Grijpma P (1986) Competition between larvae of Ips
typographus. Entomologia Experimentalis et Applicata 41: 121–133.
48. Eriksson M, Neuvonen S, Roininen H (2008) Ips typographus (L.) attack on patchesof felled trees: ‘‘Wind-felled’’ vs. cut trees and the risk of subsequent mortality.
Forest Ecology and Management 255: 1336–1341.49. Robins G, Reid M (1997) Effects of density on the reproductive success of pine
engravers: is aggregation in dead trees beneficial? Ecological Entomology 22:
329–334.50. Anderbrant O, Schlyter F, Birgersson G (1985) Intraspecific competition
affecting parents and offspring in the bark beetle Ips typographus. Oikos 45: 89–98.51. Gilbert M, Nageleisen LM, Franklin A, Gregoire JC (2005) Post-storm surveys
reveal large-scale spatial patterns and influences of site factors, forest structureand diversity in endemic bark-beetle populations. Landscape Ecology 20: 35–49.
52. Mousseau TA, Fox CW (1998) Maternal Effects as Adaptations. New York:
Oxford University Press.53. Bossdorf O, Richards CL, Pigliucci M (2008) Epigenetics for ecologists. Ecology
Letters 11: 106–115.54. Pureswaran D, Sullivan B, Ayres M (2008) High individual variation in
pheromone production by tree-killing bark beetles (Coleoptera: Curculionidae:
Scolytinae). Naturwissenschaften 95: 33–44.55. Wallin KF, Rutledge J, Raffa KF (2002) Heritability of Host Acceptance and
Gallery Construction Behaviors of the Bark Beetle Ips pini (Coleoptera:Scolytidae). Environmental Entomology 31: 1276–1281.
Population Dynamics in Bark Beetles
PLoS ONE | www.plosone.org 13 May 2011 | Volume 6 | Issue 5 | e18274