TreeHouse Foods, Inc. (THS) 10-Q
49
TreeHouse Foods, Inc. (THS) 10-Q Quarterly report pursuant to sections 13 or 15(d) Filed on 11/05/2010 Filed Period 09/30/2010
-
Upload
khangminh22 -
Category
Documents
-
view
4 -
download
0
Transcript of TreeHouse Foods, Inc. (THS) 10-Q

TreeHouse Foods, Inc. (THS)
10-Q Quarterly report pursuant to sections 13 or 15(d)
Filed on 11/05/2010Filed Period 09/30/2010

UNITED STATES SECURITIES AND EXCHANGE COMMISSIONWashington, D.C. 20549
Form 10-Q(Mark One) x Quarterly Report Pursuant to Section 13 or 15(d) of the Securities and Exchange Act of 1934
For the Quarterly Period Ended September 30, 2010.or
o Transition Report Pursuant to Section 13 or 15(d) of the Securities Exchange Act of 1934
For the Transition Period from to
Commission File Number 001-32504
TreeHouse Foods, Inc.(Exact name of the registrant as specified in its charter)
Delaware 20-2311383(State or other jurisdiction of incorporation or organization) (I.R.S. employer identification no.)
Two Westbrook Corporate Center, Suite 1070
Westchester, IL 60154(Address of principal executive offices) (Zip Code)
(Registrant’s telephone number, including area code) (708) 483-1300
Indicate by check mark whether the registrant (1) has filed all reports required to be filed by Section 13 or 15(d) of the Securities Exchange Act of 1934during the preceding 12 months (or for such shorter period that the registrant was required to file such reports), and (2) has been subject to such filingrequirements for the past 90 days. Yes x No o Indicate by check mark whether the registrant has submitted electronically and posted on its corporate Web site, if any, every Interactive Data File required tobe submitted and posted pursuant to Rule 405 of Regulation S-T (§232.405 of this chapter) during the preceding 12 months (or for such shorter period that theregistrant was required to submit and post such files). Yes x No o Indicate by check mark whether the registrant is a large accelerated filer, an accelerated filer, a non-accelerated filer, or a smaller reporting company. See thedefinitions of “large accelerated filer,” “accelerated filer” and “smaller reporting company” in Rule 12b-2 of the Exchange Act. Large accelerated filer x Accelerated filer o Non-accelerated filer o Smaller reporting Company o(Do not check if a smaller reporting company) Indicate by check mark whether the registrant is a shell company (as defined in Rule 12b-2 of the Exchange Act).Yes o No x Number of shares of Common Stock, $0.01 par value, outstanding as of October 29, 2010: 35,400,837

Table of Contents
Table of Contents PagePart I — Financial Information Item 1 — Financial Statements (Unaudited) 3 Item 2 — Management’s Discussion and Analysis of Financial Condition and Results of Operations 25 Item 3 — Quantitative and Qualitative Disclosures About Market Risk 37 Item 4 — Controls and Procedures 39 Report of Independent Registered Public Accounting Firm 40 Part II — Other Information Item 1 — Legal Proceedings 41 Item 1A — Risk Factors 41 Item 6 — Exhibits 41 Signatures 42
-2-

Table of Contents
Part I — Financial Information Item 1. Financial Statements
TREEHOUSE FOODS, INC.CONDENSED CONSOLIDATED BALANCE SHEETS
(In thousands, except per share data) September 30, December 31, 2010 2009 (Unaudited) Assets Current assets:
Cash and cash equivalents $ 3,456 $ 4,415 Receivables, net 125,432 86,557 Inventories, net 312,693 264,933 Deferred income taxes 3,962 3,397 Prepaid expenses and other current assets 16,624 7,269 Assets held for sale 4,081 4,081
Total current assets 466,248 370,652 Property, plant and equipment, net 358,243 276,033 Goodwill 953,938 575,007 Intangible assets, net 404,381 153,569 Other assets, net 19,252 9,167
Total assets $ 2,202,062 $ 1,384,428 Liabilities and Stockholders’ Equity Current liabilities:
Accounts payable and accrued expenses $ 188,827 $ 148,819 Current portion of long-term debt 981 906 Deferred income tax 16,805 —
Total current liabilities 206,613 149,725 Long-term debt 875,522 401,640 Deferred income taxes 146,795 45,381 Other long-term liabilities 36,229 31,453
Total liabilities 1,265,159 628,199 Commitments and contingencies (Note 17) Stockholders’ equity:
Preferred stock, par value $0.01 per share, 10,000 shares authorized, none issued — — Common stock, par value $0.01 per share, 90,000 shares authorized, 35,397 and 31,999 shares issued and outstanding,respectively
354 320
Additional paid-in capital 698,100 587,598 Retained earnings 258,100 195,262 Accumulated other comprehensive loss (19,651) (26,951)
Total stockholders’ equity 936,903 756,229 Total liabilities and stockholders’ equity $ 2,202,062 $ 1,384,428
See Notes to Condensed Consolidated Financial Statements.
-3-

Table of Contents
TREEHOUSE FOODS, INC.CONDENSED CONSOLIDATED STATEMENTS OF INCOME
(In thousands, except per share data) Three Months Ended Nine Months Ended September 30, September 30, 2010 2009 2010 2009 (Unaudited) (Unaudited) Net sales $ 464,242 $ 378,865 $ 1,307,561 $ 1,106,866 Cost of sales 354,005 298,347 1,002,396 874,793 Gross profit 110,237 80,518 305,165 232,073 Operating expenses:
Selling and distribution 28,740 25,671 86,423 79,969 General and administrative 25,561 20,752 79,123 56,388 Other operating expense (income), net 1,103 (14,354) 861 (13,929)Amortization expense 7,040 3,375 18,774 9,954
Total operating expenses 62,444 35,444 185,181 132,382 Operating income 47,793 45,074 119,984 99,691 Other expense (income):
Interest expense, net 12,867 4,786 31,473 14,105 Gain on foreign currency exchange (46) (2,968) (2,116) (4,772)Other income, net (1,838) (151) (3,044) (1,416)
Total other expense (income) 10,983 1,667 26,313 7,917 Income before income taxes 36,810 43,407 93,671 91,774 Income taxes 11,943 15,343 30,833 32,553 Net income $ 24,867 $ 28,064 $ 62,838 $ 59,221 Weighted average common shares:
Basic 35,421 32,280 34,870 31,797 Diluted 36,373 33,129 35,935 32,387
Net earnings per common share: Basic $ .70 $ .87 $ 1.80 $ 1.86 Diluted $ .68 $ .85 $ 1.75 $ 1.83
See Notes to Condensed Consolidated Financial Statements.
-4-

Table of Contents
TREEHOUSE FOODS, INC.CONDENSED CONSOLIDATED STATEMENTS OF CASH FLOWS
(In thousands) Nine Months Ended September 30, 2010 2009 (Unaudited) Cash flows from operating activities: Net income $ 62,838 $ 59,221 Adjustments to reconcile net income to net cash provided by operating activities:
Depreciation 31,868 24,978 Amortization 18,774 9,954 Loss (gain) on foreign currency exchange 1,012 (4,465)Mark to market adjustment on derivative contracts (3,176) (1,229)Excess tax deficiency (benefits) from stock-based payment arrangements 440 (60)Stock-based compensation 11,817 9,951 Loss (gain) on disposition of assets, net 2,552 (12,612)Deferred income taxes 7,918 11,743 Curtailment of postretirement benefit obligation (2,357) — Other 121 120
Changes in operating assets and liabilities, net of acquisitions: Receivables 2,244 (5,614)Inventories 459 (54,083)Prepaid expenses and other assets (4,592) 1,584 Accounts payable, accrued expenses and other liabilities 20,734 (10,561)
Net cash provided by operating activities 150,652 28,927 Cash flows from investing activities: Additions to property, plant and equipment (30,477) (30,877)Additions to other intangible assets (16,788) — Acquisition of business, net of cash acquired (664,655) — Proceeds from sale of fixed assets 16 35
Net cash used in investing activities (711,904) (30,842)Cash flows from financing activities: Proceeds from issuance of debt 400,000 — Borrowings under revolving credit facility 324,600 248,500 Payments under revolving credit facility (251,300) (248,900)Payments on capitalized lease obligations (836) (549)Proceeds from issuance of common stock, net of expenses 110,688 — Payment of deferred financing costs (10,783) — Proceeds from stock option exercises 3,606 3,405 Excess tax (deficiency) benefits from stock-based payment arrangements (440) 60 Cash used to net share settle equity awards (15,334) (324)
Net cash provided by financing activities 560,201 2,192 Effect of exchange rate changes on cash and cash equivalents 92 690 Net (decrease) increase in cash and cash equivalents (959) 967 Cash and cash equivalents, beginning of period 4,415 2,687 Cash and cash equivalents, end of period $ 3,456 $ 3,654
See Notes to Condensed Consolidated Financial Statements.
-5-

Table of Contents
TREEHOUSE FOODS, INC.NOTES TO CONDENSED CONSOLIDATED FINANCIAL STATEMENTS
As of and for the nine months ended September 30, 2010(Unaudited)
1. Basis of Presentation The unaudited Condensed Consolidated Financial Statements included herein have been prepared by TreeHouse Foods, Inc. (the “Company,” “we,” “us,” or“our”), pursuant to the rules and regulations of the Securities and Exchange Commission (“SEC”) applicable to quarterly reporting on Form 10-Q. In ouropinion, these statements include all adjustments necessary for a fair presentation of the results of all interim periods reported herein. Certain information andfootnote disclosures normally included in financial statements prepared in accordance with generally accepted accounting principles have been condensed oromitted as permitted by such rules and regulations. Certain prior year amounts have been reclassified to conform to the current period presentation, primarilyto present borrowings and payments under our line of credit on a gross versus net basis. These reclassifications had no effect on reported net income, totalassets or net cash flows. The Condensed Consolidated Financial Statements and related notes should be read in conjunction with the Consolidated FinancialStatements and related notes included in the Company’s Annual Report on Form 10-K for the fiscal year ended December 31, 2009. Results of operations forinterim periods are not necessarily indicative of annual results. The preparation of our Condensed Consolidated Financial Statements in conformity with accounting principles generally accepted in the United States ofAmerica (“GAAP”) requires us to use our judgment to make estimates and assumptions that affect the reported amounts of assets and liabilities, anddisclosures of contingent assets and liabilities at the date of the Condensed Consolidated Financial Statements, and the reported amounts of net sales andexpenses during the reporting period. Actual results could differ from these estimates. A detailed description of the Company’s significant accounting policies can be found in the Company’s Annual Report on Form 10-K for the fiscal yearended December 31, 2009. 2. Recent Accounting Pronouncements In January 2010, the Financial Accounting Standards Board (“FASB”) issued Accounting Standards Update (“ASU”) No. 2010-06, Fair Value Measurementsand Disclosures (“ASU 2010-06”) to provide additional guidance on fair value disclosures. ASU 2010-06 requires new disclosures about transfers in and outof Level 1 and 2, and requires that the activity in Level 3 disclosures be presented on a gross basis rather than as a net number. The ASU also clarifiesexisting disclosures about the level of disaggregation and information on inputs and valuation techniques, and includes confirming amendments to theguidance on employers’ disclosures about postretirement benefit plan assets. ASU 2010-06 is effective for interim and annual reporting periods beginningafter December 15, 2009. The Company adopted the provisions of this ASU effective January 1, 2010, and the adoption did not significantly impact theCompany’s Condensed Consolidated Financial Statements. In July 2010, the FASB issued ASU No. 2010-20, Disclosures about the Credit Quality of Financing Receivables and the Allowance for Credit Losses toprovide more robust and disaggregated disclosures regarding the credit quality of financing receivables and the related allowance for credit losses. Thisguidance is effective for fiscal years ending on or after December 15, 2010 and is not expected to have a significant impact on the Company’s disclosures. 3. Acquisition On March 2, 2010, the Company acquired Sturm Foods, Inc. (“Sturm”), a private label manufacturer of hot cereal and powdered soft drink mixes that servesretail and foodservice customers in the United States with annual sales of approximately $340 million. The acquisition of Sturm has strengthened theCompany’s presence in private label dry grocery categories. The Company paid a cash purchase price of $664.7 million, before adjusting for a $5.0 million working capital adjustment to reduce the purchase price, for100% of the issued and outstanding stock of Sturm. The $5.0 million working capital adjustment is recorded in the Receivables, net line of our CondensedConsolidated Balance Sheets as of September 30, 2010. The transaction was financed through the issuance of $400 million in high yield notes, the issuanceof 2.7 million shares of Company common stock at $43.00 per share and borrowings under the Company’s credit facility.
-6-

Table of Contents
The acquisition is being accounted for under the purchase method of accounting and the results of operations are included in our financial statements from thedate of acquisition and are included in each of our segments. Sturm contributed $187.4 million to net sales and $18.0 million in net income since the March 2,2010 acquisition date through September 30, 2010. At the date of acquisition, the purchase price was allocated to the assets acquired and liabilities assumedbased upon estimated fair market values. The Company’s purchase price allocation set forth below is preliminary and subject to tax and working capitaladjustments that are expected to be completed in the fourth quarter of 2010. Adjustments may impact the total purchase price, deferred taxes and goodwill. (In thousands) Receivables $ 35,774 Inventory 47,525 Property plant and equipment 86,106 Customer relationships 229,000 Trade name 10,000 Formulas 5,000 Other intangible assets 5,835 Other assets 3,813 Goodwill 377,143 Total assets acquired 800,196 Accounts payable and accruals (33,410)Other long-term liabilities (4,295)Deferred taxes (102,805)Total liabilities acquired (140,510)Total purchase price $ 659,686 The Company allocated $229.0 million to customer relationships that have an estimated life of twenty years. The acquired trade name will be amortizedover fifteen years. Formulas have an estimated useful life of five years. Other intangible assets consist of capitalized computer software that is beingamortized over three years. The Company increased the cost of acquired inventories by approximately $6.2 million, and expensed that amount as acomponent of cost of sales through the second quarter of 2010. The Company has allocated $371.0 million of goodwill to the North American RetailGrocery segment and $6.1 million of goodwill to the Food Away From Home segment. No goodwill is expected to be deductible for taxpurposes. Goodwill arises principally as a result of expansion opportunities, employed workforce, and the impact of Sturm’s first mover advantage. TheCompany incurred approximately $5.4 million in acquisition related costs during the nine months ended September 30, 2010. These costs are included inthe General and administrative expense line on the Condensed Consolidated Statements of Income. In connection with the issuance of debt and equity tofinance the acquisition, the Company incurred approximately $10.8 million in debt issue costs that were capitalized and are amortized over the term of thedebt on a straight line basis, and are included as a component of interest expense. The Company also incurred approximately $5.5 million of stock issuancecosts, that reduced the proceeds and were recorded as a component of additional paid in capital. The following pro forma summary presents the effect of the Sturm acquisition as though the business had been acquired as of January 1 of each periodpresented and is based upon unaudited financial information of the acquired entity and may not be indicative of actual results:
-7-
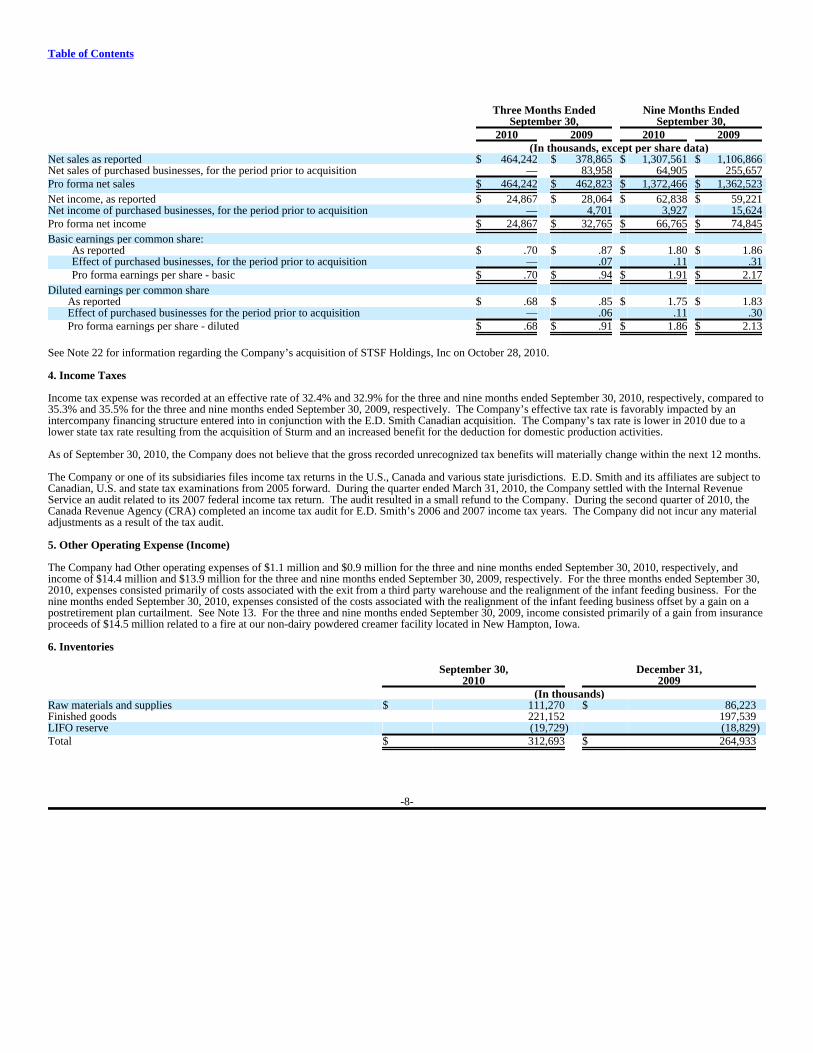
Table of Contents
Three Months Ended Nine Months Ended September 30, September 30, 2010 2009 2010 2009 (In thousands, except per share data) Net sales as reported $ 464,242 $ 378,865 $ 1,307,561 $ 1,106,866 Net sales of purchased businesses, for the period prior to acquisition — 83,958 64,905 255,657 Pro forma net sales $ 464,242 $ 462,823 $ 1,372,466 $ 1,362,523 Net income, as reported $ 24,867 $ 28,064 $ 62,838 $ 59,221 Net income of purchased businesses, for the period prior to acquisition — 4,701 3,927 15,624 Pro forma net income $ 24,867 $ 32,765 $ 66,765 $ 74,845 Basic earnings per common share:
As reported $ .70 $ .87 $ 1.80 $ 1.86 Effect of purchased businesses, for the period prior to acquisition — .07 .11 .31 Pro forma earnings per share - basic $ .70 $ .94 $ 1.91 $ 2.17
Diluted earnings per common share As reported $ .68 $ .85 $ 1.75 $ 1.83 Effect of purchased businesses for the period prior to acquisition — .06 .11 .30 Pro forma earnings per share - diluted $ .68 $ .91 $ 1.86 $ 2.13 See Note 22 for information regarding the Company’s acquisition of STSF Holdings, Inc on October 28, 2010. 4. Income Taxes Income tax expense was recorded at an effective rate of 32.4% and 32.9% for the three and nine months ended September 30, 2010, respectively, compared to35.3% and 35.5% for the three and nine months ended September 30, 2009, respectively. The Company’s effective tax rate is favorably impacted by anintercompany financing structure entered into in conjunction with the E.D. Smith Canadian acquisition. The Company’s tax rate is lower in 2010 due to alower state tax rate resulting from the acquisition of Sturm and an increased benefit for the deduction for domestic production activities. As of September 30, 2010, the Company does not believe that the gross recorded unrecognized tax benefits will materially change within the next 12 months. The Company or one of its subsidiaries files income tax returns in the U.S., Canada and various state jurisdictions. E.D. Smith and its affiliates are subject toCanadian, U.S. and state tax examinations from 2005 forward. During the quarter ended March 31, 2010, the Company settled with the Internal RevenueService an audit related to its 2007 federal income tax return. The audit resulted in a small refund to the Company. During the second quarter of 2010, theCanada Revenue Agency (CRA) completed an income tax audit for E.D. Smith’s 2006 and 2007 income tax years. The Company did not incur any materialadjustments as a result of the tax audit. 5. Other Operating Expense (Income) The Company had Other operating expenses of $1.1 million and $0.9 million for the three and nine months ended September 30, 2010, respectively, andincome of $14.4 million and $13.9 million for the three and nine months ended September 30, 2009, respectively. For the three months ended September 30,2010, expenses consisted primarily of costs associated with the exit from a third party warehouse and the realignment of the infant feeding business. For thenine months ended September 30, 2010, expenses consisted of the costs associated with the realignment of the infant feeding business offset by a gain on apostretirement plan curtailment. See Note 13. For the three and nine months ended September 30, 2009, income consisted primarily of a gain from insuranceproceeds of $14.5 million related to a fire at our non-dairy powdered creamer facility located in New Hampton, Iowa. 6. Inventories September 30, December 31, 2010 2009 (In thousands) Raw materials and supplies $ 111,270 $ 86,223 Finished goods 221,152 197,539 LIFO reserve (19,729) (18,829)Total $ 312,693 $ 264,933
-8-

Table of Contents Approximately $111.6 million and $98.7 million of our inventory was accounted for under the LIFO method of accounting at September 30, 2010 andDecember 31, 2009, respectively. The increase in inventories from December 31, 2009 to September 30, 2010 is primarily due to the Sturm acquisition. Excluding the effect of the Sturmacquisition, inventory levels increased by $1.3 million. 7. Property, Plant and Equipment September 30, December 31, 2010 2009 (In thousands) Land $ 13,624 $ 11,335 Buildings and improvements 134,849 99,856 Machinery and equipment 368,498 310,265 Construction in progress 22,635 6,778 Total 539,606 428,234 Less accumulated depreciation (181,363) (152,201)Property, plant and equipment, net $ 358,243 $ 276,033 The increase in property, plant and equipment from December 31, 2009 to September 30, 2010 is primarily due to the Sturm acquisition. Excluding the effectof the Sturm acquisition, property, plant and equipment decreased by $4.4 million. 8. Accounts Payable and Accrued Expenses September 30, December 31, 2010 2009 (In thousands)Accounts payable $ 118,605 $ 81,967Payroll and benefits 34,371 29,921Interest and taxes 8,324 12,015Health insurance, workers’ compensation and other insurance costs 5,527 4,837Marketing expenses 8,457 10,558Other accrued liabilities 13,543 9,521Total $ 188,827 $ 148,819 The increase in accounts payable from December 31, 2009 to September 30, 2010 is primarily due to the Sturm acquisition. Excluding the effect of the Sturmacquisition, accounts payable and accrued expenses decreased by $4.3 million. 9. Goodwill and Intangible Assets Changes in the carrying amount of goodwill for the nine months ended September 30, 2010 are as follows:
North
American Food Away Industrial
Retail
Grocery From Home and Export Total (In thousands) Balance at December 31, 2009 $ 355,925 $ 85,500 $ 133,582 $ 575,007 Acquisition 376,296 6,232 — 382,528 Currency exchange adjustment 1,922 205 — 2,127 Purchase price adjustment (5,635) (89) — (5,724)Balance at September 30, 2010 $ 728,508 $ 91,848 $ 133,582 $ 953,938
-9-

Table of Contents
Purchase price adjustments are primarily related to working capital and tax adjustments for the Sturm acquisition. The Company has not incurred anygoodwill impairments since its inception. The gross carrying amount and accumulated amortization of our intangible assets other than goodwill as ofSeptember 30, 2010 and December 31, 2009 are as follows: September 30, 2010 December 31, 2009 Gross Net Gross Net Carrying Accumulated Carrying Carrying Accumulated Carrying Amount Amortization Amount Amount Amortization Amount (In thousands) Intangible assets with indefinite lives: Trademarks $ 31,921 $ — $ 31,921 $ 31,422 $ — $ 31,422 Intangible assets with finite lives: Customer-related 384,896 (50,756) 334,140 147,346 (35,400) 111,946 Non-compete agreement 1,000 (917) 83 2,620 (2,162) 458 Trademarks 20,010 (3,094) 16,916 10,010 (2,311) 7,699 Formulas/recipes 6,787 (1,613) 5,174 1,762 (761) 1,001 Computer software 20,200 (4,053) 16,147 3,363 (2,320) 1,043 Total $ 464,814 $ (60,433) $ 404,381 $ 196,523 $ (42,954) $ 153,569 Amortization expense on intangible assets for the three months ended September 30, 2010 and 2009 was $7.0 million and $3.4 million, respectively, and$18.8 million and $10.0 million for the nine months ended September 30, 2010 and 2009, respectively. Estimated amortization expense on intangible assetsfor 2010 and the next four years is as follows: (In thousands) 2010 $ 25,800 2011 $ 28,471 2012 $ 28,077 2013 $ 26,001 2014 $ 25,793 10. Long-Term Debt September 30, December 31, 2010 2009 (In thousands) Revolving credit facility $ 371,500 $ 298,200 High yield notes 400,000 — Senior notes 100,000 100,000 Tax increment financing and other 5,003 4,346 876,503 402,546 Less current portion (981) (906)Total long-term debt $ 875,522 $ 401,640 Revolving Credit Facility — The Company is party to an unsecured revolving credit facility with an aggregate commitment of $600 million, of which $219.2million was available as of September 30, 2010, that expires August 31, 2011. In addition, as of September 30, 2010, there were $9.3 million in letters ofcredit under the revolving credit facility that were issued but undrawn. Our revolving credit facility contains various financial and other restrictive covenantsand requires that the Company maintain certain financial ratios, including a leverage and interest coverage ratio. The Company is in compliance with allapplicable covenants as of September 30, 2010. The Company’s average interest rate on debt outstanding under our revolving credit facility at September 30,2010 was 0.85%. See Note 22 regarding the Company’s Amended and Restated Credit Agreement entered into on October 27, 2010.
-10-

Table of Contents
High Yield Notes — On March 2, 2010, TreeHouse Foods, Inc. completed its offering of $400 million in aggregate principal amount of 7.75% high yieldnotes due 2018 (the “Notes”). The net amount of the proceeds of $391.0 million ($400.0 million notes less underwriting discount of $9.0 million providing aneffective interest rate of 8.03%) were used as partial payment in the acquisition of all of the issued and outstanding stock of Sturm. The Company issued theNotes pursuant to an Indenture, dated March 2, 2010 (the “Base Indenture”), among the Company, the subsidiary guarantors party thereto (Bay Valley Foods,LLC and EDS Holdings, LLC, the “Initial Guarantors”) and Wells Fargo Bank, National Association, (Trustee), as supplemented by a First SupplementalIndenture, dated March 2, 2010 (the “First Supplemental Indenture”), among the Company, the Initial Guarantors and the Trustee. In addition, on March 2,2010, the Company entered into a Second Supplemental Indenture, dated March 2, 2010 (the “Second Supplemental Indenture” and together with the BaseIndenture and the First Supplemental Indenture, the “Indenture”), pursuant to which Sturm (together with the Initial Guarantors, the “Guarantors”) became anadditional guarantor of the Notes, with the same force and effect as if Sturm was initially named as a guarantor under the Indenture. The Indenture provides, among other things, that the Notes will be senior unsecured obligations of the Company. Interest is payable on the Notes on March 1and September 1 of each year, beginning September 1, 2010. The Notes will mature on March 1, 2018. The Company may redeem some or all of the Notes at any time prior to March 1, 2014 at a price equal to 100% of the principal amount of the Notesredeemed, plus an applicable “make-whole” premium. On or after March 1, 2014, the Company may redeem some or all of the Notes at redemption prices setforth in the First Supplemental Indenture. In addition, at any time prior to March 1, 2013, the Company may redeem up to 35% of the Notes at a redemptionprice of 107.75% of the principal amount of the Notes redeemed with the net cash proceeds of certain equity offerings. Subject to certain limitations, in the event of a change of control of the Company, the Company will be required to make an offer to purchase the Notes at apurchase price equal to 101% of the principal amount of the Notes, plus accrued and unpaid interest. The Company’s payment obligations under the Notes are fully and unconditionally guaranteed on a senior unsecured basis by the Guarantors and futuredomestic subsidiaries of the Company, other than certain excluded subsidiaries and unrestricted subsidiaries. The Notes are not guaranteed by any of theCompany’s foreign subsidiaries. The Indenture contains restrictive covenants that, among other things, limit the ability of the Company and the Guarantors to: (i) pay dividends or make otherrestricted payments, (ii) make certain investments, (iii) incur additional indebtedness or issue preferred stock, (iv) create liens, (v) allow restrictions on theability of certain of its subsidiaries to pay dividends or make other payments to the Company or the Guarantors, (vi) merge or consolidate with other entitiesor sell substantially all of its assets, (vii) enter into transactions with affiliates and (viii) engage in certain sale and leaseback transactions. The foregoinglimitations are subject to exceptions as set forth in the First Supplemental Indenture. In addition, if in the future the Notes have an investment grade creditrating by both Moody’s Investors Services, Inc. and Standard & Poor’s Ratings Services, certain of these covenants will, thereafter, no longer apply to theNotes for so long as the Notes are rated investment grade by the two rating agencies. The Company is in compliance with the applicable covenants as ofSeptember 30, 2010. The Indenture provides for customary events of default that include, among other things (subject in certain cases to customary grace and cure periods): (i)non-payment of principal or interest; (ii) breach of certain covenants contained in the Indenture or the Notes, (iii) defaults in failure to pay certain otherindebtedness or the acceleration of certain other indebtedness prior to maturity, (iv) the failure to pay certain final judgments, (v) the failure of certainguarantees to be enforceable and (vi) certain events of bankruptcy or insolvency. Generally, if an event of default occurs (subject to certain exceptions), theTrustee or the holders of at least 25% in aggregate principal amount of the then outstanding Notes may declare all the Notes to be due and payableimmediately. Senior Notes — The Company maintains a private placement of $100 million in aggregate principal of 6.03% senior notes due September 30, 2013, pursuantto a Note Purchase Agreement among the Company and a group of purchasers. The Note Purchase Agreement contains covenants that will limit the ability ofthe Company and its subsidiaries to, among other things, merge with other entities, change the nature of the business, create liens, incur additionalindebtedness or sell assets. The Note Purchase Agreement also requires the Company to maintain certain financial ratios. The Company is in compliancewith the applicable covenants as of September 30, 2010. Swap Agreement — During 2008, the Company entered into a $200 million long term interest rate swap agreement with an effective date of November 19,2008 to lock into a fixed LIBOR interest base rate. Under the terms of the agreement, $200 million in floating rate debt was swapped for a fixed 2.9% interestbase rate for a period of 24 months, amortizing to $50 million for an additional nine months at the same 2.9% interest rate. Under the terms of the Company’srevolving credit agreement and in conjunction with our credit spread, this will result in an all-in borrowing cost on the swapped principal of not more than3.8% during the life of the swap agreement. The Company did not apply hedge accounting to this swap. In the three and nine months ended September 30,2010, and 2009 a gain of $1.1 million, $3.0 million, $23 thousand and $1.2 million, respectively, was recognized in the Other income, net line of ourCondensed Consolidated Statements of Income.
-11-

Table of ContentsTax Increment Financing — As part of the acquisition of the soup and infant feeding business in 2006, the Company assumed the payments related toredevelopment bonds pursuant to a Tax Increment Financing Plan. The Company has agreed to make certain payments with respect to the principal amountof the redevelopment bonds through May 2019. As of September 30, 2010, $2.5 million remains outstanding. 11. Earnings Per Share Basic earnings per share is computed by dividing net income by the number of weighted average common shares outstanding during the reporting period. Theweighted average number of common shares used in the diluted earnings per share calculation is determined using the treasury stock method and includes theincremental effect related to outstanding options, restricted stock, restricted stock units and performance units. In March 2010, the Company issued 2,702,500 shares of common stock in connection with the acquisition of Sturm. For the three and nine months endedSeptember 30, 2010, these shares have been included on a weighted average basis in basic shares outstanding. With respect to awards issued to our founders in connection with the founding of the Company and pursuant to certain employment agreements, the Companyissued restricted stock and restricted stock units that are subject to service and market conditions. The restricted stock awards expired in June 2010 as theconditions for vesting were not met. For the three and nine months ended September 30, 2010, the market conditions were not met and these awards havebeen excluded from diluted earnings per share. For the three months ended September 30, 2009, the market conditions were not met and the awards wereexcluded from diluted earnings per share. For the nine months ended September 30, 2009, the market conditions were met and these awards have beenincluded in diluted earnings per share. With respect to the restricted stock unit awards issued to our founders, the market conditions for these awards weresatisfied in July 2009 and the awards vested. These vested awards have been included in basic shares outstanding since that time. For the three and ninemonths ended September 30, 2009, the market conditions were met and the awards were included in diluted earnings per share, on a weighted average basis. Beginning in June 2008, the Company issued performance unit awards that contain both service and performance criteria. These awards accrue over theperformance periods and will be converted to stock or cash at the discretion of the compensation committee on the third anniversary of the grant date. TheCompany intends to settle these awards in stock using available shares. For the three and nine months ended September 30, 2010, and 2009, the performancecriteria for a portion of the awards were met and have been included in diluted earnings per share. The following table summarizes the effect of the share-based compensation awards on the weighted average number of shares outstanding used in calculatingdiluted earnings per share: Three Months Ended Nine Months Ended September 30, September 30, 2010 2009 2010 2009Weighted average common shares outstanding 35,421,250 32,280,059 34,870,110 31,797,354Assumed exercise of stock options (1) 716,384 494,237 709,760 127,794Assumed vesting of restricted stock, restricted stock unitsand performance units (1) 235,356 354,444 354,659 462,319
Weighted average diluted common shares outstanding 36,372,990 33,128,740 35,934,529 32,387,467 (1) Incremental shares from stock options, restricted stock, restricted stock units, and performance units are computed by the treasury stock
method. Stock options, restricted stock, restricted stock units, and performance units excluded from our computation of diluted earningsper share because they were anti-dilutive, were 132,859 and 132,840 for the three and nine months ended September 30, 2010 and 8,175and 1,585,412 for the three and nine months ended September 30, 2009.
12. Stock-Based Compensation Income before income taxes for the three and nine month periods ended September 30, 2010 and 2009 includes share-based compensation expense of $4.0million, $11.8 million, $3.9 million and $10.0 million, respectively. The tax benefit recognized related to the compensation cost of these share-based awardswas approximately $1.5 million and $4.6 million for the three and nine month periods ended September 30, 2010, respectively, and $1.5 million and $3.8million for the three and nine month periods ended September 30, 2009, respectively.
-12-

Table of Contents
The following table summarizes stock option activity during the nine months ended September 30, 2010. Options are granted under our long-term incentiveplan, and have a three year vesting schedule, which vest one-third on each of the first three anniversaries of the grant date. Options expire ten years from thegrant date. Weighted Weighted Average Average Remaining Aggregate Employee Director Exercise Contractual Intrinsic Options Options Price Term (yrs) Value
Outstanding, December 31, 2009 2,292,744 107,773 $ 27.28 6.4 $ 27,792,212 Granted 130,550 — $ 46.47 — — Forfeited (6,601) — $ 26.87 — — Exercised (119,097) (12,977) $ 27.36 — — Outstanding, September 30, 2010 2,297,596 94,796 $ 28.33 5.9 $ 47,570,219 Vested/expected to vest, at September 30, 2010 2,280,092 94,796 $ 28.30 5.9 $ 42,325,392 Exercisable, September 30, 2010 2,012,610 93,196 $ 27.51 5.5 $ 39,148,715
Compensation costs related to unvested options totaled $3.0 million at September 30, 2010 and will be recognized over the remaining vesting period of thegrants, which averages 2.2 years. The Company uses the Black-Scholes option pricing model to value its stock option awards. The assumptions used tocalculate the fair value of stock options issued in 2010 include the following: expected volatility of 35%, expected term of six years, risk free rate of 3.87%and no dividends. The average grant date fair value of stock options granted in the nine months ended September 30, 2010 was $19.11. The aggregateintrinsic value of stock options exercised during the nine months ended September 30, 2010 was approximately $2.4 million. In addition to stock options, the Company also grants restricted stock, restricted stock units and performance unit awards. These awards are granted under ourlong-term incentive plan. Employee restricted stock and restricted stock unit awards generally vest based on the passage of time. These awards generally vestone-third on each anniversary of the grant date. Director restricted stock units vest over thirteen months. Certain directors have deferred receipt of theirawards until their departure from the Board. A complete description of restricted stock and restricted stock unit awards is presented in the Company’s annualreport on Form 10-K for the year ended December 31, 2009. The following table summarizes the restricted stock and restricted stock unit activity during thenine months ended September 30, 2010: Weighted Weighted Weighted Employee Average Employee Average Director Average Restricted Grant Date Restricted Grant Date Restricted Grant Date Stock Fair Value Stock Units Fair Value Stock Units Fair Value Outstanding, at December 31, 2009 1,202,319 $ 24.28 784,931 $ 26.16 45,400 $ 26.96 Granted — — 246,955 $ 45.66 16,870 $ 46.47 Vested (277,254) $ 24.22 (617,466) $ 25.59 — — Forfeited (632,587) $ 24.28 (10,373) $ 30.18 — — Outstanding, at September 30, 2010 292,478 $ 24.33 404,047 $ 38.84 62,270 $ 32.24 Future compensation costs related to restricted stock and restricted stock units is approximately $16.8 million as of September 30, 2010, and will berecognized on a weighted average basis, over the next 1.9 years. The grant date fair value of the awards granted in 2010 is equal to the Company’s closingstock price on the grant date.
-13-

Table of Contents
Performance unit awards are granted to certain members of management. These awards contain service and performance conditions. For each of the threeperformance periods, one third of the units will accrue, multiplied by a predefined percentage between 0% and 200%, depending on the achievement ofcertain operating performance measures. Additionally, for the cumulative performance period, a number of units will accrue, equal to the number of unitsgranted multiplied by a predefined percentage between 0% and 200%, depending on the achievement of certain operating performance measures, less anyunits previously accrued. Accrued units will be converted to stock or cash, at the discretion of the compensation committee on the third anniversary of thegrant date. The Company intends to settle these awards in stock and has the shares available to do so. The following table summarizes the performance unitactivity during the nine months ended September 30, 2010: Weighted Average Performance Grant Date Units Fair Value Unvested, at December 31, 2009 127,800 $ 26.15 Granted 38,885 $ 46.29 Vested — — Forfeited — — Unvested, at September 30, 2010 166,685 $ 30.85 Future compensation cost related to the performance units is estimated to be approximately $3.8 million as of September 30, 2010, and is expected to berecognized over the next 1.6 years. 13. Employee Retirement and Postretirement Benefits Pension, Profit Sharing and Postretirement Benefits — Certain of our employees and retirees participate in pension and other postretirement benefitplans. Employee benefit plan obligations and expenses included in the Condensed Consolidated Financial Statements are determined based on planassumptions, employee demographic data, including years of service and compensation, benefits and claims paid, and employer contributions. Effective March 31, 2010, the Company negotiated the transfer of the postretirement union retiree medical plan at the Dixon production facility to the CentralStates multiemployer plan. The Company transferred its liability to the multiemployer plan and no longer carries a liability for the accumulated benefitobligation of the employees covered under that plan, resulting in a plan curtailment. The curtailment resulted in a gain of $2.4 million, $1.4 million net of tax,which is included in Other operating (income) expense, net on the Condensed Consolidated Statements of Income. Defined Benefit Plans — The benefits under our defined benefit plans are based on years of service and employee compensation. Components of net periodic pension expense are as follows: Three Months Ended Nine Months Ended September 30, September 30, 2010 2009 2010 2009 (In thousands) Service cost $ 515 $ 490 $ 1,545 $ 1,470 Interest cost 551 524 1,653 1,572 Expected return on plan assets (549) (440) (1,647) (1,320)Amortization of unrecognized net loss 124 149 372 447 Amortization of prior service costs 151 145 453 435 Net periodic pension cost $ 792 $ 868 $ 2,376 $ 2,604 We contributed $0.9 million to the pension plans in the first nine months of 2010. We expect to contribute approximately $1.3 million in 2010. Postretirement Benefits — We provide healthcare benefits to certain retirees who are covered under specific group contracts.
-14-

Table of Contents
Components of net periodic postretirement expenses are as follows: Three Months Ended Nine Months Ended September 30, September 30, 2010 2009 2010 2009 (In thousands) Service cost $ 18 $ 63 $ 84 $ 189 Interest cost 45 64 129 192 Amortization of prior service credit (35) (18) (70) (54)Amortization of unrecognized net loss (20) 5 (31) 15 Net periodic postretirement cost $ 8 $ 114 $ 112 $ 342 We expect to contribute approximately $0.2 million to the postretirement health plans during 2010. 14. Comprehensive Income The following table sets forth the components of comprehensive income: Three Months Ended Nine Months Ended September 30, September 30, 2010 2009 2010 2009 (In thousands) Net income $ 24,867 $ 28,064 $ 62,838 $ 59,221 Foreign currency translation adjustment 5,096 15,396 5,845 27,439 Amortization of pension and postretirement
prior service costs and net loss, net of tax 158 171 473 512 Curtailment of postretirement plan — — 862 — Amortization of swap loss, net of tax 40 41 120 122 Other — — — 5
Comprehensive income $ 30,161 $ 43,672 $ 70,138 $ 87,299 We expect to amortize $0.6 million of prior service costs and net loss, net of tax and $0.2 million of swap loss, net of tax from other comprehensive incomeinto earnings during 2010. 15. Fair Value of Financial Instruments Cash and cash equivalents and accounts receivable are financial assets with carrying values that approximate fair value. Accounts payable are financialliabilities with carrying values that approximate fair value. As of September 30, 2010, the outstanding balance of the Company’s variable rate debt (revolvingcredit facility) was $371.5 million, the fair value of which is estimated to be $365.4 million, using a present value technique and market based interest ratesand credit spreads. As of September 30, 2010, the carrying value of the Company’s fixed rate senior notes was $100.0 million and fair value was estimated tobe $106.8 million based on a present value technique using market based interest rates and credit spreads. The fair value of the Company’s 7.75% high yieldnotes due 2018, with an outstanding balance of $400.0 million as of September 30, 2010, was estimated at $429.0 million, based on quoted market prices. The fair value of the Company’s interest rate swap agreement, as described in Notes 10 and 16, was a liability of approximately $1.9 million as of September30, 2010. The fair value of the swap was determined using Level 2 inputs, which are inputs other than quoted prices that are observable for an asset orliability, either directly or indirectly. The fair value is based on a market approach, comparing the fixed rate of 2.9% to the current and forward one monthLIBOR rates throughout the term of the swap agreement. The fair value of the Company’s commodity contract as described in Note 16 was an asset of approximately $0.2 million as of September 30, 2010. The fairvalue of the commodity contract was determined using Level 1 inputs.
-15-

Table of Contents
16. Derivative Instruments The Company is exposed to certain risks relating to its ongoing business operations. Derivative instruments are used on occasion to manage interest rate,foreign currency and commodity input cost risks. Interest rate swaps are used to manage interest rate risk associated with the Company’s $600 million revolving credit facility. Interest on our credit facility isvariable and use of the interest rate swap establishes a fixed rate over the term of a portion of the facility. The Company’s objective in using an interest rateswap is to establish a fixed interest rate, thereby enabling the Company to predict and manage interest expense and cash flows in a more efficient and effectivemanner. The Company did not apply hedge accounting to the interest rate swap, and it is recorded at fair value on the Company’s Condensed ConsolidatedBalance Sheets. See Note 10 for more details of the interest rate swap, including the notional amount, interest rate and term. Note 15 discusses the fair valueof the interest rate swap. The Company enters into foreign currency contracts to manage the risk associated with foreign currency cash flows. The Company’s objective in usingforeign currency contracts is to establish a fixed foreign currency exchange rate for certain Canadian raw material purchases that are denominated in U.S.dollars, thereby enabling the Company to manage its foreign currency exchange rate risk. There were no foreign currency contracts outstanding as ofSeptember 30, 2010 and 2009. During the second quarter of 2010, the Company entered into a commodity swap contract for 5.4 million pounds of High Density Polyethylene (“HDPE”) tomanage the Company’s risk associated with the underlying commodity cost of a significant component used in packaging materials. The objective in usingthis swap is to establish a fixed commodity cost over the term of the contract. The trade date was June 3, 2010, with an effective date of July 1, 2010 and anexpiration date of December 31, 2011. The Company will settle 0.3 million pounds on a monthly basis over the term of the contract. The Company did notapply hedge accounting to the commodity swap, and it is recorded at fair value on the Company’s Condensed Consolidated Balance Sheets. The following table identifies the derivative, its fair value, and location on the Condensed Consolidated Balance Sheets. Fair Value Balance Sheet Location September 30, 2010 December 31, 2009 Liability Derivatives: (In thousands) Interest rate swap Accounts payable and accrued expenses $ 1,870 $ 3,327
$ 1,870 $ 3,327 Interest rate swap Other Long-term liabilities $ — $ 1,550
$ — $ 1,550 Asset Derivative: Commodity contract Prepaid expenses and other current assets $ 135 $ —
$ 135 $ — Commodity contract Other assets, net $ 34 $ —
$ 34 $ — The Company recognized a gain of $1.5 million and $3.2 million relating to the change in the fair value of its interest rate swap and commodity contractderivatives for the three and nine months ended September 30, 2010, respectively, compared to a gain of $23 thousand and $1.2 million in the three and ninemonths ended September 30, 2009. This gain is recorded in the Other income, net line of our Condensed Consolidated Statements of Income. The Company does not use derivatives for speculative or trading purposes. 17. Commitments and Contingencies Litigation, Investigations and Audits — We are party in the ordinary course of business to certain claims, litigation, audits and investigations. We believe thatwe have established adequate reserves to satisfy any liability we may incur in connection with any such currently pending or threatened matters. In ouropinion, the settlement of any such currently pending or threatened matters is not expected to have a material adverse impact on our financial position, annualresults of operations or cash flows.
-16-

Table of Contents
18. Supplemental Cash Flow Information Cash payments for interest were $29.3 million and $15.0 million for the nine months ended September 30, 2010 and 2009, respectively. Cash payments forincome taxes were $23.4 million and $9.6 million for the nine months ended September 30, 2010 and 2009, respectively. As of September 30, 2010 and2009, the Company had accrued property, plant and equipment of approximately $1.0 million and $1.8 million, respectively. The Company also accruedother intangible assets of $1.5 million at September 30, 2010. For the nine months ended September 30, 2009, the Company entered into capital leases ofapproximately $1.3 million. There were no new capital leases in the first nine months of 2010. As of September 30, 2010, the Company recorded areceivable of $5.0 million for a working capital adjustment to the purchase price of Sturm. As this adjustment is a noncash item, we have excluded it from theCondensed Consolidated Statements of Cash Flows for the nine months ended September 30, 2010. Noncash financing activities for the nine months endedSeptember 30, 2010 and 2009 include the vesting of 891,005 shares and 268,397 shares, respectively, of restricted stock and restricted stock units, whereshares were withheld to satisfy the minimum statutory tax withholding requirements. 19. Foreign Currency The Company enters into foreign currency contracts due to the exposure to Canadian/U.S. dollar currency fluctuations on cross border transactions. TheCompany does not apply hedge accounting to these contracts and records them at fair value on the Condensed Consolidated Balance Sheets, with changes infair value being recorded through the Condensed Consolidated Statements of Income, within Gain on foreign currency exchange. In August 2010 and May2009, the Company entered into foreign currency contracts for the purchase of $4.0 million and $5.0 million U.S. dollars, respectively. The contracts wereentered into for the purchase of U.S. dollar denominated raw materials by our Canadian subsidiary. These contracts expired by the end of September 2010and 2009, respectively. The Company has an intercompany note denominated in Canadian dollars, which is eliminated during consolidation. A portion of thenote is considered to be permanent, with the remaining portion considered to be temporary. Foreign currency fluctuations on the permanent portion arerecorded through Accumulated other comprehensive loss, while foreign currency fluctuations on the temporary portion are recorded in the Company’sCondensed Consolidated Statements of Income, within Gain on foreign currency exchange. The Company accrues interest on the intercompany note, which is also considered temporary. Changes in the balance due to foreign currency fluctuations arealso recorded in the Company’s Condensed Consolidated Statements of Income within Gain on foreign currency exchange. For the three and nine months ended September 30, 2010 and 2009, the Company recorded a gain of $46 thousand, $2.1 million, $3.0 million and $4.8million, respectively, related to foreign currency fluctuations, recorded in the Gain on foreign currency exchange line of the Condensed ConsolidatedStatement of Income. For the three and nine months ended September 30, 2010 and 2009, the Company recorded a gain of $5.1 million, $5.8 million, $15.4million and $27.4 million, respectively, in Accumulated other comprehensive loss related to foreign currency fluctuations on the permanent portion of thenote and translation of E.D. Smith financial statements from Canadian dollars to U.S. dollars. 20. Business and Geographic Information and Major Customers The Company manages operations on a company-wide basis, thereby making determinations as to the allocation of resources in total rather than on asegment-level basis. The Company has designated our reportable segments based on how management views our business. The Company does not segregateassets between segments for internal reporting. Therefore, asset-related information has not been presented. The Company evaluates the performance of our segments based on net sales dollars, gross profit and direct operating income (gross profit less freight out,sales commissions and direct selling and marketing expenses). The amounts in the following tables are obtained from reports used by our senior managementteam and do not include allocated income taxes. Other expenses not allocated include warehouse start-up costs, unallocated selling and distribution expensesand corporate expenses which consist of general and administrative expenses, amortization expense, other operating (income) expense, interest expense,interest income, foreign currency exchange and other (income) expense. The accounting policies of our segments are the same as those described in thesummary of significant accounting policies set forth in Note 1 to our 2009 Consolidated Financial Statements contained in our Annual Report on Form 10-K.
-17-

Table of Contents
Three Months Ended Nine Months Ended September 30, September 30, 2010 2009 2010 2009 (In thousands) Net sales to external customers:
North American Retail Grocery $ 319,174 $ 238,891 $ 888,254 $ 705,426 Food Away From Home 83,330 78,982 237,099 220,764 Industrial and Export 61,738 60,992 182,208 180,676
Total $ 464,242 $ 378,865 $ 1,307,561 $ 1,106,866 Direct operating income:
North American Retail Grocery $ 60,863 $ 36,894 $ 154,955 $ 107,127 Food Away From Home 12,775 9,025 34,917 24,128 Industrial and Export 8,663 9,856 31,658 26,466 Total 82,301 55,775 221,530 157,721
Unallocated warehouse start-up costs (1) — (173) — (3,223)Unallocated selling and distribution expenses (804) (755) (2,788) (2,394)Unallocated corporate expense (33,704) (9,773) (98,758) (52,413)Operating income 47,793 45,074 119,984 99,691 Other expense (10,983) (1,667) (26,313) (7,917)Income before income taxes $ 36,810 $ 43,407 $ 93,671 $ 91,774 (1) Included in Cost of sales in the Condensed Consolidated Statements of Income. Geographic Information — We had revenues to customers outside of the United States of approximately 13.8% and 13.7% of total consolidated net sales inthe nine months ended September 30, 2010 and 2009, respectively, with 13.0% and 13.1% going to Canada, respectively. Major Customers — Wal-Mart Stores, Inc. and affiliates accounted for approximately 18.7% and 14.4% of our consolidated net sales in the nine monthsended September 30, 2010 and 2009, respectively. No other customer accounted for more than 10% of our consolidated net sales. Product Information — The following table presents the Company’s net sales by major products for the three and nine months ended September 30, 2010 and2009: Three Months Ended Nine Months Ended September 30, September 30, 2010 2009 2010 2009 (In thousands) Products: Pickles $ 81,152 $ 82,164 $ 250,840 $ 240,268 Soup and infant feeding 85,759 85,606 220,760 232,607 Non-dairy powdered creamer 68,094 75,620 217,246 236,229 Salad dressing 50,003 46,249 160,825 146,012 Jams and other sauces 42,162 42,319 122,704 113,616 Powdered drinks 54,690 — 121,070 — Hot cereals 31,415 — 66,336 — Aseptic products 22,384 22,052 65,580 62,722 Mexican sauces 20,652 16,118 58,020 48,942 Refrigerated products 7,931 8,737 24,180 26,470 Total net sales $ 464,242 $ 378,865 $ 1,307,561 $ 1,106,866
-18-

Table of Contents
21. Guarantor and Non-Guarantor Financial Information On March 2, 2010, the Company issued 7.75% high yield notes due 2018, that are guaranteed by its wholly owned domestic subsidiaries (GuarantorSubsidiaries) in accordance with the applicable Indenture and fully, jointly, severally and unconditionally guarantee our payment obligations under the debtsecurities offered. The notes are not guaranteed by the foreign subsidiaries of TreeHouse (Non-Guarantor Subsidiaries). There are no significant restrictionson the ability of the parent company or any guarantor to obtain funds from its subsidiaries by dividend or loan. The following condensed consolidatingfinancial information presents the results of operations, financial position and cash flows of TreeHouse Foods, Inc., its Guarantor Subsidiaries, its Non-Guarantor Subsidiaries and the eliminations necessary to arrive at the information for the Company on a consolidated basis as of September 30, 2010 andDecember 31, 2009 and for the three and nine months ended September 30, 2010 and 2009. The equity method has been used with respect to investments insubsidiaries. The principal elimination entries eliminate investments in subsidiaries and intercompany balances and transactions.
Condensed Supplemental Consolidating Balance SheetSeptember 30, 2010
(In thousands) Parent Guarantor Non-Guarantor Company Subsidiaries Subsidiaries Eliminations Consolidated
Assets Current assets: Cash and cash equivalents $ — $ 1,597 $ 1,859 $ — $ 3,456 Receivables, net 2,577 105,201 17,654 — 125,432 Inventories, net — 277,346 35,347 — 312,693 Deferred income taxes 726 2,875 361 3,962 Assets held for sale — 4,081 — — 4,081 Prepaid expenses and other current assets 768 15,150 706 — 16,624 Total current assets 4,071 406,250 55,927 466,248 Property, plant and equipment, net 11,165 311,713 35,365 — 358,243 Goodwill — 843,417 110,521 — 953,938 Investment in subsidiaries 1,166,929 133,881 — (1,300,810) — Intercompany accounts receivable, net 626,546 (513,160) (113,386) — — Deferred income taxes 12,142 — — (12,142) — Identifiable intangible and other assets, net 34,685 306,025 82,923 — 423,633 Total assets $1,855,538 $ 1,488,126 $ 171,350 $ (1,312,952) $ 2,202,062
Liabilities and Stockholders’ Equity Current liabilities: Accounts payable and accrued expenses $ 33,363 $ 134,158 $ 21,306 $ — $ 188,827 Current portion of long-term debt — 981 — — 981 Deferred income taxes — 642 16,163 — 16,805 Total current liabilities 33,363 135,781 37,469 — 206,613 Long-term debt 862,327 13,195 — — 875,522 Deferred income taxes 8,947 149,990 — (12,142) 146,795 Other long-term liabilities 13,998 22,231 — — 36,229 Stockholders’ equity 936,903 1,166,929 133,881 (1,300,810) 936,903 Total liabilities and stockholders’ equity $1,855,538 $ 1,488,126 $ 171,350 $ (1,312,952) $ 2,202,062
-19-

Table of Contents
Condensed Supplemental Consolidating Balance Sheet December 31, 2009
(In thousands) Parent Guarantor Non-Guarantor Company Subsidiaries Subsidiaries Eliminations Consolidated Assets Current assets: Cash and cash equivalents $ 1 $ 8 $ 4,406 $ — $ 4,415 Receivables, net 325 66,573 19,659 — 86,557 Inventories, net — 229,185 35,748 — 264,933 Deferred income taxes 1,875 990 532 — 3,397 Assets held for sale — 4,081 — — 4,081 Prepaid expenses and other current assets 384 6,253 632 — 7,269 Total current assets 2,585 307,090 60,977 — 370,652 Property, plant and equipment, net 11,549 230,595 33,889 — 276,033 Goodwill — 466,274 108,733 — 575,007 Investment in subsidiaries 1,054,776 94,804 — (1,149,580) — Intercompany accounts receivable, net 87,643 65,683 (153,326) — — Deferred income taxes 21,186 — — (21,186) — Identifiable intangible and other assets, net 14,328 65,156 83,252 — 162,736 Total assets $ 1,192,067 $ 1,229,602 $ 133,525 $ (1,170,766) $ 1,384,428 Liabilities and Stockholders’ Equity Current liabilities: Accounts payable and accrued expenses $ 31,458 $ 94,936 $ 22,425 $ — $ 148,819 Current portion of long-term debt 200 554 152 — 906 Total current liabilities 31,658 95,490 22,577 — 149,725 Long-term debt 390,037 11,603 — — 401,640 Deferred income taxes 5,609 44,914 16,044 (21,186) 45,381 Other long-term liabilities 8,534 22,819 100 — 31,453 Stockholders’ equity 756,229 1,054,776 94,804 (1,149,580) 756,229 Total liabilities and stockholders’ equity $ 1,192,067 $ 1,229,602 $ 133,525 $ (1,170,766) $ 1,384,428
-20-

Table of Contents
Condensed Supplemental Consolidating Statement of Income Three Months Ended September 30, 2010
(In thousands) Parent Guarantor Non-Guarantor Company Subsidiaries Subsidiaries Eliminations Consolidated Net sales $ — $ 408,383 $ 61,788 $ (5,929) $ 464,242 Cost of sales — 312,472 47,462 (5,929) 354,005 Gross profit — 95,911 14,326 — 110,237 Selling, general and administrative expense 10,784 38,450 5,067 — 54,301 Amortization 131 5,723 1,186 — 7,040 Other operating expense, net 1,103 — — 1,103 Operating (loss) income (10,915) 50,635 8,073 — 47,793 Interest expense (income), net 12,585 (3,146) 3,428 — 12,867 Other income, net (1,081) (413) (390) — (1,884)(Loss) income from continuing operations, before income taxes (22,419) 54,194 5,035 — 36,810 Income taxes (benefit) (7,502) 18,426 1,019 — 11,943 Equity in net income of subsidiaries 39,784 4,016 — (43,800) — Net income (loss) $ 24,867 $ 39,784 $ 4,016 $ (43,800) $ 24,867
Condensed Supplemental Consolidating Statement of Income Three Months Ended September 30, 2009
(In thousands) Parent Guarantor Non-Guarantor Company Subsidiaries Subsidiaries Eliminations Consolidated Net sales $ — $ 325,971 $ 61,404 $ (8,510) $ 378,865 Cost of sales — 255,885 50,972 (8,510) 298,347 Gross profit — 70,086 10,432 — 80,518 Selling, general and administrative expense 9,601 31,361 5,461 — 46,423 Amortization 231 1,902 1,242 — 3,375 Other operating expense, net — (14,354) — — (14,354)Operating (loss) income (9,832) 51,177 3,729 — 45,074 Interest expense (income), net 4,566 (3,368) 3,588 — 4,786 Other income (expense), net (23) 1,783 (4,879) — (3,119)(Loss) income from continuing operations, before income taxes (14,375) 52,762 5,020 — 43,407 Income taxes (benefit) (2,259) 15,163 2,439 — 15,343 Equity in net income (loss) of subsidiaries 40,180 2,581 — (42,761) — Net income (loss) $ 28,064 $ 40,180 $ 2,581 $ (42,761) $ 28,064
-21-

Table of Contents
Condensed Supplemental Consolidating Statement of Income Nine Months Ended September 30, 2010
(In thousands) Parent Guarantor Non-Guarantor Company Subsidiaries Subsidiaries Eliminations Consolidated Net sales $ — $ 1,143,184 $ 184,757 $ (20,380) $ 1,307,561 Cost of sales — 876,305 146,471 (20,380) 1,002,396 Gross profit — 266,879 38,286 — 305,165 Selling, general and administrative expense 36,564 112,103 16,879 — 165,546 Amortization 394 14,867 3,513 — 18,774 Other operating income, net — 861 — — 861 Operating (loss) income (36,958) 139,048 17,894 — 119,984 Interest expense (income), net 30,923 (9,673) 10,223 — 31,473 Other (income) expense, net (3,007) 975 (3,128) — (5,160)(Loss) income from continuing operations, before income taxes (64,874) 147,746 10,799 — 93,671 Income taxes (benefit) (22,734) 50,781 2,786 — 30,833 Equity in net income of subsidiaries 104,978 8,013 — (112,991) — Net income (loss) $ 62,838 $ 104,978 $ 8,013 $ (112,991) $ 62,838
Condensed Supplemental Consolidating Statement of Income Nine Months Ended September 30, 2009
(In thousands) Parent Guarantor Non-Guarantor Company Subsidiaries Subsidiaries Eliminations Consolidated Net sales $ — $ 946,877 $ 188,248 $ (28,259) $ 1,106,866 Cost of sales — 746,433 156,619 (28,259) 874,793 Gross profit — 200,444 31,629 — 232,073 Selling, general and administrative expense 25,118 94,221 17,018 — 136,357 Amortization 694 5,736 3,524 — 9,954 Other operating expense, net — (13,929) — — (13,929)Operating (loss) income (25,812) 114,416 11,087 — 99,691 Interest expense (income), net 13,640 (9,829) 10,294 — 14,105 Other income, net (1,229) (422) (4,537) — (6,188)(Loss) income from continuing operations, before income taxes (38,223) 124,667 5,330 — 91,774 Income taxes (benefit) (13,577) 43,399 2,731 — 32,553 Equity in net income of subsidiaries 83,867 2,599 — (86,466) — Net income $ 59,221 $ 83,867 $ 2,599 $ (86,466) $ 59,221
-22-

Table of Contents
Condensed Supplemental Consolidating Statement of Cash Flows Nine Months Ended September 30, 2010
(In thousands) Parent Guarantor Non-Guarantor Company Subsidiaries Subsidiaries Eliminations Consolidated Net cash provided by operating activities $ (16,185) $ 163,284 $ 3,553 $ — $ 150,652 Cash flows from investing activities: Additions to property, plant and equipment (64) (25,839) (4,574) — (30,477)Additions to other intangible assets (9,482) (5,842) (1,464) — (16,788)Acquisition of business, net of cash acquired — (664,655) — — (664,655)Proceeds from sale of fixed assets — 16 — — 16 Net cash used in investing activities (9,546) (696,320) (6,038) — (711,904)Cash flows from financing activities: Proceeds from issuance of debt for acquisitions 400,000 — — — 400,000 Borrowings under revolving credit facility 324,600 — — — 324,600 Payments under revolving credit facility (251,300) — — — (251,300)Payments on capitalized lease obligations — (682) (154) — (836)Intercompany transfer (535,307) 535,307 — — — Proceeds from issuance of common stock, net of expenses 110,688 — — — 110,688 Payment of deferred financing costs (10,783) — — — (10,783)Excess tax (deficiency) benefits from stock-based payment arrangements (440) — — — (440)Cash used to net share settle equity awards (15,334) — — — (15,334)Proceeds from stock option exercises 3,606 — — — 3,606 Net cash provided by financing activities 25,730 534,625 (154) — 560,201 Effect of exchange rate changes on cash and cash equivalents — — 92 — 92 Net decrease in cash and cash equivalents (1) 1,589 (2,547) — (959)Cash and cash equivalents, beginning of period 1 8 4,406 — 4,415 Cash and cash equivalents, end of period $ 0 $ 1,597 $ 1,859 $ — $ 3,456
-23-

Table of Contents
Condensed Supplemental Consolidating Statement of Cash Flows Nine Months Ended September 30, 2009
(In thousands) Parent Guarantor Non-Guarantor Company Subsidiaries Subsidiaries Eliminations Consolidated Net cash provided by operating activities $ (67,918) $ 82,141 $ 14,704 $ — $ 28,927 Cash flows from investing activities: Additions to property, plant and equipment (39) (28,537) (2,301) — (30,877)Proceeds from sale of fixed assets — 35 — — 35 Net cash used in investing activities (39) (28,502) (2,301) (30,842)Cash flows from financing activities: Borrowings under revolving credit facility 248,500 — — — 248,500 Payments under revolving credit facility (248,900) — — — (248,900)Payments on capitalized lease obligations — (549) — — (549)Intercompany transfer 65,215 (53,090) (12,125) — — Proceeds from stock option exercises 3,405 — — — 3,405 Excess tax benefits from stock based payment arrangements 60 — — — 60 Cash used to net share settle equity awards (324) — — — (324)Net cash provided by financing activities 67,956 (53,639) (12,125) — 2,192 Effect of exchange rate changes on cash and cash equivalents — — 690 — 690 Net decrease in cash and cash equivalents (1) — 968 — 967 Cash and cash equivalents, beginning of period 12 7 2,668 — 2,687 Cash and cash equivalents, end of period $ 11 $ 7 $ 3,636 $ — $ 3,654 22. Subsequent Events On October 27, 2010, the Company entered into an Amended and Restated Credit Agreement with a group of participating lenders which amends and restatesthe Credit Agreement dated June 27, 2005 (as amended) and was to expire August 31, 2011. The Amended and Restated Credit Agreement provides for anincrease in the aggregate commitment under the revolving credit facility from $600 million to $750 million and extends the maturity to October 27,2015. The interest rate under the Amended and Restated Credit Agreement will be based on the Company’s consolidated leverage ratio, and will bedetermined by either LIBOR plus a margin ranging from 1.50% to 2.50% or a base rate (as defined in the Amended and Restated Credit Agreement) plus amargin ranging from 0.50% to 1.50%. Proceeds from the credit facility may be used for working capital and general corporate purposes, including acquisitionfinancing. The credit facility contains various financial and other restrictive covenants and requires that we maintain certain financial ratios, including aleverage and interest coverage ratio. On October 28, 2010, the Company acquired all of the outstanding securities of STSF Holdings, Inc. (Holdings) for approximately $180 million in cash(subject to adjustment) plus up to an additional $15 million if S.T. Specialty Foods, Inc. achieves certain earnings targets for the twelve month period endingDecember 31, 2010. S.T. Specialty Foods, Inc., a wholly owned subsidiary of Holdings, has annual net sales of approximately $100 million and is amanufacturer of private label macaroni and cheese, skillet dinners and other value-added side dishes. The acquisition will add another category to theCompany’s product portfolio for the retail grocery channel. The acquisition was financed through the Company’s Amended and Restated CreditAgreement. Due to the timing of the acquisition, information required to adequately provide proforma disclosures is not available. We expect thisinformation to be available in sufficient detail later in the fourth quarter and will be disclosed in our annual report on Form 10-K. Following the completion of the acquisition, Holdings and S.T. Specialty Foods will become guarantors under the Amended and Restated Credit Agreementand the indentures governing the Company’s 6.03% senior notes due 2013 and High Yield Notes due 2018.
-24-

Table of Contents Item 2. Management’s Discussion and Analysis of Financial Condition and Results of Operations Business Overview TreeHouse is a food manufacturer servicing primarily the retail grocery and foodservice channels. Its products include non-dairy powdered coffee creamer;canned soup, salad dressings and sauces; sugar free drink mixes and sticks, instant oatmeal and hot cereals, salsa and Mexican sauces; jams and pie fillingsunder the E.D. Smith brand name; pickles and related products; infant feeding products; and other food products including aseptic sauces, refrigerated saladdressings, and liquid non-dairy creamer. TreeHouse believes it is the largest manufacturer of pickles and non-dairy powdered creamer in the United Statesand the largest manufacturer of private label salad dressing, drink mixes and instant hot cereals in the United States and Canada based on sales volume. The following discussion and analysis presents the factors that had a material effect on our results of operations for the three and nine months endedSeptember 30, 2010 and 2009. Also discussed is our financial position, as of the end of those periods. This should be read in conjunction with the CondensedConsolidated Financial Statements and the Notes to those Condensed Consolidated Financial Statements included elsewhere in this report. ThisManagement’s Discussion and Analysis of Financial Condition and Results of Operations contain forward-looking statements. See “Cautionary StatementRegarding Forward-Looking Statements” for a discussion of the uncertainties, risks and assumptions associated with these statements. We discuss the following segments in this Management’s Discussion and Analysis of Financial Condition and Results of Operations: North American RetailGrocery, Food Away From Home, and Industrial and Export. The key performance indicators of our segments are net sales dollars, gross profit and directoperating income, which is gross profit less the cost of transporting products to customer locations (referred to in the tables below as “freight out”),commissions paid to independent sales brokers, and direct sales and marketing expenses. Our current operations consist of the following: • Our North American Retail Grocery segment sells branded and private label products to customers within the United States and Canada. These
products include pickles, peppers, relishes, Mexican sauces, condensed and ready to serve soup, broths, gravies, jams, salad dressings, sauces, non-dairy powdered creamer, aseptic products, infant feeding products, powdered drinks and hot cereals.
• Our Food Away From Home segment sells pickle products, non-dairy powdered creamers, Mexican sauces, aseptic products, hot cereals and
refrigerated products, and sauces to foodservice customers, including restaurant chains and food distribution companies, within the United Statesand Canada.
• Our Industrial and Export segment includes the Company’s co-pack business and non-dairy powdered creamer sales to industrial customers for use
in industrial applications, including for repackaging in portion control packages and for use as an ingredient by other food manufacturers. Exportsales are primarily to industrial customers outside North America.
Current economic conditions remain constrained and the Company has continued to focus its efforts on volume, cost containment and marginimprovement. This strategy, along with the addition of Sturm, has resulted in direct operating income growth of 47.6% and 40.5% for the three and ninemonths ended September 30, 2010, when compared to the three and nine months ended September 30, 2009. Recent Developments On October 27, 2010, the Company entered into an Amended and Restated Credit Agreement with a group of participating lenders which amends and restatesthe Credit Agreement dated June 27, 2005 (as amended) and was to expire August 31, 2011. The Amended and Restated Credit Agreement provides for anincrease in the aggregate commitment under the revolving credit facility from $600 million to $750 million and extends the maturity to October 27,2015. The interest rate under the Amended and Restated Credit Agreement is based on the Company’s consolidated leverage ratio, and will be determined byeither LIBOR plus a margin ranging from 1.50% to 2.50% or a base rate (as defined in the Amended and Restated Credit Agreement) plus a margin rangingfrom 0.50% to 1.50%. Proceeds from the credit facility may be used for working capital and general corporate purposes, including acquisition financing. Thecredit facility contains various financial and other restrictive covenants and requires that we maintain certain financial ratios, including a leverage and interestcoverage ratio.
-25-

Table of Contents
On October 28, 2010, the Company acquired all of the outstanding securities of STSF Holding, Inc. (Holdings) for approximately $180 million in cash(subject to adjustment) plus up to an additional $15 million in cash if S.T. Specialty Foods, Inc. achieves certain earnings targets for the twelve month periodending December 31, 2010. S.T. Specialty Foods, Inc., a wholly owned subsidiary of Holdings, has annual net sales of approximately $100 million and is amanufacturer of private label macaroni and cheese, skillet dinners and other value-added side dishes. The acquisition will add another category to our productportfolio for the retail grocery channel. The acquisition was financed through the Company’s Amended and Restated Credit Agreement. During the second and third quarter of 2010, the Company recorded charges of $4.6 million and $0.3 million, respectively, to better align the cost structure ofthe infant feeding business with its volume. Costs related to excess inventory are included in the Gross profit line of the Condensed Consolidated Statementsof Income. Fixed asset write-downs and severance costs are included in the Other operating expense (income), net line of the Condensed ConsolidatedStatements of Income. In connection with the formation of the Company, the Board of Directors of the Company adopted a stockholder rights plan that became effective June 27,2005. The plan had a life of five years. The stockholder rights plan expired on June 27, 2010 and was not renewed. Results of Operations The following table presents certain information concerning our financial results, including information presented as a percentage of net sales: Three Months Ended September 30, Nine Months Ended September 30, 2010 2009 2010 2009 Dollars Percent Dollars Percent Dollars Percent Dollars Percent (Dollars in thousands) Net sales $ 464,242 100.0% $ 378,865 100.0% $ 1,307,561 100.0% $ 1,106,866 100.0%Cost of sales 354,005 76.3 298,347 78.7 1,002,396 76.7 874,793 79.0 Gross profit 110,237 23.7 80,518 21.3 305,165 23.3 232,073 21.0 Operating expenses:
Selling and distribution 28,740 6.2 25,671 6.8 86,423 6.6 79,969 7.2 General and administrative 25,561 5.5 20,752 5.5 79,123 6.0 56,388 5.1 Other operating expenses (income), net 1,103 0.2 (14,354) (3.8) 861 0.1 (13,929) (1.2)Amortization expense 7,040 1.5 3,375 0.9 18,774 1.4 9,954 0.9
Total operating expenses 62,444 13.4 35,444 9.4 185,181 14.1 132,382 12.0 Operating income 47,793 10.3 45,074 11.9 119,984 9.2 99,691 9.0 Other expenses (income):
Interest expense, net 12,867 2.8 4,786 1.2 31,473 2.4 14,105 1.2 Gain on foreign currency exchange (46) — (2,968) (0.8) (2,116) (0.2) (4,772) (0.4)Other income, net (1,838) (0.4) (151) — (3,044) (0.2) (1,416) (0.1)
Total other expense 10,983 2.4 1,667 0.4 26,313 2.0 7,917 0.7 Income before income taxes 36,810 7.9 43,407 11.5 93,671 7.2 91,774 8.3 Income taxes 11,943 2.5 15,343 4.1 30,833 2.4 32,553 2.9 Net income $ 24,867 5.4% $ 28,064 7.4% $ 62,838 4.8% $ 59,221 5.4%
-26-

Table of Contents
Three Months Ended September 30, 2010 Compared to Three Months Ended September 30, 2009 Net Sales — Third quarter net sales increased 22.5% to $464.2 million in 2010 compared to $378.9 million in the third quarter of 2009. The increase is drivenby the acquisition of Sturm in March 2010, higher volumes in the North American Retail Grocery and Industrial and Export segments and favorable foreigncurrency exchange rates between the U.S. and Canadian dollar, partially offset by price decreases in legacy businesses. Net sales by segment are shown in thefollowing table: Three Months Ended September 30,
$
Increase/ % Increase/ 2010 2009 (Decrease) (Decrease) (Dollars in thousands) North American Retail Grocery $ 319,174 $ 238,891 $ 80,283 33.6%Food Away From Home 83,330 78,982 4,348 5.5%Industrial and Export 61,738 60,992 746 1.2%
Total $ 464,242 $ 378,865 $ 85,377 22.5% Cost of Sales — All expenses incurred to bring a product to completion are included in cost of sales. These costs include raw materials, ingredient andpackaging costs, labor costs, facility and equipment costs, costs to operate and maintain our warehouses, and costs associated with transporting our finishedproducts from our manufacturing facilities to distribution centers. Cost of sales as a percentage of net sales was 76.3% in the third quarter of 2010 comparedto 78.7% in 2009. Contributing to the reduction in cost of sales, as a percent of net sales, is the Company’s focus on purchasing savings and packagingefficiencies. The underlying commodity cost of raw materials and packaging supplies is beginning to trend higher. Decreases in the cost of raw materials andingredients were partially offset by increases in packaging materials in the third quarter of 2010 compared to 2009. Operating Expenses — Total operating expenses were $62.4 million during the third quarter of 2010 compared to $35.4 million in 2009. The increase in2010 resulted from the following: Selling and distribution expenses increased $3.1 million or 12.0% in the third quarter of 2010 compared to 2009 primarily due to the addition ofSturm. Selling and distribution expenses as a percentage of total revenues decreased to 6.2% in 2010 from 6.8% in 2009, mainly due to improved efficiencieson our outbound freight and a reduction in incentive based compensation. General and administrative expenses increased $4.8 million in the third quarter of 2010 compared to 2009. The increase is primarily related to incrementalgeneral and administrative costs of Sturm plus increases in stock based compensation and consulting fees, offset by a decrease in incentive compensation. Other operating expenses were $1.1 million in the third quarter of 2010 primarily due to costs associated with the exit of a third party warehouse and therealignment of the infant feeding business, compared to income of $14.4 million in 2009 due to the gain on our insurance settlement related to the fire at ourNew Hampton, Iowa plant. Amortization expense increased $3.7 million in the third quarter of 2010 compared to 2009, due primarily to the additional intangible assets acquired in theSturm acquisition. Interest Expense, net — Interest expense increased to $12.9 million in the third quarter of 2010, compared to $4.8 million in 2009 primarily due to an increasein debt resulting from the Sturm acquisition. Foreign Currency — The Company’s foreign currency gain was $46 thousand for the three months ended September 30, 2010 compared to a gain of $3.0million in 2009, due to fluctuations in currency exchange rates between the U.S. and Canadian dollar. Income Taxes — Income tax expense was recorded at an effective rate of 32.4% in the third quarter of 2010 compared to 35.3% in the prior year’squarter. The Company’s tax rate is lower in 2010 due to a lower state tax rate resulting from the acquisition of Sturm and increased benefit for the deductionfor domestic production activities. The Company’s effective tax rate is favorably impacted by an intercompany financing structure entered into in conjunctionwith the E.D. Smith, Canadian acquisition.
-27-

Table of Contents
Three Months Ended September 30, 2010 Compared to Three Months Ended September 30, 2009 — Results by Segment North American Retail Grocery — Three Months Ended September 30, 2010 2009 Dollars Percent Dollars Percent (Dollars in thousands) Net sales $ 319,174 100.0% $ 238,891 100.0%Cost of sales 236,416 74.1 183,240 76.8 Gross profit 82,758 25.9 55,651 23.2 Freight out and commissions 14,036 4.4 12,019 5.0 Direct selling and marketing 7,859 2.4 6,738 2.8 Direct operating income $ 60,863 19.1% $ 36,894 15.4% Net sales in the North American Retail Grocery segment increased by $80.3 million, or 33.6% in the third quarter of 2010 compared to 2009. The change innet sales from 2009 to 2010 was due to the following: Dollars Percent (Dollars in thousands) 2009 Net sales $ 238,891
Volume 6,306 2.6%Pricing (4,950) (2.1)Acquisition 78,361 32.8 Foreign currency 2,473 1.1 Mix/other (1,907) (0.8)
2010 Net sales $ 319,174 33.6% The increase in net sales from 2009 to 2010 resulted primarily from the acquisition of Sturm, higher volume and foreign currency fluctuations. Overallvolume is higher in the third quarter of 2010 compared to that of 2009, primarily due to increases in the pickle, Mexican sauces and soup product categoriespartially offset by declines in our infant feeding products. Cost of sales as a percentage of net sales decreased from 76.8% in the third quarter of 2009 to 74.1% in 2010 primarily due to net declines in raw materialsand ingredients, offset by a slight increase in packaging costs. Freight out and commissions paid to independent sales brokers were $14.0 million in the third quarter of 2010 compared to $12.0 million in 2009, an increaseof 16.8%, primarily due the addition of Sturm, offset by efficiencies in our outbound freight. Direct selling and marketing expenses increased $1.1 million in the third quarter of 2010 compared to 2009, primarily due to the addition of Sturm and anincrease in stock based compensation, offset by a decrease in incentive compensation. Food Away From Home — Three Months Ended September 30, 2010 2009 Dollars Percent Dollars Percent (Dollars in thousands) Net sales $ 83,330 100.0% $ 78,982 100.0%Cost of sales 66,236 79.5 65,702 83.2 Gross profit 17,094 20.5 13,280 16.8 Freight out and commissions 2,729 3.3 2,627 3.3 Direct selling and marketing 1,590 1.9 1,628 2.1 Direct operating income $ 12,775 15.3% $ 9,025 11.4%
-28-

Table of Contents
Net sales in the Food Away From Home segment increased by $4.3 million, or 5.5%, in the third quarter of 2010 compared to the prior year. The change innet sales from 2009 to 2010 was due to the following: Dollars Percent (Dollars in thousands) 2009 Net sales $ 78,982
Volume (1,306) (1.6)%Pricing 507 0.6 Acquisition 5,052 6.4 Foreign currency 571 0.7 Mix/other (476) (0.6)
2010 Net sales $ 83,330 5.5% Net sales increased during the third quarter of 2010 compared to 2009 primarily due to the addition of Sturm offset by decreases in volume in our legacyproduct lines. Cost of sales as a percentage of net sales decreased from 83.2% in the third quarter of 2009 to 79.5% in 2010, due to net declines in raw materials andingredients, offset by a slight increase in certain packaging costs and improved productivity at the segment’s aseptic plant. Freight out and commissions paid to independent sales brokers were $2.7 million in the third quarter of 2010 compared to $2.6 million in 2009, an increase of3.9%, primarily due to the addition of Sturm, offset by improved efficiencies on our outbound freight and higher levels of customer pickups. Direct selling and marketing was $1.6 million in the third quarter of 2010 and 2009. Industrial and Export — Three Months Ended September 30, 2010 2009 Dollars Percent Dollars Percent (Dollars in thousands) Net sales $ 61,738 100.0% $ 60,992 100.0%Cost of sales 51,353 83.2 49,232 80.7 Gross profit 10,385 16.8 11,760 19.3 Freight out and commissions 1,265 2.0 1,396 2.3 Direct selling and marketing 457 0.8 508 .8 Direct operating income $ 8,663 14.0% $ 9,856 16.2% Net sales in the Industrial and Export segment increased $0.7 million or 1.2% in the third quarter of 2010 compared to the prior year. The change in net salesfrom 2009 to 2010 was due to the following: Dollars Percent (Dollars in thousands) 2009 Net sales $ 60,992
Volume 5,937 9.7%Pricing (817) (1.3)Acquisition 2,691 4.4 Foreign currency 59 0.1 Mix/other (7,124) (11.7)
2010 Net sales $ 61,738 1.2% The increase in net sales is due to the addition of Sturm and volume increases in the co-pack business offset by an unfavorable sales mix and price decreases,as underlying commodity cost decreases were passed through to customers.
-29-

Table of Contents
Cost of sales as a percentage of net sales increased from 80.7% in the third quarter of 2009 to 83.2% in 2010 primarily due to higher co-pack sales which havelower margins. Freight out and commissions paid to independent sales brokers were $1.3 million in the third quarter of 2010 and $1.4 million in the third quarter of 2009. Direct selling and marketing was $0.5 million in the third quarter of 2010 and 2009. Nine Months Ended September 30, 2010 Compared to Nine Months Ended September 30, 2009 Net Sales — Net sales increased 18.1% to $1,307.6 million in 2010 compared to $1,106.9 million in the first nine months of 2009. The increase is driven bythe acquisition of Sturm in March 2010, volume increases in legacy businesses, and favorable foreign currency exchange rates between the U.S. and Canadiandollar. Net sales by segment are shown in the following table: Nine Months Ended September 30,
$
Increase/ % Increase/ 2010 2009 (Decrease) (Decrease) (Dollars in thousands) North American Retail Grocery $ 888,254 $ 705,426 $ 182,828 25.9%Food Away From Home 237,099 220,764 16,335 7.4%Industrial and Export 182,208 180,676 1,532 0.8%
Total $ 1,307,561 $ 1,106,866 $ 200,695 18.1% Cost of Sales — All expenses incurred to bring a product to completion are included in cost of sales. These costs include raw materials, ingredient andpackaging costs, labor costs, facility and equipment costs, costs to operate and maintain our warehouses, and costs associated with transporting our finishedproducts from our manufacturing facilities to distribution centers. Cost of sales as a percentage of net sales was 76.7% in the first nine months of 2010compared to 79.0% in 2009. Contributing to the reduction in cost of sales, as a percent of net sales, is the Company’s focus on purchasing savings andpackaging efficiencies. The underlying commodity cost of raw materials and packaging supplies is beginning to trend higher. Decreases in the cost of rawmaterials, ingredients and packaging materials in the first nine months of 2010 compared to 2009 were partially offset by the write-off of excess infant feedinginventories. Operating Expenses — Total operating expenses were $185.2 million during the first nine months of 2010 compared to $132.4 million in 2009. The increasein 2010 resulted from the following: Selling and distribution expenses increased $6.5 million or 8.1% in the first nine months of 2010 compared to 2009 primarily due to the addition ofSturm. Selling and distribution expenses as a percentage of total revenues decreased to 6.6% in 2010 from 7.2% in 2009, due to improved efficiencies on ouroutbound freight and reduction in incentive based compensation. General and administrative expenses increased $22.7 million in the first nine months of 2010 compared to 2009. The increase is primarily related toincremental general and administrative costs of Sturm, Sturm acquisition costs, stock based compensation, and increases related to consulting fees, offset by adecrease in incentive based compensation. Amortization expense increased $8.8 million in the first nine months of 2010 compared to the first nine months of 2009, due primarily to the additionalintangible assets acquired in the Sturm acquisition. Other operating expense was $0.9 million in the first nine months of 2010 compared to operating income of $13.9 million in the first nine months of2009. Expense in 2010 was primarily related to costs associated with the realignment of the infant feeding business offset by the gain on a postretirement plancurtailment at our Dixon facility. Income in 2009 was related to the gain on our insurance settlement relating to a fire at our New Hampton, Iowa plant. Interest Expense, net — Interest expense increased to $31.5 million in the first nine months of 2010, compared to $14.1 million in 2009, primarily due to anincrease in debt in connection with the Sturm acquisition. Foreign Currency — The Company’s foreign currency gain was $2.1 million for the nine months ended September 30, 2010 compared to a gain of $4.8million in 2009, due to fluctuations in currency exchange rates between the U.S. and Canadian dollar.
-30-

Table of Contents
Income Taxes — Income tax expense was recorded at an effective rate of 32.9% in the first nine months of 2010 compared to 35.5% in 2009. The Company’stax rate is lower in 2010 due to a lower state tax rate resulting from the Sturm acquisition and increased benefits for the deduction for domestic productionactivities. The Company’s effective tax rate is favorably impacted by an intercompany financing structure entered into in conjunction with the E.D. Smith,Canadian acquisition. Nine Months Ended September 30, 2010 Compared to Nine Months Ended September 30, 2009 — Results by Segment North American Retail Grocery — Nine Months Ended September 30, 2010 2009 Dollars Percent Dollars Percent (Dollars in thousands) Net sales $888,254 100.0% $705,426 100.0%Cost of sales 668,348 75.2 539,451 76.5 Gross profit 219,906 24.8 165,975 23.5 Freight out and commissions 41,404 4.7 37,558 5.3 Direct selling and marketing 23,547 2.7 21,290 3.0 Direct operating income $154,955 17.4% $107,127 15.2% Net sales in the North American Retail Grocery segment increased by $182.8 million, or 25.9% in the first nine months of 2010 compared to the third quarterof 2009. The change in net sales from 2009 to 2010 was due to the following: Dollars Percent (Dollars in thousands) 2009 Net sales $ 705,426
Volume 11,427 1.6%Pricing (6,655) (0.9)Acquisition 168,602 23.9 Foreign currency 15,558 2.2 Mix/other (6,104) (0.9)
2010 Net sales $ 888,254 25.9% The increase in net sales from 2009 to 2010 resulted from the acquisition of Sturm, foreign currency fluctuations, and higher unit sales. Overall volume ishigher in the first nine months of 2010 compared to that of 2009, primarily due to new customers and line extensions in the pickle, Mexican sauces and saladdressings product lines. These increases were partially offset by declines in our soup and infant feeding products. Cost of sales as a percentage of net sales decreased from 76.5% in the first nine months of 2009 to 75.2% in 2010 primarily due to net declines in rawmaterial, ingredient and packaging costs. The segment continues to see improvements from last year’s salad dressing plant expansion. Negatively impactingcosts in 2010 is the revaluation of acquired inventories from the Sturm acquisition and the write-off of excess infant feeding inventory. Freight out and commissions paid to independent sales brokers were $41.4 million in the first nine months of 2010 compared to $37.6 million in 2009, anincrease of 10.2%, primarily due to the addition of Sturm. Direct selling and marketing expenses increased $2.3 million, or 10.6% in the first nine months of 2010 compared to 2009 due to the Sturm acquisition and anincrease in stock based compensation offset by a decrease in incentive compensation.
-31-

Table of Contents
Food Away From Home — Nine Months Ended September 30, 2010 2009 Dollars Percent Dollars Percent (Dollars in thousands) Net sales $ 237,099 100.0% $ 220,764 100.0%Cost of sales 188,833 79.6 183,615 83.2 Gross profit 48,266 20.4 37,149 16.8 Freight out and commissions 7,891 3.4 7,755 3.5 Direct selling and marketing 5,458 2.3 5,266 2.4 Direct operating income $ 34,917 14.7% $ 24,128 10.9% Net sales in the Food Away From Home segment increased by $16.3 million, or 7.4%, in the first nine months of 2010 compared to the prior year. Thechange in net sales from 2009 to 2010 was due to the following: Dollars Percent (Dollars in thousands) 2009 Net sales $ 220,764
Volume (741) (0.3)%Pricing 2,683 1.2 Acquisition 10,262 4.6 Foreign currency 2,497 1.1 Mix/other 1,634 0.8
2010 Net sales $ 237,099 7.4% Net sales increased during the first nine months of 2010 compared to 2009 partially due to the acquisition of Sturm, foreign currency fluctuations and priceincreases. Cost of sales as a percentage of net sales decreased from 83.2% in the first nine months of 2009 to 79.6% in 2010, due to net declines in raw material,ingredient and packaging costs and improved productivity at the segment’s aseptic plant. Freight out and commissions paid to independent sales brokers were $7.9 million in the first nine months of 2010 compared to $7.8 million in 2009. Direct selling and marketing increased $0.2 million in the first nine months of 2010 compared to 2009. Industrial and Export — Nine Months Ended September 30, 2010 2009 Dollars Percent Dollars Percent (Dollars in thousands) Net sales $182,208 100.0% $ 180,676 100.0%Cost of sales 145,215 79.7 148,504 82.2 Gross profit 36,993 20.3 32,172 17.8 Freight out and commissions 3,987 2.2 4,279 2.4 Direct selling and marketing 1,348 0.7 1,427 0.8 Direct operating income $ 31,658 17.4% $ 26,466 14.6%
-32-

Table of Contents
Net sales in the Industrial and Export segment increased $1.5 million or 0.8% in the first nine months of 2010 compared to the prior year. The change in netsales from 2009 to 2010 was due to the following: Dollars Percent (Dollars in thousands) 2009 Net sales $ 180,676
Volume 7,766 4.3%Pricing (6,010) (3.3)Acquisition 8,542 4.7 Foreign currency 781 0.4 Mix/other (9,547) (5.3)
2010 Net sales $ 182,208 0.8% The increase in net sales is primarily due to higher volumes in the co-pack business and the addition of the Sturm co-pack business. The volume andacquisition increases were partially offset by price decreases, as the underlying commodity cost decreases were passed through to customers, and anunfavorable mix due to higher co-pack sales. Cost of sales, as a percentage of net sales, decreased from 82.2% in the first nine months of 2009 to 79.7% in 2010 reflecting productivity improvementsrealized in the quarter and net declines in raw material, ingredient and packaging costs. Freight out and commissions paid to independent sales brokers were $4.0 million in the first nine months of 2010 compared to $4.3 million in 2009, adecrease of 6.8%, due to improved efficiencies on our outbound freight and higher levels of customer pickups. Direct selling and marketing was $1.3 million in the first nine months of 2010 and $1.4 million in the first nine months of 2009. Liquidity and Capital Resources Cash Flow Management assesses the Company’s liquidity in terms of its ability to generate cash to fund its operating, investing and financing activities. The Companycontinues to generate substantial cash flow from operating activities and remains in a strong financial position, with resources available for reinvestment inexisting businesses, acquisitions and managing its capital structure on a short and long-term basis. If additional borrowings are needed, approximately $219.2million was available under the revolving credit facility as of September 30, 2010. This facility was amended and restated on October 27, 2010 and theaggregate commitment was increased from $600 million to $750 million. After giving effect for our Amended and Restated Credit Agreement and theacquisition of STSF Holdings, Inc. approximately $200 million was available under the revolving credit facility as of October 28, 2010. See Note 22 to ourCondensed Consolidated Financial Statements for additional information regarding our revolving credit facility. We believe that, given our cash flow fromoperating activities and our available credit capacity, we can comply with the current terms of the revolving credit facility and meet foreseeable financialrequirements.
-33-

Table of Contents
The Company’s cash flows from operating, investing and financing activities, as reflected in the Condensed Consolidated Statements of Cash Flows issummarized in the following tables:
Nine Months Ended
September 30,
2010 2009 (In thousands) Cash flows from operating activities: Net income $ 62,838 $ 59,221 Depreciation and amortization 50,642 34,932 Stock-based compensation 11,817 9,951 Loss (gain) on foreign currency exchange 1,012 (4,465)Mark to market adjustment on interest rate swap (3,176) (1,229)Loss (gain) on disposition of assets, net 2,552 (12,612)Curtailment of postretirement benefit obligation (2,357) — Deferred income taxes 7,918 11,743 Changes in operating assets and liabilities, net of acquisitions 18,845 (68,674)Other 561 60 Net cash provided by operating activities $ 150,652 $ 28,927 Our cash from operations was $150.7 million in the first nine months of 2010 compared to $28.9 in the first nine months of 2009, resulting in an increase of$121.8 million. The increase in cash from operating activities is due in part to higher levels of net income plus depreciation and amortization resulting fromthe acquisition of Sturm. Also contributing to the increase in operating cash flows is a decrease in working capital, net of acquisitions resulting frommanagement’s continuing efforts to manage accounts receivable, accounts payable and inventory levels.
Nine Months Ended
September 30,
2010 2009 (In thousands) Cash flows from investing activities: Additions to property, plant and equipment $ (30,477) $(30,877)Additions to other intangible assets (16,788) — Acquisition of business, net of cash acquired (664,655) — Other 16 35 Net cash used in investing activities $(711,904) $(30,842) In the first nine months of 2010, cash used in investing activities increased by $681.1 million compared to 2009 primarily due to the acquisition of Sturm for$664.7 million. We expect capital spending programs to total approximately $72.0 million in 2010. Capital spending in 2010 is focused on food safety, quality, productivityimprovements, installation of an ERP system and routine equipment upgrades or replacements at all of our production facilities, and is funded by cash fromoperations.
-34-

Table of Contents
Nine Months Ended
September 30,
2010 2009 (In thousands) Cash flows from financing activities: Proceeds from issuance of debt for acquisitions $ 400,000 $ — Borrowings under revolving credit facility 324,600 248,500 Payments under revolving credit facility (251,300) (248,900)Proceeds from issuance of common stock, net of expenses 110,688 — Payment of deferred financing costs (10,783) — Proceeds from stock option exercises 3,606 3,405 Cash used to net share settle equity awards (15,334) (324)Other (1,276) (489)Net cash provided by financing activities $ 560,201 $ 2,192 Net cash flow from financing activities increased from $2.2 million in the first nine months of 2009 to $560.2 million in 2010. To finance the Sturmacquisition in the first quarter of 2010, we issued $400.0 million of new debt, common stock in the net amount of $110.7 million and borrowings under ourrevolving credit facility. Cash provided by operating activities is used to pay down debt. Our short-term financing needs are primarily for financing working capital during the year. Due to the seasonality of pickle and fruit production, driven byharvest cycles which occur primarily during late spring and summer, inventories generally are at a low point in late spring and at a high point during the fall,increasing our working capital requirements. In addition, we build inventories of salad dressings in the spring and soup in the late summer months inanticipation of large seasonal shipments that begin late in the second and third quarters, respectively. Our long-term financing needs will depend largely onpotential acquisition activity. We expect our revolving credit facility, plus cash flow from operations, to be adequate to provide liquidity for currentoperations.
-35-

Table of Contents
Debt Obligations At September 30, 2010, we had $371.5 million in borrowings outstanding under our revolving credit facility, 7.75% High Yield Notes due 2018 of $400million outstanding, Senior Notes of $100 million outstanding and $5.0 million of tax increment financing and other obligations. Interest rates on debtoutstanding under our revolving credit facility as of September 30, 2010 averaged 0.85%. In addition, at September 30, 2010, there were $9.3 million inletters of credit under the revolver that were issued but undrawn. Our revolving credit facility provides for an aggregate commitment of $600 million of which $219.2 million was available at September 30, 2010. Aftergiving effect for our Amended and Restated Credit Agreement and the acquisition of STSF Holdings, Inc. approximately $200 million was available under therevolving credit facility as of October 28, 2010. We are in compliance with the applicable debt covenants as of September 30, 2010. See Notes 10 and 22 to our Condensed Consolidated Financial Statements for additional information regarding our indebtedness and related agreements andthe Amended and Restated Credit Agreement. Other Commitments and Contingencies We also have the following commitments and contingent liabilities, in addition to contingent liabilities related to ordinary course of litigation, investigationsand tax audits: • certain lease obligations, and • selected levels of property and casualty risks, primarily related to employee health care, workers’ compensation claims and other
casualty losses. See Note 17 to our Condensed Consolidated Financial Statements and Note 20 in our Annual Report on Form 10-K for the fiscal year ended December 31,2009 for more information about our commitments and contingent obligations. In 2010, we expect cash interest to be approximately $46.0 million based on anticipated debt levels and cash income taxes are expected to be approximately$28.8 million. Recent Accounting Pronouncements Information regarding recent accounting pronouncements is provided in Note 2 to the Company’s Condensed Consolidated Financial Statements. Critical Accounting Policies A description of the Company’s critical accounting policies is contained in our Annual Report on Form 10-K for the year ended December 31, 2009. Therewere no material changes to our critical accounting policies in the nine months ended September 30, 2010. Off-Balance Sheet Arrangements We do not have any obligations that meet the definition of an off-balance sheet arrangement, other than operating leases and letters of credit, which have orare reasonably likely to have a material effect on our Condensed Consolidated Financial Statements. Forward Looking Statements From time to time, we and our representatives may provide information, whether orally or in writing, including certain statements in this Quarterly Report onForm 10-Q, which are deemed to be “forward-looking” within the meaning of the Private Securities Litigation Reform Act of 1995 (the “Litigation ReformAct”). These forward-looking statements and other information are based on our beliefs as well as assumptions made by us using information currentlyavailable. The words “anticipate,” “believe,” “estimate,” “expect,” “intend,” “should” and similar expressions, as they relate to us, are intended to identify forward-looking statements. Such statements reflect our current views with respect to future events and are subject to certain risks, uncertainties andassumptions. Should one or more of these risks or uncertainties materialize, or should underlying assumptions prove incorrect, actual results may varymaterially from those described herein as anticipated, believed, estimated, expected or intended. We do not intend to update these forward-lookingstatements.
-36-

Table of Contents
In accordance with the provisions of the Litigation Reform Act, we are making investors aware that such forward-looking statements, because they relate tofuture events, are by their very nature subject to many important factors that could cause actual results to differ materially from those contemplated by theforward-looking statements contained in this Quarterly Report on Form 10-Q and other public statements we make. Such factors include, but are not limitedto: the outcome of litigation and regulatory proceedings to which we may be a party; the impact of product recalls; actions of competitors; changes anddevelopments affecting our industry; quarterly or cyclical variations in financial results; our ability to obtain suitable pricing for our products; development ofnew products and services; our level of indebtedness; the availability of financing on commercially reasonable terms; cost of borrowing; our ability tomaintain and improve cost efficiency of operations; changes in foreign currency exchange rates; interest rates and raw material and commodity costs; changesin economic conditions; political conditions; reliance on third parties for manufacturing of products and provision of services; general U.S. and globaleconomic conditions; the financial condition of our customers and suppliers; consolidations in the retail grocery and foodservice industries; our ability tocontinue to make acquisitions in accordance with our business strategy or effectively manage the growth from acquisitions; and other risks that are set forth inthe Risk Factors section, the Legal Proceedings section, the Management’s Discussion and Analysis of Financial Condition and Results of Operations sectionand other sections of this Quarterly Report on Form 10-Q, our Annual Report on Form 10-K for the year ended December 31, 2009 and from time to time inour filings with the Securities and Exchange Commission. Item 3. Quantitative and Qualitative Disclosures About Market Risk Interest Rate Fluctuations On October 27, 2010, the Company entered into an Amended and Restated Credit Agreement (Agreement) with a group of participating lenders whichamends and restates the Credit Agreement dated June 27, 2005 (as amended) and was to expire August 31, 2011. The Agreement provides for an increase inthe aggregate commitment under the revolving credit facility from $600 million to $750 million, extends the maturity to October 27, 2015, amends certaindefinitions and increases interest and various fees payable to the lenders. The interest rate under the Amended and Restated Credit Agreement is based on theCompany’s consolidated leverage ratio, and will be determined by either LIBOR plus a margin ranging from 1.50% to 2.50% or a base rate (as defined in theAmended and Restated Credit Agreement) plus a margin ranging from 0.50% to 1.50%. Proceeds from the credit facility may be used for working capital andgeneral corporate purposes, including acquisition financing. The credit facility contains various financial and other restrictive covenants and requires that wemaintain certain financial ratios, including a leverage and interest coverage ratio. The Company entered into a $200 million long term interest rate swap agreement with an effective date of November 19, 2008 to lock into a fixed LIBORinterest rate base. Under the terms of agreement, $200 million in floating rate debt will be swapped for a fixed 2.9% interest rate base for a period of 24months, amortizing to $50 million for an additional nine months at the same 2.9% interest rate. Under the terms of the Company’s revolving credit agreementand in conjunction with our credit spread, this will result in an all in borrowing cost on the swapped principal being no more than 3.8% during the life of theswap agreement. In July 2006, we entered into a forward interest rate swap transaction for a notional amount of $100 million as a hedge of the forecasted private placement of$100 million senior notes. The interest rate swap transaction was terminated on August 31, 2006, which resulted in a pre-tax loss of $1.8 million. Theunamortized loss is reflected, net of tax, in Accumulated other comprehensive loss in our Condensed Consolidated Balance Sheets. The total loss will bereclassified ratably to our Condensed Consolidated Statements of Income as an increase to interest expense over the term of the senior notes, providing aneffective interest rate of 6.29% over the terms of our senior notes. We do not utilize financial instruments for trading purposes or hold any derivative financial instruments, which could expose us to significant interest ratemarket risk, other than our interest rate swap agreement, as of September 30, 2010. Our exposure to market risk for changes in interest rates relates primarilyto the increase in the amount of interest expense we expect to pay with respect to our revolving credit facility, which is tied to variable market rates. Based onour outstanding debt balance of $371.5 million under our revolving credit facility at September 30, 2010, and adjusting for the $200 million fixed rate swapagreement, as of September 30, 2010, each 1% rise in our interest rate would increase our interest expense by approximately $1.7 million annually.
-37-
Table of Contents
Input Costs The costs of raw materials, as well as packaging materials and fuel, have varied widely in recent years and future changes in such costs may cause our resultsof operations and our operating margins to fluctuate significantly. We experienced decreases in certain costs such as oils, casein, sweeteners and certainpackaging materials in the nine months ended September 30, 2010 compared to 2009, however, we have recently incurred cost increases in certain packagingmaterials. Contributing to the reduction in cost of sales, as a percent of net sales, is the Company’s focus on purchasing savings and packagingefficiencies. The underlying commodity cost of input and packaging supplies is beginning to trend higher. Fuel costs, which represent the most importantfactor affecting utility costs at our production facilities and our transportation costs, have stabilized in the past year. In the second quarter of 2010, theCompany entered into a 5.4 million pound High Density Polyethylene (“HDPE”) commodity swap contract that expires December 31, 2011 to manage theCompany’s risk associated with the underlying commodity cost of a significant component used in certain packaging materials. The objective in using thisswap is to establish a fixed commodity cost over the term of the contract. The contract will settle 0.3 million pounds on a monthly basis over the term of thecontract. The most important raw material used in our pickle operations is cucumbers. We purchase cucumbers under seasonal grower contracts with a variety ofgrowers strategically located to supply our production facilities. Bad weather or disease in a particular growing area can damage or destroy the crop in thatarea, which would impair crop yields. If we are not able to buy cucumbers from local suppliers, we would likely either purchase cucumbers from foreignsources, such as Mexico or India, or ship cucumbers from other growing areas in the United States, thereby increasing our production costs. Changes in the prices of our products may lag behind changes in the costs of our materials. Competitive pressures may also limit our ability to quickly raiseprices in response to increased raw materials, packaging and fuel costs. Accordingly, if we are unable to increase our prices to offset increasing raw material,packaging and fuel costs, our operating profits and margins could be materially adversely affected. In addition, in instances of declining input costs,customers may be looking for price reductions in situations where we have locked into pricing at higher costs. Fluctuations in Foreign Currencies The Company is exposed to fluctuations in the value of our foreign currency investment in E.D. Smith, located in Canada. Input costs for certain Canadiansales are denominated in U.S. dollars, further impacting the effect foreign currency fluctuations may have on the Company. The Company’s financial statements are presented in U.S. dollars, which require the Canadian assets, liabilities, revenues, and expenses to be translated intoU.S. dollars at the applicable exchange rates. Accordingly, we are exposed to volatility in the translation of foreign currency earnings due to fluctuations inthe value of the Canadian dollar, which may negatively impact the Company’s results of operations and financial position. For the nine months endedSeptember 30, 2010 the Company recognized a gain of $7.9 million, of which $5.8 million was recorded as a component of Accumulated othercomprehensive loss and $2.1 million was recorded on the Company’s Condensed Consolidated Statements of Income within the Other expense (income)line. For the nine months ended September 30, 2009, the Company recognized a net foreign currency exchange gain of $32.2 million, of which $27.4 millionwas recorded as a component of Accumulated other comprehensive loss and $4.8 million was recorded on the Company’s Condensed ConsolidatedStatements of Income within the Other expense (income) line. The Company has entered into foreign currency contracts due to the exposure to Canadian/U.S. dollar currency fluctuations on cross border transactions. TheCompany does not apply hedge accounting to these contracts and records them at fair value on the Condensed Consolidated Balance Sheets. In August 2010,the Company entered into foreign currency contracts for the purchase of $4.0 million U.S. dollars. The contracts were entered into for the purchase of U.S.dollar denominated raw materials by our Canadian subsidiary. These contracts expired by the end of September 2010. For the three and nine months endedSeptember 30, 2010, the Company recorded a gain on these contracts totaling approximately $0.1 million. For the three and nine months ended September30, 2009, the Company recorded a loss on these contracts totaling approximately $0.4 million and a gain of $0.2 million, respectively.
-38-

Table of Contents
Item 4. Controls and Procedures Evaluations were carried out under the supervision and with the participation of the Company’s management, including our Chief Executive Officer and ChiefFinancial Officer, of the effectiveness of the design and operation of our disclosure controls and procedures (as defined in Rule 13a-15(e) under the SecuritiesExchange Act of 1934, as amended) as of the end of the period covered by this report. Based upon those evaluations, the Chief Executive Officer and ChiefFinancial Officer have concluded that as of September 30, 2010, these disclosure controls and procedures were effective. We have excluded Sturm from ourevaluation of disclosure controls and procedures, as of September 30, 2010, because Sturm was acquired by the Company during the first quarter of2010. Sturm’s net assets, total assets and net revenues represented approximately 2%, 36% and, 14%, respectively, of the related Condensed ConsolidatedFinancial Statement amounts as of and for the quarter ended September 30, 2010. There have been no changes in our internal control over financial reporting during the quarter ended September 30, 2010 that have materially affected, or arelikely to materially affect, the Company’s internal control over financial reporting.
-39-
Table of Contents
REPORT OF INDEPENDENT REGISTERED PUBLIC ACCOUNTING FIRM To the Board of Directors and Stockholders ofTreeHouse Foods, Inc.Westchester, IL We have reviewed the accompanying condensed consolidated balance sheet of TreeHouse Foods, Inc. and subsidiaries (the "Company”) as of September 30,2010, and the related condensed consolidated statements of income for the three-month and nine-month periods ended September 30, 2010 and 2009, and ofcash flows for the nine-month periods ended September 30, 2010 and 2009. These interim financial statements are the responsibility of the Company’smanagement. We conducted our reviews in accordance with the standards of the Public Company Accounting Oversight Board (United States). A review of interimfinancial information consists principally of applying analytical procedures and making inquiries of persons responsible for financial and accounting matters.It is substantially less in scope than an audit conducted in accordance with the standards of the Public Company Accounting Oversight Board (United States),the objective of which is the expression of an opinion regarding the financial statements taken as a whole. Accordingly, we do not express such an opinion. Based on our reviews, we are not aware of any material modifications that should be made to such condensed consolidated interim financial statements forthem to be in conformity with accounting principles generally accepted in the United States of America. We have previously audited, in accordance with the standards of the Public Company Accounting Oversight Board (United States), the consolidated balancesheet of TreeHouse Foods, Inc. and subsidiaries as of December 31, 2009, and the related consolidated statements of income, stockholders’ equity, and cashflows for the year then ended (not presented herein); and in our report dated February 16, 2010, we expressed an unqualified opinion on those consolidatedfinancial statements. In our opinion, the information set forth in the accompanying condensed consolidated balance sheet as of December 31, 2009 is fairlystated, in all material respects, in relation to the consolidated balance sheet from which it has been derived. /s/ DELOITTE & TOUCHE LLP Chicago, IllinoisNovember 5, 2010
-40-
Table of Contents
Part II — Other Information Item 1. Legal Proceedings We are party to a variety of legal proceedings arising out of the conduct of our business. While the results of proceedings cannot be predicted with certainty,management believes that the final outcome of these proceedings will not have a material adverse effect on our consolidated financial statements, annualresults of operations or cash flows. Item 1A. Risk Factors Information regarding risk factors appears in Management’s Discussion and Analysis of Financial Condition and Results of Operations — InformationRelated to Forward-Looking Statements, in Part I — Item 2 of this Form 10-Q and in Part I — Item 1A of the TreeHouse Foods, Inc. Annual Report on Form10-K for the year ended December 31, 2009. There have been no material changes from the risk factors previously disclosed in the TreeHouse Foods, Inc.Annual Report on Form 10-K for the year ended December 31, 2009. Item 6. Exhibits 2.1 Securities Purchase Agreement, dated as of September 13, 2010, among STSF Holdings LLC, STSF Holdings, Inc., S.T.
Specialty Foods, Inc. and the Company is incorporated by reference to Exhibit 2.1 to the Company’s Current Report onForm 8-K dated September 13, 2010.
2.2 Earnout Agreement between STSF Holdings, LLC and the Company is incorporated by reference to Exhibit 2.2 to the
Company’s Current Report on Form 8-K dated September 13, 2010. 10.1 Amended and Restated Credit Agreement, dated as of October 27, 2010 is incorporated by reference to Exhibit 10.1 to the
Company’s Current Report on Form 8-K dated October 27, 2010. 12.1 Computation of Ratio of Earnings to Fixed Changes 15.1 Awareness Letter from Deloitte & Touche LLP regarding unaudited financial information 31.1 Certification of Chief Executive Officer pursuant to Section 302 of the Sarbanes-Oxley Act of 2002 31.2 Certification of Chief Financial Officer pursuant to Section 302 of the Sarbanes-Oxley Act of 2002 32.1 Certification of Chief Executive Officer pursuant to Section 906 of the Sarbanes-Oxley Act of 2002 32.2 Certification of Chief Financial Officer pursuant to Section 906 of the Sarbanes-Oxley Act of 2002 101.INS* XBRL Instance Document 101.SCH* XBRL Taxonomy Extension Schema Document 101.CAL* XBRL Taxonomy Extension Calculation Linkbase Document 101.LAB* XBRL Taxonomy Extension Label Linkbase Document 101.PRE* XBRL Taxonomy Extension Presentation Linkbase Document
*Attached as Exhibit 101 to this report are the following documents formatted in XBRL (Extensible Business Reporting Language): (i) the CondensedConsolidated Statement of Income for the three and nine months ended September 30, 2010 and 2009, (ii) the Condensed Consolidated Balance Sheet atSeptember30, 2010 and December 31, 2009, (iii) the Condensed Consolidated Statement of Cash Flows for the nine months ended September 30, 2010 and2009, and (iv) Notes to Condensed Consolidated Financial Statements for the nine months ended September 30, 2010. Users of this data are advised pursuantto Rule 406T of Regulation S-T that this interactive data file is deemed not filed or part of a registration statement or prospectus for purposes of sections 11 or12 of the Securities Act of 1933, is deemed not filed for purposes of section 18 of the Securities and Exchange Act of 1934, and otherwise is not subject toliability under these sections.
-41-

Table of Contents
SIGNATURES Pursuant to the requirement of the Securities Exchange Act of 1934, the registrant has duly caused this report to be signed on its behalf by the undersignedthereunto duly authorized. TREEHOUSE FOODS, INC. /s/ Dennis F. Riordan Dennis F. Riordan Senior Vice President and Chief Financial Officer November 5, 2010
-42-

Exhibit 12.1
TreeHouse Foods, Inc.Computation of Ratio of Earnings to Fixed Charges
(Dollars in thousands) Nine Months Ended September 30, 2010 Earnings:
Income from continuing operations before income taxes $ 93,671 Add:
Fixed charges 39,836 Amortization of interest, net of capitalized interest 25 Other (51)
Earnings available for fixed charges (a) $ 133,481 Fixed charges:
Interest expense $ 31,473 Capitalized interest and tax interest 91 One third of rental expense (1) 8,272
Total fixed charges (b) $ 39,836 Ratio of earnings to fixed charges (a/b) 3.35 (1) Considered to be representative of interest factor in rental expense.

Exhibit 15.1 November 5, 2010 TreeHouse Foods, Inc.Two Westbrook Corporate CenterSuite 1070Westchester, IL 60154 We have reviewed, in accordance with the standards of the Public Company Accounting Oversight Board (United States), the unaudited interim financialinformation of TreeHouse Foods, Inc. and subsidiaries for the three and nine months periods ended September 30, 2010, and 2009, as indicated in our reportdated November 5, 2010; because we did not perform an audit, we expressed no opinion on that information. We are aware that our report referred to above, which is included in your Quarterly Report on Form 10-Q for the quarter ended September 30, 2010, isincorporated by reference in Registration Statement Nos. 333-126161 and 333-150053 on Form S-8 and Registration Statement No. 333-164903 on FormS-3. We also are aware that the aforementioned report, pursuant to Rule 436(c) under the Securities Act of 1933, is not considered a part of the RegistrationStatement prepared or certified by an accountant or a report prepared or certified by an accountant within the meaning of Sections 7 and 11 of that Act. /s/ DELOITTE & TOUCHE LLP Chicago, Illinois

Exhibit 31.1
CERTIFICATION PURSUANT TO SECTION 302 OF THE SARBANES-OXLEY ACT OF 2002
I, Sam K. Reed, certify that: 1. I have reviewed this quarterly report on Form 10-Q of TreeHouse Foods, Inc.; 2. Based on my knowledge, this report does not contain any untrue statement of a material fact or omit to state a material fact necessary to make the
statements made, in light of the circumstances under which such statements were made, not misleading with respect to the period covered by this report; 3. Based on my knowledge, the financial statements, and other financial information included in this report, fairly present in all material respects the
financial condition, results of operations and cash flows of the registrant as of, and for, the periods presented in this report; 4. The registrant’s other certifying officer and I are responsible for establishing and maintaining disclosure controls and procedures (as defined in Exchange
Act Rules 13a-15(e) and 15d-15(e)) and internal control over financial reporting (as defined in Exchange Act Rules 13a-15(f) and 15d-15(f)) for theregistrant and have:
a) Designed such disclosure controls and procedures, or caused such disclosure controls and procedures to be designed under our supervision, to
ensure that material information relating to the registrant, including its consolidated subsidiaries, is made known to us by others within thoseentities, particularly during the period in which this report is being prepared;
b) Designed such internal control over financial reporting, or caused such internal control over financial reporting to be designed under our
supervision, to provide reasonable assurance regarding the reliability of financial reporting and the preparation of financial statements for externalpurposes in accordance with generally accepted accounting principles;
c) Evaluated the effectiveness of the registrant’s disclosure controls and procedures and presented in this report our conclusions about the
effectiveness of the disclosure controls and procedures, as of the end of the period covered by this report based on such evaluation; and d) Disclosed in this report any change in the registrant’s internal control over financial reporting that occurred during the registrant’s most recent fiscal
quarter (the registrant’s fourth fiscal quarter in the case of an annual report) that has materially affected, or is reasonably likely to materially affect,the registrant’s internal control over financial reporting; and
5. The registrant’s other certifying officer and I have disclosed, based on our most recent evaluation of internal control over financial reporting, to the
registrant’s auditors and the audit committee of registrant’s board of directors (or persons performing the equivalent functions): a) All significant deficiencies and material weaknesses in the design or operation of internal control over financial reporting which are reasonably
likely to adversely affect the registrant’s ability to record, process, summarize and report financial information; and b) Any fraud, whether or not material, that involves management or other employees who have a significant role in the registrant’s internal control
over financial reporting. Date: November 5, 2010 /s/ Sam K. Reed Sam K. Reed
Chairman of the Board and ChiefExecutive Officer

Exhibit 31.2
CERTIFICATION PURSUANT TO SECTION 302OF THE SARBANES-OXLEY ACT OF 2002
I, Dennis F. Riordan, certify that: 1. I have reviewed this quarterly report on Form 10-Q of TreeHouse Foods, Inc.; 2. Based on my knowledge, this report does not contain any untrue statement of a material fact or omit to state a material fact necessary to make the
statements made, in light of the circumstances under which such statements were made, not misleading with respect to the period covered by this report; 3. Based on my knowledge, the financial statements, and other financial information included in this report, fairly present in all material respects the
financial condition, results of operations and cash flows of the registrant as of, and for, the periods presented in this report; 4. The registrant’s other certifying officer and I are responsible for establishing and maintaining disclosure controls and procedures (as defined in Exchange
Act Rules 13a-15(e) and 15d-15(e)) and internal control over financial reporting (as defined in Exchange Act Rules 13a-15(f) and 15d-15(f)) for theregistrant and have:
a) Designed such disclosure controls and procedures, or caused such disclosure controls and procedures to be designed under our supervision, to
ensure that material information relating to the registrant, including its consolidated subsidiaries, is made known to us by others within thoseentities, particularly during the period in which this report is being prepared;
b) Designed such internal control over financial reporting, or caused such internal control over financial reporting to be designed under our
supervision, to provide reasonable assurance regarding the reliability of financial reporting and the preparation of financial statements for externalpurposes in accordance with generally accepted accounting principles;
c) Evaluated the effectiveness of the registrant’s disclosure controls and procedures and presented in this report our conclusions about the
effectiveness of the disclosure controls and procedures, as of the end of the period covered by this report based on such evaluation; and d) Disclosed in this report any change in the registrant’s internal control over financial reporting that occurred during the registrant’s most recent fiscal
quarter (the registrant’s fourth fiscal quarter in the case of an annual report) that has materially affected, or is reasonably likely to materially affect,the registrant’s internal control over financial reporting; and
5. The registrant’s other certifying officer and I have disclosed, based on our most recent evaluation of internal control over financial reporting, to the
registrant’s auditors and the audit committee of registrant’s board of directors (or persons performing the equivalent functions): a) All significant deficiencies and material weaknesses in the design or operation of internal control over financial reporting which are reasonably
likely to adversely affect the registrant’s ability to record, process, summarize and report financial information; and b) Any fraud, whether or not material, that involves management or other employees who have a significant role in the registrant’s internal control
over financial reporting. Date: November 5, 2010 /s/ Dennis F. Riordan Dennis F. Riordan
Senior Vice President and Chief FinancialOfficer

Exhibit 32.1
CERTIFICATION PURSUANT TO 18 U.S.C. SECTION 1350,ADOPTED PURSUANT TO SECTION 906 OF THE SARBANES-OXLEY ACT OF 2002
In connection with the Quarterly Report on Form 10-Q of TreeHouse Foods, Inc. (the “Company”) for the period ended September 30, 2010, as filed with theSecurities and Exchange Commission on the date hereof (the “Report”), I, Sam K. Reed, Chairman of the Board and Chief Executive Officer of the Company,certify to the best of my knowledge, pursuant to 18 U.S.C. Section 1350, as adopted pursuant to Section 906 of the Sarbanes-Oxley Act of 2002, that: (1) The Report fully complies with the requirements of Section 13(a) or 15(d) of the Securities Exchange Act of 1934, and (2) The information contained in the Report fairly presents, in all material respects, the financial condition and results of operations of the Company. /s/ Sam K. Reed Sam K. Reed
Chairman of the Board and ChiefExecutive Officer
Date: November 5, 2010

Exhibit 32.2
CERTIFICATION PURSUANT TO 18 U.S.C. SECTION 1350,ADOPTED PURSUANT TO SECTION 906 OF THE SARBANES-OXLEY ACT OF 2002
In connection with the Quarterly Report on Form 10-Q of TreeHouse Foods, Inc. (the “Company”) for the period ended September 30, 2010, as filed with theSecurities and Exchange Commission on the date hereof (the “Report”), I, Dennis F. Riordan, Senior Vice President and Chief Financial Officer of theCompany, certify to the best of my knowledge, pursuant to 18 U.S.C. Section 1350, as adopted pursuant to Section 906 of the Sarbanes-Oxley Act of 2002,that: (1) The Report fully complies with the requirements of Section 13(a) or 15(d) of the Securities Exchange Act of 1934, and (2) The information contained in the Report fairly presents, in all material respects, the financial condition and results of operations of the Company. /s/ Dennis F. Riordan Dennis F. Riordan Senior Vice President and Chief Financial Officer Date: November 5, 2010