Coincident retroperitoneal and sigmoid colon liposarcoma: A rare occurrence
Upload
unitusdistuCategory
view
4download
0
Forest Ecology and Management 262 (2011) 1950–1962
Contents lists available at SciVerse ScienceDirect
Forest Ecology and Management
journal homepage: www.elsevier .com/ locate/ foreco
Tree size distribution at increasing spatial scales converges to the rotatedsigmoid curve in two old-growth beech stands of the Italian Apennines
Alfredo Alessandrini a, Franco Biondi b, Alfredo Di Filippo a, Emanuele Ziaco a, Gianluca Piovesan a,⇑a DendrologyLab, Department of Agriculture, Forests, Nature and Environment (DAFNE), Università degli Studi della Tuscia, Via S.C. de Lellis, I-01100 Viterbo, Italyb DendroLab, Department of Geography, MS 154, University of Nevada, Reno, NV 89557, USA
a r t i c l e i n f o a b s t r a c t
Article history:Received 5 May 2011Received in revised form 9 August 2011Accepted 14 August 2011Available online 28 September 2011
Keywords:Old-growthBeechForest structureCommunity dynamicsDeadwoodShifting mosaic
0378-1127/$ - see front matter � 2011 Elsevier B.V. Adoi:10.1016/j.foreco.2011.08.025
⇑ Corresponding author. Tel.: +39 0761 357387,fax: +39 0761 357250.
E-mail address: [email protected] (G. Piovesan).URL: http://www.daf.unitus.it/dendro/ (G. Piovesa
Tree size distributions of old-growth forests are a fundamental tool for both scientific analysis and con-servation management. In old-growth forests the diameter distribution shape may depend on spatialscale, but theoretical models often show fundamental similarities that suggest general underlying mech-anisms controlling regeneration, mortality, and growth under different disturbance regimes. In this studywe investigated the horizontal structure of two old-growth beech (Fagus sylvatica L.) forests in centralItaly using a series of spatial scales and analytical approaches. Individual plots (each one 0.13 ha in size)were progressively aggregated into larger groups to simulate an increase in sampled area. A third-orderpolynomial was fit to the diameter distributions of the aggregated areas, and the curves were ranked bythe AIC method. The rotated sigmoid (RS) shape was the most common descriptor of tree size distribu-tions, and became dominant once aggregated spatial scales exceeded 0.6–0.8 ha. The same result wasobtained when a single plot was made progressively larger. Given the relatively small scale (starting from0.1 ha) at which the RS model emerged, old-growth beech forests of the Italian Apennines show acomplex, yet highly resilient structure, recognizable even in small (<1 ha) patches. Most likely, therotated sigmoid structure is a function of endogenous structural processes (e.g. self-thinning) in thisshade-tolerant species in combination with intermediate-to-fine-scale disturbance (which especiallyimpacts the largest trees) and resulting gap dynamics.
� 2011 Elsevier B.V. All rights reserved.
1. Introduction structures (Enquist et al., 2009). In fact, studies based on demo-
Diameter size distributions of uneven-aged forests have beenextensively studied as a tool for quantifying structural development(Goff and West, 1975; Zenner, 2005) and evaluating disturbance im-pacts (Baker et al., 2005; Coomes and Allen, 2007), but there is noconsensus in the literature regarding what distribution shapes aremost common in old-growth stands. A commonly adopted modelfor the diameter (i.e. horizontal) structure of tree populations isthe reverse-J distribution (e.g. Rubin et al., 2006), but recent analyt-ical and theoretical developments have expanded the range of mod-els that appear appropriate for uneven-aged stands (Wang et al.,2009). In particular, hyperbolic functions have been derived fromthe Metabolic Theory of Ecology (MTE), which considers the rela-tionships between organism size, temperature, and metabolic ratesas the controlling factors behind most observed ecological patterns(Brown et al., 2004). This theory has found little empirical support inforest populations (e.g. Wang et al., 2009), possibly because distur-bance processes play a greater role in shaping old-growth forest
ll rights reserved.
mobile: +39 380 4399787;
n).
graphic processes have shown that mortality rates are not constant,rather they tend to be U-shaped, as they are greater at both ends ofthe diameter distribution than in its middle portion (Lines et al.,2010).
A commonly observed model for stem size distribution in old-growth forest populations is the rotated sigmoid curve (Goff andWest, 1975; Gove et al., 2008). From an ecological point of view,this size distribution model is closely linked to U-shaped mortalityprocesses (Lorimer et al., 2001; Leak, 2002) and is commonly foundin forest ecosystems where stand dynamics are controlled by com-petition for light. A recent study of old-growth beech forests hasindeed pointed out that rotated sigmoid curves well representtheir size distributions (Westphal et al., 2006). While some authorshave argued that this theoretical shape arises because of under-sampling, i.e. when sampled plots are too small (e.g. Rubin et al.,2006), other studies have used progressively larger sampling areasto show how the rotated sigmoid often becomes the dominantmodel as spatial scales increase (e.g. Janowiak et al., 2008).
Because the type and number of development stages and phasesin a forest cycle may depend on specific bioclimatic environmentand disturbance processes (e.g. Král et al., 2010), and on thetolerances and ecophysiological requirements of forest species, it

A. Alessandrini et al. / Forest Ecology and Management 262 (2011) 1950–1962 1951
is paramount to expand investigations on tree size distributions toinclude as many forest ecosystems as possible. At the same time, itis essential to establish an objective methodology to determinethe minimum sampling area needed to obtain a convincing repre-sentation of the horizontal structure of a stand. An effective methodfor removing model dependence on spatial scales consists of pro-gressively aggregating sample plots and then to determine the bestcurve fit for stem size distribution on such increasing areas (Jan-owiak et al., 2008). During this process, it is possible to develophypotheses on the mechanisms that generate a stable diameter dis-tribution. The combined area at which the model fit no longerchanges can also be used to determine a minimum samplingrequirement for the forest type under study. A similar approachhas been adopted in ecology for analyzing and quantifying plant bio-diversity using the species accumulation curve (Gotelli and Colwell,2001).
An uneven-aged silvicultural system adopted in Alpine forests,the ‘‘plenter’’ system (O’Hara and Gersonde, 2004), has been suc-cessful at producing large trees for over a century. This empiri-cally-based management practice has generated beech (andspruce) populations whose size distribution is closely representedby a rotated sigmoid curve (Schütz, 2006). In order to infer mecha-nisms that underlie the generation of this model in temperate forestecosystems (Gove et al., 2008), one could then compare the structureof these highly managed forests with old-growth beech stands hav-ing much greater degree of naturalness (Sagheb-Talebi and Schütz,2002). Old-growth beech forests in the Italian Apennines are an idealcase study for investigating how tree distributions can be repre-sented by various theoretical models. Several of these high-eleva-tion Fagus sylvatica stands are dominated by the oldest (400–550 years) beech trees in Europe (Piovesan et al., 2005b, 2010) undera variety of ecological conditions (elevation, topography, fertility)and a low-severity disturbance regime (Piovesan et al., 2011).
In this paper we analyzed the horizontal structure of two beechforests showing different old-growth conditions, with the objectiveof determining which model, and which spatial scale, best repre-sents their tree size distribution. Since diameter distribution modelsfor uneven-aged forests, either managed or old-growth, have beendeveloped using either a few large plots (full calliperings of coherentareas >1 ha and up to 10 ha; e.g. Westphal et al., 2006), or manysmall plots (�0.1 ha or smaller, down to 0.04 ha e.g. Schwartz etal., 2005; Coomes and Allen, 2007; D’Amato et al., 2008; Gove etal., 2008; Gronewold et al., 2010), results obtained from aggregatingsmall circular plots scattered throughout the forest were tested byprogressively increasing the size of a continuous plot (concentric cir-cular areas). Finally, a comparison was performed against publisheddata for ‘‘plenter’’ managed forests, in order to define a suitable tar-get model and guide conservation strategies that enhance resilienceand sustainability of old-growth beech forest ecosystems.
2. Materials and methods
Our study areas, Valle Cervara (VCH) and Coppo del Principe(COP), are located in the central Italian Apennines, within the
Table 1Summary of geographical features for the two study areas.
Site Code Latitude (�N) Longitude (�E) Elevation (m asl) S
Valle Cervara VCH 41.828 13.732 1700–1850 4
Coppo del Principe COP 41.788 13.738 1500–1750 2
a Scattered plots (all stand).b Scattered plots (old-growth core area).c Contiguous concentric plots (old-growth core area).
NW corner of the Abruzzo-Lazio-Molise National Park (PNALM;Abruzzi region, L’Aquila province). VCH lies in the town districtof Villavallelonga, COP in that of Pescasseroli. Both forests coverslopes from 1500–1600 m to the treeline (1800–1900 m asl), butVCH has a prevailing N–NW aspect and COP a prevailing NE aspect(Table 1). Bedrock consists of Cretaceous limestone; soils can be re-ferred to the brown group (Piovesan et al., 2005b). Climate regimeat both sites can be described as Mediterranean montane, withcold snowy winters and dry summers (Piovesan et al., 2005b). Oro-graphic precipitation at these high-elevations sites (annual precip-itation at VCH is about 1500 mm/year; Piovesan et al., 2008)provides favorable conditions for the establishment of a mesichardwood deciduous forest (Polysticho-Fagetum; Feoli and Lagone-gro, 1982).
Sampled stands occupy the upper beech altitudinal range incentral Italy so they can be ascribed to the bioclimatic zone ofhigh-elevation beech forests, whose growth is mainly limited byspring temperature (Piovesan et al., 2005a). Prior to becoming anational park, the two forests escaped logging because of difficultaccess and their protective function against avalanches and land-slides (Piovesan et al., 2005b). VCH can be considered a primarymulti-cohort forest (Frelich, 2002), with no signs of past humanexploitation (Piovesan et al., 2005b). The COP stand also showedno signs of logging, several senescent and dying individuals, anda heterogeneous vertical/horizontal structure. Multi-century treesare present, reaching 340–400 years at COP and exceeding500 years at VCH, where we identified the oldest known Fagus treein the Northern Hemisphere (Piovesan et al., 2005b). From a struc-tural point of view, the two study forests are uneven-aged, withold-growth indicators above the thresholds commonly reportedfor mesic hardwood deciduous forests (Table 2; also see Piovesanet al., 2005b, 2010). In particular, both stands were characterizedby high values of tree basal area and volume, with many large indi-viduals, which typically account for most volume in old-growthforests. The deadwood component was similarly abundant (11–13% of living volume), including several large (diameter at breastheight, dbh > 67.5 cm) snags per hectare.
Field sampling was initially based on circular plots with a 20-mradius, scattered within areas with minimal human impact. The 18plots sampled at Valle Cervara in 2003 (Piovesan et al., 2005b)were considered at first, then we focused on a primary old-growtharea (Figs. 1 and 9) that harbors the oldest European beech treesyet reported (Piovesan et al., 2011), including a recently identified560-year old individual. Inside this core stand, which is split by anold avalanche tract (see Fig. 9), 11 scattered plots had been sam-pled in 2003, and nine more were sampled in 2010. In each plot,all living trees with dbh > 2.5 cm were measured; deadwood wasalso sampled as reported in Piovesan et al. (2010). Snags werequantified by size class as percentage of the live tree density forthat size class. Diameter distributions were developed using 5 cmdiameter classes starting from 2.5 cm. When no trees of a certaindbh class were present inside a plot, such absence was recordedeither as zero (the coding used by Janowiak et al., 2008) or as amissing observation, which may be more appropriate given the
lope (%) Main aspect Stand area (ha) Sampled area (ha) Plots N (Year)
0–60 N–NW 24 2.26 18a (2003)1.38 11b (2003)1.13 9b (2010)0.75 6c (2011)
0–60 NE 45 0.88 7a (2009)

Table 2Summary of structural features for the two study areas.
Site (Year) Live trees structure Dead trees structure Age structure
Stem ha�1 m2 ha�1 m3 ha�1 m3 ha�1 Stem ha�1 Years Years
N VST ST MT LT VLT BA V DW Snags Agemax Age5
Valle Cervara (2010) 818 620 35 49 72 42 38 545 59 27 560 507Coppo del Principe (2009) 296 108 14 46 52 76 44 715 91 28 378 344
N = stand density (trees with diameter at breast height (dbh) P 2.5 cm); VST = density of very small trees (2.5 cm 6 dbh < 17.5 cm); ST = density of small trees(17.5 cm 6 dbh < 27.5 cm); MT = density of medium trees (27.5 cm 6 dbh < 42.5 cm); LT = density of large trees (42.5 cm 6 dbh < 57.5 cm); VLT = density of very large trees(dbh P 57.5 cm); BA = basal area; V = woody volume of living trees; DW = deadwood volume; Snags = density of snags (dbh P 10 cm); Agemax = age of the oldest tree cored inthe stand; Age5 = mean age of the five oldest trees cored in the stand.
Fig. 1. Vertical structure of the Valle Cervara old-growth beech forest, recorded along a 20 � 50 m transect. All trees shown in the sketch are Fagus sylvatica L.; shaded crownsrepresent trees in the background.
1952 A. Alessandrini et al. / Forest Ecology and Management 262 (2011) 1950–1962
relatively small size (0.13 ha) of each plot (see Noel et al., 1998).When the absence of a certain dbh class was recorded as zeroand because the logarithm of zero is undefined, 1.0 was added toall values of trees per hectare (tph) before transformation (Jan-owiak et al., 2008).
In order to simulate how diameter distributions changed as thesampling area increased, individual scattered plots were aggre-gated by means of k-combination without repetitions; hence sub-sets comprised of distinct k elements of the total number of plots(n) ranged from 1 to n. This was done separately by site and year,so that, for example, the nine plots available for Valle Cervara in2010 simulated spatial scales up to 1.13 ha at 0.13 (0.1256) haintervals. Diameter distributions were also studied by progres-sively increasing the area of a sampling plot by means of concentriccircular areas, starting at 0.13 ha and expanded by 0.13 (0.1256) ha
increments up to 0.75 ha. This method minimized boundary effectswhile allowing the analysis of changing spatial scales in compari-son with the aggregation method. The starting 0.13-ha plot hadan initial diameter distribution that was far from the rotated sig-moid one (see Fig. 7).
A logarithmic scale was used for density, as normally done foruneven-aged populations, and polynomials up to the third-orderwere fit to the diameter distribution of each aggregated or concen-tric sample area using ordinary least squares (e.g. Janowiak et al.,2008). The best significant (P < 0.05) model among all possiblecombinations was selected using the AIC criterion (Akaike, 1974).Adjusted R2 and root mean square error (RMSE) were then com-puted for the selected model. The diameter distribution shapewas named according to the terminology used in Table 2 of Jan-owiak et al. (2008). An additional model we encountered, defined

Fig. 2. Diameter distribution shapes present in old-growth beech forests of theItalian Apennines. The shapes were selected using signs of significant (P < 0.05)coefficients in a third-order polynomial fit to the diameter distribution (Janowiaket al., 2008). IQ = increasing-q, NE = negative exponential, UNI = unimodal,CO = concave, RS = rotated sigmoid.
A. Alessandrini et al. / Forest Ecology and Management 262 (2011) 1950–1962 1953
by a negative coefficient for dbh and dbh2, plus a non-significantcoefficient for dbh3, was assigned to the increasing-q category.Spatial dependence of forest structure (i.e. selected model in eachplot) was analyzed using two-dimensional sample variograms andisotropic models (Isaaks and Srivastava, 1989) for 40-m distanceintervals up to a 240-m maximum.
A space-for-time approach was employed to investigate struc-tural changes over time (Watt, 1947) using abundance of different
Fig. 3. Effect of increasing spatial scales, obtained by aggregating more and more circularthroughout the forest. Absence of a dbh class in a plot was coded as zero. For goodness-ofshapes (see Fig. 2 for the codes of the five main models; NS = non-significant model (P > 0with increasing sampled area. At each spatial scale the curve is the average of the signifisigmoid converges to a final model at aggregated areas of about 0.6 ha. (For interpretativersion of this article.)
size classes as an indicator of the developmental stage of a forest,or, in other words, of the phase reached by the tree population inthe structural cycle (e.g. Král et al., 2010). As commonly done whenassessing uneven-aged forest management practices (e.g. Sagheb-Talebi and Schütz, 2002), we subdivided the range of measureddbh values in a few categories using traditionally accepted inter-vals for Italian silviculture (Piovesan and Portoghesi, 1993). Ourfive categories were very small trees (VST, dbh classes 5–15 cm),small trees (ST, dbh classes 20–25 cm), medium trees (MT, dbhclasses 30–40 cm), large trees (LT, dbh classes 45–55), and verylarge trees (VLT, dbh classes P60 cm), and their abundance wasquantified in each sampled plot. We then performed a principalcomponent analysis (PCA, Jolliffe, 1986) based on the correlationmatrix of these abundance values, plus the deadwood volume, atall sampled plots, including both sites and both years. Most numer-ical computing was done in the R software environment (R Devel-opment Core Team, 2010).
3. Results
Tree size distributions (Fig. 2) were well described by the fivemodels identified by Janowiak et al. (2008). Diameter distributionconvergence to the rotated sigmoid shape at spatial scales >0.8 hawas observed in 95% or more of all possible combinations of the 18original scattered plots sampled at Valle Cervara in 2003 (Fig. 3 andFig. S1). While aggregated sampled area had a clear influence onthe shape of the model fit to the tree size distribution at very smallscales (Fig. 4), it became unimportant for spatial scales larger thanabout 0.6 ha. This result was robust with respect to the area understudy (either old-growth forest or primary core area of old-growthforest) and year of sampling, as well as coding convention used toreport dbh size classes with no tallies (Fig. 5). As the combined sur-face of sampled plots increased, distribution shape converged tothe rotated sigmoid at both Valle Cervara (Figs. 5 and 6, Figs. S2and S3) and Coppo del Principe (Figs. S4–S6) beech forests, andfor both 2003 and 2010 years at the same study site (Valle
plots (18 total, each one 0.13 ha in size, sampled in 2003 at Valle Cervara) scattered-fit statistics see Fig. 4. (Left) Cumulative relative frequency of diameter distribution.05); VAR = variable). (Right) Evolution of the rotated sigmoid diameter distributioncant rotated sigmoid distributions (green bars in the figure on the left). The rotatedon of the references to color in this figure legend, the reader is referred to the web

1954 A. Alessandrini et al. / Forest Ecology and Management 262 (2011) 1950–1962
Cervara). Model goodness-of-fit indicators (adjusted R2 and RMSE)showed that combinations of five or more plots were enough tocapture the rotated sigmoid distribution (Fig. 4, Figs. S2, S3 andS6). For progressively larger concentric areas, the rotated sigmoiddistribution became the model of choice at spatial scales largerthan 0.5 ha (Fig. 7 and Fig. S7). Based on the spatial evolution ofthe sigmoidal shape and on the goodness-of-fit results (Fig. 7),the RS model for the 0.75-ha area is not only stable but also closelyresembles the shape obtained by aggregating plots scattered overthe whole population (Fig. 8).
Convergence to the rotated sigmoid shape occurred for slightlysmaller aggregated areas when a dbh class with no tallies was con-sidered a missing observation (see Fig. S1 for all Valle Cervara plotssampled in 2003). More variable (‘‘noisier’’) distribution modelswere selected for small aggregated areas (<1 ha) when absence ofa dbh class in a sampled plot was coded as zero. In particular, ‘‘re-verse J-type’’ shapes (such as the negative exponential) and theincreasing-q shape appeared more often under this coding scheme(Figs. 3 and 5 vs. Fig. S1). At Coppo del Principe (Fig. S4), unimodaldistributions for small aggregated areas were selected morefrequently than at Valle Cervara. At that site, when absence was
Fig. 4. Adjusted R2 and RMSE value at increasing spatial scales, shown by aggregating mValle Cervara. The two methods to report absence of a dbh class in a plot are compared
coded as missing, distribution shape was non-significant in a fewmore cases than at Valle Cervara, mostly because the unimodal(UNI) and concave (CO) distribution were not recognized (see leftvs. right panel of Fig. S4).
The final shape of the rotated sigmoid curve was not heavily af-fected by coding option, i.e. zero vs. missing, used to identify ab-sence of a dbh class (Figs. 6 and 7, and Fig. S5). As soon as theaggregated sampled area exceeded 0.6 ha, the shape of the curveremained essentially stable using either method in both spaceand time. However, at Valle Cervara, and particularly for the2003 field campaign, there was a large difference between theshape of the rotated sigmoid for the smallest areas (<0.3–0.4 ha)compared to larger ones. When zero values were used, the absenceof small and medium-size dbh classes pushed further downwardthe initial decreasing portion of the rotated sigmoid curve(Fig. 6). Interestingly, the evolution of the rotated sigmoid curvesas shown by the aggregation of multiple plots compensates for thiscoding difference. A direct comparison between average diameterdistribution of individual plots that were modeled using a rotatedsigmoid at Valle Cervara core area for the three different samplingyears (Fig. 8), revealed a remarkable level of overlap, suggesting
ore and more scattered sample plots (18 total, each one 0.13 ha) sampled in 2003 at: (Left) absence coded as zero; (Right) absence coded as missing value.

Fig. 5. Cumulative relative frequency of diameter distribution shapes for the Valle Cervara core area (primary old-growth stand) comparing two different years of samplingand two methods to report absence of a dbh class in a plot. For goodness-of-fit statistics see Figs. S2 and S3. (Left) Scattered plots (11) sampled in 2003; (Right) scattered plots(9) sampled in 2010. (Top) Absence coded as zero; (Bottom) absence coded as missing value.
A. Alessandrini et al. / Forest Ecology and Management 262 (2011) 1950–1962 1955
temporal stability of the rotated sigmoid shape even at smallscales. Size distribution models were spatially autocorrelated(Fig. 9 bottom), with a tendency for the dominant shape (mostlythe RS) to remain unchanged over distances up to about 60 m.These spatial relationships between forest structures remained sta-ble from 2003 to 2010, especially when absence of a dbh class wascoded as missing value (Fig. 9 top).
The first two principal components of dbh categories (VST, ST,MT, LT, VLT) in all plots, together with deadwood, explained morethan half of the variance (35.3% PC1, and 22.0% PC2). The PCA plotof selected distribution shapes, superimposed with a biplot of theoriginal dbh categories and deadwood (Fig. 10), revealed a strongconnection between tree size distribution and development phasein the structural cycle of a forest. The graph uncovered an inverse
relationships between areas dominated by medium (MT) to large(LT) trees as opposed to areas where very small (VST) trees are moreabundant. In fact, the biplot axis for VST is almost exactly opposite tothat for LT. Basal area was most correlated (r = 0.51, P = 0.006) withthe second principal component, since total basal area is usuallygreater where large trees dominate, a typical feature of old-growthforests (Sagheb-Talebi and Schütz, 2002). The order of the biplotaxes highlights the structural cycle of old-growth forests, as it pro-gresses counterclockwise from the lowest (VST) to the largest(VLT) dbh categories. Deadwood biomass (DW) falls close to the LTand VLT area, as larger individuals typically contribute the most tothis component of forest biomass (Marage and Lemperiere, 2005).
Overall, by arranging individual plots in principal componentspace (Fig. 10), we were able to capture most temporal phases of

Fig. 6. Evolution of the rotated sigmoid diameter distribution shape at Valle Cervara core area (primary old-growth stand) with increasing sampled area, obtained byaggregating more and more scattered sample plots. At each spatial scale the curve is the average of the significant rotated sigmoid distributions. For goodness-of-fit see Figs.S2 and S3. The rotated sigmoid converges to a final model at aggregated areas of about 0.6 ha regardless of sampling year or method used to report absence of a dbh class in aplot. (Left) Plots (11) sampled in 2003; (Right) plots (9) sampled in 2010. (Top) Absence coded as zero; (Bottom) absence coded as missing value.
1956 A. Alessandrini et al. / Forest Ecology and Management 262 (2011) 1950–1962
the structural cycle: aggradation, biostasis, and degradation (Olde-mann, 1990; Peters, 1997). The innovation phase was not includedin the analysis (and only mentioned in parenthesis within thegraph) because no data on tree regeneration were considered inthe PCA. Size distribution models tend to follow the structuralphases even at very fine scales, given that each plot is 0.13 ha.The rotated sigmoid curve is absent in plots occupied by mediumto large trees, while it becomes the model of choice in the centerof the principal component graph, and when very small trees(VST) are most abundant. This suggests that a developed old-growth structure can be recognized even on extremely small areas,as long as they are not dominated by intermediate to large sizeclasses. In fact, the late aggradation and biostasis phases are
characterized by the greatest total basal area, and by a mostly uni-modal size distribution when absence was coded as zero (Fig. S8).Notably, several non-significant size distribution models are lo-cated close to the deadwood axis, suggesting that the forest popu-lation, during the degradation phase of the structural cycle, canproduce both a large amount of dead material and an irregular treesize distribution.
The stand-level rotated sigmoid curves obtained over time andover space provide information on the ecological development ofbeech forest populations (Fig. 11). It is clear that Valle Cervarahas a well-developed, stable, and widespread old-growth struc-ture, as the rotated sigmoid curves obtained by sampling differentplots in 2003 and 2010 are remarkably similar. Our previous

Fig. 7. Concentric circular plots sampling method at Valle Cervara old-growth core area. Effect of increasing spatial scales is shown by expanding concentric sample plots(each one 0.13 ha). The modeled mean diameter distribution of the 2010 scattered sample plots (gray dotted line) is also shown. (a) Absence coded as zero (R2 = adjusted R2);(b) absence coded as missing value; (c) area of the circular plot.
Fig. 8. Average diameter distribution modeled using a third-order polynomial –rotated sigmoid – at Valle Cervara old-growth core area for the two samplingmethods in three different years: scattered (year 2003, 11 plots, total sampled area1.38 ha; year 2010, 9 plots, total sampled area 1.13 ha) and concentric plots (year2011, total continuous sampled area 0.75 ha).
A. Alessandrini et al. / Forest Ecology and Management 262 (2011) 1950–1962 1957
studies (e.g. Piovesan et al., 2005b, 2011) had already shown thatthis forest was a prime example of Fagus old-growth stands, alsocontaining the oldest (>500 years) beech trees in Europe. A reduc-tion over time in the presence of trees with 20–30 cm dbh waslikely due to an increase in mortality among the smallest sizes(as shown later – see Fig. 12), causing slower outgrowth into themedium dbh classes and/or a release of the surviving trees that
would then quickly grow through this size category. Coppo delPrincipe and Valle Cervara RS distributions showed a mild diver-gence for these 20–30 cm stem sizes, but were otherwise in closeragreement for all other dbh classes. The similarity of distributionshape for large dbh classes indicates a convergence between thesetwo forest populations with respect to structural processes thatdetermine the presence of the oldest and largest trees. Comparingour stand-level rotated sigmoid curves with that of the plenter sys-tem (Schütz, 2006) revealed an expected difference for large sizes(Fig. 11), since logging preferentially targets the bigger trees. Onthe other hand, the overall shape of the plenter rotated sigmoidwas parallel to ours, and almost overlapped the Valle Cervaracurves for dbh less than 40 cm.
4. Discussion
By evaluating tree size distribution models for increasing spatialscales, as proposed by Janowiak et al. (2008), it was possible to sys-tematically determine the genesis of the most representative shapefor old-growth beech stands. In order to adequately capture thestructure of a forest, sampling plots are supposed to be scatteredas much as possible over the landscape (Rubin et al., 2006); forboth fixed-area and prism sampling, Grenier et al. (1991) foundthat more dispersed sampling locations provide greater probabilityof obtaining a sample diameter distribution not significantly differ-ent from the underlying population distribution. Therefore, theaggregation of scattered circular plots was appropriate for under-standing the minimum area and the type of numerical processingthat are required to capture stand structure. Following this ap-proach, stable uneven-aged patterns in old-growth beech forestsof the Italian Apennines were recognized even at aggregated spa-tial scales of 0.6–0.8 ha. While distribution models for smallerareas included the rotated sigmoid, negative exponential, and

Fig. 9. Spatial features of scattered sampled plots within the old-growth core area at Valle Cervara. (Top) Topographic map with 25-m contour intervals and the location ofsampled plots (colored circles). Black solid circle or triangle inside the plot identifies the sampling year; plot circle color refers to the shape of the diameter distribution (seeFigs. 2 and 3 and for explanation of codes) when absence of a dbh class in a plot was coded as a missing value. Although there is no overlap between the location of 2003 and2010 plots, they were both well distributed inside the core area. (Bottom) Sample (black circles) and model (red curve) semivariogram computed for the dbh distributionshapes mapped above, showing that the dominant forest structure (mostly the rotated sigmoid) tends to be maintained up to distances of about 60 m. The formula for theexponential model variogram is shown in the figure, with Co = nugget; C = sill; Ao = one-third of the effective range (57.6 m), which is the distance at which the total sill(C + Co) is within 5% of the asymptote (the sill never meets the asymptote in the exponential model); R2 = coefficient of determination; RSS = residual sum of squares. (Forinterpretation of the references to color in this figure legend, the reader is referred to the web version of this article.)
1958 A. Alessandrini et al. / Forest Ecology and Management 262 (2011) 1950–1962
increasing-q curves, the rotated sigmoid shape was always thedominant model starting at 0.6–0.8 ha aggregated spatial scales.A few unimodal distributions were also revealed at the smallestaggregated scales (<0.3 ha), and were more common in the lessstructured forest (Coppo del Principe). While reporting as zero
the absence of a dbh class within a plot led to an underestimationof intermediate size classes, convergence of tree distributionshapes to the rotated sigmoid was rapidly obtained regardless ofcoding choices. When the sampled area was progressively ex-panded using concentric plots, the rotated sigmoid shape became
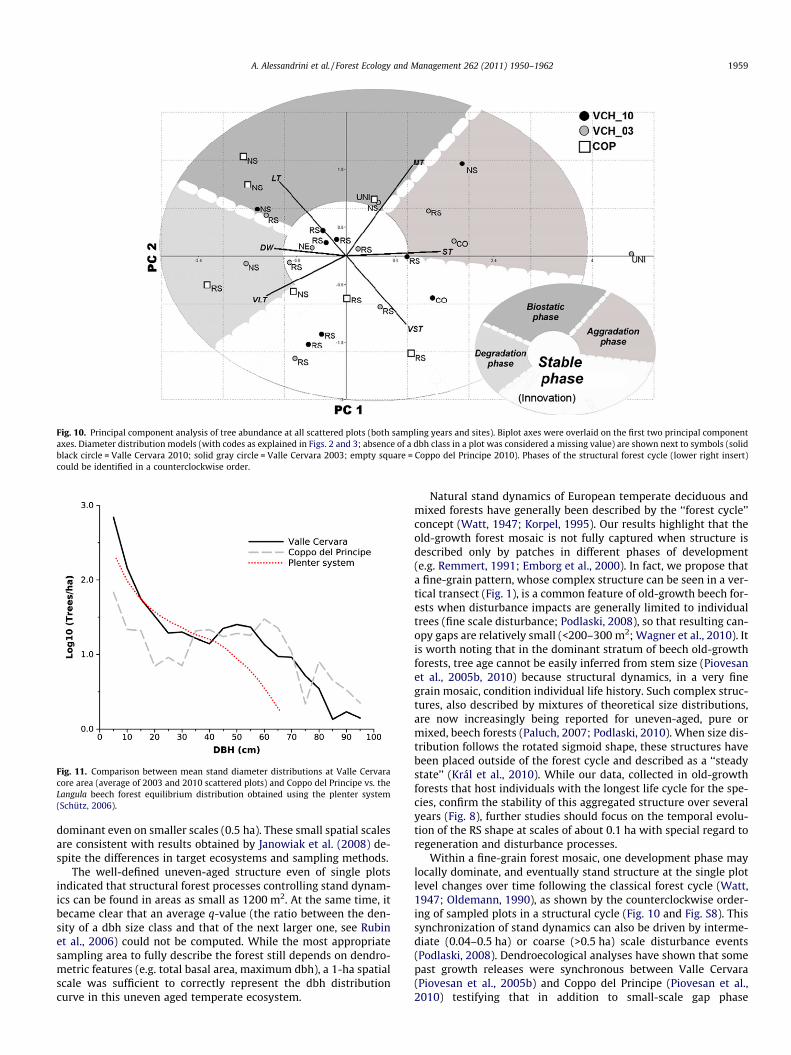
Fig. 10. Principal component analysis of tree abundance at all scattered plots (both sampling years and sites). Biplot axes were overlaid on the first two principal componentaxes. Diameter distribution models (with codes as explained in Figs. 2 and 3; absence of a dbh class in a plot was considered a missing value) are shown next to symbols (solidblack circle = Valle Cervara 2010; solid gray circle = Valle Cervara 2003; empty square = Coppo del Principe 2010). Phases of the structural forest cycle (lower right insert)could be identified in a counterclockwise order.
Fig. 11. Comparison between mean stand diameter distributions at Valle Cervaracore area (average of 2003 and 2010 scattered plots) and Coppo del Principe vs. theLangula beech forest equilibrium distribution obtained using the plenter system(Schütz, 2006).
A. Alessandrini et al. / Forest Ecology and Management 262 (2011) 1950–1962 1959
dominant even on smaller scales (0.5 ha). These small spatial scalesare consistent with results obtained by Janowiak et al. (2008) de-spite the differences in target ecosystems and sampling methods.
The well-defined uneven-aged structure even of single plotsindicated that structural forest processes controlling stand dynam-ics can be found in areas as small as 1200 m2. At the same time, itbecame clear that an average q-value (the ratio between the den-sity of a dbh size class and that of the next larger one, see Rubinet al., 2006) could not be computed. While the most appropriatesampling area to fully describe the forest still depends on dendro-metric features (e.g. total basal area, maximum dbh), a 1-ha spatialscale was sufficient to correctly represent the dbh distributioncurve in this uneven aged temperate ecosystem.
Natural stand dynamics of European temperate deciduous andmixed forests have generally been described by the ‘‘forest cycle’’concept (Watt, 1947; Korpel, 1995). Our results highlight that theold-growth forest mosaic is not fully captured when structure isdescribed only by patches in different phases of development(e.g. Remmert, 1991; Emborg et al., 2000). In fact, we propose thata fine-grain pattern, whose complex structure can be seen in a ver-tical transect (Fig. 1), is a common feature of old-growth beech for-ests when disturbance impacts are generally limited to individualtrees (fine scale disturbance; Podlaski, 2008), so that resulting can-opy gaps are relatively small (<200–300 m2; Wagner et al., 2010). Itis worth noting that in the dominant stratum of beech old-growthforests, tree age cannot be easily inferred from stem size (Piovesanet al., 2005b, 2010) because structural dynamics, in a very finegrain mosaic, condition individual life history. Such complex struc-tures, also described by mixtures of theoretical size distributions,are now increasingly being reported for uneven-aged, pure ormixed, beech forests (Paluch, 2007; Podlaski, 2010). When size dis-tribution follows the rotated sigmoid shape, these structures havebeen placed outside of the forest cycle and described as a ‘‘steadystate’’ (Král et al., 2010). While our data, collected in old-growthforests that host individuals with the longest life cycle for the spe-cies, confirm the stability of this aggregated structure over severalyears (Fig. 8), further studies should focus on the temporal evolu-tion of the RS shape at scales of about 0.1 ha with special regard toregeneration and disturbance processes.
Within a fine-grain forest mosaic, one development phase maylocally dominate, and eventually stand structure at the single plotlevel changes over time following the classical forest cycle (Watt,1947; Oldemann, 1990), as shown by the counterclockwise order-ing of sampled plots in a structural cycle (Fig. 10 and Fig. S8). Thissynchronization of stand dynamics can also be driven by interme-diate (0.04–0.5 ha) or coarse (>0.5 ha) scale disturbance events(Podlaski, 2008). Dendroecological analyses have shown that somepast growth releases were synchronous between Valle Cervara(Piovesan et al., 2005b) and Coppo del Principe (Piovesan et al.,2010) testifying that in addition to small-scale gap phase

Fig. 12. Snag/living trees size distribution at Valle Cervara core area in 2003 (VCH_03) and 2010 (VCH_10), and at Coppo del Principe in 2010 (COP).
1960 A. Alessandrini et al. / Forest Ecology and Management 262 (2011) 1950–1962
processes, periodic intermediate severity disturbance events areanother driver of forest dynamics (Splechtna et al., 2005; Nagelet al., 2007; Fraver et al., 2008; Gravel et al., 2010).
Three main mechanisms are likely behind the generation of arotated sigmoid structure (Westphal et al., 2006): infrequent dis-turbance at intermediate and coarse scales, as mentioned in theprevious paragraph, U-shaped mortality, and nonlinear diameterincrement (faster in medium-size trees compared to smaller andlarger ones; see also Leak, 2002). In beech old-growth forests,snags represent about 30–40% of dead biomass (Piovesan et al.,2010; Meyer and Schmidt, 2011), but their size distribution allowsan estimation of mortality rates by dbh class. Snags were not abun-dant, suggesting relatively low mortality, and more so at ValleCervara than at Coppo del Principe (Fig. 12). Relative snagfrequency confirmed a tendency towards higher mortality for verylarge trees (see also Fig. 6 in Piovesan et al., 2005b). For small sizes(up to 20 cm dbh) snags are likely an outcome of self-thinning(Coomes and Allen, 2007), while their absence in the medium sizeclasses (25–40 cm), normally composed of trees that just reachedthe canopy (20–30 m height) and achieved dominance (see Fig. 4in Piovesan et al., 2005b and table 5.2 in Peters, 1997), is closelylinked to a ‘‘step-up’’ growth phase typical of shade-tolerant spe-cies (Leak, 2002). The 25–30 cm dbh corresponds to the inflexionpoint in the rotated sigmoid curve, not only in our study, but gen-erally in old-growth beech forests (Commarmot et al., 2005). Forlarger sizes, snags are essentially a result of disturbance processesthat leave the stem standing, such as drought. It is intriguing thatsnags recorded in 2010 at Valle Cervara were more numerousamong the smallest size classes compared to 2003, since such in-crease in mortality of smaller trees over time is consistent with adrying trend in climate (Piovesan et al., 2008), as reported in otherstudies (Van Mantgem et al., 2009).
The third factor that drives the development of a rotated sigmoidcurve is a strong positive relationship between diameter incrementand stem size when small trees start exploiting resources freed bygap formation, followed by a stabilization of the increment as thesame trees, larger and now part of the overstory, close the canopygap (Westphal et al., 2006). We could not clearly test this relation-ship because our growth data, obtained from increment cores, did
not include understory trees (dbh < 20–25 cm). A step-up relation-ship between diameter increment and tree size was evident in old-growth beech forests (see Table 5.5 in Peters, 1997). Stands managedusing the plenter system, where the rotated sigmoid is still the bestrepresentation of the resulting tree distribution, feature a nonlinearrelationship between stem size and radial increment (e.g. Schütz,2006). In fact, it is surprising to find the rotated sigmoid under sucha managed regime, since the largest individuals are constantlylogged in the plenter system. When we compared data from plen-ter-managed stands and our old-growth forests, it was evident thatthe latter included a greater number of very large individuals, asshown by the deviation between the two rotated sigmoid curvesfor stems greater than 40–45 cm. Regeneration in the plenter systemhas to be sustained by removing large trees, which otherwise wouldimpede renovation processes, as observed when a plenter-managedstand is left to its natural evolution (Schütz, 2006). The negative cor-relation we found between abundance of large trees and that of verysmall trees confirms why the plenter system requires logging oflarge trees: in the absence of naturally forming gaps (because novery large trees exist), regeneration needs to be maintained byremoving the dominant trees. While the influence of diametergrowth on size distributions of old-growth beech forests in the Ital-ian Apennines requires further studies, it is already evident that theinterlinking between mortality, fine-to-intermediate scale distur-bances, individual life history, and growth patterns of beech treesis fundamental for the stability of the reversed sigmoid distribution.
The rotated sigmoid, whose final shape differs only slightly be-tween areas <1 ha and larger aggregation levels under uniform bio-climatic conditions, is well representative of temperate old-growthdeciduous forests (Janowiak et al., 2008). From our investigation,this model, which also emerges when larger sampling plots areused (5–10 ha; Westphal et al., 2006; Commarmot et al., 2005),is therefore a primary tool for analyzing and managing forest eco-systems (Keeton, 2006), especially those with old-growth features.For beech populations in the Italian Apennines, the rotated sigmoidstructure was found in separate stands, and also in the same forestafter about a decade, therefore it appears stable both in space andin time. Minimum areas (�10 ha; Emborg et al., 2000) that weresupposed to be required for a continuous shifting mosaic steady

A. Alessandrini et al. / Forest Ecology and Management 262 (2011) 1950–1962 1961
state under a relatively mild disturbance may therefore containpockets where forest structure is complex and stable at scales anorder of magnitude smaller (see also Paluch, 2007). This conclusionis even more intriguing if we consider that a stable forest mosaicshould become established on areas whose size is directly propor-tional to the longevity of the species (Emborg et al., 2000), but oursampled forests host the oldest individuals yet identified for thisspecies. Given that uneven-aged structures, and associated dead-wood production, emerge even on an aggregated area of about1 ha, one can conclude that small forest ‘‘islands’’ (e.g. few hect-ares) are a valuable tool for a ‘‘natural’’ way of managing beechpopulations (Jakoby et al., 2010), and should therefore provide anadditional option when considering the best strategy for the con-servation and preservation of old-growth beech stands in the Med-iterranean basin.
Acknowledgements
University of Tuscia authors were partially funded by the2007AZFFAK PRIN project: ‘‘Climate change and forests – Dendro-ecological and ecophysiological responses, productivity and carbonbalance on the Italian network of old-growth beech forests’’. F.Biondi was funded by the Fulbright Senior Specialist program.We thank E. D’Andrea, M. Baliva and F. Natalini for their participa-tion in field surveys and C. Sinibaldi for drawing Fig. 1.
Appendix A. Supplementary data
Supplementary data associated with this article can be found, inthe online version, at doi:10.1016/j.foreco.2011.08.025.
References
Akaike, H., 1974. A new look at the statistical model identification. IEEE Transactionon Automatic Control AC-19 716–723.
Baker, P.J., Bunyavejchewin, S., Oliver, C.D., Ashton, P.S., 2005. Disturbance historyand historical stand dynamics of a seasonal tropical forest in western Thailand.Ecological Monographs 75, 317–343.
Brown, J.H., Gillooly, J.F., Allen, A.P., Savage, V.M., West, G.B., 2004. Toward ametabolic theory of ecology. Ecology 85, 1771–1789.
Commarmot, B., Bachofen, H., Bundziak, Y., Bürgi, A., Ramp, B., Shparyk, Y.,Sukhariuk, D., Viter, R., Zingg, A., 2005. Structures of virgin and managed beechforests in Uholka (Ukraine) and Sihlwald (Switzerland): a comparative study.Forest Snow and Landscape Research 79, 45–56.
Coomes, D.A., Allen, R.B., 2007. Mortality and tree-size distributions in naturalmixed-age forests. Journal of Ecology 95, 27–40.
D’Amato, A.W., Orwig, D.A., Foster, D.R., 2008. The influence of successionalprocesses and disturbance on the structure of Tsuga canadensis forests.Ecological Applications 18, 1182–1199.
Emborg, J., Christensen, M., Heilmann-Clausen, J., 2000. The structural dynamics ofSuserup Skov, a near-natural temperate deciduous forest in Denmark. ForestEcology and Management 126, 173–189.
Enquist, B.J., West, G.B., Brown, J.H., 2009. Extensions and evaluations of a generalquantitative theory of forest structure and dynamics. Proceedings of NationalAcademy of Science USA 106, 7046–7051.
Feoli, E., Lagonegro, M., 1982. Syntaxonomy of beechwoods of Apennines based onIAHOPA. Vegetatio 50, 129–173.
Fraver, S., Jonsson, B.G., Jönsson, M., Esseen, P.A., 2008. Demographics anddisturbance history of a boreal old-growth Picea abies forest. Journal ofVegetation Science 19, 789–798.
Frelich, L.E., 2002. Forest Dynamics and Disturbance Regimes. Cambridge UniversityPress, Cambridge, UK.
Goff, F.G., West, D., 1975. Canopy-understory interaction effects on forestpopulation structure. Forest Science 21, 98–108.
Gotelli, N.J., Colwell, R.K., 2001. Quantifying biodiversity: procedures and pitfalls inthe measurement and comparison of species richness. Ecology Letters 4, 379–391.
Gove, J.H., Ducey, M.J., Leak, W.B., Zhang, L., 2008. Rotated sigmoid structures inmanaged uneven-aged northern hardwood stands: a look at the Burr Type IIIdistribution. Forestry 81, 161–176.
Gravel, D., Beaudet, M., Messier, C., 2010. Large-scale synchrony of gap dynamicsand the distribution of understory tree species in maple–beech forests.Oecologia 162, 153–161. doi:10.1007/s00442-009-1426-6.
Grenier, Y., Blais, L., Lavoie, E., 1991. Aire minimum d’echantillonnage ou nombre sepoints de prisme necessaires pour etablir la structure d’un peuplementinequienne. Canadian Journal of Forest Research 21, 1632–1638.
Gronewold, C.A., D’Amato, A.W., Palik, B.J., 2010. The influence of cutting cycle andstocking level on the structure and composition of managed old-growthnorthern hardwoods. Forest Ecology and Management 259, 1151–1160.
Isaaks, E.H., Srivastava, R.M., 1989. An Introduction to Applied Geostatistics. OxfordUniversity Press, New York.
Jakoby, O., Rademacher, C., Grimm, V., 2010. Modelling dead wood islands inEuropean beech forests: how much and how reliably would they provide deadwood? European Journal of Forest Research 129, 659–668.
Janowiak, M., Nagel, L.M., Webster, C., 2008. Spatial scale and stand structure innorthern hardwood forests: implications for quantifying diameter distributions.Forest Science 54, 497–506.
Jolliffe, I.T., 1986. Principal Component Analysis. Springer-Verlag, New York.Keeton, W.S., 2006. Managing for late-successional/old-growth characteristics in
northern hardwood-conifer forests. Forest Ecology and Management 235, 129–142.
Korpel, S., 1995. Die Urwålder der Westkarpaten. G Fischer-Verlag, Stuttgart.Král, K., Vrška, T., Hort, L., Adam, D., Šamonil, P., 2010. Developmental phases in a
temperate natural spruce-fir-beech forest: determination by a supervisedclassification method. European Journal of Forest Research 129, 339–351.
Leak, W.B., 2002. Origin of sigmoid diameter distributions. Research Paper NE-718.Newtown Square, PA: U.S. Department of Agriculture, Forest Service,Northeastern Research Station. pp. 10.
Lines, E.R., Coomes, D.A., Purves, D.W., 2010. Influences of forest structures, climateand species composition on tree mortality across the Eastern US. PloS ONE5(10), e13212. doi:10.1371/journal.pone.0013212.
Lorimer, C.G., Dahir, S.E., Nordheim, E.V., 2001. Tree mortality rates and longevity inmature and old-growth hemlock-hardwood forests. Journal of Ecology 89, 960–971.
Marage, D., Lemperiere, G., 2005. The management of snags: a comparison inmanaged and unmanaged ancient forests of the Southern French Alps. Annals ofForest Science 62, 135–142.
Meyer, P., Schmidt, M., 2011. Accumulation of dead wood in abandoned beech(Fagus sylvatica L.) forests in northwestern Germany. Forest Ecology andManagement 261, 342–352.
Nagel, T.A., Levanic, T., Diaci, J., 2007. A dendroecological reconstruction ofdisturbance in an old-growth Fagus-Abies forest in Slovenia. Annals of ForestScience 64, 891–897.
Noel, J.M., Platt, W.J., Moser, E.B., 1998. Structural characteristics of old- andsecond-growth stands of longleaf pine (Pinus palustris) in the gulf coastal regionof the USA. Conservation Biology 12, 533–548.
O’Hara, K.L., Gersonde, R.F., 2004. Stocking control concepts in uneven-agedsilviculture. Forestry 77, 131–143.
Oldemann, R.A.A., 1990. Forests: Elements of Silvology. Springer-Verlag, Berlin,Heidelberg, New York, pp. 624.
Paluch, J.G., 2007. The spatial pattern of a natural European beech (Fagus sylvaticaL.)–silver fir (Abies alba Mill.) forest: a patch-mosaic perspective. Forest Ecologyand Management 253, 161–170.
Peters, R., 1997. Beech forests. Geobotany 24. Kluver Academic Publishers, TheNetherlands.
Piovesan, G., Portoghesi, L., 1993. Tecniche di analisi multivariata per lo studiostrutturale di un bosco di faggio. Atti del 2� Seminario ‘‘Ricerca ed esperienzenella pianificazione multifunzionale del bosco’’. Centro Ricerche ENEA, (23-24November 1993), Brasimone (Bo), Italia.
Piovesan, G., Biondi, F., Bernabei, M., Di Filippo, A., Schirone, B., 2005a. Spatial andaltitudinal bioclimatic zones of the Italian peninsula identified from a beech(Fagus sylvatica L.) tree- ring network. Acta Oecologica 27, 197–210.
Piovesan, G., Di Filippo, A., Alessandrini, A., Biondi, F., Schirone, B., 2005b. Structure,dynamics and dendroecology of an Apennine old-growth beech forest. Journalof Vegetation Science 16, 13–28.
Piovesan, G., Biondi, F., Di Filippo, A., Alessandrini, A., Maugeri, M., 2008. Drought-driven growth reduction in old beech (Fagus sylvatica L.) forests of the centralApennines, Italy. Global Change Biology 14, 1265–1281.
Piovesan, G., Alessandrini, A., Baliva, M., Chiti, T., D’Andrea, E., De Cinti, B., Di Filippo,A., Hermanin, L., Lauteri, M., Scarascia Mugnozza, G., Schirone, B., Ziaco, E.,Matteucci, G., 2010. Structural patterns, growth processes, carbon stocks in anItalian network of old-growth beech forests. L’ Italia Forestale e Montana 65,557–590.
Piovesan, G., Alessandrini, A., Biondi, F., Di Filippo, A., Schirone, B., Ziaco, E., 2011.Bioclimatology, growth processes, longevity and structural attributes in anItalian network of old-growth beech forests spreading from the Alps to theApennines. Beech Forests - Joint Natural Heritage of Europe. (eds. Knapp, H.D. &Fichtner, A.), BfN-Skripten 297, 173-192, Bonn-Bad Godesberg.
Podlaski, R., 2008. Dynamics in Central European near-natural Abies-Fagus forests:does the mosaic-cycle approach provide an appropriate model? Journal ofVegetation Science 19, 173–182.
Podlaski, R., 2010. Diversity of patch structure in Central European forests: are treediameter distributions in near-natural multilayered Abies–Fagus standsheterogeneous? Ecological Research 25, 599–608.
R Development Core Team. (2010) R: A language and environment for statisticalcomputing. R Foundation for Statistical Computing, Vienna, Austria. <http://www.r-project.org/>.

1962 A. Alessandrini et al. / Forest Ecology and Management 262 (2011) 1950–1962
Remmert, H., 1991. The Mosaic-Cycle Concept of Ecosystems. Ecological Studies 85.New York, Springer. pp. 168.
Rubin, B.D., Manion, P.D., Faber-Langendoen, D., 2006. Diameter distributions andstructural sustainability in forests. Forest Ecology and Management 222, 427–438.
Sagheb-Talebi, K., Schütz, J.P., 2002. The structure of natural oriental beech (Fagusorientalis) forests in the Caspian region of Iran and potential for the applicationof the group selection system. Forestry 75, 465–472.
Schütz, J.P., 2006. Modelling the demographic sustainability of pure beech plenterforests in Eastern Germany. Annals of Forest Science 63, 93–100.
Schwartz, J.W., Nagel, L.M., Webster, C.R., 2005. Effects of uneven-agedmanagement on diameter distribution and species composition of northernhardwoods in Upper Michigan. Forest Ecology and Management 211, 356–370.
Splechtna, B.E., Gratzer, G., Black, B.A., 2005. Disturbance history of a European old-growth mixed-species forest – A spatial dendroecological analysis. Journal ofVegetation Science 16, 511–522.
Van Mantgem, P.J., Stephenson, N.L., Byrne, J.C., Daniels, L.D., Franklin, J.F., Fulé, P.Z.,Harmon, M.E., Larson, A.J., Smith, J.M., Taylor, A.H., Veblen, T.T., 2009.Widespread increase of tree mortality rates in the Western United States.Science 323, 521–524.
Wagner, S., Collet, C., Madsen, P., Nakashizuka, T., Nyland, R.D., Sagheb-Talebi, K.,2010. Beech regeneration research: from ecological to silvicultural aspects.Forest Ecology and Management 259, 2172–2182.
Wang, X., Hao, Z., Zhang, J., Lian, J., Li, B., Ye, J., Yao, X., 2009. Tree size distributionsin an old-growth temperate forest. Oikos 118, 25–36.
Watt, A.S., 1947. Pattern and process in the plant community. Journal of Ecology 35,1–22.
Westphal, C., Tremer, N., von Oheimb, G., Hansen, J., von Gadow, K., Härdtle, W.,2006. Is the reverse J-shaped diameter distribution universally applicable inEuropean virgin beech forests? Forest Ecology and Management 223, 75–83.
Zenner, E.K., 2005. Development of tree size distributions in douglas-fir forestsunder differing disturbance regimes. Ecological Applications 15, 701–714.
Copyright © 2022 FDOKUMEN