Tree shape plasticity in relation to crown exposure
11
ORIGINAL PAPER Tree shape plasticity in relation to crown exposure Degi Harja • Gre ´goire Vincent • Rachmat Mulia • Meine van Noordwijk Received: 16 November 2011 / Revised: 10 February 2012 / Accepted: 18 February 2012 / Published online: 2 March 2012 Ó Springer-Verlag 2012 Abstract Trees outside closed forest stands differ in the relation between stem diameter, height and crown volume from trees that grew with neighbours close by. Whether this plasticity in tree shape varies between species in relation to their light requirement is unknown. We pur- posefully sampled 528 trees ranging 5–100 cm diameter at breast height growing in a range of light conditions. Across ten broad-leaved species observed in Sumatra or Kali- mantan, a generic relationship was found between light exposure of the crown and a light-dependent a l parameter that modifies the height–diameter allometric equation (H = a l D b ) from those for closed stands. In our results, vertical stretching is well predicted by light availability. In fully open conditions, trees are on average 31% shorter for the same diameter than under (partial) shade. Most of the stretching response occurs in all species as soon as some degree of lateral shading occurs. The response, however, varies by species (8–44% reduction) in a way apparently unrelated to species’ successional status. Crown volume varied less than stem height in its relationship with stem diameter across all light conditions tested. The scaling of crown volume with stem diameter, however, differed markedly between tree species. Keywords Tree height Crown shape Humid tropics Wood density Allometry Introduction Competition for light and space between neighbouring trees plays a central role in shaping forest structure and dynamics (King et al. 2005; Kohyama 1994). The spatial arrangement of a tree’s foliage relative to its competing neighbours controls the outcome of the competition for light (Weiner 1990). The pattern of leaf display over time and space also drives biomass allocation rules between photosynthetic leaves and structural components to support them mechanically and in terms of water transport (Niklas 1994; Weiner 2004). Tree shape plasticity in response to light availability reflects changes in growth-allocation rules that probably have strong adaptive significance (Vincent and Harja 2008; Weiner 2004). There is, however, little quantitative infor- mation available regarding the degree of plastic response of the allometric relations between tree overall dimensions (stem diameter, stem height, crown depth, crown width) to various light regimes. How this plasticity may relate to ecological strategies and vary across species is also poorly documented. Known responses to environment involving changes in growth allocation include modification of the height– diameter relationship and modification of relative crown radius and height. Several factors affecting within-species variation of the stem height–diameter relationship have been identified and are briefly reviewed below. 1. The proximate (physiological), direct effect of the light regime on slenderness (height/dbh ratio) is ascribed to Communicated by R. Matyssek. D. Harja (&) R. Mulia M. van Noordwijk Southeast Asia Regional Program, World Agroforestry Centre (ICRAF), Jalan CIFOR, Situ Gede, Sindang Barang, Bogor 16115, Jawa Barat, Indonesia e-mail: [email protected] G. Vincent Unite ´ Mixte de Recherche AMAP, Institut de Recherche pour le De ´veloppement (IRD), TA A-51/PS2, 34398 Montpellier Cedex 5, France 123 Trees (2012) 26:1275–1285 DOI 10.1007/s00468-012-0703-x
-
Upload
independent -
Category
Documents
-
view
2 -
download
0
Transcript of Tree shape plasticity in relation to crown exposure
ORIGINAL PAPER
Tree shape plasticity in relation to crown exposure
Degi Harja • Gregoire Vincent • Rachmat Mulia •
Meine van Noordwijk
Received: 16 November 2011 / Revised: 10 February 2012 / Accepted: 18 February 2012 / Published online: 2 March 2012
� Springer-Verlag 2012
Abstract Trees outside closed forest stands differ in the
relation between stem diameter, height and crown volume
from trees that grew with neighbours close by. Whether
this plasticity in tree shape varies between species in
relation to their light requirement is unknown. We pur-
posefully sampled 528 trees ranging 5–100 cm diameter at
breast height growing in a range of light conditions. Across
ten broad-leaved species observed in Sumatra or Kali-
mantan, a generic relationship was found between light
exposure of the crown and a light-dependent al parameter
that modifies the height–diameter allometric equation
(H = alDb) from those for closed stands. In our results,
vertical stretching is well predicted by light availability. In
fully open conditions, trees are on average 31% shorter for
the same diameter than under (partial) shade. Most of the
stretching response occurs in all species as soon as some
degree of lateral shading occurs. The response, however,
varies by species (8–44% reduction) in a way apparently
unrelated to species’ successional status. Crown volume
varied less than stem height in its relationship with stem
diameter across all light conditions tested. The scaling of
crown volume with stem diameter, however, differed
markedly between tree species.
Keywords Tree height � Crown shape � Humid tropics �Wood density � Allometry
Introduction
Competition for light and space between neighbouring
trees plays a central role in shaping forest structure and
dynamics (King et al. 2005; Kohyama 1994). The spatial
arrangement of a tree’s foliage relative to its competing
neighbours controls the outcome of the competition for
light (Weiner 1990). The pattern of leaf display over time
and space also drives biomass allocation rules between
photosynthetic leaves and structural components to support
them mechanically and in terms of water transport (Niklas
1994; Weiner 2004).
Tree shape plasticity in response to light availability
reflects changes in growth-allocation rules that probably
have strong adaptive significance (Vincent and Harja 2008;
Weiner 2004). There is, however, little quantitative infor-
mation available regarding the degree of plastic response of
the allometric relations between tree overall dimensions
(stem diameter, stem height, crown depth, crown width) to
various light regimes. How this plasticity may relate to
ecological strategies and vary across species is also poorly
documented.
Known responses to environment involving changes in
growth allocation include modification of the height–
diameter relationship and modification of relative crown
radius and height. Several factors affecting within-species
variation of the stem height–diameter relationship have
been identified and are briefly reviewed below.
1. The proximate (physiological), direct effect of the light
regime on slenderness (height/dbh ratio) is ascribed to
Communicated by R. Matyssek.
D. Harja (&) � R. Mulia � M. van Noordwijk
Southeast Asia Regional Program, World Agroforestry
Centre (ICRAF), Jalan CIFOR, Situ Gede,
Sindang Barang, Bogor 16115, Jawa Barat, Indonesia
e-mail: [email protected]
G. Vincent
Unite Mixte de Recherche AMAP,
Institut de Recherche pour le Developpement (IRD),
TA A-51/PS2, 34398 Montpellier Cedex 5, France
123
Trees (2012) 26:1275–1285
DOI 10.1007/s00468-012-0703-x

the phytochrome-mediated perception of far-red radi-
ation (700–800 nm wavelength) scattered from the
leaves of neighbours, which provides early warning of
shading and triggers the change in the growth-alloca-
tion characteristic of the shade-avoidance response
(increased allocation in height). This response has
been clearly established at sapling stage (Gilbert et al.
2001; Ballare 1999) and most probably affects a tree’s
entire growth. The functional interpretation and selec-
tive advantage (ultimate cause) of the response
requires understanding of the immediate trade-offs:
every unit of internal resources can be invested in
diameter increment or height growth of the main stem,
and/or in branches and leaf formation. The payoff in
terms of light capture clearly depends on the alloca-
tions made by neighbours and competitors.
2. Competition in a stand (as measured through basal area
at stand level) has long been known to affect growth in
diameter more than growth in height. This observation
is at the heart of the site fertility index concept
developed by European foresters in the eighteenth
century and defined as the dominant height of a stand
at a given age (Skovsgaard and Vanclay 2008). The
stability of height growth for a range of planting
density—and resulting basal areas—is well illustrated
by Zeide and Vanderschaaf (2002), who studied shade-
intolerant Pinus taeda. As a consequence, trees tend to
be slender in denser stands. The extent to which the
response is light dependent or rather reflects priority
rules in growth allocation independent of light status
is, however, unclear. At individual level, the same
observation holds as the competitive status of a tree
within a stand (as captured by crown depth, for
example) is typically negatively correlated to its
slenderness coefficient. This was reported for shade-
intolerant silver birch (Betula pendula) (Ilomaki et al.
2003) as well as semi-tolerant ash (LeGoff and
Ottorini 1996) and shade-intolerant P. taeda (Naidu
et al. 1998).
3. Site fertility (height/age) was found to be positively
correlated to slenderness (height/dbh ratio) in planta-
tion of Callitris sp. in Australia (Vanclay and Henry
1988) and in five species of mixed boreal forest
covering a wide range of shade tolerance (Wang et al.
1998). The generality of this relation was questioned
by Geoff Wang (1998), who found no such relation in
his study on white spruce (Picea glauca Voss, a late
successional species of intermediate tolerance to shade
according to Burns and Honkala 1990). To reconcile
those conflicting results, the following hypothesis may
be put forward. Fertility needs not to have a monotonic
effect on slenderness: extremely poor soil may bear
lank trees with an underdeveloped crown because
height growth (primary growth) may have strict
precedence over diameter growth (secondary growth)
and crown development may be severely reduced
under low fertility. Trees with stunted crowns will also
experience lower mechanical stress (lower weight,
lower wind resistance) compatible with more slender
stems. On the other end of the fertility spectrum,
stronger competition (for light and/or belowground
resources or mere space) may result in an increased
height/diameter growth-allocation ratio and, hence,
increased slenderness. So, depending on the fertility
gradient explored the relation with slenderness may be
positive, negative or non-monotonic.
4. Wind-exposed edge Sitka spruce [Picea sitchensis
(Bong.) Trautv. & C.A.Mey.] trees were found to grow
shorter and more tapered than more sheltered trees
(Bruchert and Gardiner 2006). Site differences in
height–dbh relationship in Pinus radiata D. Don have
also been related to local wind regimes in New
Zealand (Watt et al. 2010).
5. Topography: Dipterocarp trees growing on steep
slopes (Robert and Moravie 2003) were found to be
shorter and more tapered, possibly reflecting stronger
mechanical constraints and correlative butt swelling
due to more demanding anchorage or tension wood
developed to compensate for early leaning (Loehle
1997) or merely better access to light (less shading
from down-slope neighbours).
As already mentioned, plasticity in crown vertical
extension (crown depth) has been reported in various
contexts (see also Williams et al. 1999, who examined
crown morphology of conifer saplings under varying can-
opy openness) and this plasticity is typically more pro-
nounced in light-demanding species (Jack and Long 1991).
Contrasting with crown depth (length), it has been noted
for plasticity in many species both in natural and plantation
forests that the species-specific relation between crown
lateral extension and stem diameter (either measured at
breast height or preferably below crown) was hardly
affected by competitive status (Bohlman and O’Brien
2006; Dawkins 1963; Hemery et al. 2005; Pryor 1988).
From this brief review, it appears that the shape of a tree
is affected by its local environment and that factors
accounting for this plasticity may be confounded (local
competitive status and local fertility or exposure to
mechanical stress associated with topography or wind
regime). Furthermore, the plasticity in response to crowd-
ing seems to vary between species. Shade-tolerant species
may be expected to be less responsive to crowding both in
precocity and extent of response in as much as light is the
dominant factor governing the response (Gilbert et al.
2001).
1276 Trees (2012) 26:1275–1285
123

In the present study, we analyse height–diameter–crown
extension data of 10 tree species growing in a wide range
of light conditions in the humid tropics of Indonesia,
ranging from isolated trees on field boundaries through
half-open types of agroforestry to closed (agro)forest
conditions and aim to answer the following questions:
1. To what extent are height–diameter and crown
volume–stem diameter relationships affected by access
to light across a range of species?
2. How much of the response is species dependent?
3. Is the species effect related to light preference or other
ecological characteristics of the species?
Materials and methods
Study sites and species
A collection of 528 trees from 10 tropical species of
diverse successional status were purposefully sampled in
contrasting environments across the lowlands of Sumatra
and Kalimantan (Indonesia): isolated trees growing in the
open, co-dominant trees in (agro)forest stands and over-
topped trees in the (agro)forest understory.
The species studied were common agroforest species in
Sumatra and Kalimantan and were predominantly light-
demanding species but included some late successional
species and one understorey species. A brief description of
each species follows (the local Indonesian name is in
parentheses). Species are tentatively arranged in three
shade-tolerance groups, namely intolerant, intermediate,
and tolerant. This classification is based on the scantly
available published information and the authors’ expertise
and considers both seedling/sapling tolerance as well as
adult stages sensitivity to canopy closure.
Intolerant
• Albizia falcataria (L.) Fosberg (Sengon). Synonym:
Paraserianthes falcataria, Albizia moluccana, Ade-
nanthera falcataria. This is a medium-to-large tree, up
to 40 m tall; with a spreading flat crown. It is a strongly
light-demanding species (Agroforestry Tree Database,
ICRAF).
• Acacia mangium Willd (Akasia) is a single-stemmed,
evergreen tree that grows 25–35 m in height. A pioneer
species, it is also light demanding (Agroforestry Tree
Database, ICRAF).
• Alstonia scholaris (L.) R.Br (Pulai) is a medium-to-
large tree, up to about 40 m high. It is found not only in
secondary as well as primary forest but also in open
grasslands. It has light wood, a fast growth rate
(Agroforestry Tree Database, ICRAF), the best growth
of seedlings is achieved in the open (Vincent 2006) and
the best germination occurs in full sunlight (Jøker
2000). It is classified as shade intolerant.
• Fagraea fragrans Roxb. (Tembesu) is a medium-sized
or occasionally large tree up to 25–55 m tall. It occurs
in light primary and secondary forest. It is classified as
a light-demanding species (Agroforestry Tree Data-
base, ICRAF).
Intermediate
• Schima wallichii (DC.) Korth (Seru) is an evergreen,
medium-to-large tree growing to 47 m in height. It is
particularly common in disturbed and secondary for-
ests, scrub and grassland. Its light requirement is,
however, considered as moderate and is explicitly
mentioned as being less than that of Fagraea fragrans
(Agroforestry Tree Database, ICRAF).
• Hevea brasiliensis (Willd. ex A. Juss.) Muell. Arg
(Karet) is a large tree native to the forests of Amazonia
but cultivated widely throughout the humid tropics as a
source of latex for commercial rubber production. The
species can be classified as intermediate as it germi-
nates readily in the shade but tolerates full sunlight
even at seedling stage (Vincent 2006).
• Archidendron jiringa (Jack.) I. C. Nielsen (Jengkol)
grows up to 24 m tall. It is fast growing and found in
primary and secondary rainforest. Specific information
on light requirements is lacking but the species is
abundant in young fallows after shifting cultivation
(Lawrence et al. 2005). It is therefore classified as
intermediate.
• Shorea stenoptera Burck. (Tengkawang) is a dominant
or emergent tree with height reaching 60 m. Given its
rapid growth, relatively light wood within the meranti
group and early fruiting (Weinland 1998), it is consid-
ered intermediate, notwithstanding its shade tolerance
at seedling stage.
Tolerant
• Durio zibethinus L. (Durian) is a medium-to-large
buttressed tree up to 45 m tall. Under natural conditions
its early development occurs in the shaded understorey
and the adult tree reaches the top canopy. Seedlings
require shading to survive and develop vigorously
(Vincent 2006).
• Lansium domesticum Corr. (Duku) is a small-to-
medium tree. An understorey specialist, it is adapted
to shade. Its seedlings do not, physiologically, adapt
readily to very open conditions (Vincent 2001, 2006).
Trees (2012) 26:1275–1285 1277
123

Tree sampling and measurement
Individual trees from 5 cm diameter at breast height were
sampled according to a stratified design (Table 1). The three
strata/social statuses were defined as: (a) an ‘‘isolated’’ tree
growing alone or with a few other trees scattered in an open
area (roadside, grassland, garden); (b) overtopped/sup-
pressed trees growing in a stand, clearly over-shaded by
competitors but with no significant restriction to crown lat-
eral expansion; and (c) co-dominant trees growing in a stand
i.e. with no competitor over-shading them.
Most of the trees growing in stands were measured in
mixed agroforest plots except for Albizia and Acacia,
which were measured in monocultural stands.
Variables measured for individual trees were: stem
diameter (measured at breast height) (D), tree height (H),
crown width and crown depth. Crown width was defined as
the average of the largest extension of the crown projection
in two perpendicular directions. Crown depth was defined
as the length of crown from crown base to the top of the
tree. The base of the crown was defined as the height of the
lowest foliage, which was most often very close to the
height of first branching. Tree height and crown base height
were measured using a Carl-Leiss Altimeter and a standard
measuring tape was used for diameter and crown width
measurement.
For each tree we also recorded the crown position (CP)
index sensu (Dawkins 1966), which is an index of how
much light a crown receives. This index is commonly used
as a growth predictor (Aasamaa and Sober 2001; Vincent
et al. 2002, 2011). The CP scale was defined following
Alder and Synnott (1992):
• Emergent = 5, crown exposed vertically and free from
lateral competition at least within 90� inverted crown
subtended by the crown base
• Full overhead light = 4, crown plan fully exposed
vertically but adjacent to other crowns of equal or
greater height within the 90� cone
• Some overhead light = 3, crown partially exposed
vertically but partly vertically shaded by other crowns
• Some side light = 2, crown plant entirely vertically
shaded but exposed to some direct light due to a gap or
edge of overhead canopy
• No direct light = 1, crown plant entirely shaded
vertically and laterally.
We also recorded all trees with D [ 5 cm in the immediate
neighbourhood of each target tree. The neighbourhood was
defined by a circular plot centred on the target tree with radius
equal to the maximum between two distances r1 and r2, where
r1 was the width of the target tree crown and r2 was the dis-
tance to the furthest tree in contact with target tree. Local
crowding indices were then computed in the following way.
When r1 [ r2 the local basal area was the sum of all cross-
sectional areas of individual trees divided by plot area. If
r2 [ r1 then the furthest tree (which determined the plot
radius) was counted as half inside and half outside the plot and,
hence, given a weight of 0.5 for both when computing basal
area. This varying neighbourhood size was adopted to ensure
that neighbourhood size would be consistent with target tree
size while not neglecting the case of large competitors not
included in a radius limited to crown width, which is a com-
mon situation in uneven-aged stands. In the remainder of the
text, the log of the ratio of the sum of cross-sectional areas of
all neighbouring stems (excluding the target tree) to the
neighbourhood area is referred to as the local crowding index.
Crown volume was derived from crown depth and
crown width measurements assuming a half ellipsoid shape
(Vhalf) of the crown with half major axis equal to crown
depth (a) and minor axis equal to crown radius (b):
Vhalf ¼2
3pab2 ð1Þ
Statistical analysis
A series of general linear models was tested to explore the
relative importance of the local aboveground environment
Table 1 Frequency table of
data per tree species and social
status group; stem diameter
range per species
Species Isolated Understorey Co-dominant Total Diameter (cm)
Albizia falcataria 9 0 27 36 17–73
Alstonia scholaris 19 13 16 48 6–79
Pithecelobium jiringa 26 7 10 43 8–41
Shorea stenoptera 10 16 67 93 5–124
Acacia mangium 28 1 20 49 5–47
Durio zibethinus 19 10 13 42 6–73
Hevea brasiliensis 34 16 15 65 5–60
Schima wallichii 12 13 18 43 5–51
Fagraea fragrans 22 10 22 54 5–66
Lansium domesticum 18 9 28 55 6–75
Total 197 95 236 528
1278 Trees (2012) 26:1275–1285
123
(i.e. social status) and species’ identity (or some proxy of
species’ identity) and their possible interaction in shaping
the allometric equations examined.
Models were fitted either on the whole set of species or
on a subset of eight species adequately sampled in all types
of aboveground environments (Table 1).
The general form of the models tested was:
Log Hð Þ � Log Dð Þ � Social Status � Species ið Þ ð2Þ
Log crown volumeð Þ � Log Dð Þ � Social Status
� Species iið Þ ð3Þ
where 9 indicates that all direct and interaction terms were
included.
We further examined crown dimension (crown depth
and crown width) from which crown volume was derived.
Models used had the following form:
Log crown depthð Þ� Log Hð Þ � Social Status
� Species iiið Þ ð4Þ
Log crown widthð Þ�Log Dð Þ � Social Status
� Species ivð Þ ð5Þ
Log(H) was used rather than log(D) in predicting log(crown
depth) as it provided better predictions (lower AIC).
For each model we ran a step() function in order to
select the best model starting with the most complete
model including all predictors and interactions. Akaike
Information Criterion (AIC) was used to select among the
various models tested. AIC is defined as 2k - 2ln(L) where
k is the number of parameters in the model, and L is the
maximized value of the likelihood function for the esti-
mated model (Akaike 1974).
We evaluated the models above after replacing social
status by crown position index or local crowding index. To
help interpret differences in AIC when comparing non-nes-
ted models, we compared the likelihood of the models (M).
The likelihood of model i (conditional to the data) was
computed as (Burnham and Anderson 2002):
LðMi=dataÞ� exp � 1
2DiðAICÞ
� �ð6Þ
where Di AICð Þ ¼ AIC� AICmin, AICmin is the AIC of the
best model and *reads ‘‘is proportional to’’.
When comparing any pair of models (i, j) we reported
the ‘‘evidence ratio’’, which is simply defined as the rela-
tive likelihood of one model to the other:
LðMi=dataÞLðMj=dataÞ ð7Þ
Tree dimensions (H, D, crown volume, crown width and
crown depth) were systematically log transformed to
improve normality of residuals, which was checked using
Shapiro–Wilk statistic. This allowed meaningful testing for
significance of effects.
However to avoid bias involved by back-transforming
log-transformed data (Beauchamp and Olson 1973; Sprugel
1983), we used a non-linear regression (nls( ) function) to
adjust an individual species’ model and compare coeffi-
cients across species and environments. The H–D relation
was modelled with a power function H = a 9 Db (Niklas
1994).
Finally, we used generalized additive models (GAM)
(Hastie and Tibshirani 1990) to explore the species-specific
shape of the response of tree change in slenderness with
decreasing access to light. GAM is a generalized linear
model in which part of the linear predictor is specified as a
sum of smooth functions of predictor variables. We used
spline regression to model the CP effect implementing the
following model in R (GAM package) for each species:
Log Hð Þ�Log Dð Þ þ s CP; df ¼ 2ð Þ vð Þ ð8Þ
where df is the equivalent degrees of freedom of the spline
smoother.
All the statistical analyses were conducted with R sta-
tistical software and programming language (http://cran.
rproject.org).
Results
We first restricted the analysis to the eight species ade-
quately sampled in all three environments i.e. excluding
Acacia mangium and Albizia falcataria, which were not
sampled in the understorey (Table 1).
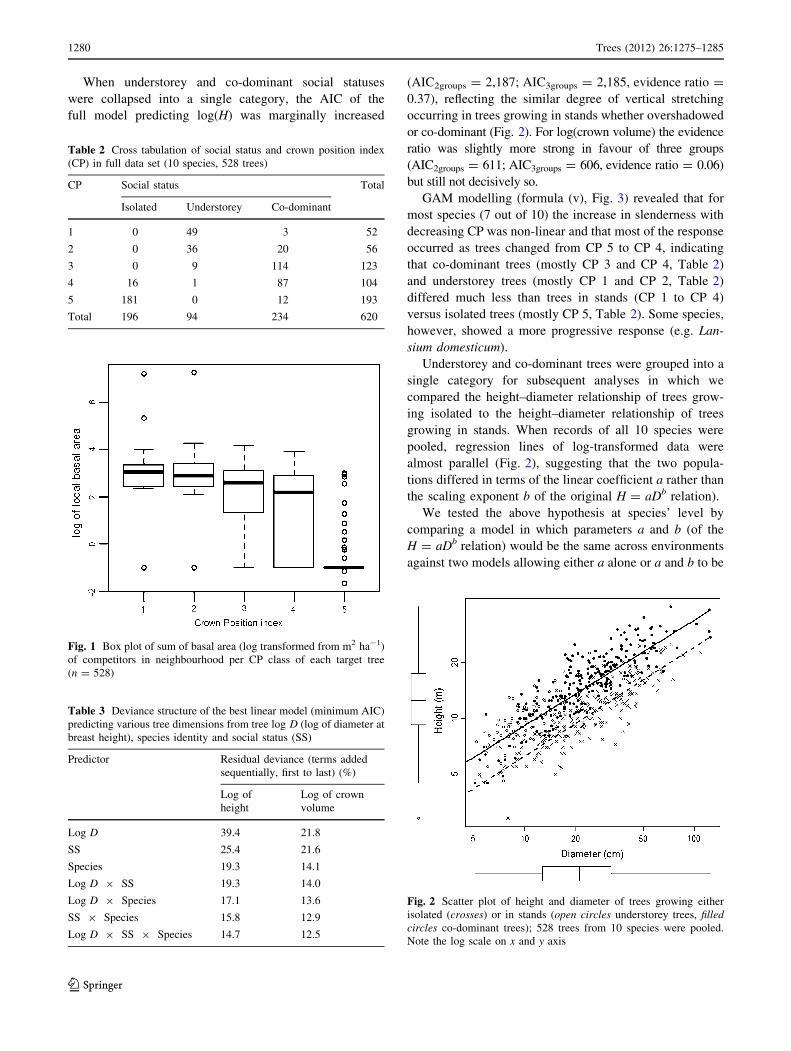
As expected, there was a tight relation between social
status and CP (Table 2). Similarly, the local crowding
index decreased with increasing CP index (Fig. 1,
r2 = 0.40***).
The best models of tree height and crown volume both
included all predictors and all their interactions. However,
the contribution of the various predictors to deviance
reduction differed significantly between the two models
(Table 3). Log(D) alone captured almost 61% of deviance
in log(H) and more than 78% of deviance in log(crown
volume). Social status captured 14% of the deviance in
log(H) but only 2% of the deviance in log(crown volume).
Species’ identity accounted for about the same amount of
deviance in both models i.e., respectively, 6 and 7% (not
taking into account the interaction terms).
The contribution of social status to prediction of
log(crown_width) was small, accounting for less than 1.4%
of the deviance reduction, and much smaller than its con-
tribution to log(crown_depth), which accounted for 7.6%
of the deviance reduction (Table 4).
Trees (2012) 26:1275–1285 1279
123
When understorey and co-dominant social statuses
were collapsed into a single category, the AIC of the
full model predicting log(H) was marginally increased
(AIC2groups = 2,187; AIC3groups = 2,185, evidence ratio =
0.37), reflecting the similar degree of vertical stretching
occurring in trees growing in stands whether overshadowed
or co-dominant (Fig. 2). For log(crown volume) the evidence
ratio was slightly more strong in favour of three groups
(AIC2groups = 611; AIC3groups = 606, evidence ratio = 0.06)
but still not decisively so.
GAM modelling (formula (v), Fig. 3) revealed that for
most species (7 out of 10) the increase in slenderness with
decreasing CP was non-linear and that most of the response
occurred as trees changed from CP 5 to CP 4, indicating
that co-dominant trees (mostly CP 3 and CP 4, Table 2)
and understorey trees (mostly CP 1 and CP 2, Table 2)
differed much less than trees in stands (CP 1 to CP 4)
versus isolated trees (mostly CP 5, Table 2). Some species,
however, showed a more progressive response (e.g. Lan-
sium domesticum).
Understorey and co-dominant trees were grouped into a
single category for subsequent analyses in which we
compared the height–diameter relationship of trees grow-
ing isolated to the height–diameter relationship of trees
growing in stands. When records of all 10 species were
pooled, regression lines of log-transformed data were
almost parallel (Fig. 2), suggesting that the two popula-
tions differed in terms of the linear coefficient a rather than
the scaling exponent b of the original H = aDb relation).
We tested the above hypothesis at species’ level by
comparing a model in which parameters a and b (of the
H = aDb relation) would be the same across environments
against two models allowing either a alone or a and b to be
Table 2 Cross tabulation of social status and crown position index
(CP) in full data set (10 species, 528 trees)
CP Social status Total
Isolated Understorey Co-dominant
1 0 49 3 52
2 0 36 20 56
3 0 9 114 123
4 16 1 87 104
5 181 0 12 193
Total 196 94 234 620
Fig. 1 Box plot of sum of basal area (log transformed from m2 ha-1)
of competitors in neighbourhood per CP class of each target tree
(n = 528)
Table 3 Deviance structure of the best linear model (minimum AIC)
predicting various tree dimensions from tree log D (log of diameter at
breast height), species identity and social status (SS)
Predictor Residual deviance (terms added
sequentially, first to last) (%)
Log of
height
Log of crown
volume
Log D 39.4 21.8
SS 25.4 21.6
Species 19.3 14.1
Log D 9 SS 19.3 14.0
Log D 9 Species 17.1 13.6
SS 9 Species 15.8 12.9
Log D 9 SS 9 Species 14.7 12.5
Fig. 2 Scatter plot of height and diameter of trees growing either
isolated (crosses) or in stands (open circles understorey trees, filledcircles co-dominant trees); 528 trees from 10 species were pooled.
Note the log scale on x and y axis
1280 Trees (2012) 26:1275–1285
123

adjusted per subgroup (isolated trees or trees in stands)
using non-linear regression. For six out of 10 species the
best model (i.e. with the lowest AIC) was obtained when
allowing the scaling parameter to vary between subgroups
while keeping the power coefficient constant at species
level (Table 5). When species were pooled, allowing both
parameters a and b to be adjusted per group was marginally
preferable than setting the power exponent b equal across
groups (Table 5).
The plasticity of the height–diameter relationship (the
percentage increase in height due to shading) differed
across species (last column, Table 6). However, there was
no obvious relation between this plasticity and species’
light requirements. In particular, early successional Alsto-
nia scholaris showed low plasticity in the H–D relation-
Table 4 Deviance structure of the best linear model (minimum AIC)
predicting crown dimensions from species identity, social status (SS)
and tree log H (log of tree height for crown depth) or log D (log of
diameter at breast height, for crown width)
Predictor Residual deviance (terms added
sequentially, first to last) (%)
Log of
crown depth
Log of
crown width
Log H (or Log D) 42 24.7
SS 34.4 23.3
Species 29.9 14.1
Log H (Log D) 9 SS 27.4 –
Log H (Log D) 9 Species 24.4 –
SS 9 Species – 13.2
Fig. 3 Effect of CP on logHeight estimated per species using spline regressor (GAM). Dashed lines represent upper and lower point wise twice-
standard error curves. NS, asterisk and double asterisk are significance values (Fisher test) comparing a spline smoother to the linear effect
Trees (2012) 26:1275–1285 1281
123
ship, Fagraea fragrans (also classified as light demanding)
had the lowest plasticity, while Lansium domesticum (the
most shade-tolerant species) was amongst the most plastic.
Similarly, the two species showing the most progressive
response to change in CP index, Lansium domesticum and
Acacia mangium (Fig. 3), belonged to the two extreme
light requirement groups represented in this study.
Finally, light preference was introduced as a three-level
factor (intolerant, intermediate, tolerant) in replacement of
species’ identity to predict height from diameter. It per-
formed poorly (evidence ratio of model using light pref-
erence to reference model was 5.0 9 10-22).
The local crowding index was tested in models (i), (ii),
(iii) and (iv). The local crowding index was always a
poorer predictor of crown shape than CP (data not shown).
For instance, the evidence ratio of model predicting
log(H) using log(crowding_index) instead of CP [as in the
reference model (i)] was 3.0 9 10-16, indicating that CP
was clearly a better predictor of slenderness than local
crowding.
Discussion
We found the height–diameter relationship to be much
affected by social status for all species examined while the
crown volume–diameter relationship was not. The response
was found to be species dependent but successional status
was not a good predictor of the differential response.
Some degree of plasticity in the height–diameter rela-
tionship with the light environment and some degree of
variability between species was expected (Cabanettes et al.
1998; Gilbert et al. 2001; Vincent and Harja 2008; Wil-
liams et al. 1999). The magnitude of the response and the
variability across species were less predictable and were
found to be large (Table 6; Fig. 3). The lack of relation
between the degree of plasticity of slenderness and species’
light preference was also unexpected and seems at odds
with theoretical arguments and previous findings (see
‘‘Introduction’’). Two reasons why this may be the case can
be suggested.
1. The observed change in allometry in response to
crowding may be a response to competition for
belowground resources and space as well as for light.
So part of the response may be unrelated to species’
light requirements: under more stringent competition,
height growth is maintained while stem diameter and
crown volume is reduced. Strong colinearity between
the local crowding index and the CP index (Fig. 1)
suggests that distinguishing both competition effects is
not possible with the present dataset. The poorer
predictive power of local crowding may simply reflect
suboptimal characterisation of global competition by
the index used. Crowding has been successfully distin-
guished from shading in analyses by Canham et al.
(2004) but their approach requires data on diameter
increments. Heineman et al. (2011), on the other hand,
has shown the importance of belowground resources to
allometric plasticity, where trees growing on fertile soil
tend to be less slender (regardless the species’ light
preferences). This conforms with the crowding index
effect in colinearity with CP, where less competitive
neighbours may result in less slender trees. Further
study could include more comprehensive data on
belowground competition related to root architecture.
2. Another reason why no relation was found between
light requirements and plasticity may be that there is
no such relation. Arguably, even a shade-tolerant
species tree would benefit from early signalling of the
presence of a close competitor in its neighbourhood
and from the capacity to develop a morphological
Table 5 Akaike Information
Criterion (AIC) of a series of
increasingly complex allometric
model of tree height
Models are adjusted for each
species allowing none, one or
both of the parameters of the
basic model to vary according to
tree local environment (open
area or stand)
The italic values are the relative
lowest AIC value within the
models for each species
Species AIC mod1 AIC mod2 AIC mod3
H = aDb H = a1Db (if isolated) H = a1Db1 (if isolated)
H = a2Db (if in stand) H = a2Db2 (if in stand)
Albizia falcataria 226.8 191.8 189.8
Alstonia scholaris 209.6 197.3 194.6
Pithecelobium jiringa 295.1 255.6 256.9
Shorea stenoptera 491.0 461.2 463.2
Acacia mangium 200.2 160.1 158.2
Durio zibethinus 230.2 166.4 168.3
Hevea brasiliensis 259.0 258.0 250.7
Schima wallichii 232.0 184.3 186.3
Fagraea fragrans 246.5 194.6 196.3
Lansium domesticum 318.9 288.1 290.0
All species pooled 2,933.9 2,675.6 2,674.6
1282 Trees (2012) 26:1275–1285
123
response allowing itself to maintain its leaf area (to
achieve resource preemption) through increased height
growth. Shade-tolerant and light-demanding species
may differ more in terms of sensitivity to shading than
in terms of plasticity (the amplitude of the response).
Our data set is ill suited to detect such possible
relations between species’ light requirements and
sensitivity to crowding. Even the CP index, which
provides a more direct estimate of light availability
than social status, is probably too crude for that
purpose. For instance, co-dominant trees under differ-
ent planting densities would all score a 4, irrespective
of the planting density and the correlative difference in
light availability. Furthermore, an identical CP index
at one point in time does not preclude the existence of
fairly different past light conditions.
Despite significant inter-specific variation in the degree
of plasticity in the height–diameter relationship, there is a
common trend of increasing height when light exposure is
reduced and this reaction seems to affect similarly trees in
the understorey and co-dominant trees (Fig. 2). In most
cases, this change can be parsimoniously modelled by
allowing the linear coefficient a of the standard height–
diameter relationship to vary according to tree environ-
ment, either open or closed (Table 6).
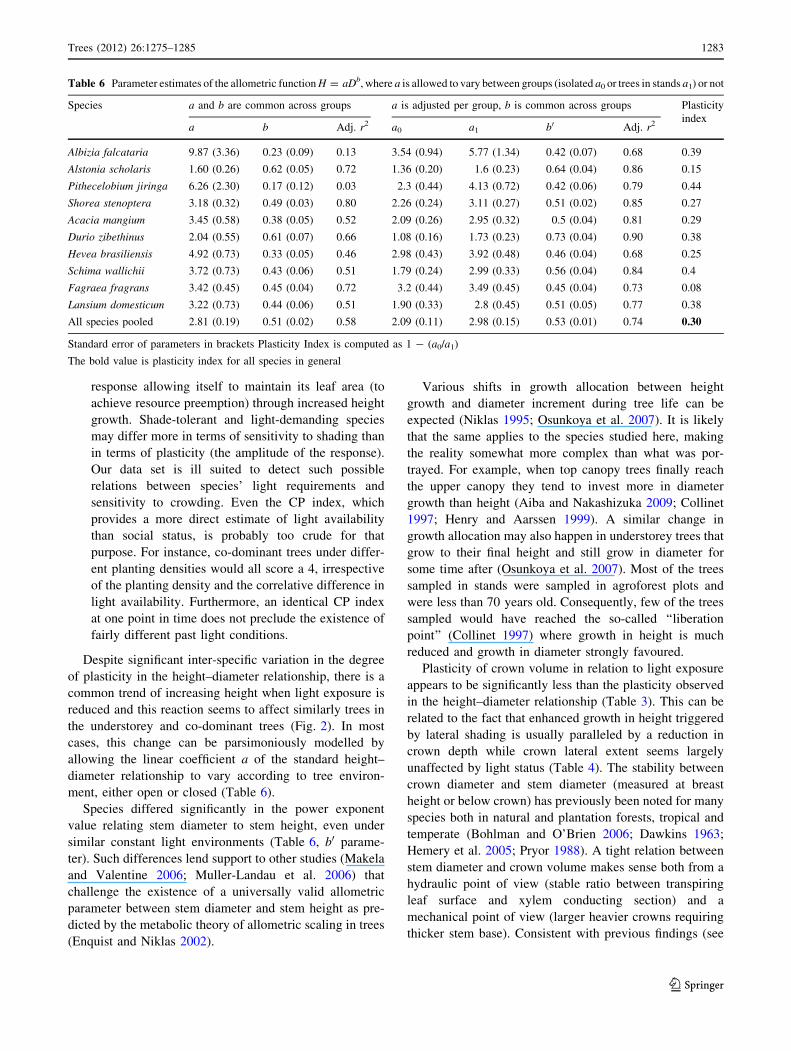
Species differed significantly in the power exponent
value relating stem diameter to stem height, even under
similar constant light environments (Table 6, b0 parame-
ter). Such differences lend support to other studies (Makela
and Valentine 2006; Muller-Landau et al. 2006) that
challenge the existence of a universally valid allometric
parameter between stem diameter and stem height as pre-
dicted by the metabolic theory of allometric scaling in trees
(Enquist and Niklas 2002).
Various shifts in growth allocation between height
growth and diameter increment during tree life can be
expected (Niklas 1995; Osunkoya et al. 2007). It is likely
that the same applies to the species studied here, making
the reality somewhat more complex than what was por-
trayed. For example, when top canopy trees finally reach
the upper canopy they tend to invest more in diameter
growth than height (Aiba and Nakashizuka 2009; Collinet
1997; Henry and Aarssen 1999). A similar change in
growth allocation may also happen in understorey trees that
grow to their final height and still grow in diameter for
some time after (Osunkoya et al. 2007). Most of the trees
sampled in stands were sampled in agroforest plots and
were less than 70 years old. Consequently, few of the trees
sampled would have reached the so-called ‘‘liberation
point’’ (Collinet 1997) where growth in height is much
reduced and growth in diameter strongly favoured.
Plasticity of crown volume in relation to light exposure
appears to be significantly less than the plasticity observed
in the height–diameter relationship (Table 3). This can be
related to the fact that enhanced growth in height triggered
by lateral shading is usually paralleled by a reduction in
crown depth while crown lateral extent seems largely
unaffected by light status (Table 4). The stability between
crown diameter and stem diameter (measured at breast
height or below crown) has previously been noted for many
species both in natural and plantation forests, tropical and
temperate (Bohlman and O’Brien 2006; Dawkins 1963;
Hemery et al. 2005; Pryor 1988). A tight relation between
stem diameter and crown volume makes sense both from a
hydraulic point of view (stable ratio between transpiring
leaf surface and xylem conducting section) and a
mechanical point of view (larger heavier crowns requiring
thicker stem base). Consistent with previous findings (see
Table 6 Parameter estimates of the allometric function H = aDb, where a is allowed to vary between groups (isolated a0 or trees in stands a1) or not
Species a and b are common across groups a is adjusted per group, b is common across groups Plasticity
indexa b Adj. r2 a0 a1 b0 Adj. r2
Albizia falcataria 9.87 (3.36) 0.23 (0.09) 0.13 3.54 (0.94) 5.77 (1.34) 0.42 (0.07) 0.68 0.39
Alstonia scholaris 1.60 (0.26) 0.62 (0.05) 0.72 1.36 (0.20) 1.6 (0.23) 0.64 (0.04) 0.86 0.15
Pithecelobium jiringa 6.26 (2.30) 0.17 (0.12) 0.03 2.3 (0.44) 4.13 (0.72) 0.42 (0.06) 0.79 0.44
Shorea stenoptera 3.18 (0.32) 0.49 (0.03) 0.80 2.26 (0.24) 3.11 (0.27) 0.51 (0.02) 0.85 0.27
Acacia mangium 3.45 (0.58) 0.38 (0.05) 0.52 2.09 (0.26) 2.95 (0.32) 0.5 (0.04) 0.81 0.29
Durio zibethinus 2.04 (0.55) 0.61 (0.07) 0.66 1.08 (0.16) 1.73 (0.23) 0.73 (0.04) 0.90 0.38
Hevea brasiliensis 4.92 (0.73) 0.33 (0.05) 0.46 2.98 (0.43) 3.92 (0.48) 0.46 (0.04) 0.68 0.25
Schima wallichii 3.72 (0.73) 0.43 (0.06) 0.51 1.79 (0.24) 2.99 (0.33) 0.56 (0.04) 0.84 0.4
Fagraea fragrans 3.42 (0.45) 0.45 (0.04) 0.72 3.2 (0.44) 3.49 (0.45) 0.45 (0.04) 0.73 0.08
Lansium domesticum 3.22 (0.73) 0.44 (0.06) 0.51 1.90 (0.33) 2.8 (0.45) 0.51 (0.05) 0.77 0.38
All species pooled 2.81 (0.19) 0.51 (0.02) 0.58 2.09 (0.11) 2.98 (0.15) 0.53 (0.01) 0.74 0.30
Standard error of parameters in brackets Plasticity Index is computed as 1 - (a0/a1)
The bold value is plasticity index for all species in general
Trees (2012) 26:1275–1285 1283
123
‘‘Introduction’’), crown depth was found to be more
responsive to light availability (Table 4).
Our results suggest that the current use of allometric
equations that were developed for closed stands for trees
growing in more open conditions, as is common in land-
scape-level carbon stock assessments (Hairiah et al. 2011),
contains a risk of considerable overestimate of tree biomass
and carbon stocks, unless empirical equations and field data
incorporate an indicator of crowding.
Conclusion
In all species examined, the aboveground environment
strongly affected some of the allometric scaling rules and,
most significantly, the height–diameter relation. Once
diameter was accounted for, two-thirds of the remaining
deviance in height was accounted for by social status
(isolated, co-dominant or suppressed) alone, i.e., regardless
of the species. Conversely, crown volume was found to be
fairly stable at species level: three-quarters of the reduction
in residual deviance in crown volume (once corrected for
stem diameter) was accounted for by the species’ factor
alone and only modestly affected by the aboveground local
environment.
This plasticity in height–diameter relationships varied
between species but was not related to successional status
in a systematic way. Stability of the crown volume–stem
diameter relation at species’ level probably reflects some
biophysical constraint, possibly the hydraulic supply/
demand ratio, which limits the range of variation to be
expected within species. Vertical stretching was similar in
co-dominant and understorey trees.
References
Aasamaa K, Sober A (2001) Hydraulic conductance and stomatal
sensitivity to changes of leaf water status in six deciduous tree
species. Biol Plant 44:65–73
Aiba M, Nakashizuka T (2009) Architectural differences associated
with adult stature and wood density in 30 temperate tree species.
Funct Ecol 23:265–273
Akaike H (1974) A new look at the statistical model identification.
IEEE Trans Autom Control 19:716–723
Alder D, Synnott TJ (1992) Permanent sample plot techniques for
mixed tropical forest, vol 25. Oxford Forestry Institute, Depart-
ment of Plant Science, Oxford, pp 81–83
Ballare CL (1999) Keeping up with the neighbours: phytochrome
sensing and other signalling mechanisms. Trends Plant Sci
4:97–102
Beauchamp JJ, Olson JS (1973) Corrections for bias in regression
estimates after logarithmic transformation. Ecology 54:1403–1407
Bohlman S, O’Brien S (2006) Allometry, adult stature and regener-
ation requirement of 65 tree species on Barro Colorado Island,
Panama. J Trop Ecol 22:123–136
Bruchert F, Gardiner B (2006) The effect of wind exposure on the tree
aerial architecture and biomechanics of Sitka spruce (Piceasitchensis, Pinaceae). Am J Bot 93:1512–1521
Burnham KP, Anderson DR (2002) Model selection and multimodel
inference. A practical information-theoretic approach. Springer,
New York
Burns RM, Honkala BH (eds) (1990) Silvics of North America.
USDA Forest Service, Washington, DC
Cabanettes A, Auclair D, Imam W, Dupraz C (1998) Diameter and
height growth curves for widely-spaced trees in European
agroforestry. Agrofor Syst 43:169–181
Canham CD, LePage PT, Coates KD (2004) A neighborhood analysis
of canopy tree competition: effects of shading versus crowding.
Can J For Res 34:778–787
Collinet F (1997) Essai de regroupements des principales especes
structurantes d’une foret dense humide d’apres l’analyse de leur
repartition spatiale (Foret de Paracou-Guyane) In: vol. PhD.
Universite de Lyon 1, Lyon, p 313
Dawkins HC (1963) Crown diameters: their relation to bole diameter
in tropical forest trees. Commonw For Rev 42:318–333
Dawkins HC (1966) The productivity of tropical high-forest trees and
their reaction to controllable environment. Commonwealth
Forestry Institute, Oxford
Enquist BJ, Niklas KJ (2002) Global allocation rules for patterns of
biomass partitioning. Science 295:1517–1519
Geoff Wang G (1998) Is height of dominant trees at a reference
diameter an adequate measure of site quality? For Ecol Manag
112:49–54
Gilbert IR, Jarvis PG, Smith H (2001) Proximity signal and shade
avoidance differences between early and late successional trees.
Nature 411:792–795
Hairiah K, Dewi S, Agus F, Velarde SJ, Ekadinata A, Rahayu S, van
Noordwijk M (2011) Measuring carbon stocks across land use
systems: a manual. World Agroforestry Centre (ICRAF) South-
east Asia Regional Program. Bogor, Indonesia
Hastie TJ, Tibshirani RJ (1990) Generalized additive models.
Chapman & Hall, New York
Heineman KD, Jensen E, Shapland A, Bogenrief B, Tan S, Rebarber
R, Russo SE (2011) The effects of belowground resources on
aboveground allometric growth in Bornean tree species. For Ecol
Manag 261(11):1820–1832
Hemery GE, Savill PS, Pryor SN (2005) Applications of the crown
diameter–stem diameter relationship for different species of
broadleaved trees. For Ecol Manag 215:285–294
Henry HAL, Aarssen LW (1999) The interpretation of stem diameter-
height allometry in trees: biomechanical constraints, neighbour
effects, or biased regressions? Ecol Lett 2:89–97
Ilomaki S, Nikinmaa E, Makela A (2003) Crown rise due to
competition drives biomass allocation in silver birch. Can J
For Res Revue Canadienne De Recherche Forestiere 33:2395–
2404
Jack SB, Long JN (1991) Analysis of stand density effects on canopy
structure: a conceptual approach. Trees Struct Funct 5:44–49
Jøker D (2000) Alstonia scholaris (L.) R.Br. In: Seed leaflet, vol 9.
Danida Forest Seed Centre, Denmark
King DA, Davies SJ, Supardi MNN, Tan S (2005) Tree growth is
related to light interception and wood density in two mixed
dipterocarp forests of Malaysia. Funct Ecol 19:445–453.
http://onlinelibrary.wiley.com/doi/10.1111/j.1365-2435.2005.
00982.x/full
Kohyama T (1994) Size-structure-based models of forest dynamics to
interpret population- and community-level mechanisms. J Plant
Res 107:107–116
Lawrence D, Suma V, Mogea JP (2005) Change in species
composition with repeated shifting cultivation: limited role of
soil nutrients. Ecol Appl 15:1952–1967
1284 Trees (2012) 26:1275–1285
123

LeGoff N, Ottorini JM (1996) Leaf development and stem growth of
ash (Fraxinus excelsior) as affected by tree competitive status.
J Appl Ecol 33:793–802
Loehle C (1997) The adaptive significance of trunk inclination on
slopes: a commentary. Proc R Soc Lond Ser B Biol Sci
264:1371–1374
Makela A, Valentine HT (2006) Crown ratio influences allometric
scaling in trees. Ecology 87:2967–2972
Muller-Landau HC et al (2006) Testing metabolic ecology theory for
allometric scaling of tree size, growth and mortality in tropical
forests. Ecol Lett 9:575–588
Naidu SL, DeLucia EH, Thomas RB (1998) Contrasting patterns of
biomass allocation in dominant and suppressed loblolly pine.
Can J For Res 28:1116–1124
Niklas KJ (1994) Plant allometry: the scaling of form and process.
University of Chicago Press, Chicago
Niklas KJ (1995) Size-dependent allometry of tree height, diameter
and trunk-taper. Ann Bot 75:217–227
Osunkoya OO, Omar-Ali K, Amit N, Dayan J, Daud DS, Sheng TK
(2007) Comparative height crown allometry and mechanical
design in 22 tree species of Kuala Belalong rainforest, Brunei,
Borneo. Am J Bot 94:1951–1962
Pryor SN (1988) The silviculture and yield of wild cherry. Forestry
Commission Bulletin, London
Robert A, Moravie MA (2003) Topographic variation and stand
heterogeneity in a wet evergreen forest of India. J Trop Ecol 19
Part 6:697–707
Skovsgaard JP, Vanclay JK (2008) Forest site productivity: a review
of the evolution of dendrometric concepts for even-aged stands.
Forestry 81:13–31
Sprugel DG (1983) Correcting for bias in log-transformed allometric
equations. Ecology 64:209–210
Vanclay JK, Henry N (1988) Assessing site productivity of indige-
nous cypress pine forest in southern Queensland. Commonw For
Rev 67:53–64
Vincent G (2001) Leaf photosynthetic capacity and nitrogen content
adjustment to canopy openness in tropical forest tree seedlings.
J Trop Ecol 17:495–509
Vincent G (2006) Leaf life span plasticity in tropical seedlings grown
under contrasting light regimes. Ann Bot 97:245–255
Vincent G, Harja D (2008) Exploring ecological significance of tree
crown plasticity through three-dimensional modelling. Ann Bot
101:1221–1231
Vincent G, De Foresta H, Mulia R (2002) Predictors of tree growth in
a Dipterocarp based agroforest: a critical assessment. For Ecol
Manag 161:39–52
Vincent G, Azhima F, Joshi L, Healey JR (2011) Are permanent
rubber agroforests an alternative to rotational rubber cultivation?
An agro-ecological perspective. For Trees Livelihoods
20:85–109
Wang Y, Titus SJ, LeMay VM (1998) Relationships between tree
slenderness coefficients and tree or stand characteristics for
major species in boreal mixedwood forests. Can J For Res
28:1171–1183
Watt MS, Palmer DJ, Kimberley MO, Hock BK, Payn TW, Lowe DJ
(2010) Development of models to predict Pinus radiataproductivity throughout New Zealand. Can J For Res
40:488–499
Weiner J (1990) Asymmetric competition in plant populations. Tree
5:360–364
Weiner J (2004) Allocation, plasticity and allometry in plants.
Perspect Plant Ecol Evol Syst 6:207–215
Weinland G (1998) Plantation. In: Turnbull SAJM (ed) A review of
dipterocarps: taxonomy, ecology, and silviculture. CIFOR,
Bogor, pp 151–186
Williams H, Messier C, Kneeshaw DD (1999) Effects of light
availability and sapling size on stem growth and crown
morphology of understory Douglas-fir and lodgepole pine. Can
J For Res 29:222–231
Zeide B, Vanderschaaf C (2002) The effect of density on the height–
diameter relationship. In: General Technical Report SRS-48.
U.S. Department of Agriculture, Forest Service, Southern
Research Station, Asheville, NC, pp 463–466
Trees (2012) 26:1275–1285 1285
123