treat.ment of sexually transmitted diseases as an hn ...
272
TREAT.MENT OF SEXUALLY TRANSMITTED DISEASES AS AN HN PREVENTION STRATEGY? Gojactor magnitudes, syndromic managementand a reappraisal of the Mwanza and Rakai trials
-
Upload
khangminh22 -
Category
Documents
-
view
3 -
download
0
Transcript of treat.ment of sexually transmitted diseases as an hn ...

TREAT.MENT OF
SEXUALLY TRANSMITTED
DISEASES AS AN HN
PREVENTION STRATEGY?
Gojactor magnitudes, syndromic managementand a reappraisal of the Mwanza and Rakai trials
Dit proefschrift is mede tot stand gekomen dankzij de finandële steun van het instituut Maatschappelijke Gezondheidszorg, de ].E.Jurriaanse Stichting en GlaxoSmithKline.
Treatment of so..-ually transmitted diseases as an HIV prevention strategy? Cofactor magnitudes, S}ndromic management and a reappraisal of the Mwanza and Rakai trials. Eline Louise Korenromp (2001). Proefschrift Rotterdam. Met samenvatting in het Nederlands.
Trefuroorden: HIV/AIDs-preventie; seksueel-overdraagbare aandoeningen; epidemiologie; simulatiemodellen.
ISBN 90-<5734-011-1
Layout en omslagonrw-erp:Anna Bosselaar ([email protected]) Druk: Optima Grafische Communicatie, Rotterdam

Treatment of sexually transmitted diseases as an HIV prevention strategy?
Cofactor magnitudes, syndromic management and a reappraisal of the Mwanza and Rakai trials
Behandeling van seksueel-overdraagbare aandoeningen ter preventie van HIV?
Een herbeschouwing van cofactorgroottes, syndroom-benadering en de trials in Mwanza en Rakai
PROEFSCHRIFT
ter verkrijging van de gtaad van doctor aan de Erasmus Universiteit Rotterdam
op gezag van de Rector Magnificus Prof.dr.ir.J.H. van Bemmel
en volgens besluit van het College voor Promoties.
De openbare verdediging zal plaatsvinden op woensdag 28 november 2001 om 15.45 uur
door
Eline Louise Korenromp
Geboren te 's-Gravenhage

Promotiecommissie
Promotor: Prof.dr.].D.E Habbema
Overige leden: Prof.dr.A. Hofman Prof.dr.A. Osterhaus Prof. R.]. Hayes
Copromotor: Dr. S.J. de Vlas

VooR MIJN OUDERS

Contents
Chapter 1
INTRODUCTION
1.1 The HIV I AIDS pandemie 3 1.2 HIV spread and control in sub-SaharanAfrica 4 1.3 Sexually transmitted diseases 6 1. 4 SID as cofuctors in HIV transmission 9 1.5 Community-randomized SID treatment trials in Mwanza and Rakai 12 1.6 Explaining the contrasting outcomes of the Mwanza and Rakai trials 14 1.7 Methods: simulation modelling ofthe Mwanza and Rakai trials 18 1.8 Aims and outline of the thesis 20
Chapter 2
EsTIMATING THE MAGNITUDE OF STD COFACTOR EFFECTS ON HIV TRAl\'SMISSION - HOW WELL CA;-, IT BE DONÛ
2.1 Summary 25 2.2 Introduetion 25 2.3 2.4 2.5
Estimating SID cofactor magnitudes 26 Example of a cofactor estimation 31 Discussion 34
Chapter 3
!HE PREVALENGE OF SELF-REPORTED DISCHARGE AND DYSURIA IN NEISSERIA GONORRHOEAE AND CHLAMYDIA TRACHOMAI'IS INFECTION: A SYSTEMATIC REVIEW
3.1 Summary 39 3.2 Introduetion 39 3.3 Methods 40 3.4 Results 42 3.5 Discussion 46 3.6 Appendix I - Summary of publisbed data on symptom prevalenee in
NG- and CT-infeetion 49
1
37

3.7 Appendix ll- Studies on the prevalenee of discharge and/or dysuria in NG- and CT-infection, parient delay interval among symptomatic patients seeking treatment, and proportion of symptomatic patients seeking effective medica! treatment 5 3
Chapter 4
WRAT PROPORTION OF EPISODES OF GON'ORRHOEA AND CHLAMYDIA BEGOMES SYMPTOMATIC?
4.1 Summary 57 4.2 Introduetion 57 4.3 Methods 59 4.4 Results 66 4.5 Discussion 67 4.6 Appendix - Effect of reinteerion on the estimation of STD durations
from cohort studies 71
Chapter 5
COMPARISON' OF BASELINE STD PREVALENCES BETWEL'\l MWANZA AND RAKAI POPULATIONS: THE ROLE OF SELECTION BIAS AND TEST DIAGN'OSTICS 5.1 Summary 75 5.2 Introduetion 75 5.3 Methods 76 5.4 Results 79 5.5 Discussion 85 5.6 Appendix - Denvation of adjustment for diagnostic and screening,
Equation 2 88
Chapter 6
HIV SPREAD AND PARTNERSHIP REDUCTION FOR DIFFERENT PATTERNS OF
55
73
SEXVAL BEHAVIOUR - A STIIDY WITI! THE MICROSIMULATION MODEl STDSIM 89 6.1 Summary 91 6.2 Introduetion 91 6.3 The S1VSIM model 93 6.4 Modelling sexual behaviour 95 6.5 The epidemiology of HN inthefout profiles 105 6.6 Impact of behavioural interventions 109 6.7 Discussion 115
Chapter 7
MODEL-BASED EVALUATION OF Sit\GLE-ROUND STD MASS TREATMENT FOR HIV CONTROL IN MW&'I;ZA
7.1 Summary 123 7.2 Introduetion 123 7.3 Methods 125 7.4 Results 133 7.5 Discussion 142
121

7.6 Appendix- Demography and se-:ua\ behaviour in SIDSIM: model structure and parameter values used in the simulation of rura\ Mwanza 147
Chapter 8
HIV/STD DYNAMICS M'D BEHAVIOUR CHANGE AS DETERMINANTS OF TilE IMPACT oF STD TREATMENT oN HIV sPREAD oVER TIIE RAKAI EPIDEMie 155
8.1 Summary 157 8.2 Introduetion 157 8.3 Methods 159 8.4 Results 163 8.5 Discussion 168
Chapter 9
Cfu'l BEHAVIOUR CHANGE EXPLAIN INCREASES IN TilE PROPORTION OF GEWTAL ULCERS ATTRIBUTABLE TO lffiRPES IN SUB-SAHARAN AffircA? A SIMULATION MODELLING STUDY
9.1 Summary 175 9.2 Introduetion 175 9.3 Methods 176 9.4 Results 182 9.5 Discussion 188
Chapter 1 0
GENERAL DISCUSSION
10.1 The magnitude of STD cofactor effects on HN transmission 195 10.2 The discrepant omeomes ofthe Mwanza and Rakai ttials 197 10.3 Simulation rnadelling of STD!HIV spread and contrOl 210 10.4 lmplications for future research 215 10.5 lmplications for HN prevention policy 219 10.6 Condusion 223
Bibliography
Summary
Samenvatting
Acknowledgements
Dan1:woord
Curticulum vitae
Publicatielijst
173
193
225
249
255
259
261
263
264

chapter 1
Introduetion


Introduetion
T HIS THESIS CONSISTS of studies assessing the extent to which the treatment of common se.,:ually transmitted diseases (STD), such as gonorrhoea and syphilis, can help to prevent HIV infections and curtail the spread of the
HIV epidemie in sub-SaharanAfrica. Several types of observations have suggested that STD are a risk factor in the transmission of HIV; but the ""1:ent to which treatment of SID can contribute to HIV prevention is unclear. ~owledge of the latter helps determine the extent of HIV control measures and the amount
of money that should be spent on STD treatment, relative to other prevention strategies such as education on behavioural risk reduction and the promotion of condom use.This is especially important indeveloping countties, where the HIV epidemie is most severe, where budgets for HIV control are most limited, and where SID are common.
This introductory chapter describes the background to our studies. It starts with an explanation of the HIV virus, of the HIV epidemie and of AIDS, the dis-
ease it causes (1.1). Next, prevention srrategies for HIV are discussed, with partielilar reierenee to the options that are feasible in developing countries with widespread epidemics, such as those in sub-Saharan Africa (1.2). Section 1.3 gives a brief introduetion to the natura! history, epidemiology and treatment of STD. Sections 1.4 through 1.6 focus on the role of STD in HIV transmission, and examine how this has been investigated so far. Section 1.7 introduces the contribution this thesis makes to this research, and explains one of the main methods employed: the re-analysis of two STD treatment trials conducted in Uganda and Tanzania with an epidemiological transmission model. Finally (1.8), the specific objectives are detailed and the division ofwork over the chapters is outlined.
1.1 THE IDV/AIDS PANDEMie
The pandemie of the acquired immunodeficiency syndrome (AIDS) is among the most pressing global issues in public health. The World Health Organization has estimated that, by the end of year 2000, 36 million people were infected with the human immunodeficiency virus (HIV), the underlying cause of AIDS. Thitty three million out of this totallive in developing countties. Since the beginning of the pandemie in the late 1970s, 22 million people have died fromAIDS. In 2000 alone, 5 million new HIV infections occurred, of which 3.8 million in sub-Saharan Africa (SSA) [UNAIDS & WHO 2000]. In 1999,AIDS was the fourth leading cause of death in the world, and it is rnaving up the tables.
The HIV retrovirus is thought to have originated from a simian (monkey) immunodeficiency virus (SIV) somewhere between 1930 and 1960 in West
Africa, but no major spread began until the late 1970s [Gao et al. 1999, Goldberg & Stticker 2000]. Both the timing and mode of its crossing to the human species and the role human played herein are subject to debate [Korber et al. 2000,
3

4 Chapter 1
HiJlis 2000]. Two types of HIV are distinguished, HIV-I and HIV-2, which originated separately from different SNs. HIV-2 occnrs mai.nly in West-Africa, and is the cause of relatively little clisease burden [Marlink et al. 1994].1n this thesis we focus on HIV-1, and all references to HIV should be understood to denote HIV-1.
HIV infection is acquired via elireet exposure to the body fluids of infected patients; sexual intercourse is the most common mode of transmission. The infection can also be acquired during the transfusion of blood or blood products and, to the cbildren of infected mothers, during birth or via breast feecling. The HIV virus causes AIDS by infecting the patient's white blood cells and impairing the inunune system, the body's defence against infections and cancers. As yet, no
cure bas been found for AIDS.ln the absence of specific care, patients develop AIDS within S-10 years after HIV infection, and die 1-2 years thereafter. Death follows from opportunistic infections sucb as tuberculosis and other lung infections, from the development of fatal cancers, or due to general weakening and wasring [Colebunders & Latif 1991,Ambroziak & Levy 1999].
Around 1995, higbly active antiretroviral combination therapies against HIV became avallable in Western countries. By reducing the level of the HIV virus in blood, these improve the patient's cliuical status and life e>.-pectancy.Antiretrovirals are, however,no cure for AIDS, nor are they a light therapy: once the patient quits, as conunonly happens due to the severe side effects of these drugs, the beneficia! effects cease. Even more important, aftersome time the virus becomes resistant to the drugs, so that their effect stops altogether. Due both to the need
for lifelong continuatien of the therapy and to its novelty, the therapy is very e>.-pensive. 1n adclition, in order to establish toxicity, side effects and optima! drug dosage, antiretroviral therapy requires frequent parient check-ups, thereby posing a heavy burden on the health infrastructure, in particular on physicians and laboratory capacities. All in all, these factors mean that antiviral therapy is not avallable widely in all populations, e:xcept for in the most developed,Westem countries where relatively few HIV patients live [Forsythe 1998].
1.2 lllV SPREAD AND CONTROL IN SUB-SAHARAN AfluCA
More than 80% of people infected with HIV (some 25 million out of the 36 mil
tion total) live in SSA, where the infection is spread mai.nly through heterose>.'llal contact. In certain regions, inclucling, for example, Botswana, Zambia and Zimbabwe, HIV prevalences (i.e. the proportions of the popuiatien infected) as high as
30% of adultsin the general population have been recorded.Young adults are the main group affected. Over the whole of sub-Saharan Africa, HIV inddence (i.e.
the numbers of new infections) appears to be stabilising or even to be falling slightly. This is due mai.nly to stabilisation and to the saturation of the epidemie in the countries first affected, such as Uganda. But in other countries, inclucling

Introduetion
Nigeria and SouthAfrica which up to the 1990s had 'escaped' the epidemie, HIV spread has not only begun, it is also rising to alarmingly higb prevalenee levels, 5% and 20%, respectively. At prevalences of over 20% in the adult population,
which now apply to the majority of sub-SabaranAfrican countries, today's 15-year olds have a 50% chance of dying from HIV I AIDS if current infection rates are not cut dramatically [Stover & Way 1998,Worldbank 1997, UNAIDS &WHO 2000].
By deplering both the vigour and the numbers of young adults at the heigbt of their productivity in work and fum.i.ly, the AIDS epidemie impacts not only on the health of populations, but also on the socio-economie and demograpbic situation: current estimates of the impact of the epidemie indude a cumulative 16 miJlion orphans from pareuts who died fromAIDS, an annual reduction in population growth of on average 2.6% to 2.2%, and parallel decreases in economie growth (e.g. by 0.3-0.4 percentage point per year in South Africa in the late 1990s).The HIV epidemie also indirectly affeers the health ofAfrican populations. The care of AIDS patients not only poses an increased burden on the health system, HIV/AIDS also directly depletes the numbers of health care workers, thereby resulring in deterioriating care for other common diseases. Due to the frequent occurrence of severe, infectieus tuberculosis as an opporttmistic infection in AIDS patients, the prevalenee of tuberculosis in HIV epidemie countries is also increasing in the genera!, non-HIV infected population. Decreases in child vaccination rates over the past decade have been associated with the HIV epidemic.As a combined result of lower levels of care and of HIV infection around birth, infant and child mortallty have begun to rise back to the levels of before the 1970s; in several SSA countries, life expectancy is now 10 to 20 years shorter than it would have been withoutAIDS [Stover & Way 1998,Worldbank 1997].
Since no cure or vaccine is available and sirree effective antiretroviral therapy is not within reach ofthe greater number ofpatienrs, the ma1o mode of HIV/AIDS control in Africa lies in prevenring infection. The primary means of prevention is a reduction in unprotected sexual contact between infected and uninfected individuals. Govermnenral and health agencies try to promote this in health campaigns explaining the modes whereby the virus is acquired and the options for preventing infection, such as sticking to one sö.Llal partner at a time, or the use of condoms with casual partners.
As a complement to the prevention of exposure, efforts may sametimes focus on reducing the probability of virus transmission during unprotected sexual contact. Generally, HIV is not very infectieus; during heteros""--ual intercourse between an HIV-positive and an HIV-negative healthy partner, the risk of viral transmission is below 1 in 1000. However, tltis risk varles greatly between indi
viduals, depending, among other things, on the disease stage of the HIV-positive partner (who is more infectious during the two months following infection, and during the late, symptomatic stages of disease, than in the long asymptomatic
5

6 Chapter 1
stage), as well as on specific sexual practices, and possibly on the circumcision status of the male partner [Levy 1993, Mostad et al. 2000].
Among the preventabie conditions that may aid the efficient transmission of IDV is concurrent infection with other STD [Cameron et al. 1989, Laga et al. 1991,Wasserheit 1992]. STD are therefore considered ·cofactors' in the transmission of HIV: Since STD are highly prevalent inAfrican populations, and since their control and treatment is amenable to improvement, their role :in HIV spread has received the attention of HIV prevention werkers.
1.3 SEXUAILY TRANSMITfED DISEASES
Sexually transmitted diseases comprise all those infectious diseases whose main or sole mode of transmission involves sexual contact with infected partners.The most common STD, and those that are probably the most important as cofactors in mv transmission inAfrican populations, are described below.The description focuses on aspects relevant to the role of STD in HIV transmission înAfrican settings.ln addition, the modes of STD treattnent available to developing countries are discussed. For a more elaborate description of STD and their treattnent, we referto [Brunham & Plummer 1990,Brunham & Ronald 1991,Hoirnes et al. 1999, Morse et al. 1990].This section may be skipped by readers who are familiar with STD epidemiology.
Gonorrhoea: Gonorrhoea is caused by the bacterium Neissera gonorrhoea. The disease causes inflammation of the urethra (in males) and cervix uteri (in females), which may cause urethral or cervical discharge, respectively, and pain at urination. Not all patients become symptomatic at every episode of gonorrhoea. Especially in females, physical signs of the infection often go unnoticed. Gonorrhoea is treatable with commonly available antibiotics, but in the absence oftreattnent the disease disappears spontaneously after an estimated 2-3 months. Prevalences of gonorrhoea in African adult populations typically range between 1% and 7%,and peak in the most sexually active age range (15-35 years). Chlamydia: Chlamydia is caused by the bacterium Chlamydia trachomatis. The cervical/urethral infection may give non-ulcerative symptoms similar to those of gonorrhoea, but it is usually milder, meaning that even more :infections go unrecognised. Chlamydia is curable with antibiotics, and, in the absence of treattnent, will disappear spontaneously after 4-24 months. Due to its Jonger duration, prevalenee is somewhat higher than for gonorrhoea, at 3-12%. Trichomoniasis:This bacterial infection is caused by Trichomonas vaginalis. In females, tbe vaginal infection may cause inflammation and symptoms of vaginal discharge and itching which can last for years.The disease is se:J>.-ually transmitted, but in rnales usually passes without either symptoms or complications, and

Introduetion
resolves soon. In line with this gender di:fference, prevalences are estimated to range between 10 and 30% in females, but to be only 1-5% in males.Trichomonia
sis is curable with antibiotics. Bacterial vaginasis (BV): BV is a vagina! disorder tbat is not sexually transrnitted (and is tbus, strictly speaking, not an STD), but is nonetbeless associated witb STD and s<:J>:ual prorniscuity. It is caused by an alternation in tbe vagina! flora, witb replacement of tbe normally predominant bacteria (lactobacilli) by anaero
bic bacteria, genital mycoplasms and Gardnerella, causing a rise in vagina! pH. Depending on its severity, BV ean cause vagina! discharge and/or itcbing or go unnoticed. The altera.tion of vaginal milieu may render the patient more susceptible to infection witb otber non-ulcerative STD [van de Wijgert et al. 2000, Spiegel 1991]. BV is treatable witb (a nill:ture of) braad-spectrum antibiotics, but tbis may require a multiple dose regimen. Even tben, tbe clinical response- measured as the percentage of patients who no langer have the condition several months after t11erapy, and in whom it does not recur witbin tbis period - is often poor. Prevalenee levels in populations of Aftiean wo men differ according to tbe defini
tion used, but may be as high as 50%. Syphüis: Syphilis is caused by tbe bacterium Treponema pallidum. In tbe majority of patients it causes one or two genital ulcers in the six months following infection. During tbe next 1-3 years, whicb are denoted tbe 'active phase', (smaller) ulcers may occasionally recur, but in tbe later phases of infection tbe genital symptoms disappear.Thereafter, while tbe patient is na langer infectious, tbe infection bas lifelong persistence. 'Late syphilis' may have severe complications induding cardiovascular and neurological disease, from which tbe patient may die. Syphilis can be cured witb antibiotics at all stages. lts overall prevalenee varles widely betweenAftican settings, e.g. between 0.5% and 12%.This depends in tbe first instanee on tbe definition of positivity: some diagnostic tests are only positive for'active syphilis', while atbers also detect 'late syphilis'. In addition, tbe actual prevalenee may vary between populations, depending on tbe local intensi
ties of screening and treatment programmes. The prevalenee of syphilitic ulcers is not usually measured, but is likely to be mucb lower tban tbe prevalenee of active syphilis, at somewhere under 1%. Chancroïd: Chancroïd is caused by the bacterium Haemophilus ducreyi. The discase causes painful ulcers lasting approximately 2-3 montbs, after which tbe infection dissolves. Chancroïd is curable with antibiotics.As the disease is notoriously di.fficult to diagnose, prevalenee levels are nat known ( except in populations of STD patients witb ulcers). Estimates of tbe population prevalenee of chancroidal ulcers range from 0.5 to 2%; recent observations in STD clinics in someAfrican cities indicate that the disease is now becom.ing less common. Genital herpes: Genital herpes is caused by infection witb Herpes simplex virus type 2 (HSV-2). The discase is recognisable in a proportion of patients
by an initia! painful genital ulcer lasting approximately tbree weeks. Thereafter, smaller, less severe ulcers will recur for several decades, e.g. 1-4 times every
7
8 Chapter 1
year, although the frequency of recurrences varles widely between individuals. In inununocompromised lllV I AJDS..patients, herpetic recurrences may occur at a higher frequency and with increased duration, size and severity. In Western settings - but not yet in developing countries -, antiviral therapy is now available to limit bot the severity and duration of herpetic ulcers, and, for as long as the medication is taken, to reduce the frequency with which they recur.This therapy, however, does not cure the infection. In developing countries, HSV-2 seroprevalence (i.e. the prevalenee of antibocties against HSV-2 in blood, which indicates past infection) ranges between 30% and 60%, increasing steadily with age. The prevalenee of herpetic recurrences is nor known, but is likely to be much lower.
All STD (including lllV) are more efficiently transmitted from men to women than vice versa, a fuct that is due mainly to the larger area of genital exposure in women than in men. In line with tltis, prevalences are mostly higher in women [Brunham & Plummer 1990]. Sevetal of the STD can, if untreated, have serious complications, including severe pelvic or abdominal inflanunation, infertility, and, in pregnant and breast-feeding women, illness and death of their foetuses or infants. STD are therefore also an important cause of sociopsychological distress, including risks of stigmatisation, dornestic violence and marltal breakdown. In
around 199;, about 340 million new STD episodes were occurring every year (even excluding viral STD), the majority indeveloping countries [WHO 1999]; here, STD were the cause of a substantial disease burden in adults [Murray & Lopez 1996]. Even apart from their possible role in lllV spread, improverneut in STD treatment is considered an important and cost-effective pubtic health intervention for developing countries [Piot &Tezzo 1990, Brunham & Ronald 1991, Over & Piot 1996,Adler 1996].
1.3.1 STD treatment
STD share most of their symptoms, but differ with regard to the drugs that are effective in curing them. The choice of treatm.ent for patients seeking care for STD-related symptoms cannot therefore be based on clinical examination alone. The infection responsible neects fust to be diagnosed, which is possible using blood or genital swab samples. Diagnosis and subsequent infection-specific treatment is common practice in SID clinics in Western, industrialised countries: patients are sampled and asked to return for a second clinic visit to receive the diagnostic result and corresponding treatment.
For several reasons, STD diagnostics is often not feasible in many developing settings. Diagnosis generally requires a well-equipped laboratory with skilied staff, the costs of which may be prohibitive. Espedally in remote rural areas, it is risk-y to send patients away in the e>..-pecration that they will return to hear the outcome: they may not be able to return for the secoud visit, and will thus

Introduetion
have to forego treatment. In order to overcome this problem, the approacb currently reco=ended for deve!oping countries, and adopted in most of them, is so-called syndromic management [WHO 1994]. Syndromic management is based on the idea that a specifi.c set of signs and symptoms constitutes a syndrome, and indicates the presence of a certain class of infection.A combination of treatments is then prescribed that is effective against the most common organisms underlying this syndrome - and these drugs are intmediately given on the spot. For example, patients with abnormal genital discharge would be presumptive!y treated for gonorrhoea, chlamydia and trichomoniasis.
However, as an STD control strategy, the treatment of symptomatic patients seeking care in clinics has only a limited role. A majority of patients may not have symptoms, may not recognise them, or may otherwise fail to seek time!y treatment. Even if patients seek and receive effective treatment, they may have alteady infected their partner befare they are cured.To enhance the role of treatment in STD contra!, so-called mass treatment has been proposed. This consists of the presumptive treatment of a whole population, whether infected and/or symptomatic or not. The idea bebind mass treatment is that it catcbes all STD, whether symptomatic or asymptomatic, and that reinfection by untreated sexual partners is de!ayed because the whole population is treated at the same point in time.While mass treatment is nota commonly implemented service, it is sometimes used temporarily to achleve a rapid reduction in STD burden, especially in high-prevalenee populations or in epidemie outbreaks [ Cutier et al. 1952, Olsen 1973,Steen&Dallabetta 1999].
1.4 SID AS COFACTORS IN ffiV TRANSMISSION
Evidence fora so-called 'cofactor effect' of STD on HIV transmission sterns from sevetal observations. Generally speaking, individuals with STD also have the highest rat es of H!Y.lf studied prospective!y over time, individuals with STD at start of observation run a higher risk of subsequently acqulring HIV Similarly, as yet unin
fected partners of HIV patients have a higher risk of getring infected if the HIVpositive partner has STD. This suggests that STD enhance both the acqulsition of HIV (in HIV-negative persons) and the transmission of HIV to sexual partners (in HIV-positive persons). These epidemiological correlations involve typically between two-fold and ten-fold increases in prevalenee and transmission risks [Cameron et al 1989, Laga et al 1991], and they are the subject of numerous studies and literature reviews [Wasserheit 1992, Fleming & Wasserheit 1999]. Their interpretation, however, is not straightforward (see below).
Biologica!, Iabaratory or clinical observations have provided insight into the mechanisms by which STD may enhance HIV acquisition and infectivity [Kreiss et al. 1994, Mostad & Kreiss 1996, Cohen et al. 1997, Fiscus et al. 1998, Fleming
9

10 Chapter 1
& Wasserheit 1999, Rotchford et al. 2000, McCielland et al. 2001]. SID can contribute to H1V transmission via several mechanisms:
Ulcers or smaller ulcer-like skin lesions increase the permeability ofthe geultal tract to the entry or excretion of the HN virus, by disropring the normal epithelial (i.e. skin) harrier. To a lesser extent, inflammation, wbich is associated with SID like gonorrhoea, also renders the genital mucosa more permeable to pathogens. Inflammation attracts (CD4-positive) wbite blood cells, the target cells for infection with the HN virus, to the genital tract. The increased presence of HNsusceptible or HN-infected wbite blood cells in the genital tract increases the likelihood of infection or its transmission [Kreiss et al. 1994]. Inflanunation may also enhance HN infectivity by increasing the levels of certain cytokines (i.e. biological messenger substances) in the genital tract, and thus by stimulating the replication of infectious HN virus.
· A simllar enhancement of replication of HN may result from coinfection of genital epithelial cells by the viruses HN and HSV-2; tbis is called vita! upregulation [Aibrecht et al. 1989].
· Another mechanism for enhanced HN replication may be the co-infection of macrophages (a certain type of wbite blood cells) by Treponema pallidum, the bacterium causing syphilis [Theus et al. 1998].
On the basis of these biomedical mechanisms, ulcerative STD are seen as stronger cofactors in HIV transmission than non-ulcerative STD.Among non-ulcerative SID, cofactor strength probably varles with the n-rent of inflammation.According to this interpretation, gonorrhoea would be a more important cofactor than chlamydia and trichomoniasis [Jackson et al. 1997a, Mostad 1998]. in females, it has been suggested that BV, wbich does not cause inflanunation but wbich alters vaginal flora and also lowers vagina! pH, enhances susceptibility to HN infection. The importance of tbis putative cofactor effect is subject to debate, however [Taba et al. 1998, Martin et al. 1999, Sturm-Ramirez et al. 2000].
laboratory studies have shown that treatment of sm reduces shedding of the HN virus in the geultal tract - a likely correlate of infectivity [Cohen et al. 1997, McClelland et al. 2001, Rotchford et al. 2000]. Tbis observation provides important support for the causality of the relationsbip between SID and HIV:
That is, it implies that the clustering between SID and HN is indeed due to SID predisposing to HN transmission, and not (entirely) tothereverse effect, i.e. that HN infection predisposes to STD [Wald et al. 1993], or to conformding due to the many risk factors that SID and HN share.
On the basis of these data, it is thus likely that the treatment of SID (and the improverneut of such treatment) helps to limit the spread of HIV: But how much wil! SID treatment help to prevent HN transmission? lfwe are to detertnine the proportion of HN prevention inputs that should be dedicated to improving STD treatment services- inputs that wil! inevitably be made at the n-pense of inputs

Introduetion
on other prevention strategies • this must be established. This is not sarnething we can leam ditectly from biologica! and epidemiologi
cal studies of the kind described above.Although the outcomes measured in biologica! studies are indicators of infectivity (such as genital HIV shedding) or of susceptibility, it is not known how they translate quantitatively into transmission rates. The translation of epidemiological HIV /STD correlations into STD cofactor effects is also probiernatie [Dickerson et al. 1996, Boily & Anderson 1996, Merrens et al. 1990,Nagelkerke et al. 1995,Hayes et al. 1995c].Their most important cause is that STD and HIV are both acquired during unprotected sex with high-risk partners: the more high-risk sö.-ual cantacts an individual has, the more likely he or she is to contract both STD and HIV This means that, even if STD cofactor effects did not exist, individuals who had STD would be more likeiy to have or contract HIV Unless this phenomenon is properly 'corrected for' in data analysis · which is very difficult ·, observed correlations cannot therefore teil us the magnitude of STD cofactor effects.
The role of STD in HIV spread can be better quantified on the basis of ö.-perimental studies that monitor the effect of improved STD treattuent on HIV spread .in actual populations. To date, a number of such 'intervention studies' have been conducted.The best evidence comes from community-randomised trials measur.ing the impact of STD treatment via comparisons between an intervention arm (i.e. group) and a 'comparison arm' that is not given the intervention. The impact is measured at the level of the popu!ation, rather than at the level of the individual participant. This is because the treattuent of STD in trial participants may not only affect these participants' own susceptibility to acquiring HIV but also their chances of infectiog their partners, who may or may not be receiving STD treattuent.At the community level, the impact of treanuent is further multiplied by the inditect effects even on individuals who neither participate nor have contact with participants, sirree STD prevalences in the whole population fall, reducing everyone's ö.-posure. In African settings in which HIV and STD spread throughout the popu!ation and are not conlined to high-risk groups, the popu!ation is also the most logica! level for evaluatiog interventions; in (rural) Africa, the village or community is the popu!ation level that is typically judged appropriate for the .inclusion of most direct and .indirect effects. In order to minimise the possibility that differences in outcomes between the study arms might be caused by unintended pre-existiog differences in risk level rather than to the intervention under study, the partidpating communities are distributed at random bernreen the intervention and comparison arm. This process is called ( community-)randomisation.
At time of writiog, two population-based randomised trials of improved STD treatment had been completed [Grossb.-urth et al. 1995a, Wawer et al. 1999]. Their interpretation and its implications form the main topic of this thesis. For an overview of the outcomes of other, less rigorously designed STD treattuent studies,
11

12 Chapter 1
the reader is referred to recent comprehensive reviews [Fleming & Wasserheit 1999,Mersonetal. 2000].
1.5 CoMMUNITY-RANDOMISED sm 'fREAThffiNT TRIALS
IN MWANZA AND RAKAI
The community-randomised STD treatment trials were conducted in rural U ganda aod Taozania in the 1990s. Their design aod main outcomes are summarised in Table 1.1. Both trials involved the impravement of STD treatment for the entire population in balf of the (10 or 12) rural communities, and foliowed approximately 12,500 adults to monitor the effects. Communities were distributed at random between the intervention and comparison arms.For rnro years, each trial measured the prevalenee of STD and the incidence of HIV in all participating adults. Subsequently, they calculated the impact of the intervention as relative reductions in these outcomes in the intervention arm as compared to the comparison arm.
Whereas the design of the trials was similat, the interventions tested differed. In Mwanza, Tanzania, the intervention involved an impravement of synd.rornic management for patients with STD symptoms who were seeking treatment in clinics (see 1.3). To encourage the population's use of the improved services, in addition,an outreach team made biannual visits to the communities served by the intervention clinics, giving health education on the availability of free, improved STD treatment aod on the importance of prompt treatment [Grossk"Urth et al. 1995b, Grossk"Urth et al. 1995a,Hayes et al. 1995b] .lo Rakai, Uganda, the intervention was home-based mass treatment of the entire adult population. The mass treatment and coinciding STD survey was repeated every ten months, so that the evaluation period between 1994 aod 1996 covered three survey rounds and the epidemiological impact of the fust two treatment rounds [Wawer et al. 1998, Wawer et al. 1999]. The difference between the trials in thelr treatment strategies paralleled a difference in their rationale. The Mwaoza trial intended to test a feasible aod sustainable STD intervention which, if effective, was to be actually implemented on a latger scale, preferably integrated into the general 'primary' health care system. The Rakai trial was a so-called 'proof-of-concept' study that almed to test the maximum reduction in HIV incidence that could be brought about by a maximum reduction in SID rates; to achleve the latter, the intensive periadie mass treatment intervention was considered the best means.
After two years, both trials observed reductions in STD prevalerrees in the intervention arm relative to the comparison arm, although these seemed falrly llmited, especially in Mwanza [Mayaud et al. 1997a, Wawer et al. 1999]. 1o
Mwaoza, an exceptionally large reduction was found in symptomatic urethritis (0.51,95% Cl 0.24-1.10 [Mayaud et al. 1997a]), but the interpretation ofthis out-

Introduetion 13
Table 1.1 The design and outcomes of the randomised community~based STD treatment trials in Tanzania and Uganda. Unless indieated, risk ratios were adjusted for (a) in Mwanza: Community pair, age, sex, history of STD ever prior to baseline survey, circumeision in men, travel during follow-up, STD prevalenee in community pair at enrolment; and in case of HIV also for: HIV prevalenee in community pair at enrolment; (b) in Rakai: Community pair, sex, age, marital status, religion, reported number of sex partner in previous year, partners resident ..2:_5km di stance from respondent's house, and condom use; and, in case of STD and HIV, respectively, also for: STD or HIV prevalenee in pair atenrolment [Grosskurth et al. 1995a, Hayes et al. 1995b, Hayes et al. 1995a, Mayaud et al. 1997a, Wawer et al. 1998].
design
period
follow-up at 2 years
STD inteTVention
Mwanza, Tanzania
randomisation of 6 pairs of rural eommunities
1992-4 (2 years)
71% of 12,500 adults (15-54 years)
syndromic management of symptomatic STD in clinics + population-based health education
Rakai, Uganda
randomisation of 5 pairs of rural eommunities
1994-6 (20 months)
74% of 12,500 adults (15-59 years)
home-based mass treatment of whole adult popuiatien every 10 months
Risk ratio intervention!comparison arm alter 2 years (95% confidence interval):
(active) syphilis' 0.71 (0.54-0.93) 0.59 (0.32-1.09)'
gonorrhoea
chlamydia
trichomoniasis in females
genital ulcers in past year
ineidence of HIV (over 2 years)
} 0.96 (0.50-1.85)3
1.09 (0.92-1.28)
1.275
0.62 (0.45-0.85)
1 Defined as TPHA-positive and RPR-titer > 1:8. 2 Adjusted only for community pair and baseline preva!ence. 3 Men on!y. 4 Statistica! significanee level in Wi!coxon test. 5 Crude.
0.66 (p ~ 0.444)
0.88 (0.50-1.53)
0.59 (0.38-0.91)
1.02 (0.80-1.29)
0.97 (0. 81-1.16)
come is unclear, as symptomatic urethritis was diagnosed only among men with reported genital symptoms or signs, the number of wbich changed during the trial (see 10.2.1).
Impact on HIV incidence differed markedly between the trials. ln Mwanza, STD treatment was associated with a 38% reduction (incidence ratio 0.62, with a 95% confidence interval of 0.45-0.85) [Hayes et al. 1995a], whereas in Rakai, HIV incidence was hardly reduced at all (incidence ratio 0.97, 95% confidence interval 0.81-1.16) [Wawer et al. 1999].

14 Chapter 1
1.6 EXPLAINING THE CONTRASTING OUTCOMES OF THE
MWANZA AND RAK:A:l TRIALS
The two trials gave different answers to the question of whether STD control can contribute to HIV prevention.lt is critica! to understand why they produced such different results, as this determines their implications for practical HIV prevention policy. Specitic questions include: W1ry was the impact on HIV incidence relatively large in Mwanza while STD had decreased there relatively little? W1ry did the STV reductions in Rakai not translate into an impact on HIV incidence? This section lists the hypotheses that have been advanced to explain the discrepancy in outcomes between the studies [Habbema & De Vlas 1995,Habbema & Korenromp 1999, Gross1.'ll11ll et al. 2000, Hudson 2001].
Table 1.2 Possible reasons for the difference in impact on HIV incidence between syndromic STD treatment (Sn in the Mwanza trial and mass STD treatment (Mn in the Rakai trial.
Differences in the interventions
ST but not MT continually provides treatment, improving coverage of STD episodes Mobility/migration disturbs periodic MT more than continua! ST Some cofactors, such as bacterial vaginosis, are more effectively treated by ST than byMT Most STD episodes become symptomatic, therefore ST misses only few (asymptomatic) infections Colactor effects are higher for symptomatic STD, the focus of ST The impact of ST on HIV in Mwanza is (in part) due to mechanisms other than a reduction in STD cofactor burden (like patient counselling on safe sex)
Ditierences in the study populations
Mwanza was in an earlierstage of the HIV epidemie, when STD cofactors are more important Rates of incurable colactor genital herpes (HSV-2) higher in Rakai Preceding behavioural response to HIV epidemie in Rakai had reduced rates of curable STD Greater mobility in Rakai than in Mwanza population
Viiierences in study design
Open cohort in Rakai included new participantsen rolled halfway, diluting apparent impact, vs. closed cohort in Mwanza The Rakai cohort but not the Mwanza cohort bordered non-intervention area, resulting in more di!ution of impact due to (re-)infection from outside
Random chance
In Mwanza, intervention arm started out with lower HIV/STD rates than comparison arm, intlating apparent impact

Introduetion
Possible explanations can be divided into tbe following categoties (Table 1.2): differences in the interventions differences in tbe study populations differences in study design random chance.
Interventions' mass vs. syndromic treatment
Because of tbeir different accessibiliry and target groups. mass treatment and syndromic treatment may differ in the number of cofactor STD treated. For several reasons, syndromic, clinic-based treatment (the Mwanza intervention) may reduce SID coJàctor burden more tban mass treatment (tbe Rakai intervention). Under a syndromic approach, treatment can be sought by patients at all times and at their own convenience. With periadie mass treatm.ent, in contrast, no treatm.ent is possible in episodes that occur in between treatment rounds, or in residents who are temporarily absent at the moment of treatm.ent. Since mass treatment derives its effect mainly from tbe simultaneous cure of a majortry of infected persons, its effectiveness may be markediy reduced by high SID reinfection rates; this is to be 0.1'ected in smali-scale trials in which infections are reintroduced into tbe communiry soon afrer each round by infected immigrants or by residents who were temporarily absent.Anotber potentially relevant difference is tbat some SID respond better to syndromic treatment · which allows for multiple-dose drug tberapies . tban to tbe single-dose mass treatment regimen adopted in Rakai. In particular, syndromic treatment may be comparatively efficient at eliring bacterial vaginosis.
As indicated in subsection 1.3.1, tbese advantages of syndromic treatment have to be weighed against its disadvantages: that it reacbes only symptomatic patients, and tbat reinfection by partners is not e>:plicitly combated (except in tbe rare case in which all sexual partners are co-treated).As additional explanations for tbe larger impact on HN in Mwanza, tbese disadvantages of syndromic treatment have been put into question. In particular, it has been proposed that missing asymptomatic infections is actually a minor disadavantage. First, only a small fraction of episodes may be asymptomatic. Second, the supposed benefit of covering asymptomatic infections might, from tbe perspective of HN prevention, be limited if tbe relative coJàctor effect of asymptomatic SID is small in comparison to tbat of symptomatic SID. This hypothesis follows tbe line of reasoning that coJàctor effects are in part mediared by mechanisms associated witb symptoms, such as inflammation and ulceration (see section 1.4).
A different mecbanism for a larger impact on HN under tbe Mwanza approach may have been tbat this intervention package also affected HN transmission by mechanisms otber tban tbe reduction of tbe STD coJàctor burden, for example
15

16 Chapter 7
through the STD health education offered to patients in conjunCtion with the antibictic treatment.
Study populations
Three dilierences in the popuiations in which the trials were conducted may have contributed to their contrasring outcomes.
At time of the trial, Mwanza was at an earlier stage of the HN epidemie than Rakai, and the role of STD cofactors is larger in earlierstages ofthe HN epidemie [Robinson et al. 1997]. In Mwanza, at the start of the trial in 1992 (which was estimated to be the tenth year of the HN epidemie), HN prevalenee among aduits was 4% and rising (reaching 6% two years later). In the Rakai trial between 1994 and 1996 (which were estintated to be the 16th and 18th years ofthe epidemie), HN prevalenee was roughly stable, at around 16% throughout. Earlyin HN epidemics, infeetions take place primarily in 'core groups' of highly sexually active individuals, who have high rates of STD. Later on, once HN has spread into the general population, more HN transmissions will occur in stabie relationships between !ow-risk individuals,fewer ofwhom have STD.In addition, due to deaths from AIDS among high-risk groups, STD preva!ences may fu.ll during the HN epidemie, further Jo wering the role of STD cofactors. An additional mechanism behind the decreasing cofactor role in actvaneed HN epidernies for curable STD specifically, might be an increase in the prevalenee of the incurable cofactor herpes (HSV-2) [O'Farrell 1999].This wouid occur because herpetic uicers are a symptom of HN/AlDS, and thus become more common with the increasing occurrence of AIDS.
Furthermore, at the time of trial, Rakai had just experienced a behavioural risk reduetion following the end of its civil war in 1986 [Serwadda et al. 1992, Konde-Luie et al 1993,Konde-Luie et al. 1997,Kilian et al 1999].By reducing the prevalences of STD and the relative frequency of occurrence of high-risk sexual cantacts in which STD are most important, this may have helped to decrease the importance of cofactor STD at time of the trial. In Mwanza, in contrast, risk behaviour had presumably been at a lower level than in Rakai during the 1980s -which wouid explain the fact that its HN epidemie was less severe as compared to that in Rakai -,but this risk level seems to have been maintained throughout.
A finaJ difference between Rakai and Mwanza that may have influenced the trial outcomes is their relative exposure to STD re-infeetion from people moving in and out of the trial area who had not previously bene.fited from the intervention. Living on themaintrading route between Tanzania and Uganda where there are relatively many trading centres, the Rakai population may have been more mobile than the Mwanza popuiation - which, in an area that is generally known for its poor infrastructure, induded isolated fishing villages far away from major roads.

Introduetion
Study design
Whereas the trials were similar with respect to the unit of randomisation and the time interval of impact measurement, they cliffered in two other design aspects that may have contributed to the clifference in the observed impact'. First, in Mwanza, impact on HIV incidence was measured in a closed cohort, wbich only
included individuals who were present both at the start and the end of the trial. In Rakai, the cohort included individuals who were present in the study area between any two rounds, but not necessatily all three.The Mwanza cohort, therefore, excluded a relatively bigher number of mobile individuals, limiting impact measurement to a lower-risk and more compliant part of the population. As a result, apparent impact may have been infl.ated as compared to what can be expected for actual target populations.
Second, in Mwanza the IllV incidence cohort was confined to com.munities in the inner part of the intervention area, whereas the Rakai cohort covered all intervention villages including those hordering the non-study area. The cohort selection in Mwanza may thus have reduced STD reinfection rates resulting from exposure of study partielpants to individuals from outside the intervention area, as compared to Rakai (over and above the possible clifferences in mobility levels between the populations described above).
Random chance
Since both the Mwanza and Rakai trials were single e>..-periments that were performed on a subsample of the target population, their outcomes are subject to random chance. The level of uncertainty in the impact estimates is represented by the large confidence intervals surrounding them. For Rakai, impact was estimated at a 3% reduction in HIV incidence, but with the preelietion that, in the hypothetical case that the trial should be repeated, the true impact could, with 95% certainty, !ie anywhere in a range of between -16% and +19%. For Mwanza, the cortesponding 95% confidence interval around its point estimate of 38% HIV incidence reduction ranged between 15% and 55%. It is therefore possible that, entirely by chance, the Mwanza trial found an unusually large effect, and the Rakai trial found an unusually small one.
Random chance may also have played a role in the baseline population characteristics co-determining their outcomes. In Mwanza, the communities randomised into the intervention arm by chance had, at the start of the trial, a lower average HIV prevalenee than the communities in the comparison arm (3.8 vs.
* It is of note that these differences do not denote true differences in intervention effectiveness, but rather observation artciacts assodated 'With small-scale trials.
17

18 Chapter 1
4.4%) [Grossk:urth et al. 1995a]. Because of this imbalance- which also held for some known HIV riskfactors [Grossk-urth et al. 1995a,Mayaud et al. 1997a]- the intervention arm cou1d be expected to have a lower incidence of HIV during the trial, even apart from intervention e:ffects.
1.7 METHODS: SIMUIADON MODEll.ING OF THE MWANZA
AND RAKAI TRIALS
The above sections make clear that it is not yet understood to what extent STD treatment can contribute to HIV prevention in SSA. Observational studies on STD cofactor effects do not provide evidence on this, and the two STD treatment trials yielded Contradietory resu1ts.ln this thesis we have mainly used simwation (computer) modelling to further evaluate the outcomes ofthe Mwanza and Rakai trials. This section describes the rationale for simulation modelling, and the char
acteristics of the model we used.
Rationale for modelling
Empirical testiog of the hypotheses that have been actvaneed to explain the ditferences in outcomes between the Mwanza and Rakai trials wou1d require large numbers of additional trials. For example, to exclude the role of random chance in the Mwanza outcomes, new trials wou1d need to be conducted, in a way that was as comparable as possible to the original trial.This is not possible,for several reasons.ln the years since the original trial, the Mwanza HIV epidemie has developed; therefore, in any 'repeat Mwanza trial' the starting HIV prevalenee wou1d inevitably be higher. Similarly, empirical testiog of, for example, mass treatment in Rakai at an earlier stage of the HIV epidemie wou1d not be possible. One solution might be to replace Rakai with another population that was comparable in all respects except for the factor under study, but, for obvious reasons, the existence of such populations is unlikely. Some may have ethical objections against repeat trials of syndromic STD treatment: since the Mwanza trial found a positive impact on HIV; withholding such intervention from a comparison group wou1d be unacceptable.Finally, even if additional trials cou1d be done, they wou1d be costly and their resu1ts wou1d require a long wait.
A sim pier, faster and cheaper way to extra po late trial outcomes to other populations and to explore the impact of alternative interventions may be to do theoretica} studies on the existiog data.Theoretical models can predict systematically what wou1d happen if only a single factor of interest were changed. For infectious diseases, this is commonly done with the aid of epidemiological transmission models [Yorke et al. 1978, Hethcote & Yorke 1984,Anderson & May 1991,

Introduetion
Habbema et al. 1992]. 'Dynamic" transmission modelling allows for the complex interactions between the infection status of different individuals or popuiatien groups, consictering the non-linear effects in disease spread within populations over time. For example, a rise in STD prevalenee brings with it increased exposure for STD-negative persons, and wiJl therefore increase incidence [Anderson 1994].As a result, a shortening of STD durations, thanks to for example improved treatment, can more than proportionally reduce STD rates. Another dynamic effect is changes in the popuiatien composition due to HIV/AIDS deaths. An example of a model study on the role of the type of STD treatment would be to sirnulare a Rakai-like mass treatment intervention in the Mwanza population and vice versa. Besides allowing the study of hypothetical alternative intetventions, or combinations of such interventions, modelling allows us to look at outcomes that are not easily measured in empirica! studies, such astheimpact over a Jonger time period than a two-year trial duration, and such as savings in disabilityadjusted Jife years - which allows for bener comparison of STD interventions withother health interventions [Over & Piot 1992].
Simnlation model STDSIM
The model studies in this thesis were performed with the microsimulation model STDSIM. This model describes the heterose>.."Ual spread of STD and HIY, and the effect of control measures upon it [Van der Ploeg et al. 1998]. STDSIM has been under development at Brasmus University Ronerdam since 1994, at the request of the Department of International Aid (Directorate-General 8) of the European Commission. The model is described in greater detail in Chapter 6. Below, we summarise its main features, consictering the different types of models available and the requirements imposed by our research questions.
The simplest models used for studying the spread and control of STD [Andersou 1989,Anderson 1991] setveto describe the general mechanisms operaring in disease spread and control at popuiatien level. Such models are commonly deterministic, i.e. they consist of a set of mathematica! equations descrihing the flow of individuals between 'healthy' and 'infected" or 'diseased' groups; the outeernes obtained under a given set of input assumptions are fixed.Another type of model, including STDSIM, simulates the transmission of infectionsin a popuiatien at the level of individual persons (so-called microsimulation) [Habbema et al. 1996]. Each individual is represented by a number of characteristics, some of which remaio constant (such as sex and date ofbirth),and some ofwhich change (e.g. the disease status). Changes in personal characteristics result from stochastic events (such as getting infected); whether and when an event occurs is determined by Monte-Carlo sampling from probability distributions. As an example, for a single sexual contact between an HIV-infected and an HIV-uninfected partner, one rnay specity a 0.1% chance that the infection wiJl be transmined.
19

20 Chapter 1
Repeated simulation runs of this model will differ in whether transmission actually occurred at this timepoint, and thereby in the subsequent course of the HIV
epidemie. Microsimulation roodels thus give an indication of the stochastic vanation in disease spread.
Modelling at the level of individuals is essential to the study of the relationship between HIV and SID spread: after all, interactions between these diseases occur at the level of individuals and their sexual contacts. One example is the effect of the HIV epidemie on SID epidemiology: due to deaths from AIDS among persons in high-risk groups, the average level of risk beltaviour and of
sm in the population is likely to decrease during the epidemie. This dynamic effect is much more difficult to represent in a group-compartmental model [Gar
nett &Anderson 1996a, Kretzschmar et al. 1995]. Similarly, the simulation of individuals whomayor may not be (co-)infected with different mixtures ofSID and HIV is the most intuitive, and technically the easiest, method of modelling biologica! interactions between SID and HIV [Boily &Anderson 1996, Koopman & Longini 1994]. Furthermore, so-called 'sexual network effects' are fully captured exdusively in individual-based roodels [Ghani et al. 1998, Morris & Kretzschmar 1998]. The term 'sexual nerwork' denotes the pattems in sexual partnerships, induding the heterogencity in sexual behaviour within the population (most individuals have few partners and few have many); it also denotes the mixing between individuals differing in age or in their respective numbers of ( concurrent) partners. These factors influence individuals' risk of infection, on top of their own risk behaviour. A final argument in fuvour of microsimulation is that such models are f!exible with regard to the specification of input, and especially of output. Both can be chosen to optimally resembie real-world (trisl) data,allowing,for example,for particular statistica! analyses and fucilitating meaningful comparisons between empirica! data and model outcomes.
1.8 .AJM.s AND 0~ OF Tiffi TiffiSIS
The overall aim of this thesis was to investigate the role of SID cofuctors on HIV transmission, and of SID treattnent in HIV prevention. We delined the following specific objectives:
· To estimate the magnitude of SID cofuctor effects on HIV transntission; · To quantitatively explore the importance of the explanations listed in Table
1.2 for the discrepancy in outcomes between the Rakai and Mwanza SID treat
ment trials.
The magnitude of sm cofuctor effects (Chapter 2) had to be estimated because
these values are input parameters to the trial simulations.At the same time, by explaining the difficulties and biases in estimating sm cofactor effects derived

Introduetion
from observational studies, thls study served as a (retrospective) justification of
the intervention ttials. And it can be seen as a cri ti cal reappraisal of the earlier insight - deemed proven by the Mwanza ttial and little disputed until after Rakai - that STD cofactor values are very large.
Of the categoties of potential determinants in Table 1.2, our studies focused on the type of STD treatruent and the type of population, because these were a priori thought to be most important. Chapters 3 and 4 explored the prob
ability with whicb episodes of gonorrhoea and chlamydia become symptomatic, a determinant of the impact of syndromic STD treatruent (and as sucb also an input parameter to the simulation model SlDSlM).This wasdoneon the basis of survey data from the Rakai ttial; the extent to whicb the outcomes are representative for the Mwanza population is addressed in the Generai Discussion (Chapter 10). As part of the studies on population differences, Chapter 5 doeurneuts a systematic comparison of STD prevalerrees between the ttials at their start. Both datasets had to be standardised for the relative sensitivities and specificities of the different diagnostic tests used, for differences in the age/sex composition of the tested subcohort, and for other eligibility criteria. Chapter 6
describes SlDSIM, with particular attention to its representation of sexual behaviour, whicb is one of the most difficult and critical aspects of the model. Chapters 7 and 9 give more details on the SlDSIM representations of STD, lllV and their biological interactions, whicb were especially relevant to their specific objectives. Chapters 7 and 8 e>:plore the importance of the type of STD treatment. This was done by simulating, besides the actual ttials, the hypothetical impact of a Rakai-like mass treatruent intervention in Mwanza (Chapter 7) and a Mwanza-like syndromic treatruent intervention in Rakai (Chapter 8).The role
played by the stage of the respective lllV epidernies was studied by simulating the impact of hypothetical STD treatruent ttials in Rakai at various stages of the lllV epidemie (Chapter 8).Among the mecbanisms detertnining the outcomes of this study was the effect of lllV on the dynamics of the incurable cofactor STD HSV-2. The model representation of HSV-2 was derived from a separate, more theoretica} simulation study, whicb is described in Chapter 9. Chapters 8 and 9 also address the role behavioural risk reduction played in explaining the outcomes of the Rakai ttial.
In the General Discussion (Chapter 10), the results of these studies are retumed to the perspective of the full set of hypotheses proposed to explain the contradictory outcomes of the Mwanza and Rakai ttial, as listed in Table 1.2. This cbapter also summarises the results of additional studies not reported in the thesis. Some of these provide additional evidence for or against the hypotheses
addressed in Chapters 2 to 9, and others shed light on the applicability and importance of the remaining hypotheses.
21


L.
Estirnating the magnitude of STD cofactor effects on
HIV transmission - how well can it be done?
Korenromp EL, De Vlas SJ,Nagelkerke NJD,Habbema]DF (200l),Estimating the magnitude of SID co factor effects on HIV transmission · how well can it be done? Sex. Transm.Dis., :in press. Reused with perm.ission of the American So.-uallyTransmitted DiseasesAssociation.

Acknowledgements The authors would like to thank Drs. Richard Hayes, Heiner Grosskurth and jam ie Robinsen for helpful discussions and comments on the manuscript. The study was supported and frnanced by the Commission of the European Communities (contract 87.6211/ 97/017).
Estimating STD catactor magnitudes
2.1 SUMMARY
Objective: To review possibilities for estimating cofactor effects of sexually transmitred diseases (STD) on HN transmission based on observational studies. Study design: We analyzed factors influencing associations between HN and STD, wbicb can bias STD cofactor estimations, from a seJ>.-ual network perspective. We discuss study designs tbat reduce distortions and metbods to improve estimates in tbe preserree of confounding. Results: Standard statistical adjustments of cofactor estimates are insufficient because tbey ignore dustering between HN and STD in partners of study subjects, resulting from population heterogencity in risk factors and assortative mixing. Reverse causation due to IDV-related immunosuppression may further inflate cofactor estimates. Misdassification of STD and dustering between STD can bias estimates in eitber direction. We quantitatively demonstrate that ignorance of se...-ual nernrork effects may result in considerable overestimation of cofactor magnitudes. Conclusion: The limitations of observational studies complicate quantitative inferences on the role of STD in HIV transmission.
2.2 INrR.ODUCTION
Observational studies have consistently shown tbe preserree of seJ>.-ually transmitted diseases (STD) to correlate witb increased rates of seJ>.-ual HN transmission. Biologica! and clinical studies suggest tbat tbis association is in part caused by cofactor effects of STD on HN transmission. STD may enhance tbe infectivity of HN-positive patients, because tbey increase shedding of tbe HN virus in tbe genital tract (tbe infectivity cofactor effect).Aiso, STD may increase tbe susceptibility to HN infection, because tbey disropt tbe mucosal integtity of tbe genital tract and increase tbe preserree and activation of HN susceptible leukocytes in tbe genital tract due to inflammation (tbe susceptibility cofactor effect) [Moss &
Kreiss 1990, Laga et al. 1991,Wasserheit 1992, Mostact & Kreiss 1996,Vemazza et al. 1999,Fieming & Wasserheit 1999].
If STD cofactor effects are strong and STD are bighly prevalent, STD control e.g. via impravement of STD management can be a strategy for HIV prevention. The effectiveness of STD treatment for HIV prevention has recently been tested in two trials in sub-Saluu-anAfrica, witb apparently contrasting outcomes [Wawer et al. 1999, Grosslmrtb et al. 1995a ]. While community-randomized trials can provide evidence of tbe role of STD in HN transmission in a particular population, tbeir implications for prevention policy in otber populations (e..xtemal validity) are not straightforward. The population-attributable fraction (PAF) of HN
incidence wbich is due to cofactor STD varies between populations [Vittingboff
25

26 Chapter 2
& Padian 1996], for example with the type of sexual network and the stage ofthe HJV epidemie [Robinson et al. 1997].Because ofthis, similar STD reductions may impact HJV incidence differently in different populations, and this neects consideration in the evaluation of cofactor effects and the implementation of interventions. For example, the lack of impact of STD reductions on HJV incidence in the mass treatment trial in Rakai, Uganda [Wawer et al. 1999] does notdisprove the existence of co.factor effects, nor the possible effectiveness of mass treatment in populations with a larger PAF of STD in HJV spread [Gray et al. 1999, Korenromp et al. 2000c].
Besides e.>.1:ernal validity, other probierus can complicate the interpretation of trial outcomes. Lack of impact on HJV may point at the non-existence of (strong) STD cofactor effects, but migbt as well simply be due to a failure to reduce STD rates. Conversely, if a trial showed a large rednetion in HJV incidence but only liltie reductions in STD rates (as did the trial of syndromic case management in Mwanza, Tanzania [Grossk-urth et al. 1995a, Mayaud et al. 1997a]), the impact of the intervention on HJV is not easily e.x-plained from a reduced STD cofactor burden, and other causa! pathways cannot be excluded [Hudson 200 1].
Prior to organizing STD intervention trials,and as a complementary approach tothese trials, researchers have tried to inter the importance of STD in HJV transmission by estimating the magnitude of biological cofactor effects. Using cofactor magnitudes as input in epidemiological transmission models, the proportion of HJV transmission attributable to STD, and the impact of STD control relative to alternative HN prevention strategies can be predicted for various settings [Stover & O'Way 1995,Robinson et al. 1995,Robinson et al. 1997,Bernstein et al. 1998, Korenromp et al. 2000c]. Provided good estimates of STD cofactor values are available, this approach would obviate the need to repeat effectiveness trials of every alternative STD control strategy in every new target population.
2.3 ESTIMATING STD COFACTOR MAGNITUDES
Cofactor valnes are commonly estimated from longitudinal observational studies monitoring HIV transmission in subjects or couples who had or did not have STD during or at start of an observation interval. (Often, the acqulsition of STD is however measured retrospectively, as otherwise it would have to be treated.) Associations between HIV transmission and SID presence in these studies can be expressedindifferent ways: as odds ratiosof cumulative transmission throughout the duration of follow-up intervals, as hazard rate ratios based on a survival analysis, or as relative risks per single sexual contact [Boily & Anderson 1996]. The interpretation of these cofactor measures is e:x.tremely difficult, as they are subject to a multitude of possible biases which may intlate or deflate thcir value [Mertens et al. 1990,Wasserheit 1992, Nagelkerke et al. 1995, Hayes et al. 1995c,

Estimating STD cofactor magnitudes
Boily &Anderson 1996, Dickerson et al. 1996].
Factors in.fl.ating STD cofactor estimates
Table 2.1 lists factors contributing to a positive association between STD and HN, whicb may inflate cofactor estimates. Tbe ptimary cause of spurious associations between STD and HIV is tbeir common mode of acquisition, tbrougb se:2..-ual contact with an infected partner. Since individuals with many or promiscuous partners are at higb risk for both STD and HN, associations between STD and IllV incidence are expected even in the absence of biologica! interactions [Mertens et al. 1990,Wasserheit 1992, Boily &Anderson 1996].ln order to reduce confaunding resulting from underlying same risk factors, cofactor estimates are commonly statistically adjusted for tbe presence of known risk factors, such as tbe number of partners of tbe subject at risk, e.g. by multivariate logistic regression or Mantel-Haenszel stratification. Such adjustment typically reduces the magnitude of tbe risk estimate [Telzak et al. 1993, Weir et al. 1994, Nelson et al. 1997, Nopkesom et al. 1998], as would be expected in case of confounding. It may however not fully resolve confounding, because STD, HIV and risk behaviour cluster not only in study subjects, but also in tbe ( unknown) partners of study
Table 2.1 Factors enhancing the association between HIV and STD, which can intlate STD cofactor estimates.
Factor
Same underlying risk behaviourfor STD and HIV
Heterogeneity in susceptibility to both STD and HIV, due to: - circumcision - general health, nutritional and immune status - hormonal contraception - young age in females
Heterogeneity in infectivity with both STD and HIV, due to: - circumcision - general hea!th, nutritiona! and immune status - HIV-related immunosuppresssion
Concurrent other cofactor STD, including entanglement of susceptibility and infectivity cofactors
Differential misclassification of STO status, due to: - misreporting of symptoms -short duration of STD relative to observation interval
Applies to which STD:
all
esp. u!cerative STD all all all
esp. ulcerative STD all esp. HSV-2 and chancroïd?
all
all esp. STD of short duration like gonorrhoea
27

28 Chapter 2
subjects, the partners of their partners, i.e. their sexual netwerk at large. Associations between STD and HN caused by common underlying risk behaviour are particularly streng because of heterogeneiry in risk bebaviour (for example, few individuals have many partners while the majoriry has few) and assortative mixing (bigb-risk individuals tend to choose higb-risk partners) [ Garnett &Andersen 1993a, Morris 1997]. Thus, having at least 1 unprotected contact in the form of an STD souree partner may indicate a relatively large probabiliry of unprotected centacts with other high-risk partners, which may confer a risk of HN on top of that from the STD souree partner.
Consicter a cohort of HN-susceptibles, some ofwhom experience an STD episode during the observation period, and some of whom do not.A subject experiencing an STD must have had an STD infected partner during fellow-up, who has him-/herself earlier acquired this STD by risk contact and is therefore relatively likely to harbeur HN as well. Consequently, an STD-exposed subject is at increased risk of being exposed to HN from the STD-infected partner, relative to subjects who do not experience STD. By enhancing the association between STD and HN acquisition, this effect thus infiates susceptibiliry colactor estimates. Importantly, since the window period tii1 diagnostic detectabiliry of STD (rypically 1 week [Holmes et al. 1999]) is shotter than the window period till seroconversion for HN (hetween 2-3 months [Horsburgb]r. et al. 1989,Willerford et
al. 1993]), the acquisition ofHN and STD in a single semal contact from an HN
and STD positive partner may in Iongitudinal studies appear as if the STD infection preceded HIV acquisition.
Non-behavioural risk factors that enhance either the infectiviry with or the susceptibiliry to STD and HN slmulraneously also contribute to the association between STD and HIY.Lack of circumcision, for insrance, probably contributes to the association between ulcerative STD and HN by increasing the susceptibiliry to, and possibly the infectiviry with those STD and HN in rnales independently [Cameron et al. 1989, ]essamine et al. 1990, Moses et al. 1998, lavreys et al.
1999, Quino et al. 2000].This effect may indirectly also inflate colactor estimates in females, if male circumcision causes STD and HN to cluster in their male partners and consequently in the women themselves. Other non-behavioural common risk factors include general immune and health status, nutritional/ vitamin A status, hormonal contraception and young age in females [Ciemetson et al. 1993,Mostad et al. 1997,]ohn et al. 1997].By causing heterogeneiry among individuals in the fragiliry of the gemtal mucosa and hence in susceptibiliry to and infectiviry with HN and STD, these- and other unknown- factors will inflate STD colactor estimates, unless they could be adjusted for in both study subjects and partners.
In the relation between HN infectiviry and STD, besides common risk factors, 'reverse causation', i.e. HN predisposing to having STD, is a souree of bias. A factor indueîng such 'reverse causation' is HIV-related immunosuppression. lmmunosuppression increases the presence and duration of STD in the later,

Estimating STD cofactor magnitudes
highly infectious stages of HN I AIDS disease, due to a worse treatment response, prolongation of the episode duration if left untreated and an increased occurrence of (recurrent) ulcers [Nzila et al. 1991,Wasserheit 1992,Wald et al. 1993, Ghys et al. 1995, Kau1 et al. 1997]. Evidence for this can be gleaned from the fact that treatment of HN patients for STD coinfection reduces the level of HN shedding, but commonly not to the low levels of non-STD infected HN patients [Moss et al. 1995, Cohen et al. 1997, Ghys et al. 1997, Rotchford et al. 2000]. It has also been suggested on theoretica! grounds that HN disease might increase the susceptibility to STD infection by altering the host response [Wasserheit 1992], althougil empirica! support for this is lacking.
Finally, dustering between different STD - which is plausible because of common underlying risk factors and has been observed empirically [laga et al. 1993, Cameron et al. 1989, Mbizvo et al. 1996, Dada et al. 1998] - enhances the association between HN and any single STD. Unless adjusted for, dustering may cause the effect on HIV transmission of each single cofactor to be overestimated. Clustering between a cofactor STD and a non-cofactor STD may cause the noncofactor STD to be erroneously perceived as a cofactor itself. This effect may for instanee play a role in observed associations between bacterial vaginosis (BV)
and HN [Cohen et al. 1995, Sewankambo et al. 1997, Taha et al. 1998, van de Wijgert et al. 2000], because BV has been showo to associate independently with trichomoniasis and other non-u1cerative STD [Sewankambo et al. 1997, Zenilman et al. 1999,Taha et al. 1999, van de Wijgert et al. 2000].
A special case of clustering of STD is in sexual couples. Due the high transmission efficiency of classica! STD (in the order of 10-30% per sexual contact [Brunham & Plummer 1990,Hohnes et al. 1999]), STD in HW-discordant couples are often present in both partners during at least part of the follow-up period. Estimates of the susceptibility cofactor can then be inflated by an additional enhancement of HIV transmission by the infectivity cofactor, and vice versa. The likelihood and extent of intlation due to concurrent STD depends on the internction between coexistent cofactors, wbich has notbeen srudied empirically.Their effectscan either mu1tiply- e.g. if genital u1cer disease (GUD) increases HN transmission 5-fold and chlamydia 3-fold, their combination increases HN transmission 15-fold - , add up - e.g. the combination increases HN transmission 7-fold
- , or saturate ~ e.g. chlamydia on top of GUD does not further increase HIV trans
mission. If cofactors multiply, the concurrent STD can increase HIV transmission equally in GUD-positive and GUD-negative individuals, and, in case the concurrent STD clusters with GUD, its cofactor effect then enhances the association between HN and GUD. If the cofactor effects add up or sarurate, however, the net effect on the risk estimate for the STD of interest is not obvious and depends on the degree of clustering between STD in the study popu1ation. In the ""xtreme case of no clustering between STD and saturatiog or additive cofactors, the concurrent STD might increase HN transmission more in GUD-negative individuals than in GUD-positive individuals, thus deflatiog the risk estimate for GUD. If
29

30 Chapter 2
cofactors result from different mechanisms, multiplication of their effects is biologically plausible. Tltis may for example be the case if an ulcer in an HN-negative person created a portal of entry for HIV; while a concurrent chlamydia infection increased the presence of HN-susceptible lnflammatory cells in the genital region. One same STD in both partners, e.g. genital ulcers wltich can create blood-blood contact, mayalso have a combined cofactor effect of at least the product of the individual cofactor effects (Heiner Gross1:urth, p.c.). For cofactor effects resulting from the same underlying mechanisms, saturation wollid seem more like!y.An example could be coinfection of an HN-patient with chancroid and syphilis. Each alone, these infections enhance the infectivity with HN [Fleming & Wasserheit 1999], but their combined effect probably saturates at some point.
Factors deilating STD cofactor estimates
Other mechanisms may dilute observed associations between STD and HN and bias cofactor estimates downward (Table 2.2).
N on-differential ntisciassification of STD status will dil u te any association, whether positive or negative. Misclassification is particularly likely for selfreported symptoms of non-ulcerative STD in females, wltich often cause only mild and aspecific symptoms that are not perceived at all [Holmes et al. 1999]. Also for laboratory-diagnosed infections, getting a complete track of STD occurrence during follow-up is often difficult. Poor sensitivity and specificity of diagnostic tests may cause misclassification. The time interval between fellow-up visits in cofactor studies is typically longer than the duration of STD episodes, so that infections may appear and resolve in between two subsequent visits and hence go unnoticed.
Table 2.2 Factors weakening the association between HIV and STO, which can deflate STD cofactor estimates.
Factor
(Non-)differential misclassification of STD status, due to: - misreporting of symptoms
- limitations in diagnostic tests -short duration of STD relative to observation interval
Non-differential misclassification of HIV status due to delayed seroconversion
Sexual abstinence during STD symptoms
Applies to which STD:
esp. non-ulcerative STD in females all esp. STD of short duration like gonorrhoea
all
esp. painful STD like ulcers

Estimating STD cofactor magnitudes
Differentlal STD misclassification, by contrast, can eitber dilute or enbance STD /HIV associations.As an ex:ample of enbancement, study participants e>..-periencing frequent STD episodes rnay be more likely to be classified as STD-exposed tban participants e>..-periencing STD less frequently, because tbe former are better at symptom recognition and tbeir chances of having at least one episode coin- · ciding witb a sampling moment are larger. In tbat case, tbe true difference in tbe number of STD episodes between tbe 'positive' and 'negative' group would be larger tban apparent, leading to overestimation of per-episode or per-contact cofactor effects.
like for STD, non-differentlal misclassification of HIV status at tbe beginning and end of follow-up intervals, due to a delay in seraconversion after HIV infection of about two montbs [Horsburgh Jr. et al. 1989, Wilierford et al. 1993] de.tlates positive assocïations.
Finally, if STD patients abstain from ha ving sex when symptomatic, actual associations would be lower tban tbe theoretica! cofactor effect, because tbe number of STD-enbanced HIV e..'>.-posures is small
2.4 EXAMPIE OF A COFACTOR ESTIMATION
The above sumrnary of determinants of STD /HIV associations elucidates tbe complexity of estimating cofactor magnitudes from observational studies. While confaunding due to common risk factors can be reduced by adjusting for as many subject attributes as possible, the conformding due to sexual network effects is however virtually impossible to completely control for. Even tbough tbe majority of studies taken as evidence for tbe existence of sigrtificant cofactor effects can be credited for using designs and statistica! analyses tbat reduce confaunding and otber distortions as much as possible [Holmberg et al. 1988, Cameron et al. 1989, Pluntmer et al. 1991, Laga et al. 1993,Telzak et al. 1993, Hayes et al. 1995c, Nelson et al. 1997], none oftbese can befree of all bias.Theoretically, tbe ideal design for a cofactor study would be a trial randantizing (rnatched pairs of) individuals into two groups, of which one would be infected witb STD and tbe otber not. Botb individuals in a pair would tben be exposed eitber in a controlled way and at a controlled frequency to tbe same HIV-positive partner(s), or uncontrolled to a randomized set of HIV-positive partners. By controlling and/or randantizing bath subjects and partners, distortions due to heterogencity in susceptibility to and infectivity witb STD and HIV are avoided. Cantrolling tbe mode and frequency of contact witb HIV-positive partner(s) should ensure homogeneity in e..xposure. Obviously, such human experiments are for ethica! and practical reasoos never performed; :imagi.ning them however illustrates how observational studies inevitably fall short of tbe standards. The impossibility for observational studies to avoid all tbese biases would not be of such importance if this could
31

32 Chapter 2
cause only small deviations. However, this is not true, as we will illustrate with data trom an often quoted quantitative example.
The cofactor effect of GUD on female susceptibility was estimated [Hayes et al 1995c] from a study ofHIV-negative prostitutes in Nairobi who were foliowed for on average 21 montbs [Plummer et al. 1991].ln this cohort,of68 prostitutes who reported one or more GUD episodes during follow-up, 72% seroconverted for HN, while 55% of 49 prostitutes without GUD seroconverted.To avoid biases in the estimates due to the relatively long duration of follow-up, during only part of which the S1D wouid be really present, the cofactor estimation focused on the effect per single s""-ual contact. Per-contact cofactors were derived from the observed cumulative risks, using estimates of the numbers of s""-ual contacts with HIV-positive dient-partners during follow-up and the duration of SID episodes [Hayes et al. 1995c].As summarized in Table 2.3, it was estimated that GUD enhances the per-contact risk of HIV acquisition by the women by a factor 23 [Hayes et al. 1995c ].
1n this calculation, HIV prevalenee was assumed to be equal in clients of GUDexposed and unexposed prostitutes. Because of clustering between the presence of HIV and STD and between HIV exposure and SID, which has for instanee been observed in studies in Uganda [ Catpenter et al. 1999] and Cameroon [Weir et al. 1994], the prevalenee of HIV rnight however be higher among the clients of GUD-exposed prostitutes.ln addition, S1D- and HIV- ""-posed prostitutes may have more frequent clients contacts.ln a subcohort of the same Nairobi population, HIV-positive prostitutes had a 22% higher elient contact frequency than HIVnegative prostitutes [Kaui et al. 1997]. lf we assume that, due to these effects, the number of HIV exposures was 20% lower among GL'D-unexposed prostitutes relative to GUD-exposed prostitutes, the cofactor estimate reduces from 23-fold to 12-fold (Table 2.3).
Table 2.3 also shows the possible bias ifthe effect ofGUD were confounded with that of Iack of circumcisîon in clients. Based on circumcision ra.tes in Nai~ robi rnales of about 91% in the general population [Hunter et al 1994] and between 73-81% among S1D clinic attenders [Simonsen et al 1988, Cameron et al. 1989, Nasio et al 1996], we estimated that about 20% of clients of GUD""-posed prostitutes, and 10% of clients of GUD-unexposed prostitutes were uncircumcised. lf we assume that the per-contact infectivity with HIV is 3-fold
higher in uncircumcised rnales [Cameron et al. 1989, Jessantine et al 1990, Moses et al 1998, Quinn et al. 2000], the cofactor estimate wouid be 14.
1n a third scenario, we considered that the GUD-exposed prostitutes suffered not only a susceptibility cofactor effect due to their own GUD, but, preceding this, also a male infectivity cofactor effect during the elient contact in which they acquired GUD.We estimated that GL'D-""-posed prostitutes, who each experienced on average 2.5 GUD episodes during follow-up [Hayes et al. 1995c],had on average 2.5 centacts with IDV~posîtive GUD souree clients during follow-up, during which a cofactor effect of 5 applied; no such effect was assumed for GUD-

Table 2.3 Quantitative illustration of the effect of confaunding on a per·contact cofactor estimate for genital ulcer disease (GUD) on susceptibility to HIV, basedon a cohort study of female prostitutes in Nairobi IPiummer et al. 1991, Hayes et al. 1995c]. Formulas adopted: rco = 1- (l-P)n {Eq. 1 ); 1t1 = 1- (1-P)no * (1-{P)nr (Eq. 2), where: rco = the observed cumuialive risk of HIV seraconversion for the STD-unexposed group; m = the observed cumuialive risk of HIV seraconversion for the STD-exposed group; n = thees limaled average number of sexual exposures to HIV over the follow-up period for the unexposed group; P = the corresponding per-contact HIV transmission probability in the absence of STD; no = the estimated average number of sexual exposures to HIV over the follow-up period for the STD--exposed group during the absence of the STD; n1 = the estimated average number of sexual exposures to HIV over the follow-up period for the STD-exposed group during the presence of the STD; f = the calculated per-contact cofactor effect. The stratifications in brackets in columns n , no and nr denale contributions of subgroups of dient-partners. Explanation of calculation for Base-case scenario: At a reported average frequent.-y of elient contactsof 3.8 daily [Piummer et al. 19911, 10% of which we re on average protected by condom u se, 1to = 55%, m = 72% and an estimated prevalenee of HIV in the male dient population of 11% [Hayes et al. 1995c], n was estimated at about 246, giving P = 0.0032 (Eq. 1). Assuming a fixed Ju ration per GUD episode of 1 week, no and 01 we re estimated at 242 and 6.6, respectively, giving f = 23 (Eq. 2) [Hayes et al. 1995c].
Confaunder
Base-case scenario
1. Sexual network
2. Circumcision
3. Clustering with STD in partner
Combination of 1,2and3.
Original (implicit) assumption
All below
Frequency of unprotected cantacts with HIV+ dienis is equal for GUD 1 and cuo· prostitutes
No cofactor effect of circurncision, and/or no clustering between GUD and circumcision
No clustering in STD status between partners, and/or no cofactor effect of GUD in the 'source' dient.
See above
t c = circumcised; u = uncircumcised
Alternative assumption
Frequency of unprotected contact with HIV 1
partners is 20% higher for GUD 1 relative to GUo· prostitutes. Cantacts with HJV+ partners do nol temporally cluster with GUD in the prostîtutes.
20"/o of partners of GUo+ prostitutes and 10% of partners of GUD· prostilllies are uncircumcised. Transmission probability is 3x Pin case of lack of circumcision. HIV exposures to uncircumcised partners do nol temporally cluster with GUD in the prostitute.
GUD-exposed prostitutcs have an average of 2.5 contacts with GUD souree partners, while GUDunexposed prostitutes do nat. GUD souree partners are all HIV+. GUD in souree partner increases P 5-fold, and does nut coincide with GUD in the prostitute.
All above. GUD souree partners are uncircumcised. The effect of dreunKision multiplies with the cofactor effects of GUD.
n'
246.0
220.4
246.0 le221.4; u 24.6)
246.0
220.4 Ie 198.4; u 22.0)
p
0.00324
0.00362
0.00270
0.00324
0.00301
no'
242.4
260.6
242.4 Ie 193.9; u 48.5)
242.4 {Guo- 239.9; GUD' 2.5)
260.6 Ie GUD· 208.5; u Guo- 49.6; u GUo+ 2.5)
"'' 6.6
7.1
6.6 (c 5.3; u 1.3)
6,6
7.1 (c 5.7; u 1.4)
23
12
14
20
3
~ "' ~·
"" ij 8 iil'
~ 3
<§
J
w w

34 Chapter 2
unexposed prostitutes. This changed the cofactor estimate from 23 to 20. Finally, as an illustration of the overall effect that residual confounding may
have, we consîdered these three confounders in combination. In thîs combined scenatio, the per-<:ontact cofactor estimate for GCD on female susceptibility consistent with the Nairobi data was only 3 (Table 2.3).
In contrast to factors intlating cofactor estimates (Table 2.1), factors deilating cofactor estimates (Table 2.2) are unlikely tobave played a large role in this example. Misclassification of ulcer incidence would seem uncornmon in this group of prostitutes, who thank:s to intensive and regular counselling on symptom reecguition and health seeking were believed to report to the clinic for the majority ofulcer episodes [Plurnmer et al. 1991, Hayes et al. 1995c].The long follow-up (21 months) relative to the HN window period renders misclassification of HN
status during the first and last months ofthe observation interval relatively unim
portant. A reduced frequency of seo..-ual contact during GCD was however possible, and indeed taken into account in the original analysis, under the estimated number ofHN exposures during the presence of GUD [Hayes et al. 1995c].
2.5 DISCUSSION
By consictering all determinants of associations between STD and HIV; we showed that available study designs and methods of statistica! correction are not sufficient to resolve all biases that can occur when estimating the magnitude of STD cofactor effects from observational studies. The most important souree of bias is confouncling due to the common mode of acquisition, and hence the multiple cornmon risk factors, for STD and HN (Table 2.1). In particular, ignorance of sexual netwerk effects can result in considerable overestimation of cofactor effects. Our quantitative example hereof, in which the consideration of three plausible confounders reduced a per-<:ontact cofactor estimate for GUD
on female susceptibility from 23 to 3 (Table 2.3), by no means exhausts all possibie levels and combinations of distortions.ln more heterogeneons study populations, confaunding is probably more severe than in the NairObi prostitute cohort, where heterogeneity in risk behaviour was likely present in the elient partners but probably not so much among the prostitutes themselves [Plurnmer et al. 1991].
In contrast to confounding, which besets all observational studies, a subset of cofactor studies is affected by STD misclassification (Table 2.2). The dilution of cofactor estimates that may result from this can be reduced by increasing the frequency of follow-up visits, as has been done in recent studies [Ral,war et al. 1999].The avallability of more reliable STD diagnostic tests may in future reduce this problem further.

Estimating STD catactor magnitudes
Within the restrietion of observational studies, a preterred study design may be the follow-up of monogamous HIV-discordant couples [De Vincenzi 1994,
Gray et al. 1999, Carpenter et al. 1999, Quinn et al. 2000]. In such cohorts, partner attributes such as circumcision status and the level of immunosuppression can be taken into account, and heterogeneity in exposure to HIV and STD is relatively limited. Couple studies, however, have disadvantages as wel!. These
relationshlps may not be representative for all partnershlps. For example, stabie relationships in which HIV has not yet been transmitted from the HIV-positive partner may disproportionally indude recently initiated relationships, or partners who forsome reason are relatively non·infectious. Furthermore, the validity of this design depends critically on whether the HIV-negative partners behave truly monogamously during follow-up, and the HIV-positive partners do not.
A further step can be the re-analysis of observational studies using dynamic individual-based transmission rnadeis th.at simulate the dustering between STD
and HIV due to same underlying risk factors, pattems in seJ..-ual behaviour and STD cofactor effects. Projected STD/HlV associations in simulated individuals and couples can be compared with dassical cofactor estimates by processing them statistically as commonly done with actual data, iteratively fitting them
against those empirica! estimates by varying the underlying model input catactor values. By simuiaring a speci.fic cohort study with respect to its design, the se...",-ual netwerk in which it was based and the statistica! analysis, cofactor magnitudes can thus be indirectly estimated from these data, accounting for both commonly considered biases and sexual network effects. Network simulations have provided important theoretica! insigbts into the determinants of STD /HlV associations [Koopman et al. 1991, Robinson 1994, Boily &Anderson 1996].1t must however he bome in mind that the added value of model-based cofactor estimates depends critically on the correctness of representation of the sexual netwerk and of the quantitative effect of all other sourees of bias.lf the netwerk or some sourees of bias are not well known, model-based estimates may not be better than simpler estimates.
Previous overestimation of STD cofactor effects may be one of the reasens for t11e disappointing lack of impact of STD prevalenee reductions on HIV incidence
in the STD treattnent trial in Raka.i [Wawer et al. 1999].The contrasting outeernes of the Mwanza trial, which showed a large impact of improved syndromic STD management on HIV incidence with apparently very limited STD reductions [Grosslmrth et al. 1995a, Mayaud et al. 1997a] have been discussed elsewhere [Fiabbema & De Vlas 1995, Hudson 1999, Grosslmrth et al. 2000]. Like intervention expectations, estimates of the fraction of HIV transmission attributable to STD calculated on the basis of classica! cofactor estimates may as wel! be inflated [Otten Jr. et al. 1994, laga et al. 1993, Fleming & Wasserheit 1999, Gray et al 1999, Orroth et al. 2000].Also,previous model projections, which have assumed cofactor effects of up toa 100-fold per sexual contact [Robinson et al. 1995,Rob-
35

36 Chapter 2
inson et al. 1997, Bernsrein et al. 1998, Korenromp et al. 2000c] may have exaggerated the importance of STD in HN spread and prevention.
Besides biasing the overall value of cofactor estimates, the limitations of observationa! studies have other implications.The strengthof distortions differs between populations, depending on the extent of heterogeneity in seJ>."Ua.l behaviour and the loca! prevalenee of additiona! confounders, such as AIDS-induced immunosuppressîon.This complicates the comparison between studies and pop~ ulations ofPAFs based on such population-dependent risk estimates.For instance, the PAF of STD in HN transmission has been estimated as larger in the Mwanza trial population as compared to the Rakai trial population. This was however for a considerable part due to higher risk estimates in Mwanza, and not only to a higher fraction of HN seroconverters exposed to STD [Gray et al. 1999, Orroth et al. 2000] .lf the larger risk esthnates in Mwanza related mainly to more (residua!) conformding than in Rakai, e.g. due to the different follow-up scheme or to stronger dustering in Mwama between STD and other risk factors, the site comparison would be flawed and the site difference in PAFs overestimated.
Furthermore, as some biases apply only to subsets of STD, it is unclear whether the observed strengthof associations with HN of different STD directly reflect their relative cofactor strengths. For example, the relatively strong association between HN and ulcerative STD as compared to non-ulcerative STD may in part result trom the srrong association of ulcerative STD with Jack of circumcision and HIV-related immunosuppression.
In condusion, given the difficulty in estimating the magnitude of STD cofactor effects and the absence of solid and consistent evidence from STD intervention trials, it remains uncertain how much STD treatment can contribute to HIV prevention. Clearly, additiona! commtmity-based intervention trials would help darify this issue. As yet, for evidence-based HN prevention policy, condom promotion and other forms of (targeted) primary prevention - which directly prevent the transmission of HIV as wellas STD- remaio the safest bet. However, even if STD co.fuctor effects on HN transmission would be weaker than previously thought, improving STD management remains an important component of HN
prevention programmes.Any association between STD and HN, whether causa! or not, indicates that STD patients are at high risk of contracting and transmitting HN.The education, counselling, condom provision and contact tracing that is part of comprehensive STD management can therefore be an effective means of targeting these HIV prevention strategies to those most in need.

The prevalenee of selfreported discharge and
dysuria inNeisseria gonorrhoeae and
Chlamydia trachomatis infection:
a systematic review
Sudaryo MK, Korenromp EL,.Arends LR, Habbema]DEThe prevalenee of self-reported dis-charge and dysuria in Neisseria gonorrhoeae and Chlamydia trachomatis infection: a systematic review. Submitted for publication.

Acknowledgements We thank Prof. T Steijnen and Prof. A Ah i bom lor statistica! advice. ELK and JDFH were financially supported by the European Community (contract number 87.6211/97/017). MKS was financially supported by the lslamic Development Bank.

Symptom prevalenee in gonorrhoea and chlamydia infection
3.1 SUMMARY
Objective: To estimate the point prevalenee of self-reported discharge and dysuria among patients infected with Neisseria gonorrhoeae (NG) or Chlamydia trachomatis (Cl), and to assess the influence of treatment seeking behaviour in the population hereon.
Methods: Literature review and pooling of prevalences across studies. Correlations in the occurrence of discharge and dysuria, and the relation between symptom prevalenee and indicators of STD treatment pattems, were assessed as Pearson correlation coefficients. Resufts: Pooled prevalerrees of discharge and dysuria were 23% and 17% for NG in females, 26% and 7% for CT in females, 18% and 22% for NG in males, and 6% and 6% for CT in rnales. For fernales with either infection, the prevalenee of discharge vatied considerably between studies. For rnales but less for females, the prevalerrees of discharge and dysuria tended to correlate positively, across populations and within individual patients. Symptom prevalenee did not eerrelate with the proportion of cases seeking medica! treatment (p = 0.97) or the patient delay interval in the popwation (p = 0.6). Conclusions:The prevalenee of self-reported symptoms is low among NG- and CT-infected subjects across a range of populations, in spite of vatiation in rates of sm treatment. Besides the pathogenicity of the infections and treatment pattems, geographical variation in (subjective) reporting behaviour and, for fernales, aspecific discharge may be importantdeterminantsof symptom prevalence.The prevalenee of self-reported symptoms alone is not a good rationale for choosing bernreen NG- and CT- control strategies, nor for evaluating the success of treatment services.
3.2 INTR.ODUCTION
Se..xually transmitted diseases (Sills) are widespread and a major cause of acute and chronic morbidity among adults throughout the developing world; their control is considered important and highly cost-effective [Piot & Islam 1994, Over & Piot 1996]. The choice of the most appropriate Sm control strategy should take into account how many cases are symptomatic. If most patients become symptomatic and seek treatment for these symptoms, high quality clinical case management would be an important component of control programmes. Even in settings where diagnostics on the aetiologie agent is not feasible, the syndromic approach, which consists of treating patients for the main possible causes of their symptoms [Adier 1996,WJ.I.kinson 1997, Dallabetta et al. 1998], could guarantee adequate treatment. lf most patients develop symptoms but fail to recognize these or do not seek treatment, education on symptom recognition and on
39

40 Chapter 3
the importance of prompt treatment becomes essential. However, ifthe majority of infections pass without symptoms, more active intervention, such as screeningor mass treatment,may be appropriate in addition.Therefore,knowledge on symptom frequency is important in S~are decision making.
For Neisseria gonorrhoeae (NG) and Chlamydia trachomatis (C1) infection, the main acute symptoms, which form the entrance point for syndromic treatment, are genital discharge and dysuria.These infections are however thought to often pass without producing these symptoms, especially in wamen [Handsfield et al. 1974, Oates & Csonka 1990, Martin 1990, Holmes et al. 1999]. Symptom probability is usually estimated from cross-sectional studies measuring the proportion of STD infected persons reporting current symptoms. In this chapter, we present a systematic review on the prevalenee of self-reported discharge and/or dysuria among NG- and CT-infected rnales and females in general populations from across the world that were reeruired according to the same set of criteria. We assess the correlation between the occurrence of both symptoms, and how these rates relate to the e":tent of STD treatment in the population. We discuss the use and limitations of the prevalenee of self-reported symptoms as the rationale for choosing between STD control strategies in the light of our results.
3.3 M:Ernoos
literature search
A systematic review was performed of English language articles reporting any of the following outcomes of interest on infection with NG and/or CT in adult and adolescent rnales and females (with the exception of sexual abuse cases in adolescents):
the proportion who experience current discharge (females: abnormal vagina! discharge; males: urethra! discharge) and/or dysuria; the proportion seeking effective medica! treatment; the patient delay interval, i.e. the time period between the onset of symptoms and the receipt of effective medica! treatment (more properly, this is the sum of patient delay and health care delay, but we will use the term 'patient delay' for brevity).
We interpreted any treatment in modem health facilities providing recommended antibictics as effective.
Eligibility criteria for studies on symptom prevalenee were: · The artiele contains quantitative information on the proportion of infected
patients reporting genita! or urethra! discharge or dysuria.This could be either
Symptom prevalenee in gonorrhoea and chlamydia infection
a direct estimate of this proporti on, or the possibility to derive this proportion from reported numbers or proportions with and without STD among symptomaric and non-symptomaric groups.
· The subjects have been recruited in such way that they are non-selecrive for the symptoms of interest, i.e. from general popularions, antenatal and family planning clinic artenders or comacts referred by STD parients. Thus, we excluded studies involving subjects visiting clinics because of symptoms. Symptoms refer to those perceived and reported by subjects (as opposed to "signs" observed by physicians).
· The term' current' refers to symptoms perceived at the time of study interview or within a period of maximally 6 months before the interview.
The search was done on Medline databases of between 1966 and 2000, with the search program Ovid Search Software version 3.0, by combining the subject headings gonorrhoea, chlamydia, urethritis, vagina! discharge, urinary tract infection, and cervicitis with rhe text worcts discharge and dysuria. For symptom prevalence, this search was combined with a search of te.."\.'1: word symptom*; for parient delay with subject heading time factor and/or text word delay; for the proportion seeking treattnent with subject heading patient acceptance of health care and/or tö..'t words health seeking, treatment seeking. or seek treati'. To increase specificity, searches from subject headings were limited to the fields diagnosis, drug therapy, epidemiology, eriology, and transmission. ln addition, we identified eligible articles by back tracing from the reference list of articles already included, or upon suggesrion by experts. These addirional strategies served to reduce the probability of misssing papers due to limitarions in our search strategy, incompleteness of the Medline database, and missing informarion in ritles or abstracts of articles included in Medline and identified by our search strategy.
Data e..-..:traction
From each article, we extracted place and time period of the study, characterisrics of the study popularion and sampling frame, method of diagnosis of the infection, time of e>...-periencing symptoms, and if available the presence of concurrent other non-ulcerarive STD and the prevalenee of symptoms among uninfected controls. Data on patient delay were recorded as means or medians. For studies reporting only the distribution of patients over categories of delay intervals, we estimated the median assuming a homogeneaus distribution of cases within each category, and assurning a mean durarion of 1.5 times the lower limit for each uppermost category (e.g.10.5 days fora category of'7 or more days').Data were independently extracted by two invesrigators (MKS and ELK) and subsequently compared. Discrepancies were resolved by discussion and consensus.
41

42 Chapter 3
Statistica! analysis
We pooled "primary data" as if all patients in all studies combined were one big sample and calculated tbe overall symptom prevalenee and tbe corresponding 95% confidence interval (CI).To analyse tbe relation between outcomes, Pearson correlation coefficients (r) and tbe cortesponding p-values of statistica! significanee were ca!culated, using SPSS version 9.
3.4 RESULTS
Articles identified
Using tbe criteria outlined above, we induded 36 artides, publisbed between 1969 and 2000 (Appendices I and II). The studies come from 5 continents and indude botb developing and industrialized countries. The nurnber of subjects per study varied from 2 to 2570. Some artides were undear about tbe time of experiencing symptoms (Appendix I); in these cases we interpreted symptoms as "current".
Symptom prevalences
Talcing into account tbe sample sizes of srudies, the prevalenee of self-reported symptoms were reasonably similar across studies, except for discharge in temales (Figure 3.1). For discharge, tbe range was zero to 100% in females and zero to about 50% in males, while tbe prevalenee of dysuria ranged from zero to about 20% in females and zero to 40% in males. Studies reporting a 0% prevalenee were mainly ones witb small sample sizes, and this omeome rnay tberefore in part relate to chance variatien around a very low prevalenee in tbe base-popuiatien from which tbe study popuiatien was sampled. No dear relations were apparent between symptom prevalenee and the geographical location of tbe study (Appen
dix I). Figure 3.1 also shows tbe pooled symptom prevalence. For temales witb
either NG or CT, discharge was on average more common than dysuria. Oppositely, among rnales witb NG, dysuria was more common tban discharge.Among males, botb symptoms are more common in NG tban in CT, while for females, only dysuria was more common in NG tban in CT infection. Discharge was more often seen in temalestban in rnales for botb STD. On average, for NG, both symptoms were about as frequent in females as in males, while for CT, discharge was more prevalent in females tban in males.

Symptom prevalenee in gonorrhoea and chlamydia infection
0
0
""":""''"::: ------o----7 ... ,(i) •••
Femalc
0
0
0
0 0
0 0
0
0
0
11 Q s!IJdy of (opproxlmnt<>IY) 130 cooos
0 study of (opproxlmntoly) 15 cases I
::::::: poolod pmvnlonce I
llmlto of95% Cl of tho ml<t<l pravnlonoo
0
-0-
dlscMrgo dy.;urto dlcchO'!JO dysurlo dlschorgo dysuno
<G c• Male
Symptom, type of lnfcctlon, gender
figure 3.1 Prevalenee (%) of discharge and dysuria in females and rnales infected with Neisseria gonorrhoeae (NG) or Chlamydia trachomatis (CT), in individual studies and pooled across studies. Each ei rele represents one individual study. Study sample size is proportional to the square of the cirde surface area (see insert).
100 I
so-
~
60 j . ~ ~ ~
~
"1 ~ D
• • ~
201 có'
D
• • 0 -. • 20
0
• • •
60
Prevalenee of discharge (%)
I
o0
NG female CT fomale
c NG male • CTmala
• eo 100
Figure 3.2 Correlation between preva~
lences (%) of dysuria and dis-charge, stratified by gender and type of infection, from studies reporting both categ<r ries of symptoms for the same population. Each symbol represents one individual study .
Correlations between discharge and dysuria within populations
Among studies reporting both discharge and dysuria separately (Figure 3.2), for rnales the proportion with discharge correlated positively with the proportion
43

44 Chapter 3
with dysuria, for both NG and CT (r = 0.92,p = 0.03, and r = l.OOO,p < 0.001, respectively). For females, however, discharge was more frequent than dysuria in all but one study, and these two proportions did not correlate (r = 0.72,p = 0.28, and r = 0.07,p = 0.87, fur NG and CT respectively). While the proportion of female patients with discharge varled widely among these studies (between 0 and 76%), the proportion with dysuria was low (between 0 and 22%) in all.
Prevalenee of either vs. both symptOins
In most countries, syndromic treatment guidelines use as criterion for non-ulcerative STD the presence of discharge and/ or dysuria [Dallabetta et al. 1998]. For assessing the value of syndromic management, we therefore looked at the com· bined prevalenee of at least one of these symptoms. Due to overlap in symptoms (some patients having both and others neither), the overall symptom prevalenee wil! be less than the sum of the prevalences of discharge and of dysuria sepa· rately.This effect may be enhanced if the occurrence of both symptoms clusters within individual patients, due to variations in symptomaticity between bacterial strains or types, patients and ethnical groups [Crawford et aL 1977,Workowski et al. 1994,Alary et al 1996, Royce et al. 1999] .In the studies in this review, cluster· ing may be interred from the correlation in prevalenee between these 2 symp· toms across populations (Figure 3.2). We therefore compared the prevalences of discharge, dysuria and the combination of either or both symptoms in the subset of studies reporting all3 outcomes.ForNG infemales, this subset of stud· ies had an average prevalenee of 9% for discharge and 16% for dysuria [Catterson & Zadoo 1993, Colvin et al. 1998, ~'ton et al. 1998b].lf both symptoms would occur independently, the combination of at least one symptom would be expected to occur in 24% of cases,i.e.in (100. ((100.9)'(100.16))%.The observed prevalenee of reporting at least one symptom was 25%, suggesting that these two symptoms did not correlate. Also in rnales with NG Uohn & Donald 1978, Mayaud et al. 1997a, Rees et al. 1977, Colvin et al. 1998, Paxton et al. 1998b], the observed prevalenee of at least one symptom was similar to the eJ>.-pected combined prevalenee (both 30%), suggesting no correlation between discharge and dysuria. In line with this, in 4 studies in NG-infected rnales that did not discriminate between discharge and dysuria [Arya et al. 1973, Fransen et al. 1985, Handsfield et al. 1974,]ackson et al. 1997b], the average prevalenee of discharge and/or dysuria was 39% (Appendix 1), similar to the sum of the averages for discharge (15%) and for dysuria (22%) over all studies included. For CT, however, the prevalences of at least one symptom were, at 5% and 14%, only 0.6 and 0.8 times the eJ>.-pected value in case of independenee in rnales [Colvin et al. 1998, ~'ton et al. 1998b, Harms et al. 1998, Matondo et al. 1995] and females [Cat· terson & Zadoo 1993, Colvin et al. 1998, ~'ton et al. 1998b, Oriel et al 1972], respectively, suggesting clustering between both symptoms.

Symptom prevalenee in gonorrhoea and chlamydia infection
Relation of symptom prevalenee with treatment seeking and patient delay
If most symptomatic patients seek tteatment and get cured, the prevalenee of symptomatic infection falls; consequently, the point prevalenee of symptoms is in genera!lower than the cumulative probability per episode of getting symptoms, and symptom prevalenee would be e;.:pected to vaty with treatment patterns in the popwation [McCormack 1981, Gamett et al. 1999].ln orderto understand to what extent the observed variations in symptom prevalenee (Figure 3.1) was due to varlation bernreen populations :in treatment patterns, we assessed whether symptom prevalenee correlated with tteatment rates and average patient delay in the same population. Since very few studies reported both symptom prevalenee and proportion tteated or patient delay for NG- or CT-infected populations, we also correlated outcomes derived from different studies on dosely related populations. For example, the patient delay interval among male STD clinic attenders with NG in London between 1973 and 1975 [Alaul et al. 1977] was correlated with the symptom prevalenee among rnales infected with NG who were identified as comacts ofNG patients in clinics in London in 1977 [John & Donald 1978] (Appendix 11). Where matching between closely related NG- or CT-infected populations was not possible, studies reporting patient delay or treatment seeking rates for STD in general (i.e. not only NG and CT) were used. Among 5 populations with information on symptom prevalenee and the propnrtion seeking tteatment, no correlation was apparent (r = -0.02,p = 0.97; Figure 3.3a). Among the 8 populations with dara on symptom prevalenee and patient delay, these two outcomes did not correlate either (r = -0.18,p = 0.6; Figure 3.3b).
'"" 100-
~ :1 '" j ~
1 oo-
• ~J '" j •
E • • % • • • • • ~ ~ '"- • ': l • •
~ " '" "' " " ' '" " " a. Proportion sceklng trcatmcnt (%) b. Paticnt delay înterval (days)
45
•
'" " "
Figure 3.3 Correlation between prevalenee (%) of symptoms and (a) proportion (%) of patients seeking treatment; (b) average patient delay interval (in days), in the same or a similar population. For matching of studies, see Appendix 11.

46 Chapter 3
3.5 DISCUSSION
Our review of the prevalenee of self-reported symptoms in NG and CT infection revealed two interesting findings. Discharge among females was on average the most prevalent symptom, although discharge prevalences varled widely between studies; un!ike symptoms for either infection in males, discharge clid in females not correlate with dysuria. Furthermore, for the other categories, prevalences were relatively similar (and low) across populations, despite likely varlation in the intensities of treatment; and symptom prevalenee clid not correlate with indicators of the extent of sm treatment.
If we ignore the outcomes on discharge :in females, the results confirm the genetal notion that infection with NG and CT is often asymptomatic [Handsfield et al. 1974, Oates & Csonka 1990,Martin 1990,Hohnes et al. 1999].Among males, dysutia was slightly more prevalent than discharge in either infection.These findings are in line with insights in the natura! course of NG and CT infections [Hohnes 1974, Schachter et al. 1975,Martin 1990, Oates & Csonka 1990, Hohnes et al. 1999].Among males, both symptoms were more prevalent in NG than in CT, and among females, dysuria was more prevalent in NG than in CT. These outcomes are as expected if NG infection produces more severe symptoms than CT does [Schachter et al. 1975, McCutchan 1984, Stammet al. 1984, Martin 1990, Hohnes et al 1999].Among NG patients, dysutia was about equally prevalent in rnales and females. This may seem inconsistent with the existing idea that nonulcerative sm pass more mildly in females than in rnales [Oates & Csonka 1990, Wiesner 1981]. However,as explained above, symptom prevalences are not only determined by the pathogenicity of the infection, but also by the levels of treatment of symptomatic patients [McCormack 1981, Garnett et al. 1999]. If treatment rates are lower for females than for males, or if females who get treated do so less timely than males, as has been observed in many sertings [Faxelid et al. 1998,Moses et al. 1994,Newell et al. 1993,Wrlkinson et al. 1998], this dynamic effect may cause symptom prevalenee to be higher in females than in mal es, even though per infection episode, symptoms are more likely to develop in males.
A likely explanation for the relatively high prevalenee of discharge in females is aspecific clischarge. Genital tract infections other than NG and CT, as well as pregnancy [Hohnes et al. 1999] can also cause abnortnal clischarge, and may in fact be a more common cause of this syndrome than NG and CT [Dallabetta et al. 1998].ln our review, 6 stuclies [Chokephaibulkit et al. l997,Edwards et al. 1985, Mayaud et al. 1997b, Saltzet al 198l,Tait et al. 1980,Waters & Roulston 1969] reported on co-infections in female patients, with prevalences of trichomoniasis vaginalis, canclicliasis, and bacterial vaginosis ranging between 6% and 51%. In
line with this, prevalences of discharge among NG- or CT-negative controls were sometimes almost equally high as among infected subjects [Chokephaibulkit et al. 1997,Keimetal. 1992,Kovacsetal. 1987,Lhnetal1989,Saltzetal. 198l].ln comparison, for rnales only one study reported on coinfection, at a 29% rate for

Symptom prevalenee in gonorrhoea and chlamydia infection
Trichomonas vaginalis [Watson-Jones et al. 2000]; no studies reported on symptom prevalerrees among NG- or CT-negative male controls (Appendix I). Because only a subset of tbe studies included reported symptom rates in control groups, we could not adjust for aspecific symptoms in tbe pooled analysis. This implies tbat tbe obtained symptom prevalerrees overestimate tbe proportion of NG- or CT-episodes tbat induce specific symptoms providing temales witb an incentive to seek care. Importantly, concurrent vaginal infection witb otber patbogens and pregnancy are most prevalent in tbose populations witb least access to STD diagnostic and treatment facilities. Therefore, the overestimation of symptom prevalence, and consequently of tbe effectiveness of tbe syndtomic STD treatment approach, may be especially large for resource-poor settings.Aspeci.fic discharge mayalso have conttibuted to tbe observed population heterogeneity in tbe prevalence of discharge among NG- and CT-infected women, as tbe study populations, which came from a wide range of countties (Appendix I) likely differed in the rates of coinfection and pregnancy.
Contrary to tbe tbeory [McCormack 1981, Garnett et al. 1999], our correlation analyses did not confirm a dependency of symptom prevalenee on treatment pattems (Figure 3.3), despite vatiation between tbe populations studied in the e.."\:tent of STD treatment (Appendix ll). Several factors may e:>--plain this finding. First, the matching between studies reporting on tbe different outcomes was far from perfect (Appendix ll), and tbese analyses were based on smal! numbers of studies witl1 often small sample sizes, limiting tbe power to detect pattems.
Perhaps more importantly, the effect of treattnent may be obscured by, and possibly negatively confounded with that of reporting behaviour - which also differs between populations. Signs perceived as worrisome in some populations may be considered normal in others; conversely, reporting of symptoms unrelated to clinical signs may occur in some but not all populations [Paxton et al.
1998b,Mayaud et al. 1997b, Hawkes et al. 1999,Trollope-Kumar 1999].More specifically, symptom reporting may be better in populations witb higher treattnent rates, as both depend on tbe general health care and developing standards of t11e country. Thus, in Western industtialized countties, the prevalenee of signs in NG and CT infection may be relatively low tbanks to high treattnent rates, but symptom awareness is relatively high. 1n populations with low treattnent rates as .in many developing countries, the prevalenee of disease signs among infected individuals is higher, but symptom recognition likely worse. This might result in comparable prevalences of self-reported symptoms in populations diffeting in the use and quality of STD treattnent.
Seve:ral other limitations in the review methods and data used must be taken into account when .interpretating the estimated symptom prevalences. Por Gram stain, culture and leucocyte-esterase dipstick (lED) in tbe diagnosis of NG Uudson 1990a, }ackson et al. 1997b], sensitivities are higher in symptomatic infection tban in asymptomatic NG infection; tbe same has been suggested for enzyme-
47

48 Chapter 3
linked immunoassay (EIA) in the detection of CT. As these were the main tests used for diagnosis in the studies included (Appendix 1), this may have biased symptom prevalences upward.Besides treatment patterns and pathogenidty,also the duration of the incubation period infiuences symptom prevalence. Por example, a disease in which every patient would develop symptoms after 3 weeks and in which patients remairred symptomatic for 1 week would, in the absence of treatm.ent, be consistent with a symptom point prevalenee of 25% only. However, since the incubation periods of chlamydia and females are short relative to the duration of symptoms and reasonably similar in both sexes [Holmes et al. 1999], this is unlikely to have infiuenced the ranking of symptom rates between the categoties studled here. Despite large variation between individual studies in tbe prevalenee of discharge among infected females, which is unlikely to be due to chance alone (altbough we did not formally test tbe homogeneity assumption), we used a fixed effect modelandnota random effect model to pool all outcomes. Where tbe prevalences found in tbe largest studies are distributed in reasonable balance between and around tbe smaller studies, tbis is unlikely to have markedly biased tbe estimated means. Only for temales witb CT, tbe larger studies had outcomes mostly below tbe estimated average (figure 3.1), so that tbe fixed effect model may have biased symptom prevalenee downward. The use of the fixed effect model may also have led to underestimation of tbe 95% contiderree intervals, but that was not an outcome of main interest. Pinally, in tbe definition of symptoms in females, we did not include abdominal pain, which may be associated witb late untreated NG or CT infection resulting in pelvic infiammatory disease [Holmes et al. 1999]. The combination 'discharge and!or dysuria' tberefore underestimates the total spectrum of symptoms that may ultimately lead women toseek care [Costello Daly et al. 1998b].Yet, a meaningful definition should probably be restticted to acute symptoms leading to timely treatment, before complications occur.
In conclusion, our review shows that prevalences of self-reported symptoms among NG- and CT-infected subjects are low across a range of populations, and in spite of varlation in rat es of STD treatment.
Besides tbe patbogenidty of tbe infections and treatment pattems, geographical variation in (subjective) reporting behaviour may be an important determinant of symptom prevalences. Por females, non-specific causes of discharge add to tbis: among NG- and CT-infected females, tbe occurrence of discharge in fact appears to be largely unrelated to tbe NG or CT infection. Por these reasons, tbe prevalenee of self-reported symptoms alone may not be a good rationale for choosing between NG- and CT- control strategies or for evaluating tbe successof STD treatment services.
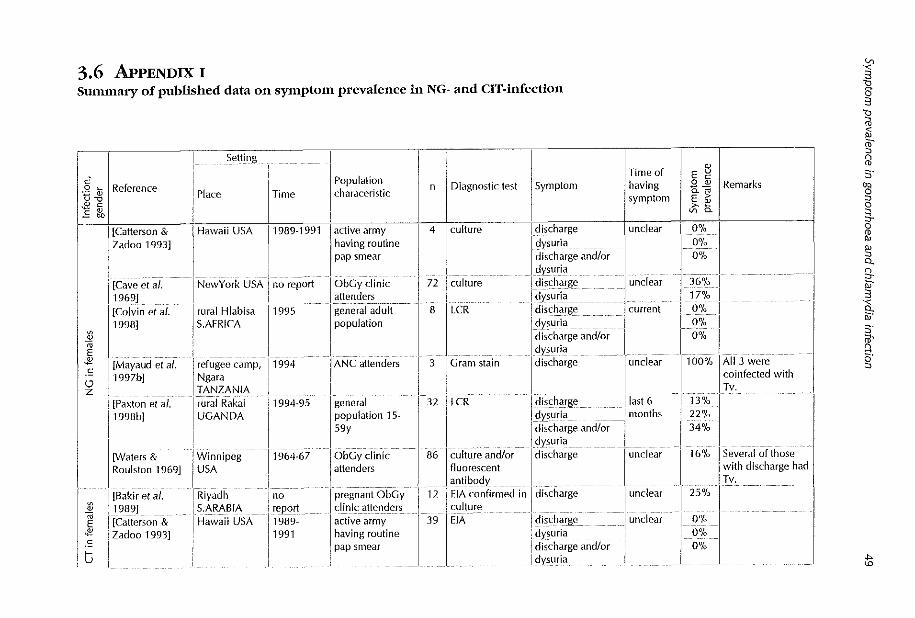
3.6 APPENDIX I Summary of publlshcd data on symptom prevalenee in NG- and CIT-infectlon
\
c" 0 ' 'f3 ~ w c ~" E"'
~
" E ~ .~
'-' z
~
11 ~ c
16 '
Reference
I [Catterson & j Zadoo 1993]
I' [.Cave···· ct al. 1969] -rCOivin et al. 1998]
[Mayaud et af. 1997b]
[Paxton et al. 1998b]
[Waters & Roulston 1969]
[Bakir et al. 1989] [Catterson & Zadoo 1993]
Setting
Place Time
I Ha\vaiiusA 1989-1991
I NewYork USA no report
I rural Hlabisa 11995-S.AFRICA
i
refugee camp, Ngara TANZANIA rural Rakai UGANDA
Winnipeg USA
Riyadh S.ARA81A Hawaii USA
1994
1994-95
1964-67
no ~epor!_ 1989-1991
Population characeristic
active army having routine pap smear
ObGy clinic attenders general adult population
ANC attenders
general population 15-59y
ObGy clinic altenders
pregnant ObGy clinic attenders active army having routine
1 pap smear
n
4
72
8
I I Time of E § Diagnostic test 1
1
Symptom ! having @_ "* I Remarks I symptom E ~ I 3;-al
fdiScharge I unclear i 0%
I dysuria .. ·~· I I 0%
I
disch. • ... rge and/or 0"/o dysurra 1
-! disch_arg_e I undear - I 36% I I dY~~rî_i_ - ! ; 17% -I I discharge- __ --- -~ current i 0% I
I
dysuria . ~ · i I O% I -dîsc .. ha.rg-e and/or I' I 0% dysuna
culture
culture
LCR
I 3 Gram stain comfected w1th
I discharge I undear . 11.0 .. 0 .. '.-1o.l A. ··1·1· 3- \vere .
I Tv. 32 LCR
lld.is.c.ha···rge . . lias! 6 T1~3;/; J dysuria ! months , 22% I l .. dis~harg. e and/Ür- I 34% dysuria I
86 cul·t·ure an···d/or ... 1 d ... is. c.h .. a~ge. unclear I' 16% I Se·v· e~~i.~f those fluorescent with discharge had antibody Tv.
12 EIA Confirmed in I discharge- unc!ear I 25% I . culture _ ____ ___ __ , _
39 EJA i discharge undear ; dysuria I discharge and/or I dysurîa
0% 0% 0%
ï ~ ~ ~ ~ hl ,, g 0
3-~ ~ 0.. g.
" 3
~ :;·
"' ~·
;l;

[Chokephaibulkit! Knoxville ct al. 1997] : USA
1988-94
I [Col vin et a/.
'1998]
~u-rai_H_IäiJ-isa ! 1995
S.AFRICA
I I·------------- -
I
[Edwards et al. 1985]
Christchurch no report N. ZEALAND
[Keim et al. 1992]
I Michigan USA 1987~ 89
_______________ ! ___ _
1987] 1 AUSTRALIA I.[.Ko.vacs et .. al. .. il Victoria
~ I [Lim et al. -19891 I Singapore "* SINGAPORE
~ I [Oriel et al, I London UK ~ 1972] I
tJ I
i [Paxton et al. !' rural Rakai 1998b] I UGANDA
--------- --r cïilCïrmaii
I USA [Saltz et af.
11981] i
I
[Tait et al. 19801 ( Uverpool UK
i [Mayaud et al. I Mwanza 1995] . i TANZANIA
1985-86
1984-86
no report
1994-95
1979-80
no report
1992-93
pregnant ad alescents aged < 19y
general adult population
FP clinic attenders college womem having routine gynecological exam FP clinic attenders cantacts of M with NGU cantacts of M STD clinic attenders
general population 15-59y
adolescent clinic attenders
cO,ltactS-Of M STD clinic aftenders
ANC attenders
67 I culture
9 ILCR
79 I DFA
140 I DFA
1 51 eu_lt-ur~---
33 I culture
13 I culture
50 ILCR
22 I culture
70 1
1 culture
i~ 1"'-~---~liii~fe Ag.detect
I ~iscbarge I dysuria
-[-diSdla-rge--I dysuria
I
discharge and/or dysuria
I discharge
i undear
I discharge
I dysurla
--- rcns~h-arg~- ! undear
j_cj_i~!=:b~~g~_ _ --~~ undear I dysuria i discharge I unclear
ll:~r:~~~~g;-;n-d/~-r--- -j dysuna
l_~is_ç_Q~g~----- __________ i last 6
I dysuria I months
I disch~rge and/or ll
1 dysurra I ({i;;a:;arge------------------- -~-U-ndear
dysuria j
discharge
! d-iS~ha-rge I dysuria
' '
I lunclear
i_ --
1 current
I
76% 3%
O% 0% 0%
5%
16% 3%
i 28%
I. 46%
6% i 31%
8% 31%
contra[': 73% control: 1.6°/o, Coinfections with c~:m~Wa!__~v,__:ry.
1
1 had NG and 5 had Tv.
I control: 14%
I contra!, 0.7%
j contrOI:--:ifiO/o
1
-co~_t_r~ I_: ;J_~_oj~ _ control:14%
12% I 20%
24% I 55% 1-contrOJ: 3-iö/o 9%
31%
20% 40%
control: 17% 36% was coinfected wilh either Tv,_ Candida or Streptococcus au reus. 10were coinfected with Tv and 16 with Candida
"' 0
f w

general discharge last_6 __ ...
I 13°/o "' V> {Paxton et al. rural Rakai 1994-95 78 LCR § ' ~ 1998b] UGANDA population 15- dysuria months 121% o-~" ~ -o E 59y discharge and/or 28% c ~
-~ dysuria 3 lJ c i
z iJ ' [Vuylsteke ct al. Kinshasa 11990 pregnant ANC 75 culture I discharg~ current 36% "' 1993b] ZAl RE attenders Ag.detect dysuria 7% <ii
i iii [Arya et al. rural Teso 11971 general 24 Gram stain & discharge and/or current 42% if 1973} UGANDA I pnpulation culture dysuria lil Uackson et al. Mombasa, 11994-5 transport workers 15 Gram stain & disc~a_rg~ ___________ unclear 53% CT and Tv s· 1997b] KENYA culture discharge and/or 67% coinfections 'B
dy_sl:'~ia excluded, 00 0
[Colvin et al. rural Hlabisa Î 1995 general adult 2 LCR discharge current 0% ~
3-1998] S.AFRICA ' population ~ysur_i_<l_ 0%. 0
I discharge and/or 0%. iB dysuria "' :0
[Fransen et al. Nairobi 11983 fathers of infants 10 culture discharge and/or undear 30% Q
1985] KENYA with ophtalmia dysuria 9-neonalorum " [Grosskurth et rural Mwanza 11991-92 general 128 Gram stain discharge unclear 18°/o 3
" af. 1996] TANZANIA population t 5- ~ ~ [HandSiieic_l __ €i
54y s· -;;; Washington, I no report USA army 59 culture discharge and/or undear 32""/o in' E af. 1974] USA stationed in, or dysuria g. .s i returning from in <.J Vietnam and
:0
,z Saint Louis having routine
-r1977 exam
Uohn & Donald London cantacts of NG 50 ~-Gram st~in ___ & discha;ge undear 8o/., lso NG episodes in
1978] UK cases
1
culture dysuria 20% 140 pallenis discharge and/Or 28% dysuria
[Mayaud et af. Refugee camp, j1994 outpatient clinic 7 I Gram stain -~_i-~charge undear 14% I 1997b] Ngara altenders & dysuria 14% \
TANZANIA random discharge and/or 29% J subsample of
I dysuria
adults {Paxton et af. Rural Rakai 1994-95 g~n-e-~;;1 15 LCR discharg~ last 6 20°/-o I 1998b] UGANDA population 15- dysuria months 40°/-o
59y (!ischarge and/or 47"/o I <.n dysuria

[Rees et al. 1977]
[Colvin et al. 1998]
Uackson et al. 1997b]
l.iverpool UK
Rural HlabiS-~S.AFRICA
Mombasa, KENYA
{Fish et al. 1989] I London UK
[GrÖ-SSkurih et al. 1996]
ti
~
" E -.~ I [MatondÜ et
1995]
{Paxton et~/". 1998b]
[Rees et al. 1977]
rural Mwanza TANZANIA
Hartshill UK
rural Rakai UGANDA
Liverpool UK
i 1973-76
!
no report
1994-95
1973-76
fathers of infants with conjunctivitis
general adult population
4
5
36
discharge I unclear I 0% i
dysuria · - I I 0% i -~-~~~~~~ge and/or_ __ __ 0% ___ I_
d .. isc.ha~g~ current I 0% I _dt~uria 0% I
.di.sch~rge and/or I 0% ] _ _dys_urra : __ _
I discharge unclear 115% i NG and Tv discha~g.-~--~-n&. '.'.'. 23% I coinfections dysuria I i excluded,
I dysuria ----- - unclear 114% Î
I discl;arge unclear I 8% i
l_~l_ischarge unc!ear oo/o I
I clYSU~ta _ _ _ o% i
~~~~~~ge ~n-dl~r __ _ --___ -oo;~-- -~
-~.d_i_~~-b_<!_~ge .. -------- . -.-1 fa st 6 1:_-__ 6.0;~-. I
dysuria months 8% I
_ ___ I ~~5~hr~ge-andl~r -~ ~---8°;~--
I cultcrre
t.CR
LCR
1
fathers of infilnts 4 I culture ------- - I_~J.?~b-~_rge ________ --_1 unclear -~--Qo,:;---
with I I dysuria .. ________ I l_o_o;, -------------- _ ,_____ ______ _,_________ __ 1 c~J-~~-~~~::_~i~is I -------------- ___ ~~s~~Î;_~~ andfor __ _ --~~/o I [Grosskurt-h et I rural Mwanza 11991-92 I general 1158 I Gram sta in discharge I unclear. 115°/o
al. 1996] TANZANIA population 15- 11 -.2 J!;_ _________ _l __ 54y __ ____ __ ____________ _
-g Ei [Paxton et a/: rural Rakai 1994-95 I general I 51 t.CR discharge __ last 6 I_ 10%
"'.~! 1998b) UGANDA .. population .~ .. 5-.. 1... . . ldysuria .1.110nths 118% ~ 0; 159y _ : _ _ ~~5~hr~~ge <md/o~--- _ __ 20%
I [Wats~~-j~n.es et I rural Mwanza I no --- -. I general -- -----.. 1 . 21 ... l.culture/ LCR ... I Di_s5···'·h···arge l." .... ".cl.ea. r I 33% 6 were co. infected al. 2000] TANZANIA report populatlon 15- I Dysuria 10% with Tv.
s4y I 'controls ~€Uninfected sUbje(1S from the s-affi~ base population ~-s -tr-1~-NG~-Or CT-infected ~~SeS~ M-=Male; F = Fefn3Te;y= year; i nel= incJUded; -NG=Neisseria gonorrhoeae; CT =Chlamydia trachomatis; Tv= Trichomonas vagina/is; NGU=non-gonococcal urethritis; ANC=antenatal clinic; ObGy=obstetric & gynecologic; FP=family planning; LCR=ligase chain reaction; EIA=enzyme-linked immunoassay; DFA=dire{j immunofluorescent anti ~E-~ y;_A_g_""': antigen.
I
<.n
"'
9
~ w

3. 7 APPENDIX n Studies on the l'revalence of discharge and/ot· dysuria in NG- and CT-infection, patleut delay interval among symptomatic patients seeking treatment, and pt·opm·tion of syml'tomatic pa ticuts seeking effectivc medical treatment, uscd for co1'1'elation analyses in Figut·e 3.3.
Sex
F
M
Reference
(Hook 111 el al. 1997]
PI ace
5 USA cities
(Darrow Sacramento 1976] USA
-waxencrer------u-rban tusaka, al. 1998] ZAMBIA
[Wilkinson ruraT t-HäïJTSa~ et al. 1998] S.AFRICA
[Aiani et al. London, UK 19771
-JJU(kÖn Denver, USA 1981]
-rMoses ët-a/: Nairobi, 1994] KENYA
[Wilkinson rural HlabiSa-; et a/. 1998] S.AFRICA
_ ~!!!!~t ~e_Jay_[ntervaf (days) 1 Mean I I ----------- SymP:!_~n~_f?!CValen~e {Of~)
Time
1995
1971
1994-95
1996
1973-75
1979-80
1991
1996
Infection Population " median Reference Place Time Infection Population " NG
STD
STD
STD
NG
NG
STD
STD
STD clinic altenders
STD clinic altenders
health center altenders
primary care clinic altenders and general populatioJl
NG: 5.6 1 I[Catterson & Hawaii USA 1989- NG NGU: 6.8 1 Zadoo 1993] 91 and/or
}_6_:?1_ _ _ --------·--- CT
10.01
I[Cave et al . .. Ne.w Yo. rk, ."o. NG 1969] USA _ _ report
I(Vuylsteke et l(fr\Sh-asa, 1990 NG al, 1993a] ZAIRE and/or
CT
16
617
238 14.0
2570 18.0 1998] Hlabisa, andlor
S.AFRICA CT sro clinic .lïten-d-er-~--- a2 11.0
··~[C. o .... l.vineta.l. rural --- 1995 NG
IUohn--&-------- .london, UK 1977---~~fG
Donald
health clinic attenders -890 3.0
health centers allenders
primar; care clinic altenders and general populatiofl
104 7.9 1
2199 10.0
1978] (Handsfiefd Washington et al. 1974] USA
I(Fransen et al. 1985]
lrcolvin et al. 1998]
N-airObi, KENYA
rurdl Hlabisa, S.AFRICA
00
report NG
1983 NG
1995 NG andlor CT
active <~rmy having routine pap smear
43
ObGy diJÎic altenders 72
pregnant ANC allenders
genr>ral adUll-population
cantacts of NG patients
--USA army sl<~tioned in, or returning frorn in Vietnam and Saint louis having routine exam
75
17
50
59
fathers of infants with 10 ophtalmia neonalorum gerlê'i-af"adUit 7 population
Prevalenee
0%
47% _{_1~-53) 2
40% (36-43)1
0%
28%
32%
30%
0%
"' 1 l l;J <i; Oi if @ s· g ~ ffi Pi Q
9-~ ~ s· ii1' g. "
<.n w

'C
Proportion of patients seeking treatment (%) 1 Symptom prevalenee (%) Se< Reference Place Time Infection Population " Mean/ ! Reference PI ace Time Infection Population " Preva-
median I lence
[Moses E't al. Nairobi KE-NYA 1991 STD STD clinic 62 04% i[Vuylsteke E't Kinshasa 1990 NG pregnant ANC 75 40% 1994] altenders asked !a/, 1993b] ?.Al RE and/or altenders (36-43) 1
about treatment CT seeking behaviour
F during previous
I STOepisodes [tviosh"a ei -al. urban/ rural 1990- STD general population 154 55% I[Mayaud et Mwanza 1992- NG ANC altenders 81 52% 1993, Mwanza 91 15-54y ,a/. 1995] TANZANIA 93 and/or (40-60) 1
Newell el .1/. TANZANIA I CT 1993] I
[Moses et al. NaXrObi-KE-NYA- 1991 STD STD clinic 52 67% I [Fransen et Nairobi, 1983 NG fathers OTinfa~itS-with 10 30% 1994] altenders asked la/. 1985] KENYA ophtalmia
about treatment neonalorum seeking behaviour
I
during previous STD episodes
M [Ma~'aud et refugee camp 1994 STD general population 289 47% IIM'y'"d et refugee 1994 NG outpatient clinic 7 29% al. 1997b] Ngara, al. 1997b} camp, altenders and r.mdom
TANZANIA Ngara, subsample of adults
! TANZANIA [Mosha et al. --Urban/ rural 1990- STD general population 563 67% i[Grosskurth rural 1991- NG general population 15- 128 18% 1993, Mwan?a 91 15-54y !et al. 1996] Mwanza 92 54y Newe11 el a/. TANZANIA I TANZANIA 1993] I
1 The median palient delay interval was es limaled from a categorical distri bulion assuming a homogeneaus distri bution of cases within each category, and a mean duration of 1 .5 tirnes the lower limit for each uppermost category (e.g. 10.5 days fora category of '7 or more days'). 1 Range for the estimated proportion with discharge and/or dysuria, derived from reports of the proportions witheither symptom separately. STD~sexually transmilled disease(s); NG~ Ncisseria gonorrlweae; CT ~Chlamvdia trachomatis; t\NC~antenatal clinic; ObGy=obstetric & gynaecologie.
9
~ w

What proportion of episodes of gonorrhoea
and chlamydia becomes symptomatic?
Korenromp EL, Sudaryo MK, De Vlas SJ, Gray R, Sewankambo NK, Serwadda D, Wawer MJ, Habbema]DEWhat proportion of episodes of gonorrhoea and chlamydia becomes symptomatic? IntJ.STD&AIDS, in press. Reused with permission of the Royal Society of Medicine.

Acknowledgements We thank Ni co Nagelkerke and Richard Hayes lor statistica! advice, and David Mabey lor comments regarding STD biology and epidemiology. The studywas financially supported by the European Community (contract number 87.6211/97/017). MKS received support from the Islam ie Development Bank.

Symptom probabilities in gonorrhoea and chlamydia episodes
4.1 SUMMARY
The effectiveness of syndromic treatment as an STD control strategy depends on the proportion of episodes which become symptomatic; few studies have measured this directiy.We estimated these proportions for gonorrhoea (NG) and chla
mydia (CT), synthesizing data on the point prevalenee of self-reporred discharge and dysuria among infected cases in rura! Uganda, the durations of symptoms, incubation period and asymptomatic episodes, and the effect of treatment on symptom duration.
Estimated proportions of episodes that become symptomatic were 45% for rnales with NG, ll% for rnales with CT, 14% for fema!es with NG, and 6% for females with CT; this was on average 1.5-fold higher than symptom prevalenee at cross-section among :infected cases in this population. Estimates were sensitive to assumptions on the relative durations of asymptomatic and symptomatic episodes, but were invariably inconsistent with previous direct estim.ates based on a US cohort study.
These results show that the probability of recognizing symptoms in NG and er episodes varles between sertings. In populations with low treatment rates like Uganda, these probabilities can be very low; here, health education should have priority in STD management programmes.
4.2 INmODUCTION
In developing countries, se.>:ually transmitted diseases (STDs) are an important cause of morbidity among adults and STD control has high priority [De Schryver & Meheus 1990]. The choice among STD control strategies depends upon several factors, including the probability that acute symptoms of infection develop [Wilkinson et aL 1999, Garnett et al. 1999].lf most patients become symptomatic and seek tteatment for these symptoms, high quality clinical case management could be an important component of control programmes [Wilkinson et al. 1999].lf most patients develop symptoms, but fuil to recognize these or do not seek treatment, education on symptom recognition and on the importance of prompt treatment becomes essential. However, if the majority of infections pass without symptoms, syndromic management may be insuffident, and more active interventions, such as screening or mass treatment, may be appropriate in addi~ ti on.
In cross-sectionar surveys among infected cases, the majority of prevalent nonulcerative infections with Neisseria gonorrhoeae (NG) and Chlamydia trachomatis (CT) are asymptomatic, especially in fema!es [Adler 1996, McCormack et al. 1977, Oates & Csonka 1990, Oriel1982, Saltzet aL 1981].This does not imply that the probability of developing symptoms at some time dwing an episode of
57

58 Chapter4
these infections is a!so low [ Garnett et al. 1999, McCormack 1981]. The duration of symptoms is usually Iess than the total duration of infection, because symptoms are preceded by an incubation period, and may be foliowed by a second asymptomatic period before the infection is resolved [judson 1990b, Thompson & Washington 1983]. Consequently, even if all STD episodes involve symptoms at some point in time, the proportion of infections with symptoms at cross--sec~ tiona! survey would be Iess than 100%. The proportion of prevalent cases experiencing current symptoms is further reduced if symptomatic cases seek treatment
Cross~scctional survey on symptom prevalenee among infected cases
~ G) ~f'--T-oto_l_d_""_' __ ,-, -,,-,.,-ympto--m-o_ti_o (-w>-=~,,-d-) in<-=---"--"1-
Incubntion period
Symptom dun1tion în (untreated) infection
Symptom status on survey
(-)
(+)
notin survey
Figure 4.1 Diagramrnatic representation of the alternative courses of an episode of gonorrhoea or chlamydia. I) without the development of symptoms; 11) with symptoms that are not recognized (or acted upon) by the patient; lil) with symptoms recognized by the patient, foliowed by treatment. The verticalline represents a cross-sectional survey on symptom prevalenee among infected cases; the negative and positive signs on the right the symptom status as observed in the survey. For discussion of assumptions, see main text.

Symptom probabi/;ties in gonorrhoea and chlamydia episodes
[Garnett et al. 1999, McCormack 1981], because successful medical treatment shortens the duration of symptoms [Garnett &Anderson 1993b, Mayaud et al. 1997a]. The influence of these factors on symptom prevalenee as observed in cross-sectional surveys is depicted in Figure 4. L
Thus, the probability of STDs becoming symptomatic is higher than the point prevalenee of symptoms as observed at cross-section among infected cases, and
might be reasonably high even in population with low symptom prevalerrees [Garnett et al. 1999,McCortnack 1981].This has for example been suggested for underserviced populations in rural Uganda [Serwadda et al. 1992, Sewankambo et al. 1994, Wawer et al. 1999, Pa:\.'ton et al. 1998b, Paxton et al. 1998a], for which it is being debated whether symptom meidences are high enough for a syndromic treatment approach to be adequate for STD controL In surveys in this area [Pa.c\.'tOn et al. 1998b], point prevalerrees of self-reported current discharge and/or dysutia were 33% ± 9% for NG-infected males, 7% ± 3.6% for CT-infected males, 9% ± 4% for NG-infected females, and 4% ± 2.5% for CT-infected females. (These values are lower than previously publisbed period prevalences, which pertained to symptoms either at the time of survey or in the preceding 6 months [Paxton et al. 1998b ].) No quantitative estimates are however available on how much higher proportions of episodes that become symptornatic are, and this may vary between populations based on their respective STD treatment pattems.
In this chapter, using the natural history model shown in Figure 4.1, we estimate the probability that NG and CT infection become symptomatic based on data from tural Uganda. We explore how the difference between the probability that symptoms develop and symptom point prevalenee va.ties with alternative treatment pattems, and how it depends on the natural history of the STDs. We discuss the generalizability of the symptom probabilities estimated for Uganda to other settings, and the implications for STD treatment polides in ruralAftica.
4.3 MEmons
Literature reviews were performed to identify English language articles containing data on the biological determinants of symptom rates among heterose»cually infected NG- or CT-patients.
Incuba.tion period
Studies on incubation periods were induded if: (i) they were conducted in patients who (all) eventually developed symptoms, and (ii) the estimated date of infection was derived from the sexual history of the patient.This included studies among STD clinic attendees, but not studies among initially asymptornatic preva-
59

"' 0
Tab/e 4.1 Estimation of (total) duration of NG and CT infection from prospective studies on infeclion dissolution.
Follow-up duration Proportion (%) infected Estimated
Symptom status of study (days) at follow-up mean
Reference n corrected duration of subjects at enrolment estimated % testing
for culture infection range mean positive
sensitivity1 (days) 2
NG in rnales [Handsfield et al. 28 originally asymptomatic; 1-165 11 82% 91% 118 1974] n ~ 10 develop
symptoms during follow-up _
__ pooled3 118
CT in rnales [Stamm & Cole 10 asymptomatic 7-28 14 90°/o 100% >2694
1986] [Handsfield et al. 10 symptomatic 7-10 9 100% 100% > 1754
1976] [Prentice ct al. 13 symptomatic 7 (fixed) 7 69% 77% 26 1976] rr erho 1978] 13 symptomatic 6-56 18 85% 94% 320 Uohannisson et al. 52 symptomatic 7-28 18 60% 67% 44 1979] [Paavonen et al. 21 symptomatic 28 (fixed) 28 76% 84% 166 1980] [Mclean et al. 17 symptomatic 14 (fixed) 14 53°/o 59% 26 1990] [Parks et al. 1997] 5 62% (of n~74 Mand F 4-45 25 40% 44% 31
c~:nnbin~d) sympto_matic
pooled3 132
NG in females [Mahoney et al. 73 all had clinical signsi no 1-120 72 46% 51% 107 1942] report on perceived 9
"' symptoms '0 :;;
pooled~---- 107 ,
------ ...

CT in females Uohannisson et al. 59 symptomatic and 14-45 23 51% 57% 40 "' '< 1980] asymptomatic 3
"' [McCormack et al. 14 symptomatic and 450- 720 585 50% 56% 995 8 1979] asymptomatic 3
"' [Alexander et al. 15 asymptomatic 42 (fixed) 42 20% 22% 28 a 1977] Cr
"' [Rees 1980] 132 symptomatic (with NG) 1-90 36 84% 93% 522 Cr
[ [Paavonen et al. 15 asymptomatic 28 (fixed) 28 80% 89% 238 1980] s· [Rahm et al. 1986] 109 asymptomatic 90 (fixed) 90 83% 92% 1112 'ê ISorensen et al. 17 asymptomatic 60-720 330 29% n.a.5 267 " 0 1994] 3.. [Schachter et al. 33 symptomatic and 14-224 119 76% 84% 704 0
"' 1975] asymptomatic "' "' [Parks et al. 1997] 69 62% (of n~74 Mand F 4-45 25 74% 82°/o 128 " Q
com~ined) syn1ptomatic g_ poo/ed3 499 ;;;-
3 1 Assuming a 90% sensitivity of culture. 2 Under the exponential distri bution underlying the calculation of mean durations, the corresponding median va lues are ~ fixed at ln(2)*mean. E.g. for NG in ma les, the mean 118 days corresponds to an estimated median of 82 days. 3 Paoled mean over means of individual studies. .;g 4 Based on the approximation that the proportion still infected was 95% (n = 10 out of 1 0.5), instead of 100°/o (n = 10 out of 10), as a fini te size correct ion. <;;· 5 Study used enzyme immuno-assay, rather than culture, for diagnosis; we assumed a 100% sensitivity for immuno-assay. 0
~
~

62 Chapter 4
Jent cases identified by screenmg.We used median incubation periods, but when studies reported only a mean, this was used. For srudies reporting only a distribution of cases over intervals of incubation periods, we estimated the median duration assuming a homogeneaus distribution of cases within each interval. A weighted average incubation period was calculated by pooling the median or mean încubation periods across studies.
frorrationofunection
Ideally, the duration of infection would be estimated from follow-up srudies of sexually infected patients followed from infection untill spontaneous resolution (i.e. foregoing treatment). For practical and ethica! reasons, such srudies have not been dorre. Some prospective srudies are available that report proportions of infected patients who are still infected at follow-up, among untreated asymptomatic cases identified by screenmg or contact tracing, or symptomatic cases folIowedfora short period before treatment (fable 4.1).These data do notprovide direct estimates of infection duration, because the duration of infection before the first test is unknown (left-censoring), and follow-up is often fora short time relative to the typical duration till resolution of infection, resulting in a high proportion still infected at follow-up and thus preduding a direct measurement of duration till resolution (right-censoring). The average duration of infection can however be estimated, by taking into account the probability that an episode of a given duration is sampled in a cross-sectional srudy, and the probability that such episodes wiil have ended by the time of follow-up.Assuming that durations vary between episodes and individuals according to an eJ>:ponential distribution, the remaining duration of infection from any point in time (here) the moment of detection in a cross-sectional survey) equals the mean total duration, because the rate of resolution under this distribution is constant over time and independent of the past duration. Consequently, the mean duration of infection equals foiIow-up time divided by the log of the redprocal of the proportion still infected. So fora typical srudy where aftera follow-up time of 3 months 83% of subjects are still infected [Rahm et al. 1986], we would infer a mean duration of infection of483 days.
ln applying this estimation method, some complications had to be considered. First, in the srudies induded, infection starus was mostly measured by culture which has lintited sensitivity [Holmes et al. 1999],resulting in false-negative test results for subjects still infected and consequent underestimation of the duration. Estimating the average culture sensitivity at 90% [Holmes et al. 1999], we adjusted for this bias by dividing proportions testing positive at follow-up in studies which used culture for diagnosis by 0.9. Second, the calculation does not allow for srudies in which all subjects are stillinfectedat follow-up.To allow inclusion of such srudies, we applied a tirrite size correction, by adding to the acrual
Symptom probabilities in gonorrhoea and chlamydia episodes
number of observed subjects a hypothetical half non-infected case. For example, in a study where all 10 ( or 1 00%) of subj ects were infected at follow-up [Handsfield et al. 1976], we replaced this by n=10 out of 10.5 (or 95%). Furthermore, the calculation ignores the fact that positive diagnosis at follow-up may be due to re-infection after spontaneons cure, rather than to unresolved infection. Calculations (Appendix) confirmed that this caused an overestimation of the duration of NG and CT in women, but ovetall the effect was smal!; therefore, for simplicity we ignored reinfeetien in the remainder of the chapter. Finally, most available studies did nat distinguish between asymptomatic and symptomatic episodes, or it was undear whether their outcomes pertain to either or both of these categories. Studies that did report specifically on symptomatic or asymptomatic episodes did not show significant differences in duration between (untreated) asymptomatic and symptomatic episodes (Table 4.1).We therefore assumed, as a baseline scenario, that the tota! duration of untreated infection is equal for asymptomatic and symptomatic episodes.
Having thus estimated mean infection durations for each study included, we estimated ovetall means by averaging the durations over studies. We weighed all studies equally, because we suspected the variability in their outcomes to relate to heterogeneity in unknown determinants, and nat mainly to chance according totheir sample sizes. By substracting the incubation period (see previous subsecti on) from the estimated total duration of infection, we estimated the duration of symptoms in untreated symptomatic infection.
Treatment and patient delay
Estimates of the proportion of symptomatic cases seeking treatment were derived from survey data collected duting the Rakai sm mass treatment trial
[Wawer et aL 1999, PaJ...1:on et al. 1998a]. Basedon reported treatment seeking behaviour among participants, at most 38% of symptomatic sm patients in rura1 Uganda receive appropriate treatment fortheir infection [Paxton et al. 1998a]. We used this value as the cure rate for symptomatic NG and CT episodes in bath rnales and females.We assumed that symptomatic cases who seek treatment are all immediately cured after treatment. This is based on observations of very short post-treatment durations of infectiousness for (non-resistant strains of) gonorrhoea [Holmes et aL 1967]. Furthermore, we assumed that na asymptomatic cases are treated - which could theoretically occur upon detection by screening or due to non-Sm related use of antibiotics. The rationale tor this assumption is that access to health services is very limited in this region.
No data were available on patient delay (i.e. the time period between onset of symptoms and reedving treatment) from rural Uganda. We therefore estimated patient delay from reports from a rural South African sm clinic, where the average delaywas 10 days in rnales and 18 days internales [W!.lkinson et al. 1998].To
63

64 Chapter 4
account for the langer patient delay for CT and non-gonococcal urethritis other than NG [Schofield 1982, Boyd et al. 1958, Jacobs & Krans 1975, McCutchan 1984], we speci.fied the patient delay in Uganda as 8 days for gonorrhoea and 12 days for chlamydia in males, and 15 days for gonorrhoea and 21 days for chlamydia in fernales.
Estimation of the probability of developing symptoms and sensitivity analysis
According to the model (Figure 4.1), the relation between the proportion of infections that are symptomatic at cross-sectional survey (symptom point prevalence) and the probability that episodes become symptomatic at some time, is determined by the relative durations and frequency of asymptomatic and symptomatic stages. Thus, the proportion of infections found symptomatic (P"'"'~ at cross-sectional surveys equals:
PS}mprcv ps;.mprob • p trear • ( ddoy + PS}mprob (l- ptrcal) · t s;:mptom
where P ""'pro' denotes the probability that episodes become symptomatic at some time, t sympwm' t1nam and t asymp_tnf are the duration of symptoms in untreated symptomatic episodes, the incubation period in symptomatic episodes, and the rota! duration of asymptomatic episodes,respectively;P """' represents the propartion of symptomatic cases seeking treatment and t dcloy the patient delay interval.
Assuming that symptomatic and asymptomatic episodes have equal durations, this equation simpli.fies to:
P,ymp~of;, • l~)mptom - psy,mprob • P,rc{ll (tsymprom - lddu;.·)
tim:ub +t.\'l'mptcm -Psymprob ·P,,=(t:cymprom -lddu;J (Eq.1)
This forrnula does not allow for varlation between individuals or episodes in the duration of disease stages, which leads to some underestimation of the probability of developing symptoms (not shown); for simplicity, this small bias is ignored.
In order to assess how robust our estimates of the probability of developing symptoms are, and on which parameters they depend most, we conducted a sensitivity analysis. In univarlate sensitivity analysis, each time the estimated value of one single parameter was doubled or halved. In a multivariate sensitivity analysis, we assessed how much estimated symptom probability would change, if multiple parameters were simultaneously doubled or halved in the direction that they either all increased or all decreased the symptom estimate.

Table 4.2 Estimation of the probability to develop symptoms per episode of gonorrhoea (NG) and chlamydia (CD in a rural Ugandan population, based on symptom point prevalenee among infected cases and its determinants. For description of methods, see main text.
Symbol in equation Male Female
1 (see Section 4.3) NG CT NG CT
lncubation period for symptomatic episodes t.incub 5 days 11 days 9 days 20 days
Total duration of infection for asymptomatic episodes t.asymp _inf 118days 132 days 107 days 499 days
Duration of symptoms t.symptom 113 days 121 days 98 days 479 days
Proportion of symptomatic cases treated P .treat 38% 38% 38% 38%
Patient delay for treated cases t.delay 8 days 12 days 15 days 21 days
Observed symptom prevalenee among infected cases P.symprev 33% 7% 9% 4%
Estimated probability of developingsymptomsper episode P.symprob 45% 1 11% 14°/o 6%
Ratio symptom probability I symptom prevalenee 1.4 1.6 1.5 1.6
1 Example of calculation, for NG in males: 0.33 =x* (0.38*8+(1-0.38)*113)/ (x*(0.38*(5+8)+{1-0.38)*(5+ 113))+{1~x)*118) ---7 x=0.45.
f ~ 15-
[ :;·
'<§ " ~ re "' " a.. g. ~ ~ -@
~
"' '"

66 Chapter4
4.4 Rf:SULTS
Stage durations
The median incubation periods poo!ed over all studies identified were about 5 days for NG in rnales [Harrison et al. 1979, Lodin 1955, Molin 1970, Boyd et al. 1958, Schofield 1982, Sherrard & Barlow 1993, 1996, Wallin 1974, Willcox 1976], 11 days for CT in rnales [Oriel et al. 1972, Boyd et al. 1958, }ohannisson et al. 1979, Schofield 1982], and 9 days for NG in temales [Molin 1970, Wallin 1974]. For CT in females, no studies were identified. By artalogy to the relative difference between NG and CT in mal es, we inferred an incubation duration for CT in females Jonger than that for NG, of 20 days.
Table 4.1 shows estimates of infection duration for all studies. The estimated mean durations of infection were around 4.5 months for rnales with CT and 16 months for females with CT. For rnales with NG, only one study was identified, from which we estimated the duration at around 4 months. For females with NG, the single study available also gave an estimate of 4 months.
By substracting incubation periods from total durations, mean durations of symptoms in symptomatic episodes were estimated at around 113 days in rnales with NG, 121 days for rnales with CT, 98 days for females with NG, and 479 days for females with CT (Table 4.2).
Probabilities of developing symptoms and sensitivity analysis
Basedon Equation 1, the observations in rural Uganda were consistent with probabilities of developing recognlzed symptoms per episode of 45% for NG in males, 11% for CT in males, 14% for NG in females and 6% for CT in females (Tab!e 4.2).These symptom probabilities were on average 50% (a factor 1.5) higher than observed symptom point prevalences.
The results of the sensitivity analysis are plotted in Figure 4.2. The duration of symptoms relative to the duration of asymptomatic episodes, and the fraction of symptomatic cases treated were the most critica! determinants of the rela
tion between symptom point prevalenee and symptom probability per episode. Patient delay and the incubation period did not markedly affect the estimated symptom probability.lfthe duration ofboth symptomatic and asymptomatic episodes were simultaneously doubled or halved, the relationship between symptom prevalenee and symptom probability remalned almost unchanged. Results were qua!itatively similar for both infections and gender categories. In multivari
ate sensitivity analysis,estimates of symptom probabilities per episode consistent with the symptom point prevalenee observed in rural Uganda ranged from 3% (for females with CT) to 83% (for rnales with NG).

Symptom probabilities in gonorrhoea and chlamydia episodes 67
a. MaleNG b. Male CT
,_ 19% o-------o76"/o P.troot 19% =-1= 76%
tdclay i tdoloy 24<1 ~ 6d
226d22~6d, 236d. 56.50, 59d 56.50
59d 236d
2.5d 10d
tonfoetion
toymptom
ttncub
tinloetion 242d, 264d • 60.5d, 66d
toymptom 242d* 60.50
t""ymp_lnf. 66d 264d
llnoub S.Sd 22d
mumvmjote
~ ~
c. Female NG d. Female CT
,_,I 19%o-------e 76%
tclelny 30d- 7.5d
tlnlodlOil 196d, 214d t 49d, 53.50
'"~'"'I 196d 49d
t""ymp_lnf. 53.5d 214<1
tlnoub, 4.5d • 18d
mu:tlvarlote
P.troot 19% e--o76%
tdolay 42d t 10.5d
tinfoetion 958d, 998d , 239.Sd, 249.Sd
toymptom 958d --239.5d
tooymp_in(. 249.Sd -998d
"'~'I 10d t 40d
muiWorlate
~ '" 00 " " M
Estlmotod symptom probablllty (%of episodes) Estlmotod symptom proboblllty (%of oplsodos)
Figure 4.2 Sensitivity analysis: Ranges of estimated probabilities (%) of developing recognized symptoms in episodes of gonorrhoea (NG) or chlamydia (en when doubling or halving values of the determinants of the point prevalenee of self~reported symptoms. The vertical lines represent the baseline estimates shown in Table 4.2. The upper 6 horizontal I i nes are outeernes of varying 1 parameter at a time. An exception is the line 't_infection', which involves a doubling or halving ofthe duration of symptoms {t.symptom) and of the total duration of asymptomatic infection (t.asymp _inf) simultaneously. The lewest line in each graph presents a multivariate sensitivity analysis, in which the incubation period and the proportion of symptomatic cases treated were doubled, while the duration of symptoms without treatment and patient delay were halved (and vice versa). lncubation period (t.incub), duration of infection in asymptomatic episodes (t.asymp_inf), duration of symptoms without treatment (t.symptom), and patient delay interval (t.de/ay) are expressed in days {d); the proportion of symptomatic cases treated (P.treat) is expressed as percentage {%).These results indicate that the estimated probability of developing symptoms is most sensitive to the proportion of symptomatic episodes that is treated and to the relative durations of symptoms and of asymptomatic infection.
4.5 DISCUSSION
Consictering the biomedical and setting-dependent determinants of symptom prevalence, we estimated the probabilities to develop recognized symptoms per episode of NG and CT infection using data from rural Uganda. Estimated symp-

68 Chapter4
torn probabilities ranged between 6%, for females witb CT, and 45% for rnales witb NG. The probability of symptomatic episodes was higher for gonorrhoea tban cblamydia, and higher for rnales tban for females, as reported by otbers [Schachter et al. 1975, McCutchan 1984, Starrun et al. 1984, Martin 1990, Holmes et al. 1999].
Estimated probabilities to develop symptoms were on average 1.5-fold larger than observed symptom point prevalerrees among infected cases in a cross-sectional survey in Uganda.This difference between tbe two measures was so small due to tbe Iow treatment rate of symptomatic infections in this population, and
tbe short duration of incubation period relative to symptomatic stages in NG and CT infection. This implies tbat in populations witb treatment rates as low as in rura1 Uganda, symptom prevalenee among NG-or CT-infected cases may in fact be a reasonable indicator of tbe probability tbat episodes of these infections become symptomatic.
In order to assess symptom probabilities, we estimated tbe duration of NG and CT episodes (Table 4.1). These results generally corroborate previous reports based on less systematic approaches. The estimated duration was longest for CT in females (16 montbs). Previous workers reported tbe typical duration of CT in females to range between 6 months to 2 years [Rahm et al. 1986, Buhaug et al. 1989, Parks et al. 1997]. The duration of NG in females was previously estimated at 10 weeks to 1 year [Hetbcote & Yorke 1984, Wlesner & Thompson 1980], which is consistent with our estimate of 4 months. For males, we estimated CT tolast slightly Jonger tban NG (about 4.5 and 4 montbs, respectively). Previously, NG in rnales was estimated tolast between 3 weeks and 6 months [Holmes 1974,
Hetbcote &Yorke 1984,Wlesner &Thompson 1980, Garnett &Anderson 1993b]. CT is believed tolast Jonger tban NG in rnales [Holmes et al 1999, Kretzschmar et al. 1996], but we could not identify publisbed estimates of tbe duration of male CT infection. Sensitivity analyses (Figure 4.2) showed tbat changing tbe overall duration of infection, by a magnitude likely encompassing tbe effect of tbe possible biases discussed above, did not markedly affect estimates of symptom probabilities. This suggests tbat our estimates of symptom probabilities are robust.
The relative duration of symptomatic as compared to asymptomatic infection
was however important (Figure 4.2).Available data (Table 4.1) did not suggest differences between asymptomatic and symptomatic episodes, and on this basis we assumed tbeir durations to be equal. But given tbe poor definitions of tbe
populations studied witb respect to symptomatology, we had limited power to detect possible differences. Based on biomedical insight, symptomatic episodes could last eitber Jonger (because tbey are more severe) or short er (if tbey would induce a faster immune response) tban asymptomatic episodesA reason for similar durations may be tbat, in populations witb poor knowledge of STD symptoms
as in rura1 Uganda, symptomatology appears to be determined more by subjec-

Symptom probabilities in gonorrhoea and chlamydia episodes
tive awareness than by objective disease signs, and would thus be unlikely to cor
re!ate with episode duration. Our specification that, for both untreated and treated symptomatic NG and
CT, the infection and its symptoms resolve at the same time also warrants caution. Although post-symptomatic phases of infection have been suggested [Judson 1990b, Thompson & Washington 1983], there is no empirical support for thls
conjecture. Some studies, on the contrary, suggest that symptoms disappear only after culture has become negative, both for treated [Johannlsson et al. 1980] and untreated episodes [Mahoney et al. 1942, McCutchan 1984]. (In the latter case, our estimation procedure remains valid, since it used the prevalenee of symptoms only from cases positive on diagnostic tests.)
Besides uncertainty about the durations of symptomatic and asymptomatic infection, several other limitations must be kept in mind. The assumed propartion receiving treatment was based on treatment seeking rates reported by partiei pants in the comparison arm of an STD mass treatment trial who were referred to clinics for free treattnent [Paxton et al. 1998a], and these may be bigher than in the general popu!ation.This may have biased the estimated symptom development probabilities upward.Perhaps most importantly, the prevalenee of reported symptoms among infected cases may systematically be bigher than the propartion in wbich the STD under study is the cause of these symptoms. Vaginal discharge in particu!ar, the main acute symptom of NG and CT infection in females, is a very non-specific complaint, which may also oecur as a result of trichomoniasis, bacterial vaginosis, candidiasis or pregnancy [Hoimes et al. 1999]. In the Ugandan study population, the prevalenee of (current) discharge was 5% in NGnegative or CT-negative females, wbich is hardly lower than symptom prevalenee
among infected females. Therefore, the prevalenee of symptoms in NG or CT infected females that is really caused by these infections, may be considerably lower than the values we used. Since estimated symptom probabilities varied almost proportionally with symptom prevalenee (Eq. 1), reporting of non-specific symptoms may have biased our probability estimates in temales upward.
Finally, we assumed that in the Ugandan surveys on symptom prevalenee in NG- and CT-infectees, asymptomatic and symptomatic NG and CT infections were both detected with 100% sensitivity. Gram stain, culture and leucocyte-esterase dipstick (LED), however, have a bigher sensitivity in the diagnosis of symptomatic NG than for asymptomatic NG [Judson 1990a,Jackson et al. 1997b]. If, by analogy, the sensitivity of the LCR test used in Uganda were also lower for asymptomatic than for symptomatic infection, the survey omeome may have overestimated symptom prevalence, and, hence, we may have overestimated the probability of developing symptoms.
69

70 Chapter 4
Comparison with previous estimates of symptom probabilities
Few prospective studies directly measured the probability of developing symptomsin untreated NG or CT infection.A study on gonorrhoea in US seamen [Har
rison et aL 1979] reporred a symptom probability of 98%, mucb higher than the 45% we estimatedfrom the Ugaudan data.lfwe use Equation 1 intheinverse way (estimating symptom prevalenee from symptom probability), with the treatrnent pattems of rural Ugauda, a 98% symptom probability would be consistent with a symptom point prevalenee of 91% for rnales with NG, whicb is mucb higher than the observed 33% in Ugaudan men.
Consictering the outcomes of the sensitivity analyses (Figute 4.2a), this dis
crepancy is unlikely due to imprecision in our methods or the data used. Rather, we may infer that parient delay aud treatrnent rates are not the only setting-speeitic delerminauts of symptom prevalence. Notably, a higher degree of underreporting of STD symptoms in Ugauda relative to US populations could contribute to this discrepancy.An example of the large influence of reporting bebaviour can be found in data from an STD intervention trial in rural Tanzania [Mayaud et al. 1997a].ln this study, improved syndromic STD management coupled with information, education and communication (]EC) on symptom recognition and on the benefits of eady treatrnent increased the population prevalenee of symptomatic NG and CT. Since the intervention did not alter the overall prevalenee of NG aud CT [Mayaud et al 1997a], the increase in symptomatic NG and CT probably re:flects improved recognition and reporting.
Also varlation in the gonococcal serogropus or serovars that prevalled in the respective populations may bave influenced their different symptomatology [Ross et al. 1994].
Tbe setting-dependency in symptom recognition may as wel! explain why symptom point preva/ences in infected populations in Western settings are not always lower than in developing countries, despite higher treatrnent rates (MK Sudaryo et aL, submitted). For example, with the 98% probability of developing recognized symptoms doeurnenled for USA male NG patients [Harrison et al. 1979], if in this population 95% of symptomatic cases got treated after a meau 2 days of parient delay Uudson 1981], the cortesponding symptom point prevalenee in the USA would be 50%,i.e.even higherthan the rural Ugaudan value of 33%. Important!y, this example also illustrates that the ratio of the probability of developing symptoms to symptom prevalenee increases with the level of treatment: for rnales with NG, estimated ratios were 1.9 (98% over 50%) for the US population, as compared to 1.4 ( 45% over 33%) for rural Ugauda.
In conclusion, this cbapter demonstrated that symptom point prevalenee is like!y to underestimate the probability of developing symptoms during an episode of infection, by a factor depending largely on STD treatrnent patterns in the population under study. Given uncertainties about the delerminauts of this relation,

Symptom probabilities in gonorrhoea and chlamydia episodes
the obtained symptom probabilities must be considered approximate estimates.
These findings nevertheless suggest that in populations with low STD treatment ratesasin rural Uganda, the probabilities of developing symptoms in NG and CT
episodes may be very low, and not mucb higher than symptom point prevalenee among infected cases. Furthermore, probabilities to develop recognized symptoms vary between populations, and are likely mucb lower in poorly educated
and underserviced populations than in Western settings. The results imply that in underserviced populations, (improved) syodrornic treatment alone is unlikely to be a sufficient STD control measure, because it fails to cover the majority of infectees and to curtail transrnission. In sucb populations, population-based education on symptom recognition and treatment seeking is of (at least) paramount importance.
4.6 APPENDIX
Effect of reinfection on the estimation of STD durations from cohort studies
The proportion of subjects found infected at follow-up in cohort studies of infected patients is the sum of: the proportion who remaioed infected throughout the follow-up interval; and: the proportion who resolved the infection but got reinfected within the follow-up interval.Ifwe assume that the duration tillloss of infection is disttibuted exponentially with average t
0, then the probability P" of
remaining infected til! the end of a follow-up interval~ is:P" (t>~) = e ·vca. Assum
ing in actdition that the probability of reinfection for previously infected subjects is constant over time according and the duration till re:infection exponentially disttibuted with mean t,, then the probability P ft of resolving the infection and
getring reinfected within the follow-up interval ~ is: P a+ft (t,;;~) = 1 - t" /( t"-t~ '' e Jt/to: + t~ /(to:-t~ * e _,,~~. Using these equations, we can calculate infection durations to: that take into account the influence of re:infection.
Several studies have measured reinfection rates for NG and CT, and these appear to vary between populations. CT was found to recur at a rate of 5% per year over the first 1. 4 years among US male and female sol di ers [Barnen & Brundage 2001], and among US females after a median duration of 8-11 months [Burstein et al. 2001],in 15% after an average follow-up of 3.4 years [Xu et al. 2000], and in 31% over an average interval of 9 months [Ricbey et al. 1999]. For gonorrhoea, one
study observed a risk of reinfection within 6 months among US rnales of 13%
[Thomas et al. 1996]. When estimating reinfection rates in the studies we used for evaluating dura
tions, we considered that, with a reinfection probability above 30% per year
71

72 Chapter4
(i.e. t, = 2.8 year) the outcomes of four studies listed in Table 4.1 [Parks et al. 1997, Maboney et al. 1942,Alexander et al. 1977, Sorensen et al. 1994] could not be explained, wbatever the chosen infection duration. For rwo studies of chlamydia in females with particularly low observed proportions infected at follow-up (Table 4.1) [Alexander et al. 1977, Sorensen et al. 1994], observations were inconsistent with any annual infection rate above 10%. We therefore concluded tbat the actual reinfection rates were for these populations Jikely lower than these values.
To assess the maximum influence of reinfection, we calculated infection durations assurning a 10% anuual reinfection rate for the rwo studies of chlamydia in
females, and a 30"/o rate for all other studies. Under these assumptions, estimated durations derived from the pool of studies shown in Table 4.1 were 82 days for females with gonorrhoea (as compared to 107 days in the base-case) and 454 days for females with chlamydia (as compared to 499 days in the base case). For rnales witheither infection, estimates remained essentially uncbanged.These upperbound estimates suggest tbat reinfection affecred our estimates of infection duration only little.

chapter 5
Comparison of baseline STD prevalences between
Mwanza and Rakai populations:
the role of selection bias and test diagnostics
Orroth KK, Korenromp EL, White R, Changalucha J, Serwadda D, De Vlas SJ, Hayes RJ, ÇTrossk-urth H. Comparison of SID prevalences in the Mwanza and Rakai trial populations: the role of selection bias and diagnostics errors. Manuscript in preparation.

Acknowledgements Th is work was supported by the UK Department for International Development as part of a project to performa comparative analysis of the cost-effectiveness of intervention strategies for the prevention of HIV transmission. We would like to thank Ron Gray, Maria Wawer and Nelson Sewankambo for their helpfu! comments on the manuscript. The authors also thank GlaxoSmithKiine for financial support.

Baseline STO prevalenee in the Mwanza and Rakai trials
5.1 SUMMARY
Objectives: To assess bias in estimates of STD prevalenee in population-based surveys resulting from diagnostic error and selection bias.To evaluate tbe effects of such biases on STD prevalenee estimates from two community-randomised trials of STD treatment in Mwanza, Tanzania and Rakai, Uganda. Methods: Age- and sex-stratified prevalences of gonorrhoea, chlamydia, syphilis, HSV-2 infection and trichomoniasis observed at baseline in botb trials were adjusted for tbe sensitivity and specificity of tbe screening and diagnostic tecbniques, and for sample selection criteria. ResuUs: Mter adjustments, gonorrhoea prevalenee was higher in men and women in Mwanza (2.7% and 2.8%, respectively) compared tomen and women in Rakai (1.0% and 0.9%, resepectively). Prevalenee of chlamydia infection was higher in wo men in Mwanza (9. 0%) compared to Rakai (3 .3%) but similar in men (2.0% and 2.5%). Prevalenee of trichomoniasis was higher in women in Mwanza compared to wamen in Rakai (39.7% versus 29.5%). HSV-2 seroprevalence was similar in tbe two populations.Adjustments for syphilis were not required. Prevalenee of serological syphilis (TPHA+JRPR+) was similar in tbe two populations but tbe prevalenee of active, high-titre syphilis (TPHA+JRPR :2: 1:8) in men and wamen was higher in Mwanza (5.6% and 6.3%) tban in Rakai (2.3% and 1.4%). Conclusions: Baseline STD prevalences were underestimated in Rakai and, especially, in Mwanza, due to dîagnostic errors and selection bias. After adjustment, prevalenee of curable STD were generally higher in Mwanza tban in Rakai. This may partly explain tbe larger impact of STD treatment on HIV transmission in tbe Mwanza trial.
5.2 INTRODUeTION
Prevalences of sexually transruitred diseases (STD) are aften compared between populations in order to gain a better understanding of STD and HIV epidemiology or to determine which control strategy may be most effective in a given epidemiological siruation.Two community-randomised trials of STD treatment as an HIV prevention strategy have been conducted in EastAfrica in Mwanza,Tanzania, and Rakai, Uganda [Grossl-:urth et al. 1995a, Wawer et al. 1999].1n tbe Mwanza trial, improved SID case management was associated with a 38% reduction in HIV incidence [Hayes et al. 1995a] .In tbe Rakai trial, STD mass treatment had no impact on HIV incidence [Wawer et al. 19991 .Vatious hypotbeses have been suggested to ö.-plain tbe apparently contrasting results, including tbat tbe two trials differed witb respect to tbe baseline prevalenee of curable STD [ Grossk-urth et al. 2000]. Based on tbe reduction in HIV incidence in Mwanza and tbe association between STD and HIV transmission we would e>.-pect a higher prevalenee of STD
75

76 Chapter 5
in Mwanza than Rakai. However, the STD prevalerrees reported in the rwo trials cannot be directly compared, as different diagnostic tests and different sampling strategies were used.
STD prevalerrees observed in surveys such as in Mwanza and Rakai depend upon selection of the sample tor measurement, extrapolation of the prevalenee measured in this sample to the general population, and the diagnostic technique used. Selection of the population in wbich the STD is measured may bias observed STD prevalenee either upward or downward.The net effect of diagnostic performance depends on the true prevalenee level: if prevalenee is low, speeiftdry is most important but if prevalenee is higb sensitiviry is critica!. Diagnostic errors can lead to either overestimation or underestimation of prevalence.
In this chapter, the measurement errors in STD prevalerrees due to the selection of the sample in which the STD was measured, screening and test diagnostics were assessed for the Mwanza and Rakai trial surveys. We adjusted the observed baseline prevalerrees of Neisseria gonorrhoea (NG), Chlamydia tracbomatis (CT), Trichomonas vaginalis (TV), syphilis and herpes simplex virus type 2 (HSV-2) infection for these biases, and then compared prevalerrees herween the rwo populations.We also considered the implications of these comparisons for the interpretation of the discrepant ttial outcomes.
5.3 MEmons
Framework for adjustments
Observed prevalerrees were adjusted for the sensitiviry and specificiry of the diagnostic tests, according to equation 1 [Kelsey et aL 1986]:
(p_+Sp-1)
(Se+Sp-1) Eq.1
where, p truc= true prevalence,p obst.•nu.'d = observed prevalence, Se = sensitivîty, and . Sp = specificiry.
For outcomes where diagnostics were perfonned on only a subset of the popula· tion based on results of a screening test, prevalerrees were also adjusted for the screening algorithm.The formula for this combined adjustment is:
P.--P (1-Sp) E 7 P- Se'(Se+Sp-1) q.-
where per== true prevalence,p obs("f'L't'd = observed prevalenee (i.e. on the combination of screening test and diagnostic test, under the assumption that those negative on screen are all truly negative),p_o;cn:m = prevalenee of a positive screening

Baseline STO prevalenee in the Mwanza and Rakai trials
test, Se = sensitivity of the diagnostic test, Sp= specificity of the diagnostic test, and Se·= sensitivity of the screening test. The denvation of Equation 2 is given io
the Appendix. After these adjustments, the overall prevalenee of each iofection io adults
aged 15-54 years was obtaioed after standardisiog for age usiog an average population structure of the two populations based on census data [Bureau of Staristics
& Macro-Internationall997, Republic of U ganda 1991]. Wh en data were not avall
abie for the entire age range 15 to 54, restricted age ranges were used.
Estimates of sensitivity and specificity for diagnostic tests
The sensitivity and specificity of the tests used were estimated based on values documented io the literature for general populations and populations of asymptomatic subjects.When outcomes forthese populations could not be found, studies in sro clinic pat:ients were used instead. We averaged test sensitivities and specificities across publisbed studies, and the mean values were used for adjustment of the Mwanza and Rakal observations. This was foliowed by a sensitivity analysis usiog the ltighest documented value for sensitivity from any siogle study, and the lowest value for specificity from any siogle study, to estiroate a lower liotit for the adjusted prevalenee range. Siotilarly, the upper liotit for the range was determioed by usiog the lowest sensitivity and ltighest specificity.
Gonorrhoea and chlamydia - In Rakai, urioe Iigase chain reaction (LCR, Abbott Laboratories,Abbot Park, Illinois, USA) was used to diagnose NG and CT
in men and women. In Mwanza, Gram stain on urethral smears was used to diagnose NG in men. For women, culture and Gram stain from endocervical swabs were used to diagnose NG, and the subject was considered iofected if either test was positive. In Mwanza, enzyme immunoassay (ElA, IDEIA Chlamydia; Novo Nordisk Diagnostika, Cambridge, England, UK) from urethra! swabs was used to diagnose CT in men, and EIA from endocervical swabs were used for Cf in women.
To obtaio estimates of sensitivity and specificity, we iocluded only studies usiog an 'expanded' gold standard, defioed as positivity on either cell culture or - if cell culture was negative - on rwo different non-culture tests such as LCR or PCR. Studies usiog culture alone as the gold standard were not used, because the imperfect sensitivity of culture would iocorrectiy suggest a low specificity for the tests under study wltich have ltigher sensitivity than culture, such as LCR
[Robioson & Ridgway 1996]. In Mwanza, a screening test was used to select the sample of men to be tested
for NG and CT, with testing confioed to men who either tested positive on urioe leucocyte esterase dipstick (LED; Nephur-Test + Leuco, Boehringer-Mannheim, Lewes, England, UK) tests, who complained of discharge duriog the ioterview, or whohad discharge upon clinical examination.To allow adjustment for the perfor-
77

78 Chapter 5
rnanee of the screening test (according to Equation 2), we estimated its sensitivity based on findings in a separate study conducted in 1996 in a rural community in Mwanza region [Watson-Jones et al. 2000] (see Results).
Trichomoniasis - The prevalenee of Trichomonas vaginalis in women was assessed via InPoucb TV culture (BioMed Diagnostics, San ]ose, Califomia, USA) on self-collected vaginal swabs in Rakai and by wet mount microscopy ofvaginal smears in Mwanza. In the reviewed literature, InPoucb culture was compared with other culture techniques, PCR, and wet mount microscopy as gold standards. To assess the performance of wet mount microscopy on vaginal specimens, we considered studies cernparing this test with InPoucb culture, other culture techniques, and PCR.
Syphüis- A non-treponemal test, the toluidine red unbeated serum test (TRUST; New Horizons, Columbia, Maryland, USA), was used to screen the Rakai population for sypbilis. Those testing positive on the TRUST test were tested using the Treponema pallidurn hemoagglutination assay (TPHA;TPHA Sera-Tek,Fujirebio, To1:yo,Japan) test [Wawer et al. 1998]. In Mwanza, theTPHA test was conducted on all study participants. A non-treponemal rapid plasma reagin (RPR; VD-25 Murex, Dartford, England, UK) test was conducted for those who were TPHA-positive [Gross1:urth et al. 1995b]. In both populations, we compared the prevalenee of serological sypbilis (TPHA-positive with any RPR/TRUST titre) and the prevalenee of active, high-titre syphilis (TPHA-positive with RPR titre;:;,: 1:8). Tbe diagnostic performance of the RPR and TRUST tests are simi1ar with 98% sensitivity and 99% specificity [I.arsen et al. 1995, Hart 1986] and TPHA tests were used in both populations, so no adjustment was needed to validly compare serological or active high-titre syphilis prevalenee as measured in Mwanza and Rakai.
HSV-2 seroprevalence - HSV-2 serology for the Rakai trial was conducted at the Centers for Disease Control (COC) using an inuuunoblot assaywhich discriminates between antibocties for HSV-1 and HSV-2 [Wawer et al. 1999]. Tbe diag
nostic adjustments proposed for the Rakai data are based on comparison with another inuuunoblot assay as the gold standard [Sanchez-Martinez et al 1991]. Seroprevalence in Mwanza was measured using a monoclonal antibody blocking inuuunoassay test and the diagnostic adjustment is based on the comparison of tbis test with Westem-blot in a ruralAfrican popuiatien [Obasi et al. 1999].
Estimation of selection bias
1f random samples of the population were selectedor the entire sample was evaluated, we adjusted STD prevalenee for diagnostic test performance only.This was

Baseline STD prevalenee in the Mwanza and Rakai trials
the case for NG, CT, Tv; and syphilis in Rakai and HSV-2 and syphilis in Mwanza [Grosslmrth et al. 1995b, Obasi et al. 1999,Wawer et al. 1998].We restricted comparison of SID prevalences to the gender and age ranges for wbicb data were available from both sites. Thus, comparisons for NG and CT were restricted to women and men aged 15-39 years. Comparisons for TV included women aged 15-49 years (data were not available forTVin menfrom either site).We compared HSV-2 seroprevalence in 15-29 year-olds and syphilis in 15-54 year-olds.
Where only non-random samples of the populations had been measured, additional adjustments were considered. In woroen in Mwanza, prevalences for NG, CT, and TV were measured only among antenatal clinic (ANC) attendees. ANC data from Mwanza town have been shown to underestimate HIV prevalenee and syphilis prevalenee in women in the general population [Kigadye et al. 1993, Mosha et al. 1993]. Similarly, unpublished analysis on Rakai trial data found age-standardised NG prevalenee among 15-39 year-olds to be 0.7% among selfreported pregnant women and 1.6% among women in the general population. For CT in Rakai, the corresporrding prevalerrees were 2.9% and 2.7%, and forTV prevalerrees were 24% in both groups. These data suggest levels of curable SID are similar or slightly lower in pregnant women compared to the general population in African populations. Ho wever, it is unclear whether this can be assumed to apply to women attending anterratal clinics in rural Mwanza. It may be tl1at selection biases associated with antenatal populations dïffer bernreen urban and rural areas, or that HIV-assodated effects on fertility may lead to different biases in rural Mwanza (4% HIV prevalence) and Rakai (16% HIV prevalence).Therefore, the Mwanza data were rrot adjusted forselection of theANC sample. Instead, our analyses for Rakai were limited to data from pregnant women (according to selfreport), allowing fora valld site comparison.
HSV-2 seroprevalence in Rakai was measured only among individuals reporting they were sexually active. Hence the population adjusttnent must take into account the prevalenee of se2..-ual activity in the different age strata in the sarnpled group (15-29 year-olds).For this, we assumed that self-report of sexual activity was 50% (half of those truly se>.-ually active reported se>.-ual activity) or 100% sensitive in 15-19 year-olds, 95% or 100% sensitive in 20-24 year-olds, and 100% sensitivity in 25-29 year-olds.After adjusting prevalenee of HSV-2 among sexually actives in Rakai for diagnostic biases, the estimated prevalenee for this group was multiplied by the estimated proportion sexually active.
5.4 HEsmTs
Table 5.1 shows publisbed estimates of the sensitivity and specificity of the diagnostic tests of interest.The average sensitivity and specifidty for eacb test arealso given. For Gram stain of urethra! smears for NG in men, only one study on diag-
79

Table 5.1 Published values for sensitivities and specificities of gonorrhoea and chlan1ydia diagnostics in women and men and trichomoniasis in women. LCR = Iigase chain reaction; EIA = enzyme-immuno-assay; MOMP = major outer membrane protein; ANC =
antenatal clinic; Ob-gyn = obstretical/gynaecology patients; Se = sensitivity; Sp = specificity.
Trial and Test Gold Standard and Specimen Se(%) Sp(%) Population Reference
Women
Chlamydia in Rakai- Gen-Probe (endocervica[) I El A (endocervica[) I LCR (urine) 98.4 100 Ob-gyn [lauderdale et al. 1999] LCR on urine Gen-Probe (endocervical) I LCR (urine) 86.8 100 STD clinic [Carroll et al. 1998]
LCR (urine) I MOMP-LCR (urine) I culture (endocervical) 95 100 Ob-gyn [lee et al. 1995] LCR (urine) I MOMP-LCR (urine) I culture (endocervical) 92,3 100 STD clinic [Lee et al. 1995] LCR {urine) I MOMP-LCR (urine) I culture (endocervicall 78.8 99.4 STD clinic [Buimer et af. 1996] LCR (urine) I direct immunofluorescence (urine) or if negative but 69.6 99.8 STD clinic [Ridgway et al. 1996] positive on LCR then MOMP-LCR (urine) I culture (endocervical) LCR (urine) I MOMP-LCR (urine) I culture (endocervical) 92.6 100 STDdink [van Doornurn et af. 1995]
Mean 87.6 99.9
Chlamydia in Gen-Probe (endocervical) I EIA (endocervica[) I LCR {urine) 50 100 Ob-gyn [Lauderdale et af. 1999] Mwanza: EIA on PCR (endocervical) I culture (endocervical) I EJA (endocervica[) 61.1 99.9 Hospita[ [Skulnick et al. 1994] endocervical swab PCR {endocervical) I culture (endocervical) I EIA {endocervical) 76.4 97,8 STD clinic [Wu et al. 1992] Mean
------- -------·-62,5 ___ 99.2 ------·--- ---.. ---
Gonorrhoea in Rakai: LCR (urine) I MOMP-LCR {urine) I culture (endocervical) 50 100 STD clinic [Buimer et al. 1996] LCR on urine LCR (urine) I Pilin~LCR (urine) I culture (endocervica/) 94.7 100 STD clinic [Stary et al. 1997]
LCR (urine) I LCR (endocervica[) I culture (end acervicaO 91.7 100 STD clinic [Carroll et al. 1998} Mean 78.8 100
-------------- ------ -------- -------- -------
Gonorrhoea in LCR (urine) I MOMP-LCR (urine) I culture {endocervical) 50 100 STD clinic [Buimer et al. 1996] Mwanza: culture LCR (urine) I Pilin-LCR (urine) I culture (endocervical) 84.2 100 STD clinic [Stary et al. 1997] Mean 67.1 100
Trichomoniasis in lnPouch culture (vagina I) I Diamand's culture (vagina!) I wet 88.3 100 ANC [Draper et al. 1993] Rakai: lnPouchTV on mount (vagina[) vagina! swab PCR (vagina[) I lnPouchTV culture (vagina!) I wet mount (vagina[) 69,7 100 Army medica[ [Madico et af. 1998]
clinic Diamand's culture {vagina\) 81 100 Adolescent [Ohlemeyer et af. 1998]
clinic Mean 79.7 100
"' 0
9 .g iii ~
"'

Trichomoniasis in PCR (vagina]) llnPouchTV culture (vagina I) I wet mount (vagina\) 36.4 100 Army medica! [Madico et al. 1998] "" Mwanza: wet mount clinic e: microscopy on lnPouch culture (vagina!) I Diamand's culture (vagina!) I wet 85,3 99.5 ANC [ Draper et al. 1993] ~ vagina! swab mount (vagina!) <1>
V> lnPouch culture (vagina I) 15 n.a. Hospita I [Borchardt et af. 1992]
<::! Diamand's culture (vagina!) I Feinberg-Whittington culture 60 93.2 STD clinic [Krieger et al. 1988] (vagina])
<:J
" Diamand's culture (vagina!) I Feinberg-Whittington culture 50.4 100 STD clinic [Fouts & Kraus 1980] iii (vagina!) i;)
" Mean 61.8 ... 98,2 lil
Men s· Chlamydia in Rakai: LCR (urine) I MOMP-LCR (urine) I culture (urethra!) 77.3 99.4 STO clinic [Buimer et al. 1996] s.
<1> LCR on urine LCR (urine) I MOMP-lCR (urine) I culture (urethra!) 86.2 100 STD clinic {van Doornurn et al. 1995] 2:::
lCR (urethral) /lCR (urine) I Gen·Probe (urethral) 92.5 100 STO clinic {Carroll et af. 1998] ~ Mean 85.3 99.8 " --------------- ---------------- -------------- -------- :;; Chlamydia in PCR (urine, urethra!) I El A (urine, urethra]) I culture (urethra!) 76 99.5 General [Noren et al. 1998] Mwanza: EIA on Population "' " urethra! swab PCR (urine) I EIA (urethra\) I supplemental PCR 60 100 STD clinic {Palladino et al. 1999] Q
"' PCR (urethra!) I culture (urethra]) IE IA (urethra!) 91.7 100 STD clinic [Wu et af. 1992] "' Mean 75.9 99.8 [ -- --- ---------'" -------··- --------- ----·--- ------------·-
'l Gonorrhoea in Rakai: LCR {urine) I P1 and pil in genes-lCR (urine) I culture (urethra!) 88.9 100 STD clinic [Buimer et af. 1996] ;;;· LCR on urine lCR {urine) ILCR (urine) I culture (urethra[) 94.7 100 STD clinic [Carroll et al. 1998] <;;-Mean 91.8 100
Gonorrhoea in PCR {urine) I culture and/or microscopy (urethra!) I supplemental 86.8 100 STD clinic [Palladino et al. 1999] Mwanza: Gram stain PCR
~

Table 5.2 Diagnostic test, screening test and selection bias adjustments for STD measured at baseline in Rakai and Mwanza. Observed prevalenee adjusted according to equation 1 if no screening test used1 according to equation 2 when screening test used. Forselection bias adjustments see text. M=male; F=female; y = year; NG = gonorrhoea; CT= chlamydia; TV= trichomoniasis; HSV~2 =herpes simplex virus type 2 serology; Se = sensitivity of diagnostic test in Eqs. 1 and 2; Sp = specificity of diagnostic test in Eqs. 1 and 2; Se1
= sensitivity of screening test in Eq. 2; p,Liffn = prevalenee of positive screening test in Eq. 2.
Diagnostic test adjustment Screening test adjustment ------"'-----:__ _______ -----~-~---- Selection bias adjustment
Se (range) (%) Sp (range) (%) Se'(%) Pmtto (%)
Rakai
CT F: 87.6 (69.6- 98.4) F: 99.9 (99.4- 1 00) n.a. n.a. n.a. M: 85.3 (77.3 - 92.5) M: 99.8 (99.4- 100)
NG F: 78.8 (50- 94.7) F: 100 (n.a.) n.a. n.a. n.a. M: 91.8 (88.9- 94.7) M: 100 (n.a.)
TV F: 79.7 (69.7- 88.3) F: 100 (n.a.) n.a. n.a. n.a.
HSV-2 92 (n.a.) 100 (n.a.) n.a. n.a. Prevalenee of sexual activity Females: 15-19y: 0.71 - 0.86 20-24y: 0.99- 1 25-29y: 1 Mal es: 15-19y: 0.52-0.76 20-24y: 0.94-0.97 25-29y: 1
Mwanza
CT F: 62.5 (50- 76.4) F: 99.2 (97.8 -100) F: n.a. F: n.a. n.a. M: 75.9 (60- 91.7) M: 99.8 (99.5 -100) M: 53.3 M: 15-19y: 0.24
20-24y: 0.26 25-29y: 0.25 30-34y: 0.21 35-39y: 0.26 40-44y: 0.23 45-49y: 0.27 50-54y: 0.27
::3
l ~ <n

NG
TV
HSV-2
F: 67.1 (50- 84.2) M: 86.8 (n.a.)
F: 61.8 (15- 85.3)
91 (n.a.)
F: 100 (n.a.) M: 100 (n.a.)
F: 98.2 (93.2- 100)
93 (n.a.)
F: n.a. M: 87.5
n.a.
n.a.
F: n.a. M: 15-19y: 0.24
20-24y: 0.26 25-29y: 0.25 30-34y: 0.21 35-39y: 0.26 40-44y: 0.23 45-49y: 0.27 50-54y: 0.27
n.a.
n.a.
n.a.
"' "' ~ ~ "' "' ö
"0 ;;; ;i ii)
" @ 3' S-<1)
s:: ~ " :;; "' " Q
"" "' [ ~-;;;-
0> w

84 Chapter 5
nostic properties in comparison to an appropriate gold standard was identified, fora SID clinic population [Palladino et al. 1999],and so we used data from this study. Forthetests used in Mwanza, sensitivity was generally low, mean estimates ranging between 62% and 87%). For tbe Rakai tests, mean sensitivities ranged between 79% and 92%. Mean specificities were between 98.2% and 100% for Mwanza, and 99.5% and 100% for Rakai.
Table 5.2lists all adjustments required for tbe Mwanza-Rakai comparison. For diagnostic tests, tbese were based on tbe means and ranges given in Table 5.1. For the screening test used for NG and CT in men in Mwanza, we estimated sensitivity at 53% for CT and 88% for NG; prevalences of positive screening test, needed for tbe adjustment according to Equation 2, are also given. For selection bias adjustment of tbe Rakai HSV-2 data, estimated proportions se>.-ually active for eacb age group are listed according to tbe assumptions discussed above.
Table 5.3 shows tbe observed and adjusted prevalenee levels for CT, NG, TV and HSV-2 serology.For serological (fPHA+/RPR+) and active high-titre (fPHA+/
Table 5.3 Observed and adjusted prevalenee among women and men for CT, NG, TV, HSV-2 serology, serological syphilis (TPHA+/RPR+) and active syphilis (TPHA+/RP~1:8) in Rakai and Mwanza. Prevalences are age-standardised by fiveyear age groups according to average age structure of Rakai district and rural Mwanza Region [Republic of Uganda 1991, Bureau of Statistics & Macro-International 1997]. NG = gonorrhoea; CT = chlamydia; TV = trichomoniasis; HSV-2 = herpes simplex virus type 2.
Observed prevalenee Adjusted prevalenee (%) and (%) range
Ra ka i Mwanza Rakai Mwanza
Women
CT (15-39y)* 2.9 6.4 3.3 (2.5 - 4.2) 9.0 (5.6- 12.7)
NG (15-39y) * 0.7 1.9 0.9 (0.8- 1.5) 2.9 (2.3 - 3.0)
TV (15-49y) * 24.0 25.6 29.5 (26.6- 30) 39.7 (24- 1 00)
HSV-2 (15-29y) 41.9 46.8 39.6-40.7 47.4
All syphilis (15-54y) 9.9 8.9
Active syphilis (15-54y) 1.4 6.3
Men
CT (15-39y) 2.4 1.0 2.5 (1.9- 3.1) 2.0 (1.5 - 2.7)
NG (15-39y) 0.9 2.0 1.0 (1.0 -1.1) 2.7
HSV-2 (15-29y) 23.0 18.2 16.6-17.8 13.3
All syphilis (15-54y) 9.6 7.3
Active syphilis (15-54y) 2.3 5.6
* for se!f-reported pregnant (Rakai) and ANC (Mwanza) women.

Baseline STD prevalenee in the Mwanza and Rakai trials
RPR;?_l:S) syphilis for men and wamen in Mwanza and Rakai, the directy observed prevalences are given. In wamen, observed prevalenee of CT in Mwanza was more than rwo-fold bigher than in Rakai, while after adjustment for diagnostics, it was almast three-fold higher. Similarly the adjustment accentuated the bigher prevalenee of NG in Mwanza as compared to Rakai. Observed TV prevalenee was similar in the rwo sites, but after adjustment, prevalenee was bigher in Mwanza compared to Rakai. Observed prevalenee of serological syphilis was slightly bigher in Rakai than Mwanza but prevalenee of active syphilis was bigher in Mwanza than Rakai. Also for HSV-2, seroprevalence tended to be bigher in Mwanza than in Rakai, even after allowing for possible under-reporting of se:>.-ual activity in Rakai. In men, observed CT prevalenee was bigher in Rakai than Mwanza but after adjustment this difference became smaller. Observed NG prevalenee was bigher in Mwanza than Rakai and the difference was accentuated after adjustment. Similar to results for wamen, the observed prevalenee of serological syphilis was bigher in Rakai than Mwanza, but prevalenee of active syphilis was much bigher in Mwanza than Rakai. Levels ofHSV-2 were slightly bigher in Rakai compared to Mwanza.
The sensitivity analyses (last column in Table 5.3) indicate that the omeomes were fuirly robust against uncertainty in our estimates of sensitivity and specificity of the diagnostic tests.An exception was TV in females in Mwanza, for wbicb estimated prevalences changed considerably when replacing the mean estimates for sensitivity by val u es doeurnenred from single studies (Tab ie 5 .I).
5.5 DISCUSSION
Previously publisbed results from the Mwanza and Rakai ttials studies suggested STD prevalences to be camparabie in the rwo sites at baseline [Wawer et al. 1998, Gross1:urth et al. 1995b]. We have shown that, due to measurement error, the levels of curable STD may have been underestimated. This was espedally the case in Mwanza, and taking the measruement errors into account, prevalerrees of curable STD proved to be considerably bigher in Mwanza than Rakai for NG, CT (apart from CT in men),TY, and active, high-titre syphilis (for wbicb adjustments were nor made). These infections reileet recent sexual behaviour in the populations. On the other hand, the prevalences of HSV-2 and serological syphilis were similar across the sites but these STD reileet the level of sexual risk behaviour over a Jonger past period.The bigher STD prevalences in Mwanza may be due to bigher risk behaviour in Mwanza compared to Rakai at the baseline of the trials, wbicb may in turn relate to the more actvaneed HIV epidemie in Rakai.
Severa! limitations in our analysis must be bighlighted. The adjusted prevalences depend on the effect of selection bias, the performance of screening algorithms,
85

86 Chapter 5
and the measured sensitivity and speciiicity of the diagnostic tests. Regarding selection bias, we must consicter selection of the ANC sample in Mwanza compared to pregnant women in Rakai when comparing NG, CT and TV prevalences. It is not dear how the data from ANC women in Mwanza may differ from those for all women who lmow they are pregnant in the population.About 90% of pregnant woroen in Mwanza attend ANC so we would not expect selective factors such as STD symptoms to bias STD prevalenee in theANC sample [Bureau ofStatistics & Macro-International1997].TheANC attendees in Mwanza would have been, on average, at later gestation than all pregnant women in the population. Hence, STD prevalenee may be underestimated in Mwanza compared to Ral-ai
since wamen with pregnancies that resulted in spontaneous abortions due to STD intections would nothave been in the&."!C sample. It seems most likely that ANC sample in Mwanza would have underestimated STD prevalenee but there may be other unlmown factors which may have biased STD prevalenee upwards in theANC sample.
When camparing NG and Cf prevalenee in men we have to consicter limitations of the performance of the complicated screening algorithm used in
Mwanza. We interred the performance of the screening algorithm (urine LED tests and reporting of symptoms or signs on clinical examination) from its use in a general population survey among men in a rural community of Mwanza region, Misungwi, in 1996 [Watson-Jones et aL 2000]. This interenee was appropriate because the proportion of men positive for the LED-test, reporting symptoms, or with signs on clinical examination were lmown to be similar between the Misungwi study and the Mwanza ttial. In the ttial, the distribution of reasous for positivity on the screening test was: 92% (out of 1451 men) LED-positive only, 4% complaining of discharge or ulcerative symptoms or with signs on clinical exam but LED-negative, and 4% with symptoms or signs and LED-positive [Grossl-urth et al. 1996]. In the Misungwi study of 438 men, 96% of men who tested positive on the screening algorithm had a positive LED-test only, 2% had signs or symptoms only, and 2% had symptoms or signs and were LED-positive.A further prerequisite for this interenee is that the sensitivity of this screening algorithm was similar in both populations.We think this is the case because the determinantsof this sensitivity, such as the prevalenee of schistosomiasis, are similar in Misungwi and the Mwanza ttial communities.
Finally, limitations in the performance of the diagnostic tests used influenced the measured prevalenee in the two trials. Due to the earlier date of the Mwanza trial, it was not feasible to use highiy sensitive and speciiic tests which were not available or affordable at that time.This explains why diagnostic biases were Iarger in Mwanza than Rakai. In this analysis, low sensitivity played a more critical role than low speciiicity since most adjustments of prevalences were upward (Table 5.3). For NG and CT in men in Mwanza, the effect of low sensitivity of the diagnostic test was enhanced by the low sensitivity of the screening test.The true magnitude of these diagnostic biases are however not certain, since we used

Baseline STD prevalenee in the Mwanza and Rakai trials
estimates of test sensitivity and specificity mostly from Iabaratory evaluations in
Western senings (Table 5.1), where sensitivity and/or specificity may be better than under the conditions in the rural African sites. In addition, the majority of
estimates for sensitivity and specificity of diagnostic tesrs came from STD clinic populations. We ntight expect the sensitivity of the tests to be worse for asymptomatic individuals compared to symptomatic individuals, and tbis would under
estimate STD prevalenee in both Mwanza and Rakai. Finally, the gold standards used to measure sensitivity and specificity may be imperfect, which would harm our abiliry to estimate tru.e absolute preavlence. However, where possible the same gold standards were used for Mwanza and Rakai, so our site comparison of the relative prevalerrees in the two populations should be valid even if the absolute prevalerrees remain unknown due to an imperfect gold standard.
This illustration ofthe importance of sample selection and diagnostic techniques in biasing observed STD prevalerrees has implications for the conduct and inter
preration of randontised trials and other surveys with STD prevalenee outcomes. The complexity of the adjustments made for the screening algorithm in Mwanza indicates it is preferabie to use random sub-samples ofthe general population to
monitor STD prevalence. With respect to diagnostic biases, in intervention trials, not only their effects
on baseline prevalenee but also the observed impact of the intervention on prevalenee must be considered. limitations in accuracy of diagnostic tests will in general result in dilution of observed impact on prevalenee (i.e., differences between arms at follow-up, or reductions over time within one arm).lf specificity is lintited, prevalenee in any sample will be overestimated, and the relative difference in prevalenee between arms or timepoints underestimated.As an example, assume the observed impact of an intervention on CT was to reduce prevalenee from 4% to 2% (relative risk=0.5).With 100% sensitivity and 99% specificity, the true prevalenee - after adjustment for imperfect specificity- would be 3% in the comparison arm and 1% in the intervention arm, consistent with a relative risk of 0.33.lf sensitivity is lintited but specificity is 100%, the relative difference in the tru.e prevalenee between arms or timepoints is the same as the relative difference in observed prevalence.
In condusion, the biases demonstrared in STD prevalerrees in the general population cohorrs of the Mwanza and Rakai trials illustrate the critica! attention which should be paid to selecting the population in which the STD is to be measured and the diagnostic technique to be used when conducting a research study with STD prevalenee outcomes. Notably, besides the properties of diagnostic tests, the
sensitivity of screening tesrs must not be neglected. In intervention trials, high specificity is critica! to avoid dilution of impact measures. We have shown that, after taking into account the biases, the prevalerrees of curable STD were higher in Mwanza than Rakai at the baseline of the trials. Based on tbis, we would expect
87

88 Chapter 5
STD treatment to have a larger impact on HN incidence in Mwanza than Rakai. This finding would, in part, ""-".Plain why STD treatment resulted in reduced HN
incidence in Mwanza but not in Rakai.
5.6 APPENDIX
Derivation of adjustment for diagnostics and screening, Equation 2
Test 1: Screening test Test 2: Diagnostic test
True Status I Test Positive 'Negative Total I Test Positive a b c I Positive Negative c d f I Negative
Total I g h N I Total
Let: Se = sensitivity of diagnostic test = __k_
k+m
Sp = specificity of diagnostic test =....!1.. l+n
Se'= sensitivîty of screening test= ~ a+c
Sp' = specificity of screening test = __Q_ b+d
p =.i ob:=ved N
P = ~ = p Se'+ (1-Sp')(l-p > screen N rrue truc"
i= aSe + (1-Sp )b i= gSe'Se + (1-Sp)(1-Sp')h
P•""""'' = p=•Se'Se + (1-Sp)(l-Sp')(l-p=) = p=•Se'Se + (1-Sp)(p==- p=<Se') = P=o(Se'Se- Se'+ SpSe') + p=(1-Sp)
p•""""''- p=~ (1-Sp) Equation 2 inSection 5.3: Pwo = Se'(Se + Sp -l)
True Status I
Positive I Negative : Total k I I i m 'n i i a lb e
I
i
:-"' -- ,._ ·.-. -·- ::::: -~ ""- ......
HIV spread and partnership reduction for different
pattems of sexual behaviour- a study with
the microsimulation model STDSIM
Korenromp EL, Van Vliet C, Bakker R, De Vlas SJ, Habbema ]DF (2000). HIV spread and partnership reduction for different pattems of sexual behaviour - a study 'With the microsimulation model STDSIM. Math.PopuLStudies 8(2): 135-173. Reused with permission of Taylor & Francis.

Acknowledgements The authors thank Hélène Voeten, the anonymous referees, and the participants of the IUSSP conference on Measuring Risk and Modelling the Spread of AIDS lortheir useful comments on the manuscript. The study was supported and financed by the Commission of the European Communities ( contracts 87.6211/96/010 and 87.6211/97/017).

Microsimufation model STDS!M and modeffing sexual behaviour
6.1 SUMMARY
We studied how sexual behaviour affects popuiatien HN spread simulating stylized risk profiles: 1) prostitution, no short relationships (resembling settings in South-East Asia); 2) prostitution, concurrent short relationships (resembling Soutb-America and urban sub-Saharan Africa); 3) no prostitution, concurrent
short relationships (resembling rura1 sub-Saharan Africa); 4) prostitution, serlal short relationships (a genetic !ow-risk setting).
We e...xplored the impact on HIV prevalenee of prevention programs accomplishing postponement of se>."Ual debut, reduction in partner cbange rate and in prostitution. We described the representation of se::\."Ual behaviour in the microsimulation model SWSIM, compating it to non-individual-based models.
The profiles generare markediy different time courses of HN spread. Concentratien of risk causes a rapid initial spread (Profiles 1 and 2), whereas the final prevalenee depends more on the overall extent of risk beha'\-iour in the general popuiatien (highest for Profiles 2 and 3). Effects of partnership reduction are strongly cont""-r-dependent. Small decreases in numbers of partners reduce HN
spread considerably if they reflect decreases in the comacts of highest risk in that setting. 1n settings with risk behaviour dispersed over a large part of the popuiatien (Profiles 2 and 3), indirect effects can cause the impact on HN to be disproportionately large compared to the magnitude of behaviour change.
6.2 INTRODUeTION
In the continuing absence of cure or vaccines for Hiv, avoidanee of exposure remains the primary mode of HN controL 1n the developing world, over 90% of HN infections occur through heteros"""Ual transmission [Over & Piot 1992].Yet, little systematic research has been performed into the effects of different forms of behavioural risk reduction on HN spread in the general popuiatien [ Choi &
Coates 1994, Peterman &Aral 1993, Oakley et al. 1995]-Sexual behaviour varies mdely between countries, as has been shown in
surveys performed throughout the world [Caraël 1995, WHO/UNAIDS 1998]. Large differences in se::\."Ual practices also exist within populations. Mathematica! roodels have shown that the e...xt:ent of heterogeneity in se...xual promiscuity within a popuiatien [Anderson & May 19911 and of concurrency in relationships [Morris & Kretzschmar 1995, 1997, Garuett &Johnson 1997] have a large impact on the spread of HIY. Much less studied is how these variables affect the out
comes of behavioural interventions. Obviously, the impact of reducing certain types of risk, sucb as prostitution or overlap in relationships, varles '<'ith their relative occurrence in a population. Moreover, behavioural pattems may affect the effectiveness of interventions via the time course in HIV spread they gener-
91

92 Chapter 6
ate. The same intervention may work out differently in settings where HIV has already spread into the general population, compared to settings where the infection îs still confined to core groups and about to spread wider.
Mathematica! rnadelling can help studying the complex interactions determining the spread of se.:ually transmitted diseases (STD) and their controL Different types of models can be used. On the one hand, there are relatively simp Ie, deterministic models descrihing general mechanisms operaring in the spread of infectieus diseases on a popwation level [Gupta et al. 1989, Garnett &Andersou 1996a].The other e..xtreme are stochastic, comprehensive models simuiaring the dynamics of disease spread at the level of individuals and their interactions [Mode et al. 1989,Auvert et al. 1990,Leslie & Bronham 1990,Kretzschmar et al. 1993, Morris & Kretzschmar 1995, Boily &Anderson 1996, Ghani et al. 1997].The latter type of models is particularly suitable for application in specific epidemiological settings. One such microsllnulation model) under development as a tooi in decision support in developing countries, is STDSIM [Van der Ploeg et al. 1998].
In this chapter, we present how the spread and control of HIV is simulated in STDShW.To illustrate how STDSIM can be adapted to specific settings, we projected the effectiveness of behavioural interventions for four hypothetical settings, differing in the pattem of sexual behaviour: 1) prostitution is the only type of risk behaviour; 2) prostitution and short, possibly concurrent relationships put men of all ages and young women at risk; 3) both rnales and females have multiple short, often concurrent relationships throughout life, but there is no prostitution; and 4) serial monogamy and limited prostitution.The fust three 'profiles' could be thought of as simplistic descriptions of behavioural pattems encoun-
Table 6.1 Schematic description of model profiles of sexual behaviour. lndicated is which risk behaviours are allowed in each profile, depending on individuals' present engagement in steady relationship(s) ('unmarried' vs. 'married').
Mal es Females
~ prostitute visiting short relationships short relationships Real-world setting
cê approximated unmarried married unmarried married unmarried married
+ + South-East As ia
2 + + + + + South-America, urban sub-Saharan Africa
3 + + + + rural sub-Saharan Africa
4 + +' +' generic low-risk
1 Serial monogamy. Source: Worldbank, 1997.

Microsimulation model STDSIM and rnadelling sexuaf behaviour
tered in, respectively, 1) South-EastAsia [Caraël et al. 1995,WHO/UNAIDS 1998], 2) Soutb-America and urban sub-SaharanAfrica [D'Costa et al. 1985, Buvé et al. 1995] and 3) rural sub-Saharan Africa [Caraël et al. 1995, Morris et al. 1995]. The fourth profile is a genetic low risk profile, included for contrast with the other three profiles. The profiles are schematically described in Table 6.l.ln earlier work, we have analyzed the effectiveness of condom use in different risk groups in preventing HIV using the above profiles [Worldbank 1997, Van Vliet et al. 1998]. Here, we focus on interventions accomplishing reductions in the num.her of partners: less prostitution, lower relationshïp formation rates, and postponement of se}..'Ual dehut. We cernpare our results to insights into the mechanisms of STD spread gained with simpler models. We discuss the relevanee of the projections for policy making in HIV controL Finally, we pay attention to the advantages and disadvantages of using microsimulation in rnadelling STD control, with special reference to the representation of sexual hehaviour in the STDSIM model.
6.3 Tm: STDSIM MODEL
Projeetiens were made with the microsimulation model STDSIM [Van der Ploeg et al. 1998].1n a microsimulation model, the life histories of hypothetical individuals are simulated over time in a computer program. Each individual is represenred hy a num.her of characterist:ics, of which some remain constant during simulated life (e.g. sex and date of birth), whereas ethers change (e.g. number of se>.'Ual partners). Changes in personal characteristics result from events such as the start and end of se>.'Ual relationships. These events are stochastic: if and when an event occurs is determined by Monte-Carlo sampling from probability distributions.To generate model outeernes fora simulated population, the characteristics of the simulated individuals are aggregated.
STDSIM simulates the transmission, natura! history and health consequences of HIV and four classica! se>.'Ually transruitred diseases (cSTDs), and possibilities for their controL The model is event-driven: all events are listed and performed in chronological order. At the occurrence of an event, the cl1aracteristics of the individual(s) and/or relationship(s) to which the event pertains are updated. In addition, events can generare new events, which occur either immediately - for example, the death of an individual terminates all relationships of this individualer later in the simuiatien- for e......::ample, at birth, the moment is determined when the persen wiJl fust become se>.'Ually active.
Aspects affecting the transmission of STDs are grouped into si.x modules. The modules demography, transmission,natural history,health care and interventions were described by Van der Ploeg et al. [Van der Ploeg et al. 1998], and are only summarized below. 1n order to e>.-plain the profiles of Se>.'Ual behaviour used in
93

94 Chapter 6
this analysis, we describe the module sexual behaviour in detail in the ne>."t section.
Model assumptions on demography, the transmission and natura! course of HN/STDs,and the generallevel ofhealth care referto a 'typical'third world country Input quantifications for this chapter are based on data from surveys and scientific studies performed mainly in Africa, as documented earlier [Van Vliet et aL 1998],We use age-specific fertility rates corresponding to an average total fertility rate of 3,6 [Unicef 1995], Mortalityrates are specified according toa standard, Coale-Demeney (West) life table, with a mean life e>.-pectancy of 625 for females and the corresponding life expectancy for rnales [Coale & Demeneny 1966], Migration is not taken into account,
Assumptions on the transmission, natural course and treatment of curable STDs are specified for each STD separately on the basis of the sdentific literature, We assumed HN disease to last for 8 years on average, after which the patient dies [Morgan et aL 1997b, Nagelkerke et aL 1990], We model HN transmission efficiency as a bath-tub pattem [Anderson & May 1988,Jacquez et aL 1994, De Vincenzi 1994], Transmission probabilities are 0,2% per contact from male to female and 0,1% per contact from female to male during the long asymptomatic phase (average duration 7 years), 20 times as high during the first 10 weeks of infection, and 5 times as high during the last, symptomatic year, Stage-specific HN transmission risks are increased by the presence of a cSTD in either partner of an HW-discordant seo.:ual couple by a factor 5 for chlamydia or gonorrhoea, and by a factor 25 for (infectious) syphllis or chancroid [Cameron et aL 1989, Laga et aL 1993,KreissetaL 1994,HayesetaL 1995c],
HN is introduced into the model population randomly in 1 prostitute or, in scenarios without prostitution, ID 10 sexually active rnales and 10 sexually active females, In addition, each year some STD infections are atrtibuted to persons in the model population randomly. These represem infections acquired through se>.-ual contacrs with persons living outside the model population, For HIV; this annual inddence was set at a constant 0. 01% for the population aged 16 and over, from the time of fllV introduetion onwards.
Model projections and analyses
Projections were made fora time period of 33 years after introduetion of HN in the population in year 0. Prevention strategies were specified tostart in year 15 after introduetion of HN and to lead to sustained behaviour changes until the end of the simulation period, In order to reduce stochastic fluctuations in sirnulatien outcomes, for each profile and intervention scenario we averaged the results of 150 runs. Population size was chosen at approximately 20,000 individuals at start of the intervention; this may re:flect the size of an average community, within which the majority of sexual partners of inhabitanrs live, We assessed

Microsimulation model STDSIM and rnadelling sexual behaviour
the effectiveness of interventions by camparing HIV prevalences in the general adult population between 15 and 49 years between simulations with and without interventions.
6.4 MODElliNG SEXVAL BEHAVIOUR
ln STDSIM, se:>:ual cantacts and relationships constitute a dynamic network througb which STDs can be transmitted. For example, when a simulated person contracts an STD, his/her uninfected parrner(s) become(s) at risk for infection. We consicter three types of ( exclusively hetero-)sexual contact: (i) sready relationships ('marriages'); (ii) short relationships; (iii) prostitution (conracts between female prostitutes and male clients). Formation of relationships occur in a process-like way, using the conceptsof availabiiity for (supply) and search (demand) of new partners [Le Pont & Blower 1991, Morris 1991]. Figure 6.1 illustrates this process. New relationships are formed between available men and available women. People become available for relationships for the fust time at se:>:ual debut (t1 in Figure 6.1). At each subsequent change in the number of current partners, a new duration ti11 availabiiity is determined.This duration (e.g. the interval between t
5 tot, in Figure 6.1) maybe shorterthan the duration ofan ongoing
relationship (t5
to the end of the end of the horizon in Figure 6.1), thus allowing for concurrent relationships (t
3 to t,).Availability ends when a new relationship
is formed. This happens either when someone is selected by a new partner (t5
in Figure 6.1), or when a full 'period of availability' (t, to t,) has elapsed and the
short relationship
~~ short refationship
I• ·,._ •I numberot relations R_J. steady relationship
yes * + * available J no
t, lz Î3 4ts ls !7 ls ls
95
time
Figure 6.1 Example ofthe sexuallife history of a typical young male in Profile 3. The male becomes first available at t
1 (sexual debut}. As he is nat found during his 'period of availability' betvveen t
1 and
t2
, he selects a partner himself (*) and starts a short relationship at t2
• Th is relationship ends at t3
• After a delay, he becomes available again at t
4 fora period until t
6• At t
5 he is however selected ( +) by a
partnerfora steady relationship, which terminates his remaining time of avai!ability (the remainder is indicated with a dashed line). Ou ring this relationship, the man becomes availab!e again att7• After his period of availability, at t
8, he selects (*) a partnerfora concurrent short relationship which ends
at t9
•

96 Chapter 6
person selects a partner from the pool of available people ofthe opposite sex in a preferred age group (at t,).
The mecbanisms of availability and partner selection do not reileet actual (psychological, behavioural or social) processes, but allow us to steer the rep
resentation of behaviour from both the male and the female population. The mathematica] framewerk of the behavioural module and the input parameter operationalization for this chapter are described in detail below.
Sexual debut
Se>.-ual de but is defined as the start of a fust period of availability for se>.-ual relationships. In this exercise,for both rnales and females, the timepoint offirst availability is drawn from a uoiform probability distribution with a minimum of 12 and a maximum of 20 years. This distribution ensures adequate fit of data from
sub-Sabaran Africa, including that virtually all persons eventually become Se>.1lally active [Feyisetan & Pebley 1989, Caraël et al. 1991,Bertrand et al. 1991,Hogsborg &Aaby 1992, Munguti et al. 1997, Konings et al. 1994].
Relationships' availability and partner selection
The time till availability fora new relationship is determined by an exponential probability function. At each change in an individuars number of current partners, a new time till availability is drawn, according to:
/()_1 -tlfl
t --·e f1
Eq. (!)
where J1. is the mean time ti11 availability for one specific individual at a given point in his simulated life:
f1 =-z;,, I (r,,a · p) Eq.(2)
with 1:. = the time interval that depends on the person's sex (s) and relationship s,r
status (r) (currently in a steady,short or no relationship);r"" =sex (s) and age (a)
group specific promiscuity factor;p = personal promiscuity level. The values for
"" and r,.a are listed in Tables 6.2 and 6.3.Where applicable, a distlnction is made between the 4 behavioural profiles used in this chapter.
The personal promiscuity level p, which reflects the heterogencity in promiscuity within the population, is determined by a gamma distribution:
f(p) I a-1 -pi/3 ·p ·e j3a .f(a)
Eq. (3)

Microsimulation model STOSIM and rnadelling sexuaf behaviour
Table 6.2 Values of the mean time till availability, depending on current relationship status, denoted 'tv in Eq. 2. = = infinite, i.e. these persons wil! not become avai!able anymore, so that concurrency is not possible for persons in this relationship status. M=male; F =female.
Profile 1 Profile 2 Profile 3 Profile 4 relationship status
M F M F M F M F
married ~ ~ 10 5 5 ~ ~
only short relationship(s) 1 1 1 ~
no relationship 0.5 0.5 0.5 0.5 0.5 0.5 0.5 0.5
Table 6.3 Sex and age specific promiscuity indices r5"'. M= male; F =female.
Profile 1 Profile 2 Profile 3 Profile 4 age (years)
M F M F M F M F
< 25 0.001 0.001 4 4 4 4 20 20
25-29 0.5 1
30-89
The average personal promiscuity levelp m is 1.0, because p m is used merely to specify heterogeneity in promiscuity in the population, and not its level. In this chapter, we chose the shape parameter a equal to 2.5 (j3 equals p m /a).
While being available for new relationships, an individual can be selected by someone who has ended his/her period of availability.lf the person has not been selected by the end of his period of availability, he himself then selects a partner from the pool of available people of the opposite sex.The period of availability (e.g. t
1 to t
2 in Figure 6.1) is given by an exponential probability distribution:
J(t) = L e- tiK: K
Eq.(4)
where the mean duration of availability Kis given by:
0 K
rs,a ·p Eq. (5)
with 8=0.5 yr in this chapter; see Table 6.3 for r,.a and Eq. 3 for p.
97

98 Chapter 6
Relationshlps: partner preferences
Partnership formation is guided by age preferenee matrices (one for each sex, Table 6.4) specifying the probability to prefera partner from a certain age class. In case no potenrial partner is available in the preferred age dass, a partner is sought in another age dass, by immediate renewed sampling among the remaining age classes for which the preferenee was larger than zero (e.g. in Table 6.4a, for rnales aged 15-19 years:the 3 female classes in the range 15-29 years,but not the older age classes).lf no partner is available in any of the preferred age classes, the person remains available for another availability period, according to Eq. 4. This cycle repeats until the person has a new partner.
We used age preferences matrices estimated to realize reported age differences between seJ>:ual partners [Hogsborg &Aaby 1992, Konings et al. 1994, Munguti et al. 1997]. In case of imbalances between the availability of and demand for partners in certain age/sex classes (e.g. strong preferences for female partners in
Tahle 6.4 Age preferenee matrices forselectinga new partner of a) rnales (male age groups in rows, fernale age groups in columns) and b) females (female age groups in rows, male age groups in columns). Mal es prefer somewhat younger partners, e.g. 75% of mal es between 25 and 30 choose females under age 25, whereas females prefer somewhat older partners. !f no value is indicated, partners in this age category are not allowed.
a. female age (y)
male age (y) 12-14 15-19 20-24 25-29 30-34 35-39 40-44 45-49 50-89
12-14 0.8 0.2 15-19 0.6 0.3 0.1 20-24 0.3 0.4 0.2 0.1 25-29 0.1 0.25 0.4 0.2 0.05 30-34 0.1 0.25 0.4 0.2 0.05 35-39 0.1 0.25 0.4 0.2 0.05 40-44 0.1 0.25 0.4 0.2 0.05 45-49 0.1 0.25 0.4 0.2 0.05 50-89 0.1 0.25 0.4 0.25
b. male age (y)
female age (y) 12-14 15-19 20-24 25-29 30-34 35-39 40-44 45-49 50-89
12-14 0.4 0.3 0.2 0.1 15-19 0.15 0.25 0.3 0.2 0.1 20-24 0.1 0.2 0.35 0.25 0.1 25-29 0.1 0.2 0.35 0.25 0.1 30-34 0.1 0.2 0.35 0.25 0.1 35-39 0.1 0.2 0.35 0.25 0.1 40-44 0.1 0.3 0.35 0.25 45-49 0.1 0.2 0.7 50-89 0.2 0.8

Microsimulation model STDSIM and rnadelling sexual behaviour
age group 15-19, but few females ofthis age available),however, tbe realized age mixing does not match tbe pre-specified age preferences. This is apparently tbe case in the simulations ofthis chapter:whereas the age preferenee matrices specify rnales selecting on average 5 years younger females (Table 6.4a) and females on average 5 years older rnales (Table 6.4b), realized age differences (Table 6.7) are less tban tbose in tbe input age matrices, indicating a relative shortage of young females.Anotber reason for smaller age differences realized as compared to the input age matrices is that model output on realized age differences pertains to relationships ongoing at 1 time point (as do empirica! data pertaining to ongoing relationships), rathertban to all relationships ever formed. In such crosssections, shorter relationships are underrepresented, whereas these relatively often include relationships between very old men and young women tbat end comparatively early due to tbe male's deatb.Apart from assortativeness by age, no otber preferences apply; for example, promiscuous individuals have no explicit preferenee for other promiscuous partners.
Relationships: steady or short
The probability tbat a new relationship is steady depends on whetber or not at least one of tbe partners is already engaged in a steady relationship, and on tbe age of tbe male partner. Table 6.5 lists tbese probabilities.At the start of a new steady relationship, its duration is drawn from an e.-xponential distribution witb a mean of 100 years. This quanti.fication was chosen to make most steady relationships lifelong while allowing some divorces to occur (e.g. 18% of steady relationships last less tban 20 years).The duration of short relationships is drawn from a ganuna distribution witb a mean of 0.2 years and shape parameter 0.5.
In the model, the frequency of intercourse in relationships varles with the age of tbe male partner, but it is identical for steady and short relationships, and independent of tbe number of current relationships. In tbis chapter, tbe frequency
Table 6.5 Probability that a new relationship is steady, by age of the male partner and marital status of both partners.
Profile 1 age male
Profile 2 Profile 3 Profile 4
99
(years) both one!both both one!both both one/both both one!both unmarrîed married unmarrîed married unmarried married unmarried married
<19 0 0 0 0 0 0 0
20-24 0 0.5 0 0.5 0 0.5 0
25-29 0 0.8 0 0.8 0 0.8 0
30-90 0 1.0 0.1 1.0 0.1 1.0 0

100 Chapter 6
was 1.5 times per week per relationship [Bertrand et al. 1991, Hogsborg &Aaby 1992, Borgdorff 1994, Konings et al. 1994].
Prostitution
Males· frequency of prostitute vislts is deterrnined by defining a number of frequency classes (in this chapter 0, 1, and 6 visits per year), and subsequently specifying the proportions of the married and unmarried male population (up to a ma.'dmum age, in this chapter 60 years) in each class (fable 6.6). A personal prostitute visiting inclination, assigned to each male at birth, deterrnines which individual rnales are assigned to which frequency classes, for both married and urnnarried (part of) life. The assignment is made such that no rnales move to a higher frequency class at marriage, or to a lower frequency class than before marriage at divorce. For Profile 1, this means that all single rnales visiting prostitutes once a year (i.e. 50%) quit this practice upon marriage, while of the 50% with 6
visits per year, 10% stop visiting prostitutes, 20% reduce the frequency to once a year, and 20% continue -with 6 visits per year.
At each prostitute visit as wellas at SE\.llal debut, the time tiil a male's next prostitute visit is determined according to the exponential distribution:
I ti"' f(t)=-·e· " rjJ
where 1/ <p is the persona! frequency of prostitute visiting.
Eq.(6)
Prostitutes are reeruired according to the male demand from sa..-ually active females within a user-specified age range. In this study the minimum age of prostitutes ranged from 15-25 years, the maximum age was 30 years, the minimum career duration was 1 year. We chose an average number of visits per week per prostitute of 10, which - in the absence of adequate data of wholly representative samples -we believe is a reasonable order of magnitude [Kreiss et al. 1986,
Table 6.6 Distribution (in%) of rnales over different frequency classes of prostitute visiting, according to marital status.
Number of Profile 1 Profile 2 Profile 3 Profile 4 prostitute visits per year unmarried married unmarried married unmarried married unmarried married
0 0 60 60 60 100 100 60 100
1 50 20 20 20 20
6 50 20 20 20 20
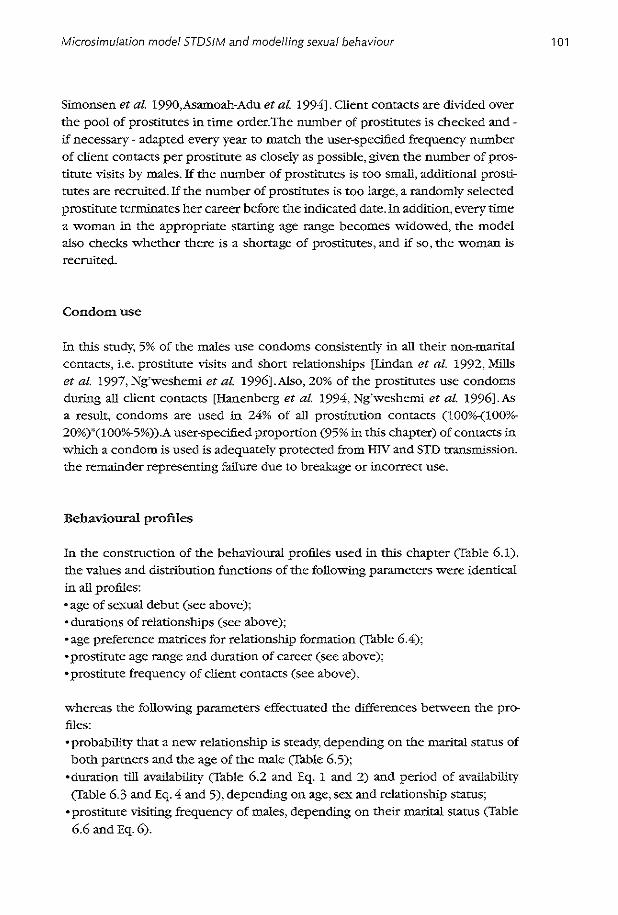
Microsimu!ation model STOS!M and rnadelling sexual behaviour
Simonsen et al. 1990,Asamoah-Adu et al. 1994]. Client cantacts are divided over the pool of prostitutes in time order.The number of prostitutes is checked andif necessary - adapted every year to match the user-specified frequency number of elient cantacts per prostitute as closely as possible, given the number of prostitute visits by males. If the number of prostitutes is too small, additional prostitutes are recruited.lf the number of prostitutes is too large, a randomly selected prostitute terminates her career befare the indicated clate.ln addition, every time a woman in the appropriate starting age range becomes widowed, the model also checks whether there is a shortage of prostitutes, and if so. the woman is recruited.
Condomuse
In this study, 5% of the rnales use condoms consistently in all their non-marital contacts, i.e. prostitute visits and short re!ationships [lindan et al. 1992, Mills et al. 1997, Ng'wesheml et al. 1996].A!so, 20% of the prostitutes use condoms during all elient cantacts [Hanenberg et al. 1994, Ng'weshemi et al. 1996].As a result, condoms are used in 24% of all prostitution centacts (100o/o-(100%-20%)"'(100o/o-5%)).A user-specifi.ed proportion (95% in this chapter) of cantacts in which a condom is used is adequately protected from HIV and STD transmission, the remaioder represent:i.ng failure due to breakage or incorrect use.
Behaviow:al profiles
ln the construction of the behavioural profiles used in this chapter (fable 6.1), the values and distribution firnelions of the following parameters were identical in all profil es: • age of se-"\.-ual debut (see above); • durations of relationships (see above); • age preferenee matrices for re!ationship formation (fable 6.4); • prostitute age range and duration of career (see above); •prostitute frequency of elient centacts (see above),
whereas the following parameters effectuated the differences between the profiles; • probability that a new relationship is steady, depending on the marltal status of both partners and the age of the male (fable 6.5);
•duration ti11 availability (Table 6.2 and Eq. 1 and 2) and period of avallability (Tab!e 6.3 and Eq. 4 and 5), depending on age, sex and relationship status;
• prostitute visiting frequency of males, depending on their marltal status (fable 6.6 and Eq. 6).
101
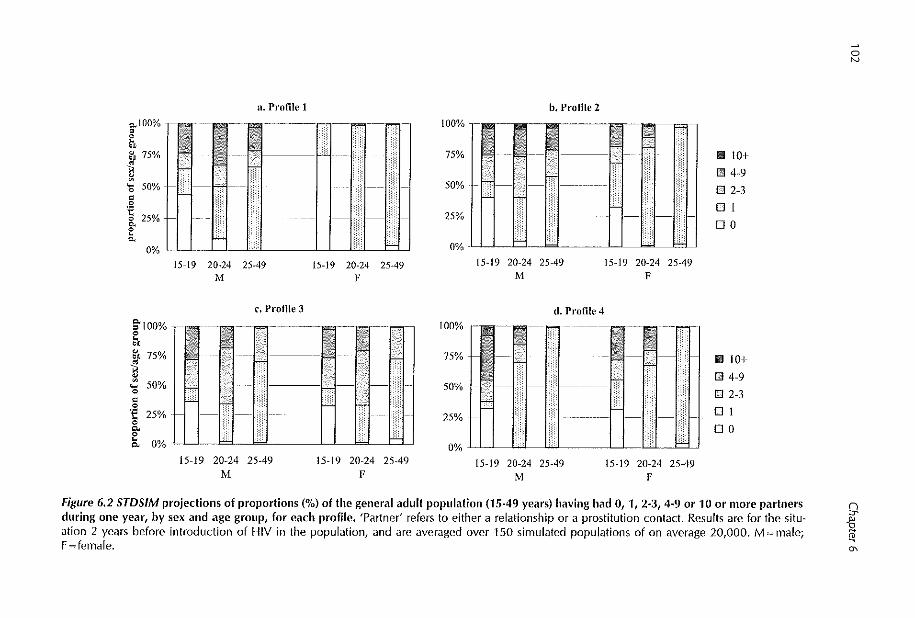
o..100% g ~' S"J) 75%
~
n. Profile 1
<S 50% +-1 '1-bcl-c
~ ~ 25%
"' 0% I I I I I
§"IOO%
~ ~IJ 75%
]
"' • 0
'f 25% 0 g.
15-19 20-24 25-49 .i\· i
c. Profile 3
15-19 20-24 25-49 F
-· llb.JHI E., O%JJ I _bd W
15-19 20-24 25-49 M
15-19 20-24 25-49 F
100%
75%
50%
25%
0%
100%
75%
50%
b, Profile 2
-~ ~] ~=- ---. ~~ -; --17- _7 __ -· ~
w: Ui ---- ----
h 15-19 20-24 25-49
M
d. Profile 4
15-19 20-24 25-49 F
0% LJ H I
15-19 20-24 25-49 M
15-19 20-24 25-49 F
111 101
I!! 4-9
D 2-3
Dl
DO
111 I 0+
I!! 4-9
D 2-3
Dl
DO
Figure 6.2 STDSJM projectionsof proportions (%)of the general adult poptdation (15-49 years) having had 0, 1, 2-3, 4·9 or 10 or more partners during one year, by sex and age group, for each profile. 'Partner' refers to either a relationship or a prostitution contact. Results are for the situation 2 years before introduetion of HIV in the population, and are averaged over 150 simuialed populations of on average 20,000. M =male; F ~female.
0 N
9
1 "'

Microsimulation model STDSIM and modefling sexual behaviour
For the latter set of parameters, we chose extreme values so as to create contrasts between the profiles.These parameter values- in contrast to the former- do therefore not necessarily correspond to actual situations.
The resulting dilierences in partnership dynamics between the profiles can be grasped from the respective age and sex distributions in the number of partners duting 1 year, an outcome also commonly used in behavioural surveys. In
the model output, each prostitute contact counts as a new partner for both the elient and the prostitute. Figure 6.2 shows the number of partners during 1 year predicted for each profile, fora timepoint just befare introduetion of HN in the population. In all profiles, the epidemie will ultimately change the level and distribution of risk behaviour, due to selective HN-re!ated deaths among persons at high risk. Table 6.7 gives the corresponding proportions in current steady and short relationships, proportions with multiple partners over 3 months and 5 yea.rs, realized age differences between spouses, and proportion of prostitutes for each profile.
In Profile 1 (prostitution), numbers of partners are strongiy asymmetrie between rnales and females. With the exception of prostitutes, woroen have se....'Cllal intercourse only "Within steady relationships. This is reflected in a majority of females having 0 or 1 recent partner. All single rnales engage in prostitution, resulting in high numbers of recent partners for rnales aged 20-24 years, who have all initiated se2..-ual activity but are mostly not yet in a steady relationship. Since 40% of married rnales also visit prostitutes, the proportion "With more than 1 recent partner remains high for age group 25-49 years. In Profile 2 (prostitution + concurrent relationships), both men and woroen who are not in a steady relationship engage in - possibly overlapping - short relationships. Concurrency in relationships and high rates of partner change imply large numbers of partners for the young.At older ages, females end up in monogamous steady re!ationships, as evidenced by a majority having only 1 recent partner. In contrast, married rnales continue to engage in short relationsbips "With single · mostly younger -females, and 40% visit prostitutes; this results in continued high numbers of partners. In Profile 3 (concurrent relationships), behaviour is relative!y synunetric between the sexes: both women and men have multiple, concurrent relationships, also after marriage. Full symmetry in numbers of partners is not accom· plished, because in relationships women are usually younger than men (Tables 6.4 and 6.7). Despite the absence of prostitution, the number of persons with more than 1 partner inthelast year is high, due to overlap in relationships.ln Profile 4 Cserial monogamy), all persons behave monogamously, apart from- maiuly young - rnales who may visit prostitutes while unmarried, but engaged in a short relationsbip. Among adolescents, high promiscuity causes new relationsbips to be initiated almast immediately afrer termmation of previous ones. Consequently, the number of recent partners is high for the youngest age group (15-19 years). In comparison to Profile 3, numbers of partners in this age group are low for females, because Profile 4 does not allow concurrent relationships, but high for
103

0
Table 6.7 Basic behavioural model output for each profile (means over 150 simuialed populations). Results are for the situation 2 years ,,
befare introduetion of HIV. In view of the average durations of STD episodes and of the highly infectious primary HIV stage {see Section 6.3), the proportion with ~2 partners during the last 3 months is an approximation of the proportion with concurrent partnerships induding prostitute cantacts [Ghani et al. 1997].
age group Profile 1 Profile 2 Profile 3 Profile 4 Outcome
(years) M F M F M F M F
15-19 17 25 0 40 0 33 0 27 Proportion (%) currently in 20-24 52 61 77 83 77 79 88 74 steady relationship 25-49 98 95 97 93 96 91 99 94
15-49 76 76 76 82 75 78 79 78
15-19 n.a. 1 21 16 32 26 48 34 Proportion (%) currently in 20-24 n.a. 1 10 8 21 22 9 21 short relationship 25-49 n.a. 1 2 1 15 12 0 0
15-49 n.a. 1 6 5 12 11 10 10
15-19 15 0.2 22 16 26 30 37 23 Proportion (%) with ;:::2 partner (incl. 20-24 22 1.1 30 8 30 34 9 14 prostitute contacts) in past 3 months 25-49 20 0.2 27 0.7 18 16 0.2 0.1
15-49 20 0.3 26 5 21 22 9 7
15-19 52 0.3 57 58 61 64 65 62 Proportion (%) with ;.:.:2 partner (incl. 20-24 84 1.6 95 59 98 97 99 73 prostitute contacts) in past 5 years 25-49 49 4.6 67 13 69 67 9 11
15-49 55 3 71 29 72 72 34 31 15-19 -1.6 -3.9 n.a. 1 -6.0 n.a. 1 -5.3 n.a. 1 -4.8
Average age difference with steady partner 20-24 -0.6 -2.7 2.2 -4.4 1.8 -3.8 0.5 -2.7 (own age - age partner, in years) 25-49 1.0 -1.4 2.8 -3.2 2.1 -2.8 1.0 -1.3
15-49 0.7 -1.6 2.7 -3.6 2.1 -3.0 0.9 -1.7 Proportion (%) of adult female population active as a prostitute 0.36 0.28 n.a. 0.05 9 ------"" ~ 1 No partnersbips possible in this category. M=male, F=female.
~
"'

Microsimulation model STDSIM and modelling sexual behaviour
males, due to prostitution in Profile 4. Sirree only urnnarried rnales visit prostitutes, persons of older age, who are aften martied, mostly have only one recent partner.
Although these theoretica! profiles of sexual behaviour cannot be equalled to specific countties, the qualitative resemblances to the geographical regions mentierred in the Introduetion (Table 6.1) are parallelled by similatities in numbers and age/sex pattems in having non-regu!ar partners, as can be seen by campati
sen with general popuiatien behavioural and health surveys [ Cataël et aL 1991, Cleland et al. 1992,WHO/UNA1DS 1998].
Prevention strategies
We considered the effects on the spread of HN of the following three ways of reducing numbers of partners: 1. a 2-year delay in the age of s<:J>:ual debut. This intervention was implemented
as a shift of the whole probability distribution function, i.e. a shift of the mini
mum from 12 to 14, the mean from 16 to 18,and the maximum from 20 to 22 years;
2. a halving of relationship formation rates. This intervention was implemented as a ;o% reduction in the average personal promiscuity level, which doubles the mean duration till availability and the mean period of availability til! selectinga partner. Note that reducing relationship formation rates was not compensated by pro Iongation of the duration of ongoing relationships;
3. a ;o% reduetion in prostitution, implemented as a halving of the proportion of rnales in the frequency categoties of 1 and 6 prostitute visits per year (Table 6.6).
These magnitudes of behaviour change were based on risk reductions observed in sub-Saharan African and South-East Asian countties: 1) [Asiimwe-Okiror et al. 1997], 2) [Ng'weshemi et aL 1996, Konde-Luie et aL 1997] and 3) [Ng'weshemi et aL 1996,Jackson et al. 1997c,Mills et al. 1997,Asiimwe-Okiror et al. 1997].
6.5 THE EPIDEMIOLOGY OF JllV IN THE FOUR PROFILES
Figure 6.3 shows the prevalenee of HN in the general adult popuiatien resulting from uncontrolled spread of the virus over time, as a mean over 150 simulation runs for each profile. Figure 6.4 gives the relationship between risk behaviour, indicated as individuals' numbers of partners over the past year, and HN prevalenee for the years 3, 13 and 33 after introduetion of the virus into the population.
105

106 Chapter 6
In Profile 1, the epidemie evolves rapidly, starting with prostitutes and rnales visiting prostitutes (Figures 6.3 and 6.4a,b). On!y after some time, prevalenee in females in the general population (most of whom have 1 partner) starts to increase. The more rapid rise of prevalenee among temales with 2 or 3 partners represents monogamous woroen widowed and remarried after their busband's death from HIY.Around the 10th year of the epidemie, population prevalenee slightly falls again and stahilizes at about 10%.Tb.is fall is due to selective HIV mortality in the high risk group of rnales visiting prostitutes.While selective mortality reduces the level of prostitution in the surviving population, it does not change the prevalenee within each risk group because HIV status is malnly determined by persons' own (male) or busbands (female) behaviour, and hardly by the ö.1:ent of prostitution in the rest of the population. Around year 20, an equilibrium is reached: the intlow of new HIV cases counterbalances the outflow of infected persons by HIV-related death. Comparison of prevalences among rnales and females with 4 or more partners (Figure 6.4a+b) shows that being a prostitute is more risk-y than being a prostitute visitor.Tb.is results from the respective frequencies of cantacts - 1 or 6 times per year for male clients, 10 times per week for prostitutes - and the higher effidency of transmission from male to female, as compared to female to male. The pace of HIV spread in Profile 2 and 1 is comparab1e for the fust few years. In contrast to Profile 1, however, HIV prevalenee
40
~ c 30 - --Profile 1 '"· "' ' 'Profile 2 "' - 20 "
-u ---· .. Profile 3 § -;; ~
- ~ - Profile 4
" 10 z. -
>-:;: 0
.·· T ----------- ·y - __ ,_,_,_ .. ,·---- -xl .,._-;: .. --
0 5 10 15 20 25 30
time (year)
figure 6.3 Projections of HiV prevalenee (average over 150 runs) in the adult popula~ tion (15-49y) for the four behavioural profiles. Time is indicated in years since the introduetion of HIV in the population. The vertical bars indicate 10th and 90th percentiles over 150 runs for years 15 and 30; these have been s!ightly shifted horizonta!ly to prevent overlap.

Microsimulation model STDS!M and rnadelling sexuaf behaviour
a. Profile 1. rnales b. Profile 1. fernales 100% 100%
0 0
5 75% 75%-
~ ~ycar33
- 50%- 50% · · ..rr · ·ycar 13 0.
~ § 25%- --ycar3 25%-
0% • 0% 0 2-3 4-9 10+
0 2-3 4-9 10+
c. Proflle 2. nales d. Profile 2. fernales 100% 100%
~ = 75% 75% "' = --+-ycar33 > ~ 50%- 50% --· · · -à· · -ycar 13 c.
?: 25%- 25% --ycar3 =
0% 0%
0 2-3 4-9 10~ 0 2-3 4-9 10+
e. Prome 3. rnales f. Proflle 3. fernales 100% 100%
~ 5 75%- 75%-
~ 50% --+-ycar33
50% • ~ ··-à-· -ycar 13 -0.
> 25% -· 25% . --y,ad :;: . .-(:" .... .-(:". ..--.6.'
0% 0% -'
0 2-3 4-9 10-'- 0 2-3 4-9 10+
g. Profile 4. rnales h. Prome 4, fernales
" 100% 100%
" = 75% 75% 0
" --ycar33 > 50% 50% --..rr--ycarl3 " -"' > 25% 25% --y=3 ~ ...,-:"'- -··· ~ ~ 0% 0%
0 1 2-3 4--9 10+ 0 2-3 4-9 10+ # partners in 1 year # partners in 1 year
Figure 6.4 Predieled HIV prevalenee (%) stratified by numbers of partners over the last year in the adult population (15-49y), for each profile in different years in the epidemie. Time is indicated in years si nee the introduetion of HIV in the population. M =male; F = fema!e. The size of each partner group can be seen in Figure 6.2.
107
108 Chapter 6
in Profile 2 contillues to rise to a much higher level of 30% in year 30 (Figure 6.3). In the beginning of the epidemie (before year 13 in Fig. 6.4c), most infections result from prostitution contacts, as can be seen in the increase of HN prevalenee for rnales having 4 or more partners (Fig. 6.4c), and females having 10 or more recent partners (Figure 6.4d). Between year 13 and 33 (Fig. 6.4c,d), the virus invades the general population through the partners of prostitute clients and short relationships,and the slope ofthe curve ofHN prevalenee by numbers of partners flattens. In Profile 3, the epidemie starts at the lowest pace of all profiles, since there is no high-risk group of prostitutes and their clients to fuel the epidemie. However, by year 10 prevalenee is growing faster than in any other profile, and is still increasing when it reaches 32% in year 33 (Figure 6.3). This continued riseis due to the occurrence of concurrent relationships in allage/sex groups in the general population. By year 33, HN prevalenee exceeds 25% even for individuals with only one partner per year (Figure 6.4e,f). The latter group consists of those who got infected through risk behaviour at younger age, and those put at risk by their partners. In Profile 4, the HN epidemie starts slowly, but the prevalenee contillues to rise until after year 30 (Figure 6.3). The absence of overlap in relationships in Profile 4 precludes an eventually wide spread of the epidemie, prevalenee reaching only 8% in year 30.
\'Vhereas overalllllV prevalenee at the end of the evaluation horizon is comparable between Profiles 1 and 4, the link between HN prevalenee and an individual's recent number of partners is much sttonger in Profile 1 than in Profile 4 (Figure 6.4a,b and 4g,h:year 33).This reflects the specification that risk status - the own or the husband's inclination to visit prostitutes - is fairly constant throughout life in Profile 1 (apart from changes in marltal status), whereas it changes with age in Profile 4 - most youth engage in risk behaviour, while few older persons do. In other words, in Profile 1 the number of partners during the last year is a better indicator of the lifetime risk of infection than in Profile 4.
Camparing Profiles 2 and 3, the assodation between HN prevalenee by number of partners is similar for year 33 - by which time absolute prevalenee levels in the general population are also similar. For earlier years however, the assodation is strenger in Profile 2, where the prevalenee reaches its maximum level in the groups with 4 or more partners already by year 13 (Fig. 6.4c,d).
In profile 3, in contrast, HIV prevalenee continues to rise further between year 13 and 33 in all groups including those with 4 or more partners (Fig. 6.4e,f). The rapidity of saturation in high risk groups in Profile 2, as compared to Profile 3, thus corresponds with the faster spread of HN into the general population in Profile 2.
Summarizing, the more concentrared risk behaviour in part of the population (Profiles 1 and 2), the faster the initia! spread of HIY, since an increase in the number of infected persons in the high-risk group inunediately increases the risk of exposure for other high-risk group members.lf the rest ofthe population does
Microsimulation model STDS!M and rnadelling sexual behaviour
not engage in risk behaviour (Profile 1), saruration of infection and selective mor
tality in the high-risk groups later in the epidemie cause HIV prevalenee to stabilize or even decline after an initial outbreak lf risk behaviour is more dispersed over the popwation (Profile 3), there is no initia! fuel in the form of a high-risk group, but the number of people who are at some risk due to their behaviour is
evenrually much larger, so that the infection spreads slower but finally reaches
a much higher prevalenee leveL These resuits are consistent with general conclusions drawn on the basis of earlier models [Gupta et aL 1989, Garnett &
Anderson 1993a, 1996a].The comparison between profiles makes clearthat an initially steep rise in prevalenee is not necessarily ind.icative of the most devastating epidemie. Countries with stilllow prevalenee levels shouid therefore remain alert, rather than optimistically hope the epidemie wiJl pass by their countty.The
marked differences in time courses of (uncontrolled) epidernies also illustrate that caution is needed when evaluating the impact of interventions by simply monitoring prevalenee trends.
Camparing the projected HIV prevalerrees to the real-world settings they are intended to represem (Table 6. 1), the effective condom programme implemented in an early phase of the epidemie in Thailand [Hanenberg et al. 1994, Nelson et aL 1996] prohibits a comparison between Profile 1 and Thailands hypothetical 'uncontrolled' HIV epidemie, Profiles 2 and 3 reasonably project the prevalerrees attained in Uganda and other sub-Saharan African countries in the early years of- but before major intervention in- the epidemie [Carswell 1987, Serwadda et aL 1992].
HIV spread varled considerably between individual simwation runs (see confidence intervals in Figure 6.3). Outliers occurred on the lower side of the distribution - no epidemie at all, or only after a delay - and reflect a large variability in the onset of spread of the virus after its introduetion in the population. For simuiating the impact of interventions in ongoing HIV epidemics, we therefore
excluded runs with an HIV prevalenee in the actuit population under 0.5% in the starting year of interventions from the analyses below. This criterion resulted in exclusion of 1 out of 150 runs for Profiles 1 and 3, and 24 runs for Ptofile 4.
6.6 IMPACT OF BEHAVIOURAL INTERVENTIONS
Effects on numbers of partners
To understand how the simulated behaviour changes affect HIV spread, we first
show their effects on recent numbers of partners of aduits, over the 3rd year
after start of the intervention (Figure 6.5). In Profile 1, a delay of se>--ual de but or halving of relationship formation rat es
bas litrle effect on the number of partners for rnales (Fig. 6.5a).The reason is that
109

• 0
'€ 0 e
100%
75%
50%
c.. 25%
a. Profile 1
I-
0%_!11 111111 !! !! 11 UJ
§ '€ 8. e
100%
75%
50%
c.. 25%
bas dcb rel pro M
c. Profile 3
HJ------
bas deb rel pro F
Qo/o I I I I I I I u,_LJ_LJ _ ___j
bas deb rel pro M
bas dcb rel pro F
b. Profile 2
100% ill'%
75% H Hl-
50%
25%
0% ~
100%
75%
50%
25%
bas dcb rel pro M
d. Profile 4
1-
bas deb rel pro F
O% _I I I I L....-U_LJ ___ ULlJLLLLU bas deb rel pro
M bas deb rel pro
F
111 I 0+ !!l 4-9
D 2-3 Dl
DO
11111 10+
!!l 4-9
D 2-3
Dl
DO
figure 6.5 Predicted effect of behavioural interventions on the numbers of sexual partners during the last year of adults rnales and females (15-49y) in the model, for the 3rd year aft er start of the interventions (year 18). bas= baseline; deb = delay of sex u al de but; rel= reduction in relationship formation rates; pro= reduction of prostitution; M =male; F = female.
0
9 ~ ~ "'

Microsimulation model STDSIM and modelling sexual behaviour
in Profile 1 the number of partners is almost exlusively deterruined by prostitute visits, which occur throughout life at a constant frequency (apart from changes associated with marital status). For females, both interventions slightly increase the proportion single, especially in the youngest age group (15-24 years), reflecting a de!ay of martiage. This effect is largest for reducing re!ationship formation rates. 1n contrast to the former interventions, halving the proportion of rnales visiting prostitutes markedly reduces the number of partners of males, in all age groups. This intervention does, however, nat affect the number of partners of females, except for halving the number of prostitutes.ln Profile 2, delay of se.'<Uai debut for both se.xes increases the proportion singles while decreasing the proportion with multiple recent partners (Fig. 6.5b).Whereas the change is moderate on an aggregate level, it is considerable in the younger age groups (15-24 years). Halving relationship formation rates decreases the proportion with multiple partners as well, but in all age groups equally, and this is compensated by an increase in the proportion with one, rather than zero, recent partners. A reduction in prostitution increases the proportion of rnales with 1 partner at the expense of the proportion with multiple partners.As in Profile 1, it has little effect on the number of partners of females.ln Profile 3, a delay of se.,:ual debut reduces numbers of partners markedly, but less than halving re!ationship formation rates (Fig. 6.5c), because concurrent re!ationships can be started at all ages. As in Profile 2, postponing sexual debut increases the proportion with zero partners, whereas reducing relationship formation rates mainly increases the propartion with 1 partner. These shifts are similar for rnales and females, as can be e.xpected from the symmetry in nurnbers of partners in the situation without intervention.ln Profile 4, delaying Se>.'Ual debut reduces the proportion witll multiple partners considerably for bath sexes, and even more than a reduction in relationship formation rates or in prostitution (Fig. 6.5d). This follows from the restrietion of risk-y to urnnarried youth, and the fact that both types of risk behaviour (short serial re!ationships and prostitution) are reduced by postponement of sexual de but.
1n all profiles, the shortening of the premarltal period with high partner change rates by a delay in sexual debut is partially - but not fully - compensated by a consequent delay in fust marriage (not shown).ln Profiles 1, 2 and 4, for males, decreasing prostitution causes the largest reduction in numbers of partners, whereas for females, larger reductions result from decrease in relationship formation rates or de!ay of se>.'Ual debut.
Effects on HIV spread
The projected impact of the interventions on lllV prevalenee in the different profiles is depicted in Figure 6.6.Figure 6.7 shows prevalerrees of HIV by nurnber of partners in the past year for the different interventions, in year 33 of the sinm-
111

a. Profile 1 b. Profile 2 15 ------------~ 40
[ T 30
~----V --baseline -~ "-- f±Î • 10 -·-- ~- ...
" debut • -'l 20 ........ >·., - --IT • ~ "' --- .. ____ I1 ·- · · · · relationships
" 5 ~ "' 10. - - - ------------ - - prostitution > Sl
0 0 5 10 15 20 25 30 0 5 10 15 20 25 30
c. Profile 3 d. Profile 4 40 --- - 15
~ 30 --baseline • 10 ·······················-·~ " debut • T T ~ 20 ~····· TT · - · · · relationships ~ ---~-11
1 " r- ··.. 1 5 . prostitution c. $ 10 ·· ....... I 0 0
0 5 10 15 20 25 30 0 5 10 15 20 25 JO time (year) time (year)
Figure 6.6 Projected impact of behaviour interventions on HIV prevalenee (average, 10th and 90lh percentiles) in the general adult population (15-49y) for each profile. lnterventions start in year 15. Confidence intervals around intervention projections for year 30 have been shifted hori~ zontally to prevent overlap.
N
9 j "'

Microsimufation model STDSIM and modeffing sexual behaviour
100% ~c======:::;----, j a. Profile 1, rnales
80%
60%
40%
0 2-3 4-9 10+
100% lj-;:=====:::::;-----1 c.. Profile 2, rnales
80%
0 2-3 4-9 10+
100%r,=====:::;----~ j e. Profile 3, rnales
80%-
0 2-3 4-9 10+
100% I I g. Profile 4, rnales 80% cc ____________ _o
60%
40%
0 2-3 4-9 10+
0 2-3 4-9 10+
100% ~==============~--------, I d. Profile 2, females 80%
0 2-3 4-9 10+
100%.1~============~---------J I f. Profile 3, temales
80%i
:::l'~ 20%- I
0% - -~
0 2-3 4-9 10+
100% ~c======:::;----, I h. Profile 4, females
80%
60%
0 2-3 4-9 10+
Figure 6.7 Predicted HIV prevalenee (%) stratified by numbers of partners over the past year in the adult population (15-49y), 33 years alter the introduetion of HIV (i.e. 18 years afterstart of the simulated interventions). Symbo! key: + no intervention, JE. delay of sexual debut, L. reduction in partnership formation rate, X reduced prostitution. The size of each partner group can beseen in Figure 6.5.
113

114 Chapter 6
lated intervention. In Profile 1, halving the number of rnales visiting prostitutes markedly reduces
IDV prevalenee in the general population (Figure 6.6a). In spite of the reduction in the number of rnales with multiple partners (Fig. 6.5a), the intervention hardly reduces in prevalenee within each male risk group (Fig. 6.7a). In monogamous women (those with 1 partner in Fig. 6.7b),IDV prevalenee is somewhat reduced indirectly, thanks to busbands quitting prostitution. A similar lowering of IDV prevalenee is seen for females with 2-9 partners, wbich is however a very small group (Fig. 6.5a). Since this dynamic effect is limited to monogamous women, the magnitude of impact on IDV in the general population (a halving of the equilibrium prevalenee from 10% to 5%) is proportional to the halving in the number of rnales visiting prostitutes. The margillal effect of the other two interventions is in line with their negligible effects on numbers of partners (Figure 6.5a,b).
In contrast to Profile 1, all interventlans in Profile 2 are effective in reducing HIV Halving relationship formation rates, by decreasing numbers of partners in both sexes, has a much larger impact than reducing prostitution, which predominantly reduces numbers of partners of males. Notably, if the interventloos in Profile 2 were performed earlier in the epidemie, e.g. in year 3, reducing prostitution would initially be the most effective intervention (not shown). Delay of sexual de but has an intermediate effect. In contrast to Profile 1, effective intenrentions reduce IDV not only in the toral population, but also to some extent within each partner group (Fig. 6. 7 e+d), indicating an additional effect on top of the decrease in the number of individuals with multiple partners. This explains why halving relationship formation rates reduces the equilibrium prevalenee more than half (from over 30% to under 15%) even though this intervention does not reduce prostitution.
In Profile 3, halving relationship formation rates brings IDV prevalenee down
to a very low level, the equilibrium prevalenee falling from over 33% to below 5%. This disproportionally large effect results from an - indirect - reduetion in IDV prevalenee within each risk group, on top of the reduction in the number of persons with multiple partners (Fig. 6.7e+f). Counterintuitively, at the end of this intervention, HIV prevalenee is lowest in those with multiple partners. Tbis group consists of young persons who have not yet become infected, wlille those with fewer partners are older and have become infected by risk behaviour at a younger age. The total effect of halving relationship formation rates is much larger in Profile 3 than in Profile 2, because in Profile 3 concurrent relationships are the only type of risk behaviour, in contrast to in Profile 2. Delay of sexual debut decreases IDV less than halving relationship formation rates, in agreement with their respective effect on numbers of partners. Relative to the small age band reached with this intervention - only the fust 2 years out of a prolonged
period of continued promiseuity (seeTable 6.3 and Fig. 6.2)- however, the magnitude of effect on IDV prevalenee is still considerable.As demonstrated by reductions in prevalenee within each partner group (Fig. 6.7e+f), this disproportional

Microsimulation model STDSIM and rnadelling sexual behaviour
impact is also due to additional indirect effecrs. in Profile 4, reducing prostitution does slightly better than the other inter
ventions, even though postponement of sexual debut reduces the numbers of partners most (Fig. 6.5d).Apparently, avoidanee of speci.fically a prostitute contact reduces HIV spread more than avoidanee of an average partnership among youths, which can be either a prostitution contact or a serial relationship. This is understandable since for relationships to become ris!,:y, one partner must fust have become infected; for monogamous adolescents not '\-isiting prostitutes, this may take several years.ln line with this, limiting prostitution reduces HN prevalenee within each partner group more than the other rwo interventions (Fig. 6.7g+h).ln other words, limiting prostitution has largerindirect effeers in Profile 4 than postponing sexual debut or halving relationship formation rates.
6.7 DISCUSSION
Microsimulation: the level of individuals
The results of this study were obtained by using the microsimulation technique. The actvanrages of the microsimulation approach in infectious disease rnadelling are: (i) intuitive representation: microsimulation describes characteristics and evenrs at the level of the individual, as they may be considered to be in realworld situations - e.g. individuals · present status and history of so:ual partnersrups and STD infections, or starring to use condoms with a eerraio partner; (ii) dynamic interactions and network e.ffects: changes at the macro-level automatically follow from processes defined at the individuallevel. For example, selective HN atttibutable mortality of high risk groups automatically results from simulation of underlying risk behaviour of indi,iduals and their interacri ons; (iii) applicability to specijic settings: it is easy to define and sirnulare speci.fic settings with respect to demography, behaviour, epidemiology and the type of interventions being considered or executed, for instance, a rise in condom use from 20% to 60% of casual conracts for young rnales in Nairobi; (iv) jlexibility in output: it is easy to produce the type of output matching available data, or to mimic the omeomes of epidemiological studies including their possible biases, e.g. the odds ratio for HN infection of having had an STD during the last year as an approximation of the STD cofactor effect. Our ultimate goal witl1 STDSIM is its application
in the evaluation of HN and STD control options in various developing settings. Since these differ in behaviour, epidemiology etc., and in the type of data available, the above mentioned actvanrages of microsimulation are of critica! impor
tance. A problem in applying microsimulation rnadeis to the spread of infectious dis
ease is to fit paran1eter values to available data. The represenration of especially
115

116 Chapter 6
sexual behaviour as individual events requires parameters which do no necessarily have a straightforward relation to data. Even with sophisticated types of data as collected in local network studies [Morris 1997], input parameters must often be determined by iterative fitting of model output against these data under varying input assumptions. An example in STVSlJ\1 are the mean durations ti11 availability and of availability for new relationships, which we fit by comparing current and recent numbers of partners to the data from behavioural surveys. Adequate fit of model outcomes to data does not guarantee the uniqueness of the chosen set of parameter values. Especially if few data are avallable, as is often the case, different combinations of parameter values may each be compatible with the sameset of data.Lacking comprehensive data sets in current application areas of the model, this difficulty is partly solved by using expert opinion, in actdition to data trom different sources, to fix part of the parameters, improving the chances to find a unique fit of the remairring ones [Van der Ploeg et al. 1998, Korenromp et al. 2000d].
Microsimulation: stochasticity
A vita! characteristic of STVSIM is stochasticity in outcomes.ln the present simulations, stochastic varlation over runs in mv prevalenee over time was considerable, largely due to outlier runs in which the epidemie emerged much later or not at all.This feature, which has been observed in other microsimulation models [Morris & Kretzschmar 1995], could reflect true stochasticity in disease spread for populations of a given size, and e..xtent of isolation/mobility. Large dilierences in the timing of HN emergence and spread have been observed between regions which lie isolated from one another, but have similar risk pattems [Buvé et al. 1995]. Handling of this variability in model predictions can be difficult. Clearly, it makes no sense to calculate the impact of interventions on non-existing epidemics; therefore, în this theoretica! exercise, we have excluded zero-runs from such analyses. Less evident is whether - and to what o..1:ent - outlier runs should be excluded when trying to fit the model to a real-world epidemie of known magnitude at a certain timepoint, which probably has resulted from many (sub-)local, differently timed epidemics.
Context dependency of intervention impact
Our projections demonstrated that the impact of different forms of partnership reduction on HN spread depends to a large extent on the type(s) and extent of prevalling risk behaviour. Obviously, the impact of a delay of S""-"Ual debut is considerable in settings where risk behaviour is concentrated in youth (Profiles 2, 3, and especia!ly 4). The extent of this effect, however, depends critically on

Microsimulation model STDSIM and modelhng sexual behaviour
the assumption that a delay of se>:ual debut is not accompanied by a parallel shift in the age window of high-risk behaviour (e.g. by postponement of marriage). Comparison of Profiles 2 and 3 with Profiles 1 and 4 showed that lowering the rate of partner d1ange is more effective in reducing risk in case of concurrent relationships as compared to monogarnous populations.This supports earlier suggestions [Morris & Kretzschmar 1997] that messages promoting one partner at a time may be as important as messages promoting fewer partners. The context dependenee of the impact of interventlens also implies that progranunes proven highly effective in some settings, e.g. 100% condom use in prostitution in Thai· land, are not necessarily equally effective in other settings.
Dynamics of intervention effects
The simulations showed disproporrionately large effects on HN spread of partnership reductions in some profiles. ln Profile 3, halVing relationship formation rates reduced the average number of partners during one year from 1.7 to 1.3, but in the Jonger term almost eradicated mv. This dynamic effect, which was illusrrated with reductions of prevalenee within groups of a certain number of partners (Fig. 7e+f), results from two mechanisms. First, a reduction in numbers of partners reduces the risk of HN acqulsition for an individual both directly -because offewer (concurrent) partners- and indirectly- because those partners also have fewer partners themselves, and are less often HN-infected. Second, this effect is multiplied with a concurrent, disproportionate lowering of STD cofactor prevalences in individuals and their partners, as this mechanism applies also to the other STDs.
The projectlens for Profile 3 illusrrate that promiscuity neects not to be abolished completely for a large and decisive epidemiological impact. This condusion matches insights gained earlier using the concept of (basic) reproductive numbers (RJ: a reduction moving the reproductive number in the group most determining popuiatien prevalenee below 1 suffices [Hethcote & Yorke 1984, Garnett & Andersen 1995]. Practically, the potentlal for large dynamic effects of behaviour change implies that apparently small shifts in numbers of partners, as somelimes detected in behavioural surveys e.g. in Uganda [Asümwe-Okiror et al. 1997], are potentially significant contributors to halring HN spread. In Profile 1, in contrast, halVing the proportion of rnales engaging in prostitution lowered the equilibrium HN prevalenee only proportionally, corresponding with the absence of HN reductions within groups srrati.fied by numbers of partners (Figure 6.7a+b).While this intervention halves the size ofthe group at risk (prostitutes, clients and their spouses), it doesnotaffect the spread ofHN beyond this risk group, lacking a bridge type of centacts to the rest of the popuiatien (e.g. non-prostitution casual partnersrups between high-risk and !ow-risk members; cf. [Morris et al. 1996]).
117

118 Chapter 6
In summary, the e>.1:ent to which a reduction in a single dominant type of risk behaviour succeeds in lowering HIV depends not only on the magnitude of impact in the target group, but also on the se>.<Jai network in the whole population. Indirect effects are largest in dense sexual networks including concurrent relationships eventually coveringa large part of population (Profiles 2 and 3), and smallest in looser networks that Jack bridglng between the high-risk (prostitu· tion) setting totherest of the (monogamous) population (Profile 1).
Comparison of model outputs on reductions in numbers of partners (Fig. 6.5), changes in HIV prevalenee stratified by number of partners (Fig. 6. 7), and impact on overall HIV prevalenee (Fig. 6.6), showed that shifts in numbers of partners alone cannot fully explain the magnitude of impact on HIV spread. To predict long-term epidemiological effects on a population level, changes in multiple attributes must be analyzed simultaneously- e.g. numbers of partners and HIV prevalenee by number of partners.
For increased condom use as an alternative preventive measure, cernparabie dynamic effects on HIV spread as for partnership reduction would apply, sirree condoms also reduce both HIV and STD incidence directly, and HIV incidence also indirectly through STD prevalenee reduction. In earlier STDSIM projections, halving the proportion of rnales or of prostitutes not using condoms consîstently in casual partnersbips [Van Vliet et al. 1998] was indeed almost as effective as halving of partnership formation rates (this chapter). Camparing partnership reduction and condom use to STD treattnent, however, the STD treatment Iikely has much less dynamic effects, sirree it reduces HN incidence exclusively indirectiy by lowering STD prevalences.Therefore, halving the number of casual part· ners Iikely has a larger potentlal for HIV prevention than doubling the proportion of STD episodes treated.
Validity and usefulness of intervention projections
Uncertainty about what would have been the course of an epidemie without an observed behaviour change hampers valld comparisons between observational studies and model outcomes. In Uganda, reductions in casual partnersbips and in prostitution have been credited for the stabilization and subsequent drop in HIV prevalenee as observed in different sentinel surveillance groups sînce the early 1990s [Mulder et al. 1995, Konde-Lule & Sebina 1993, Konde-Lule et al. 1997,Asiimwe-Okiror et al. 1997]. Others [Wawer et al. 1997, Brody 1996] have explained this decline from saturation effects, as evident from AIDS-mortality outweighing HIV incidence in cohort studies in rura1 Uganda. Our baseline simulations of Profiles 2 and 3, which in behavioural pattems and HIV epidemiology come ciosest to Uganda (before large-scale prevention efforts), suggest that declines in HIV prevalenee as large as observed in Uganda are unlikely to be explained by saturation effects alone. The simulations also showed that behav-

Microsimulation model STDSIM and modelling sexual behaviour
iour changes as noted in Uganda- a 2 year delay in se»:ual debut [Asümwe-Okiror et al. 1997] and a 20-50% reduction in the proportion of adolescents having nonregular sex [Konde-Lule et al. 1997] - can indeed contribute disproportionally to lowering mv prevalence.
No studies have yet been publisbed that quantitatively and in a controlled way investigated the effects of behaviour change on IDV or STD incidence in developing countries. Therefore, our results can best be regarded as qualitative and in the right order of magnitude, rather than as exact quantitative estimates. One souree of uncertainty in the model predictions lies in the assumptions on STD/HIV interactions. Since the projeered impacts of partnership reductions were in part accomplished via STD cofactors, the magnitude of the predicted impact on IDV depends on the assumed cofactor magnitudes, which are as yet unknown. The larger STD cofactors, the larger the prediered impact of partnership reduction will be. Uncertainty also pertains to the assumptions on intervention coverage.The magnitudes of risk reduction in intervention studies on which these were based Uacksonet aL 1997c, Mills et al. 1997] need not be indicative of what can be achieved in other, non-research, settiogs. Feasibility may also differ between settiogs, whereas we applied the risk reductions observed in certain countries to all model profiles. Moreover, behavioural responses are often not sustainable after the end of the intervention, especially if resulting from vertically implemented, small-scale prevention programs (e.g. [Stall et al. 1990,Asamoah-Adu et al. 1994]).This could cause the assumed reductions in numbers of partners - which were based on short-term intervention studies and programme evaluations - to be unrealistic for the 15 years of the simuiared interventions. On the side of intervention efficacy~ the simulated interventions could in reality have additional effects ignored by the model. For example, delay of sexual de but could have a larger impact on IDV spread if risk factors associated with young age of females, such as cervical ectopy and trauma during intercourse [UN 1993, Mayer &Anderson 1995, Suilivan et al. 1997, Mostad 1998], would increase susceptibility to and/or infectivity of STD infection. Finally, even if all relevant effects of interventions were included in the model, projected effectiveness at realistic coverage could nor be the only criterion when prioritizing between IDV control options. Costs must also be considered. For programmes achieving certain behavioural changes in developing countries, costs can as yet only be guessed and they will probably vaty considerably between settiogs. Still, the large indirect effects of even small behaviour changes, as demonstrated in this chapter, make such intervention effects a valuable aim striving for.
119


-.r- _._ :::::::.
'-"-'""" --'
Model-based evaluation of single-round STD mass
treatment for HIV control inMwanza
Korenromp EL, Van Vliet C, Grossk.-urth H, Gavyole A, Van der Ploeg CPB, Fransen L, Hayes RJ, Habbema ]DF (2000). Model-based evaluation of single-round mass treatment of so..-ually transmitted diseases for HIV control in a ruralAfrican population.AlDS 14: ;73-593. Reused with permission of Lippincon Williams & W:tlkins.

Acknowledgernents We thank Maria Wawer, Ron Gray, Sake de Vlas, Liesbeth Meester, Roei Bakker and the anonymous reviewers fortheir useful comments on the manuscript. The study was supported and financed by the Commission of the European Communities (contracts 87.6211/96/010 and 87.6211/97/017).

Modelling STD mass treatment in Mwanza
7.1 SUMMARY
Objectives: To compare the impact of single-round mass treatment of se;,.-ually transmitted diseases (STD), sustairred syndromic treatment and their combination on the incidence of mv in rural Africa.
Methods: We stuclied the effects of STD interventions by stochastic simulation using the model STDSIM. Parameters were fitred using data from a trial of
improved STD treatment services in Mwanza,Tanzania. Effectiveness was assessed by camparing the prevalences of gonorrhoea, cblamydia, syphilis and chancroid, and the incidence of HIY, in the general adult population in simulations with and without intervention. Results: Single~round mass treatment was projected to achieve an immediate, substantial reduction in STD prevalences, wbich would return to baseline levels over 5-10 years. The effect on syphilis was somewhat larger if participants cured of latent syphilis were not immediately susceptible to re~infection.At 80% cover~ age, the model projected a reduction in cumulative HIV incidence over 2 years of 36%.A similar impact was acbieved if treatment of syphilis was exduded from the intervention or confined tothese in the infectieus stages. In comparison with sustained syndromic treatment, single~round mass treatment had a greater shortterm impact on mv (36 versus 30% over 2 years), but a smaller long-term impact (24 versus 62% over 10 years). Mass treatment combined with improved treat
ment services led to a rapid and sustairred fall in mv incidence (57% over 2 years; 70% over 10 years). Concl:usions: In populations in wbich STD control can reduce mv incidence, mass treatment may, in the short run, have an impact comparable to sustained syndromic treatment. Mass treatment combined with sustained syndromic treatment may be particularly effective.
7.2 INrRODUCTION
IDV/AIDS contillues to spread rapidiy in many developing countries. For e..xample, mv prevalenee in the general adult population exceeds 30% in parts of southemAfrica, and high incidence rates have been reported from partsof southeast Asia [GNAIDS 1997]. In most of these countries, neither vaccination nor affordable and effective treatments are likely to be available for many years, leaving preventive measures as the only realistic option for controL
The results of epidemiological studies strongly suggest that other Sö.'Ually transmitted diseases (STDs) enhance the Sö.'Ual transmission of mv [ Cameron
et al. 1989, Plummer et al. 1991, Laga et al. 1993], by increasing both the susceptibility of IDV-uninfected and the infectiousness of IDV-infected indi,iduals [Mertens et al. 1990]. Increased shedding of IDV in the genital tract in STD-
123

124 Chapter 7
infected HIV patients seems to be one of tbe biologica} mechanisms underlying tbis cofactor effect [Mostad et aL 1997, Cohen et al. 1997]. Whilst STDs represent a major pubtic healtb problem intheir owln right [Worldbank 1993], it has been suggested tbat STD control should also ~educe HIV transmission [Pepin et al. 1989]. The World Healtb Organization has promoted syndromic case management of STDs in areas lacking reliable cliagnostic services [WHO 1994] .ln a community-randomized trial in tbe rura1 popuiatien of Mwanza region, Tanzania (witb an HIV prevalenee of 4% in mid-1992), hnproved STD services using tbis approach reduced HIV incidence by 38% (95% confidence interval (Cl): 15- 55) over 2 years [Grossl.-urtb et al. 1995a, Hayes et al. 1995a].
Syndromic treatrnent of STDs relles critically .on tbe occurrence and recognition of symptoms, and on appropriate treatrnent-seeking behaviour and tberapy coropliance [Aiary et aL 1996,Wllkinson 1997, Dallabetta et al. 1998]. Unfortunately, a considerable proportion of STDs are asymptomatic, and symptoroatic patients often fail to recognise their condition or resort to ineffective sourees of care. Furthermore, partner treatment rates are generally low in developing coun
tries [Buvé et aL 1993, Hayes et aL 1997, Wm.field & latif 1985]. To ovcrcome these limitations, STD mass treatment has been suggested as an alternative or coroplementary approach for the control of STDs and HIV [Adler et al. 1996, Wawer et al. 1998]. Mass treatrnent has been applied successfully in eraclication progranunes for yaws and endemie syphilis [WHO 1965,Anta1 & Causse 1985]. As a test of concept, the effectiveness of repeated mass treatment of STDs has recently been investigated in a communiry-randomized trial in rural Rakai district, Uganda, witb a high HIV prevalenee (16%).After two rounds of mass treatrnent at 10-month intervals, the investigators observed significant reductions in the prevalenee of syphilis and trichomoniasis and non-significant reductions in gonorrhoea, chiamyclia and bacterial vaginosis, but surprising1y no reduction in HIV incidence, the adjusted incidence rate ratio of HN (interventionJcomparison arm) over tbe fust 20 mentbs being 0.97 (95% Cl, 0.81-1.16) [Wawer et al. 1999].
Despite these disappointing results, STD roass treatrnent, possibly in combination 'With other interventions, may represent an effective strategy for STD and HIV control in soroe populations. It is tberefore important to understand tbe roechanisms iniluencing tbe dynarnics of STD and HIV transmission under conditions of roass treatment. Computer roodels tbat are sufticiently sophisticated to simulate tbe transmission dynarnics of STD infections witbin human populations, are increasingly used to analyze complex probieros oftbis kind [Anderson & May 1988,Andetson 1989, Garnett &Anderson 1996a, Robinson et al. 1997].Various models have been used to study tbe impact of alternative strategies to prevent tbe spread of HIV in Sub-Saharan Aftica [Rowley & Andersen 1994, Garnett & Andcrson 1995, Kault 1995, Low-Beer & Stoneburner 1997,Bemstein et al. 1998]. So far, simulations e.xploring tbe impact of STD control on HIV spread [Robinson et al. 1997, Bemstein et al. 1998,Auvert et al. 1990, Stover & O'Way 1995, Robin-

Modelling STD mass treatment in Mwanza
son et al. 1995] distuinguished at maximum two types of STDs (ulcerative and inflammatory) acting as cofactors for HfV transmission. However, the transmis
sion dynamics, and hence the response to control measures, of STDs of different aetiologie origin within these types can be very different [Brunham & Pluromer 1990, Stigum et al. 1994, Kretzschmar et al. 1996].To predict the impact ofSTD control on lllV transmission, it is important, therefore, to distinguish between STDs. The stochastic microsimulation model STDSIM was specifi.cally designed
for this purpose. This chapter describes the application of the STDSIM model to predier the
short- and long-term effects of a single round of STD mass treatrnent on STDs and HfV in a rural African population. We discuss a nurnber of biomedical determinants of the effectiveness of this intervention, and examine the predicted impact of mass treatment in comparison with, or in combination with, the continuous provision of syndromic treatment services. The model was quantified using data from the Mwanza trial population, in order to assess the likely impact of mass treatment in a setring at a comparatively early stage of the HfV epidemie (as evidenced by a relatively low prevalenee and a high incidence/prevalence ratio) compared to rural areasin liganda [Wawer et al. 1999, Nunn et al. 1995]. We considered a single·round rather than a multi-round treatment strategy to better illustrate the short·term and long·term effects of mass treatment, and because a single-round approach is likely to be more feasible in resource poor settings.
7.3 METHODS
Microsimulation model STDSIM
The model has been described in detail elsewhere [Van der Ploeg et al. 1998, Korenromp et al. 2000c ]. STDSIM simulates the natura! history and transmission of HfV infection and four bacterial STDs (gonorrhoea, chlamydia, syphilis and chancroid) in a population defined by a detailed set of parameters. The model population consists of individuals with assigned characteristics that change over time. The formation and dissalution of sexwll partnersbips between individwlls, and transmission of STDs during cantacts between sexaal partners, are mod
elled as stochastic events.The explicit representation of individwlls, partnerships, instauces of STD transmission and STD episodes is considered a valid approach to simulate STD transmission dynamics [Robinson et al. 1997,Auvert et al. 1990, Robinson et al. 1995, Kretzschmar et al. 1996, Mode et al. 1989, Lestie & Brun
ham 1990, Ghani et al. 1997, Morris & Kretzschmar 1997]. For example, it allows for concurrent partnerships, an important determinant of STD spread [Morris &
Kretzschmar 1997,Watts & May 1992]. Moreover, the microsimulation approach makes STDSIM flexible in the specificatien of interactions bernreen different
125

126 Chapter ï
STDs and HIV at the level of single sexual centacts between uninfected and infected partners. STVSIM allows us to sirnulare a variety of ( combiflations of) interventions, and to study their impact on various epidemiological outcome measures over time.
Model quantification
Demographlc, bebavioural and biomedical model parameters were quanti.fied using data from the rural popuiatien of Mwanza region, Tanzania, doeurnenred tbrougb a series of studies conducted in the context of the trial of improved (syndromic) STD treatment services [Grossk"Urth et al. 1995a, Grossk"Urth et al. 1995b, Grossk"Urth et al. 1996, Hayes et al. 1995a, Mayaud et al. 1995, Mayaud et al. 1997a, Munguti et al. 1997,Todd et al. 1997]. Baseline prevatences of Hiv, syphilis, gonorrhoea and chlamydia were fitted to those measured at the start of the rrial in 1992, whereas HIV incidence (in the absence of intervention) was fitted to tbat observed in the comparison arm of the trial during follow-up from 1992 to 1994.1n the model, HIV was assumed to enter the population in 1983.
Demography The model structure and the set of parameter values used in thls study with respect to Demography and Se-:ual behaviour are described in detail in the Appendix. In brief, age-speci.fic fertility rates per woman per year were speci.fied using data from the 1996 Demograpbic Health Survey of rura1 Tanzania [Bureau of Statistles & Macro-International 1997]. Mortallty rates in HIV-uninfected individuals were quanti.fied using data from the Mwanza rrial cohort [Todd et al. 1997]. Migration was ignored. Simuiared populations averaged 19,080 individuals in mid-1992. This population size, of whlch about half was in the age range of 15-54 years, was estimated to be roughly the average sîze of communities in the Mwanza rrial [Grossk"Urth et al. 1995b ].The age/sex distribution and growth rate of the model population corresponded to tbat in rura1 Tanzania in 1996 [Bureau of Staristics & Macro-International 1997].
Sexual behaviour The model allows for tbree categoties of (hetero-)seJ>:ual partnershlps: steady relationshlps (e.g. marriages), short relationshlps, and 'one-off se":ual comacts between a small group ofwomen, whomayor may not define themselves as prostitutes, and a larger group of men. Formation of relationshlps is simulated using the conceptsof availability for (supply) and selection of (demand) new partners [Le Pont & Blower 1991]. Relationshlp formation fellowsage preferenee matrices guiding the search for new partners from the same or adjacent age groups.
Heterogeneity within the population in se:x"Ual bebaviour, whlch has an important influence on STD transmission dynamics [Garnett &Anderson 1996a, Ghani

Modelling STD mass treatment in Mwanza
et al. 1997, Morris 1991, Garnett & Andersou 1993a], is incorporated in three ways in SWSIM. First, the simulated popwation is heterogeneaus in the number, type and overlap of sexual relations, which vary according to age, sex and an individua! promiscuity level. Second, the frequency of having one-off comacts with female 'prostitutes' varies between ma!es. This personal frequency can change with marltal status, but is otherwise constant throughout a rnan's sexua! life. Third, the age of sexua! debut varies between individuals and between the sexes. For this study, parameter values were based as tàr as possible on data on reported s<o.:ual behaviour collected from a random sub-sample ofthe Mwanza trial cohort [Munguti et al. 1997].Age of sexua! debut in the model was assumed to average 15 years for ma! es and 15.5 years for females, and was distributed between individuals uniformiy over the age range 12-18 years for rnales and 12.5-18.5 years for females.
The values of parameters determining partnership fortnation and dissalution and the frequency of one-off contacts were detertnined by simultaneons fitting of the following types of data [Munguti et al. 1997]: (i) the proportion currently matried and the number of spouses, by age group and sex; (ii) the numbers of partners over the past year reported by males, by age group; (iii) the age pattem in the number of partners over the past year reported by females. In the absence of cross-sectional data on the occurrence of overlap in partnerships, we consicter that fitting the model simultaneously to these static (i) and dynamic (ii, iii) measures of sexua! activity should provide an adequate representation of partnership dynamics, induding concurrency, in the Mwanza population.
In the resulting quantification, 55% of single and 25% of matried sexually active rnales aged 15-49 years engaged in one-off sexua! contacts, at an average frequency of once yearly.A furtber 5% of rnales in tltis age range had one-off contacts on average 6 times per year, irrespective of their marltal status. This male demand for one-off contacts was fulfilled by a mean 0.5% of the female s<o.:ually active population, who each had on average 1 such contact per week. TI1is quantüication provided a good fit to the proportion married and numbers of recent partners of ma!es in different age groups (Figure 7.1). For females, the model fitted the observed age pattem in numbers of partners, but the predicted number of partners was higher than reported. This is defensible because of likely underreporting of non-marital partners by females and underrepresentation of highrisk temales in the sub-cohort [Munguti et al. 1997].
The frequency of intercourse was assumed to be 1.5 times per week in relationships where the male partner was younger than 35 years of age and once per week for older males, consistent with data on factory workers in Mwanza town [Borgdorff et al. 1994].These frequencies applied to both steady and short relationships, and were constant over the course of relationships.The prevalenee of condom use during follow-up of the Mwanza trial was very low: only 2.4% of men and 2.3% of woroen reported ever using condoms with partners other than their spouse, and only three individuals (out of 1117) reported regular use
127

128
100%
80%
60%
40%
20%
0%
-
-
-
100%
80%
60%
40%
20%
0%
a. Proportion married/living together
.I -19 -24 -29 -34 -44 -54
M age (y), sex
-19 -24 -29 -34 -44 -54 F
b. i\umber of partners of rnales in past year
~-r- r- r- r- r- r-
r:-,... I
I -[< 1-:- ,...
-,...
.··.··. r r- re -19 -34 -54 -19 -34 -54
DATA MODEL age (y)
Chapter ï
DDATA
lil MODEL
11115+
1111 3-4
D2
Dl
DO
Figure 7.1 Fit of the STDSIM quantification against data from a subcohort of the Mwanza trial population at start of the intervention in mid-1992 [Munguti et al. 1997]. a) proportion married and/or in a steady relationship, by sex and age group (youngest age group: 15-19 years); b) number of sexual partners during the past year of mal es, by age group. Mean of 130 simulated populations.
[ Gross1:urth et al. 1995a ]. Therefore, condom use was ignored in the model. To model the effects of se>--ual contacts with individuals outside the study pop
ulation (e.g. with visitors or during travel), additional risks of infection for HIV and each STD were assumed for each individual aged 15-44 years. These corresponded to an average of0.40 and 0.15 extra sexual contact per personperyear,

Mode/ling STD mass treatment in Mwanza
for rnales and females respectively. Lacking corresponding data from Mwanza, these numbers were basedon the proportion of study participants reporting outside partners during the last year in rural Rakai (12% for males, 7% for females [Wawer et al. 1998], multiplied by an assumed number of cantacts per outside
partner of 3 for rnales and 2 for females.
Biomedical parameters Assumptions regarding the narural history and transmission of HIV and other STDs (fable 7.1) were derived mostly from the literature. Since we focus on outcomes for adults, and since heterose2..~ transmission accounts for the great majority of adult infectlans in this region [Over & Piot 1992], other modes of transmission were not taken into account.
Durations of (stages of) STD infectlans were assumed exponentially distributed 'W:ith means given in Table 7.l.As a convenient simplification, syphilis was assumed to consist of two consecutive stages.The 'infectieus' stage co:rresponds roughly to primary and secondary syphilis, and this accounts for the relatively long duration assumed for this stage. In the absence of effective treatment, patients progress to a non-infectious 'latent' stage. HN infection was represented as two consecutive stages, pre-AIDS (mean duration 7 years) and AIDS (mean duration 9 months), each following a Weibull distribution with shape parameter
2. Of all biomedical parameters, per-contact transmission probabilities and STD
cofactor effects are probably the most uncertain.Transmission probabilities were within plausible ranges adjusted to provide a good fit to HIV and STD prevaJences in Mwanza. For chancroid, tl1ere is only one publisbed empirica! estimate of the per-contact transmission probability ( 43%, for male-te-female transmission) [Plunlffier et al. 1983]. We adjusted this pointestinlate downwarcts to obtain a
predicted chancroid prevalenee consistent with the llmited data from Mwanza. We esti.mated an approximate population prevalenee of 1%, based on 1.3% of rnales reporting geniral ulcers in rural Mwanza in 1990/1 [De Vincenzi 1994], assuming some under-reporting of ulcers, and given (unpublished) data from an STD clinic in Mwanza town showing that 20o/o-55% of ulcers were attributable to chancroïd.
Transmission probabilities and cofactor effects of STDs were assumed identical for symptomatic and asymptomatic episodes. For syphilis, tl1e cofactor effect applied only during the infectieus stage. in case of multiple cofactors (one partner in an HIV-discordant couple carrying multiple STDs sinlultaneously, or both partners carrying one or more STDs), the maximum cofactor for any single STD applied. We assessed the robustness of results to variations in these uncertain parameters by sensitivity analyses (see below).
Following eute of STD infectlans (either spontaneous or due to treatment),
individuals were assumed inlmediately susceptible to re-infection, in line with clinical experience [Hoinles et al. 1970]. For syphilis, however, it is unclear
129

w Tab/e 7.1 STDSIM parameter values concerning transmission and natural history of STD infections, cofactor effects and performance of 0
treatment, used to reflect the situation in rural Mwanza, Tanzania.
"' ~ "' "0 0 'ö i' >- ~ 'i2
E u 0 :c c 2o c -" o_ "' 0 ~ >- ~
Parameter I lJ u "' u Reference
Transmission probability per contact M~F 0.003 0.22 0.20 0.30b 0.15 [Piummer et al. 1983, De Vincenzi 1994,
F->M 0.0006 0.15 0.12~ 0.20b 0.10 Holmes et al. 1970, Hooper et al. 1978, Katz 1992, Lycke et al. 1980, McCutchan 1984, Csonka & Oates 1990]
Relative increase in per-contact HJV- susceptibility 10 10 1001, 100 [Cameron et af. 1989, laga et al. 1993, transmission probability due to STD infectiousness 10 10 100b 100 Robinson et al. 1997, Laga et al. 1991,
Ha~'es et al. 1995c]
Annual risk of infection by cantacts M 0.043 2.1 2.4 0.72 0.48 [\IVawer ct al. 1998), E
from outside study population' (x 1 0'3) F 0.061 1.2 1.5 0.41 0.27
Probability that infection becomes symptomatic M 1.0 0.50 0.30 0.95 0.95 [Grosskurth et af. 1996, Holmes et a/. 19991, F 1.0 0.20 0.15 0.50 0.70 E
Mean duration of infectious stage if not treated M 400 9 12 26 16 [fodd et al. 1997, Holmes et al. 1999, (weeks) F 400 13 16 26 16 Mwijarubi et af. 1993, Over & Piot 1992,
Morgan et al. 1997b]
Mean duration of infectious stage if treated (weeks) M NA 2 3 2 2 [Hol mes et a/. 1999] F NA 6 10 2 2
Mean duration of latent (non-infecHous) stage M 520 [Holmes et al. 1999, Magnuson er a/. 1956, (weeks) F 520 Sparling 1990, Garnett ct al. 1997], E
Fraction of symptomatic STD episodes cured by M 0.05 0.05 0.05 0.05 [Mosha et af. 1993] unimproved services F 0.05 0.05 0.05 0.05
Fraction of symptomatic STD episodes cured by M 0.5 0.5 0.5 0.5 [Mosha et al. 1993}, E basedon unpublished improved services F 0.5 0.5 0.5 0.5 data from intervention clinics in Mwanza ()
:r
"' Fraction of steady partners of STD patients notified M 0.28 0.26 0.26 0.28 E based on unpublished data from "0
'" and cured under improved services<~ F 0.26 0.28 0.26 0.28 intervention clinics in Mwanza , ,,

Fraction of ST Os cured by mass treatment M F
0.95 0.95 0.95 0.95 E 0.95 0.95 0.95 0.95
a In contrast to certain empirica! observations [lycke et al. 1980}, in the model the transmission probability of chlamydia was chosen not much lower than that of gonorrhoea, to adjust for the low sensitivity of culture of chlamydia relative to gonorrhoea. b Refers to infectious stages only. c Product of transmission probability, prevalenee in outside partners (assumed similar to that within the study population), proportion reporting outs i de partner(s) over the past year (12% formales and 7% for fernales in the age range 15-44 years [Wawer et af. 1998}, and an assumed number of cantacts per outside partner of three for rnales and two for females. d Product of fraction of steady partners of patients treated (35%) and estimated efficacy of treatment (80<>/e>). M = male, F = female, NA = nat applicable under conditions prevailing in rural Mwanza, E = authors' estimate.
s: 0
~
~ V,
êl 3 ~
I ~ 3'
f SJ
w

132 Chapter ï
whether this assumption is valid [Hooper et al. 1978, Katz 1992], and cure may be foliowed by a period of reduced susceptibility, particularly if treatment is given at a late stage of :infection. Projeetiens were therefore made not only for immediate susceptibility (default scenario),but also for alternative scenarios varying in the duration of non-susceptibility after mass treatment in the latent stage (means of 1 and 5 years).
Gaverage and e.ffectiveness of STD treatment Assumptions regarding the coverage and effectiveness of (improved) syndromic services were basedon observations from Mwanza. For each STD,a frsed preportion of symptomatic patients was assumed to be treated and cured clinically.The trial intervention was assumed to increase this proportion from 5% to 50%. STD episodes cured were assumed to have a shotter duration than untreated episodes (Table 7.1). Only the symptomatic STD for which the patient sought treatment was cured; concurrent asymptomatic infections were not. Partner refer:ral in the intervention arm of the trial was represented as the simultaneous cure of the STD for which a pa ti ent sought treatment in 28% of steady partners infected with that STD. This level was basedon estimates from Mwanza intervention clinics.
STD mass treatment was assumed to cover 80% of the population, in line with the coverage achieved in the Rakai trial [Wawer et al. 1999]. Mass treatment was in the model delivered at a single point in time, and instantaneously cured 95% of infected individuals, irrespective of the STD and stage of infection. We also examioed the effects of alternative mass treatment regimens, in which syphilis treatment either was exduded or covered the infectieus stage only.
Simulation design
Projeetiens of HIV and STD prevalenee and incidence were made for four sce~ narios: (a) no intervention; (b) sustairred syndromic STD treatment services commencing in mid-1992; (c) a single round of mass treatment in mid-1992; (d) a combination of single-round mass treatment in mid-1992 foliowed by sustairred syndromic treatment.This thning corresponded to the Mwanza trial, in which the intervention was introduced between December 1991 and December 1992.
In order to reduce stochastic fluctuations in the projections, 500 simulation runs were conducted to generate 500 populations. This set of 500 simulated populations was used for fitting parameter values. Thereafter, populations with a HIV prevalenee among adults (15-54 years) of <2 or >6% at start ofthe interventions were excluded, since they were inconsistent with the observed baseline prevalenee in Mwanza of 4%. Applying these criteria, 130 out of the simulated populations were induded. The full set of 500 populations and the selected 130 populations were very comparable in mean STD and HIV prevalerrees and incidences over time, age/sex pattems in num.hers of partners, and age/sex pat-

Modelfing STD mass treatment in Mwanza
tems in mv prevalenee and incidence in mid-1992 (not shown). The selection reduced the variability around the mean for mv prevalenee and incidence, but not for STD prevalences. For instance, in mid-1992 IDV prevalenee was 3.7 (2.2 - 5.6; mean, 10th and 90th percentiles) for the 130 included populations, as compared to 3.7 (0.12- 9.7) for all populations.ln the remainder ofthe chapter, we focus on average outcomes for the subset of simulated populations.
Simulations with and without interventions were run for each included population. The impact of an intervention on mv was calculated as the cumulative reduction in the number of new mv infectionsin adults (15-54 years) for each popwation separately (matched comparison), for different evaluation periods. Impact was expressed as the mean ± the standard error of the mean (SE) over the 130 populations.
Sensitivity analyses
Simulations were repeated for alternative quantifications varying in the values of uncertain biomedical parameters. For each alternative scenario, the mv transmission probability was re-adjusted to fit the prevalenee measured at the start of the Mwanza trial ( 4%). Thereafter, populations fitting Mwanza with respect to IDV prevalenee in mid-1992 were selected, interventions simulated and their impact calculated as described in the prevîous section.
7.4 RESULTS
Simulations in the absence of intervention and fit against Mwanza baseline data
Model predictions for the prevalenee of STDs and IDV and the incidence of IDV and syphilis in the absence of intervention are shown in Figures 7.2 and 7.3. Syphilis was the most prevalent STD (Figure 7.2c), with a prevalenee of around 7% in mid-1992. Most individuals with syphilis were in the latent stage, and the prevalenee of infectieus syphilis was about 0.5% (Figure 7.4). Prevalences of chlamydia, gonorrhoea and chancroïd in mid-1992 were around 5%, 3% and 1% respectively; after the introduetion of HIV; these showed a spontaneous decline over time (Figure 7.2a,b,d), resulting from IDV-related mortality. Since having multiple sexual partners puts individuals at risk of both mv and STDs, STDs are more prevalent among IDV-infected subjects, so that deaths of IDV-positives reduce the number of STD-infected individuals. 1n the absence of intervention, syphilis incidence remained almast constant (Figure 7.3a).ln contrast, mv meidenee increased from around 1% in 1992 to over 2% by 2005 (Figure 7.3b), while
133

134
a.gonorrhoea
4~-----------~
~
~ " " = " "2 ~
" ~ 0.
0
1983
10
8
6-
4-
2-
0
1983
1983
1988
1988
1988
1993 1998 2003
c. syphilis
X -- ,o"";;_ZE~~~"'~ _\,,c" I
1993 1998 2003
time (year)
e. HIV (130 runs)
1993 1998 2003
time (year)
Chapter 7
b. chlamydia
0+---,------~----~ 1983 1988 1993 1998 2003
d. chancroïd
25 -r---------------,
2,0-
1.5 -
1.0 -
05-
o.o -f-----------~---_j 1983 1988 1993 1998 2003
time (year)
--+---without intervention -=- mass treatment
x data point estimates
Figure 7.2 Dynamic effect of single round mass STD treatment with 80% coverage (default scenario) in mid-1992, in comparison with the scenario without intervention, on the prevalences of a) gonorrhoea; b) chla
mydia; c) syphilis; d) chancroïd and e) HIV in the general adult popuiation (15-54 years). Mean of 130 simulated populations. 1 Oth and 90th pereentil es lor mid-1992 are plotted, butlor clarity slightly shifted to the left. Empirica! point estimates of prevatences of syphilis and HIV from the trial baseline survey and of HIV in mid-1990 IBarongo et al. 1992] are indicated as x. Th is default scenario of mass treatment assumed immediate susceptibility to syphilis reinfeetien after treatment of all farms of syphilis. Numbers on the x-axis reflect the beginning of each calendar year.

Modelling STD mass treatment in Mwanza
b. HIV a. syphilis 13,-------~~~~-------, 3r---------------,
2
135
-without intervention
-::-MT. non-sus. Oy (default)
~--MT, non-sus. ly 1
··X·· MT, DOD-:lUN. 5y
1990 1995 2000 2005 1990 1995 2000 2005
time (year) time (year)
Figure 7.3 Impact of single round mass treatment on a) syphilis incidence and b) HIV incidence in the general adult population (15-54 years), for varying durations of non-susceptibility to reinfeeti onafter cure of latent syphilis. The curves with 0 years of non-susceptibility constitute the default scenario, corresponding to the results shown in Figures 7.2 and 7.4. Mean of 130 simulated populations.
8,-----------------------------,
0 infectieus lil htcnt
2.
1990 1995 2000 time (year)
2005
Figure 7.4 Dynamic effects of single--round mass treatrnent (default scenario) on the prevalenee of syphilis in the general adult pop· ulation (15-54 years), differenti~
ated by disease stage. Mean of 130 simulated popu!ations.
mv prevalenee inereased from 4% in 1992 to 15% in 2005 (Figure 7.2e). Where reliable population-based data were available, projeetions for 1992
were in good agreement with results from the comparison arm of the Mwanza trial (Fig. 7.2e and 7.2e) [Grossb:urtb et al. 1995a, Grosslmrtb et al. 1995b, Mayaud et al. 1997a ].Also, tbe projeered prevalenee of HlV in mid-1990 (2%) was in line witb a point-estirnare of 2.5% in mid-1990 in rural villages in Mwanza eomparable totbetrial communities (Fig. 7.2e) [Barongo et al. 1992]. For outeomes measured in tbe trial by sex and age (HlV incidenee, HlV prevalenee and syphilis prevalence), age and se..x pattemsin model outcomes were consistent with the
data.

136 Chapter 7
Simulations of syndromic treatment and fit against Mwanza trial data
The impravement of syndromic treatment services was projected to increase the average number of STD episodes cured over 2 years (the duration of the ttial) from 121 to 1074, fora model population of around 19,080 individuals. in compatison,during the Mwanza trial,an estimated 1,551 STD episodes were treated per 19,080 individuals in the intervention arm [Gilson et al. 1997].Assuming that about 70% of these patients were cured (unpublished observations from the trial), this corresponds to 1036 STD episodes cured per 19,080 adults, with wbich the model predictions agree wel!.
After the onset of this intervention, HIV incidence was predicted to decrease markedly over time (Figure 7.5;Table 7.2).The reduction was steepest during the fust few years, but still continued 10 years later. Over two years of intervention, a cumulative reduction in HIV incidence of 30% was projected; over 10 years, the reduction amounted to over 60%. The predicted reduction in HIV incidence over rwo years was lower than that observed inthetrial over 2 years of fellow-up (30% versus 38%), but fel! wel! within the limits of the 95% Cl (15-55%) obtained from the empirica! data [Hayes et al. 1995a].
For the STDs induded, the model predicted that the introduetion of improved syndromic management was foliowed by substantial reductions in prevalence.
3 ,-------------------------------------------,
time (year)
-without intervention
-=-~
_,_ST
-X-ST+MT
Figure 7.5 Impact of different STD treatment strategies on HIV incidence in the general adult population (15~54 years). MT: single round mass treatment (default); ST: sustained syndromic treatment; ST +MT: combination of single-round mass treatment (default) with sustained syndromic treatment. Interventiens were implemented in mid-1992. Mean of 130 simulated populations.

Modelling STD mass treatment in Mwanza
These predîctiorrs are difficult to campare with data from Mwanza.After 2 years, the prevalenee of infectious syphilis in the model was reduced by 59% and that of all stages of syphilis by 13%. The empirica! data showed a sigoificant reduction in the prevalenee of syphilis in the intervention compared with the comparison arm [Mayaud et al. 1997a].The reduction in active syphilis (Treponema pallidurn haemagglutination assay (TPHA)+, rapid plasma reagin (RPR) >=1:8) was 29% (95% Cl, 7-46), but this was observed after treatment of all RPR+ cohort members for syphilis at baseline of the trial for ethica! reasons. The observed reduction in new cases of active syphilis, which are more likely to represent cases of infectious syphilis [Sparling 1990], was 38% (95% Cl, -2 to 62). These observations seem broadly consistent with the predicted prevalenee reduction. The prevalerrees of chlamydia and gorrorrhoea were in the model reduced by 20% and 43% after 2 years. In comparison, amorrg a subset of men in the trial, the prevalenee of gonorrhoea and/or chlamydia was reduced by only 4% (95% Cl, -85 to 50), but the prevalenee of symptomatic urethritis was reduced by 49% (95% CI,-3 to 75) [Mayaud et al. 1997a].Among female antenatal clinic attenders, the reduction in the prevalenee of gonorrhoea and/or chlamydia was 7% (95% Cl, -75 to 51). These data were, however, basedon smal! numbers, available for only subsets of the trial population, and there were limitations in the sensitivity and specificity of the diagnostic tests. The model predicted an 81% reduction in the prevalenee of chancroïd; in the trial it was not possible to deterrnine the prevalenee of chancroïd.
Si.mulations of single-round mass treatment
The projected single-round mass treatment cured 1,119 STD episodes in the total population of 19,080. By reducing STD incidence, the intervention reduced the number of symptomatic episodes cured by clinical treatment in the years thereafter, for example, over the fust two years from 121 to 67.
Mass treatment resulted in an immediate and steep reduction in all STDs, and prevalerrees 1 year later were 50-80% lower than without intervention (Figure 7 .2). Thereafter, without further intervention, prevalerrees increased over time and approached the levels observed in the absence of intervention within 5 to 10 years.The recurrence was comparatively slow for chancroïd.
The reduction in the prevalenee of syphilis was due mainly to a marked decrease in latent syphilis (Figure 7.4). The prevalenee of infectious syphilis showed a much smaller reduction, and retumed to and exceeded its previous level within a short time. The incidence of syphilis also showed an initia! reduction, but thereafter increased rapidly, exceeding initia! levels by around 50% within 3 years (Figure 7.3a).The size of these effects depended critically on the assumed period of non-susceptibility to re-infection following cure. The langer the period of non-susceptibility, the greater was the initia! fall in incidence, and
137

138 Chapter 7
the slower and less marked the subsequent increase above baseline levels. However, a 'rebound' effect was observed even when assuming a 5-year period of nonsusceptibility, albeit delayed.
Mass treatment reduced HIV inddence by up to 50% for the fust 6 months after the intervention (Figure 7.3b; Table 7.2). Tbereafter incidence increased over time, but 10 years later it was still lower than without intervention. The short-term effect of mass treatment on HIV incidence was sligbtly greater assum· inga period of non-susceptibility following cure of latent syphilis (Figure 7.3b). When alternative regimens of mass treatment were considered, the reduction in
HIV incidence was in the Jonger term comparable if treatment for syphilis was excluded or if infectieus syphilis cases were treated whlle latent cases were not (Table 7.2).
Simulations of mass treatment combined with improved SID treatment services
Tbe projected combined intervention achieved cure of 1,119 STD infections by mass treatment in mid-1992; the sustairred improverneut of syndromic treatment resulted in a furtber 513 episodes cured overthe fust 2 years,as compared to 121 effective clinical treatments for the scenario without intervention.
Under this combined intervention,HIV incidence was reduced steeply within the fust year and continued to decrease thereafter (Figure 7.5; Table 7.2). Tbe reduction in cumulative HIV incidence over 2 years (57%) was much larger than the impact of either mass treatment (36%) or syndromic treatment (30%) in isolation. In the long run, incidence levels achieved under either the combined intervention or syndrornic treatment alone converged. However, the cumulative rednetion in HIV incidence over 10 years achieved with the combined interven· tion (70%) was larger than that of syndromic treatment alone (62%), because of a greater number of infections prevented over the fust few years.
Sensitivity analyses for SID parameter assumptions
As an indication ofthe robustness ofthe results, we assessed the sensitivity ofthe predicted impact of treatment strategies to variations in STD parameter assumptions (Table 7.1), some of which were basedon limited data. Table 7.3 shows prevalences of HIV and STDs by mid-1992 and the impact of the treatment strategies on mv inddence over the fust 2 years, for several alternative scenarios. Decreasing all cofactor magnitudes in the samedirection markedly decreased the projeered impact on HIV of all interventions in comparison with the default scenario.At cofactor valnes above the default, however, impact hardly increased,indi· cating a saruration effect. These variations did not affect the ranking of impact

Modelling STD mass treatment in Mwanza
bernreen the three treatment strategies. The impact of mass treatment was insensitive to the relative cofactor strengths
of gonorrhoea and chlamydia (inflammatory STDs) as compared to syphilis and chancroid (ulcerative STDs). The impact of syndromic treatment, io contrast, would be larger ( 40% reduction over 2 years) if the cofactor effect of ioflanunatory STDs was decreased (from 10 to 2.5 times) while the cofactor effect of ulcerative STDs was at the sametime iocreased (from 100 to 250 times). If ioflammatory and ulcerative STDs had equal cofactor effects (25 times), the impact of syndromic treatment was much less (14% over 2 years) than io the default scenario.
Increasing or decreasing STD transmission probabilities caused an increase or decrease io the prevalenee of the respective STD of a much larger magnitude, reflecting the non-lioearity io STD transmission dynamics [ Garnett & Andersen 1995, Koopman & Longini 1994].The resulting prevalenee levels of gonorrhoea, chlamydia and syphilis, differed markedly from those observed io Mwanza. For chlamydia, the higher the transmission probability and, consequently, its prevalence, the more favourable the impact on HIV incidence of mass treatment wou1d be as compared to syndromic treatment. 1n contrast, for chancroid, the higher the transmission probability and prevalence, the less favourable the impact of mass treatment would be relative to synd.romic treatment. These opposite effects reflect the low proportion of chlamydia episodes that are symptomatic (fable 7.1) and, hence susceptible to syndromic treatment, and the high proportion symptomatic for chancroid. For gonorrhoea, the relative impact on HIV incidence of the different STD interventlans was insensitive to variations in the trans
mission probability and prevalence.Assuming a higher transmission probability for syphilis, the impact of mass treatment was markedly less than io the default scenario, and less than of syndromic treatment even in the fust year of in.tervention. This reflects the critica! iofluence of the ra te of re-iofection with syphilis on the impact of STD mass treatment.
The relative impact over time of the different treatment strategies on HIV was iodependent of whether HN iofectivity was assumed to be constant (the default scenario) or to vary over the course of iofection, with peaks duriog primary iofection andAIDS (Table 7.3).
1n all scenarios except those varyiog the transmission probability of syphilis and the relative cofactor effects of ioflanunatory and ulcerative STD, siogle-round mass treatment reduced cumu1ative HIV incidence over the fust 2 years as much as or slightly more than sustaioed syndromic treatment.ln all scenarios, the combined intervention had about rn.rice the impact of synd.romic treatment alone over this period. Time pattems in HIV incidence under the respective interventions were cernparabie between all scenarios.ln all scenarios except that equalliog the cofactor effects of ioflammatory and ulcerative STD, the iostantaneous HN iocidence rate under conditions of syndromic treatment feil below that for mass treatment withio 2 years (results not shown).
139

Table 7.3 Sensitivity analyses for STD assumptions. Results refer to the subset of simulated populations with an HIV prevalenee among ad u lts ... 0
(15-54 years) in rnid-1992 between 2 and 6% (varying between 105 and 263 out of 500 populations). Impact of interventions is expressedas the proportion reduction in cumulative HIV incidence over 2 years (mean ±SE, in %).
(adjusted) HIV Projected STD prevalences Proportionaf reduction in HIV
transmission probability
in mid-1992 (%) incidence over 2 years (%)
"' "' "' -o 0 'ö ·e f >- ·"' E u
> 0
"' .<= c c :ë c. "' Scenario I parameter change M-->F F-->M ï 0 >- .<=
ST MT ST+MT "' u ~ u
default (see Table 7.1) 0.003 0.0008 3.7 2.8 5.0 7.0 1.3 30 ± 1.2 36 ± 2.1 57 ± 1.3
STD cofactors cofactor values: gonorrhoea/chlamydia 2.5x 0.01 0.003 3.6 2.8 5.0 7.3 1.3 24 ± 1.6 28 ± 1.7 44 ± 1.3 syphilis/chancroid 25x
gonorrhoea/chlamydia 25x 0.0012 0.00035 3.8 2.8 5.0 7.0 1.2 29 ± 1.5 38 ± 1.8 61 ± 1.2 syphilis/chancroid 250x
gonorrhoea/chlarnydia 2.5x 0.0017 0.00045 4.0 2.8 4.9 6.5 1.1 40 ± 1.9 36 ± 2.7 62 ± 2.2 syphilis/chancroid 250x
gonorrhoea/chlamydia 25x 0.0041 0.0011 3.7 3.0 5.0 6.9 1.1 14 ± 0.9 37 ± 0.8 48 ± 0.7 syphilis/chancroid 25x
STD transmission gonorrhoea t 0.0028 0.00075 3.9 12 4.9 6.8 1.1 23 ± 1.1 30 ± 1.5 49 ± 1.1 probabilities -1- 0.0032 0.00085 3.7 0.2 5.0 7.1 1.2 30 ± 1.6 37 ± 1.9 57 ± 1.5
chlamydia t 0.0028 0.00075 3.8 2.8 15 6.8 1.2 21 ± 1.3 32 ± 1.4 48 ± 1.2 -1- 0.0034 0.0009 3.9 2.8 0.4 7.0 1.2 34 ± 1.3 34 ± 2.4 59 ± 1.2
syphilis t 0.0029 0.008 3.8 2.9 5.0 13 1.0 25 ± 1.5 11 ±2.4 41 ± 1.9 -1- 0.0032 0.00085 3.9 2.9 5.1 2.5 1.6 32 ± 1.2 43 ± 1.4 61 ± 0.9 9
chancroïd t 0.0009 0.00025 3.8 2.9 5.1 6.7 12 35 ± 0.6 34 ± 0.7 65 ± 0.4 ~ -1- 0.0056 0.0015 3.9 2.8 5.0 7.2 0.1 16±1.3 26 ± 1.9 41 ± 1.6 ~
"'

HIV infectivity over the course Üf infection ('bathtub' pattern)
stage of infection: - fi rst 1 0 weeks - asymptomatic (350 weeks) -AIDS (40 weeks)
0.026 0.0013 0.0065
0.007 0.00035 0.00175
4.0 2.8 4.9 7.0 1.1 33 ± 1.9 40±2.6 61 ± 1.5
t = transmission probability x 1.5; 1 = transmission probability x 0.67. Bold i talie text indlcates the projeeled prevalenee of the STD for which parameters we re changed in that scenario. ST = syndromic treatment; MT = mass treatment; ST+ MT = combined intervention; M = male; F = female.
~ il-
~ v-, (j 3 ~
~ ~ s· :;: ~ " i'j
:':':

142 Chapter ï
7.5 DISCUSSION
The projections indicate that single-round mass treatment may substantially reduce the prevalenee of gonorrhoea, chlamydia and cbancroid.I.acking regular repetition, however, the impact of mass treatment on the transmission dynamics of STDs is only temporary, so that prevalences will finally return to their equilibrium levels.The rate at which this occurs depends on the case reproduetion rate of eacb STD, the coverage achieved, and the rate of re-introduction of STDs due to sexual contact with infected individuals trom outside the study population. In these projections, chancroïd, the STD wîth the lewest assumed transmission probability, re-emerged slowest.
The model showed that effects on syphilis are complex. In a population with poor treatment services, most prevalent cases have a latent infection and are therefore immune to new episodes of syphilitic ulceration [Sparling 1990,]ekel 1968]. Relatively few have ulcers or are in the infectious secondary stage, but mass treatment reaches both the ïnfectious and the latent cases.As cured patients become susceptible again and are re-înfected, syphilis incidence increases steeply, resulting in rates higber than before intervention. This effect is enhanced by heterogencity in se>.-ual behaviour. For example, in the simulation, the baseline syphilis prevalenee in wamen engaging in one-off centacts was 38% compared with 7% in all women.Thus, althougb the overall pool of susceptible individuals increased only marglually as a result of mass treatment (trom 93 to 98%), the number of susceptibles among persons at higb risk, and consequently of potential new souree infections, increased substantially.
The e>.'tent and timing of any increase in syphilis inddence depends on the duration of non-susceptibility to re-infection following cure (Figure 7.3a). Unfortunately empirica] data on the duration and extent of non-susceptibility are sparse [Magnuson et al. 1956, Garnett et al. 1997], and both may depend on the stage of infection when treatment is given. Epidemiological evidence for or against resurgence of syphilis at a population level following mass treatment is also scarce. Mass treatment campaigns against endemie syphilis and yaws were generally successful, althougb in some cases resurgence was noted [Antal & Causse 1985, Grin & Guthe 1973,Willcox 1985, Meheus &Antal1992]. However, the majority of these campaigns were uncontrolled, accompanied by general împrovements of health services and livîng conditions, which may themselves have led to reductions in endemicity, and foliowed by regular re-treatment rounds. Furthermore, comparability with STD mass treatment is limited by dit
ferences between the endemie treponematoses and venereal syphilis in their mode of transmission (and consequently in the role of population heterogeneity in se>.-ual behaviour), and in baseline prevalences. Prospective studies involving long-term follow-up of patients treated for venereal syphilis at different stages are needed to address this question.

Modelling STD mass treatment in Mwanza
Model simulations were based on cofactor effects by wbicb STDs enbance
tbe transmission of HIY. The results of cohort studies and intervention trials strongly argue for tbe existence of tbese effects [ Cameron et al. 1989. Pluromer et al. 1991, Laga et al. 1993, Grossb:urth et al. 1995a, Laga et al. 1994], and biologica! studies have provided evidence for underlying mechanisms [Mostad et al. 1997, Cohen et al. 1997,Laga et al. 1991]. However, tbe magnitudes oftbese
cofactor effects are not yet known. Odds ratlos from observational studies are likely to considerably underestimate tbem, since tbey usually refer to e;,:tended periods of exposure during only some of wbich an STD would have been present [Boily &Anderson 1996]. Data from cohort studies in Nairobi [Cameron et al. 1989, Pluromer et al. 1991] have been estimated to be consistent witb a 10- to 50-fold increase in tbe probability of male-to-female HIV transmission per single sexual exposure, and a 50- to 300-fold increase for female-to-male transmission, in tbe preserree of genital ulcers [Hayes et al. 1995c].ln simuiadons of a rural population cohort in Uganda, tbe assumption most consistent witb empirica! data was tbat tbe probability of HIV transmission per sexual contact was enbanced 100-fold during episodes of ulcerative STDs, and 5-fold during episodes of nonulcerative STDs [Robinson et al. 1997]. Assurning similar cofactor effects in our study, we obtained a satisfactory fit to HIV prevalenee and incidence rates observed in the comparison arm of the Mwanza trial cohort, and to the impact of syndromic treatment. Assuming weaker or stronger cofactor effe cts, the prediered impact ofboth mass treatment and syndromic treatment would besmaller or larger,respectively (fable 7.3). Some conditions witb potentially sizeable cofactor effects, sucb as Hetpes simplex virus type-2 (HSV-2) infection and bacterial vaginasis [Sewankambo et al. 1997, Spiegel 1991], cannot be effectively treated. At present sucb infections are not induded in STDSIM. If incurable STDs are prevalent and their cofactor effects are substantial, we may have overestimated tbe cofactor magnitudes for curable STDs and, consequently, tbe impact on HIV incidence of any STD treatment strategy.
The projected impact of mass treatment on HIV incidence was determined by tbe beneficia! effect of comparatively long-lasting deercases in tbe prevalenee of
gonorrhoea, chlamydia and chancroid, and tbe actverse effect on tbe incidence and prevalenee of infectious syphilis occurting soon after mass treatment. In
these simulations, including the scenario assuming immediate susceptibility to reinfection after treatment intbelatent phase (Figure 7.3b;Table 7 .2), tbe net effect was positive.Yet tbis may differ according to epidemiological conditions, depending for example on tbe relative prevalerrees of syphilis and otber curable STDs in a population.
In tbe investigation of alternative regimens of mass treatment of syphilis, tbe model prediered a similar long-term impact on HIV incidence if syphilis treatment was excluded from tbe mass treatment regimen altogetber, or if infectious stages of syphilis were covered but latent syphilis remairred untreated (Table 7 .2).
143

144 Chapter 7
The fust of these scenarios might be acbieved if mass tteatment consisted of a combination of single-dose ora! antibiotics including azithtomycin and ciprofloxacin, wbich would cover all fout target STDs e.xcept sypbilis.Azithtomycin may have some effect on active infections with Treponema pallidum, but is un!ikely to be curative unless given overalonger period [Verdon et al. 1994].The second scenario would be acbieved if single-dose benzathine penicillin injections were given only to individuals presenting with the symptoms or signs of a genira! ulcer or condylomata lata (a common and bighly infectious form of secondary sypbilis).This regimen would combine featutes of mass tteatment and syndromic tteatment. lts disadvantages would be that genital examinatien would be required to detect unrecognised ulcers, wbich is un!ikely to be feasible in mass tteatment campaigns, and that patients with non-syphilitic ulcers would be treated unnecessarily, including some with latent sypbilis. It is of note that the tteatment sttategy most effective in reducing HIV incidence may not be the best sttategy for reducing the disease burden of sypbilis at the individuallevel. Untreated latent sypbilis may lead to serieus late complications, and in wamen to perinatal infection and actverse birth outcomes. The design of STD interventions clearly neects to take such ethical considerations into account.
In out projections for the Mwanza population, the impact of a single round of mass treatment on HIV incidence was in the long run much smaller than that of sustairred syndromic tteatment (Figure 7.5, Table 7.2). However, mass treatment acbieved a mucb steeper initia! decUne in HIV incidence. From an epidemiological perspective, the effectiveness of mass treat:ment relatiVe to syndromic treatment depends on the relative contribution to HIV transmission of commonly asymptomatic curable STD, like gonorrhoea and cb!amydia, as compared to commonly symptomatic curable STD, like cbancroid. This in turn depends on the relative prevalerrees of these infections and on their cofactor effects (Table 7.3). Other influential factors are the frequency of occurrence and the relative cofactor effects of a symptomatic relative to an asymptomatic course of an episode with a certain STD. Cofactor effects may be stronger for symptomatic than for asymptomatic STD, as suggested by a study of HIV-infected men with urethtitis in wbich vira! shedding correlated with the degree of inflammation [Cohen et al. 1997]. In our model, identical cofactor effects were assumed for symptomatic and asymptomatic episodes.Thus our projections may underestimate the impact of syndromic treatment, provided that a significant proportion of symptomatic patients would recognize their symptoms and act upon them. This Jatter effect could however not be explored with the present STDSIM, in wbicb the cofactor effect of each STD is assumed to be the same regardless of symptomatology. If both treatment st:rategies were combined, the short-term decrease in HIV incidence resulting trom mass treatment was sustained over time, because individuals experiencing new STD infections could thereafter access syndromic treatment services. This advantage would be particularly strong if sypbilis incidence were to increase following mass treatment, as our projections suggest.

Modelling STD mass treatment in Mwanza
A number of comparisons were made between model projections and trial outcomes. The reduction in IITV inddence observed in Mwanza over the two years of follow-up was 38% (95% Cl, 15-55) after adjustment for potentlal conformding variables [Hayes et al. 1995a]. In the simulations, a reduction of 30% was achieved over the fust 2 years (Table 7.2), whicb is well within the conftdenee interval of the trial. Apart from random error, several factors may have
contributed to the simuiared impact being slightly lower than the point estimate from the trial: (i) Some reproductive tract infections treated in the Mwanza intervention such
as trichomoniasis, candidiasîs, bacterial vaginosîs and non-specific urethritis were not incorporated in the model;
(ü) Syndromic management in Mwanza covered not only the symptomatic infection presenred by the patient but also concurrent, possibly asymptomatic, STDs, but this was not the case in the model;
(ili) The time between infection and cure may in reality have been shorter than assumed, reflecting an impravement in treatment-seekîng behavîour in the intervention arm;
(iv) In the simulations, patients were assumed immediately susceptible to reinfection for all STDs considered, and re-infection may t!1erefore have
occurred earlier than in reality in some cases; (v) The model assumed identical cofactor effects for asymptomatic and symp
tomatic STDs.
On the other hand, omission from the model of untreated STD sucb as HSV-2, and of immigration and mobility, whicb re-intrOduce STD from outside the study population, may have worked in the opposite direction, leading to overestimation of impact on HIV in Mwanza.
in the Rakai trial, periodic mass treatment resulted in only a small and non-significant reduction in HIV incidence (relative risk 0.97; 95% Cl, 0.81-1.16) over the fust two rounds [Wawer et al. 1999], which is mucb smaller than the reduction in our simulation (36% over 2 years).A number of factors may explain this appar
ent discrepancy: (i) Our model fitted the demograpbic and epidemiological situation in Mwanza
rather than Rakai, and the two situations are different. In particular, the HIV epidemie in Rakai bas reached maturity, with an HIV prevalenee and iocidenee of 16% and 1.5/100 person-years, compared with 4% and l/100 person-years in Mwanza. In the later stages of an HIV epîdemîc, transmission may depend to a lesser extent on the enllancing effect of STDs [Robinson et
al. 1997]; (ü) Incurable STDs, sucb as HSV-2, and genital tract infections only temporarily
cured by single dose mass treatment, such as bacterial vaginosîs, may have played a substantial role in ongoing HIV transmission in Rakai. More than
145

146 Chapter 7
40% of genital ulcers in Rakai were due to HSV-2 [Wawer et al. 1999], and
bacterial vaginosis is highly prevalent [Sewankambo et al. 1997]. Neither of these infections was incorporated in STDSIM;
(ili) In the model, mass treatment was given throughout the population at a
single point in time. In Rakai, mass treatment of a cluster of villages took several weeks, as it was delivered at household level in order to achleve high coverage [Wawer et al. 1998]. In a situation of e.>."tended sexual nerworks, the time taken to deliver mass treatment may influence the reinfeetien rate;
(iv) The model ignored inward migration and may have underestimated the rate
of re-introduction of infection from outside the study population. Mobility may reduce the long~term impact of STD mass treatment on HIV incidence by increasing STD re-infection rates [Korenromp et al. 1998]. In a mass treatment trial for the control of trachoma in The Gambia, ocular chlamydial infection was reintroduced rapidly by retumîng residents, visitors and migrants, in spite of high coverage and the use of effective antimicrobials [Mabey et al. 1998].
Finally, consictering the many uncertainties in its determinants, no firm eendusions can yet be drawn on the effectiveness of STD mass treatment for HN prevention. Our simulations predicted that in a ruralAfrican setting in which syndrornic SID treatment can reduce HIV incidence, single-round mass treatment may also be effective in the short-term. Mass treatment foliowed by sustairred syndromic treatment would be particularly effective, both in the short and long term. The impact of mass treatment on syphilis is complex and requires further investigation. As we have shown, the impact of mass treatment relat:ive to syndromic treatment depends on the relative prevalenee and eetactor effects of symptomatic and asymptomatic curable STD. However, the effectiveness and cost -effectiveness of different STD treatment strategies are also affected by many other epidemiological and non-epidemiological determinants which were beyond the scope of this study. Simulation modeiling of alternative STD control strategies in different settings may help to identify those determinants, estimate their relative importance, and identify needs for further empirica! research. We will use the STDSIM model to address these issues using the population-based longitudinal data of the trials of STD controlfor HN prevention in Mwanza,Rakai
and Masaka. The results may have major implications for the design of effective STD and HN control strategies in populations in Africa, Asia and La tin Am erica exposed to high STD prevalences.

ModeJJing STD mass treatment in Mwanza
7.6 APPENDIX- DEMOGRAPHY AND SEXDAL BEHAVIOUR IN
STDSJM: MODEL STRUCTURE AND PARAMETER VALDES USED
IN THE Sil\flJLATION OF RURAL MWANZA
The microsimulation model STVSIM simulates the spread and control of HIV and four bacterial STDs (gonorrhoea, chlamydia, syphilis and chancroid) over time in a population consisting of hypothetical individuals in a computer program [Van der Ploeg et al. 1998, Korenromp et al. 2000c ]. Each individual is represented by a number of characteristics, of which some remain constant during simulated life (e.g. sex and date of birth), whereas others change (e.g. number of sexual partners and infection status). Changes in personal characteristics result from events such as the start and end of sexual relationships, or the acquisition of infection. These events are stochastic: if and when an event occurs is detennined by MonteCarlo sampling from probability distributions. Model outcomes for a simulated population are generated by aggregating the characteristics of the simulated individuals. STVSIM is event -driven: all events are listed and performed in chronologica! order. At the occurrence of an event, the characteristics of the individual and/or relationship to which the event pertains are updated. In addition, events can generate new events, wbich occur either immediately - for example, the death of an individual terrninates all relationships of this individual - or later in the simulation - for example, acquisition of HIV infection advances a person's earlier scheduled moment of death.
Aspects affecting the transmission and control of STDs are grouped into six modules. The modules: Transmission, Natura! history, Health care and Interventions are described inSection 7.3, subsections 'Biomedical Parameters' and 'Coverage and effectiveness of STD treatrnent'. Below, we describe the structure and parameter quantification for the modules Demography and S""--ual behaviour. For all parameter specifications, the distribution functions, numbers and borders of age groups and values listed are those used to represent rural Mwanza in this chapter. The madelier can however change these in an input file, for example to base assumptions on differently structured datasets, or to do projections for populations with other enderoic conditions.
Demog:raphy
Fertility is simulated by attributing pregnancies to se..xually active females on the basis of user-specified fertility rat es. The duration till each subsequent pregoancy in a certain age group a is sampled from an exponentlal distribution with mean b a * FJt), where: b a is the user-specified birth rate for age group a and FJt) the number of females in age group a at timet. Each new pregoancy is attributed randomly toa female in the age group concemed who is engaged in a sE\.-ual rela-
147

148 Chapter 7
Table 7 .A 1 Specification of fertility and mortality among HIV~negatives in STDSIM, and parameter values used to represent rural Mwanza.
Age group Birth rate Survival probability
(years, upper limits) per woman per year Mal es Females
-1 0 0.90 0.90 -5 0 0.85 0.85
-15 0 0.80 0.80 -20 0.143 0.784 0.787 -25 0.288 0.771 0.772 -30 0.270 0.752 0.756 -35 0.239 0.722 0.733 -40 0.192 0.683 0.722 -45 0.097 0.644 0.711 -50 0.040 0.602 0.667 -55 0 0.560 0.622 -60 0 0.506 0.620 -70 0 0.33 0.46 -80 0 0.1 0.2 -90 0 0 0
tionsbip and not already pregnant.Ail pregnancies result in life births 9 months after their start. The period of pregnancy can be used to sirnulate the effects of STD on pregnancy outcomes, for example, still-birth due to syphilis, but this option was not used in the current study.The fertility rates used to sirnulate rural Mwanza in this study were based on the 1996 Demograpbic Health Survey of rural Tanzania [Bureau of Statistics & Macro-International 1997] and are Iisted in Table 7.Al.We assumed half of all births to be males.At the birth of a sirnulated person, the moment of bis or her death is sampled from a stepwise linear life table specifying the proportion still alive at certain ages. For the sirnulation of rural Mwanza, the lifetable was speci.fied according to mortality estimates for HNuninfected individuals inthetrial cohort (Table 7.Al) [Todd et al. 1997].1f a sirnulated persons contracts HN, a moment of HN-attributable death is sampled from the survival distribution of HN patients (see Section 7.3, subsection 'Biomedical Parameters' and Table 7.A1).1f the moment of HN-attributable death is earlier than that of non-HN-attributable death, the actual moment of death is actvaneed to the former, and this event is recorded as an HN-attributable death.Although STDSIM can sirnulate migration into and out of the population, this option was not used in this study.

Modelling STD mass treatment in Mwanza
Sexual behaviour
Se.-ual cantacts and relationships between men and wamen in smsiM constitute a dynamic netwerk tbrough whicb STDs can be transmitted. We consider tbree types of (exdusively hetero-)se,mal contact: steady relationships ('marriages'); short relationships; and one-off cantacts between a small group of females, who may or may nat define themselves as prostitutes, and a larger group
of mal es. In the remainder of this Appendix, we will refer to these individuals as prostitutes and clients, respectively.
Formation of relationships is simulated using the concepts of availability for (supply) and search (demand) of new partners [Le Pont & Blower 1991]. Figute 7.Al illustrates this process. New relationships are formed between available men and available wamen. People become available for relationships for the first time
at sexual debut (t, in Figute 7 .Al).At each subsequent d1a11ge in the number of current partners, a new duration till availability is determined. This duration (e.g. the interval between t
5 to t,) may be shorter than the duration of an ongoing
relationship (t5
to the end of the horizon in Figute 7 .Al), thus allowing for concurrent relationships (t
8 to t,).Availability temporarily ends when a new relationship
îs formed. This happens eîther when someone îs selected by a new partner (t5
in Figute 7.Al), or when a full 'period of availability' (t, tot,) has elapsed and the
person selects a partner from the pool of available people of the opposite se..x in a preferred age group (e.g. at t,). The mecbanisms of availability and partner selection do not reflect actual (psycbological, behavioural or social) processes,
short relationship
~~ short relationship
I• ·I numberof R__j. relations steady relationship
yes * * available J ········-~
no
t, t, t, 4 ls Is t, Is t,
149
time
Figure 7.AI. Example of the relationship history of a young male in STDSIM. The man becomes first available at t1 (sexual debut). Because heisnot selected during his 'period of availability' between t1
and t2
, he selects a partner himself (*) and starts a short relationship at t2
• Th is relationship ends at t3
•
Aftera delay, he becomes available again at t4
fora period which might have lasted until t6
• Ou ring availability, the man is selected (+,at t
5) by a female fora steady relationship, which terminates this
period of availability (the no Jonger applicable remaioder is indicated with a dashed line). During this relationship, he becomes available again at t
7• After this period of availability, at t8, he selects (*)
a partnerfora concurrent short relationship which ends at~- On top of the relationships depicted in this figure, one-off centacts with female prostitutes can occur (see text).

150 Chapter ï
but allow us to steer tbe representation ofbebaviour from botb tbe male and tbe female population.
Se.xual debut Sa.:ual debut is defined as tbe start of a first 'period of availability' for sexual relationships.ln tbe representation of Mwanza, the timepoint of fust availability was
drawn from a uniform probability distribution witb a range of 12-18 years for mal es, and 12.5-18.5 years for females.
Sexual relationships: availability ana partner selection At each change in an individua!'s number of current partners, a new duration ~ til! availability for a new relationship is drawn from an exponentlal distribution
witb mean 8"/ (r,.a * p,), where: 8,_, is tbe mean duration til! availability, which depends on tbe person's sex (s) and relationship status (r) (currently engaged in a steady, short or no relationship);r,,a is tbe sex (s) and age (a) group specific prorniscuity factor; and P, is tbe persona! prorniscuity level. In this study, tbe values of 8. were set at 10 and 25 years for rnales and females, respectively, at tbe start
·'·r of a steady relationsbip; at 2 and 4 years for urnnarried rnales and females, respec-tively, at tbe start of a short relationship; and at 0.5 years for botb sexes at tbe end of a last relationship, i.e. if becoming single again. The va!ues of r,p are listed in Table 7.A2. Every time an individua! passes an age border at which an age-specific parameter tbat affects a waiting time (e.g. r,) changes va!ue, a new duration is drawn according to tbe parameter value of tbe new age group. This applies also to the duration of availability (see below).
The personal prorniscuity level p, of individua! i, wbich reflects tbe heterogencity in prorniscuity witbin age groups, is determined by a gamma distribution witb mean 1.0 and shape parameter a:
a a-1 -a·p; f(p;) = r(a). (a P•) . e Eq. (I)
Variatien in promiscuity within age groups decreases with increasing values of a. In this study, a equalled 1.5.
Wbile bcing available for new relationsbips, an individual can be selected by someone of tbe opposite sex who has just ended bis/her period of availability.lf a person has notbeen selected by tbe end of bis/her period of availability, he/she bim-Jherselftben selects a partner from tbe pool of available people oftbe opposite sex. This period of availability is drawn from by an e.xponential probability distribution witb a mean of z l(r,,;P), witb e=0.25 yr in this study.SeeTable 7.A2 for quantification of r,a and Eq. 1 for p,.

Modelling STD mass treatment in Mwanza
Table 7.A2 Values of parameters descrihing partnership formation in the STDSJM representation of rural Mwanza.
Age- and sex-dependent Probability that a new relationship is
promiscuity levels (rs.~) steady, depending on the age of the male
partner Age group
Neither partner One or both lyears) Mal es Females al ready in a steady partners already in a
relationship steady relationship
<15 3.5 4.0 0 0 15-19 3.5 4.0 0.1 0 20-24 4.0 2.5 0.3 0.1 34-39 3.0 1.5 0.6 0.15 30-34 2.0 1.0 0.8 0.2 35-44 1.0 0.6 0.8 0.15 45-54 0.4 0.4 0.8 0.1 55+ 0.2 0.2 0.8 0.1
Sexual relationships: partner preferences Partnership formation is guided by age preferenee matrices (one for eacb sex, Table 7.A3) specifying the probability toselect a partner from a certain age class. In case no potential partner is available in the preterred age class, a partner is selected in another age class by intmediate renewed sampling among the remairring age classes for which the preferenee is larger than zero (e.g. in Table 7 .A3 a, for rnales aged 15-19 years: the 3 temale classes <24 years, but not the older temale age classes). lf no partner is available in any of the preterred age classes, the person remains available for another period sampled as described above. This cycle repeats until the person has found a new partner.
As the age preferenee matrices determine age ditterences at the start of simulated relationships, the realized age differences in partnersbips existing at a single point in time - in whicb long relationships are relatively overrepresented
- do not necessarily match the user-speci.fied preferences. ln the present simulations, the matrices speci.fied rnales to preter on average 5 years younger temales and females on average 5 years older rnales (Table 7 .A3), in line with reported age difference between spouses in Mwanza [Munguti et al. 1997];realized age dif
ferences in the model popwation on cross-sectien averaged only 2 years. Apart trom assortativeness by age, no other preferences apply. Thus, promiscuous individuals have no explicit preferenee for promiscuous partners.
Types and durations of relationships The probability that a new relationship is steady depends on whether or not at least one of the partners is already engaged in a steady relationship, and on the age of the male partner (Table 7.A2).At the start of a new relationship its dura-
151

152 Chapter 7
Table 7 .A3 Age preferences in partner selection in the STDSIM representation of rural Mwanza. a) rnales and (b) females.
(a) age of male age of female (years)
(years) <15 15-19 20-24 25-29 30-34 35-44 44-54 55+
<15 0.8 0.2 0 0 0 0 0 0 15-19 0.6 0.3 0.1 0 0 0 0 0 20-24 0.3 0.4 0.2 0.1 0 0 0 0 25-29 0.1 0.25 0.4 0.2 0.05 0 0 0 30-34 0 0.1 0.25 0.4 0.2 0.05 0 0 35-44 0 0 0.1 0.25 0.4 0.2 0.05 0 45-54 0 0 0 0.1 0.25 0.4 0.2 0.05 55+ 0 0 0 0 0.1 0.25 0.4 0.25
(b) age of female age of male (years)
(years)
<15 15-19 20-24 25-29 30-34 35-44 45-54 55+
<15 15-19 20-24 25-29 30-34 35-44 44-54 55+
0.4 0.3 0.2 0.1 0 0 0 0 0.15 0.25 0.3 0.2 0.1 0 0 0 0 0.1 0.2 0.35 0.25 0.1 0 0 0 0 0.1 0.2 0.35 0.25 0.1 0 0 0 0 0.1 0.2 0.35 0.25 0.1 0 0 0 0 0.1 0.2 0.35 0.35 0 0 0 0 0 0.1 0.3 0.6 0 0 0 0 0 0 0.2 0.8
tion is drawn, in this study from gamma distributions with shape parameter 0.5 and means of 25 years for steady relationships and 0.5 years for short relationships. This distribution function and parameter values were chosen to obtain fit against the data of Mwanza [Munguti et al. 1997] for the proportions of rnales and females married in different age groups (Fig. 7.1a), simultaneously with the
total number of partners during the past year of rnales in different age groups (Fig. 7.1b).
in the current version of STDSIM, the frequency of intercourse in relationships varies with the age ofthe male partner, but does notdepend on the number
and type of ongoing relationships. For this study, we assumed frequencies of once a week for relationships in whicb the male was <15 or between 35-54 years of age, 1.5 times weekly for rnales aged 15-34, and 0.5 times weekly for rnales aged 55 and over, consistent with data from factory workers in Mwanza town [Borgdorff et al. 1994].
One-off cantacts / Prostitution The occurrence of one-off cantacts bernreen male 'clients' and female 'prostitutes' is specified by defining a number of frequency classes of prostitute visiting, and

ModeJ/ing STD mass treatment in Mwanza
Table 7.A4 Frequency of prostitute visits of rnales assumed in the STDSIM representation of rural Mwanza.
frequency (contacts per year)
0
1
6
fraction of unmarried rnales fraction of married rnales
40% 70%
55% 25% 5% 5%
subsequently specifying the proportions of married and urnnarried rnales (up to a maximum age, in this study 50 years) in ead1 dass.A personal indination to
visiting prostitutes, assigned to each male at birth, determines to which classes a male belongs for the married and unmarried parts of life. As the inclination remains the same througbout life and does not depend on relationship situation, frequency of prostitute visiting is always the same before and afrer marriage. For the distribution of rnales in this study (Table 7 .A4), this means that 5% of rnales visits prostitutes 6 times per year irrespective of marital status. Of the 55% visiting prostimtes once yearly while unmarried, 30% quits tbis practice upon marriage, but would take up prostitute visiting again in case of divorce. The other 25% visiting prostitutes once yearly does so irrespective of marital status.At each prostitute contact as wellas at se...xual debut, the time interval till the ellent's ne...-r contact is determined according to the exponential distribution with mean <p,
where 1/<p is the personal frequency of prostitute visits. Prostitutes are recruited according to tl1e male demand from all s=ually
active females within a user-specified age range, in this study 15-30 years.A pmstitute's 'career' lasts at least 1 year and ends somewhere before a user-specified ma.'Ximum age (in this study 35 years), according toa uniform distribution.ln this study, the frequency of elient comacts per prostitute averaged 1 per week. In the absence of adequate data, we believe this is not unreasonable for rural Mwanza, and it allowed us to achleve adequate fit of numbers of partners of rnales- whidl indudes each one-off contact as a separate partner - (Figure 1 b) and STD epidemiology (Figures 2 and 3). In this study, elient comacts were divided over the pool of prostitutes in time order.
Eadl year, the model dlecks, and - if necessary - adapts the number of prostitutes to match the user-specified frequency number of elient cantacts per prostitute as closely as possible,given the number ofvisits by clients and the frequency of elient cantacts of prostitutes. If the number of prostitutes is too small, additional women are recruited. If the number of prostitutes is too large, a randomly selected prostitute terminates her career before the scheduled date. In addition, every time a woman in the starting age range (15-30 years) becomes widowed (i.e.loses a steady partner), a similar check for the number of prostitutes is per-
153

154 Chapter 7
formed; and if there is a shortage, the widow is recruited as a prostitute.
Start of the simulation
At start of a simwation, an initial popwation is created; the popwation used in this study is given in Table 7 A5 .All individuals start as singles; formation of sex-ual relationships and one-off contacts then occurs as described above. STD infections are attributed to the initial population at user-speci.fied prevalences, in this study 3.5% for gonorrhoea, 5% for chlamydia, 9% for syphilis and 1.2% for chancroid. Ini
tia! STD infections are randomly distributed only among individuals with a high individual promiscuity level (p ;> 1) who have had their sex-ual de but. Simulations are started in a user-speci.fied year (here 1930) well in advance of the introduetion of HIV: This allows the model popwation to reach dynamic equilibria with respect to demography, partnership formation and STD epidemiology, before the simwated start of HIV spread.Neither the chosen composition ofthe initial population nor the user-speci.fied STD rates in the initial popwation are critica! to
the situation of equilibrium. HIV is introduced into the model popwation by randomly infecting one prostitute, in a user-speci.fied year (here 1983). In applications of the model în which one-off centacts are not assumed, HIV introduetion occurs by simwtaneous infection of 10 sex"llillly active rnales and 10 sexually active females in the general popwation.
Table 7 .AS Specification of the initia! population (in absolute numbers) in STDSIM, and values used to represent rural Mwanza, forstarting year 1930.
Age group (years) Mal es Females
0- 9 500 500 10 -19 375 375 20-29 223 223 30-39 150 150 40-49 100 100 50-59 80 80 60-69 40 40 70- 79 20 20 80-89 10 10
HIV /STD dynamics and behaviour change as
deterrnininants of the impact of STD treatment
on HIV spread over the Rakai epidemie
Korenromp EL, Bakker R, De Vlas SJ, Gray RH, Wawer MJ, Serwadda D, Sewankambo NK, JDF Habbema. mv /STD dynamics and behaviour change as determinants of the cbanging impact of sm treatment on HIV spread - implications for the interpretation of the Rakai triaL Submitted for publication.

Acknowledgements We thank Richard Hayes lor advising on the design olthe study and lor helplul comments on the manuscript. The study was financially supported by the European Community (contract number 87.6211/97/017).

The impact of STD treatment in different stages of the Rakai epidemie
8.1 SUMMARY
Objective: To assess how the impact of STD treatment on HIV incidence varles between stages of the HN epidemie. Methods: We simulated the spread of curable STDs, herpes simplex virus type 2 and HN iu the dynamic transmission model STDSIM. Parameters were quantified to represem a severe HN epidemie as iu Rakai, Uganda, usiug demographic, beha,ioural and epidemiological data from its recent STD treatment trial. Results: The model fitred the HN epidemie iu Rakai adequately ifwe assumed a considerable behavioural risk reduction stattiug at the end of the U gandan ei vil war iu 1986.1mprovement of STD treattnent was projeered to reduce HN iucidence iu this population by 35% over 2 years if implemenred iu 1981, but by only 11% and 8% iu 1988 or 1998.This trend resulted iu part from the hypothesized behaviour change, which markedly reduced the prevalences ofbacterial STDs.ln a simulated epidemie without behavioural change, the correspondiug impacts iu 1988 and 1998 would be 19% and 15%. Enhanced herpetic ulceration iu immunocompromised HN-patients contributed little to the falliug impact of treatment of bacterial STDs over time. Conclusious: In HN epidernies beyond the first decade, the impact of STD treatment programmes on HIV transmission may depend more on whether a behavioural risk rednetion occurred, than on the stage of the epidemie. Precediug behavioural change associated with civil stabiliry may have contributed to the Jack of impact of STD treatment on HN iu the Rakai trial. 1n actvaneed epidemies with less behaviour change, STD treatment may still be important iu HN prevention.
8.2 INTRODUeTION
Epidemiological and clinical studies suggest that the se.'illally transmitted d.iseases (STDs) act as cofactors for the se>:ual transmission of HN [Moss & Kreiss 1990, Laga et al. 1991, Wasserheit 1992, Flemiug & Wasserheit 1999] .lf STDs are highly prevalent, as iu sub-Sahar.m Africa, and STD cofactor effects are strong, improved treatmem of STDs may be a strategy for HN prevention. The effectiveness of STD treatment for HIV prevention has been tested in two randomized communiry-based trials iu Uganda and Tanzania, which had very different outcomes [Wawer et al. 1999, Gross1:urth et aL 1995a].lmproved clinical management of symptomatic STD treatment in Mwanza, Tanzania, was associated wîth a rednetion iu HN iucidence by 38% (95% confidence iuterval 15% - 55%) over 2 years [Hayes et al. 1995a, Gross1:urth et al. 1995a]. Over a same iuterval, and with comparable proportional reductions iu the treated STDs, perioctic mass treatment iu Rakai, Uganda d.id not reduce HN iucidence (i.e. a 3% HN iucidence
157

158 Chapter 8
reduction,95%C!-16%to 19%) [Waweretal. 1999]. Several eq)Janations have been proposed for this apparent discrepancy,
induding differences in tbe treatment strategy, study populations and tbe stage of tbe HIV epidemie, study design, and random chance [Wawer et al. 1999, Fleming & Wasserheit 1999, Grossk"Urth et al. 2000, Hudson 2001].Among differences between tbe populations, one factor may be that STD cofactors play a Iarger role in early, concent:rated HIV epidernies -as in Mwanza- than in mature epidernies -as in Rakai. Early in HIV epidemics, infections are tbought to take place primarily in core groups of highly sexua.Ily active individuals, who have high rates of STDs. Later in HIV epidemics, more HIV transmissions wil! oecur in stabie relationships between !ow-risk individuals, few of whom have STDs.An additional mechanism may be that, due to selective HIV-attributable mortality among highrisk individuals, STD prevalerrees in tbe population fail over tbe evolution of tbe HIV epidemie [Korenromp et al. 2000e].
Tbe deereasing importanee of STD eofactors during tbe HIV epidemie has been demonstrared in several rnadelling studies, in which tbe impact of hypotbetical programmes was simulated for various time points in tbe HIV epidemie [Robinson et al. 1997, Korenromp et al. 1999b].However, two aspects that may in:fluence the role of STD cofactors were not taken into account in these studies. First, besides curable bacterial STDs targeted by STD treatment, tbe uncurable infection witb herpes simplex virus type 2 (HSV-2) may act as a cofactor in HIV transmission. HSV-2 is highly prevalent in SSA populations witb severe HIV epidemics, and its prevalenee may be increasing due to increased reactivation in immunocompromisedAIDS patients [Wassetbeit 1992, O'Farrell 1999], possibly reducing tbe relative importance of curable STDs in HIV transmission. Second, it is becoming increasingly clear that several SSA countries, induding Uganda, have experienced or are experiencing reductions in sexual risk behaviour, induding decreases in casual sex and in prostitution, and increases in condom use [Ng"weshemi et al. 1996,Jackson et al. 1997c, Konde-Luleet al. 1997,AsümweOkiror et al. 1997, Kilian et al. 1999, Kamali et al. 2000, Gregson et al. 1998, Meekers 2000, Fylkesnes et al. 2001]. Since such behaviour change wil! cause tbe prevalenee of short-duration STDs like gonorrhoea, chlamydia and chancroid to fail [Korenromp et al. 2001a], it mayalso reduce the importance oftbese curable cofactors in HIV spread.
In this chapter, we assess how tbe impact of STD treatment on HIV transmission would vary over time during tbe Rakai HIV epidemie, taking into account tbe role of HSV-2 in ongoing HIV transmission and behavioural change. We used tbe dynamic transmission model STDSIM [Van der Ploeg et al. 1998, Korenromp et al. 2000b] to simulate tbe spread of HIV; curable STDs and HSV-2 in tbe Rakai population.To distinguish tbe iofluence ofbehaviour change from that of natura! HIV/STD dyoamics, we also simulated a hypotbetical Rakai-like population witbout a behaviour change. Tbe simulated intervention was syodromic STD treatment, whlch was feit most interesting witb respect to tbe diserepant results and

The impact of STD treatment in different stages of the Rakai epidemie
policy implications of the Mwanza and Rakai trials. We discuss the importance of the respective phases of the HIV epidernies in the Mwanza and Rakai trials as an explanation for their discrepant outcomes, in the light of the simulation outcomes.
8.3 METIIODS
STDSIM model
STDSIM simulates the natura! history and transmission of STDs and HIV; in a dynamic population consisting of individuals with assigned characteristics that change over time [Korenromp et aL 2000b, Korenromp et al. 2000c]. The formation and dissalution of heterose":ual partnerships and transmission of STDs during cantacts bttween sexual partners, are modelled as stochastic events. Recently, the model was adapted to include the simulation of genital infection with HSV-2 and the effects of HIV infection on the natura! history and transmissi on of HSV-2 [Korenromp et aL accepted]. The adapted model allowed us to study the impact of STD treatment on HIV spread, in varying scenarios of interactions between STDs and HIV
Simulated populations
The simulation of the Rakai HIV/STD epidemie was based on data collected in the context of the STD treatment trial and preceding cohort studies [Wawer et aL 1991, Wawer et al. 1994, Wawer et al. 1997, Serwadda et al. 1992]. Some additional quantifications foliowed from previous simulations [Korenromp et aL 2000c] of the trial in Mwanza, which also involved a ruta1 population [ Gross1:urth et aL 1995a, Gross1:urth et al. 2000]. Few data are available on SeJ>.-uai behaviour in either Rakai or Mwanza prior to 1988.Two assumptions were made to explain the much higher prevalenee of HIV in Rakai (15-25% [Serwadda et al. 1992, Wawer et al 1997]) as compared to Mwanza (2.5% [Barongo et al. 1992]) in 1988. First, we estimated that HIV spread started relatively early in Rakai. Because the time of HIV introduetion in Uganda is not precisely known and the fustAIDS cases were observed in Rakai in 1982 [Serwadda et aL 1985, Sewankambo et aL 1987], this timepoint was set at 1978, i.e. around the time of the Tanzanian invasion which marked the start of the U gandan ei vil war. Second, we assumed that partner change rates had been higher in Uganda during the period of civil
war between 1978 and 1986, due to social disruption, relative to Tanzania. Compared to tl1e first Ugandan surveys around 1988, behavioural risk reductions have been observed during the 1990s, including reductions in numbers of partners,
159

160 Chapter 8
increased condom use, and possibly delays in the age of fust sex [Konde-Lule et al. 1997,Asiimwe-Okiror et al. 1997, Kilian et al. 1999, Kamali et al. 2000, Millistry ofHealth et al. 1989, Statistics Dept. Uganda 1996].There is anecdotal evidence that in Rakai., commercial sex had become less common in the 1990s as compared to the 1980s [Serwadda et al. 1992] .These changes are compatible with the restored stability after the end of the Ugandan civil war, and the adoption of a national AIDS control policy including IEC programmes and voluntary HIV testing and counselling.lo line with earlier models of Uganda [Stoneburner et al. 1996, Kilian et al. 1999], the behavioural change was represented Jo STDSIM as a 50% reduction in the proportion of rnales having one-off sexual contacts with female sex workers after 1986.1o addition, a 25% reduction in partner change rates in the whole population was assumed after this time point. This quantification resulted in adequate fit of the model with respect to proportions married, numbers of recent partners of males, and age/sex pattems in data from the trial baseline survey (not shown). Jo addition, we simulated a hypothetical Rakai.-like population in which the assumed behavioural changes in 1986 were omitted.
Assumptions on SID natural. history and transmission
The STDS!J.lf representations of the natura! history and transmission of curable SIDs were basedon literature review [Korenromp et al. 2001a] and are summarized in Table 8.1.
The representation of HSV-2, whicb resulted in realistic age/sex patterns in simulated HSV-2 seroprevalence, has been described elsewhere [Korenromp et al. accepted]. In brief, the infection was speellied to start with a primary ulcer lasting on average 3 weeks [Cone et al. 1991, Koelie et al. 1992, Corey et al. 1983].After healing of this lesion, symptomatic and asymptomatic ulcers were assumed to recur at an average 6 months interval [Wald et al. 2000, Langenberg et al. 1989] fora period of on average 15 years denoted as the ·early latent stage'. Jo line with their relative clinical severity [Corey et al. 1983], herpetic recurrences were assumed to be less severe in terros of perceived symptoms, infectivM
ity and cofactor effects on HIV transmission than primary ulcers. Jo between recurrences, a low continuous level of infectivity was assumed which represented the regular occurrence of sulx:linical HSV-2 shedding [Adam et al. 1979, McCaughtry et al. 1982,Wald et al. 1997].At the end ofthe HSV-2 'early latent stage', patients were assumed to no Jonger suffer recurrences nor to be infectieus, but to remain seropositive for life.
HIV infection was speellied as four subsequent stages, named primary HIV infection, asymptomatic Qatent) stage, symptomatic pre-AIDS stage, and AIDS. 1t was assumed that symptomatology [Morgan et al. 1997b] and effects on herpetic ulcerations (see below), differed with HIV progression. HIV transmission

The impact of STD treatment in different stages of the Ra ka i epidemie 161
Table 8.1 Representation of natura! history and transmission of HIV and STDs in the STDSIM simulation of the Uganda HIV epidemie.
Transmission Cofactor Proportion
Infection & stage Mean duration 1 probability ~ effect on symptomatic HIV trans-
M~F F~M mission~-3 M F
HIV
Primary 10 weeks 0.045 0.015 na na na
Asymptomatic 5 years 0.00225 0.00075 na na na
Symptomatic pre-Al DS 2 years 0.00225 0.00075 na na na
AIDS 40 weeks 0.01125 0.00375 na na na --- -------- ---------- ------
Syphilis
lnfectious 6 months 0.3 0.2 10x 80% 50%
Latent 15 years 0 0 na na na
Chancroïd 10 weeks 0.20 0.15 25x 90% 70%
HSV-2
Primary u!cer 3 weeks 0.30 0.15 25x 30%
Early latent {with recurrent 15 years4 0.0054 0.00255 na5 na' na' ulcers)
Recurrent ulcer 1 week4; 0.20 0.10 10x 15% 7.5%
Interval bet\Neen ulcers: 6 months4
Late latent Lifelong 0 0 na na na . ··- ____ " ___ - -------------- ---- ----------------- ------------------
Gonorrhoea M 9 weeks; 0.22 0.15 5x 50% 20% F 13 weeks
---~------- -------- --------------------------------- ----------------
Chlamydia M 12 weeks; 0.20 0.12 5x 30% 15% F 16 weeks
1 lndividual stage durations were sampled from a Weibull distribution function with shape parameter 2, except for the duration of the early latent stage of HSV-2 and the interval between recurrent HSV-2 ulcers, which used exponent ia! distribution func:tîons. 2 Per contact; equal for recognized and unrecognized episodes. 3 Both for susceptibility (in HIV-negative partner) and înfectîvîty (in HIV-positive partner). 4 Except in symptomatic HIV patients, for whom the va lues are 30 years, 2 weeks, and 3 months. 5 Except during recurrent ulcers. M= male; F-female; na- not applicable.
probabilities were modelled in a 'bath-tub' pattem, with infectivity being highest during primary HN disease and, secondly, during AIDS [Jacquez et al. 1994, De
Vmcenzi 1994, Quinn et al 2000, Gray et al. 2001].
Biomedical interactions between STD and HIV
We assumed that STDs enhance the infectivity with HN and the susceptibility to HIY, by a factor varying with the dlsease stage (Table 8.1). In the absence

162 Chapter 8
of lmowledge on STD cofactor magnitudes from expertmental studies, we esti
mated these variables from mathematica! calculations based on observational studies among commercial sex workers and clients in NairObi [Hayes et al.
1995c, Korenromp et al. 200lb]; the resulting cofactor values were lower than those assumed in previous simulations [Korenromp et al. 2000c]. The relative cofactor magnitude for the different ulcerative STDs were cbosen in line with their relative clinical severity. For the infectious stage of syphilis during whicb sevetal ulcer episodes may occur interrnittently [Holmes et al. 1999],an average cofactor effect of 1 0-fold was applied througbout. Chancroïd and primary HSV-2 were assumed to enhance HIV transmission 25-fold, but only for the duration of the ulcer.
HIV disease may enhance the frequency and duration of herpetic ulcerations, as is inferred from studies observing 3- to 4-fold increases in the number ofHSV-2 culture-positive days [Augenbraun et al. 1995, Scbacker et al. 1998,Mbopi-Keou et al. 1999] and increases in the incidence rate of clinical ulcers [Kaul et al. 1997, Scbacker et al. 1998]. in line with these data, we assumed that during the symptomatic stages of HIV infection (fable 8.1), the duration and the frequency of recurrent herpetic ulcers are doubled.
Simulation of STD intervention
The simulated STD intervention încreased the cure rate of symptomatic episodes of gonorrhoea, chlamydia, syphilis and chancroïd from 5% to 38% [Buvé et al. 1998] .As a simplification in the model, only the symptomatic STDs for whicb the patient sought treatment was cured; concurrent asymptomatic infections were not.The simulated intervention was initiated in 1981,1988 or 1998 (the 3rd, 10th or 20th year of the simulated HIV epidemie), and was SUStained througbout the simulation period.
Simulation design
Simulations were done for several scenarios: (a) Rakai;(b) hypothetical Rakai-like
population without behaviour change; (c) Rakai with STD intervention implemenred in year 3, 10 or 20 of the HIV epidemie; (d) ) hypothetical Rakai-like population without beha,iour cbange, with STD intervention in year 3, 10 or 20 of the HIV epidemie. In order to reduce random fluctuations associated with stochastic simulations, for each scenario 100 simulation runs were conducted.All outcomes are reported as averages over 100 runs in the general adult population aged 15-49 years.

The impact of STO treatment in different stages of the Rakai epidemie
Sensitivity analyses
To assess the robustness of results, we repeated simulations for alternative quantifications of parameters known to affect the rapidity of saturation of HIV epidemies and interactions between STDs and HIV In actdition to the parameter of interest, in each alternative simulation, the transmission probability of HIV was
re-adjusted, if necessary, to fit the 16% point prevalenee of HIV in Rakai at start
of the trial in 1995.
8.4 RESULTS
Figure 8.1 shows the simulated prevalerrees of curable STDs and HSV-2 during the HIV epidemie in Rakai and in the population without behaviour change.The simulated Rakai epidemie fitred data from the trial reasonably well with respect to the prevalenee of gonorrhoea, chlamydia and syphilis (Figure 8.1a-d).Also, the simulated stage distribution in syphilis cases [Wawer et al. 1999], and age- and se.x-specific seroprevalences of HSV-2 matched the empirical data (not shown).
After 1986, STD prevalerrees fell in the Rakai simulation, following the assumed behavioural risk reduction (Figure 8.1a-e).The simulated decline in syphilis prevalenee matebed that observed in Rakai between 1992 and 1996, although it was somewhat earlier. The prevalenee fall in the model was fastest and largest for chancroid. Because chancroid has the lowest reproductive number [Brunham &
Plummer 1990], behavioural change will have most impact on thls STD; however no empirical data are avallable on Haemophilus ducreyi to valldate thls prediction. The decline was comparatively slow and small for HSV-2 seroprevalence (from 48% to 40%), for two reasons. Since HSV-2 is a lifelong infection with a high baseline prevalenee and recurrent nature, a reduction in herpetic ulceration can only follow from reductions in new infections in the youngest age groups. Therefore, reduced HSV-2 transmission takes a long time to impact HSV-2 seroprevalence at a population level. Furthermore, the behavioural effect is to some eo.."tent counterbalanced by the assumed enhancement of herpetic ulceration in HIV patients, wbich increases HSV-2 transmissîon.
HIV prevalenee in the Rakai simulation peaked at 16% around 1990.Therafter, it stabilized and started a slow decline (Figure 8.11), in line with trends in risk
behaviour and epidemiological observations in Rakai [Wawer et al. 1991,Wawer et al. 1997] and other parts of Uganda [Mulder et al. 1995, Kamali et al. 2000, Kilian et al. 1999, Stoneburner et al. 1996].
In the hypothetical population without behavioural change, prevalerrees of the bacterial STDs also slightly feil during the 1990s (Figure 8.1a-d), due to selective HIV-atttibutable mortality in high-risk groups. The simulated prevalenee of HSV-2, in contrast, remalned stabie at around 47% throughout the HIV epidemie
163

a. gonorrhoea
15 j + 1
~ "I I • u
c 2 • ~ I+ c.
~·+ I ----···
1930 1935 1990 1995 2000
d. chancroid
- -~ 3
\ • u c 2
~ e 1 c.
1980 1985 1990 1995 2000
time (year)
b. chlamydia
" 10
I + 1930 1985 1990 Hl95 2000
e. HSV-2
501
40 ----..:.:::::.: ----1
301 I
20
I "L 1995 2000
0 1930 1935 1990
time (year)
c. syphilis 10,------
10
5 "-
1930 1985 1990 1995 2000
f. HIV
30
20
10
0 1980 1985 1990 1995 2000
time {year)
tJakal o behaviour change mpîricat data
Figure 8.1 Simuialed prevalences (%)of STDs and HIV in adults (15-49 years), for rural Rakai and a hypothetical Rakai-like population without
'i:
a behaviour change. Syphilis: RPR+frPHA + any titer [Wawer et al. 19991; HSV~2: seroprevalence. Mean of 100 simulated populations. Empirica! n data, for comparison, for 1992~ 1996 from the comparison arm of the STD treatment trial at baseline and pre-trial cohort studies in Rakai; for gonor~ i rhoea and chlamydia 1994~6: subsample aged 15~29 years; gonorrhoea data 1979: random subsamples of general popuiatien in 1971~2 in rural ib Ankole and Teso districts [Arya et al. 1973]. ;:;,

The impact of STD treatment in different stages ofthe Rakai epidemie
(Figure 8.le), due to the counterbalancing effect of enhanced herpetic ulceration in HN patients. ln the absence of behaviour change, HN prevalenee continued to increase till after 2000, albeit at decreasing pace (Figure 8.lf). HN incidence stabilized earlier, around 1995 (Figure 8.2c). This reflects a saturation due to HN
vira1 dynamics: later in the HN epidemie, fewer HN patients are in the primary, most infectieus, disease stage, and most new infectlens occur outside the high
transmitter core groups.
Impact of STD treatment over time
ln the population with unchanged behaviour, improverneut of STD treatment reduced the prevalences of curable STDs considerably; the magnirude of these reductions was independent of the timepoint of implementation (Figure 8.2a).
a. gonorrhoea in population without behaviour change
15,--------------------,
ê • u c • .. > ~ ~
10 •
~ ~ '\:I
:l I 1980 1985 1990 1995 2000
c. HIV in population without behaviour change
5,---------------------,
1980 1985 1990 1995 2000
time (ycar)
b. gonorrhoea in Rakai 15----------------------~
~
t':l H~t 1980 1985 1990 1995 2000
d. HIV in Rakai
'~---------------------,
1980 1985 1990 1995 2000
tlme (year)
figure 8.2 Simulated impact of improved STD treatment intervention implemented in different stages (year 3, 10 and 20) of the HIV epidemie on: (a) gonorrhoea prevalenee (%) in population without behaviour change, (b) gonorrhoea prevalenee (%) in Rakai (c) HIV incidence U100 person-years) in population without behaviour change, (d) HIV incidence (/100 person-years) in Rakai, in adults (15-49 years). Mean of 100 simulated populations. The arrows in figures (b) and (d) indicate the timing of the actual trial in Rakai.
165

166 Chapter 8
In the Rakai simulation, the intervention caused STD prevalences to decrease at rates camparabie to those in the population without bebaviour change, if implemented in 198l.After 1986, the combination of improved STD treatment and behavioural change achieved lower equilibrium prevalenee levels for all STDs than in the simulation without changing behaviour (Figure 8.2b). Other curable STDs showed similar responses to STD treatment as gonorrhoea, but the prevalenee of HSV-2, which is not curable, was unaffected by improved syndromic treatment (not shown).
The impact of the simulated intervention on HIV incidence varied with the timepoint of implementation. In the population without behaviour change, with implementation in 1981, improved STD management slowed-but did notstop - the projected increase over time in HIV incidence (Figure 8.2c).lf STD management was implemented at later times, when HIV incidence had already exceeded 3 per 100 person-years, the intervention resulted in a decreasein HIV incidence to approximately 3 per 100 person-years. In the Rakai simulation, impact on HIV of the intervention in 1981 was initially camparabie to that in the population without behavioural change (Figure 8.2d).At start of the bebavioural cbange in 1986, the combination of these two interventions would result in a stabilization of HIV incidence at around 1 per 100 person-years.With implementation at later stage of the HIV epidemie more close to the timing of the actual trial in 1995 (arrow in Figure 8.2), STD treatment decreased HIV incidence to this same equilibrium level, but over a langer time period.
For comparison with the Rakai and Mwaoza trial outcomes, we calculated the sîmulated intervention impact as the proportional reduction in HIV incidence over the fust 2 years of the intervention. In the model, the STD intervention reduced HIV incidence over the fust 2 years by 35% if implememed in 1981. However, when implemented in 1988 or 1998, the rednetion in HIV incidence feil to 19% or 15%, respectively, in the simulation without behaviour change. In
the Rakai epidemie, simulated impact in the lüth and 20th year of the HIV epidemie was 11% or 8%, respectively.
Sensitivity analyses
Table 8.2 shows the simulated impact of STD treatment for alternative scenarios varying in the quantification of possibly critical parameters.Across all scenarios, the fall in impact in the absence of bebaviour cbange was largest between years 3 end 10.After year 10, falls over time in impact were always much larger for the Rakai epidemie than for the population with unchanged bebaviour.This supports the robustness of these conclusions with respect to the R.akai simulations.
To single out the influence of the dyoamics of HSV-2 infection during the HIV epidemie on the impact of treatment ofbacterial STD, separate simulations were ruo in which HSV-2 was omitted as a cofactor for Hiv, or in which herpetic ulcer-

Table 8.2 Sensitivity analysis on the proportion (%)of new adult HIV infections averied by improved STD treatmenl implemenled in year 3, 10 or 20 of the HIV epidemie in Uganda and a Uganda·like populalion without behaviour change. Evaluation perioei is the the first two years of implementation of the inte!Vention. Simulations are shown for the base-case as wel! as for alternative scenarios differing in the values of critica! parameters. Base-case outcomes correspond to the results shown in the Figures. Outcomes are the mean of 100 simulated populations.
Scenario
Base-case
Lower/higher cofactors
HSV-2 lesslmare important
Nolstronger bathtub pattern in HIV infectivity over the course of infection
Assumptions
(see T able 8.1)
Gonorrhoea/chlamydia: 2x Syphilislrecurrent HSV-2: Sx ChancroicVprimary HSV-2: 10x
Gonorrhoea/chlamydia: 1 Ox Syphilislrecurrent HSV-2: 30x Chancroidlprimary HSV-2: 100x
HSV-2 removed as colactor for HIV transmission
HSV-2 stronger colactor effects: Primary ulcers: 1 OOx; Recurrent ulcers: 25x
Constant HIV infectivity ('no bathtub')
Primary HIV 1 OOx (instead of 20x) and AIDS 20x (instead of Sx) as infectivo as asymptomatic I preAIDS phase.
Proportional reduction in HIV incidence over 2
year 3
35%
31%
44%
38%
32%
39%
30%
years --
population without
behaviour change
year 10
19%
16%
27%
20%
16%
18%
22%
year 20
15%
12%
22%
17%
11%
13%
17%
Rakai
---year 10
11%
7%
17%
15%
8%
12%
11%
year 20
8%
4%
10%
8%
4%
5%
5%
;! <l>
~· ::4 0 ~
V>
d
I ~ ,, 9, ~ ~
~ ~ g. <l>
~ -@
~ ?i'
"' '"
168 Chapter 8
ations were a more important cofactor than the bacterial ulcers. In both alternative scenarios, the fall in impact of STD treatment during the HIV epidemie was similar to the base-case.
8.5 DISCUSSION
The simulations confirmed that the proportion of new HN infections that can be prevented with STD treatment decreases during the evolution of severe HN epidernics. In populations with unchanged risk behaviour, the most marked decline in impact occurs with STD intervention over the fust 10 years of the epidemie (Table 8.2). This relates mainly to a rapid initia! change in the types of relationships in which most new HN infections take place: from high-risk partnersbips of short duration between individuals among whom STDs are prevalent, to stabie relationships with a higher sexual contact frequency and lower concurrent STD O...'J>OSure.Previous simulations suggested this outcome to hold true fora range of populations with varying pattems of sexual behaviour [Korenromp et al. 1999b, Robinson et al. 1997]. Furthermore, our sensitivity analysis (Table 8.2) supports that this condusion is robust across a range of scenarios varying in HIV /STD transmission dynamics and the rapidity of saturation of the HN epidemie.
The simulated slight decline in STD prevalences over time in the scenario without behaviour change (Figure 8.1a-d) indicates that selective HN-attributable mortality contributes only modestly to the changing impact of STD treatment. Magnitudes of STD declines during HN epidernies have however notbeen
measured emptrically, preduding a validatien of this model predietien [Korenromp et al. 2001a].The sensitivity analyses suggest that the dynamics of HSV-2 spread also contribute little to the falling impact of treatment of bacterial STDs on HN incidence during the HN epidemie. In line with this, HSV-2 seroprevalence increased little due to increased herpetic ulceratien in HIV patients (Figure 8.1e). This is firstly because the majority of HSV-2 patients are not HN-infected, because of the high prevalenee of HSV-2 (48%) relative to HN (around 16%), and those who are infected die earliest, which limits concurrent infection with HN and HSV-2. Furthermore, the majority of partners of HSV-2/HN patiellts
are already infected with HSV-2, so that increased infectivity does not always increase HSV-2 transmission in the population. The predicted stability of HSV-2
seroprevalence throughout the simulated HN epidemie is in line with the sirnilar HSV-2 seroprevalences measured in the severe, mature HIV epidemie in Rakai and the earlier, less severe epidemie in Mwanza [Orroth et al. 2001]. Although the simulated prevalenee of herpetic ulcers increased relative!y more than HSV-2 seroprevalence (from 2.1 to 3.3 in the scenario without behaviour change between years 3 and 20), this increase was insignificant at a popuiatien level.

The impact of STD treatment in different stages of the Rakai epidemie
The simulations suggest that behavioural risk rednetion as occurred in Uganda
after the end of its civil war is a powerful determinant of the HN epidemie and of the potenrial impact of subsequent STD treatment programmes on HN spread (Table 8.2). By reducing the prevalences of curable STDs, behavioural risk reduction limits the importance of STD cofactors in HN transmission. An additional mechanism is that, following a reduction in high-risk contacts, an increasing proportion of HN transmissions wil! take place in lower-risk, stabie relationships, in which due to the longer duration and more regular sexual contact, HN is likely to be transmitted regardless of cofactor STDs. Importantly, the effect of behavioural risk reduction on the impact of STD treatment programmes may occur at any
stage of tl1e HN epidemie. Caution is however warranted in the interpretation of this model outcome.
Although a number of data sourees from U ganda indicate that a rapid decline in risk behaviours has occurred, and this effect would be consistent with the end of the civil war and sociopolitical stabilization after 1986, the actual magnitude of this change is not known. For tl1e period 1970s through late 1980s, data are lacking. Behavioural surveys conducted in later years have methodological limitations, such as cross-sectional design, varying sampling frames, and weak measures of risk, e.g. 'ever use' of condoms. Outcomes are also prone to reporting biases, which may have changed over time as an effect of the very health education programmes which advocated behavioural change- obscuring actual trends. Although there was almast certainly substantial behavioural change after 1986, it is impossible to determine the relative contributions of the end of the civil war and the contemporaneous implementation of the nationalAIDS Control program. Finally, although the assumed time trends in risk beha,iours resulted in adequate fit of observed HN and STD epidemiological pattems, we cam1ot exclude the possibility that in reality other mechanisms ignored in the model contributed also to these pattems. For example, the model did not allow for changes in HN
infectivity over time, by which the virus may have been more virulent and infectious in the early years of theepidemie than it is currently [Ewald 1994]. Due to
such effects, we may have overestimated the e:-..."tent the effects of risk behaviour in Uganda in the early 1980s and/or and the magnitude ofthe consequent subsequent risk reduction.
Implications for the interpretation of the Mwanza and Rakai. trials
Our results shed light on the discrepant omeomes between the Rakal and Mwanza trials, if we consicter their timing relative to the onsets of the respective HN epidemics. For Rakai, we estimated the trial started at around the 17th year of the HN epidemie; and for Mwanza, assun1ing HN spread to have begun around 1983 [Korenromp et al. 2000c], we situate the trial in 1992-4 to have
been around the 1 Oth year of me epidemie. The expected ioiluence of this differ-
169

170 Chapter 8
ence in HN epidemie on the impact of STD treatment is approximated by the difference between the simulated 19% and 15% HN rednetion in years 10 and 20 for the population without behaviour change, and by the difference between 11% and 8"/o HN rednetion in years 10 and 20 for Rakai. Thus, it appears that the stage of the epidemie on its own cannot fully explain the discrepancy in observed impacts of STD control between Mwanza and Rakai (38% and 3% reduction in HN incidence, respectively). However,ifwe also consicter the behavioural risk rednetion in Uganda [Konde-Lule et al. 1997, Asümwe-Okiror et al. 1997, Kilian et al. 1999, Kamali et al. 2000, Millistry of Health et al. 1989, Staristics Dept. Uganda 1996] and the apparent absence hereof in Mwanza [Gross1:urth et al. 1995a], the simulated difference in impact (19% rednetion fora population without behaviour change in year 10 vs. 8"/o in Rakai in year 20) is more comparable with the actual discrepancy between the trials. The simulated 8% impact for Rakai in year 20 is in line with the observed 3% HIV incidence reduction în the trial, the slight excess simulated impact being possibly due to random chance (the 95% confidence interval around the empitical estintate was -16% to 19%).1t is of note that the excess simulated impact is unlikely to be due to the difference in simulated and acrual type of STD treatment (syndromic treatment vs. periadie mass treatment), because the simulated STD prevalenee reduetions (Figure 8.2b) approximated the actually observed STD reductions in the mass treatment trial [Wawer et al. 1999].
Model fit was less satisfactory with respect to the simulated impact of STD treatment in the lüth year of the HN epidemie with unchanged behaviour (19%) in comparison to the outcome of the Mwanza trial (38%) - although the simulation still fitred the empirica! confidence interval of 15-55%.Considering the similarity between simulated and observed magnitudes of STD reductions (Figure 8.2 and [Mayaud et al. 1997a]), the following factors are the most likely contributors to this sub-optima! fit: • The model represented the behavioural and epidemiological situation in Rakai
rather than Mwanza, and these two situations were different also in other aspects than those discussed above. Notably, in the 10th year of the respeetive HN epidemics, HN prevalenee in Rakai had reached and was stahilizing at a 16% prevalenee [Wawer et al. 1991, Wawer et al. 1997], whereas the actual
prevalenee in Mwanza was only 4% and still rising [Grossk-urth et al. 1995a]. Because of the lower HIV prevalenee in Mwanza, fewer HIV transmissions were like!y taking place in stabie re!ationships,rendering STDs more important. In addition, due to the lower HN prevalence, the effects of AIDS-related selective mortality and enhancement of herpetic ulceration may have been Iess pronounced; Observed impact in the Mwanza trial may have been biased upward by a coincidental higher baseline prevalenee of Hiv, some STDs and some HN risk factors in the intervention arm as compared to the control arm [Grossk-urth et al.

The impact of STD treatment in different stages of the Rakai epidemie
1995a, Mayaud et al. 1997a], and this factor was ignored in these simulations [Korenromp et al 2000a]; Some reproductive tract infections that may be cofactors in HIV transmission, such as trichomoniasis and candidiasis, were treated in the Mwanza intervention but not incorporated in the model.
In conclusion, the impact of STD treatment on HIV incidence decreases over time due to the natural dynantics of the HIV epidemie, but this effect is mainly important within the fust decade of the HIV epidemie. The simulations suggest that the cofactor role of HSV-2 increase littly in importance dnring the HIV epidemic.A stronger contributor to a decreasing role of curable STDs in HIV transmission in actvaneed HIV epidernies can be behaviour change.The lack of impact of STD treatrnent in the Rakai trial may thus relate to the behavioural change following cessation of civil disruption in Uganda before the trial. By implication,
improved STD treatrnent may be more effective than in the Rakai trial not only in earlier-stage HIV epidernies - like India -, but also in actvaneed HIV epidernies in which no strong behaviour change has yet occurred - like South-Africa.
171

Can behaviour change explain increases in the
proportion of genital ulcers attributable to herpes
in sub-Saharan Africa? A simulation modeHing study
Korenromp EL, Bakker R, De Vlas SJ, Robinson 1\1)", Hayes R, Habbema]DE Can behaviour change e..""<plain increases in the proportion of genital ulcers attributable to herpes in subSaharanAfrica? A simulation rnadelling study. Sex.Transm.Dis., in press. Reused with permission of the American Se..'-"UallyTransmitted Diseases Association.

Acknowledgements The authors thank Nico Nagelkerke and Kate Orroth for useful comments on the manuscript. We arealso grateful to Frances Cowan and Richard White for advice on the HSV-2 model representation. The study was financially supported by Glaxo Wellcome Research and Development.

The epidemiology of genital ulcer disease and herpes during HIV epidernies
9.1 SUMMARY
Objective: To assess the contributions of HIV disease and behavioural response to the HIV epidemie to the increasing proportion of genital ulcer disease (GlJD) artributable to herpes simplex virus type 2 (HSV-2) in sub-SaharanAfrica. Study design: Simulations of the transmission dynantics of ulcerative sexually transmitted diseases and HIV using the model STDSIM. Results: In simulations, 28% of GUD was caused by HSV-2 prior to a severe HIV epidemie. If HIV disease was assumed to double the duration and frequency of HSV-2 recurrences, this proportion rose to 35% by year 2000.Assuming stronger effeers of HN, this proportion rose further, but due to increased HSV-2 trans
mission, this would shift the peak in HSV-2 seroprevalence to an unrealistically young age.A simulated 25% reduction in partner change rates increased the proportion of GUD caused by HSV-2 to 56%, following relatively large decreases in chancroid and syphilis. Conclusion: Behavioural change may make an important contribution to relative increases in genital herpes.
9.2 INTRODUeTION
The distribution of aetiologies of genital ulcer disease (GUD) differs widely between countries within Africa. The proportion of GUD artributable to herpes simplex virus type 2 (HSV-2) appears to be higher or increasing in countries with severe HIV epidernies [Morse 1999, O'Farrell1999, Chen et al. 2000]. For example, the proportion of GUD cases that was herpes-positive on culture increased from 11% in 1986-8 to 21% in 1990-2 among HIV-positives in Rwanda [Bogaerrs et al. 1998], from 3% before 1981 to 14% in 1994 among gold miners in Johannesburg, South Africa [Htun et al. 1997], and from 7% in 1984 to 40% in 1998 in Durban, South Africa [O'Farrell 1999]. Increases have also been reported in the occurrence of genital herpes as a proportion of new diagnoses of sexually ttansmitted diseases (STD),e.g.in Durban (from 7% in 1989 to 11% in 1997) and Harare, Zimbabwe (6% in 1982, 10% in 1997). Moreover, GOD appears to constitute a larger proportion of STD diagnoses in sub-Saharan African (SSA) countries with severe HIV epidernies than in WestAfrica [O'Farrell2000].
Several explanations have been proposed for the apparent increase in HSV-2 as a cause of GUD in SSA.lmmunosuppression during actvaneed HIV disease can increase the duration, severity and incidence of herpetic recurrences, leading to an increased herpes ulcer load [Wasserheit 1992,Wald et al. 1993].This effect may be enhanced if the increased herpes ulcer load in HIV patienrs increases the transmission of HSV-2. Decreases in the prevalenee of bacterial causes of GUD, in particular chancroid, may induce a relative increase in HSV-2 as a cause
175

176 Chapter 9
of GUD. Bacterial GGD can decrease due to selective HIV-atttibutable mortality among higb-risk gtoups [Korentomp et al. 2000d], and due to behavionr change as a result of HIV control programmes promoting safer se..x [Asümwe-Okiror et al. 1997, Kilian et al. 1999, Kamali et al. 2000, Gregson et al. 1998]. lmproved management of bacterial STD mayalso contribute to decreases in bactetial GGD [Dangor et al. 1999,Steen et al. 1999, O'Farrell 1999,De Coito et al. 1999].Finally, apparent increases in genital herpes may reflect changes in detection, rather tban true shifts in GGD aetiology [Cowan et al. 1996, O'Farrell 1999].1mproved HSV-2 detection could result from increased awareness among clinicians and/or patients of herpes as a cause of GGD, and improved diagnostic possibilities such as PCR as a complement to viral culrure and clinical appearance [Morse 1999].
Available data cannot directly distinguish between tbese eq)lanations. Yet, tbeir implications for tbe bnrden of disease and tbe control of ulcerative STD and possibly HIV in SSA may be different. This chapter presents simulations of tbe infiuence of tbese possible causes on tbe epidentiology ofulcerative STD.We used tbe stochastic nticrosimulation model STVSIM [Van der Ploeg et al. 1998, Korenromp et al. 2000c, Korenromp et al. 2000d] to simulate tbe spread of ulcerative STD and HIVfora typical SSA population witb a severe HIV epidentic. Gomparing simulation outcomes witb empirica! data, we discuss the likelibood and importance of tbe suggested e>..-planations.
9.3 METHODS
Microsimulation model STDSIM
SIVSIM simulates tbe natnral history and transntission of multiple STD and HIV in a population consisting of individuals witb assigned characteristics tbat change over time.The formation and dissolution of (hetero-)sexual partnersrups and transntission of STDs dnring contacts between sexual partners are modelled as stochastic events [Van der Ploeg et al. 1998, Korenromp et al. 2000c, Korenromp et al. 2000d]. Recently, tbe model was adapted to include tbe simulation of genital infection witb HSV-2 and effects of HIV infection on tbe natnral history and transntission of STD including HSV-2, allowing us to study tbe epidentiology of HSV-2 in relation to that of otber ulcerative STD and HIV
Simulated population
Assumptions on demography, se>..-ual behavionr and healtb care were chosen to reflect conditions in a typical SSA city witb a severe and actvaneed HIV epidentic.

The epidemiology of genita/ u/eer disease and herpes during HIV epidernies
For this, we adapted a previous model representation of a population in rural Tanzania [Korenromp et al, 2000d], by specifying a higher frequency of prostitute visits by men (25% more than in the Tanzania simulation), a higher frequency of elient cantacts per prostitute ( average 2 per week), and an earlier time of introduetion of HIV (1980). To adequately reproduce HSV-2 seroprevalence pattems observed in SSA cities [McFarland et al. 1999, Robinson & Hosseini 2000], the representation of so:ual behaviour was funher adapted by specifying: (i) larger age differences between se>.-ual partners ( rnales being on average 3-3 years older than their spouses), and (ii) an increase in the mean age of sexual debut to 18 years in men and a corresponding decrease to 15 years in women.
Representation ofHSV-2
Figure 9.1 shows the model representation of HSV-2 infection; the corresponding parameter val u es are given in Table 9 .1. Infection starts with a primary ui eer episode of on average 3 weeks duration [Rawls et al. 1971, Corey et al. 1983a, Coneet al. 1991,Koelle et al. 1992, Corey et al. 1983b].The incubation period is ignored, because it is short [Corey et al. 1983a, Coneet al. 1991] and unlikely to influence HSV-2 transmission dynamics.
infectivity
eajactor effect on HIV
recogni::able symptoms
r---r:----~rT-- ------1 I i i i i i
: i i i i i :--------'~c--------_. : i i i i i I
i i i i l i i -r1
- ~r---n ~ : ----·~ \I, \\ I,\ 1:
- ----- -~
time
primary ulcer
t infection
i i i i i i
early latent phase, Mth recurrent ulcers
late latent phase, Mthout recurrent ulcers
Figure 9.1 Diagramrnatic representation of the natura! history of genital HSV-2 infection in the STDSIM model. Drawing not to scale. Corresponding parameter values are given in Table 9.1.
177

178 Chapter 9
Table 9.1 STDSIM representation of natural history and transmission of ulcerative STD
Transmission Cofactor effect % of u!cers that are
Stage Mean duration 1 probability' on HIV trans- recognized
M-7F F-7M mission2•3
M F
HSV-2
PrimaJY u leer 3 weeks 0.30 0.15 25x 30% 30%
Early latent 15 years4•5 0.0055 0.0025 5 na5 na5 na5
Recurrent ulcer 1 week4; 0.20 0.10 10x 15% 7.5%
Interval between u!cers: 6 months4
Late latent Lifelong 0 0 na na na
Syphilis
Infectieus 6 months 0.30 0.20 10x 80% 50%
Latent 15 years 0 0 na na na
Chancroïd 10 weeks 0.20 0.15 25x 90% 70%
HIV
primary 10 weeks 0.045 0.015 na na na
asymptomatic 3 or 5 years6 0.00225 0.00075 na na na
symptomatic 4 or 2 years6 0.00225 0.00075 na na na
AIDS 40 weeks 0.01125 0.00375 na na na
1 lndividual stage durations were sampled from a Weibull distribution function with shape parameter 2, except for the duration of the early latent stage of HSV-2 and the interval between recurrent HSV-2 ulcers, whîch used exponential distrîbutions. 2 Per contact; equal for recognized and unrecognîzed ulcers. 3 Bath for susceptîbility (HIV-negative partner) and infectivity (HIV-posîtîve partner). 4 ln scenarios 1 and 3 of no effects of HIV on the natura! hîstory of HSV-2, and in scenario 2 only for individuals nat symptomatic with HIV. In scenario 2a, va lues of these parameters for symptomatic HIV patîents are: 30 years, 2 weeks, 3 months; and in scenario 2b: 60 years, 4 weeks, 1.5 month. See also Sectien 9.3, subsectien 'Scenarios of effects of HIV on the natura! history of HSV-2'. 5 Except during recurrent ulcers. 6 For scenarios 1, 2a and 3, asymptomatic phase 5 years and symptomatic phase 2 years; for scenario 2b, asymptomatic phase 3 years and symptomatic phase 4 years; (see also Section 9.3, subsectien 'Scenarios of effects of HIV on the natura! history of HSV-2'). M=male; F = female; na = nat applicable.
After the primary episode, patients progress to a long 'early latent' phase during which ulcers can recur.ln the remaioder of the chapter, the terms 'ulcer' and 'recurrence' denote both recognized and unrecognized genital lesions. The frequency of recurrences is known to decrease over the fust years after primary infection Ueansson & Molin 1974, Rattray et al. 1978, Knox et al. 1982, Mertz et al. 1988b, Broek et al. 1990, Koelie et al. 1992,Wald et al. 1995, Corey &Wald 1999). Since no long-term patient follow-up studies have been conducted, it is however unknown whether recurrences stop aftera certain period, or continue at a (much) lower frequency. Comparisons of age profiles in clinic presentations

The epidemiology of genital ulcer disease and herpes during HIV epidernies
with herpetic recurrences and in GUD reporting - which peak between age 30 and 40 years [Adam et al. 1979, Guinan et al. 1981, Knox et al. 1982, Mertz et al. 1988a, Mertz et al. 1988b,Brock et al. 1990,Wald et al. 1995,Wawer et al. 1999, Wald et al. 2000] -, HSV-2 seroprevalence - which peaks at older age [Nahmias et al. 1990, Kamall et al. 1999] - and HSV-2 incidence - which peaks between age 20 and 30 [Rawls et al. 1971, Kinghom 1994] suggest that the majority of symptomatic recurrences occur within 15-20 years after infection.
Among clinic patients, frequencies of 5 to 8 recurrences annually are reported as typical [Knox et al. 1982, Mertz et al. 1988a, Broek et al. 1990, Wald et al.
1995, Wald et al. 1996, Wald et al. 2000], but these studies likely oversampled individuals with relatively severe and frequent recurrences [Benedetti et al. 1994, Wald et al. 2000].Follow-up studies among HSV-2 infectees sampled from general populations observed recurrence frequencies of 2-4 annually [Wald et al. 2000, Langenberg et al. 1989].ln line with these observations, we estimated that the 'early latent phase' during which ulcers recur lasts for on average 15 years, during which ulcers recur at a mean interval of 6 months.To reileet the large heterogeneity between individuals [Wald et al. 1995], we assumed the duration of the 'early latent' phase and the interval between recurrences to vary randomly between episodes within individuals, according to exponential distributions. After the 'early latent' phase, simulated patients progress into a 'late latent phase', during which they count as prevalent on serologie tests, but no longer have recurrences.
Recurrences were specified to last for on average 1 week. As this duration appears to be relatively homogeneons [Rawls et al. 1971, Rattray et al. 1978, Guinan et al. 1981, Corey et al. 1983a,Wald et al. 2000], we assumed a Weibull dis
tribution with shape parameter 2. During ulcers, patients are thought to be infectieus; a proportion of patients recognizes symptoms. From their relative clinical severity [Rawls et al. 1971, Corey et al. 1983b], we infer that infectiousness and symptom recognition rates are higher for primary ulcers than for recurrences.
No data are available on per-contact transmission probabilities for HSV-2. Geniral shedding, a likely correlate of infectivity, is higher during symptomatic episodes than during asymptomatic episodes or in between episodes, and higher during primary episodes than during recurrences [Rawls et al. 1971, Corey et al. 1983a]. Because it is not known how shedding levels translate into transmission probabilities, the latter were chosen from a range of estimates for other ulceralive STD [Plununer et al. 1983, Csonka & Oates 1990, Brunham & Plununer 1990]. Transmission was assumed to be twice as efficient from male-to-female relative to female-to-male [Mertz et al. 1990, Mertz et al. 1992, Bryson et al. 1993]. To account for episodes of viral shedding in the absence of clinical signs [Adam et al. 1979, McCaughtry et al. 1982, Corey 1994,Wald et al. 1995,Wald et al. 1997], a continuous low level of infectiousness throughout the early latent phase, i.e. :in between recurrences, was specified.
179

180 Chapter 9
Between 10% and 50% of HSV-2 seropositive individuals in WeS1ern settings report a history of genital herpes [Mertz 1993, Brugha et al. 1997], symptoms being more common in men than women [jeansson & Molin 1974,Stavra1:y et al. 1983, Obasi et al. 1999]. In a Tanzanian population, 28% and 8% ofHSV-2 seropositive men and woroen reported ulcers ever in the past, as compared to 3% and 2% of HSV-2 seronegatives; over the previous year, ulcers were reported by 11% and 6% of male and female HSV-2 seropositives, and by 1% and 2% of seronegatives [Obasi et al. 1999]. Based on these data, we estimated that 30% of ptimary hetpetic ulcers, and 15% and 7.5% of recurrent hetpetic ulcers in men and women, respectively, are recognized in SSA populations. Recognition was assumed to occur randomly and independently over different episodes and individuals, i.e. recognition at one episode did not influence recognition at subsequent episodes.
Scenarios of effects of HIV on the natura! history ofHSV-2
HlV disease is associated with 3- to 4-fold increases in the number of HSV-2 cu!
ture-positive days [Augenbraun et al. 1995, Hittiet al. 1997, Schacker et al. 1998, Mbopi-Keou et al. 1999] and the incidence of clinical ulcers [Kaul et al. 1997]. The level of HSV-2 shedding during symptomatic ulcers increases with decreasing CD4 count [Bagdades et al. 1992,Augenbraun et al. 1995]. In addition, herpetic recurrences may last longerand be more severe in HIV patients [Kamya et al. 1995, Chen et al. 2000,Schacker et al. 1998].
Translating these effects into model parameters is not straightforward. It is unknown how shedding levels and clinical signs quantitatively translate into infectivity, symptom recognition and cofactor effects. Studies likely oversample HlV patients in the later, symptomatic stages of disease. No prospective studies are available on the duration of untreated recurrences by HlV S1atus. To refiect these uncertainties, we simulated several scenarios. In scenario 1, HIV was assumed not to affect the natura! history of HSV-2. In scenario 2a, HlV doubled the duration and the frequency ofhetpetic recurrences duringAIDS and the last 2 years oftheAIDS incubation period.In addition, the (remaining) duration ofthe early latent phase was doubled from the onset of symptomatic HN.This ensured that most simulated HIV patients continue to have recurrent ulcers until theîr death from AIDS. Thus, HSV-2 patients with HlV disease in this simulation suffered hetpetic ulcers for on average 8 weeks per year, as compared to a mean 2 weeks for patients without HIV: In scenario 2b, stronger biologica! effects were assumed: HlV quadrupled the duration and frequency of recurrences and the (remaining) duration of the early latent phase during AIDS and the last 4 years of the AIDS incubation period. This corresponds to an average ulcer load of 32 weeks annually.

The epidemiology of genital u/eer disease and herpes during HIV epidernies
Representation of HIV, syphilis and chancroïd
The STDSIM representations of syphilis, chancroïd and HIV (Table 1) were based on the scientific literature. Syphilis was represented by twn consecutive stages, with the fust, "infectieus" stage corresponding to primary and secondary syphilis [65]. For computations of ulcer incidence, we assumed that each syphilis infection causes two ulcers during the infectieus stage. Chancroid was represented as a continuous ulcerative episode lasting on average 10 weeks [66, 67]. Transmission probabilities were speellied at a lower level (l5-20%;Table 1) than the single available empirica! estimate ( 43%, for male-to-female transmission [ 45 ]). This was dorre in order to have the model preeliet a realistic prevalenee level and a realistic fraction of ulcers attributable to chancroïd (see Results). To allow for effects of HIV disease on HSV-2 natura! history described above, the AIDS incubation period was split into 3 phases, named primary HIV disease, asymptomatic preAIDS and symptomatic pre-AIDS.
It was assumed that throughout the simulation period, 5% of symptomatic episodes of chancroid and the first syphilis stage were cured upon antibictic treatment, which reduced episode duration to 2 weeks.
STD cofactor effects on HIV transmission
We assumed the presence of ulcers to enhance the infectivity of HIV and the susceptibility to HIV In the absence of knowledge on SID cofactor magnitudes from contrOlled experimental studies, we estimated thesebasedon observational studies among prostitutes and clients in Nairobi (Table 9.1 [Hayes et aL 1995c, Korenromp et al. 2001b]). In line with their relative clinical severity, herpetic recurrences were attributed a lower cofactor effect (10-fold per contact) than primary HSV-2 and chancroïd (25-fold per contact). For the infectieus stage of syphilis during which several ulcer episodes may occur [Holmes et al. 1999], an average cofactor effect of 10-fold was applied throughout. Identical cofuctor effects were assumed for recognized and unrecognized ulcers.
Scenario of changing sexual behaviour
Several SSA countries have documented recent reductions in risk behaviour, including decreases in casual sex and in prostitution and increases in condom use [Ng'weshemi et al. 1996,Asiimwe-Okiror et al. 1997,Jackson et aL 1997c, Wawer et al. 1997, Gregson et al. 1998, Kilian et aL 1999, Kamali et al. 2000, Meekers 2000]. We assessed the influence of such behavionral change on the proportion of GUD attributable to herpes, in a scenario 3 with a 25% reduction in the proportion of men visiting prostitutes combined with a 25% reduction in
181

182 Chapter 9
relationship formation rates after 1990. This type and magnitude of behaviour change provided good fit against survey data from Uganda [Konde-Lule et al. 1993,Asümwe-Okiror et al. 1997, Wawer et al. 1997, Kilian et al. 1999, Kamall et al. 2000].
Simulation design
To reduce random fluctuations associated with stochastic simulations, 100 sirnulatien runs were conducted for each scenario . .All outeernes are reported as averages over 100 runs, and focus on the general adult population (15-49 years).ln univarlate sensitivity analyses, simulations were re-run for a set of alternative quantifications in which the values of HSV-2 biomedical parameters were doubled and halved.
9.4 REsmTs
HSV-2 epidemiology before the HIV epidemie
The model provided a reasonable fit to data on HSV-2 seroprevalence by age and sex in Ndola, Zambia (Figure 9.2) and other SSA populations [McFarland et al. 1999, Robinson & Hosseini 2000]. Seroprevalence in wo men exceeds that in men, especialiy in the youngest age group. This reflects that (i) women become se:,-ually active at younger ages than men; (ü) women typically have older sexual partners while men have younger partners [Garnett &Anderson 1993a, Gregson et al. 2000], so that women more often meet HSV-2 infected partners; and (ili) male-tofemale transmission is more effident than female-to-male transmission [Mertz et al. 1990, Mertz et al. 1992, Bryson et al. 1993] .This sex difference was somewhat smaller in the model than in the data, perhaps partly because simu!ated age differences between partners (e.g. mean 3.3 years in marriages) may have been less than in reality [Munguti et al. 1997, Glynn 2000].
Simu!ated incidence of primary herpetic ulcers was 2.6 and 2.7 per 100 person-years in men and women, respectively (in the total population induding both HSV-2 positives and negatives), with corresponding peaks in age groups 20-24 years and 15-19 years. For recurrences including unrecognized episodes, simulated incidence was 41 and 53 per 100 person-years in men and women. Recurrences peaked at age 25-34 years for men, and 20-29 years for women. The overall simulated incidence of recognized herpetic ulcers was 5.9 per 100 person-years.

The epidemiology of genita/ u/eer disease and herpes during HIV epidernies 183
80 l 60
"" .._ • 0
40-~ • .. > ~ "-
0 ..
c.
:;d··· - Fmodel ···0·· F data
Figure 9.2 Simulated HSV~2 seropreva~ lence (%) in the general population by age and sex in a hypothetical SSA city in year 1980. In the absence of empirica! data on HSV-2 seroprevalence from general SSA populations in the 1980s, we used data from Ndola, Zambia in 1997 [Robinson & Hosseini 2000], for comparison.
20
- Mmodel D··· M data
0 ...... ~ ,..."r:ot.. l""l~ ~'t.. ,.,_t.. "'~
...... ~ 'j,.,fV {>'V ":J<;;:{ ":J<,;j ~
age (years)
illeer aetiology before the HIV epidemie
Based on simulated incidence of herpetic ulcers, syphilis and chancroïd, we derived a distribution of aetiologies of incident ulcers. Of all incident ulcers in 1980, 72% were attributable to HSV-2, 24% to chancroïd and 4% to syphilis. For comparison with proportions reported in surveys or seen in STD clinics, we also derived tbe distribution for recognized ulcers only. Among recognized ulcers, 28% were attributable to HSV-2, reflecting tbe specified relativeiy poor recognition of herpetic recurrences (Tabie 9.1); 64% and 8%, respectiveiy, were caused by chancroïd and syphilis.
Trends in ulcer epidemiology during the HIV epidemie
The simulated HIV epidentic reached a prevalenee of 31% in 2000 (Figure 9.4d), allowing a clear illustration of tbe possibie effects of HIV on tbe epidentioiogy of HSV-2 and GUD.
Assunting no enhancing effect of HIV on HSV-2 (scenario 1), tbe simulated incidence of recognized herpetic ulcers was stabie between 1980 and 2000 at around 6 per 100 person-years (Figure 9.3). The proportion of recognized ulcers attributed to HSV-2 remained rougbly stabie at 28%. HSV-2 seroprevalence decreased from 48% to 43%, due to excess IDV-related mortality in high-risk groups (Figure 9.4). Due totbis same effect, tbe incidence of chancroid feil also duting tbe HIV epidentic, and tbe proportion of recognized GlJD attributable to cl=croid decreased from 64% in 1980 to 59% by 2000. For syphilis, incidence and tbe contribution to GUD were fairiy stabie over time.
Moderately strong effects of HIV on HSV-2 (scenario 2a) increased tbe inci-

184
30~----------------------------------------,
25..;
~
~ c 20 0 ~ ID 0. 0 15 0
""' 1l c 10
-15 .,, -~
5
0
100
0
Chapter 9
111!111111 HSV-2 c::::J chancroid ~ syphilis
a
Em11i1 HSV-2 c::J chancroid ~ syphilis
b
Figure 9.3 Simulated incidence of recognized ulcers in the general population (15-49 years) by aetiology, in 1980 (most lelt bar) and 2000 (right bars). a) absolute incidence (/100 person-years); b) proportional contribution (%) to genital ulcer disease (GUD). Scenarios: 1) no interactions; 2a) moderate HIV: moderateiy strong effects of HIV on the natoral history of HSV-2; 2b) strong HIV: very strong effects of HIV on the natoral history of HSV-2; 3) beh. change: behaviour changestarting in 1990; 4) combination = combination of behaviour change and moderately strong effects of HIV on HSV-2. For description of scenarios, see Methods.

a. HSV-2 b. chancroid 4
60 1-- ___.~~ ........ -e---• -----o- streng HIV
~ 3 ê 0 moderate HIV
" 40 - no interactions 0
" 2 ------Ä-- behaviour change (I)
~ ---1\-- combination Q) 20 ~ ~
0. 1
0-1----- -~ 0 -1980 1985 1990 1995 2000 1980 1985 1990 1995 2000
c. syphil!s d.HIV 40 -,-------
12 -----~ 30 ~ "--" 0
8 1: 20 " (ij > i!! 4 a. 10
0 I - o......-=· _, 1980 1985 1990 1995 2000 1980 1985 1990 1995 2000
time (year) time (year)
Figure 9.4 Simulated prevalenee (%)in the general popuiatien (15-49 years) over time of (a) HSV-2, (b) chancroïd; (c) syphilis (ulcerative and nonulceralive stages combined, corresponding to serological syphilis); (d) HIV in alternative scenarios. For description of scenarios, see Methods.
;1
"' {!; g: 3 a· 0 ~ 0 ~
'rn ~
[ <: @ , ~ "' ., ~
"' ., ~ Q :,-
"' 'Ö D: Q <:
5· Oq
:r: < {!;
~ a·
co
"'

186 Chapter 9
dence of recognized herpetic ulcers from 5.9 to 7.4 per 100 person-yea.rs between 1980 and 2000. Combined with the relatively large fall in the incidence of cbancroid due to selective AIDS mortality, this increased the proportion of
recognized GUD atttibutable to HSV-2 from 28% to 35%.1n absolute terms, the increase in he:rpetic ulcer incidence counterbalanced the decrease in GUD incidence due to selective HlV-attributable mortality. As a result, HSV-2 seroprevalence and the overall incidence of GUD (of any aetiology) remained stabie between 1980 and 2000. Similar but more pronormeed shifts in GUD aetiology were predicted for scenario 2b of very strong effects of H1V Here, the fraction of GUD atttibutable to HSV-2 increased to 48%. The absolute incidence of herpetic ulcers increased from 6 to 13 per 100 person-yea.rs, while HSV-2 seroprevalence increased from 48% in 1980 to 58% in 2000.
Behaviour change (scenario 3) reduced the incidence and prevalenee of chancroid and syphilis considerably and rapidly (figures 9.3 and 9.4). Chancroid fel! more markedly than syphilis, because of its lower reproductive number [Brunham & Plummer 1990]. Both HSV-2 seroprevalence and the incidence of herpetic ulcers fel! relatively little (from 48% to 39%, and from 5.9 to 4.8 per 100 personyea.rs, respectively). Since HSV-2 is a lifelong infection with a higb baseline prevalenee and recurrent nature, a reduction in herpetic ulceratien can only follow from reductions in new infectionsin the youngest age groups.Therefore, reduced
~ ~
" " = " <ij > " -0-
80,-------------------------------------------------,
60
40
20
• --<>- streng HIV -o- moderate HIV -- no interactîons -6---- combination __.._ behaviour change -- ~ empirica! data
0~--~--------------------~----------------~ ~ ~rt 0f<f> ~r?j< ~ <.}-0;
~,'ó ~'i) <:"' ~" ~"' ~·
sex,age
Figure 9.5 Simulated HSV~2 seroprevalence (%) by age and sex in 2000 in alternative scenarios. For description of scenarios, see Methods. Empirica! data, for comparison, are from Ndola, Zambia in 1997 [Robinson & Hossein i 2000].

The epidemiofogy of genitaf ufcer disease and herpes during HIV epidernies
HSV-2 transmission takes a long time to impact the incidence of herpetic ulcers at a population leveLAs aresult of the large fall in chancroid relative to herpes and syphilis, the proportion of recognized incident GUD atrtibutable to HSV-2 increased from 28% in 1980 to 56% in 2000, while the proportion caused by d1.ancroid decreased from 64% to 28%.
In a fourth scenario combining behaviour change and moderately strong effects of HIY, the incidence of herpetic ulcers remairred unchanged over time, while chancroid and syphilis feil, increasing the proportion of GeD attributable to HSV-2 to 61% byyear 2000.
Figure 9,5 shows the age and sex-specific seroprevalence of HSV-2 in year 2000 in the various scenarios. Effects of HIV on herpetic ulcerations increased HSV-2 seroprevalence especially in the younger age groups.Very strong effects of H1V (scenario 2b) would shift the peak from the oldest group toa plateau from age 25-29 years onwards for men and age 20-24 years for women, resulting in an unrealistic age pattem [McFarland et al. 1999, Robinson & Hosseini 2000]. Behaviour change, in contrast, slightly decreased HSV-2 seroprevalence in the younger age groups, who had the highest partnership change rates.The age pattem in the combined scenario 4 resembied that in scenario 1 of no interactions.
Sensitivity analyses
To e..xplore the robustness of the results, we assessed their sensitivity to variations in model assumptions on HSV-2 and its possible interactions with HlV
Of the parameters tested, the average duration of the early latent phase, the probability distribution function assumed for this duration, and the interval bernreen recurrent ulcers were the most important determinants of HSV-2 seraprevalenee and ulcer incidence levels. While halving durations considerably reduced HSV-2 seroprevalence, doubling them did not substantially increase seroprevalence, due to saturation. In all simulations, the gender difference in HSV-2 seroprevalence was insensitive to the relative efficiencies of male-to-temale and female-to-male transmission, indicating that its popuiatien distribution is mainly determined by sexual behaviour patterns. Across all quantifications, behaviour change shifted GUD aetiologie distributions much more than moderately strong biologica! effects of H1V Of the different possible effects of HIY, that on the frequency of herpetic recurrences impacted GUD aetiology most. Of the two assumed components of behavioural change, a 25% reduction in relationship formation rates impacted GUD aetiology more than a 25% reduction in prostitute visits.
187

188 Chapter 9
9.5 DISCUSSION
HSV-2 transmission dynamics
In order to simulate both observed adult HSV-2 seroprevalences In SSA (;:o:45%) and plausible frequenties of herpetic recurrences ( <5 per 100 person-years), a high level of asymptomatic HSV-2 transmission had to be assumed. This findlog supports the empirica! evidence that a large proportion of herpetic ulcerations go unrecognized and these contribute substantially to transmission [Mertz et aL 1992,Mertz 1993,Brughaetal. 1997].
Simulated HSV-2 epidemiology and Gt:D aetiologie distribution were robust agalnst most uncertalnties in the natura! history of HSV-2 (sensitivity analysis). This corroborates findlogs with sim pier transmission models, in which interventions impacting HSV-2 infectivity and ulceration had little influence on seroprevalence levels [Blower et al. 1998,White & Garoett 1999].The duration ofthe 'early latent phase' during which ulcers recur, and the variability of this duration within the population were however critica!. Better knowledge of these parameters, from long-term follow-up studies in unselected populations, would help to better understand the transmission dynamics of HSV-2.
GUD incidence and aetiology
The model showed that realistic prevalenee levels of HSV-2 and syphilis are consistent with an incidence of recognized GUD as high as 20 per 100 person-years. The simulated fraction of the population with recognized GUD inthelast year, in contrast, was only 9% (scenarios 1 and 2), in line with fractions reported in SSA populations [Waweretal. 1999,McFarland et al. 1999].The difference between the incidence rate and the fraction with ulcers results from the occurrence of recurrent ulcers, such as for HSV-2, and repeat infections, such as for chancroïd. Another reasen is that ulcers caused by different STD duster because of sh.ared risk factors.
The simulated aetiologie distribution of recognized GUD in 1980 (Figure 9.3) matebed data from the l980s from SSA cities. Chancroid was the predominant cause of GLl) [Halnes et al. 1978, Fast et al. 1984, Hazlett et al. 1984, Pluromer et al. 1985, Greenblatt et al. 1988, Bogaerts et al. 1989, Bogaerts et al. 1998, O'Farrell1999]. Observed proportions should however be viewed with caution, because diagnosis was based on either culture methods with limited sensitivity - likely resulting in underestimation - or clinical appearance - possibly resulting in overestimation [Fast et al. 1984, Hazlett et al. 1984, Htun et al. 1998]. The simulated 28% attributable to HSV-2 is higher than values reported for Nairobi (2-16%) [Fast et al. 1984, Hazlett et al. 1984, Pluromer et al. 1985, Greenblatt et

The epidemiology of genital u/eer disease and herpes during H!V epidernies
al. 1988],Kigali (11-19%) [Bogaerts et al. 1989,Bogaerts et al. 1998], Durban and Johannesburg (3-7%) [Htun et al. 1997, O'Farrell 1999]. These older studies all used culture to diagnose herpes, which due to low sensitivity may have caused underestimation [Morse 1999]. The low simuiared proportion attributable to syphilis (8%) matches proportions found in Nairobi (3-10%) [Fast et al. 1984, Greenblatt et al. 1988] and Zimbabwe (6%) [Haines et al. 1978]. Studies in}ohannesburg and Rwanda found proportions of 15% and 19% [Bogaerts et al. 1998, Duncan et al. 1981], but, being basedon serologie diagnosis wl1ich remains positive for years after the disappearance of ulcers [Morse 1999, Holmes et al. 1999, Malonza et al. 1999], these may be overesthnates.
Behavioural change versus biologica! effects of HIV
In both scenarios 2b and 3, the proportion of GUD attributable to HSV-2 încreased considerably during the IllV epidemie (from 28% to 48% and 56%, respectively), resulting in GUD aetiologie distributions in yeat 2000 (Figure 9.5) in the range of those observed in actvaneed HN epidemics. In Uganda, 75-85% of reported ulcers with known aetiology were attributable to HSV-2, 6-9% to chancroid and 4-17% to syphilis [Kamya et al. 1995, Wawer et al. 1999]. In Malawi, the three infections accounted for about equal proportions of GUD [Behets et al. 1995]. In rural Zimbabwe, 32% of diagnosed ulcers were attributable to HSV-2, 47% to chancroid and 22% to syphilis [Le Bacq et al. 1993].
Seemingiy very strong biologica! effects (scenario 2b) had to be assumed to explain a shift in GUD aetiology approaching that caused by appatently realistic magnitudes of behaviour change (scenario 3), and only in scenario 2b would HSV-2 seroprevalence and GUD incidence increase in absolute terms.The limited sensitivity of HSV-2 epidemiology in the general population to enhancement of herpetic ulceration in HN patients is firstly because not all HSV-2 patients are infected with HIV. Even in a severe IllV epidemie, nat all HSV-2 patients contract Hiv, and those who do die earliest, which limits the combined prevalence. Secondly, the majority of partners of HSV-2/HIV patients are aiready infected with HSV-2, so that încreased infectivity does not always actually încrease transmission in the population. Long-term follow-up studies in HN-positive and HN-negative populations could help to determine whether HN truly enhances herpetic ulceratien as strongly as assumed here.
We may have overestimated the increase in the proportion of GLTI attributable to HSV-2 because the simulation did not allow for a possible enhancement by HN disease of chancroidal ulceration [Wasserheit 1992]. Due to its low reproductive number [Brunham & Plummer 1990], the latter effect could markedly increase the spread of chancroid during HN epidemics. It should also be noted that the simulated HN epidemie was, at a prevalenee of 31% in 2000, more actvaneed than in many SSA populations. For less severe epidemics, increases in
189

190 Chapter 9
herpetic ulceration due to HN would be less. Furthermore, we assumed semal
activity to be unaffected by symptoms.lf many ulcer patients would temporarily abstain or reduce the frequency of intercourse [O'Farrell et al. 1992, Kamya et al. 1995], we may have overestimated the influence of herpetic ulceration on HSV-2 transmission. On the other hand, we ignored an effect of HN on the severity of herpetic ulcers, which may lead HN patients to more often recognize these.This may have caused our model to underestimate the shift in GCD aetiology possible among clinical cases in severe, actvaneed HN epidemics.
The simuiared shifts in GUD aetiology in scenarios 2b and 3 were mediared through different mechanisms, which had opposing effects on HSV-2 seroprevalence and the absolute incidence of herpetic ulcers, chancroid and syphilis (Figures 9.3-9.5). Does comparison of these prediered concomitant effects with empirical data allow inference as to which scenario best reflects reality?
No data are avallable on HSV-2 seroprevalence over time periods spanning the course of SSA HN epidernies [ 0 'Farrell 1999]. One study reports an increase in seroprevalence in urban and rural Zaire between 1959 and 1985 (from 21 to 60% and from 6 to 32%, respectively) [Nahmias et al. 1990]. But sampling for these surveys was among young men in 1959 [Motulslq• et al. 1966] and in undefined general populations in 1985, leaving doubts about their comparability in
terms of age and risk profile. Moreover, this putative time trend occurred largely before the HN epidemie in this region. For herpetic ulcer incidence, longitudinal data allowing assessment of time trends in SSA are also lacking. The contrast between scenarios 2b and 3 in their effect on the absolute incidence of her~ petic Gul) and HSV-2 seroprevalence does therefore not allow proper valldation. Future population-based surveillance on trends in these indicators may help to solve this issue.
Data on time trends in bacterial ulcerative and non-ulcerative STD in several SSA settings are available, and some match the simulated reduction in rates of syphilis, chancroid and recognized GUD in scenario 3. For example, the number of chancroid diagnoses feil 7-fold in Harare between 1990 and 1998 [O'Farrell 1999], prevalences of gonorrhoea, chlamydia and syphilis decreased 2- to 3-fold among women in Nairobi between 1992 and 1997 [Moses et al. 2000], Malawi saw 1.1- to 2-fold falls in the prevalenee of syphilis, trichomoniasis, gonorrhoea and genital ulcers between 1990 and 1996 [Taha et al. 1998a], and factory
workers in Mwanza, Tanzania, reported 35% less GUD in 1994 than in 1991 [Ng'weshemi et al. 1996].
Comparison between empirica! data and simulations on age pattemsin HSV-2 seroprevalence suggests that the true effect of HN on herpetic ulceration is less strong than assumed in scenario 2b.The simulated saturation ofHSV-2 seroprevalence at age 20-29 years in this scenario (Figure 9.5) is inconsistent with available data from SSA populations. For example in Ndola, Harare and Kisumu, HSV-2 seroprevalence peaked above age 45 or 35 years in both sexes [McFarland et al. 1999, Robinson & Hosseini 2000].This inconsistency was apparent in spite
The epidemiology of genital ulcer disease and herpes during HfV epidernies
of conservative assumptions on the relationship bernreen ulceratien and infectiv~ ity, since we specified a non-zero infectivity throughout the early latent phase in between recurrences, and ignored a possibly higher infectivity during recognized (more severe) ulcers as compared to unrecognized episodes. If HSV-2 infectivity in SSA populations would correlate more strongly with (recognized) ulcers than in these simulations, the specified strong effects of HIV would result in even more unrealistic age panerns. Behaviour change, in contrast, did not produce unrealistic age panems in HSV-2 seroprevalence, although the limited avallabie epidentiological data did not allow us to check whether this scenario fined bener for populations with recorded behaviour change than for populations without. For Ndola, the simulated decrease in HSV~2 seroprevalence among the young upon behavioural risk reduction improved the fit for males, but worserredit for females (Figures 9.2 and 9.5). For this actvaneed HIV epidentic, scenario 4 combining behaviour change with moderately strong effects of HIV fined observed age pattems in HSV~2 seroprevalence equally well as scenario 1 of no interactions.
Other explanations?
The large influence of behaviour change can explain why increases in HSV-2 as a cause of GUD are also pronounced in developing countries without severe HIV epidentics, like in South EastAsia [Chua & Cheong 1995,Taylor et al. 1984, Beyrer et al. 1998]. For example, in Thailand the incidence of clinical syphilis and chancroid decreased 3- and 20-fold between 1987 and 1993 [Beyrer et al. 1998], the peri ad of the 100% condom programme which succesfully constrained the spread of HIV [Hanenberg et al. 1994].
Of note, the simulated reduction in partner change rates is not the only form ofbehaviour change that can underly relative increases in herpes.With increased condom use, the shift in GUD aetiology could be even more marked than with partner reduction, because condom efficacy is likely lower against HSV-2 -which can cause lesions outside the condom-protected genital area - than against bacterial STD.
Nat all countries with changes in GUD aetiology have evidence of behaviour change, with as example South Africa [Dangor et al. 1999, Steen et al. 1999, O'Farrell 1999, De Coito et al. 1999, Low-Beer et al. 2000].Also, the only published reports on absolute increases in genital herpes - which according to our simulations could result ln actvaneed HIV epidentics, if biologica! effects of HIV are streng and in the absence of behavioural responses - come from Singapore and India [Goh 1995, Kumar & Rajagopalan 1991].As Singapore and India were at the time of these studies nor in actvaneed HIV epidemics, these absolute increases cannot be explained from HIV~related immunosuppression. This suggests that risk reduction and, in severe HIV epidemics, HIV~related immunosup~
191

192 Chapter 9
pression, are not the main explanations of (relative) increases in HSV-2 in all countries. increased detection of genital herpes following higher awareness may wel! be another important factor.
Finally, improved antibiotic STD management may have contributed to relative increases in herpes, through falls in syphilis and especially chancroïd. lmproved STD care is a likely to have contributed to GCD epidemiologcal shifts in more developed, e.g. South-EastAsian countries [Goh 1995]. For SSA populations, where besîdes treatment facilities also symptom recognition and treatment seeking behaviour are much poorer [Adler 1996], it is questionable whether STD treatment has so far played an important role.Yet,improvement of STD treatment coupled with population-based health education to imprave clinic attendance certainly has the potential to enhance trends in GUD epidemiology ongoing in this region.
Condusion and implications
Our results suggest that seeming increases in genital herpes in SSA are mainly relative, or artefacts reflecting changes in detection, rather than absolute. Even in severe HIV epidemics, the overall incidence of GUD and HSV-2 seroprevalence are unlikely to increase in absolute terms, because the effects of IllV-related enhancement of herpetic ulceration are at a population level easily offset by factors causing Gu'D to fall, such as HIV-atttibutable mortality. Behavioural response to the HIV epidemie is a particularly potent cause of relative increases in herpes among Gu'D, through rapid and large falls in chancroïd.
The increas:ing proportion of HSV-2 as a cause of GUD presenting in clinics implies that, as long as antiviral therapy for HSV-2 is not evident in developing countries, education on the prevention of transmission and on avoiding possible consequences of ulcers induding enhanced transmission of HIY, e.g. through temporary abstinence or condom use, becomes an increasingly important component of STD management.

,...... ,-. :: ."..., _._ ::::_ .,.. '--'-----~·~ ..........
General discussion


General discussion
T HRO"CGH A REVIEW of methods for estimating STD eetactor magnitudes and a reappraisal of rwo African trials of improved STD treatment, I have investigated whether and how much STD treatment may contribute to HN pre
vention. In this final chapter of the thesis, I will try to integrate the findings and conclusions of the previous chapters. Section 10.1 focuses on estimates of the magnitude of STD cofactor effects on mv transmission. Section 10.2 discusses the analyses of some of the determinants of the discrepant outcomes of the Mwanza and Rakai trials. The results of these investigations are reconsidered in the context of the original broader set of e":planatory hypotheses (Table 1.2); the results of additional studies documented elsewhere are also summarised. On this basis, we estimate the comparative likelibood and importance of all possible factors. Sectien 10.3 reflects on the methodology of simulation and micro-simu· lation: i.e. (why) was STDSIM necessary for these studies? Which improvements to roodels such as STDSIM would help their use in decision support questions in HN and STD control? Section 10.4 discusses the implications of the findings for future research into the role of STD and STD treatment in HN prevention. Sectien 10.; bring us back to the rationale for our research, and discusses the implications for practical HN/STD control in sub-Saharan Africa. Sectien 10.6 condudes the chapter with a brief summary of findings and implications.
10.1 THE MAGNITUDE OF STD COFACTOR EFFECTS ON
HIV TRANSMISSION
In Chapter 2, the magnitude by which STD enhance HN transntission was estimated on the basis of observational (non-intervention) studies. Befere the STD intervention trials, thls was the most common way of estimating the importance of STD in HN spread. After the Mwanza and Rakai trials had led to contrasring outcomes, research once more resorred to analyses of observational data.
Cofactor estimations derived from observational studies commonly adjust for confaunding caused by shared risk factors for STD and HIY, using information on (for example) the number of recent se>.-ual partners reported by study subjects. Because the adjustment is lirnlted to the risk profile of the study subjects themselves and ignores wider, indirect effects through the se>.-ual 'netwerk' of which they are a part, it does not fully resolve the confounding.We illustrated the overestimation of cofactor effects that may result: for genital ulcers :in prostitutes in Nairobi, Kenya [Hayes et al. 1995c], disregard of three common confounders may have inflated the cofactor estimate from a ('best estimate') 3-fold per se>.-ual contact to 23-fold. Neither of these estimates is precise, since each is basedon num.erons assumptions, such as the duration of the STD, the effects of ulcer symptoms on sexual behaviour, and the sexual nerwork of which the study subjects formed part. Therefore we did not sneeeed in our original aim of estimating the trne
195

196 Chapter 10
magnitude of STD cofactor effects. The re-estimation nevertheless illustrated that previously, STD cofactor magni
tudes had probably been overestimated, and that people may have been too optillistic about the potential for HIV prevention by STD treatment.In retrospect, we would say that this is llkely to hold true for our simulations in Chapter 7 as well. There, we assumed cofactor values of a 100-fold per se":ual contact for ulcers due to chancroid and syphilis, as wellas for syphilis throughout the fust halfyear, i.e. including the phase in between ulcers. On the basis of the insights stated in Chapter 2, the more recent simulations in Chapters 8 and 9 used lower cofactor values for ulcerative STD (1 0- to 25-fold, depending on the severity of the ulcer); values for the non-ulcerative STD were reduced correspondingly (from lü-fold to 5-fold). The resulting inconsistency between the simulations makes it clear that the predictions for the magnitude of impact of STD treatment in our studies should not be taken as precise quantitative outcomes. Since a range of cofactor values were consistent with the available data from observational studies and the ttials, all simulations included sensiti,ity analyses exploring the robustness of the condusions against uncertainty about cofactor magnitudes. In all cases, the main qualitative conclusions were robust against variation in cofactor assump~ tions, but the absolute predicted impacts of STD treatment were not. For example, in Chapter 7 we concluded that (if cofactor effects for asymptomatic and symptomatic STD are equal) one round of mass treatment in Mwanza would, in the short term, be roughly as effective against HIV as syndromic treatment, at all assumed cofactor values. Yet the reduction in HN incidence achieved by the simulated STD treatments varled between 14% and 62% eTabie 7.3).
Cofactor estimations from obsenrational studies can be improved in various ways, for example by conducting them in more homogeneaus populations and by following couples rather than individuals, so that outcomes can be corrected for the characteristics of each partner. A recent study of this kind on HIV-discordant marltal couples in Rakai found a per-contact cofactor effect of GUD of 2.6 (95% Cl: 1.0-5.7) [Gray et al. 2001], i.e. much lower than in earlierstudies with less rigarous control for confounding, and well in line with our adjusted estimate. For other syndromes or laboratory-diagnosed STD, the Rakai study detected no significant cofactor effects. Nonetheless, cofactor studies are unlikely ever to yield precise answers, and it even remains possible that STD cofactor effects are
insi.gnificant, at least at a public health level.Another factor conrributing to overestimation of cofactor magnitudes is a publication bias in favour of studies finding stronger associations [Garnett & Rottingen 2001]. On the basis of clinicaland biological studies on HIV shedding and leukocyte involvement in inflammatory STD, we do however consicter the existence of cofactor effects to be proven.
Section 10.4 addresses the implications to HIV prevention policy of downsealing cofactor estimates;in section 10.5 we discuss the options for and usefulness of additional studies.

General discussion
10.2 THE DISCREPANT OUTCOMES OF THE MWANZA AND RAKAI TRIALS
The major part of this thesis has dealt with explaining the discrepancy in outcomes between the Mwanza and Rakai STD treatment trials (Chapters 3 through 9). However, we have not srudied all the hypotheses that have been raised to explain the contrast (Table 1.2).Table 10.1 gives an overview ofthe hypotheses addressed in the respective chapters, and those investigated in studies doeumenred elsewhere.Thîs section discusses the results of these studies in the same order as that shown in Table 10.1. Where possible, I have tried to indicate the estimated importance of each factor.
Befare proceeding ra the discussion of hypotheses, I will e:'<plaln three important general considerations.
First, an obvious determinant of the relationship between STD reduction and HIV reduction is the (unknown) magnitude of STD cofactor effects. This, however, is oflittle relevanee to the Rakaî-Mwanza discrepancy.The large reduction in HIV incidence associated with limited STD reductions in the Mwanza trial would suggest that cofactor magnimdes are large, while the lack of HIV reduction associated 'With significant STD reductions in Rakaî might be interprered as evidence for small cofactor magnitudes. In reality, the cofactor magnitude is likely to be the same across populations, as it reflects the biology of the pathogen-host interaction (i.e. the STD- human interaction) rather than population-specific characteristics.Therefore, when explaining the trial outcomes 'With simulation models, assunting bigher cofactor values would imprave fit against the Mwanza outcomes (although the impravement saturates at a still imperfect fit: see Table 7.3), but worsen fit for Rakai. Conversely, choosing lower co factorvalues impraves fit against the Rakai observations (Table 8.2), but worsens it for Mwanza.
Second, the main contrast in outcomes between the trials appears to lie in the impacts on HIV incidence, and nat in the impact on STD. Comparison of the magnitudes of STD reductions in the two trials is nor straightforward, as the definîtions of STD rates and reductions they adopted were not exactly camparabie (Chapter 5), and this analysis is still underway. However, prelimioary results indicate that, overall, both interventions reduced STD rates by a similar fraction.Thus, a focus on the impact on HIV is warranted, and this means that ö.-planations of the trial contrast which would act via the respective magnitudes of STD reduc
tion are a priori not the most likely. More plausible are hypotheses that impiy a difference in the relationsbip between a given magnitude of STD reduction and HIV reduction. Thîs criterion would lend credence to the e..xplanation that Mwanza was at a relatively early stage ofthe epidemie, when STD cofactor effects are more important than in late-stage epidernies such as that in Rakai, because this e..'\.-planation is consistent with similar proportional STD reductions in both trials but a larger HIV reduction in Mwanza. In contrast, the hypothesis that syndromic treatment has better sm coverage than mass treatment is less likely to
197

Tab/e 10.1 Overview of the research on reasans for the difference in impact on HIV incidence of syndromic STD treatment (ST) in Mwanza trial and mass STD treatment (MT) in Rakai trial, and the relative estimated importance of these reasons.
Differences in the interventions ST but nol MT continually provides treatment, improving coverage Mobility/migration disturbs periadie MT more than continua! ST Same cofactors, such as bacterial vaginasis are more effectively treated by ST than by MT Most STD episodes become symptomatic, therefore ST misses only few infedions Cofactor effects are higher for symptomatic STD, the focus of ST The impact of ST on HIV in Mwanza is (in part) due to mechanisms other than a redttction in STD cofactor burden (such as pat i ent counselling on safe sex)
Differcnces in thc studv populations Mwanza was in earlierstage of HIV epidemie, when STD cofactors are more important - Rates of incurable cofactor genital herpes {HSV-2) higher in Rakai 1
Behavioural response to HIV epidemie in Rakai had reduced rates of curab!e STD Greater population mobility in Rakai than in Mwanza
Differenccs in swdv design Open cohort in Rakai included new participants enrolled halfway, diluting apparent impact, vs. closed cohort in Mwanza The Rakai cohort but nat the Mwanza cohort hordered non-intervention area, resulting in more impact dilution due to (re-)infection from outs i de
Random chance In Mwanza, intervention arm starled out with luwer HIV/STD rates than comparison arm, inflating apparent impact
Description of research
Chapters 7 and 8 [Korenromp et al. 1999a] nat investigated Chapters 3 and 4 Chapters 3 and 4 nol investigated
Chapters 5 and 8 Chapters 5, 8, 9 Chapters 5 and 7 unpublishcd results (Richard White, LSHTM)
not investigated
nol investigated
{Koren romp ct al. 2000a]
Affects main-ly impact on
Estimated STD, or on importance1 HIV given
eertaio STD reduction?
STD STD
~I HIV STD
+I HIV ++I HIV
+ HIV HIV
++ HIV STD
STD
STD
+ HIV and STD
1 Meaning of scorings: -(?) = (possibly) nol important; + (?) = (possib!y) important, + + (?) = (possib!y) very important. 2 Th is factor is considered one of the intermediale mechanisms behind the braader explanation proposed in the row above (stage of the HIV epidemie).
"' "'
~ ~ a

General discussion
hold true, because it would imply larger proportional STD reductions in Mwanza. This evaluatlon criterion is indicated inthelast column ofTable 10.1 for all
hypotheses considered. Third, wbile it has been questioned whether a relevant reduction in STD
cofactor burden should always be visible as a proportional STD prevalenee reduction, this premise is not relevant to the interpretation of our simulation~based studies. Tbe results of the Mwanza trial inspired the proposition that syndromic STD treatment reduced STD cofactor burden more than STD prevalence, because it primarily reduced the duration of STD episodes, and not so much their inci~ dence [Hayes et al. 1995a]. Others have added that, due to the relatlvely high transmission probabiliry of STD, STD may in many cases already have been trans
mitted before the patlent receives treatment (limiting the population impact of treatment on STD prevalenee in the populatlon), wbile for transmission of the less infectlous HN, a shortening of STD episode duratlon is more influential [Hudson 1999]. While they are very real, these effects do not stand in the way of conclusions that arose from our simulation studies, as we automatically accounted for these effects by separate rnadelling of the transmission characteristlcs of STD and HIV infectlons.
10.2.1 Evaluation of hypotheses: differences in the interventions
Three hypotheses centered around the coverage of sustairred syndromic treatment versus perioctic mass treatment.These hypotheses arenota priori the most likely explanatlons, because they would imply an - unobserved - discrepancy in impact on STD, besides the - observed - one on HIV. Our simulations rendered these explanatlons even less likely. For Mwanza (Chapter 7), they predicted that a single round of mass treatment would, over the fust two years of intervention, be roughly as effectlve against most STD and HIV as syndromic treatment would be. Predicted proportional reductions in HIV incidence over two years were 36% and 30%, respectively, under assumptions ofvery strong cofactor effects. For Rakai, syndromic treatment was predicted to be hardly more effectlve against HIV (an 8% incidence reduction) than was periadie mass treatment in the trial (Chapter 8).This sectlon discusses the plausibiliry and importance of differentlal intervention coverage as an explanation for the Mwanza-Rakai discrepancy, by consictering the validiry of these simulatlon results.
Intervention coverage Tbe coverages assumed for both interventlans in Chapter 7 (50% of symptomatlc episodes covered by improved syndromic management and 80% of resident adults receiving mass treatment) were in retrospect bigher than the most recent estimates derived from the respective trials: 38% [Buvé et al. 1998] and 70% [Wawer et al. 1999] .Therefore, bath simulated impacts may have been slight over-
199

200 Chapter 7 0
estimates. For comparison of the impact of mass treatment between the Mwanza simulation and the Rakai trial, we must however also consicter that the simulated intervention was a single round, whereas the Rakai intervention covered two subsequent rounds (at a ten-month interval).This may bave counterbalanced the
excessively high simulated coverage per round. For syndromic treatment, in J.ine with the excessively high coverage assmned in the Mwanza simulation, the cor~ responding simulated STD reductions were larger than the STD reductions actually observed in the trial.
Popu/ation mobility Population mobility as an (indirect) determinant of intervention coverage deserves separate attention, as this phenomenon was not included in the simulations covered in this thesis. Simulations described elsewhere suggest that migration can considerably reduce the impact (on both HIV and STD) of mass treatment. However, this condusion is specific to the case 'With a high coverage of between 80 and 95% [Habbema & Korenromp 1999]. At the 70% coverage achieved in Rakai, in contrast, the dilution of impact would be less, and bardly more than for a syndromic treatment intervention [Korenromp et al. 1999a]. Thus, the differential effect of population mobility on the impact of syndromic treatment vs. mass treatment is an unlikely explanation for the contrast in outcomes between the Mwanza and Rakai trials.
Differentiai efficacy against non-STD co factors As an additional difference berw-een the interventions, it has been hypothesised tbat bacterial vaginosis (BV) (i) is a non-STD cofactor, (li) responds better to mul
tiple-close syndromic treatment than to single-close mass treatment.This hypothesis has notbeen investigated in this thesis*, and BV was not included as a cofactor for HIV transmission in the simulations. E..-xamination of the literature suggests that BV is not a strong independent cofactor for HIV transmission. First, the cofac~ tor effect of BV would be lintited because the infection involves neither inflammation (sucb as gonorrhoea and chlamydia) nor ulceration (sucb as syphilis and
cbancroid). The mechanism supposed to account for an independent cofactor effect is the disturbance of vaginal flora and an increase in vaginal pH. These would result in a weakening of the bartier to invasion by pathogens including
the HIV virus, but this seems to be a comparatively weak cofactor mechanism (see also 1.4). Second, the effect of disturbance ofvaginal milieu on HIV transmis-
* The evaluation of the importance of the second part of this hypothesis would be difficult because in Mwanza, the impact of the intervention on BV rates had not been monitored. In Rakai, mass treatment reduced BV rates only little, a fact that was attributed to a rapid recurrence of the infection during the 1 0-month interval bernreen treatment rounds. Thus, it remains unproven whether synclromic treatment reduced BV burden more than mass treatment.

General discussion
sion may in part be indirect, through an increased susceptibility to otber STD, sucb as gonorrhoea and chlamydia. This is supported by observational studies that found less strong associations between BV and HN transmission after adjustment for correlations between BV and cofactor STD. Finally, still unpublished studies from discordant stabie se,.:ual couples in tbe Rakai trial cohort suggest tbat BV may also be a consequence of, ratber tban a predisposing factor to, HN seraconversion (Ron Gray, persollal communication).
Symptom probabilities The predicted impact of syndromic treatment depended on tbe proportion of STD episodes that become symptomatic. Unlike intervention coverage, this determinant could not directly be detived from trial data. Also, tbere is little otber direct empitical evidence (whicb should come from cohort studies of untreated and unselected patients foliowed from tbe moment of infection).
The symptom probabilities assumed in our simulations (fables 7.1 and 8.1) were mainly derived from handhooks doeurnenting expert opinion.An indirect eb eek on tbeir validity is provided by tbe fit of tl1e simulations with respect to tbe STD reductions observed in the Mwanza trial: under realistic assumptions about symptom probabilities, tbe model should reproduce tbe empitically observed STD reductions (provided that it also uses correct rates for coverage and treatment effectiveness).Yet in all simulations of syndromic management (including an adaptation of Chapter 7 witl1 reduced coverage; not shown), tbe reductions in tbe prevalenee of gonorrhoea, chlamydia and syphilis were higher than had actually been observed in Mwanza, suggesting t11at tbe assumed symptom probabilities for tbese STD were on tbe high side.
Several independent analyses support tbis conclusion. For active syphilis, less tl1an 20% of patients in tbe trial populations (as compared to a not insignificant fraction of tbose witbout syphilis) had recognised ulcers over tbe past half year - which is mucb lower tl1an tl1e symptom probability of 50.95% assumed in the simulations. For chancroid, studies in :Manila, Nairobi and Bangkok suggest symptom probabilities per episode of between 40% and 90% [I.ao & Trussel 1947, Plunuuer et al. 1983a, Vuavan et al. 1996], i.e. also lower tl1an tbe model assumed.
In Chapter 4, we estimated symptom probabilities for gonorrhoea and chlamydia, integrating data on symptom point prevalerrees and treatment pattemsin the Rakai population witb insights into tbe natura! history of tbese STD in a natural history modei.Thls yielded estimates of around 45% for rnales witb gonorhoea, 11% for rnales witb chlamydia, 14% for females witb gonorrhoea, and 6% for females witb chlamydia, i.e. lower tl1an tbe symptom probabilities assumed in tbe Rakai and Mwanza simulations. When doing tbe same analysis dorre for tbe Mwanza trial population, using data on symptom prevalenee among gonorrhoea-infected (or occasionally chlamydia-infected) male participants at follow-up [Mayaud et al. 1997a], symptom probabilities in tbe same order as in
201

202 Chapter 10
Rakai result: at estimated treatment rates of symptomatic cases of 5% and 38% for the comparison arm and intervention arm, respectively [Buvé et al. 1998], the corresponding symptom probabilities would be 41% and 50%'. The difference between the Mwanza intervention arm, on the one hand, and the Mwanza comparison arm and Rakai.,, on the other, may reflect the impact of the periadie population-based STD health education that was part of the Mwan2a intervention package. At the same time, the outcome suggests that for gonorrhoea in
ma!es, the symptom probability assumed in the Mwanza trial simulations was in the right order.
The latter symptom estimates were lower than the estimates made in bandhooks based on observations in Western populations. Probably, this is due to geogtaphica! dilierences in symptom recognition behaviour: in developed populations in Western, industrialised countries with good availability of and access to hea!th services, the knowledge and perception of symptoms is generally high, whereas in under-serviced and poorly educated populations such as those in rura! Rakai and Mwanza, symptom recognition and reporting is worse. 1n retrospect, we can therefore say that our models, which used symptom estimates basedon observations in Western populations, probably overestimated the symptom probabilities for the trial populations for gonorrhoea and chlamydia. Overestimation of symptom probabilities may have contributed to overoptimistic predictions of the impact of syndromic treatment (especia!ly in Chapter 7, for Mwan2a).At any rate, these analyses indicate that our simulations are unlikely to have underestimated the coverage of STD under syndromic treatment.
In summary, the relative efficacies of the two treatment strategies in covering episodes ofbacteria! STD do nat appear to be a main determinant ofthe contrast between the trials. As wel! as depending on coverage, however, the influence of the type of intervention a!so depends on whether cofactor magnitudes are similar for symptomatic and asymptomatic STD. Furthermore, we have nat yet consid-
* The symptom probability for gonorrhoea and/or chlamydia for Mwanza reduces to 14% and 1 ï% in comparison and intervention arm, respectively, if symptom point prevalences are derived not from the follow-up but from the basellne survey.The reason for the apparent increase trial in symptom probability in the comparison arm during the Mwanza is undear . .An increase in symptom rates in both arms during the Mwan?..a trial was also apparent among male uretbriris cases (Mayaud et al 1997a), which was the reason why symptomatic uretbriris was not considered in our analyses of SID reductions (Table l.I).These considerations illustrate that the symptom probabilities we calculated are only rough estimates. t In comparison to the estimated treatment rate of 5% for the comparison arm in Mwanza, the estimated 38% clinical treatment rate for Rakai (Chapter 4), in which this service had notbeen improved either, may now seem inappropriately high. Using 5% as the treatment rate in Rakai, estimated symptom probabilities for this popu1ation fa11 (from 44%) to 36% for gonorrhoea and (from 11%) to 8% for chlamydia.

General discussion
ered possible effects ofthe respective interventlans other than curing STD.These factors are therefore addressed in the following two subsections.
Co factor magnitudes of symptomatic vs. asymptomatic STD In the simulations, cofactor magnitudes were the same for symptomatic and asymptomatic STD episodes.This assumption influenced the simulated effective
ness of syndromic treatment (of symptomatic STD) relative to mass treatmem (of symptomatic and asymptomatic STD): if the true cofactor effect of symptomatic STD were relatively higher, our simulations may have underestimated the impact of syndromic treatment.
The hypothesis that symptomatic STD facilitate HIV transmission more than asymptomatic STD, is based mainly on laboratory studies observing higher levels of HIV shedding in symptomatic STD than in asymptomatic STD. However, the relationship between shedding and transmission is unclear, complicating the interpretation of this finding.An important additional consideration is that 'symptomaticity' in shedding studies always relates to disease signs as they are detectable by the clinician upon genital ex:amination. This ctiterion encompasses a larger fraction of patients than does the 'recognised symptoms' criterion, which is nevertheless the factor of interest trom the perspective of treatment seeking and, therefore, the meaning of the symptom probability parameters in STDSIM. As e..'\.-plained above, the occurrence of (objective) disease signs is only one of the
determinants of the probability that symptoms will be recognised and reported. Our finding of large geographical variation in the probabilities of recognising symptoms for gonorrhoea and chlamydia (Chapters 3 and 4) in fact suggests that symptomaticity forthese STD has little to do with the severity of the intlammation they underlie. In the Rakai population, only a subset of individuals with inflammatory gonorrhoea and chlamydia apparently report symptoms of these infections. We therefore condude that in rural African populations, symptom reporting is unlikely to be an indicator of the severity of HIV cofactor effects that gonorrhoea and chlamydia patients may suffer.
For syphilis and chancroid, the two main other curable STD, the relationship between symptoms and cofactor magnitude is less of an issue. Ulceration, the main genital symptom of these STD and the likely mechanism of their effect on mv transmission, is easily recognised. The temporal coincidence between the periods with cofactor effect and with recognised symptoms for these infections is reflected in their representation in STDSIM. (An example is given in Figure 9.1, the STDSIM representation of infection with HSV-2.) It is, however, conceivable
that the subset of ulcers that go unrecognised by the patient are less severe, and facilitate HIV transmission less than the majority of ulcers that are recognised by
the patiem. In summary, it is still unknown whether there is any significant association
between symptom recognition and strengtil of cofactor effect on HIV transmission. In the rural SSA populations under study, symptom recognition is unlikely
203

204 Chapter 70
to be an indicator of elevated cofactor magnitudes for non-ulcerative STD. Por ulcerative STD, this possibility warrants furtber research.
Otber mecbanisms bebind tbe impact of syndromic STD management Syndromic STD management includes nat only treatment of the possible causes of the symptom, but also patient education on sexual abstinence or the consistent use of condoms until treatment is completed, in order to prevent infection of partners, and counselling on how to prevent reinfeetien [WHO 1994]. lt is therefore conceivable that the reduction in HIV incidence observed under the Mwanza intervention may partly have been due tothefact that patients were following recommendations of this type. This effect would be highly influential, as patients with STD infections may aften have recently acquired HIV as well (e.g. from the samehigh-risk seJ>."Ual contact), and infectivity with HIV is highest in the weeks immediately after infection Uacquez et al. 1994].!t is truethat bebavioural change would reduce STD rates as well, but over the fust few years, impact on HIV incidence might be more pronormeed (Figure 8.2b+d and [Korenromp et al. 200laJ), resulting in a picture consistent with the Mwanza observations. The hypothesis is partlcularly attractive, because it would explain bath why impact on HIV in Mwanza was so large relative to that in Rakai - where the intervention did not include health education- and the intemal inconsistency within the Mwanza trial, in which the impact on HIV was relatively much greater than tbat onSTD.
Analyses of available data on reported risk behaviour at fellow-up in the two arms of the Mwanza trial <lid nat clearly confirm or refute the hypothesis. The intervention had not :increased reponed condom usage; in line with this, the uptake of condoms given to patients in intervention clinics had been very low [Grosslauth et al. 1995a].Among subsamples of adolescents, no differences were detected between arms in HSV-2 seroprevalence (unpublished analyses). However, whereas, at baseline, arms were similar in numbers of recent partners, participantsin the intervention arm tended to report slightly fewer recent (casual) partners at fellow-up than camparisen arm participants [Gross1:urtb et al. 1995a]. And among a subset of men with STD symptoms interviewed at fellow-up, a lower proportion (32%) in the intervention arm reported having had sex during symptoms than reported this in the camparisen arm (50%, p=0.039 in 1-sided Fisher's exact test; unpublished data); this may be indicative of an intervention effect on temporary abstinence as a preventative behaviour.Among women, no difference was detected between armsin abstinence during symptoms (intervention: 46%; comparison: 43%; unpublished data). Importantly, these analyses could nat exclude the possibility of more subtie behavioural effects. Changes may, for example, have been too small to be detected in the surveys, which were conducted on only subsamples of the population, thus limiting the power for comparison. Due to various biases in seJi-reports, surveys on sntia.l behaviour are known to be unrealiable and therefore liable to miss trends [Susser et al. 1998,

General discussion
Morris 1993, Wadsworth et al. 1996]. Thus, on the basis of the available data we cannot make any condusions with regard to the presence or absence of behavioural effects in the Mwanza trial. However, if they exist, even very modest behavioural cbanges could have marked effects on the spread of HN (see also Chapters 6 and 9).
lt is of note that all hypotheses on dilierences in interventions pertain to the contrast between perioctic mass treatment and clinical services for symptomatic patients -whether synd.romic or not. In other words, the same comparative actvantages and disadvantages would apply with a test-based, 'aetiological' treatment instead of with the syndromic approacb - and the interred benefits of syndtomic treatment would hold only over mass treatment, but not over test-based algorithms that may become available in future (see 10.4.2).
10.2.2 Evaluation of hypotheses: differences in the populations
Three hypotheses on the contrast between the trial outcomes related to the populations in which the interventions were delivered.
More mobility in Rakai? The hypothesis that the Rakai trial had less impact because it was diluted by
greater mobility than the Mwanza study is similar to the hypothesis discussed above, i.e. that mobility is more critica! to trials of mass treatment than to synd.romic treatment. 1bis new hypothesis is unsatisfacto:ry for the same reasons. First, it would imply a contrast in impact not only on HN, but also on STD. Second, at the coverages acbieved in the trials, population mobility would cause only a smal! dilution of impact [Korenromp et al. 1999a]. In addition, a comparative analysis of demograpbic data from both trials has indicated that there is no evidence of greater mobility in Rakai'.
Stage ofthe HIV epidemie, HSV-2 and behaviour change The studies in Chapters 5, 8 and 9 addressed other possibilities that centred around the lower prevalences of curable STD in Rakai relative to Mwanza. Systematic comparisons of trial data demonstrared gonorrhoea, chlamydia, trichomoniasis and active syphilis to be considerably less prevalent in Rakai than in Mwanza (Chapter 5). In contrast to active (recently acquired) syphilis - wbich was more
prevalent in Mwanza - late sypbilis was prevalent at similar levels in both sites,
* On closer e..~ation, any ind.ications of greater mobility in Rakai turoed out to relate to methodological differences in eligibility criteria and de:finitions of mobility (unpublished results by Richard White et al., Londen School of Hygiene & Tropical Medicine, spring 2001).
205

206 Chapter 10
and, among older participants, was even more prevalent in Rakai.
One of the explanations for the lower prevalences of curable SID in Rakai is found in the respective levels of risk behaviours in both sites. At the time of the trials, numbers of recent and ongoing senla.l partnersbips were higber in Mwanza than in Rakai, while condom use in casual cantacts was reported.ly lower. The excess num.hers of partners in Mwanza was, however, lower for lifetime partners•. This suggests that se>.-ual promiscuity may have been higber in Rakai in the 1980s than in the 1990s, and also than in Mwanza througbout the HIV epidemie.
Another explanation lies in the relatively late stage of the HIV epidemie in Rakai. Chapters 8 and 9 explored which of these two explanations was the most important in quantitative terms. Chapter 8 compared the impact of STD treatment over stages of the HIV epidemie, for Rakai and a hypothetical Rakai-like popuiatien without behaviour change. Impact on HIV transmission was largest at the beo-~g of the epidemie, when HIV transmission was still confined to higb-risk groups of individuals with higb rates of partner change and SID.A shift toward transmission in lewer-risk relationships caused the impact to fall over time, this effect being mostly pronounced befere the tenth year of the epidemie. In the interval between the tenth and the twentieth year, which approximates the ditterenee in epidemie stages between the Mwanza and Rakai trial populations,impact feil only moderately,from 19% to 15%.This suggests that the natura! dynarnics of the HIV epidemie contributed to the contrast in outeernes between the trials, but not much.
!nteractions in epidemiology between HSV-2 and HIV hardiy affected the simulated impact of SID treatment over time. The reason for this was explored further in Chapter 9, where we considered the distribution of cofactor ulcers over the HIV epidemic.ln contrast to the prevalling thougbt, increased herpetic ulceratien in immunocomprornised HIV patients was predicted to cause, at population level, only a moderate increase in herpes incidence - even in an HIV epidemie that was more actvaneed and severe than that in R.a.kai. Furthermore, in populations with se>.-ual behaviour allowing for severe HIV epidemics, genital herpes constitutes only a small proportion of prevalent ulcers and of prevalent cofactor SID; therefore, any change in herpes incidence hardiy affects the impertanee of curable STD in ongoing HIV transmission.
For Rakai-like populations, the decline in impact of STD treatment between year 10 and 20 of the epidemie was larger if also the behavioural change in Uganda was considered; then simulated impact fel! to 8% in year 20, i.e. wel! within the con1idence interval around the impact estimate of the Rakai trial (Chapter 8).The considerable influence ofbehaviour change is explained by the shifts it causes in the aetiological distribution of cofactor ulcers (Chapter 9);
* Unpublished results, Kate Orroth et aL, London School of Hygicne & Tropical Medicinc, spring 200 I.

General discussion
behaviour change greatly and rapidly decreases rates of, especially, chancroïd -which is of short duration and sensitive to control efforts - relative to HSV-2 - an infection lasting lifelong and responding slow to intervention.A further contribution to the reduction in the proportion of curable cofactor SID is made by similarly large and rapid reductions in the rates of the curable cofactors gonorrhoea and chlamydia.
In summary, simulations and comparative analyses of empirica! data suggest that tl1e behavioural risk reduction that has occurred in U ganda since the late 1980s is an important explanation of the limited impact of SID treatment on HlV incidence in Rakai. This effect was enhanced by the late stage of the HlV epidemie at the time of the Rakai trial.
10.2.3 Evaluation of hypotheses: differences in study design
T'wo hypotheses related to differences between the trials in their design with respect to impact measurement. First, in Mwanza, impact on HIV incidence was measured in a closed cohort while in Rakai it was measured in an open cohort, which also included new immigrants who had not yet benefited trom previous rounds of treatment*. Second, in Rakai, both the intervention area and the cohort for each community consistedof the whole village, or the 1000 householcts ciosest to the main road. Because of this, cohort memhers were always close to non-intervention area, and thereby relatively much exposed to reinfection. In
Mwanza, in contrast, the cohort included only individuals living in the midst of a larger intervention area, which for each community comprised the whole, broader geographical area served by the health centre where SID management was strengthened. The effect of these differences in study design were not addressed specifically in the previous chapters, but we can note several points.
As with the hypotheses on intervention coverage, these are a priori not the most satisfying explanations for the difference between Rakai and Mwanza, as they would imply an equal discrepancy between the two trials in impact on SID and HIV rather than mainly on mv. Furthermore, design factors could dilute impact in the cohort only if there were a true impact in the target population. In Rakai, where the impact of SID reductions on HlV incidence was probably truly limited because the prevalenee of SID was already low, dilution would
'i< Specifically, HIV /STD measurement in Rakai at round two (I 0 months after onset) induded partleipants of round 1 as well as residents who had immigra.ted in to the area between rounds 1 and 2, and had thus not participated in the mass treatment at round 1. The round 3 evaluation (20 months after onset) induded repcaters of round 1, of round 2 and of rounds 1 and 2, as well as new immigrants who had not yet been exposed to the intervention. HIV incidence calculations therefore included participants who participated in any of (at least) two rounds: round 1 and 2, 1 and 3 or 2 and 3.
207

208 Chapter 10
therefore seem unimportant.ln other words, even with a design that allowed less reinfeetien and larger STD reductions in the eva!uation cohort, observed impact in Ra.kai on HN inddence would have been !imited.The design factors are therefore important mainly for the interpretation of impact observed in Mwanza.
With respect to the size and Iocation of the IDV incidence cohort relative to the intervention area, it is of note that the large-scale set-up of the intervention tested in Mwanza guaranteed outcomes relevant to the case of large-scale imple
mentation, the target of practical health policy.ln contrast, the smali-scale set up of Ra.kai, which would limit the impact of any effective intervention, does not constitute a true determinant of intervention impact, but must rather be seen as an artefact. From this perspective, it is fortunate that the way in which intervention effects are simulated in STDSIM resembied the Mwanza design more than it resembied the Ra.kai design'".
Regarding the type of cohort, however, the limitation of .Mwanza to a c!osed cohort may have given a rnisleading împression of the true impact that occurred in the entire population. Overestimation of impact is likely, because a c!osed cohort commonly misses re!atively mobile individuals, who are at higher risk of STD and HN and at the same time less able to benefit from improved health services. In addition, compared to Ra.kai, .Mwanza may have over!ooked a re!atively high number of mobile individuals, because the survey schedule included fewer repeat visits to catch individuals who had not been present at a fust visit. From this perspective, the Mwanza trial and the simulations may have been optimistic
about the population effect of STD interventions.
10.2.4 .Evaluation of hypotheses: random chance
The trial outcomes were subject to random chance, the importance of which is reflected in the large confidence intervals around the point estimates of their impact.The influence of chance was probably great especially for HN incidence, as there were small numbers of incident cases in either trial cohort, and both trials inc!uded only a !imited number of communlry pairs (six in Mwanza, live in Ra.kai). Results relating to STD rate reductions were also imprecise, as STD rates were moflitored only in subsamples ofthe trial cohorts and also because diagnos
tic methods for STD measurement were imperfect (espedally in .Mwanza; see Chapter 5). The influence of random chance can by definition not be estimated trom the (single) trials themselves, and it is common to attribute all variatien not
* Like most epidemiological models, STDSIM largely ignores the influences of exposure of the closed, small model population to the outside-world, as would in reality occur due to frequent temporary movements, drculatory migration, and stl."Ual relationships with individuals living far away. In the simulations in this thesis, such disregard was flirther enhanced because the options for simulating migration were not used.

General discussion
explained by specilic other determinants, to random chance. In contrast with the actual trials, the simulations- the intermediate in our con
dusions on the trial outcomes- were hard!y subject to random error.Although they were produced stochastically, the model outcomes were aggregates of large numbers of simulations. In other words, had the simulation started at a different random number, the overall outeernes would have been nearly the same. Insome ofthe simulation results presented (e.g.Table 7.2), this is illustrated in the narrow confidence intervals surrounding averages, wbich indicate the variation between multiple runs ofthe sameinput specification.These simulation confidence intervals should not be confused with statistica! con.fidence intervals around single field observations as the trials are, or with intervals around point estimates of intervention impactbasedon multivariate statistica! modelling.When camparing simulations with actual trial outcomes, it must also be borne in mind that the simulations identified differences between the Mwanza and Rakai trials that contributed to theit contrasting outcomes, but did not precisely state the quantitative role of all explanations in comparison.As a result, the simulations could not either attribute an exact amount of remaining lack-of-fit to 'random chance' (see 10.3.1).
If we consicter the overall fit of the various simulations, bearing in mind that, for Mwan7..a, the simulated syndrornic treatment interventions (whatever the coverage and cofactor magnitudes assumed) either produced STD reductions that were too large, or an HN incidence reduction that was too small (Chapter 7), the main lack-of-fit would appear to !ie in the Mwanza trial outcome rather than in the Rakai outcome. From this perspective, a chance factor ignored in the simulations in this thesis, becomes interesting. In the Mwanza trial, the conununities randornised to the intervention arm started out with higher rat es of HN and with certain HN risk factors higher than those randomised into the compatison arm. In particular, HN prevalenee in the cohort was 4.4% in the intervention arm and 3.8% in the compatison arm [Gross1:urth et al. 1995a, Habbema & De Vlas 1995]. Preliminary simulations of the influence of this 'imbalance · suggested that, if the study arms truly differed this much in baseline HN prevalence, this could have given a considerable upward bias to the difference in HN inddence between the arms during the follow-up: e.g. from 17% to 28-32%' [Korentomp et al. 2000a]. In reality, however, the true difference in HN prevalenee between the arms was
* The exact value of the simuiared bias depended on the assumed cause underlying the irobalance: a difference between arms in the average time of onset of HIV spread, or in the underlying level of risk behaviour. Given that behavioural surveys conducted during the trial did nor identify dear differences between anns in numbers of partners or other STD risk behaviours (see 10.2.1), the fust factor might be considered a more likely cause. On the other hand, the tendency toward lower baseline rates of, besides HIV; also ulcer report~ ing, syphilis, gonorrhoea and chlamydia in the intervention arm (Mayaud et al., 1997a) might point at a rrue - but subtie and otherwise undetectable - difference in risk level.
209

210 Chapter 10
probably only around 72% of rbat measured in the cohort, because the cohort consisted of only a subset of the residents living in both study areas so that 'regression to the mean' mUst be taken into account (Richard Hayes, personal communication).Yet, these results illustrate that random imbalances at baseline can considerably affect the 'impact' observed in trials.
As an alternative approach to account for the imbalances at baseline in risk fuctors, the imbalance in baseline HN prevalenee was induded as a covariate in a direct statistica! analysis of the trial outcomes. This resulted in a rednetion of estimated impact from 42% to 38% [Hayes et al. 1995a ]',i.e. a smaller correction than suggested by our simulations.A reasou for this difference may be that the statistica! correction did not account for the parallel imbalances in the prevalences of STD.Aitematively, the closed model may have overestimated the dependenee of HN JSTD exposure in a population on its HN JSTD prevalence. It may also just be a matter of random chance, i.e. that în the trial the correlation bernreen realised HN incidence and baseline HN prevalenee on the community level was
coincidentally very low, despite the filet rbat HN prevalenee is generally a good indicator of HN exposure in epidernies such as the one studied in Mwanza.
10.3 SIMULATION MODEUJNG OF STD/HN SPREAD AND
CONTROL
The greater number of the studies in this thesis were conducted with the aid of a model, STDSIM, simulating the transmission dynamics of STD and HN across populations.This section reflects on the need for and use of such analytica! tools, the problems encountered in applying them, and areas for their future application.
10.3.1 Modelling inthls thesis
The modelling allowed us to explore the long-term impact of STD interventions including rbat of programmes not actually performed, e.g. mass treatment and combiflations of mass and syndtomic STD treatment in Mwanza, and to identify critica! detemtinants of intervention impact (e.g. cofuctor magnitudes as determinant of absolute impact; see sensitivity analyses in Chapters 7 and 8). Conclusions from such explorations, however, did not prove to be the most revealing in
explaining the contrast between the Mwanza and Rakai trials. In hindsigbt, the
" HIV imbalance corrected for regression to the mean; imbalances in STD rates not înduded except for the indicator 'bistory of self~reported STD ever' (Grossl._"Urth et aL 1995a,HayesetaL 1995a).
General discussion
findings most pertinent to e>:plaining this discrepancy seem predictabie even
witbout modelling.This is true particularly for tbe criterion we proposed, i.e. tbat e-.:planatory hypotheses should deal primarily witb the relationship between
STD and HIV reduction, and not witb the (proportional) magnitude of STD reductions tbemselves.Yet, tbe most insightful non-model-based condusions (Chapters 2, 4, 5 and section 10.2) were reached only after tbe fust simulation studies had
been cartied out (Chapter 7; [Korenromp et al. 1998, Korenromp et al. 1999a]). \Vlille this was not a coincidence, it illustra.tes the main use of the modelling. F:irst, modelling forcedus to make eÀ"J)licit all assumptions conunonly made in evaluat~ ing these conununity-trials and study them in one comprehensive framework, while continually adopting tbe necessary population perspective. Secondiy, mismatches between tbe model and empirical observations stimulated tbe formation of new hypotheses, aod identied needs for further analyses of existing data or gaps io data. For example, tbe criterion tbat explanations of tbe MwanzaRakai discrepancy must deal primarily witb tbe relationship between STD and HIV reduction, was based on the condusion of Chapter 7 that, over a rwo-year period, mass treatment reduces STD prevalerrees by proportions similar to tbose achieved by syodromic treatment. 1o addition, tbe rnadelling served to explain unexpected outcomes of direct data analyses. For example, contrary to origioal hypotheses, tbe seroprevalence of HSV-2 was found nat to be higher io Rakai tban in Mwanza (Chapter 5), and tbis was corroborated and explaioed by simula
tions io Chapter 9. 1o tbe light of tbe above, was it necessary to use a model as sophisticated
as STDSIM! Theoretically, to structure viewpoiots and thoughts and to systematically arrange hypotheses, simple rnadeis would have sufficed - and have been preferable. For our predictions of tbe impact of STD treatment on HIV io tbe trials, it seems questionable whetber tbe level of detail of separately representiog four curable and one incurable STD was warranted, given tbat trichomoniasis, anotber cofactor STD targeted by tbe ioterventions, was not simulated.Yet, workiog witb a model that could be adapted ad libitum to our ioterests and tboughts may have been very helptul to tbe generation of new ideas and tbe initiation of new analyses on existing data. A nice illustration of this can be found io tbe condusions on the differential effects of mass treatment and syndromic treat~ ment on tbe epidemiology of syphilis (Chapter 7). These would probably nat have been drawn witbout tbe detailed representation of this STD in STDSIM, but tbey were tb ereaft er reproduced in a simp Ier compartmental model [ Garnett & Brunbam 1999]. 1o contrast, io our simulations of trends io tbe aetiology of genital ulcers (Chapter 9), tbe intuitive and flexible representation of different iodividual STD was certainly iodispensable. Fioally, tbe typical flexibility of microsimulation models to match tbe empirical data with respect to tbe structure of its output (e.g. tbe STD iofection stages tbat count as prevalent on eertaio diagnostic tests) also proveda great advantage io validating model omeomes (see for
example Chapter 9).
211
212 Chapter 10
10.3.2 Problems in modelling
Like any model of infectious disease spread, STDSIM has its limitations, and some of the limitations relevant to the simulation of STD/HIV interventions must there· fore be considered.
First and foremost, the rnadelling did not provide quantitative condusions on the impact of STD treatment or other HIV control options. This had little to do with technicallimitations in STDS1L11building, but should instead be imputed to our imperfect knowledge of the determinants of intervention impact. There are various reasons for this, particularly uncertainty about the magnitude of STD cofactor magnitudes, the impossibility of disentangling random effects from systematic effects in the rwo trials, and the fact that the trial data were not best suited for testing hypotheses that arose only after their collecrion.ln other words, these limitations hold equally for non-model-based studies.
Second, we are uncertain about the correctness of model representations of the 'sexual nerwork', i.e. the patterns of sexual cantacts in populations. While
individual-based models can account for these critica! aspects of seJ>:ual behav· iour [Kretzschmar et al. 1995, Morris & Kretzsdtmar 1995, Ghani et al. 1998], when fitting STDSIM to the trial populations, we limited model verification with respect to seJ>.-uai behaviour largely to some basic measures, such as the propor· tion of people that were married and their numbers of partners. With regard to sexual netwerk aspects, only age differences between marltal partners were con~ sidered · which the model fitted rather poorly. This Jack of attention was in part unavoidable, because data on se.x"Ual nerwork structure were limited, especially for Mwanza. It is also of note that the model representation might not have been better even with more behavioural data: this would have produced dilemmas if improving fit for epidemiology and for SeJ>.'Ual behaviour had required opposing adjustments*. Fortunately, the uncertainty about rnadelling sexual networks was probably not critica! to the interpretation of the STD treatment trials, which centred on the relationship herween magnitudes of STD and HIV reductions:
most determinants ofthis relationship (Table 1 0.1) have little to do with nerwork effects.The single determinant that might beseen as a sexual nerwork effect, i.e. population mobility, was stuclied without STDSIM (see 10.2.1 and 10.2.2). How· ever, correctness of the sE\..'Ual net~1ork representation may be critical to future rnadelling of behavioural/structural lnterventions and vaccine trials. The same may apply for the evaluation of STD mass treatment programmes in relevant populations (where STD are important in HIV transmission). For such studies, the model would need to be run repeatedly withalternative options for the represen· tation of this (and other) uncertain features, to verify the robustness of predic·
* Such conflicts were already encountered within the restricted set of data used. For e.xam~ ple, age pattems in STD prevalences suggested a later onset of so..'Ual activity in men than data on reported so..-ual debut.

General discussion
tions. A third possible limitation is that - in all existing models of HN spread so far
- the phenomenon of evolution of the virus over time has been overlooked.As is common with vîruses newly entering the human community, HN îs believed to have been more virulent and lethal in the early years of its spread than it is now
[Ambroziak & Levy 1999, Morgan et al. 1997a]. Higher virulence may mean that
in earlier days, recently infected HN patients were more infectieus than they are now, wbich has obvious implications for e.xplaining and modelling the onset of HN epidemics. Notably, for Uganda, a bigher initial infectiviry would mean that behavioural risk may have been less elevated duting the late 1970s and 1980s than we interred in Chapter 8.
Finally, a problem specific to the stochastic modelling of infectieus disease spread îs the interpretation of variatien between simuiatien runs :in relation to the single actual situation. STDSIM produced large varlation between runs in the onset and pace of initial STD spread and in the consequent pattem of epidemics. Particularly for HIV; a relatively new, relatively non-infectieus disease wbich was introduced into model populations by randornly attributing one infection to one prostitute*, variatien between simulations was impressive. This model feature îs thought to reileet a real-world phenomenon - possibly also explaining why in apparently similar populations, HN statred to spread early and rapidiy in some, but only much later in others [Buvé et al. 1995] -but for application to single
real-world epidemi es, it poses a problem. In STDSIM simulations of the Mwanza HN epidemie, even though the average simulation outcome adequately fitted the actual epidemie, some individual runs produced HN prevalerrees that were totally inconsistent with the empirical data (Chapter 7). We solved this problem by systematically dropping all simulated epidernies that fell outside a predetermined range of HN prevalenee for the trial starring year (wbich was derived trom the prevalenee measured in the trial baseline survey). This procedure avoided calculations of intervention impact based on non~existing (0% preva~ lence) HN epidernies- ofwbich there were several (around 25% of runs) in the simulation ofthis low prevalenee epidemic.The exclusion algorithm did notalter the main outcomes of the intervention evaluation; and in simulations of the more severe Rakai epidemie (Chapter 8), such exclusion was not needed.
Care should be taken that exclusion of outlier runs is not used inappropriately. In simulations of the spread of HSV-2 for a genetic population [Blower et al. 1998], tbis infection was not sustairred in 28% of simulated populations, wbich were therefore excluded from subsequent intervention evaluations. Since HSV-2 is in realiry present in all real-world populations [Nahmias et al. 1990], this exclusion may have served to mitigate the effects of an :incorrect specificatien of the disease model.
* Except in simulation of populations withno prostitution, such as Profile 3 in Chapter 6.
213

214 Chapter 7 0
An alternative methad for avoiding reliance on unrealistic simulation runs would be to, retrospectively, adjust the time line of each simuiatien until it fits one or more known points on the actual epidemie, This method is based on the consideration that, since for most real-world epidernies the onset is not exactly known, each simuiatien that can fit the limited empirica! dara on recent years is equally valid. Or, specifically for the study of HN epidemics, stochastic varlation could be constrained by increasing the number of individuals in whom the infection is seeded (e.g. to several prostitutes, or several prostitutes and prostitute clients).
1 0.3.3 Future use of models
In a review on the influence of the mathematica! modelling of HN control polides in the developing world, Stover et al. conduded that, while modelling has played a major role in increasing our undersranding of the dynamics of the epidemie and in identifying gaps in our knowledge, its impact on policies and programs has been limited. The authors recommended a better translation of modelling findings to policy action [Stover 2000]. The use of modelling in our analyses of the STD treattnent trials nicely illustrates this fust statement. In future, the interpretation of new com.munity-randomised mv prevention trials (such as trials on the introduetion of HSV-2 treatm.ent in developing countries and on HN and HSV-2 vaccination) may be a proruising application of microsimulation models; at the time of writiog, however, few trials that would benefit from modelbased analysis are underway.
Also outside the realm of trials, there have been few brea1:throughs over the past decade that decisively altered the spread or the prospects for centrolling HN and STD in developing counrries. In the same period, the modelling business has grown explosively. In the short-term, there thus seems to be little need for scientific modelling to further our undersranding. To enbance rational control policy, however, the ongoing publication and dissernioation of existiog work is certainly indicated. Such educational rnadelling exercises may elaborate on the cost-effectiveness of alternative interventlens (whether single or in combi~ nation) in different geographical settings, a subject highiy relevant to decision makers faced with the task of distributiog or redisrributing health care budgets.
At the same time, new theoretica! research may be useful in providing insight into the biases and distortions inherent to field observations in STD/HN epidemiology.While common sratistical models cannot fully grasp these, sophisticated microsimulation models employing advanced modem options of computing demand and output, e.g. individual-level databases, can. Recent simuiatien studies using these techniques have illustrated the difficulties in interpreting dara on STD/HN dustering [Boily & Andersou 1996] and on sexual networks surrounding STD patients [Ghani et al. 1998]. Furthermore, on the natura! history, epide-

General discussion
miology and intervention response of viral STD, such as infection with HSV-2 and human papilloma virus (HPV), new lessons are likely to be learnt through modelling. These infections behave differently trom the better-known bacterial STD, options for their control differ and are in development, and because of the long duration of these infections, modelling provides an attractive alternative for difficult and lengthy field studies (see as an example Chapter 9).
With regard to forecasting the future course of the HN epidemie, one subject
of interest is the global impact of and prospects for bighly active antiretroviral therapy (HAAR1). Since its introduetion in around 1995, HAART has considerably d1anged the Western HN epidemie, grossly reducing AIDS mortality. Because HAART reduces HN viral loads, it may also prevent HN transmission [Blower et al. 2000, Garnett & Andersen 1996b, Ferguson et al. 2000]. With the falling costs of the relevant drugs and the continued expausion of HN in developing countries, HAART is now being advocated for resource-poer countries as wen. However, due to the high demands on health infrastructure, logistics, patient education and compliance, this is unlikely to be a successful intervention: most patients treated wil! probably quickly develop resistance against the drugs, wbile the majority of patients wil! remain untreated [Forsythe 1998, ]ha et al. 200 1].
Although the impact of HAART on the HN epidemie in developing countries is thus likely to remain limited, a consequent possible spread of drug-resistant HN
strains to Western countries may critically alter the prospects of the epidemie there.
10.4 IMPLICATIONS FOR FUTURE RESEARCH
10.4.1 STD treatment for HIV prevention?
The simulation-aided analyses of the Rakai and Mwanza STD treattnent trials suggested three factors to be important in explaining their contrasting outcomes:
the behaviour change in Uganda preceding the Rakai trial, wbich reduced risk behaviour and rates of curable STD to below the level in Mwanza; the relatively late stage of the HN epidemie in Rakai, compared to the rising epidemie in Mwanza; an imbalance at baseline in HN prevalence, STD rates and their risk factors in Mwanza.
In the model, these factors were suflident to e:>:plain the lack of impact STD treatment had on HN in Rakai . behaviour change in Rakai probably having made the largest contribution.They could not, however, fully ~xplain the finding of considerable impact on HN without large STD reductions in Mwanza.An alternative
215

216 Chapter 7 0
explanation for the latter may be alternative (or subsidiary) behavioural effects of the Mwanza întervention on HN incidence; this could, however, not be ascertained from the trial data.
Although the different approaches to antibictic tteattnent (mass or syndromic) and their comparative effects on the magnitude of STD reductions thus appear unrelated to the trial discrepancy, considerations of feasibility, sustainability and cost-effectiveness argue that clinic-based, syndromic treattnent is the most practical option for STD management (at least in rural Africa) [Islam et al. 1994, Costello Daly et al. 1998a,Adier 1996]. This section therefore focuses on further research into clinical STD management.
From a scientific perspective,highest priority wou1d have the conduct of new trials of syodromic management.The aitn of such trials wou1d be to find the mechanism behind its impact and resolve the intemal inconsistency between the HIV and STD reductions in the Mwanza trial. Trials wou1d have to be conducted in relevant popu1ations, in which STD are not already of reduced importaoce due to behavioural responses to the HIV epidemie. They might, for example, be conducted either in early HIV epidemics, such as those in some parts of India, or in later ones where there has been no behaviour change, such as in South Africa. Care should be taken to closely monitor intermediate outcome measures, induding both STD (with reliable diagnostic tests) and risk behaviour (with validated indicators). To facilitate our ability to distinguish between behavioural and treatment effects, STD measurements shou1d preferably include both curable and incurable infections - reductions in the latter wou1d prove that part of the effect is mediated through behavioural responses.
One barrier to the conduct of such trials - and one that may be decisîve - is ethics: the Mwanza trial proved that syndromic STD management combined with health education is - somehow - effective against mv. From this perspective, it may be unacceptable to withhold (part of) this intervention from future trial comparison groups. However, an alternative worth consictering :might involve a trial of improved counselling of STD patients aloneversus improved counselling combined with improved syndromic treattnent [Hudson 2001]. In this respect, the ongoing debate on the ethics of intervention trials in developing countries, where the local standard of care (which cou1d define the comparison group) is less than the best proven option available elsewhere (which wou1d form the comparison group were the study conducted in a ticher country) is of interest.
Even if the efficacy of syndromic STD management is deemed proven, trials on its cost-effectiveness may be indicated. Cost-effectiveness varles between settings, so it may not be possible to generalise the cost-per-averted-HIV-case estimaled in Mwanza. Furthermore, cost-effectiveness cou1d be assessed separately for the behavioural and the medica! sides of STD patient management, possibly with important implications for theîr relative priorities.And comparisons in costeffectiveness between STD management and other (e.g. behavioural) interventions may be worthwhlle.

General discussion
Currently, the results are awaited of a recent trial of syndromic treatment on top of education on risk reduction that was conducted in Masaka, a district of Uganda neighbouring Rakai.This trial was designed to answer another highly relevant question, that on the impact of STD treatment as a possible complement to a behavioural intervention.As with the trial in Rakai, whicb Masaka resembles closely in terms of the stage of the HIV epidemie, the occurrence of bebaviour
change and low STD prevalences [Mulder et al. 1995, Kamali et al. 2000], the Masaka study is however unlikely to provide the desired outcome. Evaluation is also ongoing of progranunes of selective mass treatment, delivered at high frequency (e.g. monthly) to high-risk groups sucb as prostitutes, as an effort to maximise the benefits of mass treatment while limiting its costs [Ho !mes et al. 1996, Fonck et al. 2000, Steen et al. 2000] .Whereas targeting high-risk groups is gener
ally an appropriate way of maximising benefits while limiting the costs of STD interventions (see also Chapter 6 [Brunham 1997]), tbis may apply less to mass treatment: the primary benefit of mass treatment lies in the simultaneous treatment of all infectees in order to reduce STD (re-)infection in the whole sexual network. Selective mass treatment may therefure be less proruising than hoped. However, if the cbanoels for treatment delivery are simultaneously used for health education and condom provision, the overall (cost-)effectiveness of such
combined interventions may be high.
Further studies should also include a re-simulation of the Mwanza trial, after cor
recting STDSIM forsome limitations relevant to the outcomes of Chapter 7. First, the cofactor STD tricbomoniasis, whicb was treated and reduced in Mwanza, should be added to the modeL This will improve the fit for small reductions in each single STD on the one hand, and the large reduction in HIV on the other. Second, the recently improved representation in STDSIM of syndromic treatment, whicb allows for the simultaneous treatment for all possible causes of a specific syndrome and other coinfections - must be used. 1n the light of the results of Chapter 4, the assumed durations of episodes of gonorrhoea - in rnales - and espedally cblamydia - in both sexes - may require (upward) adjustment. Combined with a (downward) adjustment of the transmission probabilities- whicb would be needed to maintain fit to observed prevalenee levels- these alternative specifications may result in larger predicted impacts of syndromic treatment on STD prevalences. Since the SID reductions in the current simulations were, at the estimated coverage, already on the high side, these adaptations may worsen fit to the data and stimulate a further reileetion on the actual coverage acltieved in the trial. The antidpated worsening of fit may however be compensated by the
need, identified in Chapter 4 and in the pre-~;ious section, to downwardly adjust symptom probabilities for chlamydia, syphilis and perhaps gonorrhoea and chancroid.A relevant feature of the Mwanza trial whicb was ignored in Chapter 7 is the round of'mass treatment' for syphilis for all partielpants in both study arms with suspected active syphilis (by RPR-positivity) at the start of the trial. Finally,
217

218 Chapter 10
actapration may be required with respect to the magnitude of STD reductions achieved, depending on the outcomes of ongoing trial data analyses. in particuIar, the limitations of the diagoostic tests used in Mwanza (Chapter 5) deserve further consideration, because they may have diluted observed impact.
Re-simulations wil! help delineate the magnitude of the inconsistency in effects on STD and mv in the Mwanza trial. It must however be realised that the additional gain in knowledge is ultimately restricted by the uncertainty inherent to the data of this single study.
10.4.2 sm cofactor effects
As discussed above, further observational studies are unlikely to reveal the true magnitude of STD cofactor effects. The only option for answering this question
would beatrial of an STD intervention that targeted STD alone (i.e. not targetiog risk behaviour and mv directiy), and that resulted in large STD reductions. Mass treatment in a relevant population with high STD baseline rates, and preferably at a higher coverage and in a larger implementation area than Rakai, would come dosest to these criteria. However, in view of the criticism of mass treatment that has foliowed the disseminarion of the Rakai results, i.e. that it is neither feasible nor sustainable [Hitchcock & Fransen 1999, Handsfield 1999, Boily et al. 2000, Hudson & Smith 2000], such a second mass treatment trial is unlikely to be ever conducted.
Nonetheless, several types of observational and laboratory studies can still
help our understanding of the effects of STD on mv transmission and of relevant mv prevention strategies based on these effects. One question has cleat priority: whether cofactor magnitudes are larger for recognised (symptomatic) than for unrecognised (subjectively asymptomatic, as opposed to clinically detectable) STD.An interestiog subsidiaty question may be whether the correlation between symptoms and mv transmission increases when health education campalgos take place.While scientifically, the ideal desigo would be to evaluate not only mv shedding but also actual transmission, the ethica! acceptability of this is debatable.Another area of interest is the effect on mv shedding and mv transmission of bacterial vaginasis - with a correction for its clustering with other STD - in
order to test the current insight that BV is not an independent cofactor. Furthermore, in view of the increasing proportion of genital ulcers that are due to HSV-2 in many developing countries [O'Farrell1999], the strength ofthe cofactor effect ofherpetic recurrences relative to syphilis, chancroïd and ptimary HSV-2 may be worth investigatiog.

General discussion
10.5 IMPUCATIONS FOR mv PREVENTION POUCY
10.5.1 STD treatment vs. behavioural intervention
The cofactor studies demonstrated that cofactor values remain uncertain and are possibly lower than previously tbought.The simulations suggested that the reduction in HIV incidence following the Mwanza intervention is unlikely to have been fully mediated by reductions in STD cofactor burden brought about by the STD treatment. These combined results suggest that the expectations of the role of STD cofactor burden rednetion in HIV prevention should be tempered.
A question not yet ö.-plidtly addressed is how STD treatment fares as an HIV prevention strategy in comparison with alternative control options, notably reductions in sö."Ua! risk behaviour. In sub-Saharan Africa, strikingly few 'primary prevention progranunes · have been evaluated for their effects on SID and HIV rat es in randomised trials [La ga et al. 1994, Aral & Peterman 1998, Oakley et al. 1995]. Simulations described lochapters 6, 8 and 9 and elsewhere [Worldbank 1997] indicated that behaviour change in high-risk groups · locluding decreased partner change rates, reduced prostitution, or postponement of first sexual activity by actalescents. at response levels actually found loA.frican populations [Asi· imwe-Okiror et al. 1997,Ng'weshemi et al. 1996, Konde-Luleet al. 1997,]ackson et al. 1997c], is very effective against both HIV and STD'. lmportantly, behavioural change is relatively powerful as compared to STD treatment at the level achieved in the Mwanza and Rakai trials, irrespective of the magnitude of STD cofactor effects. This is because behaviour change, by prevenring both HIV and STD, also benefits from the cofactor effect. In termsof cost-effectiveness, the pri· macy of primary prevention over STD treatment may be even more pronounced, because of the high costs of STD clinic set-up, maintenance, drugs, and staff train·
ing, relative to education progranunes and media campaigns [Moses et al. 1991, Worldbank 1997]. The costs and cost -effectiveness of behavioural interventlans have, however, proven diffi.cult to estimate quantitatively [Sweat et al. 2000,]ha et al. 200 1]; and they may vary between populations, depending on what types and frequencîes of activities are most appropriate.
Inspired by tl1e recent expansion of possible types of control activities, includ· ing antiviral HIV therapy and STD screening, there are now calls to re-prioritise (targeted) behavioural interventions [Aggleton et al. 1994,Ainsworth & Teok"U! 2000,Jha et al. 2001, Mersonet al. 2000].The idea is that, where implementation capaciry is weak, focusing on a smaller, core set of the most cost-effective
* For comparison with the STD treatment intenrentions: simulated proportional IDV incidence reductions over the fust two years of interventions reducing the rate of partner change or the occurrence of prostitution ranged between 19% and 58%.
219

220 Chapter 10
actlvities is most likely to have an impact. In most African countries, efforts on promoting behavioural change can - with the aid of international donor money - be upscaled [Over & Piot 1996, Worldbank 1997,Ainsworth & Teol.ul 2000]. Meanwhile, further research on behavioural intervendons in SSA is being both advocated and conducted [Aral & Peterman 1998, Ainsworth & Teol.ul 2000, Merson et al. 2000]; these indude intervention trials, qualitative and sociobehavioural studies on the optimisation of education sessions, media messages and condom distribution campaigns in termsof groups targeted and context-specificiry [Steen et al. 2000].
Conduding that behavioural intervendons always have more potendal than STD treatment would, however, depend on several additional considerations. It is questionable whether behavioural changes at the intensities that occurred in Uganda and featured in the success stories that forrned the examples in Chapter 6, are to be expected in all populations. The Ugandan trend may have resulted from an intrinsic response in the population occurring independently of the nationalAIDS control programme, or it may have been just the effect of socioeconomie stabilisation after the end of the civil war in 1986 (Chapter 8 and [LewBeer et al. 2000]). Thus, even though behavioural change would be the most effective response, it may be a more feasible goal for intervention programmes to improve the qualiry and use of STD treatment services. In addition, it is undear whether a behavioural focus is recommended for countries where (spontaneous) behaviour change is already taking place. In such populations, more might be gained by improving the medica} management of cofà.ctor STD not rapidly responding to behavioural risk reduction, such as recurrent genital herpes.
These results do not imply that improving comprehensive STD management is
unimportant for HIV prevention, since any association between STD and Hiv, whether causal or due to shared risk factors, supports the strategy of targeting HIV prevention to STD patients. Although this remains to be evaluated, the Mwanza trial outeernes may be interpreted as evidence of a beneficia! effect of comprehensive STD management on HIV incidence by other means than the reduction of STD cofactor burden. Regardless of cofà.ctor magnitudes, STD management induding counselling and education is therefore an important way to reach those individuals at highest risk of contracting and spreading HIV In several SSA countries, these sociobehavioural aspects of dinic-based STD management receive comparatively little attention, and are amenable to impravement [Bryce et al. 1994, Harrison et al. 1998, Garcia et al. 1998, Harrison et al. 2000, O'Hara et al. 2001,Voeten et al. 2001, Chilongozi et al. 1996, Somseet al. 2000, Moses et al. 2000]. Finally, even though the compatative impact of STD management on HIV prevention may be limited, no single prevention strategy in isolation is sufticient to halt HIV spread in the countries worst affected.
The main limitation to the ovetall effectiveness of clinical STD management is probably its Iow coverage, which is due to low symptom probabilities. This
General discussion
means that population-based STD health education to improve STD symptom recognition and health seeking behaviout is of paramount importance. In view of the large proportion of STD patients who, in the fust instance, seek care from such non-medically-trained hea!th care providers as drug peddlers, pharmades or traditional healers [Mwabu 1986, Faxelid et al. 1998, Moses et al. 1994, Ward et al. 1997,Wa!ker et al. 2001], there may be great potential for soda! marketing of
pre-packaged self-help STD management kits containing, besides antibiotics for (syndromic) treatment, patient education matetial, condoms and partner referral cards [Kambugu et al. 2000, Castro et al. 2000, Hartison et al. 2000]. Training of staffin pharmades mayalso be indicated [Garcia et al. 1998].
Two behaviout components to patient management are key to improving
cute rates among symptomatic STD clinic attendants [Adler 1996]. The fust is counselling on therapy compliance, i.e. on completing multiple-dose therapies and not shating dosages with partners and ftiends - a practice which increases the development of drug resistance. Second, better notification and referral for treatment ofinfected partners maybe desirable,forthe prevention of (continua!) STD re-infection (the so-called ping-pong effect). On the medical/technical site, options for improverneut might be sought in the improverneut of diagnostics and oftherapies.With regard to improving the cost-effectiveness of clinical management in lower-prevalence populations, the challenges include the development of diagnostic tests that are cheap and easy to perform by unskilled staff workingin less-well-equipped laboratories.An additional actvanrage of this alternative to the syndromic approach might be that it reduces the risk of development and spread of drug resistance caused by the overtreatment of uninfected patients [Steen & Dallabetta 1999]. Priorities for treatment options include the development of cheaper drugs, of alternative drugs for resistant STD strains (such as for gonorrhoea), and of single-dose regimens, the intake of which can
be observed by the physician, ensuting compliance and thus redudng the risk of resistance development. Recently, attention has also tutned to affordable forms for antiviral treatment of herpetic ulcers, especially for immunocompromised HJV 1 AIDS patients who may suffer severe and frequent herpetic recutrences [Chen et al. 2000].
The aims proposed for the improverneut of clinical STD treatment are mostly long-term and, once acbieved, are not likely to be the most cost -effective improvements to STD or HJV control. Nevertheless, their indirect effects should not be overlooked. Improved clinical management will improve patient satisfaction and
lead to increased clinic attendance. A consideration so far ignored is the effect of interventions on the disease
butden caused by STD themselves. In comparison to the morbidity and mottality caused by HIV; this butden is small, especially in sub-Saharan Attica [Mutray &
Lopez 1996]; therefore, the ranking of interventions in terms of their impact on
HJV will mostly outweigh the ranking in terrns of impact on STD. In genera!, the intervention that is the most (cost-)effective against HIV is also the most (cost-
221

222 Chapter 7 0
)effective against STD [Pettifor et al. 2000, Moses et al. 2000] - although there are exceptions (see for example sectien 75 on syphilis control).
10.5.2 Other HIV prevention strategies?
Relatively new fields of attention are 'structural intervention' and the 'multisectoral approach', which a.i.tn to address the envirOnment in which risk behaviour takes place [Decosas & Pedneault 1996, O'Reilly & Piot 1996, Sweat & Denison 1995, Merson et al. 2000]. Structural interventlens would focus on removing or mitigating structural and environmental risk tactors, such as mobility and migration, including seasonal Iabour and bmily segregation, social disroption due to war and politica! instability, and the lack of education and income opportunities for woroen that underlies their economie and se>..-ual dependence, as well as underlying overall economie underdevelopment and poverty.Though their feasi· bility and effectiveness remain to be demonstrated, these interventions are con· sidered by some to have great promise ·at least in the longer-term [Merson et al. 2000] .Yet it is questionable whether HIV prevention budgets should be diverted to these more general health and developmental interventlens [Ainsworth &
Teoh."Ul2000], and this could not be dedded by epidemiologists and health policy makers alone.
Probably more important for HIV prevention than a continued focus on HIV/ STD interactions is the deve!opment of an HIV vacdne. This has progressed considerably over the last decade, and several candidate vaccines are being evaluated in phase ill trials. Yet, in the short term, the prospects for the use of effective vaccination remain poor. Due to the large geographical variability between HIV viral strains and subtypes, vacdnes which are effective in one population may not be useful in others. The implementation of vaccination wil! pose additional challenges: immunisation programmes targeting all se"."ually active adults require more upscaled and sophisticated logistics than the programmes of inbnt and child vaccination that are currently feasible [Stott & Hahn 1999, Esparza & Bhama· rapravati 2000]. And even with universa! vaccination against HN, the need for behavioural programmes would remain: HIV vaccines are like!y to be less than 100% protective, so a false sense of security and consequent upsurge in unsafe behaviours could easily have deleterleus actverse effects [Blower & Mclean 1994, Andersen et al. 1995]. Additionally, in theory at least, if there is no behaviour change, the countries now most affected and at risk wil! remain highly susceptible to similar epidernies of new se:>:ually-transmitted viruses.

General discussion
10.6 CONCLUSION
In condusion, our studies on STD cofactor effects on IllV transmission demonstrared that, while the magnitude of these effects remains uncertain and cannot be estimated on the basis of observational studies, they are possibly mucb lower tban previously thought. At the same time, this reanalysis con.fumed that SID
are good indicators of the risk of contracting and spreading HIY, and that, as sucb, SW clinics are an important access cbannel for targeting HIV prevention to those individuals most in need.
The simulation-aided analyses of the Rakai and Mwanza SID treatment ttials suggested three factors to be important in explaining their contrasring outcomes:
the behaviour change in U ganda preceding the Rakai trial
the relatively late stage of the HIV epidemie in Rakai as compared to Mwanza an imbalance between study arms in HIV prevalence, sm rates and some of tbeir risk factors at baseline in Mwanza.
These factors were sufficient to e.:plain the lack of impact on HIV in Rakai, but could not fully explain the considerable impact on HIV - without large Sm reductions - in Mwanza. Another explanation for the latter - apart from chance - may lie in behavioural effects of the Mwanza intervention on HIV incidence; this could however not be ascertained from the ttial data. For a better quantitative understanding of the role of sm care in HIV prevention, new ttials of syndromic management, allowing a distinction bernreen cofactor-mediated and other (behavioural) effects, would therefore be needed.
The results suggest that the high expectations of the effectiveness of sm cofactor burden reduction in HIV prevention should be tempered. Lacking further evidence, this has three main implications for practical HIV control:
More attention for the behavioural components of STD management, such as counselling on the prevention of re-infection and partner infection, and the distribution of condoms, is essential.
· To imprave the use of SW management services, parallel population-based sm health education is indicated.
· The promotion of behavioural risk reduction reroains the frrst priority in any setting; this should be addressed through education, skill-bullding, and through novel, possibly more structural, approaches.
223


BmuoGRAPHY
Adam E, Kaufman RH, Mirkovic RR and Meinick ]L (1979). Persistenee of virus shedding in asymptomatic woroen after recovery from herpes genitalis. Obstet Gynecol 54(2): 171-3.
Ad.Ier M, Foster S, Richens] and Slavin H (1996). Sexual health and care: so:ually transmitted infections. Guidelines for prevention and treat:ment [occasional paper}. London, ODA Health and population.
Adler MW (1996). Se..'.."Ually transmitted dlseases control in developing countries. Genitourin Med 72(2): 83-8.
Aggleton P, O'Reilly K, Slutkin G and Davies P (1994). Risking everything? Risk behavior, behavior change, andAIDS. Science 265: 341-345.
Ainsworth M and Teoh.-ul W (2000). Breaking the silence: setting realistic priorities for AIDS control in less-developed countries.Lancet 356:55-60.
Alani MD,Darougar S,Macd.Burns DC,Thin RN and Dunn H (1977).lsolation of Cblatnyd.Ia trachorn.atis from the male urethra.BritJ.Vener.Dis. 53:88-92.
Alary M, Laga M,Vuylsteke B, Nzila N and Piot P (1996). Signs and symptoms of prevalent and inddent cases of gonorrhea and genital chlamydia! infection among female prostitutes in Kinshasa, Zalte. Clin Infect Dis 22(3): 477-84.
Albrecht MA, DeLuca NA, Byrn RA, Schaffer PA and Hammer SM (1989). The herpes simplex virus immediate-early protein, ICP4, is required to potentiate replication of human inununodeficiency virus in CD4+ lymphocytes.]Viro/63(5): 1861-8.
Alexander ER, Chand.Ier J, Pheifer TA, Wang S-P, English M and Hohnes KK (1977). Prospective study of perinatal Chlamydia trachomatis infection. In: Nongonococcal uretbritis and related infections. D Hobson and KK Holmes [Eds.]. Washington DC, Am.Soc.for Microbiology: 148--152.
AmbroziakJ and Levy JA (1999). Epidemiology. natura! history, and pathogenesis of HlV infection (Ch.lS). In: Sexually Transmitted Diseases. KK Holmes, P-A Mardh et aL [Eds.]. NewYork, McGraw-Hill Companies, Inc.
Andersen RM and May RM (1988). Epidemiological parameters of HIV trnnsmission. Nature 333(6173): 514-9.
Anderson R.J.\1 (1989).Mathematical and statistica! studies ofthe epidemiology of HIV [Editorial review].AIDS 3: 333-346.
Andersen RM (1991). Mathematica! roodels of the potential demograpbic impact of AIDS inAfrica. [Review].Aids 5(1): 537-44.
Andersen RM and May R.i.\1 (1991)./nfectious diseases ofhumans;dynamics and control. Oxford, Oxford Uoiversity Press.
Anderson R.M (1994). The Croonian lecture, 1994. Populations, infectious discase and immunity: a very non-linear world.
Anderson RM, Swinton J and Garnett GP (1995). Potenrial impact of low efficacy HlV-1 vaccines in populations with high rates of infection. Proc R Soc Lond B Biol Sci 261(1361): 147-51.
.Antal GM and Causse G (1985). The control of endemie treponematoses. Rev.InfDis. 7(Suppl.2): S22Q-S226.
Aral SO and Peterman TA (1998). Do we know the effectiveness of behavioural intenren~ tions? Sex.Transm.Dis. 35l(Suppl.III): S33-S36.
Arya OP,Nsanzumuhire Hand Taber SR (1973). Clinical, cultural, and demographic aspects of gonorrhoea in a rural community in Uganda. Bull World Health Organ 49(6): 587-95.
Asamoah·AduA,Weir S,Pappoe M, Kanlisi N, NeequayeA and Lamptey P (1994).Evaluation of a targetedAIDS prevention inrenrention to increase condom use among prostitutes
225

226 Bibliography
in Ghana. AIDS 8: 239-246. Asümwe-Okiror G, OpioAA, MusinguziJ, Madraa E,Tembo G and Carael M (1997). Cbange
in sex"Ual behaviour and decline in HIV infection among yount pregnant women in urban Uganda.AIDS 11: 1757-1763.
Augenbraun M, Felchrum J, Chirgwin K, Zenilman ], C!arke L, DeHovitz ], Landesman S and Minkoff H (1995). Increased genital shedding of HSV type 2 in HN-seropositive women.Ann.IntMed. 123(11): 845-347.
Auvert B, Moore M, Eertrand WE, Beauchet A, Aegerter P, Lusamba D, Diong KT and KlinowskiJ (1990). Dynamics of HIV infection andAIDS in centralAfrican cities.Jnt j Epidemio/19(2):417-28.
BakirTME HossainA, De-Silva S, SiddiquiA, Sengupta BS, El-Sheikh MM and Bakir AF (1989). Enzyme immunoassay in the diagnosis of Chlamydia trachomatis infections in diverse patient groups.]Hyg.Epid.Microbiol.ImmunoL 33(2): 189-197.
Barnett SD and BrundageJF (2001). Incidence of recurrent diagnoses of Chlamydia trachomatis genital infections among male and female soldiers of the US Army. Sex Transm Infect 77(1): 33-6.
Barongo l.R,BorgdorffMw,Mosha FF et al. (1992).The epidernio1ogy ofHN-1 infection in urban areas, roadside settlements and rural villages in Mwan7..a region,Tanzania.AJDS 6: 1521-1528.
Bemstein RS, Sokal DC, Seitz ST,Auvert B, Stover] and Namaara W (1998). S!mulating tbe control of a heteroso..-ual HIV epidemie in a severely affected East~African city: computational modeling of single vs. combined intervention strategies with the iwgAIDS and sirnulAIDS models.Inteifaces 28(3): 101-126.
Eertrand JT, Makani B, Hassig SE, Lewu Niwembo K, Djunghu B, Muanda M and Chirhamoleh."Wa C (199l).AlDS-related knowledge, so.:ual behavior, and condom use among men and women in Kinshasa, Zan:e.AmJPubl.Healtb 81(1): 53-58.
Blower SM and Mclean AR (1994). Prophylactic vaccines, risk behavior change and the probability of eradicating IDV in San Francisco. Science 265: 1451-1454.
Blower SM, Porco TC and Darby G (1998). Predicting and preventing the emergence of antivital drug resistance in HSV-2.Nat.Med. 4(6): 673-678.
Blower SM, Gershengom HB and Grant Rl\1 (2000).A tale of two futures: IDV and antiretroviral therapy in San Francisco Isee comments]. Science 287(5453): 650-4.
Boily MC andAnderson R..l\1 (1996). Human immunode.ficiency virus transmission and the role of other se..,:ually transmitted diseases. Measures of association and study design. Sex Transm Dis 23(4): 312-332.
Boily MC, Lowndes CM and Alary M (2000). Complementary hypothesis conceming the community sö."Ually transmitted disease mass treatment puzzle in Rakai, Uganda.Aids 14(16): 2583-92.
Borchardt KA, Hemandez V, Milier S, Loaiciga K, Cruz L, Naranjo S and Maida N (1992).A clinical evaluation of trichomoniasis in San ]ose, Costa Rica using the InPouch TV test. Genitourin Med 68(5): 328-30.
Borgdorff MW (1994). Epiderniology of HN-1 infection in Mwarza region,Tanzania, University of Amsterdam.
Borgdorlf MW, Baron go LR, Newell ]N, Senkoro KP, Deville W, Vel erna ]P and Gabone R.J.\1. (1994). So.."Ual partner change and condom use among urban factory workers in northwestTanzania. Genitourin Med 70(6): 378-83.
Boyd JT, Csonka GW and Oates JK (1958). Epiderniology of non-specific uretbtitis. BritJVener.Dis. 34:40-43.
Brody S (1996).Incidence ofiDV infection decreases because of nature of epidemics.BMJ 312:125.
Bronham RC and Plummer FA (1990).A genetal model of sexually transrnitted disease epiderniology and its !mplications for contro!.Med Clin North Am 74(6): 1339-52.

Bibliography
Brunham RC and Ronald AR (1991). Epidemiology of Se.,:ual.ly Transmitted Diseases in developing countries.ln: Research Issues un Human Bebaviour and Sexually Transmitted Diseases in tbe AIDS era.]N Wasserheit IEds.]. Washington,American Society for Microbiology' 61-80.
Bronham RC (1997). Core group theory: a central concept in STD epidemiology-. Venereology 10(1): 34-39.
Bryce J,Vernon A, Brathwaite AR, Perry S, Figueroa]P and Emerson RB (1994). Quality of se-.."Ually transrnitted disease services in Jamaica: evaluation of a dinic-based approach. Collaborative Werking Group on Indicators of SID Case Management. Bull World Health Organ 72(2): 239-47.
Buhaug H, Skjeldestad FE, Backe B and Dalen A (1989). Cost effectiveness of testing for chlamydia! infectionsin asymptorn.atic women.Med Care 27(8):833-41.
Buimer M, van Doomurn GJ, Chlng S, Peerbooms PG, Plier PK, Ram D and Lee HH (1996). Detection of Chlamydia trachomatis and Neisseria gonorrhoeae by Iigase chain reaction-based assays with clinical specimens from various sites: implications for diagnostic testing and screening.] Clin Microbiol34(10): 2395-400.
Bureau of Statistics Tan7.ania and Macro-International (1997). Tan7..ania Demographic and Health Survey 1996. Calverton, MD, Bureau of Statistics and Macro International.
Burstein GR, Zenilman JM, Gaydos CA, Diener-West M, Howell .MR, Brathwaite W and Quinn TC (2001). Predietors of repeat Chlamydia trachomatis infections diagnosed by DNA amplifi.cation testing among inner city females.Sex Transm Infect 77(1): 26-32.
BuvéA, I.aga M, Crabbe F,Vuylsteke Band Van Lerberghe W (1993).A model for the operational assessment of case detection and management of STDs [abstract \VRT 015]. Vlllth International Conference on AIDS inAfrica, Marrakech.
BuvéA, Carael M,Hayes Rand Robinson NJ (1995).Variations in HIV prevalenee between urban areas in sub-SaharanAfrica: do we understand them? [Review] .AIDS 9(Suppl.A): S103-109.
Buvé A, Gavyole A, Mugeye K, Mayaud P, Grossb:urth H, Todd J and Ha yes R (1998).A closer look at the intervention of the Mwam:a trial: how many patients with an STD are cured by health services? 12th World AIDS conference, Gen eva, Swit7.erland.
Cameron DW, Simonsen JN, D'Costa LJ et al. (1989). Female to male transmission of human immunode.ficiency virus type 1: risk factors for seraconversion in men. Lancet 2(8660): 403-7.
Caraël M, ClelandJ andAdeolüm L (1991). Overview and selected findingsof so.."Ual behaviour surveys. [Review].Aids 5(1): S65-74.
Caraël M (1995). Sö."Ual Behaviour. In: Sexual bebaviour and AIDS in the developing world.J Cleland and B Ferry [Eds.]. London,World Health Organization' 75-123.
Caraël M, ClelandJ, Deheneffe}<.:,Ferry Band lngham R (1995). So:ual behaviour in developing countries: implications for HIV controLAIDS 9(10): 1171-1175.
Carpenter L\1, KamaliA, RuberantwariA, Malamba SS and WhitworthJAG (1999). Rates of HIV-1 transmission within marriagein rural Uganda in relation to the HIV sero-status ofthe partners.AIDS 13:1083-1089.
Carroll KC,Aldeen WE,Morrison M,Anderson R, LeeD and Mottice S (1998). Evaluation of the Abbott LCx ligase chain reaction assay for detection of Chlamydia trachomatis and Neisseria gonorrhoeae in urine and genital swab specimens from a sexually transmitted disease clinic population.J Clin Microbio/36(6): 163().3.
Carswell]W (1987). HlV infection in healthy persons in Uganda.AIDS 1:223-227. Castro JR, D'Agnes L,Aquino C and Bocromeo ME (2000). Breaking the HlV transmission
cycle tbrough social marketing of STI management kits in the Philippines. XIIIth InternationalAids Conference, Durban, SouthAfrica.
Cattersou ML and Zadoo V (1993). Prevalenee of asymptomatic chlamydia! cervical infectionin active dury army females.Milit.Med. 158: 618-619.
227

228 Bibliography
Cave VG, Bioomfield RD,Hurdle ES, Gordon EW and Hannnock D (1969), Gonorrhea in the obstetrie and gynecologic clinic,)AMA 210(2): 309-31 L
Chen CY,Ballard RC,Beck-Sague CM et aL (2000).H1V infection and genital ulcer disease in South Africa. The herpetic connection. Sex. Transm.Dis. 27(1): 21 ~29.
Chilongozi DA, Daly CC, Franco L, Liomba NG and Dallabetta G (1996). Se>.-ual.ly transmitted diseases:a survey of case management in Malawi. Int] STDAIDS 7(4): 269-75.
Choi K-H and Coates TM (1994). Prevention of HIV infection [Editorial review].AJDS 8: 13ïl-1389.
Chokephaibulkit K, Patamasucon P, List M, Moore B and Rodriguez H (199ï). Genital Chlamydia trachomatis infection in pregnant adolescents in East Tenessee: a 7-year casecontrol study.JPediatr.Ad.olesc.Gynecol. 10:95-100.
Cl eland], Caraël M, Deheneffe J-C and Ferry B (1992). S""--ual behaviour in the face of risk: prelim.inary results from fust AIDS..related surveys. Health Transition Rev 2, suppL: 185.
Clemetson DBA, Moss GB,Willerford DM et al (1993). Detection of H1V DNA in cervical and vaginal secretions. Prevalenee and correlates among woroen in Nairobi, Kenya. ]AMA 269(22): 2860-2864.
Coale JA and Demeneny P (1966). Regionat model life tables ana stabie populations. Princeton, New Jersey, Princeton Urtiversity Press.
Cohen CR, Duerr A, Pruithlthada N, Rugpao S, Hiliier S, Garcia P and Nelson K (1995). Bacterial vaginasis and HIV seroprevalence among temale commercial sex workers in Chlang Mal, Thailand. AIDS 9(9): 1093-109ï.
Cohen MS, Ho.ffman IF, Royce RA et al. (1997). Reduction of concentradon of HIV-I in semen after treatment of uretbritis: implications for prevention of so.."Ua.l transmission ofHlV-l.Lancet 349: IS68-18ï3.
Colebunders RL and Latif AS (1991). Natura! lUstory and clinical presentation of HlV-1 infection in adults. [Review].A.ids 5(1): S 103-12.
Colvin M, Abdool Karim SS, Connolly C, Hoosen AA and Ntuli N (1998). H1V infection and asymptomatic sexually transrrtitted infections in a rural SouthAfrican community. IntJ.=&AIDS 9: 548-550.
Cone RW, Hobson AC, Palmer J, Remington M and Corey L (1991). fu.-tended duration of herpes simplex virus DNA in genitallesions detected by the polymerase chain reaction.j Infect Dis 164(4): ï5ï-60.
Corey L, BenedettiJ, Critchlow C et al. (1983). Treaunent of primary fust-episode genital herpes simplex virus infections with acyclovir: results of topica!, intravenous and oral therapy.j Antimierob Cbemother 12 Suppl B: ï9-88.
Costello Daly C, Franco L, Chilongozi DAT and Dallabetta G (1998a).A cost comparison of approaches to so..-ually transrrtitted discase treatment in Malawi.Health Policy and Planning 13(1): Sï-93.
Costello Daly C,Wangel &\1, Hoffman IF, Canner ]K, Lule GS, Lema VM, Liomba NG and Dallabetta GA (1998b). Validation of the WHO diagnostic algorithm and development of an alternative scoring system for the management of women presenting with vagina! discharge in Malawi. Sex Transm Infect ï4 Suppll: S50-8.
Crawford C, Knapp JS, Hale ] and Holmes KK (19ïï). Asymptomatic gonorrhea in men: caused by gonococcî with unique nutritional requirements. Science 196( 4296): 1352-3.
Csonka GW and Oates ]K (1990). Syphilis. In: Sexually Transmitted Diseases;A textbook of genitourinary Medicine. GW Csonka and]K Oates [Eds.J. London etc, Bailliere Tindali. ho, 22ï-2ï6.
Cutier ]C, Kvittingen], Rose E and McCulloughJC (1952). Mass treaunent of syphilis in an Indian province.Bu/1. Worid llltb. Org. 5: 3ïï-439.
DadaAJ,AjayiAO, Diamondstone L, Quinn TC, BlattnerWA and Biggar RJ (1998).A sero-

Bibliography
survey of Haemophilus ducreyi, syphilis, and herpes simplex virus type 2 and their association with human immunodeficiency virus among temale sex workers in Lagos, Nigeria. Sex Tram;m Dis 25(5): 237-42.
Dallabetta GA, Gerbase AC and Holmes KK (1998). Problems, solutions and challenges in syndromic management of so.-ually transmitted d.iseases.Sex. Transm.Dis. 74(SuppL 1): S1-Sll.
Darrow WW (19ï6). Venereal infections in three ethnic groups in Sacramento. Arn.]Publ.Health 66(5): 446-450.
D'Costa LJ, Plutnmer FA, Bowmer I, Fransen L, Piot P, Ronald AR and Nsanze H (1985). Prostitutes are a major reservoir of se..'\."Ually transmitted discases in Nairobi, Kenya. Sex Transm Dis 12(2): 64-7.
De Schryver A and Meheus A (1990). Epiderrtiology of so..'Ually transrnitted diseases: the global picture. Bull. WHO 68(5): 639-654.
De Vmcenzi I, for the European study group on heteroso..-ual transmission of HN, (1994). A longitudinal study of HIV transmission by heterose:x.-ual partners. New EnglJ.Med. 331(6):341-346.
Decasas J and Pedneault V (1996). Preventing STD tbrough individual- and population-based pubtic health approaches: social and politica! implications. Jlnf.Dis. 174(Suppl.2): S248-S52.
DickersonMC,JohnstonJ,DeleaTE,WhiteA andAndrews E (1996).The causal role for genital ulcer disease as a risk factor for transmission of human immunodeficiency virus -an application of the Bradford Hili criteria. Sex.Transm.Dis. 5: 429-440.
Draper D, Parker R, Patterson E,Jones W, Beutz M, French J, Borchardt K and McGregor J (1993). Detection ofTrichomonas vaginalis in pregnant women with the InPouch TV culture system.j Clin Microbiol31(4): 1016-8.
Edw.u:ds D, Phillips D and Stancorobe S (1985). Chlamydia trachomatis infection at a family planning clinic.New ZealandMedical]ournal98: 333-335.
Esparza} and Bbamarapravati N (2000).Accelerating the development and future availability of HIV-1 vaccines: why, when, where, and how? Lancet 355(9220): 2061-6.
Ewald PW (1994). Evolution of mutation rate and virulence among human retroviruses. Fbilos Trans R Soc Lond B Biol Sci 346(1317): 333-41;discussion p. 341-3.
Fa.xelid E,Ahlberg B:\1, Ndulo] and Krantz I (1998). Health-seeking behaviour of patients with STDs in Z:.rmbia.EastAJrMedJ April: 232-236.
Ferguson NM, de Wolf F, Ghani AC et al. (2000). Antigen-driven CD4+ T cell and HIV-1 dynamics: residual viral replication under highly active antiretroviral therapy. PNAS 96(26): 15167-15172.
Feyisetan Band Pebley AR (1989).Premarital sö.-ual.ity in urban Nigeria. Studies in Famüy Planning 20(6 Pt.): 343-354.
Fiscus SA,Vemazza PL, Gilliam B,Dyer J, Eron]J and Cohen MS (1998). Factors associated with changes in HIV shedcling in semen. AIDS Res.&Hum.Retrovir. 14(Suppl.1): S27-S31.
FishAN], Fairweather DVl, Oriel ]D and Ridgway GL (1989). Chlamydia trachomatis infection in a gynaecology clinic population: identification of high-risk groups and the value of contact traciDg.EuropJObstet.Gynecol.Reprod.Biol. 31:67-74.
Fleming DT and Wasserheit ]N (1999). From epidemiological synergy to public health policy and practice: the contribution of other sö."Ually transmitted discases to sö.-ual transmission of HIV infection. Sex. Transm.Inf 75: 3-17.
Fonck K, Ka u! R, Kimani] et al. (2000).A randomized, placebo-<:ontrolled trial of monthly v .. itbromycin prophylaxis to prevent sö."Ually transmitted infections and HIV-1 in Kenyan se.x workers: smdy design and baseline findings. Int] STD AIDS 11(12): 804-ll.
Forsythe SS (1998). The affordability of antiretroviral therapy in developing countries:
229

230 Bibliography
wbat policymakers need to know.AIDS 12(Suppl2): Sll-S18. Fouts AC and Kraus SJ (1980).Trichomonas vaginalis: reevaluation of its clinical presenta
tion and laboratory dlagnosis.J Infect Dis 141(2): 137-143. Fransen L, Nsanze H, D'Cosra LJ, Bronbam RC and Piot P (1985). Parents of infants
with ophthalmia neonatorum: a high-risk group for so..-ually transrnitted diseases. Sex Transm Dis 12(3): 150-4.
Fylkesnes K, Musonda RM:, Sichone M, Ndhlovu Z, Tembo F and Monze M (2001). Declining HIV prevalenee and risk behaviours in Zambia: e\>idence from surveillance and population-based surveys. Aids 15(7): 907-16.
Gao F,Bailes E,Robertson DL et al. (1999). Origin of HIV-I in the ebimpanzee Pan troglodytes troglodytes.Nature 397(6718):436-41.
Garcia PJ. Gotuzzo E, Hughes ]Pand Holmes KK (1998). Syndromic management of STDs in pharm.acies: evaluation and randomised intervention triaL Sex Transm Infect 7 4 Suppl1:Sl53-8.
Garnett GP and .Anderson RM (1993a). Factors centrolling the spread of HIV in heteroSe::\.'Ua.l cornmunities in developing countries: patterns of mi""'ring bernreen different age and se;,-ual acti,ity classes. Fbilos Trans R Soc Land B Biol Set 342(1300): 137-59.
Gamett GP and Anderson RM (1993b). Contact tracing and the estimation of se."Cllal mix:ing patterns: the epidemiology of gonococcal infections. Sex.Transm.Dis. 20(4): 181-191.
Gamett GP and.Anderson RM (1995). Strategies for limiting the spread of mv in developing countries: conclusions based on studies of the transmission dynamics of the virus. jAcq.lmm.DefSyndr.Hum.Retrovirol. 9:500-513.
Gamett GP and.Anderson R..\1 (1996a). SC),.-ualJy transmitted diseases and se-..Llal behavior: insights from mathematica! models. [Review].] Infect Dis 174(2): S150-61.
Gamett GP andAnderson R.l\1 (1996b).Antiviral therapy and the transmission dynanalcs of fflV-l.]Antimicrob.Chemother. 37(Suppl.B): 135-150.
Gamett GP, Ara! SO, Hoyle DV, Cates W and Anderson RL\1 (1997). The natura! history of syphilis. Implications for the transmission dynamics and control of infection. Se.x.Transm.Dis. 24(4): 185-200.
Gamett GP and Johnson AL\1 (199ï). Coining a new term in epidemiology: concurrency and fflV [editorial; comment] .Aids 11(5): 681-3.
Garnett GP and Brunham RC (1999). Magie bullets need accurate guns - syphilis eradication. elimination, and controLMicrobes Infect 1(5): 395-404.
Gamett GP, Mertz KJ, Finelli L, Levine WC and St. Louis ME (1999). The transmission dynamics of gonorrhoea: rnadelling the reported behaviour of infected patients from Newark, New Jersey.Phil.Trans.R.Soc.London 354:787-797.
Garnett GP and Rottingen JA (2001). Understanding the dynamic consequences of infectieus disease interactions and fractions attributable to STDs.14th Meeting of the International Society for Sexually Transmitted Diseases Research, Berlin, Germany.
Ghani AC, Swinton J and Garnett GP (199ï). The role of se-..Llal partnership networks in the epidemiology of gonorrhea. Sex.Transmitted Dis. 24(!): 45-56.
Ghani AC. Donnelly CA and Gamett P (1998). Sampling biases and missing data in ex-plorations of se;.,._Llal partner nerworks for the spread of SC)..-ually transm.itted diseases. Stat.Med. 17:2079-2097.
Ghys PD, Diallo MO, Ettiègne-Traoré V et al. (1995). Genital ulcers associated with human immunodeficiency virus-related immunosuppression in female sex workers inAbidjan, lvory Coast.J Infect Dis 172: 1371-1374.
Ghys PD, Fransen K, Diallo :MP et al. (1997). The associations between cervicovaginal lllV shedding, se;.,._Lially transmitted diseases and immunosuppression in female sex workers inAbidjan, Cote d'lvoire.AIDS 11: F85-F93.
Gilson L, Mkanje R, Grossl"Urth H et al. (199ï). Cost-effectiveness of improved treatment

Bibliography
services for se:x."Ually transmitted diseases in prevenring HIV~ 1 infection in Mwanza region,Tanzania.Lancet 350:1805-1809.
Goh CL. Epidemiology of se..'\.."Ualy transmitted diseases in Singapore, 19n to 1993- Ann AcadMed Singapore 1995, 24(4): 495·9.
Goldberg B and Stricker RB (2000). Bridging the gap: human diploid cell straffis and the origin of AIDS.] Theor Bio/204(4): 497-503.
Gray RH, Wawer MJ, Sewankambo NK et al (1999). Relative risks and population attributable fraction of inddent HIV associated with symptoms of so..."Ually transmitted discases and treatable symptomatic se.. ..... "Ually tra.nsmitted discases in Rakai district, Uganda.AIDS 13: 2113·2123.
Gray RH, Wawer MJ, Broekmeyer R et aL (2001). Probability of HIV-I transmission per coital act în monogamous, heteroso:ual, HIV-I-discordant couples in Rakai, Uganda. Lancet 357(9263): 1149-53.
Gregson S, Zhuwau T, Andersen RM and Chancliwana SK (1998). Is there evidence for behaviour change in response to AIDS in rurai Zimbabwe? Soc Sci Med 46(3): 321-330.
Grin EI and GutheT (1973). Evaluation of a previous mass treatment campaign against endemie syphilis in Bosnia and Herzegovina.BritJ.Vener.Dis. 49(1): 1·19.
Grossk.Llrth H, Mosha F, Todd J et al. (1995a). Impact of improved treatment of sexually transmitted diseases on HIV infection in rural Tanzania: randomised controlled trial. Lancet 346(8974): 530-6.
Gross>:urth H, Mos ha F,Todd J et aL (1995b ).A community trial of the impact of improved sexually transmitted disease treatment on the HIV epidemie in rural Tanzania: 2. Base· line survey results.AIDS 9(8): 927-934.
Grossl.-urth H. Mayaud P, MoshaF et al (1996).Asymptomatic gonorrhoea and chlamydia! infection in rural Tan7..anian men.Bmj 312(7026): 2ï7.SO.
Grossk.Llrth H, Gray R, Ha yes R, Mabey D and Wawer M (2000). Control of STDs for HIV pre· vention: understanding the implications of the Mwanza and Rakai trials. [Viewpoint paper].Lancet 355:1981-1987.
Gupta S,Anderson Rt.\1 and May RM (1989). Networks of sexual contacts: implications for the pattem of spread of HN.Aids 3(12): 807-17.
HabbemaJDF,Alley ES, Plaisier AP,Van Oortmarssen GJ and Remme JDF (1992). Epidemiological modelling for onchocerciasis control.Parasitology Today 8(3): 99·103.
Habbema JDF and De Vlas SJ (l995).1mpact of improved treatment of se:,:ually transruitred disease on HIV infection [letter; comment]. Lancet 346(8983): 1157-8 (discussion 1159-60).
HabbemaJDF,DeV!as SJ,PlaisierAP andVan Oortmarssen GJ (1996).The microsimulation approach to epidemiologie modeling of helminthic infections. whlth special reference to scbisosomiasis.Am.J.Trop.Med.Hyg. 55(5): 165-169.
Habbema JDF and Korenromp EL (1999). Chapter 6: Interprering the Mwanza and Rakai results. In: From knowledge to practice. STD control and HIV prevention. KAttawell, H Grossh.Llrth and L Fransen, EU HIV I AIDS programme in developing countries.
Handsfield HH, lipman TO, Harnisch JP,Tronca E and Holmes KK (1974).Asymptomatic gonorrhea in men. Diagnosis, natural course, prevalenee and significance. N Eng!] Med 290(3): 117-23.
Handsfield HH.Alexander ER, Pin Wang S. PedersenAH and Holmes KK (1976). Dilierences in the therapeutic response of chlamydia·positive and chlamydia·negative forms of nongonococcal uretluitis.j Am Vener DisAssoc 2(3): 5·9.
Handsfield HH (1999). Perspectives on presumptive therapy as a so."Ual.l.y transm.itted dis-ease control strategy.Sex.Transm.Dis. 26(4 Suppl.):S21·22.
Hanenberg RS, Rojanapithayakorn W, Kunaso I P and Sokal DC (l994).1mpact ofThalland's HIV-control programme as indicated by the decline of sexually transm.itted diseases.
231

232 Bibliography
Lancet 344(8917): 243-5. Harros G,Iyambo SN, CoreaA, Radebe F, Febier HG and Ballard RG (1998). Perceptions and
patterns of reproductive tract infections in a young rural population in North-West Namibia.IntJSTD&AIDS 9:744-750.
Harrison A, Wllkinson D, Lurie M, Connolly A.c'\1 and Karim SA (1998). Improving quallty of so.."Ua.lly transmitted disease case management in rural South Africa. Aids 12(17): 2329-35.
Harrison A, Karim SA, Floyd K, Lombard C, Lurie M, Ntuli N and Wllkinson D (2000). Synd.rome packets and health worker training improve so..'Ua.lly transmitted disease case management in rurai SouthAfrica: random.ized controlled triaLAids 14(17): 2769-79.
Harrison WO, Hooper RR, Wïesner PJ, Carnpbell AF, Karney WW, Reynolds GH, Jon es OG and Holmes KK. (1979).A trial of mycocycline given after exposure to prevent gonorrhea. NEJM 300: 107 4-1078.
Hart G (1986). Syphilis tests in diagnostic and therapeutic decision making. Ann Intern Med 104(3): 363-76.
Hawkes S, Morison L, Foster S, Gausia K, Cbakraborty ], Peeling RW and Mabey D (1999). Reproductive-tract infections in women in low-income, lew-prevalenee situations: assessment of syndrornic management in Matlab, Bangladesh. Lancet 354: 1776-1781.
Hayes RJ, Grossb:urth H and ka-Gina G (1995a). Impact of improved treatment of so:ually transmitted discase on HIV infection [Author's reply]. Lancet 346: 1159-1160.
Hayes R], ~osha F, Nicoll A, Grossl.-urth H, Newell ], Todd ], Killewo ], Rugernalila ] and Mabey D (1995b).A community trial of the impact of improved sexnally transmitted disease treatment on the HIV epidemie in rural Tanzania: 1. Design. AIDS 9(8): 919-926.
Hayes RJ, Schulz KF and Plummer FA (1995c).The cofactor effect of genital ulcers on the per-o.."Posure risk of HIV transmission in sub-Sab.aranAfrica. [Review].JTropJl1edHyg 9B(1): I-8.
Hayes R],Wawer M, Gray R, WhitworthJ, GrossJ.:urth H, Mabey D and Group HSTW (1997). Randomised trials of STD treatment in HIV preven ti on: report of an international workshop. Genitourin.Med. 73: 432-443.
Hethcote 1-f\V and Yorke JA (1984). Gonorrhea transmission dynamics and control. Berlin, Springer-Verlag.
Hillis DM (2000).AIDS. Origins of HIV Science 288(5472): 1757-9. Hitchcock P and Fransen L (1999). Preventing HIV infection: lessens from Mwanza and
Rakai.Lancet 353:513-515. Hogsborg M andAaby P (1992). Se..'..-ual relations, use of condoms and perceptions of AIDS
in an urban area of Guinea-Bissau with a high prevalenee of HIV-2. In:Antropological and socio-cultural studies in the transmission of HJv.T Dyson [Eds.J. Uege, Ordina Publications: International Union for the Scienti:fic study of the population: 29-36.
Halmberg SD, Stewart ]A, Gerber AR, Byers RH, Lee FK, O'Malley P~ and Nahmias A] (1988). Prior HSV-2 infection as a risk factor for HIV infection. ]AMA 259(7): 1048-1050.
HoJmes KK,Johnson DW and Floyd TM (1967). Studies of venereal disease. I. Probenecidprocaine penicillin G combination and tetracycline hydrachloride in the treatment of
"penicillin-resistant" gonorrhea in men.jama 202(6): 461-73. HoJmes KK,]ohnson DW and Trosde H] (1970).An estimate of the risk of men acquiring
gonorrhea by sexual contact with infected females.Am j Epidemiol91(2): 170-4. HoJmes KK (1974). Gonococcal Infection. In:Advances in Internat Medicine. GH Steller
man and et.al.,YearBook Medica! Publisher.Inc.: 259-85. Holmes KK,]ohnson DW, Kvale PA,Halverson CW, KeysTF and Martin DH (1996).lmpact
of a gonorrhea control program, including selective mass treatment, in female sex workers.] Infect Dis 174(2): S230-9.

Bibliography
Holmes KK., Mardh P-A, Sparling PF, Lemon SM, Stamm WE, Piot P and Wasserheit ]N, Eds. (1999). Sexually transmitted diseases_. 3rd edition. New York, McGraw-Hill Companies.Inc.
Hook ill Ew, Richey CM, Leone P. Bolan G, Spalding C, Henry K, Clarke P. Smith M and Celum CL (199ï). Delayed presentation to clinics for SID by symptomatic patients.A potential contributor to continuing SID morbidity. Sex. Transm.Dis. 24(8): 443-448.
Hooper RR, Reynolds GH,]ones OG et al. (1978). Cohort srudy of venereal disease. I: the risk of gonorrhea transmission from infected woroen tomen. Am] Epidemio/108(2): 136-44.
Horsburgh Jr. R.}ason ], Long;ini L\1 et al. (1989). Duration of HIV infection before dereetion of antibody. Lancet 8664:637-640.
Hudson CP (1999). Syndromic management for SIDs: back to the drawing board [Review}. IntJ.STD&AIDS 10: 423-434.
Hudson CP and SmithAN (2000). Ethics of mass STD treatment. Lancet 356(9235): 1115. Hudson CP (2001). Community-based trials of se-..-ually transmitted disease treatment:
repercussions for epidemiology and HIV prevention.Bull. WHO 79(1): 48-58. Hunter DJ, Maggwa BN, Mati JK,Tukei PM and Mbugua S (1994). Se.'\."Ual behavior, so.."Ually
transmitted diseases. male circumcision and risk of HIV infection among women in Nairobi, Kenya.Aids 8(1): 93-9.
Islam .YtQ, Latif A, Burton T and Piot P (1994). Analysis of the cost-effectiveness of approaches to STD case management. Sex Tram-m Dis supplement 1994: S 138.
]ackson DJ, R.a.h."War JP, Bwayo JJ, Kreiss JK and Moses S (1997a). Ureth.ral Trichomonas vaginalis infection and HIV-I transmission [letter]. Lancet 350(9084): 1076.
Jackson DJ, Rak-war JP, Chohan B, Mandaliya K, Bwayo JJ, Ndinya-Achola JO, Nagelkerke NJ, Kreiss ]K and Moses S (1997b). Urethra! infection in a workplace population of East African men: evaluation of strategies for screening and management.] Infect Dis 175(4): 833-8.
Jacksen DJ, Rakwar JE Richardson BA et al. (1997c). Decreased incidence of seJ>..--ually transmitted d.iseases among trucking company workers in Kenya: results of a behavioural risk-reduetion programme.AIDS 11(7): 903-909.
}acobs * and Kr.ms SJ (1975). Gonoccocal and nongonococcal urethritis în men. Clinical and laboratory differentiation.Ann.lntern.Med. 82: 7~12.
Jacquez JA, KoopmanJS, Sirnon CP and Longini !.Jr. (1994). Role of the primary infection în epidernies of HIV infection in gay cohorts. [Review].] Acquir Immune Defic Syndr 7(11): !169-84.
Jekel ]F (1968). Role of acquired immunity to T. pallidurn in the control of syphilis. Publ.Healtb Reports 83(8): 627-632.
Jessamine PG. Plummcr FA, Ndinya Achola JO et al. (1990). Human immunodeficiency virus, genital ulcers and the male foreskin: synergism in HIV~1 transmission. [Re"iew]. Scand] Infect Dis Suppl69: 181-6.
)ha P. Nagelkerke JD, Ngugi EN, Prasada Rao ]\( Willbond B. Moses S and Plummer FA (2001). Public health. Reducing HIV transmission in developing countries. Science 292(5515): 224-5.
Johannisson G. SernrydA and Lycke E (1979). Susceptibility of Chlamydia trachomatis to antibictics in vitro and in vivo. Sex Transm Dis 6(2): 50~7.
Johannissou G,Lowhagen GB and Lycke E (1980). Genital Chlamydia trachomatis infection in women. Obstet Gynecol56(6): 671~5.
John GC, Nduati RW, Mbori-Ngadu D et al. (1997). Genital shedding of human immunodeficiency virus type 1 DNA during pregnancy: association with immunosuppression, abnormal cervical or vaginal clischarge, and severe vitamin A de.ficiency.] Infect Dis 175(1): 57-62.
John J and Donald WH (1978).Asymptomatic urethral gonorrhoea in men. Brit] Vener.Dis.
233

234 Bibliography
54: 332-323. Judson FN (1981). Epidemiology and control of non-gonococcal urethritis and genital chla
mydia! infections: a review. Sex.Transm.Dis. 8(2): 117-126. ]udson FN (1990a). Gonorrhea.Med.Clin.NorthAmerica 74(6): 1353-1366. ]udson 1\'F (1990b). Clinical facilities for se.'-.<Jaliy transmitted diseases contro!.ln:Sexually
Transmitted Diseases. KK Holmes, P-A Mardh et al. [Eds.]. NewYotk [etc], McGrawHill,lnco 1047-1055.
KamaliA, Carpenter L\1,Whitworth]A, Pool R RuberantwariA and OjwiyaA (2000). Sevenyear trends in HIV-I infection rates, and changes in se..'\..lla.l behaviour, among adults in rural Uganda.Aids 14(4): 427-34.
Kambugu FSK,Jacobs B, LwangaA, Ochwo M, Cutier JR Tifft S, PoolRand Whitworth}AG (2000). Evaluation of a socially marketed pre-packaged treatment kit for men with urethral discharge in Uganda. Xlllth InternationalAids Conference, Durban, South.Africa.
Katz BP (1992). Estimating transmission probabilities for chlamydial infection. Stat Med 11(5): 565-77.
Kaul R Kimani ], Nagelkerke NJD, Pluromer FA. Bwayo JJ, Brunbam RC. Ngugi EN and RonaldA (1997).Risk factors for genital ulcerations in Kenyan se......: workers.The role of HIV-1 infection. Sex. Transm.Dis. 24(7): 387-392.
Kault DA (1995). ModellingAIDS reduction strategies.Int]Epid. 24(1): ISS-197. Keim],Woodard P andAnderson MK (1992). Screening for Chlamydia trachomatis in col~
lege women on routine gynecological exams. College Health 41: 17-23. Kelsey J, Thompson WD and Evans AS (1986). Metbods in observational epidemiology.
O:xford, Oxford Univcrsity Press. Kigadye R.J."\1_, Klokke A, NicollA et al. (1993). Sentinel surveillance for HIV-I among preg
nant women in a developing country: 3 years' e-..-perience and comparison with a population serosurvey.Aids 7(6): 849-55.
KilianAhD, Gregson S, Ndyanabangi B et al. (1999). Reductions in risk behaviour provide the most consistent e..""<planation for declining HIV-1 prevalenee in Uganda. AIDS 13: 391-398.
Koelie DM. Benedetti], langenberg A and Corey L (1992).Asymptomatic reactivation of herpes simplex virus in women after the fust episode of genital herpes. Ann Intern Med 116(6):433-7.
Konde-Lule ]K, Musagara Mand MusgraveS (1993). Focus group interviews aboutAIDS in Rakai district ofUganda. Soc Sci Med 37(5): 679-84.
Konde-Luie ]K and Sebina A} (1993). Tbe impact of AIDS in a rural Ugandan community. EastAfr Med]70(11): 725-9.
Konde-Luie JK, Wawer MJ, Sewankambo NK, Serwadda D, Kelly RK, Li C, Gray RH and Kigongo D (1997). Adolescents. sex'Ual behaviour and HIV-I in rural Rakai districr, Uganda.AIDS 11:791-799.
Konings E, Blattner WA, Levin A, Brubaker G, Siso Z, Shao ], Goedert ]] and Andersen R...\1 (1994). So.."Ual behaviour survey in a nua1 area of northwest Tanzania. AIDS 8: 987-993.
Koopman JS, Longini IM, Jacques JA, Sirnon CP, Ostrow DG, Martin WR and Woodcock DM (1991). Assessing risk factors for transmission of .infection. AmJ.Epid. 133(2): 1199-1209.
Koopman JS and Longini L\1 (1994). The ecological effects of .indhidual e..'posures and nonllnear disease dynamics in populations.Am]PublHealth 84(5): 836-842.
Korber B, Muldoon M, Theiler J, Gao F, Gupta R, Lapedes A, Hahn BH, Wolinsl:y S and Bhattacharya T (2000). Trming the ancestor of the HIV-1 pandemie strains. Science 288(5472): 1789-96.
Korenromp EL, Van Vliet C, Gavyole A, Grossb:urth H, Hayes RH and Habbema ]DF (1998). Pattems of participation in mass STD treatment: model-aided evaluation of impact on

Bibliography
IDV incidence [ oral presentation]. 12th World AIDS Conference, Gen eva. Korenromp EL, Grossl-urth H, Hayes R, Meester EI, Wawer MJ and Habbema JDF (1999a).
Modelling the impact of STD treatment on HIV in sub-SaharanAfrica: use in the interpreration of trials [oral presentation]. 13th Meeting of the International Society for Se-..-uallyTransrnitted Diseases Research, Denver, USA.
Korenromp EL, Meester EI and Habbema]DF (1999b). SID treatment for HIV preventionmodel-based evaluation of the impact in different phases of the HIV epidemie [poster presentation].l3th Meeting ofthe International Society for $C)..'UallyTransmitted Dis-eases Research, Denver, USA.
Korenromp EL, De Vlas SJ and Habbema]DF (2000a).The effect of imbalances in risk factors betw"een arms at baseline in community-:randomized IDV prevention trials. XIII InternationalAIDS conference:Abstract nr.WePpP1313.
Korenromp EL, Van Vliet C, Bakker R, De Vlas SJ and Habbema JDF (2000b). HIV spread and partnership reduction for different pattems of se.'\.."Ual behaviour- a srudy 'With the microsimulation model STDSIM.Math.PopuLStudies 8: 135-173.
Korenromp EL, Van Vliet C, Grossh."Urt:h H, Gavyole A, Van der Ploeg CPB, Fransen L, Hayes RJ and Habbema]DF (2000c). Model-based evaluation of single-round mass STD treatment for :mv control in a ruralA.frican population.AIDS 14(5): 573-593.
Korenromp EL, Bakker R, Gray R, Wawer MJ, Serwadda D and Habbema JDF (2001a). The effect of mv, behavioural change and STD syndromic management on STD epidemiology in sub-SaharanAfrica- simulations of Uganda. Sex.Transm.Inf accepted.
Korenromp EL, De Vlas I'<J, Nagelkerke NJD and Habbema JDF (2001b). Estimating the magnitude of STD cofactor effects on HIV transmission - how well can it be done? Sex. Trans.Dis. in press.
Korenromp EL, Bakker R, De Vlas SJ, Robinson NJ, Hayes R and Habbema JDF (in press). Can behaviour change e.':plain increases in the proportion of genital ulcers attributable to herpes in sub-Saharan Africa? A simu1ation rnadelling srudy. Sex. Trans.Dis. in press.
Kovacs GT, Westcott M. Rusden J,Asche V, King H, Haynes SE, Moore EK and Keterbey JW (1987). The prevalenee of Chlamydia trachomatis in a young sexually-active population.MecL]Austr. 147: 550·552.
Kreiss J, Wilierford DM, Hensel M et al. (1994).Association between cervical i.nflammation and cervical sbedding of HIV DNA.jlnfDis. 170: 1597-1601.
Kreiss JK Koech D. Plurnmer FA et al. (1986).AIDS virus infection in Nairobi prostitutes. Spread ofthe epidemie to EastAfrica.N Eng!] Med 314(7): 414-S.
Kretzschmar M, Reinking OP.; Van Zessen G, Brouwers H and Jager JC (1993). Network modds: from paradigm to mathematica! tool. In: ModeZing the AIDS epidemie. E Kaplan and M Brandeau [Eds.I.NewYork,Raven Press: ;61o;s3.
Kret7..schmar M,Jager JC,Reinking DP,Zessen Gv and Brouwers H (199;).A network modelling approach for assessing the efficiency of prevention strategies.j Math Soc 20( 4): 351-374.
Kretzschmar M,Van Duynhoven YT and SeverijnenAJ (1996) . .Modeling prevention strategies for gonorrhea and chlamydia using stochastic network simulations. Am] Epidemio/144(3): 306--17.
Krieger JN,Tam MR, Stevens CE, Nielsen !0, Hale J, Kiviat NB and Holmes KK (1988). Diagnosis of trichomoniasis. Comparison of conventional wet-mount e.xamination with cytologie studies, cultures, and monodorral antibody staining of direct specimens. ]ama 259(8): 1223·7.
Laga M, Nzila N and Goeman J (1991). The interrelationship of so..."Ually transmitted dis-eases and HIV infection: implications for the control of both epidernies in Africa. [Review].Aids 5(1): SS5-63.
Laga M, ManokaA, Kivuvu M et al. (1993). Non-ulcerative so...-ually transmitted diseases as
235

236 Bibliography
risk factors for HIV~ I transmission in women: results from a cohort study.AIDS 7(1): 95-102.
Laga M, Alary M, N7ila N, Manoka AT, Tuliza M, Behets F, Goeman ] , St Louis M and Piot P (1994). Condom promotion, so..llally transmitted diseases treatment, and declining incidence of HIV-I infection in female Zairian sex werkers. Lancet 344(8917): 246-S.
Langenberg A, Benedetti],Jenkins J,Ashley R Wmter C and Corey L (1989). Development of clinically recognizable genitallesions among women previously identified as having
"'asymptom.aticH herpes simplex virus type 2 infection. Ann Intern Med 110(11): 882-7.
Lao DG andTrussel RE (1947). Chancroid in woroen in Man.ila.AmJ.Syph. 31: 27ï-288. Larsen SA, Steiner BM and RudolphAH (1995). Laberatory diagnosis and interpretation of
tests for syphilis. Clin Microbiol Rev 8(1): 1-21. LauderdaleTL, Landers L.Thorneycroft I and Chapin K (1999). Comparison of the PACE
2 assay, two amplification assays, and Clearview EIA for detection of Chlamydia trachomatis in female endocenical and urine specimens.] Clin Microbiol370): 2223-9.
Lavreys L, fu11:war JP,Thompson ML,Jackson DJ, Mandaliya K, Chohan BH, Bwayo ]], NdinyaAchola JO and Kreiss ]K (1999). Effect of circumcision on incidence of HIV type I and other STDs: a prospective cohort study of truckin.g company employees in Kenya. JlnJDis. 180: 330-336.
Le Pont F and Blower SM (1991).The supply and demand of se."\.'l.lal beha'\-ior: implications for heterose>.-ual HIV epidemics.]Acq.Imm.DefSyndr. 4: 987-999.
Lee HH. Chernesl:y MA, Schachter J, BurC7.ak JD,Andrews WW, Muldoon S, Leckie G and Stamm W'E (1995). Diagnosis of Chlamydia trachomatis genitourinary infection in wamen by ligase chaîn reaction assa:y of urine. Lancet 345(8944): 213-6.
Leslie WD and Brunham RC (1990). The dynamics of HIV spread: a computer simulation model. Gomput Biomed Res 23(4): 380-401.
Levy JA (1993). The tnmsmission of HIV and factors influencing progression to AIDS [review].Am]Med. 95: 86-9100.
Lim KB, ThirumoorthyT, Lee CT, Sng EH and Tan T (1989). Endocervical chlamydia! infection .in female comacts of patients with non-gonococcal urethritis. Sing.Medj 30: !64-!66.
Undan CE Allen S, Serufi.JiraA et aL (1992). Predietors of mortaliry among HIV-infeered women in Kigali,Rwanda.Ann Intern Med 116(4): 320-8.
loctin A (1955). Has the incubation period of gonorrhoea undergone a change? Acta Derm. VenereoL 35: 457-462.
Low-Beer D and Stonebumer Rl. (199ï).An age- and sex-structured HIV epidemiological model: features and applications.Bull. WHO 75(3): 213-221.
Low-Beer D, Barnett T, Whiteside A and Stoneburner R (2000). Knowledge diffusion and the personalisation of risk as key indicators of behaviour change in Uganda compared to SouthernMrica. Xlllth InternationalAIDS conference, Durban, SouthAfrica.
Lycke E, Lowhagen GB, Hallhagen G,]ohannisson G and Ramstedt K (1980). The risk of transmission of genital Chlamydia trachomatis infection is less than that of genital Neisseria gonorrhoeae infection.Sex Transm Dis 7(1): 6-10.
Mabey D. Bailey RC, Faal H, Mabey D,Vitale S and Schachter] (1998).Azithromycin in control of trachoma. 2. Community-based treatment of trachoma with oral azithromycin: a one year fellow-up study in the Gambia. 9th International symposium on human chlamydial infection, San Franciso.
Madico G, Quinn TC, Rompalo A, McKee KT,]r. and Gaydos CA (1998). Diagnosis ofTrichomonas vaginalis infection by PCR us.ing vaginal swab samples.] Clin Microbiol36(11): 3205-10.
Magnuson H, Thomas E, Olansk1' S, Kaplan B, de Mello Land Cutier] (!956). !noculation of syphilis in human volunteers.M~edicine 35:33-82.

Bibfiography
Mahoney JF,Van Slyke],Wolcott RR Thayer JD and "'imelmanA (1942). Culture studies in chronic gonorrhea ofwomen.AmJ.Syph.Gon. Ven.Dis. 26: 3&47.
Marlink R, Kanki P,Thior I et al. (1994). Reduced rate of discase development after HIVw2 infection as compared to HIVw1.Science 265: 1587w1590.
Martin DH (1990). Chlamydia! infections.Med.Clin.NorthAmerica 74(6): 1367-1387. Martin HL, Richardson BA, "'yange PM et al. (1999).Vaginallactobacilli, mierob ia! flora, and
risk of human immunodeficiency virus type 1 and so...ll.ally transmitted discase acquisition.j Infect Dis 180(6): 1863-8.
Matondo P, ]ohnson I and Sivapalan S (1995). Morbidity and discase prevalenee in male and fern.ale so...-ual contacts of patients with genital chlamydia! infection. Int] STD & AIDS 6: 367-368.
Mayaud P, GrossJ.arrth H, ChangaluchaJ et al. (1995). Risk assessment and other screening options for gonorrhoea and chlamydial infections in wo men arrending rural Tanzanian antenatal clinics. Bull WHO 73(5): 621-630.
Mayaud P. Mosha F.ToddJ et al. (1997a). Improved treatment services significandy reduce the prevalenee of STDs in rural Tanzania: results of a randomised controlled trial. AIDS 11(15): 1873-1880.
Mayaud P, Msuya W.ToddJ Kaatano G,West B. Begkoyian G, Grossk"Urth Hand Mabey D (1997b ). STD rapid assessment in Rwandan refugee campsin Tan7..ania. Genitourin.Med. 73:33-38.
Mayer KH andAnderson DJ (1995). Heterose.'"-ual HIV transmission. InfectAgents Dis. 4: 273-284.
Mbizvo MT, Macbekano R, McFarland W. Ray S, Bassett M, Latif A and Katzenstem D (1996). HIV seroincidence and condates of seroconversion in a cohort of male factory workers in Harare. Zimbabwe. Aids 10(8): 895-901.
MbopiwKeou F-X, Grésenguet G, Mayaud P,Weiss HA, Go pal R, Bro'Wn DWG, Ha yes RJ, Mabey DCW and Bélec L (1999). Genital HSVw2 shedding is increased in HIV-infeered women inAfrica.AJDS 13(4): 536-537.
McCaugbtry Ml, Fleagle GS and Docberry J] (1982). Inapparent genital herpes simplex virus infection in college women.J Med Virol10(4): 283-90.
McClelland RS, Wang CC, Mandaliya Ket al. (2001). Treatment of cervicitis is associated with decreased cervical shedding ofHlV-l.Aids 15(1): 105-10.
McCorm.ack w:M, Srumacher RJ, Johnson K and Donner A (1977). Clinical spectrum of gonococcal infection in women.Lancet 1(8023): 1182~5.
McCormack WM, Alpert S, McComb DE, Nichols RL, Semine DZ and Zinner SH (1979). Fifteen-month follow-up study of women infected with Chlamydia trachomatis. NE]M 300(3): 123-125.
McCormack w:M (1981). Clinical spectrum of infection with Neisseria gonorrhoeae. Sex.Transm.Dis. 8(4): 305-37.
McCutchanJA (1984). Epidemiology ofvenereal urethritis: comparison of gonorrhea and nongonococcal urethri!is.Rev.InjDis. 6(5): 669-688.
McLean KA, Evans BA, Lim JM and Azadin BS (1990). Postgonococcal urethritis: a doubleblind study of do:-..)'cycline vs placebo [see conunents). Genitourin Med 66(1): 20..3.
Meekers D (2000). Going underground and going after wo men: trends in so...l.lal risk behaviour among gold miners in SouthAfrica.Jntj =AIDS 11(1): 21-6.
Meheus AandAntal G:M (1992). The endemie treponematoses: not yet eradicated. World Health Statist.Q. 45: 228-237.
Merson :MH, Dayton JM and 0 'Reilly K (2000). Effectiveness of HIV prevention interventions indeveloping countries.Aids 14 Suppl2: 568-84.
Merrens TE, Hayes RJ and Smith PG (1990). Epidemiological methods to study the interaction between HIV infection and other SC.'\."Ually transmitted diseases. [Review]. Aids 4(1): 57-65.
237

238 Bib/iography
Mills S, Benjarattanapom P, Bennet A, Pattalung R..~, Sundhagul D,Trongsawad P, Gregorich SE, Hearst N and Mandel JS (1997). HN risk behaviaral surveillance in Bangkok, Thailand: se>:ual behavior tt=ds among eigbt population groups. AIDS ll(suppl 1): S43-S51.
Ministry of Health, Kaijuka E.'l, Kaija EZA, Cross AR and Loaiza E (1989). Uganda Demographic and Health Survey 1988/1989. Entebbe, Uganda, Ministry of Health, in collaboration with Ministry of Planning and Economie Development, Dept. of Geography and Institute of Staristics and Applied Economics, Makerere University, and Institute for Resource Development!Macro Systems Inc., Columbia, Maryland USA.
Mode CJ, Gollwitzer HE, Salsburg MAand Sleeman CK (1989).A methodological study of a nonlinear stochastic model of an AIDS epidemie with recruitn:lent. !ma] Matb Appl Med Bio/6(3): 179-203.
Molin L (1970). Gonorrhoea in 1968.Acta Dermatovener. (Stockholm) 50: 157-160. Morgan D,Malamba SS,Maude GH, Okongo MJ,Wagner H-U,Mulder DW andWhitworthJA
(1997a).An HN-1 natura! history cohort and sunival times in rural Uganda.AIDS 11: 633-640.
Morgan D,Maude GH,Malamba SS, Okongo MJ,Wagner H-U,Mulder DW andWhitworthJA (199ïb). IDV-1 discase progression and.AIDS-defining disorders in rural Uganda. The Lancet 350(245-250).
Morris M (1991). A log-linear modeling framewerk for selective mixing. Math Biosci 107(2):349-77.
YJ:orris M (1993). Telling tails e."-"Plain the discrepancy in so."l.lal partner reports. Nature 365(6445): 437-40.
Morris M and Kretzschmar M (1995). Concurrent partnersbips and transmission dynamics in nerworks. Social networks 17: 299-318.
Mortis M, Sewankambo 1\'K, Wawer MJ, Serwadda D and l.a.injo B (1995). Concurrent partnersbips and HIV transmission in Rakai district, Uganda (Abstract TuC105). Kampala, IXth International Conference on AIDS and STD inA.frica.
Mortis M, Podhisita C, Wawer MJ and Handcock MS (1996). Bridge populations in the spread ofHN/AIDS inThailand.Aids 10(11): 1265-71.
Mortis M (1997). Se>:ual networks and Hiv. AIDS ll(supp!A): S209-S216. MorrisMand Kretzschmar M (1997). Concurrent partnersbips and the spread of HIV [see
comments].Aids 11(5): 641-8. MorrisMand Kretzschmar M (1998).A microsimulation study of the effect of concurrent
partnersbips on the spread of HIV in Uganda. IUSSP seminar on Measurement and modelZing the spread of AIDS. Kopenhagen.
Morse SA, Moreland AA and Thompson SE (1990).Atlas of sexually transmitted diseases. NewYork. Gower Medica! Publishing.
Moses S, Plummer FA, Ngugi EN, Nagelkerke 1\'J,AnzalaAO and Ndinya-AcbolaJO (1991). Controlling HIV inAfrica: effectiveness and costof an intervention in a high-frequency STD transmitter core group.Aids 5(4):407-11.
Moses S, Ngugi EN, Bradley JE, Njeru EK, Eldridge G, Muia E, Olenja J and Plummer FA (1994). Health care-seeking behavier related to the transmission of so.-ually transmitted ruseases.AmJ.Publ.Health 84(12): 1947-1951.
Moses S,Bailey RC and RonaldAR (1998). Male drcumcision: assesment of health benefits and risks. Se.xually Transmitted Infections 74: 368-373.
Moses S, Ngngi EN, CostiganA, Katiuki C, RonaldAR, Maclean I and Plummer FA (2000). Declining STD and HIV prevalences among antenatal and family planning clinic attenders in Nairobi, Kenya, from 1992-1999. XIIIth International AIDS conference, Durban, SouthAfrica.
Mosha F,Nico!IA.Barongo Let al (1993).A population-based study of syphi!ls and se:nmlly transmitted disease syndromes in north-westernTanzania.l.Prevalence and incidence.

Bibliography
Genitourin Med 69(6): 415-20. Moss GB and Kreiss JK (1990). The :interrelationship between human immunodeficiency
virus infection and other so.."Ually transrnitted diseases. [Review].Med Clin Nortb Am 74(6): 1647-60.
Moss GB, Overbaugh],Welch M, Reilly M, Bwayo }, Pluromer FA, Ndinya-Achola JO. Malisa MA and Kreiss ]K (1995). HIV DNA in UI'ethral secretions in men: assodation with gonococcal urethritis and CD4 cel! depletion.]Jnf.Dis. 172: 1469~ 147 4.
Mosrad SB and Kreiss JK (1996). Shedding of IDV-1 in rbe genital tract [Editorial review]. AIDS 10:1305-1315.
Mosrad SB, Overbaugh J, DeVange DM et al. (1997). Hormorral contraception, vitamin A deficiency and other risk factors for shedding of HIV-I infected cells from the cervix and vagina. Lancet 350(350).
Mosrad SB (1998). Prevalenee and correlates of HIV-I shedcling in the female genital tract [review].AIDS Res.&Hum.Retrovir. 14(Suppl.1): S11-S15.
Mostact SB, Kreiss JK, Ryncarz A}, Mandaliya K, Chohan B, Ndinya-Achola ]. Bwayo JJ and Corey L (2000). Cervical shedding of HSV-2 in IDV-infected women: effects of hormorral contraception, pregnancy and viraminA defieiency.JlnfDis. 181(1): 58-63.
Mulder DW, NunnA, KamaliA and Kengeya-Kayondo J (1995). Decreasing IDV-1 seroprevalence in young adultsin a rural Ugandan cohort.B1l1J 311:833-836.
Munguti K Grossk"Urth H, Newell] et al. (1997). Patterns of so..llal behaviour in a rural population in Norrb-WestemTanzania.Soc.Sci.Med. 44(10): 1553-1561.
Murray C]L and LopezAD (1996). The global burden of disease.A comprehensive assessment of mortality and disability from diseases_. injuries_. and risk factors in 1990 and projeeled to 2020, Harvard School of Pubtic Health, on behalf of the World Health Organization and the World Bank.
Mwabu GM (1986). Health care dedsions at the househeld level: results of a rural health survey in Kenya.Soc.SciMed. 22(3): 315-319.
Mwijarubi E, Grossk"Urth H and Mayaud P (1993). Integration of SID control into a rural pri.mary health care setting: experience from 25 health units in North-West Tanzania. VIIIth International Conference on .AIDS in.Africa, Marrakech.
:-!agelkerke i'<J, Pluromer FA, Holton D,AnzalaAO, Manji F, Ngugi EN and Moses S (1990). Transition dynamics of HIV d.isease in a cohort of A:frican prostirutes: a Markov model approach.Aids 4(8): 7 43-7.
Nagelkerke N}D, Kimani J, Moses S and Pluromer FA (1995). E.'<ploring conformding in nested case-control studies [letter].AJDS 9(10): 1202-1203.
NaluniasAJ, Lee FK and Beckman-Nalunias S (1990). Sero-epidemiological and -sociological patterns of herpes simplex virus infection in the world. Scand] Infect Dis Suppl 69:19-36.
Nasio JM, Nagelkerke NJD, MwarbaA, Moses S, Ndinya-Achola}O and Pluromer FA (1996). Genital ulcer d.isease among SID clinic attenders in Nairobi: association with HIV-1 and circumdsion starus./nt] STDAIDS 7:410-414.
Nelson KE, Celentarro DD, Eiumtrakol S, Hoover DR, Beyrer C, Suprasert S, Kuntolbutra S and Khamboonruang C (1996). Changes in sexual behavier and a decline in HIV infection among young men in Thailand [see comments].N Eng!] Med 335(5): 297-303.
Nelson KE, Eiumtrah."Ul. S, Celentano D, Madean I, RonaldA, Suprasert S, Hoover DR, Kuntolbutra S and Zenilm.an f.\1 (1997). The assodation of herpes simplex virus type 2 (HSV-2), Haemophilus ducreyi, and syphilis with HIV infection in young men in northem Thailand.] Acquir Immune Defic Syndr Hum Retroviro/16(4): 293-300.
Newell J, Senkoro K, Mosha F et al (1993). A population-based study of syphilis and SC)..-ualiy transmitted d.isease syndromes in north-western Tanzania. 2. Risk factors and healrb seeking behaviour. Genitourin Med 69(6): 421-6.
Ng'weshemi JZL, Boerma JT, Pool R et al. (1996). Changes in male SCÀ-ual behaviour in
239

240 Bibliography
response to the AIDS epidemie: evidence from a cohort study in urban Tanzania. AIDS 10(12): 1415~1420.
Nopkesom T. Mock PA, Mastro TD et aL (1998). HIV-1 subtype E incidence and STD in a cohort of military conscripts in northem Thalland.]Acq.Imm.DefSyndr.Hum. Virol. 18:372-379.
Noren L. von Krogh G, Bondessen L, Nohlgard C and Grillner L (1998). Potential pubtic health benefits from testing with Chlamydia trachomatis PCR technique on fust void urine in men. Acta Denn Venereol78(1): 63-6.
NunnA},Wagner HU.KamaliA,Kengeya-Kayondo ]F and Mulder DW (1995).Mi,_gration and HIV-I seroprevalence in a rural Ugandan population.AIDS 9(5): 503-6.
Nzila N, Laga M, Thiam MA et al. (1991). HN and other se:\.-ually transmitted discases among female prostitutes in Kinshasa. Aids 5(6): 715-21.
Oakley A, Fullerton D and Holland J (1995). Behavioural interventions for HIV/AIDS prevention. [Review].Aids 9(5): 479-86.
Oates JK and Csonka GW (1990). Gonorrhoea. In: Sexually Transmitted Diseases_:A Textbook of Genitourinary Medicine. GW Csonka and JK Oates [Eds.]. London etc, BailliereTi.ndall: 206-226.
Obasi A, Mosha F, Quigley M et al. (1999).Antibody to HSV-2 as a marker of so..."Ual risk behaviour in rurai TanYMJia.]InfD~'- 179(1): 16-24.
O'Farrell N (1999). Increasing prevalenee of genital herpes in developing countries: implications for heterose..'\."Ual IllV transmission and STI control programmes.Sex.Transm.Inf 75: 377-384.
O'Hara HB, Voeten HACM, Kuperus AG, Otido JM, Kusimba], H:lbbema JDF, Bwayo JJ and Ndinya-AcholaJO (2001). Quality ofhealth education during SID case management in Nairobi, Kenya.JntJSTD&AJDS 12:315-323.
Ohlemeyer CL, Homberger LL, Lynch DA and Swîerkosz EM (1998). Diagnosis ofTrichomonas vaginalis in adolescent females: InPouch TV culture versus wet-mount microscopy.J Adolesc Healtb 22(3): 205-8.
Olsen GA (1973). Epidemiological mea:,-ures against gonorrhoea. E."\.-perience in Greenland. Brit]Vene1:Dis. 49:130-133.
O'Reilly KR and Piot P (1996). International perspectives on individual and community approaches to the prevention of so...llally transmitted discase and human immunode:fi.ciencyvirus infection. [Review].] Infect Dis 174(2): 5214-22.
Oriel JD, Reeve P, Powis P, Milier A and Nîcol CS (1972). Chlamydia infection. Isolation of chlamydia from patients with non-specific genital infection. BritJ.Vener.Dis. 48: 429-236.
Oriel ]D (1982). Epidemiology of genital Chlamydia infections. Infection 10(Suppl.l): 532-9.
Orroth K.K. Gavyole A. Todd J, Mosha F, Ross D, Mwîjarubi E, Grossk'Urth H and Hayes RJ (2000). Syndromic treatment of so..."Ually transmitted discases reduces the proportion of incident IllV infections attributable to these discases in rura1 Tarv..ania.Aids 14(1 0): 1429-37.
Orroth KK, Korenromp EL,White RG et al (2001). Higher risk behaviours and SID rates in Tarv..ania compared to Uganda- contribution to different outeernes of SID treatment trials? [poster presentation,abstractW006] .i 4th Meeting ofthe International Sodety for Sexually Transmitted Diseases Research, Berlin, Germany.
Otten]r.M\)7,ZaidiAA.PetermanTA.Rolfs RT andWïtteJJ (1994).High rate ofHJV serocon~ version among patients attending urban SID clinics. AIDS 8: 549-553.
Over .M and Piot P (1992). H1V Infection and Se.."\.ïlally Transmitted Diseases. In: Disease control priorities indeveloping countries. DT Jamison,WH Mosley et al. [Eds.].New York, Oxford. Universiry Press for the World Bank: 455-527.
Over M and Piot P (1996). Human immunodeficiency virus infection and other so.."Ually

Bibliography
t:ransmitted diseases in developing countries: public health importance and priorities for resource allocation.] Infect Dis 174(2): 5162-75.
Paavonen J, Kousa M, Saikh.-u P,Vartiainen E, Kanerva L and Lassus A (1980). Treatment of nongonococcal urethritis with trimethoprim-sulphadiazine and V\lith placebo. A double-blind partner-controlled study.Br ]Vener Dis 56(2): 101-4.
Palladino S, Pearman JW, Kay ID, Smith DW, Hamett GB, Woods M, Marshall L and McCloskey] (1999). Diagnosis of Chlamydia trachomatis and Neisseria gonorrhoeae. Genitourinary infectionsin rnales by theAmplicor PCR assay ofurine.Diagn Microbiol Infect Dis 33(3): 141-6.
Parks KS. DLxon PB, (ASCP) Yl, Richey CM and Hook EW (1997). Spontaneous clearance of chlamydia trachomatis infection in untreated patients. Sex.Transm.Dis. 24(4): 229-235.
Pa.--.·ton LA, Kiwanuks :-!, Nalugoda F, Gnly R Wawer MJ and Group RPS (1998a). Community-based study of treatment seeking among subjects with symptoms of se..,."ually t:ransmitted disease in rural Uganda. Brit.Medj 317: 1630-1631.
Pa.--.·ton LA, Sewankambo N, Gray R, Serwadda D, McNaim D and Wawer MJ (1998b). Asymptomatic non-ulcerative genital tract infections in a rural Ugandan population. Sex.Transm.Inf 74:421-42;.
PepinJ, Pluromer FA, Brunham RC, Piot P, Cameron DW and RonaldAR (1989).The internction of HIV infection and other se..'."Ualiy transmitted diseases: an opportunity for intervention. [Review].Aids 3(1): 3-9-
Peterman TA andAral SO (1993). Evaluating behaviaral intervemions: need for randomized controlled trials-]AMA 269(22): 2845.
Pettifor A, Walsh J, Wllkins V and Raghunathan P (2000). How effective is syndromic management of STDs?:A review of current studies. Sex Transm Dis 270): 371-85.
PiotPand Tezzo R (1990).The epidemiology of HIV and other se..'\..llally transrnitted infectionsin the developing world. [Review].Scand] Infect Dis Suppl69:89-97.
PiotPand Islam MQ (1994). Se..'-llally transmitted discases in the l990ies.Sex.Transm.Dis. 21(2(SuppL)): 57-513.
Pluromer FA,D'Costa L], :-!sanze H, Dylewski], Karasira Pand RonaldAR (1983). Epidemiology of chancroïd and Haemophilus ducreyi in Nairobi, Kenya. Lancet 2(8362): 1293-5.
Plummer FA, Simonsen ]).T, Cameren DW et al. (1991). Cofactors in male-female se}.:ual transmission of human immunode.ficiency virus type L] Infect Dis 163(2): 233-9.
Plummer M, Todd J, Changalucha J et al. (2000). Triangulation of biologica! markers and quantitative and qualitative responses in se..'\..-ual behaviour research with adolescents in rural Tanzania. XIIIth InternationalAIDS conference. Durban. South Africa.
Prentlee MJ,Taylor-Robinson D and Csonka GW (1976). Non-specific urethritis.A placebocontrolled trial of minocycline in conjunction with laboratory investigations. Br] Vener Dis 52( 4): 269-75.
Quinn TC, Wawer MJ, Sewankambo N, Serwadda D. Li C, Wabwire-Mangen F, .Meehan MO, LutaloT and Gray RH (2000).Vrralload andheterose.'\..-ual transmission ofhuman immunode.ficiency virus type 1. Rakai Project Study Group [see corn.ments].N Engl] ;.11ed 342(13): 921-9.
Rahm VA, Belsheim], Gleerop A, Gnarpe Hand Rosén G (1986).Asymptomatic carriage of cblamydia trachomatis- a study of 109 teerrage girls.EurJ.STD 3:91-94.
Ral:war ], Lavreys L, Thompson ML,]ackson D, Bwayo]. Hassanali S, Mandaliya K, NdinyaAcholaJ and Kreiss J (1999). Cofactors for the acquisition of IDV-1 among heterosexual men: prospective cohort study of trucking company workers in Kenya.AIDS 13: 607-614.
Rees E,Tait IA, Hobson D.Byng RE and]ohnson F\'V'A (1977). ).feonatal conjunctivitis caused by Neisseria gonorrhoeae and Chlamydia trachomatis. Brit] V ener. Dis. 53(173-179).
Rees E (1930).The treatment of pelvic inflammatory disease.Am] Ob::.-tet Gynecol138(7
241

242 Bibliography
Pt 2): 1042-ï. Republic of Uganda MoP (1991). 1991 Population and Housing Census, Rakai district.
Entebbe: Statistica/ division_. Ministry of Planning. Ricbey CM, Macaluso M and Hook EW (1999). Determinants of reinfection with Chla
mydia tracbomatis.Sex Transm Dis 26(1):4-11. Ridgway GL, Mumtaz G, RobinsonAJ, Franchini M, Carder C, BurczakJ and Lee H (1996).
Comparison of the Iigase chain reaction with cell culture for the diagnosis of Chlamydia trachomatis infection in women.J Clin Pathol 49(2): 116-9.
RobinsonAJ and Ridgway GL (1996). Modem diagnosis and management of genital Chlamydia trachomatis infection.Br J Hosp Med 55(ï): 388-93.
Robinson ]N, Mulder D\V,Auvert B and Hayes RJ (1995). Modelling the impact of alternative IDV intenrention strategiesin rura1 Uganda.AIDS 9(11): 1263-1270.
Robinson NJ (1994).The association ofiDV-1 and other sexually transmitted diseases,and its relevanee to intervention programmes in rural Uganda: a simulation rnadelling e......::ercise [PhD thesis]. London, London School of Hygiene and Tropical Medicine.
Robinson N],Mulder DW,Auvert Band Hayes RJ (199ï).Proportion of HIV infections attributable to other so...'Ually transmitted diseases in a rural Ugandan population: simulation model estimates.IntJ.Epidemiol 26(1): 180-189.
Rotchford K, Sturm AW and Willdnson D (2000). Effect of coinfection with S1Ds and of STD treatment on HIV shedding in genital-tract secretions: systematic reöew and data syuthesis. Sex Transm Dis 27(5): 243-13.
Rowley ]T and Andersen R.l\1 (1994). Modeling the impact and cost-effectiveness of HIV prevention efforts.Aids 8(4): 539-48.
Royce RA,Jackson TP,Thorp JM,Jr., Hiliier SL, Rabe LK, Pastore L'\1 aud Savitz DA (1999). Race/etbnicity, vagina! flora pattems, and pH during pregnancy.Sex Transm Dis 26(2): 96-102.
Saltz GR, Linuemann CC, Brookman RR aud Rauh JL (1981). Chlamydia tracbomatis cervical infectionsin female ado!escents.]Pediatr. 98(6): 981-985.
Sanchez-Martinez D, Schmid OS, Whittington W: Brown D, Reeves WC, Charterjee S, Whitley RJ and Pellen PE (1991). Evaluation of a testbasedon baculovirus-expressed glycoprotein G for dereetion of herpes simplex virus type-specific antibodles-I Infect Dis 164(6): 1196-9.
Scbacbter], Hanna L, Hili EC, Massad S, Sheppard CW, Con te JE, Jr., Co hen SN and Meyer KF (1975).Are chlamydia .infection the most prevalent venereal disease? )AMA 231(12): 1252-5.
SchackerT, ZehJ, Hu HL, Hili E aud Corey L (1998). Frequency of symptomatic and asymptomatic herpes simplex "irus type 2 reactivations among human immunodeficiency virus-infected men.J Infect Dis 178(6): 1616-22.
Schafield CBS (1982). Some factors affecting the incubation period and duration of symptoms ofurethritis in men.Br]Vener.Dis. 58:184-187.
Serwadda D, Sewankambo NK., Carswell ]Wet al. (1985). Slim disease: a new disease in Ugauda and its association with HTLV-ID infection. Tbe Lancet II(8460): 849-852.
Serwadda D,Wawer MJ,Musgrave SD,Sewankambo NK,Kaplan]E and Gray RH (1992).HN risk factors in three geogra.pbic strata of rural Rakai District, Uganda [see comments]. AIDS 6(9): 983-9.
Sewankambo N, Gray RH, Wawer MJ et al (1997). HIV-1 infection assocîated with abnarmal vagina! flora morphology and bacterial vaginosis. Tbe Lancet 350: 546-550.
Sewankambo NK, Carswell.rw, Mugerwa RD, Lloyd G, Kataaha P, Downing RG aud Lucas S (198ï). HN infection through normal heterose.--rual contact in Uganda. AIDS 1: 113-116.
Sewankambo NK, Wawer MJ, Gray RH, Serwadda D, Li C, Stalliugs Rx; Musgrave SD aud Konde-Luie J (1994). Demograpbic impact of HN infection in mral Rakai district,

Bibliography
Uganda: results of a population-based cohort srudy.Aids 8(12): 1707-13. SherrardJ and Barlow D (1993). Gonorrhoea in men [lener].Lancet 341:245. Sherrard J and Barlew D (1996). Gonorrhoea in men: clinical and d.iagnostic aspects.
Genitourin.Med. 72: 422-426. Simonsen ]N, Cameren DW, Gakinya MN et aL (1988). Human immunode:ficiency virus
infection among men 'With se.xually transmitted diseases. E..-... .. perience from a center in Africa.N Eng!] Med 319(5): 274-8.
Simonsen JN, Plummer FA, Ngugi EN et al. (1990). HIV infection among lower socioeconomie strata prostitutes in Nairobi. Aids 4(2): 139-44.
Sk-ulnick M, Chua R, Sirnor AE, Low DE, Khosid HE, Fraser S, Lyons E, Legere EA and Kitch~ ing DA (1994). U se ofthe polymerase chain reaction for the detection of Chlamydia tra
chomatis from endocervical and urine specimens in an asymptomatic lew-prevalenee population ofwomen.Diagn Microbiol Infect Dis 20(4): 195-201.
Somse P, Mberyo-Yaab F, Morency P, Dubois MJ. Gresenguet G and Pep in] (2000). Quality of se..·,:ually transmitted discase treat:ments in the formal and informal sectors of Bangui, Centra!African Republic. Sex Transm Dis 27(8): 458-64.
Sorensen JL. Thranov I, Hoff G and Dirach J (1994). Early- and late-onset pelvic inflammatory d.isease among women with cervical Chlamydia trachomatis infection at the time of induced abortion ~ a follow~up srudy. Infection 22( 4): 242-6.
Sparling PF (1990). Syphilis.ln: Sexually Transmitted Diseases. KK Holmes. P Mardh et aL [Eds.].NewYork.McGraw-HiJJ, 131-148.161-180,263-272.
Spiegel CA (1991). Bacterial Vaginosis. Clin.MicrobioLRev. 4(4): 485-502. Stall R. Eksnand M. Pollack L, McKusick L and Coat es 1J (1990). Relapse from safer sex: the
ne..'\.."t challenge for AIDS prevention efforts.]Acq.Imm.DefSyndr. 3: 1181 ~ 1187. Stam.m WE. Kouts1.-y LA, Benedetti ].K, Jourden JL. Brunharu RC and Holmes KK (1984).
Chlamydia trachorn.atis urethral infectionsin men.Ann.lntern.Med. 100:47~51. Stamm WE and Cole B (1986).Asymptomatic Chlamydia trachomatis urethritis in men. Sex
Transm Dis 13(3): 163-5. Stary A, Ching SF,Teodorowicz Land Lee H (199ï). Comparison of ligase chain reaction
and culture for detection of Neisseria gonorrhoeae in genital and ö.'tragenital speci~ mens.] Clin Ll1icrobiol35(1): 23942.
Sratistics Dept. Gganda Mil (1996). Uganda Demograpbic and Health Survey. 1995. Calverton, Maryland, Staristics Dept. [Uganda}, Macro International Inc.
Steen R and Dallabetta G (1999). The use of epidemiological mass treatment and syn~ drome management for sö.-ually transmitted disease controL Sex. Transm.Dis. 26( 4 (Suppl.)): S12-S20.
Steen R, Vuylsteke B, DeCoito T, Ralepeli S, Fehler G, Conley J, Bruckers L, Dallabetta G and Ballard R (2000). Evidence of declining STD prevalenee in a SouthAfrican mining com~ munity following a core-group intervention. STD 27(1): 1-8.
Stigum H. Falck W and Magnus P 0994). The core group revisited: the effect of partner mixing and migration on the spread of gonorrhea, chlamydia and mv: 1l1ath.Biosc. 120: 1~23.
Stoneburner RL, Low~Beer D,Tembo GS, MertensTE andAsümwe-Qkiror G (1996). Human immunode:ficiency virus infection dynamics in east Africa deduced from surveillance data. Am] Epidemio/144(7): 682-9;.
Ston J and Hahn BH (1999). Vaccines and immunology- an overview. AIDS 13(Suppl.A): S103-S104.
Stover J and O'Way P (1995). Impact of interventions on reducing the spread of HN in developing countries: computer simulation applications. African J of Medical Prae~ tice 2(4): 110-120.
Stover] and Way P (1998). Projecting the impact of AIDS on mortality.AIDS 12(Suppl.!): S29-S39.
243

244 Bibliography
Stover J (2000). In:fluence of mathematica! modeling of lllV andAIDS on policies and programsin the developing world.Sex Transm Dis 27(10): 572-8.
Sturm-Ramirez I, Gaye-DialloA, MboupS and KankiP (2000). Bacterial vaginasis is associated with increased levels ofproinflammatory cyrokines in cervical secretions.XITith InternationalAIDS conference, Durban, SouthA.frica.
Sullivan.AK,Atkins MC and Boag F (199ï). Factors facilitating the sex-ual transmission of IDV-l [review].Aids patient care and STDs 11(3): l6ï-lïï.
Susser E, Desvarieu.x M and Wittkowski KM (1998). Reporting sex"Ual risk behavier for HIV: a practical risk index and a method for improving risk indices.AmJ.Publ.Health 88(4):6ï1-6ï4.
Sweat M. Gregorich S, Sangiwa G, Furlonge C. Balmer D, Kamenga C, Grinstead 0 and CoatesT (2000). Cost-effectiveness ofvoluntary HN-1 counselling and testing in reducing sexllal transmission ofHIV-1 in Kenya andTanzania.Lancet 356:113-121.
Sweat MD and Denison]A (1995). Reducing HIV incidence indeveloping countries with strocrural and en"ironmental interventions.AJDS 9(Suppl.A): S251~S25ï.
Taha TE, Hoover DR, Dallabcru GA et aL (1998). Bacterial vaginasis and disturbances of vagina! flora: association with increased acquisition of HN.AIDS 12: 1699-1 ï06.
Taha TE. Gray RH, Kumwenda NI, Hoover DR. Mtimavalye LA, Iiomba GN, Chiphangwi ]D, Daliabctra GA and .Miotti PG (1999). HIV infection and disturbances of vagina! flora during pregnancy.] Acquir Immune Defic Syndr Hum Retrovirol20(1): 52-9.
Tait IA, Rees E. Hobson D, Byng RE and Tweedie MCK (1980). Chlamydia infection of the cervix in centacts of men with nongonococcal urethritis.BritJ.Vener.Dis. 56: 3ï-45.
Telzak EE, Chiasson MA, Be vier PJ, Stoneburner RL, Castro KG and ]affe HW (1993). IDV-l seraconversion m patients withand without genital ulcer discase A prospective study. Ann.lntern.Med. 119: 118!-1 186.
Terho P (19ï8). Chlamydia trachomatis in non-specific urethritis. BrJ.Vener.Dis. 54: 251-256.
Theus SA, Harrich DA, Gaynor R. Radolf JD and Norgard MV (l998).Treponema pallidum, lipoproteins, and synthetic lipoprotein analogues induce human immunodeficiency virus type 1 gene e.xpression in monocytes via NF~kappaB activation.] Infect Dis 177(4):941-50.
Thomas JC, Schoenbach V]. Weiner DH, Parker EA and Earp JA (1996). Rural gonorrhea in the southeastem United States: a negleered epidemie? Am] Epidemiol 143(3): 269-ïï.
Thompson SE and Washington E (1983). Epidemiology of sex-ually transmitted chlamydia trachomatis infections.Epidemiologic Reviews 5:96-123.
ToddJ, Balira R. Grossk.-urth H et al. (199ï). HIV~associated adult mortality in a rurai Tan7..a~ nian population.AJDS 11: 801-80ï.
Trollope-Kumar K (1999). Symptoms of reproductive-tract infection ~ not all that they seem to be.Lancet 354: lï45~1ï46.
UN (1993).Young women: silence, susceptibility and the HIV epidemie. New York, Dnited 1'\ations Development Programme.
UNAIDS (l99ï). Report on the global IDV/AIDS epidemie. Geneva, UNAIDS. UNAIDS and WHO (2000).AIDS epidemie update: December 2000. Geneva. Unicef (1995). The state ofthe world's children 1995. Oxford and NewYork, Oxford Uni
versity Press for Unicef. van de Wijgen ]HHM, Mason PR Gwanzura L, M.bizvo MT, Chirenje ZM. lliffV, Shiboski
S and Padian ::--JS (2000). Intravaginal practices, "\"aginal flora disturbances, and acquisi~ tion of SID in Zimbabwean women.jlnjDis. 181: 5Sï-594.
Van der Ploeg CPB, Van Vliet C, De Vlas SJ, Ndinya~AcholaJO, Fransen L, Van Oortmarssen G] and Habbema JDF (1998). SIDSlM: a microsimulation model for decision support on sm controLinterfaces 28:84-100.

Bibliography
van Doomurn GJ, Buimer M, Prins M, Henquet CJ, Coutinho RA. Plier PK, Tornazie-Allen S, Hu Hand Lee H (1995). Dereetion of Chlamydia trachomatis infection in urine samples from men and woroen by ligase d13.in reaction.j Clin Microbiol33(8): 2042-7.
Van Vliet C, Holmes K, Singer B and Habbema J (1998). Effectiveness of HIV prevention strategies under alternative epiderniological scenarios: evaluation with the model STDSL.VL In: Confronting AIDS; pubtic priorities in a global epidemie: background studies. European Commission [Eds.]. Brussels. European Commission.
Verdon MS, Handsfield HH and Johnson RB (1994). Pilotstudy of azithromycin for treatment of primary and secondary syphilis. Clin.lnfectDis. 19:486488.
Vemazza PL, EronJJ, Fiscus SA and Cohen MS (1999).Se.'."Ual transmission ofHIV:infectiousness and prevention.AIDS 13: 155-166.
Viravan C,Dance DA,Ariyari.t C et al. (1996).A prospective clinicaland bacteriologie srudy of inguinal buboes in Thai men. Clin Infect Dis 22(2): 233-9.
Vittinghoff E and Padian NS (1996).Attributable risk of exposures associated with sc;..."U3.ily transmitted disease.J Infect Dis 174 Suppl2: 5182-7.
Voeten H. Otido ], O'Hara H, Kuperus A, Barsboom G, Ndinya-Achola J, Bwayo J and Habbema] (2001). Quality of sm case management in ::-.Tairobi, Kenya; a comparison of different types of health care facilities. Sex. Transm.Dis.: in press Quly 200 1).
Vuylsteke B, Bastos R, Barreto J, Crucitti T, Folgosa E. Moncllane J, DusauchoitT, PiotPand Laga M (1993a). High prevalenee of se.'\."U3.lly transmitted diseases in a rural area in Mozambique. Genitourin Med 69(6): 427-30.
Vuylsteke B, Laga M, Alary M, Gemiers M.\1, Lebughe JP, Nzila N, Behets E Van Dyck E and Piot P (1993b). Clinical algorithms fo:r the screening of woroen for gonococcal and chlamydia! infection: evaluation of pregnant woroen and prostitutes in Zaire. Clin Infect Dis 17(!): 82-8.
Wacb-çvorth J,Johnson .A..\1, Wellings K and Field J (1996). What's in a mean? - an e.;:aminatîon of d1e inconsistency benveen men and women in reporting se-.."Ual partnerships. ] R StatSocA 159(Part 1): 111-123.
Wald A, Corey L, Handsfield HH and Holmes KK (1993). In.fluence of :mv infection on manifcstations and natural hîstory of other SIDs.Annu.Rev.PubLHealtb 14: 19-42.
Wald A, Corey L, Cone R, Hobson A, Davis G and Zeh J (1997). Frequent genital herpes simple.;: virus 2 shedding in immunocompetent women. Effect of acyclovir treatment.
] Clin fnvest 99(;): 1092-7. WaldA. Zeh]. Selke s. Warren T, RyncarzA],Ashley R, Krieger JN and Corey L (2000). Reac
tivation of genital herpes simplex virus type 2 infection in asymptomatic seropositive persons.N Engl] Med 342(!2):844-50.
Walker D, Muyinda H, Foster S, Kengeya-Kayondo] and WbitworthJ (2001).The quality of care by private practitioners for se.'\.'Ually transmitted diseases in Ugmdz.Health Policy Plan 16(1): 35-40.
WallinJ (19ï4). Gonorrhoea in 1972.A 1-year study ofpatients attending theVD unit in Uppsala.B1'].Vener.Dis. 51:41-47.
Ward H, Mertens TE and Thomas C (1997). Health seeking behaviou:r and the control of so.."Ually transmitted disease.Health Policy Planning 12(1): 19-28.
Wasserheit pr (1992). Epidemîological synergy. Interrelationships between human immunodeficiency virus infection and other se)..'1.laliy transmîned diseases. [Review]. Sex Transm Dis 19(2): 61-77.
Waters ]R md Roulston TM (1969). Gonococcal infection in a prenatal clinic. Am]Obstet.Gynec. 103(4): 532-536.
Watson:Tones D, Mugeye K, Mayaud P et al, (2000). High prevalenee of trichomoniasis in rura1 men in .Mwanza,Tanzanîa:results from a population-based srudy. Sex.Transm.Inf 76: 355-362.
Watts CH and May RM (1992).The influence of concurrent partnersbips on the dynamics
245

246 Bibliography
of HIV I AIDS. Math Bios ei 108: 89-104. Wawer MJ, Serwadda D, Musgrave SD, Konde-Luie JK, Musagara M and Sewankambo ::--n<:
(1991)- Dyruu:nics of spread of HIV-I infection in a rural district of Uganda_ BM]. 303(6813): 1303-6.
Wawer MJ, Sewankambo NK., Beddey S, Serwadda D, Musgrave SD. Gray RH, Musagara M, Stallings RY and Konde-lule ]K (1994). Incidence of HIV-I infection in a rural region ofUganda [see comments].B.M.J 308(6922): 171-3-
Wawer M], Serwadda D, Gray RH, Sewankambo NK, Li C, Nalugoda F. Lutalo T and KondeLuie ]K (199ï). Trends in HIV-I prevalenee may not reflect trends in incidence in mature epidernics: data from the Rakai population-based cohort. Uganda. AIDS 11: 1023-1030.
Wawer MJ, Gray RH,Sewankambo NK et al. (1998).A randomized community trial of intensive so.:ually transmitted discase control for AIDS prevention. Rakai, Uganda.AJDS 12: 1211-1225.
Wawer MJ, Sewankambo NK., Serwadda D et al. (1999). Control of se..'\.."Ual.ly transrnitted diseases for AIDS prevention in Uganda: a randomised community trial. Lancet 353: 525-535.
Weir SS, Feldblum PJ, Roddy RE and Zekeng L (1994). Gonorrhea as a risk factor for HIV acquisition.AIDS 8:1605-1608.
WHO (1965). International work in endemie treponematoses and venereal infections, I948-1963.WH Organization. Geneva.
WHO (1994)_ Management of Se>:uallyTransmitted Diseases.WHOIGPA/TEM/94. L WHO (1999).An overview of selected curable sexually tra.nsmitted diseases. Geneva,World
Health Organization, Global programme onAlDS/SIDs. WHOIIL"AIDS (1998). Global report on AIDS I Epidemiological Fact Sheets, June
1998. http://WW'\V.who.ch/emc/diseasesfhiv· htm:/WW'\V.unaido;;.org, Working group on global HIV/AIDS and sm surveillance.
Wiesner PJ and Thompson SEI (1980). Gonococcal diseases. Disease~a~month 27(5): 1-44. Wiesner PJ (198!)_ Gonorrhea. Cutis 27:249-54. Wilkinsou D (1997). Syndromic management of SIDs in developing countries: what role in
the control of the SID and HIV epidemics? [Editorial). Genitourin.Med. 73: 427-428. Willdnson D, Connolly Al\1, HanisonA, Lurie Mand Karim SS (1998). Se>:ually transmitted
discase syndromes in rurai South Africa. Results from health facility surveillance. Sex Transm Dis 25(1):20~3.
Wilkinson D,Abdool Karim SS, Hanison A. Lurie M, Colvin M, Connolly C and Sturm AW (1999). Unrecognized se;...--ually transmitted infectionsin rural South African women: a hidden epidemie. BulL WHO 77(1): 22-28.
Willcox RR (1976). Single oral dose of 1.5g talampicillin in the treatment of gonorrhoea. Britj.Vener.Dis. 52: !84-186.
Willcox RR (1985). Mass treatment campaigns against the endemie treponematoses. RevJnfDis. 7(SuppL2): S278-S283.
Wilierford DM, Bwayo )J, Hensel M, Emonyi W, Plummer FA, Ngugi EN. Nagelkerke N, Gallatin W'l\1 and Kreiss] (1993).Human immunode.ficiency virus infection among high~risk seronegative prostitutes in Nairobi.] Infect Dis 167(6): 1414-7.
Winfield J and Latif AS (1985). Tracing: cantacts of persons with se;...-ually tra.nsmitted discases in a developing country. Sex Transm Dis 12(1): 5-7.
Workowski KA, Stevens CE, Suchland RJ, Holmes KK, Eschenbach DA, Pettinger MB and Stamm WE (1994). Clinical manifcstations of genital infection due to Chlamydia tracho~ matis in women: differences related to serovar. Clin Infect Dis 19(4): 756-60.
Worldbank, Ed. (1993). World Development Report 1993: investing in health. NewYork, Oxford Cniversity Press, Inc.
Wor!dbank (199ï)- Confronting AIDS: pubtic priorities in a global epidemie (A World

Bibliography
Bank Policy Research Report). ~ewYork, Oxford University Press,Inc. Wu CH, Lee MF,Yin SC, Yang DM and Cheng SF (1992). Comparison of polymerase chain
reaction, monodonal antibody based enzyme irnmunoassay, and cell culture for detection of Chlamydia trachomatis in genital specimens. Sex Transm Dis 19( 4): 193-7.
X u F, Schilling er JA, Markowitz LE, Stemberg MR,Aubin MR and St. Louis ME (2000). Repeat Chlamydia trachomatis infection in women: analysis through a surveillance case registry in Washington State, 1993-1998.AmJ Epidemio/152(12): 1164-70.
Yorke JA, Hethcote HW and NoldA (1978). Dynamics and control of the transmission of gonorrhea.Sex Transm Dis 5(2): 51-ó.
Zenilman JM, Fresia A, Berger B and McCormack WM (1999). Bacterial vagi.nosis is not associated with circumcision status of the current male partner. Sex.Transm.lnf 75: 347-348.
247


SUMMARY
The epidemie of the acquired immunodeficiency syndrome (AIDS) is among the most pressing global issues in public health. By the year 2000, 36 million people were infected with the human immunodeficiency virus (HIV), the underlying cause of AIDS; more than 80% of them were living in sub-Saharan Africa. There
is no vaccine against HN infection, and in most developing countries the price of treaunent puts it beyond the reach of mostAIDS patients. For this reason, the prevention of infection is the primary mode of controL In sub-Saharan Africa, most HIV infections are acquired by heterose-...~al intercourse, and prevention progranunes focus on reducing its se.xual spread.
This thesis studies the extent to which the treatment of sexually transmitted diseases (Slli) can help to prevent HIV spread in sub-SaharanAfrica, where both STD and HN are conunon. People with sm are often infected with HN and vice versa, and STD seem to be a risk or 'co-'factor in the transmission of mv. STD damage the skin barrier to the entrance and disseminarion of viruses, and allow HN-susceptible white blood cells to accuroulate in the genital tract. Yet it is undear to what extent treatment of STD can cantribure to HIV prevention. Knowing this is important, as it detertnines the proportion of HN control efforts and money that should be spent on STD treatment, relative to ether prevention strategies.
To anSW"er this question,numerous studies have been conducted over the past two decades on STD/HIV associations.These include two intervention trials that assessed the impact of improved STD treatment on HIV incidence in rural.African populations.ln a trial in Mwanza, Tanzania, improved syndromic management of symptomatic STD in clinic attendees was associated wîth a 38% reduction in HIV incidence (with a 95% confidence interval of 15% to 55%), but with limited reductions in sm rates.ln contrast, a trial of home-based mass sm treatment of the whole population in Rakai, Uganda, found reductions in Sm rates without a reduction in HIV incidence (3%, wîth a 95% confidence interval of -16% to + 19%). As aresult of these contrasring outcomes, it remained undear whether STD treatment is an effective HIV prevention strategy. In this thesis, I have therefore reexamined, quantitatively, these and other data on the role of Sm cofactors in HN spread and controL
The magnitude of STD cofactor effects on HIV transmission
Previous estimations of the magnitude of STD cofactor effects derived from observational studies were reconsidered. Chapter 2 reviews the multiple rea
sous underlying the fact that sm and HN occur in the same individuals. Most importantly, Sm and HN share a conunon primary risk factor, i.e. (frequent) unprotected sexual intercourse wîth many different partners. Since data are
249
250 Summary
often incomplete, it is difficult to statistically adjust for all relevaut factors when estimating cofactor magnirudes from observational srudies. Notably, STD and mv cluster not only in srudy subjects and their direct partners, but also in the part· ners of their partners. Of the Jatter, little is usually known, but their risk profile wil! certa!nly enbance the IDV/STD association in srudy subjects. On the other band,IDV/STD associations are sometimes diluted by factors such as the miscJas. sification of exposure status due to unrecognised symptoms or imperfect STD diagnostic tests. As an illusttation of the way in which these factors affect cofac· tor estimations, we recalculated the cofactor effect for genital ulcers on mv acquisition in prostitutes in Nairobi. If several plausible non-cofactor determinants of the IDV luleer association were taken into account, they would reduce the cofactor estimate from 23-fold to 3-fold (per se::..'llal contact), suggesting a strong conformding in the original estimate.We conclude that observational srudies such as those done so far have mostly overestimated STD cofactor magnirudes.
Another condusion of this re-analysis is that STD are an important indicator of an individual's risk of IDV infection · irrespective of how much of the IDV /STD association is due to STD cofactor effects.This implies that care for STD patients, if it includes counselling on behavioutal risk reduction and perhaps condom provision, can be an important means of targeting mv prevention to the group most in need.
STD sym.ptom probabilities and treatment seeking
Chapters 3 and 4 focus on a determinant of the efficacy of clinical, syndromic STD tteatment (the intervention evaluated in the Mwanza trial): i.e. the propor· tion of STD episodes in which recognised symptoms occur · which may prompt the patient to seek treatment.
Chapter 3 documents a meta-analysis of cross-sectional surveys on the proportion of gonorrhoea and chlamydia infections in which the patient has symptoms. This proportion was generally low, between 6% and 40%. Symptom prevalenee varled very little between a number of ( developed and developing) countries and populations. This was not e::..-pected, as, logically, symptom prevalenee should decrease with the proportion of symptomatic STD infections that gets timely treatment, and treatment pattems do vary considerably between these populations. No correlations were found between symptom prevalenee and indicators of treatment rates in the respective populations. We infer that, set· ting-specific reporting behaviour co-determine the prevalenee of reported symptoms, together with treatment pattems. Symptom recognition and reporting is probably better in countries with good treatment facilities, thus counterbalancing the effect of tteatment on symptom prevalence.
Chapter 4 estimated the probability with which gonorrhoea and chlamydia

Summary
episodes become symptomatic. We used symptom prevalences derived from a cross-sectional survey in Raka.i, which were combined in a natura! history model
with data on the duration of symptomatic and asymptomatic disease phases, and with data bath on the proportion of patients seeking treatment and on parient delay in treatment seeking. Symptom probabilities for the Rakai population were estimated at 45% for gonorrhoea in males, 14% for gonorrhoea in females, 11% for chlamydia in rnales and 6% for chlamydia in females.These fractions proved to be much lower than estimates for men in the United States. This outcome thus corroborates the conclusions of Chapter 3, that symptom reporting varles bernreen populations, and is very poor in underserviced and uneducated populations sucb as that in rural U ganda.
Explaining the discrepant outcomes of the Mwanza and Rakai SID treatment trials
We e.oxplored possible reasous for the seeming discrepancy in outcomes between the STD treatment trials in Mwanza and Raka.i. Several hypotheses centred around the apparently lower prevalenee of curable STD in Rakai as compared to Mwanza.Where curable STD are less prevalent, their importance in HN transmission is less and the impact of STD treatment wili also be less.
In Chapter 5, STD prevalences were systematically compared between the two trials, taking into account differences in the population (e.g. age) groups sampled, and the sensitivities and specificities of the different diagnostic tests used. After standardisation, the prevalences of gonorrhoea, chlamydia and trichomoniasis proved to be considerably higher in Mwanza than in Rakai.Active (recently acquired) syphilis was also more prevalent in Mwanza, but overall (i.e. if also
induding late stages of infection), syphilis was equally prevalent in bath sites. In contrast,for the incurable STD herpes simplex virus type 2 (HSV-2), no site differences in seroprevalence were found.
To further study the role of differences in the types of STD intervention and in the study populations between Rakai and Mwanza, we made use of an epidemiological model that simulates the spread ofHN and STD througb populations, and specifically the trial populations.The model, SWSIM, was first'fitted' to reproduce the trial outcomes, using data collected during the trials and from related surveys on demography, sexual behaviour and epidemiology.The model wasthen used to preeliet the impact of intervention scenarios not actually perforrned, sucb as mass treatment in Mwanza. Chapter 6 describes SWSIM in detail. Particular reference is given to the model representation of seJ~..llal behaviour, one of its most complex features.This cbapter also demonstrates that behavioural interventions of seemingly moderate scope (e.g. whicb induce small decreases in num
bers of partners) can have a starding influence on the spread of HN.
Chapter 7 describes SWSIM simulations of STD interventlans in Mwanza.
251

252 Summary
We fust fitred the model to the actual Mwanza trial outcomes. The model best fitred the observed impact of syndromic treattuent on HN incidence (a 38% reduction) ifwe assumed high cofactors (as compared to the outcomes of Chapter 2). Even with high assumed cofactors (resulting in a simulated impact on HN of syndromic treattuent of 30%), reductions in STD prevalenee had to be specified as Iarger than they appeared to be in the actual trial. In all scenarios, a hypothetical single-round of mass treattuent (resembling the Rakai intervention) was predicted to be about effective as syndromic treattuent over the fust two years (e.g. 36% aod. 30% HN incidence reduction, respectively).
As a complementary approach to assessing the role of the type of intervention in determining the trial outcomes, we simulated the effect of syndromic STD management in Rakai. Chapter 8 shows that, if it had been implemented in the late 1990s, i.e. at the time of the Rakai trial, this intervention would hardly have been any more effective against HIV than was mass treatment in the actual trial (8% HIV incidence reduction in the best model scenario, vs. 3% in the actual trial). These outeernes argue against the hypothesis that the difference in impact bernreen the trials was due to differential impact of the respective interventions on curable STD.
Chapter 8 also shows that, had STD interventions been implemented earlier in the HIV epidemie in Rakai (e.g. around 1988), they might have been more effective (for example achieving a 11% reduction in HIV incidence, rather than one of 8% in 1998).This trend over time was due in parttoa behaviour change that occurred in the late 1980s, after the end of Uganda's civil war. The consequent fall in STD prevalences and in the occurrence of short, casual partnersbips in which STD cofactors are most important, reduced the importance of STD in HN spread in the 1990s. Simulations of a hypothetical Rakai-like population without behaviour change revealed that, even without behaviour change, the impact of STD treattuent on HN spread would have fallen somewhat over the HN epidemie (e.g. from 19% in 1988 to 15% in 1998). This is due firstly to selective A1D5-related morta!ity among high-risk groups where STD are highly prevalent, which reduces the prevalenee of STD in the population. In addition, the types of relationships in which most HIV transmissions occur shifts during the epidemie, from casual short relationships to long-term relationships, in which STD cofactors are less important. Contrary to what has been hypothesised, an increase in ulcers due to the incurable cofactor HSV-2 during the HN epidemie, due toAlDS
patients suffering more frequent herpetic recurrences, make little difference to the impact of STD treattuent at different timepoints in the Rakai epidemie.
In summary, the results of Chapters 5 to 8 indicate that the behaviour change in Uganda preceding the Rakai trial and the re!atively late stage of the HN epidemie in Rakai, both contributed to the relatively low impact ofthe STD intervention on HIV incidence there. Wbat remains to be explained is the omeomes of the Mwanza trial • which were difficult to reproduce in simulations: how could

Summary
such a large reduction in HN incidence occur with so little reduction in STD prevalences? Studies not documented in this thesis suggest two possible explanations: - The coincidentally low starting prevalenee of HN and STD, and their main
risk factors in the Mwanza intervention arm as compared to the comparison arm. This phenomenon may have caused residual confaunding in the statistiw cal analysis of trial outcomes, and was shown in simulations to be potentially iofluential;
· Alternative, non-cofactor mediated mechanisms of the Mwanza intervention on HN incidence. For example, participants' risk behaviour may have been reduced by counselling provided during the clinic visit, and by the populationbased STD health education affered to increase clinic attendance, thus reducing the transmission of HN directly (and, initially, probably more tillUl the transmission of STD).
Interactions between mv and HSV-2
Chapter 9 elaborates on the interactions in epidemiology between HN and HSV-2. In several developing countries, the proportion of genital ulcers that are due to HSV-2 is increasing, at the expense of the curable causes, syphilis and chancroid. This is commonly thought to be due to the enl1ancing effect of HN
disease on herpetic ulceration, as wellas to the consequent increase in the trans-mission of HSV-2 from HN patients to their partners. However, by simulating the interactions between HN and HSV-2 during a severe African HN epidemie, we demonstrared that, at the population level, the increase in genital herpes is likely to be limited. This is because only a minority of HSV-2 patients have (symptomatic) HN, and because the putative increase in HSV-2 transmission is limited by the existing high prevalenee of HSV-2 among partners of HN patients. By contrast, behavioural risk reduction (as occurred in Rakai) was shown tobring about a large increase in the proportion of ulcers that are of herpetic nature (although not an absolute increase in herpes incidence), as it decreases syphilis and espew cially chancroïd much more than genital herpes.
hnp.lications
The combined results suggest that we should temper our expectations of the role of STD treatment in HIV prevention. For a better quantitative understandw ing of the role of STD care in HN prevention, new trials of syndromic management that allow a distinction between cofactor-mediated and behavioural effects, would be needed. Furtl1er trials would also help to delineate the cost-effectiveness of syndromic STD management as compared, for example, to behavioural
253

254 Summary
interventions. For several reasons, it is unclear whether such new trials will be conducted. In the meantime, four main conclusions can be drawn with regard to
HN control: lt is essential that greater attention is paid to the behavioural components of STD management, such as counselling on the prevention of reinfection and partner infectión, and the provision of condoms;
· To improve the use of STD management services, parallel population-based STD health education is indicated;
· The promotion of behavioural risk reduction remains the fust priority in any setting (for example, via education and condom disrribution);
· With regard to the future, the greatest potentiallies in the development of effective vaccines against mv.

SAMENVATTING
Dit proefschrift gaat over de preventie van de verspreiding van AIDS in Afrika.
Deze dodelijke ziek1:e is het gevolg van Infectie met HW (het humaan immunodeficiëntie-virus).ffiVwordt overgedragen van mens tot mens via seksueel contact, via bloed en van moeder op kind rondom de geboorte.
De AIDS-epidemie, die rond 1980 begon met de verspreiding van Hiv, is één van de belangrijkste ziek1:e· en doodsoorzaken geworden, met name in onrwikkelingslanden. In het jaar 2000 waren er wereldwijd 36 miljoen mensen geïnfecteerd met HW; meer dan 80% hiervan woonde in Afrika beneden de Sahara. Er bestaat geen geneesmiddel tegen AIDS. Sinds de jaren 1990 zijn er wel medicij· nen tegen het fllV-virus, die de levensverwachting en levensk-waliteit van patiënten aanzienlijk verhogen. Deze medicijnen zijn echter slechts beschikbaar voor een klein deel van de geïnfecteerden, nl. diegenen in de rijkste landen waar geavanceerde medische zorg voorhanden is.Bovendien hebben de antivirale middelen moeilijk te tolereren bijwerkingen, en wordt hun effectiviteit verminderd door virusresistentie die na verloop van tijd optreedt in een meerderheid van de gebruikers. Er wordt gewerk1: aan vaccins die HW-besmetting k'Ullllen verhinderen, maar tot op heden bestaan die niet.
In Afrika wordt HW voornamelijk overgebracht via heteroseksueel contact. De bestrijding van AIDS concentreert zich op het voorkómen van HW-besmetting. Behalve op het vermijden van onveilig seksueel contact, richt men zich
op het verminderen van het risico van transmissie (overdracht) tijdens onbe-' schermd contact. Dit risico varleen tussen mensen en bevolkingsgroepen, en hangt onder meer af van het ziehesradium van de HW -geïnfecteerde, de algehele gezondheidstoestand van beide partners en het type geslachtsverkeer.
Als één van beide partners tegelijkertijd een andere seksueel overdraagbare aandoening (SOA) heeft, kan het transmissierisico aanzienlijk oplopen (het zgn. SOA-cofuctor-effect).Voorbeelden hiervan zijn genitale zweren (door syfilis, weke sjanker en genitale herpes) of Infecties die ontsteking van de huid of het slijmvlies veroorzaken (zoals gonorroe en chlamydia). Deze aandoeningen vergemakkelijken het binnendringen van het HW-virus doordat zij de huid lokaal
besdudigen en meer doorlaatbaar maken. Op vergelijkbare wijze vergtoot een SOA in de HW -geïnfecteerde partner het risico van besmetring van de partner, omdat deze leidt tot verhoogde genitale uitscheiding van het HIV-virus. In de landen waar de HW-epidemie het ergst is, komen SOA's veel voor. Daarom wordt verondersteld dat het bestrijden van SOA's - de meeste h."Uillen worden genezen met antibiotica · een belangrijke bijdrage kan leveren aan het verminderen van HW-verspreiding.
In dit proefschrift heb ik bestudeerd hoe groot de rol van SOA's als 'cofactoren' in HW-transmissie is en hoeveel SOA-behandeling kan bijdragen aan HW-preventie in Afrika. Kennis hierover is belangrijk omdat dit mede bepaalt hoeveel geld er
255

256 Samenvatting
aan SOA-behandeling moet worden besteed in vergelijking met andere typen bestrijdingsprogramma's,Met name in ontwikkelingslanden, waar budgetten voor gezondheidszorg klein zijn, is een goede prioritering tussen (kosten-)effectieve en minder (kosten~)effectieve activiteiten essentieel.
Over dit onderwerp zijn al eerder veel studies gedaan, maar deze leverden geen eenduidig anTivoord op. Met name zijn er twee eJ>,."Perimentele onderzoeken
(trials) in Uganda en Tanzania uitgevoerd, waarin werd bekeken hoeveel minder uieuwe HIV-infecties optraden in dorpen waar SOA-behandeling verbeterd werd ten opzichte van dorpen met het normale, beperh."te niveau van zorg. In de trial
in Tanzania verminderde HIV-incidentie met naar schatting 38% door verbeterde zorg voor SOA-patiënten die naar algemene klinieken k'Wamen,Tegen de verwachting in reduceerde deze interventie het aantal SOAs zelf echter nauwelijks, In
Uganda, daarentegen, had een herhaalde 10-maandelijkse behandeling van de hele bevolking met antibiotica tegen SOA's geen noemenswaardig effect op HIVincidentie (3% reductie over 2 jaar), hoewel deze interventie aantallen SOA's wél verminderde. Dit boek bevat een aantal nadere analyses van deze twee eerdere onderzoeken, alsook van andere typen gerelateerde studies,
Als eerste (hoofdstuk 2) bekeek ik schattingen van de grootte van het SOAcofactoreffect, die waren gebaseerd op correlaties tussen het voorkomen van beide infecties, Mensen met HIV hebben vaker SOAs, en omgekeerd, Dit verband bestaat onder andere doordat SOA's cofactoren voor HIV-infectie zijn, Een belangrijker reden is echter dat SOA en HIV samenhangen met dezelfde onderliggende factoren, zoals onbeschermde seks met verschillende partners of met partners met een verhoogd risico op zowel SOA als IllV door wisselende contacten. Schattingen van cofactorgroottes uit zulke correlaties, moeten gecorrigeerd worden voor deze samenhang. Een heranalyse toont echter aan dat de meeste studies niet voldoende (k-unnen) cortigeren, omdat de benodigde gegevens - bijvoorbeeld over de eigenschappen van partners-uiet compleet zijn, Als illustratie berekenden we de cofactorgrootte van genitale zweren op het krijgen van HIV voor vrouwen in Nairobi. Onder plausibele aannamen, zoals dat vrouwen met zweren vaker risicovolle partners hebben, vergrootte het hebben van zweren de kans op HIV-overdracht met een factor 3 per seksueel contact. Oorspronkelijk was de cofactorgrootte echter - zonder correctie voor deze verstorende factoren - door andere onderzoekers op een factor 23 geschat. Dit voorbeeld toont aan dat correlatiestudies de rol van SOA-cofactoren in HIV-verspreiding aanzienlijk k-unnen overschatten.
Hoofdstukken 3 en 4 behandelen de kans dat SOA herkenbare symptomen geven. Deze kans bepaalt hoeveel SOA-patiënten vanwege symptomen naar kli
uieken komen, en daarmee het torale effect van SOA-zorg, Sommige SOAs, waaronder syfilis en weke sjanker, geven bijna altijd symptomen die de patiënt makkelijk voelt of ziet, zoals geuitale zweren, Ziek-tes zoals gonorroe en chlamy-

Samenvatting
dia leiden echter niet altijd tot symptomen, of het symptoom (bijv. jeuk) is te mild om de patiënt aan te sporen hulp te zoeken. Herbeschouwingen van de proporties van SOA-patiënten met symptomen in versebillende landen, toonden het volgende aan. In alle landen heeft slechts een klein deel van de SOA-patiënten symptomen op het moment van ondervraging. In geïndustrialiseerde, Westerse landen komt dit omdat de meeste patiënten met symptomen onmiddellijk behandeld worden, zodat alleen de patiënten zonder symptomen met de infectie blijven rondlopen. In ontwikkelingslanden ktijgen daarentegen weinig SOApatiënten behandeling, zelfs wanneer ze symptomen hebben. De proportie met symptomen is nienemin laag, omdat symptoomberkenning slecht is in de vaak slecht opgeleide bevolking.Volgens een scharring voor het planeland van Uganda, leidt chlamydia hier slechts in 6-11% van de gevallen tot herkende symptomen, en gonorroe in 14% tot 45%. Deze analyses maken duidelijk dat in onderontwikkelde regio's het effect van verbetering van behandeling van symptomatische patiënten in de bestrijding van SOA (en HIV) slechts beperk'! is. In zulke gebieden moeten programma's van verbeterde klinische zorg gepaard gaan met voorlichting aan een breed publiek over symptoomherkennîng en het belang van vToegtijdige behandeling.
lk onderzocht verder waarom SOA-behandeling in de trials in Uganda en Tanzania zo'n verschillend effect op HW liet zien. Een deel van dit onderzoek (hoofdstukken 6-9) werd gedaan met behulp van een epidemiologisch computermodel dat de verspreiding van SOA en HW nabootst (hoofdstuk 6). Met dit model k-unnen ook de effecten van bestrijdingsprogramma's worden doorgerekend en voorspeld. We pasten dit model toe door eerst de werkelijke uitkomsten van de twee trials te simuleren, en daarna te bekijken wat zou zijn gebeurd als steeds één factor anders dan in werkelijkheid zou zijn geweest.
Een belangrijke verklaring voor het grotere effect van SOA-behandeling op HW-verspreiding in Tanzania bleek te zijn dat ten tijde van de trials SOA's veel meer voork-wamen in Tanzania dan in Uganda (hoofdstuk 5). Daarom was de rol van SOA's in HW-verspreiding het grootst in Tanzania. De lagere SOA-prevalentie in Uganda had twee redenen. Ten eerste was de HIV-epidemie in Uganda in een later stadium, waarin HW zich al had verspreid buiten de hoog-risicogroepen die de meeste SOA hebben, en waarin bovendien veel SOA-patiënten door AIDS gestorven waren. Ten tweede, maarwaarschijnlijk belangrijker, had in Uganda al een aantal jaren vóór de trial een vermindering van seksueel risicogedrag plaatsgevonden, in de vorm van minder prostitutie en minder wisselende partners.Als gevolg hiervan k-wam het geteste SOA-bestrijdingsprogramma in Uganda op een moment dat SOA al niet meer zo belangrijk waren. Scharringen met behulp van het model tonen aan dat, als de interventie in Uganda eerder in de epidemie zou zijn uitgevoerd, de vermindering in HW-infecties waarschijnlijk geen 3% maar ongeveer 19% zou zijn geweest (hoofdstukken 8 en 9).
Verder suggereerden simulaties van de Uganda-interventie in de Tanzaniaanse
257

258 Samenvatting
bevolking en vice versa, dat het verschil in type SOA-behandeling (klinische behandeling voor symptomatische patiënten danwel periodieke massabehandeling) tussen de twee trials weinig bijdroeg aan het verschil in hun uitkomsten (hoofdstukken 7 en 8).
Mijn studies konden niet volledig verklaren waarom in Tanzania zo'n groot effect op mv werd gevonden terwijl de aantallen SOA-infecties weinig verminderden. Voor deze uitkomst bestaan wel twee mogelijke redenen. Ten eerste kan de grote IDV-reductie deels een toevalsbevinding zijn. Deze verklaring wordt ondersteund door het feit dat in de trial, bij toeval de dorpen mét interventie al begonnen met een lagere prevalentie van HN, SOA en andere IDV-risicofactoren (oftewel in een bij voorbaat gunstigere uitgangssituatie) in vergelijking tot de dorpen zonder interventie. Simulatiestudies die we elders beschreven, lieten zien dat zulke toevalligheden de trialuitkomst aanzienlijk 1:unnen beiiJ.vloeden. Ten tweede wordt wel geopperd dat de Tanzania-interventie IDV-verspreiding vermindere via andere wegen dan SOA-behandeling. Dit zou 1:unnen zijn omdat
- naast antibiotica en in tegenstelling tot in Uganda - ook voorlichting aan SOApatiënten over het voorkomen van herinfectie werd gegeven, alsook voorlichting
over SOA aan een breder publiek buiten de klinieken. De hypothese is dan dat deze voorlichting de bevolking bewoog tot veiliger gedrag, wat de inddentie van mv rechtsreeks zou hebben verminderd. (Weliswaar zou gedragsverandering SOA-aantallen óók venninderen, maar minder, vanwege verschillende eigenschappen van deze typen infecties.)
Samenvattend betekenen de resultaten dat de vernrachtingen over de rol van SOA-behandeling in IDV-preventie naar beneden bijgesteld moeten worden -totdat eventueel uit verder onderzoek meer zekerheid over (grote) effectiviteit is verkregen. Concreet impliceert dit voor de IDV-bestrijding in Aftika in de
komende jaren: · Binnen de zorg voor SOA-patiënten verdienen de componenten gericht op pre
ventie van herinfectie, zoals voorlichting en verspreiding van condooms, meer aandacht; Bij verbetering van zorg voor SOA-patiënten hoort altijd voorlichting onder een breder publiek buiten de klinieken, om het gebruik van deze diensten te
optimaliseren;
De eerste prioriteit blijft vermindering van risicogedrag, hetzij via voorlichting van de bevolking hetzij door meer structurele (bijv. sociaal-economische) veran
deringen; · Voor de verdere toekomst ligr de hoop vooral bij de ontwikkeling van vaccins
tegen HIY.

AcKNOWLEDGEMENTS
The studies described in this thesis were conducted as part of two international collaborative projects.
The first project was titled 'The validation ofthe STDSIM model on the data ofthe STD mass treatment trial in Rakai, Uganda'. Besides Erasmus University Rotterdam (Prof. Dik Habbema, Drs. Sake de Vlas and Roei Bakker, Mrs. Carina van Vliet and Eline Korenromp ), four groups involved in the conduct and ana!ysis of tbe Rakai trial partlcipated: Uganda VIrus Research Institute, Entebbe, Uganda; Makerere University, Kampala, Uganda (Prof. Nelson Sewankambo, co-principa! investigator; Drs. David Serwadda, Fred Wabwire-Mangen andJoseph Konde-Lule, project investigators; Dr. Lynn Paxton, trial field manager); Columbia University, New York, School of Public Hea!tb, USA (Prof. Matia Wawer, co-principa! investigator); Johns Hopkins University School of Public Hea!tb, Dept. of Population Dynamics, Ba!timore, Maryland, USA (Prof. Rona!d Gray, project investigator; Mr. Chuanjun li, statistician). The project was supported by tbe European Community (contract B7 .6211/97/0 17) and ran between July 1997 and December 2000.
The project 'The impact and cost-effectiveness of HIV prevention strategies in sub-Saharan Africa: a comparative analysis of jour strategies evaluated in three randomized trials' involved tbe model-aided ana!ysis of not only tbe Rakai trial but a!so tbe Mwanza trial and anotber ongoing trial of STD treatment in combination witb interventlans promoting behavioura! change in Masaka, Uganda. This project was a collaboration between the groups mentioned above, those involved in tbe Mwanza trial (AL\ffi.EFTanzania, Drs.Awene Gavyole andJim Todd; London School of Hygiene and Tropical Medicine, Prof. Richard Hayes, Dr. Reiner Gross1:urtb, Mrs. Kate Karter-Orrotb, Mr. Richard Wbite), and in tbe Masaka trial (Medica! Research Council UK/Entebbe, Prof.Jim Wbitworth, Dr.Anatoli Kama!e). The project ran between December 1998 and December 2001, and was sponsared by tbe Department for International Development, UK. Furtber support was provided by Gla..xoSmitbKline, UK, specifically for tbe actdition of HSV-2 to the STDSIM modeland for tbe study described in Chapter 9.
The STDSIM model used in this tbesis had originally been developed witb support of tbe European Commission, Directarate-Gen era! 8 (contract B7.6211/ 96!010) in collaboration witb Dr.lieve Fransen, for decision support in STD/HlV contrOl in Kenya.
259


DANKWOORD
Na haarloze muizen, ongehoorzaam DNA en murkasten waren Afrikaanse virussen in computers heel wat anders - maar de overstap bleek meer dan gelukkig. Ik had destijds niet durven hopen dat het onderzoek van dit proefschrift me zo zou gaan fascineren, noch dat dit zulke plezierige werkjaren zouden worden.
Hiervoor ben ik de collega -ogen,-isten en -ici op iM.GZ en overigen die dit mogelijk maa1:ten heel dankbaar!
Mijn dank gaat allereerst uit naar Dik Habbema en Sake de Vlas .Als team van promotor, copromotor en promovendus hebben wij nooit veel gedrieën om de tafel gezeten, maar de hilateraaltjes met jullie vulden elkaar fantastisch aan. Dik ben ik zeer gaan waarderen om zijn snelle en toch diepe inzicht in de diverse onderzoeksmaterie en de politieke belangen die daarmee verweven zijn, alsook om zijn niet-aflatend streven de strategieën om daar mee om te gaan op prettige wijze over te brengen. Dik's k"UUISt te delegeren heb ik bij (drukke) tijden verfoeid ... maar bovenal gewaardeerd. Bij Sake denk ik allereerst met plezier terug aan zijn 'gebîologeerdheid' door het wel en wee van collega's waaronder ik, en
de welkome uitleg die hij verstrek"te over o zo belangrijke sociale en persoonlijke aspecten van het MGZ.gebeuren. Uiteraard mag ook Sake's stimulerende hulp in veel fasen van het onderzoek niet onvermeld blijven - zeker nu we h."U11Ilen constateren dat het boek (toch?) 'op tijd' is afgekomen ...
Teamgenoten Carina van Vliet en Kitty van der Ploeg dank ik heel hartelijk voor de kans die ze me gaven voort te borduren op hun inspirerende SIDSIMmodel en voor hoe toegewijd zij me inwerk"ten. Met Roei Bakker kijk ik terug op een soms woelige, maar bovenal zeer geslaagde samenwerking. Ik ben benieuwd hoe wij beiden over 5 of 10 jaar op SWSIM terugkijken! Verder heb ik ook onze gedachten- en papierenuitwisselingen over netwerken, de viruSW'ereld etc. erg gewaardeerd. Nico Nagelkerke bedank ik voor zijn steeds pijlsnelle hulp en advies, van statistiek tot SOA-politiek, en zijn onnavolgbare grappen.
I'm very grateful to have had the opportunity to intensively collaborate with memhers of the Rakai and Mwanza trial teams. l'd rather not think what would have become of this thesis without the insightful and ever so kind advice of Richard Hayes tbraughout the years. Richard knows how much I enjoyed our 'lively' discussions - not the least those that remain unresolved .... It has been a particular pleasure to share the work with Kate Orroth during the second half of the project; I would almast regret that l've left Rotterdam now she is rnaving to Holland ... Heiner Gross1:urth and Richard White were unforgettable colleagues as well-also for putting academies into perspective. Ron Gray, Maria Wawer, Nelson Sewankambo, David Serwadda and Chuanjun Li started by allowing and enabling me to work with the Rakai data, but I most appreciate their critica! and constructive advice in various phases of the research, and the nice stories and dinners.
My further thanks go my student Mandastri Sudaryo; the two years of our collaboration may have been equally instructive to both of us.
261

262 Dankwoord
Het aangename gezelschap van kamergenoten Henriëtte, Hein en Rikard (blij
bij deze Rikarct's eerder beschreven wens in vervulling te doen gaan!) - en het mogen meekijken in hun (promotie-)keuken woog zonder meer op tegen de druk1:e op kamer Ee20.08.W!Ima en Sita dank ik heel hartelijk voor alle bijstand in de laatste fase van het proefschrift - van proeflezen en tips over MS-offi.ce, tot partjes sinaasappel en een steeds gewillig oor. Bram en overige CDTDC.genoten:
dank voor jullie gezelligheid! - en sorry voor mijn onstuitbare haast ... Onontbeerlijk was verder de ondersteuning bij secretariaat, bibliotheek en
beheer, in het bijzonderTineke, Sonja, Else, Edith, Mona, Barry,Yolande en Selma. Hoeveel zou niet in het honderd zijn gelopen als zij niet steeds aan de bel hadden getrokken voor brieven, kopieën en bonnen? Voor de laatste essentiële zaken rondom de promotie en de soepele overstap naar Genève ben ik vooral Mirela, Koos en llse erkentelijk. Op de automatisering wil ik Ton, Hans en Roe! Faber bedanken voor talloze computertips en -reparaties, maar ook voor het zonder boze blikken weer in het stopcontact komen steken van stekkers aan mijn PC's ...
Hélène was onmisbaar in de tijd dat belangrijke discussies met de Mwanzaen Rakai-collega's ontstonden. Ik ben blij dat ik zoveel stoom bij haar kon afblazen, met de aardige en geduldige reacties en de afleiding in de vorm van haar besognes.Annalily zal de afloop van deze onderneming sinds het vertrek uit Den Haag nooit verbaasd hebben, al duurde het misschien lang voordat daadwerkelijk dit feestje te organiseren h."Vlam ... Het is me een bijzonder genoegen hen beiden als paranimf daarbij te hebben.
Mijn ouders, Pauline, overige familie en vrienden wil ik bedanken voor hun niet-aflatende belangstelling naar de vorderingen. In het bijzonder dank ik Gijs voor programmeertips tijdens Kunstorkestrepetities - hoewel het bewuste paper nooit is afgeschreven, had deze bijstand symbolisch grote betekenis - Pascale en Truus voor fraaie 7insneden in belangrijke brieven en het goede voorbeeld hoe teleurstellende resultaten te relativeren, en Marijke voor veel belangstelling voor het onderzoek en het me voorhouden van spiegels wat betreft de menselijke kant ervan.
Ten slotte is daar Aldo - liefste steun en toeverlaat steeds, en nog toegewijd tekst-corrector. Beda.nh."t voor alles!
Eline augustus 2001

CURRICULUM VITAE
Eline Korenromp werd op 9 augustus 1972 geboren te Den Hxlg. Zij behaalde daar in 1990 het gymnasium-beta diploma aan het Christelijk Gymnasium Sorghvliet. Tussen 1990 en 1996 studeerde zij medische biologie aan de Rijksuniversiteit Utrecht (tegenwoordig Universiteit Utrecht), waar zij bovendien een propaedeuse in de wijsbegeerte deed. Onderzoeksstages voerde zij uit bij het
RudolfMagnus Instituut voor Neurowetenschappen,het Rijksinstituut voorVolksgezondheid en Milieuhygiëne (RIVM), en het Clarke Institute of Psychiatry, University ofToronto.
Sinds maart 1997 is zij als wetenschappelijk medewerker verbonden aan het instituut Maatschappelijke Gezondheidszorg van de Brasmus Universiteit Rotterdam. Haar onderzoek betrof de besttijding van HIV/AIDS en seksueel-overdraagbare aandoeningen in Afrika. Dit had plaats in de vorm van een aantal internationale projecten in samenwerking met onder meer de London School of Hygiene and Tropica! Medicine, UK;Johns Hopkins University School of Public Health, Maryland, USA; Makerere Universiteit, Kampala, Uganda; en Uganda VIrus Research Instititute, Entebbe, Uganda. In februari 2000 behaalde zij een registratie als epidemioloog-A.
Sinds augustus 2001 wed:t zij bij de Wereldgezondheidsorganisatie (WHO) te Genève, Co romunicabie Diseases cluster, in de evaluatie van infectieziek'tebestrijding.
263

264
PlmUCATIEUJST
Steerenberg PA, Korenromp EL, Van Loveren H, Mol DQ, Geerse L and De Gruijl FR 1997 Natura! killer cell activity during UV radiation-iaduced skin tumor formation ia the Skh hairless mouse. ]Photochem.Photobiol., 65(1): 150-154.
Gray RH, Wawer MJ, Sewankambo NK, Serwadda D, Li C, Moulton LH, Luta!o T, Wabwire-Mangen F, Meehan MP,Ahmed S, Paxton LA, Kiwanuka N, Nalugoda F,
Korenromp EL, Quion TC and the Rakai ProjectTeam 1999 Relative risks and population attributable fraction of iacident HlV associated with STD symptoms and treatable STDs ia Rakai District, Uganda.AJDS 13:2113-2123.
Korenromp EL, Van Vliet C, Bakker R, HabbemaJDF 2000 HlV spread and partner reduction for different pattems of se:.."llal behaviour - a study with the microsimulation model STDSIM.Math Pop Studies, 8(2): 135-173.
Korenromp EL, Van Vliet C, Grossb.-urth H, Gavyole A, Van der Ploeg CPB, Fransen L, Hayes RJ,Habbema]DF 2000 Mode!.-based evaluation of siagle-round mass STD treatment for HlV control ia a ruralAfrican population.AJDS, 14(5): 573-593.
Van Vliet C, Meester El, Korenromp EL, Siager B, Bakker R, Habbema JDF 2001 Focusing strategies of condom use against HIV in different behavioural settings: an evaluation based on a simulation model Bull. WHO, 79(5): 442-454.
Korenromp EL, De Vlas SJ, Nagelkerke J\'JI), Habbema JDE 2001 Estimating the magnitude of STD cofactor effects on HlV transmission - how well can it be done? Sex.Trans.Dis., ia press.
Korenromp EL, Bakker R, Gray RH, Wawer MJ, Serwadda D, Habbema JDE 2001 The effect of HN, behavioural change and STD syndromic management on STD epidemiology ia sub-Saharan Africa: simulations of Uganda. Sex.Transm.Inf., ia press.
Korenromp EL, Bakker R, De Vlas SJ, Robiason NJ, Hayes R, Habbema ]DE Can behaviour change explain increases in the proportion of genital ulcers attributable to herpes ia sub-Saharan Africa? A simulation rnadelling study. Sex.Transm.Dis., in press.
Korenromp EL, Sudaryo MK, De Vlas SJ, Gray R, Sewankambo NK, Serwadda D, Wawer MJ, Habbema]DEWhat proportion of episodes of gonorrhoea and chla
mydia become symptomatic? Jnt]STD&AIDS, ia press. Sudaryo MK, Korenromp EL, Arends, LR, Habbema JDE The prevalenee of dis
charge and dysnria ia Neisseria gonon-hoea and Chlamydia trachomatis infection: a systematic review. Submitted.
Korenromp EL, Bakker R,De Vlas SJ, Gray RH,Wawer MJ, Serwadda D,Sewankambo NK,HabbemaJDEHlV/STD dyuamics and behaviour change as determinants of the changlng impact of STD treatment on HlV spread- implications for the iaterpretation of the Rakai trial. Submitted.
Orroth KK, Korenromp EL, White RP, De Vlas SJ, Hayes R, Grossb:urth H. Comparison of STD prevalerrees among general populations ia sub-Sahara Africa: the role of selection bias and test diagnostics.Manuscript in preparation.