Treatment of a clay soil deposited in ... - Open Research Exeter
37
ORE Open Research Exeter TITLE Treatment of a clay soil deposited in saline water by cement AUTHORS Estabragh, AR; Kouchakzadeh, M; Javadi, AA JOURNAL European Journal of Environmental and Civil Engineering DEPOSITED IN ORE 04 March 2019 This version available at http://hdl.handle.net/10871/36225 COPYRIGHT AND REUSE Open Research Exeter makes this work available in accordance with publisher policies. A NOTE ON VERSIONS The version presented here may differ from the published version. If citing, you are advised to consult the published version for pagination, volume/issue and date of publication
-
Upload
khangminh22 -
Category
Documents
-
view
0 -
download
0
Transcript of Treatment of a clay soil deposited in ... - Open Research Exeter

ORE Open Research Exeter
TITLE
Treatment of a clay soil deposited in saline water by cement
AUTHORS
Estabragh, AR; Kouchakzadeh, M; Javadi, AA
JOURNAL
European Journal of Environmental and Civil Engineering
DEPOSITED IN ORE
04 March 2019
This version available at
http://hdl.handle.net/10871/36225
COPYRIGHT AND REUSE
Open Research Exeter makes this work available in accordance with publisher policies.
A NOTE ON VERSIONS
The version presented here may differ from the published version. If citing, you are advised to consult the published version for pagination, volume/issue and date ofpublication

1
Treatment of a clay soil deposited in saline water by cement
A. R. Estabragh
Associate Professor. Faculty of Soil and Water Engineering, University
of Tehran, PO BOX 4411 Karaj 31587-77871, Iran
Tel: +98 26 32241119
Fax: +98 26 32226181
Email: [email protected]
M. Kouchakzadeh
Postgraduate Student, Department of Civil Engineering, University
Science and Culture.
Tehran, Iran
Email: [email protected]
A.A. Javadi
Professor. Computational Geomechanics Group, Department of
Engineering, University of Exeter, Devon, EX4 4QF, UK
Tel: +44 1392 723640
Fax: +44 1392 217965
Email: [email protected]

2
Abstract
The behavior and treatment of a clay soil deposited in natural and saline (sodium chloride)
water is studied through experimental tests. A clay soil was deposited in natural water
and water with different concentrations of sodium chloride (40, 80 and 150 g/L) in a
reservoir at lab. The samples were taken from dry deposited soil and they were treated
with 5, 8 and 10% cement. Atterberg limits, compaction and unconfined compression
tests were carried out on the deposited soil and treated soil samples. The results show that
the physical and mechanical behaviors of soil deposited in natural water and salinity
water are not the same and they are function of salt concentration. The results also
indicate that cement can improve the strength of the deposited soil in saline water but this
improvement is not a direct function of salt concentration. In addition, for a constant salt
concentration the strength of treated soil is function of percent of cement and curing time.
Based on SEM (Scanning Electron Microscopy) analysis, it was found that salt
concentrations of 80 and 150 g/L may have prevented the interaction between soil and
cement in the deposited soil.
Key words: Treatment soil, deposited soil, saline water, cement, strength, SEM
Introduction
Soils originate from rock and minerals of the earth’s crust. There is ongoing but rather
inconspicuous and very slow process whereby rocks are decomposed into soil (Cernica,
1995). The process of rock disintegration and break down of rock mass into small sizes is
3
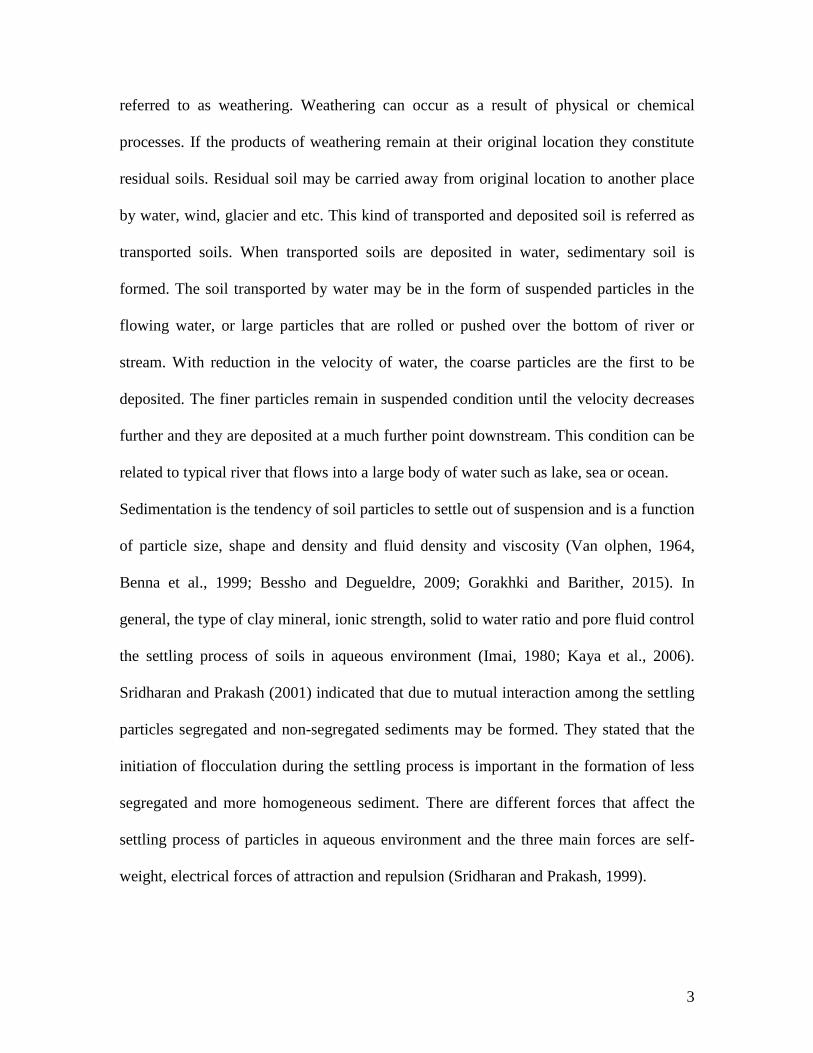
referred to as weathering. Weathering can occur as a result of physical or chemical
processes. If the products of weathering remain at their original location they constitute
residual soils. Residual soil may be carried away from original location to another place
by water, wind, glacier and etc. This kind of transported and deposited soil is referred as
transported soils. When transported soils are deposited in water, sedimentary soil is
formed. The soil transported by water may be in the form of suspended particles in the
flowing water, or large particles that are rolled or pushed over the bottom of river or
stream. With reduction in the velocity of water, the coarse particles are the first to be
deposited. The finer particles remain in suspended condition until the velocity decreases
further and they are deposited at a much further point downstream. This condition can be
related to typical river that flows into a large body of water such as lake, sea or ocean.
Sedimentation is the tendency of soil particles to settle out of suspension and is a function
of particle size, shape and density and fluid density and viscosity (Van olphen, 1964,
Benna et al., 1999; Bessho and Degueldre, 2009; Gorakhki and Barither, 2015). In
general, the type of clay mineral, ionic strength, solid to water ratio and pore fluid control
the settling process of soils in aqueous environment (Imai, 1980; Kaya et al., 2006).
Sridharan and Prakash (2001) indicated that due to mutual interaction among the settling
particles segregated and non-segregated sediments may be formed. They stated that the
initiation of flocculation during the settling process is important in the formation of less
segregated and more homogeneous sediment. There are different forces that affect the
settling process of particles in aqueous environment and the three main forces are self-
weight, electrical forces of attraction and repulsion (Sridharan and Prakash, 1999).
4
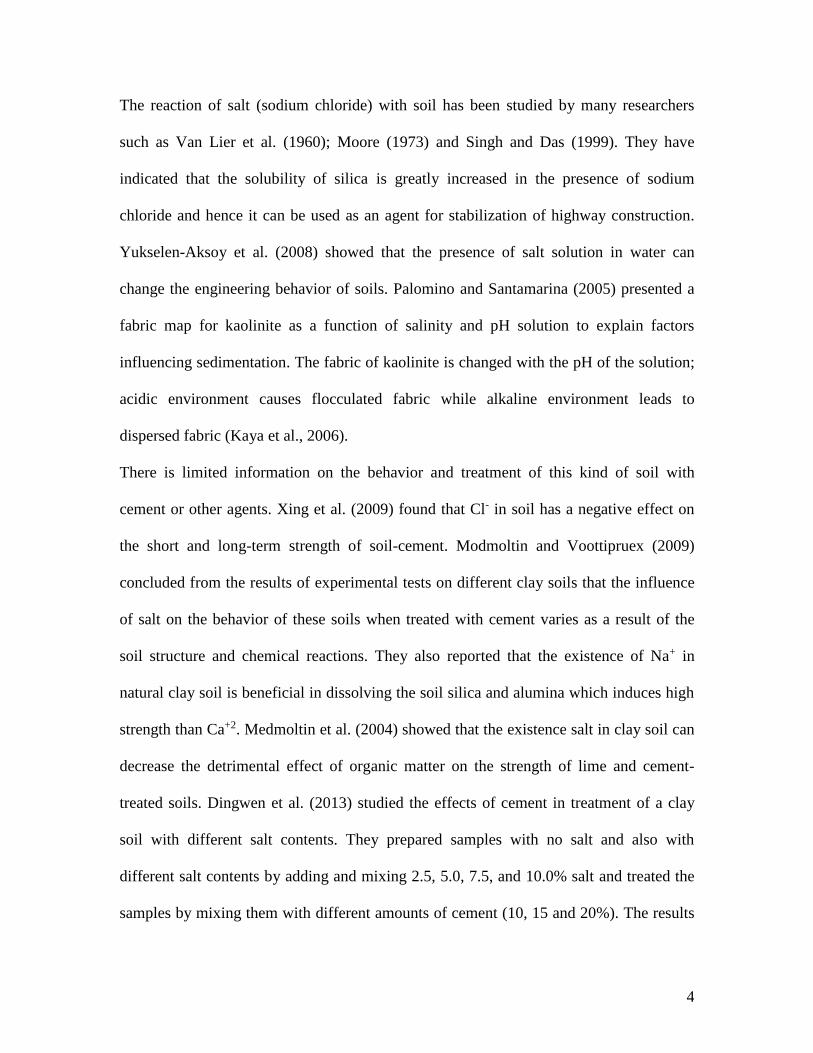
The reaction of salt (sodium chloride) with soil has been studied by many researchers
such as Van Lier et al. (1960); Moore (1973) and Singh and Das (1999). They have
indicated that the solubility of silica is greatly increased in the presence of sodium
chloride and hence it can be used as an agent for stabilization of highway construction.
Yukselen-Aksoy et al. (2008) showed that the presence of salt solution in water can
change the engineering behavior of soils. Palomino and Santamarina (2005) presented a
fabric map for kaolinite as a function of salinity and pH solution to explain factors
influencing sedimentation. The fabric of kaolinite is changed with the pH of the solution;
acidic environment causes flocculated fabric while alkaline environment leads to
dispersed fabric (Kaya et al., 2006).
There is limited information on the behavior and treatment of this kind of soil with
cement or other agents. Xing et al. (2009) found that Cl- in soil has a negative effect on
the short and long-term strength of soil-cement. Modmoltin and Voottipruex (2009)
concluded from the results of experimental tests on different clay soils that the influence
of salt on the behavior of these soils when treated with cement varies as a result of the
soil structure and chemical reactions. They also reported that the existence of Na+ in
natural clay soil is beneficial in dissolving the soil silica and alumina which induces high
strength than Ca+2. Medmoltin et al. (2004) showed that the existence salt in clay soil can
decrease the detrimental effect of organic matter on the strength of lime and cement-
treated soils. Dingwen et al. (2013) studied the effects of cement in treatment of a clay
soil with different salt contents. They prepared samples with no salt and also with
different salt contents by adding and mixing 2.5, 5.0, 7.5, and 10.0% salt and treated the
samples by mixing them with different amounts of cement (10, 15 and 20%). The results
5
of unconfined compression tests showed that the strength is increased with increasing the
percent of cement. On the other hand, at the same curing time and percent of cement the
strength is decreased by increasing the salt concentration. Similar results were reported
by Sinat (2006); Xing et al. (2009); Miura et al. (1998) and Onitsuka et al. (2004) showed
that the existence of salt in soil can cause increase in strength of soil-cement while
Dingwen et al. (2013) showed the effect of salt on reduction in strength of soil-cement.
They indicated that increasing the percent of cement and curing time is also effective in
increasing the strength of salty soil mixed with cement. A review of the literature
indicates that there has been very limited research on the treatment of salty soils,
particularly the soils formed by deposition in saline water. On the other hand, the
existing investigations have primarily focused on salty clay soils that were artificially
made (by adding a certain amount of salt to the soil) and then treated with cement. In
other words, they considered the short-term condition (short term referring to the
condition of soil that a portion of voids has been filled with salt solution). There has been
no investigation on the behavior and treatment of clay soils that were deposited in a saline
aqueous environment (produced naturally). There are soils deposited in high sodium
chloride concentration around coastal areas with high water content, low strength and
high compressibility (Dingwen et al. 2013). These sediments may be used as
geomaterials for construction of roads, embankments, etc. Therefore, understanding the
behavior and treatment of these soils would be necessary for such construction projects.
This study consists of two stages. In the first stage, the mechanical behavior of a sediment
that has been deposited in water is examined (long term condition) and then the treatment
of the sediment by adding 5, 8 and 10% cement is investigated. In the second stage, the

6
mechanical behavior of sediments that were deposited in solutions of salt (sodium
chloride) with concentrations of 40, 80 and 150 g/L is studied their treatment by adding
different percentages of cement (5, 8 and 10%) is investigated. The results of the two
stages are compared to study the effect of different percentages of salt solution on the
behavior of sediment and the effect of cement on treatment of the deposits at different
curing times.
Materials and experimental methods
The main materials that were used in this program are soil, Portland cement and salt
(sodium chloride). The properties of these materials are described in this section.
Soil
The soil that was used in this work was a clay soil comprising of 12.6% sand, 54.2% silt
and 33.2% clay. The physical and mechanical properties of soil were determined
according to ASTM standard and are depicted in Table 1. According to the Unified Soil
Classification System (USCS), the soil can be classified as clay with high plasticity (CH).
Table 2 shows the chemical composition of this soil.
Cement
The Cement used in this experimental work was Portland cement type 1 with Blaine
fineness of 4100 cm2/g and specific gravity of 3.15. Table 3 shows the physical and
mechanical properties of the cement.
Water
Drinking water was used in this work. It had a pH of 7.76, chloride content of 17 meq/L
and calcium+magnesium content of 9.1 meq/L.
7
Sodium chloride
Sodium chloride is an ionic compound with chemical formula NaCl showing a 1:1 ratio
of sodium and chloride ions. Sodium chloride is the salt most responsible for the salinity
of seawater. On average, seawater has a salinity of about 35 g/L. Local lakes in some
countries are in hypersaline condition. For example, the salinity of Urmia Lake in the
northwest of Iran has risen to more than 300 g/L (Eimanifar and Mohebi, 2007). Large
quantities of sodium chloride are used in many industrial processes as well as de-icing of
roadways in sub-freezing weather where salt enters the soil and changes the properties of
the soil. Review of the literature shows that up to now, the effect of high salinity on the
behavior of sediments has not been studied. On the other hand, the deposited soil in high
salinity water may be used as construction material such as borrow area or foundation for
buildings. In such projects, it is necessary to understand the behavior of these soils and
also improve the mechanical properties of them. Therefore, solutions of sodium chloride
with concentrations of 40, 80 and 150 g/L were selected. The measured values of pH for
these solutions are nearly the same as drinking water.
Sediment and sample preparation
The soil samples used in this study are natural soil, soil sediment deposited in water and
soil sediment deposited in 40, 80 and 150 g/L sodium chloride dissolved in water. The
sedimentation process was carried out through a circular reservoir with 1.6 m diameter
and 0.4 m height. Selection of the ratio of solid to water is important in controlling the
settling process of soils in aqueous environment (Imai, 1980 and Kaya et al., 2006). The
ratio of solid was chosen as 5% weight of the mixture (fluid+solid) that is similar to the
recommended value for hydrometer testing (ASTM D 422-63). The required quantity of

8
dry soil was added to the reservoir in increments and mixed thoroughly to reach a dilute
soil-water mixture. For the other test series, 40, 80 and 150 g/L sodium chloride was
added to water and mixed thoroughly to reach water-salt solution to the desired value of
solution content. The soil was then added to each of these solutions as in the previous
stage and mixed to obtain a dilute mixture of soil and solution water. This dilute mixture
was then allowed to settle for two weeks. After that the excess liquid above the soil was
drained off, the soil was then air dried and the desired samples were prepared from this
sediment for the experimental tests. Standard compaction tests according to ASTM D
698-07e were conducted on the sediments deposited in normal water and in different salt
solutions. 5, 8 or 10% cement was added to the soil samples that were taken from each
deposited soil and standard compaction tests were carried out on these mixtures as well.
The maximum dry unit weight and optimum water content were determined for each of
them. The samples for unconfined compression test were prepared from different dry
sediments at the optimum water content and maximum dry unit weight from the
compaction test. For preparing the soil samples the grounded sediment was mixed with
an amount of water corresponding to the optimum water content. For the soil-cement
samples, after weighing the required amounts of materials, they were mixed in a
container and then water was added up to the optimum water content. The prepared
samples for testing should be uniform and repeatable. Different methods are available for
compation and preparing samples including dynamic and static compaction methods.
Sivakumar (1993) examined these two methods of compaction and found that preparing
samples by dynamic compaction is less repeatable than static compaction. He used static
compaction in his research work. Wheeler and Sivakumar (1995) and Estabragh and
9
Javadi (2008) also used this method of compaction for preparing samples. Based on
previous research, the static method was used in this work for preparing the samples.
Compaction was done in a special mould by applying a static pressure to the soil in three
layers using a loading machine. Each layer was compacted at a fixed displacement of 1.5
mm/min until the maximum dry unit weight corresponding to compaction curve was
achieved. The diameter and length of the samples were 50 and 100 mm respectively.
After preparing soil-cement samples they were stored in a special curing cabinet,
according to ASTM standard, at constant temperature and relative humidity for curing
times of 7, 14 and 28 days.
Test Program
Suspension tests were conducted on samples of soil. In these tests 50 g of natural dry soil
was mixed with 125 cm3 liquid of desired composition (water or water with sodium
chloride with concentrations of 40, 80 or 150 g/L) and transferred in an electrical mixture
for a duration about 30 minutes. The mixed solution was poured in a cylinder and then
more fluid was added to bring the total volume of the mix to 1000 cm3. The top of the
cylinder was then covered and it was shaken by hand for a few minutes in order to ensure
that the soil particles were completely mixed in the solution. The soil was then allowed to
settle until it reached the condition that no changes in the sediment thickness were
observed. During the settlement, the height of the sediment was measured with accuracy
of 1.0 mm. Atterberg limits, compaction and unconfined compression tests were also
conducted on the samples of natural soil, soil sediment in water and soil sediment in
different concentrations of salt according to the ASTM standard. For unconfined
compression tests the samples were loaded in a compression loading frame at an axial
10
displacement rate of 1 mm/min. The applied load was recorded continually, and tests
were terminated when the failure of samples was attained.
Scanning electron microscopy (SEM) tests were performed on the samples in order to
observe the microstructure of the samples in different conditions (sediments with
different quality of pore fluid and treated with different percentages of cement at various
curing times). The samples of sediment were obtained from air dry sediments and the
treated soil samples were prepared at the optimum water content and maximum dry unit
weight. The SEM tests on samples were performed according to the method that was used
by Tremblay et al. (2002) and Estabragh et al. (2017).
Results and Discussion
Clay particles surfaces, dry or wet, carry residual negative charges. When water is added
to dry clay, a number of anions and cations are released in pore water because of
dissolved salt sediments between particles. The cations existing in pore water are
attracted to the clay surface to neutralize the existing imbalanced charges along the clay
surface. The net effect is the formation of a dispersed layer around the particles and the
concentration of cations is decreased with increasing distance from the surface until the
concentration becomes equal to that in the normal water in void space (Craig, 1995). The
term diffused double layer (DDL) is referred to the negative charge of a particle surface and
the dispersed layer of cations and anions around it. The change in the thickness of this layer
produces different soil structures. The shrinking and reduction of the DDL thickness
causes a flocculated structure and increase of thickness of the DDL results in a dispersed
structure in the soil. Dielectric constant is one of the important parameters that influence
on the thickness of DDL.

11
The results of variations of height of sediment with time for the soil deposited in water
and in salt solutions with different concentrations are shown in Fig.1. As shown in this
figure, after about 48 hours, the sediment thickness for the soil deposited in water reached
a constant value of 5 cm. The thicknesses of the sediments deposited in salt solutions
with concentrations 40, 80 and 150 g/L after 2 hours reached to 2.3, 1.6 and 1.4 cm
respectively. This shows that the settlement of particles is slower in water than the salt
solutions. It is resulted from Fig.1 that the structure of the deposited sediment is
flocculated but the degree of flocculation is increased with concentration of sodium
chloride. Figs. 2a, b, c and d show the results of the SEM tests for soil sediments in water
and in salt solutions with concentrations 40, 80 and 150 g/L respectively. As shown in
Fig.2, for the soil sediment in water, the spaces between particles are relatively large in
comparison with sediments in salt solutions. Increasing the salt concentration causes the
particles to be formed as parallel sheets pasted together with small spaces between them
(Figs.2b, c and d). Therefore, by increasing the salt concentration the deposited sediments
attain a denser fabric (with less void ratio) than those deposited in water. Kaya et al.
(2006) stated that the variations in the thickness and structure of sediments are a function
of pH and number of existing ions in solution. With increasing the concentration of the
solution of sodium chloride, the exchange of ions between soil and pore fluid is increased
and this leads to increase in the degree of flocculation and pasting of particles to each
other.
Fig.3 shows the results of LL (liquid limit) and PI (Plastic index) for the soil deposited in
water and salt solutions with different concentrations. For the soil deposited in water the
values of LL and PI are 56 and 26% while for the soil deposited in salt solution with

12
concentration of 150 g/L they change to 31 and 12% respectively. This shows a reduction
of about 50% in the values of LL and PI at this concentration in comparison with natural
water. Kaya and Fang (1997) indicated that the dielectric constant of solution of sodium
chloride is less than water (the dielectric constant of water is 80) and there is a reduction in
the amount of dielectric constant with increasing the concentration of sodium chloride.
Therefore, the degree of flocculation of the soil deposited in 150 g/L sodium chloride
solution is more than the soil deposited in natural water. When the structure of soil
becomes flocculated, the particles paste to each other and form coarse particles; so their
specific surface is less than the particles of soil deposited in natural water. Therefore, the
capacity to adsorb water is reduced which causes reduction in the Atterberg limits.
Similar results were reported by Bowders et al. (1985), Foreman and Daniel (1986),
Sridharan et al. (2000), Kaya and Fang (2005) and Modmoltin and Voottipruex (2009)
who suggested that the reduction in consistency limits of soil is due to the decrease of
dielectric constant. Reduction in the value of dielectric constant of pore fluid compresses
and shrinks the thickness of the DDL and in turn, the resulting increase in electrostatic
repulsion causes coagulation of soil particles.
The results of Atterberg limits for the soil at different concentrations of salt, treated by
10% cement are also shown in Fig.3. Adding cement causes reduction in the Atterberg
limits. For example, for salt concentration of 80 g/L, the values of LL and PI are 43 and
20%. By adding 10% cement they are changed to 34 and 10% respectively. There is a
reduction in the values of LL and PI in comparison with the values for the soil with no
cement. At a constant concentration of salt, by increasing the percent of cement the
reduction in the values of LL and PI becomes higher.

13
One of the effects of cement on soil is cation exchange. Cation exchange starts when the
cement is mixed with soil. Therefore, adding cement causes substitution of ions in soil
particles which results in pasting of the particles to each other and reduces the water
absorption capacity of soil due to the reduction in the specific surface of particles
(Estabragh et al., 2016). This results in reduction of Atterberg limits.
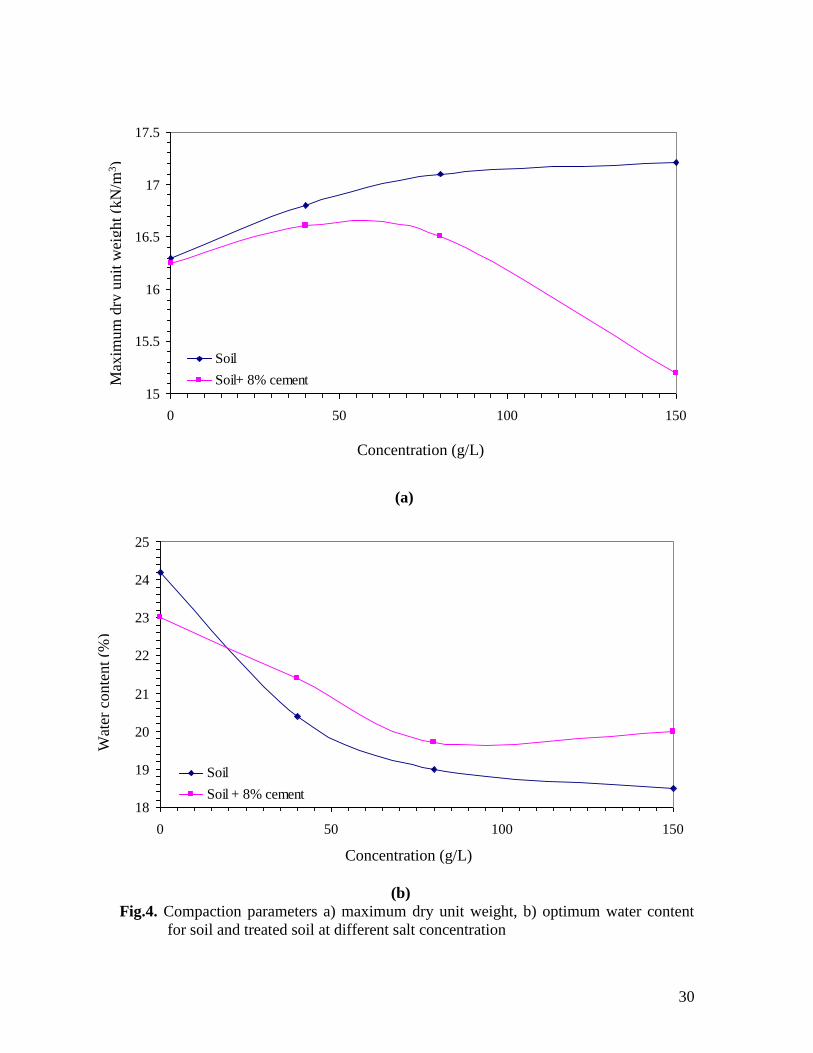
Typical results of compaction tests for the soil at different salt concentrations and also
with 8 % cement are shown in Fig.4. The results show that by increasing the
concentration of salt, the maximum dry unit weight of the soil deposited in salt solutions
is increased (Fig. 4a) and the optimum water content is decreased (Fig.4b). The
maximum dry unit weight and optimum water content of the soil deposited in water are
16.28 kN/m3 and 24.2% respectively. These values for the soil deposited in salt solution
with concentration of 80 g/L are changed to 17.1 kN/m3 and 19.0%. As explained earlier,
this is due to the reduction of the DDL thickness due to the salt concentration that leads to
flocculated structure and formation of new grain size distribution of soil by pasting the
fine particles together. These results are consistent with the findings that were presented
by Moore (1973). Fig.4 also shows that adding 8% cement to the soil deposited in salt
solution results in an increase in maximum dry unit weight until the concentration of
about 40 g/L followed by decrease in maximum dry unit weight at higher used salt
concentrations. However, the optimum water content of treated soil is decreased with
increasing the salt concentration (Fig.4b). The same trend is observed for 10% cement,
however, for 5% cement there is increase and then decrease in maximum dry unit weight
and optimum water content for all concentrations of salt. It is also shown in Fig.4a that
the values of maximum dry unit weight are lower for the soil treated with cement than the
14
untreated soil (deposited in water and salt solution). It can be said when cement is added
to the soil deposited in 40 g/L salt solution, it fills the spaces between particles and the
reactions that occur between them produce coarse particles. This results in increase in
maximum dry unit weight in compaction test. For the soil deposited in salt solutions with
concentrations of 80 and 150 g/L, the cement cannot fill the pores between the particles
completely because of the limited pore spaces between particles in comparison with the
soil deposited in water with salt concentration of 40 g/L. As it was explained the structure
of deposited soils is changed with the concentration of salt. In other words, the
arrangement of particles relative to each other is dependent on the degree of salt
concentration as shown in Fig.1. At low concentrations the flocculated structure is in the
cardhouse form with large pores between them but at high concentrations, the particles
tend to be parallel with small voids (Lintern, 2003) as shown in Figs. 2c and d. Fig.1 also
shows that the sediment deposited in water with salt solution of 150 g/L is denser than the
sediments deposited in 80 and 40 g/L salt solutions or water. Therefore, it can be
concluded that the voids between the particles of soil deposited in salt solution with
concentration of 40 g/L are more than the soil deposited in salt solutions with
concentrations of 80 or 150 g/L (see Fig.2a).
Fig. 5 shows typical results of SEM for different sediments (sediments in water and in
salt solutions with concentrations of 40, 80 and 150 g/L) treated with 8% cement at
curing time of 7 days. As shown in Figs. 5c and d, the particles of soil are pasted to form
lump masses with spaces between them, therefore, the cement cannot chemically interact
with some of the soil particles. The additional cement may cover the surface of particles
or remain as lumps in the matrix of soil. Therefore, for soil deposited in salt solutions

15
with concentrations of 80 and 150 g/L the ability of cement for reaction with soil particles
is less than the soil deposited at salt solution with concentration of 40 g/L. Since the
compaction test is carried out under constant energy at constant volume, therefore the
maximum dry unit weight of treated soil deposited at 80 and 150 g/L concentrations is
reduced in comparison with the treated soil deposited in water with salt concentration of
40 g/L. It can be said that, for the soil deposited in 40 g/L salt solution, all the added
cement causes chemical reaction with soil and creates a strongly bonded soil in
comparison with soil deposited in water with salt solutions of 80 and 150 g/L. The
created bonds prevent from displacement of particles during compaction. The results
showed the optimum water content is reduced for all conditions of salt concentration.
This may be due to the formation of coarse particles at concentration of 40 g/L and
adsorption of water by additional cement that was not able to cause chemical reactions
with soil particles due to the limited amount of voids at concentrations 80 and 150 g/L.
The stress-strain curves for the soil samples deposited in water and solutions with
different concentrations of salt are shown in Fig.6. As shown in this figure, the final
strength of the soil deposited in water is 190.2 kPa but for the soils deposited in saline
water with concentrations of 40, 80 and 150 g/L it changes to 353.7, 242 and 142 kPa
respectively. It is seen (Fig.6) that the strength at concentration of 150 g/L is even less
than the soil deposited in water. It can be said that the attractive Van der Waals and
electrostatic forces contribute to the formation of flocculated structure. When the
electrostatic forces are dominated by the Van der Waals forces in saline water, the
positive charges at the edge of clay particles are attracted to the negative charges of the
face, leading to a nearly perpendicular array of particles constituting a floc cardhouse

16
structure. If the dominated forces are Van der Waals forces, this leads the plates pasting
nearly parallel to each other (as shown in Figs.2c and d). When the particles are nearly
parallel the friction between particles is less than when they are perpendicular to each
other. It is resulted that by increasing the concentration of salt, the dominated forces are
Van der Waals forces and it tends to change the formation of deposited particles to
parallel condition which leads to the reduction in strength in comparison with low
concentration.
Fig.7 shows the stress-strain curves for the soils that were deposited in water with
different concentrations of salt and also the samples treated with 5% cement at curing
time of 7 days. As shown in this figure, the final strength of the soil deposited at
concentration of 40 g/L is 353 kPa at 3.6 % strain. By treating the soil with 5% cement
the final strength changes to 2005 kPa to strain of 1.6%. The results show that adding
cement increases the strength and brittleness of the sample and the amount of increase in
strength is dependent on the concentration of salt. The effect of curing time for the soil
with 8% cement that was deposited in saline water with concentration of 80 g/L is shown
in Fig.8 As shown in this figure, the final strength of the treated soil after 7 days curing
time is 1481.7 kPa and it changes to 1940 and 2341 kPa at curing times of 14 and 28 days
respectively. It is seen that curing time is important in increasing the strength of the
treated soil. Fig.9 shows the effect of different percentages of cement in treating soil
deposited in saline water with concentration of 150 g/L at curing time of 28 days. It is
seen from this figure that with 5% cement, the final strength is 681 kPa and it changes to
958 and 1764 kPa with 8 and 10% cement. It is resulted that, at a constant curing time,
increasing the percent of cement causes increase in strength of the soil. When cement is

17
mixed with soil, the resulting reactions can be divided into three stages, namely cation
exchange, cement hydration and pozzolanic reaction. The hydration stage leads to
increase in the pH value of the pore water and production of strong bases. The produced
bases dissolve both aluminium and silicon from the clay minerals and amorphous
material on the clay particle surfaces. During pozzolanic stage, the cementation of the
soil mass is formed. In this stage, the calcium hydroxide in the soil water reacts with
silicates and aluminates (pozzolans) that were liberated in previous stage form cementing
materials. Calcium ions react with dissolved SiO2 and Al2O3 to produce hydrated gel of
calcium silicate hydrate (CSH) and calcium aluminate hydrate (CAH). These gels bind
the soil particles in a manner similar to that produced by the hydration of cement and
form a hard structure so that particles of soil can no longer slide over each other
(Estabragh et al., 2016). This stage increases the strength and reduces the water holding
capacity. The results show that the treatment of soil deposited in saline water is also
possible by cement.
Figs.10a, b and c show the variations of compressive strength with curing time for 5, 8
and 10% cement for samples that were deposited in water with different percentages of
salt. As shown in these figures, increasing the curing time causes increase in strength.
The results indicate that the compressive strength of the soil deposited in water with salt
concentration of 40 g/L and treated with different percentages of cement is more than that
of the corresponding soil-cement mixtures deposited in water and 80, 150 g/L salt
concentrations. By increasing the concentration of salt beyond a certain limit (40 g/L)
there is a reduction in the strength of the soil with different cement contents. At a specific
curing time and salt concentration, increasing in the percent of cement causes increasing

18
in strength. Therefore, the curing time, percent of cement and concentration of salt are
important factors in strength of treated deposited soils.
Fig.11 shows the results of compressive strength at different curing times for different
amounts of salt concentration at constant percent of cement. As shown in Fig.11a, for the
soil treated with 5% cement content, the strength is increased by increasing the
concentration of salt up to about 40 g/L beyond which, further increase in salt
concentration leads to reduction in strength. For the soil deposited in the salt solution
with concentration of 40 g/L, the particles are not parallel to each other because of the
dominated electrostatic forces but for the soils deposited in solutions with 80 and 150 g/L
salt, the particles are nearly parallel to each other due to the dominating Van der Waals
forces. It can be said that the volume of voids for the soil deposited in water solution with
salt concentration of 40 g/L is more than the soil deposited in the solutions with
concentrations of 80 and 150 g/L. The volume of void space is decreased with increasing
the concentration of salt. Therefore, when a specific percent of cement is added to soil
samples with different deposition conditions, it fills the space between the particles. As
shown in Fig.5, adding cement causes reduction in pore size of soil in comparison with
the soil deposited in water (Fig.5a). Since the space for the soil deposited in 40 g/L
solution is more than the soils deposited in 80 and 150 g/L solutions, most of the added
cement fills the voids but for other concentrations a portion of the added cement can fill
the space between particles and the rest of it may cover the surface of particles. This leads
to greater increase in strength for the soil deposited in 40 g/L solution than those in 80
and 150 g/L solutions. Figs. 5c and d show the effect of cement on the microstructure of
soil deposited in salt solutions with concentrations 80 and 150 g/L. It is seen from these

19
figures that the particles of soil are in the form of parallel sheets. The cement pastes these
particles together which leads to the formation of lumped massed with relatively large
voids between them.
This study shows that it is possible to treat clay soils deposited in saline water. An
important factor that should be considered is the concentration of salt in the water in
which the soil is deposited which can change the results of treatment. A high
concentration of salt may not produce a reasonable treatment, while at low degree of
concentration there is a positive effect of the process of cementation and treatment of soil.
Conclusion
The behavior and treatment of a clay soil deposited in natural water and water with salt
concentrations of 40, 80 and 150 g/L by cement as an agent was studied through a
program of experimental tests. The following conclusions can be drawn from this study
based on the experimental results:
- Atterberg limits (LL and PI) of soil deposited in saline water are decreased with
increasing the concentration of salt. The maximum dry unit weight increases and
optimum water content decreases with increasing the salt concentration.
- The strength of soil deposited in saline water is a function of salt concentration.
The strength is higher at 40 g/L and by increasing the concentration to 80 and 150
g/L there is reduction in strength.
- Cement as an agent can improve the behavior of clay soils deposited in saline
water but the amount of improvement is dependent on the salt concentration. The
Atterberg limits of a soil treated with a constant amount of cement are decreased
with increasing the salt concentration. The strength of the treated soil is higher in

20
comparison with the soil deposited in natural water but for the soil deposited in
saline water there is reduction in strength with increasing the salt concentration.
21
References
Benna, M. Kbir-Ariguib, N. Magnin, A. & Bergaya, F. (1999). Effect of pH on
rheological properties of purified sodium bentonite suspensions. Journal of
Colloid Interface Science, 218(2), 442-455.
Bessho, K. & Degueldre, C. (2009). Concentration and sedimentation of colloidal
bentonite particles in water. Applied Clay Science 43(2), 253-259.
Bowders, J. Daniel, D.E. Broderick, G.P. & Liljestrand, H.M. (1985). Methods for testing
the compressibility of clay liners with landfill leachate. ASTM STP 886,
Hazardous and Industrial Solid waste Testing. In 4th Symposium American Society
for Testing Materials, P. 233-250.
Cernica, J.N. (1995). Geotechnical Engineering: Soil Mechanics. John Wiley & Sons,
Inc., USA.
Craig, R.F. (1995). Soil Mechanics. Chapman and Hall, UK.
Dingwen, Z. Libin, F. Songyu, L. & Yongfeng, D. (2013). Experimental investigation of
unconfined compression strength and stiffness of cement treated salt-rich clay.
Marine Georesources Geotechnology 31, 360-374.
Eimanfar, A. & Mohebbi, F. (2007). Saline systems, BioMed, 3(5), 1-8.
Estabragh A.R., Ranjbari, S. & Javadi, A.A. (2017). Properties of a Clay Soil and Soil-
Cement Reinforced with Polypropylene Fibers. ACI, Materials Journal 114 (2),
195-205.
Estabragh, A.R. Khatibi, M. & Javadi, A.A. (2016). Effect of cement on the mechanical
behaviour of a soil contaminated with Mono Ethylene Glycol (MEG). ACI Material
Journal 113 (6), 709-717.

22
Estabragh, A.R. & Javadi A.A. (2008). Critical state for overconsolidated silty soil.
Canadian Geotechnical Journal 45, 408-420.
Foreman, D.E. & Daniel, D.E. (1986). Permeation of compacted clay with organic
chemicals. Journal of Geotechnical Engineering 112(7), 669-681.
Gorakhki, M.H. & Bareither, C.A. (2015). Salinity effects on sedimentation behaviour of
kaolin, bentonite and soda ash mine tailing. Applied Clay Science 114, 593-602.
Imai, G. (1980). Setting behaviour of clay suspension . Soils and Foundations 20, 61-77.
Kaya, A. & Fang, H.-Y. (1997). Identification of contaminated soils by dielectric
constant and electrical conductivity. Journal of Environmental Engineering
123(2), 169-177.
Kaya, A. & Fang, H.-Y. (2005). Experimental evidence of reduction in attractive and
repulsive forces between clay particles permeated with organic fluids. Canadian
Geotechnical Journal 42, 632-640.
Kaya, A. Ören, A.H. & Yukselen-Aksoy, Y. (2006). Setting of kaolinite in different
aqueous environment. Marine Georesources Geotechnology 24 (3), 203-218.
Lintern, D.G. (2003). Influences of flocculation on bed properties for fine grained
cohesive sediment. PhD thesis University of Oxford, Oxford, UK.
Miura, N. Taesiri, Y. Koga, Y. & Nishida, K. (1998). Practical of Improvement of Ariake
clay by mixing admixtures. Proceeding International Symposum On Shallow Sea
and Low land, Saga, pp.159-168.
Modmoltin, C.M. Lu, M.J. & Onistsuka, K. (2004). Influence of humic acid and salt
concentration on lime stabilised and ariake cays and microstructure research.
Chinese Journal of Geotechnical Engineering 26(2), 281-286.

23
Modmoltin, C. & Vootripruex , P. (2009). Influence of salts on strength of cemented
clays. Proceeding of the Institute of Civil Enginnering, Ground Improvement, GI,
15-26.
Moore, J.C. (1973). Effect of sodium chloride treatment on the engineering properties of
compacted earth materials. PhD Dissertation University of Illinois, Champaign-
Urbana, IL
Onitsuka, K. Modmoltin, M. Kouno, M. & Negami, T. (2004). Effect of organic matter
on lime and cement stabilised ariake clay. Journal of Geotechnical Engineering,
ASCE 729, III-62, 1-13.
Palomino, A.M. & Santamarina , J.C. (2005). Fabric map for kaolinite : effect of pH and
ionic concentration on behaviour. Clay and Clay Minerals. 56 (6), 599-611.
Sinat, K. (2006). Influence of storage condition on geotechnical properties of Ariake clay
and on its chemical stabilization. PhD Dissertation Saga University, Saga, Japan
Singh, G. & Das, B.M. (1999). Soil stabilization with sodium chloride. Transportation
Research Record: Journal of Transportation and Research Board 1673,46-55.
Sivakumar, V. (1993). A critical state framework for unsaturated soil. Ph.D. thesis,
University of Sheffield, Sheffield, UK.
Sridharan, A. & Prakash, K. (1999). Influence of clay mineralogy and pore medium
chemistry on clay sediment formation. Canadian Geotechnical Journal 36, 961-
966.
Sridharan, A. El-Shafei, A. & Miura, N. (2000). A study on the dominating mechanisms
and parameters influence the physical properties of Ariake clay. International
Association Lowland Technology Journal 2, 55-70.
24
Sridharan, A. & Prakash, K. (2001). Setting behaviour and clay mineralogy. Soils and
Foundations 4(2), 105-109.
Tremblay H., Duchesne J., Locat J., & Leroueil S. (2002).Influence of the natural of
organic compounds on fine soil stabilization with cement, Canadian Geotechnical
Journal, 39 (3), 535-546.
Van Lier, J.A. Bruyn, P.L. & Overbek, J.T.G. (1960). The solubility of quartz. Journal
physics and Chemistry 64
Van Olphen, H. (1964). Internal mutuial flocculation in clay suspension. Journal of
Colloid and Interface Science 19, 313-319.
Wheeler, S.J., and Sivakumar, V. (1995). An elasto plastic critical state framework for
unsaturated soil. Géotechnique 45(1), 35-53.
Xing, H.F. Yang, X.M. Xu, C. & Ye, G.B. (2009). Strength characteristics and
mechanisms of salt-rich soil-cement. Engineering Geology 103(1-2), 33-38.
Yukselen-Aksoy, Y. Kaya, A. & Ören, A.H. 2008. Seawater effect on consistency limits
and compressibility characteristics of clays. Engineering Geology 102, 54-61.

25
Table 1. Physical and mechanical properties of soil
Property Standard designation Value
Specific gravity, Gs
ASTM D 854-10 2.70
Particle distribution
Gravel (%) 0.0
Sand (%) 12.6
Silt (%) 54.2
Clay (%) 33.2
Consistency limits
Liquid limit, LL (%) ASTM D 4318-10 52.0
Plastic limit, PL (%) ASTM D 4318-10 26.0
Plastic index, PI (%) ASTM D 4318-10 26.0
Shrinkage limit, SL (%) ASTM D 427-04 13.0
USCS classification ASTM D 2487-11 CH
Compaction characteristics
Optimum water content, w
(%)
ASTM D 698-07e
16.3
Maximum dry unit weight,
γdmax (kN/m3)
19.0
Table. 2 Chemical components of soil
Chemical
component
Amount Chemical
component
Amount
pH 8.4 Mg2+ (meq/L) 6.0
EC* (dS/m) 13.90 Cl- (meq/L) 49.0
Na+ (meq/L) 142.0 HCO3- (meq/L) 7.5
Ca2+ (meq/L) 21.0 SO42- (meq/L) 112.0
• Electrical Conductivity

26
Table. 3 Properties of cement
Properties Standard designation Value
Normal consistency (%) ASTM C 187-10 27.3
Primary setting time (min) ASTM C 191-08 90
Final setting time (min) ASTM C 191-08 220
Compressive strength
(MPa)
7days
ASTM C 109-08
26.3
Tensile strength (MPa)
7 days
ASTM C 190-85
2.8
Flexure strength (MPa)
7 days
5.2

27
0
5
10
15
20
25
30
35
0.001 0.01 0.1 1 10 100
Water 40 g/L NaCl
80 g/L NaCl 150 g/L NaCl
Fig.1. Variations of sediment with setting time for soil suspension in water and water
with different salt concentrations
Time (hour)
T
hic
knes
s of
sedim
ent
(cm
)

28
(a) (b)
(c ) (d)
Fig.2 . SEM images of various soil sediments in (a) water and in; (b) 40 g/L ; (c ) 80 g/L
and (d) 150 g/L NaCl solutions
Particles
Pores
Particles
Pores
Particles
Pores
Particles
Pores

29
0
10
20
30
40
50
60
0 50 100 150
LL of SoilPI of SoilLL for soil with 10% cementPI for soil with 10% cement
Fig.3. Variations of Atterberg limits for soil and treated soil at different salt
concentrations
Concentration (g/L)
W
ater
conte
nt
(%)
30
15
15.5
16
16.5
17
17.5
0 50 100 150
Soil
Soil+ 8% cement
(a)
18
19
20
21
22
23
24
25
0 50 100 150
Soil
Soil + 8% cement
(b)
Fig.4. Compaction parameters a) maximum dry unit weight, b) optimum water content
for soil and treated soil at different salt concentration
Concentration (g/L)
M
axim
um
dry
unit
wei
ght
(kN
/m3)
Concentration (g/L)
Wat
er c
onte
nt
(%)

31
(a) (b)
(c) (d)
Fig.5. SEM images of various soil sediments treated with 8% cement at curing time of 7
days for: (a) soil deposited in water ; (b) soil deposited in 40 g/L ; (c ) 80 g/L and
(d) 150 g/L NaCl solutions.
CSH CSH
CSH
CSH

32
0
50
100
150
200
250
300
350
400
0 2 4 6 8 10 12
Water
40 g/L
80 g/L
150 g/L
Fig.6. Stress-strain curves for soil deposited at different salt concentrations
0
500
1000
1500
2000
2500
0 2 4 6 8 10 12
water 40 g/L80 g/L 150 g/L5% cement+ water 5% cement+40 g/L5% cement+80g/L 5% cement+150 g/L
Fig.7. Stress-strain curves for soil deposited at different salt concentrations and treated
soil with 5% cement at curing time of 7 days
Strain (%)
A
xia
l st
ress
(kP
a)
Strain (%)
Axia
l st
ress
(kP
a)

33
0
500
1000
1500
2000
2500
0 1 2 3 4 5 6 7
80 g/L 7 days
14 days 28 days
Fig.8. Stress-strain curves for soil deposited at 80 g/L salt solution and treated with 8%
cement at different curing times
0
200
400
600
800
1000
1200
1400
1600
1800
2000
0 2 4 6 8 10 12
150 g/L
5% cement
8% cement
10% cement
Fig.9. Stress-strain curves for soil deposited at 150 g/L salt solution and treated with
different percentages of cement at curing time of 28 days
Strain (%)
Axia
l st
ress
(kP
a)
Strain (%)
Axia
l st
ress
(kP
a)

34
0
500
1000
1500
2000
2500
3000
0 5 10 15 20 25 30
No Salt 40 g/L
80 g/L 150 g/L
(a)
0
500
1000
1500
2000
2500
3000
3500
4000
0 5 10 15 20 25 30
No Salt 40 g/L80 g/L 150g/L
(b)
Curing time (day)
Str
ength
(kP
a)
Curing time (day)
S
tren
gth
(kP
a)

35
0
500
1000
1500
2000
2500
3000
3500
4000
0 5 10 15 20 25 30
No Salt 40 g/L
80 g/L 150 g/L
(c )
Fig.10. Strength-curing time curves for treatment of deposited soil with a) 5% cement, b)
8% cement c) 10% cement
0
500
1000
1500
2000
2500
3000
0 50 100 150
7 days
14 days
28 days
(a)
Curing time (day)
S
tren
gth
(kP
a)
Concentration (g/L)
S
tren
gth
(kP
a)

36
0
500
1000
1500
2000
2500
3000
3500
4000
0 50 100 150
7 days
14 days
28 days
(b)
0
500
1000
1500
2000
2500
3000
3500
4000
0 50 100 150
7 days
14 days
28 days
(c )
Fig.11. Strength-concentration curves for treatment of deposited soil at different curing
times a) 5% cement, b) 8% cement c) 10% cement
Concentration (g/L)
Str
ength
(kP
a)
Concentration (g/L)
S
tren
gth
(kP
a)